RchyOptimyx: Cellular hierarchy optimization for flow cytometry
Upload
khangminh22Category
view
1download
0
Flow Cytometry Based Screening System for Finding
and Improving Bioindustrial Important B
Date of Defense: 4th
of December, 2009
School of Engineering and Science
Flow Cytometry Based Screening System for Finding
and Improving Bioindustrial Important Biocatalysts
Cytochrome P450 BM3 by
Milan Blanusa
A thesis submitted in partial fulfillment
of the requirements for the degree of
Doctor of Philosophy
in
Biochemical Engineering
Approved, Thesis Committee
_______________________________________________
Prof. Dr. Ulrich Schwaneberg
RWTH Aachen University, Aachen
Jacobs University Bremen, Bremen
___________________________________
Prof. Dr. Sebastian Springer
Jacobs University Bremen, Bremen
_______________________________________________
Prof. Dr. Harald Gröger
University of Erlangen-Nuremberg, Erlange
of December, 2009
School of Engineering and Science
Flow Cytometry Based Screening System for Finding
iocatalysts –
____________________________
_______________________________________________
____________________________
Nuremberg, Erlangen

Page | 2
Table of contents
Acknowledgements
Abbreviations
Abstract
Overview of the Thesis
1. Introduction ...................................................................................................................... 8
1.1 Directed evolution and rational design ..................................................................................... 8
1.2 High throughput and ultra high throughput screening systems ............................................... 9
1.3 Ultra high throughput screening and directed evolution using double emulsions and flow
cytometry ........................................................................................................................................ 14
1.4 P450 monooxygenases (P450s) and Cytochrome P450 BM3 (Cyt P450 BM3) as a model
System ............................................................................................................................................. 19
1.5 Metagenome libraries: a source for novel enzyme activity ...................................................... 30
2. Phosphorothioate based Ligase-Independent Gene cloning (PIGe) and application in cloning of
Cyt P450 BM3 ........................................................................................................................ 31
2.1 Introduction ............................................................................................................................... 31
2.2 Materials and methods ............................................................................................................. 33
2.3 Results and discussion ............................................................................................................... 44
2.4 Conclusion ................................................................................................................................. 53
3. Expression and purification of Cyt P450 BM3 ...................................................................... 55
3.1 Introduction ............................................................................................................................... 55
3.2 Materials and methods ............................................................................................................. 58
3.3 Results and discussion .............................................................................................................. 62
3.4 Conclusion ................................................................................................................................. 66
4. Coumarine based substrates for high throughput screening of Cyt P450 BM3 activity in microtiter
plates (MTPs) and by flow cytometry in double emulsions ..................................................... 68
4.1 Introduction .............................................................................................................................. 68
4.2 Materials and methods ............................................................................................................. 71
4.3 Results and discussion .............................................................................................................. 80
4.4 Conclusion ................................................................................................................................ 109
5. Development of ultra high throughput screening system based on flow cytometry and double
emulsions for directed evolution of Cyt P450 BM3 ................................................................. 112
5.1 Introduction .............................................................................................................................. 112
5.2 Materials and methods ............................................................................................................. 113
5.3 Results and discussion ............................................................................................................... 116
5.4 Conclusion ................................................................................................................................. 123
6. Screening the metagenome libraries using flow cytometry and double emulsions: the source of
novel P450 activity ................................................................................................................ 124
6.1 Introduction .............................................................................................................................. 124
6.2 Materials and methods ............................................................................................................. 125
6.3 Results and discussion .............................................................................................................. 126
6.4 Conclusion ................................................................................................................................ 130
7. Future outlook .................................................................................................................. 131
8. References ........................................................................................................................ 133
Supplementary data

Page | 3
Acknowledgements
This Thesis is a product of three-year-long
research in the field of directed evolution of Cyt P450
and development of ultra high throughput technology
based on flow cytometry and double emulsion. In this
Part I would like to acknowledge all the people who
contributed to this work in any way; people who
helped me with mental, scientific as well as financial
support and people who helped me ease my long time
here in Bremen.
First, I would like to thank my professor and
supervisor Ulrich Schwaneberg, for his courage to
accept me in his group, for his guidance and help
through these three years. I know that most of the
time I was a difficult person to work with but Uli had a
great deal of patience and confidence in me and gave
me freedom to pursue my scientific interests. This I
could not have found in many other places. At the end
we had very fruitful collaboration and I hope it will
continue wherever each of us ends up.
I am grateful to my project coordinator, Dr.
Radivoje Prodanovic, for his unselfish help in scientific
work. Long discussions and never ending scientific
quarrels always ended up with some good results,
problem solutions and ideas. At the end, I would like
to thank him not just as a scientist but as a friend for
always being there for me.
I am grateful to Raluca Ostafe and Ran Tu
who worked together with me on this hard project.
They were truly good coworkers always participating
in fruitful discussions and having fresh ideas. I think
that without our team work this project would not
have been so successful. Raluca will always, besides
being my colleague, remain one of my dearest friends.
Additionally, I would like to thank Frank
Niehaus and Jürgen Eck, our collaborators from
B.R.A.I.N. AG for their help in writing the project,
putting together endless reports and supplying us with
metagenome libraries needed for experimental work.
I would like to thank my committee members
Prof. Springer and Prof. Krüger for accepting to read
my thesis. Their advice and criticism will help me to
improve my constructive and writing skills in the
future.
I would like to acknowledge BMBF:
Bundesministerium für Bildung und Forschung for
financial support of this project.
I would specially like to thank to my all-time-
best colleague, my flat mate and my friend Jovana
Grujic for her unconditional help in every aspect of my
life. I think I would have never had the strength to
push this PhD as far as I did, without you. Thank you
for your support in those hard moments, and we both
know we had them a lot in the first two years. I would
like to thank the Serbian group members and friends
Dragana and Ljubica, for the scientific help but also for
all those small gossips in Serbian. They truly made my
time in the group more pleasant. I miss you both.
My students: Hengameh, Tsvetan, Vladimir,
Alexey and Jacob deserve special gratitude. They
spent a lot of time under my guidance and I hope it
was worth their while. I hope that I was able to give
them at least a little bit of knowledge and experience
that will help them on their future path.
I would like to thank my ex-colleagues: Tuck,
Ziwei, Carmen and Ozana for their help in getting to
know the lab and adapting to studies at International
University Bremen, at that time. Also, people who
spend most of their time in the lab together with me –
the Schwaneberg group – Aala, Aamir, Amol, Arcan,
Dominik, Guray, Hemanshu, Jan, Kang Lan, Katja,
Krishna, Lei Lei, Li-Quing, Marko, Matthias, Noor,
Pravin, Ronny, Saskia, Zhenwei and Ying ying. Thank
you guys you are really great. Special thanks need to
go to Andreea.
Specially, I would like to thank Marina and
Daniela. Without them my practical work, in the lab,
would be impossible.
These people played a special role in my life,
not as much in Bremen as in the period before. They
helped me to become a person and a scientist I am
now and I will be forever grateful to them. Biljana,
without you I would have never finished my basic
studies, never learnt how to push things in life and
how to truly fight. You will forever remain my best
and dearest friend, no matter where I am. Milice, I
need to say thanks to you too. Without our “wonder

Page | 4
trio” energy at University we would have never
achieved what we have until today.
J, for you I can not even put my words here. I
hope you know what you mean to me. Your love and
guidance in the last years have meant a great deal to
me. I can not and do not want to spend any moment
of my life without you.
Finally, I would like to thank my parents,
Gordana and Milovan for believing in me from the
beginning. I know I was not a role-model-child but this
never stopped them to teach me about right things in
life and how to discover what I really want. I would
have never made it anywhere without them and I can
not even express my gratitude in words.
Putting together this Thesis took a lot of
mental and physical effort and I apologize if I forgot to
mention someone in these Paragraphs. Once more - I
apologize.

Abbreviations
4-MU = 4-metyl umbelliferone
ALA = aminolevulinic acid
Amp = Ampicillin
BCA = Bicinchoninic acid
BCC = 7-benzoxy-3-carboxy coumarin methyl ester
BCC Acid = 7-benzoxy-3-carboxy coumarin
CFU = Colony Forming Unit
CV = Column Volume
Cyt P450 BM3; P450 BM3; BM3 = Cytochrome P450
BM3
DBCC = 7-benzoxy-3-carboxy coumarin benzyl ester
DMSO = dimethyl sulfoxide
EDTA = ethylenediaminetetraacetic acid
EGFP = Enhanced Green Fluorescent Protein
FACS = Fluorescence Activated Cell Sorting
FAD = Flavin Adenine Dinucleotide
FMN = Flavin Adenine Mononucleotide
FPLC = Fast Protein Liquid Chromatography
FRET = Fluorescence Resonance Energy Transfer
FSC = Forward Scattering
HTS = High Throughput Screening
IPTG = Isopropyl β-D-1-thiogalactopyranoside
IVC = in vitro compartmentalization
Kan = Kanamycin
LB media = Luria-Bertani media
LIC = ligase independent cloning
MSC = Multiple Cloning Site
MTP = micro-titer plate
NADPH = Nicotinamide Adenine Dinucleotide
Phosphate (reduced)
NMR = Nucleic Magnetic Resonance
OD600 = Optical Density at 600 nm
PAA = polyacryl amide
PBS = Phosphate Buffer Saline
PCR = Polymerase Chain Reaction
PEG = Polyethylene glycol
PIGe = Phosphorothioate based Ligase-Independent
Gene Cloning
PMB = Polymixin B Sulphate
PMBN = Polymixin B Sulphate Nonapeptide
pNCA = para- Nitrophenoxycarboxylic Acid
RP-HPLC = Reverse Phase High Pressure Liquid
Chromatography
RPM = rotations per minute
SB buffer = sodium borate buffer
SDS-PAGE = sodium dodecyl sulfate polyacrylamide
gel electrophoresis
SSC = Side Scattering
TAE buffer = tris, acetic acid, EDTA buffer
TB media = Terrific broth media
TE = transformation efficiency
TEA = N,N,N-Triethylamine
TLC = thin layer chromatography
UV = ultra violet
`

Abstract
Directed evolution presents one of the most common ways of tailoring biocatalysts
for a certain application, especially when the information about the structure of biocatalyst
is lacking. It consists of iterative cycles of diversity generation, on genetic level, and
screening for the target property using a specific screening system. One of the “bottle-
necks” of directed evolution experiment is the throughput of currently available screening
systems. Recently, a new technology based on double emulsions and flow cytometry/FACS
enabled screening for the enzyme activity with ultra high throughput (>109 clones per round
of directed evolution). In this work, we have optimized this technology for directed evolution
of bacterial enzyme, Cytochrome P450 BM3. With no fluorescent detection assay available,
the novel coumarine based substrates had to be synthesized. The assay was optimized in the
microtiter plate and emulsion format using F87A/R471C variant of BM3, which was showing
activity with all the substrates. Finally, the screening system was employed in one round of
directed evolution for the increase in activity towards novel coumarine substrates. Library
containing >105 different variants was screened in the matter of hours and improved
variants were enriched in three rounds of enrichment/sorting process using Partec CyFlow
Space flow cytometer. Three selected variants have been kinetically and genetically
characterized. The best variant showed ~14 times improvement compared to the starting
variant, F87A/R471C. Numerous amino acid changes have been found and their role in
improvement of activity was postulated. Finally, libraries containing random genes isolated
from different habitats (metagenome libraries) were screened in search of novel P450
activity. As a conclusion, a powerful ultra high throughput system has been optimized for
directed evolution of Cytochrome P450 BM3. This system, in future, will allow us to probe
much higher clone numbers in less time, allowing the new methods for high diversity library
generation to be employed.

Page | 7
Overview of the thesis
Work in this Thesis is summarized in six main Chapters. Each Chapter is describing a part of
the “big puzzle”, but on the other hand each Chapter is written as self-explanatory, containing all
data relevant for its understanding separately from all others chapters. In each Chapter short
Introduction is followed by Materials and methods, summarizing all experimental procedures used;
Results and discussion summarize all relevant data and give critical view of our findings while
Concussions in short describe the main achievements and future prospects of each Chapter.
Chapter one contains all introductory information necessary for understanding the topic of
this Thesis. In short high- and ultra- high throughput methodology is described, together with the
detailed background of the model enzyme used in this research – Cytochrome P450 BM3.
Chapter two introduces new cloning method based on Ligase-Independent Cloning (LIC) and
phosphorothioate bond cleavage with iodine (PIGe). It gives an overview of steps taken to design the
cloning method itself, proof of principle of each of these important steps (phosphorothioate bond
cleavage, cloning using phosphorothioated primers) and it describes in detail the applicability of the
method under different conditions (iodine concentration, vector/insert concentration etc.) for
cloning of three target genes. Finally, it describes the applicability of the PIGe method for cloning of
Cyt P450 BM3 and library construction for directed evolution experiments.
Chapter three summarizes the achievements in the optimization of expression of Cyt P450
BM3 using pET28 and pALXtreme vectors. The optimized protocol for an ion-exchange
chromatography using DEAE matrix is also described here.
Chapter four contains all information about synthesis of novel Cyt P450 BM3 substrates and
assay establishment. All synthesis protocols and substrate characterization are described in detail.
Establishment of the assay in MTP and emulsion format is described as well as using di-benzyl
substrate for the single cell analysis/sorting.
Chapter five is the most important chapter summarizing all the achievements of the previous
chapters into ultra-high throughput methodology for directed evolution of Cyt P450 BM3. Detailed
protocol for library and emulsion preparation is given here, as well as protocol for the flow cytometry
screening/sorting of the libraries. Main results are summarized and validated using the MTP screen.
The variants of BM3 with novel critical positions are isolated and characterized.
Chapter six focuses on application of the ultra-high throughput methodology in the
metagenome library screening. This is the first report of this technology applied in this, still new and
unexplored field.
Summary of the Thesis contains summary of the work as well as plans and ideas that might
be inspired by work in this Thesis.

Page | 8
1. Introduction
1.1 Directed evolution and rational design
In the last decade the biocatalysts are becoming a very useful tool in the synthesis of
different complex compounds, offering many advantages compared to classical chemical
methods (1). Principal benefits include stereo-, regio- and chemo-selective conversions of
molecules under mild reaction conditions (pH, pressure and temperature). On the other
side, bioindustrial application includes large scale application under the conditions which are
rarely ideally suited for maintaining highly active and long lasting enzymes. Therefore the
biocatalysts useful for that kind of application are not easily found in nature. Few
approaches of which two showed most success, directed evolution and rational design, have
been used to alter the properties of biocatalysts in a matter to make them more suitable for
harsh conditions of industrial bioreactors. The most popular properties to evolve by directed
evolution have been: activity, substrate specificity, thermal and oxidative stability, enantio-
selectivity or enantio-specificity, pH range and tolerance to different solvents.
Rational design relies on the knowledge of enzyme structure and function; one or
more amino acids changes are predicted which are suppose to elicit desired improvements
on enzyme structure and activity. The knowledge about enzyme function/structure
relationship is based on: bioinformatics analysis of the protein sequences and amino acid
properties, generalized rules derived from studying the effect of certain mutations on
protein structure/activity and implementation of molecular potential functions which are
enabling us to predict the effect of certain mutations on protein structure/activity. Rational
design is highly dependant on the property/ies of the enzyme which wants to be evolved. In
some cases general rules might be applied (i.e. increasing the stability of protein) while
sometimes specific knowledge is needed (i.e. when changing substrate specificity). In the
latter case knowledge about catalytic residues and their interaction in catalysis is necessary.
So far many success stories exist about using rational design to improve conformational
stability (i.e. with introducing disulfide bonds), making membrane proteins more soluble (i.e.
by removing their hydrophobic domains) and recently also in de novo protein design where
new binding properties or even new activity have been introduced into existing protein
structure.
Directed evolution is, on the other hand, imitating the natural process of evolution
based on random mutagenesis and sexual recombination. In laboratory conditions directed
evolution is based on iterative cycles of diversity generation followed by screening for
desired improved property. After improved variants have been indentified their genetic
material is used for another round of diversity generation. Cycles are repeated until desired
trait is achieved (Figure 1).

Page | 9
Figure 1 Scheme of directed evolution experiment. Taken over from (2).
Two most important requirements for one successful directed evolution experiment
are: a) screening or selection system which is able to identify desired hits in the library and
b) the appropriate mutagenesis strategy which could generate improvements of desired
property on genetic level. These two requirements will be further discussed in details trough
certain Chapters of this Thesis.
The ability to isolate variants from larger libraries will increase the chances of finding
the variant with desired improved property. This demonstrates the importance of high
diversity generation methods and even more importance of high throughput (103-10
6), ultra
high throughput (>109) and selection (10
14) screening systems. High throughput screening
systems are normally based on microtiter plate or solid phase screening. They are easy to
optimize, cost-effective and reproducible but still limited to screening low number of clones.
Ultra high throughput screening systems are based on flow cytometry or display technology
(phage/cell display). Their throughput is much higher but they are either limited to
fluorescence detection or screening the affinity rather than activity of the protein. Selection
based methods posses the highest throughput but they can be applied only in specific cases;
this approach rarely can be generalized. Advantages and disadvantages of these approaches
will be discussed in detail in the next part of the Introduction as well as in Chapter 4 of this
Thesis.
1.2 High throughput and ultra high throughput screening systems
High throughput and ultra-high throughput screening systems present the core of
directed evolution experiments. Most commonly HTS systems employ microtiter plate
screens and solid phase systems (agar, filter paper or nylon/nitrocellulose membranes) with
ATGGATGCGCTGA.................................GCTACTGGTCAGTAATACCTACGCGACT..................................CGATGACCAGTCATT
GENE ENCODING PROTEIN OF INTEREST
MUTANT LIBRARY
ATGGATGC CTGA.................................GCTACTGGTCAGTAATACCTACG GACT..................................CGATGACCAGTCATT
ATGGATGCGCT A................................. GCTACTGGTCAGTAATACCTACGCGA T..................................CGATGACCAGTCATTATGGATGCGCTGA.................................GCTACTGGT C GTAATACCTACGCGACT................................. CGATGACCAG CATT
ATGGATGCGCTGA.................................GCTA TGGTCAGTAATACCTACGCGACT..................................CGAT ACCAGTCATT
AT
GC
TA
CG
Step 2: Screening for improved variants
(10 to >10 )2 7
IMPROVED MUTANT(few)
Step 3: Iterative cycle
START
DESIRED VARIANT
DIRECTEDEVOLUTION
Step 1: Genetic diversity generation(400 amino acid
20 possibilities)→400

Page | 10
a throughput of 103-10
6. These systems are predominantly used for improving the enzyme
properties but not affinity. Ultra-HTS systems become more popular recently due to their
higher throughput (>107-10
9). They are based either on flow cytometry and in vitro
compartmentalization technology in double emulsions (3) or display technology (Table 1).
Table 1 Overview of screening systems. Taken over from (2).
Method Through-
put Principle Main advantages Main disadvantages
GC/LC-MS,
NMR,
HPLC
102 – 10
4
- Increased throughput of
”classical” analytical
methods ; often adapted to
sampling in 96-well plate
format
- Enantioselective
analytics
- Significant investments in
equipment and comparably
high running costs
- Low throughput
Microtiter
plate
103 – 10
5
- Colorimetric or
fluorometric reaction
performed for each
individual clone in each
well of a microtiter plate
- Quantitative
information derived for
individual variant
- Accurate
- High expenses
- Medium throughput
- Laborious
Solid phase 104 – 10
6
- Screening on a solid
surface such as agar plates,
filter papers or membrane
- High-throughput
- Low costs
- Comparably low accuracy;
often used as prescreen for
qualitative/ semi-
quantification of activity
Flow
cytometry >10
7
- Sorting of individual cells
based on the generated
fluorescence
- Ultra high throughput
- Cells are directly
isolated after screening
(no replica required)
- Mode of detection
limited to fluorescence
- Comparably low accuracy
due to dye diffusion and
variation in catalyst
expression per cell
Phage/cell
display >10
7
- Proteins are display on
the phage/cell surface
providing phenotype and
genotype linkage
- Ultra high throughput
- Powerful for
improving protein
affinities
- No general use as many
enzymes cannot be
displayed in active form
- Limited applications for
improving enzyme activity
Screening systems for oxygenases can be developed in a way that they detect: a)
cofactor or cosubstrate; b) use surrogate substrates or c) detect product formation (Figure
2). Detection of cofactors (NADH, NADPH) or cosubstrates (oxygen) presents a universal
detection system used for different substrates but still suffer from disadvantage of high
background, especially when using whole cell systems. Surrogate substrates are very
applicable for directed evolution of oxygenases (thermostability, co-solvent resistance etc.)
but problem arises in structure of surrogate substrate which is usually different than that of
the natural one. Product formation is difficult to screen in most of the cases. Usually low- or
medium throughput systems have to be employed (HPLC, NMR, GC-MS).

Page | 11
Figure 2 Reaction scheme for oxygenases with marked possible detection spots; cofactor or cosubstrate detection (blue)
and surrogate substrate or product formation detection (red). Adapted from (2).
Screening systems based on cofactor or cosubstrate detection are generally
applicable, which is one of their main advantages. They can be used for screening the activity
of oxygenases with their real substrates. NAD(P)H consumption is a continuous assay that
can be monitored by the decrease of absorbance at 340 nm. Also, fluorescence detection is
possible (ex. 360 nm, em. 460 nm) which increases the sensitivity of the assay (4).
Disadvantage of this assay is high background when using whole cell system. Detecting
oxygen has also general applicability as for previously mentioned assay. Commercially
available oxygen-sensitive fluorescence probes are now available. These probes have been
incorporated into 96- and 384-well MTP which are commercially available and can be used
directly for screening (OxoPlate). Concentration of oxygen is in this case inversely
proportional to detected fluorescence. Recently this system has been used, in medium
throughput format, for the detection of P450 activity with different substrates (5). Detection
of peroxides, as a driving force for P450s, is also possible due to existence of so called “shunt
pathway”(6). The only disadvantage is low stability of P450s towards peroxides so this
property had to be evolved by means of directed evolution (7).
Surrogate and product based screening systems have been developed and validated
for hydroxylation of fatty acids, alkanes and aromatic compounds. These systems include: p-
nitrophenyl surrogate substrates for fatty acids (p-nitro carboxylic acid, pNCA), dimethyl
ether (DME), hexametyl ether (HME) and coupled alcohol dehydrogenase (ADH) assay.
Mentioned systems are based on spectrophotometric detection (by release or formation of
chromophore). Systems based on fluorimetric detection include: screening systems based on
coumarine or resorufin probes. For aromatic compounds following detection systems have
been developed: 4-aminoantioyridine (4-AAP) assay, a Fast Blue B assay, a catechol
detection assay, HRP coupled assay and Gibbs assay. All these assays are nicely summarized
in review article by Tee at al. (2). In this Thesis only most important assays will be discussed
in detail.
O2 H O2
NAD(P)H NAD(P)+
HO
OH
OH
O
Hydroxylation(Assays: -nitrophenyl surrogates;
ether surrogates; ADH coupled assay; coumarin and resorufin surrogates;
4-AAP assay; HRP-coupled assay;catechol assay; Fast Blue B;
Gibbs assay)
p
Dihydroxylation(Assays: Gibbs assay; Catechol
assay; Biphenyl assay; HRP-coupledassay)
Epoxydation(Assays: NBP assay; pNTP assay)
Modelsubstrate

Page | 12
The first continuous screening assay for monitoring fatty acid hydroxylation, p-
nitrocarboxylic acid (pNCA) assay, was developed by Schwaneberg et al. It has been
developed for F87A variant of Cyt P450 BM3 which showed nearly exclusive terminal
hydroxylation.
Figure 3 Principle of pNCA assay developed by Schwaneberg et al. for terminal hydroxylation activity of Cyt P450 BM3
F87A .
The assay is based on terminal hydroxylation of pNCA leading to formation of
instable hemiacetal (Figure 3). This hemiacetal dissociates and releases a chromophore, p-
nitrophenolate, which can be monitored continuously at 410 nm. The pNCA assay has a
reported standard deviation of 10-13 % and linear detection range of 0.03-0.3 mM for F87A
variant of Cyt P450 BM3 (8). This screening system has been reported in various directed
evolution experiments: increasing activity towards non-natural substrates (9),
thermostability (10), hydrogen peroxide tolerance (7), co-solvent resistance (11) and
mediated electron transfer (12).
Figure 4 Overview of fluorogenic substrates for mammalian Cyt P450 activity screening. Taken over from (2).
O
NO2
p-nitrophenyl
surrogate
Rn
O
NO2
RnHO
unstable hemiacetal
dissociation
O-
NO2
p-nitrophenolate
(yellow product)
+RnH
OP450 BM-3
NADPH + H+
NADP+
H2O O2
n = 5 to 8
R: - COO-
- H
OO
FF
F
O
7-ethoxy-4-trifluoro-
methylcoumarin
OO
N
O
7-methoxyresorufin
OO
coumarin
OO OH
7-hydroxycoumarin
(fluorescent product)
OO
N
OH
7-hydroxyresorufin
(fluorescent product)
OO
FF
F
OH
7-hydroxy-4-trifluoro-methylcoumarin
(fluorescent product)
+ CH3OH
CH3CH2OH+
Page | 13
Most system developed for mammalian P450s are based on O-dealkylation of
substrate molecule generating fluorescent product (Figure 4). Fluorescence is a requirement
for screening of mammalian P450 due to their low conversion rate. Detection in this case is
possible using whole or permeabilized cells but in same cases media exchange is needed to
minimize the background. Most of the fluorescence assays allow continuous monitoring.
Some of these assays have been reported in directed evolution experiments (Table 2).
Table 2 Fluorescence based screening system for mammalian P450 employed in directed evolution experiments. Adapted
from (2).
Detection system
(Mode of operation; detection limit under assay
conditions)
Oxygenase
(Improved property(ies)) Reference
7-ethoxy-4-trifluoromethyl coumarin surrogate
(continuous; not reported )
P450 2B1 from rat liver
(activity for 7-ethoxy-4-trifluoromethyl
coumarin)
(13)
7-methoxyresorufin surrogate
(continuous; not reported)
P450 1A2 from human
(activity for 7-methoxyresorufin) (14)
Coumarin hydroxylation
(continuous; not reported)
P450 2A6 from human
(activity for coumarin hydroxylation) (15)
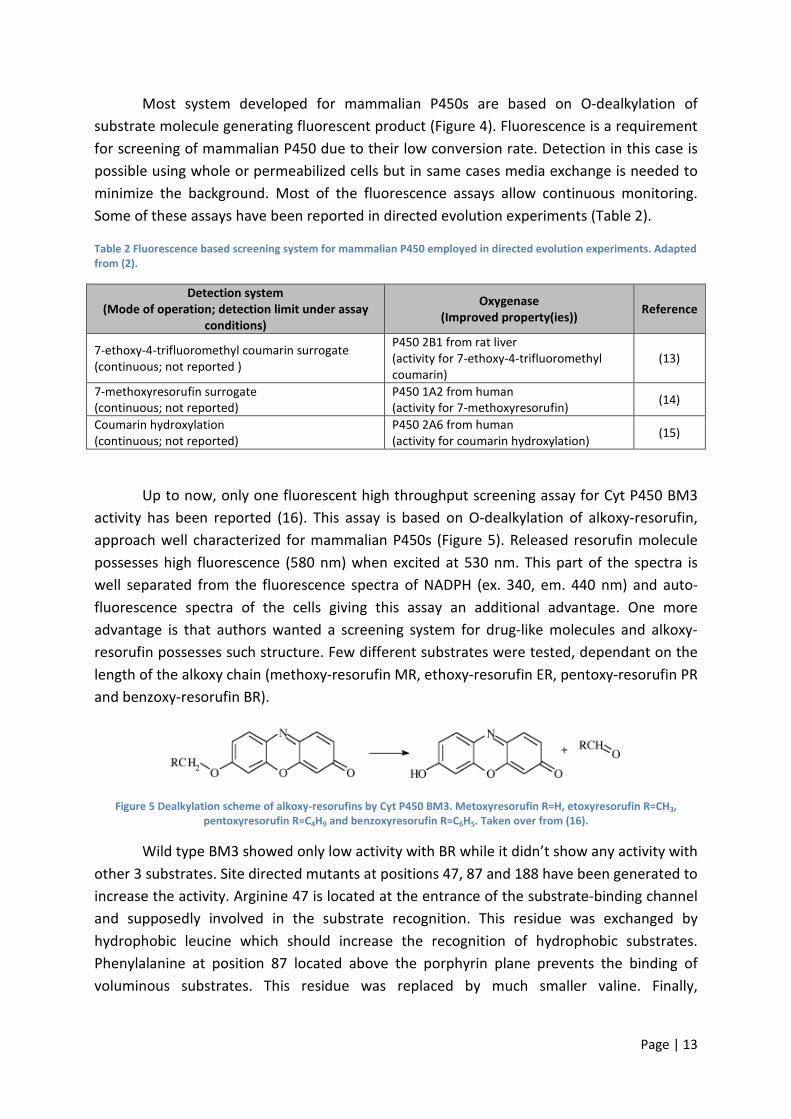
Up to now, only one fluorescent high throughput screening assay for Cyt P450 BM3
activity has been reported (16). This assay is based on O-dealkylation of alkoxy-resorufin,
approach well characterized for mammalian P450s (Figure 5). Released resorufin molecule
possesses high fluorescence (580 nm) when excited at 530 nm. This part of the spectra is
well separated from the fluorescence spectra of NADPH (ex. 340, em. 440 nm) and auto-
fluorescence spectra of the cells giving this assay an additional advantage. One more
advantage is that authors wanted a screening system for drug-like molecules and alkoxy-
resorufin possesses such structure. Few different substrates were tested, dependant on the
length of the alkoxy chain (methoxy-resorufin MR, ethoxy-resorufin ER, pentoxy-resorufin PR
and benzoxy-resorufin BR).
Figure 5 Dealkylation scheme of alkoxy-resorufins by Cyt P450 BM3. Metoxyresorufin R=H, etoxyresorufin R=CH3,
pentoxyresorufin R=C4H9 and benzoxyresorufin R=C6H5. Taken over from (16).
Wild type BM3 showed only low activity with BR while it didn’t show any activity with
other 3 substrates. Site directed mutants at positions 47, 87 and 188 have been generated to
increase the activity. Arginine 47 is located at the entrance of the substrate-binding channel
and supposedly involved in the substrate recognition. This residue was exchanged by
hydrophobic leucine which should increase the recognition of hydrophobic substrates.
Phenylalanine at position 87 located above the porphyrin plane prevents the binding of
voluminous substrates. This residue was replaced by much smaller valine. Finally,

Page | 14
hydrophobic leucine at position 188 was replaced by glutamine. All mutation had an effect
on activity of new variant. These activities with all substrates are summarized in Table 3.
Table 3 Alkoxy-resorufin dealkylation by Cyt P450 BM3 Wt and site-directed variants. Table adapted from (16).
MR ER PR BR
Wt BM3 - - - 0.005
R47L - - - 0.005
R47L/L188Q - - - 0.20
R47L/F87V - - 0.20 0.71
F87V/L188Q - - - 1.44
R47L/F87V/L188Q - 0.012 0.22 4.48 Note: Values are expressed as nanomoles resorufin per minute per nanomole of enzyme. Substrate
concentrations were 10 µM. Enzyme concentrations were 100 nM for BM3 Wt and R47L and 10 nM for other
mutants
Assay was established in 96-well MTP format using partially purified enzyme as well
as the whole cells. LPS deficient strain of DH5α, generated by the authors, showed much
higher response possibly due to much higher transport of the substrate trough the
membrane of E. coli. Also, a high throughput inhibition assay was established and tested on
few commercially available drugs known to inhibit or to be substrates for the human P450s.
1.3 Ultra high throughput screening and directed evolution using
double emulsions and flow cytometry
Ultra high throughput methods (>109) are based either on flow cytometry or
phage/cell display. Latter have much higher throughput, reaching 1014
, but are limited to
screening for the protein affinity, rather than for the activity. Modern flow cytometers
having the possibility to sort >104 events/s, even using multiple parameters, are very
perspective candidates for use in high throughput screening schemes. The challenge which
remains to be solved is to maintain a physical connection between the enzyme, diffusible
product and the enzyme encoding gene (Figure 6).
Figure 6 Overview of methods for maintaining a link between enzyme, diffusible product and enzyme encoding gene.
Taken over from (17).

Page | 15
Few approaches can be applied. Specific case would be when the target reaction
involves modification of the hydrophobic substrate by introducing a charged group. That
way unmodified substrate can be washed out of the cell while product would be retained
within (Figure 6a). One example would be modification of 7-amino-4-chlorometyl coumarin
with glutathione by the action of intracellular glutathione-S-transferase (GST). Product is too
hydrophilic and entrapped within the cell. This approach was used for directed evolution of
GST expressed as intracellular enzyme in E. coli (18). Second approach would be display of
the enzyme on the cell surface and the entrapment of the product on the cell surface at the
same time (Figure 6b). Example would be expression of protease OmpT on the surface of E.
coli cells. FRET substrate (positively charged) that adheres to the membrane of E. coli cells
was used for screening. After cleavage by the protease, quenching group is released leading
to increase in fluorescence on the cells displaying active OmpT. These cells could then easily
be distinguished and isolated by flow cytometry (19). Third approach would include
entrapment of fluorescent products by compartmentalization in emulsion droplets (in vitro
compartmentalization, IVC) (Figure 6c). Technology is based on use of water-in-oil (w/o)
droplets to compartmentalize the gene, the encoded enzyme and reaction product. After
conversion of this primary emulsion into water-in-oil-in-water (w/o/w) emulsions they can
be analyzed and sorted by flow cytometry. This approach has been used for directed
evolution of different enzymes (i.e. endonucleases (20), β-galactosidase (21) and
thiolactonases (22)) and will be discussed in detain in the following Paragraphs.
Generally two approaches exist in IVC regarding weather the enzyme is expressed in
a cell or a cell free system (Figure 7). In one case entire cell expressing the target enzyme is
entrapped within an aqueous phase of primary emulsion while in the latter case only the
gene is entrapped and the enzyme production happens within the emulsion droplet. First
approach is easier to optimize and offers wide range of intracellular expressed enzymes to
be used. Second approach allows us to overcome the transformation efficiency problem of
expression hosts by using genetic material directly in the emulsion droplet.
One successful application of the whole cell system would be directed evolution of
the thiolactonases using double emulsions and FACS (22). In this case, the mutant library was
prepared and transformed into expression host (E. coli BL21-Gold) constitutively expressing
GFP as a cell marker. Cells were entrapped within the aqueous phase of primary emulsion.
Subsequently, substrate (TBL) together with fluorogenic product detection dye (CPM) was
added. Secondary emulsion was prepared, incubated on ice and subsequently analyzed and
sorted by FACS (Figure 8A). Emulsions were prepared by homogenization (Ultra Turax)
employing polymeric detergent ABIL EM-90 in the primary emulsion.
Page | 16
Figure 7 Overview of ultra high throughput screening technology using double emulsion and flow cytometry in whole cell
(b, c and d) and cell free systems (a, c, and d). Taken over from (23).
In the three rounds of sorting library was enriched with active clones (from few
percent of active clones up to ~30 % of active clones). Over 107 mutants were screened by
FACS. After MTP screening and characterization clones with 20-100 times increased activity
compared to the starting clones were isolated. After sequencing, residues responsible for
increased activity were identified (22).
Second, a cell free, approach was successfully used for directed evolution of Ebg
protein into β-galactosidase (21). Generated mutant library was directly entrapped in the
aqueous phase of the double emulsion together with components of the cell free expression
system (Figure 9 1-2). Carboxyl coumarin was used as the internal water phase control dye.
Expressed enzyme converted the fluorogenic substrate and released fluorescein as a product
(Figure 9 3). Green droplets, containing the active enzyme, were analyzed and sorted out by
flow cytometry (Figure 9 4). Isolated genetic material was used in the new round of diversity
generation (Figure 9 5-6). Emulsion formulation was somewhat different from the previously
described method; more adapted to the components of cell free expression system.
Membrane emulsification was used in this case.

Page | 17
Figure 8 Overview of ultra high throughput screening strategy for thiolactonases using double emulsions and FACS (A)
and fluorogenic assay used for product detection (B). Taken over from (22).
Figure 9 Overview of ultra high throughput screening methodology for ββββ-galactosidases using cell free system in double
emulsions. Taken over from (21).

Page | 18
This system allowed screening up to 4 x 10⁷ different variants in every generation.
Finally, the characterized β-galactosidases had 1700-fold increase in kcat/Km compared to the
starting, wild type Ebg. Only two specific mutations were responsible for this remarkable
increase in the activity.
Emulsion offer many advantages compared to standard HTS system. First, it is
possible to generate >1010
discrete compartments per one ml of emulsion. This practically
means that 108 different reaction compartments can be generated (statistically 99/100 have
to be empty to make sure that 1/100 contains only one entity). Using flow cytometry for
analysis and sorting of double emulsions throughput can be increased up to 107-10
9. This can
not be achieved by any standard HTS systems including solid phase screening. Flow
cytometry gives an option for clones to be sorted directly in wells of MTP or on agar plates.
Also multiple parameters can be analyzed simultaneously.
Disadvantage of this method would be it’s limitation to fluorescence detection. Up to
now, the fluorescent assays are still not unavailable for many enzyme classes. Also
equipment needed for fully employing the technique is usually quite expensive.
Overall, having this technology widely applicable could push directed evolution a step
further. Screening the libraries generated with new, high diversity generation methods,
would allow us to screen more protein sequence space simultaneously, draw new
structure/function relationship concussions and eventually develop new, highly improved
biocatalysts.
1.4 P450 monooxygenases (P450s) and Cytochrome P450 BM3 (Cyt
P450 BM3) as a model system
Cytochrome P450s: classification, structure and function
Cytochrome P450 (abbreviated CYP or P450) is a very large and diverse superfamily
of hemoproteins. Usually they form part of multi-component electron transfer chains, called
P450-containing systems. The most common reaction catalyzed by Cytochrome P450 is a
monooxygenase reaction, e.g. insertion of one atom of oxygen into an organic substrate (RH)
while the other oxygen atom is reduced to water:
RH + O2 + 2H+ + 2e
– → ROH + H2O
The name Cytochrome P450 is derived from the fact that these are colored ('chrome')
cellular ('cyto') proteins, with a "pigment at 450 nm", so named for the characteristic Soret
peak formed by absorbance of light at wavelengths near 450 nm when the heme iron is
reduced (often with sodium dithionite) and complexed to carbon monoxide.
Until recently P450s have been categorized into four classes, depending on the
electron transport from NAD(P)H to the active site (24). However, the recently discovered

Page | 19
P450 redox systems have broadened this classification to ten classes which are summarized
in Figure 10 (25).
Mitochondrial and the most bacterial P450s are three component systems
comprising a P450, ferredoxin and NADH-dependent, FAD-containing ferredoxin reductase
(Class I). The best representative of this class would be the most intensively studied -
camphor hydroxylase (P450cam) from Pseudomonas putida. Class II P450s are the most
common ones in eukaryotes and include the microsomal P450s. They are two component
systems, both membrane bound, with a P450 and a NADPH-dependent diflavin reductase
(FAD and FMN). Class III P450s were reported in 2002 as a novel class, strongly resembling
the classical bacterial system i.e. Class I (26). They are also a three component system
consisting of an NAD(P)H-dependant, FAD-containing ferrodoxin, a flavodoxin (as opposed to
ferrodoxin of Class I) and a P450. The class is represented by the novel Cytochrome P450cin
isolated from Citrobacter braakii. Class IV Cytochromes P450 are represented by the soluble
CYP119 identified in the extreme acidothermophilic archeon Sulfolobus solfataricus (27).
This was the first discovered thermophilic Cytochrome P450 and the first example of a P450
enzyme that does not obtain its reducing equivalents from an NAD(P)H-dependent
flavoprotein (28). The novel Class V Cytochromes P450 consist of two separate protein
components: a so far unknown NAD(P)H-dependant reductase and a Cytochrome P450-
ferrodoxin-fusion protein. The only example of this class of P450s is CYP51 isolated from
Methylococcus capsulatus. The class VI Cytochrome P450 system is composed of an
NAD(P)H-dependent flavoprotein reductase and a flavodoxin-P450-fusion protein. The class
is standing somewhere in between the P450 BM3 and P450cin systems, which principally use
the same redox centers – FAD, FMN and heme – but differ in the number and characteristics
of separate proteins comprising the system. The first example of the novel class VI P450s is
the Cytochrome P450-like gene from Rhodococcus rhodochrous strain 11Y (designated as
xplA) (29). The bacterial fusion system of class VII is a completely novel class of P450 systems
with a unique structural organization. The Cytochrome P450 is C-terminally fused to a
phthalate dioxygenase reductase domain. The first class VII Cytochrome P450 to be reported
is the Cytochrome CYP116B2 (P450RhF) from Rhodococcus sp. strain NCIMB 9784. Class VIII
compromises P450s which are fused to their eukaryotic-like diflavin reductase partner in a
single polypeptide chain and are therefore catalytically self-sufficient as monooxygenases.
The most widely studied member of this class of P450s is P450 BM3 from Bacillus
megatherium. The only member of Class IX P450s is nitric oxide reductase. CYP55 (P450nor)
was identified in Fusarium oxysporum as a P450 with particular features. It is a soluble
protein that independent of other electron transfer proteins, uses NADH to reduce two
molecules of nitric oxide to nitrous oxide (30). The P450s of Class X catalyze substrate
conversion using an independent intramolecular transfer system. Enzymes of this family are
localized in membranes of chloroplasts (31) and unlike typical P450 monooxygenases do not
require O2 , the reductase or even the electron source NAD(P)H for the rearrangements of
fatty acid hydroperoxides (32,33). They employ the acyl hydroperoxide of the substrate as
oxygen donor to form C – O bonds.
Page | 20
Sequence identity between classes is very low, less than 20 %. Many of the
mammalian and some prokaryotic P450 have been crystallized. Crystal structure revealed
that highest preservation in sequence and structure was around heme, suggesting the
common mechanism of oxygen activation in all P450s. Highest variability was in the regions
involved in membrane anchoring as well as in substrate binding and recognition, giving an
explanation for such high substrate diversity of this class of enzymes.
Genes for P450s are subdivided and classified on the basis of amino acid identity,
phylogenic diversity and gene organization. P450s originated from Prokaryotes. It is believed
that diversity of P450s family was a result of gene duplication and less frequent gene
amplification, conversions, genome duplication, gene loss and lateral transfer. They can be
found throughout the nature in really surprising number, i.e. Mycobacterium tuberculosis
has 20 P450 genes while E. coli has none; S. cerevisiae has 3 while Drosophila melanogaster
has 83 genes and 7 pseudogenes. Humans have in total 55 P450 genes and 25 pseudogenes
while in plant life they are more common and more diverse; Arabidopsis thaliana has 286
P450 genes.
P450s in their resting (substrate free) state generally exist as a mixture of a hexa-
coordinate low spin Fe(III) heme with a water molecule ligated trans to the endogenous
cysteinate ligand and penta-coordinate high-spin Fe(III) heme with the cysteinate as the only
axial ligand. Substrate binding causes a shift in the equilibrium between two Fe(III) states
favouring the penta-coordinate complex, accompanied by the displacement of the sixth
water ligand and an increase in the heme’s reduction potential. This triggers one electron
transfer, reducing the complex to a ferrous state Fe(II). Oxygen binds to ferrous P450
resulting in an unstable ferrous-oxy species which then accepts the second electron. The
electron transfer steps are believed to be rate-limiting under natural conditions. The
mechanism following the formation of the peroxo-iron species involves incorporation of two
protons and cleavage of the O-O bond, resulting in water formation. The two protons are
pumped into the active site to the distal peroxo-oxygen, with the initial formation of a
hydroperoxo-iron intermediate. The two electrons required for this step come from the
heme, resulting in heme oxidation to an oxy-ferryl, or ironoxo species. Oxygen atom transfer
from the iron-oxo complex to the substrate yields the oxidized product (ROH) and
regenerates the resting state. In the presence of external oxygenation agents like H2O2, the
complex may yield the hydroperoxo-complex via a “shunt” pathway. The catalytic
mechanism is shown in Figure 11.

Page | 21
Figure 10 Schematic organization of different Cytochrome P450 systems. (A) Class I, bacterial system; (B) Class I,
mitochondrial system; (C) Class II microsomal system; (D) Class III, bacterial system; example P450cin; (E) Class IV,
bacterial thermophilic system; (F) Class V, bacterial [Fdx]–[P450] fusion system; (G) Class VI, bacterial [Fldx]–[P450]
fusion system; (H) Class VII, bacterial [PFOR]–[P450] fusion system; (I) Class VIII, bacterial [CPR]–[P450] fusion system; (J)
Class IX, soluble eukaryotic P450nor; (K) independent eukaryotic system, example P450TxA. Taken over from (25).

Page | 22
Figure 11 Catalytic cycle of P450 including the peroxide shunt pathway. RH is substrate, and ROH is product. The
porphyrin molecule is represented as a parallelogram. The overall charge on the structures is shown to the left of each
bracket (Adapted from “Laboratory Evolution of Cytochrome P450 for Peroxygenase Activity” Thesis by Patrick C. Cirino).
Function of P450 is very diverse specially when compared trough different kingdoms
in nature. In Prokaryotes P450s are mostly soluble enzymes. Primary role is catabolism of
compounds used as a carbon source, detoxification of xenobiotics in some extent, fatty acid
metabolism and synthesis of antibiotics. In Eukaryotic organisms Class I P450s are mostly
associated with mitochondrial membrane and catalyze few important steps in steroid
hormone biosynthesis; in mammals additionally vitamin D3 production. This Class is found in
insects and nematodes but not in Plants. Class II P450s are most spread throughout
Eukaryotes. P450 and NADPH-P450 reductase are dissociated and independently anchored
in membrane of endoplasmic reticulum. In some cases it is found that Cytochrome b5 is the
one who enhanced the activity of P450s and conveys electrons from cofactor source
(NAD(P)H). Functions of this Class are extremely diverse. In Funghi they are involved in
synthesis of membrane sterols and mycotoxins, detoxification and metabolism of lipid
carbon sources. In Plants they are involved in biosynthesis and catabolism of all types of
hormones and in oxygenation of fatty acids for the synthesis of cutins. Additionally, many
P450s are involved in pathways of secondary metabolism which involve process of
lignifications, synthesis of flower pigments and defense chemicals. Many of these chemicals
have diverse applications as aromas, flavors, antioxidants and anti-cancer drugs.

Page | 23
Most important role of both classes is detoxification and this role is present in all
organisms. It has been shown that P450s of both classes have contribution in cancerogenesis
and are essential in drug and pesticide metabolism, tolerance, selectivity and compatibility
to some drugs.
Cytochrome P450 BM3 (CYP102A1): structure, mechanism and function
Cytochrome P450 BM3 (Cyt P450 BM3, CYP102) is a 119 kDa water soluble heme
containing enzyme originally isolated from Bacillus megaterium. Interestingly, heme domain
of BM3 is fused to a mammalian like NADPH-diflavin reductase making this enzyme self-
sufficient in catalysis. Catalytic activity is one of the highest among all known P450s (up to
17000 min-1
with arachidonate). Due to these properties P450 BM3 presents an excellent
example for studying factors that govern substrate binding and catalysis as well as electron
transfer from NADPH to catalytic core. Natural substrates for BM3 comprise long chain poly
unsaturated and saturated fatty acids. Conversion of long chain alcohols and amines has also
been reported as natural activity (34). Hydroxylation preferentially occurs at ω-1, ω-2 and
rarely ω-3 position of fatty acid. Natural role of P450 BM3 still remains unclear although
there are some speculations about its involvement in detoxification of poly unsaturated fatty
acids.
The single polypeptide chain of P450 BM3 contains three structural domains that
contain heme, FMN and FAD. Attempts to crystallize full length protein were unsuccessful
possibly due to the presence of very flexible “hinge” region connecting heme and reductase
domains of the protein. On the other hand, structure of heme (35) as well as heme/FMN-
binding complex (36) have been solved. These structures enabled rational investigation of
structure/function relationship in the P450 BM3 by identifying key residues involved in the
substrate binding and catalysis as well as electron transfer from NADPH.
The heme domain of P450 BM3 consists of α and β sub-domains. The heme in the
active site is positioned on the “bottom” of long hydrophobic substrate binding channel
formed predominantly by β sub-domain. Heme porphyrin ring is bound to the rest of the
polypeptide chain trough Cys400 residue, well conserved among other P450s. A number of
different residues have been indentified as the ones having a possible effect on binding or
catalysis. Arg47 and Thr51 are thought to interact with carboxyl group of fatty acid
stabilizing the negative charge of the substrate trough ionic interaction (Arg47) and trough
hydrogen bonding (Tyr51). Phe87 is thought to have the important role on substrate binding
and regioselectivity of oxidation. Phe42 is forming a “cap” on the long hydrophobic substrate
binding pocket. It is believed that this residue has important role on substrates binding (37).
Structure of heme domain is shown on Figure 12.

Page | 24
Figure 12 Model of the tertiary structure of P450 monooxygenases. The heme (protoporphyrin IX) is colored orange, the
substrate recognition site (SRS1-SRS6) is colored red, and the heme coordinating I and L helices are shown in green. The
model was generated using PyMol (http://pymol.sourceforge.net) from the crystal structure 1jpz of P450 BM-3 (38).
Resolved crystal structure of heme- and FMN-binding domains has given us an insight
on the residues involved in FMN binding as well as electron transfer from FMN to heme
domain (36). The FMN-binding domains consist of 5 stranded parallel β sheets surrounded
by 4 α helices. Important residues are shown in Figure 13. It is believed that transfer of
electrons from FMN involves Trp574 residue, then Pro382-Gln387 peptide and then directly
to heme iron via Cys400. Alternatively, main- or side-chain atoms of Pro392, Gly393 and
Arg398 might be involved.

Page | 25
Figure 13 Crystal structure of part of the complex between the heme- and FMN-binding domains of P450 BM3 showing
amino acid residues involved in electron transfer from the FMN- to the heme-binding domain (PDB code: 1bvy). Taken
over from Nazor, J. (2007) PhD Thesis.
Up to now, no structure is available for reductase domain of P450 BM3. Alternatively,
the reductase domain of rat CPR has been crystallized and it provided and insight into
important residues and spatial organization of this domain (39). Homology analysis with
BM3 amino acid sequence has been done (40).
Interestingly, in solved conformation orientation of the FMN was opposite to that
obtained from complex of heme/FMN-binding domain crystal. Since in BM3 FMN and FAD
reside on distinct domains connected with a flexible “hinge” domain it is suggested that
during catalytic cycle this “hinge” region moves reduced FMN from FAD towards heme. Later
it has been proposed that this process occurs between reductase domain of one BM3
molecule and heme domain of other BM3 molecule suggesting that active form of the
enzyme is actually a dimer (41).
The crystal structure of the palmitoleate-bound form of P450 BM3 provided clear
picture of how long-chain fatty acids bind in the hydrophobic pocket of the enzyme and
allowed rational design altering substrate selectivity. The site-directed mutant F87G
catalyzed the accelerated oxidation of polycyclic aromatics (including pyrene and benzo-a-
pyrene), as well as affecting the regioselectivity of fatty acid oxidation (42). In addition,
mutant F87V specifically catalyzed the production of 14S,15R-epoxyeicosatrienoic acid from
arachidonic acid, as opposed to the mixture of this compound with 18R-

Page | 26
hydroxyeicosateraenoic acid formed by wild-type P450 BM3 (43). Removal of the
carboxylate-binding motif of P450 BM3 in the double mutant R47L Y51F increased the
capacity of the enzyme to oxidize pyrene and other polycyclic aromatic hydrocarbons, and
additional mutations to phenylalanine (F87A) and an active site alanine (A264G) further
improved the turnover and coupling of substrate oxidation to NADPH oxidation, respectively
(44). Mutant R47E also catalyzed efficient hydroxylation of fatty acid alkyl
trimethylammonium derivatives, further showing the potential of the engineered P450 in
organic synthesis (45). Rational mutagenesis was also used to alter the fatty acid substrate-
binding profile of P450 BM3. The P450 BM3 F87A mutant has been shown to shift its
substrate specificity (towards lauric and myristic acid) from sub-terminal to terminal
hydroxylation (42). This fact has been cleverly used to design surrogate substrates with
different chromophores attached to the terminal position of different-length chain fatty
acids (8). Engineering alternative carboxylate-binding residues closer to the heme in the
hydrophobic active site core resulted in improved binding and turnover of short chain
alkanoic acids. Mutant L181K and double mutant L75T L181K had catalytic efficiencies
improved 13-fold and 15-fold with butyrate and hexanoate, respectively (46). Laboratory (or
directed) evolution has also proven to be a useful tool in engineering P450s substrate
selectivity. One notable success in this area has been the engineering of P450 BM3 into a
highly efficient catalyst for the conversion of alkanes to alcohols (47). The same mutant was
found to be active also on benzene, styrene, cyclohexene, 1-hexene and propylene.
Lately more effort has been put to use the prokaryotic Cytochromes in catalysis of
reactions normally done by human P450s due to their superior properties (stability, self-
sufficiency and higher activity) (48). It has been shown that P450 BM3 Wild type has an
ability to convert substrates normally used by human P450 (Figure 14).

Figure 14 Activity of P450 BM3 with metabolites normally converted by human P450s. Taken over from
This spectrum was broadened by means of directed evolu
proving the potential of P450 BM3 as a biocatalyst with possible bioindustrial application
Mutants of P450 BM3 with higher activities
human homologues have been indentified (Figure 15).
Activity of P450 BM3 with metabolites normally converted by human P450s. Taken over from
This spectrum was broadened by means of directed evolution and rational design
proving the potential of P450 BM3 as a biocatalyst with possible bioindustrial application
with higher activities and broader substrate range to
s have been indentified (Figure 15).
Page | 27
Activity of P450 BM3 with metabolites normally converted by human P450s. Taken over from (48).
tion and rational design
proving the potential of P450 BM3 as a biocatalyst with possible bioindustrial application.
and broader substrate range to that of their

Page | 28
Figure 15 Conversion of human metabolites catalyzed by P450 BM3 mutants. Taken over from
As mentioned previously, Cytochrome P4
with growing interest in the
their low stability, low activity, substrate/product inhibit
reduction co-factors (NADH, NADPH).
In the last 20 years, with the discovery of Prokaryotic P450s, efforts have been made
to use these instead of their Eukaryotic P450 counterparts, due to their superior properties.
They are usually water soluble, self
Conversion of human metabolites catalyzed by P450 BM3 mutants. Taken over from
As mentioned previously, Cytochrome P450s comprise a large family of biocatalysts
bioindustrial application. This application is still hampered by
their low stability, low activity, substrate/product inhibition and dependence on high cost
, NADPH).
In the last 20 years, with the discovery of Prokaryotic P450s, efforts have been made
to use these instead of their Eukaryotic P450 counterparts, due to their superior properties.
They are usually water soluble, self-sufficient systems with significantly higher turnover rate.
Conversion of human metabolites catalyzed by P450 BM3 mutants. Taken over from (48).
50s comprise a large family of biocatalysts
bioindustrial application. This application is still hampered by
ion and dependence on high cost
In the last 20 years, with the discovery of Prokaryotic P450s, efforts have been made
to use these instead of their Eukaryotic P450 counterparts, due to their superior properties.
nificantly higher turnover rate.

Page | 29
But even so these biocatalysts are still far from optimal for harsh bioindustrial processes. By
means of rational design and directed evolution properties like: substrate specificity,
catalytic activity, co-solvent resistance, thermostability and reduction cofactor exchange
were successfully altered in the case of P450 BM3. These efforts made us a step closer of
using this biocatalyst in industrial scale processes. With recent development of powerful
ultra high throughput systems (flow cytometry, microfluidics) directed evolution became
more versatile and more applicable weapon for biocatalysts design.

Page | 30
1.5 Metagenome libraries: a source for novel enzyme activity
More than 99 % of the microorganisms existing in the environment can not be
cultivated in laboratory conditions. Few PCR methods have been devised to overcome this
obstacle but they all suffer from a problem of accessing full genetic diversity of the sample.
Finally, in the late 1990s the metagenomics appeared as a best solution to accessing full
natural diversity of a certain sample.
Metagenomics is based on culture-independent isolation of DNA from environmental
samples (Figure 16). DNA isolation and purification is followed by metagenome library
construction in suitable cloning/expression vectors (plasmids, cosmids, fosmids and bacterial
artificial chromosomes – BACs). Sometimes to increase efficiency of cloning library
enrichment step is performed in laboratory. E. coli is used as a common expression stain.
Finally, library is then screened using two different approaches: a) – sequence based
screening – where degenerated primers are used in PCR reaction and homology sequences
are screened and b) – functional based screening – where activity assay is used in high
throughput format (usually MTPs or solid phase) and novel activity is screened.
Figure 16 Key steps in Metagenomics. Taken over from (49)

Page | 31
2. Phosphorothioate based Ligase-Independent Gene Cloning
(PIGe) development and application for cloning of Cyt P450
BM3
2.1 Introduction
Directed protein evolution, has over the last decades, become a versatile and
successful approach for tailoring protein properties to industrial demands and for advancing
our understanding of structure/function relationships in biocatalysts. In iterative cycles of
diversity generation and functional selection/screening for improved variants, numerous
success stories (e.g. enantioselectivity (50), enzymes for bioremediation (51), vaccines (52))
have been reported. Directed protein evolution employs as host mainly E. coli strains and
requires, in contrast to standard cloning methods, a high number of variants and in ideal
case zero background to generate statistical relevant information on mutational loads,
mutation frequencies and biases.
A high number of robust and powerful gene cloning methods have been published
and validated in the last decades (53). Those methods can, depending on the DNA
preparation, be grouped in Group 1: “fully” enzyme/ligase dependent methods; Group 2:
methods which employ enzyme or ligase in one of DNA preparation/fusion steps and Group
3: completely enzyme/ligase-free methods (Figure 17). Enzyme/ligase based methods (group
1) rely on the activity of restriction enzymes to generate compatible single stranded ends
(“sticky and blunt ends”) and ligase to fuse them. Enzyme/ligase-free methods (group 2 and
group 3) have been developed to address problems often related to restriction cloning
protocols (group 1 methods) due to incomplete enzymatic reactions, laborious handling,
variations in transformation efficiency and “empty” vector background. Group 2 methods
employ either enzymes to generate long complementary sticky ends (6-12 nt; such as. LIC
cloning (54)) or employ ligase only to fuse pre-formed DNA fragments into a final construct
(e.g. TA cloning (55)). Group 3 methods do not employ any enzymes in DNA preparation or in
DNA fusion and are mostly PCR based (i.e. heterostagger cloning (56,57), ligase-free
subcloning (58,59), restriction free cloning (60), TOPO cloning (61)).
The first and most commonly cited LIC (Ligase Independent Cloning)-PCR method
(54), is based on the 3’->5’ exonuclease activity of T4 DNA polymerase. Dependant on DNA
sequence and nucleotides supplemented in reaction mix T4 DNA polymerase exhibits
exonuclease activity. When only one nucleotide is present it reaction mix polymerase starts
to digests single strand of double stranded DNA, starting from 3’ end and stops when it
reaches in the sequence “the one” nucleotide type that is supplemented (54,62). In this way
long single stranded (12 bp) regions are generated. Inserts ranging from 150-3000 bp have
been cloned in pUC119 vector (size 3 kb) with transformation efficiencies up to 2-5x10⁵
cfu/µg vector backbone (54). Alternatives to T4 DNA polymerase comprise exonucleases

Page | 32
(Exonuclease III (42,63), T7 Gene6 Exonuclease (64)) and uracil-DNA glycosylase (65,66).
Commercialized ligase-independent methods comprise: the Gateway system (based on
recombination using bacteriophage lambda integrase/att system, Invitrogen (67)), the In-
Fusion™
system (employing In-Fusion enzyme blend, Clonetech (68)), the LIC kit (based on T4
DNA polymerase digestion, Novagen), and the USER Friendly Cloning Kit (based on uracil-
DNA glycosylase, New England Biolabs (69)).
Figure 17 Overview of commercially available cloning methods. More detailed overview is summarized in a Table X
(Supplementary data)
Reported transformation efficiencies (4.4 kbp: 100 %, 8 kbp: 80 %, 10.3 kbp: 40 % and
13.2 kbp: 20 % (70)) are calculated for small vector like pUC and mostly rely on transforming
DNA isolated using standard mini-prep protocol (compact super-coiled DNA). E. coli
transformation efficiencies are however largely affected by the vector/insert size and
compactness of DNA. Standard vectors in commercial cloning systems and molecular biology
labs are often 5 to 6 kb in size. Additionally, ligated DNA constructs are very relaxed in
structure. Therefore, high transformation efficiencies can only be generated for relatively
short inserts (<2 kb).
Chemical cleavage of DNA fragments offers many advantages over “Km-dependent”
enzymatic systems if specific cleavage chemistry can be developed. The phosphorothioate
chemistry provides the opportunity to specifically cleave phosphorothiodiester bonds with
an efficiency of 70 % per position in presence of ethanol/iodine in alkaline solution (71).
Primers can be ordered with multiple phosphorothioate nucleotides as “phosphorothioate-
tails”.

Page | 33
With PIGe we report a first mutant library cloning system optimized for directed
protein evolution in E. coli. In this report we solved the chemical cleavage challenge by
including multiple phosphorothioate nucleotides and optimizing cleavage conditions,
resulting in a background-free cloning system that is sequence-independent from the gene
of interest and allows cloning of mutant libraries up to sizes of 3.5 kb with efficiencies up to
105 at room temperature with minimized time consumption (10 min) and preparative effort
(no purification of digested fragments required).
2.2 Materials and methods
Chemicals and reagents
All chemicals used in this research were purchased from Sigma-Aldrich (Steinheim,
Germany), Serva (Heidelberg, Germany) and AppliChem (Darmstadt, Germany) and were of
analytical grade unless stated otherwise. Milli-Q water (Millipore, Billerica, MA, USA) was
used in all experiments. All enzymes for molecular biology work were purchased from
Fermentas (St. Leon-Rot, Germany).
Cells and media
Strains used in this research are following. For cloning purposes E. coli XL10-Gold was
used. As expression strains E. coli BL21-Gold (DE3) and E. coli BL21-Gold (DE3) lacIQ1
were
used. All original cell stocks were purchased from Stratagene (La Jolla, CA, USA). E. coli BL21-
Gold (DE3) lacIQ1
strain was produced by Dr Alexander Schenk (Jacobs University Bremen,
Bremen, Germany).
Chemically competent E. coli XL10-Gold, BL21-Gold (DE3) and BL21-Gold (DE3) lacIQ1
cells were prepared as published before (70) with transformation efficiency being 2x10⁸,
1x10⁶ and 1x10
7 cfu/µg pUC19 vector, respectively. All transformations have been done
according to standard protocol (70).
For cell growth LB (Luria Bertani) liquid and agar (1.5 % wt/vol) media was used (53).
Kanamycin was supplemented in final concentration of 50 µg/ml. For expression IPTG was
supplemented in final concentration of 0.5 mM. For preparation of expression agar plates
IPTG was added directly into prepared agar media before solidification. For skim milk agar
plates, 2 % skim milk was supplemented.
Vectors and oligonucleotides
Four vector backbones have been used for cloning purposes in this research. pET-
28a(+) was purchased from Stratagene (La Jolla). It’s homolog harboring gene for
levansucrase (sacB), pET-28a(+)-sacB, has been constructed by Kang Lan (Jacobs University
Bremen, Bremen, Germany). pALXtreme-1a and pALXtreme-1a-sacB have been constructed
and kindly donated by Dr Alexander Schenk (Jacobs University Bremen, Bremen).

Page | 34
pEGFP was purchased from BD Biosciences Clonetech (Heidelberg, Germany). pET-
42b(+)-protease M57 (M57) was courtesy of Ran Tu (Jacobs University Bremen, Bremen).
pCWORI-Cyt P450 BM3 was available from glycerol stock of Schwaneberg group (Jacobs
University Bremen, Bremen).
pUC19 vector has been purchased from Stratagene (La Jolla) and was kept at -80°C.
All vector maps are available in Supplementary data.
All oligonucleotides have been purchased from Operon (Cologne, Germany) in dry
from. Solutions have been made in concentration of 100 µM in 1X TBE buffer (0.1 mM tris-
HCl pH 7.5, 1 mM EDTA) and kept at -20°C. List of all used oligonucleotides is available in
Supplementary data.
DNA electrophoresis was performed on 1 % agarose gels using TAE buffer system (53)
or SB buffer system (72,73) as specified.
I. Restriction cloning of Cyt P450 BM3 gene
Cyt P450 BM3 gene was originally cloned in both vectors, pET28a(+) and pALXtreme-
1a using restriction enzymes (NcoI, BamHI and EcoRI) and ligase (T4 DNA ligase).
Sites for restriction enzymes were incorporated in forward (FP) and reverse primer
(RP) used to amplify target gene from pCWORI vector (Table 1, Supplementary data). PCR
amplification of the target gene was assembled according to the table (prepare 2 tubes of
the following):
Component Volume per PCR reaction (µl) Final concentration
10X Taq buffer 5 1X
dNTP mix (10 mM) 1 0.2 mM each
Forward primer (25 µM) 1 0.5 µM
Reverse primer (25 µM) 1 0.5 µM
2 mM MnCl2 (optional) X -
Template DNA (~100 ng/µl) 1 2 ng/µl
Taq polymerase (5 U/µl) 1 5 U
MilliQ water 40 -
Final volume 50-x -
Cycling was done as following:
Step Temperature (°C) Time (min) Number of cycles
Initial denaturation 94 2 1
Denaturation 94 1
35 Annealing 65 0:30
Extension 72 2*
Final extension 72 10 1 *longer time necessary for epPCR
After the PCR two tubes were pooled together and PCR purification kit (Qiagen) was
used to recover and purify specific PCR product (band should be 3.2 kb). Sample was eluted

Page | 35
in 40 µL of elution buffer. Product was quantified using the NANO Drop (concentration
should be around 100-150 ng/µL). Sample was diluted with Milli-Q water up to 80 µL and
used in the next step. pET28 and pALXtreme vectors were purified using standard plasmid
purification protocol (74) starting from 3 ml of pre-culture. Sample was diluted in 40 µL of 1X
TE buffer and concentration was determined by Nano Drop (around 2000-4000 ng/uL).
Restriction digestion was set up as follows:
Digestion with NcoI/EcoRI
10X Tango buffer 20 µL final concentration 2X
Sample (~40-100 ng/µL) 40 µL 4-10 ng/µL
NcoI (10 U/µL) 1 µL 10 U/reaction
EcoRI (10 U/µL) 1 µL 10 U/reaction
Milli-Q water 38 µL
Final volume: 100 µL
Digestion with BamHI/EcoRI
10X Tango buffer 20 µL final concentration 2X
Sample (~40-100 ng/µL) 40 µL 4-10 ng/µL
BamI (10 U/µL) 2 µL 10 U/reaction
EcoRI (10 U/µL) 1 µL 10 U/reaction
Milli-Q water 37 µL
Final volume: 100 µL
Reaction mix was incubated overnight (37°C). Subsequently enzymes were
inactivated (80°C, 20 min). Samples were purified using PCR Purification Kit (Qiagen) and
eluted in 40 µL elution buffer supplied with the kit. Quantify of the samples was determined
after purification using the NANO Drop (concentration should be around 40-80 ng/µl).
In the tubes with the vector 2 µl of CIAP (Calf Intestine Alkaline Phosphatase) was
added and incubated 2 hours at 37°C. Subsequently enzymes were inactivated at 80°C for 15
min.
Ligation reaction was assembled directly on ice. Components were pipetted in the
following order:
Vector (40-50 ng/µl) 2 µl final concentration 4-5 ng/µl
Insert (80-100 ng/µl) 2 µl 8-10 ng/µl
10X ligation buffer 2 µl 1X
50% PEG 4000 (optional) 2 µl 5%
Milli-Q water 11.8 (13.8) µl
T4 DNA ligase (5 U/µl) 0.4 µl 2 U/reaction
Final volume: 20 µl

Page | 36
Reaction mix was incubated for one hour (16°C or at room temperature) and then
left at 4°C over night. In case of adding PEG T4 DNA ligase was inactivated by incubation
(65°C, 20 min). Aliquot (3-5 µl) was directly transformed into 50-100 µl chemically
competent E.coli cells.
II. MEGAWHOP cloning of Cyt P450 BM3 whole gene and heme domain
For MEGAHWOP two components are required for cloning: 1. vector template
(purified using Plasmid isolation kit (Qiagen), concentration adjusted to 100 ng/µl) and 2.
megaprimer - amplified in the following PCR reaction:
Component Volume per PCR reaction (µl) Final concentration
10X Taq buffer (with magnesium) 5 1X
dNTP mix (10 mM) 1 0.2 mM each
Forward primer (25 µM) 1 0.5 µM
Reverse primer (25 µM) 1 0.5 µM
2 mM MnCl2 (optional) x -
Template DNA (~100 ng/µl) 1 2 ng/µl
Taq polymerase (5 U/µl) 1 5 U
MilliQ water 40 -
Final volume 50-x -
Cycling was done as following:
Step Temperature (°C) Time (min) Number of cycles
Initial denaturation 94 2 1
Denaturation 94 1
35 Annealing 65 0:30
Extension 72 2*
Final extension 72 10 1 *longer time necessary for epPCR. Additionally, in case when only heme domain needs to be amplified shorter extension time can be used.
Both megaprimers (Cyt P450 BM3 whole gene and heme domain) were purified using
PCR Purification kit (Qiagen) and concentration was, after measurement with NANO Drop,
adjusted to 200 ng/µl. Final extension reaction was set up as following:
Component I II III IV
10X TLA buffer 20
dNTP (10 mM) 6
MEGAPRIMER (200 ng/µl) 10
Vector template (100 ng/µl) 2.4
Taq/Pfu mix (10:1) 4
Milli-Q water 100
Aliquot 4 x 35.6 µl and add following components.
5 M betaine - 10 - 10
DMSO - - 1.5 1.5
Milli-Q water 14.4 4.4 12.9 2.9
Total volume 50 50 50 50

Page | 37
The following program was run:
Step Temperature (°C) Time (min) Number of cycles
“Polishing” 68 5 1
Initial denaturation 94 5 1
Denaturation 94 1
24 Annealing 55 0:30
Extension 68 8
Final extension 68 30 1
Aliquots of all samples (5 µl), before and after PCR were analyzed on SB agarose gels
(120 V, 20 min). Additionally, left over sample was purified using PCR purification kit
(Qiagen) and transformed (3-5 µl) directly into chemically competent E. coli XL10-Gold.
III. Cleavage of phosphorothioate bonds in oligonucleotides using
iodine/ethanol solution – proof of principle
Components were added, according to the Table bellow, in the following order:
phosphorothioated oligonucleotide (Table 1, Supplementary data), Milli-Q water, cleavage
buffer, ethanol and finally iodine in ethanol (5, 50 and 100 mM stock). All the components
were kept on ice while pipetting.
Component Control 1 I II III IV V VI VII VIII Control 2
Sample (µl) 10 10 10 10 10 10 10 10 10 10
Iodine (50 mM) - 0.1+ 0.25
+ 0.5
+ 0.1 0.5 2.5 5 5
* -
Ethanol (100%) 5 4.9 4.75 4.5 4.9 4.5 2.5 - - 5
10 x Cleavage buffer (µl) 5 5 5 5 5 5 5 5 5 5
Milli-Q water (µl) 30 30 30 30 30 30 30 30 30 30
5 min, 70°C
Final volume (µl) 50 50 50 50 50 50 50 50 50 50
Final conc. iodine (mM) 0 0.01 0.025 0.05 0.1 0.5 2.5 5 10 10
Final conc. ethanol (%) 10 10 10 10 10 10 10 10 10 10 + Use 5 mM iodine in ethanol.
* Use 100 mM iodine in ethanol.
Mixed and digested sample (70°C, 5 min) was split in 2 tubes (2 x 25 µl). In one tube
75 µl of Mili-Q water was added and sample was left on 60°C (10 min) on room temperature
(15 min) and then transferred to the vacuum for ethanol to evaporate. This sample was run
on C2/C18 RP-HPLC under standard conditions described bellow in Section 1.
In other 25 µl concentrated loading dye (12.5 µl) was added. Sample was heated
(60°C, 10 min) and analyzed (7.5 µl) on 20 % denaturing poly-acrylamide (PAA) gel as
described bellow in Section 2.
1. Denaturing polyacrylamide (PAA) gel electrophoresis of phosphorothio-
oligonucleotides and digestion products
Denaturing polyacrylamide (PAA) gel was prepared by mixing the following
components in plastic 15 mL Falcon tube:

Page | 38
10% gel 15 % gel 20 % gel
Urea 2.52 g 2.52 g 2.52 g
10 x TAE 0.6 mL 0.6 mL 0.6 mL
40% AA solution 1.5 mL 2.3 mL 3 mL
Water up to 6 mL
All the components were mixed until completely dissolved. If necessary, components
were incubated in water bath at 55-60°C for 10-15 minutes. When all components were
dissolved and well mixed, gel was transferred in small vacuum bottle and degassed until
bubbles were completely gone. After that 4 µl TEMED (kept on ice) and 33 µl 10% APS (kept
on ice) were quickly added.
Gel was mixed slowly by rotating the flask, not to introduce air bubbles. Mixture was
poured in between the glass plates, comb was immersed immediately and gel was let
polymerize for 30 minutes. Wells were washed thoroughly with Milli-Q water before
applying the sample. Once loading the sample gel was run on 150-200 V for 180 minutes in
1X TAE buffer. Staining was done in 1X SYBR Green (Invitrogen) dye diluted in 1X TAE buffer,
with agitation.
Sample was prepared as described. Twenty five µl of sample was mixed with 12.5 µL
of 3X Loading dye with urea. Sample was heat up on 60°C for 10 minutes. Load 2-3 µL on the
gel.
2. Reverse phase (RP)-HPLC chromatography of phosphorothio-oligonucleotides
and digestion products
All the solutions for HPLC have been filtered and degassed before the separation.
Following solutions were used: Milli-Q water (degassed 20 minutes in sonic bath); 0.1 TEA
pH 7.0 (2.77 mL TEA, 1.12 mL glacial acetic acid in 150 mL of Milli-Q water, pH adjusted to
7.0 and then filled up to 200 mL, filtered trough 0.45 µm filter, degassed 20 minutes in sonic
bath) and acetonitrile (HPLC grade).
Following buffers were prepared for separation: Buffer A (95% 0.1 TAE pH 7.0, 5%
acetonitrile (v/v)), Buffer B (85% 0.1 TAE pH 7.0 , 15% acetonitrile (v/v)) and Buffer C (100%
acetonitrile).
C2/C18 RP-HPLC column was connected to Akta Purifier (GE Healthcare). Pumps were
washed with Milli-Q water before starting the analysis. Column was also washed with Milli-Q
water. Then inlets were correctly positioned into the running buffers. Inlet A1 in Buffer A,
inlet B1 in Buffer B and inlet B2 in Buffer C. Pumps were washed again with running buffers.
Column was flushed with buffer C (2 CV), then buffer B (2 CV) and then equilibrated in buffer
A (5 CV). Fifty µl of sample was loaded trough 100 µl loading loop.

Page | 39
Run the following program:
1. Equilibrate column – buffer A – 2 CV
2. Inject the sample
3. Wash unbound sample – buffer A – 2 CV
4. Elution – linear gradient 1 – buffer A/B – 0-60% B in 2 CV
5. Elution – linear gradient 2 – buffer A/B – 60-100% B in 8 CV
6. Wash – buffer B – 1 CV
Flow was kept constant at 0.8 ml/min while detection was absorbance measurement
at 260 nm.
IV. Establishing Phosphorothiate based Ligase-Independent Gene (PIGe)
cloning platform for directed evolution experiments
1. Preparation of templates for vector backbone and gene amplification in PCR
As a template for amplification 4 vectors backbones have been used. Two were
pET28a(+) (5.3 kbp) and its smaller homolog pALXtreme-1a (2.3 kbp). As an option for
“background” free cloning pET28-sacB and pALXtreme-sacB vectors, harboring the selection
gene (coding for levansucrase), were used.
pALXTreme-1a vector is constructed from pET-28a(+) backbone by removing 63 % of
sequence and integrating lacI gene in E. coli BL21-Gold (DE3) genome. All vectors have been
isolated from 4 ml of overnight culture (LBKan, 37°C, 250 rpm) using a standard protocol (74).
Digestion was set up as follows: 40 µl plasmid sample, 20 µl 10X TANGO buffer (Fermentas),
39 µl Milli-Q water and 1 µl EcoRI (10 U/ µl, Fermentas). Mixture was incubated at 37°C for 2
hours after what enzymes were inactivated at 65°C for 15 minutes. Sample was purified
using PCR purification kit (Qiagen) and eluted in 40 µl of EB buffer. Concentration was
adjusted to ~50 ng/µl with EB buffer, aliquoted and stored at -20°C.
For gene amplification plasmids (pEGF for EGFP, pET42-M57 for M57 protease and
pCWORI-P450 BM3 for Cyt P450 BM3) were purified using a standard protocol (74). Samples
were aliquoted and stored at -20°C.
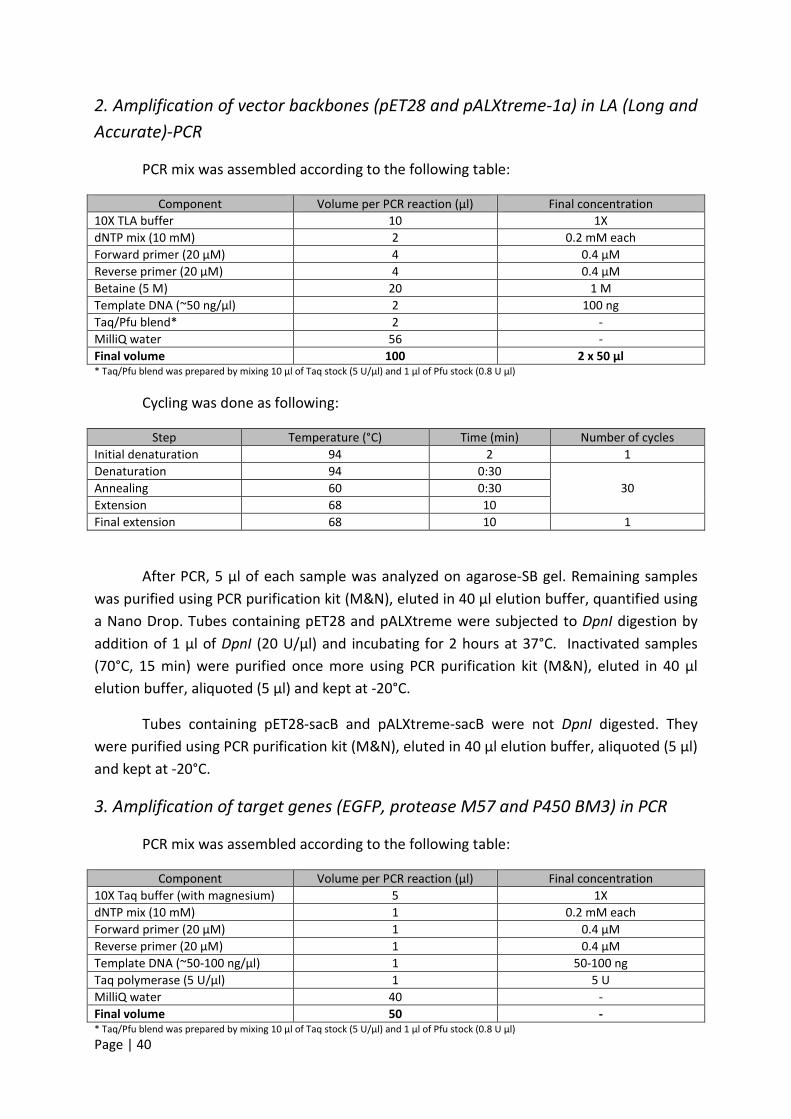
Page | 40
2. Amplification of vector backbones (pET28 and pALXtreme-1a) in LA (Long and
Accurate)-PCR
PCR mix was assembled according to the following table:
Component Volume per PCR reaction (µl) Final concentration
10X TLA buffer 10 1X
dNTP mix (10 mM) 2 0.2 mM each
Forward primer (20 µM) 4 0.4 µM
Reverse primer (20 µM) 4 0.4 µM
Betaine (5 M) 20 1 M
Template DNA (~50 ng/µl) 2 100 ng
Taq/Pfu blend* 2 -
MilliQ water 56 -
Final volume 100 2 x 50 µl * Taq/Pfu blend was prepared by mixing 10 µl of Taq stock (5 U/µl) and 1 µl of Pfu stock (0.8 U µl)
Cycling was done as following:
Step Temperature (°C) Time (min) Number of cycles
Initial denaturation 94 2 1
Denaturation 94 0:30
30 Annealing 60 0:30
Extension 68 10
Final extension 68 10 1
After PCR, 5 µl of each sample was analyzed on agarose-SB gel. Remaining samples
was purified using PCR purification kit (M&N), eluted in 40 µl elution buffer, quantified using
a Nano Drop. Tubes containing pET28 and pALXtreme were subjected to DpnI digestion by
addition of 1 µl of DpnI (20 U/µl) and incubating for 2 hours at 37°C. Inactivated samples
(70°C, 15 min) were purified once more using PCR purification kit (M&N), eluted in 40 µl
elution buffer, aliquoted (5 µl) and kept at -20°C.
Tubes containing pET28-sacB and pALXtreme-sacB were not DpnI digested. They
were purified using PCR purification kit (M&N), eluted in 40 µl elution buffer, aliquoted (5 µl)
and kept at -20°C.
3. Amplification of target genes (EGFP, protease M57 and P450 BM3) in PCR
PCR mix was assembled according to the following table:
Component Volume per PCR reaction (µl) Final concentration
10X Taq buffer (with magnesium) 5 1X
dNTP mix (10 mM) 1 0.2 mM each
Forward primer (20 µM) 1 0.4 µM
Reverse primer (20 µM) 1 0.4 µM
Template DNA (~50-100 ng/µl) 1 50-100 ng
Taq polymerase (5 U/µl) 1 5 U
MilliQ water 40 -
Final volume 50 - * Taq/Pfu blend was prepared by mixing 10 µl of Taq stock (5 U/µl) and 1 µl of Pfu stock (0.8 U µl)

Page | 41
Cycling was done as following:
Step Temperature (°C) Time (min) Number of cycles
Initial denaturation 94 2 1
Denaturation 94 0:30
35 Annealing 60 0:30
Extension 72 0:20, 0:30 and 1*
Final extension 72 5 1 * Time is stated for EGFP, M57 and P450 BM3 gene, respectively.
After PCR, 5 µl of sample was analyzed on agarose-SB gel (120 V, 40 min).
Subsequently, all samples were purified using PCR purification kit (M&N), eluted in 40 µl
elution buffer, quantified using a Nano Drop, aliquoted and stored at -20°C. Sample
containing M57 protease was additionally digested with DpnI as described previously.
4. Optimization of iodine concentration needed for phosphorothioated DNA
cleavage
To estimate the amount of iodine needed for phosphorothioate bonds cleavage, 0.01
pmol/µL of vector (pET28) and 0.03 pmol/µL of insert (EGFP) were prepared in Milli-Q water.
Concentrated (10X) cleavage buffer was 0.5 mM tris-HCl pH 9.0 while cleavage solution was
100 mM iodine in 99% ethanol (keep in dark). Reaction mix was set up as follows for both
vector and insert:
# Sample (µL) 10X cleavage
buffer (µL)
Cleavage solution
(µL) 99% ethanol (µL)
Final concentration
of iodine (mM)
1 4 0.5 0.2 0.3 4
2 4 0.5 0.3 0.2 6
3 4 0.5 0.4 0.1 8
4 4 0.5 0.5 - 10
5 4 0.5 - 0.5 0
Samples were mixed, votrexed shortly and spun down. Incubation was at 70°C for 5
minutes in Eppendorf Mastercycler.
Hybridization reaction was assembled by mixing equal amounts (1 µL) of vector and
insert, incubating at room temperature for 5 minutes and transforming total amount (2 µL)
into 40 µL competent XL10-Gold cells (70). Cells were grown as specified under Cells and
media. Three repetitions were done for each iodine concentration. Transformation efficiency
was calculated as number of colony forming units (cfu) per µg of vector backbone and 100
µL of competent cells.

Page | 42
5. Effect of iodine cleavage products on transformation efficiency of E. coli
To test weather iodine or any other component of cleavage mix are affecting
transformation efficiency of E. coli, experiments were designed as follows. Small amount of
pUC19 vector (20 pg) was added to cleavage reaction mix (specified in the table above),
incubated at room temperature for 5 minutes and transformed in 40 µl of competent XL10-
Gold cells. Cells were plated and grown as specified under Cells and media. Three repetitions
were done for each iodine concentration. Transformation efficiency was calculated as
number of colony forming units (cfu) per µg of vector backbone and 100 µL of competent
cells.
6. Effect of vector/insert concentration on iodine cleavage and transformation
efficiency of E. coli
To examine weather vector/insert concentration will have an effect on iodine
cleavage step and subsequently on transformation efficiency of E. coli experiment was
designed as follows. Three different concentrations of the vector (pET28, 0.022, 0.011 and
0.005 pmol/µL) and insert (EGFP, 0.07, 0.04 and 0.02 pmol/µL) were prepared in Milli-Q
water. Reaction mix was assembled according to the table:
# Sample (µL) 10X cleavage
buffer (µL)
Cleavage solution
(µL) 99% ethanol (µL)
Final concentration
of iodine (mM)
1 4 0.5 0.2 0.3 4
2 4 0.5 0.3 0.2 6
3 4 0.5 0.4 0.1 8
4 4 0.5 0.5 - 10
5 4 0.5 - 0.5 0
Samples were mixed, votrexed shortly and spun down. Incubation was at 70°C for 5
minutes in Eppendorf Mastercycler.
Hybridization reaction was assembled by mixing equal amounts (1 µL) of vector and
insert (for each vector/insert concentration respectively), incubating at room temperature
for 5 minutes and transforming total amount (2 µL) into 40 µL competent XL10-Gold cells.
Cells were grown as specified under Cells and media. Transformation efficiency was
calculated as number of colony forming units (cfu) per µg of vector backbone and 100 µL of
competent cells.

Page | 43
7. Cloning of EGFP, M57 and P450 BM3 genes into target vectors using PIGe
From previous set of experiments optimal conditions for cloning using PIGe have
been discovered (6 mM iodine, 10% ethanol). Under these conditions three target genes
(EGFP, protease M57 and P450 BM3) have been cloned into two target vectors (pET28 and
pALXtreme-1a).
Following samples were prepared: pET28 (0.02 pmol/µL), pALXtreme (0.01 pmol/µL),
EGFP (0.03 pmol/µL), M57 (0.04 pmol/µL) and BM3 (0.03 pmol/µL) in Milli-Q water.
Cleavage mix was assembled by mixing 4 µL sample, 0.5 µL 10X cleavage buffer, 0.3 µL
cleavage solution and 0.2 µL 99% ethanol. Incubation was done on 70°C for 5 minutes in
Eppendorf Mastercycler. Cleaved vectors and inserts were mixed in 1:1 ratio (1 µL of each),
incubated on room temperature for 5 minutes and transformed in 40 µL of competent XL10-
Gold cells (70). Cells were plated and grown as specified under Cells and media.
Transformation efficiency was calculated as number of colony forming units (cfu) per µg of
vector backbone and 100 µL of competent cells.
8. Verification of clones by plasmid preparation, analytical digestion, colony PCR
and expression
To check the integrity of the transformants plasmid isolation, analytical digestion and
colony PCR were performed. Plasmid was isolated from 4 ml of overnight culture (LBKan,
37°C, 250 rpm) using a standard plasmid isolation protocol (74). Restriction digestion was set
up as following: 8 µl plasmid sample, 1 µl 10X TANGO buffer (Fermentas) and 1 µl XbaI (10
U/µl, Fermentas). Reaction mix was vortexed spin down and incubated at 37°C for 2 hours.
Enzymes were inactivated at 60°C for 15 minutes. Colony PCR was assembled according to
the following table:
Component Volume per PCR reaction (µl) Final concentration
10X Taq buffer 5 1X
dNTP mix (10 mM) 1 0.2 mM each
Forward primer (25 µM) 1 0.5 µM
Reverse primer (25 µM) 1 0.5 µM
Taq polymerase (5 U/µl) 1 5 U
Template (plasmid prep) 1
MilliQ water 40 -
Final volume 50 -
Cycling was done as following:
Step Temperature (°C) Time (min) Number of cycles
Initial denaturation 94 2 1
Denaturation 94 1
30 Annealing 60 0:30
Extension 72 0:20, 0:30, 1*
Final extension 75 5 1 * Extension time is stated for EGFP, M57 and P450 BM3 gene, respectively.

Page | 44
After plasmid isolation, restriction digestion and colony PCR, 5 µl of each sample was
analyzed on agarose-TAE gel (120 V, 30 min).
Plasmids were re-transformed into expression strain E. coli BL21-Gold (DE3) in case of
pET28 and BL21-Gold (DE3) lacIQ1
in case of pALXtreme-1a. Cells harboring a vector with
EGFP gene were spread on induction agar plates (containing IPTG), grown and visualized
under UV light (366 nm). Cells harboring vectors with M57 protease gene were spread on
induction plates with skim milk (2 %), grown and inspected for halo formation. Detail about
growth and media are described under Cells and media.
9. Verification of clones by sequence determination
Sequencing was done by MWG Biotech (Cologne, Germany). Plasmid was isolated
from 4 ml of overnight culture (LBKan, 37°C, 250 rpm) using Mini Prep kit (Qiagen). Sample
was eluted in 40 µl elution buffer and quantified via NANO Drop. Concentration of DNA was
adjusted to ~75 ng/µl with Milli-Q water. Sequencing was done starting from T7 promoter of
pET28/pALXtreme vectors (primer sequence – Supplementary data).
2.3 Results and discussion
I. Restriction cloning of Cyt P450 BM3
As mentioned previously Cyt P450 BM3 has been cloned in both (pET28 and
pALXtreme) vectors using restriction cloning. Restriction sites have been integrated in PCR
primers with few bases overhang to increase efficiency of restriction (Table 1,
Supplementary data). Using restriction cloning with BamHI and EcoRI we achieved
transformation efficiency of 6.8 x 10³ cfu/µg vector backbone. On the other hand, cloning
efficiency in restriction cloning was quite low, reaching only ~73 %.
When cloning into pALXtreme higher transformation efficiencies were obtained (up
to one order magnitude more) but problem with low cloning efficiency was still present.
II. MEGAWHOP cloning of Cyt P450 BM3
MEGAWHOP is elegant way of creating mutant libraries (75). It requires gene to be
cloned into target vector and can not be used as an initial construct generation method. We
optimized conditions to obtain MEGAWHOP PCR product (Figure 18).

Page | 45
Figure 18 MEGAWHOP PCR of whole protein (left) and heme domain (right) without additives (I), with betaine (II), with
DMSO (III) and with betaine/DMSO (IV). Left lane is PCR mix before cycling while right lane is PCR mix after cycling.
MEGAWHOP product is marked with blue arrow. M – Molecular weight markers.
In our case, MEGAWHOP gave satisfying cloning efficiency, especially in the case
when only heme domain was mutated. Unfortunately, low transformation efficiency (up to
103) was achieved with this method.
III. Cleavage of phosphorothioate bonds in oligonucleotides using
iodine/ethanol solution – proof of principle
Before devising a strategy for development of new cloning method we needed to test
weather phosphorothioated oligos can indeed be digested with iodine/ethanol solution and
what is the concentration dependence in this cleavage reaction.
Samples (thioated and non-thioated oligonucleotide) have been subjected to
cleavage using different iodine concentration (0-10 mM) while ethanol concentration was
kept constant. From our previous experimental data it has been shown that both iodine and
ethanol concentrations affect the cleavage (data not shown). Due to not fully known
mechanism of cleavage changing both variables (concentration of iodine and ethanol) would
be difficult to optimize. On the other hand, from the supposed mechanism of reaction we
hypothesized that ethanol needs to be added in excess while iodine has catalytic role and
thus, its concentration is more important (Figure 20). We decided to investigate effect of
different iodine concentrations on cleavage.
As mentioned in Materials and methods samples were subjected to cleavage with
iodine/ethanol and then analyzed by PAA denaturing electrophoresis. Visualization was done
by staining with SYBR Green. Control 1 contains phosphorothioated oligo but no iodine (only
ethanol) while control 2 contains non-phosphorothioated oligo in highest concentration of
iodine/ethanol. After PAA separation both control samples gave only one band. This shows
us that none of the phosphorothioate bonds can be digested only by ethanol alone. Iodine is

Page | 46
needed to catalyze the cleavage reaction.
specifically degraded in highest
In samples containing both,
iodine/ethanol, two bands are visible
with increase in iodine concentration
products and it is not sharp since 4
digestion products. These can not
iodine up to 0.5 mM are not su
incubation time. Higher concentrations (>0.5 mM) do
of the bands meaning that this concentration is critical for quantitative digestion.
sample contained 20 µM thioated oligo which would correspond to 80 µM thioated bond
per tube. Judging from our experimental data we
of iodine are needed compared to phosphorothioated bonds
cleavage.
From the control 2 we concluded that iodine can not degrade DNA unless
phosphorothioates are present in the backbone
excess iodine has been added in reaction.
Figure 19 Polyacrylamide gel electrophoresis of phosphorothioated and non
cleavage with iodine/ethanol. Control 1 contains phosphorothioated oligo but no iodine while control 2 contains non
phosphorothioated oligo in highest iodine/ethanol concentration. Other lanes contain phosphorothioated oli
using different concentrations of iodine (0.01
done under UV light (366 nm) aft
We also observed that even in highest iodine/ethanol concentration cleavage is not
complete. This is a consequence of the mechanism of the
we can see from the figure there are three possible r
are giving cleaved products (in our case shorter bands) while the third one substitutes the
sulfur in the backbone with oxygen and actually restores phosphodiester bond. In this case
needed to catalyze the cleavage reaction. Additionally, non-thioated oligo can
ally degraded in highest concentration of iodine (Figure 19).
In samples containing both, phosphorothioated oligo and different concentrations of
, two bands are visible after cleavage (Figure 19). Ratios of the bands change
concentration, as expected. Lower band corresponds to
products and it is not sharp since 4 phosphorothioates are present giving at least 4 differe
digestion products. These can not be well separated on 20% PAA gel. Concentrations
up to 0.5 mM are not sufficient for complete phosphorothioate digestion in 5 min
Higher concentrations (>0.5 mM) do not affect the intensity or distribution
of the bands meaning that this concentration is critical for quantitative digestion.
contained 20 µM thioated oligo which would correspond to 80 µM thioated bond
per tube. Judging from our experimental data we could see that much higher concentration
needed compared to phosphorothioated bonds, for “quantitative” bond
2 we concluded that iodine can not degrade DNA unless
phosphorothioates are present in the backbone. This property can be utilized
excess iodine has been added in reaction.
Polyacrylamide gel electrophoresis of phosphorothioated and non-phosphorothioated oligonucleotide after
. Control 1 contains phosphorothioated oligo but no iodine while control 2 contains non
ed oligo in highest iodine/ethanol concentration. Other lanes contain phosphorothioated oli
using different concentrations of iodine (0.01-10 mM) in constant ethanol concentration (10 % vol/vol). Visualization was
done under UV light (366 nm) after staining with SYBR Green.
that even in highest iodine/ethanol concentration cleavage is not
complete. This is a consequence of the mechanism of the cleavage reaction (Figure
we can see from the figure there are three possible routes in reaction pathway. Two of them
are giving cleaved products (in our case shorter bands) while the third one substitutes the
sulfur in the backbone with oxygen and actually restores phosphodiester bond. In this case
oligo can not be un-
different concentrations of
of the bands change
. Lower band corresponds to digestion
are present giving at least 4 different
. Concentrations of
fficient for complete phosphorothioate digestion in 5 min
not affect the intensity or distribution
of the bands meaning that this concentration is critical for quantitative digestion. In all cases
contained 20 µM thioated oligo which would correspond to 80 µM thioated bonds
see that much higher concentrations
for “quantitative” bond
2 we concluded that iodine can not degrade DNA unless
can be utilized in case when
phosphorothioated oligonucleotide after
. Control 1 contains phosphorothioated oligo but no iodine while control 2 contains non-
ed oligo in highest iodine/ethanol concentration. Other lanes contain phosphorothioated oligo cleaved
10 mM) in constant ethanol concentration (10 % vol/vol). Visualization was
that even in highest iodine/ethanol concentration cleavage is not
reaction (Figure 20). As
outes in reaction pathway. Two of them
are giving cleaved products (in our case shorter bands) while the third one substitutes the
sulfur in the backbone with oxygen and actually restores phosphodiester bond. In this case

Page | 47
product has original length. If all routes are equally substituted, maximum cleavage per
phosphorothioate bond would be 66.7 %.
In our case this means if we want to have quantitative removal of a part of a DNA
multiple phosphorothioate bonds need to be included in this region.
Figure 20 Mechanism of phosphorothioate alkylation and cleavage (71).
Result from PAA analysis was additionally confirmed by RP-HPLC (Figure 21). Samples
prepared in the same manner were, after cleavage, run on C2/C18 RP column under
conditions described in Materials and methods.
Control sample had retention time of 13.23 ml with peak high approx. 40 mAU. With
addition of small concentration of iodine (0.05 mM) cleavage starts and this can be seen by
decreasing the peak height (approx. 20 mAU) while retention time still corresponds to un-
cleaved sample (12.89 ml). Peaks corresponding to cleavage products could not be detected
in this case. In conditions with higher iodine concentrations (0.5 mM and 5 mM) peaks
corresponding to un-cleaved oligo disappeared completely while peak corresponding to
products appeared (10.26 ml and 10.73 ml).
Highest iodine concentration (5 mM), used in this experiment, didn’t degrade DNA.
Retention times and peak heights were comparable with sample with optimal iodine
concentration (0.5 mM).

Page | 48
Figure 21 Chromatogram of RP-HPLC separation of phosphorothioated poly-T oligo cleaved using different iodine
concentrations. Colored curves represent absorbance at 260 nm (blue – no iodine, green – 0.05 mM iodine, brown – 0.5
mM iodine and red – 5 mM iodine). Concentration of ethanol was kept constant (10 % vol/vol).
IV. Establishing Phosphorothioate based Ligase-Independent Gene (PIGe)
cloning platform for directed evolution experiments
As preliminary experiments showed, phosphorothioate bonds included in
oligonucleotide can be specifically cleaved without affecting the rest of the DNA molecule.
Next step was development of novel cloning method based on LIC (54). Primers, for vector
and gene amplification, have been designed in a way that they contain 5’
phosphorothioated tail (12 nucleotides) and vector/gene specific part at 3’ end (Table 1,
Supplementary data). Phosphorothioated sequences in vector and insert primers were
complementary to each other.
Due to complexity and length of vector backbone, amplification only with Taq or Pfu
polymerases alone was unsuccessful, even with addition of DMSO (data not shown). Only
blend of two polymerases was able to amplify long (5.3 kb) vector backbone in LA-PCR
(Figure 22). Yield was drastically increased (more than 2 times) when 1 M betaine was
included in PCR mix. Target genes (EGFP, M57 protease and P450 BM3) were easily amplified
under standard conditions using Taq polymerase. In order to increase transformation
efficiency (TE) with large genes, such as P450 BM3, alternative vector backbone to pET28
was used (pALXtreme, size ~2.3 kbp).

Page | 49
As mentioned previously, both vector backbones have been successfully amplified in
LA-PCR using optimized conditions. Yield per PCR reaction (50 µl) was 6-7 µg DNA. Inserts
have been amplified in PCR using Taq polymerase, as described in Materials and methods.
Yield per reaction (50 µl) was 2-3 µg DNA. Bands of all products, after agarose
electrophoresis and staining, are shown in Figure 22. All products were purified via PCR
purification kit (Qiagen) and quantified using a Nano Drop. Concentrations were as follows:
pET28 385.0 ng/µl (0.11 pmol/µl), pALXtreme 179.0 ng/µl (0.13 pmol/µl), EGFP 159.0 ng/µl
(0.35 pmol/µl), M57 71.6 ng/µl (0.09 pmol/µl) and P450 BM3 62.2 ng/µl (0.03 pmol/µl).
Figure 22 Agarose electrophoresis of EGFP (lane 1), M57 (lane 2) and P450 BM3 (lane 3) amplified in PCR using Taq
polymerase. pET28 (lane 4) and pALXtreme (lane 5) were amplified in LA-PCR using blend of Taq and Pfu polymerase
with addition of betaine. Smearing in the lane 4 and 5 is due to viscosity of the sample caused by the betaine.
As we have seen from preliminary experiments, both concentration of iodine and
ethanol affect the cleavage efficiency. Additionally, concentrations of vector and insert will
affect the cleavage, as well, due to the fact that they are directly proportional to the amount
of phosphorothioate bonds present in the reaction mix. Reviewing the mechanism of
reaction we assumed that iodine is used in the reaction as the catalyst, while ethanol needs
to be supplemented in excess (Figure 20).
Taking all this into account, we decided to optimize iodine concentration needed for
optimal cleavage, while keeping ethanol concentration constant (10 % vol/vol). Amount of
vector and insert were adjusted to 0.01 and 0.03 pmol/µl, respectively. Iodine
concentration, in reaction mixture, was varied from 4 to 10 mM (in 2 mM increments).
Vector and insert were cleaved, both under same conditions, mixed (1:1 ratio) and
transformed in XL10-Gold. Transformation efficiency (TE) plotted over iodine concentration
showed typical bell-shaped form with peak at 6 mM iodine (Figure 23). This indicated the
optimal concentration of iodine which is needed for maximal TE. Peak in TE can also be
explained by the fact that lower concentrations of iodine are not sufficient for quantitative

Page | 50
phosphorothioate-bond cleavage, while higher concentrations are interfering with DNA or
transformation process itself.
0 4 6 8 10
0
1
2
3
4
5
6
7
Iodine concentration (mM)
Transform
ation efficiency
(x104 cfu/ug vector backbone)
Figure 23 Optimization of iodine concentration needed for cleavage of vector (pET28, 0.01 pmol) and insert (EGFP, 0.03
pmol).
In order to investigate weather iodine or any component of cleavage reaction
mixture interferes with TE of the E. coli cells, pUC19 vector was incubated together with the
mix and transformed into E. coli. This could, on one hand, explain the drop in TE with iodine
concentrations >6 mM. On the other hand, if this effect would be minor purification of DNA
out of cleavage reaction mix wouldn’t be necessary.
After incubation of pUC19 (20 pg) and transformation into E. coli, no significant
difference between samples containing different iodine concentrations (4-10 mM) and blank
sample (no iodine), was observed (Figure 24). This means that cleaved DNA can be directly
used in hybridization reaction and transformation. Additionally, it also proves that drop in TE
with iodine concentrations >6 mM could be assigned to nonspecific degradation of DNA.
0 4 6 8 10
0
2
4
6
8
10
12
14
Transform
ation efficiency
(x108 cfu/ug vector backbone)
Iodine concentration (mM)
Figure 24 Effect of iodine (or any other component of cleavage mix) on transformation efficiency of E. coli with pUC19.
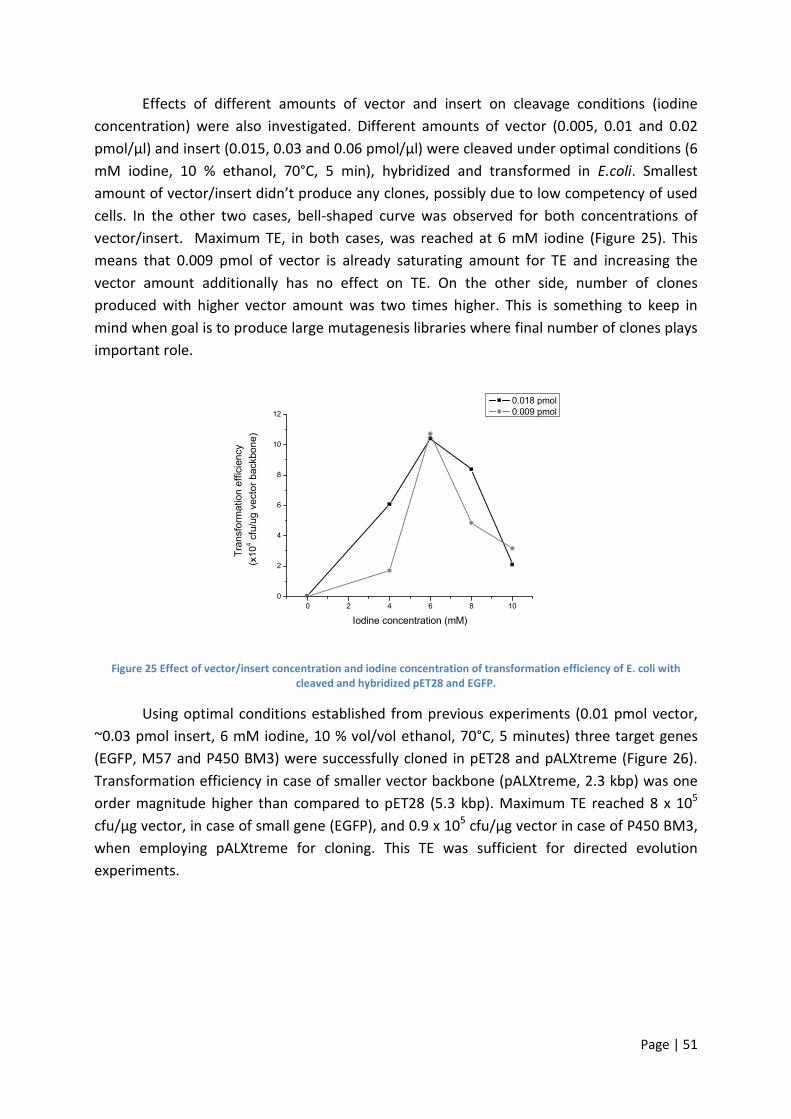
Page | 51
Effects of different amounts of vector and insert on cleavage conditions (iodine
concentration) were also investigated. Different amounts of vector (0.005, 0.01 and 0.02
pmol/µl) and insert (0.015, 0.03 and 0.06 pmol/µl) were cleaved under optimal conditions (6
mM iodine, 10 % ethanol, 70°C, 5 min), hybridized and transformed in E.coli. Smallest
amount of vector/insert didn’t produce any clones, possibly due to low competency of used
cells. In the other two cases, bell-shaped curve was observed for both concentrations of
vector/insert. Maximum TE, in both cases, was reached at 6 mM iodine (Figure 25). This
means that 0.009 pmol of vector is already saturating amount for TE and increasing the
vector amount additionally has no effect on TE. On the other side, number of clones
produced with higher vector amount was two times higher. This is something to keep in
mind when goal is to produce large mutagenesis libraries where final number of clones plays
important role.
0 2 4 6 8 10
0
2
4
6
8
10
12
Transform
ation efficiency
(x104 cfu/ug vector backbone)
Iodine concentration (mM)
0.018 pmol
0.009 pmol
Figure 25 Effect of vector/insert concentration and iodine concentration of transformation efficiency of E. coli with
cleaved and hybridized pET28 and EGFP.
Using optimal conditions established from previous experiments (0.01 pmol vector,
~0.03 pmol insert, 6 mM iodine, 10 % vol/vol ethanol, 70°C, 5 minutes) three target genes
(EGFP, M57 and P450 BM3) were successfully cloned in pET28 and pALXtreme (Figure 26).
Transformation efficiency in case of smaller vector backbone (pALXtreme, 2.3 kbp) was one
order magnitude higher than compared to pET28 (5.3 kbp). Maximum TE reached 8 x 10⁵
cfu/µg vector, in case of small gene (EGFP), and 0.9 x 10⁵ cfu/µg vector in case of P450 BM3,
when employing pALXtreme for cloning. This TE was sufficient for directed evolution
experiments.

Page | 52
Blank EGFP M57 BM3
0.0
0.2
0.4
0.6
0.8
2
4
6
8
10
Transform
ation efficiency
(x105 cfu/ug vector backbone)
pALXtreme-1a
pET-28a(+)
Figure 26 Cloning of three target genes EGFP (0.7 kbp), M57 protease (1.3 kbp) and P450 BM3 (3.2 kbp) in two target
vectors, pET28 (5.4 kbp) and pALXtreme (2.3 kbp) using optimized conditions for PIGe.
Clones were validated by plasmid isolation, restriction digestion (XbaI) and colony
PCR. Expression test was performed directly on induction agar plates after re-transformation
in expression strain (BL21-Gold (DE3) for pET28 and BL21-Gold (DE3) lacIQ1
for pALXtreme).
Sequencing was performed to prove that iodine and ethanol cause no changes is DNA
structure (deamination, oxidation). All clones tested (20 of each construct) showed correct
plasmid size after plasmid isolation and additionally after digestion. Colony PCR proved that
all clones harbor target genes, achieving cloning efficiency of 100 %. All clones harboring
EGFP gene after induction showed green fluorescence when visualized under UV light (366
nm, Figure 27A). Also, all clones harboring M57 protease formed halo after induction on
skim milk agar plates (Figure 27B).

Page | 53
Figure 27 Expression test of clones harboring EGFP gene in pET28 (A, left) and pALXtreme (A, right) vector. Green
fluorescence is visualized under UV light (366 nm).
At the end 9 kbp of DNA from different construct was sequenced. Only one mutation
was found which would correspond to error rate of Taq polymerase used in amplification of
these genes (77). Additionally, this mutation was transition (A->T) showing the bias of the
polymerase.
2.4 Conclusion
High throughput screening technologies have in the recent years been advanced
rapidly and allow to routinely screen >106 variants in less than one hour employing for
instance in-vitro compartmentalization technology and flow cytometry (78). Directed protein
evolution experiments comprise iterative cycles of diversity generation and high throughput
screening. Directed evolution experiments require therefore robust cloning and
transformation protocols to generate large mutant libraries (105-10
6) in order to increase the
likelihood to find variants that are improved in the targeted property. Figure 17 categorizes
the existing cloning technologies in three groups depending on the method employed for
DNA digestion/preparation and subsequent DNA fusion. Group 1 and group 2 methods
employ enzymes for primer digestions and/or ligase for DNA fusions and are therefore
limited in their completeness by Km values of employed enzymes. In order to maximize the
number of mutant variants the existing cloning technology was advanced by introducing a
chemical cleavage reaction of phosphorothioate bonds in aqueous solution in presence of

Page | 54
iodine and ethanol and thereby avoiding any enzymatic digestion or ligation step. Figure 28
illustrate the principle of PIGe.
Figure 28 Principle of PIGe cloning technology (A). Comparison of 5’-3’ phosphodiester and 5’-3’ phosphothioate linkage
(B).
Key to success and robustness of PIGe was the introduction of subsequent
phosphorothioate bonds (12 nts) in the cloning primers since the iodine-ethanol cleavage
reaction has an efficiency of ~70 % per phosphorothioate position. A iodine concentration of
6 mM in presence of 10 vol% ethanol proved to be efficient in the cleavage reaction (70°C, 5
min, 0.05 M tris, pH 9) and iodine did not effect negatively transformation efficiency (see
control in Supplementary data). Restriction analysis of 240 variants yielded for all three
investigated genes (BM3, M57, EGFP) and both vectors (pET-28 and pALXtreme) only
transformations with inserts of correct size. Sequencing of in total 9 kb showed 1 mutations
(transition bias) which are close to reported mutation frequencies of employed Taq-
polymerase. The PIGe primers were designed to hybridize with the vector-backbones of pET-
28 or pALXtreme. Hybridization within the vector backbone enables to develop cloning
systems that are gene independent using vectors which can be amplified well. A further
advantage of PIGe compared to existing cloning technologies (Figure 17, Supplementary
Table 1, Supplementary data) is the rapid cloning procedures which require 10 min for
digestions and hybridization without any purification step. Cleaved primer fragments
containing phosphorothioate bonds did slightly reduce the cloning efficiency (7.4 vs 5.8x10⁴
cfu/µg) likely because the cleaved primer tails consisting of phosphorothioates (12 nt) are
cleaved in a multiple manner resulting in small sized fragments which do not hybridize at
room temperature. Two further advantages of PIGe are: A) background-free cloning and B)

Page | 55
robustness in handling since hybridization is exclusively driven by H-bond formation
between complementary DNA sequences. These two attributes are important prerequisite
for developing successful strategies in directed evolution experiments through determining
mutational loads and fraction of active clones. Since the transformation efficiencies for long
genes like BM3 were insufficient (~0.9x10⁴ cfu/µg) a shortened vector pALXtreme was
generated increasing the transformation efficiency to (~9x10⁴ cfu/µg) in E. coli. Figure 26
shows that reducing the vector size by 3 kb (pET-28; 5.3 kb // pALXtreme; 2.3) boosted the
transformation efficiency by an order of magnitude.
Supplementary Table 1 in the Supplementary data summarizes, mainly for
commercialized methods, the key performance parameters (transformation efficiency,
cloning efficiency, time requirement, handling effort and general applicability (sequence
dependency)) and introduces briefly their cloning principles. PIGe performs competitively to
commercialized methods in terms of transformation (8x10⁵ cfu/µg (PIGe) vs 5x10
5 cfu/µg
(LIC; Table XY) and cloning efficiencies (>95 %). Most commercialized cloning methods
employ small vectors (<3 kb; pUC derivates) and small inserts (<2 kb) for benchmarking their
performance. PIGe is advantageous is terms of time requirement and robustness in handling.
PIGe is furthermore one of few other cloning methods (exonuclease, In-Fusion, restriction-
free, ligase-free cloning; see Supplementary Table 1, Supplementary data) that are sequence
independent.
In summary we hope that the efficient PIGe cloning technology will assist many
researchers to succeed in directed evolution experiments by obtaining with minimal effort
high numbers of transformants, allowing statistical analysis and comparison of mutational
loads in directed evolution experiments. Furthermore a patent has been filed for employing
PIGe in mutant library generation through DNA fusion, metabolic pathway engineering and
gene assembly which seem further attractive applications of the PIGe cloning technology.
3. Expression and purification of Cyt P450 BM3
3.1 Introduction
Cytochrome P450s, especially eukaryotic ones, are membrane bound proteins
containing heme in their catalytic core. Expression of such proteins in heterologous hosts,
especially in bacteria, is somewhat difficult without modifications of enzyme on its amino
terminus. Using E. coli as an expression host usually leads to improper protein folding and
formation of inclusion bodies. Additionally, proper incorporation of heme into functional
enzyme is a problem by itself. On the other hand, prokaryotic P450s are fusion proteins,
containing both - heme domain and diflavin reductase in one polypeptide chain. More
importantly, they are cytosolic enzymes which make them very water soluble. Expression of
prokaryotic P450s in E. coli has been well established using many different expression
systems leading to high levels of produced enzyme.

Page | 56
Table 4 Overview of expression systems for Cyt P450 in
Most of the systems for high
(Table 4). pCWori is inducible vector under control of
temperature-inducible vector. Lately, there are reports about cloning of P450 variants into
pET28 vector (80,81)(see also
more stable, giving less expression background due to two control points
polymerase and lac promoter (Figure
Figure 29 Expression control in pET28 (left) and
Disadvantage of pET vectors is their big size, being between 5.5 an
containing large BM3 gene (~3.2 kbp) are drastically decreasing the transformation efficiency
of E. coli (down to 103 cfu/µg vector backbone
Overview of expression systems for Cyt P450 in E. coli host. Taken over from (79).
Most of the systems for high-level expression include pCWori and pCYTEX vectors
). pCWori is inducible vector under control of lac promoter while pCYTEX is
inducible vector. Lately, there are reports about cloning of P450 variants into
(see also Chapter 2). Compared to the others, pET expression system is
more stable, giving less expression background due to two control points
promoter (Figure 29, left)
Expression control in pET28 (left) and pALXtreme (right) vectors. Adapted from pET System Manual
Edition, Novagen).
Disadvantage of pET vectors is their big size, being between 5.5 an
large BM3 gene (~3.2 kbp) are drastically decreasing the transformation efficiency
cfu/µg vector backbone, see Chapter 2). Smaller vector backbone
level expression include pCWori and pCYTEX vectors
promoter while pCYTEX is
inducible vector. Lately, there are reports about cloning of P450 variants into
). Compared to the others, pET expression system is
more stable, giving less expression background due to two control points – T7 RNA
pET System Manual (11th
Disadvantage of pET vectors is their big size, being between 5.5 and 6 kbp. Constructs
large BM3 gene (~3.2 kbp) are drastically decreasing the transformation efficiency
Smaller vector backbone

Page | 57
would be preferred for cloning of large genes. pALXtreme vectors are modified pET vectors
where 63 % of the non-crucial sequences have been deleted (Dr Alexander Schenk,
unpublished data). Additionally, lacI gene has been transferred to genome of E. coli host
under the control of Q1 promoter (Figure 29, right). In this way, BL21-Gold (DE3) lacIQ1
expression strain has been generated. This system drastically improved transformation
efficiency (see Chapter 2) keeping all the advantages of good and stable expression system.
Expression system, if it was to be used for ultra-HTS based on flow cytometry has to
posses few important properties:
1. Expression needs to be inducible;
2. Background expression has to be low;
3. Induction of target protein must not affect cell growth;
4. Expression level of target protein has to be easily fine-tunable.
First three properties are especially important for the expression of cell toxic proteins
like P450s. Expression system needs to be established in a way that cell growth is unaltered
both when protein induction doesn’t occur and when protein of interest is induced.
Otherwise there would be a big difference, when growing a library, between cells expressing
functional or improved target genes, which would grow much slower, compared to the cells
carrying “dead” genes or no target genes at all. Last mentioned point is important for fine-
tuning of the activity signal in double emulsions. Usually, due to high sensitivity of the flow
cytometer and double emulsion system expression level of the expressed enzyme has to be
low. This decreases stress applied on the cell due to synthesis of heterologous proteins but
also due to concentration of reaction product in cytosol (especially if the reaction products
are toxic for the cell). Opposite to flow cytometry for MTP screening much higher protein
levels are needed for activity detection.
Due to their associations with the membrane, mammalian P450s are difficult to
purify. Usually, whole membrane preparations are used for the conversion experiments. On
the other hand, prokaryotic P450s including BM3 are water soluble and therefore easily
purified using different chromatography methods. There are reports of purification of BM3
using anion-exchange chromatography with step salt elution (82) and combination of
hydrophobic/size exclusion chromatography (83). Anion-exchange chromatography using
DEAE matrix and FPLC (Fast Protein Liquid Chromatograpy) present reproducible, easy, cost-
effective way to isolate P450 BM3. Method can be optimized for high purity (85-95 %) and
high amount of protein in single step purification.
In this Chapter we describe optimization of conditions for small scale (flow cytometry
application) and high scale (purification application) expression of Cyt P450 as well as
expression in MTPs. Two different expression systems have been used – BL21-Gold
(DE3)/pET28 and BL21-Gold (DE3) lacIQ1
/pALXtreme. We determined that media plays

Page | 58
important role in expression with an influence on cell growth as well as on protein activity.
Additionally, in this Chapter, optimized protocol for purification of P450 BM3 has been
described. It is based on previously published protocol by Schwaneberg et al. with a
difference that combination of step and gradient salt elution was used. High purity (90-95 %)
of protein obtained was sufficient for kinetic characterization.
3.2 Materials and methods
Chemicals and reagents
All chemicals used in this research were purchased from Sigma-Aldrich (Steinheim,
Germany), Serva (Heidelberg, Germany) and AppliChem (Darmstadt, Germany) and were of
analytical grade unless stated otherwise. Milli-Q water (Millipore, Billerica, MA, USA) was
used in all experiments.
Cells and media
For optimization of expression of Cyt P450 BM3 two strains were used: BL21-Gold
(DE3) carrying pET28-Cyt P450 BM3 F87A and BL21-Gold (DE3) lacIQ1
carrying pALXtreme-Cyt
P450 BM3 F87A.
LB (Luria Bertani) media was used for pre-culture preparation, cell growth and
expression (53). TB (Terrific Broth) was used as a standard rich media for expression (53).
Auto-induction media (MD-5052, LSG-5052, P-5052 and TYM-5052) were used for protein
expression in high density cultures (84). All media were supplemented with kanamycin (50
µg/ml) to enable selection of cells harboring pET28/pALXtreme vectors. Additionally, in
some cases medium was supplemented with δ-amino levulinic acid (ALA, 0.5 mM) and
thiamine (0.5 mM) to enhance cofactor production. Trace elements (TE), as a source of iron
for heme biosynthesis, were added when stated (53).
Vectors
pET28 vector with Cyt P450 BM3 gene was constructed using restriction cloning (as
described in Chapter 2) while gene was inserted in pALXtreme using PIGe cloning (as
described in Chapter 2).
I. Small scale expression (4 ml) of Cyt P450 BM3 from BL21-
Gold(DE3)/pET28 system in auto-(MD-5052, LSG-5052, P-5052 and TYM-
5052) and non-auto induction media (TB)
BL21-Gold (DE3) carrying pET28 vector with Cyt P450 BM3 F87A gene was used. Cells
were grown overnight (4 ml LBKan, 37°C, 250 rpm, 16 h) and used as a pre-culture. Auto-
induction media (MD-5052, LSG-5052, P-5052 and TYM-5052) were prepared as described in
Cells and media. As standard control TB media was used.

Page | 59
For MD-5052 media, pre-culture was inoculated in specified dilutions (1:50, 1:100
and 1:200) and expression was continued for 14 hours (37°C, 250 rpm). For other auto-
induction media only 1:100 dilution of pre-culture was used. In case of TB media, pre-culture
was inoculated in 1:100 dilution, grown for 2 hours (OD600~0.6-0.9, 37°C, 250 rpm), induced
with IPTG (0.5 mM) and expression was continued for additional 12 hours (37°C, 250 rpm).
In 2 hour interval 25 µl of cell suspension was taken and centrifuged (8000 rpm, 3
min). Wet cell mass (WCM), as a measurement of cell growth was calculated from difference
of tube containing a cell pellet and empty tube using analytical scale.
Optical density at 580 nm (OD580) was measured using TECAN Sunrise in 100 µl of cell
suspension. For activity determination sample of cell suspension (100 µl) was centrifuged
(8000 rpm, 3 min) and re-suspended in the same volume of 0.1 M phosphate buffer pH 9.
Assay was set up by mixing 25 µl of cell suspension with 40 µl of reaction mix (80 mM
phosphate pH 9, 450 µM PMB, 187 µM BCC and 1 mM NADPH). Fluorescence (exc. 400 nm,
em. 440 nm) was monitored for 15 minutes (1 minutes interval) using TECAN Safire. Slope
(AU/min) was calculated for first 10 minutes of reaction (linear range).
II. Small scale expression (4 ml) of Cyt P450 BM3 from BL21-
Gold(DE3)/pET28 and BL21-Gold(DE3) lacIQ1
/pALXtreme system in auto-
induction media (MD-5052)
In this case two different cell/expression systems were used. BL21-Gold (DE3) cells
were used for expression of Cyt P450 BM3 F87A gene from pET28 vector, while BL21-Gold
(DE3) lacIQ1
cells were used for the expression of the same mutant from pALXtreme-1a.
Pre-culture as prepared as described in Part I. Auto-induction media (4 ml MD-5052)
was inoculated with different dilutions of pre-culture (1:25, 1:50 and 1:100) and protein was
expressed for 12 hours (30 and 37°C, 250 rpm).
Optical density (OD600) and expressed enzyme activity were determined as described
previously (Part I).
III. Small scale expression (3 ml) of Cyt P450 BM3 from BL21-
Gold(DE3)/pET28 and BL21-Gold(DE3) lacIQ1
/pALXtreme system in non
auto-induction media (TB)
For this experiments following cell/expression systems were used. For expression of
Cyt P450 BM3 139-3 mutant from pET28 vector, BL21-Gold (DE3) strain was used. For the
expression of the same mutant from pALXtreme-1a vector, BL21-Gold (DE3) lacIQ1
strain was
used.
Pre-culture was prepared as described in Part I. Dilution (1:100) of pre-culture was
inoculated in 3 ml TBKan media with supplements (specified under Cells and media) and

Page | 60
grown (37°C, 250 rpm, 2 h) in pre-induction phase. Cells were induced with addition of IPTG
(0.5, 0.05 and 0.005 mM) and grown for another 8 hours (30 and 37°C, 250 rpm).
Optical density (OD600) and activity measurements were done as described previously
(Part I).
IV. Expression (4 ml) of Cyt P450 BM3 from BL21-Gold(DE3)
lacIQ1
/pALXtreme system under inducing and non inducing conditions
(LB)
For the pre-culture BL21-Gold (DE3) lacIQ1
strain harboring pALXtreme P450 BM3
F87A was used. Pre-culture was prepared as described in Part I. Different dilutions of pre-
culture (1:25, 1:50, 1:100 and 1:500) were inoculated in 4 ml LBKan media. Media was
supplemented with ALA (0.5 mM), thiamine (0.5 mM) and trace elements (1X). Inducer was
also supplemented directly into media (5, 50 and 500 µM IPTG). Cell growth and enzyme
expression was monitored for 24 hours (30°C, 250 rpm).
Optical density (OD600) and activity measurements were done as described previously
(Part I).
V. Large scale expression (200 ml) of Cyt P450 BM3 from BL21-Gold
(DE3)/pET28 system in auto- (MD-5052, TYM-5052 and LSG-5052) and
non auto-induction media (LB and TB)
BL21-Gold (DE3) cells carrying pET28 P450 BM3 F87A were used. Media was
prepared as described under Cells and media. Overnight culture was prepared (4 ml LBKan,
37°C, 250 rpm, 16 h) and used to inoculate 1 l flasks, each containing 200 ml different media
(LB, TB and auto-induction media MD-5052, TYM-5052, LSG-5052). Dilution of the pre-
culture was 1:100. Media was supplemented with 0.5 mM ALA. Cultures were grown at 200
rpm and 30°C and 37°C, respectively. Induction in TB and LB media was achieved by addition
of 0.25 mM IPTG after the culture reached OD600 of 0.6-0.9. Expression was monitored for 14
hours.
Samples were taken at intervals of 2 hours and OD600 measurements made with
Specord 200 UV/Vis spectrophotometer (Analytik Jena). Activity was detected by performing
an assay as follows. Twenty five micro liters of cell suspension was centrifuged (8000 rpm, 3
min); supernatant was discarded and pellet was re-suspended in 55 µl 0.1 M phosphate
buffer pH 9. Five micro liters of PMB (3.6 mM) were added together with 1 µl DBCC
substrate (10 mM in DMSO). Sample was incubated for 5 minutes at room temperature.
Four micro liters of NADPH (10 mM) were added to initiate the reaction. Fluorescence was
measured in TECAN Safire (exc. 400 nm, em. 440 nm) after 10 minutes.

Page | 61
VI. Expression of Cyt P450 BM3 from BL21-Gold(DE3) lacIQ1
/pALXtreme
system in microtiter plates
For expression in 384-well format deep well plates (Eppendorf) were used. Cells,
harboring vector with Cyt P450 BM3 F87A gene, were picked directly from the agar plate
using sterile tooth picks into wells containing 200 µl LBKan media. Cells were grown until
saturation (37°C, 900 rpm, 70 % humidity, 16 hours). Glycerol stock was prepared by adding
50 µl sterile 50 % glycerol and freezing the plate on -80°C (Master plate). Master plate was
replicated into Assay plate and grown (TBKan media, 5 µM IPTG, 30°C, 700 rpm, 70 %
humidity) for 12 hours. Assay was done after transferring cell pellet into black flat bottom
384-well plate.
For expression in 96-well format Master plate was prepared as follows. Cells,
expressing Cyt P450 BM3 F87A variant, were picked directly from agar plates into 150 µL
LBKan media and grown until saturation (37°C, 900 rpm, 70 % humidity, 16 hours). Glycerol
stock was prepared by adding 50 µl of sterile 50 % glycerol and freezing the plate on -80°C.
Assay plate was prepared by replicating Master plate directly into black flat bottom 96-well
plate containing 150 µl media. LB media without and with 5 µM IPTG was used to test the
expression (30°C, 700 rpm, 70 % humidity, 14 hours). Assay was done directly after pelleting
the cells (4000 rpm, 10 min, 4°C).
VII. Purification of Cyt P450 BM3 using DEAE ion-exchange chromatography
with gradient elution of salt
For purification, Cyt P450 BM3 was expressed on large scale (250 ml) as described in
Part VI. After expression cells were pelleted by centrifugation (4000 rpm, 10 min, 4°C). Pellet
was well re-suspended in 15 ml lysis buffer (10 mM tris-HCl pH 7.8) by vortexing and
pipetting up/down. Cell suspension was passed trough French press (3 passes, 1500 bar).
Cell debris was removed by centrifugation (14000 rpm, 10 min, 4°C). Additionally, sample
was cleared by filtration (Millipore filter, 0.45 µm).
Sample (10 ml) was loaded on DEAE-ion exchange column equilibrated in 100 mM
tris-HCl pH 7.8 (buffer A). Flow was kept constant (5 ml/min). Detection was absorbance set
up for total proteins (280 nm) and for heme proteins (417 nm). Unbound sample was
washed with 2 CV of buffer A. Gradient of buffer B (100 mM tris-HCl pH 7.8 with 2 M NaCl)
was adjusted to 5 % and loosely bound proteins were washed out (2 CV). Then linear
gradient 5-20 % was set up in 5 CV. Cyt P450 BM3 was eluted in this region. After 20 % B
gradient was adjusted to 100 % B in 2 CV and washing of the column (100 % B) was
continued for another 2 CV. At the end, column was washed with buffer A, then with Milli-Q
water and kept in 20 % ethanol.

Page | 62
Fractions containing Cyt P450 BM3 were pooled together and analyzed by SDS-PAGE
for purity (85). Total protein concentration was determined using commercial BCA Protein
Kit (Pierce). Concentration of Cyt P450 BM3 was determined with CO binding assay (86).
3.3 Results and discussion
I-VI. Expression of Cyt P450 from pET28 and pALXtreme vectors using
different media
Auto-induction media presents an elegant solution for expression of proteins under
the control of T7 promoter (84). Media is supplemented with dual sugar source, glucose and
lactose. After glucose, being the favored sugar source, is consumed cell are forced to switch
to lactose as an alternative energy source. On the other side, lactose serves as an inducer for
T7 promoter, so protein expression starts automatically.
We tested Cyt P450 BM3 expression in three different auto-induction media (L-5052,
P-5052 and MD-5052) as well as one non-induction media (TB) where expression needs to be
initiated by addition of inducer (IPTG). Growth and activity curves are shown in Figure 9
(Supplementary data). Cell growth (proportional to CWM) was most pronounced in TB and
TYM-5052 media, both being rich source media. From minimal media, MD-5052 showed best
performance regarding cell growth. Increase in protein expression (activity) was most
pronounced in TB media between 2-6 hours, while in other media activity was only marginal.
After 6 hours of expression in TB media drop of activity is detected. In all auto-induction
media expression started somewhat later (between 6-8 hours) and kept constant level
during the monitored time (14 hours). From data presented here MD-5052 was chosen as
the most suitable for expression of P450 BM3.
In the next experiment, expression of P450 BM3 was tested using two expression
systems pET28/BL21-Gold (DE3) and pALXtreme/BL21-Gold (DE3) lacIQ1
. Not so much
literature data is available for expression from lacIQ1
strains but we expected that conditions
would need to be slightly adjusted compared to pET28 system. In these experiment
constructs generated using PIGe cloning platform were used. Distance between ribosome
binding site (RBS) and beginning of the gene was adjusted to optimal, and we expected that
this would additionally affect expression. Media was MD-5052 and different pre-culture
dilutions were used (1:25, 1:50 and 1:100). Expression was tested on 30 and 37°C. Lower
temperatures are known to increase yield of expressed proteins from T7 promoter system
(Invitrogen pET System Manual). BL21-Gold lacIQ1
strain showed similar growth speed on
both temperatures, while growth of BL21-Gold strain was much slower at 30°C. Regarding
the protein expression, in both cases expression was much higher at lower temperature, as
expected. Growth and activity curves are shown in Figure 10/11 (Supplementary data).
Expression of protein from pALXtreme vector, on the other side, was quite low on both
temperatures, showing that auto-induction media maybe is not the best option for optimal
Page | 63
expression. Additionally, when tested for expression in 96-well MTP format auto-induction
media (MD-5052) showed very high standard deviation of cell growth, reaching up to ~50 %.
In order to reduce standard deviation in MTP and to be able to control expression
easier in tube format, we decided to use non-inducing rich media (TB). Pre-culture was
inoculated, grown for 2 hours at 37°C for cells to reach optimal OD for expression (0.6-0.9)
and then induced with addition of IPTG. We used different concentrations of IPTG (5, 50 and
500 µM) and two different expression temperatures 30 and 37°C. Growth and activity curves
are shown in Figure 12/13 (Supplementary data). In case of BL21-Gold/pET28 system growth
of cells was the same at both temperatures, unaffected by the addition of inducer.
Nevertheless, expression was lower at 37°C. In case of pALXtreme/BL21-Gold lacIQ1
expression system low expression level was observed on 37°C. In case when 500 µM IPTG
was used (recommended conditions, Invitrogen pET System Manual) no activity could be
seen at all. Additionally, here we observed negative effect of inducer on cell growth. Higher
concentrations of inducer hampered the cell growth. On both temperatures, drop in activity
was observed after 6-8 hours of expression. One explanation could be that high protein
concentration in cytoplasm lead to inclusion body formation. We could confirm this partially
by SDS-PAGE showing that band from expressed protein was present in soluble fraction at
the beginning of expression, while the activity was high and after prolonged incubation most
of the protein was in insoluble fraction (drop in activity).
At the end, as we concluded from many previous experiments, for flow cytometry
system we need to have expression system which would satisfy the following conditions:
1. Expression needs to be inducible, especially in the case of proteins which are toxic
for cells or could use cellular metabolites (i.e. NADPH) and hamper the cell growth;
2. Expression doesn’t need to yield high amount of protein, since detection on flow
cytometry is very sensitive;
3. Expression has to be timed in a way that preparation of sample and screening on
the flow cytometer would be possible in the same day.
From IVC/flow cytometry literature we found out that even low amount of enzyme,
leaked from the vector, would be sufficient for detection by flow cytometry. System was
tested as follows. Cells were inoculated in simple media (LB) with or without
supplementation of inducer, for comparison, and grown on 30 and 37°C. Activity and OD
were measured in 24 hour period. Again, in case when 500 µM IPTG was used as an inducer
cell growth was affected, while in case of other two concentrations. Growth and activity
curves are shown in Figure 14 (Supplementary data).
Growth and activity curves for large scale, batch (250 ml) expression of Cyt P450 BM3
are shown in Figure 15 (Supplementary data).

Page | 64
For verification of flow cytometry screening and assay in MTP format we tested
expression in deep well 384-well MTP and flat bottom 96-well MTP. Cell growth and
expression level showed high standard deviation (>50 %) when 386-well MTP were used. For
expression in 96-well plates there was no need to used deep well plates since sensitivity of
the assay was sufficient to detect enzyme expressed in 100-150 µl media.
For minimizing standard deviation coming from media evaporation during incubation
different sealing techniques were tested. Results of cell growth and standard deviation are
shown in Table 5. Smallest standard deviation of growth was in the case when MTP plate
was sealed with plastic sticky tape.
Table 5 Standard deviation of cell growth in 96-well MTPs sealed with different types of sealers.
Type of sealing Average OD600 Standard error Standard deviation (%)
Commercial plastic sealer 0.697 0.23 32.99
Parafilm 1.083 0.14 12.93
Plastic sticky tape 1.223 0.02 1.63
Semi permeable film 1.138 0.04 3.51
We chose LB media as expression media in this case, and tested expression without
inducer and in the presence 5 µM IPTG. Standard deviation of the assay is shown in Figure
30. There was a decreasing trend in standard deviation in time due to the fact that
fluorescence intensity was increasing while measurement and other errors remained the
same in the time. Ninety minutes was chosen as optimal for activity measurement in 96-well
MTP assay.
0 20 40 60 80 100 120
0
5
10
15
20
25
30
35
40
Standard deviation (%)
Time (min)
no IPTG
with 5 µM IPTG
Figure 30 Standard deviation (%) of assay in 96-well MTP during the incubation.

Page | 65
VII. Purification of Cyt P450 BM3 using DEAE ion-exchange chromatography
with gradient elution
Cyt P450 BM3 has previously been purified using DEAE ion-exchange
chromatography with the step elution of salt (82). We slightly modified the protocol in a way
that gradient elution was used.
First, loosely bound proteins are washed out with 5 % buffer B in 2 CV. Cyt P450 BM3
is eluted in ~10 ml of elution buffer, at linear gradient of buffer B (5-20 % B), well separated
from other contaminating proteins (Figure 31).
Figure 31 Chromatogram of purification of Cyt P450 BM3 Wt. Blue line indicates absorbance of total protein (280 nm),
red line indicated absorbance of prosthetic group (heme, 417 nm), green line represents fraction of the buffer B (%) while
brown line is conductivity (mS/min).
Purity of the protein was estimated to 90-95 % using SDS-PAGE (Figure 32). Result
was confirmed by comparing concentrations of total proteins (determined with BCA
method) and concentration of Cyt P450 BM3 (determined with CO binding method).

Page | 66
Figure 32 SDS-PAGE comparison of Cyt P450 BM3 purified by previously published ion
et al. (lane 2 and 3) and our optimized protocol (lane 3).
After chromatography protein purity was sufficient for kinetic characterization.
3.4 Conclusion
Expression of Cytochrome P450 in heterologous hosts (
problematic due the presence of hydrophobic “docking” region. Removing or modifying this
amino terminal region leads to higher expression
formation. Additional problem with Cytochrome
active site. Cytochromes are mostly expressed in
have a functional enzyme reductase domain has to be expressed in the same host
Cytochrome P450 BM3 is
and purification much easier. P450 BM3 has been expressed in
using a series of different vectors, pCWORI, pCTEX, pET28 etc. Each vector possesses
different induction system and offers some advantages and disadvantages compared to the
others. pCWORI is the commonly used, high yield, expression vector under the control of
promoter. This vector has been used in most directed evolution experiments, also in our
laboratory. Due to control over
background activity. Also, problems in site directed and site saturation
protocols have been reported
PCR (data not shown).
pET system offers many advantages. First, expression i
points, lac promoter and T7 RNA polymerase (Figure
background. Vectors are commercially available and offer many
(multiple tags, different resistance). Expression
M 1 2 3 4
PAGE comparison of Cyt P450 BM3 purified by previously published ion-exchange method by
(lane 2 and 3) and our optimized protocol (lane 3). Lane 4 is non purified sample (cell homogenate
molecular weight markers (Fermentas).
After chromatography protein purity was sufficient for kinetic characterization.
Conclusion
Expression of Cytochrome P450 in heterologous hosts (E. coli, S. cerevisia
problematic due the presence of hydrophobic “docking” region. Removing or modifying this
amino terminal region leads to higher expression levels and prevents inclusion body
formation. Additional problem with Cytochrome P450 expression is incorporation of heme in
active site. Cytochromes are mostly expressed in E. coli using pCWORI vector. In order to
have a functional enzyme reductase domain has to be expressed in the same host
3 is a self-sufficient water soluble enzyme making its expression
and purification much easier. P450 BM3 has been expressed in E. coli as a heterologous host
using a series of different vectors, pCWORI, pCTEX, pET28 etc. Each vector possesses
uction system and offers some advantages and disadvantages compared to the
others. pCWORI is the commonly used, high yield, expression vector under the control of
promoter. This vector has been used in most directed evolution experiments, also in our
aboratory. Due to control over lac promoter expression is “leaky”
background activity. Also, problems in site directed and site saturation
protocols have been reported due to the difficult amplification of the vector backbone
pET system offers many advantages. First, expression is regulated by two control
and T7 RNA polymerase (Figure 29, left) giving very low expression
background. Vectors are commercially available and offer many cloning possibilities
(multiple tags, different resistance). Expression strains used with this vector are
exchange method by Schwaneberg
ell homogenate) while lane M is
After chromatography protein purity was sufficient for kinetic characterization.
coli, S. cerevisiae) is usually
problematic due the presence of hydrophobic “docking” region. Removing or modifying this
and prevents inclusion body
expression is incorporation of heme in
using pCWORI vector. In order to
have a functional enzyme reductase domain has to be expressed in the same host (79).
sufficient water soluble enzyme making its expression
as a heterologous host
using a series of different vectors, pCWORI, pCTEX, pET28 etc. Each vector possesses
uction system and offers some advantages and disadvantages compared to the
others. pCWORI is the commonly used, high yield, expression vector under the control of lac
promoter. This vector has been used in most directed evolution experiments, also in our
giving high P450
background activity. Also, problems in site directed and site saturation mutagenesis
due to the difficult amplification of the vector backbone in
s regulated by two control
, left) giving very low expression
cloning possibilities
strains used with this vector are also

Page | 67
commercially available – BL21 (DE3) and BL21-Gold (DE3). Disadvantage of this vector
system is its size, being between 5-6 kb. Cloning of large genes, i.e. P450 BM3 (size ~3.2 kb),
is problematic resulting in low transformation efficiency (see Chapter 2). Smaller version of
the pET vectors has been generated in our lab by Dr. Alex Schenk (pALXtreme vector series).
Non-crucial sequences (63%) have been deleted out from the vector. Additionally, lacI gene
has been transferred into the genome of expression host resulting in new strain BL21-Gold
(DE) lacIQ1
. This drastically reduced the size of the vector to ~2 kb and increased
transformation efficiency for one order of magnitude (see Chapter 2). Finally,
pET28/pALXtreme expression vectors offer few advantages for flow cytometry screening
system: low expression background and fine tunable expression level.
In this chapter, we report optimization of expression conditions using two expression
systems – BL21-Gold (DE3)/pET28 and BL21-Gold (DE3) lacIQ1
/pALXtreme. Seldom reports
exist about optimal conditions of expression of Cytochrome P450s out of pET28 system
while pALXtreme expression system has been first tested in this Thesis. We observed that
different media play important role not only in level of protein expression but also in activity
of expressed protein.
We tested different auto-induction media where induction of the target protein
starts automatically after critical optical density of cells is reached. We observed that
different media formulation affect the cell growth as well as the protein expression. This
media seemed like a very elegant way for large batch expression experiments but in the
MTPs gave high growth and expression variations (up to 50%).
Different non auto-induction media have been tested (LB, TB, etc.). In this case
protein expression had to be induced by addition of IPTG. We observed that high level of
P450 BM3 expression affect the growth of the cells drastically possibly due to the toxic effect
of this protein on cell metabolism (consumption of reduction cofactors – NADPH). Lower
amount of IPTG led to lower levels of expression and thus did not affect the cell growth so
drastically. Concentrations of IPTG between 5-50 µM didn’t affect the growth at all. Level of
expressed protein, in this case, was sufficient to be detected by the flow cytometry/double
emulsion system as well as by fluorescent assay in 96- and 384-well MTP. Testing standard
assays (pNCA, 4-AAP) gave high coefficient of variance due to low levels of measured values.
Reason was too low expression level of P450 BM3. Expression was optimized for flow
cytometry experiments and MTP screening by using 5 µM for induction and longer
incubation times on 30°C. For batch expression 0.5 mM IPTG was used and only 8 hours of
induction (30°C).
Purification of Cyt P450 BM3 has been done by using ion-exchange chromatography
(82) or combination of hydrophobic/size-exclusion chromatography (83). Here we adapted a
method by Schwaneberg et al. to include linear gradient in which protein is eluted freed
from other contaminating proteins (Figure 31). Purity determined by measuring protein
concentration and by SDS-PAGE (90-95%) was satisfying for kinetic characterization.

Page | 68
4. Coumarine based substrates for high throughput screening of
Cyt P450 BM3 activity in microtiter plates (MTPs) and by flow
cytometry in double emulsions
4.1 Introduction
Two bottlenecks exist in one typical directed evolution experiment: the
transformation efficiency of the commonly used expression strains and the availability of
screening methods (Figure 33).
Up to now, few high diversity generation methods have been available (i.e. SeSaM
(87)). These methods are able to generate libraries with up to 1012
different gene variants.
On the other hand, transformation efficiency (TE) of most commonly used expression strains
(E. coli, S. cerevisiae, B. subtilis) is reaching only 108-10
9 meaning that significant part of the
library will be lost. Additionally, high throughput screening (HTS) methods developed up to
now, based on microtiter plate (MTP) or solid phase screening, have throughput of 103-10
6.
The inability to screen more clones would lead to loss of additional part of originally
generated diversity. Recently, methods based on flow cytometry and phage/cell display have
been published. These method increase throughput to 108-10
9, and can be regarded as ultra-
high throughput methods (ultra-HTS), but they still suffer from few main disadvantages.
Flow cytometry based methods are limited only to fluorimetric detection, while phage/cell
display techniques are limited in screening for protein affinity rather than activity.
The core of one ultra- and HTS methodology is the activity detection assay. Assay
needs to be reproducible, easy to perform, cost effective and most important, adaptable to
ultra- or HTS format. Fluorescence detection based assays offer many advantages compared
to the other detection based methods (i.e. spectrometry). Fluorescent assays are highly
reproducible and highly sensitive, decreasing the detection limits of target compounds. Also,
simultaneous detection of multiple probes is possible. Commercial substrates are available
for detection of different enzyme activity. Finally, fluorescent assays can be easily adapted to
HTS format using 96-, 384- and recently 1536-well MTPs.

Page | 69
Figure 33 Typical scheme of directed evolution experiment marking two bottlenecks of the method; transformation
efficiency of expression strains (red) and throughput of activity assay (blue). Adapted from Wong, T.S. (2006) PhD Thesis
Screening systems for monooxygenase activity in general can be based on detection
of changes in: A) cofactor or co-substrate, B) surrogate substrate or C) can detect the
product formation. Each of these approaches offers different advantages and disadvantages.
Detecting a cofactor/co-substrate can lead to many interference by other cellular
components when using a whole cell system. Additionally, variants are preferably selected
for improved cofactor/co-substrate binding or consumption and in rare cases for improved
product formation. Surrogate substrates are commonly used to improve enzyme properties
(pH, thermostability, solvent resistance). These often suffer from a problem that structure of
surrogate substrate is most of the time very different from the natural one. This leads to
variants with shifted substrate specificity. Finally, product formation is in most of the cases
difficult to detect unless it possesses a new property (i.e. color, fluorescence, luminescence),
compared to the substrate(s), which can be easily monitored with most commonly used
detection techniques (spectroscopy, fluorimetry). Otherwise, HTS techniques can not be
applied and a low- and medium-throughput approach has to be developed (i.e. HPLC, MS)
(88).
Cytochromes are principal enzymes involved in oxidative metabolism of drugs and
other xenobiotics. From the bioindustrial point of view these enzymes can be involved in
diverse synthetic transformations such as hydroxylation of the alkanes and aromatic
hydrocarbons, epoxidation of carbon-carbon double bonds and heteroatom oxygenation
(89,90). Reaction of hydroxylation from the chemical point of view doesn’t change drastically
the properties of the product molecule. Rarely any of those changes can be detected by
Page | 70
standard methods (spectrophotometry, fluorimetry). On the other side, detection of
reduction cofactors (NADH, NADPH) and co-substrates (oxygen) is more difficult due to high
interference of many compounds. That is why designing an assay for monitoring the activity
of Cytochromes still presents quite a challenge.
Up to now, MTP fluorimetry assays have been developed for mammalian
Cytochromes CYP1A1 (91) and CYP2B1 (92). Most assays for other mammalian Cytochromes
(i.e. CYP2C9, CYP2C19, CYP2D6 and CYP3A4) are time consuming and labor intensive; usually
requiring HPLC separation for metabolite quantification and therefore difficult to perform in
HT format.
Unlike mammalian, prokaryotic Cytochromes are mostly fusion proteins, with all
domains present in one polypeptide chain (25). Cytochrome P450 BM3 is isolated from
Bacillus megatherium and presents one of the most studied prokaryotic Cytochromes and in
many cases has been taken as a model system not only for prokaryotic members but
mammalian Cytochromes as well (48). Natural substrates of Cyt P450 BM3 comprise long
chain fatty acids and alcohols.
Many screening system have been developed for Cytochrome P450 BM3. Most of
them are based on detection of color (spectrometry) arising from conversion of chromogenic
surrogate substrate (8). Some assays have been developed to detect the product formation
(93). Additionally, NADPH consumption assays have been developed for Cyt P450 BM3 (94)
but these suffer from high background and high number of interfering compounds. Recently,
assay for monitoring co-substrate (oxygen) consumption has been developed (5). This
approach offers few advantages compared to other methods. It can be universally applied
for screening of activity towards any substrates, fluorescent detection which is used is highly
sensitive and oxygen probes are commercially available. On the other hand, this assay
suffers from problems when whole cells are used (increased background due to cellular
oxygen consumption).
Only one fluorescent assay for Cyt P450 BM3, based on surrogate substrate
conversion, has been published up to now. It is based on dealkylation of alkoxy-resorufin
and increase in green/yellow fluorescence arising from released resorufin (ex. 530 nm, em.
580 nm). Different alkoxy chains have been tested with P450 BM3 Wt and difference in the
activity was more than obvious. Benzoxy-resorufin was converted, in a very small extent, by
the P450 BM3 Wt. For the conversion of metoxy-, ethoxy- and pentoxy-resorufin site
directed mutants were produced (16).
Main idea of our work was to develop new fluorogenic substrates for Cytochrome
P450 BM3 which could be a part of HTS and more importantly ultra-HTS platform (based on
flow cytometry). The logic of the assay was based on previously well characterized
chromogenic substrate, pNCA (8). Fluorescent probe was to be attached on the terminal
position of the 12-dodecanoic acid. This chemical reaction would lead to decrease in
fluorescence of the probe and result in non-fluorescent substrate. After hydroxylation of the

Page | 71
substrate by P450 BM3 variant, instable hemiacetal would be formed. Hemiacetal would be
stabilized by release of fluorescent probe and increase in fluorescence of the reaction mix
could be detected (Figure 34).
Additionally, since the system was to be applied for double emulsion/flow cytometry
screening fluorescent probe had to fulfill certain demands: 1) excitation wavelength had to
be in the range of laser employed by flow cytometry device (375 or 488 nm); 2) detection
has to be possible in blue (455 nm), green (520 nm) or red (620 nm) filter channel and 3)
probe needs to be relatively small not to affect overall structure of the substrate. One of the
most important properties of the probe, if it is to be used in double emulsion/flow
cytometry screening, which we discovered by ourselves is the presence of the charge on the
core molecule. Non-charged molecules diffuse out through the lipid layer of the double
emulsion droplet (95).
In this Chapter we describe, in detail, the synthesis and characterization of novel,
coumarine based substrates for Cyt P450 BM3 Wt and variants. Also, we describe
optimization of the HTP assay in 96- and 384-well MTP’s as well as conversion in double
emulsions and single E. coli cells. Results of this Chapter will be later compiled into ultra-HTS
platform based on flow cytometry and double emulsion for directed evolution of Cyt P450
BM3 (see Chapter 5).
4.2 Materials and methods
Chemicals and reagents
All chemicals used in this Chapter were purchased from Sigma-Aldrich (Steinheim,
Germany), Serva (Heidelberg, Germany) and AppliChem (Darmstadt, Germany) and were of
analytical grade unless stated otherwise.
TLC plates coated with silica gel 60 F254 were from Merck (Haar, Germany).
Phosphomolybdic acid was used for visualization. After TLC has been developed plate has
been sprayed with phosphomolybdic acid and heated for short. Black spots appear on the
place where organic compound is present. Additionally, UV detection system was used. TLC
plates were exposed to UV light (366 nm and 254 nm).
Silica gel, used for chromatography, was type 60 and purchased from Roth
(Karlsruhe, Germany).
Rotary evaporator (Rotavap) was from Heidolp Instruments (Schwabach, Germany).
All fluorescent spectra were recorded using TECAN Safire (TECAN Group, Maenndorf,
Switzerland) in black flat bottom 96- or 384-well MTP (Greiner Bio-One, Frickenhausen,
Germany).

Page | 72
Proton and carbon NMR spectra were recorded using NMR Joel ECX 400 (Peabody,
USA).
I. Synthesis and characterization of substrates for Cyt P450 BM3 using 4-
methyl umbelliferone (4-MU) as a fluorescent probe
Synthesis and characterization of 12-(4-MU)-dodecanoic acid and methyl ester
Step 1 – protection of carboxylic group of fatty acid by esterification. For this step,
1.275 g (4.57 mmol) of 12-bromo-dodecanoic acid was dissolved in 20 ml dry methanol.
Next, 100 µl of concentrated H2SO4 was added. Reaction was incubated at 75°C for 3 hours.
Process was monitored by TLC using petrol ether: ethyl acetate (2:1) as a developing
solution. For visualization phosphomolybdic acid system was used.
BrOH
O
9
+ CH3 OH BrO
O
CH3
9+ OH2
75 °C, 3 h
cat. H2SO
4
After reaction was completed, sample was evaporated using ad Rotavap at 40°C for
10-15 minutes. Pellet was dissolved in CH2Cl2 and extracted twice with 10 ml of saturated
KHCO3, once with distilled water and once with brine. Organic phase was separated, dried
with MgSO4, filtered and evaporated using Rotavap.
Step 2 – Conversion of 4-MU into sodium salt. For this step, 0.80 g (4.54 mmol) of 4-
MU was dissolved in 15 ml dry methanol. 0.18 g (4.50 mmol) of NaOH was added. Reaction
was mixed with magnetic stirrer until NaOH completely dissolved. At this point, solution
changed color to bright yellow. Methanol was evaporated using Rotavap.
O O
CH3
OH
+ NaOH
O O
CH3
NaO
Step 3 – Attaching of fluorescent probe (4-MU) to fatty acid. Previously prepared
sodium salt of 4-MU was dissolved in 15 ml DMSO and dried shortly (10 min) on 120°C using
an oil bath. Then methyl ester of 12-bromo-dodecanoic acid was added (dissolved in 15 ml
DMSO). Mixture was stirred at 160°C for 3 hours. Progress was monitored by TLC.
BrO
O
CH3
9
+O O
CH3
NaOO O
CH3
OO
CH2
CH3
9180 °C 4 h
DMSO
After the reaction was done, mixture was poured into 200 ml of ice cold distilled
water and white precipitate formed immediately. After 10-15 minutes mixture was
centrifuged (4000 rpm, 5 min). Pellet was dissolved in CH2Cl2, extracted twice with saturated

Page | 73
NaHCO3 and twice with distilled water. Organic layer was dried with MgSO4, filtered and
evaporated using Rotavap.
Step 4 – de-esterification of the substrate – release of carboxyl group. Pellet from
previous step was dissolved in 25 ml potassium-metoxide (prepared by dissolving 0.8 g
(20.46 mmol) of KOH in 5 ml of water and then filling it up to 50 ml with methanol). Reaction
was incubated for 1 hour at 80°C. Sample was cooled down to room temperature and
poured in ~100 ml ice cold water (pH adjusted to ~1 with HCl). Formed precipitated was
filtered and dried over night under the vacuum.
OO
CH3
OO
CH2
CH3
9
OO
CH3
OOH
CH2
980 °C 1 h
potassium metoxide
For characterization by NMR, ~10 mg of both samples, ester and acid, were dissolved
in 1 ml of CDCl3. 13
C and 1H NMR spectra were recorded using a 400 MHz NMR (JOEL ECX
400, Peabody, USA).
For fluorescent spectra characterization stock solution of substrate was prepared in
DMSO (15 mM). Dilutions of stock solution were made in buffer and 3D fluorescent spectra
were recorded using TECAN Safire (Switzerland).
Conversion of 12-(4-MU)-dodecanoic acid and methyl ester
To test the possibility of conversion of novel coumarin/fatty acid compounds by Cyt
P450 BM3 we used soluble purified enzyme. Activity was tested with Cyt P450 BM3 wild-
type (Wt) and selected variants (F87A, F87A/R47Y, F87A/R47Y/M354S and Y51F).
Assay was assembled as follows: 230 µl of buffer (50 mM phosphate, 50 mM tris-HCl
pH 8.0 0.25 KCl), 5 µl substrate (15 mM in DMSO) and 10 µl soluble enzyme. Reaction was
incubated for 5 minutes at room temperature. Conversion was initiated by addition of 20 µl
NADPH (5 mM). Fluorescence was monitored using TECAN Safire (ex. 310 and 380 nm, em.
390 and 440 nm, respectively) in black flat bottom 96-well MTPs (Greiner Bio-One). After
reaction, 3 µl of each sample was analyzed by TLC (petrol ether: ethyl acetate = 1: 1).
Visualization was by UV light (254 and 366 nm).
To test protonation/deprotonation of the fluorescent probe 20 µl of 2 M NaOH was
added in 200 µl reaction mix. 3D fluorescent spectra were recorded before and after
addition.
Synthesis and characterization of 7-benzoxy-4-MU
First, 0.5 g (2.84 mmol) of 4-MU was dissolved in 20 ml DMSO with stirring. 600 µl
(3.51 mmol) of benzyl bromide was added together with catalytic amount of NaOH and
mixture was refluxed at 100°C for 2 hours. After the reaction mixture was poured into ice

Page | 74
cold water (~200 ml) and left over night. Precipitate was separated by filtration and dried in
vacuum. Dry pellet was re-dissolved in CH2Cl2. Chromatography was done on silica gel
column using petrol ether: ethyl acetate (1:1) for elution. Fractions with target compound
are pooled, solvent evaporated on Rotavap and pellet dried in vacuum, overnight.
Br
+
O O
CH3
OHO O
CH3
O100 °C 2 h
DMSO, cat. NaOH
For NMR characterization 5 mg of purified compound was dissolved in 1 ml CDCl3. 13
C
and NMR spectra were recorded using a 400 MHz NMR (JOEL ECX 400, Peabody, USA).
Conversion of 7-benzoxy-4-MU
To test the conversion of coumarin/benzyl compound (crude) with Cyt P450 BM3,
reaction was assembled as follows: 100 µl buffer (50 mM phosphate, 50 mM tris-HCl pH 8.0,
0.25 mM KCl), 2.5 µl substrate (15 mM in DMSO) and 10 µl enzyme. After 5 minutes
incubation on room temperature reaction was initiated with addition of 10 µl NADPH (10
mM). Conversion was done 1 hour at room temperature. Reaction products were analyzed
by TLC using petrol ether: ethyl acetate (1:1) as a developer. Visualization was done under
UV light (366 nm). Activity was tested for both, Cyt P450 BM3 wild-type (Wt) and selected
variants (F87A, F87A/R47Y, F87A/R47Y/M354S and Y51F).
For kinetic testing assay was assembled as described in paragraph above.
Fluorescence was monitored using TECAN Safire (ex. 380 nm, em. 440 nm, gain 50) in 60
minutes period (5 minutes interval).
To test applicability of NADPH-recycling system, assay was assembled as described in
paragraph above. Additionally, 5 µl of isocitric acid (80 mM) and 10 µL of isocitrate
dehydrogenase (0.01 U/µL) were added in reaction mix. Reaction was initiated with addition
of 2.5 µl NADPH (5 mM). Fluorescence was monitored using TECAN Safire (ex. 380 nm, em.
440 nm, gain 50) in 60 minutes period (5 minutes interval).
Influence of substrate concentration on conversion reaction was tested in the
following experiment. Reaction mix was assembled as follows: 100 µl buffer (50 mM
phosphate, 50 mM tris-HCl pH 8.0, 0.25 KCl), 2.5 µl substrate (different concentrations in
DMSO), 10 µl enzyme (Wt, 11 µM), 5 µl isocitric acid (80 mM), 10 µl isocitric dehydrogenase
(0.01 U/µl). Reaction mix was incubated 5 minutes on room temperature. Reaction was
initiated by addition of 2.5 µl of NADPH (5 mM). Concentration of the substrate was ranging
from 2.9 mM to 23 µM (in serial dilution by two). Fluorescence was monitored using TECAN
Safire (ex. 380 nm, em. 440 nm, gain 50) in 160 minutes period (10 minutes interval). V0 was
calculated for first 30 minutes of reaction (linear part).

Page | 75
Standard curve, using 4-MU, was prepared by measuring fluorescence of different
dilutions of fluorescent probe under the conditions stated in the paragraph above.
To test dependence of the conversion on enzyme concentration as well as detection
limit of the assay reaction was assembled as described above. Serial dilutions of the enzyme
stock (11 µM, 2-128 dilution) were prepared in activity buffer.
II. Synthesis and characterization of substrates for Cyt P450 BM3 using 3-
carboxy coumarin (3-CC) as a fluorescent probe
Step 1 – synthesis of methyl ester of 3-carboxy coumarine. 8.4 g (60.82 mmol) of 2,4-
dihydroxybenzaldehyde was dissolved in 45 ml of anhydrous methanol. Solution was stirred
and 8.7 g (65.85 mmol) of dimethyl malonate was added. Solution was brought to reflux
temperature. 450 mg (5.16 mmol) of moprholine and 150 mg (2.49 mmol) of acetic acid
were added to 2 ml of methanol and stirred until precipitate fully dissolved. This solution
was then added to refluxed reaction mixture and reflux was continued for another 3 hours.
After cooling, the product was filtered and re-crystallized from boiling methanol (~300 ml).
O
OH
OH
OO
O O
CH3 CH3+O O
O
OCH3
OH3 h
methanol
cat. morpholine, cat. CH3COOH
Step 2 – preparation of sodium salt of 3-CC. For this step, 1.5 g (6.81 mmol) of 3-CC
methyl ester was re-suspended in 50 ml of toluene, with stirring, and heated at 120°C until 5
ml of toluene evaporated (30-60 minutes). After cooling the mixture to room temperature
0.5 g (10.84 mmol) of NaH was added. Mixture was heated at 120°C and stirred until toluene
evaporated (1-2 hours). Obtained salt was dried in vacuum overnight.
O O
O
OCH3
OH
+ Na H120 °C 2 h
toluene
O O
O
OCH3
NaO
Step 3 – Attaching benzyl group to 3-CC methyl ester. 3 g (12.39 mmol) of prepared 3-
CC methyl ester sodium salt was dissolved in 200 ml of DMF (dried with molecular sieves).
Mixture was heated to 120°C. During heating, 2.138 g (12.5 mmol) of benzyl bromide was
added. Mixture was kept on 120°C for 2 hours with stirring. Then, additional 1 g (5.85 mmol)
of benzyl bromide was added and reaction continued at 120°C for 4-6 hours. At the end, one
more batch (0.7 g, 4.09 mmol) of benzyl bromide was added. Reaction was continued for
additional hour. At the end, mixture was cooled to room temperature for few hours and
poured to 400 ml of ice cold water. After precipitate formed (30-60 min), suspension was
filtered and rinsed with water. Precipitated was dried and re-dissolved in CH2Cl2. Organic
phase was extracted twice with water, filtered and evaporated on Rotavap. Precipitate was
dried overnight in vacuum.

Page | 76
CH3
+
ONaO O
O
OCH3
O O
O
O
O
CH3
120 °C 6 h
THF
Target compounds were isolated after chromatography on silica gel. Sample was
loaded in CH2Cl2. Elution was done by adding small amount of ethyl acetate into CH2Cl2
(1:20). Two main fractions were pooled according to TLC. Re-chromatography of un-pure
Fraction II was done on silica gel using CH2Cl2: ethyl acetate (20:1) for elution. Purity was
monitored on TLC using the same solvent system.
Step 4 – De-esterification of methyl ester group. 50 mg (161.13 µmol) of 7-benzoxy-3-
carboxy coumarin methyl ester was dissolved in 4 ml THF (kept at 4°C). At the same time,
0.07 g (1.67 mmol) of LiOH was dissolved in 4 ml of distilled water (kept at 4°C). When both
components were cooled to 4°C they were mixed, stirred 1 hour on ice and left overnight in
the fridge (with constant stirring). The following day, 1.66 ml of 3M HCl was added to
reaction mix and left to warm up to room temperature. Finally, 3.22 ml of brine was added
and organic phases separated. Reaction mix was extracted three times with 20 ml ethyl
acetate. All organic phases are pooled, evaporated on Rotavap and precipitate was dried
overnight under vacuum. Purity was monitored by TLC.
O O
O
O
O
CH3
O O
O
OH
O4 °C overnight
50% THF
For characterization by NMR, ~5 mg of both samples (Fraction 12 and Fraction 24)
were dissolved in 1 ml of CDCl3. 13
C and 1H NMR spectra were recorded using a 400 MHz
NMR (JOEL ECX 400, Peabody, USA).
Conversion of 3-carboxy coumarine based compounds using Cyt P450 BM3
Conversion of substrates based on 3-carboxy coumarine was done with purified Cyt
P450 BM3. Tested variants included Wt and mutants F87A, F87A/R47F, F87A/R47Y,
F87A/R47F/M354S and Y51F. Assay was assembled in black flat bottom 384-well MTPs
(Greiner Bio-One) as follows: 50 µl buffer (100 mM phosphate buffer pH 9.0), 1 µl substrate
(15 mM BCC and BCC Acid in DMSO, 10 mM DBCC in DMSO) and 5 µl enzyme (10 mg/ml).
Reaction mix was incubated 5 minutes on room temperature. Reaction was initiated by
addition of 4 µl NADPH (10 mM). Fluorescence was monitored in 1 min interval for 40
minutes using TECAN Safire (TECAN Group, gain 70, z-position 7800).
After reaction 3 µl of each reaction mix was loaded and analyzed on TLC.
Visualization was done by UV light (366 nm).

Page | 77
Reverse phase HPLC was performed to analyze reaction products of conversion of
BCC and BCC Acid by Cyt P450 BM3 F87A/R47F/M354S variant.
HPLC was performed on AKTA Purifier (GE Healthcare) connected to SOURCE 5RPC ST
4.6/450 column (GE Healthcare). Buffer A was 10 mM phosphate buffer pH 2.8 and buffer B
was 90 % acetonitrile in 10 mM phosphate buffer pH 2.8. Flow was kept constant at 1
ml/min and detection was on 210 nm and 350 nm (specific for the coumarin structures).
Sample (100 µl) was loaded in buffer A. Next, unbound sample is washed out with 2 CV of
buffer A and linear gradient of buffer B (0-100 % in 10 CV) was applied. All target compounds
were eluted in this region. Column was washed with 3 CV of buffer B (100 %). Four samples
were prepared for each substrate and they included:
Sample 1 (100 µl) – blank: buffer + DMSO + NADPH + enzyme
Sample 2 (100 µl) – standard substrate: buffer + substrate
Sample 3 (100 µl) – standard product: buffer + 3-carboxy coumarin
Sample 4 (100 µl) – reaction mix: buffer + substrate in DMSO + NADPH + enzyme
Reaction mix was incubated 2 hours on room temperature before analysis. Fractions
containing unknown reaction products were collected and analyzed by TLC and by 3D
spectral fluorimetry. 3D spectra were recorded using TECAN Safire (TECAN Group) and black
flat bottom 96-well MTP (Greiner Bio-One).
For optimization of different excitation/emission wavelengths assay was set up as
follows: 50 µl buffer (100 mM phosphate buffer pH 7.5), 1 µl substrate (dilution in DMSO)
and 5 µl enzyme (Cyt P450 BM3 139-3). Reaction mix was incubated on room temperature
for 5 minutes. Reaction was initiated by addition of 4 µl NADPH (10 mM). Assay was done in
black flat bottom 384-well MTPs (Greiner Bio-One). Fluorescence was monitored using
TECAN Safire on three excitation (375, 400 and 405 nm) and three emission (455, 440 and
455 nm) wavelengths, respectively. Substrate concentrations were 167, 83, 42, 21, 10 and
5.2 µM, respectively.
To test effect of different permeabilizers (organic solvents and polymixin B sulphate -
PMB) on conversion of BCC experiment was set up as follows. E. coli DH5α harboring
pCWORI vector with Cyt P450 BM3 Wt gene was expressed in TBAmp media overnight (50 ml,
0.5 mM IPTG, 37°C, 250 rpm). After expression cells were centrifuged (4000 rpm, 10 min,
4°C) and washed twice with PBS. At the end, cell pellet was re-suspended in 10 ml of activity
buffer (100 mM phosphate buffer pH 7.5) and kept on ice. This concentrated cell suspension
was used in assays. Assay was carried out as described in paragraph above using only 167
µM substrate and adding 5 µl of cell suspension instead of purified enzyme. Organic solvents
(ethanol, acetone, isopropanol and toluene) were added directly to reaction mix in final
concentration of 10 % (vol/vol). Fluorescence (ex.400 nm, em. 440 nm) was recorded for 60
minutes (1 min interval).
After testing different permeabilizers we tested the effect of different concentrations
of PMB on activity. DH5α expressing Cyt P450 BM3 Wt has been used. Assay was assembled

Page | 78
as described in the paragraph above. Different amounts (1-5 µl in 1 µl steps) of PMB stock
solution (3.6 mM) have been added. Final volume of the reaction mix was kept constant by
decreasing the volume of activity buffer.
To test the difference in permeabilization potential between PMB and PMBN
experiment was set up as follows. DH5α cells expressing Cyt P450 BM3 139-3 variant have
been used. Assay was assembled as described previously. Five and one µl of each
permeabilizer stock (3.6 mM PMB or PMBN) was added in the reaction mix. Fluorescence
was monitored for 60 minutes (1 min interval).
III. Optimization of the conversion of target compounds based on 3-carboxy
coumarin with Cyt P450 BM3
Optimization of conditions using 3-carboxy coumarin based substrates and Cyt P450 BM3
F87A
By changing different parameters we investigated conversion of the novel coumarine
substrates. Only substrates based on 3-carboxy coumarin were used (BCC, BCC Acid and
DBCC). Parameters we changed were:
1. Composition of the buffer (0.1 M phosphate and 0.1 M tris-HCl)
2. pH of the buffers (pH 5-12)
3. Effect of different salts (NaCl and MgCl2)
4. Different concentration of substrates (167-3 µM)
For all assays black flat bottom 384-well plates (Greiner Bio-One) were used. Assay
was assembled as following: 50 µl of buffer, 5 µl enzyme (P450 BM3 F87A/R47F, c = 15.6
µM) and 1 µL substrate (in DMSO). Reaction mix was incubated for 5 minutes, with shaking,
on room temperature. Reaction was initiated by addition of 4 µl NADPH (10 mM).
Fluorescence was monitored using TECAN Safire (ex. 400 nm, em. 440 nm). Slope was
calculated for the first 9 minutes of reaction (linear range).
IV. Testing the 7-benzoxy-3-carboxy coumarin (BCC) in double emulsions
To test the applicability of 7-benzoxy-3-carboxy coumarin (BCC Acid) as a probe for
detection of Cyt P450 BM3 activity in double emulsion experiment was done as follows. Cells
harboring Cyt P450 BM3 gene were grown and expressed in MD-5052 auto-induction media
as described previously. After washing the cells with PBS, concentration was adjusted to ~3 x
108 cell/ml using 0.1 M tris-HCl pH 7.5 as activity buffer. Emulsion reaction mix was prepared
by mixing 80 µl of cell stock, 10 µl of PMB (3.6 mM) and 20 µl of NADPH (10 mM). Sample
was vortexed and kept on ice. Primary emulsion was prepared by mixing 100 µl of emulsion
reaction mix and 1 ml of solution A (2.9 % (wt/wt) ABIL EM90 in LMO). Components were
emulsified using Ultra Turax at setting 2 (~1000 rpm) for 5 minutes, on ice. Substrate (4 µl,

Page | 79
200 mM in DMSO) was added directly in primary emulsion. Secondary emulsion was
prepared immediately by adding 1 ml of solution B (1.5 % (wt/vol) CMC, 2 % (wt/vol) Tween
20 in PBS) to primary emulsion. Components were emulsified using Ultra Turax at setting 1.5
(~8000 rpm) for 3 minutes, on ice.
Dilutions of secondary emulsion were prepared in PBS (1:200) every 30 minutes and
analyzed on CyFlow Space flow cytometer (Partec). Forward and side scatter (FSC and SSC)
were detected from blue laser (488 nm) while product florescence was in blue spectra (UV
ex: 375 nm laser, em: 440 nm blue filter).
To increase analysis and sorting rate of “true” double droplets fluorescein (5 µM) was
included as internal control dye. Fluorescein is excited with blue laser (488 nm) and shows
high green fluorescence (520 nm, green filter). In this case, recordings could be taken using
“green triggering” where machine is guided by green fluorescence coming from fluorescein.
Samples were prepared in the same manner as described previously except that 5 µM
fluorescein was included in emulsion reaction mix. Diluted emulsion (1:100 in PBS) was
recorded using normal settings and “green triggering”.
To test the effect of permeabilizer PMB emulsions are prepared as described with an
exception that PMB was excluded from emulsion reaction mix.
V. Testing 7-benzoxy-3-carboxy coumarine benzyl ester (DBCC) in single cell
flow cytometry experiments
Conversion products of purified Cyt P450 BM3 139-3 variant and BCC/DBCC
substrates were analyzed by TLC. Reaction was set up in the MTP as follows: 50 µl of 100
mM tris-HCl buffer pH 7.5, 1 µl substrate (15 mM in DMSO), 5 µl enzyme solution (~8 µM).
Reaction was incubated 5 minutes on room temperature and initiated with addition of 4 µl
NADPH (5 mM). Incubation time was 120 minutes on room temperature. Three µl of
reaction mix were applied on TLC plates and developed using CH2Cl2 : ethylacetate (20 : 1)
mixture. Acetic acid (100 µl per 10 ml of eluent) was supplemented to the developing
solution. TLC was visualized under UV light (366 nm).
To test weather DBCC can be used as a substrate for activity cell staining experiment
was set up as follows. DH5α cells carrying pCWORI BM3 139-3 vector were used. Cells were
inoculated in 100 ml TBAmp medium, grown 5-6 hours (37°C, 250 rpm) and then induced with
IPTG (0.1 mM). Cell suspension was expressed overnight (16-20 h, 37°C, 250 rpm). After
induction cells were washed twice with PBS (3000 rpm, 10 min, 10°C) and re-suspended in
20 ml PBS.
Reaction mix consisted of 50 µl tris-HCl buffer pH 7.5, 1 µl DBCC (5, 10, 77 and 100
mM stock in DMSO), 5 µl PMBN (3 mg/ml) and 5 µl cell suspension. After 5 minutes of
incubation 4 µl NADPH was added (10 mM). Reaction mix was incubated 60 minutes at room
temperature with shaking (800-900 rpm). After incubation cells were washed twice with ice

Page | 80
cold PBS and finally re-suspended in PBS. Analysis was done on Partec CyFlow Space flow
cytometer using PBS as sheet fluid.
To test weather permeabilization of membrane by sucrose would increase transport
of substrate into the cell experiment was done as follows. Cells were grown and enzyme
expressed as described previously. After expression cell suspension was cooled at 4°C. Cells
were harvested by centrifugation (1000 x g, 5 min, 4°C) and pellet was re-suspended in ice
cold TSE buffer (10 mM tris-HCl pH 7.5, 10 % sucrose, 2.5 mM EDTA) to OD600~0.4. Cell
suspension was incubated for 10 minutes on ice. Pellet was harvested by centrifugation
(1000 x g, 5 min, 4°C) and re-suspended in the same volume of 1 mM ice cold MgCl2 (1 mM).
Substrate (100 mM DBCC in DMSO) was added directly in 100 µl cell suspension and
incubated 60 min on room temperature or on ice (in dark). Reaction was diluted up to 1 ml
with ice cold PBS and directly analyzed on flow cytometer. Standard sample was prepared as
follows: 100 this buffer pH 7.5, 10 µl cell suspension (non-treated with sucrose), 1 µl DBCC
(100 mM in DMSO) and 10 µl PMBN (3.6 mM). After 5 minutes incubation at room
temperature 8 µl NADPH (10 mM) was added. Reaction was done for 60 minutes at room
temperature after what reaction mix was diluted to 1 ml in PBS and directly analyzed as
described previously.
4.3 Results and discussion
I. Synthesis and conversion of substrates based on 4-MU by Cyt P450 BM3
Wt and variants
Synthesis and conversion of 12-(4-MU)-dodecanoic acid and ester
Both substrates 12-(4-MU)-dodecanoic acid and
corresponding methyl ester were synthesized successfully
(TLC Figure 16/17, Supplementary data). After purification
structure was confirmed by 1H and
13C NMR (Figure 18,
Supplementary data).
Our substrates were based on published
chromogenic substrate for Cyt P450 BM3, pNCA (22).
Instead of chromophore (p-nitrophenolate), we used
fluorescent reporter molecule 4-methyl umbelliferone (4-
MU), one of the most commonly used coumarine based
reporter molecule. After hydroxylation of the specific
location in the fatty acid part (Figure 34) instable
hemiacetal is formed. Structure is stabilized by the release
of fluorescent reporter molecule (4-MU) and fluorescence
Figure 34 Principle of fluorogenic assay. After hydroxylation of
the fluorogenic substrate by Cyt P450 BM3, instable
hemiacetal is formed. Hemiacetal is stabilized by release of
highly fluorescent 4-MU (ex. 400 nm, em. 440 nm).

or the reaction mixture increases
Recorded 3D fluorescent spectra of substrate
fluorescence peak in pink region,
35). Peak was more pronounced in case of acid substrate. This peak should,
conversion by the enzyme, shift
(ex. 360 nm, em. 450 nm).
When doing a conversion reaction w
the substrate is quenched by the addition of NADPH and
spectral region, when enzyme is added in the reaction mix.
plate reader we couldn’t detect fluorescence coming fr
A)
Figure 35 3D fluorescence spectra (x
substrate (B) showing specific fluorescence peak at excitation 310 nm and emission ~390 nm
As mentioned, after reaction,
emission spectra, but more the increase in the
same spectral region (Figure 36
A)
350 370 390 410 430 450 470 490 510
350 370 390 410 430 450 470 490 510
increases.
orescent spectra of substrates showed that both pos
in pink region, at excitation of 310 nm and emission of
Peak was more pronounced in case of acid substrate. This peak should,
, shift to wavelengths corresponding to fluorescence of
When doing a conversion reaction we observed phenomenon that fluorescence of
y the addition of NADPH and it increases again
when enzyme is added in the reaction mix. Using the fluoresc
couldn’t detect fluorescence coming from 4-MU.
A) B)
3D fluorescence spectra (x axis – emission (nm), y axis – excitation (nm)) of acid substrate (A) and ester
showing specific fluorescence peak at excitation 310 nm and emission ~390 nm
after reaction, we didn’t observe a shift in fluorescence
but more the increase in the intensity of the substrate fluorescence
36).
B)
300
320
340
360
380
400
530 550
150-200
100-150
50-100
0-50
350 370 390 410 430 450 470 490 510
300
320
340
360
380
400
530 550
400-600
200-400
0-200
350 370 390 410 430 450 470 490 510
Page | 81
that both posses a
at excitation of 310 nm and emission of ~390 nm (Figure
Peak was more pronounced in case of acid substrate. This peak should, after the
fluorescence of 4-MU itself
that fluorescence of
increases again, in the same
Using the fluorescence microtiter
) of acid substrate (A) and ester
showing specific fluorescence peak at excitation 310 nm and emission ~390 nm
we didn’t observe a shift in fluorescence towards blue
intensity of the substrate fluorescence in the
300
320
340
360
380
400
510 530 550
400-600
200-400
0-200
300
320
340
360
380
400
510 530 550
400-600
200-400
0-200

Page | 82
C)
Figure 36 3D fluorescence spectra (x axis
conversion (B); and acid substrate before (C) and after co
Interestingly, increase
reaching a plateau when reaction is finished
depletion). Additionally, different
substrate (Figure 37).
-5
0
2000
4000
6000
8000
10000
12000
14000
16000
18000
20000
Fluorescence (AU)
Figure 37 Enzyme kinetics of conversion of ester substrate by Cyt P450 BM3 Wt and different variants
measured at excitation 310 nm and emissio
Therefore we concluded
fluorophore (4-MU) is probably
analyzed both substrates and
we saw that enzyme is converting both substrates into products, in s
multiple ones (ester substrate). Unfortunately
corresponded to fluorescent probe (4
product at a similar position as 4
with the substrates, had pink color after UV illumination while fluor
blue fluorescence (Figure 38).
350 370 390 410 430 450 470 490 510
D)
3D fluorescence spectra (x axis – emission (nm), y axis – excitation (nm)) of ester substrate before (A) and after
conversion (B); and acid substrate before (C) and after conversion (D) by Cyt P450 BM3 Wt. All scale
to same fluorescence level.
ncrease in fluorescence was showing typical enzyme kinetics
a plateau when reaction is finished (i. e. inhibition by the product, NADPH
different we mutants tested showed different
-5 0 5 10 15 20 25 30 35
Blank
Wt
F87A
F87A/R47Y
F87A/R47Y/M354S
Y51F
Time (min)
Enzyme kinetics of conversion of ester substrate by Cyt P450 BM3 Wt and different variants
measured at excitation 310 nm and emission at 390 nm.
Therefore we concluded that both substrates actually do get converted, but the
probably not released as a product. To test this hypothesis
both substrates and products by TLC. After visualization under UV
we saw that enzyme is converting both substrates into products, in s
multiple ones (ester substrate). Unfortunately in case of the ester none of the products
corresponded to fluorescent probe (4-MU). In case of the acid substrate, we could see a
product at a similar position as 4-MU standard. On the other hand, all products, together
with the substrates, had pink color after UV illumination while fluorophore showed
.
300
320
340
360
380
400
530 550
400-600
200-400
0-200
350 370 390 410 430 450 470 490 510
excitation (nm)) of ester substrate before (A) and after
nversion (D) by Cyt P450 BM3 Wt. All scales have been adjusted
was showing typical enzyme kinetics curve,
inhibition by the product, NADPH
tested showed different activity with ester
Enzyme kinetics of conversion of ester substrate by Cyt P450 BM3 Wt and different variants. Fluorescence was
get converted, but the
not released as a product. To test this hypothesis we
After visualization under UV light (366 nm)
we saw that enzyme is converting both substrates into products, in some cases even
none of the products
substrate, we could see a
ll products, together
ophore showed bright
300
320
340
360
380
400
510 530 550
400-600
200-400
0-200

Page | 83
Figure 38 TLC of conversion of ester (lane 1-7) and acid substrate (lane 8-14). Lane 1 and 8 contain pure substrates, while
lane 2 and 9 contain substrates with NADPH. Lane 3-14 contain reaction products of conversion with Cyt P450 BM3 Wt
(lane 3 and 10), F87A (lane 4 and 11), F87A/R47Y (lane 5 and 12), F87A/R47F/M354S (lane 6 and 13) and Y51F (lane 7 and
14), respectively. Lane 15 contains Cu4 standard.
Figure 39 TLC image of conversion of ester (lane 2 and 3) and acid C12 substrates (lane 4 and 5). Lane 2 and 4 contain
substrate and NADPH while lane 3 and 5 contain corresponding reaction mix with Cyt P450 BM3 Wt, respectively.
According to a literature paper (96) fluorescence peak we observed (ex. 310 nm, em.
390 nm) could be assigned to protonated form of the fluorophore. In order to increase
fluorescence and shift to spectra towards expected wavelengths (ex. 360 nm, em. 450 nm)
fluorophore needs to be de-protonated (Figure 40). The pKa value of the 7-OH group being
quite high, around 8, would mean that reaction needs to be done at pH>10 in order for the
group to be fully deprotonated.
O O
CH3
OH O O
CH3
O-
-H
+H
Figure 40 Protonation and deprotonation of fluorophore 4-MU (pKa~8). Fluorescent probe need to be in deprotonated
form (right) to show specific blue fluorescence (ex. 360 nm, em. 450 nm)
To test weather we could get the expected fluorescence peak from 4-MU after the
reaction, we increased the pH by adding base (NaOH) to reaction mix.

Page | 84
3D spectra showed, indeed, that a
expected fluorescence peak of
By this we proved that acid substrate is indeed being converted into desired product, at least
to some small extent. On the other hand,
product are insufficient for detection by fluorescence readers
A)
Figure 41 3D fluorescence spectra (x axis
This assay couldn’t be used as a detection assay for Cyt P450 BM3 activity due to the
fact that continuity of the assay couldn’t be maintained. Since Cytochromes
activity on pH>9 reaction would have to be done on lower pH and products detected by
adding base to reaction mix. Additionally, this kind of detection in the “assay” would limit its
application only to MTPs and disable the application in flow cytometry/double emulsion
system.
We speculated that size of the surrogate substrate (fatty acid together with 4
was simply too big for efficient conversion by Cyt P450 BM3 we decided to synthesize a
smaller one. From the literature we knew that Cyt P450 BM3 can, in very low ex
benzyl-resorufin (22). We decided to synthesize a
probe and benzyl residue as surrogate substrate part
Synthesis and conversion of 7
Substrate was synthesized successfully
Figure 19/20, Supplementary data)
structure was confirmed with
In order to see weather enzyme can at all convert
tested the conversion of crude (
30
0
32
0
34
0
36
0
38
0
40
0
42
0
44
0
46
0
48
0
Emisson (nm)
3D spectra showed, indeed, that a shift in the pH produced perfect match of the
ce peak of fluorescent probe, 4-MU (Figure 41, ex. 360 nm, em. 45
acid substrate is indeed being converted into desired product, at least
On the other hand, reaction conditions or very small
product are insufficient for detection by fluorescence readers on the pH<11
B)
3D fluorescence spectra (x axis – emission (nm), y axis – excitation (nm)) of product before (A) and after (B)
addition of NaOH
This assay couldn’t be used as a detection assay for Cyt P450 BM3 activity due to the
ct that continuity of the assay couldn’t be maintained. Since Cytochromes
9 reaction would have to be done on lower pH and products detected by
adding base to reaction mix. Additionally, this kind of detection in the “assay” would limit its
to MTPs and disable the application in flow cytometry/double emulsion
We speculated that size of the surrogate substrate (fatty acid together with 4
big for efficient conversion by Cyt P450 BM3 we decided to synthesize a
smaller one. From the literature we knew that Cyt P450 BM3 can, in very low ex
. We decided to synthesize a homolog, using a 4-MU as a fluorescent
as surrogate substrate part.
nversion of 7-benzoxy-4-MU
Substrate was synthesized successfully as described in Materials and methods
, Supplementary data). After purification trough a silica gel chromatography,
structure was confirmed with 1H and
13C NMR (Figure 21, Supplementary data)
In order to see weather enzyme can at all convert surrogate structure like this we
tested the conversion of crude (non-purified) 7-benzoxy-4-MU by TLC (Figure
300
320
340
360
380
400
420
440
460
480
500
50
0
20000-30000
10000-20000
0-10000
30
0
32
0
34
0
36
0
38
0
40
0
42
0
44
0
46
0
Emission (nm)
produced perfect match of the
ex. 360 nm, em. 450 nm).
acid substrate is indeed being converted into desired product, at least
or very small amount of
on the pH<11.
excitation (nm)) of product before (A) and after (B)
This assay couldn’t be used as a detection assay for Cyt P450 BM3 activity due to the
ct that continuity of the assay couldn’t be maintained. Since Cytochromes mostly show no
9 reaction would have to be done on lower pH and products detected by
adding base to reaction mix. Additionally, this kind of detection in the “assay” would limit its
to MTPs and disable the application in flow cytometry/double emulsion
We speculated that size of the surrogate substrate (fatty acid together with 4-MU)
big for efficient conversion by Cyt P450 BM3 we decided to synthesize a
smaller one. From the literature we knew that Cyt P450 BM3 can, in very low extent, convert
MU as a fluorescent
aterials and methods (TLC
a silica gel chromatography,
, Supplementary data).
structure like this we
TLC (Figure 42).
300
320
340
360
380
400
420
440
460
480
500
48
0
50
0
3000-4000
2000-3000
1000-2000
0-1000

Page | 85
Figure 42 TLC of conversion of crude benzyl-Cu4. Lane 1 contains fluorophore standard (Cu4). Lane 2 contains only
substrate while lane 3 contains substrate with NADPH. Lanes 4-7 contain reaction mix of conversion with Cyt P450 BM3
Wt (lane 4), F87A (lane 5), F87A/R47Y (lane 6) and F87A/R47F/M354S (lane 7).
After identifying the spot coming from released 4-MU we were sure that specific
hydroxylation of the benzyl part of the substrate can release the desired product. 7-benzoxy-
4-MU was additionally purified to remove other components and lower the background
fluorescence of the substrate.
We recorded the kinetics of conversion of 7-benzoxy-4-MU by Cyt P450 BM3 Wt and
selected mutants (Figure 43). Interestingly, from all the variants tested, wild-type showed
the highest activity for the novel substrate. Second in activity was F87A variant, while other
tested variants showed very low or no activity. This finding was opposite from the one when
fatty acid-4-MU substrates were employed suggesting a different mechanism involved in
enzyme reaction, probably due to the structure of the substrate itself.
0 10 20 30 40 50 60
0
100
200
300
400
500
Blank 1
Blank 2
Wt
F87A
F87A/R47Y
F87A/R47F/M354S
Y51F
Fluorescence (AU), gain 50
Time (min)
Figure 43 Kinetics of Cyt P450 BM3 Wt and selected mutants with 7-benzoxy-4-MU.

Page | 86
To see if higher levers of fluorescence can be reached we employed NADPH-recycle
system (Figure 44). In that way NADPH which is being used up by Cyt P450 BM3 is being
recycled by another enzyme system – isocitrate/isocitrate-dehydrogenase.
0 20 40 60 80 100 120
0
50
100
150
200
250
300
350
400
450
Blank
Wt
F87A
F87A/R47Y
F87A/R47Y/M354S
Y51FFluorescence (AU), gain 50
Time (min)
Figure 44 Kinetics of Cyt P450 BM3 Wt and selected mutants with 7-benzoxy-4-MU employing NADPH-recycling system
We saw that fluorescence plateau was reached after ~60 minutes of the reaction and
it is similar in intensity to one when no NADPH-recycle system was employed. This suggests
that the reaction stops probably due substrate/product inhibition and not due to NADPH
depletion.
Next, we tested the activity under different substrate concentrations (Figure 45).
Increasing the concentration of the substrate up to 180 µM had a positive effect on activity
(increase in V0). On the other hand, concentrations of substrate higher than 180 µM showed
radical drop in activity. Explanation could be connected with lowered solubility of substrate
in aqueous solution, at high concentrations. This hypothesis could be additionally supported
by the observation that “fatty looking” precipitate was formed on the surface of reaction
mixture when higher substrate concentrations were used.

Page | 87
-20 0 20 40 60 80 100 120 140 160
0
50
100
150
200
250
300
350
400
2.9 mM
1.4 mM
720 µM
360 µM
180 µM
90 µM
45 µM
23 µM
Fluorescence (AU), gain 50
Time (min)
0 500 1000 1500 2000 2500 3000
2
3
4
5
6
7
8
9
10
Slope (AU/m
in)
Substrate concentration (µM)
Figure 45 Kinetic curves of Cyt P450 BM3 Wt with 7-benzoxy-4-MU employing different concentrations of the substrate
(left) and V0 (slope) of Cyt P450 BM3 Wt with varying substrate concentration (right)
Dilution of enzyme had a negative influence on activity. Diluted enzyme solutions
showed very low activity in concentrations bellow ~100 nM. This might be as well the lowest
detection limit of the assay regarding the enzyme concentration.
0 20 40 60 80 100 120
0
20
40
60
80
100
120
140
160
180
200
220
Fluorescence (AU)
Time (min)
423 nM
212 nM
106 nM
53 nM
26 nM
13 nM
7 nM
Blank
0 100 200 300 400 500
0
5000
10000
15000
20000
25000
30000
35000
Fluorescence (AU)
Enzyme concentration (nM)
Figure 46 Kinetic curves of different serial dilutions (2-128X) of Cyt P450 BM3 Wt with 7-benzoxy-4-MU (left) and plot
enzyme concentration (nM) vs. fluorescence (AU) after 60 minutes of reaction (right)
Using the standard curve prepared for 4-MU kinetic parameters (Km and kcat) for Cyt
P450 BM3 Wt enzyme and 7-benzoxy-4-MU substrate could be calculated (y = 153.29x).
Michaelis-Menten hyperbola fit was used to acquire kinetic parameters.
Calculated kcat value for Wt enzyme was 0.07 eq min-1
while Km value was ~30 µM (eq
= nmolproduct/nmolenzyme).

Page | 88
II. Synthesis and conversion of substrates based on 3-carboxy coumarin by
Cyt P450 BM3 Wt and variants
Using a 3-carboxy coumarine as a fluorescent probe we synthesized a series of novel
Cyt P450 BM3 substrates with structures shown in Table 6. All substrates were purified (TLC
Figure 22, Supplementary data) and structure was confirmed by NMR spectroscopy (Figure
23/24, Supplementary data).
Table 6 Structure and names of novel coumarine based substrates for screening Cyt P450 BM3 activity in MTP and double
emulsions
Structure IUPAC name Common name Short name
OO O
O
OCH3
Methyl 7-
(benzyloxy)-2-oxo-
2H-chromene-3-
carboxylate
7-benzoxy-3-carboxy
coumarin methyl ester BCC
OO O
O
OH
7-(benzyloxy)-2-oxo-
2H-chromene-3-
carboxylic acid
7-benzoxy-3-carboxy
coumarin BCC Acid
OO O
O
O
Benzyl 7-
(benzyloxy)-2-oxo-
2H-chromene-3-
carboxylate
7-benzoxy-3-carboxy
coumarin benzyl ester DBCC
To test weather substrates could be converted by Cyt P450 BM3 we set up reaction
as described in Materials and methods and analyzed products by TLC (Figure 47). BCC and
DBCC substrates could be converted by all tested variants except Y51F. Wild type in both
cases showed lowest activity; spot from the product could be barely seen (Figure 47A and B).
Other variants (F87A, F87A/R47F, F87A/R47Y and F87A/R47F/M354S) showed increase in
activity respectively. This was opposite to our findings with conversion of 7-benzoxy-4-MU,
which from a chemical point of view had a very similar structure to novel substrates but Wt
and variants showed activity in reverse order (Wt had a highest activity while triple mutant
had no activity). Conversion products from BCC Acid could not bee seen on TLC due to
charge present on substrate and product molecule. Molecule was simply to polar to move
with a solvent in TLC, even when acetic acid was added (Figure 47C and D).

Page | 89
A) 1 2 3 4 5 6 7 B) 1 2 3 4 5 6 7
C) D)
Figure 47 TLC of conversion of BCC (A), DBCC (B) and BCC Acid (C, D). Conversion was tested with Cyt P450 BM3 Wt (lane
2) and variants F87A (lane 3), F87A/R47F (lane 4), F87A/R47Y (lane 5), F87A/R47F/M354S (lane 6) and Y51F (lane 7).
Reaction containing only substrate and NADPH (Blank) was analyzed in lane 1
To analyze product molecules after the reaction with Cyt P450 BM3
F87A/R47F/M354S we used RP-HPLC. With this technique we were able to directly analyze
the reaction mix, separate target molecules (products) according to their properties (size,
hydrophobicity) and indentify them in comparison to standards separated under same
conditions. We optimized conditions for separation and detection of coumarine compounds
using C5 ST 4.6/450 column and Akta Purifier HPLC system. Detection was based on
absorbance of all aromatic organic compounds (210 nm) and compounds having coumarine
ring system (350 nm). Analysis of blank sample (containing only buffer, enzyme and NADPH)
showed no peaks on selected wavelengths which could interfere with product analysis
(Figure, Supplementary data). Retention time of 3-carboxy coumarine, as a product
standard, was determined (~16 ml, fraction 12) as well as retention times of both substrates
BCC (~35 ml) and BCC Acid (~27 ml) (Figure 25, Supplementary data).
After analyzing conversion products of BCC substrate by RP-HPLC we detected a new
peak. Retention time was lower (~25 ml) which would correspond to more hydrophilic
released coumarine molecule, 3-carboxy coumarin methyl ester (Figure 26, Supplementary
data). This was indeed confirmed by 3D fluorescence spectroscopy (data not shown).

Page | 90
In the other case, when BCC Acid was used a substrate for conversion, after analysis,
two new peaks were detected (Figure 27, Supplementary data). Both peaks in fluorescence
spectroscopy showed spectra corresponding to 3-carboxy coumarin, an expected reaction
product (data not shown). Since observed spot showed the same Rf value on TLC in case of
both mentioned fractions we suppose that RP-HPLC was able to separate stereoisomers of
the corresponding molecule (data not shown).
By RP-HPLC we indeed proved that hydroxylation of BCC and BCC Acid by Cyt P450
BM3 occurs. Additionally, hydroxylation is at expected position (Figure, C-α atom of benzyl
group) so that fluorescent reporter molecule is released. In the case of BCC used as a
substrate, 3-carboxy coumarin methyl ester is released while in case of BCC Acid, 3-carboxy
coumarin was the reporter molecule. In both cases reaction was followed by increase in
specific blue fluorescence (ex. 380 nm, em. 440 nm) originating from released coumarine
probe.
Fluorescence detection is one of the most important parameters determining the
sensitivity of the assay, both in MTPs and emulsions. When using a MTP fluorescence reader
one is not limited to excitation/emission wavelengths. Newer devices are usually based on
diode technology and choice of any wavelength is possible. On the other hand, excitation
and emission wavelengths in flow cytometer are defined by installed lasers. These are
usually quite expensive and couldn’t be easily exchanged. As mentioned previously, one of
our reasons for synthesis of substrates based on coumarin fluorophore was that excitation
and emission of the fluorophore corresponded to the UV laser present in Partec CyFlow
Space flow cytometer (ex. 375 nm, em. 455 nm). Unfortunately, when using a cofactor as
NADPH, which by itself shows fluorescence in the similar region as coumarine (ex. 340 nm,
em. 440 nm) it might be interfering with the detection (increasing the background).
We wanted to test sensitivity (Product/Blank ratio) of our assay using different
settings which would correspond to real conditions, either screening in MTPs or in double
emulsions. Three different sets of wavelengths were tested; excitation at 400, 375 and 405
and emission at 440, 455 and 455 nm, respectively (Figure 48). The first setting (400/440 nm)
was found to be optimal for detection using MTP reader, since excitation wavelength was
shifted away from excitation wavelength of NADPH and background interference was
minimal. Second excitation/emission wavelength pair (375/455 nm) was corresponding to
UV laser in flow cytometer while third set (405/455 nm) corresponded to “hypothetical”
violet laser. Recordings were tested under six different substrate concentrations.

Page | 91
A) B)
Figure 48 Sensitivity of the assay (Product/Blank ratio) under different recording settings employing BCC (A) or DBCC (B)
as a substrate
As it prove to be the case, the highest sensitivity (relative increase in fluorescence)
could be achieved when using excitation/emission pair of 400/440 nm. This was chosen as
an optimal setting for MTP assay. For flow cytometry, best results could be achieved with
violet laser setting (405/455 nm). Unfortunately, sensitivity of the assay when using UV laser
settings (375/455 nm) is very low, barely detectable when compared to other two. There are
two possible reasons for this. One reason is high level of fluorescence arising from NADPH
which is excited and emits in the same spectral region (ex. 340 nm, em. 460 nm). Second one
is high background arising from substrates which also show high fluorescence in the selected
region (Figure, Supplementary data). These two reasons could cause big problems when
applying coumarine substrates for flow cytometry screening and UV laser settings.
Subsequently, we tested kinetics of conversion employing all three novel coumarine
substrates and different variants of Cyt P450 BM3.
0
50
100
150
200
250
166.7 83.4 41.7 20.8 10.4 5.2
Pro
du
ct/B
lan
k r
ati
o
Substrate concentration (µM)
400/440
405/455
375/455
0
200
400
600
800
1000
1200
1400
1600
1800
166.7 83.4 41.7 20.8 10.4 5.2
Pro
du
ct/B
lan
k r
ati
o
Substrate concentration (µM)
400/440
405/455
375/455

Page | 92
A)
0 10 20 30 40 50
0
5000
10000
15000
20000
25000
30000
35000
Fluorescence (AU)
Time (min)
Blank
Wt
F87A
F87A/R47F
F87A/R47Y
F87A/R47F/M534S
Y51F
B)
0 10 20 30 40 50
0
1000
2000
3000
4000
5000
6000
7000
Fluorescence (AU)
Time (min)
Blank
Wt
F87A
F87A/R47F
F87A/R47Y
F87A/R47F/M354S
Y51F
C)
0 10 20 30 40 50
0
5000
10000
15000
20000
25000
30000
Fluorescence (AU)
Time (min)
Blank
Wt
F87A
F87A/R47F
F87A/R47Y
F87A/R47F/M354S
Y51F
Figure 49 Kinetic curves of conversion of BCC (A), BCC Acid (B) and DBCC (C) by Cyt P450 BM3 Wt and selected variants
Together, Cyt P450 BM3 Wt and few selected variants were tested (F87A, F87A/R47F,
F87A/R47Y, F87A/R47F/M354S and Y51F). Interestingly, all variants showed different kinetic
profiles with three different substrates (Figure 49).

Page | 93
BCC is non-charged and not as bulky substrate as compared to its homolog DBCC.
Different variants of P450 BM3 showed increased activity compared to wild-type in the
following order F87A>F87A/R47F=F87A/R47F/M354>F87A/R47Y. Double mutant
(F87A/R47F) and triple mutant (F87A/R47F/M354S) showed same staring speed; with a
difference that triple mutant reached the plateau (~ 5000 AU) only after few minutes. This
clearly shows that for conversion of BCC, mutation M354S has no influence on activity.
Additionally, it could even be responsible for fast stop of reaction by possible product
inhibition. Interestingly, two double mutants F87A/R47F and F87A/R47Y showed remarkable
difference in activity (~2500 AU/min and 9000 AU/min, respectively) pointing out how one
amino acid can have important role in substrate binding or catalysis. For conversion of BCC
Acid and DBCC variants showed increase in activity in the following order
Wt>F87A>F87A/R47F>F87A/R47Y>F87A/R47F/M354S. In this case triple mutant showed
increase in activity compared to both double mutants suggesting a difference in the
mechanism of catalysis between three substrates. In all cases, Y51F variant didn’t show any
detectable activity.
Next step was to test weather assay can be applied to whole cell system. Since Cyt
P450 BM3 is expressed as intracellular enzyme in E. coli host, it was necessary to test
weather substrates can at all reach the enzyme or membrane needs to be permeabilized.
When we tested conversion of substrates using only cells we couldn’t observe any increase
in fluorescence, probably due to slow or no diffusion of substrates into cytoplasm. This
suggested that permeabiliziers has to be used to increase the influx of substrates trough
membrane of E. coli. It is know that organic solvents can increase transport trough
membrane and we tested: ethanol, acetone, iso-propanol and toluene (Figure 50). We also
tested polymixin B sulphate (PMB), peptide permeabilizer known to increase transport of
pNCA trough membrane (22).
0 10 20 30 40 50 60
0
10000
20000
30000
40000
50000
Fluorescence (AU)
Time (min)
No permeabilizer
Polymixin B
Ethanol
Aceton
Isopropanol
Toluene
Figure 50 Effect of permeabilizers (PMB and organic solvents) on activity of Cyt P450 BM3 in whole cell assay

Page | 94
From all organic solvents used, increase in fluorescence was detected only in the case
of toluene. On the other side, PMB showed high increase in fluorescence suggesting that
influx of the substrate trough the membrane is high. Also, it could be the case that PMB
lysed the cell and that enzyme was released in the buffer. We tested different
concentrations of PMB to see the influence on the product formation (increase in
fluorescence, Figure 51).
0 5 10 15 20 25 30
600
800
1000
1200
1400
1600
1800
2000
2200
2400
Fluorescence (AU)
Time (min)
0 µM
60 µM
120 µM
180 µM
240 µM
300 µM
Figure 51 Effect of concentration of permeabilizer PMB on activity of Cyt P450 BM3 in whole cell assay
There was so significant difference in fluorescence increase when PMB was used in
concentrations ranging 60-300 µM. Once more we confirmed that if we do not add the PMB
no conversion (increase in fluorescence) occurs.
Unfortunately, when plating the cells exposed to PMB on agar media we observed
very low survival rate (~10-40%). Due to disturbance of the membrane cells were dying out.
On the other side we had to use polymixin compounds to increase fluidity of the membrane
or no conversion would occur. This problem becomes even more pronounced when doing
screening in double emulsion where it is critical that cell containing an active enzyme
survives. Since this cell contains only copy of the gene encoding the desired variants it is
necessary that it can propagate.
This is why, consulting the literature, we decided to test polymixin B nonapeptide
(PMBN). Due to its changed structure (absence of fatty acid part), permeabilization capacity
should remain similar to PMB but survival of the cells should be much higher (~90-100%).

Page | 95
A) B)
0 10 20 30 40 50 60
0
10000
20000
30000
40000
50000
60000
Fluorescence (AU)
Time (min)
No polymixin B
60 µM polymixin B
300 µM polymixin B
0 10 20 30 40 50 60
0
1000
2000
3000
4000
5000
6000
7000
8000
Fluorescence (AU)
Time (min)
No polymixin B nonapeptide
60 µM polymixin B nonapeptide
300 µM polymixin B nonapeptide
Figure 52 Effect of concentration of different polymixin based permeabilizers PMB (A) and PMBN (B) on activity of Cyt
P450 BM3 in whole cell assay
Indeed we showed that PMBN still posses permeabilization capabilities (Figure 52B)
although much lower than its homolog PMB (Figure 52A). On the other side, survival of the
cells was much higher (90-100%, data not shown).
III. Optimization of conversion conditions using Cyt P450 BM3
Finally, after choosing the most optimal substrates which on one side could show
activity with Cyt P450 BM3 and on the other side still can be used for screening in double
emulsions we wanted to optimize the conditions for conversion (highest activity). All the
experiments were done with purified variants of Cyt P450 BM3.
First we tested different buffer compositions and pH (Figure 53). We used 0.1 M
phosphate and 0.1 M tris-HCl buffer. Knowing that Cyt P450 BM3 would be sensitive to
changes in pH but we had to have another thing in the mind, 3-carboxy coumarin and 3-
carboxy coumarin methyl ester both posses 7-OH group which can be protonated dependant
on the pH of the buffer (Figure 28, Supplementary data). As we have seen with 4-MU,
protonation of 7-OH group could have a drastic effect on fluorescence of the probe.
A) B)
Figure 53 Activity (AU/min) of Cyt P450 BM3 F87A in 0.1 M phosphate (A) and 0.1 M tris-HCl buffer (B) under different pH
As it proves to be the case, enzyme is more tolerable to pH changes in tris-HCl buffer,
but on the other side showed lower overall activity (400-1000 AU/min). In phosphate buffer,
0
200
400
600
800
1000
1200
1400
1600
1800
pH 5.0 pH 6.0 pH 7.0 pH 8.0 pH 9.0 pH 10.0 pH 11.0 pH 12.0
Slo
pe
(A
U/m
in)
0
200
400
600
800
1000
1200
1400
1600
1800
pH 7.0 pH 7.5 pH 8.0 pH 8.5 pH 9.0 pH 10.0 pH 11.0 pH 12.0
Slo
pe
(A
U/m
in)

Page | 96
we could see the pick of activity at pH 9.0 and total drop in activity at pH higher than 10 and
lower than 7.
Since Cytochromes are enzymes working on hydrophobic substrates we tested if
addition of salts would have a positive effect on reaction (Figure 54). In theory, hydrophobic
effect (in this case binding of the substrate to the enzyme) would be enhanced in high
dialectic constant environment.
A) B)
C)
Figure 54 Effect of NaCl on activity of Cyt P450 BM3 F87A in 0.1 M phosphate buffer pH 9.0 (A) and 0.1 M tris-HCl buffer
pH 8.0 (B). Effect of MgCl2 on activity of enzyme in 0.1 M tris-HCl buffer pH 8.0 (C)
As seen from the graphs, NaCl did not have high influence on activity of the enzyme
in any of the buffers. Activity slightly dropped at high salt concentrations (0.6 M NaCl) in case
of phosphate buffer. In tris-HCl buffer the effect of NaCl was even lower for all salt
concentration. When using divalent salt (MgCl2) effect was somewhat different. Addition of
salt had a positive effect (increase in activity) up to ~0.2 M after what addition of salt had
diminishing effect on activity.
Nevertheless, highest activity could be achieved in 0.1 M phosphate buffer pH 9.0
without addition of any salts and this was the buffer chosen for all the assays.
We postulated that concentration of the substrate would play an important role in
activity of the enzyme. Not only due to properties of enzyme (Km and kcat) but also due to the
fact that solubility of substrates drops with increasing concentration and eventually
precipitation occurs.
0
200
400
600
800
1000
1200
1400
1600
0.00 0.05 0.10 0.20 0.30 0.60
Slo
pe
(A
U/m
in)
Concentration of NaCl (mM)
0
200
400
600
800
1000
1200
1400
1600
0.00 0.05 0.10 0.20 0.30 0.60S
lop
e (
AU
/min
)
Concentration of NaCl (mM)
0
200
400
600
800
1000
1200
1400
1600
0.00 0.05 0.10 0.20 0.30 0.60
Slo
pe
(A
U/m
in)
Concentration of MgCl2 (mM)

Page | 97
We tested activity (calculated as slope in linear range) of all three substrates with Cyt
P450 BM3 F87A but also evaluated Product/Blank ratio (increase in fluorescence compared
to blank reaction) as a measure of sensitivity of the assay (Figure 55).
A)
B)
C)
Figure 55 Effect of concentration of BCC (A), BCC Acid (B) and DBCC (C) on activity of Cyt P450 BM3 F87A (gray).
Sensitivity of detection represented as Product/Blank ratio for all three substrates and different concentrations (orange)
As expected at the concentrations of substrates higher than 83 µM we detected
slight drop in activity. Also drop in activity was detected as the concentration got lower, but
profile was different for each of the substrates. When compared between the substrates,
F87A variant showed highest conversion rate with DBCC (max ~1800 AU/min). Conversion of
BCC was lower (max ~750 AU/min) while conversion of BCC Acid was the slowest (max ~140
AU/min). This clearly demonstrates that Km of this variant of each of the substrates has
different value.
0
100
200
300
400
500
600
700
800
167 83 42 21 10 5 3
Slo
pe
(A
U/m
in)
BCC concentration (µM)
0
100
200
300
400
500
600
167 83 42 21 10 5 3
Pro
du
ct/B
lan
k r
ati
o
BCC concentration (µM)
0
20
40
60
80
100
120
140
160
167 83 42 21 10 5 3
Slo
pe
(A
U/m
in)
BCC Acid concentration (µM)
0
20
40
60
80
100
120
167 83 42 21 10 5 3
Pro
du
ct/B
lan
k r
ati
o
BCC Acid concentration (µM)
0
200
400
600
800
1000
1200
1400
1600
1800
2000
167 83 42 21 10 5 3
Slo
pe
(A
U/m
in)
DBCC concentration (µM)
0
50
100
150
200
250
300
167 83 42 21 10 5 3
Pro
du
ct/B
lan
k r
ati
o
DBCC concentration (µM)

Page | 98
Also, due to difference in background fluorescence Product/Blank ratio showed
different profile for each of the substrate. In case of BCC, highest detection was achieved at
lowest concentrations of substrate (5-3 µM) while for BCC Acid and DBCC this value was in
the middle of the concentration range (42-21 µM)
IV. Conversion of 7-benzoxy-3-carboxy coumarin (BCC acid) in double
emulsions
Conversion of BCC Acid substrate by Cyt P450 BM3 should release 3-carboxy
coumarin, fluorescent probe hydrophilic enough to be entrapped within the aqueous phase
of double emulsions. This should lead to increase in the population of droplets having blue
fluorescence (em. 455 nm) when excited in UV region (ex. 375 nm).
To test this hypothesis whole cells (BL21-Gold (DE3)) expressing P450 BM3 F87A
were entrapped together with substrate (BCC Acid) as described in Materials and methods.
Every 30 minutes a sample of double emulsion was diluted (1:200) and analyzed by flow
cytometry using standard settings for emulsions. Due to limited space in this thesis we are
only showing FSC/FL3-DAPI plot for each recording of the sample (Figure 56).
A) B) C) D)
E) F) G)
Figure 56 Flow cytometry recording (FSC/FL3-DAPI) of double emulsion containing BL21-Gold cells expressing Cyt P450
BM3 F87A and BCC Acid substrate. Measurements are taken at 0 time (A) and every 30 minutes for the next 3 hours (B-
G). Forward scattering (FSC) is proportional to particle size and detected from blue laser (ex. 488 nm, em. 488 nm) while
FL3-DAPI is the blue fluorescence detected from the product (UV laser - ex. 375 nm, blue filter – em. 455 nm)
It is clearly seen that population of blue droplets, in this case droplets containing the
product of conversion 3-carboxy coumarin, increase in time. Result is even more obvious in
the Table 7. By this we not only proved that BCC Acid can be used as a substrate for Cyt P450
BM3 but also that product is hydrophilic (charged) enough to be entrapped inside aqueous

Page | 99
phase of double emulsion. Incubation of emulsion on room temperature didn’t affect the
integrity of the double emulsion.
Table 7 Increase in population of blue droplets (gating R1) in time as consequence of Cyt P450 BM3 activity in emulsions.
Time of incubation (min) Percentage of droplets in R1 (%)
0 3.14
30 2.49
60 4.61
90 3.99
120 7.14
150 6.35
180 9.03
As we see percentage of the blue droplets (R1) in 0 time is relatively high (3.14 %).
This is due to the presence of high concentration of NADPH which shows fluorescence in the
same region. As the cells, even the ones not expressing P450 BM3, start consuming this
energy rich compound background fluorescence drops and the target population of droplets
(containing the product) gets more distinguished from the background population. This can
bee seen by the shape of the recorded population in 0 time where we observe “tail” in high
fluorescence region. As incubation proceeds, this “tail” is lost and new population of blue
droplets is well separated from the background droplets (empty secondary emulsion,
primary emulsion, lipid droplets etc).
After the plating of the diluted emulsion we observed low survival rate of the cells
preferably due to the use of permeabilizer (PMB) inside emulsion. PMB is affecting the
fluidity of the E. coli membrane and in higher concentrations causes cell death (22). In the
following experiment we tested weather permeabilizer needs to be included in double
emulsions to get high fluorescence response (Figure 57).

Page | 100
A)
B)
C)
D)
Figure 57 Flow cytometry recording of double emulsion on normal (A, C) and “green” triggering (B, D) with (A, B) and
without PMB (C, D).
1000 0.1 1 10 100 10000
320
640
960
1280
1600
FL3 -DAPI
counts
1 10 100 10000.1
1
10
100
1000
FSC -FL3 -DAPI
0.1 1 10 100 10000.1
1
10
100
1000
FL1 -FITC
FL3 -DAPI
1000 0.1 1 10 100 10000
320
640
960
1280
1600
FL3 -DAPI
counts
RN1
1 10 100 10000.1
1
10
100
1000
FSC -FL3 -DAPI
0.1 1 10 100 10000.1
1
10
100
1000
FL1 -FITC
FL3 -DAPI
0.1 1 10 100 10000
200
400
600
800
1000
FL3 -DAPI
counts
1 10 100 10000.1
1
10
100
1000
FSC -
FL3 -DAPI
0.1 1 10 100 10000.1
1
10
100
1000
FL1 -FITC
FL3 -DAPI
0.1 1 10 100 10000
200
400
600
800
1000
FL3 -DAPI
counts
RN1
1 10 100 10000.1
1
10
100
1000
FSC -
FL3 -DAPI
0.1 1 10 100 10000.1
1
10
100
1000
FL1 -FITC
FL3 -DAPI
0.1 1 10 100 10000
500
1000
1500
2000
2500
FL3 -DAPI
counts
1 10 100 10000.1
1
10
100
1000
FSC -
FL3 -DAPI
0.1 1 10 100 10000.1
1
10
100
1000
FL1 -FITC
FL3 -DAPI
0.1 1 10 100 10000
500
1000
1500
2000
2500
FL3 -DAPI
counts
RN1
1 10 100 10000.1
1
10
100
1000
FSC -
FL3 -DAPI
0.1 1 10 100 10000.1
1
10
100
1000
FL1 -FITC
FL3 -DAPI
1000 0.1 1 10 100 10000
200
400
600
800
1000
FL3 -DAPI
counts
1 10 100 10000.1
1
10
100
1000
FSC -
FL3 -DAPI
0.1 1 10 100 10000.1
1
10
100
1000
FL1 -FITC
FL3 -DAPI
1000 0.1 1 10 100 10000
200
400
600
800
1000
FL3 -DAPI
counts
RN1
1 10 100 10000.1
1
10
100
1000
FSC -
FL3 -DAPI
0.1 1 10 100 10000.1
1
10
100
1000
FL1 -FITC
FL3 -DAPI

Page | 101
As we can see from flow cytometry recordings response is very similar when using
PMB (Figure 57D) and when no permeabilized was used (Figure 57B). Explanation could be
that concentration of substrate which we use in emulsion preparation in high enough to
break diffusion barrier over the E. coli membrane. Enough substrate could penetrate inside
the cell and get converted to the product to get the same response as when using
membrane permeabilizer. On the other hand, sensitivity of flow cytometer is higher that
that of MTP fluorescence reader so lower amounts of product are needed in order to be
seen by the machine. To ensure higher survival rate of cells after sorting we decided to
exclude permeabilizer from emulsion reaction mix.
Finally, to increase analysis and sorting rate we decided to include an internal water
phase standard. In our case it was 5 µM fluorescein (ex. 488 nm, em. 520 nm). Fluorescein is
water soluble probe which couldn’t diffuse trough the lipid layer of the double emulsion and
therefore would stay located in inner aqueous phase. This would allow us to distinguish by
flow cytometer “real” double emulsions from primary emulsions and lipid droplets present
in the mixture as a result of incomplete emulsification. Additionally, flow cytometer has an
option to be guided by fluorescence signal that we choose meaning that only particles
possessing that signal could be “visible” by the device. This is called “triggering”. Normally,
device is triggered by blue fluorescence coming from 488 nm laser known as forward
scattering (FCS) or side scattering (SSC) which would correspond to particle size and
complexity, respectively. In this way machine practically detect all particles which posses a
certain size (>200 nm). In our case this would mean that machine would count and analyze a
vast majority of particles which are not at all double emulsions (improperly formed double
emulsion, primary emulsion, lipid droplets, and cell debris) and by this way the whole
analysis process would be slowed down. By using “green triggering” machine would be able
to detect only properties of the particles having green fluorescence in our case only “real”
double emulsions. By this way, analysis and sorting rates could be increased drastically.
We tested recordings using ”normal” (FCS) and “green triggering” (FL1-FITC) to see if
we could get improvement in detection and speed of analysis (Figure 58).

Page | 102
A)
B)
1 10 100 10000
500
1000
1500
2000
2500
FSC -
counts
1 10 100 10000
500
1000
1500
2000
2500
SSC -
counts
1 10 100 10001
10
100
1000
FSC -
SSC -
1 10 100 10000.1
1
10
100
1000
FSC -
FL1 -FITC
0.1 1 10 100 10000
500
1000
1500
2000
2500
FL1 -FITC
counts
0.1 1 10 100 10000
500
1000
1500
2000
2500
FL3 -DAPI
counts
1 10 100 10000.1
1
10
100
1000
FSC -
FL3 -DAPI
0.1 1 10 100 10000.1
1
10
100
1000
FL1 -FITC
FL3 -DAPI
1 10 100 10000
500
1000
1500
2000
2500
FSC -
counts
1 10 100 10000
500
1000
1500
2000
2500
SSC -
counts
1 10 100 10001
10
100
1000
FSC -
SSC -
1 10 100 10000.1
1
10
100
1000
FSC -
FL1 -FITC
0.1 1 10 100 10000
500
1000
1500
2000
2500
FL1 -FITC
counts
0.1 1 10 100 10000
200
400
600
800
1000
FL3 -DAPI
counts
1 10 100 10000.1
1
10
100
1000
FSC -
FL3 -DAPI
0.1 1 10 100 10000.1
1
10
100
1000
FL1 -FITC
FL3 -DAPI

Page | 103
C)
D)
Figure 58 Flow cytometry recording of blank (A, C) and positive (B, D) double emulsion under “normal” (A, B) and “green”
triggering (C, D).
1 10 100 10000
500
1000
1500
2000
2500
FSC -
counts
1 10 100 10000
200
400
600
800
1000
SSC -
counts
1 10 100 10001
10
100
1000
FSC -
SSC -
1 10 100 10000.1
1
10
100
1000
FSC -
FL1 -FITC
0.1 1 10 100 10000
1000
2000
3000
4000
5000
FL1 -FITC
counts
0.1 1 10 100 10000
100
200
300
400
500
FL3 -DAPI
counts
1 10 100 10000.1
1
10
100
1000
FSC -
FL3 -DAPI
0.1 1 10 100 10000.1
1
10
100
1000
FL1 -FITC
FL3 -DAPI
1 10 100 10000
500
1000
1500
2000
2500
FSC -
counts
1 10 100 10000
200
400
600
800
1000
SSC -
counts
1 10 100 10001
10
100
1000
FSC -
SSC -
1 10 100 10000.1
1
10
100
1000
FSC -
FL1 -FITC
0.1 1 10 100 10000
1000
2000
3000
4000
5000
FL1 -FITC
counts
0.1 1 10 100 10000
100
200
300
400
500
FL3 -DAPI
counts
RN1
1 10 100 10000.1
1
10
100
1000
FSC -
FL3 -DAPI
0.1 1 10 100 10000.1
1
10
100
1000
FL1 -FITC
FL3 -DAPI
1 10 100 10000
500
1000
1500
2000
2500
FSC -
counts
1 10 100 10000
200
400
600
800
1000
SSC -
counts
1 10 100 10001
10
100
1000
FSC -
SSC -
1 10 100 10000.1
1
10
100
1000
FSC -
FL1 -FITC
0.1 1 10 100 10000
1000
2000
3000
4000
5000
FL1 -FITC
counts
0.1 1 10 100 10000
100
200
300
400
500
FL3 -DAPI
counts
1 10 100 10000.1
1
10
100
1000
FSC -
FL3 -DAPI
0.1 1 10 100 10000.1
1
10
100
1000
FL1 -FITC
FL3 -DAPI
1 10 100 10000
500
1000
1500
2000
2500
FSC -
counts
1 10 100 10000
200
400
600
800
1000
SSC -
counts
1 10 100 10001
10
100
1000
FSC -
SSC -
1 10 100 10000.1
1
10
100
1000
FSC -
FL1 -FITC
0.1 1 10 100 10000
1000
2000
3000
4000
5000
FL1 -FITC
counts
0.1 1 10 100 10000
100
200
300
400
500
FL3 -DAPI
counts
RN1
1 10 100 10000.1
1
10
100
1000
FSC -
FL3 -DAPI
0.1 1 10 100 10000.1
1
10
100
1000
FL1 -FITC
FL3 -DAPI

Page | 104
V. Conversion of 7-benzoxy-3-carboxy coumarin benzyl ester (DBCC) by
intracellular expressed Cyt P450 BM3 139-3 variant
When performing a TLC analysis of different reaction products using BCC and DBCC
as substrates and selected variants of Cyt P450 for conversion we observed an interesting
event. In the case of di-benzyl substrate, Cyt P450 BM3 139-3 variant was giving additional
reaction product. Spot on TLC had very low Rf value and high hydrophylicity (was moving
very slow in TLC). Additionally, acetic acid had a positive effect on the movement in TLC
indicating that molecule might contain a negative charge. We hypothesized that 139-3
variant was able to hydroxylate substrate at two positions and as a side product release
charged 3-carboxy coumarin (Figure 59).
O OO
O
O
P450 BM-3
F98A/R47F 139-3
NADPH, O2
NADP+, H2O
NADPH, O2
NADP+, H2O
O OHO
O
O
O OHO
O
O
O OHO
OH
O
+
non fluorescent in blue region
high blue fluorescence (λext=405; λem=455)
high blue fluorescence (λext=405; λem=455)
Figure 59 Supposed reaction products of conversion of DBCC by Cyt P450 BM3 F87A/R47F variant (left) and 139-3 variant
(right).
To test the hypothesis we performed conversion reaction in MTP using BCC and
DBCC, as substrates and Cyt 139-3 variant. Substrates and products were analyzed by TLC
(Figure 60). Additionally, acetic acid was added to into eluent to protonate carboxyl group of
3-carboxy coumarin and to enhance TLC separation (Figure 60, right).

Page | 105
Figure 60 TLC analysis of substrates (lanes 1 and 3) and products (lanes 2 and 4) of the conversion of BCC (lanes 1 and 2)
and DBCC (lanes 3 and 4) by Cyt P450 BM3 139-3 variant.
As expected, after conversion of BCC by 139-3 only one product is observed (Figure
60, lane 4). This product corresponds to 7-hydroxy-3-carboxy coumarin methyl ester. Methyl
group was too small to be recognized by the enzyme as a place of hydroxylation. On the
other hand, when using DBCC as a substrate two products are visible, main product, which
would correspond to 7-hydroxy-3-carboxy coumarin benzyl ester and a side product, 3-
carboxy coumarin (Figure 59).
This means what benzyl group bound by ether or ester connection to the coumarin
core can serve as a hydroxylation point. This is the first proof of using the Cytochrome P450
enzymes for de-esterification reactions and presents and interesting model of shifting the
type of enzyme reaction by using surrogate substrates.
This discovery could have another practical application. Release of charged
fluorescent probe from non-charged hydrophobic precursor could be property used for
activity cell staining.
Hydrophobic molecules can penetrate slightly permeablized membrane of E.coli and
end up in cytoplasm. After conversion by an intracellular enzyme into charged probe
diffusion trough the membrane, outside of the cell, is disabled. If the probe has a detectable
property like fluorescence (in our case coumarin) it could be use to stain specifically, in our
case, cells containing only Cyt P450 BM3 139-3 activity.
To test if the cells expressing intracellular Cyt P450 BM3 139-3 could be stained with
DBCC we used native cells and cells with slightly permeabilized membrane (PMBN, Figure
61).

Page | 106
Figure 61 Flow cytometry recording of DBCC stained cells expressing CytP450 BM3.
Cells whose membrane was not permeabilized showed no increase in expected blue
region (Figure 61, left). Cells whose membrane had increased fluidity, as a consequence of
PMBN, showed a new discrete population in the expected blue region (Figure 61, right).
Since diffusion in responsible for substrate entering the cytoplasm of E. coli higher
concentrations of substrate in the reaction mix should increase cell staining. We tested this
hypothesis by adding 0.08, 0.17, 1.18 and 1.53 mM DBCC in the reaction mix (Figure 62).
Figure 62 Flow cytometry of cells expressing Cyt P450 BM3 stained with different concentrations of DBCC (0.08, 0.17,
1.18, 1.53 mM).
1000 1 10 100 10000.1
1
10
100
1000
FSC -
FL3 -DAPI
1000 1 10 100 10000.1
1
10
100
1000
FSC -
FL3 -DAPI
R1
partec PAS
1 10 100 10000.1
1
10
100
1000
FSC -
FL3 -DAPI
1 10 100 10000.1
1
10
100
1000
FSC -
FL3 -DAPI
R1
partec PAS
1000 1 10 100 10000.1
1
10
100
1000
FSC -
FL3 -DAPI
1000 1 10 100 10000.1
1
10
100
1000
FSC -
FL3 -DAPI
R1
partec PAS
1000 1 10 100 10000.1
1
10
100
1000
FSC -
FL3 -DAPI
1000 1 10 100 10000.1
1
10
100
1000
FSC -
FL3 -DAPI
R1
partec PAS
1000 1 10 100 10000.1
1
10
100
1000
FSC -
FL3 -DAPI
1000 1 10 100 10000.1
1
10
100
1000
FSC -
FL3 -DAPI
R1
partec PAS
1000 1 10 100 10000.1
1
10
100
1000
FSC -
FL3 -DAPI
1000 1 10 100 10000.1
1
10
100
1000
FSC -
FL3 -DAPI
R1
partec PAS

Page | 107
As it can be clearly seen, after reaction population of stained cells increases (Figure
62). This number of gated events, even though it shows increase, has to be taken as relative
since background of the sample wasn’t determined (Table 8). Additionally, when using
higher concentrations of substrate (1.53 mM) aggregation of cell is observed (data not
shown).
Table 8 Increase in stained cell population with increase in concentration of DBCC.
Concentration of DBCC (mM) Gated population (%)
0.08 6.18
0.17 10.99
1.18 24.66
1.53 20.28
Using alternative permebilization methods could increase the transport of the probe
trough the membrane and result in higher cell staining. We tested few methods but cell
survival was low (data not shown). From the literature mild permeabilization method, using
sucrose and hypotonic cells shock, should increase membrane permeability without effect
on cell survival. This method was tested in comparison to permeabilization using PMBN.
Cells were treated with sucrose and hypotonic solution of Mg2+
after expression of
the enzyme. Sucrose permeabilized cells were then incubated with substrate both on room
(Figure 64) temperature and on ice (Figure 63). As a control PMBN was added to both
sucrose permeabilized and sucrose non-permeabilized cell to observe the effect on staining.
Figure 63 Flow cytometry recording of samples treated on ice (for detailed explanations refer to text bellow).

Page | 108
Sample that was treated on ice showed small population of blue cells (possibly only
background) in the control containing only DMSO and NADPH (black line), in the sample
containing only substrate (red line) and sample containing substrate and NADPH (blue line).
When PMBN was added to sucrose permeabilized cells together with substrate and NADPH
big shift in fluorescence was observed (Figure 63). Whole population of detected cells was
moved towards the blue region (pink line). We have to keep in mind that in this case
aggregation of the cells is observed on forward scatter graph (Figure 63, left, green line). The
cause is possible exposure of hydrophobic patches on the surface of E.coli as a consequence
of action of PMBN. Hydrophobic patches lead to additional aggregation of E.coli (even native
E.coli has a tendency to aggregate) which could also partially account for increase in
fluorescence (sum of small fluorescencent cells would give higher signal).
Figure 64 Flow cytometry recording of samples treated on room temperature (for detailed explanations refer to text
bellow).
Sample treated on room temperature showed a different profile (Figure 64). Control
containing only DMSO and NADPH (black line) didn’t show any blue cell population. Slight
increase towards blue region was detected in the sample containing only substrate but not
NADPH (red line). This slight shift could be attributed to the fact that E.coli cells contain
small amount of internal NADPH and that conversion is possible even when NADP is not
supplemented into the reaction mix. Sample containing substrate and supplemented NADPH
(blue line) showed increase in the blue region when compared to both controls mentioned
previously. No cell aggregation is observed in this case. This shows that diffusion of the
substrate is possible trough sucrose-treated membrane, but only on room temperature.
Product is charge enough not to diffuse out and to make cells detectable by flow cytometry.
From all selected conditions for cell staining this one would prove to be most optimal. Due to
the fact that no aggregation is observed and increase in the fluorescent population is
significant (Table 9) this would probably allow hugest activity detection and ensure cell

Page | 109
survival (due to less damaged membrane). Last sample containing additionally PMBN as a
permeabilizer (pink line) showed radical increase in blue region (Table 9). On the other hand,
high level of aggregation is observed.
Sample which contained only PMBN and was treated with the substrate on the room
temperature was taken as a control in both cases (Figure 63 and 64, green line). High level of
blue fluorescence is observed (Table 9) with slight cell aggregation. Together with the
sucrose treatment on room temperature mentioned previously would be the most optimal
condition for cell staining. Still survival rate in this case has to be tested.
Table 9 Summary of flow cytometry recording of DBCC treated cells (for detailed explanations refer to text above).
Sample Components of reaction mix Incubation Percentage of gated population (%)
0 NST*, S, PMBN, NADPH RT 68.07
1 DMSO, NADPH
Ice
11.57
2 S 13.58
3 S, NADPH 8.43
4 S, PMBN, NADPH 63.08
5 DMSO, NADPH
RT
1.03
6 S 2.55
7 S, NADPH 19.19
8 S, PMBN, NADPH 62.06 * NST means that cells were not treated with sucrose/hypotonic shock
4.4 Conclusion
In this Chapter we describe synthesis and characterization of novel, coumarine based
substrates for Cyt P450 BM3 (Table 6). These substrates were synthesized for high
throughput screening (HTS) format (i.e. BCC) and for ultra-high throughput screening (ultra-
HTS) format (i.e. BCC Acid, DBCC) using flow cytometry and double emulsions.
Ultra-HTS screening is based on IVC of E. coli cells expressing target enzyme inside an
aqueous phase of double emulsions. After adding fluorogenic substrate and its conversion to
fluorescent product emulsions can be analyzed and sorted using flow cytometry. Sorted
population is enriched in positive droplets containing only active variants of the enzyme (23).
This technique and its application for screening Cyt P450 BM3 activity will be in detail
described in Chapter 5.
Assay which is to be used in flow cytometry/double emulsion screening had to fulfill
certain conditions. First, it has to be based of fluorescent detection. Detection is limited by
the properties of the flow cytometer used in the experiments. In our work we used CyFlow
Space flow cytometer pre-equiped with UV (375 nm) and blue (488 nm) lasers. Detection
was possible in blue (455 nm), green (520 nm) and red (620 nm) region. Second probe needs
to be hydrophilic enough to be retained inside an aqueous phase of the double emulsion
droplet (95). Additionally, probe needs to be small not to interfere with the overall structure
of the substrate.

Page | 110
This limited the choice of fluorophores which could be used for substrate generation.
First, we synthesized a series of surrogate substrates using 4-methyl umbelliferone (4-MU)
as a fluorophore and fatty acid (dodecanoic acid, decanoic acid) as a substrate part. Assay
was based on previously well established pNCA assay (8). These substrates (acid and ester of
dodecanoic acid mentioned in this Thesis) were successfully converted by Cyt P450 BM3 Wt
and tested variants. Unfortunately, as it turned out released probe was not fluorescent
enough on pH used for conversion reaction (pH 7-8). Due to the properties of the 7-OH
group of the probe (pKa~7.8) much higher pH has to be used in order to produce highly
fluorescent anion (97). In our case it was not possible due to low activity of Cyt P450 BM3 on
higher pH (pH>9).
Smaller, 7-benzoxy-4-MU substrate was converted in higher extent so released
fluorescent probe (4-MU) could be detected both by TLC and spectrofluorimetry in MTP. On
the other hand, as it turned out to be this probe was not hydrophilic (charged) enough and
could not be used in double emulsions. When probe was entrapped inside an aqueous phase
of double emulsion, due to absence of charge, it would fast diffuse out and all emulsion
droplets would be without fluorescence (“dark”).
Using the previous knowledge we synthesized series of novel Cyt P450 BM3
substrates based on 3-carboxy coumarin (3-CC). This probe possesses charge in 3-position
and could be successfully entrapped inside double emulsions. Also, compared to 4-MU it
possesses more advantageous properties like higher fluorescence, insensitivity to changes in
pH and no effect on microbial growth (97). So far, only one fluorescence based assay was
developed for Cyt P450 BM3 based on commercially available alkoxy-resorufins (16).
Advantages of this assay would be usage of the probe which spectra is well separated from
fluorescent spectra of NADPH (98), but on the other hand it couldn’t be used in emulsion
systems due to absence of charge on resorufin molecule.
All three substrates which we synthesized, 7-benzoxy-3-carboxy coumarin methyl
ester (BCC), 7-benzoxy-3-carboxy coumarin (BCC Acid) and 7-benzoxy-3-carboxy coumarin
benzyl ester could be applied for specific screening system. Unfortunately, all substrates are
surrogate and their structure was quite different from native Cyt P450 BM3 substrates. On
the other hand, screening with theses substrates could produce mutants with drug-like
substances activity which would show high applicability in pharmaceutical industry (99).
BCC compound is small, drug-like, non-charged molecule (Table 6) converted by Cyt
P450 BM3 Wt and all tested variants (F87A, F87A/R47F, F87A/R47Y and F87A/R47F/M354S).
This substrate could be used for MTP screening of activity Cyt P450 BM3 towards drug-like
molecules. Advantages of this substrate are activity with Wt enzyme and all tested mutants,
high sensitivity (due to high fluorescence of released probe 7-hydroxy-3-carboxy coumarin
methyl ester), possibility to use whole cells directly (without any lysis and purification steps)
and continuitivity of the assay.

Page | 111
BCC Acid is charged drug-like compound (Table 6). Novelty of this substrate is that it
is the first Cyt P450 BM3 available substrate that could be used in flow cytometry/double
emulsion based screening systems. Drawback is that Wt enzyme show very low, barely
detectable activity with this substrate so another, more active variant (F87A) has to be used
for screening. On the other hand, using flow cytometry/double emulsions allow us to screen
up to 108-9
variants of enzyme in very short time frame (few hours). Under these conditions,
high mutational rate conditions can be used to randomize the gene (i.e. SeSaM) and
produced low activity library can be successfully screened/enriched. This throughput would
not be possible by standard HTS screening methods based on MTPs and solid phase.
We tested BCC Acid substrate in double emulsions and showed that increase in blue
droplets containing reaction product could be detected in time. Including second fluorescent
dye (fluorescein) as an inner water phase control could radically increase analysis speed. We
also showed that permeabilization of the bacterial membrane is not necessary, due to very
high concentrations of the substrate present in inner aqueous phase of double emulsion. In
the following Chapter this technology was further optimized and used to establish a flow
cytometry based system for screening Cyt P450 activity in double emulsions. Up to now, this
is the first such system to be established for monooxygenase screening.
DBCC is most bulky substrate compared to other two, containing two benzyl groups
at both ends of the molecule (Table 6). One of the benzyl groups is connected to coumarine
core with ether bond while other is connected with ester bond. This substrate is converted
by Wt enzyme as well as all other tested variants. As expected hydroxylation only occurs on
α-C atom of one benzyl group (bound with ether bond). Interestingly, 139-3 variant of Cyt
P450 BM3 is able to hydroxylate both α-C atoms of benzyl groups. This as a consequence has
s release of charged 3-carboxy coumarin (Figure 59). This principle, release of charged core
molecule from non-charged hydrophobic substrate has been used for activity staining of
eukaryotic cells. Similarly, our substrate could be used for Cyt P450 BM3 activity staining of
E. coli cells. We stained the cells containing expressed 139-3 variant with DBCC and could see
blue population of cells on flow cytometer. We also observed that due to the properties of
bacterial membrane substrate doesn’t diffuse freely and membrane needs to be
permeabilized (100). We tested few permeabilizers and saw that permeabilization has an
effect on stained population. More experiments are needed to optimize this system and use
it for screening and directed evolution of P450.
To conclude, novel coumarine based Cyt P450 BM3 substrates have been
synthesized. They can be used for HTS and well as ultra-HTS system employing flow
cytometry/double emulsions. New ultra-HTS have not been published for Cytochrome class
so far. Novelty of using this system for a class of these, bio-industrially important enzymes
would be much higher throughput when compared to classical HTS methods (up to 109). This
would allow high mutagenesis methods (i.e. SeSaM) to be used for gene randomization.
These libraries usually contain low amount of activity and screening then using classical HTS
methods would be very laborious and expensive. On the other hand, using flow

Page | 112
cytometry/double emulsion would allow us to enrich library in activity and additionally, with
selection parameters (gating), we could also fine tune activity of the clones in the final
library.
5. Development of ultra high throughput screening system based
on flow cytometry and double emulsions for directed
evolution of Cyt P450 BM3
5.1 Introduction
Cytochrome P450 (P450s) comprise large super-family of hemoproteins known to
catalyze diverse type of chemical reactions on broad range of chemically dissimilar
substrates. They are key components of oxidative, peroxidative and reductive metabolism of
such endogenous and xenobiotic substrates as environmental pollutants, steroids,
prostaglandins and fatty acids (101). Due to their substrate and reaction type diversity they
pose an interesting target for bioindustrial application especially in fine chemical (i.e.
pharmaceuticals) synthesis. Mammalian P450s are not suitable for industrial application due
to low stability, low catalytic activity and need for reductase partner. Bacterial P450s in
general have higher stability and much faster catalytic activity making them more suitable
candidate for large scale applications (48). On the other side they still suffer from
substrate/product inhibition and are hampered by consumption of expensive reduction co-
factors (NADH, NADPH). Directed evolution and rational design have been employed as
tools to improve properties of P450s making them more suitable for large scale industrial
applications. So far properties like substrate specificity (102-104), co-solvent resistance (11),
thermostability (105) and usage of alternate co-factors (106,107) have been successfully
improved. Even with significant success in directed evolution experiments these this suffer
from small number of clones probed (<106) due to limitations of available high throughput
screening systems. Ultra high throughput screening systems (>107) based on display
technology and in vitro compartmentalization (IVC) offer new possibilities for directed
evolution allowing us to explore more protein sequence space in single experiment.
Cytochrome P450 BM3 (CYP102A1) originally isolated from Bacillus megatherium is
self-sufficient monooxigenase with substrate specificity towards long chain fatty acids,
alcohols and amides. In the presence of NADPH and O2 it catalyses ω-1, -2 or -3
hydroxylation of fatty acid substrate with 12-22 carbon atoms (34). Unlike mammalian
P450s, BM3 is a soluble fusion protein, with heme and reductase domain present in one
polypeptide chain. Recently, it has been shown that P450 BM3 can be, by rational design or
directed evolution, be modified into an enzyme which is catalyzing reactions on substrates
structurally different that its native one. It has been engineered to convert alkanes (108),
short and medium-chain fatty acids (9,104), drug like molecules (109) and polycyclic
aromatic hydrocarbons (PAHs)(103).

Page | 113
Directed evolution offers few advantages over rational design especially in the case
where full crystal structure of the enzyme is not available. Microtiter plate and solid phase
screening systems, with throughput of 102-10
6, are commonly applied screening formats for
improving enzyme properties when it comes to oxygenases. On the other hand, even with
highest throughput these methods are still limited to sampling only small number of clones.
Recently, new techniques with ultra high throughput (>107), based on fluorescent detection
and flow cytometry have been published (3). These could potentially enable us to screen
larger libraries generated with high diversity methods (i.e. SeSaM) and explore in single
experiment more of sequence space. Additional problem occurring is low transformation
efficiency of commonly used expression hosts (E. coli, S. cerevisisae). This can be overcome
by employing small vectors for cloning in E. coli or use cell-free expression systems. Ultra
high throughput methods are either based on surface display technology (successfully used
for protein evolution trough binding affinities) or in vitro compartmentalization (IVC) within
double emulsions. The latter allowed development of flow cytometry based screening
systems which, compared to display techniques, can be extended to intracellular/excreted
enzymes with soluble reaction product. Most important is that IVC enables physical
connection between gene, encoding active variant of enzyme, and reaction product,
fluorescent probe. In case when only genes are entrapped enzymes are expressed within the
droplet using cell-free expression system. This approach has been successfully applied for
directed evolution of DNA polymerases (110), phosphotriesterases (111), methyltransferases
(112), endonucleases (20) and galactosidases (21). Whole cell can be entrapped inside the
aqueous droplets in which case enzyme is expressed within the cell. This has been a
successful approach in directed evolution of thiolactonases (22).
In this work we present ultra high throughput screening system for directed
evolution of Cytochrome P450 BM3 (Cyt P450 BM3). Method is based on IVC of cells
expressing active variants of P450 BM3 in double emulsions and sorting them by flow
cytometry. Substrate for Cyt P450 BM3 has been synthesized using 3-carboxy coumarin as a
fluorescent probe. In 7-position benzyl group has been attached. After the enzymatic
hydroxylation probe is released. This is followed by increase in fluorescence in droplets of
double emulsions containing active variants of P450 BM3, which are then enriched in 3
subsequent rounds of sorting using Partec CyFlow Space flow cytometer. Active clones are
rescreened in the 96-well MTP and only the best ones purified and kinetically characterized.
5.2 Materials and methods
All chemicals were of analytical grade or higher purchased from Sigma-Aldrich
(Steinheim, Germany), AppliChem (Darmstadt, Germany) and Serva (Heidelberg, Germany).
ABIL EM-90 was purchased from Dechema (Frankfurt am Main, Germany). All enzymes and
buffers used in cloning experiments were from Fermentas (St. Leon-Rot, Germany).

Page | 114
As a PCR template for P450 BM3 gene and library and library amplification pCWORI
vector harboring F87A/R471C variant of BM3 was used (Prof. Frances Arnold, Caltech,
Pasadena, USA). All libraries were constructed in pALXtreme-1a vector (pET-28a(+) derivative
where 63 % of sequence have been deleted and lacI gene has been transferred to the
genome of BL21-Gold (DE3) under the control of Q1 promoter, Dr. Alexander Schenk, Jacobs
University Bremen, Bremen, Germany). For plasmid isolation constructs were transformed in
E. coli XL10-Gold (Invitrogen, Karlsruhe, Germany) and for protein expression in BL21-Gold
(DE3) lacIQ1
(Dr. Alexander Schenk). Cells were normally grown in LBKan media (50 µg/ml)
unless stated otherwise.
Substrate (7-benzoxy-3-carboxy coumarin) has been synthesized starting from 3-
carboxy coumarin methyl ester as described in the Chapter 4. Dilutions were made in DMSO
and kept on 4°C (in dark).
Assay in the emulsion was assembled as described below. Concentrated Screening
master mix was prepared by mixing 25 µl isocitric acid (80 mM), 25 µl NADPH (10 mM), 12.5
µl isocitrate dehydrogenase (0.5 U/µl) and 5 µl of fluorescein (500 µM). Cell suspension (40
µl) in buffer (0.1 M tris-HCl pH 8.0) was mixed with concentrated Screening mix (13 µl),
vortexed shortly and emulsified as described.
Assay in 96-well microtiter plate format (MTP) was performed using Corning (Hagen,
Germany) 96-well black flat bottom plates. Cells expressing P450 BM3 variants were grown
directly in the MTP, centrifuged and re-suspended directly in 100 µl of Assay mix (100 mM
phosphate buffer pH 9.0, 54 µM PMB, 75 µM BCC Acid and 250 µM NADPH). Fluorescence
was monitored using TECAN Safire (Crailsheim, Germany) MTP spectrofluorimeter
(excitation: 400 nm, emission: 440 nm, gain: 55, z-position: 5000 µm, integration time: 40 µs
and number of light flashes: 5).
Gene was amplified in error prone PCR (epPCR) conditions using balanced dNTPs,
addition of Mn2+
ions, decreasing the amount of template DNA and increasing the number of
cycles (113). All PCRs were done in 50 µl volume using thin-wall PCR tubes (Sarstedt,
Germany) and Eppendorf Gradient Cycler (Darmstadt, Germany). Reaction consisted of 1X
PCR buffer pH 9.2 (50 mM tris-HCl, 16 mM ammonium-sulphate, 1.75 mM magnesium-
chloride and 0.1% Tween 20), dNTPs (0.2 mM each), forward and reverse primer (400 nM
each, forward primer: 5’- A*C*C*A*T*G*G*G*C*A*G*C*ATGACAATTAAAGAAATGCCTCAGCC
AAAAACG -3', reverse primer: 5’- G*G*C*T*T*T*G*T*T*A*G*C*TTACCCAGCCCACACGTCTTT
TGCGTATC -3', asterisk marks positions of phosphothioester bond), MnCl2 (0.2 mM), Taq
polymerase (5 U) and template DNA (25 ng). Cycling was done as follows: 1 cycle of initial
denaturation (94°C, 2 min), 35 cycles consisting of denaturation (94°C, 30 sec), annealing
(67°C, 30 sec), elongation (72°C, 2 min) and 1 cycle of final elongation (72°C, 5 min). After
PCR sample was purified using PCR purification kit (Qiagen, Hilden, Germany) and quantified
via Nano Drop (ND-1000, Nano Drop Technologies, Delaware, USA). Gene was cloned in
pALXtreme-1a vector using Phosphorothioate based Ligase Independent Gene cloning

Page | 115
system (PIGe, see Chapter 2) and transformed in XL10-Gold cells (114). Few tubes of
transformed cells were pooled and grown together in liquid LBKan media (4 ml, 37°C, 12 h,
250 rpm). Small aliquot (5 µl) of transformation mixture was plated on LBKan agar plates to
determine transformation efficiency and size of primary library. Plasmid was recovered using
Plasmid Prep Kit (Qiagen, Hilden, Germany) and re-transformed to expression strain BL21-
Gold (DE3) lacIQ1
(114).
Induction of P450 BM3 variants was done by inoculating cells in LBKan media (4 ml)
and growing them for 2 hours (37°C, 250 rpm). Then IPTG (0.5 mM) was added and
expression was continued (30°C, 250 rpm) for additional 3 hours. After this cells were
centrifuged (5900 x g, 3 min) and washed twice with ice cold PBS. Finally cells were re-
suspended in activity buffer (0.1 mM tris pH 8.0) in concentration of 5 x 10⁶
cell/µl. Prior to
emulsification cell suspension was passed trough 5 µm filter. Cell suspension was mixed with
concentrated Screening master mix as described under the Assay part of Materials and
methods. Emulsification was done as described previously (3) with decreasing the final
volume of emulsion to 525 µl and using Miccra D-1 (ART, Müllheim, Germany)
homogenizator. After preparation of primary emulsion, substrate was added (1 µl of 200
mM BCC Acid in DMSO) and secondary emulsion was prepared immediately after. Emulsion
was incubated on room temperature (2 h), in dark. For visualization of integrity of secondary
emulsion fluorescent microscopy was used (Keyence BZ-8000, Neu-Isenburg, Germany,
mercury lamp excitation, blue (450±20 nm) and green (520±20 nm) filters for emission).
For analysis and sorting emulsion was diluted 100 times in sterile PBS. Sample was
run with speed 5 µl/min trough Partec CyFlow Space flow cytometer (Partec, Muenster,
Germany). Sheet fluid (0.9% NaCl, 0.01 Triton X-100 in Milli-Q water) was filtered and
autoclaved before use. Detection was “triggered” on green fluorescence (excitation: 488 nm,
emission: 530 nm) coming from fluorescein used as an internal control dye. Analysis speed
was approx. 6000-7000 events/sec while sorting speed was 5-10 events/sec. For sorting
~0.1-0.01% of active population was chosen and sorted in approx. 50 ml volume.
Sorted sample was passed trough 0.2 µm filter, recovered in 1 ml of LBKan media with
shaking (1400 rpm, 10 min) and then inoculated in LBKan media (4 ml). For the next round of
enrichment this was used as a pre-culture sample. Enrichment/sorting was repeated 3 times.
After each round, 100 µl of sorted sample was plated on LBKan agar plates with IPTG
(5 µM) for activity assay and cell quantification. Cells were grown overnight (37°C, 16 h).
Activity assay was done by picking colony from the agar plate directly in 50 µl Assay mix (see
under Assay part of Materials and methods) in black flat bottom 386-well MTP. Fluorescence
(excitation: 400 nm, emission: 440 nm) was monitored using TECAN Safire in 60 min period
(gain: 80, z-position: 8500 µm, integration time: 40 µs and number of light flashes: 10).
Finally, after flow cytometry enrichment steps cells were grown on LBKan agar plates
(37°C, 16 h) and picked into 150 µl LBKan media in flat bottom transparent 96-well MTP using
sterile toothpicks. Suspension was grown (37°C, 900 rpm, 70% humidity, 16 h), diluted with

Page | 116
glycerol (25% final) and stored on -80°C (Master plate). Replica of Master plate for activity
testing was made in 150 µl LBKan media with supplements (0.5 mM δ-aminolevulinic acid, 0.5
mM thiamine, 1 x trace elements and 5 µM IPTG) in flat bottom black 96-well MTP and
grown (30°C, 700 rpm, 70% humidity) for another 12 h. Plates were centrifuged (3200 x g, 10
min, 4°C) and assay was done as described under the Assay part of Materials and methods.
Most active clones (including the starting clone M0) were selected from MTP
screening and inoculated in 4 ml LBKan media. Four milliliters of pre-culture was transferred
to 250 ml TBKan media (in 1 l flask) with supplements (0.5 mM δ-aminolevulinic acid, 0.5 mM
thiamine and 1 x trace elements), grown (37°C, 250 rpm) for 2 hours and then induced by
addition of IPTG (0.5 mM). Protein was expressed (30°C, 250 rpm) for 8 hours. After
expression cell suspension was kept on ice. Expressed cells were centrifuged (3200 x g, 10
min, 4°C), re-suspended in 15 ml lysis buffer (0.01 M tris pH 7.8) and passed trough French
press (3 times, 1500 bars). Cell lysate was cleared by centrifugation (21000 x g, 10 min, 4°C)
and filtering (0.45 µm). Protein was purified using ion-exchange chromatography as
described in Chapter 3. Peak corresponding to P450 BM3 was pooled (10 ml) and
concentration of protein was determined using CO binding method (86). Purity of the
samples was confirmed by SDS-PAGE (85).
Kinetic characterization was done in black flat bottom 96-well MTP in final volume of
120 µl. Enzyme fractions were diluted 10-15 times in PBS and kept on ice. Assay was
assembled as follows: 100 µl 0.1 M phosphate buffer pH 9.0, 10 µl enzyme solution and 2 µl
of substrate. After incubation with shaking (750 rpm, 5 min) 8 µl of NADPH (10 mM) was
added. Fluorescence (excitation: 400 nm, emission: 440 nm) was monitored for 10 minutes
(1 min interval, gain: 80, z-position: 5500 µm, integration time: 40 µs and number of light
flashes: 10). Slope (AU/min) was calculated in first 5 minutes of the reaction (linear range)
using Microsoft Excel. Concentration of the product was calculated form the standard curve
constructed for 3-carboxy coumarin (10-325 nM). For determination of standard deviation 5
repetitions were done for each substrate concentration. For Km and kcat determination data
was plotted and fitted using Origin 7.0 (OriginLab Corporation, Northampton, USA).
Sequencing of selected variants was done with MWG (Ebersberg, Germany).
Sequence was analyzed using Vector NTI (Invitrogen, Karlsruhe, Germany).
5.3 Results and discussion
As a substrate, for screening Cyt P450 BM3 activity in MTPs and double emulsions, 7-
benzoxy-3-carboxy coumarin was used. After the specific enzyme hydroxylation, fluorophore
(3-carboxy coumarin), is released (Figure 65). In emulsion, this is followed by increase in
fluorescence (excitation: 375 nm, emission: 440 nm) of droplets containing active variant of
the P450 BM3. The negative charge present in 3-position disabled diffusion of the probe
trough the lipid layer of the double emulsion droplet and the integrity was preserved even
after incubation (2 h) on room temperature. This was not the case when probe without the

Page | 117
charge was entrapped (3-carboxy coumarin methyl ester or 4-methyl umbeliferone). In this
case fast diffusion (within minutes) disabled flow cytometry analysis and mentioned probes
could not be used as reporter molecules for activity screening in double emulsions.
Figure 65 Schematic representation of ultra high throughput based method for Cytochrome P450 BM3 directed
evolution. E. coli cells expressing different variants of Cyt P450 BM3 are entrapped in aqueous droplets of double
emulsions together with fluorogenic substrate. After the reaction and conversion to fluorescent product, “active”
droplets are enriched by using flow cytometry. Positive clones are rescreened in 96-well MTP, purified and characterized.
After sequence and amino acid analysis models of the new variants were generated and influence of new mutations
explained on molecular level.
As the wild type P450 BM3 practically showed no activity with the charged 3-carboxy
coumarin substrate, more active variant M0 (F87A/R471C) which was known to catalyze
reactions on bulky substrates (42,44), was used in all experiments. Assay was optimized in
emulsion format using 0.1 M tris-HCl pH 8.0 as activity buffer while in MTP format 0.1 M
phosphate buffer pH 9.0 was used due to more pronounced difference between substrate
and product fluorescence. NADPH shows fluorescence in conditions used for flow cytometry
screening (excitation: 375 nm, emission 440 nm). To decrease background fluorescence
arising from NADPH, lower amount had to be used in emulsion assay, but instead,
components of NADP-recycling system have been entrapped to ensure higher product/signal
levels. In MTP problem of background fluorescence was eliminated by exciting the reaction

Page | 118
mixture on higher wavelengths (400 nm instead of 375 nm) where NADPH shows very low
fluorescence. Additionally, when using whole cells for the assay in 96-well MTP
permeabilizer (polymyxin B sulphate) was added to ensure efficient transfer of substrate
trough membrane of E. coli (115). In emulsion, substrate concentration and sensitivity of the
device were higher so there was no need to disrupt the membrane of the cell. On one side
this ensured higher survival rate of cells after sorting. Finally, under the optimal settings for
96-well MTP assay showed standard deviation of 13% while standard deviation of the cell
growth in the MTP was ~9%.
Using balanced dNTPs in epPCR conditions whole P450 BM3 F87A/R471C gene was
randomized and successfully cloned in pALXtreme-1a vector. Constructs were transformed in
XL10-Gold cells and after growth in liquid culture recovered using plasmid isolation. Small
fraction of sample was plated on the agar plates after transformation and library size was
calculated. Primary library contained ~5 x 10⁵ different variants. These were transformed in
BL21-Gold (DE3) lacIQ1
strain for protein expression. Error prone conditions we used (0.2 mM
Mn2+
, 35 cycles and 25 ng template DNA) ensured high mutagenesis rate compared to
conditions previously published (116,117). Expectantly, under there conditions large
numbers of clones in the library were rendered inactive (~98 %). This low amount of active
clones would make “standard” high throughput screening systems virtually impossible to
use. On the other side, high mutagenesis rates enable us to introduce more radical changes
in protein structure and explore more in detail structure/function relationship and
synergistic activity of certain mutations.
For flow cytometry enrichment/sorting cells were induced (0.5 mM IPTG) and grown
until OD600~0.5 which corresponds to 108 cells/ml. Finally, after washing and filtering step
which were necessary to remove cell aggregates, concentration was adjusted to 5 x 10⁶
cells/µl. Cells were compartmentalized as published before (3) together with NADPH
recycling system (NADPH, iso-citrate, iso-citrate dehydrogenase) and substrate (BCC Acid). In
total, ~1.3 x 10⁸ cells were entrapped in 525 µl of secondary emulsion. Number of aqueous
droplets in emulsion (>1010
) was in excess compared to number of cell entrapped, rendering
large majority of the droplets empty (22). Fluorescein (5 µM) was therefore used as internal
water phase control, enabling us to distinguish “real” double emulsions from the primary
emulsions and empty lipid droplets. Together with “green triggering” (excitation: 488 nm,
emission: 520 nm) this enabled us to use higher analysis and sorting speed. To choose
proper gaiting for sorting, negative (containing the cells with empty vector) and positive
control (cells expressing starting variant M0) were entrapped and analyzed under the same
settings. Emulsion was incubated 2 hours on room temperature and in that time showed
stability, confirmed by fluorescence microscopy. Released product (3-carboxy coumarin),
containing a negative charge, was hydrophilic enough to be stable inside the aqueous phase
of the double emulsion even after incubation (Figure 66).

Page | 119
A) B) C)
Figure 66 Fluorescent microscopy of double emulsions after the incubation (2h, room temperature) in bright field (A),
green channel (emission coming from fluorescein used as internal control, UV excitation, green emission filter: 520 nm)
(B) and blue channel (emission coming from 3-carboxy coumarin, reaction product, UV excitation, blue emission filter:
450 nm) (C). Size of the aqueous droplet varies from 2-5 µm while lipid droplets are bigger in size (20-40 µm).
Emulsion containing entrapped cells, each expressing a different P450 BM3 variant in
a cytoplasm, was subjected to three rounds of sorting/enrichment by flow cytometry. After
each enrichment step, fraction of the cells (as well as the starting library) was grown on
induction agar plates and checked for activity and survival rate. In total ~2.6 x 10⁷ cells were
screened (100 µl of secondary emulsion). Out of this, approximately 0.1-0.01 % was sorted
out (~2.6 x 10³ – 2.6 x 10
4 clones) and grown in liquid culture. Staring library showed low
percentage of activity (1.85 %, 1 active clones out of 54 screened) in agar plate/liquid assay.
After three rounds of sorting/enrichment activity reached 41 % (20 active clones out of 49
screened) resulting in quite high enrichment factor (22 times, Table 10). Flow cytometry
analysis of the emulsified cell population after each round of sorting showed increase in
percentage of blue droplets corresponding to increase in number of active clones (Figure
67A/B). Survival rate of sorted clones was ranging from 60-80%.
Figure 67 Flow cytometry recording (A) of empty emulsion (black), emulsion before (red) and after one (blue) and two
(pink) rounds of sorting. FL3 represents the blue fluorescence (emission: 520 ± 10 nm) from UV excitation (375 ± 10 nm)
coming from released 3-carboxy coumarin. Graphic representation (B) of positive events from flow cytometry recording
(light gray, gating M1) and from agar/liquid activity assay (dark grey) after successive rounds of sorting.

Page | 120
Table 10 Enrichment factors after each round of sorting obtained by agar plate/liquid assay
Sample Active/total clones
screened Percentage (%) Enrichment factor
Starting library 1/54 1.85 -
1st
round of sorting 4/23 17.39 9.4
2nd
round of sorting 18/48 37.50 2.2
3rd
round of sorting 20/49 40.82 1.1
Total 22.1
High activity, reached after three rounds of flow cytometry enrichment/sorting
(~41%) was sufficient for MTP characterization. On the other side, MTP characterization
enabled us to validate in detail flow cytometry screening system for P450 BM3 since this
data was not available so far. In total, 176 clones were screened in the 96-well MTP using
the same substrate (BCC Acid) employed previously in flow cytometry screening (Table 11).
Out of 176 total screened clones 90 showed activity (51%), which is in good correlation with
agar plate/liquid assay (~41%). Out of 90 active clones 30 clones (33%) showed activity which
was at least two times higher when compared to the staring variant (M0), expressed and
characterized under the same conditions. Out of total active population high number of
clones showed activity 3-5 times higher to that of the staring clone (Table 12). This proved
that settings used for sorting/enrichment not only enabled us to increase the number of
active clones in the library but to select clones with higher activity. This again showed the
superiority of flow cytometry methods compared to MTP high throughput screening systems
since by “fine tuning” of gating region we can influence the final outcome of the library. The
more stringent the sorting is, the more activity is present in the final library ensuring that the
clones which need to be rescreened in the MTP really poses superior properties compared
to the parent variant (22).
Table 11 Statistics on screening in the 96-well MTP
Active/screened
clones Active clones (%)
>2 times
improved/number
of active
>2 times active
clones (%)
90/176 51.14 30/90 33.33
Table 12 Screening in 96-well MTP; comparison of percentage of active clones with activity higher that starting clone
Activity
compared
to M0
0 1 2 3 4 5 Total
Number n.d. 17 6 5 16 3 47
Percentage
(%) n.d. 18.89 6.67 5.56 17.78 3.33 52.23
Three best clones from 96-well MTP screening were chosen for kinetic
characterization. They were grown in batch culture (250 ml) and purified as explained
before. On chromatograms all mutants, as compared to the starting one (M0), had slightly

Page | 121
altered retention times showing that mutations didn’t affect, in large, overall charge of the
protein (Figure 68). All analyzed fractions containing different BM3 variants showed similar
concentration after CO binding assay proving that expression level was as well not affected
by mutations. SDS-PAGE showed that all variants had sufficient purity for kinetic
characterization (>90%, Figure 69).
Figure 68 Purification of P450 BM3 variant using DEAE ion-exchange chromatography; detection was based on
absorbance at 417 nm. Chromatograms in color represent different P450 BM3 variants: red (M0), blue (M1), gray (M2)
and brown (M3) with their respective retention times, while green line represents gradient of buffer B
Figure 69 SDS-PAGE analysis of cell homogenate (a) and purified (b) P450 BM3 variants M1(1), M2 (2) and M3 (3);
molecular weight markers (MWM) were 116, 66, 45, 35, 25, 18 and 14 kDa
Kinetic characterization was done using 96-well black MTP as described earlier, final
volume being 120 µl. Substrate concentrations were ranging from 250 µM to 0.98 µM (9
concentrations). Enzyme concentration was ranging from 50-140 nM, well in the linearity

Page | 122
range of the assay. Concentration of product was recalculated (nM) using a standard curve
generated using 3-carboxy coumarin. All kinetic parameters for characterized variants as
well as for the starting one (M0) are shown in Table 13.
Table 13 Kinetic characterization of improved P450 BM3 variants (M1, M2 and M3) in comparison to starting variant
(M0)
Variant Mutations Km
(µM)
kcat
(eq min-1
)*
Kcat/Km
(eq min-1
µM-1
)* M/M0
M0 F87A, R471C 42.46 0.187 0.004 1
M1 L29S, R47Y, F87A, Q189R, R471C, Y857N 40.64 1.142 0.028 7.0
M2 E13G, R47L, F87A, R471C, L1030S 22.32 0.935 0.042 10.5
M3 E64G, F87A, R223H, M354S, R471C, T883H,
P884R, N952D 47.94 2.621 0.055 13.8
* eq represent nmol product/nmol enzyme
All variants, but one (M3), showed slightly decreased Km values for the charged
substrate being even up to two times lower (M2). On the other hand all of them showed
increased kcat values reaching even up to 13 times compared to the starting variant. Overall
activity (kcat/Km) was improved for all selected variants (from 7 to 14 times, Table 13).
As a consequence of high mutagenesis conditions used in the epPCR large numbers
of mutations (5-12) were present in DNA sequence. This corresponded to 4-8 additional
amino acid changes in the variants. Out of the nucleotide changes 16 were transitions and 9
were transversions showing bias of epPCR mutagenesis method (118). Two of the 3
characterized variants contained exchange at position 47 from Arg to Tyr (M1) and Leu (M2).
This position has been known to affect the binding of the substrate via compensating
negative charge of carboxylate group.
Variant M1 contained 5 mutations in DNA sequence giving 4 exchanges in amino acid
sequence compared to the variant M0 (Table 13). Most of the mutations were located in the
heme domain, close to the entry point of substrate binding channel. These changes at
position 29, 47 and 189 probably affect the entrance of the substrate to the heme pocket
and ease up the conversion. Only one residue has been exchanged in reductase domain,
Y857N, part of the sequence responsible for interaction with FAD (39). Variant M2 contains 3
additional mutations in amino acid sequence of which most of them are located in reductase
domain (Table 13). Variant M3 contained on DNA level 8 mutations, including one base par
deletion and insertion. This reflected 6 additional mutations in amino acid sequence (Table
13). Position 354 was exchanged from Met to Ser and this mutation has already been shown
to affect enzyme activity towards different substrates (107). Interestingly, mutation E64G
was observed. This exact mutation was found by Commandeur and coworkers in directed
evolution of P450 BM3 towards drug like molecules using resorufin based substrates (109).
Location of this residue is far from active site of the enzyme but the fact that it was present
in two unrelated screening evens using random diversity generation methods might point
out its importance.

Page | 123
5.4 Conclusion
Directed evolution, even being powerful tool for improving biocatalysts and
discovering new structure/function relationships within the protein, still suffers from few
disadvantages. First being low transformation efficiency of commonly used expression
strains (E. coli, S. cerevisiae), and the second lack of ultra high throughput screening
methods which would allow high number of clones to be probed within one directed
evolution experiment (>107).
In our work we present a novel ultra high throughput platform for screening and
improving activity of Cytochrome P450 BM3. Technology is based on in vitro
compartmentalization (IVC) of E. coli cells while detection is based on conversion of
coumarine based fluorogenic substrate. After cells, expressing different variants of Cyt P450
BM3, are entrapped within the aqueous phase of double emulsions convert the fluorogenic
substrate into fluorescent product, “positive” droplet are screened and enriched via flow
cytometry. This screening system allowed us to screen more than 107 variants within few
hours and sort out only the most active variants. The system is validated with 96-well MTP
re-screening (176 clones) and the best variants are purified and characterized (3 clones). In
three rounds or enrichment/sorting activity of the library was increased from ~2% to ~40%.
Improvement in activity of characterized variants was ranging from 7 to 14 times
when compared to the starting clone which was the consequence of 4-9 amino acid changes
in the protein structure. In the spectra of acquired mutations positions L29, R47 and M354
have been known to affect the activity in the positive way. Together with positions E13, L29,
E64, Q189 and R223, located near the entry channel in heme domain, they are probably
influencing substrate binding. However, many new positions have been discovered in the
reductase domain and the relationship with the increased activity is yet to be discovered.
From the preliminary model analysis, mutations located in the reductase domain of P450
could on one side have an effect on increase of electron transfer within the protein or simply
enhance the binding of the important co-factors (FAD). One thing is clear that most of them
are located in the reductase part responsible for interactions with FAD (I824, D838, S847,
E852 and Y857)(39).
Using high mutational load in directed evolution experiments is possible only with
development of adequate ultra high throughput screening platforms. High number of
inactive clones would render the normal screening system virtually impossible to use. If one
is aiming to evolve properties of a biocatalyst in fewer steps then benefit from multiple
mutations would be important. On one side many mutations could be complementing
themselves i.e. help the binding of the substrate and conversions at the same time. But
additionally, formation of hydrogen bonds and salt bridges would have a positive effect on
protein stability and activity under non-optimal conditions (high pH, presence of organic
solvents). It has been shown that activity of thiolactonases could be improved up to 100
times using same technology. Randomization of 16 positions within the gene enabled
Page | 124
exploration of many possible outcomes for increased activity. It has also been shown that
out of huge repertoire of possibilities only some of the mutations, present in selected clones,
were most responsible for the increase in activity (22).
IVC technology combined with flow cytometry is a powerful addition to directed
evolution. No doubt that application of this technology would be a new step further in
tailoring biocatalysts for certain applications. When planning to apply this technology few
things should be kept in mind. Detection is based only on fluorescence signal, thus
fluorescent assay for detection of activity needs to be developed. In some cases (hydrolytic
enzymes) this is easier than in other (very specialized enzymes). Using the surrogate
substrate limits the screening to improving activity towards substrate used and not the real
substrate. This activity, on the other side, can still be unaffected or even decreased.
Additional problem is diffusion of fluorescent probes trough oil layer of emulsion droplet.
Unless the probe is hydrophilic enough (preferably containing a charge) it will not be
entrapped within the water phase and it can not be used in this system.
Developing new technologies for directed evolution of bio-industrially important
enzymes, such as Cytochrome P450 BM3, is still a challenge. Problems mentioned in
previous paragraph, like low transformation efficiency or diffusion of the probes are still to
be solved. Using cell free instead of in vivo expression could overcome low transformation
problems and using per-fluoro generated emulsions would allow us to use more generalized
detection systems but nevertheless, these systems are still far from routine practice.
Our future work will be focused on using the platform described in this article and
evolve Cyt P450 BM3 in few properties which could in future help its more general
application. Changing the substrate specificity towards drug like molecules could find a
valuable place in pharmaceutical industry together with increase in activity. This platform
could help evolve other properties like thermo- and pH stability, substrate/product
inhibition and employment of alternate cofactors, all important for possible large scale
application.
6. Screening the metagenome libraries using flow cytometry and
double emulsions: the source of novel P450 activity
6.1 Introduction
Vast majority of microorganism in certain habitats can not be cultivated in laboratory
conditions. Approaches have been devised to recover gene from one such pool but most of
them were based on PCR and suffered from many disadvantages. In 1990 metagenomics was
developed. It involved isolating complete DNA out of a habitat, fractionating it and cloning it
into suitable expression hosts. This is known as a construction of metagenome libraries.

Page | 125
Libraries are then screened either with sequence based screening or activity based screening
systems to recover genes/enzymes with novel or improved activity.
Isolating and fragmenting the complete genetic material from a certain habitat after
cloning leaves a majority of clones containing “junk” DNA, fragments not cloning any of the
functional proteins. In that case, HTS methodology has to be devised to screen as high
number of clones as possible increasing a chance to find a positive hit. So far MTP screening
systems have been established and in some specific cases solid based HTS platforms (i. e.
hydrolases). No ultra-HTS methodology has, up to date, been used to screen metagenome
libraries.
As mentioned previously, Cytochrome P450, especially self-sufficient ones, present
an interesting asset to be used in bioindustrial application. Screening metagenome library
for novel P450 activity using activity screening approach would be very difficult due to low
hit rate of these enzymes and insufficient throughput of available assays. Sequence based
screening approach was devised to browse the natural diversity of self sufficient P450s
(119). Metagenome library was constructed in fosmid vectors using genetic material isolated
from soil. Final clone number was ~2 x 10⁶
with an average insert size of 32 kb. Degenerated
primers for screening were devised on account of sequences of known self-sufficient P450s.
Many P450s sequences were found but two, syk51 and syk181, showed to be the most
different one from all known P450s (~70% homology). Sequences were fully recovered,
genes re-cloned and novel P450 expressed and characterized (119). This was the first report
of novel self-sufficient P450s discovery using metagenomics approach.
In this Thesis we have devised and optimized new ultra-HTS system for screening
mutant libraries for P450 BM3 activity using flow cytometry in double emulsions (see
Chapter 5). In the final Chapter we tested the novel methodology on screening the
metagenome libraries for β-galactosidase activity and finally, P450 activity. Identified
positive hits were still to be genetically characterized (fully sequenced), re-cloned in
expression vectors and expressed.
6.2 Materials and methods
I. Screening for ββββ-galactosidase activity using MTP and flow cytometry
Thirteen metagenome libraries together with additional “referent” library (B.
megatherium) were supplied in the form of the plasmid preparation from our collaborators
B.R.A.I.N. AG (Zwingenberg, Germany). All vectors were, as suggested by the collaborator,
transferred to electrically competent E. coli One shot MAX Efficiency DH10β (Invitrogene,
Karlsruhe, Germany) according to manufacturer’s instruction and kept in the form of glycerol
stock.
Page | 126
To test weather β-galactosidase activity is present in any of original libraries fraction
(50 µl) was directly spread on X-Gal agar plates (250 µg/ml) and incubated until
development of blue color.
One positive and one negative colony have been selected as a model system for flow
cytometry conditions optimization (substrate addition, sorting conditions). Emulsions were
prepared as described in details in Chapter 5. We tested internal and external substrate
delivery as well as different conditions for sorting. Optimized conditions were used for
sorting of the selected sample (H171/195) that showed the highest β-galactosidase activity.
Sample before and after the sorting was pleated on the X-Gal plates and results was
observed (overnight, 30°C) after color development.
II. Screening for novel P450 activity using coumarine substrates and flow
cytometry
For detection of novel P450 activity we used BCC acid as a substrate for flow
cytometry screening and all three substrates (BCC, BCC acid and DBCC) in the MTP screen.
E. coli DH10β cells harboring all 13 metagenome libraries were grown overnight (4 ml
LBChl, 30°C, 250 rpm). Cell preparation and emulsification was as described previously in the
Chapter 5. All emulsion samples were incubated 2 hours on room temperature and analyzed
on flow cytometry together with the blank sample (cells which don’t show any P450 BM3
activity). Sample showing highest population of positive (“blue”) droplets was further used
for sorting. Sample was subjected to three subsequent rounds of enrichment process and
finally plated on agar plate containing chloramphenicol (25 µl/ml). Clones were transferred
to 96-well flat bottom MTP and kept in glycerol stock (-80°C). For activity assay in 96-well
MTP, cells were transferred into 150 µl LKChl media, grown overnight (30°C, 700 rpm, 70 %
humidity), centrifuged (4000 x g, 10 min, 4°C) and assayed as described in Chapter 5.
Clones showing activity with any of the substrates used, BCC and BCC Acid, were
grown in 4 ml LBChl media and plasmid was isolated as described previously (74). Name of
clones and relative slopes towards substrates are shown in Table 17.
6.3 Results and discussion
Detailed information about the name of all the metagenome libraries, number of the
inserts and size of the libraries is summarized in the Table 14. From the information supplied
by out collaborators two vectors have been used for library construction. They differ only in
promoter in front of MSC. Both promoters are constitutive and work both E. coli and Bacillus
hosts. Vector is high copy number vector in both hosts and can be easily propagates using 25
µl/ml chloramphenicol resistance. Fragments are inserted by using KpnI and HindIII
combination of restriction enzymes.

Page | 127
Table 14 Metagenome libraries supplied by our collaborators, B.R.A.I.N.
All the plasmid preps were diluted 25 times with Milli-Q water and stored at -80°C.
DNA content was determined in the diluted libraries (Table, Supplementary data) using
NANO Drop and 1 µl was transformed to 100 µl commercially available cells as described by
manufacturer.
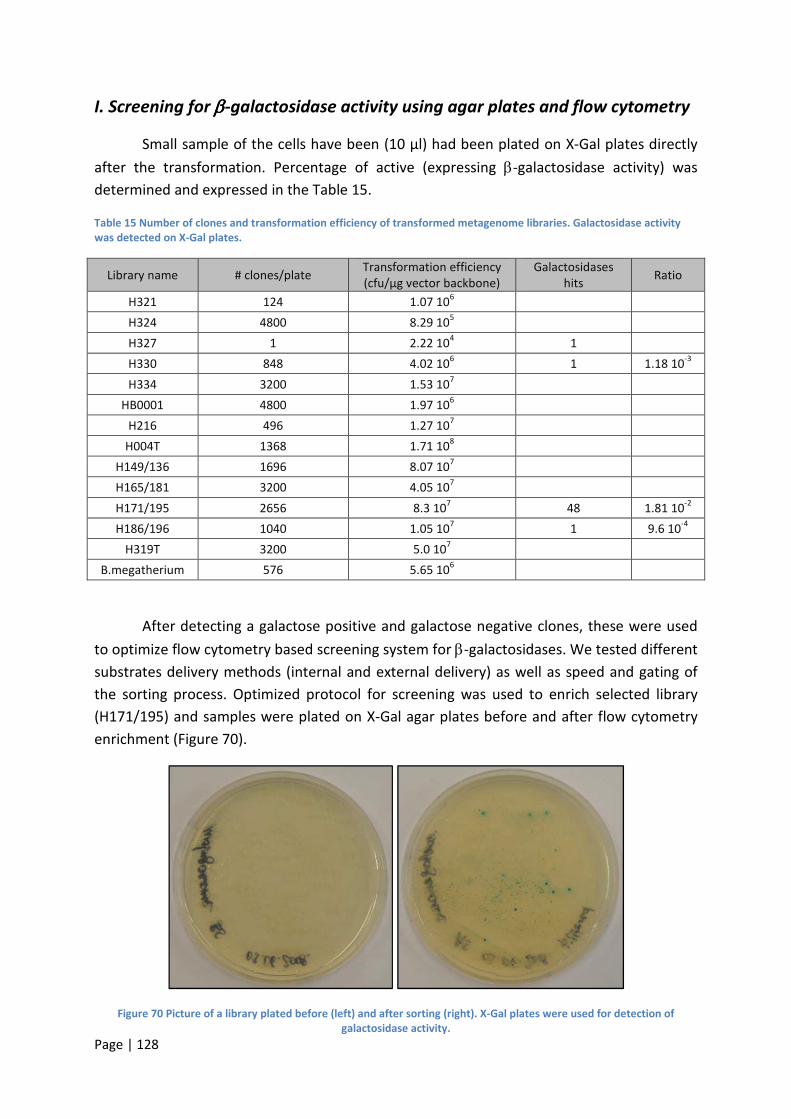
Page | 128
I. Screening for ββββ-galactosidase activity using agar plates and flow cytometry
Small sample of the cells have been (10 µl) had been plated on X-Gal plates directly
after the transformation. Percentage of active (expressing β-galactosidase activity) was
determined and expressed in the Table 15.
Table 15 Number of clones and transformation efficiency of transformed metagenome libraries. Galactosidase activity
was detected on X-Gal plates.
Library name # clones/plate Transformation efficiency
(cfu/µg vector backbone)
Galactosidases
hits Ratio
H321 124 1.07 106
H324 4800 8.29 105
H327 1 2.22 104 1
H330 848 4.02 106 1 1.18 10
-3
H334 3200 1.53 107
HB0001 4800 1.97 106
H216 496 1.27 107
H004T 1368 1.71 108
H149/136 1696 8.07 107
H165/181 3200 4.05 107
H171/195 2656 8.3 107 48 1.81 10
-2
H186/196 1040 1.05 107 1 9.6 10
-4
H319T 3200 5.0 107
B.megatherium 576 5.65 106
After detecting a galactose positive and galactose negative clones, these were used
to optimize flow cytometry based screening system for β-galactosidases. We tested different
substrates delivery methods (internal and external delivery) as well as speed and gating of
the sorting process. Optimized protocol for screening was used to enrich selected library
(H171/195) and samples were plated on X-Gal agar plates before and after flow cytometry
enrichment (Figure 70).
Figure 70 Picture of a library plated before (left) and after sorting (right). X-Gal plates were used for detection of
galactosidase activity.

Page | 129
II. Screening for novel Cyt P450 activity using coumarine substrates and flow
cytometry
As mentioned previously, same principle was applied for Cyt P450 activity screening.
All libraries were grown and assayed in emulsions by flow cytometry as well as in the liquid
culture using BCC acid and BCC substrates. Most prominent results are shown in Table 16.
Table 16 Positive hits from metagenome libraries after screening in double emulsions and liquid culture (in MTPs).
Library name
MTP screening Flow cytometry
screening (%)
Ratio between
sample and
blank
Cumulative
results BCC acid BCC
Blank* - - 0.18 1.0 -
B.megatherium* + + 0.61 3.4 +
H171/195* + + 0.31 1.7 +
Blank - - 0.40 1.0 -
H194/136 + - 0.41 1.0 -
H321 + + 0.59 1.5 -
H195/181 + + 2.84 7.1 ++
H329/T ++ ++ 2.11 5.3 ++
H186/194 + - 0.51 1.3 -
H330 - - 0.75 1.9 -
H216 ++ + 2.91 7.3 ++
HB0001 + + 1.08 2.7 +
H334 + ++ 3.37 8.5 ++
Good correlation was observed with the sample which showed activity both in MTP
and by flow cytometry.
We decided to proceed with the sample H171/195. This sample was subjected to
three rounds of sorting and transferred to MTP in the form of glycerol stock. Activity
screening was done as described previously employing all three substrates. Results are
shown in the Table 17.
Table 17 Positive hits isolated from the metagenome library H171/195 after MTP screening with BCC and BCC Acid
substrates.
Clone designation Activity with BCC (rel. units) Activity with BCC Acid (rel. units)
Clones that work preferentially with BCC
2C7 119 33
3H6 145 -41
Clones that work preferentially with BCC Acid
1C3 30 309
1C6 30 189
1C11 24 228
Clones that work with both BCC and BCC Acid
2C3 305 175
2C10 168 135
3G8 149 150
Page | 130
6.4 Conclusion
Metagenome libraries are usually constructed by fragmenting and cloning complete
genetic material isolated from a specific natural habitat (soil, deep see samples, hot spring
water). Amongst clones containing genes encoding novel, yet uncharacterized proteins, vast
majority of clones is harboring “junk” DNA; DNA not coding for any proteins. Screening such
libraries, with very low amount of positive clones, would require a usage of high or ultra high
throughput methodology which is in most of the cases unavailable for the desired activity.
Sequence based screening systems, based on PCR techniques, can also be used (49).
In this Thesis we report a new ultra high throughput screening system developed for
screening mutant libraries of Cyt P450 BM3. This screening system is based in IVC of E. coli
cells within droplets of double emulsions and using flow cytometry to screen these double
emulsions. Positive events are enriched in few rounds of flow cytometry analysis and sorting.
Since this methodology has not been previously used on screening metagenome
libraries, we tested the system by screening these libraries for β-galactosidase activity, as a
proof of principle. Metagenome libraries were first tested on agar plates, for the presence of
β-galactosidases, by using well know substrate - X-Gal. One positive and one negative clone
have been isolated from the library and used to optimize conditions for flow cytometry
screening. Optimized protocol was then used to screen/enrich H171/195 metagenome
library for β-galactosidase activity. Process of enrichment was quite successful which can be
directly seen by growing the sample on the activity agar plates before and after the sorting.
Multiple clones with β-galactosidase activity can be observed after sorting process (Figure
70).
So far, only sequence based screening methodology has been used for detecting
novel P450 activity in metagenome libraries due to low number of positive hits and
unavailability of HTS assays (119). We tested our optimized system (Chapter 5) on screening
of few metagenome libraries for P450 activity (Table 16).
Cells were grown, expressed and emulsified as described previously. Screening in
emulsions was done with BCC Acid substrate. Few libraries showed presence of positive
population of blue droplets. Library showing highest number of positive events (H171/195)
was enriched in three rounds of sorting by using flow cytometry and then transferred into
MTP. Final validation of active clones was done with BCC and BCC Acid substrate in 96-well
MTPs. Some clones indeed showed activity with either of the substrates (Table 17). These
positive hits were isolated and plasmid DNA was recovered. Partial sequencing of the
inserted fragments was done by our collaborators and recovered sequence was compared to
database using BLAST software.
Interestingly, no P450 motives were found amounts analyzed sequences. Most of
the active clones contained a domain of parathion hydrolase; enzyme which naturally works

Page | 131
on structurally similar compound as the substrate we used for screening. Nevertheless, the
full sequence of the inserts needs to be recovered and analyzed.
Here we demonstrate, for the first time, application of flow cytometry based
screening system in metagenomics. As mentioned previously, metagenome libraries contain
low activity (low number of positive clones) and are perfect candidates for screening with
this ultra-HTS method. Its ultra high throughput (>109) allows large number of clones to be
probed and rare, positive events, can be enriched by repeating growing and sorting process.
Something to keep in mind is that enzymes with diverse activity, working on the
same substrates, could be identified. Metagenome libraries contain proteins with novel
functions most of them exhibiting promiscuous activity. Additionally, there could be multiple
enzymes, from genetically different classes, working on the same substrate but catalyzing
different reactions (i.e. hydroxylation, hydrolysis). All these could be identified as positive
hits in a metagenome library.
7. Summary of the Thesis
Second Chapter of this Thesis describes the work connected to development of new
cloning method based on cleavage of phosphorothioate bonds.
Directed evolution experiments require cloning method which could generate large
number of clones in a library (high transformation efficiency) with possibly no background
(high cloning efficiency). Then statistical analysis of the libraries, percentage of active clones,
mutational frequency can be done with a certainty. Otherwise high background disables us
to get correct number but also screening of larger part of the library is necessary in order to
overcome the number of wild type/inactive clones present.
We have developed a background free, fast and reproducible cloning method based
on Ligase-Independent cloning: Phosphorothioate based Ligase-Independent Gene Cloning
(PIGe). In our case, complete method is enzyme free. Phosphorothioated nucleates are
incorporated in cloning primers which are used for vector and insert amplification. After
cleavage of these bonds in iodine/ethanol solution, single stranded regions are formed on
both vector and insert, complementary to each other. Hybridized constructs are transformed
directly to E. coli.
We optimized PCR conditions for vector backbone and insert application, iodine and
ethanol concentration for cleavage of thio-primers and amount of vector/insert needed for
cloning. To show applicability of the method, using optimal conditions, we cloned three
different genes (EGFP, M57 protease and Cyt P450 BM3) in two target vectors (pET28 and
pALXtereme). Transformation efficiency was high; in case of EGFP reaching 9 x 10⁵ cfu/µg
vector in case of pALXtreme backbone. Entire cloning procedure requires only 10 minutes,
making it one of the fastest cloning methods available. Additional advantages are that the
method is completely enzyme free, very robust and finally, employs cost effective reagents.

Page | 132
This method has been employed for construction of Cyt P450 BM3 epPCR libraries
used for directed evolution experiments.
Third Chapter focuses on expression of Cyt P450 BM3 out of pET28 and pALXtreme
vectors. Expression has been tested under different conditions (E. coli strains, media, and
temperature) and best conditions for flow cytometry application and microtiter plate
screening application have been selected. Also, batch expression (250 ml media) has been
optimized.
We also optimized purification of Cyt P450 BM3 using DEAE-ion exchange
chromatography on HPLC. By adapting previously published method we have been able to
get highly pure protein (>95%) in one step purification.
Fourth Chapter includes synthesis and characterization of novel coumarine based
fluorogenic substrates for Cyt P450 BM3. Since no fluorogenic substrate, which could fulfill
the requirements of our flow cytometry machine was available we had to synthesize them
by ourselves. Few trials have resulted in substrates which showed activity with the enzyme
but properties of the fluorophore (hydrophilicity) were not suitable for application in double
emulsions.
Finally, substrates employing 3-carboxy coumarine as a fluorescent probe fulfilled all
the requirements: detection was possible with our flow cytometry setting (ex. 375 nm, em.
455 nm), substrates were showing activity with F87A/R471C variant and released
fluorophore was hydrophilic enough (due to negative charge in position 3) to be retained
inside an aqueous droplet of double emulsion. Assay employing these substrates was
optimized in double emulsions and in 96-well MTP format. Standard deviation of the assay in
MTPs was ~13%, while standard deviation of cell growth was 9%.
Fifth Chapter summarizes all the methods from previous three chapters in
development of ultra high throughput screening system using flow cytometry and double
emulsions.
Using flow cytometry screening system we were able to enrich library starting from
~2% up to 41% in three round of sorting. For validation, enriched library was screened in 96-
well MTP showing increased number of clones (~33%) with activity improved compared to
the starting clone (>2). Three clones have been selected and kinetically characterized. Best
one had ~14 times increased activity compared to the starting clone. Multiple amino acid
changes were present in the sequence. Modeling remains to be done and explains the role
of each amino acid in substrate binding or conversion process.
Finally, sixth Chapter focuses on application of the previously described method on
metagenome library screening.
As a proof of principle, β-galactosidases were screened using the same method,
employing fluorescein-digalactoside as a substrate. High enrichment of active clones was
achieved after only one round of sorting.Metagenome libraries obtained from our
collaborators, B.R.A.I.N. AG were screened using BCC Acid substrate in double emulsions.
Some libraries showed no activity while the ones having activity were subjected to three
rounds of sorting process. Enriched library was screened in 96-well MTP and selected clones
were sent back to our collaborators for genetic analysis.

Page | 133
8. References
1. Jaeger, K.E. (2004) Protein technologies and commercial enzymes - White is the hype - biocatalysts on
the move - Editorial overview. Current Opinion in Biotechnology, 15, 269-271.
2. Tee, K.L. and Schwaneberg, U. (2006) A screening system for the directed evolution of epoxygenases:
importance of position 184 in P450 BM3 for stereoselective styrene epoxidation. Angew Chem Int Ed
Engl, 45, 5380-5383.
3. Miller, O.J., Bernath, K., Agresti, J.J., Amitai, G., Kelly, B.T., Mastrobattista, E., Taly, V., Magdassi, S.,
Tawfik, D.S. and Griffiths, A.D. (2006) Directed evolution by in vitro compartmentalization. Nat
Methods, 3, 561-570.
4. Passonneau, J.V., and Lowry, O. H. (1993), Enzymatic Analysis. A Practical Guide. Humana Press, New
York, pp. 85-110.
5. Olry, A., Schneider-Belhaddad, F., Heintz, D. and Werck-Reichhart, D. (2007) A medium-throughput
screening assay to determine catalytic activities of oxygen-consuming enzymes: a new tool for
functional characterization of cytochrome P450 and other oxygenases. Plant J, 51, 331-340.
6. Otey, C.R., Bandara, G., Lalonde, J., Takahashi, K. and Arnold, F.H. (2006) Preparation of human
metabolites of propranolol using laboratory-evolved bacterial cytochromes P450. Biotechnol Bioeng,
93, 494-499.
7. Cirino, P.C. and Arnold, F.H. (2003) A self-sufficient peroxide-driven hydroxylation biocatalyst. Angew
Chem Int Ed Engl, 42, 3299-3301.
8. Schwaneberg, U., Schmidt-Dannert, C., Schmitt, J. and Schmid, R.D. (1999) A continuous
spectrophotometric assay for P450 BM-3, a fatty acid hydroxylating enzyme, and its mutant F87A.
Anal Biochem, 269, 359-366.
9. Li, Q.S., Schwaneberg, U., Fischer, M., Schmitt, J., Pleiss, J., Lutz-Wahl, S. and Schmid, R.D. (2001)
Rational evolution of a medium chain-specific cytochrome P-450 BM-3 variant. Biochim Biophys Acta,
1545, 114-121.
10. Salazar, O., Cirino, P.C. and Arnold, F.H. (2003) Thermostabilization of a cytochrome p450
peroxygenase. Chembiochem, 4, 891-893.
11. Wong, T.S., Arnold, F.H. and Schwaneberg, U. (2004) Laboratory evolution of cytochrome p450 BM-3
monooxygenase for organic cosolvents. Biotechnol Bioeng, 85, 351-358.
12. Nazor, J. and Schwaneberg, U. (2006) Laboratory evolution of P450 BM-3 for mediated electron
transfer. Chembiochem, 7, 638-644.
13. Kumar, S., Chen, C.S., Waxman, D.J. and Halpert, J.R. (2005) Directed evolution of mammalian
cytochrome P450 2B1: mutations outside of the active site enhance the metabolism of several
substrates, including the anticancer prodrugs cyclophosphamide and ifosfamide. J Biol Chem, 280,
19569-19575.
14. Kim, D. and Guengerich, F.P. (2004) Enhancement of 7-methoxyresorufin O-demethylation activity of
human cytochrome P450 1A2 by molecular breeding. Arch Biochem Biophys, 432, 102-108.
15. Kim, D., Wu, Z.L. and Guengerich, F.P. (2005) Analysis of coumarin 7-hydroxylation activity of
cytochrome P450 2A6 using random mutagenesis. J Biol Chem, 280, 40319-40327.
16. Lussenburg, B.M., Babel, L.C., Vermeulen, N.P. and Commandeur, J.N. (2005) Evaluation of
alkoxyresorufins as fluorescent substrates for cytochrome P450 BM3 and site-directed mutants. Anal
Biochem, 341, 148-155.
17. Bershtein, S. and Tawfik, D.S. (2008) Advances in laboratory evolution of enzymes. Curr Opin Chem
Biol, 12, 151-158.
18. Griswold, K.E., Aiyappan, N.S., Iverson, B.L. and Georgiou, G. (2006) The evolution of catalytic
efficiency and substrate promiscuity in human theta class 1-1 glutathione transferase. J Mol Biol, 364,
400-410.
19. Varadarajan, N., Gam, J., Olsen, M.J., Georgiou, G. and Iverson, B.L. (2005) Engineering of protease
variants exhibiting high catalytic activity and exquisite substrate selectivity. Proc Natl Acad Sci U S A,
102, 6855-6860.
20. Doi, N., Kumadaki, S., Oishi, Y., Matsumura, N. and Yanagawa, H. (2004) In vitro selection of restriction
endonucleases by in vitro compartmentalization. Nucleic Acids Res, 32, e95.
21. Mastrobattista, E., Taly, V., Chanudet, E., Treacy, P., Kelly, B.T. and Griffiths, A.D. (2005) High-
throughput screening of enzyme libraries: in vitro evolution of a beta-galactosidase by fluorescence-
activated sorting of double emulsions. Chem Biol, 12, 1291-1300.

Page | 134
22. Aharoni, A., Amitai, G., Bernath, K., Magdassi, S. and Tawfik, D.S. (2005) High-throughput screening of
enzyme libraries: thiolactonases evolved by fluorescence-activated sorting of single cells in emulsion
compartments. Chem Biol, 12, 1281-1289.
23. Kelly, B.T., Baret, J.C., Taly, V. and Griffiths, A.D. (2007) Miniaturizing chemistry and biology in
microdroplets. Chem Commun (Camb), 1773-1788.
24. Werck-Reichhart, D. and Feyereisen, R. (2000) Cytochromes P450: a success story. Genome Biol, 1,
REVIEWS3003.
25. Hannemann, F., Bichet, A., Ewen, K.M. and Bernhardt, R. (2007) Cytochrome P450 systems--biological
variations of electron transport chains. Biochim Biophys Acta, 1770, 330-344.
26. Hawkes, D.B., Adams, G.W., Burlingame, A.L., Ortiz de Montellano, P.R. and De Voss, J.J. (2002)
Cytochrome P450(cin) (CYP176A), isolation, expression, and characterization. J Biol Chem, 277, 27725-
27732.
27. Wright, R.L., Harris, K., Solow, B., White, R.H. and Kennelly, P.J. (1996) Cloning of a potential
cytochrome P450 from the archaeon Sulfolobus solfataricus. FEBS Lett, 384, 235-239.
28. Puchkaev, A.V. and Ortiz de Montellano, P.R. (2005) The Sulfolobus solfataricus electron donor
partners of thermophilic CYP119: an unusual non-NAD(P)H-dependent cytochrome P450 system. Arch
Biochem Biophys, 434, 169-177.
29. Seth-Smith, H.M., Rosser, S.J., Basran, A., Travis, E.R., Dabbs, E.R., Nicklin, S. and Bruce, N.C. (2002)
Cloning, sequencing, and characterization of the hexahydro-1,3,5-Trinitro-1,3,5-triazine degradation
gene cluster from Rhodococcus rhodochrous. Appl Environ Microbiol, 68, 4764-4771.
30. Kizawa, H., Tomura, D., Oda, M., Fukamizu, A., Hoshino, T., Gotoh, O., Yasui, T. and Shoun, H. (1991)
Nucleotide sequence of the unique nitrate/nitrite-inducible cytochrome P-450 cDNA from Fusarium
oxysporum. J Biol Chem, 266, 10632-10637.
31. Froehlich, J.E., Itoh, A. and Howe, G.A. (2001) Tomato allene oxide synthase and fatty acid
hydroperoxide lyase, two cytochrome P450s involved in oxylipin metabolism, are targeted to different
membranes of chloroplast envelope. Plant Physiol, 125, 306-317.
32. Lau, S.M., Harder, P.A. and O'Keefe, D.P. (1993) Low carbon monoxide affinity allene oxide synthase is
the predominant cytochrome P450 in many plant tissues. Biochemistry, 32, 1945-1950.
33. Shibata, Y., Matsui, K., Kajiwara, T. and Hatanaka, A. (1995) Fatty acid hydroperoxide lyase is a heme
protein. Biochem Biophys Res Commun, 207, 438-443.
34. Narhi, L.O. and Fulco, A.J. (1986) Characterization of a catalytically self-sufficient 119,000-dalton
cytochrome P-450 monooxygenase induced by barbiturates in Bacillus megaterium. J Biol Chem, 261,
7160-7169.
35. Ravichandran, K.G., Boddupalli, S.S., Hasermann, C.A., Peterson, J.A. and Deisenhofer, J. (1993) Crystal
structure of hemoprotein domain of P450BM-3, a prototype for microsomal P450's. Science, 261, 731-
736.
36. Sevrioukova, I.F., Li, H., Zhang, H., Peterson, J.A. and Poulos, T.L. (1999) Structure of a cytochrome
P450-redox partner electron-transfer complex. Proc Natl Acad Sci U S A, 96, 1863-1868.
37. Noble, M.A., Miles, C.S., Chapman, S.K., Lysek, D.A., MacKay, A.C., Reid, G.A., Hanzlik, R.P. and Munro,
A.W. (1999) Roles of key active-site residues in flavocytochrome P450 BM3. Biochem J, 339 (Pt 2), 371-
379.
38. Haines, D.C., Tomchick, D.R., Machius, M. and Peterson, J.A. (2001) Pivotal role of water in the
mechanism of P450BM-3. Biochemistry, 40, 13456-13465.
39. Wang, M., Roberts, D.L., Paschke, R., Shea, T.M., Masters, B.S. and Kim, J.J. (1997) Three-dimensional
structure of NADPH-cytochrome P450 reductase: prototype for FMN- and FAD-containing enzymes.
Proc Natl Acad Sci U S A, 94, 8411-8416.
40. Roitel, O., Scrutton, N.S. and Munro, A.W. (2003) Electron transfer in flavocytochrome P450 BM3:
kinetics of flavin reduction and oxidation, the role of cysteine 999, and relationships with mammalian
cytochrome P450 reductase. Biochemistry, 42, 10809-10821.
41. Neeli, R., Girvan, H.M., Lawrence, A., Warren, M.J., Leys, D., Scrutton, N.S. and Munro, A.W. (2005)
The dimeric form of flavocytochrome P450 BM3 is catalytically functional as a fatty acid hydroxylase.
FEBS Lett, 579, 5582-5588.
42. Oliver, C.F., Modi, S., Sutcliffe, M.J., Primrose, W.U., Lian, L.Y. and Roberts, G.C. (1997) A single
mutation in cytochrome P450 BM3 changes substrate orientation in a catalytic intermediate and the
regiospecificity of hydroxylation. Biochemistry, 36, 1567-1572.
43. Graham-Lorence, S., Truan, G., Peterson, J.A., Falck, J.R., Wei, S., Helvig, C. and Capdevila, J.H. (1997)
An active site substitution, F87V, converts cytochrome P450 BM-3 into a regio- and stereoselective
(14S,15R)-arachidonic acid epoxygenase. J Biol Chem, 272, 1127-1135.

Page | 135
44. Carmichael, A.B. and Wong, L.L. (2001) Protein engineering of Bacillus megaterium CYP102.The
oxidation of polycyclic aromatic hydrocarbons. Eur J Biochem, 268, 3117-3125.
45. Oliver, C.F., Modi, S., Primrose, W.U., Lian, L.Y. and Roberts, G.C. (1997) Engineering the substrate
specificity of Bacillus megaterium cytochrome P-450 BM3: hydroxylation of alkyl trimethylammonium
compounds. Biochem J, 327 (Pt 2), 537-544.
46. Ost, T.W., Miles, C.S., Murdoch, J., Cheung, Y., Reid, G.A., Chapman, S.K. and Munro, A.W. (2000)
Rational re-design of the substrate binding site of flavocytochrome P450 BM3. FEBS Lett, 486, 173-
177.
47. Edgardo, T.F., Ulrich, S., Anton, G. and Frances, H.A. (2001) Directed Evolution of a Cytochrome P450
Monooxygenase for Alkane Oxidation. Advanced Synthesis & Catalysis, 343, 601-606.
48. Yun, C.H., Kim, K.H., Kim, D.H., Jung, H.C. and Pan, J.G. (2007) The bacterial P450 BM3: a prototype for
a biocatalyst with human P450 activities. Trends Biotechnol, 25, 289-298.
49. Lorenz, P. and Eck, J. (2005) Metagenomics and industrial applications. Nat Rev Microbiol, 3, 510-516.
50. Jaeger, K.E. and Eggert, T. (2004) Enantioselective biocatalysis optimized by directed evolution. Curr
Opin Biotechnol, 15, 305-313.
51. Furukawa, K. (2003) 'Super bugs' for bioremediation. Trends in Biotechnology, 21, 187-190.
52. Locher, C.P., Soong, N.W., Whalen, R.G. and Punnonen, J. (2004) Development of novel vaccines using
DNA shuffling and screening strategies. Current Opinion in Molecular Therapeutics, 6, 34-39.
53. T. Maniatis, E.F.F., J. Sambrook. (1982) Molecular cloning: a laboratory manual. Cold Spring Harbor
Laboratory, Cold Spring Harbor, N.Y.
54. Aslanidis, C. and de Jong, P.J. (1990) Ligation-independent cloning of PCR products (LIC-PCR). Nucleic
Acids Res, 18, 6069-6074.
55. Zhou, M.Y., Clark, S.E. and Gomez-Sanchez, C.E. (1995) Universal cloning method by TA strategy.
Biotechniques, 19, 34-35.
56. Liu, Z. (1996) Hetero-stagger cloning: efficient and rapid cloning of PCR products. Nucleic Acids Res, 24,
2458-2459.
57. de Jong, R.N., Daniels, M.A., Kaptein, R. and Folkers, G.E. (2006) Enzyme free cloning for high
throughput gene cloning and expression. J Struct Funct Genomics, 7, 109-118.
58. Shuldiner, A.R., Scott, L.A. and Roth, J. (1990) PCR-induced (ligase-free) subcloning: a rapid reliable
method to subclone polymerase chain reaction (PCR) products. Nucleic Acids Res, 18, 1920.
59. Shuldiner, A.R., Tanner, K., Scott, L.A., Moore, C.A. and Roth, J. (1991) Ligase-free subcloning: a
versatile method to subclone polymerase chain reaction (PCR) products in a single day. Anal Biochem,
194, 9-15.
60. van den Ent, F. and Lowe, J. (2006) RF cloning: a restriction-free method for inserting target genes into
plasmids. J Biochem Biophys Methods, 67, 67-74.
61. Shuman, S. (1994) Novel approach to molecular cloning and polynucleotide synthesis using vaccinia
DNA topoisomerase. J Biol Chem, 269, 32678-32684.
62. Aslanidis, C., de Jong, P.J. and Schmitz, G. (1994) Minimal length requirement of the single-stranded
tails for ligation-independent cloning (LIC) of PCR products. PCR Methods Appl, 4, 172-177.
63. Kaluz, S., Kolble, K. and Reid, K.B. (1992) Directional cloning of PCR products using exonuclease III.
Nucleic Acids Res, 20, 4369-4370.
64. Zhou, M. and Hatahet, Z. (1995) An improved ligase-free method for directional subcloning of PCR
amplified DNA. Nucleic Acids Res, 23, 1089-1090.
65. Nisson, P.E., Rashtchian, A. and Watkins, P.C. (1991) Rapid and efficient cloning of Alu-PCR products
using uracil DNA glycosylase. PCR Methods Appl, 1, 120-123.
66. Rashtchian, A., Buchman, G.W., Schuster, D.M. and Berninger, M.S. (1992) Uracil DNA glycosylase-
mediated cloning of polymerase chain reaction-amplified DNA: application to genomic and cDNA
cloning. Anal Biochem, 206, 91-97.
67. Landy, A. (1989) Dynamic, structural, and regulatory aspects of lambda site-specific recombination.
Annu Rev Biochem, 58, 913-949.
68. Berrow, N.S., Alderton, D., Sainsbury, S., Nettleship, J., Assenberg, R., Rahman, N., Stuart, D.I. and
Owens, R.J. (2007) A versatile ligation-independent cloning method suitable for high-throughput
expression screening applications. Nucleic Acids Res, 35, e45.
69. Nour-Eldin, H.H., Hansen, B.G., Norholm, M.H., Jensen, J.K. and Halkier, B.A. (2006) Advancing uracil-
excision based cloning towards an ideal technique for cloning PCR fragments. Nucleic Acids Res, 34,
e122.
70. Inoue, H., Nojima, H. and Okayama, H. (1990) High efficiency transformation of Escherichia coli with
plasmids. Gene, 96, 23-28.

Page | 136
71. Nakamaye, K.L., Gish, G., Eckstein, F. and Vosberg, H.P. (1988) Direct sequencing of polymerase chain
reaction amplified DNA fragments through the incorporation of deoxynucleoside alpha-
thiotriphosphates. Nucleic Acids Res, 16, 9947-9959.
72. Brody, J.R. and Kern, S.E. (2004) Sodium boric acid: a Tris-free, cooler conductive medium for DNA
electrophoresis. Biotechniques, 36, 214-216.
73. Brody, J.R., Calhoun, E.S., Gallmeier, E., Creavalle, T.D. and Kern, S.E. (2004) Ultra-fast high-resolution
agarose electrophoresis of DNA and RNA using low-molarity conductive media. Biotechniques, 37, 598,
600, 602.
74. Zhou, A., Jiang, X. and Xu, X. (1997) Improved alkaline lysis method for rapid isolation of plasmid DNA.
Biotechniques, 23, 592-594.
75. Miyazaki, K. and Takenouchi, M. (2002) Creating random mutagenesis libraries using megaprimer PCR
of whole plasmid. Biotechniques, 33, 1033-1034, 1036-1038.
76. Shultzaberger, R.K., Bucheimer, R.E., Rudd, K.E. and Schneider, T.D. (2001) Anatomy of Escherichia coli
ribosome binding sites. J Mol Biol, 313, 215-228.
77. Tindall, K.R. and Kunkel, T.A. (1988) Fidelity of DNA synthesis by the Thermus aquaticus DNA
polymerase. Biochemistry, 27, 6008-6013.
78. Taly, V., Kelly, B.T. and Griffiths, A.D. (2007) Droplets as microreactors for high-throughput biology.
Chembiochem, 8, 263-272.
79. Gonzalez, F.J. and Korzekwa, K.R. (1995) Cytochromes P450 expression systems. Annu Rev Pharmacol
Toxicol, 35, 369-390.
80. Dietrich, M., Eiben, S., Asta, C., Do, T.A., Pleiss, J. and Urlacher, V.B. (2008) Cloning, expression and
characterisation of CYP102A7, a self-sufficient P450 monooxygenase from Bacillus licheniformis. Appl
Microbiol Biotechnol, 79, 931-940.
81. Liu, L., Schmid, R.D. and Urlacher, V.B. (2006) Cloning, expression, and characterization of a self-
sufficient cytochrome P450 monooxygenase from Rhodococcus ruber DSM 44319. Appl Microbiol
Biotechnol, 72, 876-882.
82. Schwaneberg, U., Sprauer, A., Schmidt-Dannert, C. and Schmid, R.D. (1999) P450 monooxygenase in
biotechnology. I. Single-step, large-scale purification method for cytochrome P450 BM-3 by anion-
exchange chromatography. J Chromatogr A, 848, 149-159.
83. Jun, H., Lehe, M., Qing, S., Dongqiang, L. and Shanjing, Y. (2005) Purification of cytochrome P450 BM-3
as a monooxygenase. Protein Pept Lett, 12, 327-331.
84. Studier, F.W. (2005) Protein production by auto-induction in high density shaking cultures. Protein
Expr Purif, 41, 207-234.
85. Laemmli, U.K. (1970) Cleavage of structural proteins during the assembly of the head of bacteriophage
T4. Nature, 227, 680-685.
86. Omura, T. and Sato, R. (1964) The Carbon Monoxide-Binding Pigment Of Liver Microsomes. I. Evidence
For Its Hemoprotein Nature. J Biol Chem, 239, 2370-2378.
87. Wong, T.S., Tee, K.L., Hauer, B. and Schwaneberg, U. (2004) Sequence saturation mutagenesis
(SeSaM): a novel method for directed evolution. Nucleic Acids Res, 32, e26.
88. Tee, K.L. and Schwaneberg, U. (2007) Directed evolution of oxygenases: screening systems, success
stories and challenges. Comb Chem High Throughput Screen, 10, 197-217.
89. Bernhardt, R. (2006) Cytochromes P450 as versatile biocatalysts. J Biotechnol, 124, 128-145.
90. Guengerich, F.P. (2002) Cytochrome P450 enzymes in the generation of commercial products. Nat Rev
Drug Discov, 1, 359-366.
91. Kennedy, S.W. and Jones, S.P. (1994) Simultaneous measurement of cytochrome P4501A catalytic
activity and total protein concentration with a fluorescence plate reader. Anal Biochem, 222, 217-223.
92. Donato, M.T., Gomez-Lechon, M.J. and Castell, J.V. (1993) A microassay for measuring cytochrome
P450IA1 and P450IIB1 activities in intact human and rat hepatocytes cultured on 96-well plates. Anal
Biochem, 213, 29-33.
93. Wong, T.S., Wu, N., Roccatano, D., Zacharias, M. and Schwaneberg, U. (2005) Sensitive assay for
laboratory evolution of hydroxylases toward aromatic and heterocyclic compounds. J Biomol Screen,
10, 246-252.
94. Tsotsou, G.E., Cass, A.E. and Gilardi, G. (2002) High throughput assay for cytochrome P450 BM3 for
screening libraries of substrates and combinatorial mutants. Biosens Bioelectron, 17, 119-131.
95. Hai, M. and Magdassi, S. (2004) Investigation on the release of fluorescent markers from w/o/w
emulsions by fluorescence-activated cell sorter. J Control Release, 96, 393-402.

Page | 137
96. Frenette, M., Ivan, M.G. and Scaiano, J.C. (2005) Use of fluorescent probes to determine catalytic
chain length in chemically amplified resists. Canadian Journal of Chemistry-Revue Canadienne De
Chimie, 83, 869-874.
97. Chilvers, K.F., Perry, J.D., James, A.L. and Reed, R.H. (2001) Synthesis and evaluation of novel
fluorogenic substrates for the detection of bacterial beta-galactosidase. J Appl Microbiol, 91, 1118-
1130.
98. Steigenberger S, F.T., H-P Grossart & R Reuter. (2004) Blue-fluorescence of NADPH as an indicator of
marine primary production. EARSeL eProceedings, 3, 18-25.
99. Urlacher, V.B. and Eiben, S. (2006) Cytochrome P450 monooxygenases: perspectives for synthetic
application. Trends Biotechnol, 24, 324-330.
100. Vaara, M. (1992) Agents that increase the permeability of the outer membrane. Microbiol Rev, 56,
395-411.
101. Danielson, P.B. (2002) The cytochrome P450 superfamily: biochemistry, evolution and drug
metabolism in humans. Curr Drug Metab, 3, 561-597.
102. Glieder, A., Farinas, E.T. and Arnold, F.H. (2002) Laboratory evolution of a soluble, self-sufficient,
highly active alkane hydroxylase. Nat Biotechnol, 20, 1135-1139.
103. Li, Q.S., Ogawa, J., Schmid, R.D. and Shimizu, S. (2001) Engineering cytochrome P450 BM-3 for
oxidation of polycyclic aromatic hydrocarbons. Appl Environ Microbiol, 67, 5735-5739.
104. Appel, D., Lutz-Wahl, S., Fischer, P., Schwaneberg, U. and Schmid, R.D. (2001) A P450 BM-3 mutant
hydroxylates alkanes, cycloalkanes, arenes and heteroarenes. J Biotechnol, 88, 167-171.
105. Li, Y., Drummond, D.A., Sawayama, A.M., Snow, C.D., Bloom, J.D. and Arnold, F.H. (2007) A diverse
family of thermostable cytochrome P450s created by recombination of stabilizing fragments. Nat
Biotechnol, 25, 1051-1056.
106. Ryan, J.D., Fish, R.H. and Clark, D.S. (2008) Engineering cytochrome P450 enzymes for improved
activity towards biomimetic 1,4-NADH cofactors. Chembiochem, 9, 2579-2582.
107. Nazor, J., Dannenmann, S., Adjei, R.O., Fordjour, Y.B., Ghampson, I.T., Blanusa, M., Roccatano, D. and
Schwaneberg, U. (2008) Laboratory evolution of P450 BM3 for mediated electron transfer yielding an
activity-improved and reductase-independent variant. Protein Eng Des Sel, 21, 29-35.
108. Peters, M.W., Meinhold, P., Glieder, A. and Arnold, F.H. (2003) Regio- and enantioselective alkane
hydroxylation with engineered cytochromes P450 BM-3. J Am Chem Soc, 125, 13442-13450.
109. van Vugt-Lussenburg, B.M., Stjernschantz, E., Lastdrager, J., Oostenbrink, C., Vermeulen, N.P. and
Commandeur, J.N. (2007) Identification of critical residues in novel drug metabolizing mutants of
cytochrome P450 BM3 using random mutagenesis. J Med Chem, 50, 455-461.
110. Ghadessy, F.J., Ong, J.L. and Holliger, P. (2001) Directed evolution of polymerase function by
compartmentalized self-replication. Proc Natl Acad Sci U S A, 98, 4552-4557.
111. Griffiths, A.D. and Tawfik, D.S. (2003) Directed evolution of an extremely fast phosphotriesterase by in
vitro compartmentalization. Embo J, 22, 24-35.
112. Cohen, H.M., Tawfik, D.S. and Griffiths, A.D. (2004) Altering the sequence specificity of HaeIII
methyltransferase by directed evolution using in vitro compartmentalization. Protein Eng Des Sel, 17,
3-11.
113. Cadwell, R.C. and Joyce, G.F. (1992) Randomization of genes by PCR mutagenesis. PCR Methods Appl,
2, 28-33.
114. Hanahan, D., Jessee, J. and Bloom, F.R. (1991) Plasmid transformation of Escherichia coli and other
bacteria. Methods Enzymol, 204, 63-113.
115. Schwaneberg, U., Otey, C., Cirino, P.C., Farinas, E. and Arnold, F.H. (2001) Cost-effective whole-cell
assay for laboratory evolution of hydroxylases in Escherichia coli. J Biomol Screen, 6, 111-117.
116. Urlacher, V.B., Makhsumkhanov, A. and Schmid, R.D. (2006) Biotransformation of beta-ionone by
engineered cytochrome P450 BM-3. Appl Microbiol Biotechnol, 70, 53-59.
117. Li, H.M., Mei, L.H., Urlacher, V.B. and Schmid, R.D. (2008) Cytochrome P450 BM-3 evolved by random
and saturation mutagenesis as an effective indole-hydroxylating catalyst. Appl Biochem Biotechnol,
144, 27-36.
118. Wong, T.S., Zhurina, D. and Schwaneberg, U. (2006) The diversity challenge in directed protein
evolution. Comb Chem High Throughput Screen, 9, 271-288.
119. Kim, B.S., Kim, S.Y., Park, J., Park, W., Hwang, K.Y., Yoon, Y.J., Oh, W.K., Kim, B.Y. and Ahn, J.S. (2007)
Sequence-based screening for self-sufficient P450 monooxygenase from a metagenome library. J Appl
Microbiol, 102, 1392-1400.

Page | 138

Supplementary data – Page | 1
Supplementary data
1. Introduction
2. Phosphorothioate based Ligase-Independent cloning (PIGe) and application
for cloning of Cyt P450 BM3
Figure 1 Vector map of pET-28a(+) (Stratagene)
Figure 2 Vector map of pET-28a(+)-sacB (courtesy of Kang Lan)
pET-28a(+)
5369 bp
lac I
kan sequence
lac operator
T7 promoter
His tag
T7 tag
His tag
thrombin
ColE1 pBR322 origin
f1 origin
T7 terminator
BamHI (199)
EcoRI (193)
Nco I (297)
Sal I (180)
pET28IODnew2_FP (100.0%)
pET28IODnew2_RP (100.0%)
RBS (88.9%)
RBS (88.9%)
RBS (88.9%)
pET28 sacB
7159 bp
BamHI (2083)
Nco I (2087)
Sma I (6091)
XmaI (6089)
AvaI (159)
AvaI (6089)
EcoRI (831)
EcoRI (2077)
HindIII (174)
HindIII (1967)
ApaLI (2894)
ApaLI (4829)
ApaLI (5329)
ClaI (990)
ClaI (1327)ClaI (5908)
pET28IODnew1_FP_comp (85.7%)
pET28IODnew1_RP_comp (100.0%)

Supplementary data – Page | 2
Figure 3 Vector map of pALXtreme-1a (courtesy of Dr. Alex Schenk)
Figure 4 Vector map of pALXtreme-1a-sacB (courtesy of Dr. Alex Schenk)
pALXtreme-1a
2055 bp
lac operator
kan sequence
T7 promoter
thrombin
His tag
T7 tag
His tag
rbs
ColE1 pBR322 origin
T7 terminator
ApaLI (1734) BamHI (190)
ClaI (1157)
EcoRI (196)
HindIII (215)
Nco I (92)
Sma I (976)
XmaI (974)
AvaI (230)
AvaI (974)
pALXtreme-1a-sacB
3747 bp
kan sequence
lac operator
sacB
shine dalgarno
T7 promoter
His tag
T7 tag
His tag
thrombin
rbs
rbs
ColE1 pBR322 origin
T7 terminator
-10
-35
signal peptide
EcoRI (7)
HindIII (26)
Nco I (1958)
Nde I (2018)
Sal I (20)
Stu I (3241)
XbaI (1919)
XhoI (41)
BamHI (1)
BamHI (2056)
pET28IODnew2_FP (100.0%)
pET28IODnew2_RP (100.0%)

Supplementary data – Page | 3
Figure 5 Vector map of pEGFP (BD Biosciences Clonetech)
Figure 6 Vector map of pET-42b-M57 (courtesy of Ran Tu)
pEGFP
3355 bp
Amp
EGFP
AvaI (270)
BamHI (265)
EcoRI (1026)
HindIII (235)
Nco I (288)
PstI (251)
Sma I (272)
XmaI (270)
ApaLI (1294)
ApaLI (1671)
ApaLI (2917)
pET42b M57
6337 bp
HindIII (190)
Sma I (5269)
XmaI (5267)
AvaI (175)
AvaI (5267)
ApaLI (2309)ApaLI (4007)
ApaLI (4507)
ClaI (494)
ClaI (912)
ClaI (1606)
ClaI (5086)

Supplementary data – Page | 4
Figure 7 Vector map of pCWORI-P450 BM3 (strain collection – Schwaneberg
Figure 8 Vector map of pUC19 (Stratagene)
pCWoriBM3 Wt
8119 bp
AvaI (3672)
BamHI (8095)
EcoRI (3170)
HindIII (84)
HindIII (319)
HindIII (2076)
PstI (570)
PstI (3102)
PstI (4467)
ClaI (1758)
ClaI (3177)
ClaI (7896)
ClaI (7904)
ClaI (8102)
ApaLI (540)
ApaLI (2034)
ApaLI (4037)
ApaLI (5283)
ApaLI (5783)
ApaLI (7321)
P450IODnew_FP (77.8%)
P450IODnew_RP (73.2%)
pUC19
2686 bp
AP r
ALPHAP(BLA)
P(LAC)
ORI
AvaI (413)
BamHI (418)
EcoRI (397)
HindIII (448)
PstI (440)
Sma I (415)
XmaI (413)
ApaLI (178)
ApaLI (1121)
ApaLI (2367)

Supplementary data – Page | 5

Supplementary data – Page | 6
Table 1 List of all oligonucleotide used in development of PIGe cloning method. Start and stop codons are marked in red, restriction sites are
underlined and phosphorothioated nucleotides are marked with an asterisk.
Name Sequence (5’����3’)
BM3_NcoI_FP ATCCATGGGAATGACAATTAAAGAAATGCCTCAGCCAAAAACG
BM3_BamHI_FP ATGGATCCATGACAATTAAAGAAATGCCTCAGCCAAAAACG
BM3_EcoRI_RP TCGAATTCTTACCCAGCCCACACGTCTTTTGCGTATC
BM3_megawhop_FP ATGACAATTAAAGAAATGCCTCAGCCAAAAACG
BM3_megawhop_RP TTACCCAGCCCACACGTCTTTTGCGTATC
BM3_heme_megawhop_RP TTTTGCTTTTACCACAAAGCCTTCAGGTTTTAACG
polyT_IOD TTTTTT*T*T*T*TTTTTTTTTTTTTTTTTTTTTTTTTTTTTTT
polyT_Control TTTTTTTTTTTTTTTTTTTTTTTTTTTTTTTTTTTTTTTT
pET28_IOD_FP G*C*T*G*C*C*C*A*T*G*G*T*ATATCTCCTTCTTAAAGTTAAAC
pET28_IOD_RP G*C*T*A*A*C*A*A*A*G*C*C*CGAAAGGAAGCTGAGTTGGCTGC
GFP_IOD_FP A*C*C*A*T*G*G*G*C*A*G*C*ATGGTGAGCAAGGGCGAGGAGCTGTTC
GFP_IOD_RP G*G*C*T*T*T*G*T*T*A*G*C*GGTTTACTTGTACAGCTCGTCCATGCC
M57IOD_FP A*C*C*A*T*G*G*G*C*A*G*C*ATGTTTGAACAAGCGAGTTTTTCAACTCC
M57IOD_RP G*G*C*T*T*T*G*T*T*A*G*C*TCATTGGGGCGCTTGTGCTAAGC
P450IOD_FP A*C*C*A*T*G*G*G*C*A*G*C*ATGACAATTAAAGAAATGCCTCAGCCAAAAACG
P450IOD_RP G*G*C*T*T*T*G*T*T*A*G*C* TTACCCAGCCCACACGTCTTTTGCGTATC
T7_promoter TAATACGACTCACTATAGGG

Supplementary data – Page | 7
3. Expression and purification of Cyt P450 BM3
I. Small scale expression (4 ml) of Cyt P450 BM3 from BL21-
Gold(DE3)/pET28 system in auto- (MD-5052, LSG-5052, P-5052 and
TYM-5052) and non-auto induction media (TB)
Figure 9 Activity (up) and cell growth (down) profile of Cyt P450 BM3 in different auto- and non-auto media.

Supplementary data – Page | 8
II. Small scale expression (4 ml) of Cyt P450 BM3 from BL21-
Gold(DE3)/pET28 and BL21-Gold(DE3) lacIQ1
/pALXtreme system in auto-
induction media (MD-5052)
Figure 10 Expression (up) and cell growth (down) profile of Cyt P450 BM3 from BL21-Gold(DE3)/pET28 system on 37°C (left) and 30°C (right).
Figure 11 Expression (up) and cell growth (down) profile of Cyt P450 BM3 from BL21-Gold(DE3) lacIQ1
/pALXtreme system on 37°C (left) and 30°C
(right).

Supplementary data – Page | 9
III. Small scale expression (3 ml) of Cyt P450 BM3 from BL21-
Gold(DE3)/pET28 and BL21-Gold(DE3) lacIQ1
/pALXtreme system in non
auto-induction media (TB)
Figure 12 Expression (up) and cell growth (down) profile of Cyt P450 BM3 from BL21-Gold(DE3)/pET28 system on 37°C (left) and 30°C (right).
Figure 13 Expression (up) and cell growth (down) profile of Cyt P450 BM3 from BL21-Gold(DE3) lacIQ1
/pALXtreme system on 37°C (left) and 30°C
(right).

Supplementary data – Page | 10
IV. Expression (4 ml) of Cyt P450 BM3 from BL21-Gold(DE3)
lacIQ1
/pALXtreme system under inducing and non inducing conditions
(LB)
Figure 14 Expression (up), cell growth (middle) and expression/cell growth (down) profile of Cyt P450 BM3 from BL21-Gold(DE3)
lacIQ1
/pALXtreme system on 30°C.

Supplementary data – Page | 11
V. Large scale expression (250 ml) of Cyt P450 BM3 from BL21-
Gold(DE3)/pET28 system in auto- (MD-5052, TYM-5052 and LSG-5052)
and non-auto induction media (LB and TB)
Figure 15 Cell growth (up) and activity (down) profile of Cyt P450 BM3 in different auto- and non-auto media on 37°C (left) and 30°C (right).

Supplementary data – Page | 12
4. Coumarine based substrates for high
BM3 activity in microtiter plates (MTPs) and by flow cytometry in double
emulsions
Figure 16 TLC of synthesis of Cu4 fatty acid substrates
Coumarine based substrates for high throughput screening of Cyt P450
BM3 activity in microtiter plates (MTPs) and by flow cytometry in double
TLC of synthesis of Cu4 fatty acid substrates – esterification (A) and substitution (B) detected with p
nm (2) and UV 366 nm (3).
Figure 17 TLC of purification of Cu4-fatty acid.
screening of Cyt P450
BM3 activity in microtiter plates (MTPs) and by flow cytometry in double
A) and substitution (B) detected with phosphomolybdic acid (1), UV 254

Figure 18 1H (up) and
H (up) and 13
C (down) NMR spectra of 12-(4-MU)-dodecanoic acid methyl ester.
Supplementary data – Page | 13
dodecanoic acid methyl ester.

Supplementary data – Page | 14
Figure 19 TLC of synthesis steps of benzyl Cu4: start of esterification (left), end of esterification (middle) and substitution (right)
Figure 20 TLC of purification of benzyl
TLC of synthesis steps of benzyl Cu4: start of esterification (left), end of esterification (middle) and substitution (right)
(A) and UV 366 nm (B).
TLC of purification of benzyl-Cu4 (detection on UV 366 nm).
TLC of synthesis steps of benzyl Cu4: start of esterification (left), end of esterification (middle) and substitution (right) on UV 254 nm
Cu4 (detection on UV 366 nm).

Figure 21
21 1H (up) and
13C (down) NMR spectra of 7-benzoxy-4-MU
Supplementary data – Page | 15

Supplementary data – Page | 16
Figure 22 TLC of purification of DBCC and BCC (detection UV 366 nm).
TLC of purification of DBCC and BCC (detection UV 366 nm).
TLC of purification of DBCC and BCC (detection UV 366 nm).

Figure
Figure 23 1H (up) and
13C (down) NMR spectra of BCC.
Supplementary data – Page | 17

Supplementary data – Page | 18
Figure
Figure 24 1H (up) and
13C (down) NMR spectra of DBCC.

Figure 25
Supplementary data – Page | 19

Supplementary data – Page | 20
Figure 26
Figure 27

Supplementary data – Page | 21
O O
O
O
-O O O
O
O
HO
+ H
- H
O O
OH
O
-O O O
ONa
O
HO+ H
- H
+ H
- H
O O
OH
O
HO
Figure 28
5. Development of ultra high throughput screening system based on flow
cytometry and double emulsions for directed evolution of Cyt P450 BM3
6. Screening the metagenome libraries using flow cytometry and double
emulsions: the source of novel P450 activity
Copyright © 2022 FDOKUMEN