Protocol M Sc - UFS
261
Obesity, undernutrition and the double burden of disease in the Free State Reinette Tydeman-Edwards Dissertation submitted in fulfilment of the requirements for the degree Magister Scientiae Dietetics In the Faculty Health Sciences, Department of Nutrition and Dietetics, University of the Free State Supervisor: Prof. CM Walsh Bloemfontein July 2012
-
Upload
khangminh22 -
Category
Documents
-
view
0 -
download
0
Transcript of Protocol M Sc - UFS

Obesity, undernutrition and
the double burden of disease
in the Free State
Reinette Tydeman-Edwards
Dissertation submitted in fulfilment of the requirements for the degree
Magister Scientiae Dietetics
In the Faculty Health Sciences, Department of Nutrition and Dietetics, University of the Free State
Supervisor: Prof. CM Walsh
Bloemfontein July 2012

Declaration of Independent work
I certify that the dissertation hereby submitted by me for the M. Sc.
Dietetics degree at the University of the Free State is my independent
effort and had not previously been submitted for a degree at another
university/faculty. I further more waive copyright of the dissertation in
favour of the University of the Free State.
Reinette Tydeman-Edwards July 2012

Table of contents
Index of Tables ........................................................................................................................................................... 1 Index of Figures .......................................................................................................................................................... 5 List of Acronyms and Abbreviations ........................................................................................................................... 6 Index of Appendices ................................................................................................................................................... 9
Chapter 1 - Problem Statement ............................................................................................................................ 10
1.1. Motivation for the study ............................................................................................................................. 10 1.1.1. Socio-economic challenges ................................................................................................................ 10 1.1.2. Health challenges ................................................................................................................................ 10 1.1.3. The double burden of disease ............................................................................................................ 12 1.1.4. Implications of undernutrition .............................................................................................................. 14 1.1.5. The nutrition transition ......................................................................................................................... 15 1.1.6. Current study ....................................................................................................................................... 17
1.2. Aim and objectives .................................................................................................................................... 18 1.2.1. Main aim .............................................................................................................................................. 18 1.2.2. Objectives............................................................................................................................................ 18
1.3. Outline of the dissertation ......................................................................................................................... 18
Chapter 2 – Literature review ............................................................................................................................... 19
2.1. Introduction ............................................................................................................................................... 19
2.2. The Barker theory ..................................................................................................................................... 19 2.2.1. Early life influences ............................................................................................................................. 20 2.2.2. Obesity ................................................................................................................................................ 20 2.2.3. Hypertension ....................................................................................................................................... 22 2.2.4. Cardiovascular disease and diabetes mellitus .................................................................................... 22 2.2.5 Correlation between undernutrition and overweight ........................................................................... 23
2.3. The nutrition transition .............................................................................................................................. 25 2.3.1. In the world .......................................................................................................................................... 26 2.3.2. In Africa and South Africa ................................................................................................................... 27
2.4. The burden of disease .............................................................................................................................. 30 2.4.1. In the world .......................................................................................................................................... 30 2.4.2. In Africa ............................................................................................................................................... 33 2.4.3. In South Africa ..................................................................................................................................... 34
2.5 Undernutrition ............................................................................................................................................ 36 2.5.1 In the world .......................................................................................................................................... 36
2.5.1.1 Stunting .......................................................................................................................................... 38 2.5.1.2 Underweight and wasting ............................................................................................................... 39
2.5.2 In Africa and South Africa ................................................................................................................... 40 2.5.2.1 In adults .......................................................................................................................................... 40 2.5.2.2 In children ....................................................................................................................................... 40
(i) Stunting ....................................................................................................................................... 41 (ii) Underweight ................................................................................................................................ 42 (iii) Wasting ........................................................................................................................................ 43
2.6 Chronic diseases of lifestyle ..................................................................................................................... 43 2.6.1 Global prevalence and epidemiology .................................................................................................. 43 2.6.2 Prevalence and epidemiology in South Africa .................................................................................... 47 2.6.3 Specific CDLs ...................................................................................................................................... 54
2.6.3.1 Overweight and obesity ................................................................................................................. 54 (i) In the world .................................................................................................................................. 56
(a) In children ............................................................................................................................. 58
(b) In adults ................................................................................................................................ 59
(ii) In Africa ....................................................................................................................................... 60 (i) In South Africa ............................................................................................................................. 60
(a) Incidence, prevalence and epidemiology ............................................................................. 61

(b) Etiology ................................................................................................................................. 64 2.6.3.2 Diabetes mellitus ............................................................................................................................ 65
(i) Incidence and prevalence ........................................................................................................... 65 (ii) Etiology ........................................................................................................................................ 67
2.6.3.3 Cardiovascular diseases ................................................................................................................ 68 (i) Incidence, prevalence and epidemiology .................................................................................... 69 (ii) Etiology ........................................................................................................................................ 71
2.6.3.4. Hypertension .................................................................................................................................. 73 (i) Incidence, prevalence and epidemiology .................................................................................... 74 (ii) Etiology ........................................................................................................................................ 76
2.6.3.5 Stroke ............................................................................................................................................. 76 2.6.3.6 Coronary heart disease and dyslipidemia ...................................................................................... 77
(i) Incidence, prevalence and epidemiology .................................................................................... 77 (ii) Etiology ........................................................................................................................................ 78
2.6.3.7 Cancer ............................................................................................................................................ 79 (i) Etiology and risk factors .............................................................................................................. 79 (ii) Incidence, prevalence and epidemiology .................................................................................... 81
(a) Esophagus ............................................................................................................................ 82 (b) Colorectal .............................................................................................................................. 83 (c) Liver ...................................................................................................................................... 83 (d) Breast .................................................................................................................................... 84 (e) Endometrium ........................................................................................................................ 85 (f) Prostate................................................................................................................................. 85
2.7. The cost of disease ................................................................................................................................... 85
2.8. The influence of diet on health .................................................................................................................. 88 2.8.1. Breastfeeding ...................................................................................................................................... 89 2.8.2. Fruits and vegetables .......................................................................................................................... 90 2.8.3. Meat and meat alternatives ................................................................................................................. 94
2.8.3.1 Red meat ........................................................................................................................................ 94 2.8.3.2. Fish ................................................................................................................................................ 94 2.8.3.3 Soy ................................................................................................................................................. 95
2.8.4. Fibre .................................................................................................................................................... 95 2.8.5. Sugar ................................................................................................................................................... 96 2.8.6. Fat ....................................................................................................................................................... 97 2.8.7. Nuts ..................................................................................................................................................... 99 2.8.8. Alcohol ................................................................................................................................................. 99 2.8.9. Salt .................................................................................................................................................... 102 2.8.10 Coffee ................................................................................................................................................ 103
Chapter 3 - Methodology .................................................................................................................................... 104
3.1. Introduction ............................................................................................................................................. 104
3.2. Ethical considerations ............................................................................................................................. 104
3.3. Study design ........................................................................................................................................... 104
3.4. Sample selection ..................................................................................................................................... 104 3.4.1. Population ......................................................................................................................................... 105 3.4.2. Sample .............................................................................................................................................. 105
3.4.2.1. Inclusion criteria ........................................................................................................................... 105 3.4.2.2. Exclusion criteria .......................................................................................................................... 105
3.5. Operational definitions ............................................................................................................................ 106 3.5.1. Dietary intake .................................................................................................................................... 106
3.5.1.1 Adults ........................................................................................................................................... 107 3.5.1.2 Children ........................................................................................................................................ 109
3.5.2 Anthropometry ................................................................................................................................... 111 3.5.2.1 Adults ........................................................................................................................................... 111
(i) Body-mass-index (BMI) ............................................................................................................. 111 (ii) Waist circumference .................................................................................................................. 111 (iii) Estimated weight and height ..................................................................................................... 112 (v) Total body fat percentage .......................................................................................................... 112

3.5.2.2 Children ........................................................................................................................................ 113
3.6. Pilot Study ............................................................................................................................................... 114
3.7. Data collection process ........................................................................................................................... 114
3.8. Techniques .............................................................................................................................................. 115 3.8.1 Dietary intake ................................................................................................................................... 115
3.8.1.1 24-hour recall of reported usual intake ........................................................................................ 115 3.8.1.2 FFQ .............................................................................................................................................. 116
3.8.2. Anthropometric measurements ......................................................................................................... 117 3.8.2.1 Weight .......................................................................................................................................... 117 3.8.2.2 Height ........................................................................................................................................... 117 3.8.2.3 Circumferences ............................................................................................................................ 118
(i) Waist circumference .................................................................................................................. 118 (ii) Hip circumference...................................................................................................................... 118 (iii) Head circumference .................................................................................................................. 118 (iv) Mid-upper arm circumference ................................................................................................... 118 (v) Wrist circumference ................................................................................................................... 119
3.8.2.4 Knee height .................................................................................................................................. 119 3.8.2.5 Skinfolds ....................................................................................................................................... 120
(i) Triceps ....................................................................................................................................... 120 (ii) Biceps ........................................................................................................................................ 120 (iii) Supra-iliac .................................................................................................................................. 120 (iv) Subscapular ............................................................................................................................... 120 (v) Calf ............................................................................................................................................ 121 (vi) Thigh .......................................................................................................................................... 121
3.9. Statistical analysis ................................................................................................................................... 121
3.10. Validity and reliability .............................................................................................................................. 121 3.10.1. Dietary intake questionnaires ............................................................................................................ 121
3.10.1.1 Validity .......................................................................................................................................... 122 3.10.1.2 Reliability ...................................................................................................................................... 122
3.10.2. Anthropometry ................................................................................................................................... 122 3.10.2.1 Validity .......................................................................................................................................... 122 3.10.2.2 Reliability ...................................................................................................................................... 123
Chapter 4 - Results .............................................................................................................................................. 124
4.1 Dietary intake .......................................................................................................................................... 124 4.1.1 Early feeding ..................................................................................................................................... 124
4.1.1.1 Breastfeeding ............................................................................................................................... 124 4.1.1.2 Formula feeding ........................................................................................................................... 126 4.1.1.3 Solids ........................................................................................................................................... 127
4.1.2 Reported usual intake of different food groups ................................................................................. 128 4.1.2.1 Children younger than two years ................................................................................................. 128 4.1.2.2 Children older than two years ...................................................................................................... 130 4.1.2.3 Adults ........................................................................................................................................... 133
4.1.3 Reported usual intake of different food items ................................................................................... 137 4.1.3.1 Children younger than two years ................................................................................................. 137 4.1.3.2 Children older than two years ...................................................................................................... 139 4.1.3.3 Adults ........................................................................................................................................... 140
4.1.4 Mean/median macronutrient intakes ................................................................................................. 142 4.1.4.1 Children younger than two years ................................................................................................. 142 4.1.4.2 Children older than two years ...................................................................................................... 143 4.1.4.3 Adults ........................................................................................................................................... 144
4.2 Anthropometric variables ........................................................................................................................ 145 4.2.1 Children ............................................................................................................................................ 145
4.2.1.1 Weight-for-age ............................................................................................................................. 145 4.2.1.2 Height-for-age .............................................................................................................................. 146 4.2.1.3 Weight-for-height ......................................................................................................................... 146 4.2.1.4 BMI-for-age .................................................................................................................................. 147 4.2.1.5 Head circumference ..................................................................................................................... 148
4.2.2 Adults ................................................................................................................................................ 149 4.2.2.1 BMI ............................................................................................................................................... 149 4.2.2.2 Waist circumference .................................................................................................................... 150 4.2.2.3 Triceps skinfold ............................................................................................................................ 150 4.2.2.4 Upper arm fat area ....................................................................................................................... 151 4.2.2.5 Upper arm muscle area ............................................................................................................... 151 4.2.2.6 Body fat percentage ..................................................................................................................... 152
4.2.3 Children vs. caregivers ...................................................................................................................... 152
Chapter 5 - Discussion of results ...................................................................................................................... 154
5.1 Introduction ............................................................................................................................................. 154
5.2 Limitations of the study ........................................................................................................................... 154 5.2.1 Study population ............................................................................................................................... 154 5.2.2 Dietary intake .................................................................................................................................... 155 5.2.3 Anthropometrical measurements ...................................................................................................... 155
5.3 Dietary intake .......................................................................................................................................... 155 5.3.1 Children younger than two years ...................................................................................................... 156
5.3.1.1 Breastfeeding ............................................................................................................................... 156 5.3.1.2 Formula feeding ........................................................................................................................... 157 5.3.1.3 Introduction of solids .................................................................................................................... 157
5.3.2 Reported usual intake of different food items ................................................................................... 158 5.3.2.1 Children younger than two years ................................................................................................. 158
(i) Breads and cereals ................................................................................................................... 161 (ii) Fats and oils .............................................................................................................................. 161 (iii) Fruit and vegetables .................................................................................................................. 162 (iv) Milk and milk products ............................................................................................................... 162 (v) Sweets and sugar ...................................................................................................................... 162 (vi) Tea ............................................................................................................................................ 163 (vii) Conclusion ................................................................................................................................. 163
5.3.2.2 Children older than two years ...................................................................................................... 163 (i) Breads and cereals ................................................................................................................... 166 (ii) Fats and oil ................................................................................................................................ 166 (iii) Fruit and vegetables .................................................................................................................. 167 (iv) Milk and milk products ............................................................................................................... 167 (v) Sweets and sugar ...................................................................................................................... 168 (vi) Salt ............................................................................................................................................ 168 (vii) Tea ............................................................................................................................................ 169 (viii) Conclusion ................................................................................................................................. 169
5.3.2.3 Adults ........................................................................................................................................... 169 (i) Breads and cereals ................................................................................................................... 170 (ii) Fats and oils .............................................................................................................................. 174 (iii) Fruit and vegetables .................................................................................................................. 174 (iv) Milk and milk products ............................................................................................................... 175 (v) Sweets and sugar ...................................................................................................................... 175 (vi) Salt ............................................................................................................................................ 176 (vii) Tea ............................................................................................................................................ 177 (viii) Coffee ........................................................................................................................................ 177 (ix) Alcohol ....................................................................................................................................... 177 (x) Conclusion ................................................................................................................................. 178
5.3.3 Mean macronutrient intakes .............................................................................................................. 179 5.3.3.1 Children younger than two years ................................................................................................. 179
(i) Total energy intake .................................................................................................................... 179 (ii) Carbohydrates ........................................................................................................................... 181 (iii) Protein ....................................................................................................................................... 181 (iv) Fat ............................................................................................................................................. 182
5.3.3.2 Children older than two years ...................................................................................................... 182 (i) Total energy intake .................................................................................................................... 182 (ii) Carbohydrates ........................................................................................................................... 184 (iii) Protein ....................................................................................................................................... 185 (iv) Fat ............................................................................................................................................. 186
5.3.3.3 Adults ........................................................................................................................................... 186 (i) Total energy intake .................................................................................................................... 187
(ii) Carbohydrates ........................................................................................................................... 190 (iii) Protein ....................................................................................................................................... 191 (iv) Fat ............................................................................................................................................. 192
5.4 Anthropometric variables ........................................................................................................................ 193 5.4.1 Children younger than seven years .................................................................................................. 193
5.4.1.1. Weight-for-age ............................................................................................................................. 193 5.4.1.2. Height-for-age .............................................................................................................................. 196 5.4.1.3. Weight-for-height ......................................................................................................................... 198 5.4.1.4. BMI ............................................................................................................................................... 199
5.4.2 Adults ................................................................................................................................................ 199 5.4.2.1. Underweight ................................................................................................................................. 199 5.4.2.2. Overweight and obesity ............................................................................................................... 201 5.4.2.4 Waist circumference .................................................................................................................... 204
5.5 The double burden .................................................................................................................................. 204 5.5.1 Underweight ...................................................................................................................................... 205 5.5.2 Stunted .............................................................................................................................................. 205
Chapter 6 – Conclusions and Recommendations ............................................................................................ 206
6.1 Introduction ............................................................................................................................................. 206
6.2 Conclusions ............................................................................................................................................. 206 6.2.1 Dietary intake .................................................................................................................................... 206
6.2.1.1 Food groups ................................................................................................................................. 207 6.2.1.2 Frequent intake of food items ...................................................................................................... 207 6.2.1.3 Macronutrients ............................................................................................................................. 207 6.2.1.4 Breastfeeding ............................................................................................................................... 208
6.2.2 Anthropometry ................................................................................................................................... 208 6.2.2.1 Undernutrition............................................................................................................................... 208
(i) Stunting ..................................................................................................................................... 209 (ii) Wasting ...................................................................................................................................... 210 (iii) Underweight .............................................................................................................................. 210
6.2.2.2 Overnutrition ................................................................................................................................. 210 (i) Overweight and obesity ............................................................................................................. 211 (ii) Central adiposity ........................................................................................................................ 211
6.2.3 The double burden ............................................................................................................................ 211
6.3 Recommendations .................................................................................................................................. 212 6.3.1 Healthier lifestyles ............................................................................................................................. 213 6.3.2 Stopping the vicious circle of undernutrition ..................................................................................... 214
6.3.2.1 Getting the message on nutrition out ........................................................................................... 215 6.3.2.2 Government involvement ............................................................................................................. 216
6.4 Suggestions for further research ............................................................................................................. 217
Summary ................................................................................................................................................................ 218
Opsomming ............................................................................................................................................................ 221
References ........................................................................................................................................................... 224
Appendices .......................................................................................................................................................... 235

Acknowledgements
Thank you to the following for making this study possible:
Professor Corinna Walsh, Department of Nutrition and Dietetics, University of the Free
State – for her support, guidance, patience and countless late nights.
Mr Cornel van Rooyen and colleagues, Department of Biostatistics, University of the Free
State – for their valuable input regarding the statistical analysis of the data.
The National Research Foundation – for their financial support to execute this study.
Dietetics students from the Department of Nutrition and Dietetics, University of the Free
State – for their assistance in gathering the data.
The study respondents – for taking part in the study.
My husband, Gavin - for his love, moral support and encouragement.
My son, Wayne – for just being there.
My family and friends.
The Lord, my strength and my salvation.
~ Dedicated to Gavin and Wayne ~

Page 1 of 252
Index of Tables Page
Chapter 2
2.1. Global changes in ranking for selected causes of death from 1990 to 2020 31
2.2. Percentage distribution of current (1990) and projected DALYs (2020) for diabetes mellitus, cardiovascular disease, malignant neoplasms and other neoplasms for certain countries in the world
32
2.3 Selection of projected leading causes of DALYs in 2020 according to baseline projections 32
2.4 Top twenty specific causes of death in children under five years, South Africa, 2000 35
2.5 Leading causes of death by income group in 2004 44
2.6 Percentage of CDL-related deaths per country 46
2.7 Estimated DALYs per 100 000 for WHO world regions, including South Africa, 2000 47
2.8 Deaths attributable to 17 selected risk factors compared with underlying causes of death 49
2.9 DALYs attributed to 17 selected risk factors compared with the underlying causes of DALYs 50
2.10 Top twenty specific causes of premature mortality burden (YLLs) by sex 50
2.11 Comparison of the proportions of deaths and YLLs due to CDLs and HIV/AIDS 51
2.12 Initial and revised estimated number of deaths in each group and HIV/AIDS 51
2.13 Cause of death estimates of South African Burden of Disease study vs. WHO 51
2.14 Estimated DALYs – SABD vs. WHO 52
2.15 Age standardized mortality rates for CDLs in South Africa, by population group 52
2.16 Percentage of cardiovascular diseases by cause, South Africa, 2000 54
2.17 Differential manifestations of the features of metabolic syndrome in South Africa 55
2.18. Summary of strength of evidence on factors that might promote or prevent weight gain and obesity
56
2.19 Summary of strength of evidence on lifestyle factors and risk of developing type 2 DM 68
2.20 Summary of strength of evidence on lifestyle factors and risk of developing CVD 72
2.21 Comparison of CVD risk factors between patients with acute MI and controls in three ethnic groups participating in the African countries
73
2.22 Summary of strength of evidence on lifestyle factors and the risk of developing cancer 80
2.23 Ranges of population nutrient intake goals 88
2.24 Alcohol-related health outcomes 100
Chapter 3
3.1. Cut off points for analysis of food intake in portions, according to the recommendations of the ADA Food Guide Pyramid
106
Page 2 of 252
Index of Tables (continued) Page
3.2. Portion sizes for adults 107
3.3. Exchange list for legumes and soy beans. 107
3.4. Energy and macronutrient content of select alcoholic beverages 108
3.5. Calculation of dietary intake using recommended daily servings 108
3.6 Prudent dietary guidelines (recommended macronutrient proportions) 109
3.7 Dietary Reference Intakes (DRIs): recommended daily intakes for macronutrients and acceptable distribution ranges [adapted to kJ]
109
3.8 Portion sizes for children, depending on age 109
3.9. Guidelines for suggested servings for infants from birth through 8 months to meet the Recommended Daily Allowance
110
3.10 Suggested daily servings for infants and children (ages 8 months+) to meet the Recommended Daily Allowance
110
3.11. Guidelines for interpretation of waist circumference and risk for chronic diseases of lifestyle 111
3.12. Equations for estimating body weight (W) from knee height (KH) and mid-arm circumference (MAC) for various groups
112
3.13 Equations for estimating height (S) from knee height (KH) for various groups 112
3.14 Six-skinfold formulae 112
3.15 Body fat ranges for persons 18 years of age or older 113
3.16 Categories of classification of all data in children 114
3.17 Classification of malnutrition 114
Chapter 4
4.1 Breastfeeding prevalence 124
4.2 Period of current breastfeeding 125
4.3 Previous breastfeeding 125
4.4 Period (in weeks) of previous breastfeeding 125
4.5 Period (in weeks) of exclusive breastfeeding (currently and previously breastfed) 125
4.6 Predominant method of feeding 126
4.7 Does child's formula feeding regimen fall within recommendations? 126
4.8 Type of formula milk used by carer 127
4.9 Where does the carer get the formula? 127
4.10 Age (in weeks) at introduction of solids 127
Page 3 of 252
Index of Tables (continued) Page
4.11 Reported usual intake of different food groups for rural and urban boys (<2 years) 129
4.12 Reported usual intake of different food groups for rural and urban girls (<2 years) 129
4.13 Reported usual intake of different food groups for rural and urban boys (>2 years) 131
4.14 Reported usual intake of different food groups for rural and urban girls (>2 years) 132
4.15 Reported usual intake of different food groups for rural and urban men 134
4.16 Reported usual intake of different food groups for rural and urban women 136
4.17 Frequency of intake of different food items for rural and urban boys (times per month) (<2 years)
138
4.18 Frequency of intake of different food items for rural and urban girls (times per month) (<2 years)
138
4.19 Frequency of intake of different food items for rural and urban boys (times per month) (>2 years)
139
4.20 Frequency of intake of different food items for rural and urban girls (times per month) (>2 years)
140
4.21 Frequency of intake of different food items for rural and urban men (times per month) 141
4.22 Frequency of intake of different food items for rural and urban women (times per month) 141
4.23 Mean macronutrient intake for rural and urban boys (<2 years) 142
4.24 Mean macronutrient intake for rural and urban girls (<2 years) 143
4.25 Mean macronutrient intake for rural and urban boys (>2 years) 143
4.26 Mean macronutrient intake for rural and urban girls (>2 years) 144
4.27 Mean macronutrient intake for rural and urban men 144
4.28 Mean macronutrient intake for rural and urban women 144
Anthropometry
Children
4.29 Weight-for-age 145
4.30 Height-for-age 146
4.31 Weight-for-height 146
4.32 BMI-for-age 147
4.33 Median BMI for age 148
4.34 Head circumference (WHO charts) 0-2 years old 148
4.35 Head circumference (CDC charts) 0-3 years old 149
Page 4 of 252
Index of Tables (continued) Page
Adults
4.36 BMI 149
4.37 Waist circumference 150
4.38 Triceps skinfold 150
4.39 Upper arm fat area 151
4.40 Upper arm muscle area 151
4.41 Body fat percentage – males 152
4.42 Body fat percentage – females 152
Children vs. adults
4.43 Incidence of malnourished children residing with an overweight/obese caregiver 153
Chapter 5
5.1 Comparison of ten most frequently consumed food items with results from other studies - children <2 years old
159-160
5.2 Comparison of ten most frequently consumed food items with results from other studies - children >2 years old
164-165
5.3 Comparison of ten most frequently consumed food items with results from other studies – adults 25 – 64 years
171-173
5.4 Comparison of macronutrient intakes with other studies‘ data – children < 2 years old (from 24 hour recall)
180
5.5 Comparison of macronutrient intakes with other studies‘ data – children > 2 years old 183
5.6 Comparison of mean total energy and percentage macronutrient intake - adults 25-64 years - with THUSA study results
188
5.7 Comparison of mean total energy and percentage macronutrient intake - adults 25-64 years - with other studies
189
5.8 Comparison of current study‘s weight-for-age results with NFCS results 194
5.9 Comparison of current study‘s height-for-age results with NFCS results 194
5.10 Comparison of current study‘s weight-for-height results with NFCS results 197
5.11 Comparison of current study‘s BMI results with NFCS results 197
5.12 Comparison of current study‘s BMI results with THUSA results 200
5.13 Comparison of current study‘s BMI results with SADHS results 200
5.14 Comparison of median BMI values 203
5.15 Comparison of current study‘s BMI results with FYFS results 204
Page 5 of 252
Index of Figures Page
Chapter 1
1.1 The vicious, inter-generational cycle of undernutrition and poverty 15
Chapter 2
2.1. The UNICEF Conceptual Framework 37
2.2 Breakdown of deaths in South Africa caused by CDLs 53
2.3 Projected increases in obesity (BMI>30 kg/m2) in selected countries 2002-2015 57
2.4 Factors which may promote or inhibit cancer development and progression 79
2.5 Alcohol-related DALYs by cause 101
Page 6 of 252
List of Acronyms and Abbreviations
ADA American Dietetics Association
AHA FS Assuring Health for All in the Free State
AICR American Institute for Cancer Research
AIDS Acquired Immune Deficiency Syndrome
BFHI Breastfeeding Hospital Initiative
BMI Body mass index
BRISK Black Risk Factor study
CDLs Chronic diseases of lifestyle
CNPP Center for Nutrition Policy and Promotion
CHD Coronary heart disease
CHO Carbohydrates
CI Confidence Interval
COPD Chronic obstructive pulmonary disease
CORIS Coronary Risk Factor Study
CRC Colorectal cancer
CRISIC Coronary Risk Factor Study
CVD Cardiovascular disease
DALYs Disability adjusted life years
DHA Docosahexanoic acid
DM Diabetes mellitus
DNA Deoxyribonucleic-acid
DoH Department of Health
DRIs Daily recommended intakes
EPA Eicosapentanoic acid
FAO Food and Agriculture Organization
FFQ Food frequency questionnaire
FSRDPP Free State Rural Development Partnership Programme
FYFS First Year Female Students Project
GDP Gross domestic product
GI Glycemic index

Page 7 of 252
List of Acronyms and Abbreviations (continued)
GL Glycemic load
HDL High-density lipoprotein
HIV Human immunodeficiency virus
IHD Ischemic heart disease
KH Knee height
LBW Low birth weight
LDL Low-density lipoprotein
MAC Mid-arm circumference
MI Myocardial infarction
MRC Technical Report Medical Research Council Technical Report
MTHFR Methylenetetrahydrofolate reductase
MUCPP Mangaung University Community Partnership Programme
MUFAs Mono-unsaturated fatty acids
MGRS Multicentre Growth Reference Study
NFCS National Food Consumption Survey
PUFAs Poly-unsaturated fatty acids
QoL Quality of life
RUTF Ready-to-use therapeutic food
S Stature
SADHS South African Demographic and Healthy Survey
SAFBDG South African Food-based Dietary Guidelines
SASOM South African Society of Obesity and Metabolism
SAVACG The South African Vitamin A Consultative Group
SCF Save the Children Fund
SCEC Squamous cell esophageal carcinoma
SD Standard deviations
SEMDSA The Society for Endocrinology, Metabolism and Diabetes of South Africa
SFA Saturated fatty acid
SNP Single nucleotide polymorphism
TB Tuberculosis
Page 8 of 252
List of Acronyms and Abbreviations
THUSA Transition, Health and Urbanisation in South Africa
THUSA BANA Transition and Health during Urbanisation of South African children
UK United Kingdom
UNICEF United Nations Children‘s Fund
USA United States of America
USDA United States Department of Agriculture
USDHHS Unites States Department of Health and Human Services
USSR Union of Soviet Socialist Republics
VIGHOR Vanderbijl Park Information Project on Health, Obesity and Risk Factor
W Weight
WCRF World Cancer Research Fund
WDF World Diabetes Foundation
WHO World Health Organization
WHR Waist-to-hip ratio
WRFS Weight and Risk Factor Study
YLD Years lived with a disability
YLL Years of life lost
Page 9 of 252
Index of Appendices Page
Appendix A Consent forms 235
Appendix B Information document 238
Appendix C Participation letter 247
Appendix D 24-hour recall of reported usual intake 250
Appendix E Evaluation of dietary intake and adjusted food frequency questionnaire 251
Appendix F Dietary intake form for children 0-2 years 252
Appendix G Anthropometry form 253
Page 10 of 252
Chapter 1 - Problem Statement
1.1. Motivation for the study
In this chapter an overview will be given of socio-economic and health challenges that may affect or be
affected by the nutrition transition. The resultant double burden of disease, which includes both
undernutrition and chronic diseases of lifestyle (CDLs), will be highlighted. In addition, the main aim and
objectives for the current study will be defined and a brief outline of the dissertation given.
1.1.1. Socio-economic challenges
South Africa is a middle income country characterized by a variety of living conditions, from wealthy and
middle income suburbs to deprived peri-urban areas, rural farms and under-developed rural areas (Steyn
et al., 2006:6; Department of Health (DoH) et al., 2002:2). Increasing urbanization and changes in diet
and health behaviours are occurring as a result of changing social, political and economic factors.
Limited resources contribute to a high level of poverty in South Africa, with increasing numbers of informal
settlements around cities and towns (Bourne et al., 2002:157; DoH et al., 2002:15). The Medical
Research Council Technical Report on dietary changes and the health transition in South Africa
(hereinafter referred to as the ―MRC Technical Report‖) states that forty to fifty percent of South Africans
are categorized as poor and 25% of these are ultra-poor (Steyn et al., 2006:11). Poverty is reported to be
the highest in rural areas (Labadarios et al., 2005:534).
Almost a third of South African households live in informal and traditional settlements (Steyn et al.,
2006:11). According to the South African Demographic and Health Survey (SADHS) conducted in 1998,
51% of all homes had their main walls plastered. Amongst shack settlements in urban areas, 16% had
plastic, cardboard or corrugated iron walls. In rural areas, most homes had mud and plaster walls (DoH et
al., 2002:15).
In 1998, about 39% of South Africans had piped water and 46% had their own flush or chemical toilet
inside their homes. In urban areas, the main fuel used for cooking food was electricity, whereas in rural
areas it was either wood or paraffin. Only 37% of rural households had an electricity supply as opposed to
84% of urban households (Steyn et al., 2006:11-12; DoH et al., 2002:16).
1.1.2. Health challenges
A quadruple burden of disease exists in South Africa, which consists of: a combination of poverty-related
infectious diseases; life-style related non-communicable diseases (i.e. CDLs); human immunodeficiency
virus (HIV) and/or Acquired Immune Deficiency Syndrome (AIDS); and injuries due to violence-related
trauma (Steyn et al., 2006:6; Bradshaw et al., 2003:v; Bourne et al., 2002:157). After HIV/AIDS (29,8%),
cardiovascular disease (CVD) (16,6%) and cancer (7,5%) were some of the leading causes of death for
South Africans in 2000 (Bradshaw et al., 2003:v). In 2001, about sixty percent of deaths world-wide were
attributed to CDLs and they contributed to 47% of the total burden of disease (Steyn et al., 2006:6).
In 1998, the United Nations Children‘s Fund (UNICEF) stated that for children younger than five years,
half of the world‘s deaths occurred in Africa. In their opinion, Africa remains the most difficult place in the

Page 11 of 252
world for a child younger than five to survive (UNICEF, 2008:22). Child mortality rates are higher in
households where there are poor living conditions (i.e. no piped water, no flush toilet and/or no electricity)
(DoH et al., 2002:105). According to the 1998 SADHS, mortality is significantly higher among children in
rural areas in South Africa, as well as in Africa as a whole. Mortality rates were also found to be four
times higher for black children younger than five years as opposed to their white counterparts (DoH et al.,
2002:101). The mortality rate for black infants was 8,6% of live births in urban areas and 9,4% in rural
areas. The mortality rate for urban children younger than five years of age was 12,5% and for rural
children 13,9% (Labadarios et al., 2005:534). A decline in infant mortality rates was seen between 1970
and 1983 with a decline of 33% for white children, 64% for coloured children and 53% for black children
(Yach et al., 1991:214). Bradshaw et al. (2003:11, Table 2.1) report estimated mortality rates for the year
2000 (using ASSA2000 model of the Actuarial Society of South Africa) at 98 per 1000 live births for boys
under five years old and 91 per 1000 live births for girls under five years old.
Poor living conditions contribute to a high prevalence of infectious diseases, such as measles and
tuberculosis (TB) (Steyn et al., 2006:34). TB remains the most commonly reported notifiable disease in
South Africa. It was estimated that there were 127 798 cases of TB among persons older than 15 years in
1998 (DoH et al., 2002:176). Diarrhea can also be linked to poor living conditions. In the 1998 SADHS,
there was a very high prevalence of diarrhea among children six to 23 months of age (23%). This finding
was consistent with age-specific diarrhea morbidity patterns in other developing countries. The lower
prevalence rate among children younger than six months (11%) may reflect the protective effect of
breastfeeding. The total diarrhea prevalence rate was highest in black children (14%) (DoH et al.,
2002:124). In addition to these, a high proportion of child deaths in South Africa are due to HIV/AIDS
(35,1%) (Nannan et al., 2007:737).
In addition to the high burden of infectious diseases in South Africa, CDLs such as: obesity; diabetes; and
CVD (including hypertension and stroke); as well as lung-, esophageal-, breast- and colorectal cancers,
are also increasing. CDLs were previously limited to higher income groups, but this is no longer the case
(Steyn et al., 2006:6). In the last three decades, CDLs have become prominent causes of morbidity and
mortality, particularly in the black communities. In 2000, CDLs accounted for forty percent of deaths in
females, and 36% of deaths in males in South Africa (37% cause of death for both sexes combined)
(Bradshaw et al., 2003:iii, Table 2; Steyn et al., 2006:5, 12), with stroke being the most common fatal CDL
for women and ischemic heart disease (IHD) for men (Steyn et al., 2006:5, 12). According to the 1998
SADHS, hypertension, IHD, diabetes mellitus (DM) and cancer were all reported more in urban than rural
areas of South Africa (DoH et al., 2002:168). It was found that rural blacks had a significantly lower risk
for hypertension than urban blacks (Steyn et al., 2008:378). Norman et al. (2007a:692) also state that
urbanization among black South Africans predisposes them to hypertension. In 2000, it was estimated
that hypertension caused nine percent of all deaths in South Africa, and contributed to 2,4% of all
disability adjusted life years (DALYs). Murray and Lopez (1997a:1436) define the DALY as ―the sum of
life years lost due to premature mortality and years lived with disability adjusted for severity.‖
Hypertension contributes to fifty percent of stroke cases, 42% of IHD, 72% of hypertensive disease and
22% of other CVD burden in both adult male and female South Africans older than thirty years (Norman
et al., 2007a:692; 695, Table III).

Page 12 of 252
The only published data representative of CDL in a Free State community dates from 1995 (Mollentze et
al., 1995). Mollentze et al. (1995:90) showed that 29% of the rural (QwaQwa) black population and 30,3%
of the urban (Mangaung) black population were hypertensive. Diabetes was present in 4,8% of the rural
and six percent of the urban sample. Hypercholesterolemia (high-risk) was present in 12,5% of rural men
and six percent of urban men between 25 and 34 years of age. For moderate risk hypercholesterolemia,
the figures were 34% and 44,8% respectively. The mean body-mass-index (BMI) for both rural and urban
women exceeded 25 kg/m2.
Because South Africa is a developing country with limited resources, it is of the utmost importance to limit
the burden of disease. The direct costs of CDLs to South Africa is estimated to be as high as 6,8% of
health care costs. Indirect costs are also involved, which include work days lost, doctors‘ visits, impaired
quality of life (QoL) and premature mortality (Steyn et al., 2006:21). These are discussed in more detail
later in this dissertation.
In 2000, HIV/AIDS accounted for 39% of all deaths in South Africa, while CDLs accounted for 38% of
deaths (Seedat, 2007:318). When looking at actuarial models of projection of AIDS- and CDL mortality for
2010, the contribution of CDLs to the burden of disease in South Africa cannot be ignored, despite
increasing rates of HIV and AIDS. It is projected that in 2025, one in ten South Africans will be sixty years
or older. This may also increase the burden disease attributable to CDL (Steyn, 2005b:249).
1.1.3. The double burden of disease
Two types of malnutrition can be distinguished, namely undernutrition (resulting in underweight, wasting
or stunting) and overnutrition (resulting in either overweight or obesity).
It is estimated that about 32% of children in Africa are undernourished (De Villiers & Senekal, 2002:1231).
The South African Vitamin A Consultative Group (SAVACG) nationwide survey undertaken in 1994 found
that undernutrition was a serious health problem for children younger than six years. The Free State
province presented with the second highest percentage of stunted children in the country, together with
the Eastern Cape province (De Villiers & Senekal, 2002:1231-1232).
The SAVACG and the NFCS surveys reported that 6,9% to 10,7% of children were underweight (weight-
for-age below minus two standard deviations (<2SD) from the reference median), 16,1% to 27% were
stunted (height-for-age <2SD), and 1,8% to 3,7% were wasted (weight-for-height <2SD) (Steyn et al.,
2006:19). The prevalence of undernutrition was usually higher in rural areas in comparison with urban
areas (Steyn et al., 2006:20). By using data from four nationwide surveys, including the Living Standards
Measurements Survey conducted in 1994 in South Africa, Popkin et al. (1996:3012) concluded that
30,6% of South African black- and coloured children aged between 36 and 91 months were stunted. The
NFCS found that nearly twenty percent of children aged between one and nine years old were stunted,
and 17% were overweight (Labadarios et al., 2005:536).
Stunted children have a higher risk of being overweight or obese, either in childhood and/or adulthood
(Popkin et al., 1996:3012), which raises the risk of developing CDLs in later life (Steyn et al., 2006:20;
Mendez et al., 2005:720).
Page 13 of 252
The 1998 the SADHS reported that 29% of men and 56% of women in South Africa were overweight (BMI
between >25 kg/m² and <30 kg/m2) (Steyn, 2005a:43, 45; DoH et al., 2002:244). Almost a tenth of South
African men and a third of South African women were severely overweight or obese (BMI > 30 kg/m²)
(Steyn, 2005a:45; DoH et al., 2002:244). According to the MRC Technical Report, overweight/obesity was
more prevalent in urban areas, which may be indicative of the nutrition transition (Steyn et al., 2006:20).
In 1998, seven percent of all men included in the SADHS and 32% of all women had a waist-to-hip ratio
(WHR) above the reference cut-off point for increased risk for chronic disease, with a predominantly
higher percentage of women with a high WHR living in urban areas (DoH et al., 2002:245).
Abdominal obesity (WHR > 1,0 in men; > 0,85 in women) (Gibson, 2005:281) is associated with
increased risk of insulin resistance, diabetes, hypertension, dyslipidemia and atherosclerosis (Goedecke
et al., 2005:68). The 1998 SADHS showed that about a third (35,2%) of black South African women and
6,9% of black South African men had a high waist circumference that placed them at risk (Bourne et al.,
2002:160). Among all populations groups in the 1998 SADHS, abdominal obesity was present in 42,2% of
women and 9,2% of men; and was most common in black urban women and white urban men (Goedecke
et al., 2005:65-66). Data from the 1998 SADHS showed that obesity appeared to start in women at a
younger age, since ten percent of South African women were obese at age 15 to 24 years old (Goedecke
et al., 2005:66). Steyn et al. (2006:5) stated that the presence of obesity (and sedentary lifestyle)
contributed significantly to the increased prevalence of CDLs, as did the high prevalence of tobacco- and
alcohol use.
A high prevalence of overweight and obesity amongst caregivers was also found in the same household
as underweight or stunted children (Goedecke et al., 2005:71; Sawaya et al., 2003:170; Faber et al.,
2001:410). In the rural Limpopo province, 31% of underweight children were found to have an overweight
mother or caregiver, and in the rural North West Province, nearly fifty percent of mothers and/or
caregivers of stunted and underweight children were found to be overweight. This occurrence is also
found in other developing countries, such as Brazil, China, and Russia (Steyn et al., 2005:10). In their
1958 British cohort study, Li et al. (2004:185) also found that stunting in early life was associated with
short adult stature. Childhood nutritional stunting is associated with long-term impairment of fat oxidation,
a factor which strongly predicts obesity (Sawaya et al., 2003:172). Stunted Brazilian girls had significantly
lower total energy expenditure compared to boys, which may help explain the particular high risk of
obesity in stunted adolescent girls and women (Sawaya et al., 2003:172-173). Stunting is thus associated
with risk of obesity and abdominal fatness in women (Sawaya et al., 2003:171).
A review conducted by Sawaya et al. (2003:171), comparing data of studies conducted in Brazil, Russia,
China and South Africa, states that epidemiologic evidence supports the association between childhood
undernutrition (also called ―nutritional stunting‖ in the review) and adult obesity, and therefore related
CDLs (Sawaya et al., 2003:171; Popkin et al., 1996). They postulate that during catch-up growth in
infants and children recovering from undernutrition, there is a disproportionately greater replenishment of
body fat stores as opposed to body protein stores. Catch-up growth can be defined as an increase in
growth velocity in height and/or weight when some constraints on normal growth have been removed
(Cameron, 2003:39). The combination of low birth weight (LBW) and small size during infancy, followed
by accelerated weight gain from age three to 11 years, is predictive of hypertension, coronary heart
disease (CHD) and type 2 DM (Bihl, 2003:757). Sawaya et al. (2003:171) reports an association between
Page 14 of 252
short stature and increased risk for hypertension. The authors reported that stunted individuals had higher
triglycerides, low-density lipoprotein (LDL) cholesterol and higher total cholesterol than non-stunted adults
(Sawaya et al., 2003:171).
According to the UNICEF conceptual framework, one of the immediate causes of malnutrition (seen here
as undernutrition) is inadequate dietary intake (Nannan et al., 2007:733; Schrimpton & Kachondham,
2003:5). In 1998, about 87% of South African babies were breastfed for at least some time. Only seven
percent of babies younger than six months were, however, exclusively breastfed in 1998 (DoH et al.,
2002:132). As expected, the prevalence of exclusive breastfeeding decreased as the child got older.
About 16% of babies younger than two months were exclusively breastfed, whereas only 0,3% were
breastfed by age six to seven months. Seventy percent of babies younger than six months received
complementary feeds and 17% were not breastfed at all (DoH et al., 2002:134). About one-third of
breastfed babies younger than two months also received infant formula, and just over half received other
fluids. About 28% of all infants younger than five months received other foods. Nine percent of these
children received meat, fish and eggs (DoH et al., 2002:138). When median duration of breastfeeding
was investigated, rural children were breastfed longer than their urban counterparts, with black mothers
breastfeeding their children the longest (DoH et al., 2002:135).
Inadequate nutritional intake, which leads to undernutrition, has short- and long term consequences for
both adults and children (De Villiers & Senekal, 2002:1232). UNICEF expects that the rise in global food
prices, especially in basic foods like vegetables, oils, grains, dairy products and rice, may increase the
vulnerability of millions to hunger and undernutrition (UNICEF, 2008:24). Nutritional deficiencies related to
undernutrition account for 1,2% of deaths in South Africa.
1.1.4. Implications of undernutrition
Undernutrition influences child development significantly, even before birth. Undernutrition also influences
motor development, cognitive function and school performance, which can play a role in work capacity
and reproductive health in adulthood (Victora et al., 2008:343, 345; Nannan et al., 2007:733). Decreased
work capacity in adults can lead to reduced earning capacity and to a cycle of poverty and hunger (De
Villiers & Senekal, 2002:1232), as also illustrated in Figure 1.1 The poor physical and mental
development of an undernourished child, together with the loss of individual achievement and poor quality
of life, play a significant role in social and economic development at the national level (Witten et al.,
2002:online [unpublished]).
One of the most important implications of undernutrition in childhood is an increased risk of overweight
and obesity in adulthood, as discussed in detail in the previous section on double burden of disease.
When Popkin et al. (1996:3012) assessed the effects of previous stunting on present overweight status
by examining risk ratio, they found a risk ratio of 2,6 for all races of South African children. There is an
odds ratio of 1,8 when looking at the increased risk for overweight if also stunted (Goedecke et al.,
2005:71; Labadarios et al., 2005:536; Steyn, 2005a:44). In many developing countries, increasing
prevalence of adult obesity has been found to coincide with high prevalence of childhood undernutrition.

Page 15 of 252
Figure 1.1. The vicious, inter-generational cycle of undernutrition and poverty (Vorster & Kruger, 2007:322, Figure 1).
Diabetes contributes significantly to the burden of disease in South Africa (Steyn, 2005a:43). According to
Sawaya et al. (2003:171) catch-up growth is a risk factor for insulin resistance. Children born from women
with high BMIs during pregnancy had more rapid growth during childhood, with an increased incidence of
type 2 DM as adults (Forsen et al., 2000:176, 180).
Undernutrition in utero, low birth weight and poor maternal nutrition has also been associated with
increased risk for osteoporosis, lung disease, immune dysfunction and mental disease (Victora et al.,
2008:340).
1.1.5. The nutrition transition
The nutrition transition is identified as the progression from a traditional diet (low fat, high fibre diet) to a
Western diet (high fat, low fibre, high energy diet, with habitual intake of fast foods) (Cameron, 2003:37;
Bourne et al., 2002:157; MacIntyre et al., 2002:253). This transition is also usually accompanied by a
behavioural transition towards a less active/more sedentary lifestyle (Cameron, 2003:73). Globally,
traditional diets (largely plant-based) have been replaced by high-fat, energy-dense diets with a
substantial content of animal-based foods (World Health Organization and Food and Agriculture
Organization (WHO/FAO), 2002:6). Traditional diets consist of >60% to 65% of total energy from
carbohydrates, and <25% of total energy from fat, whereas the Western diet consists of <50 to 55% of
total energy from carbohydrates and >30% to 35% of total energy from fat. Fibre intake is also lower with
a Western diet and free sugar intake is high (>10% of total energy) (Joubert et al., 2007:684; Steyn et al.,
2006:13,14; Steyn, 2005a:36; Bourne et al., 2002:157,159; WHO/FAO, 2002:19). The nutrition transition
plays a key role in increasing the risk for CDLs, and its role in South Africa cannot be ignored.
As part of the Transition, Health and Urbanisation in South Africa (THUSA) study undertaken in the North
West Province, MacIntyre et al. (2002:239) reported that the dietary intakes between rural and urban
communities showed a shift from the traditional diet to the Western diet associated with CDLs. The MRC
Undernutrition of pregnant
mothers
Adults with decreased human capital and
competence
Individuals with increased risk of CVD
Food insecurity
Lack of care
Unhygienic environments
Undernourished babies (low birth weight)
Growth impairment
(stunting)
Mental underdevelopment
Poverty
Page 16 of 252
Technical Report states that intake of carbohydrates among black people in transition decreased with
increased time of living in the city, while fat intake increased (Steyn et al., 2006:13). The report also
states that the black population was the only ethnic group still undergoing transition from a traditional to a
Western diet. The other groups (white, Coloured and Indian) already followed the Westernized dietary
patterns (Joubert et al., 2007:684; Steyn et al., 2006:5). Steyn et al. (2006:15, Table 2.2.1) and Steyn
(2005a:35, Table 4.2a) confirmed that urban blacks consumed more fat and less carbohydrates than their
rural counterparts by comparing results from the 1998 SADHS, the Dikgale study (Steyn et al., 2001) and
the BRISK study (Steyn et al., 1991). Also, by comparing the results of the Dikgale study (black rural) to
the BRISK study (black urban), it was seen that vegetable and legume intake was greater in the Dikgale
study, whereas meat intake was nearly double in the BRISK study. Fat intake was also six times greater
in the BRISK study (Steyn et al., 2006:15; Steyn, 2005a:39). The THUSA study confirmed a nutrition
transition, when comparing the dietary intake of rural and urban adults. In urban areas (as compared to
rural areas) fat intake increased from 22,9% to 30,6%, carbohydrate decreased from 67,4% to 57,3%,
and protein increased from 11,6% to 13,2% (Steyn, 2005a:43; MacIntyre et al., 2002:243, Table 1). In the
North West Province, low intake of fruit, vegetables and milk was reported in all groups studied except for
the upper middle class in the urban community. Alcohol consumption was higher in the rural community
(MacIntyre et al., 2002:253). Steyn (2005a:36) mentions that the Coronary Risk Factor Study (CORIS
study), which was conducted in rural Western Cape, found that fat intake was very high and did not
conform to prudent dietary guidelines. Intake of meat, dairy and eggs was very high, which accounted for
the high percentage total fat and saturated fat intake. There was also a high sugar intake, but fruit and
vegetable intake was also high.
The MRC Technical Report reported that white males had the highest intake of fat (>30% of total energy),
protein and added sugar (>10%) and the lowest intake of carbohydrates (<55%) (Steyn et al., 2006:34).
In contrast, rural blacks had the highest intake of carbohydrates (>60% of total energy) and the lowest
intake of protein, fat (<20%) and added sugar (<10%) (Steyn et al., 2006:35). Black urban males‘ intake
seemed to be between these two extremes. At that time, Steyn et al. (2006:14) suggested that the
transition in blacks from a traditional rural diet to an urban diet is approaching the completely Westernized
diet of the white and Indian population.
In the past fifty years the intake of carbohydrates has decreased from 69,3% to 61,7% of total energy,
with a relative decrease of 10,9%, and the fat intake amongst urban blacks increased from 16,4% to
26,2% of total energy, with a relative increase of 59,7% (Goedecke et al., 2005:71; Bourne et al.,
2002:157). Shifts to the Western diet were also found amongst rural black communities. Steyn et al.
(2006:13) found the same trends in their urban communities. Carbohydrate intake decreased from 61,4%
to 52,8% and fat intake increased from 23,8% to 31,8%. Protein intake remained more or less the same
over time, although the contribution from animal protein increased and the amount from plant protein
decreased. These changes are all consistent with a population that is undergoing a nutrition transition. It
is well known that an increased prevalence of CDLs results in populations following the so-called
―Western diet‖ (Bourne et al., 2002:157). Other risk factors for CDLs, other than physical inactivity and
obesity, are low intake of fruits and vegetables and high intake of alcohol (Steyn et al., 2006:6).
Alcohol consumption in South Africa increased from 1962 to 2001. Nearly thirty percent of adult males
reported excessive alcohol use, compared with ten percent of females. High alcohol consumption is a risk
Page 17 of 252
factor for CDLs and needs to be addressed in the prevention of CDLs (Steyn et al., 2006:18). The 1998
SADHS (DoH et al., 2002:238) found that 45% of adult men and 17% of women consumed alcohol. For
the total population, the consumption rate was 28%. The consumption was slightly higher in urban areas
for both sexes. For males, the highest drinking levels were reported in the Free State and Gauteng
provinces. For females, the highest drinking levels were reported in the Free State, Western Cape and
Northern Cape (DoH et al., 2002:238).
The health of a nation can be monitored by gathering information on the burden of disease. The
information should be comprehensive, timely and precise so that practical and implementable health
policies can be formulated, which will in turn meet the demand for appropriate health services and
interventions. It is imperative to set priorities in a health sector where resources are scarce, to prevent
wastage (Bradshaw et al., 2003:1). Investigation of changes in diet and the health transition in South
Africa can contribute to the development of national strategy with a strong dietary policy component,
which will be effective in the long term (Steyn et al., 2006:6). According to Steyn (2005a:45) active and
progressive action is needed by policy makers, to prevent the burden of CDLs in South Africa from
increasing in the next few decades. Steyn (2005a:45) also states that policy makers should be reminded
of the very important role that diet plays as a determinant of most CDLs. It is impossible to prevent or
manage CDLs without managing the dietary aspects. Thus, Steyn (2005a:45) implies that the population
has to be educated regarding a healthy diet, being physically active and abstaining from excessive
alcohol intake and tobacco use.
1.1.6. Current study
The current study formed part of the baseline of the larger Assuring Health for All in the Free State (AHA
FS) Study, which aimed to provide the Free State with a direct estimate of the health/disease burden
attributable to established and emerging risk factors for obesity, diabetes, and CVD., as well as infectious
disease such as HIV/AIDS, TB and undernutrition, in both rural and urbanized communities. The results
related to risk for CDL and the metabolic syndrome in the rural and urban communities included in the
study have recently been published (Van Zyl et al., 2012:online). Factors that may have contributed to
these health challenges (such as the role of diet), however, need to be determined in order to plan and
implement relevant interventions to address the identified health challenges.
Since only a limited amount of studies have ever been conducted in the Free State, it would be prudent to
gather information specific to the Free State region to obtain a clearer view of the current situation in the
Free States as compared to the national- and African trends. By comparing data obtained from the rural
AHA FS study with data obtained in the urban AHA FS study, the extent of the nutrition transition in the
Free State can be determined. Findings from the AHA FS study can be used to develop appropriate
educational and health promoting programs. The results can also be used to facilitate effective public
health policies, which may alleviate the burden of disease for the Free State.

Page 18 of 252
1.2. Aim and objectives
1.2.1. Main aim
The main aim of this study was to determine the diet and anthropometric status of adults (between 25 and
64 years old) and pre-school children (zero to seven years old) in rural and urban areas. Rural areas
included Trompsburg, Philippolis and Springfontein. Urban areas included communities located around
the Mangaung University Community Partnership Program (MUCPP) Clinic. In addition, this study
investigated associations between anthropometric status of children and adults in rural and urban areas
in order to determine whether a double burden of disease existed.
1.2.2. Objectives
In order to achieve the main aim, the following were determined in both urban and rural children and
adults:
Dietary food and drink intake; and
Anthropometry.
1.3. Outline of the dissertation
Chapter 1 Problem statement
Chapter 2 Literature review
Chapter 3 Methodology
Chapter 4 Results
Chapter 5 Discussion of results
Chapter 6 Conclusion and recommendations
Page 19 of 252
Chapter 2 – Literature review
2.1. Introduction
Many developing countries, including South Africa, face both the burden of overnutrition and undernutrition,
known as the double burden of disease.
Only one study by Mollentze et al. (1995) has previously reported on the extent of CDLs in the Free State.
More recently, the AHA-FS study was undertaken to provide more recent data from both rural and urban
areas of the Free State to ascertain the current burden of disease in this province and to determine which
factors may have contributed to it.
The costs of CDLs are tremendous, not only in monetary terms, but also in mortality and quality of life;
even more so in developing countries such as South Africa (Steyn et al., 2006:21; Goedecke et al.,
2005:65; Kruger et al., 2005:492; WHO/FAO, 2002:4).
In this chapter the focus will be on a review of the literature related to the nutrition transition and how it is
related to undernutrition on the one hand and to various chronic diseases of lifestyle on the other. The
influence of changes in diet will be highlighted.
2.2. The Barker theory
A number of studies have reported on maternal nutritional status and how it is associated with child
undernutrition (Victora et al., 2008:340; Schrimpton & Kachondham, 2003:3). Countries with emerging
economies; in particular India, China, the Caribbean, and South Africa, have contributed to epidemiological
data related to the association of LBW with adult onset CDLs, such as: CVD (including CHD); DM;
hypertension; dyslipidemia; stroke; and cancer. In developing countries, where the vast majority of LBW
babies are born, a steep rise has been observed in the prevalence of obesity, diabetes and CVD (Levitt et
al., 2005:58). There is increasing evidence that increased risk for CDLs begin in fetal life and continues into
old age (WHO/FAO, 2002:31).
The Barker hypothesis (also known as the fetal origins theory) states that events occurring before birth may
program a person to certain physiological responses, which can then lead to cardiovascular- and metabolic
disorders in later life (Levitt et al., 2005:59). Early work by Barker and colleagues linked an adverse intra-
uterine environment to the development of CDLs, and specifically found an association between LBW and
CVD mortality (Goedecke et al., 2005:70; WHO/FAO, 2002:35). The Barker hypothesis suggests that
disturbed intra-uterine growth has a negative influence on the development of the cardiovascular system
and favours the occurrence of CDLs and morbidities (Seedat, 2007:318; Vorster & Kruger, 2007:322;
Goedecke et al., 2005:70; Levitt et al., 2005:59; WHO/FAO, 2002:8). Small babies are believed to have
suffered intra-uterine growth retardation, which affected their overall size and proportion; reducing the size
and altering the function of various organs (e.g. the kidneys pancreas and liver) in order to compensate for
normal brain growth (Cameron, 2003:39). Barker and his colleagues found that in certain areas in Britain
where there were high death rates from CVD, there was also a high prevalence of infant mortality (Barker,
1990:1111). Small size at birth in full-term pregnancies is linked with a subsequent ―programming‖ for the
Page 20 of 252
metabolic syndrome; including: glucose intolerance; increased blood pressure; dyslipidemia; and increased
mortality from CVD (Goedecke et al., 2005:71). The degree of elevated blood pressure, glucose intolerance
and insulin resistance was greater when LBW was linked with adult obesity. This suggests an interaction
between intra-uterine events and later environmental influences (Victora et al., 2008:340; Levitt et al.,
2005:59).
LBW, due to slow fetal growth, increases the risk of type 2 diabetes and the metabolic syndrome. Insulin
plays an important role during fetal growth and insulin- and glucose metabolism are altered in the fetus
during undernutrition. Patients with type 2 DM may present with both insulin resistance and insulin
deficiency, which may have been caused by adaptations during the fetal period (Forsen et al., 2000: 176).
2.2.1. Early life influences
Seedat (2007:318) suggests that many CDLs manifesting later in life may be related to two factors in
early life, which may seem contradictory, namely: (1) poverty, where malnourished mothers give birth to
malnourished LBW infants; and (2) prosperity, where a LBW child is exposed to a high-energy diet,
which may lead to obesity. Cameron (2003:39) states that intra-uterine growth retardation can cause a
child to adversely respond to a diet high in energy, fat and sodium, resulting in obesity later in life. Popkin
et al. (1996:3010) propose two explanations for the link between LBW and subsequent obesity in later
life: (1) the effect of undernutrition during pregnancy and infancy; and (2) gestational diabetes and poor
diet. It was already suggested in 1976 that metabolic tissues such as the hypothalamus are
reprogrammed as a result of early malnutrition during gestation. The setting of the hypothalamus to
inappropriately alter appetite control, could possibly lead to obesity (Popkin et al., 1996:3014).
Levitt et al. (2005:58) state that the expression of the intra-uterine programming for obesity depends on
early life experiences; maternal nutrition; post-natal nutrition; and timing of catch-up growth. It should,
however, be kept in mind that many factors can have an impact on birth weight, including: birth order;
gestational age; maternal age; maternal size; weight gain in pregnancy; maternal diabetes; maternal
hypertension; maternal smoking; alcohol- and drug use; stress and infection. Care should thus be taken
when assuming that LBW is the only factor involved in intra-uterine and fetal undernutrition (Levitt et al.,
2005:61).
According to the WHO/FAO (2002:8), approximately 23,8% of thirty million new-born babies per year are
affected by intra-uterine growth retardation. A child‘s growth pattern plays an important role in underlying
disease pathways (i.e. restricted fetal growth followed by very rapid postnatal catch-up growth). Intra-
uterine programming, together with subsequent early life influences that interact with genetic factors,
influences an ―adult chronic disease phenotype‖ (Goedecke et al., 2005:71).
2.2.2. Obesity
In 1990, over 4000 LBW infants born in Soweto and Johannesburg were enrolled in the Birth-to-Ten
cohort study, who were then followed up for ten years. A higher risk of obesity, higher body fat and
centralized fat patterns were present by five years of age in LBW children who demonstrated catch-up
growth. Such risk factors have even been illustrated in South African urban children as young as one year
of age (Cameron, 2003:39). Childhood obesity plays a larger role in the development of the metabolic

Page 21 of 252
syndrome, than does adult obesity (Forsen et al., 2000:176). Associations between early life exposures
with obesity and the ―chronic disease phenotype‖ have been demonstrated in South African studies with
large and representative samples of children, specifically the South African Birth-to-Twenty study that was
initiated in 1990 in the metropolitan area of Soweto and Johannesburg. The ―chronic disease phenotype‖
was prominent in LBW children who were above the median for BMI, or with central adiposity when they
were older. The association between LBW and increased body fat content, were linked to reduced lean
tissue mass.(Levitt et al., 2005:58-59).
The Birth-to-Twenty study found that twenty percent of black- and coloured children presented with catch-
up growth, while they were also significantly taller, heavier and fatter throughout their childhood and more
likely to be overweight or obese by nine years of age (Cameron, 2003:39; Levitt et al., 2005:59). Barker
and his colleagues have shown that adults with LBWs or underweight at one year of age had a greater
tendency to store fat abdominally (Popkin et al., 1996:3009).
Apart from the Birth-to-Twenty study, South African data concerning early life ―programming‖ and
subsequent obesity is limited. One study conducted by Mamabolo et al. (2005:online) involving 162 rural
children followed from birth, from central Limpopo province, showed a high prevalence of stunting (48%),
overweight (22%) and obesity (24%) at three years of age. Nineteen percent of the children were both
stunted and overweight (Mamabolo et al., 2005:online). Rapid weight gain within the first year of life in
children who were underweight at birth increased the risk six-fold for being overweight at three years of
age. In the Birth-to-Twenty cohort, weight gain or growth velocity was associated with increased
adiposity, measured by skinfold thickness (Goedecke et al., 2005:71; Levitt et al., 2005:59).
The explanation by Hales and Barker (1992:599) for the fetal origins of adult disease was the ―thrifty
phenotype hypothesis‖, initially associated specifically with type 2 DM (Levitt et al., 2005:61), which states
that in developing countries, the progression to obesity and morbidity associated with LBW appears to
depend on the interaction between birth weight and subsequent growth during critical developmental
periods (Levitt et al., 2005:58). An adverse intra-uterine environment (related to poor fetal nutrition)
programmes the fetus‘ metabolism to use subsequent nutrition sparingly (termed ―nutritional thrift‖). If this
nutritional hardship persists, this physiological adaptation remains appropriate; but should the individual
be exposed to improved nutrition, disease would occur due to ―physiological maladaptation,‖ e.g. glucose
intolerance which may lead to diabetes (Levitt et al., 2005:61).
Alternatively, the theory of the ―thrifty genotype” also exists, in an attempt to explain the overwhelming
rise in diabetes prevalence among the Pima Indians and Nauruans, who have also experienced a
nutrition transition. This theory proposes that certain genes persist in a population, since they would
ensure survival during stages of famine. However, in stages of abundance these genes are
disadvantageous (Levitt et al., 2005:61).
The time at which an insult occurs in utero may also influence the relationship between birth weight and
subsequent adiposity. Persons who were exposed to the Dutch famine during the Second World War,
while in utero during the first and second trimesters, were nearly three times more likely to become obese
(Goedecke et al., 2005:71; Levitt et al., 2005:58; Popkin et al., 1996:3009).
Page 22 of 252
Sawaya and Roberts (2003:online) raise the question whether the increase in the prevalence of obesity is
greater among poor people of transitional societies, since these populations (especially women), have a
higher susceptibility to the effects of a Western lifestyle (high intake of animal and processed food, low
physical activity, etc.). They debate that one strong candidate for this higher susceptibility seems to be
early undernutrition, as it could permanently programme the individual to increase and/or preserve fat
stores (Sawaya & Roberts, 2003:online).
On the flip side, when looking at higher birth weight, numerous studies have shown a direct association
between higher birth weight and higher BMI (Levitt et al, 2005:58). Large size at birth (macrosomia) is
also associated with an increased risk of diabetes and CVD (WHO/FAO, 2002:31). The WHO/FAO
(2002:32) state that higher birth weight has also been related to an increased risk of breast and other
cancers. However, Victora et al. (2008:350) found no convincing evidence that child‘s higher body weight
predicts cancer in later life, and some trials have even suggested that the opposite is true.
2.2.3. Hypertension
In a Jamaican study, blood pressure levels were found to be highest in 11 to 12 year old children who had
retarded fetal growth and greater weight gain between ages seven and 11 years. Similar results were
found amongst LBW Indian babies, where poor muscle-, but high fat preservation, was found (the ―thin-
fat‖ babies). An increased central adiposity was found in these children, with raised blood pressure
(WHO/FAO, 2002:34). If adjustment for current body size (through BMI) is made, the association between
LBW and high blood pressure is especially strong (WHO/FAO, 2002:34). The Birth-to-Twenty study found
that systolic blood pressure was inversely associated with birth weight, without regard to current weight or
height. For every one kilogram increase in birth weight, systolic blood pressure was 3,4 mmHg lower at
five years of age. However, for children who fell into the lowest quartile for birth weight (<2 800 g) as well
as in the highest quartile for current weight at five years of age, the blood pressure was the highest, which
suggested that birth weight‘s effect on blood pressure may be intensified by events in early childhood and
subsequent growth (Levitt et al., 2005:60).
2.2.4. Cardiovascular disease and diabetes mellitus
Van der Merwe and Pepper (2006:4) point out that if a previously stunted individual remains lean and
maintains a ―non-obesigenic lifestyle,‖ that person can remain ―metabolically healthy.‖ The risk for insulin
resistance in adulthood increases if there is weight gain in a previously undernourished individual due to
food becoming abundant (Van der Merwe & Pepper. 2006:4). Persons with a LBW who became obese
adults, have a higher risk for type 2 DM (Forsen et al., 2000:176).
Barker‘s study (1990:1111) found that men who suffered fetal growth retardation had higher mortality
from CVD (related to dyslipidemia), as well as a higher prevalence of hypertension and DM. The
WHO/FAO (2002:40) also states that LBW, followed by adult obesity, contributes to a particularly high risk
for CHD and DM (WHO/FAO, 2002:40). The risk for impaired glucose tolerance is the highest in obese
adults who had a LBW. When intra-uterine growth retardation is followed by rapid catch-up growth in
weight and height, there is an increased risk of adult disease (WHO/FAO, 2002:40). A link between short
stature and a higher risk of CHD, stroke and adult-onset DM is also probable (WHO/FAO, 2002:40).
Page 23 of 252
Glucose intolerance is influenced by birth weight, weight at one year old, and a high BMI during childhood
(Cameron, 2003:40). A study conducted by Forsen et al. (2000;176), in Helsinki, Finland, using data
collected between 1964 and 1997, found that type 2 DM is programmed in utero in association with low
rates of fetal growth. The increased risk for type 2 DM associated with small birth size, further increased
when there were higher growth rates after seven years of age (Forsen et al., 2000:176).
The Birth-to-Twenty study, reported that LBW children who were above the median weight-for-age, had
increased blood pressure at age five years, and a greater insulin response to oral glucose tolerance
testing at age seven (Goedecke et al., 2005:71; Levitt et al., 2005:59; Steyn, 2005b:249). Post-natal and
childhood growth patterns modulate the development of insulin resistance (Levitt et al., 2005:60). This
confirms the relationship between poor fetal growth (as measured by birth weight), and both glucose
intolerance and insulin resistance (Levitt et al., 2005:60). The study found that lower birth weight was
linked to greater insulin production and higher glucose concentrations when children fasted for ten to
twelve hours and then underwent an oral glucose tolerance test. The results suggested that the ability to
clear glucose from the circulation through insulin secretion was reduced in LBW children. Shorter children
at one and seven years old also presented with higher glucose concentrations. It has been postulated
that poor fetal growth followed by higher post-natal growth leads to low ß-cell counts and higher insulin
resistance (Cameron, 2003:40). Small-for-gestational age neonates with the greatest post-natal gain in
weight, had the greatest risk of developing insulin resistance. These abnormalities were already evident
in the first few week of life (Levitt et al., 2005:61).
Children born to mothers with high BMIs during pregnancy had more rapid growth during childhood, with
an increased incidence of type 2 DM (Forsen et al., 2000:176, 180). These children had faster growth
rates in height, weight, and BMI between the ages of seven and 15 years (Forsen et al., 2000:178). The
offspring of heavier mothers also have higher rates of type 2 DM as adults (Forsen et al., 2000:180) and
infants born to women with diabetes are often fatter and larger. Even if they are born with normal birth
weights, they still have an increased risk of childhood obesity. High glucose during fetal development
increases the risk of insulin resistance, onset of diabetes before the child-bearing years, and continuation
into the next generation (Victora et al., 2008:348).
2.2.5 Correlation between undernutrition and overweight
A relationship is suggested between stunting and obesity in developing countries undergoing nutrition
transition (Mukuddem-Petersen & Kruger, 2004:online). Nutritional stunting causes an increased risk of
obesity (Sawaya & Roberts, 2003:online). There is the possibility that child undernutrition is linked to adult
overweight, as the fetal origins hypothesis suggests. Persistent child undernutrition may contribute to the
burden of overweight in women (Mendez et al., 2005:720). The risk of stunting with concurrent obesity is
primarily related to low socio-economic status and maternal overweight. A child with an obese mother had
more than double the risk of being overweight or obese (Fernald & Neufeld, 2007:628-629).
The association between childhood stunting and adult obesity has been investigated in several studies,
amongst others by Popkin et al. (1996) and Sawaya et al. (1998). Mukuddem-Petersen and Kruger
(2004:online) speculate that the reduced body mass of malnourished children results in decreased basal
metabolic rate. Linear growth may then be limited when protein and other nutrient intakes are not
Page 24 of 252
adequate, but potential fat deposition will continue (Mukuddem-Petersen & Kruger, 2004:online). Mild
stunting might be associated with a greater susceptibility to the effects of a high-fat diet (Steyn et al.,
2005:12). Increased body fat deposits in stunted children may be due to a lower fasting fat oxidation rate
(Kruger et al., 2005, 492). A greater central fat distribution has been found in children stunted early in
childhood (Steyn et al., 2005:12).
As previously mentioned, stunting in early childhood, is associated with excess weight gain later in life, as
well as with the development of type 2 DM and hypertension (Van der Merwe & Pepper, 2006:4; Steyn et
al., 2005:5). There is more rapid weight gain in childhood and adolescence, especially as sub-cutaneous
fat, in stunted children as opposed to non-stunted children (Mukuddem-Petersen & Kruger, 2004:online).
Independent of LBW, adult obesity is linked to cortisol axis activation with adult metabolic- and
cardiovascular disease and elevated blood pressure in young adults (Van der Merwe & Pepper, 2006:4).
Stunting in childhood also predisposes the child to overweight or obesity when sufficient food becomes
available; which increases the risk of developing CDL (especially with a Westernized diet in adulthood)
should the child develop into an obese adult (Vorster & Kruger, 2007:323; Steyn et al., 2006:20).
A study conducted in a Brazil shantytown in 1995, found a high prevalence of undernutrition in children
(30%) with a shift toward overweight and obesity among adolescents (21% in girls and 8,8% in boys) and
adults (14,6%) (Sawaya & Roberts, 2003:online). Sawaya and Roberts (2003:online) also found a high
prevalence of obesity associated with stunting, indicating that obesity could occur when growth faltering
occurred. Other studies that were conducted later, have replicated these findings, showing an association
between stunting and overweight in other countries such as Russia, China and South Africa. All of these
countries are undergoing nutrition transition (Fernald & Neufeld, 2007:629; Jinabhai et al., 2003:online;
Sawaya & Roberts, 2003:online; Popkin et al., 1996:3013). A greater BMI was considered a reflection of a
greater reduction in height, rather than greater increase in weight (Kruger et al., 2005, 492; Popkin et al.,
1996:3014).
In Mexico, the prevalence of concurrent obesity or overweight with stunting was double among a rural
group of children, than urban children. The prevalence in three year old urban children was 5,9%, and
12,1% for rural children (Fernald & Neufeld, 2007: 626). Popkin et al. (1996:3012) showed that children
in China, Russia and South Africa who were stunted were also at risk of being overweight. However,
Brazilian data did not show this effect. The relative risk of being overweight if stunted was 2,6 amongst
South African children and 7,7 amongst Russian children (Jinabhai et al., 2003:online; Faber et al.,
2001:401; Popkin et al., 1996:3012). ―Small‖ and ―thin‖ babies in India had poor muscle mass as well as
visceral mass, but higher adiposity for a certain weight when compared with Caucasian babies (Van der
Merwe and Pepper, 2006:4).
The high prevalence of undernutrition in South African children places them at a higher risk for CDLs in
later life (Vorster & Kruger, 2007:323). The NFCS found that stunting increased the risk of being
overweight (Steyn et al., 2006:34; Steyn, 2005a:44; Steyn et al., 2005:4). Joubert et al. (2007:688)
mentions the coexistence of over- and undernutrition in the same household. Cameron (2003:38) states
that recent research links stunting in infancy and childhood to obesity. Stunting itself confers an increased
risk for overweight in children (Levitt et al., 2005:59). It is interesting to note that underweight children are
often found in the same households as overweight caregivers. This is the case in both South Africa and
Page 25 of 252
other developing countries, such as China, Russia and Brazil (Vorster & Kruger, 2007:323; Goedecke et
al., 2005:71; Steyn et al., 2005:10; WHO/FAO, 2002:61; Faber et al., 2001:410). Where there is a high
prevalence of obesity among black women, a high prevalence of stunting in children is found, particularly
in rural areas (Steyn et al., 2005:5).
In the 1994 Living Standards Measurement Survey, 30,6% of South African children between three and
six years old were found to be stunted and 7,5% were either overweight or obese. Thirteen percent of the
children were both stunted and obese, as opposed to five percent who were neither stunted nor obese
(Cameron, 2003:38).
In a rural area of Limpopo Province, 19% of children were both stunted and overweight. Having a greater
length/height at one year of age was protective against stunting at the age of three, while gaining more
weight within the first year of life increased the risk of being overweight at three years by 2,39 times.
During the follow-up at three years of age, 48% of the children were stunted, nine percent were
underweight, one percent were wasted, 18% were overweight and 24% were obese (Mamabolo et al.,
2005:online). The NFCS in South African children between one and nine years of age reported that the
prevalence of combined overweight and obesity (17,1%) at the national level was as high as that for
stunting (19,3%) (Mamabolo et al., 2005:online; Steyn, 2005b:249).
In a study of nearly 500 school girls aged between ten and 15 years from the North West Province
(THUSA-BANA study), stunting was associated with increased deposition of subcutaneous fat and
centralization of body fat stores ( Mukuddem-Petersen & Kruger, 2004:online).
The relative risk for overweight if stunted, was found to be 2,6 among South African children (Steyn et al.,
2005:12; Jinabhai et al., 2003:online; Faber et al., 2001:410; Popkin et al., 1996:3012). Because the
focus of the health services budget may still primarily be on the prevention and treatment of
undernutrition, rather than overweight or obesity, it is important to determine whether undernutrition in
young children may in the long term lead to overweight or obesity in older children and adults, since the
negative health and economic consequences of obesity are prevalent in South Africa (Steyn et al.,
2005:12).
2.3. The nutrition transition
According to the WHO/FAO, ―rapid changes in diets and lifestyles have occurred with industrialization,
urbanization, economic development and market globalization, which have a significant impact on the
health and nutritional status of populations, particularly those in developing countries and in countries in
transition‖ (WHO/FAO, 2002:1). Mukuddem-Petersen and Kruger (2004:online) classify the nutrition
transition as ―a sequence of characteristic changes in dietary patterns and nutrient intakes associated
with social, cultural and economic changes during the demographic transition.‖ The WHO/FAO (2002:13)
state that it entails changes in diet as well as reduced physical activity. The dietary changes include a
shift towards a higher energy-density diet with increased intake of fat, especially saturated fat (from
animal origin), refined carbohydrates and added sugars, as well as a reduced intake of vegetables and
fruit (Steyn, 2005b:249; WHO/FAO, 2002:2,13,15). As mentioned previously; traditional diets in South
Africa consisted of >60% to 65% of total energy from carbohydrates, and <25% of total energy from fat,
whereas the Western diet consists of <50 to 55% of total energy from carbohydrates and >30% to 35% of
Page 26 of 252
total energy from fat; and is lower in fibre intake and higher in free sugar intake (>10% of total energy)
(Joubert et al., 2007:684; Steyn et al., 2006:13,14; Steyn, 2005a:36; Bourne et al., 2002:157,159;
WHO/FAO, 2002:19).
The World Cancer Research Fund (WCRF) and American Institute for Cancer Research (AICR) state that
food supplies usually become more secure with industrialization and urbanization, which consequently
makes food more available for consumption. Diets usually become denser in energy, with fewer starchy
foods and more fats; oils; sugars; and additives, as well as alcoholic drinks being ingested. At the same
time, physical activity decreases, with the need for energy decreasing and the rate of overweight and
obesity increasing (WRCF/AICR, 2007:4). Traditional diets and lifestyles are rapidly changing in
developing countries even though food insecurity and undernutrition persist where CDLs are becoming
epidemic (WHO/FAO, 2002:8). Kruger et al. (2005:493) state that globalization increases the CDL risk in
urban populations, because an environment that promotes intake of fatty and sugary foods is created.
The traditional diet is associated with a low prevalence of degenerative diseases, whereas the Western
diet is associated with increased prevalence of CDLs (Bourne et al., 2002:157). Modern dietary patterns
are seen by the WHO/FAO (2002:5) as ―risk behaviours that travel across countries and are transferable
from one population to another almost like an infectious disease, affecting disease patterns globally‖
[emphasis added]. The nutrition transition contributes to a higher risk for developing CDLs, even in the
poorest countries. The apparent accelerating pace of the transition is especially evident in low– and
middle-income countries (WHO/FAO, 2002:13). The nutrition transition has important implications for
preventive strategies to control CDLs (Jinabhai et al., 2003:online). The urbanized poor in developing
countries are ―at the greatest risk for developing health problems associated with dietary changes (Yach
et al., 1991:212).
2.3.1. In the world
Rapid urbanization is occurring globally. In 1994, the rate was 44,5%; and it is projected to be 61% by
the year 2025. Among developing countries, the rate was 12,6% in 1970; 21,9% in 1994; and is
projected to be 43,5% by 2025 (Seedat, 2007:317).
Diets in developing countries are changing as income rises. The intake of staple foods, such as cereals,
roots and tubers, has declined, while consumption of meat, dairy and oil has increased. The per capita
meat consumption in developing countries rose by 150% between 1964 and 1966; as well as between
1997 and 1999. By 2030, the per capita consumption of livestock products could rise by a further 44%.
Poultry consumption is predicted to grow the fastest (WHO/FAO, 2002:26). In developing countries,
demand is predicted to grow faster than the production of meat products (WHO/FAO, 2002:27).
In many countries, like the United States of America (USA), eating patterns have changed over the past
thirty years, with increased consumption of fast foods, pre-prepared meals and carbonated drinks
(WHO/FAO, 2002:38). In Europe, North America, Oceania and Japan, life expectancy has continued to
increase throughout the past century, with CDLs now being the main cause of death. It is estimated that
approximately one-third of all cancers and one-quarter of CVD are attributable to an ―affluent‖ diet.
Many countries in Asia are in transition, both epidemiologically and demographically. In China, fat levels
Page 27 of 252
in the diet have risen from 26% of total energy in 1981, to thirty percent in 1988, as the diets have
become more Westernized (Darnton-Hill & Coyne, 1998:25).
An important feature of the nutrition transition is the increase in the quantity and quality of dietary fats.
On average, Africa has the lowest fat consumption, while parts of Europe and North America have the
highest consumption (WHO/FAO, 2002:17). The 2010 dietary guidelines for Americans recommend that
total fat intake should provide twenty percent to 35% of the total energy in the diet, while saturated fat
should provide less than ten percent of total energy (United States Department of Agriculture (USDA)
and United States Department of Health and Human Services (USDHHS), 2010:24).
According to a study conducted by the FAO between 1988 and 1990, nineteen countries (mostly Sub-
Saharan African and some South Asian), had a total fat intake of less than 15%; and 24 countries‘ total
fat intake was above the maximum recommendation of 35%; the majority of these countries being in
North America and Western Europe (WHO/FAO, 2002:18). The WCRF/AICR (2007:11) state that in
recent years, rapid changes in diet have been seen in the middle- and low-income countries of Asia,
Africa, the Middle East and Latin America, with a shift in energy consumption towards more fats, oils
and added sugars. Various national dietary survey data show that the proportion of animal fat in total fat
intake was lower than ten percent in the Democratic Republic of the Congo, Mozambique, Nigeria, Sao
Tome and Principe, and Sierra Leone, while it was above 75% in Denmark, Finland, Hungary, Mongolia,
Poland and Uruguay (WHO/FAO, 2002:19). In Japan, total fat intake has increased from 15% of dietary
energy in 1965, to 25% in 1985 (Darnton-Hill & Coyne, 1998:25).
2.3.2. In Africa and South Africa
According to O‘Keefe et al. (1983:679), only 12,6% of the black population of South Africa was
urbanized in 1911. That figure has risen to 18% by 1960, and it was predicted to reach 75% by the year
2000. Analysis of the 1985 census data showed that South African blacks moved into urban areas at a
rate of 3,5% per year. Yach et al. (1991:212) reported that the majority of the white population in South
Africa was already urbanized in the early 1990s. It was predicted that the urban Black population would
increase from 6,5 million in 1985 to more than twenty million by 2000 (Cameron, 2003:32; Yach et al.,
1991:212). Urban areas were predicted to double in size by 2010. The expected increases in the urban
population did not happen, however. The United Nations Commission for Human Settlement reported in
2001 that the urbanization rate was only 1,2% during the late 1990s (Cameron, 2003:32).
Currently, the black population represents approximately 76% to 79% of the total South African
population (Steyn et al., 2006:6; Labadarios et al., 2005:534; Statistics South Africa, 1999:1). The
percentage of the black population living in urban areas increased from 35,8% in 1993, to 43,3% in
1996 (Vorster, 2002:239). It should however be kept in mind that the 1996 census was the first
comprehensive census conducted in South Africa (Bradshaw et al., 2003:1) and figures before that date
should be interpreted with caution. Since the percentages of coloureds, Indians and whites in urban
areas remained relatively constant for the period 1993 to 1996, the increase in urbanization from 48,3%
to 53,7% was because of the rapid migration of blacks (Vorster, 2002:239). Kruger et al. (2005:492)
state that the nutrition transition is occurring because the black population now (i.e. post-apartheid) has
more freedom of movement and are more exposed to the global market economy.
Page 28 of 252
Already in 1977, Seftel (1977:121) reported that the diseases in the urban black population in South
Africa, were those of a population in transition. Two groups of new disorders were identified, namely (1)
alcohol-related disorders; and (2) the diseases encountered in Western populations (i.e. CDLs). At that
time, Seftel (1977:121) had already indicated that obesity and hypertension had attained epidemic
proportions among urban Blacks. He even went so far as to state that their prevalence may actually
have exceeded that of the white population. Other conditions, such as CHD, gout, gallstones and
colonic cancer, which emerged later, were still uncommon amongst the black population at that time
(Seftel, 1977:121). In 1983, O‘Keefe et al. (1983:679) already noted a change in nutritional status in
females; characterized by a shift from chronic malnutrition to obesity, and the appearance of more
Westernized disease patterns.
In 1997, Darnton-Hill and Coyne (1998:27), reported that Sub-Saharan Africans were eating less coarse
grains and roots and tubers and more wheat and rice. Africa was the only continent where intake of
dietary fats had not increased (WHO/FAO, 2002:17). However, this is not the case in South Africa, as
will be shown.
If rural Africans follow traditional lifestyles (including a traditional diet) they usually have a good
nutritional status and very low risk factors for CDLs (Vorster & Kruger, 2007:323). With urbanization,
however, the diet consists of more fats and oils (more total and trans-fatty acids), more animal-derived
foods (more saturated fatty acids), less staples, fruits and vegetables (less unrefined carbohydrate) and
less dietary fibre and micronutrients (Vorster & Kruger, 2007:323; Seedat, 2007:318). This diet is
associated with increased risk for all CDLs, including CVD. Vorster and Kruger (2007:323), refer to
―another double burden,‖ where individuals who were programmed during fetal life and infancy through
undernutrition are more vulnerable to CVD, develop an even greater risk for CVD in later life when they
are exposed to modern/Westernized diets.
According to the MRC Technical Report on dietary changes and the health transition in South Africa
(Steyn et al., 2006:6), the unhealthy lifestyles associated with CDLs are the same globally. Diets
associated with CDLs consist of a high consumption of energy-dense foods with low levels of
micronutrients or fibre, and are high in total fat, saturated fat, trans fatty acids, free sugars and salt
(Steyn et al., 2006:6; Darnton-Hill & Coyne, 1998:25).
South Africa has become the most important African market for ―Coca-Cola‖, and one of their largest
markets in the world (Kruger et al., 2005:493). Rapid and unplanned urbanization have taken place
which accelerated changes in traditional diets (Steyn et al., 2005:4; Kruger et al., 2005: 493), and easy
access to high-fat foods and tobacco, which are contributing risk factors to CDLs (Kruger et al., 2005:
493).
Over a period of fifty years (1940 to 1990), fat intake amongst urban blacks increased from 16,4% to
26,2% of total energy, with a relative increase of 59,7%; and intake of carbohydrates decreased from
69,3% to 61,7% of total energy, with a relative decrease of 10,9% (Goedecke et al., 2005:71; Bourne et
al., 2002:157). Shifts to the Western diet were also found amongst rural black communities. There was
an increased prevalence of CDLs with a Western diet (Bourne et al., 2002:157). Bourne et al.
(2002:158) found that as urban exposure increased, so did the ―atherogenicity‖ of the diet. According to
Goedecke et al. (2005:71), the changes that were reported over the fifty year period, were more
Page 29 of 252
dramatic than those observed in Western countries undergoing rapid industrialization over longer
periods.
As part of THUSA study undertaken from 1996 to 1998, MacIntyre et al. (2002:253) reported that the
dietary intakes of urban communities in the North West Province indicated that a nutrition transition was
present, with an increase in total fat and animal protein intake, and less carbohydrates being consumed
(Vorster, 2002:241).. A high fat intake among urban subjects has been reported to contribute to
increasing rates of obesity among South Africans (Goedecke et al., 2005:71; Kruger et al., 2005:493).
The THUSA study found that the lowest fat intake was in rural participants (46 g per day) and the
highest fat intake in urban middle-class populations (56,3 g per day) (Kruger et al., 2002:426).
In 2006, the intake of carbohydrates and fibre among black people in transition decreased with
increased time of living in a city, while fat intake increased. Protein intake remained more or less the
same, but the source changed from mostly plant-based to mostly animal-based protein (Steyn et al.,
2006:13).
The 1998 SADHS (DoH et al., 2002), Dikgale study (Steyn et al., 2001) and BRISK study (Steyn et al.,
1991) all confirm that urban blacks consume more fat and less carbohydrates than their rural
counterparts. Again, protein intake stayed more or less the same in all above-mentioned studies. In the
North West Province, low intake of fruit, vegetable and milk was reported in all groups studied, except
for the upper middle class in urban communities. Alcohol consumption was higher in rural communities
(MacIntyre et al., 2002:253). Men consumed alcohol far more frequently than women (Steyn,
2005b:249; MacIntyre et al., 2002:253). Alcohol consumption seemed to have increased in the South
African population from 1962 to 2001, with thirty percent of males reported to use alcohol excessively as
compared to ten percent of women (Steyn et al., 2006:18). In addition, high intakes of sodium and low
intakes of foods containing potassium, calcium and magnesium contributed to the increased
prevalence of hypertension in black communities (Steyn, 2005b:249).
The MRC Technical Report also noted that although rural populations had higher intakes of cereals and
vegetables, urban populations consumed more sugar, meat, vegetable oil, dairy, fruit, roots, tubers and
alcohol (Steyn et al., 2006:17). Vorster et al. (2005:online) state that the decreased intake of the South
African staple food (maize porridge) and the increased intake of added fats and oils, as well as foods of
animal origin during urbanization represents similar dietary patterns as observed in other developing
countries. Their findings of decreased intake of total carbohydrate and increases in animal protein and
total fat intake correlate with earlier studies comparing nutrient intakes between rural and urban South
Africans (Vorster et al., 2005:online).
As far as dietary intake of children is concerned, the NFCS found that one in three children of all age
groups in the Northern Cape, Mpumalanga, Northern Province and the Free State received less than
half of their daily energy needs (Labadarios, et al., 2005:537). Intake of sugar, as a percentage of total
energy, was highest in the Western Cape (15%) and Northern Cape (13%) and lowest in the Free State,
Northern Province and Mpumalanga. The ratio of poly-unsaturated to saturated fats was 0,9 in Gauteng
and Western Cape and 1,4 in the Eastern Cape and Northern Province. Girls received more energy
Page 30 of 252
from fat than boys. Rural children received a greater percentage of energy from plant-based protein,
similar to the national pattern (Labadarios et al., 2005:539).
Half of the South African population does not meet the local dietary guidelines of four portions of fruits
and vegetables daily, while a quarter of the population eats none at all. Shifts towards the Western diet
have been suggested in both rural and urban areas with a decrease in starchy foods and fibre
consumption and an increase in fat intake (WCRF/AICR, 2007:9).
2.4. The burden of disease
As previously mentioned, many developing countries face a double burden of both overnutrition and
undernutrition (Mendez et al., 2005:714).
2.4.1. In the world
Many developing countries have increased rates of child mortality, while obesity and CDLs prevalence
are also increasing (Darnton-Hill & Coyne, 1998:23). In 1990, CDLs accounted for 28,1 million deaths
worldwide (Murray & Lopez, 1997a:1436; Murray & Lopez, 1997b:1498). This amount is predicted to
increase to 49,7 million by 2020 (Murray & Lopez, 1997b:1498). According to the World Health
Organization‘s Global Status of Health Report, the Americas have ten percent of the global burden of
disease and utilize 38% of the world‘s healthcare workers for fifty percent of the world‘s diseases. In
contrast, in Africa 11% of the world‘s population has 24% of the world‘s diseases, but only three percent
of the healthcare workers and one percent of the global financial resources (Seedat, 2007:317). There
are 57 countries that cannot meet a widely accepted basic standard of healthcare, of which 36 countries
are in Sub-Saharan Africa (Seedat, 2007:317). In high-income countries, only one percent of deaths
occurred in children younger than 15 years, and 84% occurred in people older than sixty years (WHO,
2008:8). According to Murray and Lopez (1997c:1269), the developing world presents with 98% of all
deaths worldwide among children younger than 15 years old; 83% of all deaths worldwide among 15- to
59-year-olds, and 59% of deaths worldwide among seventy-year-olds. The probability of death between
birth and 15 years is 22% in Sub-Saharan Africa, compared to 1,1% in countries with established
market economies (Murray & Lopez, 1997c:1269). The probability of adult death due to CDLs is also
higher in Sub-Saharan Africa and other developing countries than in first world countries (Murray &
Lopez, 1997c:1269). In 1990, CDLs already accounted for a higher burden of disease in countries like
China, Latin Ame9rica and the Caribbean than Asia and the Middle East (Murray & Lopez, 1997a:1441).
An initial global assessment of the burden of disease was conducted from 1993 to 1996 by the Harvard
School of Public Health, the World Bank and the WHO (Murray & Lopez, 1997a, 1997b and 1997c).
With the application of various mathematical formulae and projections, consistent and coherent
estimates were derived from the data. The study estimated disease and injury rates by age and sex for
1990 in eight world geographical regions and these were categorized according to DALYs (Bradshaw et
al., 2003:1).
The primary indicator used to summarize the burden of premature mortality and disability (including
temporary disability) was the DALY. Murray and Lopez (1997a:1436) define the DALY as ―the sum of
life years lost due to premature mortality and years lived with disability adjusted for severity.‖ The DALY

Page 31 of 252
is incidence-based, rather than prevalence-based and can be used as a summary measure of health
gaps in a population. . The DALY consists of Years of Life Lost (YLL) due to premature mortality, plus
Years lived with a disability (YLD), which are weighted according to the severity of the disability. Thus
DALY = YLL + YLD (Bradshaw et al., 2003:3).
The DALY includes any health outcome that represents a loss of welfare. Only age and sex are
included as individual characteristics in the set of variables. Health outcomes are also treated as alike,
irrespective of where or to whom they occur. No preference is given to socio-economic setting
(Bradshaw et al., 2003:4).
In 1997, developed countries accounted for 11,6% of the world‘s burden from all causes of death and
disability and accounted for 90,2% of health expenditure worldwide. CDLs accounted for 40,9% of
worldwide DALYs, malignant cancers for 5,1% and cardiovascular conditions for 9,7% (Murray & Lopez,
1997a:1436).
A change is predicted in the rank orders of disease burden for 15 leading causes of disability and death
in the world, as shown by DALYs. IHD will be the most common cause of DALYs worldwide in 2020
(Seedat, 2007:318). The changes in ranking as predicted by Murray and Lopez (1997b:1499) for certain
selected CDLs and other disease, are set out in Table 2.1. The summarized percentage distribution of
current DALYs (for 1990) and projected DALYs (for 2020) for certain diseases are set out in Table 2.2.
Table 2.1. Global changes in ranking for selected causes of death from 1990 to 2020 (Murray & Lopez, 1997b:1499, Table 1 - amended)
Disorder Within top 15
Ranking Change in ranking
1990 2020
Ischemic heart disease 1 1 0
Cerebrovascular disease 2 2 0
Chronic obstructive pulmonary disease 6 3 ↑3
Trachea, bronchus and lung cancers 10 5 ↑5
Liver cirrhosis 13 12 ↑1
Stomach cancer 14 8 ↑6
Diabetes mellitus 15 19 ↓4
Outside top 15
Liver cancer 21 13 ↑8
HIV 30 9 ↑21
In 1997, IHD and cerebrovascular disease (i.e. stroke) were already the leading CDL-specific causes of
global DALYs (Murray & Lopez, 1997a:1436,1441). As can be seen from Table 2.1, HIV has made a big
leap up the ranks and stomach cancer, liver cirrhosis, respiratory cancers and chronic obstructive
pulmonary disease (COPD) have all moved up the ranks. Only DM has moved down the rankings.
Both CVD and malignant neoplasms are predicted to increase in both developed and developing
countries by 2020 (Table 2.2). Interestingly, the projections for DM show that figures will remain
relatively fixed. Murray and Lopez (1997b:1502) project that by 2020, almost sixty percent (59,7%) of
DALYs worldwide will come from CDLs, as opposed to 40,9% in 1990. The projected increase in deaths
from CDLs is expected to be larger for males (91%) than for females (61%) (Murray & Lopez,
1997b:1501). A selection of leading causes of DALYs in 2020 according to baseline projections is set
out in Table 2.3.
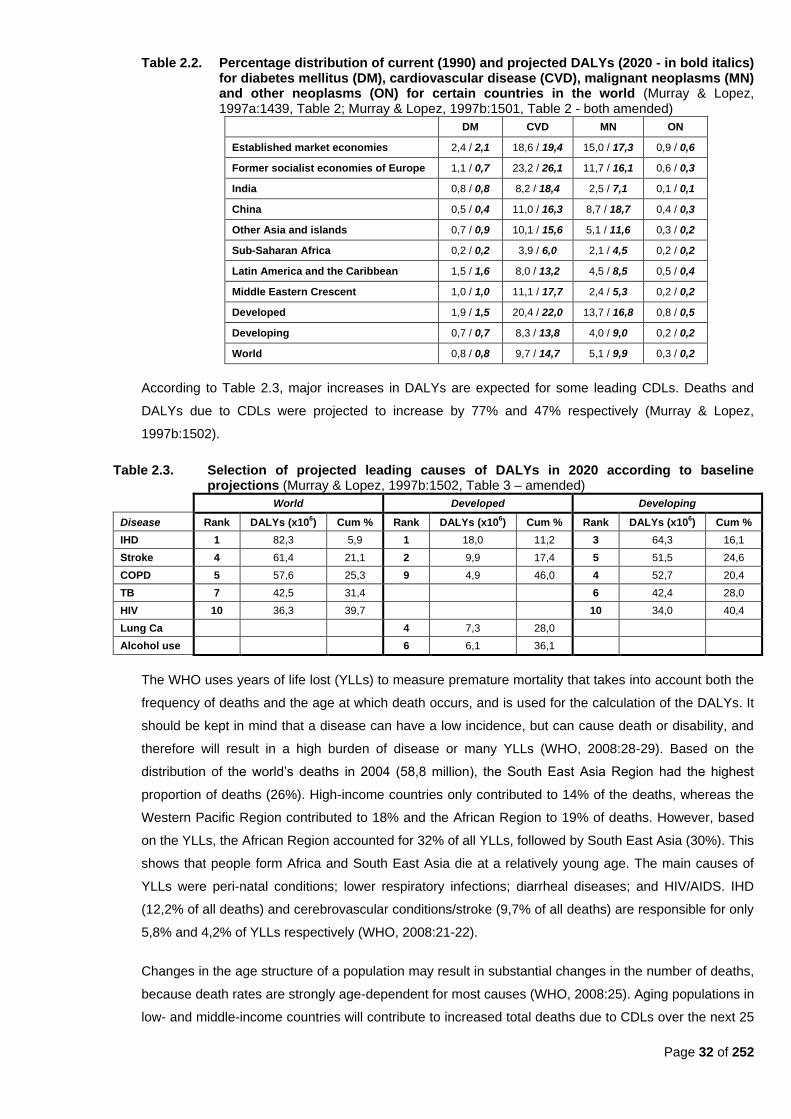
Page 32 of 252
Table 2.2. Percentage distribution of current (1990) and projected DALYs (2020 - in bold italics) for diabetes mellitus (DM), cardiovascular disease (CVD), malignant neoplasms (MN) and other neoplasms (ON) for certain countries in the world (Murray & Lopez, 1997a:1439, Table 2; Murray & Lopez, 1997b:1501, Table 2 - both amended)
DM CVD MN ON
Established market economies 2,4 / 2,1 18,6 / 19,4 15,0 / 17,3 0,9 / 0,6
Former socialist economies of Europe 1,1 / 0,7 23,2 / 26,1 11,7 / 16,1 0,6 / 0,3
India 0,8 / 0,8 8,2 / 18,4 2,5 / 7,1 0,1 / 0,1
China 0,5 / 0,4 11,0 / 16,3 8,7 / 18,7 0,4 / 0,3
Other Asia and islands 0,7 / 0,9 10,1 / 15,6 5,1 / 11,6 0,3 / 0,2
Sub-Saharan Africa 0,2 / 0,2 3,9 / 6,0 2,1 / 4,5 0,2 / 0,2
Latin America and the Caribbean 1,5 / 1,6 8,0 / 13,2 4,5 / 8,5 0,5 / 0,4
Middle Eastern Crescent 1,0 / 1,0 11,1 / 17,7 2,4 / 5,3 0,2 / 0,2
Developed 1,9 / 1,5 20,4 / 22,0 13,7 / 16,8 0,8 / 0,5
Developing 0,7 / 0,7 8,3 / 13,8 4,0 / 9,0 0,2 / 0,2
World 0,8 / 0,8 9,7 / 14,7 5,1 / 9,9 0,3 / 0,2
According to Table 2.3, major increases in DALYs are expected for some leading CDLs. Deaths and
DALYs due to CDLs were projected to increase by 77% and 47% respectively (Murray & Lopez,
1997b:1502).
Table 2.3. Selection of projected leading causes of DALYs in 2020 according to baseline projections (Murray & Lopez, 1997b:1502, Table 3 – amended)
World Developed Developing
Disease Rank DALYs (x106) Cum % Rank DALYs (x10
6) Cum % Rank DALYs (x10
6) Cum %
IHD 1 82,3 5,9 1 18,0 11,2 3 64,3 16,1
Stroke 4 61,4 21,1 2 9,9 17,4 5 51,5 24,6
COPD 5 57,6 25,3 9 4,9 46,0 4 52,7 20,4
TB 7 42,5 31,4
6 42,4 28,0
HIV 10 36,3 39,7
10 34,0 40,4
Lung Ca
4 7,3 28,0
Alcohol use
6 6,1 36,1
The WHO uses years of life lost (YLLs) to measure premature mortality that takes into account both the
frequency of deaths and the age at which death occurs, and is used for the calculation of the DALYs. It
should be kept in mind that a disease can have a low incidence, but can cause death or disability, and
therefore will result in a high burden of disease or many YLLs (WHO, 2008:28-29). Based on the
distribution of the world‘s deaths in 2004 (58,8 million), the South East Asia Region had the highest
proportion of deaths (26%). High-income countries only contributed to 14% of the deaths, whereas the
Western Pacific Region contributed to 18% and the African Region to 19% of deaths. However, based
on the YLLs, the African Region accounted for 32% of all YLLs, followed by South East Asia (30%). This
shows that people form Africa and South East Asia die at a relatively young age. The main causes of
YLLs were peri-natal conditions; lower respiratory infections; diarrheal diseases; and HIV/AIDS. IHD
(12,2% of all deaths) and cerebrovascular conditions/stroke (9,7% of all deaths) are responsible for only
5,8% and 4,2% of YLLs respectively (WHO, 2008:21-22).
Changes in the age structure of a population may result in substantial changes in the number of deaths,
because death rates are strongly age-dependent for most causes (WHO, 2008:25). Aging populations in
low- and middle-income countries will contribute to increased total deaths due to CDLs over the next 25
Page 33 of 252
years. It is projected that global cancer deaths will increase from 7,4 million in 2004, to 11,8 million in
2030; and cardiovascular deaths from 17,1 million in 2004, to 23,4 million in 2030. CDLs are projected
to account for over 75% of all deaths in 2030 (WHO, 2008:22). The four projected leading causes of
death globally in 2030 will be IHD; cerebrovascular disease/stroke; COPD; and lower respiratory
infections (WHO, 2008:23).
The majority of the world‘s poor still face hunger and undernutrition, which continue to dominate the
health of the world‘s poorest nations. Nearly thirty percent of the world‘s population is currently suffering
from one or more forms of undernutrition (WHO/FAO, 2002:8). People in lower socio-economic groups
have the largest burden of disease and the least amount of resources for adequate treatment (Sawaya
& Roberts, 2003:online). Therefore, the mortality is higher in poorer communities in developing
countries; especially among children younger than five years of age and adults with CDLs (Sawaya &
Roberts, 2003:online). Undernutrition affects about 200 million children younger than five years in
developing countries (Nannan et al., 2007:733). Almost 16% of all DALYs worldwide in 1997 were
attributed to childhood undernutrition (Murray & Lopez, 1997a:1436,1441). The rapidly increasing
burden of CDLs is a key determinant of global public health. Already 79% of deaths attributable to CDLs
are occurring in developing countries, predominantly in middle-aged men (WHO/FAO, 2002:31).
It is estimated that more than one billion adults in the world are overweight, of which at least 300 million
are obese. Obesity, as a risk factor for CDLs, is a global public health concern (Kruger et al., 2005:491).
Increases in obesity over the past thirty years have been paralleled by a dramatic rise in the prevalence
of DM (WHO/FAO, 2002:61). Countries in transition, such as China, Brazil and South Africa, have an
increased rate of obesity across all economic levels and age groups (Kruger et al., 2005:491).
Populations of many countries suffer the worst of both worlds, i.e. the effect of undernutrition, impacting
mostly on infants, children and women of child-bearing age; and overnutrition, creating a variety of
chronic health conditions in the middle-aged and older populations (Darnton-Hill & Coyne, 1998:25).
The co-existence of undernutrition and obesity among the poor places a burden on social-, economic-
and health care systems (Sawaya & Roberts, 2003:online).
Mendez et al. (2005:714) found that the prevalence of overweight amongst women exceeded
underweight in over half of the countries studied, including the urban areas of mostly South American
and African countries. The median ratio of overweight to underweight was 5,8:1 in urban and 2,1:1 in
rural areas. In many of the developed countries, the ratio was about 20,0 (Mendez et al., 2005:719).
Countries with high levels of urbanization had a high absolute prevalence of overweight, with little
difference between urban and rural areas, and a high ratio of overweight to underweight. Even in poor
countries, where underweight usually persisted, there was a fairly high prevalence of overweight in rural
areas (Mendez et al., 2005:714).
2.4.2. In Africa
In 1995, the African population was estimated to be 580 million (Seedat, 2007:317). Between 1990 and
1995, two million children died annually before their first birthday. About 291 million African residents
had an average income below US$1 (R8) a day in 1998; and 124 million of those younger than 39 years
Page 34 of 252
were at risk of dying before forty years. During 1990 to 1995, about 205 million Africans had no access
to health services and 249 million were without clean drinking water (Seedat, 2007:317).
In Africa, elevated blood pressure and cholesterol are among the top ten risk factors for the overall
disease burden (WHO, 2008a:8). Poor households undergoing industrialization in urban areas are
particularly affected by underweight coexisting with obesity (Kruger et al., 2005:491). Eleven percent of
the world‘s population (in Africa) has 24% of the world‘s diseases, but only three percent of the world‘s
healthcare workers and only one percent of global financial resources. Fifty-seven countries cannot
meet a widely accepted basic standard of healthcare, of which 36 are in Sub-Saharan Africa (Seedat,
2007:317).
Deaths in children younger than five, showed a burden distribution which leaned heavily towards Africa
(WHO, 2008:16). In 2004, almost half (46%) of all deaths in Africa occurred in children under 15 years.
Only twenty percent of deaths occurred in people older than sixty years (WHO, 2008:8).
The main focus of public health programs in Sub-Saharan Africa over the past decade has been the
eradication of undernutrition and infectious diseases (Kruger et al., 2005:491). In 1994, about a third
(32%) of children in Africa were undernourished (De Villiers & Senekal, 2002:1231). In 1998, 43 million
of the African population were stunted due to undernutrition (Seedat, 2007:317). In 2004, 13,7 million
children younger than four years were wasted and 51,9 million were stunted (WHO, 2008:32).
Thirty-five percent of children younger than five are believed to be stunted in Africa as a whole, and
42% in Sub-Saharan Africa (Mamabolo et al., 2005:online). A higher prevalence of stunting in male
children has occasionally been reported in Sub-Saharan Africa. In ten countries (including Cameroon,
Ghana, Kenya, Malawi, Namibia, Nigeria, Tanzania, Uganda, Zambia and Zimbabwe) boys younger
than five years were more likely to become stunted than girls. This sex difference was more pronounced
in lower socio-economic groups, and might suggest that boys are more vulnerable to illness (Wamani et
al., 2007:online).
2.4.3. In South Africa
It was already predicted in 1972 that increasing urbanization and a rise in socio-economic status in
developing populations would increase their proneness to obesity, DM, hypertension and stroke. This
has largely come true for the black population in South Africa (Bourne et al., 2002:159). It was predicted
in 1988 that by the turn of the century about 75% of South Africa‘s population would be urbanized (Brink
AJ. 1988, as referred to by Mollentze et al., 1995:90).
South Africa suffers from a quadruple burden of disease, which can be classified as a combination of:
poverty-related infectious disease and underdevelopment; CDLs; violence-related trauma and injuries;
and the HIV/AIDS epidemic (Steyn et al., 2006:6; Bradshaw et al., 2003:iii; Bourne et al., 2002:157).
The double burden of disease consisting of undernutrition-related infections and overnutrition-related
CDLs within families, communities and population groups, is also experienced in South Africa (Vorster &
Kruger, 2007:323).
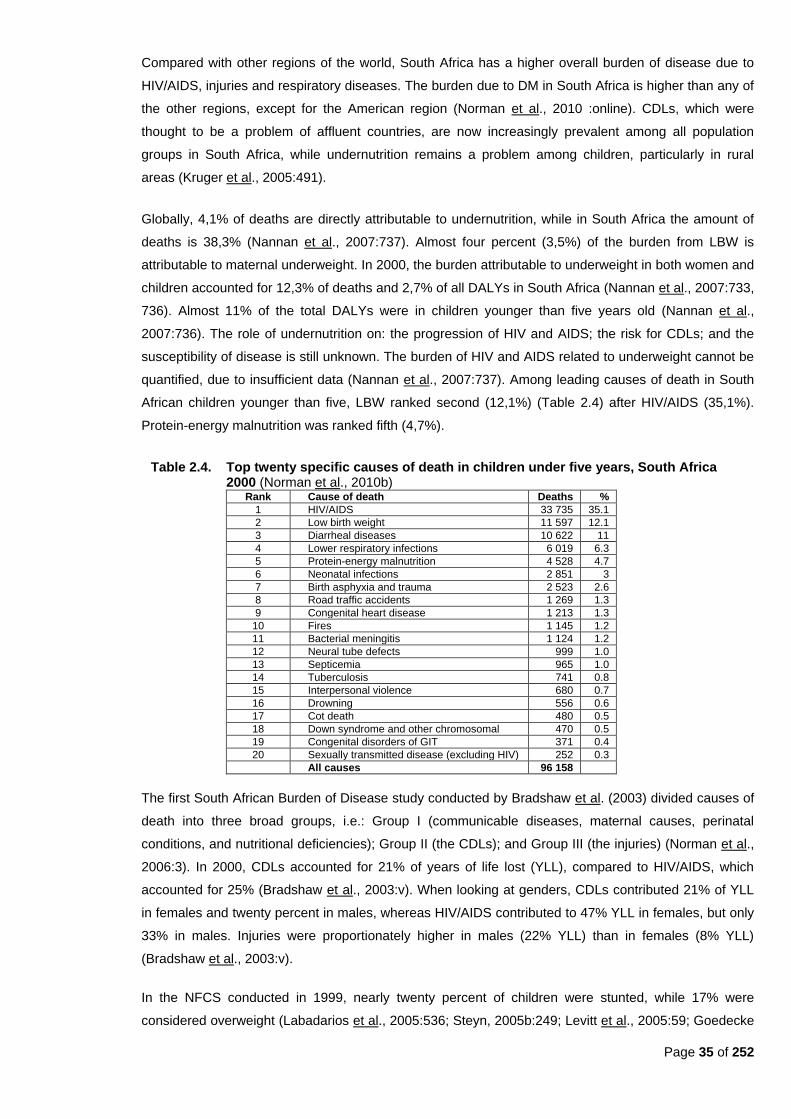
Page 35 of 252
Compared with other regions of the world, South Africa has a higher overall burden of disease due to
HIV/AIDS, injuries and respiratory diseases. The burden due to DM in South Africa is higher than any of
the other regions, except for the American region (Norman et al., 2010 :online). CDLs, which were
thought to be a problem of affluent countries, are now increasingly prevalent among all population
groups in South Africa, while undernutrition remains a problem among children, particularly in rural
areas (Kruger et al., 2005:491).
Globally, 4,1% of deaths are directly attributable to undernutrition, while in South Africa the amount of
deaths is 38,3% (Nannan et al., 2007:737). Almost four percent (3,5%) of the burden from LBW is
attributable to maternal underweight. In 2000, the burden attributable to underweight in both women and
children accounted for 12,3% of deaths and 2,7% of all DALYs in South Africa (Nannan et al., 2007:733,
736). Almost 11% of the total DALYs were in children younger than five years old (Nannan et al.,
2007:736). The role of undernutrition on: the progression of HIV and AIDS; the risk for CDLs; and the
susceptibility of disease is still unknown. The burden of HIV and AIDS related to underweight cannot be
quantified, due to insufficient data (Nannan et al., 2007:737). Among leading causes of death in South
African children younger than five, LBW ranked second (12,1%) (Table 2.4) after HIV/AIDS (35,1%).
Protein-energy malnutrition was ranked fifth (4,7%).
Table 2.4. Top twenty specific causes of death in children under five years, South Africa 2000 (Norman et al., 2010b)
Rank Cause of death Deaths %
1 HIV/AIDS 33 735 35.1
2 Low birth weight 11 597 12.1
3 Diarrheal diseases 10 622 11
4 Lower respiratory infections 6 019 6.3
5 Protein-energy malnutrition 4 528 4.7
6 Neonatal infections 2 851 3
7 Birth asphyxia and trauma 2 523 2.6
8 Road traffic accidents 1 269 1.3
9 Congenital heart disease 1 213 1.3
10 Fires 1 145 1.2
11 Bacterial meningitis 1 124 1.2
12 Neural tube defects 999 1.0
13 Septicemia 965 1.0
14 Tuberculosis 741 0.8
15 Interpersonal violence 680 0.7
16 Drowning 556 0.6
17 Cot death 480 0.5
18 Down syndrome and other chromosomal 470 0.5
19 Congenital disorders of GIT 371 0.4
20 Sexually transmitted disease (excluding HIV) 252 0.3
All causes 96 158
The first South African Burden of Disease study conducted by Bradshaw et al. (2003) divided causes of
death into three broad groups, i.e.: Group I (communicable diseases, maternal causes, perinatal
conditions, and nutritional deficiencies); Group II (the CDLs); and Group III (the injuries) (Norman et al.,
2006:3). In 2000, CDLs accounted for 21% of years of life lost (YLL), compared to HIV/AIDS, which
accounted for 25% (Bradshaw et al., 2003:v). When looking at genders, CDLs contributed 21% of YLL
in females and twenty percent in males, whereas HIV/AIDS contributed to 47% YLL in females, but only
33% in males. Injuries were proportionately higher in males (22% YLL) than in females (8% YLL)
(Bradshaw et al., 2003:v).
In the NFCS conducted in 1999, nearly twenty percent of children were stunted, while 17% were
considered overweight (Labadarios et al., 2005:536; Steyn, 2005b:249; Levitt et al., 2005:59; Goedecke
Page 36 of 252
et al., 2005:71). Kruger et al. (2002:427) showed that overweight and obesity in black women of the
North West Province in South Africa was not only related to diet, but also to inactivity, which illustrates
that other lifestyle factors are also involved in increasing risk for CDLs. For the period 2002–2003, 44%
of South African men and 49% of women aged between 18 and 69 years old were sedentary
(WCRF/AICR, 2007:9).
WCRF/AICR (2007:8) states that in 2001, the population of South Africa was almost 47,5 million with a
gross domestic product (GDP) of US$8 506 (about R68 048) per person. However, Bradshaw et al.
(2003:ii), (as part of a study for the Initial Burden of Disease Estimates for South Africa) estimated the
South African population at just over 45 million in 2000. In 2000, Bradshaw et al. (2003:ii) estimated the
life expectancy at birth of South African males at 52,4 years and females 58,5 years of age, whereas
the WCRF/AICR (2007:8) estimated the life expectancy at birth in 2001 at 47 years for men and 46
years for women. The WCRF/AICR (2007:8) also states that CDLs accounted for 53,9% of deaths,
while infections, maternal-, perinatal- and nutritional conditions, contributed to 40,2% of deaths. Injuries
caused only 5,9% of deaths in 2000. Bradshaw et al.‘s data again contradicts this by showing that in
2000, CDLs were estimated to account for 37% of deaths, while infections, maternal, perinatal and
nutritional conditions contributed to 21% of deaths and injuries 12%. WCRF/AICR used the 2006 South
African census data, whereas Bradshaw et al. (2003:ii), used various resources, including the 1996
cause of death census data; the Department of Home Affairs data and the UNISA/MRC national injury
mortality surveillance system to make their estimates.
2.5 Undernutrition
2.5.1 In the world
Undernutrition in young children captures society‘s extent of development and can be used as a marker
for overall population well-being (Subramanyam et al., 2010:1). Undernutrition manifests as underweight
(weight-for-age <-2SD from the reference median), wasting (weight-for-height <-2SD) and stunting
(height-for-age <-2SD) (WHO, 2008:14; Nannan et al., 2007:733; Steyn et al., 2006:19). Subramanyam et
al. (2010:1) states that ―the nutritional status of young children is an important indicator of health and
development—it is not only a reflection of past health insults but an important indicator of future health
trajectories.‖ Children younger than three years old are the most vulnerable to undernutrition, because
their growth rate is the greatest. Therefore, their risk for growth retardation is also increased
(Subramanyam et al., 2010:1).
The UNICEF conceptual framework (Figure 2.1) for the development of undernutrition explains that the
causes of growth failure are complex, which promote a multi-factorial approach in intervention planning.
The causes consist of immediate, underlying and basic. Immediate causes include: inadequate dietary
intake; poor psychosocial care; and infectious disease. Underlying causes refer to: insufficient household
food security; inadequate maternal- and child care; poor access to clean water; insufficient health
services in an unhealthy environment; and inadequate female education and information. The basic
causes include: available potential resources; economic structures in place; and political-, social- and
cultural factors (Nannan et al., 2007:733; De Villiers & Senekal, 2002:1232; The World Bank &
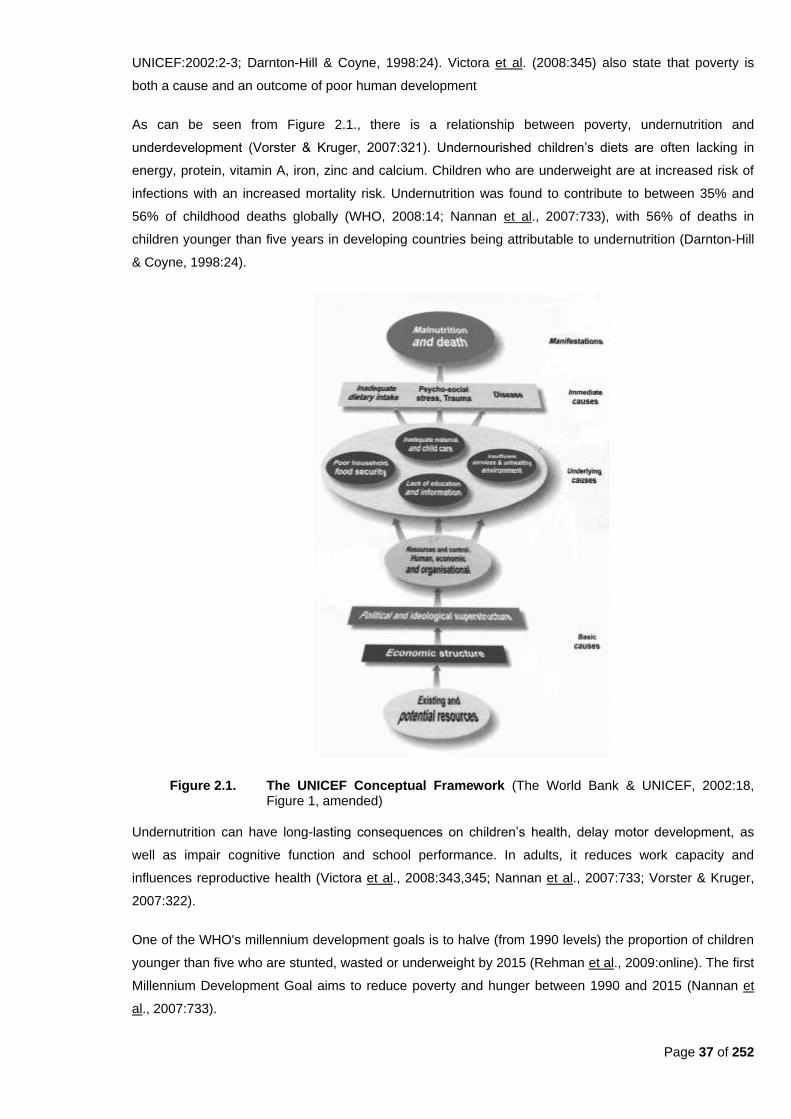
Page 37 of 252
UNICEF:2002:2-3; Darnton-Hill & Coyne, 1998:24). Victora et al. (2008:345) also state that poverty is
both a cause and an outcome of poor human development
As can be seen from Figure 2.1., there is a relationship between poverty, undernutrition and
underdevelopment (Vorster & Kruger, 2007:321). Undernourished children‘s diets are often lacking in
energy, protein, vitamin A, iron, zinc and calcium. Children who are underweight are at increased risk of
infections with an increased mortality risk. Undernutrition was found to contribute to between 35% and
56% of childhood deaths globally (WHO, 2008:14; Nannan et al., 2007:733), with 56% of deaths in
children younger than five years in developing countries being attributable to undernutrition (Darnton-Hill
& Coyne, 1998:24).
Figure 2.1. The UNICEF Conceptual Framework (The World Bank & UNICEF, 2002:18, Figure 1, amended)
Undernutrition can have long-lasting consequences on children‘s health, delay motor development, as
well as impair cognitive function and school performance. In adults, it reduces work capacity and
influences reproductive health (Victora et al., 2008:343,345; Nannan et al., 2007:733; Vorster & Kruger,
2007:322).
One of the WHO's millennium development goals is to halve (from 1990 levels) the proportion of children
younger than five who are stunted, wasted or underweight by 2015 (Rehman et al., 2009:online). The first
Millennium Development Goal aims to reduce poverty and hunger between 1990 and 2015 (Nannan et
al., 2007:733).
Page 38 of 252
An improvement in weight-for-age of only five percent can reduce child mortality by thirty percent (and for
children under five years, by 13%) (Nannan et al., 2007:733). In 2005, the WHO estimated, by using the
new child growth standards, that 32% of all children under five years old in developing countries were
stunted and ten percent were wasted (Rehman et al., 2009:online). High levels of undernutrition are still
found in South Asia, the Indo-Chinese countries and much of Africa (Darnton-Hill & Coyne, 1998:26). In
2004, 56,2 million of the world‘s children, aged between zero and four years, were wasted, of which 13,7
million (24,4%) were from Africa and another 27 million (48%) were from South East Asia. Another 182,7
million children younger than four years were stunted, where 51,9 million (28,4%) were from Africa and
76,5 million (41,9%) were from South East Asia (WHO, 2008:32, Table 7). Undernutrition in Indian
children is mostly higher among the urban poor compared to rural areas (Kanjilal et al., 2010:online).
Subramanyam et al. (2010:3-4) state that in India greater household wealth was associated with lower
probability of undernutrition. Children whose mothers had a greater education had a lower likelihood of
undernutrition. The absolute rates of undernutrition in India remain higher than the majority of developing
countries.
2.5.1.1 Stunting
Stunting is an indicator of chronic undernutrition (Waterlow, 1994:S1). Linear growth faltering causes
stunting, which is an important public health problem for children living in developing countries where
poverty, poor nutrition and a high prevalence of infectious diseases are common (Mamabolo et al.,
2005:online). Short stature and short leg length are sensitive indicators of early socio-economic
deprivation (WHO/FAO, 2002:35). Sawaya and Roberts (2003:online) postulate that in Brazil, stunting
has been related to poverty levels more than to genetic background. Schrimpton and Kachondham
(2003:3) state that stunted children are more likely to fall ill and die, compared to underweight or
wasted children. Although the nutritional insult that caused stunting has happened in the past, the
resulting consequences are ongoing (Schrimpton & Kachondham, 2003:4).
According to the criteria established by the WHO, the prevalence rate of 42% for stunting in 2002 in
the Democratic People‘s Republic of Korea was still very high (Schrimpton & Kachondham, 2003:4).
One-third of the world‘s young children in low-income countries were stunted due to undernutrition
around 1997 (Darnton-Hill and Coyne; 1997:23). In 2004, an estimated 32% of children under five
years of age were stunted (WHO, 2008:112). A non-representative survey of young children in
government kindergartens in Korea, conducted in 1997 by the World Food Programme, found that
83% of children were stunted (Schrimpton & Kachondham, 2003:4). In Mexico, almost twenty percent
of children younger than five years of age were stunted, with a higher incidence in rural areas (Fernald
& Neufeld, 2007:624). The national average for stunting in Mexican children is 17%. The prevalence of
stunting was 21,3% in non-indigenous (urban) children and 42,7% in indigenous (rural) children
(Fernald & Neufeld, 2007:626).
In Tibet, the proportion of stunted children was greater in rural areas than in urban areas (Harris et al.,
2001:345).
In 1992, 52,4% of Indian children younger than three years were stunted. The number decreased to
50,7% in 1998, and further to 44,7% in 2005 (Subramanyam et al., 2010:3). In the Indian National
Page 39 of 252
Family Health Survey-3, a nationwide survey conducted between 2005 and 2006, it was found 38% of
Indian children younger than three years were stunted (Kanjilal et al., 2010:online; Rehman et al.,
2009:online). At age three, two-thirds (66%) of South Indian urban boys and 56% of girls were stunted.
Factors associated with stunting in this study were: birth weight less than 2,5 kg; manual production of
cigarettes for a daily wage in the household; maternal height less than 150 cm; being stunted, wasted
or underweight at six months of age; and having at least one older sibling (Rehman et al.,
2009:online).
Van der Merwe and Pepper (2006:4) note the interesting relationship between stunting and obesity in
India, where the clinical measurement of BMI underestimates adiposity. When compared to white
Caucasian babies, small and thin Indian new-borns had poor muscle and visceral mass but higher
adiposity.
2.5.1.2 Underweight and wasting
While a large proportion of children are extensively underweight in many parts of the developing world,
far fewer countries face the burden of acute undernutrition in young women. Underweight, however,
still remains a concern, but predominates only among women living in rural areas of the least
developed countries (Mendez et al., 2005:719-720). Maternal underweight leads to an increased risk
of intra-uterine growth retardation and increases the risk of LBW (Victora et al., 2008:346; Nannan et
al., 2007:734). This is also associated with increased mortality risk in early childhood (Nannan et al.,
2007:734).
In 1997, more than thirty percent of the world‘s children under five years of age were underweight
(Darnton-Hill & Coyne, 1998:24). In 2002, sixty percent of deaths among children under five years in
developing countries were associated with malnutrition (WHO/FAO, 2002:8).
Sixty percent of Korean children were found to be underweight in 1998, ―the worst rate of any nation in
the world at the time‖ (Schrimpton & Kachondham, 2003:4). In 2002, an international survey found that
rates have been reduced to 21%. A Korean government funded survey in 2003, found rates of 28%.
According to Schrimpton and Kachondham (2003:4), this indicates that food aid has indeed been well
used in Korea.
The prevalence of underweight among Indian children younger than three years old was 49,1% in
1992, 43,8% in 1998, and 40,3% in 2005 (Subramanyam et al., 2010:3). In the Indian National Family
Health Survey-3, 19% of children were wasted and 46% were underweight at three years of age in
2005/6 (Kanjilal et al., 2010:online; Rehman et al., 2009:online). About eight percent of three year-old
South Indian urban boys resident in slum areas and seven percent of girls were wasted. Another 43%
of boys and 39% of girls were underweight in 2005/6 (Rehman et al., 2009:online). Between 15% to
94% of children were underweight in different slum populations in Northern India around 2004
(Rehman et al., 2009:online). India has one of the highest prevalences of underweight among children
younger than five (43% in 2006), surpassed only by Bangladesh, Yemen and Timor-Leste
(Subramanyam et al., 2010:1). India contributes to about one-third of the global burden of underweight
for children under five years old (Subramanyam et al., 2010:1). Subramanyam et al. (2010:1) state that
during the ―prosperous‖ 1990s there was a decline in the prevalence of underweight by about 0,9%

Page 40 of 252
per annum in India, whereas in China, with its rapidly growing economy, the decline was about five
percent per year.
2.5.2 In Africa and South Africa
2.5.2.1 In adults
In 1998, less than six percent of South African females and 13% of males were underweight (Steyn et
al., 2006:34; DoH et al., 2002:244). At that time, men and women aged between 15 and 24 years were
the most likely to be underweight, as well as those living in the province of the Northern Cape and of
Asian/Indian descent. There was a higher prevalence of underweight among rural black men than in
the other groups of men (DoH et al., 2002:244).
About 10,5% of deaths worldwide due to LBW can be attributed to maternal underweight. This amount
is about three times higher than South African estimates, because of the lower prevalence of
underweight among South African women (Nannan et al., 2007:737). The prevalence of underweight
in adult males (12,9%) and females (5,6%) is however, much lower than the prevalence of overweight
and obesity (Steyn et al., 2006:21). The WCRF/AICR (2007:9) state that the NFCS undertaken in 1999
found that in rural areas, adults from lower-income households were shorter and had a lower BMI.
2.5.2.2 In children
When looking at the UNICEF Conceptual Framework depicted in Figure 2.1, the immediate
determinants of undernutrition (poor diet and infections) appear in South African children who lack
sufficient intake of dietary energy, protein, and micronutrients (vitamin A, iron, zinc and calcium).
Underweight children are at risk for infectious diseases, e.g. diarrhea and pneumonia, which increase
their mortality risk. Undernutrition was found to contribute to fifty percent of deaths in children, with a
direct relationship between the degree of underweight and mortality. The concomitant presence of
both infection and underweight obviously increases the risk of mortality, with the duration of infection in
the undernourished child playing an important role (Nannan et al., 2007:733). The Birth-to-Ten study
found in 1991 that the children in peri-urban areas were at higher risk for undernutrition, especially if
they were born in rural areas and migrated afterwards (Yach et al., 1991:218).
Mamabolo et al. (2005:online) state that, compared to younger Sub-Saharan African children, a
greater proportion of younger South African children are stunted (21% to 48%) rather than
underweight (8% to 15%).
Steyn et al. (2006:19) state that the results from the SAVACG study conducted in 1994 and the NFCS
conducted in 1999 were similar for pre-school children, with underweight ranging from 6,9% to 10,7%,
stunting from 16,1% to 27%, and wasting from 1,8% to 3,7%. Undernutrition was higher in the rural
areas (Nannan et al., 2007:734; Steyn et al., 2006:19), with the highest prevalence of stunting and
underweight found among the children aged between one and three years old (Steyn et al., 2005:11).
The NFCS showed that among children aged between one and nine years old, about one in ten
children were underweight, about one in five children were stunted and about three percent were
wasted (Vorster & Kruger, 2007:323; Steyn et al., 2006:34; Steyn et al., 2005:8; Labadarios & Nel,
Page 41 of 252
2000:180, 183). Thirty-five percent of children were suffering from some form of undernutrition (Vorster
& Kruger, 2007:323; Steyn et al., 2006:34).
The NFCS further found that the prevalence of all undernourished children (stunted, underweight and
wasted) was higher in all age groups in rural areas (Labadarios & Nel, 2000:176) and that children
between one and three years old were more severely affected. They had about double the prevalence
of stunting and underweight when compared with the other age groups (Labadarios & Nel, 2002:180).
(i) Stunting
According to the NFCS, the national prevalence of stunting among South African children one to
nine years old was 19,3% in 1999, with the highest prevalence (24,4%) amongst the one to three
year olds (Steyn et al., 2005:4, 8). Van der Merwe and Pepper (2006:4) state that stunting is more
prevalent in rural areas in South Africa, and that it remains a significant problem in school-aged
children. The Birth-to-Ten cohort study found that the prevalence of stunting was 19,5% by two
years of age (Cameron, 2003:38). The 1999 NFCS found that stunting affected nearly one in five
children. Urban children (17%) were less affected (WCRF/AICR, 2007:9; Labadarios et al.,
2005:533). Nearly 26% of children on commercial farms (Steyn et al., 2005:4, 8) and almost 24%
of rural children were affected by stunting (Labadarios et al., 2005:535. At the national level,
stunting was prevalent in 19,3% of children (Steyn et al., 2005:8).
The Eastern Cape and Free State provinces were found to have the second highest percentage of
stunted children in South Africa during the SAVACG study (De Villiers & Senekal, 2002:1232). In
the NFCS, the Free State province had the second largest prevalence of stunting (30%). The
prevalence of severe stunting was also second largest in the Free State (10%) (Labadarios & Nel,
2000:174).
In the secondary anthropometric data analysis of the NFCS, it was found that stunting decreased
with age and the highest prevalence was among children aged one to three years (24,4%) (Steyn
et al., 2005:8; Labadarios & Nel, 2000: 176). The prevalence of stunting was 25.5% in children
aged one to three years old; 21% in those aged four to six years; and 13% in those aged seven to
nine years (Labadarios et al., 2005:536; Labadarios & Nel, 2000:168). The Northern Cape had the
highest prevalence of stunting (31%), followed by the Free State (30%) and Mpumalanga (26%)
(DoH, 2001:1).
In 1995, the South African National Nutrition Survey Study (SANNSS) group conducted a
systematic review of dietary surveys since 1979. Their results showed that black rural children
between two and six years old had the lowest energy and macronutrient intake, probably due to
low fat intake, which could explain the high prevalence of stunting in this group (Vorster et al.,
1995, as referred to by Witten et al., 2002:online [unpublished]).
In the THUSA BANA study conducted on ten to 15 year old children in the North West province,
stunting was most prevalent in rural areas (girls 23,7% and boys 26,7%). The prevalence in
informal settlements was 26,4% for boys and 13,7% for girls. The lowest prevalence was in urban
girls (11,6%) and boys (17,1%). About one-third of the children (35,8%) lived in rural areas, 17,8%
Page 42 of 252
lived in informal settlements and 46,4% lived in urban areas. About half (51%) of the stunted girls
and 43% of the stunted boys came from the rural areas (Mukuddem-Petersen & Kruger,
2004:online).
New legislation that was introduced in the early 1990s to improve the QoL of the ―previously
disadvantaged‖ (i.e. non-White South Africans), included free health care for children under five
years of age. A positive trend has been seen when comparing data from a 1978 study (Richardson,
1978:246-249) with the Birth-To-Ten study data in that height for non-White girls has been
improving since the 1970s. An increase of between five to ten centimeters has occurred during this
period, which translates to about four to five centimeters per decade. However, there has been no
change in height patterns in the White population for the same period (Cameron, 2003:37).
When comparing data from the NFCS with the SAVACG, the national average for prevalence of
stunting has not changed remarkably, but a slight increase was noted in urban children (Labadarios
& Nel, 2000:178).
(ii) Underweight
Poverty, hunger and poor household food security are among the main factors contributing to high
rates of childhood underweight, especially in rural areas (Nannan et al., 2007:738).
Nannan et al. (2007:733) state that 11,8% of children under five years old were underweight, which
contributed to 12,3% of deaths. This amount is smaller than the global maternal and child
underweight risk factor assessment finding of 34,7%. The prevalence of underweight in South
Africa is lower than in many other developing countries and a high proportion of child deaths in
South Africa are due to HIV/AIDS (35,1%) (Nannan et al., 2007:737). Protein-energy malnutrition
attributed to 44,7% of the total burden of disease (Nannan et al., 2007:733, 736).
According to the NFCS, the prevalence of underweight in children was one in ten at the national
level (Labadarios et al., 2005:533; Steyn et al., 2005:8). The highest prevalence was in one to
three year olds (11,4%), in rural areas (10,9%) and particularly among children on commercial
farms (13,7%) (Steyn et al., 2005:8). The WCRF/AICR (2007:9) state that the 1999 NFCS that ten
percent of children between one and three years old consumed less than half of their
recommended daily needs and another 26% consumed less than two-thirds. The prevalence of
underweight decreased with age (Labadarios & Nel, 2000:176) from 13% in the children aged one
to three years to eight percent in the children aged seven to nine years (Labadarios & Nel,
2000:168). Less than 1,5% of children were severely underweight (<-3SD), except on commercial
farms where the prevalence was five percent (Labadarios et al., 2005:536). The Free State
province had the fourth highest prevalence of underweight (14%) (Labadarios & Nel, 2000:174).
When comparing data from the NFCS with the SAVACG, the prevalence of underweight increased
in rural children (especially in the Northern- and Eastern Cape) between 1994 and 1999
(Labadarios & Nel, 2000:178)
Page 43 of 252
(iii) Wasting
The NFCS found that one in twenty children living in rural areas were wasted (Labadarios et al.,
2005:536). At the national level 3,3% of children were wasted (Steyn et al., 2005:8) and one
percent were severely wasted (<-3SD) (Labadarios et al., 2005:536). The prevalence of wasting
remained constant in all age groups (Labadarios & Nel, 2000:169).
When comparing data from the NFCS with the SAVACG, the prevalence of wasting decreased in
the Eastern Cape and the Free State (Labadarios & Nel, 2000:178)
2.6 Chronic diseases of lifestyle
CDLs are largely preventable diseases (WHO/FAO, 2002:5). The growing epidemic of CDLs is mostly
related to dietary and lifestyle changes (WHO/FAO, 2002:1). The transition to CDLs is due to a greater
intake of saturated fat and energy and a higher prevalence of other risk factors (Darnton-Hill & Coyne,
1998:25), such as: high blood pressure; dyslipidemia (including hypercholesterolemia); overweight and
obesity; physical inactivity; tobacco use; and inadequate fruit and vegetable intake (Steyn et al., 2006:6).
Vorster (2002:242) states that the genetic expression of CDLs is influenced by a combination of certain
environmental factors, of which nutrition forms a part. CDLs are becoming an ever-increasing significant
cause of disability and premature mortality, both in developing- and newly developed countries. As the
prevalence of CDLs increases, additional burdens are placed on already overtaxed national health care
budgets (WHO/FAO, 2002:2).
From the second half of the twentieth century, major shifts in disease patterns occurred in developed
countries due to increased life expectancy and changes in diets and lifestyles, which contributed to an
epidemic of CDLs. This occurrence is now also becoming apparent in developing countries (WHO/FAO,
2002:81).
Compared to other industrialized countries, the Republic of Korea has lower rates of CDLs and lower than
expected levels of fat intake and obesity prevalence. According to WHO/FAO (2002:7), this can be
explained by the continued intake of a traditional high-vegetable diet despite major social and economic
changes.
In this section, the prevalence and epidemiology of CDLs, both globally and South Africa, will be discussed,
followed by a discussion of specific CDLs.
2.6.1 Global prevalence and epidemiology
In developed countries, low socio-economic status is associated with higher risk of CVD and DM.
However, in industrialized countries like China, an increased prevalence of CVD among the higher socio-
economic groups has become apparent (WHO/FAO, 2002:39). The WHO/FAO (2002:39) anticipates that
CVD will progressively shift to the more disadvantaged sectors of society. In fact, there is some evidence
that this is already happening, especially in women of low-income groups in Brazil and South Africa
(WHO/FAO, 2002:39).
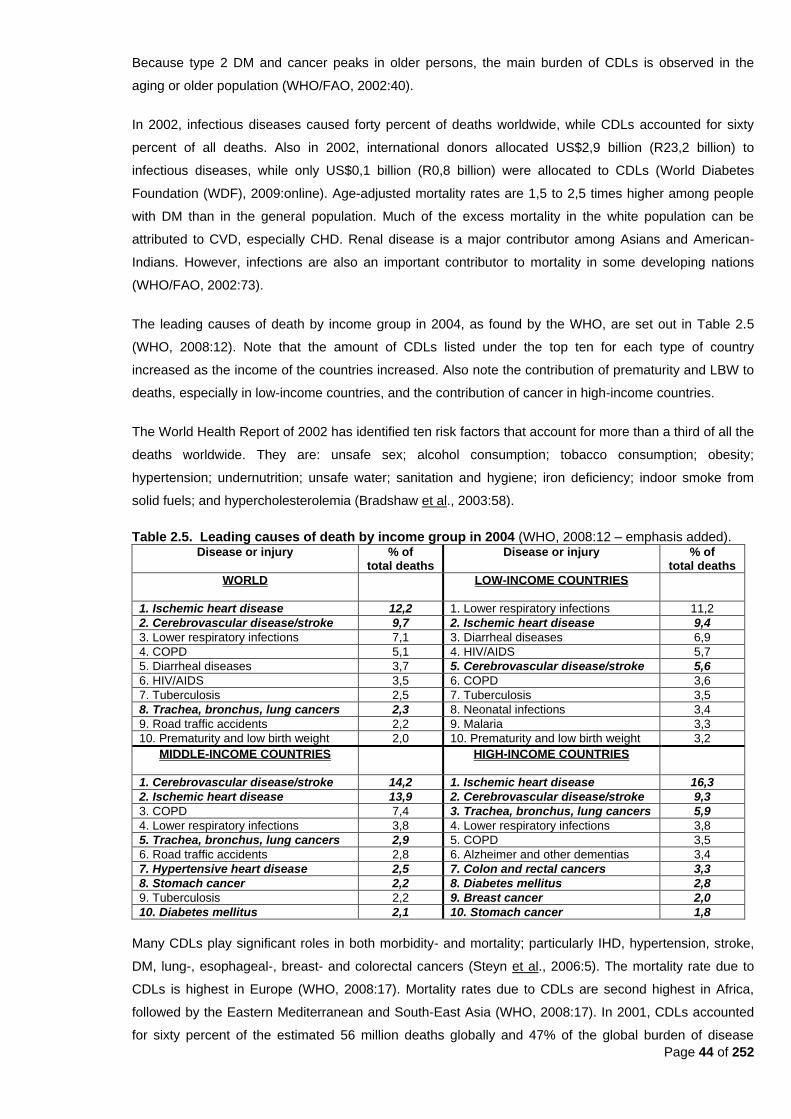
Page 44 of 252
Because type 2 DM and cancer peaks in older persons, the main burden of CDLs is observed in the
aging or older population (WHO/FAO, 2002:40).
In 2002, infectious diseases caused forty percent of deaths worldwide, while CDLs accounted for sixty
percent of all deaths. Also in 2002, international donors allocated US$2,9 billion (R23,2 billion) to
infectious diseases, while only US$0,1 billion (R0,8 billion) were allocated to CDLs (World Diabetes
Foundation (WDF), 2009:online). Age-adjusted mortality rates are 1,5 to 2,5 times higher among people
with DM than in the general population. Much of the excess mortality in the white population can be
attributed to CVD, especially CHD. Renal disease is a major contributor among Asians and American-
Indians. However, infections are also an important contributor to mortality in some developing nations
(WHO/FAO, 2002:73).
The leading causes of death by income group in 2004, as found by the WHO, are set out in Table 2.5
(WHO, 2008:12). Note that the amount of CDLs listed under the top ten for each type of country
increased as the income of the countries increased. Also note the contribution of prematurity and LBW to
deaths, especially in low-income countries, and the contribution of cancer in high-income countries.
The World Health Report of 2002 has identified ten risk factors that account for more than a third of all the
deaths worldwide. They are: unsafe sex; alcohol consumption; tobacco consumption; obesity;
hypertension; undernutrition; unsafe water; sanitation and hygiene; iron deficiency; indoor smoke from
solid fuels; and hypercholesterolemia (Bradshaw et al., 2003:58).
Table 2.5. Leading causes of death by income group in 2004 (WHO, 2008:12 – emphasis added). Disease or injury % of
total deaths Disease or injury % of
total deaths
WORLD
LOW-INCOME COUNTRIES
1. Ischemic heart disease 12,2 1. Lower respiratory infections 11,2
2. Cerebrovascular disease/stroke 9,7 2. Ischemic heart disease 9,4
3. Lower respiratory infections 7,1 3. Diarrheal diseases 6,9
4. COPD 5,1 4. HIV/AIDS 5,7
5. Diarrheal diseases 3,7 5. Cerebrovascular disease/stroke 5,6
6. HIV/AIDS 3,5 6. COPD 3,6
7. Tuberculosis 2,5 7. Tuberculosis 3,5
8. Trachea, bronchus, lung cancers 2,3 8. Neonatal infections 3,4
9. Road traffic accidents 2,2 9. Malaria 3,3
10. Prematurity and low birth weight 2,0 10. Prematurity and low birth weight 3,2
MIDDLE-INCOME COUNTRIES
HIGH-INCOME COUNTRIES
1. Cerebrovascular disease/stroke 14,2 1. Ischemic heart disease 16,3
2. Ischemic heart disease 13,9 2. Cerebrovascular disease/stroke 9,3
3. COPD 7,4 3. Trachea, bronchus, lung cancers 5,9
4. Lower respiratory infections 3,8 4. Lower respiratory infections 3,8
5. Trachea, bronchus, lung cancers 2,9 5. COPD 3,5
6. Road traffic accidents 2,8 6. Alzheimer and other dementias 3,4
7. Hypertensive heart disease 2,5 7. Colon and rectal cancers 3,3
8. Stomach cancer 2,2 8. Diabetes mellitus 2,8
9. Tuberculosis 2,2 9. Breast cancer 2,0
10. Diabetes mellitus 2,1 10. Stomach cancer 1,8
Many CDLs play significant roles in both morbidity- and mortality; particularly IHD, hypertension, stroke,
DM, lung-, esophageal-, breast- and colorectal cancers (Steyn et al., 2006:5). The mortality rate due to
CDLs is highest in Europe (WHO, 2008:17). Mortality rates due to CDLs are second highest in Africa,
followed by the Eastern Mediterranean and South-East Asia (WHO, 2008:17). In 2001, CDLs accounted
for sixty percent of the estimated 56 million deaths globally and 47% of the global burden of disease
Page 45 of 252
(Steyn et al., 2006:6). CDLs dominate the disease burden in high-income countries, which represents the
older population, because CDL risk increases with age (WHO, 2008:48). Because most countries have an
increase in life expectancy, larger proportions of their populations move into the age range where CDLs
become the major cause of ill health and death (Darnton-Hill & Coyne, 1998:25). In many developing
countries, population ageing and changes in the distribution of risk factors have accelerated the CDLs‘
share of disease burden (WHO, 2008:47). IHD and stroke are the largest sources of the burden of
disease in low- and middle-income countries, especially in Europe, where CVD account for more than
25% of the total burden of disease (WHO, 2008:40).
Globally, the estimated prevalence of DM increased from 191 million in 2002, to 220,5 million in 2004,
and there were 30,7 million stroke survivors in 2004 (WHO, 2008:112; WHO, 2008:32, Table 7). The
estimated global prevalence of angina pectoris increased from 25 million in 2002, to 54 million in 2004
(WHO, 2008:114). In China, the prevalence rate of DM has risen by 0,1% every year since 1980 (when it
was 0,67%) (Darnton-Hill & Coyne, 1998:25).
Hyperinsulinemia, hypertriglyceridemia, hypertension and central adiposity (all part of the metabolic
syndrome) are becoming more common in developed countries (Darnton-Hill & Coyne, 1998:26).
Van der Merwe and Pepper (2006:4) state that the effect of ethnicity on obesity prevalence and CDLs has
been studied in many parts of the world. In the USA, African-Americans, and particularly women, have
the highest incidence of obesity, hypertension, IHD, and stroke. Compared to other ethnic groups in the
USA, obese African-Americans have a ―less atherogenic‖ lipid profile; as well as a lower risk for DM when
compared to native American-Indians, but a higher risk than Caucasians (Van der Merwe & Pepper,
2006:4).
If compared to Caucasian women with a similar BMI and WHR, African-American women have lower
insulin sensitivity. Black women also have less visceral fat (similar to South African women), but
subcutaneous abdominal fat is significantly correlated with reduced insulin sensitivity and fasting insulin in
African-American women, which may explain the high rate of DM seen in the African-American population
(Van der Merwe & Pepper, 2006:4; Goedecke et al., 2005:68). White American women had higher total
cholesterol, LDL and triglycerides, consistent with higher levels of visceral fat (Goedecke et al., 2005:68).
Nearly two-thirds of all deaths for ages 15 to 59 years in low- and middle-income countries are associated
with CVD, cancer and other CDLs (WHO, 2008:17). In most countries, CVD is the leading cause of
morbidity and premature death. This is followed by cancer in developed countries. The increase in DM
also represents a global epidemic. In over three-quarters of countries, at least three to five leading causes
of death are now CDLs (Darnton-Hill & Coyne, 1998:25). In industrialized countries, CVD incidence has
declined, but less so in lower socio-economic countries (Darnton-Hill & Coyne, 1998:23).
Native American males and females have BMIs consistently and considerably greater than in the general
American population, at each year of age from five to 18 years. Socio-economic status and ethnicity may
have an impact on the prevalence of CVD and some cancers, as seen in the Native Americans and
African-Americans of the USA, who have far higher levels of obesity and DM and/or hypertension.
African-American females below the poverty level have a hypertension rate of forty percent, compared to
African-American females above the poverty level (30%) and white American females above the poverty
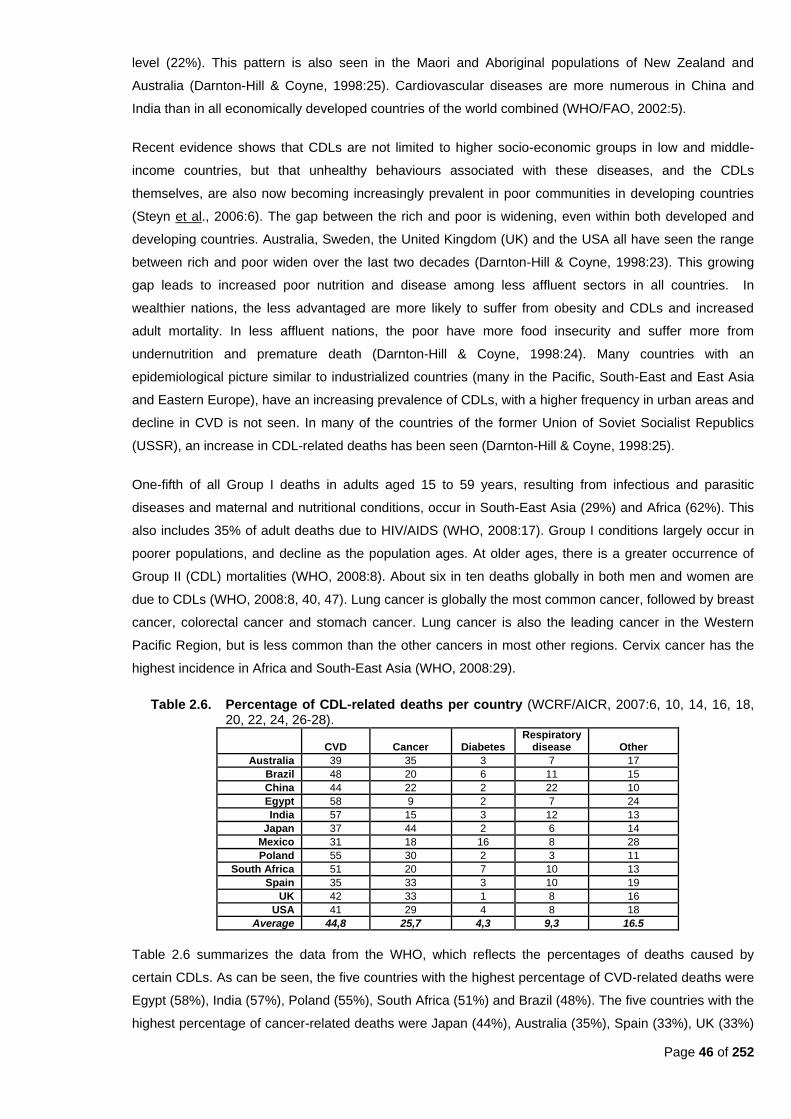
Page 46 of 252
level (22%). This pattern is also seen in the Maori and Aboriginal populations of New Zealand and
Australia (Darnton-Hill & Coyne, 1998:25). Cardiovascular diseases are more numerous in China and
India than in all economically developed countries of the world combined (WHO/FAO, 2002:5).
Recent evidence shows that CDLs are not limited to higher socio-economic groups in low and middle-
income countries, but that unhealthy behaviours associated with these diseases, and the CDLs
themselves, are also now becoming increasingly prevalent in poor communities in developing countries
(Steyn et al., 2006:6). The gap between the rich and poor is widening, even within both developed and
developing countries. Australia, Sweden, the United Kingdom (UK) and the USA all have seen the range
between rich and poor widen over the last two decades (Darnton-Hill & Coyne, 1998:23). This growing
gap leads to increased poor nutrition and disease among less affluent sectors in all countries. In
wealthier nations, the less advantaged are more likely to suffer from obesity and CDLs and increased
adult mortality. In less affluent nations, the poor have more food insecurity and suffer more from
undernutrition and premature death (Darnton-Hill & Coyne, 1998:24). Many countries with an
epidemiological picture similar to industrialized countries (many in the Pacific, South-East and East Asia
and Eastern Europe), have an increasing prevalence of CDLs, with a higher frequency in urban areas and
decline in CVD is not seen. In many of the countries of the former Union of Soviet Socialist Republics
(USSR), an increase in CDL-related deaths has been seen (Darnton-Hill & Coyne, 1998:25).
One-fifth of all Group I deaths in adults aged 15 to 59 years, resulting from infectious and parasitic
diseases and maternal and nutritional conditions, occur in South-East Asia (29%) and Africa (62%). This
also includes 35% of adult deaths due to HIV/AIDS (WHO, 2008:17). Group I conditions largely occur in
poorer populations, and decline as the population ages. At older ages, there is a greater occurrence of
Group II (CDL) mortalities (WHO, 2008:8). About six in ten deaths globally in both men and women are
due to CDLs (WHO, 2008:8, 40, 47). Lung cancer is globally the most common cancer, followed by breast
cancer, colorectal cancer and stomach cancer. Lung cancer is also the leading cancer in the Western
Pacific Region, but is less common than the other cancers in most other regions. Cervix cancer has the
highest incidence in Africa and South-East Asia (WHO, 2008:29).
Table 2.6. Percentage of CDL-related deaths per country (WCRF/AICR, 2007:6, 10, 14, 16, 18, 20, 22, 24, 26-28).
CVD Cancer Diabetes Respiratory
disease Other
Australia 39 35 3 7 17
Brazil 48 20 6 11 15
China 44 22 2 22 10
Egypt 58 9 2 7 24
India 57 15 3 12 13
Japan 37 44 2 6 14
Mexico 31 18 16 8 28
Poland 55 30 2 3 11
South Africa 51 20 7 10 13
Spain 35 33 3 10 19
UK 42 33 1 8 16
USA 41 29 4 8 18
Average 44,8 25,7 4,3 9,3 16.5
Table 2.6 summarizes the data from the WHO, which reflects the percentages of deaths caused by
certain CDLs. As can be seen, the five countries with the highest percentage of CVD-related deaths were
Egypt (58%), India (57%), Poland (55%), South Africa (51%) and Brazil (48%). The five countries with the
highest percentage of cancer-related deaths were Japan (44%), Australia (35%), Spain (33%), UK (33%)
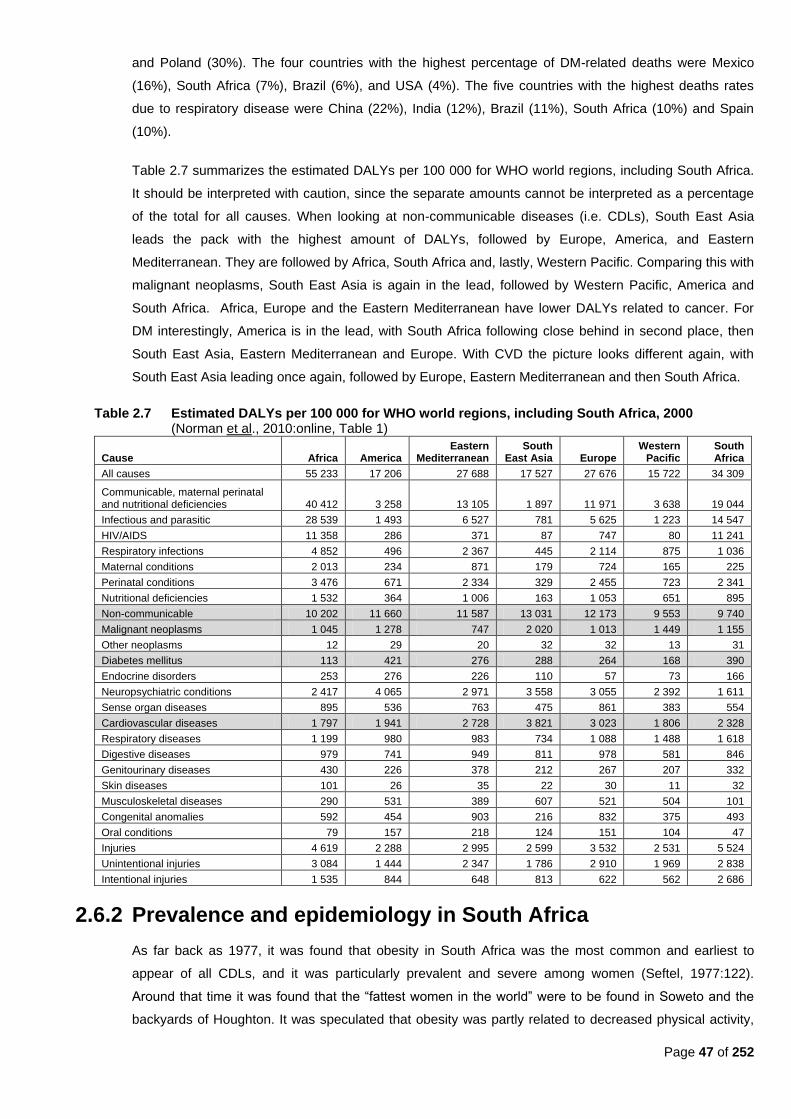
Page 47 of 252
and Poland (30%). The four countries with the highest percentage of DM-related deaths were Mexico
(16%), South Africa (7%), Brazil (6%), and USA (4%). The five countries with the highest deaths rates
due to respiratory disease were China (22%), India (12%), Brazil (11%), South Africa (10%) and Spain
(10%).
Table 2.7 summarizes the estimated DALYs per 100 000 for WHO world regions, including South Africa.
It should be interpreted with caution, since the separate amounts cannot be interpreted as a percentage
of the total for all causes. When looking at non-communicable diseases (i.e. CDLs), South East Asia
leads the pack with the highest amount of DALYs, followed by Europe, America, and Eastern
Mediterranean. They are followed by Africa, South Africa and, lastly, Western Pacific. Comparing this with
malignant neoplasms, South East Asia is again in the lead, followed by Western Pacific, America and
South Africa. Africa, Europe and the Eastern Mediterranean have lower DALYs related to cancer. For
DM interestingly, America is in the lead, with South Africa following close behind in second place, then
South East Asia, Eastern Mediterranean and Europe. With CVD the picture looks different again, with
South East Asia leading once again, followed by Europe, Eastern Mediterranean and then South Africa.
Table 2.7 Estimated DALYs per 100 000 for WHO world regions, including South Africa, 2000 (Norman et al., 2010:online, Table 1)
Cause Africa America
Eastern Mediterranean
South East Asia Europe
Western Pacific
South Africa
All causes 55 233 17 206 27 688 17 527 27 676 15 722 34 309
Communicable, maternal perinatal and nutritional deficiencies 40 412 3 258 13 105 1 897 11 971 3 638 19 044
Infectious and parasitic 28 539 1 493 6 527 781 5 625 1 223 14 547
HIV/AIDS 11 358 286 371 87 747 80 11 241
Respiratory infections 4 852 496 2 367 445 2 114 875 1 036
Maternal conditions 2 013 234 871 179 724 165 225
Perinatal conditions 3 476 671 2 334 329 2 455 723 2 341
Nutritional deficiencies 1 532 364 1 006 163 1 053 651 895
Non-communicable 10 202 11 660 11 587 13 031 12 173 9 553 9 740
Malignant neoplasms 1 045 1 278 747 2 020 1 013 1 449 1 155
Other neoplasms 12 29 20 32 32 13 31
Diabetes mellitus 113 421 276 288 264 168 390
Endocrine disorders 253 276 226 110 57 73 166
Neuropsychiatric conditions 2 417 4 065 2 971 3 558 3 055 2 392 1 611
Sense organ diseases 895 536 763 475 861 383 554
Cardiovascular diseases 1 797 1 941 2 728 3 821 3 023 1 806 2 328
Respiratory diseases 1 199 980 983 734 1 088 1 488 1 618
Digestive diseases 979 741 949 811 978 581 846
Genitourinary diseases 430 226 378 212 267 207 332
Skin diseases 101 26 35 22 30 11 32
Musculoskeletal diseases 290 531 389 607 521 504 101
Congenital anomalies 592 454 903 216 832 375 493
Oral conditions 79 157 218 124 151 104 47
Injuries 4 619 2 288 2 995 2 599 3 532 2 531 5 524
Unintentional injuries 3 084 1 444 2 347 1 786 2 910 1 969 2 838
Intentional injuries 1 535 844 648 813 622 562 2 686
2.6.2 Prevalence and epidemiology in South Africa
As far back as 1977, it was found that obesity in South Africa was the most common and earliest to
appear of all CDLs, and it was particularly prevalent and severe among women (Seftel, 1977:122).
Around that time it was found that the ―fattest women in the world‖ were to be found in Soweto and the
backyards of Houghton. It was speculated that obesity was partly related to decreased physical activity,
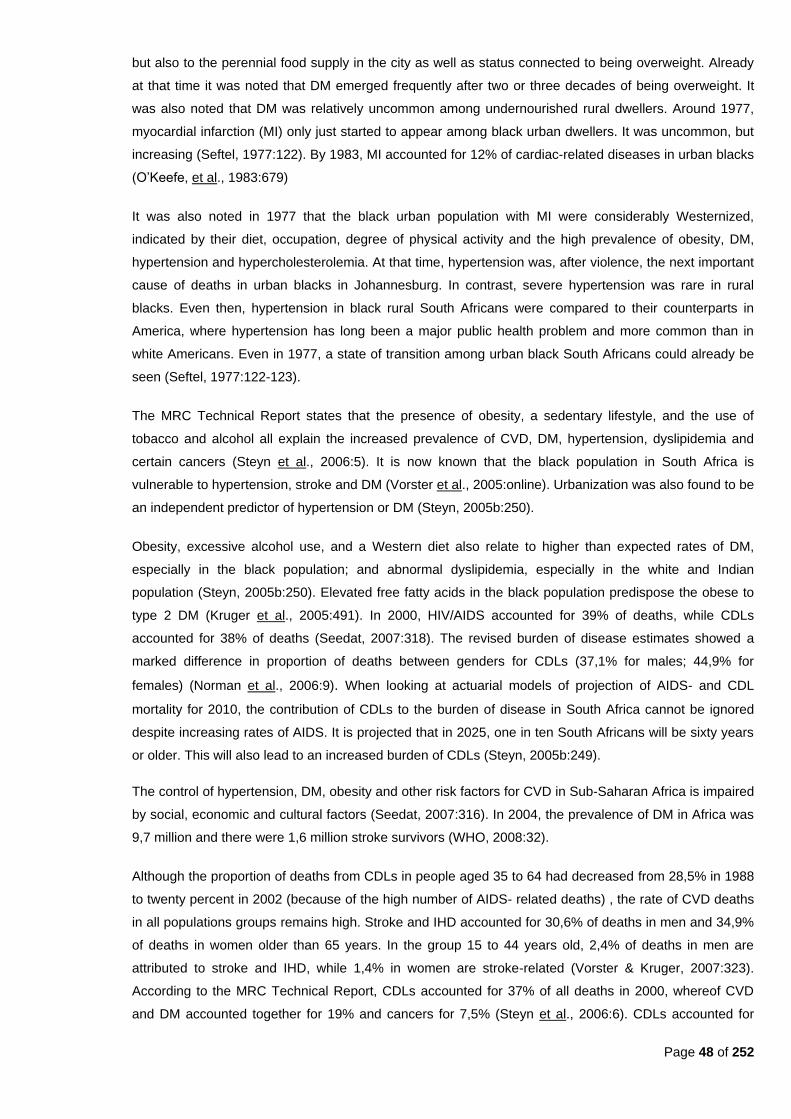
Page 48 of 252
but also to the perennial food supply in the city as well as status connected to being overweight. Already
at that time it was noted that DM emerged frequently after two or three decades of being overweight. It
was also noted that DM was relatively uncommon among undernourished rural dwellers. Around 1977,
myocardial infarction (MI) only just started to appear among black urban dwellers. It was uncommon, but
increasing (Seftel, 1977:122). By 1983, MI accounted for 12% of cardiac-related diseases in urban blacks
(O‘Keefe, et al., 1983:679)
It was also noted in 1977 that the black urban population with MI were considerably Westernized,
indicated by their diet, occupation, degree of physical activity and the high prevalence of obesity, DM,
hypertension and hypercholesterolemia. At that time, hypertension was, after violence, the next important
cause of deaths in urban blacks in Johannesburg. In contrast, severe hypertension was rare in rural
blacks. Even then, hypertension in black rural South Africans were compared to their counterparts in
America, where hypertension has long been a major public health problem and more common than in
white Americans. Even in 1977, a state of transition among urban black South Africans could already be
seen (Seftel, 1977:122-123).
The MRC Technical Report states that the presence of obesity, a sedentary lifestyle, and the use of
tobacco and alcohol all explain the increased prevalence of CVD, DM, hypertension, dyslipidemia and
certain cancers (Steyn et al., 2006:5). It is now known that the black population in South Africa is
vulnerable to hypertension, stroke and DM (Vorster et al., 2005:online). Urbanization was also found to be
an independent predictor of hypertension or DM (Steyn, 2005b:250).
Obesity, excessive alcohol use, and a Western diet also relate to higher than expected rates of DM,
especially in the black population; and abnormal dyslipidemia, especially in the white and Indian
population (Steyn, 2005b:250). Elevated free fatty acids in the black population predispose the obese to
type 2 DM (Kruger et al., 2005:491). In 2000, HIV/AIDS accounted for 39% of deaths, while CDLs
accounted for 38% of deaths (Seedat, 2007:318). The revised burden of disease estimates showed a
marked difference in proportion of deaths between genders for CDLs (37,1% for males; 44,9% for
females) (Norman et al., 2006:9). When looking at actuarial models of projection of AIDS- and CDL
mortality for 2010, the contribution of CDLs to the burden of disease in South Africa cannot be ignored
despite increasing rates of AIDS. It is projected that in 2025, one in ten South Africans will be sixty years
or older. This will also lead to an increased burden of CDLs (Steyn, 2005b:249).
The control of hypertension, DM, obesity and other risk factors for CVD in Sub-Saharan Africa is impaired
by social, economic and cultural factors (Seedat, 2007:316). In 2004, the prevalence of DM in Africa was
9,7 million and there were 1,6 million stroke survivors (WHO, 2008:32).
Although the proportion of deaths from CDLs in people aged 35 to 64 had decreased from 28,5% in 1988
to twenty percent in 2002 (because of the high number of AIDS- related deaths) , the rate of CVD deaths
in all populations groups remains high. Stroke and IHD accounted for 30,6% of deaths in men and 34,9%
of deaths in women older than 65 years. In the group 15 to 44 years old, 2,4% of deaths in men are
attributed to stroke and IHD, while 1,4% in women are stroke-related (Vorster & Kruger, 2007:323).
According to the MRC Technical Report, CDLs accounted for 37% of all deaths in 2000, whereof CVD
and DM accounted together for 19% and cancers for 7,5% (Steyn et al., 2006:6). CDLs accounted for

Page 49 of 252
forty percent of female deaths and 36% of male deaths. Stroke was the most common CDL-related cause
of death in women, and IHD in men. Hypertensive heart disease, DM and COPD were among the leading
causes of fatal CDLs in 2000 (Steyn et al., 2006:12). DM mortality increased in all ethnic groups, mostly
in blacks (Steyn et al., 2006:26). IHD is particularly high for the white and Indian population (Steyn et al.,
2006:28). Stroke is a major public health problem amongst black South Africans (Kruger et al., 2005:494).
In the 1998 SADHS, 13% of men and 16% of women reported a family history of IHD. Frequency was
also higher in urban areas (DoH et al., 2002:168).
In 2000, type 2 DM accounted for the highest number of deaths and DALYs in women, followed by
hypertension. IHD accounted for the most male deaths and DALYs, followed by type 2 DM and
hypertension. Cancer contributed for 4,4% of the total burden in females and 1,1% in males (Joubert et
al., 2007:686).
As Table 2.7 shows (estimated DALYs per 100 000 for WHO world regions), South Africa is quite low on
the ranks for total DALYs from CDLs, but rankings are higher for cancer and CVD (both ranked fourth).
South Africa has the highest DALYs for DM, second only to America Norman et al., 2010:online, Table 1).
Table 2.8. Deaths attributable to 17 selected risk factors compared with underlying causes of death (Norman et al., 2007c:638, Table I).
Rank Risk factor % total deaths Rank Disease, injury or condition % total deaths
1 Unsafe sex/STIs 26.3 1 HIV/AIDS 25.5
2 High blood pressure 9.0 2 Ischemic heart disease 6.6
3 Tobacco smoking 8,5 3 Stroke 6.5
4 Alcohol harm 7.1 4 Tuberculosis 5.5
5 High BMI (excess body weight) 7.0 5 Interpersonal violence injury 5.3
6 Interpersonal violence (risk factor) 6.7 6 Lower respiratory infections 4.4
7 High cholesterol 4.6 7 Hypertensive disease 3.2
8 Diabetes (risk factor) 4.3 8 Diarrheal diseases 3.1
9 Physical inactivity 3.3 9 Road traffic injury 3.1
10 Low fruit and vegetable intake 3.2 10 Diabetes mellitus 2.6
11 Unsafe water, sanitation and hygiene
2.6 11 Chronic obstructive pulmonary disease
2.5
12 Childhood and maternal underweight
2.3 12 Low birth weight 2.2
13 Urban air pollution 0.9 13 Asthma 1.3
14 Vitamin A efficiency 0.6 14 Trachea/bronchi/lung cancer 1.3
15 Indoor air pollution 0.5 15 Nephritis/nephrosis 1.3
16 Iron deficiency anemia 0.4 16 Septicemia 1.2
17 Lead exposure 0.3 17 Esophageal cancer 1.1
The aim of the MRC‘s Comparative Risk Assessment study was to estimate the contributions of 17
selected risk factors to the burden of disease in South Africa in 2000. The study followed the WHO‘s
standardized comparative risk assessment methodology (Norman et al., 2006:2). The 17 selected risk
factors were identified based on the burden of disease experienced in South Africa, as well as on the
input from various stakeholders, including the Department of Health (both provincially and nationally). The
risk factors were chosen based on the following criteria: (i) likely to be among the leading causes of
burden of disease and injury; (ii) evidence of causality; (iii) being potentially modifiable; and (iv)
availability of data (Norman et al., 2007c:637). The results are set out in the Tables below as: deaths
attributable to 17 selected risk factors compared with underlying causes of death (Table 2.8); and DALYs
of the 17 risk factors compared to the DALYs of underlying causes of death (Table 2.9).
When looking again at Table 2.7., South Africa has similar DALY rates for HIV/AIDs when compared with
the rest of Africa, but lower rates for other communicable, maternal, perinatal and nutritional conditions.
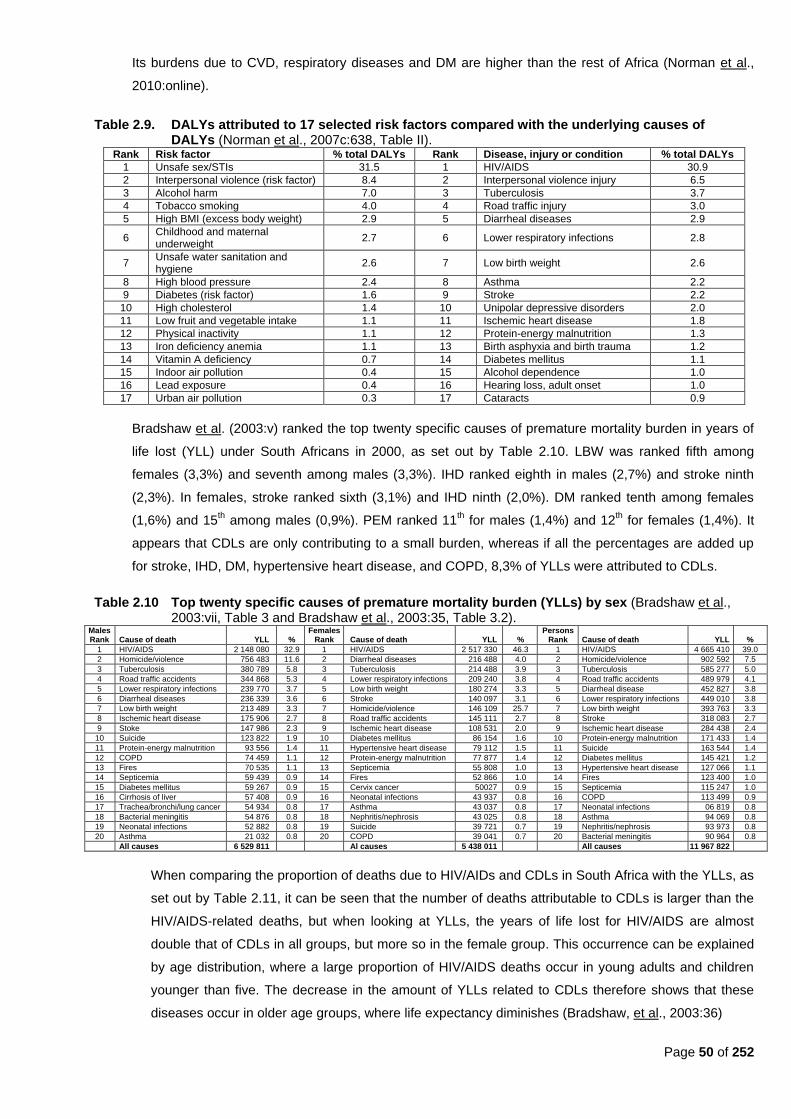
Page 50 of 252
Its burdens due to CVD, respiratory diseases and DM are higher than the rest of Africa (Norman et al.,
2010:online).
Table 2.9. DALYs attributed to 17 selected risk factors compared with the underlying causes of DALYs (Norman et al., 2007c:638, Table II).
Rank Risk factor % total DALYs Rank Disease, injury or condition % total DALYs
1 Unsafe sex/STIs 31.5 1 HIV/AIDS 30.9
2 Interpersonal violence (risk factor) 8.4 2 Interpersonal violence injury 6.5
3 Alcohol harm 7.0 3 Tuberculosis 3.7
4 Tobacco smoking 4.0 4 Road traffic injury 3.0
5 High BMI (excess body weight) 2.9 5 Diarrheal diseases 2.9
6 Childhood and maternal underweight
2.7 6 Lower respiratory infections 2.8
7 Unsafe water sanitation and hygiene
2.6 7 Low birth weight 2.6
8 High blood pressure 2.4 8 Asthma 2.2
9 Diabetes (risk factor) 1.6 9 Stroke 2.2
10 High cholesterol 1.4 10 Unipolar depressive disorders 2.0
11 Low fruit and vegetable intake 1.1 11 Ischemic heart disease 1.8
12 Physical inactivity 1.1 12 Protein-energy malnutrition 1.3
13 Iron deficiency anemia 1.1 13 Birth asphyxia and birth trauma 1.2
14 Vitamin A deficiency 0.7 14 Diabetes mellitus 1.1
15 Indoor air pollution 0.4 15 Alcohol dependence 1.0
16 Lead exposure 0.4 16 Hearing loss, adult onset 1.0
17 Urban air pollution 0.3 17 Cataracts 0.9
Bradshaw et al. (2003:v) ranked the top twenty specific causes of premature mortality burden in years of
life lost (YLL) under South Africans in 2000, as set out by Table 2.10. LBW was ranked fifth among
females (3,3%) and seventh among males (3,3%). IHD ranked eighth in males (2,7%) and stroke ninth
(2,3%). In females, stroke ranked sixth (3,1%) and IHD ninth (2,0%). DM ranked tenth among females
(1,6%) and 15th among males (0,9%). PEM ranked 11
th for males (1,4%) and 12
th for females (1,4%). It
appears that CDLs are only contributing to a small burden, whereas if all the percentages are added up
for stroke, IHD, DM, hypertensive heart disease, and COPD, 8,3% of YLLs were attributed to CDLs.
Table 2.10 Top twenty specific causes of premature mortality burden (YLLs) by sex (Bradshaw et al., 2003:vii, Table 3 and Bradshaw et al., 2003:35, Table 3.2).
Males Rank
Cause of death
YLL
%
Females Rank
Cause of death
YLL
%
Persons Rank
Cause of death
YLL
%
1 HIV/AIDS 2 148 080 32.9 1 HIV/AIDS 2 517 330 46.3 1 HIV/AIDS 4 665 410 39.0
2 Homicide/violence 756 483 11.6 2 Diarrheal diseases 216 488 4.0 2 Homicide/violence 902 592 7.5
3 Tuberculosis 380 789 5.8 3 Tuberculosis 214 488 3.9 3 Tuberculosis 585 277 5.0
4 Road traffic accidents 344 868 5.3 4 Lower respiratory infections 209 240 3.8 4 Road traffic accidents 489 979 4.1
5 Lower respiratory infections 239 770 3.7 5 Low birth weight 180 274 3.3 5 Diarrheal disease 452 827 3.8
6 Diarrheal diseases 236 339 3.6 6 Stroke 140 097 3.1 6 Lower respiratory infections 449 010 3.8
7 Low birth weight 213 489 3.3 7 Homicide/violence 146 109 25.7 7 Low birth weight 393 763 3.3
8 Ischemic heart disease 175 906 2.7 8 Road traffic accidents 145 111 2.7 8 Stroke 318 083 2.7
9 Stoke 147 986 2.3 9 Ischemic heart disease 108 531 2.0 9 Ischemic heart disease 284 438 2.4
10 Suicide 123 822 1.9 10 Diabetes mellitus 86 154 1.6 10 Protein-energy malnutrition 171 433 1.4
11 Protein-energy malnutrition 93 556 1.4 11 Hypertensive heart disease 79 112 1.5 11 Suicide 163 544 1.4
12 COPD 74 459 1.1 12 Protein-energy malnutrition 77 877 1.4 12 Diabetes mellitus 145 421 1.2
13 Fires 70 535 1.1 13 Septicemia 55 808 1.0 13 Hypertensive heart disease 127 066 1.1
14 Septicemia 59 439 0.9 14 Fires 52 866 1.0 14 Fires 123 400 1.0
15 Diabetes mellitus 59 267 0.9 15 Cervix cancer 50027 0.9 15 Septicemia 115 247 1.0
16 Cirrhosis of liver 57 408 0.9 16 Neonatal infections 43 937 0.8 16 COPD 113 499 0.9
17 Trachea/bronchi/lung cancer 54 934 0.8 17 Asthma 43 037 0.8 17 Neonatal infections 06 819 0.8
18 Bacterial meningitis 54 876 0.8 18 Nephritis/nephrosis 43 025 0.8 18 Asthma 94 069 0.8
19 Neonatal infections 52 882 0.8 19 Suicide 39 721 0.7 19 Nephritis/nephrosis 93 973 0.8
20 Asthma 21 032 0.8 20 COPD 39 041 0.7 20 Bacterial meningitis 90 964 0.8
All causes 6 529 811 Al causes 5 438 011 All causes 11 967 822
When comparing the proportion of deaths due to HIV/AIDs and CDLs in South Africa with the YLLs, as
set out by Table 2.11, it can be seen that the number of deaths attributable to CDLs is larger than the
HIV/AIDS-related deaths, but when looking at YLLs, the years of life lost for HIV/AIDS are almost
double that of CDLs in all groups, but more so in the female group. This occurrence can be explained
by age distribution, where a large proportion of HIV/AIDS deaths occur in young adults and children
younger than five. The decrease in the amount of YLLs related to CDLs therefore shows that these
diseases occur in older age groups, where life expectancy diminishes (Bradshaw, et al., 2003:36)
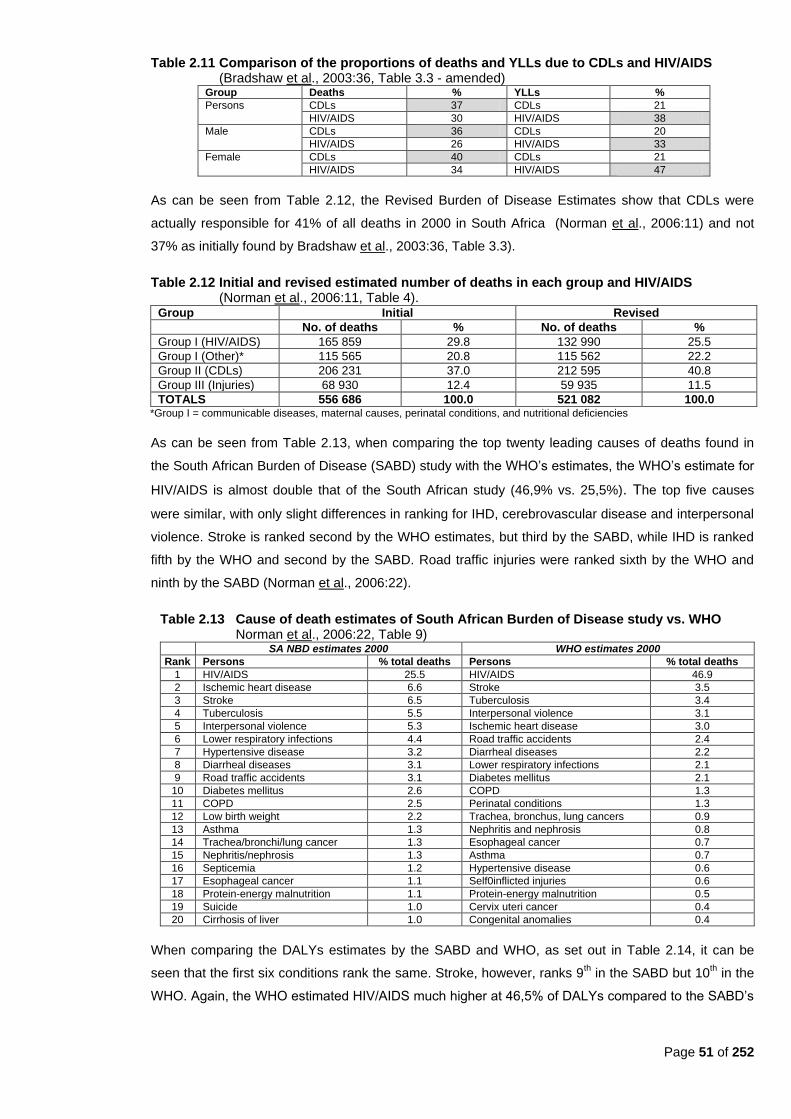
Page 51 of 252
Table 2.11 Comparison of the proportions of deaths and YLLs due to CDLs and HIV/AIDS (Bradshaw et al., 2003:36, Table 3.3 - amended)
Group Deaths % YLLs %
Persons CDLs 37 CDLs 21
HIV/AIDS 30 HIV/AIDS 38
Male CDLs 36 CDLs 20
HIV/AIDS 26 HIV/AIDS 33
Female CDLs 40 CDLs 21
HIV/AIDS 34 HIV/AIDS 47
As can be seen from Table 2.12, the Revised Burden of Disease Estimates show that CDLs were
actually responsible for 41% of all deaths in 2000 in South Africa (Norman et al., 2006:11) and not
37% as initially found by Bradshaw et al., 2003:36, Table 3.3).
Table 2.12 Initial and revised estimated number of deaths in each group and HIV/AIDS (Norman et al., 2006:11, Table 4).
Group Initial Revised
No. of deaths % No. of deaths %
Group I (HIV/AIDS) 165 859 29.8 132 990 25.5
Group I (Other)* 115 565 20.8 115 562 22.2
Group II (CDLs) 206 231 37.0 212 595 40.8
Group III (Injuries) 68 930 12.4 59 935 11.5
TOTALS 556 686 100.0 521 082 100.0 *Group I = communicable diseases, maternal causes, perinatal conditions, and nutritional deficiencies
As can be seen from Table 2.13, when comparing the top twenty leading causes of deaths found in
the South African Burden of Disease (SABD) study with the WHO‘s estimates, the WHO‘s estimate for
HIV/AIDS is almost double that of the South African study (46,9% vs. 25,5%). The top five causes
were similar, with only slight differences in ranking for IHD, cerebrovascular disease and interpersonal
violence. Stroke is ranked second by the WHO estimates, but third by the SABD, while IHD is ranked
fifth by the WHO and second by the SABD. Road traffic injuries were ranked sixth by the WHO and
ninth by the SABD (Norman et al., 2006:22).
Table 2.13 Cause of death estimates of South African Burden of Disease study vs. WHO Norman et al., 2006:22, Table 9)
SA NBD estimates 2000 WHO estimates 2000
Rank Persons % total deaths Persons % total deaths
1 HIV/AIDS 25.5 HIV/AIDS 46.9
2 Ischemic heart disease 6.6 Stroke 3.5
3 Stroke 6.5 Tuberculosis 3.4
4 Tuberculosis 5.5 Interpersonal violence 3.1
5 Interpersonal violence 5.3 Ischemic heart disease 3.0
6 Lower respiratory infections 4.4 Road traffic accidents 2.4
7 Hypertensive disease 3.2 Diarrheal diseases 2.2
8 Diarrheal diseases 3.1 Lower respiratory infections 2.1
9 Road traffic accidents 3.1 Diabetes mellitus 2.1
10 Diabetes mellitus 2.6 COPD 1.3
11 COPD 2.5 Perinatal conditions 1.3
12 Low birth weight 2.2 Trachea, bronchus, lung cancers 0.9
13 Asthma 1.3 Nephritis and nephrosis 0.8
14 Trachea/bronchi/lung cancer 1.3 Esophageal cancer 0.7
15 Nephritis/nephrosis 1.3 Asthma 0.7
16 Septicemia 1.2 Hypertensive disease 0.6
17 Esophageal cancer 1.1 Self0inflicted injuries 0.6
18 Protein-energy malnutrition 1.1 Protein-energy malnutrition 0.5
19 Suicide 1.0 Cervix uteri cancer 0.4
20 Cirrhosis of liver 1.0 Congenital anomalies 0.4
When comparing the DALYs estimates by the SABD and WHO, as set out in Table 2.14, it can be
seen that the first six conditions rank the same. Stroke, however, ranks 9th in the SABD but 10
th in the
WHO. Again, the WHO estimated HIV/AIDS much higher at 46,5% of DALYs compared to the SABD‘s
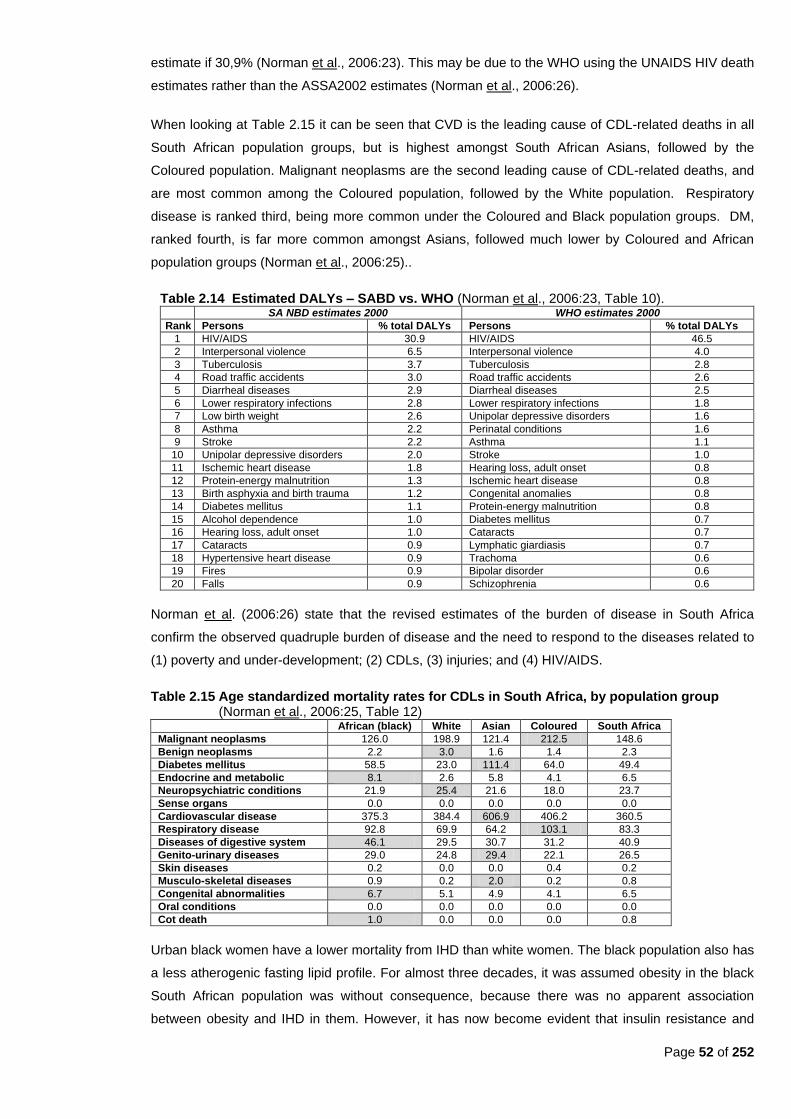
Page 52 of 252
estimate if 30,9% (Norman et al., 2006:23). This may be due to the WHO using the UNAIDS HIV death
estimates rather than the ASSA2002 estimates (Norman et al., 2006:26).
When looking at Table 2.15 it can be seen that CVD is the leading cause of CDL-related deaths in all
South African population groups, but is highest amongst South African Asians, followed by the
Coloured population. Malignant neoplasms are the second leading cause of CDL-related deaths, and
are most common among the Coloured population, followed by the White population. Respiratory
disease is ranked third, being more common under the Coloured and Black population groups. DM,
ranked fourth, is far more common amongst Asians, followed much lower by Coloured and African
population groups (Norman et al., 2006:25)..
Table 2.14 Estimated DALYs – SABD vs. WHO (Norman et al., 2006:23, Table 10). SA NBD estimates 2000 WHO estimates 2000
Rank Persons % total DALYs Persons % total DALYs
1 HIV/AIDS 30.9 HIV/AIDS 46.5
2 Interpersonal violence 6.5 Interpersonal violence 4.0
3 Tuberculosis 3.7 Tuberculosis 2.8
4 Road traffic accidents 3.0 Road traffic accidents 2.6
5 Diarrheal diseases 2.9 Diarrheal diseases 2.5
6 Lower respiratory infections 2.8 Lower respiratory infections 1.8
7 Low birth weight 2.6 Unipolar depressive disorders 1.6
8 Asthma 2.2 Perinatal conditions 1.6
9 Stroke 2.2 Asthma 1.1
10 Unipolar depressive disorders 2.0 Stroke 1.0
11 Ischemic heart disease 1.8 Hearing loss, adult onset 0.8
12 Protein-energy malnutrition 1.3 Ischemic heart disease 0.8
13 Birth asphyxia and birth trauma 1.2 Congenital anomalies 0.8
14 Diabetes mellitus 1.1 Protein-energy malnutrition 0.8
15 Alcohol dependence 1.0 Diabetes mellitus 0.7
16 Hearing loss, adult onset 1.0 Cataracts 0.7
17 Cataracts 0.9 Lymphatic giardiasis 0.7
18 Hypertensive heart disease 0.9 Trachoma 0.6
19 Fires 0.9 Bipolar disorder 0.6
20 Falls 0.9 Schizophrenia 0.6
Norman et al. (2006:26) state that the revised estimates of the burden of disease in South Africa
confirm the observed quadruple burden of disease and the need to respond to the diseases related to
(1) poverty and under-development; (2) CDLs, (3) injuries; and (4) HIV/AIDS.
Table 2.15 Age standardized mortality rates for CDLs in South Africa, by population group (Norman et al., 2006:25, Table 12)
African (black) White Asian Coloured South Africa
Malignant neoplasms 126.0 198.9 121.4 212.5 148.6
Benign neoplasms 2.2 3.0 1.6 1.4 2.3
Diabetes mellitus 58.5 23.0 111.4 64.0 49.4
Endocrine and metabolic 8.1 2.6 5.8 4.1 6.5
Neuropsychiatric conditions 21.9 25.4 21.6 18.0 23.7
Sense organs 0.0 0.0 0.0 0.0 0.0
Cardiovascular disease 375.3 384.4 606.9 406.2 360.5
Respiratory disease 92.8 69.9 64.2 103.1 83.3
Diseases of digestive system 46.1 29.5 30.7 31.2 40.9
Genito-urinary diseases 29.0 24.8 29.4 22.1 26.5
Skin diseases 0.2 0.0 0.0 0.4 0.2
Musculo-skeletal diseases 0.9 0.2 2.0 0.2 0.8
Congenital abnormalities 6.7 5.1 4.9 4.1 6.5
Oral conditions 0.0 0.0 0.0 0.0 0.0
Cot death 1.0 0.0 0.0 0.0 0.8
Urban black women have a lower mortality from IHD than white women. The black population also has
a less atherogenic fasting lipid profile. For almost three decades, it was assumed obesity in the black
South African population was without consequence, because there was no apparent association
between obesity and IHD in them. However, it has now become evident that insulin resistance and

Page 53 of 252
type 2 DM are more prevalent in black women. Urban black women who follow a Westernized diet and
lifestyle, present with more hypertension (30%) and type 2 DM (7%) than do white women (15% and
3,6% respectively). The prevalence of obesity in black South African with DM, was 15% to 16% of men
and 35% to 47% of women. Central obesity in black women were more strongly associated with
components of the metabolic syndrome than BMI (Kruger et al., 2005:494). In the 1998 SADHS, 12%
of men and 13% of women reported a family history of DM. Rates were much higher in the urban
areas. Indian participants reported the highest rates. For cancer, five percent of men and six percent
of women reported a family history, more often in urban participants (DoH et al., 2002:168).
In the 2003 SADHS, chronic conditions among males older than 15 years was as follows:
hypertension (8,8%), heart attack/angina (2,7%), stroke (0,9%), high blood cholesterol (2%), DM
(2,6%), and cancer (0,6%). In women, it was hypertension (18,8%), heart attack/angina (3,9%), stroke
(1%), high blood cholesterol (2,1%), DM (3,9%), and cancer (0,8%) (DoH, 2004:23-24).
Increased serum triglycerides, LDL and plasma fibrinogen are all accepted risk factors for CVD. In the
THUSA study, these levels were relatively low in most groups, although urban groups already had
levels that needed intervention to protect against future CVD. Both triglycerides and LDL cholesterol
are related to obesity and low activity, especially in women. The THUSA study also showed that blood
pressure correlated positively and significantly with age, level of urbanization, WHR and smoking.
Diastolic blood pressure correlated positively and significantly with BMI in women, as well as serum
lipids and serum γ-glutamyl transferase (a marker of alcohol intake) (Vorster et al., 2005:online). In the
1998 SADHS, only four percent of respondents reported a family history of dyslipidemia, more
frequently in whites (DoH et al., 2002:168).
The WCRF/AICR (2007:8) reports that in 2001, the most common cancers among South African men
were found in the prostate; lungs; esophagus; colon; rectum; and bladder. Kaposi‘s sarcoma,
attributable to the HIV and AIDS epidemic, has become more common in both men and women. In
women, the most common cancers were in the cervix; breast; colon; rectum; lungs and esophagus
(WCRF/AICR, 2007:9).
Figure 2.2: Breakdown of deaths in South Africa caused by CDLs (WCRF/AICR, 2007:8)

Page 54 of 252
As can be seen from Figure 2.2, more than half of CDL-related deaths in South Africa were caused by
CVD, and a further twenty percent were related to cancer (WCRF/AICR, 2007:8). The biggest
contributor to CDL-related deaths is CVD.
The CVD-specific causes of death in South Africa in 2000 as shown in Table 2.16 were derived from the
revised estimates of Burden of Disease for the Comparative Risk Factor Assessment for South Africa
(Norman et al., 2010a:online). The top five causes were found as follows: IHD accounted for 35%;
stroke for another 34,5%; hypertensive heart disease for 16,9%; inflammatory heart disease for 5,5%;
and pulmonary embolism for 2,1%.
Table 2.16 Percentage of cardiovascular diseases by cause, South Africa, 2000 (Norman et al., 2010a:online)
Persons Males Females
Rank Cause of death % Rank Cause of death % Rank Cause of death %
1 Ischemic heart disease 35 1 Ischemic heart disease 42 1 Ischemic heart disease 37
2 Stroke 35 2 Stroke 32 2 Stroke 30
3 Hypertensive heart disease 17 3 Hypertensive heart disease 12 3 Hypertensive heart disease 21
4 Inflammatory heart disease 5.5 4 Inflammatory heart disease 6.1 4 Inflammatory heart disease 4.9
5 Pulmonary embolism 2.1 5 Pulmonary embolism 2.1 5 Pulmonary embolism 2.1
6 Rheumatic heart disease 1.7 6 Non-rheumatic valvular disease 1.3 6 Rheumatic heart disease 1.9
7 Non-rheumatic valvular disease 1.7 7 Rheumatic heart disease 1.6 7 Non-rheumatic valvular disease 1.7
8 Peripheral vascular disorders 1 8 Aortic aneurism 1.1 8 Peripheral vascular disorders 0.9
9 Aortic aneurism 1 9 Peripheral vascular disorders 1.3 9 Aortic aneurism 0.7
10 Other cardiovascular 0.5 10 Other cardiovascular 0.6 10 Other cardiovascular 0.4
All cardiovascular 100
All cardiovascular 100
All cardiovascular 100
2.6.3 Specific CDLs
Specific CDLs will be discussed in this section, with emphasis on: overweight and obesity (including the
metabolic syndrome); DM; CVD; hypertension; stroke; CHD; and cancer.
2.6.3.1 Overweight and obesity
Obesity is seen as a global epidemic with an estimated 1,3 billion people overweight or obese. The
WHO/FAO (2002:5) states that overweight and obesity are increasing at a substantial rate annually in
developing countries. According to SASOM (2006b:online), obesity has been acknowledged as a very
complex endocrine abnormality with a strong genetic predisposition, and not simply a lifestyle disease.
The WHO has officially classified it as a chronic disease of ―epidemic proportions;‖ in both the
developed- and developing world (WHO/FAO 2002:3). Obesity is especially increasing among the
poor population groups of developed- and developing countries, (Sawaya & Roberts, 2003:online).
Almost all countries are experiencing an obesity epidemic (WHO/FAO, 2002:61).
Increased morbidity and mortality, with significantly increased healthcare costs, are just some of the
health consequences of obesity (Kruger et al., 2005:492). Relative weight in adulthood as well as
weight gain, are associated with an increased risk of breast-, colon-, rectum- and prostate cancer
(WHO/FAO, 2002:34). There is clear evidence of a relationship between onset of obesity and cancer
risk (WHO/FAO, 2002:35). The WHO lists being overweight as one of the ten leading risk factors for
high mortality, thus contributing to the burden of disease in developing- and developed countries.
Thus, the ―epidemic of obesity,‖ together with its accompanying co-morbidities (e.g. heart disease,
hypertension, stroke and DM), is not a health problem only found in industrialized countries
(WHO/FAO, 2002:8). According to the WHO/FAO, (2002:61-62), mortality rates increase with an
increase in BMI. As the BMI increases, so does the proportion of people with one or more co-morbid
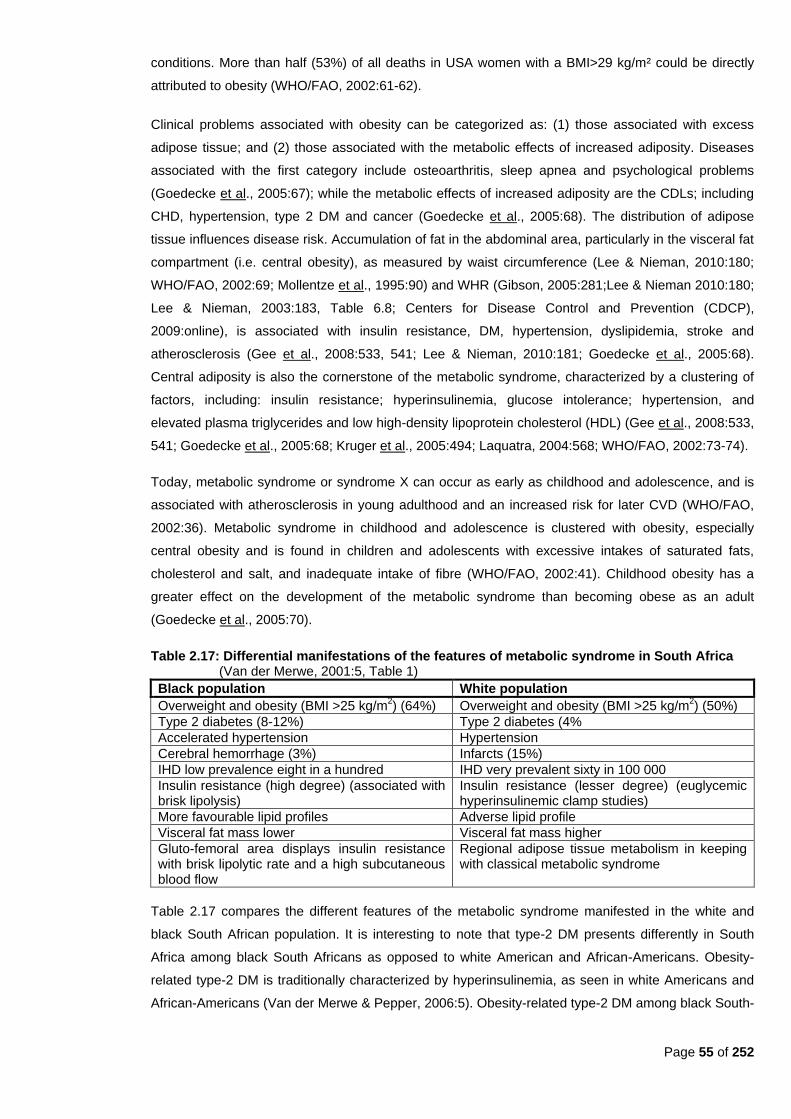
Page 55 of 252
conditions. More than half (53%) of all deaths in USA women with a BMI>29 kg/m² could be directly
attributed to obesity (WHO/FAO, 2002:61-62).
Clinical problems associated with obesity can be categorized as: (1) those associated with excess
adipose tissue; and (2) those associated with the metabolic effects of increased adiposity. Diseases
associated with the first category include osteoarthritis, sleep apnea and psychological problems
(Goedecke et al., 2005:67); while the metabolic effects of increased adiposity are the CDLs; including
CHD, hypertension, type 2 DM and cancer (Goedecke et al., 2005:68). The distribution of adipose
tissue influences disease risk. Accumulation of fat in the abdominal area, particularly in the visceral fat
compartment (i.e. central obesity), as measured by waist circumference (Lee & Nieman, 2010:180;
WHO/FAO, 2002:69; Mollentze et al., 1995:90) and WHR (Gibson, 2005:281;Lee & Nieman 2010:180;
Lee & Nieman, 2003:183, Table 6.8; Centers for Disease Control and Prevention (CDCP),
2009:online), is associated with insulin resistance, DM, hypertension, dyslipidemia, stroke and
atherosclerosis (Gee et al., 2008:533, 541; Lee & Nieman, 2010:181; Goedecke et al., 2005:68).
Central adiposity is also the cornerstone of the metabolic syndrome, characterized by a clustering of
factors, including: insulin resistance; hyperinsulinemia, glucose intolerance; hypertension, and
elevated plasma triglycerides and low high-density lipoprotein cholesterol (HDL) (Gee et al., 2008:533,
541; Goedecke et al., 2005:68; Kruger et al., 2005:494; Laquatra, 2004:568; WHO/FAO, 2002:73-74).
Today, metabolic syndrome or syndrome X can occur as early as childhood and adolescence, and is
associated with atherosclerosis in young adulthood and an increased risk for later CVD (WHO/FAO,
2002:36). Metabolic syndrome in childhood and adolescence is clustered with obesity, especially
central obesity and is found in children and adolescents with excessive intakes of saturated fats,
cholesterol and salt, and inadequate intake of fibre (WHO/FAO, 2002:41). Childhood obesity has a
greater effect on the development of the metabolic syndrome than becoming obese as an adult
(Goedecke et al., 2005:70).
Table 2.17: Differential manifestations of the features of metabolic syndrome in South Africa (Van der Merwe, 2001:5, Table 1)
Black population White population
Overweight and obesity (BMI >25 kg/m2) (64%) Overweight and obesity (BMI >25 kg/m
2) (50%)
Type 2 diabetes (8-12%) Type 2 diabetes (4%
Accelerated hypertension Hypertension
Cerebral hemorrhage (3%) Infarcts (15%)
IHD low prevalence eight in a hundred IHD very prevalent sixty in 100 000
Insulin resistance (high degree) (associated with brisk lipolysis)
Insulin resistance (lesser degree) (euglycemic hyperinsulinemic clamp studies)
More favourable lipid profiles Adverse lipid profile
Visceral fat mass lower Visceral fat mass higher
Gluto-femoral area displays insulin resistance with brisk lipolytic rate and a high subcutaneous blood flow
Regional adipose tissue metabolism in keeping with classical metabolic syndrome
Table 2.17 compares the different features of the metabolic syndrome manifested in the white and
black South African population. It is interesting to note that type-2 DM presents differently in South
Africa among black South Africans as opposed to white American and African-Americans. Obesity-
related type-2 DM is traditionally characterized by hyperinsulinemia, as seen in white Americans and
African-Americans (Van der Merwe & Pepper, 2006:5). Obesity-related type-2 DM among black South-
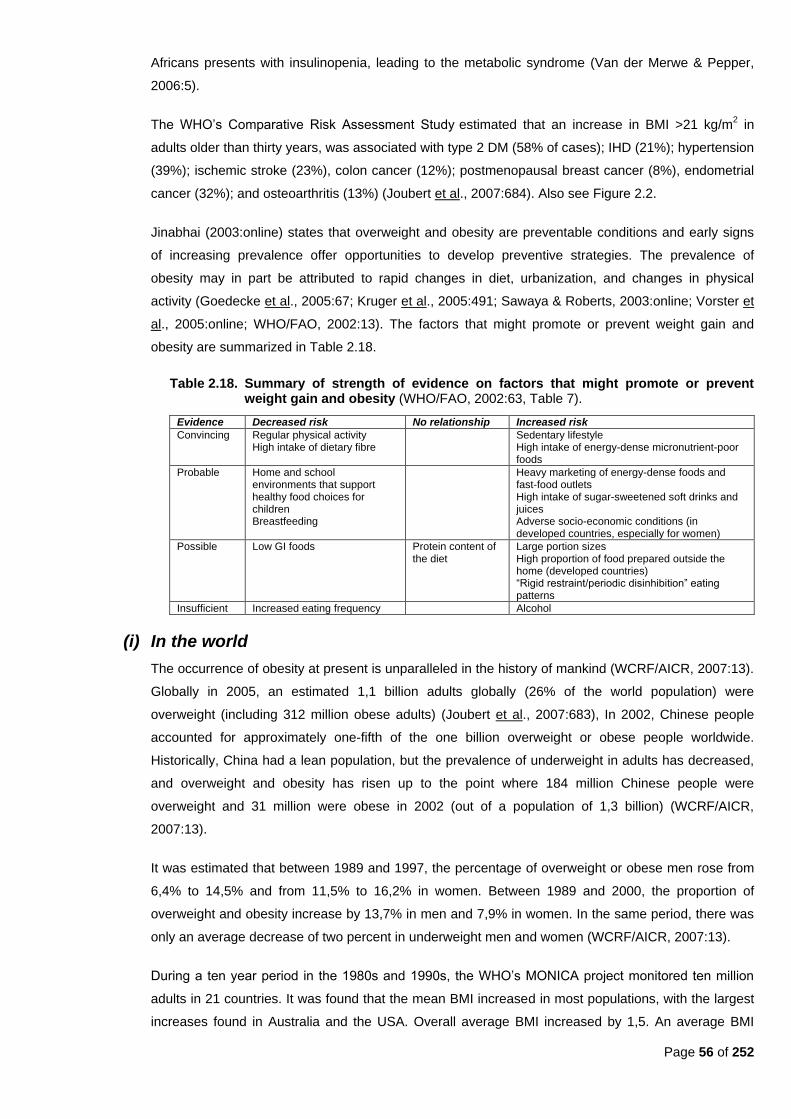
Page 56 of 252
Africans presents with insulinopenia, leading to the metabolic syndrome (Van der Merwe & Pepper,
2006:5).
The WHO‘s Comparative Risk Assessment Study estimated that an increase in BMI >21 kg/m2 in
adults older than thirty years, was associated with type 2 DM (58% of cases); IHD (21%); hypertension
(39%); ischemic stroke (23%), colon cancer (12%); postmenopausal breast cancer (8%), endometrial
cancer (32%); and osteoarthritis (13%) (Joubert et al., 2007:684). Also see Figure 2.2.
Jinabhai (2003:online) states that overweight and obesity are preventable conditions and early signs
of increasing prevalence offer opportunities to develop preventive strategies. The prevalence of
obesity may in part be attributed to rapid changes in diet, urbanization, and changes in physical
activity (Goedecke et al., 2005:67; Kruger et al., 2005:491; Sawaya & Roberts, 2003:online; Vorster et
al., 2005:online; WHO/FAO, 2002:13). The factors that might promote or prevent weight gain and
obesity are summarized in Table 2.18.
Table 2.18. Summary of strength of evidence on factors that might promote or prevent weight gain and obesity (WHO/FAO, 2002:63, Table 7).
Evidence Decreased risk No relationship Increased risk
Convincing Regular physical activity High intake of dietary fibre
Sedentary lifestyle High intake of energy-dense micronutrient-poor foods
Probable Home and school environments that support healthy food choices for children Breastfeeding
Heavy marketing of energy-dense foods and fast-food outlets High intake of sugar-sweetened soft drinks and juices Adverse socio-economic conditions (in developed countries, especially for women)
Possible Low GI foods Protein content of the diet
Large portion sizes High proportion of food prepared outside the home (developed countries) ―Rigid restraint/periodic disinhibition‖ eating patterns
Insufficient Increased eating frequency Alcohol
(i) In the world
The occurrence of obesity at present is unparalleled in the history of mankind (WCRF/AICR, 2007:13).
Globally in 2005, an estimated 1,1 billion adults globally (26% of the world population) were
overweight (including 312 million obese adults) (Joubert et al., 2007:683), In 2002, Chinese people
accounted for approximately one-fifth of the one billion overweight or obese people worldwide.
Historically, China had a lean population, but the prevalence of underweight in adults has decreased,
and overweight and obesity has risen up to the point where 184 million Chinese people were
overweight and 31 million were obese in 2002 (out of a population of 1,3 billion) (WCRF/AICR,
2007:13).
It was estimated that between 1989 and 1997, the percentage of overweight or obese men rose from
6,4% to 14,5% and from 11,5% to 16,2% in women. Between 1989 and 2000, the proportion of
overweight and obesity increase by 13,7% in men and 7,9% in women. In the same period, there was
only an average decrease of two percent in underweight men and women (WCRF/AICR, 2007:13).
During a ten year period in the 1980s and 1990s, the WHO‘s MONICA project monitored ten million
adults in 21 countries. It was found that the mean BMI increased in most populations, with the largest
increases found in Australia and the USA. Overall average BMI increased by 1,5. An average BMI
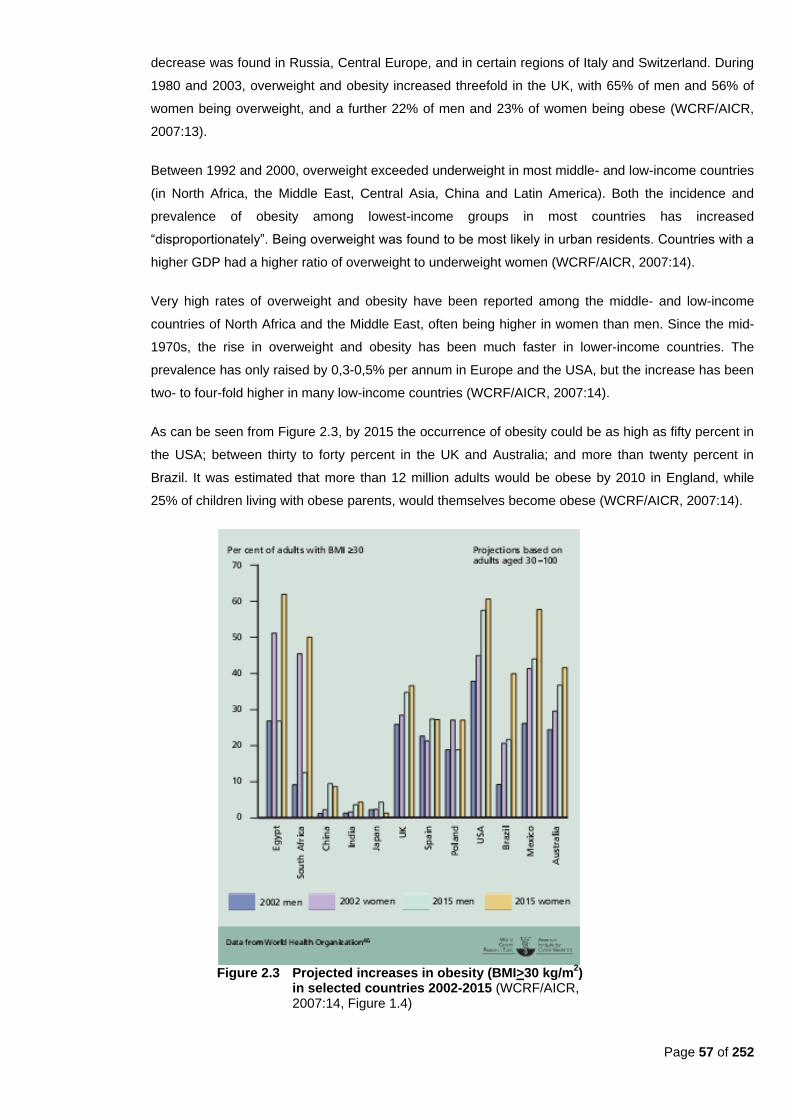
Page 57 of 252
decrease was found in Russia, Central Europe, and in certain regions of Italy and Switzerland. During
1980 and 2003, overweight and obesity increased threefold in the UK, with 65% of men and 56% of
women being overweight, and a further 22% of men and 23% of women being obese (WCRF/AICR,
2007:13).
Between 1992 and 2000, overweight exceeded underweight in most middle- and low-income countries
(in North Africa, the Middle East, Central Asia, China and Latin America). Both the incidence and
prevalence of obesity among lowest-income groups in most countries has increased
―disproportionately‖. Being overweight was found to be most likely in urban residents. Countries with a
higher GDP had a higher ratio of overweight to underweight women (WCRF/AICR, 2007:14).
Very high rates of overweight and obesity have been reported among the middle- and low-income
countries of North Africa and the Middle East, often being higher in women than men. Since the mid-
1970s, the rise in overweight and obesity has been much faster in lower-income countries. The
prevalence has only raised by 0,3-0,5% per annum in Europe and the USA, but the increase has been
two- to four-fold higher in many low-income countries (WCRF/AICR, 2007:14).
As can be seen from Figure 2.3, by 2015 the occurrence of obesity could be as high as fifty percent in
the USA; between thirty to forty percent in the UK and Australia; and more than twenty percent in
Brazil. It was estimated that more than 12 million adults would be obese by 2010 in England, while
25% of children living with obese parents, would themselves become obese (WCRF/AICR, 2007:14).
Figure 2.3 Projected increases in obesity (BMI>30 kg/m
2)
in selected countries 2002-2015 (WCRF/AICR, 2007:14, Figure 1.4)
Page 58 of 252
Puoane et al. (2004:2) state that this worldwide problem can be considered to be a result of social-,
economic- and cultural problems being encountered by developing- and newly industrialized countries,
as well as ethnic minorities and the disadvantaged in developed countries.
Weight gain, overweight, and obesity are now generally much more common than in the 1980s and
1990s. Rates of overweight and obesity doubled in many high-income countries between 1990 and
2005. In most countries in Asia and Latin America, and some in Africa, chronic diseases, including
obesity, are now more prevalent than nutritional deficiencies and infectious diseases (WCRF/AICR,
2007:xvii).
(a) In children
Overweight in childhood and early life is liable to be followed by overweight and obesity in
adulthood (WCRF/AICR, 2007:xvii). Obesity not only persists from infancy into adulthood, but it has
also been associated with an unfavourable cardiovascular risk profile in the first twenty years of life
(Mukuddem-Petersen & Kruger, 2004:online). Childhood obesity is associated with several risk
factors for CDLs, including heart disease, in later life (Jinabhai et al., 2003:online). The increase in
overweight and obesity in the adult population has resulted in an increase in the prevalence of
CDLs (Mamabolo et al., 2005:online). Childhood is therefore a key period in which to identify the
risk of becoming obese in adulthood (Mukuddem-Petersen & Kruger, 2004:online).
In 2005, 22 million children under age five years were classified as overweight. The prevalence of
overweight in American children tripled between the 1960s and 1990s. In Chile, between 1987 and
2000, obesity prevalence in six year olds increased from 6,5% to 7,8% in boys and from 17% to
18,6% in girls (Goedecke et al., 2005:67). The prevalence of overweight has also increased in
children over the past twenty years in developing countries such as India, Mexico, Nigeria and
Tunisia (WHO/FAO, 2002:8).
In a study carried out on children living in informal settlements in Sao Paulo, Brazil, it was found
that low energy expenditure may be the most important risk factor for weight gain in susceptible
populations (Hoffman et al., 2000:1030). This may explain the increased risk of excess weight gain
leading to obesity among girls from this population as compared to the boys (Mukuddem-Petersen
& Kruger, 2004:online). Obesity in children is also becoming a significant problem in industrialized
countries, including those in South-East Asia (Darnton-Hill & Coyne, 1998:24).
About twenty to 25% of Mexican children aged between two and six years old, are overweight or
obese (Fernald & Neufeld, 2007:623). There is a higher prevalence in girls (Fernald & Neufeld,
2007:624). Overweight in children is more common in urban areas, and particularly in girls (Steyn
et al., 2005:12). The risk of overweight and obesity in childhood increased with maternal
overweight (Fernald & Neufeld, 2007:629).
High blood pressure in children is strongly associated with obesity, in particular central obesity,
together with an adverse serum lipid profile (especially in LDL and total cholesterol) and glucose
intolerance. The thinner the child was, the more obese the adult becomes; with a greater
subsequent risk of developing CDLs (WHO/FAO, 2002:36-37). The later the weight gain in
childhood and adolescence, the greater the persistence of being overweight. More than sixty
Page 59 of 252
percent of overweight children aged five to ten years, have at least one additional risk factor for
CVD, such as hypertension, dyslipidemia or hyperinsulinemia, and more than 25% have two or
more risk factors (Goedecke et al., 2005:70; WHO/FAO, 2002:37). A large increase in type 2 DM in
children and adolescents has been documented. In the USA the incidence of type 2 DM increased
tenfold between 1982 and 1994 (Goedecke et al., 2005:70). In 2002, the amount of DM cases were
estimated to be around 150 million worldwide. This number was expected to double by 2025, with
the largest proportion to be in China and India (WHO/FAO, 2002:72).
Intra-abdominal adipose tissue in obese children has a significant relationship with dyslipidemia
and glucose intolerance. Childhood obesity also results in the development of co-morbidities of
obesity in adulthood, since childhood obesity often persists into adulthood. Childhood obesity has a
greater effect on developing the metabolic syndrome than becoming obese as an adult (Goedecke
et al., 2005:70; Vanhala et al., 1999:657-658; Vanhala et al., 1998:319-320).
(b) In adults
In the USA, between the 1960s and the 1990s, the increase in obesity among adults was 1,6 fold
(Goedecke et al., 2005:67). According to Darnton-Hill and Coyne (1998:24), almost half of North
American adults were overweight in 1997; and more than a third of Australian- and American
populations are overweight. The greatest increase in obesity has been found in developing
countries (Goedecke et al., 2005:67).
In the USA, obesity prevalence is as high as 26,6% in men and 32,2% in women above twenty
years of age (Goedecke et al., 2005:65). The prevalence of overweight ranges from nine percent to
31% in the UK and USA (Jinabhai, 2003:online). The prevalence of overweight in China ranges
from 0,2% to 11%. Russia and Spain are approaching a prevalence rate similar to the UK and
USA. When looking at black, Indian and mixed race populations of Trinidad and Tobago, the
pattern appears similar to the UK‘s (Jinabhai, 2003:online). Obesity is also becoming an increasing
problem in countries undergoing epidemiological transition, such as South Africa, Mexico and
South American countries (Goedecke et al., 2005:65). In Mexico, the prevalence of obesity in
women increased from 9,4% in 1988, to 24,4% in 1999 (Goedecke et al., 2005:66). Also in Mexico,
17,1% of mothers were obese and 35,5% were overweight in 2003 (Fernald & Neufeld, 2007:627).
In Brazil, the prevalence of overweight tripled from 4,1% in 1974, to 13,9% in 1997 (Goedecke et
al., 2005:66). According to Mendez et al. (2005:720), overweight in Brazilian adults appears to
have replaced undernutrition as a public health problem. In Brazil, it was found that the prevalence
of obesity increased with increased income in men, whereas in women obesity increased with
poverty (Sawaya & Roberts, 2003:online). In the Federated States of Micronesia, over fifty percent
of women between forty and 49 years of age were obese and eighty percent were overweight in
1984. A high prevalence of obesity has also been described in many populations undergoing
transition in the Pacific and Indian Oceans (Darnton-Hill & Coyne, 1998:25). According to Darnton-
Hill and Coyne (1998:25) obesity is increasingly seen, mainly in urban areas. In Mauritius, similar
results were found between 1987 and 1992 with a prevalence of overweight and obesity increasing
from 26,1% to 35,7% in men and from 37,9% to 47,7% in women (Goedecke et al., 2005:67).
Page 60 of 252
According to Mendez et al. (2005:720), the overweight burden is generally higher than that of
underweight in young women. In low-income countries, obesity is more common in middle-aged
women, people with a high socio-economic status and urban residents (WHO/FAO, 2002:61). In
developed countries, overweight was high in women with low socio-economic status from both rural
(38%) and urban areas (51%) (Mendez et al., 2005:714). In comparison with low-income countries,
obesity seems to be more common in developed countries among middle-aged people, younger
adults and children. Obesity also tends to be associated more with lower socio-economic status,
especially in women, and the differences between rural- and urban residents are diminished or
reversed (WHO/FAO, 2002:61).
(ii) In Africa
In most African countries studied in the International Obesity Task Force: Global Burden of Disease
Analyses 2002, women had a higher BMI than men. In Cameroon, the average BMI for ages 15 to 59
was 24 kg/m² for males and 24,8 kg/m² for females. In the Seychelles, the average BMI for males
aged between 15 and 69 years was 23,2 kg/m², but for women of the same age it was 25,9 kg/m². In
South Africa, the average BMI in males for the same age group was 24 kg/m² and for females 27,9
kg/m² (Goedecke et al., 2005:66, Table 7.1).
Van der Merwe and Pepper (2006:4) state that the prevalence of obesity is increasing in most African
countries, especially in urban areas. The impact of obesity on CDLs varies and the impact of obesity
on type 2 DM is unclear. In the African population with type 2 DM, the prevalence of obesity varies
between 15% to seventy percent. In Sub-Saharan Africa, type 2 DM is accompanied by ―severe
insulinopenia‖ combined with varying levels of insulin resistance (Van der Merwe & Pepper, 2006:4).
In Ghana, BMI did not differ between natives with normal fasting glucose and those with DM, but
biceps and triceps skinfolds were significantly larger in the diabetic population. Interestingly,
hyperinsulinemia, insulin resistance and abdominal obesity were found in hypertensive subjects (Van
der Merwe & Pepper, 2006:4).
Globally, the prevalence of childhood obesity is a serious problem, but there is insufficient data for
most African countries (Mukuddem-Petersen & Kruger, 2004:online).
(i) In South Africa
The high number of overweight and obesity among women can be attributed to the fact that weight
loss is associated with HIV and AIDS and that moderately overweight women are thought of as
attractive, affluent and well-cared-for by their husbands (Joubert et al., 2007:688; WCRF/AICR,
2007:9).
The Burden of Disease study found in 2000 that excess body weight accounted for one in every ten
female deaths in South Africa (Joubert et al., 2007:687). Urban black women are at greatest risk for
obesity (Goedecke et al., 2005:66).
Page 61 of 252
Childhood obesity is a strong predictor of obesity in adulthood (Joubert et al., 2007:688). SASOM
(2006c:online) states that twenty percent of children under the age of six in South Africa are
overweight. These children have a high likelihood of growing into overweight adults.
(a) Incidence, prevalence and epidemiology
In the 1990s, three adult studies found the prevalence of obesity in black women as 34,4%, 53,1%
and 53,4% respectively. Lower prevalence of obesity was found in black men with 7,9%, 23% and
32,9% respectively (Bourne et al., 2002:159).
According to WHO data, in 1998 South African men aged between 15 to 24 years old, had an average
BMI of 21,1 kg.m2. For the group between 35 to 65 years of age, the average was 25 kg/m
2. Only
7,8% of men aged between 25 and 34 years old had a BMI >30 kg/m2, compared to 17,3% of men
aged between 45 and 54 years old (WCRF/AICR, 2007:9).
In 1998, women between 15 and 24 years old had an average BMI of 23,7 kg/m2. For the 35 to 64
years age group, the average BMI was 29 kg/m2. For women aged between 25 and 34 years old, 27%
had a BMI >30 kg/m2, compared with 45% of women aged 45 to 64 years old. Overall, 21,1% of men
and 25,9% of women were overweight (BMI >25 kg/m2), and 10,1% of men and 27,9% of women were
obese (BMI >30 kg/m2) (WCRF/AICR, 2007:9). Refer to Figure 2.3 to ascertain the projections for
2015.
In the Cape Peninsula study (Steyn et al., 1998:35), the prevalence of overweight was 36,4% in
women and 22% in men. In the Free State study (Mollentze et al., 1995:93), the prevalence of obesity
among women ranged from 27,5% to 49% in QwaQwa (rural area), and from 31,1% to 54,3% in
Mangaung (urban area). The prevalence among men was only in the range of 7,4% to 19,2% for
QwaQwa men, and from three percent to 24% for Mangaung men. The MRC Technical Report (Steyn
et al., 2006, 20) stated that overweight/obesity was more prevalent in urban areas, which is indicative
of nutrition transition. Higher levels of BMI were found in older men, those living in the city, and white
men. Vorster et al. (2005:online) found in the North West Province that overweight and obesity
increased with an improvement in micronutrient intakes and micronutrient status. Vorster and Kruger
(2007:323) indicate the rate of overweight and obesity in men was 25,4% in blacks, 30,8% in
coloureds, 32,7% in Indians, and 54,5% in whites. In women, the figures were 58,4% in blacks, 52,2%
in coloureds, 48,9% in Indians, and 49,2% in whites. Black female students were more likely to be
either underweight or overweight/obese than their white counterparts, with 26,8% underweight; 18,2%
overweight and 6,5% obese as compared to 7,2% underweight, ten percent overweight and 0,8%
obese. In a postal survey it was found that 56,4% of white men, 49,3% of black men and 74,6% of
black women were overweight or obese. The prevalence was lower in men (45,7%) and women
(66%); 35,5% for Indian men, 37% for white men and 42,2% for white women (Senekal et al.,
2003:112).
Goedecke et al. (2005:69) state that a study in South Africa confirmed what has already been found in
America: black women have less visceral adipose tissue than white women, but were more insulin
resistant. However, the 1998 SADHS found that more than twice as many black women (35,3%) than
white women (17,4%) had a waist-hip-ratio greater than 0,85 cm (Goedecke et al., 2005:69). In 1995,

Page 62 of 252
Mollentze et al. (1995:93) found that WHR for men exceeded that for women. It also increased with
age in both rural and urban areas in the Free State. The mean BMI for both rural and urban men were
below 25 kg/m2, whereas the mean BMI for women in both rural and urban Free State exceeded 25
kg/m2
(Mollentze et al., 1995:93). Forty-two percent of women had central obesity (android fat pattern)
and this was more prevalent in urban black women and coloured women (Goedecke et al., 2005:65).
About nine percent of men had central obesity, with higher levels in older and white men (Goedecke et
al., 2005:66). However, in the 1998 SADHS, seven percent of men and 32% of women had a WHR
above the cut-off point, with the ratio increasing with age for men and women. In women, the
prevalence for a WHR above the cut-off point was higher in the rural areas (DoH, et al., 2002:245).
In 1998, the SADHS showed an adult South African population with a malnutrition pattern consisting
predominantly of overnutrition, particularly in black women (DoH et al., 2002:21). Ten percent of
women were already obese at 15 to 24 years of age (Goedecke et al., 2005:66; Bourne et al.,
2002:159) and forty percent of women were found to be obese by age 35 (Steyn et al., 2006:21). In
the 1998 SADHS, the mean BMI was 23,4 kg/m² for men and 27,3 kg/m² for women. According to
WHO standards, 29% of men and 56% of women were overweight and obese (Joubert et al.,
2007:683; Steyn, 2005b:249; Mukuddem-Petersen & Kruger, 2004:online; DoH et al., 2002:244). This
is higher than reported in other African countries (Goedecke et al., 2005:65). Interestingly, less than
five percent of men and 15% of women perceived themselves as obese (Bourne et al., 2002:159).
Nearly thirty percent of South African women aged between thirty and 59 years were obese
(Goedecke et al., 2005:65). Only about ten percent of men are obese. Overweight and obesity were
highest in the Western Cape, KwaZulu-Natal and Gauteng. The highest prevalence of overweight and
obesity was among black women with 26,7% being overweight and 31,8% obese with a total of 58,5%
(Vorster & Kruger, 2007:323; Goedecke et al., 2005:65). Fifty-two percent of coloured women, 49,2%
of white women and 48,9% of Indian women were overweight/obese. The prevalence of obesity was
particularly high among women in general (30%), with 33% of urban- and 25% of rural women
presenting with obesity (Joubert et al., 2007: 638; Goedecke et al., 2005:65)
In men, a different pattern was noted. The prevalence of overweight and obesity was the highest in
white men (54,5%), while 32,7% of Indian men and 31% of coloured men were overweight or obese.
The lowest prevalence was seen in black men (total of 25%), with only six percent being obese and
19,4% being overweight (Goedecke et al., 2005:66). Urban men and older men had the highest BMIs
(Goedecke et al., 2005:66; DoH et al., 2002:244). Women were five to ten times more obese than
men, and the percentage of men with low to normal BMI (<18.0 to 24.9 kg/m2) was higher than in
women (Vorster et al., 2005:online). In 1998, the prevalence of obesity among adults, particularly in
women ranged from 21% to 31% in different population groups. In white males it was 21%, while it
was less than ten percent in other population groups. The prevalence amongst all males was twenty
percent (Steyn et al., 2006:34).
The second SADHS conducted in 2003, provides information of a five year trend. Minimal changes in
the percentage of overweight men were noted. There was a decline in the proportion of obese men as
well as obese women (DoH, 2004:25-26). The 2003 SADHS found that 21% of adult men were
overweight and nine percent obese. In women, 29% were overweight and 23% obese. Obesity was
more prevalent in older men and women and in the urban areas. Obesity in men was most common in
Page 63 of 252
the provinces of the Western Cape, Gauteng and KwaZulu-Natal. Obese women were more common
in the provinces of Eastern Cape, Gauteng and Western Cape (DoH, 2004:24-25). The MRC‘s Burden
of Disease study found that the mean BMI for both genders was ―well above‖ 21 kg/m2 and that it
declined with increasing age. The mean BMI for adults older than 30 years was 28,7 kg/m2
for women
and 24,1 kg/m2 for men. When using the WHO classifications, 27,3% of men and 29,1% of women
older than 30 years were overweight and another 11,0% of men and 38,6% of women older than thirty
years were obese (Joubert et al., 2007:685).
In the Burden of Disease study, for type 2 DM and cardiovascular outcomes, the risk was highest in
the thirty to 44-year age group, with risk decreasing with age. Cancer-related outcomes and
osteoarthritis in males peaked in the 45 to 59 years group and in females peaked in the sixty to 69
years groups (Joubert et al., 2007:685).
The Burden of Disease study also found that the largest proportion of deaths related to excess body
weight occurred between 45 and 59-years of age (Joubert et al., 2007:687).
In 1998, combined figures for overweight and obese South African adults across all ethnic groups
were 57% for women and 29% for men (Van der Merwe & Pepper, 2006:1). In 2006, it was estimated
that the prevalence of obesity in black women was between 31% and 34%, in white women between
18% and 24%; in Indian women between 20% and 22%; and in coloured women between 26% and
28%. The prevalence of obesity in black men was estimated at eight percent, in Indian men between
three- and nine percent; in coloured men between six- and nine percent; and the highest prevalence
was estimated for white men (between 15% to 20%) (Van der Merwe & Pepper, 2006:1-2). The
combined figures for overweight and obesity in the different ethnic groups were: 75% black women;
49% black men; 66% coloured women; 45,7% coloured men; 37% Indian women; 36% Indian men;
42% white women; and 56% white men (Van der Merwe & Pepper, 2006:6). Determinants associated
with an increased risk for overweight include: black race; inactivity; and at least one overweight parent
(Steyn et al., 2005:12).
As stated previously, the NFCS reported that in 1999 the prevalence of combined overweight and
obesity (17,1%) among children between one and nine years of age at the national level was as high
as that for stunting (19,3%) (Steyn et al., 2006:34; Steyn, 2005a:43-44; Steyn et al., 2005:4;
Goedecke et al., 2005:67; Labadarios et al., 2005:536; Mamabolo et al., 2005:online; Steyn,
2005b:249). The prevalence of overweight in the Free State province (6,2%) as well as in urban areas
nationally (7,7%) exceeded the national average (6%) (Labadarios & Nel, 2000:175). Nationally, the
prevalence for overweight (6%) remained constant in all age groups (Labadarios & Nel, 2000:169).Ten
percent of South Africa women aged between 15 and 24 years old are already obese (Goedecke et
al., 2005:66). In the Youth Risk Behaviour Survey, 17% of adolescents were found to be overweight
and 4,2% were obese (Goedecke et al., 2005:66; Kruger et al., 2005: 492).
There seems to be some contradictory results when prevalence of obesity according to race is
investigated. In a regional school survey, the prevalence of obesity in black girls aged 18 was
projected to be 37%, as compared to ten percent for white girls and twenty percent for coloured girls
(Goedecke et al., 2005:66). However, the THUSA BANA study conducted in the North West Province
Page 64 of 252
found the BMI in black children to be lower than those of white and Indian children. The same was true
for body fat percentage. Iin children aged ten to 15 years old, the highest prevalence of overweight
and obesity was found among white children (14,2%), compared to black (7,1%), Indian children
(6,4%) and coloured children (2,9%). Body fat was significantly higher in girls of all races, than in boys
(Mukuddem-Petersen & Kruger, 2004:online).
In 1996, Popkin et al. (1996:3012) analyzed the nutritional status of South African pre-school children
(between three and six years of age) using the WHO NHANES III definition. They found that the
prevalence of overweight was 25% for boys and 20,3% for girls.
In the THUSA-BANA study, Kruger et al. (2005:492) found that approximately ten percent of children
were overweight, but that overweight was almost non-existent in younger, rural boys. Obesity may
start during the adolescent growth spurt (Mukuddem-Petersen & Kruger, 2004:online). Kruger et al.
(2005:492) reports that females were more prone to obesity, with overweight occurring more
frequently before the growth spurt at ten years of age, as well as after menarche. None of the rural
boys were overweight before the age of 15 years, after which body fat increased to a peak at
seventeen years. In girls, body fat increased after menarche, also peaking at 17 years of age with 11%
of girls being classified as ―over-fat.‖ In one to nine year olds, 6,7% were overweight and 3,7% were
obese. The highest overweight prevalence was among urban children (Kruger et al., 2005:492; Steyn
et al., 2005:8).
At the national level, the NFCS found that 12,4% of all children were overweight and 6,6% were
obese. The combined rate for overweight and obesity was again the highest in urban areas in all age
groups (20,7%) (Steyn et al., 2005:8; Labadarios & Nel, 2000:176). Also of interest was that 17,1% of
children had a BMI of at least 25 kg/m2. The highest prevalence of overweight was in urban areas
(18,6%) and in those children aged one to three years. Only 13,4% of rural children were overweight
(Steyn et al., 2005:9,10,12). According to weight-for-age data, 6,7% of children nationally were
overweight and 3,7% were obese (10,4% together). The highest prevalence was in urban areas.
According to weight-for-height data, 12,4% were overweight and 6,6% were obese (19% together),
again with the highest prevalence in the urban areas (Steyn et al., 2005:8).Urbanization appears to
influence the prevalence of obesity in South African children (Goedecke et al., 2005:67). However,
rates of overweight and obesity higher than those previously reported were found by Mamabolo et al.
(2005:online) in 2003, who reported a high prevalence of overweight (22%) and obesity (24%)
amongst rural children in Limpopo. This may be indicative of a nutrition transition.
(b) Etiology
Overweight and obesity result from the energy consumed from fat, carbohydrate, protein and alcohol
exceeding energy needs (Vorster & Kruger, 2007:323). Household income, total energy intake, fat
intake and low physical activity are the major determinants of obesity (Vorster et al., 2005:online).
Kruger et al. (2005:492) postulates that the obesity epidemic in South Africa is indicative of
globalization, which compels the nutrition transition. Obesity and its co-morbidities affect South
Africans negatively and the burden of disease contributes to the increasing healthcare costs, both in
the private and public sector (Goedecke et al., 2005:65).
Page 65 of 252
The difference in obesity among different ethnic groups is influenced by many factors, including the
environment and genetics. However, there has been limited progress on the identification of genetic
components. A few single-gene disorders have assisted in identifying significant components involved
with metabolic pathways where gene disruption can lead to obesity, e.g. leptin; pro-opiomelanocortin
and prohormone convertase. In South Africa, the only genetic data available refers to the gene which
encodes for the ß3 subunit of heterotrimeric G proteins. The 825T allele is significantly linked to
obesity in blacks and is also linked to hypertension. There are similar allele frequencies found both in
rural and urban populations. When genotyping was conducted among 5254 individuals from 55
population groups from Africa, the Americas, Europe, Asia, Australia and New Guinea, the highest
825T allele frequencies were found in black Africans (82%) (Van der Merwe & Pepper, 2006:5).
It is speculated that greater visceral fat mass may have been promoted by higher cortisol levels and
may lead to higher lipid profiles (Kruger et al., 2005:495).
2.6.3.2 Diabetes mellitus
According to the WDF (2006:online), DM is one of the major causes of premature death worldwide.
Worldwide, a person dies from DM-related causes every ten seconds (WDF, 2006:online). DM
contributes to a considerable increase in both morbidity and mortality (Bradshaw et al., 2007:700;
Franz, 2004:794). Complications of type 2 DM include: blindness; kidney failure; foot ulcers (which
may lead to gangrene and amputations); CHD; stroke; and increased infection risk. DM is responsible
for over one million amputations annually; as well as a large percentage of cataracts and at least five
percent of blindness worldwide. DM is also the largest cause of kidney failure in developed countries
(WDF, 2006:online). Type 2 DM is also now starting to occur in children, where before it was only
found in adults (SASOM, 2006c:online).
Obesity-related type-2 DM among black South-Africans presents with insulinopenia, leading to the
metabolic syndrome. An insulin resistance is often also noted in these persons (due to free fatty acid
toxicity). The insulin resistance together with the insulinopenia increase the risk for keto-acidosis. It
has been found that even if young persons in good physical condition are matched for body
composition and weight, black South Africans are relatively more insulinopenic than their white
counterparts (Van der Merwe et al., 1999:910).
(i) Incidence and prevalence
Type 2 DM (resulting from insufficient production of insulin in order to overcome the underlying insulin
resistance) (WDF, 2006:online; Franz, 2008; 769; Franz, 2004:797), accounts for most cases of DM
(between 90% to 95% worldwide) (WDF, 2006:online). In the early stages of type 2 DM, insulin is
overproduced, but later on insulin levels may fall as a result of partial failure of the ß-cells of the
pancreas (WDF, 2006:online).
In 2000, DM was estimated to be the fifth leading cause of death worldwide, accounting for 5,2% of
global deaths, and the tenth leading cause of death in South Africa, accounting for an estimated 2,6%
of deaths (Bradshaw et al., 2007:700). The lowest mortality (2,4%) for DM is reported for the poorest
African- and Western Pacific countries, and the highest mortality (+9%) is found in the Arabian
Peninsula, East Mediterranean region, Canada and the USA (Bradshaw et al., 2007:703).

Page 66 of 252
The prevalence of DM increases with age. It affects 18,4% of people older than 65 years of age
(Franz, 2004:794). However, type 2 DM no longer only affects mainly older adults. Between 1990 and
1998, the prevalence increased (by 76%) among people in their thirties and has also increased
dramatically amongst children (up to 45% among certain racial groups) (Franz, 2008:766).
Whereas DM was previously a disease of the middle-aged and elderly, it has recently escalated in all
age groups; including adolescents and children, especially in high-risk populations (WHO/FAO,
2002:72), and where major changes in diet, reduction in physical activity, and increase in overweight
and obesity have occurred (WHO/FAO, 2002:73).
In 1985, an estimated thirty million people had DM worldwide (WDF, 2006:online). The WHO
estimated that 135 million had DM in 1998 (Bradshaw et al., 2007:700). In 2002, the WHO estimated
the incidence of DM worldwide at around 150 million (WHO/FAO, 2002:72) and the prevalence was
estimated around 171 million in 2000 (Bradshaw et al., 2007:700). The prevalence increased to 220,5
million worldwide in 2004, of which 9,7 million (4,4%) were from Africa. The Western Pacific countries
had the highest prevalence with 56 million or 25,4% (WHO, 2008:32, Table 7). In 2006, DM affected
about six percent of the world‘s adult population (230 million people). In 2006, India had the world's
largest DM population (35 million people) (WDF, 2006:online). It is also particularly prevalent in the
minorities of the USA, including: African-Americans; Hispanics, Native Americans, Alaska natives;
Asian-Americans and Pacific Islanders (Franz, 2004:794). In many countries in Asia, the Middle East,
Oceania and the Caribbean, DM affected twelve to twenty percent of the adult population (WDF,
2006:online).
By 2025, the number of DM cases is predicted to double, with most cases expected in China and India
(WHO/FAO, 2002:72). The WHO predicts that developing countries will be affected the most by the
DM epidemic, with eighty percent of all new cases appearing in developing countries by 2025, mostly
among people aged between 45 and 64 years old (WDF, 2006:online). DM prevalence is projected to
increase to 366 million worldwide by 2030 (Bradshaw et al., 2007:700). The projected increase in
developing countries is partly due to an ageing and growing population, but also attributable to
urbanization and the nutrition- and physical activity transition. Increasing prevalence of obesity globally
will exacerbate this situation (Bradshaw et al., 2007:700)
Bourne et al. (2002:161) state that the prevalence of DM in the black South African population is
considerably higher than 25 years ago, ranging from five percent in the Gauteng province to eight
percent in Cape Town. In the early 1990s, Mollentze et al. (1995:93) found DM prevalence to be at
4,8% in rural Free State and six percent in urban Free State. The condition was more frequent in men
older than 45 and women older than 35 years of age. The Indian population of South Africa has the
highest DM prevalence, followed by the coloured- and black populations (Bradshaw et al., 2007:700).
About one to 1,5 million South Africans are considered to have DM, which amounted to 5,5% of the
population older than thirty years (Bradshaw et al., 2007:700). The prevalence increased with age in
both genders, although there was a marked difference over the age of sixty years, with the prevalence
being much higher among females of all population groups except Indian, where there was a marked
increase for the age group 45 to 49 years in both genders (Bradshaw et al., 2007:702). After taking
various factors into consideration, Bradshaw et al. (2007:702) reported that 4,3% of all deaths were
Page 67 of 252
attributed to DM in South Africa in 2000, which makes it the seventh leading cause of death
(Bradshaw et al., 2007:702), unlike the figure they mentioned earlier of 2,6%, which excluded excess
deaths resulting from increased mortality risk from DM-associated CVD or –renal failure (Bradshaw et
al., 2007:700). Almost half (47,2%) of the 4,3% DM-related deaths occurred in persons younger than
65 years. The peak burden was for men aged between 45 and 59 years, and for women aged sixty to
69 years. More South African women (5,7%) than men (3,0%) died from DM in 2000 (Bradshaw et al.,
2007:702).
(ii) Etiology
Bradshaw et al. (2007:703) states that the high mortality rate in comparison to the prevalence, might
be linked to: suboptimal access to health care; inadequate blood glucose- and blood pressure control;
infrequent examinations for DM-related complications; and lack of access to hypercholesterolemia
treatment.
Among the Indian South African population, peripheral insulin resistance and type-2 DM are more
prevalent than in white South Africans. There is a high degree of acquired insulin resistance among
obese black urban women, and insulin resistance is also an independent feature of essential
hypertension among black South Africans. This type of hypertension is usually partly corrected by
administration of long-acting angiotensin-converting enzyme (ACE) inhibitors (Van der Merwe &
Pepper, 2006:3). Insulinopenia is related to a reduced β-cell mass, whereas insulin resistance is more
a consequence of obesity. Both insulinopenia and insulin resistance are involved in type 2 diabetic
black South Africans (see Table 2.17) (Van der Merwe, 2001:5, Table 1). Insulin resistance appears to
be an important factor in the black South African population, especially in those presenting with
hypertension and obesity, together with DM (Kruger et al., 2005:495). As mentioned earlier, the
elevated FFA in the black population may be due to the reduced anti-lipolytic effect of insulin on
adipocytes, which in turn may down-regulate the insulin receptors (Van der Merwe & Pepper, 2006:3).
Taking all these metabolic effects into account may explain why obese black patients are predisposed
to type 2 DM. It is interesting to note that the pathogenesis and clinic presentation of type 2 DM among
black South Africans resembles type 1 DM, which explains why this population can present with
diabetic ketoacidosis by age forty (Van der Merwe & Pepper, 2006:3-4).
The risk of type 2 DM increases with the presence of maternal DM, gestational DM and intra-uterine
growth retardation, especially when a rapid catch-up growth occurs (WHO/FAO, 2002:73). Babies
born to mothers after they have developed DM have a three-fold higher risk of developing DM
themselves (WHO/FAO, 2002:74).
Overweight and obesity are associated with an increased risk of type 2 DM, especially with central
adiposity (Goedecke et al., 2007:69; WHO/FAO, 2002:73). Central adiposity is an important
determinant of insulin resistance. Waist-to-hip ratio and waist circumference are more powerful
determinants of subsequent risk of type 2 DM than BMI (WHO/FAO, 2002:74). Voluntary weight loss
improves insulin sensitivity and reduces risk of progression from impaired glucose tolerance to type 2
DM (WHO/FAO, 2002:74). In the Nurses Health Study undertaken in the USA, the risk for DM
increased forty-fold when BMI increased from 22 to 35 kg/m². In the Health Professional Follow-Up
Study, the relative risk of developing DM was 42 in men with a BMI > 35 kg/m², as compared to those
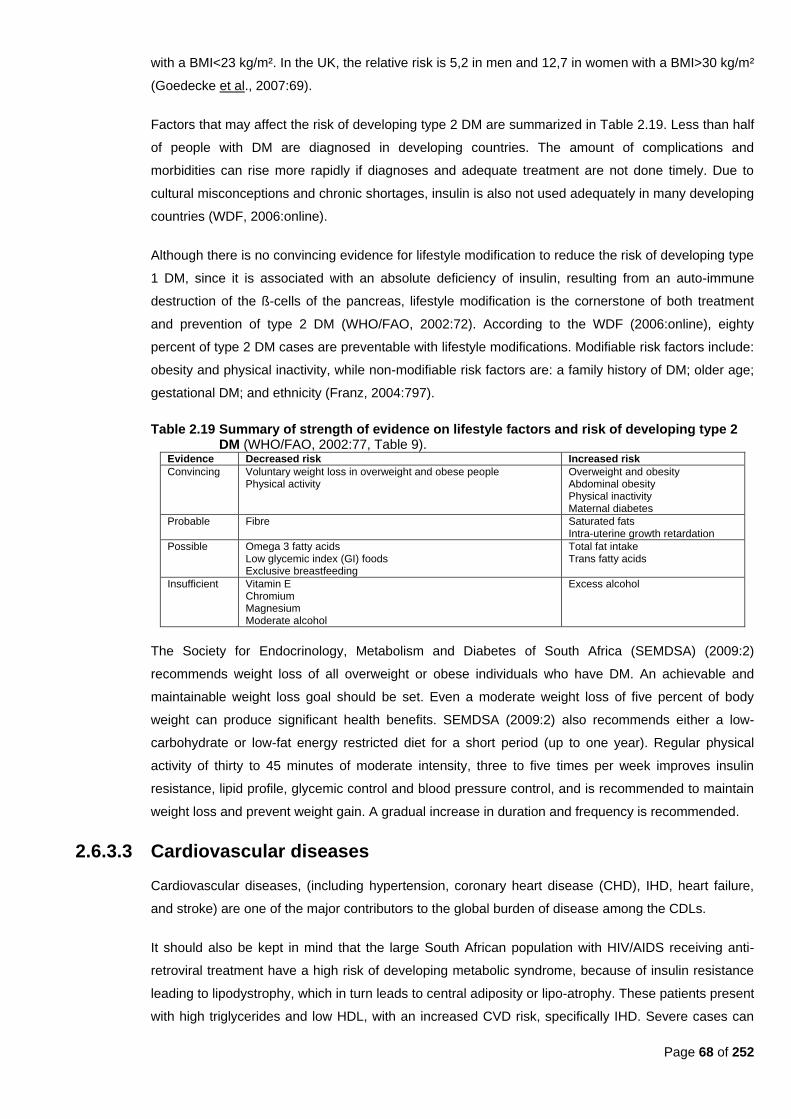
Page 68 of 252
with a BMI<23 kg/m². In the UK, the relative risk is 5,2 in men and 12,7 in women with a BMI>30 kg/m²
(Goedecke et al., 2007:69).
Factors that may affect the risk of developing type 2 DM are summarized in Table 2.19. Less than half
of people with DM are diagnosed in developing countries. The amount of complications and
morbidities can rise more rapidly if diagnoses and adequate treatment are not done timely. Due to
cultural misconceptions and chronic shortages, insulin is also not used adequately in many developing
countries (WDF, 2006:online).
Although there is no convincing evidence for lifestyle modification to reduce the risk of developing type
1 DM, since it is associated with an absolute deficiency of insulin, resulting from an auto-immune
destruction of the ß-cells of the pancreas, lifestyle modification is the cornerstone of both treatment
and prevention of type 2 DM (WHO/FAO, 2002:72). According to the WDF (2006:online), eighty
percent of type 2 DM cases are preventable with lifestyle modifications. Modifiable risk factors include:
obesity and physical inactivity, while non-modifiable risk factors are: a family history of DM; older age;
gestational DM; and ethnicity (Franz, 2004:797).
Table 2.19 Summary of strength of evidence on lifestyle factors and risk of developing type 2 DM (WHO/FAO, 2002:77, Table 9).
Evidence Decreased risk Increased risk
Convincing Voluntary weight loss in overweight and obese people Physical activity
Overweight and obesity Abdominal obesity Physical inactivity Maternal diabetes
Probable Fibre Saturated fats Intra-uterine growth retardation
Possible Omega 3 fatty acids Low glycemic index (GI) foods Exclusive breastfeeding
Total fat intake Trans fatty acids
Insufficient Vitamin E Chromium Magnesium Moderate alcohol
Excess alcohol
The Society for Endocrinology, Metabolism and Diabetes of South Africa (SEMDSA) (2009:2)
recommends weight loss of all overweight or obese individuals who have DM. An achievable and
maintainable weight loss goal should be set. Even a moderate weight loss of five percent of body
weight can produce significant health benefits. SEMDSA (2009:2) also recommends either a low-
carbohydrate or low-fat energy restricted diet for a short period (up to one year). Regular physical
activity of thirty to 45 minutes of moderate intensity, three to five times per week improves insulin
resistance, lipid profile, glycemic control and blood pressure control, and is recommended to maintain
weight loss and prevent weight gain. A gradual increase in duration and frequency is recommended.
2.6.3.3 Cardiovascular diseases
Cardiovascular diseases, (including hypertension, coronary heart disease (CHD), IHD, heart failure,
and stroke) are one of the major contributors to the global burden of disease among the CDLs.
It should also be kept in mind that the large South African population with HIV/AIDS receiving anti-
retroviral treatment have a high risk of developing metabolic syndrome, because of insulin resistance
leading to lipodystrophy, which in turn leads to central adiposity or lipo-atrophy. These patients present
with high triglycerides and low HDL, with an increased CVD risk, specifically IHD. Severe cases can
Page 69 of 252
even present with chylomicronemia syndrome, compared with similar factors as seen in diabesity
(Norman et al., 2007b:714).
(i) Incidence, prevalence and epidemiology
One-third of all deaths worldwide (15,3 million) are attributable to CVD (WHO/FAO, 2002:81). In the
1990s, the leading causes of DALYs in terms of CDLs were: IHD; cerebrovascular disease; COPD;
and pulmonary disease (Murray & Lopez, 1997b:1498). In 1998, developing countries, low-income
and middle-income countries accounted for 86% of the DALYs lost to CVD. Ten years ago the
WHO/FAO predicted that an increased burden of CVD would mostly be on developing countries within
the following two decades (WHO/FAO, 2002:81), especially among people aged thirty to 64 years of
age (Seedat, 2007:317). In 2004, CVD was the leading cause of death in the world, especially among
women; with CVD causing almost 32% of deaths in women and 27% in men (WHO:2008:8). Around
2007, 29,2% (or 16,7 million) of the total global deaths were from CVD. Around eighty percent of the
deaths took place in low- and middle-income countries. In the world, at least twenty million people
survive heart attacks and strokes annually (Seedat, 2007:317).
The CVD prevalence in America is highest in non-Hispanic blacks (about 41% for men and 45% for
women). The prevalence is 34% in white men and 24% in white women. In comparison, the
prevalence in Mexican-Americans (i.e. Hispanic) is the same for both genders (29%) . The prevalence
also increases with age; with rates doubling between 35 and 44 years of age, and between 65 and 74
years of age (Krummel, 2008:834). The majority (82%) of coronary events in women are attributable to
lifestyle factors, including: an unbalanced diet; inactivity; smoking and overweight (Krummel,
2004a:861).
Heart disease and stroke cause the most deaths in both sexes and in all races. CHD, expressed as
MI, is the main form of heart disease responsible for CVD deaths (Krummel, 2008:834). In 1983,
O‘Keefe (1983:683) found that while there was an increased prevalence of MI in urbanized South
African blacks, the rate was still only two percent of that of the white population.
Twenty-five percent of men and 26% of women were found to be hypertensive in the 1998 SADHS.
The prevalence of obesity in hypertensive men was 19% and in hypertensive women it was 45%. The
prevalence of obesity in hypertensive persons included in the 1998 SADHS was much higher than in
the general population, where only nine percent men and 26% of women were obese. Hypertension
was two-fold higher in obese participants than in normal weight participants and hypertension was
more prevalent in black obese women (Steyn et al., 2008:376-377). This occurrence identifies the
need to investigate the ever increasing rates of obesity in South Africans and, in particular, in black
women (Steyn et al., 2008:376; DoH et al., 2002:215).
During 1990, stroke accounted for 7,35% of total deaths in South Africa, while IHD accounted for
4,86%. In 1995, stroke was the fourth highest cause of premature death among men aged between 45
and 59 years (6,3%) and the second highest cause among women of the same age (10,1%). IHD was
the fifth highest cause of death in men (5,6%) and seventh highest in women (3,8%). Globally, this
order is reversed (Vorster, 2002:240). High levels of LDL and/or low levels of HDL increase the risk of
developing IHD. The most powerful lipid-profile predictors for IHD are apo-lipoproteins ApoA1 and
Page 70 of 252
ApoB. Total cholesterol measurement is usually more effective as a dyslipidemic marker for risk of
IHD, ischemic stroke, and other CVD. Levels of total cholesterol usually increase with age in
westernized populations. A diet high in fat (particularly saturated fat from animal origin) as well as high
in dietary cholesterol, and low in fiber, is associated with high total cholesterol levels (Norman et al.,
2007b:708).
It was already noted in 1977, that atheroma with myocardial infarction (MI) was one of the ―Western‖
diseases appearing most commonly among urban blacks in South Africa. The patients who presented
with MI were all ―Westernized‖ according to their diet; occupation; degree of physical activity; and the
high prevalence of obesity; DM; hypertension and dyslipidemia (Seftel, 1977:122).
Currently, the predominant CVD among the black South African population is cerebrovascular disease
(i.e. stroke). But, as total cholesterol levels increase, the pattern shifts to IHD. It is already reported
that the incidence of IHD is increasing among the black population, especially in urban hospitals
(Norman et al., 2007b:708-709).
Vorster (2002:239) postulates that black South Africans may be protected against IHD because of
their serum lipid profiles (low total cholesterol and high HDL cholesterol), as well as their low
homocysteine values. IHD was still rare among urban black South Africans in 1985, with an incidence
of only ten per 100 000 in Soweto (Walker & Walker, 1985:1410). Mollentze et al. (1995:93)
speculated that since IHD has a long incubation period of thirty to forty years, the development of
hypercholesterolemia then noted in the black population of the Free State may point to an impending
CVD epidemic in this black population in years to come. The risk factors for CVD are already prevalent
in South Africa and are predicted to increase with growing urbanization of the black population
(Norman et al., 2007b:708).
Steyn (2005b:253) also states that two recent studies have challenged the notion that black people in
Africa are ―immune‖ to the development of IHD. In the first study, the African data of the Interheart
study compared first-time acute MI patients with controls similar in age and gender. It was found that
more than eighty percent of the African participants were South African. The black, coloured and white
subgroups were compared to the findings in the overall Interheart study (conducted in 52 countries)
and it was found that the degree of association for each of the major risk factors with an acute MI
among the African population, were consistent with that found in the global study. Five modifiable risk
factors could be attributed to 89,2% of the African participants, most of whom were South African
(Seedat, 2007:317; Steyn, 2005b:250). Acute MI risk increased with higher income and education
levels in the black population (Seedat, 2007:317). The second study compared black African MI or
angina patients with similar age and gender controls living in the same township outside Pretoria. The
data of this study, which was collected two decades earlier than the Interheart study, showed an
association between IHD, major CVD risk factors and a family history of CVD among urban black
South Africans. The same risk factors and family histories were also associated with eye -, kidney -
and peripheral damage (Steyn, 2005b:253).
However, the Burden of Disease study found that there is a ―striking‖ difference between
hypercholesterolemia prevalence rates in the black South African population as compared to the other
three population groups (i.e. white, Indian, coloured). This was consistent with the lower levels of
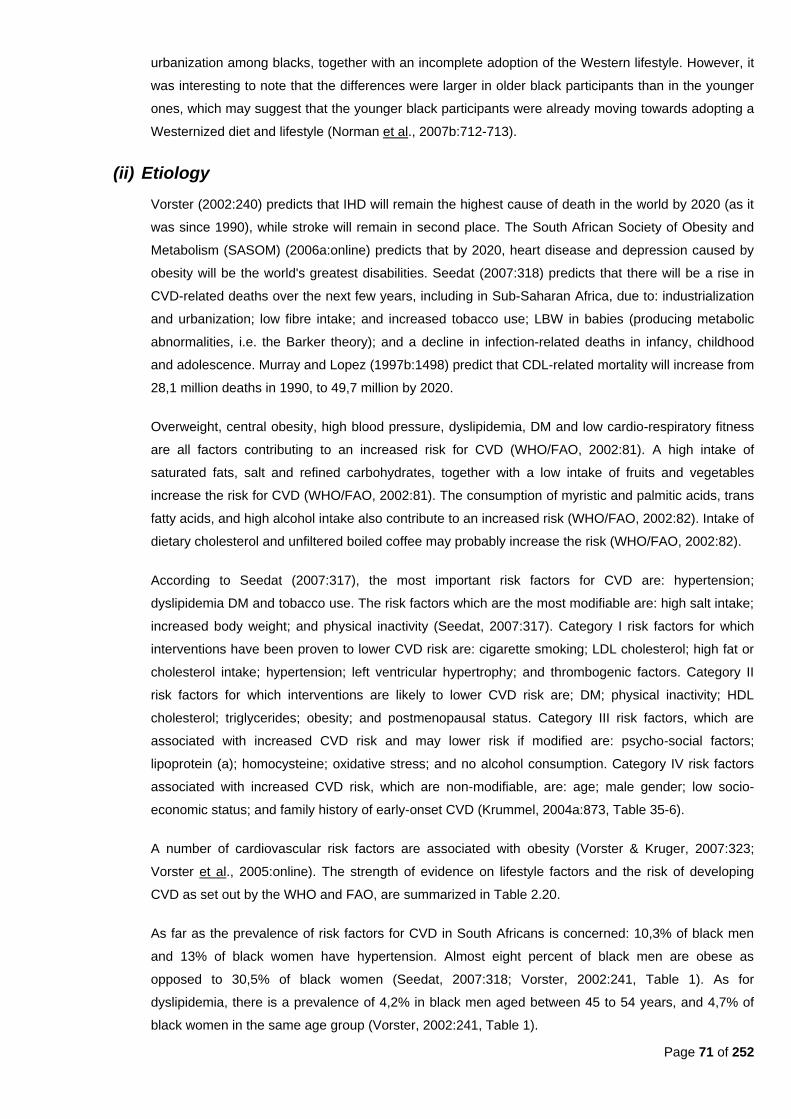
Page 71 of 252
urbanization among blacks, together with an incomplete adoption of the Western lifestyle. However, it
was interesting to note that the differences were larger in older black participants than in the younger
ones, which may suggest that the younger black participants were already moving towards adopting a
Westernized diet and lifestyle (Norman et al., 2007b:712-713).
(ii) Etiology
Vorster (2002:240) predicts that IHD will remain the highest cause of death in the world by 2020 (as it
was since 1990), while stroke will remain in second place. The South African Society of Obesity and
Metabolism (SASOM) (2006a:online) predicts that by 2020, heart disease and depression caused by
obesity will be the world's greatest disabilities. Seedat (2007:318) predicts that there will be a rise in
CVD-related deaths over the next few years, including in Sub-Saharan Africa, due to: industrialization
and urbanization; low fibre intake; and increased tobacco use; LBW in babies (producing metabolic
abnormalities, i.e. the Barker theory); and a decline in infection-related deaths in infancy, childhood
and adolescence. Murray and Lopez (1997b:1498) predict that CDL-related mortality will increase from
28,1 million deaths in 1990, to 49,7 million by 2020.
Overweight, central obesity, high blood pressure, dyslipidemia, DM and low cardio-respiratory fitness
are all factors contributing to an increased risk for CVD (WHO/FAO, 2002:81). A high intake of
saturated fats, salt and refined carbohydrates, together with a low intake of fruits and vegetables
increase the risk for CVD (WHO/FAO, 2002:81). The consumption of myristic and palmitic acids, trans
fatty acids, and high alcohol intake also contribute to an increased risk (WHO/FAO, 2002:82). Intake of
dietary cholesterol and unfiltered boiled coffee may probably increase the risk (WHO/FAO, 2002:82).
According to Seedat (2007:317), the most important risk factors for CVD are: hypertension;
dyslipidemia DM and tobacco use. The risk factors which are the most modifiable are: high salt intake;
increased body weight; and physical inactivity (Seedat, 2007:317). Category I risk factors for which
interventions have been proven to lower CVD risk are: cigarette smoking; LDL cholesterol; high fat or
cholesterol intake; hypertension; left ventricular hypertrophy; and thrombogenic factors. Category II
risk factors for which interventions are likely to lower CVD risk are; DM; physical inactivity; HDL
cholesterol; triglycerides; obesity; and postmenopausal status. Category III risk factors, which are
associated with increased CVD risk and may lower risk if modified are: psycho-social factors;
lipoprotein (a); homocysteine; oxidative stress; and no alcohol consumption. Category IV risk factors
associated with increased CVD risk, which are non-modifiable, are: age; male gender; low socio-
economic status; and family history of early-onset CVD (Krummel, 2004a:873, Table 35-6).
A number of cardiovascular risk factors are associated with obesity (Vorster & Kruger, 2007:323;
Vorster et al., 2005:online). The strength of evidence on lifestyle factors and the risk of developing
CVD as set out by the WHO and FAO, are summarized in Table 2.20.
As far as the prevalence of risk factors for CVD in South Africans is concerned: 10,3% of black men
and 13% of black women have hypertension. Almost eight percent of black men are obese as
opposed to 30,5% of black women (Seedat, 2007:318; Vorster, 2002:241, Table 1). As for
dyslipidemia, there is a prevalence of 4,2% in black men aged between 45 to 54 years, and 4,7% of
black women in the same age group (Vorster, 2002:241, Table 1).

Page 72 of 252
Table 2.20. Summary of strength of evidence on lifestyle factors and risk of developing CVD (WHO/FAO, 2002:88, Table 10).
Evidence Decreased risk No relationship Increased risk
Convincing Regular physical activity Linoleic acid Fish and fish oils (EPA and DHA) Vegetables and fruit (incl. berries) Potassium Low to moderate alcohol intake (for CHD)
Vitamin E supplements Myristic and palmitic acid Trans fatty acids High sodium intake Overweight High alcohol intake
Probable Alpha linolenic acid Oleic acid Fibre Wholegrain cereals Nuts Plant sterols/stanols Folate
Stearic acid Dietary cholesterol Unfiltered boiled coffee
Possible Flavonoids Soy products
Fats rich in lauric acid Impaired fetal nutrition Beta-carotene supplements
Insufficient Calcium Magnesium Vitamin C
Carbohydrates Iron
The high prevalence of hypertension, obesity and hypercholesterolemia among South Africans may
explain the higher prevalence of CVD (Steyn et al., 2006:25). In the THUSA study, the effects of
urbanization on some CVD risk factors could clearly be seen. Men in rural areas had a mean BMI of
20,7 kg/m², whereas in urban men the mean BMI was 23,1 kg/m². For the women, the same trend
could be seen, where the BMI of 25,6 kg/m² for rural women increased to 28,1 kg/m² in urban women.
Total serum cholesterol showed the same trend, with a mean value of 3,9 mmol/l in rural men as
opposed to 4,7 mmol/l in urban men. Again, the same was seen for women with an increase from 4,0
mmol/l in rural women to 4,8 mmol/l in urban women (Vorster, 2002:241, Table 2). The total serum
cholesterol values were still within the limit of <5 mmol/l, but an increase of between 0,6 and 0,8
mmol/l was already present. An even higher increase in serum cholesterol can be anticipated with a
longer periods of urbanization.
Table 2.21 sets out the Interheart study‘s comparison of the three ethnic groups‘ risk factor profiles
compared with the black group. This shows that the black group is at an earlier epidemiological
transition than the other groups. Self-reported hypertension was much higher in the MI group of black
participants (50,4%), than the controls (13,1%). For the white (―European‖) or Indian (―other Africans‖)
group, hypertension was self-reported in 34,4% of MI cases as opposed to only 13,3% of the controls.
The occurrence was not so pronounced among coloured Africans, where self-reported hypertension
was about double in the MI cases (41,7%) as compared with the control group (26,5%). DM was also
more pronounced among the black population, with 23,6% of MI cases having DM in comparison to
only four percent of the control group. Again, the difference was less pronounced among the coloured
group (23,4% vs. 11,5%) than the white/Indian (―European/other African‖) group (24,0% vs. 7,6%).
Interestingly, there was minimal difference for fruit and vegetable intake among the control groups and
MI cases, except for the European/other Africans, where fruit and vegetable consumption was lower in
the MI cases group (43,86%) as compared to the controls (50%).
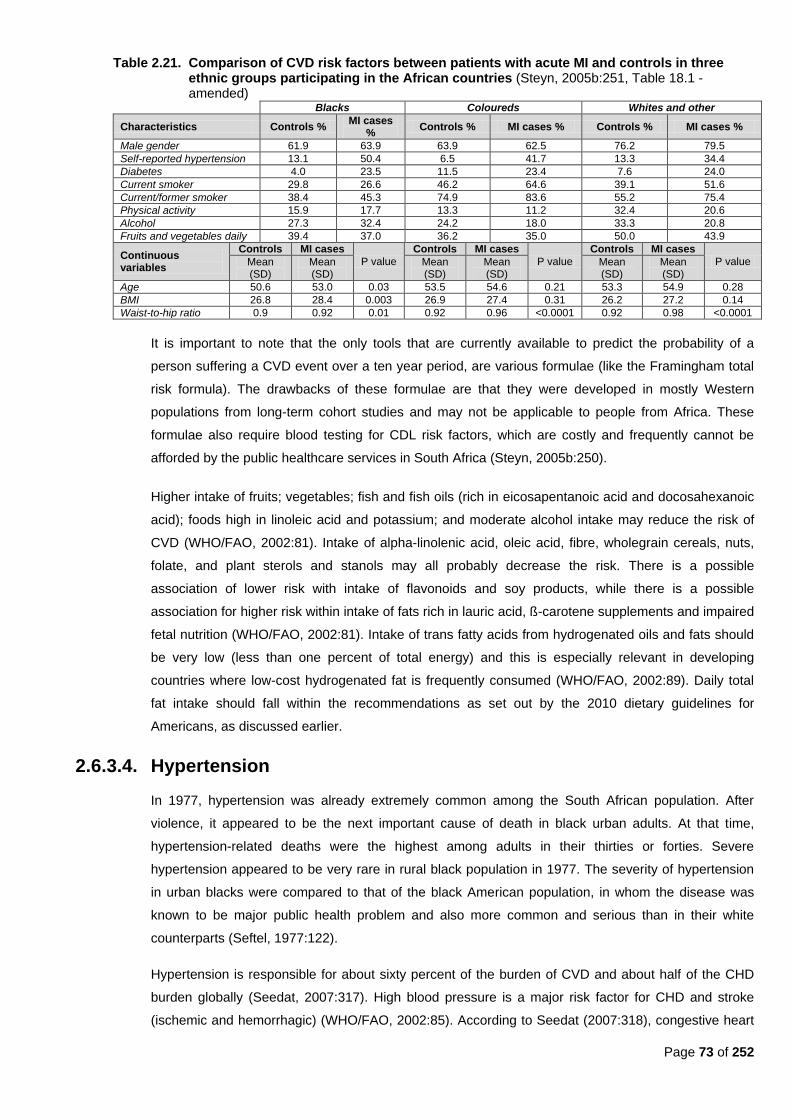
Page 73 of 252
Table 2.21. Comparison of CVD risk factors between patients with acute MI and controls in three ethnic groups participating in the African countries (Steyn, 2005b:251, Table 18.1 - amended)
Blacks Coloureds Whites and other
Characteristics Controls % MI cases
% Controls % MI cases % Controls % MI cases %
Male gender 61.9 63.9 63.9 62.5 76.2 79.5
Self-reported hypertension 13.1 50.4 6.5 41.7 13.3 34.4
Diabetes 4.0 23.5 11.5 23.4 7.6 24.0
Current smoker 29.8 26.6 46.2 64.6 39.1 51.6
Current/former smoker 38.4 45.3 74.9 83.6 55.2 75.4
Physical activity 15.9 17.7 13.3 11.2 32.4 20.6
Alcohol 27.3 32.4 24.2 18.0 33.3 20.8
Fruits and vegetables daily 39.4 37.0 36.2 35.0 50.0 43.9
Continuous variables
Controls MI cases
P value
Controls MI cases
P value
Controls MI cases
P value Mean (SD)
Mean (SD)
Mean (SD)
Mean (SD)
Mean (SD)
Mean (SD)
Age 50.6 53.0 0.03 53.5 54.6 0.21 53.3 54.9 0.28
BMI 26.8 28.4 0.003 26.9 27.4 0.31 26.2 27.2 0.14
Waist-to-hip ratio 0.9 0.92 0.01 0.92 0.96 <0.0001 0.92 0.98 <0.0001
It is important to note that the only tools that are currently available to predict the probability of a
person suffering a CVD event over a ten year period, are various formulae (like the Framingham total
risk formula). The drawbacks of these formulae are that they were developed in mostly Western
populations from long-term cohort studies and may not be applicable to people from Africa. These
formulae also require blood testing for CDL risk factors, which are costly and frequently cannot be
afforded by the public healthcare services in South Africa (Steyn, 2005b:250).
Higher intake of fruits; vegetables; fish and fish oils (rich in eicosapentanoic acid and docosahexanoic
acid); foods high in linoleic acid and potassium; and moderate alcohol intake may reduce the risk of
CVD (WHO/FAO, 2002:81). Intake of alpha-linolenic acid, oleic acid, fibre, wholegrain cereals, nuts,
folate, and plant sterols and stanols may all probably decrease the risk. There is a possible
association of lower risk with intake of flavonoids and soy products, while there is a possible
association for higher risk within intake of fats rich in lauric acid, ß-carotene supplements and impaired
fetal nutrition (WHO/FAO, 2002:81). Intake of trans fatty acids from hydrogenated oils and fats should
be very low (less than one percent of total energy) and this is especially relevant in developing
countries where low-cost hydrogenated fat is frequently consumed (WHO/FAO, 2002:89). Daily total
fat intake should fall within the recommendations as set out by the 2010 dietary guidelines for
Americans, as discussed earlier.
2.6.3.4. Hypertension
In 1977, hypertension was already extremely common among the South African population. After
violence, it appeared to be the next important cause of death in black urban adults. At that time,
hypertension-related deaths were the highest among adults in their thirties or forties. Severe
hypertension appeared to be very rare in rural black population in 1977. The severity of hypertension
in urban blacks were compared to that of the black American population, in whom the disease was
known to be major public health problem and also more common and serious than in their white
counterparts (Seftel, 1977:122).
Hypertension is responsible for about sixty percent of the burden of CVD and about half of the CHD
burden globally (Seedat, 2007:317). High blood pressure is a major risk factor for CHD and stroke
(ischemic and hemorrhagic) (WHO/FAO, 2002:85). According to Seedat (2007:318), congestive heart
Page 74 of 252
failure is the most common cardiac manifestation of hypertension in the Sub-Saharan African
population, although CHD is still relatively uncommon, due to low serum cholesterol levels and high
HDL levels. Atheroma (of the aorta and cerebral arteries) and renal failure (from malignant
hypertension) are common (Seedat, 2007:318).
(i) Incidence, prevalence and epidemiology
Steyn (2005b:250) states that it is not surprising that a quarter of South Africans have hypertension,
since there are high rates of risk factors for hypertension, including: obesity; excessive alcohol use;
high intake of sodium and low intake of potassium. In the 1998 SADHS, it was found that 13% of the
men in South Africa have hypertension and 16% of women. Of these, only ten percent of men and
18% of women have their blood pressure under control (DoH et al., 2002:264). In the 1998 SADHS,
27% of men and 32% of women reported a family history of hypertension (DoH et al., 2002:168). The
national prevalence rate of 21%, is equivalent to other industrialized countries and greater than many
developing countries. It is likely that this rate will increase in the black population (currently 23,5% in
men and 25% women) because of a more Westernized lifestyle (Bourne et al., 2002:161). It appears
that the incidence of hypertension has increased dramatically in the black population, as well as stroke
(Steyn et al., 2006:26).
Van der Merwe and Pepper (2006:3) state that hypertension prevalence is highest among black South
Africans, where it is a risk factor for stroke. The inverse was found among data from three different
studies: the Cape Peninsula study among the coloured community; the CORIS study conducted in
rural Western Cape; and the BRISK study (black urban Cape Peninsula community). These studies
showed that the differences in hypertension prevalence were not based on race, but on differences in
―other socio-demographic parameters‖ (Steyn et al., 2008:378).
Hypertension is more common in urban than in rural South Africa. This also seems to be the case in
Kenya, where hypertension was associated with a rise in blood pressure in migrants moving from rural
to urban areas (Seedat, 2007:317). It was found in Kenya that rural blacks‘ hypertension risk was
significantly lower than that of urban black, coloured and white participants (independent of other
socio-demographic and risk factors) due to urbanization and the nutrition transition. Rural Kenyan men
migrating to the cities were exposed to factors associated with developing hypertension, including:
consuming more salt; less physical activity; and having more stressful life (Steyn et al., 2008:378). The
urban-rural differences were more pronounced among black women. Rural black women appear to be
more protected against having hypertension than black men (Steyn et al., 2008:378).
Obesity significantly increases the risk of hypertension (Goedecke et al., 2005:69). Obesity is
associated with hypertension in the black South African population, where eight percent of black males
and 30,5% of black females are obese (Seedat, 2007:318; Vorster, 2002:241, Table 1; DoH et al.,
2002; 244). However, USA data shows that obesity has a lesser effect on black American women than
white American women. Obese black American women had a lower prevalence of risk factors for
cerebrovascular disease and lower mortality than white American women. Obese black women have
fewer health disadvantages than obese white women, although there is no difference in risk for
hypertension, CHD or breast cancer among the races (Steyn et al., 2008:379). Steyn et al. (2008:379)
found no significant differences in hypertension risk between obese black Africans and other obese
Page 75 of 252
women compared with women of normal weight. However, obese blacks are predisposed to
hypertension, glucose intolerance and DM, since 35-47% of type 2 diabetic black South African
women and 15-16% of black men, who were attending primary care services in both rural and urban
areas, were obese (Nthangeni et al., 2002:329). In Kwa-Zulu Natal, 37% of the diabetic patients
attending a district public health service were obese (Rotchford & Rotchford, 2002:538).
In America, obesity was associated with a relative adjusted risk of 3,5 for hypertension (Goedecke et
al., 2005:69). Among the black South African population, Steyn (2005b:250) found high rates of risk
factors for hypertension, including: obesity; excessive alcohol use; high sodium intake; and low
potassium intake. Seedat (2007:317) reports that the high prevalence of hypertension in urban black
Kenyan subjects was due to: obesity; increased peripheral vascular resistance; sodium
hypersensitivity; cellular abnormalities; increased epithelial sodium channels; different genes
controlling the renin-angiotensin-aldosterone system; low plasma rennin values; low socio-economic
status and the ―underweight phenotype.‖ Krummel (2004b:905, Box 36-2) and Krummel (2008:868,
Box 33-1) state that risk factors for developing hypertension, include: family history of hypertension;
black race; youth; male gender; persistent diastolic pressure >115 mmHg; smoking; DM;
hypercholesterolemia; overweight/obesity; excessive salt consumption; physical inactivity; excessive
alcohol consumption and evidence of end organ damage.
In 1995, Mollentze et al. (1995:93) found that the rates of high blood pressure were higher in the urban
Free State than in the rural areas, as the population aged. They found that the prevalence of
hypertension was 29% in rural Free State and 30,3% in the urban Free State, according to WHO
guidelines. More rural women (34,5%) than rural men (22,1%) were hypertensive, and the same was
true for urban women (36,3%) as compared to urban men (22,8%). The prevalence of high risk
hypertension (>160/95 mmHg) increased with age, peaking at 43,4% for elderly QwaQwa (rural) men
and 66% for women; and sixty percent for elderly Mangaung (urban) men and 78,1% for women
(Mollentze et al., 1995:93).
The 1998 SADHS found the lowest prevalence of hypertension in black men (20,2%) and the highest
in white men (38%). Coloured women, white women and Indian men had a high prevalence (close to
30%). White women and Indians controlled their hypertension far better than black men and coloured
women, of which less than ten percent had their hypertension under control (Steyn et al., 2006:25). In
1998, the prevalence of hypertension in blacks was 24,4% (Bourne et al., 2002:157; DoH et al.,
2002:210), with a 23,5% prevalence amongst men and 25% prevalence amongst women (Bourne et
al., 2002:160; DoH et al., 2002:210). In the THUSA study, Vorster (2002:240) found hypertension
prevalence to be the highest among black women and white men; more than twenty percent of
―apparently healthy‖ subjects had hypertension. The highest prevalence (32,9%) was seen in informal-
settlements in urban areas (Vorster, 2002:241).
In 1998, approximately 21% of adult South Africans (all races together) had hypertension (Seedat,
2007:319; Goedecke et al., 2005:69). Only about twenty percent of black men were aware that they
had hypertension. Fourteen percent were on treatment and seven percent had their hypertension
under control. Forty-seven percent of females were aware of their hypertension. Twenty-nine percent
were on treatment and 15% had their hypertension under control (Seedat, 2007:319). Coloured men
Page 76 of 252
had a lower risk of developing hypertension than black or white men, while rural black women had a
significantly decreased risk of hypertension, as compared to white women (Goedecke et al., 2005:69).
The estimated prevalence of hypertension in 2000 in Sub-Saharan Africa was about 41,6 million men
and 38,2 million women. Globally it is about 950 million people out of a population of 6,2 billion, with
65% coming from the developing world (Seedat, 2007:318).
(ii) Etiology
A study conducted in the USA compared the underlying factors that contributed to the higher
prevalence of hypertension in black African-Americans with those in white Americans. Hypertension
prevalence among blacks increased with age. Genetic factors played a lesser role than environmental
factors. Even though 75% of Jamaican and African-American blacks‘ ancestry are from African
populations (mostly similar to Nigerians), the hypertension prevalence in blacks was only 16% in West
Africa, 26% in the Caribbean, and 33% in the USA. The higher prevalence in the USA could be
attributed to: obesity; a high salt/low potassium diet; psycho-social stress; physical inactivity and high
alcohol intake (Steyn et al., 2008:379).
The Dietary Approaches to Stop Hypertension (DASH) requires many dietary behavioural changes,
including: eating twice the average amount of fruits, vegetables and dairy daily; reducing the intake of
meat to one-third of usual intake; halving the use of fats; and reducing to one-quarter the amount of
snacks and sweets (Krummel, 2004b:905). The DASH diet was found to be very effective in black
Americans, but poverty and cultural factors may hinder the implementation of this high-fruit, high-
vegetable, low-salt diet in South Africa (Seedat, 2007:318). To achieve eight to ten servings a day, two
to three fruit- and vegetable servings should be consumed with every meal (Krummel, 2004b:905).
2.6.3.5 Stroke
In the 1984, the incidence of stroke in the urban South African black population was 1,01 per 1000
annually with a peak of 10,31 per 1000 annually for men aged 65 to 74 years. Hypertension was
present in 69,8% of stroke patients (Rosman, 1986:668, Table 1).
In 2000, there were about 79,8 million people with stroke in Sub-Saharan Africa. This incidence is
projected to rise to 150,9 million by 2025 (Seedat, 2007:318).
Stroke seems to be the main contributor to CVD in black South Africans, as has also been seen in
black Americans, and is a major public health problem for black South Africans. When comparing
available mortality figures for 1984 to 1986 for some CDLs in South Africa, stroke had the highest
mortality rate in the black population, followed by hypertension, DM and IHD (Vorster, 2002:239-240).
In the coloured population, there was high mortality from stroke and IHD, followed by DM and
hypertension. Vorster (2002:239) suggests that urbanization in blacks may be characterized by early
emergence of stroke. Even in rural areas, the prevalence of stroke was relatively high, with a rate
approaching that of the high-income countries (Seedat, 2007:318).
Page 77 of 252
2.6.3.6 Coronary heart disease and dyslipidemia
Atherosclerosis describes the disease of ―thickened and narrowed arterial walls in arteries, due to
inflammation, accompanied by accumulation of oxidized cholesterol,‖ due to hypercholesterolemia (i.e.
dyslipidemia) (Krummel, 2008:833).
(i) Incidence, prevalence and epidemiology
In 1992, about 4,8 million South African presented with hypercholesterolemia, including 3,1 million
presenting with raised LDL levels. Both of these conditions increase the risk for CHD (Goedecke et al.,
2005:69).
Hypercholesterolemia caused about 4,6% of all deaths in South Africa in 2000. It contributed to only
1,4% of all DALYs because cholesterol-related CVD events usually occurred more in middle or old
age. There were more hypercholesterolemia-related deaths among females than males. The deaths
from ischemic stroke were double in females than in males. Mortality rates from hypercholesterolemia
were higher in Indian- and white males than females, but the reverse was true for the black and
coloured groups (Norman et al., 2007b:708, 712).
The cut-off points for blood lipid levels are: total cholesterol <5.2 mmol/l; LDL-cholesterol <3.4 mmol/l;
HDL-cholesterol >1.2 mmol/l (females) and >1.0 mmol/l (males); and total triglycerides <1.7 mmol/l
(Mayo Foundation for Medical Education and Research, 2011:online). In a study conducted in the
Free State, Mollentze et al. (1995:92-93) found that mean total cholesterol levels for rural men aged
25 to 34 years was 4,7 mmol/l. This value remained about the same with increasing age. In urban men
the mean level was also 4,7 mmol/l, but this value increased with age to 5,3 mmol/l (by age 65 years
and older). In women, the mean total cholesterol was 4,4 mmol/l for both rural (QwaQwa) and urban
(Mangaung) areas. However, there was an increase in both areas with an increase in age. For the
rural area the value increased to 5,2 mmol/l and for the urban area it was 5,7 mmol/l. HDL levels were
1,2 mmol/l for rural and 1,4 mmol/l for urban men aged between 25 and 34 years, and did not increase
with age. This pattern was also evident in women. However, an increase in LDL levels was noted in
middle-aged women in both rural and urban areas. Fasting triglyceride levels peaked at 1,7 mmol/l for
rural men aged 35 to 44 years. For urban men, the value peaked at 1,8 mmol/l for men aged 45 to 54
years. Values also tended to increase for women in both urban and rural areas.
In the 1998 SADHS, white men had the highest mean total cholesterol, and black women the lowest.
Men of all other racial groups had mean total cholesterol above 5,2 mmol/l, except black men. Thus,
all the races of South Africa have a high risk for developing CHD, except blacks (Steyn et al.,
2006:25).
When comparing the results of the South African Burden of Disease in 2000 with worldwide values,
56% of IHD mortality and disease burden worldwide was attributable to hypercholesterolemia (>3,8
mmol/l) as compared to 59% in South Africa. Worldwide, 32% of ischemic stroke cases were attributed
to hypercholesterolemia, compared to 29% in South Africa (26% in blacks and 48% in whites). The
highest amount of hypercholesterolemic-related deaths and DALYs worldwide were found in European
sub-regions, where the highest mean cholesterol levels were found (Norman et al., 2007b:712).
Page 78 of 252
(ii) Etiology
Catch-up growth between birth and seven years of age is associated with an increased risk for the
development of CHD (Forsen et al., 2000:180). The risk for CHD increases with obesity, with a relative
risk of approximately 2,8 for men and 3,4 for women. The risk of developing CHD amongst American
women increased by 3,3-fold when their BMI was >29 kg/m² (Goedecke et al., 2005:69).
Numerous modifiable factors affect serum cholesterol levels, such as: age; diets high in saturated fats
and cholesterol; genetics; endogenous and exogenous hormones; body weight, glucose tolerance;
physical activity levels and the presence of other CDLs (like DM) (Krummel, 2008:837-838; Krummel,
2004a:867). Dyslipidemia among the black population of Sub-Saharan Africa is still low. Thus it is not
a major risk factor for CVD yet in this population, but it is on the increase (Seedat, 2007:317). Black
South Africans are less likely to develop hypercholesterolemia and raised LDL levels, even though
they have a higher prevalence of obesity. In 1993, the prevalence of CHD was only 2,4% in an urban
Zulu population. In a 2004 study among peri-urban South Africans with ―mixed ancestry,‖
hypercholesterolemia was present in almost half of the population (47% of men and 46% of women)
(Goedecke et al., 2005:69). In 2000, the Burden of Disease study estimated that about 59% of IHD
and 29% of ischemic stroke burden in adult males and females older than thirty years were attributable
to hypercholesterolemia (≥ 3.8 mmol/l) (Norman et al., 2007b:708, 712).
The slower emergence of IHD among black South Africans (when compared to stroke), could be
explained by their advantageous lipid profiles (low total cholesterol, high HDL and low homocysteine
levels) (Van der Merwe & Pepper,2006:2; Vorster, 2002:242). Black South African men and women
had low mean serum total cholesterol levels (Vorster, 2002:240). Almost all of the black population
had HDL levels above twenty percent of total cholesterol, which indicates a protective effect against
IHD (Seftel et al., 1995:63). The cholesterol values in women were higher than those in men, probably
because they had higher BMIs (Vorster, 2002:241). Between 1984 and 1986, the highest IHD mortality
rates were among the white and Indian populations, followed by stroke, DM and hypertension (Vorster,
2002:239). Serum cholesterol increased in the black population with urbanization, but HDL levels
remained high. Low homocysteine levels in black South Africans due to genetics, may have a
protective effect against CHD (Vorster, 2002:242). However, Van der Merwe and Pepper (2006:2)
state that genetic predisposition remain to be established.
When taking the above into consideration, it is clear why white South Africans have such a high
prevalence of hypercholesterolemia, since they are mostly from European descent. As mentioned
earlier, it should be kept in mind that there are genetic disorders that contribute to CVD, including
essential hypertension and familial hypercholesterolemia. Familial hypercholesterolemia is an
autosomal dominant disease where affected persons develop CHD by age forty to fifty years. South
Africans have the highest reported frequency of this genetic disorder in the world (1 in 71 persons). In
Europe, Japan and the USA, the frequency is one in 500. In regions of Quebec, Canada, the
frequency is one in 122 (Cummings, 2006:110). By extrapolating the Burden of Disease study's data
to all South Africans older than thirty years, it is estimated that about eight million people have a risk
for CDLs due to hypercholesterolemia (Norman et al., 2007b:713). This amounts to about one in every
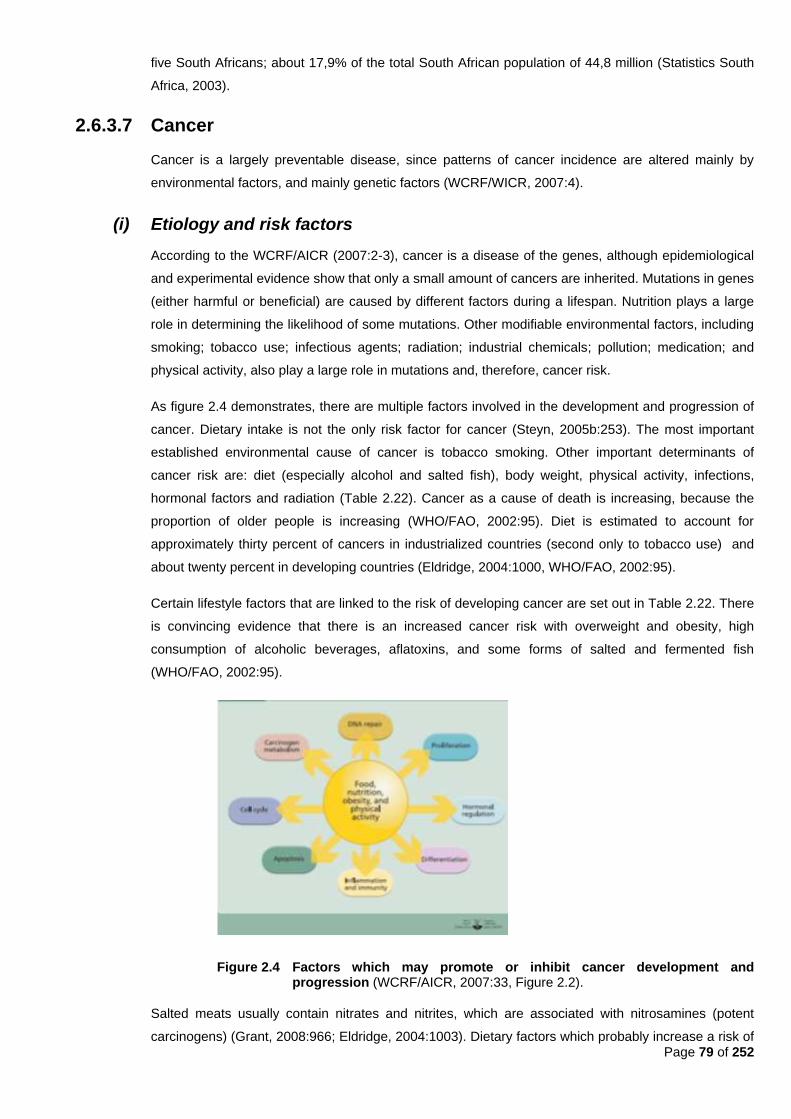
Page 79 of 252
five South Africans; about 17,9% of the total South African population of 44,8 million (Statistics South
Africa, 2003).
2.6.3.7 Cancer
Cancer is a largely preventable disease, since patterns of cancer incidence are altered mainly by
environmental factors, and mainly genetic factors (WCRF/WICR, 2007:4).
(i) Etiology and risk factors
According to the WCRF/AICR (2007:2-3), cancer is a disease of the genes, although epidemiological
and experimental evidence show that only a small amount of cancers are inherited. Mutations in genes
(either harmful or beneficial) are caused by different factors during a lifespan. Nutrition plays a large
role in determining the likelihood of some mutations. Other modifiable environmental factors, including
smoking; tobacco use; infectious agents; radiation; industrial chemicals; pollution; medication; and
physical activity, also play a large role in mutations and, therefore, cancer risk.
As figure 2.4 demonstrates, there are multiple factors involved in the development and progression of
cancer. Dietary intake is not the only risk factor for cancer (Steyn, 2005b:253). The most important
established environmental cause of cancer is tobacco smoking. Other important determinants of
cancer risk are: diet (especially alcohol and salted fish), body weight, physical activity, infections,
hormonal factors and radiation (Table 2.22). Cancer as a cause of death is increasing, because the
proportion of older people is increasing (WHO/FAO, 2002:95). Diet is estimated to account for
approximately thirty percent of cancers in industrialized countries (second only to tobacco use) and
about twenty percent in developing countries (Eldridge, 2004:1000, WHO/FAO, 2002:95).
Certain lifestyle factors that are linked to the risk of developing cancer are set out in Table 2.22. There
is convincing evidence that there is an increased cancer risk with overweight and obesity, high
consumption of alcoholic beverages, aflatoxins, and some forms of salted and fermented fish
(WHO/FAO, 2002:95).
Figure 2.4 Factors which may promote or inhibit cancer development and progression (WCRF/AICR, 2007:33, Figure 2.2).
Salted meats usually contain nitrates and nitrites, which are associated with nitrosamines (potent
carcinogens) (Grant, 2008:966; Eldridge, 2004:1003). Dietary factors which probably increase a risk of
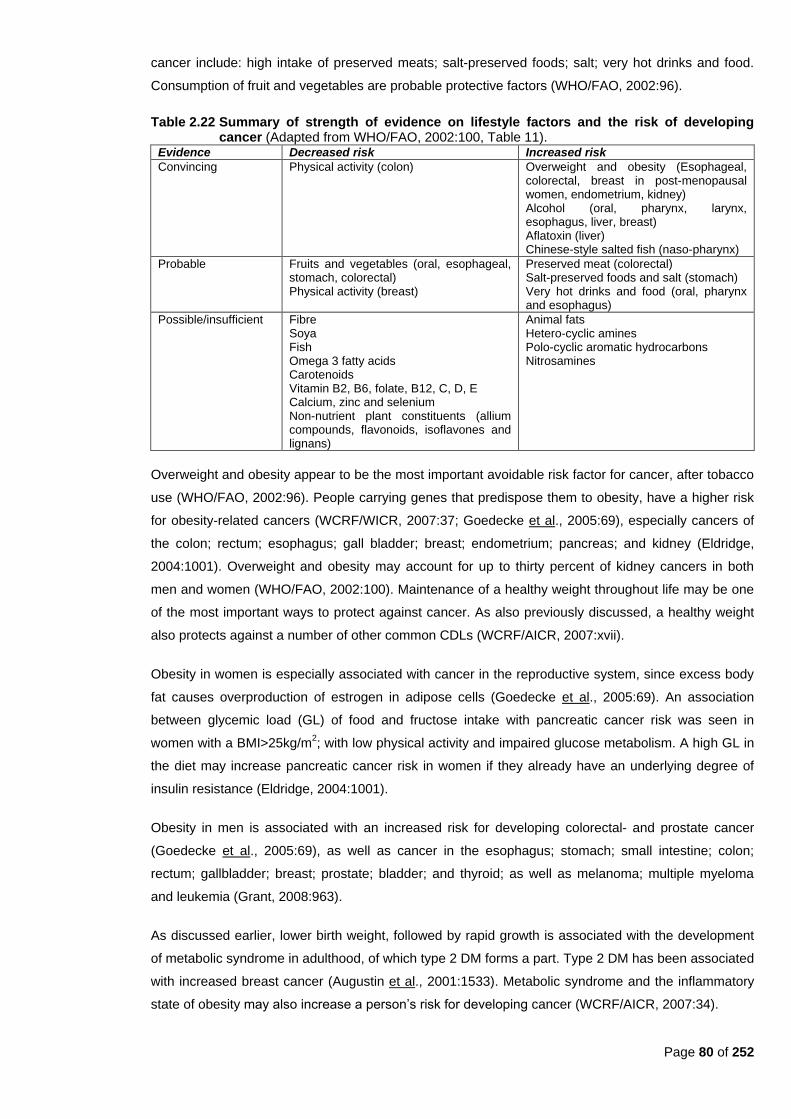
Page 80 of 252
cancer include: high intake of preserved meats; salt-preserved foods; salt; very hot drinks and food.
Consumption of fruit and vegetables are probable protective factors (WHO/FAO, 2002:96).
Table 2.22 Summary of strength of evidence on lifestyle factors and the risk of developing cancer (Adapted from WHO/FAO, 2002:100, Table 11).
Evidence Decreased risk Increased risk
Convincing Physical activity (colon) Overweight and obesity (Esophageal, colorectal, breast in post-menopausal women, endometrium, kidney) Alcohol (oral, pharynx, larynx, esophagus, liver, breast) Aflatoxin (liver) Chinese-style salted fish (naso-pharynx)
Probable Fruits and vegetables (oral, esophageal, stomach, colorectal) Physical activity (breast)
Preserved meat (colorectal) Salt-preserved foods and salt (stomach) Very hot drinks and food (oral, pharynx and esophagus)
Possible/insufficient Fibre Soya Fish Omega 3 fatty acids Carotenoids Vitamin B2, B6, folate, B12, C, D, E Calcium, zinc and selenium Non-nutrient plant constituents (allium compounds, flavonoids, isoflavones and lignans)
Animal fats Hetero-cyclic amines Polo-cyclic aromatic hydrocarbons Nitrosamines
Overweight and obesity appear to be the most important avoidable risk factor for cancer, after tobacco
use (WHO/FAO, 2002:96). People carrying genes that predispose them to obesity, have a higher risk
for obesity-related cancers (WCRF/WICR, 2007:37; Goedecke et al., 2005:69), especially cancers of
the colon; rectum; esophagus; gall bladder; breast; endometrium; pancreas; and kidney (Eldridge,
2004:1001). Overweight and obesity may account for up to thirty percent of kidney cancers in both
men and women (WHO/FAO, 2002:100). Maintenance of a healthy weight throughout life may be one
of the most important ways to protect against cancer. As also previously discussed, a healthy weight
also protects against a number of other common CDLs (WCRF/AICR, 2007:xvii).
Obesity in women is especially associated with cancer in the reproductive system, since excess body
fat causes overproduction of estrogen in adipose cells (Goedecke et al., 2005:69). An association
between glycemic load (GL) of food and fructose intake with pancreatic cancer risk was seen in
women with a BMI>25kg/m2; with low physical activity and impaired glucose metabolism. A high GL in
the diet may increase pancreatic cancer risk in women if they already have an underlying degree of
insulin resistance (Eldridge, 2004:1001).
Obesity in men is associated with an increased risk for developing colorectal- and prostate cancer
(Goedecke et al., 2005:69), as well as cancer in the esophagus; stomach; small intestine; colon;
rectum; gallbladder; breast; prostate; bladder; and thyroid; as well as melanoma; multiple myeloma
and leukemia (Grant, 2008:963).
As discussed earlier, lower birth weight, followed by rapid growth is associated with the development
of metabolic syndrome in adulthood, of which type 2 DM forms a part. Type 2 DM has been associated
with increased breast cancer (Augustin et al., 2001:1533). Metabolic syndrome and the inflammatory
state of obesity may also increase a person‘s risk for developing cancer (WCRF/AICR, 2007:34).
Page 81 of 252
Individuals who possess certain genotypes are predisposed to certain cancers, including: breast-;
prostate-; lung-; and colon cancers, with nutrition playing an influential role. During cancer, mutations
occur both in oncogenes and tumour suppressor genes. Activation of oncogenes, together with
inactivation of tumour suppressor genes, has a large influence on cancer progression (WCRF/AICR,
2007:35). For example, a single nucleotide polymorphism (SNP) in the methylenetetrahydrofolate
reductase (MTHFR) gene influences folate metabolism by reducing activity of MTHFR, which reduced
colorectal cancer risk. Other SNPs in the N-acetyltransferase gene influence enzyme activity during
the activation of heterocyclic amines from meat cooked at high temperatures, which may increase
colon cancer risk (WCRF/AICR, 2007:37). People who eat large amounts of red- and processed meats
who also have the CYP2E1 gene, may have a greater risk of rectal cancer. Eating cruciferous
vegetables protects individuals lacking the STM1 gene against lung cancer (WCRF/AICR, 2007:37).
Migration contributes to the increase in incidence of certain cancers and the decrease of other cancers
(WCRF/AICR, 2007:24). When people migrate from a low-risk to a high-risk area of the world, the
incidence of colorectal cancer increases quickly, e.g. the incidence rate for colorectal cancer is higher
in Japanese people born in USA than white people born there (WCRF/AICR 2007:20). Breast cancer
rates change when women move to a new country (WCRF/AICR, 2007:21). More recent studies show
that cancer incidence among second-generation immigrants becomes similar to those of people in the
adopted country (WCRF/AICR, 2007:25). Therefore, environmental factors (food patterns, nutrition
and physical activity) obviously have an impact on incidence during migration. Since the genetic pool
of any population does not change dramatically within two generations, environmental exposure can
influence deoxyribonucleic acid (DNA) damage and gene expression in a relatively short period,
influencing cancer incidence (WCRF/AICR, 2007:25).
(ii) Incidence, prevalence and epidemiology
In 2000, over six million cancer deaths and an estimated ten million new cases occurred globally
(WHO/FAO, 2002:95). In 2002, ten million new cancer cases were recorded worldwide (excluding non-
melanoma skin cancer) and nearly seven million people died from cancer (WCRF/AICR, 2007:17).
In lower-income countries, like Africa, Asia and Latin America, the most common cancers are found in
the: upper digestive tract; stomach; liver and cervix (WCRF/AICR, 2007:2-4). Liver cancer is the
second leading cause of cancer death in Africa (WHO, 2008:12). Cancers of the mouth and oro-
pharynx are the second leading cause of cancer deaths in South East Asia (WHO, 2008:12). Breast
cancer is the most common cancer among women from low-income countries (WCRF/AICR, 2007:17).
Prostate cancer is the leading cause of cancer deaths among men in Africa and in America‘s low- and
middle-income countries (WHO, 2008:12).
In 2000, the South African National Burden of Disease Study found that cancer was the fourth leading
cause of death for all South Africans, and the second leading cause of death among persons older
than sixty years (Steyn et al., 2006:29). Steyn (2005b:253) states that neoplasms were the second
most common cause of death in South Africa. In males, the leading cause of cancer death was
trachea/bronchi/lung cancer (22,5%), followed by esophagus cancer (17,2%). In women, cervix was
the leading cause of cancer deaths (17,9%), followed by breast- (15,7%) and lung (10,9%) cancer
(Steyn et al., 2006:29).

Page 82 of 252
As populations migrate around the world, and as countries become more urbanized and industrialized,
patterns of cancer change. In general, cancer rates are expected to increase (WCRF/AICR, 2007:2).
The total number of cancer cases in the developing world is predicted to increase by 73% between
2000 and 2020, and in the developed world by 29%, mostly because of the increase in number of
older people (WHO/FAO, 2002:95). Cancer figures are estimated to rise to over 16 million new cases
and ten million deaths in 2020, and more than twenty million new cases in 2030. Seventy percent of
cancer deaths will be from low-income countries (WCRF/AICR, 2007:4, 17).
Various factors are taken into account when projecting these figures, including: increased global
population; the aging world population; increase in tobacco smoking; the amount of people with
HIV/AIDS; as well as improved screening tests and treatment for cancer, which will increase the
number of cancer survivors (WCRF/AICR, 2007:17).
Although there are many different cancers, only cancers related to the nutrition transition will be briefly
discussed.
(a) Esophagus
Worldwide, esophageal cancer is the seventh most common type of cancer. More than 460 000 new
cases were recorded in 2002 (WCRF/AICR, 2007:17). It has a poor survival rate and therefore, is the
fifth most common cause of cancer death (nearly 390 000 deaths in 2002) (WCRF/AICR, 2007:18).
Southern- and Eastern Africa, South-Central Asia, and some South-American countries all have a high
risk for esophageal cancer (WCRF/AICR, 2007:18). This can be partly explained by geographical
variability of exposure to carcinogens (WCRF/AICR, 2007:18-19). High rates of squamous cell
esophageal carcinoma (SCEC) are found in China, central Asia, the Caspian littoral region of northern
Iran, and the Eastern Cape region of South Africa (Churma & Horrell, 2005:45). WHO/FAO (2002:96)
state that around sixty percent of esophageal-, oral- and pharyngeal cancers are thought to be due to
micronutrient deficiencies from a diet low in fruit, vegetables and animal products. Churma and Horrell
(2005:46) state that low levels of selenium, zinc, and low intakes of especially citrus fruit are
associated with increased risk. Consuming very hot food and beverages also increases the risk of
these cancers (WHO/FAO, 2002:96). Exposure to indoor smoke from solid fuels, and undernutrition
contribute to the high rates of esophagus cancer in South African men (Steyn, 2005b:253).
The incidence of esophageal cancer in South Africa has increased since the 1950s. The risk is highest
for the Eastern Cape population, particularly in rural areas. Since the mid-1980‘s, esophageal cancer
incidence has decreased, but the reason is unclear. Unlike in the USA, the highest incidence of
esophageal cancer is in the black population of South Africa. In 1995, esophageal cancer was the
leading cause of cancer in black males, but was replaced by prostate cancer between 1996 and 1999,
with esophageal cancer then being the second leading cancer with a lifetime risk of one in 59.
Esophageal cancer was the third leading cancer in black women (10%) in 1999, and the lifetime risk
was one in 113 (Steyn et al., 2006:30).
In 2003, mortality rates for esophageal cancer in South Africa were high, with 17,2% of all males dying
of this cancer and ten percent of all females. It was the leading cause of cancer death in black South
Page 83 of 252
African males and the second leading cause in black South African females. Rates steadily increased
from age 35 to 44 years (Steyn et al., 2006:30).
(b) Colorectal
Colorectal cancer (CRC) is one of the most common occurring cancers in the Western world (Masino,
2005:29). CRC is the second most common malignancy in affluent societies in developing countries
(Steyn et al., 2006:31). It is the third most common cancer worldwide, with over one million new cases
in 2002 (WCRF/AICR 2007:20).
In the white South African population, CRC was the second leading cause of cancer deaths, with the
age-standardized death rate being five times greater than in the black population It is the sixth leading
cause of cancer deaths among South African men (5,3%) and the fifth leading cause in South African
women (6,6%). In 2003, the rates among the white population were about 25,4 in 100 000 in men
(more than eight times the rate of the black men) and 17,5 in 100 000 in women (seven time the rate
of the black women). However, an increased risk was seen in younger black South Africans, because
of a change in lifestyle and diet (Steyn et al., 2006:31).
There is no obvious cause for an estimated 65% to 85% of CRC cases. Another ten to thirty percent of
cases are related to a family history of polyps or CRC. Another small percentage (6%) of cases are
related to inherited syndromes like: non-polyposis CRC; familial adenomatous polyposis; and other
rare syndromes (Masino, 2005:29). Smoking, meat intake and alcohol consumption are known risk
factors. Consumption of fruit and vegetables and physical activity are protective (Steyn et al.,
2006:31). Overweight/obesity, high energy intake and physical inactivity increase the risk of CRC in
men and women (Masino, 2005:29-30; Eldridge, 2004:1000). Overweight and obesity are the best
established diet-related risk factors (WHO/FAO, 2002:97). Hyperinsulinism, associated with obesity,
may stimulate the growth of CRC (Masino, 2005:30). Some aspects of the Westernized diet are major
determinants of risk. High intakes of meat, alcohol and fat may increase risk, and high intakes of fruits,
vegetables, dietary fibre, folate and calcium may decrease the risk (Masino, 2005:30; WHO/FAO,
2002:97).
(c) Liver
Worldwide, liver cancer is the sixth most common type of cancer (625 000 new cases in 2002). Due to
its poor prognosis, it is the third most common cause of cancer death (600 000 deaths in 2002)
(WCRF/AICR, 2007:20). Seventy-five percent (WHO/FAO, 2002:98) to eighty percent (WCRF/AICR,
2007:20) of cases occur in developing countries. Fifty-five percent of all new cases are in China
(WCRF/AICR, 2007:20). Rates are much higher in Sub-Saharan Africa and South-East Asia
(WCRF/AICR, 2007:20; WHO/FAO, 2002:98) than in North America, Europe (WHO/FAO, 2002:98)
and Latin America (WCRF/AICR, 2007:20). Japan and areas of southern Europe have intermediate
incidence levels (WCRF/AICR, 2007:20).
The major risk factor for liver cancer is chronic infection with the hepatitis B or C viruses (WCRF/AICR,
2007:20; James & Kulakowski, 2005:117; WHO/FAO, 2002:98). Excessive alcohol consumption is the
main diet-related risk factor in industrialized countries (WHO/FAO, 2002:98). Overweight and obesity
possibly increase the risk. High intake of meat increases the risk, while high intakes of vegetables

Page 84 of 252
reduces the risk (WHO/FAO, 2002:98). Ingestion of foods contaminated with mycotoxin (an aflatoxin),
or aflatoxin B1 (a product of the Aspergillus fungus), increase the risk (James & Kulakowski, 2005:118;
WHO/FAO, 2002:98). Aflatoxin is also found in water and stored food grains in countries with hot,
humid climates (James & Kulakowski, 2005:118).
(d) Breast
The WRCF/AICR (2007:21) state that breast cancer is the third most common cancer in the world,
while the WHO/FAO (2002:99) state that breast cancer is the second most common cancer in the
world. However, they both agree that it is most common type of cancer in women (WCRF/AICR,
2007:21; WHO/FAO, 2002:99). It is the sixth most common cause of cancer deaths overall, but the
second most common cause of cancer death in women, with 410 000 deaths in 2002 (WCRF/AICR,
2007:21).
In South Africa, black females aged between 35 and 44 years, have very similar age-specific death
rates than those of white, coloured and Indian women. It is only the older aged black women that have
much lower rates. This also applies to incidence (Steyn et al., 2006:30). In 1999, the incidence
amongst black women was 18,4 per 100 000, as compared to 76,5 in 100 000 for coloured and white
South African women (Steyn et al., 2006:31). In 2004, rural black South African women had a very low
incidence of breast cancer (about ten in 100 000), whereas the incidence was higher in urban black
women (15,1 in 100 000) (Goedecke et al., 2005:69). Breast cancer risk is associated with high socio-
economic status (usually among women with high education or -income) (Steyn et al., 2006:31).
Inherited cancers only account for about five to ten percent of all breast cancer cases. In 1994 and
1995, two tumour suppressor genes (BRCA1 and BRCA2) were identified, which increase a woman‘s
risk for breast cancer substantially. Women with these genetic mutations have a lifetime breast cancer
risk of about 82% (Fletcher & Hayward, 2005:17). In these women, increased activity as a teenager
and normal weight at menarche and at age 21 were associated with later onset of breast cancer
(Fletcher & Hayward, 2005:17). Other risk factors for breast cancer not mentioned earlier include:
smoking; and physical inactivity (Steyn et al., 2006:31). Therefore, diet and exercise are important risk
reduction factors for these and other high-risk women (Fletcher & Hayward, 2005:17).
Obesity increases breast cancer risk in post-menopausal women by around fifty percent (WHO/FAO,
2002:99). As mentioned earlier, adipose tissue synthesizes estrogen and extended exposure to
estrogen increases the risk of breast cancer (Fletcher & Hayward, 2005:16; Goedecke et al., 2005:69).
Adipose tissue becomes the strongest contributor of estrogen following menopause (Fletcher &
Hayward, 2005:16). A positive association with breast cancer is seen in post-menopausal women who
gain weight, but an increased risk is also seen in relative leanness in pre-menopausal women
(Eldridge, 2004:1000). The WHO/FAO (2002:99) state that obesity and alcohol intake are the only
dietary factors which have been shown to increase breast cancer risk. There is a small increased risk
with increasing alcohol consumption. An average consumption of one alcoholic drink per day
increases the risk by about ten percent.
High fruit and vegetable intake has been shown to protect against cancer in general, but research
specific to breast cancer is inconsistent. Apparently several studies found an increase in breast cancer
Page 85 of 252
risk in vegetarians (Fletcher & Hayward, 2005:17). A recent meta-analysis study concluded that total
dietary fat has a positive association with breast cancer risk. High intake of saturated fat, especially
from red meat, contributed to an increased relative risk of cancer (Fletcher & Hayward, 2005:18).
(e) Endometrium
Endometrial cancer is the most commonly diagnosed gynecologic cancer in the USA, with the average
age of diagnosis at sixty years. The highest incidence in the USA is among white women (Hamilton &
Roche, 2005:87).
Extreme obesity, which leads to adipose retention of estrogen (as discussed under breast cancer) is a
risk factor (Hamilton & Roche, 2005:88-89). Obese women have a three-fold higher risk for
endometrial cancer (WHO/FAO, 2002:99). There is also an increased incidence of endometrial cancer
in women with hypertension and coexisting DM (Hamilton & Roche, 2005:89). High consumption of
fruits and vegetables may reduce risk; and diets high in saturated- and total fat increase risk
(WHO/FAO, 2002:99).
(f) Prostate
Prostate cancer is the sixth most common cancer in the world, and the third most common cancer in
men, with 680 000 new cases and 220 000 cancer deaths in 2002. It is the eighth most common
cause of cancer deaths globally. The majority of cases are found among men older than 65 years. It is
more common in high-income countries (except Japan). Screening programs have increased
diagnosis rates, which consequently have influenced incidence rate (WCRF/AICR, 2007: 21), resulting
in increased number of cases recorded in the USA in recent years, even though the incidence has
declined in several high-income countries since the 1990s. Increased awareness and screening might
also explain the increase in incidence in low-income countries, particularly in Latin American countries
(Costa Rica, Columbia and Ecuador) and China (WCRF/AICR, 2007: 22).
Death from prostate cancer is about ten times more common in North America and Europe than in
Asia (WCRF/AICR, 2007:22; WHO/FAO, 2002:99). However, it still only contributes to 5,8% of all
cancer deaths in men (WCRF/AICR, 2007:22). Prostate cancer is positively associated with a
Westernized diet. Inconsistent data exists for the influence of diets high in red meat, dairy and animal
fat on the development of prostate cancer. Consistent evidence show that β-carotene supplements do
not alter the risk of prostate cancer (WHO/FAO, 2002:99), but suggest that vitamin E and selenium
might be protective (Eldridge, 2004:1003; WHO/FAO, 2002:99). Lycopene has been associated with a
reduced risk, but again, data is inconsistent (WHO/FAO, 2002:99).
2.7. The cost of disease
The costs of CDLs are tremendous, not only in monetary terms, but also in mortality and quality of life;
even more so in developing countries such as South Africa (Steyn et al., 2006:21; Goedecke et al.,
2005:65; Kruger et al., 2005:492; WHO/FAO, 2002:4).
A disease can have a low incidence, but cause death and disability, which then results in a high burden of
disease (with many life years lost) (WHO, 2008:29). The WHO/FAO (2002:61) estimated that the direct
costs of obesity in the USA in 1995 accounted for 6,8% of total health care costs (US$70 billion or R560
Page 86 of 252
billion) and physical inactivity for a further US$24 billion (R192 billion). The direct costs in other
industrialized countries were slightly lower, but they still made out a noticeable part of national healthcare
budgets. Indirect costs are usually far greater than direct costs and include: workdays lost; doctor visits;
disability pensions; and premature mortality. Hidden costs were also enormous and include impaired
quality of life.
Seedat (2007:316) has stated that the healthcare costs in many of the 54 countries in Sub-Saharan Africa
are only around US$10 (R80) per person annually. This amount is completely insufficient to address the
needs posed by the double burden of CDLs and infectious diseases, including AIDS (Seedat, 2007:319).
In industrialized Western countries, the difference is noticeable, with costs amounting to between US$2
000 (R16 000) and US$5 000 (R40 000) annually. This is explained by the fact that Africa has a huge
debt and interest on this debt is equal to twice the amount spent on healthcare and education (Seedat,
2007:316).
South Africa‘s financial health care resources are comparable to that of Brazil, Mexico and Thailand, but
even though these countries spend similar amounts of their gross domestic product (3,5%) in the public
sector, they have far better health outcomes than South Africa if life expectancy and maternal mortality
are considered. South Africa‘s health expenditure is expected to rise on average by 7,1% per fiscal year
between 2009 and 2013, with costs estimated around R100 billion for G70
2009/2010. Eighty-five percent of South Africa‘s population is dependent on the public sector. Currently
the public sector expenditure is approximately R1600 (US$200) per person per annum, which is
approximately four times the amount expended in other sub-Saharan countries. To save maternal and
neonatal lives, South Africa has to spend two to four times more money than Cameroon or Southern
Nigeria, due to a lack of input costs and human resources. South Africa‘s per capita expenditure on non-
hospital primary care varies considerably by province and by district, ranging between R220 to R505 per
person. Of course, these figures do not include the out-of-pocket expenses and direct costs to families
and patients themselves. Nearly sixty percent of all poor South African households are found in rural
areas, where access to health care is compromised. It was found that in 2006 that in a rural South African
province, up to sixty percent of a patient‘s monthly income was spent on seeking health care, a large
portion of which was used for transport costs (Hofman & Tollman, 2010:798). Therefore, the burden of
disease is much higher on the poor.
Obesity can affect quality of life in many ways. A 55-year follow-up study of previously obese
adolescents, showed that women who had been obese as adolescents were eight times more likely to
report difficulty with activities of daily living than those who were lean in adolescence. Obesity in
adolescence also had a negative impact on socio-cultural and economic factors, such as household
income, self-esteem, marital status and education level, particularly in women (Goedecke et al., 2005:70).
The health care expense for obesity and related illnesses is five- to eight percent of the health budget in
most developed countries. The impact on indirect cost is considerable. For obese workers, long-term sick
leave is up to 2,4 times higher than for their thinner counterparts (SASOM, 2006a:online). In South Africa,
the rising prevalence of obesity causes serious concerns because of increased risk of DM and CVD. The
direct costs may be as high as 6,8% of healthcare costs, and indirect and intangible costs should also be
considered (Steyn et al., 2006:21).

Page 87 of 252
The HIV/AIDS epidemic also has a high impact on health resources on services and health statistics in
South Africa (Vorster & Kruger, 2007:321). CDLs dominate the mortality statistics for five out of six
regions of the WHO. Africa is the only region where HIV/AIDS dominates instead (WHO/FAO, 2002:4).
Hofman and Tollman (2010:799) suggest that the current, predominantly vertical HIV programs in South
Africa should be changed to include more broadly the other chronic disease also, since the infectious
illnesses are paralleled by a rising burden of CVD, DM and cancer.
The WHO estimates that it would take US$136 million (R1 088 million) per country annually to achieve
eighty percent of coverage of basic healthcare. Currently there is a critical shortage in doctors, nurses
and midwives. To achieve the eighty percent coverage rate, an average increase in healthcare
expenditure of US$2,80 (R22,40) per person annually must occur. However, payment of salaries and
emigration of trained workers are not included in these costs, which would amount to an additional
US$311 million (R2 488 million). The staff shortage in Sub-Saharan Africa occurs due to a number of
reasons, including: underproduction of qualified healthcare workers; internal mal-distribution of
professionals; and emigration of trained workers (Seedat, 2007:317).
CDLs related to diet (obesity, DM, CVD, cancer, osteoporosis and dental diseases) present the greatest
public health burden, in terms of direct cost to society and government, as well as DALYs (WHO/FAO,
2002:4). According to the WHO/FAO (2002:5), the public health implications of the increasing rate of
overweight and obesity annually in most developing countries are ―staggering.‖ Currently, almost half of
the total CDL-related deaths are attributable to CVD, but obesity and DM are also showing concerning
trends, since they affect a large proportion of the population, and already appear earlier in life. Developing
countries are constantly exposed to increasing levels of public health problems related to CDLs
(WHO/FAO, 2002:4).
The WHO/FAO estimates that in 2001, CDLs contributed to approximately sixty percent of the 56,5 million
deaths in the world and approximately 46% of the global burden of disease. The proportion of the burden
of CDLs is expected to increase to 57% by 2020, and will by then account for almost 75% of all deaths
worldwide. It is predicted that the number of people in developing countries with DM will increase more
than 2,5 fold by 2025 and that sixty percent of the burden of CDLs will occur in developing countries
(WHO/FAO, 2002:4-5).
DM is an expensive chronic disease, because of the necessary means to control and prevent the severe
complications. According to the WDF (2006:online), the economic and social costs for type 2 DM in the
world are ―enormous and escalating.‖ In most developing countries, mechanisms for financing health care
are non-existent and health expenses are typically for the public‘s own expense. Because the public is left
with the choice between health care and food or clothing, financial constraints result in under-
consumption of health services. About eighty percent of developing countries‘ population pay for some or
all of their medication. In Latin America, forty to sixty percent of DM costs are for the public‘s own pocket.
In India, as much as 25% of a family‘s income may be spent on DM care. In 2002, DM costs amounted to
US$132 billion (R1 056 billion) in the USA, of which direct costs were US$ 91,8 billion (R734,4 billion) and
indirect costs US$39,8 billion (R318,4 billion). The total direct costs of medical care for a person with DM
would be around US$13 243 (R105 944) annually, as compared to US$2 560 (R20 480) for a person
without DM (Franz, 2008:766; Franz, 2004:794). It was estimated that in 2007, the world would spend
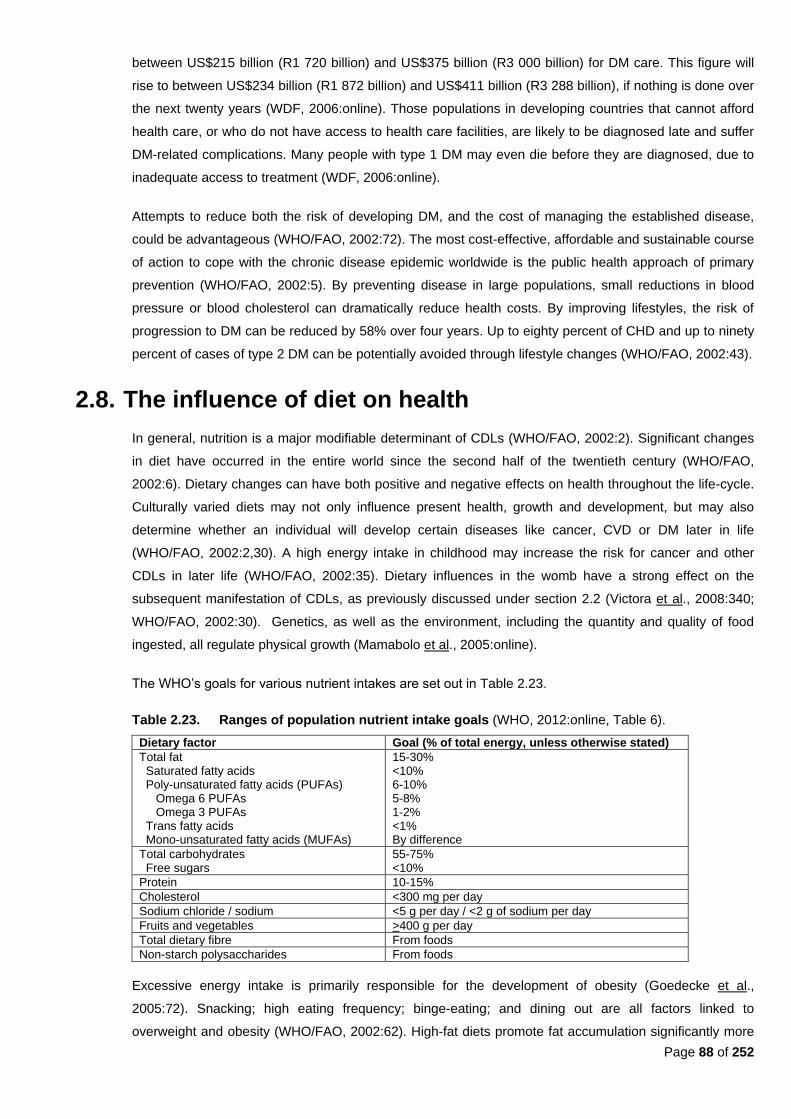
Page 88 of 252
between US$215 billion (R1 720 billion) and US$375 billion (R3 000 billion) for DM care. This figure will
rise to between US$234 billion (R1 872 billion) and US$411 billion (R3 288 billion), if nothing is done over
the next twenty years (WDF, 2006:online). Those populations in developing countries that cannot afford
health care, or who do not have access to health care facilities, are likely to be diagnosed late and suffer
DM-related complications. Many people with type 1 DM may even die before they are diagnosed, due to
inadequate access to treatment (WDF, 2006:online).
Attempts to reduce both the risk of developing DM, and the cost of managing the established disease,
could be advantageous (WHO/FAO, 2002:72). The most cost-effective, affordable and sustainable course
of action to cope with the chronic disease epidemic worldwide is the public health approach of primary
prevention (WHO/FAO, 2002:5). By preventing disease in large populations, small reductions in blood
pressure or blood cholesterol can dramatically reduce health costs. By improving lifestyles, the risk of
progression to DM can be reduced by 58% over four years. Up to eighty percent of CHD and up to ninety
percent of cases of type 2 DM can be potentially avoided through lifestyle changes (WHO/FAO, 2002:43).
2.8. The influence of diet on health
In general, nutrition is a major modifiable determinant of CDLs (WHO/FAO, 2002:2). Significant changes
in diet have occurred in the entire world since the second half of the twentieth century (WHO/FAO,
2002:6). Dietary changes can have both positive and negative effects on health throughout the life-cycle.
Culturally varied diets may not only influence present health, growth and development, but may also
determine whether an individual will develop certain diseases like cancer, CVD or DM later in life
(WHO/FAO, 2002:2,30). A high energy intake in childhood may increase the risk for cancer and other
CDLs in later life (WHO/FAO, 2002:35). Dietary influences in the womb have a strong effect on the
subsequent manifestation of CDLs, as previously discussed under section 2.2 (Victora et al., 2008:340;
WHO/FAO, 2002:30). Genetics, as well as the environment, including the quantity and quality of food
ingested, all regulate physical growth (Mamabolo et al., 2005:online).
The WHO‘s goals for various nutrient intakes are set out in Table 2.23.
Table 2.23. Ranges of population nutrient intake goals (WHO, 2012:online, Table 6).
Dietary factor Goal (% of total energy, unless otherwise stated)
Total fat Saturated fatty acids Poly-unsaturated fatty acids (PUFAs) Omega 6 PUFAs Omega 3 PUFAs Trans fatty acids Mono-unsaturated fatty acids (MUFAs)
15-30% <10% 6-10% 5-8% 1-2% <1% By difference
Total carbohydrates Free sugars
55-75% <10%
Protein 10-15%
Cholesterol <300 mg per day
Sodium chloride / sodium <5 g per day / <2 g of sodium per day
Fruits and vegetables >400 g per day
Total dietary fibre From foods
Non-starch polysaccharides From foods
Excessive energy intake is primarily responsible for the development of obesity (Goedecke et al.,
2005:72). Snacking; high eating frequency; binge-eating; and dining out are all factors linked to
overweight and obesity (WHO/FAO, 2002:62). High-fat diets promote fat accumulation significantly more
Page 89 of 252
than high-carbohydrate diets, because of their higher energy density. Their high palatability combined
with weak satiety effect can also cause higher intake, which leads to poor regulation. With urbanization in
South Africa the Westernized diet was adopted, with its higher fat and lower carbohydrates and fibre
content (Goedecke et al., 2005:71). However, a high intake of fat alone cannot account alone for weight
gain. A lower physical activity level (Kruger et al., 2005:491) and an inability to increase fat oxidation
(Goedecke et al., 2005:72) may also contribute to obesity.
2.8.1. Breastfeeding
In South Africa in 1998, about 16% of babies younger than two months were exclusively breastfed,
whereas this number decreased to 0,3% by age six to seven months. Seventy percent of babies younger
than six months received complementary feeds and 17% were not breastfed at all (DoH et al., 2002:134).
The 2003 SADHS found little change in breastfeeding practices overall, but an increased proportion of
children younger than four months who were not breastfed (20,1%), and there was a large decrease in
the proportion of children who were fed with a bottle (40%) (DoH, 2004:1). The 2003 SADHS also found
that supplementation of breast milk starts early, and that exclusive breastfeeding is uncommon in South
African mothers. Plain water or other liquids are the most common supplementary feeds given. In 2004,
six percent of babies under four months and 27% of babies between four and six months were given
mushy or semi-solid foods. By seven to nine months, almost fifty percent of babies received
complementary foods (DoH, 2004:19). The 2003 SADHS (DoH, 2004:ii) stated that 12% of South African
infants younger than three months were exclusively breastfed (as opposed to 10% in 1998). Only 1,5% of
infants aged between four and six months were exclusively breastfed, about the same amount when
compared to the 1998 SADHS (DoH, 2004:ii; DoH et al., 2002:267).
There is strong evidence that breastfeeding lowers the risk of obesity, which is directly related to the
length of exclusive breastfeeding. Current evidence also indicates that formula milk adversely affects the
development of CVD, with increased mortality in older adults who were formula-fed infants (WHO/FAO,
2002:32). Short term breastfeeding or consumption of formula milk is associated with an increased risk
for type 1 DM, celiac disease, inflammatory bowel disease and childhood cancers (WHO/FAO, 2002:33).
Breastfeeding is further associated with significantly lower blood pressure levels in childhood.
Consumption of formula milk instead of breast milk in infancy may increase diastolic and mean arterial
blood pressure in later life.
High cholesterol feeding in early life may regulate cholesterol and lipoprotein metabolism later in life.
Mean plasma total cholesterol by age four months in breastfed infants were lower than in those receiving
formula milk (WHO/FAO, 2002:33). Apparently the fatty acid content, rather than the cholesterol, in the
diet regulates cholesterol homeostasis (WHO/FAO, 2002:34).
The WHO/FAO (2002:34) reported that growth rates in infants in Bangladesh, most of whom had chronic
intra-uterine undernourishment and were breastfed, were similar to growth rates of breastfed infants in
industrialized countries, but catch-up growth was limited and weight at 12 months was relative to weight
at birth.
Exclusive breastfeeding protects against overweight or obesity (WHO/FAO, 2002:62). The protective
factor of breastfeeding against weight gain has been examined in at least twenty studies. Two of the
Page 90 of 252
largest studies found that the reduction in the risk of developing obesity was substantial (20% to 37%)
(WHO/FAO, 2002:66).
Introduction of supplemental foods and breastfeeding practices are important determinants of children‘s
nutritional status, especially for those younger than two years of age. It is unnecessary to supplement
breast milk before four months of age, because it contains all the nutrients needed by children in the first
four to six months of life (DoH, 2004:18). Supplementation of breast milk is also discouraged because of
the risk of contamination, leading to diarrhea (DoH, 2004:19). In exclusively breastfed children younger
than five months, the risk for diarrhea-related mortality was 6-fold less and the risk for pneumonia-related
mortality was 2,5-fold less (Nannan et al., 2007:738). In babies whose mothers are HIV-negative, the
contribution of exclusive breastfeeding to health is substantial. The ‖older‖ WHO/UNICEF guidelines
stated that HIV-positive women should avoid breastfeeding if it is acceptable, feasible, affordable,
sustainable and safe to give formula milk. If formula milk is not viable, exclusive breastfeeding for three
months was less risky than mixed feeding (Nannan et al., 2007:737). However, the current 2009 WHO
guidelines state that even when anti-retrovirals (ARVs) are unavailable, mothers who still choose to
breastfeed should be counselled to exclusively breastfeed in the first six months of life and continue
breastfeeding thereafter ―unless environmental and social circumstances are suitable to sustain safe
formula feeding (WHO, 2010b:4). Furthermore, the WHO states that HIV positive mothers with infants
who are either HIV-negative or who are of unknown HIV status, should exclusively breastfeed for the first
six months, where after they should introduce appropriate complementary foods; and should further
continue breastfeeding until 12 months of life. After 12 months, breastfeeding should only stop ―once a
nutritionally adequate and safe diet without breast milk can be provided.‖ Exclusive breastfeeding is
therefore still recommended for HIV-positive mothers for the first six months of life unless replacement
feeding is acceptable, feasible, affordable, sustainable and safe for them and their infants before that
time. When the mother decides to stop breastfeeding at any time, she should stop gradually within one
month. If either the mother or infant is receiving ARV prophylaxis, this intake of these ARVs should
continue for one week after breastfeeding has been fully stopped. Therefore, abrupt cessation of
breastfeeding is not advised (WHO, 2010b:6).
As stated by WCRF/AICR (2007:xxi), sustained, exclusive breastfeeding is protective for the mother as
well as the child against cancer, as well as other diseases. Breastfeeding plays a large role in the
development of the baby‘s immature immune system; protects the child against infections in infancy as
well as against other childhood diseases. Breastfeeding is especially important where water supply is
considered unsafe and among low socio-economic status families where there may not be money to buy
infant formula (WCRF/AICR, 2007:xxi).
2.8.2. Fruits and vegetables
Currently only a small amount of the world‘s population consume the recommended amount of fruits and
vegetables daily (i.e. 400 g per capita per day – see Table 2.23) (WCRF/AICR, 2007:12; WHO/FAO,
2002:24).
The low consumption of fruits and vegetables in many developing (i.e. low-income) countries has been
confirmed by food consumption surveys (WCRF/AICR, 2007:12; WHO/FAO, 2002:24). Vegetables are
Page 91 of 252
usually more available than fruit (WCRF/AICR, 2007:12). Representative surveys in India found a
consumption of only 120 g to 140 g per capita per day (WCRF/AICR, 2007:12; WHO/FAO, 2002:24). In
contrast, in 1992 China consumed about 369 g per capita per day (WHO/FAO, 2002:23,56). The
WCRF/AICR (2007:12) state that there are high levels of fruit and vegetable intake in Japan, North
America and in Australia (300 g/day). The average daily consumption in Europe is about 250 g to 350 g.
The consumption is often even much higher in Mediterranean countries, with an average daily
consumption of 550 g per day in Spain. Scandinavian countries also have ―particularly high‖ fruit intakes
(WCRF/AICR, 2007:12). South Africa is estimated to have an average per capita intake of about 200g
daily (similar to intake in the UK). The intake is greater than that of India (120 g to 140 g daily), it is
considerably less than that of China (369 g daily) and Spain (600 g daily) (Schneider et al., 2007:718).
Even in countries like Italy and Israel, the daily consumption for adults rarely go above 500 g daily day
and never above 550 g daily. Greece has the highest mean daily intake of fruit and vegetables (about 700
g to 800 g per person per day) (Schneider et al., 2007:718). National food consumption studies in South
Africa show that fruit and vegetable intake was higher in urban areas (168 g per day) than rural areas
(137g per day), which can be related to easier access and availability of fruit and vegetables in urban
areas (Schneider et al., 2007:721). On the other hand, increasing urbanization decreases the poor urban
community‘s autonomy in their own food production, which may influence the availability of adequate
fruits and vegetables (WHO/FAO, 2002:24).
Since the 1960s, countries in Europe, Latin America, North America and South-East Asia have seen an
increase in fruit and vegetable availability. However, eastern and central Africa has shown a decrease
since the mid-1960s (WCRF/AICR, 2007:12-13). The global average vegetable supply in 2000 was 102
kg per capita per year. The highest supply was in Asia with 116 kg, and the lowest levels were in Africa
(52 kg) and South America (48 kg) (WHO/FAO, 2002:24). It should be kept in mind that wild and
indigenous vegetables were not taken into account in these production or consumption statistics
(WHO/FAO, 2002:24).
The annual per capita fruit intake in South Africa increased from 67,6 kg in 1962 to 80,2 kg by 2001, while
vegetable intake remained more or less the same at 120 g per day. Thus, an increase in combined fruit
and vegetable intake per capita per day has been seen (from 185 g in 1962 to 220 g by 2001) (Schneider
et al., 2007:718). Globally it was estimated that 4,9% of deaths and 1,8% DALYs per year were attributed
to low fruit and vegetable intake in 2000. Worldwide low intake of fruit and vegetables was linked to about
31% of IHD; 19% of ischemic stroke; 20% of esophageal cancer; 19% of gastric cancer; 12% of lung
cancer and two percent of colorectal cancer (Schneider et al., 2007:717).
The Burden of Disease study found that the mean fruit and vegetable intake was markedly lower for
males aged thirty to 44 years than in any of the other age groups of either males or females (Schneider et
al., 2007:717). Mean per capita intake over all the age groups was 235 g per day for males and 226 g per
day for females, (just under three servings per day). It was estimated that about eighty percent of adults
15 years and older ate less than five fruits and vegetables per day (400 grams per day). This translated to
about 11,1 million males and 12,5 million females older than 15 years of age eating too little fruit and
vegetables in South Africa in 2000. The largest proportion of total years of life lost in both genders
(attributed to low fruit and vegetable intake) accounted for proportionate years of life lost due to IHD in
60,6% of men and 52,2% of women. Ischemic stroke contributed to 17,8% of attributable DALYs in men
Page 92 of 252
and 32,7% in women. Esophageal cancer accounted for 9,8% attributable DALYs in men and 7,0% in
women, with lung cancer accounting for 7,8% of all DALYs attributable to low fruit and vegetable
consumption in men and 4,7% in women (Schneider et al., 2007:720). Low fruit and vegetable intake
ranked 10th to 11
th on the list of 17 selected risk factors (as set out in Tables 2.8 and 2.9) in the
Comparative Risk Assessment study for South Africa in 2000. South Africa‘s values were lower than
global values with 3,2% of deaths vs. 4,9% of deaths globally, and with 1,1% of DALYs vs. 1,8% global
DALYs (Schneider et al., 2007:721).
Increased consumption of fruit and vegetables have been shown to lower the risk of cancers of the
mouth; pharynx; larynx; esophagus; lung; kidney; stomach; colon; rectum; ovary; and bladder; especially
when consumption include: raw and fresh fruit and vegetables; green leafy vegetables; cruciferous
vegetables; lettuce; and carrots (Grant, 2008:965; Eldridge, 2004:1002).
Fruit and vegetables contain various vitamins, minerals, phytochemicals and fibre which may, in different
combinations, or even individually, protect against CVD and certain cancers (Schneider et al., 2007:717).
The WHO also states that consumption of fruits and vegetables has a significant protective effect for CHD
and stroke (WHO/FAO, 2002:86), as well high blood pressure and obesity (Schneider et al., 2007:717),
through their phytonutrient, fibre (WHO/FAO, 2002:89) and potassium content (Schneider et al.,
2007:717; WHO/FAO, 2002:89). According to the WHO, there is probable evidence for decreased risk for
certain cancers (oral cavity, esophagus, stomach, colon and rectum) via increased fruit and vegetable
intake through the blocking and suppressing of carcinogen action and prevention of oxidative DNA
damage by anti-oxidants, various micronutrients and other substances. There is also probable evidence
for decreased risk for type 2 DM with increased fruit and vegetable intake. Daily intake of berries, green
leafy- and cruciferous vegetables, and legumes totalling 400 g to 500 g per day is recommended to
reduce the risk of CHD, stroke and hypertension (WHO/FAO, 2002:89). The WHO recommends an intake
of five portions of eighty grams each fruit/vegetables (totalling 400g) to prevent CVD and certain cancers
(Schneider et al., 2007:717).
The risk for atherosclerosis in older women was found to be thirty percent lower in women who ate five to
ten servings of fruits and vegetables per day, compared to those who only ate two to five servings per day
(WHO/FAO, 2002:40). Dietary plant sterols reduce serum cholesterol by inhibiting cholesterol absorption
(WHO/FAO, 2002:84). Fiber from fruit and vegetables also lowers blood cholesterol levels. Eating ―plenty‖
of fruit and vegetables also reduces the risk of fractures, cataracts, age-related macular degeneration,
and birth defects, and influences the response to infections, through the function of vitamin A, which
maintains the lymphocyte pool and is involved in T-cell mediated response (Schneider et al., 2007;717).
An inverse association exists between potassium intake and the risk of stroke (WHO/FAO, 2002:86).
Higher intakes of potassium are associated with lower blood pressure (Couch & Krummel, 2008;872-873;
Krummel, 2004b:910). Adequate dietary intake lowers blood pressure and protects against stroke and
cardiac arrhythmias. Intake should be at a level where a ratio of 1,0 is kept with sodium intake (about
seventy to eighty mmol or 2730 mg to 3120 mg potassium per day) (WHO/FAO, 2002:90). With a sodium
intake of around one hundred mmol (2300 mg) less than normal and a potassium intake of up to seventy
mmol (2730 mg) daily, a ratio of around 1,0 is achieved, which results in a reduction of 3,4 mmHg in
systolic blood pressure (Krummel, 2004b:910; *conversions from Mahan & Escott-Stump, 2004a:1176,
Page 93 of 252
Appendix 4). It has also been suggested that an intake of no more than seventy mmol (or 1,7g) of sodium
per day also reduces blood pressure. The recommended levels of intake for fruits and vegetables (Table
2.23) ensure an adequate intake of potassium (WHO/FAO, 2002:86,90). By consuming the
recommended amounts of fruits and vegetables recommended by the DASH diet, an intake of around
ninety mmol (3510 mg) can be achieved per day (Couch & Krummel, 2008:873; Krummel, 2004b:911).
While potassium supplements have protective effects on blood pressure and CVD, there is no evidence
that long-term potassium supplements should be administered to reduce the risk of CVD (WHO/FAO,
2002:86). The equivalent intake of one to two extra servings of fruit, citrus juice, vegetables or potatoes,
contributed to a forty percent decrease in the incidence of stroke-related deaths (Krummel, 2004b:911). A
higher potassium intake was also linked to a 38% reduction in stroke risk (Couch & Krummel, 2008:873).
Deficiencies in folic acid, vitamin B12 and pyridoxine (vitamin B6) increase levels of homocysteine and free
radicals, which result in oxidative damage to endothelial cells, leading to the aggregation of monocytes
and platelets which cause vasoconstriction (Schneider et al., 2007:717). High fruit and vegetable
consumption can therefore protect against atherosclerosis. A common single gene mutation that reduces
the activity of an enzyme that is involved in folate metabolism, is associated with a moderate (20%)
increase in serum homocysteine, which raises the risk of both IHD and deep vein thrombosis (DVT)
(WHO/FAO, 2002:42). One would assume that persons with this gene mutation should consume even
more fruits and vegetables than the general population, to reduce the risk of IHD and DVT.
A diet that protects against cancer has been shown to mainly contain foods of plant origin. It is probable
that higher consumption of several plant-based foods probably protects against cancer in various sites.
Emphasis should be placed on plant-based foods which are high in nutrients and fiber and low in energy.
It is probable that fruit and non-starchy vegetables, including green, leafy vegetables; broccoli; okra;
eggplant and bok choy; as well as non-starchy roots and tubers, including carrots; Jerusalem artichokes;
celery root, rutabaga and turnips, protect against some cancers, as well as weight gain (because they are
typically low in energy-density) (WCRF/AICR, 2007:xviii). Cruciferous vegetables alter the metabolism of
carcinogens because they contain glucosinolates, which are transformed into isothiocyanates during food
preparation. Indoles and isothiocyanates weaken the effects of polycyclic aromatic hydrocarbons and
nitrosamines via the induction of glutathione-S-transferases and the inhibition of cytochrome P450
(WCRF/AICR, 2007:37).
One of the public health goals of the WCRF/AICR (2007:xviii) is that the average consumption non-
starchy vegetables and fruits by a population should be at least 600g per day. Different colours of red,
green, yellow, white, purple and orange vegetables and fruit, including tomato-based products and allum
vegetables (e.g. garlic) should be included daily. Unprocessed cereals and grains and/or legumes should
contribute to at least 25 g non-starchy polysaccharides per day. The personal recommendations of the
WCRF/AICR (2007:xviii) are to eat at least five portions/servings (equal to at least 400g) of a variety of
non-starchy fruit and vegetables daily; to eat relatively unprocessed cereals and grains and to limit refined
starchy foods. If starchy roots or tubers are consumed as a staple food, sufficient intake of non-starchy
vegetables, fruit and legumes should also be ensured.
Page 94 of 252
2.8.3. Meat and meat alternatives
A remarkable increase in consumption of animal products has been seen in Brazil and China, although
levels are still below the levels of North America and most other industrialized countries (WHO/FAO,
2002:21). The per capita supply of vegetable protein is slightly higher in developing countries, while the
supply of animal protein is three times higher in industrialized countries (WHO/FAO, 2002:16). Protein,
especially animal protein, has a selective effect in promoting height growth. When protein intake is
adequate, adult height is expressed as determined by genes (phenotype) (WHO/FAO, 2002:35).
Excessive consumption of animal products can, however, lead to excessive intakes of fat (WHO/FAO,
2002:21) and childhood obesity is related to excess protein intake (WHO/FAO, 2002:35).
A strong positive relationship exists between the level of income and the consumption of animal protein.
As income increases, so does consumption of meat, milk and eggs, at the expense of staple foods.
Urbanization creates opportunities for improved infrastructure. The availability of refrigeration stimulates
trade in perishable goods. The urban diet therefore becomes rich in animal proteins and fats, with a high
consumption of meat, poultry, milk and other dairy products (WHO/FAO, 2002:20).
2.8.3.1 Red meat
Intake of red or processed meats shows convincing or probable cause of some cancers. High intake of
animal fats often equate to relatively high intake of energy, increasing the risk of weight gain
(WCRF/AICR, 2007:xix). High intake of red meat has been associated with an increased risk of colon-
and prostate cancer (Grant, 2008:964). Preserved meat is associated with an increased risk for
colorectal cancer, but fresh meat is not (WHO/FAO, 2002:97). High intake of red meat may result in a
higher absorption of haem iron, which may cause greater oxidative stress and increase the risk for
potential DNA damage. High red meat intake is also associated with N-nitroso compounds formation,
which is associated with the formation of DNA adducts in colon cells and increased levels of
nitrogenous residues in the colon. Iron overload can activate oxidative transcription factors and
inflammation in the colon (WCRF/AICR, 2007:37).
Bourne et al. (2002:158) states that higher levels of atherosclerotic factors were found amongst 11-
year old urban black children in Cape Town, compared to their rural counterparts. It was also found an
increase in dietary atherogenicity occurred with increased urban exposure. Intake of protein from meat
sources also increased significantly for the urban areas. Therefore, high intake of meat is related to
higher atherogenicity. Improvements in socio-economic status do not lead to improved nutritional
status, but to a diet pattern associated with atherosclerosis, including high consumption of high-fat and
refined foods (Bourne et al., 2002:159).
2.8.3.2. Fish
Fish consumption reduces the risk of CHD. If forty- to sixty grams of fish is consumed by high-risk
populations per day, an approximate reduction of fifty percent in deaths from CHD would occur
(WHO/FAO, 2002:86). Regular fish consumption of one to two servings a week, protects against CHD
and ischemic stroke (WHO/FAO, 2002:90). When survivors of a first MI received advice to consume
fatty fish at least twice weekly, two-year mortality was reduced by 29% (WHO/FAO, 2002:86).
Page 95 of 252
Servings should provide an equivalent of 200 mg to 500 mg of eicosapentanoic acid (EPA) and
docosahexanoic acid (DHA) (WHO/FAO, 2002:90).
Currently, about 13,8% to 16,5% of animal protein intake in the world is derived from fish, crustaceans
and molluscs. In the early 1960‘s per capita fish supply in low-income countries with a food deficit was
thirty percent of that of the richest countries. This gap has gradually narrowed until in 1997, the supply
was seventy percent of that of the richest countries. Thus, despite the low consumption of fish in low-
income food-deficit countries, the contribution of fish to total animal protein intake is still considerable
(WHO/FAO, 2002:22). The recommendation for increased fish consumption should be balanced
against the sustainability of marine stocks and the potential for depletion (WHO/FAO, 2002:23).
2.8.3.3 Soy
Soy is rich in isoflavones, the intake of which may provide protection against CHD (WHO/FAO,
2002:87). Soy lowers total cholesterol, LDL and triglycerides (Krummel, 2004a:882). However, to
decrease LDL by a few percent would require a soy intake of at least half of a person‘s daily protein
intake (Krummel, 2008:858). An average consumption of 47g of soy per day led to a nine percent
decline in total cholesterol and a 13% decline in LDL cholesterol in subjects free of CHD (WHO/FAO,
2002:87). Krummel (2004a:882) states that an intake of 25 grams of soy per day lowers LDL
cholesterol by four- to eight percent. Plant sterols and stanols made from soybean oil (and pine tree
oil), now found in margarines, lower blood cholesterol by nine- to twenty percent, if two to three grams
are consumed per day (Krummel, 2008:858; Krummel, 2004a:882). A daily serving size of about one
to two ounces (28 g to 56 g) of soy is recommended (Krummel, 2008:858).
If soy is consumed before reaching adulthood, it may be protective against breast cancer. However,
commercially prepared soy supplements should be limited in women with estrogen receptor positive-
type breast cancer (Grant, 2008:964).
2.8.4. Fibre
Soluble fibres lower serum cholesterol and LDL (Krummel, 2008:858; Krummel 2004b:881). Soluble
fibres include: pectins; gums; mucilages; and some hemi-celluloses (Krummel, 2008:858; Krummel,
2004a:881; WHO/FAO, 2002:84). Insoluble fibres, like cellulose and other hemicelluloses, have no effect
on serum cholesterol levels (Krummel, 2008:858; Krummel, 2004a:881; WHO/FAO, 2002:84). The total
recommended intake of fibre (25 g to 30 g per day) should contain about six to ten grams of soluble fibre,
which is easily achieved by consuming five or more servings of fruit and vegetables per day and six or
more servings of grains per day (Krummel, 2008:858; Krummel, 2004a:881). The WHO/FAO (2002:77)
recommends a minimum daily intake of 20g fibre from wholegrain cereals, legumes, fruit and vegetables
to reduce the risk of type 2 DM. The recommended intake of fruits and vegetables of >400g per day and
the consumption of wholegrain foods is likely to provide >25 g of total dietary fibre per day (WHO/FAO,
2002:58).
The infrequency of DM in rural Africa may result from the consumption of substantial amounts of fibre in
the diet, from minimally-processed or unprocessed carbohydrates. High intakes of fibre have been shown
to reduce blood glucose and insulin levels in people with type 2 DM and impaired glucose tolerance
Page 96 of 252
(WHO/FAO, 2002:75). High intake of dietary fibre also promotes weight loss (WHO/FAO, 2002:63),
lowers blood pressure and protects against CHD. Most fibres reduce plasma total and LDL cholesterol
(WHO/FAO, 2002:84).
A fibre-rich diet is associated with a protective effect in colon cancer, but genetics should also be
considered (Grant, 2008:964; Eldridge, 2004:1001). When consuming 4,5 servings or more of whole
grains daily, a 35% lower risk of colon cancer has been reported, when compared to eating less than 1,5
servings of whole grains daily (Grant, 2008:964).
2.8.5. Sugar
The WHO/FAO (2002:57) recognizes that their recommendation for the intake of free sugars to be less
than ten percent of total energy, is controversial. However, they maintain their opinion that high intakes of
free sugars threaten the nutrient quality of the diet by providing significant energy without specific
nutrients. They maintain their opinion that restricting the amount of free sugars in the diet, reduces the
risk of weight gain (WHO/FAO, 2002:57). Processed foods contain substantial amounts of fat or sugar
and tend to be more energy-dense than fresh foods (WCRF/AICR, 2007:xviii). It is speculated that the
global increase in obesity may be related to the increased consumption of energy-dense foods and
sugary drinks worldwide (Van den Berg, 2011:259; WCRF/AICR, 2007:xviii). However, it should be kept
in mind that eating any food or beverage in excessive amounts, thereby exceeding energy intake above
recommended daily requirements, will cause weight gain (Van den Berg, 2011:258).
Sugar-rich drinks increase overall energy intake by reducing appetite control, which leads to an increased
body weight, as compared with consumption of artificially sweetened drinks (WHO/FAO, 2002:57).
Sugary drinks are postulated to promote weight gain because they provide energy without inducing
satiety or reducing subsequent energy intake, which then promotes overconsumption of energy
(WCRF/AICR, 2007:xviii). Children with a high consumption of soft drinks rich in free sugars are more
likely to be overweight and to gain weight (WHO/FAO, 2002:57). Every extra can or glass of sugar-
sweetened drink taken by children per day, increases their obesity risk by sixty percent. Many fruit drinks
and cordials are equally energy-dense and may promote weight gain if drunk in large quantities
(WHO/FAO, 2002:66), especially since sugar-sweetened drinks may contain from 170 kJ to 200kJ per
100 ml (Van den Berg, 2011:259).
When adults with metabolic syndrome replaced high glycemic index (GI) carbohydrates with low GI
carbohydrates, a beneficial change in weight and metabolic indices was observed (WHO/FAO, 2002:57).
Hyperinsulinemia and insulin resistance, which form part of the metabolic syndrome, are associated with
increased triglyceride and LDL levels (Van den Berg, 2011:259). Drinking one to two sugar-sweetened
drinks per day increases the risk for metabolic syndrome, insulin resistance, type 2 DM, CVD, and
hypertension (Van den Berg, 2011:257). Grant (2008:965) states that blood glucose and triglyceride
levels can increase when there is high consumption of simple sugars on a regular basis. This can raise
the levels of insulin and other hormones that may stimulate cancer cell growth (Grant, 2008:965).
According to Augustin et al. (2001:1533) high GI or GL carbohydrates (such as refined carbohydrates)
increase glucose and insulin levels more than legumes or whole grains. Raised insulin levels may raise
insulin-like growth factor levels, which may increase breast cancer risk. There have been various
Page 97 of 252
hypotheses that high insulin levels, dietary GI and GL have been directly associated with increased risk of
several CDLs, including colorectal cancer, type 2 DM, CHD and obesity. The study by Augustin et al.
(2001:1533) supported the hypothesis that there is an association between moderate, direct GI or GL and
the risk of breast cancer, as well as an association between hyperinsulinemia or insulin resistance and
breast cancer. However, a less clear association between sugar (categorized as a medium-high GI food)
and breast cancer was found (Augustin et al., 2001:1535). Potischman et al. (2002:937) found that there
was an increased risk for breast cancer in their study group who consumed high amounts of sweet items,
particularly soda drinks and desserts. Those participants who consumed sweet foods more than 2,8 times
per week had an increased risk of breast cancer. After adjusting for energy intake were made, the
association was even greater. Grant (2008:965) states that the consumption of high GI foods may be
associated with an increased risk of ovary-; endometrium-; breast-; colorectal-; pancreas-; and lung
cancer. Sugar has an intermediate GI and, when consumed together with a low-GI meal, does not
exaggerate insulin response (Van den Berg, 2011:260).
When sugar is consumed in moderate quantities, there is no detrimental effect on dental health, weight
management, or CDLs. However, excessive consumption of sugar-sweetened beverages is associated
with weight gain and obesity (Van den Berg, 2011:257). It is recommended to limit intake of refined and
processed sugars and to emphasize whole grains or complex carbohydrates as part of a balanced diet
(Grant, 2008:965). Excessive intake of added sugars should be avoided, and especially products
sweetened with fructose (Van den Berg, 2011:257). Frequent brushing with fluoride toothpaste and good
dental care prevents dental caries more effectively than avoiding sugary foods (Van den Berg, 2011:258).
2.8.6. Fat
According to the WHO/FAO (2002:56), a total fat intake of twenty percent of total energy is consistent
with good health. However, highly active groups with diets rich in vegetables, legumes, fruits and
wholegrain cereals may have a total fat intake of up to 35% without the risk of weight gain.
Energy from fat is no more fattening than the same amount of energy from carbohydrates or proteins, but
diets that are high in fat tend to be energy-dense. By comparing the intake of high-fat diets versus low-fat
diets over a two month-period, a reduction in fat intake by ten percent corresponded to about a 1000 kJ
reduction in energy intake and a loss of three kilograms of body weight. This equates to about one BMI
unit or about a five percent difference in obesity prevalence (WHO/FAO, 2002:64).
Populations that consume high amounts of saturated fatty acids (SFAs), tend to have increased blood
cholesterol levels, which increases CHD incidence and mortality (Krummel, 2008:837). A high saturated
fat intake impairs glucose tolerance and is associated with higher fasting glucose and insulin levels.
Higher SFA levels in serum and muscle are associated with higher fasting insulin levels, lower insulin
sensitivity and a higher risk for developing type 2 DM (WHO/FAO, 2002:74). High intake of saturated- and
animal fat may relate to an increased risk of breast-, colon-, lung- and prostate cancer (Eldridge,
2004:1001). Myristic acid is the most hypercholesterolemic, followed by palmitic and lauric acid
(Krummel, 2008:855). Myristic and palmitic acids are abundant in diets rich in dairy products and meat
(WHO/FAO, 2002:82). Palm oil is becoming an important edible oil in diets of much of South East Asia
(WHO/FAO, 2002:20). To reduce the risk of DM and CVD, saturated fat intakes should not exceed ten
Page 98 of 252
percent of total energy (WHO/FAO, 2002:77) as recommended in Table 2.23; and <7% of total energy in
high risk groups (WHO/FAO, 2002:88). SFAs raise total- and LDL cholesterol. The most effective
replacement for SFAs, in terms of CHD outcome, is poly-unsaturated fatty acids (PUFAs), especially
linoleic acid (WHO/FAO, 2002:82).
Trans fatty acids elevate LDL and decrease HDL, thus contributing to the development of CHD. To a
large degree, trans fatty acids have been reduced or eliminated from retail fats and spreads, but deep
fried foods and baked goods are still major sources (WHO/FAO, 2002:82). According to Krummel
(2004a:880), fifty percent of fat intakes come from SFA sources, such as beef, butter and milk. The trans-
isomer of oleic acid (elaidic acid) raises blood cholesterol as compared with PUFAs, but less than myristic
or lauric acid.
Both mono-unsaturated fatty acids (MUFAs) and omega 6-PUFAs lower plasma total -and LDL
cholesterol, when substituted for SFAs. PUFAs are more effective than MUFAs (WHO/FAO, 2002:83).
Good sources of omega 6-PUFAs are vegetable oils, salad dressings and margarine containing linoleic
acid (Krummel, 2004a:879). Linoleic acid is abundant in soybean and sunflower oil (WHO/FAO, 2002:83).
If carbohydrates in the diet are replaced by linoleic acid (omega 6-PUFA), LDL is lowered and HDL is
raised. If SFAs are replaced with PUFAs, both LDL and HDL are lowered (Krummel, 2004a:879).
Omega 3-PUFAs have the potential to increase LDL and lower triglycerides (Krummel, 2004a:879;
WHO/FAO, 2002:83). They are also precursors of prostaglandins that interfere with blood clotting
(Krummel, 2008:857; Krummel, 2004a:879; WHO/FAO, 2002:83). Thus, overconsumption of omega 3-
PUFAs (either via intake of fish or supplements) can prolong bleeding times, as shown by the Eskimo
population who have a high omega-3 dietary intake and low CHD incidence (Krummel, 2008:857;
Krummel, 2004a:879). The most important omega 3-PUFAs, are EPA and DHA (found in fatty fish, fish oil
and –capsules), and α-linolenic acid (found in plants) (Krummel, 2004a:879; WHO/FAO, 2002:83). For
persons with CVD, a daily combined intake of one gram of EPA and DHA, preferably from fish, is
recommended. For persons with hypertriglyceridemia, an intake of two to four grams of EPA and DHA is
required for a lowering effect (Krummel, 2008:867). Omega 3 fatty acids suppress or decrease the mRNA
of interleukin, which is elevated in atherosclerosis, arthritis and other auto-immune diseases (WHO/FAO,
2002:42).
Replacing SFAs with MUFAs lowers serum cholesterol levels, LDL and triglycerides to about the same
amount as with PUFAs (Krummel, 2008:855). The only important source of MUFAs is oleic acid,
abundant in olive oil (Krummel, 2004a:880; WHO/FAO, 2002:83); as well as canola oil and nuts
(WHO/FAO, 2002:83). Olive oil is an important edible oil consumed largely in the Mediterranean region
(WHO/FAO, 2002:20).
A proportionate higher intake of unsaturated fatty acids is associated with a reduced risk of type 2 DM.
Higher proportions of long-chain PUFAs in muscle are associated with increased insulin sensitivity
(WHO/FAO, 2002:74). However, when total fat intake is high (>37% of total energy), altering the quality of
the fat has little effect on decreasing glucose intolerance (WHO/FAO, 2002:75).
Dairy fat and meat are major sources of cholesterol. Egg yolk is also rich in cholesterol, but unlike dairy
and meat, it does not contain saturated fats. Evidence for an association between dietary cholesterol and

Page 99 of 252
CVD is contradictory (WHO/FAO, 2002:83), since specific genotypes in humans raise cholesterol levels
more than others (WHO/FAO, 2002:42). The WHO/FAO (2002:83) is of the opinion that if the intake of
dairy fat and meat is controlled, there is no need to severely restrict egg yolk intake.
The incidence of hypertension is lower in vegans, because they tend to consume more PUFAs and less
total fat, saturated fat and cholesterol. The prostaglandins produced by PUFAs affect renal sodium
excretion and relax vascular muscles, which can have an effect on blood pressure. An olive oil-enriched
diet can decrease the use of anti-hypertensive drugs by 48% (Couch & Krummel, 2008:873; Krummel,
2004b:911).
2.8.7. Nuts
Nuts contain a high amount of arginine, which is an amino acids of which nitric oxide, a vasodilator, is
synthesized. This may explain the positive association between nut intake and a reduced prevalence of
CVD (Krummel, 2004a:865).
Nuts are high in unsaturated fatty acids and low in saturated fats. Frequent consumption of nuts
decreases the risk of CHD. Because of the high energy content of nuts, dietary intake should be
moderate to achieve the desired energy balance (WHO/FAO, 2002:87).
2.8.8. Alcohol
In 1998, 45% of South African men and 17% of women consumed alcohol at the time of the SADHS
(Schneider et al., 2007:665; DoH et al., 2002:238). Schreider et al. (2007:664) indicates that the figure
approximated more to fifty percent of men and twenty percent of women, and that this might even be
underestimated. The 1998 SADHS found the rate was 28% for the general South African population in
1998, which at that time translated to 8,3 million South Africans. In males, the highest drinking levels
(50% or more) were reported in the Free State and Gauteng provinces. The lowest levels (28%) were in
the Northern Province. For females, the highest levels (23% to 24%) were in the Free State, Western
Cape and Northern Cape, and the lowest levels (9%) were in the Northern Province (DoH et al.,
2002:238). The observed rates of fetal-alcohol syndrome in the Western Cape‘s poorer communities
were between 18 to 141 times greater than those found in the USA (Schneider et al., 2007a:665). In a
study conducted in the Western Cape, about a quarter (23,7%) of pregnant women reported alcohol
intake sufficient to place their unborn child at risk (Schneider et al., 2007a:666).
Alcohol forms an integral part of the South African economy. The wine and brewing industries contributed
to South Africa becoming an important player in the global alcohol market. Alcohol taxes has raised R4,2
billion in 2002/3, but the costs of alcohol abuse were estimated at around R9 billion, amounting to about
one percent of the GNP (Schneider et al., 2007a:664).
In 2000, adult per capita alcohol consumption was estimated around 10,2 litres of pure alcohol annually,
but if adjusted for unrecorded consumption (especially home brews), the estimated amount increases to
12,4 litres. Although these figures are low compared to most developed countries, because a large part of
the South African population does not drink, this means that the amount consumed per person should be
nearer to about twenty litres of absolute alcohol per year (Schneider et al., 2007a:665). The Comparative
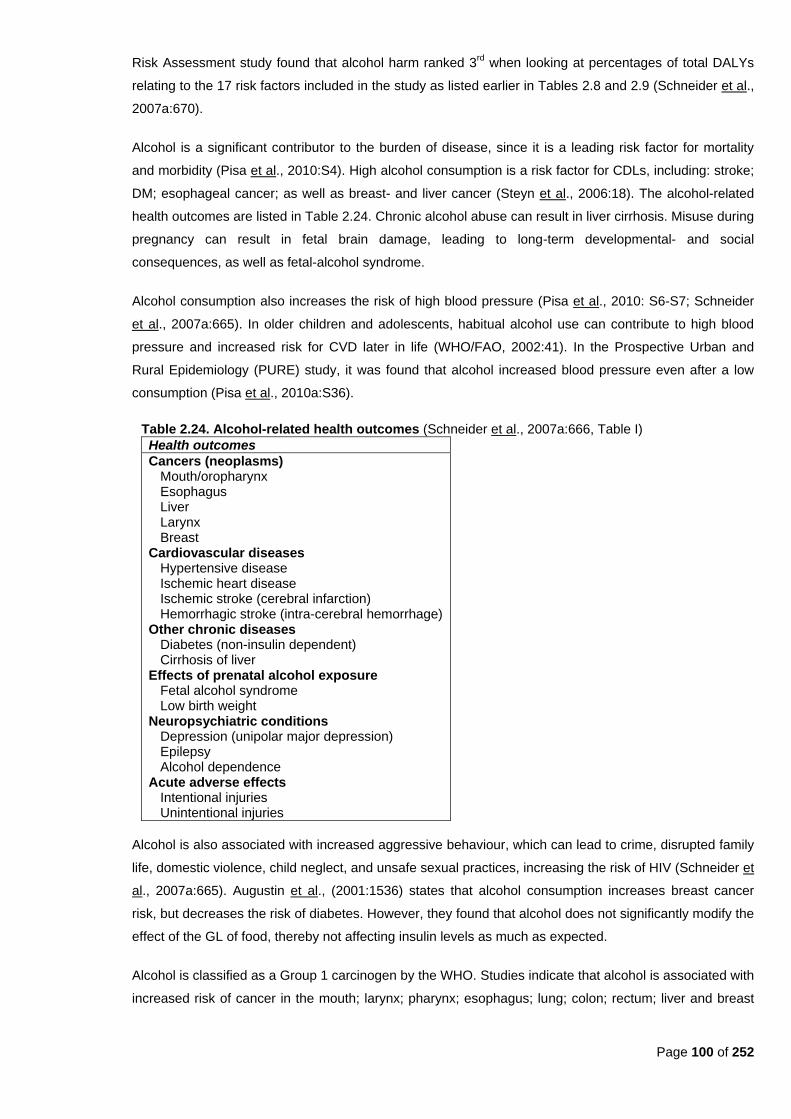
Page 100 of 252
Risk Assessment study found that alcohol harm ranked 3rd
when looking at percentages of total DALYs
relating to the 17 risk factors included in the study as listed earlier in Tables 2.8 and 2.9 (Schneider et al.,
2007a:670).
Alcohol is a significant contributor to the burden of disease, since it is a leading risk factor for mortality
and morbidity (Pisa et al., 2010:S4). High alcohol consumption is a risk factor for CDLs, including: stroke;
DM; esophageal cancer; as well as breast- and liver cancer (Steyn et al., 2006:18). The alcohol-related
health outcomes are listed in Table 2.24. Chronic alcohol abuse can result in liver cirrhosis. Misuse during
pregnancy can result in fetal brain damage, leading to long-term developmental- and social
consequences, as well as fetal-alcohol syndrome.
Alcohol consumption also increases the risk of high blood pressure (Pisa et al., 2010: S6-S7; Schneider
et al., 2007a:665). In older children and adolescents, habitual alcohol use can contribute to high blood
pressure and increased risk for CVD later in life (WHO/FAO, 2002:41). In the Prospective Urban and
Rural Epidemiology (PURE) study, it was found that alcohol increased blood pressure even after a low
consumption (Pisa et al., 2010a:S36).
Table 2.24. Alcohol-related health outcomes (Schneider et al., 2007a:666, Table I)
Health outcomes
Cancers (neoplasms) Mouth/oropharynx Esophagus Liver Larynx Breast
Cardiovascular diseases Hypertensive disease Ischemic heart disease Ischemic stroke (cerebral infarction) Hemorrhagic stroke (intra-cerebral hemorrhage)
Other chronic diseases Diabetes (non-insulin dependent) Cirrhosis of liver
Effects of prenatal alcohol exposure Fetal alcohol syndrome Low birth weight
Neuropsychiatric conditions Depression (unipolar major depression) Epilepsy Alcohol dependence
Acute adverse effects Intentional injuries Unintentional injuries
Alcohol is also associated with increased aggressive behaviour, which can lead to crime, disrupted family
life, domestic violence, child neglect, and unsafe sexual practices, increasing the risk of HIV (Schneider et
al., 2007a:665). Augustin et al., (2001:1536) states that alcohol consumption increases breast cancer
risk, but decreases the risk of diabetes. However, they found that alcohol does not significantly modify the
effect of the GL of food, thereby not affecting insulin levels as much as expected.
Alcohol is classified as a Group 1 carcinogen by the WHO. Studies indicate that alcohol is associated with
increased risk of cancer in the mouth; larynx; pharynx; esophagus; lung; colon; rectum; liver and breast
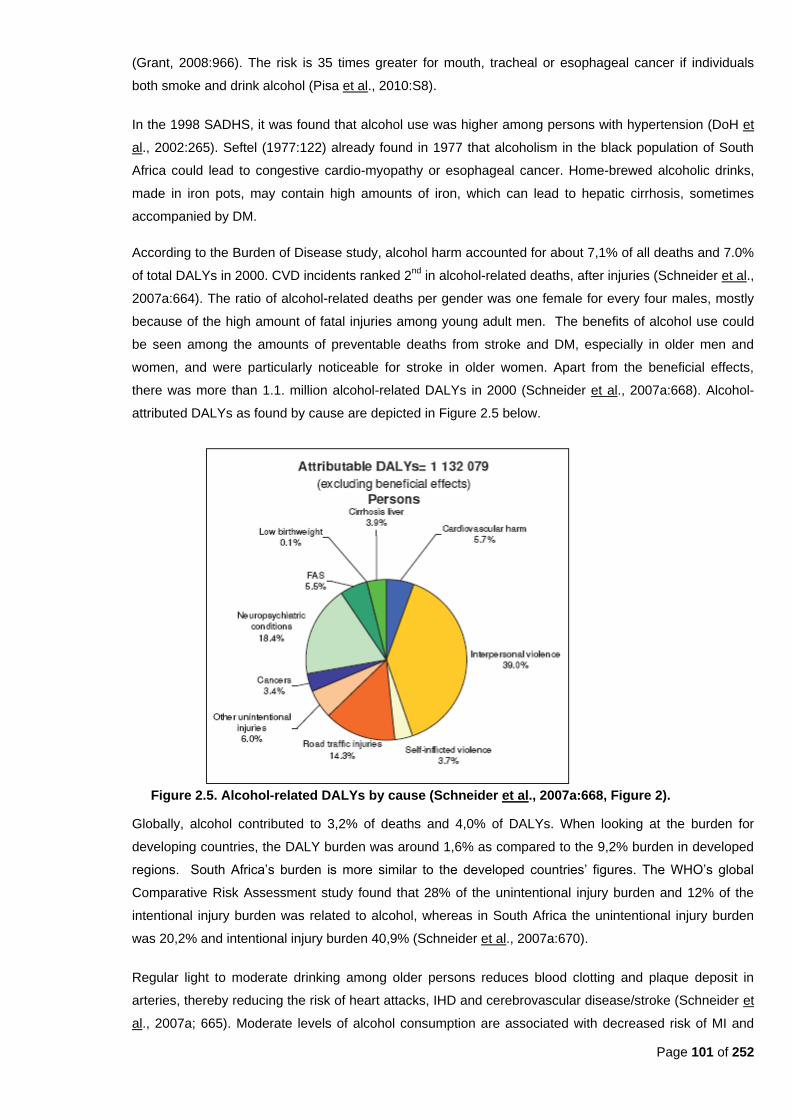
Page 101 of 252
(Grant, 2008:966). The risk is 35 times greater for mouth, tracheal or esophageal cancer if individuals
both smoke and drink alcohol (Pisa et al., 2010:S8).
In the 1998 SADHS, it was found that alcohol use was higher among persons with hypertension (DoH et
al., 2002:265). Seftel (1977:122) already found in 1977 that alcoholism in the black population of South
Africa could lead to congestive cardio-myopathy or esophageal cancer. Home-brewed alcoholic drinks,
made in iron pots, may contain high amounts of iron, which can lead to hepatic cirrhosis, sometimes
accompanied by DM.
According to the Burden of Disease study, alcohol harm accounted for about 7,1% of all deaths and 7.0%
of total DALYs in 2000. CVD incidents ranked 2nd
in alcohol-related deaths, after injuries (Schneider et al.,
2007a:664). The ratio of alcohol-related deaths per gender was one female for every four males, mostly
because of the high amount of fatal injuries among young adult men. The benefits of alcohol use could
be seen among the amounts of preventable deaths from stroke and DM, especially in older men and
women, and were particularly noticeable for stroke in older women. Apart from the beneficial effects,
there was more than 1.1. million alcohol-related DALYs in 2000 (Schneider et al., 2007a:668). Alcohol-
attributed DALYs as found by cause are depicted in Figure 2.5 below.
Figure 2.5. Alcohol-related DALYs by cause (Schneider et al., 2007a:668, Figure 2).
Globally, alcohol contributed to 3,2% of deaths and 4,0% of DALYs. When looking at the burden for
developing countries, the DALY burden was around 1,6% as compared to the 9,2% burden in developed
regions. South Africa‘s burden is more similar to the developed countries‘ figures. The WHO‘s global
Comparative Risk Assessment study found that 28% of the unintentional injury burden and 12% of the
intentional injury burden was related to alcohol, whereas in South Africa the unintentional injury burden
was 20,2% and intentional injury burden 40,9% (Schneider et al., 2007a:670).
Regular light to moderate drinking among older persons reduces blood clotting and plaque deposit in
arteries, thereby reducing the risk of heart attacks, IHD and cerebrovascular disease/stroke (Schneider et
al., 2007a; 665). Moderate levels of alcohol consumption are associated with decreased risk of MI and
Page 102 of 252
CHD mortality in white men. Wine contains resveratrol, an antifungal compound found in grape skins,
which increases HDL cholesterol and inhibits LDL oxidation. The French paradox describes high-fat diet
and lower rates of CVD, because of the French population‘s consumption of red wine (Krummel,
2004a:881).
Alcohol has both beneficial and harmful effects on health, but on the whole the impact of alcohol
consumption on health is more negative than positive (Schneider et al., 2007a:664). The WHO states that
general recommendations do not favour the use of alcohol, because of its other health risks (WHO/FAO,
2002:87).
Pisa et al. (2010a:S36) suggests that there is not enough scientific evidence to promote any alcohol
consumption among persons who do not drink. The WCRF/AICR (2007:xix) state that the evidence on
cancer justifies the avoidance of alcohol altogether because no clear level of consumption is shown below
which there is no increase in cancer risk. However, other evidence shows that modest intake of alcohol
may likely reduce the risk of CHD, and that all alcoholic drinks have the same effect. The WCRF/AICR
panel did emphasize that children and pregnant women should not consume alcoholic drinks at all.
Alcohol intake should be less than two drinks per day in men and one drink per day in women and lighter-
weight men, to prevent high blood pressure (Couch & Krummel, 2008:872; Krummel, 2004b:910) and
cancer (Grant, 2008:966).
2.8.9. Salt
Sodium intake is directly associated with blood pressure (WHO/FAO, 2002:85). In 1998, South African
young people consumed more salty foods than older people, suggesting that hypertension prevalence
may increase as this generation ages (DoH et al., 2002:265).
According to the WHO (2008a:65), 8,5 million lives could be saved in a decade in the 23 developing
countries that comprise eighty percent of the global chronic disease burden, if manufacturers reduce
dietary salt intake by 15% through manufacturing practices; and if a mass-media campaign to encourage
dietary change is sustained.
In societies where 9g to 12g of salt (150 mmol to 200 mmol sodium) is consumed per day, hypertension
and stroke is more prevalent (Krummel, 2004b:907). A reduction of sodium intake by 50 mmol per day
may lead to a fifty percent reduction in the number of people requiring anti-hypertensive therapy; as well
as a 22% reduction in deaths resulting from strokes; and a 16% reduction in deaths resulting from CHD.
A difference in sodium intake of one hundred mmol per day is associated with an average difference in
systolic blood pressure of 5 mmHg in 15 to 19 year olds and 10 mmHg in sixty to 69 year olds
(WHO/FAO, 2002:85). An intake of no more than seventy mmol sodium per day is beneficial in reducing
blood pressure (WHO/FAO, 2002:90). A two grams salt-restricted diet is equal to about 34 mmol sodium
(Krummel, 2004b:910). Total sodium intake should take into account all sources, including monosodium-
glutamate and preservatives (WHO/FAO, 2002:90).
The WCRF/AICR (2007:xx) state that salt and salt-preserved foods probably increase the risk of
developing stomach cancer. Although salt is necessary in the human body, much lower levels are
necessary than those typically consumed in most parts of the world.

Page 103 of 252
2.8.10 Coffee
High coffee intake has been associated with CHD. Coffee beans contain a terpenoid lipid called cafestol,
which raises total and LDL cholesterol, if consumed in large amounts (WHO/FAO, 2002:87). Heavy
consumption of regular coffee (approximately equal to 720 ml daily), minimally increases total cholesterol,
LDL and HDL (Krummel, 2004a:881). Boiled, unfiltered coffee contains high amounts of cafestol
(WHO/FAO, 2002:87). According to Krummel (2004a:881), boiled coffee causes a greater elevation in
plasma lipids than filtered coffee. Thus, drinking filtered coffee instead of boiled coffee, contributes to a
significant decline in serum cholesterol (WHO/FAO, 2002:87).
Nel and Steyn (2002:53-58, Table 22) found that coffee was consumed by 7,2% of children between one
to five years old, 9,4% of children aged six to nine years, and between 16,2% and 34% of South Africans
who were ten years and older. In comparison, tea was consumed by 56,8% of children age one to five
years; 60,6% of children aged six to nine years; and between 61,9% and 68,2% of South Africans who
were ten years and older.

Page 104 of 252
Chapter 3 - Methodology
3.1. Introduction
The purpose of the AHA FS study was to determine how urban and rural lifestyles of populations
predispose them to the double burden of disease, i.e. chronic diseases of lifestyle related to obesity (such
as DM and CVD) as well as to undernutrition and to investigate factors that may play a role in these health
challenges (such as diet).
The rural leg of the AHA study was undertaken during a two week period in March 2007, in Trompsburg,
Springfontein and Philippolis (as part of the Free State Rural Development Partnership Programme
(FSRDPP)). The urban leg of the AHA study was undertaken during a two week period between 2 and 13
March 2009, at the Mangaung University Community Partnership Programme (MUCPP) clinic.
3.2. Ethical considerations
Approval for the study was obtained from the Ethics Committee of the Faculty of Health Sciences at the
University of the Free State (ETOVS NR 21/07A), Free State Department of Health, local municipalities and
community leaders.
Informed consent was signed by each participant (Appendix A). In the case of the children, a parent or
guardian gave consent. The study was explained to the participant before he/she was required to sign the
consent form. Each participant received a copy of the consent form, together with an information document
(Appendix B). Illiterate persons could make a cross in the presence of a witness on the consent form.
Consent forms were available in English, Afrikaans and Sotho. All information was kept confidential and
participants‘ privacy was respected.
The community leaders were contacted in each of the specific communities via community health workers.
The reason for the study was explained as well as the type of data that would be collected, and the method
in which data would be collected. Benefits to the community were also explained. Community health
workers visited selected households, explained the study and obtained informed consent. If community
members refused to participate, they were not discriminated against. Participants could also withdraw from
the study at any time. In addition to the information document, community members received a participation
letter (Appendix C), which the participant could present to his/her employer to enable him/her to be granted
leave from work to participate in the study on a specific day.
3.3. Study design
The baseline phase of the AHA FS study comprised a descriptive cross-sectional design.
3.4. Sample selection
The AHA FS study included both a rural leg, undertaken during 2007 and an urban leg, undertaken during
2009. The current study formed part of both the rural and the urban baseline surveys of the AHA FS study.
Page 105 of 252
3.4.1. Population
The MRC Technical Report states that the black population is the only ethnic group still undergoing a
nutrition transition from a traditional to a Western diet, since the other population groups (white,
coloured and Indian) mostly already follow the westernized dietary patterns (Steyn et al., 2006:5). For
this reason, it was decided to include areas where mostly black population groups resided in an urban
and rural area of the Free State. In rural areas, black and coloured communities often resided in the
same area.
3.4.2. Sample
For the rural part of the study in 2007, three rural communities in the Southern Free State (part of the
Free State Rural Development Partnership Programme) were selected, namely Trompsburg, Philippolis
and Springfontein. All households in the black and coloured communities in these three towns were
included in the study.
For the urban part of the study in 2009, six urban communities (serviced by MUCPP) in Mangaung were
selected, namely an area of Rocklands indicated as ―Buffer‖ on the municipal map, as well as the
communities of Freedom Square, Kagisanong, Chris Hani, Namibia and Turflaagte.
The number of plots in the MUCPP service areas was counted on a municipal map, and an estimate
was made of additional squatter households in open areas. A stratified proportional cluster sample was
selected, stratified by area and formal plot/squatter households in open areas. Using randomly selected
X and Y coordinates, hundred starting points were selected in this way. From each starting point five
adjacent households were approached. In the Rocklands buffer community, three formal households
from a total of 345 were included. In Freedom Square, forty formal households from a total of 4791 and
three squatter households from a total of 300 were included. In Kagisanong, six formal households from
a total of 651 formal (and fifty squatter) households were included. In Chris Hani, nine formal
households from a total of 1126 and one squatter household from a total of seventy were included. In
Namibia, 16 formal households from a total of 2011 and one squatter household from a total of sixty
were included. In Turflaagte, 18 formal households from a total of 2216 and three squatter households
from a total of 300 were included.
3.4.2.1. Inclusion criteria
Every household in both the rural and urban communities, which met the following inclusion
criteria, was eligible to participate:
If informed consent was given;
Adults between the ages of 25 and 64 years; and
Preschool children (0-7 years old).
3.4.2.2. Exclusion criteria
People with mental disabilities were excluded from the study.
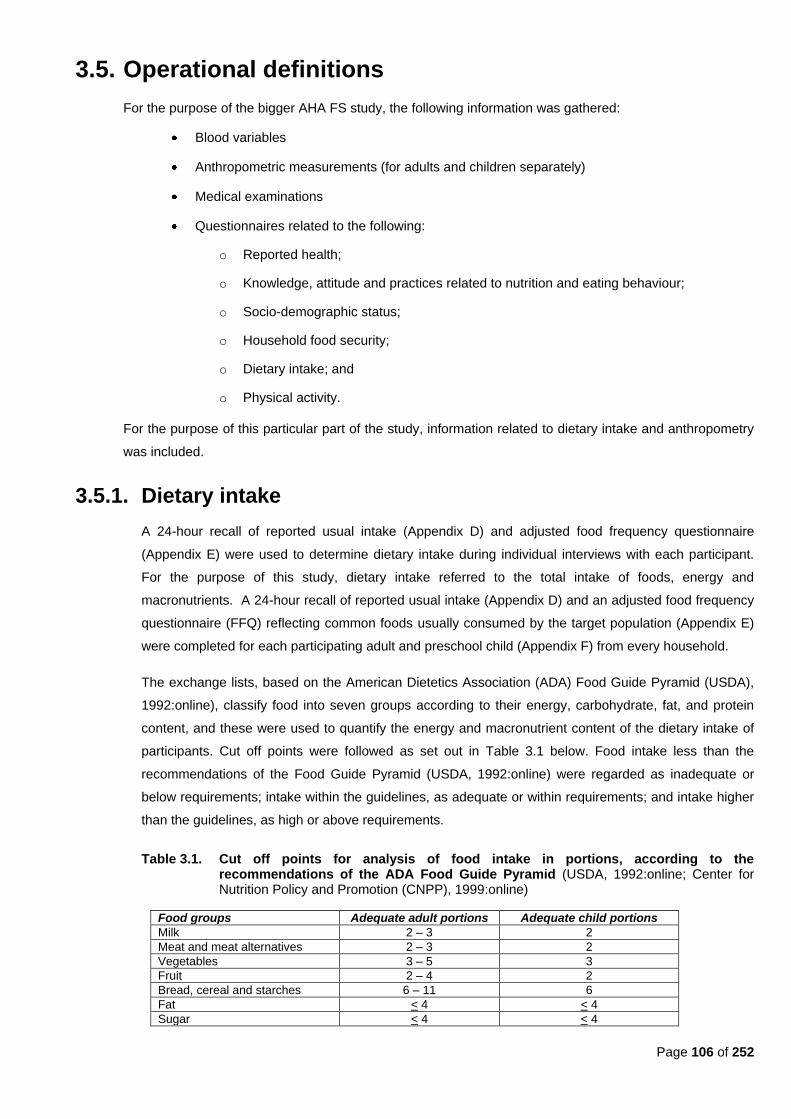
Page 106 of 252
3.5. Operational definitions
For the purpose of the bigger AHA FS study, the following information was gathered:
Blood variables
Anthropometric measurements (for adults and children separately)
Medical examinations
Questionnaires related to the following:
o Reported health;
o Knowledge, attitude and practices related to nutrition and eating behaviour;
o Socio-demographic status;
o Household food security;
o Dietary intake; and
o Physical activity.
For the purpose of this particular part of the study, information related to dietary intake and anthropometry
was included.
3.5.1. Dietary intake
A 24-hour recall of reported usual intake (Appendix D) and adjusted food frequency questionnaire
(Appendix E) were used to determine dietary intake during individual interviews with each participant.
For the purpose of this study, dietary intake referred to the total intake of foods, energy and
macronutrients. A 24-hour recall of reported usual intake (Appendix D) and an adjusted food frequency
questionnaire (FFQ) reflecting common foods usually consumed by the target population (Appendix E)
were completed for each participating adult and preschool child (Appendix F) from every household.
The exchange lists, based on the American Dietetics Association (ADA) Food Guide Pyramid (USDA),
1992:online), classify food into seven groups according to their energy, carbohydrate, fat, and protein
content, and these were used to quantify the energy and macronutrient content of the dietary intake of
participants. Cut off points were followed as set out in Table 3.1 below. Food intake less than the
recommendations of the Food Guide Pyramid (USDA, 1992:online) were regarded as inadequate or
below requirements; intake within the guidelines, as adequate or within requirements; and intake higher
than the guidelines, as high or above requirements.
Table 3.1. Cut off points for analysis of food intake in portions, according to the recommendations of the ADA Food Guide Pyramid (USDA, 1992:online; Center for Nutrition Policy and Promotion (CNPP), 1999:online)
Food groups Adequate adult portions Adequate child portions
Milk 2 – 3 2
Meat and meat alternatives 2 – 3 2
Vegetables 3 – 5 3
Fruit 2 – 4 2
Bread, cereal and starches 6 – 11 6
Fat < 4 < 4
Sugar < 4 < 4
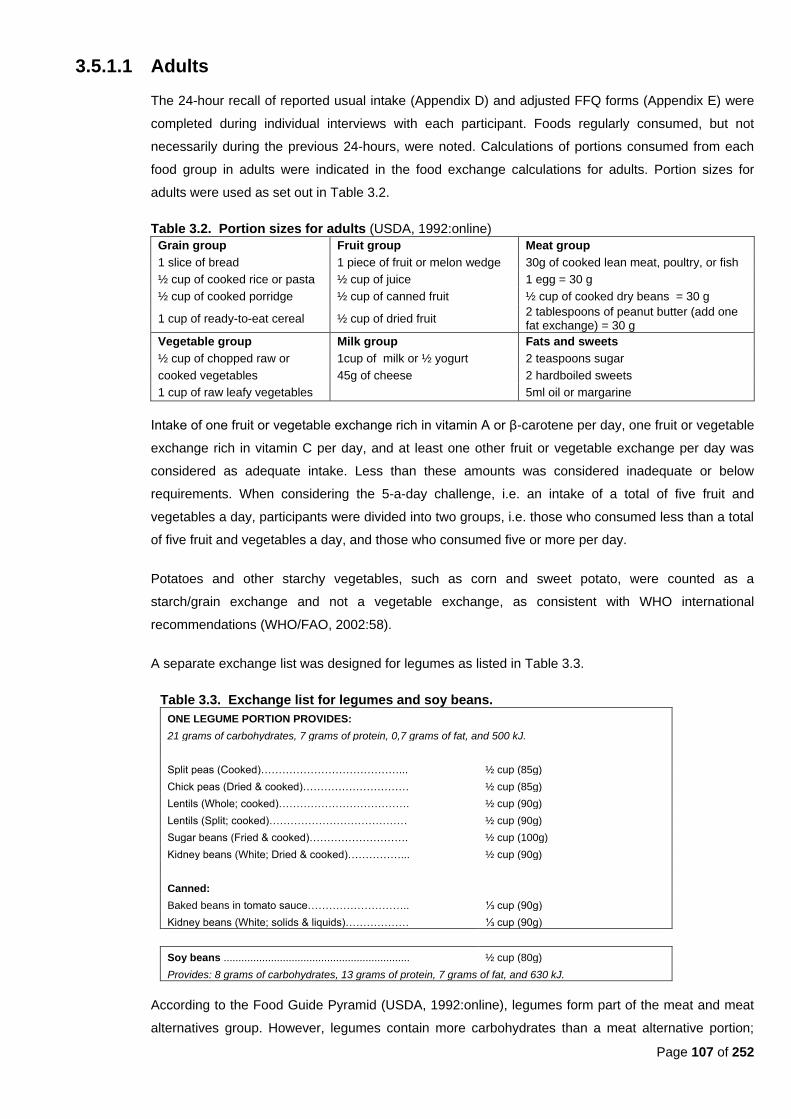
Page 107 of 252
3.5.1.1 Adults
The 24-hour recall of reported usual intake (Appendix D) and adjusted FFQ forms (Appendix E) were
completed during individual interviews with each participant. Foods regularly consumed, but not
necessarily during the previous 24-hours, were noted. Calculations of portions consumed from each
food group in adults were indicated in the food exchange calculations for adults. Portion sizes for
adults were used as set out in Table 3.2.
Table 3.2. Portion sizes for adults (USDA, 1992:online)
Grain group Fruit group Meat group
1 slice of bread 1 piece of fruit or melon wedge 30g of cooked lean meat, poultry, or fish
½ cup of cooked rice or pasta ½ cup of juice 1 egg = 30 g
½ cup of cooked porridge ½ cup of canned fruit ½ cup of cooked dry beans = 30 g
1 cup of ready-to-eat cereal ½ cup of dried fruit 2 tablespoons of peanut butter (add one fat exchange) = 30 g
Vegetable group Milk group Fats and sweets
½ cup of chopped raw or 1cup of milk or ½ yogurt 2 teaspoons sugar
cooked vegetables 45g of cheese 2 hardboiled sweets
1 cup of raw leafy vegetables 5ml oil or margarine
Intake of one fruit or vegetable exchange rich in vitamin A or β-carotene per day, one fruit or vegetable
exchange rich in vitamin C per day, and at least one other fruit or vegetable exchange per day was
considered as adequate intake. Less than these amounts was considered inadequate or below
requirements. When considering the 5-a-day challenge, i.e. an intake of a total of five fruit and
vegetables a day, participants were divided into two groups, i.e. those who consumed less than a total
of five fruit and vegetables a day, and those who consumed five or more per day.
Potatoes and other starchy vegetables, such as corn and sweet potato, were counted as a
starch/grain exchange and not a vegetable exchange, as consistent with WHO international
recommendations (WHO/FAO, 2002:58).
A separate exchange list was designed for legumes as listed in Table 3.3.
Table 3.3. Exchange list for legumes and soy beans.
ONE LEGUME PORTION PROVIDES:
21 grams of carbohydrates, 7 grams of protein, 0,7 grams of fat, and 500 kJ.
Split peas (Cooked)…………………………………... ½ cup (85g)
Chick peas (Dried & cooked)………………………… ½ cup (85g)
Lentils (Whole; cooked)………………………………. ½ cup (90g)
Lentils (Split; cooked)………………………………… ½ cup (90g)
Sugar beans (Fried & cooked)………………………. ½ cup (100g)
Kidney beans (White; Dried & cooked)……………... ½ cup (90g)
Canned:
Baked beans in tomato sauce……………………….. ⅓ cup (90g)
Kidney beans (White; solids & liquids)……………… ⅓ cup (90g)
Soy beans ............................................................... ½ cup (80g)
Provides: 8 grams of carbohydrates, 13 grams of protein, 7 grams of fat, and 630 kJ.
According to the Food Guide Pyramid (USDA, 1992:online), legumes form part of the meat and meat
alternatives group. However, legumes contain more carbohydrates than a meat alternative portion;
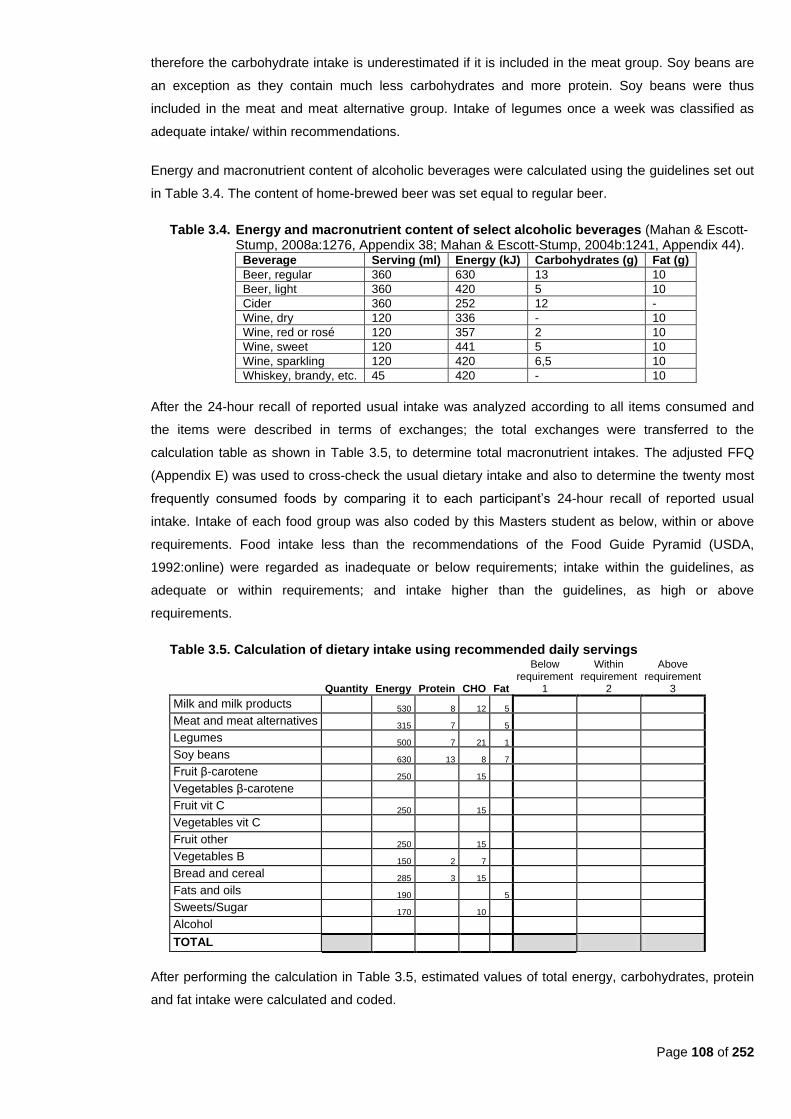
Page 108 of 252
therefore the carbohydrate intake is underestimated if it is included in the meat group. Soy beans are
an exception as they contain much less carbohydrates and more protein. Soy beans were thus
included in the meat and meat alternative group. Intake of legumes once a week was classified as
adequate intake/ within recommendations.
Energy and macronutrient content of alcoholic beverages were calculated using the guidelines set out
in Table 3.4. The content of home-brewed beer was set equal to regular beer.
Table 3.4. Energy and macronutrient content of select alcoholic beverages (Mahan & Escott-Stump, 2008a:1276, Appendix 38; Mahan & Escott-Stump, 2004b:1241, Appendix 44).
Beverage Serving (ml) Energy (kJ) Carbohydrates (g) Fat (g)
Beer, regular 360 630 13 10
Beer, light 360 420 5 10
Cider 360 252 12 -
Wine, dry 120 336 - 10
Wine, red or rosé 120 357 2 10
Wine, sweet 120 441 5 10
Wine, sparkling 120 420 6,5 10
Whiskey, brandy, etc. 45 420 - 10
After the 24-hour recall of reported usual intake was analyzed according to all items consumed and
the items were described in terms of exchanges; the total exchanges were transferred to the
calculation table as shown in Table 3.5, to determine total macronutrient intakes. The adjusted FFQ
(Appendix E) was used to cross-check the usual dietary intake and also to determine the twenty most
frequently consumed foods by comparing it to each participant‘s 24-hour recall of reported usual
intake. Intake of each food group was also coded by this Masters student as below, within or above
requirements. Food intake less than the recommendations of the Food Guide Pyramid (USDA,
1992:online) were regarded as inadequate or below requirements; intake within the guidelines, as
adequate or within requirements; and intake higher than the guidelines, as high or above
requirements.
Table 3.5. Calculation of dietary intake using recommended daily servings
Quantity Energy Protein CHO Fat
Below requirement
1
Within requirement
2
Above requirement
3
Milk and milk products 530 8 12 5
Meat and meat alternatives 315 7 5
Legumes 500 7 21 1
Soy beans 630 13 8 7
Fruit β-carotene 250 15
Vegetables β-carotene
Fruit vit C 250 15
Vegetables vit C
Fruit other 250 15
Vegetables B 150 2 7
Bread and cereal 285 3 15
Fats and oils 190 5
Sweets/Sugar 170 10
Alcohol
TOTAL
After performing the calculation in Table 3.5, estimated values of total energy, carbohydrates, protein
and fat intake were calculated and coded.
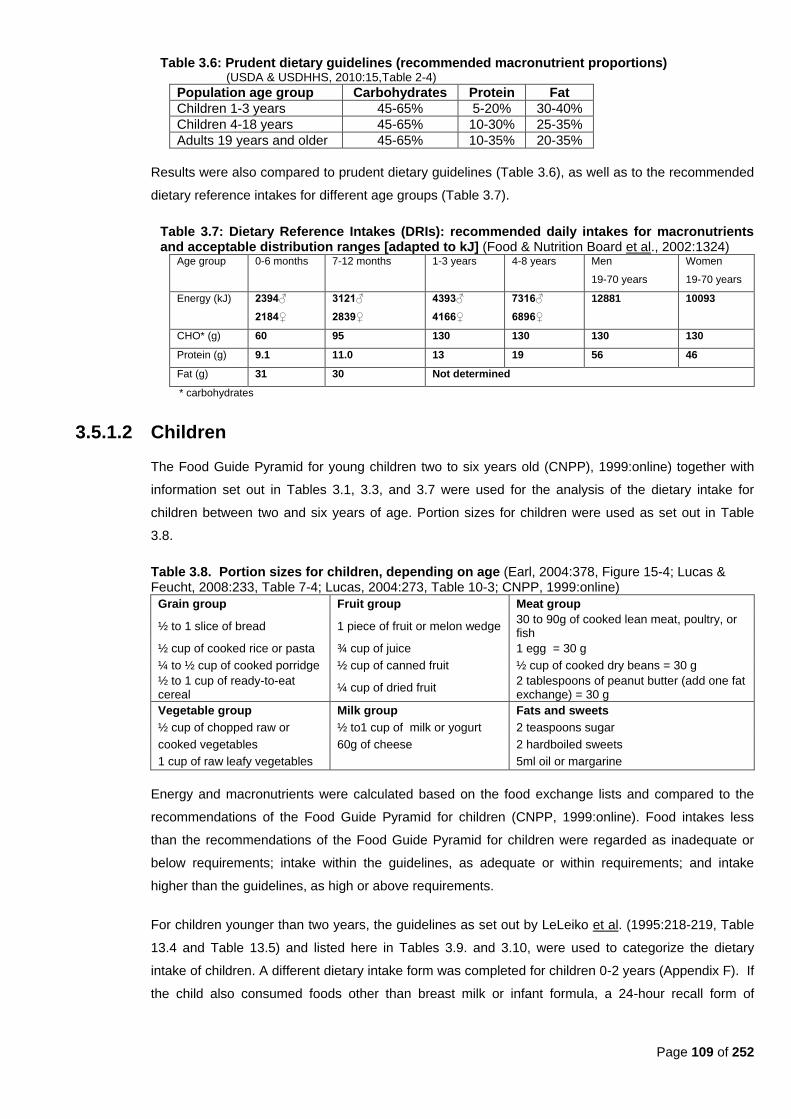
Page 109 of 252
Table 3.6: Prudent dietary guidelines (recommended macronutrient proportions) (USDA & USDHHS, 2010:15,Table 2-4)
Population age group Carbohydrates Protein Fat
Children 1-3 years 45-65% 5-20% 30-40%
Children 4-18 years 45-65% 10-30% 25-35%
Adults 19 years and older 45-65% 10-35% 20-35%
Results were also compared to prudent dietary guidelines (Table 3.6), as well as to the recommended
dietary reference intakes for different age groups (Table 3.7).
Table 3.7: Dietary Reference Intakes (DRIs): recommended daily intakes for macronutrients and acceptable distribution ranges [adapted to kJ] (Food & Nutrition Board et al., 2002:1324)
Age group 0-6 months 7-12 months 1-3 years 4-8 years Men
19-70 years
Women
19-70 years
Energy (kJ) 2394♂
2184♀
3121♂
2839♀
4393♂
4166♀
7316♂
6896♀
12881 10093
CHO* (g) 60 95 130 130 130 130
Protein (g) 9.1 11.0 13 19 56 46
Fat (g) 31 30 Not determined
* carbohydrates
3.5.1.2 Children
The Food Guide Pyramid for young children two to six years old (CNPP), 1999:online) together with
information set out in Tables 3.1, 3.3, and 3.7 were used for the analysis of the dietary intake for
children between two and six years of age. Portion sizes for children were used as set out in Table
3.8.
Table 3.8. Portion sizes for children, depending on age (Earl, 2004:378, Figure 15-4; Lucas & Feucht, 2008:233, Table 7-4; Lucas, 2004:273, Table 10-3; CNPP, 1999:online)
Grain group Fruit group Meat group
½ to 1 slice of bread 1 piece of fruit or melon wedge 30 to 90g of cooked lean meat, poultry, or fish
½ cup of cooked rice or pasta ¾ cup of juice 1 egg = 30 g
¼ to ½ cup of cooked porridge ½ cup of canned fruit ½ cup of cooked dry beans = 30 g
½ to 1 cup of ready-to-eat cereal
¼ cup of dried fruit 2 tablespoons of peanut butter (add one fat exchange) = 30 g
Vegetable group Milk group Fats and sweets
½ cup of chopped raw or ½ to1 cup of milk or yogurt 2 teaspoons sugar
cooked vegetables 60g of cheese 2 hardboiled sweets
1 cup of raw leafy vegetables 5ml oil or margarine
Energy and macronutrients were calculated based on the food exchange lists and compared to the
recommendations of the Food Guide Pyramid for children (CNPP, 1999:online). Food intakes less
than the recommendations of the Food Guide Pyramid for children were regarded as inadequate or
below requirements; intake within the guidelines, as adequate or within requirements; and intake
higher than the guidelines, as high or above requirements.
For children younger than two years, the guidelines as set out by LeLeiko et al. (1995:218-219, Table
13.4 and Table 13.5) and listed here in Tables 3.9. and 3.10, were used to categorize the dietary
intake of children. A different dietary intake form was completed for children 0-2 years (Appendix F). If
the child also consumed foods other than breast milk or infant formula, a 24-hour recall form of
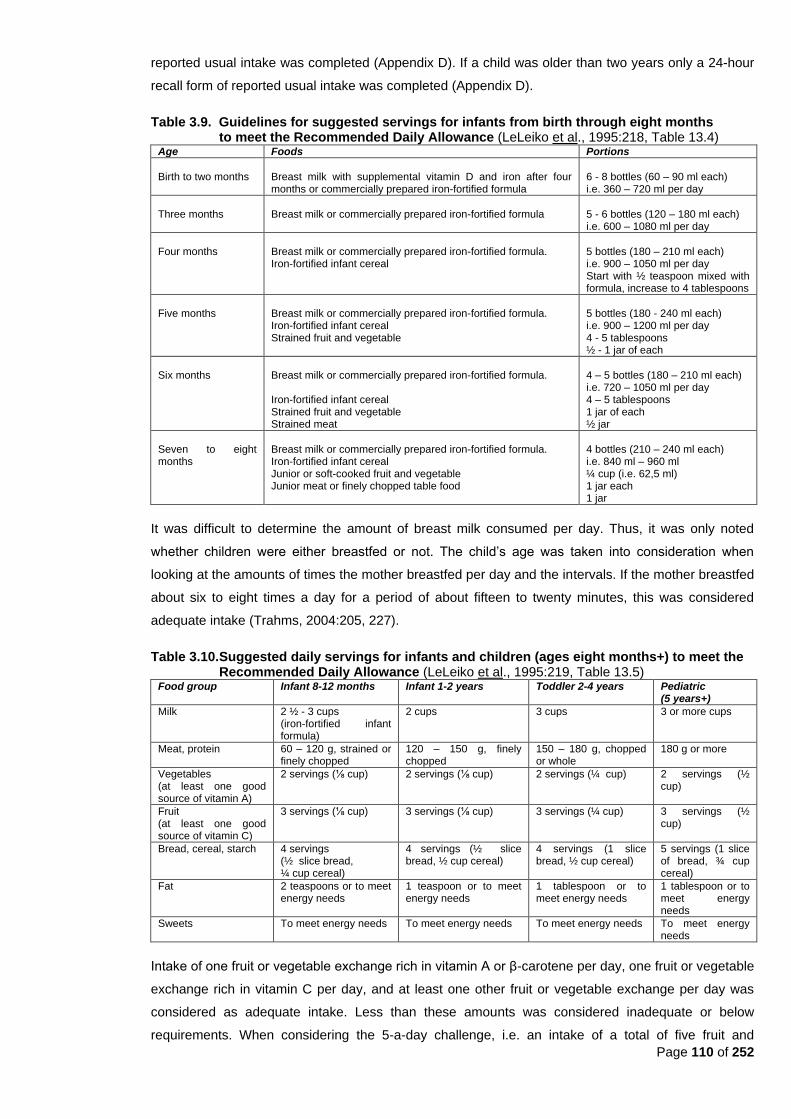
Page 110 of 252
reported usual intake was completed (Appendix D). If a child was older than two years only a 24-hour
recall form of reported usual intake was completed (Appendix D).
Table 3.9. Guidelines for suggested servings for infants from birth through eight months to meet the Recommended Daily Allowance (LeLeiko et al., 1995:218, Table 13.4)
Age Foods Portions
Birth to two months
Breast milk with supplemental vitamin D and iron after four months or commercially prepared iron-fortified formula
6 - 8 bottles (60 – 90 ml each) i.e. 360 – 720 ml per day
Three months
Breast milk or commercially prepared iron-fortified formula
5 - 6 bottles (120 – 180 ml each) i.e. 600 – 1080 ml per day
Four months
Breast milk or commercially prepared iron-fortified formula. Iron-fortified infant cereal
5 bottles (180 – 210 ml each) i.e. 900 – 1050 ml per day Start with ½ teaspoon mixed with formula, increase to 4 tablespoons
Five months
Breast milk or commercially prepared iron-fortified formula. Iron-fortified infant cereal Strained fruit and vegetable
5 bottles (180 - 240 ml each) i.e. 900 – 1200 ml per day 4 - 5 tablespoons ½ - 1 jar of each
Six months
Breast milk or commercially prepared iron-fortified formula. Iron-fortified infant cereal Strained fruit and vegetable Strained meat
4 – 5 bottles (180 – 210 ml each) i.e. 720 – 1050 ml per day 4 – 5 tablespoons 1 jar of each ½ jar
Seven to eight months
Breast milk or commercially prepared iron-fortified formula. Iron-fortified infant cereal Junior or soft-cooked fruit and vegetable Junior meat or finely chopped table food
4 bottles (210 – 240 ml each) i.e. 840 ml – 960 ml ¼ cup (i.e. 62,5 ml) 1 jar each 1 jar
It was difficult to determine the amount of breast milk consumed per day. Thus, it was only noted
whether children were either breastfed or not. The child‘s age was taken into consideration when
looking at the amounts of times the mother breastfed per day and the intervals. If the mother breastfed
about six to eight times a day for a period of about fifteen to twenty minutes, this was considered
adequate intake (Trahms, 2004:205, 227).
Table 3.10. Suggested daily servings for infants and children (ages eight months+) to meet the Recommended Daily Allowance (LeLeiko et al., 1995:219, Table 13.5)
Food group Infant 8-12 months Infant 1-2 years Toddler 2-4 years Pediatric (5 years+)
Milk 2 ½ - 3 cups (iron-fortified infant formula)
2 cups 3 cups 3 or more cups
Meat, protein 60 – 120 g, strained or finely chopped
120 – 150 g, finely chopped
150 – 180 g, chopped or whole
180 g or more
Vegetables (at least one good source of vitamin A)
2 servings (⅛ cup) 2 servings (⅛ cup) 2 servings (¼ cup) 2 servings (½ cup)
Fruit (at least one good source of vitamin C)
3 servings (⅛ cup) 3 servings (⅛ cup) 3 servings (¼ cup) 3 servings (½ cup)
Bread, cereal, starch 4 servings (½ slice bread, ¼ cup cereal)
4 servings (½ slice bread, ½ cup cereal)
4 servings (1 slice bread, ½ cup cereal)
5 servings (1 slice of bread, ¾ cup cereal)
Fat 2 teaspoons or to meet energy needs
1 teaspoon or to meet energy needs
1 tablespoon or to meet energy needs
1 tablespoon or to meet energy needs
Sweets To meet energy needs To meet energy needs To meet energy needs To meet energy needs
Intake of one fruit or vegetable exchange rich in vitamin A or β-carotene per day, one fruit or vegetable
exchange rich in vitamin C per day, and at least one other fruit or vegetable exchange per day was
considered as adequate intake. Less than these amounts was considered inadequate or below
requirements. When considering the 5-a-day challenge, i.e. an intake of a total of five fruit and
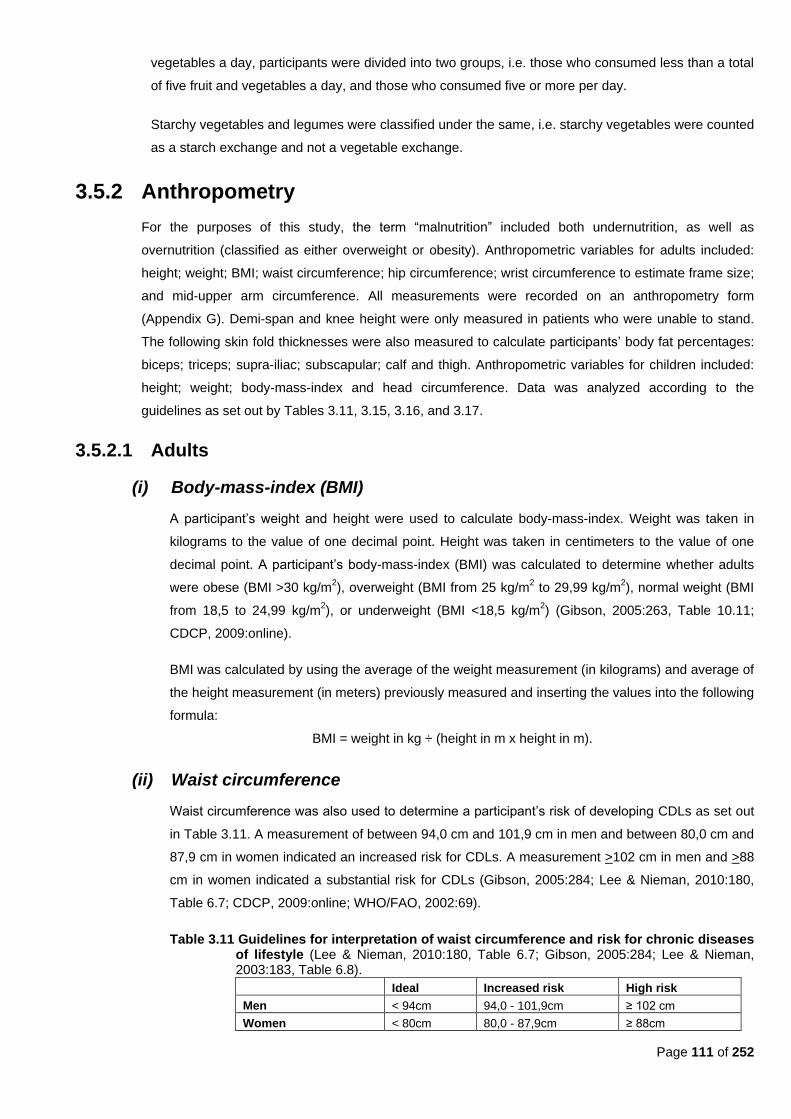
Page 111 of 252
vegetables a day, participants were divided into two groups, i.e. those who consumed less than a total
of five fruit and vegetables a day, and those who consumed five or more per day.
Starchy vegetables and legumes were classified under the same, i.e. starchy vegetables were counted
as a starch exchange and not a vegetable exchange.
3.5.2 Anthropometry
For the purposes of this study, the term ―malnutrition‖ included both undernutrition, as well as
overnutrition (classified as either overweight or obesity). Anthropometric variables for adults included:
height; weight; BMI; waist circumference; hip circumference; wrist circumference to estimate frame size;
and mid-upper arm circumference. All measurements were recorded on an anthropometry form
(Appendix G). Demi-span and knee height were only measured in patients who were unable to stand.
The following skin fold thicknesses were also measured to calculate participants‘ body fat percentages:
biceps; triceps; supra-iliac; subscapular; calf and thigh. Anthropometric variables for children included:
height; weight; body-mass-index and head circumference. Data was analyzed according to the
guidelines as set out by Tables 3.11, 3.15, 3.16, and 3.17.
3.5.2.1 Adults
(i) Body-mass-index (BMI)
A participant‘s weight and height were used to calculate body-mass-index. Weight was taken in
kilograms to the value of one decimal point. Height was taken in centimeters to the value of one
decimal point. A participant‘s body-mass-index (BMI) was calculated to determine whether adults
were obese (BMI >30 kg/m2), overweight (BMI from 25 kg/m
2 to 29,99 kg/m
2), normal weight (BMI
from 18,5 to 24,99 kg/m2), or underweight (BMI <18,5 kg/m
2) (Gibson, 2005:263, Table 10.11;
CDCP, 2009:online).
BMI was calculated by using the average of the weight measurement (in kilograms) and average of
the height measurement (in meters) previously measured and inserting the values into the following
formula:
BMI = weight in kg ÷ (height in m x height in m).
(ii) Waist circumference
Waist circumference was also used to determine a participant‘s risk of developing CDLs as set out
in Table 3.11. A measurement of between 94,0 cm and 101,9 cm in men and between 80,0 cm and
87,9 cm in women indicated an increased risk for CDLs. A measurement >102 cm in men and >88
cm in women indicated a substantial risk for CDLs (Gibson, 2005:284; Lee & Nieman, 2010:180,
Table 6.7; CDCP, 2009:online; WHO/FAO, 2002:69).
Table 3.11 Guidelines for interpretation of waist circumference and risk for chronic diseases of lifestyle (Lee & Nieman, 2010:180, Table 6.7; Gibson, 2005:284; Lee & Nieman, 2003:183, Table 6.8).
Ideal Increased risk High risk
Men < 94cm 94,0 - 101,9cm ≥ 102 cm
Women < 80cm 80,0 - 87,9cm ≥ 88cm
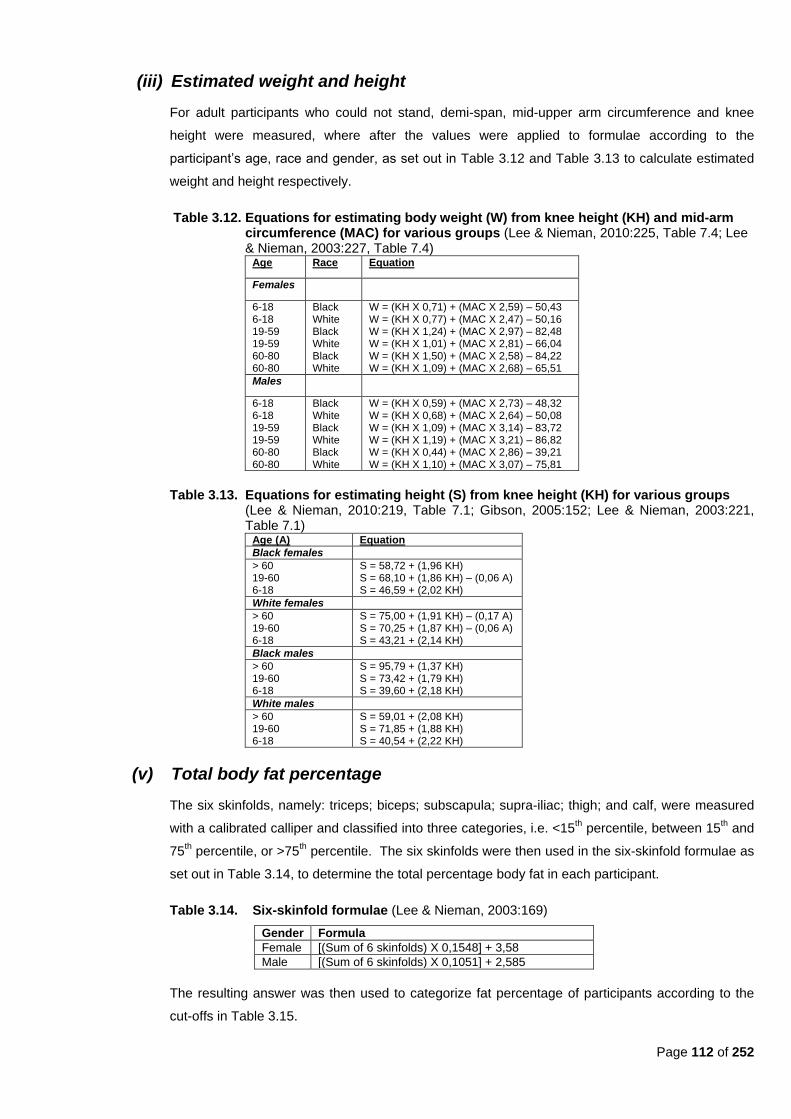
Page 112 of 252
(iii) Estimated weight and height
For adult participants who could not stand, demi-span, mid-upper arm circumference and knee
height were measured, where after the values were applied to formulae according to the
participant‘s age, race and gender, as set out in Table 3.12 and Table 3.13 to calculate estimated
weight and height respectively.
Table 3.12. Equations for estimating body weight (W) from knee height (KH) and mid-arm circumference (MAC) for various groups (Lee & Nieman, 2010:225, Table 7.4; Lee & Nieman, 2003:227, Table 7.4)
Age Race Equation
Females
6-18 6-18 19-59 19-59 60-80 60-80
Black White Black White Black White
W = (KH X 0,71) + (MAC X 2,59) – 50,43 W = (KH X 0,77) + (MAC X 2,47) – 50,16 W = (KH X 1,24) + (MAC X 2,97) – 82,48 W = (KH X 1,01) + (MAC X 2,81) – 66,04 W = (KH X 1,50) + (MAC X 2,58) – 84,22 W = (KH X 1,09) + (MAC X 2,68) – 65,51
Males
6-18 6-18 19-59 19-59 60-80 60-80
Black White Black White Black White
W = (KH X 0,59) + (MAC X 2,73) – 48,32 W = (KH X 0,68) + (MAC X 2,64) – 50,08 W = (KH X 1,09) + (MAC X 3,14) – 83,72 W = (KH X 1,19) + (MAC X 3,21) – 86,82 W = (KH X 0,44) + (MAC X 2,86) – 39,21 W = (KH X 1,10) + (MAC X 3,07) – 75,81
Table 3.13. Equations for estimating height (S) from knee height (KH) for various groups (Lee & Nieman, 2010:219, Table 7.1; Gibson, 2005:152; Lee & Nieman, 2003:221, Table 7.1)
Age (A) Equation
Black females
> 60 19-60 6-18
S = 58,72 + (1,96 KH) S = 68,10 + (1,86 KH) – (0,06 A) S = 46,59 + (2,02 KH)
White females
> 60 19-60 6-18
S = 75,00 + (1,91 KH) – (0,17 A) S = 70,25 + (1,87 KH) – (0,06 A) S = 43,21 + (2,14 KH)
Black males
> 60 19-60 6-18
S = 95,79 + (1,37 KH) S = 73,42 + (1,79 KH) S = 39,60 + (2,18 KH)
White males
> 60 19-60 6-18
S = 59,01 + (2,08 KH) S = 71,85 + (1,88 KH) S = 40,54 + (2,22 KH)
(v) Total body fat percentage
The six skinfolds, namely: triceps; biceps; subscapula; supra-iliac; thigh; and calf, were measured
with a calibrated calliper and classified into three categories, i.e. <15th percentile, between 15
th and
75th percentile, or >75
th percentile. The six skinfolds were then used in the six-skinfold formulae as
set out in Table 3.14, to determine the total percentage body fat in each participant.
Table 3.14. Six-skinfold formulae (Lee & Nieman, 2003:169)
Gender Formula
Female [(Sum of 6 skinfolds) X 0,1548] + 3,58
Male [(Sum of 6 skinfolds) X 0,1051] + 2,585
The resulting answer was then used to categorize fat percentage of participants according to the
cut-offs in Table 3.15.
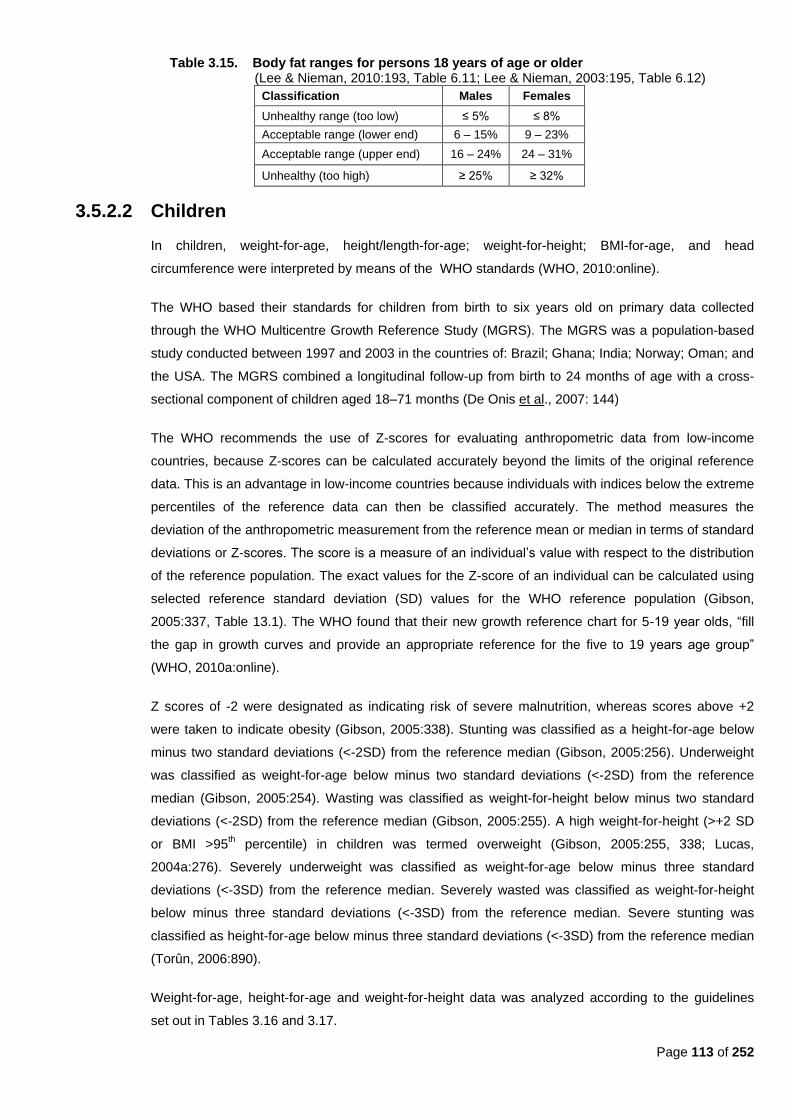
Page 113 of 252
Table 3.15. Body fat ranges for persons 18 years of age or older (Lee & Nieman, 2010:193, Table 6.11; Lee & Nieman, 2003:195, Table 6.12)
Classification Males Females
Unhealthy range (too low) ≤ 5% ≤ 8%
Acceptable range (lower end) 6 – 15% 9 – 23%
Acceptable range (upper end) 16 – 24% 24 – 31%
Unhealthy (too high) ≥ 25% ≥ 32%
3.5.2.2 Children
In children, weight-for-age, height/length-for-age; weight-for-height; BMI-for-age, and head
circumference were interpreted by means of the WHO standards (WHO, 2010:online).
The WHO based their standards for children from birth to six years old on primary data collected
through the WHO Multicentre Growth Reference Study (MGRS). The MGRS was a population-based
study conducted between 1997 and 2003 in the countries of: Brazil; Ghana; India; Norway; Oman; and
the USA. The MGRS combined a longitudinal follow-up from birth to 24 months of age with a cross-
sectional component of children aged 18–71 months (De Onis et al., 2007: 144)
The WHO recommends the use of Z-scores for evaluating anthropometric data from low-income
countries, because Z-scores can be calculated accurately beyond the limits of the original reference
data. This is an advantage in low-income countries because individuals with indices below the extreme
percentiles of the reference data can then be classified accurately. The method measures the
deviation of the anthropometric measurement from the reference mean or median in terms of standard
deviations or Z-scores. The score is a measure of an individual‘s value with respect to the distribution
of the reference population. The exact values for the Z-score of an individual can be calculated using
selected reference standard deviation (SD) values for the WHO reference population (Gibson,
2005:337, Table 13.1). The WHO found that their new growth reference chart for 5-19 year olds, ―fill
the gap in growth curves and provide an appropriate reference for the five to 19 years age group‖
(WHO, 2010a:online).
Z scores of -2 were designated as indicating risk of severe malnutrition, whereas scores above +2
were taken to indicate obesity (Gibson, 2005:338). Stunting was classified as a height-for-age below
minus two standard deviations (<-2SD) from the reference median (Gibson, 2005:256). Underweight
was classified as weight-for-age below minus two standard deviations (<-2SD) from the reference
median (Gibson, 2005:254). Wasting was classified as weight-for-height below minus two standard
deviations (<-2SD) from the reference median (Gibson, 2005:255). A high weight-for-height (>+2 SD
or BMI >95th percentile) in children was termed overweight (Gibson, 2005:255, 338; Lucas,
2004a:276). Severely underweight was classified as weight-for-age below minus three standard
deviations (<-3SD) from the reference median. Severely wasted was classified as weight-for-height
below minus three standard deviations (<-3SD) from the reference median. Severe stunting was
classified as height-for-age below minus three standard deviations (<-3SD) from the reference median
(Torûn, 2006:890).
Weight-for-age, height-for-age and weight-for-height data was analyzed according to the guidelines
set out in Tables 3.16 and 3.17.
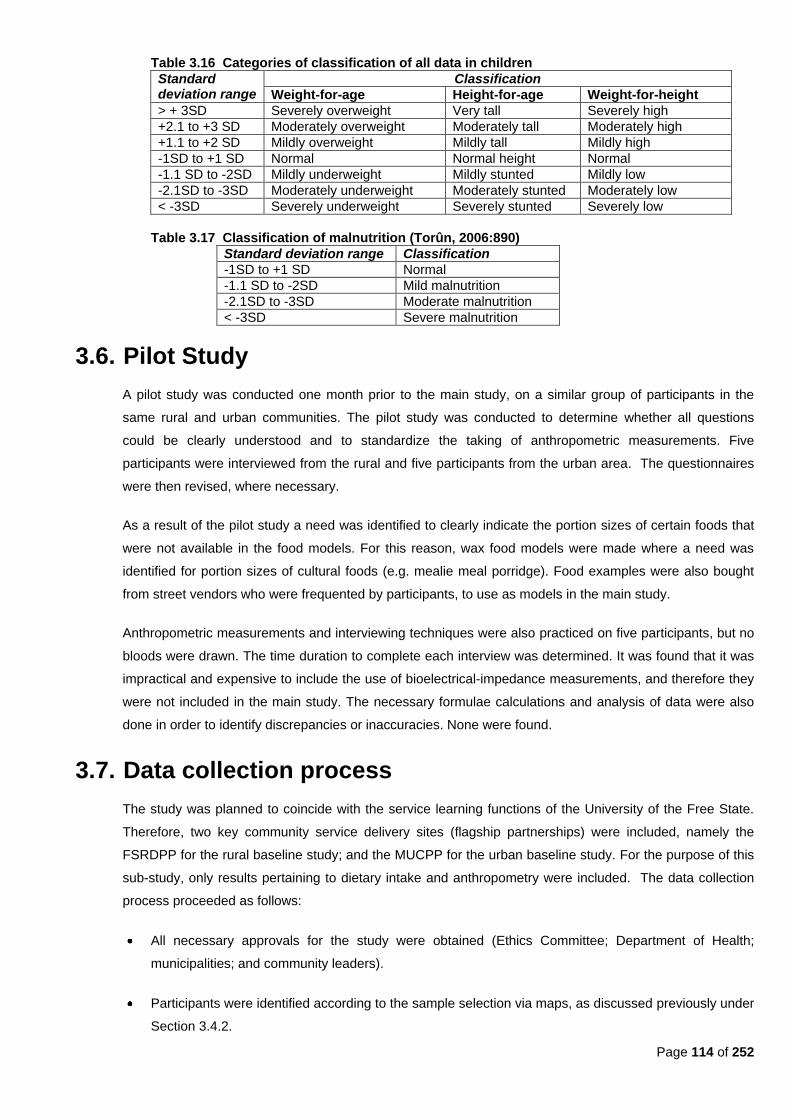
Page 114 of 252
Table 3.16 Categories of classification of all data in children
Standard deviation range
Classification
Weight-for-age Height-for-age Weight-for-height
> + 3SD Severely overweight Very tall Severely high
+2.1 to +3 SD Moderately overweight Moderately tall Moderately high
+1.1 to +2 SD Mildly overweight Mildly tall Mildly high
-1SD to +1 SD Normal Normal height Normal
-1.1 SD to -2SD Mildly underweight Mildly stunted Mildly low
-2.1SD to -3SD Moderately underweight Moderately stunted Moderately low
< -3SD Severely underweight Severely stunted Severely low
Table 3.17 Classification of malnutrition (Torûn, 2006:890)
Standard deviation range Classification
-1SD to +1 SD Normal
-1.1 SD to -2SD Mild malnutrition
-2.1SD to -3SD Moderate malnutrition
< -3SD Severe malnutrition
3.6. Pilot Study
A pilot study was conducted one month prior to the main study, on a similar group of participants in the
same rural and urban communities. The pilot study was conducted to determine whether all questions
could be clearly understood and to standardize the taking of anthropometric measurements. Five
participants were interviewed from the rural and five participants from the urban area. The questionnaires
were then revised, where necessary.
As a result of the pilot study a need was identified to clearly indicate the portion sizes of certain foods that
were not available in the food models. For this reason, wax food models were made where a need was
identified for portion sizes of cultural foods (e.g. mealie meal porridge). Food examples were also bought
from street vendors who were frequented by participants, to use as models in the main study.
Anthropometric measurements and interviewing techniques were also practiced on five participants, but no
bloods were drawn. The time duration to complete each interview was determined. It was found that it was
impractical and expensive to include the use of bioelectrical-impedance measurements, and therefore they
were not included in the main study. The necessary formulae calculations and analysis of data were also
done in order to identify discrepancies or inaccuracies. None were found.
3.7. Data collection process
The study was planned to coincide with the service learning functions of the University of the Free State.
Therefore, two key community service delivery sites (flagship partnerships) were included, namely the
FSRDPP for the rural baseline study; and the MUCPP for the urban baseline study. For the purpose of this
sub-study, only results pertaining to dietary intake and anthropometry were included. The data collection
process proceeded as follows:
All necessary approvals for the study were obtained (Ethics Committee; Department of Health;
municipalities; and community leaders).
Participants were identified according to the sample selection via maps, as discussed previously under
Section 3.4.2.
Page 115 of 252
A pilot study was also conducted as discussed previously under Section 3.6.
Field workers were appointed in each community (with the aid of the community health committee)
and received training to explain the purpose of the study to eligible participants and to obtain written
informed consent before data collection (Appendix A).
Students were trained on how to complete questionnaires correctly. Written informed consent was
obtained from selected household members and parents or caretakers of children in the language of
their choice (Sotho, English or Afrikaans). Parents or guardians signed consent forms on behalf of any
pre-school children.
Each participant also received an information document, detailing all relevant information regarding
the study (Appendix B).
A participation letter (Appendix C) was given to each selected household member in the language of
their choice (Sotho, English or Afrikaans) by field workers to inform them of the date that they should
be at the research venue to participate in the study as well as the procedures that were to be followed
(e.g. no eating from the previous evening). This letter could also be used to inform employers of the
study and the reason for not being able to attend work on that day. Any questions the participants had
were answered by the field workers.
On the days of data collection participants were introduced to the researchers, and a checklist card
was issued to each participant. All checkpoints that needed to be visited by the participant were listed
on the card. The field workers assisted with Sotho interpretation, orienting participants as to all the
information points that they needed to visit (i.e. bloods and medical examination; anthropometry;
health questionnaire; knowledge, attitude and practices of eating behaviour; socio-demographic;
household food security; dietary intake; and physical activity)
Questionnaires were completed by trained 4th year students and this Masters degree student during
interviews with participants, under the supervision of the study leader (Appendices D, E, F and G).
After the data collection process, the completed dietary intake questionnaires (Appendices D, E and F)
and anthropometry forms (Appendix G) were processed and coded by this Masters degree student,
whereafter they were sent to the Department of Biostatistics of the Faculty of Health Sciences for data
entry and statistical analysis as further discussed under Section 3.9.
3.8. Techniques
3.8.1 Dietary intake
3.8.1.1 24-hour recall of reported usual intake
The information gathered from the dietary intake of the last 24 hours (as in a 24-hour recall), is not
representative of an individual‘s usual intake (Langenhoven & Wolmarans, 1997:250). For this reason
a 24-hour recall of reported usual intake (Appendix D) and adjusted food frequency questionnaire
(Appendix E) were used to determine dietary intake for a typical week during individual interviews with
Page 116 of 252
each participant. Reported usual intake for weekends was also recorded, which may have been
different from intake during the week. Therefore, the adjusted FFQ (Appendix E) was also completed
to ascertain a more typical weekly intake. However, with all dietary data gathered, over- and
underreporting could still have occurred.
Participants were requested by trained students to report their usual dietary intake for a 24 hour
period, by means of a multi-pass 24-hour recall, consisting of (1) a quick list of uninterrupted recall by
the respondent from time of arising in the morning until retiring at night; (2) a detailed interview
elaborating on the quick list, where questions were asked about portion sizes, cooking methods and
types of foods (e.g. low fat- vs. full cream milk / brown- vs. white bread); and (3) a thorough review of
the detailed interview, whereby the interviewer read back the data to the participant for confirmation
and/or clarification. The dietary intakes of children were determined by interviewing the parent or
caregiver most often responsible for their meals.
Where possible, portion sizes were quantified using the food models designed by Life-form® (Nesco,
USA). Where food models were not available for cultural foods, regular household utensils, cups and
plates used by the population were used to determine portion sizes. Where participants bought food
items from vendors in the vicinity of the study, examples were purchased from the vendors, weighed,
set equal to exchanges and presented to the participants as food models. Quantified wax models (e.g.
½ cup, 1 cup, etc.) were also made of cooked mealie-meal porridge, since this was one of the
identified staple-foods of the population during the pilot study.
Researchers completed all questionnaires. A Sotho translator was used if the individual could not
understand English or Afrikaans. The reported intake was converted to the number of servings as
listed on the exchange lists, in order to quantify energy and macronutrient content in usual dietary
intake.
After the 24-hour recall of reported usual intake was analyzed according to all items consumed and
the items were described in terms of exchanges; the calculation table as shown in Table 3.5, was
completed. Intake of each food group was also coded as below, within or above requirements.
The exchange lists were used to quantify the energy and macronutrient content of the dietary intakes
of all participants. The exchange lists were used to quantify the 24-hour recall of reported usual intake
retrospectively. It must be noted that potatoes and other starchy vegetables, such as corn and sweet
potato, were counted as a starch/grain exchange and not a vegetable exchange. Legume exchanges
were also counted separately, and entered into the exchange list calculation form (Table 3.5).
3.8.1.2 FFQ
In adults and children older than two years, the adjusted FFQ (Appendix E) was used to cross-check
the usual dietary intake and also to determine the twenty most frequently consumed foods. The food
frequency questionnaire was used to ensure that patients had reported all additional drinks and other
foods not reported in the 24 hour recall. The adjusted FFQ was completed by researchers in a detailed
interview with each participant during which the researchers asked the participant to report as to the
frequency of consumption of twenty selected food items, shown to be most often consumed. This
Page 117 of 252
questionnaire was also of particular significance to confirm more accurately the typical weekly intake
of participants and to determine the most commonly consumed foods by frequency of intake..
3.8.2. Anthropometric measurements
As discussed previously under Section 3.5.2., height, weight, waist circumference and hip
circumference were taken of non-disabled adults. Although there were few disabled participants, demi-
span, knee height and mid-upper arm circumference were included for disabled adults.
3.8.2.1 Weight
Weight was taken in kilograms to the value of one decimal point. The floor surface where the scale
was placed was firm and level and no measurements were taken on a carpeted floor. Weight was
taken with a calibrated digital electronic SECA scale. The participant wore a minimum amount of
clothes and no shoes. The scale was zeroed before measurement and calibration was accurate. The
participant stood in the middle of the scale without support. Weight was evenly distributed between
both feet. The participant stood upright and looked straight ahead (Lee & Nieman, 2010:164; Lee &
Nieman, 2003:167-168). Three consecutive measurements were taken in kilogram, accurate to one
decimal point. After all three measurements were taken, the average of the three values was
calculated and noted on the anthropometry form (Appendix G) where indicated.
All infants were weighed with the minimum amount of clothing and without a nappy to the nearest 0,01
kg on an infant scale (Lee & Nieman, 2010:164; Lee & Nieman, 2003:167; ADA, 2000:48).
If a child could stand, he/she was weighed on an adult scale. The scale was placed on a hard flat
surface and adjusted to zero before each measurement. The child wore a minimal amount of clothing,
and no shoes. The child stood in the centre of the platform and looked straight ahead, standing
unassisted and relaxed (Lee & Nieman, 2010:164; Gibson, 2005:253; Lee & Nieman, 2003:167; ADA,
2000:12).
Where it was difficult to weigh a child alone, the mother and subject were weighed together using a
calibrated scale, with an accuracy to one decimal point (0,1 kg). Thereafter, the mother was weighed
alone. The subject‘s weight was then calculated by subtracting the two values (Gibson, 2005:252).
3.8.2.2 Height
Height was taken in centimeters to the value of one decimal point. The participant stood with feet
together, with the participant‘s heels, buttocks and upper part of the back touching the stadiometer.
The head was placed in the Frankfort horizontal plane, by the person taking the measurement placing
her hands under the participant‘s jaw and her fingertips on the mastoid process. The participant then
took a deep breath while the measurer delicately placed the head in the Frankfort plane. Then the
head board was moved down firmly onto the vertex of the head, with all hair pressed down. The
measurer ensured that the participant did not lift his/her feet from the floor and that the head was in
the Frankfort plane before taking the reading. The reading was taken at the end of the deep breath
(Lee & Nieman, 2010:161-162; Lee & Nieman, 2003:166-167; ADA, 2000:11). The value (in
centimeters) was converted to meters before applying the value to the BMI calculation.
Page 118 of 252
Height/length of children up to three years of age was taken by the ruled board method, if the
stadiometer method was impossible. Measurement was taken by two measurers. One measurer held
the child‘s head, while the other moved the foot board and took the measurement. The child was laid
on the board and stretched out on the board for the most accurate measurement. The moveable flat
end was placed against the bottom of the child‘s feet and the result was read up to an accuracy of one
decimal point in millimeters. If the subject was restless only the left leg was positioned for the
measurement (Gibson, 2005:246; ADA, 2000:48).
If a child was older than two years and taller than 85cm, standing height was measured to the nearest
0,1 cm with a stadiometer (ADA, 2000:48) via the same method as described above for adults. The
child‘s heels were held by the measurer to ensure they did not leave the ground.
3.8.2.3 Circumferences
(i) Waist circumference
The umbilicus level was used as the site of measuring the waist circumference in this study. The
measurer stood in front of the participant. The participant stood straight with abdomen relaxed.
Feet were together and arms hung at the sides. The participant was asked to take a normal breath
and the waist circumference was recorded when the participant breathed out. The measuring tape
followed a level and straight circumference. The tape was snug against the skin, but not so tight as
to compress the skin. Three consecutive measurements were taken in centimeters, with accuracy
to one decimal point (Lee & Nieman, 2010:180; Lee & Nieman, 2003:183).
(ii) Hip circumference
Hip circumference was measured at the widest point of the posterior protrusion of the buttocks. The
measurer stood on the right side of the participant to ensure that the measuring tape followed a
horizontal circumference when taking the measurement. The participant‘s feet were together and
the gluteal muscles relaxed. Arms hung at the sides. The measuring tape was placed around the
subject‘s widest part of the hip and the value recorded. Three consecutive measurements were
taken, with accuracy to the nearest millimeter (Gibson, 2005:281).
(iii) Head circumference
Measurements were made just above the eyes to include the maximum circumference of the head,
with the child supported in an upright position and looking straight ahead (Shaw & Lawson,
2001:5). The child‘s head was held still. The measuring tape was placed over the most prominent
part of the forehead, just above the supra-orbital ridge. It was ensured that the measuring tape was
not loose and the measurement was taken in centimeters, to the nearest decimal point (Lee &
Nieman, 2010:163; Gibson, 2005:246).
(iv) Mid-upper arm circumference
Mid-upper arm circumference was used, together with the knee height value in order to determine
the participant‘s weight. Three consecutive measurements were taken. Mid-upper arm
circumference was only taken if the adult could not stand.

Page 119 of 252
The circumference was taken of the right arm, unless the participant‘s right arm had been
amputated. Circumference was measured in centimeters using a standardized, calibrated, flexible,
non-stretch measuring tape. The subject stood erect and sideways to the measurer, with the head
in the Frankfort plane, arms relaxed, and legs apart. If the subject was wearing a sleeved garment,
it was removed or the sleeves rolled up. The measurement was taken at the midpoint of the upper
arm, between the acromion process and the tip of the olecranon. The distance halfway between
the acromion process of the scapula and the radial point of the elbow was measured. The
acromion process was found when the measurer palpitated the upper point of the scapula towards
the corner of the acromion. The corner represented the uppermost point of the upper arm (A). The
radial point of the elbow was represented by the lowest point of the upper arm (B). The radial point
was found by lightly moving the elbow, while the point was palpitated. To determine the middle
point of the upper arm, the arm had to be in the anatomical position. The middle point was between
points A and B. The middle point was correctly projected to the triceps and biceps. Mid-upper arm
circumference was measured at this middle point. After locating the midpoint, the arm was
extended so that it was hanging loosely at the side, with the palm facing inward. The tape was
then wrapped gently but firmly around the arm at the midpoint, care being taken to ensure that the
arm was not squeezed (Gibson, 2005:290).
(v) Wrist circumference
The participant‘s right arm was flexed at the elbow with the palm facing upward and the hand
muscle relaxed. A non-stretch measuring tape, no wider than 0,7 cm, was placed around the
participant‘s right wrist just distal to the styloid processes of the radius and ulna. The measurer also
ensured that the tape was perpendicular to the long axis of the forearm, and that the tape only
touched the skin, not compressing the soft tissue. Measurement was recorded to the nearest
0,1cm (Lee & Nieman, 2010:175; Lee & Nieman, 2003:178).
3.8.2.4 Knee height
Knee height was taken in the seated or reclining position. Knee height was measured with a sliding
calliper consisting of an adjustable measuring stick with a blade attached to each end at a ninety
degree angle. The measurement was taken using the left leg, which was bent at the knee at a ninety
degree angle. One blade of the broad-blade calliper was placed under the heel of the left foot flexed at
ninety degrees. The second blade was placed over the anterior surface of the left thigh above the
condules of the femur and just proximal to the patella. The shaft of the calliper was held parallel to the
shaft of the tibia and gentle pressure was applied to the blades of the calliper. At least two consecutive
measurements were made and they agreed within five millimeter, where after the mean was then
calculated (Gibson, 2005:251; Mahan & Escott-Stump, 2008b:1213, Appendix 20; Mahan & Escott-
Stump; 2004c:1184, Appendix 15; Lee & Nieman, 2010:219-220; Lee & Nieman, 2003:167). The
average value was then noted on the form where indicated (Appendix G).
Page 120 of 252
3.8.2.5 Skinfolds
Proper measurement of skinfolds required careful attention to site selection and strict adherence to the
protocol as set out by Lee and Nieman (2010:183; 2003:186) . Measurements were all noted on the
form attached as Appendix G.
(i) Triceps
The triceps skinfold was taken at the midpoint of the upper right arm, between the acromion
process and the tip of the olecranon, with the arm hanging relaxed. To mark the midpoint, the
participant‘s right arm was bent ninety degrees at the elbow, and the forearm was placed palm
down across the body. The tip of the acromion process of the shoulder blade at the outermost
edge of the shoulder, and the tip of the olecranon process of the ulna, were located and marked.
The distance between these two points was measured using a non-stretch measuring tape, and the
midpoint was marked with a soft pen or indelible pencil, directly in line with the point of the elbow
and acromion process. The right arm was then extended to hang loosely by the side. The
measurer grasped a vertical fold of skin plus the underlying fat, at a point two centimeter above the
marked midpoint, in line with the tip of the olecranon process, using both the thumb and the
forefinger. The skinfold was gently pulled away from the underlying muscle tissue, and then the
calliper jaws were applied at right angles, exactly at the marked midpoint. The skinfold remained
held between the fingers while the measurement was taken (Lee & Nieman, 2010:186; Gibson,
2005:276). Three consecutive measurements were taken.
(ii) Biceps
The mid-upper-arm point was located and the participant relaxed the right arm. A vertical skinfold
at one centimeter above the midpoint of the biceps was grasped and the calliper was applied. The
measurement was recorded directly after the calliper reading stabilized (Gibson, 2005:277). Three
consecutive measurements were taken.
(iii) Supra-iliac
The supra-iliac skinfold was measured just above the iliac crest at the mid-axillary line. The
participant stood erect with feet together and arms hanging at the sides. The measurer grasped the
skinfold about one centimeter posterior to the mid-axillary line and measured the skinfold at the
mid-axillary line (Lee & Nieman, 2010:187-188; Lee & Nieman, 2003:189). Three consecutive
measurements were taken.
(iv) Subscapular
The subscapular site is one centimeter below the lowest angle of the scapula. The long axis of the
skinfold is on a 45° angle directed down and to the right side. The site was located by gently
feeling for the inferior angle of the scapula or by having the participant place the arm behind the
back. It was measured with the participant standing with arms relaxed to the sides. The skin was
grasped one centimeter above and medial to the site along the axis (Lee & Nieman, 20103:187;
Lee & Nieman, 2003:187). Three consecutive measurements were taken.
Page 121 of 252
(v) Calf
With the participant sitting, the right leg was flexed about ninety degrees at the knee with the sole
of the foot flat on the floor. The point of maximum calf circumference was marked at the inner
aspect of the calf. A vertical skinfold was grasped about one centimeter proximal to the marked
site and measured at the site (Lee & Nieman, 2010:189; Lee & Nieman, 2003:191). Three
consecutive measurements were taken.
(vi) Thigh
This site is a vertical skinfold along the midline of the anterior aspect of the thigh midway between
the junction of the midline and the inguinal crease and the upper border of the patella. The
participant was required to shift the weight to the left foot and to relax the leg being measured by
slightly flexing the knee with the foot flat on the floor (Lee & Nieman, 2010:188; Lee & Nieman,
2003:190). Three consecutive measurements were taken.
3.9. Statistical analysis
Adequacy of diets was evaluated by comparing the intake of each participant to the intake recommended
by the Food Guide Pyramid. The Food Guide Pyramid (Earl, 2004:368, Table 15-2; CNPP, 1999:online;
USDA, 1992:online) was used to determine whether participants‘ dietary intake of each food group fell
below requirements (inadequate); within the guidelines (adequate); or above requirements.
Food, energy and macronutrient intake; were described by means of descriptive statistics. Descriptive
statistics, namely frequencies and percentages for categorical data; and means and standard deviations or
medians and percentiles for continuous data, were calculated. Differences between urban and rural groups
were assessed using 95% confidence intervals or p-values, as applicable, for the difference in rural and
urban proportions.
An association between anthropometric status of children and adults of the same household was also
investigated.
Data was analyzed with the assistance of the Department of Biostatistics of the Faculty of Health Sciences,
University of the Free State using SAS® software (SAS, 2001).
3.10. Validity and reliability
The validity of a test or instrument refers to its ability to measure the phenomenon it intends to measure.
The reliability of a test or instrument is determined by the consistency of results when applied
repeatedly by either the same or different persons (Monsen, 1992:13).
3.10.1. Dietary intake questionnaires
A dietary assessment method is considered precise (i.e. reliable/reproducible) if it gives very similar
results when repeated in the same situation (Koh & Owen, 2000:182).
Page 122 of 252
3.10.1.1 Validity
The performance of any dietary assessment method is markedly influenced by the motivation and
compliance of the respondents (Gibson, 2005:161).
A 24-hour recall of reported usual intake was used to determine the usual intake of foods and drinks
by participants. Participants were asked to report usual dietary intake for a usual 24 hour period.
Information related to food preparation methods were also obtained. Because the information related
to dietary intake was only used to determine the intake of different foods and not nutrients, this
method was considered valid.
An adjusted FFQ was used to ensure that participants had reported all additional drinks and other
foods not reported in the 24 hour recall of reported usual intake. Careful attention was given to the
choice of foods, the clarity of the questions and the format of the frequency response section, when
constructing the FFQ (Koh & Owen, 2000:187). By using an adjusted FFQ, which listed commonly
consumed foods of the target population, results could be more representative of the population‘s
actual intake of cultural foods.
3.10.1.2 Reliability
A dietary assessment method is considered reliable if it gives very similar results when used
repeatedly in the same situation. Replication observations in dietary assessment are impossible, and
therefore true reproducibility is very difficult to determine (Gibson, 2005:129).
Single 24-hour recalls can be used to assess actual intakes of foods and nutrients, even though any
estimate of an individual‘s usual intake, based on a single 24-hour recall has low reproducibility
because of relatively large within-subject variation in food intake. The reproducibility of a 24-hour
recall can be improved by obtaining several 24-hour recalls for the same individual, preferably on
non-consecutive days (Gibson, 2005:131) or by employing a 24-hour recall of reported usual intake,
as was done in this study, for practical reasons.
For practical reasons, the adjusted FFQ questionnaire used in this study was also only administered
once to each participant and thus no measure of reliability was included.
3.10.2. Anthropometry
Validity and reliability of anthropometric results were ensured in the following ways:
3.10.2.1 Validity
Validity was ensured by including variables and methods recommended in the literature to measure
anthropometric parameters. By using these variables and measures, results could be compared to
the results of other studies that had used the same variables and techniques.

Page 123 of 252
3.10.2.2 Reliability
Researched were extensively trained by a certified anthropometrist to ensure accuracy of
measurements. Measurements were repeated three times on each study participants and the
average used to ensure reliability. Researchers used the same, standardized techniques, the
appropriate measuring tools and calibrated equipment.
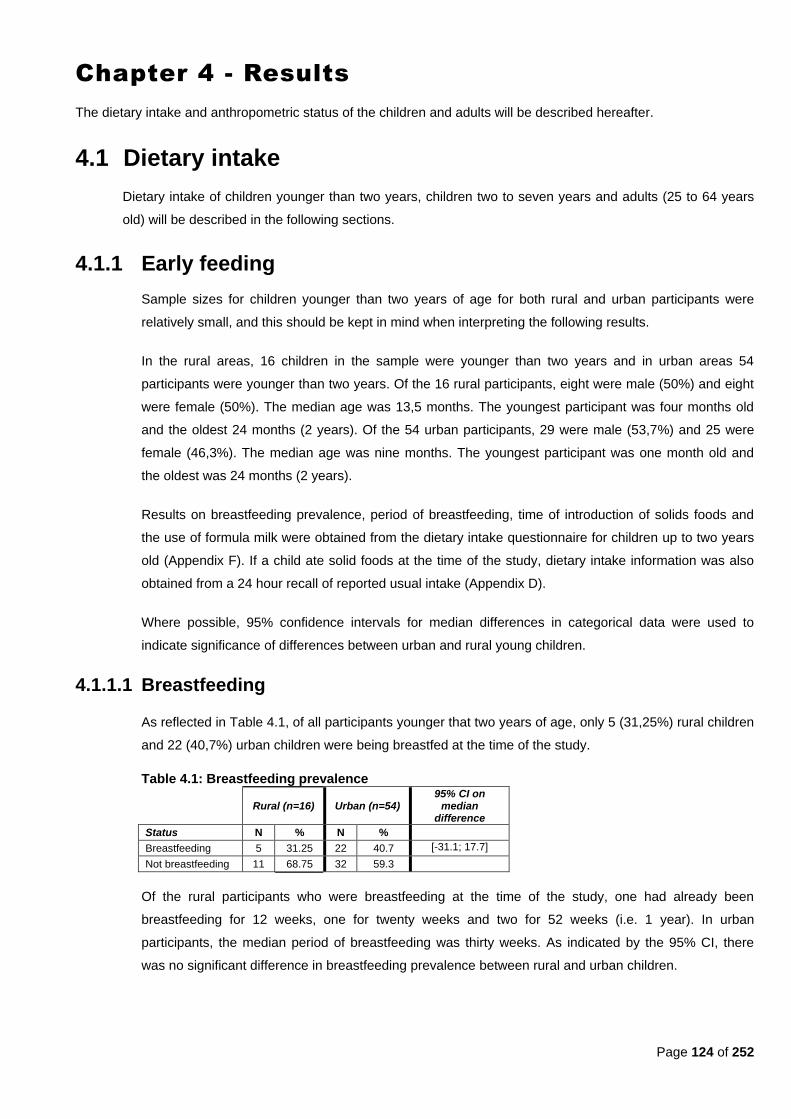
Page 124 of 252
Chapter 4 - Results
The dietary intake and anthropometric status of the children and adults will be described hereafter.
4.1 Dietary intake
Dietary intake of children younger than two years, children two to seven years and adults (25 to 64 years
old) will be described in the following sections.
4.1.1 Early feeding
Sample sizes for children younger than two years of age for both rural and urban participants were
relatively small, and this should be kept in mind when interpreting the following results.
In the rural areas, 16 children in the sample were younger than two years and in urban areas 54
participants were younger than two years. Of the 16 rural participants, eight were male (50%) and eight
were female (50%). The median age was 13,5 months. The youngest participant was four months old
and the oldest 24 months (2 years). Of the 54 urban participants, 29 were male (53,7%) and 25 were
female (46,3%). The median age was nine months. The youngest participant was one month old and
the oldest was 24 months (2 years).
Results on breastfeeding prevalence, period of breastfeeding, time of introduction of solids foods and
the use of formula milk were obtained from the dietary intake questionnaire for children up to two years
old (Appendix F). If a child ate solid foods at the time of the study, dietary intake information was also
obtained from a 24 hour recall of reported usual intake (Appendix D).
Where possible, 95% confidence intervals for median differences in categorical data were used to
indicate significance of differences between urban and rural young children.
4.1.1.1 Breastfeeding
As reflected in Table 4.1, of all participants younger that two years of age, only 5 (31,25%) rural children
and 22 (40,7%) urban children were being breastfed at the time of the study.
Table 4.1: Breastfeeding prevalence
Rural (n=16) Urban (n=54) 95% CI on
median difference
Status N % N %
Breastfeeding 5 31.25 22 40.7 [-31.1; 17.7]
Not breastfeeding 11 68.75 32 59.3
Of the rural participants who were breastfeeding at the time of the study, one had already been
breastfeeding for 12 weeks, one for twenty weeks and two for 52 weeks (i.e. 1 year). In urban
participants, the median period of breastfeeding was thirty weeks. As indicated by the 95% CI, there
was no significant difference in breastfeeding prevalence between rural and urban children.
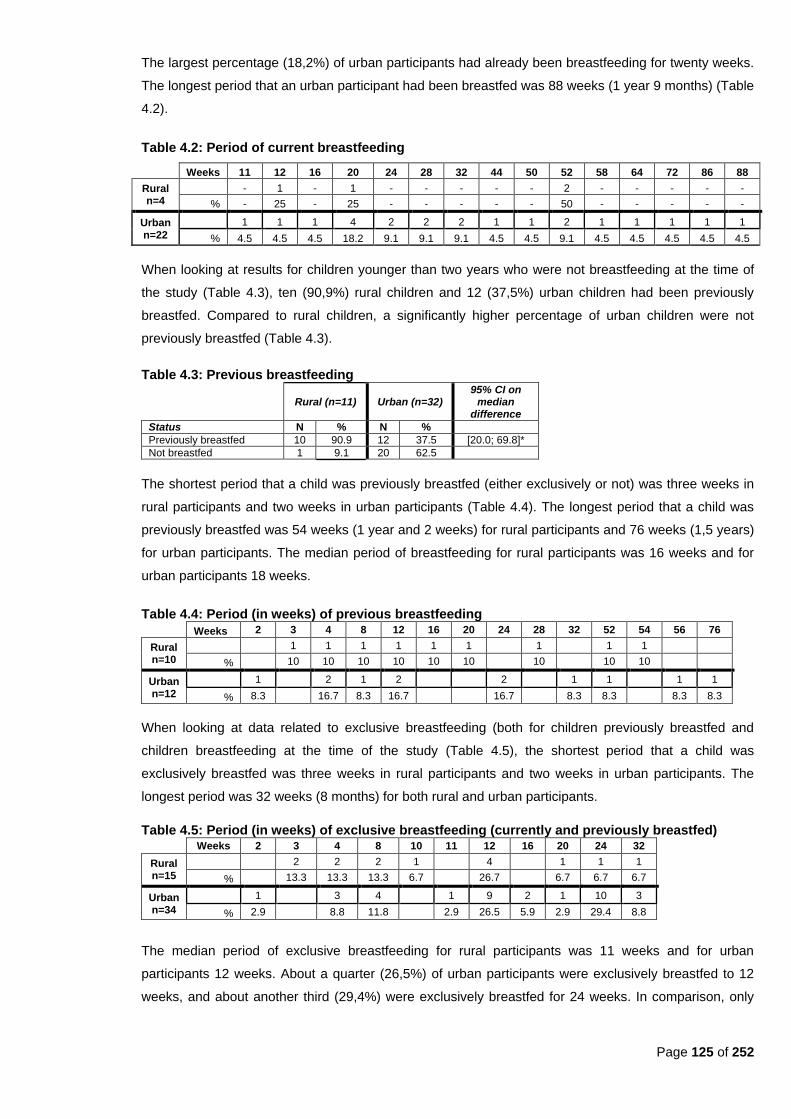
Page 125 of 252
The largest percentage (18,2%) of urban participants had already been breastfeeding for twenty weeks.
The longest period that an urban participant had been breastfed was 88 weeks (1 year 9 months) (Table
4.2).
Table 4.2: Period of current breastfeeding
Weeks 11 12 16 20 24 28 32 44 50 52 58 64 72 86 88
Rural n=4
- 1 - 1 - - - - - 2 - - - - -
% - 25 - 25 - - - - - 50 - - - - -
Urban n=22
1 1 1 4 2 2 2 1 1 2 1 1 1 1 1
% 4.5 4.5 4.5 18.2 9.1 9.1 9.1 4.5 4.5 9.1 4.5 4.5 4.5 4.5 4.5
When looking at results for children younger than two years who were not breastfeeding at the time of
the study (Table 4.3), ten (90,9%) rural children and 12 (37,5%) urban children had been previously
breastfed. Compared to rural children, a significantly higher percentage of urban children were not
previously breastfed (Table 4.3).
Table 4.3: Previous breastfeeding
Rural (n=11) Urban (n=32)
95% CI on median
difference
Status N % N %
Previously breastfed 10 90.9 12 37.5 [20.0; 69.8]*
Not breastfed 1 9.1 20 62.5
The shortest period that a child was previously breastfed (either exclusively or not) was three weeks in
rural participants and two weeks in urban participants (Table 4.4). The longest period that a child was
previously breastfed was 54 weeks (1 year and 2 weeks) for rural participants and 76 weeks (1,5 years)
for urban participants. The median period of breastfeeding for rural participants was 16 weeks and for
urban participants 18 weeks.
Table 4.4: Period (in weeks) of previous breastfeeding
Weeks 2 3 4 8 12 16 20 24 28 32 52 54 56 76
Rural n=10
1 1 1 1 1 1 1 1 1
% 10 10 10 10 10 10
10
10 10
Urban n=12
1 2 1 2 2 1 1 1 1
% 8.3
16.7 8.3 16.7
16.7
8.3 8.3
8.3 8.3
When looking at data related to exclusive breastfeeding (both for children previously breastfed and
children breastfeeding at the time of the study (Table 4.5), the shortest period that a child was
exclusively breastfed was three weeks in rural participants and two weeks in urban participants. The
longest period was 32 weeks (8 months) for both rural and urban participants.
Table 4.5: Period (in weeks) of exclusive breastfeeding (currently and previously breastfed)
Weeks 2 3 4 8 10 11 12 16 20 24 32
Rural n=15
2 2 2 1 4 1 1 1
% 13.3 13.3 13.3 6.7 26.7 6.7 6.7 6.7
Urban n=34
1 3 4 1 9 2 1 10 3
% 2.9 8.8 11.8 2.9 26.5 5.9 2.9 29.4 8.8
The median period of exclusive breastfeeding for rural participants was 11 weeks and for urban
participants 12 weeks. About a quarter (26,5%) of urban participants were exclusively breastfed to 12
weeks, and about another third (29,4%) were exclusively breastfed for 24 weeks. In comparison, only
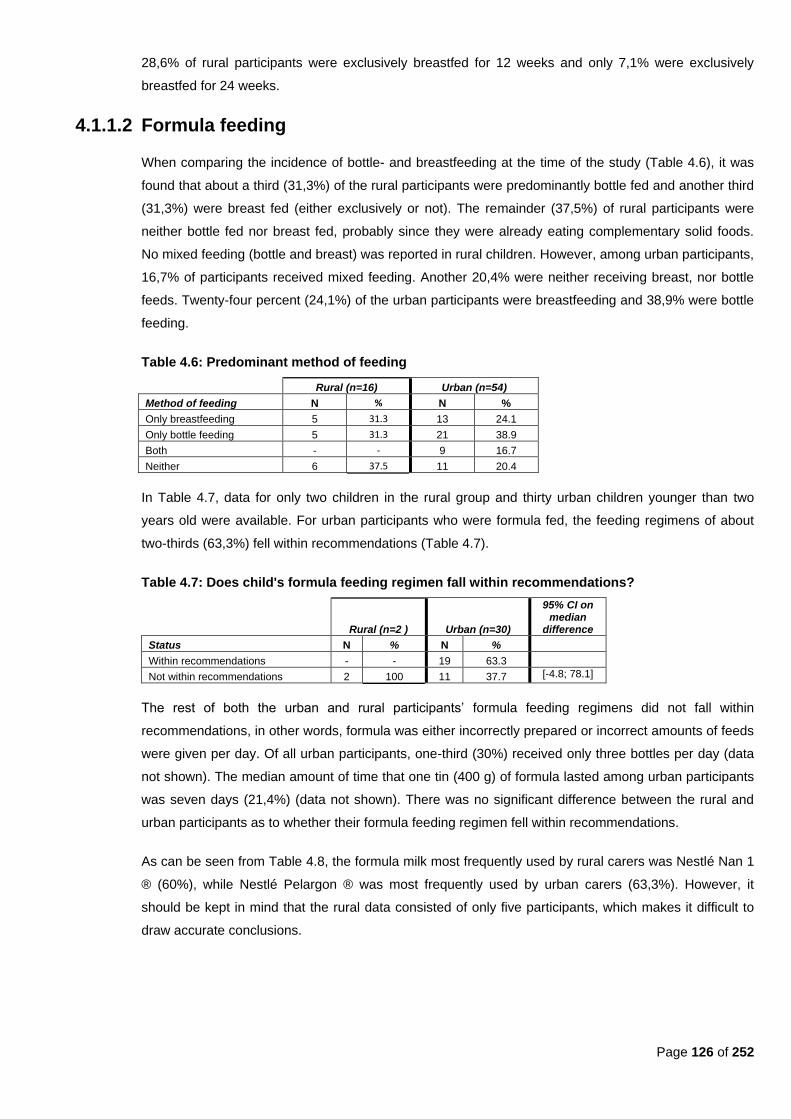
Page 126 of 252
28,6% of rural participants were exclusively breastfed for 12 weeks and only 7,1% were exclusively
breastfed for 24 weeks.
4.1.1.2 Formula feeding
When comparing the incidence of bottle- and breastfeeding at the time of the study (Table 4.6), it was
found that about a third (31,3%) of the rural participants were predominantly bottle fed and another third
(31,3%) were breast fed (either exclusively or not). The remainder (37,5%) of rural participants were
neither bottle fed nor breast fed, probably since they were already eating complementary solid foods.
No mixed feeding (bottle and breast) was reported in rural children. However, among urban participants,
16,7% of participants received mixed feeding. Another 20,4% were neither receiving breast, nor bottle
feeds. Twenty-four percent (24,1%) of the urban participants were breastfeeding and 38,9% were bottle
feeding.
Table 4.6: Predominant method of feeding
Rural (n=16) Urban (n=54)
Method of feeding N % N %
Only breastfeeding 5 31.3 13 24.1
Only bottle feeding 5 31.3 21 38.9
Both - - 9 16.7
Neither 6 37.5 11 20.4
In Table 4.7, data for only two children in the rural group and thirty urban children younger than two
years old were available. For urban participants who were formula fed, the feeding regimens of about
two-thirds (63,3%) fell within recommendations (Table 4.7).
Table 4.7: Does child's formula feeding regimen fall within recommendations?
Rural (n=2 ) Urban (n=30)
95% CI on median
difference
Status N % N %
Within recommendations - - 19 63.3
Not within recommendations 2 100 11 37.7 [-4.8; 78.1]
The rest of both the urban and rural participants‘ formula feeding regimens did not fall within
recommendations, in other words, formula was either incorrectly prepared or incorrect amounts of feeds
were given per day. Of all urban participants, one-third (30%) received only three bottles per day (data
not shown). The median amount of time that one tin (400 g) of formula lasted among urban participants
was seven days (21,4%) (data not shown). There was no significant difference between the rural and
urban participants as to whether their formula feeding regimen fell within recommendations.
As can be seen from Table 4.8, the formula milk most frequently used by rural carers was Nestlé Nan 1
® (60%), while Nestlé Pelargon ® was most frequently used by urban carers (63,3%). However, it
should be kept in mind that the rural data consisted of only five participants, which makes it difficult to
draw accurate conclusions.
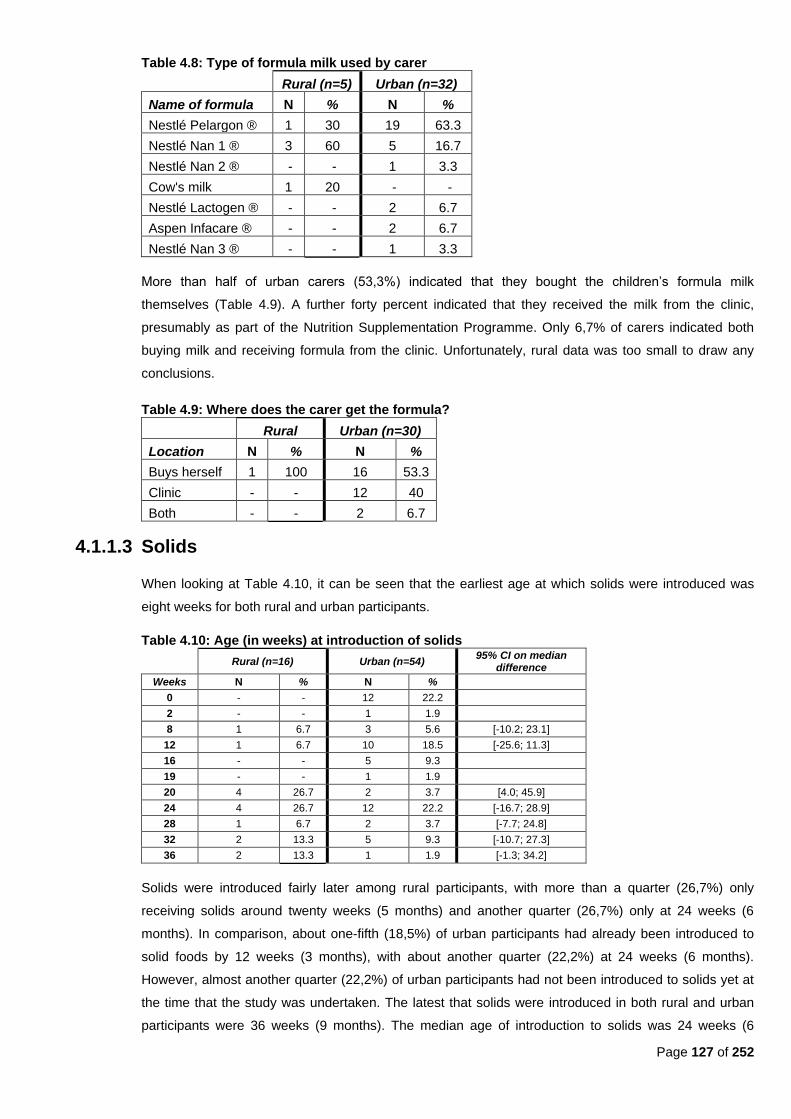
Page 127 of 252
Table 4.8: Type of formula milk used by carer
Rural (n=5) Urban (n=32)
Name of formula N % N %
Nestlé Pelargon ® 1 30 19 63.3
Nestlé Nan 1 ® 3 60 5 16.7
Nestlé Nan 2 ® - - 1 3.3
Cow's milk 1 20 - -
Nestlé Lactogen ® - - 2 6.7
Aspen Infacare ® - - 2 6.7
Nestlé Nan 3 ® - - 1 3.3
More than half of urban carers (53,3%) indicated that they bought the children‘s formula milk
themselves (Table 4.9). A further forty percent indicated that they received the milk from the clinic,
presumably as part of the Nutrition Supplementation Programme. Only 6,7% of carers indicated both
buying milk and receiving formula from the clinic. Unfortunately, rural data was too small to draw any
conclusions.
Table 4.9: Where does the carer get the formula?
Rural Urban (n=30)
Location N % N %
Buys herself 1 100 16 53.3
Clinic - - 12 40
Both - - 2 6.7
4.1.1.3 Solids
When looking at Table 4.10, it can be seen that the earliest age at which solids were introduced was
eight weeks for both rural and urban participants.
Table 4.10: Age (in weeks) at introduction of solids
Rural (n=16) Urban (n=54)
95% CI on median difference
Weeks N % N %
0 - - 12 22.2
2 - - 1 1.9
8 1 6.7 3 5.6 [-10.2; 23.1]
12 1 6.7 10 18.5 [-25.6; 11.3]
16 - - 5 9.3
19 - - 1 1.9
20 4 26.7 2 3.7 [4.0; 45.9]
24 4 26.7 12 22.2 [-16.7; 28.9]
28 1 6.7 2 3.7 [-7.7; 24.8]
32 2 13.3 5 9.3 [-10.7; 27.3]
36 2 13.3 1 1.9 [-1.3; 34.2]
Solids were introduced fairly later among rural participants, with more than a quarter (26,7%) only
receiving solids around twenty weeks (5 months) and another quarter (26,7%) only at 24 weeks (6
months). In comparison, about one-fifth (18,5%) of urban participants had already been introduced to
solid foods by 12 weeks (3 months), with about another quarter (22,2%) at 24 weeks (6 months).
However, almost another quarter (22,2%) of urban participants had not been introduced to solids yet at
the time that the study was undertaken. The latest that solids were introduced in both rural and urban
participants were 36 weeks (9 months). The median age of introduction to solids was 24 weeks (6
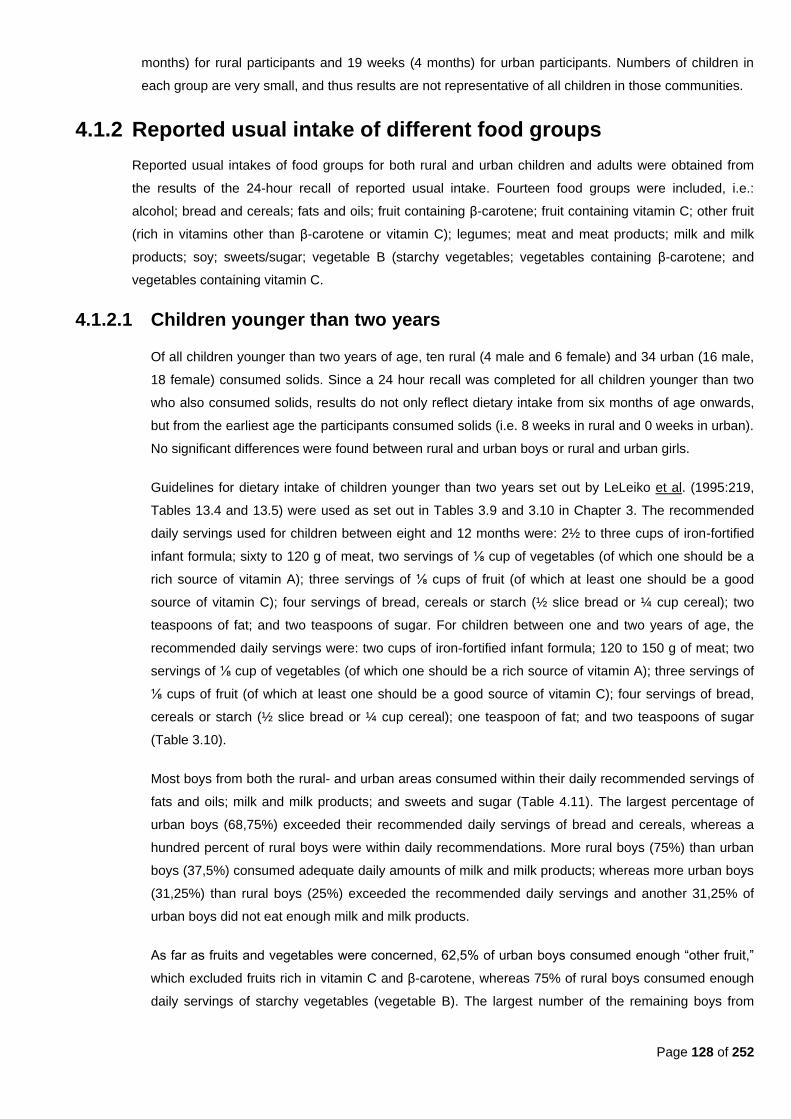
Page 128 of 252
months) for rural participants and 19 weeks (4 months) for urban participants. Numbers of children in
each group are very small, and thus results are not representative of all children in those communities.
4.1.2 Reported usual intake of different food groups
Reported usual intakes of food groups for both rural and urban children and adults were obtained from
the results of the 24-hour recall of reported usual intake. Fourteen food groups were included, i.e.:
alcohol; bread and cereals; fats and oils; fruit containing β-carotene; fruit containing vitamin C; other fruit
(rich in vitamins other than β-carotene or vitamin C); legumes; meat and meat products; milk and milk
products; soy; sweets/sugar; vegetable B (starchy vegetables; vegetables containing β-carotene; and
vegetables containing vitamin C.
4.1.2.1 Children younger than two years
Of all children younger than two years of age, ten rural (4 male and 6 female) and 34 urban (16 male,
18 female) consumed solids. Since a 24 hour recall was completed for all children younger than two
who also consumed solids, results do not only reflect dietary intake from six months of age onwards,
but from the earliest age the participants consumed solids (i.e. 8 weeks in rural and 0 weeks in urban).
No significant differences were found between rural and urban boys or rural and urban girls.
Guidelines for dietary intake of children younger than two years set out by LeLeiko et al. (1995:219,
Tables 13.4 and 13.5) were used as set out in Tables 3.9 and 3.10 in Chapter 3. The recommended
daily servings used for children between eight and 12 months were: 2½ to three cups of iron-fortified
infant formula; sixty to 120 g of meat, two servings of ⅛ cup of vegetables (of which one should be a
rich source of vitamin A); three servings of ⅛ cups of fruit (of which at least one should be a good
source of vitamin C); four servings of bread, cereals or starch (½ slice bread or ¼ cup cereal); two
teaspoons of fat; and two teaspoons of sugar. For children between one and two years of age, the
recommended daily servings were: two cups of iron-fortified infant formula; 120 to 150 g of meat; two
servings of ⅛ cup of vegetables (of which one should be a rich source of vitamin A); three servings of
⅛ cups of fruit (of which at least one should be a good source of vitamin C); four servings of bread,
cereals or starch (½ slice bread or ¼ cup cereal); one teaspoon of fat; and two teaspoons of sugar
(Table 3.10).
Most boys from both the rural- and urban areas consumed within their daily recommended servings of
fats and oils; milk and milk products; and sweets and sugar (Table 4.11). The largest percentage of
urban boys (68,75%) exceeded their recommended daily servings of bread and cereals, whereas a
hundred percent of rural boys were within daily recommendations. More rural boys (75%) than urban
boys (37,5%) consumed adequate daily amounts of milk and milk products; whereas more urban boys
(31,25%) than rural boys (25%) exceeded the recommended daily servings and another 31,25% of
urban boys did not eat enough milk and milk products.
As far as fruits and vegetables were concerned, 62,5% of urban boys consumed enough ―other fruit,‖
which excluded fruits rich in vitamin C and β-carotene, whereas 75% of rural boys consumed enough
daily servings of starchy vegetables (vegetable B). The largest number of the remaining boys from
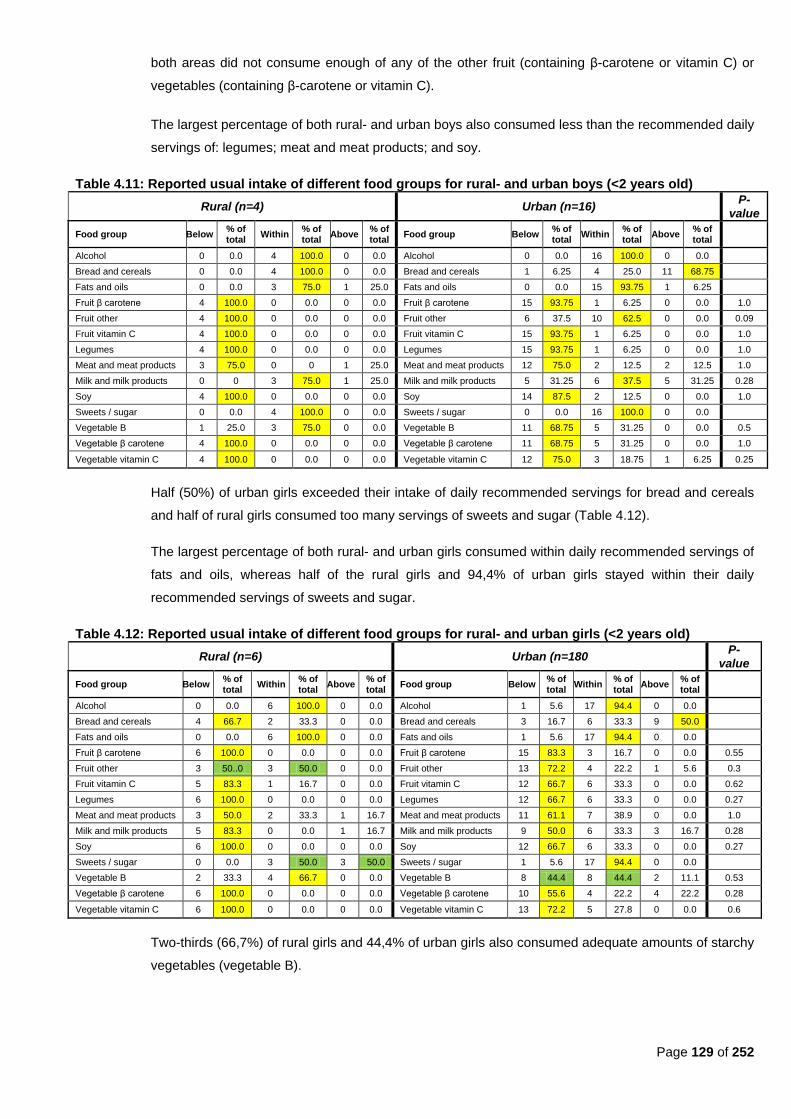
Page 129 of 252
both areas did not consume enough of any of the other fruit (containing β-carotene or vitamin C) or
vegetables (containing β-carotene or vitamin C).
The largest percentage of both rural- and urban boys also consumed less than the recommended daily
servings of: legumes; meat and meat products; and soy.
Table 4.11: Reported usual intake of different food groups for rural- and urban boys (<2 years old)
Rural (n=4) Urban (n=16) P-
value
Food group Below % of total
Within % of total
Above % of total
Food group Below % of total
Within % of total
Above % of total
Alcohol 0 0.0 4 100.0 0 0.0 Alcohol 0 0.0 16 100.0 0 0.0
Bread and cereals 0 0.0 4 100.0 0 0.0 Bread and cereals 1 6.25 4 25.0 11 68.75
Fats and oils 0 0.0 3 75.0 1 25.0 Fats and oils 0 0.0 15 93.75 1 6.25
Fruit β carotene 4 100.0 0 0.0 0 0.0 Fruit β carotene 15 93.75 1 6.25 0 0.0 1.0
Fruit other 4 100.0 0 0.0 0 0.0 Fruit other 6 37.5 10 62.5 0 0.0 0.09
Fruit vitamin C 4 100.0 0 0.0 0 0.0 Fruit vitamin C 15 93.75 1 6.25 0 0.0 1.0
Legumes 4 100.0 0 0.0 0 0.0 Legumes 15 93.75 1 6.25 0 0.0 1.0
Meat and meat products 3 75.0 0 0 1 25.0 Meat and meat products 12 75.0 2 12.5 2 12.5 1.0
Milk and milk products 0 0 3 75.0 1 25.0 Milk and milk products 5 31.25 6 37.5 5 31.25 0.28
Soy 4 100.0 0 0.0 0 0.0 Soy 14 87.5 2 12.5 0 0.0 1.0
Sweets / sugar 0 0.0 4 100.0 0 0.0 Sweets / sugar 0 0.0 16 100.0 0 0.0
Vegetable B 1 25.0 3 75.0 0 0.0 Vegetable B 11 68.75 5 31.25 0 0.0 0.5
Vegetable β carotene 4 100.0 0 0.0 0 0.0 Vegetable β carotene 11 68.75 5 31.25 0 0.0 1.0
Vegetable vitamin C 4 100.0 0 0.0 0 0.0 Vegetable vitamin C 12 75.0 3 18.75 1 6.25 0.25
Half (50%) of urban girls exceeded their intake of daily recommended servings for bread and cereals
and half of rural girls consumed too many servings of sweets and sugar (Table 4.12).
The largest percentage of both rural- and urban girls consumed within daily recommended servings of
fats and oils, whereas half of the rural girls and 94,4% of urban girls stayed within their daily
recommended servings of sweets and sugar.
Table 4.12: Reported usual intake of different food groups for rural- and urban girls (<2 years old)
Rural (n=6) Urban (n=180 P-
value
Food group Below % of total
Within % of total
Above % of total
Food group Below % of total
Within % of total
Above % of total
Alcohol 0 0.0 6 100.0 0 0.0 Alcohol 1 5.6 17 94.4 0 0.0
Bread and cereals 4 66.7 2 33.3 0 0.0 Bread and cereals 3 16.7 6 33.3 9 50.0
Fats and oils 0 0.0 6 100.0 0 0.0 Fats and oils 1 5.6 17 94.4 0 0.0
Fruit β carotene 6 100.0 0 0.0 0 0.0 Fruit β carotene 15 83.3 3 16.7 0 0.0 0.55
Fruit other 3 50..0 3 50.0 0 0.0 Fruit other 13 72.2 4 22.2 1 5.6 0.3
Fruit vitamin C 5 83.3 1 16.7 0 0.0 Fruit vitamin C 12 66.7 6 33.3 0 0.0 0.62
Legumes 6 100.0 0 0.0 0 0.0 Legumes 12 66.7 6 33.3 0 0.0 0.27
Meat and meat products 3 50.0 2 33.3 1 16.7 Meat and meat products 11 61.1 7 38.9 0 0.0 1.0
Milk and milk products 5 83.3 0 0.0 1 16.7 Milk and milk products 9 50.0 6 33.3 3 16.7 0.28
Soy 6 100.0 0 0.0 0 0.0 Soy 12 66.7 6 33.3 0 0.0 0.27
Sweets / sugar 0 0.0 3 50.0 3 50.0 Sweets / sugar 1 5.6 17 94.4 0 0.0
Vegetable B 2 33.3 4 66.7 0 0.0 Vegetable B 8 44.4 8 44.4 2 11.1 0.53
Vegetable β carotene 6 100.0 0 0.0 0 0.0 Vegetable β carotene 10 55.6 4 22.2 4 22.2 0.28
Vegetable vitamin C 6 100.0 0 0.0 0 0.0 Vegetable vitamin C 13 72.2 5 27.8 0 0.0 0.6
Two-thirds (66,7%) of rural girls and 44,4% of urban girls also consumed adequate amounts of starchy
vegetables (vegetable B).
Page 130 of 252
The largest percentage of both rural- and urban girls did not consume enough daily servings of all the
fruit groups and remaining vegetable groups. They also did not consume enough legumes, meat and
meat products, and soy.
These findings agree with the data in Tables 4.17 and 4.18, which shows that cooked porridge; sugar;
full cream milk; tea and margarine/oil/fat mostly fell within the top ten of the most frequently consumed
food items among these children.
4.1.2.2 Children older than two years
In the rural areas, there were 26 boys and 24 girls older than two years; and in the urban areas there
were 64 boys and 48 girls older than two years. P values were calculated for the differences in the
percentage of rural and urban children that had intakes that fell in the ―within recommendation‖ ranges
for the different food groups.
Recommended daily servings for children older than two years were used as set out in Table 3.1, i.e.
two servings of milk or milk products; two servings of meat or meat products; six servings of bread or
cereals; two servings of fruit of which one should be a good source of vitamin C; three servings of
vegetables of which one should be a good source of β-carotene; four servings of fat or less; and four
servings of sugar or less. Portion sizes of servings varied according to the child‘s age as set out by
Table 3.10.
As with children younger than two years old, most of both rural- and urban boys older than two years
ate little fruit, legumes, soy, vegetables, milk and milk products (Table 4.13). Most of both rural- and
urban boys ate within the daily requirements of fats and oils. A significantly larger percentage of urban
boys consumed fats and oils (p=0.002) and β-carotene rich vegetables (p=0.003) within the daily
recommended number of servings than rural boys.
Urban boys exceeded their daily requirements for bread and cereals more often than the rural boys. A
significantly larger percentage of rural boys consumed bread and cereals within daily
recommendations (p=0.001) than rural boys. A significantly larger percentage of urban boys
consumed sugar and sweets within recommendations (p<0.0001) than rural boys.
Half (50%) of the urban boys consumed more than the required number of six servings from the bread
and cereals group, while a further 39,1% consumed the required six daily servings. In comparison,
76,9% of rural boys consumed bread and cereals within required amounts and 19,2% consumed less
than the required six servings.
Intakes of fat and oil intake were mostly within requirements for both rural (57,7%) and urban (87,5%)
groups, although 42,3% of the rural group also consumed amounts above requirements (more than
four daily servings) compared to only 12,5% of urban boys.
Fruit consumption was mostly low, with only 11,5% and 23,1% of rural boys meeting their
requirements for one vitamin C-rich fruit or one other fruit daily. In urban areas 15,6% of boys ate
enough vitamin-C rich fruit, 40,6% consumed enough other fruit and 12,5% consumed more than the
required serving of one other fruit.

Page 131 of 252
Table 4.13: Reported usual intake of different food groups for rural- and urban boys (>2 years old)
Rural (n=26) Urban (n=64) P
value
Food group Below % of total
Within % of total
Above % of total
Food group Below % of total
Within % of total
Above % of total
Alcohol 0 0.00 26 100.0 0 0.00 Alcohol 0 0.0 64 100.0 0 0.0
Bread and cereals 5 19.2 20 76.9 1 3.9 Bread and cereals 7 10.9 25 39.1 32 50.0 0.001*
Fats and oils 0 0.0 15 57.7 11 42.3 Fats and oils 0 0.0 56 87.5 8 12.5 0.002*
Fruit β carotene 26 100.0 0 0.0 0 0.0 Fruit β carotene 62 96.9 1 1.6 1 1.6
Fruit other 20 76.9 6 23.1 0 0.0 Fruit other 30 46.9 26 40.6 8 12.5
Fruit vitamin C 23 88.5 3 11.5 0 0.0 Fruit vitamin C 53 82.8 10 15.6 1 1.6
Legumes 26 100.0 0 0.0 0 0.0 Legumes 60 93.8 4 6.3 0 0.0
Meat and meat products 5 19.2 8 30.8 13 50.0 Meat and meat products 38 59.4 13 20.3 13 20.3 0.3
Milk and milk products 16 61.5 8 30.8 2 7.7 Milk and milk products 33 51.6 12 18.8 19 29.7
Soy 26 100.0 0 0.0 0 0.0 Soy 59 92.2 4 6.3 1 1.6
Sweets / sugar 0 0.0 13 50.0 13 50.0 Sweets / sugar 0 0.0 57 89.1 7 10.9 <0.0001*
Vegetable B 17 65.4 9 34.6 0 0.0 Vegetable B 39 60.9 24 37.5 1 1.6
Vegetable β carotene 25 96.2 1 3.9 0 0.0 Vegetable β carotene 37 57.8 22 34.4 5 7.8 0.003*
Vegetable vitamin C 21 80.8 5 19.2 0 0.0 Vegetable vitamin C 47 73.4 11 17.2 6 9.4
Intake of legumes was mostly low. Rural boys tended to eat more meat and meat products, with fifty
percent consuming more than the required two daily servings and a further 30,8% consuming within
requirements of two daily servings. In comparison, 59,4% of urban boys did not meet their daily
requirements for meat intake. However, 20,3% of urban boys ate adequate servings of meat and meat
products and another 20,3% consumed more than the required two servings of meat and meat
products per day.
Almost two-thirds (61,5%) of rural boys and half (51,6%) of urban boys did not consume the required
number of two servings of milk and milk products per day. However, almost a third (29,7%) of urban
boys consumed more than their required number of two servings per day. Soy intake was low, with
only 6,3% of urban boys consuming enough soy and 1,6% eating more than the required one serving
per day.
Half (50%) of the rural boys (n=13) ate four servings or less of sugar, while the other half consumed
more than the recommendation of four or less servings per day. Urban boys stayed more within their
requirements (89,1%), with only 10,9% exceeding their requirements for sugar of four servings or less.
It seems that as a whole, urban boys consumed comparatively more fruit and vegetables than rural
boys, although the majority still did not meet their daily requirements. Almost two-thirds of both rural
(65,4%) and urban (60,9%) boys did not consume enough starchy vegetables (Vegetable B).
However, the other one-third of both rural (34,6%) and urban (37,5%) boys did meet their
requirements of one serving per day. This was however not the case for beta-carotene-rich
vegetables. Most rural boys (96,2%) did not eat one serving a day, with only 3,9% meeting their daily
requirement of one serving. The urban picture looks a little different, with only over half (57,8%) of the
boys not meeting their daily requirements of one serving, a third (34,4%) meeting their requirements
and a further 7,8% exceeding their requirements. Vitamin-C rich vegetable intake was about the same
among both groups with about three-quarters of both rural (80,8%) and urban (73,4)% boys eating
less than one daily serving and only 19,2% of rural and 17,2% of urban boys eating one daily serving.
A further ten percent of urban boys consumed more than one daily serving.
As expected, none of the boys consumed alcohol.

Page 132 of 252
Table 4.14: Reported usual intake of different food groups for rural and urban girls (>2 years old)
Rural (n=24) Urban (n=48) P-
value
Food group Below % of total
Within % of total
Above % of total
Food group Below % of total
Within % of total
Above % of total
Alcohol 1 4.2 23 95.8 0 0.0 Alcohol 1 2.1 47 97.9 0 0.0
Bread and cereals 5 20.8 17 70.8 2 8.3 Bread and cereals 12 25.0 10 20.8 26 54.2 <0.0001*
Fats and oils 1 4.2 16 66.7 7 29.2 Fats and oils 2 4.2 41 85.4 5 10.4
Fruit β carotene 24 100.0 0 0.0 0 0.0 Fruit β carotene 44 91.7 3 6.3 1 2.1
Fruit other 18 75.0 6 25.0 0 0.0 Fruit other 19 39.6 24 50.0 5 10.4 0.04*
Fruit vitamin C 20 83.3 4 16.7 0 0.0 Fruit vitamin C 37 77.1 10 20.8 1 2.1
Legumes 24 100.0 0 0.0 0 0.0 Legumes 41 85.4 7 14.6 0 0.0
Meat and meat products 10 41.7 8 33.3 6 25.0 Meat and meat products 25 52.1 15 31.3 8 16.7
Milk and milk products 14 58.3 7 29.2 3 12.5 Milk and milk products 25 52.1 10 20.8 13 27.1
Soy 24 100.0 0 0.0 0 0.0 Soy 40 83.3 7 14.6 1 2.1
Sweets / sugar 1 4.2 15 62.5 8 33.3 Sweets / sugar 1 2.1 44 91.7 3 6.3 0.002*
Vegetable B 14 58.3 10 41.7 0 0.0 Vegetable B 28 58.3 17 35.4 3 6.3
Vegetable β carotene 24 100.0 0 0.0 0 0.0 Vegetable β carotene 28 58.3 13 27.1 7 14.6 0.003*
Vegetable vitamin C 18 75.0 6 25.0 0 0.0 Vegetable vitamin C 39 81.3 9 18.8 0 0.0
Urban girls exceeded their daily requirements for bread and cereals more often than the rural girls. A
significantly larger percentage of rural girls consumed bread and cereals within recommendations
(p<0.0001) than urban girls. On the other hand, a significantly larger percentage of urban girls
consumed sweets and sugar (p=0.002) and β-carotene rich vegetables (p=0.003) within
recommendations than rural girls.
Overall, both rural- and urban girls consumed inadequate amounts of legumes, soy, vegetables, meat
and meat products, and milk and milk products (Table 4.14). Urban girls consumed more other fruit
than rural girls, but intake of vitamin C-rich or ß-carotene–rich fruit remained low among both rural-
and urban girls. About half (54,2%) of urban girls consumed breads and cereals in excess, whereas
seventy percent of rural girls stayed within their requirements of six servings a day Sugar and sweets
intake as well as intake of fats and oils were mostly within limits among both the rural- and urban girls,
but about a third of rural girls also exceeding their daily limits of four servings of sugar, sweets, fats
and oils in comparison with a very small amount of urban girls.
More than half (54,2%) of the urban girls consumed above their requirements of six daily servings of
bread and cereals as compared to only 8,3% of rural girls. About three-quarters (70,8%) of rural girls
did, however, meet their daily requirements, with only 20,8% consuming too little. In comparison, a
quarter of urban girls (25%) did not meet their requirements of six daily servings, but a further 20,8%
did.
Consumption of fats and oils were sufficient (four daily servings) in two-thirds (66,7%) of rural girls and
85,4% of urban girls, with 29,2% of rural girls and 10,4% of urban girls exceeding their daily
requirements of four servings.
Fruit intake was low, with only 16,7% of rural girls eating enough (one daily serving) of vitamin C-rich
fruit and 25% eating enough (one daily serving) of other fruit. Fruit intake was higher in urban girls,
with 20,8% consuming enough vitamin C-rich fruit and fifty percent eating enough other fruit. A further
10,4% of urban girls ate more than the required one daily serving of other fruit. All the rural girls
Page 133 of 252
(100%) and almost all the urban girls (91,7%) did not meet their daily requirement of one serving of
beta-carotene-rich fruit per day.
Legume intake was low for all rural girls and most urban girls (83,3%), but 14,6% of urban girls did
reach their intake goal of one daily serving.
About half of both rural (41.2%) and urban girls (52,1%) did not eat sufficient daily servings from the
meat and meat products group. However, about one-third of both rural (33.3%) and urban (31.3%)
girls did meet their daily requirements of two servings and a further quarter (25%) of rural girls and
16,7% of urban girls ate more meat and meat products than required.
More than half of both the rural (58,3%) and the urban (52,1%) girls consumed too little dairy (less
than two servings per day). About a quarter of the rural girls (29,2%) consumed adequate amounts
compared to 20,8% of urban girls. In comparison, more than a quarter of urban girls (27,1%)
consumed more than two daily servings compared with only 12,5% of rural girls. As was found
amongst the boys, all the rural girls consumed too little soy (less than one daily serving), whereas
14,6% of urban girls consumed adequate amounts of soy and 2,1% consumed above their required
daily amounts.
Almost two-thirds (62,5%) of the rural girls consumed within their daily requirements of four servings of
sugar and sweets, and a further third (33,3%) consumed above this daily requirement. In comparison,
almost all the urban girls (91,7%) did not eat more than four servings of sugar and sweets per day.
Only 6,3% of urban girls consumed too much sugar and sweets.
More than half of both rural (58,3%) and urban (58,3%) girls consumed less than one serving of
starchy vegetables (vegetable B). Another 41,7% of rural girls and 35,4% of urban girls consumed one
serving of starchy vegetables per day and a further 6,25% of urban girls consumed more than one
daily serving. All of the rural girls did not eat at least one serving of beta-carotene-rich vegetable per
day, whereas only about half (58,3%) of urban girls did not. Another 27,1% of urban girls met their
requirements and 14,6% ate more than one daily serving of beta-carotene-rich vegetables. Three-
quarters (75%) of rural girls did not eat enough vitamin C-rich vegetables, and a quarter (25%) ate
enough (one daily serving). In comparison, the majority of urban girls (81,3%) did not eat one daily
serving, and only 18,8% did.
Only 14 urban children (12%) (N=117), consumed the recommended five portions of fruit and
vegetables per day (data not shown).
4.1.2.3 Adults
Of the 549 rural participants, 160 were men and 389 women. Of the 419 urban participants, 99 were
men and 320 were women. P values were calculated for the differences in the percentage of rural and
urban adults that had intakes that fell in the ―within recommendation‖ ranges for the different food
groups.
The daily recommended servings guidelines were: two to three servings of milk or milk products; two
to three servings of meat or meat products; six to eleven servings of bread or cereals; two to four
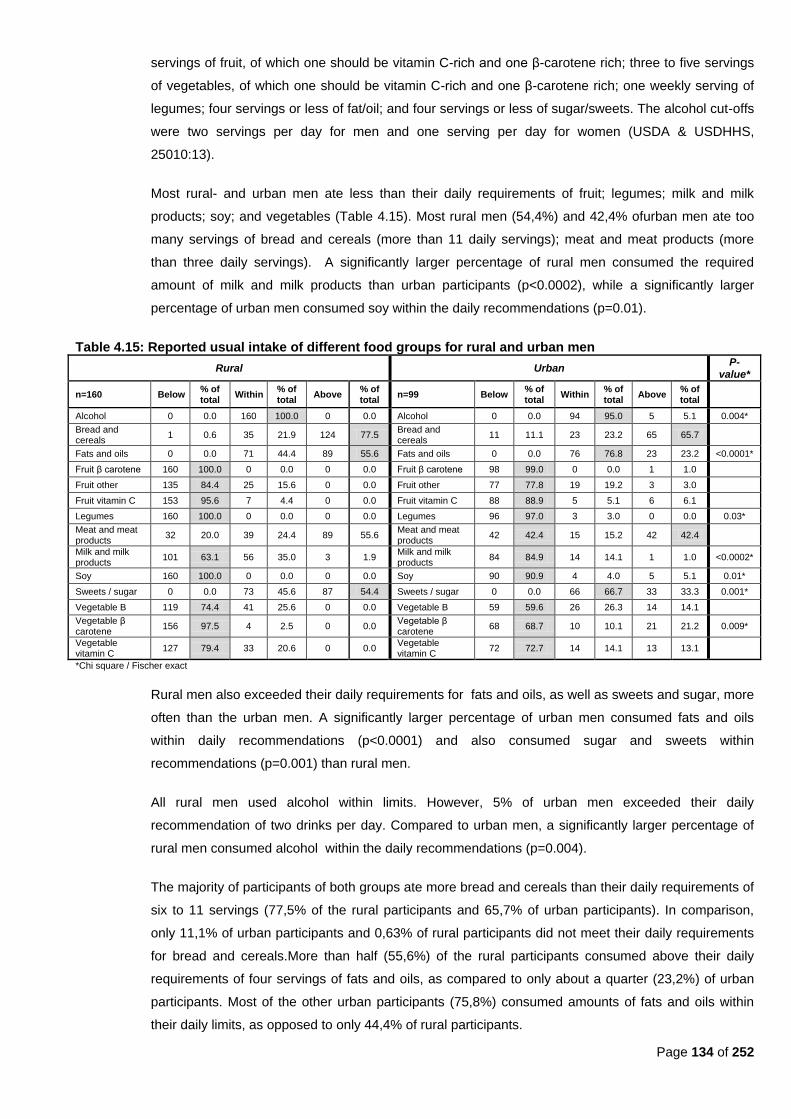
Page 134 of 252
servings of fruit, of which one should be vitamin C-rich and one β-carotene rich; three to five servings
of vegetables, of which one should be vitamin C-rich and one β-carotene rich; one weekly serving of
legumes; four servings or less of fat/oil; and four servings or less of sugar/sweets. The alcohol cut-offs
were two servings per day for men and one serving per day for women (USDA & USDHHS,
25010:13).
Most rural- and urban men ate less than their daily requirements of fruit; legumes; milk and milk
products; soy; and vegetables (Table 4.15). Most rural men (54,4%) and 42,4% ofurban men ate too
many servings of bread and cereals (more than 11 daily servings); meat and meat products (more
than three daily servings). A significantly larger percentage of rural men consumed the required
amount of milk and milk products than urban participants (p<0.0002), while a significantly larger
percentage of urban men consumed soy within the daily recommendations (p=0.01).
Table 4.15: Reported usual intake of different food groups for rural and urban men
Rural Urban P-
value*
n=160 Below % of total
Within % of total
Above % of total
n=99 Below % of total
Within % of total
Above % of total
Alcohol 0 0.0 160 100.0 0 0.0 Alcohol 0 0.0 94 95.0 5 5.1 0.004*
Bread and cereals
1 0.6 35 21.9 124 77.5 Bread and cereals
11 11.1 23 23.2 65 65.7
Fats and oils 0 0.0 71 44.4 89 55.6 Fats and oils 0 0.0 76 76.8 23 23.2 <0.0001*
Fruit β carotene 160 100.0 0 0.0 0 0.0 Fruit β carotene 98 99.0 0 0.0 1 1.0
Fruit other 135 84.4 25 15.6 0 0.0 Fruit other 77 77.8 19 19.2 3 3.0
Fruit vitamin C 153 95.6 7 4.4 0 0.0 Fruit vitamin C 88 88.9 5 5.1 6 6.1
Legumes 160 100.0 0 0.0 0 0.0 Legumes 96 97.0 3 3.0 0 0.0 0.03*
Meat and meat products
32 20.0 39 24.4 89 55.6 Meat and meat products
42 42.4 15 15.2 42 42.4
Milk and milk products
101 63.1 56 35.0 3 1.9 Milk and milk products
84 84.9 14 14.1 1 1.0 <0.0002*
Soy 160 100.0 0 0.0 0 0.0 Soy 90 90.9 4 4.0 5 5.1 0.01*
Sweets / sugar 0 0.0 73 45.6 87 54.4 Sweets / sugar 0 0.0 66 66.7 33 33.3 0.001*
Vegetable B 119 74.4 41 25.6 0 0.0 Vegetable B 59 59.6 26 26.3 14 14.1
Vegetable β carotene
156 97.5 4 2.5 0 0.0 Vegetable β carotene
68 68.7 10 10.1 21 21.2 0.009*
Vegetable vitamin C
127 79.4 33 20.6 0 0.0 Vegetable vitamin C
72 72.7 14 14.1 13 13.1
*Chi square / Fischer exact
Rural men also exceeded their daily requirements for fats and oils, as well as sweets and sugar, more
often than the urban men. A significantly larger percentage of urban men consumed fats and oils
within daily recommendations (p<0.0001) and also consumed sugar and sweets within
recommendations (p=0.001) than rural men.
All rural men used alcohol within limits. However, 5% of urban men exceeded their daily
recommendation of two drinks per day. Compared to urban men, a significantly larger percentage of
rural men consumed alcohol within the daily recommendations (p=0.004).
The majority of participants of both groups ate more bread and cereals than their daily requirements of
six to 11 servings (77,5% of the rural participants and 65,7% of urban participants). In comparison,
only 11,1% of urban participants and 0,63% of rural participants did not meet their daily requirements
for bread and cereals.More than half (55,6%) of the rural participants consumed above their daily
requirements of four servings of fats and oils, as compared to only about a quarter (23,2%) of urban
participants. Most of the other urban participants (75,8%) consumed amounts of fats and oils within
their daily limits, as opposed to only 44,4% of rural participants.
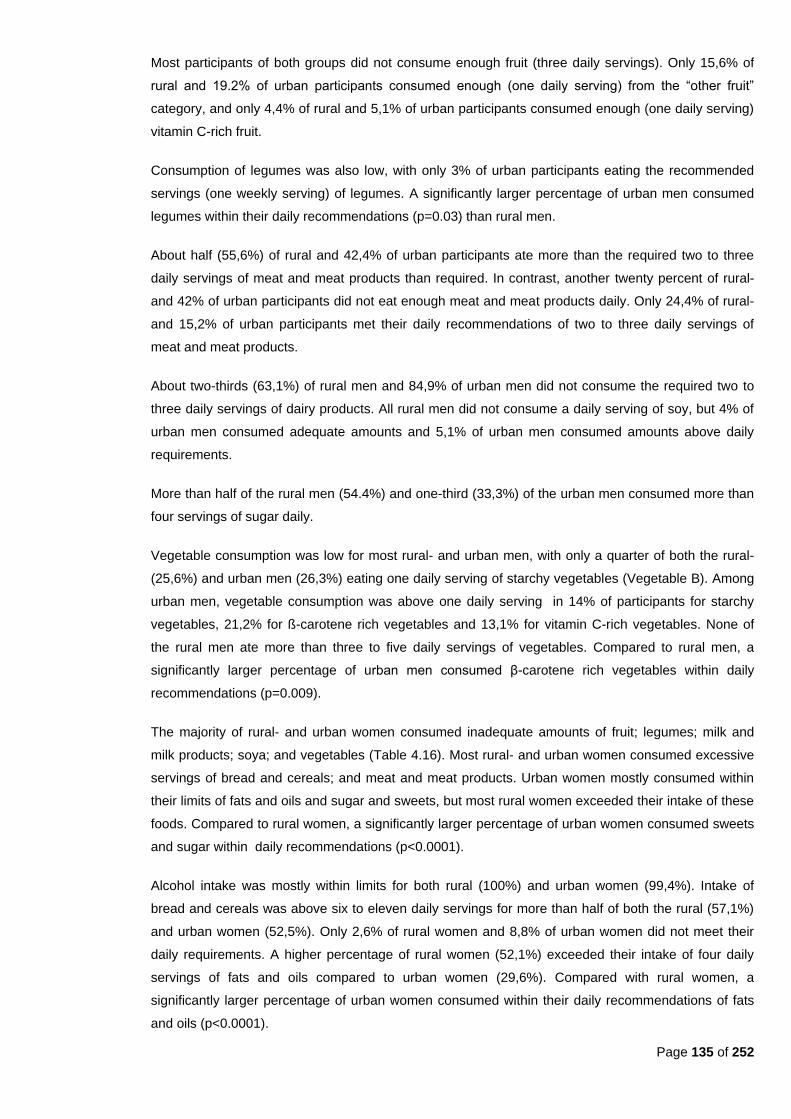
Page 135 of 252
Most participants of both groups did not consume enough fruit (three daily servings). Only 15,6% of
rural and 19.2% of urban participants consumed enough (one daily serving) from the ―other fruit‖
category, and only 4,4% of rural and 5,1% of urban participants consumed enough (one daily serving)
vitamin C-rich fruit.
Consumption of legumes was also low, with only 3% of urban participants eating the recommended
servings (one weekly serving) of legumes. A significantly larger percentage of urban men consumed
legumes within their daily recommendations (p=0.03) than rural men.
About half (55,6%) of rural and 42,4% of urban participants ate more than the required two to three
daily servings of meat and meat products than required. In contrast, another twenty percent of rural-
and 42% of urban participants did not eat enough meat and meat products daily. Only 24,4% of rural-
and 15,2% of urban participants met their daily recommendations of two to three daily servings of
meat and meat products.
About two-thirds (63,1%) of rural men and 84,9% of urban men did not consume the required two to
three daily servings of dairy products. All rural men did not consume a daily serving of soy, but 4% of
urban men consumed adequate amounts and 5,1% of urban men consumed amounts above daily
requirements.
More than half of the rural men (54.4%) and one-third (33,3%) of the urban men consumed more than
four servings of sugar daily.
Vegetable consumption was low for most rural- and urban men, with only a quarter of both the rural-
(25,6%) and urban men (26,3%) eating one daily serving of starchy vegetables (Vegetable B). Among
urban men, vegetable consumption was above one daily serving in 14% of participants for starchy
vegetables, 21,2% for ß-carotene rich vegetables and 13,1% for vitamin C-rich vegetables. None of
the rural men ate more than three to five daily servings of vegetables. Compared to rural men, a
significantly larger percentage of urban men consumed β-carotene rich vegetables within daily
recommendations (p=0.009).
The majority of rural- and urban women consumed inadequate amounts of fruit; legumes; milk and
milk products; soya; and vegetables (Table 4.16). Most rural- and urban women consumed excessive
servings of bread and cereals; and meat and meat products. Urban women mostly consumed within
their limits of fats and oils and sugar and sweets, but most rural women exceeded their intake of these
foods. Compared to rural women, a significantly larger percentage of urban women consumed sweets
and sugar within daily recommendations (p<0.0001).
Alcohol intake was mostly within limits for both rural (100%) and urban women (99,4%). Intake of
bread and cereals was above six to eleven daily servings for more than half of both the rural (57,1%)
and urban women (52,5%). Only 2,6% of rural women and 8,8% of urban women did not meet their
daily requirements. A higher percentage of rural women (52,1%) exceeded their intake of four daily
servings of fats and oils compared to urban women (29,6%). Compared with rural women, a
significantly larger percentage of urban women consumed within their daily recommendations of fats
and oils (p<0.0001).

Page 136 of 252
Table 4.16: Reported usual intake of different food groups for rural and urban women
Rural Urban P-
value*
n=389 Below % of total
Within % of total
Above % of total
n=320 Below % of total
Within % of total
Above % of total
Alcohol 0 0.0 389 100.0 0 0.0 Alcohol 0 0.0 318 99.4 2 0.6
Bread and cereals 10 2.6 157 40.4 222 57.1 Bread and cereals 28 8.8 124 38.8 168 52.5
Fats and oils 0 0.0 184 47.3 205 52.7 Fats and oils 2 0.6 223 69.7 95 29.7 <0.0001*
Fruit β carotene 388 99.7 1 0.3 0 0.0 Fruit β carotene 313 97.8 2 0.6 5 1.6
Fruit other 295 75.8 94 24.2 0 0.0 Fruit other 228 71.3 78 24.4 14 4.4
Fruit vitamin C 362 93.1 26 6.7 1 0.3 Fruit vitamin C 277 86.6 10 3.1 33 10.3 0.03*
Legumes 384 98.7 5 1.3 0 0.0 Legumes 305 95.3 9 2.8 6 1.9
Meat and meat products
71 18.3 122 31.4 196 50.4 Meat and meat products
114 35.6 83 25.9 123 38.4
Milk and milk products
265 68.1 119 30.6 5 1.3 Milk and milk products
275 85.9 36 11.3 9 2.8 <0.0001*
Soy 389 100.0 0 0.0 0 0.0 Soy 295 92.2 11 3.4 14 4.4 <0.0001*
Sweets / sugar 0 0.0 175 45.0 214 55.0 Sweets / sugar 2 0.6 214 66.9 104 32.5 <0.0001*
Vegetable B 235 60.4 154 39.6 0 0.0 Vegetable B 157 49.1 126 39.4 37 11.6
Vegetable β carotene
371 95.4 18 4.6 0 0.0 Vegetable β carotene
176 55.0 54 16.9 90 28.1 <0.0001*
Vegetable vitamin C
261 67.1 128 32.9 0 0.0 Vegetable vitamin C
216 67.5 48 15.0 56 17.5 <0.0001*
*Chi square/Fischer exact
As found in the other groups discussed previously, fruit intake was low, with only about a quarter of
both rural (24,2%) and urban (24,4%) women consuming one daily serving of ―other fruit.‖ A
significantly larger percentage of rural women consumed vitamin C rich fruit within daily
recommendations (p=0.03) than urban women.
Legumes intake was mostly low, with only 2,8% of urban women eating enough legumes and a further
1,9% exceeding the recommended one weekly serving. About half (50,4%) of rural women and a third
(38,4%) of urban women ate more than two to three daily servings of meat- and meat products. In
comparison, 18,3% of rural women and a third (35,6%) of urban women did not consume enough
meat- and meat products.
Results for dairy products are comparable to the men‘s intakes, with two-thirds (68,1%) of rural women
and 85,9% of urban women not consuming two to three daily servings of milk- and milk products. Only
1,3% of rural and 2,8% of urban women exceeded their daily requirements. Compared to urban
women, a significantly larger percentage of rural women consumed milk and milk products within daily
recommendations (p<0.0001).
All rural women ate less than one serving of soy. In contrast, 3,4% of urban women met and 4,4% of
urban women exceeded their daily requirements for soy. A significantly larger percentage of urban
women consumed soy within daily recommended servings (p<0.0001), compared to rural women.
More than half (55%) of rural women and a third (32,5%) of urban women used more than four daily
servings of sugar/sweets. More than a third of both rural- (39,6%) and urban (39,4%) women
consumed one daily serving of starchy vegetables (vegetable B) with a further 11,6% of urban women
exceeding the daily requirement. Intake of one daily serving of ß-carotene-rich vegetables was
comparatively low in rural women, whereas 16,9% of urban consumed adequate amounts and another
28,1% consumed more than one daily serving. A significantly larger percentage of urban women
consumed β-carotene-rich vegetables within daily recommendations than rural women (p<0.0001).

Page 137 of 252
Only one-third (32,9%) of rural women consumed one daily serving of vitamin C-rich vegetables as
opposed to 15% urban women meeting and another 17,5% exceeding their daily requirements for
vegetables from the vitamin C-rich group. Compared to urban women, a significantly larger percentage
of rural women consumed vitamin C-rich vegetables within daily recommendations (p<0.0001).
These findings agree with data in Tables 4.21 and 4.22, which shows that cooked porridge; sugar; full
cream milk; tea; bread; and margarine/oil/fat mostly fell within the top ten of the most frequently
consumed food items among these adults.
4.1.3 Reported usual intake of different food items
Reported usual intake of different food items were obtained by means of a food frequency questionnaire.
There were 26 different food items ranked in order of frequency consumed per month, with the most
frequently consumed item ranked as first. Results were calculated for three groups, namely: children
younger than two years; children older than two years; and adults (25 to 64 years old).
4.1.3.1 Children younger than two years
Reported usual intake of different food items were calculated for ten rural children (4 boys and 6 girls)
and 34 rural children (16 boys and 18 girls) in the group younger than two years old. Since the sample
sizes were small, caution should be taken when interpreting the results as set out in Table 4.17 and
Table 4.18. Median amounts instead of means were used, because data was not always distributed
normally. No confidence intervals for differences between urban and rural children were calculated,
since the sample sizes were too small.
Tea, cooked porridge, margarine/oil, salt/stock, bread, fruit, and vegetables were all ranked in the top
ten items consumed by both rural and urban boys younger than two years old. Rural boys consumed
full cream milk more often than boys, whereas urban boys consumed more fruit than rural boys. Rural
boys also consumed coffee creamer and cakes/biscuits more often than urban boys.
Cooked porridge, tea, margarine/oil, salt/stock, vegetables, bread, and fruit were within the top ten
items most frequently consumed by both rural and urban girls younger than two years old. Rural girls
consumed fruit and chips/crisps more often than urban girls, whereas urban girls consumed full cream
milk more often than rural girls.
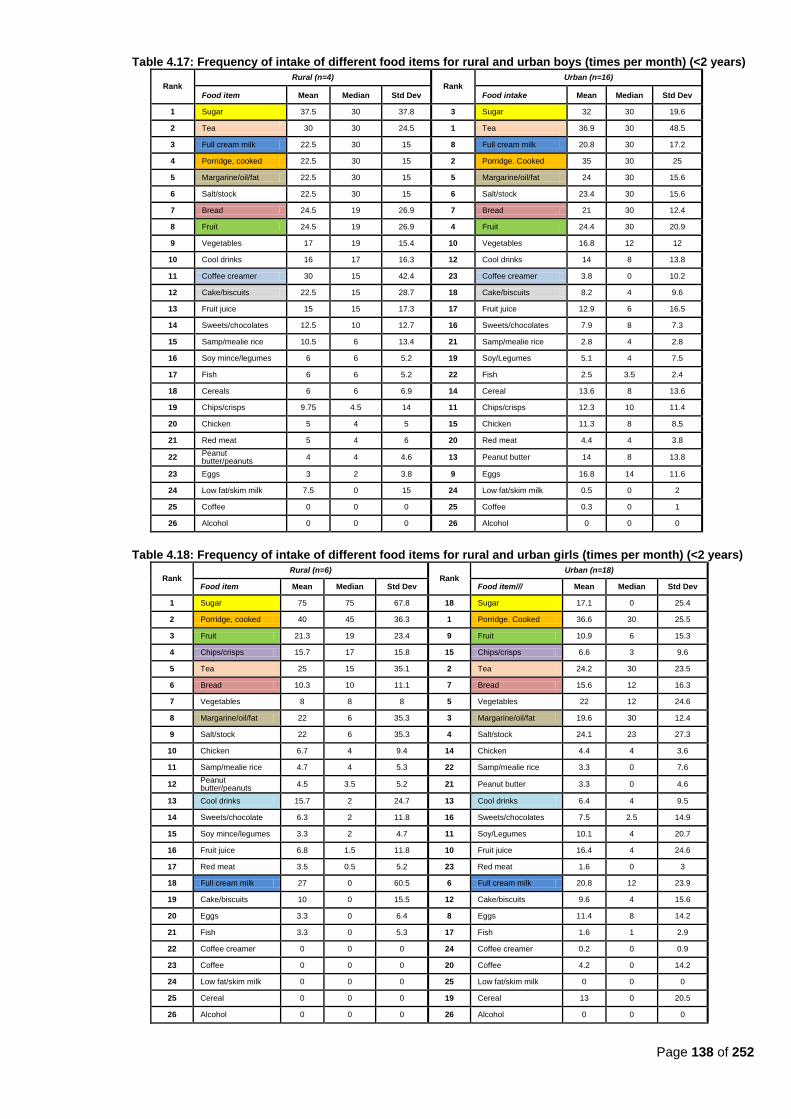
Page 138 of 252
Table 4.17: Frequency of intake of different food items for rural and urban boys (times per month) (<2 years)
Rank Rural (n=4)
Rank Urban (n=16)
Food item Mean Median Std Dev Food intake Mean Median Std Dev
1 Sugar 37.5 30 37.8 3 Sugar 32 30 19.6
2 Tea 30 30 24.5 1 Tea 36.9 30 48.5
3 Full cream milk 22.5 30 15 8 Full cream milk 20.8 30 17.2
4 Porridge, cooked 22.5 30 15 2 Porridge. Cooked 35 30 25
5 Margarine/oil/fat 22.5 30 15 5 Margarine/oil/fat 24 30 15.6
6 Salt/stock 22.5 30 15 6 Salt/stock 23.4 30 15.6
7 Bread 24.5 19 26.9 7 Bread 21 30 12.4
8 Fruit 24.5 19 26.9 4 Fruit 24.4 30 20.9
9 Vegetables 17 19 15.4 10 Vegetables 16.8 12 12
10 Cool drinks 16 17 16.3 12 Cool drinks 14 8 13.8
11 Coffee creamer 30 15 42.4 23 Coffee creamer 3.8 0 10.2
12 Cake/biscuits 22.5 15 28.7 18 Cake/biscuits 8.2 4 9.6
13 Fruit juice 15 15 17.3 17 Fruit juice 12.9 6 16.5
14 Sweets/chocolates 12.5 10 12.7 16 Sweets/chocolates 7.9 8 7.3
15 Samp/mealie rice 10.5 6 13.4 21 Samp/mealie rice 2.8 4 2.8
16 Soy mince/legumes 6 6 5.2 19 Soy/Legumes 5.1 4 7.5
17 Fish 6 6 5.2 22 Fish 2.5 3.5 2.4
18 Cereals 6 6 6.9 14 Cereal 13.6 8 13.6
19 Chips/crisps 9.75 4.5 14 11 Chips/crisps 12.3 10 11.4
20 Chicken 5 4 5 15 Chicken 11.3 8 8.5
21 Red meat 5 4 6 20 Red meat 4.4 4 3.8
22 Peanut butter/peanuts
4 4 4.6 13 Peanut butter 14 8 13.8
23 Eggs 3 2 3.8 9 Eggs 16.8 14 11.6
24 Low fat/skim milk 7.5 0 15 24 Low fat/skim milk 0.5 0 2
25 Coffee 0 0 0 25 Coffee 0.3 0 1
26 Alcohol 0 0 0 26 Alcohol 0 0 0
Table 4.18: Frequency of intake of different food items for rural and urban girls (times per month) (<2 years)
Rank Rural (n=6)
Rank Urban (n=18)
Food item Mean Median Std Dev Food item/// Mean Median Std Dev
1 Sugar 75 75 67.8 18 Sugar 17.1 0 25.4
2 Porridge, cooked 40 45 36.3 1 Porridge. Cooked 36.6 30 25.5
3 Fruit 21.3 19 23.4 9 Fruit 10.9 6 15.3
4 Chips/crisps 15.7 17 15.8 15 Chips/crisps 6.6 3 9.6
5 Tea 25 15 35.1 2 Tea 24.2 30 23.5
6 Bread 10.3 10 11.1 7 Bread 15.6 12 16.3
7 Vegetables 8 8 8 5 Vegetables 22 12 24.6
8 Margarine/oil/fat 22 6 35.3 3 Margarine/oil/fat 19.6 30 12.4
9 Salt/stock 22 6 35.3 4 Salt/stock 24.1 23 27.3
10 Chicken 6.7 4 9.4 14 Chicken 4.4 4 3.6
11 Samp/mealie rice 4.7 4 5.3 22 Samp/mealie rice 3.3 0 7.6
12 Peanut butter/peanuts
4.5 3.5 5.2 21 Peanut butter 3.3 0 4.6
13 Cool drinks 15.7 2 24.7 13 Cool drinks 6.4 4 9.5
14 Sweets/chocolate 6.3 2 11.8 16 Sweets/chocolates 7.5 2.5 14.9
15 Soy mince/legumes 3.3 2 4.7 11 Soy/Legumes 10.1 4 20.7
16 Fruit juice 6.8 1.5 11.8 10 Fruit juice 16.4 4 24.6
17 Red meat 3.5 0.5 5.2 23 Red meat 1.6 0 3
18 Full cream milk 27 0 60.5 6 Full cream milk 20.8 12 23.9
19 Cake/biscuits 10 0 15.5 12 Cake/biscuits 9.6 4 15.6
20 Eggs 3.3 0 6.4 8 Eggs 11.4 8 14.2
21 Fish 3.3 0 5.3 17 Fish 1.6 1 2.9
22 Coffee creamer 0 0 0 24 Coffee creamer 0.2 0 0.9
23 Coffee 0 0 0 20 Coffee 4.2 0 14.2
24 Low fat/skim milk 0 0 0 25 Low fat/skim milk 0 0 0
25 Cereal 0 0 0 19 Cereal 13 0 20.5
26 Alcohol 0 0 0 26 Alcohol 0 0 0
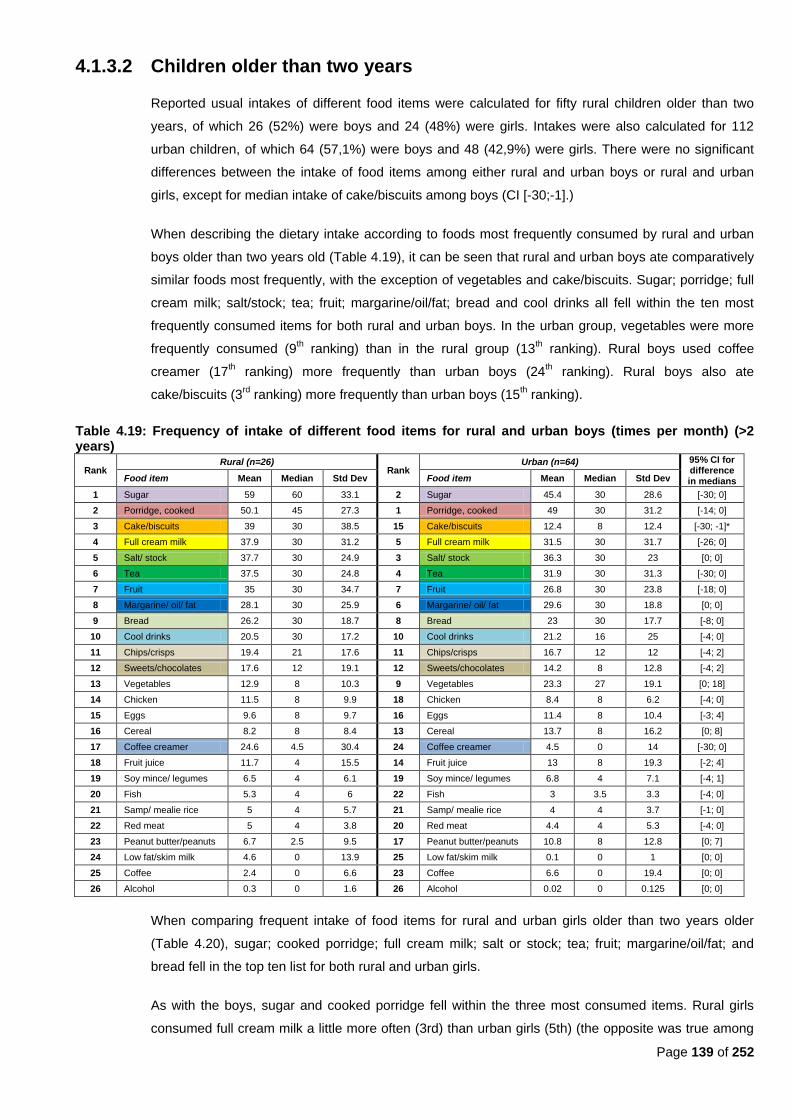
Page 139 of 252
4.1.3.2 Children older than two years
Reported usual intakes of different food items were calculated for fifty rural children older than two
years, of which 26 (52%) were boys and 24 (48%) were girls. Intakes were also calculated for 112
urban children, of which 64 (57,1%) were boys and 48 (42,9%) were girls. There were no significant
differences between the intake of food items among either rural and urban boys or rural and urban
girls, except for median intake of cake/biscuits among boys (CI [-30;-1].)
When describing the dietary intake according to foods most frequently consumed by rural and urban
boys older than two years old (Table 4.19), it can be seen that rural and urban boys ate comparatively
similar foods most frequently, with the exception of vegetables and cake/biscuits. Sugar; porridge; full
cream milk; salt/stock; tea; fruit; margarine/oil/fat; bread and cool drinks all fell within the ten most
frequently consumed items for both rural and urban boys. In the urban group, vegetables were more
frequently consumed (9th ranking) than in the rural group (13
th ranking). Rural boys used coffee
creamer (17th ranking) more frequently than urban boys (24
th ranking). Rural boys also ate
cake/biscuits (3rd
ranking) more frequently than urban boys (15th ranking).
Table 4.19: Frequency of intake of different food items for rural and urban boys (times per month) (>2 years)
Rank Rural (n=26)
Rank Urban (n=64) 95% CI for
difference in medians Food item Mean Median Std Dev Food item Mean Median Std Dev
1 Sugar 59 60 33.1 2 Sugar 45.4 30 28.6 [-30; 0]
2 Porridge, cooked 50.1 45 27.3 1 Porridge, cooked 49 30 31.2 [-14; 0]
3 Cake/biscuits 39 30 38.5 15 Cake/biscuits 12.4 8 12.4 [-30; -1]*
4 Full cream milk 37.9 30 31.2 5 Full cream milk 31.5 30 31.7 [-26; 0]
5 Salt/ stock 37.7 30 24.9 3 Salt/ stock 36.3 30 23 [0; 0]
6 Tea 37.5 30 24.8 4 Tea 31.9 30 31.3 [-30; 0]
7 Fruit 35 30 34.7 7 Fruit 26.8 30 23.8 [-18; 0]
8 Margarine/ oil/ fat 28.1 30 25.9 6 Margarine/ oil/ fat 29.6 30 18.8 [0; 0]
9 Bread 26.2 30 18.7 8 Bread 23 30 17.7 [-8; 0]
10 Cool drinks 20.5 30 17.2 10 Cool drinks 21.2 16 25 [-4; 0]
11 Chips/crisps 19.4 21 17.6 11 Chips/crisps 16.7 12 12 [-4; 2]
12 Sweets/chocolates 17.6 12 19.1 12 Sweets/chocolates 14.2 8 12.8 [-4; 2]
13 Vegetables 12.9 8 10.3 9 Vegetables 23.3 27 19.1 [0; 18]
14 Chicken 11.5 8 9.9 18 Chicken 8.4 8 6.2 [-4; 0]
15 Eggs 9.6 8 9.7 16 Eggs 11.4 8 10.4 [-3; 4]
16 Cereal 8.2 8 8.4 13 Cereal 13.7 8 16.2 [0; 8]
17 Coffee creamer 24.6 4.5 30.4 24 Coffee creamer 4.5 0 14 [-30; 0]
18 Fruit juice 11.7 4 15.5 14 Fruit juice 13 8 19.3 [-2; 4]
19 Soy mince/ legumes 6.5 4 6.1 19 Soy mince/ legumes 6.8 4 7.1 [-4; 1]
20 Fish 5.3 4 6 22 Fish 3 3.5 3.3 [-4; 0]
21 Samp/ mealie rice 5 4 5.7 21 Samp/ mealie rice 4 4 3.7 [-1; 0]
22 Red meat 5 4 3.8 20 Red meat 4.4 4 5.3 [-4; 0]
23 Peanut butter/peanuts 6.7 2.5 9.5 17 Peanut butter/peanuts 10.8 8 12.8 [0; 7]
24 Low fat/skim milk 4.6 0 13.9 25 Low fat/skim milk 0.1 0 1 [0; 0]
25 Coffee 2.4 0 6.6 23 Coffee 6.6 0 19.4 [0; 0]
26 Alcohol 0.3 0 1.6 26 Alcohol 0.02 0 0.125 [0; 0]
When comparing frequent intake of food items for rural and urban girls older than two years older
(Table 4.20), sugar; cooked porridge; full cream milk; salt or stock; tea; fruit; margarine/oil/fat; and
bread fell in the top ten list for both rural and urban girls.
As with the boys, sugar and cooked porridge fell within the three most consumed items. Rural girls
consumed full cream milk a little more often (3rd) than urban girls (5th) (the opposite was true among
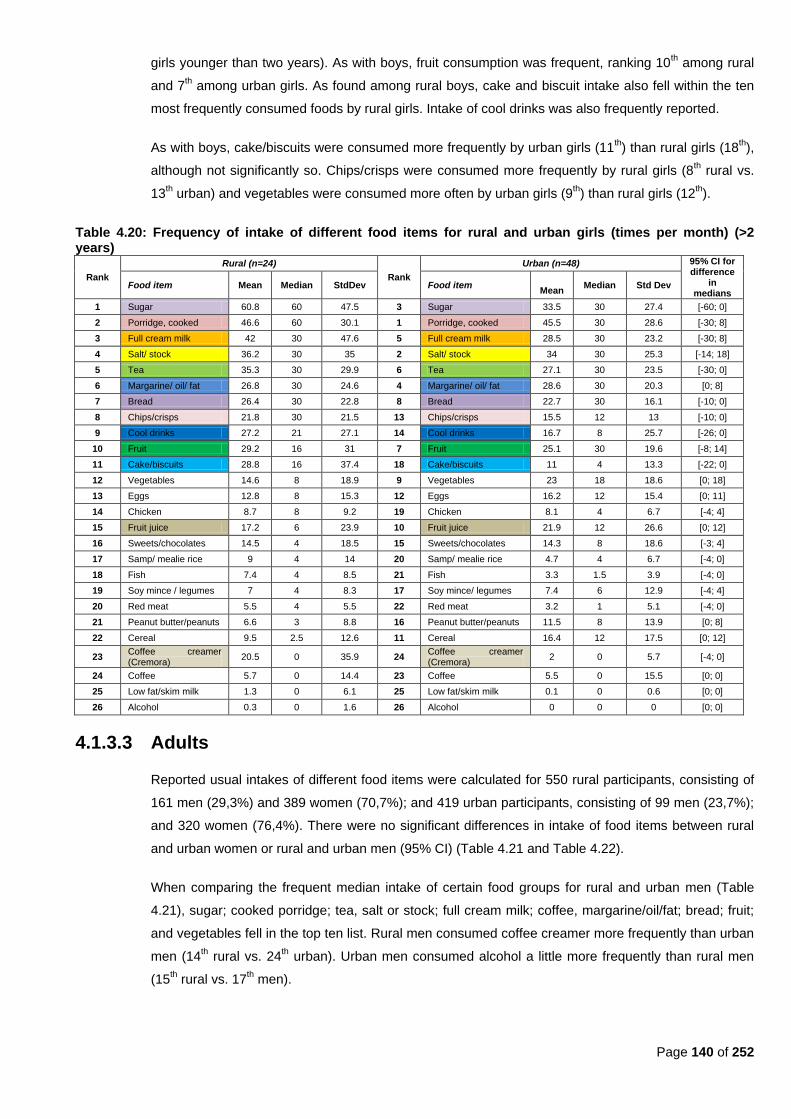
Page 140 of 252
girls younger than two years). As with boys, fruit consumption was frequent, ranking 10th among rural
and 7th among urban girls. As found among rural boys, cake and biscuit intake also fell within the ten
most frequently consumed foods by rural girls. Intake of cool drinks was also frequently reported.
As with boys, cake/biscuits were consumed more frequently by urban girls (11th) than rural girls (18
th),
although not significantly so. Chips/crisps were consumed more frequently by rural girls (8th rural vs.
13th urban) and vegetables were consumed more often by urban girls (9
th) than rural girls (12
th).
Table 4.20: Frequency of intake of different food items for rural and urban girls (times per month) (>2 years)
Rank
Rural (n=24)
Rank
Urban (n=48) 95% CI for difference
in medians
Food item Mean Median StdDev Food item
Mean Median Std Dev
1 Sugar 60.8 60 47.5 3 Sugar 33.5 30 27.4 [-60; 0]
2 Porridge, cooked 46.6 60 30.1 1 Porridge, cooked 45.5 30 28.6 [-30; 8]
3 Full cream milk 42 30 47.6 5 Full cream milk 28.5 30 23.2 [-30; 8]
4 Salt/ stock 36.2 30 35 2 Salt/ stock 34 30 25.3 [-14; 18]
5 Tea 35.3 30 29.9 6 Tea 27.1 30 23.5 [-30; 0]
6 Margarine/ oil/ fat 26.8 30 24.6 4 Margarine/ oil/ fat 28.6 30 20.3 [0; 8]
7 Bread 26.4 30 22.8 8 Bread 22.7 30 16.1 [-10; 0]
8 Chips/crisps 21.8 30 21.5 13 Chips/crisps 15.5 12 13 [-10; 0]
9 Cool drinks 27.2 21 27.1 14 Cool drinks 16.7 8 25.7 [-26; 0]
10 Fruit 29.2 16 31 7 Fruit 25.1 30 19.6 [-8; 14]
11 Cake/biscuits 28.8 16 37.4 18 Cake/biscuits 11 4 13.3 [-22; 0]
12 Vegetables 14.6 8 18.9 9 Vegetables 23 18 18.6 [0; 18]
13 Eggs 12.8 8 15.3 12 Eggs 16.2 12 15.4 [0; 11]
14 Chicken 8.7 8 9.2 19 Chicken 8.1 4 6.7 [-4; 4]
15 Fruit juice 17.2 6 23.9 10 Fruit juice 21.9 12 26.6 [0; 12]
16 Sweets/chocolates 14.5 4 18.5 15 Sweets/chocolates 14.3 8 18.6 [-3; 4]
17 Samp/ mealie rice 9 4 14 20 Samp/ mealie rice 4.7 4 6.7 [-4; 0]
18 Fish 7.4 4 8.5 21 Fish 3.3 1.5 3.9 [-4; 0]
19 Soy mince / legumes 7 4 8.3 17 Soy mince/ legumes 7.4 6 12.9 [-4; 4]
20 Red meat 5.5 4 5.5 22 Red meat 3.2 1 5.1 [-4; 0]
21 Peanut butter/peanuts 6.6 3 8.8 16 Peanut butter/peanuts 11.5 8 13.9 [0; 8]
22 Cereal 9.5 2.5 12.6 11 Cereal 16.4 12 17.5 [0; 12]
23 Coffee creamer (Cremora)
20.5 0 35.9 24 Coffee creamer (Cremora)
2 0 5.7 [-4; 0]
24 Coffee 5.7 0 14.4 23 Coffee 5.5 0 15.5 [0; 0]
25 Low fat/skim milk 1.3 0 6.1 25 Low fat/skim milk 0.1 0 0.6 [0; 0]
26 Alcohol 0.3 0 1.6 26 Alcohol 0 0 0 [0; 0]
4.1.3.3 Adults
Reported usual intakes of different food items were calculated for 550 rural participants, consisting of
161 men (29,3%) and 389 women (70,7%); and 419 urban participants, consisting of 99 men (23,7%);
and 320 women (76,4%). There were no significant differences in intake of food items between rural
and urban women or rural and urban men (95% CI) (Table 4.21 and Table 4.22).
When comparing the frequent median intake of certain food groups for rural and urban men (Table
4.21), sugar; cooked porridge; tea, salt or stock; full cream milk; coffee, margarine/oil/fat; bread; fruit;
and vegetables fell in the top ten list. Rural men consumed coffee creamer more frequently than urban
men (14th rural vs. 24
th urban). Urban men consumed alcohol a little more frequently than rural men
(15th rural vs. 17
th men).
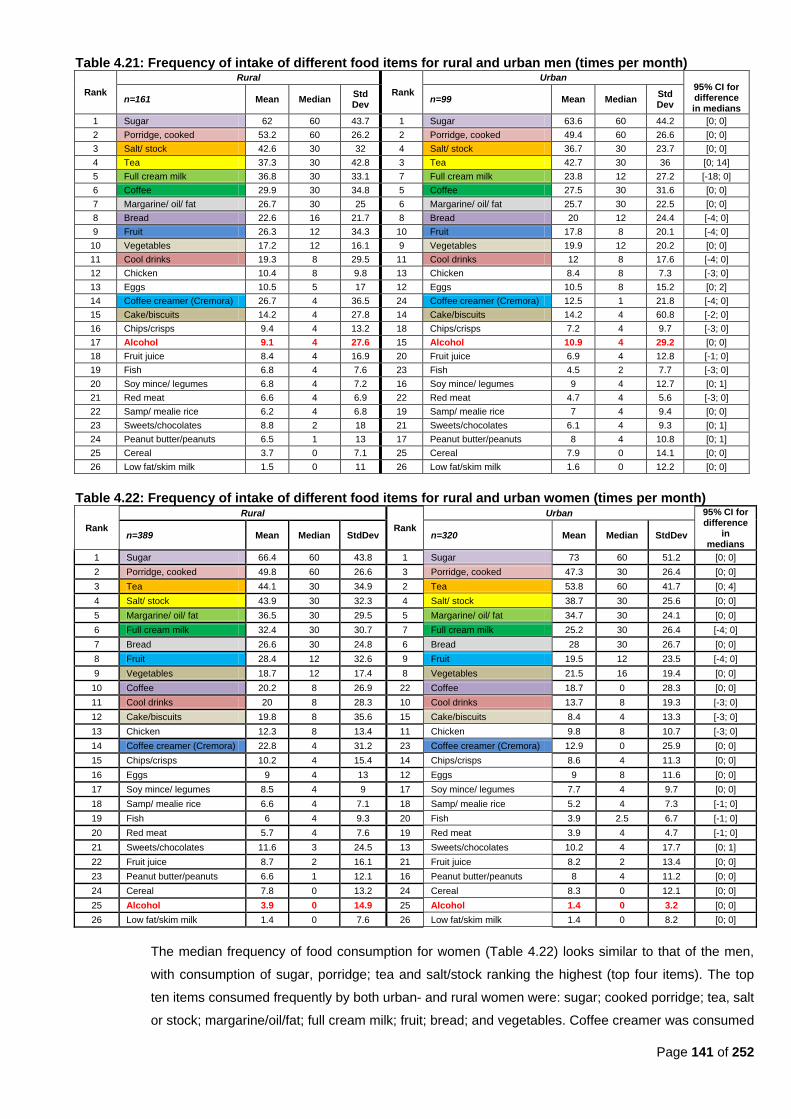
Page 141 of 252
Table 4.21: Frequency of intake of different food items for rural and urban men (times per month)
Rank
Rural
Rank
Urban 95% CI for difference in medians
n=161 Mean Median Std Dev
n=99 Mean Median Std Dev
1 Sugar 62 60 43.7 1 Sugar 63.6 60 44.2 [0; 0]
2 Porridge, cooked 53.2 60 26.2 2 Porridge, cooked 49.4 60 26.6 [0; 0]
3 Salt/ stock 42.6 30 32 4 Salt/ stock 36.7 30 23.7 [0; 0]
4 Tea 37.3 30 42.8 3 Tea 42.7 30 36 [0; 14]
5 Full cream milk 36.8 30 33.1 7 Full cream milk 23.8 12 27.2 [-18; 0]
6 Coffee 29.9 30 34.8 5 Coffee 27.5 30 31.6 [0; 0]
7 Margarine/ oil/ fat 26.7 30 25 6 Margarine/ oil/ fat 25.7 30 22.5 [0; 0]
8 Bread 22.6 16 21.7 8 Bread 20 12 24.4 [-4; 0]
9 Fruit 26.3 12 34.3 10 Fruit 17.8 8 20.1 [-4; 0]
10 Vegetables 17.2 12 16.1 9 Vegetables 19.9 12 20.2 [0; 0]
11 Cool drinks 19.3 8 29.5 11 Cool drinks 12 8 17.6 [-4; 0]
12 Chicken 10.4 8 9.8 13 Chicken 8.4 8 7.3 [-3; 0]
13 Eggs 10.5 5 17 12 Eggs 10.5 8 15.2 [0; 2]
14 Coffee creamer (Cremora) 26.7 4 36.5 24 Coffee creamer (Cremora) 12.5 1 21.8 [-4; 0]
15 Cake/biscuits 14.2 4 27.8 14 Cake/biscuits 14.2 4 60.8 [-2; 0]
16 Chips/crisps 9.4 4 13.2 18 Chips/crisps 7.2 4 9.7 [-3; 0]
17 Alcohol 9.1 4 27.6 15 Alcohol 10.9 4 29.2 [0; 0]
18 Fruit juice 8.4 4 16.9 20 Fruit juice 6.9 4 12.8 [-1; 0]
19 Fish 6.8 4 7.6 23 Fish 4.5 2 7.7 [-3; 0]
20 Soy mince/ legumes 6.8 4 7.2 16 Soy mince/ legumes 9 4 12.7 [0; 1]
21 Red meat 6.6 4 6.9 22 Red meat 4.7 4 5.6 [-3; 0]
22 Samp/ mealie rice 6.2 4 6.8 19 Samp/ mealie rice 7 4 9.4 [0; 0]
23 Sweets/chocolates 8.8 2 18 21 Sweets/chocolates 6.1 4 9.3 [0; 1]
24 Peanut butter/peanuts 6.5 1 13 17 Peanut butter/peanuts 8 4 10.8 [0; 1]
25 Cereal 3.7 0 7.1 25 Cereal 7.9 0 14.1 [0; 0]
26 Low fat/skim milk 1.5 0 11 26 Low fat/skim milk 1.6 0 12.2 [0; 0]
Table 4.22: Frequency of intake of different food items for rural and urban women (times per month)
Rank
Rural
Rank
Urban 95% CI for difference
in medians
n=389 Mean Median StdDev n=320 Mean Median StdDev
1 Sugar 66.4 60 43.8 1 Sugar 73 60 51.2 [0; 0]
2 Porridge, cooked 49.8 60 26.6 3 Porridge, cooked 47.3 30 26.4 [0; 0]
3 Tea 44.1 30 34.9 2 Tea 53.8 60 41.7 [0; 4]
4 Salt/ stock 43.9 30 32.3 4 Salt/ stock 38.7 30 25.6 [0; 0]
5 Margarine/ oil/ fat 36.5 30 29.5 5 Margarine/ oil/ fat 34.7 30 24.1 [0; 0]
6 Full cream milk 32.4 30 30.7 7 Full cream milk 25.2 30 26.4 [-4; 0]
7 Bread 26.6 30 24.8 6 Bread 28 30 26.7 [0; 0]
8 Fruit 28.4 12 32.6 9 Fruit 19.5 12 23.5 [-4; 0]
9 Vegetables 18.7 12 17.4 8 Vegetables 21.5 16 19.4 [0; 0]
10 Coffee 20.2 8 26.9 22 Coffee 18.7 0 28.3 [0; 0]
11 Cool drinks 20 8 28.3 10 Cool drinks 13.7 8 19.3 [-3; 0]
12 Cake/biscuits 19.8 8 35.6 15 Cake/biscuits 8.4 4 13.3 [-3; 0]
13 Chicken 12.3 8 13.4 11 Chicken 9.8 8 10.7 [-3; 0]
14 Coffee creamer (Cremora) 22.8 4 31.2 23 Coffee creamer (Cremora) 12.9 0 25.9 [0; 0]
15 Chips/crisps 10.2 4 15.4 14 Chips/crisps 8.6 4 11.3 [0; 0]
16 Eggs 9 4 13 12 Eggs 9 8 11.6 [0; 0]
17 Soy mince/ legumes 8.5 4 9 17 Soy mince/ legumes 7.7 4 9.7 [0; 0]
18 Samp/ mealie rice 6.6 4 7.1 18 Samp/ mealie rice 5.2 4 7.3 [-1; 0]
19 Fish 6 4 9.3 20 Fish 3.9 2.5 6.7 [-1; 0]
20 Red meat 5.7 4 7.6 19 Red meat 3.9 4 4.7 [-1; 0]
21 Sweets/chocolates 11.6 3 24.5 13 Sweets/chocolates 10.2 4 17.7 [0; 1]
22 Fruit juice 8.7 2 16.1 21 Fruit juice 8.2 2 13.4 [0; 0]
23 Peanut butter/peanuts 6.6 1 12.1 16 Peanut butter/peanuts 8 4 11.2 [0; 0]
24 Cereal 7.8 0 13.2 24 Cereal 8.3 0 12.1 [0; 0]
25 Alcohol 3.9 0 14.9 25 Alcohol 1.4 0 3.2 [0; 0]
26 Low fat/skim milk 1.4 0 7.6 26 Low fat/skim milk 1.4 0 8.2 [0; 0]
The median frequency of food consumption for women (Table 4.22) looks similar to that of the men,
with consumption of sugar, porridge; tea and salt/stock ranking the highest (top four items). The top
ten items consumed frequently by both urban- and rural women were: sugar; cooked porridge; tea, salt
or stock; margarine/oil/fat; full cream milk; fruit; bread; and vegetables. Coffee creamer was consumed
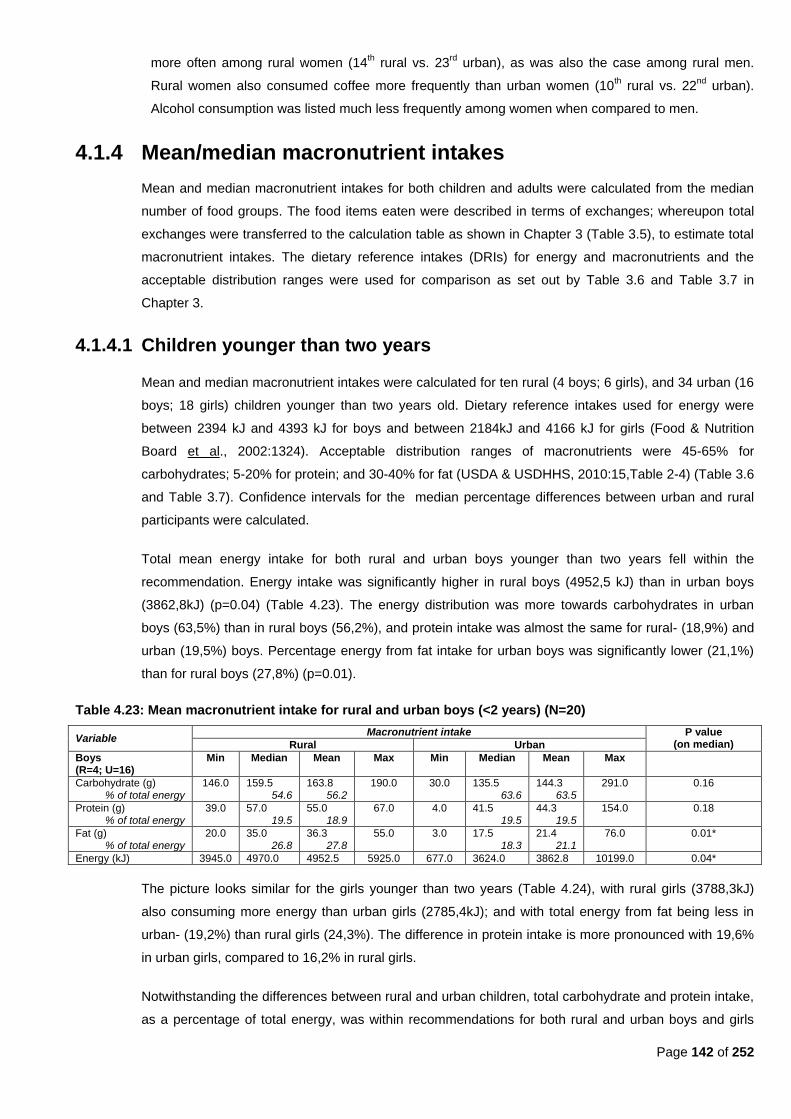
Page 142 of 252
more often among rural women (14th rural vs. 23
rd urban), as was also the case among rural men.
Rural women also consumed coffee more frequently than urban women (10th rural vs. 22
nd urban).
Alcohol consumption was listed much less frequently among women when compared to men.
4.1.4 Mean/median macronutrient intakes
Mean and median macronutrient intakes for both children and adults were calculated from the median
number of food groups. The food items eaten were described in terms of exchanges; whereupon total
exchanges were transferred to the calculation table as shown in Chapter 3 (Table 3.5), to estimate total
macronutrient intakes. The dietary reference intakes (DRIs) for energy and macronutrients and the
acceptable distribution ranges were used for comparison as set out by Table 3.6 and Table 3.7 in
Chapter 3.
4.1.4.1 Children younger than two years
Mean and median macronutrient intakes were calculated for ten rural (4 boys; 6 girls), and 34 urban (16
boys; 18 girls) children younger than two years old. Dietary reference intakes used for energy were
between 2394 kJ and 4393 kJ for boys and between 2184kJ and 4166 kJ for girls (Food & Nutrition
Board et al., 2002:1324). Acceptable distribution ranges of macronutrients were 45-65% for
carbohydrates; 5-20% for protein; and 30-40% for fat (USDA & USDHHS, 2010:15,Table 2-4) (Table 3.6
and Table 3.7). Confidence intervals for the median percentage differences between urban and rural
participants were calculated.
Total mean energy intake for both rural and urban boys younger than two years fell within the
recommendation. Energy intake was significantly higher in rural boys (4952,5 kJ) than in urban boys
(3862,8kJ) (p=0.04) (Table 4.23). The energy distribution was more towards carbohydrates in urban
boys (63,5%) than in rural boys (56,2%), and protein intake was almost the same for rural- (18,9%) and
urban (19,5%) boys. Percentage energy from fat intake for urban boys was significantly lower (21,1%)
than for rural boys (27,8%) (p=0.01).
Table 4.23: Mean macronutrient intake for rural and urban boys (<2 years) (N=20)
Variable Macronutrient intake P value
(on median) Rural Urban
Boys (R=4; U=16)
Min Median Mean Max Min Median Mean Max
Carbohydrate (g) % of total energy
146.0 159.5 54.6
163.8 56.2
190.0 30.0 135.5 63.6
144.3 63.5
291.0 0.16
Protein (g) % of total energy
39.0 57.0 19.5
55.0 18.9
67.0 4.0 41.5 19.5
44.3 19.5
154.0 0.18
Fat (g) % of total energy
20.0 35.0 26.8
36.3 27.8
55.0 3.0 17.5 18.3
21.4 21.1
76.0 0.01*
Energy (kJ) 3945.0 4970.0 4952.5 5925.0 677.0 3624.0 3862.8 10199.0 0.04*
The picture looks similar for the girls younger than two years (Table 4.24), with rural girls (3788,3kJ)
also consuming more energy than urban girls (2785,4kJ); and with total energy from fat being less in
urban- (19,2%) than rural girls (24,3%). The difference in protein intake is more pronounced with 19,6%
in urban girls, compared to 16,2% in rural girls.
Notwithstanding the differences between rural and urban children, total carbohydrate and protein intake,
as a percentage of total energy, was within recommendations for both rural and urban boys and girls
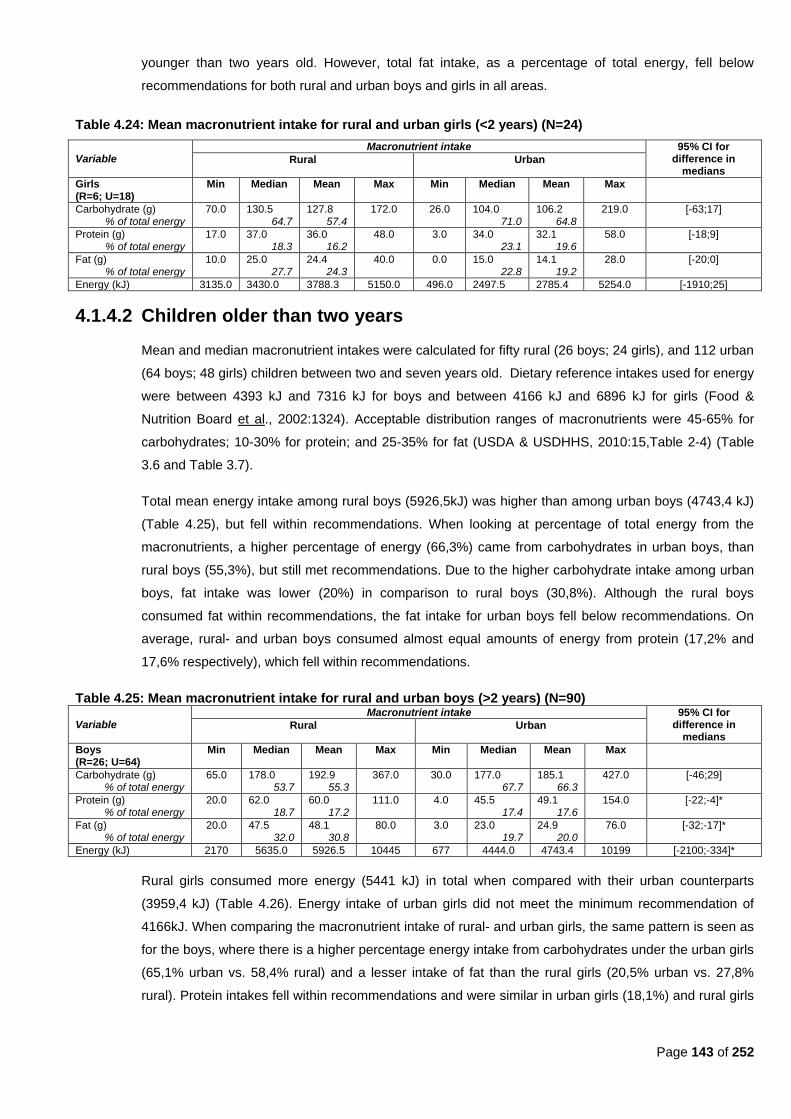
Page 143 of 252
younger than two years old. However, total fat intake, as a percentage of total energy, fell below
recommendations for both rural and urban boys and girls in all areas.
Table 4.24: Mean macronutrient intake for rural and urban girls (<2 years) (N=24)
Variable Macronutrient intake 95% CI for
difference in medians
Rural Urban
Girls (R=6; U=18)
Min Median Mean Max Min Median Mean Max
Carbohydrate (g) % of total energy
70.0 130.5 64.7
127.8 57.4
172.0 26.0 104.0 71.0
106.2 64.8
219.0 [-63;17]
Protein (g) % of total energy
17.0 37.0 18.3
36.0 16.2
48.0 3.0 34.0 23.1
32.1 19.6
58.0 [-18;9]
Fat (g) % of total energy
10.0 25.0 27.7
24.4 24.3
40.0 0.0 15.0 22.8
14.1 19.2
28.0 [-20;0]
Energy (kJ) 3135.0 3430.0 3788.3 5150.0 496.0 2497.5 2785.4 5254.0 [-1910;25]
4.1.4.2 Children older than two years
Mean and median macronutrient intakes were calculated for fifty rural (26 boys; 24 girls), and 112 urban
(64 boys; 48 girls) children between two and seven years old. Dietary reference intakes used for energy
were between 4393 kJ and 7316 kJ for boys and between 4166 kJ and 6896 kJ for girls (Food &
Nutrition Board et al., 2002:1324). Acceptable distribution ranges of macronutrients were 45-65% for
carbohydrates; 10-30% for protein; and 25-35% for fat (USDA & USDHHS, 2010:15,Table 2-4) (Table
3.6 and Table 3.7).
Total mean energy intake among rural boys (5926,5kJ) was higher than among urban boys (4743,4 kJ)
(Table 4.25), but fell within recommendations. When looking at percentage of total energy from the
macronutrients, a higher percentage of energy (66,3%) came from carbohydrates in urban boys, than
rural boys (55,3%), but still met recommendations. Due to the higher carbohydrate intake among urban
boys, fat intake was lower (20%) in comparison to rural boys (30,8%). Although the rural boys
consumed fat within recommendations, the fat intake for urban boys fell below recommendations. On
average, rural- and urban boys consumed almost equal amounts of energy from protein (17,2% and
17,6% respectively), which fell within recommendations.
Table 4.25: Mean macronutrient intake for rural and urban boys (>2 years) (N=90)
Variable Macronutrient intake 95% CI for
difference in medians
Rural Urban
Boys (R=26; U=64)
Min Median Mean Max Min Median Mean Max
Carbohydrate (g) % of total energy
65.0 178.0 53.7
192.9 55.3
367.0 30.0 177.0 67.7
185.1 66.3
427.0 [-46;29]
Protein (g) % of total energy
20.0 62.0 18.7
60.0 17.2
111.0 4.0 45.5 17.4
49.1 17.6
154.0 [-22;-4]*
Fat (g) % of total energy
20.0 47.5 32.0
48.1 30.8
80.0 3.0 23.0 19.7
24.9 20.0
76.0 [-32;-17]*
Energy (kJ) 2170 5635.0 5926.5 10445 677 4444.0 4743.4 10199 [-2100;-334]*
Rural girls consumed more energy (5441 kJ) in total when compared with their urban counterparts
(3959,4 kJ) (Table 4.26). Energy intake of urban girls did not meet the minimum recommendation of
4166kJ. When comparing the macronutrient intake of rural- and urban girls, the same pattern is seen as
for the boys, where there is a higher percentage energy intake from carbohydrates under the urban girls
(65,1% urban vs. 58,4% rural) and a lesser intake of fat than the rural girls (20,5% urban vs. 27,8%
rural). Protein intakes fell within recommendations and were similar in urban girls (18,1%) and rural girls
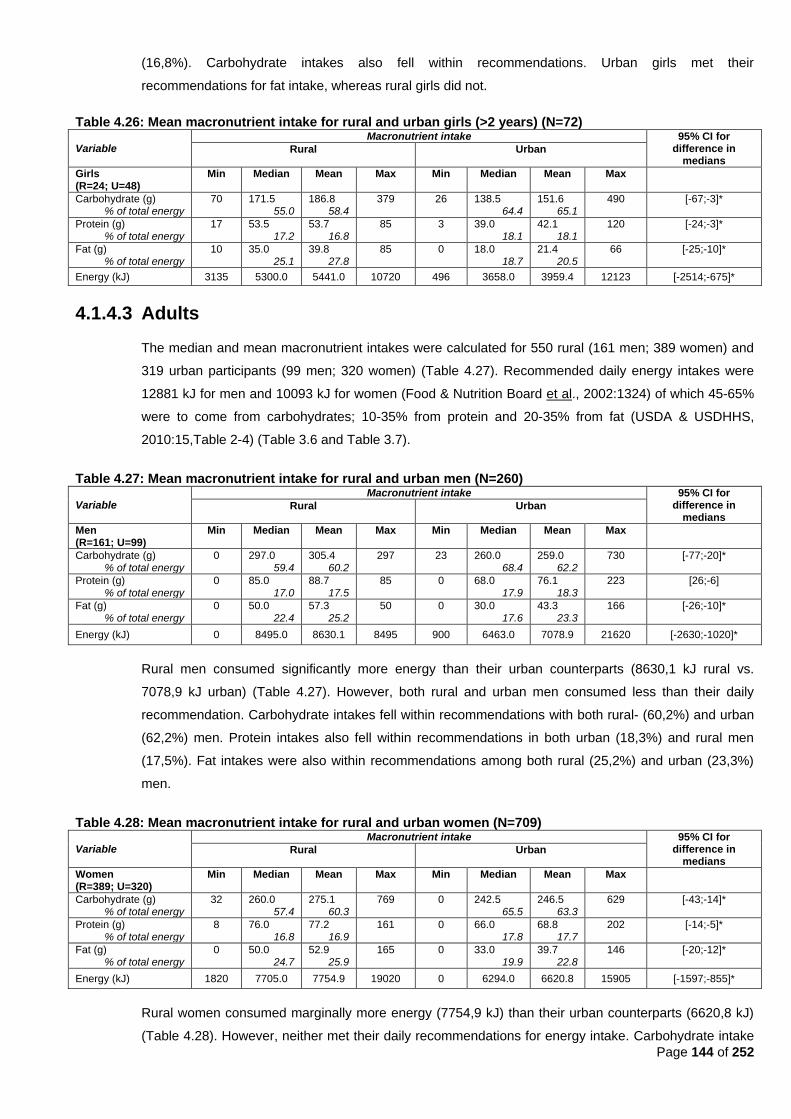
Page 144 of 252
(16,8%). Carbohydrate intakes also fell within recommendations. Urban girls met their
recommendations for fat intake, whereas rural girls did not.
Table 4.26: Mean macronutrient intake for rural and urban girls (>2 years) (N=72)
Variable Macronutrient intake 95% CI for
difference in medians
Rural Urban
Girls (R=24; U=48)
Min Median Mean Max Min Median Mean Max
Carbohydrate (g) % of total energy
70 171.5 55.0
186.8 58.4
379 26 138.5 64.4
151.6 65.1
490 [-67;-3]*
Protein (g) % of total energy
17 53.5 17.2
53.7 16.8
85 3 39.0 18.1
42.1 18.1
120 [-24;-3]*
Fat (g) % of total energy
10 35.0 25.1
39.8 27.8
85 0 18.0 18.7
21.4 20.5
66 [-25;-10]*
Energy (kJ) 3135 5300.0 5441.0 10720 496 3658.0 3959.4 12123 [-2514;-675]*
4.1.4.3 Adults
The median and mean macronutrient intakes were calculated for 550 rural (161 men; 389 women) and
319 urban participants (99 men; 320 women) (Table 4.27). Recommended daily energy intakes were
12881 kJ for men and 10093 kJ for women (Food & Nutrition Board et al., 2002:1324) of which 45-65%
were to come from carbohydrates; 10-35% from protein and 20-35% from fat (USDA & USDHHS,
2010:15,Table 2-4) (Table 3.6 and Table 3.7).
Table 4.27: Mean macronutrient intake for rural and urban men (N=260)
Variable Macronutrient intake 95% CI for
difference in medians
Rural Urban
Men (R=161; U=99)
Min Median Mean Max Min Median Mean Max
Carbohydrate (g) % of total energy
0 297.0 59.4
305.4 60.2
297 23 260.0 68.4
259.0 62.2
730 [-77;-20]*
Protein (g) % of total energy
0 85.0 17.0
88.7 17.5
85 0 68.0 17.9
76.1 18.3
223 [26;-6]
Fat (g) % of total energy
0 50.0 22.4
57.3 25.2
50 0 30.0 17.6
43.3 23.3
166 [-26;-10]*
Energy (kJ) 0 8495.0 8630.1 8495 900 6463.0 7078.9 21620 [-2630;-1020]*
Rural men consumed significantly more energy than their urban counterparts (8630,1 kJ rural vs.
7078,9 kJ urban) (Table 4.27). However, both rural and urban men consumed less than their daily
recommendation. Carbohydrate intakes fell within recommendations with both rural- (60,2%) and urban
(62,2%) men. Protein intakes also fell within recommendations in both urban (18,3%) and rural men
(17,5%). Fat intakes were also within recommendations among both rural (25,2%) and urban (23,3%)
men.
Table 4.28: Mean macronutrient intake for rural and urban women (N=709)
Variable Macronutrient intake 95% CI for
difference in medians
Rural Urban
Women (R=389; U=320)
Min Median Mean Max Min Median Mean Max
Carbohydrate (g) % of total energy
32 260.0 57.4
275.1 60.3
769 0 242.5 65.5
246.5 63.3
629 [-43;-14]*
Protein (g) % of total energy
8 76.0 16.8
77.2 16.9
161 0 66.0 17.8
68.8 17.7
202 [-14;-5]*
Fat (g) % of total energy
0 50.0 24.7
52.9 25.9
165 0 33.0 19.9
39.7 22.8
146 [-20;-12]*
Energy (kJ) 1820 7705.0 7754.9 19020 0 6294.0 6620.8 15905 [-1597;-855]*
Rural women consumed marginally more energy (7754,9 kJ) than their urban counterparts (6620,8 kJ)
(Table 4.28). However, neither met their daily recommendations for energy intake. Carbohydrate intake
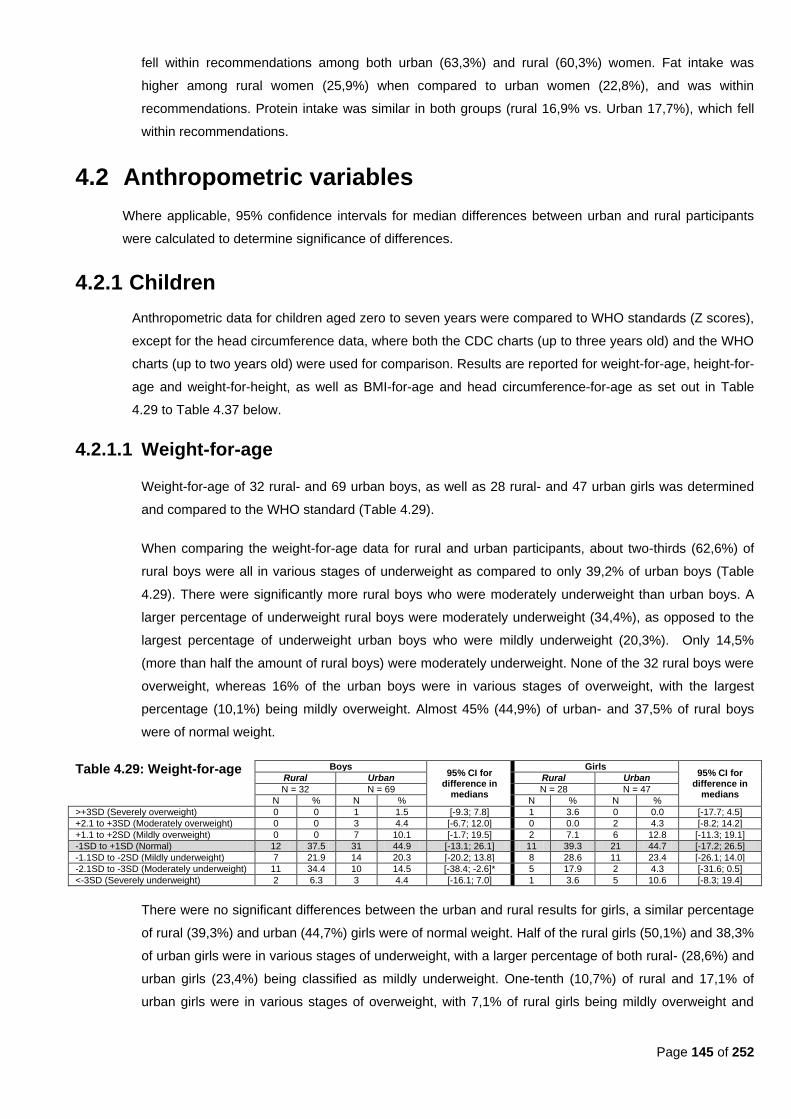
Page 145 of 252
fell within recommendations among both urban (63,3%) and rural (60,3%) women. Fat intake was
higher among rural women (25,9%) when compared to urban women (22,8%), and was within
recommendations. Protein intake was similar in both groups (rural 16,9% vs. Urban 17,7%), which fell
within recommendations.
4.2 Anthropometric variables
Where applicable, 95% confidence intervals for median differences between urban and rural participants
were calculated to determine significance of differences.
4.2.1 Children
Anthropometric data for children aged zero to seven years were compared to WHO standards (Z scores),
except for the head circumference data, where both the CDC charts (up to three years old) and the WHO
charts (up to two years old) were used for comparison. Results are reported for weight-for-age, height-for-
age and weight-for-height, as well as BMI-for-age and head circumference-for-age as set out in Table
4.29 to Table 4.37 below.
4.2.1.1 Weight-for-age
Weight-for-age of 32 rural- and 69 urban boys, as well as 28 rural- and 47 urban girls was determined
and compared to the WHO standard (Table 4.29).
When comparing the weight-for-age data for rural and urban participants, about two-thirds (62,6%) of
rural boys were all in various stages of underweight as compared to only 39,2% of urban boys (Table
4.29). There were significantly more rural boys who were moderately underweight than urban boys. A
larger percentage of underweight rural boys were moderately underweight (34,4%), as opposed to the
largest percentage of underweight urban boys who were mildly underweight (20,3%). Only 14,5%
(more than half the amount of rural boys) were moderately underweight. None of the 32 rural boys were
overweight, whereas 16% of the urban boys were in various stages of overweight, with the largest
percentage (10,1%) being mildly overweight. Almost 45% (44,9%) of urban- and 37,5% of rural boys
were of normal weight.
Table 4.29: Weight-for-age Boys 95% CI for
difference in medians
Girls 95% CI for
difference in medians
Rural Urban Rural Urban
N = 32 N = 69 N = 28 N = 47
N % N % N % N %
>+3SD (Severely overweight) 0 0 1 1.5 [-9.3; 7.8] 1 3.6 0 0.0 [-17.7; 4.5]
+2.1 to +3SD (Moderately overweight) 0 0 3 4.4 [-6.7; 12.0] 0 0.0 2 4.3 [-8.2; 14.2]
+1.1 to +2SD (Mildly overweight) 0 0 7 10.1 [-1.7; 19.5] 2 7.1 6 12.8 [-11.3; 19.1]
-1SD to +1SD (Normal) 12 37.5 31 44.9 [-13.1; 26.1] 11 39.3 21 44.7 [-17.2; 26.5]
-1.1SD to -2SD (Mildly underweight) 7 21.9 14 20.3 [-20.2; 13.8] 8 28.6 11 23.4 [-26.1; 14.0]
-2.1SD to -3SD (Moderately underweight) 11 34.4 10 14.5 [-38.4; -2.6]* 5 17.9 2 4.3 [-31.6; 0.5]
<-3SD (Severely underweight) 2 6.3 3 4.4 [-16.1; 7.0] 1 3.6 5 10.6 [-8.3; 19.4]
There were no significant differences between the urban and rural results for girls, a similar percentage
of rural (39,3%) and urban (44,7%) girls were of normal weight. Half of the rural girls (50,1%) and 38,3%
of urban girls were in various stages of underweight, with a larger percentage of both rural- (28,6%) and
urban girls (23,4%) being classified as mildly underweight. One-tenth (10,7%) of rural and 17,1% of
urban girls were in various stages of overweight, with 7,1% of rural girls being mildly overweight and

Page 146 of 252
3,6% being severely overweight. No urban girls were severely overweight, but 12,8% were found to be
mildly overweight and a further 4,3% were moderately overweight.
4.2.1.2 Height-for-age
Height for age of 32 rural- and 69 urban boys, as well as 28 rural- and 47 urban girls were determined
and compared to the WHO standards (Table 4.30). There were no significant difference between rural
and urban boys or rural and urban girls. Rural boys were generally shorter than urban boys. About two-
thirds (65,7%) of both rural- and urban (62,3%) boys were shorter than the standard. A larger
percentage of short rural boys (25%) were severely stunted as opposed to 29% of urban boys who were
moderately stunted. However, about another third of both rural (31,3%) boys and urban (29,0%) boys
were of normal height. Only 3,1% of rural boys were mildly tall as opposed to 5,8% of urban boys. A
small percentage of urban boys (1,5%) were moderately tall and another 1,5% were very tall.
Table 4.30: Height-for-age Boys 95% CI for
difference in medians
Girls 95% CI for
difference in medians
Rural Urban Rural Urban
N = 32 N = 69 N = 28 N = 47
N % N % N % N %
>+3SD (Very tall) 0 0 1 1.5 [-9.3; 7.8] 1 3.8 1 2.1 [-15.7; 8.0]
+2.1 to +3SD (Moderately tall) 0 0 1 1.5 [-9.3; 7.8] 0 0.0 1 2.1 [-10.1; 11.1]
+1.1 to +2SD (Mildly tall) 1 3.1 4 5.8 [-10.4; 11.2] 0 0.0 1 2.1 [-10.1; 11.1]
-1SD to +1SD (Normal height) 10 31.3 20 29.0 [-22.0; 15.4] 12 42.9 16 34.0 [-30.4; 12.9]
-1.1SD to -2SD (Mildly stunted) 6 18.8 10 14.5 [-23.8; 11.2] 7 25.0 10 21.3 [-24.3; 14.7]
-2.1SD to -3SD (Moderately stunted) 7 21.9 20 29.0 [-12.2; 23.0] 4 14.3 13 27.7 [-6.9; 29.9]
<-3SD (Severely stunted) 8 25.0 13 18.8 [-24.8; 9.8] 4 14.3 5 10.6 [-21.9; 11.0]
As in the case of boys, rural girls were also generally shorter than urban girls The largest percentage of
both rural (42,9%) and urban (34,0%) girls were of normal height. More than half of both rural (53,6%)
and urban (59,6%) girls were shorter than normal. A quarter (25,0%) of rural girls were mildly stunted as
opposed to 21,3% of urban girls. A larger percentage of urban girls (27,7%) were moderately stunted.
When looking at the data for the girls, 3,8% of rural girls were very tall, as opposed to 6,3% of urban
girls who were either mildly- (2,1%), moderately- (2,1%), or very tall (2,1%), respectively.
4.2.1.3 Weight-for-height
The weight-for-height data of 28 rural- and 58 urban boys, as well as 23 rural- and 41 urban girls are
categorized in Table 4.31.There were significantly more rural boys who were mildly wasted than urban
boys. A larger percentage of rural boys (46,4%) had a lower than normal weight-for-height when
compared to only 15,5% of urban boys; 17,5% of rural girls; and 19,6% of urban girls. A larger
percentage of both urban boys (39,6%) and urban girls (39,0%) had a higher weight-for-height than their
rural counterparts, although the percentage rural girls did not fall far behind (30,4% of rural girls). Only
17,9% rural boys had a higher than normal weigh-for-height.
Table 4.31: Weight-for-height Boys 95% CI for
difference in medians
Girls 95% CI for
difference in medians
Rural Urban Rural Urban
N = 28 N = 58 N = 23 N = 41
N % N % N % N %
>+3SD (Severely high) 0 0 5 8.6 [-4.4; 18.6] 0 0.0 1 2.4 [-12.0; 12.6]
+2.1 to +3SD (Moderately high) 1 3.6 6 10.3 [-8.4; 17.6] 2 8.7 5 12.2 [-15.9; 18.3]
+1.1 to +2SD (Mildly high) 4 14.3 12 20.7 [-12.8; 21.2] 5 21.7 10 24.4 [-20.1; 21.9]
-1SD to +1SD (Normal) 10 35.7 26 44.8 [-12.9; 28.8] 12 52.2 17 41.5 [-33.8; 13.8]
-1.1SD to -2SD (Mildly low) 9 32.1 3 5.2 [-45.8; -10.2]* 2 8.7 4 9.8 [-18.0; 15.3]
-2.1SD to -3SD (Moderately low) 3 10.7 5 8.6 [-19.3; 10.1] 1 4.4 2 4.9 [-16.5; 12.3]
<-3SD (Severely low) 1 3.6 1 1.7 [-16.1; 6.1] 1 4.4 2 4.9 [16.5; 12.3]

Page 147 of 252
There were no significant differences between the percentage of rural and urban girls that fell within
each of the various weight-for-height categories. Almost a third (35,7%) of rural boys and 44,8% of
urban boys fell within the normal weight-for-height category. About a third (32,1%) of rural boys and
5,2% of urban boys had a mildly low weight-for-height (mildly wasted); 10,7% of rural- and 8,6% of
urban boys had a moderately low weight-for-height (moderately wasted); and 3,6% of rural- and 1,7% of
urban boys had a severely low weight-for-height (severely wasted). More urban boys (39,6%) than rural
boys (17,9%) had above normal weight-for-height, with the largest percentage of both urban- (20,7%)
and rural (14,3%) boys having mildly high weight-for-height.
More than half of rural girls (52,2%) and 41,5% of urban girls were of normal weight-for-height. Only
17,5% of rural girls and 19,6% of urban girls were below normal for weight-for-height; with 8,7% of rural
and 9,8% of urban girls being mildly wasted; 4,4% of rural-and 4,9% of urban girls being moderately
wasted and 4,4% of rural- and 4,9% of urban girls being severely wasted. A total of 30,4% of rural girls
and 39,0% of urban girls had higher than normal weight-for-height. About a fifth (21,7%) of rural girls
and about a quarter (24,4%) of urban girls had mildly high weight-for-height; 8,7% of rural- and 12,2% of
urban girls had moderately high weight-for-height; 2,4% of urban girls and no rural girls had a severely
high weight-for-height.
4.2.1.4 BMI-for-age
The BMI-for-age was categorized according to age for sixty rural children (32 boys and 28 girls) and 116
urban children (69 boys and 47 girls) (Table 4.32). No significant differences were found between the
percentage of rural and urban boys or rural and urban girls that fell within each of the various categories
for BMI-for-age.
Table 4.32: BMI for age Boys 95% CI for
difference in medians
Girls
95% CI for difference in medians
Rural Urban Rural Urban
N = 32 N = 69 N = 28 N = 47
N % N % N % N %
>+3SD 0 0 6 8.7 [-3.0; 17.7] 0 0.0 1 2.1 [-10.1; 11.1]
+2.1 to +3SD 2 6.3 8 11.6 [-9.6; 16.0] 2 7.1 3 6.4 [-16.8; 11.2]
+1.1 to +2SD 5 15.6 15 21.7 [-12.0; 20.2] 5 17.9 13 27.7 [-10.9; 27.1]
-1SD to +1SD (Normal) 14 43.8 26 37.7 [-26.0; 13.5] 14 50.0 20 42.6 [-29.2; 15.0]
-1.1SD to -2SD (Mildly low) 8 25.0 8 11.6 [-31.4; 1.8] 4 14.3 5 10.6 [-21.9; 11.1]
-2.1SD to -3SD (Moderately low) 0 0.0 5 7.3 [-4.2; 15.9] 2 7.1 4 8.5 [-15.0; 13.9]
<-3SD (Severely low) 3 9.4 1 1.5 [-22.8; 0.9] 1 3.6 1 2.1 [-15.7; 8.0]
Almost half (43,8%) of rural boys were of normal BMI in comparison with 37,7% of urban boys.
According to the BMI-for-age, there were more rural boys (34,4%) than urban boys (20,4%) with a BMI-
for-age lower than normal. Almost a tenth (9,4%) of rural boys were found to have a severely low BMI,
with the remaining 25% having a mildly low BMI. Among urban boys, 11,6% had a mildly low BMI, 7,3%
had a moderately low BMI, and only 1,5% had a severely low BMI. Overall, urban boys were fatter than
their rural counterparts. A total of 42% of urban boys were classified as having a BMI-for-age above
normal, whereas only half as many of the rural boys (21,9%) were found to have a BMI-for-age above
normal. Most urban boys (21,7%) only had a mildly high BMI, a further 11,6% had a moderately high
BMI and 8,7% had a severely high BMI. In comparison, only 15,6% of rural boys had a mildly high BMI,
and a further 6,3% had a moderately high BMI.
Half (50%) of rural girls were of normal BMI in comparison with 42,6% of urban girlss. According to the
BMI-for-age, there were more rural girls (25%) than urban girls (21,2%) with a BMI-for-age lower than

Page 148 of 252
normal. A total of 36,2% of urban girls were classified as having a BMI-for-age above normal, whereas
only 25% of the rural girls were found to have a BMI-for-age above normal.
The median BMI-for-age was calculated for 37 rural boys, 76 urban boys, 37 rural girls and 54 urban
girls (Table 4.33). The median BMI for both rural- and urban boys was in the normal range (overweight
was between 17,42 kg/m2 and 18,41 kg/m
2 in boys aged two to seven years old) as well as for rural-
and urban girls (between 17,15 kg/m2 and 18,02 kg/m
2 in girls aged two to seven years old), according
to the cut-off points for overweight in children of different ages suggested by Cole et al. (2000:1-6).
Table 4.33: Median BMI for age Boys Girls
Rural Urban Rural Urban
N = 37 N = 76 N = 37 N = 54
Median (kg/m2) 15.2 16.4 15.8 16.5
4.2.1.5 Head circumference
Head circumference data was compared with both the WHO charts (CDCP, 2010:online), which went up
to two years of age (Table 4.34), and the CDC charts (Mahan & Escott-Stump, 2004d:1178, Appendix 7;
Mahan & Escott-Stump, 2004e:1181, Appendix 10), which went up to three years of age (Table 4.35).
Table 4.34: Head circumference of boys and girls 0-2 years old (WHO charts)
Boys Girls
Rural Urban Rural Urban
N=9 N=29 N=10 N=22
N % N % N % N %
Larger than normal 2 22.2 3 10.3 3 30 7 31.8
Normal 3 33.3 13 44.8 5 50 9 40.9
Smaller than normal 4 44.4 13 44.8 2 20 6 27.3
Head circumference data of 9 rural- and 29 urban boys, as well as 10 rural- and 22 urban girls were
categorized for children younger than two years old (Table 4.34). The head circumference data was
compared to the WHO standards. A large percentage of urban boys had either a normal head
circumference (44,8%) or smaller than normal head circumference (44,8%). Only 10,3% of urban boys
had a larger than normal head circumference in comparison with 22,2% of rural boys. One-third or rural
boys (33,3%) had a normal head circumference. About the same percentage of rural boys (44,4%) than
urban boys (44,8%) had a smaller than normal head circumference.
In contrast to the boys, half of rural girls (50%) had a normal head circumference as opposed to only
40,9% of urban girls. Of the remaining rural girls, thirty percent had heads larger than normal and twenty
percent had heads smaller than normal. In the urban girls, there was about the same percentage of girls
(31,8%) with larger than normal head circumferences, but there were more urban girls (27,3%) who had
smaller than normal head circumferences.
Head circumference data of 17 rural- and 42 urban boys, as well as 13 rural- and 31 urban girls were
categorized for children younger than three years old (Table 4.35). As expected, the percentage
distribution stayed similar for boys when compared with CDC standards, with urban boys having
marginally more boys with normal head circumferences (40,5%) versus rural boys (35,3%). However,
for girls the results obtained when compared to the CDC standards were different to the WHO
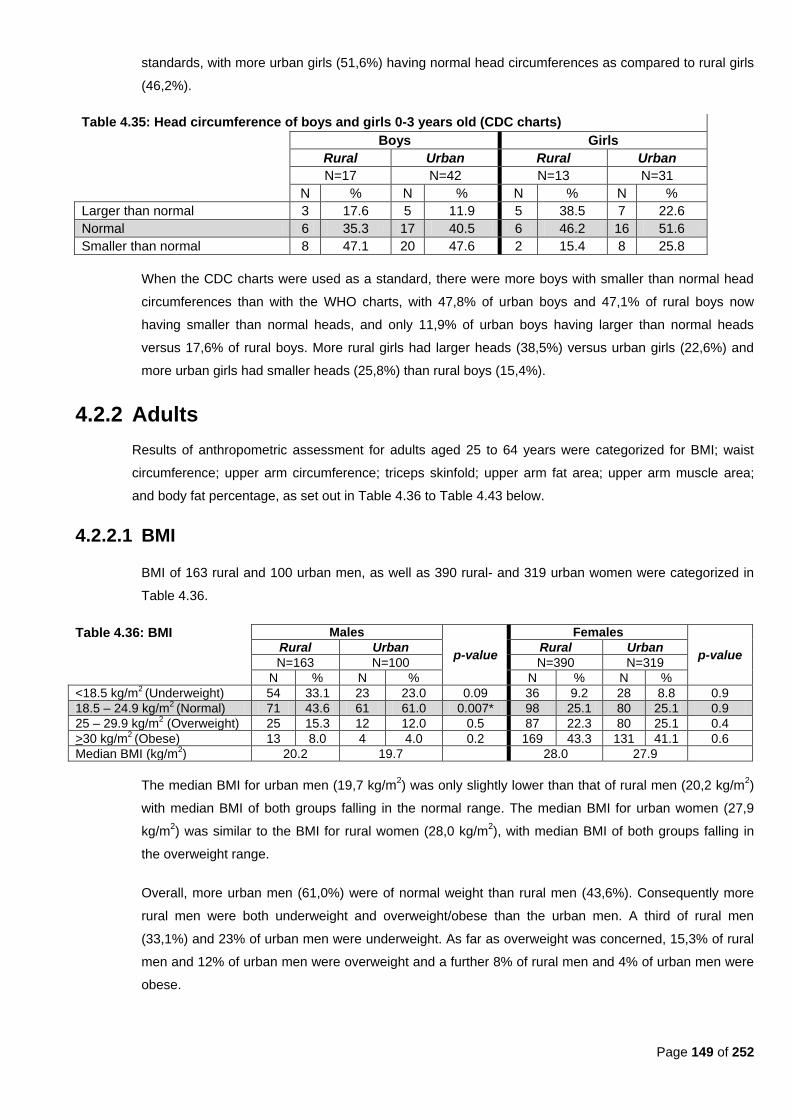
Page 149 of 252
standards, with more urban girls (51,6%) having normal head circumferences as compared to rural girls
(46,2%).
Table 4.35: Head circumference of boys and girls 0-3 years old (CDC charts)
Boys Girls
Rural Urban Rural Urban
N=17 N=42 N=13 N=31
N % N % N % N %
Larger than normal 3 17.6 5 11.9 5 38.5 7 22.6
Normal 6 35.3 17 40.5 6 46.2 16 51.6
Smaller than normal 8 47.1 20 47.6 2 15.4 8 25.8
When the CDC charts were used as a standard, there were more boys with smaller than normal head
circumferences than with the WHO charts, with 47,8% of urban boys and 47,1% of rural boys now
having smaller than normal heads, and only 11,9% of urban boys having larger than normal heads
versus 17,6% of rural boys. More rural girls had larger heads (38,5%) versus urban girls (22,6%) and
more urban girls had smaller heads (25,8%) than rural boys (15,4%).
4.2.2 Adults
Results of anthropometric assessment for adults aged 25 to 64 years were categorized for BMI; waist
circumference; upper arm circumference; triceps skinfold; upper arm fat area; upper arm muscle area;
and body fat percentage, as set out in Table 4.36 to Table 4.43 below.
4.2.2.1 BMI
BMI of 163 rural and 100 urban men, as well as 390 rural- and 319 urban women were categorized in
Table 4.36.
Table 4.36: BMI Males
p-value
Females
p-value Rural Urban Rural Urban
N=163 N=100 N=390 N=319
N % N % N % N %
<18.5 kg/m2 (Underweight) 54 33.1 23 23.0 0.09 36 9.2 28 8.8 0.9
18.5 – 24.9 kg/m2 (Normal) 71 43.6 61 61.0 0.007* 98 25.1 80 25.1 0.9
25 – 29.9 kg/m2 (Overweight) 25 15.3 12 12.0 0.5 87 22.3 80 25.1 0.4
>30 kg/m2 (Obese) 13 8.0 4 4.0 0.2 169 43.3 131 41.1 0.6
Median BMI (kg/m2) 20.2 19.7 28.0 27.9
The median BMI for urban men (19,7 kg/m2) was only slightly lower than that of rural men (20,2 kg/m
2)
with median BMI of both groups falling in the normal range. The median BMI for urban women (27,9
kg/m2) was similar to the BMI for rural women (28,0 kg/m
2), with median BMI of both groups falling in
the overweight range.
Overall, more urban men (61,0%) were of normal weight than rural men (43,6%). Consequently more
rural men were both underweight and overweight/obese than the urban men. A third of rural men
(33,1%) and 23% of urban men were underweight. As far as overweight was concerned, 15,3% of rural
men and 12% of urban men were overweight and a further 8% of rural men and 4% of urban men were
obese.
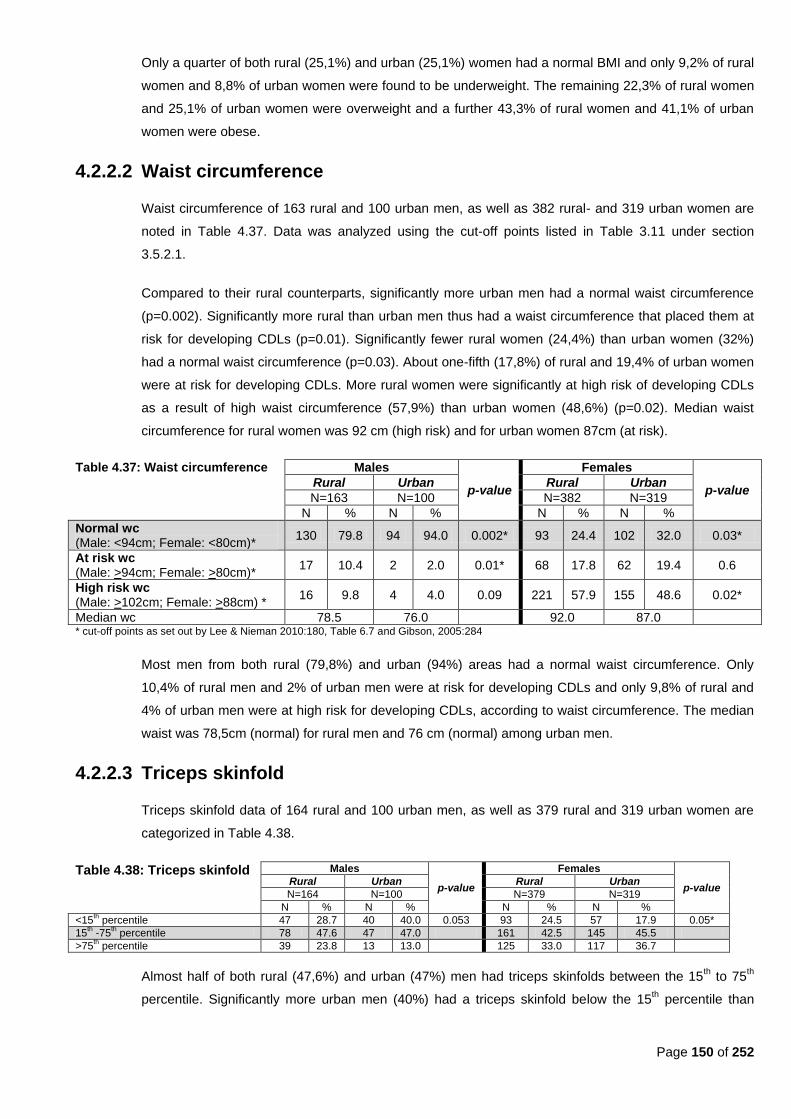
Page 150 of 252
Only a quarter of both rural (25,1%) and urban (25,1%) women had a normal BMI and only 9,2% of rural
women and 8,8% of urban women were found to be underweight. The remaining 22,3% of rural women
and 25,1% of urban women were overweight and a further 43,3% of rural women and 41,1% of urban
women were obese.
4.2.2.2 Waist circumference
Waist circumference of 163 rural and 100 urban men, as well as 382 rural- and 319 urban women are
noted in Table 4.37. Data was analyzed using the cut-off points listed in Table 3.11 under section
3.5.2.1.
Compared to their rural counterparts, significantly more urban men had a normal waist circumference
(p=0.002). Significantly more rural than urban men thus had a waist circumference that placed them at
risk for developing CDLs (p=0.01). Significantly fewer rural women (24,4%) than urban women (32%)
had a normal waist circumference (p=0.03). About one-fifth (17,8%) of rural and 19,4% of urban women
were at risk for developing CDLs. More rural women were significantly at high risk of developing CDLs
as a result of high waist circumference (57,9%) than urban women (48,6%) (p=0.02). Median waist
circumference for rural women was 92 cm (high risk) and for urban women 87cm (at risk).
Table 4.37: Waist circumference Males
p-value
Females
p-value Rural Urban Rural Urban
N=163 N=100 N=382 N=319
N % N % N % N %
Normal wc (Male: <94cm; Female: <80cm)*
130 79.8 94 94.0 0.002* 93 24.4 102 32.0 0.03*
At risk wc (Male: >94cm; Female: >80cm)*
17 10.4 2 2.0 0.01* 68 17.8 62 19.4 0.6
High risk wc (Male: >102cm; Female: >88cm) *
16 9.8 4 4.0 0.09 221 57.9 155 48.6 0.02*
Median wc 78.5 76.0 92.0 87.0 * cut-off points as set out by Lee & Nieman 2010:180, Table 6.7 and Gibson, 2005:284
Most men from both rural (79,8%) and urban (94%) areas had a normal waist circumference. Only
10,4% of rural men and 2% of urban men were at risk for developing CDLs and only 9,8% of rural and
4% of urban men were at high risk for developing CDLs, according to waist circumference. The median
waist was 78,5cm (normal) for rural men and 76 cm (normal) among urban men.
4.2.2.3 Triceps skinfold
Triceps skinfold data of 164 rural and 100 urban men, as well as 379 rural and 319 urban women are
categorized in Table 4.38.
Table 4.38: Triceps skinfold Males
p-value
Females
p-value Rural Urban Rural Urban
N=164 N=100 N=379 N=319
N % N % N % N %
<15th percentile 47 28.7 40 40.0 0.053 93 24.5 57 17.9 0.05*
15th -75
th percentile 78 47.6 47 47.0 161 42.5 145 45.5
>75th percentile 39 23.8 13 13.0 125 33.0 117 36.7
Almost half of both rural (47,6%) and urban (47%) men had triceps skinfolds between the 15th to 75
th
percentile. Significantly more urban men (40%) had a triceps skinfold below the 15th percentile than
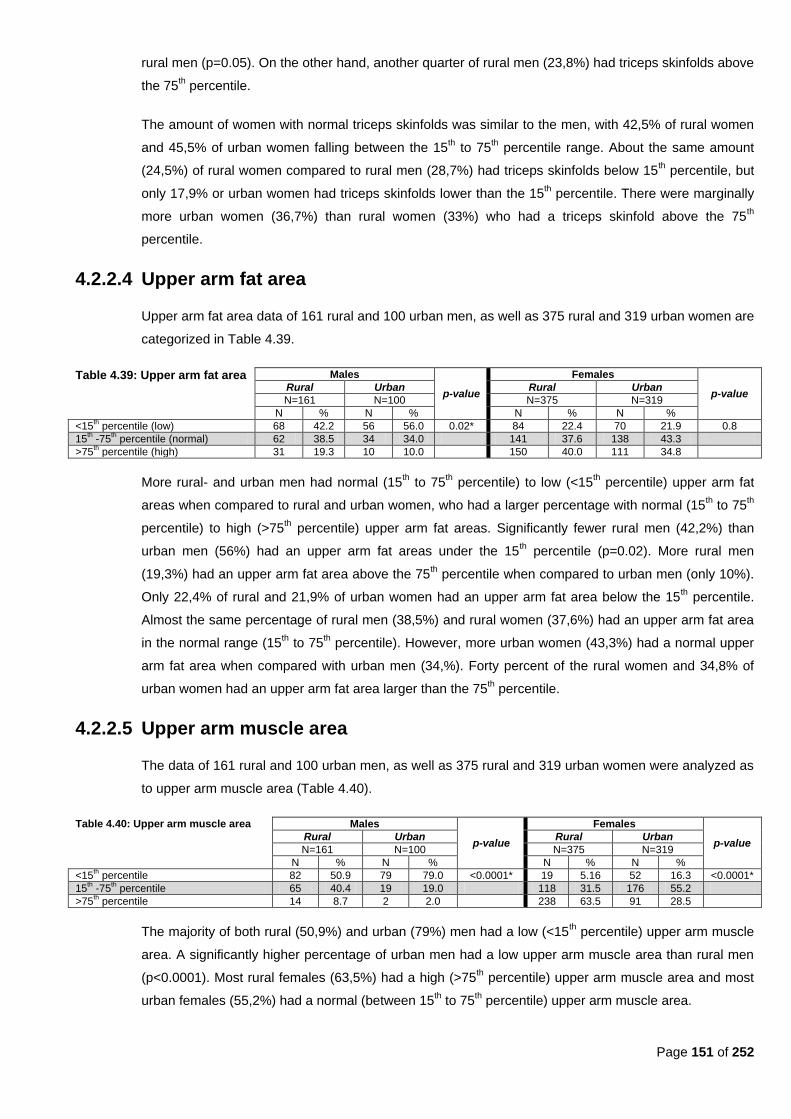
Page 151 of 252
rural men (p=0.05). On the other hand, another quarter of rural men (23,8%) had triceps skinfolds above
the 75th percentile.
The amount of women with normal triceps skinfolds was similar to the men, with 42,5% of rural women
and 45,5% of urban women falling between the 15th to 75
th percentile range. About the same amount
(24,5%) of rural women compared to rural men (28,7%) had triceps skinfolds below 15th percentile, but
only 17,9% or urban women had triceps skinfolds lower than the 15th percentile. There were marginally
more urban women (36,7%) than rural women (33%) who had a triceps skinfold above the 75th
percentile.
4.2.2.4 Upper arm fat area
Upper arm fat area data of 161 rural and 100 urban men, as well as 375 rural and 319 urban women are
categorized in Table 4.39.
Table 4.39: Upper arm fat area Males
p-value
Females
p-value Rural Urban Rural Urban
N=161 N=100 N=375 N=319
N % N % N % N %
<15th percentile (low) 68 42.2 56 56.0 0.02* 84 22.4 70 21.9 0.8
15th -75
th percentile (normal) 62 38.5 34 34.0 141 37.6 138 43.3
>75th percentile (high) 31 19.3 10 10.0 150 40.0 111 34.8
More rural- and urban men had normal (15th to 75
th percentile) to low (<15
th percentile) upper arm fat
areas when compared to rural and urban women, who had a larger percentage with normal (15th to 75
th
percentile) to high (>75th percentile) upper arm fat areas. Significantly fewer rural men (42,2%) than
urban men (56%) had an upper arm fat areas under the 15th percentile (p=0.02). More rural men
(19,3%) had an upper arm fat area above the 75th percentile when compared to urban men (only 10%).
Only 22,4% of rural and 21,9% of urban women had an upper arm fat area below the 15th percentile.
Almost the same percentage of rural men (38,5%) and rural women (37,6%) had an upper arm fat area
in the normal range (15th to 75
th percentile). However, more urban women (43,3%) had a normal upper
arm fat area when compared with urban men (34,%). Forty percent of the rural women and 34,8% of
urban women had an upper arm fat area larger than the 75th percentile.
4.2.2.5 Upper arm muscle area
The data of 161 rural and 100 urban men, as well as 375 rural and 319 urban women were analyzed as
to upper arm muscle area (Table 4.40).
Table 4.40: Upper arm muscle area Males
p-value
Females
p-value Rural Urban Rural Urban
N=161 N=100 N=375 N=319
N % N % N % N %
<15th percentile 82 50.9 79 79.0 <0.0001* 19 5.16 52 16.3 <0.0001*
15th -75
th percentile 65 40.4 19 19.0 118 31.5 176 55.2
>75th percentile 14 8.7 2 2.0 238 63.5 91 28.5
The majority of both rural (50,9%) and urban (79%) men had a low (<15th percentile) upper arm muscle
area. A significantly higher percentage of urban men had a low upper arm muscle area than rural men
(p<0.0001). Most rural females (63,5%) had a high (>75th percentile) upper arm muscle area and most
urban females (55,2%) had a normal (between 15th to 75
th percentile) upper arm muscle area.

Page 152 of 252
More than forty percent of rural men (40,4%) and one-fifth (19%) of urban men had a normal upper arm
muscle area. Only 8,7% of rural men and 2% of urban men had upper arm muscle areas above the 75th
percentile.
Almost two-thirds (63,5%) of rural women had an upper arm muscle area above the 75th percentile, as
opposed to only 28,5% of urban women. More than half (55,2%) of urban women and 31,5% of rural
women had a normal upper arm muscle area. Significantly more urban women (16,3%) than rural
women (5,2%) had an upper arm muscle area below the 15th percentile (p<0.0001).
4.2.2.6 Body fat percentage
Body fat percentage was determined in 161 rural and 99 urban men (Table 4.41). Significantly more
urban men (90,9%) than rural men (78,3%) had an acceptable low (6-15%) body fat percentage
(p=0.001), while significantly more rural (17,4%) than urban men (6,1%) had an acceptable high (16-
24%) body fat percentage (p=0.001). Few rural (3,1%) and urban (3%) men had a high body fat
percentage. No urban men and only 1,2% of rural men had a body fat percentage below 5%.
Table 4.41: Body fat percentage rural and urban men
Rural Urban p-value N=161 N=99
N % N %
<5% (low)* 2 1.2 0 0.0 0.5
6-15% (acceptable low)* 126 78.3 90 90.9 0.001*
16-24% (acceptable high)* 28 17.4 6 6.1 0.001*
>25% (high)* 5 3.1 3 3.0 0.9 * Cut-off points as defined by Lee & Nieman, 2010:193, Table 6.11)
Body fat percentage was determined in 375 rural and 316 urban women (Table 4.42). No rural women
and only 0,3% of urban women had a low body fat percentage. About one-third of rural (32,8%) and
urban (30,4%) women had an ―acceptable low‖ body fat percentage. Another quarter of rural (22,9%)
and urban (26,9%) women had an ―acceptable high‖ body fat percentage. About 44,3% of rural and
42,4% of urban women had a high body fat percentage.
Table 4.42: Body fat percentage of rural and urban women
Rural Urban
p-value N=375 N=316
N % N %
<8% (low) 0 0.0 1 0.3
9-23% (acceptable low) 123 32.8 96 30.4 0.4
24-31% (acceptable high) 86 22.9 85 26.9 0.2
>32% (high) 166 44.3 134 42.4 0.7 * Cut-off points as defined by Lee & Nieman, 2010:193, Table 6.11)
4.2.3 Children vs. caregivers
Data was also categorized as to how many malnourished children resided in the same household as an
overweight/obese caregiver. Among rural children, the prevalence of stunting (height-for-age <-2SD)
was 42,2% (n=19). A third (33,3%; n=15) were underweight (weight-for-age <-2SD) and 13,3% (n=6)
were wasted (weight-for-height <-2SD). In urban children fifty percent (n=39) were stunted; 19,2% were
underweight (n=15) and 10,3% (n=8) were wasted.
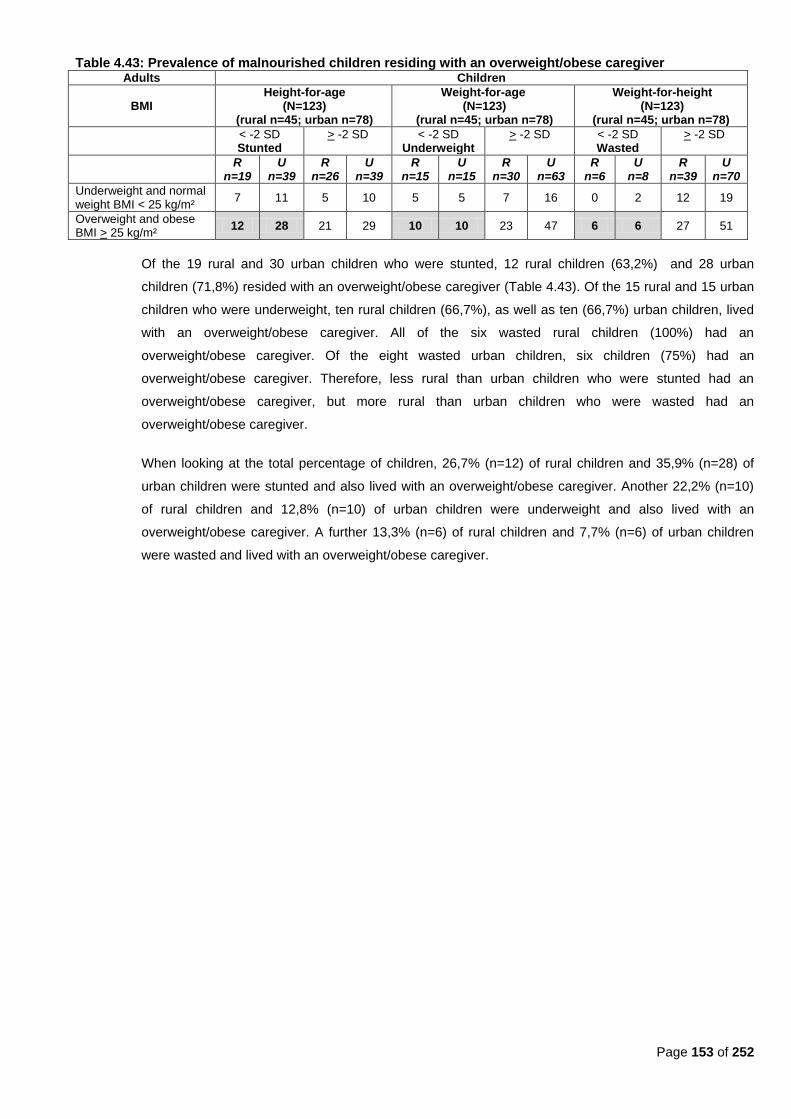
Page 153 of 252
Table 4.43: Prevalence of malnourished children residing with an overweight/obese caregiver Adults Children
BMI Height-for-age
(N=123) (rural n=45; urban n=78)
Weight-for-age (N=123)
(rural n=45; urban n=78)
Weight-for-height (N=123)
(rural n=45; urban n=78)
< -2 SD Stunted
> -2 SD
< -2 SD Underweight
> -2 SD
< -2 SD Wasted
> -2 SD
R
n=19 U
n=39 R
n=26 U
n=39 R
n=15 U
n=15 R
n=30 U
n=63 R
n=6 U
n=8 R
n=39 U
n=70
Underweight and normal weight BMI < 25 kg/m²
7 11 5 10 5 5 7 16 0 2 12 19
Overweight and obese BMI > 25 kg/m²
12 28 21 29 10 10 23 47 6 6 27 51
Of the 19 rural and 30 urban children who were stunted, 12 rural children (63,2%) and 28 urban
children (71,8%) resided with an overweight/obese caregiver (Table 4.43). Of the 15 rural and 15 urban
children who were underweight, ten rural children (66,7%), as well as ten (66,7%) urban children, lived
with an overweight/obese caregiver. All of the six wasted rural children (100%) had an
overweight/obese caregiver. Of the eight wasted urban children, six children (75%) had an
overweight/obese caregiver. Therefore, less rural than urban children who were stunted had an
overweight/obese caregiver, but more rural than urban children who were wasted had an
overweight/obese caregiver.
When looking at the total percentage of children, 26,7% (n=12) of rural children and 35,9% (n=28) of
urban children were stunted and also lived with an overweight/obese caregiver. Another 22,2% (n=10)
of rural children and 12,8% (n=10) of urban children were underweight and also lived with an
overweight/obese caregiver. A further 13,3% (n=6) of rural children and 7,7% (n=6) of urban children
were wasted and lived with an overweight/obese caregiver.
Page 154 of 252
Chapter 5 - Discussion of results
5.1 Introduction
The main aim of this study was to determine the diet and anthropometric status of adults (between 25 and
64 years old) and pre-school children (zero to seven years old) in rural and urban areas and to describe
anthropometric status of children and adults in the same household.
In this chapter, data for both dietary intake and anthropometry is divided into three age groups: children
younger than two years old; children aged between two to seven years old (older than two); and adults
aged 25 to 64 years old. Results of the various groups were compared to similar studies conducted in
South Africa among similar age groups.
5.2 Limitations of the study
5.2.1 Study population
Sample sizes for children were small, especially for those younger than two years of age. There were
also more urban than rural children, and was consistently kept in mind when interpreting results.
With respect to the adult sample, only about one in four participants were men in both rural and urban
participants, which means that the male gender was under-represented. Because data was only
gathered during weekdays (not weekends), it is possible that a portion of employed male participants
who were eligible to participate in study interviews, could not attend due to work obligations.
The median age for both male and female participants was between 45 and 50 years of age. The fact
that a medical examination was performed on each participant, could have resulted in persons with
illnesses being more likely to attend, especially in rural areas where medical services are usually
limited. This could also be the reason why the median age of rural participants (men: 50 years; women:
49 years) was older than that of urban participants (men: 45 years; women: 45 years), which could
have impacted on results. This bias is acknowledged, and taken into account in the interpretation of
results.
In some instances, a language barrier occurred. In order to overcome this limitation, students that were
fluent in the language of choice of participants assisted with completing those interviews. All consent
forms and information documents were available in the language of choice (English, Afrikaans and
Sotho).
It should also be kept in mind that HIV status, although not determined in this study, may have had an
influence on nutritional status.
Page 155 of 252
5.2.2 Dietary intake
For practical reasons, only one 24-hour recall of reported usual intake was included in this study. The
use of a short qualitative FFQ was included to increase the likelihood of obtaining good information
related to usual food intake.
In open-ended methods, like the 24-hour recall of usual intake, persons may consciously or
unconsciously tend either to deny or to exaggerate their food intake (Koh & Owen, 2000:178).
Consumption of fruits and vegetables may be over-reported and consumption of high fatty junk foods
and alcohol may be under-reported. Overweight persons tend to under-report their food intake (Koh &
Owen, 2000:180).
Over-reporting can also occur when administering a FFQ with an overly long list of foods. On the other
hand, under-reporting could be due to failure of the interviewer to ask the right questions about food
preparation or the use of a cultural food (Koh & Owen, 2000:181). In an effort to obtain good quality
information in this study, the short FFQ included foods commonly consumed by the target population.
The food frequency questionnaire used in this study was only qualitative and not quantitative. It could
thus indicate the frequency of food consumption, but not the amounts in which food items were
consumed.
The choice of techniques used to determine dietary intake meant that nutrient content of the diet could
not be determined, only intake of foods and food patterns. In order to ensure that participants
answered as honestly as possible, they were informed of the benefits of the study to the community at
large and encouraged to answer as comprehensively and truthfully as possible. Confidentiality of
results was also emphasised.
Intensive training of interviewers and coders; standardization of interviewing techniques and
questionnaires; and pretesting of questionnaires prior to the main surveys were all implemented in an
effort to obtain the most valid and reliable information possible using the chosen tools and techniques.
5.2.3 Anthropometrical measurements
It is possible that mothers were more likely to bring their children to participate in the study if they were
ill (a free medical examination was performed), which could have had an impact on the results related
to growth status that were obtained.
5.3 Dietary intake
Dietary intake for children younger than two was compared to similar studies in terms of breastfeeding;
introduction of solids; formula feeding; as well as reported usual intake of different food groups; food items
and macronutrients.
Dietary intake for children older than two, as well as for adults, was compared to similar studies in terms of
reported usual intake of different food groups; food items and macronutrients.
Page 156 of 252
Results for dietary intake in the children will be discussed first, whereafter the dietary intake amongst the
adults will be discussed.
5.3.1 Children younger than two years
Data for children younger than two years was mostly compared to the results of the National Food
Consumption Survey (NFCS) (Labadarios et al., 2005:533; Nel & Steyn, 2002:48, 59, Table 23)..
5.3.1.1 Breastfeeding
It should be kept in mind that the amount of total participants younger than two years of age was small
and further separating data into age groups (e.g. 1-3 age group, etc.) was not feasible.
About one-third (31,24%) of rural children were breastfed at the time of the study and 40,7% of urban
children. These percentages are higher than that found in the Free State group of children from the
NFCS (1–3 age group), who reported a second highest percentage of children (13%) who were still
being breastfed at the time of the study (Northern Cape was first with 19%)(MacIntyre & Labadarios,
2000:320;391, Table 6.13).
Almost all rural participants were previously breastfed (90,9%) as compared to only 37,5% of urban
participants. In comparison, the SADHS of 1998 found that 84,3% of their urban- and 89% of their rural
participants were ever breastfed. Of the Free State participants in the SADHS, 89,5% were ever
breastfed (DoH et al., 2002:133, Table 8.1). The NFCS reported that 89% of Free State participants
were previously breastfed (MacIntyre & Labadarios, 2000:392, Table 6.16). However, the NFCS made
no distinction between rural and urban areas.
The longest period a rural child was previously breastfed was 54 weeks (1 year) (median=16 weeks/4
months) and the shortest was three weeks. The longest period an urban child was previously breastfed
was 76 weeks (1½ years) (median=24 weeks/6 months) and the shortest was two weeks. From this
data one might be led to deduce that urban children were breastfed for longer periods compared to rural
children, but sample sizes of children younger than two years were small, which makes it difficult to
interpret results. The NFCS found that 55% of all urban participants were previously breastfed for more
than a year as opposed to 71% of all rural participants (MacIntyre & Labadarios, 2000:394, Table 6.20).
The NFCS also found that 64% of all Free State participants (rural and urban) were previously breastfed
for more than a year (MacIntyre & Labadarios, 2000:393-394, Table 6.19).
When looking at the data for exclusive breastfeeding (both for children previously breastfed and children
breastfeeding at the time of the study), 32 weeks (8 months) was the longest period of exclusive
breastfeeding for both rural and urban participants. The median period of exclusive breastfeeding for
rural participants was 11 weeks and for urban participants 12 weeks (3 months), which would lead one
to assume that, in general, solids were introduced by three months. Again, sample sizes were small,
which makes results difficult to interpret. However, the recommended age for introduction of solids is six
months of age (WHO, 2002:2). The WHO (2002:2) recommends introduction of ―nutritionally adequate,
safe and appropriate complementary foods, in conjunction with continued breastfeeding‖ after six
Page 157 of 252
months of age. The South African Food-Based Dietary Guidelines (SAFBDG) for children recommend
that breastfeeding is best for the first six months of life (Bourne, 2007:227).
Dewey (2006:168) indicated that promotion of exclusive breastfeeding for the first six months of life may
promote weight loss in mothers, especially considering the high rates of obesity among women in many
countries. By only introducing solids at six months in developing countries, the risk for gastrointestinal
illness in infants is reduced. Furthermore, it can be beneficial for motor development in the infant if
solids are only introduced after six months. No benefit was found in introducing solids at an earlier age.
Parsons et al. (1999:S21), in their systematic review, found that that there was no relationship between
the type of infant feeding; the duration of breast feeding; or the age when solids were introduced, with
obesity in adulthood. However, Wilson et al. (1998:21, 24) found that children who received solids
before 15 weeks of age had a higher body fat percentage at age seven years.
5.3.1.2 Formula feeding
The small sample size of rural children younger than two years was too small to draw any conclusions
from the results. Two-thirds (63,3%) of urban participants used enough formula that was also correctly
prepared (Table 4.8). A large percentage of participants, however, used formula that was incorrectly
prepared or given in insufficient amounts.
About a third (31,3%) of rural children and 38,9% of urban children were exclusively formula fed at the
time of the current study. A further 16,7% of urban children received mix feeding (breast and bottle). In
the 1998 SADHS, 28% of infants younger than 5 months were receiving formula feeds together with
breast milk (DoH et al., 2002:138). In comparison, only three percent of children in the NFCS were
receiving infant formula (Labadarios & Nel, 2000:396, Table 6.23). It should, however, be kept in mind
that the age range for the NFCS only started at one years old.
Nestlé Pelargon® was the most frequently used formula milk among urban carers (63,3%). If it is
considered that forty percent of the urban carers indicated that they received their supply of milk from
the clinic, it is understandable that Nestlé Pelargon® should be the predominant feed, since it formed
part of the NSP at the time of the study. The predominant feeds in the NFCS were Nan® (25%),
Nespray® (11%); Lactogen® (10%) and Lactogen 2® (10%) (MacIntyre & Labadarios, 2000:321,396,
Table 6.24).
There is some concern regarding the high intake of coffee creamer, which might indicate that it was
possibly used as a milk substitute.
5.3.1.3 Introduction of solids
Food groups mostly consumed in adequate- or more than adequate amounts by most children younger
than two years of age were: fats and oils; sweets and sugar, and bread and cereals; reflecting that
these would be the food groups to be introduced first as solids to these children, together with some
meat and meat products and vegetables, and to a lesser extent fruit, legumes and soy. Milk and milk
products were also more likely to be consumed in adequate- or more than adequate amounts, probably
because these foods were still given as a staple food at this age, together with porridge; sugar and tea.
Page 158 of 252
The WHO also states that all children need complementary foods from six months of age (WHO,
2010:7,27,35). The SAFBDG for children recommend that from six months small amounts of solid foods
should be given to children (Bourne, 2007:228, Table 1). The median age of introduction of solids was
24 weeks (6 months) for rural participants and 19 weeks (+5 months) for urban participants (Table 4.7).
The age of introduction of solids in rural children in the present study therefore complied with the WHO
guidelines, but urban children were weaned too early.
5.3.2 Reported usual intake of different food items
Intake of different food items for both adults and children was obtained by means of a food frequency
questionnaire listing 26 different food items. Results were compared to various studies, which will be
discussed in more detail below. Results were also compared to the report of Nel and Steyn (2002:48-
103, who conducted a secondary data-analysis of existing dietary databases obtained from surveys
undertaken in South Africa between 1983 and 2000. They included data from the following studies that
used the 24 hour recall method: National Food Consumption Survey (NFCS); Lebowa study; Dikgale
study; Black Risk Factor study (BRISK) and Coronary Risk Factor study (CORIS). They also included
data from the following studies that used the food frequency questionnaire method: NFCS; the Transition
and Health during Urbanisation of South Africans Study (THUSA); First Year Female Students Project
(FYFS): and Weight and Risk Factor Study (WRFS).
5.3.2.1 Children younger than two years
Frequency of consumption of certain food items in children younger than two years was determined for
four rural boys, 16 urban boys, 16 rural girls and 18 urban girls (the rest were still being breastfed or
formula fed). Table 5.1 sets out the current study‘s results as compared to the results from various other
studies. However, it must be kept in mind that there were small sample sizes of children younger than
two years in this study, and results should therefore be interpreted with caution.
The following studies‘ data for one-to-five years old age groups were used for comparison to the current
study‘s data for children younger than two years: the BRISK study conducted between 1983 and 1990
in the urban Western Cape (Nel & Steyn, 2002:103); the Lebowa study conducted in 1991 in the rural
Limpopo province (previously named Northern Province) (Nel & Steyn, 2002:97); and the national
results of the NFCS (Labadarios et al., 2005:533; Nel & Steyn, 2002:48). The study conducted by Faber
and Benadé in 2000 in rural Kwa-Zulu Natal was the only study used as comparison where the age
group was limited to between four and 24 months (Faber and Benadé, 2001).
Nel and Steyn (2002) conducted a meta-analysis of all dietary intake studies conducted in South Africa
between 1983 and 1990 and their extrapolations were also noted in Table 5.1 for comparison with the
current data. It should be noted that the data from the national NFCS was used exactly as is for Nel and
Steyn‘s (2002) national meta-analysis data and this should be kept in mind when reference is made to
the national NFCS data in this discussion. However, for the rural and urban sections of the meta-
analysis, data was extrapolated from more than one reference source (e.g. BRISK, Lebowa and NFCS)
and this is the reason why that data is different. The BRISK and Lebowa studies used the 24 hour recall
as their measuring tool, while the NFCS used both the 24 hour recall and the food frequency
questionnaire.
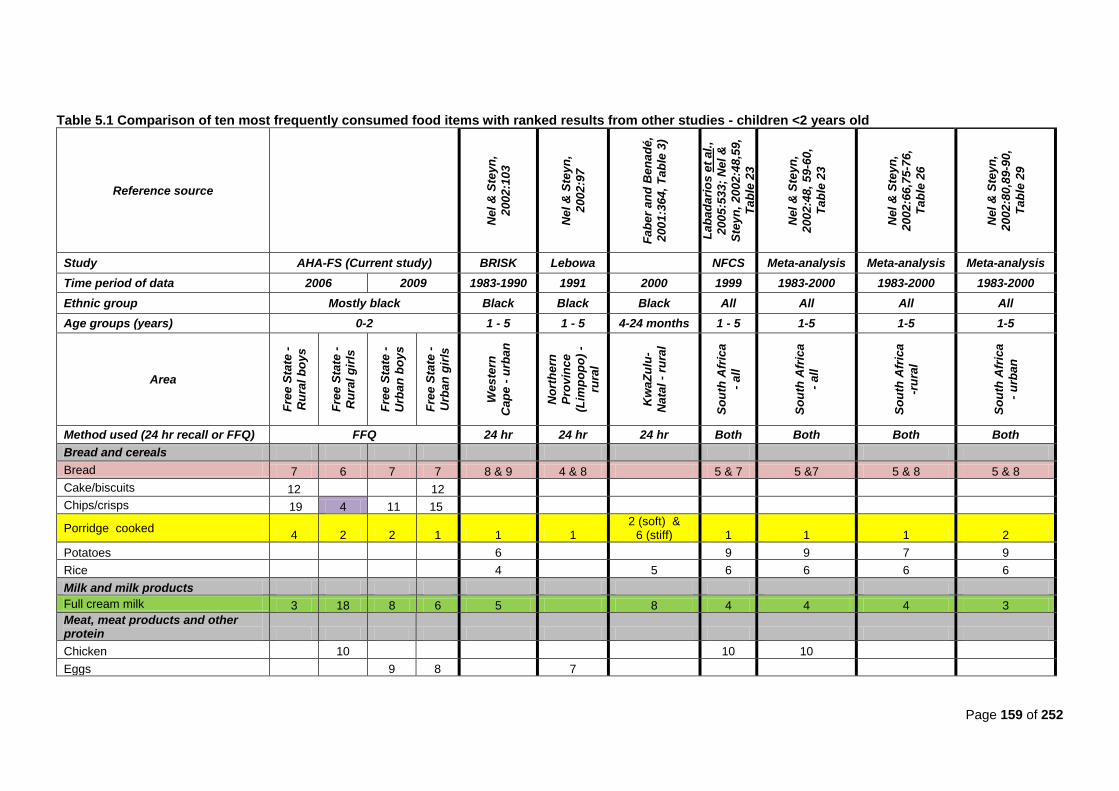
Page 159 of 252
Table 5.1 Comparison of ten most frequently consumed food items with ranked results from other studies - children <2 years old
Reference source
Nel
& S
teyn
,
200
2:1
03
Nel
& S
teyn
,
200
2:9
7
Fab
er
an
d B
en
ad
é,
200
1:3
64,
Tab
le 3
)
Lab
ad
ari
os e
t al.
,
200
5:5
33;
Nel
&
Ste
yn
, 2002:4
8,5
9,
Tab
le 2
3
Nel
& S
teyn
,
200
2:4
8,
59-6
0,
Tab
le 2
3
Nel
& S
teyn
,
200
2:6
6,7
5-7
6,
Tab
le 2
6
Nel
& S
teyn
,
200
2:8
0,8
9-9
0,
Tab
le 2
9
Study AHA-FS (Current study) BRISK Lebowa NFCS Meta-analysis Meta-analysis Meta-analysis
Time period of data 2006 2009 1983-1990 1991 2000 1999 1983-2000 1983-2000 1983-2000
Ethnic group Mostly black Black Black Black All All All All
Age groups (years) 0-2 1 - 5 1 - 5 4-24 months 1 - 5 1-5 1-5 1-5
Area
Fre
e S
tate
-
Ru
ral
bo
ys
Fre
e S
tate
-
Ru
ral
gir
ls
Fre
e S
tate
-
Urb
an
bo
ys
Fre
e S
tate
-
Urb
an
gir
ls
Weste
rn
Cap
e -
urb
an
No
rth
ern
Pro
vin
ce
(Lim
po
po
) -
rura
l
Kw
aZ
ulu
-
Nata
l -
rura
l
So
uth
Afr
ica
- all
So
uth
Afr
ica
- all
So
uth
Afr
ica
-ru
ral
So
uth
Afr
ica
- u
rban
Method used (24 hr recall or FFQ) FFQ 24 hr 24 hr 24 hr Both Both Both Both
Bread and cereals
Bread 7 6 7 7 8 & 9 4 & 8 5 & 7 5 &7 5 & 8 5 & 8
Cake/biscuits 12 12
Chips/crisps 19 4 11 15
Porridge cooked 4 2 2 1 1 1
2 (soft) & 6 (stiff) 1 1 1 2
Potatoes 6 9 9 7 9
Rice 4 5 6 6 6 6
Milk and milk products
Full cream milk 3 18 8 6 5 8 4 4 4 3
Meat, meat products and other protein
Chicken 10 10 10
Eggs 9 8 7

Page 160 of 252
Table 5.1 Comparison of ten most frequently consumed food items with ranked results from other studies - children <2 years old (continued)
Reference source
Nel
& S
teyn
,
200
2:1
03
Nel
& S
teyn
,
200
2:9
7
Fab
er
an
d
Ben
ad
é,
200
1:3
64,
Tab
le 3
)
Lab
ad
ari
os
et
al.
,
200
5:5
33;
Nel
& S
teyn
,
200
2:4
8,,
59,
Tab
le 2
3
Nel
& S
teyn
,
200
2:4
8,
59
-
60,
Tab
le 2
3
Nel
& S
teyn
,
200
2:6
6,7
5-
76,
Tab
le 2
6
Nel
& S
teyn
,
200
2:8
0,8
9-
90,
Tab
le 2
9
Study AHA-FS (Current study) BRISK Lebowa NFCS Meta-analysis Meta-analysis Meta-analysis
Time period of data 2006 2009 1983-1990 1991 2000 1999 1983-2000 1983-2000 1983-2000
Ethnic group Mostly black Black Black Black All All All All
Age groups (years) 0-2 1 - 5 1 - 5 4-24 months 1 - 5 1-5 1-5 1-5
Area
Fre
e S
tate
-
Ru
ral
bo
ys
Fre
e S
tate
-
Ru
ral
gir
ls
Fre
e S
tate
-
Urb
an
bo
ys
Fre
e S
tate
-
Urb
an
gir
ls
Weste
rn
Cap
e -
urb
an
No
rth
ern
Pro
vin
ce
(Lim
po
po
) –
rura
l
Kw
aZ
ulu
-
Nata
l -
rura
l
So
uth
Afr
ica
- all
So
uth
Afr
ica
- all
So
uth
Afr
ica
-ru
ral
So
uth
Afr
ica
- u
rban
Method used (24 hr recall or FFQ) FFQ 24 hr 24 hr 24 hr Both Both Both Both
Fruit and vegetables
Fruit 8 3 4 9
Fruit juice
10
Legumes 4
Pumpkin 9
Vegetables 9 7 10 5
Wild green leaves 6 9
Fats and oils
Gravy
Margarine/ oil/ fat 5 8 5 3 3 1 & 7 8 8 10 7
Non-dairy creamer (Cremora) 11 5
Other
Cool drinks 10 13 10 10
Salt/ stock 6 9 6 4
Sugar 1 1 3 18 2 2 3 2 2 2 1
Tea 2 5 1 2 7 3 10 3 3 3 4
Page 161 of 252
(i) Breads and cereals
When describing dietary intake according to foods most frequently consumed, cooked porridge was
consumed frequently by all children in the current study; similar to rural children in the Lebowa study
(Nel & Steyn, 2002:97); rural children in the meta-analysis study of Nel and Steyn (2002:66,75-76);
rural children in the study by Faber and Benadé (2001:364, Table 3); urban children in the meta-
analysis by Nel and Steyn (2002:80, 89-90); urban children in the BRISK study (Nel & Steyn,
2002:103); and all children in both the NFCS (Labadarios et al., 2005:533) and the meta-analysis by
Nel and Steyn (2002: 48, 59-60).According to the SAFBDG for children from one to seven years,
starchy foods should form the basis of most meals (Bourne, 2007:228, Table 1). Children younger
than two years in the current study did consume porridge, a starch, as the basis of most of their
meals. Cooked porridge was one of the most frequently introduced solids to this age group.
For bread intake, the current study‘s findings were similar to the urban BRISK study (Nel & Steyn,
2002:103); the rural children in the Lebowa study (Nel & Steyn, 2002:97); the NFCS (Labadarios et
al., 2005:533) and rural meta-analysis (Nel & Steyn, 2002:66, 75-76, Table 26); the urban meta-
analysis (Nel & Steyn, 2002:66, 75-76); and the national meta-analysis (Nel & Steyn, 2002:80, 89-
90, Table 29). Bread is a also starchy food, which should form the basis of most meals as
recommended by the SAFBDG (DoH, 2004:12; Vorster & Nell, 2001:S17). Therefore, most children
in the current study complied with this guideline. The dietary reference intakes also recommend that
carbohydrates should form 45% to 65% of a child‘s energy intake after the age of one year. By
consuming bread and cooked porridge frequently, this recommendation was complied with (Food &
Nutrition Board et al., 2002:1324).
(ii) Fats and oils
In this study, margarine, oil and fat were used frequently by rural and urban boys and urban girls. In
comparison, they were also used often among urban children in the BRISK study (Nel & Steyn,
2002:103). Oil was listed as the first item in the study by Faber and Benadé (2001:364, Table 3), and
margarine was listed as seventh in the same study.
Rural girls consumed chips and crisps 4th most frequently and urban boys consumed chips and
crisps 11th most frequently. None of the other studies found this food item to be consumed within the
ten most frequently consumed food items.
Rural boys in the current study consumed non-dairy creamer more frequently (11th) than the other
groups. The only study that found non-dairy creamer to be frequently consumed, was the rural
Lebowa study (Nel & Steyn, 2002:97), where it was found to be the fifth most frequently consumed
food item.
In the current study, caregivers sometimes referred to non-dairy-creamer as milk, which may partially
explain why non-dairy creamer was found as a frequently consumed food item on further
investigation. Similar results were reported by Faber et al. (2001:408).This finding is of concern, due
to the fact that non-dairy creamer may have been given to children younger than two years of age as
a milk substitute.
Page 162 of 252
Even though fats and oil were consumed frequently, it was not to say that they were consumed in
large amounts, since amounts were not quantified in the food frequency questionnaire. According to
dietary reference intakes, children younger than two years can consume between thirty to forty
percent of energy from fats per day, therefore frequently consumption of margarine, oil and fats are
necessary to meet this recommendation (Food & Nutrition Board et al., 2002:1324). There are no
recommendations in the SAFBDG for children with regards to fat intake.
(iii) Fruit and vegetables
Fruit was more frequently consumed among urban- than rural boys and rural- than urban girls in the
current study. Fruit was not listed among the top ten in any of the studies used for comparison.
The SAFBDG recommend that vegetables and fruit should be given to children daily, but no serving
amounts are specified (Bourne, 2007:228, Table 1). Frequent consumption of fruit among children in
the current study did, however, meet this requirement.
(iv) Milk and milk products
Full cream milk was consumed frequently by this study‘s rural boys and urban girls in this study, as
was the case among urban children in the meta-analysis by Nel and Steyn (2002:80,89-90, Table
29); urban children in the BRISK study (Nel & Steyn, 2002:103); the national NFCS (Labadarios et
al., 2005:544) and the rural meta-analysis (Nel & Steyn, 66, 75-76, Table 26). The current study‘s
urban boys consumed full cream milk a little less frequently (8th), but this results compares with the
findings of the study by Faber and Benadé (2001:364, Table 3).
When looking at the SAFBDG recommendations for children which states that children need to drink
milk daily (Bourne, 2007:228, Table 1), the current study‘s participants mostly complied with this
guideline.
(v) Sweets and sugar
In the current study, sugar was consumed frequently, similar to the rural and urban children in the
meta-analysis of Nel & Steyn (2002: 66, 75-75, Table 26, 80, 89-90); the rural children in the study
by Faber and Benadé (2001:364, Table 3), the BRISK (Nel & Steyn, 2002:103), Lebowa (Nel &
Steyn, 2002:97), and NFCS (Labadarios et al., 2005, 533).
The frequent consumption of sugar occurred most often added to cooked porridge and tea. However,
the SAFBDG for children recommend that sugar should be offered in small amounts with meals
(Bourne, 2007:228, Table 1). There are concerns that if sugar is consumed in excess it may displace
other foods that are good sources of vitamins and minerals in the diet (Van den Berg, 2011:260;
DoH, 2004:32). However, the current study‘s results only found that sugar was consumed frequently
and not what the quantities of consumption were.
Various articles state that consumption of too much sugar can contribute to dental caries (DoH,
2004:33; Lucas, 2004a:278; Touger-Decker, 2004:670-671; Vorster & Nell, 2001:S23). However, a
Page 163 of 252
systematic review concluded that frequent brushing with fluoride toothpaste and good dental care
prevents dental caries more effectively than avoiding sugary foods (Van den Berg, 2011:258).
(vi) Tea
Results for tea consumption were similar to consumption by: rural children in the Lebowa study (Nel
& Steyn, 2002:97); rural children in the meta-analysis (Nel & Steyn, 2002:80, 89-90, Table 26). the
NFCS (Labadarios, et al., 2005:533; Nel & Steyn, 2002:48); and the urban children in the meta-
analysis (Nel & Steyn, 2002:80, 89-90, Table 29).
The frequent intake of tea, especially during meal times, can affect iron status, since tea inhibits the
absorption of iron (Faber et al., 2001:409). Also, since tea was reported as a frequently consumed
fluid more often than milk in some instances, it can be assumed that tea replaced milk in the diet of
some children. However, when looking at intake of different food groups (Table 4.11 and Table 4.12),
all rural boys, 68,8% of urban boys, and fifty percent of urban girls took within the recommended
number of servings of milk and milk products.
(vii) Conclusion
Tea, cooked porridge, margarine/oil, salt/stock, bread, fruit, and vegetables were all ranked in the top
ten items consumed by both rural and urban boys younger than two years old. Rural boys consumed
full cream milk more often than boys, whereas urban boys consumed more fruit than rural boys.
Rural boys also consumed coffee creamer and cakes/biscuits more often than urban boys.
Cooked porridge, tea, margarine/oil, salt/stock, vegetables, bread, and fruit were within the top ten
items consumed by both rural and urban girls younger than two years old. Rural girls consumed fruit
and chips/crisps more often than urban girls, whereas urban girls consumed full cream milk more
often than rural girls.
5.3.2.2 Children older than two years
Frequently consumed food items were determined for 26 rural boys, 64 urban boys, 24 rural girls and
48 urban girls. Table 5.2 sets out the current study‘s results as compared to the results from various
other studies. The following studies were used for comparison to the data for children older than two
years: the BRISK study conducted between 1983 and 1990 in the urban Western Cape (Nel & Steyn,
2002:103); the Lebowa study conducted in 1991 in the rural Limpopo province (previously named
Northern Province) (Nel & Steyn, 2002:97); the study by MacKeown et al. (1998:307) conducted in the
urban area of Johannesburg/Soweto and rural area of previously-named Bophuthatswana in 1984;
the national results of the NFCS (Labadarios et al., 2005:533; Nel & Steyn, 2002:48); and the results
of the NFCS for the Free State (MacIntyre & Labadarios, 2000). The results of Nel and Steyn‘s meta-
analysis (2002) were also included.
The BRISK and Lebowa studies used the 24 hour recall as their measuring tool, while the NFCS used
both the 24 hour recall and the food frequency questionnaire. The current study used a single 24 hour
recall of reported usual intake.
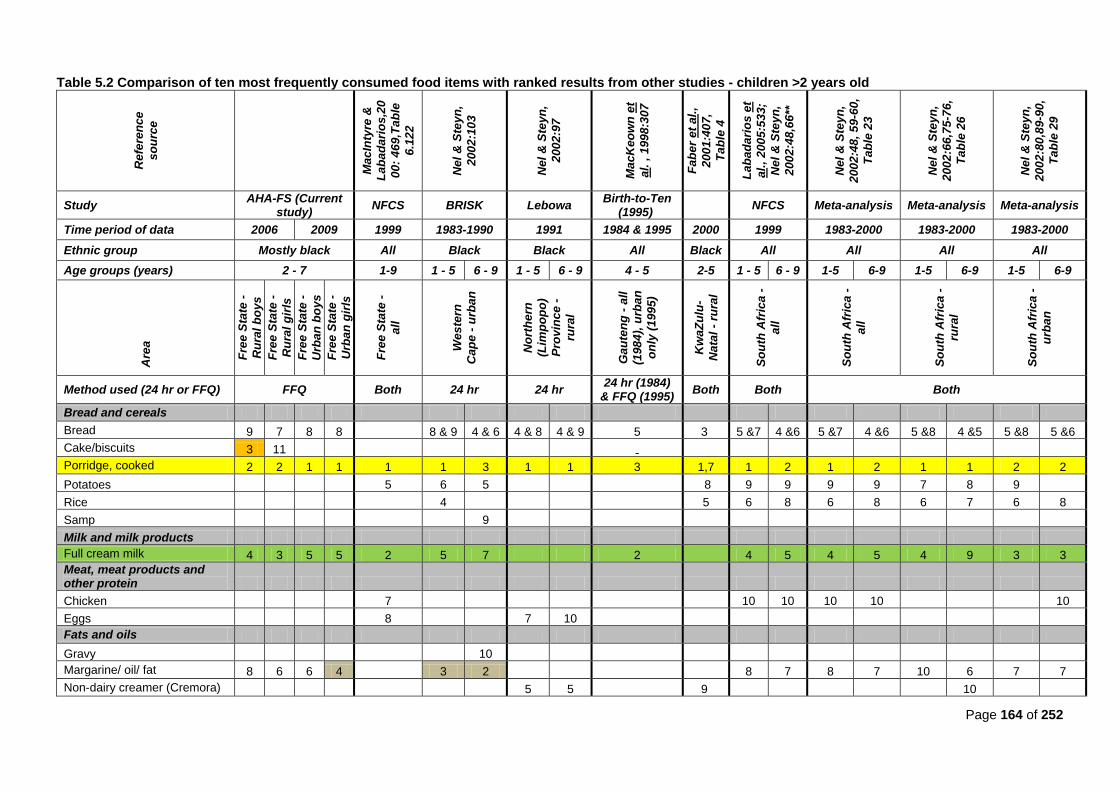
Page 164 of 252
Table 5.2 Comparison of ten most frequently consumed food items with ranked results from other studies - children >2 years old
Refe
ren
ce
so
urc
e
MacIn
tyre
&
Lab
ad
ari
os,2
0
00:
46
9,T
ab
le
6.1
22
Nel
& S
teyn
,
200
2:1
03
Nel
& S
teyn
,
200
2:9
7
MacK
eo
wn
et
al.
, 1
998:3
07
Fab
er
et
al.
,
200
1:4
07,
Tab
le 4
Lab
ad
ari
os e
t
al.
, 2005:5
33;
Nel
& S
teyn
,
200
2:4
8,6
6**
Nel
& S
teyn
,
200
2:4
8,
59
-60
,
Tab
le 2
3
Nel
& S
teyn
,
200
2:6
6,7
5-7
6,
Tab
le 2
6
Nel
& S
teyn
,
200
2:8
0,8
9-9
0,
Tab
le 2
9
Study AHA-FS (Current
study) NFCS BRISK Lebowa
Birth-to-Ten (1995)
NFCS Meta-analysis Meta-analysis Meta-analysis
Time period of data 2006 2009 1999 1983-1990 1991 1984 & 1995 2000 1999 1983-2000 1983-2000 1983-2000
Ethnic group Mostly black All Black Black All Black All All All All
Age groups (years) 2 - 7 1-9 1 - 5 6 - 9 1 - 5 6 - 9 4 - 5 2-5 1 - 5 6 - 9 1-5 6-9 1-5 6-9 1-5 6-9
Are
a
Fre
e S
tate
-
Ru
ral
bo
ys
Fre
e S
tate
-
Ru
ral
gir
ls
Fre
e S
tate
-
Urb
an
bo
ys
Fre
e S
tate
-
Urb
an
gir
ls
Fre
e S
tate
-
all
Weste
rn
Cap
e -
urb
an
No
rth
ern
(Lim
po
po
)
Pro
vin
ce -
rura
l
Gau
ten
g -
all
(198
4),
urb
an
on
ly (
1995)
Kw
aZ
ulu
-
Nata
l -
rura
l
So
uth
Afr
ica -
all
So
uth
Afr
ica -
all
So
uth
Afr
ica -
rura
l
So
uth
Afr
ica -
urb
an
Method used (24 hr or FFQ) FFQ Both 24 hr 24 hr 24 hr (1984)
& FFQ (1995) Both Both Both
Bread and cereals
Bread 9 7 8 8 8 & 9 4 & 6 4 & 8 4 & 9 5 3 5 &7 4 &6 5 &7 4 &6 5 &8 4 &5 5 &8 5 &6
Cake/biscuits 3 11
Porridge, cooked 2 2 1 1 1 1 3 1 1 3 1,7 1 2 1 2 1 1 2 2
Potatoes 5 6 5 8 9 9 9 9 7 8 9
Rice 4 5 6 8 6 8 6 7 6 8
Samp 9
Milk and milk products
Full cream milk 4 3 5 5 2 5 7 2
4 5 4 5 4 9 3 3
Meat, meat products and other protein
Chicken 7 10 10 10 10 10
Eggs 8 7 10
Fats and oils
Gravy 10
Margarine/ oil/ fat 8 6 6 4 3 2
8 7 8 7 10 6 7 7
Non-dairy creamer (Cremora)
5 5 9 10
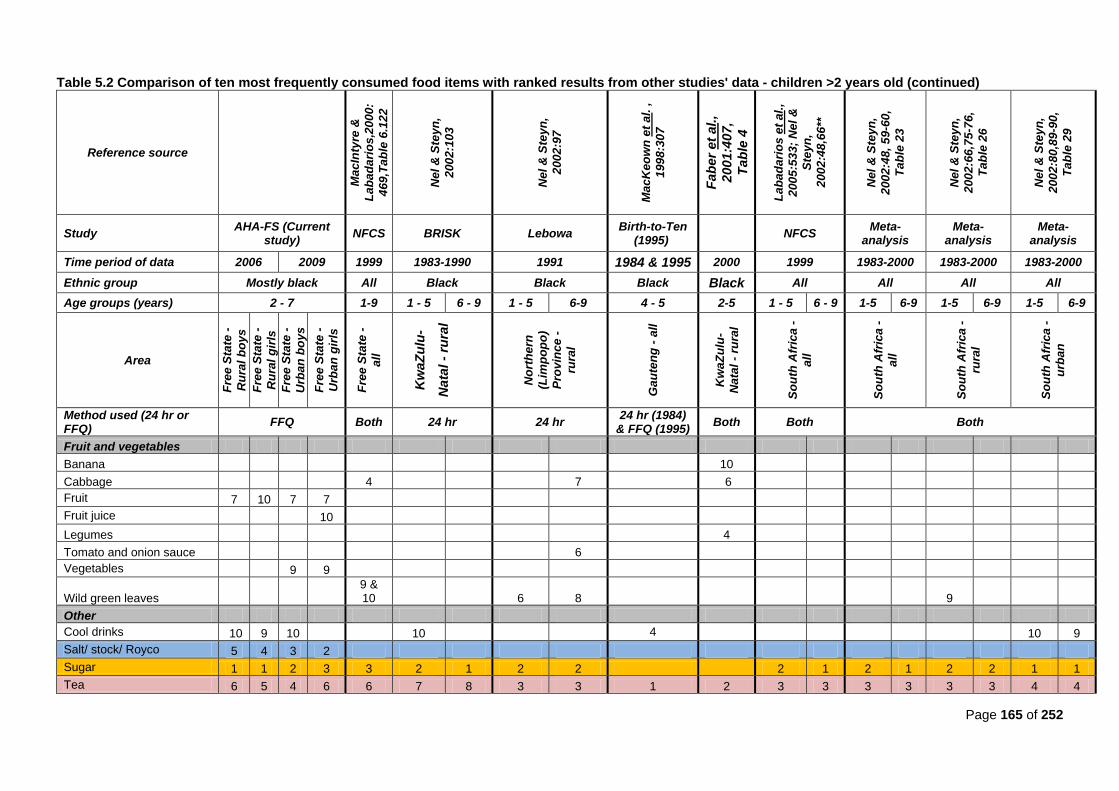
Page 165 of 252
Table 5.2 Comparison of ten most frequently consumed food items with ranked results from other studies' data - children >2 years old (continued)
Reference source
MacIn
tyre
&
Lab
ad
ari
os,2
000:
469,T
ab
le 6
.12
2
Nel
& S
teyn
,
200
2:1
03
Nel
& S
teyn
,
200
2:9
7
MacK
eo
wn
et
al.
,
199
8:3
07
Fa
be
r et
al.,
20
01
:407
,
Ta
ble
4
Lab
ad
ari
os e
t al.
,
200
5:5
33;
Nel
&
Ste
yn
,
200
2:4
8,6
6**
Nel
& S
teyn
,
200
2:4
8,
59
-60,
Tab
le 2
3
Nel
& S
teyn
,
200
2:6
6,7
5-7
6,
Tab
le 2
6
Nel
& S
teyn
,
200
2:8
0,8
9-9
0,
Tab
le 2
9
Study AHA-FS (Current
study) NFCS BRISK Lebowa
Birth-to-Ten (1995)
NFCS
Meta-analysis
Meta-analysis
Meta-analysis
Time period of data 2006 2009 1999 1983-1990 1991 1984 & 1995 2000 1999 1983-2000 1983-2000 1983-2000
Ethnic group Mostly black All Black Black Black Black All All All All
Age groups (years) 2 - 7 1-9 1 - 5 6 - 9 1 - 5 6-9 4 - 5 2-5 1 - 5 6 - 9 1-5 6-9 1-5 6-9 1-5 6-9
Area
Fre
e S
tate
-
Ru
ral
bo
ys
Fre
e S
tate
-
Ru
ral
gir
ls
Fre
e S
tate
-
Urb
an
bo
ys
Fre
e S
tate
-
Urb
an
gir
ls
Fre
e S
tate
-
all
Kw
aZ
ulu
-
Na
tal -
rura
l
No
rth
ern
(Lim
po
po
)
Pro
vin
ce -
rura
l
Gau
ten
g -
all
Kw
aZ
ulu
-
Nata
l -
rura
l
So
uth
Afr
ica -
all
So
uth
Afr
ica -
all
So
uth
Afr
ica -
rura
l
So
uth
Afr
ica -
urb
an
Method used (24 hr or FFQ)
FFQ Both 24 hr 24 hr 24 hr (1984)
& FFQ (1995) Both Both Both
Fruit and vegetables
Banana 10
Cabbage 4 7 6
Fruit 7 10 7 7
Fruit juice 10
Legumes 4
Tomato and onion sauce 6
Vegetables 9 9
Wild green leaves 9 & 10 6 8 9
Other
Cool drinks 10 9 10 10 4 10 9
Salt/ stock/ Royco 5 4 3 2
Sugar 1 1 2 3 3 2 1 2 2
2 1 2 1 2 2 1 1
Tea 6 5 4 6 6 7 8 3 3 1 2 3 3 3 3 3 3 4 4

Page 166 of 252
(i) Breads and cereals
When describing the dietary intake according to foods most frequently consumed, both urban boys
and girls consumed cooked porridge (including both maize meal- and sorghum porridge) as their first
most frequently consumed food item and both rural boys and girls consumed it as their second most
frequently consumed food item.
Maize porridge was also consumed most frequently among urban one-to-five-year olds in the BRISK
study (Nel & Steyn, 2002:103); rural one-to-five-year olds in the Lebowa study (Nel & Steyn, 2002:97);
rural one-to-five-year olds in the meta-analysis study conducted by Nel & Steyn (2002:66,75-76, Table
26); rural six-to-nine-year olds in the Lebowa study (Nel & Steyn, 2002:97); and rural six-to-nine-year
olds in the meta-analysis study (Nel & Steyn, 2002:66,75-76, Table 26).
Maize porridge was also most frequently consumed by the Free State data group of the NFCS
(MacIntyre & Labadarios, 2000:469, Table 6.122) and the one-to-five-year olds nationally in the NFCS
and meta-analysis study (Labadarios et al., 2005:533; Nel & Steyn, 2002:48,59-60, Table 23).
Maize porridge was ranked as the second most frequently consumed food item among both the urban
one-to-five-year old and the six-to-nine-year old groups in the meta-analysis (Nel & Steyn, 2002:80,89-
90, Table 29) as well as the national group of six-to-nine-year-olds of the NFCS (Labadarios et al.,
2005:533; Nel & Steyn, 2002:48,59-60, Table23). Faber and Benadé, 2001:364, Table 3) found that
soft maize porridge was eaten second most frequently and stiff maize porridge sixth most frequently
among their 4-to-24-month old rural children.
Maize porridge was consumed third most frequently among urban six-to-nine-year olds in the BRISK
study (Nel & Steyn, 2002:103) as well as four-to-five-year olds in the study of MacKeown et al.
(1998:307).
These findings reflect that porridge is the staple food of the majority of children older than two years,
and is in compliance with SAFBDG for children, which states that starches (of which porridge forms
part) should form the basis of the main meals for children (Bourne, 2007:228, Table 1).
Bread also fell within the top ten most frequently consumed items, as was found by most of the other
studies, except for the NFCS. Bread is a starchy food, which should form the basis of most meals as
stated by the SAFBDG for children (Bourne, 2007:228, Table 1). Frequent intake of bread (preferably
brown bread) is necessary to meet this guideline.
(ii) Fats and oil
When describing the dietary intake according to foods most frequently consumed, margarine, oil or fat
was a frequently consumed food item, especially amongst rural and urban girls and urban boys. In
comparison, it was the third most frequently consumed item among urban one-to-five-year olds in the
BRISK study, and second among urban six-to-nine-year olds in the BRISK study (Nel & Steyn,
2002:103). Faber and Benadé (2001:364, Table 3) found that oil was the most frequently consumed
food item among 4-to-24-month olds and margarine was the seventh most frequently consumed food
item.
Page 167 of 252
Urban boys also had a close to significantly more frequent intake of coffee creamer in comparison to
rural boys (95% CI [-30;0]).
Frequent consumption of fats and oils does not necessarily mean that they were consumed in
excessive amounts. There are no recommendation as to fat intake from the SAFBDG for children.
According to the DRIs, children between one and three years may consume between thirty to forty
percent of energy from fats per day and children aged four to 18 years old may consume 25-35% of
their total energy from fat (Food & Nutrition Board et al., 2002:1324).
However, consuming fats and oil in excessive amounts may lead to weight gain, which may increase
the risk for chronic diseases of lifestyle (DoH, 2004:27). However, they are good sources of essential
fatty acids and fat-soluble vitamins, which are essential for growth and development in infants
(Wolmarans & Oosthuizen, 2001:S48).
A significantly larger percentage of rural boys consumed cake/biscuits/cookies frequently (95% CI [-
30;-1]) than urban boys. However, the NFCS found that only 5,3% of their rural one-to-five-year-olds
(Nel & Steyn, 2002:.60, Table 23) and 6,9% of their rural six-to-nine-year-olds consumed
cookies/biscuits and/or cake (Nel & Steyn, 2002:.61, Table 23). More urban children in the NFCS
consumed cookies/biscuits and/or cake, with 7,9% among one-to-five-year-olds (Nel & Steyn,
2002:.89, Table 29) and 11,3% of all six-to-nine-year-olds (Nel & Steyn, 2002: 91, Table 29). Cookies
are high in saturated fat and sugar and frequent consumption can lead to weight gain (USDA &
USDHHS, 2010:13,24,30; Potischman et al., 2002:946). In addition, the micronutrient content of
cookies and biscuits are very low.
(iii) Fruit and vegetables
All children consumed fruit and vegetables seventh most frequently except rural girls (10th ranking).
Fruit was consumed almost as frequently as bread among most of the groups, except in the rural girls.
Faber et al. (2001:407, Table 4) found in their children in rural Kwa-Zulu Natal that bananas were the
tenth item within the top ten most frequently consumed food items. Consumption of fruit in children
met the recommendations of the SAFBDG for children, which states that South African children should
eat vegetables and fruit daily (Bourne, 2007:228, Table 1). However, frequent consumption does not
necessarily mean that sufficient amounts of servings were consumed. Only 12% of urban children
consumed five servings or more of fruit and vegetables per day. Frequent consumption of fruit and
vegetables is associated with numerous health benefits (Love & Sayed, 2001:S26).
(iv) Milk and milk products
Full cream milk was the third most frequently consumed item by rural girls, the fourth item by rural
boys and the fifth item by both urban boys and girls. In the Free State group of the NFCS and in the
study conducted by MacKeown et al. (1998:307), it was the second most frequently consumed food
item. Nel and Steyn (2002, 80,89-90, Table 29) found it the third most frequently consumed item
among urban children between one and nine years old, and it was the fourth most frequently
consumed food item nationally among one-to-five-year olds in the NFCS (Labadarios et al., 2005:533;
Nel & Steyn, 2002:48), as well as the rural one-to-five year olds in the meta-analysis (Nel & Steyn,
2002, 66, 75-76, Table 26). It was the fifth most frequently consumed food item among urban one-to-
Page 168 of 252
five-year olds in the BRISK study (Nel & Steyn, 2002:103) as well as the six-to-nine-year olds in the
national NFCS (Labadarios et al., 2005:533; Nel & Steyn, 2002:48).
The SAFBDG for children recommend that children should drink milk daily (Bourne, 2007:228, Table
1), and frequent consumption of milk in the current study‘s children possibly ensured that children met
this requirement, although the amounts of milk consumed were not specified.
(v) Sweets and sugar
There was a close to significant difference in the frequency of consumption of sugar, with rural boys
consuming sugar more frequently than urban boys (95% CI [-30;0]). The significant difference was
even closer in girls, with rural girls also consuming sugar more frequently than urban girls (95% CI [-
60;0]).
In comparison with other studies, sugar was also consumed most frequently by: urban one-to-five-year
olds and six-to-nine-year olds in the meta-analysis by Nel and Steyn (2002:80,89-90, Table 29); as
well as six to nine year old urban children in the BRISK study (Nel & Steyn, 2002:103), and six-to-nine-
year olds nationally in the NFCS (and meta-analysis) (Labadarios et al., 2005:533; Nel & Steyn,
2002:48,59-60, Table 23).
Sugar was second most frequently consumed by urban one-to-five-year old groups in the BRISK study
(Nel & Steyn, 2002:103); as well as both rural one-to-five-year olds and six- to-nine-year-olds in the
Lebowa study (Nel & Steyn, 2002:97); the rural one-to-five-year olds and six-to-nine-year olds in the
meta-analysis (Nel & Steyn, 2002: 66,75-76, Table 26), and the national NFCS (Labadarios et al.,
2005:533; Nel & Steyn, 2002:48).
Sugar was the third most frequently consumed food in the Free State group of children in the NFCS
(MacIntyre & Labadarios, 2000:469, Table 6.122) as well as the rural 4-to-24-month old South African
children (Faber & Benadé, 2001:364, Table 3).
The frequent consumption of sugar most probably stems from the fact that sugar was frequently added
to the frequently consumed cooked porridge and to tea.
What is of more concern in the current study is the frequent consumption of sugar sweetened
beverages (cool drinks) among children older than two years, since excessive consumption of sugar-
sweetened beverages is associated with weight gain and obesity (Van den Berg, 2011:257). Both rural
and urban boys consumed it tenth most frequently. Rural girls consumed it ninth most frequently and
urban girls consumed it 14th most frequently.
The SAFBDG for children recommend that sugary treats and drinks should be given sparingly to
children and only at meal times (Bourne, 2007:228, Table 1). Replacing soft drinks (that contain sugar)
with milk or water, can help with weight management in obese children (Bourne & Seager, 2001:S66).
(vi) Salt
Salt (together with beef stock) was listed as a food item on the FFQ. Results should be interpreted
with caution, since only frequent consumption of salt was reported and not the amount of added salt.

Page 169 of 252
Salt was the second most frequently consumed item among urban girls and the third item among
urban boys, whereas it was the fourth and fifth item respectively among rural girls and rural boys.
None of the comparison studies investigated salt/stock as a frequently consumed food item, and
therefore there were no studies available for comparison. The NFCS found that 57% of Free State
respondents used iodized salt in their child‘s food (MacIntyre & Labadarios, 2000:432, Table 6.80) and
17% used flavoured salts (e.g. Beefstock, Aromat, Bisto, etc.) in their child‘s food (MacIntyre &
Labadarios, 2000:433, Table 6.83).
The SAFBDG (for adults) recommends that salt should be used sparingly (DoH, 2004:30). However,
no recommendation is made for children The SAFBDG for children are in the process of being revised.
(vii) Tea
There was a close to significant difference in frequency of tea intake among both boys (95% CI [-
30;0]). and girls (95% CI [-30;0]). Tea was consumed more frequently by urban boys (4th) than rural
boys (6th) and rural girls consumed tea more frequently (5
th) than urban girls (6
th). This corresponds
well with the Free State group of the NFCS, where tea was ranked sixth (MacIntyre & Labadarios,
2000:469, Table 6.122) and the BRISK study, where it was ranked seventh for one-to-five-year olds,
and eighth for six-to-nine-year olds (Nel & Steyn, 2002:103). However, it was more frequently
consumed in the Lebowa study and NFCS nationally, where it was ranked third. It was ranked first in
the study by MacKeown et al. (1998:307).
(viii) Conclusion
Food groups mostly consumed in adequate- or more than adequate amounts by most children older
than two years of age were: sweets and sugar; fats and oils; and bread and cereals, with the fourth
most commonly consumed food group being meat and meat products, followed by milk and milk
products, reflecting that children tend to consume more meats and less dairy as they age.
These findings agree with data in Tables 4.19 and 4.20, which show that cooked porridge; sugar; full
cream milk; tea; bread; and margarine/oil/fat mostly fell within the top ten of the most frequently
consumed food items among these children. Intake of cool drinks (which were mostly sugar-
sweetened) was also frequently reported.
There were no significant differences between the frequent intake of food items among either rural and
urban boys or rural and urban girls, except for a higher frequent median intake of cake/biscuits among
rural boys (95%CI [-30;-1]).
A nutrition transition from a traditional diet to a Western diet has occurred in both rural and urban boys
and rural and urban girls, when looking at consumption of food groups and the top ten frequently
consumed food items.
5.3.2.3 Adults
A ranking of food items most frequently consumed were determined for 161 rural men, 99 urban men,
389 rural women and 320 urban women. Results of the current study were compared with the results
Page 170 of 252
from various studies and summarized in Table 5.3. The following studies were used for comparison:
the BRISK study conducted between 1983 and 1990 among black urban residents of the Western
Cape aged between three and 60+ years old (Nel & Steyn, 2002:21, Table 4); the Coronary Risk
Factor Study (CORIS) conducted in 1979 among white urban adults aged 15 to 64 years in the
Western Cape (Steyn et al., 2006:15, Table 2.21; Steyn et al., 2003:636, Table 3; Nel & Steyn,
2002:21, Table 4); the Dikgale study conducted among rural black adults of Northern/Limpopo
Province aged 19 years and older (Steyn et al., 2006:15, Table 2.2.1, Steyn, 2005a:35, Table 4.2a;
Steyn et al., 2003:636, Table 3; Nel & Steyn, 2002:23, Table 4); the Lebowa study conducted on 19 to
24 year olds in 1991 in the rural Northern (Limpopo) province (Nel & Steyn, 2002:97); the FYFS
Project conducted in 1994 among black female aged from 18 to 34 years old in Gauteng (Steyn et al.,
2003:636, Table 3; Nel & Steyn, 2002:23, Table 5); the THUSA Study conducted between 1996 and
1998, in the North West Province among urban and rural blacks aged 14 years and older (Steyn et al.,
2006:244, Table 2, Vorster et al., 2005:485, Table 4; Steyn et al., 2003:636, Table 3; Nel & Steyn,
2002:23, Table 5); the Weight and Risk Factor (WRFS) study conducted through a postal survey
among all South Africans aged between 18 and 55 years old (Steyn et al., 2003:636, Table 3; Nel &
Steyn, 2002:23, Table 5).
(i) Breads and cereals
In the current study, cooked porridge was consumed second most frequently by rural men and
women, and urban men. Urban women consumed it third most frequently. In comparison, it was
found to be the first most frequently consumed food item in: the meta-analysis studies for rural and
all South Africans (Nel & Steyn, 2002:62, Table 23, Nel & Steyn, 2002:77, Table 26); the Dikgale
study (rural Northern/Limpopo Province)(Nel & Steyn, 2002:101); and the THUSA study (rural
women; men and women from farms; men from urban middle- and upper class) (MacIntyre et al.,
2002:247-248, Tables 5-6). In the THUSA study, it was the second most frequently consumed food
item among all participants overall; as well as in rural men, men and women from informal
settlements, and women from urban middle class (MacIntyre et al., 2002:247-248, Tables 5-6).
Eating cooked porridge, as part of starchy foods, is recommended by the SAFBDG, since it may be
a good source of fibre and starch, in sufficient quantities. Vorster and Nell (2001:S17) state that
there is convincing evidence that foods rich in carbohydrates influence health and prevent CDLs
directly via digestion, absorption, fermentation and metabolism; and indirectly by adding
micronutrients and phytochemicals to the diet, as well as replacing fat and animal protein in the
diet. Vorster & Nell (2001:S17, S20-S23) in their systematic review of the scientific evidence linked
to the SAFBDG of ―make starchy foods the basis of most meals‖ state that a high-carbohydrate diet
lowers the risk for obesity, DM, CVD, stroke, CHD, cancer and gastrointestinal diseases (Vorster &
Nell, 2001:S17,S20-S23). Since it is also a fortified staple food (Labadarios et al., 2005:542),
higher intake can be of benefit to an individual‘s micronutrient status. However, it is possible to
become obese on a low-fat, high-carbohydrate diet, especially if physical activity is also low
(Vorster & Nell, 2001:S20).
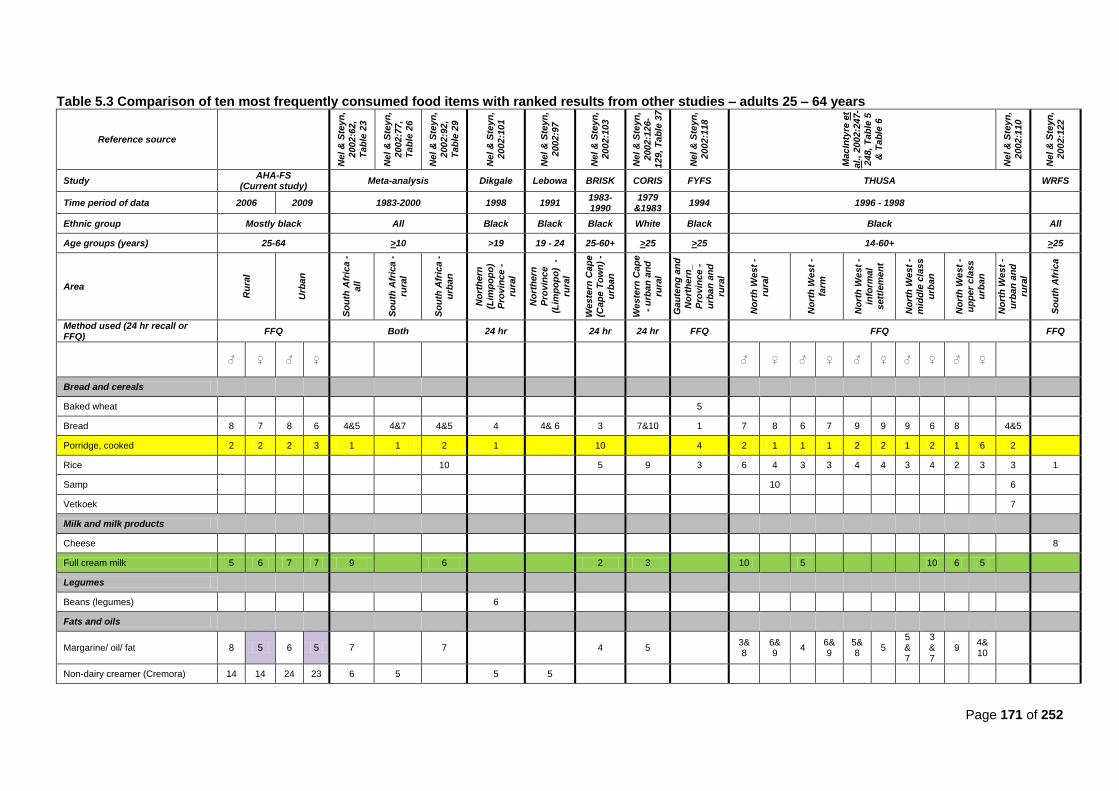
Page 171 of 252
Table 5.3 Comparison of ten most frequently consumed food items with ranked results from other studies – adults 25 – 64 years
Reference source
Ne
l &
Ste
yn
, 2002:6
2,
Ta
ble
23
Ne
l &
Ste
yn
,
2002:7
7,
Ta
ble
26
Ne
l &
Ste
yn
,
2002:9
2,
Ta
ble
29
Ne
l &
Ste
yn
,
2002:1
01
Ne
l &
Ste
yn
,
2002:9
7
Ne
l &
Ste
yn
, 2002:1
03
Ne
l &
Ste
yn
,
2002:1
26
-1
29
, T
ab
le 3
7
Ne
l &
Ste
yn
,
2002:1
18
Ma
cIn
tyre
et
al.
, 2
00
2:2
47-
24
8, T
ab
le 5
& T
ab
le 6
Ne
l &
Ste
yn
,
2002:1
10
Ne
l &
Ste
yn
,
2002:1
22
Study AHA-FS
(Current study) Meta-analysis Dikgale Lebowa BRISK CORIS FYFS THUSA WRFS
Time period of data 2006 2009 1983-2000 1998 1991 1983-1990
1979 &1983
1994 1996 - 1998
Ethnic group Mostly black All Black Black Black White Black Black All
Age groups (years) 25-64 >10 >19 19 - 24 25-60+ >25 >25 14-60+ >25
Area
Ru
ral
Urb
an
So
uth
Afr
ica -
a
ll
So
uth
Afr
ica -
rura
l
So
uth
Afr
ica -
urb
an
No
rth
ern
(Lim
po
po
)
Pro
vin
ce -
rura
l
No
rth
ern
Pro
vin
ce
(Lim
po
po
) -
rura
l
We
ste
rn C
ap
e
(Ca
pe
To
wn
) -
urb
an
We
ste
rn C
ap
e
- u
rba
n a
nd
ru
ral
Ga
ute
ng
an
d
No
rth
ern
_
Pro
vin
ce -
urb
an
an
d
rura
l
No
rth
We
st
-
rura
l
No
rth
We
st
-
farm
No
rth
We
st
-
info
rmal
se
ttle
me
nt
No
rth
We
st
- m
idd
le c
las
s
urb
an
No
rth
We
st
- u
pp
er
cla
ss
urb
an
No
rth
We
st
-
urb
an
an
d
rura
l
So
uth
Afr
ica
Method used (24 hr recall or FFQ)
FFQ Both 24 hr
24 hr 24 hr FFQ FFQ FFQ
♂ ♀ ♂ ♀ ♂ ♀ ♂ ♀ ♂ ♀ ♂ ♀ ♂ ♀
Bread and cereals
Baked wheat
5
Bread 8 7 8 6 4&5 4&7 4&5 4 4& 6 3 7&10 1 7 8 6 7 9 9 9 6 8
4&5
Porridge, cooked 2 2 2 3 1 1 2 1
10
4 2 1 1 1 2 2 1 2 1 6 2
Rice
10
5 9 3 6 4 3 3 4 4 3 4 2 3 3 1
Samp
10
6
Vetkoek
7
Milk and milk products
Cheese
8
Full cream milk 5 6 7 7 9
6
2 3
10
5
10 6 5
Legumes
Beans (legumes)
6
Fats and oils
Margarine/ oil/ fat 8 5 6 5 7
7
4 5
3& 8
6& 9
4 6&9
5&8
5 5&7
3&7
9 4&10
Non-dairy creamer (Cremora) 14 14 24 23 6 5
5 5
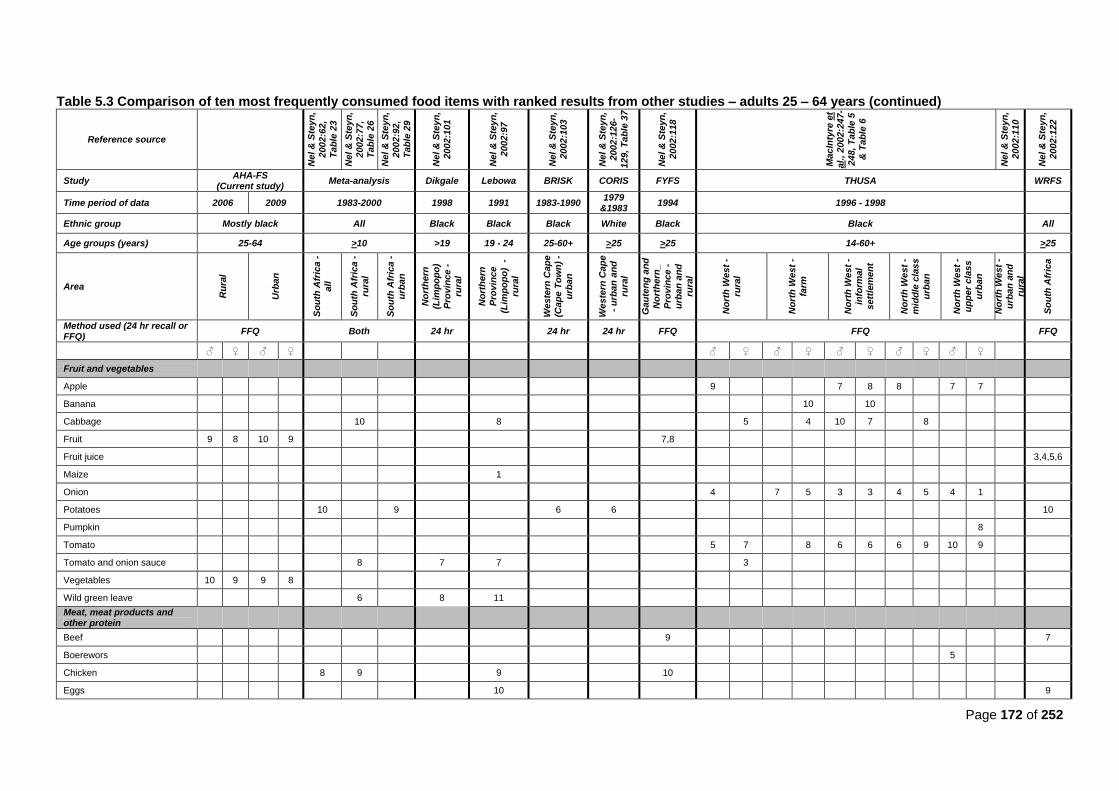
Page 172 of 252
Table 5.3 Comparison of ten most frequently consumed food items with ranked results from other studies – adults 25 – 64 years (continued)
Reference source
Ne
l &
Ste
yn
,
2002:6
2,
Ta
ble
23
Ne
l &
Ste
yn
,
2002:7
7,
Ta
ble
26
Ne
l &
Ste
yn
, 2002:9
2,
Ta
ble
29
Ne
l &
Ste
yn
, 2002:1
01
Ne
l &
Ste
yn
,
2002:9
7
Ne
l &
Ste
yn
,
2002:1
03
Ne
l &
Ste
yn
,
2002:1
26
-1
29
, T
ab
le 3
7
Ne
l &
Ste
yn
,
2002:1
18
Ma
cIn
tyre
et
al.
, 2
00
2:2
47-
24
8, T
ab
le 5
& T
ab
le 6
Ne
l &
Ste
yn
,
2002:1
10
Ne
l &
Ste
yn
,
2002:1
22
Study AHA-FS
(Current study) Meta-analysis Dikgale Lebowa BRISK CORIS FYFS THUSA WRFS
Time period of data 2006 2009 1983-2000 1998 1991 1983-1990 1979
&1983 1994 1996 - 1998
Ethnic group Mostly black All Black Black Black White Black Black All
Age groups (years) 25-64 >10 >19 19 - 24 25-60+ >25 >25 14-60+ >25
Area
Ru
ral
Urb
an
So
uth
Afr
ica -
all
So
uth
Afr
ica -
rura
l
So
uth
Afr
ica -
urb
an
No
rth
ern
(Lim
po
po
)
Pro
vin
ce -
ru
ral
No
rth
ern
Pro
vin
ce
(Lim
po
po
) -
rura
l
We
ste
rn C
ap
e
(Ca
pe
To
wn
) -
urb
an
We
ste
rn C
ap
e
- u
rba
n a
nd
ru
ral
Ga
ute
ng
an
d
No
rth
ern
_
Pro
vin
ce -
urb
an
an
d
rura
l
No
rth
We
st
-
rura
l
No
rth
We
st
-
farm
No
rth
We
st
-
info
rmal
se
ttle
me
nt
No
rth
We
st
-
mid
dle
cla
ss
urb
an
No
rth
We
st
-
up
pe
r c
lass
urb
an
No
rth
We
st
-
urb
an
an
d
rura
l
So
uth
Afr
ica
Method used (24 hr recall or FFQ)
FFQ Both 24 hr
24 hr 24 hr FFQ FFQ FFQ
♂ ♀ ♂ ♀ ♂ ♀ ♂ ♀ ♂ ♀ ♂ ♀ ♂ ♀
Fruit and vegetables
Apple
9
7 8 8
7 7
Banana
10
10
Cabbage
10
8
5
4 10 7
8
Fruit 9 8 10 9
7,8
Fruit juice
3,4,5,6
Maize
1
Onion
4
7 5 3 3 4 5 4 1
Potatoes
10
9
6 6
10
Pumpkin
8
Tomato
5 7
8 6 6 6 9 10 9
Tomato and onion sauce
8
7 7
3
Vegetables 10 9 9 8
Wild green leave
6
8 11
Meat, meat products and other protein
Beef
9
7
Boerewors
5
Chicken
8 9
9
10
Eggs
10
9
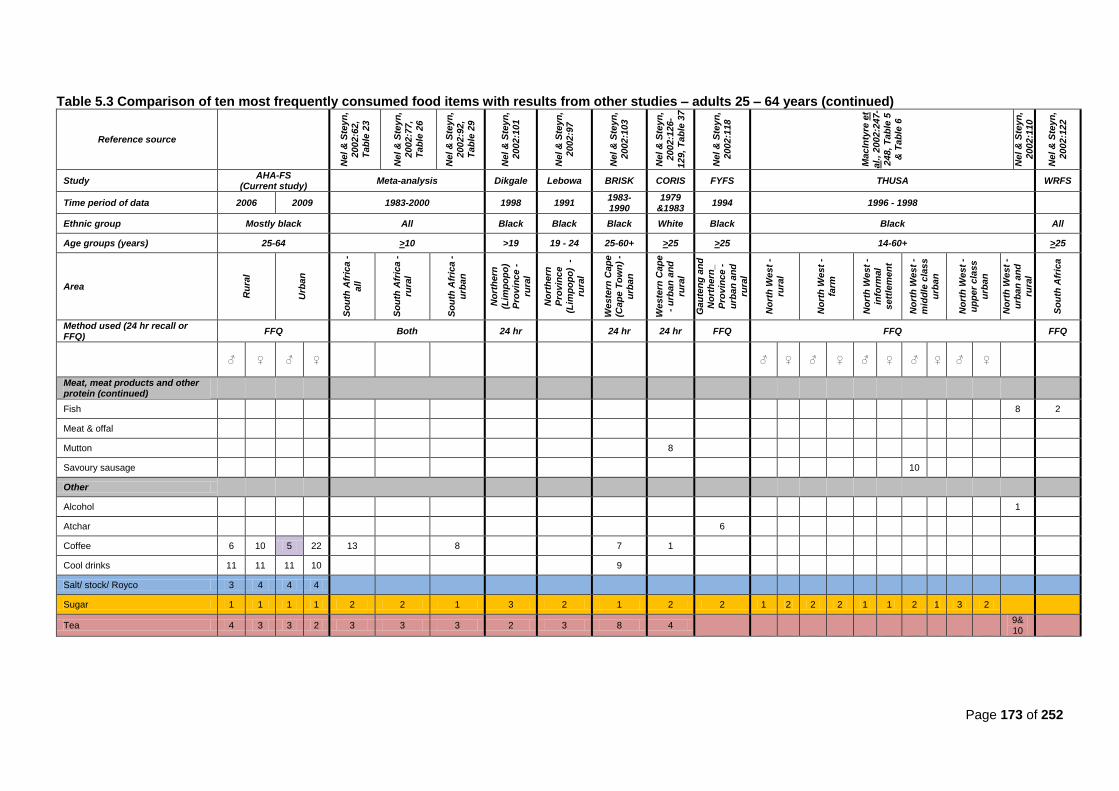
Page 173 of 252
Table 5.3 Comparison of ten most frequently consumed food items with results from other studies – adults 25 – 64 years (continued)
Reference source
Ne
l &
Ste
yn
, 2002:6
2,
Ta
ble
23
Ne
l &
Ste
yn
,
2002:7
7,
Ta
ble
26
Ne
l &
Ste
yn
,
2002:9
2,
Ta
ble
29
Ne
l &
Ste
yn
, 2002:1
01
Ne
l &
Ste
yn
, 2002:9
7
Ne
l &
Ste
yn
,
2002:1
03
Ne
l &
Ste
yn
, 2002:1
26
-
12
9, T
ab
le 3
7
Ne
l &
Ste
yn
,
2002:1
18
Ma
cIn
tyre
et
al.
, 2
00
2:2
47-
24
8, T
ab
le 5
& T
ab
le 6
Ne
l &
Ste
yn
,
2002:1
10
Ne
l &
Ste
yn
,
2002:1
22
Study AHA-FS
(Current study) Meta-analysis Dikgale Lebowa BRISK CORIS FYFS THUSA WRFS
Time period of data 2006 2009 1983-2000 1998 1991 1983-1990
1979 &1983
1994 1996 - 1998
Ethnic group Mostly black All Black Black Black White Black Black All
Age groups (years) 25-64 >10 >19 19 - 24 25-60+ >25 >25 14-60+ >25
Area
Ru
ral
Urb
an
So
uth
Afr
ica -
all
So
uth
Afr
ica -
rura
l
So
uth
Afr
ica -
urb
an
No
rth
ern
(Lim
po
po
)
Pro
vin
ce -
rura
l
No
rth
ern
Pro
vin
ce
(Lim
po
po
) -
rura
l
We
ste
rn C
ap
e
(Ca
pe
To
wn
) -
urb
an
We
ste
rn C
ap
e
- u
rba
n a
nd
rura
l
Ga
ute
ng
an
d
No
rth
ern
_
Pro
vin
ce -
urb
an
an
d
rura
l
No
rth
We
st
-
rura
l
No
rth
We
st
-
farm
No
rth
We
st
-
info
rmal
se
ttle
me
nt
No
rth
We
st
-
mid
dle
cla
ss
urb
an
No
rth
We
st
-
up
pe
r c
lass
urb
an
No
rth
We
st
-
urb
an
an
d
rura
l
So
uth
Afr
ica
Method used (24 hr recall or FFQ)
FFQ Both 24 hr
24 hr 24 hr FFQ FFQ FFQ
♂ ♀ ♂ ♀ ♂ ♀ ♂ ♀ ♂ ♀ ♂ ♀ ♂ ♀
Meat, meat products and other protein (continued)
Fish
8 2
Meat & offal
Mutton
8
Savoury sausage
10
Other
Alcohol
1
Atchar
6
Coffee 6 10 5 22 13
8
7 1
Cool drinks 11 11 11 10
9
Salt/ stock/ Royco 3 4 4 4
Sugar 1 1 1 1 2 2 1 3 2 1 2 2 1 2 2 2 1 1 2 1 3 2
Tea 4 3 3 2 3 3 3 2 3 8 4
9& 10
Page 174 of 252
(ii) Fats and oils
Margarine, oil and fat were frequently consumed, but the amounts consumed were not determined.
Rural and urban women both consumed margarine/oil/fat fifth most frequently. The BRISK study
(Nel & Steyn, 2002:103) found it to be consumed fourth most frequently. The CORIS study (Nel &
Steyn, 2002:126-129, Table 37) also found it to be the fifth most frequently consumed item. The
THUSA study found it to be in the third to fifth most frequently consumed range (see Table 5.3).
Brick margarine was consumed by 61% of participants in the CORIS study (6th most frequently
consumed); 57% of Coronary Risk Factor Study (CRISIC) participants (6th most frequently
consumed); and forty percent of BRISK participants (8th most frequently consumed) (Wolmarans &
Oosthuizen, 2001:S52, Table III).
The SAFBDG recommend that fats should be eaten sparingly, which means that fats should form
part of a balanced diet, but should be consumed in limited amounts. Fats are important sources of
the essential fatty acids: linoleic and alpha-linolenic acids, and are also precursors for eicosanoids,
phospholipids and hormones, but overconsumption may lead to CHD, obesity and breast-, colon-
or prostate cancer. To prevent CDL, it is recommended that intake of fried foods, fat from animal
sources and non-dairy creamers should be lowered, and that unsaturated margarines (spread
thinly on bread) and oils should preferably be consumed (Wolmarans & Oosthuizen, 2001:S48-
S49).
Providing generic medication to high-risk CVD individuals to lower blood pressure and cholesterol
is cost-effective (Rodgers et al., 2006:online). However, such a strategy remains to be extensively
researched (Norman et al., 2007b:714).
(iii) Fruit and vegetables
Overall, women more frequently consumed vegetables and fruit than men (Table 21 and Table 22).
The SAFBDG recommend that South Africans should consume ―plenty‖ of fruit and vegetables
daily, based on the five-a-day for better health strategy in the United States (Love & Sayed, 2001:
S24, S30). Convincing evidence exists that fruit and vegetables protect against cancers of the
stomach, esophagus and lungs (Love & Sayed, 2001:S24). Vegetable and fruit also play a
protective role against CVD, CHD, and stroke, due to their high content of phytonutrients;
flavonoids; potassium; folate and fibre (Schneider et al., 2007:717; WHO/FAO, 2002:86, 89; Love &
Sayed, 2001:S24, S27-S28). Increased intake of fruits and vegetables also decreases serum
homocysteine, thereby decreasing the risk of developing CVD (Carlson, 2004:449). Fruits and
vegetables also have a significant protective effect on high blood pressure and obesity (Schneider
et al., 2007:717). The South African burden of disease study found that esophageal cancer
accounted for 9,8% attributable DALYs attributable to low fruit and vegetable consumption in men
and 7,0% in women, with lung cancer accounting for 7,8% of all DALYs in men and 4,7% in women
(Schneider et al., 2007:720).
Page 175 of 252
(iv) Milk and milk products
Full cream milk was consumed frequently by all participants (between 5th and 7
th ranking) (Table
5.3). Milk was the third most frequently consumed food item in the THUSA study, but overall intake
was low (MacIntyre et al., 2002:252). In the BRISK study, 58% of participants consumed milk and
milk products (Scholtz et al., 2001:S43). Many South Africans consume milk, but in a lesser
amount than the recommended intake (400 ml or more per day) (Scholtz et al., 2001:S43).
Dairy products are considered expensive in South Africa and intake is also influenced by culture,
tradition and religion (MacIntyre et al., 2002: 252; Scholtz et al., 2001:S42). A large portion of the
South African black population also struggle with lactose intolerance (MacIntyre et al., 2002:252;
Scholtz et al., 2001:S43). This may partly explain why most of the current study‘s participants did
not meet their daily recommended servings of milk and milk products, since they may avoid dairy
products. Only 45% of participants in the BRISK study consumed full cream milk (Wolmarans &
Oosthuizen, 2001:S53).
In the current study, full cream milk was frequently used in beverages and porridge, but not in large
quantities. If two to three servings of dairy are not consumed per day, a person‘s diet may be
deficient in vitamin D, calcium , magnesium and zinc (Scholtz et al., 2001:S43). By consuming
inadequate amounts of milk and milk products, the requirement of 1000mg of calcium per day
cannot be met (Scholtz et al., 2001:S43). There are unfounded concerns that dairy may increase
the risk of CVD, due to increased saturated fat intake. However, saturated fatty acids do elevate
blood cholesterol if they are substituted for carbohydrates or other fatty acids in the diet (Krummel,
2004a:878). However, consumption of fermented milk may decrease blood cholesterol
concentrations (Scholtz et al. 2001:S43). The Dietary Approaches to Stop Hypertension (DASH)
diet recommends increased intake of low fat milk and milk products (USDA & USDHHS, 2010:17;
Krummel, 2004b:906).
(v) Sweets and sugar
Sugar was the most frequently consumed food item among all male and female participants in the
current study. In comparison it was also found to be the most frequently consumed food item
among the following studies: Nel and Steyn‘s (2002:92, Table 92) urban meta-analysis results;
BRISK study (urban Western Cape) (Nel & Steyn, 2002:103); and THUSA study (in the North West
province: rural men; men and women living in informal settlements; and women from the middle
class urban area)(MacIntyre et al. 2002:247-248, Tables 5-6). It was the second most frequently
consumed food item in the following studies: the rural and national meta-analysis results from Nel
and Steyn (2002:62, Table 23; 2002:77, Table 26); Lebowa study (rural Limpopo province) (Nel &
Steyn, 2002:97); CORIS study (urban and rural Western Cape) (Nel & Steyn, 2002:126-129, Table
37); FYFS project (urban Gauteng and rural Northern province) (Nel & Steyn, 2002:118); and the
THUSA study (North West province‘s rural women; men and women from farms; men from urban
middle class and women from urban upper class)(MacIntyre et al., 2002:247-248, Tables 5-6).
Page 176 of 252
One of the trademarks of the nutrition transition is higher consumption of sugar (Joubert,
2007:683). If sugar is consumed in excess it may displace other foods that are good sources of
vitamins and minerals in the diet (Van den Berg, 2011:260; DoH, 2004:32). However, eating any
food or beverage in excessive amounts, thereby exceeding energy intake above recommended
daily requirements, will cause weight gain (Van den Berg, 2011:258).
Therefore, frequent consumption of added sugar in the current study is not necessarily a concern,
except where it is consumed in conjunction with high intakes of fat (i.e. the Westernized diet)
(Steyn et al., 2006:5,14; Steyn, 2005b:249).
What is also of concern is the frequent consumption of cool drinks, which are sweetened with
sugar, both among rural (11th) and urban (11
th) men and rural (11
th) and urban (10
th) women.
Drinking one to two sugar-sweetened drinks per day increases the risk for metabolic syndrome,
insulin resistance, type 2 DM, CVD, and hypertension (Van den Berg, 2011:257).
When sugar is consumed in moderate quantities, there is no detrimental effect on dental health,
weight management, or CDLs (Van den Berg, 2011:257). However, excessive consumption of
sugar-sweetened beverages is associated with weight gain and obesity (Van den Berg, 2011:257).
It is recommended to limit intake of refined and processed sugars and to emphasize whole grains
or complex carbohydrates as part of a balanced diet (Grant, 2008:965). Excessive intake of added
sugars should be avoided, and especially products sweetened with fructose (Van den Berg,
2011:257).
The WHO recommends a population nutrient intake goals of less than ten percent of total energy
from free sugars (WHO, 2012:online, Table 6).
(vi) Salt
Salt/stock was consumed third most frequently by rural men and fourth most frequently by rural
women; urban men and urban women in the current study. None of the comparison studies
investigated salt/stock as a frequently consumed food item, and therefore there are no studies
available for comparison to salt intake per se. However, again, it should be kept in mind that the
current findings do not quantify the amount of salt used, only the frequency.
The SAFBDG recommends that salt should be used sparingly (Charlton & Jooste, 2001:S55).
Black hypertensive South Africans are more salt sensitive and more likely to have an increased risk
of developing cardiovascular disease. Salt can also influence kidney function (Schutte et al.,
2003:343). The SADHS found that 48,3% of black urban men and 43,9% of black urban women
consumed salty snacks three or more times per week (Charlton & Jooste, 2001:S59; Bourne et al.,
1993:241). A study conducted in the Cape Metropole found that 34% of participants wrongly
believed that flavour enhancers that contain monosodium glutamate (e.g. stock) can be used
instead of salt to lower salt intake in the diet (Steyn, 2005a:44).
Page 177 of 252
(vii) Tea
Tea was second most frequently consumed by urban Free State women; third most frequently
consumed by the urban men and rural women; and fourth most frequently consumed by rural men
in the current study. In comparison, it was also second most frequently consumed in the Dikgale
study (Nel & Steyn, 2002:101), and third most frequently in the Lebowa study (Nel & Steyn,
2002:97) as well as in all areas of the meta-analysis study (Nel & Steyn, 2002:62,77,92, Tables 23,
26 and 29). It was fourth most frequently consumed in the CORIS study (Nel & Steyn, 2002:126-
129, Table 37). The THUSA study found that next to maize products and milk, tea was consumed
in large amounts (Scholtz et al., 2001:S43).
The SAFBDG recommends that two litres of safe, clean water should be consumed, in the form of
tap water, tea, coffee or other water-based drinks (Bourne & Seager, 2001:S69). Some studies
suggest that flavonoids may protect against heart disease (Love & Sayed, 2001:S26). Tea is a
good source of flavonoids (Love & Sayed, 2001:S26). Therefore, one would assume that
consumption of tea would bear health benefits. However, one must also consider the amount of
sugar that is added to the tea, as well as whether non-dairy creamer or milk is added. High intakes
of tea can inhibit iron absorption due to its high tannin content (Anderson, 2004:139), which can be
disadvantageous to health (Anderson, 2004:140). The NFCS found that iron intake was low in all
age groups, and was especially low in the Free State (Labadarios et al., 2005:539). High intakes of
tea concurrently with low iron intake, can therefore be detrimental to health.
(viii) Coffee
Men consumed coffee more frequently (5th urban, 6
th rural) than women (10
th in both rural and
urban areas). Coffee consumption in rural and urban children was infrequent (Tables 4.17 to 4.20).
It was consumed in similar frequency in the meta-analysis study reported by Nel and Steyn
(2002:62, Table 23).
Drinks that contain caffeine, such as coffee, can cause diuresis (Bourne & Seager, 2001:S65).
Consuming more than 720 ml of regular coffee per day can increase total cholesterol (Krummel,
2004a:861).
High intakes of coffee also increases homocysteine levels (Verhoef et al., 2002:1246), which has a
negative effect on cardiovascular health, since it is linked with several major risk factors for CVD,
e.g. blood pressure and hypercholesterolemia (Carlson, 2004:449; Krummel, 2004a:876). Even with
a slightly elevated homocysteine, risk for CHD, stroke, peripheral vascular disease increases
significantly (Carlson, 2004:449). For these reasons, the SAFBDG recommends that tea and coffee
should be drunk in moderation (DoH, 2004:9).
(ix) Alcohol
There was a significant difference in alcohol intake between urban and rural men, with a
significantly larger percentage or rural men consuming alcohol within their daily recommendations

Page 178 of 252
(Table 4.15). Five percent of urban men exceeded their daily recommendation of two drinks per
day. In the THUSA study, no relationship between the level of urbanisation and amount of
consumption was found (Gopane et al., 2010:S16).
The SADHS also found that more men (45%) than women (17%) consumed alcohol (Van Heerden
& Parry, 2001:S75). According to Van Heerden and Parry (2001:S75), more urban men (47%) and
urban women (19%) usually consume alcohol than rural men (41%) and women (13%). Drinking
prevalence was also highest in males of the Free State and Gauteng (50%) (Van Heerden & Parry,
2001:S75). Excessive alcohol intake has been linked with cancer; hypertension (Charlton & Jooste,
2001:S55-S56; Love & Sayed, 2001:S28; Van Heerden & Parry, 2001:S72, Table II), stroke
(Charlton & Jooste, 2001:S56; Van Heerden & Parry, 2001:S72, Table II); liver disease; obesity;
malnutrition and gastro-intestinal side effects (Van Heerden & Parry, 2001:S72, Table II)
Alcohol and tobacco smoke are some of the carcinogens responsible for esophageal cancer
(WCRF/AICR, 2007:19; Churma & Horrell, 2005:45; WHO/FAO, 2002:96), In 2003, mortality rates
for esophageal cancer in South Africa were high, with 17,2% of all males dying of this cancer and
ten percent of all females. It was the leading cause of cancer death in black South African males
and the second leading cause in black South African females (Steyn et al., 2006:30).
Even though men have a higher risk for esophageal cancer than women, both genders should be
encouraged to drink alcohol sensibly, as recommended by the SAFBDG (Van Heerden & Parry,
2001:S77).
(x) Conclusion
When comparing frequentintake of certain food items for rural and urban men (Table 4.21), there
were no significant differences. The following food items fell within the top ten list: sugar; cooked
porridge; tea, salt or stock; full cream milk; coffee, margarine/oil/fat; bread; fruit; and vegetables fell
in the top ten list. Rural men consumed coffee creamer more frequently than urban men (14th rural
vs. 24th urban). Urban men consumed alcohol a little more frequently than rural men (15
th rural vs.
17th men).
The frequent intake of food items for women (Table 4.22) looks similar to that of the men. The top
ten items consumed frequently by both urban- and rural women were: sugar; cooked porridge; tea,
salt or stock; margarine/oil/fat; full cream milk; fruit; bread; and vegetables. As was also the case
among rural men, coffee creamer was consumed more frequently by rural women (rural 14th; urban
23rd
), as was coffee (rural 10th; urban 22
nd). Alcohol consumption was listed much less frequently
among women when compared to men.
When comparing the intake of different food groups, the majority of all participants (both men and
women, rural and urban) ate less than their daily requirements of fruit; legumes; milk and milk
products; soy; and vegetables (Table 4.15 and Table 4.16). The majority of the male and all of the
Page 179 of 252
female participants consumed alcohol within limits. However, 5% of urban men exceeded their
daily recommendation of two drinks per day. Most participants consumed excessive servings of
bread and cereals; and meat and meat products. The majority of rural men and women exceeded
their daily intake of fats and oils and sweets/sugar, whereas the majority of urban men and women
consumed within their limits of fats and oils; and sweets/sugar. This seems to indicate that the
nutrition transition is present in both rural and urban areas, but is more pronounced in rural
participants than in urban participants, when looking at consumption of food groups and the top ten
frequently consumed food items.
5.3.3 Mean macronutrient intakes
Mean macronutrient intakes were calculated from the 24 hour recall of reported usual intake data and
compared to results from similar studies conducted in South Africa. Data was also compared to the
current prudent dietary guidelines and recommended dietary reference intakes (Table 3.6) and (Table
3.7).
5.3.3.1 Children younger than two years
The results for the children younger than two years old were compared to the results for the NFCS
(Steyn et al., 2006:17, Table 2.4.1; Labadarios et al., 2005:538, Table 3; MacIntyre & Labadarios,
2000:444-449, Tables 6.97-6.101) and the study conducted by Faber and Benadé (2001:364, Table 3)
in rural KwaZulu-Natal. Different methods were used to determine dietary intake. The 24 hour recall was
used in the current study as well as in the study of Faber and Benadé (2001:359), whereas both the 24
hour recall and food frequency questionnaire were used in the NFCS (Nel & Steyn, 2002:9, Table 1).
Comparative data was summarized in Table 5.4. Acceptable distribution ranges of macronutrients were
45-65% for carbohydrates; 5-20% for protein; and 30-40% for fat (Table 3.6 and Table 3.7) (USDA &
USDHHS, 2010:15,Table 2-4).
(i) Total energy intake
As reflected by Table 5.4, the average total energy intake of all children younger than two in the
current study was 3510,9 kJ. In comparison, the NFCS found it to be higher at 4690 kJ for all
children in the Free State (Labadarios et al., 2005:538, Table 3; MacIntyre & Labadarios, 2000:444,
Table 6.97) and 4200kJ nationally (Steyn et al., 2006:17, Table 2.4.1). The average total energy
intake for the current study‘s rural children was 4254 kJ compared to the national average of 3992
kJ in the rural NFCS (Steyn et al., 2006:17, Table 2.4.1). Faber and Benadé (2001:364, Table 3)
found it to be 3691 kJ for their rural children. The average total energy intake for the current study‘s
urban children was 3292,4 kJ, far less than the 4403kJ found in the urban NFCS nationally (Steyn
et al., 2006:17, Table 2.4.1).Therefore, the current study‘s total energy intake for rural children was
similar to both the rural NFCS and Faber and Benadé‘s study. However, the urban children‘s intake
in the current study was than that of the urban NFCS participants.
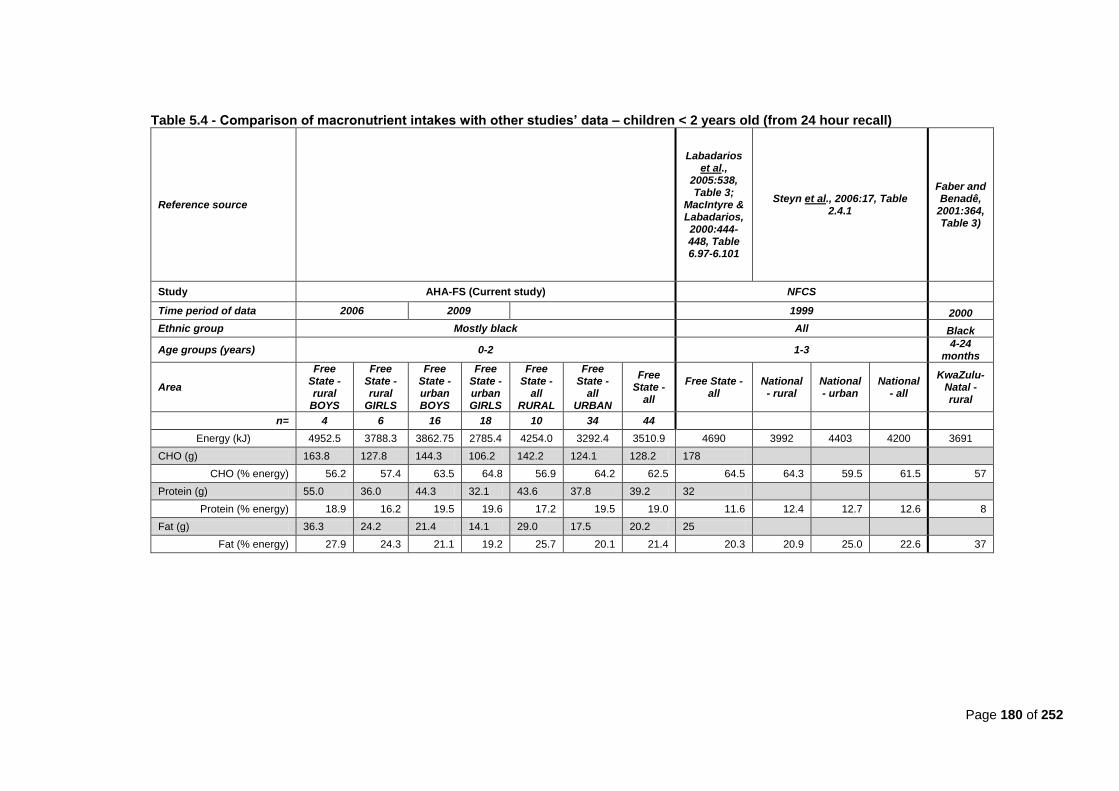
Page 180 of 252
Table 5.4 - Comparison of macronutrient intakes with other studies’ data – children < 2 years old (from 24 hour recall)
Reference source
Labadarios et al.,
2005:538, Table 3;
MacIntyre & Labadarios, 2000:444-448, Table 6.97-6.101
Steyn et al., 2006:17, Table 2.4.1
Faber and Benadê,
2001:364, Table 3)
Study AHA-FS (Current study) NFCS
Time period of data 2006 2009 1999 2000
Ethnic group Mostly black All Black
Age groups (years) 0-2 1-3 4-24
months
Area
Free State - rural
BOYS
Free State - rural
GIRLS
Free State - urban BOYS
Free State - urban GIRLS
Free State -
all RURAL
Free State -
all URBAN
Free State -
all
Free State - all
National - rural
National - urban
National - all
KwaZulu-Natal - rural
n= 4 6 16 18 10 34 44
Energy (kJ) 4952.5 3788.3 3862.75 2785.4 4254.0 3292.4 3510.9 4690 3992 4403 4200 3691
CHO (g) 163.8 127.8 144.3 106.2 142.2 124.1 128.2 178
CHO (% energy) 56.2 57.4 63.5 64.8 56.9 64.2 62.5 64.5 64.3 59.5 61.5 57
Protein (g) 55.0 36.0 44.3 32.1 43.6 37.8 39.2 32
Protein (% energy) 18.9 16.2 19.5 19.6 17.2 19.5 19.0 11.6 12.4 12.7 12.6 8
Fat (g) 36.3 24.2 21.4 14.1 29.0 17.5 20.2 25
Fat (% energy) 27.9 24.3 21.1 19.2 25.7 20.1 21.4 20.3 20.9 25.0 22.6 37
Page 181 of 252
The current study‘s overall total energy intake results for children younger than two years (3510,9
kJ) was sufficient if compared to the DRI for children 7-12 months (2839 kJ ♀; 3121 kJ ♂), but it
was insufficient when compared to the DRI for 1-to-3 year olds (4166 kJ ♀; 4393 kJ ♂) (Food &
Nutrition Board et al., 2002:1324). The current study‘s rural children (4254 kJ) met the DRI for 1-to-
3 year olds, but the urban children (3292,4 kJ) did not.
(ii) Carbohydrates
The average percentage energy from carbohydrates for all the current study‘s children together
was 62,5%. In comparison, it was found to be 64,5% in the Free State section of the NFCS
(Labadarios et al., 2005:538, Table 3; MacIntyre & Labadarios, 2000: 446, Table 6.99) and 61,5%
in the NFCS nationally (Steyn et al., 2006:17, Table 2.4.1). The total percentage energy intake from
carbohydrates was 56,9% for rural children and 64,2% for urban children included in this study. In
comparison, it was 64,3% in the rural NFCS nationally and 59,5% in the urban NFCS nationally
(Steyn et al., 2006:17, Table 2.4.1). Faber and Benadé (2001:364, Table 3) found carbohydrate
intake to be 57% of total energy in their study. The NFCS found that intake was higher in rural
areas than in urban areas. However, the current study found the opposite to be true. The current
findings for rural children are therefore closer to Faber and Benadé‘s findings for rural children in
KwaZulu-Natal than the NFCS finding.
Intake for the current study‘s findings for percentage energy from carbohydrates (rural: 56,9%;
urban: 64,2%; overall:62,5%) fell within the prudent dietary guidelines (Table 3.6) of 45% to 65%
(USDA & USDHHS, 2010:15, Table 2.4). The average grams of carbohydrate consumed in the
current study was 128,2g, which almost falls within the DRI recommendation of 130g per day (Food
& Nutrition Board et al., 2002:1324)(Table 3.7). The current study‘s rural children (142,2 g)
consumed amounts within the DRI recommendations, but the urban children (124,1g) did not.
(iii) Protein
The mean percentage energy from protein for all children in the current study was 19% (in rural
children it was 17,2% and in urban children it was 19,5%). The current findings are much higher
than the finding of both the NFCS for the Free State (11,2%) (Labadarios et al., 2005:538, Table 3;
MacIntyre & Labadarios, 2000:445, Table 6.98); and the study by Faber and Benadé (8%) (Faber &
Benadé, 2001:364, Table 3). The current study‘s finding still fall within prudent dietary guidelines of
between five and twenty percent energy from protein for one-to-three-year olds (USDA &
USDHHS, 2010:15, Table 2-4).
When looking at total grams of protein consumed, (rural: 43,6 g; urban: 37,8g; overall: 39,2g),
intakes are far higher than the DRI recommendation of 13 g for 1-to-3 year olds (Food & Nutrition
Board et al., 2002:1324). This may indicate that the first solids introduced to children may include a
larger portion of protein-based foods, rather than carbohydrate-based foods. When looking again at
the intake of food groups (Table 4.16), and specifically meat and meat products, 50,4% of rural
women and 38,4% of urban women consumed above their recommended daily servings of meat
and meat products.
Page 182 of 252
(iv) Fat
When comparing grams of fat consumed by the current study‘s children younger than two years
(rural 29g; urban 17,5g; overall: 20,2 g), the current study‘s findings fell below the DRIs for both 0-6
month old children (31 g) and 7-12 month old children (30 g) (Food & Nutrition Board et al.,
2002:1324). However, the lower fat intake may be due to the higher proportionate intake of protein
found in the current study.
The percentage energy from fat was 21,4% for children younger than two years in the current study
(rural: 25,7%; urban: 20,1%). In comparison, the NFCS found it to be quite similar at 20,3% in their
Free State group (Labadarios et al., 2005:538, Table 3; MacIntyre & Labadarios, 2000:448, Table
6.101) and 22,6% nationally (Steyn et al., 2006:17, Table 2.4.1). The rural children in the NFCS
nationally consumed 20,9% and the urban children consumed 25% (Steyn et al., 2006:17, Table
2.4.1). Intake was even higher among rural children in KwaZulu-Natal at 37% of total energy (Faber
& Benadé, 2001:364, Table 3). Again, the current study‘s results differ from the NFCS inasmuch as
the current study‘s rural children consumed a higher percentage energy from fat than urban
children, as opposed to the NFCS‘s urban children who consumed more than the rural children.
However, keep in mind that sample sizes in especially the rural sample were very small.
When looking at prudent dietary guidelines for macronutrient proportions in children one-to-three
years old (30-40%)(USDA & USDHHS, 2010:15, Table 2-4), the current study‘s children consumed
too little energy from fat. This low intake of fat is of concern, and may be related to the a high
prevalence of underweight (Table 4.29) and stunting found in children in this study (Table 4.30).
5.3.3.2 Children older than two years
The current results for children older than two years were compared with the following studies: NFCS
with different age groups (i.e. one to three years old; four to six years old, as well as one to nine years
old) and different areas (i.e. Free State, rural or urban national areas) (Steyn et al., 2006:17, Table
2.4.1; Labadarios et al., 2005:538; MacIntyre & Labadarios, 2000:444-448, 450. Table 6.97-6.101, 6-
103); the BRISK study in urban Western Cape (Steyn et al., 2003:636, Table 3; Nel & Steyn, 2002:21,
Table 4); the Lebowa study rural Limpopo province (Steyn et al., 2003:636, Table 3; Nel & Steyn,
2002:22,Table 4); the study conducted by MacKeown et al. in rural and urban Gauteng (1998:301,
Table 2); and the study conducted by Faber et al. (2001:405, Table 2) in rural KwaZulu-Natal.
Comparative data was summarized in Table 5.5. Again, methods for determination of dietary intake
were different in the studies. The 24 hour recall was used in: the current study; the Lebowa study (Nel &
Steyn, 2002:9, Table 1); and the study by Faber et al. (2001:402). The food frequency questionnaire
was used in the study by MacKeown et al. (1998:300, Table 1). Both methods were used in the NFCS
(Labadarios et al., 2005:533: Nel & Steyn, 2002:9, Table 1), and the BRISK study (Nel & Steyn, 2002:9,
Table 1).
(i) Total energy intake
Average total energy intake combined for all the current Free State children between two and
seven years old was 4976,5 kJ. In the NFCS, it was very similar in all Free State children aged
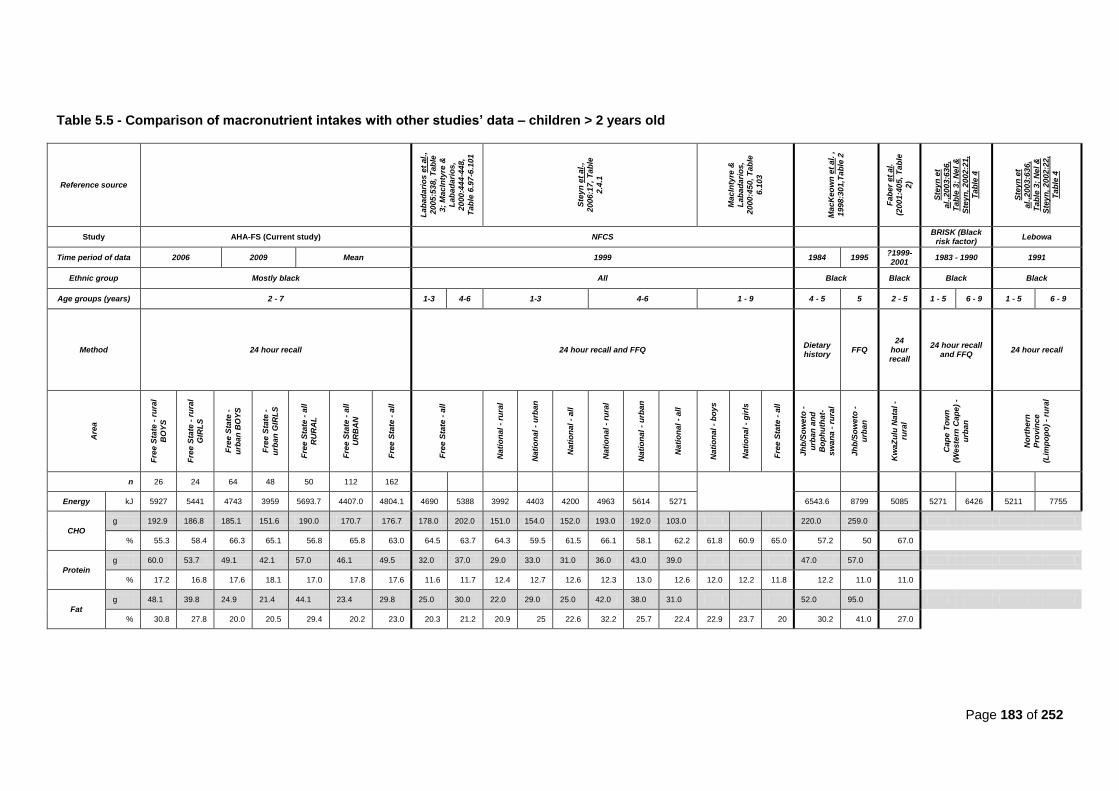
Page 183 of 252
Table 5.5 - Comparison of macronutrient intakes with other studies’ data – children > 2 years old
Reference source
Lab
ad
ari
os
et
al.
,
20
05
:53
8,
Tab
le
3;
Ma
cIn
tyre
&
Lab
ad
ari
os
,
20
00
:44
4-4
48
,
Tab
le 6
.97
-6.1
01
Ste
yn
et
al.
,
20
06
:17
, T
ab
le
2.4
.1
Ma
cIn
tyre
&
Lab
ad
ari
os
,
20
00
:45
0,
Tab
le
6.1
03
Ma
cK
eo
wn
et
al.
,
19
98
:30
1,T
ab
le 2
Fab
er
et
al.
(20
01
:40
5, T
ab
le
2)
Ste
yn
et
al.
,20
03
:63
6,
Tab
le 3
; N
el
&
Ste
yn
, 2
002
:21
,
Tab
le 4
Ste
yn
et
al.
,20
03
:63
6,
Tab
le 3
; N
el
&
Ste
yn
, 2
002
:22
,
Tab
le 4
Study AHA-FS (Current study) NFCS
BRISK (Black risk factor)
Lebowa
Time period of data 2006 2009 Mean 1999 1984 1995 ?1999-2001
1983 - 1990 1991
Ethnic group Mostly black All Black Black Black Black
Age groups (years) 2 - 7 1-3 4-6 1-3 4-6 1 - 9 4 - 5 5 2 - 5 1 - 5 6 - 9 1 - 5 6 - 9
Method 24 hour recall 24 hour recall and FFQ Dietary history
FFQ 24
hour recall
24 hour recall and FFQ
24 hour recall
Are
a
Fre
e S
tate
- r
ura
l
BO
YS
Fre
e S
tate
- r
ura
l
GIR
LS
Fre
e S
tate
-
urb
an
BO
YS
Fre
e S
tate
-
urb
an
GIR
LS
Fre
e S
tate
- a
ll
RU
RA
L
Fre
e S
tate
- a
ll
UR
BA
N
Fre
e S
tate
- a
ll
Fre
e S
tate
- a
ll
Nati
on
al
- ru
ral
Nati
on
al
- u
rba
n
Nati
on
al
- a
ll
Nati
on
al
- ru
ral
Nati
on
al
- u
rba
n
Nati
on
al
- a
ll
Na
tio
na
l -
bo
ys
Na
tio
na
l -
gir
ls
Fre
e S
tate
- a
ll
Jh
b/S
ow
eto
-
urb
an
an
d
Bo
ph
uth
at-
sw
an
a -
ru
ral
Jh
b/S
ow
eto
-
urb
an
Kw
aZ
ulu
Na
tal
-
rura
l
Cap
e T
ow
n
(We
ste
rn C
ap
e)
-
urb
an
No
rth
ern
Pro
vin
ce
(Lim
po
po
) -
rura
l
n 26 24 64 48 50 112 162
Energy kJ 5927 5441 4743 3959 5693.7 4407.0 4804.1 4690 5388 3992 4403 4200 4963 5614 5271
6543.6 8799 5085 5271 6426 5211 7755
CHO
g 192.9 186.8 185.1 151.6 190.0 170.7 176.7 178.0 202.0 151.0 154.0 152.0 193.0 192.0 103.0 220.0 259.0
% 55.3 58.4 66.3 65.1 56.8 65.8 63.0 64.5 63.7 64.3 59.5 61.5 66.1 58.1 62.2 61.8 60.9 65.0 57.2 50 67.0
Protein
g 60.0 53.7 49.1 42.1 57.0 46.1 49.5 32.0 37.0 29.0 33.0 31.0 36.0 43.0 39.0 47.0 57.0
% 17.2 16.8 17.6 18.1 17.0 17.8 17.6 11.6 11.7 12.4 12.7 12.6 12.3 13.0 12.6 12.0 12.2 11.8 12.2 11.0 11.0
Fat
g 48.1 39.8 24.9 21.4 44.1 23.4 29.8 25.0 30.0 22.0 29.0 25.0 42.0 38.0 31.0 52.0 95.0
% 30.8 27.8 20.0 20.5 29.4 20.2 23.0 20.3 21.2 20.9 25 22.6 32.2 25.7 22.4 22.9 23.7 20 30.2 41.0 27.0
Page 184 of 252
between one and three years old (4690 kJ), but lower than in the Free State children aged between
four and six years old (5388 kJ) (Labadarios et al., 2005:538, Table 3; MacIntyre & Labadarios,
2000:444, Table 6.97). Nationally in the NFCS it was lower among one-to-three-year olds (4200 kJ)
and higher among four-to-six- year olds (5271 kJ)(Steyn et al., 2006:17, Table 2.4.1).
The average total intake for the current study‘s rural participants was 5693,7 kJ. In the NFCS it was
less, at 3992 kJ for one-to-three-year old rural children and 4963 kJ for the rural four-to-six-year
olds (Steyn et al., 2006:17, Table 2.4.1). In rural KwaZulu-Natal it was also less with 5085 kJ
among two-to-five-year olds (Faber et al., 2001:405, Table 2). Energy intake was higher among
four-to five-year olds from rural and urban Gauteng in 1984 (6543,6 kJ)(MacKeown et al. ,
1998:301, Table 2). In rural Limpopo (Lebowa study) it was less with 5211 kJ in children aged one
to five years old, and higher with 7755 kJ in children aged six to nine years old (Steyn et
al.,2003:636, Table 3; Nel & Steyn, 2002:22, Table 4).
Among the current study‘s urban children the average intake was less (4407 kJ) than in rural
children (5693,7 kJ); less in comparison to the national intake among urban children aged between
four to six years old (5614 kJ); but similar to the national NFCS for urban children aged between
one and three years old (4403 kJ) (Steyn et al., 2006:17, Table 2.4.1). It was higher in the BRISK
study for both one-to-five-year olds (5271 kJ) and six-to-nine-year olds (6426 kJ)(Steyn et al.,
2003:636, Table 3; Nel & Steyn, 2002:21, Table 4). Intake was even higher in five-year-olds in
urban Gauteng in 1995 (8799 kJ)(MacKeown et al., 1998:301, Table 2).
When comparing the current study‘s results for energy intake (rural 5693,7kJ; urban:4407 kJ;
overall 4804,1 kJ), with the DRIs (Table 3.7); participants consumed sufficient quantities if the DRIs
for 1-3 years old were used (4166 kJ ♀; 4393 kJ ♂), but were insufficient if DRIs for 4-8 years old
(6895 kJ ♀; 7316 kJ ♂) were used (Food & Nutrition Board et al., 2002:1324). Our samples were
too small to divide children who were two years and older into smaller groups (e.g. one-to-three
years old and four-to-eight years old).
(ii) Carbohydrates
The average percentage energy from carbohydrates was 61,1%. These results compared well to
the national NFCS‘s findings among one-to-three-year olds (61,5%), and four-to-six-year olds
(62,2%) (Steyn et al., 2006:17, Table 2.4.1). In the NFCS for the Free State, it was 64,5% among
one-to-three-year olds and 63,7% among four-to-six-year olds (Labadarios et al., 2005:538, Table
3; MacIntyre & Labadarios, 2000:446, Table 6.99). It was also similar among one-to-nine-year olds
in the Free State NFCS (65%) (MacIntyre & Labadarios, 2000:450, Table 6.103). MacKeown et al.
(1998:301, Table 2) found percentage intake to be lower among four-to-five-year olds in Gauteng
(57,2%).
In rural areas, children consumed an average percentage energy from carbohydrate of 56,8%. It
was higher nationally in rural areas of the NFCS among one-to-three-year olds (64,3%) and four-to-
six-year olds (66,1%)(Steyn et al., 2006:17, Table 2.4.1). It was also higher (67%) among two-to-
five-year olds of rural KwaZulu-Natal (Faber et al., 2001:405, Table 2).
Page 185 of 252
Among the current urban children percentage energy from carbohydrates was 65,8%. In
comparison, it was found to be less in the urban NFCS among both one-to-three-year olds (59,5%)
and four-to-six-year olds (58,1%) (Steyn et al., 2006:17, Table 2.4.1). It was also lower in urban
five-year olds in Gauteng (50%) (MacKeown et al., 1998:301, Table 2).
Again, among children older than two years in the current study, intake was higher in urban than
rural children, whereas the opposite was true for the NFCS findings. Despite differences between
above-mentioned study results, all intakes were still within prudent dietary guidelines of 45-65%
energy from carbohydrates (USDA & USDHHS, 2010:15, Table 2-4).
When looking at the amount of carbohydrates consumed in grams (rural: 190g; urban 170,7g;
overall:176,7 g), intakes exceed the DRI recommendation of 130g per day (Food & Nutrition Board
et al., 2002:1324).
(iii) Protein
For children between two and seven years, the average energy from protein was 17,4%. Among
rural children it was 16,9% and among urban children it was 17,9% (Table 5.5). As was the case
among the children younger than two years old in the current study; other studies found lower
results for protein intake. In the Free State section of the NFCS it was 11,6% in all one-to-three-
year olds; and 11,7% in four-to-six-year olds (Labadarios et al., 2005:538, Table 3; MacIntyre &
Labadarios, 2000:445, Table 6.98). In the national section of the NFCS it was 12,6% among one-
to-three-year olds and four-to-six-year olds (Steyn et al., 2006:17, Table 2.4.1); and 11,8% among
one-to-nine-year olds in the Free State (MacIntyre & Labadarios, 2000:450, Table 6.103). It was
also lower (12,2%) in MacKeown et al.‘s study (1998,301, Table 2).
In the current study‘s rural children, percentage energy from protein was on average 17,0%. This
was higher than the 12,4% among the rural national NFCS in one-to-three-year olds; and 12,3% in
the four-to-six-year olds (Steyn et al., 2006:17, Table 2.4.1). Faber et al. (2001:405, Table 2) found
it at 11% in rural KwaZulu-Natal two-to-five-year olds.
Percentage energy from protein for the urban children in the current study was a little higher
(17,8%) than the rural children. It was also higher than the national urban NFCS for both one-to-
third-year-olds (12,7%) and four-to-six-year olds (13,0%) (Steyn et al., 2006:17, Table 2.4.1), as
well as the urban Gauteng five-year olds (MacKeown et al., 1998,301, Table 2).
Protein intakes from all studies, albeit different, still fell within the prudent dietary guidelines for
macronutrient proportions of 5-20% for children 1-3 years old and 10-30% of children 4-18 years
old (USDA & USDHHS, 2010:15, Table 2-4).
Average intake in grams (rural: 57,0g; urban: 46,1g; overall 49,6g) fell far above the DRI
recommendations for both 1-3 year olds (13 g) and 4-8 year olds (19 g) (Food & Nutrition Board et
al., 2002:1324).
A reason for the higher protein intake in the current study may be because legumes (which are
high in protein and carbohydrates) were analysed as a separate food group on their own in this

Page 186 of 252
study (1 exchange=500 kJ, 7 g protein, 21 g carbohydrates), which could have contributed more
protein to the analysis than if they were classified as part of the breads and cereals group (285kJ, 3
g protein; 15 g carbohydrates).
(iv) Fat
On average, children in the current study consumed about 25% of their energy from fat. Other
studies found a lower intake of energy from fat: 20,3% among one-to-three-year olds and 21,2%
among four-to-six-year olds in the Free State results of the NFCS (Labadarios et al., 2005:538,
Table 3; MacIntyre & Labadarios, 2000:448, Table 6.101); 22,6% among one-to-three-year olds
and 22,4% in four-to-six-year olds in the national results of the NFCS (Steyn et al., 2006:17, Table
2.4.1); and twenty percent among one-to-nine-year olds in all Free State children of the NFCS
(MacIntyre & Labadarios, 2000:450, Table 6.103). The only study that found an intake higher
(30,2%) than the current study, was among four-to-five-year olds in the study by MacKeown et al.
(1998:301, Table 2).
Fat intake was 29,4% of total energy among rural children in this study, which fell within prudent
dietary guidelines of 30-40% (USDA & USDHHS, 2010:15, Table 2-4). The NFCS found a lower
intake among one-to-three-year olds nationally (20,9%) and a higher intake among four-to-six-year
olds nationally (32,3%), which was closer to the current results (Steyn et al., 2006:17, Table 2.4.1).
Faber et al. (2001:405, Table 2) also found a similar intake (27%) in their study.
Among the current urban participants, the average percentage energy from fat intake was 20,2%,
again falling within prudent dietary guidelines (USDA & USDHHS, 2010:15, Table 2-4). All other
urban studies found it to be higher: the NFCS found it as 25% nationally among one-to-three-year
olds and 25,7% among four-to-six-year olds (Steyn et al., 2006:17, Table 2.4.1) and MacKeown et
al (1998:301, Table 2) found it to be 41%. It may be higher in the findings by MacKeown et al. since
they used the food frequency questionnaire method, whereas the other studies either used the 24
hour recall method or a combination of the 24 hour recall and food frequency questionnaire.
It is interesting to note that the national NFCS results found, similarly to the current results, that
percentage energy from fat intake was higher in urban four-to-six-year olds than among their rural
counterparts (Steyn et al., 2006:17, Table 2.4.1). When looking at the amount of grams consumed
in the current study, the rural participants consumed about double the amount in grams (rural:
44,1g; urban: 23,4 g).
5.3.3.3 Adults
The current results for energy- and macronutrient intake have been compared with results from the
following studies: BRISK (Bourne et al., 1993:241, Table II); CORIS (Wolmarans et al., 1988:12-15);
Dikgale (Steyn et al., 2006, Table 2.2.1); THUSA (Steyn et al., 2006:15, Table 2.2.2; Steyn, 2005a:35,
Table 4.2b; Vorster et al., 2005:485, Table 4; MacIntyre et al., 2002:240,243, Table 1); VIGHOR
(Oosthuizen et al., 1998:1214, Table I); Indians urban (Wolmarans et al., 1998:56-57, Tables 1&2);
CRISIC (Steyn et al., 2006, Table 2.2.1). The current results for energy intake alone have been
compared with the results from the following studies; which only have results for energy intake (not for
Page 187 of 252
macronutrients): First Year Female Students Project (Steyn et al., 2003:656, Table 3); Lebowa (Steyn et
al., 2003:656, Table 3); WRFS (Steyn et al., 2003:656, Table 3; Nel & Steyn, 2002:23, Table 5). Table
5.6 sets out the current study‘s results in comparison to the THUSA study‘s findings. All other studies‘
results in comparison with the current results are set out in Table 5.7.
The following studies used a 24 hour recall to obtain dietary intake information: BRISK; CORIS, Indians
urban; Lebowa and Dikgale. The following studies used food frequency questionnaires: THUSA, FYFS
and WRFS.
MacIntyre et al. (2002:240) divided the THUSA study‘s data into two groups. One group contained the
rural area, the farms, informal settlements and middle class urban. The second group comprised only
the upper class urban. Their argument was that the results for the areas contained in group one was
similar, whereas the results for the upper class urban participants were different (Table 5.6).
(i) Total energy intake
The current study‘s rural males consumed an average of 8630 kJ per day. It was less than that of the
THUSA study, which found for males: 9597 kJ in rural villages and 8913 kJ on farms (Steyn et al.,
2006:15, Table 2.2.2; Steyn, 2005a:35, Table 4.2b; Vorster et al., 2005:485, Table 4; MacIntyre et al.,
2002:243, Table 1). However, it must be kept in mind that the THUSA study used the food frequency
questionnaire to determine their values, whereas the current study used the 24 hour recall. Currently,
rural women consumed on average 7754,9 kJ in comparison with 7906 kJ in the THUSA study for
women in rural villages and 7973 kJ on farms (Steyn et al., 2006:15, Table 2.2.2; Steyn, 2005a:35,
Table 4.2b; Vorster et al., 2005:485, Table 4; MacIntyre et al., 2002:243, Table 1). Average energy
intake for all rural participants in the current study was 8011,1kJ. The THUSA study‘s rural result was
9333 kJ (Table 5.6). Average intake in the Dikgale study was between 6000kJ and 6700 kJ (Steyn et
al., 2006:15, Table 2.2.1; Steyn, 2005a:35, Table 4.2).
Average energy intake for urban men was 7078,9 kJ, in comparison with a higher intake in the THUSA
study of 9333 kJ for men in squatter camps; 9897 kJ in townships and 9818 kJ in upper class urban
men (Steyn et al., 2006:15, Table 2.2.2; Steyn, 2005a:35, Table 4.2b; Vorster et al., 2005:485, Table 4;
MacIntyre et al., 2002:243, Table 1) and also a higher intake among men in the VIGHOR study; 10 700
kJ (Oosthuizen et al., 1998:1214, Table I) and the BRISK study (8500 kJ) (Bourne et al., 1993:241,
Table II).
Urban women’s average energy intake was 6621 kJ. The THUSA study reported higher values, with
7893 kJ in squatter camps; 8010 kJ in townships and 8523kJ among the upper class (Steyn et al.,
2006:15, Table 2.2.2; Steyn, 2005a:35, Table 4.2b; Vorster et al., 2005:485, Table 4; MacIntyre et al.,
2002:243, Table 1). Results from the VIGHOR study (6300kJ) (Oosthuizen et al., 1998:1214, Table I)
and the BRISK study (Bourne et al., 1993:241, Table II) were similar to the current study. Average
energy intake for all urban participants (male and female together) was 6729 kJ. The THUSA study‘s
urban group intake was 8300 kJ, which is again higher than the current study‘s findings (Steyn,
2005a:35, Table 4.2; MacIntyre et al., 2002:240). The average intake for all female adults in the current
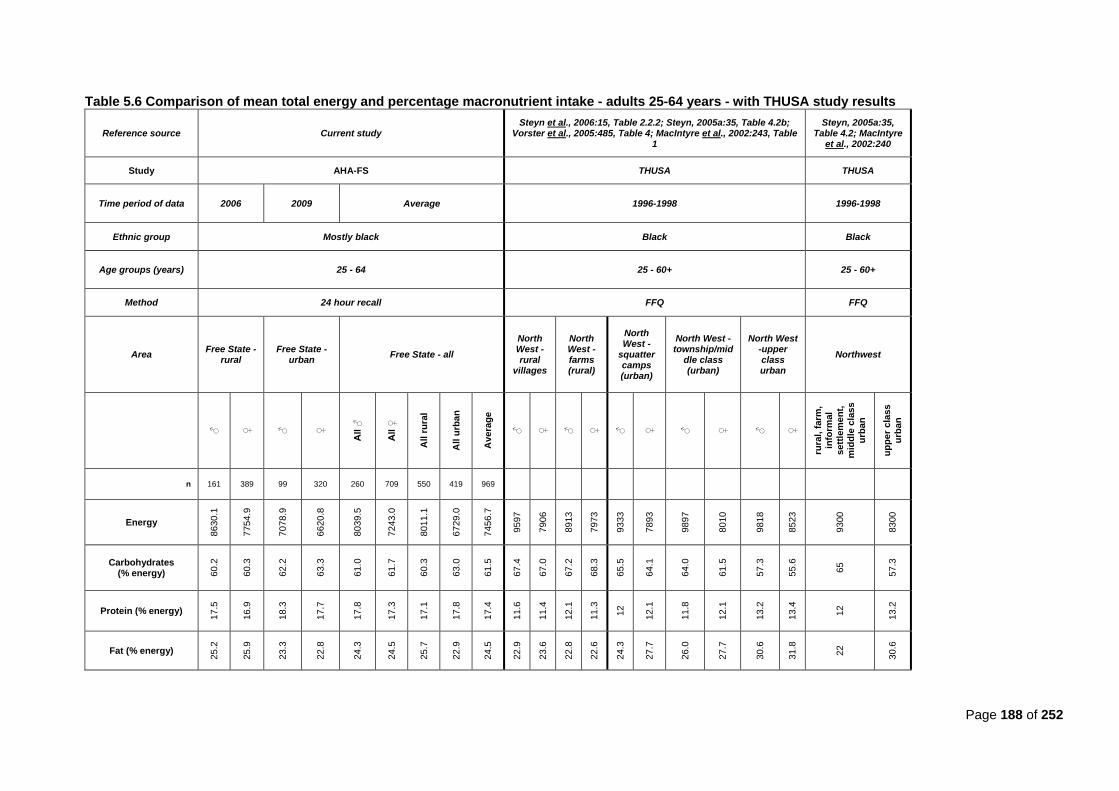
Page 188 of 252
Table 5.6 Comparison of mean total energy and percentage macronutrient intake - adults 25-64 years - with THUSA study results
Reference source Current study Steyn et al., 2006:15, Table 2.2.2; Steyn, 2005a:35, Table 4.2b;
Vorster et al., 2005:485, Table 4; MacIntyre et al., 2002:243, Table 1
Steyn, 2005a:35, Table 4.2; MacIntyre
et al., 2002:240
Study AHA-FS THUSA THUSA
Time period of data 2006 2009 Average 1996-1998 1996-1998
Ethnic group Mostly black Black Black
Age groups (years) 25 - 64 25 - 60+ 25 - 60+
Method 24 hour recall FFQ FFQ
Area Free State -
rural Free State -
urban Free State - all
North West - rural
villages
North West -farms (rural)
North West -
squatter camps (urban)
North West -township/mid
dle class (urban)
North West -upper class urban
Northwest
♂
♀
♂
♀
All ♂
All ♀
All r
ura
l
All u
rba
n
Av
era
ge
♂
♀
♂
♀
♂
♀
♂
♀
♂
♀
rura
l, f
arm
,
info
rmal
se
ttle
me
nt,
m
idd
le c
las
s
urb
an
up
pe
r c
lass
urb
an
n 161 389 99 320 260 709 550 419 969
Energy
86
30
.1
77
54
.9
70
78
.9
66
20
.8
80
39
.5
72
43
.0
80
11
.1
67
29
.0
7456
.7
9597
7906
8913
7973
9333
7893
9897
8010
9818
8523
9300
8300
Carbohydrates (% energy) 6
0.2
60
.3
62
.2
63
.3
61
.0
61
.7
60
.3
63
.0
61
.5
67
.4
67
.0
67
.2
68
.3
65
.5
64
.1
64
.0
61
.5
57
.3
55
.6
65
57
.3
Protein (% energy)
17
.5
16
.9
18
.3
17
.7
17
.8
17
.3
17
.1
17
.8
17.4
11
.6
11
.4
12
.1
11
.3
12
12
.1
11
.8
12
.1
13
.2
13
.4
12
13
.2
Fat (% energy)
25
.2
25
.9
23
.3
22
.8
24
.3
24
.5
25
.7
22
.9
24
.5
22
.9
23
.6
22
.8
22
.6
24
.3
27
.7
26
.0
27
.7
30
.6
31
.8
22
30
.6
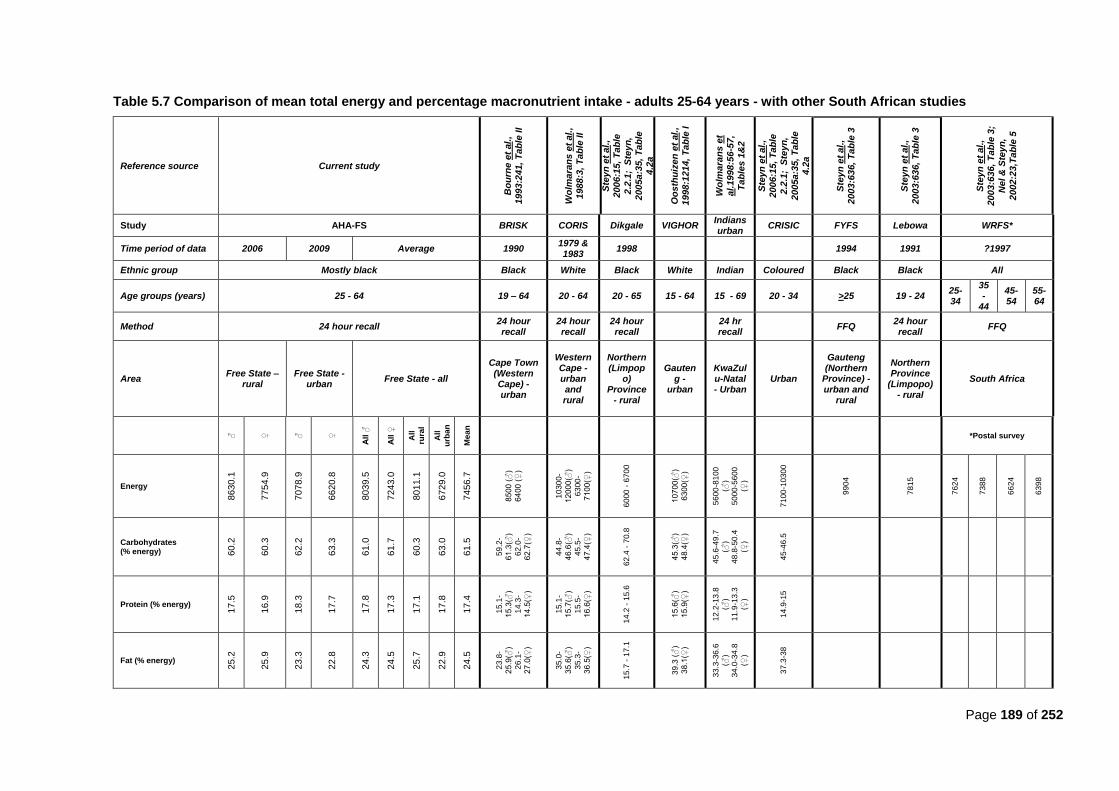
Page 189 of 252
Table 5.7 Comparison of mean total energy and percentage macronutrient intake - adults 25-64 years - with other South African studies
Reference source Current study
Bo
urn
e e
t al.
,
1993:2
41,
Tab
le II
Wo
lma
ran
s e
t a
l.,
19
88
:3, T
ab
le II
Ste
yn
et
al.,
2006:1
5, T
ab
le
2.2
.1;
Ste
yn
,
2005a:3
5,
Tab
le
4.2
a
Oo
sth
uiz
en
et
al.
,
1998:1
214,
Tab
le I
Wo
lma
ran
s e
t
al.
19
98
:56
-57
, T
ab
les
1&
2
Ste
yn
et
al.,
2006:1
5, T
ab
le
2.2
.1;
Ste
yn
,
2005a:3
5,
Tab
le
4.2
a
Ste
yn
et
al.,
2003:6
36,
Tab
le 3
Ste
yn
et
al.,
2003:6
36,
Tab
le 3
Ste
yn
et
al.,
2003:6
36,
Tab
le 3
;
Ne
l &
Ste
yn
,
2002:2
3,T
ab
le 5
Study AHA-FS BRISK CORIS Dikgale VIGHOR Indians urban
CRISIC FYFS Lebowa WRFS*
Time period of data 2006 2009 Average 1990 1979 & 1983
1998
1994 1991 ?1997
Ethnic group Mostly black Black White Black White Indian Coloured Black Black All
Age groups (years) 25 - 64 19 – 64 20 - 64 20 - 65 15 - 64 15 - 69 20 - 34 >25 19 - 24 25-34
35-
44
45-54
55-64
Method 24 hour recall 24 hour recall
24 hour recall
24 hour recall
24 hr recall
FFQ 24 hour recall
FFQ
Area Free State –
rural Free State -
urban Free State - all
Cape Town (Western Cape) - urban
Western Cape - urban and rural
Northern (Limpop
o) Province
- rural
Gauteng -
urban
KwaZulu-Natal - Urban
Urban
Gauteng (Northern
Province) - urban and
rural
Northern Province
(Limpopo) - rural
South Africa
♂
♀
♂
♀
All ♂
All ♀
All
rura
l
All
urb
an
Me
an
*Postal survey
Energy
86
30
.1
77
54
.9
70
78
.9
66
20
.8
80
39
.5
72
43
.0
80
11
.1
67
29
.0
74
56
.7
85
00
(♂
)
64
00
(♀
)
10
30
0-
12
00
0(♂
)
63
00
-
71
00
(♀)
60
00
- 6
70
0
10
70
0(♂
)
63
00
(♀)
56
00
-81
00
(♂)
50
00
-56
00
(♀)
71
00
-10
30
0
99
04
78
15
76
24
73
88
66
24
63
98
Carbohydrates (% energy) 6
0.2
60
.3
62
.2
63
.3
61
.0
61
.7
60
.3
63
.0
61
.5
59
.2-
61
.3(♂
)
62
.0-
62
.7(♀
)
44
.8-
46
.6(♂
)
45
.5-
47
.4(♀
)
62
.4 -
70.8
45
.3(♂
)
48
.4(♀
)
45
.6-4
9.7
(♂)
48
.8-5
0.4
(♀)
45
-46
.5
Protein (% energy)
17
.5
16
.9
18
.3
17
.7
17
.8
17
.3
17
.1
17
.8
17
.4
15
.1-
15
.3(♂
)
14
.3-
14
.5(♀
)
15
.1-
15
.7(♂
)
15
.5-
16
.6(♀
)
14
.2 -
15.6
15
.6(♂
)
15
.9(♀
)
12
.2-1
3.8
(♂)
11
.9-1
3.3
(♀)
14
.9-1
5
Fat (% energy)
25
.2
25
.9
23
.3
22
.8
24
.3
24
.5
25
.7
22
.9
24
.5
23
.8-
25
.9(♂
)
26
.1-
27
.0(♀
)
35
.0-
35
.6(♂
)
35
.3-
36
.5(♀
)
15
.7 -
17.1
39
.3 (
♂)
38
.1(♀
)
33
.3-3
6.6
(♂)
34
.0-3
4.8
(♀)
37
.3-3
8
Page 190 of 252
study was 7243 kJ. In the FYFS it was much higher (9904 kJ)(Steyn et al., 2003:636, Table 3).
Intake for all women and men in the current study was below DRIs for both active adults (men:
12881 kJ; women: 10093 kJ) (Food & Nutrition Board et al., 2002:1324) and sedentary adults
(men:10143 kJ; women: 7947 kJ – active DRIs / 1.27 physical activity coefficient).
(ii) Carbohydrates
In rural areas, the average intake of energy from carbohydrates in men was 60,2% and in women
was 60,3%. In the men included in the THUSA study, it was higher at 67,4% of total energy in rural
villages and 67,2% of total energy in farms. Among rural THUSA women it was also higher at 67%
in rural villages and 68,3% in farm areas (Steyn et al., 2006:15, Table 2.2.2; Steyn, 2005a:35,
Table 4.2b; Vorster et al., 2005:485, Table 4; MacIntyre et al., 2002:243, Table 1).
Average intake for all rural participants (men and women combined) in the current study was
60,3% in comparison to 65% in the THUSA study (Steyn, 2005a:35, Table 4.2; MacIntyre et al.,
2002:240).
In the current study, the average percentage of total energy from carbohydrates for urban men
was 62,2% and for women 63,3%. The BRISK study found similar values of 59,2 to 61,3% for men
and 62 to 62,7% for women (Bourne et al., 1993:241, Table II ), but the THUSA study reported
higher values of 67,2% in squatter camp men; 64% in township men and lower values of 57,3% in
upper class urban men. In the VIGHOR study, a lower value of 45,3% was reported among urban
men (Oosthuizen et al., 1998:1214, Table I). Among THUSA women it was also higher with 64,1%
of total energy from carbohydrates in squatter camps, 61,5% in townships, and lower (55,6%) in
upper class urban women (Steyn et al., 2006:15, Table 2.2.2; Steyn, 2005a:35, Table 4.2b; Vorster
et al., 2005:485, Table 4; MacIntyre et al., 2002:243, Table 1). As with energy, the VIGHOR study
reported a lower value of 48,4% among their women (Oosthuizen et al., 1998:1214, Table I).
Intake for all urban participants (men and women combined) in the current study was higher (63%)
in comparison to the THUSA study‘s average (57%) (Steyn, 2005a:35, Table 4.2; MacIntyre et al.,
2002:240).
Carbohydrate intake for rural and urban men in the current study was 61% of total energy, which
was lower than the THUSA study‘s 64,4% of total energy in men. In the current study, 61,7% of
total energy for all women were comparable to the THUSA study‘s 62,4% in women (Steyn et al.,
2006:15, Table 2.2.2; Steyn, 2005a:35, Table 4.2b; Vorster et al., 2005:485, Table 4; MacIntyre et
al., 2002:243, Table 1).
Average intake for all participants (men and women combined) in the current study was 61,5% of
total energy. The current study‘s value falls in the same range found by the BRISK study, but is
higher than the average values found by the CORIS, VIGHOR, Indians urban, and CRISIC studies
(all urban studies, except for CORIS that covered rural and urban); and lower than the average
value in the Dikgale study, which was conducted in a rural area (Steyn et al., 2006:15, Table 2.2.1;
Steyn, 2005a:35, Table 4.2a).]

Page 191 of 252
Vorster and Nell (2001:S19) argue that in order for women and men to meet their carbohydrate
intake of at least 55% of total energy (8000kJ in women; 10 000kJ in men), women should
consume at least 259 g of carbohydrate per day and men 325 g per day. Men in the current study
did not meet this requirement, since median intake for men was 297g and for urban men was 259g.
Rural women met it with a median intake of 260g, but not urban women (242,5g) (Table 4.27 and
Table 4.28). According to the DRIs, at least 130g carbohydrates need to be consumed; an amount
that the average participants in the current study met quite easily (USDA & USDHHS,
2010:15:Table 2-4).
The current study‘s results for both rural and urban participants also fell within the prudent dietary
guidelines (Food & Nutrition Board et al., 2002:1324).
(iii) Protein
In the current study, the average percentage energy from protein in rural men was 17,5% and
16,9% in women. The THUSA study found it to be lower for men at 11,6% of total energy in rural
villages and 12,1% of total energy in farm areas. For women, it was also lower: 11,4% in rural
villages and 11,3% in farm areas (Steyn et al., 2006:15, Table 2.2.2; Steyn, 2005a:35, Table 4.2b;
Vorster et al., 2005:485, Table 4; MacIntyre et al., 2002:243, Table 1). The average for all rural
participants in the current study was 17,1% and in the THUSA study it was 12% (Steyn, 2005a:35,
Table 4.2; MacIntyre et al., 2002:240).
Urban males in the current study had a protein intake of 18,3% of total energy and for women it
was 17,7% of total energy. In comparison, the THUSA study reported lower protein intakes of 12%
of total energy in squatter camps; 11,8% of total energy in townships and 13,2% of total energy in
upper class urban areas; and for women: 12,1% of total energy in squatter camps; 12,1% of total
energy in townships and 13,4% of total energy in upper class urban (Steyn et al., 2006:15, Table
2.2.2; Steyn, 2005a:35, Table 4.2b; Vorster et al., 2005:485, Table 4; MacIntyre et al., 2002:243,
Table 1). It was 15,6% for urban men and 15,9% for urban women in the VIGHOR study
(Oosthuizen et al., 1998:1214, Table I) and in the BRISK study it was between 15,1% and 15,3% in
men and 14,3 to 14,5% in women (Bourne et al., 1993:241, Table II). The overall average
percentage intake for all urban participants in the current study was 17,8% in comparison to the
THUSA study‘s 13,2% (Steyn, 2005a:35, Table 4.2; MacIntyre et al., 2002:240).
The average intake for all men in the current study was 17,8%. For all women it was 17,3%. The
average intake for all participants was 17,4% in the current study. This is higher than the ranges
found by all the other comparative studies (see Table 5.7), except for the female participants of the
CORIS study (ranging between 15,5% and 16,6%) (Wolmarans et al., 1988:13, Table II).
The reason for the higher protein intake found in the current study, may be partially due to the fact
that the exchange list that was devised for legumes, which sets out that one legume portion
contains 7 grams of protein (equal to the amount contained in a meat exchange), also finds that
soy products contain 13 grams of protein, and this was taken into consideration when protein
intake was calculated. Urban participants also frequently purchased and consumed peanuts from a
Page 192 of 252
street vendor in the vicinity where the study was conducted, which also contributed to their daily
protein intake. As can be seen from Tables 4.19 to 4.22, peanuts were consumed more frequently
by urban participants.
The prudent dietary guidelines recommend a protein intake of 10-35% of total energy and the
DRIs recommend a protein intake of 56g for men and 46g for women (USDA & USDHHS,
2010:15:Table 2-4). The current study‘s results fell within all of these guidelines (Food & Nutrition
Board et al., 2002:1324)
(iv) Fat
In the current study, total average percentage energy intake from fat was 25,2% for rural men and
25,8% for rural women. The THUSA study found it to be a little less at 22,9% for rural village men
and 23,6 for rural village women. For men from farms it was 22,8% and for women it was 22,6%
(Steyn et al., 2006:15, Table 2.2.2; Steyn, 2005a:35, Table 4.2b; Vorster et al., 2005:485, Table 4;
MacIntyre et al., 2002:243, Table 1). Average rural intake in the current study was 25,7% in
comparison to the THUSA study‘s 22% (Steyn, 2005a:35, Table 4.2; MacIntyre et al., 2002:240).
For urban participants in the current study percentage energy from protein was 23,3% for men and
22,8% for women. The BRISK study found similar results of 26,1% to 27% for women and 23,8% to
25,9% for men (Bourne et al., 1993:241, Table II). The THUSA study found it to be higher at 24,3%
(men) and 27,7% (women) in squatter camps; 26% (men) and 27,7% (women) in townships; and
30,6% (men) and 31,8% (women) in upper class urban areas (Steyn et al., 2006:15, Table 2.2.2;
Steyn, 2005a:35, Table 4.2b; Vorster et al., 2005:485, Table 4; MacIntyre et al., 2002:243, Table
1). The VIGHOR study found a much higher value of 39,3% in men and 38,1% in women
(Oosthuizen et al., 1998:1214, Table I). The average for all urban participants in the current study
was 23,1% in comparison to 30,6% in the THUSA study (Steyn, 2005a:35, Table 4.2; MacIntyre et
al., 2002:240).
The average intake for all current male participants was 24,3% and for women was 24,5%. The
average for all participants in the current study was 24,3%. Interestingly, neither the current
study‘s results nor the THUSA study‘s results were found to be above thirty percent energy intake
from fat, except for the upper class urban participants in the THUSA study.
The current study‘s results again correlate well with the BRISK study‘s range of values (Bourne et
al., 1993:241, Table II). However, all other studies found fat intake to be higher than thirty percent
intake (Table 5.7).
In studies where the prevalence of overweight and obesity was high, fat intake was usually more
than thirty percent of total energy intake (Wolmarans & Oosthuizen, 2001:S48). A positive
association was found between obesity and the percentage energy consumed from fat. However,
decreased physical activity also plays a role (Wolmarans & Oosthuizen, 2001:S51).
The prudent dietary guidelines recommend 20-35% of total energy intake from fat (USDA &
USDHHS, 2010:15:Table 2-4). The current study‘s results fell within these guidelines.
Page 193 of 252
5.4 Anthropometric variables
5.4.1 Children younger than seven years
The anthropometric findings of the current study were compared with those of the NFCS
(nationally)(Labadarios et al., 2005:536-537, Tables 1-2; Steyn et al., 2005:7-10, Tables 2-6) and the
SAVACG (Labadarios & Nel, 2000:215-216, Tables 4.31- 4.32). These results are set out by Tables 5.8
to 5.11 below.
The anthropometric measurements were compared to the WHO standards, whereas the NFCS used the
CDC charts. When using the WHO charts, the prevalence of underweight is lower after six months of age
in comparison with the CDC charts. Stunting rates are also higher when based on the WHO standard;
estimates of overweight and obesity will be higher; and estimates of wasting and severe wasting will be
lower after the seventy centimeters height cut-off (De Onis et al., 2007:145).
5.4.1.1. Weight-for-age
In the current study, 26,7% of rural children younger than seven were moderately underweight
(weight-for-age <-2SD of WHO median) and 5% were severely underweight (weight-for-age <-3SD of
WHO median) (Table 5.8). In the NFCS, there were only about half as many children (12,8%)
moderately underweight (weight-for-age <-2SD of NCHS median) and about one-fifth (1,8%) as many
severely underweight (weight-for-age<-3SD of NCHS median) children (Steyn et al., 2005:8, Table 3).
Among the urban children, 10,4% of children were moderately underweight (weight-for-age <-2SD of
WHO median) and 6,9% severely underweight (weight-for-age <-3SD of WHO median). This was
more in line with the NFCS as to moderately underweight (weight-for-age <-2SD of NCHS median)
children (7,7%), but the severely underweight (weight-for-age<-3SD of NCHS median) children were
far less (1,1%) in the NFCS (Steyn et al., 2005:8, Table 3).
Overall, 15,9% of all children in the current study were moderately underweight {weight-for-age <-2SD
of WHO median] in comparison to the Free State section of the NFCS 14,3% (Labadarios & Nel,
2000:174; Labadarios & Nel, 2000:202, Table 4.14). Nationally, there was a prevalence of
underweight of 10,3% among NFCS children and 9,3% among SAVACG children. In the current study
6,3% of all children were severely underweight (weight-for-age <-3SD of WHO median) in comparison
to only 1,4% of NFCS children nationally, 1,4% of SAVACG children and only 1% in the Free State
section of the NFCS (Steyn et al., 2005:8, Table 3; Labadarios & Nel, 2000: 174, 202, Table 4.14;
Labadarios & Nel, 2000:215-216, Tables 4.31- 4.32).
One would expect that using the WHO standards, the occurrence of underweight would be lower (after
six months of age) than when using the CDC charts (De Onis et al., 2007:145). However, a higher
percentage of children were underweight than reported in the national and Free State NFCS.
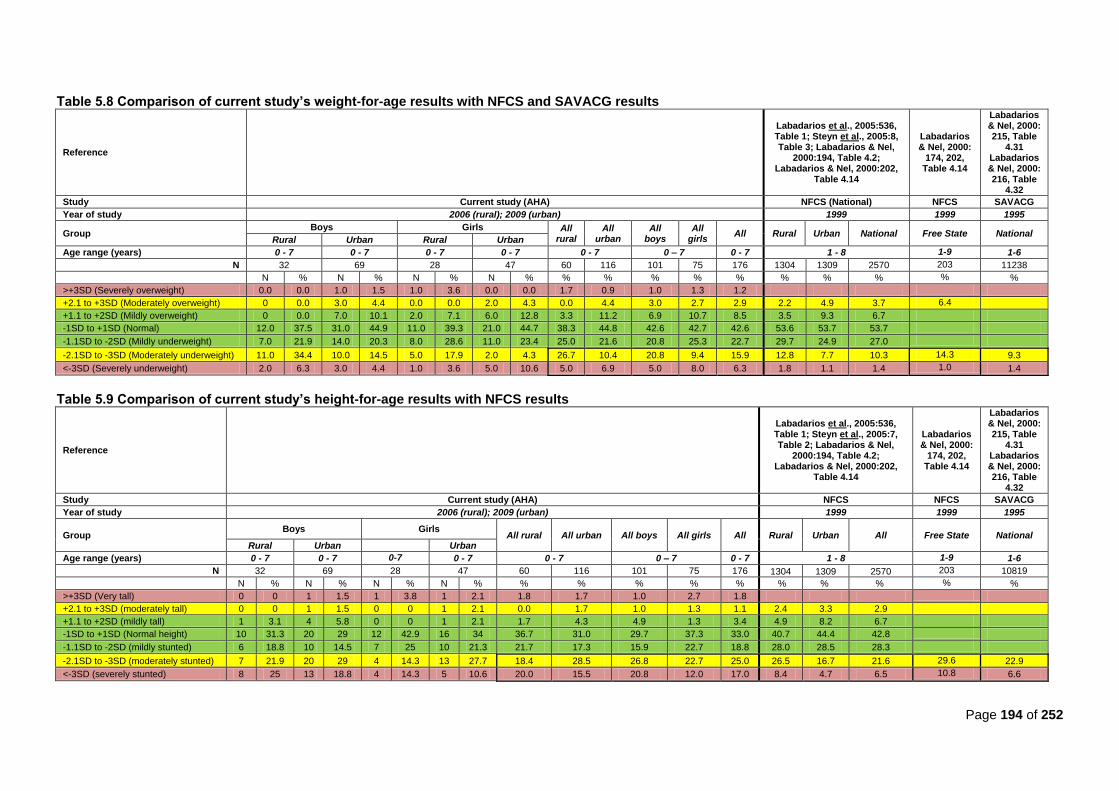
Page 194 of 252
Table 5.8 Comparison of current study’s weight-for-age results with NFCS and SAVACG results
Reference
Labadarios et al., 2005:536, Table 1; Steyn et al., 2005:8, Table 3; Labadarios & Nel,
2000:194, Table 4.2; Labadarios & Nel, 2000:202,
Table 4.14
Labadarios & Nel, 2000:
174, 202, Table 4.14
Labadarios & Nel, 2000: 215, Table
4.31 Labadarios & Nel, 2000: 216, Table
4.32
Study Current study (AHA) NFCS (National) NFCS SAVACG
Year of study 2006 (rural); 2009 (urban) 1999 1999 1995
Group Boys Girls All
rural All
urban All
boys All
girls All Rural Urban National Free State National
Rural Urban Rural Urban
Age range (years) 0 - 7 0 - 7 0 - 7 0 - 7 0 - 7 0 – 7 0 - 7 1 - 8 1-9 1-6
N 32 69 28 47 60 116 101 75 176 1304 1309 2570 203 11238
N % N % N % N % % % % % % % % % % %
>+3SD (Severely overweight) 0.0 0.0 1.0 1.5 1.0 3.6 0.0 0.0 1.7 0.9 1.0 1.3 1.2
+2.1 to +3SD (Moderately overweight) 0 0.0 3.0 4.4 0.0 0.0 2.0 4.3 0.0 4.4 3.0 2.7 2.9 2.2 4.9 3.7 6.4
+1.1 to +2SD (Mildly overweight) 0 0.0 7.0 10.1 2.0 7.1 6.0 12.8 3.3 11.2 6.9 10.7 8.5 3.5 9.3 6.7
-1SD to +1SD (Normal) 12.0 37.5 31.0 44.9 11.0 39.3 21.0 44.7 38.3 44.8 42.6 42.7 42.6 53.6 53.7 53.7
-1.1SD to -2SD (Mildly underweight) 7.0 21.9 14.0 20.3 8.0 28.6 11.0 23.4 25.0 21.6 20.8 25.3 22.7 29.7 24.9 27.0
-2.1SD to -3SD (Moderately underweight) 11.0 34.4 10.0 14.5 5.0 17.9 2.0 4.3 26.7 10.4 20.8 9.4 15.9 12.8 7.7 10.3 14.3 9.3
<-3SD (Severely underweight) 2.0 6.3 3.0 4.4 1.0 3.6 5.0 10.6 5.0 6.9 5.0 8.0 6.3 1.8 1.1 1.4 1.0 1.4
Table 5.9 Comparison of current study’s height-for-age results with NFCS results
Reference
Labadarios et al., 2005:536, Table 1; Steyn et al., 2005:7, Table 2; Labadarios & Nel,
2000:194, Table 4.2; Labadarios & Nel, 2000:202,
Table 4.14
Labadarios & Nel, 2000:
174, 202, Table 4.14
Labadarios & Nel, 2000: 215, Table
4.31 Labadarios & Nel, 2000: 216, Table
4.32
Study Current study (AHA) NFCS NFCS SAVACG
Year of study 2006 (rural); 2009 (urban) 1999 1999 1995
Group Boys Girls
All rural All urban All boys All girls All Rural Urban All Free State National Rural Urban Urban
Age range (years) 0 - 7 0 - 7 0-7 0 - 7 0 - 7 0 – 7 0 - 7 1 - 8 1-9 1-6
N 32 69 28 47 60 116 101 75 176 1304 1309 2570 203 10819
N % N % N % N % % % % % % % % % % %
>+3SD (Very tall) 0 0 1 1.5 1 3.8 1 2.1 1.8 1.7 1.0 2.7 1.8
+2.1 to +3SD (moderately tall) 0 0 1 1.5 0 0 1 2.1 0.0 1.7 1.0 1.3 1.1 2.4 3.3 2.9
+1.1 to +2SD (mildly tall) 1 3.1 4 5.8 0 0 1 2.1 1.7 4.3 4.9 1.3 3.4 4.9 8.2 6.7
-1SD to +1SD (Normal height) 10 31.3 20 29 12 42.9 16 34 36.7 31.0 29.7 37.3 33.0 40.7 44.4 42.8
-1.1SD to -2SD (mildly stunted) 6 18.8 10 14.5 7 25 10 21.3 21.7 17.3 15.9 22.7 18.8 28.0 28.5 28.3
-2.1SD to -3SD (moderately stunted) 7 21.9 20 29 4 14.3 13 27.7 18.4 28.5 26.8 22.7 25.0 26.5 16.7 21.6 29.6 22.9
<-3SD (severely stunted) 8 25 13 18.8 4 14.3 5 10.6 20.0 15.5 20.8 12.0 17.0 8.4 4.7 6.5 10.8 6.6

Page 195 of 252
When comparing boys with girls, twice as many boys (20,8%) were moderately underweight (weight-
for-age <-2SD of WHO median) than girls (9,4%). Less boys (5%) were severely underweight (weight-
for-age <-3SD of WHO median) than girls (8%). In total, 25,8% of boys were moderately or severely
underweight (weight-for-age <-2SD of WHO median plus weight-for-age <-3SD of WHO median) and
17,4% of girls (Table 5.8).
Overall, rural children (especially boys) were far more likely to be underweight than their urban
counterparts. Barker and his colleagues have shown that children who were underweight at one year
of age had a greater tendency to store fat in the visceral area as adults (Popkin et al., 1996:3009),
which increases the risk for CDLs in adulthood (Vorster & Kruger, 2007:323) Children who are
underweight are at increased risk of infections, e.g. diarrhea and pneumonia, with an increased
mortality risk (WHO, 2008:14; Nannan et al., 2007:733). Undernourished children younger than two
years who gain weight rapidly later in childhood (after two years of age up to adolescence) have a
higher risk for CDLs (Victora et al., 2008:340).
The NFCS combined the values for their moderately and severely overweight children; all children
who had a weight-for-age >2SD of NCHS median were termed ―obese‖ (Labadarios et al., 2005:536,
Table 1; Steyn et al., 2005:8, Table 3). In the current study, there were no rural children found to be
moderately overweight (>2SD of WHO median) and there were 1,7% of children who were severely
overweight (>3SD of WHO median) (total 1,7% of children = ―obese‖). The current study had more
urban children (4,4%) who were moderately overweight (>2SD of WHO median), but less children
(0,9%) who were severely overweight(>3SD of WHO median) (total 5,3% = ―obese‖). In comparison,
the NFCS found 2,2% of their rural children to be ―obese‖ and 4,9% of their urban children to be
―obese.‖ These values are comparative to the current study‘s results. Overall, from all the children in
the current study, 2,9% of children were moderately overweight (>2SD of WHO median) and 1,2%
were severely overweight (>3SD of WHO median), totalling 4,1% with a weight-for-age >2SD (Table
5.8). These results again compare well with the NFCS findings of 3,7% nationally (Labadarios et al.,
2005:536-537, Tables 1-2; Steyn et al., 2005:7-10, Tables 2-6) and 6,4% in the Free State
(Labadarios & Nel, 2000:175; Labadarios & Nel, 2000:202, Table 4.14).
The same percentage of girls in the current study (4%) were found to be overweight/obese than the
boys (4%), which was a very small percentage of the total sample.
Overall, the current study‘s findings correlate well with the results of the NFCS in terms of
overweight/obese children, even after taking into account that the WHO standard analysis may find
more children to be overweight/obese in comparison with a NCHS chart analysis (De Onis et al.,
2007:145).
Urban children had a higher prevalence of overweight/obesity. Overweight in childhood and early life is
liable to be followed by overweight and obesity in adulthood (WCRF/AICR, 2007:xvii). The later the
weight gain in childhood and adolescence, the greater the persistence. Victora et al. (2008:340) found
in their systematic review that rapid weight gain among in the first two years of life in children with poor
fetal growth did not increase the risk of CDLs, However, undernourished children younger than two
years who gained weight rapidly later in their childhood or adolescence did have a high risk for CDLs
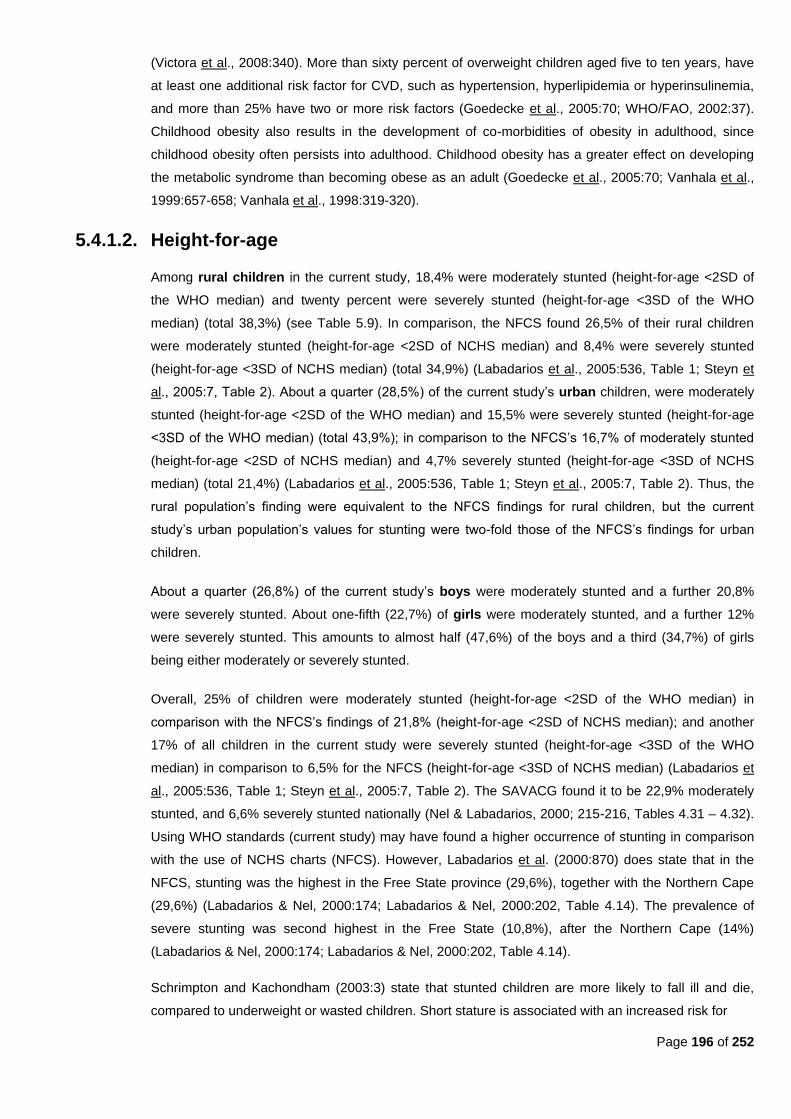
Page 196 of 252
(Victora et al., 2008:340). More than sixty percent of overweight children aged five to ten years, have
at least one additional risk factor for CVD, such as hypertension, hyperlipidemia or hyperinsulinemia,
and more than 25% have two or more risk factors (Goedecke et al., 2005:70; WHO/FAO, 2002:37).
Childhood obesity also results in the development of co-morbidities of obesity in adulthood, since
childhood obesity often persists into adulthood. Childhood obesity has a greater effect on developing
the metabolic syndrome than becoming obese as an adult (Goedecke et al., 2005:70; Vanhala et al.,
1999:657-658; Vanhala et al., 1998:319-320).
5.4.1.2. Height-for-age
Among rural children in the current study, 18,4% were moderately stunted (height-for-age <2SD of
the WHO median) and twenty percent were severely stunted (height-for-age <3SD of the WHO
median) (total 38,3%) (see Table 5.9). In comparison, the NFCS found 26,5% of their rural children
were moderately stunted (height-for-age <2SD of NCHS median) and 8,4% were severely stunted
(height-for-age <3SD of NCHS median) (total 34,9%) (Labadarios et al., 2005:536, Table 1; Steyn et
al., 2005:7, Table 2). About a quarter (28,5%) of the current study‘s urban children, were moderately
stunted (height-for-age <2SD of the WHO median) and 15,5% were severely stunted (height-for-age
<3SD of the WHO median) (total 43,9%); in comparison to the NFCS‘s 16,7% of moderately stunted
(height-for-age <2SD of NCHS median) and 4,7% severely stunted (height-for-age <3SD of NCHS
median) (total 21,4%) (Labadarios et al., 2005:536, Table 1; Steyn et al., 2005:7, Table 2). Thus, the
rural population‘s finding were equivalent to the NFCS findings for rural children, but the current
study‘s urban population‘s values for stunting were two-fold those of the NFCS‘s findings for urban
children.
About a quarter (26,8%) of the current study‘s boys were moderately stunted and a further 20,8%
were severely stunted. About one-fifth (22,7%) of girls were moderately stunted, and a further 12%
were severely stunted. This amounts to almost half (47,6%) of the boys and a third (34,7%) of girls
being either moderately or severely stunted.
Overall, 25% of children were moderately stunted (height-for-age <2SD of the WHO median) in
comparison with the NFCS‘s findings of 21,8% (height-for-age <2SD of NCHS median); and another
17% of all children in the current study were severely stunted (height-for-age <3SD of the WHO
median) in comparison to 6,5% for the NFCS (height-for-age <3SD of NCHS median) (Labadarios et
al., 2005:536, Table 1; Steyn et al., 2005:7, Table 2). The SAVACG found it to be 22,9% moderately
stunted, and 6,6% severely stunted nationally (Nel & Labadarios, 2000; 215-216, Tables 4.31 – 4.32).
Using WHO standards (current study) may have found a higher occurrence of stunting in comparison
with the use of NCHS charts (NFCS). However, Labadarios et al. (2000:870) does state that in the
NFCS, stunting was the highest in the Free State province (29,6%), together with the Northern Cape
(29,6%) (Labadarios & Nel, 2000:174; Labadarios & Nel, 2000:202, Table 4.14). The prevalence of
severe stunting was second highest in the Free State (10,8%), after the Northern Cape (14%)
(Labadarios & Nel, 2000:174; Labadarios & Nel, 2000:202, Table 4.14).
Schrimpton and Kachondham (2003:3) state that stunted children are more likely to fall ill and die,
compared to underweight or wasted children. Short stature is associated with an increased risk for
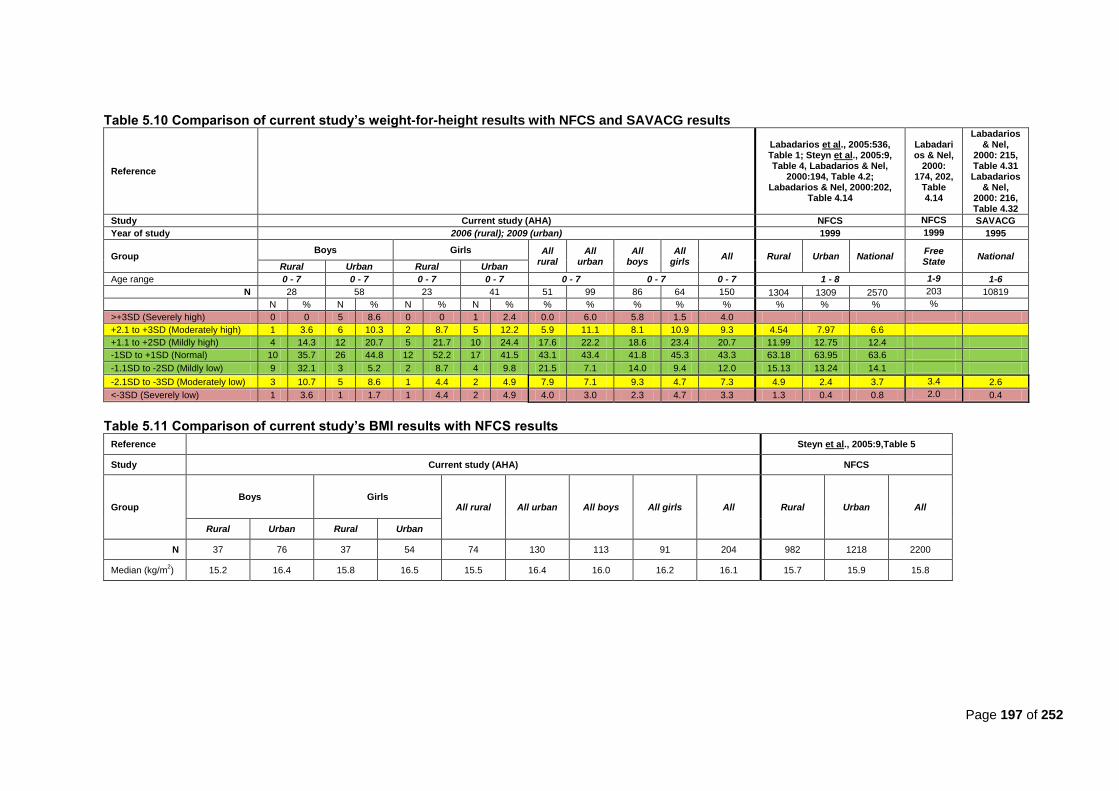
Page 197 of 252
Table 5.10 Comparison of current study’s weight-for-height results with NFCS and SAVACG results
Reference
Labadarios et al., 2005:536, Table 1; Steyn et al., 2005:9, Table 4, Labadarios & Nel,
2000:194, Table 4.2; Labadarios & Nel, 2000:202,
Table 4.14
Labadarios & Nel,
2000: 174, 202,
Table 4.14
Labadarios & Nel,
2000: 215, Table 4.31 Labadarios
& Nel, 2000: 216, Table 4.32
Study Current study (AHA) NFCS NFCS SAVACG
Year of study 2006 (rural); 2009 (urban) 1999 1999 1995
Group Boys Girls All
rural All
urban All
boys All
girls All Rural Urban National
Free State
National Rural Urban Rural Urban
Age range 0 - 7 0 - 7 0 - 7 0 - 7 0 - 7 0 - 7 0 - 7 1 - 8 1-9 1-6
N 28 58 23 41 51 99 86 64 150 1304 1309 2570 203 10819
N % N % N % N % % % % % % % % % %
>+3SD (Severely high) 0 0 5 8.6 0 0 1 2.4 0.0 6.0 5.8 1.5 4.0
+2.1 to +3SD (Moderately high) 1 3.6 6 10.3 2 8.7 5 12.2 5.9 11.1 8.1 10.9 9.3 4.54 7.97 6.6
+1.1 to +2SD (Mildly high) 4 14.3 12 20.7 5 21.7 10 24.4 17.6 22.2 18.6 23.4 20.7 11.99 12.75 12.4
-1SD to +1SD (Normal) 10 35.7 26 44.8 12 52.2 17 41.5 43.1 43.4 41.8 45.3 43.3 63.18 63.95 63.6
-1.1SD to -2SD (Mildly low) 9 32.1 3 5.2 2 8.7 4 9.8 21.5 7.1 14.0 9.4 12.0 15.13 13.24 14.1
-2.1SD to -3SD (Moderately low) 3 10.7 5 8.6 1 4.4 2 4.9 7.9 7.1 9.3 4.7 7.3 4.9 2.4 3.7 3.4 2.6
<-3SD (Severely low) 1 3.6 1 1.7 1 4.4 2 4.9 4.0 3.0 2.3 4.7 3.3 1.3 0.4 0.8 2.0 0.4
Table 5.11 Comparison of current study’s BMI results with NFCS results
Reference
Steyn et al., 2005:9,Table 5
Study Current study (AHA) NFCS
Group Boys Girls
All rural All urban All boys All girls All Rural Urban All
Rural Urban Rural Urban
N 37 76 37 54 74 130 113 91 204 982 1218 2200
Median (kg/m2) 15.2 16.4 15.8 16.5 15.5 16.4 16.0 16.2 16.1 15.7 15.9 15.8

Page 198 of 252
CHD, stroke and DM in adulthood (WHO/FAO, 2002:35). Stunting is linked to an increased risk of
delayed motor and mental development as well as of morbidity and mortality (Labadarios et al.,
2000:870). Victora et al. (2008:345) found in their systematic review that height-for-age predicts
cognitive performance later in life. Stunting in childhood can persist into adulthood, leading to
decreased work capacity (Labadarios et al., 2000:870).
5.4.1.3. Weight-for-height
In the current study, 7,9% of all rural children were moderately wasted (weight-for-height <2SD of the
WHO median) and 4% were severely wasted (weight-for-height <3SD of the WHO median), whereas
4,9% of rural children in the NFCS were moderately wasted (weight-for-height <2SD of NCHS median)
and a further 1,3% were severely wasted (weight-for-height <3SD of NCHS median) (see Table 5.10).
Among urban children in the current study, 7,1% were moderately wasted (weight-for-height <2SD of
the WHO median) and another 3% were severely wasted (weight-for-height <3SD of the WHO
median), compared to 2,4% of urban children in the NFCS being moderately wasted (weight-for-height
<2SD of NCHS median) and only 0,4% severely wasted (weight-for-height <3SD of NCHS median)
(Labadarios et al., 2005:536, Table 1; Steyn et al., 2005:9, Table 4).
The results for rural and urban children in the current study are more or less the same, whereas there
were more wasted children in the rural areas of the NFCS than in the urban areas. The current study‘s
rural values (11,7%) are about forty percent more than those reported in the NFCS (6,2%). The urban
values (10,1%) are about five times more than the NFCS‘s values (2,8%).
More boys (11,6%) than girls (9,4%) were wasted in the current study. Almost one-tenth (9,3%) of
boys were moderately wasted vs. half the amount of girls (4,7%). Furthermore, another 2,3% of boys
were severely wasted vs. 4,7% of girls.
Overall, 7,3% of children in the current study were moderately wasted (weight-for-height <2SD of the
WHO median) and 3,3% were severely wasted (weight-for-height <3SD of the WHO median) (total
10,6%). In comparison, the NFCS found only 3,7% of children were moderately wasted (weight-for-
height <2SD of NCHS median) and only 0,8% were severely wasted ((weight-for-height <3SD of
NCHS median) nationally (total 4,5%) (Labadarios et al., 2005:536, Table 1; Steyn et al., 2005:9,
Table 4). For the Free State part of the NFCS, 3,4% of children were moderately wasted, and 2% were
severely wasted (Labadarios & Nel, 2000: 174, 202, Table 4.14). In the SAVACG, 2,6% of children
were moderately wasted in 1995, and 0,4% were severely wasted (Labadarios & Nel, 2000:215-216,
Tables 4.31 – 4.32). The current study‘s occurrence of wasting was about double that found in the
NFCS (nationally). Nel and Labadarios (2000:178) state that, when comparing the results of the NFCS
to the SAVACG survey (conducted in 1995), the prevalence of wasting appeared to have decreased at
the time of their study (1999). However, it seems that values for the Free State have increased since
1999, since when basing estimates on the WHO standard; estimates of wasting and severe wasting
were supposed to decrease in comparison with the NCHS estimates (De Onis et al., 2007:145).
However, this was not the case in the current study. Although wasting prevalence in the current study
was low in comparison to stunting and underweight values, as was also the case in the NFCS
(Labadarios et al., 2005:536) wasting is a sign of acute current undernutrition, and is of concern, since

Page 199 of 252
the mortality rate in children younger than five with severe wasting ranging from thirty percent to fifty
percent (WHO, 2012a:online).
5.4.1.4. BMI
The findings for median BMI among rural children (15,5 kg/m2) were similar to the NFCS (15,7 kg/m
2)
(see Table 5.11). However, the urban children‘s median BMI (16,4 kg/m2) was higher than that found
in the NFCS nationally (15,9 kg/m2). Overall, the mean BMI for all children in the current study (16,1
kg/m2), was comparative to the 15,8 kg/m
2 for the NFCS (Steyn et al., 2005:9,Table 5).
5.4.2 Adults
Anthropometric findings of the current study results were compared with results from the 1998 SADHS
(Bourne et al., 2002:160, Table 1); the 2003 SADHS (DoH, 2004a:25-26, Tables 19.1 & 19.2); the CORIS
study (Mollentze et al., 1995:92-93, Tables II & III); the VIGHOR study (Oosthuizen et al., 1998:1213) and
the THUSA study (Vorster et al., 2005:486, Table 5; Vorster, 2002:240, Table 1). Comparison of the
current study‘s results with the results from other studies are set out in Tables 5.15 through 5.18.
5.4.2.1. Underweight
In the current study, 33,1% of rural men and 9,2% of rural women were underweight (BMI<18,5
kg/m2) (Table 5.12). In the THUSA study, 86,7% of rural men and 52% of rural women in tribal
villages; and 90,6% of rural men and 46,9% of women on commercial farms had a BMI between <18,0
kg/m2 and 24,9 kg/m
2 (Vorster et al., 2005:486, Table 5). In the 2003 SADHS, 13,8% of rural men and
6,8% of rural women were underweight (DoH, 2004a:25-26, Tables 19.1 & 19.2). The current study‘s
findings for women are similar to the 2003 SADHS (nationally), but more men had a BMI<18,5 kg/m2
than in the SADHS.
When taking the prevalence of HIV into consideration among the male study participants (17% rural,
41% urban) (found in separate sub-study; unpublished), as well as the high levels of physical activity
(also found in separate sub-study; unpublished) (two-thirds of rural men were either active or very
active - Table 5.7), it is not surprising that a third of rural men (33,1%) and about a quarter of urban
men (23%) were underweight.
Among urban participants in the current study, 23% of men and 8,8% of women were underweight. In
the THUSA study, 93,3% of men from squatter camps; 87,3% of township men; and 66,7% of upper
class urban men had a BMI between <18,0 kg/m2 and 24,9 kg/m
2 (Vorster et al., 2005:486, Table 5).
The 2003 SADHS found nationally, that 11,7% of urban men and 5,6% of urban women were
underweight (DoH, 2004a:25-26, Tables 19.1 & 19.2). Again, the percentage of men with a
BMI<18,5kg/m2 in the current study was higher than those of the SADHS (Table 5.13) and for women
the findings are almost similar.
Of all men (rural and urban) in the current study, 29,3% were underweight, whereas only 9% of all
women were (Table 5.12). In the 1998 SADHS, 12,9% of men and 4,8% of women were underweight
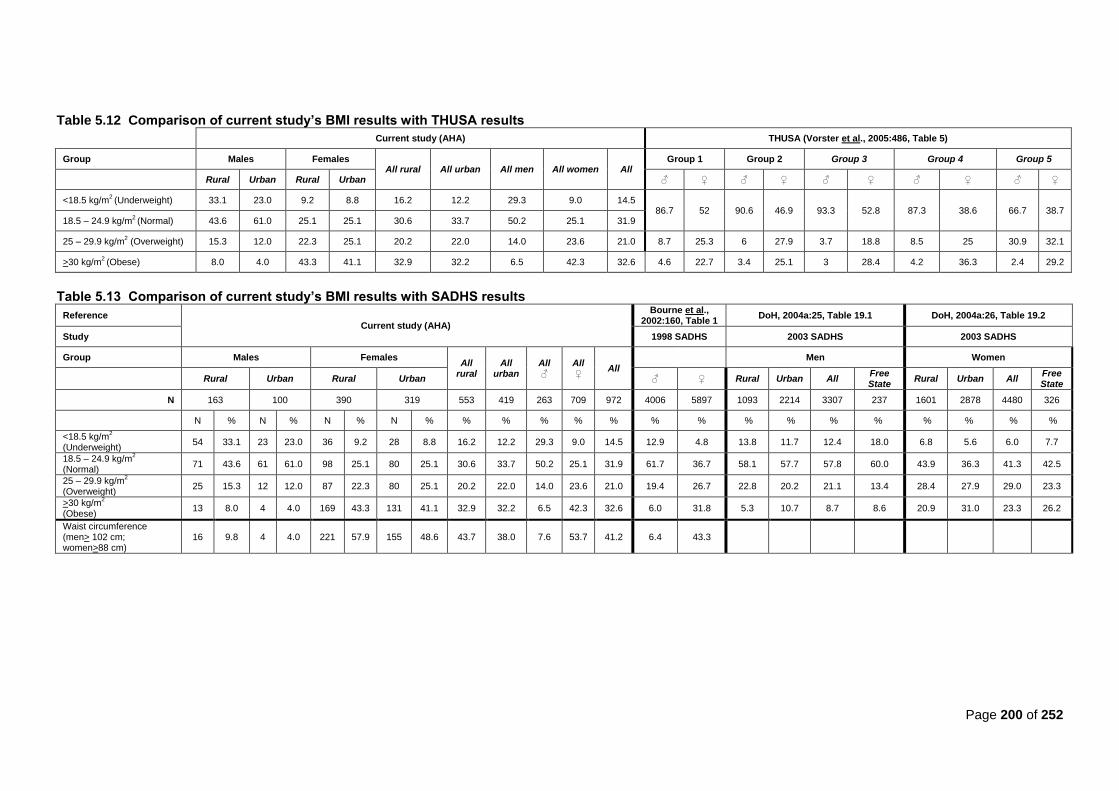
Page 200 of 252
Table 5.12 Comparison of current study’s BMI results with THUSA results
Current study (AHA) THUSA (Vorster et al., 2005:486, Table 5)
Group Males Females All rural All urban All men All women All
Group 1 Group 2 Group 3 Group 4 Group 5
Rural Urban Rural Urban ♂ ♀ ♂ ♀ ♂ ♀ ♂ ♀ ♂ ♀
<18.5 kg/m2 (Underweight) 33.1 23.0 9.2 8.8 16.2 12.2 29.3 9.0 14.5
86.7 52 90.6 46.9 93.3 52.8 87.3 38.6 66.7 38.7 18.5 – 24.9 kg/m
2 (Normal) 43.6 61.0 25.1 25.1 30.6 33.7 50.2 25.1 31.9
25 – 29.9 kg/m2 (Overweight) 15.3 12.0 22.3 25.1 20.2 22.0 14.0 23.6 21.0 8.7 25.3 6 27.9 3.7 18.8 8.5 25 30.9 32.1
>30 kg/m2 (Obese) 8.0 4.0 43.3 41.1 32.9 32.2 6.5 42.3 32.6 4.6 22.7 3.4 25.1 3 28.4 4.2 36.3 2.4 29.2
Table 5.13 Comparison of current study’s BMI results with SADHS results
Reference Current study (AHA)
Bourne et al., 2002:160, Table 1
DoH, 2004a:25, Table 19.1 DoH, 2004a:26, Table 19.2
Study 1998 SADHS 2003 SADHS 2003 SADHS
Group Males Females All
rural All
urban All ♂
All ♀
All
Men Women
Rural Urban Rural Urban ♂ ♀ Rural Urban All Free State
Rural Urban All Free State
N 163 100 390 319 553 419 263 709 972 4006 5897 1093 2214 3307 237 1601 2878 4480 326
N % N % N % N % % % % % % % % % % % % % % % %
<18.5 kg/m2
(Underweight) 54 33.1 23 23.0 36 9.2 28 8.8 16.2 12.2 29.3 9.0 14.5 12.9 4.8 13.8 11.7 12.4 18.0 6.8 5.6 6.0 7.7
18.5 – 24.9 kg/m2
(Normal) 71 43.6 61 61.0 98 25.1 80 25.1 30.6 33.7 50.2 25.1 31.9 61.7 36.7 58.1 57.7 57.8 60.0 43.9 36.3 41.3 42.5
25 – 29.9 kg/m2
(Overweight) 25 15.3 12 12.0 87 22.3 80 25.1 20.2 22.0 14.0 23.6 21.0 19.4 26.7 22.8 20.2 21.1 13.4 28.4 27.9 29.0 23.3
>30 kg/m2
(Obese) 13 8.0 4 4.0 169 43.3 131 41.1 32.9 32.2 6.5 42.3 32.6 6.0 31.8 5.3 10.7 8.7 8.6 20.9 31.0 23.3 26.2
Waist circumference (men> 102 cm; women>88 cm)
16 9.8 4 4.0 221 57.9 155 48.6 43.7 38.0 7.6 53.7 41.2 6.4 43.3
Page 201 of 261
(Bourne et al., 2002:160, Table 1) and in the 2003 SADHS, 12,4% of men nationally and 6% of
women nationally were underweight, compared with 18% of Free State men and 7,7% of Free State
women (DoH, 2004a:25-26, Tables 19.1 & 19.2). The current study‘s findings are similar to the
SADHS‘s findings for women, but for men the findings are almost two-fold that of the findings for men
in the SADHS (see Tables 5.12 and 5.13). The FYFS (Steyn et al., 2000:149, Table III) used different
cut off points in their study for underweight (BMI <20 kg/m2), therefore their findings of 26,8% of
underweight women cannot be compared with the current study (Table 5.15).
There seems to be a pattern of more men (rural and urban) being underweight than women in the
current study, as was also found in other studies. This may be related to alcohol intake, especially
since there was a higher than recommended intake of alcohol among 5% of urban men, but also due
to higher physical activity levels among men (Table 5.7), with a significantly larger percentage of rural
men (rural: 42,1%; urban: 12,6%) being classified as very active (p<0.0001) (found in separate sub-
study; unpublished).
However, taking into account that about ten percent of both rural and urban women were underweight,
the possibility of these women bearing low-birth-weight infants, which increases these infants‘ mortality
risk, as well as risk for infections in childhood as well as CDLs in adulthood, cannot be discounted
(Victora et al., 2008:346; WHO, 2008:14; Nannan et al., 2007:733, 734, 737; Levitt et al., 2005:58;
WHO/FAO, 2002:31). Almost four percent (3,5%) of the burden from LBW is attributable to maternal
underweight. In 2000, the burden attributable to underweight in both women and children accounted
for 12,3% of deaths and 2,7% of all DALYs in South Africa (Nannan et al., 2007:733,736).
5.4.2.2. Overweight and obesity
In the current study, 15,3% of rural men and 22, 3% of rural women were overweight (BMI=25 to 29,9
kg/m2), whereas 8% of rural men and 43,3% of rural women were obese (BMI>30 kg/m
2) (Table 5.12).
A significantly larger percentage of urban men (urban 61,0%; rural: 43,6%) were of a normal BMI (18.5
to 24.9 kg/m2) than rural men (p=0.007) (Table 4.36). The Free State study by Mollentze et al.
(1995:93) found that obesity prevalence ranged between 27,5% and 49% among rural women of
different age groups and between 7,4% and 19,2% among rural men. It should be noted that the urban
population data from the Mollentze et al. study (1995) came from the same area (namely Mangaung)
than the current study. However, the rural population sample in the study conducted by Mollentze et
al. (1995) was from the Eastern Free State (namely Qwa Qwa), and not the Southern Free State as in
the current study.
In the THUSA study, 8,7% of tribal men and 6% of farm dwelling men were overweight, whereas
25,3% of women from tribal villages and 27,8% from farms were overweight; 4,6% of tribal men and
3,4% of farming men were obese, as well as 22,7% of women from tribal villages and 25,1% of women
from commercial farms (Vorster et al., 2005:486, Table 5). In the 2003 SADHS, 22,8% of rural men
and 28,4% of rural women were overweight; and 5,3% of men and 20,9% of women were obese (DoH,
2004a:25-26, Tables 19.1 & 19.2).
Page 202 of 252
Of all urban men in the current study, 12% were overweight as opposed to 25,1% of urban women.
Four percent of urban men and 41,1% of women were obese. In the THUSA study, 3,7% of men from
squatter camps; 8,5% of men from townships and 30,9% of upper class urban men were overweight,
whereas 18,8% of women from squatter camps; 25% of women from townships and 32,1% of upper
class urban women were overweight (Vorster et al., 2005:486, Table 5). As far as obesity was
concerned: 3% of men from squatter camps; 4,2% of men from townships; and 2,4% of upper class
urban men were obese, whereas 28,4% of women from squatter camps; 36,3% of women from
townships and 29,2% of upper class urban women were obese (Vorster et al., 2005:486, Table 5). The
Free State study by Mollentze et al. (1995:93) found that the prevalence of obesity ranged from 31,1%
to 54,3% among urban women and from 3% to 20,4%. among urban men.
Only 14,1% of all men in the current study were overweight and 6,5% were obese. This compares well
with the Free State result of the 2003 SADHS (Table 5.13) (13,4% overweight men; 8,6% obese
men)(DoH, 2004a:26, Table 19.1); the 1998 SADHS (19,4% overweight nationally and 6% obese)
(Bourne et al., 2002:160, Table 1); the 2003 SADHS (21,1% overweight nationally and 8,7% obese
(DoH, 2004a:26, Table 19.1) and the THUSA study (9,1% obese) (Vorster, 2002:240).
In the current study, 23,6% of females were overweight, which compares well with results from the
2003 SADHS‘s Free State section (23,3%)(DoH, 2004a:26, Table 19.2). The SADHS (26,7%) found
the prevalence to be a little higher (Bourne et al., 2002:160, Table 1). There were more obese female
participants in the current study (42,3%) in comparison with the 1998 SADHS (31,8%) (Bourne et al.,
2002:160, Table 1); the Free State 2003 SADHS (26,2%); the national 2003 SADHS (23,3%)(DoH,
2004a:26, Table 19.2); and the THUSA study (29,4%)(Vorster, 2002:240). The FYFS found that 18,2%
of their female students older than 24 years old were overweight and 6,5% were obese (total 24,7%
with BMI> 25 kg/m2) (Steyn et al., 2000:149, Table III). In the CORIS study, the amount of overweight
respondents increased as they aged, i.e. in the group of males aged twenty to 42 years the
prevalence of respondents with BMI >25 kg/m2 was fifty percent and for females 39,9%. By age 45 to
64 years, the prevalence was 76,7% in males and 75,2% in females (Wolmarans et al., 1988:13, Table
I).
There is an overall pattern in all South African studies where more women than men are found to be
overweight or obese. In the current study, the occurrence of obesity was much higher in women than
in men (Tables 5.12 and 5.13). As Vorster and Nell (2001:S20) state, women may become obese due
to a low-fat, high-carbohydrate diet, especially if they are also inactive. However, Vorster and Nell
(2001:S20) also state that it is more likely to become overweight through overconsumption of fat,
rather than carbohydrates, because fat is more energy-dense. It should be kept in mind that the mean
energy intake of women in the current study was relatively low in comparison to some other studies,
but there was a high consumption from the bread and cereals group among both urban and rural
women, with more than half of urban (52,5%) and rural (57,1%) women consuming above the amount
of recommended daily servings (Table 4.16).
Even though participants consumed less than the DRIs for energy, a large portion of participants,
especially women, were overweight or obese (rural: 65,6%; urban: 66,2%) (Table 4.36). However,
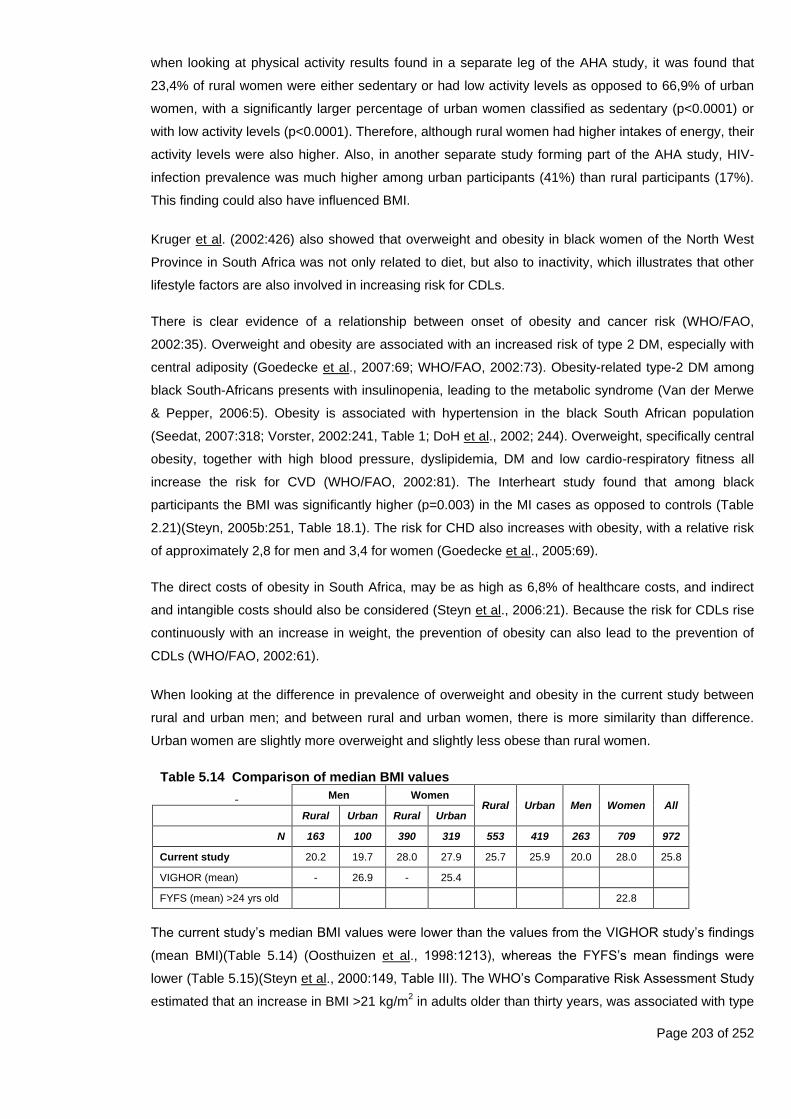
Page 203 of 252
when looking at physical activity results found in a separate leg of the AHA study, it was found that
23,4% of rural women were either sedentary or had low activity levels as opposed to 66,9% of urban
women, with a significantly larger percentage of urban women classified as sedentary (p<0.0001) or
with low activity levels (p<0.0001). Therefore, although rural women had higher intakes of energy, their
activity levels were also higher. Also, in another separate study forming part of the AHA study, HIV-
infection prevalence was much higher among urban participants (41%) than rural participants (17%).
This finding could also have influenced BMI.
Kruger et al. (2002:426) also showed that overweight and obesity in black women of the North West
Province in South Africa was not only related to diet, but also to inactivity, which illustrates that other
lifestyle factors are also involved in increasing risk for CDLs.
There is clear evidence of a relationship between onset of obesity and cancer risk (WHO/FAO,
2002:35). Overweight and obesity are associated with an increased risk of type 2 DM, especially with
central adiposity (Goedecke et al., 2007:69; WHO/FAO, 2002:73). Obesity-related type-2 DM among
black South-Africans presents with insulinopenia, leading to the metabolic syndrome (Van der Merwe
& Pepper, 2006:5). Obesity is associated with hypertension in the black South African population
(Seedat, 2007:318; Vorster, 2002:241, Table 1; DoH et al., 2002; 244). Overweight, specifically central
obesity, together with high blood pressure, dyslipidemia, DM and low cardio-respiratory fitness all
increase the risk for CVD (WHO/FAO, 2002:81). The Interheart study found that among black
participants the BMI was significantly higher (p=0.003) in the MI cases as opposed to controls (Table
2.21)(Steyn, 2005b:251, Table 18.1). The risk for CHD also increases with obesity, with a relative risk
of approximately 2,8 for men and 3,4 for women (Goedecke et al., 2005:69).
The direct costs of obesity in South Africa, may be as high as 6,8% of healthcare costs, and indirect
and intangible costs should also be considered (Steyn et al., 2006:21). Because the risk for CDLs rise
continuously with an increase in weight, the prevention of obesity can also lead to the prevention of
CDLs (WHO/FAO, 2002:61).
When looking at the difference in prevalence of overweight and obesity in the current study between
rural and urban men; and between rural and urban women, there is more similarity than difference.
Urban women are slightly more overweight and slightly less obese than rural women.
Table 5.14 Comparison of median BMI values
Men Women Rural Urban Men Women All
Rural Urban Rural Urban
N 163 100 390 319 553 419 263 709 972
Current study 20.2 19.7 28.0 27.9 25.7 25.9 20.0 28.0 25.8
VIGHOR (mean) - 26.9 - 25.4
FYFS (mean) >24 yrs old 22.8
The current study‘s median BMI values were lower than the values from the VIGHOR study‘s findings
(mean BMI)(Table 5.14) (Oosthuizen et al., 1998:1213), whereas the FYFS‘s mean findings were
lower (Table 5.15)(Steyn et al., 2000:149, Table III). The WHO‘s Comparative Risk Assessment Study
estimated that an increase in BMI >21 kg/m2 in adults older than thirty years, was associated with type
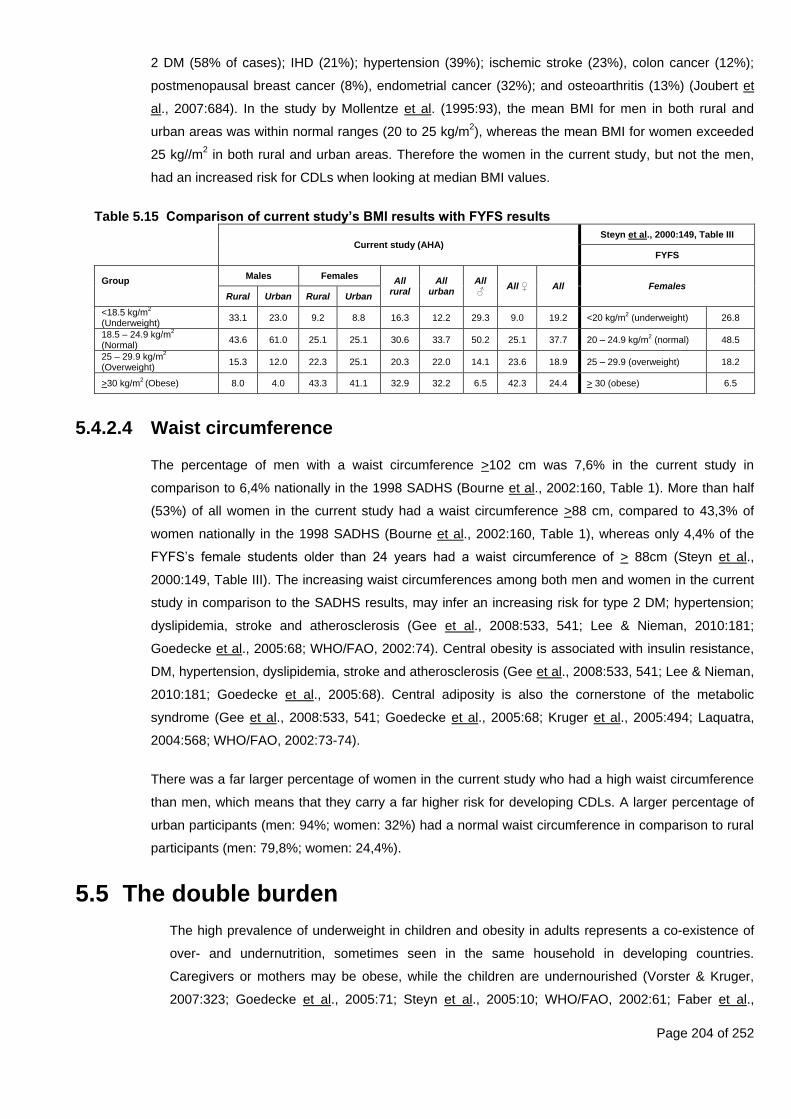
Page 204 of 252
2 DM (58% of cases); IHD (21%); hypertension (39%); ischemic stroke (23%), colon cancer (12%);
postmenopausal breast cancer (8%), endometrial cancer (32%); and osteoarthritis (13%) (Joubert et
al., 2007:684). In the study by Mollentze et al. (1995:93), the mean BMI for men in both rural and
urban areas was within normal ranges (20 to 25 kg/m2), whereas the mean BMI for women exceeded
25 kg//m2 in both rural and urban areas. Therefore the women in the current study, but not the men,
had an increased risk for CDLs when looking at median BMI values.
Table 5.15 Comparison of current study’s BMI results with FYFS results
Current study (AHA)
Steyn et al., 2000:149, Table III
FYFS
Group
Males Females All
rural All
urban All ♂
All ♀ All Females Rural Urban Rural Urban
<18.5 kg/m2
(Underweight) 33.1 23.0 9.2 8.8 16.3 12.2 29.3 9.0 19.2 <20 kg/m
2 (underweight) 26.8
18.5 – 24.9 kg/m2
(Normal) 43.6 61.0 25.1 25.1 30.6 33.7 50.2 25.1 37.7 20 – 24.9 kg/m
2 (normal) 48.5
25 – 29.9 kg/m2
(Overweight) 15.3 12.0 22.3 25.1 20.3 22.0 14.1 23.6 18.9 25 – 29.9 (overweight) 18.2
>30 kg/m2 (Obese) 8.0 4.0 43.3 41.1 32.9 32.2 6.5 42.3 24.4 > 30 (obese) 6.5
5.4.2.4 Waist circumference
The percentage of men with a waist circumference >102 cm was 7,6% in the current study in
comparison to 6,4% nationally in the 1998 SADHS (Bourne et al., 2002:160, Table 1). More than half
(53%) of all women in the current study had a waist circumference >88 cm, compared to 43,3% of
women nationally in the 1998 SADHS (Bourne et al., 2002:160, Table 1), whereas only 4,4% of the
FYFS‘s female students older than 24 years had a waist circumference of > 88cm (Steyn et al.,
2000:149, Table III). The increasing waist circumferences among both men and women in the current
study in comparison to the SADHS results, may infer an increasing risk for type 2 DM; hypertension;
dyslipidemia, stroke and atherosclerosis (Gee et al., 2008:533, 541; Lee & Nieman, 2010:181;
Goedecke et al., 2005:68; WHO/FAO, 2002:74). Central obesity is associated with insulin resistance,
DM, hypertension, dyslipidemia, stroke and atherosclerosis (Gee et al., 2008:533, 541; Lee & Nieman,
2010:181; Goedecke et al., 2005:68). Central adiposity is also the cornerstone of the metabolic
syndrome (Gee et al., 2008:533, 541; Goedecke et al., 2005:68; Kruger et al., 2005:494; Laquatra,
2004:568; WHO/FAO, 2002:73-74).
There was a far larger percentage of women in the current study who had a high waist circumference
than men, which means that they carry a far higher risk for developing CDLs. A larger percentage of
urban participants (men: 94%; women: 32%) had a normal waist circumference in comparison to rural
participants (men: 79,8%; women: 24,4%).
5.5 The double burden
The high prevalence of underweight in children and obesity in adults represents a co-existence of
over- and undernutrition, sometimes seen in the same household in developing countries.
Caregivers or mothers may be obese, while the children are undernourished (Vorster & Kruger,
2007:323; Goedecke et al., 2005:71; Steyn et al., 2005:10; WHO/FAO, 2002:61; Faber et al.,
Page 205 of 252
2001:410). This phenomenon includes the double burden of undernutrition-related infections and
the overnutrition-related CDLs (Vorster & Kruger, 2007:323). The co-existence of undernutrition
and obesity among the poor places a burden on social-, economic- and health care systems
(Sawaya & Roberts, 2003:online).
5.5.1 Underweight
The double burden was present, since 66,7% of rural underweight children and 66,7% of urban
underweight children lived with an overweight/obese caregiver. A high prevalence of overweight
and obesity amongst caregivers was also found in the same household as underweight or stunted
children in the Lebowa study (Steyn et al., 1995:53-59), as well in the study conducted by Faber et
al. (2001:410) in KwaZulu-Natal.
In comparison, about one-third (31%) of rural underweight children in the Limpopo province were
found to live with an overweight or obese caregiver, and nearly fifty percent of caregivers of stunted
or underweight children in rural North West province were overweight or obese (Steyn et al.,
2003:10).
5.5.2 Stunted
Again, the double burden was present, since 63,2% of rural stunted children and 71,9% of urban
stunted children lived with an overweight/obese caregiver.
In previous studies, the relative risk for overweight if stunted, was found to be 2,6 among South
African children (Steyn et al., 2005:12; Jinabhai et al., 2003:online; Faber et al., 2001:410; Popkin
et al., 1996:3012). A high prevalence of overweight and obesity amongst caregivers was also found
in other studies in the same household as underweight or stunted children (Goedecke et al.,
2006:71; Sawaya et al., 2003:170; Faber et al., 2001:410). In the rural Northwest Province, nearly
fifty percent of overweight mothers and/or caregivers lived with a stunted or underweight child
(Steyn et al., 2005:10).
Stunted South African children are often found in the same households with overweight or obese
caregivers, especially in rural areas (Vorster & Kruger, 2007:323; Goedecke et al., 2005:71; Steyn
et al., 2005:5, 10; WHO/FAO, 2002:61; Faber et al., 2001:410).
5.5.3 Wasted
All of the wasted rural children and 75% of wasted urban children resided with overweight/obese
caregivers. The high prevalence of wasting in these households can be indicative of a high level of
food insecurity among children in these households.
Page 206 of 252
Chapter 6 – Conclusions and Recommendations
6.1 Introduction
The main aim of this study was to investigate the diet and anthropometric status of adults (between 25 and
64 years old) and pre-school children (zero to seven years old) in rural and urban areas in order to
determine whether a nutrition transition and double burden of undernutrition in children and overweight/
obesity in mothers or caretakers was present.
6.2 Conclusions
The nutrition transition in South Africa entails a shift from a traditional diet consisting of >60% to 65% of
total energy from carbohydrates and <50% to 55% of total energy from fat to a Westernized diet consisting
of <50 to 55% total energy from carbohydrates and >30% to 35% of total energy from fat (Joubert et al.,
2007:684; Steyn et al., 2006:13,14; Steyn, 2005a:36; Bourne et al., 2002:157,159; WHO/FAO, 2002:19).
As a traditional eating pattern is exchanged for a more Western eating pattern, diets usually become
denser in energy, with fewer starchy foods and more fats; oils; sugars; and additives, as well as alcoholic
drinks being ingested. At the same time, physical inactivity increases, with the need for energy decreasing
and the rate of overweight and obesity increasing (WRCF/AICR, 2007:4). The traditional diet is associated
with a low prevalence of degenerative diseases, whereas the Western diet is associated with an increased
risk for developing CDLs (Bourne et al., 2002:157).
A nutrition transition was identified in the study population of both the rural and urban areas among children
and adults. This was manifested in the dietary intake and anthropometric profiles of the samples. As found
by a separate AHA sub-study, levels of physical activity differed significantly between urban and rural
participants, indicating that a physical activity transition was not yet evident in rural populations (not
published). As far as diet (of children and adults) and anthropometry (of adults) is concerned, a nutrition
transition was confirmed in both rural and urban populations, with rural participants (especially women)
often having a higher risk of CDLs than their urban counterparts. Although a number of factors could have
played a role in this finding (older median age of rural participants and the possibility that rural participants
who already had CDL were more likely to participate in the study due to the free medical examination that
was performed), the most likely explanation would be the higher prevalence of HIV found in the urban
sample (41%) compared to the rural sample (17%) (separate unpublished sub-study) and its impact on
anthropometric variables.
6.2.1 Dietary intake
The intake of food groups, and the frequent intake of certain food items, reflect the presence of a nutrition
transition in both rural and urban communities included in this study. Energy intake and macronutrient
distribution in the diets were within prudent dietary guidelines.
Page 207 of 252
6.2.1.1 Food groups
Dietary intake, as reflected by the intake of adequate numbers of foods from the different food groups,
of both children and adults was mostly inadequate. According to this reference, the nutrition transition
was more pronounced in the rural population, with both rural adults and children consuming above
their daily recommended servings of fats and oils; sweets and sugar; and meat and meat products and
eating fewer fruit and vegetables than their urban counterparts. However, keep in mind that results
were only from a single 24 hour recall of reported usual intake.
On the other hand, urban adults and children tended to consume above their daily recommended
servings of bread and cereals more often than their rural counterparts.
The intake of legumes and soy was low in both rural and urban participants.
6.2.1.2 Frequent intake of food items
In most instances sugar was the most frequently consumed food item, especially among rural
participants. Cooked porridge was the most frequently consumed starchy food, followed by bread.
Tea was the most frequently consumed fluid. Sugar-sweetened beverages (cool drink) were also
frequently consumed, especially by children. Men consumed coffee more frequently than the women
and children.
Fruit and vegetables were consumed frequently, but fruit more so than vegetables. Fruit and vegetable
intakes were, however, mostly below the recommended number of servings per day as evidenced by
the intake of foods from the different food groups.
Salt and stock powders were used frequently during food preparation and chips and crisps were
consumed frequently by children, but adults consumed them less frequently. Sweets were consumed
frequently by urban women, as well as rural and urban boys. Margarine, oil and fat were frequently
added during food preparation, and margarine was frequently spread onto bread. Full cream milk was
the most frequently consumed dairy product.
Alcohol was consumed excessively by five percent of urban men, while rural men consumed alcohol
less frequently.
6.2.1.3 Macronutrients
The average total energy intake of rural adults and children was higher than that of urban adults and
children. In addition, the average percentage energy from protein and from fat was higher in rural
adults and children than it was in their urban counterparts.
Children younger than two years consumed sufficient energy if compared to the DRI for children 7-12
months, but not when compared to the DRI for 1-to-3 year olds (Food & Nutrition Board et al.,
2002:1324). The current study‘s rural children met the DRI for 1-to-3 year olds, but the urban children
did not.
Page 208 of 252
Children older than two years consumed sufficient energy if the DRIs for 1-3 years old were used, but
were insufficient if DRIs for 4-8 years old were used (Food & Nutrition Board et al., 2002:1324). The
sample sizes of children in this study were too small to divide children who were two years and older
into smaller groups (e.g. one-to-three years old and four-to-eight years old).
Even though adult participants reported consuming less than the DRIs for energy, a large portion of
participants, especially women, were overweight or obese.
The percentages of energy from macronutrients for carbohydrates fell within the recommended 45% to
65% for all groups. However, adults and rural children older than two years old consumed fat within
the recommendations (25% to 35% for children; 20% to 35% for adults). The remaining participants
consumed less than the recommended percentage range. Average percentage energy intake from
protein was similar in urban and rural areas, and fell within recommendations for all groups.
Despite the relatively prudent energy intake and macronutrient distribution, the intake of foods from
different food groups and the intake of specific foods (as determined by the FFQ) of a large
percentage of both the rural and urban samples did not fall within recommendations for prudent intake.
6.2.1.4 Breastfeeding
The majority of babies were not breastfed at the time of the study. However, the majority of rural
children (90,9%) were previously breastfed as opposed to only 37,5% of urban children.
The median period of exclusive breastfeeding was around four months for both rural and urban
children, which was lower than the WHO recommendation of six months.
The median age for introduction of solid foods was six months in rural participants and four months in
urban participants. The rural group thus generally waited till the recommended six months to introduce
solid foods, but the urban children were weaned onto solids earlier than recommended.
6.2.2 Anthropometry
The numbers of adults included in the study were large, but due to the small numbers of children included
in this sample (rural: n=60; urban: n=116) it was no possible to draw representative conclusions from the
results of the children.
6.2.2.1 Undernutrition
Undernutrition can have long-lasting consequences on children‘s health, delay motor development, as
well as impair cognitive function and school performance. In adults, it reduces work capacity and
influences reproductive health (Victora et al., 2008:343,345; Nannan et al., 2007:733; Vorster &
Kruger, 2007:322).
Keeping in mind that the impact of HIV status on nutritional status was not determined as part of the
study, undernutrition was present in a large percentage of children and adult men, as reflected by the
large number of stunted or wasted children; and underweight adults and children. In general, there
was a larger percentage of boys that were underweight, stunted and wasted than girls. This finding is
Page 209 of 252
supported by the results of other studies who have also found the prevalence of undernutrition to be
higher in boys than girls. A higher prevalence of stunting in boys has occasionally been reported in
Sub-Saharan Africa. In ten countries (including Cameroon, Ghana, Kenya, Malawi, Namibia, Nigeria,
Tanzania, Uganda, Zambia and Zimbabwe) boys younger than five years were more likely to become
stunted than girls. This sex difference was more pronounced in lower socio-economic groups, and
might suggest that boys are more vulnerable to illness (Wamani et al., 2007:online). Epidemiological
studies have also previously shown that morbidity and mortality was consistently higher in boys in
early life, but the underlying mechanisms are unclear (Wamani et al., 2007:online).
When comparing the rural children to urban children, rural children were more often underweight (rural
31,5% vs. urban 17,2%) than urban children, but urban children were more often stunted than rural
children (rural 38,3% vs. urban 43,9%). Prevalence of wasting was similar in rural and urban children
(rural 11,7% vs. urban 10,1%). These findings are in contrast to the NFCS that have reported that rural
children tend to be more chronically malnourished and stunted than urban children (Labadarios et al.,
2005:536, Table 1; Steyn et al., 2005:7, Table 2). As seen in the adult sample, the current study did
not support the notion that rural communities in developing countries are worse off than urban
communities.
In comparison to the NFCS‘s national findings, a larger percentage of children in the current study
were stunted, underweight and wasted. The percentages of overweight children were similar to that
reported in the NFCS (the very small number of overweight children is acknowledged). In comparison
to the NFCS‘s findings for the Free State, the children in the current study tended to be more
malnourished, which may indicate that in approximately ten years‘ time the nutritional status of
children in the Free State may have deteriorated. It is also possible that mothers were more likely to
bring their children to participate in the study if they were ill (a free medical examination was
performed), which could have had an impact on the results related to growth status that were
obtained.
(i) Stunting
Stunting, is a sign of chronic undernutrition and the result of an overall poor diet (The Save the
Children Fund (SCF), 2012: 2). Stunting, as reflected by a low height-for-age, can have a significant
effect on a child‘s health in both the short and the long-term (SCF, 2012:xiii; Victora et al., 2008:340).
If a child was stunted in the first 1000 days of life, the damage done is largely irreversible, even if the
child‘s diet improves after two years of age (SCF, 2012:xiii; Victora et al., 2008:340).
About half of all boys (47,6%) and a third of all girls (34,7%) were either moderately or severely
stunted. Moderate stunting was present in about one in four urban children and one in five rural
children. A further twenty percent of rural children and 15,5% of urban children were severely
stunted. This finding is in contrast to the NFCS that have reported that rural children tend to be more
chronically malnourished and stunted than urban children (Labadarios et al., 2005:536, Table 1;
Steyn et al., 2005:7, Table 2).
Page 210 of 252
(ii) Wasting
Wasting is a sign of acute and severe undernutrition and is often the result of a sudden lack of food
or illness in an already malnourished child (SCF, 2012:2). Wasting is reflected by a low weight-for-
height.
A similar percentage (about 7%) of both rural and urban children were moderately wasted. There
was also a similar percentage of severely wasted children in both rural (4%) and urban (3%) areas.
Slightly more boys (11,6%) than girls (9,4%) were either moderately or severely wasted.
The results for rural and urban children in the current study are more or less the same, whereas
there were more wasted children in the rural areas of the NFCS than in the urban areas (Labadarios
et al., 2005:536, Table 1; Steyn et al., 2005:9, Table 4, Labadarios & Nel, 2000:194, Table 4.2;
Labadarios & Nel, 2000:202, Table 4.14). The current study‘s rural values (11,7%) are about four
percent higher than those reported in the NFCS (6,2%). The urban values (10,1%) are about five
times higher than the NFCS‘s values (2,8%).
(iii) Underweight
Underweight individuals do not consume enough energy, in relation to their energy expenditure, to
maintain a healthy body weight (Food & Nutrition Board et al., 2002:111). In children underweight is
reflected by a low weight-for-age, and in adults by a BMI<18,5 kg/m2. Undernourished women have
a higher risk of having low birth weight babies, which increases both mortality risk and the risk of
developing CDLs in adulthood. This problem can perpetuate even further into the next generation
(Victora et al., 2008:346).
About one in four rural children and one in ten urban children were moderately underweight. Another
5% of rural children and 7% of urban children were severely underweight.
In the current study, 33,1% of rural men (one in every three rural men) and 23% of urban men (one
in every four urban men) were underweight as opposed to 9,2% of rural women and 8,8% of urban
women (almost one in every ten women). Although the results pertaining to physical activity were not
included in the initial objectives of this study, the higher percentage of underweight rural men can be
explained by the fact that a significantly larger percentage of rural men (rural: 42,1%; urban: 12,6%)
were classified as very active (p<0.0001). Since a large number of rural men are farm labourers, the
high percentage of underweight in rural men may be due to the high physical activity required by the
occupation. In the case of urban men, the higher prevalence of HIV-infection and alcohol use in
urban compared to rural participants may be responsible for the large percentage of underweight
urban men.
6.2.2.2 Overnutrition
Overnutrition, as reflected by overweight and obesity, was present in a large percentage of both rural
and urban women.

Page 211 of 252
(i) Overweight and obesity
In overweight individuals, energy intakes are higher than energy expenditures (Food & Nutrition
Board et al., 2002:111). On the one hand, childhood obesity is a strong predictor of obesity in
adulthood (Joubert et al., 2007:688; WCRF/AICR, 2007:xvii); and on the other hand, undernutrition in
children also predisposes them to overweight and obesity as adults. Overweight and obesity has far
reaching consequences, both in childhood and in adulthood, including an increased risk of
developing CDLs (Goedecke et al., 2005:70; WHO/FAO, 2002:37). In children, the prevalence of
overweight and obesity (reflected by a high weight-for-age and high BMI-for-age) was very low in this
sample with only four percent of both boys and girls in the urban area being overweight or obese. A
high BMI reflected overweight or obesity in adulthood.
Almost two-thirds of both rural and urban women were either overweight or obese, as opposed to
less than one in five rural or urban men. The MRC‘s Burden of Disease study, the 1998 SADHS and
the THUSA study all found that a higher percentage of women than men were overweight or obese
(Joubert et al., 2007:638, 685; Goedecke et al., 2005:65; Vorster, 2002:241, Table 2). The high
percentage of participants that ate above recommended number of servings of fats and oils; sweets
and sugar and meat and meat products can possibly explain this finding.
(ii) Central adiposity
Central obesity, as reflected by a high waist circumference, is associated with insulin resistance, DM,
hypertension, dyslipidemia, stroke and atherosclerosis (Gee et al., 2008:533, 541; Lee & Nieman,
2010:181; Goedecke et al., 2005:68). Central adiposity is also the cornerstone of the metabolic
syndrome (Gee et al., 2008:533, 541; Goedecke et al., 2005:68; Kruger et al., 2005:494; Laquatra,
2004:568; WHO/FAO, 2002:73-74). Increasing obesity due to an inactive lifestyle and a Westernized
diet can contribute to the increasing prevalence of CDLs that was previously identified in the
participants of this study (Van Zyl et al., 2012:online). Compared to the urban participants, rural
participants had a higher prevalence of risk factors for metabolic syndrome (Van Zyl et al.,
2012:online). The results related to diet and anthropometry obtained in this study can explain these
findings.
As expected, a higher percentage of both rural and urban women than men had a waist
circumference that placed them at risk for CDLs (central adiposity was present in two-thirds of both
rural and urban women). This corresponded with the high percentage of women that were classified
as either overweight or obese according to BMI. One in five rural men also had a high risk waist
circumference which confirms a nutrition transition. Only six percent of urban men had central
adiposity, which may be related to the higher occurrence of HIV infection and alcohol abuse in this
group, compared to the rural men.
6.2.3 The double burden
The high prevalence of underweight in children and obesity in adults points to a co-existence of over- and
undernutrition (i.e. the double burden), placing the children at a higher risk for CDLs in later life. This
phenomenon has been reported in various other studies (Joubert et al., 2007:688; Vorster & Kruger,
Page 212 of 252
2007:323; Goedecke et al., 2005:71; Steyn et al., 2005:10; WHO/FAO, 2002:61; Faber et al., 2001:410).
Caregivers or mothers may be obese, while the children are undernourished. Where there is a high
prevalence of obesity among black women, a high prevalence of stunting in children is found, particularly
in rural areas (Steyn et al., 2005:5). The co-existence of undernutrition and obesity among the poor
places a burden on social-, economic- and health care systems (Sawaya & Roberts, 2003:online).
Cameron (2003:38) states that stunting in infancy and childhood is linked to later obesity. Stunting itself
confers an increased risk for overweight in children (Levitt et al., 2005:59). The association between short
stature and a higher risk of CDL has been detailed earlier in this dissertation.
A double burden of overnutrition and undernutrition in the same household was confirmed in the current
study. Two-thirds of both rural and urban children who were underweight resided with an overweight or
obese caregiver. About two-third of rural- and 72% of urban children who were stunted resided with an
overweight or obese caregiver. All the wasted rural children and three-quarters of the urban wasted
children resided with an overweight or obese caregiver.The large percentage of stunted children in the
study is of concern, since stunted children have a higher risk of being overweight or obese, either in
childhood and/or adulthood (Goedecke et al., 2005:71; Mendez et al., 2005:720; Steyn et al., 2006:20;
Faber et al., 2001:410; Popkin et al., 1996:3012).
6.3 Recommendations
To prevent CDLs in adulthood, it is critical that undernutrition in childhood be either prevented or
addressed. In addition, relevant interventions to address existing overweight and obesity in adults also
need to be emphasized.
To prevent or address the double burden of disease, the following challenges should receive attention:
Undernutrition in children, particularly stunting; and
Overweight and obesity in adults.
SCF (2012:77) mentions six steps to achieving nutrition transformation, which include:
Make malnutrition visible;
Invest in direct interventions;
Fill the health worker gap;
Protect families from poverty;
Harness agriculture to help tackle malnutrition; and
Galvanize political leadership.
With this in mind the following practical recommendations are made:
Page 213 of 252
6.3.1 Healthier lifestyles
Because dietary intake among both rural and urban participants reflects the nutrition transition,
nutrition interventions (emphasizing healthy food choices) should be implemented in both rural and
urban areas.
Broadly, the interventions to address food intake patterns should entail reducing consumption of:
saturated fats;
unhealthy snack foods;
sugar-sweetened beverages;
salt; and
alcohol;
and increasing consumption of:
fruits and vegetables; and
legumes.
In an effort to encourage healthier food choices, the SAFBDG, as they are currently available to health
care workers in a printed format by the Department of Health, should be fundamental to nutrition
education of all members of the community. Nutrition education programmes need to be implemented
in community settings as part of the FSRDPP and the MUCPP, both of which are ideal forums through
which the communities included in this study can be reached.
There are various practical recommendations that can assist in making communities aware of healthy
lifestyle options:
Printed media, e.g. the pamphlets and brochures that have been developed by organisations such
as the Sugar Association of South Africa, which discuss the FBDG and specifically focus on how
healthy eating can be made practical and relevant in the treatment or prevention of obesity,
diabetes, hypertension and HIV/AIDS. These aids can be used in the clinic setting as well as by
community health workers that do home visits.
Health care workers can be trained on how to make scientific information understandable and
easier to apply in communities where a large percentage of members are often illiterate. This can
be done by giving talks in the clinics; placing posters with the key messages in visible areas; and
also distributing the pamphlets in homes where a specific problem has been identified. Community
health workers and community service dieticians can be of immense value in this regard. These
dieticians can also play an important role in developing printed media that bring the message
across in laymen‘s terms and can be used as a reminder of the guidelines that have been given
during nutrition education.
Planting of fruit trees and vegetable gardens that can improve the intake of fruit and vegetables
can make a significant contribution to improving household food security. In addition, the sale of
vegetables from community gardens can have a unique income generating potential. Dieticians
Page 214 of 252
should collaborate with staff from other sectors, such as agriculture, to make sure that challenges
to planting gardens (e.g. water shortages) are addressed and that communities are taught how to
successfully plant gardens taking these challenges into account. Provision of vegetable seed, and
education on how to make a garden with limited space, are important considerations. Children who
are involved with planting and maintaining a vegetable garden will also be more likely to eat these
vegetables.
Other health care professionals, such as physiotherapists and biokineticists can also be recruited
to become involved at clinics and in the workplace to counsel on healthy and safe exercises,
especially to obese adults who also struggle with comorbidities such as diabetes and hypertension.
Groups can be convened on specific days where community members can attend a thirty minute
training session, to encourage sustainability.
Special focus should be placed on the importance of health care workers setting a good example
to the community. Health care workers should be encouraged to be role models, in order to more
successfully convey the ideal lifestyle and relevant information to patients and people in the
communities in a culturally acceptable way (teach by example
6.3.2 Stopping the vicious circle of undernutrition
Since the double burden of disease has been confirmed in the current study group, action is required
to address and prevent stunting in these and other rural and urban communities. According to Vorster
and Kruger (2007:322), nutrition- and other interventions that address poverty-related causes of
undernutrition have the potential to improve child growth and development, especially if instituted in
the first three years of life. According to the WHO/FAO (2002:68), nutrition programmes designed to
control or prevent undernutrition, need to assess stature in combination with weight to prevent
providing excess energy to children with a low weight-for-age but a normal weight-for-height. Global
targets, specifically measuring stunting, should be implemented to ensure that nutrition is included in
major political processes – linking directly to the Millennium Development Goals, and specifically the
forty percent reduction in childhood stunting by 2022 (proposed by the WHO) (Rehman et al.,
2009:online). In this regard, regular and reliable growth monitoring in the community setting needs to
receive attention.
Nutrition as a basic human right, is reflected by the Constitution (Nannan et al., 2007:738) and
addressing undernutrition successfully is essential in meeting the Millennium Development Goals.
Ideally, the immediate, underlying and basic causes of undernutrition should all be addressed, but in
reality this is not so easy to do in a fragmented manner and will require a multidisciplinary and inter-
sectoral approach. One of the WHO's millennium development goals is to halve (from 1990 levels) the
proportion of children younger than five who are stunted, wasted or underweight by 2015 (Rehman et
al., 2009:online). The first Millennium Development Goal aims to reduce poverty and hunger between
1990 and 2015 (Nannan et al., 2007:733).
The 13 low-cost interventions to reduce stunting in children by 36% and child mortality by 25%, as set
out by the SCF (2012:xiv), can go a long way to addressing undernutrition. These interventions

Page 215 of 252
include: interventions to encourage change in behaviour to improve nutrition; micronutrient
interventions; and therapeutic feeding interventions, e.g. ready-to-use foods (RUTFs) for severely
malnourished children (SCF, 2012:20). The interventions to encourage change in behaviour to
improve nutrition include: promoting breastfeeding for newborns at birth; promoting exclusive
breastfeeding; promoting complementary feeding in addition to continued breastfeeding from six to 24
months of age; and encouraging better hygiene (e.g. encouraging hand washing). Micronutrient
interventions include: increasing supplementation of zinc in infants and children; giving zinc to manage
diarrhea; providing vitamin A either via fortification or supplementation; and iodization of salt.
Micronutrient interventions in pregnant and breastfeeding mothers include: implementing multiple
micronutrient supplementation by way of iodized salt; iron, folate and calcium supplements (SCF,
2012:20).
6.3.2.1 Getting the message on nutrition out
Children can also be provided with information on healthy living by:
Incorporating topics on nutrition and exercise into school curricula, including basic knowledge of
good nutrition, as well as how it can be incorporated into the family‘s nutrition practices and limited
resources. The current emphasis on nutrients needs to be replaced with a more ―food-based‖
approach that is easier to implement.
Nutrition week, which is held annually for a week, raises public awareness of nutrition and provides a
good opportunity to get the message on nutrition across to everyone in communities. Information,
especially on child nutrition, can be disseminated by various means:
Posters with matching pamphlets containing the necessary information, which children and parents
can take home. These can be placed in visible areas, such as entrances to shopping malls,
hospitals, government offices, schools, etc.
Thinking more broadly:
Emphasizing the message in the media, e.g. a government funded broadcasting campaign on
television and radio to advertise and endorse the FBDG. Briefly focusing on each FBDG at different
time slots can also be an option.
Dieticians, community members or celebrities that are role models can become spokespersons in
the media. These persons can promote the FBDG in the media
Articles discussing the FBDG with interesting recipes related to the dietary guidelines can be
published in various popular magazines and newspapers. Competitions can be arranged to
encourage community participation.
Dieticians employed by the Department of Health, community service dieticians and community health
workers can all play an important role in ensuring that the Integrated Nutrition Programme is
implemented to its full potential by supporting the following:

Page 216 of 252
The Nutrition Supplementation programme.
Growth monitoring.
Vitamin A supplementation.
School feeding schemes.
Vegetable gardens.
Promotion of breastfeeding and support of the Breastfeeding Hospital Initiative (BFHI), as well as
the introduction of complementary feeding and continued breastfeeding after six months of age.
Food fortification. Fortified food items should be affordable (either in the private or public sector);
accessible and culturally acceptable.
Provision of RUTF-type supplements to severely malnourished children.
By empowering women in communities, the health of especially children can be improved:
Training should be provided to social workers and community service dieticians (among others) on
how to teach women (especially in female-headed households) how to budget and spend
available resources wisely.
Information should also be provided to these women on what economical food choices entail and
how they can make the most of the little money and food sources they have.
Support and training of community health workers by nutrition experts (e.g. dieticians) in
implementation and maintenance of nutrition programmes are important. Qualified dieticians who
have the knowledge and expertise should be appointed in management positions where an in-
depth knowledge of nutrition is required (e.g. as INP managers).
6.3.2.2 Government involvement
Government should be involved in making nutrition a priority in the country:
Nutrition should be given the priority that it deserves for interventions to be successful (SCF,
2012:62). If governments support a programme, it will be much more likely to have the desired
impact.
The necessary support should be provided to other sectors that also support nutrition, such as
agriculture.
The viability of Social Protection Programmes can be investigated. In such programmes persons
receiving support are expected to perform certain tasks in the community for a certain amount of
hours in the month in exchange for food or money.
Nutrition programmes, should be monitored and evaluated regularly to determine the impact of
these interventions.
Page 217 of 252
Comprehensive nutrition screening and growth monitoring programmes need to be implemented to
ensure the timely identification of problems and necessary nutrition support.
Financial support of nutrition interventions should be assured, depending on the evidence-based
impact of these programmes.
Sustainable employment opportunities need to be supported by government in an effort to address
the basic poverty-related causes of malnutrition.
6.4 Suggestions for further research
Based on the findings of this study, it is recommended that the associations between diet and
anthropometry with other variables such as HIV/AIDS, levels of physical activity, and alcohol use be further
investigated in the AHA FS dataset.
Page 218 of 252
Summary
Stunting in childhood predisposes to obesity, increasing the risk for chronic diseases of lifestyle in adulthood (i.e.
the double burden of disease). To plan relevant nutrition interventions, the burden of disease, and lifestyle factors
that contribute to these, need to be determined. The aim of this sub-study of the Assuring Health for All in the Free
State (AHA FS) study was to gain insight into the dietary intake and anthropometric nutritional status of pre-school
children and adults aged 25 to 64 years in the rural and urban Free State. Rural areas included Trompsburg,
Philippolis and Springfontein. Urban areas included communities located around the Mangaung University
Community Partnership Program (MUCPP) Clinic.
Dietary intake was measured in 60 rural- and 116 urban children; and 553 rural- and 419 urban adults using a 24-
hour recall of reported usual intake and qualitative food frequency questionnaire. Intake of foods was compared
with the recommendations of the Food Guide Pyramid and categorised as above, below or within
recommendations. Intakes of energy and macronutrients were estimated from the number of foods eaten from each
food group and compared to prudent dietary guidelines. Anthropometric data was collected using standard
measuring techniques and categorised using World Health Organization (WHO) standards.
At the time that the study was conducted, about one-third (31,24%) of rural children and 40,7% of urban children
were breastfed. A significantly larger percentage (90,9%) of rural participants (95% confidence interval (CI) [20,0;
69,8]) were previously breastfed, compared to 37,5% of urban participants.
Rural adults and children consumed above daily recommended servings of fats and oils; sweets and sugar and
meat and meat products and ate fewer fruit and vegetables than their urban counterparts. On the other hand, urban
adults and children consumed bread and cereals above their daily recommended servings more often than their
rural counterparts. The intake of legumes and soy was low in both rural and urban participants.
Sugar was the most frequently consumed food item, especially among rural participants. Cooked porridge was the
most frequently consumed starchy food, followed by bread. Tea was the most frequently consumed fluid. Sugar-
sweetened beverages (cool drinks) were also frequently consumed, especially by children. Men consumed coffee
more frequently than women and children. Salt, stock powders, margarine, oil and fat were used frequently during
food preparation and margarine was frequently spread onto bread. Fruit and vegetables were consumed
frequently, but fruit more so than vegetables. Fruit and vegetable intake was, however, mostly below the
recommended number of servings per day. Chips and crisps were consumed frequently by children. Sweets were
consumed frequently by urban women, as well as rural and urban boys. Full cream milk was the most frequently
consumed dairy product. Alcohol was consumed excessively by five percent of urban men.
Mean energy intake was 4254 kJ for rural children younger than two years (56,9% carbohydrates; 17,2% protein;
25,7% fat) and 3292kJ for urban children younger than two years (64,2% carbohydrates; 19,5% protein; 20,1% fat).
The percentage of energy from carbohydrates and protein were within prudent dietary guidelines (carbohydrates
(CHO): 45-65%; protein: 5-20%), while the percentage energy from fat was lower than the recommended 30-40%.
Mean energy intake for rural children older than two years was 5581kJ (57,5% carbohydrates; 16,9% protein;
28,7% fat) and 4220kJ for urban children (65,5% carbohydrates; 17,9% protein; 20,3% fat). As in the younger
children, the percentage of energy from carbohydrates and protein were within prudent dietary guidelines (CHO:
Page 219 of 252
45-65%; protein: 10-30%; fat: 25-35%) except for fat intake which was lower than recommended among urban
participants.
The average energy intake for all men was 8040 kJ (61% carbohydrates; 17,8% protein; and 24,3% fat) and for all
women in the current study was 7243 kJ (61,7% carbohydrates; 17,3% protein and 24,5% fat). Macronutirent
distributions were thus within prudent guidelines (CHO: 45-65%; protein: 10-35%; fat: 20-35%). The energy intake
was below the estimated energy requirements (EER) range of 10143 kJ for sedentary men and 7947 kJ for
sedentary women.
More than half (65,6%) of rural females and two-thirds (66,2%) of urban females were overweight or obese (body-
mass-index (BMI) >25kg/m2). Fewer men were overweight or obese (23,3% rural men and 16% urban men). A
significantly larger percentage of urban than rural men (urban: 61,0%; rural: 43,6%) had a normal BMI (18,5 to 24,9
kg/m2) (p=0.007). A third (33,1%) of rural men and 23% of urban men were underweight (BMI <18,5kg/m
2). Mean
BMI for men was within the normal range at 20 kg/m2. For women mean BMI fell in the overweight range at 28
kg/m2.
Significantly more urban than rural men had a normal waist circumference (<94 cm) (p=0.002) and similarly,
significantly more urban (32%) than rural women (24,4%) had a normal waist circumference (<80 cm) (p=0.03).
Significantly more rural than urban men had a waist circumference >94 cm (p=0.01), placing them at risk for
developing chronic diseases of lifestyle (CDLs). About one-fifth (17,8%) of rural and 19,4% of urban women were at
risk (>80 cm). Significantly more rural women (57,9%) were at high risk of developing CDLs (>88cm) than urban
women (48,6%) (p=0.02). Median waist circumference for rural women was 92 cm (high risk) and for urban women
87cm (at risk). The median waist circumference for rural men was 78,5 cm (normal) and for urban men 76 cm
(normal).
Rural children were more often underweight (weight-for-age <-2 standard deviations (SD))(rural: 31,7%; urban:
17,3%) than urban children. In contrast to what was expected, urban children were more often stunted (height-for-
age <-2SD) than rural children (rural: 38,4%; urban: 44,0%). Prevalence of wasting (weight-for-height <-2SD) was
similar in rural and urban children (rural: 11,9%; urban: 10,1%).
A double burden of undernutrition in children and overweight in caretakers was confirmed in this sample, with
63,2% of stunted- and 66,7% of underweight rural children and 71,9% of stunted- and 66,7% of underweight
children in urban areas living with an overweight/obese caregiver.
Although energy intake and macronutrient composition of the diets were within prudent guidelines, information
related to the types of foods eaten as well as the foods most frequently consumed confirm that a nutrition transition
was present in both urban and rural communities included in this study.
Although not initially included in the objectives of this sub-study, possible reasons for differences in anthropometric
status of rural and urban adult participants include a higher prevalence of human immunodeficiency virus (HIV)-
infection amongst urban participants (41% in urban adults and 17% in rural participants) as well as higher alcohol
consumption in urban men and higher levels of physical activity in rural men. Associations between these variables
need to be investigated further in this dataset.

Page 220 of 252
Relevant and culturally acceptable nutrition interventions aimed at addressing both undernutrition in children and
overweight and obesity in adults need to be implemented in an effort to address the high risk of CDLs as well as
the poor quality of diet identified in this sample.
Page 221 of 252
Opsomming
Groei-inkorting in kinderjare voorbestem hul vir vetsug, wat die risiko vir chroniese leefstylsiektes in volwassenheid
verhoog (d.i. die dubbele las van siekte). Om die toepaslike voedingsintervensies te beplan moet die las van siekte,
en die leefstylfaktore wat daartoe bydra, bepaal word. Die doel van hierdie substudie, wat deel gevorm het van die
―Assuring Health for All in the Free State‖ (AHA FS) studie, was om ‗n insig te kry in die dieetinname en
antropometriese voedingstatus van voorskoolse kinders en volwassenes tussen die ourderdomme van 25 en 64
jaar in landelike en stedelike areas van die Vrystaat. Die landelike areas het bestaan uit Trompsburg, Philippolis en
Springfontein. Die stedelike areas het bestaan uit gemeenskappe rondom die ―Mangaung University Community
Partnership Program‖ (MUCPP) kliniek.
Dieetinname was bepaal vir 60 landelike en 116 stedelike kinders, en 553 landelike en 419 stedelike volwassenes
deur middel van ‗n 24-uur herroep van gewoonlike inname en ‗n kwalitatiewe voedselfrekwensie-vraelys. Inname
van voedsels was met die voedselpiramide vergelyk en gekategoriseer as meer as, minder as, of binne
aanbevelings. Inname van energie en makrovoedingstowwe was bepaal vanaf die aantal voedsels wat ingeneem is
van elke voedselgroep, waarna dit met verstandige (―prudent‖) dieetriglyne vergelyk is. Antropometriese data was
versamel deur middel van standaard meettegnieke en gekatagoriseer volgens die Wêreld Gesonheidsvereniging
(WHO) se standaarde.
Tydens die tydperk van die studie was ongeveer ‗n derde (31,24%) van landelike kinders en 40,7% van stedelike
kinders op borsvoeding. ‗n Betekenisvolle groter persentasie (90,9%) van landelike deelnemers (95%
vertrouensinterval (VI) [20,0; 69,8]) was voorheen geborsvoed, in vergelyking met 37,5% van stedelike
deelnemers.
Oor die algemeen het landelike volwassenes en kinders meer as die aanbevole daaglikse hoeveelhede van vet en
olie; lekkergoed en suiker; en vleis en vleisproduke ingeneem, asook minder vrugte en groente as die stedelike
deelnemers. Daarteenoor het stedelike volwassenes en kinders meer gereeld brood en graanprodukte bo die
daaglikse aanbevole hoeveelhede ingeneem. Die inname van peulgroente en soja was laag in beide landelike en
stedelike deelnemers.
Suiker was die voedselitem wat mees gereeld ingeneem was, veral onder landelike deelnemers. Gekookte pap
was die mees gereelde stapelvoedsel wat ingeneem was, gevolg deur brood. Tee was die mees gereelde vloeistof
wat ingeneem was. Suiker-versoete drankies (koeldranke) was ook gereeld ingeneem, veral deur kinders. Mans
het koffie meer gereeld gedrink in vergelyking met vrouens en kinders. Sout, boeljonpoeiers, margarien, olie en vet
was gereeld in voedselbereiding gebruik en margarien was gereeld op brood gesmeer. Vrugte en groente was
gereeld ingeneem, maar vrugte meer as groente. Vrugte en groente-inname was egeter oor die algemeen minder
as die aanbevole daaglikse hoeveelhede. Skyfies en slap aartappelskyfies was gereeld deur kinders ingeneem.
Landelike en stedelike seuns, sowel as stedelike vroue, het gereeld lekkergoed ingeneem. Volroommelk was die
mees gereelde suiwelproduk wat ingeneem is. Alkohol was oormatig ingeneem deur vyf persent van stedelike
mans.
Gemiddelde energie-inname was 4254 kJ vir landelike kinders jonger as twee jaar (56,9% koolhidrate; 17,2%
proteïen; 25,7% vet) en 3292kJ vir stedelike kinders jonger as twee jaar (64,2% koolhidrate; 19,5% proteïen; 20,1%
vet). Die persentasie energie van koolhidrate en proteïen was binne verstandige dieetriglyne (CHO: 45-65%;
proteïen: 5-20%), terwyl die persentasie energie van vet laer as aanbevelings (30-40%) was.

Page 222 of 252
Gemiddelde energie-inname vir landelike kinders ouer as twee jaar was 5581kJ (57,5% koolhidrate; 16,9%
proteïen; 28,7% vet) en 4220kJ vir stedelike kinders (65,5% koolhidrate; 17,9% proteïen; 20,3% vet). Die
persentasie energie vanaf koolhidrate en proteïen was binne die verstandige dieetriglyne, (koolhidrate (CHO): 45-
65%; proteïen: 10-30%; vet: 25-35%) soos gevind was by kinders jonger as twee jaar. Die vet inname was egter
laer as aanbevelings onder stedelike deelnemers.
Die gemiddelde energie-inname vir alle mans was 8040 kJ (61% koolhidrate; 17,8% proteïen; en 24,3% vet). Vir
vroue in die huidige studie was dit 7243 kJ (61,7% koolhidrate; 17,3% proteïen and 24,5% vet). Die verspreiding
van makrovoedingstowwe was binne verstandige dieetriglyne (CHO: 45-65%; proteïen: 10-35%; vet: 20-35%). Die
energie-inname was minder as die benaderde energiebehoeftes (EER) van 10143 kJ in onaktiewe mans en 7947
kJ in onaktiewe vrouens.
Meer as helfde (65,6%) van landelike vroue en twee derdes (66,2%) van stedelike vroue was oorgewig of vetsugtig
(liggaamsmassaindeks (LMI) >25kg/m2). Minder mans was oorgewig of obees (23,3% landelike mans en 16%
stedelike mans). Daar was ‗n betekenisvolle groter persentasie van stedelike mans as landelike mans (stedelik:
61,0%; landelik: 43,6%) met ‗n normale LMI (18,5 tot 24,9 kg/m2) (p=0.007). ‗n Derde (33,1%) van landelike mans
en 23% van stedelike mans was ondermassa (LMI <18,5kg/m2). Die gemiddelde LMI vir mans (20 kg/m
2) was
binne normale reikwydtes. Vir vroue het die gemiddelde LMI (28 kg/m2) in die oormassa reikwydte geval.
Betekenisvol meer stedelike as landelike mans het ‗n normale middelomtrek gehad (<94 cm) (p=0.002) en
soortgelyk, het betekenisvol meer stedelike (32%) as landelike vroue (24,4%) ‗n normale middelomtrek gehad (<80
cm) (p=0.03). Betekenisvol meer landelike as stedelike mans het ‗n middelomtrek >94 cm gehad (p=0.01), wat hul
geplaas het binne ‗n risiko grens vir die ontwikkeling van chroniese leefstylsiektes. Ongeveer ‗n vyfde (17,8%) van
landelike en 19,4% stedelike vroue was binne die risiko grens (>80 cm). Betekenisvol meer landelike vroue
(57,9%) was in die hoë risiko grens vir die ontwikkeling van chroniese leefstylsiektes (>88cm) as stedelike vroue
(48,6%)(p=0.02). Mediaan middelomtrek vir landelike vroue was 92 cm (hoë risiko) en vir stedelike vroue 87cm
(risiko). Die median middelomtrek vir landelike mans was 78,5 cm (normaal) en vir stedelike mans 76 cm
(normaal).
Landelike kinders was meer gereeld ondermassa (massa-vir-ouderdom <-2 standaardafwykings)(landelik: 31,7%;
stedelik: 17,3%) as stedelike kinders. In kontras tot verwagtinge het stedelike kinders meer gereeld groei-inkorting
(lengte-vir-ouderdom <-2 standaardafwykings) as landelike kinders getoon (landelike: 38,4%; stedelike: 44,0%).
Die voorkomsyfer van wegkwyning (massa-vir-lengte <-2 standaardafwykings) was soortgelyk in landelike en
stedelike kinders (landelik: 11,9%; stedelik: 10,1%).
‗n Dubbele las van ondermassa in kinders en oormassa in versorgers was bevestig in hierdie studiegroep, met
63,2% van groei-ingekorte landelike kinders en 66,7% van ondermassa landelike kinders, sowel as 71,9% van
groei-ingekorte stedelike kinders en 66,7% van ondermassa stedelike kinders wat woonagtig was saam met ‗n
oormassa of vetsugtige versorger.
Alhoewel energie-inname en makrovoedingstof-samestellings van die diëte binne verstandige dieetriglyne geval
het, het inligting verwant aan die tipes voedsels wat ingeneem was, asook die voedsels wat mees gereeld
ingeneem was, die voedingsoorgang (―nutrition transition‖) bevestig in beide stedelike en landelike gemeenskappe
wat in hierdie studie ingesluit was.

Page 223 of 252
Alhoewel moontlike oorsake nie oorspronklik ingesluit was in die doelwitte van hierdie substudie nie, kan verskille
in antropometriese status van landelike en stedelike volwassenes verwant wees aan die hoë voorkomsyfer van
HIV-infeksie onder stedelike deelnemers (41% in stedelike volwassenes en 17% in landelike volwassenes), asook
‗n hoër alkoholinname in stedelike mans en hoër vlakke van fisiese aktiwiteit in landelike mans. Verwantskappe
tussen hierdie veranderlikes moet verder in hierdie datastel ondersoek word.
Toepaslike en kultureel aanvaarbare voedingsintervensies wat gemik is daarop om beide ondermassa in kinders
en oormassa en obesiteit in volwassenes aan te spreek, moet geïmplementeer word in ‗n poging om die hoë risiko
van chroniese leefstylsiekstes, sowel as die swak kwaliteit van die dieet wat in hierdie studiegroep geïdentifiseer is,
aan te spreek.
Page 224 of 252
References
American Dietetics Association (ADA). 2000. Manual of clinical dietetics. 6th edition. London: Yale University
Press.
Anderson JJB. 2004. Minerals, In Krause‘s food, nutrition and diet therapy. Ed. by Mahan KL and Escott-Stump S. 11
th ed. Philadelphia:WB Saunders Company:121-163.
Augustin LS, Dal Maso L, La Vecchia C, Parpinel M, Negri E, Vaccarella S, Kendall CW, Jenkins DJ and Francesch S. 2001. Dietary glycemic index and glycemic load, and breast cancer risk: a case-control study. Annals of Oncology, 12(11):1533-1538.
Barker DJP. 1990. Fetal and infant origins of adult diseases. British Medical Journal, 301(6761):1111.
Bihl GR. 2003. Intra-uterine growth and disease in later life – Barker and beyond. South African Medical Journal, 93(10):757-760.
Bourne LT and Seager JR. 2001. Water – the neglected nutrient. South African Journal of Clinical Nutrition, 14(3):S64-S70.
Bourne LT, Lambert EV and Steyn K. 2002. Where does the black population of South Africa stand on the nutrition transition? Public Health Nutrition, 5(1A):157-162.
Bourne LT, Langenhoven ML, Steyn K, Jooste PL, Laubscher JA, Van der Vyver E. 1993. Nutrient intake in the urban African population of the Cape Peninsula, South Africa. The Brisk study. Central African Journal of Medicine, 39(12):238-247.
Bourne LT. 2007. South African paediatric food-based dietary guidelines. Maternal and Child Nutrition, 3:227-229.
Bradshaw D, Groenewald P, Laubscher R, Nannan N, Nojilana B, Norman R, Pieterse D and Schneider M. 2003. Initial Burden of Disease Estimates for South Africa, 2000. Cape Town: South African Medical Research Council. [Online]. Available from: http://www.mrc.ac.za/bod/initialbodestimates.pdf [Accessed June 19
th, 2012].
Bradshaw D, Norman R, Pieterse D, Levitt NS and the South African Comparative Risk Assessment Collaborating Group. 2007. Estimating the burden of disease attributable to diabetes in South Africa in 2000. South African Medical Journal, 97(7):700-706.
Brink AJ. 1988. People for research and development 1988. Proceedings of a conference held at the CSIR Conference Centre, Pretoria, 23-24 August 1988.
Cameron N. 2003. Physical growth in a transitional economy: the aftermath of South African apartheid. Economics and Human Biology, 1: 29–42.
Carlson TH. 2004. Laboratory data in nutrition assessment, In Krause‘s food, nutrition and diet therapy. Ed. by Mahan KL and Escott-Stump S. 11
th ed. Philadelphia:WB Saunders Company:436-454.
Center for Nutrition Policy and Promotion (CNPP). 1999. Food Guide pyramid for young children 2 to 6 years old. Washington, DC: US Department of Agriculture. [Online]. Available from: http://www.cnpp.usda.gov/fgp.htm [Accessed June 19
th, 2012].
Centers for Disease Control and Prevention (CDCP). 2009. Healthy weight – it‘s not a diet, it‘s a lifestyle! [Online]. Available from: http://www.cdc.gov/healthyweight/assessing/bmi/adult_bmi/index.html [Accessed June 19
th, 2012].
Centers for Disease Control and Prevention (CDCP). 2010. Growth Charts. [Online]. Available from: http://www.cdc.gov/growthcharts/who_charts.htm [Accessed March 22
nd, 2012].
Charlton KE and Jooste PL. 2001. Eat salt sparingly – sprinkle, don‘t shake! South African Journal of Clinical Nutrition, 14(3):S55-S64.

Page 225 of 252
Churma SA and Horrell CJ. 2005. Esophageal and gastric cancers, In Nutritional issues in cancer care. Ed. by VJ Kogut and SL Luthringer. Pittsburgh, Pennsylvania:Oncology Nursing Society:45-63.
Couch SC and Krummel DA. 2008. Medical nutrition therapy in hypertension, In Krause‘s food and nutrition therapy. Ed. by Mahan KL and Escott-Stump S. 12
th ed. Philadelphia:WB Saunders Company:865-883.
Cummings, MR. 2006. Human heredity, 7th edition. Belmont, California:Thomson Learning Inc.
Darnton-Hill I and Coyne ET. 1998. Feast and famine: socioeconomic disparities in global nutrition and health. Public Health Nutrition, 1(1):23-31.
De Onis M, Garza C, Onyango AW and Borghi E. 2007. Comparison of the WHO child growth standards and the CDC 2000 growth charts. The Journal of Nutrition, 137:141-148.
De Villiers A and Senekal M. 2002. Determinants of growth failure in 12-24 month-old children in a high-density urban slum community in East London, South Africa. European Journal of Clinical Nutrition, 56:1231-1241.
Department of Health, South African Medical Research Council and Measure DHS+. 2002. South African Demographic and Health Survey - 1998. [Online]. Available from: http://www.hst.org.za/sites/default/files/ SADHS_1998_Full.pdf [Accessed June 19
th, 2012].
Department of Health. 2001. National food consumption survey in children aged 1-9 years: South Africa 1999. Part I: Methodology, sociodemographic and anthropometric data. Medical Update Number 37, Directorate: Nutrition, Department of Health.
Department of Health. 2004. South African guidelines for healthy eating. Directorate Nutrition, Pretoria.
Department of Health. 2004a. South African Demographic and Health Survey 2003 – Preliminary Report. Pretoria:South Africa. [Online]. Available from: http://www.hst.org.za/sites/default/files/SADHS_2003.pdf [Accessed June 19
th, 2012].
Dewey KG. 2006. What is the optimal age for introduction of complementary foods? In Protein and Energy Requirements in Infancy and Childhood - Nestlé Nutrition Workshop Series Pediatric Program, Ed. By Ziegler RJ. Nestec Ltd., 58:161-175.
Earl R. 2004. Guidelines for dietary planning, In Krause‘s food, nutrition and diet therapy. Ed. by Mahan KL and Escott-Stump S. 11
th ed. Philadelphia:WB Saunders Company, Table 15-2:368, Figure 15-4:378 .
Eldridge B. 2004. Medical nutrition therapy for cancer prevention, treatment and recovery, In Krause‘s food, nutrition and diet therapy. Ed. by Mahan KL and Escott-Stump S. 11
th ed. Philadelphia: WB Saunders
Company:1000-1003.
Faber M and Benadé AJS. 2001. Perceptions of infant cereals and dietary intakes of children aged 4-24 months in a rural South African community. International Journal of Food Sciences and Nutrition, 52:359-365.
Faber M, Jogessar VB and Benadé AJS. 2001. Nutritional status and dietary intakes of children aged 2-5 years and their caregivers in a rural South African community. International Journal of Food Sciences and Nutrition, 52:401-411.
Fernald LC and Neufeld LM. 2007. Overweight with concurrent stunting in very young children from rural Mexico: prevalence and associated factors. European Journal of Clinical Nutrition, 61(5):623-632.
Fletcher DM and Hayward MC. 2005. Breast cancer, In Nutritional issues in cancer care. Ed. by VJ Kogut and SL Luthringer. Pittsburgh, Pennsylvania:Oncology Nursing Society:15-28.
Food and Nutrition Board, Institute of Medicine and National Academies. 2002. Dietary reference intakes for energy, carbohydrate, fiber, fat, fatty acids, cholesterol, protein and amino acids.. Washington DC:The National Academies Press. [Online]. Available from: http://fnic.nal.usda.gov/dietary-guidance/dri-reports/energy-carbohydrate-fiber-fat-fatty-acids-cholesterol-protein-and-amino#overlay-context=dietary-guidance/dietary-reference-intakes/dri-reports [Accessed June 19
th, 2012].
Page 226 of 252
Forsen T, Eriksson J, Tuomilehto J, Reunanen A, Osmond C, Barker D. 2000. The fetal and childhood growth of persons who develop type 2 diabetes. Annals of Internal Medicine, 133:176-182.
Franz MJ. 2004. Medical nutrition therapy for diabetes mellitus and hypoglycemia of nondiabetic origin, In Krause‘s food, nutrition and diet therapy. Ed. by Mahan KL and Escott-Stump S. 11
th ed. Philadelphia: WB
Saunders Company: 794, 797.
Franz MJ. 2008. Medical nutrition therapy for diabetes mellitus and hypoglycemia of nondiabetic origin, In Krause‘s food and nutrition therapy. Ed. by Mahan KL and Escott-Stump S. 12
th ed. Philadelphia:WB Saunders
Company:764-809.
Gee M, Mahan LK and Escott-Stump S. 2008. Weight management, In Krause‘s food and nutrition therapy. Ed. by Mahan KL and Escott-Stump S. 12
th ed. Philadelphia:WB Saunders Company:532-562.
Gibson RS. 2005. Principles of nutritional assessment. 2nd edition. New York: Oxford University Press.
Goedecke JH, Jennings CL and Lambert EV. 2005. Obesity in South Africa. Chapter 7 – Chronic Diseases of Lifestyle in South Africa since 1995-2005. [Online]. Available from: http://www.mrc.ac.za/chronic/cdlchapter7.pdf [Accessed June 19
th, 2012].
Gopane RE, Pisa PT, Vorster HH, Kruger A and Margetts BM. 2010. Relationships of alcohol intake with biological health outcomes in an African population in transition: the Transition and Health during Urbanisation in South Africa (THUSA) study. South African Medical Journal, 23(32)(Supplement1):S16-S21.
Grant B. 2008. Medical nutrition therapy for cancer, in Krause‘s food and nutrition therapy. Ed. by Mahan KL and Escott-Stump S. 12
th ed. Philadelphia:WB Saunders Company:959-990.
Hales CN, Barker DJP. 1992. Type 2 (non-insulin dependent) diabetes mellitus: the thrifty phenotype hypothesis. Diabetologia;35:595-601.
Hamilton K and Roche SM. 2005. Gynecologic cancers, In Nutritional issues in cancer care. Ed. by VJ Kogut and SL Luthringer. Pittsburgh, Pennsylvania:Oncology Nursing Society:79-102.
Harris NS, Crawford PB, Yangzom Y, Pinzo L, Gylatsen P and Hudes M. 2001. Nutritional and health status of Tibetan children living at high altitudes. New England Journal of Medicine; 344(5): 341–347.
Hoffman DJ, Sawaya AL, Coward WA, Wright A, Martins PA, De Nascimento C, Tucker KL and Roberts SB. 2000. Energy expenditure of stunted and non-stunted boys and girls living in the shantytowns of São Paulo, Brazil. American Journal of Clinical Nutrition, 72:1025-1031.
Hofman KJ and Tollman SM. 2010. Health Policies and Practice: Setting priorities for health in 21st-century South Africa. South African Medical Journal, 100(12):798-800.
James HC and Kulakowski KP. 2005. Hepatobiliary cancer, In Nutritional issues in cancer care. Ed. by VJ Kogut and SL Luthringer. Pittsburgh, Pennsylvania:Oncology Nursing Society:117-125.
Jinabhai CC, Taylor M, Sullivan KR. 2003. Implications of the prevalence of stunting, overweight and obesity amongst South African primary school children: a possible nutritional transition? European Journal of Clinical Nutrition [Online], 57:358–365 Available from: http://www.nature.com/ejcn/journal/v57/n2/full/1601534a.html [Accessed June 19
th, 2012].
Joubert J, Norman R, Bradshaw D, Goedecke JH, Steyn NP, Puoane T and the South African Comparative Risk Assessment Collaborating Group. 2007, Estimating the burden of disease attributable to excess body weight in South Africa in 2000. South African Medical Journal, 97(8):683-690.
Kanjilal B, Mazumdar PG, Mukherjee M and Rahman MH. 2010. Nutritional status of children in India: household socio-economic condition as the contextual determinant. International Journal Equity in Health, [Online], 9:19, Available from: http://www.equityhealthj.com/content/9/1/19 [Accessed June 19
th, 2012].
Koh ET and Owen WL. 2000. Introduction to nutrition and health research. Massachusetts:Kluwer Academic Publishers.
Page 227 of 252
Kruger HS, Puoane T, Senekal M and Van der Merwe MT. 2005. Obesity in South Africa: challenges for government and health professionals. Public Health Nutrition, 8(5):491-500.
Kruger HS, Venter CS, Vorster HH, Margetts BM. 2002. Physical inactivity is the major determinant of obesity in black women in the North West Province, South Africa: the THUSA study. Transition and Health During Urbanisation of South Africa. Nutrition;18:422-427.
Krummel DA. 2004a. Medical nutrition therapy in cardiovascular disease, In Krause‘s food, nutrition and diet therapy. Ed. by Mahan KL and Escott-Stump S. 11
th ed. Philadelphia: WB Saunders Company:861-899.
Krummel DA. 2004b. Medical nutrition therapy in hypertension, In Krause‘s food, nutrition and diet therapy. Ed. by Mahan KL and Escott-Stump S. 11
th ed. Philadelphia: WB Saunders Company:910-911.
Krummel DA. 2008. Medical nutrition therapy for cardiovascular disease, In Krause‘s food and nutrition therapy. Ed. by Mahan KL and Escott-Stump S. 12
th ed. Philadelphia:WB Saunders Company:833-864.
Labadarios D and Nel JH. 2000. Chapter 4: Anthropometric status. The National Food Consumption Survey, [Online], 162-187. Available from: http://www.sahealthinfo.org/nutrition/food4anthrostatus.pdf [Accessed June 19
th, 2012].
Labadarios D, Mauner E, Swart R, Bagriansky J, Steyn NP, MacIntyre U, Gericke G, Huskisson J, Dannhauser A, Vorster HH and Nesamvuni AE. 2000. Chapter 9: general discussion and recommendations. The National Food Consumption Survey, [Online], 856-946. Available from: http://www.sahealthinfo.org/nutrition/food9discussion.pdf [Accessed June 19
th, 2012].
Labadarios D, Steyn NP, Maunder E, MacIntyre U, Gericke G, Swart R, Huskisson J, Dannhauser A, Vorster HH, Nesamvuni AE and Nel JH. 2005. The National Food Consumption Survey (NFCS): South Africa, 1999. Public Health Nutrition, 8(5):533-543.
Langenhoven M and Wolmarans P. 1997. Assessment of dietary intake, In Epidemiology: a manual for South Africa. Ed. by Katzenellenbogen JM, Joubert G, Abdool K. Cape Town:Oxford University Press:250.
Laquatra I. 2004. Nutrition for weight management, In Krause‘s food, nutrition and diet therapy. Ed. by Mahan KL and Escott-Stump S. 11
th ed. Philadelphia:WB Saunders Company, Table 24-1:565.
Lee RD and Nieman DC. 2003. Nutritional Assessment. 3rd
edition. New York: McGraw Hill.
Lee RD and Nieman DC. 2010. Nutritional Assessment. 5th edition. New York: McGraw-Hill.
LeLeiko N, Rollinson MS and Sockolow RE. 1995. Nutrition in infancy and childhood, In Total Nutrition: The only guide you‘ll ever need, Ed. by Herbert V and Subak-Sharpe GJ. New York:St Martin‘s Press, Tables 13-4 and 13-5:218-219.
Levitt NS, Lambert EV and Norris SA. 2005. Early life origins of adult chronic diseases: a South African perspective. Chapter 6 – Chronic Diseases of Lifestyle in South Africa since 1995-2005. [Online], 58-64. Available from: http://www.mrc.ac.za/chronic/cdlchapter6.pdf [Accessed June 19
th, 2012].
Li L, Manor O and Power C. 2004. Early environment and child-to adult growth trajectories in the 1958 British birth cohort. American Journal of Clinical Nutrition, 80:185-1992.
Love P and Sayed N. 2001. Eat plenty of vegetables and fruits every day. South African Journal of Clinical Nutrition, 14(3):S24-S31.
Lucas BL. 2004. Nutrition in childhood, In Krause‘s food, nutrition and diet therapy. Ed. by Mahan KL and Escott-Stump S. 11
th ed. Philadelphia:WB Saunders Company, Table 10-1:267.
Lucas BL. 2004a. Nutrition in childhood, In Krause‘s food, nutrition and diet therapy. Ed. by Mahan KL and Escott-Stump S. 11
th ed. Philadelphia:WB Saunders Company:259-283.
MacIntyre U and Labadarios D. 2000. Chapter 6: dietary intake: quantitative food frequency method. The National Food Consumption Survey, [Online], 312-367. Available from: http://www.sahealthinfo.org/nutrition/
Page 228 of 252
food6dietaryintake.pdf [Accessed June 19th, 2012].
MacIntyre UE, Kruger HS, Venter CS and Vorster HH. 2002. Dietary intakes of an African population in different stages of transition in the North West Province, South Africa: the THUSA study. Nutrition Research, 22(3):239-256.
MacKeown JM, Cleaton-Jones PE, Edwards AW and Turgeon-O‘Brien H. 1998. Energy, macro-and micronutrient intake of 5-year-old urban black South African children in 1984 and 1995. Paediatric and Perinatal Epidemiology, 12:297-312.
Mahan KL and Escott-Stump S. 2004a. Nutritive values for alcoholic beverages and mixes, In Krause‘s food, nutrition and diet therapy. 11th ed. Philadelphia: WB Saunders Company, Appendix 44:1241.
Mahan KL and Escott-Stump S. 2004b. Indirect methods for measuring height, In Krause‘s food, nutrition and diet therapy. 11th ed. Philadelphia: WB Saunders Company, Appendix 15:1184.
Mahan KL and Escott-Stump S. 2004c. Milliequivalents and milligrams of electrolytes, In Krause‘s food, nutrition and diet therapy. 11th ed. Philadelphia: WB Saunders Company, Appendix 4:1176.
Mahan KL and Escott-Stump S. 2004d. Birth to 36 months: boys head circumference-for-age and weight-for-length percentiles, In Krause‘s food, nutrition and diet therapy. 11th ed. Philadelphia: WB Saunders Company, Appendix 7:1178.
Mahan KL and Escott-Stump S. 2004e. Birth to 36 motnhs: girls head circumference-for-age and weight-for-length percentiles, In Krause‘s food, nutrition and diet therapy. 11th ed. Philadelphia: WB Saunders Company, Appendix 10:1181.
Mahan KL and Escott-Stump S. 2008a. Nutritional facts on alcoholic beverages, In Krause‘s food and nutrition therapy. 12
th ed. Philadelphia: WB Saunders Company, Appendix 38:1276.
Mahan KL and Escott-Stump S. 2008b. Indirect methods for measuring height, In Krause‘s food and nutrition therapy. 12
th ed. Philadelphia: WB Saunders Company, Appendix 20:1213.
Mamabolo RL, Alberts M, Steyn NP, Delemarre-van de Waal HA and Levitt NS. 2005. Prevalence and determinants of stunting and overweight in 3-year old black South African children residing in the Central Region of Limpopo Province, South Africa. Public Health Nutrition, [Online], 8(5):501-508. Available from: http://journals.cambridge.org/action/displayAbstract?fromPage=online&aid=585132 [Accessed June 19
th, 2012].
Masino K. 2005. Colorectal cancer, In Nutritional issues in cancer care. Ed. by VJ Kogut and SL Luthringer. Pittsburgh, Pennsylvania:Oncology Nursing Society:29-43.
Mayo Foundation for Medical Education and Research. 2011. Cholesterol levels: What numbers should you aim for? [Online]. Available from: http://www.mayoclinic.com/health/cholesterol-levels/CL00001/METHOD=print [Accessed on June 19
th, 2012].
Mendez MA, Monteiro CA and Popkin BM. 2005. Overweight exceeds underweight among women in most developing countries. American Journal of Clinical Nutrition, 81:714-721.
Mollentze WF, Moore AJ, Steyn AF, Joubert G, Steyn K and Oosthuizen GM. 1995. Coronary heart disease risk factors in a rural and urban Orange Free State population. South African Medical Journal, 85:90-96.
Monsen ER. 1992. Research. 1st edition. Chicago: The American Dietetic Association.
Mukuddem-Petersen J and Kruger HS. 2004. Association between stunting and overweight among 10-15 year old children in the North West Province of South Africa: the THUSA BANA Study. International Journal of Obesity, 28:842-851.
Murray CJ and Lopez AD. 1997a. Global mortality, disability, and the contribution of risk factors: Global Burden of Disease Study. Lancet, 349(9063):1436-1442.
Murray CJ and Lopez AD. 1997b. Alternative projections of mortality and disability by cause 1990-2020: Global Burden of Disease Study. Lancet, 349(9064):1498-1504.

Page 229 of 252
Murray CJ and Lopez AD. 1997c. Mortality by cause for eight regions of the world: Global Burden of Disease Study. Lancet, 349(9061):1269-1276.
Nannan N, Norman R, Hendricks M, Dhansay MA, Bradshaw D and the South African Comparative Risk Assessment Collaborating Group. 2007. Estimating the burden of disease attributable to childhood and maternal undernutrition in South Africa in 2000. South African Medical Journal, 97(8):733-739.
Nel JH and Steyn NP. 2002. Report on South African food consumption studies undertaken amongst different population groups (1983 – 2000): Average intakes of foods most commonly consumed. Department of Health. Pretoria:South Africa.
Norman R, Bradshaw D, Schneider M, Joubert J, Groenewald P, Lewin S, Steyn K, Vos T, Laubscher R, Nannan N, Nojilana B, Pieterse D and the South African Comparative Risk Assessment Collaborating Group. 2007c. A comparative risk assessment for South Africa in 2000: Towards promoting health and preventing disease, South African Medical Journal, 97(7):637-641.
Norman R, Bradshaw D, Schneider M, Pieterse D and Groenewald P. 2006. Revised burden of disease estimates for the Comparative Risk Factor Assessment, South Africa 2000.
Norman R, Bradshaw D, Schneider M, Pieterse D and Groenewald P. 2010. How does South Africa compare with other countries? [Online]. Available from: http://www.mrc.ac.za/bod/faqcompare.htm [Accessed on June 19
th, 2012].
Norman R, Bradshaw D, Schneider M, Pieterse D and Groenewald P. 2010a. What are the top causes of death due to cardiovascular disease in SA? [Online]. Available from: http://www.mrc.ac.za/bod/faqcardio.htm [Accessed on June 19
th, 2012].
Norman R, Bradshaw D, Schneider M, Pieterse D and Groenewald P. 2010b. What are the leading causes of death in children under 5 years of age? [Online]. Available from: http://www.mrc.ac.za/bod/faqchildren.htm [Accessed on June 19
th, 2012].
Norman R, Bradshaw D, Steyn K, Gaziano T and the South African Comparative Risk Assessment Collaborating Group. 2007b. Estimating the burden of disease attributable to high cholesterol in South Africa in 2000, South African Medical Journal, 97(7):708-715.
Norman R, Gaziano T, Laubscher R, Steyn K, Bradshaw D and the South African Comparative Risk Assessment Collaborating Group. 2007a. Estimating the burden of disease attributable to high blood pressure in South Africa in 2000. South African Medical Journal, 97(8):692-698.
Nthangeni G, Steyn NP, Alberts M, Steyn K, Levitt NS, Laubscher R, Bourne L, Dick J, Temple N. 2002. Dietary intake and barriers to dietary compliance in black type 2 diabetic patients attending primary health-care services. Public Health Nutrition, 5: 329–338.
O‘Keefe SJD, Thusi D and Epstein S. 1983. The fat and the thin – a survey of nutritional status and disease patterns among urbanized Black South Africans. South African Medical Journal, 63:679-683.
Oosthuizen W, Van der Merwe AM, Kotzé JP, Vorster HH and Steyn HS. 1998. Dietary composition and body mass index at different levels of added sugar consumption – the VIGHOR study. South African Medical Journal, 88 (9):1212-1217.
Parsons TJ, Power C, Logan S and Summerbell CD. 1999. Childhood predictors of adult obesity:a systematic review. International Journal of Obesity, 23, Supplement 8:S1-S107.
Pisa PT, Kruger A, Vorster HH, Margetts BM and Loots DT. 2010a. Alcohol consumption and cardiovascular disease risk in an African population in transition: the Prospective Urban and Rural Epidemiology (PURE) study. South African Medical Journal, 23(3)(Supplement 1):S29-S37.
Pisa PT, Loots DT and Nienaber C. 2010. Alcohol metabolism and health hazards associated with alcohol abuse in a South African context: a review. South African Medical Journal, 23(3)(Supplement 1):S4-S10.
Popkin BM, Richards MK and Montiero CA. 1996. Stunting is associated with overweight in children of four
Page 230 of 252
nations that are undergoing the nutrition transition. The Journal of Nutrition, 126:3009-3016.
Potischman N, Coates RJ, Swanson CA, Carroll RJ, Dalings JR, Brogan DR, Gammon MD, Midthune D, Curtin J and Brinton LA. 2002 .Increased risk of early-stage breast cancer related to consumption of sweet foods among women less than age 45 in the United States. Cancer Causes and Control, 13:937.
Puoane T, Steyn K, Bradshaw D, Laubscher R, Fourie J, Lambert V and Mbananga N. 2002. Obesity in South Africa: the South African demographic and health survey. Obesity Research, 10: 1038–1048
Rehman AM, Gladstone BP, Verghese VP, Muliyil J, Jaffar S and Kang G. 2009. Chronic growth faltering amongst a birth cohort of Indian children begins prior to weaning and is highly prevalent at three years of age. Nutrition Journal, [Online], 8:44. Available from: http://www.nutritionj.com/content/8/1/44 [Accessed on June 19
th,
2012].
Richardson, BD, 1978. Growth patterns of South African children. South African Medical Journal, 74:246–249.
Rodgers A, Lawes CMM, Gaziano T, Vos T. 2006. The growing burden of risk from high blood pressure, cholesterol and bodyweight. In Disease Control Priorities in Developing Countries. Ed by DT Jamison, JG Breman, AR Measham, G Alleyne, M Claeson, DB Evans, P Jha, A Mills and P Musgrove. 2
nd ed. Washington
(DC): World Bank. [Online] Available from: www.ncbi.nlm.nih.gov/books/NBK11738/#A6551 [Accessed September 9
th, 2012].
Rosman KO. 1986. The epidemiology of stroke in an urban black population. Stroke, 17:667-669.
Rotchford AP and Rotchford KM. 2002. Diabetes in rural South Africa – an assessment of care and complications. South African Medical Journal, 92:536–541.
SAS. 2001. SAS Institute Inc., Cary, North Carolina.
Save the Children Fund (SCF). 2012. A life free from hunger. London:Save the Children UK.
Sawaya AL and Roberts S. 2003. Stunting and future risk of obesity: principal physiological mechanisms Cadernos de Saúde Pública [Online], 19(S1). Available from: http://www.scielosp.org/ scielo.php?script=sciarttext&pid=S0102-311X2003000700003&lng=en&nrm=iso [Accessed July 26
th, 2009].
Sawaya AL, Martins P, Hoffman D and Roberts SB. 2003. The link between childhood undernutrition and risk of chronic disease in adulthood: a case study of Brazil. Nutrition Reviews, 61(5):168-173.
Schneider M, Norman R, Parry C, Bradshaw D, Plüddemann A and the South African Comparative Risk Assessment Collaborating Group. 2007a. Estimating the burden of disease attributable to alcohol use in South Africa in 2000. South African Medical Journal, 97(8):664-672.
Schneider M, Norman R, Steyn N, Bradshaw D and the South African Comparative Risk Assessment Collaborating Group. 2007. Estimating the burden of disease attributable to low fruit and vegetable intake in South Africa in 2000, South African Medical Journal, 97(8):717.
Scholtz SC, Vorster HH (jun), Matshego L and Vorster HH. 2001. Foods from animals can be eaten every day – not a conundrum! South African Journal of Clinical Nutrition, 14(3):S39-S47.
Schrimpton R and Kachondham Y. 2003. Analysing the causes of child stunting in Democratic People‘s Republic of Korea. [Online], 1-35. Available from: http://www.unicef.org/dprk/further_analysis.pdf [Accessed June 19
th,
2012].
Schutte AE, Van Rooyen JM, Huisman HW, Kruger HS and De Ridder JH. 2003. Factor analysis of possible risks for hypertension in a black South African population. Journal of Human Hypertension, 17:339-348.
Seedat YK. 2007. Impact of poverty on hypertension and cardiovascular disease in sub-Saharan Africa. Cardiovascular Journal of Africa, 18(5):316-320.
Seftel HC, Raal FJ, Joffe BI. 1995. Dyslipidaemia in South Africa. In Chronic Diseases of Lifestyle in South Africa: Medical Research Council (MRC) Technical Report. Ed. by J Fourie and K Steyn K. Tygerberg: MRC, 61–71.

Page 231 of 252
Seftel HC. 1977. Diseases in urban and rural black populations. South African Medical Journal, 51:121-123.
Senekal M, Steyn NP and Nel JK. 2003. Factors associated with overweight/obesity in economically active South African populations. Ethnicity and Disease, 13:109-116.
Shaw V and Lawson M. 2001. Clinical paediatric dietetics. 2nd
ed. Oxford:Blackwell Science Ltd.
Society for Endocrinology, Metabolism and Diabetes of South Africa (SEMDSA). 2009. Guidelines for diagnosis and management of type 2 diabetes mellitus for primary health care.
South African Society for Obesity and Metabolism (SASOM). 2006a. SA Obesity Statistics. [Online]. Available from: http://www.sasom.co.za/index.php?p=sa_obesity_statistics.php [Accessed July 26
th, 2009].
South African Society for Obesity and Metabolism (SASOM). 2006b. An estimated 400 million adults around the world are clinically obese; 2 billion are overweight and the numbers are rising each year. [Online]. Available from: http://www.sasom.co.za/index.php [Accessed July 26
th, 2009].
South African Society for Obesity and Metabolism (SASOM). 2006c. Obesity in African Women. [Online]. Available from: http://www.sasom.co.za/index.php?p=obesity_in_african_women.php [Accessed July 26
th, 2009].
Statistics South Africa. 1999. Population Census, 1996: Primary Tables Report 03-01-17 (1996). Pretoria: Statistics South Africa.
Statistics South Africa. 2003. Census 2001. [Online]. Available from: www.hst.org.za/publications/census-2001 [Accessed March 14
th, 2012].
Steyn K, Bourne LT, Jooste PL, Fourie J, Rossouw K, and Lombard C. 1998. Anthropometric profile of a black population of the Cape Peninsula in South Africa. East African Medical Journal, 75:35-40.
Steyn K, Bradshaw D, Norman R and Laubsher R. 2008. Determinants and treatment of hypertension in South Africans: the first demographic and health survey. South African Medical Journal, 98(5):376-380.
Steyn K, Jooste PL, Bourne L, Fourie J, Badenhorst CJ, Bourne DE, Langenhoven ML, Lombard CJ, Truter H, Katzenellenbogen J, Marais M and Oelofse A. 1991. Risk factors for coronary heart disease in the Black population of the Cape Peninsula. The BRISK Study. South African Medical Journal, 79:480-485.
Steyn K. 2005b. Overview and conclusions: a perspective on dealing with chronic diseases of lifestyle in South Africa. Chapter 18 – Chronic Diseases of Lifestyle in South Africa since 1995-2005. [Online], 249-267. Available from: http://www.mrc.ac.za/chronic/cdlchapter18.pdf [Accessed June 19
th, 2012].
Steyn NP, Bradshaw D, Norman R, Joubert J, Schneider M, Steyn K, and Fourie J. 2006. The Medical Research Council Technical Report on dietary changes and the health transition in South Africa: implications for health policy. [Online]. Available from: http://www.sahealthinfo.org/lifestyle/dietaccess.pdf [Accessed June 19
th, 2012].
Steyn NP, Burger S, Monyeki KD, Alberts M and Nthangeni G. 2001. Variation in dietary intake of the adult population of Dikgale. South African Journal of Medical Nutrition, 14(4):140-145.
Steyn NP, Labadarios D, Maunder E, Nel J, Lombard C and Directors of the National Food Consumption Survey. 2005. Secondary anthropometric data analysis of the national food consumption survey in South Africa: the double burden. Nutrition, 21(1):4-13.
Steyn NP, Nel JH and Casey A. 2003. Secondary data analyses of dietary surveys undertaken in South Africa to determine usual food consumption of the population. Public Health Nutrition: 6(7), 631–644.
Steyn NP, Nel JH, Dhansay MA, Tichelaar HY, Kriek JA, Prinsloo JF. Differences in nutritional status between caretakers of underweight and normal weight Pedi pre-school children. South African Food Science and Nutrition, 7:53-59.
Steyn NP, Senekal M, Brits S, Alberts M, Mashego T and Nel JH. 2000. Weight and health status of black female students. South African Medical Journal, 90(2):146-152.
Page 232 of 252
Steyn NP. 2005a. Chapter 4. Nutrition and the chronic diseases of lifestyle in South Africa since 1995-2005. [Online], 33-47. Available from: http://www.mrc.ac.za/chronic/cdlchapter4.pdf [Accessed June 19
th, 2012].
Subramanyam MA, Kawachi I, Berkman LF, and Subramanian SV. 2010. Socioeconomic inequalities in childhood undernutrition in India: analyzing trends between 1992 and 2005. PLoS One, 5(6):1-9.
The World Bank and United Nations Children‘s Fund (UNICEF). 2002. Background Papers: World Bank/UNICEF Nutrition Assessment.
Torûn B. 2006. Protein-energy malnutrition, In Modern nutrition in health and disease, Ed. by ME Shils, M Shike, AC Ross, B Caballero and RJ Cousins. 10
th edition. Baltimore: Lippincott Williams & WIlkins:890.
Touger-Decker R. 2004. Nutrition for oral and dental health, In Krause‘s food, nutrition and diet therapy. Ed. by Mahan KL and Escott-Stump S. 11
th ed. Philadelphia:WB Saunders Company:667-683.
Trahms CM. 2004. Nutrition during infancy, In Krause‘s food, nutrition and diet therapy. Ed. by Mahan KL and Escott-Stump S. 11
th ed. Philadelphia:WB Saunders Company:214-233.
United Nations Children‘s Fund (UNICEF). 2008. The state of the world‘s children 2009: Maternal and newborn health. New York: United Nations Children‘s Fund.
United States Department of Agriculture (USDA) and United States Department of Health and Human Services (USDHHS). 2010. Dietary Guidelines for Americans, 2010. 7
th Edition, Washington, DC:U.S. Government Printing
Office.
United States Department of Agriculture (USDA). 1992. The Food Guide Pyramid. Home and Garden Bulletin, no. 252. Washington: US Government Printing Office. [Online]. Available from: http://www.mypyramid.gov/ [Accessed June 19
th, 2012].
Van den Berg VL. 2011. Current opinion: Is added dietary sugar detrimental to health? South African Family Practice, 53(3):257-261.
Van der Merwe MT and Pepper MS. 2006. National Prevalence of Obesity: Obesity in South Africa. The International Association for the Study of Obesity: Obesity reviews:1-8.
Van der Merwe MT, Panz VR, Crowther NJ, Schlaphoff GP, Gray IP, Froguel P, Joffe BI and Lönnroth PN. 1999. Free fatty acids and insuling levels-relationship to leptin levels and body composition in various patient groups from South Africa. International Journal of Obesity, 23:909-917.
Van der Merwe MT. 2001. Adipose tissue lipolysis, metabolic indices and insulin resistance in South African ethnic groups. PhD Thesis. Faculty of Health Sciences, University of the Witwatersrand: Johannesburg.
Van Heerden IV and Parry CDH. 2001. If you drink alcohol, drink sensibly. South African Journal of Clinical Nutrition, 14(3):S71-S77.
Van Zyl S, Van der Merwe LJ, Walsh CM, Groenewald AJ, and Van Rooyen FC. 2012. Risk factor profiles for chronic diseases of lifestyle and metabolic syndrome in an urban and rural setting in South Africa. African Journal of Primary Health Care and Family Medicine, 4(1):Art.#346.
Vanhala M, Vanhala P, Kumpusalo E, Halonen P and Takala J. 1998. Relation between obesity from childhood to adulthood and the metabolic syndrome: population based study. British Medical Journal, 317(7154):319-320.
Vanhala MJ, Vanhala PT. Keinänen-Kiukaanniemie SM, Kumpusalo EA and Takala JK. 1999. Relative weight gain and obesity as a child predict metabolic syndrome as an adult. International Journal of Obesity and Related Metabolic Disorders, 23(6):656-659.
Verhoef P, Pasman WJ, Van Vliet T, Urgert R and Katan MB. 2002. Contribution of caffeine to the homocysteine-raising effect of coffee: a randomized controlled trial in humans. The American Journal of Clinical Nutrition, 76:1244-1248.
Victora CG, Adair L, Fall C, Hallal PC, Martorell R, Richter L, and Sachdev HS. 2008. Maternal and child
Page 233 of 252
undernutrition: consequences for adult health and human capital. Lancet, 371:340-357.
Vorster HH and Kruger A. 2007. Poverty, malnutrition, underdevelopment and cardiovascular disease: a South African perspective. Cardiovascular Journal of Africa, 18(5):321-324.
Vorster HH and Nell TA. 2001. Make starchy foods the basis of most meals. South African Journal of Clinical Nutrition, 14(3):S17-S24.
Vorster HH, Jerling JC, Oosthuizen W, Becker P, Wolmarans P. 1995. Nutrient Intakes of South Africans. An analysis of the literature (SANNSS Group Report). Isando: Roche.
Vorster HH, Venter CS, Wissing MP and Margetts BM. 2005. The nutrition and health transition in the North West Province of South Africa: a review of the THUSA (Transition and Health during Urbanisation of South Africans) study. Public Health Nutrition [Online], 8:480-490. Available from: http://journals.cambridge.org/action/ displayFulltext?type=6&fid=631528&jid=&volumeId=&issueId=05&aid=585100&bodyId=&membershipNumber=&societyETOCSession=&fulltextType=RA&fileId=S1368980005000674 [Accessed June 19
th, 2012].
Vorster HH. 2002. The emergence of cardiovascular disease during urbanization of Africans. Public Health Nutrition, 5(1A):239-243.
Walker ARP and Walker BF. 1985. Coronary disease in blacks in underdeveloped populations (Letter). American Heart Journal, 109:1410.
Wamani H, Astrøm AN, Peterson S, Tumwine JK and Tylleskär T. 2007. Boys are more stunted than girls in sub-Saharan Africa: a meta-analysis of 16 demographic and health surveys. BMC Pediatric [Online], 7(17). Available from: http://www.ncbi.nlm.nih.gov/m/pubmed/17425787/http://pubmedcentral.nih.gov/articlerender.fcgi?tool= pubmed&pubmedid =17425787 [Accessed June 19
th, 2012].
Waterlow JC. 1994. Causes and mechanisms of linear growth retardation (stunting). European Journal of Clinical Nutrition; 481 (Supplement): S1–S4
Wilson AC, Forsyth JS, Greene SA, Irvine L, Hau C, Howie PW. 1998. Relation of infant diet to childhood health: seven year follow up of cohort of children in Dundee infant feeding study. British Medical Journal, 316(7): 21-25.
Witten C, Jooste P, Sanders D and Chopra M. 2002. Successful micronutrient programmes: South Africa case study. Draft – February 2002. Unpublished. [Online]. Available from: http://www.dogpile.com/ clickserver/_iceUrlFlag=1?rawURL=http%3A%2F%2Fwww.tulane.edu%2F~internut%2FIUNSpresentations%2FSouth%2520Africa%2FSouthAfrica.doc&0=&1=0&4=67.63.50.146&5=196.207.47.60&9=b6ea5e5027714999a14b1eb1be0dca01&10=1&11=info.dogpl&13=search&14=867530&15=main-title&17=4&18=1&19=0&20=2&21= 2&22=Th7aNhJqNkg%3D&23=0&40=0jBKynNwjm8tRm2O%2FdrBRg%3D%3D&_IceUrl=true [Accessed June 19
th, 2012].
Wolmarans P and Oosthuizen W. 2001. Eat fats sparingly – implications for health and disease. South African Journal of Clinical Nutrition, 14(3):S48-S55.
Wolmarans P, Langenhoven ML, Benadé AJS, Swanepoel ASP, Koue TJvW and Rossouw JE. 1988. Intake of macronutrients and their relationship with total cholesterol and high-density lipoprotein cholesterol: the Coronary Risk Factor Study, 1979. South African Medical Journal, 73: 12-15.
Wolmarans P, Seedat YK, Mayet FGH, Joubert G, Wentzel E. 1998. Dietary intake of Indians living in the metropolitan area of Durban. Public Health Nutrition, 2(1):55-60.
World Cancer Research Fund (WCRF) / American Institute for Cancer Research (AICR). 2007. Food, Nutrition, Physical Activity, and the Prevention of Cancer: a Global Perspective. Washington DC: American Institute for Cancer Research.
World Diabetes Foundation (WDF). 2006. Diabetes facts. [Online]. Available from: http://worlddiabetesfoundation.org/composite-35.htm [Accessed June 19
th, 2012].
World Diabetes Foundation (WDF). 2009. WHO launches Action Plan for NCDs. [Online]. Available from: http://worlddiabetesfoundation.org/composite-2447.htm [Accessed June 19
th, 2012].
World Health Organization (WHO) and Food and Agriculture Organization (FAO). 2002. Joint Expert Consultation
Page 234 of 252
on Diet, Nutrition and the Prevention of Chronic Diseases. WHO Technical Report Series No. 916. World Health Organization:Geneva, Switzerland.
World Health Organization. 2002. Report of the expert consultation on the optimal duration of exclusive breastfeeding. Geneva, Switzerland.
World Health Organization. 2008. The Global Burden of Disease: 2004 update. Geneva:Switzerland. [Online]. Available from: http://www.who.int/healthinfo/global_burden_disease/2004_report_update/en/ [Accessed June 19
th, 2012].
World Health Organization. 2008a. The World Health Report 2008 – Primary Health Care. Geneva:Switzerland. [Online]. Available from: http://www.who.int/entity/whr/en/index.html [Accessed June 19
th, 2012].
World Health Organization. 2010. Growth reference data for 5-19 years. [Online]. Available from: http://www.who.int/entity/growthref/en/ [Accessed June 19
th, 2012].
World Health Organization. 2010a. Development of a WHO growth reference for school-aged children and adolescents. [Online]. Available from: http://www.who.int/entity/growthref/growthref_who_bull/en/index.html [Accessed June 19
th, 2012].
World Health Organization. 2010b. Guidelines on HIV and infant feeding 2010: principles and recommendations for infant feeding in the context of HIV and a summary of evidence. Geneva, Switzerland.
World Health Organization. 2012. Population nutrient intake goals for preventing diet-related chronic diseases. [Online}. Available from: http://www.who.int/nutrition/topic/5_population_nutrient/en/index.html [Accessed June 19
th, 2012].
World Health Organization. 2012a. Severe acute malnutrition [Online]. Available from http://www.who.int/nutrition/topics/malnutrition/en/index.html [Accessed June 19
th, 2012].
Yach D, Cameron N, Padayachee N, Wagstaff L, Richter L and Fonn S. 1991. Birth to ten: child health in South Africa in the 1990s. Rationale and methods of a birth cohort study. Paediatric and Perinatal Epidemiology, 5:211-233.

Page 235 of 252
Appendices
Appendix A
Assuring Health for All (AHA) in the Free State
CONSENT TO PARTICIPATE IN RESEARCH
You have been asked to participate in a research study.
You have been informed about the study by ………………………………………. .
You may contact Prof Corinna Walsh at 083 297 6030 at any time if you have questions about the research or if
you are injured as a result of the research.
You may contact the Secretariat of the Ethics Committee of the Faculty of Health Sciences, UFS at telephone
number (051) 4052812 if you have questions about your rights as a research subject.
Your participation in this research is voluntary, and you will not be penalized or lose benefits if you refuse to
participate or decide to terminate participation.
If you agree to participate, you will be given a signed copy of this document as well as the participant information
sheet, which is a written summary of the research. You are also giving permission that some of the same blood
can be retained in storage for possible future research related to the present research question.
The research study, including the above information has been verbally described to me. I understand what my
involvement in the study means and I voluntarily agree to participate.
_____________________ __________________
Signature of Participant Date
For children:
_____________________ __________________
Name/ Signature of Child Date
_____________________ __________________
Signature of Parent Date

Page 236 of 252
Assuring Health for All (AHA) in the Free State
TOESTEMMING TOT DEELNAME AAN NAVORSING
U is versoek om aan ‗n navorsingstudie deel te neem.
U is oor die studie ingelig deur ………………………………………. .
U kan Prof Corinna Walsh enige tyd kontak by 083 297 6030 indien u vrae oor die navorsing het of as
gevolg van die navorsing beseer is.
U kan die Sekretariaat van die Etiekkomitee van die Fakulteit Gesondheidsweteskappe, UV by
telefoonnommer (051) 4052812 kontak indien u enige vrae het oor u regte as ‗n proefpersoon.
U deelname aan hierdie navorsing is vrywillig, en u sal nie gepenaliseer word of voordele verbeur as u
weier om deel te neem of besluit om deelname te staak nie.
As u instem om deel te neem, sal ‗n ondertekende kopie van hierdie dokument sowel as die
deelnemerinligtingsblad, wat ‗n geskrewe opsomming van die navorsing is, aan u gegee word .
Die navorsingstudie, insluitend die bogenoemde inligting is verbaal aan my beskryf. Ek begryp wat my
betrokkenheid by die studie beteken en ek stem vrywillig in om deel te neem.
________________________ __________________
Handtekening van deelnemer Datum
Vir kinders:
_____________________ __________________
Naam/ Handtekening van kind Datum
_____________________ __________________
Handtekening van ouer Datum

Page 237 of 252
Assuring Health for All (AHA) in the Free State
(Tshepiso ya Bophelo ho bohle ba Foreisitata)
TUMELLO YA HO NKA KAROLO DIPATLISISONG
O kopuwe ho nka karolo dipatlisisong.
O tsebisitswe ka dipatlisiso tsena ke ...............................................
O ka ikopanya le Prof Corinna Walsh ho 083 297 6030 nako e nngwe le e nngwe ha o na le dipotso ka dipatlisiso
kapa ha o ka wa lematseha ka lebaka la dipatlisiso.
O ka ikopanya le mongodi wa komiti ya Ethics ho Faculty ya Health Sciences, Yunivesithing ya Foreisitata
nomorong ya (051) 4052812 ha o ena le dipotso ka ditokelo tsa hao jwalo ka motho ya nkang karolo dipatlisisong.
O nka ka karolo dipatlisisong ka ho ithaopa, ka hoo o ke ke wa ahlolwa kapa wa lahlehelwa ke di letho ha o ka wa
hana ho nka karolo kapa wa tlohella ho nka karolo.
Ha ebe o dumela ho nka karolo, o tla fuwa lengolo le tshwanang le lena le saenuweng hammoho le lengolo le
fanang ka tlhahiso leseding, eo e leng tlhaloso e ngotsweng ya dipatlisiso tsena.
Ke hlaloseditswe sepheo sa dipatlisiso, hammoho le tlhahiso leseding ena e ka hodimo ka molomo. Ke utlwisisa
ho nka karolo ha ka dipatlisisong mme ke dumela ho nka karolo ka ho ithaopa, ntle le ho qobellwa.
_____________________ __________________
Signature ya ya nkang karolo Letsatsi
Bakeng sa bana
_____________________ __________________
Signature ea ngoana Letsatsi
_____________________ __________________
Signature ea motsoali Letsatsi

Page 238 of 252
Appendix B
Assuring Health for All (AHA) in the Free State
INFORMATION DOCUMENT
Study title: Assuring Health for All (AHA) in the Free State
Thank you for being willing to help us in this very important project. We are sure that the project will contribute to
improving the health of all the people of the Free State.
We, the University of the Free State, Faculty of Health Sciences, are doing research on determining the factors
involved in causing disease and disability in the Southern Free State. Research is just the process to learn the
answer to a question. In this study we want to learn what factors need to be addressed in health programmes in
the Free State. The study involves research and is not part of routine medical care.
Invitation to participate: We are asking/inviting you to participate in this research study, or/and asking for your
permission to include your child in this research study.
What is involved in the study: The aim of the project is to get enough information regarding the development of
chronic diseases like diabetes, stroke, high blood pressure and heart disease as well as HIV/AIDS to plan
appropriate health and nutrition intervention strategies for the people of the Free State. Trompsburg, Philippolis
and Springfontein have been chosen as the rural areas and Mangaung as the urban area.
For this study we need households whom we can follow for 12 years. The baseline survey will be done during
March 2009 in Mangaung. You will be asked to visit the MUCPP clinic for one day to take the necessary
measurements and to complete the questionnaires. After the baseline survey has been completed, we will
implement a nutrition intervention in your community to address the problems identified in the baseline survey. This
intervention will form part of the service learning interventions of the University. In addition to the services that we
will render in the community, we will visit your community again after three to six years to repeat the
measurements.
All the questionnaires will be filled out at MUCPP clinic by students from the University of the Free State.
Respondents from the chosen households will be asked to complete the following questionnaires in an interview
with the students:
Socio-demographic and household questionnaire,
Household food security and food procurement questionnaire,
Health questionnaire,
Knowledge, practices and attitudes (KPA) about nutrition questionnaire,
Diet and physical activity questionnaire.
We will also take some measurements such as weight, height, skinfold thicknesses, blood pressure, blood samples
and a urine sample. With your permission we will draw 60ml of blood in adults and this will only be done once. In
adults blood and urine samples will be used to determine the following: Full blood count; HbA1c; Glucose; Insulin;
Page 239 of 252
Lipogram; Homocysteine; Red cell Folate; Serum Vitamin B12; Fibrinogen; Gamma glutermyl transferases (GGT);
Carbohydrate-deficient transferrin (CDT); Ferritin; Uric acid; Creatinin; C-reactive protein; Albumin; Pre-albumin;
Transferrin; Retinol-binding protein; TSH; Iodine (urine); Leptin; Tumour Necrosis Factor alpha; Interleuken 6;
Melatonin; Brain natriuretic peptide; ACTH; Cortisol; Orexin; Urotensin-11; Endothelin 1; Plasminogen Activation
Inhibitor (PAI-1); Adiponectin; Micro-albuminuria (urine); Glucose tolerance (sub-sample); FFA (sub-sample).
A short medical examination will be performed on all participants members to identify any serious health problems.
We would like to retain some of the same blood in storage for possible future research related to the present
research question. Blood samples will be stored anonymously for a period of five years at the Department of
Chemical Pathology at the University of the Free State. If you are unhappy to have your blood stored for future
research, it will be disposed of at the end of the study, once the sample storage and record-keeping requirements
of good research practice have been met.
It is very important that we gather quality data and knowledge. Because HIV/AIDS is a devastating illness and
affects almost all aspects of health, it is necessary to know if HIV is absent before we analyse the data. It will be to
your benefit as well as the benefit of the research to determine your HIV status. Therefore we will also ask
permission to draw blood to determine your HIV status and ask questions about your HIV status which you are
allowed not to answer. You will be asked to sign a separate consent form for the HIV test. You will receive pre- and
post-testing counselling by a medical practitioner and all results will be kept strictly confidential in accordance with
the guidelines of the Health Professions Council of South Africa (HPCSA). You will only be informed of your HIV
result if you choose to be. All respondents who choose to be informed of the results will be informed by a medical
doctor and referred for relevant management. None of the researchers (other than one doctor) will know the HIV
status of any participants.
Blood tests will involve an analysis of the genetic composition of red blood cells and are aimed at increasing the
understanding of the causes and behaviour of chronic diseases of lifestyle such as obesity, diabetes and heart
disease. Genes are what you inherit from your parents. They are found in every part of your body and therefore
they will be present in the blood that we draw. The findings may benefit/eventually benefit others in terms of
prevention or treatment of diseases. You are free to refuse consent and you do not have to give reasons for doing
so. The following arrangements have been made to ensure privacy and confidentiality of your genetic information:
All blood samples will be stored anonymously. Your genetic material and information will be used in an identifiable
form. The research may reveal information of potential importance to the future health of an identifiable or
potentially identifiable participant or the participant‘s offspring.
Researchers will endeavour to provide information about the outcome of the research. If research generates
information about you which may be of relevance to the health of other family members, your consent will be
sought before offering to disclose such information to the family members concerned. Your material and
information will not be released for other uses without consent, unless required by law.

Page 240 of 252
Risks of being involved in the study: Medical doctors and registered nurses will be responsible for safely drawing
blood samples. In the unlikely event that an adverse event results from the procedure, you will be compensated for
any expenses.
Benefits of being in the study: By participating in the study you will help us to develop health and nutrition
strategies that will benefit the people of the Free State. You will be given pertinent information on the study while
involved in the project and after the results are available.
Participation is voluntary, and refusal to participate will involve no penalty or loss of benefits to which you are
entitled; you may discontinue participation at any time without penalty or loss of benefits to which you are otherwise
entitled.
Confidentiality: Efforts will be made to keep personal information confidential. Absolute confidentiality cannot be
guaranteed. Personal information may be disclosed if required by law. Organizations that may inspect and/or copy
your research records for quality assurance and data analysis include groups such as the Ethics Committee for
Medical Research and the Medicines Control Council. If results are published, this may lead to individual/cohort
identification.
Kind regards
PROF CORINNA WALSH
Contact details: 083 297 6030 / 051 4013818(W)

Page 241 of 252
INLIGTINGSDOKUMENT
Studietitel: Assuring Health for All (AHA) in the Free State
Dankie dat u bereid is om ons te help met hierdie baie belangrike projek. Ons is seker dat die projek sal bydra om
die gesondheid van alle persone in die Vrystaat te verbeter. Ons, die Universiteit van die Vrystaat, Fakulteit
Gesondheidswetenskappe, doen navorsing oor die faktore wat betrokke is by die oorsake van siekte in die
Vrystaat. Navorsing is slegs die proses waardeur die antwoord op ‗n vraagstuk verkry word. In hierdie studie wil
ons leer watter faktore aangespreek moet word in gesondheidsprogramme in die Vrystaat. Die studie behels
navorsing en is nie deel van roetine mediese behandeling nie.
Uitnodiging om deel te neem: Ons versoek/nooi u uit om aan ‗n navorsingstudie deel te neem of/en vra u
toestemming om u kind by die navorsingstudie in te sluit.
Wat behels die studie – Die doelwit van hierdie projek is om genoeg inligting in te samel oor die ontwikkeling van
chroniese siektes soos diabetes, beroerte, hoë bloeddruk en hartsiektes sowel as MIV/VIGS om toepaslike
gesondheids- en voedingintervensie strategieë te kan beplan vir die mense van die Vrystaat. Trompsburg,
Philippolis en Springfontein is as die plattelandse areas gekies en Mangaung as die stedelike area.
Vir die studie benodig ons huishoudings wat ons vir 12 jaar kan opvolg. Die basislyn opname sal in Mangaung
gedoen word tydens Maart 2009. U sal gevra word om die MUCPP kliniek vir een dag te besoek waar die nodige
metings gedoen sal word en vraelyste voltooi sal word. Nadat die basislynopname voltooi is, sal ons ‗n
voedingintervensieprogram in u area implementeer om die probleme wat in die basislynopname identifiseer is aan
te spreek. Hierdie intervensie vorm deel van die diensleer intervensies van die universiteit. Tesame met die
intervensie sal ons ook die gemeenskap elke drie jaar tot ses jaar besoek om die metings te herhaal.
Al die vraelyste sal by MUCPP voltooi word deur studente van die Universiteit van die Vrystaat. Respondente van
die gekose huishoudings sal gevra word om die volgende vraelyste te voltooi in ‗n onderhoud met die student:
Sosio-demografiese en huishoudelike vraelys,
Huisehoudelike voedselsekuriteit en voedselverkrygings vraelys,
Gesondheids vraelys,
Kennis, praktyke en houding teenoor voeding vraelys,
Dieet en fisiese aktiwiteit vraelys.
Ons sal ook sekere metings soos gewig, lengte, velvoudiktes, bloeddruk, bloed monsters en uriene monsters
neem. Met u toestemming sal ons in volwassenes 60ml bloed trek en dit sal slegs een keer geskied. In
volwassenes sal bloed en uriene monsters gebruik word om die volgende te bepaal: Volbloedtelling; HbA1c;
Glukose; Insulien; Lipogram; Homositeïen; Rooisel Folaat; Serum Vitamien B12; Fibrinogeen; Gamma glutermyl
transferases (GGT); Carbohydrate-deficient transferrin (CDT); Ferritin; Uriensuur; Kreatinien; C-reactiewe proteïen;
Albumien; Pre-albumien; Transferrien; Retinol-binding proteïen; TSH; Jodium (uriene); Leptien; Tumor Nekrosis
Faktor alfa; Interleuken 6; Melatonien; Brain natriuretic peptide; ACTH; Kortisol; Orexin; Urotensien-11; Endothelien

Page 242 of 252
1; Plasminogen Activation Inhibitor (PAI-1); Adiponektien; Mikro-albumienuria (uriene); Glukose toleransie (sub-
sample); FFA (sub-sample).
‗n Kort mediese ondersoek sal ook gedoen word op sekere lede van die huishouding om ernstige
gesondheidsprobleme te identifiseer.
Ons wil graag van die bloed bêre vir moontlike toekomstige navorsing wat verband hou met die huidige
navorsingsvrae. Bloed monsters sal anoniem gestoor word vir ‗n periode van vyf jaar. As u ongelukkig daaroor voel
dat u bloed vir toekomstige navorsing geberg word sal daar aan die einde van die studie daarmee weggedoen
word sodra die monsterbergings- en aantekeningsvereistes van goeie navorsingspraktyk nagekom is.
Dit is baie belangrik dat ons inligting van ‗n hoë kwaliteit versamel. Omdat MIV/VIGS ‗n siekte is wat amper alle
aspekte van gesondheid beïnvloed, is dit nodig dat ons weet of MIV afwesig is voordat ons die data ontleed. Dit
sal tot voordeel van uself en die navorsing strek indien u HIV status bepaal kan word. Dus sal ons toestemming
vra om bloed te trek om u MIV status te bepaal en vrae oor HIV vra wat u nie hoef te antwoord indien u nie wil nie.
U sal gevra word om ‗n aparte teostemmingsvorm te voltooi vir die HIV toets. U sal voor en na die toets berading
ontvang deur ‗n mediese dokter en alle uitslae sal streng vertroulik hanteer word volgens die riglyne van die Health
Professions Council of South africa (HPCSA). U sal slegs van u MIV uitslae in kennis gestel word indien u kies om
dit te ontvang. Alle respondente wat kies om van hulle uitslae in kennis gestel te word sal deur ‗n mediese dokter
in kennis gestel word en verwys word vir die relevante hantering. Die navorsers (met uitsluiting van een dokter) sal
nie weet wat u uitslae is nie.
Bloedtoetse sal die analise van die genetiese samestelling van rooibloedselle insluit en is gemik daarop om die
oorsake en gevolge van chroniese siektes soos vetsug, diabetes en hartsiektes beter te verstaan. Gene is dit wat
u van u ouers erf en word in elke deel van u liggaam aangetref. Daarom sal dit in enige weefsel of bloed wat deur
ons verwyder word teenwoordig wees. Die bevindings kan tot ander se voordeel strek met betrekking tot
voorkoming en behandeling van die toestand. Dit staan u vry om toestemming te weier en u hoef geen redes
daarvoor te verstrek nie. Die volgende reëlings is getref om privaatheid en vertroulikheid van u genetiese inligting
te verseker: Alle bloedmonsters sal anoniem geberg word. U genetiese materiaal en inligting sal in ‗n
identifiseerbarevorm gebruik word. Die navorsing mag inligting openbaar wat van potensiële belang mag wees vir
die toekomstige gesondheid van ‗n identifiseerbare of potensieel identifiseerbare deelnemer of die deelnemer se
nakomelinge.
Navorsers sal poog om inligting oor die uitkoms van die navorsing te verskaf. As navorsing inligting aan die lig
bring wat van belang mag wees vir die gesondheid van u familielede, sal u toestemming verkry word voordat
sodanige inligting aan die betrokke familielede bekend gemaak word. U bloed en inligting sal nie sonder
toestemming vir ander gebruike beskikbaar gestel word nie tensy vereis deur die wet.
Risikos van deelname aan die studie: Mediese dokters of geregistreerde verpleegkundiges sal verantwoordelik
wees vir die veilige neem van bloedmonsters. In die onwaarskynlike geval dat ‗n negatiewe gevolg ontstaan as
gevolg van die prosedure sal u vir enige onkostes vergoed word.
Page 243 of 252
Voordele van deelname aan die studie: Deur aan die studie deel te neem sal u ons help om gesondheids- en
voedingstrategieë te ontwikkel wat die mense van die Vrystaat sal baat. Die proefpersoon sal pertinente inligting
oor die studie ontvang tydens betrokkenheid by die projek en agterna wanneer die resultate beskikbaar is.
Deelname is vrywillig, en weiering om deel te neem sal geen boete of verlies van voordele waarop die deelnemer
andersins geregtig is behels nie; die proefpersoon kan te eniger tyd aan deelname onttrek sonder boete of verlies
van voordele waarop die proefpersoon andersins geregtig is.
Vertroulikheid: Daar sal gepoog word om persoonlike inligting vertroulik te hou. Volkome vertroulikheid kan nie
gewaarborg word nie. Persoonlike inligting kan bekend gemaak word as die wet dit vereis. Organisasies wat u
navorsingsrekords mag ondersoek en/of kopieer vir kwaliteitsversekering en data-analise sluit groepe soos die
Etiekkomitee vir Mediese Navorsing en die Medisynebeheerraad in. As resultate gepubliseer word kan dit lei tot
individuele/groepsidentifikasie.
Vriendelike groete
Prof CORINNA WALSH
Kontakbesonderhede: 083 297 6030 / 051 4013818(W)

Page 244 of 252
Assuring Health for All (AHA) in the Free State
(Tshepiso ya Bophelo ho bohle ba Foreisitata)
LENGOLO LA TLHAHISO LESEDING
Sehloho sa dipatlisiso: Assuring Health for All in the Free State
Re leboha ha o dumetse ho re thusa dipatlisisong tsena tse bohlokwa. Re tshepa ha dipatlisiso di tla re thusa ho
ntlafatsa maphelo a batho bohle ba Foreisitata.
Rona, re le Yunivesithi ya Foreisitata, Lefapha la tsa Maphelo, re etsa dipatlisiso ho shebana le dintho tse bakang
mafu le boqhwala mona Foreisitata e Borwa.
Dipatlisiso ke mokgwa wa ho ithuta karabo ya potso e itseng. Ka dipatlisiso tsena re batla ho ithuta hore na ke
dintho dife tse hlokang hore di amuwe ditsamaisong tsa tsa bophelo mona Foreisitata. Tsena ke dipatlisiso feela,
mme ha se karolo ya tshebeletso ya tsa bongaka.
Sememo sa ho nka karolo: Re a o kopa/ re a o mema ho nka karolo dipatlisisong tsena, ebile/ kapa re kopa
tumello ya hao ho sebedisa ngwana wa hao dipatlisisong tsena.
Dipatlisiso tsena di kenyeleditse eng: Sepheo sa dipatlisiso tsena ke ho fumana tlhahiso leseding e lekaneng
mabapi le tswello pele ya mafu a kang diabetes, stroke, high blood pressure le mafu a pelo hammoho le HIV/AIDS
hore ho tle ho thalwe mekgwa ya tsamaiso ya tsa bophelo le phepo bakeng sa batho ba Foreisitata. Trompsburg,
Phillippolis le Springfontein di kgethilwe jwalo ka dibaka tsa mahaeng mme Mangaung e kgethilwe e le sebaka sa
ditoropong tse tla sebediswang dipatlisisong.
Bakeng sa dipatlisiso tsena re hloka ho sebetsa le malapa ohle motseng wa lona bakeng sa dilemo tse 12.
Dipatlisiso tsa pele di tla qala ka Hlakubele (March) 2009. O tla kopuwa ho etela MUCPP letsatsi le le leng hore o
tle o tsebe ho tlatsa diforomo le hore o methuwe. Kamora dipatlisiso tsena tsa pele, ho kenywa tshebetsong
mekgwa ya tlhokomelo mabapi le tsa phepo sebakeng seo o dulang ho sona hore ho tle ho lokisanwe le mathatha
a tla be a hlahelletse dipatlisisong tsa pele. Tlhokomelo ena e tla ba karolo ya ho ithuta ho bile ho fanwa ka
ditshebeletso ke baithuti ba Yunivesithi. Hammoho le ditshebetso tseo re tla be re fana ka tsona motseng, re tla
etela motse wa hao ka mora dilemo tse tharo hoisa ho tse tseletseng hore ho phethwe ho metha.
Diforomo tsohle di tla tlatswa sebakeng seo liphuputso li tla tswareloa teng ke baithuti ba tswang Yunivesithing ya
Foreisitata kapa ke bathusi ba kwetlisitsweng ba tswang motseng wa hao. Batho ba nkang karolo ho tswa
malapeng a kgethilweng ba tla kopuwa ho tlatsa diforomo tse latelang ho ya ka dipotso tseo ba tla beng ba di
botswa ke moithuti kapa mosebeletsi wa setjhaba:
Dipotso ka maemo a hao le ka lelapa la hao,
Theko ya dijo le ‗food security‘,
Tsebo, tshebetso le mekgwa e amanang le phepo,
Tsela ya ho ja le boikwetliso.
Re tla o metha boima, botelete, botenya ba momeno wa letlalo (skinfold) le kgatello ya madi (blood pressure), o tla
nkuwa madi hammoho le metsi. Ho batho ba baholo re tla hula madi a kana ka dimililitara tse 60 hona ho tla etswa
hanngwe feela. Ho tla etswa dihlahlobo tsa bophelo ho batho ba itseng ba lelapa ho shebana le mathata a

Page 245 of 252
bophelo a tshosetsang. Ka tumello ea hau re tla ntsa madi a ka bang dimelimetara tse mashome a tseletseng
(60ml) ho motho e moholo le tse leshome le metso e mehlano, mme hona ho tla etwa hangoe feela. Madi le
metsetse e nkuoeng ho batho ba baholo e tla sebediswa ho hlalhoba matsoai le matsooeana a fumanehang ho
tsona a kenyeletsang tse latelang: Full blood count; HbA1c; Glucose; Insulin; Lipogram; Homocysteine; Red cell
Folic acid; Serum Vitamin B12; Fibrinogen; Gamma glutermyl transferases (GGT); Carbohydrate-deficient
transferrin (CDT); Ferritin; Uric acid; Creatinin; C-reactive protein; Albumin; Pre-albumin; Transferrin; Retinol-
binding protein; TSH; Iodine (urine); Leptin; Tumour Necrosis Factor alpha; Interleuken 6; Melatonin; Brain
natriuretic peptide; ACTH; Cortisol; Orexin; Urotensin-11; Endothelin 1; Plasminogen Activation Inhibitor (PAI-1);
Adiponectin; Micro-albuminuria (urine); Glucose tolerance (sub-sample); FFA (sub-sample). Tse ding tsa matsoai le
matsoaeana ana di tla hlahlojoa mading le metsetseng ea bana
Re ka rata ho boloka a mang a madi hore a tle a tsebe ho sebediswa ka nako e tlang dipatlisisong tse tshwanang
le tsena. Madi ana a tla bolokwa kantle le ho ngolwa mabitso bakeng sa dilemo tse hlano. Ha o sa rate ha madi a
hao a bolokwa bakeng sa dipatlisiso tse ding, a tla lahlwa ha ho qetwa ka dipatlisiso le hang feela ha a ile a
bolokwa hantle e bile dintho tse hlokahalang bakeng sa dipatlisiso di ile tsa fumanwa ka mokgwa o nepahetseng.
Ho bohlokwa haholo hore tlhahiso leseding eo re e fumanang ke e hlwahlwa. Hobane lefu la HIV e le le
hlokofatsang haholo, ebile le ama maphelo a rona, ho a hlokahala hore re tsebe hore kokwana-hloko ena e teng
kapa tjhe. Ke molemong oa hau le oa mofuputse ho fumana boemo ha hau ba HIV. Ka hona re tla kopa tumello ea
ho ntsa madi ho uena ho ea hlahloba boemo ba hau ba HIV mme re tla u botsa lipotso tse ling tse amanang le
boemo ba hau ba HIV tseo u sa qobelloeng ho li araba. U ka li araba ka ho rata ha hau. U tla kopuoa ho saena
foromo eo u re fang tumello ea ho hlahloba boemo ba hau ba HIV. Ka hoo re tla hula madi le ho o botsa dipotso
mabapi le maemo a hao a HIV. O dumelletswe ho se arabe dipotso tsena. Ho tla buisanwa le wena ho tebesitswe
maikutlo pele le ka mora dihlahlobo tse tla etswa ke ngaka, mme diphetho tsohle di tla ba sephiri ho ya ka ditaelo
tsa Health Professions Council ya South Africa (HPCSA). O tla tsebiswa ka maemo a hao a HIV feela ha o kgetha
hore o tsebiswe. Batho bohle ba batlang ho tsebiswa ka sephetho sa dihlahlobo tsa HIV, ba tla tsebiswa ke ngaka,
mme ba tla romellwa ho batho ba tla tseba ho ba fa thuso. Babatlisisi ba bang (ka ntle ho dingaka) ba ke ke ba
tseba maemo a ba nka karolo a HIV.
Ho hulwa ha madi ho kenyelleditse ho hlahloba ‗genetic composition‘ e ho di ‗red blood cells‘, mme hona ho tla
thusa ho phahamisa kutlwisiso ya dintho tse bakang mafu a kang monono, diabetes le mafu a pelo. Di ‗genes‘, ke
dintho tseo o di futsang ho tswa ho batswadi ba hao. Di fumanwa dikarolong tsohle tsa mmele kahoo di a
fumaneha le ho madi a tla hulwa. Dintlha tse tla fumanwa di tla thusa batho ba bang ka ho thusa ho thibela, kapa
ho phekola mafu a fapaneng. O na le tokelo ya ho hana ho nka karolo ebile ha ho hlokahale hore o fane ka
lebaka. Ho netefatsa hore dintlha tse tla fumanwang ho wena di dula e le sephiri, ho entswe dintho tsena tse
latelang: Madi ohle a tla bolokwa ntle le ho ngolwa mabitso. ‗Genetic material‘ ya hao e tla sebediswa ka mokgwa
o tsebahalang. Dipatlisiso tsena di ka nna tsa fana ka tlhahiso leseding e bohlokwa bakeng sa bokamoso ba
monka karolo kapa ba bana ba hae.
Babatlisisi ba tla leka ho fana ka lesedi mabapi le sephetho sa dipatlisiso. Ha dipatlisiso di ka fana ka dinthla tse
leng bohlokwa bakeng sa maphelo a ba bang ba lelapa, tumello e tla kopuwa ho wena pele batho ba amehang ba
tsebiswa. Dintlha tsohle tsa hao di ke ke tsa sebediswa nqeng tse ding kantle ho tumello ya hao, kantle le ha ho
ka hlokeha hore ho etswe jwalo ho ya ka molao.

Page 246 of 252
Kotsi tse ka bang teng dipatlisisong: Dingaka le baoki ba tla ikarabella ho huleng ha madi ka mokgwa o
bolokehileng. Ha ho ka etsahala hore ho be le se o etsahallang se sa lokang o tla lefuwa ditshenyehelo tsa hao
tsohle.
Ditholwana tsa ho nka karolo: Ha o nka karolo o tla thusa ho tsweletsa pele metjha ya tsa bophelo le phepo ho
thusa batho ba Foreisitata. O tla fuwa tlhahiso leseding e bohlokwa tsamaong ya dipatlisiso le ha sephetho sa
dipatlisiso se fumaneha.
O nka karolo ka ho ithaopa, mme ha o hana ho nka karolo o ke ke wa lahlehelwa ke letho; o ka tlohella ho nka
karolo nako e nngwe le e nngwe ntle le ho lahlehelwa ke letho.
Sephiri: Ho tla etswa maleba-leba a hore dintlha tsa hao di dule di le lekunutu. O tshepiswa lekunutu ka hohle-
hohle. Dintlha tsa hao di phatlalatswa feela ha molao o re jwalo. Mekgatlo e tla hlahloba kapa e tla kopisa dintlha
tsa hao ho lekola boleng e kenyeleditse e kang Ethics Committee ya Medical Research hammoho le Medicine
Control Council.
Ha diphetho di ka phatlalatswa, hona ho ka lebisa ho tsebiswa ha motho kapa sehlopha.
Ka boikokobetso
Prof Corinna Walsh
Mohala: 083 297 6030 / 051 401 3818

Page 247 of 252
Appendix C
Assuring Health for All (AHA) in the Free State
Participation letter
Dear Participant
Thank you for being willing to help us in this very important project. We are sure that the project will contribute to
improving the health of all the people of the Free State.
At the time you receive this letter you would have already been visited by a fieldworker and you have already
signed consent to give a blood sample. This letter serves to inform you of the date and time the blood sample and
other measurements will be taken at the MUCPP clinic (basement).
IMPORTANT INFORMATION
1. You must be at MUCPP on ……………………. by 0….h00.
2. You MUST NOT EAT OR DRINK anything after ten o‘clock of the previous night (10 pm of the night
before). This is necessary for the glucose test to be accurate.
3. You MUST BRING YOUR ID DOCUMENT with you
4. Bring along a list of people that live in the household with you and their birth dates.
5. You will receive something to eat and drink after the blood sample is taken.
6. After participating in the project, you will receive an amount of R10 to pay for your transport costs.
7. If you are employed, please show this letter to your employer.
Dear Employer
This serves to ask you to give one day‘s paid leave to…………………………………. in order to allow him/her to
attend his appointment with the research team of the Faculty of Health Sciences at the University of the Free
State.
Thank you for your cooperation. For any further information please contact Prof Corinna Walsh at 083 297
6030.
Prof C Walsh (project leader)

Page 248 of 252
Assuring Health for All (AHA) in the Free State
Deelname brief
Beste Deelnemer
Dankie dat u bereid is om ons te help met hierdie belangrike projek. Ons is seker dat die projek sal bydra tot die
verbetering van gesondheid van al die mense in die Vrystaat.
Teen die tyd wat u hierdie brief ontvang het ‗n veldwerker u al reeds besoek en u het toestemming gegee om deel
te neem aan die projek en ‗n bloed monster te gee Met hierdie brief wil ons u graag in kennis stel van die datum
en tyd wat die bloed getrek sal word en ander mates geneem sal word by die navorsingseenheid (saal)naaste aan
u woning.
BELANGRIKE INLIGTING
1. U moet by MUCPP wees op ……………… teen 0….h00.
2. U MOET NIKS EET OF DRINK na tien uur die vorige aand (10 pm van die aand voor die toets). Dit is
nodig vir die glukose toets om betroubaar te wees.
3. U MOET U ID DOKUMENT saam met u kliniek toe bring
4. Bring asseblief ‗n lys van persone wat saam met u in die huis woon saam met hule geboortedatums.
5. U sal ‗n ligte ete en iets om te drink ontvang nadat die bloedtoets voltooi is.
6. Nadat u deelgeneem het , sal u ‗n bedrag van R10 ontvang om te betaal vir u vervoerkostes.
7. Indien u werk, moet u asseblief hierdie brief aan u werkgewer wys.
Geagte Werkgewer
Met hierdie brief vra ons dat u een dag betaalde verlof toestaan aan……………………………. om dit vir
haar/hom moontlik te maak om hierdie afspraak met die navorsingsspan van die Fakulteit
Gesondheidswetenskappe by die Universiteit van die Vrystaat by te woon.
Dankie vir u samewerking. Vir verdere inligting kontak asseblief vir Prof Corinna Walsh by 083 297 6030.
Prof C Walsh (projekleier)

Page 249 of 252
Assuring Health for All in the Free State
(Tshepiso ya Bophelo ho bohle ba Foreisitata)
Lengolo la ho nka karolo
Ho ya nkang karolo
Re leboha ha o dumetse ho re thusa mosebetsing ona o bohlokwa. Re tshepa ha mosebetsi ona o tla thusa ho
ntlafatsa maphelo a batho bohle ba Foreisitata.
Nako eo o fumanang lengolo lena, o tla be o se o etetswe ke e mong wa bathusi ba rona ebile o tla be o se o
saenile ho fana ka tumello ya ho hula madi. Lengolo lena ke le o tsebisang ka letsatsi le nako eo tla methwang le
ho hulwa madi tliliniking e haufi le lelapa la hao.
DINTLHA TSA BOHLOKWA
1. O tlamehile ho ba MUCPP ka di .................... nako e le 0......h00.
2. O SE KE WA JA KAPA WA NWA letho ka mora hora ya leshome(10:00) bosiu bo ka pele ho fihlela o
hlahlobuwa tliliniking. Hona ho bohlokwa hore dihlahlobo tsa tswekere e be tse nepahetseng.
3. O TSHWANETSE HO TLA LE BUKANA YA HAO YA BOITSEBISO (ID) ha o tla
4. O tle o tshwere le wena lenane la batho bohle bao o dulang le bona ka tlung hammoho le matsatsi a bona
a tswalo
5. O tla fumana dijo kamora hore o hulwe madi.
6. O tla fuwa tjhelete e e kana ka R10 bakeng sa transport ha o nka karolo dipatlisisong.
7. Ha e be o sebetsa, re kopa o bontshe monga hao lengolo lena.
Monga mosebetsi
Lengolo lena le kopa hore of fane ka letsatsi le leng leng le patallwang ho ........................................ hore a tle a
tsebe ho ba teng ka nako eo a e beetsweng bakeng sa sehlopha se etsang dipatlisiso sa Lefapha la tsa maphelo
Yunivesithing ya Foreisitata.
Re lebohela tshebedisano mooho ya hao. Ha ebe o hloka tlhalosetso e fetang mona o ka ikopanya le Dr Corinna
Walsh ho 083 297 6030.
Prof C Walsh (moetelledipele)

Page 250 of 252
Appendix D

Page 251 of 252
Appendix E

Page 252 of 252
Appendix F

Page 253 of 252
Appendix G
Assuring Health for All (AHA) in the Free State
Anthropometry
Area in Mangaung:_________________ 1
Household number: 2-4
Member number (as on socio-demographic form): 5-6
D D M M Y Y Y Y
Interview Date: 7-14
Measurer (interviewer):___________________ 15-16
Weight (kg):___________________ . 17-21
Height (cm): ____________________ . 22-26
If height cannot be measured:
Knee height (cm):_________________ . 27-31
Demispan (cm):___________________ . 32-36
Circumferences (cm):
Upper-arm (adults and children):________________ . 37-40
Waist (adults): ___________________ . 41-45
Hip (adults): _____________________ . 46-50
Wrist (adults):__________________ . 51-54
Head circumference (children):___________________ . 55-58
Bio-impedance fat percentage (adults):____________________ . 59-62
Skinfold thicknesses (mm):
Triceps (adults and children):________ ________ ________ 63-64
Biceps (adults): ________ ________ ________ 65-66
Supra-ileac (adults): ________ ________ ________ 67-68
Subscapular (adults): ________ ________ ________ 69-70
Thigh (adults): ________ ________ ________ 71-72
Calf (adults): ________ ________ ________ 73-74