An Integrated Geologic Map of the Rembrandt Basin ... - MDPI
Upload
independentCategory
view
1download
0
Application of electrical resistivity imaging to thedevelopment of a geologic model for a proposedEdmonton landfill site
Lindsay N. Meads, Laurence R. Bentley, and Carl A. Mendoza
Abstract: Electrical resistivity imaging (ERI) was used to further characterize the geologic setting at the proposedAurum solid-waste landfill site near Edmonton, Alberta. Two bedrock channel aquifers, the east and south channels,exist in or near the site. Previous studies at the proposed site used borehole and pumping test data to determine thatthe two aquifers are separate and hydraulically disconnected by a sheet of ice thrust bedrock. The three objectives ofthe ERI were to resolve the sand channels and terrace sands, resolve the top of the thrust bedrock, and resolve thesand channels beneath the thrust bedrock. The ERI survey, in combination with the borehole data, presented a moredetailed representation of the site’s complex geology than borehole data alone. The south channel has a long and evenbottom, steeply sloping sides, and two levels. The thrust bedrock occurs as irregular massive blocks throughout the site,and the aquifers are hydraulically confined by the glacial till. The bedrock surface is highly variable where it has beenmodified by glacial ice thrusting and relatively uniform elsewhere. Electrical resistivity imaging was found to be usefulfor the prompt and accurate development of a geologic model for the proposed Aurum landfill site.
Key words: electrical resistivity imaging, thrust bedrock, site characterization.
Résumé : On a utilisé l’imagerie par résistivité électrique (IRE) pour caractériser davantage le cadre géologique sur lesite proposé de l’enfouissement sanitaire de résidus solides d’Aurum près d’Edmonton, Alberta. Il existe sur ou près dusite deux canaux d’aquifères dans le socle rocheux, les canaux de l’est et du sud. Dans les études antérieures sur lesite proposé, on a utilisé des données de forages et d’essais de pompage pour déterminer que les deux aquifères sontséparés et isolé l’un de l’autre du point de vue hydraulique par une couche de lit rocheux charriée par la glace. Lestrois objectifs d’imagerie ont été de définir les canaux et les terrasses de sable, définir le dessus du lit de roc charrié,et définir les canaux de sable sous le lit rocheux charrié. Le relevé à l’IRE, combiné avec les données des forages, ontfourni une représentation de la géologie complexe du site plus détaillée que les données des forages seules. Le canalsud a un fond plat et long, des côtés en pentes abruptes, et deux niveaux. Le lit rocheux se présente sous la forme deblocs massifs irréguliers sur l’ensemble du site et les aquifères sont confinés du point du vue hydraulique par le tillglaciaire. La surface du lit rocheux est extrêmement variable là où il a été modifié par le charriage des glaciers, etrelativement uniforme ailleurs. On a trouvé que la technique d’IRE était utile pour le développement prompt et précisd’un modèle géologique pour le site d’enfouissement proposé d’Aurum.
Mots clés : imagerie par résistivité électrique, lit rocheux charrié, caractérisation de site.
[Traduit par la Rédaction] Meads et al. 558
Introduction
Location and backgroundThe Aurum site was a proposed city of Edmonton waste
management centre. The proposed solid-waste landfill site islocated in Section 22, Township 53, Range 23, west of the4th Meridian and lies 0.5 km south of the North Saskatche-
wan River (Andriashek et al. 1993). The study area is ap-proximately 1.8 km by 1.8 km and is bounded by 137Avenue N.E. to the north and 33 Street N.E. to the east(Fig. 1). Stanley Associates Engineering Ltd. conductedthree detailed hydrogeologic investigations of the site from1987 to 1990 (Stanley Associates Engineering Ltd. 1990;Andriashek et al. 1993). During the course of these investi-gations, 50 auger boreholes, 15 rotary boreholes, and 2pumping wells were completed at the site. The bedrock un-derlying the Aurum site is the Horseshoe Canyon Formation(Andriashek et al. 1993). The bedrock mostly consists ofsoft, grey and greenish grey, fine-grained, bentonitic andfeldspathic sandstones; grey, brown and green, siltybentonitic shales; carbonaceous shales; and coal seams.Most bedrock layers contain some or a large amount of ben-tonite (Irish 1970). Two bedrock channels of preglacial sandand gravel were identified. The east channel trends north–south along the eastern edge of the study area and the south
Can. Geotech. J. 40: 551–558 (2003) doi: 10.1139/T03-017 © 2003 NRC Canada
551
Received 23 July 2002. Accepted 28 December 2002.Published on the NRC Research Press Web site athttp://cgj.nrc.ca on 7 May 2003.
L.N. Meads and L.R. Bentley.1 University of Calgary,Geology and Geophysics, 2500 University Drive N.W.,Calgary, AB T2N 1N4, Canada.C.A. Mendoza. University of Alberta, Earth and AtmosphericSciences, 1–26 Earth Sciences Building, Edmonton, ABT6G 2E3, Canada.
1Corresponding author (e-mail: [email protected]).
I:\cgj\CGJ40-03\T03-017.vpFriday, May 02, 2003 2:42:58 PM
Color profile: Generic CMYK printer profileComposite Default screen

channel trends northwest–southeast through the middle ofthe Aurum site (Fig. 1). These channels are separated by ice-thrust bedrock and glacial till. The nature and extent of thisseparation proved difficult to resolve using borehole dataalone; however, hydraulic testing demonstrated that the twochannels are discrete and hydraulically unconnected(Andriashek et al. 1993). The final investigation found theAurum site to be an unsuitable sanitary landfill site becauseof the potential for leachate migration into the North Sas-katchewan River.
Geophysical backgroundThe purpose of our research is to determine whether elec-
trical resistivity imaging (ERI) would have been valuable inthe investigation of the Aurum site. Boreholes are a neces-sary and reliable source of primary data, and ERI interpreta-tions provide secondary information. Although borehole dataprovides a good sample for a six-inch diameter verticalcylindrical volume, it can be a poor representation of theseveral square metres surrounding the borehole. Alterna-tively, ERI provides block averages of resistivity. Also, bore-hole data can be a more expensive data acquisition methodwhen compared to an ERI survey. When the resistivity val-ues are correlated with differing types of geologic materials,they can provide useful information for interpreting betweenboreholes.
Electrical resistivity is a function of porosity, saturation,resistivity of the pore fluids and the solid phase, and thematerial texture. Because sand, fine grained sediments, and
bedrock are expected to exhibit large contrasts in such prop-erties, electrical resistivity should be well suited to resolvingsand channels in bedrock and thrust bedrock in unconsoli-dated sediments. Electrical resistivity imaging has been usedto map bedrock channels by Gilson et al. (2000), Ramag etal. (1998) and Chen et al. (1996).
Subsurface resistivity is measured by applying an electriccurrent through two current electrodes and measuring the re-sulting voltage difference between two potential electrodes.The measurement is reported as apparent resistivity (ρa)
[1] ρa = k VI
where V is the measured voltage difference, I is the appliedcurrent, and k is a geometric factor based on the electrodearrangement (Ward 1990). The Wenner electrode array hasone current electrode, followed by two potential electrodes,and ends with the second current electrode. The four elec-trodes are spaced an equal distance apart (a or a-spacing).The geometric factor (k) for the Wenner array is 2πa. TheWenner array was chosen for several reasons. It is a robustarray in the presence of measurement noise. It is well suitedto resolving horizontal structures because it is more sensitiveto vertical changes in resistivity than to horizontal changesin resistivity (Ward 1990). The structures we are resolvingare primarily horizontal. In practice, a line of multiple elec-trodes is deployed across the land surface. Electrodes are se-quentially activated as either current or potential electrodes,and apparent resitivities are determined for numerous over-
© 2003 NRC Canada
552 Can. Geotech. J. Vol. 40, 2003
Fig. 1. Aurum site map with selected borehole and pumping well locations (interpreted geology adapted from Andriashek et al. 1993).
I:\cgj\CGJ40-03\T03-017.vpFriday, May 02, 2003 2:42:59 PM
Color profile: Generic CMYK printer profileComposite Default screen
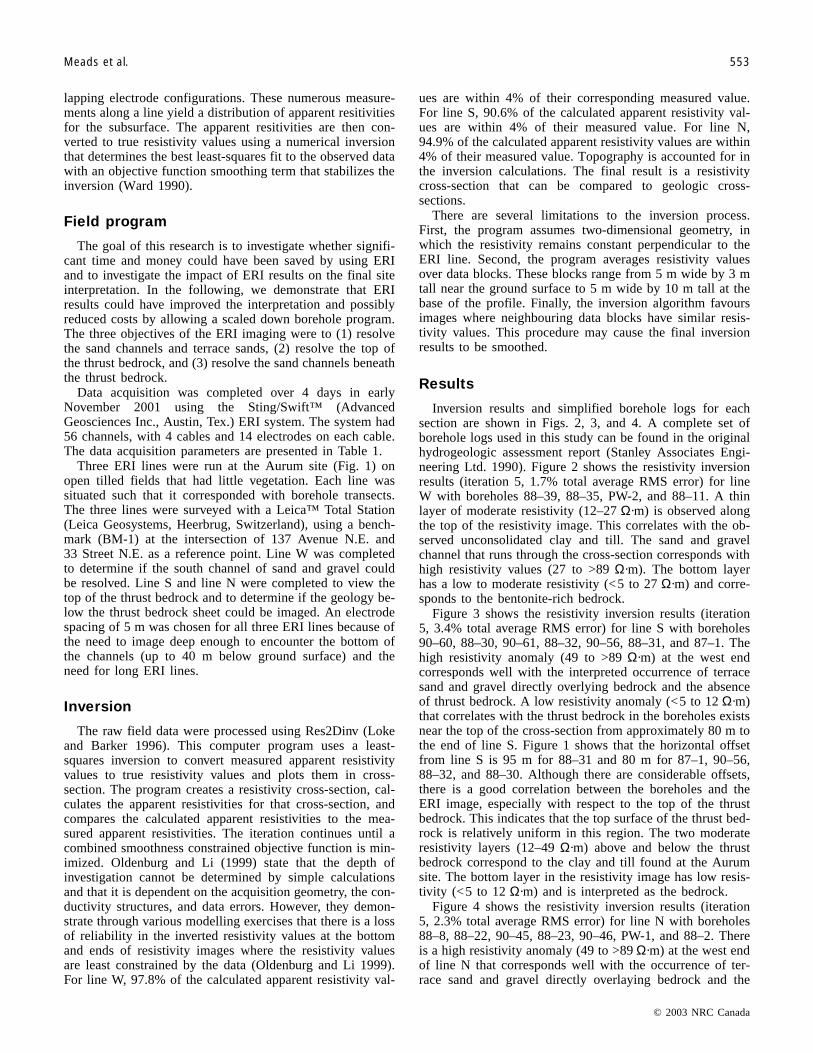
lapping electrode configurations. These numerous measure-ments along a line yield a distribution of apparent resitivitiesfor the subsurface. The apparent resitivities are then con-verted to true resistivity values using a numerical inversionthat determines the best least-squares fit to the observed datawith an objective function smoothing term that stabilizes theinversion (Ward 1990).
Field program
The goal of this research is to investigate whether signifi-cant time and money could have been saved by using ERIand to investigate the impact of ERI results on the final siteinterpretation. In the following, we demonstrate that ERIresults could have improved the interpretation and possiblyreduced costs by allowing a scaled down borehole program.The three objectives of the ERI imaging were to (1) resolvethe sand channels and terrace sands, (2) resolve the top ofthe thrust bedrock, and (3) resolve the sand channels beneaththe thrust bedrock.
Data acquisition was completed over 4 days in earlyNovember 2001 using the Sting/Swift™ (AdvancedGeosciences Inc., Austin, Tex.) ERI system. The system had56 channels, with 4 cables and 14 electrodes on each cable.The data acquisition parameters are presented in Table 1.
Three ERI lines were run at the Aurum site (Fig. 1) onopen tilled fields that had little vegetation. Each line wassituated such that it corresponded with borehole transects.The three lines were surveyed with a Leica™ Total Station(Leica Geosystems, Heerbrug, Switzerland), using a bench-mark (BM-1) at the intersection of 137 Avenue N.E. and33 Street N.E. as a reference point. Line W was completedto determine if the south channel of sand and gravel couldbe resolved. Line S and line N were completed to view thetop of the thrust bedrock and to determine if the geology be-low the thrust bedrock sheet could be imaged. An electrodespacing of 5 m was chosen for all three ERI lines because ofthe need to image deep enough to encounter the bottom ofthe channels (up to 40 m below ground surface) and theneed for long ERI lines.
Inversion
The raw field data were processed using Res2Dinv (Lokeand Barker 1996). This computer program uses a least-squares inversion to convert measured apparent resistivityvalues to true resistivity values and plots them in cross-section. The program creates a resistivity cross-section, cal-culates the apparent resistivities for that cross-section, andcompares the calculated apparent resistivities to the mea-sured apparent resistivities. The iteration continues until acombined smoothness constrained objective function is min-imized. Oldenburg and Li (1999) state that the depth ofinvestigation cannot be determined by simple calculationsand that it is dependent on the acquisition geometry, the con-ductivity structures, and data errors. However, they demon-strate through various modelling exercises that there is a lossof reliability in the inverted resistivity values at the bottomand ends of resistivity images where the resistivity valuesare least constrained by the data (Oldenburg and Li 1999).For line W, 97.8% of the calculated apparent resistivity val-
ues are within 4% of their corresponding measured value.For line S, 90.6% of the calculated apparent resistivity val-ues are within 4% of their measured value. For line N,94.9% of the calculated apparent resistivity values are within4% of their measured value. Topography is accounted for inthe inversion calculations. The final result is a resistivitycross-section that can be compared to geologic cross-sections.
There are several limitations to the inversion process.First, the program assumes two-dimensional geometry, inwhich the resistivity remains constant perpendicular to theERI line. Second, the program averages resistivity valuesover data blocks. These blocks range from 5 m wide by 3 mtall near the ground surface to 5 m wide by 10 m tall at thebase of the profile. Finally, the inversion algorithm favoursimages where neighbouring data blocks have similar resis-tivity values. This procedure may cause the final inversionresults to be smoothed.
Results
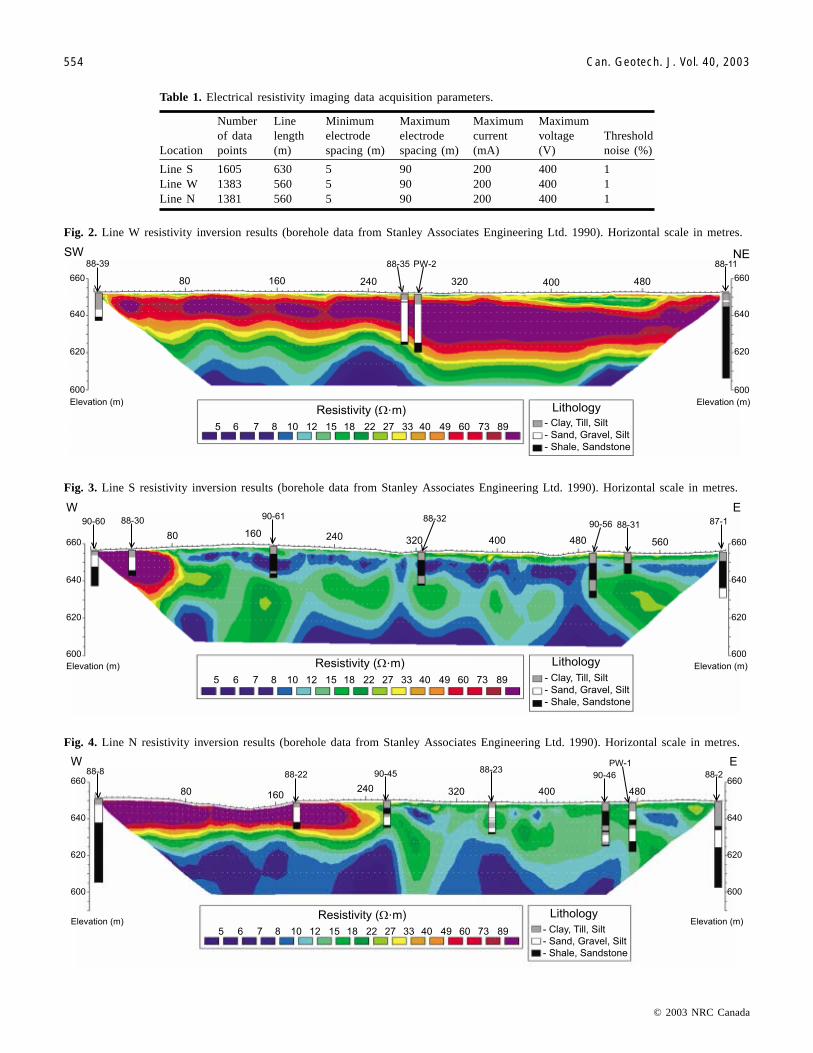
Inversion results and simplified borehole logs for eachsection are shown in Figs. 2, 3, and 4. A complete set ofborehole logs used in this study can be found in the originalhydrogeologic assessment report (Stanley Associates Engi-neering Ltd. 1990). Figure 2 shows the resistivity inversionresults (iteration 5, 1.7% total average RMS error) for lineW with boreholes 88–39, 88–35, PW-2, and 88–11. A thinlayer of moderate resistivity (12–27 Ω·m) is observed alongthe top of the resistivity image. This correlates with the ob-served unconsolidated clay and till. The sand and gravelchannel that runs through the cross-section corresponds withhigh resistivity values (27 to >89 Ω·m). The bottom layerhas a low to moderate resistivity (<5 to 27 Ω·m) and corre-sponds to the bentonite-rich bedrock.
Figure 3 shows the resistivity inversion results (iteration5, 3.4% total average RMS error) for line S with boreholes90–60, 88–30, 90–61, 88–32, 90–56, 88–31, and 87–1. Thehigh resistivity anomaly (49 to >89 Ω·m) at the west endcorresponds well with the interpreted occurrence of terracesand and gravel directly overlying bedrock and the absenceof thrust bedrock. A low resistivity anomaly (<5 to 12 Ω·m)that correlates with the thrust bedrock in the boreholes existsnear the top of the cross-section from approximately 80 m tothe end of line S. Figure 1 shows that the horizontal offsetfrom line S is 95 m for 88–31 and 80 m for 87–1, 90–56,88–32, and 88–30. Although there are considerable offsets,there is a good correlation between the boreholes and theERI image, especially with respect to the top of the thrustbedrock. This indicates that the top surface of the thrust bed-rock is relatively uniform in this region. The two moderateresistivity layers (12–49 Ω·m) above and below the thrustbedrock correspond to the clay and till found at the Aurumsite. The bottom layer in the resistivity image has low resis-tivity (<5 to 12 Ω·m) and is interpreted as the bedrock.
Figure 4 shows the resistivity inversion results (iteration5, 2.3% total average RMS error) for line N with boreholes88–8, 88–22, 90–45, 88–23, 90–46, PW-1, and 88–2. Thereis a high resistivity anomaly (49 to >89 Ω·m) at the west endof line N that corresponds well with the occurrence of ter-race sand and gravel directly overlaying bedrock and the
© 2003 NRC Canada
Meads et al. 553
I:\cgj\CGJ40-03\T03-017.vpFriday, May 02, 2003 2:42:59 PM
Color profile: Generic CMYK printer profileComposite Default screen
© 2003 NRC Canada
554 Can. Geotech. J. Vol. 40, 2003
Location
Numberof datapoints
Linelength(m)
Minimumelectrodespacing (m)
Maximumelectrodespacing (m)
Maximumcurrent(mA)
Maximumvoltage(V)
Thresholdnoise (%)
Line S 1605 630 5 90 200 400 1Line W 1383 560 5 90 200 400 1Line N 1381 560 5 90 200 400 1
Table 1. Electrical resistivity imaging data acquisition parameters.
Fig. 2. Line W resistivity inversion results (borehole data from Stanley Associates Engineering Ltd. 1990). Horizontal scale in metres.
Fig. 3. Line S resistivity inversion results (borehole data from Stanley Associates Engineering Ltd. 1990). Horizontal scale in metres.
Fig. 4. Line N resistivity inversion results (borehole data from Stanley Associates Engineering Ltd. 1990). Horizontal scale in metres.
I:\cgj\CGJ40-03\T03-017.vpFriday, May 02, 2003 2:43:05 PM
Color profile: Generic CMYK printer profileComposite Default screen

absence of thrust bedrock. Low resistivity anomalies (<5 to12 Ω·m) exist near the top of the cross-section from 265 to315 m, 365 to 375 m, 385 to 395 m, 402.5 to 412.5 m, and475 to 525 m. These low resistivity zones are interpreted asbeing due to irregular blocks of low resistivity thrust bed-rock. Thrust bedrock of variable thickness is also observedin the borehole logs along this section of the line. There aretwo moderate resistivity layers (12–49 Ω·m) above and be-low the thrust bedrock that correlate with the clay and tillfound at the Aurum site. The bedrock is the lowest layer inthe resistivity image and corresponds to a low resistivityvalue (<5 to 12 ohm·m).
A summary of the main lithologies at the proposed Aurumlandfill site and the corresponding resistivity values arefound in Table 2. Resistivity ranges for each line were deter-mined by superimposing the boreholes over the ERI imageand observing the correlation between the borehole lithologyand the image resistivity. For each line, the sand and gravelcorresponded to the highest resistivity, the bedrock andthrust bedrock corresponded to the lowest resistivity, and theclay and till corresponded to intermediate values. The lowresistivity of the bedrock is due to its high bentonite content.
Interpretation
Terrace and channel sandsLine W was run to resolve the south channel of sand and
gravel. Figure 5a shows a simplified geologic cross-sectionadapted from the resistivity image in Fig. 2. Figure 5b showsthe geological cross-section for the same location as inter-preted from the 1987–1990 investigations. The morphologyof the sand channels is seen to be different, although theresistivity image matches data from the boreholes relativelywell. The ERI cross-section displays a two-level channel thathas a long, flat bottom and steep sides, while the 1987–1990interpretation shows a central low and gradually slopingsides.
A portion of the terrace sands can be seen in line S andline N as a high resistivity anomaly (Figs. 6 and 7). Thesands occur at the very west end of line S and the resistivityimage shows the sand and gravel to be thicker than shown inboreholes 88–30 and 90–60. This poor imaging of the bot-tom of these sands can be attributed to a combination ofreduced inversion reliability at the ends of the line, as men-tioned above, inversion smoothing, and the fact that 88–30 isoffset 80 m from line S. The maximum a-spacing for elec-trode arrays that were completely over the terrace sands forline S is 30% of the total maximum a-spacing. In contrast,the maximum a-spacing for electrode arrays that were com-pletely over the terrace sands for line N is 89% of the totalmaximum a-spacing. This increased a-space coverageresulted in boreholes 88–22 and 88–8 on line N matchingthe interpreted channel thickness much better than boreholes88–30 and 90–60 on line S. If line S had been extended fur-ther west, we expect that the inversion would have provideda better match for the depth to the bottom of the terracesands.
The east channel runs underneath the thrust bedrock at theeast end of line S and line N, and both ERI lines failed toimage this channel (Figs. 6 and 7). For line S, the maximuma-spacing over the east channel was 17% of the total maxi-
mum a-spacing. This degree of coverage proved to be inade-quate in imaging the top of the channel sands. Line N ran di-rectly over the east channel with a maximum a-spacing of50% of the total maximum a-spacing, yet line N failed toresolve the sand and gravel in the channel. The failure to im-age the east channel is likely due to a combination of thechannel being close to the end of the line, the depth of thesands, and the thinness of the beds. It may be possible thatthe channel sands could be imaged with a smaller electrodespacing, where there would be better resolution, or witha line centrally located over the east channel. This issueremains unresolved because logistical constraints preventsuch additional surveys.
Thrust bedrockFigure 6a shows a simplified geologic cross-section
adapted from the resistivity image of line S in Fig. 3. Fig-ure 6b shows the geological cross-section for the same areainterpreted from the 1987–1990 investigations. Figure 6ashows that the thrust bedrock has a minimum thickness of3 m (at 520 m) and a maximum thickness of 25 m (at420 m). Figure 6b shows that the thrust bedrock has a mini-mum thickness of 1.3 m (at 90 m) and a maximum thicknessof 15 m (at 620 m). Although the resistivity image matchesthe borehole logs fairly well at their particular locations,there is a major difference in the shape of the thrust bedrock.The original interpretation depicts the thrust bedrock as afairly uniform sheet. Our interpretation of the resistivity im-age indicates highly irregular, massive blocks of displacedbedrock embedded in till. Thus, it may be that bedrock wasthrust in blocks by the glacial ice, instead of as a uniformsheet. A similar pattern in the interpreted thrust bedrock ge-ometry is observed in Fig. 7. Figure 7a shows that the thrustbedrock has a minimum thickness of 2 m (at 265 m) and amaximum thickness of 14 m (at 515 m). Figure 7b showsthat the thrust bedrock has a minimum thickness of 1.3 m (at350 m) and a maximum thickness of 12.5 m (at 450 m). Thebroken up nature of the thrust bedrock is more pronouncedin this ERI cross-section, which is in contrast with the inter-preted cross-section from the 1987–1990 investigations.
The Edmonton area is characterized as a valleyglaciotectonic setting, which features ice-pushed structuresalong the walls of the preglacial valleys (Tsui et al. 1989).
© 2003 NRC Canada
Meads et al. 555
Lithology Resistivity values (Ω·m) RMS error
Line S 3.4%Clay and till 12 to 19Sand and gravel 49 to >89Bedrock <5 to 12Line W 1.7%Clay and till 12 to 27Sand and gravel 27 to >89Bedrock <5 to 27Line N 2.3%Clay and till 12 to 19Sand and gravel 49 to >89Bedrock <5 to 12
Table 2. Interpreted correlation between resistivity valuesand site lithology.
I:\cgj\CGJ40-03\T03-017.vpFriday, May 02, 2003 2:43:05 PM
Color profile: Generic CMYK printer profileComposite Default screen

These structures are often composite ridges that consist ofmultiple slabs of up-thrust and contorted bedrock that maybe transported (Benn and Evans 1998). It is common for theslabs to ultimately be overridden by the glacier (Bennett andGlasser 1996). The formation of composite ridges has beenassociated with surging glaciers (Mooers 1990; Bennett andGlasser 1996; Boulton et al. 1996; and Benn and Evans1998). The tendency of a glacier to surge is dependent onincreased basal water pressures resulting from trapped
subglacial water (Benn and Evans 1998). Glaciers in theEdmonton area exhibited proglacial water ponding and in-creased pore-water pressures (Tsui et al. 1989). Thus, it islikely that the thrust bedrock at the Aurum site is a series ofcomposite ridges formed by surging glaciers. Most of theresulting topographic relief was eliminated by subsequentglacial erosion.
The resistivity images are generally consistent with theborehole logs; however, there are two main inconsistencies.
© 2003 NRC Canada
556 Can. Geotech. J. Vol. 40, 2003
Fig. 5. Geologic cross-sections for line W from (a) the November 2001 ERI survey and (b) the 1987–1990 studies (adapted from Stan-ley Associates Engineering Ltd. 1990). Horizontal scale in metres.
Fig. 6. Geologic cross-sections for line S from (a) the November 2001 ERI survey and (b) the 1987–1990 studies (adapted fromAndriashek et al. 1993). Horizontal scale in metres.
I:\cgj\CGJ40-03\T03-017.vpFriday, May 02, 2003 2:43:07 PM
Color profile: Generic CMYK printer profileComposite Default screen
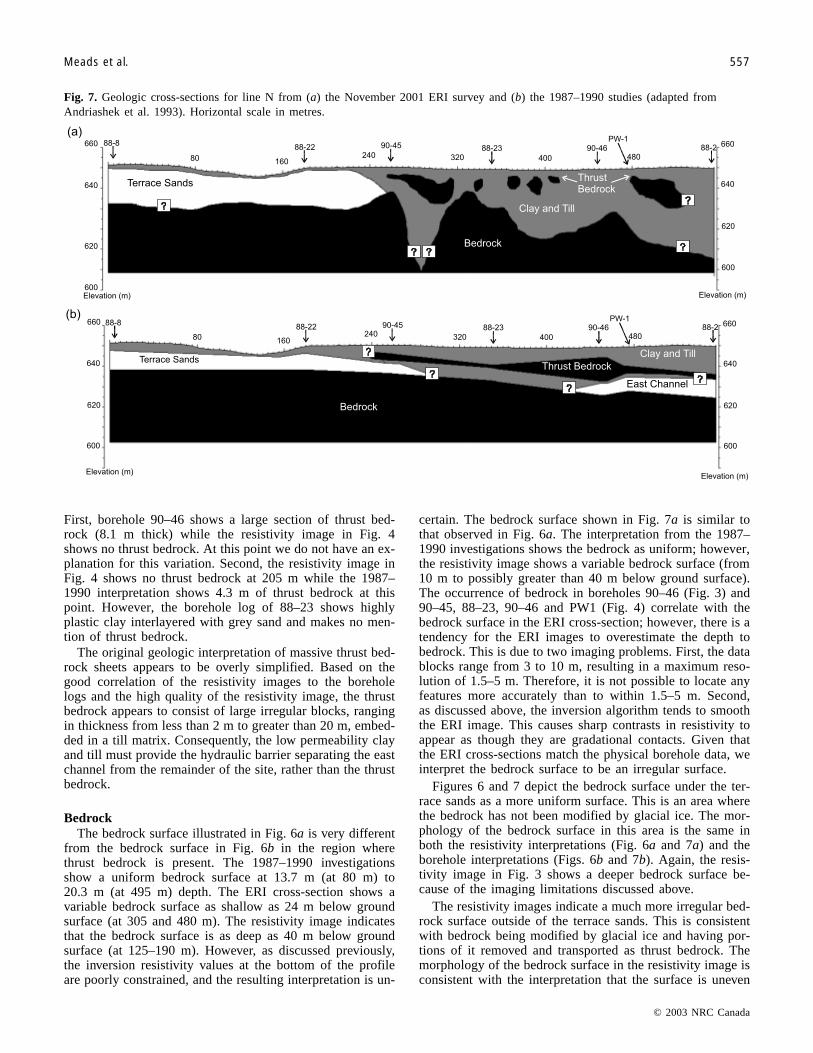
First, borehole 90–46 shows a large section of thrust bed-rock (8.1 m thick) while the resistivity image in Fig. 4shows no thrust bedrock. At this point we do not have an ex-planation for this variation. Second, the resistivity image inFig. 4 shows no thrust bedrock at 205 m while the 1987–1990 interpretation shows 4.3 m of thrust bedrock at thispoint. However, the borehole log of 88–23 shows highlyplastic clay interlayered with grey sand and makes no men-tion of thrust bedrock.
The original geologic interpretation of massive thrust bed-rock sheets appears to be overly simplified. Based on thegood correlation of the resistivity images to the boreholelogs and the high quality of the resistivity image, the thrustbedrock appears to consist of large irregular blocks, rangingin thickness from less than 2 m to greater than 20 m, embed-ded in a till matrix. Consequently, the low permeability clayand till must provide the hydraulic barrier separating the eastchannel from the remainder of the site, rather than the thrustbedrock.
BedrockThe bedrock surface illustrated in Fig. 6a is very different
from the bedrock surface in Fig. 6b in the region wherethrust bedrock is present. The 1987–1990 investigationsshow a uniform bedrock surface at 13.7 m (at 80 m) to20.3 m (at 495 m) depth. The ERI cross-section shows avariable bedrock surface as shallow as 24 m below groundsurface (at 305 and 480 m). The resistivity image indicatesthat the bedrock surface is as deep as 40 m below groundsurface (at 125–190 m). However, as discussed previously,the inversion resistivity values at the bottom of the profileare poorly constrained, and the resulting interpretation is un-
certain. The bedrock surface shown in Fig. 7a is similar tothat observed in Fig. 6a. The interpretation from the 1987–1990 investigations shows the bedrock as uniform; however,the resistivity image shows a variable bedrock surface (from10 m to possibly greater than 40 m below ground surface).The occurrence of bedrock in boreholes 90–46 (Fig. 3) and90–45, 88–23, 90–46 and PW1 (Fig. 4) correlate with thebedrock surface in the ERI cross-section; however, there is atendency for the ERI images to overestimate the depth tobedrock. This is due to two imaging problems. First, the datablocks range from 3 to 10 m, resulting in a maximum reso-lution of 1.5–5 m. Therefore, it is not possible to locate anyfeatures more accurately than to within 1.5–5 m. Second,as discussed above, the inversion algorithm tends to smooththe ERI image. This causes sharp contrasts in resistivity toappear as though they are gradational contacts. Given thatthe ERI cross-sections match the physical borehole data, weinterpret the bedrock surface to be an irregular surface.
Figures 6 and 7 depict the bedrock surface under the ter-race sands as a more uniform surface. This is an area wherethe bedrock has not been modified by glacial ice. The mor-phology of the bedrock surface in this area is the same inboth the resistivity interpretations (Fig. 6a and 7a) and theborehole interpretations (Figs. 6b and 7b). Again, the resis-tivity image in Fig. 3 shows a deeper bedrock surface be-cause of the imaging limitations discussed above.
The resistivity images indicate a much more irregular bed-rock surface outside of the terrace sands. This is consistentwith bedrock being modified by glacial ice and having por-tions of it removed and transported as thrust bedrock. Themorphology of the bedrock surface in the resistivity image isconsistent with the interpretation that the surface is uneven
© 2003 NRC Canada
Meads et al. 557
Fig. 7. Geologic cross-sections for line N from (a) the November 2001 ERI survey and (b) the 1987–1990 studies (adapted fromAndriashek et al. 1993). Horizontal scale in metres.
I:\cgj\CGJ40-03\T03-017.vpFriday, May 02, 2003 2:43:09 PM
Color profile: Generic CMYK printer profileComposite Default screen

© 2003 NRC Canada
558 Can. Geotech. J. Vol. 40, 2003
where glacial activity has altered it and that the surface is atypical erosional surface where the glaciers have not had aneffect.
Conclusions
The goal of this study was to investigate whether ERIcould be used to come to the same conclusions as the previ-ous studies in 1987–1990. We found that the ERI survey atthe Aurum site allowed an expansion on the conclusions thatwere previously reached. The ERI was easily able to resolvethe south channel in surrounding bedrock and delineate thetop of the thrust bedrock surface, but was unable to resolvethe east channel beneath the thrust bedrock. In addition, theERI survey was able to resolve the bedrock surface under-neath the thrust bedrock. A combined interpretation usingthe ERI survey and available borehole logs was able to pro-vide a more detailed picture of the Aurum site. The bedrocksurface is highly variable and ranges from less than 10 mbelow ground surface to possibly more than 40 m belowground surface. The bedrock surface underneath the terracesands is a flat erosional surface. The thrust bedrock occursas erratic massive blocks that are less than 2 m to greaterthan 30 m thick. The south channel has a long and flat bot-tom, two levels, and abruptly sloping sides.
We estimate that the commercial cost of this ERI surveywould be $10 000 to $15 000CAN. The cost of drilling a15 m deep auger borehole is $1000 to $1500CAN. Our re-sults show that, even at such a large scale, the borehole databy itself was still too sparse to capture the details of thecomplex geology at the proposed Aurum landfill site. The1987–1990 studies completed 50 auger boreholes, 15 rotaryboreholes and two pumping wells at the site. By replacing10–15 auger boreholes with a 3 line ERI survey, an inte-grated program that included 35–40 auger boreholes, 15mud rotary boreholes, 2 pumping wells, and 3 ERI linescould be completed for the same cost as the 1987–1990 in-vestigations. As well, if ERI surveys were completed priorto drilling, the results would help locate strategic boreholes.Thus, an integrated geophysical, geologic, and hydro-geologic study would have provided a more rapid and accu-rate understanding of the geology at the Aurum site.
Acknowledgements
The authors would like to thank the Natural Sciences andEngineering Research Council (NSERC) for their supportto make this research possible. We also give thanks toLaurence Andriashek at the Alberta Research Council andMehran Gharibi at the University of Calgary for theirinformation and assistance with the field research.
Brian Smerdon and Arif Alkalali at the University of Al-berta assisted with the fieldwork. Access to the site waskindly granted by Jack Agrios, QC, on behalf of the land-owner and the lessee, André Moizard.
References
Andriashek, L.D., Thomson, D.G., and Jackson, R. 1993. Edmon-ton landfill site investigation: a case study applying hydraulicinformation to interpret a glacially disturbed site. GeoscienceCanada, 20(4): 157–164.
Benn, D.I., and Evans, D.J.A. 1998. Glaciers and glaciation.Arnold, London.
Bennett, M.R., and Glasser, N.F. 1996. Glacial geology; ice sheetsand landforms. John Wiley & Sons, Inc., Chichester.
Boulton, G.S, van der Meer, J.J.M., Hart, J., Beets, D.,Ruegg, G.H.J., van der Wateren, F.M., and Jarvis, J. 1996. Tilland moraine emplacement in a deforming bed surge — an ex-ample from a marine environment. Quaternary Science Review,15: 961–987.
Chen, W., Xuanqing, Z., Naihua, H., and Yonghong, M. 1996.Compiling the map of shallow-buried palaeochannels on theNorth China Plain. Geomorphology, 18(1): 47–52.
Gilson, E.W., Nimeck G., Bauman P.D., and Kellett, R. 2000.Groundwater exploration in prairie environments. In Proceed-ings of the Symposium on the Application of Geophysics toEngineering and Environmental Problems. Arlington, Va., 20–24 February. Edited by M.H. Power, A.B. Ibrahim, andL. Cramer. Environmental and Engineering Geophysical Society,Wheat Ridge, Colo., pp. 955–959.
Irish, E.J.W. 1970. The Edmonton group of south-central Alberta.Bulletin of Canadian Petroleum Geology, 18(2): 125–155.
Loke, M.H., and Barker, R.D. 1996. Rapid least-squares inversionof apparent resistivity pseudosections by a quasi-Newtonmethod. Geophysical Prospecting, 44: 131–152.
Mooers, H.D. 1990. Ice-marginal thrusting of drift and bedrock:thermal regime, subglacial aquifers, and glacial surges. Cana-dian Journal of Earth Sciences, 27: 849–862.
Oldenburg, D.W., and Li, Y. 1999. Estimating depth of investigationin DC resistivity and IP surveys. Geophysics, 64(2): 403–416.
Ramag, J.M., Gardner, T.W., and Sasowsky, I.D. 1998. Early Pleis-tocene glacial Lake Lesley, west branch Susquehanna RiverValley, central Pennsylvania. Geomorphology, 22(1): 19–37.
Stanley Associates Engineering Ltd. 1990. Hydrogeologic assess-ment — Edmonton Waste Management Centre. Report 48–115–01–01. Edmonton, Alta.
Tsui, P.C., Cruden, D.M., and Thomson, S. 1989. Ice-thrust ter-rains and glaciotectonic settings in central Alberta. CanadianJournal of Earth Sciences, 26: 1308–1318.
Ward, S.H. 1990. Resistivity and induced polarization methods.In Geotechnical and environmental geophysics. Edited byS.H. Ward. Society of Exploration Geophysicists, Tulsa, Okla.,Vol. 1, pp. 147–189.
I:\cgj\CGJ40-03\T03-017.vpFriday, May 02, 2003 2:43:09 PM
Color profile: Generic CMYK printer profileComposite Default screen
Copyright © 2022 FDOKUMEN