
Application of DSS to Traffic Management
20
Application of DSS to Traffic Management ODUBANJO EZEKIEL
Transcript of Application of DSS to Traffic Management

Application of DSS to Traffic Management
ODUBANJO EZEKIEL

Table of Contents
Table of Figures ............................................................................................................................................. 1
Table of Tables .............................................................................................................................................. 1
Introduction .................................................................................................................................................. 2
Framework and Infrastructure ...................................................................................................................... 3
MODELLING AND APPLICATION OF DSS TO TRAFFIC MANAGEMENT .......................................................... 8
MSTEM By (Hasan, 2010) .......................................................................................................................... 8
Fuzzy Logic Application by (Almejalli, Dahal, & Hossain, 2006) .............................................................. 12
MultiAgent Modelling by (Ossowski, et al., 2005) .................................................................................. 15
Conclusion ................................................................................................................................................... 18
References .................................................................................................................................................. 19
Table of Figures
Figure 1: Basic Variables and relationships in transportation system analysis ............................................ 3
Figure 2: Hassan M.K Framework ................................................................................................................. 4
Figure 3: Abstract dialogue between DSS and DM. ...................................................................................... 5
Figure 4: Social role model for DSS ............................................................................................................... 6
Figure 5: Influencing Factors and Typical Decisions - Almejalli et al. ........................................................... 8
Figure 6: The structure of the traffic fuzzy inference system ..................................................................... 12
Figure 7: The architecture and information flow of the intelligent decision support system for urban
transportation systems analysis as TCMS by Hasan M.K. ........................................................................... 14
Figure 8: Bilbao before DSS application ...................................................................................................... 16
Figure 9: Bilbao after DSS application ......................................................................................................... 17
Table of Tables
Table 1: Four approaches and 22 techniques reduction of peak period traffic congestion. ...................... 11
Table 2: SELECTIVE RULES FROM THE RIYADH TRAFFIC RULE-BASED STRUCTURE .................................... 13

Introduction
One of the most inevitable problems we encounter in our major cities all over the world is traffic
management. There are always many reasons leading to traffic congestion ranging for accidents,
to insufficient road space, traffic violations, recklessness on the part of the drivers, improper
traffic management systems, etc. Few cities all over the world have been able to manage their
traffic congestion issues to a bearable minimum and one of the tools that have been used in
achieving this milestone is the DSS. Decision Support Systems (DSS) provides assistance to
humans involved in complex decision making process. Modern DSS help decision makers to
explore the implications of their judgments so as to make decisions based on their understanding.
Due to the inherent distribution of domains where humans have to make operational decisions
regarding the management of complex industrial or environmental processes, (Cuena J. &
Ossowski, 1999) asserted that the construction of DSS have become popular.
Many researchers agree that Transportation Management is a problem in urban areas all over
the world and DSS is a tool that can be used to proffer solution to this great problem facing the
uni9verse. Various models of DSS and solutions as suggested by three of the studies that had
been conducted in this field. The three papers used in this study are (Hasan, 2010), (Ossowski, et
al., 2005) and (Almejalli, Dahal, & Hossain, 2006).

Framework and Infrastructure
Figure 1: Basic Variables and relationships in transportation system analysis
The framework used by (Hasan, 2010) has its components such as the socio-economic
environmental description, user characteristics and behaviors, owner and operator’s behavior,
transport demand, transport equilibrium, systems, performance, traffic flow impacts, evaluation
and choice and finally implementation of the model.
Socio-Economic Environmental description:
The factors considered here include the population distribution, income, car ownership, and land
use of the study area. Also, the transportation problems that should be addressed and clearly
and specifically determined the symptoms, cause, and consequences for each problem in
addition to the objectives and goals that should be satisfied by solving these problems.
User Characteristics and behavior:
This part represents the transportation demand side where there are, for example, the following
residence locations, economic& social activities locations, frequency, destination, purpose, travel
mode and time of trip, work locations and trip route.
Owners, Operators and Regulators Behavior
Represented in this part are the transportation system performance which consists of network
configurations, investment and maintenance policies, vehicle fleets characteristics, routing,
scheduling and pricing policies, laws, regulations and controls and institutions.
Transportation System Performance
This is as a result of functions of transportation supply and transportation demand.
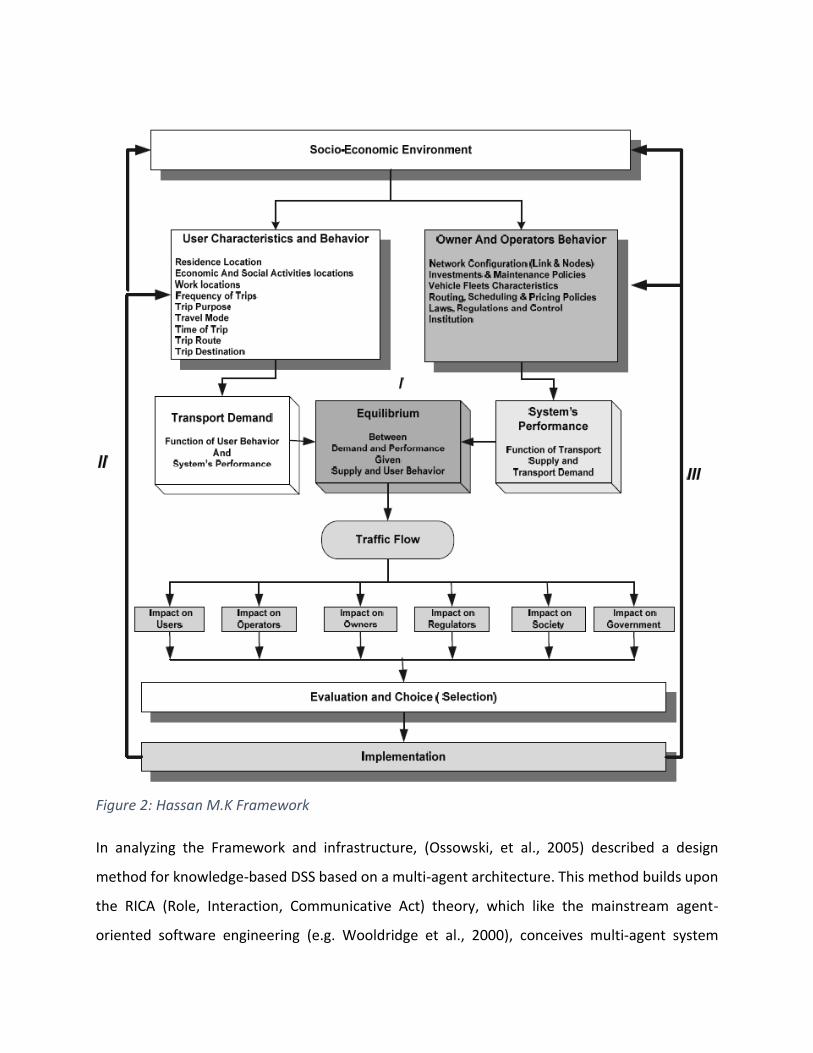
Figure 2: Hassan M.K Framework
In analyzing the Framework and infrastructure, (Ossowski, et al., 2005) described a design
method for knowledge-based DSS based on a multi-agent architecture. This method builds upon
the RICA (Role, Interaction, Communicative Act) theory, which like the mainstream agent-
oriented software engineering (e.g. Wooldridge et al., 2000), conceives multi-agent system
design in terms of organizational concepts (e.g. Ferber et al., 2000, or Zambonelli et al., 2000). It
was established that there is always a communication between decision makers (DMs) and the
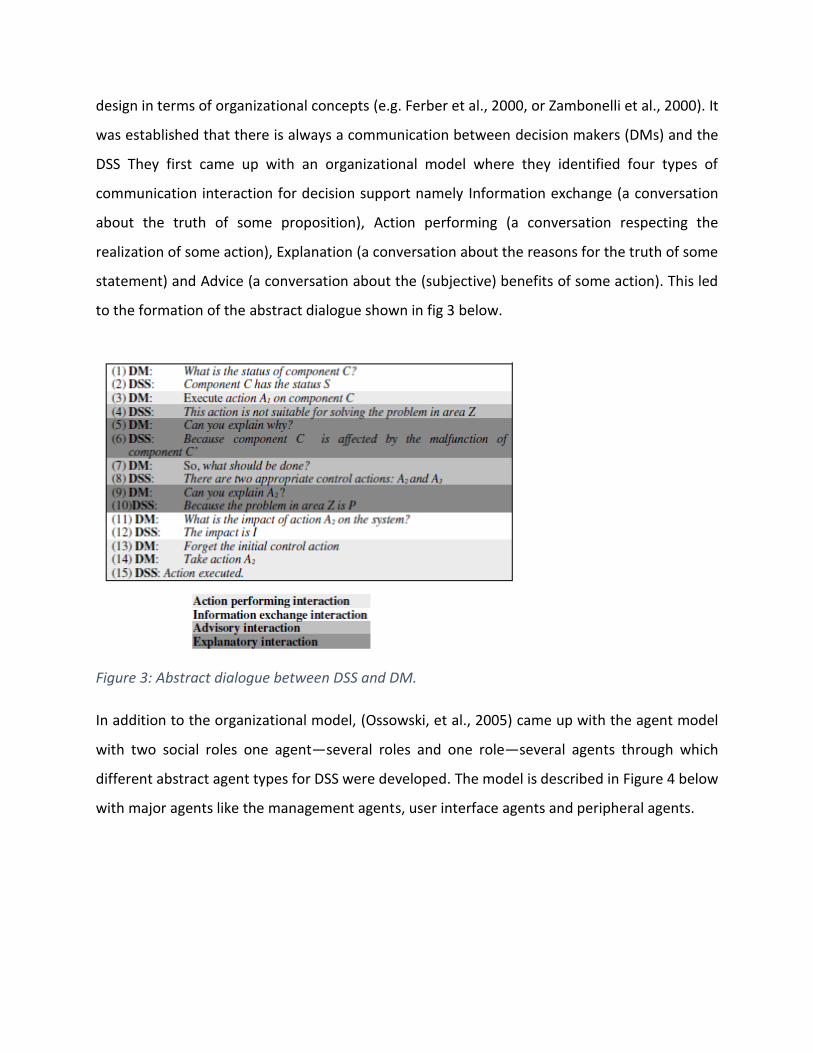
DSS They first came up with an organizational model where they identified four types of
communication interaction for decision support namely Information exchange (a conversation
about the truth of some proposition), Action performing (a conversation respecting the
realization of some action), Explanation (a conversation about the reasons for the truth of some
statement) and Advice (a conversation about the (subjective) benefits of some action). This led
to the formation of the abstract dialogue shown in fig 3 below.
Figure 3: Abstract dialogue between DSS and DM.
In addition to the organizational model, (Ossowski, et al., 2005) came up with the agent model
with two social roles one agent—several roles and one role—several agents through which
different abstract agent types for DSS were developed. The model is described in Figure 4 below
with major agents like the management agents, user interface agents and peripheral agents.
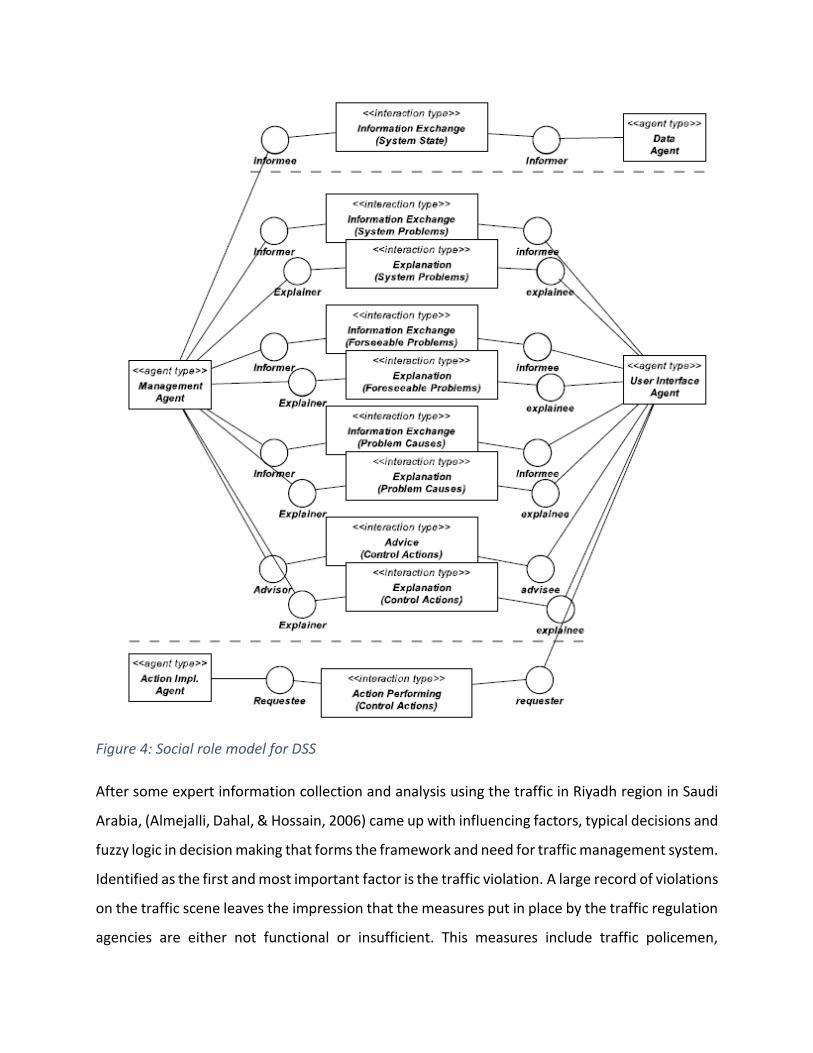
Figure 4: Social role model for DSS
After some expert information collection and analysis using the traffic in Riyadh region in Saudi
Arabia, (Almejalli, Dahal, & Hossain, 2006) came up with influencing factors, typical decisions and
fuzzy logic in decision making that forms the framework and need for traffic management system.
Identified as the first and most important factor is the traffic violation. A large record of violations
on the traffic scene leaves the impression that the measures put in place by the traffic regulation
agencies are either not functional or insufficient. This measures include traffic policemen,
cameras, etc. It could even be considered that the fines associated with traffic violations are
either not enforced or are very much affordable by the citizens so they find it fun breaking the
rules knowing that they will only be charged a meagre.
The number of traffic accidents is another worrying factor as it is one inevitable fact that the
transport system always look to completely extinct but it still occurs regardless the number of
cautions and measures placed. Two other factors considered are the number of vehicles per
traffic policeman on duty and the number of vehicles per traffic camera. The number of vehicles
per traffic policeman is calculated by dividing the number of vehicles by the number of traffic
policemen on duty, while dividing the number of vehicles by the number of traffic cameras yields
the number of vehicles per traffic camera. These two parameters are determined as influencing
factors because they are considered as a measure of controlling and monitoring traffic.
Thus, to keep the traffic controlled, the number of vehicles per policeman and the number of
vehicles per traffic camera should not be high. The values of these two factors in a particular
period are based on how many vehicles are used at that period, and also on how many traffic
policemen and traffic cameras are available at that period.
Considered the least important among the factors is the rate of traffic jam as it does not directly
affect the traffic decision but it does affect traffic accidents.
Based on the aforementioned factors, the decisions that are to be made are as follows;
1. Launch traffic awareness campaign
2. Increase punishment or fine
3. Increase the number of traffic policemen
4. Increase the number of traffic cameras
The mapping of the decisions to the factors can be seen tin figure 4.

Figure 5: Influencing Factors and Typical Decisions - Almejalli et al.
MODELLING AND APPLICATION OF DSS TO TRAFFIC MANAGEMENT MSTEM By (Hasan,
2010)
The model used by (Hasan, 2010) is known as the Multi-class Simultaneous Transportation
Equilibrium Model (MSTEM) which combines the departure time as one of the main components
of the prediction process for the first time and will be considered as a new generation of new
Case 6 of the multiclass model classification of (Boyce & Bar-Gera, 2004). The MSTEM includes
all the features of ESTRAUS in addition to the other features mentioned above and more flexible
structure for demand models where the trip generation can depend upon the system’s
performance through an accessibility measure that is based on the random utility theory of users’
behavior (instead of being fixed as in ESTRAUS), trip distribution is given by a more behaviorally
richer Multinomial Logit (MNL) model based on the random utility theory (instead of being given
by an entropy maximization model in ESTRAUS), and modal split and departure time are given by
Multinomial Logit (MNL) models based on the random utility theory (in-stead of hierarchical Logit
for modal split only in ES-TRAUS).

ESTRAUS is a computer package for solving supply demand equilibrium problems on multimodal
urban transportation networks with multiple user classes. This was a software designed in Chile
in the 1989. It has been used for analyzing and strategic projects for development plans for the
city of Santiago in Chile, whose population is near, 5.5 million inhabitants (De Cea, Fernandez,
Dekock, & Soto, 2002). The MSTEM is formulated as a Variational Inequality problem and a
diagonalization (relaxation) algorithm is proposed to solve it.
Just as in the ESTRAUS, the different modal networks considered in the MSTEM are car, bus,
metro, shared taxi, bus/metro, shared taxi/metro and car/metro networks.
The notations used for the MSTEM model include;
G = (N,A) A multimodal network consisting of a set of nodes and a set of A links N
L = User class (e.g., income level, car availability, etc.)
L = Set of all user classes
O = Trip purpose (e.g., home-based-work, home-based-shopping, etc.)
O = Set of all trip purpose.
I lo = Set of origin nodes for user class l and trip purpose o
i = An origin node in the set I lo for user class l with trip purpose o
𝐷𝑖𝑙𝑜= Set of destination nodes that are accessible from a given origin i for user class l with trip
purpose o
j = A destination node in the set 𝐷𝑖𝑙𝑜 for user class l with trip purpose o
Rlo = Set of origin-destination pairs ij for user class l with trip purpose o, i.e., the set of all origins
i∈Ilo and destinations j∈𝐷𝑖𝑙𝑜
M = Any transportation mode in the urban area
n= Nest of transportation modes that has a specific characteristics (e.g., pure modes including
private and public or combined modes) that are available for user class l with trip purpose o travel
between origin-destination pairs mij
An example of the complex notifications used in the model is

𝑇𝑖𝑗𝑙𝑜𝑛𝑚= the number trips of users of class l with trip purpose o traveling from the origin node i∈Ilo
to the destination node j∈𝐷𝑖𝑙𝑜 and whose already chose the mode of transport m∈𝑀𝑛
𝑙𝑜 from the
nest of modes n∈∧𝑖𝑗𝑙𝑜 and start their trip at the time t∈𝐾𝑚
𝑙𝑜.
The assumptions generated from this model included the travel cost functions, trip generation,
Trip Distribution, Nest/Mode Split, and Departure Time Logit Models (TD/MS/DT) and trip
assignment all based on the notations described above.
In the application of the MSTEM to traffic management, (Hasan, 2010) recommended that
household survey data, traffic counts, road side interviews, network inventory (road network and
transit network), parking spaces, cordon surveys, screen-line surveys and socio economic data
are necessary information that must be gathered to have an efficient application of the model in
solving traffic management problem.
Furthermore, (Hasan, 2010) analyzed changing demand (Users Characteristics and Behavior in
Figure 2: Hassan M.K Framework to meet system capabilities and changing system capacities
(Owners, Operators and Regulators Behavior in Figure 2: Hassan M.K Framework) to meet
demand. Four approaches which included 22 techniques were revealed to be the solution to
reduction in demand. The approaches and techniques are shown in Table 1: Four approaches and
22 techniques reduction of peak period traffic congestion.

Table 1: Four approaches and 22 techniques reduction of peak period traffic congestion.

Fuzzy Logic Application by (Almejalli, Dahal, & Hossain, 2006)
The Fuzzy Logic saw the analysis of some parameters and the factors stated above to form a
framework for the transport management system. This involved some logic simulations involving
the IF X AND Y THEN Z rules and deffusification (Rule Box) to come up with the inference shown
in fig 2. The justification of the output is seen in the table 1.
Figure 6: The structure of the traffic fuzzy inference system

Table 2: SELECTIVE RULES FROM THE RIYADH TRAFFIC RULE-BASED STRUCTURE
Architecture
The architecture analysed by (Hasan, 2010) is represented by a high level blueprint for the
implementation of the framework for an Intelligent Decision Support system Traffic Congestion
Management System. The framework is derived and guided by the methodological framework
for urban transportation system analysis and depicted in Figure 1. A fourth component, the
scenario management was added to package the functionally required by scenarios creation,
storage, retrieval, analysis, evaluation and reporting. An Intelligent Agent for supporting scenario
creation is also included in the frame-work. Figure 7 shows the main components of the DSS,
their interactions (data and control flows) with the Transportation Object Repository, with each
other and with the User Interface Management Subsystem (UIMS) directly or indirectly.

Figure 7: The architecture and information flow of the intelligent decision support system for
urban transportation systems analysis as TCMS by Hasan M.K.
MultiAgent Modelling by (Ossowski, et al., 2005)
The application of DSS to traffic management by (Ossowski, et al., 2005) saw the citation of two
places in Spain. Malaga and Bilbao. This section saw the application of the agents described in
the framework to traffic problems in this major cities.
The problem scenario in Malaga is seen below
“The first application of the multiagent DSS architecture refers to the domain of road traffic management.
In particular, we are concerned with part of the high-capacity road network in the Bilbao area. Regular
information about the traffic situation in this highly used area, registered by loop detectors, is received in
the Mobility Management Centre located at Malmasin, in the vicinity of the city of Bilbao. On the basis of
this data, traffic operators have to take decisions on what the control actions to take to solve or minimize
congestion. These actions include: (1) displaying messages on Variable Message Signal (VMS) panels
installed above the road to warn drivers about traffic problems or recommend alternative routes and/or
(2) contacting local authorities to send the right people to manage the situation. As the traffic control
infrastructure becomes more complex, there is an increasing need to assist operators with their
management task, helping them to configure consistent control plans for the whole road network, and
making the best use of the available signal devices from a global perspective. This is precisely the purpose
of the Bilbao DSS demonstrator described in the following sections”
The Problem Scenario in Bilbao is seen below
“In many big cities, innercity buses are equipped with radio and GPS devices that provide operators in a
Bus Fleet Management (BFM) centre with up-to-date information on bus locations, and can be used to
communicate with the drivers. A typical task of a BFM operator is to detect incidents (buses that are behind
or ahead of schedule, breakdowns,. . .) by comparing a bus_ schedule with its current location data and to
send orders or control actions to bus drivers (increase/reduce speed, switch from timetable regulation to
frequency regulation,. . .) so as to maintain or re-establish an acceptable quality of service.
In the Spanish town of Malaga, control centre operators of the local transport consortium (EMT, Empresa
Malaguena de Transporte) use an Operating Support System that displays information related to the
status of the buses with regard to the scheduled services. There is a line inspector for each line who takes
decisions to adjust services to unforeseen circumstances, and supervisors who are in charge of taking
broader and more complex decisions for several lines. In the following sections, we report on the
architecture of a prototype DSS that extends the functionality of the Operating Support System by

engaging in dialogues with EMT operators concerning the causes of the problems and the best control
actions to take.”
Figure 8: Bilbao before DSS application
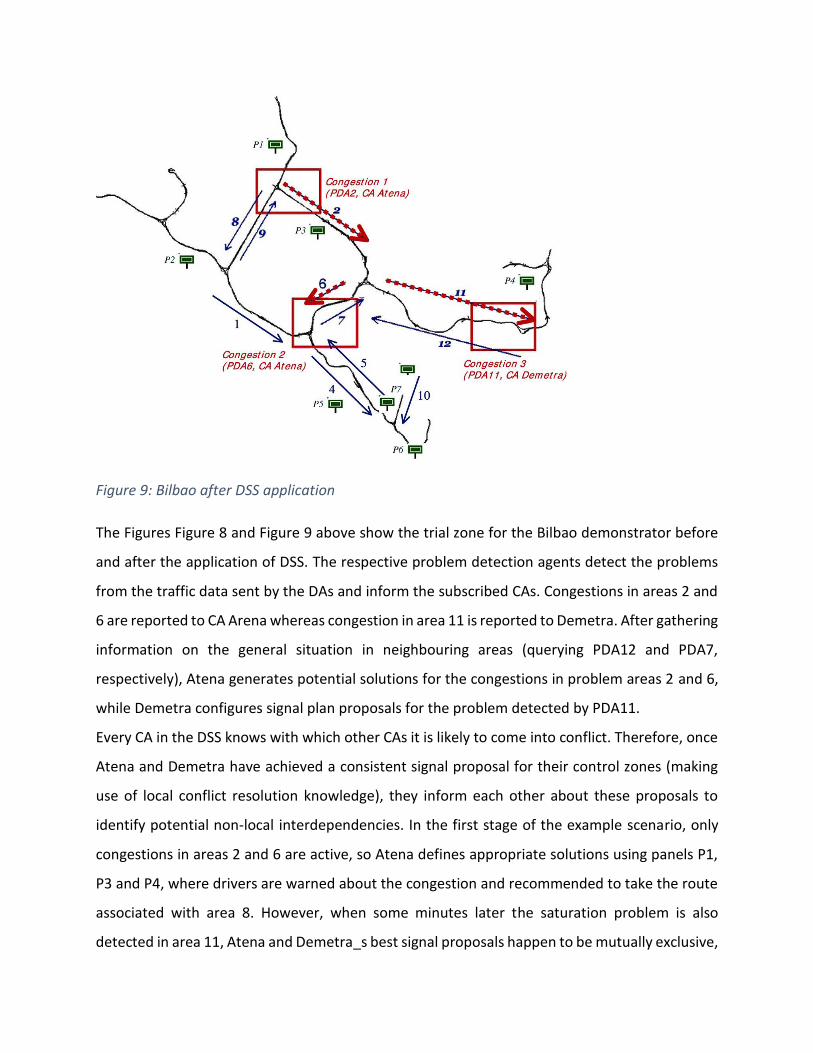
Figure 9: Bilbao after DSS application
The Figures Figure 8 and Figure 9 above show the trial zone for the Bilbao demonstrator before
and after the application of DSS. The respective problem detection agents detect the problems
from the traffic data sent by the DAs and inform the subscribed CAs. Congestions in areas 2 and
6 are reported to CA Arena whereas congestion in area 11 is reported to Demetra. After gathering
information on the general situation in neighbouring areas (querying PDA12 and PDA7,
respectively), Atena generates potential solutions for the congestions in problem areas 2 and 6,
while Demetra configures signal plan proposals for the problem detected by PDA11.
Every CA in the DSS knows with which other CAs it is likely to come into conflict. Therefore, once
Atena and Demetra have achieved a consistent signal proposal for their control zones (making
use of local conflict resolution knowledge), they inform each other about these proposals to
identify potential non-local interdependencies. In the first stage of the example scenario, only
congestions in areas 2 and 6 are active, so Atena defines appropriate solutions using panels P1,
P3 and P4, where drivers are warned about the congestion and recommended to take the route
associated with area 8. However, when some minutes later the saturation problem is also
detected in area 11, Atena and Demetra_s best signal proposals happen to be mutually exclusive,
since they try to display different messages on the same VMS panel, i.e. panel P3. This conflict is
resolved locally by each CA, applying conventions respecting priorities for the use of the VMS
panels, based on the severity of the problems and the time of the day when these problems
occur. Finally, both CAs send potential signal plans for their control zones to the UIA, which
displays them to the DM as a coherent global action proposal. In this example, the severity of the
problems to be solved by Atena is initially higher than the severity of the new congestion in area
11. Therefore, Atena and Demetra agree that panel P3 should be used by Atena. Note that thirty
minutes later the opposite may occur, and Demetra will use P3 to divert traffic from area 11.
Conclusion All along, we have seen the creation of different models of DSS by the three set of authors
analyzed in this study and how they have all been able to use DSS as a tool to provide solution to
traffic management problems in major urban areas across the globe. DSS has proven to be a very
efficient tool based on the models that were developed and it has been seen to be a tool that
provides solution to the traffic problems deciding the points where there is need to widen lanes,
provide traffic personnel, and stiffen traffic rules amongst other possible revealed solutions.
References
Almejalli, K., Dahal, K., & Hossain, A. (2006). Road Traffic Decision Support System. Bradford.
Boyce, D. E., & Bar-Gera, H. (2004). Multiclass Combined Models for Urban Travel Forecasting.
Networks and Spatial Economics, Vol. 4, 115-124.
Cuena J., J., & Ossowski, S. (1999). Distributed Models for Decision Support in Multi Agent
Systems. A Modern Approach to DAI, ed. Weib, Cambridge, MA: The MIT Press., 459-504.
De Cea, J. J., Fernandez, L., Dekock, V., & Soto, A. O. (2002). ESTRAUS: A Computer Package For
Solving Supply Demand Equilibrium Problems on Multimodal Trban Transportation
Networks With Multiple User Classes. Santiago: Unpublished.
Hasan, M. K. (2010). A Framework for Intelligent Decision Support System for Traffic Congestion
Management System. Scientific Research, 270-289.
Lerebourg, S., Dutot, A., Bertelle, C., & Olivier, D. (2002). Road Traffic Management Based on Ant
System and Regulation Model.
Ossowski, S., Hernandez, J. Z., Belmonte, M.-V., Alberto, F., Garcıa-Serrano, A., Perez-de-la-Cruz,
J.-L., . . . Triguero, F. (2005). Decision support for traffic management based on
organisational and communicative multiagent abstractions. Elsevier, 272-298.