
Corrosion Behaviors of SMSS 13Cr and DSS 22Cr in H2S/CO2
17
Int. J. Electrochem. Sci., 11 (2016) 9542 – 9558, doi: 10.20964/2016.11.13 International Journal of ELECTROCHEMICAL SCIENCE www.electrochemsci.org Corrosion Behaviors of SMSS 13Cr and DSS 22Cr in H 2 S/CO 2 - Oil-Water Environment Wei Yan 1 , Peike Zhu 2 , Jingen Deng 1 1 State Key Laboratory of Petroleum Resource and Prospecting, China University of Petroleum, Beijing102249, China 2 PetroChina Research Institute of Petroleum Exploration & Development, Beijing, 100083, China * E-mail: [email protected] Received: 20 July 2016 / Accepted: 4 September 2016 / Published: 10 October 2016 A series of corrosion tests were performed in field and laboratory to investigate corrosion behaviors of Supermartensitic Stainless Steel 13Cr (SMSS 13Cr) and Duplex Stainless Steel 22Cr (DSS 22Cr) in H 2 S/CO 2 containing environment. Carbon steel of P110S was chosen as comparison specimens in this study. A new field corrosion testing apparatus was designed and manufactured in order to perform this study. The corrosion species of the pipe flow include CO 2 , H 2 S and saline formation water; the water cut of the production flow was 16%. The flow temperature near the wellhead was 50 ℃, the corrosion test was 90 days. Analysis techniques, such as Weight loss, X-Ray Diffraction (XRD), Scanning Electron Microscope (SEM), Energy Dispersive Spectrum (EDS), double-loop electrochemical potentiokinetic reactivation (DL-EPR) and Scanning Kelvin Probe Force Microscopy (SKPFM) methods were used in this study. The results showed that pitting attack happened on DSS 22CR and P110S specimens, however, SMSS13Cr steel was survival. In high H 2 S containing environment, the reactivation ratio of SMSS 13Cr was lower than DSS 22Cr and the intergranular corrosion and the degree of sensitization (DOS) of DSS 22Cr was higher, and the risk of localized corrosion in DSS 22Cr steel was higher. Corrosion mechanism models in H 2 S/CO 2 -oil-water system for the three types of steel were proposed. Keywords: Corrosion; H 2 S/CO 2 -oil-water system; pitting attack; SMSS 13Cr; DSS 22Cr 1. INTRODUCTION Exploration of the sour oilfields (containing H 2 S or H 2 S/CO 2 ) is becoming more common in recent decades years. Corrosion failure caused by H 2 S or H 2 S/CO 2 containing multiphase flow has affected the normal operation of the oil field, some production wells have to be shut down in a severe corrosion case. Kermani has reported that over 25% of failures in the oil and gas industry are related with corrosion. More than half of these failures are associated with produced oil and gas containing
-
Upload
khangminh22 -
Category
Documents
-
view
3 -
download
0
Transcript of Corrosion Behaviors of SMSS 13Cr and DSS 22Cr in H2S/CO2
Int. J. Electrochem. Sci., 11 (2016) 9542 – 9558, doi: 10.20964/2016.11.13
International Journal of
ELECTROCHEMICAL SCIENCE
www.electrochemsci.org
Corrosion Behaviors of SMSS 13Cr and DSS 22Cr in H2S/CO2-
Oil-Water Environment
Wei Yan1, Peike Zhu
2, Jingen Deng
1
1 State Key Laboratory of Petroleum Resource and Prospecting, China University of Petroleum,
Beijing102249, China 2 PetroChina Research Institute of Petroleum Exploration & Development, Beijing, 100083, China
*E-mail: [email protected]
Received: 20 July 2016 / Accepted: 4 September 2016 / Published: 10 October 2016
A series of corrosion tests were performed in field and laboratory to investigate corrosion behaviors of
Supermartensitic Stainless Steel 13Cr (SMSS 13Cr) and Duplex Stainless Steel 22Cr (DSS 22Cr) in
H2S/CO2 containing environment. Carbon steel of P110S was chosen as comparison specimens in this
study. A new field corrosion testing apparatus was designed and manufactured in order to perform this
study. The corrosion species of the pipe flow include CO2, H2S and saline formation water; the water
cut of the production flow was 16%. The flow temperature near the wellhead was 50℃, the corrosion
test was 90 days. Analysis techniques, such as Weight loss, X-Ray Diffraction (XRD), Scanning
Electron Microscope (SEM), Energy Dispersive Spectrum (EDS), double-loop electrochemical
potentiokinetic reactivation (DL-EPR) and Scanning Kelvin Probe Force Microscopy (SKPFM)
methods were used in this study. The results showed that pitting attack happened on DSS 22CR and
P110S specimens, however, SMSS13Cr steel was survival. In high H2S containing environment, the
reactivation ratio of SMSS 13Cr was lower than DSS 22Cr and the intergranular corrosion and the
degree of sensitization (DOS) of DSS 22Cr was higher, and the risk of localized corrosion in DSS
22Cr steel was higher. Corrosion mechanism models in H2S/CO2-oil-water system for the three types
of steel were proposed.
Keywords: Corrosion; H2S/CO2-oil-water system; pitting attack; SMSS 13Cr; DSS 22Cr
1. INTRODUCTION
Exploration of the sour oilfields (containing H2S or H2S/CO2) is becoming more common in
recent decades years. Corrosion failure caused by H2S or H2S/CO2 containing multiphase flow has
affected the normal operation of the oil field, some production wells have to be shut down in a severe
corrosion case. Kermani has reported that over 25% of failures in the oil and gas industry are related
with corrosion. More than half of these failures are associated with produced oil and gas containing

Int. J. Electrochem. Sci., Vol. 11, 2016
9543
H2S and CO2 [1]. In 1999, more than 1100 corrosion failures occurred in the oil and gas production
system in Zhongyuan oilfield, among which 758 corrosion perforations occurred in wellhead pipeline
[2]. Most of the corrosion failures are starting with corrosion pits, and then developing into a
perforation and leakage. It is significant to conduct an investigation on pitting corrosion in the
presence of H2S and CO2 environment of production pipeline or tubing [3-5]. In the presence of
H2S/CO2 environment, iron sulfide is superior to precipitating on the steel surface compared with iron
carbonate. The iron sulfide has an important role of preventing ion diffusion and protecting metal,
however, the protective film property is determined by the concentration of H2S [6-8]. Additionally,
pH value has a great influent on the stability of ion sulfide.
Aqueous CO2 corrosion of carbon and low alloy steels is an electrochemical process involving
the anodic dissolution of iron and the cathodic evolution of hydrogen [9]. The electrochemical
reactions are often accompanied by the formation of products such as FeCO3 [10]. The overall reaction
is:
2322 HFeCOOHCOFe (1)
Iofa [11] presented that H2S on the surface of iron formed ions and dipoles, their cathode point
media. Thus, the reactions of iron in H2S media include, in order, chemical adsorption reaction
(Equation (2)) and anodic discharge reaction (Equation (3)): OHFeSHOHSHFe ads 322 (2)
eFeSHFeSH adsads 2 (3)
Shoesmith [12] presented that
adsFeSH may directly form FeS (Equation (4)) following the
discharge reaction (Equation (5)) in a small amount of acid solutions but hydrolyze in mostly acid
solutions:
HFeSFeSHads (4)
OHSHFeOHFeSHads 22
2
3 (5)
The key factor of corrosion resistance alloys (CRA) for anti-corrosion is the passive films on
the CRA surface, including the dissolution and self-repairing of the passive films. Once the passive
films are locally damaged by the corrosive media, and can’t effectively self-repair, local corrosion will
occur. Sato [13] discovered the bipolar mechanism of the passive films. The outermost hydroxide layer
prevents anions spreading to the inner layer of passive films and the innermost oxide layer prevents
positive ions spreading to outer layer, thus the passive films protect the metal. The existence of CO2
and H2S may destroy the stability of passive films on high alloy steels and hamper the activation-
passivation transition.
Super-martensitic stainless steel (SMSS) and duplex stainless steel (DSS) possess the
outstanding corrosion resistance in CO2 environment [14], due to the presence of the thin passive layer.
Enrichment of chromium is a remarkable feature of the passive layer. Generally, the thickness of
passive layer is only 1 to 3 nm, but it can decrease the corrosion rate significantly [15-17]. However,
once the passivity film damaged in a localized zone, the big cathode area (passive film) will accelerate
corrosion rate of the small anodic area (active point) and severely localized attack will occur [18].
SMSS has the advantages of low production and maintenance costs, good mechanical properties and
corrosion resistance [19, 20]. DSS are characterized by a two-phase structure comprising a mixture of
Int. J. Electrochem. Sci., Vol. 11, 2016
9544
ferrite (α) and austenite grains (γ). The relationship (by volume) between both phases can vary
between 30% and 70% but is usually about 50%. DSS also has the advantages of superior mechanical
strength and corrosion resistance than common austenitic stainless steels, but with lower cost than
nickel alloy. In general, chromium, molybdenum and nitrogen are beneficial alloying elements against
pitting corrosion [21-22].
However, the study of corrosion behavior of stainless steels in the sour environment (H2S or
H2S/CO2) is relatively less and the corrosion mechanism is not fully understood. This paper presented
the corrosion performance of SMSS 13Cr, DSS 22Cr and P110S by long-term tests in Missan oil field.
These results will be significant to anti-corrosion material selection in high H2S containing oil and gas
field.
2. EXPERIMENTAL
2.1. Materials
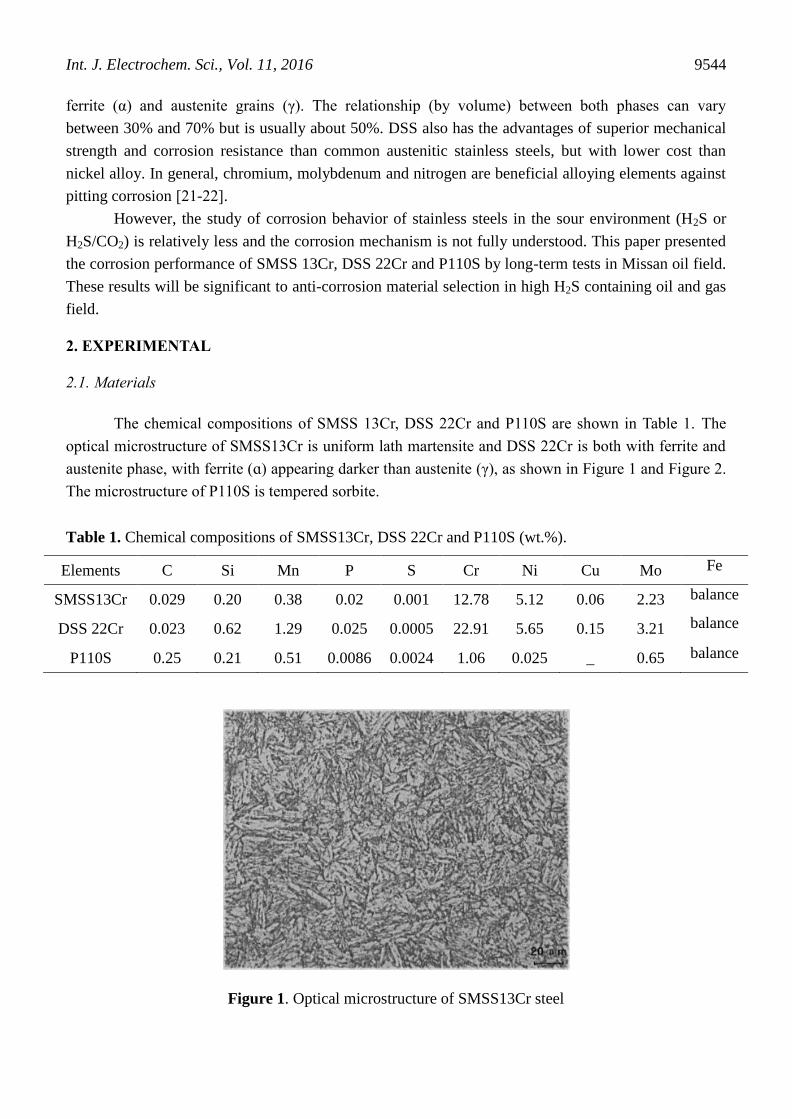
The chemical compositions of SMSS 13Cr, DSS 22Cr and P110S are shown in Table 1. The
optical microstructure of SMSS13Cr is uniform lath martensite and DSS 22Cr is both with ferrite and
austenite phase, with ferrite (ɑ) appearing darker than austenite (γ), as shown in Figure 1 and Figure 2.
The microstructure of P110S is tempered sorbite.
Table 1. Chemical compositions of SMSS13Cr, DSS 22Cr and P110S (wt.%).
Elements C Si Mn P S Cr Ni Cu Mo Fe
SMSS13Cr 0.029 0.20 0.38 0.02 0.001 12.78 5.12 0.06 2.23 balance
DSS 22Cr 0.023 0.62 1.29 0.025 0.0005 22.91 5.65 0.15 3.21 balance
P110S 0.25 0.21 0.51 0.0086 0.0024 1.06 0.025 _ 0.65 balance
Figure 1. Optical microstructure of SMSS13Cr steel

Int. J. Electrochem. Sci., Vol. 11, 2016
9545
Figure 2. Optical microstructure of DSS 22Cr steel (ɑ is ferrite phase; γ is austenite phase).
2.2. Production flow and water chemistry
Table 2 shows the parameters of production flow. High concentration of CO2 and H2S are
containing in the production flow. The flow rate is 1.8m/s, and water cut is 16%. According to the
previous study [23], the flow pattern inside the pipe is the dispersed flow. The pipe flow simulation by
using the FLUENT software is shown in Figure 3; the simulation result is generally consistent with the
previous study. The side wall specimens can be wetted by the production water (corrosion will
happen).
Figure 3. Simulation result of water volume fraction of the pipe flow. (calculation parameters: pipe
line OD =152.4mm (6inch), wall thickness 5.56mm; two phase flow: phase 1 is oil, oil density
850kg/m3, oil dynamic viscosity 0.02kg/m.s; phase 2 is water; water cut 16% ; inlet flow rate
1.8m/s)

Int. J. Electrochem. Sci., Vol. 11, 2016
9546
Table 2. Operational conditions of the production pipeline, well#1, Missan oil field
Parameters Values
CO2 concentration, % 7.12
H2S concentration, % 4.44
CO2 partial pressure, MPa 0.13
H2S partial pressure, MPa 0.08
Flow quantity (liquid), m3/day 91.58
Flow quantity (oil), m3/day 80.61
Flow quantity (water), m3/day 10.97
Water content, % 16
Flow rate, m/s 1.8
Temperature, ℃ 50
The pH value of the formation water is 7.27 and the ion concentration of production water is
shown in Table 3.
Table 3. water chemistry of production water (mg/L)
pH Na+ Ca
2+ Mg
2+ K
+ Cl
- SO4
2- HCO3
-
7.27 64870 14298 2137 1061 139552 951 417
2.3. Field corrosion testing method and specimen preparation
制图
审核
描图
比例
件数
重量
材料
中国石油大学(北京)
朱培珂 2013年5月
序号 名称 件数 材料 备注
1 短接体 1 X42
不锈钢螺栓M10*45 48 5.8 GB/T 898-1988
泄油阀
2
3 1
B
B
B-B(2:1)
C
C
C-C
A
A
A-A
1
43 5 6 8
7
2 9
Figure 4. Oilfield test apparatus (1-field test apparatus; 2-flanged joint; 3-end shield; 4-stainless steel
bolt; 5-pedestal; 6-body wall of field test apparatus at B-B; 7-specimens; 8-PTFE holder; 9-
body wall of field test apparatus at C-C)
Int. J. Electrochem. Sci., Vol. 11, 2016
9547
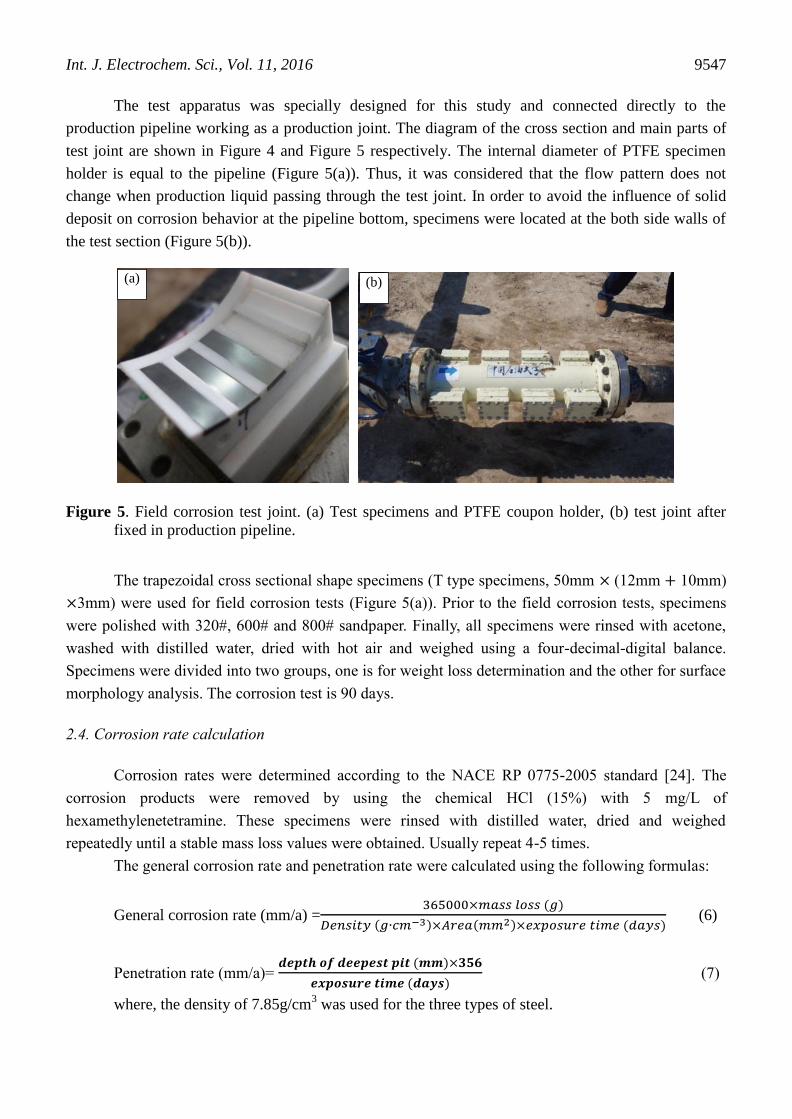
The test apparatus was specially designed for this study and connected directly to the
production pipeline working as a production joint. The diagram of the cross section and main parts of
test joint are shown in Figure 4 and Figure 5 respectively. The internal diameter of PTFE specimen
holder is equal to the pipeline (Figure 5(a)). Thus, it was considered that the flow pattern does not
change when production liquid passing through the test joint. In order to avoid the influence of solid
deposit on corrosion behavior at the pipeline bottom, specimens were located at the both side walls of
the test section (Figure 5(b)).
Figure 5. Field corrosion test joint. (a) Test specimens and PTFE coupon holder, (b) test joint after
fixed in production pipeline.
The trapezoidal cross sectional shape specimens (T type specimens, 50mm × (12mm + 10mm)
×3mm) were used for field corrosion tests (Figure 5(a)). Prior to the field corrosion tests, specimens
were polished with 320#, 600# and 800# sandpaper. Finally, all specimens were rinsed with acetone,
washed with distilled water, dried with hot air and weighed using a four-decimal-digital balance.
Specimens were divided into two groups, one is for weight loss determination and the other for surface
morphology analysis. The corrosion test is 90 days.
2.4. Corrosion rate calculation
Corrosion rates were determined according to the NACE RP 0775-2005 standard [24]. The
corrosion products were removed by using the chemical HCl (15%) with 5 mg/L of
hexamethylenetetramine. These specimens were rinsed with distilled water, dried and weighed
repeatedly until a stable mass loss values were obtained. Usually repeat 4-5 times.
The general corrosion rate and penetration rate were calculated using the following formulas:
General corrosion rate (mm/a) = ×
× × (6)
Penetration rate (mm/a)=
𝒅𝒆𝒑𝒕𝒉 𝒐𝒇 𝒅𝒆𝒆𝒑𝒆𝒔𝒕 𝒑𝒊𝒕 𝒎𝒎 ×𝟑𝟓𝟔
𝒆𝒙𝒑𝒐𝒔𝒖𝒓𝒆 𝒕𝒊𝒎𝒆 𝒅𝒂𝒚𝒔 (7)
where, the density of 7.85g/cm3 was used for the three types of steel.
(a) (b)
Int. J. Electrochem. Sci., Vol. 11, 2016
9548
2.5. Surface morphology analysis
Scanning electron microscopy (SEM, FEI Quanta 200F), Energy Dispersive Spectroscopy
(EDS) and X-ray diffraction (D/MAX2500) were used to analyze the corrosion product. After
corrosion products were removed, the surface of specimen was analyzed by SEM. Cross-section
morphology was used to determine the profile and depth of pitting.
2.6. Double-loop electrochemical potentiokinetic reactivation
The DL-EPR (double-loop electrochemical potentiokinetic reactivation) test specimens include
SMSS13Cr and DSS 22Cr. The test solution was 2 mol L-1
H2SO4 with 0.05 mol L-1
KSCN, at room
temperature. The test conditions are including H2S saturated and without H2S. The tests were
performed using a three-electrode cell system with a saturated calomel electrode (SCE) as a reference
and a carbon rod as counter electrode and CS310 potentiostat.
The DL-EPR polarization curves were obtained after two steps: (1) the working electrode was
subjected to open circuit conditions, until a steady state potential (Ecorr) was reached; (2) An anodic
potentiodynamic sweeping rate of 0.5 mV/s, from Ecorr to +150 mVSCE, was imposed. An anodic
current peak, as Ia was measured. At +150 mV, the potential scanning was reversed to Ecorr and the
current peak during cathodic direction, as Ir was measured. The test results were expressed in the
current densities’s ratio, Ir/Ip*100.
2.7. Scanning kelvin probe force microscopy
Scanning Kelvin Probe Force Microscopy (SKPFM) method was used to measure the surface
potential of DSS 22Cr steel. The surface morphology and contact potential difference around DSS
22Cr were obtained using a dimension atomic force microscope (AFM). The probes used in
measurements were Pt-Ir-coated silicon tips. SKPFM is calibrated before testing with a standard
specimen. Prior to the SKPFM measurements, 22Cr specimens were corroded in the certain solution
(10mL HNO3+30mL HCl+20mL CH3CH2OH) for 3-5 seconds. All measurements were conducted
under the tapping mode by the mechanical excitation of cantilever and potential when a tip voltage is
applied to the probe tip.
3. RESULTS AND DISCUSSION
3.1. Corrosion rates
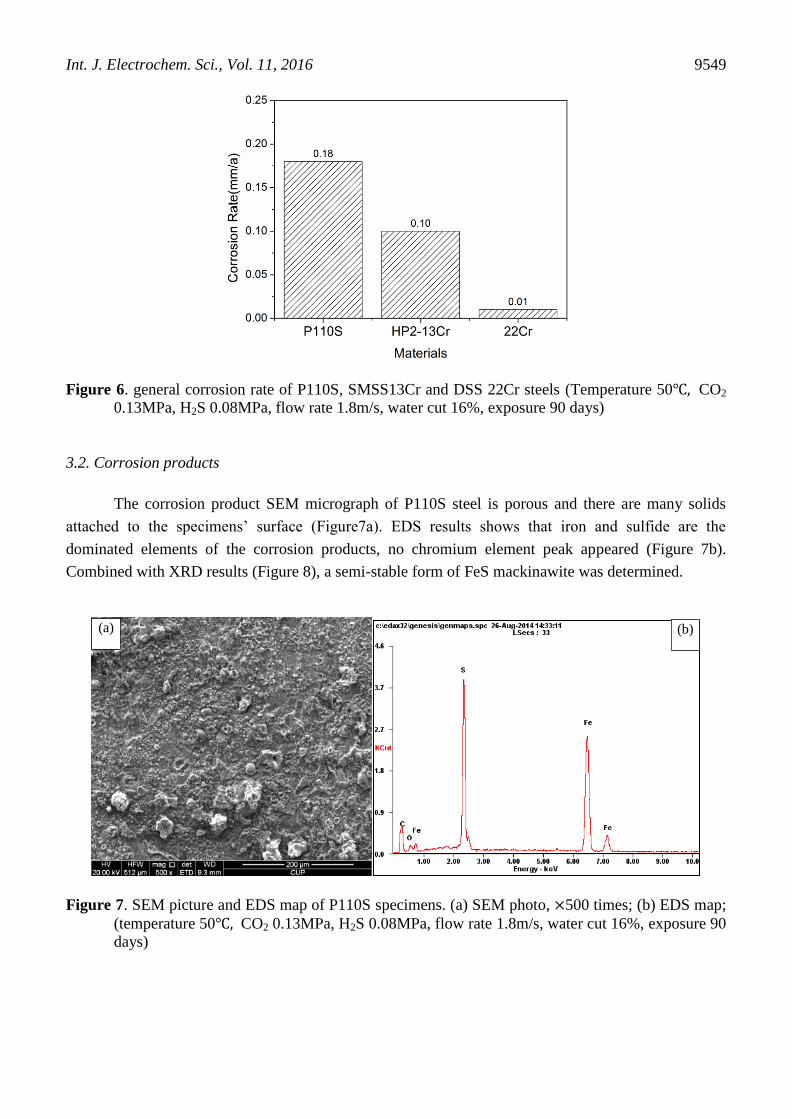
Figure 6 shows the average corrosion rate of P110S, SMSS13Cr and DSS 22Cr in field
production pipeline environment after 90 days test. Average corrosion rates of P110S, SMSS 13Cr and
DSS 22Cr are 0.18mm/a, 0.10mm/a and 0.01mm/a respectively. Average corrosion rate of carbon steel
is obviously higher than the other two stainless steels, and the corrosion rate of SMSS 13Cr is about
ten times higher than DSS 22Cr.
Int. J. Electrochem. Sci., Vol. 11, 2016
9549
Figure 6. general corrosion rate of P110S, SMSS13Cr and DSS 22Cr steels (Temperature 50℃, CO2
0.13MPa, H2S 0.08MPa, flow rate 1.8m/s, water cut 16%, exposure 90 days)
3.2. Corrosion products
The corrosion product SEM micrograph of P110S steel is porous and there are many solids
attached to the specimens’ surface (Figure7a). EDS results shows that iron and sulfide are the
dominated elements of the corrosion products, no chromium element peak appeared (Figure 7b).
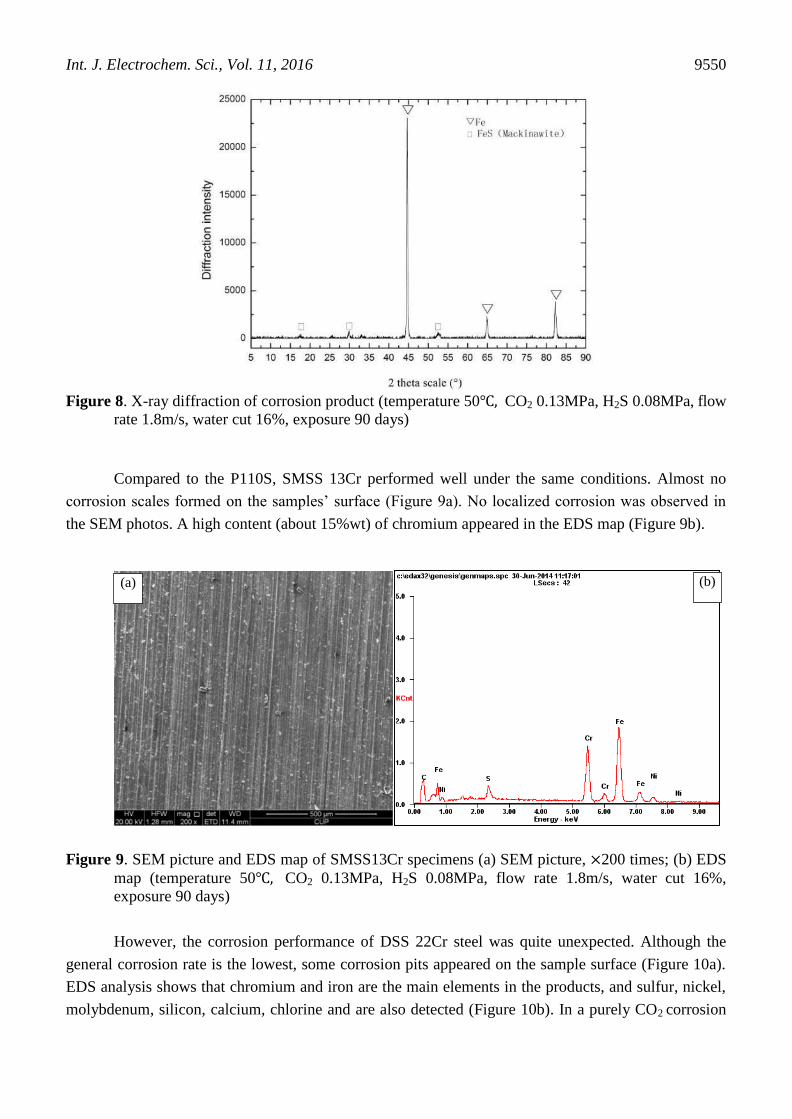
Combined with XRD results (Figure 8), a semi-stable form of FeS mackinawite was determined.
Figure 7. SEM picture and EDS map of P110S specimens. (a) SEM photo, ×500 times; (b) EDS map;
(temperature 50℃, CO2 0.13MPa, H2S 0.08MPa, flow rate 1.8m/s, water cut 16%, exposure 90
days)
(a) (b)
Int. J. Electrochem. Sci., Vol. 11, 2016
9550
Figure 8. X-ray diffraction of corrosion product (temperature 50℃, CO2 0.13MPa, H2S 0.08MPa, flow
rate 1.8m/s, water cut 16%, exposure 90 days)
Compared to the P110S, SMSS 13Cr performed well under the same conditions. Almost no
corrosion scales formed on the samples’ surface (Figure 9a). No localized corrosion was observed in
the SEM photos. A high content (about 15%wt) of chromium appeared in the EDS map (Figure 9b).
Figure 9. SEM picture and EDS map of SMSS13Cr specimens (a) SEM picture, ×200 times; (b) EDS
map (temperature 50℃, CO2 0.13MPa, H2S 0.08MPa, flow rate 1.8m/s, water cut 16%,
exposure 90 days)
However, the corrosion performance of DSS 22Cr steel was quite unexpected. Although the
general corrosion rate is the lowest, some corrosion pits appeared on the sample surface (Figure 10a).
EDS analysis shows that chromium and iron are the main elements in the products, and sulfur, nickel,
molybdenum, silicon, calcium, chlorine and are also detected (Figure 10b). In a purely CO2 corrosion
(a) (b)

Int. J. Electrochem. Sci., Vol. 11, 2016
9551
environment, the corrosion resistance is usually correlated the chromium content, a higher chromium
content implies a better resist ability to corrosion (both general corrosion and localized corrosion).
Thus, 22% wt of Cr content steel (DSS 22Cr) should perform better than 13%wt Cr content steel
(SMSS 13Cr). Nevertheless, the presence of high concentration of H2S changed this traditional
understanding totally [25].
Figure 10. SEM picture and EDS map of DSS 22Cr specimens (a) SEM picture, ×500 times; (b) EDS
map (temperature 50℃, CO2 0.13MPa, H2S 0.08MPa, flow rate 1.8m/s, water cut 16%,
exposure 90 days)
3.3. Surface morphologies after removing the scales
Figure 11. photographs of P110S, SS13Cr and 22Cr specimens after removing corrosion scale
(temperature 50℃, CO2 0.13MPa, H2S 0.08MPa, flow rate 1.8m/s, water cut 16%, exposure 90
days)
(a) (b)
Int. J. Electrochem. Sci., Vol. 11, 2016
9552
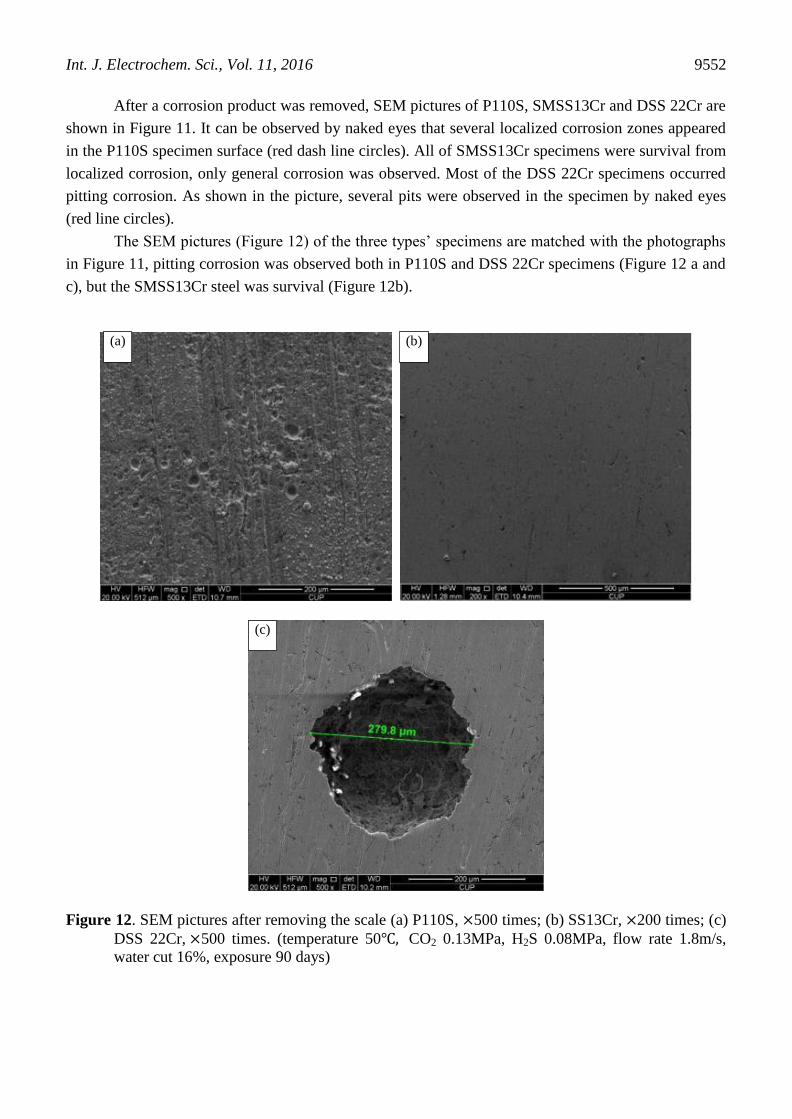
After a corrosion product was removed, SEM pictures of P110S, SMSS13Cr and DSS 22Cr are
shown in Figure 11. It can be observed by naked eyes that several localized corrosion zones appeared
in the P110S specimen surface (red dash line circles). All of SMSS13Cr specimens were survival from
localized corrosion, only general corrosion was observed. Most of the DSS 22Cr specimens occurred
pitting corrosion. As shown in the picture, several pits were observed in the specimen by naked eyes
(red line circles).
The SEM pictures (Figure 12) of the three types’ specimens are matched with the photographs
in Figure 11, pitting corrosion was observed both in P110S and DSS 22Cr specimens (Figure 12 a and
c), but the SMSS13Cr steel was survival (Figure 12b).
Figure 12. SEM pictures after removing the scale (a) P110S, ×500 times; (b) SS13Cr, ×200 times; (c)
DSS 22Cr, ×500 times. (temperature 50℃, CO2 0.13MPa, H2S 0.08MPa, flow rate 1.8m/s,
water cut 16%, exposure 90 days)
(a) (b)
(c)
Int. J. Electrochem. Sci., Vol. 11, 2016
9553
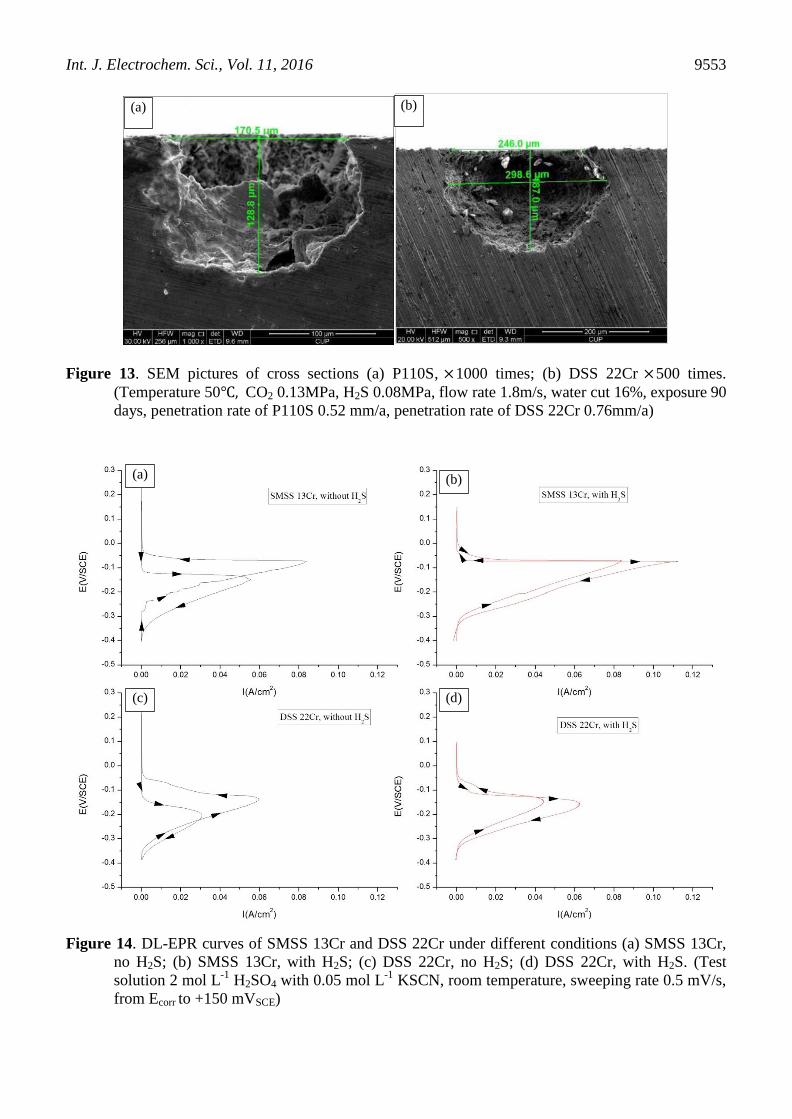
Figure 13. SEM pictures of cross sections (a) P110S, ×1000 times; (b) DSS 22Cr ×500 times.
(Temperature 50℃, CO2 0.13MPa, H2S 0.08MPa, flow rate 1.8m/s, water cut 16%, exposure 90
days, penetration rate of P110S 0.52 mm/a, penetration rate of DSS 22Cr 0.76mm/a)
Figure 14. DL-EPR curves of SMSS 13Cr and DSS 22Cr under different conditions (a) SMSS 13Cr,
no H2S; (b) SMSS 13Cr, with H2S; (c) DSS 22Cr, no H2S; (d) DSS 22Cr, with H2S. (Test
solution 2 mol L-1
H2SO4 with 0.05 mol L-1
KSCN, room temperature, sweeping rate 0.5 mV/s,
from Ecorr to +150 mVSCE)
(a) (b)
(a) (b)
(c) (d)
Int. J. Electrochem. Sci., Vol. 11, 2016
9554
As the SEM cross-sectional pictures shown in Figure 13, the pit depth of P110S specimen is
128.8μm, get a penetration rate of 0.52mm/a according to the formula (2); the pit depth of DSS 22Cr is
187.0μm, get a penetration rate of 0.76mm/a. The pits show a typical shape characteristic of pitting
corrosion, which is usually called “sack shape” (small opening with a big belly). The penetration rate
of DSS 22Cr is even higher than the carbon steel.
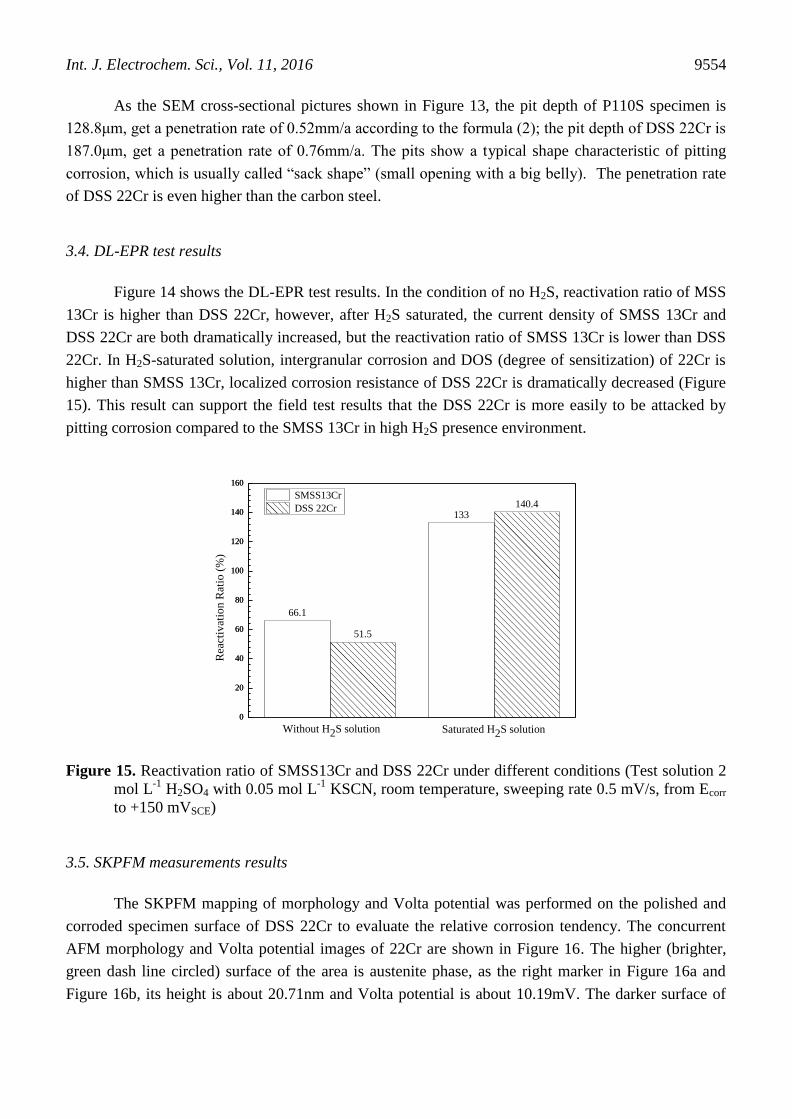
3.4. DL-EPR test results
Figure 14 shows the DL-EPR test results. In the condition of no H2S, reactivation ratio of MSS
13Cr is higher than DSS 22Cr, however, after H2S saturated, the current density of SMSS 13Cr and
DSS 22Cr are both dramatically increased, but the reactivation ratio of SMSS 13Cr is lower than DSS
22Cr. In H2S-saturated solution, intergranular corrosion and DOS (degree of sensitization) of 22Cr is
higher than SMSS 13Cr, localized corrosion resistance of DSS 22Cr is dramatically decreased (Figure
15). This result can support the field test results that the DSS 22Cr is more easily to be attacked by
pitting corrosion compared to the SMSS 13Cr in high H2S presence environment.
66.1
133
51.5
140.4
0
20
40
60
80
100
120
140
160
0
20
40
60
80
100
120
140
160
Saturated H2S solution
Rea
ctiv
atio
n R
atio
(%
)
SMSS13Cr
DSS 22Cr
Without H2S solution
Figure 15. Reactivation ratio of SMSS13Cr and DSS 22Cr under different conditions (Test solution 2
mol L-1
H2SO4 with 0.05 mol L-1
KSCN, room temperature, sweeping rate 0.5 mV/s, from Ecorr
to +150 mVSCE)
3.5. SKPFM measurements results
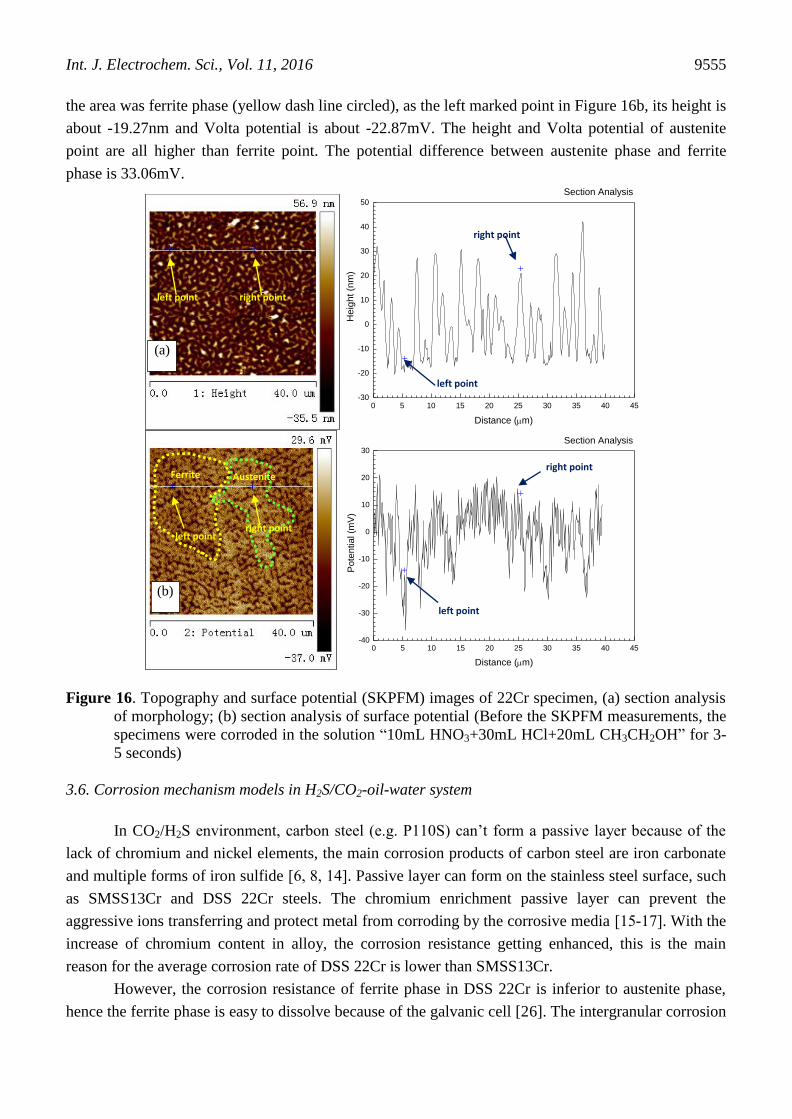
The SKPFM mapping of morphology and Volta potential was performed on the polished and
corroded specimen surface of DSS 22Cr to evaluate the relative corrosion tendency. The concurrent
AFM morphology and Volta potential images of 22Cr are shown in Figure 16. The higher (brighter,
green dash line circled) surface of the area is austenite phase, as the right marker in Figure 16a and
Figure 16b, its height is about 20.71nm and Volta potential is about 10.19mV. The darker surface of
Int. J. Electrochem. Sci., Vol. 11, 2016
9555
the area was ferrite phase (yellow dash line circled), as the left marked point in Figure 16b, its height is
about -19.27nm and Volta potential is about -22.87mV. The height and Volta potential of austenite
point are all higher than ferrite point. The potential difference between austenite phase and ferrite
phase is 33.06mV.
0 5 10 15 20 25 30 35 40 45-30
-20
-10
0
10
20
30
40
50
He
igh
t (n
m)
Distance (m)
Section Analysis
0 5 10 15 20 25 30 35 40 45-40
-30
-20
-10
0
10
20
30
Pote
ntia
l (m
V)
Distance (m)
Section Analysis
Figure 16. Topography and surface potential (SKPFM) images of 22Cr specimen, (a) section analysis
of morphology; (b) section analysis of surface potential (Before the SKPFM measurements, the
specimens were corroded in the solution “10mL HNO3+30mL HCl+20mL CH3CH2OH” for 3-
5 seconds)
3.6. Corrosion mechanism models in H2S/CO2-oil-water system
In CO2/H2S environment, carbon steel (e.g. P110S) can’t form a passive layer because of the
lack of chromium and nickel elements, the main corrosion products of carbon steel are iron carbonate
and multiple forms of iron sulfide [6, 8, 14]. Passive layer can form on the stainless steel surface, such
as SMSS13Cr and DSS 22Cr steels. The chromium enrichment passive layer can prevent the
aggressive ions transferring and protect metal from corroding by the corrosive media [15-17]. With the
increase of chromium content in alloy, the corrosion resistance getting enhanced, this is the main
reason for the average corrosion rate of DSS 22Cr is lower than SMSS13Cr.
However, the corrosion resistance of ferrite phase in DSS 22Cr is inferior to austenite phase,
hence the ferrite phase is easy to dissolve because of the galvanic cell [26]. The intergranular corrosion
Austenite Ferrite
left point right point
right point left point
left point
right point
left point
right point
(a)
(b)

Int. J. Electrochem. Sci., Vol. 11, 2016
9556
occurred generally in areas surrounding the austenite phases [27]. Additionally, the solid particles from
the reservoir could damage the passive layer, and then chloride ions accumulate inside the weak point
to start pitting corrosion. Large cathode area (passivate area) will accelerate corrosion of small anodic
area (active point). Metal ions which dissolve at the anode, such as Fe2+
, Cr3+
and Ni2+
react with water
to form H+. Then, the pH value of media inside the pit is decreased and the metal’s dissolution is
accelerated. In order to keep the electric neutrality of media, lots of Cl- move into the pit and bind
metal ions. High concentration of chloride ions in formation water increase the activity coefficient of
H+ and prevent the reactivation of anodic area in pit. The autocatalytic effect of localized corrosion
makes the pitting rate is considerably larger than the uniform corrosion rate [28]. The microstructure of
SMSS 13Cr is single martensitic phase, and no selective dissolution of metal substrate occurred.
Passive layer of SMSS 13Cr seems more stable than DSS 22Cr in Missan field condition.
According to the Al-Yaari’s study [23], the continuous phase is oil, the dispersed phase is
aqueous and the stable water-in-oil emulsion is formed. The adsorbed crude oil on the metal surface
may diminish the contact between aqueous phase and metal. The inhibitive organic components which
adsorbed onto the metal surface serve as a physical barrier to suppress the anodic reaction and cathodic
reaction in corrosion process and diminish the corrosion of metal caused by aqueous phase. However,
the physical barrier effect is not stable because of the flush of the multiphase flow. The dispersed
aqueous phase may contact with metal intermittently to cause corrosion.
Based on the test results in this study, the author suggests that the corrosion behaviors of SMSS
13Cr and DSS 22Cr are significantly impacted by crude oil. The schematic of corrosion film of the
three type of metal in H2S/CO2- oil-water multiphase flow is shown in Figure 17. The inhibitive
organic components in crude oil adsorbs onto the metal surface non uniformly. The dispersed aqueous
phase may touch the metal under the influence of high velocity flow. CO2, H2S and Cl- dissolved in the
water droplets to work as corrosion species. In addition, FeS, as the main corrosion products, formed
very fast on to the steel surface [29]. The corrosive ions may locally penetrate the corrosion scales and
cause pitting corrosion of metal.
2 15 4 3 18 7 6 2 126910
Figure 17. The schematic of corrosion film of the three type of metal in H2S/CO2- oil-water
multiphase flow, (a)P110S, (b)SMSS 13Cr and (c) DSS 22Cr,1-crude oil; 2-water;3-
corrosion scales;4-pitting;5-matrix of P110S;6-passive films;7-local breakdown of
passive films on SMSS;8-Matrix of SMSS SS13Cr;9-local breakdown of passive films on
DSS;10-Matrix of DSS 22Cr
(a) (b) (c)

Int. J. Electrochem. Sci., Vol. 11, 2016
9557
The microstructure of SMSS 13Cr is single phase martensite. Passive films can form on SMSS
13Cr in the CO2/H2S-oil-water environment. When the high speed dispersed flow pass through the
pipeline, the passive films may be locally destroyed. However, the protective effect for substrate of
passive film on SMSS 13Cr is inferior to DSS 22Cr, thus, the local breakdown of its passive films may
easily transform into general corrosion (Figure 17b). Meanwhile, due to the pure phase microstructure,
the passive film of SMSS 13Cr is more easily to be self-repaired.
Due to the different electrochemical potential of ferrite phase and austenite phase in DSS 22Cr,
micro corrosion galvanic cell may form and induce the localized corrosion. Austenite phase of DSS
22Cr has a more positive potential acting as the anode to diminish the passive film self-repairing. In
the presence of H2S environment, the intergranular corrosion susceptibility is significantly increased.
Big cathode area (passivate films) will accelerate corrosion of small anodic area (active point) and
pitting progress. In addition, the acidification of media inside the pits and the enrichment of Cl-, S
2-
and HS- may also diminish the self-repairing of passive films, accelerate dissolving metal and
exacerbate pitting corrosion further (Figure17c).
4. CONCLUSIONS
The corrosion behaviors of SMSS 13Cr and DSS 22Cr in H2S/CO2-oil-water multiphase flow
were investigated through the long term field test and a series of laboratory analysis. The flowing
conclusions were obtained:
(1) The average corrosion rate of DSS 22Cr was the lower than SMSS 13Cr, but several
pitting attack occurred. The penetration rate was 0.76 mm/a and the pit shows a typical shape of “small
opening with a big belly”. This type of pit tends to have higher penetration rate than an open hole pit.
(2) All of SS13Cr specimens only occurred uniform corrosion. The general corrosion rate
of SMSS13Cr is 0.10 mm/a.
(3) In the no H2S condition, reactivation ratio of SMSS 13Cr was higher than DSS 22Cr,
however, this result was changed after H2S added, and the reactivation ratio of DSS 22Cr became
higher. In H2S-saturated solution, intergranular corrosion and DOS (degree of sensitization) of 22Cr
was higher than SMSS 13Cr. DSS 22Cr has a higher risk of localized attack.
(4) The potential difference between austenite phase and ferrite phase is over 30 mV. It will
have a significant effect on intergranular corrosion and be disadvantageous to the passive layer self-
repairing.
(5) According to the laboratory analysis, mechanism models of the three type of metal in
H2S/CO2- oil-water multiphase flow were proposed. SMSS13Cr shows a superior pitting resistance
compared to DSS 22Cr, moreover, it has a lower cost than DSS 22Cr. Thus, SMSS 13Cr is
recommended in this oil field.
ACKNOWLEDGEMENTS
The authors would like to thanks the sponsor company of China National Offshore Oil Corporation
(CNOOC) , Iraq limited for their full support.

Int. J. Electrochem. Sci., Vol. 11, 2016
9558
References
1. M.B. Kermani and D.Harrop, SPE Production & Facilities. 11(1996) 186-190
2. M. X. Lu, Z. Q. Bai, X.W. Zhao,J.H. Luo, C.F. Chen, Corrosion & Protection. 23(2002)105-113
3. S. D. Kapusta, B. F. M. Pots, R. A. Connell, Corrosion, NACE International, (1999) paper No.45.
4. G. Svenningsen, P. Attila, K. Jon, Corrosion, NACE International, (2009) paper No.09359.
5. A. Miyasaka, D. Kozo, O. Hiroyuki, SPE production engineering. (1998), paper No. SPE15804.
6. Z.F. Yin, W.Z. Zhao, Z.Q. Bai, Electrochimica Acta. 53(2008)3690-3700.
7. B. Kermani, J. W. Martin, K. A. Esaklul, Corrosion, NACE International,(2006) paper No. 06121
8. W. Yan, J. G. Deng, P. K. Zhu, X. J. Xing, Corrosion Engineering, Science and Technology.
50(2015)525-532
9. Y.H. Lin, A. Singh, E. E. Ebenso, M. A. Quraishi, Y. Zhou, Y. Huang, Int. J. Electrochem. Sci. 10
(2015) 194- 208.
10. S. Nesic, Corrosion Science, 49 (2007) 4308- 4338.
11. Z.A. Iofa, V.V. Batrakov , Cho-Ngok-Ba, Electrochimica Acta,12 (1964): 1645 –1653.
12. D. W. Shoesmith, P. Taylor, M. G. Bailey, D. G. Owen, Journal of Electrochemical Society,127
(1980) 1007-1015.
13. N. Sato, Corrosion, 45(1989)354-368.
14. L.J. Mu and W.Z. Zhao, Corrosion science. 52(2010)82-89.
15. H. Fischmeister and U. Roll, Fresenius Journal of Analytical Chemistry. 319(1984)639-645
16. C.-O.A. Olsson and D. Landolt, Electrochimica Acta , 48(2003 ) 1093-1104.
17. D. Sidorin, D. Pletcher, B. Hedges, Electrochimica Acta, 50(2005) 4109- 4116.
18. M. Ueda, K. Nakamura, N. Hudson, Corrosion, NACE International, (2003) paper No.03097
19. M. Herve, E. A. Hafida, L. Jean. Corrosion, NACE International, (2009) paper No.09084
20. D. K. Russell and S. C. Michael, Corrosion, NACE International,(1998) paper No.274
21. J. Shu, H. Bi, X. Li, Z. Xu, Corrosion Science, 57 (2012) 89-98.
22. R. Merello, F.J. Botana , J. Botella, M. V. Matres, M. Marcos, Corrosion Science,45(2003) 909-
921.
23. M. A. Al-Yaari and B. F. Abu-Sharkh, Asian Transactions on Engineering,1 (2011) 68-75
24. National Association of Corrosion Engineers, NACE (2005) RP 0775
25. X. L. Cheng, H. Y. Ma , S. H. Chen, L. Niu, S. B. Lei, R. Yu, Z. M. Yao,
26. L. F. Garfias-Mesias, J. M. Sykes, C. D. S. Truck, Corrosion science,38(1996)1319-1330.
27. B.H.Lee, H.W.Lee, Y. T. Shin. Int. J. Electrochem. Sci., 10 (2015) 7535 – 7547.
28. Corrosion Science, 41(1999) 773-788.
29. H. Shuji, M. Katsumi, Y. Kazuo, Corrosion, NACE International,(2003) paper No.03095
30. Y.G. Zheng, B. Brown, S. Nesic, Corrosion, 70(2014) 351-365
© 2016 The Authors. Published by ESG (www.electrochemsci.org). This article is an open access
article distributed under the terms and conditions of the Creative Commons Attribution license
(http://creativecommons.org/licenses/by/4.0/).