
Application of displacement-based design method to assess the level of structural damage due to...
7
Journal of Mechanical Science and Technology 24 (3) (2010) 649~655 www.springerlink.com/content/1738-494x DOI 10.1007/s12206-009-1218-2 Application of displacement-based design method to assess the level of structural damage due to blast loads † Ramezan Ali Izadifard * and Mahmoud Reza Maheri Department of Civil Engineering, Shiraz University, Shiraz, Iran (Manuscript Received July 18, 2008; Revised August 4, 2009; Accepted October 19, 2009) ---------------------------------------------------------------------------------------------------------------------------------------------------------------------------------------------------------------------------------------------------------------------------------------------- Abstract In this paper, a displacement-based design (DBD) methodology commonly used for seismic design and evaluation of structures is adopted to determine the performance of structures to blast loading. In this method, structural performance is linked to measurable quan- tities such as the displacement ductility. To verify the applicability of the method and the accuracy of the results, a simple structural shape, including a square steel plate, is subjected to out-of-plane blast loading with different explosive charge weights and stand-off distances. With the adaptation of the AUTODYN software, the above-mentioned examples in a similar condition are also subjected to blast loading. It is found that the results of the DBD method agree favorably with the results obtained from a numerical method. It is also shown that a good prediction of the damage level can be made for steel plates subjected to different charge weights and stand-off distances. Keywords: Blast load; Damage level; Steel plate; Displacement-based design (DBD) ---------------------------------------------------------------------------------------------------------------------------------------------------------------------------------------------------------------------------------------------------------------------------------------------- 1. Introduction Recent terrorist events around the world have emphasized the need to re-evaluate the vulnerability of structures and structural members to blast loading and to carry out protective measures against such loadings. As “protection” is not an absolute concept for any structure based on a certain criterion, a particular level of protection may thus be considered. In designing against blast loading, an acceptable level of resis- tance and protection should be established, as blast loads may cause different levels of damage to structures, which may range from a minor damage to a complete structural failure. In steel structures, two different levels of failure are often speci- fied. The damage level is associated with the ratio of ultimate displacement to yield displacement of structure, which is de- noted by µ [1]. The first level constitutes those that are ca- pable of functioning after the blast. The blast effect is minor in these structures, and they can become functional again with certain repairs. The ductility level for these structures is lim- ited to 3 = µ . In the second level, structures are expected to sustain heavy damage beyond repair, while the integrity of the structure remains in place. The maximum ductility level con- sidered for these structures is 6 = µ , above which the stability of the structure is jeopardized. There is a close relationship between the above damage lev- els and the weight of the explosive charge and its distance. In the present paper, a displacement-based method generally used in seismic analysis and design [2] is adopted to evaluate the strength of structure against blast loading. The structural system considered here is a steel plate undergoing different loading conditions. First, damage level is defined, and then considering the ductility ratio of 1 = µ to 3 = µ , the weight and distance of the explosion causing such damage are then evaluated. 2. Evaluation of blast load As a result of a chemical blast, an overpressure is developed, the peak of which, s P , can be evaluated as follows [3]: 2 1 2 2 1 2 2 1 2 2 0 35 . 1 1 . 32 . 0 1 . 048 . 0 1 5 . 4 1 808 ⎥ ⎥ ⎦ ⎤ ⎢ ⎢ ⎣ ⎡ ⎟ ⎠ ⎞ ⎜ ⎝ ⎛ + ⎥ ⎥ ⎦ ⎤ ⎢ ⎢ ⎣ ⎡ ⎟ ⎠ ⎞ ⎜ ⎝ ⎛ + ⎥ ⎥ ⎦ ⎤ ⎢ ⎢ ⎣ ⎡ ⎟ ⎠ ⎞ ⎜ ⎝ ⎛ + ⎥ ⎥ ⎦ ⎤ ⎢ ⎢ ⎣ ⎡ ⎟ ⎠ ⎞ ⎜ ⎝ ⎛ + = Z Z Z Z P P s (1) In the above equation, Z is the scaled distance and is ex- pressed in terms of the explosive material weight, W , and the explosion distance, R , as 3 / 1 / W R Z = . (2) † This paper was recommended for publication in revised form by Associate Editor Jeonghoon Yoo * Corresponding author. Tel.: +98 2188552459, Fax.: +98 2188552429 E-mail address: [email protected] © KSME & Springer 2010
Transcript of Application of displacement-based design method to assess the level of structural damage due to...

Journal of Mechanical Science and Technology 24 (3) (2010) 649~655
www.springerlink.com/content/1738-494x DOI 10.1007/s12206-009-1218-2
Application of displacement-based design method to assess the level of structural
damage due to blast loads† Ramezan Ali Izadifard* and Mahmoud Reza Maheri
Department of Civil Engineering, Shiraz University, Shiraz, Iran
(Manuscript Received July 18, 2008; Revised August 4, 2009; Accepted October 19, 2009)
----------------------------------------------------------------------------------------------------------------------------------------------------------------------------------------------------------------------------------------------------------------------------------------------
Abstract In this paper, a displacement-based design (DBD) methodology commonly used for seismic design and evaluation of structures is
adopted to determine the performance of structures to blast loading. In this method, structural performance is linked to measurable quan-tities such as the displacement ductility. To verify the applicability of the method and the accuracy of the results, a simple structural shape, including a square steel plate, is subjected to out-of-plane blast loading with different explosive charge weights and stand-off distances. With the adaptation of the AUTODYN software, the above-mentioned examples in a similar condition are also subjected to blast loading. It is found that the results of the DBD method agree favorably with the results obtained from a numerical method. It is also shown that a good prediction of the damage level can be made for steel plates subjected to different charge weights and stand-off distances.
Keywords: Blast load; Damage level; Steel plate; Displacement-based design (DBD) ---------------------------------------------------------------------------------------------------------------------------------------------------------------------------------------------------------------------------------------------------------------------------------------------- 1. Introduction
Recent terrorist events around the world have emphasized the need to re-evaluate the vulnerability of structures and structural members to blast loading and to carry out protective measures against such loadings. As “protection” is not an absolute concept for any structure based on a certain criterion, a particular level of protection may thus be considered. In designing against blast loading, an acceptable level of resis-tance and protection should be established, as blast loads may cause different levels of damage to structures, which may range from a minor damage to a complete structural failure. In steel structures, two different levels of failure are often speci-fied. The damage level is associated with the ratio of ultimate displacement to yield displacement of structure, which is de-noted by µ [1]. The first level constitutes those that are ca-pable of functioning after the blast. The blast effect is minor in these structures, and they can become functional again with certain repairs. The ductility level for these structures is lim-ited to 3=µ . In the second level, structures are expected to sustain heavy damage beyond repair, while the integrity of the structure remains in place. The maximum ductility level con-sidered for these structures is 6=µ , above which the stability of the structure is jeopardized.
There is a close relationship between the above damage lev-els and the weight of the explosive charge and its distance. In the present paper, a displacement-based method generally used in seismic analysis and design [2] is adopted to evaluate the strength of structure against blast loading. The structural system considered here is a steel plate undergoing different loading conditions. First, damage level is defined, and then considering the ductility ratio of 1=µ to 3=µ , the weight and distance of the explosion causing such damage are then evaluated.
2. Evaluation of blast load
As a result of a chemical blast, an overpressure is developed, the peak of which, sP , can be evaluated as follows [3]:
21
221
221
2
2
0
35.11.
32.01.
048.01
5.41808
⎥⎥⎦
⎤
⎢⎢⎣
⎡⎟⎠⎞
⎜⎝⎛+
⎥⎥⎦
⎤
⎢⎢⎣
⎡⎟⎠⎞
⎜⎝⎛+
⎥⎥⎦
⎤
⎢⎢⎣
⎡⎟⎠⎞
⎜⎝⎛+
⎥⎥⎦
⎤
⎢⎢⎣
⎡⎟⎠⎞
⎜⎝⎛+
=
ZZZ
Z
PPs (1)
In the above equation, Z
is the scaled distance and is ex-
pressed in terms of the explosive material weight, W , and the explosion distance, R , as
3/1/WRZ = . (2)
† This paper was recommended for publication in revised form by Associate EditorJeonghoon Yoo
*Corresponding author. Tel.: +98 2188552459, Fax.: +98 2188552429 E-mail address: [email protected]
© KSME & Springer 2010

650 R. A. Izadifard and M. R. Maheri / Journal of Mechanical Science and Technology 24 (3) (2010) 649~655
We can also calculate the amount of sP from the graphs submitted by some other references [1, 4]. In Fig. 2(a), the submitted graph in the TM5-1300 code with Eq. (1) is graphed [4].
With the transfer of the blast wave, a dynamic pressure is applied to the structure, which can be evaluated as follows:
( )0
2
725
PPPq
s
ss += , (3)
where 0P is the pressure of the ambient atmosphere. When the blast wave reaches the surface at right angles, reflective pressure, rP , is produced.
⎥⎦
⎤⎢⎣
⎡++
=s
ssr PP
PPPP0
0
7472 (4)
The variation in pressure in time is a logarithmic function,
and it is often modeled as a linear triangular relationship for simplicity, as shown in Fig. 1. In this figure, dt is the time at which the blast impulse on the structure ends and is usually referred to as the “clearing-time.” This time is dependent on the time of application of overpressure as well as on the veloc-ity of shockwave [5]. In TM5-1300 [4], a graph is presented to calculate the duration of explosion time, dt , and this graph can be simplified with Eq. (5).
( ) ( )( ) ( ) 1;28.0log31.0/log
1;28.0log5.2/log
103/1
10
103/1
10
≥+=
≤+=
ZZWtZZWt
d
d (5)
In Fig. 2(b), the comparison of this equation with TM5-1300 is shown.
The peak blast pressure on the structure ( )maxP and the du-ration of its application ( dt ) are plotted against the scaled distance Z in Figs. 2(a) and 2(b), respectively.
3. Material model of steel
To make a model of the nonlinear behavior of steel plate under blast loading, it is necessary to use a suitable material model. Since blast loading occurs in a fraction of a second, factors such as strain hardening, high strain rate, and high temperature variation, which result from plastic deformation, must be considered in addition to the behavioral characteris-tics of steel.
Fig. 1. The simplified pressure-time relation in blast loading.
In the Johnson-Cook model [6], the effects of strain harden-ing, strain hardening rate, and temperature softening must be considered in the calculation. Moreover, with great accuracy, yield stress and steel fail stress in blast can be predicted [7, 8].
The Johnson–Cook model clearly states the material yield stress with Eq. (6) [6, 9].
( )[ ] ( )[ ] ( )[ ]MNPy TCBA ** 1ln1 −∈+∈+=σ (6)
In this equation, the first brackets show the effect of strain hardening, where A is the yield stress, B and N are the harden-ing parameters, and P∈ is the effective plastic strain. The second bracket shows the effect of the strain rate ( )*∈ , and the third brackets show the dependency of the yield stress to tem-perature variation. C and M are experimental parameters, and
*T is a dimensionless quantity that can be derived from Eq. (7) as follows:
( ) ( )refmeltref TTTTT −−= /* (7)
In the above equation, refT is the ambient temperature, meltT is the material melting point, and T is the temperature in which
yσ is calculated. The constants of A, B, C, N, and M result from the torsional test with a high strain rate along with the dynamic stress test.
(a)
(b)
Fig. 2. Peak blast pressure and its time of application.
R. A. Izadifard and M. R. Maheri / Journal of Mechanical Science and Technology 24 (3) (2010) 649~655 651
Table 1. Parameters of mild steel.
( )3/ mkgρ 7890 ( )MPaB 275
( )GPaE 208 n 0.36
v 0.28 C 0.079
( )MPaA 250 0∈ 1
The effective plastic strain is calculable based on the plastic
strain tensor ( )Pijd ∈ ,
∫∈
∈=∈0
PP d (8)
21
32
⎟⎠⎞
⎜⎝⎛ ∈∈=∈ P
ijP
ijP ddd (9)
The dimensionless strain rate ( )*∈ can also be calculated
from Eq. (10),
0* /∈∈=∈ P , (10)
where P∈ is the effective plastic strain rate, and 0∈ is an initial constant. Some of these experimental constants are available from the Johnson–Cook equation. Some of the con-stants for mild steel are presented in Table 1 [10].
4. Application of DBD method
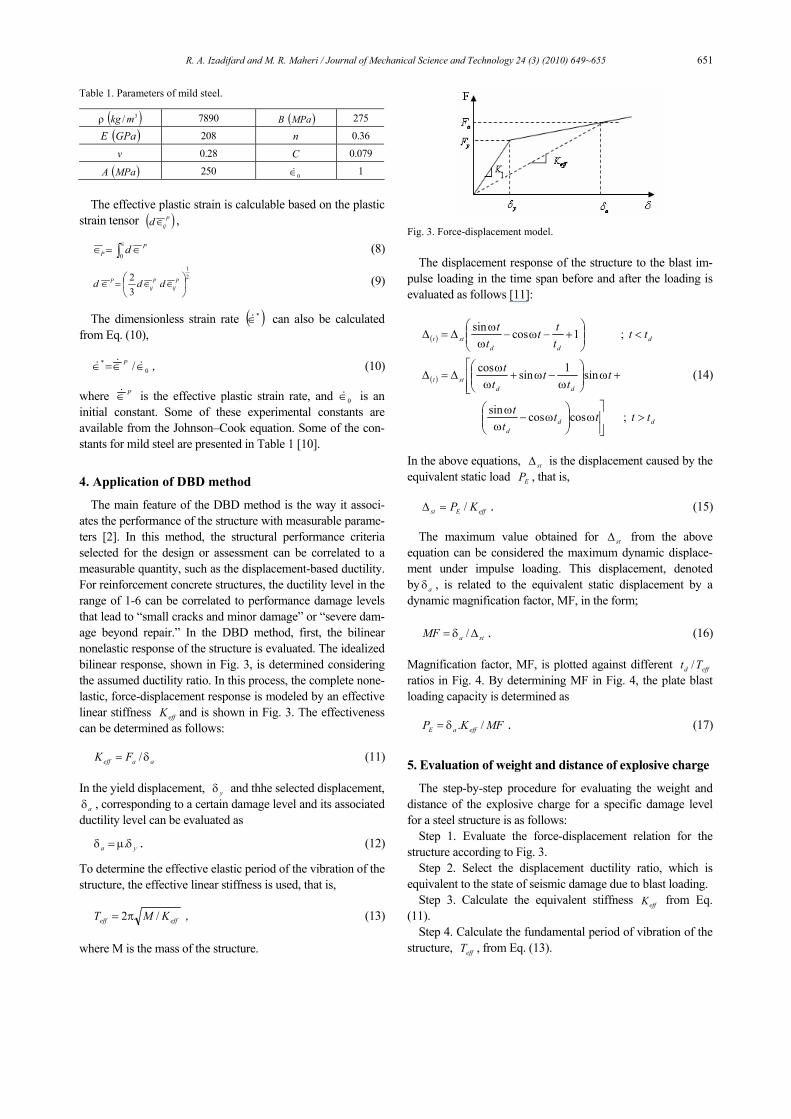
The main feature of the DBD method is the way it associ-ates the performance of the structure with measurable parame-ters [2]. In this method, the structural performance criteria selected for the design or assessment can be correlated to a measurable quantity, such as the displacement-based ductility. For reinforcement concrete structures, the ductility level in the range of 1-6 can be correlated to performance damage levels that lead to “small cracks and minor damage” or “severe dam-age beyond repair.” In the DBD method, first, the bilinear nonelastic response of the structure is evaluated. The idealized bilinear response, shown in Fig. 3, is determined considering the assumed ductility ratio. In this process, the complete none-lastic, force-displacement response is modeled by an effective linear stiffness effK and is shown in Fig. 3. The effectiveness can be determined as follows:
aaeff FK δ= / (11) In the yield displacement, yδ and thhe selected displacement,
aδ , corresponding to a certain damage level and its associated ductility level can be evaluated as
ya δµ=δ . . (12) To determine the effective elastic period of the vibration of the structure, the effective linear stiffness is used, that is,
effeff KMT /2π= , (13) where M is the mass of the structure.
Fig. 3. Force-displacement model.
The displacement response of the structure to the blast im-
pulse loading in the time span before and after the loading is evaluated as follows [11]:
( )
( )
ddd
ddstt
ddd
stt
ttttt
t
tt
tt
t
ttttt
tt
>⎥⎥⎦
⎤ω⎟⎟
⎠
⎞⎜⎜⎝
⎛ω−
ωω
⎢⎢⎣
⎡+ω⎟⎟
⎠
⎞⎜⎜⎝
⎛ω
−ω+ωω
∆=∆
<⎟⎟⎠
⎞⎜⎜⎝
⎛+−ω−
ωω
∆=∆
;coscossin
sin1sincos
;1cossin
(14)
In the above equations, st∆ is the displacement caused by the equivalent static load EP , that is,
effEst KP /=∆ . (15)
The maximum value obtained for st∆ from the above equation can be considered the maximum dynamic displace-ment under impulse loading. This displacement, denoted by aδ , is related to the equivalent static displacement by a dynamic magnification factor, MF, in the form;
staMF ∆δ= / . (16)
Magnification factor, MF, is plotted against different effd Tt / ratios in Fig. 4. By determining MF in Fig. 4, the plate blast loading capacity is determined as
MFKP effaE /.δ= . (17) 5. Evaluation of weight and distance of explosive charge
The step-by-step procedure for evaluating the weight and distance of the explosive charge for a specific damage level for a steel structure is as follows:
Step 1. Evaluate the force-displacement relation for the structure according to Fig. 3.
Step 2. Select the displacement ductility ratio, which is equivalent to the state of seismic damage due to blast loading.
Step 3. Calculate the equivalent stiffness effK from Eq. (11).
Step 4. Calculate the fundamental period of vibration of the structure, effT , from Eq. (13).

652 R. A. Izadifard and M. R. Maheri / Journal of Mechanical Science and Technology 24 (3) (2010) 649~655
Fig. 4. Dynamic magnification factor, MF.
Step 5. Select the initial amount Z with consideration of R
and W from Eq. (2). Step 6. Calculate the blast loading time, dt , from Eq. (5) or
Fig. 2(b). Step 7. Determine the magnification factor, MF, from Fig. 4,
or derive it from Eq. (14). Step 8. Calculate the blast loading capacity of the structure,
EP , from Eq. (17). Step 9. Calculate the scaled distance, Z, from Eqs. (1) and
(3). If the scaled distance, Z, determined in step 9 , falls within a
specific tolerance compared with the distance evaluated in the previous step, the process stops; otherwise, steps 6-9 are re-peated until the required convergence is achieved. When reaching the convergence, the weight and distance of the ex-plosive charge capable of creating the deformation or the damage level can be evaluated. This process enables the user to forego a laborious dynamic analysis and to obtain accept-able results with a simple static analysis.
It should be noted that because of the very short duration of blast loading, the usual dynamic solution based on im-plicit methods do not generally reach convergence, and it is necessary to employ explicit methods. With every step of the dynamic analysis, the deformation corresponding to the blast with a specific weight of explosive at a certain dis-tance from the structure is also obtained. Therefore, to reach the required deformation or damage level, repeated dynamic solutions are necessary, which increase the solution time.
Fig. 5. Configuration of the modeling. (a) situation of the charge and plate, (b) meshed plate along with the boundary condition.
6. Numerical simulation
Autodyn hydrocode is used for numerical simulation, and an explicit method is adopted in this software. The explosive is placed at a distance away from plate and above the midpoint. Therefore, the load is vertical to the plate, and the displacement is in the vertical direction as well [Fig. 5(a)]. This problem is modeled in a 3D environment, and Lagrangian shell elements are used for modeling.
The plate perimeter has been fixed against bending. Therefore, two rows of neighboring nodes are constrained under vertical displacements. A schematic of the meshed plate along with the boundary conditions is shown in Fig. 5(b).
Dynamic load is applied in distributed form and is perpen-dicular to the plate. The material behavior is modeled using the Johnson–Cook model, and the equation of state is linear. The needed constants for the material model and equation of state are shown in Tables 1 and 2, respectively. The initial time step is assumed to be 2.7334×10⁻⁶.
To examine the effect of meshes on result accuracy, a 1m*1m plate is divided into the elements of different dimen-sions such as 25, 50, 100 and 225 mm. This plate is subjected to compression loading of a 1 kg TNT explosive material in the distance of 2 m. Using equations 1 to 5,
Z = 2 m/kg1/3; Ps = 207.9 kPa; Pr = 968.6 kPa qs = 117.8 kPa; td = 2.36 mSec
R. A. Izadifard and M. R. Maheri / Journal of Mechanical Science and Technology 24 (3) (2010) 649~655 653
Table 2. Linear equation of the state parameters.
Bulk modulus (Gpa)
Specific heat (J/kgoK)
Reference temperature (oK)
159 477 300
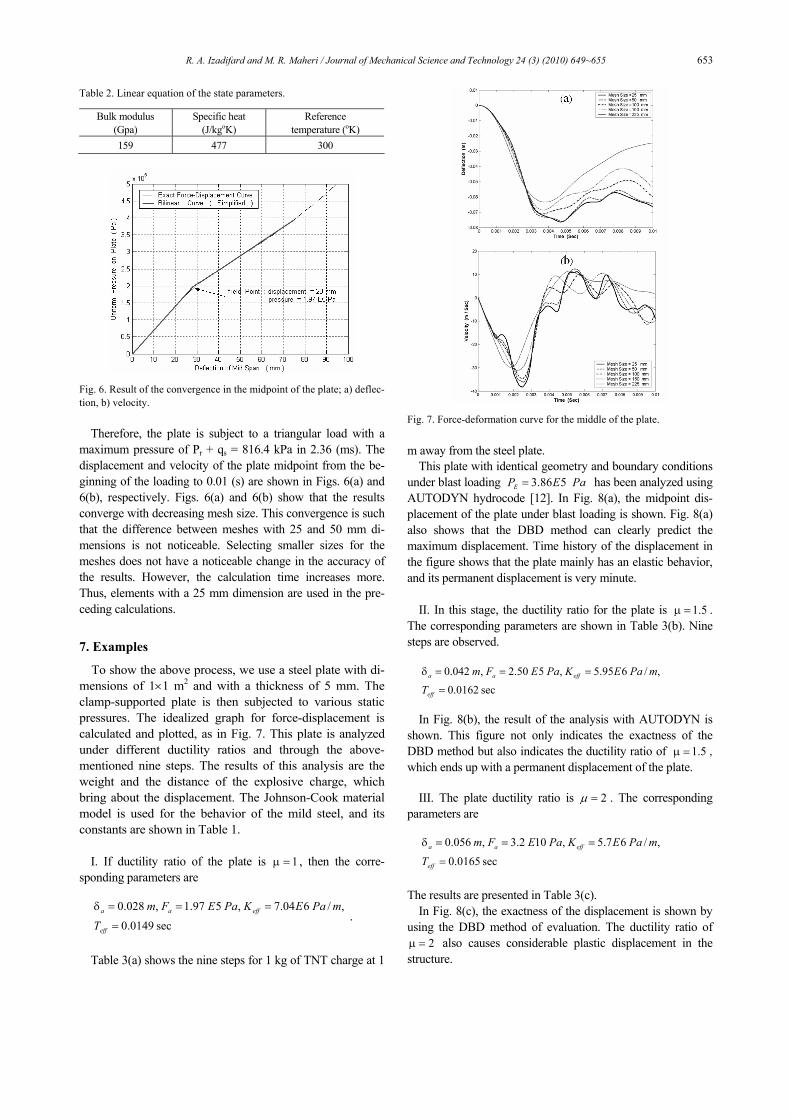
Fig. 6. Result of the convergence in the midpoint of the plate; a) deflec-tion, b) velocity.
Therefore, the plate is subject to a triangular load with a
maximum pressure of Pr + qs = 816.4 kPa in 2.36 (ms). The displacement and velocity of the plate midpoint from the be-ginning of the loading to 0.01 (s) are shown in Figs. 6(a) and 6(b), respectively. Figs. 6(a) and 6(b) show that the results converge with decreasing mesh size. This convergence is such that the difference between meshes with 25 and 50 mm di-mensions is not noticeable. Selecting smaller sizes for the meshes does not have a noticeable change in the accuracy of the results. However, the calculation time increases more. Thus, elements with a 25 mm dimension are used in the pre-ceding calculations.
7. Examples
To show the above process, we use a steel plate with di-mensions of 1×1 m2 and with a thickness of 5 mm. The clamp-supported plate is then subjected to various static pressures. The idealized graph for force-displacement is calculated and plotted, as in Fig. 7. This plate is analyzed under different ductility ratios and through the above-mentioned nine steps. The results of this analysis are the weight and the distance of the explosive charge, which bring about the displacement. The Johnson-Cook material model is used for the behavior of the mild steel, and its constants are shown in Table 1.
I. If ductility ratio of the plate is 1=µ , then the corre-
sponding parameters are
sec0149.0
,/604.7,597.1,028.0
=
===δ
eff
effaa
T
mPaEKPaEFm.
Table 3(a) shows the nine steps for 1 kg of TNT charge at 1
Fig. 7. Force-deformation curve for the middle of the plate.
m away from the steel plate.
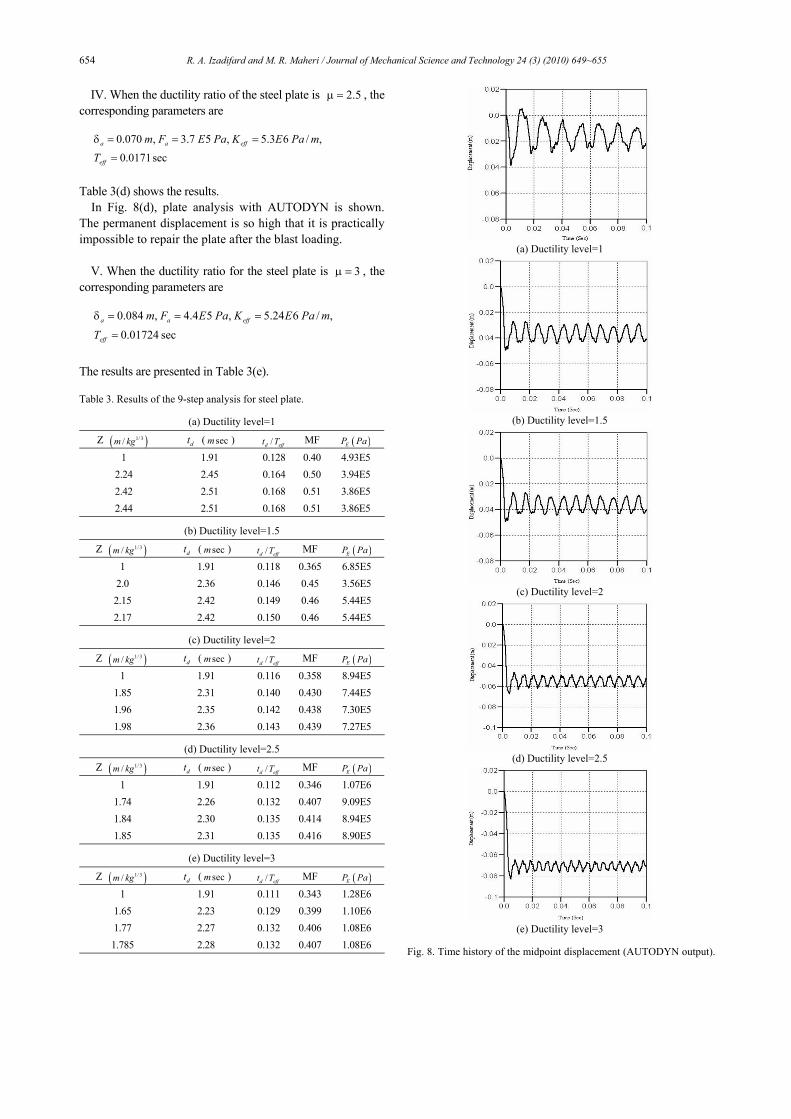
This plate with identical geometry and boundary conditions under blast loading PaEPE 586.3= has been analyzed using AUTODYN hydrocode [12]. In Fig. 8(a), the midpoint dis-placement of the plate under blast loading is shown. Fig. 8(a) also shows that the DBD method can clearly predict the maximum displacement. Time history of the displacement in the figure shows that the plate mainly has an elastic behavior, and its permanent displacement is very minute.
II. In this stage, the ductility ratio for the plate is 5.1=µ .
The corresponding parameters are shown in Table 3(b). Nine steps are observed.
sec0162.0,/695.5,550.2,042.0
=
===δ
eff
effaa
TmPaEKPaEFm
In Fig. 8(b), the result of the analysis with AUTODYN is
shown. This figure not only indicates the exactness of the DBD method but also indicates the ductility ratio of 5.1=µ , which ends up with a permanent displacement of the plate.
III. The plate ductility ratio is 2µ = . The corresponding
parameters are
sec0165.0,/67.5,102.3,056.0
=
===δ
eff
effaa
TmPaEKPaEFm
The results are presented in Table 3(c).
In Fig. 8(c), the exactness of the displacement is shown by using the DBD method of evaluation. The ductility ratio of
2=µ also causes considerable plastic displacement in the structure.
654 R. A. Izadifard and M. R. Maheri / Journal of Mechanical Science and Technology 24 (3) (2010) 649~655
IV. When the ductility ratio of the steel plate is 5.2=µ , the corresponding parameters are
sec0171.0,/63.5,57.3,070.0
=
===δ
eff
effaa
TmPaEKPaEFm
Table 3(d) shows the results.
In Fig. 8(d), plate analysis with AUTODYN is shown. The permanent displacement is so high that it is practically impossible to repair the plate after the blast loading.
V. When the ductility ratio for the steel plate is 3=µ , the
corresponding parameters are
sec01724.0,/624.5,54.4,084.0
=
===δ
eff
effaa
TmPaEKPaEFm
The results are presented in Table 3(e). Table 3. Results of the 9-step analysis for steel plate.
(a) Ductility level=1
( )EP Pa MF /d efft T dt ( secm ) Z ( )1/3/m kg 4.93E5 0.40 0.128 1.91 1 3.94E5 0.50 0.164 2.45 2.24 3.86E5 0.51 0.168 2.51 2.42 3.86E5 0.51 0.168 2.51 2.44
(b) Ductility level=1.5
( )EP PaMF /d efft T dt ( secm ) Z ( )1/3/m kg 6.85E5 0.365 0.118 1.91 1 3.56E5 0.45 0.146 2.36 2.0 5.44E5 0.46 0.149 2.42 2.15 5.44E5 0.46 0.150 2.42 2.17
(c) Ductility level=2
( )EP PaMF /d efft T dt ( secm ) Z ( )1/3/m kg 8.94E5 0.358 0.116 1.91 1 7.44E5 0.430 0.140 2.31 1.85 7.30E5 0.438 0.142 2.35 1.96 7.27E5 0.439 0.143 2.36 1.98
(d) Ductility level=2.5
( )EP PaMF /d efft T dt ( secm ) Z ( )1/3/m kg 1.07E6 0.346 0.112 1.91 1 9.09E5 0.407 0.132 2.26 1.74 8.94E5 0.414 0.135 2.30 1.84 8.90E5 0.416 0.135 2.31 1.85
(e) Ductility level=3
( )EP PaMF /d efft T dt ( secm ) Z ( )1/3/m kg 1.28E6 0.343 0.111 1.91 1 1.10E6 0.399 0.129 2.23 1.65 1.08E6 0.406 0.132 2.27 1.77 1.08E6 0.407 0.132 2.28 1.785
(a) Ductility level=1
(b) Ductility level=1.5
(c) Ductility level=2
(d) Ductility level=2.5
(e) Ductility level=3
Fig. 8. Time history of the midpoint displacement (AUTODYN output).

R. A. Izadifard and M. R. Maheri / Journal of Mechanical Science and Technology 24 (3) (2010) 649~655 655
In Fig. 8(e), the application of the DBD method shows the exactness of the displacement. It also shows that the plastic displacement is such that the structure is practically beyond repair.
8. Conclusion
In this paper, a displacement-based method DBD is pre-sented by which the weight of the charge and its distance from the steel plate are evaluated for a specific level of damage. The proposed numerical examples confirm the correctness of such method. Moreover, the ductility ratio of 32−=µ causes massive permanent displacement in the plate, which in turn represents a very severe permanent displacement. Investiga-tions also show that the damage in the plate with a ductility ratio of 5.1=µ is relatively severe.
References
[1] P. D. Smith and J.G .Hetherington, Blast and Ballistic Load-ing of Structures, Butterworth- Heinemann Ltd., (1994).
[2] M. J. N. Priestley, Performance Based Seismic Design, Pro-ceeding of the 12th world conference on Earthquake Engi-neering, Auckland, New Zealand, State of the Art Paper, 2831 (2000) 325-346.
[3] G. F. Kinney and K. J. Graham, Explosive Shocks in Air, 2nd ed, Berlin, Springer, (1985).
[4] TM5-1300, Design of Structures to Resist the Effects of Ac-cidental Explosions, US Department of the Army, Technical Manual, (1990).
[5] N. Lam, P. Mendis and T. Ngo, Response Spectrum Solution for Blast Loading, Electronic Journal of structural Engi-neering, 4 (2004) 28-44.
[6] G. R. Johnson and W. H. Cook, Fracture Characteristics of Three Metals subjected to various strains, strain Rates, Tem-peratures and Pressures, Engineering Fracture Mechanics, 21 (1) (1985) 31-48.
[7] S. D. Borvik, T. Hopperstad and M. Langseth, on the Influ-ence of Fracture Criterion in Projectile Impact of steel plates. Computational Materials Science, 38 (1) (2006) 176-191.
[8] S. C. K. Yuen and G. N. Nurick, Experimental and Numeri-
cal studies on the Response of Quadrangular stiffened Plates. Part I: Subjected to Uniform Blast Load, International Jour-nal of Impact Engineering, 31 (1) (2005) 55-83.
[9] G. R. Johnson and W. H. Cook, A Constitutive Model and Data for Metals Subjected to large Strains, High Strain Rates and High Temperatures in Proceedings of the 7th Interna-tional symposium on Ballistics. The Hague, The Netherlands, (1983) 541-547.
[10] T. Umeda, H. Umeki, and K. Mimura, Numerical Evalua-tion of Measurement Accuracy of Non-Coaxial Hopkinson Bar Method, JSME International Journal, Series A, 48 (4) (2005) 215-221.
[11] R. W. Clough and J. Penzein, Dynamics of Structures, New York, McGraw Hill, Inc., (1978).
[12] AUTODYN User Manual, Century Dynamics. Version 6.1 (2005).
R. A. Izadifard received his Ph.D. in Civil Engineering from Shiraz Univer-sity. He is currently a faculty member of the Department of Civil Engineering, Imam Khomeini University, Iran. He is a member of several national commit-tees on structural engineering codes of practice and construction. His current
research interests are structural analysis and design under ex-treme loads, seismic analysis, and fluid-structure dynamic interaction.
Mahmoud R. Maheri received his Ph.D. in Civil Engineering from Bristol Uni-versity, UK, in 1987. Professor Maheri is currently a faculty of the Civil Engineer-ing department of Shiraz University, Iran. He is a core member of the Iranian Cen-tre of Excellence in Computational Me-chanics. He also serves on several na-
tional committees on structural and earthquake engineering codes of practice. Professor Maheri’s current research interests include seismic analysis and retrofitting of structures and fluid-structure dynamic interaction.