Application of a New Simple Spectrophotometric Method to the Simultaneous Determination of...
12
ISSN: 0975-8585 March - April 2014 RJPBCS 5(2) Page No. 552 Research Journal of Pharmaceutical, Biological and Chemical Sciences Application of a New Simple Spectrophotometric Method to the Simultaneous Determination of Diclofenac Sodium and Diflunisal in Their Combined Dosage Form Tarek S Belal a *, Mohamed S Mahrous b , Magdi M Abdel-Khalek b , Hoda G Daabees c , and Mona M Khamis b a Pharmaceutical Analytical Chemistry Department, Faculty of Pharmacy, University of Alexandria, Elmessalah 21521, Alexandria, Egypt b Pharmaceutical Chemistry Department, Faculty of Pharmacy, University of Alexandria, Elmessalah 21521, Alexandria, Egypt. c Pharmaceutical Chemistry Department, Faculty of Pharmacy, Damanhour University, Damanhour, Egypt. ABSTRACT In this work, a simple and sensitive spectrophotometric method is presented for determination of the non-steriodal anti-inflammatory drugs; diclofenac sodium (DCL) and diflunisal (DIF) in their binary mixture without prior separation. The proposed method is based on the generation of ratio spectra of one compound using the other as the divisor followed by measurement of the peak-to-trough amplitudes between two selected wavelengths in the generated ratio spectra. For the determination of DCL, a standard solution of DIF 5 μg/mL was used as the divisor, and the peak-to-trough amplitudes between 251 and 291 nm were measured and correlated to the corresponding concentrations. Similarly, DCL 7.5 μg/mL was set as the divisor in DIF determination and the peak-to-trough amplitudes at the same wavelengths were recorded. The proposed method was found linear over the concentration ranges 5-50 and 1.5-30 μg/mL for DCL and DIF, respectively. The developed method was validated following the ICH guidelines and successfully applied to the determination of both drugs in various laboratory prepared mixtures. In addition, satisfactory results were obtained from analysis of the commercial pharmaceutical preparation (suppositories) with no significant statistical differences from a reference HPLC method. Keywords: Spectrophotometric analysis; Binary mixture; Ratio spectra; Peak-to-trough amplitudes; Diclofenac sodium; Diflunisal. *Corresponding author Email: [email protected]
Transcript of Application of a New Simple Spectrophotometric Method to the Simultaneous Determination of...
ISSN: 0975-8585
March - April 2014 RJPBCS 5(2) Page No. 552
Research Journal of Pharmaceutical, Biological and Chemical
Sciences
Application of a New Simple Spectrophotometric Method to the Simultaneous Determination of Diclofenac Sodium and Diflunisal in Their
Combined Dosage Form
Tarek S Belal a*, Mohamed S Mahrous b, Magdi M Abdel-Khalek b, Hoda G Daabees c, and Mona M Khamis b
a
Pharmaceutical Analytical Chemistry Department, Faculty of Pharmacy, University of Alexandria, Elmessalah 21521, Alexandria, Egypt b
Pharmaceutical Chemistry Department, Faculty of Pharmacy, University of Alexandria, Elmessalah 21521, Alexandria, Egypt. c Pharmaceutical Chemistry Department, Faculty of Pharmacy, Damanhour University, Damanhour, Egypt.
ABSTRACT
In this work, a simple and sensitive spectrophotometric method is presented for determination of the
non-steriodal anti-inflammatory drugs; diclofenac sodium (DCL) and diflunisal (DIF) in their binary mixture without prior separation. The proposed method is based on the generation of ratio spectra of one compound using the other as the divisor followed by measurement of the peak-to-trough amplitudes between two selected wavelengths in the generated ratio spectra. For the determination of DCL, a standard solution of DIF 5 µg/mL was used as the divisor, and the peak-to-trough amplitudes between 251 and 291 nm were measured and correlated to the corresponding concentrations. Similarly, DCL 7.5 µg/mL was set as the divisor in DIF determination and the peak-to-trough amplitudes at the same wavelengths were recorded. The proposed method was found linear over the concentration ranges 5-50 and 1.5-30 µg/mL for DCL and DIF, respectively. The developed method was validated following the ICH guidelines and successfully applied to the determination of both drugs in various laboratory prepared mixtures. In addition, satisfactory results were obtained from analysis of the commercial pharmaceutical preparation (suppositories) with no significant statistical differences from a reference HPLC method. Keywords: Spectrophotometric analysis; Binary mixture; Ratio spectra; Peak-to-trough amplitudes; Diclofenac sodium; Diflunisal.
*Corresponding author Email: [email protected]
ISSN: 0975-8585
March - April 2014 RJPBCS 5(2) Page No. 553
INTRODUCTION
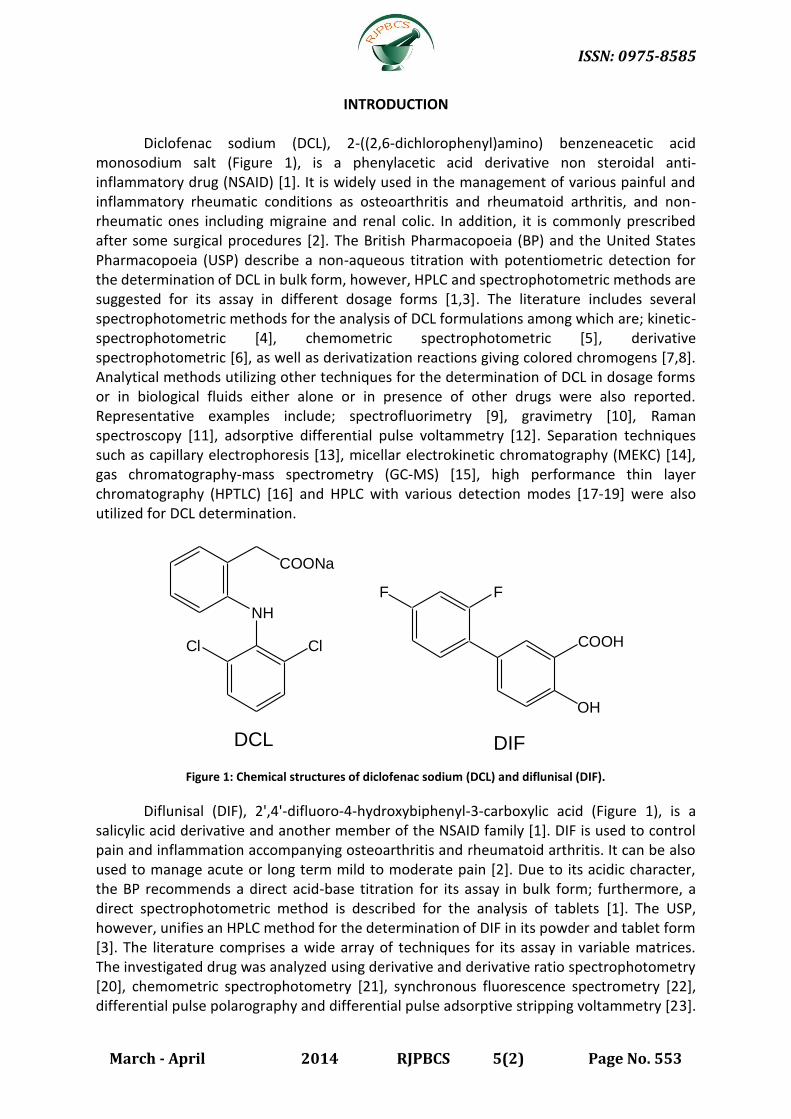
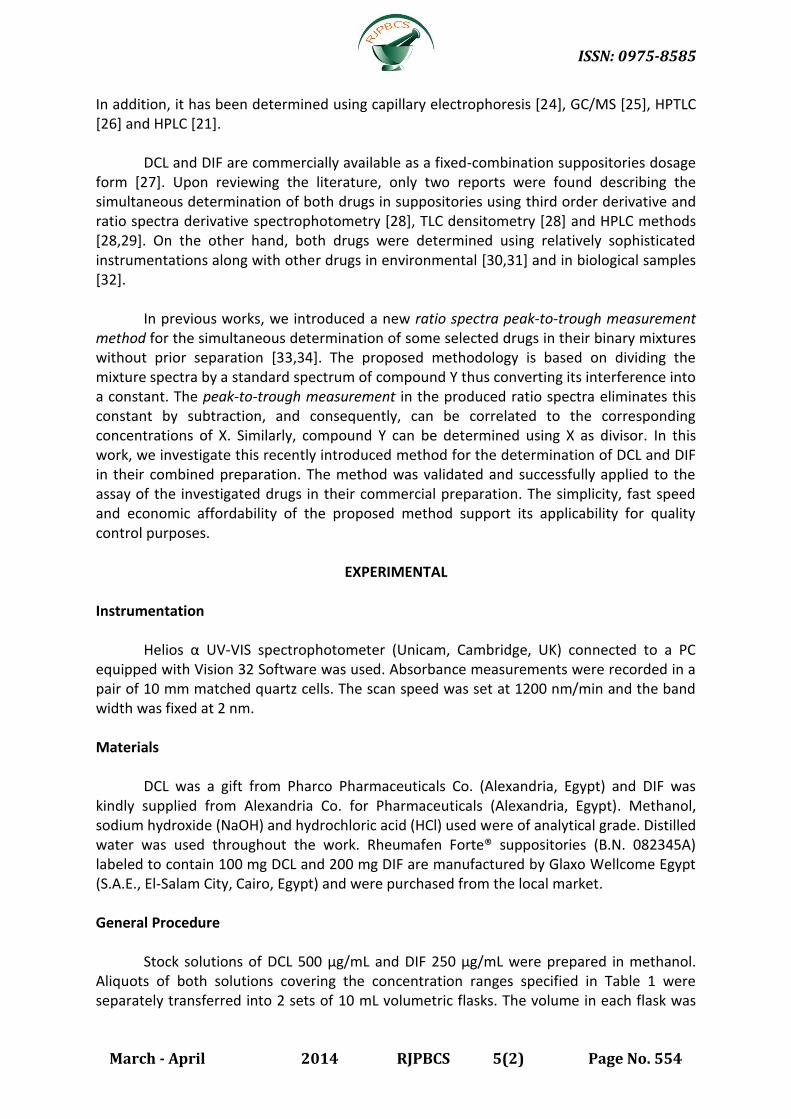
Diclofenac sodium (DCL), 2-((2,6-dichlorophenyl)amino) benzeneacetic acid monosodium salt (Figure 1), is a phenylacetic acid derivative non steroidal anti-inflammatory drug (NSAID) [1]. It is widely used in the management of various painful and inflammatory rheumatic conditions as osteoarthritis and rheumatoid arthritis, and non-rheumatic ones including migraine and renal colic. In addition, it is commonly prescribed after some surgical procedures [2]. The British Pharmacopoeia (BP) and the United States Pharmacopoeia (USP) describe a non-aqueous titration with potentiometric detection for the determination of DCL in bulk form, however, HPLC and spectrophotometric methods are suggested for its assay in different dosage forms [1,3]. The literature includes several spectrophotometric methods for the analysis of DCL formulations among which are; kinetic-spectrophotometric [4], chemometric spectrophotometric [5], derivative spectrophotometric [6], as well as derivatization reactions giving colored chromogens [7,8]. Analytical methods utilizing other techniques for the determination of DCL in dosage forms or in biological fluids either alone or in presence of other drugs were also reported. Representative examples include; spectrofluorimetry [9], gravimetry [10], Raman spectroscopy [11], adsorptive differential pulse voltammetry [12]. Separation techniques such as capillary electrophoresis [13], micellar electrokinetic chromatography (MEKC) [14], gas chromatography-mass spectrometry (GC-MS) [15], high performance thin layer chromatography (HPTLC) [16] and HPLC with various detection modes [17-19] were also utilized for DCL determination.
NH
ClCl
COONa
F F
COOH
OH
DIFDCL
Figure 1: Chemical structures of diclofenac sodium (DCL) and diflunisal (DIF).
Diflunisal (DIF), 2',4'-difluoro-4-hydroxybiphenyl-3-carboxylic acid (Figure 1), is a salicylic acid derivative and another member of the NSAID family [1]. DIF is used to control pain and inflammation accompanying osteoarthritis and rheumatoid arthritis. It can be also used to manage acute or long term mild to moderate pain [2]. Due to its acidic character, the BP recommends a direct acid-base titration for its assay in bulk form; furthermore, a direct spectrophotometric method is described for the analysis of tablets [1]. The USP, however, unifies an HPLC method for the determination of DIF in its powder and tablet form [3]. The literature comprises a wide array of techniques for its assay in variable matrices. The investigated drug was analyzed using derivative and derivative ratio spectrophotometry [20], chemometric spectrophotometry [21], synchronous fluorescence spectrometry [22], differential pulse polarography and differential pulse adsorptive stripping voltammetry [23].
ISSN: 0975-8585
March - April 2014 RJPBCS 5(2) Page No. 554
In addition, it has been determined using capillary electrophoresis [24], GC/MS [25], HPTLC [26] and HPLC [21].
DCL and DIF are commercially available as a fixed-combination suppositories dosage
form [27]. Upon reviewing the literature, only two reports were found describing the simultaneous determination of both drugs in suppositories using third order derivative and ratio spectra derivative spectrophotometry [28], TLC densitometry [28] and HPLC methods [28,29]. On the other hand, both drugs were determined using relatively sophisticated instrumentations along with other drugs in environmental [30,31] and in biological samples [32].
In previous works, we introduced a new ratio spectra peak-to-trough measurement
method for the simultaneous determination of some selected drugs in their binary mixtures without prior separation [33,34]. The proposed methodology is based on dividing the mixture spectra by a standard spectrum of compound Y thus converting its interference into a constant. The peak-to-trough measurement in the produced ratio spectra eliminates this constant by subtraction, and consequently, can be correlated to the corresponding concentrations of X. Similarly, compound Y can be determined using X as divisor. In this work, we investigate this recently introduced method for the determination of DCL and DIF in their combined preparation. The method was validated and successfully applied to the assay of the investigated drugs in their commercial preparation. The simplicity, fast speed and economic affordability of the proposed method support its applicability for quality control purposes.
EXPERIMENTAL
Instrumentation
Helios α UV-VIS spectrophotometer (Unicam, Cambridge, UK) connected to a PC equipped with Vision 32 Software was used. Absorbance measurements were recorded in a pair of 10 mm matched quartz cells. The scan speed was set at 1200 nm/min and the band width was fixed at 2 nm.
Materials
DCL was a gift from Pharco Pharmaceuticals Co. (Alexandria, Egypt) and DIF was kindly supplied from Alexandria Co. for Pharmaceuticals (Alexandria, Egypt). Methanol, sodium hydroxide (NaOH) and hydrochloric acid (HCl) used were of analytical grade. Distilled water was used throughout the work. Rheumafen Forte® suppositories (B.N. 082345A) labeled to contain 100 mg DCL and 200 mg DIF are manufactured by Glaxo Wellcome Egypt (S.A.E., El-Salam City, Cairo, Egypt) and were purchased from the local market. General Procedure
Stock solutions of DCL 500 µg/mL and DIF 250 µg/mL were prepared in methanol. Aliquots of both solutions covering the concentration ranges specified in Table 1 were separately transferred into 2 sets of 10 mL volumetric flasks. The volume in each flask was
ISSN: 0975-8585
March - April 2014 RJPBCS 5(2) Page No. 555
adjusted to 1 mL with methanol and then completed to mark with distilled water. The absorption spectra of the prepared solutions were recorded in the range of 200-340 nm against a similarly treated solvent blank. For the determination of DCL; the scanned absorption spectra were divided, wavelength by wavelength, by a previously stored standard spectrum of DIF 5 µg/mL. The peak-to-trough amplitudes in DCL ratio spectra between 251 and 291 nm were measured and plotted versus the corresponding concentration. By analogy, a standard spectrum of DCL 7.5 µg/mL was employed as the divisor in the determination of DIF and the peak-to-trough measurements between 251 and 291 nm in DIF ratio spectra were used for the construction of the calibration curve.
Assay of Suppositories
Five suppositories were accurately weighed, melted in a thermostatically controlled water bath set at 40 °C, and then cooled while stirring. A weight of the suppository mass equivalent to 25 mg of DCL and 50 mg DIF was transferred into a 100 mL volumetric flask. The drugs were extracted with 80 mL of methanol-water (80:20, v/v) with the aid of an ultrasonic bath for 15 min. The volume was completed to mark with the same solvent and the solution was then filtered. Portions of the filtered extract were treated as under General procedure and concentration of both drugs were calculated from the corresponding regression equations.
RESULTS AND DISCUSSION
Spectral Characteristics and Optimization of Measurements
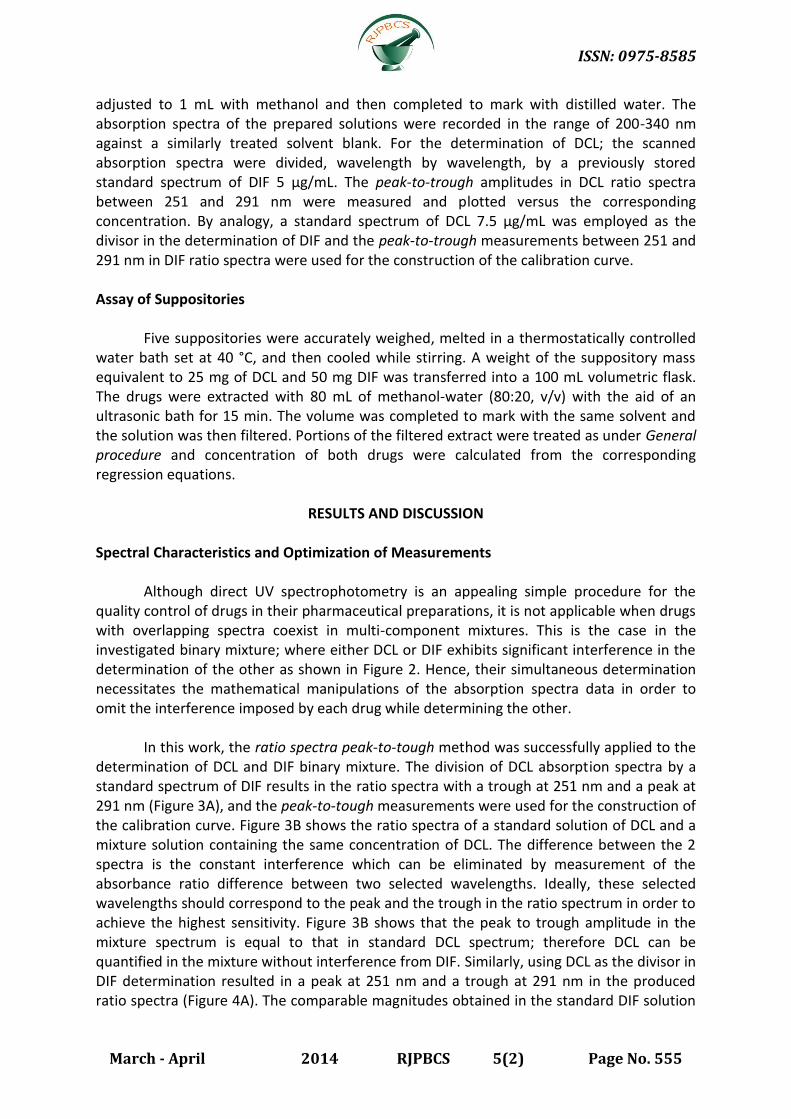
Although direct UV spectrophotometry is an appealing simple procedure for the quality control of drugs in their pharmaceutical preparations, it is not applicable when drugs with overlapping spectra coexist in multi-component mixtures. This is the case in the investigated binary mixture; where either DCL or DIF exhibits significant interference in the determination of the other as shown in Figure 2. Hence, their simultaneous determination necessitates the mathematical manipulations of the absorption spectra data in order to omit the interference imposed by each drug while determining the other.
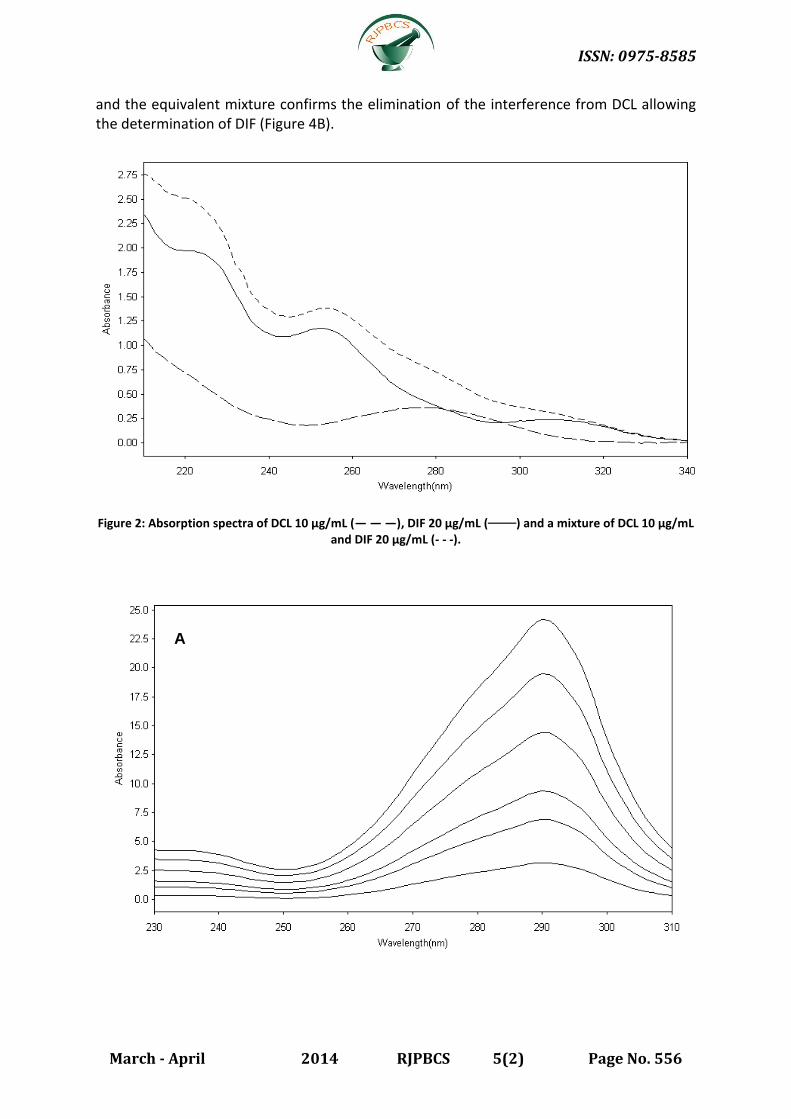
In this work, the ratio spectra peak-to-tough method was successfully applied to the
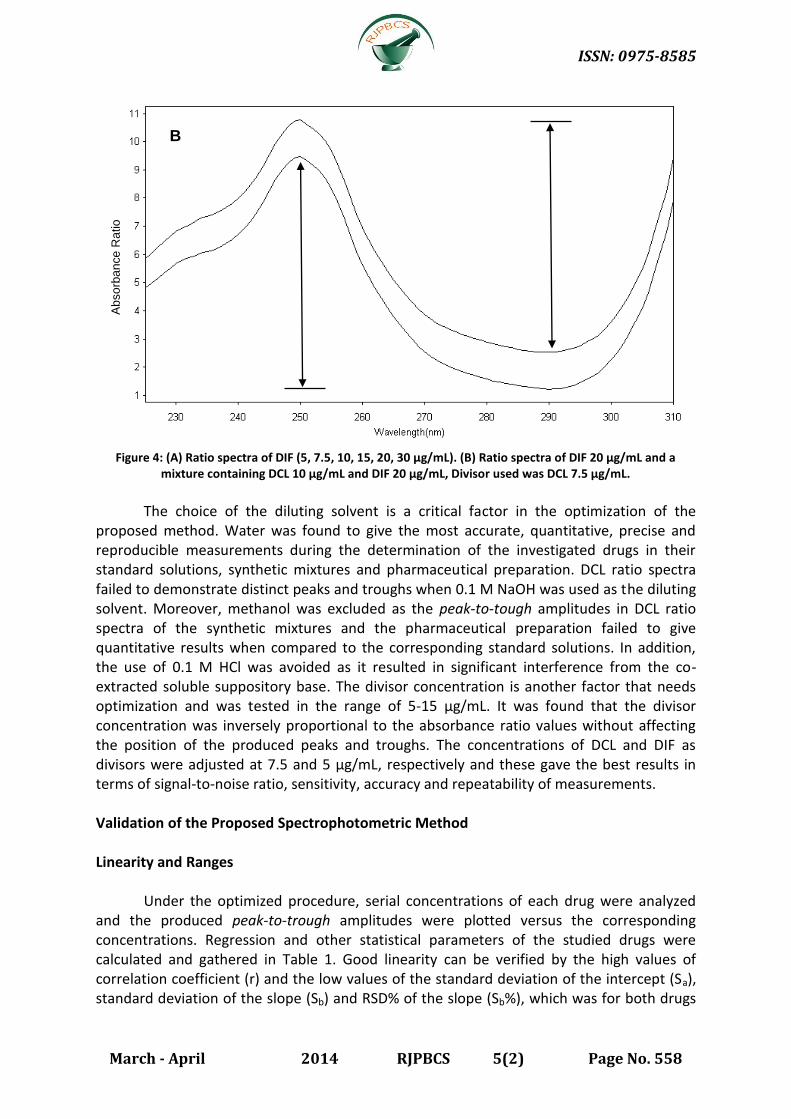
determination of DCL and DIF binary mixture. The division of DCL absorption spectra by a standard spectrum of DIF results in the ratio spectra with a trough at 251 nm and a peak at 291 nm (Figure 3A), and the peak-to-tough measurements were used for the construction of the calibration curve. Figure 3B shows the ratio spectra of a standard solution of DCL and a mixture solution containing the same concentration of DCL. The difference between the 2 spectra is the constant interference which can be eliminated by measurement of the absorbance ratio difference between two selected wavelengths. Ideally, these selected wavelengths should correspond to the peak and the trough in the ratio spectrum in order to achieve the highest sensitivity. Figure 3B shows that the peak to trough amplitude in the mixture spectrum is equal to that in standard DCL spectrum; therefore DCL can be quantified in the mixture without interference from DIF. Similarly, using DCL as the divisor in DIF determination resulted in a peak at 251 nm and a trough at 291 nm in the produced ratio spectra (Figure 4A). The comparable magnitudes obtained in the standard DIF solution
ISSN: 0975-8585
March - April 2014 RJPBCS 5(2) Page No. 556
and the equivalent mixture confirms the elimination of the interference from DCL allowing the determination of DIF (Figure 4B).
Figure 2: Absorption spectra of DCL 10 µg/mL (— — —), DIF 20 µg/mL (───) and a mixture of DCL 10 µg/mL and DIF 20 µg/mL (- - -).
A

ISSN: 0975-8585
March - April 2014 RJPBCS 5(2) Page No. 557
Figure 3: (A) Ratio spectra of DCL (7.5, 15, 20, 30, 40, 50 µg/mL). (B) Ratio spectra of DCL 10 µg/mL and a mixture containing DCL 10 µg/mL and DIF 20 µg/mL, Divisor used was DIF 5 µg/mL.
Ab
so
rba
nce
Ra
tio
B
A
ISSN: 0975-8585
March - April 2014 RJPBCS 5(2) Page No. 558
Figure 4: (A) Ratio spectra of DIF (5, 7.5, 10, 15, 20, 30 µg/mL). (B) Ratio spectra of DIF 20 µg/mL and a
mixture containing DCL 10 µg/mL and DIF 20 µg/mL, Divisor used was DCL 7.5 µg/mL.
The choice of the diluting solvent is a critical factor in the optimization of the
proposed method. Water was found to give the most accurate, quantitative, precise and reproducible measurements during the determination of the investigated drugs in their standard solutions, synthetic mixtures and pharmaceutical preparation. DCL ratio spectra failed to demonstrate distinct peaks and troughs when 0.1 M NaOH was used as the diluting solvent. Moreover, methanol was excluded as the peak-to-tough amplitudes in DCL ratio spectra of the synthetic mixtures and the pharmaceutical preparation failed to give quantitative results when compared to the corresponding standard solutions. In addition, the use of 0.1 M HCl was avoided as it resulted in significant interference from the co-extracted soluble suppository base. The divisor concentration is another factor that needs optimization and was tested in the range of 5-15 µg/mL. It was found that the divisor concentration was inversely proportional to the absorbance ratio values without affecting the position of the produced peaks and troughs. The concentrations of DCL and DIF as divisors were adjusted at 7.5 and 5 µg/mL, respectively and these gave the best results in terms of signal-to-noise ratio, sensitivity, accuracy and repeatability of measurements. Validation of the Proposed Spectrophotometric Method Linearity and Ranges
Under the optimized procedure, serial concentrations of each drug were analyzed and the produced peak-to-trough amplitudes were plotted versus the corresponding concentrations. Regression and other statistical parameters of the studied drugs were calculated and gathered in Table 1. Good linearity can be verified by the high values of correlation coefficient (r) and the low values of the standard deviation of the intercept (Sa), standard deviation of the slope (Sb) and RSD% of the slope (Sb%), which was for both drugs
B
Ab
so
rba
nce
Ra
tio
ISSN: 0975-8585
March - April 2014 RJPBCS 5(2) Page No. 559
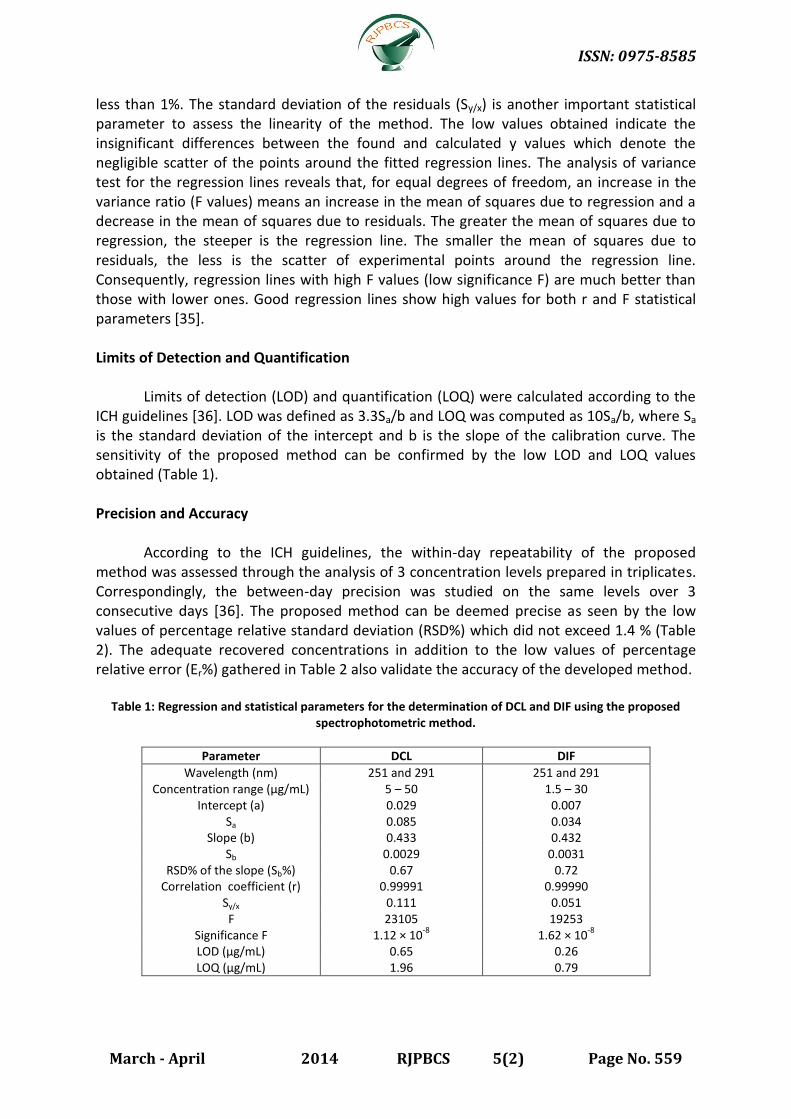
less than 1%. The standard deviation of the residuals (Sy/x) is another important statistical parameter to assess the linearity of the method. The low values obtained indicate the insignificant differences between the found and calculated y values which denote the negligible scatter of the points around the fitted regression lines. The analysis of variance test for the regression lines reveals that, for equal degrees of freedom, an increase in the variance ratio (F values) means an increase in the mean of squares due to regression and a decrease in the mean of squares due to residuals. The greater the mean of squares due to regression, the steeper is the regression line. The smaller the mean of squares due to residuals, the less is the scatter of experimental points around the regression line. Consequently, regression lines with high F values (low significance F) are much better than those with lower ones. Good regression lines show high values for both r and F statistical parameters [35].
Limits of Detection and Quantification
Limits of detection (LOD) and quantification (LOQ) were calculated according to the ICH guidelines [36]. LOD was defined as 3.3Sa/b and LOQ was computed as 10Sa/b, where Sa is the standard deviation of the intercept and b is the slope of the calibration curve. The sensitivity of the proposed method can be confirmed by the low LOD and LOQ values obtained (Table 1).
Precision and Accuracy
According to the ICH guidelines, the within-day repeatability of the proposed method was assessed through the analysis of 3 concentration levels prepared in triplicates. Correspondingly, the between-day precision was studied on the same levels over 3 consecutive days [36]. The proposed method can be deemed precise as seen by the low values of percentage relative standard deviation (RSD%) which did not exceed 1.4 % (Table 2). The adequate recovered concentrations in addition to the low values of percentage relative error (Er%) gathered in Table 2 also validate the accuracy of the developed method.
Table 1: Regression and statistical parameters for the determination of DCL and DIF using the proposed
spectrophotometric method.
Parameter DCL DIF
Wavelength (nm) 251 and 291 251 and 291 Concentration range (µg/mL) 5 – 50 1.5 – 30
Intercept (a) 0.029 0.007 Sa
0.085 0.034
Slope (b) 0.433 0.432 Sb
0.0029 0.0031
RSD% of the slope (Sb%) 0.67 0.72 Correlation coefficient (r) 0.99991 0.99990
Sy/x
0.111 0.051 F
23105 19253
Significance F 1.12 × 10⁻⁸
1.62 × 10⁻⁸
LOD (µg/mL) 0.65 0.26 LOQ (µg/mL) 1.96 0.79

ISSN: 0975-8585
March - April 2014 RJPBCS 5(2) Page No. 560
Table 2: Precision and accuracy for the determination of DCL and DIF in bulk form using the proposed spectrophotometric method.
Analyte Parameter Nominal value (μg/mL) Found ± SDa (μg/mL) RSD(%)
b Er(%)
c
DCL
Within-day
10 10.08 ± 0.06 0.60 0.80
20 19.90 ± 0.08 0.40 -0.50
40 39.92 ± 0.17 0.43 -0.20
Between-day
10 10.09 ± 0.14 1.39 0.90
20 19.89 ± 0.18 0.91 -0.55
40 40.03 ± 0.44 1.10 0.08
DIF
Within-day
7.5 7.48 ± 0.05 0.67 -0.27
15 15.00 ± 0.04 0.27 0.00
30 29.87 ± 0.19 0.64 -0.43
Between-day
7.5 7.45 ± 0.09 1.21 -0.67
15 15.13 ± 0.07 0.46 0.87
30 30.12 ± 0.22 0.73 0.40 a Mean ± standard deviation for three determinations.
b % Relative standard deviation.
c % Relative error.
Stability of Solutions
Stock solutions of the studied drugs prepared in methanol were found stable for a period of not less than 2 weeks when stored at 4°C. Also, stability of the prepared standard solutions in distilled water was confirmed by keeping them at room temperature for 4 hours, and no significant spectrophotometric changes were noticed. Applications of the Proposed Method Analysis of Laboratory-Prepared Synthetic Mixtures
The validity of the proposed method was further appraised via the analysis of laboratory-prepared synthetic mixtures. To prepare these mixtures; DCL and DIF stock solutions were added in different proportions both above and below their nominal ratio in suppositories. The content of each drug was then calculated from the corresponding regression equation. As seen in Table 3, the acceptable found concentrations, RSD(%) and Er(%) values confirm the accuracy and precision of the method, and demonstrate its analytical power to resolve and quantify the investigated drugs when present in different proportions.
Table 3: Determination of DCL – DIF laboratory-prepared mixtures using the proposed spectrophotometric
method.
Nominal value (μg/mL)
Found ± SDa
(μg/mL) RSD(%)
Er(%)
DCL DIF DCL DIF DCL DIF DCL DIF
5 30 4.95 ± 0.03 30.05 ± 0.23 0.61 0.77 -1.00 0.17 5 20 5.02 ± 0.07 19.94 ± 0.17 1.39 0.85 0.40 -0.30
10 20 9.94 ± 0.11 20.03 ± 0.13 1.11 0.65 -0.60 0.15 15 15 14.94 ± 0.11 15.00 ± 0.12 0.74 0.80 -0.40 -0.00 30 15 30.06 ± 0.27 14.86 ± 0.15 0.90 1.01 0.20 -0.93 40 10 39.76 ± 0.27 9.81 ± 0.13 0.68 1.33 -0.60 -1.90
a Mean ± standard deviation for five determinations.
ISSN: 0975-8585
March - April 2014 RJPBCS 5(2) Page No. 561
Analysis of Commercial Suppositories
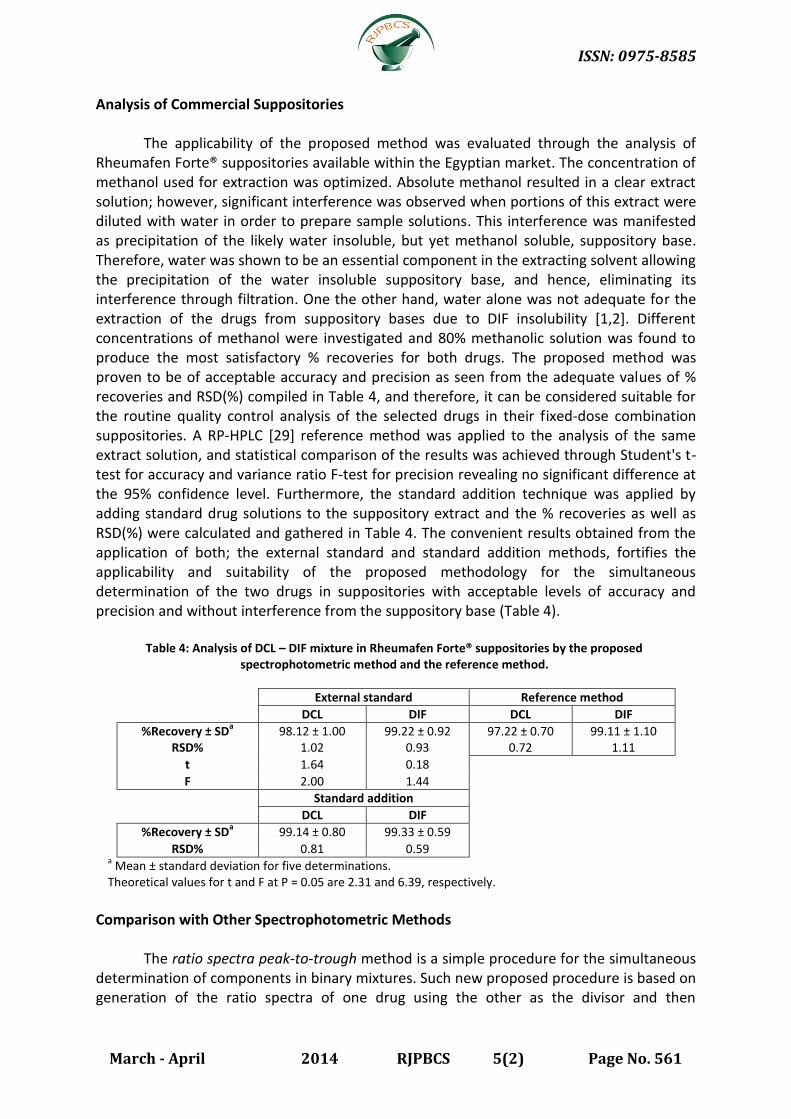
The applicability of the proposed method was evaluated through the analysis of Rheumafen Forte® suppositories available within the Egyptian market. The concentration of methanol used for extraction was optimized. Absolute methanol resulted in a clear extract solution; however, significant interference was observed when portions of this extract were diluted with water in order to prepare sample solutions. This interference was manifested as precipitation of the likely water insoluble, but yet methanol soluble, suppository base. Therefore, water was shown to be an essential component in the extracting solvent allowing the precipitation of the water insoluble suppository base, and hence, eliminating its interference through filtration. One the other hand, water alone was not adequate for the extraction of the drugs from suppository bases due to DIF insolubility [1,2]. Different concentrations of methanol were investigated and 80% methanolic solution was found to produce the most satisfactory % recoveries for both drugs. The proposed method was proven to be of acceptable accuracy and precision as seen from the adequate values of % recoveries and RSD(%) compiled in Table 4, and therefore, it can be considered suitable for the routine quality control analysis of the selected drugs in their fixed-dose combination suppositories. A RP-HPLC [29] reference method was applied to the analysis of the same extract solution, and statistical comparison of the results was achieved through Student's t-test for accuracy and variance ratio F-test for precision revealing no significant difference at the 95% confidence level. Furthermore, the standard addition technique was applied by adding standard drug solutions to the suppository extract and the % recoveries as well as RSD(%) were calculated and gathered in Table 4. The convenient results obtained from the application of both; the external standard and standard addition methods, fortifies the applicability and suitability of the proposed methodology for the simultaneous determination of the two drugs in suppositories with acceptable levels of accuracy and precision and without interference from the suppository base (Table 4).
Table 4: Analysis of DCL – DIF mixture in Rheumafen Forte® suppositories by the proposed spectrophotometric method and the reference method.
External standard Reference method
DCL DIF DCL DIF
%Recovery ± SDa 98.12 ± 1.00 99.22 ± 0.92 97.22 ± 0.70 99.11 ± 1.10
RSD% 1.02 0.93 0.72 1.11
t 1.64 0.18
F 2.00 1.44
Standard addition
DCL DIF
%Recovery ± SDa 99.14 ± 0.80 99.33 ± 0.59
RSD% 0.81 0.59 a Mean ± standard deviation for five determinations.
Theoretical values for t and F at P = 0.05 are 2.31 and 6.39, respectively.
Comparison with Other Spectrophotometric Methods
The ratio spectra peak-to-trough method is a simple procedure for the simultaneous determination of components in binary mixtures. Such new proposed procedure is based on generation of the ratio spectra of one drug using the other as the divisor and then
ISSN: 0975-8585
March - April 2014 RJPBCS 5(2) Page No. 562
calculating the magnitudes between pre-selected wavelengths (ideally a peak and a trough) in the produced ratio spectra. In our earlier work, we have verified the validity and applicability of this method through the analysis of several pairs of drugs in their pure and combined dosage forms [33,34]. Pertaining to the simplicity of the method, it can be considered advantageous over its two lengthier versions; the ratio spectra derivative method; that involves the additional derivative curve generation step, and the ratio subtraction method; which includes the division, constant subtraction and multiplication steps. Unlike derivative spectrophotometry, this method does not depend on the two steps; the optimization of the derivative order and the selection of the wavelength of measurements (zero-crossing points). Furthermore, in the apparently simpler difference spectrophotometric method, each sample must be prepared in two solvent media, a time, solvent and chemical consuming situation that is absent in the current methodology. Finally, compared to the dual wavelength procedure, there is no need for the tedious search for two wavelengths where the interfering compound exhibits the same absorpitivity.
CONCLUSION
In this current work, DCL and DIF binary mixture was successfully analyzed by the newly introduced ratio spectra peak-to-trough method. The method was validated according to the ICH guidelines and it showed acceptable levels of linearity, precision and accuracy. Its applicability was also assessed through the analysis of laboratory-prepared mixtures as well as commercially available suppositories. Only two articles can be found in the scientific literature for the simultaneous determination of DCL and DIF in suppositories using derivative and ratio spectra derivative spectrophotometry, TLC densitometry and HPLC methods [28,29]. Obviously, the proposed method is much simpler, economic and environment friendly due to the minimum consumption of organic solvents. The proposed method does not require elaborate treatment or sophisticated experimental setup usually associated with HPLC; in addition, it exhibits several advantages over conventional spectrophotometric methods. Therefore, it is quite suitable for the routine analysis of the fixed-dose combination suppositories within quality control laboratories.
REFERENCES
[1] The British Pharmacopoeia, Her Majesty’s Stationery Office, London, 2010, p. 671–673, 686–687, 2606–2610, 2615.
[2] Sweetman SC. Martindale-The Complete Drug Reference, Volume 1, Thirty-sixth edition, The Pharmaceutical Press, London, UK, 2009, p. 44–48.
[3] The United States Pharmacopeia, 34th edition, The National Formulary, 29th edition, The Official Compendia of Standards, The United States Pharmacopeial Convention, Rockville, MD, 2011, p. 780–781, 2544–2549, 2564–2565.
[4] Mitic S, Miletic G, Pavlovic A, Tosic S, Pecev E. Chemical and Pharmaceutical Bulletin 2007; 55(10): 1423–1426.
[5] Cantarelli MA, Pellerano RG, Marchevsky EJ, Camiña JM. Anal Sci 2011; 27(1): 73–78. [6] Patel A, Patel J, Shah A. Int J Pharm Pharm Sci 2012; 4(Suppl. 5): 496–500. [7] El-Didamony AM, Amin AS. Analytical Letters 2011; 37(6): 1151–1162. [8] Kormosh ZhO, Hunka IP, Bazel Ya R. J Chinese Chem Soc 2008; 55(2): 356–361. [9] Ulu ST. Journal of Food and Drug Analysis 2011; 19(1): 94–101.
ISSN: 0975-8585
March - April 2014 RJPBCS 5(2) Page No. 563
[10] Tubino M, de Souza RL. Journal of AOAC International 2005; 88(6): 1684–1687. [11] Szostak R, Mazurek S. Drug Testing and Analysis 2013; 5(2): 126–129. [12] Fernandez-Llano L, Blanco-Lopez MC, Lobo-Castanon MJ, Miranda-Ordieres AJ,
Tunon-Blanco P. Electroanalysis 2007; 19(15): 1555–1561. [13] Yang X, Feng J, Chen Z, Liao R, Li X. Chromatographia 2012; 75 (1-2): 71–76. [14] El-Kommos ME, Mohamed NA, Abdel Hakiem AF. J Pharm Anal 2013; 3(1): 53–60. [15] Yilmaz B. Chromatographia 2010; 71(5/6): 549–551 [16] Ali N, Hegazy M, Abdelkawy M, Abdelaleem E. J Planar Chromatogr Modern TLC
2012; 25(2): 150–155. [17] Emara LH, Taha NF, El-Ashmawy AA, Raslan HM, Mursi NM. Journal of Liquid
Chromatography and Related Technologies 2012; 35(15): 2203–2216. [18] Chmielewska A, Konieczna L, Plenis A, Bieniecki M, Lamparczyk H. Biomedical
Chromatography 2006; 20(1): 119–124. [19] Abdel-Hamid ME, Novotny L, Hamza H. J Pharm Biomed Anal 2001; 24(4): 587–594. [20] Abdel-Hay MH, Galal SM, Ragab MAA. Taiwan Pharm J 2007; 59(4): 157–170. [21] Wahbi AAM, Mabrouk MM, Moneeb MS, Kamal AH. Pakistan Journal of
Pharmaceutical Sciences 2009; 22(1): 8–17. [22] Pulgarin JAM, Molina AA, Robles ISF. Applied Spectroscopy 2010; 64(8): 949–955 [23] Sayin F, Kir S. J Pharm Biomed Anal 2001; 25(1): 153–163. [24] Milofsky R, Bauer E. J High Res Chromatogr 1997; 20(12): 638–642. [25] El Haj BM, Al Ainri AM, Hassan MH, Bin Khadem RK, Marzouq MS. Forensic Science
International 1999; 105(3): 141–153. [26] Bebawy LI, El-Kousy NM. J Pharm Biomed Anal 1999; 20(4): 663–670. [27] Information about the product from the webpage:
http://drugbase.org/drugs/drug_details.php?drugid=904 [28] El-Saharty YS, Refaat M, El-Khateeb SZ. Bulletin of Faculty of Pharmacy, Cairo
University 2002; 40(3): 47–64. [29] Shaalan RA, Belal TS. Scientia Pharmaceutica 2013; 81(3): 713–731. [30] Garcia MDG, Canada FC, Culzoni MJ, Vera-Candioti L, Siano GG, Goicoechea HC,
Galera MM. Journal of Chromatography A 2009; 1216(29): 5489–5496. [31] Dawod M, Breadmore MC, Guijt RM, Haddad PR. Journal of Chromatography A 2009;
1216(15): 3380–3386. [32] Maurer HH, Tauvel FX, Kraemer T. J Anal Toxicol 2001; 25(4): 237–244. [33] Belal TS, Daabees HG, Abdel-Khalek MM, Mahrous MS, Khamis MM. Journal of
Pharmaceutical Analysis 2013; 3(2): 118–126. [34] Ashour HK, Belal TS. Arabian Journal of Chemistry, In Press,
http://dx.doi.org/10.1016/j.arabjc.2013.06.024 [35] Armitage P, Berry G. Statistical Methods in Medical Research, 3rd edition, Blackwell,
Oxford, UK, 1994, p. 283–285. [36] ICH, Q2 (R1), Validation of Analytical Procedures: Text and Methodology,
International Conference on Harmonisation Geneva, November 2005.