Application for a Permit to Operate a Class I Landfill - Utah ...
910
gLC)C)C^.o\\o5 Application for a Permit to Operate a Class I Landfill SUVSWD Bayview Class I Landfill Permit Application Prepared for Bayview Landfill South Utah Valley Solid Waste District SpringviUe, Utah Prepared by HDR Engineering, Inc. 3995 South 700 East, Suite 100 Salt Lake City, UT 84107 October 23, 2009
-
Upload
khangminh22 -
Category
Documents
-
view
1 -
download
0
Transcript of Application for a Permit to Operate a Class I Landfill - Utah ...

gLC)C)C^.o\\o5
Application for a Permit to Operate a
Class I Landfill
SUVSWD Bayview Class I Landfill Permit Application
Prepared for Bayview Landfill
South Utah Valley Solid Waste District SpringviUe, Utah
Prepared by HDR Engineering, Inc.
3995 South 700 East, Suite 100 Salt Lake City, UT 84107
October 23, 2009

SUVSWD Bayview Landflll Class I Landfill Permit Application
Table of Contents
Part 1: General Information 1 Part 2: General Report 2-1
2.1 Facility Description 2-1 2.1.1 General 2-1 2.1.2 Area Served 2-2 2.1.3 Waste Types 2-2 2.1.4 Landfill Development 2-3
2.2 Solid Waste Management Plan 2-4 2.3 Legal Description 2-5 2.4 Operations Plan 2-5 2.5 Financial Assurance Plan 2-5
2.5.1 Cost Estimate for Closure and Post-Closure Care 2-5 2.5.2 Proposed Financial Assurance Mechanism 2-6
2.6 Closure Plan 2-6 2.6.1 Final Cover Installation 2-7 2.6.2 Site Capacity 2-8 2.6.3 Closure Schedule and Funding 2-8
2.7 Post-Closure Care Plan 2-9 2.7.1 Monitoring and Maintenance 2-9 2.7.2 Land Title, Land Use, and Zoning Restrictions 2-11 2.7.3 Post Closure Costs 2-11
2.8 References 2-11 Part 3: Technical and Engineering Report 3-1
3.1 Introduction 3-1 3.1.1 Facility Maps and Draw ings 3-1
3.2 Geohydrological Evaluation 3-2 3.2.1 General 3-2 3.2.2 Geology 3-3 3.2.3 Hydrology 3-4
3.3 Engineering Report 3-7 3.3.1 Location Standards 3-7 3.3.2 Engineering Design 3-11
3.4 Composting 3-18 3.5 References 3-19
March 2009 SUVSWD Bayview Class I Landfill Permit Application

Part 4: Figures
Figure 1. USGS Topographic Map of Bayview Landfill and Vicinity
Figure 2. USGS Topographic Map of Bayview Landfill
Figure 3. Cell 2 Existing Contours
Figure 4. Earthquake Distribution Map
Figure 5. Planned and Existing Landfill Facilities
Figure 6. Cell 2 Final Contours
Figure 7. Cell 2 Liner/Excavation Contours
Figure 8. Cell 2 Typical Cross Sections
Figure 9. Cell 2 - Stage 1 & 2 Liner/Excavation Contours
Figure 10. Liner Details
Figure 1L Cell 2 Leachate Collection System and Liner Details
Figure 12. Cell 2 Leachate Collection System, Sump Plan, and Section Details
Figure 13. CeU 2 Leachate Collection System Details
List of Appendices Appendix A: Cell 2 Master Plan (2009)
Special Use Lease Agreement Cost Breakdown for Closure/Post-Closure Engineering Drawings Boring Logs District's Groundwater Quality Report
Appendix G: Utah Hydrologic Data Report No. 50 Appendix H: Lineament Study
Inspection Forms Seismic Analysis Leachate Generation Calculations Stormwater/Evaporation Pond Runon-Runoff Calculations Closure Cap Equivalency
Appendix O: Construction Quality Assurance Plan Appendix P: Cell 2 Geosynthetic Analysis Appendix Q: Conceptual Gas Extraction System Appendix R: Permanent Compost Operations Plan Appendix S: Landfill Operations Plan Appendix T: Cell 1 Closure Certification
Appendix B: Appendix C: Appendix D: Appendix E: Appendix F:
Appendix I: Appendix J: Appendix K: Appendix L: Appendix M: Appendix N:
March 2009 SUVSWD Bayview Class I Landfill Permit Application

Par t i : General Information K : : & J d i S U : r « J I ! _ L k & J K m f t l » « > •-*• •^•*^Ji^^^ '*m
Par t i : General Information
Utah Class I and V Landfill Permit Application Form
Part I General Information
/. Landfill Type: Class I //. Application Type: Renewal Application
Current Permit Number: 9420R1
///. Facility Name and Location
Legal Name of Facility: Bayview Landfill
Site Address: 10800 S. State Road 68 County: Utah
Township 9 South Range 1 West All of Section 17 plus the S 'A of the SE % of the NE YA of Section 18
Main Gate Latitude degrees minutes seconds
North 40 02 00
Longitude degrees minutes seconds
West 111 57 30
IV. Facility Lessee and Operator Information
Legal Name of Lessee and Operator: South Utah Valley Solid Waste District
Address (mailing): PO Box 507
City: SpringviUe State: Utah Zip Code: 84663-0507 Telephone: 801-489-3027
V. Property Owner(s) Information
Legal Name of Property Owner: Utah School and Institutional Trust Lands Administration
Address (mailing): 675 East 500 South, Suite 500
City: Salt Lake City State: Utah Zip Code: 84102-2818 Telephone: 801-538-5100
VI. Contact Information
Operator Contact: Richard Henry Title: District Manager
Address (mailing): PO Box 507
City: SpringviUe State: Utah
Operator Contact: Scott Aitken
Zip Code: 84663-0507 Telephone: 801-489-3027
Title: Landfill Foreman
Address (mailing): PO Box 507
City: SpringviUe State: Utah Zip Code: 84663-0507 Telephone: 801-489-3027
March 2009 SUVSWD Bayview Class I Landfill Permit Application

Part 1: General Information
Certification of Submitted Information
I certify under penalty of law that this document and all attachments were prepared under my
direction or supervision in accordance with a system designed to assure that qualified personnel
properly gather and evaluate the infonnation submitted. Based on my inquiry of the person or
persons directly responsible for gathering the information, the information submitted is, to
the best of my knowledge and belief, true, accurate, and complete. I am aware that there are
significant penalties for submitting false information, including the possibility of fine and
imprisonment for knowing violations.
Name: Richard Henry Title: District Manager
Signature: Date:
SUBSCRIBED AND SWORN to before this day of , 2009.
My commission expires on the day of , 20 .
Notary Public in and for
(Seal) County, Utah
SUVSWD Bayview Class I Landfill Permit Application March 2009

Part 2

Part 2: General Report ! ' i i t S B » * ' ^ * ^ ^ ^ h ' * ! . - > i ^ . ^ ^ ^ m s » s j ^ ^ ^ ^ : S
#
Part 2: General Report
2 2.1 Facility Description
3 2.1.1 General
4 The South Utah Valley Solid Waste District (the District) was formed in 1989 to
5 own and operate solid waste facilities for the cities of Prove, Salem, Spanish
6 Fork, SpringviUe, Mapleton, and Goshen, Utah. It assumed the existing and
7 previously permitted landfill operations from the City of Provo. Solid waste
8 facilities operated by the District are:
9 • A transfer station located in SpringviUe;
10 • The Bayview Landfill located north of Elberta.
11 A separate, non-District-owned transfer station in Goshen also provides waste to
12 the Bayview Landflll. This Permit Application applies only to the landflll, and
13 does not include design, construction, or operation plans ofthe transfer stadons.
14 The District added a compost facility at the Bayview Landfill in 2004. The
compost facility processes a combination of yard waste and biosolids and is
16 jointly permitted through the Division of Solid and Hazardous Waste and the
17 Division of Water Quality. The Operating Plan for the compost facility is
18 included as Appendix R to this Permit Application.
19 The Bayview Landflll was located, permitted, designed, and constructed by
20 Provo City Corporation during the 1980s. The City received a Conditional Use
21 Permit for the landfill site through the Utah County Board of Adjustment.
22 Several conditions were attached to the Conditional Use Permit, one of which
23 requires that only compacted or baled garbage be accepted at the landflll. A
24 second of these conditions permits disposal of garbage from Provo City
25 Corporation only; this condition was later modified to allow disposal of garbage
26 from the District only. Therefore, no out-of-District wastes can be disposed of in
27 the Bayview Landfill without approval ofthe County Board of Adjustment. A
28 copy ofthe District's Condhional Use Permit is included as an attachment to
29 Appendix S.
30 The Bayview Landflll is located in Sections 17 and 18, T9S, RIW approximately
31 6 miles north of Elberta, Utah, and directly west of State Highway 68. The
32 landfill property includes all 640 acres of Section 17, and a 20-acre parcel in
Section 18. All solid waste disposal activities are planned within the Section 17
October 2009 SUVSWD Bayview Class I Landfill Permit Application 2-1

Part 2: General Report
1 parcel; the 20-acre Section 18 parcel houses a culinary well, a water storage tank,
2 and an upgradient monitoring well associated with the landfill operations.
3 The Bayview Landfill site is located in the Goshen Valley approximately 2 to 3
4 miles west of Goshen Bay, the southwestern-most portion of Utah Lake. The
5 Goshen Valley slopes upward away from the lake toward the East Tintic
6 Mountains some 7 miles southwest ofthe lake. The landfill site similarly slopes
7 with an approximate 150-foot rise from the eastem to the westem boundaries of
8 Section 17. The eastem boundary ofthe landfill site is approximately 120 feet
9 above the current water elevation of Utah Lake.
10 The land use surrounding the site is generally rural agricultural, with orchard,
11 grain, hay, and livestock grazing as the predominant land uses in the vicinity of
12 the site. The nearest residence is located more than 1 mile from the northem
13 property boundary, and the nearest town, Elberta, is 5.5 miles south ofthe site.
14 2.1.2 Area Served
15 The service area for the Bayview Landflll includes the cities of Provo, Salem,
16 Spanish Fork, SpringviUe, Mapleton, Goshen, and some contiguous areas. As
17 stated above, the landfill's Conditional Use Permit prohibits it from receiving
18 wastes generated outside ofthe District service area. The landfill is also
19 prohibited from receiving wastes that have not been compacted or baled. These
20 prohibitions limit the landfill's ability to accept wastes from other areas ofthe
21 County or adjoining counties. The conditions also prohibit use by the general
22 public.
23 2.1.3 Waste Types
24 The Bayview Landfill accepts wastes from the District's transfer station in
25 SpringviUe and a city-owned transfer station in Goshen. The transfer stations
26 provide record keeping, screening and compacting of incoming wastes, and
27 shipping ofthe solid wastes to the Bayview Landfill. The transfer stations accept
28 residential and commercial solid wastes, including yard wastes, but generally do
29 not accept construction debris (C&D) wastes. The transfer stations also do not
30 accept regulated hazardous wastes. The waste screening operation is outlined in
31 the transfer station's operating plan.
32 Yard wastes arriving at the transfer stations may either be segregated for
33 composting, or commingled and compacted with the residential and commercial
34 wastes for compacting and disposal. Transfer station personnel make these
35 decisions based on the quantity and ease of separation of the yard wastes, and the
36 workload at the specific moment in time. Yard wastes that are segregated will be
2-2 SUVSWD Bayview Class I Landfill Permit Application October 2009

Part 2: General Report
transferred to the closed Spanish Fork Landfill for grinding and then transferred
to the compost facility at the Bayview Landfill.
3 The landfill will occasionally receive special waste (bulky waste and dead
4 animals) directly at the landflll under special arrangements with the waste
5 generator. Bulky waste is cmshed and moved to the working face and is buried
6 so that the potential for liner damage is avoided and so that large materials are
7 not easily uncovered by operations at a later date. Dead animals are immediately
8 covered with at least two (2) feet of material to minimize odors and to prevent
9 the attraction firom insects, rodents, and other animals.
10 The wastes accepted at the transfer stations are generally compacted, loaded into
11 over-the-road vehicles, and transported to the landflll for disposal. When transfer
12 station staff observe recyclable materials, and when there is time to easily and
13 safely remove the recyclable materials, they will segregate these materials into
14 on-site dumpsters for recycling.
15 Table 1-1 provides a summary ofthe quantity of wastes disposed of at the
16 Bayview Landfill since it began operation in Febmary 199L The data reflects
17 actual quantities shipped firom the transfer stations during each fiscal year (July 1
18 through June 30).
Table 1-1: Tonnage Disposed at the Bayview Landfill
Year Actual Tonnage ~^m
90-91 32,713 91-92 82,841 21 92-93 92,045
93-94 96,899 ^
94-95 106,641 ^3
95-96 105,746
96-97 108,305 24
97-98 119,391
98-99 126,661
99-00 124,286 26
00-01 127,031
01-02 126,664
02-03 130,521
03-04 131,689
04-05 136,940 29
05-06 141,047
06-07 149,499
07-08 146,509
25
27
28
30
October 2009 SUVSWD Bayview Class I Landfill Permit Application 2-3

Part 2: General Report
2 2.1.4 Landfill Development
3 Landflll Cell 1 reached capacity and Cell 2 - Stage 1 began receiving waste
4 during fiscal year 2004. The landfill is currently placing waste in Cell 2 - Stage 1
5 and expects to reach capacity by the end of 2009, at which time Cell 2 - Stage 2
6 will begin receiving waste. Excavation of Cell 2 - Stage 2 is currently ongoing.
7 Part 3 ofthis Pennit Application describes the landfill staging plan.
8 The District has produced three master plans to guide development ofthe
9 Bayview Landfill. The initial Landfill Master Plan (HDR, 1988) projected seven
10 separate cells with a total waste disposal capacity of 7.64 million tons at the
11 Bayview Landflll. This capacity was calculated based on a conservative in-place
12 density of 1,000 pounds of solid waste per cubic yard (Ibs/cy). The current in-
13 place density based on known weights and surveyed volumes is approximately
14 1,500 Ibs/cy, thereby increasing the capacity ofthe 7-cell plan by 50%. The
15 Bayview Landfill Master Plan Update (HDR, 2002) considered several scenarios
16 to utilize the airspace and footprint of Cells 2 and 3 more efficiently. The
17 selected scenario combined Cells 2 and 3 into a single landfill Cell, deepened the
18 excavation, and decreased the elevation of the liner requiring pumping of
19 generated leachate.
20 A revised Cell 2 Master Plan (HDR, 2008; Appendix A) evaluated changes to the
21 base grade of Cell 2 to further increase capacity. The Cell 2 Master Plan revised
22 the base grade of Stage 2 to a 2% slope down to the northeast on the westem
23 portion of Stage 2, and a 2% slope down to the southeast on the eastem portion
24 of Stage 2. This increased the capacity of Stage 2 to 2,300,000 cy, and the total
25 capacity of Cell 2 to approximately 8,460,000 cy, with 7,800,000 cy remaining as
26 of Febmary 2009. At 1,500 Ibs/cy, this equates to about a total capacity of
27 6,345,000 tons, with 5,900,000 tons remaining.
28 Since CeU 2 is expected to remain active through approximately 2032, it is not
29 timely to revise the master plan for the remainder ofthe Bayview Landflll.
30 However, it is expected that a revised master plan would more than double the
31 capacity calculated in the 1988 Landfill Master Plan, yielding a total capacity of
32 more than 20 million tons. This means that the Bayview Landfill has an expected
33 usefiil lifetime of more than 50 years from the date ofthis Permit Application.
34 2.2 Solid Waste Management Plan
35 During 1992, the District participated in the development ofthe Utah County
36 Solid Waste Management Plan (SWMP). The SWMP was developed in response
2-4 SUVSWD Bayview Class I Landfill Permit Application October 2009

Part 2: General Report ^ ^ ^ ^ » ' « ^ 5«i^^fertW»! #
to Senate Bill 255 to address county-wide planning for solid waste disposal over
the next 20-year period. Two copies ofthis SWMP have previously been
3 submitted to the Utah Division of Solid and Hazardous Waste. All of the
4 activities discussed in this pemiit application were anticipated in, and are
5 consistent with, the SWMP.
6 In addition, the District has prepared a Landfill Master Plan (HDR, 1988), a
7 Bayview Landfill Master Plan Update (HDR, 2002), and a Cell 2 Master Plan
8 (HDR, 2009) to guide development ofthe Baj view Landfill site. A copy ofthe
9 most recent plan, the Cell 2 Master Plan is attached to this application as
10 Appendix A.
11 2.3 Legal Description
12 The Bayview Landflll consists ofthe following parcels:
13 • Parcel "A": SWl/4 NWl/4 Secfion 17, T9S, RIW.
14 • Parcel "B": That portion of Secfion 17, T9S, R1W not described in Parcel
15 "A."
16 • Parcel "C": Sl/2 ofthe SEl/4 ofthe NEl/4, Section 18, T9S, RIW.
This land was conveyed by the Utah Division of State Lands to the Provo City
18 Corporation for a term of 51 years under Special Use Lease Agreement No. 498
19 (Appendix B). The term ofthis lease agreement extends through the year 2035.
20 The lease agreement contains a clause for extension ofthe lease beyond the 51-
21 year period.
22 2.4 Operations Plan
The two Operating Plans relevant to the Bayview Landfill site are presented in
the Appendices to this Permit Application. Appendix S presents the current
Landfill Operating Plan, while Appendix R presents the current Compost Facility
Operating Plan.
Financial Assurance Plan
Cost Estimate for Closure and Post-Closure Care
29 Federal and State of Utah Rules and Regulations require that the owners of
30 municipal solid waste landfills demonstrate the financial capability to conduct
closure, post-closure care, and corrective action (if necessary). To meet these
requirements, the owner must place in the operating record for the landflll an
October 2009 SUVSWD Bayview Class I Landfill Permit Application 2-5
23
24
25
26
27
28
2.5
2.5.1
m
Part 2: General Report
1 estimate ofthe cost of hiring a third party to perform closure, post-closure care,
2 or corrective action. In addition, the owner must demonstrate that the funding is
3 fully available for any year after 2009 to provide for closure, post-closure care,
4 and corrective action for landfill cells that may require closure, post-closure care,
5 or corrective action within the five year period between permit revisions. Both
6 the cost estimate and the funding mechanism must be updated on an annual basis.
7 The regulations allow six different funding mechanisms to demonstrate financial
8 assurance including: tmst fiands, surety bonds, insurance, letters of credit, local
9 govemment financial tests, or local govemment guarantees. These funding
10 mechanisms may be used individually or in combination with one another to
11 demonstrate financial assurance. The regulations define specific requirements for
12 each fiinding mechanism.
13 Appendix C contains an estimate ofthe costs for post-closure care of Cell 1 and
14 closure and post-closure care of Cell 2 - Stage 1 and Stage 2 at the Bayview
15 Landfill. Landfill Cell 2 - Stage 2 will remain active beyond the period covered
16 by this permit application. As calculated in Appendix C, the estimate for third-
17 party closure and post-closure care is $2,216,022.
18 2.5.2 Proposed Financial Assurance Mechanism
19 The District will use a tmst fund to demonstrate financial assurance. In 1992, the
20 District established separate accounts in the State Pool accumulating fiinds for
21 closure and post-closure care of Cell 1 and correcfive action. During 1997, the
22 District transferred these funds into the Closure Tmst Fund established by the
23 State Treasurer. As of October 31, 2008, the closure/post-closure account held
24 $2,979,148 which means that the tmst fund is fully funded.
25 The District has consistently operated on a cash basis since its inception in 1990.
26 h accumulates funds in advance to finance its capital facilities needs, and pays
27 cash for all capital improvements, equipment, and services. This means that the
28 District has no long-term debt to encumber its resources.
29 An altemative closure cap has been approved for the Bayview Landfill and the
30 landflll plans to use the ahemative cap design for Cell 2. Details ofthe
31 altemative cap are discussed in Secfion 2.6 and Appendix N. The District plans
32 to finance the partial closure of Cell 2 - Stage 1 from operating hands and does
33 not intend to diminish the Tmst Fund. In 2010, District personnel will begin
34 depositing intermediate cover on the side slopes of Cell 2 - Stage 1. Therefore,
35 Cell 2 will be partially closed during this permit period. Therefore, the Tmst
36 Fund account is adequately funded and will remain ftilly fiinded during the
37 remainder ofthe current permit. In any case, the District will continue to report
38 on the status and adequacy ofthe tmst fiind in its annual reports to UDEQ.
2-6 SUVSWD Bayview Class I Landfill Permit Application October 2009

Part 2: General Report ^ , ^-rtW^^W^^^NVt^'il^^^^MS*.^
#
2.6 Closure Plan
2 This section describes post-closure care for Cell 1 and the closure plan for Cell 2.
3 Landfill Cell 1 reached capacity in 2004 and the final cover was placed in 2008.
4 Stage 1 of Cell 2 will reach operating capacity by the end of 2009, at which time
5 Stage 2 of Cell 2 will begin receiving waste. Waste will be placed in Cell 2 Stage
6 2 for about 9 years, or until 2019. Landfill Cell 2 will operate beyond the five-
7 year period covered by this permit and will not reach capacity until
8 approximately 2032.
9 2.6.1 Final Cover Installation
10 An altemate final cover design ofthe capping system for the Bayview Landfill
11 has been completed. The final contours of Cell 1 were projected in the 1988
12 Master Plan, and are depicted on Figure T-3 in Appendix T. Final contours of
13 Cell 1 were achieved in 2004, at which point Cell 2 - Stage 1 began receiving
14 waste. As mentioned. Stage 1 of Cell 2 will reach capacity and intermediate final
15 cover placement will begin in 2010. The approved altemative fmal cover is
16 planned for Cell 2 when it reaches final contours in 2032. The design for the
17 altemate capping system includes the following layers of material from the
bottom up:
• 6 inches of intermediate cover placed over the daily cover to provide a 20 12-inch cushion of soil over the solid waste;
21 • 34-inches of evaporative cap constmcted from the olive-brown silty sand
22 available on-site. The top six inches ofthis evaporative cap will be
23 capable of supporting vegetative growth by amending it with compost to
24 aid in initial seed germination.
25 As with Cell 1, a series of metal stakes with plastic fibers attached to the top will
26 be placed in the final cover of Cell 2 on 100-foot centers across the cell. These
27 metal stakes are commonly referred to as "blue tops" or "whiskers" and will be
28 driven into the final cover until the plastic fibers are just below the completed
29 final cover surface. This will provide a visual method (if the fibers begin to show
30 over time) to determine if erosion ofthe final cover is occurring. Additionally, a
31 series of benchmarks will be located around the perimeter ofthe landfill to be
32 used to determine when settlement ofthe waste or cover materials has ceased.
33 The Landflll Foreman will inspect the completed cap weekly until vegetation is
34 established, and monthly thereafter to ensure that damage to the capping system
35 is detected and repaired early. The vegetation on the landflll cap will be
maintained to blend into the surrounding semi-arid landscape.
October 2009 SUVSWD Bayview Class I Landfill Permit Application 2-7

Part 2: General Report
1 The Landfill Foreman will also inspect the completed cap to determine that the
2 fmal contours are maintained, and that the flow of stormwater is unimpeded.
3 Areas in which excessive settlement or erosion of 1 inch has occurred, as
4 evidenced by the exposure ofthe blue top survey stakes, will be regraded,
5 mulched, and seeded as specified above.
6 2.6.2 Site Capacity
7 The landflll is currently achieving an in-place waste density of approximately
8 1,500 Ibs/cy. At capacity. Cell Icontained approximately 1,800,000 tons of solid
9 waste (2.4 million cubic yards at 1,500 Ibs/cy). At the current rate of solid waste
10 compaction, the District esfimates that Cell 2 will contain approximately
11 6,345,000 tons of solid waste (8,460,000 million cy at 1,5001bs/cy). At the
12 current waste acceptance rate of 146,000 tons plus a 3% annual increase, Cell 2 is
13 expected to last until approximately 2032.
14 Based on the 1988 Master Plan, Cells 4 through 7, as currenfiy configured, have
15 a capacity of about 4,600,000 tons ofwaste with a waste density of 1,000 Ibs/cy.
16 The Bayview landfill currently achieves about 1,500 Ibs/cy of in-place waste.
17 Making this conversion. Cells 4 through 7 would have a capacity for about
18 6,900,000 tons, equating to an addifional 46 years of life (at 150,000 tons per
19 year).
20 2.6.3 Closure Schedule and Funding
21 Cell 1 reached capacity in 2004 and the final cover was placed in 2008. Seeding
22 ofthe Cell 1 final cover is scheduled to be completed during early 2009 and is
23 the only requirement remaining for final closure of Cell 1. Cell 2 - Stage 1 will
24 reach capacity by the end of 2009 and begin receive intermediate cover on the
25 side-slopes in 2010. Cell 2 - Stage 2 will begin receiving waste in 2010. Cell 2 -
26 Stage 2 will remain active beyond the five-year period covered by this permit and
27 will not reach final contours until approximately 2019.
28 Final closure constmction will begin within 2 months of final receipt of solid
29 waste in Cell 2. Closure constmction will proceed on a continuous schedule to
30 provide for completion of the closure cap within 18 months of final receipt of
31 solid waste. The exact schedule cannot be predicted because the closure must be
32 coordinated with both the final receipt ofwaste, and the beginning ofthe active
33 growing season to provide cover vegetation an optimal chance of survival. The
34 UDEQ will be notified when closure constmction has been completed so that a
35 final inspection can be made.
36 The closure costs projected in Section 2.5 assume that the entire closure cap,
37 including intermediate soil cover, for Cell 2 Stage 1 and Stage 2 will be
2-8 SUVSWD Bayview Class I Landfill Permit Application October 2009

Part 2: General Report
constmcted as part ofthe closure. This is a very conservative assumption, since
intermediate cover material will be placed as part of landfill operations.
3 Furthermore, closure costs are anticipated to be paid from operating fiinds,
4 leaving the tmst ftind intact. These assumptions allow the expedited closure of
5 the landfill cell, and ensure that handing will be available to allow a third party to
6 close the landfill under tight time constraints, if needed.
7 2.7 Post-Closure Care Plan
8 Post-closure care for Cell 1 ofthe Bayview Landfill will consist of long-term
9 maintenance ofthe closure cap and ongoing sampling ofthe groundwater
10 monitoring wells and gas monitoring stations to ensure that the landfill cell has
11 been closed in accordance with regulations. The post-closure care period will be
12 30 years unless unexpected environmental contamination or continued
13 subsidence occurs, or a shorter period if it can be proven that it no longer
14 presents a threat to human health or the environment. The costs for post-closure
15 care identified in Section 2.5 include Cell 2 - Stages 1 and 2, as well as Cell 1.
16 The post-closure care plan will be applied to other cells as they are closed.
il 17 2.7.1 Monitoring and Maintenance
Semi-annual groundwater and quarterly landflll gas monitoring will occur
19 throughout the post-closure period. This frequency will be increased if data
20 indicate that contamination may have occurred. The post-closure monitoring
21 frequency will revert if the more frequent monitoring demonstrates that
22 contamination, if present, is not attributable to the landfill.
23 Collection and treatment of leachate generated in Cell 1 and Cell 2 will be
24 provided by a new dual-lined evaporation pond to be constmcted directly north
25 and upstream ofthe existing evaporation pond. The new pond will also have a
26 leak detection system. The existing pond will provide stormwater and process
27 water mnoff containment for the adjacent biosolids compost facility. These
28 leachate collection and treatment systems will be inspected as part ofthe ongoing
29 activities for other landfill cells during the post-closure period for Cell 1 and Cell
30 2. Since the Bayview Landflll has no plaimed surface water discharge, no surface
31 water monitoring will be required during the post-closure period.
32 Table 7-1 provides a schedule for conducting inspections and maintenance and
33 for recording these routine activities. The Landflll Foreman will be responsible
34 for conducting the inspections, scheduling maintenance, and recording these
35 activities on the forms provided in Appendix I.
October 2009 SUVSWD Bayview Class I Landfill Permit Application 2-9

Part 2: General Report >•!• a - - ' - r - m
Table 7-1: Frequency of Inspection and Maintenance of Facilities During Post-Closure Care
Landfill Facility
Landflll Cell
Stormwater / Leachate Pond
Other Appurtenances
Inspection or Maintenance
Closure cap integrity.
Cell perimeter fence Integrity.
Perimeter fence integrity. Water depth.
Liner system integrity.
Entrance gate integrity.
Perimeter fence Integrity.
Monitoring station integrity.
Berm integrity.
Run-on and Run-off Control Systems.
Frequency
Quarterly
Quarterly
Quarterly
9
10
11
12
13
14
15
16
17
18
19
20
21
The above activities will be carried out as part ofthe ongoing operations during
the active life ofthe site. They will be expanded to include the entire site at final
landfill closure and will continue throughout the post-closure monitoring period.
A written summary ofthe activifies performed during each inspection will be
maintained. The District will retain the right of entry to the closed landflll,
maintain all right-of-ways, and conduct maintenance and/or remediation
activities as needed. The landfill will be inspected on a quarterly basis for the
following conditions:
• Integrity ofthe final cover (including erosion, subsidence, seeps and
settlement);
• Loss of vegetative cover or growth of undesirable plant species;
• Visible debris, litter, and waste;
• Condition of access roads, gates, and fences;
• Integrity of on-site stmctures;
• Integrity of groundwater monitoring system;
• Integrity of methane monitoring system;
• Integrity of drainage features;
• Integrity of the leachate collection system;
2-10 SUVSWD Bayview Class I Landfill Permit Application October 2009

Part 2: General Report
The final cover will be inspected for erosion or other maintenance problems. Any
problems detected during routine site inspections will be corrected as soon as
3 practicable. All eroded areas will be recovered with suitable soil to establish
4 erosion control and infiltration layers, as well as positive drainage to maintain the
5 integrity ofthe final cover as outlined in Section 2.6.1. All bare areas in the final
6 cover will be re-vegetated as necessary.
7 The need for final cover system repairs due to differential settlement or
8 subsidence will be determined based on an evaluation of whether the final cover
9 in the affected area has been impaired. Any areas where the integrity ofthe final
10 cover has been compromised will be repaired as necessary.
11 Eroded areas in drainage ditches will be repaired and re-graded. Sediment
12 buildup will be removed from areas where flow is restricted. Temporary
13 stormwater control stmctures will be constructed and maintained as needed.
14 The leachate collection system will be maintained and operated as needed to
15 minimize leachate head on the liner. The District may seek the approval ofthe
16 UDEQ to cease leachate extraction and treatment if it can demonstrate that
17 leachate generation has diminished and no longer poses a threat to human health
18 and environment.
2.7.2 Land Title, Land Use, and Zoning Restrictions
20 The ftiture land use of Cells 1 and 2 is reversion to grazing land, which is the
21 historical land use. The title ofthe land is expected to remain with its current
22 owner, the Utah Division of State Lands. The Utah County Board of Adjustment
23 did not impose zoning restrictions on the site. However, the District will
24 cooperate with the landowner and the County Board of Adjustment in developing
25 zoningrestrictions that are in the best interests of the landowner.
26 2.7.3 Post Closure Costs
27 The costs identified in Section 2.5 for post-closure care have been assumed to be
28 recurring annual costs. The tmst fiind for this post-closure care has been assumed
29 to be available in its entirety at the beginning ofthe post-closure care period.
30 This is a very conservative assumption since the landflll is planned to operate for
31 a minimum of 25 years (by term of lease). The interest on the principal ofthe
32 tmst fiand is expected to cover the limited inspection and maintenance activities
33 currently scheduled as part ofthe ongoing operation (e.g., leachate collection and
34 evaporation facilities) ofthe landfill site if the site is unexpectedly closed.
October 2009 SUVSWD Bayview Class I Landfill Permit Application 2-11

Part 2: General Report
1 2.8 References
2 HDR Techserv, Inc. 1987. Landfill Approval Assistance Hydrogeologic and Seismic Review,
3 p.37.
4 HDR Techserv, Inc. 1988. Landfill Master Plan, Bayview Landfill.
5 South Utah Valley Solid Waste District. 1994. Annual Report, p.6.
6 HDR Engineering - Permit Application Bayview Landfill, 1996.
7 HDR Engineering - Master Plan Update, Bayview Landfill, 2002.
8 HDR Engineering - Permit Application, Bayview Landfill, 2003.
9 HDR Engineering - Permanent Composting Facility Operating Plan, 2004.
10 HDR Engineering - Cell 2 Master Plan Update, 2008.
11 South Utah Valley Solid Waste District. 2008. Annual Report.
2-12 SUVSWD Bayview Class I Landfill Permit Application October 2009

Parts

Part 3: Technical and Engineering Report
15
Part 3: Technical and Engineering Report
2 3.1 Introduction
3 This Part 3 - Technical and Engineering Report presents information on geology,
4 hydrology, location restrictions and engineering design for the Bayview Landfill.
5 This information has been updated from previous permits to reflect the final
6 closure of Cell I, pending interim closure of Cell 2 - Stage 1, and modifications
7 to the leachate collection system and Cell 2 - Stage 2 liner design and excavation
8 contours. Portions ofthe text that do not require modifications have been left as
9 originally presented in previous permit applications.
10 3.1.1 Facility Maps and Drawings
11 Figures for this permit application are found in Part 4. Figure I contains the most
12 recent USGS Topographic Map ofthe vicinity surrounding and including the
13 Bayview Landfill. The boimdaries ofthe property are shown on this map, as well
14 as a I- and 2-mile radius around the property boundary. Figure 2 is the most
15 recent USGS Topographic Map of just the Bayview landfill property. Figure 3 is
a recent topographic map of Cell 2 produced from aerial photography performed
17 in December 2008 and updated with ground survey information obtained during
the same month.
19 Figure 4 is a portion ofthe state of Utah Earthquake Distribution Map (MF-
20 1856). Figure 5 is a Landfill Facilities Map showing the current and planned
21 facilities. Figure 6 to 13 contain permit level constmction details for the
22 development of revised Cell 2 - Stage 2, a new leachate evaporation pond, and
23 projected final contours of Cell 2. Cell 2 is the combination of previously
24 permitted Cells 2 and 3, as outlined in the January 2002 Master Plan update and
25 modified in the January 2009 Cell 2 Master Plan by HDR, Inc. The most recent
26 plan, the Cell 2 Master Plan, is included as Appendix A to this application.
27 Appendix D contains the final engineering drawings and specifications for the
28 development of Cell 2 - Stage 2. Appendix T contains a draft Cell I closure
29 status letter and as-built drawings.
March 2009 SUVSWD Bayview Class I Landfill Permit Application 3-1

Part 3: Technical and Engineering Report
1 3.2 Geohydrological Evaluation
2 3.2.1 General
3 Several studies are available in the public and nonpublic arenas that describe the
4 geology and hydrogeology ofthe region and the site. The hydrogeology ofthe
5 Goshen Valley has been described by Dustin (1978) and Cordova (1970). These
6 studies also describe the general geology ofthe area including the Bayview
7 Landfill site. Two hydrogeological investigations were commissioned by Provo
8 City Corporation during the original permitting ofthe site in the 1980s (Chen and
9 Associates, 1980; Rollin, Brown, and Gunnell [RBG], 1983). These
10 investigations provided shallow geological data specific to the landfill site.
11 During litigation regarding permitting ofthe site, several parties (Hintze and
12 Fuhriman, 1983; Environmental Science and Engineering, 1986; and Danzberger,
13 1986) re-evaluated and re-interpreted the data presented in the Dustin, Cordova,
14 Chen, and RBG studies, and re-interpreted site-specific geologic and
15 hydrogeologic data. These re-evaluations presented no new data, and do not
16 contribute to the understanding of the site.
17 During 1986 and 1987, the Utah County Planning Commission evaluated the
18 Bayview Landfill site seismicity. This evaluafion included on-site trenching to
19 determine whether lineaments present on the site represented the surface
20 expression of geologic faults. The Planning Commission's geologist concluded
21 that the lineaments were not related to faults or seismic activities at the site
22 (Robison, 1987).
23 During the original constmction ofthe Bayview Landfill in 1989, the contractor
24 drilled and installed 12 monitoring wells. Six of these wells are deep wells (170
25 to 310 feet below ground surface) that provide geological data from regions
26 deeper than earlier Provo studies. Three additional deep monitoring wells have
27 been installed since the Bayview Landfill began operating. These wells serve as
28 compliance monitoring wells and also provide hydrogeological data specific to
29 the site. In April 1994, the District published an evaluation of two years of
30 hydrograph and laboratory analytical data. Groundwater monitoring has been
31 ongoing at the site with evaluations submitted to the UDEQ. The Districts
32 Groundwater Monitoring Plan is included as Appendix F. Boring logs for
33 monitoring wells are included as Appendix E.
34 During 1993, the U.S. Geological Survey (U.S.G.S.) conducted an evaluafion of
35 the aquifers in Utah and Goshen Valleys. A summary of selected data collected
36 during this evaluation has been published as Utah Hydrologic Data Report No.
37 50, and is attached to this permit application as Appendix G.
3-2 SUVSWD Bayview Class I Landfill Permit Application March 2009

Part 3: Technical and Engineering Report
^ ^ 0
3.2.2 G e o l o g y
2 3.2.2.1 Strat igraphy
3 The Bayview Landfill site is located in Goshen Valley between the East Tintic
4 Mountains and Utah Lake. The Goshen Valley is bounded on the north by the
5 Lake Mountains, on the west by the Mosida Hills and the East Tintic Mountains,
6 on the south by Long Ridge, and on the east by Utah Lake and West Mountain.
7 The site lies on the eastem slope ofthe East Tintic Mountains as the slope
8 approaches Utah Lake. The terrain in the vicinity ofthe landfill site slopes
9 toward the lake at approximately 2.5%; the terrain is steeper to the west and
10 shallower to the east ofthe site.
11 The Goshen Valley is underlain by a thick sequence of consolidated and
12 unconsolidated sediments overlying sedimentary Paleozoic limestone and
13 dolomitic basement rock. The surficial materials at the site consist of
14 heterogeneous deposits of gravel, sand, silt, and clay laid down in Lake
15 Bonneville. These deposits were derived from erosion ofthe East Tinfic
16 Mountains, and were dropped into the lake as beach, bar, and spit deposits along
17 the fluctuating shoreline. The materials are poorly to moderately well sorted and
are derived from a mixture of Paleozoic sedimentary (limestone and quartzite)
and Tertiary volcanic outcrops. In some places, these lake sediments are overlain
by beach and dune sands representing Lake Bonneville shoreline and Quatemary
21 deposits, respectively. The westem portion ofthe landfill site exhibits dune and
22 beach sand deposits. The thickness of these strata is discussed in Section 3.2.3.2
23 - Aquifers.
24 Two other Pleistocene deposits underlie the Lake Bonneville Group sediments:
25 the Terrace gravel, and the Older Alluvium. The Terrace gravel consists of gravel
26 and sand benches and contains an aquifer referred to as the Upper Pleistocene
27 aquifer. The Older Alluvium consists of cemented gravel and sand
28 (fanglomerate) and contains an aquifer referred to as the Lower Pleistocene
29 aquifer. Miocene latites and conglomerates reportedly underlie the Pleistocene
30 deposits; the conglomerates reportedly consist of cobbles and boulders in a sandy
31 matrix. It does not appear that the deep monitoring wells constmcted at the
32 Bayview Landfill site penetrate into the Lower Pleistocene aquifer.
33 3.2.2.2 I ns tab i l i t y a n d S e i s m i c i t y
34 No unstable slopes or subsidence areas have been mapped in the vicinity ofthe
35 Bayview Landflll site. However, the Utah County Planning Commission has not
^36 prepared landslide, unstable area, or subsidence maps for this portion ofthe
p county. To the best recollection of Commission personnel, the Planning
March 2009 SUVSWD Bayview Class I Landfill Permit Application 3-3

Part 3: Technical and Engineering Report : , . / . - . : £ • — a i - i J _ * J t S _
10
11
12
13
14
15
16
Commission has received no reports of landslides or subsidence. The site is
relatively flat and is not subject to steep cuts that would create slope stability
problems. There does not appear to be any surface observable evidence that the
site is located in a floe type land stability problem area.
Numerous faults traverse the Goshen Valley. Most of these faults are believed to
be inactive; however, more than 25 earthquake epicenters have been plotted
within approximately 5 miles ofthe landflll site. Most of these epicenters are
located south, southeast, or southwest ofthe site (Figure 4). These epicenters
include one with a reported intensity of VII on the Modified Mercali Intensity
Scale, and several with reported intensifies of IV or V (U.S.G.S, 1986).
The Utah County Planning Commission has not prepared seismicity maps for this
portion ofthe county. The Uniform Building Code (1994) classifies this portion
of Utah as a Class 3 Seismic Zone, and requires use of a horizontal acceleration
of 0.3g in the design of engineered stmctures. This classification places the
Bayview Landfill site in a seismic impact zone as defined under the Utah Solid
Waste Permitting and Management Rules.
17 3.2.3
3.2.3.1
Hydrology
Surface Water
19
20
21
22
23
24
25
26
27
28
29
30
31
32
33
34
Three surface water channels cross the landfill site (see Figure 2). These surface
water channels flow ephemerally from watersheds west ofthe landflll site. The
northem and central channels originate about 2 miles west ofthe site in Section
14. Each of these channels has a drainage basin of less than 1,000 acres. The
southem channel originates less than 1 mile west ofthe site in Section 18, and
has a drainage basin of less than 200 acres.
The northem and central channels have cut gullies approximately 5 feet deep and
30 feet wide through the dune sands on the steep, westem portion ofthe landfill
site. These channels decrease in size to less than 3 feet in depth and less than 10
feet in width on the eastem portion of the site. The southem channel is only 1 to
2 feet in depth.
The drainage channels appear to be completely dry during most years. These
channels carry water only during storm events and during spring mn-off from the
foothills west ofthe site. The sandy nature ofthe area and ofthe channel bottoms
allows water to infiltrate into subsoils during storm events with a more frequent
retum period.
3-4 SUVSWD Bayview Class I Landfill Permit Application March 2009

Part 3: Technical and Engineering Report ^ ' • - • - • - *
3.2.3.2 Hydrology
2 Aquifers
3 Previous studies (Cordova, 1980; Dustin, 1978) have defined four aquifers
4 underlying the Goshen Valley; however, not all of these aquifers appear to be
5 present at the Bayview Landfill site (Brook, 1994; Carpenter, 1994a). As
6 identified in previous reports, the uppermost aquifer, the water table aquifer, is
7 contained in the Lake Bonneville group, and is commonly found at depths of less
8 than 25 feet below ground level (bgl). The second aquifer, the Upper Pleistocene
9 aquifer, is contained in a sand and gravel deposit, the Terrace gravel, at depths of
10 150 to 300 feet bgl in the Goshen Valley. The Upper Pleistocene aquifer
11 reportedly ranges from 75 to 100 feet in thickness. The Upper and Lower
12 Pleistocene aquifers are separated by a 50- to 100-foot thick cemented sand and
13 gravel confining layer. This confining layer is thought to partially separate the
14 two Pleistocene aquifers. The Lower Pleistocene aquifer is reported to vary in
15 thickness from 25 to 175 feet. The third aquifer, the Tertiary aquifer, is
16 reportedly found at 200 to 500 feet bgl; hs thickness is unknown, but may exceed
17 1,500 feet in the Goshen Valley.
^ ^ 0
18 Eight shallow soil borings, six shallow monitoring wells, and six deep
monitoring wells indicate that the Lake Bonneville group water table aquifer is
not present at the site (Carpenter, 1994a). The six shallow monitoring wells are
21 constmcted with a 20-foot screen and a 1-foot sump below 49 feet of casing. The
22 wells contain dedicated pumps mounted at 65 feet bgl. Boring logs are attached
23 to this permit application as Appendix E. All ofthe shallow wells have contained
24 small amounts of water during most sampling events; however, none ofthe wells
25 have contained sufficient water to allow purging or sampling. The water in these
26 wells is believed to be condensation within the well, rather than perched
27 groundwater (Carpenter, 1994a).
28 The nine deep monitoring wells appear to be screened in the Upper Pleistocene
29 aquifer (Carpenter, 1994a). The nine deep monitoring wells do not appear to have
30 penetrated through the Upper Pleistocene aquifer into the Lower Pleistocene
31 aquifer. Boring logs for these wells are presented in Appendix E. This aquifer is
32 the uppermost usable aquifer in the immediate vicinity ofthe landfill site.
33 The landflll culinary well appears to be screened in the Lower Pleistocene aquifer
34 (Carpenter, 1994a). The well log indicates that the partially confining layer
35 between Upper and Lower Pleistocene aquifers is not present at the site. This is
36 consistent with the interpretation ofthe U.S. Geological Survey for this portion
37 ofthe Goshen Valley (Brook, 1994). The Upper and Lower Pleistocene aquifers
March 2009 SUVSWD Bayview Class I Landfill Permit Application 3-5

Part 3: Technical and Engineering Report
4
5
6
7
8
9
10
11
12
13
14
15
16
17
18
19
20
21
22
23
24
25
26
27
28
29
30
31
32
33
34
35
appear to represent a single, water table (imconfined) aquifer in the vicinity of the
Bavview Landflll.
Water Rights
Groundwater Flow
The Utah Department of Natural Resources Water Rights Division lists only one
active water right within 2,000 feet ofthe Bayview Landfill site boundary. This
active water right is the culinary water well for the landfill. This well is located
upgradient ofthe site, and is screened in the Lower Pleistocene aquifer.
Based on a review of the USGS topographic maps for the site, approximately 7
wells are located up to 2 miles from the site boundary (USGS, 1993) including
the landfill culinary well.
The previous studies indicate that groundwater flow enters the Goshen Valley
from the south through Current Creek Gap, and from the northwest through the
Mosida Hills. These groundwater flows converge near the Bayview Landfill site.
The groundwater underlying the site is expected to flow northeast toward Utah
Lake. Cordova (1970) estimated transmissivity ofthe Pleistocene aquifer to be
between 50,000 and 300,000 gallons per day per foot (gpd/ft). Earthfax (1984)
estimated the velocity of groundwater flow north of Elberta to be 24 feet per year
(ft/yr).
In April 1994, the District issued a report on the results ofthe District's
background monitoring program (Carpenter, 1994b). This report provided an
assessment ofthe background water quality and flow direction in the immediate
vicinity of landfill. This report stated that the groundwater flow at the site moves
northeasterly toward Utah Lake, and esfimated the velocity ofthis flow at 1.8
ft/yr. The report in Appendix F has been updated to include recent groundwater
monitoring events.
The discrepancy between the published values and the apparent velocity of
groundwater at the site is unexplained. However, this does not seem to be
important since the upper aquifer is more than 100 feet below the bottom ofthe
landfill.
Groundwater Chemistry
The uppermost aquifer (the Upper Pleistocene aquifer) underlying the Bayview
Landflll site is classified as a Class II aquifer. Appendix F contains the
groundwater monitoring plan for the landfill. Statistical analyses of groundwater
monitoring data have been completed semi-annually since the completion of
3-6 SUVSWD Bayview Class I Landfill Permit Application March 2009

Part 3: Technical and Engineering Report
background sampling in 1993. Statistical analysis results are submitted with the
2 District's annual reports. The analyses show no contamination ofthe
3 groundwater by inorganic or organic chemicals. Statistical evaluation ofthe data
4 shows a general trend of increasing concentration for total dissolved solids,
5 sulfate, chloride, calcium, magnesium, sodium, and bicarbonate from southwest
6 to northeast below the site. This is consistent with the regional trend of increased
7 concentration of inorganic chemicals as they move toward Utah Lake through the
8 shallow Pleistocene aquifer (Carpenter, 1994). Groundwater analytical resuhs
9 are submitted to UDEQ armually.
10
#
#
3.3 Engineering Report
11 3.3.1 Location standards
12 UDEQ has adopted specific locational restrictions that include the locational
13 criteria specified in the federal Subtitle D regulations. The Utah location
14 restrictions for municipal solid waste landfills are outlined below. Subtitle D
15 criteria are highlighted with an asterisk (*).
16 Location Restriction Compliance was previously analyzed as part ofthe 1996
permit application. The following portions of Section 3.1 are excerpted from that
applicafion.
19 I. Land Use Compatibility (R315-302-l(2)(a))
20 a. Parks and protected areas
21 b. Ecologically and scientifically significant areas
22 c. Prime farmland
23 d. Dwellings and stmctures*
24 e. Airport mnways*
25 f. Archeological sites
26 g. Land use plarming or zoning
27 2. Geology (R315-302-l(2)(b)) Fauh areas*
28 a. Seismic impact zones*
29 b. Unstable areas*
30 3. Surface Water (R315-302-l(2)(c)
31 a. Floodplains*
b. Wetlands*
March 2009 SUVSWD Bayview Class I Landfill Permit Application 3-7

Part 3: Technical and Engineering Report
4. Groundwater (R315-302-l(2)(e))
a. Groundwater/landfill separation
b. Sole source aquifer
c. Groundwater quality
d. Source protection areas
The following sections present the State of Utah location restrictions and discuss
the Bayview Landfill's compliance with those requirements.
3.3.1.1
9
10
11
12
13
14
15
16
17
18
19
20
21
22
23
24
25
26
27
28
29
30
31
32
33
34
Land Use Compatibility
The Utah Solid Waste Permitting and Management Rules state that no municipal
solid waste landfill shall be located within the following restriction zones:
• One thousand feet of a national, state, or county park, monument, or
recreation area; designated wilderness or wildemess study area; or wild
and scenic river area.
• Ecologically and scientifically significant natural areas, including
wildlife management areas and habitat for listed or proposed
endangered species as designated pursuant to the Endangered Species
Act of 1982.
• Farmland classified as prime, unique or of statewide importance by
the U.S. Department of Agriculture Soil Conservation Service under
the Prime Farmland Protection Act.
• One-fourth mile of existing permanent dwellings, residential areas, and
other incompatible stmctures such as schools, churches, and historic
structures or properties listed or eligible to be listed in the State or
National Register of Historic Places.
• Ten thousand feet of any airport mnway end used by turbojet aircraft, or
5,000 feet of any airport mnway end used by only piston-type aircraft.
• Areas with respect to archeological sites that would violate R9-8-404.
• An area that is at variance with any locally adopted land use plan
or zoning requirement unless otherwise provided by local law or
ordinance.
The Bajrview Landfill is not located within any of these restriction zones. The
land use directly adjacent to the landflll is primarily agricultural. The nearest
residence is located more than 1 mile north of the site boundary, and the nearest
town, Elberta, is located approximately 5.5 miles south ofthe site. The nearest
3-8 SUVSWD Bayview Class I Landfill Permit Application March 2009

Part 3: Technical and Engineering Report
airport is located approximately 17 miles from the site. No parks, ecologically
2 significant areas, prime farmland, or archeological sites are known to exist near
3 the site. The Bayview Landfill site is surrounded on the north and west by land
4 zoned mining and grazing (MEGl), and on the south and east by land zoned
5 agricultural (Al). The landfill is not inconsistent with these planned land uses. In
6 any case, the site was permitted by the Utah County Board of Adjustment under a
7 Conditional Use Permit, and therefore, is consistent with the local zoning and
8 land use planning.
9 3.3.1.2 Geology
10 The Utah Solid Waste Permitting and Management Rules state that no municipal
11 solid waste landflll shall be located in a subsidence area, in a dam failure flood
12 area, over an underground mine or salt bed, or on or adjacent to geologic features
13 that could compromise the stmctural integrity ofthe facility.
14 • Fault Areas. A new facility or a lateral expansion of an existing facility
15 shall not be located within 200 feet of a Holocene fault.
16 • Unstable Areas. Unstable areas require demonstration that the site has
17 been engineered to ensure that the integrity ofthe stmctural components
ofthe facility will not be damaged by the unstable conditions.
19 • Seismic Impact Zones. A new facility of a lateral expansion of an
20 existing facility shall not be located in seismic impact zones unless all
21 containment stmctures are designed to resist the maximum anticipated
22 horizontal acceleration for the site.
23 The Bayview Landflll site does not include known Holocene faults, and all solid
24 waste containment will occur more than 200 feet from the property boundary. A
25 trenching study was conducted to determine whether apparent lineaments
26 represented the surface expression of faults. This study concluded that the
27 lineaments were not related to faults (see Appendix H). The Bayview Landfill is
28 not located within a known unstable area as defined in the regulations.
29 Historic seismic records indicate that more than 25 earthquake events have
30 occurred with epicenters within approximately 5 miles ofthe Bayview Landfill
31 site. These earthquake events have occurred south, southwest, and southeast of
32 the site. These earthquake events are presented in USGS Miscellaneous Field
33 Studies Map MF-1856 and are summarized in Figure 4.
34 The Utah County Planning Department has not mapped the westem portions of
35 Utah County for seismic activity. The Uniform Building Code (1991) appears to
36 classify aU of Utah County as a Class 3 Seismic Zone. Stmctures in a Class 3
March 2009 SUVSWD Bayview Class I Landfill Permit Application 3-9

Part 3: Technical and Engineering Report
1 Seismic Zone are required to use a horizontal acceleration of 0.3g unless studies
2 demonstrate that another horizontal acceleration is more appropriate.
3 Design for Cell 2 has been analyzed considering seismic activity and has been
4 found to be stable with an adequate factor of safety. See Appendix J.
5 Seismic stability analyses have been conducted to demonstrate that the proposed
6 landfill components can resist the maximum horizontal acceleration expected at
7 the site. These analyses were conducted in accordance with the State of Utah
8 Administrative Rules and EPA guidance presented in RCRA Subtifle D (258)
9 Seismic Design Guidance for Municipal Solid Waste Facilities, (EPA, 1995).
10 The landfill components considered in these analyses included: linear systems,
11 leachate collection and delivery systems, the leachate collection and mn-on/mn-
12 off control systems and the final cover.
13 The scope ofthe analyses included a review of regional and local soils, geology
14 and seismic selection ofthe design earthquake and the site specific earthquake
15 acceleration; static and pseudo-static stability analyses for each landflll
16 component: and evaluation of stability and potential deformations for each
17 landflll component.
18 The results of these analyses are presented in Appendix J and indicate the
19 following:
20 • The Bayview Landflll site is located in a Seismic Impact Zone. Both
21 deterministic and probabilistic methods indicate a peak bedrock
22 acceleration of 0.5g. The dense granular soils offer little amplification
23 or attenuation of the bedrock acceleration through the overlying soil
24 column.
25 • The cut and fill slopes and mn-on/mn-off stmctures have adequate static
26 factor of safety and indicate minimal permanent deformations (U<1 cm)
27 in response to the design seismic event.
28 • The side slope liner and leachate collection/recovery system wil! require
29 a geosynthetic reinforcement to increase the static factor of safety and
30 limit permanent deformations in response to the design seismic event.
31 • The closure cap system has an adequate stafic factor of safety and
32 indicates acceptable permanent deformation (U<10 cm) in response to
33 the design seismic event. No reinforcement is required for the final
34 cover.
35 These demonstration analyses indicate that the proposed Bayview landflll
36 components are designed to resist the "maximum horizontal acceleration" at the
37 site.
3-10 SUVSWD Bayview Class I Landfill Permit Application March 2009

Part 3: Technical and Engineering Report
3.3.1.3 Surface Water
2 The Utah Solid Waste Permitting and Management Rules state that no municipal
3 solid waste landfill shall be located within a public water system watershed, a
4 floodplain, or a wetland without specific approval ofthe Execufive Secretary.
5 The Bayview Landflll site is not located within a public water system watershed
6 or 100-year floodplain. Three surface water drainage features cross the site from
7 west to east. The Landfill Master Plan provides that the three drainage areas will
8 be improved to divert mn-on from the active landfill cells. The drainage features
9 do not contain vegetation that is characteristic of wetlands areas. No other
10 wetland areas have been identified on the site. Calculations for mn-on and mn-
11 off ditches can be found in Appendix M.
12 3.3.1.4 Groundwater
13 The Utah Solid Waste Permitting and Management Rules state that no municipal
14 solid waste landflll shall be located within the following restriction zones:
15 • Within 5 feet of the historical high groundwater elevation.
tf 16 • Within 100 feet vertically (50 feet for high total dissolved solids [TDS
between 1,000 and 3,000 mg/1] aquifers) of an aquifer that could be
used for drinking water unless constructed with a composite liner
19 system.
20 • Over an aquifer designated as a sole source aquifer or a IB aquifer.
21 • In a drinking water source protection area.
22 The Bajrview Landfill is not located within a sole source or 1B aquifer, or in a
23 drinking water source protection area. Landflll cells will not be constmcted
24 within 5 feet of the historical high groundwater elevation. The shallowest
25 groundwater at the site, the Upper Pleistocene aquifer, is located more than IOO
26 feet below the bottom ofthe proposed liner system. A composite liner system
27 consisting of a geosynthetic clay liner (GCL) and an HDPE geomembrane is
28 proposed for the bottom of Cell 2.
29 3.3.2 Engineering Design
30 In 1987, the District prepared a Landfill Master Plan (HDR, 1987) to guide
31 development ofthe site over its active life, which is expected to exceed 50 years.
32 Figure 5 in Part 4 illustrates the landflll facilifies, which include the following:
33 • Six landfill cells (previous Cells 2 and 3 have been combined into Cell
U 2). Cell 2 will be approximately 83 acres in size. The cells are ftirther
35 subdivided into smaller areas, called "stages," to facilitate constmction
March 2009 SUVSWD Bayview Class I Landfill Permit Application 3-11

Part 3: Technical and Engineering Report
1 and to minimize the area open to receiving stormwater at any one time.
2 Each stage represents approximately 15 acres;
3 • Three stormwater/leachate evaporation ponds:
4 o An existing pond designed to receive contact stormwater and
5 leachate from the northern half of the site,
6 o A proposed leachate evaporation pond designed to receive
7 stormwater and leachate from Cells 1 and 2 so that the existing pond
8 can contain stormwater and process mnoff produced by the compost
9 facility, and
10 o A third, future pond to receive contact stormwater and leachate
11 from the southem half of the site;
12 • Screening berms to provide visual screening ofthe active landflll cells
13 from State Highway 68;
14 • Three stormwater diversion channels using the existing ephemeral surface
15 water drainage channels;
16 • A windrow composting facihty located east of Cell 2;
17 • A maintenance building.
18 The Master Plan was updated in 2002 (HDR) to show a combined Cell 2 and 3,
19 and to increase excavation depths in this new Cell 2. A 2008 Cell 2 Master Plan
20 (Appendix A) modified Cell 2 - Stage 2 base grades to drain the westem two-
21 thirds down at 2% to the north and east, and the eastem third down at 2% to the
22 southeast, and modified the leachate drainage plan to accommodate the new
23 grades. Excavation depths remain more than 100 feet above the uppermost
24 aquifer. An additional leachate evaporation pond was designed to collect leachate
25 and stormwater from Cells 1 and 2 only. The Cell 2 Master Plan is attached to
26 this permit applicafion as Appendix A.
27 Landfill Cell 1 achieved final contours in 2004 and the final cover was placed in
28 2008. Cell 1 was built as designed and final cover seeding is all that remains for
29 closure to be completed. Landfill Cell 2 - Stage 1 will reach capacity by the end
30 of 2009, at which time landfill personnel wiU begin placing the intermediate
31 cover on the side slopes of Stage 1. After Cell 2 reaches final contours and the
32 final cap is in place in approximately 2032, long-term monitoring ofthe fmal
33 cover and groundwater monitoring wells will continue for the 30-year post-
34 closure care period.
3-12 SUVSWD Bayview Class I Landfill Permit Application March 2009

Part 3: Technical and Engineering Report
3.3.2.1 Landfi l l Cell 2 - Stage 2
2 Stage 2 of Landfill Cell 2 consists of a 15-acre, geosynthetic clay and HDPE-
3 lined area located in the El /2 ofthe NWl/4 of Secfion 17. The excavation for
4 this cell stage began in 2004 and is ongoing. The excavated soils have been used
5 for liner protection, daily cover, with a portion used to close Cell lor stockpiled.
6 The stockpiled soil will be used for daily cover and intermediate cover on Cell 2
7 - S t a g e 1.
8 Cell 2 - Stage 2 grading is divided into two parts (Figure 9). Generally,
9 excavation side slopes will be constmcted on a 4:1 (H:V) slope. The excavation
10 bottom slopes ofthe larger, westem portion will be graded down at 2% north to
11 south and 2.5% west to east, so that leachate drains to the northeast comer ofthe
12 western portion of Cell 2 - Stage 2. The excavation will be constmcted with a
13 leachate collection trench along the eastem edge ofthe excavation bottom. The
14 leachate collection swale will be graded at a 2.0% slope down from south to
15 north toward a sump at the north edge of Stage 2. From the sump, leachate will
16 be conveyed north to the existing leachate drain line. The smaller, eastem portion
17 of Stage 2 slopes down at 2% to the south and east, where a new leachate
18 collection sump will be built and a new leachate drain line will convey leachate
19 from the eastem portion of Stage 2 to the leachate collection system in Stage 1.
'o The liner system for Cell 2 - Stage 2 consists ofthe following components (from
21 bottom to top):
22 • A 12- to 20-ounce non-woven, needle punched polypropylene geotextile.
23 The excavation specification will allow 4-inches minus material to
24 remain on the surface ofthe excavation. A heavy geotextile will
25 provide puncture resistance for the overlying geomembrane.
26 Altemately, a sand cushion may be used in lieu of, or to reduce the
27 required weight of, the geotextile cushion;
28 ' A bentonite impregnated geotextile (geosynthetic clay liner - GCL). The
29 GCL provides an additional barrier to leachate and landfill gas
30 migrafion;
31 • A 60-mil textured HDPE flexible membrane liner;
32 ' A woven reinforced geotextile. This high strength geotextile will provide
33 the tensile strength necessary to resist the sliding forces generated on a
34 4:1 slope by the 2-foot-thick soil protective layer;
35 • A 12- to 16-ounce non-woven geotextile placed on top ofthe HPDE liner
.36 (ofthe floor ofthe excavation) to provide protection to the HDPE liner;
March 2009 SUVSWD Bayview Class I Landfill Permit Application 3-13

Part 3: Technical and Engineering Report
1 • A 2-foot thick protective cover layer. This soil layer will protect the
2 geotextile, HDPE and GCL during placement ofthe first lift of solid
3 waste. It is also intended to provide a pathway for leachate
4 movement above the HDPE toward the leachate collection and removal
5 system.
6 Appendix O contains a Constmction Quality Assurance Plan (CQA). This CQA
7 plan requires the installation contractor to conduct a constmction quality control
8 program during installation. As a result, all seams will be tested for continuity.
9 In addition, periodic samples will be removed from the rolls and subjected to
10 tensile testing at a third party laboratory. Constmction oversight personnel will
11 be on-site at all times during HDPE, GCL and geotextile installation, and during
12 placement ofthe 2-foot thick protective layer. These personnel will provide a
13 CQA review ofthe constmction and installation ofthe liner system.
14 3.3.2.2 Leachate Management
15 In its current design, mnoff and leachate from Cell 1, Cell 2 - Stage 1, and the
16 compost facility are contained in the existing leachate pond. However, the pond
17 is not dual lined and does not have leak detection, both of which are now
18 required for leachate ponds. Therefore, a new leachate pond has been designed
19 and will be constmcted as part ofthis permit renewal. The new pond will receive
20 leachate and stormwater from Cell 1 and Cell 2 only. The existing pond will
21 receive stormwater and process mnoff from the compost facility only.
22 Leachate and contact stormwater within the active landfill cell (Cell 2 - Stage 2)
23 will drain via one of two collection pipes and sumps. Leachate and storm water
24 will be transmitted through a 2-foot thick protective cover soil to a leachate
25 collection pipe (See Figures 11 and 12). The leachate collection pipe will consist
26 of an 8-inch diameter perforated PVC or HDPE pipe encased in a granular fill
27 wrapped with a geotextile. The pipe trench will be approximately 2 feet in depth,
28 matching the thickness ofthe protective cover. The perforated leachate
29 collection pipe will enter a gravel-filled sump. The leachate collection pipes will
30 be installed along the eastem edge of each portion of Stage 2. The western
31 portion of Stage 2 will drain to a sump at the north edge of Stage 1. The eastem
32 portion will drain to a new sump at the southeast comer of Stage 2 where it will
33 be pumped back to the existing sump at the north edge of Stage 1. From the
34 sumps, the pipe (solid wall) continues up the side slopes and terminates at the top
35 of excavation as a clean-out. An 18-inch HDPE pipe also continues up the side
36 slope. A submersible pump capable of pumping a minimum of 50 gallons per
37 minute can be lowered down the 18-inch pipe to pump leachate out ofthe cell
38 into the existing leachate drain line that mns along the northem edge of Cell 2.
39 The leachate drain line will discharge to a newly designed evaporation pond that
3-14 SUVSWD Bayview Class I Landfill Permit Application March 2009

Part 3: Technical and Engineering Report
m
m
will be constmcted immediately north ofthe existing pond. Leachate will be
managed by this system during filling and after closure. Design details of these
3 systems can be seen on Figures 11 to 13. Sizing calculations for the new pond are
4 found in Appendix L.
5 The new leachate evaporation pond will be constmcted, tested, and inspected
6 using the same personnel and techniques as used for the previously constmcted
7 landfill cells and evaporation pond. The south side ofthe pond will be
8 constmcted on a 10:1 slope to allow access for equipment to remove sediments
9 with the remaining sideslopes 4:1. The new evaporation pond was designed to
10 contain the leachate generated from all of Cell 1 and Cell 2 and contact
11 stormwater from the largest ofthe currently undeveloped Cell 2 stages (Stage 3)
12 for the 25-year, 24-hour storm event.
13 The proposed evaporation pond liner system consists ofthe following layers
14 (from bottom to top):
15 • A 16-ounce non-woven geotextile;
16 ' A 60-mil HDPE geomembrane;
17 ' A geonet, sandwiched between two layers of non-woven geotextile;
• A UV-resistant 60-mil HDPE geomembrane, textured on side slopes;
19 • A 6-inch layer of sand (bottom and the 10:1 sideslope only) as a cushion
20 layer beneath the soil cement to protect the 60-mil HDPE geomembrane;
21 and
22 • An 8-inch layer of soil cement (bottom and the 10:1 sideslope only). The
23 cement will allow the District to enter the pond and remove accumulated
24 sediment using a front-end loader.
25 The proposed evaporation pond will also have a leak detection system between
26 the lower 60-mil HDPE geomembrane and the sandwiched geonet/geotextile
27 layer. The geonet will convey any fluid that leaks through the primary liner to a
28 gravel-filled sump with an 8" perforated HDPE pipe. The pipe will extend up a
29 4:1 sideslope as a solid-wall pipe and terminate at a manhole stmcture where a
30 portable water level meter and, if needed, a pump can be lowered down to check
31 for leaks in the primary evaporation pond liner.
32 Mode l ing
33 Since the leachate generation calculations were done for the October 2003 Permit
34 Application, no modifications have been made to the landfill that affect the
|5 amount of leachate generated or the performance ofthe leachate collection
"36 system. Because ofthis, the Hydrologic Evaluation of Landfill Performance
March 2009 SUVSWD Bayview Class I Landfill Permit Application 3-15

Part 3: Technical and Engineering Report
1 (HELP) model, hydraulic head calculations, and calculations for the flow
2 capacity ofthe leachate collection pipe used for the 2003 Permit Application are
3 still valid and are included in Appendix K.
4 Analyses have been conducted to evaluate the sizing and capacity ofthe
5 proposed leachate evaporation pond for the combination of contact stormwater
6 run-off from the contributing cell area and leachate generation from all of Cell 1
7 and Cell 2. Only stormwater from the largest stage in Cell 2 (Stage 3) was
8 considered in the stormwater mnoff calculations because the stages will be
9 developed in sequence, with each stage receiving intermediate cover when it
10 reaches capacity, thereby reducing contact stormwater runoff. The 25-year, 24-
11 hour storm event was used to compute mn-off. The results ofthe analysis,
12 presented in Appendix L, indicate the proposed leachate evaporation pond is
13 sized adequately to contain the leachate generated from Cell 1 and Cell 2 and the
14 contaminated stormwater mn-off from the equivalent area of Cell 2 - Stage 3.
15 3.3.2.3 Surface Water Controls
16 The Bayview Landfill site and its vicinity generally drain from west to southeast.
17 Stormwater originating west of the site is routed through three existing surface
18 water channels. See Figure 2. Constmction of Landfill CeUs 2 required that the
19 northem ephemeral surface drainage channel be relocated (see Figure 5).
20 Stormwater originating on-site is managed as either non-contact or contact
21 stormwater depending on its source. Non-contact stormwater is water falling on
22 unimproved portions ofthe site, or on improved portions ofthe site having no
23 contact with solid waste (e.g., the maintenance building vicinity) or on the final
24 cover of Cell 1. Run-on control stmctures divert this water from the active
25 landflll cell and stormwater/leachate pond and route this water into the existing
26 surface water channels. Contact stormwater is water falling onto the active
27 landflll cell. Run-off control stmctures divert water falling on the active landfill
28 cell into the leachate collection system. Ultimately, contact stormwater is stored
29 and evaporated in the evaporation pond. Neither leachate nor contact stormwater
30 are discharged from the site.
31 Analyses have been conducted for mn-on and run-off control systems around
32 Cell 2. These analyses were conducted for a 25-year storm event and the
33 associated time of concentration that produced peak flow. The analyses,
34 presented in Appendix M, indicate that a triangular ditch, nominally 1 foot deep,
35 provides adequate flow capacity. This ditch geometry was constmcted concurrent
36 with the Cell 2 constmction.
3-16 SUVSWD Bayview Class I Landfill Permit Application March 2009

Part 3: Technical and Engineering Report
3.3.2.4 Closure and Post-Closure
2 Cell 1
3 The final cover of Cell 1 was completed in 2008. An altemate final cap
4 consisting of 34 inches of on-site, olive-brown silty sand was used to close Cell
5 L A seed mix similar to that shown in Table 3-1 will be used to establish
6 vegetation during 2009. Final contours for Cell 1 can be seen on Figure T-3 in
7 Appendix T. The side slopes ofthe landfill were constmcted at a 4:1 (H:V)
8 slope, with the top slope being approximately 5%. After seeding the final cover,
9 closure of Cell 1 will be considered completed.
10 T a b l e 3 - 1 : Seed M i x for Bayview Landf i l l
% Mix Type of Grass
21 Cell 2
m
0.50%
1.50%
3.50%
17.50%
17.50%
3.00%
4.00%
16.25%
16.25%
20.00%
100.00%
Sand Drop Seed
Alkali Sacaton
Blue Grama
Blue Bunch Wheat Grass
Indian Rice Grass
Sandberg Blue Grass
Sheep Fescue
Slender Wheat Grass
Stream Bank Wheat Grass
Western Wheat Grass
Total
11 The fmal capping system used for Cell 1 varies from the standard design in the
12 Utah Administrafive Code at R315-303-3(4). However, based on modeling
13 performed for the 2003 permit application, the approved cap is equivalent to the
14 standard design in preventing infiltration. A copy ofthis analysis is included in
15 Appendix N.
16 A conceptual design of the gas system is included in Appendix Q. Recent
17 landflll gas monitoring indicates that gas collection is not required. At such time
18 that active extraction is needed, wells will be installed and connected to header
19 pipes and the system will be connected to a blower and the landflll gas bumed in
20 a flare or used in a landfill gas generator.
22 Landfill Cell 2 - Stage 1 wiU reach capacity by die end of 2009. Stage 2 of Cell 2
will be constmcted in 2009, with a portion ofthe excavated soils used for daily
March 2009 SUVSWD Bayview Class I Landfill Permit Application 3-17

Part 3: Technical and Engineering Report
1 cover, intermediate cover on Stage 1, or stockpiled. Landfill Cell 2 is not
2 expected to reach capacity until approximately 2032.
3 The same altemate final capping system as used for Cell 1 will be used for Cell 2
4 when final contours are reached. In general, this capping system consists ofthe
5 following layers from the bottom up:
6 " 6 inches of intermediate cover placed over the daily cover to provide a
7 12-inch cushion of soil between the solid waste and the barrier layer;
8 • 34-inches of evaporative cap constmcted from the olive-brown silty sand
9 available on-site. The top six inches of this evaporafive cap will be
10 capable of supporting vegetative growth by amending the soil with
11 compost to aid in initial seed germination.
12 A seed mix similar to that shown in Table 3-1 will be used to establish
13 vegetation. Projected final contours for Cell 2 can be seen on Figure 6. The side
14 slopes of Cell 2 wiU be constmcted at a 4:1 (H:V) slope, with a top slope of
15 approximately 5%.
16 Pos t -C losure C a r e
17 Post-closure care is expected to consist ofthe following tasks:
18 • Quarterly inspections ofthe cap to detennine whether significant erosion
19 or differential settlement has occurred;
20 • Quarterly inspections of the stormwater/leachate evaporation pond;
21 • Quarterly monitoring of landfill gases at the extraction wells;
22 • Quarterly inspection of groundwater weh integrity;
23 • Semi-annual monitoring and sampling of groundwater wells.
24 These activities have been initiated on Cell 1 and will be expanded to all closed
25 areas at the appropriate times. A maintenance program will be developed for the
26 landfill gas recovery system when the system is activated. Closure and post-
27 closure is discussed in more detail in Sections 2.6 and 2.7 ofthis application.
28 3.4 Composting
29 A composting facility was constmcted in 2004 after Cell 1 reached capacity. The
30 compost facility is jointly permitted through the Division of Solid and Hazardous
31 waste and the Division of Water Quality. The facility is located east of Cell 2,
32 adjacent to the existing leachate evaporation pond in the SE 'A ofthe NE % of
33 Section 17. The composting facility uses windrows to processes two waste
3-18 SUVSWD Bayview Class I Landfill Permit Application March 2009

Part 3: Technical and Engineering Report
Streams, one containing a mixture of biosolids, food and beverage waste, and
2 yard waste, and another containing yard wastes only. An operations plan for the
3 compost facility is included in Appendix R. Quantities ofwaste processed at the
4 composting facility each year from 2004 through 2007 are shown in Table 3-2.
5 Table 3-2. Tons of Waste Processed at the Bayview Composting Facility
#
#
2004
2005
2006
2007
Total
Year Biosolids (tons)
496
1015
1036
1058
3,605
Yard Waste (tons)
1,556
2,866
4,189
5,874
14,485
7 3.5 References
8 Brooke, L.E. 1994. U.S. Geological Survey. Personal Communication.
9 Carpenter, C H . 1994a. Provo City Corporation, Department of Water Resources. Personal 10 communication.
Carpenter, C H . 1994b. Quahty of Groundwater at the Bayview Landfill Site. Chen and Associates, Inc.. J2 1980. Proposed Sanitary Landflll Site. 15 p.
13 Cordova, R.M. 1970. Groundwater Conditions in Southem Utah Valley of Goshen Valley, Utah: Utah
14 Department of Natural Resources. Technical Publication 28, 79 p.
15 Danzberger. 1986. Assessment of Siting Considerations at the Proposed Provo Sanitary Landfill Site. 4 p.
16 Dustin and C B . Merritt. 1980. Hydrogeology of Utah Lake with Emphasis on Goshen Bay: Utah 17 Geological and Mineral Survey Water Resources Bulletin No. 147-5, 115 p.
18 Environmental Science and Engineering. 1986. Evaluation of Hydrogeologic and Seismic Conditions,
19 Proposed Sanitary Landfill Site in Goshen Valley, Utah. 31 p.
20 HDR Techserv, Inc. 1987. Landfill Approval Assistance Hydrogeologic and Seismic Review.
21 HDR Techserv, Inc. 1988. Landfill Master Plan, Bayview Landfill. 44 p.
22 HDR Engineering, Inc. 2002. Landfill Master Plan Update, Bayview Landfill. 29 p.
23 HDR Engineering, Inc. 2008. Cell 2 Master Plan, Bayview Landfill. 7 p.
24 Hintze, L.F. and D.K. Fuhrman. 1983. Geohydrology Study of Proposed West Lake Landfill Site. 20 p.
25 RBG (Rolin, Brown, and Gunnell, Inc.). 1983. Investigafion Report. 12 p.
26 Robison, R.M. 1987. Evaluation of Lineaments at the Proposed Provo City Landfill, Goshen Valley, 27 Utah. 15 p.
28 Uniform Building Code. 1994.
U.S.G.S. (U.S. Geological Survey). 1986. Seismicity Map ofthe State of Utah.
March 2009 SUVSWD Bayview Class I Landfill Permit Application 3-19
Part 3: Technical and Engineering Report
1 U.S.G.S. (U.S. Geological Survey). 1993. Selected Hydrologic Data for Southem Utah and Goshen 2 Valleys, Utah 1890-1992.
3-20 SUVSWD Bayview Class I Landfill Permit Application March 2009

Part 4

Part 4: Figures
#
Part 4: Figures
2 Figure 1. USGS Topographic Map of Bayview Landflll and Vicinity
3 Figure 2. USGS Topographic Map of Bajrview Landfill
4 Figures. Cell 2 Existing Contours
5 Figure 4. Earthquake Distribution Map
6 Figure 5. Planned and Exisfing Landfill Facilities
7 Figure 6. Cell 2 Final Contours
8 Figure 7. Cell 2 Liner/Excavation Contours
9 Figure 8. Cell 2 Typical Cross Section
10 Figure 9. Cell 2 - Stage 1 & 2 Liner/Excavation Contours
11 Figure 10. Liner Details
12 Figure 11. CeU 2 Leachate Collection System and Liner Details
13 Figure 12. Cell 2 Leachate Collection System, Sump Plan, and Section
Details
15 Figure 13. Cell 2 Leachate Collection System Details
March 18, 2009 SUVSWD Bayview Class I Landfill Permit Application 4-1

I.r ! Ill '!• 'JU
=i--.. ' .
V •^
.1 I V:
I I
f'' ,/^
.(•.vJ
" " ^ •v.]
* . - f \ \ ' i ; :^
..<<-!
m. ' V•^?T^^.•;••^-/i;lfi^s.•>.^•;/^;^,
.. \^':'^-M.'-:^iSf^i^i^:^i:.:/\:.
; .Q 5 I \ m^r,-Mm^mmsr::Jmk
1 |-:>ni \\k:-:y:::4U-Mi;j ?Sm'' -: ; - y ^ I ; (^^^i:-
^^^i^^^?
\i;iv
' -y• •v / r i / : ' ' -^ v r t \ A \ - - •• - Y - -3^^ . M ^ r ' - N • -'"'"" ^ ' V : - / . !' J .'• ; •• ' ••. • ! " i r s ' ' •'' • •- ^ V l -• ; •. V
?^;i4i^
• i=. j?s.| i^;^;
•< :;::-:
1^- , '5.- i! .- , i-^ •
'- •' - I l y ^ V - y • '
' : I I ; - f c - ^ < ? . • • . - / I
/
y
I . " H ^ ; \
Vl
\ \ it \ i ! J'
i \ ••X \ 28 I
^ -rrT" •....•ei
:i »
LEGEND
I I 1-Mile Boundary
2-Mile Boundary
y j Property Line (Approximate)
USGS TOPOGRAPHIC MAPS USED:
Aliens Ranch Eureka Goshen Goshen Valley North
"uesday, January 13, 2009 1:58:43 PM
N
0.5
Miles
BAYVIEW L A N D F I L L
FIGURE l
USGS Topographic Map with Two Mile Boundary

LEGEND
^ B e r m
i m Cell Cement Pad/Propane Tank
Chain Link Fence
Y y / \ Compost Facility
Fuel Tank
Leachate Basin
Litter Control Fence
^ Proposed Leachate Basin Location
J SepficTank
, N ^ \ Soil Stockpile Area
Structure
Water Tank
j y ^ J Property Line (Approximate)
USGS TOPOGRAPHIC MAP USED: Goshen Valley North
N
s
0.125
Miles
BAYVIEW LANDFILL
FIGURE 2
USGS Topographic Map of Bayview Landfill
0.25 H I
Monday, January 12, 2009 9:47:47 AM


LEGEND
Earthquake*
Decade, Magnitude
1990s, 2.00 - 2.99
1990s, 1.00 -1.99
1990s, 0.00 - 0.99
1980s, 4.00 - 4.99
1980s, 3.00 - 3.99
1980s, 2.00 - 2.99
1980s, 1.00-1.99
1980s, 0.00 - 0.99
1970s, 2.00 - 2.99
1970s, 1.00 -1.99
1970s, 0.00 - 0.99
1960s, 2.00 - 2.99
1960s, 1.00 -1.99
Earthquake Outside 15-Mile Radius of the Property Line
r.._J Property Line (Approximate)
Earthquakes displayed are within a 15-mile radius of the property line.
o
o
«
A
A
A
A
•
D
n
H
0
0
N
5
Miles
10
BAYVIEW LANDFILL
FIGURE 4
Earthquake Distribution Map
Friday, January 9, 2009 11:52:25 AM

LEGEND
o Fire Hydrant
• Leachate Collection Manhole Structure
o Monitoring Well, Approximate Location
A Monitoring Well, Perched Water Table
® Monitoring Well, Shallow Pleistocene Aquifer
• Pump
Channel Diversion
Drain Field
• = Gate
• Leachate Drain Line
o== [Mew Leachate Drain Line
Surface Water Diversion Ditch
Water Line
^ 2 Berm
Cell
[ ' I Cement Pad/Propane Tank
~ \ Chain Link Fence
\ / ^ J l Compost Facility
Fuel Tank
IHXK^ Leachate Basin
r^ ^ j Litter Control Fence
Proposed Leachate Basin Location
Septic Tank
Soil Stockpile Area
Structure
^ ^ Water Tank
-«»w,i Property Line (Approximate)
N
s
0.125
Miles
BAYVIEW LANDFILL FIGURE 5
Planned and Existing Landfill Facilities
0.25 H I
Tuesday, March 3,2009 1:4925 PM H:\SLC STAFF\Ros8mary\SUVSVVD\Bayview_Lancttill\map_docs\mxd\map_bL_Bayvievk(Undtill.iiKd


1

I
/
—
1-f
1
'
<
po/r-:
• , - ' • •
/ • •
[7
'
\
\ .
\
: '~2- t
/
/
\
\
^
<S'~"
^ '
\
\
\ 1 ' V
r :
1
' ^
V \
\
00
^ '
\
\
\
4+
v . _ . • . • . .
"' .
y ^
\
V-\
00
. - ^
5+
2
.
00
" ~
^
6+
HDR E n g m M r i n g , Inc . 3995 S 700 E SiiiU 100 Salt Lah* City. UT 84107-250*
. ,
V .
- ^
00
^
• >
71
ISSUE
1
"^ ,
N(
^ ,
^ —
^ i ~ .
)t
DATE
^
--^
l l
^
. / ^
)F
;
^
\ ^
"~~~-
M
• N
y "
;d
-'
l \
^ ~
~ ~
IT
•s^
y
FOO
Rl
1
\ ^
y "
t
DESCRIPTION
.
CEU
DOS
~ 7 "
•00
TII
• « ; . ^
2 r w
ING CR
13H
^ ^^ . CWE
lUND SI
-
\ \
1-00
Ic PROJECT MANAGER
ARCHITECT
CML
MECHANICAL
ELECTRICAL
STRUCTURAL
DESIGNED
DRAWN BY
PROJECT NUMBER
4
'
mux.
1 j
1 1
H
\ I 'V
\ \ V
14
RC
- \
V 1
1-00
)S
/ /
, « .
A \.
"~~~-
1
l ^ v
/ ^
- -
\ .
.^^
\ \
\
' -.
FOR c ;LL 2
15+00 16+00 17+00
S SECTION C
T WARNER
S. WOMACK
96439
5
• \
\
^
• - -
18+00
• ^
-^
~ ^
"^
- ^
19+00
1
s %
--
\ • ^
" • ~ ^
20+00
^ \
~~~- -
21+00
•
- -
B
\
—,
• ~ ^
22+00
•s ^ \
• ^
^ ^
23+00
—
1
•>v
- -
• ^
24+00
- ^
25+00
7
•
- ^
26+00
SOUTH UTAH VALLEY SOLID WASTE DISTRICT
BAYVIEW LANDFILL PERMIT APPLICATION
_
— -
~~—
/
/ /
27+00
/
p. '
1
^
\
/
/ /
V
28+00
V
A f
—\
\
29+00
\ \
\
8
^ \
30+00
CELL 2 TYPICAL CROSS SECTION
FILENAME
SCALE
OOC-e.DWG
H: r = 1 0 0 ' V: r = 1 0 '
FIGURE
8A

I
1 2
• l??*^
469"
/
'168'^
457n
4 R f i n
4 f i R n
•^R'^f^
4^2 "
k:. .^:-v-.. KR HDR EnQinMring. Inc. 5995 5 700 E SuiU 100 San Lakt City. OT 04107-2594
ISSUE
V .
1+
1
1
1
\
_V
00
DATE
/ /
/
~v \
2+
j
*fl 1 1
I
\
\
r
00
/
—.
\
' \ ,.L\
3+
3
^ '
__
I
\
\ >
00
r -^
V \
4+
, ^
\
00
cm
^ '
/
PROP FOR
5+
N
1
FfNAL
^
ISEO Ut CLL 2
00
0"
DESCRIPTION
y z '
ER GRA
6+
c
rf
> -
A
y
)E
00
RC
=0
• " " ^
; OF 1
y
7+
s ;
P PROJECT MANAGE
ARCHITEC
CM
MECHANICA
ELECTRICA
STRUCTURA
DESIGNE
DRAWN BY
PROJECT NUMBEf
4
-14 -O f
y y
J i ^
00
....-
/ '
8+
SE
—
A _ j
00
CT
01
• ^
^ _
' ' ^
—
9+O0
ION
R T WARNER
T
L S. WOMACK
L
L
L
D
! 96439
- - .
~-~-
\
10+00
D
^0
• ~ ^
4aj
- ^
^
5
^
11+00
ft!"
^.
— -
1
1
12+00
' v
- • . _ '
/
A A^H
\ \
V
\ \
/
>
/
/
13+00
1
\ \
/
/ /
i. \
- \ 1
14+00
\
\
15+00
6
' ~ .
16+00
1
^720
-if^qo
. \ 4fifin
V
i f i7n
-1660
4fifiO
4P'50
..... .. .. 1620
SOUTH UTAH VALLEY SOLID WASTE DISTRICT
BAYVIEW LANDFILL PERMIT APPLICATION
7 1 8
CELL 2 TYPICAL CROSS SECTION
0 1" 2" HLENAME
SCALE
ooc-a.DWG
NOT TO SCALE
FIGURE
8B

i

2 ' PROTECTIVE-SOIL COVER (SEE NOTE
UPPER GEOTEXTILE (TYPE 2 ON BOTTOM) (TYPE 1 ON SIDES)
TEXTURED 6 0 MIL HDPE GEOMEMBRANE
2 ' PROTECTIVE SOIL COVER
UPPER GEOTEXTILE HIGH STRENGTH WOVEN (TYPE 1)
TEXTURED 6 0 MIL HDPE GEOMEMBRANE
HDPE LINER LIMIT
2 ' 3 ' ^ 10 '
COMPACTED NATIVE SOIL
8 '
GEOSYNTHETIC CLAY LINER
LOWER GEOTEXTILE (TYPE 2 )
SUBGRADE
TYPICAL LANDFILL LINER DETAIL NOT TO SCALE
LOWER GEOTEXTILE (TYPE 2 )
GEOSYNTHETIC CLAY LINER
INTERMEDIATE COVER
WASTE
UPPER GEOTEXTILE
ANCHOR TRENCH COMPACTED BACKFILL-(TYPE 2 GEOTEXTILE/ GCL/HDPE)
NOTE:
. AREA BETWEEN TOP OF EXCAVATION AND BACK OF ANCHOR TRENCH TO BE GRADED SMOOTH AND EVEN PRIOR TO PLACING UPPER GEOTEXTILE. REMOVE ANGULAR STONES.
L INER S Y S T E M A N C H O R T R E N C H
NOT TO SCALE
TEXTURED 6 0 MIL HDPE GEOMEMBRANE
TEXTURED 6 0 MIL HDPE GEOMEMBRANE
INTERMEDIATE COVER
NEW LEACHATE COLLECTION TRENCH
UPPER GEOTEXTILE (TYPE 1)
2 ' PROTECTIVE-SOIL COVER
TYPE 1 GEOTEXTILE
5 '
2 ' MIN. PROTECTIVE SOIL COVER
STAGE 2 EASTERN LINER TERMINATION NOT TO SCALE
TYPE 2 GEOTEXTILE (OVERLAP TYPE 1 GEOTEXTILE AND SEW TOGETHER)
-TEXTURED 6 0 MIL HDPE GEOMEMBRANE
GEOSYNTHETIC CLAY LINER
LOWER GEOTEXTILE (TYPE 2 )
LINER AT SLOPE TRANSITION NOT TO SCALE
NOTE: THICKNESS MEASURED PERPENDICULAR TO EXCAVATION SURFACE.
NOT ii ' ^ i i i '^'y».'gi<w' I ..lic^ ^ ^ON • . ~ \
•.~^
4:
LOWER GEOTEXTILE
STAGE 1/STAGE 2 LINER CONNECTION NOT TO SCALE
NOTES:
1. TEMPORARY STORMWATER INTERCEPTOR BERM TO BE PLACED IN FRONT OF WORKING AREA TO DIVERT STORMWATER AWAY FROM ACTIVE FACE. OWNER WILL RELOCATE AS NEEDED.
2. STAGE 2 GEOMEMBRANE TO BE WELDED TO STAGE 1. FUTURE GEOSYNTHETIC COMPONENTS TO BE OVERLAPPED AND SECURED.
3. TYPE I GEOTEXTILE IS REINFORCED AND REQUIRED ON SIDE SLOPES ONLY, ABOVE HDPE LINER. TYPE 2 GEOTEXTILE IS NON-REINFORCED (NON-WOVEN) AND IS TO BE USED ABOVE HDPE LINER ON BOTTOM AND BETWEEN SUBGRADE AND GCL A SAND CUSHION MAY BE USED IN LIEU OF THE LOWER TYPE 2 GEOTEXTILE WITH PRIOR APPROVAL OF ENGINEER AND OWNER.
4. SEE SPECIFICATION 0 2 2 4 0 FOR PROTECTIVE COVER MATERIAL REQUIREMENTS.
GEOTEXULE SCHEDULE | LOCATION
AU_
LOWER GEOTEXTILE
UPPER GEOTEXULE
ON SIDESLOPES
UPPER GEOTEXULE ON BOTTOM
(FLOOR)
TTPE
ALL
2
1
2
COMMENTS
REMOVE ALL ANGULAR STONES GREATER THAN Q5 INCHES USE 16 OZ/SY NON-WOVEN IF ROUNDED STONES GREATER THAN 25INCHESARE REMOVED. USE 20 OZ/SY NON-WOVENIFONLY ROUNDED STONES GREATER THAN 4INCHES ARE REMOVED. NO HORIZONTAL SEAMS ON SIDESLOPES.
REINFORCED GEOTEXTILE. NO HORIZONTAL SEAMS ON SIDESLOPES.
USE 12 OZ/SY NON-WOVEN BENEATH DUNE SAND (PROTECTIVE SOIL COVER)
KK HDR Engin««ring, Inc. 3995 S 700 E Suit* 100 Salt Lak» City. UT 84107-2594-
PROJECT MANAGER
PROJECT NUMBER
SOUTH UTAH VALLEY SOLID WASTE DISTRICT
BAYVIEW LANDFILL PERMIT APPLICATION
LINER DETAILS
RGURE 10.DWG
N/A 10

?" HOLES AT 6" C/C
SECTION A~A
8" DIA. PERFORATED LEACHATE COLLECTION PIPE ^
NOT TO SCALE
8 OZ.GEOTEXTILE (1' MIN. SEWN OVERLAP)
DRAINAGE AGGREGATE (1x10⁻² CM/SEC)
2' PROTECTIVE SOIL COVER (SEE GENERAL NOTE 3)
SMOOTH 60 MIL HDPE GEOMEMBRANE
NOT TO SCALE
• <« O 10' E.W.
LEACHATE SUMP ACCESS STRUCTURE- SECTION rT\
NOT TO SCALE
rONCRFTF NOTTS-
1. ALL CONCRETE SHALL HAVE •OOOPSI COMPRESSIVE STRENGTH O 23 DAYS. NORMAL WEIGHT
2. ALL CONCRETE SHALL BE IN ACCORDANCE WITH THE 'BUILDING CODE REQUIREMENT FOR REINFORCED CONCRETE" ACI-318 LATEST EDITION.
3. REINFORCING BARS SHALL CONFORM TO SPECIFICATIONS FOR "DEFORMED BILLET-STEEL FOR CONCRETE REINFORCEMENr WITH 60KSI YIELD STRENGTH: ASTM A615 GRADE 60.
•. REINFORCING BARS TO BE WELDED SHALL COMPLY WITH THE REOUIREMENT OF ASTM A706 GRADE 60.
5. COVER ON ALL REINFORCEMENT SHALL BE AS FOLLOWS. UNLESS OTHERMSE NOTED:
I CONCRETE PLACED AGAINST GROUND 3 IN II EXPOSED FORMED SURFACES
A. f 5 AND SMALLER 1.5 IN B. |6 AND LARGER 2 IN
6. ALL EXPOSED CORNERS SHALL HAVE 1 IN CHAMFER. UNLESS OTHERWISE NOTED.
7. SAWED GROOVES SHOULD BE MADE WITHIN APPROXIMATELY 4 TO 12 HOURS OF SLAB OR PAVEMENT FINISHING. IF THIS IS NOT PRACTICABLE, USE PREHOLDED STRIPS.
8. AS AN ALTERNATTlt, A PRECAST CONCRETE BOX MAY BE USED. THE PRECAST BOX SHOULD HAVE A MINIMUM CONCRETE COMPRESSIVE STRENGTH OF 5000 PSI O 28 DAYS.
18" DIA LEACHA'. SUMP COLLECTION RISER PIPE (HDPE)
_-v-\_
^ = l ' - 6 ' , MIN.
18" DIA. SUMP RISER PIPE / ^ NOT TO SCALE
ALL LAP SPLICES FOR #4 BAR
TYPICAL CORNER REINFORCING / T \ NOT TO SCALE
2" DIA. ELECTRICAL CONDUIT ACCESS
LEACHATE SUMP ACCESS STRUCTURE- PLAN
NOT TO SCALE
GENERAL NOTES: 1. LEACHATE RETURN LINE IS TO ALLOW
ANY SPILLAGE OR RAINWATER ACCUMULATION IN SUMP ACCESS STRUCTURE TO RETURN TO LANDFILL SUMP FOR REMOVAL. GROUT BOTTOM OF STRUCTURE TO VALVE AFTER INSTALUT10N, IF NECESSARY.
2. GROUT BOTTOM TO DRAIN TO RETURN UNE
3. SEE SPECIFICATION SECTION 02240 FOR PROTECTIVE SOIL COVER REQUIREMENTS.
- 6 " OIA. NOMINAL EXTRA STRONG STEEL (YIELD Fy-35 KS) PIPE BOLLARD W/CONCRETE FILL, PLACE 3 - 0 " DEEP IN r - 6 " DIA. CONCRETE BASE.
-HNAL GRADE
TYPICAL BOLLARD NOT TO SCALE
8" DIA. LEACHATE COLLECTION PIPE CLEANOUT RISER (HDPE) PREFABRICATED
HDPE END CAP
LEACHATE SUMP ACCESS STRUCTURE WAa OR PIPE SADDLE
8" DIAMETER CLEANOUT RISER PIPE END CAP/11 NOT TO SCALE | c 5
f4 O 10' E.W.
PUMP WIRING J-BOX
NOT FOR CONSTRUCTION NOTE: THIS AREA IS CORROSIVE. NOT TO SCALE
HDR Enflin»«rin9. inc. 3995 S 700 £ SuiU 100 Salt Loiie City. UT 8*107-2594
PROJECT MANAGER
PROJECT NUMBER
SOUTH UTAH VALLEY SOLID WASTE DISTRICT
BAYVIEW LANDFILL PERMIT APPLICATION
CELL 2 LEACHATE COLLECTION SYSTEM AND LINER DETAILS
RGURE 11.DWG
N/A 11

SMOOTH 6 0 MIL HDPE -GEOMEMBRANE
UMIT OF TEXTURED 6 0 MIL HDPE GEOMEMBRANE
4 5 " (TYP)
3 / 8 " DIA HOLES
18" DIA. PERFORATED END CAP NOT TO SCALE
- T O 1 0 " LEACHATE DRAIN UNE
2' MIN. COVER OVtR PIPES
- O O J
O W O C! '-
vJz-3 / 8 " DIA HOLES
18"
(TYP)
DIA. PERFORATED LEACHATE SUMP COLLECTION PIPE
NOT TO SCALE
DIA SOLID WALL LEACHATE COLLECTION CLEANOUT RISER PIPE
DIA SOLID WALL LEACHATE SUMP COLLECTION RISER PIPE
LEACHATE SUMP RISER- SECTION / 6 NOT TO SCALE
LEACHATE SUMP- PLAN/ i NOT TO SCALE
-GEONET/GEOTEXTILE DRAINAGE COMPOSITE
•wmm0^
C10.J.SU|4g.^C0LLECTI0N PIPE
( • • • " " • - ^ ^ ' • ' • y 4
PROPOSED 1 0 " LEACHATE DRAIN UNE
KR HOR Engin«ring, hic. 3993 S 700 E Suit! 100 Salt Lakt City. UT 84107-2594
NQTFORRnwSTRlOOM
PROJECT NUMBER
SOUTH UTAH VALLEY SOLID WASTE DISTRICT
BAYVIEW LANDFILL PERMIT APPLICATION
CELL 2 LEACHATE COLLECTION SYSTEM, SUMP PLAN, AND SECTION DETAILS
nOURE 12.DWG
N/A 12

i UNPAVED AREA
FOUNDATION SEE SPECinCATIONS FOR REQUIREMENTS-
m^mm.
MINIMUM WIDTH = GREATER OF B c + 1 6 " OR B c ' 1 . 2 5 + 1 2 "
- P I P E SPRINGUNE
- P I P E INVERT
• HDPE PIPE FOR LEAK DETECTION
UV RESISTANT 60 MIL HDPE UNER (TEXTURED ON SIDESLOPES)
_ 6 0 MIL HDPE UNER (TEXTURED ON SIDESLOPES)
COMPACTED SUBGRADE OR ENGINEERED FILL'
( 9 5 ) ! STD. PROCTOR) ^ 1 6 O Z / S Y NON-WOVEN
_ PERFORATED GEOTEXTILE HDPE PIPE
NOTES;
1 . Bc-OUTSIDE DIAMETER OF PIPE.
2 . NOT APPUCABLE TO TRENCH SECTIONS WITH NORMAL GROUNDWATER LEVELS ABOVE THE PIPE CROWN.
3. SEE SPECIFICATIONS FOR MATERIAL AND COMPACTION REOUIREMENTS.
PROPOSED LEACHATE POND TYPICAL SECTION f ^ ^ NOT TO SCALE C l l
PIPE TYPICAL TRENCH SECTION NOT TO SCALE
J : ' y j-r->^-
v s i v ; ? i" :-^; :• : :• :-• : . - ; \ - A )
^ • • • - , : • • ; v.-KR HDR EnsinMrIng, Inc. 3993 S 700 E 5uit« 100 Salt Laha Ci^. IT* 84107-2394
NOT FOR CONSTRUCTION
DESCRIPTION
PROJECT MANAGER
PROJECT NUMBER
SOUTH UTAH VALLEY SOLID WASTE DISTRICT
BAYVIEW LANDFILL PERMIT APPLICATION
CELL 2 LEACHATE COLLECTION SYSTEM DETAILS
FIGURE 13 . DWG
N/A 13

APPENDIX A
Cell 2 Master Plan
SUVSWD Bayview Class I Landfill Permit Application

Appendix A: Bayview Landfill Cell 2 Master Plan
SUVSWD Bayview Class I Landfill Permit Application
Prepared for Bayview Landfill
South Utah Valley Solid Waste District SpringviUe, Utah
Prepared by HDR Engineering, Inc.
3995 South 700 East, Suite 100 Salt Lake City, UT 84107
March 2009

Contents
Contents
1.0 INTRODUCTION 2
2.0 DESIGN CONSIDERATIONS 3
2.1 LandfiU Development 3 2.1.1 Stage 2 Volume Increase and Operating Life Estimates 3
3.0 CONCLUSION 5
Attachments
A-1: Figures
A-2: Volume and Operating Life Calculations
March 2009 SUVSWD Bayview Class I Landfill Permit Application

Cell 2 Master Plan
1.0 introduction
The South Utah Valley Solid Waste District (SUVSWD) was formed in 1989 to
own and operate solid waste facilities for the cities of Provo, Salem, Spanish
Fork, SpringviUe and Mapleton, Utah. It assumed the existing and previously
permitted landfill operations from the City of Provo. These solid waste facilities
include a transfer station located in SpringviUe and a landfill located north of
Elberta. An additional transfer station owned and operated by the City of Goshen
also provides waste to the Baiyview Landfill. A vicinity map showing the site is
included as Figure 1 in Part 4 ofthe Bayview Landfill Permit Application.
Two Landfill Master Plans have been previously prepared for the Bayview
Landfill, the Landfill Master Plan (HDR, 1988), which provided an overview and
outlined the sequential development ofthe site; and the Master Plan Update
(HDR, 2002), which evaluated several scenarios for optimizing the development
of landfill Cells 2 and 3, and ultimately combined the cells into one revised Cell
2. These plans are available from the SUVSWD and were included in previous
submittals ofthe Landflll Pennit Application. This master plan covers only those
changes since the previous Master Plan Update (HDR, 2002). Further details can
be found in the previous master plans and in the 2009 Permit Application.
Current in-place Tonnages as of January 2009
Cell - Stage
CelM
Cell 2 - Stage 1
Cell 2 - Stage 2
Total
TonsofWaste^
1,800,000
1,000,000
NA
2,800,000
Status
Pending Closure
Currently Operating
Excavation Ongoing
^Assumes an In-place density of 1,500 Ibs/cy
SUVSWD Bayview Class I Landfill Permit Application March 2009

Cell 2 Master Plan
2.0 Design Considerations
This Cell 2 Master Plan provides information on the status of Stage 1 of Cell 2
and further revises the design ofthe remaining Cell 2 stages. Design
modifications described in this Cell 2 Master Plan include (Attachment A):
• Revising the base grade of Cell 2 - Stage 2 so that the west two-thirds is
graded at 2% down to the northeast, and the east third is graded at 2%
down to the southeast;
• Adding a second leachate collection sump and drain line for the eastem
portion of Cell 2 - Stage 2;
• Design of a new leachate collection pond to be solely dedicated to
leachate and contact stormwater from Cells 1 and 2;
• Final contours ofthe interim closure of Stage 1, and the anticipated final
contours of Cell 2 upon closure;
2.1 Landfill Development
Incorporating the above design modifications, the landfill development schedule
has been revised. The following assumptions were used to estimate the volume
and operating life of each Cell 2 stage:
• In-place waste density: 1,500 Ibs/cy;
• In-place waste to daily cover soil ratio: 4:1;
• Waste tormage annual increase: 3%;
2.1.1 Stage 2 Volume Increase and Operating Life Estimates
Removing the ititercell berm between Stages 1 and 2 and revising the base grade
of Stage 2 results in a Cell 2 total volume of 8,460,000 cubic yards, and a
remaining operating life of 24 years. At the current waste acceptance rate of
140,000 tons per year, plus a 3% annual increase. Cell 2 is projected to reach
final contours by 2032.
Development Schedule
Cell 2 - Stage 1 is expected to reach capacity by the end of 2009, at which time
Cell 2 - Stage 2 will begin receiving waste. Excavation has already begun in Cell
2 - Stage 2. Excavation in Stage 2 is expected to be completed by September,
2009. The useful life of Stage 2 will last until 2019, at which time Stage 3 will
March 2009 SUVSWD Bayview Class I Landfill Permit Application

Cell 2 Master Plan
begin receiving waste. Excavation will begin on Stage 3 during 2017 to
simultaneously excavate waste capacity and provide daily and intermediate cover
material for Stage 2. Excess soil will be stockpiled and used for daily and
intermediate cover material. Stage 3 is estimated to operate for 6 years beyond
the life of Stage 2. Stage 4 will be excavated to provide cover material while
Stage 3 is receiving waste. Using the above assumptions ofwaste acceptance
rates and waste density. Stage 4 will begin receiving waste in 2024 and will have
an operating life of 9 years, or a total operating life of Cell 2 through the year
2032.
SUVSWD Bayview Class I Landfill Permit Application March 2009

Ceil 2 Master Plan
3.0 Conclusion
The design specifications included in this document and attachments replace and
supersede portions ofthe 1988 Master Plan (HDR) and 2002 Master Plan Update
(HDR). These modifications have or will provide the SUVSWD a more cost
effective and time efficient means of operating Landfill Cell 2. The design
specifications contained herein result in a net cost savings and life-span increase
for the Bayview Landfill. Incorporating these specifications will result in a useful
life of Cell 2 through approximately the year 2032.
March 2009 SUVSWD Bayview Class I Landfill Permit Application

Cell 2 Master Plan
ATTACHMENT A-1
Figures
SUVSWD Bayview Class I Landfill Permit Application March 2009

—
1+
1
1
— ^
00
V H / r7 V /
/
i \
\
2+
/
/
\
\ \
00
t f
y \
\ r V
3+
1
\
\
00
\
\
4+
^
\
\ -\
00
. ^ ^
5+
2
I—
00
—
j
6+
KR 3993 5 700 C Su'ta 100 Salt IjJta CHy. UT B4107-2S9+
^ ,
V .
- ^
30
^
~~\
7-^
ISSUE
1
^
00
~ >
V
- ^
8+
DATE
" ^
- ^
^ . ^
00
~^ -V
A
9+
"^
\ " - N
00
^
/ " ^
101
- '
^
00
^ ^
~ '
t w
r~
00
1
\ ^
y '
-
12H
F
DESCRIF=T10N
s
CEU
EXIS
L /'
-00
t^ 2 RHIL COVEF
NG GROUND Sl
UH
\ \
00
c ROJECT MANAGER
ARCHirca
CML
MECHANICAL
ELECTRICAL
STRUCTURAL
DESIGNED
DRAWN BY
PROJECT NUMBER
4
RFACE
/
/
_/
H
\ V
1 4 1
RC
^ \
v /
^
00
^ S f
/ ~ /
t5-(
3
r. WARNER
3. WOMACK
96439
- ^
A \ .
^ ^
00
SE
1
h .
i ~ ~
_EB0P! roS c
164
Cl
• - - -
^ ^
:u . 2
00
"10
\ . i
\ \ \ \
SRJiBS
171
N
\
\
E
00
c
5
- V
s
\ " - -
16+00
^
• ^
1 19+00
_
s N
^ .
" - i ! .
20+00
^
r ^
\
21+00
•v
6
• ^
—.
-~^
22+00
^ "s
—- .
^
\
^
23+00
1
~>-
- -
24+00
- —
1 \
25+00
^ ^
7
1 \
~
26+00
SOUTH UTAH VALLEY SOUD WASTE DISTRICT
BAYVIEW LANDFILL PERMIT APPLICATION
— -
^ ^
^
- -
27+00
/ Jl i.
1
1
V
/
/
/
V
28+00
V
\ >-
A /
—\
A
29+00
\ \
8
V
V. \
30+00
CELL 2 TYPICAL CROSS SECTION
0 RLENAME
SCALE
00C-8.DWG
H: 1"=100' V: r = 1 0 '
RGURE
A4

1 2
HDR Cnglnwrtng. he. 3999 S 700 E SuiU 100 Salt Laki City. UT 84107-
474
471 p
470
469
468
467
p
/ /
D .-
465
4640
4630
4620
4610
, ^
1 +
1
; / / V \ \
—
00
/ /
/ /
\ \
2+
*r7 7
\
\ \
r
00
^ 1
•
^
V \
• H \
3+
3
. -
• 1
V
\ \
^
00
-2594
ISSUE DATE
r - ^
\ ^
4+
. ""
\
00
CELL
,--'
/
PROP FOR
5+
1
RNAL
^ ..
^ -
SED Ul EU. 2
00
OTBF
---'
y
—
ER GW
6+
A
/ /
OE
00
^^
S OF I f
, y
7+
4
KUUNL -14-OB
^ /
< i ^
DO
/ "
8+
: \
;
00
^ _
^--.
9+00
- V
^
\
10+00
....
^
5
~s-
-\ •
11+00
CROSS SECTION D
DESCRIPTION
PROJECT MANAGE
ARCHITEC
CM
MECHANICA
ELECTRICA
STRUCTURAJ
DESIGNE
DRAWN BY
PROJECT NUMBEf
R T. WARNER
T
L S. WOMACK
L
L
L
D
! 96439
^ ^
^^
CZ/
^ >.
1
1
1
12+00
• s
r "
/
k /y„
V \
V
\
^J
1
/ / - -
13+00
1
\
\ \ i_B__
• "
/ /
/ / /
/
y i ' v
\ - \ / /
14+00
"A \ \ \
15+00
6
1 -- -
16+00
1
I 7 i n
•1700
V
4670
4640
4630
4620
4610
SOUTH UTAH VALLEY SOLID WASTE DISTRICT
BAYVIEW LANDFILL PERMIT APPLICATION
7 1 8
CELL 2 TYPICAL CROSS SECTION
0 1" £• RLENAME
SCAL£
OOC-B.DWG
NOT TO SCALE
FIQURE
A5

Cell 2 Master Plan
•
ATTACHMENT A-2
Volume and Operating Life Calculations
16 SUVSWD Bayview Class I Landfill Permit Application March 2009

Cell 2 Remaining Capacity Projected Waste Volumes
Yearly Tonnage
Total Volume
Remaining [CY]
Waste
140,649
8,460,000
4
Annual Increase
Site Area [ACRE]
Soil
3%
83.0
1
Waste Density [LB/CY]
Bottom Cover Depth [FT]
Soil Cap/Cover Depth [FT]
1,500
2
2.83
CALCULATIONS
Soil For Cover [CY] ' 582,682 Initial Airspace [CY] 7,877,318
SOIL BALANCE
Year (July 1-June
30) 2008 - 09 2009-10 2010-11 2011- 12 2012-13 2013 - 14 2014- 15 2015- 16 2016-17 2017- 18 2018-19 2019-20 2020 - 21 2021 - 22 2022 - 23 2023 - 24 2024 - 25 2025 - 26 2026 - 27 2027 - 28 2028 - 29 2029 - 30 2030 - 31 2031 - 32 2032 - 33
Yearly Tonnage 140,649 144,868 149,215 153,691 158,302 163,051 167,942 172,981 178,170 183,515 189,020 194,691 200,532 206,548 212,744 219,127 225.700 232,471 239,446 246,629 254,028 261,649 269,498 277,583 285,910
Cumulative Tonnage Received
140,649 285,517 434,732 588,423 746,725 909,775
1,077,718 1,250,698 1,428,868 1,612,383 1,801,404 1,996,095 2,196,627 2,403,174 2,615,919 2,835,045 3,060,746 3,293,217 3,532,662 3,779,291 4,033,319 4,294,968 4,564,466 4,842,049 5,127,959
Waste Volume
Received [CY]
187,532 193,158 198,953 204,921 211,069 217,401 223,923 230,641 237,560 244,687 252,027 259,588 267,376 275,397 283,659 292,169 300,934 309,962 319,261 328,838 338,704 348,865 359,331 370,111 381,214
Cumulative Waste Volume Received [CY]
187,532 380,690 579,643 784,564 995,633
1,213,034 1,436,957 1,667,598 1,905,157 2.149,844 2,401,872 2,661,460 2,928,835 3,204,233 3,487,892 3,780,060 4,080,994 4,390,956 4,710,217 5,039,055 5,377,759 5.726,623 6,085,954 6,456,065 6,837,279
Daily Soil Cover Volume Required [CY]
37,506 38,632 39,791 40,984 42.214 43,480 44,785 46,128 47,512 48,937 50,405 51,918 53,475 55,079 56,732 58,434 60,187 61,992 63,852 65,768 67,741 69,773 71,866 74,022 76,243
Cumulative Daily Soil
Cover Required [CY]
37,506 76,138
115,929 156,913 199,127 242,607 287,391 333,520 381,031 429,969 480,374 532,292 585,767 640,847 697,578 756,012 816,199 878,191 942,043
1,007,811 1,075,552 1,145,325 1,217,191 1,291,213 1,367,456
Airspace Consumed [CY]
225,038 231,790 238,743 245,906 253,283 260,881 268,708 276,769 285,072 293,624 302,433 311,506 320,851 330,476 340,391 350,602 361,121 371,954 383,113 394,606 406,444 418,638 431,197 444,133 457,457
Cumulative Airspace
Consumed [CY] 225,038 456,828 695,571 941,477
1,194,759 1,455,641 1,724,348 2,001,117 2,286,189 2,579,813 2,882,246 3,193,752 3,514,603 3,845,079 4,185,470 4,536,072 4,897,193 5,269,147 5,652,260 6,046,866 6,453,310 6,871,948 7,303,145 7,747,278 8,204,735
Remaining Airspace [CY]
7,652,279 7,420,490 7,181,747 6,935,841 6,682,558 6,421,677 6,152,970 5,876,201 5,591,129 5,297,505 4,995,072 4,683,566 4,362,715 4,032,239 3,691,848 3,341,245 2,980,125 2,608,171 2,225,058 1,830,452 1,424,007 1,005,370
574,173 130,040
(327,417)
Remaining
Life ' [YR] 34.0 32.0 30.1 28.2 26.4 24.6 22.9 21.2 19.6 : 18.0 16.5 15.0 13.6 12.2 10.8 9.5 8.3 7.0 5.8 4.6 3 5 2.4 1.3 0.3 -0.7
CONSTRUCTION SCHEDULE
Stage Stage 2 Stage 3 Stage 4
Airspace Available [CY] 2,650,000 1,870,000 3,357,318
Cumulative Airspace Available [CY]
2,650,000 4,520,000 7,877,318
Construction Start 2009 2017 2022
Year Airspace Consumed ^^ 2018-2019 2023-2024 2032-2033
Notes: 1 .Soil for bottom cover of Cell 2 Stage 1 not included because the stage has already been constructed. 2. Year airspace consumed taken from Soil Balance table, above. 3. Remaining life estimate is based on the projected annual waste accepted in the year represented in each row.
SOUTH UTAH VALLEY SOLID WASTE DISTRICT Bayview Landflll Cell #2 Capaciiy
HDR Engineering, Inc.
January 2009

Appendix B

APPENDIX B
Special Use Lease Agreement
SUVSWD Bayview Class I Landfill Permit Application

•:-t:-•-:•. 3 5 9 ; . W e ^ C e n t e r - S t r e e t ; ' : . . ry^.-.::i^^V-iM^^^^m^>^!^S^
/v;.^retai^b6ffc'COirtes.t6. t h f e c g e a § ^ ^ p | | j j e ^ ^
^ .- i .- i . . ,>-..7-
.>;:^-^i:^vi^ . V • • • • - . ' W ^ ^ ^
' . . . - • • • ; . . ., - ... . " i ^ j i ' - V i i ' S '
^ ^ ' - V - . - . - - . •.--••-.v-.v;...•. •• • • • ^ ^ • ; v ^ J ' • • • > • • ' • i:-,:;'-;!i= •••••; • - ' • • ' • - ? ' • - ? i - s i ' [ t : T - - ^ &§??;; ; ; • . ; :>: ; • . • . . • • ' • - - ; , • • . . :v . ' i ^ ' l c i - ^ ' - ^ : - : ? ? ^ ^ ••••• : 'Aii?5^%?>??S;
* % . " • - " ' • * ^ - ' ^ ' * - - • • " • ^ • ' ' • ' • • • • •
•.: .;-i"i..«'J

SPECIAL USE LEASE AGREEMENT NO. 498
School Fund
The STATE OF UTAH, act ing by and through the DIVISION OF STATE LANDS, LESSOR, hereby leases to Provo C i t y Corporat ion, LESSEE, 359 West Center St reet , Provo, Utah 84601, the fo l low ing described t rac t of State land in Utah County, Utah , t o - w i t :
Parcel "A":
Township 9 South. Range 1 West. SLB&M Section 17: SWJsNWJj
Containing 40 acres, more or less .
•
Parcel " B " :
Township 9 South. Range 1 West. SLB&H Section 17: That portion of the section ot described by Parcel "A*.
Containing 600 acres, more or less.
TO HAVE AND TO HOLD for a term of 51 years, beginning as of January 1, 1984, subject to any and all existing valid rights in said land and subject also to the following terms and conditions. LESSOR and LESSEE enter into this Special Use Lease Agreement for the purpose that LESSEE develop the land in the manner hereinafter described and consistent with the principles and objectives of land development expressed and Implicit in the Enabling Act of Utah (Act of July 16. 1894, Ch. 138, 28 Stat. 107) and Article X of the Constitution of the State of Utah.
1. The subject tract shall be used by LESSEE for the purpose of constructing and maintaining a sanitary landfill. Including all improvements reasonably associated therewith. All improvements constructed on the subject tract shall comply with the applicable provisions of the Uniform Building Code, Current Edition, International Conference of Building Officials.
2. LESSEE shall pay, to the LESSOR as rental, for the subject tract, the sum of $1,000.00 per year until LESSEE commences construction of the sanitary landfill on the subject property, after which the annual rate shall be $40.00 per acre per annum for that portion of the subject property which is currently being used as the sanitary landfill proper (Parcel A ) . The sanitary landfill proper is that portion of the subject tract enclosed by a fence and which is used for sanitary landfill purposes. The fee for that portion of the subject property which is not currently being used as the sanitary landfill proper is $10.00 per acre per annum (Parcel B ) . The annual lease fee, based on th above rates is $7600.00 per annum. LESSOR acknowledges the receipt of $1,020.00 which is payment of this rental for the year January 1, 1984 through December 31, 1984 plus the $20.00

SULA NO. 498 Page No. 2
application fee. Should construction on the sanitary landfill conmence during the 1984 rental year, or any other subsequent rental year, the lease rates will be prorated according to the rates as outlined above. Failure to pay the rental for a period of one month from the date such rent Is due shall work a forfeiture of the lease upon expiration of thirty (30) days written notice by LESSOR to LESSEE, requiring perfonnance, if payment shall not be made within said thirty (30) day period.
3. LESSEE agrees that LESSOR shall have the right to^adjust the annual rentals as provided for in Paragraph 2 at the end of each five (5) year period as LESSOR shall deem to be reasonably necessary in the best interest of the State.
tESSEE also agrees that at the end of five (5) years from the date of this lease, and, if necessary, for each two (2) year period thereafter, LESSEE has not developed the land as proposed In Paragraph (1), LESSEE shall then be required to appear before the Board of State Lands and show that It has exercised due diligence toward development of the land. If LESSEE falls to show due diligence, then LESSEE agrees that LESSOR mi^ at its option, terminate this Tease agreement as to any or all the land leased hereunder. In the event LESSOR so terminates, LESSEE 's Interest In the land shall revert to*, the State.
4. LESSEE, in exercising the privileges granted by this lease, shall comply with the provisions of all valid Federal, State, County, and Municipal laws, ordinances, and regulations which are applicable to the subject tract and operations covered by this lease.
5. LESSEE shall take reasonable precautions to protect, in place, all public land survey monuments and private property corners.
6. LESSEE shall be bound by all of the provisions, conditions, and prohibitions of Chapter 14 of Title 73, Utah Code Annotated (1953) as amended. No waste or by-products shall be discharged which contain any substance in concentrations which will result In substantial harm to fish and wildlife, or to human water supplies. Storage facilites for materials capable of causing water pollution, if accidentally discharged, shall be located so as to prevent any spillage into waters, or channels leading Into water, that would result In substantial harm to fish and wildlife or to human water supplies.
7. LESSEE agrees to permit LESSOR free and unrestricted access to and upon the subject tract at all reasonable times for all lawful and proper purposes not inconsistent with the intent of this lease or with the reasonable exercise and enjoyment by the LESSEE of the rights and privileges granted herein.

SULA NO. 498 Page 3
8. It Is hereby understood and agreed that all treasure-trove and all articles of antiquity In or upon the subject lands are and shall remain the property of the State of Utah. LESSEE shall report any discovery of a "site* or "Specimen" to the Division of State History In compliance with the provisions of Section 63-18-27, Utah Code Annotated (1953), as amended.
9. LESSEE may relinquish or surrender this lease at any time during the term.hereof by giving LESSOR one year's advance written notice, and by paying all rentals due to the effective date of such relinquishment or surrender; provided, all accounts are In good standing and all terms and conditions have been perfonned.by LESSEE. The relinquishment or surrender shall become effective upon written acceptance thereof by LESSOR.
10. This lease may be terminated by LESSOR upon breach of any conditions hereof. If LESSOR determines that the LESSEE, its assigns o r successors In interest have breached any conditions of this lease, LESSOR shall notify the breaching party (parties) In writing by certified mall, retum receipt requested, specifying the particular breach. The breaching party (parties) shall have thirty (30) days from the date of such notice, or such longer period as may reasonably be required under the cfrcunstances, to correct such breach. If breaching party (parties) fails (fall) to correct such breach within such period, LESSOR may terminate this lease upon thirty (30) days notice; provided, however, such termination shall not release breaching party (parties) from liability for damage prior to such termination.
11. This lease is made pursuant to the provisions of all applicable laws and subject to the rules and regulations of the departments and agencies of the State of Utah presently In effect and to such laws, rules and regulations as may be hereafter promulgated by the State.
12. It is understood that the LESSEE will use the subject lands as a sanitary landfill and consistent with such a use, the LESSEE shal maintain the subject lands in a reasonable state of repair, orderliness, neatness, sanitation and safety. In no event shall the condition of the subject lands be less than that required by law and applicable regulations.
13. LESSEE shall have the right to remove any improvements and any personal property placed on the lands by LESSEE, provided that the same shall be removed within sixty (60) days after the expiration of the term of this lease, provided that the LESSEE shall properly restore any damage caused thereby to the subject tract or any Improvements remaining thereon; provided further, that LESSOR shall have the option to retain without compensation to LESSEE any and all underground pipes or facilities for water and sewer now on the premises or subsequently Installed thereon by LESSEE.
14. LESSEE assumes liability for and agrees to indemnify LESSOR for and against any and all liability (including attorney's fees) of any nature imposed upon, incurred by, or asserted against LESSOR which in any way relates to or arises out of the activity or presence upon the premises of LESSEE, its servants, employees, agents, sublessees, assignees or invitees.

SULA ND. 498 Page 4,
15. LESSEE shall not assign this lease. In whole or In part, nor sublease the leased premises, nor allofw unauthorized or commercial use of the premises without obtaining the prior written consent of LESSOR.
16. LESSOR expressly reserves the right to lease said lands to third parties for mineral exploration and/or development purposes together with the right to grant the mineral lessee reasonable access by Ingress and egress to and from the mineral estate through the surface estate In connection with mineral exploration and/or development, but without damage to Improvements made by LESSEE. Provided, however, that the rights reserved by this paragraph and any rights conveyed by the LESSOR to a mineral lessee shall In no event be inconsistent with the construction or maintenance of a sanitary landfill.
17. LESSOR claims title In fee simple, but does not warrant to LESSEE the validity of title to the leased premises. LESSEE shall have no claim from damages or refund against the LESSOR for any claimed failure or deficiency of LESSOR'S title to said lands or for interference by any third party.
18. If LESSEE shall initiate or establish any water right on the leased premises, such right shall become an appurtenance of the leased premises. LESSEE agrees that any existing application to app rop r i a t e water on said Statr land shall be transferred to the Division of State Lands after the application has been completed, without any cost to the State. It is expressly understood and agreed that this lease does not confer any rights upon LESSEE to use any water presently developed on the subject lands.
19. LESSEE shall at all times observe reasonable precautions to prevent fire on the leased premises and shall comply with all applicable laws and regulations of any governmental ageiicy having Jurisdiction.' In the event of a fire on the leased premises proximately caused by LESSEE, Its servants, employees, agents, sublessees, assignees or licensees which necessitates suppression action by the State Forester, LESSEE agrees to reimburse LESSOR for the cost of such fire suppression action. «
20. LESSEE shall comply with any.and all valid sanitation and pollution regulations prescribed by any governmental agency having Jurisdiction; and the LESSEE agrees to indemnify LESSOR for any damage which LESSOR may suffer which arises out of the improper or unlawful disposal of refuse associated with said . land.
21. LESSEE may fence the leased premises at his own expense, but if there Is no fence erected, LESSEE shall have no right of action against any other State grazing permittee by reason of a trespass upon the leased premises.
22. In the event of any breach of this agreement, the party at fault shall pay all costs of enforcing the same, including reasonable attorney's fees.
#

SULA NO. 498 Page 5
23. Any hot Ice contemplated herein to be served upon LESSEE shall be in writ ing and shall be deemed suff ic ient I f deposited In the United States mal l , postage prepaid and cer t i f ied or registered, and addressed as fol lows:
Provo Ci ty Corporation 359 West Center Street Provo, Utah 84601
or at any such other address as LESSEE may from time to time designate by written notice to LESSOR.
24. The provisions hereof shall inure to and be binding upon the successors and assigns of LESSEE.
25. IN WITNESS WHEREOF, the Director of the Utah Division of State Lands has executed this instrument as of the day of ' 1983, by authority of a resolution of the Board of State Lands, dated January 20, 1982.
LESSOR: STATE OF UTAH DIVISION OF STATE LANDS 3100 State Office Building Salt Lake Ci ty , Utah 84114
' GENERALS OFRCS
By:
LESSEE:
By:
RALPH A. MILES, Director
STATE OF UTAH . ) : ss.
COUNTY OF SALT LAKE ) *
On the " day of , 1983, personally appeared before me Ralph A. Miles, who being by me duly sworn did say that he is the Director of the Division of State Lands of the State of Utah, and that said instrument was signed in behalf of.said Board by resolution of the Board, and said Ralph A. Miles acknowledged to me that said Board executed the same in behalf of the State of Utah.
m Given under my hand and seal this day of 1983.
Notary Public, residing at:
My Commission Expires:

' • : • SJUiiNO. 498 Page 6 .
: ss.
26.
STATE OF UTAH
COUNTY OF
On the me that he is the said executed the same.
Given under my hand and seal this 1983.
)
day of •
» 1983, personally appeared before ., who being by me duly sworn did say
of Provo City Corporation, and acknowledged to me that said City
day of
Notary Public, residing at:
My Commission Expires:
• v ^ ^
\'M-
1.

If V * i t > - r . - • mfP.. ..l-.: . . . , - . ; . 1 ; - . . • • » , • . • •;• .-iJZ.-.'.-^—r=^-:sit.^:s?t-Jfc^fe";^.s,Ij.3:r-. ,
, f - - . - . .....
-i ------— J . - — , - - - - - • •
JAtCNDjCNT
Tflb
- SPEClPL-\tSi^yiSl-'P^RE&&ff--H0^A9^-==T^
m
r^^hb^ W 7 m , ; r s c a k i ^ g t i ^ "r;, v^J".. ^S"'^'* :-i- ' ' ;
.... . , „ ^ ^ - „ „ ^ , . - . ^ j ^ _ , , ^ p o u ^ r t ^ t p e : j B I V I S I ^ FOf^EStRV, ;L^SSbg, and ?mSto teipp^^tiortivLESSEE, .-bgi*^ agree! to amend, i-t Special"(Jse | i l^e"AgreeBiert^:^^ ' ••"• ^ -v .''' - - . . r . :
The leased p ran i ses s h a l l ir icll ide, in add i t i on to Parcel "A" and Parcel "B.'':as desd^1bed:in SUlA' ^ ^ ^ "C" which i s a t r a c t of S t a t e land i n Utah County, Utah, t o - w i t ~" .1
irIowDShip 9.:Souths RaoqeiHWest. SLB&M .3Secti;on-18: S2SE4NE4 • .4cr4, .v-. . , , >
Jv^Ohtaining 20 acres v'T .V
•
1. Parcel "C" shall be used jay LESSEE .for the purpose of constructing and maintaining a water well and water tank to be used in conjuction with a sanitary landfill including irapro>^ments reasonably associated . All improv€njents constr-ucted^ion the siAiJect tract shall canply with the applicable prov15tioti? "of • the^ iJnif ora BuiId+ngj Code, C-urrent^Edtti ony'^-nternatl^nal-
•Conference of Building Officials^-j .
- ' ' Vi.-:;:^LESS^^at1 p^^ 'w^t lw sum of-5Yt)bd.iXJ-pB: yaari'imttl Ll landfill on the -subject property, pe* acre per-anhum.for that per tt being" used -as -the sanitary 1 andf proper is that portion of the subjj for sanitary landfill purposes... property which is not currently bi $10.00 per acre per annum (Parcel property which is used for the wa be $6.00.00 per; yesr...rThe ^nuat $8,200.00 per annun.
k^?SOR:;ias:,.Tental, for the subject tract the' f l commences construction of the sanitary • f ter which the annual rate shall be $40.00
of subject- property, which is currently proper (Parcel A). The sanitary landfill
ct tract enclosed by a fence which is used Ihe fee for that portion of the subject ng used as the sanitary landfill proper is ) . The fee for that portion of the subject
er well and water tank site (Parcel C) will ease fee, based on the..above rates 1s_

/
SULA NO. .4.98 Page 2
i t
• • • • • J
3. IN WITNESS WHEftEOF, the l>1rector of the Utah Div is ion of State Lands and Forestry has executed th i s insij-unent as of the /^"^^ day of " J / V J . . 198y, by authori ' ty of a resolut ion of the 3oard of State Lands, dated January 20, 1982. j
j LESSOR: STATE OF UTAH DIVISION OF STATE LANDS AMD.. FORESTRY-^-7- " ^^ • 3 Tr iad Center, Suite 400 355 west North Temple SaljLLake C i t y , Utah 84180
t ^
APPROVED AS TO FORM: UAUID L. WILKINSON AjVoRNEY bEN
BY: im/wJj
....\
m LESSEE: Provo C i t y Corporation
359 Wes t Center Provo C i t y , UT 84601
STATE- OF UTAH )
COUNTY OF SALT LAKE ) ss.
On the I H ' ' ^ day of \J)h/y/t/C64 198"^, personally appeared before me Ralph. A. .Miles,..who being by me|dulyvsworn did s^y that he 1.s..the..0i.re.c.tor of the Oivlsion-of State Lands aadjForestry of the State of Utah, and that said instrunent was signed In behajf of said Board by resolut ion of the Board, and said Ralph A. Miles acknowledged to me that said Board executed the same in behalf of the State of Utah. 1
biven under my hand and seal th is Jl/±. day of SJA*JUA<.CI . 19817. *=r
A73, 0. ' J 3 t ^
Public, residing ^ \ \ ^ . c - c . •
My Commission Expires: H - ^ ^ ' ^ ^

• 1
SOLA NO. 498 Page.3
i 1
-i ,4
4.
STATE OF OTAH'
X:0UNT.Y.DE.._.
O j C t h e - ^ 3 /
f i ^ i s thtf " _ <
v
me _ that said execu'tiC^he same
Given under my hand and seal th is . ^ / 1986.
, 1986, personally appeared before tX*.^ ^ , who beini^by me dub' sworn did say
cknowl edged to me t h a t ^ ^ i d company
day
• My Commission Expires;
Not(ary Bdbl ic, residing at :

Appendix C

APPENDIX C
Cost Break(down for Closure/Post-Closure
SUVSWD Bayview Class I Landfill Pernnit Application

Bayview Landfiii Closure Cost Estimate
Cell 2 - Stages 1 and 2 (2008 Dollars)
Cell #2 Stage 1 Cell #2 Stage 2 Total
20 23 43
Acres Acres Acres
1.00 1.01 1.02 1.03 1.04 1.05 1.06 1.07 1.08 1.09 1.10
item Engineering/Management Topo Survey Initial Topo Survey Final Site Reconnaissance Boundary Survey Construction Plans/Specs Bidding and Award Quality Control Testing Construction Management/QC Closure Report/As-Builts Obtain UPDES and other permits
Unit
HR HR HR HR
LUMP LUMP LUMP LUMP LUMP LUMP
Unit Cost
$140 $140 $140 $140
$55,000 $6,000
$20,000 $180,000
$25,000 $10,000
Quantity
95 80 55 40
Cost
$13,300 $11,200
$7,700 $5,600
$55,000 $6,000
$20,000 $180,000
$25,000 $10,000
Subtotal $333,800 Contingency 20% $66,760 Engineering Subtotal $400,560
2.00 2.01 2.02 2.03 2.04 2.05 2.06
2.07
Construction Grading Top of Intermediate Cover 34" On-site Fill Placement/Grading Silt Fence/Erosion Control Dust Control and Watering Drainage Ditches Temporary Drainage Control
Gas Collection System ' '
SY CY LF LS LF LS
ACRE
$1.25 $1.75 $2.50
$11,000.00 $3.00
$11,000.00
$15,000.00
208,120 196,558
5,500 1
5,500 1
0
$260,150 $343,977
$13,750 $11,000 $16,500 $11,000
$0 Subtotal $656,377 Contingency 20% $131,275 Construction Subtotal $787,652
Summary Engineering Construction Legal 5%
Total
$400,560 $787,652
$59,411 $1,247,622
Assumptions/Notes: 1. Estimate assumes closure of Cell #2 Stage 1 and 2. 2. Proposed pond will be constructed with Cell 2 Stage 2 and no additional improvements will
be necessary. 3. No permanent culverts or drainage piping is required. 4. Assumes cover is imported from an off-site source TBD. 5. Assumes topsoil is available onsite. 6. Active gas collection system not required at this time.
Appendix C 1/13/2009

Bayview Landfill Post-Closure Care Cost Estimate for
Cell 1 and Cell 2 - Stages 1 and 2 (2008 Dollars)
COST ESTIMATE FOR LANDFILL POST-CLOSURE CARE
1.0 1.1 1.2 1.3 1.4 2.0 3.0
• . • . • ; • • ; ' , - I t e m ; V
ENGINEERING Post Closure Plan Site Inspection & Recordkeeping (quarterly) Correctional Plans & Specs (annual) Site Monitoring (semi-annually) * '
MAINTENANCE COSTS LEACHATE DISPOSAL '"
Unit
LUMP PER YEAR PER YEAR PER YEAR PER YEAR
PER GALLON
IJnit Cost
$6,000 $2,500 $1,200
$17,000 $6,000
$0.05
Quantity
1 30 30 30 30
0 Subtotal
Contingency (20%) Total
Cost ;
$6,000 $75,000 $36,000
$510,000 $180,000
$0 $807,000 $161,400 $968,400
Closure Estimate (previous page)
Total Closure/Post Closure
$1,247,622
$2,216,022
Assumptions/Notes: 1. Includes groundwater monitoring and statistical analysis and gas sampling 2. Includes repairing eroded final cover material with on site material, compost and seed
Appendix C 1/13/2009

STATEMENT OF ACCOUNT
/ PTIF UTAH PUBLIC TREASURERvS' INVESTMENT FUND
Edward T. Alter, Utah State Treasurer, Fund Manager POBox 142315
S-SO N State Street, Suite 180 Salt Lake City, Utah 84114-2315
Local Call (801) 538-1042 Toll Free (800) 395-7665 www.treasurer.utah.gov
ESC-SO UT VALL SOLID WASTE GEORGE STEWART PO BOX 507 SPRINGVILLE, UT 84663-0507
Account Account Period 254
Summary Beginning Balance Deposits
^Withdrawals ^Plding Balance
Date Activity
10/01/2008 FORWARD BALANCE
10/31/2008 REINVESTMENT
10/31/2008 ENDING BALANCE
October 01, 2008 through
$2,971,839.48 Average Daily Balance $ 7,309.17 Interest Earned
$ 0.00 360 Day Rate $ 2.979,148.65 365 Day Rate
Deposits
$ 0.00
$ 7,309.17
$0.00
.Withdrawals
$0.00
$0.00
$0.00
October 31, 2008
$ 2,971,839.48 $ 7,309.17
2.8562 2.8958
Balance
$ 2,971,839.48
$ 2,979,148.65
$ 2,979,148.65
Pa pp. 1 nf /

Appendix D

APPENDIX D
Engineering Drawing and Specifications
NOT FOR GONSTRUCTION SUVSWD Bayview Class I Landfill
Permit Application

APPENDIX D - ENGINEERING DRAWINGS
The following conceptual engineering drawings are for reference only and are
not intended for construction.
Final engineering drawings and specifications will be inserted here upon completion.

\ : ^
/ A \ —
V n
'A s p
K -
C1
CELL 2 STAGE 2 30% GRADING PLAN
MARGH 4, 2009
I
DRAWING SCHEDULE
1 COVER SHEET
2 GENERAL NOTES, SYMBOLS &L ABBREVIATIONS
3 EXISTING CONTOURS & SITE PLAN
4 CELL 2 STAGE 2 EXCAVATION PLAN
5 CELL 2 STAGE 2 WASTE PILL CONTOURS
6 PINAL COVER PLAN
7 LINER DETAILS
8 LEACHATE COLLECTION PLAN AND PROFILE
9 LEACHATE COLLECTION SYSTEM DETAILS
10 LEACHATE COLLECTION SYSTEM DETAILS
11 TYPICAL CROSS SECTIONS
12 TYPICAL CROSS SECTIONS
13 TYPICAL CROSS SECTIONS
14 LEACHATE POND GRADING PLAN
15 LEACHATE POND DETAILS
KR HDR Enginiiring. Inc. :iB05 S 700 E Suits 100 Salt Laki aty. UT 04107-2594
ISSUE DATE DESCRIPTION
PROJECT MANAGER
ARCHITECT
CML
MECHANICAL
ELECTRICAL
STRUCTURAL
DESIGNED
DRAWN BY
PROJECT NUMBER
T. WARNER
S. WOMACK
C. MCCARTY
C. MCCARTY
96439
NOT FOR CONSTRUCTION
SOUTH UTAH VALLEY SOLID WASTE DISTRICT
BAYVIEW U\NDFILL CELL 2 STAGE 2
30% GRADING PL^N
COVER SHEET
0 r 2- HLENAME
SCALE
OOC-Ol.DWG
N/A
SHEET
01 OF 15

GENERAL NOTES STANDARD ABBREVIATIONS
>
1. COORDINATE SYSTEM IS BASED ON LOCAL SURVEY. THE BENCHMARK TO BE USED FOR CONSTRUCTION IS LOCATED AS SHOWN ON DRAWING NO. C3. EXISTING CONTOURS ARE BASED ON AERIAL SURVEY FLOWN NOVEMBER U , 2008, BY OLYMPUS AERIALS INC. SALT LAKE CITY, UTAH. CURRENT GROUND ELEVATIONS MAY VARY FROM THOSE SHOWN DUE TO SITE WORK THAT HAS BEEN PERFORMED SINCE THE AERIAL WAS FLOWN.
2. THE CONTRACTOR SHALL VERIFY EXISTING CONTOURS PRIOR TO THE START OF EARTHWORK.
3. GROUNDWATER AT THE SITE MAY VARY DEPENDING ON STREAM FLOW, RAINFALL, AND SUBSURFACE CONDITIONS. THERE SHALL NOT BE ANY ADDITIONAL PAYMENT OR EXTENSION OF CONTRACT TIME FOR WORKING WITH SATURATED SOILS OR HANDLING GROUNDWATER SEEPAGE.
4. THE CONTRACTOR SHALL TAKE ALL NECESSARY PRECAUTIONS TO PROTECT THE EXISTING LANDFILL ROADS, GAS PROBES, AND GROUNDWATER MONITOR WELLS DURING THE CONSTRUCTION PERIOD. THE CONTRACTOR SHALL BE SOLELY RESPONSIBLE FOR ANY AND ALL DAMAGES WHICH MIGHT BE INCURRED BY THE CONTRACTOR'S FAILURE TO EXACTLY LOCATE AND PROTECT EXISTING LANDFILL FEATURES.
5. THE LOCATIONS OF EXISTING UNDERGROUND UTILITIES HAVE NOT BEEN ESTABLISHED BY THE OWNER OR HIS REPRESENTATIVES. THE CONTRACTOR SHALL DETERMINE THE EXACT LOCATION OF ALL EXISTING UTILITIES BEFORE COMMENCING WORK, AND AGREES TO BE FULLY RESPONSIBLE FOR ANY AND ALL DAMAGES WHICH MIGHT BE OCCASIONED BY THE CONTRACTOR'S FAILURE TO EXACTLY LOCATE AND PRESERVE ANY AND ALL UTILITIES. THE CONTRACTOR SHALL BE RESPONSIBLE FOR MAINTAINING PROPER SAFE WORKING DISTANCE FROM ALL UTILITY EASEMENTS.
6. EXCAVATION BY "BLASTING" IS NOT PERMITTED ON THIS PROJECT.
7. FINISHED GROUND ELEVATIONS SHALL MATCH EXISTING GROUND ELEVATIONS EXCEPT AS SHOWN ON THE PLANS. EXCESS SOIL FROM EXCAVATION AND GRADING SHALL BE PLACED IN DESIGNATED STOCKPILE LOCATIONS AS APPROVED BY THE OWNER. TRANSPORT OF SOIL TO FILL AREAS SHALL BE CONDUCTED BY THE CONTRACTOR AT NO ADDITIONAL EXPENSE TO THE OWNER.
8. GEOTECHNICAL INVESTIGATION REPORTS FOR THE SITE ARE AVAILABLE FOR REVIEW AT THE DISTRICTS TRANSFER STATION OFFICE OR HDR ENGINEERING. THE CONTRACTOR MAY PERFORM ADDITIONAL GEOTECHNICAL INVESTIGATIONS AS HE DEEMS NECESSARY FOR CONSTRUCTION ACTIVITIES. HOWEVER, THERE SHALL BE NO ADDITIONAL PAYMENT TO THE CONTRACTOR FOR ADDITIONAL GEOTECHNICAL INVESTIGATIONS.
9. THE CONTRACTOR SHALL CONSTRUCT, AND UPON COMPLETION OF THE PROJECT, REMOVE TEMPORARY CONSTRUCTION ACCESS ROADS. SUCH ROADS SHALL BE LOCATED AS APPROVED BY THE OWNER. DRAINAGE PATTERNS AT THE SITE SHALL NOT BE ALTERED BY ROAD CONSTRUCTION. THE CONTRACTOR SHALL BE RESPONSIBLE FOR CONSTRUCTION AND MAINTENANCE OF TEMPORARY DRAINAGE STRUCTURES, INCLUDING CULVERTS, AT NO ADDITIONAL COST TO THE OWNER.
10. THE CONTRACTOR SHALL CREATE SWPPP AND SUBMIT TO ENGINEER AND OWNER FOR APPROVAL. THE CONTRACTOR SHALL OBTAIN AND CONDUCT WORK CONSISTENT WITH A UPDES PERMIT FOR LANDFILL CONSTRUCTION. REFER TO TECHNICAL SPECIFICATIONS.
11. THE CONTRACTOR SHALL INSTALL, MAINTAIN, AND UPON COMPLETION OF THE PROJECT, REMOVE TEMPORARY EROSION AND SEDIMENT CONTROLS IN ACCORDANCE WITH THE SITE SWPPP AND PURSUANT TO REOUIREMENTS. SUCH CONTROLS SHALL BE PLACED AT THE LIMITS OF DISTURBED AREAS AND AT INTERMEDIATE LOCATIONS WHERE CONCENTRATED FLOW IS LIKELY.
12. THE CONTRACTOR SHALL KEEP THE LANDFILL HAUL ROAD OPERATIONAL AT ALL TIMES. THE CONTRACTOR SHALL SUBMIT A SCHEDULE TO THE O'WNER FOR REVIEW AND APPROVAL 72 HOURS PRIOR TO CONDUCTING OPERATIONS THAT MAY AFFECT OPERATION OF THE LANDFILL ACCESS ROADS. DURING LANDFILL OPERATION, THE CONTRACTOR SHALL PROVIDE FLAGMEN AND FLASHING WARNING DEVICES AT ALL LOCATIONS WHERE EQUIPMENT WILL BE CROSSING THE LANDFILL ACCESS ROAD.
13. TEMPORARY CONSTRUCTION SLOPES SHALL NOT BE GREATER THAN 2H:1V. STEEPER SLOPES WILL ONLY BE ALLOWED IF THE CONTRACTOR PROVIDES A GEOTECHNICAL ENGINEERING REPORT SPECIFYING MAXIMUM SLOPES AND THE DURATION FOR WHICH SUCH SLOPES SHALL REMAIN IN PLACE.
14. THE CONTRACTOR SHALL REMOVE ALL VEGETATION WITHIN THE CONSTRUCTION LIMITS AS REQUIRED TO CONSTRUCT THE PROJECT. ALL VEGETATION MAY BE DISPOSED OF ON-SITE AS DIRECTED BY THE OWNER.
15. THE CONTRACTOR SHALL IMMEDIATELY REPORT TQ THE ENGINEER ANY ERROR OR DISCREPANCY FOUND ONCE THE CONTRACT DOCUMENT IS CAREFULLY REVIEWED ANO ALL ASPECTS OF FIELD WORK HAVE BEEN VERIFIED. IN THE EVENT THE CONTRACTOR CONTINUES TO WORK ON AN ITEM WHERE AN ERROR EXISTS, IT SHALL BE DEEMED THAT THE CONTRACTOR BID AND INTENDED TO EXECUTE THE MORE STRINGENT OR HIGHER QUALITY REOUIREMENT WITHOUT AN INCREASE IN CONTRACT SUM OR TIME. THE CONTRACTOR SHALL ALSO BE RESPONSIBLE TO CORRECT ANY FAILURE OF COMPANY PARTS TO COORDINATE OR FIT PROPERLY INTO FINAL POSITION, AS A RESULT OF CONTRACTOR FAILURE TO RAISE OR RESOLVE A DISCREPANCY.
16. THE DRAWINGS AND SPECIFICATIONS SHOULD AGREE WITH EACH OTHER, AND WORK CALLED FOR BY DRAWINGS AND NOT MENTIONED IN SPECIFICATIONS, QR VICE VERSA, SHALL BE FURNISHED BY BOTH. WHEN DISCREPANCIES EXIST BETWEEN SCALE AND DIMENSIONS, THE DIMENSIONED FIGURE SHALL BE USED. IF DISCREPANCIES EXIST BETWEEN THE DRAWINGS AND SPECIFICATIONS, THE CONTRACTOR SHALL NOT WORK WITHOUT CLARIFICATION FROM ENGINEER AND RESOLUTION BY OWNER. THE OWNER'S DECISION ON THE RESOLUTION IS FINAL.
17. CONTRACTORS AND EACH SUB CONTRACTOR SHALL VERIFY ALL GRADES, LINES, LEVELS, AND DIMENSIONS AS INDICATED ON DRAWINGS, AND HE SHALL REPORT ERRORS TO THE ENGINEER. THE CONTRACTOR SHALL ESTABLISH BENCHMARKS IN AT LEAST TWO WIDELY SEPARATED PLACES, AND AS WORK PROGRESSES THE CONTRACTOR WILL MAINTAIN ADEQUATE HORIZONTAL AND VERTICAL CONTROL.
18. REFER TO CQA DOCUMENT FOR MATERIAL SPECIFICATIONS.
& APPROX ASPH 19 AVG BOE BM BOL X BLDG CL CMP CO CFS CY DIA DET DWG ELEV EXIST EXC FL FML FT G GAL GND GCL GCDL GDL GLER GNDL GP HDPE HORIZ ID IN IE LCRS LCS LCP LCPR LF LEG LB LG MH MAX MIL
AND APPROXIMATELY ASPHALT AT AVERAGE BOTTOM OE EXCAVATION BENCHMARK BOTTOM OF LINER BY BUILDING CENTERLINE CORRUGATED METAL PIPE CLEAN OUT CUBIC FEET PER SECOND CUBIC YARD DIAMETER DETAIL DRAWING ELEVATION EXISTING EXCAVATION FLOW LINE FLEXIBLE MEMBRANE LINER FEET GAS PROBE GALLON GROUND GEOCOMPOSITE LINER GEOCOMPOSITE DRAINAGE LAYER GRAVEL DRAINAGE LAYER GEOMEMBRANE LINER EVALUATION REPORT GEONET DRAINAGE LAYER GAS PROBE HIGH DENSITY POLYETHYLENE HORIZONTAL INSIDE DIAMETER INCHES INVERT ELEVATION LEACHATE COLLECTION AND REMOVAL SYSTEM LEACHATE COLLECTION SYSTEM LEACHATE COLLECTION PIPE LEACHATE COLLECTION PIPE RISER LINEAR FEET LANDFILL GAS POUND LONG MANHOLE MAXIMUM .001 INCHES
MIN MW MSL N NIC NO NTS OC oz % PLCP PERF PGV PC PVI PT PZ Q QTY R ROP REF REQ RD SCH SDL SEC SHT S SDR SP SO STA SLER SLQCP SS SWPPP TL TOC TQFC TOL TOS TS TEMP TYP VCP VERT VLDPE W W/ YD
MINIMUM MONITOR WELL MEAN SEA LEVEL NORTH NOT IN CONTRACT NUMBER NOT TO SCALE ON CENTER OUNCE PERCENT PERFORATED LEACHATE COLLECTION PIPE PERFORATED PASSIVE GAS VENT POINT OF CURVATURE POINT OF VERTICAL INTERSECTION POINT OF TANGENCY PIEZOMETER FLOW QUANTITY RADIUS REINFORCED CONCRETE PIPE REFERENCE REQUIRED ROAD SCHEDULE SAND DRAINAGE LAYER SECTION SHEET SOUTH STANDARD DIMENSION RATIO STEEL PIPE SQUARE STATION SOIL LINER EVALUATION REPORT SOIL LINER OUALITY CONTROL PLAN SIDE SLOPE STORMWATER POLLUTION PREVENTION PLAN TANGENT LENGTH TOP OF COVER TOP OF FINAL COVER TOP OF LINER TOE OF SLOPE TOP SLOPE TEMPORARY TYPICAL VITRIFIED CLAY PIPE VERTICAL VERY LOW DENSITY POLYETHYLENE WEST WITH YARD
SYMBOLS SECTION DETAIL INDICATORS DRAWING ON WHICH SECTION IS CUT:
I > — I
SECTION NUMBER
•SHEET NUMBER ON WHICH SECTION IS DRAWN
DRAWING ON WHICH SECTION APPEARS:
SECTION NUMBER
SECTION
4. SHEET NUMBER ON WHICH SECTION IS DRAWN
DRAWING ON WHICH DETAll IS INDICATED:
-DETAIL NUMBER
, DETAIL NAME
•SHEET NUMSER ON WHICH DETAIL IS DRAWN
DRAWING ON WHICH DETAIL APPEARS:
DETAIL NUMBER -
DETAIL SCALE
-^. SHEET NUMBER ON WHICH
CURVE WITH HORIZONTAL CONTROL:
CURVE RADIUS CALLOUT
\ C L BERM PVI STA 1 8 + 5 0 . 2 5 N 14995 .00 E 12885 .00 ELEV = 6 5 0 . 0 0
VERTICAL CONTROL DESIGNATION
\ BEGINNING OR ENDING CURVE NODE
CURVE NUMBER CALLOUT
8 %
3
_____iJ.—— ' ^ N 14995.00
/ E 12885.00
V
GRADE
SLOPE DESIGNATION (HORIZONTAL
SLOPE DESIGNATION
COORDINATE
WATER SURFACE (PROFILE)
VERTICAL)
4 3 0 SPOT ELEVATION, FEET
KR HDP EnfinMring, Inc. 3995 S 700 E Suite 100 Salt Lak« City. UT B4107-2594
PROJECT MANAGER
PROJECT NUMSER
NOT FOR CONSTRUCTION
SOUTH UTAH VALLEY SOLID WASTE DISTRICT
BAYVIEW LANDFILL CELL 2 STAGE 2
30% GRADING PLAN
GENERAL NOTES, ABBREVIATIONS &c SYMBOLS
N/A
SHEET
C2 OF 15

LEGEND
EXISTING CONTOURS
CELL FOOTPRINT BOUNDARY (APPROX.)
PROPOSED LEACHATE DRAIN UNE
UTTER CONTROL FENCE LOCATION
NOTES: , TOPOGRAPHIC DATA IS PROVIDED FROM OLYMPUS I AERIALS, INC., NOVEMBER U , 2008. EXISTING
CONTOURS IN CEU- 2, STAGE 1 AREA WLL VARY FROM THOSE SHOWN DUE TO ONGOING EXCAVATION SINCE THE AERIAL MAPPING WAS COMPLETED.
BENCHMARKS
BM J 4
572 573 574 575 576 577 578
N 8492.798 7813.839 9992.856 10095.881 4670.902 4756.794 8118.956 7321.380 7334.971
E 5605.987 7697.793 3357.395 8608.668 8792.512 3567.638 1185.133 1456.147 3456.716
ELEVATION 4711.11
4645.33 4757.29 4623.28 4610.47 4737.42 4806.22 4786.62 4763.08
N
® 150 300
SCALE IN FEET
KR HDR Ehginaaring, Inc. 3995 S 700 E Suit* 100 Satt Lah* Qty. UT 84107-2504
PROJECT MANAGER
PROJECT NUMBEF
S. WOMACK
NOT FOR CONSTRUCTION
SOUTH UTAH VALLEY SOLID WASTE DISTRICT
BAYVIEW LANDFILL CELL 2 STAGE 2
30% GRADING PLAN
EXISTING CONTOURS & SITE PLAN
00C-03.DWG SHEET
C3 OF 15

LEGEND
I • . )
y
-• V ^ : .• ..
.•• r . - ^ - , . v / > ^ • - - • , • • • > < - -
- ... • , . . . j A •' '.
• A^ '' ;>^-^: / y .A-y
/ / ^-^ / / .-^ / / / .--1 s '
_'• 4 / y
V . /
CELL FOOTPRINT BOUNDARY (APPROX.)
LEACHATE DRAIN UNE
UTTER CONTROL FENCE LOCATION
2. TOPOGRAPHIC DATA IS PROVIDED FROM OLYMPUS AERIALS, INC., NOVEMBER 14, 2008. OWNER WILL PREPARE SUBGRADE FOR EXPANSION UNER. CONTRACTOR WILL BE
^, RESPONSIBLE TO REMOVE ALL ANGULAR AND ROUNDED 1 STONES TO MEET GEOTECHNICAL SPECIRCATIONS.
SCALE IN FEET
KR HDR Enginaaring, inc. 3995 S 700 e Suita 100 SaK Loha CHy, U l 84107-2594
PROJECT MANAGER
PROJECT NUMBER
NOT FOR CONSTRUCTION
SOUTH UTAH VALLEY SOLID WASTE DISTRICT
BAYVIEW LANDFILL CELL 2 STAGE 2
30% GRADING PLAN
CELL 2 STAGE 2 EXCAVATION PLAN
00C-04.DWG SHEET
04 OF 15

. y
'\~~' .i
J j ' ' •
--. y
. \--- M y ^ ' J - ^.^•^ • ,A y y y - y y
. • ^yy ' ' ' . y A - y ' ^^'•'^ r y - - y "•y' ' . , - '
/ y , - . y y - . y y y : . y . y ..cy . y , y yy - ' - yy^ - / / x - : . / - ^ - y
I. A " •••'yy.";y'- r' \ : / • - y - ' • > - \ ^ r ^ ^ - . .
y y y y . 1 . --••
y - y " • ^ •o - .
\ , \ . \
^ . A : \ . • • \ .
! • • V . \ .
\ ' ] • • ) •
yfi .•• 7 . . . r
/ • / , / / •
UESEMa
/
\,^y
^ V- ' "«
, / .
KR HOR En»?5^ ' 3 9 « 5 ^ 700 E
| 5 ' ^ C i 1 , . > « » . W 7 - « » '
ARCHITECT
" ^ H A N I C W -
"gXCTRICAL
" i T R U ^ ^ L ^ „w —EiSG^E^SiEL
rp-ROJECTNUMSBli^
„ 0 T FOR CONSTRUCTION
SOUTH UTAH VALLEY SOLID WASTE DISTRICT
BAYVIEW LANDFILL CELL 2 STAGE 2
30% GRADING P U N
\
•: i ! i
EXISTING CONTOURS
PROPOSED CONTOURS
LEACHATE DRAIN UNE
CELL 2 STAGE 2 WASTE FILL CONTOURS
— j flLENAME O O C - 0 5 ^ 1SHEET
C5 OF 151 SCALE
nESCRIPTIO" _

N LEGEND
- 4640 -
- 4S40 -
EXISTING CONTOURS
PROPOSED CONTOURS
LEACHATE DRAIN UNE
m 100 200
SCALE IN FEET
PROJECT MANAGER
KR HDR Enjinnring, Inc. 3995 S 700 E SuiU 100 Sort Lak« aty. UT 84107-2594
NOT FOR CONSTRUCTION
PROJECT NUMBER
SOUTH UTAH VALLEY SOLID WASTE DISTRICT
BAYVIEW LANDFILL CELL 2 STAGE 2
30% GRADING PLAN
FINAL COVER PLAN
r 2" 00C-06.DWG SHEET
06 OF 15

2' PROTECTIVE-SOIL COVER (SEE NOTE
UPPER GEOTEXTILE (TYPE 2 ON BOTTOM) (TYPE 1 ON SIDES)
TEXTURED 60 MIL HDPE GEOMEMBRANE
2' PROTECTIVE SOIL COVER
UPPER GEOTEXTILE HIGH STRENGTH WOVEN (TYPE 1)
TEXTURED 60 MIL HDPE GEOMEMBRANE
JDPE UNER LIMIT
2' 3' 10' COMPACTED NATIVE SOIL
8'
GEOSYNTHETIC CLAY LINER
LOWER GEOTEXTILE (TYPE 2)
-SUBGRADE
TYPICAL LANDFILL LINER DETAIL NOT TO SCALE
LOWER GEOTEXTILE (TYPE 2)
GEOSYNTHETIC CLAY LINER
INTERMEDIATE COVER
WASTE
'ipiH UPPER GEOTEXTILE
ANCHOR TRENCH COMPACTED BACKFILL-(TYPE 2 GEOTEXTILE/ GCL/HDPE)
NOTE:
. AREA BETWEEN TOP OF EXCAVATION AND BACK OF ANCHOR TRENCH TO BE GRADED SMOOTH AND EVEN PRIOR TO PLACING UPPER GEOTEXTILE. REMOVE ANGULAR STONES.
LINER SYSTEM ANCHOR TRENCH NOT TO SCALE
TEXTURED 60 MIL HDPE GEOMEMBRANE
TEXTURED 60 MIL HDPE GEOMEMBRANE
INTERMEDIATE COVER •
NEW LEACHATE ^^ I COLLECTION TRENCH
UPPER GEOTEXTILE (TYPE 1)
2' PROTECTIVE-SOIL COVER
TYPE 1 GEOTEXTILE
5'
%w-^''^'-i'^i'^0m'm^0'/s 2' MIN. PROTECTIVE SOIL COVER
TYPE 2 GEOTEXTILE (OVERLAP TYPE 1 GEOTEXTILE AND SEW TOGETHER)
-TEXTURED 60 MIL HDPE GEOMEMBRANE
GEOSYNTHETIC CLAY LINER
LOWER GEOTEXTILE (TYPE 2)
STAGE 2 EASTERN LINER TERMINATION NOT TO SCALE
LINER AT SLOPE TRANSITION NOT TO SCALE
NOTE: THICKNESS MEASURED PERPENDICULAR TO EXCAVATION SURFACE.
LOWER GEOTEXTILE
STAGE 1/STAGE 2 LINER CONNECTION NOT TO SCALE
NOTES:
1. TEMPORARY STORMWATER INTERCEPTOR BERM TO BE PLACED IN FRONT OF WORKING AREA TO DIVERT STORMWATER AWAY FROM ACTIVE FACE. OWNER WILL RELOCATE AS NEEDED.
2. STAGE 2 GEOMEMBRANE TO BE WELDED TO STAGE 1. FUTURE GEOSYNTHETIC COMPONENTS TO BE OVERLAPPED AND SECURED.
3. TYPE I GEOTEXTILE IS REINFORCED AND REQUIRED ON SIDE SLOPES ONLY, ABOVE HDPE LINER. TYPE" 2 GEOTEXTILE IS NON-REINFORCED (NON-WOVEN) AND IS TO BE USED ABOVE HDPE LINER ON BOTTOM AND BETWEEN SUBGRADE AND GCL. A SAND CUSHION MAY BE USED IN LIEU OF THE LOWER TYPE 2 GEOTEXTILE WITH PRIOR APPROVAL OF ENGINEER AND OWNER.
4. SEE SPECIFICATION 02240 FOR PROTECTIVE COVER MATERIAL REOUIREMENTS.
GEOTEXTILE SCHEDULE LOCATION
ALL
LOWER GEOTEXTILE
UPPER GEOTEXTILE
ON SIDESLOPES
UPPER GEOTEXTILE ON BOnOM
(FLOOR)
TYPE
AU-
2
1
2
COMMENTS
REMOVE ALL ANGULAR STONES GREATER THAN Q5INCHES USE 16 OZ/SY NON-WOVEN IF ROUNDED STONES GREATER THAN 2 5 INCHES ARE REMOVED. USE 23OZ/SY NON-WOVENIFONLY ROUNDED STONES GREATER THAN 41NCHES ARE REMOVED. NO HORIZONTAL SEAMS ON SIDESLOPES.
REINFORCED GEOTEXULE. NO HORIZONTAL SEAMS ON SIDESLOPES.
USE 12 OZ/SY NON-WOVEN BENEATH DUNE SAND (PROTECTIVE SOIL COVER)
KK HDR Cnginvaring, Inc. 3995 S 700 E SuH* 100 Sou Lok« City. UT a+107-2594
PROJECT MANAGER
PROJECT NUMBER
NOT FOR CONSTRUCTION
SOUTH UTAH VALLEY SOUD WASTE DISTRICT
BAYVIEW LANDFILL CELL 2 STAGE 2
30% GRADING PLAN
LINER DETAILS
00C-07.DWG
N/A
SHEET
07 OF 15

4740
4730
4720
4710
4690
\ V^
•-•V ^
^
k= :ONN
ixisT
y
J ^
:CT T
+53" •IG Ih
-—-
o_uja
iaSt V IN
^ S —^
ft i't*
^HSP 466C
^ ^ ^ ^ ^ ^ ^ 1 % ^ / ^ ( V i ; ^ - o X u N E ' " " " * " " . • ' ' / ^ • , : . -
/ 1
8-.
.53
^
>-
^ *T
= ^
/
2 ^
N u LINEF LEAC
>
y GRA
lATE
*
V \ \
9i SO.OI 3DH:
^^a
?t ki :
)E AT .INE
^ F i r LE
\ \
/ :?r 5 3 |
i s" •|9
r
iJNH
INV INV
4.. AL C CHAl
>i
\
1') / / f t m p
\, \
4S N-4 ! )UT=
• - y
VER UN
1 I i f
" ~
. ™
=tFNn 57A:
NV (
iTS4
SB.Ot 668.
<r AT
."IT
/ |/
i•^5a
IIT='
ION
)0
AT Dl
u -
84
690.f
AIN
— M
. 0 : 0 3UAL
2
f
INE
£T
NV C
pA¥-
•UNE
niFi .' 11 1IM=.
UT-i
) PIP
N (Hi *02 . : 697.S
695.!
..
E
LINE
t
L
T ,
? \
—
! GR
tr
^ i;
in
-*-
n
^
DE /
?»
! II
?s
/ /
1
IV
• /
•
/ /
/
\ b \
f" \ \
f
f 1 .
1
\ _
% •
\
y
r-FiN LE/
I
^
M C( CHAT
gS
? l
V
, - •
VFR LIN
^^
=FRF !TA NV 1
AT
— ^
IRATT
!i«
" ^
- -
JiiEN
2.00
^
-
\ flA
-~
-
0-1-00 1 -l-OC 2-1-00 4-fOO 5-fOO 6-fOO 7-f-OO S+00 9-1-00 10-1-00 1 U 0 0 12•^00 13-1-00 14-fOO
KR HDR Englnoaring, Inc. 3995 S 700 E Suit* 100 Salt Lak« Cify. UT 84107-2594
PROJECT MA 4AGER
PROJECT NUMBER
CONSTRUCTION NOTES
INSTALL CLEANOLIT PER DETAIL
INSTALL 14" SDR-17 X 10 ' SDR-17 DUAL CONTAINED PIPE PER DETAIL
(D
®
0
(D
(z>
CONNECT 2 ' RETURN UNE TO 14" SDR-17 X 10" SDR-17 DUAL-CONTAINED PIPE IN LEACHATE SUMP ACCESS STRUCTURE PER DETAILS ,
INSTALL PARALLEL 18" DIA SOUD WALL LEACHATE SUMP COLLECTION RISER PIPE AND 8" DIA. SOUD CLEANOUT RISER PIPE PER D E T A I L / ^
INSTALL 8" DIA. PERFORATED LEACHATE COLLECTION HPE PER DETAILS
INSTALL CONNECTION FOR OUAL-CONTAINED PIPE AND PERFORATED PIPE WITTH PERFORATED END CAP PER DETAIL/
CONNECT PROPOSED PERFORATED LEACHATE COaECTION PIPE TO EXISTING STAGE 1 LEACHATE COLLECTION PIPE.
NOTE:
NOT INCLUDED AS PART OF THIS SUBMITTAL
N
® SCALE IN FEET
NOT FOR CONSTRUCTION
SOUTH UTAH VALLEY SOLID WASTE DISTRICT
BAYVIEW LANDFILL CELL 2 STAGE 2
30% GRADING PLAN
LEACHATE COLLECTION SYSTEM PLAN AND PROFILE
ooc-oe.DWG
H: r'=120' V: r = 1 2 '
SHEET
C8 OF 15

8 0Z.CEOTEXT1LE (1 ' MIN, SEWN OVERLAP)
DRAINAGE AGGREGATE (1x10⁻² CM/SEC)
2' PROTECTIVE SOIL COVER (SEE GENERAL NOTE 3)
SMOOTH 60 MIL HDPE GEOMEMBRANE
8" DIA. PERFORATED LEACHATE COLLECTION PIPE ( ^
NOT TO SCALE
LEACHATE COLLECTION TTJENCH nr\
1--6-
PERMISSIBLE CONSTRUCTION JOINT
FINISH GRADE
NOT TO SCALE
- #4 O 10" e.w.
LEACHATE SUMP ACCESS ^_^ STRUCTURE- SECTION A ^
TYPICAL CORNER lEINFORCINC rT\
NOT TO SCALE
2" DIA. ELECTRICAL-CONDUIT ACCESS
PREFABRICATED L _ i _ N HDPE END CAP d o
18" DIA. LEACHA SUMP COLLECTION RISER PIPE (HDPE)
3 NOTCH FOR SUMP PUMP DISCHARGE LINE
NOTCH DETAIL NOT TO SCALE
-A
l ' - 6 " ^ M I N . "
T -Ii
-T 1
r '
18 DIA. SUMP RISER PIPE NOT TO SCALE
ALL LAP SPLICES FOR #4 BAR
TYPICAL CORNER REINFORCING NOT TO SCALE
nONCRFTF NOTTS:
1. ALL CONCRETE SHALL HAVE 4000PSI COMPRESSIVE STRENGTH O 28 DAYS. NORMAL WIGHT.
2. ALL CONCRETE SHALL BE IN ACCORDANCE WITH THE "BUILDING CODE REQUIREMENT FOR REINFORCED CONCRETE" ACI-3ie LATEST EDITION.
3. REINFORCING BARS SHALL CONFORM TO SPECIFICATIONS FOR "DEFORMED BiaET-STEEL FOR CONCRETE REINFORCEMENr WITH 60Ka YIELD STRENGTH: ASTM A615 GRADE 60.
4. REINFORCING BARS TO BE WELDED SHALL COMPLY WITH THE REQUIREMENT OF ASTM A706 GRADE 60.
5. CC^R ON ALL REINFORCEMENT SHALL BE AS FOLLOWS, UNLESS OTHERWISE NOTED:
i CONCRETE PLACED AGAINST GROUND 3 IN II EXPOSED FORMED SURFACES
A. ( J AND SMALLER 1.5 IN B. #6 AND LARGER 2 IN
6. ALL EXPOSED CORNERS SHAa HA\ t 1 IN CHAMFER. UNLESS OTHERWISE NOTED,
7. SAWED GROOVES SHOULD BE MADE MTHIN APPROXIMATELY 4 TO 12 HOURS OF SLAB OR PAVEMENT RNISHING. IF THIS IS NOT PRACTICABLE. USE PREMOLDED STRIPS.
8. AS AN ALTERNATIVE, A PRECAST CONCRETE BOX MAY BE USED. THE PRECAST BOX SHOULD HAVE A MINIMUM CONCRETE COMPRESSIVE STRENGTH OF 5000 PSI O 28 DAYS.
GENERAL NOTES: 1. LEACHATE RETURN UNE IS TO AaOW
ANY SPILLAGE OR RAINWATER ACCUMULATION IN SUMP ACCESS STRUCTURE TO RETURN TO LANDFILL SUMP FOR REMOVAL GROUT BOTTOM OF STRUCTURE TO VALVE AFTER INSTALLATION. IF NECESSARY,
2. GROUT BOTTOM TO DRAIN TO RETURN UNE.
3. SEE SPECIFICATION SECTION 02240 FOR PROTECTIVE SOIL COVER REQUIREMENTS.
LEACHATE SUMP ACCESS _ ^ STT^UCTURE- PLAN / 8 \
NOT TO SCALE
6" DIA. NOMINAL EXTRA STRONG STEEL (YIELD Fy-36 KSI) PIPE BOLLARD W/CONCRETE HLL, PLACE 3 - 0 " DEEP IN r - 6 " DIA, CONCRETE BASE,
8" DIA, LEACHATE COLLECTION PIPE CLEANOUT RISER (HDPE) PREFABRICATED
HDPE END CAP
| 4 O 10" E,W,
PUMP WIRING J-BOX
H O 10" | l ' - 6 "
LEACHATE SUMP ACCESS STRUCTURE WAU.-OR RPE SADDLE
TYPICAL BOLLARD NOT TO SCALE
8" DIAMETER CLEANOUT RISER PIPE END CAP NOT TO SCALE
NOT TO SCALE
KR HDR Engin«arin9, Inc, 3995 S 700 E Suit* 100 Solt Laki Crty, UT 84107-2594
PROJECT MANAGER
PROJECT NUMBER
NOT FOR CONSTRUCTION
SOUTH UTAH VALLEY SOLID WASTE DISTRICT
BAYVIEW LANDFILL CELL 2 STAGE 2
30% GRADING PVAH
LEACHATE COLLECTION SYSTEM DETAILS
N/A
SHEET
C9 OF 15

SUMP COLLECTION PIPE PROPOSED 10" LEACHATE DRAIN UNE
KR HDR Engintaritig, Inc, 3995 S 700 E Su-da 100 Salt Lllkt City. UT 84107-259*
PROJECT MANAGER
PROJECT NUMBER
NOT FOR CONSTRUCTION
SOUTH UTAH VALLEY SOUD WASTE DISTRICT
BAWIEW LANDFILL CELL 2 STAGE 2
30% GRADING PLAN
LEACHATE COLLECTION SYSTEM DETAILS
OOC-10,DWG
N/A CIO OF 15

/ / /
/
1
- . - . J
J
1 L
-A \
4
• V ^ y
/
\
\
\
1 1
\
/ ..... . l r
1
\ \
1
I
\
\ \
^
\
1
1 i
....
^
H ^
y ' /
"~~—
J 'L -J EX A ;
v \
\
—
STING SROUND OF l l | - 1 4 - 0 8
\ i
-y- " "
INILKIM COVER FOR CELL STAGES 1 AND 2•
i ]_____
—
SURFAC '--I'
, -
1
i
" ~A
1
•-
;
1
EXIST' FOR
NG UNE ;EU. 2
1\ ! \
""1 1 1
R GRAD STAGE •
' -—
\
i ^A _; ;_
i
T -
~ ^ - - -
,-\- -----
S •X
T
"
\
i
1
V,
.
_ ^
- -
1
• - *
• ^
1
1
1
- ^
"
- .
\ 1
" ^ - - - ^
•
" \
\ \
I 1
1 '! ! J
PROPqSEli UNER GRADE FOR S u l 2 STAGE 2 -
____ J,B7%„ r ^
A
!
i
1
i
^
\
\
/
6
y /
—
" ^ N H
r
,
_ / 'l /
/
• V
V
\
y /
i '\ i
i •\
';
!
8-^00 9-fOO 10-FOO 11+00 12-fOO 13+00 14+00 15+00
CROSS SECTION A
KR HDR EnginMnng. inc. 3905 S 700 E Suit* 100 Salt Lokt aty. UT 84107-2594
PROJECT MANAGER
PROJECT NUMBER
NOT FOR CONSTRUCTION
SOUTH UTAH VALLEY SOLID WASTE DISTRICT
BAYVIEW UNDFILL CELL 2 STAGE 2
30% GRADING PLAN
NOTES
1, REFER TO SHEET C4 FOR UNER GRADING PLAN,
2, REFER TO SHEET C5 FOR INTERIM FINAL COVER GRADING PLAN,
3, REFER TO SHEET C6 FOR HNAL COVER GRADING PLAN,
4, INTERIM COVER IS FOR STAGES 1 AND 2, ADOmONAL COVER WILL BE PLACED DURING CELL 2 FUTURE EXPANSION. AFTER BERM IS REMOVED,
CELL 2 STAGE 2 TYPICAL CROSS SECTIONS
H: r = 8 0 ' V: r = 8 '
SHEET
C l l OF 15
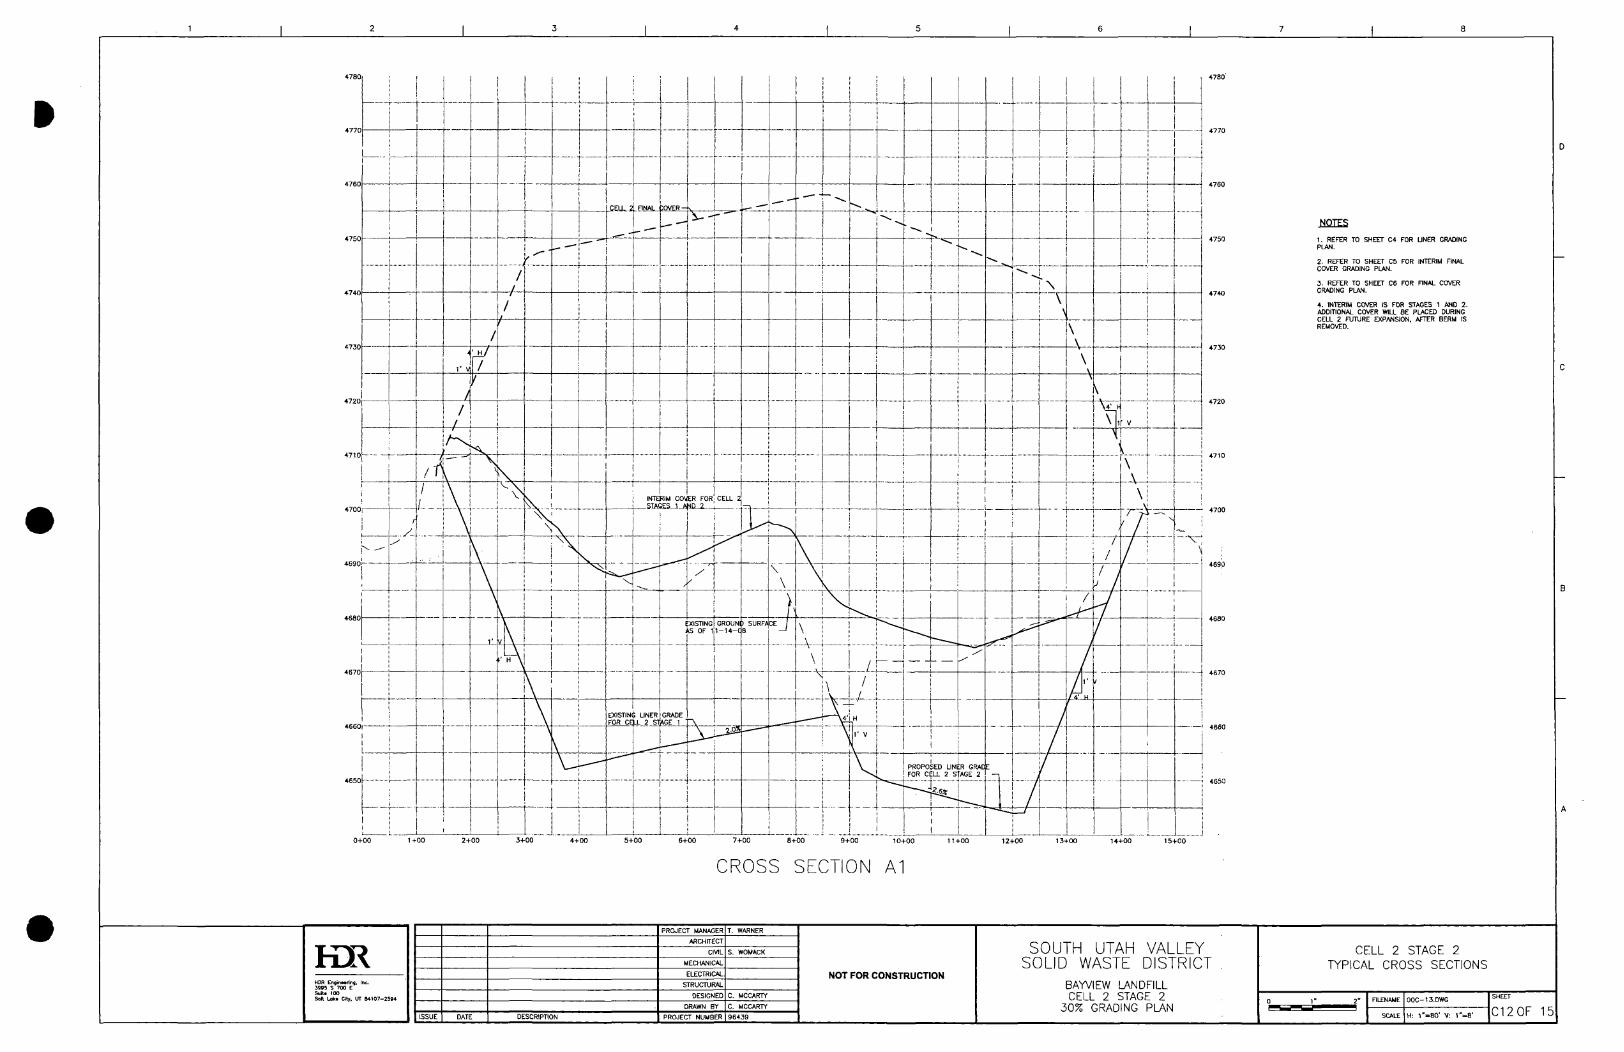
' 1
4780
4770
4760
4750
4740
4730
4720
4710
4700
4680
4670
4660
4650
0+
2
1
r
^
\ i
1
!
[
:
'
y 1
00 1 +00
K R HOR CngiriMring, Inc. 3985 S 700 E SuH* 100 SaK. Loka aty, \JT M107-25e4
_ J ISSUE
1
4
r V
/ /
/
A-s
V \
. . . \
/
1
^ w
V
\
\ \..
I.L
-
3
1 h- 1
/
/
/
\
V
V \
1 H \
2+00 3+
DATE
. - •
-. —'
i V 1
• ^
• • • " " " " • \ N r
\
\
^
00
\
V
1
.C.ELL...2
1
\ ^
—
- ^
...QNAL. COVER -
- -
INTEfllM COV „. . „ . - . STAS.ES.J. Ai
\
- - ^
EXISTIN FOR CE;
5 UNER tLJ2. ST
,
GRADE ^GE 1 -
iv
^ -
ER FOR l*[)_2.._
4
• • • •
^
1 __1
CELL 2
;
y
; XISTINGI GROUN
\S OF i ; i - 1 4 - i
i
^
IV-^
^ ^
8 URFA
1
. —-
1
i j
! i
- ^
\ \
CEJ
\
\
\ \ \.
" \
^ -
^
!
V ^ i
\
\
—
/ /
/
H
r V
~^-^
5
>^ 1 ^
^
"~~"
- " ^
1
^
i 1
i
i
t
1
~
- ^
i
^ 4 1
'•>
PROPOSED LINER GRACE FOR CELL 2 SfAGE 2 —j
- - : ^
t
1
^
1 1
\ \ \
\
6
\ ••"•\4'-f " "
\ If V
\
•" T
i /
/
r r
- -
/ / ^ /
1
1
I \
\
1 j
1
j
J i — X T
\
j i
4+00 5+00 6+00 7+00 8+00 9+00 10+00 11+00 12+00 13+00 14+00
CROSS SECTION Al
DESCRIPTION
PROJECT MANAGER
ARCHITECT
CIVIL
MECHANICAL
ELECTRICAL
STRUCTURAL
DESIGNED
DRAWN BY
PROJECT NUMBER
T. WARNER
S. WOMACK
C. MCCARTY
C. MCCARTY
96439
NOT FOR CONSTRUCTION
_
i
j
j
i
15+00
4780
4770
4760
4750
4740
4730
4720
4710
4700
4680
4670
SOUTH UTAH VALLEY SOLID WASTE DISTRICT .
BAYVIEW LANDFILL CELL 2 STAGE 2
3 0 % DRAniNC PI AN
7 1 8
NOTES
1. REFER TO SHEET C4 FOR UNER GRADING PLAN.
2. REFER TO SHEET C5 FOR INTERIM FINAL COVER GRADING PLAN,
3, REFER TO SHEET C6 FOR FINAL COVER GRADING PLAN,
4, INTERIM COVER IS FOR STAGES 1 AND 2, ADDITIONAL COVER WILL BE PLACED DURING CELL 2 FimjRE EXPANSION. AFTER BERM IS REMOVED.
CELL 2 STAGE 2 TYPICAL CROSS SECTIONS
0 1" 2" RLENAWE
SCALE
00C-13,DWG
H: 1"=80' V: r = 8 '
SHEET
C120F 15

1
^ ^ \
1
...
\
0+00 1 +
I
00
•-
2+
r
/
y \
2
1
. J \ 7
\
^
\ .
\ " l i
j i
1
! 1
1
1 1 i 1
00 3+
1
^
\
H \
^
1
00
KR 3935 S 700 E Suit* too Salt Lok» City. UT S+107-2594
—
4+
\ \
\
00
ISSUE
1
i
\ . . . . \ „ -
v;:
1
h " " " • "
3
1
1
• ~ ~ . ^ . - . .
^
1
1 E)ilSTlNG i A$ OF 11
; i 1 i \ " '
i ! j i
5+00 6+
DATE
00 7+
CR
IROUND - 1 4 - 0 8
. / "
PROF FOR
00
OS
A
j
~ ^ CELL 2 FINAL COV :R -T. i
\ 1 • - \1 X
SURFAC
. ^
OSED L CELL 2
8+
s
\ \
" •
\ , \
\ 10'
V,
H
\ ! \
r V
\ \
INTERIM CfjVER F()R CELL STAGES 11 AND 2 1
E
"A ^ ^
NER GRiAOE STAGE 2 —y^
00
SE
DESCRIPTION
— - f
-^^^.^i
1 i i
i \ \
9+00
CTION
PROJECT MANAGER
ARCHITECT
CML
MECHANICAL
ELECTRICAL
STRUCTURAL
DESIGNED
DRAWN BY
PROJECT NUMBER
10H
B
-^
\ 2
1
^^'--^
-00
• • - ,
\
\
^
J
T, WARNER
S, WOMACK
C. MCCARTY
C. MCCARTY
96439
H
...
1
\
\
\
- • •
—
^ ^ i
" A _i __
\
V
4'
\ u
hOO
\ • - ^
5
i 1
1 ;
S- i
v : \
r
\
'^
~ « ^ 1 I ~"
V
^
\
\
\ V^ \
1 \ i 1
i
12+00
5s
1
—,
1 1
i
1
1 BEFM BETW ANO STAGE REMOVED B
-^
;EN STAGES 1 -3 - 4 TO BE
EFORE WASTE IS PIA;ED IN"STAGES"
1 j
4 - ^
\,
\
\
1
/
y
yAJilD
i I
,A /
j FUTURE
~' -4- -.., i
i 13+00 14-i-OO
NOT FOR CONSTRUCTION
/
6 1 i 1 i
*-
'.
*•;• N
/
/ • • "
/ / i
\- M •
' H
J
h •• - 4760 p
2
3 G
4750 4 A C
j
• ~ ^
^ - • • ^ -
i
i
CELL 2' UNER-
r
15+00
~'~
\ . . „ . . .
\
16+00
\
^ 1
4650
17+00
SOUTH UTAH VALLEY SOLID WASTE DISTRICT
BAYVIEW LANDFILL CELL 2 STAGE 2
3 n % GRADINf; PI AN
7 1 8
NOTES REFER TO SHEET C4 FOR LINER GRADING
LAN,
, REFER TO SHEET C5 FOR INTERIM HNAL OVER GRADING PLAN,
, REFER TO SHEET C6 FOR FINAL COVER RADING PLAN,
, INTERIM COVER IS FOR STAGES 1 AND 2, DomONAi. COVER WILL BE PLACED DURING ELL 2 FUTURE EXPANSION. AFTER BERM IS EMOVED,
CELL 2 STAGE 2 TYPICAL CROSS SECTIONS
0 1" 2" RLENAME
SCALE
00C-t4.DWG
H: r = B 0 ' V: r = 8 '
SHEET
313 OF 15

4652 fgSO—-
V \
\ \
HJR HW EnglnMfing, Inc, 3995 S 700 E Suit* 100 Salt LotM City, UT S4107-2S04
\
\
EXISTING LEACHATE POND-,
LEGEND
EXISTING CONTOURS
PROPOSED CONTOURS
CELL FOOTPRINT BOUNDARY (APPROX,)
LEACHATE DRAIN UNE
CONSTRUCnON NOTES
0 INSTALL 10" PVC BEND WITH 10" PVC CLEANOUT PER DETAIL / ' ^ ^ N
( 2 ) 1NSTN.L LEACHATE POND PER DETAIL
( ? ) PIPE PENETRATION PER DETAIL m NOTE:
DETAIL / > \ NOT INCLUDED AS PART OF I THIS SUBMnTAL
N
® 30 60
SCALE IN FEET
PROJECT MANAGER
PROJECT NUMBER
NOT FOR CONSTRUCTION
SOUTH UTAH VALLEY SOLID WASTE DISTRICT
BAYVIEW UNDFILL CELL 2 STAGE 2
30% GRADING PLAN
LEACHATE POND GRADING PU\N
SHEET
C140F 15

FOUNDATION SEE SPECIFICATIONS FOR REQUIREMENTS
UNPAVED AREA
PIPE SPRINGLINE
NOTES:
1. Bc-OUTSIDE DIAMETER OF PIPE,
2, NOT APPUCABLE TO TRENCH SECTIONS WITH NORMAL GROUNDWATER LEVELS ABOVE THE PIPE CROWN,
3, SEE SPECIFICATIONS FOR MATERIAL AND COMPACTION REOUIREMENTS,
PIPE TYPICAL TRENCH SECTION NOT TO SCALE
KR HOR EnginMring. Inc. 3995 S 700 E Suit* 100 Salt Ink . City, UT 84107-2594
8 " HDPE PIPE FOR LEAK DETECTION
6 0 MIL HDPE UNER SIDESLOPES)
COMPACTED SUBGRADE OR ENGINEERED FILL-( 9 5 X STD. PROCTOR) ^ 8 " PERFORATED
HDPE PIPE
_16 OZ /SY NON-WOVEN GEOTEXTILE
PROPOSED LEACHATE POND TYPICAL SECTION f 2 NOT TO SCALE Cl
PROJECT MANAGER
PROJECT NUMBER
NOT FOR CONSTRUCTION
SOUTH UTAH VALLEY SOLID WASTE DISTRICT
BAYVIEW UNDFILL CELL 2 STAGE 2
30% GRADING PLAN
LEACHATE POND DETAILS
00C-11,DWG
N/A C15 OF 15

Appendix E

APPENDIX E
Boring Logs
SUVSWD Bayview Class I Landfill Permit Application

t
APPENDIX E-1
CULINARY WELL
#

Hmk w m aw
I B-C _...
/ . , ^ . 4 : 4 i l . • ? /
REPORT OF WELL DRILLER ^^^^fej^. 'r ."?^ STATE OF UTAH c u a N..
4. /^ /
GENERAL STATEMENT: Raport of wdl driUtr U honby madt and f l M with th« 8 U U EndnMr, In aecortUnct with th* Uwi ef UUh. (Thil report ihill bt fU«d with th« Stat* EafiBtor within tO dayi aft«r th* eonplttioB or abandoniatnt of th* w*IL Fa i l an to fU* aach report* eonstitntn a mltdcmoanor.)
L t TESTS: ^ ^ ^ « , Draw^nm b IW <lbUaM la •tatk l«*«l.
••aDi
af S«rtlon f f
Bot «rord« not n*cd«l)
(3) NATURE OF WORK (Cheek): N«.wdi B I RapUniMiit Wdl Q DMpmInt O Rapalr O Akaadoa D
M abaadoammk daairlka Batarial twt »neadar<:
(4) NATURE OF USE (cheek): Donartla D
IrriMtlaa D
ladaatria) O
W a l u O
MaaMval Q i ^ Btaaknlar
Otkir a VM w«a
(5) TYPE OF CONSTRUCTION (cheek): BateiT a y » " D '"o^ D CabI* Vr Dri»a» O »aia< O
Waa a tt iR^BiniradaT T M C^'Ha a I f aa, W wkoat,
YlaM I / S 3 (aL/nln. arltk — ^ . . ^ . fart 4 n w 4 * n
- .J ipy - ._*i.H. - ..a..e.JL. . . - _ 2 L 2
Ballar laat wUmin, wttk.. l ia l drav«an aflar.
Artaflaa flaw , *<fr.M, Data.
Ttiwparataf af wataf. €.S„.^Ci.— Waa a rtwalaal aaajyafa Madaf Na a
(13) WELLJ.OG: DUaaf f^ r^ €.^.. f««t. BaaA af aea>lata4 wall—:
l i ^
S . c ,
S . I ' •h i 3 . '
r- / so f
f t
; Plaaa«a "X~ la tha a»aaa ar aamMaalloB af ipaaM Baa4a4 ta 4Mlnata <ka aiatoilal ar camblaatlua af mauriali aaeoaatarad la aacb dapth InUmU. Uadar aBI IAaM aaba anr dnirabia a«(M aa ta accurrania ef watar aad DM aelar, alaa, aatan, ata^ atf taalvlal aiH taunlarad la aach dapU latarval. Vlaa addlUaaal ibaH U ' '
(6) CASING SCHEDULE: nr-dad o waiMtf'" / f DIAA. frMi_ M C - i ^ aa.^£id_
,, / w U . . ' Dlaai. l nm. . . jO faat U tSOmSJ im l G v S S S —
" Diam. Iraa fai l ta faat Gam
wa« p ^ »«i«rt g vmt a
(7) PERFORATIONS Trpa n f parfaralor atad — y ^
aha of parforaUaai ...,S»J4E.
laraladt T ra-a^ Ma D
( 8 ) S C R E E N S : Wall Ktaai. laaulladt TM O M* • If anufactnrar'a Nana . . ^ ^ . ^ ^ — . ^ ^ — * .
i rp . Kadil Na Diam. Slat alta..
Diam. ..Slot alM.. ..Bat fiata
(9) CONSTRUCTION: Wai wall caral paakadT Yai Q Na ST •<» af traaall—
Cra>al placaa f ia« f a a t ^
Waa a lurfaca aaal pmMad? Yaa B ^ Na Q
To -bat daptkl / ^ .<>_ . ; - - - ^ , . - f aa l ^ ^ _
Malarial a«od la Mali .. . j / G O n S i ^ t T
Did anr atrau coauln unuaabla waui
Trpa ef waur;
Method al Mallnf i trau c f l i
Yaa D Ke
.... Daptk t t a t n t a — V
Wai anrfaca cailas luadT
Wai It tamentad In Plata!
Yta ( T
T« 9 ^ Me O Ke a
(10) WATER I^EVELS: ^ ^ " ^ - ^ SUlIc lav.l " 7 ^ ] r . . / .T(H balew Ited i v f i
Artaalan praviura
Dala_1
, faat ebera land iBrfaaa Data.-
9AAJi.
LOG RECEIVED1 (11) FLOWING WELL: Contielled kr (ikaak) Talae D
Cap O riec D Ne CeoWel D
Doei well leak >ieea4 aaalwt Taa •
Me a
(14) PUMP: HanafaetBrar'i Mese
Trpe! ZMr.i.4.aJt.-Deptk to peaip ar kewlea,_ .bt.<>.Q...
• . r~
Wall Drillar'* Statcmtnt: Thii well wa* drilled und*r my (uptrrii lon, and thi* raport ii tma t«
th* beat of 0 7 knowltdg* and btUef. . ^ ^ Name _ X ^ i 4 i y i ^ j S f e _ . i ^ 4 j ! - i a L :
jFataea, f l r ^ f r aerpetatleM ^ m 4 f , <**»• "5 g<f ' )
USB OTRZB iDC FOB ABOmONAL BBMABBB

frnm m - M - n 4 t
I • . € . T . • - REPORT OF WELL DRILLER STATE OF UTAB Ctalta K K .
C e p M
GENERAL STATEMENT: R*port of w*n drlU*r ia h*r*b* mad* and filed with th* SUU Enfln**r, In aeeerdane* with th* lawi *f UUh. (Thia report ihall b* filed with th* Stata I!acla**r within SO daya aft«r th* eomplotion or abandonnant of th* w*IL Failnra to file soeh report* conititutei a ntiademaaner.)
(1) fX o
(2) LOCATION OF WELL:
Not tk
a m i k
of Sartiofl
eet worda net
. . , T . .
. C m i a d Water B a i t *
M _. , «..
• BILBM
(3) NATURE OF WORK (check): Mawwau D Raplacament Wel l D Daepenlni Q Bapalr Q Abaadae D
I f abandonaMiiL datariba taalaflal a i d preaednat.
(4) NATURE OF USE (cheek): Denaalla O ledee l i la l Q M a a M p a l Q
h f l e a t l e * D MIelee Q Otkar D 1 ^ WaU
(5) TYPE OF CONSTRUCTION (check): •etarr O » • * • * * > ^ Cable D Dfjaae Q
(() CASING SCHEDULE: Tknada* a " D i e s , f n
•• DIaa i . f n t a «ai« ta fa r t a a * « -
.•* D iam. f tee i f e r t to I t r t Oeca-
H«w D Belert O !»»•*
(7) PERFORATIONS: r.rfa..tadt Ta. a M. t i v * ^ f p«rformt0r aaad..
8I>« o t pvrforaUenf l a t h a W -
pOTferat In t f r a a . f a A t K -
.„..^p«rferaUoiiB f tMB_
p«r for«t IoM f v M i t t
._„ »OTfof«UMB i n m f M t to-.
p«rfarmUww t n a . ^ t m ^ t a -
(8) SCREENS: w.n Mrwi. m.uiMr tm Q M. Han uf u t«r«r*a K s s « ..
DUm. Slot a l l * Bat *•*— ** to..
D U m Slot i l t a I a i f w ••••, —Ite to-
(9) CONSTRUCTION: Wai wall r r a r a l patkadT Y M O Na Q I lea a t araTalL-
Cra«<l placed f r o m far t ta .
Waa a aurface aaal provldad? Y M Q Me D
To what daptk I fart
Material aMd la aM t :
Did anr a t raU centala uoaaable walarT Y M Q
Tn>* of wa te r : — Daptk ad i
Hr thod of aaallnc atrata o f f t . .
2) WELL TESTS: Drewdewa la Ike d l i t a n e l i fe r t t ke wptar leael ie lew. ared balew atatla leaal.
p e n p i M t laadal Y M D Me O I f H , V P w k e a l .
Y le ld i . . . . n L / M l i i . Wi t t f l
. (a l . /Bia.«Mh . l a r t dnwdaWB ef lav_
-a.».m. B e t a .
(13) WELL LOG: Deptk drWed
Me a -Te. D
f . ^
N O T B : Plaaa an "Tr " In Ike apew o r I ^ , „ or comUnatloB ef MatoriaU enaoeatarad la Mck dept t (ntarvaL l l e d w f ? H A W T B Make ea r dMirebIa « e l « aa ta occurrence of weler eed tke eeler. alee, aatp iv , e te - e f toetertal ee-eeuntarad la eaak daptk lntar<ral, V M addlt lesal . koM I t poeded. - — — — n ~
nMp . l l ee a f W . M . PMdid ta d a l n e t o t k * atatafW k i n u m ••
W a i l u r f a M a a i l n * e i a d l
Waa I t cvmantad I N p lac i T
Y M
T M a a
Me
Me
(10) WATER LEVELS: stat ic I n a l ., t t r t below lead n i f M * D a t a .
Artaaian p i m u r e f i a t .b«ra lead • • ! < » . Beta. .
LOG RECEIVEDi (11) FLOWING WELL: ContnlM kr (eketk) Ta in O
Cap 0 r i iw a HeOesMl D
DoM well leak a n a U o a i w t T a D
M* •
(14) PUMP: Maaetaataiwi'a Naa
Tr»a; •• r~ Deptk to peetp « r kewfae.. f a
Well DrtlWr'a 8tBt«n*Bt: Thla wdl waa drlUad undkr mjr •Bp*tTialon, and thla nport ia t n * to
th* beat of my knowl*dce and^ l in . ^n-y
Hame-^
Addr***.
i r e teaa . flita, ar lerpeiat lae) f t r w er y r m l •
(Sign*d).
LleanMNo. 2i<jr_ (Wall Pill l irl
.OaU- - . » -m c O n O B I IDB FOB «ODTnONAt. B H I A B M
APPENDIX E-2
MONITORING WELLS

• /• - >
Herm Hughes & Sons, Inci represents that we have determined and verified alT field dimensions and measurements, field construction criteria, materials, and similar data, and that ne have
coordinated this eupmlttal with the _ of/jhjr Work an^/tpe Contract
Documents.
/-2^%l

DAVE'S DRILLING 577 West 3410 South
Salt Lake CHy, Utah 84115 (801) 263-9099 Date I n - l l - g - t ^
RIG NO. .RIGTYPE f^- P - 160Z> WELL NO. S Wl U ) - i TYPE yrln^.'A g r .
JOB OWNER p>-.»wj r . ^ 4 y
LOCATION _ g x i i
TIME
Start
yfoo
m IP
stop
Olc^
. y u . V u i L
DEPTH
From
O
S^' 10
i<,
1 0
2.B
2<f-
:3,o
H^ uo '
To
.^
^ "
/£?
/5 ZC?
2.5
29-
3 P
t / i
i .0
> ^
..S.JiC^\.\^
DRILLING INFORMATION
Ft.
5 "
Log or Remarks
O ^ r . y t e.^d^ ^ O.lP. tf- c^.r^.'H«j.
»Vir,t.><» S e f M O O W ^ V W V O - t fli..'LL4-l0r.'o*
/ I " f^? 1 ^ '
c^.J-f .<.'// £ o n at.i»m«ih.*K"f' 19 p.fci/rfi - 5'a.*c(. «i tf »vfrii ^c J
Ok.;LL 6 15«K U o l t t o ^ . ^
Vu<4*.Li -7 1' i^'tz p \ j r . C ^ J L «».«,drL
P ^ r ] i X f ' „-P W.,l*.
\An\)e. ^•.'/:v <Dii«-o*\ «u.v,ci < : * T u p < 5 r t
en-
Type
A./^
Size
/ t
No.
/
1 1
STAND BY TIME HRS.
g^xifcj K J L J U
HOURLY WORK HRS. ii Signature of Owner or Representative
CASING USED: Size 12
CASING USED: Size
DRILLING MUD: Type
Ft. Used 3 0
Ft. Used
Anrwunt
Water G.P.M.
Water Static
Fuel Oil
MISC.
# ^ ^ W
Driller M Helper »»f.' e - spi^^MlL Helper

LOG OF EXPLORATORY BORING
pnojcoT NO. t)r?iLie/l: IMAier^ f>B.TJ=^jtin/it . BORING, NO. M : S i ! l ! £ : L L -PRo.iPriT MAMP ftyi</vi5yj \^AnrjPlLL •___ LOGGED BY I2i2i^££i^£i/^
DRILL ING. METHOD nPH L/ r^^vP Ai lL f^PTflP,^ \l"CA<.lril(, D A T E DRILLED ' ' ^ ' ^ ^ a o
S T A T E COUNTY D E S C R I P T I V E L O C A T I O N hlOSTA-ifA 'JJATJ^-e. -^.r/tr"
L O C A T I O N : T R SECT T R A C T P A G E _ J _ O F
HEAD SPACE USING
CPPMJ a. CD
UJ
< H (0
c m <>-
o
5 3 o o r L I T H O L O G I C DESCRIPTION
IO.
^ O
2d.
^eAvELi"/ C/VJC: R^chiLw-Ee..^'J)rl •?,7>i;gt:.g fjl^'AltlrJC r,' !,:-.!-' •:.:^f)L. jc>% ~./?A't!^.L .
^f i iC) : i -Bc£iJS,!- -/ £.o'/jr) M^/.r//> k fa . inc VJBLI lofiYci)
^i^\/EUk^ SMC '.^^CC/ai-c^p^jor). n<g^;i/hi ^O/tv- rn f g % A , ^ J y ^ L .
^/ft^/^uV 6 h m - kU-CiCi^-BfiO'jjrj lu.e^/iii'M tiPfi-fho "zcp in gfioygA
/^PAy/^ll"/ <A/i)D: FiNB-6fiAj/jsO qePOKH fL- r) l^grn^yy ^.Of>.rrD f O - ' ; n < ^ f i ^ ^ L
s/m^ P^Bt."^ 4g4v£^:/gffgg.'f.-^-/9e^w/i>>. '•g£y fiMP'.^ ^VPy-^C A^%PB.f<eLP<
REMARKS p j £ 6 r Z - 3 f i ^ T 6r^is.</^ [AjmHff i tO Sitfs^ltU. k L ^ t ) t i t i e . o f GCt-f^>,OV^ IC e.9J>bl£M Exploratory&MonHor 6E :?UJW S; iW0<. iK6^veL*. . WellDrilimg
DAVE'S DRILLING COMPANY

P R O J E C T N O .
PROJECT NAME .
DRILLING. METHOD .
S T A T E COUNTY.
LOG OF EXPLORATORY BORING
LOGGED BY
OATE DRILLED
L O C A T I O N : T.
. D E S C R I P T I V E L O C A T I O N
.SECT T R A C T PAGE ^ n P . - ^ _
HEAD SPACE USING
(PPM)
i i is Ul 7^ UJ
< H CO
lu"-oz
|1J;J Q. ca 2 2 < > coco
z 2
o l s L I T H O L O G I C DESCRIPTION
ISL
HO
i<L
S<L
(i?0
^ M v g u y </i/;Z) r kk.ov.->miw-R.'Sr-j fcofi^i^ciersc
p e ^ F K L H ^ i L i y < .hNr> ' . k5/)n\tlM- R t ^ l O f * . v t ^ ^
P ^ O f l ^ C£>f=Tyf,._^Or^!= Cun-f&A^lZ-
cgrygrJT^/j SA.TV 5/>r;<Q; [X> ir£ tp/i^cpi6/i BRJ?^t^ Vj-g.'^ "=•• r )~-• ' -cf i • ; ! ? / : - .^.--^/C/J-^/C'
CfiMfm."^ 'jr^riC f fi.e-CPiiLU-P.fz.^D'^/J, fp:>r->.h' \ee.:nfC '. Sg>kiF e^fj-.^f-trxAriiyO sg cArJC
• R E M A R K S
Exploratory & Monitor Well Drilling
DAVE'S DRILLING COMPANY

P R O J E C T N O .
P R O J E C T NAME
DRILL ING. METHOD
LOG OF EXPLORATORY BORING
a n o i M r s u n RM-SVW) UJ - )
LOGGED BY
O A T E DRILLED
S T A T E COUNTY
L O C A T I O N : T R
. D E S C R I P T I V E L O C A T I O N
. S E C T T R A C T PAGE § O P ^ ^
HEAD SPACE USING
(PPM3
Ul
;H Ul n CO
tui ILi i U l " -
oz
0. 00 2 2 < > coco
o z 2
og s L I T H O L O G I C DESCRIPTION
7 ( 2 -
. . r.D. 751 £ M \ r S - U i -ShUd'. P.'^CDC'A- F'i(iJ)'*0 .Pi^^ 'P.^ i '
R E M A R K S
Exploratory & Monitor Well Drilling
DAVE'S DRILLING COMPANY

•
DAVE'S DRILLING 5617 W. Wells Parte Road
Salt Lake City, Utah 84088 (801) 569-2000 Date/r^- /^-^^?^
RIG NO. / < ^ ' RIG TYPE.
JOB OWNER Prrn^^l / < . ' t y Bu± h L
^ .WELLNO. < m U ^ - \ TYPE ,nicniTrru7(j ,
LOCATION _ ^
TIME
Start
ife w
stop
Cl V i ^ : c : t v^
DEPTH
From
7i'
To
0
1 DRILLING INFORMATION
Ft.
7V'
Log or Remarks
Tr^-^fyJ] I ' r . ' f k l r m \ ^ ^ ^ ' ' ^ t ^ ^ . , P . O '
y . ' f ^ ^ ' U ^ r y . ^ H ^ / > 7 ^ / 4 ^ ^ / ' ^ - f h l o j i k
^-^"^irr-. 7? y n ' r t^ j - j ^Tr , / ! ^ i -hc -O ' 'f>yehC^ ^ r o t 7 n 7 ^ ' -
^ ^ '
7/7.-5"^/Z y.r^r//-^ir^ h e . / i l c ^ h , ^ rrr-z-r) ^ 4 ^ ' -
-^.o' • i : ^ < 1 ^ i l l / 7 ^ i r , T ^ < f » 7 e ^ T ^ , ^ c / r \ 2 ^ ^ ' -
< ' ^ / 7 ^ y ^y> /?^ / - ^ ^ . fJ-(^/77 ^ ' ~ C >
^ n < 7 ? , / / < f j r ' / ' a ^ e ^ y y ^ n j f o / f . f ( ru i
BIT
Type Size No.
1
4 1
STAND BY TIME HRS.
Signature of Owner or Representative.
HOURLY WORK HRS..
CASING USED: Size _
CASING USED: Size _
DRILLING MUD: Type.
.R.Used.
Ft. Used.
Amount.
.Water G.P.M.
.Water Static.
Fuel _OII. MISC.
^^"v£/ ra t. Helper Helper

DAVE'S DRILLING 577 West 3410 South
Salt Lake City. Utah 84115 (801) 263-9099 Date /'>'l'i'%-<^
•
RIG NO. .RIG TYPE ( L ~ P - " 7 0 o Q .WELLNO. $ ^ > m ? - -2 TYPE \vi^^ . ' i -cy .
JOB OWN
LOCATIOr
ER P / - o \ JO
i G ^ i . o>
TIME
Start
7 ioo
A V
Stop
ip]0^
^ . « -+ v e j c 1V»N.cX,
DEPTH
From
0
io 7 o
^o l i e 60 ho
To
m t p Ko to
SO ifO IS
U H J L C.»LL
DRILLING INFORMATION
Ft. Log or Remarks
U v / [ r » . C A C c . & ^ > * \ e i f . f D w . ^ L i p > ^ p ^
VKc^L»e <AT</ t i ^ m . p •"
h\-a.^- 4o / i ^ . N l A.A»>ue 1 7 "
S ^ i r U s.U4y •• I Z / y i e ^ U 6-9 r-Lcy
£\t-t^uei V « i „ . .J • f ^ l o k l t S
a V-•. o « L r - f ^ r - u ' i ' . - r l f - n h h L t V
^ 1 1 f <
a . f r ^ % j e L £ , t : H t r t , r r c l ^ c k k l t S .
< i . l . c < i / r L < , o . t * e X f ' ^ U k l - m S
« . p - ^ M . - L < . ^ ^ ^ f r r ^ U b l f ^
Kf i , i ;« Pl'<^, •*<? <-)*»<•« l/l p«c\
BIT
Type
Rix^Ak
'
Size
/ /
No.
/
A i
STAND BY TIME HRS.
Signature of Owner or Representative.
HOURLY WORK HRS.. ; /
CASING USED: Size _
CASING USED: Size _
DRILLING MUD: Type.
iz. FLUsed.
FLUsed.
75
_AnK>unt
.Water G.P.M.
_Water Static.
Fuel _Oil.
MISC. m Driller
I A / I ..rh, P J T ^ ^ ^ I^^'P^VVI;/;. cn.\.Jl.LL l -P '

LOG OF EXPLORATORY BORING
pnojECT MO. f^^iiLirP'. Hi;f/er/ pB.Tiie.s.c/O BORING. NO. £ i Z i ^ i ± J £ i : ^ P R O J E C T NAMP g / ) y V i e W U A r / r r ^ i t l - LOGGED BY T . eSL/ '^UA]^
n Q i i i i M P , M P T u n n DA lLL /n f i .Wt^ A l / L P . ^ A £ . ^ >g' : / i ; ,V/>n A T P DRILLED / g * / / ^ l f i > ^
D E S C R I P T I V E i n P A T i n M f.A'h,T lOP- C B L L i± . 1
_ 0 F ^
S T A T E COUNTY
L O C A T I O N : T. R . S E C T . T R A C T . PAGE
HEAD SPACE USING
CPPM]
gi
a . CO
Ul ^ Ul a. 0. 2 >• < I-co
£01 o.ff' U l " -
oz
3o C L O 2 2 < > coco
o
o X b
2 3 o o
L I T H O L O G I C DESCRIPTION
i
\o^
15-
ZO
z^L.
J 2 .
g/ r/Ci --S/Ar; 6/eg'Ai/;; /n%^/iTfr i//vey i//F/.z, :./7^>7E^?. l ^ /Z /g ^ y ^ / / / ^ Z )
/ rjflY -s/i-r r bPO'nfK Z-Pm <.fir)C vj^iiioigif. P i N ^ <LPA\n^ /^
^Mv^Lui ^MfC • eP.PMr). WgLL <:,-9/?rg/: /Z^>^,>•^ A / K ' i ' . / A r-rr-T^^J^^
/>A;OV ^g/^ygj. • 6i?p:>. rj, yy^cufy^. zsP/cr^£ /.?-^»t<A Whm'Afi ^ •'.'if-/irih,vi'^K.'i'>%-n'iC
SAtJC^ 6 f ^ ^ i ~ - 6fei?<oA', A«g/ i j f tA < j .y i - r :=C
( H - I P , ^ ^ f£>%SA>JC, C(pht^-L^ & / J * v ^ l .
ffifiei'f 6Mvgu'y s r-zQ ; 6eDMfJ. pfic>&m s.fiArrD ^gee/sg^ 77 agt^*'^ /v'/i>pedBiii ^P%6PnMS'..
REMARKS ft£ir / ^ ' f n n ^ ' 6 t i . ^ j n ^ 'S,iuT^PAe>ei^6i.Y wmoQiittu/ i / .
&lf>l-..ANiP fir &p£fiHe>t-B. IC S^f^O-t-o/aAv^L w r h - t Exploratory & Monitor Well Drilling
DAVE'S DRILLING COMPANY

# P R O J E C T N O .
P R O J E C T NAME
DRILL ING. METHOD
LOG OF EXPLORATORY BORING
LOGGED BY
. D A T E DRILLED
S T A T E COUNTY
L O C A T I O N : T R
. . D E S C R I P T I V E L O C A T I O N
. S E C T T R A C T PAGE ^ " P 9
HEAD SPACE USING
(PPM3
2i So
U) 7 ' Ul
! § : < H CO
xfi; U l " * O Z
- l O (LCD 2 2 < > COCO
z 2 B o o
L I T H O L O G I C D E S C R I P T I O N
R E M A R K S
^>C
4(2.
vr"
s-c?
5-5:
^ g "
^:f\m^ ^ M ' / ^ L • hf^/i>i\i). iJ-€>ofi: V --cf^.-^r. <v9i>-«.g f^^eiS-fi; -' ' '^".-^'•jir/O,
fiMve LL v •</ r;f: •• /Qfi.5>u/ »o KC £/ /1; v c g^er'.g/^ 2g^;,4/c^.v<L
fil^)fSll^ S A r W aA£>Mf J, PiP>Pfi.LW •^•/^.g.'rsrc
PgegZ-Y 'SAWfry C')(2AV^U'.\(-P.'^ POO/JL'i iC/PrBL
1/)'! Or.RPA^ ^otr .>^NCi
^£^VElLy </ AAD'. fig.pu;r;. > ff.c/t;hv tpi^^rs^n Uo'^o 6 M V E L /2>6>'>>»vj
Exploratory & Monitor Well Drilling
DAVE'S DRILLING COMPANY
•
•

• P R O J E C T N O . _ _
P R O J E C T NAME
DRILLING. METHOD
LOG OF EXPLORATORY B9RING
BORING. Kin ^ V - . S M W - < g .
LOGGED BY
D A T E DRILLED
STATE COUNTY
L O C A T I O N : T R
^ D E S C R I P T I V E LOCATION
.SECT T R A C T PAGE -^ OP ^
HEAD SPACE USING
(PPM3
<o E O
^ CQ
UI
< H CO
£U1 STUl U l " "
OS
sd CLOD
2 2 0 coco
= ^ s Q ^ _i
z
i 0 0
Ul
5 or Ul
^ *
L I T H O L O G I C DESCRIPTION
<AtlL'-l .^P:A'JBL : U.o-^^r) PPOiyj SOBT^C
^ O ^ n ^.htlD
R E M A R K S Exploratory & Monitor Well Drilling
DAVE'S DRILLING COMPANY

DAVE'S DRILLING 5617W. Wells Parte Road
Salt Lake City, Utah 84088 (801) 569-2000 Date / ^ - / 4 ^ - ^ ^ /
RIG NO. / O JOB OWNER Prnvo C;Ty
.RIG TYPE Fyt;l;nc( wEa NO. f5/?9A_/-2- TYPE /^cn.T^n ^
LOCATION / ^ . - t j / iKe l U
TIME
Start
^ ^ ^
•
Stop
1 r ^ DEPTH
From
w
To
0
DRILLING INFORMATION
R.
79'
Log or Remarks
Xr l<.P^ / I / v . / ^ / ' . / . ) ^ 4 ^ ''vD^^r- . ; ^ r . '
r s - f ^^ ' ' < , ^ ry^^ ^//,^y ^C^V.f"V^-^^' m-c-To y o '
'Xr7:<I7il </ /y^y <^/.^r/ 7< - /?i 7 ^ / ' -
<^4^' Z/7<y&/ / /^r-^^/O' ^e/^7^y^,~7?. -fiy.-^/! ^ ^ -
2 . 0 '
T n ^ T a l l /?co t z - .e^ey i "t -Ai/r? "7^^ ' - ^ '
^ W i^.c,ncre7€. -frr^/n 6 ^ — 0
"fyj ^ f ? i / / <( >r .•/« z* ^ ^ y 7 aJr.TJ?^ /.
BIT
Type
•
Size No.
*
1
STAND BY TIME HRS. Signature of Owner or Representative.
HOURLY WORK HRS._
CASING USED: Size CASING USED: Size DRILLING MUD: Type
R. Used R. Used
Amount
Water G.P.M. Water Static
Fuel Oil MISC.
• 1
Driller,;;^/ U — y y J ^ ^ ^ I Helper I Helper

DAVE'S DRILLING 577 West 3410 South
SaH Lake City. Utah 84115 (801) 263-9099 Date / ^ - i " ~ S y
RIG NO. 2.. RIG TYPE C - P ~ 7 ( ^ 0 0 WELLNQ.f iO-Sl i lUJ-3 TYPE
JOB OWNER _££f lJUf i__i- i -hy-M o h t U i r
LOCATION S a
TIME
Start
y\0o
•
Stop
'
(?1PO
y y» '« y.) V
DEPTH
From
0
' 0 5
10 2o 3o HO 60 Oo
To
Ki <
)0 70 3 0 MO SO ipo
1 0
Hiftni -^f^UL '.
DRILLING INFORMATION
R.
10
Log or Remarks
/»f/50€ ^ foy^ ^ S t o Otrcoi^. r t ^ ^ i ^ «.U.
0 - ^ . ^ r-o. '^^^^ri. Hfoutt «.*^cl S t f u p
©kv * ^ 3 l O ^ . ^ L L 4 l O . . V t a * ' t u S e . ' K ^ -
^ v^cKve U y ^ t r i
PfiBPL J/ <J...c.Gt/.
d > » - c u c L ~^ ^ w u c l y - C . , * t T
^ u ^ » ^ L • < * V - / v - S c . u c i
/ : . „ o^L - ^.r iy-s.^Cf ^ . c r f y t l v c ^ u e L
<C iu«o* ,L y L c y c / s . ' L f
< i v c . t < . L So.v,.ci V s . ' L f
BIT
Type
ftu^
Size
/ /
No.
i
^
<
STAND BY TIME HRS.
Signature of Owner or Representative.
HOURLY WORK HRS..
CASING USED: Size / 2 -
CASING USED: Size
DRILLING MUD: Type
R. Used y V
R. Used
Amount
Water G.P.M.
Water Static
Fuel Oil
MISC.
m f
Driller, / T / T L / . f<pJ/ , X / • ^ < f - ' ^
Helper YH.'iir. Sp>.i^a Helper go()«.-f B

i LOG OF EXPLORATORY BORING
r n o j c o T NO. D ^ I L L E P J M A ^ T J PBr/r^iei^o/J RnBiMn Mn j;v-S»«tA/-5 P R O J E C T NAME R/lVVll~yAJ UH*JDt=-)l,L 1 n r . r . e n av TOK^ £.B£.£./MK.
DRILL ING. METHQO DP-1UL/f)f i-)\IB A - l ^ t p T A l t ^ n"cJCHV6> Q A T E DRILLED 1 0 1 ^ / 3 9
D E S C R I P T I V E L O r A T l O M Mg/gf)/-'!^ gg&^ i^ S.
P A f t P / n p $
S T A T E . .COUNTY.
L O C A T I O N : T . S E C T . T R A C T .
HEAD SPACE USING
CPPM3
Q ^ U 2 0 Ul -^
Ul -1 Ul g. 0.
If CO
^ u i " -
CO
ur
2 CO
Ss a. m
coco AP
HIC
MN
& 3 0 0 E u 5
L I T H O L O G I C DESCRIPTION
£ "
IG.
/r
2^2-
2i3
f<ig/iygiiV ^M/ i j / ) : /^iegy,mgf;/u^. ' ^ i ^ i i r ^ c
rBMLV •6MV^L • 6j(>Ey, ) A A ^ I 1 ) U ) ^ €-OA:.7^/?
^g/yg z:.^^/^;-?^ 70 5?S" yvirv.
/5ieAV£LW </\A)f;' ^ , ' ; . r ; /^A-MJV', ^•\<g^i^ v / f y r r x - - / ^ - ^ : ^ ^ w ; - : ? a o ^ g ^ j y g
^Mve.Li.Y 5,'i.Ty <A/tfr'; p.PnuirJ. (€on^ ^j>/-r / '
PEfiRi^ f.eAvt^u.'i ^AffC: iRa^iiAi-^ies/ pg>?£t/ </?£7ED. g'^wtf f-gfifi l.E5 Tg> t^O Ai /A
^r,R^:ry tovEiLJ <A/^r): fiP.g'^j/J. ^^APl.i^»^ ^.:ffti-£C
R E M A R K S
7 ? t / i i d ^ f i ^ H - ^ l ^ E e^J60y l ^neeEO ^Vi?fi£- Exploratory & Monitor a(-:A;SL r^rhtJ n t - l l ^< r V ^ O . P^N^r^r^TlOri WellDrllling
g*.7tx^«6 6&Tr&)e.r>fE a i^n i -v t i ^"''^. ^ 5 , , ^ - O A V E ' S D R I L L I N G C O M P A N Y

CD Z
CC
o CQ
> -CC
O
< oc o - J Q .
X UJ
u. o a o - I
09
>4
V) 1
>
o
i >-t a
^
^
C\
o I I
^ _J H D -J ^ UJ ; ;
a: S ° O O UJ OJ J 1 -
< a
1
C i .
US
• * J
S
- J
• a
u > >-UJ
1
I I)
'-J
o r UJ I
. 2 h-< 1
1 1 .
I
( (
<i
» < u : 2 2
• H c > O 2 1 IU -» - -
) o = : oc a \. a. c
k
s r",
' • s .
.; r \
• L • •
z o
< O
o - 1 tu > 1 -a .
cc O ( 0 UJ Q
> •
) z 3 O
' o
UJ 1 H
: (-) V
«1
O
Oi
UJ
<
1 -O < OC
1 -
O U l
CO
cc
»-'
z o »-< o o
» - J
2
o 1— Q .
OC
O
CO QJ
O
o o o - I o X
~ l
13A31 IJ3XVM
Nwmoo OIHdVHOOIlin
nonwAs 3ndwvs
S31dWVS
i 3 3 d NI l i i d s a
3 d A i
aidwvs
iNnoo Moia NOI iVUi3N3d
Q J " CD 9
J - (0 3 >-'
IK
5
CQ
• 3 . IJJ •*4
h
...
*..r
VJ
U J s.t.
i-i
V I UJ ..4
flf)
• • " 1
^ •>
^ ?
0
4S
IM ~ i
. . i < 0
U l
- 4
UJ
V l l V i
• ? -—J
U! CL
1"
l i
^ —*
c-,
- *
v>
V
2
" « = l 1 V-'
si •v)
^
QJ Ui >
-5. 3
<
U J <J^
i i 0. t r - ^
<c u QL
V
1 ?>' Cl
'JL5
^
\ :.i
v>
h V >\i ^
l ,J
vn - J -
-v kJ
u I)
1 : «
• > -
' • I 1 *
•5
a '.U SJJ
" 4
- : > •
••.;1
- J
UV u .
t 5
o f *
<,
»-.-
<.i • y, l l
t o = r • J ' Vo V/) ^
1 1 1 1—J~ (
' * ,
o
o 2 •a ^ -o =
Ui 5
CO
:»: or <
UJ (C
. . .
> •
z s s o o o -J
CO UJ
§ Q

i LOG OF EXPLORATORY BORING
•P w o J E S T N Q . n / ^ / U B I t : Irvi iPTJ PBtB f i -<o / i BORING. NO, / - ' . . f - : y y / j - ~
P R O J E C T NAME P;lV\;"=tAJ l A - f J C n U l L O G G E D Rv Tt>V\n B S l O U A i l
DRILLING. METHOD rPlUL-^C-fJ^ A-i . g-V-/>V J?-'l.'/-r///6 DATE DRILLED J O S A B S U L
S T A T E COUNTY
L O C A T I O N : T R
_ D E S C R I P T I V E L Q C A T i n M r ) - f V i <U, £ •'<*^ L
. S E C T , _ _ _ _ _ T R A C T PAOF -3 QPs?
HEAD SPACE USING
(PPMJ
2 t= 2 ^ ffO
2§ aaa
UJ - 1 UJ
a. a. 2 > < H co
r-Ml
U j " -
c z
CO UJ - 1
< 0
UJ-J _ i O a. m 2 2 <>-COCO
o i 2 S 2 S 3 a i ss ZJ
L I T H O L O G I C DESCRIPTION
6 5 "
7t?
linjiL
^f\fJ^^ .•.rfif.r-^ --^f^-A^I-L' 'viPo;uKH ^PfiT^D Pi^^e.V.^'^ r o R f T w i r n .
QfJ^r^^ ^ILV^ £r.!C : ^ i^>:o/ . ; ^ rT^ - ^ X Zi^^r7 6/a4VE^ 5 g % O t > r .
R E M A R K S Exploratory & Monitor Well Drilling
DAVE'S DRILLIIsiG COMPANY

DAVE'S DRILLING 5617 W. Wells Park Road
Salt Lake City, Utah 84088 (801)569-2000 ^Ae /O 'C / . ^C /
RIGNO.y^ RIGTi9^ f y / . J / h C l ^WELLNO. ^ n i f., •'- ^ TYPE hny,,.-7^.;-n^
JOBOVtfNER / ^ l ^ r . <^/ ' /7/ \
LOCATION £
TIME
Start
_
#
Stop
! ) ^ ( / / / / y ^ ^
DEPTH
From
75'
To
(J
•
DRILLING INFORMATION
R.
7S'
•
Log or Remarks
r^.^t;./! rr.~fhL.)/^^"niy^.,yy^' r r r f - c y t y y n y^y^y^/ ^ ( ^ / ' ^ i ^ / / - - ^ " " a f y r ^ .
-T^^-yn : Tt^<.'1y/ f l <,I .Y,c/ '^O' jhy/ -/^r-yu^ TVT '—
^ ^ :
T^/y.'STyi// yr>r>^<f ^^y i7ny \ /7?- •7Vr»/i-7
^ ^ ' - p r y i r n < ; ' f / / n/f^ ' t ' t y t f^ r ) ig• /^ ' t~-p / r 'n^Z,0 ' '~
f i ' £ / n r . / /^y inmyfr -7r<^yi^ ^ ' ~ C ) .
"Ty i ^ I ^ j J < f i i ' / ^ i i ^ ^ /^.,--./^/0/y.7^ytH , '
•
BIT
Type Size No.
«
^_
1
STAND BY TIME HRS. Signature of Owner or Representative.
HOURLY WORK HRS.
CASING USED: Size _ CASING USED: Size _ DRILLING MUD: Type.
FLUsed. R. Used
AiTx>unt.
.Water G.P.M.
.Water Static. Fuel Oil
MISC.
#
i/.r/t^ Driller ^ ^ ^ ^ - ^
Helper Helper

DAVE'S DRILLING 577 West 3410 South
/ Salt Lake City. Utah 84115 (801)263-9099 Date JO' l l -^<:f
RIG N0 ._
JOB OWN
LOCATIOt
7 RIG TYPE C ' 9 ' l o o o WELL NO. S m t O - ^ j TYPE M
ER Ov^nOO c ! ^ ^
4 R t - . Y ) i ^ \ * i I c j - k y d
TIME
Start
TieiO
•
Stop
(ff)3£>
STAND BY TIME 1
Signature of Owne
DEPTH
From To
19
s IO
/s •xo 2 S
3 0
2 6 10
L I S
UO
f/(.U DRILLING INFORMATION
R.
S I O
l ^ 1 0
1 ^
3 0
3 i HO
i' l^o
13
•IRS.
r or Representat
CASING USED: Size /
CASING USED: S
DRILLING MUD: T
ize
ive
1
ype
l.og or Remarks
I c ? c * c l I T ^ ' ^ c c ^ f . ^ M ^ ^ A fiu.^LL pJp-K.
s e t u»Q.+*i» i ' W i ^ r l ^ .
S-fr" u p Aw^cl <i le.*. ' f +« dv-.^LL i ' j K V . t
12. '^
S. c't^y 01 K J . . ^ C L K I V /
1 J
c: l r e - 0 « t - ^ ^ c ^ u J
/rL.lfCi\)<. U 1- £ c » , c /
/•>»»£>«.«<• L r « vwvT*\.4f cl ^ , .
' ^
t «. X ^
t c I «
, ' ^ ^ " V L \ . \
P ^ A L L O V ; L L p . ' p e W»c7uc c > ^ ? ^\^•e
l^nLe.. VOn^k fJVA +Wi» feUjilJfl. p£.£k.'vM^.
' 0
o n ' V Q ^
BIT
Type
l^^f^h
HOURLY WORK HRS. 11 I T .
R.Used 7S R. Used
Water G.P.I
Water Stati(
M.
Amount Fuel
Size
) /
No.
1
1 ^
Oil
MISC.
• i
Driller ./> " ^ *'"»-W rxjfVn . K^
(1 l u L ^ O ^ i ^ "'^'m;r<.Sf,'J.a"* ' ^ p l n e r 1
1

4 LOG OF EXPLORATORY BORING
p n o j c o T MO. . n / ) u i i - e : v\Ar i /n^ Ps. i t i><n/D RORiNPi Mn fN-^r-^ ' iAJ-H
PROJECT NAME f \ M \ J l ^ \ A ) L/ l /JPFlLL LOGGED BY "^'^ ' ^ ^ - - '^>v^ DRILLING. M F T H O n Cfi.lU L./tfi-.1= A £ O.C^'/ie'/ t J ' V,M</^/^ DATE DRILLED ' ^Z - - ; ^-^
STATE COUNTY DESCRIPTIVE LOCATION t l l T T T O DL^.^UAE/l
LOCATION: T R SECT TRACT PAfiP / OF $ _
HEAD SPACE USirjG
(FPM3
Is UJ
< H CO
oz
yo 0. m 2 2 < > -wco
5 z 2 3 o o
L I T H O L O G I C DESCRIPTION
~3
it
r '
/ ^
a
241-
J ^
^e^Ayt^LL / - ; /T : ^^o\/jrJ. fioon^.<:afi7w. (7Wmv) PifU'Ji -AlL lO%A/e.4VEi
^A/JQ^ ^ fAVBL' i ' BtouirJ. r/zc.\\jrA-::otrrs-C
^£4v&i2.^/ <:',^T : 5£guJ?J. ^cj/ i iy ~jr~iC
ZMO'i QMMBL: 8(io\jmOi f^^Divr^. ^pfiTB/:)
ff?^7 f^fJC' I
<l^f-iC'^ fe/PAvgj..- epo\j)t), >V!g/-jL'm .^g^/'-r^^
IF R E M A R K S Exploratory & Monitor Well Drilling
DAVE'S DRILLING COMPANY

P R O J E C T N O .
P R O J E C T NAME
D R I L L I N G . METHOD _
S T A T E C O U N T Y .
LOG OF EXPLORATORY BORING
L O G G E D BY
D A T E D R I L L E D
L O C A T I O N : T .
^ D E S C R I P T I V E L O C A T I O N
. S E C T T R A C T P A G E Z^ofB.
m
HEAD SPACE USING
CrPM]
Z H
< o
a . CD
UJ
< H (0
CUJ
o z
|»H _ i O OL m 2 2 < > coco
— E < cc o o
3
z 2 3 o o
UJ > UJ
DC ^ ^ S
L I T H O L O G I C D E S C R I P T I O N
5£1
4 ^
.- H-
SP
m.
SMflV / <eAV£Z.: hf.'7j)r) pcVB.i' <pf.rEC
A M V B l i ^ ^./l(JC-t P^i^DKH fi.f...T'.u/-J N s n U M ^ . ^ / ^ / )
/ ^ i M V E u y ^ A r i n - P S U l C H d/i iM^rJ t^^LVJf •^cfHiEC
>£^^'^ A / ^ ' ^ I T L - ? A P ' L F <,A;if.
/ 5MVm' / < m ' ' P.£.Cf)li^ P ^ U W ^ A>.^n\JI^ Z:>fi7SC \S^r, f f i M F L ^Z?A/>gg . C ^
R E M A R K S Exploratory & Monitor Well Drilling
DAVE'S DRlLLirslG COMPANY

PROJECT NO.
PROJECT NAME
DRILLING. METHOD
LOG OF EXPLORATORY BORING
H n p i N P , NO fiM-SynW-^
LOGGED BY
D A T E DRILLED
STATE COUNTY
L O C A T I O N : T R
. . D E S C R I P T I V E L O C A T I O N
.SECT T R A C T PAGE v'^ OFv-^
HEAD SPACE USING
(PPM3
<o So
a. 03
UJ
a. a. 2 > < t -co a z
UJ ^ .J O Q. m 2 2 o co-co
L I T H O L O G I C D E S C R I P T I O N
(^CZ P&ftBLV GMM^Ui CfwD ' e^DwtJ, f'^rivn^ CfiCTSC
\o% p fiP.Lgs. -tp*.„ f^tAmfc^ntc^ -ANn -yj,)ca)
S/\lD^ A M y g ) : £ ^ l £ ^ ep.O^Vt) h-fLivA^ -aPT=J.
II R E M A R K S
Exploratory & Monitor Well Drilling
DAVE'S DRILLING COMPANY

DAVE'S DRILLING 5617 W. Wells Park Road
Salt Lake City, Utah 84088 . (801) 569-2000 Date/^?V;^>5r^^
RIG N 0 . / < ^ RIG TYPE JOB OWNER /^ryM^r> ^ . ^ T y
Trerhh^ .WELLN0..£^24Zl_^i^: TYPE /r?r^^.7^r;hp^
LOCATION / ^ ^ t i / f / .V U /
TIME
Start
^ 9
stop
1 y • i:^
DEPTH
From
7<'
To
C
DRILLING INFORMATION
R.
7S'
Ljog or Remarks
t . < t J / / ' r , - fhLJ^^^"^i .^r . . 7 .C>' r.f^^^ "^rry.^^ ryr,e-/ ^ / (P 'U lLnk ^^"^ i^ r - -T;: y n ' Ty<iy- / / </ / .Y f^ f^r r^nr / -A-mtn y ^ —
4^^/' T / I < . V J / yy-ri,^-<y.Loyi-ii^n/t<r' -frr-n-^ ^<^ / - ' -
-z^y Tn-yTd i / l ^ c C t T y ^ f W c n T - f i - c ^ t ^ l 7 . n ' - ^ ^ '
y / / 7 / ' / y.yrnerre'ty.'hnr,,',-, A^—C^
T'yi<i1yc/I ^ f ^ f - f y , / ^ y.^isnl y D M ^ ' n i ^
BIT
Type
,
Size No.
<
' ^
1
STAND BY TIME HRS. Signature of Owner or Representative.
"^/JLT^ft^z £
HOURLY WORK HRS..
Helper Helper
CASING USED: Size CASING USED: Size DRILLING MUD: Tvoe MISC.
R. Used R. Used
Amount
Water G.P.M. Water Static
Fuel Oil
J ^ ^
. y

DAVE'S DRILLING 577 West 3410 South
^ ^ Salt Lake city. Utah 84115 . ^ P (801) 263-9099
RIG NO. 1 . RIG TYPE C - P - l o o O WELL NO.
JOBOWNER Pj-ouo ^v"f y
Date / 6 ? - V - ? r C | (
5 S M 10 TYPE M a p i r h y
LOCATION (?i/>vy U i ' ^eO Le- iAc l ^ . ' L L
TIME
Start
yioo
iH W
Stop
(M
DEPTH
From
0
To
7/
DRILLING INFORMATION
Ft.
yf
.
Log or Remarics
v / l o u ^ f K ^ ' ^ f i ^ c o n i l ^ d ^ l O . P .
c . c f u p o rv *^ i a ^ : L L 4 O ^ i ' v A
1 2 " ( l i .^r.^yicL. 0
n - S ' s . ' L t 4.S.. . .C?
A ; . I C ' S. 'L t 4 Q ^ ^ J
W - \ ^ S c ^ J ^ S .a - f fo ycu^^'L
i 6 ^ 2 0 /5J/,.A0tf i - ^CSMC/ S.A /
2c7 ' ^ S A - ^ . K U t i L - s.^Lf-
1 ^ - S o « > ^ , , ^ / - f i u « c \
3 0 - 3 ^ i ^ . v - 6 . . j . ^ - s : i f
l>6^ ^/o \ . ^ ^ , „ ^ L H D ' ^ ^ . A . O.L HS>'So ^ \ ^ , ^ z ; ^z.^. «^^ "«^^ A f t ^ . j y L -^ c U y
£ £ . - l t O J ^ . M . t L - 4 - "
( cO 'b^ /• - ' ' y ^ ' 7 0 / ' ' ' '
- /o~73 / ' - M
BIT
Type
& . / / «
Size
/ /
No.
/
i \
STAND BY TIME HRS.
Signature of Owner or Representative.
HOURLY WORK HRS. / /
CASING USED: Size 2 -
CASING USED: Size
DRILLING MUD: Type
R. Used
R. Used
Amount
T < ' Water G.P.M.
Water Static
Fuel Oil
MISC.
m ^ ^
°*>y.7 j, fcte^ Helper /V.'^r .<^p:.rLU. Helper

i' LOG OF EXPLORATORY BORING
P R O J E C T N O . t X L l l l ^ ^ : |/\A«E.Ty P B T t a S O N a n n m r . Mn . " ^A^W £ "
P R O J E C T NAME fi/\)/VBVj L A / J D F ) U I o n r. F f. av TbvY\ 9ELCUAIC
P R I M IMP,. M F T u n r ^ O a i l l / p e W g A ] t e iTTAief \ l"0K))& D A T E DRILLED ( ^ / M / ^
S T A T E COUNTY
L O C A T I O N : T R
_ D E S C R I P T I V E I Q f J A T i n M ^AJiT i W B ^ '1^-^^-r^ .U r i l r e . F^)v
. S E C T T R A C T P A G E _ i _ O F i ^
HEAD SPACE USING
(PPMJ
ii UI - I UJ
IS: < H CO
CUJ
oz a ca 2 2 < > coco
z 2 3 o o
L I T H O L O G I C D E S C R I P T I O N
10
2^"
•^S-,
.12:
C l ^ y g y 5^l . r : 6eByiCl4 B/^W/^J^ F)r/E i^HniN^ 'ju^u <n(LTP.f) )n% r iA\i
P E E B I Y S ^ C J D ' SS-IUCV) e.e-C vf J.r ^DWrr. ^emBX>. /vign;um .-yiP.-r-t-Jfl. -or^^ p - ^ . - g -
SMPy ^fNEL : ^ £ £ y . vEfi.Y- r P c n ^ c.c^r.D, r ^ V F PEr.eLZC •% 'Zs rf-tf,
^feAvEL; ^e£y, n^ m-hi cc^TirJ6 (3>-6pmrf\)
pEee iY se^iVEL- ^ g g / F£g?u/;y. p^ /g/»- ^^^r^ •£' /X£ P£:g£;£.^ 7ir V.:">;;-V'
S/ /Vf)y 6P/^Vgl; >$g£y &^O^r^.MU- fcc^^V gcergQ . //?% auryr.T^^ PPPBL^H i , r>.Ofnr
R E M A R K S
Exploratory & Monitor Well Drilling
DAVE'S DRILLING COK'iPANY

i LOG OF EXPLORATORY BORING
P R O J E C T N O .
P R O J E C T N A M E Jif \- i \J\BVJ
BORING. MO •^>viu; < r LOGGED BV lOr^ &S.L^'-^A'^
DRILL ING. METHOD •C./M:i_ >c- . .5 / ^ - /g . ^^CTW^l/ )?"^^^W6 D A T E DRILLED / ^ ^ / ^ ^
S T A T E COUNTY D E S C R I P T I V E L O C A T I O N
L O C A T I O N : T R S E C T T R A C T P A G E _ E = _ O F ^ _
HEAD SPACE USING
(PPM)
II UJ - I UJ 0 . Q. 2 >-< H (O
•=UJ
U j " " C Z
a. 03 2 2 < > coco
L I T H O L O G I C D E S C R I P T I O N
T'OO
--2-.11
^ • ^ I T i T m('
^r
A
35*
4:?
vr
>rc>
^rr
^ '
^yi-b t^r.\ FEfhPiLeA -t^ /Oif^r^
"^AM^ r',/^\IBL'. 6 ^ ^ " / rviBOlv/Y) ^c^fifEO i.e>n,^
SILTV G / L A ^ / B L : P,fi.O\fJN.POOi^-^i' C. 'Tfi ' -O ^ / i r 16 o^ff-BC/'/K fiESSLfjTa 2/ >„.
^MVEL ; ^ £ g / . '//^€VJ>r,'' C^^^-^o<o/uE
f l - ^ ^ ^ eeteu^ 'L -th IO tf<m
S I ^ T i 61^/iVtL • B^D^^r^i '/'•^-'; FOff ---'' <C>I^T^D vEfgy ccHttf^'B -rw/yt/ Aa Zii^/^ ./..•;- -^
^A//?!/ r y M J E L : REOWfJ. n/\B/)IUm <Cfi-T^C. <or,BPF.BBL^ -fe IDr^y^
R E M A R K S Exploratory & Monitor Well DrIllInQ
DAVE'S DRILLING COMPANY

i LOG OF EXPLORATORY BORING
BQRIMfS MO. . O l ^ W - S "
B/\1^)^^^J L O G G E D SY " ^ t ^ B B l ^ U A ' ^
r R O J E C T N O .
P R O J E C T NAME
DRILL ING, M E T H O D T P ' ' , - L / D A V \ J F M ? ^ k p - ^ A f J ^ i l ! ' C ^ i l l ^ ^ D ^ T E DRILLED \ O l ^ ' S ^
S T A T E C O U N T Y D E S C R I P T I V E L O C A T I O N '.
L O C A T I O N : T R S E C T T R A C T PA fig 3 Q P 3
HEAD SPACE USING
(PPMJ a o
UJ - I UJ
< H CO
j rui
u j " -
o
^ ^ 0. m 2 ? <>• coco
= 5 tr a o 3
z 2 3
d o o
UJ
^ cr y < S
L I T H O L O G I C DESCRIPTION
d
7 ^ _
T'4_2<^
6 ^ M ^ l l i ^ f lHO ' 6^D^.N. rMEClUfll CiTr TS^
R E M A R K S Exploratory & Monitor Well Drilling
DAVE'S DRILLING COMPANY

DAVE'S DRILLING 5617 W. Welis Park Road
Salt Lake City, Utah 84088 (801)569-2000 Date/^;-7-?^^/^
RIG NO.^
JOB OWN
LOCATIO
/ / > RIG TYPE z^.; / / ' ;?^/ WELL NO. f ^ /7? c / ' ' - ^ TYPE ^ y ^ . T ^ / n n
ER / ^ . "//X'l ^ / / T /
M / ^ y .y/Vrc. /•
TIME
Start
^fSHi V
Stop
STAND BY TIM El-
Signature of Owne
' DEPTH
From
7 ( ' r '
To
0
DRILLING INFORMATION
R.
7/'
Log or Remarics
r . .< -^ / / I'n-fhLy,!^ ^ ^ ' ^ i ^ y . 2 ^ - ' ^ r f ^ ' ^ ^ ' ^ y . r yeA n n r i ^ < ^ / W h % ^ k
/>'^ ^'/nty^ 7 ^ y ^ ' •pji-^T^.-ll <./ ,Yr^ <y/yy/ -fi-y-ni 7 ^ ' ' —
^ ^ \
T.,^-i7y<ll yr,r , t<^. Jr)eni^n;t>. -hry/n A ^ -
y y ^ '
7 r y , ^ % / / / l e a T y . e v r t e ^ ' f ' r y m P . O - ^ '
ayiyf /^(^nynyf^. T^/ r? ^ '-C>
' t i ' - ,< '7yt/ f ^ r r T y i y i - y•C'/r)/P/yf?y>f^
_
BIT
Type Size
HRS. HOURLY WORK HRS.
r or Representat
CASING USED: Si
CASING USED: Si
DRILLING MUD: T
ive
26 FLUsed Water G.P.M.
ze Ft. Used Water Static
ype Amount Fuel Oil
No.
«
A
\
MISC.
# 1 ^ ^ 1
y / . / •
°*'///.r/^::z:r^ **" Helper

DAVE'S DRILLING 577 West 3410 South
Salt Lake City. Utah 84115 (801) 263-9099
<s: 1^5^
Date i o H ~ 9 H ' ^
RIG NO. 7 RIGTYPE^- P- 7^C?C7
JOBOWNER P m o o r . ^4y
LOCATION r «.v O : * to ' L ^ V. c\ C . LL u,*.^"f
WELLNO. 5 m t o - 4
«-^ VJi - S. U . R r .
TYPEv N W I O M i^itf t* \>
TIME
Start
7 ;dO
•
Stop
^l\-)
DEPTH
From
0
To
7J
DRILLING INFORMATION
R. Log or Remarics
Vrt/loVJC. V^.^du a w c i S t t " ^ U|D <?K 6
n^. M 1 4-oi..»u<. I T " rr .5*.vci . . -<J
6 ' - / ^ ' S / t t ^ S c . c A
/ ^ ' - 3 o ' s n t ^ f Sc.».c\
30*-V^' d ^ ^ ^ o r . L - V 5c..cA
"•l^'LO f j ^ . . . . ^ L >ir S ^ o (
ffO - 1 6 ' OL k-u^ J < L + 5e^ *v c f
VMrt« c i^o*.* Pv rt .''cL. 4rt -** ^
BIT
Type
thJioH
Size
/ /
'
No.
I
4
STAND BY TIME HRS. HOURLY WORK HRS. ie& Signature of Owner or Representative
CASING USED: Size I Z CASING USED: Size DRILLING MUD: Tvoe MISC.
R. Used ^ 7 ^ R. Used
Amount
S t t OvP btN.'\ rit5 PcA
Water G.P.M. Water Static
Fuel Oil
M
• 1
Y Y ) r i A l j ^ ^ P-eXQ/>ioJ>y^ I K » b r »"f Ff. Driller He^er
V-/<'-- •=:

4 L O G O F E X P L O R A T O R Y B O R I N G
r . lO jCG-T H-Q. 0 f t l L L E j 2 > / / o / ? - " / f ^ B T & T Z ^ r J a n a m n MnfiV-^JV^W-^r?
PROJECT NAME R A V v i g y v / L A / V J P P / L L LOGGED BY T . iSgLCUAt?
DRILLING. M E T H O D &glL l .yg£WP A>g g/7TAl?V n 'V jKJM D A T E DRILLED ^nf '&j f i i :
. D E S C R I P T I V E L Q n A TI n N gA-aT /J^F UtA^.^: f h ^ r-Ci'lC .
PAGE / 0 F 3 _
S T A T E . . C O U N T Y .
L O C A T I O N : T. . S E C T , T R A C T .
HEAD SPACE USING
CPPM3 C 03
UJ
< H
co C Z
3^ Q. 03 2 2 • ^ > to eo
g
I cc
o L I T H O L O G I C D E S C R I P T I O N
i
/ ^ .
5 - ^
(c>
zo
zs
so
6/e/it/gi.LV'
(S;e/ v/ELLV
SI'-TY tLEAvgi : <gfe£^, MP/ iUtv s.-^j^T^ro. A/i/ i;;.Mig i3jc£v^ *=9 t' jeAHi.T.Afi..
fiEEBiy 4£Av£Li ^^^y.^l^EQ^UK i:^ft.Tgi)
IlL/^iiiiO.
gfcAveuV $iL.TV 5A/\)f' fteovAjrJ i^/go/y/w. Sgfe,7gi3,S)ur IS ^^^fggWE
5 ; L T V <gfeftv£L \ a ^ v t tBovJt), PPQEL^ Z C C T ^
R E M A R K S Exploratory & MoriUor Well Drilling
DAVE'S DRILLING COMPANY

4 P R O J E C T N O .
LOG OF EXPLORATORY BORING
P R O J E C T NAMP R/>V\ / l g \AJ \ . f ^ t J C F l U L I n r . r . p r . av T . B E l ^ l ^ U A l C
D R I L L I N G . METHOD f i f i )LL / ( ;P \^ l r A-\/L JftntJ.^ I ^ ' ' C J I ^ J / J A D A T E DRILLED / g A / g f
S T A T E . .COUNTY.
L O C A T I O N : T.
^ D E S C R I P T I V E L O C A T I O N
. S E C T T R A C T PAGE ^ OF - 5
HEAD SPACE USING
CPPM)
li S3 a. iD
Ul
< H
CUJ
U j ' "
o z
0. o
< >
O
S 3 o o
L I T H O L O G I C D E S C R I P T I O N
35-
HO
HS
SO
SSL
(oO
^EfieiY ^ M V E L : g/esY efe ?w ). >i gfl)m (S- ig tvvrvs^ .SSCTfgg
g/2)\V£I. ; gEPPl^H 6 £ E V ftfipv^n;, wgii £^gT» fe hAm^ gpi;iVPglO
^ N O V 6^AVEL^> fiEnr-)i^H fteouylV. VEgV iJ jn j t t iX WgLL g,gE-ngO. ANAULAe
S/t>T/ 6e/^vgL ; e£ou; ^?^ fiogai,/ g^ATgn Af;6t;io^g.^:S£?K^y PPA6LFS.
SAMD^ CDWEV $/kTi fiegujr\;j fi>i>kL^ < ^ T ^ 0
3o% AftV tQrP\rr
sm^ iv f a m i au r* , ee-o'^-^f). t-i p-i 'j cr*=7^r> Wn^Ll^V
R E M A R K S
Exploratory & Monitor Well Drilling
•
DAVE'S DRILLING COfvlPANY

LOG OF EXPLORATORY BORING
BORING. N % ^ ' . S i 5 l W r ? ^ _ I n r , r . P n RV i D m B E u U ^ H t
n a i l I iMf i M C T H O n />ie/j&/9-r?aX)C/ ^ / j ^ / A /^ /?Wg^ l?lrt///)/Ln A T C DRILLED l 0 M < ^
P R O J E C T NAME
S T A T E COUNTY
L O C A T I O N : T R
. D E S C R I P T I V E L O C A T I O N
. S E C T T R A C T PAGE -s3_OFi2_
HEAD SPACE USING
UJ
Q. Q. z > < H U J " ^
O S
CJ
t t r - J J C J a. m 2 2 < > w.«
=z £ ^ rr* C5 o p D
7" i n o
UJ
> UJ
cr u < 5
L I T H O L O G I C DESCRIPTION
« •
6^5'"
7^
5|uT^ I AVSL : fi>^gbU/\;, PgoiQ^y g g e - T J ^ /g7f:^'-Ay
^ig-AvELiy <:A^'r>; /g^gUUiVj f-gg)eL' £^p;e jQ S o M g S / L T - ^ d L A y
R E M A R K S Exploratory & Monitor Well Drilling
DAVE'S DRlLLII^iG COfvlPANY

DAVE'S DRILLING 5617 W. Wells Park Road
Salt Lake City, Utah 84088 (801) 569-2000 Date A - ^ ' - ^ - ^ r ^ •
RIG NO..^
JOB OWN
LOCATIOf
4^U") RIG TYPE Fyn'l 's^r, WEU NO. S ) 7 ) U ' ^ ^ TYPE /Tfrm.'^r^J^c^ .
ER /^(-A^f? ^ / t , ' ^
4 / ? A l / f , > r . .
TIME
Start
, ^
#
Stop
STAND BY TIME ^
Signature of Owne
DEPTH
From
7^'
To
O
DRILLING INFORMATION
R.
73'
Log or Remarics
r ^ ^ f l r ^ hLnl<'^^"/)rr . Ttc-y n - f ^ ^ ^ ' ^ r r y ^ y ^ y , j . J ^ ^ r ' y - f h U l ^
^ ^ • ' n i ^ y T h y i ^ y .
'X^/?^ fe / / -^rJ.yr^ <y/y)yy/ -/yrnri ~7 "^ ' —
4 ^ 4 ^ :
T / n f O I / l yt^y/j'<>('. hp / i t ^n . fe . l 9n /T ) 4 ^ 4 ^ ^
7.n' . : Z ^ < l f l l / / f ^ t i i y f /n^ ' / iTSi - i^ - i 7 . ^ ' - ' ^ '
C/ny( y A n y y i ' T Z •ryr^nr^ ^ ' — ^
• : t : M < i ? i l l ^t-vr/ye^^er. /^<^^ynC>/^Zhy\
en-
Type
.
•
Size No.
<
#
4RS. HOURLY WORK HRS.
r or Representat
CASING USED: S
CASING USED: S
DRILLING MUD: T
ive
ze Ft. Used Water G.P.M.
ze FLUsed Water Static
voe Amount Fuel Oil
MISC.
• •
Helper Helper
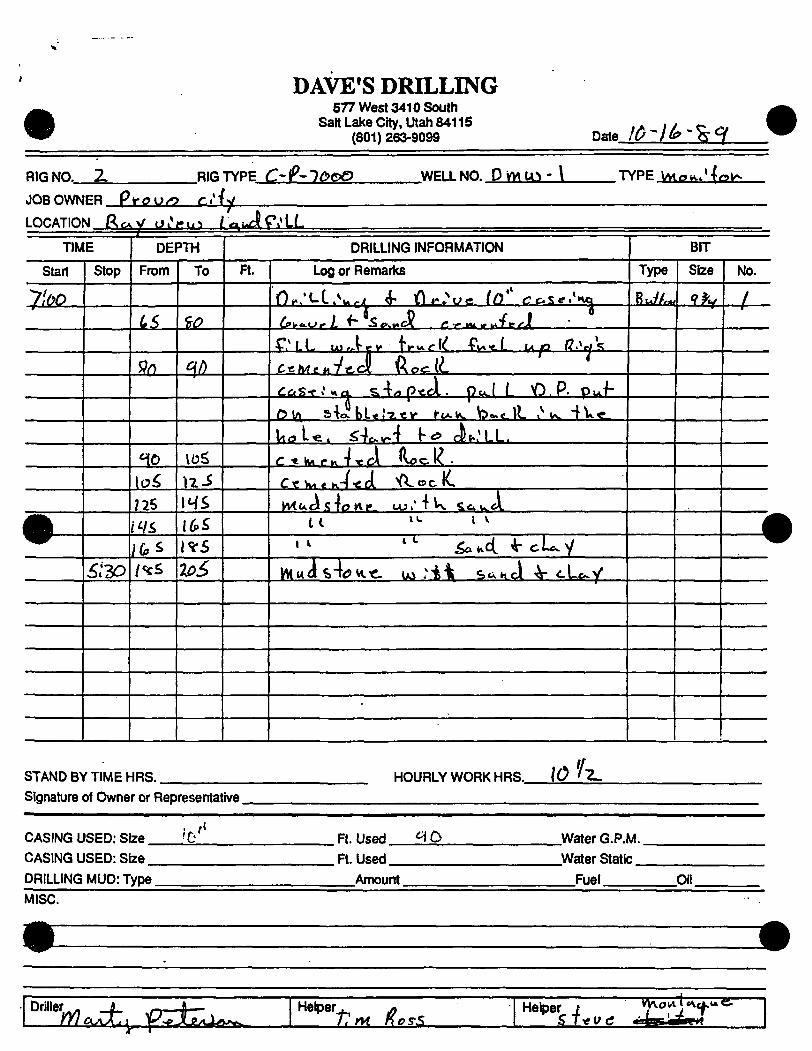
DAVE'S DRILLING 577 West 3410 South
Salt Lake City. Utah 84115 (801) 263-9099 Date I d - l ^ - ' k ^
RIG NO. Z RIG TYPE C - ' P - l O o O
JOB OWNER P y o o / o r . ' ^y
.WELLNO. D WiU^ - \ TYPE \Mo^.'n\r^
LOCATION _R£a
TIME
Start
7l(?0
^
Stop
5/30
>y U l . , . . /^uJr. 'LL DEPTH
From
(,$
^ n
10
l < ^ ^ ?25
l^/S / 6 . S
/«tS
To
^ ^
^ / )
\oS
U-^ ws 165 JVS 2^i
DRILLING INFORMATION
R. Log or Remarics
0 * . . ' L C . ^ U H ^ iH . - . ' ^U* //^*' r c S i r . ' K o
^ k c u O > - i 1 ~ S O . M C V r •.- WU » w T t . / ' v f
C L L uw l r ' ' t>-«* '< ^ ^ ^ i - ^ p J^W' C-cMti / i - f^A iko<z\L
C a ^ f ^ v , ^ ^ \ ^ p x . A . pc^l (_ O . P . p i x f
6»/^ S+ocl>L*J^«v l-i>^^. be . t )L . ^ 1 / ^ - W ^
l ,«=.U. ^4^u.-f \r<» c^K^LL. C « h / i r « - / « c l l l oc ; ! ^ .
C « K , * K - f n : c l V ^ o c K .
H4ud isTo* \ r - u j i ' + W Sc*wA l l I*. I ».
' ^ '^ ^KC( . V c U y VHua s4<?vi<. Ui . ' i 1 ^ 5 ,uhJ I V c L c ^ y
•
BIT
Type Size
'P^V
No.
/
1 ^
STAND BY TIME HRS.
Signature of Owner or Representative.
HOURLY WORK HRS. \oh
1""^..-^^ fdrr.:
CASING USED: Size
CASING USED: Size
DRILLING MUD: Type _
i f " R. Used
Ft. Used
Amount
^ 0 Water G.P.M.
Water Static
Fuel Oil
MISC.
# ' -^^ '
O r S b ^
Helper r ? ^ /? g y ^
Helper t S J-eva

DAVE'S DRILLING 577 West 3410 South
Salt Lake City, Utah 84115 . (801) 263-9099 Dale l O ' l l ' ^ ^
RIG NO.. X RIG TYPE C - P - l o o p WELL NO. Q m tA> - I TYPE yn.^»i'/^k-
JOB OWNER ^ . / . ^ K ^ r f r . ^ ' ^ y
TIME
Start
^',oo
^ ^ ^
w
stop
(nAX)
DEPTH
From
2oS
12c X40
HLO
7 S-O 2>60
3^c» ^H6 3U(? SS-c?
^ICO i ^ lO
^ H o HU> i/s^ ^ 0 0
To
27 c? 7WO lite* i?-o 3 ^ 0 3 1 0
3H^ 2(.^ B^O L\OD
»-|20
^^C>
4I<.D HS-o ^ 0 0
£xo
DRILLING INFORMATION
Ft. Log or Remarics
r i u M L , V . i ^ W yy p<-irt
Vv^uA cAnv i^ 4 c L . s / - <;r.v.cT
c. tA.iv>-r P olr tv ie j .^r t w Wr. r l i o u e l - t \ "
V /
^
lL'£^4c^^ c V i f ^ i l d £X"V 3 i -<:3*
^^^
UL? t«.7 e V- r. V -ecis. t\T 7 3 0
/ V
ujcc-^r V r V * ^ . 1^ c^-\- S O O
Pul . f J O K ^ . L O . ^ P * . .
OcA-t v i r U i S"ftvv"T-rV S> r\ O.^t-fZ-uD
BIT
Type
^if^*
,
Size
^ ^ Y
No.
/
-«" 1
STAND BY TIME HRS. Signature of Owner or Representative.
HOURLY WORK HRS. it-f^^s.
CASING USED: Size CASING USED: Size DRILLING MUD: Tvoe
R.Used R. Used
Anrwunt
Water G.P.M. Water Static
Fuel Oil MISC.
w %
°''"W„7f:. P^lTw- \ " ^ n . U f R l"°^'tH. fe^

-jOTHi- O ^ ^ ^ S2.C?'
• I LOG OF EXPLORATORY BORING
-p^v&d^^M-Ntr. n i ^ i u ^ / P : nA/ifQ-n/ f ^ T t e c o P J BORING, NO.MnfiMIzi . PROJECT NAME P.fl'I^I^VO U/JfJDPJi-l- LOGGED BY'J22l-£.£k^ujidj< DRILLING. METHOD r P i L L / n P i V H A l & P-^A/Z</ )o'c^S)NC> D A T E DRILLED l o l f ^ J C ^ Q
DESCRIPT IVE I n n A T i o M fllO^TTf ^ WHT^IL :-T.. . i 6 0 W/ZK
OFJS.
STATE COUNTY
L O C A T I O N : T R . S E C T . T R A C T . PAGE
HEAD SPACE USING
CPPM] a. (n
UJ
It CO
u j " -oz
lag OL m
< > coco
0
o o s L I T H O L O G I C D E S C R I P T I O N
• io_
is_
ZQ—
zs
BO'
•<yLTy ^BAMti.l'J PBBFiL0<.: Aee^ '-)M hOOEi'J CfitT. fiFPPi^C znVn*^'^ oo'':„'.m-\^L "y-^in-
^^tf-yi i':(--f.'-)r-vu' SAi)t>: &BJ£ i POOPL'f <:!?cret£ pisBBv^ -fe ^jgtt-,-,, i-y - I •:f>-;.£r
PSget-y ^f^tu:-: Racc.:.H fiko-jf-) t . ci'Ji . £e?E.T^C -,<. Pr:FPl.'~ TO r '-i : •• . K i i s f - / - ^ - ' f . ' /T qf'. r^fi-.-
Plgp>?igl % l.rt^^ 7e>% 6/?-<vgt.
PEfiRl^ A^^f.LL' €AW • l?«JDHH i P<?L.jr) focei. tot-tPC ?CP:n f iMv^^
R E M A R K S Exploratory & Monitor Well Drilling
DAVE'S DRILLING COMPANY

4 P R O J E C T N O .
P R O J E C T NAME
DRILL ING. METHOD
LOG OF EXPLORATORY BORING
a n B i M « MO fiV-g>VV;-/
LOGGED BY D A T E DRILLED l l O l t H l O y ^
S T A T E . .COUNTY,
L O C A T I O N : T .
_ D E S C R I P T I V E L O C A T I O N
. S E C T T R A C T PAGE 2 . QF ^
HEAD SPACE USING
(PPM3
H 0. o
Ul
CO
Ul"" o z
- l O Q. a
< > (OCO
ii L I T H O L O G I C DESCRIPTION
^ ^
JD"
ssi
Pgf i f iLV /^MV£LIV f^AWC: Re:DPI6!4 ^fjS'J) N .
P i ^ B V f 6fi»vgM.V 5AyO-. A B C D 6 I 4 B t P ' ^ f , POt^eLi/
P£6ft/W APjonif^LLH <.AMi •• P r c x c r ^ f n o j j r ) . -^'•;•:•-•
^.<ryr 7 ^ ^ ^ .6Mt/s, t . .
Pl^gRiS ••^^Ain- PPr^j^AJ 'A.twi. i ,ntxe,D.Piiif <A/tf)
/<?&^V£i.i.y 6MD:R/ i r ) ' j i ) r l <JJP.LI <.oerr-^,P)n!^ sAtJD (Z-lfivi.,^
R E M A R K S
Exploratory & Monitor Well Drilling
DAVE'S DRILLING COMPANY

PROJECT N O .
PROJECT NAME
DRILLING. METHOD
STATE COUNTY
L O C A T I O N ; T R
LOG OF EXPLORATORY BORING
BORING. NO. M l C n i W j . L O G G E D BY
D A T E D R I L L E D l O U l - y j ^ ^
_ D E S C R I P T I V E L O C A T I O N
. S E C T T R A C T PAQE 3 np &
HEAD SPACE USING
(PPM3
ii a. 03
UJ
< t -co
!ruj o.ft" oz
0 . QQ
Z Z < > coco O O
s L I T H O L O G I C D E S C R I P T I O N
•
1 0 ^
0O
Bs'
9 < ? _
B ^
S M T ) : r)P,CDi6 i fjBovu/^. UUELL LO^THIC.
cr;/;ir - Vyr-LV-JYA --ffrtr .
s A m '. R.^f)D16>ti ke^QjOn. \k)£j.L Sf /^T i fC. !i^irJB.-iff
y^AiKnrurA <nriC.
AJIAI^H^ <./lnr\'. PsrjO\tii PP•:>•))r). r-'onm ^oc-nsr CPi^P^E ^.MD ^i>'/^ Afi£-^S. I .
/fiAVguV s^^)/) •. fisnnKf/ (KP.nM r\. ' it&^ Poo^vj f^-l*^^ ^etiv^O c^Hc^^,^ ^arin H Q l n h M ^ L .
i ' />/ iVguy SAfff) r /i^fi)ni6i4- fi^oMJNi f>pP£i^ ipe-TT^ ^ Z J l x s ^ ^ I W P - y lAAP^Dl^yi^^DMO.
R E M A R K S Exploratory & Monitor Well Drilling
DAVE'S DRILLING COMPANY

P R O J E C T N O .
P R O J E C T NAME
DRILL ING. METHOD .
S T A T E C O U N T Y .
L O C A T I O N : T
LOG OF EXPLORATORY BORING
POBmn Mn fiM-OMW' LOGGED BY ,
D A T E DRILLED IOll''il^Q
^ D E S C R I P T I V E L O C A T I O N
. S E C T T R A C T PAGE *•/ OF ^
#
HEAD SPACE USING
( P P M J
ii Si
Ul
1 5 : < H
£uj
U J " "
OZ
3 ^ Q. OD ZZ o coco
o
S 3 1 8
L I T H O L O G I C DESCRIPTION
I Q 2 _
/ < P 2 _
//£f
//£.
\2d
J 2 ^
<>M0: P.ircr,y,>^ R^u) r . PootJ-'yO/f,-rr^c CO/IP-e CAAil'JF/) ^ . ^ r j c .
ST-r ' i i^coi<H PiLovpr) -r/u-miv/i/E.
(g/Q»Vt5.i.i./ ^ ) u T : ^"B^Jiifi kP-P^JiJtl. tPlf\KeNmj
tU^'f^^VDK,H Beo\it)ti. ^ / / yg £ ^ f J E P .
/!/.ftt/: kl^Z'DI'ilr' B^MJ^i , i-,riE i ^ f ^ l f l ^
J_JL
REMARKS /.rTHfi?/,^?^./ C H A f / f t f i b^fCti^i^i-fiUii
DAVE'S DRILLING COMPANY

• P R O J E C T N O .
PROJECT NAME
DRILLING. METHOD .
STATE COUNTY.
LOG OF EXPLORATORY BORING
BORING. NO. .Ey::Oi22Wd.
LOGGED BY
D A T E DRILLED l O / U ^ I ^ ^
L O C A T I O N : T .
_ D E S C R I P T I V E L O C A T I O N
. S E C T T R A C T P A G E . ^ O F ^
HEAD SPACE USING
(PPMJ
18
a. o
UI
< H (0
o^UJ
O Z
Q. m Z Z < > coco
o z z
5 L I T H O L O G I C D E S C R I P T I O N
•
]30
\ZS
IHQ_
/ • / <
152_
)5f
/?/?;i\/gi-Xy - ^ I L T : P/^..r.i<il^.D-MN . ~ W 5 -
( 2 - " ^ , . ^ ^ rfi/^'/Jff/>
6g»vEu.v ^iL-r: ^AT,=:
/-.Pfiyl^.UL^ C i u r - " ^ S f i f r ^
6ig/V5t.2«/ 6 / ^ T ' ^ .^^^F ? - ^ ^ ^ i.rK-V-
^J/ni.i.u^ r.---T --^Ah^^ l.?*^^3/"'^^5 ~
CfJA-^^i-Vj <:/t--^77?Wg.- -J^^g t r ^ / ^ ' / 5 :
• R E M A R K S Exploratory & Monitor Well Drilling
DAVE'S DRILLING COMPANY

P R O J E C T N O .
P R O J E C T NAME
DRILL ING. METHOD .
S T A T E COUNTY.
L O C A T I O N : T
LOG OF EXPLORATORY BORING
RnPiMft Mn fiV'QMlA/")
LOGGED BY '. DATE DRILLED l /? / l ^ l f i>^
_DESCRIPTIVE LOCATION
.SECT TRACT PAGE ^ QF i ^
•
HEAD SPACE USING
(PPM3
ii H z Q ^ IS
UI
CO
xte C l l u j " -o z
-J o CL OD Z Z <>-coco
O
o o L I T H O L O G I C DESCRIPTION
li'aZ
/ ^ ^
I'^QZ
; 7 5 _
/ ^
j j ^ a
s i i ^ r ^ i D n i B ; ftsmif^H s /^owN.
£;i i . r<'^n^ : > /fe/-7C/i A£..?y v ^P
<:i..T^-rp/i/r ; ^/ii^yg
'^iirr^.io/VE ><^>A'.
/ i C T ^ T f ^ •' €'/l/V.g
^ikT^m^iv^'- ^^fif^i^
R E M A R K S ilLT50f/^J<> VtA'/ H t?m6^B f i \ f 6 Exploratory* Monitor
//v TV.- A'/^hT /A/ii' diE. 6^pc ' j ^ , DAVE'S DRILLING COMPANY

• P R O J E C T NO.
P R O J E C T NAME
DRILL INQ. METHOD
S T A T E COUNTY
L O C A T I O N : T R
LOG OF EXPLORATORY BORING
RnpiNP, Mn ^ V ' C H l W - /
LOGGED BY
" D A T E DRILLED )oh/^lf^>
_ D E S C R I P T I V E L O C A T I O N
. S E C T T R A C T PAGE V O F . ^
HEAD SPACE USING
CPPM]
Zfe
So
C IS
UI 7* UJ i§: < I -co
U j " "
oz
Q. O
< > COCO
Z
. 3 Q O X o
s L I T H O L O G I C DESCRIPTION
R Q Z
/ ^ ^
-LtPO
zo^
CLUHwrJE : < A r / B
Clr i i^^.m/E : •lA^y.^
C\ i H6'wm : ^/i/^ g
R E M A R K S Exploratory & Monitor Well Drilling
DAVE'S DRILLING COMPANY

4 P R O J E C T N O .
P R O J E C T NAME
DRILL ING. METHOD .
S T A T E COUNTY,
L O C A T I O N ; T
LOG OF EXPLORATORY BORING
: «n«.M« Mn f ^ V ' D M W "
LOGGED BY •
D A T E DRILLED / ^ / / ^ / ^ ^
_ D E S C R I P T I V E L O C A T I O N
. S E C T T R A C T PAGE ^ 0 ? ^
HEAD SPACE USING
(PPM]
ii p z Q a, IS
Ul - J UJ
1 ^ < H CO
xte UJ UjC OZ'
o. m Z Z < > coco
s o o
L I T H O L O G I C DESCRIPTION
2£^'S20
I I
C^i-tH^fOt^E'' ^^DPi6H p,/&owrJ, \jtp.i/T^irJB r^Pl/DNlEn, IfJl.Vtli'mD, l y^06>l£N^D\)<,
R E M A R K S , _ - -€2-0 Exploratory & Monitor
Well Drillino
DAVE'S DRILLING COMPANY
•

DAVE'S DRILLING 5617 W. Wells Park Road
Salt Lake City, Utah 84088 (801) 569-2000 Date./^^-7^-6:7
RIG NO. / ^
JOB OWNER / ^ I ' O ^ - 7 /
.RIG TYPE/g?0-/-/?C f _WEa NO. O n O t J - l § TYPE /J fynrTcrruy^
LOCATION / ^n \ /L ' / t r . iK j
TIME
Start
•
Stop
. £ . . . , — r r -DEPTH
From
^ 0 '
To
o
DRILLING INFORMATION
FL
^2d
Log or Remarics
^ / .< , ' f cc l /rdW/-."?^ A e y i i r ^ n r t ? . / y ^
^./-/^... '^;^^' - n
•
BIT
Type Size
•
No.
*
^
9
STAND BY TIME HRS.
Signature of Owner or Representative.
HOURLY WORK HRS.
CASING USED: Size _
CASING USED: Size _
DRILLING MUD: Type.
R.Used.
FLUsed.
Amount.
.Water G.P.M.
.Water Static.
__Fuel _OH.
MISC. ao H-PL k&mj)oim/) m^-t^ ua^^wifiT^a,
r^rt l lar yrr y j t He^r He^ r

DAVE'S DRILLING 577 West 3410 South
Salt Lake City. Utah 84115 (801) 263-9099 Date 1 0 ' / S - S-q
aiG NO. 2 . .RIG TYPE C - P - l G f O O WELL NO. O m U*) - I ' ^ TYPE ynovs ' ^o i r
JOB OWN
LOCATIO^
ER Py. i i \ n r .^fv/
J 1P.C.V .,^eu> U u J ^ ^ . ^ l L
TIME
Start
7 /00
A ^
Stop
s;3D
DEPTH
From
0
0 <5
/ ^
/ ^
2 ^ i j?
To
•IP 5 )0 IS 2 0 I S ^O
DRILLING INFORMATION
R. Log or Remarics
mftouft i(?.v- -T r^w i !DvH,w- l -fo VOT-C^H
t l l f O L i ^ ' f . ) u hrf i T,
hfnu^ 'fc:> nwiiLj-H2 s,-V i^p <i,^A \o A ^ > \ V \ nv.H,.^ J»^'' rc .c* ,*v .d .
hl^A i i , . -M^Lr t rtr-f^/^urt t ov^ , 'M f ) «!,/ov4rrJ
.Cf>.V.L.t , . f . ^ h c 9 'P,>ci vor. f^c; 1 . - u
^ . L cl ,
1 1 CJ. lAo »J ,1. L
S c. ^ o l c\yc*ueL f - Mcf^sFdrtf. cv ' fC C , d
n
BIT
Type
^ M s ,
.
Size
W No.
/
i %
STAND BY TIME HRS.
Signature of Owner or Representative.
HOURLY WORK HRS. i£iL
CASING USED: Size
CASING USED: Size
Q i i ^ ING MUD: Type
' ^ • " R. Used "^ O
R. Used
Amount
Water G.P.M.
Water Static
Fuel Oil
* 1

DAVE'S DRILLING 577 West 3410 South
Salt Lake CHy, Utah 84115 (801) 263-9099 Date i ^ - / C f - % o
RiGNO. ~L n\(^nPEy~Q-10oo WELLNO. V) W L I D - 1 - ^ TYPE y JOB OWN
LOCATIO
ER p v r . . ' / - ) r . I v
O m . ' h 7 J ^
M ft.w ,>.'^u, ' / . . . r ! ^ d / TIME
Start
y.no
^ ^
#
Stop
> . N :
STAND BY TIME 1-
Signature of Owne
DEPTH
From
.Jt?
"^0
^5S
- ^ ^
V.S 5 ^ SS
Lf-^5g
To
3.:^
^ 0
y^ 6o
ss yo
n
DRILLING INFORMATION
R. Log or Remarics
) A j & \ r l n V, C . ' e L f ^ - t L n i i r y . ^ r l ^<D a , ^ f
, ' i <k4^A^ci. J\J IcrM. C ^ L A \ D J^ . ' L / . TJ- J...*(^«L JD'Vo.W.'n^.
Q.-r.A kv, 1.J <j'fo M «. / ( . t t
r t t ^
i t I t
/ I 1 ».
t i l l
HRS. HOURLY WORK HR
r or Representat
CASING USED: Si
CASING USED: Si
DRILLING MUD: T
ive
BIT
Type
« c , / / , ^
Size
7^^
No.
/
i (
i "
s. ,Diz.
ze I C ' FLUsed d O Water G.P.M.
ze Ft. Used Water Static
vpe Amount Fuel Oil
MISC. .
g | | | C c < U c r J ( p v o L ' f ^ r . ^ - f v / yc<irL r.r.Lv^r- rtu-V c< w cO L , . « k ^ J r A • • U « . C u . i h ^ . j ' < i . i
^ W •T>t-<.'cA k M o v ) ^ V i f A t ? . Wv^^l.-.p. 4 - t3 t ^ « - V A . - I ^ " + U .
nrillAr .- ' V ?,ALi.i> H^-fJjuJi-C/ lA / ^ / - T T M . Ky^^^ U a l n A r 1
wi,o.,-f c i / ^ . . e

€ pnojcoT NO. / / M f f X^g;<:vg^^3</ P R O J E C T NAME
DRILL ING. METHOD
LOG OF EXPLORATORY BORING
LOGGED BY
D A T E DRILLED
S T A T E COUNTY
L O C A T I O N : T_ R
. . D E S C R I P T I V E L O C A T I O N
.SECT T R A C T PAGE . O F .
HEAD SPACE USING
(PPMJ 0, 03
Ul - I IU
\l CO
ft: wLi f
0. m S 2 < > (OCO
o z s 3 o o
L I T H O L O G I C DESCRIPTION
^nynPv^^ u/B^^ D&a^\i^ id>v HOAD P.Qj\n-F-i^ P U D P
- p u iTHnLnf^i/:. Lnp^A/zHt^
lAin unr^ t\VJ(li/^jffBLf^ F=OIZ.
rm^^ B^^^]4ou^. DR)LkJ~J? i^^POPCr uJJ i - \ f ^ W ^ -
A,>l.-)Kni)B.£) H&D- iM\JJ)6^JlJ^
-n-t/jfyU^y-cuT j-^^m^.
R E M A R K S
Exploratory & Monftor Weii Drilling
DAVE'S DRILLING COMPANY
•

•
DAVE'S DRILLING 5617 W.Wells Park Road
Salt Lake City, Utah 84088 (801) 569-2000 Date / / ; > .? ^ - ^ 7
RIG N O . / / > RIG TYPE
JOB OWNER A r ^ l ^ C ^ ' A /
frinma .WELLNO. O W t J ' l A TYPE r)iyn/l^r,ntj
TIME
Start
. A .
W
Stop
DEPTH
From
^r
To
o
DRILLING INFORMATION
R.
r-''
Log or Renf)artc8
I l ^ / i < l 7 c l l (^-oar^^- Jr>ey)lr>nn<^- - P r n n - i
^^n '—n Aumo/p) \b/?u^
BIT
Type
*
Size No.
4
^^
1
*
STAND BY TIME HRS. Signature of Owner or Representative.
HOURLY WORK HRS.
CASING USED: Size _ CASING USED: Size _ DRILLING MUD: Type.
R.Used. FLUsed.
.Amount.
.Water G.P.M.
.Water Static. Fuel _Oil.
MISC.
#
Driller / / / ' / ^ / * ^ 7 ' * ^ " ~ ^ I Helper '• I Helper

DAVE'S DRILLING 577 West 3410 South
Salt Lake City, Utah 84115 (801) 263-9099 D a t e / i ^ - 2 ^ - % ^
•
.RIG TYPE y . - 9 ' l O O D WELL NO. H yyl t O - / ~ - g > TYPE V n n . , . ' A RIG NO.. gy-JOB OWNER. •P i>n U O ^ ,* f
LOCATION ft-.^.j.^^o^ l,c.v^C^ p . ' U L
TIME
Start
I'lOO
stop
-/.VD
• *
DEPTH
From
D 6 ID
2C 26 ZO
• \ ^
LIO
V^ 6 5
h ^ - ^6
ns
To
£ io l o 7S l o ^S ' /o IS
SS us 75.
q i ioS
DRiaiNG INFORMATION
R. Log or Remarics
K/(/jf>w. u.^« C w i v i h w » U J " / - f f -/•<-»
/-rt. S f f , . . p < f . . , + ft? J t . ' ( . / _ J- ft..'Of / l? ' ' ^ .M.* . 'v , . . .
f^».c.o^V ^ § . . , A ' <..' I /• < l , i , » r '
' '
I t 1 1 » ^
, 1 1 I ' '
h\iAtV<-reit f .
j v i „c iJ<r i ,<» >/:)•'I'r..^...'hH <k/tf^f^U-f v y '
n^ . ' LL ,^-p^vK V^L«L
iV U J «i 4(? M - t
BIT Type
BcH/H
Size
^ ^ v
No.
/
M i
STAND BY TIME HRS. Signature of Owner or Representative.
w.,-t, f.
HOURLY WORK HRS. ^
CASING USED: Size CASING USED: Size DRILLING MUD: Type _
10' 1 IW
5 3 1 if
if
V i Water G.P.M.
Water Static
Fuel Oil MISC.
w •
Driller " ^ ^ . 1 ^ . so.U,U Helper

DAVE'S DRILLING 577 West 3410 South
m RIG NO. 2 .
JOBOVWERJDi<£.'L'
LOCATION BrW n w.
RIG TYPE
d .A.J 7
<r
i
oc i i I ucuve w i i j , u i a i i o ^ i l a
(801) 263-9099
-P-7d?oO
r^u
WELL NO. Dm oO- / - ^
Date / ^ "
TYPE
2V-
>VlDr.
- ^ < ^ 1
^Aoh
TIME
Start
7/^D
Jk w
stop
3;iD
DEPTH
From
](?^
i? " N 6
l l f i i^S l o i 22S
2VJ ISS
2L-i>
;?7S
7^.s :>'?s ic iJ
To
i2S
H^ \U^
\'kS> l e 3
126
^ H S Iii* i63
2 75
295
^'f,^
.3c^S
3 i?^
DRILLING INFORMATION
R. Log or Remarics
D: .*I_L . ' i , . . l b ' ' / * ! p * ^ VinC te.
VldKrt <itcJt. T-
/ ' ( 1
\ I
I '
\ ^
I V
1 I
) ^ \ c\ L . ' H L r h . ' f ^ f cir..iscL S^ . - . ^ '5
YVl u d < , e ^ f U: • "f k , - , . . , . , v L <,-e -. i*t's
I I . " ' t
, ( ' « ' * / V
( 1 * ' I I 1 1
J Y l u J c T t f r v C l e s s e \ , / ^ v i ' L
BIT
Type
P^M,
Size
^/^v
'
No.
/
i 1
STAND BY TiME HRS.
Signature of Owner or Representative.
HOURLY WORK HRS. i£L
CASING USED: Size
CASING USED: Size
DRILLING MUD: Tvpe
MISC.
i-
FLUsed ' R. Used
Amount
- L U o '
Water G.P.M.
Water Static
Fuel Oil
^W
Driller MJZL^—J&dl ^ ^ ^ [ A I L <.p 'J .LL Helper

DAVE'S DRILLING 577 West 3410 South
Salt Lake CHy, Utah 84115 (801) 263-9099 Date / / ) - 2 < - ^ q
RIG NO.
JOB OWN
LOCATIOf
2 . RIG TYPE
ER p r c v i o r-..^V
c- P-7cC?£> WELLNO. D w u i - l - ( ^ TYPE IT.. : „ , ' l - c r J
J ft.vY . ! . ' * . a« Vc .v .c lC i " 'LL
TIME
Start
7!3to
^
Stop
S'30
STAND BY TIME 1
Signature of Owne
DEPTH
From To
DRILLING INFORMATION
R. Log or Remarics
t r s i (^o»^ U i f - ^ i r v . ftvxiA n . . M L p. 'p«-
? 1 O 1 /* < TL. ^ M A u V V -e i:^ .»\r,- U;c. <•
rtl<.u>.,^u.l i . . . . 4 . , v . •Ar.vu^ ^O ta--^Htf »A . - St
C i A \ . \ V ^ n» . .ML p ' p " ^ " ' ^ >k%7/tr^'
V / ^ if»>U. 1? p t - r . HO ' L / ' h ^ c . e e K .
t<kov. fA p i . r \(. Cvt;irv\ " ^ a C r o Z f S ' t\TVt',.'A.4r
.ir-^.L f .O r t . T L l ^ ' - ^ M ' J^/.L-r >^.'q
FMI^*. / f "f O Oec^yyy. r L . . H . ' / Kntx'e
f/o OwvCO-'-/ -«?^f u p
BIT
Type Size No.
i 1
HRS. HOURLY WORK HRS. l£>
r or Represental ive
CASING USED: Size H ' I Z A L ^ « | / P.
CASING USED:Size H ' U " 9\C ^ C Y .
DRILLING MUD: Tvpe
MISC.
_ ^ 2- H'l ' P.uc. ...p^s
[J.C, FLUsed •? "feO WaterG.P.M.
f t n FLUsed V n Water Static 2 . ^ 5 "
Amount Fuel Oil
^ / ft\, A..4 --^ S'-^^ 10-OC^ - M ;+ u . . ^ - ^ 7 V . 5 ' i
^ n f . ± i . «.v,( ^'^^W.'Uc <.p. u.LLL Helper

• I LOG OF EXPLORATORY BORING
ftfHajecT wo. cf^iLBJ^- i^^f-rV f^^TT-^O/l) BORING, NO.£ i£ iCMd6__ PROJECT NAME f^/iyVIFUJ UH/!//?nUL LOGGED BY - ^ / l ^ SS /^ i /A l ^ DRILLING. METHOD f '- 'P-JTrfSpyi QPII^l CfiPJ^ !0' ' DATE DRILLED J ^ k H M Z Z
S T A T E COUNTY
L O C A T I O N : T R
^ D E S C R I P T I V E L O C A T I O N
. S E C T TRACT PAGE OFN
HEAD SPACE USING
(PPMJ 0. CD
UJ
< I - a z
-I o Q. m
< >• COM
o
2 3 o o
L I T H O L O G I C DESCRIPTION
m
s_
IO
IS_
zo
l-S
la.
6 I IT / 6 f iAveu: 1-16^7 SfiOiU/J f^O)/?/.'
^peiv/;
PEBBL' ^ l U T i UlhUT hP-CUJ!'). \)^(i'J f^OD^i ' X-P-TPX Lf\9/hE rr£SLB^ TO roh^n^.
'z'lurY 6/MVE/-: e>£' \DiO . f 'ppi^y c^ier^C
/))VOV ^ A M B l i hp.^^
<MD^ c a m L : fiyfi^f^ Pcnfiy-^ c - c - ^ f -^y^i ^-P)r^m ryOln^Ml
/• ygAV^UV 6/TVO; ^ P g y ^nnfiy4 y o k f t f i rrv^rv^ fc^.^-rtV&<.,, l oOf C^fAVtL
REMARKS Exploratory & Monitor . Well Drilling
DAVE'S DRILLING COMPANY

4 LOG OF EXPLORATORY BORING
P R O J E C T N O .
P R O J E C T NAME
DRILLING. METHOD
BORING. NO.
LOGGED BY
D A T E DRILLED
S T A T E . .COUNTY.
L O C A T I O N : T .
^ D E S C R I P T I V E L O C A T I O N
. S E C T T R A C T ^ . PAGE ^ QP
HEAD SPACE USING
(PPM3
^5 5d UJ > 2 9 a.cD
% < K CO
truj i i iH 'Jo ag < > • <0.(0
f <| 3 § 5
^ 2 -r o n
> tu cc
S < 3
L I T H O L O G I C DESCRIPTION
5 5 ^
W<9
^5-
SQ_
SS-IO:' OMn^ ir rJE '. ^ew)6U BdoivA). \j A>f fan / pmsf .f)^ rni^f-yr-j^ i/fiacu -l\/:rfr)Ui
R E M A R K S
Exploratory & Monitor Well Drilling
DAVE'S DRILLING COMPANY

P R O J E C T N O .
PROJECT NAME
DRILLING. METHOD -
STATE COUNTY.
LOG OF EXPLORATORY BORING
BORING. NO. fiMiil]£lda.
lOlT-SlP^Cf'" LOGGED BY
D A T E DRILLED
L O C A T I O N ; T _
^ D E S C R I P T I V E LOCATION
.SECT T R A C T PAGE ^ 1 . 0 R ^
HEAD SPACE USING
CPPM] 0 , OS
UJ
< H (0 oz
0. ffl
<>-(OCO
z p.
o o 5 L I T H O L O G I C DESCRIPTION
.. I O S ' 3 ^ OM'i^-fZ^m', (JF-CC'I U 9l?.CW/\). \^A^
F//v£'i^p./i//y&f3, r,ci^^,i\if ijifj^H cvrn ihCi.
REMARKS Exploratory & Monitor Well Drilling
DAVE'S DRILLING COMPANY

DAVE'S DRILLING 5617 W. Wells Park Road
San Lake City, Utah 84088 (801) 569-2000 Date/o-?(r^-^^r
RIG NO. / O RIG TYPE P y ( , l , n C y ^WEU NO. O m W - I B - TYPE ^lrm,'TcrCnCj
JOBOWNER /^/t-^-> C ' / ' t y
LOCATION L
TIME
Start
•
Stop
r DEPTH
From
' ^9 '
To
0
DRILLING INFORMATION
R.
^"^ i '
Log or Remarics
:^<,/:^// r o^lnl^nk^^i''nl^y, 44^ ' ^ Z 4^^ ^'^^r..^.^ y,^^/ -7. h ' y f h/nnk" i ^ ^ " y >yy. Tn ^ r > \ ' r ^y ;< i f2 : / / < r J . y y ^ <y^r7yy - f rnAn 3 0 ' 7 ' -
-y .^A ' T^ji^T?, l l ^ c w / ' « r ^ A y y i ^ n / f t ! . -fn-xI-n
y,<.s^-zo' "^n f^To l i /)r'^t i y ^ / 7 j ^ / 7 1 :/yy->/7i7 0 ^
c r / / W y r i n e h y l ^ -^i^^j-n ' A '—lO
J ^ y ^ T c i i l <(>r-fctr :y. y ^ ^ h t ^ n / y . f / n n
BIT
Type Size
^
No.
*
#
STAND BY TIME HRS.
Signature of Owner or Representative.
HOURLY WORK HRS..
CASING USED: Size
CASING USED: Size
DRILLING MUD: Type
R. Used
R.Used
AnK>unt
Water G.P.M.
Water Static
Fuel Oil MISC.
• 1
"^/yf.'myTzyrp i " ^ i ""^

'• ijFi i j ' i y n oJjjFiii 01 - 02
•••• r. jvct : fV.VM: j - ' . j n i i . IJGH f:u:;;b2r: i ) m t O - I g 03 •• ^ , . - . 04 .? r.nv.ct :: Ur: Date: //- 1 2 - ^ ^ 05 ^3 •" "~ - 06 u7 l.'ell inside diameter: H Y Z IN 07 G3 08 09 Oopth of botto:n: 3 o 2 FT 09
10 . - 7 7 10 11 LGi.uih of orcvel prck: H S FT 11 52 12 13 DiL:-..;L3r of cravel pack: h - 2 o IN n 14 15 i:-?si!rcd Ly: M , . P&T^6£>/\) 17 Recorded by: " d M ^ J M ^
l \ " * ' r%
- c.
•'•3 • J l
- r t •'5 •'. Q
' 7 •••3
-'.3 £0 Cl ; .2 • 3
Color : : ! . ; r
'.::;:::EI;TS
» i . 4. — 1 > f .
i . 15 If 1/
; ."• ' Air tGiTiperature: S ^ DegF 1' 0 • . 1
<\ " j r tnGr condi t ion : f j c ^ ^ y ' .1 ^ 22
' 3 VI; JiDRAVfAL OF WELL VOLUMES 23 24
1 l.'cn Volume J.'ell Volume Well Volume 25 - - - - - 26
•/ • ' • . - ( 1 . . . I ; . r c i - a yi.^x n .i "..'rUr Uv2l f.rior _ i j ^ ^ : ' 28 .9 Tir.-i l ^gin flur.hing jli.3.C>. cL «L 29
30 Tir..2 c-nd flii^.Iiing U^iiD. 30 .il Tir„.3 v.ctc-i- 1:VG1 after 'L7..*3^" _ _ _ _ _ _ _ „ _ _ 31 32 Estir.jted volu.,3 flushed M.) '^l'-aSyD^j_jy^£v^_...lm^im.imM^SMZ. 32 33 t K- /n- Z I ^ S - ' I ^ V S L 33 34 FIELD , '.:;ALYSIS 34 35 - 35 36 l.'?.t6r tc-.,p2r:tUf-e (DcgC) („o -f 36 37 S£r,:ple pH -7 37 23 Sarr.ple conduct ivi ty (f.iiios/cm) j / ^ g 38 39 Buffer before — 39 •:0 ruffer after — • 40 a Cdor tLi.*. 41
J t s aL<sZt* /5 ^ 2 43 OKsvcAcPAienn' l ttO ujn6 rVir vvsvr otFF-icvur fO 45
CUH/llfi l lA/e6> f=fiff>n r?n£ \^fif^ • • 45
sUa-/ c .V__.^ff.j.*:! _wg.?u f ^ v . l L . 1 , ^ 58 (4a.,.'1/1. yt^'gr/ y? ^tK.5'i..<7 g ' f ' f ci-V. 49
;gr:phs of "..-ctc-r sair.ples in labeled jars. 51 52
EI:D OF SECTION 53
Tayvicw Landfill Construction 5-21-89

DAVE'S DRILLE^G 5617 W. Wells Park Road
Salt Lake CRy. Utah 84088 (801) 569-2000 Dale / 0 - 3 1 - S ^
RIG N0._
JOB OWN
LOCATIOf
7 RIG TYPE t r - P - ) ^ ^ C > WEILNO. p ^ t o - 2 TYPE>>^^>,;/
ER Vifi^iiO c A y
4 P.,.^»/.Vw i^^r\-^^LL TIME
Start
I'CO
^ • ^
•
Stop
V/so
STAND BY TIME i Signature of Owne
DEPTH
From
0
€ IS
1&
To
S IS 3o HS
DRILLING INFORMATION
f l Log or Remarks
W\rt \ ;e. n > . x , . . . r l < . . A ^1 p .«- rt
D Wi to - 1
^ v . . ' L t 4 t ) . . \ i e . / / i > ' ' r ^ ? r . ^ , .
<..A t^; ' + ' I's t . « o « / . «^ S c h d
* 1
HRS. HOURLY WORK HRS. ^ /Z_
r or Represental
CASING USED: S CASING USED: S DRILLING MUD: T
ive
^ t
BIT
Type
^-Mfi
•
Size
•v^r
ie I d R.Used ^ / S Waler G.P.M. ize FLUsed Water Static voe Amount Fuel Oil
No.
/
1
« ^
MISC.
^ 1
Driller >l/jtT, g t : ! . . : . . ^ r^'^T?ii^ ff/,.S.'=S Helper S y c r t r i ^g/? T ^ ^ . ^ . - I

•
DAVE'S DRILLING 5617 W. Wells Park Road
Salt Lake CHy, Utah 84088 (801)569-2000 Date. 11- / - ^<^
RIG NO.
JOB OWN
LOCATIO
Z RIG TYPE
ER p v o v f . <L>
C - P 7<CteO WELL NO. O m U-> - 2 TYPE )*«.,' A , *-
f v J IX^ , / .y.^..^ ; L c w J C A )
TIME
Start
lico
ii V
stop
i.r,oO
STAND BY TIME h Signature of Owne
DEPTH
From
V5 .0
To
^0 7<
DRILLING INFORMATION
R.
•
Log or Remarics
Ot.^f L - i n ^ . ^ l / t - )6'' Ci.Sr.^h J
<::i ••cu-r-L «r ^.5^*.c4
r j k t ^ i i e l J S c i i <:(
t . ^ v . p 1 -^-l « ^ n W !.> - ^ / • -r» e Wl l<4 S- '^
,
BIT
Type
Rr#^
1 Size
9¥r No.
1
«
- • •
g f
4RS. HOURLY WORK HRS. ^ r or Representat ive
CASING USED: Size j ^ CASING USED: Si DRILLING MUD: T MISC.
ze R. Used 3 O Water G.P.M. Ft. Used Water Static
voe Amount Fuel Oil
1 ^
\'^nf/..tru PT. Helper w-\ U/L e. rt«5<i " ^ S i r l , K / i I l ^ T ^ . ^ M * *

DAVE'S DRILLING 5617 W. Wells Park Road
Salt Lake City, Utah 84088 (801) 569-2000 Dale / A 1 -5^c^
RIG N0._
JOB OWN
LOCATIOf
" Z RIG TYPE
ER ^Ve\70 c H y
C - ^ - I h o G WELLNO. H w i />%-*? TYPE hi V/h'Tcv-
4 t?ikYn:'*w iL.eH C ' i l TIME
Start
l > ry
^
•
Stop
^AVY)
STAND BY TIME f
Signature of Owne
DEPTH
From
"7^ "IQ \(f?
no ; ^ < ;
160
To
^ 0
I0.<i
no as iSO i i>6
DRILLING INFORMATION
R.
•
HRS.
r or Representat
CASING USED: S
CASING USED: S
DRILLING MUD: T
ive
e 10 ze
ype
MISC.
Log or Remarics
r > v . ^ L l 4 - pw.^oe. ] l f c:<^sr.»»,d
c\ur..y,^ L 4 / - / ^U I f \ \ - <;
CA \,zx «.• L A C O I D V N U ' S
\ t ' «
/ < < ^
r^ . (
IC I f
1 3 L c « u -T l / ^ r l L / tK^ A K CArf/ t f eh , / ? .
loT^nT r o 0»ua. 's c^iiKtJ. cs A /WtLu o u t .
BIT
Type
M<^ Size
<?K
•
No.
/
f
^ i
*
HOURLY WORK HRS. ^ ' /? _
R.Used < D Waler Q.P.M.
R. Used Water Static
Amount Fuel Oil
- OK < V P - I c & n M ^ ^ r . . . ,._. _
Driller m^ itj P " ^ " L a : ^ , " - ^ - t ; ^ /?..^ Helper S / e y e:. h i cn i *^c f , . f I.
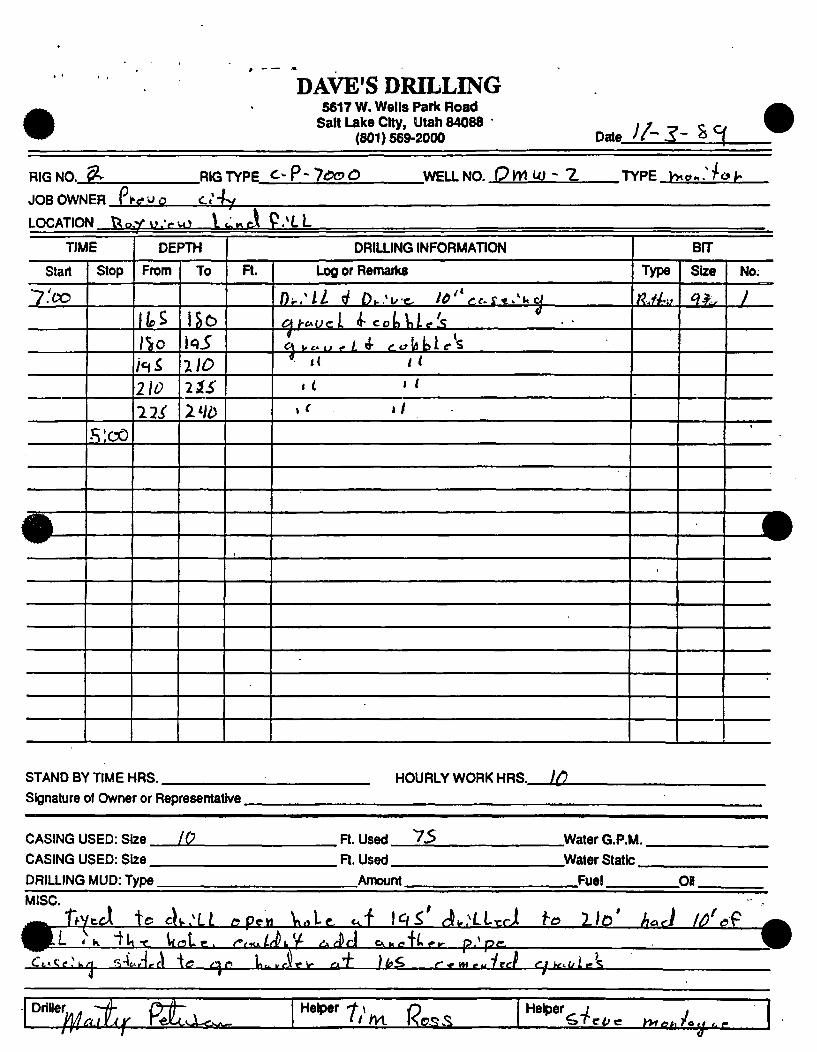
DAVE'S DRILLING 5617 W.Wells Park Road
t ^ m saitLaKeuny, u ian&woe ^ (801) 569-2000
RIGNO. ^ RIG TYPE <l-P-7c5»oO WELL NO. OVYIUJ-
JOBOWNER P r ^ o o C.'-^/
Date y / - . ? - S C( ^
Z TYPE Vve.^.':^o^
LOCATION Ur>.Vv..Vu> I c l ^ r A P.^LL
TIME
Start
7.'co
^
Stop
.s;co
DEPTH
From
(i.S /^o / ^ ^
210 13^
To
i C) i^J no l i s i^ib
DRILLING INFORMATION
R. Log or Renuuks
n . : U i D..'1/t. / ^ ' V . . r * / K c ;
a y c ^ u A ^ coit^Vle'.^ H 1
« i ( t l
U ' I
»r • /
•
BIT
Type
l^.fh
'
Size
^ ^ Y
No.
/
1
i
STAND BY TIME HRS.
Signature of Owner or Representative.
HOURLY WORK HRS. I/O
CASING USED:Size fO FLUsed 1 5
CASING USED: Size R. Used
DRILLING MUD: Tvoe Amount
MISC. ^
^ Th^^cX t c c \ ^ : L i /5peM V . , L t c . f I C j ^ ^ ^ . ^ L L r r i
Water G.P.M.
Water Static
Fuel Oil
f^ l i o ' k^A l/)^^9 \ U p L ^K i U f t r f o L r . / ' / ^ . i / ^ t ' / ^. ^ r J CM. , ,+(,,- . . P ' r * * "
C"i.» <; e.'u/| f^-lc,^..fl i c q n UcurVt-w /-^T l4»S y . ^vM^u i t r r f j ^ . t / i ^ < ; g f /
°>.7t^ Rt. ' - ^ - g > - ^
Helper ' f \ f ) If IVi Kc^S.
Helper C,ic Ot= yyr aa ' ^* 'S '- **

DAVE'S DRILLING 5617 W. Wells Park Road
Salt Lake CHy, Utah 84088 (801) 569-2000 Date l/> L~^Ci
RIG NO. 2>
JOB OWNER "Pvf^iin r . U j
.RIGTYPE P - P - l t P a a WELL NO. D h l . U , 1 TYPE /y f^^ . - l ^ i -
LOCATIOf 4 \ t u TIME
Start
7:on
0
Stop
r . , '
.-f M : ru-) J p r r : • — • — =
DEPTH
From
2^b
zrs
To
2^5 ?7o
n*MrtiJi V . L L lO«ST a-K t u l c L 1 , . K ^ S».. TA E n d
DRILLING INFORMATION
R. Log or Remarics
n . M I . H/i lO' <»p*« K^lft
CevM.nT^-J ly «V »-c^uc L l O . ^ r L P v ^ r f u i ^ e ^ -
^ * h . r L 7 c ! c l C4 f ^ . i ^ L
\ x5 .4 t v - 2 ^ . ^ '
P « u w *» i f c> ' « : . . . . . . I S O <41^ -SU^ll
/ ' l u . ^u i f L p.^^ U 4/0 2^/S Ci.o,*i Z 7 0 *
^./•ffow, o f M** .• . .^r .*K«i / S C . 4 : 2 i l 0 /
BIT
Type
f McH
Size
4^^
No.
7
<
tf H
STAND BY TIME HRS. HOURLY WORK HRS. la. Signature of Owner or Representative -
. 1
CASING USED: Size f i " S c ^ <.«; n. CASING USED: Size "/ " ' - <' ' ^ DRILLING MUD: Type MISC.
R. Used U . ^ FL Used 1 1 O
Amount
Water G.P.M. Water Static
Fuel
IS 2 3V'
Oil
^ 1 ^ --- ^
Driller WiiJh . p S f e g ^
Helper-f, i^\,\\ WC':.^, \AA' U » C n . ' M ^ r L L
Helper i . ^ C ' ^ l ^'UC'.^f>l -•!'. Li-SL.

LOG OF EXPLORATORY BORING
P R n . i t r n T Nn y^OlLLF^ , ' A^/lPTV p r r r P P C O / V R n p i M r . Mn P , \ ! ' n m W - Z .
PROJECT NAME LOGGED BY TD/f. f \FiyM/4iC
. DATE DRILLED DRILLING. METHOD
STATE COUNTY
L O C A T J O N ; T R
_ D E S C R I P T I V E LOCATION
.SECT T R A C T PAGE / O F J ^
HEAD SPACE USING
(PPM)
•
2 t
O. 03
< I -a . II
Q. CQ
< > U-O)
o
z
. 3 Q O s LITHOLOGIC DESCRIPTION
S''
IQL
za^
2 ^ ^
M:
Cz/l-ygy ^ytT; y&LiovjiiH- tPr-'j-jtK '.i r.uCry.T -
^ i k T : 6<eg fieff^/^i wv-Li- •:?/>T f: ^ upu P//t/f x/Ft-i- r^/erf^n
V (iO 1/ PINFAPfi Wi=/:- , 1-// '^ n)&
</ i f rY^tssuc ' -^P^-^ .•^^£fiiv i:^yT^x) fi/>jB-r-,fixinEC
pgeei V 6feA\jgLi / >=i/ pg/7£W -jg,e7gz;
ff^r/
P^fiftiV SAA>0: gggujrJ, »ogt?>eiy <.pe.rS^C, r tn^Mv^ 5Hrm
R E M A R K S Exploratory & Monitor Well Drilling
DAVE'S DRILLING COMPANY

# P R O J E C T N O .
P R O J E C T NAME
DRILL ING. METHOD
LOG OF EXPLORATORY BORING
BORING. NO. B V - D V A W - Z
LOGGED BY
D A T E DRILLED
S T A T E COUNTY
L O C A T I O N : T . R,
_ D E S C R I P T I V E L O C A T I O N
.SECT T R A C T
HEAD SPACE USING
(PPM)
PAGE _Z^0F_2.
Ul
< I -co O S
13o (LO 2 2 < > coco
z 2
, 3 o o s
tu > IU
I - I cc IU H <
L I T H O L O G I C DESCRIPTION
Bd
4 ^ 2 _
.. '^^J
: ^C?
SS
hCT~
^UMfAL"^ p£^p>p<:.'r^/^&'/ / /:?g;.> ccfirr/: \ ) f r& l / (7 ni^P-^ f t P^ r f L r ' < . - -~s i-'P.^'A'.
SOMBll^ CgfefiZ*/ fi^/JiQ: ^ • ^ ? / i . •/•-/: P^/^^.^ r^/r-Tr./:. ^<^-luyK<. r>A^ .>,- >/r.f-.<;;=j V^^gfti-
^gjiv;^nV gp/jpip^.-. Mf»g.v ^^^wa*/ r-/x,:^^^ T "
C O m - i f - T-TiP.P-.ir^t -tf-i C-J^/z-yVv. P-.cirff t lS^L
£M£lJ_ ^fcVEUvg£&f. kVl /l;>^^ £gf^T€/?, d/gylig .f
fw-g>.>>' fi ff.'irn r;p F)/g-S -rov ' r-f tfejiFi'fe-sg>v>v
m & L J ^ M i ^ U i 6/\i1P: CiBB' . Pi)o/^i -^^^J^P
R E M A R K S Exploratory & Monitor Well Drilling
DAVE'S DRILLING COMPANY

PROJECT NO.
PROJECT NAME
DRILLING. METHOD
LOG OF EXPLORATORY BORING
POBiKir. K.n BS-tht^VJ-Z
LOGGED BY
DATE DRILLED
STATE COUNTY
L O C A T I O N : T R
. D E S C R I P T I V E L O C A T I O N
.SECT T R A C T PAGE ^ 0 F _ 2 _
HEAD SPACE USING
(PPM)
ii is 0, m
REMARKS
lU
< H «0
xS
Q Z
0 . OD 2 2 < > (OCO
5 z 2 3 o O
L I T H O L O G I C DESCRIPTION
hi
n o ^
7 5 _
^0
et
31L
:geeiV h^^^w- ^fc!/ hKgr;iy/H tmrjrz- O)
PB&Bd nPh'l-~-L: c,(!!. -J. f,B.r.i'J/-- - : - • ' • - ' L $£?"/<, Pfi-^eh-c, -i^^-r^,..^ Al KfZl ? - ^ A , ^
f^jqez.^ feeftN&.L.- ^iP.gi/ M/ie r/i.7/v rr-^r.^-SD. /<?y/7 pg^fiAFd fe 3g>rw. iifi/^lr-L Z- ' aW^.
10% P'.h&^jy -& r ' h i.
< i>ti ' \P . (^^Bl^6Ai-'C ? e .'-frBP-Ovfi / , - r / ; ' / t:>->-r:r
Ir-Vr^fimrL SC^'y f~6e ;J ' ^n^-~ . r : - . r . .
j^fiBLH ^RTic^ 6i:,fi1~-L- "T'T'-'-f:- cp'<;rJ, i-:r6e>-r-s
T-o^r, -g ^p;*-i'^ .c/wc to'^i,
Exploratory & Monitor . Well Drilling
DAVE'S DRILLING COMPANY

P R O J E C T N O .
P R O J E C T NAME
DRILL ING. METHOD
LOG OF EXPLORATORY BORING
• BORING. NO. .£i=£liUJ4iz2-LOGGED BY
O A T E DRILLED
S T A T E . . C O U N T Y .
L O C A T I O N : T .
. D E S C R I P T I V E L O C A T I O N
.SECT T R A C T P A G E J L O F . ^ .
HEAD SPACE USING
(PPM)
is & CD
IU
! § : < t-(0
lU""
az
< 5 ^ eta 2 2 < > COCO
L I T H O L O G I C DESCRIPTION
d
ICO
)0
I I Q ^
lit
\20
f£.66kS ^Ptii^ixi 6ArJc kP.Pnn FCOPI-' yi>ni^V
^ f t B i ^ y^PAVgyi-y ^iinc.-&^.ovjt)j Poofi.\Ji yi?e>rT£>, \lP^nf^r-fT-9ir-s ia •'"Qf^f JiP^i^j^fiM^'J- >frr,.-.' ',vti
Kreei^ «A7i-/giw c„>iL: kttvix)ti (-7opyi c c ^ r ^ c tc r la fiF6euki' i S ^C'^ '^ . 7 ^ f n ^ f : i U . - 'UB- -A//r.,
\ 0 h P f b m - t i r ^ ^ . ' A , SpfffijifVSu.., w >:r./m i htiP
0£y^^;-^ f.PK'^li^ LU^ ^.ArlC :P.BO'/y() r < 9 f . ' y ' C - ^ i ^ ^ .
lo'fr>Pff.6(-f^ 'h=i^O^>^,2C^nl-cA-lt;. r ,= , / '>r Cti''(.
PBEBL' ^pft\--/-iV ' .n / l t • fJi .P- jr >.':':••- :-r:rz '-f.'JC
''' 'i^-f-fjurri -j-^^A^'/g- / 'v- y-'' 'J*- -'..-iffP •
^ ^ i -
m R E M A R K S Exploratory & Monitor Well Drilling
DAVE'S DRILLING COMPANY

LOG OF EXPLORATORY BORING
. a n o m » Kin P.M^rYAMhl
LOGGED BY
DRILLING. METHOD D A T E DRILLED
P R O J E C T N O .
PROJECT NAME
STATE COUNTY
L O C A T I O N : T R
. D E S C R I P T I V E LOCATION
.SECT T R A C T PAGE ^ 0 F . $ .
HEAD SPACE USING
(PPM)
^S 5 3
f l i z ? 0. O
IU
n (0
U j " -
az
Q. CD 2 2 < > coco
o
5 3 is
L I T H O L O G I C DESCRIPTION
115-
I^O-
i%£^
tHQ__
I ' i ^
)So
pK&ftLV 6/anvguy ^niv •• ^r^V-'i pop^y^ <^OF:ISX
/g^^p&Afi^.K zp^ '^^enm / ) r r j y . - u ' C .
P^BPiH ^SKryu-' . tATic: P?-DDfAff t pQvfJ 'J-ZU £rn-r-/> »^^grf/l;)^^.• ci^HD lt>%("^BHiS:^ i o n 4>'</-:
/ ^ M ^ n ^ <sfJD'. ^H^^i/tll- t.PDmJ J s-riOHi tiyTV£ \ifc\f a.onr-ir' •< Afir , lo^..-. -C/>fVfe//j -^ - ^
p^if^u^ 6f>^y^^y </\f')rr. ,-rzT'--.> . .•r.v.-' ,,rC:'J>^ CClirr) h.':r->ri^- .fii')r. •' 7;--t /.-' "> V-'-. "•c%iJ>nf,
PEBBLi hfJA^ lVi 6firtD: l eW)6f4 B.P.OV)rJ. t/gU- <,LfPj / P^/NE -L/ViL. ^ < PBAfii-E .-iS ^J.M , /otAJiJI / i^L
R E M A R K S Exploratory & Monitor Well Drilling
DAVE'S DRILLING COMPANY

PROJECT NO. _ PROJECT NAME DRILLINQ. METHOD
STATE COUNTY
L O C A T I O N : T R
LOG OF EXPLORATORY BORING
_ « _ _ BORING. .NO. -S l i ^HH^L LOGGED BY
D A T E DRILLED
. D E S C R I P T I V E L O C A T I O N
.SECT T R A C T PAGE 1 r i t : y
HEAD SPACE USING
(PPM)
Ul
< t -co
tUJ Ckli Ui"-
o z
CO
a . CD 2 2 o coco
5 z
o o L I T H O L O G I C DESCRIPTION
led
i9e_
. . / ^
7«t?
ZoS
z-\o
<yiy\^rz.
frf^T.
y
5KIHP
CPM^VLM 6Arin '• >;>so/ijf6;A ftfep'^r; ,'.g/?/i//h i i i ; ^ ^
P - l N ^ - ^ i^S?.frJ>^ CSf/C.
R E M A R K S Exploratory & Monitor Well Drilling
DAVE'S DRILLING COMPANY

PROJECT NO.
PROJECT NAME
DRILLINQ. METHOD
LOG OF EXPLORATORY BORING
BOBmG.uo. M z i m t ^ LOGGED BY
DATE DRILLED .
S T A T E . .COUNTY.
L O C A T I O N : T.
. D E S C R I P T I V E L O C A T I O N
.SECT T R A C T PAGE _ ^ 0 F _ 2 _
HEAD SPACE USING
(PPM)
zt=
H a. ffl
Ul
1 5 : < •-CO
lU"-
o z
CO !ijd 0 . 0 2 2 < > coco
1 3 Q T *
5
z
3 Q r j
or " t 5
L I T H O L O G I C DESCRIPTION
2.1^
I^'KT'
r i ^
-ViO
'o<r
7*10
f,tt^^^-yi ^Ktlt 'tirr!'i> B^V)/. •.o7-:' '.crf^-'
A£<l /g•^^^-V ^. f i t iP; Pz-npyA'' ^P. r^uf i yi-i.rr')h^
c. n ^ . ^ 1 g-•/!*•-- ^ f i ' n ^ ~ .?^o ->JA:r-.
<mt
Pifp.(^L^ < j \ r H \ r ^ t t P i ^ n pK te^ f i , pi::o(^i-'J Cirf>--m.-
h f n \ J ^ -'.fitit r^.^^C A?/a6A^-'-^ - /P* / ^ .
/iwt'i Pr^fifik^i: fiiroGieil BPPfjjr-i cacnH 6iPC7^ij
R E M A R K S Exploratory & Monitor . Well Drilling
DAVE'S DRILLING COMPANY

P R O J E C T N O .
P R O J E C T NAME
DRILL ING. METHOD .
S T A T E C O U N T Y .
L O C A T I O N : T,
LOG OF EXPLORATORY BORING
BORING. NO. J S V I O M T L
LOGGED BY
D A T E DRILLED
. D E S C R I P T I V E L O C A T I O N
.SECT T R A C T PAGE 3-of$.
HEAD SPACE USING
(PPM)
zfc
<o
(L ffl
Ul
n CO
Ett UJ '^2
0. ffl 2 2 < > coco | 8 | 5
L I T H O L O G I C D E S C R I P T I O N
Z4f
750
TSS"
Z(sO
lUS
^H R E M A R K S
(.flttJ^uH Uiit\'-kErt.)^.u B^POij)fJ j.-i A!U/v\ 'J2£ML •mr , ' -zi^.v ". o^T ••-,•//••••-;•
V
^Y^n E
^Rywe
I
<AM!
' ^ , /5 /« . ! -
Exploratory & Monitor Well Drilling
DAVE'S DRILLING COMPANY

•
DAVE'S DRILLING 5617 W. Wells Parte Road
Salt Lake City. Utah 84088 (801) 569-2000 Date •^'•- / / - ^ ' S r ' ^ i
RIG WO. f l ' fO RIG TYPE.
JOB OWNER Pj-r^y'r / * . ' t y
/ ^ ^ , ' J / n ^ l WELLl\Q.O/] '1(.J-^.-Z- TYPE /^v^/t / i^/- .v..
TIME
start
yco
Jjr^n m
7.'CO
Stop
9fCX
^rc
^/rn
"NC-'-V/ l r , f I t /
DEPTH
From
.
To
DRILLING INFORMATION
Ft. Log or Remarics
/ / - ^ ' f ; n r < A /^..ryirsA t ^ ^^ y>,. Ay^Jy D ^ l - ^ - U -
• P r . , ^ ' ^ A ' - n . ^ < 1 7 A l < :v . r¥r^^y
Cci-np/ift^t..,
a ^ ^ D/r ) (J '7 , .:Xl.<^t.il I'r f-h / y i Z - t l / i ^ i ' r - S ^ r t ^ A ^ . a n ^ l 7J-P S? 'y-.Jr-
^ ^ " y ) U r -Tn ? . ^ Q * . ' • r n K ' l 7 . f ^ , . n r f
ffr^^^ Z 7 / ' ' ' - -? u y \ ' . '
/ /- 7 S e t c y m p , h,-q rrr?^ I Jn i ' .K^ ySii / y j ^
r ) M L f - a . i ^ . r , J ^ l t y . . . - ^ / / - T C ^ - Z i ^ y ^
An:
/ / - ^ - / 7 M ; < / y^y^y/-r^,^ y i i A^/,^ f ^ ~ ?
f m y i A ^ ' - / I ."fnUa l l -Sot-fa^^^ -Tc*/-*,^.
\ l lc t i - 1 Av<.- j^r j 7 ^ y - A : i h , V / '
/2-i'eJyy>e A y / y < 7 r ) C ? - C ^
BIT
Type
/O^
/ c
/r^A
Size
i
f^^
' ^
No.
«
^
4
STAND BY TIME HRS.
Signature of Owner or Representative.
^r^^Zm^
HOURLY WORK HRS..
CASING USED: Size
CASING USED: Size
DRILLING MUD: Type
* FLUsed ^
RUsed
Amount
Water G.P.M.
Water Static
Fuel Oil MISC.
41k tf • . f y i / .
f /
Helper l i / in / \ y i ^ ^ " ^ <t^'y y^..,.<t,...
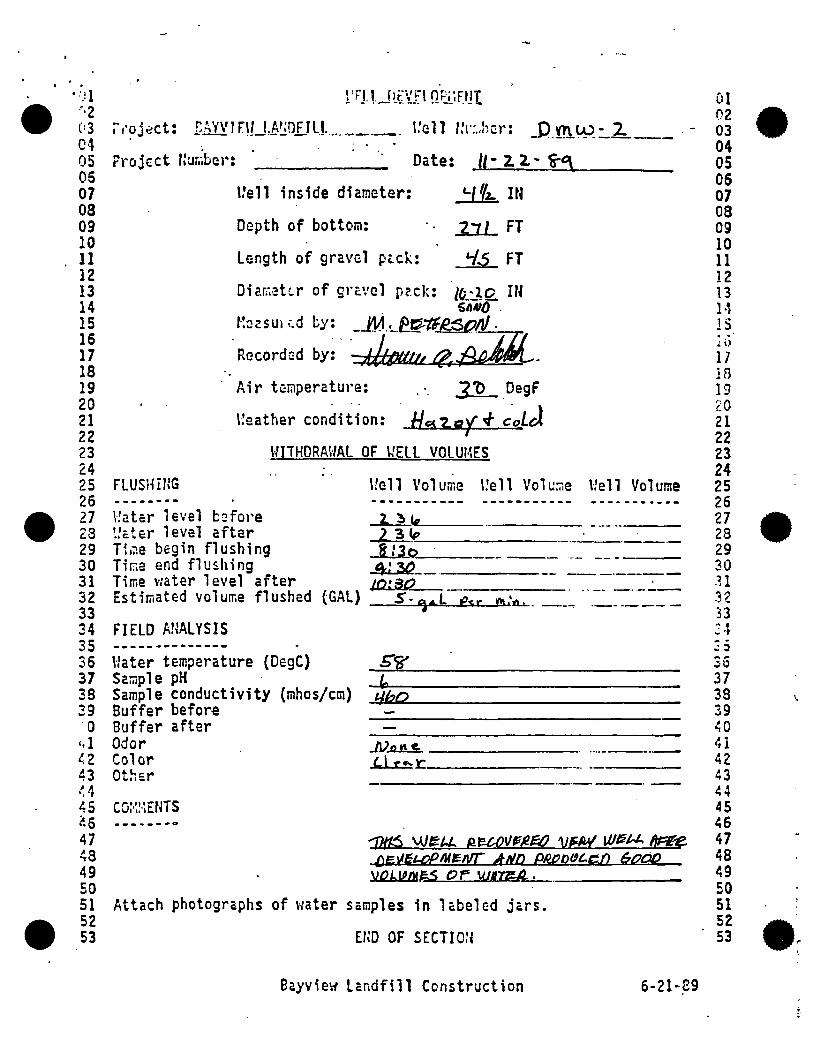
•••Jl •2 ('3 C'l 05 05 07 03 09 10 11 12 13 14 15 16 17 18 19 20 21 22 23 24 25 25 27 23 29 30 31 32 33 34 35 36 37 33 29 •0
',1 <2 43 -'.4 45 f.5
47 43 49 50 51 52 53
Vn.iJirVflOfinFMX
rroject: BAYVIFUJ^A^nnL.!. .. i.'cll f:i:.-,hcr: _Pm.VP:L2^
Project Kur.-,ber: "__ ' Date: //- Z 2,- < ^
l.'ell inside diameter: H L IH
Depth of bottom: 2 1 1 FT
Length of gravel p i c k : H S FT
Dian-.atcr of gravel pack: l ( ; 'Xo_ IN
Ksasuicd ty: _JVi, ^ X S ^ P ^ c H •
Recorded by: ' - : ^ l / p t / j / , ^^.
Air temperature: ? T ) DegF
Weather condition: / ^ c c ^ - e / ^ c o l A
WITHDRAWAL OF WELL VOLUMES
FLUSHING ' Well Volume Well Volcn-.e Well Volume
j L ^ \ t .
X^k. J . XLlo.
V.'ater level bsfore Water level after T1.?.e begin flushing lice end flushing o \ z o Time v.'ater level after J £ i l 3 £ 2 — _ Estimated volume flushed (GAL) ^'-^^L p<,- >H.'I,>. FIELD ANALYSIS
SSL Water temperature (DegC) Sample pH (. Sample conductivity (mhos/cm) t^ho Buffer before -Buffer aftar — Odor Color Other
JLLc-£.
co:'::;ErjTS
-7?^ w^/.i f i .tx^\i i^fiW M ^ M Wi^p^ ftpe^e. (^e. Bu)P/\ii£nrr AND PPDnoLcn e^oop
Attach photographs of water samples in labeled jars.
END OF SECTIOM
01 02 03 04 05 05 07 03 09 10 11 12 13 14 15 lij
17 1 8 1 9 ?-:o 2 1 22 23 24 25 26 27 23 29 30 n 32 33 34
CO 37 38 39 40 41 42 43 44 45 46 47 48 49 50 51 52 53
•
Bayview Landfill Construction 6-21-89

DAVE'S DRILLING 5617 W. Wells Paiic Road
Salt Lake City, Utafi 84088 (801)569-2000 DaleJhMzlS-
RIG NO. 2 - .RIGTYPE C-P-yoocD WELL NO. d v ^ U i ' X .VfPEJoLiJulhj^ JOB OWNER p ^ ^ o o d a . H ]f
LOCATION £L
TIME
Start
7!oo
#
Stop
5;co .
*
:^/ v.' e Wl
DEPTH
From
O
^
iO f.f? ?o 2 5
3 0
y^ i O
7^
To
,5* iO IS 2 0
2 5
.20
' • l ^ ^ 0
7 ^
^ r : >
..uci^i.^LL
DRILLING INFORMATION
R. Log or Remarics
S C j f u p rt*l O r K W - ? c i r . ur/ tL ^ . . V
' f i . ' i i c rS f5*^ Vii'rt. i - ^.*,iM.p.
>/c..-( / f t ' ' ^ d . « ; r . > u d .
m<xKe Cl vcoft.!?! sl,t>«. t b / u t . 0^;^ / . f n^.N.,- /O" c t . w / . . r i
fi^.r-fTML ificrJ^ f.^LL
a.hs.oc^L clc.V J- Sct^J)f f i . ' l ' t
OLV-c**'gL &c^v>ol C C J I D W L C C
c ^ t - a t i c L S"»AcA C c j t b l c ^
a i . « . t > e . t <;»t.vid C ^ l o ^ p i r ^
« . i . r . i ; , - L ^«xl«cV < - o t ) ( ^ l t S
4 . ( . ' ^ ^ <J I «. • \ V V \
BIT
Type Size
/?^^r1 ?^V
No.
/
«
1
STAND BY TIME HRS.
Signature of Owner or Representative.
HOURLY WORK HRS. in.
CASING USED: Size
CASING USED: Size
DRILLING MUD: Type _
/ 2 > ' ' R. Used
R. Used
Amount
Water G.P.M.
Water Static
Fuel Oil MISC.
rite M % 4
° ,M.7ti, pSFzL^ r ^ ^ / / . ....J.iL 1"'^

DAVE'S DRILLING 577 West 3410 South
Salt Lake CKy, Utaft 84115 (801) 263-9099 Date U ' 1 ^ - ^ ^
RIG N0 ._
JOB OWN
LOCATIO^
)_ RIG TYPE <
ER P^-rtfio r J ^ f
J. R^^v' i;-**- «^ TIME
Start
7.'oo
%
Stop
= '!'>0
DEPTH
From
'\o
166 \ 2 0
S6 ISO l u i
To
los Ho Yl.6 ] i D
IU5 )&c
. Ic^*'
C - ? - 2 0 0 ( D WELLNO. 0*«6 ' ) - 5 TYPE iffc>ur'^otr
JIOAL DRILLING INFORMATION
Ft. Log or Remarics
O K ' a 4 n.. ' i ;« (O'^ ccSr'.'s.cL.
C A V u i J - c l 5c^^cX C.-oV) V > l t r S
e4 Vt.^<j^l. Af^wvpl f o o l L c i S
c v V-^ W «fL 5 u weX c t j \ o l o L < : S
0\: , . . , - rL S.^-<( /-CJU k l e i
M l , c ~ u < - L .SowcA C c s t o L e . ^
( ' 5 p c l . V f ^L / - . U i , , . , _ - i L Cc f * , r -KcCX i / ^ , - h li/tfj;
BIT
Type
TSMTA
Size
W'4
No.
/
g %
STAND BY TIME HRS.
Signature of Owner or Representative.
CASING USED: Size.
CASING USED: Size ML
HOURLY WORK HRS.
\ '-*-r,^7rf.^.^.
FLUsed.
FLUsed.
7.S .Water G.P.M.
.Water Static.
DRILLING MUD: Type Amount Fuel Oil
MISC.
4 1 ^ ^ •
"^i^H/Hc sp.'JUL Helper

DAVE'S DRILLING 5617 W. Wells Parte Road
SaK Lake City, Utati 84088 (801) 569-2000 o^t_liA±3Jl
RIG NO. ZL
JOB OWNER Pr-t'Uo r ^ A y
.RIG TYPE r . ^OACcDd WELL NO. D W\ (AJ - S TYPE M t , ^ . ' [ o \
LOCATION R f ^ y v5
TIME
Start
?/cO
_
•
Stop
SlbO
•*,^<o
DEPTH
From
1^
To
m
y^'f-y-A Q.AL DRILLING INFORMATION
R. Log or Remarks
P . ' t i < ' u p ^ r r v . t p luK- / - >'i, P L k ^ A ^
i r , n ( ( A i c i . ^ L o p .
u ^ ^ A f o t K * . e i c o s f c D * - ^ < ^ ^ A
ISo'^ ' l^ 'PU^ ^ ^ iA t / -c^ \J^L^ T* eir^ H C I « p « j m ^
LcMt/./,/-C <?<•!.*/» U r ' r e t t c ' l - e t r
BIT
Type
Bulk
Size
^ / ^
No.
/
1
4 1
'
STAND BY TIME HRS. Signature of Owner or Representative.
HOURLY WORK HRS.. m.
CASING USED: Size CASING USED: Size DRILLING MUD: Tvoe MISC.
R. Usad R. Used
Amount
Water G.P.M. Water Static
Fuel OU
i w
^ ^ % ^ ^ ^ ^ r ^ '"'^'u.^iU S P U . L L r^ 'P^'Av f oss

DAVE'S DRILLING 5617 W. Wells Park Road
SaK Lake City, Utah 84088 (801) 569-2000 Date l h l 6 - ^ c \
RIGNO. I L RIGTYPE A ~ P ^ 7 o o d ) WELL NO. 0 Hi L U - ^ TYPE m ^ - / '
JOB OWN
LOCATIOf
ER pVii^Jc) ^ / l v
4 ft c.y' D . ' c t o U.wiA ^ . ' U L
TIME
Start
l ! c o
H\2>0
^
Stop
<^t30
sioO
STAND BY TIME ^ Signature of Owne
DEPTH
From
I^S
w
To
^\0 7?^
DRILLING INFORMATION
R.
.
Log or Remarics
Di^. ' L L . ' I A f l . /9p<LI^ I I / J L *
,!••< kvi -. ... \ - * r X / ^ r « « i / - f . ! .C
\ i \ ^ A ^^ ft/i jtx\A -4n S e t O U M O .
4RS. HOURLY WORK HRS. l O ' r or Representat Ive
^o^
BIT
Type
R.*fni«
Size
Cf^f^
No.
i
<
g 1
*
CASING USED: Size _ CASING USED:Size. DRILLING MUD: Type.
FLUsed. FLUsed
Amount.
.Water G.P.M.
.Water Static. Fuel -Oil.
MISC.
""" '[ ..rfri- pTn: A/rpr» Helper k'/Zi. ci^. '^ i .^ r^'P'r/V /?^S
• ^ ' / * / / . ^ l ' i ' / t n "^ / ^ ^ . . i-y 1 1 . ^ \ H

DAVE'S DRILLING 5617 W. Wells Parte Road
Salt Lake City, Utah 84088 (801) 569-2000 Date / I ' / A - S ' H
RIG N0._
JOB OWN
LOCATIOI
7 RIG TYPE ^ r - P ~ 7C?C3<D WELL NO. / ) M 05 - 3 . TYPE »ifex / / C ^ .
ER pvnMtO Ci^4 f
M fic.v.,.v^u) L c ^ ^ A P / L L
TIME
Start
2!oo
^
W
Stop
s;m
STAND BY TIME
Signature of Owne
DEPTH
From
.2 2 ^
2^o 266 270
is-i-
'
To
2^0 2SS Z>D
2gS
ZdD
DRILLING INFORMATION
R.
•
Log or Remarics
Ou . ' L l 'uH A jpHiH l»« j lc_
yfluA s L u f . U\AU c U f rf- g t ' r . l i ^ l
VhtLcl < r a u t r i-o.'Hv cCt^y 4 a t - ^ u c L
m u d s 4 o ^ « u j . ' f U «j.kcceL L i ' H L c u..ico
\^^i.A .«;T«!»k.- l u . ' f U r. u,...<.L i.c.ye/s t ^ < t . « < I i t
r . A A i l.^r! Hh P.UC 2 o ' ^ ^ S c V c e V \ t i fcvrl <^(,«.,^( pc..*' 1 / t o 2 ^ ^ '
'
HRS. HOURLY WORK HRS. M
r or Representat ive
BIT
Type
Ri-^/«
?yo'
Size
^ ^
•
/
No.
/
t
^ i
'
CASING USED: Size _
CASING USED: Size _
DRILLING MUD: Type.
y// ^i..-^ H'h.^ S c \ t / i c ^
FLUsed.
FLUsed.
2 ? 0 10_
.Amount.
.Water G.P.M.
Water Static ^ i ^ ' o '
Fuel 011
MISC.
Driller, 'v\ r.X^ e r t n ^ J""^^;.. i Coi^ He^r mnl.

DAVE'S DRILLING 5617 W. Wells Parte Road.
SaK Lake City, Utah 84088 (801) 569-2000 Date / / - / 7 > ^ q
RIG NO.. RIG TYPE gg^nPL^•f:o^. g>«. WEU. NO. 0 m VU "v^ TYPE tytoK.' h t
JOB OWN
LOCATIOI
ER p irou/5 rA y
4 Ps'^ y i/.^r .*.» L a w J C . ^ L L
TIME
Start
V.OO
^
#
Stop
^.'l€
DEPTH
From To
DRILLING INFORMATION
R. Log or Remarics
Wioor t f l - P A O O O f o LcfAouJ in . CKircur
<A I.p ^^^pUi'o^ ^r<j. -4-iarl^k Rw. v rj X k . A i y ^ A e . f J L h , I L ^ i ' A y S ' .
A c A \r> p^LI lo " ^a.«:...W a f )L>.<
.<:lUL pA-.'i.r. >^ A .J />» ,A ts .
i D ^ l V ^ A r^?s^.*hr, CVc,K. » U & * - i / ^
BIT
Type
L u e ^ ( ( • K hWr- L c ^ y J o u a h £i.»^««. L£>«^cS't4
trf/./Llk.
Size No.
«
i
STAND BY TIME HRS. Signature of Owner or Representative.
HOURLY WORK HRS.. ^
Driller W.r7t,, P^>.,v.... r r v , ; ( ^ . . .So ;J ,a \ " ^T , - rn~ l
CASING USED: Size CASING USED: Size DRILLING MUD: Tvoe MISC.
R:Used R.Used
Amount
Water G.P.M. Water Stalk:
Fuel —
OU
• 1
inSS. H

LOG OF EXPLORATORY BORING
P B O J S C T - N O . ( s P t i i P - d : I'V^/lfi'T^ J i f ^T l ^^nn f H n p i M f t Mn C\l ' f)yY\VJ^^
PROJECT NAME ft/lV\Jlg\A) l t i r ^ \ m i L - P ^ O y > 0 C i V / LOGGED BY -f , R f ^ i yU^JC
DRILLING. METHOD t,b)\^/nHWIV AlCLP/TTtAU l n " C M , m ^ D A T E DRILLED \\h(^\(>C^
S T A T E COUNTY D E S C R I P T I V E LOCATION
L O C A T J O N : T R
1
. S E C T . T R A C T . PAGE I OP i n
HEAD SPACE USING
CPPM]
Z i -
So
0. m
< H Q Z < > coco
r.
z ^ . .
- /51
z ^
^^L-
3i2. REM ARKS r c ' - ^ c ? ' hliolePj
i i o o
T
L I T H O L O G I C DESCRIPTION
g/lA/g / 6// ^7y S ^ ' l ^ l . • OHVB. aeiPUjNi \ i d ^
fi£/IV^y
i ^ve^t ; , ! / ^y i - 'T ' 0 1 ' I I \ J B BW^JO/^y VBP.'^ r i r J ^
/-../> AJf)£^ lO%i> f i f i l = rL
Pc^cf.Pi tC^-lnD.^ ie /n<:fit-lD z.-:^;/<ji^
^^ rv t '^BuH 6/piivg^ •• t^.gy BJPPfJOfO. rooi^yj '-cem. l'?''j'7 6 iu r ' 3iP% ( i^B£L£y-^ .;?g^h.
r" 5A>/e
:£ I \ 7 —
Exploratory & Monitor Well Drilling
DAVE'S DRILLING COMPANY

P R O J E C T N O .
P R O J E C T NAME
DRILL ING. METHOD .
S T A T E C O U N T Y ,
LOG OF EXPLORATORY BORING
R n a i M » MO AV^/)>nV./- '3
LOGGED BY D A T E DRILLED ')iC>/AO
L O C A T I O N : T .
^ D E S C R I P T I V E L O C A T I O N
, S E C T . _ _ _ _ _ T R A C T PAGE •> n r l O
HEAD SPACE USING
(PPM3
pi
-I a . CD
UI
& 0. S > < I-co
as 0. m Z 2 < > CO. CO
o
z
5 "
s L I T H O L O G I C DESCRIPTION
5-^-
v5-5L-
^ ^
\o'lBpm%V- i.'ili> ion-,. ZO^/i&iVlS/..
•
^MA
PFftfti-V AP,/\V;r7lV -^MiCr. hPPUJf^ /^^/g/gg/g 2p''lofijf!K^SiJ syoeu-SOfi:i D H^fPJni tZAflO
pi£>&i>i 6/gA\/guy /i/'J/Q a^iPCiCJi Bflou)/!) 2 P % P ^ B k S C . l ^ / n ^itVfeL eC/^ i^gfllVm S^/V/?.
m R E M A R K S Exploratory & Monitor Well Drilling
DAVE'S DRILLING COMPANY

P R O J E C T N O .
P R O J E C T N A M E
D R I L L I N G . M E T H O D
LOG OF EXPLORATORY BORING
• BORING, tto. £ ± : 1 1 M 1 ^ 3 -LOGGED BY
D A T E DRILLED
STATE COUNTY
L O C A T I O N : T R
.DESC R I PT I VE LOCATION
.SECT T R A C T PAGE A o F J O
HEAD SPACE USING
(PPMJ
UJ
< -V)
tit! O Z
3d a . CO SS < > coco
o z s 3 o o
L I T H O L O G I C D E S C R I P T I O N
R E M A R K S
l^X
I d
74.
eo
et
30.
PfiSeiV ^nCj- R .€D)6H A A A ^ ^ , /o%p^iEC tUF,».L ^oc-n<C n^rvJr^ --Aril-
5/1/ve
L
U-iM-L.
Cuivg-
fg^Hf <J tiL •' <rB£^t^. iO^PVBBii^ -g ^O/ .i-
i PPO^Vj '^P^.Tt-D T^<e^\ 'Oi^y^<P>A^~^' t . t^ f i£>
^ y </^mg>
Exploratory & Monitor Well Drilling
DAVE'S DRILLING COMPANY

4' P R O J E C T N O .
P R O J E C T NAME
DRILL INQ. METHOD
S T A T E COUNTY
L O C A T I O N : T R
LOG OF EXPLORATORY BORING
BORING. NO. Mh£USlMLz2-LOGGED BY
D A T E DRILLED
_ D E S C R I P T I V E L O C A T I O N
. S E C T T R A C T PAGE V CipJV
HEAD SPACE USING
(PPMJ
m
It is " J ? ^ ^ a, tn
R E M A R K S
UI sJ UJ
CO Q 5
Sd Q. ffi s z < > COCO gs
3
L I T H O L O G I C DESCRIPTION
^^Ll
ipp
la
no
\i'
n m.
^^/se/y ^/?iivgAJ.y ^s^sm-- r^f^^ BSIPMO / . ^was f r ^
^ / P / W g U y g ^ r J C / n i ^ O ^ K l r 7 ^ ^ r . ' ^ > / / - J ~ L
\Air.r,ivr-' y-cPTBr. t/^.-Pf"jK' fii^p-jji) trnvP
5ht^M OBBPlV P^lUiS^L-.APP'^-BPOvir). M(-i>0 r.J>ilP<B lC^;n^>At\r-, ^CPi^ h r r - f * . l i ^ y ^ i^Ok/^
2<P0!o^Pt^:5U
P S f A I - r y - t r yr^n,^- >£>'lnAPjt7PC.
(
7 J^ML^L.
Exploratory & Monitor . WeU DrilHng
DAVE'S DRILLING COMPANY
•

PROJECT NO.
PROJECT NAME
DRILLING. METHOD
LOG OF EXPLORATORY BORING
BORING. NO. . ^ i z M M L Z ^ LOGGED BY
D A T E DRILLED
S T A T E COUNTY
L O C A T I O N ; T R
_ D E S C R I P T I V E LOCATION
.SECT T R A C T PAGE NS" O P J O
HEAD SPACE USING
(PPMJ
•
a. ffi
UJ _ j UJ
!§ : < H CO
R E M A R K S
/ 3 ^
fcuj Ui"" OS
3d 0.01
s z < > coco
" ^ — f I 5 O X t
L I T H O L O G I C DESCRIPTION
^s_
I B Q ^
m
iH^L^
I I IS iP
I ^
'g/^ivi..£
^
snmg
^//>t//?V / n i ^ m t p - /'y.P-ffii f ^ P D ^ f l , 1 0 < ' i n < M f )
W iSV.. L A /7,P 71?/^ jT jg >i1 ' / ^< :
X
T ^/ fh 'F
/S'/^ygn-y - / i Q- f^ecni^fi- PPo'jjf. Icf'o-'^n^tz.i. • M ^ ' ^ •i ' / i^.r^-jH - g=.W:E /<:'r?i^ f»t</<C.
Exploratory & Monitor Well Drilling
DAVE'S DRILLING COMPANY

PROJECT NO. PROJECT NAME . DRILLINQ. METHOD
LOG OF EXPLORATORY BORING
LOGGED BY
D A T E DRILLED
S T A T E COUNTY
L O C A T I O N : T R
^ D E S C R I P T I V E L O C A T I O N
.SECT T R A C T PAGE / ^ n f I O
HEAD SPACE USING
(PPMJ
H UJ d 0. ffi
< CO
OS
UJ;^ - l O a.ffi ZZ < > coco
z z
o o
L I T H O L O G I C D E S C R I P T I O N
R E M A R K S
ISL
i(fiO
- /^C-
no
n L -
1 ^
/g-^uig/;./ AtirJf):ij^/roify^j BfjO'j)f is>%Afiff /t c \i/g:^-^/p^-yr >vr-.oiM^ ^r^ ^./ir/i.
PPAciL'j P,P^y|r•u^ ^AUC- ^^.Ak<ft Pfij?'jr/ t^ePoPl.^y/^PT^ts, rvxmj^A <ArJC-
v^
-J/IVVi?
^/lyyg
-5/1 ;Mg.
MJ^-t^ cei^WS/) •afi£-ig tt?CI\)r> . f.^)'€fir/D
ExplCKatory & Monitor Well Drilling
DAVE'S DRILLING COMPANY

P R O J E C T N O .
P R O J E C T N A M E
D R I L L I N G . M E T H O D
LOG OF EXPLORATORY BORING
BORING. NO. i i L : ^ ] M L L ^ : LOGGED BY .
DATE DRILLED
STATE COUNTY
L O C A T I O N : T R
^ D E S C R I P T I V E L O C A T I O N
.SECT T R A C T PAGE 1 O f / py
HEAD SPACE USING
(PPMJ
Z K
p i So
a. ffi
UJ
< t -
n UJ Q. i i _ U J _
az
0. ffi z z < > coco
z s
o o
L I T H O L O G I C D E S C R I P T I O N
A 1 ^
/ ' ? ^ 2 _
l < = i
2 £ ^
2 ^ ^
^ • \ o
p g f i . P l ' i /•y.Pt^n^-Lli 4^Afi/C • h.'C-CC-^'^ G.P^U.'/^)
-2,(^^10 f^T^y£ ' - - -Z , i^( ' /nP>£mi.^ ^ f f / E i J i f f C .
st^nn
^
5A/v\5-
ir C/^y r i ~ .
I 5mg=_
V 'S/(»fti€'
• R E M A R K S
Exploratory & Monitor . Well Drilling
DAVE'S DRILLING COMPANY

4 P R O J E C T N O .
P R O J E C T NAME
DRILL ING. METHOD
LOG OF EXPLORATORY B0RIN(3
• BORING. NO. M : ± 2 l l W L l ^ LOGGED BY
D A T E DRILLED
S T A T E COUNTY
L O C A T I O N : T R
_ D E S C R I P T I V E L O C A T I O N
.SECT T R A C T PAGE _ S - O F Z ^
HEAD SPACE USING
(PPMJ
ii U J = ^ Q. ffi
Ul 3J UJ
^ > < H co
tuj Uj ' * ' O S
o •II .-j j O
z s < > • coco
^ a ^
9 § 5
^ 2 3 0
S y f L I T H O L O G I C DESCRIPTION
t20
Zl
n^-.
230
Z ^ ^
^ ' f O
l/P jn c r^Q i . ^^ T o^ . - ^ f r r - : . . ^r)f f i -c t/ir/9
Jy
ft^JOLSi.
J l l . : k L ! 2 L ^
n|.iW^-7P/i;£;pi=jjj i.;-fife^r^^ gya/iv-cj. //z't: i/v cun\Nh<
4 ^ <.ytmg
REMARKS ixr 2.55* fkt^tismpri ^UiiriS
DAVE'S DRILLING COMPANY

P R O J E C T N O .
P R O J E C T N A M E
D R I L L I N G . M E T H O D
LOG OF EXPLORATORY BORING
• BORING. NO. M ^ M U i l l ^
LOGGED BY
DATE DRILLED
STATE COUNTY
L O C A T I O N : T R
^ D E S C R I P T I V E L O C A T I O N
.SECT T R A C T P A G E ^ ciP / n
HEAD SPACE USING
(PPMJ
UJ 7* UJ
< t -co
r u j U"Ll_
az
_ i O a ffi Z Z < > coco
z z
o l s L I T H O L O G I C D E S C R I P T I O N
IH'.
ZSO
ZSiL.
ZhCL-
K^S
J S ^
yi t i^<iv i ] j^ r Pr r f-/7g,gf/i-?;^ - ; / • . / - v^vvi-r
f 5 A H I ft:
•S'/lK^g
^/iMiL
</^Mtg-
— r —
ifiyvMT
REMARKS )2jf^ ^Af lV^T^^ ^UT7?A'6'6^/i^ 1 ^ ^ ^ J , ._. ,«, Exploratory & Monitor
Anji/lO n y p t e e i ^ l ^ i - ^ ^ ^ ' ' ^ * ^ - WellDrilimg
DAVE'S DRILLING COMPANY

PROJECiT N O . _ _
P R O J E C T NAME
DRILL INQ. METHOD
LOG OF EXPLORATORY BORING
BOR\NG.HO.Mj:QltMZ^ _ ^ LOGGED BY
'. D A T E DRILLED
S T A T E . .COUNTY.
L O C A T I O N : T.
^ D E S C R I P T I V E L O C A T I O N
. S E C T T R A C T PAGE IP^ neJO
HEAD SPACE USING
(PPMJ
li P z Q uJ =j 0, ffl
UJ ;;' uj
1^ (0
rti;
O Z
0. ffi z s o coco
o
s z z 3 o o
L I T H O L O G I C DESCRIPTION
27.
Z ^ 2 -
. . 2 -0£ l .
Z^o
Zl
'^OO
S/iii\j\s:i.%y 6/in/ri''.f)BCCh.w AP.O/)/J - " afmA. VtSjp p-Mjr, ^finmsr-P n ^ / CArtP
•^dtt -'
. I
i t.f,\
6 1 ^ X 1 1 .
aft)v^
'^AY-i
REMARKS ^ . ^ ^ ^ j j ^ b ^ t . ^ l b ^ ^ ' " ' ^
A ^ n n ^ ^ - i r & ; . \pfPl^^^l^U c y • r ? A - . ^ ^ ' ' « ' - ' ^ ' ^ ^ w S S n T ' * ' ' " ' ' "
. term's, -.vr i. «..,,!J: i:.i/r^—s,';.rvT:?wF f*Jlj'>^T /s. ^ ^.£,£ K..r?e /-/^/j^^^/.a DAVE'S DRILLING COMPANY

DAVE'S DRILLING 5617 W. Wells Park Road
Salt U k e City, Utati 84088 (801) 569-2000 Date-.V" 2 r > - g - c <
RIG NO. _RIG TYPE HeLr y ^ r ^ A ^ t r WELL NO. p M (,> - .3 TYPE JQ^^ tulf^fc. JOB OWN
LOCATIOI
ER P v/n)y> r : fv M R a y i>. ' >/•u^ Lecv,
TIME
Start
l\f ')0
•
Stop
^'30
DEPTH
From To
A P.' L l . DRILUNG INFORMATION
R. Log or Remarits
f . ' L J l i w . + r v U c ^ c f c ^
QiA ^ ^ J / , ^ A A /M t^^A p r . l l . I t ) ' / - c S c . ' i i c l A o I P ) /AVoiIJ 0.\^ck
/ K < - f e ^ ( . L ^ ' ' ^ u f C c ^ c p : p C . . ftKci kHu l / c
<r« W» e A C c A .
KV/70C e U ^ y - f f i . ' u n . - i tP ic^V AnlAi^ /•.^.rr.
/y t " t V T C M ^ - l o 3-c^ L O r t L ^
0<crt*v d:-P-7ooo
BIT
Type Size No.
«
i 1
STAND BY TIME HRS. Signature of Owner or Representative.
HOURLY WORK HRS.. ^ ' / :
CASING USED: Size _ CASING USED: Size _ DRILLING MUD: Type.
a U s e d . R.Used.
.Amount.
.Water G.P.M.
.Water Static. __Fuel _OII
MISC.
•I Driller ^ ^ ^ ^ 7 — r r ^ t — ^ l ^ ^ ^ f ^AA \ t ) C _ « . ^ . 1 . I "«•»»'

jUBU aCMpl^&wDI UOG. DAVE'S DRILLING 577 West 3410 South
Salt Lake City, Utafi 84115 (801) 263-9099 D3ie__LL i/ioje? #
RIG TYPE ^ U . l^..c^(c^r WELL NO. M QJ ' 3 TYPE 'm/^v,.'io\r
JOB OWNER 9fC\/<D C A \J
RIG NO.
LOCAl lor "* n r TIME
Start
^ w
Stop
. V ^ • t ^ u
DEPTH
From To
1
DRILLING INFORMATION
R. Log or Remarics
Q.... .v, -yon' ^I'L PX\C euc.i^ P r > ' V ' / i Si-.v-ci^i^
d f t ^ o t L p:.c i l CrtjUA 7r>o ' i o Z i s '
flt=..f<9 h."/c S f d C.-^*^ 1 / , ^ ' - 2 n '
Oi¥-nA •Ti-rti'v* 2 o - ^
<c..l(..A f.ou. T-' (^'
//>- 2^ - ^ ^ ^ A
n..^i( 4- n..\,^ i^'' O' \US* op^v. U . l r ^ i t ^ ' - 3 o o '
/ / / i ^ ^,a-/e^ c-f z ? ^ '
BIT
Type
•
Size No.
0
STAND BY TIME HRS.
Signature of (Dwner or Representative.
^ M ^ ^ ^ ^
HOURLY WORK HRS.
CASING USED: Size
CASING USED: Size
DRILLING MUD: Type
R. Used
R. Used
Amount
Water G.P.M.
Water Static
Fuel
5r
Oil
MISC.
• 1 Helper Helper

•
•
01 IMI. nrv^ii'Fi'.iMi 01 02 C2 03 Project.: .FVAMf.WJ.ANDfJ.ll '..'ell IJuTiibcr: _ P / ^ U ^ X. 03 ^ 4 • . . . - . • - - - . - ^ ^
05 Project riurobcr: • Date: ^A&ft/_^J / y S ^ 05 06 • • • 06 07 Wen Insicie dUn iB te r : 4C.9"IN 07 08 08 09 Depth of bottom: •• ^ ^ J y FT 09 10 . . . _ 10 11 Length of grave] pack: *. x ^ FT \ \ 12 12 13 DIaiTieter of gravel pack: / ^ IN 13 15 rieasured by: _ ^ ^ ^ 15 16 . 16 17 Recorded by: 17 18 . , 18 19 Air ten-iperature: .- J^j^ DegF 19 20 . • . 20 'i.\ Heather condition: • ?1 l l 22 23 WITHDRAl.'AL OF V.TLL VOLUMES 23 24 . . . 24 :5 FLUSHING l / e l l Volu.Tie Well Volume Well Volu.nie ; 5
' 5 ?6 27 '..'ater level before /i4/S'.^ • 11 28 Water level after _ _ _ I • '""" ZS 29 TIfTie begin flushing yJf.' fO '_ _,! 29 30 Time end flushing _Z.^1!£H. ____I . _ Z ' ^ 31 Time water level after ,—_I ^1 32 EstifTiated voiuma flushed (GAL) ^/^gg^ ~ I -2 33 33 24 FIELD ANALYSIS 34 35 • 35 36 1,'ater temperature (DegC) ^ O / ^ 36 37 Sample pH y,yj 37 38 Sample ccnductivity (mhos/cm) ^ J d i ^ 3-3 39 Buffer before • 39 ^0 Buffer after '-. 41 Odor Ai>^>^ \ 41 42 Color 6A.*/r- .'_ H2 43 Other ' "" " 43 /, 4 4 4 45 COMMENTS 45 45 46 47 47 50 SO 51 Attach photographs of v.'ater samples in labeled j a r s . 51 52 52 53 END OF SECTION 53
Bayview Landfill Construction 6-21-89
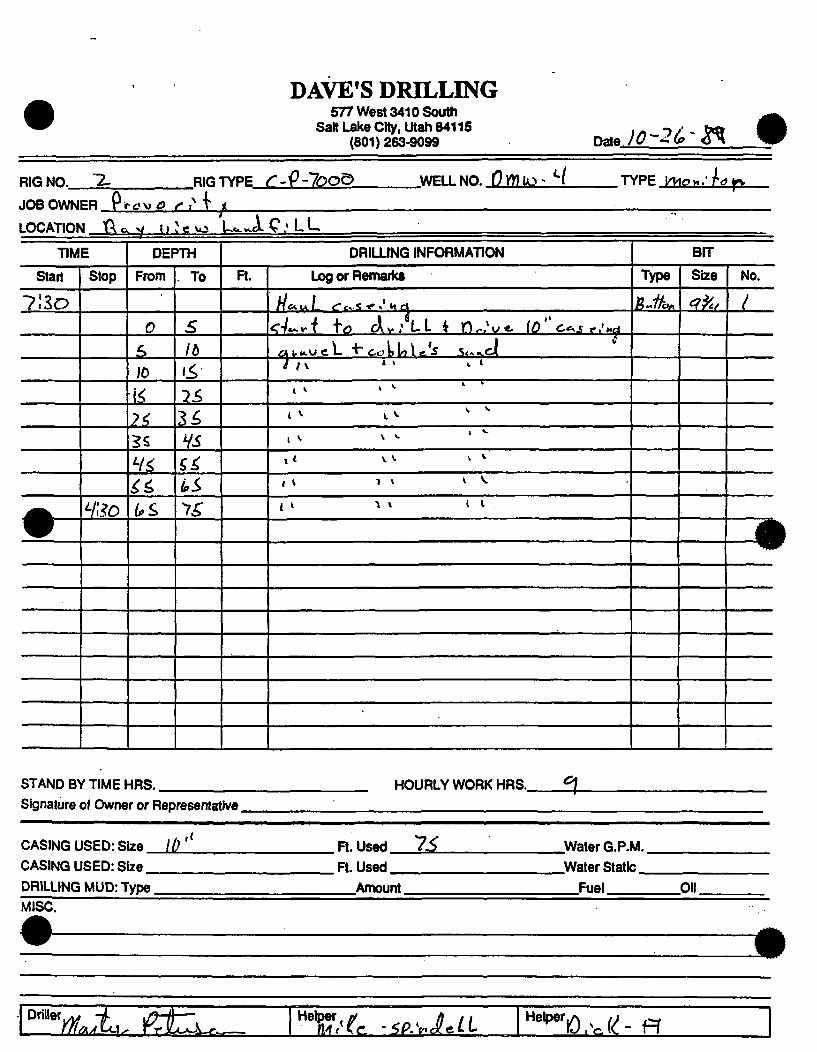
DAVE'S DRILLING 577 West 3410 South
SaK Lake City. Utah 84115 (801) 263-9099 D a i e V ^ - ^ ^ g ' j ^ •
RIG N0._
JOB OWN
LOCATIOf
"2- RIG"
ER Prtfvi<5 /• , ' i
TYPE_j
< C^ Q - l O O ^ WELLNO. OvWtO- *•/ TYPE i^on . ' / d
4 t^c,v llJ«^^ ' l ^w i -C 'LL TIME
Start
7130
^
w
Stop
v;.?o
STAND BY TIME \ Signature of Owne
DEPTH
From
0
6 iO
\ ^
-?,«? 3S
V^ ^ ^
i'S
. To
S Ib tS ^s 2S "IS iS LS IS
DRILLING INFORMATION
R.
HRS. r or Represental Ive
CASING USED: Size / / ; ' ' CASING USED: S DRILLING MUD: T
ize voe
MISC.
Log or Remarics
H C K A ^ r-f.S-^.'Krtl
< 4 ^ y i f o C X V . ' L L i n ^ . V e f f i " c ^ A ^ . ' M . i
^uuM-ucL "^ cohUXJs .s<.«.c( i / v ' ' ^ *
. V
I V
, V
I I V X- V *•
1 I I V V V
J 1 ^ I t I
BIT
Type
fi-/^/,
Size
^ ^ ^
HOURLY WORK HRS. <=
R.Used I S Water 6.P. FLUsed Water Statk
M.
Amount Fuel Oil
°""^'^..t. i^t: : . . . n?/^. -<..vj.a
- | Q ^ —
No.
/
1 ^
M 1
"'•p^'fO.v.f^-n
1
1

DAVE'S DRILLING 577 West 3410 South
Salt Lake City. Utah 84115 (801) 263-9099 Date / 0 - 2 7 ' S C |
RIG NO. 2 - RIG TYPE € r - P - lOOO ^WELL NO. D rlO fO - ^( TYPE y W t ? M . 7 o ^
JOB OWNER p y p y j o r . 4 y
LOCATION i/^CA
TIME
Start
IAD
%
Stop
SiCk.;
-y u : , . v ^ L
DEPTH
From
ys ^ s V loins' izs 135 HS
To
<5r-5 ^ 5 ) 6 ^
M^ I2J /35-
ms uo
;..A e.vcL DRILLING INFORMATION
R. Log or Remarics
r ^ . : L l 4 n v . . ^ U < . / O " y c ^ s ^ . ^ . f .
<:ij *.«.y cL - < ; t . .ucA-W<?Lj . t : v5 •
Cj t<u.v ;eL S t ^ w A S i y i A v i r S P iC « V I ^
I ^ « V. 1 \
\ C \ V. « 1
\ \ . V \ « \
V V • \ <• < >•
I V 1 1 i \
BIT
Type
Mir. Size
Q^^
No.
1
i
STAND BY TIME HRS. Signature of Owner or Representative.
HOURLY WORK HRS ;. Ci^/Z,
CASING USED: Size lO^^ CASING USED: Size DRILLING MUD: Type
R. Used R. Used
Amount
-5C Water G.P.M. Water Static
Fuel Oil MISC.
^ " - ^ i
#
Driller^ - 4 — fjfniMA/-
Helper-;., o ^ "^'^"n.^./^/:^
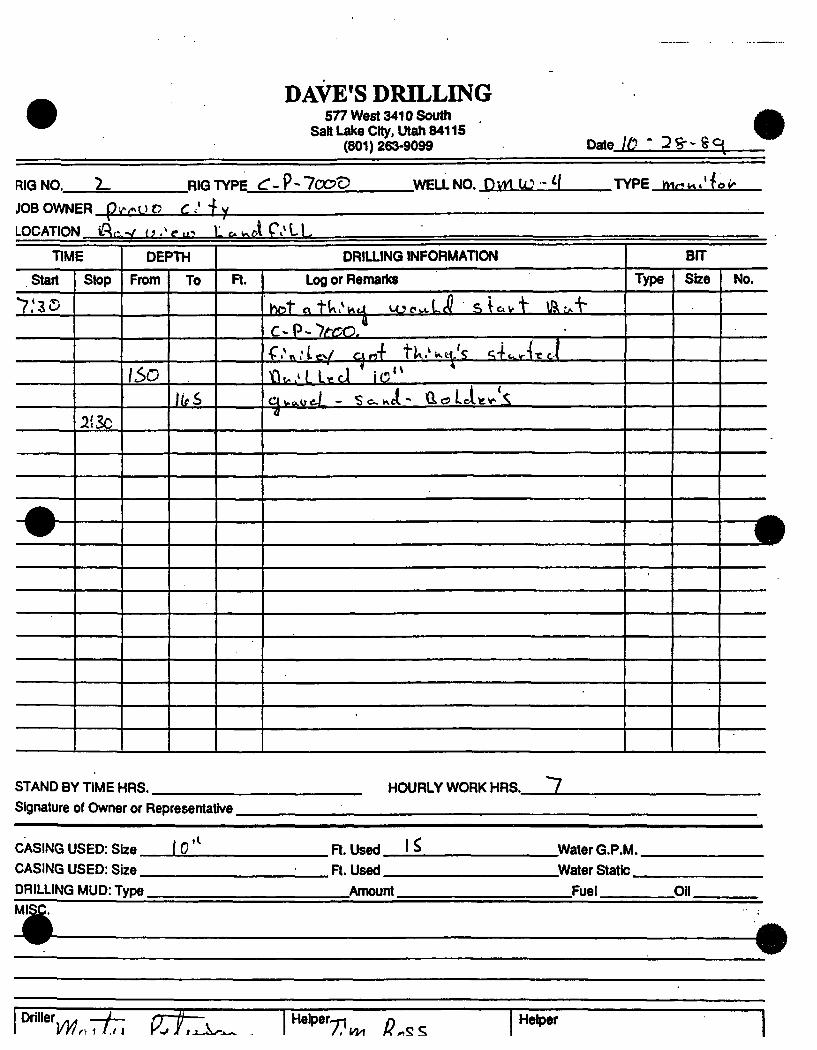
DAVE'S DRILLING 577 West 3410 South
Salt Lake City, Utah 84115 (801) 263-9099 Date Uo ' 3 S - > 8 c ^
RIG NO. 1 . RIG TYPE ^T - P- l O O V WELL NO. 0 vvt IO - ^1 TYPE VMr* v..' ^.
JOB OWN
LOCATIOf
ER p»-/^t)C ^ M
sir
V
J t t ^ f \ - / <^ . ' r .!•» K e * w f i i C v * L l .
TIME
Start
llio
^
w
stop
23C
STAND BY TIME f
Signature of Owne
DEPTH
From
ISO
To
KfS
DRILLING INFORMATION
R. Log or Remarics
h r a t a t U . V M U . ' ^ ^ L J I s U ^ t I ' ^ i . i -
C^P->CO. <^.^ ;Lrv / r ^ A tU. ' i ^ t l . ' s c ;4c . ^ - ( r J
)n . . , ^ IL . f i i n ' '
awc^otL - 5 C . K A ~ "dc?Lclfev'.s
•
HRS. HOURLY WORK HRS. " 7
r or Represental
CASING USED: S
CASING USED: S
DRILLING MUD: T
ive
BIT
Type
'
Size No.
^
4
i e ( 0 ' ^ R.Used 1 ^ Water G.P.M.
ze Ft. Used Water Statte
voe Amount Fuel Oil Ml§g.
m ^ ^ %
°*V)^i7tr~^7iiiir "•»'"77«. /?.ss Helper

LOG OF EXPLORATORY BORING
^ O J C O T f<0. CPlllBie.- yyfA/aV ^^-P-^OA/ BOR\NG.NO.&Z^ilEzd^^ PROJECT NAMg i f / r ^ / g ' - V '.^AfjrP/!-!. LOGGED BY r^-'^' h ' ^ J ^ i ^ A k j
DRILLING. METHOD OAI^'^/D/S.ive: A'l A. A^fT^-zAJ D A T E DRILLED —
1
STATE COUNTY
L O C A T I O N : T R
^ . D E S C R I P T I V E L O C A T I O N
.SECT T R A C T PAGE J-OF:Z_
HEAD SPACE USING
CPPM3
Z H
UJ u a. (Q
1 5 : < H
ft OS
a. 03 S S o cow
1 zi o o
IU
2; .J or UJ
s
L I T H O L O G I C DESCRIPTION
/ O
/r
2 ^
<;i<i;<!? /.Pf[-'rF-l- £-PE'-l- h-'Bi:-)r,-
pBeei^ ^ ]kr i efij>vjN,pi/:£-&f'A]/J^£:
- r r . :• :> r r : ^ -Skfi'rL 2-H ry//,
P^& iH. 6i\i>c'J fif-'^'j^L • .[i^r'yf^f"-:'.•';v io^CAt.r rct.t- t ^ y ' ^ 1 ^ - * ^ •» . •vViii/i'ni c.r/••.'•/.
pzSdyJ Ci'h^i-L • r . . (^H .'I - r - / • ( /
p.p/\p.<.e / I J ^ O I A P L
f^eei^,'C.MCi&eA'/e=u'. Q^n-^.r^.' iim-^ coxyf-^y
REMARKS Exploratory & Monitor Well Drilling
DAVE'S DRILLING COMPANY

PROJECT NO.
P R O J E C T NAME
DRILL ING. METHOD .
S T A T E C O U N T Y .
LOG OF EXPLORATORY BORING
• BORING. N O . S ± m J i L ± LOGGED BY
OATE DRILLED
L O C A T I O N ; T.
. . D E S C R I P T I V E L O C A T I O N
. S E C T T R A C T PAGE 2 ^ O F 7 _
HEAD SPACE USING
(PPM)
So
a. o
Ul
< t -(O
U j " " o z
0. m S S < > v).m
S
at s L I T H O L O G I C DESCRIPTION
•3^J
c?
*vr
r ^
^5>"
/ ;p- ; i \ /euy g/iryiC : ^APt?^. >;>t=/,. y/ - ' • , - - r ^
j Fj?!--:' --^r.r: ::.•'. CMf.--tWi/:\(), .^c7inhn/J:'.
/CP, V-.:>.v ->;-'.:.- • ,.>-^-,„; ^finy->A^vU
^iBBki ap.i\%I • &>P^^. v;f 1.1- i::^/:r5x s v e -
R E M A R K S Exploratory & Monitor Well Drillino
DAVE'S DRILLING COMPANY

LOG OF EXPLORATORY BORING
. BOR\NG.NO.M±!:i:±±L LOGGED BY
DRILLINQ. METHOD D A T E DRILLED
P R O J E C T NO.
PROJECT NAME
STATE COUNTY
L O C A T I O N : T R
_ D E S C R I P T I V E LOCATION
.SECT TRACT PAGE S _ O P 2 .
HEAD SPACE USING
CPPM3
2tr Bi <o
0 . CD
UJ _ j UJ
< H (0
^ U J
a z
So Q. O S S <>-». (0
ii o o 5 o
L I T H O L O G I C DESCRIPTION
( ^
7 ^
? ^
SO
^cf
5MC^ ^ P ^ S F L •• P P ^ ' / , t - ' T C J i - - -• • : r - r r L
(iPfm-vpJ 6MP'- i e 'jQP /i/gu cof-i^c. P')f- ' (^:]fy.'.--(\p "> :'-•uii.f^c - r : ' •^.-'/'.(••'•P' - - f q i
<A/Vfyf r^OKIv^l •- BPOr-f) •J • . . ' • r - r X
eg'v^ SArir
^BBi^ f,p.KiBk- tcp^n. i-ookis £>ATr fi<!;6'JU?t<^, M^''^ "•-71---f •• 'gfcl-g^ t^b^^'f-'-'^/-
Q^%v\ Sflr/CV /^/jfli^v- 9UP:\t)\- feegvj/l. ^ ; P ? ; ? H ^r/.-x; .,j,^)Ai;i;tr/. Li^t&e f-f f h i r
REMARKS (.^i^O'^yr Hl-'J'' ' ' ' '^ Wl-C^^ '^'i: r J " : ^
I-;?
Exploratory & Monitor WeU Drilling
DAVE'S DRILLING COMPANY

P R O J E C T N O .
PROJECT NAME
DRILL ING. M E T H O D
LOG OF EXPLORATORY BORING
. BORING. NO. i M ^ E J ^ l d L , LOGGED BY
D A T E DRILLED
S T A T E . . C O U N T Y .
L O C A T I O N : T .
_ D E S C R I P T I V E L O C A T I O N
.SECT T R A C T PAGE JLOFJI.
HEAD SPACE USING
(PPM)
^ ^ 5o So ^5 S^
^ " ^ n to
tUJ SJU.
OS
0. 01 SS < > <0(0
s _ 3 o o ? o s L I T H O L O G I C DESCRIPTION
" sZL
too
.. / ^ d
.. / 'e
//r
no
PPhl'ci-.u^ CMC : pbUKy'A- P.-^y>))ri PPOH^^P, ' - -
pgBfiiV &Uii?i)H "HOC, ••f-.-rr.icy frfp-nn ^^r . iyy^. T.op-rrr ^P?'/M."-../A!.:: rr^(:ir-:. t . ' ::»y.
CPhir-ll'^ <(Sf<C .kftDiO^ fpj)\xit\ PPPfiif ^PTSL ^ o % 6£y1VFL /.''ClVy^ ~> ' PS: '/C/iL .
^ f N 0 - H^hPKU PLO'xy f ) . Ai-r.JL r.'•'/ - r ? / - .
v-'. '- 'i- Ch'-'i.
CPh^^D-l^SMiry. P' -n/)l6H BPm). Vv.x:nn)r. tSO^C
R E M A R K S
Exploratory & Monitor Well Drilling
DAVE'S DRILLING COMPANY

P R O J E C T NO.
PROJECT NAME
DRILL ING, METHOD
LOG OF EXPLORATORY BORING
• BORING. NO. BM'C' /^ /^M-^ LOGGED BY
D A T E DRILLED
S T A T E COUNTY
L O C A T I O N : T R
^ . D E S C R I P T I V E L O C A T I O N
.SECT T R A C T ^ : PAGE ^ OF_Z-
HEAD SPACE USING
(PPM)
o z ^9 E" 5=9 CL CD
UJ
If CO
UjU-O Z
ad CL CD SS < > coco
o
s B o o
L I T H O L O G I C DESCRIPTION
•
1 ^ ^
t^^Z
i%r
IHO
HS
ML
SgAVgu^ 5A>Jr ; i?f=[>Di<LP, s t y j i P \tJB' u <9yr^0
PEfifiiy /^PA/rUV tt^iiO : ll^Wl6r P.P.O'JJP. PPc?py^ <PP-^-C 7.£ lyP,lA1-CA. m?rwr.^ ^.AyC-
%hmH PidfCJU^ ' ^BDDiSH B^P'J^^, WELL C f / ^ . l ^
j - ^ kV Ky P/IPVPL^. 7 . ^ % ^A/!/P ,
ip% ^ f i 1^1 >v r r ^ iw^ •r./i/^c.
^P/\)/^U : HEPOIill Bt£?\jorJ. M B D I \ ) ^ C O P T ^ I D
^^fi^'fiO^JUD^D, A - J T A ^ W
s m ^ ^P.f\vB.' /^=nf)i^H f:C?'ji)P t-opp'yj t9P-r^0 I P % 6 M I [ .
R E M A R K S Exploratory & Monitor Well Drilling
DAVE'S DRILLING COMPANY

PROJECT NO. PROJECT NAME DRILLING. METHOD
LOG OF EXPLORATORY BORING
BORXNG. NO. i L M ^ £ d L LOGGED BY
O A T E DRILLED
S T A T E COUNTY
L O C A T I O N : T R
^ D E S C R I P T I V E L O C A T I O N
.SECT T R A C T PAGE - ^ O F J Z _
HEAD SPACE USING
(PPM)
4
2!r
I" z9 0 , CD
R E M A R K S
UJ 7^ UJ
1^ CO
!ruj u j " -O Z
m - i J O 0 . CD S S o CO. CO
T
s z s 3 o o
L I T H O L O G I C DESCRIPTION
jbP^
\^s
\no
l i s
I /sH
f^P>BlS ^ m v E l ' K^boi6ri tJ'j^vofJ f p ^ n i ^ i ipeias A06IJL/1&. P E ^ h k t t y. ^ O i ^ .
^ m f ) ' ' PBDDK^H M^P'^li >/gOJi;yh <.PPTSC v\^^Owm-tg g.<?i1feiHs ' ' \nCi,
Pg6BW 6^Vg-l-•• l^BDPHil BP.9[JUr). PQopl.^ rg'ifeTgO Pg68l.B^-fe 2g**"^
/IfJOV. \^^%evl ^PM^L- fi^0Dl6li BP0v3t). \/HU/ fCiPH'^ s c p r ^ t ic>%^,nT)f) P^UU^t-iJ ^i^x.
^OAVEUV <.f\r)t\: P^::c'6i>bf-.y•/.)( Pff/?e^ -^P-^^/ •7O lo PfLh^^L C ' B ^ ^ .
f j m ' t . v A ^f;hiP'fegpoi5i^ aepi^r?. t >.F.on;>v. £g>grE£) xn' lp-, fePAWEL
Exploratory & Monitor Well Drilling
DAVE'S DRILLING COMPANY
•

• P R O J E C T N O .
PROJECT NAME
DRILL ING. METHOD
LOG OF EXPLORATORY BORING
BORiMft un B/''CyA''0''h LOGGED BY
D A T E DRILLED • _
S T A T E . .COUNTY,
L O C A T I O N : T.
^ D E S C R I P T I V E LOCATION
.SECT TRACT PAGE SL-OPSL.
HEAD SPACE USING
(PPM)
li H ^9 (L OD
Ul
& ( S >-< H CO 0 5
a, CQ S S < > COCO
s z s 3 O o
L I T H O L O G I C DESCRIPTION
.. ' €_
l^i
\o,0
/iPtiVEii^ <.i\i JO •• P^wi^i-f MiOitiP !.v^.iL ry--/?rj? Ig '^ . r - / : ;^ ; : - ! J = . / ; = -rA/^;^
R E M A R K S Exploratory & MonitCK Well Drilling
DAVE'S DRILLING COMPANY

DAVE'S DRILLING 5617 W. Wells Park Road
Salt Lake CKy, Utah 84088. (801) 569-2000 Date / y - S - V ^ •
RIG NO. /<S'
JOBOWNER //r.!-//'>
.RIGTYPE.
^ H J ^ /?1f'Ah -y
.WELL NO. D p r f i J - ^ ^ . Z- TYPE x^7.-/„ t ^ ,V,^
LOCATION r<ry.y/(^.\
TIME
Start
7.W
•
7 :0^
^
•
stop
^ :Y .
rf'PC
•„ l'J'
' DEPTH
From
^
To
DRILLING INFORMATION
R.
•
Log or Remarics
H /AZ_ //v<L'/ y^y;.'/^ c. Ty. rJi.- i L ,"rp •• cApi/ i^r . - f P"'' / ^ 1' P i n ' r / I / ^ A/^i..^ 7<;'-/<^-X '
T^L^r ./trv / /,7o <• /-• f Y ^ y C f ^ y >
fj.- 11-^ / n i 7 ~ n ^ t y f t f J / r ' h P y f y ^ . Aii/n r/J-r.1 /<-^.a. / ^ < '-y.^AyW A/nr,j /p^^'pia^y,^^77: / - / . / / A r / ,
%.
BIT
Type
9 i
/ O J '
,
Size
•
( S
C y - ^
.
No.
f
_.
•
'
STAND BY TIME HRS. Signature of Owner or Representative.
HOURLY WORK HRS..
CASING USED: Size CASING USED: Size DRILLING MUD: Type
R.Used RUsed
Amount
Water G.P.M.
Water Static Fuel OU
MISC.
^ . w , ^ • —
Driller Helper Helper

• '
DAVE'S DRILLING 5617 W. Wells Park Road
Salt Lake Ctty, Utah 84088 (801) 569-2000 Date.
0 ' ^ ^ , , - , - ^
RIG WQ.^/P)
JOB OWNER ftr-l't^ T^ . ' f y
.RIGTYPE F>lil^r^ .WELL NO. n m U - J C y ^ ^ . l TYPE / r>a/ , : ' t . .'k, .
s LOCATION / 5 A , / K / > < L /
TIME DEPTH DRiaiNG INFORMATION BIT
Start Stop From To Ft. Log or Remarics Type Size Ite. V I :2ZL m/O'-y)
1?</ fipf. ^ I t -fr^rl^l^^r/Thr.
!T7-eplPk /7y>yJ/^>/-n/y- / /V/ y jy i A y ^ / y . - ^ •-> .^.^ . , . ^ ) y y / • / — y / / y / 1 y '
63d n/?7cJ--Bl/:/'yy^.Z.-f7 -"AyAe / ' ^ y ^ ' ^ 6 ( ^ y / / ^ / j 7 : , ' s 7 7 / l ^ r ^ - r - f ^ / P ^ . y<!'/-/-7/)/c'f7y^lK, Al. l l ^
yc^c r/ - / A y , ' t ' T y , / ' i ^ ^ / ^ / 7 ^ - y^y7 / / g . A/^ ^V. / j i ^ r;7/<«?- r^g ^ n m i . / ' ^ . '^'-TypW) /^ Ay A. ^ DJDlJ-y. ^^y/yl,ll/Z..... Af' p^<.
# ^L^ 2^ / a ^
r > Ay/rr/^P/U& 7.W ^ C^7/r I ^/^-h 7 9 A - ^ . / ^ ( T . V-, .> Ay:, y.^.y7 P^pr>.pAi:> A y / y /<^7^. AC/S ' - "hO A/^PtrA/^y/'y^.'/.n yif-y^ A i y y y y i -/yf^r// y// jyJ^
/A/^/CA f.>;fk yJ..A)pype ^jmi ^
STAND BY TIME HRS. Signature of Owner or Representative.
HOURLY WORK HRS..
CASING USED: Size _ CASING USED: Size _ DRILLING MUD: Type.
FLUsed. FLUsed.
Amount.
.Water G.P.M.
.Water Static. Fuel _OII.
MISC.
m-Driller
i^ 1 ±
Helper y:-../L^< \ ' ^ <ii7yy M . P I :

• 1 \TiL ni-vriorr.hNi oi ••'^ , 02
03 Frc j .c t : • . V L Q U ' ^ L ' - O L l.'ell f.'urr.bsr: p w U i i j ^ 03 C4 . • . ' ." " 04 05 r.-cj<:ct i:ur„L::r: • D a t e : / / - / 2 . > S c^ 05 ^5 „ • " 06 07 Well inslcJe diameter: H l i . IN 07 08 08 09 . Depth of bot tom: •• /CLS FT 09 10 - 1 0 11 Length of gravti pcck: Z S FT 11 12 12 33 Dicu;ater of sravel pack: / / i j jz . IM 13 14 . , 14 15 i:=c-suvEd by: M . Pg-fgafcy/L/ 15 17 Record-:d by: ^-jjlMO,/^. O d l L 17 13 . 18 19 Air te.T.peraturG: i j Z DegF 19 ':G 20 :':1 Heather condition: r^^.v j» g^ M^ i/ 4- /^Li-t. t 21 ^2 ' 22 ?3 VflTHDRAVfAL OF WFLL VOLUMES 23 " ^ OK.
/ 5 F!iirHIi:G Well Volume Well Volume Well Volume 25 :./ •• U r l£V£l L i fc re l l S ' - W ' 27 J-.a ;.'ctrjr leva! af ter / i s ' ; "JB 29 Tirra bsgin f lushing f j ' j s 29 30 Tirr.a eiid flushing ~\i',jc, 20 31 Tima v.'ater level af ter / / w r '_ . 31 32 Estirr.ated voluT.a flushed (GAL) y C^L P^7~^,v. . 32 33 * • , " ~ " 33 34 FIELD AfiALYSIS 34 35 - 35 36 :.'iter te.Tiperature (DeaC) LO -36 37 ^iTple pH ' _JZ 37 ?3 Si:.pie conductivity (mhos/cm) ttrrS' 38 ?.9 n;jffDr before — 39 •.0 : j f fa r after — 40 .1 C'Jor /L>o»ig. 41 42 Color cLtc.\r ^2 '•3 Othzr ~ ~ 43 /4 44 '•5 cj::;iENTS 45 45 46 47 -iktS W^U. PfWOOC^ VI^*/£»ooJ> W i m B . 47 '•3 48 •'9 ~~ 49 50 50 51 .at tach f-hotogrsphs of \;cL£r san-.ples i n l a b e l e d j a r s . 51 52 52 :3 Ei;0 CF SECTION • 53
B:.yvit./ L c . d r i l l Construction 6-21-89

DAVE'S DRILLmG 5617 W. Wells Park Road
Salt Lake City. Utati 84088 (801) 569-2000 Datej/ lViJlSL
RIG NO. 1 . .RIG TYPE C - P - 2/>ryc^ WELL NO. O VH IU - ^ TYPE >^^ .» . ' - f o t ^
JOB OWN
LOCATIOI
ER 9 V O V O c >
^ G ft V 1 ? t^ c VJ
TIME
Start
roo
^^^
•
Stop
s\oo
DEPTH
From
0
S 16, 3 o H i U>o
I S 'io lo^
To
5 16 :JO
^s. ( p O
I S %o (OS U O
^i i^^A ^AL
DRILLING INFORMATION
Ft. Log or Remarics
O v ^ / L L ' i ' D ^ . ' u t \ 0 " ' re .5* . ' * . ^^
S..*.JL -i- C,. L 1-
c\ i r i -<oe.L T Sc - t ^cA
CA »-e<.oe L "* kr St>^^c-(
* f - ' ^ ^ 1 OK V d - V c U S t * M C^
• i . t ' • /
^ f *^ 4/<- i . ^ ' ^ S c w M <
BIT
Type
'
Size
^ ^
,.
No.
/
«
1 ^
STAND BY TIME HRS.
Signature of Owner or Representative,
HOURLY WORK HRS.. i
CASING USED: Size _
CASING USED: Size _
DRILLINQ MUD: Type.
Jn. a R. Used.
FLUsed.
f Z o
Amount.
.Water G.P.M.
.Water Static.
Fuel _OII
MISC. 3
rrr U a l n a r !>/ Hetoar

DAVE'S DRILLING 5617 W. Wells Park Road .
sail LBKe uny, uiane4UDo (801) 569-2000
RIG NO. '2 RIG TYPE ^ - P - l O O O WELL NO. 0 WI a i - ^
JOBOWNER P-^ni ,a c . ' 4y
Date / / - ^ - S - q ^
TYPE I M A L I . ' L ^
LOCATION ftc^V O.^^ul l o . ^ A C.'LL
TIME
Start
7.Vd
•
Stop
S\(yO
DEPTH
From
120 136 lio 106
R S \9tO
l sS " \ S
To
\3S \so ]ys iys t iO
/ ^ ^
hs 2«?
DRILLING INFORMATION
Fl. Log or Remarics
Ot-.'/.L'*.^*. 4 O^.S>*.'ta,i 10' <!:^c...«H5|
<Ul-iAOe.t r Se. ^ J^ '
/yk t * . t J t . L ^ JSe....tA
« ^ »• OL i > « . L « r Sc...^£A
m/i. 'sT « : , . «J - faL . - . n^ i . ^ o i > b l e ! s
lOo.1e.V- /a.»/.£.0<5/. <n^«.cA. A- Cvc^r.TtvV t S
U J c T t l »- < : L » , . : ^ I I « L St^ iAtA a - ( V c r 4 » - v « A
Ji\r>.h•!•».. . ' j t . c . , . L ac.*,cl 9 «^6^«-ht* v^ts
OI^ .^L I A f . . - W . I < * < ' - 2 / 0 ©ftrwv H^iLr.
p a L L D..»AL p/p>- CH h^l tvi&tj«. I A-A.
f o Olrvi UJ-J^ .
BIT
Type
iSi.rfevi
'
Size
c '/z
No.
/
f
M
1
•
STAND BY TIME HRS. Signature of Owner or Representative.
HOURLY WORK HRS.. ML
CASING USED: Size CASING USED: Size DRILLING MUD: Type
Ft. Used Ft. Used
Amount
Water G.P.M. Water Static
Fuel OU
^ 1 1
1 nr i l lar . 1 1 » JL 1 Uatnar 1 Ll<.l..<.. . . 1

LOG OF EXPLORATORY BORING
f ^no jccT-No . r\P)iLsP.! mSfi-PV PST^fi^y/ll BORING, N O . ^ i i n M i i i l PROJECT NAME ^/lyy' gv*/ Ufimr-•.•:. -PPn^V ''-^iT^ LOGGED BY / ' &., i-CyiP- k n R i i I iMft M P T H O n A ie . P-O-PAPU /^/>.'j.>//X'lv/g^ lD''/ZAP)r/i n t .y v DRILLED lo lP i lPA?
STATE COUNTY DESCRIPT IVE L O C A T I O N
L O C A T I O N : T R SECT T R A C T P A f t F i C\P 7
HEAD SPACE USING
(PPM)
Z t ui
< I-
rt; L J " " oz
Q. CQ
< > CO-CO
s o o
L I T H O L O G I C DESCRIPTION
s'H
10
i S _
ZO_
zs
?o
O L T •• OUlVE, \f Bi.L e<pP:.TrC. F/ns^ S^MJ/J^^
top.TPh 10% P 'p-Auf' -^ 5P/* /'•. iP^h - v r r .
^nAI LP.P17" u^k ' ^ J 9 ^ ' ^ ' ^ . 7 ^ J ^ ^
J^ C>l>viF
jp ftfiiy l ftyguV 5A/j/ 5 n \t\M-ro -e- i/^yfttc^y .</ fi77-o //?%APgfii-fe, A-fe^Ji w - / A/' g ^/>-/yg.
ygfiR)^ ^^^rjw ^/envg;- : ft&nai?^; - ^ o ^ P^SBUILS -n, ^f)^v,. .^o'ln-^P^ti
REMARKS QaiUC-D l o j d ^ i 'D/'y^^ Exploratory & Monitor Well Drilling
DAVE'S DRILLING COMPANY

« P R O J E C T NO.
P R O J E C T NAME
DRILL INQ. METH
S T /
LO(
VTP
: A T I O N
LOG OF EXPLORATORY BORING
L Q t i n e t BV
o n n A T P n a n 1 e n i n / P i l ^ ^
COUNTY n P S C R I P T I V F 1 n c . A T i n n
: T R .qp r .T . T H A r T P A G P 2 O P " ^
1 HEAD
SPACE USING
(PPMJ
Zh-Ul
IS CO
to tu -J
CO
0.01
LITH
OG
RA
PH
IC
CO
LUM
N
1 L I T H O L O G I C DESCRIPTION
1
ml %
«
r
so" '
ssZi
ho—
-
y
(
)
\ y
.<rA)we> »
;•
^ V-
^nmri
1 (
^
< f l m i ? .
OfiSBii/ ^ P A V F U V <:/L-rr ctiue PPupuDrJ A»> /V / />OT;
le^nPBP.ei. t^.^i i?nr^ 7a°:^C.fiKi-&u. . i - ^^ - ' i v / r ' - 'AT ,
PBf^p^\M < / i T V A / e / i y 5 i . ' pPouj iO. p i » M ^ i J t e n e
/ ^'5'rj Plf. ftei S<. TS * /? ^, W 3o^/.-;M.-r
Y
K y
fAr*.^ ^ ^
R E M A R K S Exploratory & Monitor . Well Drilling
DAVE'S DRILLING COMPANY

PROJECT NO.
PROJECT NAME
DRILLINQ. METHOD
STATE COUNTY
L O C A T I O N : T R
LOG OF EXPLORATORY BORING
BORING. NO. M : £ M : : £ LOGGED BY
D A T E DRILLED
. D E S C R I P T I V E L O C A T I O N
.SECT T R A C T PAGE OFJZ_
HEAD SPACE USING
(PPM)
ii p. a. (D
UJ
^ ^ < H CO
rt] tat O S
t i i < > coco
s ^
s Q f 3
z
3 Q 0
ai
or i^ !5 3
L I T H O L O G I C DESCRIPTION
•
es:-
no_
t P —
^i
M.
T/LTV PPMt^u U ^g^/?^< ; ^g^-y pr/^Pii^C. r- jrmfr^V
J-
\ y
snu^
PBfjBk^ ^ I U T V hP/ii'S.i-- k^cc/tft- B-evut/v, pfip/jH S C ¥ ' J ^ . < ^ / n P I P M I ^ j t ^ iP 'A.^ .^O^^/n^lLTi
• • • > • • • ^,m I • , , • ^ p » • h^ — I ^ a j i ^ M l f I I W Mar, r .^M 1 • • n i 1 a ,
<^/\Prfr
J-_ €/JIM^
f^g6fl/ty ^PAveuv p,PHD-:PEtni6t^ Pfio/tr/ fiooPU ^nO-r^S^. I0%P9BPA^.?/P^^f i - ,<^L t^.r, ,^ r^ lU/ 'y
R E M A R K S Exploratory & Monitor Well Drilling
DAVE'S DRILLING COMPANY

P R O J E C T N O .
P R O J E C T NAME
D R I L L I N G . METHOD
S T A T E COUNTY
L O C A T I O N : T R
LOG OF EXPLORATORY BORING
RnR iM f t Kin fiV-fi/YM/Z-S"
LOGGED BY .
D A T E DRILLED / / / ^ / A ^
. D E S C R I P T I V E L O C A T I O N
.SECT T R A C T PAGE ^4 np 1
HEAD SPACE USING
(PPMJ (L, CD
i$: < I -co
t i l
lu"-
0.(0 s z < > • coco
o o
1° L I T H O L O G I C D E S C R I P T I O N
/^2Z
lO ' i
u o _
\v.
JiQl
peBBL^ P,M\if^iy<^ .Pmo!P.-^ t f^ - ' " f^p/yjjrJ. ^nPV^'./)PV^(i if>^inff'&^t-V.'.7D^Lf..pA't'Si. fJ^iP£tJfATF
P.Pfe^r cr . f y/ic^r
L sT
^ h -
XT ^f^ A 'g--
iT -' ^ rf
^^Aj
^
37rrr «r R E M A R K S
Exploratory & Monitor Well Drilling
DAVE'S DRILLING COMPANY

PROJECT N O .
PROJECT NAME
DRILLINQ. METHOD
S T A T E COUNTY
L O C A T I O N : T R
LOG OF EXPLORATORY BORING
LOGGED BY
OATE DRILLED iZsm . D E S C R I P T I V E L O C A T I O N
. S E C T T R A C T P A G E Q F S L .
HEAD SPACE USING
(PPMJ
UJ
! § : < H CO
£UJ
O S
So Q. CD Z Z < > coco
z z 3 o o
L I T H O L O G I C D E S C R I P T I O N
130
/ ? 5 _
<iO
IH L ' J T
\5D
^tf~\*li\f_ /'(ifliW ^f i r : /h1 ^ , ^ r ) n n --••:'-/:) ^f?7<7 . i ,p.pv7J. • . - . / ' • - > , • < - ^ ' , - ^ . x . "p -"^^
W ' f i ' t - f y
^iTl/^,'
V
J L J H
J L ^ £±J£_
R E M A R K S Exploratory & Monitor . Well Drilling
DAVE'S DRILLING COMPANY

PROJECT NO. PROJECT NAME DRILLINQ. METHOD
LOG OF EXPLORATORY BORING
BORING. NO. LL :£ I f2 l iS^ LOGGED BY'
D A T E DRILLED
S T A T E . . C O U N T Y .
L O C A T I O N : T.
. D E S C R I P T I V E L O C A T I O N
.SECT T R A C T PAGE _ i z _ O F _ ^
HEAD SPACE USING
(PPM) a. CD
UJ
< H CO
n UJ Ul"-
0 . 0 z z o coco
L I T H O L O G I C D E S C R I P T I O N
i s d
1^0
\ s__
no
Hi
J3a.
^
iT/IKufc
PEBBl^ ^/g/n/gtW ^APP '. ^s^t^r.i^P f,PLW-fJ. S % f i f . f ^ l f i . Ip '^ 'n -^fi/)-/s!.\-r.. i-WtY '-rf .VC F-.H-h (."-r. r-'f.yl
9e=f P.i\f f.r^f,'ir.,i'J ^ Af/r - /:pn>iV). y^..^y-f^:-?^-i^- o -U. A •'• - A " ^ r • J * -Tr; : ,n , t r : '
^/ fW^
? J ^
f i M ^
Jc iM£_
- #
R E M A R K S Exploratory & Monitor . Well Drilling
DAVE'S DRILLING COMPANY

d P R O J E C T N O .
P R O J E C T N A M E
D R I L L I N Q . M E T H O D
LOG OF EXPLORATORY BORING
RnaiMri un -AM-PW^.^S L O G G E D BY
D A T E D R I L L E D
S T A T E C O U N T Y
L O C A T I O N : T R
. D E S C R I P T I V E L O C A T I O N
. S E C T T R A C T P A G E _:ioF^
HEAD SPACE USING
(PPM)
UI s^ UJ
< I -co
truj u j " -o z
0 . CD Z Z < > coco
^ z §< s
3 x8
L I T H O L O G I C D E S C R I P T I O N
/ »
190'
.. i^sZ
Zoo
loS
2m.
6f\n.-
•^/1'.V»
V
i^tl)S<(
!£ ^«Kf.
Pgafi l t / /:)=.v';:.u,t/ /fi/^/- : f?r.•./,>/•:. ^^ •.-;i/;
vT^n P f ^ ^ U i /0%iCPfiV^.L UJgi-t. "g-gr/ ^ ^P(: PU: C/ ^C-
,f\r-9
R E M A R K S Exploratory & Monitor Well Drilling
DAVE'S DRILLING COMPANY

DAVE'S DRILLING 5617 W. Wells Park Road
Salt Lake City, Utafi 84088 (801)569-2000 Date / J ' y O - ' 7 ^
RIG HO.sA'/A) RIG TYPE TflA/hO
JOB OWNER f j y y c d / T y
LOCATION 7^PiVL'/<^<^
.WELL NO. P T / ^ O ' I I S , ^ TYPE />yyi TlS.^:,,^
TIME DEPTH DRILLING INFORMATION BIT Start Stop From To Ft. Log or Remarics Type Size No.
2222.
A?7y/^'.r>(^y:Jlhrrf A ^ f f A y A n/?7i-J-<
5m. Ad7Ay<.
7'no /HO'Sp'Cf ^ ^ 70/7)^- ^ <^ t~pf^ y^ Ar - /A) ^ ' y - ^ r X / / ^yyr^_y>Ay.7%y. ^ y n f r ^ - Z / n 2 / ^ c y ^ i f y f / / y y y T f y > / y . r . y y y . . „ ' ^ f T
^UKl A ^ ±2L A ^ ^
Ap7Ay-^
STAND BY TIME HRS..
Signature of Owner or Representative.
HOURLY WORK HRS..
CASING USED: S i z e .
CASING USED: S i z e .
DRILLING MUD: Type.
.R.Used.
. a U s e d .
.Anwunt.
.Water G.P.M.
.Water Static.
Fuel _OU.
MISC.
• • ' " • i • I • !• - I • • ^ . — ^ ^ ^ * m m '^'^Tfci " ° ^ 5 ^ ^ ^ ^ ^ / i ^ . Driller Helper
<^s-s

DAVE'S DRILLING 5617 W. Wells Parte Road
Salt Lake City, Utali 84088 (601) 569-2000 D a t e / / - / ^ - ^ ^
RIG N O . ^ / ^ RIG TYPE / ^ / l i f O
JOB OWNER M > u / t 1 ^ , ; 7 y
_WEaHQ.f )n l /yJ- A TYPE moM.-iy,r: ^
LOCATION ' ^ y l A ' y u J
TIME
Start
y.rr)
%
stop
91-^?
DEPTH
From To
DRILUNG INFORMATION
FL Log or Remarks
F.n.'<l, A^^/^/VftTrM^ yiA A/lA^ jy^cJ-^ • f royn K A ) ' - / O . Ty , < .7^ l l ^ur^y^yyf
P . A/1 y f7^ /Hay .
P yy 7 ^ / ^ ) £ / / v anz- l ^ . ' J / , ,p 7A ' /0/jOf y > ^ y l TZlAe, ky/rJA-T^-^ h.jif/Ai'U
'
BIT
Type Size No.
«
1 1
STAND BY TIME HRS.
Signature of Owner or Representative.
HOURLY WORK HRS. 9 ' ^ A y < ^
I Driller ^ / V ^ ; = ^ r V I Helper THeipeT
CASING USED: Size
CASING USED: Size
DRILLING MUD: Type
R.Used
R.Used
Amount
Water G.P.M.
Water Static
Fuel ON MISC. - ..
#

•01 02 03 04 05 OS 07 03 09 10 II 12 13 14 15 16 17 18 19 20 21 22 23 24 25 26 27 23 29 30 31 32 33 24 35 35 37 38 39 40 41 42 43 ''!4 45 45' 47 43 •19 50 51 52 53
iTIL JiiXIFLpiiMhirt
.'j--)jcct: fsYyiUiJ-AL-nniL l.'ell Ni:n-.bcr: Q ynio -^C
Project IJuruber: '• • Date: l ( - 2. I ' S-^
V.'ell inside diameter:
Depth of bottom:
H / 2 . IN
21/ FT
Length of gravel pack: '7 .S FT
Diamster of gravel pack: to-2.fi IN
"iiiwxi
Ksasured by: M'-P^IJ^1S:SG/JI.
Recorded by: J Jumui . . ^ . . ^
FLUSHING
Air tGrripcrature: S S DegF
Weather condition: /g.V h A \\<K'>A/
WITHDRAWAL OF WFLL VOLUMES
" • "'• Well Volume Well Volu'me l.'ell Volume
l.'^ter level Lafora JSZJtL'Al I'ater level after ± J 3 X l _ _ __ Time begin flushing \S HS Tima end flushing JteLiS L Time v/ater level after /^ws* _" Estimated volume flushed (GAL) ?& pe>- KK.'t .
S5L
FIELD ANALYSIS
V/ater temperature (DegC) Sample pH Sample conductivity (mhos/cm) t fjO Buffer before — Buffer after — Odor Colo r Other
Pcih-c
co:;;'.EHTS
a>ttB6£ 6Alvm. HUD PIUiOVLEn ^ i/My h/XiD
Attach photographs of water samples in labeled jars.
END OF SECTION
01 02 03 04 05 06 07 08 09 10 11 12 n 14
i& 17
19 cO 21 22 23 24 25 25 2/ 28 29 30 31 52 33 34 35 36 37 38 39 40 41" 42 43 44 45 46 47 48 49 EO 51 52 53
Bayview Landfill Construction 6-21-89
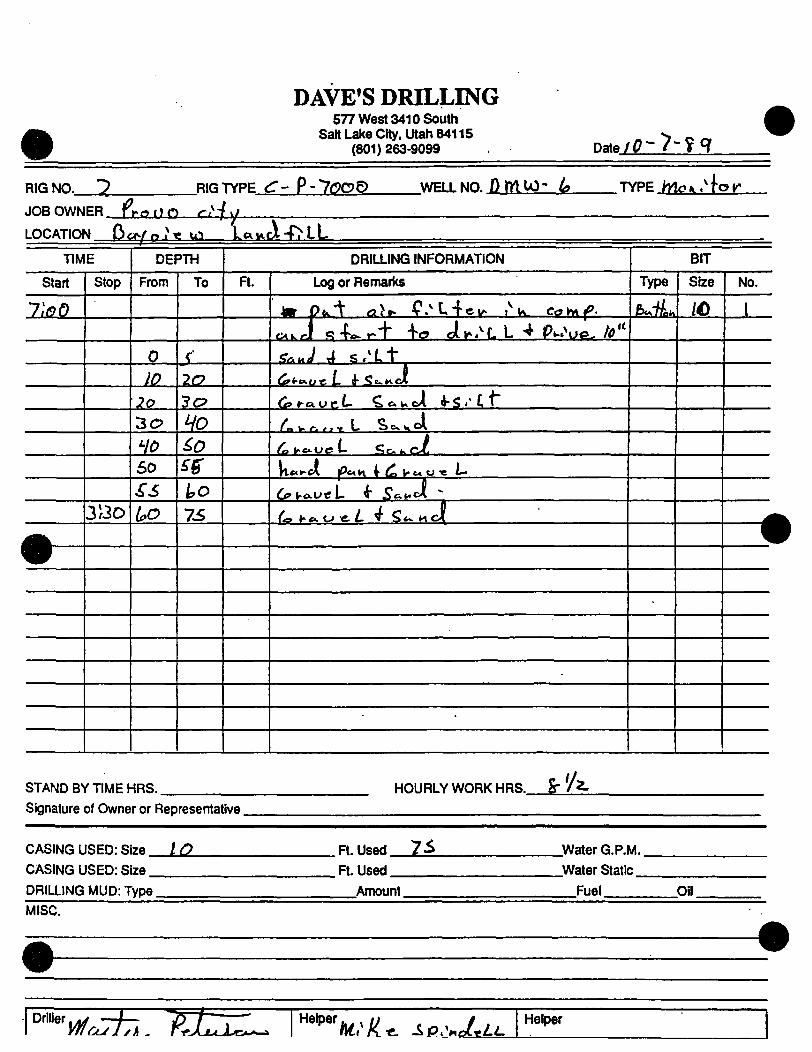
DAVE'S DRILLING 577 West 341 OSoutfl
Salt Lake CHy, Utafi 84115 (801) 263-9099 Date /g "> '?q f
RIG NO. 7 RIG TYPE dT- 9 - I O G D V^ELL NO. O m i Q - io TYPE MoiL . ' f c^ r
JOB OWNER I-0I7 0 c l
LOCATION Q>«ini i
S_SAi. kci^Jt-FMl TIME
Start
7;^o
M^ 9
Stop
3)1D
DEPTH
From
0
IQ 7 ^ 3 0
io 50
SS Uo
To
c 2C?
3c?
vo ^ 0 r
to 75
DRILLING INFORMATION
R. Log or Remarics
' lm p u - t «>^ C / l , 4 e i ^ .^u
^ . J «ji«..-+ +« iy^.^LL ^ Ct?Wi(P.
P^.^o*.^ A»"
'- i-.y rl S / L t
Cf*^CKU^L ^ <iz..v^A
6>t^cvr .L C , c ^ A i - S / C f
/ " a w r . r > v L S c ^ v O \
P a t - c U c L < i c L . c J .
n»^CA. |Oc«K •• ^ V- M O t i -
C^vo.v-eU T 5cKt>\ "
f ^ lr-e>. U -e. L V S * - M c J (
BIT
Type
fr(^7R.i^
•
Size
/O No.
i
M
i
STAND BY TIME HRS. HOURLY WORK HRS. i Signature of Owner or Recresentative
CASING USED: Size I O
CASING USED: Size
DRILLING MUD: Type
FLUsed I S
FL Used
Amount
Water G.P.M.
Water Static
Fuel Oil
MISC.
1 A ^ V
Driller )/ificj1rr>i, T^ tUZ^ \^^^'ii\i,^ii^ S ^ ^ Z L Z Helper

DAVE'S DRILLING 577 West 3410 Soutti
Salt Lake City, Utah 84115 (801) 263-9099 DAeJlz^JliS.
RIG N0 ._
JOB OWN
LOCATIOf
7 RIGTYPE
ER P r o VJ o r A > J
4 Y?s«^VO»'etO A * v * .
TIME
Start
l ioo
#
Stop
(?loo
STAND BY TIME!
Signature of Owne
DEPTH
From
7i' «=fo
To
^ 0
loS
C'P''?oaD wEaNO. D M LU'^ TYPE wi p ^ f f ^
TH I "ha
A ^^tC DRILLING INFORMATION
R.
/s /S
HRS.
r or Represental
CASING USED: S
CASING USED: S
DRILLING MUD: T
ive
ize /O ize
ype
Log or Remarics
//>c.Jl nw..'LL p . ' m t i V C^s...»u«f-
U ^ ^ L L ^ o : A ^ K i o "tW^ v>/tj_
<^.'l.U U j u 4 ^ l - A-i-uc K . \JUOt^K o h
^ l y <u.V tc^mjP. /"t-y "i? £ i A M^hyt.
<^»>^.
t l i i IVVie K T « C I e t f c O i f . L ^ Se.*^eA
<!. tJ ^Vl ». U. + e d l <LLl.e^K.«_L « ^ S ^ l . ^ C > \
^
BIT
Type
B i i j t n
'
Size
/O
HOURLY WORK HRS. / /
FLUsed S O Water G.P.M.
R. Used Water Static
Amount Fuel Oil
No.
/
1
• i 1
1 Driller ,AJ <#— r r rr-^^^ ' 1 Heioer . t / l . . 1 Hplnar n t / . ^ 1/ 4 ^
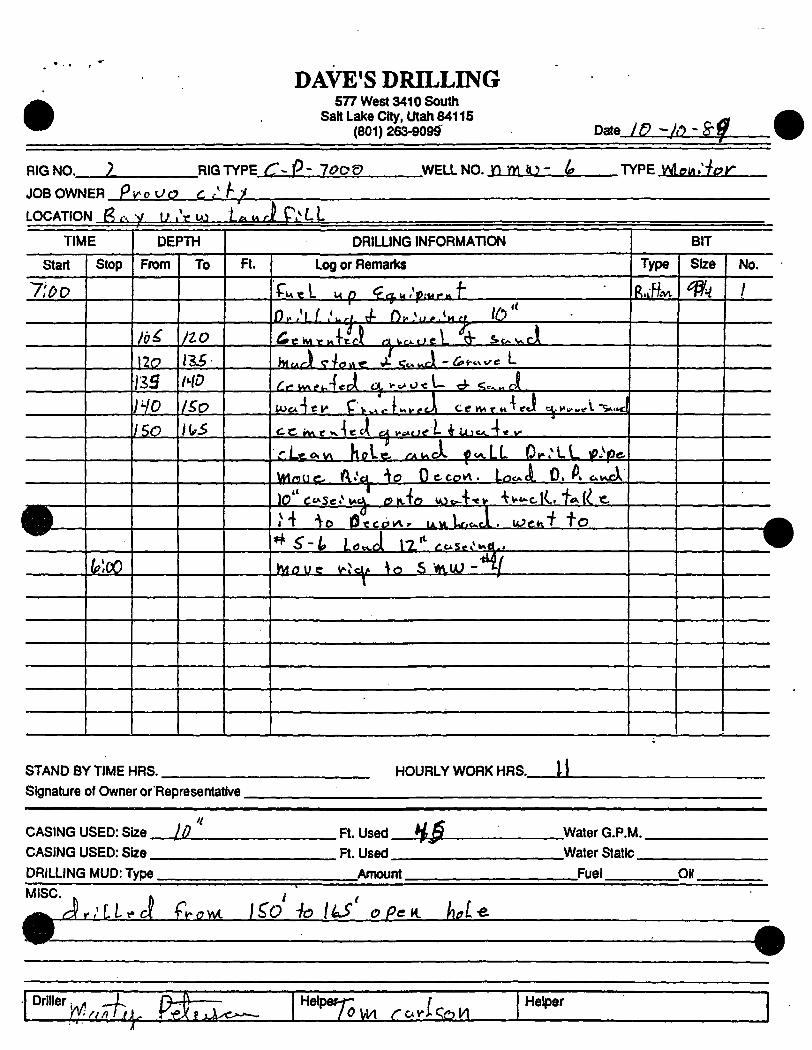
DAVE'S DRILLING 577 West 3410 Soutli
Salt Lake City, Utafi 84115 (801) 263-9099 Date m - ^ n - ^ ^
RIG NO. 1. .RIGTYPE < C ~ P - l O O V .WELLNO. n w H ? - L TYPE Wtei/..'•//?r
JOB OWN
LOCATIOI
ER F i^o t 'c?
^ R r s V i ; .
TIME
Start
7:00
9
Stop
^;«)
c P ^ y
vu> i'.uJr.^LL DEPTH
From
IbS \20
m no 150
To
/ZO
/ ^ ^
/^t?
/^c?
\\^s
DRILLING INFORMATION
R. Log or Remarics
V u t L u p ^ A u / p i M i - K T
Ov.;i.r .'uw J- r). .s. . . 'M,, /<5" ^ e WiTKTtrX /-J \.r>.tJ e L d" Sc^v^cA
hftviri c - / t f M t .L 5 ^ ^ J i - ^»-cx^« ; L
/ ^ t -Vvx i 'k .4ec l OL*'<^«J<<— « f ^ c , cX .
U J c i ' i e K CwwAc « i '< ' tA C e k V i r n t f J c<,>>c*.,|.l " ^ . M J
t : c i MT v^TecA o< v>.;»cicr L i Uio<.-t< ^
r U f t w Kole, /-xi^cl ^ U L L L O ^ . ^ L L V'^y*. VMndc- A.v*ci ^ o O t c o v t . L a d 0 . A cv^cl,
) 0 ' <:t*5c*UclL OIVTO VOo.f-«V "Vv-w-clC Ti».(C <-
M -^0 0 « C O V \ r U V t l f i O . . ! . M J c A f o
*^ S - L l a ^ A l l * ^ /-c.sr.«*.el..
Vy i oue V - M * \ r t S Vh.UJ - ' * ^ /
BIT
Type
R.IBM.
Size
^ ^
No.
/
4 i
STAND BY TIME HRS.
Signature of Owner or Representative.
HOURLY WORK HRS. Ji
CASING USED: Size _
CASING USED: Size _
DRILLING MUD:Type.
ML FLUsed.
Ft. Used 4S-
Amount.
.Water G.P.M.
.Water Static.
Fuel Oil MISC.
J . / L L ^ J f^owc i^O io ILS' oPciL hAe.
" ' ^ ' ) ^ / / ; r n j , ( ^ h ^ A y , ^ ^ \ ^ 0 m r c r U n i A Driller: Helper

^
L O G O F E X P L O R A T O R Y B O R I N G
Pl^e-JC-^T NO. I P ' I . I I P • i-^/a-Z'-^ p r - f p C A J . a n a I N n MO f ^ j - O i r V J - j P
PROJECT NAME E/^'J'/.^VJ UfsfJP.^lU. L0GGED BY LlhLj i i ; i= i lJ l£;=^
DRM I iNr, MFTHon r.PJiUcP\^!^P= Jrip__ t nT^P'/ .•y"^/ i ; .W4nATP DRILLED A g V - ; ; ; v?-
DESCRIPTIVE LOCATION f ^ ^ T P>r Ef^YA 3
PAGE _ Z _ 0 F L 2 _
STATE. _C0UNTY
LOCATION: T 0 .SECT, TRACT.
HEAD SPACE USING
(PPMJ
0 3
IS
a. ca
y,,, 1 5 : < 1-(0
=f £li! o z
Ui
< 03
- i O a. ffi
<>-coco
¥ 5 ? § 3
LITIIO
CO
- I UJ >
or
<
L I T H O L O G I C DESCRIPTION
lo
'•'n
6 I L T : RUnwN. WELL 5Pin^ lO, V f ^ y oPHca /B . p \ t ^ ' h f>m i ^ .p
6 l \ T < P B m < / 6M-/EL'- P:PSM)P)_\h,i<J pcc£v/roc:nr/
'PEPBueS I D PtO^x/K.
P£fip)\ ' PiPAlz.-py. -••^•^•P:kow^).ppoP-i^:.OfT^D PFftftLFf . a^-2.0^^ u u r I'^^jtn^ x'7.y£c;VE
PFfieiV S l l T ' i 6 M V E L •• BkO\JJt. POPP-LV £^£7g ;
PCftfiiy gM\ /g2 : &Pe*/- t f i o w r j . M ^ C I V M cai.-rw
U£?> »>s CS'St^*) fi/0 RriE6.MEUU/K^f^SP!
6 t \ m i ^ I P T : Seouofi. w e u ^ce-T^O P I N E .
&,fi.Nf)^Di ggif-gcmE vum-t) \/Jsr.
R E M A R K S Exploratory & Monitor Well Drilling
DAVE'S DRILLING CO^'!PANY

i P R O J E C T N O .
PROJECT NAME
DRILL ING. METHOD _
S T A T E C O U N T Y .
L O C A T I O N : T
LOG OF EXPLORATORY BORING
3 0R\NG. NO. Ell^J^^lJlzIZ. LOGGED BY
: D A T E DRILLED
. . D E S C R I P T I V E L O C A T I O N
. S E C T T R A C T PAGE • - Q F .V?
HEAD SPACE USING
:PPMJ
2 1 -
2 0 111 u 0 . CD
UJ - i UJ a . Q.
2 > < t -
r:UJ
az
UJ o D . CD 2 5 < > wco
c < cc o o
L I T H O L O G I C D E S C R I P T I O N
•4; fO.
'f:r
So
.-,-s
ftFftftiV ^/LtV 6M\JEL : SPOWrJ, fiOOPi.'-' -Z /CTSP^ \lf-p.-J XO:-r.-,\i'!» C/'-"^ r ^ ? / - ' /":
JtMB-uLi gftVEV ig/iT r P^\).)fO yftP. ppofy-/ -:cf:rsD M^i / g'/;g: 'Cp.f::nsP.
PfeeiV 6MVE1,: ^g.gy- eg^wA) )a.E/)ji;>w ax^-r^n ^ 5 - g K K gpaf^rgO PN>r!\CU <
R E M A R K S Exploratory & Monltof Well Drilling
DAVE'S DRILLING COMPANY

PROJECT NO. PROJECT NAME DRILLING. METHOD .
STATE COUNTY.
LOCATION; T
LOG OF EXPLORATORY BORING
LOGGED BY : DATE DRILLED
^DESCRIPTIVE LOCATION
.SECT TRACT. PAGE . 0 F _ ^
HEAD SPACE USING
^PPMJ
^ 5
zP UJ - *
UI
< 1 -(O
U j " "
o z
to UI
1 CO
!3d 0. o 2 2 < > CO-CO
¥
QR
APt
LUM
N
2 o r UJ
oc UJ ! ; s
LITHOLOGIC DESCRIPTION
__
(^£1
^7,0
3(2^
ed
3011
Msh •^ILTY fgeeH ^eAVEL: figpuj/i^^ vfegv P/>QPk < ^/^^TEZ?,
PBfiSiy ^APC'J j - / / - ; : - ^•''=:^ •:/--''v^/'/ /g.^z./
-^/?A^T^f;,^OkV'e •FIMg.g
.5/^;i;0*/ PBfiSLE<>'. P IPE^ , PPPP,L.V C O O ^ O 'Jtf-'-^ CoAe.i.^
p£he,\.H PPA^tl lM <AfJ£ i ^EDO^U ki-£>\sjt) iMEClvyi
"P^fe.
P ^ 6 t . V f;/1)'yj?V ///'/^l/£L-• P =cc;^>r 6/:>-'.'3/'j. A^oy;v
;^.•^c^ 'S^^e/ A;6t>i•;l Hr. on-invrnf)
v ftfl/CV ^MVEL • h^i id^H R(-yjJf i t DORvJ ^ o r r ^
m
m REMARKS f \F r t £ . ^C ' klT>+Pi.O&y C^H/itU^^ fi'?^*M*77^^i.i/ Exploratory & Monitor
y/i; O ?*.«?;£ '4'1'^ 7^ jm/ * i£ . AE/:;b/'-/>' i&P.CWM:I/1«'^y WellOrllling
u.fitfi.)Ai ^uTh y . m s p^ >o PP'J^ ' DAVTS Dn!LU?]G O O l ^ . W S l

• PROJECT N O .
PROJECT NAME
LOG OF EXPLORATORY BORING
. BORING. N O . B i z M M j d 2 .
DRILLING. METHOD
L O G G E D BY
D A T E DRILLED
STATE COUNTY.
L O C A T I O N : T.
. D E S C R I P T I V E L O C A T I O N
. S E C T T R A C T P A G E T C i P ^
HEAD SPACE USING
(PPM:
Z t -
So ^ ^ z Q a . CD
UJ
1 5 : < H CO
u j " -
oz
a. m 2 2 < > W W
5 3 o o
L I T H O L O G I C DESCRIPTION
9C
l <00_
\ o ^
lle_
/ /^
j[Z£
/WiVBUl^ 6Af)0: P.BC£t6H t?/?oujM ittgrinyv ;.PA7?^
PS66:. '^ < ;1»y/y ^ /^ /Vgl : RecflKW f &n jj/J
PBSei i W.')~iiH CniJC-P£crii<.ri PP,O^JJ 0. r-con^
6fiflD '' PBCC)6-y P.Po^JfJ ;vrt-i. -CoflT/:
•AflP'. RUDICIT hPO'^JiJ r.'t-LVJ-)^ •:.-•'<• r r / :
P ^ ^ P L M ^MVgL ; APB l6H BPOw/i) POoPlS -iJeTSg fE^Sftt-E-S TT? Pff m K .
« > REMARKS
Exploratory & Monitor Well Drilling
DAVE'S DRILLING COMPANY

3] rn H > 3J ?!
* * S o
CO ^
o 30
z Q O O
>
-<
K3
^
i Cb
i i i i r ^ i i i i P i i i i r i m P i
m
1
re.
I I
I I
^3^
| c ^
l i
vV
Ife?
30
n
sV g
fe
I
•b
c w -r
2 O ^
PENETRATION BLOW. COUNT
SAMPLE TYPE
DEPTH IN F E E V
SAMPLES
SAMPLE SYMBOL
LITHOGRAPHIC
COLUMN
WATEF1 LEVEL
o r-O o o o tn
o
O z
o o >
(O -1 >
m
o O c z
o 30
z o
TJ -D 3J 3 O O c c tn m O o
s z z m > O
X m O o
m O
3) > o
o m CO o 3
< m r-O O >
0 z
> o m
h o •n
O > - I m
o 3)
O o o m a
m O 3 z o
m a» ^ o -< O
r O Ci
o
m X TJ r-O 30 > H
o -< 03 O
Z
E 55
J

4 P R O J E C T N O .
P R O J E C T NAME
LOG OF EXPLORATORY BORING
. ROR.Kir, u n ^ y - C P y l W - i h
DRILL ING. METHOD LOGGED BY
D A T E DRILLED
S T A T E . .COUNTY.
L O C A T I O N : T .
. D E S C R I P T I V E L O C A T I O N
. S E C T T R A C T PAQE - ^ O F ^
HEAD SPACE USING
CPPM3
^S
G5 2 ° UJ s i a. CD
UJ
< H co
r-UJ
u j " -o z
CO UJ _J 0 .
2 CO
a ffi 2 2 < > coco
¥
GR
AP
LUM
N
0 0 -J
-J UI
S or i^ ^ 5
L I T H O L O G I C DESCRIPTION
l s
\u>
\ys
\no
A^pm^LlH 6MP : tPo-yrj!Ci^ Pr P ^ A i ^ y - i .
Pi/ -Av il-i SAf/n : RPOwmcH PSP , po'jmEC, wzjAVY •s.ytr^c. • y ''. ^ r. vr >
PiiLAvELi -fAW'. tPpyurji-LH PEC /fo-yrCfjQ •rTll.lf/ •tce-:T:C lOf... /r-f^';?: L
PmSL^.SMO^ PPAMtL : EPQ^xitm^ fe^z?. foozV <,pie.'(EO Ll\P-(?e. P B P P I E . ^ ~kj ifD<^Ay,y
R E M A R K S Exploratory & Monitor Well Drilling
DAVE'S DRILLING COMPANY

DAVE'S DRILLING 5617 W. Wells Parte Road
SaH Lake City, Utah 84088 (801)569-2000 Date AAP'7 2 - 9^^
RIG ^o.Ji£L RIG TYPE .Fhii/ppi^ .WELL NO. D m t J - A? TYPE njc^/ i rTi i^ .n^ .
LOCATION , / ? ^ i / / / . V ^ ; . . . . .
TIME
Start
^
#
Stop
. ;' — DEPTH
From
/PP'
To
^
o
DRILLING INFORMATION
Ft.
/ ^ '
Log or Reniarfw
r^ < ^ / / / ' » / hJyJ< ^ - ^ " yi t^/^ > yp^ ' yA^^' '<y.f>'.^.y y^.W7PA<i y.'A h/y.^ik-^-^" oi p. r h A ^ A ; ' T T y K T ^ j / ' ^ / A ^ . y y y<>y/yjy/ -^ynn^
'70A ' /^A^' 'P'y<7y/ / ) yr \ r f r<f ky.^iTy^y/lk • + r y y n
/ A ^ ' - 2 . A 7 '
T ^ A I Q i l M/ QL Ty^y7e'^i7~Ar(?yy\ TA) -
A ' y / n y / ^y,y)yyyAy, M / ^ A ^ - A > .
77yi<'f7i' J l <ftr-Ayc:f yyynpAy.TFy/^
BIT
Type
^
.
Size No.
«
^ ^ m
STAND BY TIME HRS. Signature of Owner or Representative.
rpA^ .
HOURLY WORK HRS.
CASING USED: Size CASING USED: Size DRILLING MUD: Type
Ft. Used Ft. Used
Amount
Water G.P.M. Water Static
Fuel
,
Oil MISC.
A 1 •
Driller .^:1.
He^er Helper

•
'11 i:''ii.j:i'V!«';:iif.f;i UI
t'3 r.oj&ct: .r.V)VlRMAN'^rnj. .. I'ell K'.':..bcr: D m W ' ^ 03 O'l , 04 05 Project Nu::,Lar: Date: / / - ? / - ^ ^ t 05 CS , • 06 07 l.'ell Inside diameter: Q'/z. IN 07 03 C8 09 Depth of bottoni: •• IL / f .^^n 09 10 . 10 11 Length of gravel peck: I S FT 11 12 12 13 Dicr.,;ter of grjivel pacl:: lOr'kP IN 13 14 "^s*^ Id 15 :;-:asu».:d by: AMjt....P.^&JZ£>C>/^ - 15
17 "c-corded by: ' : 2 ^ « J L ^ i & W ' 17 18 . - ^ . .. _ ^ 19 Air temperature: ^ 4 ? _ Dc-gF 19 2 0 " •• e o 21 V.'eather cond i t ion : S u n \ n > / ^ c i - ' ^ < ^•/^'^e / 4 > - 21 22 ^ ^ ' ' ' ' 22 23 UITHDRAVfAL OF WELL VOLUI'.ES 23 24 24 25 FLUSHING l.'ell Volume l.'ell Volu:;ie l.'ell Volume 25 '^J 26 27 l.'ctar iGvsl bsfore / 3 4 ' 27 23 '..'ater level after /a 4 13 23 Ti.73 begin flushing \1)D').. ^__ ' 29 20 Tirr.e end fli'shing jL5l5ii . " ^_ -" 51 Tina water leve l a f t e r / i f i Z o " A . "L 31 32 F.stinated volu-.e flushed (GAL) ^~ C^ [ p e r M.'M 32 33 33 34 FIELD ANALYSIS 31 35 - 35 36 '..'ater ter .perature (DegC) L o -f 36 37 Scir.pl e pH _ 2 37 38 Sample conduc t iv i ty (mhos/cm) ^*^\ 33 39 Buffer before _ : ^ 39 <0 Buffer after — " -;0 41 Odor f Jow-^ '_ A l '' 1 52 Color c i c c i c A - 2 43 Other 43 ^ ^
45 CGIWENTS 45 45 46 ^7 -V/t^. W^I4. fiJ£iC^V££B£l vu£>Plf P.»P/Diy 47 ^5 jLF/ae oi^jmym^/i/T..jp2tiuLw-V.fVf&e.. ' s l l ,MJs-i-\>4ifiiu^^.j^AJtm^. fi.p^9^P3:i ^3 50 EG 51 Attach photographs of v/ater saj.ples in l abe led j a i s . 51 52 l l 53 END OF SECTION F.3
Bayview Landfill Construction 6-21-89

)b K*lf 5 X S I U i n c . <..c.ii • • ( • ) • -« k x 9 X 2 4 CM
Kcurr^L 6 cssrn co.
f ield Copy^fNJWcU Tesl", ApplicoHon No
Hin t IH u. 1. k. \ B 2^y^^ or^
Test Conducted by Rhodes Bros.; FiJImore, Utoh — 743-6277
"^L.

• v 4I .1I I 90 SHtdS 5 iOUAIt
A I 42 . ] l f 100 iHEI t i 9 SOUAIE
26(3
3 0 6
3 7 a
M 3 ' IO
Ml
N
3 i O -
3So-
'100
F^ovo LA//prni sjT^e C /EI I .
Se/'T. 0~% / I B P
2 .9S j r - Jp^ .
K 5
:^
J 2 7
3 S - 7 •^^
7"= 2,BS v j i a a o - S^vaaffJjfy
I*
1^
/ S o TLCo : t 5 o 3 o o 3 S o ' t o 6
P/sc//j9/ec£ ^ c y r ^

367 SOUTH COMMERCE LOOP
•
OREM. UTAH 84057 (801)226-8822
CHEMTECH CHEMICAL AND BACTERIOLOGICAL ANALYSES
2875 MAIN SUITE #101
SALT UVKE CITY. UTAH 84115^ (801)483-1163
CEHT1F1CATE OF ANALYSES
SAMPL£ IDENTIFICATION
CLiENT: Prove City V/ster Dept.
Provo, ur 84601
LAS NO. UOl4823
DATE SAMPLED:
TIME SAMPLED:
MPLED BY:
9-9-8S
0940
C-IC
CATION: I^nd F i l l S i t a , fell Discharge
P i c s ( d i s = 350 gpn)
COMMENTS;
PAflAMETEa LEVEL
Alkalinity aa CaCOj, mg/I 308
Ammonia aa NHj-N, mg/I 11 •'•
Ansenic as Aa. mg/I ^'01 ^
Barium aa Sa, mg/I 0.022
Bicartionate as HCO,. mg/I ^ ' ^
Boron aa S, mg/I
Cadmium aa Cd, mg/I ^•^ '
ilcium aa Ca. mg/I '^
Caroonate aa CO3. mg/I ^
PARAMETER LEVEL
Chloride as CL mg/I 57.6 -
Chromium aa Cr (Hex.), mg/I <.01 ^
Chromium as Cr (Total), mg/I <.01 -
Ccnductivity, u.Tihoa/cm 676
Copper as Cu, mg/I 0.085 -
Fluoride as F, mg/I 0.72 •-'
Hardness as CaCOa, mg/I 136
Hydroxide as OH. mg/I ^
Iron as Fe (Dissolved), mg/I 0.082 -
Iron as Fe (Total), mg/I 0 . ! ^ ^ ^
LsadaaPb. mg/I 0.045 -
Magneaium aa Mg, mg/I 13.3
Manganeae aa Mn. mg/I < .01 "
Mercury as Hg, mg/I C.0C1S •
Nickel asNI, mg/I <-C'i
Nitrate as NOj-N, mg/I 1.60 •'
Nitrite as NOrN, mg/I <.005^
Phosphate as PO*-P. mg/I 0.01 S
Potaaaium aa K, mg/I 15.2
Selenium aa Se, mg/1 <. 002 -
SilicaaaSiO, (Diaaolved), mg/I 70.2
Silver as Ag, mg/I < -01 '
Sodium as Na, mg/I 62.4
Sulfate as SO4. mg/l 60.3 -
Total Diasolved Solids, mg/I 614 •-
Turtsidity, NTU ° ' ^ b "
Zinc as Zn. mg/I C. oRT-
pH Units S-OS ""

•
frnm IU t u a m
* t o r l m l t » . C. REPORT OF WELL DRILLER
STATE OF UTAH
->^jCct^p2iUy Ctola Ma.
GENERAL STATEMENT! Report e( woll drillor U hcnbr mado Md fil«d with th* SUU EntlnMr, In iceonUnn with th* law* e tlUh. (This report ahall be filed with th* Slat* EiifiB*«r within SO day* af t«r the completion or abandonnwat of th* W*1L Pailur* ta fil* lach report* eonstitutes a mlidcmeanor.)
(2) LOCATION OF WELL:
County „. . . . . . .
Nonh .._ U
5ocitli
•f S«rtlon . ,. ,
BUI ward, not hocdod)
. Ground Wilar Baola^
Eoll
( taan kkak)
N B t L M f (Mrikt
(3) NATURE OF WORK (check): Mow Wdl
lt .pbMm«il W<ll O t t t n i i l t i t O Ravolr O .AkonjM
(4) NATURE OF USE (ehtck):
Donatio D MnMrirU • M u W v d D
bTl io tbmD MblM D Otk« O
•tookwalar
TMWoU
(S) TYPE OF CONSTRUCTION (cheek):
Botorr a Du a CoMo D I ' ' ' ' " D
Jotta<
» o n l
a o
=
D D
a _D
(6) CASING SCHEDULE " DUai. I l « i . ' o «
" DJoH. from foot to.
" Olam. froai . <••* to.
H»w D »o<o«t g
(7) PERFORATIONS: Trp« ef perierfttar Baed._«——
fliu ef p«rlerktlotii . .->-—
r*rfaf«tWr Tai G Mo O
pvrferatkie* f rea^
p«rfer«Ueni fi«M_
..... p«r/er«Uo»e trom..
. p«rferatlo«i froH...
_.p«rferaU0Di fr««L-
(8) SCREENS: w«]i .crMn iniuiiwr Xm D N« a H a n a f a e t n r e r ' e N e « « . . . . _ ^ , — , ,. - - . - - •«
Tn« -...-Diam. .. . Slot v l ia . .
D U m Slot t U * . .
HadW V ^
.8«t frem
(9) CONSTRUCTION: Wii will ( ro . . l paekodt YM Q No O Slio ot « r » o l i —
Grir* pUcod from foot lo
Wo, • nrfooo oral pcoriiloj? Tm O Mo O
To «b>t 4«plkT ton
Holorlol aw4 !• Mol: _
DM anr otratk conUIn unusoblo watorT
Typa of water: .— . . • —
Hothod «( aomlino .Irate oft:
Y * D Mo
Doplk o< omio
Wai anrfaoo eaatne uwdT
Wai ll comontod In plaeoT
Too
Ta Ho Me
a a
(10) WATER LEVELS: sui le lav.1
Arttalan p m i u r t
. tiot Ulow lw4 a l r t u o DoU..
.. toot oboro land aortooo I>ato_
LOG RECEIVED: ( I I ) FLOWING WELL: ContnlM ky (ofcoiki •o l io Q
Cap D r i i * O Me Coaml Q
Dora waU lonk e m W ooolict Tea D
Ne a
I) WELL TESTS: Drawdoara la tba diauaoo la tool IW wolar IOTCI la low otW bolow MoUo lofoi.
npomp trat madaf Tra • No Q It oo, by wbomT
Tlaldl •oL/Mln. wltk foot dniw4owm otlor-
Ballor loot
ArlafUo tlow .
taL/tein. wHIi..
Ttf f lpwat i i ra • / water.
(13) WELL LOG: DopUi drUlod _ toot. Snr tk o t ooaplalod woB
Mo O T M D
faal.
NOTXi Flora an "X" In tha ipan or eoinblnaUoR of apoora Modod to daolnuto tko HototW or combination of mattHali oncounund In n e b doptb fnlorooL Undor MSMABKS Moko oep daalrabla BOIM aa to aecurronra of woter ood tha eolor. alta, paloro. ote.. et autorlo] «». Muaurad In each daptk tatorrol. Ura oddlUonol skaat If nudad.
'PaTtfti~7'(c^(t('tA*ML
V'^r^-PlHf-Work aurtod.. , ! • Coaaplotad..
(14) PUMP: Uanotaonioi'a Noao. .
Tipei , H. r . Doptk to pamp er kewtai.. ..foot
Well Driller'* StaUment: Thil well wa* drilled under mj luperrlilon, and tbii Mport li tm* to
the best ofjpT knowledt* and I
Nam*
st ofjnj ImowledE* and bejlii.j y ^
^fS//VA///i.cS:.JMhAJiLj. IPonen, firm, er wrparallon) (Trpo or pflet)
Addrasi.
(Signed).
Lle*ni*No. - g ^ ^ -(Woll Drillar)
. DaU.. - . » -vac invni MBB roi ADOITIOMAI. axKAtu

foaa I U - M - I I . «
Bowdadi a . C.
Inapiitlin Bhaot
Caplad
REPORT OF WELL DRILLER S T A T E O F U T A B
G E N E R A L B T A T E H E N T i Repor t ef wal l dr i l ler I t h e r e b r m a d e a n d filed wi th t h* S U U E n t i n e e r , In a t a e r d a n t * w i t h t h * l a w s ef t J l a h . (Th i s r e p o r t shal l be filed wi th t h e S U U E n f i n * * ? w l t U a SO d a y * a f U r t h e completion o r a b a n d o n m e n t ef t b * walL F a i l n i * t o ftl* n e h r e p o r U eon i t i t uUa a ml idemeanor . )
(1) :^^73 (2) LOCATION OF WELL: Cwinty ... Gfownd Wolov Boola.
Iloooo klaaki
North
Soolk foot. .
Boat
of Swtlon
out *-ordi not naadad)
Wrat
T w mn
laeriko
SLL TESTS: Dfowdown la Iko oiod bolow alMla I
dtaueoo bi fool lbo welor lotol lo low.
•ip IMt madat T M • M* Q It oob
soL/nl*. wltk foat dmwdowB ftflor—
BolUr loot
Actor loa f lew . .
TomporotilM of wntor..
. loL/Bta. wHk.. . f a l dnwdewa at la i_
. Woo aokoMlool aatlyik s i i a t Me Q Too D
(13) WELL LOG: eiOMOtOt o t woll ..
(3) NATURE OF WORK (cheek): HMTWOU Q Raplacamonl Wall D Doapanln* • Bapalr Q Aboadaa Q
If abandoninoni, doacrlbo aatorlol and pt—odaiai
(4) NATURE OF USE (cheek): Doanaatk O
I r r l e a l l a a a
ladnolrfat O
MM** D
MaaWaal Q
OIkar a
(5) TYPE OF CONSTRUCTION (cheek): RataiT • Oe* O 1 * - * •
Coblo O Drloea D Botod D
(6) CASING SCHEDULE: nrraM a waUod D „ . " Siaoi. froM taot to fMt Oae*
" DIaai. tram foot to fMt Oo«a
.- OUm. troo. foal to (ael Oaea
Now D BoJoel D Pood Q
(7) PERFORATIONS: Typo o r potforatar aood _ —
•Uo of porforatJeno
ra t ton tad t T M O Ma O
-laikM ky-
. „ portoratloaa troM.
poffoiatloiio fkoM.
.. portofattoaa t ioM. - taab
parfontloaa traM_—
porfoTotlona ftoaa.. -taal ! •_
( 8 ) S C R E E N S : Woll raroan IniutladT T M O Ma O
Mannfactoiof'a MaMa . ^ — . ^ ^ . . _ « . ^ . - ^ . _ . »
Typo Madal No.
Diam Slot alH _ Bot tram tU to
Diam .Slot alio Bol '—— " *-
(9) CONSTRUCTION: Wat wall sraoal padadT YM O Na O BIM at sraoall^
Graval plocad from foal to
Waa a iortaca oral piooMod? Tra
TO wkal daptk t . .
Material aaad la aral:
h t
Did aay olraU caatola unawkla watert T M Q M*
T>pa of watat l . . . - Do** at i t n U
Hathod of aaollas alrato ott I.....
Waa iurtoM aailne uaadt
W u It eomonlad In p l a n t
T M
T M a a
Ma
Me a a
(10) WATER LEVELS: Su i i i lavtl
Annlon pioiautw
...loot kalow I
.. foot abooo I
I oarfaM D e l e .
I taifoM B a t o -
LOG R E C E I V E D : (11) FLOWING WELL: Contiollod kr (akoak) Talaa O
Cap O r t m a Ma Coatoal O
DoM woO laak atoaad oMlaaT T M Q
Me a
Doptk dr i l lod . ,
or oomblnnllun a t piatorlaia oneovatortd la M t k doptk (ntorra l . U n d M B Z M A B K S Moke aa r dMirabIa B O I M aa to aeaarronao of walor a«d Iho oolor. aba. a a u t a , a t a , e f toalattol m .
D B ^ I I
1
^ r t f$?
, £ M . , « 5
e
% 700 5aS ?/tf
M A T S a i A L
I s l X .
^ ' ^ ' J ^ A i
Hill ^ _ . n I
_
B B t A B K B
l l <^^'Ur^ i^^3^,
y f & h t O u / i t« - *v fcA >• ^ »
Wark atortad... , I t CoMplotod..
(14) PUMP: Manataotaiat'a MaMa_...
T » e : B. r~ Doptk to paM* ar bawiM _ . . ...... tool
Wall OrtlUr 'B S t a U m e n t :
Th i s well w a s drilt*d unde r m r SBperrislon, and t h i s r a p o r t if t m * to t h e be s t • < a y lDowl*d(* andyMlidf. y ^
Nam. Z P l P / / J A & ^ . - £ l i ^ l S r A : = ^ ± z troiaoB. fitto. OT oorporallea) (Type OT pflat)
AddrasB ,
(Sipied) .
No. AAS. (Wall DiUtar)
. DaU- - .« -DSC OTBCB S M n * ADDtnONAL U M A k U

Appendix F

APPENDIX F
District's Groundwater Quality Report
SUVSWD Bayview Class I Landfill Permit Application

Appendix F: District's
Groundwater Monitoring Report
SUVSWD Bayview Class I Landfill
Permit Application
Prepared for
Bayview Landfill
South Utah Valley Solid Waste District
SpringviUe, Utah
Prepared by
HDR Engineering, Inc.
3995 South 700 East, Suite 100
Salt Lake City, UT 84107
March 2009

Appendix F: Disirict's Groundwater Monitoring Report
Contents
1.0 INTRODUCTION 1
2.0 MONITORING SYSTEM 2
3.0 GROUNDWATER SAMPLING PROGRAM 2
4.0 GROUNDWATER QUALITY 3
5.0 REFERENCES 4
Figures
Figure F-l - Monitoring Wells
Figure F-2 - Typical Monitoring Well Design
Attachments
Attachment 1 - Groundwater Monitoring Plan
Attachment 2 - Recording Forms
Attachment 3 - Typical Chain of Custody
March 2009 SUVSWD Bayview Class I Landfill Permit Application | I

Appendix F: District's Groundwater Monitoring Report
1 1.0 Introduction
2 The Bayview Landfill is located in southwestem Utah County about 6 miles
3 north of Elberta and 3 miles west of Goshen Bay of Utah Lake. The Bayview
4 Landfill is underlain by unconsolidated deposits of the Provo Formation, Lake
5 Bonneville Group, ofthe Pleistocene age. These deposits consist of poorly
6 sorted, homogeneous matrix of silt, clay, sand, and gravel. Groundwater occurs
7 under unconfined conditions in the shallow Pleistocene Aquifer and moves in a
8 northeast direction from the East Tintic Mountains towards Utah Lake. The
9 hydraulic gradient is very flat (0.02%) and the estimated velocity is 1.8 feet per
10 year. The groundwater surface is at an approximate elevation of 4500 feet
11 (Carpenter 1994).
12
March 2009 SUVSWD Bayview Class I Landfill Permit Application | 1

Appendix F: District's Groundwater Monitoring Report
21
m
2.0 Monitoring System
2 The existing groundwater monitoring system for the site consists of nine deep
3 monitoring wells, DMW-1 through DMW-9. Wells DMW-1 and DMW-7
4 provide upgradient background data for Cells 1 and 2. DMW-4 is on the southem
5 boundary upgradient of parts of Cells 6 and 7. Wells DMW-3 and DMW-8 are
6 compliance monitoring wells for Cell 1. Well DMW-6 is east ofthe existing
7 leachate basin. The remaining wells, DMW-2, DMW-5, and DMW-9 are located
8 along the property boundary north of Cells 1 and 2. See Figure F-l (Monitoring
9 Wells). The locations ofthe monitoring wells shown in this figure are
10 approximate; this figure is intended to present the general location relative to the
11 landfill cells.
12 DMW-9 serves as a compliance well, and is within 500 feet hydraulically
13 downgradient, for Cell #2. As shown in Figure F-l, two future compliance-
14 monitoring wells may be installed along the northem boundary of Cell #2. The
15 location of these two wells will be determined after future stages of Cell #2 are
16 designed. Figure F-2 shows a typical design of a groundwater monitoring well.
The groundwater monitoring system also includes six shallow groundwater-
monitoring wells, SMW-1 through SMW-6. None ofthe six shallow monitoring
19 wells have contained water sufficient to either purge or sample on any sampling
20 event, and these wells are not included in the discussion that follows.
3.0 Groundwater Sampling Program
22 The sampling program began in March of 1991 in monitoring wells DMW-1
23 through DMW-6 as part ofthe initial landfill development process. Data from
24 nine sampling events, from March 1991 to June 1992, was used to established
25 background water quality in these wells. Wells DMW-7 and DMW-8 were
26 installed in late 1999 with background samples collected quarterly through 2001.
27 DMW-9 was installed in 2004 with background water quality being collected
28 during semi-annual sampling events.
29 In accordance with Utah Administrative Code Rule 315-308-2, groundwater
30 samples are collected from all deep wells and submitted for laboratory analysis
31 on a semi-annual basis. The samples collected are analyzed for the parameters
32 listed in Utah Administrative Code Rule 315-308-4 (constituents for detection
33 monitoring). When possible, laboratory detection limits will be set one order of
magnitude below the groundwater protection standards listed in Rule 315-308-4.
Attachment 1 (Groundwater Monitoring Plan for Bayview Municipal Solid
2 I SUVSWD Bayview Class I Landfill Permit Application March 2009

Appendix F: District's Groundwater Monitoring Report
1 Waste Landfill) provides more information on sampling procedures and
2 monitored constituents.
3 The statistical analysis approach selected to analyze the ground water data uses
4 intra-well methods consisting of control charts and prediction limits. The purpose
5 ofthis analysis is to detennine if there are any statistically significant changes in
6 the compliance data relative to background pollutant concentrations. These
7 methods compare monitoring results to values established during background
8 water quality data collection for each well. Reports summarizing statistical
9 analysis of semi-aimual ground water sampling are prepared and submitted to the
10 Division of Solid and Hazardous Waste annually. These reports disclose any
11 statistically significant changes in the water quality.
12 4.0 Groundwater Quality
13 Laboratory analyses of background samples collected March 1991 to June 1992
14 show no prior contamination ofthe groundwater by inorganic chemicals, volatile
15 organic chemicals (VOC), or synthetic organic chemicals. (Carpenter 1994)
16 Laboratory analyses have never detected VOCs in groundwater samples so no
17 statistical analysis has been needed.
18 As mentioned, reports summarizing the statistical analysis are submitted to the
19 Division of Solid and Hazardous Waste annually. These reports disclose any
20 statistically significant changes in ground water quality. Analysis of ground
21 water laboratory results has shown very few statistically significant changes in
22 the data from compliance monitoring wells. Additional analysis of statistically
23 significant increases in pollutant concentration eliminated the need for any
24 corrective action. In most cases the pollutant concentrations that were found to be
25 statistically significant increases when conducting an intra-well analysis were
26 found to be similar to background concentrations in other upgradient and
27 compliance monitoring wells. Analysis of results from subsequent sampling
28 events showed that the ground water pollutant concentrations were again near
29 background levels, indicating that the landfill was not likely the source of the
30 increased pollutant concentration. Other statistically significant increases were
31 attributed to laboratory error and a change in laboratory detection limits.
32 Historic changes in the laboratory detection limits may have resulted in the
33 reporting of statistically significant changes for many constituents. In the event of
34 a constituent not being detected, the statistical analysis used one-half of the
35 laboratory detection limit as the actual concentration. The detection limit may
36 have been greater than the projected limit value (above which would constitute a
37 statistical change) calculated from background data. The result is a statistically
38 significant change being reported even though a constituent was not detected by
March 2009 SUVSWD Bayview Class I Landfill Permit Application | 3

Appendix F: District's Groundwater Monitoring Report
laboratory analysis. The laboratory detection limits will be set at or below the
groundwater protection standards listed in R315-308-4 for all fiiture analysis.
3 5.0 References
4 Carpenter, Carl, CGWP No. 3 61. 1994. Quality of Groundwater at the Bayview Landfill Site, Elberta,
5 Utah, April 1994.
4 I SUVSWD Bayview Class I Landfill Permit Application March 2009

Appendix F: District's Groundwater Monitoring Report
Figures
March 2009 SUVSWD Bayview Class I Landfill Permit Application j 5

% ;.; -• i @ i * | | M ^ ;
v , .^f^,: . iQm^^-y-rr
; .^ y
...... y-i-..,Ky
/ 'PSW»
%B00^A--'<^y.A0P' iiyyy\!A'A^ ' ^yy- A J - y •"' ^ •• ' ' ' ' myymm^mAymJyyr';) Ay-m^^ifz')]/ i y^s^Ay^^fi^ii • liii$%^g0:A:! / / / f J A<fp^A\ y P-j. /
/
i i t r i : [ m iT i
':t-y) \ S \
'"STAGE fe y \ i '
W t e S i J:
^ ^ ^ ^ • • • • • • - • • . . ^ • A U ) ' h M i ' ^ ^ s o.;^ ' \ \
DMW-7
• ~ - . - : . 1 ' ^ .
^ • ' • ^ • 7 . : Y / /
- N -
SITE ENTRANCE
LEGEND:
• DMW-X EXISTING
• DMW-X PROPOSED
[ZZZ] BERM
MONITOR WELL
MONITOR WELL
•N
OgrO
o>r5 O D g 0 ( r t O O I f 0.==C3
•S E Q . ,. « o
o 1—I <
1—
cc UJ UJ
'—' _J
111 < l/l
I (D
u. o>
© c u— D O OH-
L'c o
SALT LAKE COUNTY
DATE: Oeoambar 2003

3'-0"
Water Tight Cap
Protective Casing w/ Locking Cap Weephole 6" above concrete Concrete Surface Seal and Well Apron (4-inch thick)
Sand to within 6-inches of top of PVC casing
4 or 4-1/2-inch PVC
Cement/Bentonite Grout Seal
Bentonite Seal
Fine-grained (buffer) sand (100 mesh)
4-inch PVC Well Screen (0.010-inch factory slotted)
Filter Pack #20-40 silica sand
Bottom Cap
KR HDR Engineering, Inc.
Typical Monitoring Well Date
Jan.2004
Figure
F-9

Appendix F: District's Groundwater Monitoring Report
Attacliment F-l
District's Groundwater IVIonitoring Plan
6 I SUVSWD Bayview Class I Landfill Permit Application March 2009

GROUNDWATER MONITORING PLAN
FOR
BAYVIEW MUNICIPAL SOLID WASTE LANDFILL
SOUTH UTAH VALLEY SOLID WASTE DISTRICT
SPRINGVILLE, UTAH
Prepared by:
HDR Engineering, Inc. 3995 South 700 East, Suite 100
Salt Lake City, Utah 84107 (801)281-8892
Submitted January 1999
Revised July 2003
KR

TABLE OF CONTENTS
1.0 INTRODUCTION 1 1.1 Groundwater Monitoring System 1 1.2 Well Construction 2
2.0 GROUNDWATER ELEVATION MONITORING 3 2.1 Well Inspection 3 2.2 Monitoring Procedures 3 2.3 Protocol for Water-Level Measurements and Instrumentation 4
3.0 DECONTAMINATION PROCEDURES 5
4.0 GROUNDWATER SAMPLE COLLECTION 6 4.1 Well Purging Procedures 6 4.2 Groundwater Collection and Handling Procedures 7
4.2.1 Detection Monitoring Frequency 9 4.3 Quality Assurance and Quality Control Samples 10 4.4 Sampling in Adverse Weather 11 4.5 Purge Water Handling Procedures 11
5.0 ANALYTICAL TESTING 12 5.1 Laboratory Performing the Analyses 12 5.2 Laboratory Procedures 12 5.3 Laboratory Quality Assurance and Quality Control Samples 13 5.4 Constituents to be Analyzed and Test Methods 13 5.5 Establishment of Bacl<ground Data 15
6.0 STATISTICAL METHOD TO EVALUATE ANALYTICAL DATA 16
7.0 REPORTING REQUIREMENTS 17
Groundwater Monitoring Plan Bayview Landfill - SpringviUe, Utah Page ii July 2003 South Utah Valley Solid Waste District

TABLE OF CONTENTS (continued)
LIST OF TABLES
Table 1 Monitoring Well Data for the Bayview Landfill 2 Table 2 Background/Detection Monitoring Constituents 14
APPENDICES
1 State Reporting Forms 2 Typical Chain of Custody
Groundwater Monitoring Plan Bayview Landfill - SpringviUe, Utah Page ili July 2003 South Utah Valley Solid Waste District

1.0 INTRODUCTION
This groundwater monitoring plan (GMP) addresses the groundwater monitoring
and sampling program at the South Utah Valley Solid Waste District's Bayview
Landfill in Elberta, Utah. The GMP is required by the Utah Department of
Environmental Quality (UDEQ) Municipal Solid Waste Regulations (R315-308-2)
and will meet the requirements of the Federal US EPA Regulations under Subtitle
D of the Resource Conservation and Recovery Act (RCRA).
1.1 Groundwater Monitoring System
The groundwater monitoring system for the site consists of eight deep monitoring
wells, DMW-1 through DMW-8. Wells DMW-1 and DMW-7 serve as the
upgradient or background wells for the first three cells, which are scheduled for
development during the next 25 to 50 years. DMW-3 and DMW-8 are
downgradient or compliance wells for Cell 1, and DMW-6 is downgradient of
Leachate Basin 1. The remaining wells serve as property boundary wells; DMW-
2 and DMW-5 are on the northern boundary downgradient from parts of Cells 1
and 2; and DMW-4 is on the southern boundary upgradient of parts of Cells 6
and 7.
The groundwater monitoring system also includes six shallow groundwater
monitoring wells, SMW-1 through SMW-6. None of the six shallow monitoring
wells has contained water sufficient to either purge or sample on any sampling
event, and these wells are not included in the follow discussion.
Additional monitoring wells may be added to the system as information becomes
available indicating the necessity to meet the requirements of the regulations.
New wells may also be added to the system as new cells or leachate basins are
designed and constructed.
1.2 Well Construction

Well construction records, including drilling logs, are presented in Appendix E ofthe
Bayview Landfill Permit. Generally, wells have been constructed of 4- or 4V2 -inch
diameter PVC pipe with a 20-foot screened interval and a 1-foot silt sump. Table 1
provides information on wells DMW-1 through DMW-8, including total depth and
approximately depth to groundwater for each of the deep monitoring wells.
Table 1. Monitoring well data for the Bayview Landfill.
Well
Designation
DMW-1
DMW-2
DMW-3
DMW-4
DMW-5
DMW-6
DMW-7
DMW-8
DMW-9
Screened Interval
Top
280
270
245
175
189
145
243
225
225
Bottoni
300
278
308
195
210
166
295
270
270
Drilling
265
236
245
175
178
139
NA
NA
NA
Water Depth (ft.)
' Monitoring^
242
232
245
174
172
137
265
Variation
1.5
7.5
2.0
2.5
20.0
2.0
NA
1. Drilling means the depth at which water was reported during drilling.
2. Monitoring Is an approximate average depth to groundwater as measured during monitoring events.
3. Variation is the approximate ranges of values observed during monitoring events.

2.0 GROUNDWATER ELEVATION MONITORING
2.1 Well Inspections
During each monitoring event, the wells will be inspected for damage to the well
casing, protective cover, lock, well cap, and concrete pad. In addition, the ground
surface around the well pads will be inspected for erosion. If any problems are
discovered, they will be repaired or replaced as soon as practicable.
2.2 Monitoring Procedures
Groundwater level measurements will be collected using either an electric well
sounder marked in 1-foot increments. A measuring tape will be used to determine
the distance between 1-foot markings, with measurements recorded to the nearest
!4-inch (0.04-foot) increment. For each monitoring event the total well depth will be
measured to evaluate whether the casing has silted up. Water levels in the monitor
wells will be measured prior to purging or sampling to minimize the potential effects
of these activities the water levels across the site. The groundwater level
measurement will be recorded to the nearest 0.04 foot from the top of the monitor
well casing. Water level measurements will always be referenced to the survey
mark on the well casing. When a measurement is collected, the measuring device
will be raised and lowered several times to be sure the correct measurement is
read off the tape measure. Water level measurements collected for each monitoring
event will be converted to elevations (nearest 0.04 foot) and submitted with the
groundwater sampling report. The survey data for each monitoring well will be
referenced to the benchmark established for the landfill.
2.3 Protocol for Water-Level Measurements and Instrumentation
During each monitoring event, the current water level readings will be compared to
the readings from the previous monitoring event in order to avoid discrepancies. If
an obvious discrepancy is encountered, the water level will be measured again to
ensure the measurement was recorded correctly.

Prior to collecting water level measurements, the measuring device will be checked
for damage, including bends or kinks in the tape. To maintain consistency and
precision, and to the degree possible, the same measuring device will be used
during each monitoring event. Also once each year, the tape will be checked
against a calibrated tape measure to verify its accuracy.
Prior to conducting the well purging activities, the pH and conductivity meters will be
calibrated. Calibration of the instruments will be in accordance with the
manufacturer's procedures for the particular instrument. At a minimum, the pH
meter will be calibrated using standard calibration solutions as recommended by
the manufacturer. The conductivity meter will be calibrated using standard
solutions as recommended or supplied by the manufacturer. The same
instrumentation will be used for each monitoring event.

3.0 DECONTAMINATION PROCEDURES
Prior to beginning each sampling event and between wells, all non-dedicated
equipment including the water level measuring device will be decontaminated
thoroughly to minimize the potential for cross contamination. The decontamination
procedures will consist of thoroughly flushing the equipment with potable water
three times followed by a final rinse with deionized water. Decontamination of
larger items, such as dedicated pumps removed for repair, will be accomplished by
steam cleaning. If steam cleaning Is necessary, then a container will be used to
collect the rinsate water to prevent the water from coming into contact with the
ground. Purge and decontamination water will be stored in closed top drums and
stored in a designated area on site until analytical data is complete. The drums will
be typically labeled with the well identification number, date of collection, and
contents of drums. The disposal of the water will be based on analytical results:
contaminated water will be discharged into the leachate basin; uncontaminated
water will be discharged to the ground adjacent to the well from which it came.

4.0 GROUNDWATER SAMPLE COLLECTION
4.1 Well Purging Procedures
Prior to each sampling event, the groundwater level in each well and the total well
depth will be measured as described in Section 2.2. During the purging activities,
disposable latex gloves will be worn by the sampling team and changed between
wells. To purge a well temperature, conductivity, and pH will be continuously
measured. Once all these parameters stabilize, indicating stagnant water has been
replaced by formation water, purging will be considered complete. If a well
dewaters prior to achieving the stabile water quality parameters, it will be allowed to
recharge before sampling.
The method of well purging for this site consists of using a dedicated submersible
pump system for each well where the discharge rate can be regulated for sampling.
The pump intake will be placed within the screened section of the well casing. Fpr
wells that sustain continuous pumping without dewatering, the discharge rate on
the pump will be set to allow minimal drawdown in the well. This procedure will
minimize any cascading effects that may volatilize constituents in the groundwater
entering the well casing and will also minimize agitating sediment collected in the
bottom of the well. If the main pump system fails, temporary portable pumps will be
used as backups. If portable pumps are needed, the intake will be gently lowered
into the upper most portion of the water column to minimize agitating any residual
sediment that has collected in the bottom of the well. If a portable pump is used for
more than one well, then proper cleaning of the pump is necessary to minimize the
potential of cross contamination (refer to Section 3.0).
During the purging operations, a record of the climatic conditions, condition of the
wells and surrounding ground surface, field collected water quality, color, odors,
water level, depth of well and purge rate will be recorded. The information will be
recorded in indelible ink, will be stored either on site at the landfill office or at the
District's office in SpringviUe, and will become part of the site operating record for
the landfill.

4.2 Groundwater Collection and Handling Procedures
During groundwater collection disposable latex gloves will be worn, and changed
between wells to minimize cross contamination of samples and to reduce the
possibility of coming into contact with groundwater containing contaminants. Prior
to collecting a groundwater sample the monitor wells will be purged of groundwater
as described in Section 4.1. Purge water will be handled as discussed in Section
4.5. The monitor wells will be sampled in the same order they are purged.
Samples will be collected within 24-hours following purging. If sufficient recharge
does not occur within 7 days following purging, then the well will be considered dry
and a sample will not be collected. The District will follow the laboratory's QA/QC
protocols regarding sampling containers, preservation, and holding times.
The samples will be collected off the pump discharge. The pump discharge will be
regulated at the time of sampling to maintain as slow discharge rate as possible
(typically 0.1 liter per minute) to minimize cascading and volatilization as the sample
containers are being filled. Once the discharge rate is set for sampling, it will be
maintained at that rate for several minutes so that the sample collected will not be
from the period of time when the pump was operating at a higher discharge rate,
and to ensure that air has been adequate purged from the discharge line. The
sample containers will be held as close to the pump discharge as possible without
touching to minimize the loss of volatiles. The containers for the VOCs will be tilted
slightly to allow the water to gently wn down the inside wall of the container.
Following the filling of each sample container, they will be labeled with the well
number, date and time collected, preservatives used, analyses to be run, and the
sampler's initials. The 40-milliliter vials will be placed in zip-locked plastic bags.
The sample containers for each well will include as a minimum two-40 milliliter VOA
glass vials with Teflon® septa screw caps for volatile organic constituents (VOC),
and other bottles as provided by the laboratory. Sample containers for VOCs will
be completely filled and sealed carefully to prevent air bubbles. If an air bubble is

present, then the sample will be discarded and the sample will be collected again.
All other sample containers will be filled as completely as possible.
Once the samples have been properly sealed and labeled as described above, they
will be recorded on a Chain-of-Custody (COC) form, signed and dated by the
sampling technician(s). An example of a typical COC is presented in Appendix 2.
The COC will accompany the samples to the laboratory. The samples will be
placed in a plastic ice chest (similar to an Igloo ice chest) with ice or a re-freezable
type product to maintain a temperature as close to 4°C as possible until the
analyses are performed. Drv ice is not permitted due to the potential of freezing the
samples and breaking the containers. Precautions will be taken to secure the
samples in the ice chest to prevent them from breaking during transport. The
samples will be delivered to the laboratory within 24-hours after collection, therefore
it will not be necessary to preserve the samples in the field, except samples
collected for dissolved constituent analyses. Any samples, other than the samples
collected for dissolved constituent analyses, requiring preservatives will be
collected in pre-preserved containers supplied by the laboratory.
4.2.1 Detection Monitoring Sampling Frequency
The sampling schedule for Detection Monitoring consists of collecting samples from
each monitor well for the Detection Monitoring Constituents on a semi-annual basis
after background data has been established. Any changes to the frequency and/or
number and type of constituents for Detection Monitoring must be approved by the
Executive Secretary prior to implementing the change. The schedule for
establishing background data will be discussed in Section 5.5.
4.3 Quality Assurance and Quality Control Samples
To provide screening of field procedures, additional samples will be collected. Trip
blank samples will be prepared by the laboratory and will accompany the empty
sample containers and collected samples to and from the laboratory. The trip will
consist of filling four-40 milliliter VOA vials (two sets each) with deionized and

laboratory-grade water, respectively. The purpose of the trip blank is to assess
whether any of the sample containers or collected samples has been contaminated
before or during sampling, and during transport to the laboratory. At least one trip
blank will be prepared for each day of sampling or for every container transported
to the laboratory. The QA/QC samples will be collected and handled in a similar
fashion as the other samples and will be analyzed for VOCs.
At the discretion of the District or direction of UDEQ, blind field duplicate samples
will be collected to assess the precision of the sampling and laboratory methods.
The blind duplicate samples will be collected from well(s) with typically the highest
concentrations of contaminants. When a blind sample is collected, it will be
handled in a similar fashion as the other samples, but will be labeled in such a
manner that the laboratory does not know it is a duplicate sample for QA/QC
purposes.
4.4 Weather Protocol
Sampling of the monitor wells will not be permitted during inclement weather,
thunderstorms; to the extent possible, monitor wells will not be sampled during
periods when the temperature drops below freezing. Caution should be taken
when the temperature exceeds 100 ° F. If contamination is detected, the District will
develop a health and safety plan for further ground water monitoring activities.
While in the field, personnel engaged in the monitoring program shall adhere to this
health and safety protocol.
4.5 Purge Water Handling Procedures
Purge and decontamination water will be collected in closable drums and stored on
site for subsequent disposal. The analytical data will be reviewed to determine the
proper disposal procedures. If needed, the UDEQ can be consulted to assist in
assessing proper disposal procedures.

5.0 ANALYTICAL TESTING
5.1 Laboratory Performing the Analyses
The analytical laboratory selected to perform the required analyses will be licensed
and certified by the State of Utah. At a minimum the selected laboratory will apply
quality control procedures in accordance with EPA SW-846, Test Methods for
Evaluating Solid Waste, Third Edition, November 1986 as revised December 1987.
5.2 Laboratory Procedures
The laboratory will follow appropriate QA/QC protocol developed as part of its
licensing and certification. At a minimum, upon receipt of the samples by the
laboratory, the sample lot will be verified with the information on the COC, Appendix
2. If there is a discrepancy with the samples, the responsible party that collected
the samples will be notified and the problem will be resolved before the analyses
are performed. The COC will be signed and dated by the designated receiving
personnel at the laboratory. The COC will remain with the laboratory until the
analyses are completed, then will be attached to the completed laboratory report.
For samples that require overnight transport to the laboratory, the COC will be
signed; including date and time received by the transporter. The COC will be
attached to the sample container(s) and delivered to the laboratory and a copy of
the bill of lading will be supplied by the transporter. After the analyses is completed
and the laboratory report finalized, the complete COC with the bill of lading or
receipt if sent by certified mail will be attached to the laboratory report. The
laboratory will keep a copy of the COC and laboratory results for a period of at least
three years.
5.3 Laboratory Quality Assurance and Quality Control Samples
The laboratory will adhere to its QA/QC plan developed as part of its licensing and
certification. If possible, the laboratory will be required to achieve detection limits
(DLs) that are at least one order of magnitude below the maximum contaminant
levels (MCLs) for a constituent for which an MCL has been promulgated.

5.4 Constituents to be Analyzed and Test Methods
As specified in the UDEQ (R315-308-2) and Subtitle D (40 CFR 258.53)
regulations, the groundwater monitoring program at all MSWLFs shall consist of
detection monitoring that includes specific constituents. The constituents to be
tested for during the detection-monitoring program are listed in Table 2. Approved
testing methods, as described in 5.1, will be used for all constituents. The
laboratory DLs will be below the MCLs for each of the constituents. If a change in
the analytical method is needed, then the Executive Secretary will be notified in
writing. The Executive Secretary shall approve of the change prior to implementing
the change. All samples will be analyzed within the required holding times for the
particular analyses. The laboratory will report the CAS number for each constituent
analyzed.

TABLE 2
Background/Detection Monitoring Constituents
Inorganic Constituents Ammonia (7664-41-7) Carbonate/Bicarbonate Calcium Chemical Oxygen Demand (COD) Chlorides Iron (7439-89-6) Magnesium Manganese (7439-96-5) Nitrate (as N) pH Potassium Sodium Sulfate Total Dissolved Solids (TDS) Total Organic Carbon (TOC)
Acetone (67-64-1) Acrylonitrile (107-13-1) Benzene (71-43-2) Bromochloromethane (74-97-5) Bromodichloromethane (75-27-4) Bromoform (75-25-2) Carbon disulfide (75-15-0) Carbon tetrachloride (56-23-5) Chlorobenzene (108-90-7) Chloroethane (75-00-3) Chloroform (67-66-3) Dibromochloromethane (124-48-1) 1,2-Dibromo-3-chloropropane (96-12-8) 1,2-Dlbromoethane (106-93-4) 1,2-Dichlorobenzene, ortho (95-50-1) 1,4-Dichlorobenzene, para (106-46-7) trans-1,4-Dichloro-2-butene (110-57-6) 1,1-Dichloroethane (75-34-3) 1,2-Dichloroethane (107-06-2) 1,1-Dichloroethylene (75-35-4) cis-1,2-Dichloroethylene (156-59-2) trans-1,2-Dichloroethylene (156-60-5) 1,2-Dichloropropane (78-87-5)
VOCs
Heaw Metals Antimony (7440-36-0) Arsenic (7440-38-2) Barium (7440-39-3) Beryllium (7440-41-7) Cadmium (7440-43-9) Chromium Cobalt (7440-48-4) Copper (7440-50-8) Lead Mercury (7439-97-6 Nickel (7440-02-0) Selenium (7782-49-2) Silver (7440-22-4) Thallium Vanadium (7440-62-2) Zinc (7440-66-6)
cis-1,3-Dichloropropene (100061-01 -5) trans-1,3-Dichloropropene (10061 -02-6) Ethylbenzene (100-41-4) 2-Hexanone (591-78-6) Methyl bromide (74-83-9) Methyl chloride (74-87-3) Methylene bromide (74-95-3) Methylene chloride (75-09-2) Methyl ethyl ketone; MEK (78-93-3) Methyl iodide (74-88-4) 4-Methyl-2-pentanone (108-10-1) Styrene (100-42-5) 1,1,1,2-Tetrachloroethane (630-20-6) 1,1,2,2-Tetrachloroethane (79-34-5) Tetrachloroethylene (127-18-4) Toluene (108-88-3) 1,1,1-Trichloroethane (71-55-6) 1,1,2-Trichloroethane (79-00-5) Trichloroethylene (79-01-6) Trichlorofluoromethane; CFC-11 (75-69-4) 1,2,3-Trichloropropane (96-18-4) Vinyl acetate (108-05-4) Vinyl chloride (75-01-4) Xylenes (1330-20-7)
Note: The CAS Number if appropriate) is listed in parentheses. These
parameters were taken from UAC R315-308-2, and should be verified at least
annually.

5.5 Establishment of Background Data
As specified in the UDEQ regulations (R315-308-2 (4)(a)) and Subtitle D (40 CFR
258.53) regulations, background data for the Detection Monitoring Constituents was
established. The monitoring wells were installed, and background data were
collected prior to the effective date of these regulations. The background sampling
was performed from March 1991 to June 1992 from deep monitoring wells DMW-1
through DMW-6 with more than eight samples collected from each of these wells.
Monitoring wells DMW-7 and DMW-8 were installed during 1996, background
sampling was conducted the eight background samples on these two wells during
1999 and 2000 by collecting a sample from each well on a quarterly basis.
The District plans to install new monitoring wells adjacent to each new landfill cell
as the cells are developed. Background data on new wells will adhere to the
protocols outlined in the cited regulations.

6.0 STATISTICAL METHOD TO EVALUATE ANALYTICAL DATA
After each sampling event the groundwater monitoring data will be evaluated to
determine if statistically significant changes from background values exist for each
constituent listed in Table 2. The statistical analyses will be performed in
accordance with R315-308-2 (7). To perform the statistical methods with some
degree of confidence, a minimum of eight statistically independent samples will be
collected from each monitor well during the background-monitoring period. Based
on the available statistical methods cited in the regulations, the preferred method
selected for this site is an intra-well comparison with a control chart such as a
Shewert-CUSUM control chart. This procedure is the preferred method because of
its relative ease to implement and because it is especially applicable to sites where
no groundwater contamination exists. The analytical data may also be analyzed
using Prediction Limits (PL) with the PLs determined based on background data
collected.

7.0 REPORTING REQUIREMENTS
Upon completion of each Detection Monitoring sampling event, the analytical data
will be summarized in a report. The report will be submitted with the District's
annual report unless more immediate notification is required. Any statistically
significant change observed from the background data will be reported in writing to
UDEQ within 60 days following a sampling event. Only statistically significant
changes (SSC) detected in the compliance wells (downgradient wells) will be
reported to the UDEQ.
When a SSC has been determined, the owner/operator within 14 days of receipt
of the sample analysis results will enter this information into the operating record
and notify the Executive Secretary of the finding in writing. The notification must
indicate what constituents have shown SSC. In addition, immediately resample
all monitoring wells for the constituents listed in Table 3. If an SSC is still present
after resampling, the owner/operator must notify the Executive Secretary in
writing within seven days of receipt of the sample results. However, if the SSC
change from the background data is believed to be caused by a source other
than the landfill, then the owner/operator can prepare a report that explains the
cause of the significant change. This report must be prepared and certified by a
qualified groundwater scientist and submitted to the Executive Secretary within
90 days after the sampling event for approval. If the Executive Secretary
approves the report, then the landfill may return to Detection Monitoring. If the
Executive Secretary believes a satisfactory explanation is not given, the
Assessment Monitoring Program will be implemented at the direction of the
Executive Secretary. The Assessment Monitoring Program shall be implemented
in accordance with R315-308-2 (11)

Appendix F: District's Groundwater Monitoring Report
Attachment F-2
Recording Forms
March 2009 SUVSWD Bayview Class I Landfill Permit Application | 7

GROUNDWATER MONITORING PROQRAM
BAYVIEW MUNICIPAL SOUO WASTE LANDFILL
SOUTH UTAH VALLEY SOUD WASTE DISTRICT
DATE: ZO-DooM
SAMPLED BY: Cntg Hantaan
RCCORDEODY: CfBtgHamnan
WEATHER:
Wan Number
0MW1
DMW3
OliNV*
0MW4
DMW6
0NM6
DMW7
DMW»
Ofp«iorW«lt((nl)
300
27B
30»
« 5
210
l«6
M9
370
Omih(aWatar(fMi) T«mp.CJL.F PH CDdducMiy Cammanb

Appendix F: District's Groundwater Monitoring Report
Attachment F-3
Typical Chain of Custody
8 I SUVSWD Bayview Class I Landfill Pernnit Application March 2009

TO: A d d m n :
CtlMit: AddMM:
Chain of Custody Log Form COC/$L# ;
Page
10 PO#
Contucft PtMNia
T w m r a t m l : J o b » :
RsfKHtTo: AiddraM:
Quo(»»:
SwBfilalO DatB/TtnM
• ' "
UATWC
'
SMiptwlBy: _
i*iaMfi&IVM
2 V'
•
_ ll
Anahw—
: ..
!
•'•
•
"
•
'. \
• . .
IVOIMTO:
FMfaiauMndBy IMto Ttme RaestwdBy Oala Tima Tampanrtura AbMI l i


APPENDIX G
Utah Hydrologic Data Report No. 50
SUVSWD Bayview Class I Landfill Permit Application

U.S. DEPARTMENT OF THE INTERIOR
BRUCE BABBITT, Secretary •
U.S. GEOLOGICAL SURVEY
Dallas L. Peck, Director
t
For additional information write to: Copies of this report can be purchased from:
District Chief U.S. Geological Survey, WRD Room 1016 Administration Building 1745 West 1700 South Salt Lake City, Utah 84104
U.S. Geological Survey Books and Open-File Reports Section Federal Center Box2542S Denver, Colorado 80225
»
•
CONTENTS
Introduction 1 References cited.... 3
ILLUSTRATIONS
(Plate is in pocket)
Plate 1. Map showing selected hydrologic-data sites, southern Utah and Goshen Valleys, Utah, 1890-1992.
Figure 1. Diagram showing numbering system used in Utah for hydrologic-data sites 2
TABLES
Table 1. Records of selected wells 4 2. Drillers' logs of selected wells 33 3. Water levels in selected wells 39 4. Discharge of selected wells 61 5. Chemical analyses of water from selected wells 68 6. Measurements of discharge, temperature, and specific conductance
of water from selected springs 94 7. Measurements of discharge, temperature, and specific conductance
of water from selected springs, drains, and sloughs during seepage studies 95
8. Measurements of discharge, temperature, and specific conductance of water from selected streams and canals 98
111

CONVERSION FACTORS, VERTICAL DATUM, AND ABBREVL4TED
WATER-QUALITY UNITS
Multiply By jo obtain
acre
foot
cubic foot per second
gallon per minute
inch
mile
square mile
Water temperature is given in degrees Celsius (°C), which can be converted to degrees Fahrenheit (°F) by the following equation:
°F = 1.8 (°C) + 32.
Sea level: In this report, "sea level" refers to the National Geodetic Vertical Datum of 1929—a geodetic datum derived from a general adjustment of the first-order level nets of the United States and Canada, formerly called Sea Level Datum of 1929.
Specific conductance and water temperature are given in metric units. Specific conductance is given in microsiemens per centimeter (^S/cm) at 25 degrees Celsius. Chemical concentration is given in milligrams per liter (mg/L) or micrograms per liter (ng/L). Milligrams per liter is a unit expressing the solute per unit volume (liter) of water. For concentrations less than 7000 milligrams per liter, the numerical value is about the same as concentration in parts per million. One thousand micrograms per liter is equivalent to 1 milligram per liter.
0.4047
4,047
0.3048
0.02832
0.06308
25.4
0.0254
1.609
2.59
hectare
square meter
meter
cubic meter per second
liter per second
millimeter
meter
kilometer
square kilometer
IV

SELECTED HYDROLOGIC DATA FOR SOUTHERN UTAH AND GOSHEN VALLEYS, UTAH, 1890-1992
By Bernard J. Stolp, Marilyn Drumiler, and Lynette E. Brooks
INTRODUCTION
This report contains hydrologic data collected in southern Utah and Goshen Valleys fron, 1890 to 1992. Southern Utah and Goshen Valleys are south of Salt Lake City in Utah County, north-central Utah. The area is bounded on the east and south by the Wasatch Range, on the south by Long Ridge, on the west by the East Tintic Mountains and the Mosida Hills, and on the north by a line through about the middle of T. 7 S. Southern Utah Valley and Goshen Valley are divided by the northern tip of Long Ridge, West Mountain, and Utah Lake (Cordova, 1970). The area is in the Basin and Range physiographic province described by Fenneman (1931), and includes about 390 square miles.
Most of the data in this report were collected by the U.S. Geological Survey in cooperation with the Utah Department of Natural Resources, Division of Water Rights. Some of the earlier data were published previously by Cordova (1969 and 1970).
The purpose of this report is to provide hydrologic data for use by the general public and by officials managing the area's water resources, and to document data collected during a 4-year study of the ground-water resources in southern Utah and Goshen Valleys. Tables 1 to 8 contain selected ground- and surface-water data. Select data, including well depth and water level, is given for over 400 wells, and chemical analyses are given of samples from about 90 wells. The numbering system used in Utah for hydrologic-data sites is illustrated in figure 1. Hydrologic-data sites are shown on plate 1.
These data could not have been collected without the cooperation of local residents and officials of irrigation companies and municipalities, who permitted access to their wells and property.

The system of numbering wells and springs in Utah is based on the cadastral land-suivey system of the U.S. Govemment. The number, in addidon to designating the well or spring, describes its position in the land net. The land-survey system divides the State into four quadrants separated by Uie SaU Lake Base Line and the Salt Lake Meridian. These quadrants are designated by the uppercase letters A, B, C, and D, indicating the northeastem, northwestern, southwestem, and southeastern quadrants, respectively. Numbers designating the township and range, in that order, follow the quadrant letter, and all three are enclosed in parentheses. The number after the parentheses indicates the secUon, and is followed by three letters indicating the quarter section, the quarter-quarter section, and the quarter-quarter-quarter section—^generally 10 acres*. The lowercase letters, a, b, c, and d indicate, respectively, the northeastem, northwestern, southwestem, and southeastern quarters of each subdivision. The number after the letters is the serial number of the well or spring within the 10-acre tract. When the serial number is not preceded by a letter, the number designates a well. When the serial number is preceded by an "S," the number designates a spring. Thus, (C-10-1)24ddc-l designates the first well constructed or visited in the southwest 1/4, southeast 1/4, southeast 1/4, section 24, T. 10 S., R. 1 W. A location number with no serial number designates a surface-water data-collection site.
Sections within a township
R. 1 W. Tracts within a section
Sec. 24
b
c
a
b i «
•
nometers
(C-10-1)24ddc-1
T. 10S.. R. 1 W.
' Although the basic land unit, the section, is theoretically 1 square mile, many sections are irregular. Such sections are subdivided into 10-acre tracts, generally beginning at the southeastern comer, and the shortage is taken up along the northern and westem sides of the section.
Figure 1. Numbering system used in Utah for hydrologic-data sites.
2

REFERENCES CITED
Cordova, R.M., 1969, Selected hydrologic data, southern Utah and Goshen Valleys, Utah: U.S. Geological Survey open-file report (duplicated as Utah Basic Data Release No. 16), 35 p.
—1970, Ground-water conditions in southern Utah Valley and Goshen Valley, Utah: Utah Department of Natural Resources Technical Publication No. 28,79 p.
Fenneman, N.M., 1931, Physiography of the western United States: New York, McGraw-Hill, 534 p.

Table h—Records of
[—,no
Well number: See figure 1 for explanation of the numbering system for hydrologic-data sites. Owner: Last known or reported owner.
Use of water: C, commercial; H, domestic or household; 1, irrigation; K, mining; N, industrial: O, Casing: Diameter: Diameter of the production string of casing; Reported from the driller's log or measured
reported, only top of perforated interval is known; R, wire wound; S, screened: X, open hole. Elevation of land surface is given in feet above sea level. Elevations are reported to the nearest 0.01 foot Water level is given in feet and decimal fractions. Measured except where noted R, reported. Other data available: L, driller's log (table 2); W, water-level measurements (table 3); D, discharge
Well number
(C-7-1)26cdd-1 (C-8-1)20cdb-2 (C-8-1)20cdb-3 (C-8-1)20cdb-4 (C-8-1)29dda-1
(C-8-1)34bcc-1 (C-8-1)35dcb-1 C-8-2)25dac-1 (C-9-1)3ddb-1
(C-9-1)4ccc-1
(C-9-1)4ddc-1 (C-9-1)5ddc-1
(C-9-1)17abb-1 (0-9-1)17abb-2 (0-9-1)17ada-1 (0-9-1 )17bba-1 (0-9-1 )17bbc-1 (0-9-1 )17bbd-1 (0-9-1 )17bbd-2 (0-9-1 )17cdd-1 (0-9-1 )18add-1
^ (0-9-1 )20cdd-1 (0-9-1 )20ddd-1
(0-9-1 )26bda-3
Owner
Smith, Doyle Bateman Harold Hewlett & Sons Unknown Bateman
LDS Church Dixson, S. Steadman, Bill LDS Ohurch
LDS Ohurch
LDS Ohurch (No. 9) Steadman, Bill
South Utah Valley Solid Waste District South Utah Valley Solid Waste District South Utah Valley Solid Waste District South Utah Valley Solid Waste District South Utah Valley Solid Waste District South Utah Valley Solid Waste District South Utah Valley Solid Waste District South Utah Valley Solid Waste District South Utah Valley Solid Waste District
LDS Ohurch LDS Ohurch (No.7)
Burraston, B.
Year drilled
1979 1967 1972
. —
1973
1970 1945 1972 1964
1970
—
1970
1989 1989 1989 1989
1989 1989 1989 1989 1986
1964 1963
1915
Use Of
water
S S 1 1 1
H S S 1
1
1 1
0 0 0 0 0 0 0 0 p
1 1
S
Well depth (feet)
116 345 400 225 625
412 212 600 575
756
690 776
70 210 166 269 301
70 300 195 502
532 788
56

selected wells
data available]
observation; P, public supply; Q, aquaculture; S, stock; U, unused; Z, other, in the field. Finish: O, open end; P, perforated, where single depth is Upper or lower limits of perforations or screen are given in feet below land surface,
when the well has been surveyed.
(table 4); O, chemical analysis (table 5).
Casing
Diameter (inches) .
8 16 —
12
6 4 8
18
16
18 16
4.5 4,5 4.5 4.5 4.5 4.5 4.5 4.5
12
20 18
1.5
0 X 0
P P P 0 p p p p p p p p p
s s s s s R R R P P P P P 0
Finish (feet)
227-345
100-235 307-595
402
300-390 190-205 225-338 365-565 240-405 565-750 200-683 280-390 545-740
49-70 189-210 145-166 228-269 260-301 49-70
280-300 175-195 350-445 450-500 275-521 300-490 490-775
Clav /o t i nn
of land surface (feet)
4,495 4.620 4,620 4,620 4,595
4,535 4.489 4.770 4,510.36
Water level
Above (-) or below
land surface
22 R 120.2 R 128 R
— 89.34
43.94 -3.0 R
276 R 17.08
Date
03-05-79 04-04-67 10-10-72
— 03-02-87
03-04-91 06-15-64 05-24-72 03-04-91
Other data
available
0 0 0 0
0
L.W.C
4,620 128.76 03-14-91 W.C
4,570 4,640
4,670 4,665 4,635 4,730 4.745 4,740 4,740 4,670 4,775
4,701.40 4,640
4,496
81.01 163 R
69.18 175.19 136 232.72 241.19 69.35
243 171.7 264 R
200.34 137.98
-7.0
03-04-91 03-30-70
03-07-91 03-07-91 03-07-91 03-07-91 03-07-91 03-07-91 03-07-91 03-07-91 09-09-86
03-04-91 03-05-91
05-09-90
L.W.C 0
L
L.W.C L.W.C
W.C

Table I,—Records of
Well number
(C-9-1)26dcd-1 (0-9-1 )28ccb-1 (0-9-1 )29acc-1
Owner
Woodard. J.E. LDS Church LDS Church
Year drilled
1956 1962 1963
Use of
water
S 1 1
Well depth (feet)
37 802 700
(0-9-1 )29bcc-1 LDS Church 1963 H 800
(0-9-1 )29cdc-1 (0-9-1 )29cdc-2 (0-9-1 )34ccc-1
2 (0-9-1 )34acd-1 (C-9-1)34ddc-1 (C-10-1)2bcd-1 (C-10-1)3ddb-1 (C-10-1)4bbb-1 (C-10-1)4cbb-1
Town of Elberta Town of Elberta LDS Church
Miller, H. Miller, A. Green, Duane White, G.T LDS Church (No. 2) LDS Church
1977 1989 1951
1961 1964 1981 —
1962 1962
P P 1
S H S H 1 1
400 387 650
265 256 100 495 882 870
(C-10-1)9ccc-1 Wright, Bill 1961 474
(O-10-1)10ddc-3 (0-10-1)11ccd-1 (0-10-1)15cca-1 (C-10-1)17aaa-1 (C-10-1)17bba-1 (C-10-1)17bba-2 (0-10-1)18ccc-1 (0-10-1)24ddc-1
Green, Duane Burraston, Carma Morgan, H. Town Of Elberta Sunshine Mining Company Sunshine Mining Company Levering, Dean and Betty Lunceford, Scott
1979 1980 1951 1955 —
1986 —
1965
H —
U U
u u u u
162 160 168 376 860 320 450 533
(0-10-1 )25abd-1 Lunceford, Scott 1951 645

•
selected wells—Continued
Casing
•
Diameter (inches)
2 20 18
18
8 10 8
1.25 2 6 6
18 12
16
6 6
12.5 6 4 6 8
20
12
0 — P P P P P P P P P P 0 0 0 —
P S S S S p p p 0 p —
0 S p 0 p p p p p p p p
Finish (feet)
280-380 380-405 426-700 300-350 350-675 700-775 315-385 270-340 70-580
587-650
525-880 406-550 640-680 700-740 750-850 255-346 360-420 427-474
150-157
750-860 300-320
366-391 422-428 462-482 372-450 461-492 507-550 568-575 585-600
Elevation of land surface (feet)
4,505 4.643 4,719
4,792
4,760 4,760 4,551
4.508 4,517 4,515 4,555 4,672 4,664
Water level
Above (-) or below
land surface
-1.33 127.65 214.28
300.10
288 256.55
17.85
-6.90 -5.50 9.18
18.86 147.04 135.86
Date
03-07-91 03-04-91 03-04-91
04-02-90
05-23-88 06-29-89 12-13-74
03-07-91 03-07-91 03-07-91 04-24-67 03-05-91 03-04-91
Other data
available
L.W.C L.W,0
L,W,C
0
0 L.C
0 L.W.C L.W,C
4,681
4,555 4,550 4,600 4.711 4.810 4,810.4 4,918 4,750
131.68
6 R 4.37
28.29 170.37 266.71 266.56 353.46 212.54
03-08-77
03-07-91 03-05-91 03-07-91 12-30-71 03-04-91 03-04-91 03-05-91 03-05-91
0
0
W.C 0 W W W W
4.778 245.15 03-05-91 W.C

T^ble h—Records of
Well number
(C-10-1)28ada-2 (C-10-1)29cdd-1
Owner
LDS Ohurch LDS Ohurch
Year drilled
1979 1961
Use of
water
H 1
Well depth (feet)
775 842
(C-10-1)29dcd-1 (C-10-1)29ddd-1
LDS Church LDS Ohurch
1954 1962
H I
460 700
(C-10-1)30baa-1 (C-10-1)3lcdd-1 (0-10-1 )32ccc-1
Unknown LDS Church LDS Ohurch
1963 1961
S — I 603 I 507
•
(C-10-1)33cbb-1 (C-10-1)34bbb-1 (C-10-2)13bcc-1 (0-11-1)6abc-1
LDS Church Oritchfield, Ross Bronson, Jonathan LDS Church
1961 1949
1963
U H
567 342 300 679
(C-11-1)6bdd-1 LDS Church 1964 762
(C-11-1)6cab-1 (D-7-2)32dad-1
5 (D-7-2)33dcc-1 (D-7-2)34dcd-1 (D-7-2)35ccd-1
LDS Church Batty. Roy
Banks. A. Christofferson. B. Hales, G.
1981 1978
^_
1959 1900
1 H
S S 1
825 550
400 194 300 4

selected wells—Continued
Pa< \^el«
Diameter (inches)
8 16
6 16
— 20 16
16 —
6 18
18
20 8
2.5 2 2
sing
P P P P P P P
0 P P P P P — P P P P P P
P 0 P P P P P P
P P P P P P P P P 0 0
Finish (feet)
746-760 185-189 205-275 280-574 595-685 696-762 770-815
162-195 228-246 408-411 420-428 532-695
290-603 210-220 263-324 352-356 367-398 420-505
155-567
180-220 315-322 330-335 390-488 495-532 545-675
425-500 533-541 556-577 584-659 672-745
474-807 350-353 450-453 370-400
Elevation of land surface (feet)
4.670 4,680
4.670 4,660
4,778 4,760 4.743
4,680 4,660 5.140 4,770
4,780.9
4,795 4.493
4,495 4,505 4,507.1
Water level
Above (-) or below
land surface
135 R 151.3
129.06 100.50
228.67 210.69 204.1
115.54 89.39
172.24 229.99
234.39
262 R -22.7
—
-6.60 -7.4
Date
04-06-79 03-29-66
03-07-91 03-04-80
06-05-90 03-14-91 03-29-66
03-07-91 03-07-91 03-05-91 12-11-75
04-06-90
09-18-81 03-04-91
—
03-05-91 03-23-61
Other data
available
C
0
W L,0 0
W W L.0
L.W.C
L.W,D
D W.O D

Table 1.—Records of
Well number Owner Year
drilled
Use of
water
Well depth (feet)
D-7-D-7-D-7-D-7-D-7-P-7-D-7-D-7-0-7-D-7-D-7-P-7 D-7 D-7 D-7 D-7 D-7 D-7 D-7 D-7 D-7 D-7 D-7 D-7 D-7 D-7 D-7
2)35ccd-2 >2)36bbb-1 2)36ccb-1 2)36dad-1 2)36dcc-2 3)18dcc-1 3)19aac-1 3)20adb-1 3)20bcd-1 •3)20bcd-3 •3)28bdb-1 •3)28cab-1 •3)28dbb-1 •3)29bdb-1 •3)29dcc-1 •3)29ddd-1 •3)30aaa-1 •3)30aac-3 •3)31cac-2 -3)32bcc-1 •3)32bcc-2 -3)32bcd-1 -3)33baa-6 •3)33ccc-5 •3)33ccc-6 •3)34bcb-1 •3)34cdb-1
p-8-1)2ccd-1 D-8-1)3dda-1 D-8-1)10bcb-1 D-8-1)10bcb-2 D-8-1)11bac-1 D-8-1)13aaa-1 D-8-1)13bdd-1 D-8-1)13daa-3 D-8-1)14dad-1 D-8-1)20abb-1
Hales, A. 1961 Money, W. 1943 Money, W. 1961 Huntingdon, B. — Crandall, Condie — LDS Church 1962 John Kuhni and Sons Animal By-Product Plant 1938 Brigham Young University 1970 Pacific States Cast Iron Pipe 1926 Pacific States Cast Iron Pipe 1927 Utah Division of Wildlife Resources 1963 Park Ro-She Corp. (H.J. Robbins. Pres.) 1961 Utah Division of Wildlife Resources 1988 Fibertek 1986 Sumsion, Howard 0. 1953 SpringviUe City 1986 Perry, Robert 1977 Condie. A. 1953 Childs, Neil 1964 Wood Springs Irrigation Company 1934 Metcalf, Harold 1972 Jensen, Clarence L. 1977 Champeriain 1900 Vane,J.E. — Matson Springs irrigation Company 1966 SpringviUe City 1961 SpringviUe City 1960
Hirst, Harold — Unknown 1967 South Shore Fruit Farms — South Shore Fruit Farms — Utah County 1981 Schaffer, S. B. 1906 Atwood, G. 1950 Mecham, Darrell F. 1949 0. B. Turkey, Inc. 1966 Hi-Country Fruit Farms (Phil Belnap) —
H S I S U H N U N N U U U N I U I S S I H S H U I P P
H U U U P H S I I H
420 147 504 100 186 322 268 353 306 635 338 285 37 148 136 413 277 125 135 414 164 151 138 140 533 485 445
55 72 240 135 300 358 119 345 350 205
•
•
10

^elected wells—Continued
P a i O a :
Diameter (inches)
4 3 3
—
2 4 3
16 4 4
16 2 2 8 2
16 6 2 4
— 6 6 2 2
16 16 16
8 — 6
— 8 4 2 8 6 6
5ing
0 0 P —
0 P 0 p 0 0 p p 0 0 0
s 0 0 p — p 0 0 0 p p p p p
o —
0 —
p 0 0 p 0 0
Finish (feet)
496-504
115-121
115-350
270-330 280-285
349-413
130-135
152-159
230-533 410-475 158-230 284-395 402-442
200-251
285-328
Elevation of land surface (feet)
4.507 4.490 4,500 4,500 4.503.1 4,495 4,493 4.520 4.495 4.494 4.520 4,527 4.550 4.502 4,515 4,525 4.495 4,496 4,503 4,511 4.511 4.518 4.560 4.567 4,565 4,580 4.650
4.495 4,520 4,520 4,520 4,495 4,499 4,496 4,499 4,492 4.505
Water level
Above (-) or below
land surface
-17 • —
-35 R -5.9
-11.40 -18.9 -26.1
-1 R -25.0 -42.5 -22.4 -14.8
8.43 —
-25 R -28 R -40.9 -15.4 -14.3
-5.4 -14.5 -13.2
-4.7 -5.2
-14.3 2.0
45.9
6.87 32.32
17.01 43.34 -7.7
-11.3 -1.5
-13.9 —
15.68
Date
05-12-64 — "
10-01-61 03-04-91 03-04-91 03-05-91 04-28-47 03-11-70 10-15-64 10-15-64 09-11-87 03-04-91 04-18-89
—
03-11-53 01-15-87 03-09-82 03-04-91 09-13-89 03-04-91 03-26-81 03-04-91 03-04-91 03-04-91 03-08-91 04-22-64 07-01-65
03-05-91 02-15-91 03-05-91 03-05-91 03-04-91 03-04-91 03-05-91 06-25-65
—
03-05-91
Other data
available
D D D
W,D L,W
. 0 L.W
D
0
. W.D
L W
W,D,C W.D W
L,C
W 0 W,C W C W,D W D D W
11

u
Table 1.—Records of
Well number
(D-8-1)23bdd-1 (D-8-1)25aad-1 (D-8-1)25aba-1 (D-8-1)25cbb-1 (D-8-1)26bdd-1 (D-8-1)35cac-1 (D-8-1)35cac-2 (D-8-1)36bcc-1 (D-8-2)1baa-1 (D-8-2)2aac-1 (D-8-2)2caa-1 (D-8-2)2cda-1 (D-8-2)2daa-1 (D-8-2)3aad-1 (D-8-2)3ccd-1 (D-8-2)4abb-1 (D-8-2)4abb-2 (D-8-2)4abc-1 (D-8-2)4bab-1 (D-8-2)4cba-2 (D-8-2)4cbb-1 (D-8-2)4cdc-1 (D-8-2)4cdc-4
(D-8-2)4dad-1 (D-8-2)7cab-1 (D-8-2)7cbd-1 (D-8-2)7dda-1 (D-8-2)7ddd-1 (D-8-2)9aad-1 (D-8-2)10adb-1 (D-8-2)10bdd-1 (D-8-2)12ddc-1 (D-8-2)12ddc-2 (D-8-2)13abc-1 (D-8-2)13bdd-1 (D-8-2)14cad-1 (D-8-2)14dcc-1 (D-8-2)16caa-1
Owner
Binning. Lester and Agnes Hansen, J. Ludlow. W. Kelsey, C. Vannosdol, George Hanson, Charles K. Hanson, Charles K. Ercanbrack, L. Finch, J. Banks, L Thomas, G. Roach. T. Williams. R.D. Monk, B. Banks, L. Banks, LM. Sorensen, James Jr. Sorenson, W. Banks, L Sharp, Jeff Lakeside Irrigation Company Olsen, Chet Olsen, Chet Sorensen, W. Brooks, H. L. Nelson, Justin R. Hall, M. Hall, M. Banks, A. Ottesen, H. Sorenson, F. Diamond, Harold Diamond, Harold Johns, K. Pace, R. Elson. G. Johns. W. Lewis, R.C.
Year drilled
^ »
1953 1944 1964 1977 1975 1962 1963 1963 1961 1951 1900 1948 1963 1961 1900 1895 1950 1963 1909 1934 1908 1945 1963 1947 1962 1956 1913 1964 1966 1955 —
1961 1961
1962 1953 1939 1895
Use of
water
S S 1 S 8 H 1 S S 1 S H S 1 S 8 H 8 H 1 1 H H 1 1 H S H H H H S 8 1 H 8 H H
Well depth (feet)
120 104 173 300 126 440 351 231 182 336 338 140 346 417 420 150
—
230 324 330 500
80
143 607 263 355 276 520 385
588 411 172 372 378 378 376
377 570
•
12

selected wells—Continued
~
c.» w d .
Diameter (inches)
2 2 2 1.5 6 6 8 4 6 2 2 2 2.5 2.5 2.5 1.25
— 2 3 2 8 2 2 3 2 4 3 1.25 3
3 2.5 2 3 3 3 2.5 2 3
sing
0 0 X X 0 0 p —
p 0 0 0 0 p 0 0 0 0 p 0 0 0 0 p 0 0 0 0 0 0 0 0 p p p 0 0 0
Finish (feet)
163-173 205-300
100-345
167-182
412-417
316-324
593-607
364-372 368-378 368-378
Elevation of land surface (feet)
4,500 4,497 4.498 4,504 4.620 4,575 4,578 4,518 4,505 4,511 4,518 4,524.4 4,514.9 4,512 4,512 4,494.1 4,498.2 4,496 4,495 4.501 4,499 4,500 4,500 4,502 4.493 4,492 4,498 4,498 4,511 4,520 4,518 4,540 4,541 4,548 4,555 4,547 4,553 4,525
Water level
Above (-) or below
land surface
-8.0 -9.9 -6.5
-11.8 77.86 52.96 60.7
-10.9 -10.3 -22.8 R -11.6
-4.7 -25.7 -15.8
-8 R -14.1
-6.0 -11.3
-4.4 -17.6
-6.1 -12.2 -13.0 -13.4
-7.5 — -4.9 -9.3 -8.7
-19.7 -4.0 -2.6
-48.6 -18.4 -28 R
-3.5 -14.2 -27.2
Date
03-05-91 03-05-91 03-05-91 03-04-91 03-06-91 03-05-91 06-29-65 03-07-91 08-08-89 08-06-64 09-21-89 03-04-91 04-02-90 09-15-89 11-01-61 03-05-91 09-12-89 09-12-89 09-12-89 03-01-91 09-15-89 03-04-91 03-04-91 09-28-89 08-20-64
—
03-04-91 03-01-91 03-05-91 03-01-91 09-28-89 08-13-76 09-10-84 09-28-89 04-02-64 03-05-91 07-09-65 09-05-90
Other data
available
W.D D W W
0 W W,D D W,D W.D W.D.C W.D D W.D D W.D W.D W.D.C W,D
W W.D D D W W D
W,D D D,C D,0 W,D,C D W D W,D,C
13

Table 1.—Records of
Well number Owner Year
drilled
Use of
water
Well depth (feet)
(D-8-2)16dbb-2 (D-8-2)17ada-1 (D-8-2)17add-5 (D-8-2)17add-6 (D-8-2)17ccc-2 (D-8-2)17dab-2 (D-8-2)17dad-1 (D-8-2)17ddd-1 (D-8-2)19add-1 (D-8-2)20cad-2 (D-8-2)21aaa-1 (D-8-2)21bbb-2 (D-8-2)21ddd-1 (D-8-2)22cdc-1 (D-8-2)22cdc-2 (D-8-2)23dbd-1 (D-8-2)23dbd-2 (D-8-2)23dbd-3 (D-8-2)23dca-2 (D-8-2)24bdc-2 (D-8-2)25bca-1 (D-8-2)25dac-3
Huff, J. Hansen, B. Huff,E. Huff
Clayson, Mrs. Allen Beckstrom, J. L Evans, James 8. Simmons, Steve Beckstrom, A. Hawkins, 0. Anderson. Mrs. John Lee, Eddie Anderson. Bernell Salt Lake By-Products Salt Lake By-Products Ferto Corporation Ferto Corporation Ferto Corporation Ferto Corporation Thomas, R. Valley Asphalt, Inc. Spanish Fork City
1962 1964 1962 1950 1959 1959 1975 1944 1916 1900
1956 1936 1935 1957 1920 1916
1940 1963 1978 1961
H H H H H H H H H H H H H N
N N N
H I H N
U
168 466 105 80
363 100 110 94
480 420 498 110 347 620 385 390 390
569 352 246 620
m
(D-8-2)26aad-3 (D-8-2)26aad-4 (D-8-2)26abb-3 (D-8-2)26adc-1 (D-8-2)27acd-1 (D-8-2)28cbd-3 (D-8-2)28cca-2 (D-8-2)28daa-1 (D-8-2)29aaa-7 (D-8-2)29aab-5 (D-8-2)29add-1 (D-8-2)29bcb-1 (D-8-2)29bcd-2 (D-8-2)29cab-1
Creer. R. Leland Milling Oompany Ludlow, A. Unknown Thomas, I. Hone, Melva Thorton, S. Larson, D. Hickman. Rex L. Steele, Alice Reynolds, Reed Argyle, Bert Zieman, Jacob Hansen, Arthur
1961 1987 1946 1971 1948 1944 1951 1939 1957 1956 1935 1966 1952 1947
H N H S S H 8 H H H H H H H
223 360 371 —
180 92 200 120 390 176 222 165 166 168
i m 14

F"^
•
selected wells—Continued
•
Casing
Diameter (inches)
2 2 2 2 2 2 4 2 2 2 3 2 2 2 4 3 4 2 8 3 8
16
4 6 2.5 6 2 2 3 2 2.5 2.5 3.5 4 2.5 2.5
X P 0 0 0 0 X — —
0 0 0 0 — p p —
p p 0 p p p p 0 0 0 0 0 0 0 0 0 0 0 0 0 0
Finish (feet)
452-466 84-105
83-94
380-390 380-390
475-500 327-352
505-508 512-545 547-564 600-605
Elevation of land surface (feet)
4,522 4,514 4,517 4,515 4,509 4.514 4,518 4.522 4.514 4.522 4.536 4,522 4.541
4.545 4.545 4.565.1 4,561 4,560 4,562 4,570 4,610 4,622
Water level
Above (-) or below
land surface
-4.2 -5.4 7.74 8 R
-8.5 9.11 9.16 8 R
-12.6 -2.7 -6.85 10 R
-12.5 -15.4 -10.9 -19.6 -15.6
-1.1 -18.2
-1.5 27 R 38.42
Date
03-04-91 03-01-91 03-17-70 06-07-50 08-17-89 09-03-64 03-04-91 07-13-44 03-01-91 03-01-91 08-28-89 06-26-56 10-02-89 03-04-91 03-04-91 12-17-47 06-23-65 09-15-64 10-05-73 08-17-89 12-30-78 03-05-91
Other data
available
W W,L D D W.D D
D W W W D W,D W,D W,D
D 0 W.D
W
4.595 4.595 4.579 4.550 4,546 4,525 4,525 4,535 4.530 4.525 4.526 4,508 4,512 4,513
35.45 8
-3.9 -4.5 -5.2 -6.6 -4.1 , -2.6 -6.9 -4.6 -3.8
-10.5 -19.6 -26.4
03-06-91 09-25-87 03-04-91 02-16-71 03-05-91 07-31-89 03-01-91 09-25-64 03-05-91 03-01-91 08-10-77 08-17-89 08-17-89 03-04-91
W
W
W W.D.C W D W
C D W.D W.D
15

TEible 1.—Records of
Well number
(D-8-2)30bad-1 (D-8-2)31bcd-1 (D-8-2)31cbb-1 (D-8-2)31cda-1 (D-8-2)31cdb-1 (D-8-2)31cdb-2
(D-8-2)32aad-1 (D-8-2)32daa-1 (D-8-2)33bcc-1 (D-8-2)34acd-1 (D-8-2)34dda-1 (D-8-2)36dbd-2 (D-8-2)36dbd-3 (D-8-3)2dcd-1
(D-8-3)2dcd-2 (D-8-3)3bca-1 (D-8-3)3cca-1 (D-8-3)3dcb-1 (D-8-3)3dcd-1 (D-8-3)4caa-2 (D-8-3)4caa-3 (D-8-3)4caa-4 (D-8-3)4cad-1 (D-8-3)4daa-1
(D-8-3)5bca-1 (D-8-3)6ddd-1 (D-8-3)6ddd-2 (D-8-3)6ddd-3 (D-8-3)6ddd-4 (D-8-3)6ddd-5 (D-8-3)7aad-1 (D-8-3)7abc-1 (D-8-3)7aca-2 (D-8-3)8abd-1 (D-8-3)10cba-1 (D-8-3)10dac-1
Owner
Stewart. 1. Tanner. Art Schaerrer. Grant Schearrer, Grant Schearrer, Grant Schearrer, Grant
Young. K. Benjamin Cemetery Mackey, Boley Ludlow, N. Bearnson, Gill Gardner. L. Cloward. B. Mapleton City
Dawn. Richard SpringviUe City Snyder. Robert Fullmer, Richard Seal. Z. Eddington Canning Company Eddington Canning Company Spanish Fork City Eddington Canning Company SpringviUe City
Phillips. J.L. Unknown Unknown Unknown Unknown SpringviUe Irrigation Company Schwartz. Glade Leftwich. Jack Williams. Keith Miner, R Lee Hjorth Brothers Johnson. Kelly
Year drilled
1944 1890 1945 —
1920 1963
1934 1949 —
1946 1946 1952 1961 1954
1977 1990 1975 1978 1961 1945 1952 1965 1935 1961
1890 — —
1934 1934 1934 1946 1972 1948 1959 1961 1977
Use of
water
1 8 8 1 8 1
H
1 I S 8 H H P
H P H H 1 H 1 U — P
H U 1 i I 1 S
c 1
u 1 H
Well depth (feet)
32 60 96
450 90
435
117 247
—
80 130 260 38
533
200 428 232 305 387 117 153
—
231 371
150 —
357 149 284
160 148 156 147 300 520 62
•
• :
16

selected wells—Continued
9
#
^ « i
oa!
Diameter (inches)
2 2 3
12 22 12
2.5 5
—
2 2 4 6
10
6 16 6 6
16 4 8 8 4
16
2 —
3 3 3 3 3 8 2.5 4 8 6
sing
0 0 0 P 0 P P 0 0 —
0 0 0 —
p p 0 p p p p 0 p 0 0 p p 0 — —
0 — —
0 p 0 0 p 0
Finish (feet)
150-450
210-325 375-430
238-243 246-533
280-420 200-232 285-305 215-385
112
145-255 280-370
132-156
395-520
Elevation of land surface
(feet)
4.500 4,503.2 4,504 4.510 4.510 4.510
4,520 4,545 4,525 4.531 4.528 4.640 4.640 4,805
4,800 4.640 4,702 4,725 4,736 4.560 4,560 4,560 4,580 4.629
4,522.2 4,520 4,620 4,518 4,518 4.518 4.525 4.519 4.525 4.560 4.714 4.725
Water level
Above (-) or below
land surface
-7.3 —
-14.8 —
-15.0 -30.2
-2.5 11 — -7.4
-11.0 51.12
9.13 221.70
171.12 70.23
114.17 148.69 164 -20 —
-25 -18.1 46.2
-9.7 — — -2.7 — —
-25.1 -23.5 -25
6.14 127.6 34.44
R
R
R
R
R
R
Oate
09-28-64 —
08-28-89 —
03-07-91 03-07-91
09-28-64 11-10-49
— 03-05-91 03-09-90 03-06-91 03-06-91 03-19-65
03-08-91 03-05-91 03-05-91 03-05-91 04-22-64 06-08-45
—
07-19-65 07-02-65 07-01-65
03-04-91 — —
11-04-64 — —
03-31-64
03-04-91 07-14-48 03-04-91 06-30-65 03-05-91
Other data
available
D D W.D.C D.C W.D.C W.D.C
C
W.D.C W.C
W.C
L L
D D D D L
WD D D
D W.D D L.W L L
17

"Kible 1,—'Records of
Well number Owner Year drilled
1977 1986 1983 1961
1977 1963
1989 1972 1965
1973 1977 1950
1960 1960 1960 1963 1968
Use of
water
H i 1 P
H U
U 1 1
S H 8 1 1 H H 1 1 P
Well depth (feet)
203 242 215 500
70 675
376 363 395
70 275 65
127 295 171 350
1,000
#
(D-8-3)10ddb-2 (D-8-3)11abb-1 (D-8-3)11caa-1 (D-8-3)11ccc-1
(D-8-3)11ccc-2 (D-8-3)14acc-1
(D-8-3)14bab-1 (D-8-3)14dab-1 (D-8-3)14dca-1
(D-8-3)16aaa-1 (D-8-3)16aaa-2 (D-8-3)17ada-1 (D-8-3)17bad-1 (D-8-3)17cdc-1 (D-8-3)17cdc-2 (D-8-3)18aaa-3 (D-8-3)18bdc-1 (D-8-3)19bbb-1
Porter, Rich D. & Lois G. Edmonds, Paul K. Perry, Fay L Mapleton City
Johnson, Frank Orton, G.B.
Trojan Powder Oorporation Shurtleff. F.L. Broadbent, J.
Kimber and Johnson Rostron, Melvin Garner, R. Orton, G.B. Pierce, L. Smith, R Hanson, R. Spanish Fork City Spanish Fork City
• i
(D-8-3)19ccb-1 (D-8-3)19ccd-1 (D-8-3)19cda-1
(D-8-3)19dca-1 (D-8-3)21bbd-1 (D-8-3)21cac-1 (D-8-3)22bab-1
lO(D-8-3)22cbd-3 (D-8-3)23baa-1 (D-8-3)23ccd-1 (D-8-3)23cdd-1
Spanish Fork City Christiansen, H. Spanish Fork City
Spanish Fork City Snyder, Paul Storrs, Jan Crandall, Condie Mapleton City Dr. Orton Biesinger, N. Whiting. R.W.
1969 1890 1975
1970 1977 1976 1972 1961
1961 1973
1 H P
P H H H P 1 1
1 H
275 25 393
603 358 275 26 541
265 381
18
selected wells—Continued
Casing
Diameter (inches)
6 8 8
12
6 8
4 8
12.5
6 6 4
4 4 4 6
16
12 1.5
12
16 6 6 4
16
8 6
0 P O P P P P P P R P P P P P 0 0
0 0 0 p p p p p p 0 p p p X p p p
0 p
Finish (feet)
210-215
383-405 409-494 65-67
189-200 372-395 507-675 351-371 200-363 210-215 233-252 315-378 55-65
330-350 780-811 820-833 890-920 948-955 170-250
160-179 303-332 461-50 330-358 265-275
15 485-535
360
Elevation of land surface (feet)
4,722 4,790 4,770 4,730
4.735 4.775
4,729.1 4,800 4,800
4,710 4,705 4,700 4,600 4,705 4.710 4.550 4.554 4.675
Water level
Above (-) or below
land surface
141.47 200 R 185.60 140
46.16 177.05
144.85 210 R 195 R
14.68 123.43 24.53 — 9.79
142.22 -2.1
-23.9 —
Date
03-05-91 04-01-86 03-05-91 03-06-91
03-07-91 03-05-91
12-22-89 02-25-72 07-20-65
03-05-91 03-05-91 03-07-91
—
03-05-91 03-05-91 03-07-91 06-22-65
—
Other data
available
0 W
w
w w
w
L L
w
w w
4.585 4,590 4,660
4,690 4.719 4,735 4,720 4,760 4,770 4,960 4,980
10.7 R -6.4 88
—
135.24
133.12 11.32
179.88 —
220 R 182.96
10-19-69 03-04-91
11-05-75
03-06-91 03-06-91 03-06-91 03-06-91
—
09-29-61 03-07-91
W
L,W
L
19

Table 1.—Records of
Well number
(D-8-3)26bcd-1 (D-8-3)26cbd-1 (D-8-3)26cbd-2 (D-8-3)26cca-2 (D-8-3)26ccb-1 (D-8-3)27adc-1 (D-8-3)27adc-2 (D-8-3)27bad-1 (D-8-3)27bad-2 (D-8-3)27cdc-1
Owner
Trojan Powder Oorporation Trojan Powder Oorporation Trojan Powder Oorporation Trojan Powder Corporation Trojan Powder Oorporation Trojan Powder Oorporation Trojan Powder Oorporation Trojan Powder Oorporation Trojan Powder Corporation Spanish Fork City
Year drilled
1989 1989 1989 1989 1940 1989 1989 1989 1989 1963
Use Of
water
U U U U N U U U U P
Well depth (feet)
236 302
43 35
399 188 395 276 468 630
•
\
i
I [
*
1
i
(
(D-8-3)28abc-1 Jensen, J. 1961 470
(D-8-3)28bcd-1 (D-8-3)28bdc-1 (D-8-3)29aaa-1 (D-8-3)30dba-1 (D-8-3)31ccd-1 (D-8-3)32add-1 (D-8-3)32baa-1 (D-8-3)33aca-1 (D-8-3)33acb-1 (D-8-3)33cac-1 (D-8-3)33cac-2 (D-8-3)34aca-1 (D-8-3)34bab-1 (D-8-3)34bbb-1 (D-9-1)1bac-1 (D-9-1)1bcb-2 (D-9-1)2ada-2 (D-9-1)2cab-1 (D-9-1)2ccd-1 (D-9-1)2ddd-1 (D-9-1)11acc-1 (D-9-1)11acc-2 (D-9-1)11baa-1
Spanish Fork City Anderson. G. Famsworth, Richard 0. Haderlie, R Hendacka. H. Southeast Irrigation Company Vincent, W. Spanish Fork City Stravk^berry Water Users' Association Hunter, W. Shepherd, Lee Trojan Powder Oorporation Spanish Fork City Hurst. Harold Powell, Lynn, and Young, Dallas Powell. LM. Farr, L. Hi-Country Fruit Farm Oritchfield, Gale Stewart. M. Uddle, G. Uddle, Parley Bezzant. Clifford
20
1961 1961 1974 1970 1970
1960 1971 1910 1958 1973 1940 —
1973 1976 1973 1948 1973 1980 1945 1974
1981 1971
P 1 H , U H 1 1 H H H
H H N U 8 I H H H —
H H
8 1
410 395 289 285 246
276 328
50 100 693 261 470 151 600 416 610 210 280 60
253
85 168 4

r SCi
lected wc/fe—Continued
Casing
Diameter (inches)
4.5
Finish (feet)
8 216-236
8 4 4.5 4 5
12
12
12.5 12 8 6 4
5 6
—
4 6
10 16 8 6 6 3 8 8 2 6 8 8
P R S R R P P P P P P P — P 0 P 0
0 P 0 0 p p —
p — X 0 0 0 —
p 0 p
365-399 163-183 375-395 256-276 443-463 220-254 377-432 515-520 541-546 583-589 264-284 425-465
240-285
265-285
320
353-693 240-261
135-146
316-416
175
118-165
Elevation of land surface
(feet)
4,965.6 5,012.6 4,991.1 4,983.9 5.000 4,820.5 4,820.6 4,778.5 4.772.4 4.780
Water level
Above (-) or below
land surface
189.04 231.16 36.13 21.86
266.1 96.57
165.40 149.39 185.36 168.9
Date
03-08-91 03-08-91 03-08-91 03-08-91
03-23-65 03-08-91 03-08-91 03-08-91 03-08-91 06-30-65
Other data
available
W W
W W
L W W W L W L
4,745
4.749 4.746 4.735 4.711 4,655 4.660 4.720 4,678 4,664 4.760 4,800 4.844 4.797 4.720 4,520 4.530 4.532 4,720 4,730 4,555 4,610 4,615 4.598
154.1
178.50 160 R 113.73 67.12 —
164 R -40.6 —
62.41 -13.5 101.16 142.75 70.87
-26.5 -6.4 -3.1
182.51 205 R
5.49 73 R 77.79 62.10
06-30-65
04-22-64 10-01-75 03-06-91 03-04-91
—
03-03-65 03-04-91
—
03-07-91 03-08-91 03-24-67 03-06-91 03-06-91 08-09-89 03-05-91 03-05-91 06-26-89 06-22-80 03-06-91 07-01-74 03-06-91 03-06-91
L
L L L LW L
0 W
W W D
W W
21

Table 1.—Records of
j
1 1
•
Well number
(D-9-1)11bad-1 (D-9-1)11ddc-1 (D-9-1)12bbc-1 (D-9-1)13bdb-1 (D-9-1)13bdb-2 (D-9-1)14aad-1 (D-9-1)14aad-2
(D-9-1)14ada-1 (D-9-1)14ada-2 (D-9-1)14ddd-1 (D-9-1)23acc-2
(D-9-1)23ada-1 ^^(D-9-1)23adb-1
(D-9-1)23daa-1 (D-9-1)23dcb-1
^2(D-9-1)24acb-1 (D-9-1)25aac-1 (D-9-1)25aad-1 (D-9-1)25aad-2 (D-9-1)25aca-1 (D-9-1)25ada-1 (D-9-1)25ada-2 (D-9-1)25ada-3 (D-9-1)25ada-4 (D-9-1)25ada-5 (D-9-1)26aaa-1 (D-9-1)26aab-1 (D-9-1)26add-1
^3(D-9-1)26dda-1 (D-9-1)27aca-1 (D-9-1)27aca-2 (D-9-1)32bbd-1
^*(D-9-1)35abb-1 (D-9-1)35bcd-1 (D-9-1)35bcd-2
Owner
Bird, Terry Simpson. Leonard Bishop. A. McBetii, Clyde McBetii, Clyde Wayman, Raid L Wayman, Craig
Stewart, D. LDS Church Nay. 0. Payson Fruit Growers
Hi-Country Fruit Farm Rowley Brothers Meredity, V. Rowley Brothers Daveport. L. Spring Creek Irrigation Company Holladay Field Spring Creek Irrigation Company Unknown
Spring Creek Irrigation Oompany Unknown Holladay Field Unknown Unknown McMullin. Dave Rowley Brothers McMullin, Dave McMullin, Dave Keigley Quarry Keigley Quarry Oberg, Martin Strawberry Highline Canal Company Rowley Thompson, R
Year drilled
1971 1971 1947 1912 1920 1961 1971
1945 1961 1950 1977
1959 1959 1963 1970 1962 1934 1934
1934 1934 1934 — — — —
1973 1959 1984 1961 —
1949 —
1963 1957 1963
Use of
water
H H H 1 1 1 1
H !
H
N
1 H H H H 1 1 1 1
1 1 1 —
1 1 U
1 1 K N U 1 8 1
Well depth (feet)
160 135 70
340 340 360 300
55 363 125 363
323 290
86 201 \ 100 34 79 75
160 124
—
90 — —
380 340 200 307 310 365
80 435 190 278
22
1 selected wells—Continued
f^a< \ ja . l
Diameter (inches)
8 8 4 6
12 12 8
4 12 4
10
12 12 6 8 6 4 4 4 3 4
— — — — 10 12 10 14 8.25 8.5 3
16 6 6
sing
P 0 0 0 0 P P P 0 P 0 P P P — — P 0 0 0 0 0 0 — — — —
p p p p 0 p —
p 0 p p
Finish (feet)
126-160
90-360 97-100
190-300
110-360
120-170 220-355
44-308
126-198
100-380 70-340
100-200 90-300
220-365
145-430
160-210 218-275
Elevation of land surface
(feet)
4,615 4,608 4,562 4.605.8 4,605.8 4,619 4,605
4,620 4,620 4,649 4,770
4,667 4.695 4.687 4.760 4,659 4,695 4,682 4,680 4.705 4.680 4.680 4,680 4,680 4,680 4.705 4,715 4.735 4.741
4,765 4,760 4,530 4,800 4.822 4.822
Water level
Above (-) or below
land surface
80 R 64.81
3.63 — -7 R 57.57 28.70
15 R 42.10 30.60
243 R
23.04 50.09 39.71
114 R 3.41
-1.6 R -3.1 R -5.0 -2.6 -7.6
-12.5 -12.8
-9.4 —
53 R 61.92 45 R 51.4
226.96 224 R
15.95 103 R 151.23 160
Date
07-20-71 03-07-91 03-06-91
— 11-04-64 03-06-91 01-23-91
01-27-45 03-25-67 03-06-91 05-15-77
03-06-91 03-06-91 03-06-91 10-22-70 03-08-91 10-14-64 05-28-64 03-07-91 08-30-89 03-07-91 07-20-89 07-20-89 07-20-89
—
06-26-73 03-06-91 07-31-84 06-29-65 10-25-89 01-01-50 03-05-91 03-29-67 03-06-91 10-14-64
Other data
available
D LW LW.C
0 0 W
w,c
W
W • D
D D D W,D D W,D D D 0 W.O 0
W
W 0
0
23

Table 1.—Records of
Well number Owner Year drilled
1975
1961 1962 1955 1966
1936 1967 1956 1964 1943 —
._
1953 1956 1967 1970 1915 1915
Use of
water
1
1 H 1 1
H 1 1 8 H 1 1 1
H H 1 H 1 1 1
Well depth (feet)
415
386 185 325 733
188 196 227 138 310 165
r ,
133 142 146 156 60 162
m
(D-9-1)36acb-1
(D-9-1)36bbc-1 (D-9-1)36cdb-1 (D-9-1)36cdd-1 (D-9-2)1bcb-1
(D-9-2)2add-1 (D-9-2)2dad-1 (D-9-2)2dad-2 (D-9-2)3aba-4 (D-9-2)4cdc-1 (D-9-2)5acc-1 (D-9-2)5acc-2 (D-9-2)5acc-3 (D-9-2)5bcc-1 (D-9-2)5bcc-2 (D-9-2)5bcd-1 (D-9-2)5bcd-2 (D-9-2)5bdd-1 (D-9-2)5bdd-2 (D-9-2)5bdd-3 (D-9-2)5bdd-4
Ferguson, Bill
Strawberry Highline Canal Company Miller. M. Shaw. W.E. LDS Ohurch
Davis. Frank Culmer. E. Culmer, E. Taylor. R. Island Ranch Company Jones, H. Max Jones, H. Max Jones, H. Max Depew, Max Depew. Max Depew. Max Maurin, Charles Jones. H. Max Jones, H. Depew. Max Jones. H.M.
4
363
(D-9-2)5cbb-3 (D-9-2)5ccc-1 (D-9-2)5ccd-2 (D-9-2)5dcd-3 (D-9-2)5ddb-1 (D-9-2)5ddc-2 (D-9-2)5ddd-1 (D-9-2)6add-4 (D-9-2)6add-5 (D-9-2)6ddb-1
15 (D-9-2)6ddb-2
Stickney. Donna Wilson, Sherol Unknown Payson City Browm. Wayne L. Payson City Unknown Christiansen, G. Walker. James Wilson, Shirley
Wilson, 0.
1961 1900 1990 1934
1974 1934 1990 1961 1962 1970
1 1 U —
H U U H H 1
121 160 32.5 166 40 170 32.5
112 310 158
1964 302
24
t

selected wells—Continued
Casing
Diameter (inches)
10
16 4
12 16
2.5 4 2 4 8.4 2
4 4 6 4 2 2
6
4 2 1 3
—
3 1 6 8 8
8
P P P 0 P P P 0 0 0 0 0 —
0 0 p p 0 0
p p p 0 0 0 0 0 0 0 0 p p p p p 0
Finish (feet)
200-265 365-415
80-370
192-325 540-618 645-730
136-146 147-156
67-75 170-180 192-355
177
85-90 100-105 121-126 146-152
Elevation of land surface (feet)
4,820
4,807 4,862 4,890 4,580
4,570 4,570 4,570 4,528 4,582 4,536 4.542 4,542 4,537 4,537 4,537 4,537 4.541.6 4.542 4.540 4.541
4,541 4,560.8 4,562 4.576.8 4.565 4.576.99 4,576 4,534 4,535 4,546
Water level
Above (-) or below
land surface
102.41
102.2 167.64 187.52
-7.2
-1.6 -.6
-9.6 -15.4 13
-32.3 — —
-20 R -14.2
-8.1 —
-13.1 R -27.9 R —
-40.0
-21.1 -8.3 3.44
-12.4 -5.3
-15.2 5.96
-23.3 -31.2 -18.0
Date
03-06-91
03-06-91 03-08-91 03-06-91 03-05-91
08-17-89 03-05-91 03-04-91 03-04-91 03-06-91 03-06-91
— —
04-26-53 08-09-89 08-09-89
—
09-23-64 09-23-64
—
01-02-69
03-06-91 12-04-64 07-02-90 10-10 66 06-22-89 03-11-74 03-06-91 07-19-89 07-19-89 03-07-91
Other data
available
W,C
W,C W W.C W.D
W.D W W.D W W W.D
D W.D W.D D
D
D
W.D D W
D.C D W W.D W.D
W.D.C
4.552 -17.9 03-07-91 W
25

Table 1.—Records of J
•
Well number
(D-9-2)7bdd-1 i6(D-9-2)7cda-2
(D-9-2)7dcc-1 (D-9-2)8ccb-1 (D-9-2)9bac-1
Owner
Peart. M. Cornaby. B. Spencer, S. Unknown LDS Ohurch
Year drilled
1963
1962
1956
1990
1961
Use of
water
8 8 H U I
Well depth (feet)
66 16
310 46.5
445
(D-9-2)10cad-2 (D-9-2)10cad-4 (D-9-2)10dac-1 (D-9-2)11aaa-1
(D-9-2)11aca-3 (D-9-2)11adc-1 (D-9-2)13dbc-1 (D-9-2)13dca-1 (D-9-2)14baa-1 (D-9-2)14bdd-1 (D-9-2)15adb-1 (D-9-2)15bbb-1 (D-9-2)15bcc-1 (D-9-2)15cda-1 (D-9-2)16cbb-1
17(0-9-2)17aaa-1 (D-9-2)17ada-1 (D-9-2)17bbb-1 (D-9-2)17cbc-1
Woodhouse, Ralph Woodhouse. Mike Christensen. Don H. Wilson
Cole, Don Salem City Johnson, Hal 0. Unknown Turpin. W.T. Vachea, Dan Gasser, P. Payson City Raynaud, A.L. Allred, Rey Payson City Payson City Brimhall, Reed Unknown Payson City
1936
1966
1933
1958
1932
1976
1971
1970
1960
1961
1971
1970
1970
1961
1990
H
H
H
H
P
I
H
H
H
H
P
H
I
P
P
U
U
P
400
49
360
320
285
150
445
186
133
130
195
100
218
500
195
165
31.5
600
(D-9-2)17daa-1 (D-9-2)18aab-1 (D-9-2)18aca-1 (D-9-2)18dad-1 (D-9-2)19aca-1
Payson City Unknown Unknown Haitt, W. Emerald Turf Farm
1954
1990
1934
1949
1977
P
U
H
H
I
225
31.5
278
92
343
26

r selected wells-—Continued
•
Casing
Diameter (inches)
6 —
6 1
16
6 3
4 3 6
4 6 4
16 6 8
12 16 6
16
12 1 3 4
16
0 P 0 0 p p p p 0
0 p p 0 0 p
0 0 0 —
0 p p p
o 0 p p p p 0 0 0 p p
Finish (feet)
13-16
50-169 202-252 288-337 377-427
175-185 310-320
347-445
25-180 250-500 100-195
235-300 380-415 450-518 160-220
160-300 323-343
Elevation of land surface
(feet)
4,594 4,600 4,603 4,606 4,608
Water level
Above (-) or below
land surface
20.16 8.02 7.94 5.5
37.47
Date
03-06-91 03-06-91 03-06-91 07-02-90 03-06-91
Other data
available
W W W
W,C
4,585 4,585 4,598 4,584.63
4,595 4,596.9 4,960 5,020 4,690 4.750 4.695 4,611 4.665 4.750 4.760 4,682 4,720 4,623 4.650
4.764 4.613 4,620 4.645 4,650
-16.1 3.63
-20.9 -28.8
-22.3 -8.4 R
346 R 404.96
72.20 128.25 77.48 21.41 64.84
104 R . 156 R 74.9
117.42 14.2 40 R
158.50 6.16
17.15 37.01 40.46
03-04-91 03-04-91 03-04-91 -03-04-91
03-04-91 12-04-64 07-17-76 10-25-89 03-06-91 03-06-91 03-06-91 ,03-06-91 03-06-91 05-11-70 04-04-71 06-28-65 03-06-91 07-02-90 04-24-89
01-18-67 07-02-90 03-06-91 03-07-91 03-05-91
W.D W.O
W.D
0
W
W
0
27

Table h—Records of
Well number
(D-9-2)19acb-1 (D-9-2)20baa-1 (D-9-2)20bbc-2 (D-9-2)20bdc-1 (D-9-2)20cca-1 (D-9-2)20ccc-1
(D-9-2)22add-1 (D-9-2)22bad-1 (D-9-2)22cad-1 (D-9-2)22dac-1 (D-9-2)23abb-1
Owner
Emerald Turf Farm Hardman, H.T. Mount Loafer Irrigation Company Revel, James M. Peay. G. Spring Lake Water Works Company
Haskel, RE. Allred. Rey Brunson, Reed A. Goosenest Water Oompany Elk Ridge Corporation
Year drilled
1976 1971 1961 1974 1946 1962
1972 1957 1976 1970 1979
Use of
water
1 1 1 1 H P
H Z 1 P P
Well depth (feet)
311 175 275 445
60 145
272 855 220 500 957
(D-9-2)24aca-1 (D-9-2)24bda-1 (D-9-2)25bbb-1 (D-9-2)25bbc-1
(D-9-2)26add-1 (D-9-2)26baa-1 (D-9-2)29acd-1 (D-9-2)29acd-2 (D-9-2)29acd-3 (D-9-2)29acd-4 (D-9-2)29bba-1 (D-9-2)29cda-1 (D-9-2)29dbd-2
(D-9-2)30bcb-2 (D-9-2)30cbb-2 (D-9-2)31cda-2 (D-9-2)32bac-1 (D-9-2)32bbb-1 (D-9-2)36acd-1
Hanks. Ted Hanks. Ted Elk Ridge Oorporation Elk Ridge Oorporation
Elk Ridge Oorporation Elk Ridge Corporation Judd. Steve Judd. Steve Judd. Steve Judd. Steve Mountain View Dairy Spring Lake Water Works Oompany Spring Lake Water Works Oompany
Unknown Helm. Andrew Thorvaldson, A. Ashton, 0. Jarvis. Marvin
Loafer Water Users' Association
1971 —
1970 1969
..
1971 1950 .— —
1972 1961 1989
_
1957 1962 1953 1970 1960
1 u p p
p p
Q Q Q Q S P P
1
H H 1
1 S
450 300 340 132
500 530
70 ^^ ._ ^^
250 116 183
95 167 367 505 340
•
28

selected wells—Continued
Casing
Diameter (inches)
12
16 8 4
12
8 6 8
12 8
#
8 4 6 8
10 10 4
8 10 8
4 6
10 10 8
Finish (feet)
P X P P o p p p p p p
S s s s s s s p o p p p p p o
157-309 175
85-265 190-440
95-110
120-135
262-272
235
160-200
185-415
250-330
380-400
425-465
530-605
690-730
810-840
845-955
305
150-340
70-87
100-130
295-495
335-530
X 155-250
O
P 105-120
P 140-150
O
O
P 255-307
P 127-500
X 130-340
Elevation of land surface
(feet)
4.645 4.740 4.670 4.740 4,725 4.716
4.960 4.840 5,020 5,035 4.900
Water level
Above (-) or below
land surface
35.61 136.81 55.90
120 R 4.99
20.40
248 R 185 R 140.26 190.60 255 R
Date
03-05-91 03-05-91 03-29-67 09-27-74 03-06-91 03-05-91
09-01-72 04-19-58 03-06-91 04-28-89 09-27-79
Other data
available
0
LW
W
5.140 5.100 5.290 5,340
5,470 5,190 4,780 4,780 4.780 4.780 4.730 4.780 4.850
4,680 4,705 4.832 5,200 4.800 6,120
266 286.90 158 80.03
265 335 -12.6 -11.8 -11.1 — 67 36.43 63.0
-8.6 7.74
140.1 252.9
87 119
R
R
R R
R
R
11-01-71 03-04-91 04-20-70 03-06-91
10-23-70 07-31-71 08-09-89 08-09-89 08-09-89
—
10-01-72 03-07-91 03-07-91
08-03-89 08-03-89 06-28-65 06-28-65 12-01-70 05-11-89
L W
W
L
W.D
L L
D W,D
0
29

Table 1.—Records of
Well number
(D-9-3)5bbb-2 (D-9-3)5bbd-1
(D-9-3)5cdc-1 (D-9-3)6abb-1 (D-9-3)6cbc-1 (D-9-3)7aab-1 (D-9-3)18bbb-1 (D-9-3)19bba-1 (D-9-3)19bba-2 (D-10-1)1acd-2 (D-IO-l)lcbb-l (D-10-I)2adb-1 (D-10-1)2bba-1 (D-10-I)2ddd-1
(D-10-I)4ddc-1 (D-lO-l)IOaab-l
(D-lO-l) l lbbd-l (D-10-1)17cca-1 (D-10-I)19bad-1 (D-10-1)19bdc-1
(P-10-I)30bac-1
Owner
Brigham Young University Brigham Young University
Koyle, J. Cloward. R. Guss, P. Tanner, Paul Salem City Woodland Hills Woodland Hills East Santaquin Irrigation Company
Santaquin City Summit Creek Irrigation Company
Genola Summit Creek Irrigation Company
Ekins, Shirt Beardall. Norman
Rowley, Claude D.S. Powelson & Sons Unknown Ekins. Shirt
Lunceford. Scott
Year drilled
1959 1962
1946 1904 1965 1973 1971 — — 1965 1956 1961 1960 1969 .
1976 1974
1964 1955
• — 1970
1983
Use of
water
H 1
H 8 8 H P P — 1 P 1 P 1
H H
H U — 1
1
Well depth (feet)
276 601
105 14
280 190 584
— —
650 456 580 527 694
400 333
475 102
—
455
600
•
Previously reported as (C-9-1)20dcc-1 (Cordova, 1969, table 1). Previously reported as (C-9-1)34dba-1 (Cordova, 1969, table 1). Previously reported as (C-10-1)15cdd-1 (Cordova, 1969, table 1). Previously reported as (C-10-1)25aab-l (Cordova, 1969, table 1). Previously reported as (D-8-2)4aab-1 (Cordova, 1969, table 1). Previously reported as (D-7-3)2gdcb-1 (Cordova, 1969, table 1). Previously reported as (0-8-2)2abd-1 (Cordova, 1969, table 1). Previously reported as (D-8-2)4baa-1 (Cordova, 1969, table 1). Previously reported as (D-S-2)4bcb-1 (Cordova, 1969, table 1).
30

selected wells—Continued
"—
r.a« was
Diameter (inches)
8 12
6 20
6 6
16 — — 16 16 12 12 12
8 8
6 12 — 16
12
sing
P P O X — p p — — p p p p p p X p p p — — p X p p p p
Rnish (feet)
300-340 515-586
1-20
175 406-566
190-643 280-454 259-548 189-520 212-496 506-694 120-400 233-245 273-300 335-470
200-420 431-455 300-400 482-501 520-538 556-572
Elevation of land surface
(feet)
4.675 4.684
4.820 4.661 4.675 4.705 4,870 5.160 5.160 4.920 4.973 4.938 4.880 5.015
5.040 4,960
5,020 4,563 4,580 4,650
4,840
Water level
Above (-) or below
land surface
94.9 R 91.10
40.74 9.60
86.23 91.50
256.66 — —
229.85 270.14 234.90 144.70 313 R
—
186 R
311 31.22 —
125 R
257.30
Date
09-01-64 03-08-73
03-04-91 03-04-91 03-05-91 03-04-91 02-15-91
— —
• 08-09-65 03-07-91 02-15-67 03-14-73 02-14-70
—
03-22-74
11-04-64 03-05-91
—
08-31-70
03-19-90
Other data
available
LC
W W W W
0 W 0
C
W 0 0
0
^° Previously " Previously ^ Previously " Previously ^* Previously ^* Previously " Previously " Previously
reported as reported as reported as reported as reported as reported as reported as reported as
(D-8-3)22cac-1 (D-9-1)23aac-1 (D-9-1)24acc-1 (D-9-1)26daa-1 (D-9-1)35aba-1 (D-9-2)6ddc-1 (D-9-2)7dbc-1 (0-9-2)16bbb-1
(Cordova, 1969, table 1). (Cordova, 1969, table 1). (Cordova, 1969, table 1), (Cordova, 1969, table 1), (Cordova, 1969, table 1).
(Cordova, 1969, tablet). (Cordova, 1969, table 1).
(Cordova, 1969, table 1).
31

Table 2.—Drillers' logs of selected wells ^eli number: See figure 1 for explanation of the numbering system for hydrologic-data sites. Thickness: In feet. Depth: Depth to bottom of interval, in feet below land surface. Total depth may be deeper than well depth
reported in table 1.
Material Thickness
(C-9-1)3ddb-1 Log by Robinson Drilling Company Clay, sand, and gravel 98 Clay, yellow 17 Clay and gravel 30 Clay and sand 35 Clay, yellow 10 Sand and gravel 15 Clay, yellow 10 Sand and gravel 55 Clay and gravel 60 Clay, yellow 10 Clay, sand, and gravel 213 Clay, yellow 22
(C-9-1)4ddc-1 Log by Robinson Drilling Company Clay and sand 80 Sand and gravel (water) 32 Clay and sand 78 Clay and gravel 170 Clay and gravel 120 Clay, sand, and gravel 128 Sand and gravel 82
(C-9-1)17cdd-1 Log by Dave's Drilling Company Sand, gravel, and cobbles 75 Sand, gravel, and boulders 75 Sand and gravel 45
i(C-9-1)20cdd-1 Log by Robinson Drilling Company Silt and sand 14 Clay and gravel 124 Clay and sand 20 Clay and gravel (water) 52 Clay and sand 35 Sand and gravel 11 Clay, tan 4 Sand and gravel 30 Conglomerate 30 Clay, sand, and gravel 230 Clay, red 25
(C-9-1)20ddd-1 Log by Robinson Drilling Company Gravel and boulders 23 Clay, sand, and gravel 127
Depth Material Thickness Depth
98 115 145 180 190 205 215 270 330 340 553 575
80 112 190 360 480 608 690
75 150 195
14 138 158 210 245 256 260 290 320 550 575
23 150
(C-9-1)20ddd-1—Continued Gravel (water) 8 158 Clay and gravel 32 190 Gravel 59 249 Clay and gravel 229 478 Conglomerate 24 502 Clay and gravel 225 727 Conglomerate 2 729 Clay and gravel (red) 69 798
(C-9-1)28ccb-1 Log by Robinson Drilling Company Clay and sand 16 16 Gravel and boulders 2 18 Clay, sand, and gravel 57 75 Boulders 4 79 Clay and gravel 46 125 Sand and gravel (water) 47 172 Clay, sand, and gravel 65 237 Sand and gravel 26 263 Clay, gravel, and boulders 35 298 Sand and gravel 80 378 Conglomerate 6 384 Clay and gravel 204 588 Sand and gravel 32 620 Clay and gravel 92 712 Conglomerate 18 730 Clay and gravel 72 802
(C-9-1)29acc-1 Log by Robinson Drilling Company Silt 2 2 Clay and boulders 13 15 Clay, sand, and gravel 39 54 Clay, gravel, and boulders 31 85 Sand and gravel 30 115 Sand, gravel, and boulders 68 183 Clay and gravel 27 210 Sand and gravel (water) 22 232 Sand, gravel, and boulders 20 252 Sand and gravel 102 354 Clay and gravel (yellow) 62 416 Sand 8 424 Clay and gravel 208 632 Clay and sand 68 700
33

Table 2.—Drillers' logs of selected wells—Continued
Material Thickness Depth Material Thickness Depth
(C-9-1)29bcc-1 Log by Robinson Drilling Company Silt 1 1 Clay, sand, and boulders 39 40 Clay, gravel, and boulders 127 167 Sand 20 187 Clay, sand, and gravel 100 287 Gravel and cobbles 43 330 Clay, sand, and gravel 36 366 Clay and silt 8 374 Sand 13 387 Clay 59 446 Gravel 2 448 Clay. sand, and gravel 314 762 Sand and gravel 25 787 Clay and sand 13 800
(C-9-1)34ddc-1 Log by Angus Hales Clay and silt 100 100 Gravel 1 101 Sill and sand 56 157 Gravel 1 158 Silt and sand 38 196 Clay 12 208 Silt and sand 57 265
(C-10-1)4bbb-1 Log by Robinson Drilling Company Clay and sand 45 45 Clay, sand, and gravel 330 375 Conglomerate 20 395 Clay, gravel, and boulders 5 400 Conglomerate 23 423 Clay, sand, and gravel 50 473 Conglomerate 5 478 Clay, sand, and gravel 46 524 Clay and gravel 238 762 Clay, sand, and gravel 118 880 Unknown 2 882
(C-10-1)4cbb-1 Log by Layne-Texas Company Clay, sand, and gravel 90 90 SarKJ and gravel 54 144 Gravel and boulders 22 166 Sand and gravel 88 254 Clay and gravel 40 294 Gravel and shale 8 302 Shale 8 310 Gravel 30 340 Sand and gravel 69 409 Gravel 120 529
(C-10-1)4cbb-1—Continued Shale and rybite 50 579 Clay, sand, and gravel 608 1,187 Gravel and hard rock 13 1,200 Shale 18 1,218
(C-10-1)31 cdd-1 Log by Robinson Drilling Company Clay and silt 10 10 Sand and gravel 20 30 Clay, sand, and gravel 180 210 Clay and volcanic ash
(water) 45 255 Sand and gravel 38 293 Clay, brown 19 312 Volcanic cinders 6 318 Clay, sand, and gravel 132 450 Conglomerate 55 505 Clay and sand 5 510 Sand and gravel 18 528 Volcanic ash 8 536 Clay, conglomerate, and
volcanic ash 9 546 Clay and volcanic cinders 3 548 Clay, sand, and gravel 55 603
(C-11-1)6abc-1 Log by Eldon Comer Clay, sand, and gravel 21 21 Clay and cobbles 109 130 Gravel and boulders 8 138 Clay, sand, and gravel
(water) 248 386 Sand, gravel, and cobbles
(water) 74 460 Clay, sand, and gravel 36 496 Sand and gravel (water) 36 532 Clay, sand, and gravel 103 635 Sand and gravel (water) 42 677 Clay and gravel 11 688
(C-11-1)6bdd-1 Log by Eldon Comer Clay, sand, and gravel 23 23 Gravel and boulders 19 42 Clay, tan 6 48 Clay, gravel, and txjulders 17 65 Clay. sand, and gravel 213 278 Sand, gravel, and cobbles
(water) 26 304 Clay. sand, and gravel 20 324 Sand, gravel, and cobbles 60 384 •
34
Table 2.—Drillers' logs of selected wells—Continued
Material Thickness Depth
(C-11 -1 )6bdd-1—Continued Clay, sand, and gravel
(water) 288 672 Sand, gravel, and boulders
(water) 68 740 Clay, sand, and gravel 35 775
(D-7-2)32dad-1 Log by Jensen Construction and Drilling Company Clay and sand 190 190 Clay 160 350 Sand (water) > 10 360 Clay, sand, and gravel
(water) 190 550
(0-7-3)18dcc-1 Log by Eldon Comer Sand 26 26 Clay, blue 89 115 Gravel 6 121 Clay, tan 37 158 Sand 70 228 Clay 50 278 Gravel 4 282 Clay 7 289 Sand 33 322
(D-7-3)28cab-1 Log by Technical Services Inc. Silt, sand, and gravel 20 20 Clay (gray) 17 37 Sand (water) 4 41 Clay 33 74 Silt, sand, and gravel 93 167 Clay and gravel 16 183 Hardpan 4 187 Silt, sand, and gravel 21 208 Boulders 1 209 Sand and gravel 41 250 Gravel and hardpan 35 285 Boulders 5 290
(D-7-3)32bcc-2 Log by Jensen Construction and Drilling Company Clay 25 25 Silt and sand 8 33 Clay 72 105 Sand 3 108 Clay 36 144 Sand, gravel, and cobbles (water) 18 162 Clay 2 164
Material Thickness Depth
(D-7-3)34cdb-1 Log by J.S. Lee and Sons Gravel and boulders 9 9 Sand 14 23 Clay and gravel (water) 29 52 Sand and gravel 28 80 Clay and sand 60 140 Sand and gravel 115 255 Clay and gravel 190 445
(D-8-2)17ada-1 Log by Christopherson and Simmons Soil 10 10 Sand 26 36 Clay 41 77 Ciay (red) and sand 132 209 Clay, blue 6 215 Clay (red) and sand 23 238 Clay, blue 38 276 Clay (white) and sand 93 369 Clay, blue 9 378 Clay (red) and sand 23 401 Clay (white) and sand 33 434 Clay (blue) and sand 32 466
(D-8-3)3bca-1 Log by Lee Drilling Inc. Fill 3 3 Gravel, cobbles, and
boulders 15 18 Clay, sand, and gravel 5 23 Sand 45 68 Clay, gray 70 138 Gravel (water) 75 213 Sand and gravel 32 245 Clay 28 273 Sand and gravel (water) 12 285 Conglomerate 18 3(» Gravel (water) 125 428
(D-8-3)3cca-1 Log by Jensen Construction and Drilling Company Topsoil 5 5 Sand and boulders 5 10 Hardpan 3 13 Clay and sand 186 199 Gravel (water) 33 232
(D-8-3)4daa-1 Log by J.S. Lee and Sons Clay, sand, and boulders 40 40 Clay and sand 103 143
35

Table 2,—Drillers' logs of selected wells—Continued
Material Thickness Depth Material Thickness . Depth
(D-8-3)4daa-1-Contlnued Gravel 112 255 Clay, blue 19 274 Gravel 94 368 Clay and sand 3 371
p.8-3)8abd-1 Log by Woodhouse Drilling Top soil 2 2 Clay and gravel 58 . 60 Sand (water) 20 80 Clay, blue 40 120 Sand and gravel 93 213 Sand (water) 57 270 Clay, red 15 285 Sand and gravel 10 295 Sand 5 300
P-8-3)10cba-1 Log by J.S. Lee and Sons Sand and gravel 17 17 Sand 118 135 Clay and sand 45 180 Clay, blue 52 232 Gravel 78 310 Clay, brown 2 312 Unknown '. 208 520
(D-8-3)10dac-1 Log by Basin and Range Drilling Company Sitt and sand 4 4 Sand 7 11 Gravel and cobbles 17 28 Sand and gravel 18 46 Graveland cobbles (water) 16 62
(D-8-3)16aaa-1 Log by Jensen Construction and Drilling Company Topsoil 6 6 Gravel 9 15 Clay and silt 35 50 Gravel (water) 20 70
(D-8-3)16aaa-2 Log by Basin and Range Drilling Company Silt 2 2 Gravel ; 6 8 Sand (water) 24 32 Clay, brown 17 49 Sand and gravel 13 62 Silt, sand, and gravei 22 84 Silt and sand 53 137 Clay and sand 107 244
(D-8-3)16aaa-2-Contlnued Sand 27 271 Gravel (water) 4 275
^(D-8-3)22cbd-3 Log by Eldon Comer Clay 250 250 Clay and sand 40 290 Sand, gravel, and cobbles 21 311 Clay 134 445 Clay and sand 37 482 Gravel and cobbles 59 541
(D-8-3)23ccd-1 Log by Woodhouse Drilling Top soil 3 3 Clay, brown 17 20 Clay and sand 110 130 Ciay and gravei 30 160 Sand 101 261 Gravel (water) 4 265
(D-8-3)27adc-1 Log by Dave's Drilling Sand and silt 40 40 Sand and gravel 15 55 Sand and sitt 20 75 Sand 15 90 Sand and sitt 10 100 Sand (water) 20 120 Sand and gravel (water) 15 135 Sitt and sand 12 147 Shale 8 155 Sand and gravel 30 185 Sand and silt 15 200 Sand 22 222
(D-8-3)27bad-2 Log by Engineering Science, inc. Sand 10 10 Clay and sand 15 25 Gravel 5 30 Sand 20 50 Clay and sand 15 65 Silt and sand 5 70 Clay and sand 35 105 Silt and sand 30 135 Clay. silt, and sand (water) 115 250 Silt, sand, and gravel 15 265 Gravel 20 285 Sand and gravel 10 295 Clay, silt, and sand 139 434
36

Table 2.—^Drillers' logs of selected wells—Continued
j^jierial Thickness Depth
/D-8-3)27bad-2 —Continued Sand and gravel 16 450 Gravel 10 460 Sand and gravel 5 465 Gravel 10 475
(D-8-3)27cdc-1 Log by Eldon Comer Gravel and cobbles 18 18 Clay and sand 151 169 Sand 25 194 Clay, sand, and gravel 17 211 Sand, gravel, and cobbles
(water) 35 246 Clay, sand, and gravel 127 373 Sand, gravel, and cobbles
(water) 62 435 Clay, gravel, and boulders 16 451 Clay 14 465 Clay, gravel, and cobbles 7 472 Clay 42 514 Sand and gravel 6 520 Clay 20 540 Sand and gravel (water) 6 546 Clay and sand 36 582 Sand, gravel, and cobbles 2 584 Clay and sand 56 640
(D-8-3)28abc-1 Log by Eldon Comer Gravel 19 19 Clay 183 202 Sand and gravel (water) 82 284 Clay and sand 137 421 Sand and gravel (water) 49 470
(D-8-3)28bcd-1 Log by Woodhouse Drilling Gravel and boulders 30 30 Clay, blue 139 169 Sand (water) 85 254 Gravel (water) 37 291 Sand and clay 49 340 Conglomerate 40 380 Sand (water) 30 410
(D-8-3)28bdc-1 Log by Woodhouse Drilling Gravel 25 25 Clay 175 200 Sand 35 235 Gravel 50 285
Material Thickness Depth
(D-8-3)28bdc-1-Contlnued Clay 93 378 Gravel 4 382 Sand and gravel (water) 13 395
(D-8-3)29aaa-1 Log by Burt Drilling Company Clay, silt, and sand 22 22 Sand and gravel 45 67 Clay 203 270 Gravel (water) 19 289
(D-8-3)30dba-1 Log by Jensen Drilling Company Clay, brown 7 7 Gravel and boulders 5 12 Clay and gravel 15 27 Clay and sand (water) 91 118 Clay, blue 11 129 Clay and sand 4 133 Clay, blue 24 157 Clay and sand 58 215 Clay, sand, and hardpan 6 221 Clay and sand 42 263 Gravel (water) 22 285
(D-8-3)31ccd-1 Log by Basin and Range Drilling Sand and gravel (water) 35 35 Sitt and sand (water) 30 65 Clay, gray 22 87 Silt and sand 18 105 Clay and sand (water) 60 165 Sand and hardpan 7 172 Clay and sand (water) 46 218 Sand and gravel (water) 5 223 Clay, silt, and sand 22 245 IHardpan 5 250 Sand, gravel, and cobbles
(water) 25 275 Silt, sand, and gravel 12 287 Ciay, silt, and gravel 28 315 Sitt and sand (water) 2 317
(D-8-3)32baa-1 Log by Reda Pump Co. Clay 10 10 Gravel 10 20 Sand 22 42 Clay 98 140 Silt (water) 20 160 Sand 55 215
37

Table 2.—Drillers' logs of selected wells—Continued
Material Thickness Depth
(D-8-3)32ba8-1 —Continued Clay 25 240 Silt 20 260 Hardpan 11 271 Sand and gravel (water) 5 276
(D-9-1)14aad-1 Log by Eldon Comer Clay 60 60 Clay and gravel (water) 25 85 Clay 40 125 Clay and gravel 235 360
(D-9-1)14aad-2 Log by Binning Drilling Company Top soil 6 6 Clay and gravel 91 97 Gravel (water) 3 100 Clay, sand, and gravel 47 147 Clay and gravel (water) 173 320
(D-9-2)20ccc-1 Log by Reda Pump Company Gravel and cobbles 55 55 Clay and sand „ . 35 90 Gravel (water) 20 110 Ciay and gravel 12 122 Gravel (water) 3 125 Clay and gravel 20 145
(D-9-2)24aca-1 Log by Binning Drilling Company Topsoil 8 8 Clay, gravel, and cobbles 32 40 Clay, gravel, and t>oulders 40 80 Clay, gravel, and cobbles 69 149 Solid rock 5 154 Clay, gravel, and cobbles 13 167 Solid rock 10 177 Ciay and gravel 63 240 Clay, gravel, and boulders 20 260 Clay and gravel 13 273 Solid rock 4 277 Clay, gravel, and cobbles 23 300 Clay and boulders 5 305 Gravel (water) 10 315 Clay and gravel 34 349 Solid rock 7 356 Clay, gravel, and boulders 44 400 Clay and cobbles 37 437 Clay and gravel 5 442 Solid rock 8 450 Clay, brown 2 452
Material Thickness Diepth
38
(D-9-2)26add-1 Log by Binning Drilling Company Clay 10 10 Clay and gravel 90 100 Clay, gravel, and boulders 35 135 Conglomerate 13 148 Clay, gravel, and boulders 22 170 Conglomerate (water) 10 180 Clay, gravel, and boulders 50 230 Conglomerate (water) 8 238 Clay, cobbles, and boulders 27 265 Clay 20 285 Conglomerate 8 293 Clay and gravel 172 465 Conglomerate 58 523
(D-9-2)29cda-1 Log by Woodhouse Drilling Boulders 20 20 Clay and gravel 20 40 Sand and gravel 38 78 Gravel (water) 38 116
(D-9-2)29dbd-2 Log by Binning Drilling Company Silt and gravel 5 5 Hardpan 15 20 Clay, brown 20 40 Clay and boulders 40 80 Clay, brown 25 105 Gravel (water). 15 120 Sand 10 130 Gravel (water) 20 150 Clay 15 165 Boulders (water) 35 2(X)
(D-9-3)5bbd-1 Log by Eldon Comer Topsoil 3 3 Gravel and cobbles 12 15 Sand and gravel 18 33 Clay and sand 227 260 Clay, gravel, and hardpan 30 290 Sand, gravel, and cobbles (water) 50 340 Clay, tan 8 348 Clay and gravel 4 352 Clay 81 433 Clay and sand 64 497 Clay and gravel 3 500 Sand, gravel, and cobbles 89 589 Clay,tan.... 31 620
'Actual localion is different from historic records. See fool-note, table 1.
•
4

Table 3.—Water levels in selected wells Well number: See figure 1 for explanation of the numt>ering system tor hydrologic-data sites.
Water level: In feet above (-) or below land surface.
Well number
(C-9-1)3ddb-1
(C-9-1)4ccc-1
(0-9-1 )4ddc-1
Date
07-01-1964 10-01-1964 11-02-1964 12-07-1964 11-02-1965 12-02-1965 11-05-1966 12-19-1966 12-08-1967 12-21-1968 12-19-1969 12-09-1970 10-11-1971 12-15-1971 10-03-1972 10-14-1973 10-13-1974 03-04-1991
03-03-1974 03-11-1976 03-09-1976 03-10-1977 03-10-1978 03-12-1979 03-03-1980 03-04-1981 09-17-1981 03-01-1982 09-20-1982 03-02-1983 09-21-1983 03-10-1984 09-11-1984 03-04-1985 03-11-1986 09-08-1986 03-02-1987 09-15-1987 03-01-1988 09-14-1988 03-01-1989 09-15-1989 03-08-1990 03-14-1991 09-10-1991 03-11-1992
04-15-1964 05-12-1964
Water Well Date level number
19.0 (C-9-1 )4ddc-1 09-08-1964 16.94 Continued 10-02-1964 18.90 18.65 19.91 18.19 18.53 20.20 19.28 19.92 21.09 22.00 22.87 20.59 21.13 21.10 21.39 17.08
135.00 136.52 137.39 136.67 136.74 138.79 138.61 138.62 148.26 138.13 139.90 136.04 13574 133.17 133.24 131.29 131.30 135.05 132.67 133.84 130.43 135.80 131.09 131.72 129.86 128.76 138.60 130.68
78.96 78.04
11-05-1964 12-07-1964 02-03-1965 03-02-1965 03-25-1966 04-05-1966 12-19-1966 03-08-1967 04-05-1967 03-21-1968 03-19-1969 03-20-1970 03-15-1971 03-03-1972 03-14-1973 03-13-1974 03-11-1975 03-09-1976 03-10-1977 03-10-1978 03-12-1979 03-03-1980 03-04-1981 03-01-1982 03-02-1983 03-10-1984 03-04-1985 03-11-1986 03-02-1987 03-01-1988 12-15-1988 01-23-1989 02-27-1989 03-09-1989 06-22-1989 07-18-1989 08-15-1989 09-15-1989 10-23-1989 11-17-1989 12-20-1989 02-15-1990 03-08-1990 04-02-1990 05-09-1990 07-05-1990 08-03-1990 09-07-1990
water. level
82.20 82.80 81.10 80.81 83.94 80.37 81.94 81.76 84.04 83.00 82.82 83.71 83.87 84.00 84.20 85.42 89.32 85.69 86.29 87.34 86.65 86.32 86.1 86.55 86.93 87.03 85.24 82.60 81.19 81.54 82.73 81.57 82.26 81.82 81.59 80.90 88.70 84.72 83.16 82.66 82.27 82.15 81.94 81.53 81.37 81.34 81.13 85.11 82.82 82.88
Well number
(C-9-1)4ddc-1 Continued
VC-9-1)20ndd-1
(C-9-1 )20ddd-1
Date
10-18-1990 11-20-1990 12-18-1990 01-22-1991 03-04-1991 03-11-1992
03-25-1964 04-29-1964 05-12-1964 06-02-1964 07-01-1964 09-29-1964 10-06-1964 11-06-1964 12-07-1964 03-04-1965 05-18-1965 06-03-1965 03-10-1967 04-05-1967 04-02-1990 03-04-1991
02-07-1964 03-11-1964 04-29-1964 05-12-1964 06-02-1964 07-01-1964 08-18-1964 09-04-1964 10-06-1964 11-05-1964 12-07-1964 01-06-1965 02-03-1965 03-02-1965 04-07-1965 05-04-1965 06-09-1965 07-01-1965 10-15-1965 12-30-1965 03-25-1966 04-05-1966 08-11-1966 12-19-1966 03-08-1967
Water level
81.67 81.44 81.29 81.27 81.01 80.86
195.1 193.3 194.0 194.2 195.1 203.2 202.3 200.5 199.77 198.40 199.71 199.1 . 207.33 207.01 199.82 200.34
135.60 134.90 134.40 134.40 134.60 135.90 138.20 138.50 139.90 139.20 139.45 139.63 138.81 138.52 138.21 140.79 140.68 141.39 143.50 145.30 141.73 141.73 147.93 146.73 145.28
39

Table 3.—Water levels in selected w^/Zs—Continued m Well Date
number
(C-9-1)20ddd-1 04-05-1967 Continued 03-21-1968
03-19-1969 03-20-1970 09-09-1970 03-15-1971 10-06-1971 03-03-1972 09-27-1972 03-14-1973 03-13-1974 03-11-1975 03-09-1976 03-10-1977 03-10-1978 03-12-1979 03-04-1980 03-04-1981 03-01-1982 03-02-1983 03-10-1984 03-04-1985 03-11-1986 03-02-1987 03-01-1988 03-09-1989 05-12-1989 06-22-1989 07-18-1989 08-15-1989 10-23-1989 12-20-1989 01-30-1990 03-08-1990 04-02-1990 04-06-1990 06-05-1990 08-03-1990 09-07-1990 10-18-1990 12-18-1990 03-05-1991 09-10-1991 03-11-1992
(C-9-1)26bda-3 04-09-1964 05-26-1964 10-09-1964 03-17-1965 06-28-1965 12-13-1988 05-15-1989
Watar level
144.76 146.92 152.32 151.30 161.48 157.20 159.19 155.29 161.55 160.22 159.05 159.48 159.45 160.45 161.23 158.70 163.25 149.10 149.72 148.18 143.80 141.72 142.71 140.96 139.75 138.66 138.39 138.74 139.21 139.50 139.76 138.90 138.20 137.94 137.80 137.73 138.32 139.25 139.70 139.64 138.74 137.98 139.42 137.57
-4.5 -5.0 -5.3 -3.9 -5.3 -7.0 -6.2
Well number
(C-9-1 )26bda-3 Continued
(C-9-1)28ccb.1
Date
06-22-1989 07-18-1989 08-15-1989 09-15-1989 10-23-1989 12-20-1989 04-09-1990 05-09-1990
01-10-1963 02-13-1963 03-14-1963 06-10-1963 10-29-1963 11-14-1963 12-19-1963 01-17-1964 02-24-1964 03-23-1964 04-28-1964 05-11-1964 09-29-1964 10-06-1964 12-07-1964 01-06-1965 02-03-1965 03-02-1965 04-07-1965 06-09-1965 10-15-1965 12-30-1965 03-25-1966 12-19-1966 03-08-1967 04-05-1967 03-21-1968 03-19-1969 03-20-1970 03-14-1973 03-13-1974 03-11-1975 03-09-1976 03-10-1977 03-10-1978 03-12-1979 03-04-1980 03-04-1981 03-01-1982 03-02-1983 03-10-1984 03-04-1985 03-11-1986
Water Well Date level number
•7.0 (C-9-1 )28ccb-1 03-02-1987 •6.2 Continued 03-01-1988
-5.7 •5.7 -5.7 -5.5 -9.3
03-03-1989 03-08-1990 03-04-1991 03-11-1992
-7.0 (0-9-1)29800-1 04-03-1963
126.60 126.50 126.50 129.00 133.00 132.40 131.80 131.10 130.10 130.60 130.20 130.20 136.40 136.20 137.29 135.59 135.34 135.05 134.42 137.55 141.50 148.20 138.13 143.13 142.05 140.60 142.53 142.69 148.32 150.56 139.50 139.25 138.25 138.30 136.30 135.91 137.13 138.67 139.30 137.22 133.94 132.09 132.91
05-10-1963 06-10-1963 09-11-1963 10-28-1963 11-14-1963 12-19-1963 01-16-1964 02-24-1964 03-25-1964 04-29-1964 05-12-1964 06-05-1964 09-04-1964 11-06-1964 12-07-1964 03-04-1965 03-29-1966 03-10-1967 04-05-1967 03-21-1968 03-19-1969 03-20-1970 03-15-1971 03-03-1972 03-14-1973 03-13-1974 03-11-1975 03-09-1976 03-10-1077 03-10-1978 03-12-1979 03-04-1980 03-04-1981 03-01-1982 03-02-1983 03-10-1984 03-04-1985 03-11-1986 03-02-1967 03-01-1988 03-09-1989 03-08-1990 04-02-1990 03-04-1991 03-11-1992
Water leve)
130.98 133.53 128.43 127.79 127.65 127.62
205.50 205.70 216.70 214.50 211.20 210.80 210.30 209.90 209.50 209.70 209.20 209.20 213.60 216.60 216.20 217.29 215.40 221.20 222.30 221.86 227.00 228.40 230.34 231.10 235.02 227.95 226.85 228.52 228.16 227.64 227.19 226.59 227.00 227.98 228.37 225.17 220.78 216.53 219.59 217.57 216.40 214.97 214.50 214.26 214.28 213.37
i
40

Table 3.—Water levels in selected wells—Continued
well Date number
(C-9-1)29bCC-1 05-10-1963 06-10-1963 07-11-1963 08-12-1963 09-11-1963 10-29-1963 11-14-1963 12-19-1963 01-16-1964 02-24-1964 03-25-1964 04-29-1964 05-12-1964 06-02-1964 03-04-1965 03-10-1967 04-06-1967 03-20-1970 03-21-1990 04-02-1990
C-10-1)4bbb-1 07-23-1962 08-16-1962 09-14-1962 10-15-1962 12-03-1962 01-10-1963 02-13-1963 03-11-1963 10-28-1963 11-14-1963 12-19-1963 01-17-1964 02-24-1964 03-23-1964 04-28-1964 05-11-1964 06-01-1964 09-04-1964 10-06-1964 12-07-1964 01-06-1965 02-03-1965 03-02-1965 07-01-1965 12-30-1965 03-24-1966 12-19-1966 03-08-1967 04-05-1967 03-21-1968
Water Well Date Water level number level
287.0 (C-10-i)4bbb-1 03-19-1969 169.58 287.7 Continued 03-20-1970 161.62 288.5 289.9 290.7 292.0 291.9 292.0 291.9 291.4 292.0 291.1 291,1 291.13 296.6 304,6 304.6 309.6 298.64 300,10
168.30 172.50 151.00 151.50 150,30 149,90 149,60 150.20 159,70 155,60 154.30 153.60 152.90 152.70 152.30
03-03-1972 161.96 03-14-1973 152.24 03-13-1974 149.29 03-11-1975 151.45 03-30-1977 147.16 03-12-1979 148.08 03-04-1980 151.44 03-04-1981 153.57 03-01-1982 155.87 03-02-1983 154.89 03-10-1984 152.22 03-04-1985 150.66 03-11-1986 151.80 03-02-1987 150,06 03-01-1988 151.13 12-15-1988 147.61 02-23-1989 147.17 03-03-1989 147.35 05-12-1989 146.95 06-22-1989 146.74 07-18-1989 146.93 08-18-1989 146.69 09-15-1989 146.97 11-17-1989 147,17 01-30-1990 146,71 03-08-1990 146.76 05-09-1990 146.70 07-05-1990 147,42 09-07-1990 147.25 11-20-1990 147.18 01-22-1991 147.13 03-05-1991 147,04 03-11-1992 147.15
152.40 (C-10-l")4cbb-1 04-10-1962 143.76 152.90 162.20 161.20 165.51 161.75 157.72 156.01 162.95 163.59 158.51 163.85 161.00 160.46 163.02
03-08-1967 149.82 04-05-1967 151.88 03-21-1968 150.52 03-19-1969 157.17 03-20-1970 154,38 03-15-1971 153.45 03-03-1972 143.52 03-14-1973-140.78 03-13-1974 142.39 03-11-1975 140.06 03-09-1976 135.05 03-10-1977 134.28 03-10-1978 131.78 03-12-1979 134.05
WellDate number
(C-10-1)4cbb-1 Continued
Water
03-04-1980 03-04-1981 03-01-1982 03-02-1983 03-10-1984 03-04-1985 03-11-1986 03-02-1987 03-01-1988 03-03-1989 05-12-1989 03-08-1990 03-04-1991 03-11-1992
\C-10-1)15cca-1 10-30-1964 02-14-1991
(C-10-1)17bba-1
(G-10-1)17bba-2
03-07-1991
04-21-1989 05-16-1989 06-22-1989 07-17-1989 08-16-1989 09-18-1989 10-23-1989 12-18-1989 01-30-1990 03-07-1990 05-09-1990 07-05-1990 08-08-1990 09-07-1990 10-18-1990 11-20-1990 12-18-1990 01-22-1991 03-04-1991 09-10-1991 03-11-1992
02-23-1989 05-16-1989 06-22-1989 07-17-1989 06-16-1989 09-18-1989 10-23-1989 12-18-1989 01-30-1990 03-07-1990
level
138.53 148.75 150.06 149.91
.147.45 141.20 141.44 139.01 138.41 138.16 135.40 135.28 135.86 136.06
31.80 28.47 28.29
265,56 265.83 265.93 266.24 266.31 266.41 266.19 266.02 265.69 265.71 265.81 266.42 266.64 266.75 266.93 266.82 266.65 266.99 266.71 267.71 268.04
271.90 272.66 265.68 266.03 266.08 266.23 266.00 265.87 265.47 265.46
41

Table X—Water levels in selected wells—-ConiXnned
Well number
Date Water level
Well number
Date Water level
Well number
Date Water level
(C-10-1)17bha-2 05-09-1990 Continued 08-08-1990
09-07-1990 10-18-1990 11-20-1990 12-18-1990 01-22-1991 03-04-1991 09-10-1991 03-11-1992
(G-10-1)18ccc-1 01-20-1989 02-23-1989 04-21-1989 05-16-1989 06-22-1989 07-17-1989 09-18-1989 11-17-1989 01-24-1990 03-07-1990 04-05-1990 06-05-1990 08-08-1990 09-07-1990 10-18-1990 11-19-1990 01-22-1991 03-05-1991 03-11-1992
(C-10-1)24ddC-1 12-20-1966 01-05-1967 02-05-1967 03-05-1967 04-05-1967 05-05-1967 07-10-1967 08-05-1967 09-05-1967 10-05-1967 11-05-1967 12-05-1967 03-21-1966 04-05-1968 05-05-1968 06-05-1968 07-05-1968 08-05-1968 09-05-1968 10-05-1968 11-05-1968
265.54 266.41 266.52 266.74 266.65 266.63 266.75 266.56 267.71 267.75
3,S?.16 352.01 351.83 351.91 351.89 352.0)3 351.99 352.17 352.37 352.27 352.06 352.13 352.49 352.69 3,S?.97 352.73 353.58 353.46 355.42
217.8 217.28 217.06 216.54 216.29 216,61 219.59 223.15 224.55 222.73 219.22 217.57 215.90 215.3 214.92 216.47 217.31 217.88 222.59 226.26 225.29
(C-10-1)24ddc-1 12-05-1968 Continued 03-19-1969
03-20-1970 03-15-1971 03-12-1974 03-10-1975 03-08-1976 03-09-1977 08-12-1977 03-10-1978 08-25-1976 03-12-1979 09-17-1979 03-03-1980 09-03-1980 03-04-1981 09-17-1981 03-01-1982 09-20-1982 03-02-1983 09-21-1983 03-10-1984 09-11-1984 03-04-1985 09-10-1985 03-11-1986 09-08-1986 03-02-1987 09-11-1987 03-01-1988 09-14-1988 12-12-1988 01-20-1989 03-09-1989 04-21-1989 05-12-1989 06-22-1989 07-17-1989 08-16-1989 09-18-1989 10-23-19a9 11-17-1989 12-18-1989 01-24-1990 02-15-1990 03-07-1990 05-09-1990 06-05-1990 07-02-1990 08-08-1990 09-07-1990 10-18-1990
220.78 216.30 222 70 214.34 212.30 212.60 212.51 210.66 231.63 212.64 220.10 212.67 212,70 211.32 217.59 211.09 218.80 212.26 217.27 210.54 211:35 206.60 210.37 205,18 212.92 206.60 215.02 208.14 218.29 209.65 219.21 212.59 211.37 210.59 212.52 217.62 220.28 220.40 220.12 219.98 217.18 214.92 214.25 212.84 212,16 211.93 213.94 215.54 223.73 224.36 222.00 217.98
(C-10-1)24ddc-1 11-20-1990 Continued 12-18-1990
01-22-1991 03-05-1991 09-10-1991 09-13-1991
VC-10-1)25abd-1 02-04-1964 07-01 • ! 964 08-19-1964 05-18.1965 06-10-1965 03-30-1966 03-21-1990 03-05-1991
(C-10-1)30baa-1 09-18-1989 11-17-1989 01-24-1990 02-15-1990 03-07-1990 05-09-1990 06-05-1990
(C-10-1)34hhh-1 03-24-1964 05-14-1964 06-10-1964 07-02-1964 08-19-1964 09-04-1964 10-09-1964 12-07-1964 01-06-1965 02-03-1965 03-02-1965 04-07-1965 05-04-19B5 06-09-1965 07-01-1965 10-15-1965 03-25-1966 08-29-1966 12-19-1966 03-08-1967 12-08-1967 12-21-1968 12-19-1969 12-20-1970 03-03-1972 12-03-1972 03-09-1973 12-09-1973
214.89 214.04 213.30 212.54 222.32 223.16
259.8 263.4 266.8 295.8 280.8 252.5 242.82 245.15
226.10 225,96 225.93 225.71 225.58 225.74 228.67
96.1 96.5 96.5 97.4 96.6 96.8 97.0 96.70 96.56 96.79 96.82 96.88 97.01 97.33 99.15 95.60 99.58 96.76 99.15 97.47 97.47 97.60 97.53 95.86 90.59 94.59 94.29 98.29
42
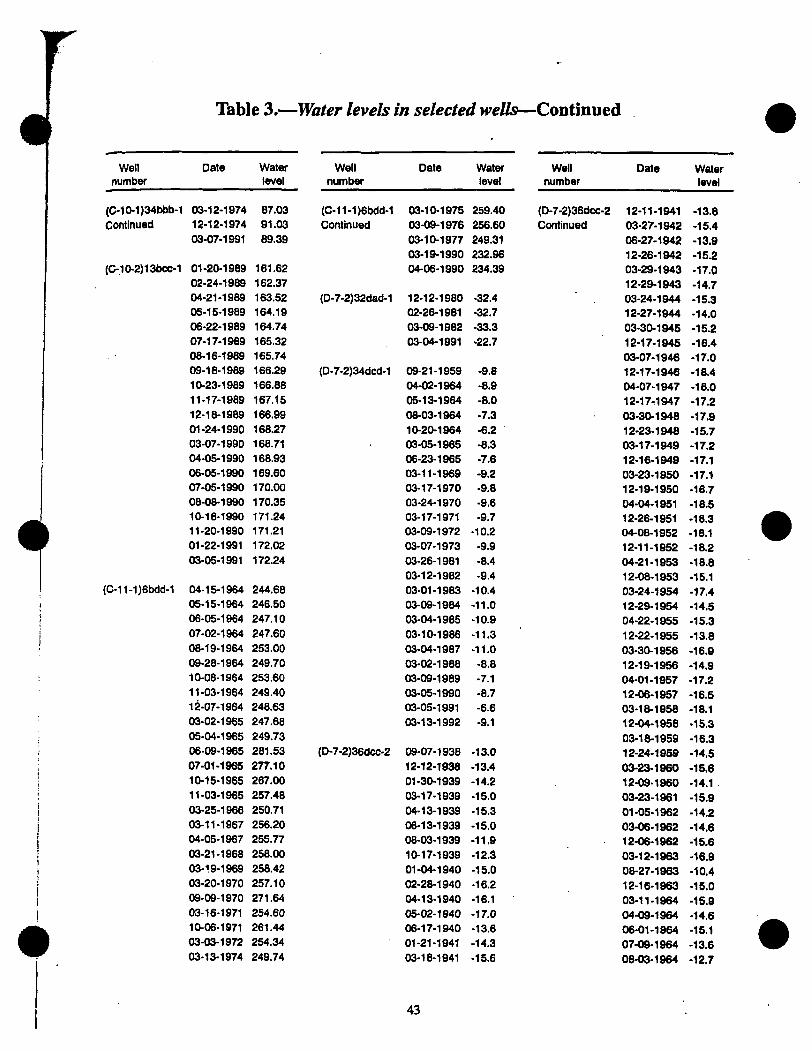
Table 3.—Water levels in selected wells—Continued
Well number
Date Water level
Well number
Date Water level
(G-10-1)34bbb-1 03-12-1974 87.03 Continued 12-12-1974 91.03
03-07-1991 89.39
(G-11-1)6bdd-1 03-10-1975 259.40 Continued 03-09-1976 256.60
03-10-1977 249.31 03-19-1990 232.96
(C-10-2)13bcc-1
(C-l l- l)ebdd-l
01-20-1989 02-24-1989 04-21-1989 05-15-1989 06-22-1989 07-17-1989 08-16-1989 09-18-1989 10-23-1989 11-17-1989 12-18-1989 01-24-1990 03-07-1990 04-05-1990 06-05-1990 07-05-1990 08-08-1990 10-18-1990 11-20-1990 01-22-1991 03-05-1991
04-15-1964 05-15-1964 06-05-1964 07-02-1964 08-19-1964 09-28-1964 10-08-1964 11-03-1964 12-07-1964 03-02-1965 05-04-1965 06-09-1965 07-01-1965 10-15-1965 11-03-1965 03-25-1966 03-11-1967 04-05-1967 03-21-1968 03-19-1969 03-20-1970 09-09-1970 03-16-1971 10-06-1971 03-03-1972 03-13-1974
161.62 162.37
04-06-1990
163.52 (D-7-2)32dad-1 12-12-1980 164.19 164.74 165.32 165.74 166.29 (D-7-! 166.88 167,15 166,99 168.27 168.71 168,93 169,60 170.00 170.35 171.24 171,21 172,02 172.24
244.68 246.50 247,10 247.60 253,00 249.70 253.60 249,40 248.63 247.68 249.73
02-26-1981 03-09-1982 03-04-1991
2)34dcd-1 09-21-1959 04-02-1964 05-13-1964 08-03-1964 10-20-1964 03-05-1965 06-23-1965 03-11-1969 03-17-1970 03-24-1970 03-17-1971 03-09-1972 03-07-1973 03-26-1981 03-12-1982 03-01-1983 03-09-1984 03-04-1985 03-10-1986 03-04-1987 03-02-1988 03-09-1989 03-05-1990 03-05-1991 03-13-1992
281.53 (D-7-2)36dCC-2 09-07-1938 277.10 267.00 257.48 250.71 256.20 255.77 258.00 258.42 257.10 271,64 254.60 261.44 254.34 249.74
12-12-1938 01-30-1939 03-17-1939 04-13-1939 06-13-1939 08-03-1939 10-17-1939 01-04-1940 02-28-1940 04-13-1940 05-02-1940 06-17-1940 01-21-1941 03-18-1941
234.3
•32.4 -32.7 -33.3 •22.7
-9.8 -8.9 -8.0 -7.3 -6.2 -8.3 -7.6 -9.2 -9.8 -9.6 -9.7
•10.2 -9.9 -8.4 -9,4
•10.4 -11.0 -10.9 -11.3 •11.0 -8,8 -7.1 -8.7 -6.6 -9.1
-13.0 -13.4 -14.2 -15.0 -15.3 -15.0 -11.9 -12.3 -15.0 -16.2 -16.1 -17.0 -13.6 -14.3 -15.6
Well number
Date Water level
(D-7-2)36dcc-2 Continued
12-11-1941 03-27-1942 06-27-1942 12-26-1942 03-29-1943 12-29-1943 03-24-1944 12-27-1944 03-30-1945 12-17-1945 03-07-1946 12-17-1946 04-07-1947 12-17.1947 03-30-1948 12-23-1948 03-17-1949 12-16-1949 03-23-1950 12-19-1950 04-04-1951 12-26-1951 04-08-1952 12-11-19.'>2 04-21-1953 12-08-1953 03-24-1954 12-29-1954 04-22-1955 12-22-1955 03-30-1956 12-19-1956 04-01-1957 12-06-1957 03-18-1958 12-04-1958 03-18-1959 12-24-1959 03-23-1960 12-09-1960 03-23-1961 01-05-1962 03-06-1962 12-06-1962 03-12-1963 08-27-1963 12-16-1963 03-11-1964 04-09-1964 06-01-1964 07-09-1964 08-03-1964
-13.8 -15.4 -13.9 -15.2 -17.0 -14.7 -15.3 -14.0 -15.2 -16.4 -17.0 -18.4 -16.0 -17.2 -17.9 -15.7 -17.2 -17.1 -17.1 -16.7 -18.5 -18.3 -18,1 -18.2 -18.8 -15.1 -17.4 -14.5 -15.3 -13,8 -16.9 -14.9 -17.2 -16.5 -18.1 -15.3 -16.3 -14,5 -15.6 -14.1 -15.9 -14.2 -14.6 -15.6 -16.9 -10.4 -15.0 -15.9 -14.6 -15.1 -13.6 -12.7
43

Table 3,—Water levels in selected we//s—Continued
Well Date number
(D-7-2)36dcc-2 09-01-1964 Continued 12-03-1964
03-01-1965 10-06-1965 12-26-1965 03-24-1966 08-17-1966 12-20-1966 03-27-1967 10-02-1968 03-26-1981 03-11-1982 03-01-1983 03-09-1984 03-04-1985 03-10-1986 03-04-1987 03-03-1988 12-13-1988 01-27-1989 03-01-1989 04-19-1989 05-12-1989 06-20-1989 07-18-1989 08-15-1989 08-24-1989 09-15-1989 10-23-1989 11-14-1989 12-19-1989 01-23-1990 02-12-1990 03-05-1990 04-09-1990 05-08-1990 06-04-1990 07-03-1990 08-02-1990 09-05-1990 10-18-1990 11-19-1990 12-17-1990 01-24-1991 03-04-1991 03-13-1992
(D-7-3)18dCC-1 12-11-1980 03-26-1981 03-09-1982 02-04-1991 03-05-1991
Water level
-8.6 -12.1 -15.9 -14.4
-6.5 -6.2 -3.4 -3.4 -6.2
-10.9 -12.8 -13.3 -14.8 -15.9 -16.0 -16.3 -15.9 -14.2 -13.0 -11.6 -12.6
-9.8 -10.0 -10.3
-9.0 -9.2 -7.9 -9.7
-10,3 -11.0 -12.2 -13.1 -12,5 -14,1 -14,2 -13.8 -13,8 -10.1 -11.9 -11.1 -12.1 -12.3 -12.2 -12.5 -11.4 -13.5
-35.5 -33.6 . -31.9 -18.8 -18.9
Well number
(D-7-3)28cab-1
(D-7-3)31cac-2
(D-7-3)32bcd-1
(D-7-3)33baa-6
Date
03-01-1961 03-30-1964 05-12-1964 09-15-1964 06-19-1989 07-19-1989 08-24-1989 09-20-1989 10-26-1989 12-19-1989 01-23-1990 02-13-1990 03-05-1990 04-09-1990 05-10-1990 06-04-1990 07-03-1990 08-02-1990 09-05-1990 10-16-1990 11-19-1990 12-17-1990 01-24-1991 03-04-1991
11-02-1964 09-13-1989
12-04-1980 03-26-1981 03-09-1982 02-06-1991 03-04-1991
08-31-1935 03-02-1936 10-03-1936 03-03-1937 09-23-1937 05-17-1938 09-14-1938 03-24-1939 09-21-1939 03-16-1940 09-24-1940 03-18-1941 12-10-1941 03-27-1942 06-27-1942 12-26-1942 03-29-1943 12-29-1943
Water Well Date level number
-15.0 (D-7-3)33baa-6 03-24-1944 -16.4 Continued 12-27-1944
-17.0 -18.5 -17.8 -17.6 -12.4 -16.6 -16.5 -16.1 •15.5 -15.9 -15.7 -15.3 -15.3 -16.2 -14.9 -15.9 -15.5 -15.4 -15.3 -15.3 -15.2 -14.8
-11.2 -14,3
-12.8 -11.8 -13,5 -13,1 -13.2
-6,8 -6.4 -8.7 -7.2 -9.0 -8.6 -9.6 -8.0 -8.1 -8.1 -8.2 -8.2
-10.6 -8.6
-12.4 •11.3
-9.7 -9.0
03-29-1045 12-17-1945 03-07-1946 12-17-1946 04-07-1947 12-17-1947 03-30-1948 12-23-1948 03-17-1949 12-16-1949 03-22-1950 12-19-1950 04-04-1951 12-28-1951 04-08-1952 12-11-1952 04-21-1953 12-08-1953 03-24-1954 12-29-1954 04-22-1955 12-22-1955 03-30-1956 12-19-1956 04-01-1957 12-06-1957 03-18-1958 12-04-1958 03-18-1959 12-24-1959 03-23-1960 12-09-1960 03-23-1961 01-05-1962 03-06-1962 12-06-1962 03-07-1963 08-27-1963 12-16-1963 04-09-1964 05-28-1964 07-09-1964 08-03-1964 09-01-1964 10-05-1964 11-02-1964 12-03-1964 01-05-1965 02-01-1965 03-01-1965
Water level
-8.4 -10.7
-9.8 -11.7 -10.7 -11.5 -10.6 -11.3 -10.0 •10.9
-9.6 -11.1
-9.9 -11.3 -9.7
-11.3 -10.5 •17.3 •14.0 •12.5 -11.7 -10.0
-9.6 -9.6 -9.2 -9.5 -9.9
-11.6 -11.0 -13.8 -11.9
-8.9 •8.6 -8.7 •7.1 •6.6 -7.1 -9.7 •8.9 -5.6 -7.7 -6.2 -7.2 -7.3 -7.4 -6.4 -7.0 -7.7 -7.9 •8.0 -8.3 -7.0
44

Table 3.—Water levels in selected wells—Continued
Well Date number
D-7-3)33baa-6 04-05-1965 ;ontlnued 05-03-1965
06-07-1965 07-02-1965 10-06-1965 12-28-1965 03-24-1966 08-17-1966 10-02-1968 03-11-1969 09-03-1969 03-17-1970 09-08-1970 03-17-1971 10-06-1971 03-09-1972 09-26-1972 03-07-1973 09-05-1973 03-07-1974 03-06-1975 08-16-1975 03-04-1976 08-12-1976 03-07-1977 08-10-1977 03-08-1978 08-22-1978 03-15-1979 09-18-1979 03-06-1980 09-03-1980 03-02-1981 09-03-1981 03-02-1982 09-20-1982 03-01-1983 09-21-1983 03-09-1984 09-10-1984 03-04-1985 09-10-1985 03-10-1986 09-08-1986 03-04-1987 09-11-1987 03-02-1988 09-14-1988 03-10-1989 06-19-1989 07-19-1969 08-24-1989
Water level
-7.7 -7.9
-10.1 -11.3 -12,0 -10,3 -8,8 -5,3
-11.3 -10.4 -11.4 -10,7 -9,1 -9.4
-11.7 -9.9 -7.4 -8.9
-11.6 -11,1
-9,6 -14.4 -11.6
-6.2 -8.9 -3.2 -5.5 -7.9 -8.3 -9.7 -8,3
-10.6 -9,2 -6,6 -9.0
-14.5 -12.1 -17 -15.4 -19.4 -16.5 -16.4 -14.2 -16.5 -13.9
-9.9 -7.3 -5.8 -8.6 -7.3 -5.0 -5.0
Well number
(D-7-3)33baa-6 Continued
(D-7-3)33ccc-5
Date
09-19-1989 10-24-1989 11-13-1989 12-19-1989 03-05-1990 03-04-1991 09-12-1991 03-13-1992
03-15-1938 09-25-1938 03-24-1939 09-21-1939 02-29-1940 10-01-1940 06-07-1964 09-01-1964 10-05-1964 03-01-1965 04-05-1965 05-03-1965 06-07-1965 07-02-1965 10-05-1965 12-28-1965 03-24-1966 08-13-1966 12-20-1966 01-21-1967 02-21-1967 03-27-1967 03-19-1968 03-11-1969 03-24-1970 03-17-1971 03-09-1972 03-12-1973 03-07-1974 03-07-1975 03-04-1976 03-07-1977 03-08-1978 03-15-1979 03-06-1980 03-02-1981 03-02-1982 03-01-1983 03-09-1984 03-04-1985 03-10-1986 03-04-1987 03-03-1988
Water Well Date level nurr
-5.5 (D-7-
iber
3)33ccc-5 12-13-1988 -5.6 Continued 01-26-1989 •5.5 •6.0 •7.0 •4.7 -4.9 -6.2
-3.6 -8.7 -7.2 -7.3 -7.7 -7.1 -9.5 -5.5 •5.9 -8.0 -8.3 -7.9 -9.5
-10.7 -13.8 -12.0 -10.5
-4.2 -7.9
03-01-1989 04-18-1989 05-15-1989 06-19-1989 07-19-1989 08-24-1989 09-19-1989 10-26-1989 11-14-1989 12-19-1989 01-23-1990 02-13-1990 03-05-1990 04-09-1990 05-10-1990 06-04-1990 07-03-1990 08-02-1990 09-05-1990 10-16-1990 11-19-1990 12-17-1990 01-24-1991 03-04-1991 03-13-1992
-7.6 (D-7-3)33ccc-6 01-21-1967 -6.2 -7.1
03-08-1991
-8.1 (D-8-1)2ccd-1 11-01-1988 -11.3 -12.1 -10.9 -10.9 -10.5 -12.2 -11.7 -13.4 -10.2 -3,5 -9.1 -9.2
-10.6 -10.2 -14.1 -18.0 -19.0 -16.3 -15.9 -9.8
12-12-1988 01-23-1989 02-24-1989 04-19-1989 05-12-1989 06-20-1969 08-15-1989 12-20-1989 02-12-1990 03-06-1990 04-02-1990 05-08-1990 07-05-1990 09-06-1990 11-18-1990 12-17-1990 01-24-1991 02-15-1991 03-05-1991 04-05-1991
Water level
-8.5 -9.9 -9.9 -8.2 -8.7 -6.4 -5.7 -5.3 -5.7 -6.7 -6.6 -7.6 -6.0 -8.0 -8.3 -7.8 -5.9 -6.4 -2.2 -2.5 -1.8 -3.5 •4.6 -4.7 -4.7 -5.2 -7.1
-21.8 -14.3
5.94 5.95 5.90 5.76 5.52 5.66 5.82 6.34 6.48 6,49 6.26 6.32 6.36 6.70 7.00. 7.11 7.07 7.01 7.10 6.87 6.99
45

Table 3.—Water levels in selected wells—Continued •
Well Date numt>er
(D-8-1)2ccd-1 05-08-1991 Continued 06-14-1991
08-12-1991 09-30-1991 01-15-1992 03-13-1992
(0-8-1)1 Obcb-1 11-22-1988 12-12-1988 01-23-1989 02-24-1989 04-19-1989 05-12-1989 06-20-1989 07-18-1989 08-15-1989 09-15-1989 10-23-1989 11-14-1989 12-20-1989 01-23-1990 02-12-1990 03-06-1990 04-02-1990 05-08-1990 06-05-1990 07-03-1990 08-03-1990 09-06-1990 10-18-1990 11-19-1990 12-17-1990 01-24-1991 03-05-1991 07-03-1991 08-21-1991 10-01-1991 01-15-1992
(D-8-1)inbch-2 11-22-1988 12-12-1988 01-23-1089 02-24-1989 04-19-1989 05-12-1989 06-20-1989 07-18-1989 08-18-1989 09-15-19a9 10-23-1989 11-14-1989 12-20^ig89
Water level
6.92 6.80 7.04 7.01 6.96 6.76
14.11 14.28 14.38 14.50 14.62 14.63 14.68 14.85 14.86 14.99 15.00 15.18 15.49 15.62 15.65 15.78 15.93 16.08 16.14 16,20 16.34 16.50 16.70 16.83 17.00 17.06 17.01 17.07 17.06 17.02 17.15
42.58 42.39 41.92 41.45 40.65 40.88 41.63 42.31 42.88 43.25 43.26 43.20 43.07
Well number
(D-B-1)10br.b-2 Continued
(0-8-1)13aaa-1
Date
01-23-1990 02-12-1990 03-06-1990 04-02-1990 05-08-1990 06-05-1990 07-05-1990 08-03-1990 09-06-1990 10-18-1990 11-19-1990 12-17-1990 01-24-1991 03-05-1991 07-03-1991 08-21-1991 10-01-1991 01-15-1992
05-02-1936 12-01-1936 03-03-1937 09-23-1937 04-06-1938 09-12-1938 03-24-1939 09-21-1939 03-19-1940 09-20-1940 03-18-1941 11-27-1941 03-27-1942 12-26-1942 03-29-1943 12-29-1943 03-24-1944 12-27-1944 03-30-1945 12-17-1945 03-07-1946 12-17-1946 04-07-1947 12-17-1947 03-30-1948 12-23-1948 03-17-1949 12-16-1949 03-22-1950 12-19-1950 04-04-1951 12-26^1951 12^08-1953
Water level
42.76 42.60 42.30 42.10 42.27 42.60 43.02 43.33 43.34 43.24 43.30 43.31 43.17 43.34 43.47 43.53 43.42 43.35
-13.4 -13.8 -14,7 -13.0 -18.0 -13.2 -17.3 -15,4 -17.5 -14.0 -16.7 -15.2 -16.2 -14.0 -15.0 -15.8 -16,1 -14.6 -14.6 -16.3 -16.7 -17.0 -16.7 -15.0 -16.4 -15.3 •16.3 -15.9 -14.9 •15.3 •15.8 •15.6 •15.5
Well number
(D^8^1)13aaa^1 Continued
(D^e^1)13bdd^1
P^8-1)20abb^1
(D^8-1)23bdd-l
Oate
09-01-1964 10-05-1964 11-02-1964 12-03-1964 09-20-1989 03-04-1991
07-07-1964 03-05-1991
11-01-1988 12-12-1988 01-23-1989 02-24-1989 04-19-1969 05-12-1989 06-20-1989 07-18-1989 08-15-1989 09-15-1989 10-23-1989 11-14-1989 12-20-1989 01-23-1990 02-12-1990 03-06-1990 04-02-1990 05-08-1990 07-05-1990 08-03-1990 09-06-1990 10-18-1990 11-19-1990 01-24-1991 03-05-1991
06-09-1937 12-13-1988 01-26-1989 03-01-1989 04-19-1989 05'-12-1989 06-20-1989 07-18-1989 08-15-1989 08-24-1989 09-15-1989 10-26-1989 11-14-1989 12-20-1989 01-23-1890 02-12-1990
Water level
•6.6 •9.5
•10.9 -11.9 -10.8 -11.3
-2.0 -1.5
12.64 12.92 12.88 12.83 11.50 12.65 13.19 13,71 14.10 14.50 14.68 14.67 14.68 14.51 14.41 14.22 14.15 14.17 14.80 15.20 15.67 16.02 15.88 15.75 15.68
-7.3 -11.9 -11.9 -12.0 •10.3 •10.2 -10.6 -11.0 -10.8 -10.8 -11.1 •10.7 -10.2
•9.6 -9.4 -9.5
•
46

Table 3.—Water levels in selected wells—Continued
Well number
(D-8-1)23bdd-1 Continued
(D-8-1)25aba-1
(D-8-1)25cbb-1
(D-8-1)36bcc-1
(D-8-2)1baa-1
(D-8-2)2caa-1
(D-8-2)2cda-1
(D-8-2)2daa-1
Date
03-06-1990 04-02-1990 05-08-1990 06-05-1990 07-03-1990 08-03-1990 09-05-1990 10-18-1990 11-19-1990 12-17-1990 01-24-1991 03-05-1991
03-24-1967 02-20-1991 03-05-1991
07-21-1964 02-20-1991 03-04-1991
07-21-1964 03-07-1991
04-08-1964 08-06-1964 08-08-1989
11-12-1951 08-06-1964 09-21-1989
08-06-1964 09-21-1989 03-04-1991
08-06-1964 04-19-1989 05-16-1989 06-22-1989 07-18-1989 08-15-1989 08-24-1989 09-15-1989 10-23-1989 11-14-1989 12-20-1989 01-23-1990 02-12-1990 03-05-1990 04-02-1990
Waler level
-10.1 -9.1 -9,1 -9.2 -9.3 -9.1 -7.9 -9.3 -9,3 -8.6 -9.0 -8,0
-12.9 -6.6 -6.5
-15.2 -11.0 -11.8
-15.9 -10.9
-11.0 -14.6 -10.3
-16 -16.7 -11,6
-6.2 -5.5 -4.7
-25.8 -26.7 -24.4 -23.6 -24.0 -22.8 -22.5 -22.9 -23.2 -24.6 -24.5 -24.8 -25.1 -25.5 -25.7
Well number
(0-8-2)3aad-1
(D-8-2)4abb-1
(D-8-2)4abc-1
^D-8-2)4bab-1
(D-8-2)4cba-2
Date
05-01-1964 09-15-1989
06-20-1964 09-12-1989 03-05-1991
04-06-1964 05-12-1964 08-04-1964 03-05-1965 06-23-1965 09-12-1989
03-25-1963 08-20-1964 09-12-1989
03-03-1937 09-23-1937 03-14-1938 09-27-1938 03-24-1939 09-21-1939 04-12-1940 09-20-1940 03-18-1941 12-29-1941 03-27-1942 12-26-1942 03-29-1943 12-29-1943 03-24-1944 12-27-1944 03-30-1945 12-17-1945 03-07-1946 12-17-1946 04-07-1947 12-17-1947 03-30-1948 03-17-1949 12-16-1949 03-23-1950 12-19-1950 04-04-1951 12-26-1951 04-09-1952 12-16-1952 04-21-1953 03-24-1954 12-29-1954
Water level
-10.0 -15.8
-8.8 •12.4 •14.1
•12.5 •12.7 •12.2 •12.5 -12.7 -11.3
-22.0 -15.2 -4.4
-26.1 -24,8 -28.1 -24.8 -29.4 -26.8 -29.5 -25.8 -29.8 •27.9 -27.6 -29.7 -29.9 -29.5 -30.8 -30.7 -32.1 •31.6 -32.5 -31.6 -34.1 -33.3 -35.2 -34.5 -35.1 -36.8 -35.8 -35.0 •34.4 -35.0 •38.1 •37,8 •37.4 •35.1
Well number
(D-8-2)4cba-2 Continued
Date
04-22-1955 12-22-1955 03-30-1956 12-19-1956 04-01-1957 12-06-1957 03-18-1958 12-04-1958 03-18-1959 12-24-1959 03-23-1960 12-09-1960 03-23-1961 01-05-1962
03-06-1962 12-06-1962 03-07-1963 08-27-1963 12-16-1963 03-11-1964 04-09-1964 05-28-1964 07-09-1964 08-03-1964 09-01-1964 10-05-1964 11-02-1964 12-03-1964 01-05-1965 02-02-1965 03-01-1965 04-05-1965 05-03-1965 06-07-1965 07-02-1965 10-21-1965 12-28-1965 03-25-1966 08-23-1966 12-30-1966 01-27-1967 02-10-1967 03-01-1967 03-16-1967 04-13-1967 04-27-1967 03-19-1968 10-02-1968 03-11-1969 09-04-1969 03-24-1970 09-06-1970
Water level
-34.7 -33.4 -33.4 -34.2 -35.6 -35.8 -36.7 -35.5 -36.5 -32.9 -35.1 -32,6 -35.1 -28.1 -29.9 -28.4 -26.3 -17.6 -20.2 -21.3 -20.6 -19.3 -18.9 -18.2 -17.0 -18.4 -19.6 -19.8 -20.8 • -21.7 -21.7 -22.3 -19.6 -19.8 -19.9 -20.8 •22,1 -20.2 -18.0 -19,7 -20.9 •20.0 •21.0 -21.0 -21.0 -20.6 -21.8 -20.5 •23.4 -19.4 -22.4 -21.1
47

Table 3.—Water levels in selected wells—Continued
Well number
(D-8-2)4cba-2 Continued
Oate
03-17-1971 10-06-1971 03-09-1972 09-26-1972 03-07-1973 09-05-1973 03-08-1974 03-07-1975 03-05-1976 08-13-1976 03-08-1977 08-10-1977 03-09-1978 08-28-1978 03-15-1979 09-18-1979 03-05-1980 09-04-1980 03-02-1881 09-03-1981 03-02-1982 09-20-1962 03-01-1983 09-21-1983 03-09-1984 09-10-1984 03-04-1985 09-10-1985 03-10-1986 09-08-1986 03-04-1987 09-11-1987 03-02-1968 09^14-1988 12-13-1988 01-26-1969 03-01-1989 04-19-1989 05-12-1989 06-20-1989 07-18-1989 08-15-1989 08-24-1989 09-15-1989 10-23-1989 11-14-1989 12-19-1989 01-23-1990 03-05^1990 04-02^1990 05-06^1990 06^04.1990
Water ievel
-22.7 -21.2 -22.4 •20.3 -22.5 -21.5 -25.8 -24.6 -25.6 -16.4 -22.6 -21.2 -19.2 -14.6 -23.2 -18.8 -21.1 -20.9 -23.9 -19.6 -22.1 -20.5 •23.6 -21.0 -23.7 -14.2 -24.8 -20.9 -24.2 -19.1 -23.0 -19.5 -19.5 -17.9 -18.7 -20.3 -20.3 -17.9 -17.6 -16.5 -15.8 -15.9 -15.3 -15.5 -15.5 -16.1 -16.2 -16.4 -17.0 -16.7 -14.7 -14.7
Well number
(0-8-2)4cba-2 Continued
'(D-8-2)4cbb-1
(D-8-2)4cdc-4
(D-8-2)4dad-1
(D-8-2)7dda-1
(D-8-2)7ddd-1
(D-8-2)10adb-1
(D-8-2)13abc-1
(D-8-2)14cad-1
(D-e-2)16caa-1
Date
07-03-1990 08-03-1990 09-05-1990 10-18-1990 11-19-1990 03-01-1991 09-10-1991 03-13-1992
04-28-1964 09-15-1989
08-20-1964 03-04-1991
04-03-1964 05-19-1964 08-04-1964 10-08-1964 03-08-1965 06-23-1965 09^28-1989
03-30-1965 03-04-1991
12-16-1963 03-01-1991
09^28-1989 03^01-1991
08-30-1961 04-02-1964 05-13-1964 08-25-1964 10-07-1964 03-04-1965 06-22-1965 09-28-1989
09-02-1964 02-20-1990 03-05-1991
04-13-1937 09-23-1937 04-06-1938 09-13-1938 03-24-1939 10-13-1939 04-04-1940
Water level
•11.8 -13.3 -14.7 -14.8 •16.6 -17.6 -14.6 -16.3
-39.0 -6.1
-12.7 -13.0
-43.8 -43.7 -43.7 -42.7 -45.4 -45.2 -13.4
-7.7 -4.9
-10,9 -9.3
-20.1 -19.7
-22.0 -28.1 -28.5 -18.7 -22.5 -29.5 -26.6 -18.4
-4.5 -3,4 -3.5
-37.3 -32.4 -41.9 -36.0 -39.2 -35.7 -40.6
WeH number
(D-8-2)16caa-1 Continued
Date
01^21 •I 941 09^02^1964 10-05-1864 11-02-1864 12-03-1864 01-05-1865 02-02^1965 03^0M865 04-05-1865 05-03-1865 06-07-1865 07-02-1865 10-21-1965 12-29-1965 03-25-1966 06-23-1966 12-20-1966 01-20^1867 02-20-1867 03-27-1867 03-19-1968 10-02-1868 03-11-1869 09-03-1969 03-15-1970 09-08-1970 03-17-1971 10-06-1971 03-10-1972 09-26-1972 03-08-1973 09-05-1973 03-08-1974 03-07-1975 03-05-1976 08-13-1976 03-08-1977 08-10-1977 03-09-1978 08-23-1978 03-15^1979 09-17-1979 03-05-1980 09-04-1980 03-03-1981 09-03-1881 03-02-1982 09-20-1982 03-03-1983 09-21-1983 03-09-1984 08-10-1984
Water level
-39.8 •33.5 -33.4 -34.7 -35.8 -36.0 -36.8 -37.4 -37.6 -37.6 -37.7 -36.7 -39.6 -38.8 -36.6 -35.4 -38.1 •36.4 -36.8 •37.5 -36.4 -37.5 -41.6 -39.5 -42.7 -38.7 -40.7 -38.4 -40.4
-36.6 -40.6 -37.8 -42.2 -41.4 -43.0 -36.4 •39.5 -34.2 -37.4 -33.8 -38.9 -35.1 -38.7 •36.3 •39.4 •35.9 -37,8 -39.6 •42.3 •44 -47.4 •48.4
^ r
• ;
48

Table 3.—Water levels in selected wells—Continued
Well number
Date Water level
Well number
Date Water level
Well number
Date Water level
(0-8-2)16caa-1 Continued
03-05-1965 09-10-1985 03-10-1986 09-08-1986 03-04-1967 09-11-1987 03-02-1988 09-14-1968 12-13-1986 01-26-1969 03-01-1989 04-19-1989 05-12-1989 06-20-1989 07-18-1989 08-15-1989 09-15-1989 10-26-1989 11-14-1989 12-19-1969 01-23-1990 02-12-1990 03-05-1990 04-02-1990 06-04-1990 07-03-1990 08-03-1990 09-05-1990
(D-6-2)21aaa-1
-50.1 -46.0 -47.0 -41.1 -44.2 -37.4 -38.0 -32.1 -31,0 -36.4 -36.3 -33.8 -32,4 -29.9 -29.0 -28.3 -28,3 -28,9 -29.3 -28.3 -32.9 -33.1 -33.7 -33.4 -32.6 -29.6 -27.7 -27.2
(0-8-2)16dbb-2 09-02-1964 -5.0 03-04-1991 -4.2
(D-8-2)17ada-1 09-03-1964 -6.3 03-01-1991 -5,4
(0-8-2)17CCC-2 04-03-1964 05-19-1964 07-23-1964 09-03-1964 10-08-1964 03-08-1965 06-24-1965 08-17-1989
-20.6 -19,7 -17.3 -15.4 -16.9 -20.8 -17,4 -8,5
(0-8-2)19add-1 09-03-1964 -13.6 03-01-1991 -12.6
(D-8-2)20cad-2 03-28-1967 -10,7 03-01-1991 -2.7
03-03-1937 -25.6 09-14-1964 -20.0 08-28-1989 -6.8
(0-8-2)21 ddd-1
(D-8-2)22cdc-1
(D-8-2)22cdc-2
(D-8-2)24bdc-2
(D-8-2)25dac-3
04-02-1964 05-18-1964 09-15-1964 03-24-1965 06-24-1965 10-02-1989
03-25-1963 04-08-1964 05-20-1964 09-17-1964 03-17-1965 06-24-1965 08-17-1989
08-15-
03-19-
03-17-
10-12-
03-06-
03-08-
03-11-
03-07-
03-05-
03-08-
03-09-
03-15-
03-05-
03-03-
03^02-
03-03-
03-12-
03-05-
03-10-
03-02-
03-02-
11-02-
12-14-
01-17-
02-23-
03-03-
04-18-
05-15-
49
1961
1970
1971
1971
1972
1973
1974
1975
1976
1977
1978
1979
1980
1981
1982
1983
1984
1985
1986
1987
1988
1988
1988
1989
1989
1989
1989
1989
-18.4 -17.5 -14.8 -18.5 •19,2 -12.5
09-15-1964 -15.2 07-19-1989 -15.1 03-04-1991 -15.4
09-15-1964 -11.4 07-19-1989 -7.8 03-04-1991 -10.9
-12,0 -9.7 -9.3 -3.7
-11.4 -6.6 -1.5
30.00 28.17 29.88 30.14 31.02 30.90 26.24 26,80 26.13 29.54 34.48 32.06 34.40 30.20 31.24 24.24 16.51 14.38 19,95 22.74 28.72 35.15 33.21 32.76 33.85 33.51 35.13 35.77
(D-8-2)25dac-3 Continued
(D-8-2)26aad-3
06-20-1989 07-17-1989 08-16-1989 09-19-1989 10-24-1989 11-13-1989 12-19-1989 01-25-1990 02-13-1990 03-06-1990 04-09-1990 05-08-1990 06-04-1990 07-03-1990 06-02-1990 09-04-1990 10-22-1990 11-19-1990 12-18-1990 01-23-1991 03-05-1991 09-12-1991 03-12-1992
03-25-1964 05-22-1964 09-17-1964 10-14-1964 03-22-1965 07-01-1965 01-31-1991 03-06-1991
(D-8-2)27acd-1
(D-8-2)28cbd-3
09-23-1964 02-20-1991 03-05-1991
(D-8-2)29aaa-7
37.27 40.07 41.51 40.18 39.10 37.20 35.89 35.60 35.32 35.44 36.38 38.29 38.79 41.87 43.70 43.56 40.45 39.15 38.65 38.88 38.42 43.76 37.47
38.1 37.2 43.9 42.1 39.9 39.8 35.80 35.45
(D-8-2)26abb-3 09-23-1964 -2.9 03-04-1991 -3.9
-2.5 -5.2 -5.2
11-04-1944 -4 09-25-1964 -5.7 07-31-1989 -6.6
(D-8-2)28cca-2 09-25-1964 -1.0 03-01-1991 -4.1
09^27^1957 -12.0 09-25-1964 -11.9 11-02-1964 -12.7 12-03-1964 -12.8

Table 3.—Water levels in selected wells—Continued
Well number
(D-8-2)29aaa-7 Continued
(0-8-2)29bcd-2
(D-6-2)29cab-1
(0-8-2)31 cbb-1
Oate
01-05-1965 02-02-1965 03-01-1965 04-05-1965 05-03-1965 06-07-1965 10-21-1965 12-30-1965 03-25-1966 04-13-1966 08-23-1966 03-24-1967 03-19-1968 03-11-1969 03-24-1970 03-18-1971 03-10-1972 03-07-1973 03-11-1974 03-07-1975 03-05-1976 03-08-1977 03-09-1978 03-15-1979 03-05-1980 03-03-1981 03-02-1982 03-03-1983 03-09-1984 03-05-1985 03-10-1986 03-04-1987 03-02-1988 03-10-1989 03-06-1990 03-05-1991 03-12-1992
04-06-1964 05-19-1964 09-25-1964 10-08-1964 03-08-1965 06-24-1965 08-17-1989
09-25-1964 08-17-1989 03-04-1991
09-28-1964
Water Well Date level nun
-13,1 (D-e--13.8 -14.2 -14.1 -13.2 -12.0 -14.8 -16,2 -14.2 -14,5 -12.1 •14.9 •16.3 •16,1 •16.4 •16.1 •16.0 -14.0 -16.0 -14.0 -12.1 -11.6
-9.4 •11.2 •7.8 -9.1 -8.7
-11.0 -10.6 -10,8 -10.6 -9.2 -7.3 -7.9 -7.5 -6.9 -6.6
-24,0 -24.4 -22.7 -22.9
Iber
2)31cdb-1 08-04-1964 09-01-1964 10-01-1964 11-02-1964 12-03-1964 01-05-1965 02-02-1965 03-01-1965 04-05-1965 05-03-1965 06-07-1965 07-02-1965 10-21-1965 12-29-1965 03-25-1966 08-24-1966 12-20-1966 03-24-1967 03-20-1968
. 03-21-1969 03-24-1970 08-18-1971 03-11-1972 03-08-1973 03-11-1974 03-10-1975 03-08-1976 08-09-1989 04-09-1990 05-08-1990 06-05-1990 07-03-1990 08-03-1990 09-05-1990 10-18-1990 11-19-1990 12-17-1990 01-24-1991 03-07-1991 09-10-1991 03-12-1992
-24,4 (D-8-2)31cdb-2 09-27-1968 -23.7 -19.6
-25.3 -22.0 -26.4
-12.5
03-12-1970 03-18-1971 03-11-1072 03-08-1973 03-11-1974 03-10-1975 03-08-1976 11-14-1989
Water level
•6.3 •5.8 •5.8 -6.5 -6,5 -7.2 -7.2 -7.7 •7.8 •8.0 -7.4 -7.9 -8.9 -9.5 -8.5 -6.8 -7.2 -8.8 -8.2 -8.4
-15.3 -13.3 -15,4 -14,6 -12.9 -10.9
-8.3 -5.6
-13,0 -7.2 -5.6 -5.6 -5.6 -5.0 -7.1
-14.3 -14.2 -14.3 -15.0 -5.9
-14.8
-18 -31.7 -31.3 -29.4 -28.4 -30.2 -29.8 -30.7 -30.0
Well Date number
(0-8-2)31 cdb-2 01-23-1990 Continued 03-06-1990
11-19-1990 12-17-1990 01-24-1991 03-07-1991 03-12-1992
(D-8-2)34acd-1 06-20-1946 09-28-1964 07-31-1989 03-05-1991
(D-8-2)34dda-1 09-29-1964 11-03-1964 12-04-1964 01-05-1965 02-02-1965 03-01-1965 04-05-1965 05-03-1965 06-07-1965 07-02-1965 10-20-1965 12-29-1965 03-25-1966 04-18-1966 08-23-1966 03-24-1967 03-20-1968 03-17-1969 03-24-1970 03-18-1971 03-10-1972 03-08-1973 03-11-1974 03-07-1975 03-05-1976 03-08-1977 03-15-1979 03-05-1980 03-03-1981 03-02-1982 03-03-1983 03-12-1984 03-05-1985 03-10-1986 03-04-1987 12-13-1988 01-26-1989 03-01-1989
Water leve)
-29.7 -29.9 -28.9 -28.9 -28.8 -30.2 -28.8
-3.0 -3.7 -4.4 -7.4
-12.4 -13.3 -13.9 -14.6 -14.5 -14.9 -14.7 -14.5 .-14.2 •13.6 -15.0 -15.0 -14.3 -14,8 -10.9 -15,0 -15.8 -17.1 -187 -17.4 -17.3 -18.0 •18.0 -18.1 -16.8 -13.8 -14.9 -13.7 -15.5 -157 -16.2 -17.6 •18.9 -17.7 -15.8
-9.8 -13,2 •13.4
i
08-01-1989 -14,4 08-28-1989 -14.8
50

Tible 3,—Water levels in selected wells—Continued
Well number
(D-8-2)34dda-1 Continued
(D-8-2)36dbd-3
((D-8-3)5bca.1
(D-8-3)7abc-1
1 F (D-8-3)8abd-1
| k
w
Date
04-18-1989 05-15-1989 06-20-1989 07-18-1989 08-16-1989 09-19-1989 10-26-1989 11-14-1989 12-19-1989 02-13-1990 03-09.-1990
09-29-1964 02-06-1991 03-06-1991
11-04-1964 09-14-1989 03-04-1991
08-03-1989 03-04-1991
03-26-1964 05-13-1964 10-14-1964 03-05-1965 06-30-1965 03-19-1967 03-19-1968 03-08-1969 03-19-1970 03-07-1971 03-08-1973 03-11-1974 03-10-1975 03-05-1976 03-09-1977 03-09-1978 03-15-1979 03-06-1980 03-02-1981 03-02-1982 03-03-1963 03-09-1984 03-04-1985 03-10-1986 03-04-1987 03-02-1988 03-02-1989 04-19-1989
Water level
-9.9 -9.0 -8.3 -6.5 -5.9 -6.5 -6.5 -8.1 -8.4
-10.5 -11.0
6.9 9.6 9.1
-14.5 -7.0 -9.7
-16.0 -23.5
6,41 6.40
10.5 6.3 6,6 6,15 6.05 4.56 3,83 4,47 2.95 2.95 5.43 3.39 4.46 5.60 4.34 4.45 3.17 3,67
.65 flowing flowing flowing flowing
2.32 3.98 4.94
Well number
(D-8-3)8abd-1 Continued
(D-B-3)11caa-1
(0-8-3)1 lccc-1
(0-8-3)1 lccc-2
D-8-3)14acc-1
Date
05-15-1989 06-22-1989 07-17-1989 08-16-1989 09-19-1989 10-24-1989 11-13^1989 12-19-1989 01-23-1990 02-13-1990 03-06-1990 04-09-1990 05-08-1990 06-04-1990 07-02-1990 08-02-1990 09-04-1990 10-16-1990 11-19-1990 12-17-1990 01-23-1991 03-04-1991 03-13-1992
06-19-1969 07-19-1989 09-19-1989 11-13-1989 01-23-1990 02-14-1990 03-05-1990 05-08-1990 07-02-1990 10-22-1990 12-17-1990 03-05-1991
06-08-1965 07-02-1965 03-27-1967 02-04-1991 03-06-1991
01-30-1991 03-07-1991
08-19-1963 04-01-1964 05-12-1964 10-14-1964 03-19-1965 06-30-1965
Water level
7.00 12.59 10.14 12.97 12.21 11.25 7.23 5.23 4.77 4,46 4,31 5.37 8.68
10.02 13.18 14.05 14.05 8.96 7.30 6.73 6.55 6.14 5.35
180.39 182.5 184,50 182,60 181.19 181.39 181.67 182.65 185.08 187.76 185.67 185.60
138,13 136,42 143.50 137.00 140,00
45.05 46.16
165.30 171.0 171.4 171.1 169.7 167,0
Well number
(0-8-3)14acc-1 Continued
(0-8-3)14bab-1
(D-8-3)17ada-1
(0-8-3)17cdc-2
« (0-8-3)18aaa-3
(0-8-3)18ccd-1
^(D-8-3)22cbd-3
Date
10-20-1865 12-28-1865 03-23-1966 04-13-1966 08-25-1966 02-21-1967 03-27-1967 12-15-1988 01-17-1989 02-23-1989 04-18-1989 05-15-1989 06-19-1989 08-24-1989 10-24-1989 01-23-1990 03-06-1990 04-09-1990 05-31-1990 08-02-1990 09-05-1990 10-22-1990 11-19-1990 01-23-1991 03-05-1991 09-13-1991 03-13--! 992
10-09-1969 10-31-1969 11-24-1989 12-22-1989
04-13-1965 02-25-1991 03-07-1991
03-23-1964 03-05-1991
03-07-1991
04-13-1965 02-26-1991 03-04-1991
01-08-1962 02-13-1962 03-14-1962 04-11-1962 04-03-1964 05-12-1964
Water level
165.1 165.62 168.00 168.82 175.52 172.56 172.34 170.76 169.82 170.53 171.48 171.47 172.27 175.46 174.41 172.18 172.39 172.86 175.23 179.75 180.70 178.84 177.49 177.36 177.05 178.60 175.37
146.45 145.93 145.02 144.85
23.60 24.11 24,43
143.70 142.22
-2.1
-2.7 •6.7 •6.4
160 175.5 175.4 175.4
176.1 176.1
51

Table 3.—Water levels in selected wells—Continued
Well number
(D^8-3)22cbd^3 Continued
(D^8-3)26bcd^1
(D^8-3)26cbd-1
(0-e-3)26cbd-2
(D-8-3)26cca-2
(D-8-3)27adc-1
(D-8-3)27adc-2
Date
10-14-1964 12-04-1964 03-19-1965 06-30-1965 03-06-1991
03-30-1989 06-28-1989 07-31-1989 08-30-1989 09-28-1989 10-31-1989 11-24-1989 12-22-1989 03-08-1991
07-31-1989 08-30-1989 09-29-1989 10-31-1989 11-24-1989 12-22-1989 03-08-1991
03-29-1989 06-29-1969 07-31-1989 08-30-1989 09-29-1989 10-31-1989 11-24-1969 12-21-1989 03-08-1991
03-29-1989 06-29-1989 07-31-1989 08-30-1989 09-28-1989 10-31-1989 11-24-1989 12-21-1989 03-08-1991
10-10-1989 10-31-1989 11-24-1989 12-22-1989 03-08-1991
03-30-1969 06-28-1989
Water level
176.3 175.7 173.9 172.1 179.88
175.64 177.89 178.22 178.91 179.47 179.91 180.54 180.91 189.04
222.45 223.02 223.68 223.68 224.29 224.77 231.16
34.72 36.69 36.96 37.22 37.46 37.36 37.02 36.58 36.13
20.43 21.32 21.67 22.06 22.49 22.77 22.72 22.70 21.66
90.13 90.62 91.05 91.34 96.57
156.15 158.59
Well number
(D-6-3)27adc-2 Continued
(D-8-3)27bad-1
(D-8-3)27bad-2
(D-8-3)30dba-1
(D-8-3)33cac-1
(D-8-3)34bab-1
Date
07-31-1989 08-30-1989 09-29-1989 10-31-1989 11-24-1989 12-26-1989 03-08-1991
10-31-1989 11-24-1989 12-22-1989 03-08-1991
01-05-1990 03-08-1991
05-24-1989 03-06-1991
10-15-1964 03-07-1991
11-13-1961 12-06-1961 01-22-1962 02-14-1962 03-14-1962 04-11-1962 03-27-1964 04-22-1964 05-21-1964 07-23-1964 10-14-1964 12-04-1964 01-05-1965 02-01-1965 03-03-1965 04-06-1965 05-03-1965 06-08-1965 07-02-1965 10-20-1965 12-29-1965 01-25-1966 02-15-1966 03-10-1966 04-05-1966 05-05-1966 06-05-1966 07-05-1966 08-05-1966 09-10-1966
Water Well Date level number
159.41 (D-8-3)34bab-1 10-05-1966 160.15 Continued 11-15-1966 160.71 160.58 160.32 160.17 165.40
151.52 149.61 148.76 149.39
180.29 185.36
114.46 113.73
58.00 62.41
153,50 153.50 153.40 154,20 154.50 154.50 161,20 160.68 160.70 164.20 163.10 161.29 160.36 160.09 159,44 159.05 158.81 157.86 158.08 155.82 154.05 154.37 154.38 154.31 154.83 155.35 155,70 163.48 161.58 162.35
12-15-1966 01-10-1967 02-05-1967 03-05-1967 04-05-1967 05-05-1867 07-10-1867 08-05-1867 09-05-1967 10-05-1967 11-05-1967 12-05-1967 01-05-1968 02-05-1066 03-05-1966 04-05-1968 05-05-1968 06-05-1968 07-05-1968 08-05-1966 09-05-1968 10-05-1968 11-05-1968 12-05-1968 01-05-1969 02-05-1969 03-05-1969 04-05-1969 05-05-1969 06-05-1969 07-05-1969 08-05-1969 09-05-1969 10-05-1969 11-05-1969 12-20-1969 01-05-1970 02-05-1970 03-05-1970 04-05-1970 05-05-1970 06-05-1070 07-05-1970 08-05-1970 09-05-1970 10-05-1970 11-05-1970 12-05-1970 01-05-1971 02-05-1971
Water level
161.44 159.44 158.52 158.48 158.11 158.41 156.01 158.28 158.63 159.07 159.03 157.82 156.91 156.15 155.80 155.85 155.48 155.60 155.30 154.67 157.65 156.25 154.85 153.38 152.72 151.89 151.51 151.10 151.01 150.64 150.02 149.80 148.60 150.00 149.00 148.52 147.21 147.19 147.22 147.40 147.57 148.28 148.69 149.30 149.19 150.38 155.05 150.50 150.06 150.09 149.80 149.57
52

Table 3.—Water levels in selected wells—Continued
< »
«
Well Date number
(D.8-3)3'»bab-1 03-05-1971 continued 04-05-1971
05-15-1971 06-05-1971 07-05-1971 08-05-1971 09-05-1971 10-05-1971 11-05-1971 12-05-1971 01-05-1972 02-05-1972 03-05-1972 04-05-1972 05-05-1972 06-05-1972 07-05-1972 08-05-1972 09-05-1972 10-05-1972 11-05-1972 12-05-1972 01-05-1973 02-05-1973 03-05-1973 04-05-1973 05-05-1973 06-05-1973 07-05-1973 08-05-1973 09-05-1973 10-05-1973 11-05-1973 12-05-1973 01-05-1974 02-05-1974 03-05-1974 04-05-1974 05-05-1974 06-05-1974 07-05-1974 08-05-1974 09-05-1974 10-05-1974 11-05-1974 i^•05•^9^4 01-05-1975 02-05-1975 03-05-1975 04-05-1975 05-05-1975 06-05-1975
Water level
149.57 150.83 150.15 150.38 152.04 153.30 152.53 150.94 149.05 148.58 146.52 148.54 149.41
.148.88 149.14 151.38 153.36 154.98 153.72 153.11 151,58 150.88 150.85 150.70 150.37 150,47 150.00 150,76 151.85 150.63 150.51 148.62
147.61 147.02 146.48 146.10 146.03 146.11 146.09 146.94 147.83 149.16 148.78 147.84 146.40 145.28 144.76 144,67 144.55 145.08 145.26 144.94
Well Date number
(D-8-3)34bab-1 07-05-1975 Continued 08-05-1975
09-05-1975 10-05-1975 11-05-1975 12-05-1975 01-05-1976 02-05-1976 03-05-1976 04-05-1976 05-05-1976 06-05-1976 07-05-1976 08-05-1976 09-05-1976 ^D^t^•^976 11-05-1976 12-05-1976 01-05-1977 02-05-1977 Q3-(a-1977 04-05-1977 05-05-1977 06-05-1977 07-05-1977 08-05-1977 09-05-1977 10-05-1977 11-05-1977 12-05-1977 01-05-1978 02-05-1978 03-05-1978 04-05-1978 05-05-1978 06-05-1978 07-05-1978 08-05-1978 09-05-1978 10-05-1978 11-05-1978 12-05-1978 01-05-1979 02-05-1979 03-05-1979 04-05-1979 05-05-1979 06-05-1979 07-05-1979 08-05.1979 09-05-1979 10-05-1979
water level
144.45 144.65 145.42 143.30 142.37 141.11 141.94 141.69 142.31 142.25 142.59 145.20 146.62 148.12 149.93 148.15 146.60 145.90 145.90 145.91 146.18 145.74 147.30 148.41 154.47 152.67 152.91 153.01 151,45 151.00 150.73 150.48 150.34 150.77 150.21 150.08 152.68 152.83 152.42 149.70 148.51 147.77 147.85 147.77 148.05 147.98 147.93 149.00 150.87 151.28 149.43 149.07
Well number
(D-8-3)34bab-1 Continued
Date
11-05-1979 12-05-1979 01-05-1980 02-05-1980 03-05-1980 04-05-1980 05-05-1980 06-05-1960 07-05-1980 08-05-1980 09-05-1980 10-05-1980 11-05-1980 12-05-1980 01-05-1981 o^-05^^96^ 03-05-1981 04-05-1981 05-05-1981 06-05-1981 07-05-1981 08-05-1981 09-05-1981 10-05-1981 11-05-1981 12.05^1981 01-05-1982 02-05-1982 03-05-1982 04-05-1982 05-05-1962 06-05-1982 07-05-1982 08-05-1982 09-05-1982 03-10-1983 03-04-1985 03-10-1986 03-02-1987 03-02-1988 11-02-1988 12-14-1988 01-17-1989 02-23-1969 03-03-1989 04-18-1989 05-15-1989 06-19-1989 07-19-1989 08-16-1989 09-19-1989 10-24-1989
Water level
147.85 147.10 146.77 146.69 146.59 146.73 146.09 146.02 146.02 146.44 145.45 144.37 143.31 143.16 143.42 143.84 144.21 144.83 145.23 145.24 146.96 149.56 148.34 147.70 146.33 146.15 146.05 146.51 146.53 146.56 146.09 144.62 144.45 143.79 143.21 139.47 124.22 130.40 126.81 135.79 143.39 141.98 142.16 143.09 142.99 144.26 144.91 145.52 149.10 148.64 148.07 147.02
53

Table 3.—Water levels in selected we/Zs—Continued
Well number
(D-8-3)34bab-1 Continued
(D-8-3)34bbb-1
(0-9-1 )1lacc-2
(D-9-1)11baa-1
Date
11-13-1989 12-19^1989 01-25-1990 02-14-1390 03-06-1990 04-09-1990 07-02-1990 08-03-1990 09-05-1990 10-22-1990 1M9^1990 12^17^1990 01-22-1991 03-06-1991 09-10-1991 03-19-1992
06-02-1969 07-19-1989 09-18-1989 10-24-1989 11-13-1989 12-19-1989 01-25-1990 02-14-1990 03-06-1990 04-09-1990 05-10-1990 06-04-1990 07-02-1990 08-02-1990 09-05-1990 10-22-1990 11-19-1990 12-17-1990 01-23-1991 03-06-1991 09-12-1991 03-13-1992
06-20-1989 03-06-1991
01-23-1969 06-20-1989 09-18-1989 11-14-1989 02-14-1990 03-06-1990 04-09-1990 05-08-1990 06-04-1990
Water Well Oate level number
145.84 (D-9-1)11baa-1 08-02-1990 143.98 Continued 09-05-1990 142.24 141.39 141.07 140.99 146.40 147.93
10-18-1990 11-19-1990 12-17-1990 01-23-1991 03-06-1991
147.11 (D-9-1)14aad-1 01-06-1965 146.09 144.99 144.28 143.44 142.75 147.47 144.98
72.52 75.13 74.93 74.07 73.12 71.73 70.32 69.66 69.41 69.25 69.98 70.73 72.81 74.18 74.38 73.52 72.55 72.01 71.42 70.87 74.43 72.38
69.74 77.79
59.93 58.98 57.05 58.17 60.33 60.72 61.28 61.77 61.89
02-01-1965 03-02-1965 04-05-1965 05-03-1965 06-08-1965 07-01-1965 10-21-1965 12-30-1965 03-23-1966 04-1VI966 12^19-196e 03-30^1967 03^20^1968 03^20-1969 03-19-1970 03-16-1971 03-06-1972 03-09-1973 03-12-1974 03-10-1975 03-08-1976 03-09-1977 03-09-1978 03-21-1979 03-05-1980 03-03-1981 03-01-198^ 03-02-19R1 03-12-1984 03-04-1985 03-11-1986 03-02-1987 03-01-1988 03-03-1989 03-06-1990 10-18-1990 11-19-1990 12-17-1990 01-23-1991 03-06-1991 09-10-1891 03-12-1992
Water Well Oate level number
59.77 (0-9-1 )14aad-2 03-14-1990
58.59 58.83 59,68 60.48 61.31 62.10
03-21-1990 10-18-1990 11-19-1990 12-17-1990 01-23-1991
(D-0-1)14ddd-1 10-15-1964
60.02 59.77 59.48
01-31 •I 991 03-06^1991
59.37 (0-9-1 )23ada-1 11-14-1961 59.16 65.15 66.90 57.06 56.00 55.95 56.68 57.24 57.34 56.25 55.46 55.78 55.89 55.14 57.49 56.81 58.74 57.86 63.23 61.00 59.94 59.12 57.54 56.37 55.20 53.22 53.75 54.87 55.40 57.49 56.66 57.22 57.35 56.74 57.04 57.37 57.57 65.90 57.24
12-2M961 01 •I 8^1962 03^05^1962 04^03-1962 05-15^1962 06-05-1962 09-10-1962 10-18-1962 11-15-1962 12-28-1962 01-30-1963 02-26-1963 03-22-1963 03-26-1964 05-15-1964 06-01-1964 10-12-1964 12-04-1964 01-06-1965 02-01-1965 04-05-1965 05-03-1965 10-21-1965 12-30-1965 03-23-1966 04-11-1966 04-12-1966 08-24-1966 12-19-1966 03-25-1967 03-20-1966 03-18-1969 03-19-1970 03-16-1971 03-06-1972 03-09-1973 03-12-1974 03-10^1975 03^06^1976 03^09^1977
Water level
26.40 26.39 28.50 28,49 28.60 28.70
34.70 30.58 30,60
24.20 24.50 24.70 24.80 24.80 25.20 24.90 27.30 25.40 24.20 23.10 22.50 22.10 22.50 27.25 26.90 27.2 28.30 26.77 25.97 25.56 24.68 24.45 22.05 20.27 19.49 19.34 19.57 26.03 22.08 22.02 16.77 12.20 11.85 12.30 11.87 18.12 9.28
15.09 11.45 17.49
. .
54

Table 3.—Water levels in selected wells—Continued
Well number
Date
(D-9-1)23ada-1 continued
O
(D-9-1)23daa-1
VD-9-1)24acb-1
(0-9-1 )25ada-1
(D-g-1)25ada-3
Water level
Well number
Date Water level
Well number
Date Water level
03-09-1978 03-15-1979 03-05-1980 03-03-1981 03-01-1982 03-02-1983 03-12-1984 03-04-1985 03-11-1986 03-02-1987 03-01-1988 03-03-1989 03-06-1990 03-06-1991 03-12-1992
10-14-1964 03-06-1991
10-14-1964 03-08-1991
12-02-1937 12-21-1937 02-25-1938 04-06-1938 06-02-1938 08-26-1938 10-09-1938 12-23-1938 03-17-1939 04-14-1939 06-19-1939 08-25-1939 10-13-1939 01-04-1940 07-20-1989 03-07-1991
04-14-1964 05-27-1964 07-09-1964' 08-03-1964 08-31-1964 10-01-1964 11-03-1964 12-04-1964 01-06-1965 02-01-1965 03-02-1965 04-05-1965 05-03-1965
24.39 (D-9-1)25ada-3 06-08-1965 17.58 Continued 07-01-1965 16.75 10.78 15.76 5.88 2.70 3.59 7.35 6.63
11.58 15.53 19.29 23.04
10-21-1965 12-30-1965 03-28-1966 08-24-1966 03-28-1967 03-20-1968 03-18-1969 03-24-1970 03-18-1971 03-11-1972 07-20-1989
21.60 (D-9-1)26aab-1 11-14-1961
44.80 39.71
7.20 3.41
-14.4 -13.6 -11.6 -10.9 -10.4 -13.7 -13.4 -14.3 -13.4 -12.8 -10.5 -10.5 -10.7 -10.8 -12,4
-7.6
-5.7 -5,4 -6.5 -7.4 -6.4 -5.7 -6.4 -7.0 -7.3 -8.0 -8.0 -7.9 -8.1
12-21-1961 01-18-1962 03-05-1962 04-03-1962 06-05-1962 09-10-1962 10-18-1962 11-15-1962 12-28-1962 01-30-1963 02-26-1963 03-22-1963 05-15-1964 10-12-1964 12-04-1964 01-06-1965 02-01-1965 03-02-1965 04-05-1965 05-03-1965 07-01-1965 10-21-1965 12-30-1965 03-23-1966 04-11-1966 12-19-1966 01-18-1967 02-15-1967 03-18-1967 03-20-1968 03-18-1969 03-19-1970 03-16-1971 03-06-1972 03-09-1973 03-12^1974 03^10^1975
-9.0 -10.7 -10.8 -12.3 -10.2 -7.7 -8.0
-10.6 -13.7 -14.4 -14.8 -15.0 -12.8
63.50 63.90 63.70 64.20 64.40 65.60 67.30 65.10 64.00 62.30 61.70 61.30 61.50 66.70 68,70 66.60 65.49 65.14 64.53 63.81 63.77 65.62 61.21 58.80 57.86 57.82 61.95 61.55 61.33 61.02 54.58 49.00 48.37 48.80 47.81 56.45 44,80 52.02
(D-9-1)26aab-1 Continued
(D-9-1)27aca-1
03-08-1976 03-09-1977 03-09-1978 03-15-1979 03-05-1980 03-03-1981 03-01-1982 03-02-1983 03-12-1984 03-04-1985 03-11-1986 03-02-1987 03-01-1986 11-22-1988 12-14-1988 01-23-1989 02-24-1989 03-03-1989 04-19-1989 05-16-1989 06-20-1989 07-17-1989 08-18-1989 09-18-1989 10-25-1989 11-14-1989 12-18-1989 01-23-1990 02-14-1990 03-06-1990 04-06-1990 05-08-1990 06-04-1990 07-03-1990 08-03-1990 09-05-1990 10-17-1990 11-19-1990 12-17-1990 01-23-1991 03-06-1991 03-12-1992
02-14^1967 03-18-1967 03-20-1968 03-20-1969 03-18-1870 12-14-1888 01-23-1989 02-27^1989 04-21 •I 989
47.20 54.93 63.60 55.58 54.70 46.37 53.49 40.78 33.38 33.28 40.39 38.82 47.45 51.28 51.42 52.02 52.36 52.53 52.82 53.30 54.91 56.22 57.19 58.46 56.89 56.93 56.85 57,06 57,01 57,21 57.28 58.41 58.64 59.92 60.43 61.41 62.20 61.84 61.88 61.88 61.92 60.28
230.94 231.14 230.64 229.61 229.00 228.29 226.67 230.87 227.30
55

Table 3.—Water levels in selected wells—Continued m Well
number
P-9-1)27aca-1 Continued
(0-9-1 )32bbd-1
(D-9-1)36acb-1
(D-9-1)36bbc-1
Date
05-16-1868 06-20-1888 07-17^1989 08^24-1969 10-25-1989
12-12-1988 01-23-1989 02-24-1988 04-19-1968 05-12-1989 06-20-1989 07-18-1989 08-15-1989 09-15-1989 10-23-1989 11-17-1989 12-20-1989 01-23-1990 02-14-1990 03-06-1990 04-09-1990 05-08-1990 06-05-1990 07-03-1990 08-03-1990 09-06-1990 10-18-1990 12-17-1990 03-05-1991 03-12-1992
05-16-1969 03-06-1991
07-09-1961 10-12-1961 11-13-1961 12-22-1961 01-19-1962 03-05-1962 04-04-1962 05-14-1962 06-05-1962 07-31-1962 10-22-1962 11-15-1962 12-28-1962 01-29-1963 02-26-1963 05-03-1963 06-17-1963
Water level
227.12 226.72 226.80 226.65 226.86
13.70 14.30 14.82 15.43 15.60 15.07 14.33 13.76 13.73 12.89 13.19 13.47 13.75 13.98 14.21 14.56 14.84 15.04 15.13 15.13 15.12 15.12 15.22 15.95 14.39
97.41 102.41
104 106.00 106.70 106.80 107.10 107.30 107.50 106.30 102.40 105.60 100.00 99.10 98.90 99.90
100.50 106.00 112.20
Well number
(0-9-1 )36bbc-1 Continued
Date
08-05-1963 09-19-1963 10-17-1963 11-26-1963 12-18-1963 01-24-1964 04-02-1864 05-14-1964 10-08-1964 03-23-1965 06-29-1965 03-18-1967 03-20-1968 03-18-1969 03-19-1870 03-16-1871 03-14-1872 03-09-1973 03-12-1974 03-10-1975 03-08-1976 03-09-1977 03-10-1978 03-15-1979 03-12-1980 03-03-1981 03-02-1982 03-02-1983 03-12-1984 03-04-1985 03-11-1986 03-02-1987 03-01-1988 03-10-1989 05-16-1989 06-22-1989 07-17-1989 08-18-1989 09-18-1989 10-25-1989 11-14-1989 01-25-1990 02-14-1990 03-07-1990 04-06-1990 05-08-1990 06-04-1990 08-08-1990 09-05-1990 10-17-1880 11-18^ig80 12-18^1880
Water Well Date level number
112.40 (D-8-1)36bbc-1 01-23-1881 113.80 Continued 03^06-1891 110.80 108.20 107.70
08-12-1991 03-12-1992
107.40 (D-9-1)36cdb-1 10-14-1864 106.50 107.70
03-08-1991
111.80 (D-8-1)36cdd-1 03-02-1962 102.20 125.40 103.69 96.80 93.24 92.57 90.35 91.30 97.51 87.77 92.73 90.09 85.93
104.27 96.02 86.60 89.88 96.04 64.29 76.68 76.32 84.99 82,38 91.69 95.58 96.31 95.76 97.57 99.16
100.54 98.83 98,40 98,74 98.95 99.29 99.75
100.17 103.63 111.28 106.52 103.92 102.53 102.23
04-03-1962 05-14-1962 06-04-1862 07-24-1962 10-17-1862 11-14-1962 12-17-1862 01-28-1863 02-25-1863 03-22-1863 05-03-1863 06-14-1863 08-05-1963 09-19-1863 10-18-1863 11-22-1863 12-18-1963 01-03-1964 01-22-1964 03-24-1964 05-15-1964 10-08-1964 12-04-1964 01-06-1965 02-01-1865 03^02^1865 04^05^1965 05^03^1965 06-08-1965 10^21 •I 865 12^30-1865 03-23-1866 12-19-1866 03-25-1967 03-20-1968 03-20-1969 03-19-1970 03-16-1871 03-06-1872 03-09^ig73 03-12-1974
. 03-10-1975 03-08-1876
Water lOVVI
102.55 102.20 100.91 100.86
170.10 167.64
190.50 191.30 189.50 185.40 181.00 182.50 181.30 181.60 182.70 183.60 184.60 187.70 188.80 206.60 195.10 193.70 191.50 191.00 181.00 180.60 181.07 181.60 190.80 186.87 189.19 189.30 188.86 187.42 187.13 199.40 179,00 180.09 182.52 186.99 187.87 181.14 176.89 176.35 174.48 173.52 183.65 173.23 183.87 172.65
56

Table 3.—Water levels in selected wells—Continued
4 1
WellDate number
(0-9-1 )36cdd-1
Continued
(0-9-2)1 bcb-1
(D-9-2)2add-1
(D-9-2)2dad-1
(D-9-2)2dad-2
Water
03-09-1977 03-09-1978 03-15-1979 03-05-1980 1
level
78.93 69.05 79.96 80.52
03-03-1981 172,83 03-01-1982 179,49 03-02-1983 165.95 03-12-1984 157.25 03-04-1985 156.19 03-11-1986 166,42 03-02-1987 153.49 03-01-1988 177.55 11-01-1988 175.71 12-22-1988 183.09 01-17-1989 185.19 02-23-1989 178,37 03-10-1969 165.19 05-18-1989 189.66 03-07-1990 187.86 03-06-1991 187.52 03-12-1992 185.57
10-10-1966 04-04-1967 03-05-1991
09-30-1964 06-17-1989
04-10-1967 03-05-1991
11-29-1956 -09-30-1964 03-20-1967 -03-20-1968 03-17-1969 03-24-1970 03-18-1971 03-10-1972 03-08-1973 03-11-1974 03-07-1975 03-05-1976 03-08-1977 03-09-1978 03-15-1979 03-05-1980 03-03-1981 03-01-1982 03-03-1983 03-12-1964
-6 -9.5 -7.2
12.0 -1.6
14.6 -.6
16 -6.0 15.2 15.1 18,4 •19,5 19,1
•20,5 17,4 21,4 -21.2 •18.7 •16.2 14.2 •14.8 -3.5
-14.3 -14.4 •19.2 24.3
Well number
(D-9-2)2dad-2 Continued
(D-9-2)3aba-4
(D-9-2)4cdc-1
(D-9-2)5acc-1
(0-9-2)5bcc-2
(D-9-2)5bcd-1
(D-9-2)5cbb-3
(D-9-2)5ccd-2
Date
03-05-1985 03-10-1986 03-02-1987 03-01-1988 03-01-1989 04-18-1989 05-15-1969 06-19-1969 07-19-1989 09-19-1989 11-13-1989 12-18-1969 01-25-1990 03-06-1990 04-09-1990 05-09-1990 06-04-1990 07-02-1990 08-02-1990 09-04-1990 10-17-1990 11-19-1990 12-17-1990 01-23-1991 03-04-1991 03-12-1992
11-03-1964 02-20-1991 03-04-1991
02-10-1967 02-22-1991 03-06-1991
01-10-1967 08-09-1989 03-06-1991
09-30-1964 08-09-1989
02-25-1967 08-09-1989
09-30-1964 08-28-1989 03-06-1991
06-21-1990 07-02-1990
Water level
-28.6 -24.6 -22.9 -15.6 -14.4 -11.7 -9.8 -7.2 -3.0 -6.0 -9.2 -9,9
-10.1 -10.7 -10.6
-7.9 -6.6 -3.9 -2.9 -3.2 -6.6 -7.5 -8.5 -8,8 -9.6
-10.2
-11,30 -15,5 -15,4
•11.70 12.90 13,00
-36.00 -26.4 -32.3
-19.6 -14.2
-18 -8.1
-19.8 -17.5 -21.1
3 3.44
Well number
(D-9-2)5ddd-1
(D-9-2)6add-4
(D-9-2)6add-5
(D-9-2)6ddb-1
(D-9-2)7bdd-1
(D-9-2)7cda-2
(D-9-2)7dcc-1
(D-9-2)9bac-1
Date
06-21-1990 07-02-1990 02-06-1991 03-06-1991
04-01-1964 07-19-1989
04-10-1963 07-19-1989
09-30-1964 03-07-1991
10-05-1964 03-06-1991
10-05-1964 01-30-1991 03-06-1091
10-05-1964 02-22-1991 03-06-1991
09-18-1961 10-12-1961 11-14-1961 12-27-1961 01-19-1962 03-06-1962 04-04-1962 05-15-1962 06-11-1962 07-02-1962 09-11-1962 10-22-1962 11-19-1962 12-28-1962 01-30-1963 02-27-1963 03-26-1963 05-03-1963 06-17-1963 09-20-1963 10-17-1963 11-26-1963 12-20-1963 01-15-1964 03-19-1964 06-25-1964 10^)1-1964
Water leve)
5 5.27 6.35 5.96
-22.9 -23.3
-15.0 -31.2
-16.8 -18.0
15.50 20.16
7.50 8.66 8.02
12.30 8.20 7.94
43.00 40.40 39.70 39.60 39.70 39.30 39.10 37.50 35.70 35.20 41.00 36.80 36.50 36.10 35.20 37.50 38.70 40.00 40.20 40.10 38.20 37.50 36.60 35.80 35.60 36.80 38.20
57

T^ble 3.—Water levels in selected wells—Continued
Wen Date number
(0-9-2)9bac-1 06-28-1965 Continued 10-10-1966
03-25-1967 03-07-1968 03-13-1969 03-05-1970 02-25-1971 03-10-1972 03-08-1973 03-11-1974 03-07-1975 03-05-1976 03-08-1977 08-11-1977 03-09-1978 03-15-1979 03-01-1982 09-20-1982 03-02-1983 09-21-1983 03-12-1984 09-10-1984 03-05-1985 09-10-1985 03-10-1986 09-08-1986 03^02^1987 09-11-1987 03-01-1988 09-14-1988 03-03-1989 09-18-1989 03-06-1990 03-06-1991 09-12-1991 03-12-1992
(0-9-2)1 Odac-1 08-31-1966 09-20-1989 03-04-1991
(0-9-2)11aaa-1 08-31-1935 10-08-1935 11-19-1935 12-14^1935 01-23^1936 03-05-19.'H6 05-02-1936 06-20-1936 08-08-1936 10-03-1936 11-30-1.936
Water level
34.90 36.81 38.39 35.55 34.61 33.98 33.70 34.40 35.65 32.30 31.23 32.55 33.97 63.20 35.67 35.14 33.96 32.55 30.95 27.67 27.67 26.12 27.62 28.33 28.98 28.77 30.20 29.63 35.05 32.30 34.61 33.96 36.29 37,47 36.85 37.90
-23.0 -27.5 -20.9
-25.4 -25.6 -25.5 -25.4 -25.6 -25.3 -25.2 -26.7 -28.2 -29.2 -29.4
Well Date number
(0-9-2)11aaa-1 02-03-1937 ConUnued 03-03-1937
04-13-1937 06-10-1937 08-01-1937 09-23-1937 11-02-1937 12-12-1937 02-14-1938 04-06-1938 05-05-1938 06-02-1938 08-26-1938 10-29-1938 12-23-1938 03-17-1939 04-14-1939 06-19-1939 08-25-1939 10-13-1939 01-04-1940 04-12-1940 05-01-1940 06-14-1940 01-21-1941 11-14-1941 12-29-1941 01-29-1942 03-26-1942 06-27-1942 03-29-1943 12-29-1943 03-24-1944 12-27-1944 03-29-1945 12-17-1945 03-07-1946 12-17-1946 04-07-1947 12-19-1947 03-30-1948 03-17-1949 12-16-1949 03-22-1950 12-19-1950 04-04-1951 07-19-1951 12-26-1951 04-09-1952 12-16-1952 04-21-19.'W 12-08-1953
Water level
-29.0 •28.5 •28.4 -27.9 -29.0 -29.1 -29.6 -29.8 -29.5 •29.2 •29.1 •29.1 •30.7 •31.8 •31.8 •32.9 -31.2 -30,8 -30.0 -30.0 -30.0 -25.2 -25.3 -28.2 -29.5 -30.0 -31.3 -31.4 -31.2 -29.8 -39.0 -38.2 -37.0 -41.4 -40.7 -43.0 -41.5 -42,3 -40.9 -39.2 -41.4 -43.7 -43.3 -42.8 -44.5 -42.7 -41.9 -41.9 -39.8 -55.3 -53.5 -50.4
Well Date number
(0-9-2)11aaa-1 03-24-1954 Continued 12-29-1954
04-22-1955 12-22^1955 03^30^1956 12-19^1956 04-01-1957 12-06-1957 03^1B^1958 12^04^1958 03-18-1959 12-24-1959 03-23-1960 12-09-1960 01-05-1962 03-06-1962 12-06-1962 03-12-1963 08-27-1963 12-16-1963 04-09-1964 05-28-1964 07-09^1964 08-03-1964 08-31-1964 10-01-1964 11-03^1964 12^04-ig64 01 •05-1965 02-02-1965 03-01-1965 04-05-1965 05-03-1965 06-07-1965 07-02-1965 10-21-1965 12-29-1865 03-25-1866 08-25-1866 12-19-1966 03-25-1967 03-20^1868 10-02-1868 03-17-1969 09-03-1969 03-24-1970 09-09-1970 03-18-1971 10-06-1971 03-10-1972 09-26-1972 03-08-1973
Water \ level \
-48.0 r -43.0 -40.2 • \ -39.8 : I -39.4 K -37.6 [ -36.0 •41.4 [ •41.7 '• •40.3 -46.1 [ -41.0 f -39.8 f -36.0 \ -34.2 [ -31.2 \ -31.3 [ -30.9 • f -27.9 F -28.2 [ -27.1 ; \ -26.8 JKjk -26.2 W f -25.9 -25.8 i •26.2 \ -26.9 i -27.0 ; -27.5 \ -27.5 • i -28.0 [ -28.1 \ -28.2 • -28.1 -28.6 -31.8 \ -33.2 •33.0 I •33.1 r •32.5 i -31.4 i •35.0 i -36.9 -40.8 -42.1 -42.3 •40.5 •40.9 •42.6 J t
^1 •40.4 ^ •40.5
58

Table 3.—Water levels in selected wells—Continued
well number
(0-9-2)11aaa-1 Continued
m w
(0-9-2)11aca-3
(0-9-2)17ada-1
[^ m w,
Date
09-06-1973 03-11-1974 03-07-1975 03-05-1976 08-16-1976 03-11-1977 08-10-1977 03-09-1978 03-15-1979 08-23-1979 03-05-1980 09-04-1980 03-03-1981 09-03-1981 03-01-1982 09-20-1962 03-03-1983 03-12-1984 09-10-1984 03-05-1985 09-10-1985 03-10-1986 09-08-1986 03-02-1987 09-11-1987 03-01-1988 09-14-1988 03-10-1989 07-19-1989 09-19-1989 03-06-1990 03-04-1991 09-12-1991 03-12-1992
10-06-1964 07-19-1989 03-04-1991
11-03-1964 12-04-1964 01-06-1965 02-01-1965 03-03-1965 04-05-1965 05-03-1965 06-07-1965 07-01-1965 10-21-1965 12-29-1965 03-23-1966 08-23-1966
Water Well Date level num
-44.5 (D-9-S
ber
>)17ada-1 12-20-1966 -50.0 Continued 03-27-1967 -50,7 -49.0 -45.5 -42.8 -37.0 -35.2 -36.7 -32.6 -36.1 -39.2 -41.0 -39.0 -39.0 -48,6 -53.8 -67.8 -74.3 -72.1 -67.3 -58.7 -59,7 -56.6 -50.9 -44.9 -39,2 -37.6 -34 -34.9 -31.6 -28.8 -26.6 -27.7
-19.3 -22.5 -22.3
112.79 113.25 113.80 114.50 114.93 115.31 115.20 112.90 113.66 108.05 109.92 111.95 115.30
03-20-1968 03-18-1969 03-19-1870 03-16-1971 03-06-1972 03-08-1973 03-12-1974 03-07-1975 03-05-1976 03-08-1977 03-09-1978 03-15-1979 03-05-1980 03-03-1981 03-01-1982 03-02-1983 03-12-1984 03-05-1985 03-10-1986 03-02-1987 03-01-1988 11-02-1988 12-22-1988 01-17-1989 02-23-1969 03-03-1989 04-19-1989 05-15-1969 06-20-1989 07-17-1989 08-16-1989 10-25-1989 11-14-1989 12-18-1989 01-25-1990 02-14-1990 03-07-1990 04-06-1990 05-08-1990 06-04-1990 07-03-1990 08-02-1990 09-04-1990 10-17-1990 11-19-1990 12-17-1990 01-23-1991 03-06-1991 03-12-1992
Water Well Date level number
112.45 (D-9-2)ieaca-1 10-07-1964 113.39 110.80 109.70
02-22-1991 03-06-1991
110.07 (0-9-2)20ccc-1 05-09-1962 110.62 115.57 111.68 109,82 110.75 111.23 112.08 114.88 112.78 112.72 110.56 110.59 106.07 105.90 106.13 106.39 108.83
10-17-1962 11-15-1962 12-17-1962 01 •29-1963 02-26-1963 03-22-1963 12-24-1963 03-01-1964 03-24-1964 05-21-1964 07-24-1964 10-09-1964 03-23-1965 06-28-1965 02-15-1991 03-05-1991
113.43 (D-9-2)22cad-1 04-20-1989 112.04 111.96 112.16 112.41 112.63 113.77 116.57 116.89 117.19 116.87 113.92 113.70 113.74 114.01 114.28 114.59 115.35 117.01
07-10-1989 09-18-1,989 10-25-1989 11-13-1989 01-25-1990 02-14-1990 03-06-1990 04-06-1990 06-04-1990 09-05-1990 10-17-1990 11-19-1990 12-18-1990 01-23-1991 03-06-1991 09-12-1991 03-12-1992
117.73 (0-g-2)24bda-1 03-02-1988 119.02 118.70 119.17 117.43 116.50 116.58 117.20 117.42 118.17
04-20-1989 05-15-1989 06-19-1989 08-18-1989 10-25-1988 01-25-1990 03-07-1990 05-09-1990 10-22-1990 01-23-1991 03-04-1991
Water level
17.20 17.42 17.15
23.0 21.5 21.8 20.2 21.9 21.5 21.4 20.5 22.00 21.7 21.1 21.6 21.3 21.2 21.1 20.49 20.40
136.05 134.11 137.20 138.24 138.50 139.45 139.72 139.87 139.97 133.17 137.52 138.74 139.36 139.74 139.63 140.26 136.08 138.96
283.55 284.16 284.26 284.50 284.76 284.64 285.05 285.35 285.68 286.44 286.73 286.90
59

Table 3.—Water levels in selected wells—Continued
Well number
(D-9-2)25bbc-1
(D-9-2)29acd-1
(D-9-2)30cbb-2
(D-9-3)5cdc-1
Date
05-01-1989 03-06-1991
06-18-1964 07-09-1964 08-03-1964 08-31-1964 10-01-1964 11-03-1964 12-04-1964
.01-06^1965 02-01-1965 03-02^1965 04^05-1865 05-03-1965 06-08-1865 08-09-1989
03-25-1967 03-20-1968 03-18-1969 03-19-1970 03-16-1971 03-06-1972 03-09-1973 03-12-1974 03-10-1975 03-08-1976 03-09-1977 03-09-1978 03-15-1979 03-05-1980 03-03-1981 03-01-1982 03-02-1983 03-12-1984 03-04-1985 08-03-1989
10-01-1964 12-04-1964 03-01-1965 06-08-1965 12-29-1965 03-23-1966 12-19-1966
Water level
72.51 80.03
-12.5 -11.7 -11.6 •11.3 -11.2 -11.4 -11.8 -11.9 -12.7 -12.5 -12.6 -12.9 -12.8 -12.6
13.25 9.00 6.46 6.04 5.05 5.02 9.44 2.52 5.90 3.93 8.02
14.10 8,04 8.11 4.08 8.00
Flowing Flowing Flowing
7.74
40.98 41.17 41.23 41.29 40.12 39.56 40.19
Well number
(D-9-3)5cdc-1 Continued
(D-9-3)6abb-1
(D-9-3)6cbc-1
(D^9-3)7aab^1
(O-IO-l)lcbb-l
(D-10-1)17cca-1
Date
02-25-1981 03-04-1881
03-11-1964 02-08-1991 03-04-1991
10-13-1965 03-05-1981
04-01-1973 02-20-1991 03-04-1991
02-13-1962 03-02-1962 04-03-1962 05-14-1962 06-04-1962 07-03-1962 08-06-1962 09-10-1962 10-17-1962 11-14-1962 12-17^1962 0V29^1963 02-25^1963 03-22-1963 01-07-1964 03-24-1964 05-15-1964 07-27-1964 10-09-1964 03-23-1965 06-28-1965 02-21-1991 03-07-1991
03-19-1964 04-15-1964 06-01-1964 07-09-1964 08-03-1964 08-31-1964 10-01-1964 11-03-1964
Water level
40.68 40.74
8.10 10.39 9.60
80.50 86.23
80.00 91.49 91.50
273.6 273.0 275.4 270,6 276.7 253.4 2637 269,4 265.7 264.6 265.2 266.2 268.8 269.2 274.6 275.2 275.5 266.2 273.7 269.4 254.0 269.98 270.14
32.40 32.52 32.62 32.53 32.52 32.35 32.40 32.46
Well number
(D-10-1)17cca-1 Continued
Date
12-02-1964 01-06-1965 02-02-1965 03-02-1965 04-07-1965 05-04-1965 06-09-1965 07-01-1965 11-02-1965 12-30-1965 03-25-1966 06-22-1966 12-19-1966 03-08-1967 03-21-1968 03-20^1969 03^20^1970 03-15-1971 03-03-1972 03-09-1973 03-12-1874 03-10-1875 03-08-1976 03-09-1977 02-14-1991 03-05-1991
Water level
32.53 32.64 32.63 32.59 32.73 32.68 32.56 32.35 32.10 32.07 32.26 31.91 32.08 32.23 31.07 31.46 31.18 31.46
.31.16 31.72 30.80 31.40 31.00 32.18 32.16 31.22
'Actual location is differenl from historic records. See footnotes, table 1.
•
60

L
Table 4.—Discharge of selected wells
^ell number: See figure 1 for explanation of the numbering system for hydrologic-data sites.
Discharge: Natural flow except where noted P, pumped; flow measured except where noted e, estimated.
Date Discharge Well number (gallons per minute)
(C-9-1 )26bda-3 11-15-39 1.0 08-18-89 .8 09-15-89 .8 10-23-89 1.0 12-20-89 1.0
(D-7-2)32dad-1 03-24-78 40 1 (D-7-2)33dcc-1 04-03-67 33
08-10-89 30 (D-7-2)35ccd-1 04-13-37 1.8
06-11-37 2.0 08-01-37 1.7 09-23-37 1.6 11-02-37 1.4 12-23-37 1.9 02-14-38 2.1 04-06-38 2.4 05-05-38 2.5 06-02-38 2.5 06-13-38 2.3 08-25-38 1.6 02-28-40 2.4 04-13-40 2.0 05-01-40 2.6
(D-7-2)35ccd-2 07-18-61 90 07-18-61 150 P 09-13-89 0
(D-7-2)36bbb-1 10-30-43 30 03-17-65 60
(D-7-2)36ccb-1 10-01-61 300 07-07-89 112
(D-7-2)36dcc-2 05-02-40 1,7 06-01-64 .5 07-09-64 .5 09-01-64 2,0 03-24-66 12
(D-7-2)36dcc-2 08-24-89 .1 09-15-89 .1 10-23-89 .1 11-14-89 .1 12-00-89 .1 01-23-90 .1
^ (D-7-3)29dcc-1 03-11-53 70 08-04-64 35
61

Table 4.—Discharge of selected wells—Continued
Well number Date Discharge
(gallons per minute)
(D-7-3)31cac-2
(D-7-3)33baa-6
(D-7-3)33ccc-5
(D-8-1)13aaa-1
(D-8-1)l3daa-3 (D-B-1)14dad-1
(D-8-1)23bdd-1
(D-8-1)25aad-1
10-08-64 11-02-64 09-13-89 10-07-35 03-02-36 05-02-36 06-20-36 08-08-36 10-03-36 12-01-36 02-03-37 06-11-37 08-01-37 09-23-37 06-02-38 12-23-38 02-21-39 03-24-39 04-13-39 04-13-40 05-02-40 07-09-64 07-00-89 11-13-89 12-00-89 04-01-05 07-00-89 08-24-89 10-26-89 11-14-89 12-00-89 01-23-90 05-02-36 04-12-40 05-01-40 07-06-64 05-14-66 05-14-66 01-31-67 03-00-18 08-24-89 09-15-89 11-14-89 12-20-89 01-23-90 02-07-53 07-21-64 08-01-89
38 35 24 12 11 14 19 19 15 14 12 19 20 16 19 15 12 9.6 10 11 13 7.5 3.5 4.4 4.0
65 12 11 11 10 12 12 30 21 25 48 30 80 I 25 3.0 1.1 .9 .9 1.0 .9
6.5 2.0 .6 i
62

Table 4.—Discharge of selected wells—Continued
Well number Date Discharge
(gallons per minute)
(D-8-2)1baa-1
1 (D-8-2)2acc-1
(D-8-2)2caa-1
(D-8-2)2cda-1
(D-8-2)2daa-1
(D-8-2)3aad-1
(D-8-2)3ccd-1 D-8-2)4abb-1
(D-8-2)4abb-2
(D-8-2)4abc-1
^ (D-8-2)4bab-1
(D-8-2)4cba-2
^ (D-8-2)4cbb-1
(D-8-2)4dad-1
(D-8-2)7cab-1
(D-8-2)cbd-1
(D-8-2)9aad-1
(D-8-2)10adb-1
05-12-63 08-06-64 06-30-61 08-06-64 11-12-51 08-06-64 09-21-89 08-06-64 09-21-89 04-12-48 08-06-64 08-24-89 09-15-89 10-23-89 01-23-90 03-17-65 03-17-65 09-15-89 12-07-61 08-20-64 09-12-89 08-20-64 09-12-89 05-23-50 07-09-64 09-12-89 03-25-63 08-20-64 09-12-89 04-01-36 08-24-89 09-15-89 10-23-89 11-14-89 12-19-89 01-23-90 07-06-64 09-15-89 03-00-63 08-00-64 09-28-89 05-07-47 08-20-64 04-15-62 08-20-64 08-24-64 09-28-89 05-31-66 06-06-66 09-28-89
50 60 50 45 40 30 P .8
15 P 3.0 80 72 .7 .9 .9 1.4 30 30 6 40 35 3.0 .5 .2
35 30 .8
80 75 .5
30 4.8 5 5.4 5.8 6.0 5.64 36 .2
60 70 5.4 35 30 35 30 35 7.2 80 60 7.5
63

Table 4.—Discharge of selected wells—Continued
Well number Date Discharge
(gallons per minute)
(D-8-2)10bdd-1
(D-8-2)12ddc-1 (D-8-2)13abc-1
(D-8-2)13bdd-1
(D-8-2)14dcc-1
(D-B-2)16caa-1
(D-8-2)17add-5 (D-8-2)17add-6 (D-8-2)17ccc-2
(D-8-2)17dab-2 (D-8-2)17ddd-1 (0-8-2)21 bbb-2 (D-8-2)21 ddd-1
(D-8-2)22cdc-1
(D-8-2)22cdc-2
(D-8-2)23dbd-3
(D-8-2)24bdc-2
(D-8-2)28cbd-3
(D-8-2)28daa-1
(D-8-2)29bcb-1
(D-8-2)29bcd-2
(D-8-2)29cab-1
(D-8-2)30bad-1
(D-8-2)31bcd-i
12-00-55 09-28-89 09-08-61 08-30-61 08-25-64 09-28-89 12-20-62 08-25-64 08-05-39 09-02-64 09-15-89 11-14-89 12-00-89 01-23-90 11-04-62 06-07-50 10-21-59 09-03-64 07-02-59 07-13-44 06-26-56 10-15-36 09-15-64 05-22-35 07-00-89 05-17-57 07-00-89 04-12-40 05-01-40 09-15-64 03-25-63 09-17-64 11-04-44 09-25-64 07-31-89 06-20-39 09-25-64 12-22-66 03-27-67 07-10-52 09-25-64 07-28-47 09-25-64 12-04-44 09-28-64 08-04-64 11-14-89
40 4.5
225 250 88 2.5
175 135 30 10 7.1 7.3 6.9 7.6 12 P 4 P 10 60 5 P 6.0 P 6.0 P 45 30 60 P 11 100 1.0 1.0
.1.0 .5
45 30 1.0 1.3 .2 5.0 1.0 P 25 50 35 10 35 63 3.0 1.5 38 22
64

Table 4.—Discharge of selected wells—Continued
Well number Date Discharge
(gallons per minute)
4
(D-8-2)31 cbb-1 (D-8-2)31cda-1 (D-8-2)31cdb-1
(0-8-2)31cdb-1
(0-8-2)31 cdb-2
(D-8-2)34acd-1
(0-8-3)4caa-2
(D-8-3)4caa-3 (0-8-3)4cad-1
(0-8-3)5bca-1
(D-8-3)6ddd-1 (0-8-3)6ddd-2
(0-8-3)7aad-1
(D-8-3)7abc-1 (0-8-3)7aca-2
(D-9-1)1bac-1 (D-9-1)13bdb-2
(D-9-1)25aac-1
(D-9-1)25aad-1
(D-9-1)25aad-2
(0-9-1 )25aca-1
(0-9-1 )25ada-1
08-28-89 07-21-89 08-04-64 10-21-65 12-29-65 03-25-66 08-24-66 03-24-67 08-31-67 08-09-89 09-27-68 07-21-89 06-20-46 09-28-64 07-31-89
1945 06-08-45 08-06-64 03-31-65 06-18-35 03-06-36 05-27-64 11-04-64 09-14-89 07-07-89 10-01-64 07-07-89 09-02-48 03-31-65 06-20-72 07-14-48 03-31-65 11-10-76 11-04-64 08-04-89 06-15-34 10-14-64 06-12-90 05-27-64 08-03-89 05-27-64 08-03-89 1938
08-30-89 07-05-34 02-25-38 06-02-38 07-09-64 07-20-89
46 72 6.0 5.5 8.0 5.8 5.4 5.8 4.6 2.6
700 264 2.5 1.3 .7
30 120 30 140 300 325 15 40 1.0 47 25 105 140 87 450 120 125 130 30 18 39 3.0 14 50 69 10 13 14 1.1 70 36 30 10 12
65

Table 4.—Discharge of selected wells—Continued
Well number Date Discharge
(gallons per minute)
(D-9-1)25ada-2
(D-9-1)25ada-3
(D-9-1)25ada-4
(D-9-1)25ada-5
(0-9-2)1 bcb-1
(D-9-2)2add-1
(D-9-2)2dad-2
(D-9-2)5acc-1 (D-9-2)5bcc-1 (D-9-2)5bcc-2
(D-9-2)5bcd-1 (0-9-2)5bcd-2
(D-9-2)5bdd-2 (0-9-2)5bdd-4
(D-9-2)5cbb-3
(D-9-2)5ccc-1
(D-9-2)5ddb-1 (D-9-2)5ddc-P
(D-9-2)6add-4
07-09-64 07-20-89 07-09-64 10-21-65 12-30-65 03-28-66 08-24-66 03-28-67 07-20-89 07-09-64 07-20-89 07-09-64 07-20-89 10-10-66 10-10-66 07-00-89 12-00-36 09-30-64 08-17-89 11-29-56 09-00-89 11-13-89 12-18-89 01-25-90 08-09-89 04-26-53 11-23-56 09-30-64 08-09-89 02-25-67 04-07-70 08-09-89 09-23-64 09^11-64 03-17-67 01-02-69 05-11-61 09-30-64 08-28-89 08-04-64 08-17-89 05-11-74 08-01-34 10-08-35 07-09-64 05-20-61 09-11-64 07-00-89
30 12 15 23 19 15 12 14 14 30 22 30 14 300 900 44 45 30 .5
35 16 21 16 17 10 38 30 30 8.0 70 125 251 6.0
220 92 450 25 45 23 30 10 15 450 25 15 130 100 100
:.
4
66

Table 4.—Discharge of selected wells—Continued
Well number Date Discharge
(gallons per minute)
(D-9-2)6add-5 (D-9-2)6ddb-1 (0-9-2)1 Odac-1 (0-9-2)11aca-3 (D-9-2)29acd-1
(D-9-2)30bcb-2
(D-9-2)30cbb-2
04-10-63 10-05-70 08-31-66 12-13-58 03-21-50 06-18-64 07-09-64 08-31-64 08-09-89 07-09-64 08-03-89 06-29-57
'' Actual location is different from historic records.
450 150 41
250 7
75 75 70
100 30 15 40 P
See footnotes, table 1.
m 67

Table 5.—Chemical analyses of [mg/L, milligrams per liter;
Well numtjer: See figure 1 for explanation of the numbering system for hydrologic-data sites. Date sampled: Except R, date received by laboratory (Cordova, 1969, table 5). Specific conductance: |xS/cm, microsiemens per centimeter at 25 degrees Celsius, measured in the Temperature: ° C, degrees Celsius.
Well number
(C-8-1)20cdb-2
(0-8-1 )20cdb-3
(C-8-1)20cdb-4 (C-8-1)29dda-1
(C-8-1)35dcb-1
(C-9-1 )3ddb-1
(C-9-1 )4ccc-1
Date sampled
07-13-81 07-07-89
06-13-90 08-19-91 07-30-80
07-25-83 07.12-89
07-12-89 07-25-83 08-23-89
07-11-90 07-06-60
06-15-64 04-28-66 08-08-90
05-04-65 04-28-66 07-13-81
07-12-89
08-23-89
07-11-90
08-21-75 08-16-76 07-12-77
08-24-78
07-17-79
08-01-79
07-31-80
09-03-80 07-15-81
Specific conductance
(^S/cm)
1,300 1,340 1,310 1,260 1,290
1.260 1,350 1,340 2.870 3,550
3,480 1,700 1,630 1,590 1,840
1,340 1,260
1,300 1,790
1,400
1.300
750 790 800
900
1,000
1,100
1,210
1.200 1,220
pH. field
(standard units)
—
7.7
6.3 7.6
—
—
7.7 7.7
— 7.9
7.7 — — — —
7.9
7.6 —
7.6
7.6
7.8
6.8 7.4
6.6 6.8
7.7
—
7.6 7.9
Temperature (°C)
26.5
26.0 24.0 25.5 24.0
25.5 25.0
25.0 18.0
22.5
18.5 —
20.5 14.0 19.5
14.5 14.5
15.5 14.5
14.5
17.5
14.5 14.0 14.0
14.0
16.0
16.0
15.5 15.0
14.5
Hardness, total (mg/L
as CaCOg)
—
340
— — —
—
— — — —
370 410 490 450
270
230 —
— —
160 170
180
210
250 —
270 280
Calcium, dis
solved (mg/L asCa)
76 — —
—
—
— — —
88
88
130 120
60
56 —
—
—
40 46
44 54
_^
62 —
66 70
Magnesium, dis
solved (mg/L
asMg)
37 — —
—
—
—
— — —
36 45 43, 36
29
22 —
—
—
. ^
15 14 16
19
. _
23 —
25
26
Sodium, dis
solved (mg/L asNa)
—
130 — —
—
—
• —
— — —
170
170 170 160
180 170
—
—
—
__
92 100 98
100
^_
110 —
130
120
68

water from selected wells —, no data; <, less than]
field.
Potassium, dis
solved (mg/L asK)
Alkalinity, field (mg/L
as CaCOa)
Sulfate, dis
solved (mg/L
asS04)
Chloride, dis
solved (mg/L asCI)
Fluoride, dis
solved (mg/L asF)
Silica, dis
solved (mg/L as
SiOa)
Solids, sum of
constituents. dissolved
(mg/L)
Nitrogen NOa-i-NOa dissolved
(mg/L asN)
100 210 .60 20
# 22 22 27 20
15
176
68
130 120 65
95
98
390 400 400
370
280 240
<.10
— — —
71
61 —
863
913 1,010
1,020
810 712
.80
8,1 8,1 8.0
9.2
148 144 140
140
59
62 59
64
110 130
140
160
.30
.30
.30
.30
58 58
56
56
477 512
505
558
1.30
1.60 —
2.60
11 130 87 210 .30 60 658 3.80
#
11 8.6
140 80 84
240 240
.30
.20 60
62 717 703
4.70 6.00
69
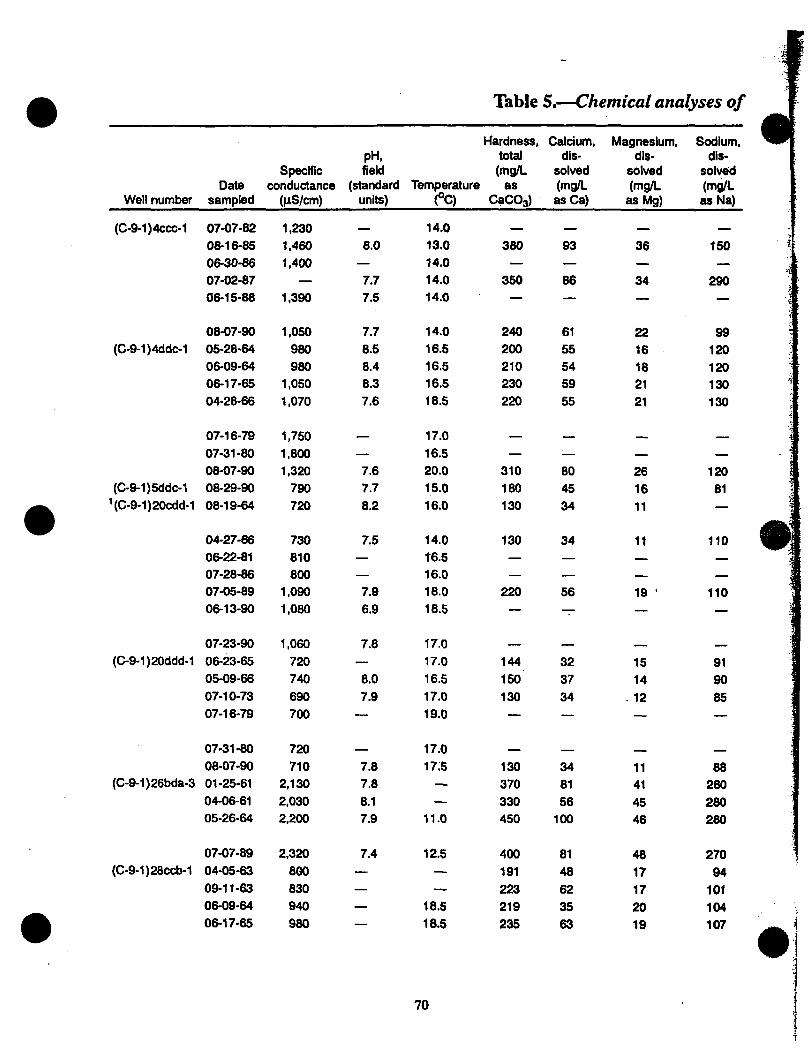
Table 5.—Chemical analyses of
Well number
(C-9-1 )4ccc-1
(C-9-1 )4ddc-1
(C-9-1 )5ddc-1
^C-9-1)20cdd-1
(C-9-1 )20ddd-1
(C-9-1 )26bda-3
(C-9-1 )28ccb-1
Date sampled
07-07-82
08-16-85
06-30-86 07-02-87 06-15-88
08-07-90 05-28-64
06-09-64
06-17-65 04-28-66
07-16-79
07-31-80 08-07-90
08-29-90 08-19-64
04-27-66 06-22-81
07-28-86 07-05-89 06-13-90
07-23-90
06-23-65
05-09-66
07-10-73
07-16-79
07-31-80
08-07-90 01-25-61
04-06-61 05-26-64
07-07-89
04-05-63
09-11-63 06-09-64
06-17-65
Specific conductance
(jiS/cm)
1,230
1,460 1,400
—
1,390
1,050
980 980
1,050
1,070
1,750
1.800 1.320
790
720
730 810 800
1,090
1,080
1,060
720
740
690
700
720 710
2,130
2,030 2,200
2,320
800
830 940
980
pH. field
(standard units)
—
8.0 —
7.7 7.5
7.7 8.5 8.4 8.3
7.6
—
7.6 7.7
8.2
7.5 — —
7.9
6.9
7.8 —
8.0
7.9
—
7.8 7.8
8.1 7.9
7.4 —
— — —
Temperature (°C)
14.0
13.0 14.0 14.0 14.0
14.0 16.5
16,5 16.5
18.5
17.0
16.5 20.0
15.0 16.0
14.0
16.5 16.0 18.0 18.5
17.0
17.0 16.5
17.0
19.0
17.0 17.5
- -—
11.0
12.5 —
—
18.5
18.5
Hardness, total (mg/L
as CaCOg)
—
380 —
350 —
240
200 210 230
220
__
—
310 180
130
130 — —
220 —
„ _
144
150
130 —
130 370
330 450
400
191
223
219
235
Calcium, dis
solved (mg/L asCa)
—
93 —
86 —
61 55
54 59
55
,
'—
80
45 34
34 — —
56
—
32
37
34 —
34
81 56
100
81
48 62
35
63
Magnesium, dis
solved (mg/L
asMg)
36 —
34
—
22
16 18 21
21
^^
—
26
16
11
11 — —
19 •
—
.
15 14
.12 —
^_
11 41
45 46
48
17 17
20
19
Sodium, dis
solved (mg/L asNa)
150 —
290
—
99
120 120 130
130
,
—
120
81 —
110 — —
110
—
_
91 90
85
—
^_
88 280
280 280
270
94
101 104
107
! 'i
^ m
70

water from selected wells—Continued
I
0
Potassium, dis
solved (mg/L asK)
^_
9.9
8.5
9.1
15 14 14
17
15 9.7
—
Alkalinity, field (mg/L
as CaCOg)
_
—
—
— — —
~
—
— —
Sulfate, dis
solved (mg/L
asS04)
^^
110
210
63
78 74
100
95
59 61 73
Chloride, dis
solved (mg/L asCI)
_ .
320
300
170
190 180 200
200
290
110 100
Fluoride, dis
solved (mg/L asF)
1
.30
.30
.10
— — —
.20
.20 —
Silica, dis
solved (mg/L as
SiOs)
._
60
58
60
— — —
77 67
58
Solids, sum of
constituents, dissolved
(mg/L)
^^
895
1,110
581 549 551 609
598
759 484
Nitrogen NOa-i-NOg, dissolved'
(mg/L asN)
__
9.80
9.20
3.90 — — —
• • ^
2.10 1.10
8.2 84 100 434
69 150 .30 59
I
10 10 8.9
8.4
34
34
37
11 11 13 13
152
84 73 53
53
110
99 150
100 80
102 98
115
98 94
86
87
460
470
490
530 112 146 151
165
.20
.40
64
67
66
408 434
459
1,150
1,110
1,270
1.60
71

Table 5.—Chemical analyses of
Well number
(C-9-1)28ccb-1
(C-9-1 )29acc-1
(C-9-1 )29bcc-1
(C-9-1)34ccc-1
VC-9-1)34acd-1
(C-9-1 )34ddc-1
(C-10-1)3ddb-1
(C-10-1)4bbb-1
Date sampled
04-27-66
07-31-80
07-15-81 07-07-82 07-17-84
07-03-85
06-12-86 08-07-90 05-23-63
05-28-64
06-18-65
04-27-66 07-31-80 06-22-81 06-19-65
05-06-66 07-02-85 08^21-75 07-17-79
08-01-79
09-03-80
07-02-86
10-09-62 04-27-66
08-17-72
04-27-66
10-12-71 06-04-91
10-09-62 08-05-70
08-11-72 09-09-74 11-01-62
04-03-63 09-11-63
Specific conductance
(jiS/cm)
960
1,120 1,170
1,120 1,140
2,310
1,120 810 760
770
760
710 960 950 930
860 740
1,400 1,550
1,600
1,700
1,510 1,120
1,050
1,200
930
1,050 1,040
2,140 2.760
4,010
1.560 690 670
800
pH. field
(standard units)
—
7.7
— 7.5
8.0
7.6 7.9 8.5
8.4
8.5
7.7 — —
8.1
7.5 — 6.6
—
7.6
7.1 —
8.2
7.8
7.7
7.6
7.5
7.5 —
—
—
—
—
8.3 8.1
Temperature (°C)
14.5
19.5
18.0 18.5 18.5
17.5
18.5 19.0
—
—
15.0
15.0 17.0 16.5
17.0
17.0 15.5 17.5 17.0
19.0
17.5 17.5
—
11.5
12.0
13.0 12.5
15.0 —
13.0
14.0
19.5 — — —
Hardness, total (mg/L
as CaCOg)
243 —
300 —
280
310 —
180 120 150
170
150 — —
290
350 —
520 —
—
590 —
350 410
390
330
330
320
400 560
910 530 107
110 150
Calcium, dis
solved (mg/L asCa)
64 —
77
—
71
81 — 50 29 37
38
36 — —
73
89 —
110 —
' —
130 —
60
82
77
66
63
61 61 91
150
120 30
26 36
Magnesium, dis
solved (mg/L
asMg)
20 —
25 —
24
26 —
14
11 13
18
14 — —
26
32 —
59 —
—
65 —
48
49
48
40
42 41
60 81
130
57
10
10 14
Sodium, dis
solved (mg/L asNa)
107
—
100 —
100
110 —
81 110
110
100
100 — —
71
71 —
93 —
—
100 —
78
80
77
69
69 67
320 —
560
100 98
98 110
72
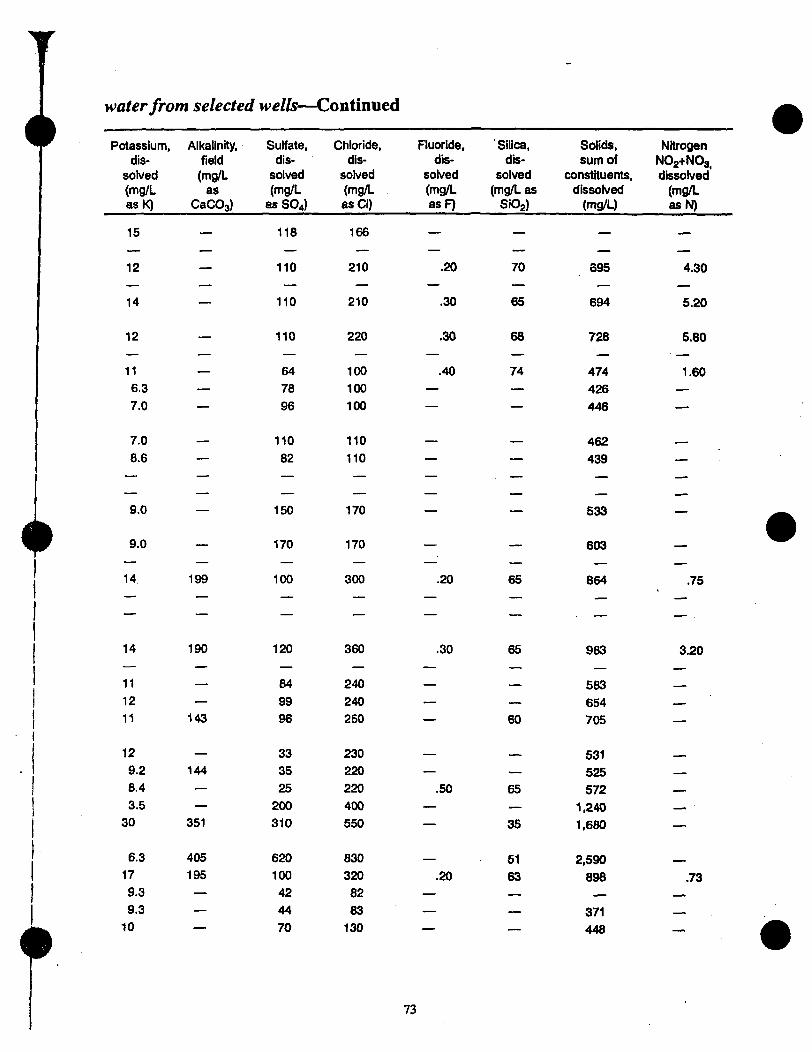
water from selected wells—Continued
4
Potassium, dis
solved (mg/L asK)
15
12
14
12
11 6.3
7.0
7.0
8.6
9.0
9.0
Alkalinity, field
(mg/L as
OaCOg)
—
—
—
—
—
—
—
I : :
Sulfate, dis
solved (mg/L
asS04)
118
110
110
110
64
78
96
110 82
150
170
Chloride, dis
solved (mg/L asCI)
166
210
210
220
100 100
100
110 110
170
170
Fluoride, dis
solved (mg/L asF)
—
.20
.30
.30
.40 — —
—
=
_^
'Silica, dis
solved (mg/L as
SiOj)
—
70
65
68
74 —
—
—
-~
....
Solids, sum of
constituents. dissolved
(mg/L)
—
895
694
728
474 426
446
462
439
533
603
Nitrogen NOa-i-NOg. dissolved'
(mg/L asN)
—
4.30
5.20
5.80
1.60 —
—
.
—
—
-
14 199 100 300 .20 65 864 .75
14 190 120 360 .30 65 983 3.20
11 12 11
12 9.2 8.4
3.5 30
6.3 17
9.3
9.3 10
— —
143
144 —
—
351
405 195
— — —
84
99
96
33 35 25
200
310
620 100
42 44
70
240
240 250
230 220
220
400 550
830
320 82
83
130
.50
.20
— —
60
—
65
—
35
51 63
—
583 654
705
531 525
572
1,240 1,680
2,590
898
371 448
.73
73

Table 5.—Chemical analyses of
Date Well number sampled
(C-10-1)4bbb-1 06-16-65
04-27-66 07-10-73
08-03-73 09-05-74
08-30-76
08-25-78
08-01-80 08-07-90
(C-10-1)4cbb-1 04-05-62
08-06-62 09-14-62 06-07-63 09-11-63 06-09-64
10-02-64
06-16-65 04-27-66 09-05-69
08-05-70
10-07-71
08-11-72
08-03-73
09-06-74
08-16-76
07-12-77
07-17-79 08-01-79
08-01-80 09-03-80
07-13-81
07-07-82 07-18-84
07-03-85
06-30-86
Specific conductance
(HS/cm)
1,330
1,340 1,320
1,230 1,350
1,160
1,100 1,200 2,460 1,770
1,440 1,390 1.310 1,280
1.300
1,350
1,320 1,330 1.230
1,290
1,260 1,110
1,100
1,150
1,050
1,000
1.100
1,150 1,510 1.500
1.750
1,900
1,740 1,830
2,490
pH. field
(standard units)
8.1 7.4 7.7
—
—
—
— —
7.5 8.5
8.2
7.5 8.3 7.8 8.2
8.3 7.5 7.7
7.9
7.6 —
7.7
—
7.2
6.5 —
7.9 —
7.6
7.8
—
7.4 —
7.6
Temperature (°C)
18.5 15.5 19.0
18.5 19.0
19.5
20.0 19.5 18.0
—
—
— — —
19.0
_
19.0
19.5 17.0
18.0
16.5
18.5 19.0
19.0
19.0
20.0
19.0
19.0
19.0 —
19.0
19.5
17.5 18.5
19.0
Hardness, total (mg/L
as CaCOg)
430
420 380
—
—
— — —
440
370 400 420 390
380
447
670 410
400
420
370 —
330 —
320
270 —
330 —
480
530 —
610 —
900
Calcium, dis
solved (mg/L asCa)
100
100 92 —
—
_
— • —
—
110
94 120 130 100
100
123
190 100 93
100
89 —
62 —
82
68 —
83 —
120
130 —
130 —
220
Magnesium, dis
solved (mg/L asMg)
42
41 37 —
—
. ^
— — —
39
34
25 22 33
31
34
49 39 40
39
35 —
30 —
27
25 —
31 —
43
49 —
69 —
84
Sodium, dis
solved (mg/L asNa)
100
110
110 —
—
^
— — —
180
140
130 120 110 120
118 110
110 —
150
100 —
97 —
97
92 —
95 —
110
120 —
110 —
150
r
74

water from selected wells—Continued
Potassium, dis
solved (mg/L asK)
Alkalinity, field
(mg/L as
CaCOg)
Sulfate, dis
solved (mg/L
asS04)
Chloride, dis
solved (mg/L asCI)
Fluoride, dis
solved (mg/L asF)
Silica, dis
solved (mg/L as
SiOa)
Solids, sum of
constituents, dissolved
(mg/L)
Nitrogen NO2+NO3 dissolved
(mg/L asN)
12 14 11 135
200 200 140
240 240 230
768 778 701
15 300 310 1,020
I
4
4
14
13 13 11 13
13
13 15 — —
10
9.0
11
9.7
11
12
11
13
— 15
— — — —
—
— —
162
149
148
153
158
160
140
140
—
—
— —
220
240 240
200
230
336 260 210 160
300
180
160
120
100
99
88
95
140
—
100
240
230
220
220 230
235
230 220 200 190
180
160
160
150
220
360
420
380
— 710
—
— — —
—
—
— — —
—
—
—-
.20
.20
.20
.20
.20
.30 —
.20
— — — —
—
—
— —
60
—
—
64
60
64
68
65
68
62 —
67
831
839 825
755 777
906 788 767
. 896
683
693
669
602
706
898
988
1,040 —
1,440
— — — —
—
— — —
—
—
—
3.80
—
3.30
3.60
3.70
5.20 — .
3.50
75

Table 5.—Chemical analyses of
Well number Date
sampled
Specific conductance
(jiS/cm)
pH. field
(standard units)
Hardness, total (mg/L
Temperature as (°C) CaCOg)
Calcium, dis
solved (mg/L asCa)
Magnesium, dis
solved (mg/L asMg)
Sodium, dis
solved (mg/L asNa)
(C-10-1)4cbb-1 08-07-90 740 7.5 (C-10-1)9ccc-1 06-13-61 2.710 7.8
09-06-62 2,670 7.7 06-06-63 2,540 7.8 09-24-63 2,320 7.5
20.5 200 1,200 1,100 1,100
930
52 270 250 260 210
18 120 110 110
99
61 86 99
100 94
05-28-64 08-07-64 04-28-66 08-11-72 09-09-74
2,530 2,280 2,200 1,920 1,940
8.1 8.0 7.4 7.3
16.5 16.5 18.5 17.0 18.0
1,100
1,000
920 740 740
250 230 210 170 170
110
110 94 77 77
100 100 110 100 100
07-17-79 2,000 — 18.0
08-04-80 2,100 — 17.0 07-25-83 2.020 — 18.0 07-28-86 1,670 — 18.0 07-12-89 1,980 7.3 17.5
08-18-89 1,960 7.4 18.0 (C-10-1)1 Oddc-3 06-04-91 2,800 — 14.5
^(C-10-1)15cca-1 06-04-91 3,000 7.2 15.0 (C-10-1)17aaa-104-27-65 770 7.5 19.5
10-12-71 1,390 7.3 18.0
690 960 710 320 560
160 170 140 84
140
70 130 88 26 50
120 220
380 30 45
w
08-17-72 07-10-73 09-09-74 08-21-75 08-16-76
1,550 1,620 1.780 1.800 2.120
7.6
7.5
6.8 6.9
20.0 20.0 20.0 18.5 19.5
630 730 730 830 980
160
190
180
210
250
57 63 69 73 86
47
54
53
55
58
07-12-77 2.180 6.8
VC-10-1 )25abd-106-06-61 1,560 8.0 07-07-61 1,570 8.3 08-09-61 1,540 7.9 08-31-62 1,460 7.8
19.5 1.100 480 490 490 380
290 110 110 110 75
95 52 50 50 47
61 130 140 140 150
06-01-64 08-04-80 07-15-81 07-02-86 07-11-90
1.700 2.150 2,300 2,100 2,090
8.1
7.2
17.0 17.5 18.5 17.5 18.5
410
520
64
110
61
60
190
230
76

water from selected wells—Continued
Potassium, dis
solved (mg/L asK)
11
16 17 15 17
17 16
18 12
14
Alkalinity, field (mg/L
as CaCOg)
— — — —
^^
— • — 134
136
Sulfate, dis
solved (mg/L
asS04)
38
580
560 610 490
630
580 510 310
290
Chloride, dis
solved (mg/L asCI)
73
480 490 460 410
430 380
370 330 300
Fluoride. dis
solved (mg/L asF)
.20 — — — —
-_
— — —
.20
Silica, dis
solved (mg/L as
SiOa)
78 — — — —
— — 60 62
Solids, sum of
constituents, dissolved
(mg/L)
455
1,610 1,560 1,600
1,360
1,580 1,480 1,390 1,140
1,210
Nitrogen NOg-l-NOg, dissolved'
(mg/L asN)
2.70 — — — —
^^
— — — 25.0
# — 14
8.7 — 12
12 14 16 14 15
16
11 11
11 12
— — —
145 126
117
113 112 107 109
98 — — — —
370
190 370 67
140
170 200 230
330
420
530
110
130 130
120
310
790 650
99 200
230 250 260
260 300
310
250
250 260 260
,10
.30
.40 — —
— .10 .10
,10
.10 — — — —
61
59 41
59
—
59
58 58 56
57
55 — — —
— 1,710
1,860 484 663
805
897 1,120
1,250 1,460
1,420
861
875 884
813
— — — — —
_
— 43.0 42.0
46.0
, _
— — — .. .
18 160 360 962
#
14 120 340 .60 51 1.1.20 <.10
77

T^ble 5.—Chemical analyses of
Date Well number sampled
(C-10-1)25abd-1 07-31-90
(C-10-1)29cdd-1 04-14-61
07-10-61 04-04-63 08-07-64
04-28-66
07-16-79 07-10-90 07-31-90
08-20-91
(C-10-1)29ddd-1 04-04-63 09-10-63 07-24-64 08-07-64
04-28-66
08-20-91 (C-10-1)31 Cdd-1 06-21-63
09-26-63 06-03-64
10-08-64
04-28-66
07-16-79 07-13-81
07-31-90 (C-10-1)32ccc-1 06-06-61
07-10-61 09-06-62
04-03-63
09-10-63 06-16-64
08-07-64
06-15-66
07-17-79
08-04-80 (C-11-1)6abc-1 07-10-63
Specific conductance
(HS/cm)
2,130
1,430
570 480 590
580
600 780
770 690
3,180 1,710
2,710 3,340
3,650
3,460
450 600 470
470
580
750
800
880 690
650
680 630
580
560
700
740 1,150
1,150
510
pH. field
(standard units)
7.2 7.6
8.1 8.4 8.0
7.6 —
7.5 7.4
6.9
7.9
8.0 8.0
8,0 7.1
6.9 8.4 7.9 8.3
8.3
8.0 — — 7.4 8.1
7.8 7.7
8.3
8.1
8.3
8.0
8.0 — —
8.2
Temperature (°C)
18.5 — — —
23.0
21.0
20.0
23.0 22.5
22.5
—
20.0
18.0 17.0
21.5 —. — —
19.0
18.5
18.5
21.0
18.5 —
— — —
20.0
20.0
20.0
19.5
19.5 —
Hardness, totai (mg/L
as CaCOg)
— 630
210 150 220
220
— 300 — —
1,000 1,000
1,100 1,400
1,700
— 150 180 180
180
230 — — —
260
240 250 220
190
190
260
280 — —
170
Calcium, dis
solved (mg/L asCa)
110 54
29 62
58 — •
78 — —
210
250
240 330
410
28 41
40
38
59 — — — 66
63 67 54
45 47
65
73 — — 43
Magnesium, dis
solved (mg/L asMg)
—
87
19 20 16
18 — 26 — —
130
100
110 140
170
—
19 19
19 20
21 — — — 22
20
20 21
19 17
23
24 — —
16
Sodium, dis
solved (mg/L asNa)
—
71 28
30 26
26 — 27 — —
110
100 110 120
130
_
26 38 24
25
26 — — —
36
36
37 37
37
36
38
36 — —
30
#
i> 78

water from selected wells—^Continued
Potassium,. dis
solved (mg/L asK)
,
19 9,8 5.9 9.8
Alkalinity, field
(mg/L as
CaCOg)
...
—
— — —
Sulfate, dis
solved (mg/L
asS04)
. ^
44
36 41 46
Chloride, dis
solved (mg/L asCI)
370 63 69 58
Fluoride, dis
solved (mg/L asF)
_^
.30 — — —
Silica, dis
solved (mg/L as
SiOa)
46 — — —
Solids, sum of
constituents, dissolved
(mg/L)
, -
811 306 249
315
Nitrogen NOa-i-NOg, dissolved'
(mg/L asN)
^^
—
— — —
9.4 40 62 308
9.4 31 100 .30 70 511 17.0
#
22
23
24
24
27
6.3
10
6,3
6,3
670 420 480 790 950
26 67 40 47
570 560 560 590 660
56 83 54 63
1,740
1,490
1,560
2,020
2,400
224
309
255
260
5.9 44 67 317
9.4 83 83 385
10
10
9.4
10
9.8
10
9,9
62 64
71 74
64
63 55
75 79
78
83 77
87 86 .50 62
362
375
347
322
310
393
440
•
7,0 67 58 279
79

Table S.^^hemical analyses of
Well number
(C-11-1)6abc-1
(C-11-1)6bdd-1
(D-7-2)34dcd-1
(D-7-3)28bdb-1
(D-7-3)30aaa-1
(D-7-3)33baa-6
Date sampled
07-24-64
06-10-65
08-21-75
07-12-77 07-13-81
07-11-89
07-18-90 08-31-64 06-11-65 07-13-81
07-18-90 07-31-90 05-13-64 06-22-65
03-26-81
06-21-63 06-24-63 05-11-64 10-14-68
09-03-69
10-08-71
06-18-72 06-18-73
09-09-74
08-18-75
08-12-76 07-12-77
08-22-78 07-30-79 09-03-80
07-30-81 08-28-81
02-11-59
04-21-60 09-15-60
Specific conductance
(HS/cm)
520 470 580
620 610
590 610 520 460
560
550
560 710 570
640
1,490 1,340 1,470 1,120
1.170
1.000
1,120
1.120
1.160 1,050
1,150
1,150 1,150 1,200 1,120
1,180 490
540
540
500
pH. fiekl
(standard units)
8.3
8.3 7.0
7.0 —
7.7
7.6 7.6 8.2
—
7.6 7.7
8.5 8.6
—
7.5 8.0 8.0 7.8 7.9
8.0 8.0
— —
— —
7.9 8.4
^^
—
7.8 8.1
8.3
Temperature (°C)
18.0
18.5 18.0
19.0 20.5
19.0 19.5 18.5 19.0
20.5
19.5 19.5 13.5
14.0 13.5
—
18.0 —
—
— —
—
—
— —
—
—
14.0
12.0
12.0 12.0
Hardness, total (mg/L
as CaCOg)
180
160 230
240 —
—
210 170.
— •
220 —
240 160
—
730
590 760 470 530
__
450
450
460
—
— —
480 —
__
170
270 260
250
Calcium, dis
solved (mg/L asCa)
42
36
62
68 —
—
— 57 43 —
57 —
46 16
—
190
130 190 73
81
73
73
77
—
— —
82
—
_
44
71 69
69
Magnesium, dis
solved (mg/L as Mg)
18
16
18
18 —
—
16 15
—
18 —
30 29 —
63 63 68 69
80
._
64 64
64 —
....
• —
—
66 —
15
22 22
20
Sodium, dis
solved (mg/L asNa)
33
29
28
28 —
:—
—
32
25 —
25 —
73 75
- ^
%
60 60 —
_ 1 63
63
60 —
— —
60 —
^^
33 — —
15 d
80

water from selected wells—Continued
Potassium, dis
solved (mg/L asK)
7.4
7.0 7.2 7.3
Alkalinity. field
(mg/L as
CaCOg)
—
— 159 160
Sulfate, dis
solved (mg/L
asS04)
50
51 35 43
Chloride, dis
solved (mg/L asCI)
65
58 60 66
Fluoride, dis
solved (mg/L asF)
—
— —
.20
Silica, dis
solved (mg/L as
SiOa)
—
57 57
Solids, sum of
constituents, dissolved
(mg/L)
285
253 363 386
Nitrogen NO2+NO3, dissolved'
(mg/L asN)
. :__
6,6 27 29
58
55 57
248
7.1 26 58 .30 62 374 1.00
5.9
5,5
212 7.0 5.1
— —
5,7 5.7
7.2
— — 52
70
30 30 —
5.3
11
540
520 560 440
410
430 430
430
43 44
78
86 82 87
80
84 84
86
— —
4 --1.4 —
.70
.70 1.0
404 334
1,080
910
1,080
786
733
738 738
6,8 34 450 85 .30 1.0 772 <.10
2.5 --1.1
— 235
230 222
<5.0 43
45 46
28
13
14 14
.30
.20
5.8
11 10 9.8
248
318
314 311
.11
81

Table S.—Chemical analyses of
Well number
(D-7-3)33baa-6
(D-7-3)34cdb-1
(D-8-1)3dda-1
(D-8-1)10bcb-1 (0-8-1)11bac-1
(D-8-1)35cac-2
(D-8-2)2daa-1
Date sampled
05-26-61 08-12-76 08-10-77
08-22-78
09-03-80
09-03-81
09-20-82 07-29-83 07-17-84
08-02-85
07-03-86 07-29-87
06-15-88 06-09-89
07-19-90
07-22-91
10-14-60R 09-09-74 08-18-75 08-12-76
07-12-77
08-25-78 07-30-79
09-02-80
07-30-81
09-20-82
06-15-88 07-20-89
07-19-90 07-22-91
05-06-91 07-03-91
06-14-91
09-04-80 08-06-64
Specific conductance
(HS/cm)
530
560 540
540 580
580
580 560 530 880
580 —
550
560
540
540 —
460 350 590
600
590 500
540
630
600 580 580
590 600
7,960 9,400
740
850
450
pH. field
(standard units)
7.7 — —
—
—
...,
—
7.2 7.4
7.5
7.2 — —
7.2
7.4
7.4 —
8.2 6.7
6.8
6.7
6.8 7.8
—
8.2
7.7 —
7.5 6.2
6.3
7.7 —
7.7
Temperature (°C)
12.0 12.5
13.0
13.5 13.0
12.5
13.0 13.5 12.5 13.5
13.0
13.0 13.0 13.0
12.5
. ^
— •
18.5 16.5 15.5
17.0
19.0 18.5
17.0
14.0
12.5
13.0 26.5 17.5 13.0
25.0 36.0
16.0
15.5
16.0
Hardness, total (mg/L
as CaCOg)
270 — —
— —
—
260 260
—
270 260
—
270
—
..,
270 220 190 300
290
300
250 —
290
^ -
290 — —
290
1.300 1.600
210 —
210
Calcium. dis
solved (mg/L asCa)
74 — —
—
—
__
—
68 68
.—
68 68 —
70
—
^^
72 56 47 72 .
70 74
61 —
69
^_
69 — —
70
360
440 50 —
51
Magnesium, dis
solved (mg/L
asMg)
21 — —
—
—
__
— •
22 22
—
24
22 —
22 —
__
23 20 18 28
29
27
24 —
28
_^
29 — —
27
97
110 20
21
Sodium, dis
solved (mg/L asNa)
__
— —
—
—
^_
—
14 14
—
20 14 —
13 —
^^
17 8.8
3.6 16
17
18
11 —
17
_
17 —
16
1,200
1,500 50 ^_
. »
•
4
82
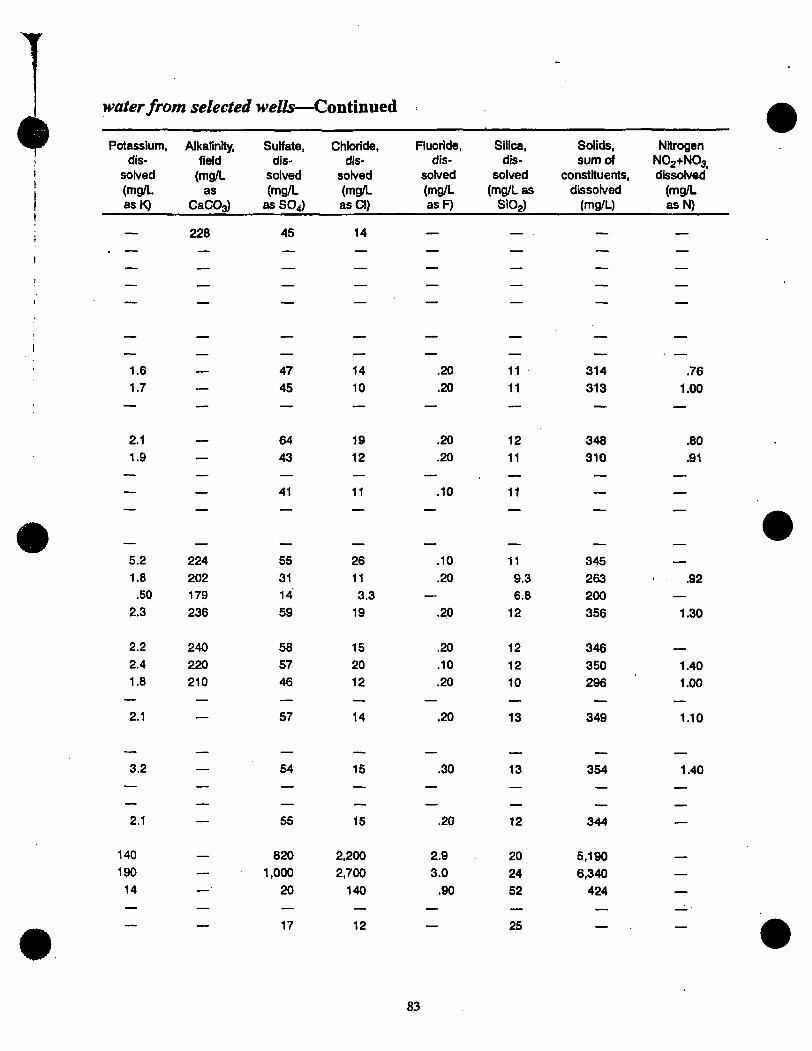
f water from selected wells—Continued
Potassium, dis
solved (mg/L asK)
Alkalinity, field
(mg/L as
CaCOg)
Sulfate, dis
solved (mg/L
asso r t
Chtoride, dis
solved (mg/L asCI)
Fluoride, dis
solved (mg/L asF)
Silica, dis
solved (mg/L as
SiOg)
Solids, sum of
constituents. dissolved
(mg/L)
Nitrogen NOa-FNOg dissolved
(mg/L asN)
228 45 14
1.6 1.7
2.1 1.9
47
45
64 43
14
10
19 12
.20
.20
.20
.20
11 11
12
11
314
313
348 310
.76
1.00
.80
.91
41 11 .10 11
5.2
1.8 .50
2.3
2.2 2.4 1.8
224
202 179
236
240
220 210
55 31 14
59
58
57 46
26
11 3.3
19
15 20
12
.10
.20 —
.20
.20
.10
.20
11 9.3 6.8
12
12 12
10
345
263 200
356
346
350 296
—
.92 —
1.30
_.,
1.40 1.00
2.1 57 14 .20 13 349 1.10
3,2 54 15 .30 13 354 1.40
2,1 55 15 .20 12 344
140
190
14
820 1,000
20
2,200 2,700
140
2.9 3.0
.90
20 24
52
5,190 6,340
424
17 12 25
83

Table 5.—Chemical analyses of
Well number
(D-8-2)2daa-1
(0-8-2)4cba-2
(D-8-2)12ddc-1
(D-8-2)12ddc-2
(D-8-2)13abc-1
(D-8-2)16caa-1
(D-8-2)23dca-2
Date sampled
06-09-89
08-13-76 09-20-82
05-03-65 10-14-68
09-03-69
08-05-70 10-14-71 08-11-72 06-18-73
09-12-74
08-13-76 05-27-64
08-25-64
09-03-69
08-05-70 10-14-71 08-11-72 06-18-73 09-12-74
08-13-76 08-01-79
09-04-80
07-29-81
09-20-82
07-26-83 07-17-84
05-13-64
08-17-90
08-13-76
09-17-79 09-20-82
05-27-64 10-14-68
07-30-70
Specific conductance
(fiS/cm)
480 440 440 630
790
740
770
780 720 800
870
750 440
460
480
490 490 460 470 520
500
500 530
520
520
510 510 450 520 390
360 400
440 410 390
pH, field
(standard units)
7.8 — —
7.7
8.1
7.8
8.7 — —
8.0
—
— 8.4
8.0
8.2 — — —
—
7.9 —
7.8 —
7.6 8.3
7.9 —
—
—
8.0
8.6
Temperature (°C)
15.0 15.0 15.5
12.0 14.0
12.0
13.0 14.0 13.0
—
14.0 12.5 16.5
15.0
14.0
12.5 15.5 14.5 14.0
16.0
15.5
14.0 15.0
16.0 16.0
15.5
16.0 14.0
15.5
15.5
15.0
16.5 16.5 15.0 14.0
Hardness, total (mg/L
as CaCOg)
220 — •
—
190 280
260
280 • —
—
270
._
—
200 230
240
240 — — —
—
^^
250 —
240 —
240 230
250 —
__
—
200 170
170
Calcium, dis
solved (mg/L as Ca)
52 — —
30
56
30 — — —
62
_
—
46 53
49
— — —
—
^_
57 —
54 —
55 49
59
—
__
—
46 38 —
Magnesium, dis
solved (mg/L
asMg)
21 — —
27 35
44 — — —
29
__
—
20 24
28
— — —
—
_
25 —
25 —
__
26 25
25 —
_
«
20 18
Sodium, dis
solved (mg/L asNa)
15
— —
75 —
— — —
71
^_
—
25 —
—
— — —
—
_
12 —
13 —
_
13 12
11 —
_
_
25 — ^^
#
•
n 84

water from selected wells—Continued
Potassium, dis
solved (mg/L asK)
Alkalinity, field
(mg/L as
CaCOg)
Sulfate, dis
solved (mg/L
asS04)
Chloride, dis
solved (mg/L asCI)
Fluoride, dis
solved (mg/L asF)
Silica, dis
solved (mg/L as
SiOa)
Solids, sum of
constituents. dissolved
(mg/L)
Nitrogen NOa-HNOg dissolved
(mg/L asN)
17 9.1 .20 26
262 338
312 332
7.0 26
26 —
54 58
53 —
12 24
366
477
412
7.9 338 25 52 26 475
27 — —
232
237
36
22
21
_
9.9
10
15
_
38
25
270
3.3
3.0
220 30
25
16
17
.20
.20
28
29
304
298
.04
3.1 2.3 2,4
25
40 30
15 17
11
.20 —
1.1
27 —
27
300
257 306
<.10 —
<.10
—
200 203
16
6.5 —
14
10 —
25
24 239
85

Table 5.—Chemical analyses of
Well number Date
sampled
Specific conductance
(HS/cm)
pH, field
(standard units)
Hardness, total (mg/L
Temperature as (°C) CaCOg)
Calcium. dis
solved (mg/L asCa)
Magnesium, dis
solved (mg/L
asMg)
Sodium, dis
solved (mg/L asNa)
(D-8-2)26cbd-3 08-30-89 980
(D-8-2)29add-1 05-03-65 510
08-13-76 540
(0-8-2)31 cbb-1 08-30-89 650
(0-8-2)31 cda-1 06-06-89 500
(0-8-2)31 cdb-1 08-30-89 1,270
(0-8-2)31 cdb-2 08-04-64 430
07-21-65 360
06-06-89 3,050
(0-8-2)32daa-1 09-05-80 850
(D-8-2)34acd-1 07-21-65 660
08-30-89 710
(D-8-2)34dda-1 05-03-65 610
07-12-89 660
(D-8-2)36dbd-3 08-23-89 1,190
(D-8-3)11abb-1 06-27-89 500
(D-8-3)33acb-1 06-03-64 750
08-22-89 900
07-27-90 900
(0-9-1 )14aad-2 07-25-83 470
(0-9-1)14ada-1 07-27-90 870
(0-9-1 )14ada-2 06-03-64 600
09-04-80 760
07-25-83 760
08-09-85 780
07-23-90 840
(D-9-1)23ada-1 07-05-62 380
08-07-62 410
06-11-63 380
08-28-63 420
07-27-79 650
(D-9-1)26aaa-1 07-05-89 660
08-22-89 650
(D-9-1)26aab-1 06-03-64 500
09-04-80 750
7.5
7.7
8.7
6.9
8.8
7.9
7.6
7.6
8.3
7.7
7.7
7.8
8.8
8.1
7.4
8.4
22.0
14.0
15.5
13.5
20.0
19.0
19.0
28.0
16.5
13.5
14.0
13.5
19.0
17.0
9.0
13.0
18.0
14.0
12.0
13.5
13.0
13.0
12.0
12.0
12.5
11.5
11.0
14.5
15.5
240
150
120
280
270
260
280
360
370
250
170
210
150
170
300
220
54
34
19
43
55
53
49
85
86
46
40
48
20
27
74
37
25
17
18
41
31
31
38
37
37
33
17
21
25
26
27
30
17
30
40
36
35
56
48
34
30
5.5
6.4
16
16
18
24
< l
86

] water from selected wells—Continued
Potassium, dis
solved (mg/L asK)
Alkalinity, field (mg/L
as CaCOg)
Sulfate, dis
solved (mg/L
asS04)
Chloride, dis
solved (mg/L asCI)
Fluoride, dis
solved (mg/L asF)
Silica, dis
solved (mg/L as
SiOz)
Solids, sum of
constituents. dissolved
(mg/L)
Nitrogen NOj-l-NOg dissolved
(mg/L asN)
225 33 12 49 325
10
29
41
15
12
63
215
24
• 3.5
4.0
2.6
2.3
307
1.9
3.9
3.0
19 .
19 19
—
.40
—
26 30
388
362 —
160
98
94 100
54
51
37 46
.30
.20
17
25
456
531
522
349
.60
7.80
1,2
1.2
2,0
1.6
8.6 16
43 44
7.1 8.2
20
21
178
216
196
218
•
2.3.
29
75
19
26
.20 19
286
87

'Dible 5.—Chemical analyses of
Well number Date
sampled
Specific conductance
(jiS/cm)
pH. fiekl
(standard units)
Hardness, total
(mg/L Temperature as
f C ) CaCOg)
Calcium, dis
solved (mg/L asCa)
Magnesium, dis
solved (mg/L
asMg)
Sodium, dis
solved (mg/L asNa)
(D-9-1)26aab-1 07-11-89 580 7.5 13.0 (D-9-1)26add-1 08-09-85 680 — 13.5
07-31-90 620 7.4 11.0 ^(D-9-1)35abb-1 06-03-63 460 8.4 —
08-29-63 330 7.9 —
230 150
58
26
21
21
6.4
6.7
07-02-65 290 8.5 _ 140 19 07-15-81 530 — 11.5 — — 07-23-90 530 7.5 11.0 270 66
(D-9-1)35bcd-2 07-16-81 700 — 14.0 — — 07-02-87 520 — 13.0 — —
23
26
7.1
6.7
08-01-90 660 7.8 18.0 — — (D-9-1)36acb-1 05-18-89 500 7.8 19.5 — —
07-10-89 470 7.7 12.0 — — (D-9-1)36bbc-1 07-05-62 470 7.5 — 220 56
08-07-62 480 7.7 — 250 52
07-01-63 330 8.5 — 160 30
08-29-63 480 7.4 — 240 60 07-13-64 480 7.5 10.0 250 63 07-02-65 290 7.7 9.5 140 21 07-29-65 300 8.3 9.5 150 24
20 28
21 22 23 22 22
6.2 6.4
6.2 6.2 6.4 6.5 6.4
m
09-03-69 08-11-72 09-12-74 08-16-76 07-12-77
500 520 520 520 480
7.9
7.3 6.5
9.0 10.0 10.5 10.0 10.0
260
280 270
61
75 70
26
23 23
5.9
6.1
07-15-81 530 7.6 11.0 270 69 06-25-89 500 — 10.0 250 62 07-23-90 490 7.4 10.0 260 63
(D-9-1)36cdd-1 07-13-64 560 7.5 9.5 300 78 07-31-81 590 — 11.5 — —
23 22 24 26
6.7 5.9 6.0 7.1
07-11-89 520 7.7 12.0 08-16-89 690 7.7 12.0 07-27-90 500 7.5 10.0
(D-9-2)5ddb-1 05-24-89 1,000 7.0 14.0 • (D-9-2)6ddb-1 05-24-89 800 7.4 14.0
260 68 21 6.4
88

water from selected wells—Continued
Potassium, dis
solved (mg/L asK)
Alkalinity, field (mg/L
as CaCOg)
Sulfate, dis
solved (mg/L
asS04)
Chloride, dis
solved (mg/L asCI)
Fluoride, dis
solved (mg/L asF)
Silica, dis
solved (mg/L as
SiOg)
Soiids, sum of
constituents. dissolved
(mg/L)
Nitrogen NOa-i-NOg, dissolved
(mg/L asN)
1.2
1.2
1.2
1.6
14 24
31
18
12
8.9
9.9
26 .30 19
240 168
159
293 2.20
1.2
1.2
1.6
1.2 1.2 .80 .80
18 26
24 24
31 24
31
11 9.2
7.8 8.2 8.2
11 8.9
239 14 12 15
289 255
173 252 267 153 164
288
•
1.4
1.5
1.5
1.3 1.3
1.2
230 220
—
— —
21 22
22
15 13
41
14
13
28
25 25
9.6
.20
.20
.20
.30
.30 —
15
16
17 16 17 —
303 285
309
276 298
321
2.20 —
2.20
1.50 1.70
—
1.2 20 13 .30 14 297 1.50
89

Table 5.—Chemical analyses of
.
Well number
(D-9-2)9bac-1
(0-9-2)11aaa-1
(D-9-2)15cda-1
(0-9-2)19aca-1
(D-9-2)19acb-1
(D-9-2)36acd-1
Date. sampled
07-05-62 08-07-62
07-02-63 08-01-63 08-22-63
07-14-64
07-27-65 07-30-70 08^11-72
07-30-73
09-12-74
08-13-76 07-12-77 08-23-78
07^27^79
08^01-79 07-30-81 09-20-82 08-09-84
07-02-87
08-23-89
09-04-90 08-19-91
05-17-64
08-16-76
09-20-82
07-19-90
07-30-81 07-10-89 07-02-87
07-10-89 09-05-80
07-26-83 07-02-86
05-11-89
Specffic conductance
(HS/cm)
490
570 550
690
680
520
550 680 660
730
560 700 650 650
670
670 690 650 640 580
640
610 630
520 570
550
550
600 540 420
690
490 510 570
540
pH. fieU
(standard units)
8.3
6.0
8.1 7.7 7.4
8.3 8.2
8.1 —
—
._
7.3 6.5 6.8
—
7.4 —
7.4
7.3
7.5
7.5
7.8
—
,
7.5 —
7.6 —
8.0 — — —
6.9
Temperature (°C)
— —
—
—
14.5
14.0 12.5 14.5
14.5
17.0 14.0
14.5 14.0
14.5
14.5 14.5 14.5 14.0
14.0
15.0 14.5
14.5
14.0 14.0
14.5
14.5 14.0 13.0
14.0 14.5
14.5 16.0
12.0
Hardness, total (mg/L
as CaCOg)
140
210 210
290 250
190
200 290
— —
310 300 290
—.
—
280 —
290 270
.,_
230 —
240 —
270 — —
—
_
— — —
—
Caldum, dis
solved (mg/L asCa)
21 42 41 73 59
31 34
67 — — •
78 73 71
—
66 —
69 67
56 —
61 —
-
66 — —
—
..^.
— — —
• —
Magnesium, dis
solved (mg/L asMg)
21
25 25
26
26
27
27
29 — —
—
27
28 27
—
—
27 —
28 26
_^
21 —
22 —
. _
26 — —
—
^..
—. — —
—
Sodium, dis
solved (mg/L asNa)
40 34
34
33
31
34
35 — — —
—
30
30
29
. —
30 —
32
180
•
36 — —
—
^..
15 — —
—
_^
— — —
—
•
•
m 90

•
water from selected wells—Continued
Potassium, dis
solved (mg/L asK)
Alkalinity, field
(mg/L as
CaCOg)
Sulfate, dis
solved (mg/L
asS04)
Chloride, dis
solved (mg/L asCi)
Fluoride, dis
solved (mg/L asF)
Silica, dis
solved (mg/L as
SiOa)
Solids, sum of
constituents. dissolved
(mg/L)
Nitrogen NO2+NO3 dissolved
(mg/L asN)
12
9.4
9.0
9.0
8.6
50
49
61
52
33
37
37
37
42
41
265
309
314
386
344
9.8
9.4
268
83
66
41
36
35
33 51
294
307
9.0 8,3 8.2
261 250 250
48 51 45
32 31 29
.30
.20
.20
49 49 45
448 423 417
4.00 —
3.40
8.1 44 25 .20 53 423 3.00
9.1
8.5
10
47 110
34
27
30 25
33
24
.30
.30
.20
_
51
50
56
_
440
644
402
3.40
3.40
2.90
1.2 28 19 .20 13 307 1.10
91

Table 5.—Chemical analyses of
Well number
(D-9-3)5bbd-1
(D-10-1)1acd-2 (D-10-1)2adb-1
(D-10-1)2ddd-1
Date sampled
07-14-64 09-03-69
10-14-71 08-11-72 07-31-73
08-17-76 07-12-77
08-23-78 08-01-79 09-04-80
07-14-89
07-29-65 07-05-66 07-30-80
07-14-89
08-17-90 08-22-89
(D-10-1)19bad-1 07-15-81 06-30-86
(D-10-1)19bdc-1 09-04-80
07-02-86 (D-10-1)30bac-1 08-09-85
07-12-89
08-29-90
Specific conductance
((iS/cm)
380 560
530 650 550
670
620 590 650 600
730
— 530 530
500
540
570 2,100 2,060 2,000
2,130 3,800 3,550
3,410
pH, fiekl
(standard units)
8.5
7.9 —
7.5 —
7.2 6.5 6.8
—
—
7.2 — 7.8
—
7.6
7.9
7.3 —
' —
—
— 7.1
7.4
Temperature (°C)
12.0 11.0 12.5 12.6 12.0
12.5
12.5 12.5 12.5 15.5
15.0 —
9.5
11.0
12.0
10.5
10.0 23.0 21.0
21.5
21.5
22.0 23.5
24.0
Hardness, total (mg/L
as CaCOg)
170 270
—
320 —
300 310 300
—
—
_
170 280
—
—
270 —
— —
—
.. .
— —
500
Caldum, dis
solved (mg/L asCa)
27
65 —
73
•—
75
75 72 —
—
— 75 —
—
71 — — —
—
— —
110
Magnesium, dis
solved (mg/L asMg)
26 27 —
33 . —
28
31 29 —
—
— 22 —
—
22 —
— • —
• —
....
— —
54
Sodium, dis
solved (mg/L asNa)
14 — —
18 —
16
19
18 —
—
^.*
—
5.3 —
—
6.4 —
— —
—
_^
— —
460
4
' Actual location is different than historic record. See footnote, table 1.
4> 92

T water from selected wells—Continued
Potassium, dis
solved (mg/L asK)
1.2
—
1.6
1.3
1.5 1.6
Alkalinity. field (mg/L
as CaCOg)
248
261
253
250
200
Sutfate, dis
solved (mg/L
asS04)
44
35
55
53
56 54
Chloride, dis
solved (mg/L asCI)
16
19
22
19
21 28
Fluoride, dis
solved (mg/L asF)
—
—
.20
.10
.20
Silica, dis
solved (mg/L as
SiOa)
13
15
12
13 13
Solids, sum of
constituents, dissolved
(mg/L)
212
327
374
360
369 338
Nitrogen NO2+NO3, dissolved'
(mg/L asN)
__
—
—
.90 —
.94
.80 30 17 291
1.3 21 21 1.1 13 296 2.10
38 120 860 .30 36 1,860 .50
93

Table 6.—Measurements of discharge, temperature, and specific conductance of water from selected springs
I—, no data] Location of spring or measurement site: See figure 1 for explanation of the numbering system for hydrologic-
data sites. Discharge: ft^/s, cubic feet per second. Temperature: "C, degrees Celsius. Specific conductance: |xS/cm, microsiemens per centimeter at 25 degrees Celsius.
Location of
spring
(D-7-3)28d-S1
(D-7-3)30a-S1
(D-7-3)32dba-S1
(0-8-3)3a-S1
(D-8-3)3dbb-Sl
(D-8-3)9d-S1
(0-9-2)1 labd-SI
(0-9-2)29ac-S1
(D-9-2)29cbb-Sl
(0-9-1 )25aac-Sl
(0-9-1 )25adb-Sl
Location of measuremeni
site
(D-7-3)28bcd
(D-7-3)30abb
(0-7-3)31 add
(0-8-3)3abc
(0-8-3)3dbb
(D-8-3)9bac
(0-9-2)11abd
(0-9-2)29acc
(D-9-2)29cbb
(D-9-1)24ddc
(0-9-1 )25ada
Name of spring
Spring Creek
Unnamed springs
Wood Springs
Wheeler Springs
Clyde Springs
Holley Springs
Salem Lake Springs
Unnamed springs
Spring Lake Springs
North Holladay Springs
Date of measure
ment
07-02-90 10-16-90 04-02-91
11-14-90
05-31-90 10-16-90 04-02-91
05-31-90 10-16-90 04-02-91
05-31-90 10-16-90 04-02-91
05-25-90 10-22-90 04-02-91
06-01-90 10-22-90
08-22-89
06-01-90 10-17-90
, 06-12-90 10-17-90
South Holladay Springs 06-12-90 10-17-90
^ Indudes about 0.5 ft /s from Matson Springs. ^ indudes 0.14 ft^/s from Matson Springs. 3 Estimated. '• Indudes about 0.4 ft /s from flowing wells.
Discharge (ft^/s)
15 16 15
.12
^3.8 ^3.9 22.9
1.1 .89
3l
.55
.72
.02
3.4 4.1 2.4
5.0 6.1
^1.0
^3.3 '2.4
1.1 .78
.67
.46
Temperature (°C)
15.5 14.0
11.0
15.5 15.0
14.0 14.0
13.0 13.0
18.5 9.0
16.0 10.0
—
14.0 13.0
13.5 8.0
16.0 8.5
Specific conductance
(^S/cm)
z 840
E —
1 -ll —
—
—
— •
—
4 k
94

] Table 7.—Measurements of discharge, temperature, and specific conductance of
water from selected springs, drains, and sloughs during seepage studies [—, no data]
Location of measurement site: See figure 1 for explanation of the numbering system for hydrologic-data sites. Listed in downstream order.
Inflow and outflow: Measured inflow to or outflow from the spring channel. Discharge: ft^/s, cubic feet per second. Used to determine ground-water discharge to springs and drains.
Upstream measurement plus Inflow minus outflow may not equal downstream measurement because of stream leakage, ground water discharge, or measurement error.
Temperature: ''C, degrees Celsius. Speciflc conductence: (xS/cm, microsiemens per centimeter at 25 degrees Celsius.
Location of measurement
site
Inflow and
outflow Discharge Temperature
(ft^/s) (°C)
Specific conductance
(nS/cm)
Spring Creek north channel, November 14,1990
(0-7-3)28bca 15 13.0
(D-7-3)20bda 15 12.5
(0-7-3)20bbd Inflow from industrial effluent .43 38.0
(0-7-3) 19bda 15 15.0
Spring Creek south channel, November 14,1990
(0-7-3)28bcb 2.1 12.0
(0-7-3)20cdb Inflow from flown ng well .22 —
(0-7-3)20cdb Inflow from waste-water treatment plant 5.1 —
(D-7-3)20cdb 9.4 12.5
Wood Springs channel, November 14,1990
(0-7-3)31 add ^3.9 13.5
(0-7-3)30cdd 6.4 8,0
Matson Springs channel, November 14,1990
(0-7-3)32ddd Inflow from fiowing well 1.1 16.0
890
1,070
880
1,180
1,050
780
620
760
560
(0-7-3)32cda
(D-7-3)32cda
(0-7-3)31 cdb
Outflow to Wood Springs area
2.6
1.5
1.6
14.0
14.0
470
610
95

Table 7.—Measurements of discharge, temperature, and specific conductance of water from selected springs, drains, and sloughs during seepage studies—
Continued •
Location of measurement
site
(D-8-3)5cdc
(D-8-3)5cdc
(D-8-3)5ccc
(D-8-3)6ddd
(D-8-3)6ccd
(0-8-2)1 dda
(D-7-2)36dcc
(0-8-3)9bac
(0-8-3)5cdc
(0-8-3) 18add
(D-8-3)8cbd
(0-8-3)5ccc
(0-9-2)29cbb
(0-9-2)30dad
(D-9-2)30daa
(0-9-2) 19bba
(0-9-2) 18ccd
(0-9-1 )13ddd
(D-9-1)13ddc
(D-9-2)7bba
(D-8-1)36dba
Inflow and Discharge
outflow (f?/s)
Dry Creek, November 15,1990
1.9
Inflow fi-om Holley Springs 4.5
Inflow fi-om unnamed springs 4.8
Inflow from flowing wells .20
Inflow from waste-water treatment plant 3.7
Inflow from unnamed drains .38
16
Holley Springs channel, November 15,
5.0
4.5
Temperature (°C)
9.0
8.0
8.0
—
—
10.5
9.5
1990
10.0
8.0
Unnamed channel, November 15,1990
1.2
1,4
4.8
Spring Creek (near Payson), March 28,
22.8
Inflow from unnamed field drain .06
Outflow to West Ditch area . 18
4.1
Inflow from West Ditch 1.0
Inflow from South Holladay Springs .61
Inflow from North Holladay Springs 1.4
6.8
7.9
7.0
8.0
8.0
1991
8.5
9.0
10,5
—
—
—
—
8.0
9.0
Specific conductance
(|iS/cm)
840
900
940
—
—
580
1,070
910
900
1,070
1,130
940
470
1,020
485
—
—
—
—
710
760
w
m 96

Table 7.—Measurements of discharge, temperature, and specific conductance of water from selected springs, drains, and sloughs during seepage studies—
Continued
Location of measurement
site
Inflow and
outflow Discharge Temperature
(ft^/s) (°C)
Specific conductance
(^S/cm)
p-8-1)36aad
0-8-1 )36dba
0-8-1 )36dba
0-8-1 )23aba
0-9-1 )24ddc
0-9-1)13ddc
0-9-1 )25ada
0-9-1 )25ada
0-9-1 )13ddd
0-9-1 )12bdd
0-8-1 )36dba
D-8-2)35cdd
0-8-2)35cdc
D-9-2)3abc
0-9-2)3bca
0-8-2)33bbc
D-8-2)32aac
0-8-2)31 bb
0-8-1 )36aad
Beer Creek and Benjamin Slough, March 28,1991
Beer Creek 22 12.5
Inflow from Spring Creek 7.9 9.0
Inflow from Dry Hollow 1.2 11.5
Benjamin Slough 33 12.0
North Holladay Springs channel, March 28,1991
.82 15.0
1.4 —
South Holladay Springs channel, March 28,1991
l59
Inflow from flowing wells 14
.61
Dry Hollow, March 28,1991
.36
1.2
Beer Creek, March 29,1991
1.9
Inflow from waste-water treatment plant .62
Inflow from Salem Lake 6.4
10
14
Inflow from waste-water treatment plant 1.3
Inflow from flowing wells 1.2
20
12.0
11.5
'14.0
1,040
760
1,400
1,060
700
750
1,400
4.5
7.5
10.5
7.0
9.0
1,350
1,110
770
940
990
'880
•
•• Includes 1.5 ft'/s from Matson Springs. ^ Includes about 0.4 ft^/s from flowing wells, ^ Includes 0.11 ft /s from flowing wells. * Average of two flowing wells.
97

Table 8.—Measurements of discharge, temperature, and specific conductance of water from selected streams and canals
[—, no data] • Location of measurement site: See figure 1 for explanation of the numbering system for hydrologic-data sites. Listed
in downstream order. Unknown, exact location not known, is t)etween known listed locations. Inflow and outflow: Measured inflow to and outflow from the stream. Calculated inflow or outflow was determined by
measuring the stream above and below the inflow or outflow. Diversion number refers to system used by the Strawberry Highline Canal Company.
Discharge: ft^/s, cubic feet per second. Used to determine interaction between streams and ground-water system. Upstream measurement plus inflow minus outflow may not equal downstream measurement because of stream leakage, ground-water discharge, or measurement error.
Temperature: °C, degrees Celsius. Specific conductance: ^S/cm, microsiemens per centimeter at 25 degrees Celsius.
Location of measurement
site
Inflow and
outflow Discharge
(ft^/s) Temperature
CO
Specific conductance
(^S/cm)
Spanish Fork River, August 30,1965
(D-8-3)33acc 11 —
(0-8-3)32daa Infiow fi-om Mill Race Canal 1.0 —
(0-8-3)32cac 9.7 —
Spanish Fork River, September 3,1965
(D-8-3)34cda 3.8 —
(D-8-3)34bbc Inflow from springs 1.1 —
(D-8-3)34bbb 7.4 —
Spanish Fork River, September 13,1965
(0-8-3)34bbb 8.9 11.5
(0-8-3)28ddc Inflow from industrial effluent .48 —
(D-8-3)33acb 7.4 —
Spanish Fork River, Octobers, 1965
(D-8-2)25ada 18 11.5
(D-8-2)25bab Inflow from ditch .48 —
(D-8-2)23dca 23 13.5
Spanish Fork River, October 8,1965
(D-8-2)23dca 32 —
(D-8-2)22dad Inflow from South Field Canal 4.0 —
(D-8-2)22da Inflow from ditch .06 —
(D-8-2)22add 33 —
« >
98
" i ^
it
•
Table 8.—Measurements of discharge, temperature, and specific conductance of water from selected streams and canals—Continued
Specific Temperature conductance
CC) inS/cm)
Location of measurement
site
(0-8-2) 15dcd
(0-8-2) 15d
(0-8-2)15cab
(0-8-2) 15cab
Unknown
(D-8-2)9aad
(0-9-3)2cab
(D-8-3)35ccc
(D-8-3)34cdd
(D-8-3)34bbb
(0-8-3)28ddc
(0-8-3)33acb
(0-8-3)33acc
(0-8-3)31 acd
(0-8-3)30ccc
(D-8-2)25add
(D-8-2)25ada
(D-8-2)25ada
(D-8-2)23dca
(D-8-2)22dad
(0-8-2)22da
(0-8-2)22da
(0-8-2)22add
Inflow and Discharge Te
outflow (ft^/s)
Spanish Fork River, October 12,1965
25
Inflow fi-om ditch .28
22
Spanish Fork River, October 13,1965
36
Inflow from drains .22
31
Spanish Fork River, June 1,1966
107
Outflow to East Bench Canal 103
18
20
Inflow from industrial effluent .03
21
Spanish Fork River, June 2,1966
31
Inflow from drain 1.1
Inflow from ditch .60
31
Spanish Fork River, Junes, 1966
18
Inflow from drains ,03
21
Inflow from South Field Canal ,39
Inflow from ditch .31
Inflow from ditch .05
21
99

Table 8.—Measurements of discharge, temperature, and specific conductance of ^ ^ water from selected streams and canals—Continued ^ B
Location of measurement
site
Inflow and
outflow Discharge
(ft^/s) Temperature
(°C)
Specific conductance
(^S/cm)
Spanish Fork River, September 29,1966
(D-8-3)34cda
(D-8-3)34bbb
(D-8-3)33acb
(D-B-3)33acc
(D-8-3)32cac
(0-8-3)31 baa
(D-8-3)30c
(D-8-2)25add
(0-8-2)25ada
(D-8-2)23dca
Unknown
(D-8-2)22aba
(0-8-2)15dca
Unknown
(D-7-2)32ddd
3.9
7.2
6.7
—
15.5
—
Spanish Fork River, September 30,1966
Inflow
20
22
21
1.1
23
Spanish Fork River, October 3,1966
•
Inflow from ditches
Outflow to South Ditch
Inflow from ditches and well
77
78
.33
27
49
.60
39
—
—
—
—
15.5
11.0
12.0
—
—
13.0
—
;
—
500
520
—
—
520
—
—
i
i
i t f
1 • ^
•1 1 ^
• - • •
r-'i
«»
:
" • '
i
I
100
T Table 8.—Measurements of discharge, temperature, and specific conductance of
water from selected streams and canals—Continued
Location of measurement
site
Inflow and
outflow
Specific Discharge Temperature conductance
(ft3/s) (°C) (nS/cm)
(D-8-3)34cda
(D-8-3)34acc
(D-8-3)34aba
(0-8-3)27acc
(0-8-3)23bdd
(D-8-3)23bdd
(0-8-3) 14aac
(D-8-3)14aac
(0-8-3)1 Iddb
(0-8-3) l l ddb
(0-8-3) 11 ddb
(0-8-3)1 ladb
(0-8-3) l l aac
(0-8-3)1 laac
(0-8-3) 11 aba
(0-8-3) 11 aba
(0-8-3)2dcd
(0-8-3) 2dca
(D-8-3)34acc
(0-8-3)34aba
(D-8-3)27acc
(D-8-3)23bdd
(0-8-3) 14aac
(0-8-3)1 Iddb
(0-8-3) 11 ddb
(0-8-3)1 laac
(D-8-3)2dcd
Outflow to ditch
Outflow to pump
Mapleton Lateral, May 26,1966
Calculated inflow from Maple Creek
Outflow to ditch
Outflow to ditch
Calculated outflow to Fullmer Ditch
43
40
41
39
40
6.8
34
,97
33
7,5
11
30
11
17
17
8,6
7,9
7.7
Mapleton Lateral, September 29,1966
Outflow to ditch
Outflow to ditch
18
17
18
18
19
,14
18
,88
18
11.0
13,0
15,0
16,0
11.0
101

Table ^.—Measurements of discharge, temperature, and specific conductance of water from selected streams and cfl/ifl/,^~Continued
Location of measuremerit
site
Inflow and
outflow Discharge
(ft'/s) Temperature
(°C)
Specific conductance
(^S/cm)
(D-8-3)33dbb
Unknown
Unknown
(0-9-2) 16adc
(0-9-2)31 ace
(0-9-2)31 cbd
(D-9-1)36dad
(D-9-1)36dad
(D-9-1)36acb
(0-9-1 )36bbc
(D-9-1)36bbc
(0-9-1 )35aaa
(D-9-1)35aaa
(D-9-1)35abb
(0-9-1 )26cbb
(D-8-3)33dbb
(D-9-3)5aaa
(D-9-3)5adb
(D-9-3)7dbc
(D-9-3)7dbc
(D-9-3)7cdb
(0-9-2) 13abc
(0-9-2) 13bad
(0-9-2) 13bd
(0-9-2) 14daa
(0-9-2) 14CCC
Strawberry Highline Canal, September 28,1965
44 —
Inflow .17 —
Outflow 3.3 —
37 —
Strawberry Highline Canal, May 31,1966
79 —
Outflow to diversion #24A
Outflow to diversion #25
Outflow to diversion #26
Inflow from well
Outflow to diversion #27
Inflow from well
2.4
2.1
70
3.7
66
4.4
3.6
70
8.7
78 15.5
Outflow to diversion #3
Strawberry Highline Canal, June 1,1966
139 14.0
13 —
124 —
121 —
5.1 — Calculated outflow to diversion #7
Outflow to diversion #8
Calculated outflow to diversion #10
Outflow to diversion #10-1
Outflow to diversion #11
.01
111
3.1
4.4
2.8
100
102

Table 8.—Measurements of discharge, temperature, and specific conductance of water from selected streams and canals—Continued
Location of measurement
site
Inflow arid
outflow Discharge
(ft'/s) Temperature
CO
Specific conductance
(^S/cm)
Strawberry Highline Canal, June 2,1966
(0-9-2)14CCC
(0-9-2)22bba
(D-9-2)22bbb
(0-9-2)21 bab
(0-9-2)21 bba
(0-9-2)21 bb
(0-9-2)21 bob
(0-9-2)21 bcb
(0-9-2)31 acc
(0-8-3)33dbb
(D-9-3)5aaa
(0-9-3)5adb
(0-9-3)7dbc
(0-9-2) 13abc
(0-9-2) 14cda
(0-9-2) 14CCC
Outflow to diversion #14.5
Outflow to diversion #18
Outflow to diversion #19
Outflow to diversion #19.5
Outflow to diversion #20
Outflow to diversion #20B
Strawberry Highline Canal,
Outflow to diversion #3
Outflow to diversion #12
85
.65
77
1.4
5.2
1.1
27
3.2
41
September 26,
73
.19
73
72
71
2.8
68
12.0
—
13.0
—
—
—
—
—
16.0
1966
—
—
—
14.0
14.5
—
—
•
103

Table 8.—Measurements of discharge, temperature, and specific conductance of water from selected streams and canals—Continued
Location of measurement
site
Inflow and
outflow
Specific Discharge Temperature conductance
(ft^/s) CC) (tS/cm)
Strawberry Highline Canal, September 27,1966
13.0
(0-9-2) 14CCC
(0-9-2)22bba
(0-9-2)21 bab
(0-9-2)21 bcb
(D-9-2)20ddb
(0-9-2)31 acc
(0-9-2)31 cbd
(0-9-1 )36dad
(0-9-1 )36bbc
(0-9-1 )35aaa
(0-9-1 )35a
(0-9-1 )26cbb
(0-8-3)32dda
(D-8-2)25dbc
(D-8-3)32dda
(0-8-3)31 odd
(D-8-2)36acd
(D-8-2)36acb
(0-8-2)25dbc
(0-8-3)32dda
(0-8-3)320
(0-8-3)31 cdd
(0-8-3)36acd
(D-8-3)25dbc
Outflow to diversion #16
Outflow to diversion #20A
Outflow to diversion #21
Outflow to diversion #24A
Outflow to diversion #25
Outflow to diversion #27
Outflow to diversion #27.5
South Field Canal,
64
64
7.0
6,0
,20
48
.01
1.5
45
4.0
2.4
44
September 13,1965
10
10
South Field Canal, June 8,1966
Outflow
33
32
35
4.9
30
South Field Canal, October 3,1966
Outflow
17
4.3
13
14
13
14.0
14.5
15.5
15.5
12.0
15.0
11.5
11.5
*
104

|_ Table 8.—Measurements of discharge, temperature, and specific conductance of Jjj^ water from selected streams and canals—Continued
Location of measurement
site
Inflow and
outflow Discharge
(ft'/s) Temperature
CO
Speciflc conductance
(\iS/cm)
South Field Canal, October 5,1966
(D-8-2)25dbc
(D-8-2)23ccc
(0-8-3)33acc
(0-8-3)33cab
(0-8-3)32add
(0-8-3) 19cdc
(0-8-3)33acc
(0-8-3)32bab
(0-8-3)30ddd
(0-8-3)30dbb
(D-8-3)30b
(0-8-3)19cdc
(0-8-3)19cca
(0-8-2)24dca
(D-8-3)33acc
(0-8-3)32bab
(0-8-3)32bb
(0-8-3)30dbb
(0-8-3)19cdc
(0-8-3) 19cca
(D-8-2)24dca
4.9
4.6
Mill Race Canal, August 30,1965
56
Outflow 8.9
Outflow to Spanish Fork River 1.0
45
Mill Race Canal, June 9,1966
51
57
55
59
Outflow .61
55
Outflow 3.0
50
Mill Race Canal, September 30,1966
39
38
Outflow 5.7
34
34
Outflow 2.5
34
—
12.0
14.5
—
—
16.5
—
13.0
15.0
—
—
15.0
—
— .
—
—
—
—
—
—
105

Ikble 8.—Measurements of discharge, temperature, and specific conductance of ^g^ water from selected streams and canals—Continued ^g§
Location of measurement
site
Inflow and
outflow Discharge
(ft^/s) Temperature
CC)
Specific conductance
(nS/cm)
East Bench Canal, August 25,1965
(D-8-3)34ddd
(D-8-3)27ccb
(0-8-3)34ddd
(D-8-3)27ccb
(D-8-3)27cbc
(D-8-3)28dac
(0-8-3)28dac
(0-8-3)28dbb
(0-8-3)28bbd
(D-8-3)29aaa
(D-8-3)34ddd
(0-8-3)27ccb
(D-8-3)28dac
(D-8-3)29aaa
(0-8-2)22aba
(0-8-2)15caa
(0-8-2) 16dad
(0-8-2) 16dcc
(0-8-2)21 bbd
(D-8-2)20caa
Outflow
Outflow
Outflow
Outflow
Outflow
Outflow
Outflow
Outflow
Outflow
14
12
East Bench Canal, June 15,1966
78
75
9.0
16
2.6
8.6
8.3
32
East Bench Canal, October 6,1966
17
15
9.3
5.7
South Ditch, June 17,1966
52
18
15
17
1.9
14
—
—
—
18
—
—
—
—
—
—
—
9.0
—
9.5
15.0
15.5
16.0
16.5
—
16.5
•
106
Table 8,—Measurements of discharge, temperature, and specific conductance of water from selected streams and canals—Continued
Location of measurement
site
(0-8-3)1 dbc
(0-8-3)1 cac
(0-8-3)1 cca
(0-8-3)1 ccb
(D-8-3)2ddb
(D-8-3)2dca
D-8-3)2dca
(0-8-3)2dca
(0-8-3)2ccb
(D-8-3)3dda
(0-8-3)3dda
(D-8-3)3dda
(D-8-3)3acc
(0-8-3)3bbd
(0-8-3)4aaa
(0-8-3)3dda
(0-8-3)4aaa
(D-8-3)3dda
(D-8-3)4aaa
(0-8-3)4aaa
(0-7-3)29dcc
Inflow and Discharge Temperature
outflow (ft'/s) CO
Hobble Creek, August 17,1965
.77
5.4
5.2
Inflow from canal 1.7
6,7
Inflow from Mapleton Lateral 11
Outflow to canal 7.7
5.3
Outflow to irrigation ditch 5.0
Calculated inflow from pipe .48
2.8
Hobble Creek, August 18,1965
2.8
Inflow from springs .20
Inflow from drains .87
13
Hobble Creek, August 19,1965
4.7
18
Hobble Creek, August 23,1965
1.5
9.9
Hobble Creek, September 22,1965
26
29
—
—
—
—
—
—
—
—
—
—
—
—
—
—
—
—
—
—
—
11.5
12.0
Specific conductance
(^S/cm)
—
—
—
—
—
—
—
—
—
—
—
—
—
—
—
—
—
—
—
—
107

Table 8.—Measurements of discharge, temperature, and specific conductance of water from selected streams and canals—Continued
Location of measurement
site
(0-8-3)1 cac
(D-8-3)2ddb
(D-8-3)2dca
(0-8-3)2
(D-8-3)3d
(D-8-3)3b
(D-8-3)4aaa
(0-8-3)1 cac
(D-8-3)2ddb
(0-8-3)2dca
(D-8-3)2ccb
(D-8-3)3dda
(0-8-3)3dbb
(0-8-3)3b
(0-8-3)4aaa
(0-8-3)4aaa
(0-7-3)29dcc
(0-8-4)6abb
(0-7-3)29dcc
(O-7-3)30acc
(0-7-3)30bda
Outflow
Outflow
inflow and
outflow Discharge Temperature
(ft'/s) CC)
Hobble Creek, May 24,1966
Calculated inflow from pipe
Inflow from springs
Hobble Creek,
Hobble Creek,
Outflow to irrigation ditch
Inflow from Wheeler Springs
Outflow
18
20
8.4
7.6
2.6
1.6
19
September 23,1966
3.8
2.8
September 27,1966
1,2
1.9
1.0
4.8
.64
7,5
Hobble Creek, October 4,1966
5,2
5.4
Hobble Creek, May 23,1990
Hobble Creek,
17
November 14,1990
19
.04
21
8.5
9.5
—
—
—
—
—
10.5
11.5
—
—
13.0
13.0
—
13.5
11.5
12.0
14.5
8.5
—
9.0
Specific conductance
(^S/cm)
—
—
—
—
—
—
—
—
—
—
—
410
600
—
560
540
540
—
520
—
540
#
108

•
Table 8.—Measurements of discharge, temperature, and specific conductance of water from selected streams and canals—Continued
Location of measurement
site
Inflow and
outflow
Specific Discharge Temperature conductance
(ft'/s) CC) (nS/cm)
0-8-3)1 acc
P-8-3)2adb
0-8-3)1 acc
Unknown
D-8-3)2adb
D-8-4)6bab
0-8-3)1 acc
0-8-4)6bab
0-8-3)1 acc
0-8-3)4aaa
0-8-3)4bbd
0-8-3) 12bbb
0-8-3) 11 aba
0-8-3)11 baa
0-8-3)1 cdc
Unknown
0-8-3)3cdc
SpringviUe Highline Canal, June 3,1965
8.3
7,5
SpringviUe Highline Canal, July 23,1965
8.0
Outflow
6.1 —
SpringviUe Highline Canal, May 23,1966
6.7 —
6.4 —
SpringviUe Highline Canal, September 28,1966
11 11.0
8.8 10.5
Swenson Ditch, September 29,1966
7.9 —
7.1 —
Fullmer Ditch, May 25,1966
9.4 —
Inflow from Mapleton Lateral 10 —
18 —
Fullmer Ditch, October 5,1966
13 9.0
Outflow 1.3 —
7.5 —
420
430
440
•
109

Table 8.—Measurements of discharge, temperature, and specific conductance of water from selected streams and canals—Continued #
Location of measurement
site
Inflow and
outflow Discharge
(ft^/s) Temperature
CO
Specific conductance
(^S/cm)
Area of West Fields Irrigation Company, November 15,1990
2Measurements given below include all known surface inflow and outflow from the West Fields Irrigation ompany area)
930
485
22,460
895
925
930
410
990
(D-8-2)24acc
(D-8-2)23dba
(D-8-2)9aad
(D-8-2)4aab
(D-7-2)34ddc
(D-7-2)35ccc
(D-7-2)35ccd
(D-8-2)2abb
(0-8-2)1 bbb
(0-9^2)21 b b c ^
(D-9-2)20bc
(0-9-2)1 Seed
(D-10-1)13d
(C-11-2)13cdc
Inflow from 9.6 Mill Race Canal
Unnamed inflow ^05
Unnamed outflow .08
Unnamed outflow .42
Unnamed outflow 2.8
Unnamed outflow 1.4
Unnamed outflow 1.8
Unnamed outflow .03
Unnamed outflow .8
Peteetneet Creek West Ditch, March 28,
3.4
Inflow .18
,96
Summit Creek, May 23,1990
17
Kimball Creek, May 25,1990
.15
7.5
—
11.5
9.0
8.0
9.0
8.5
12.0
9.5
1991
—
—
—
12.0
17.5
^ Estimated. ^ Specific conductance is higher than other values because the flow at this site is composed mainly of
ground-water discharge.
110 -ic u s , GOVERNMENT PRINTING OFFICE: t093 -780-348

Appendix H

APPENDIX H
Lineament Study
SUVSWD Bayview Class I Landfill Pernnit Application

f
•
t
EVALUATION OF LINEAMENTS AT THE
PROPOSED PROVO CITY LANDFILL,
GOSHEN VALLEY, UTAH
by
ROBERT M. ROBISON
UTAH COUNTY GEOLOGIST
APRIL 20, 1987

CONTENTS
INTRDUCTION 2
TRENCH LOCATIONS AND D E S C R I P T I O N S 5
DISCUSSION 7
CONCLUSIONS AND RECOMMENDATIONS 9
SELECTED REFERENCES 1 1
A P P E N D I X 1 2
#
#
t

t INTRODUCTION
•
The p roposed Provo C i t y l a n d f i l l i s l o c a t e d i n Goshen
V a l l e y , Utah, i n Sec . 17 , T. 9 S . , R. 1 W., SLB&M ( F i g . 1 ) . The
s i t e i s abou t 2 m i l e s w e s t of t h e s o u t h e r n end of Utah Lake and
approx imate ly 2 m i l e s e a s t of t h e T i n t i c Mountains. E l b e r t a C i t y
i s approximate ly 5.5 m i l e s to t h e sou th .
The purpose of t h i s i n v e s t i g a t i o n was to e v a l u a t e l i n e a m e n t s
i n S e c t i o n 17 t o d e t e r m i n e i f t h e y were formed by s u r f a c e f a u l t
r u p t u r e . S e v e r a l l i n e a m e n t s were i d e n t i f i e d by t h e Utah County
G e o l o g i s t ( R o b i s o n , 1 9 8 6 a ) and E n v i r o n m e n t a l S c i e n c e and
Engineer ing (ESE, Whi t ing , 1986) which may have been produced by
f a u l t i n g . The Utah County Board of A d j u s t m e n t s ( m i n u t e s d a t e d
January 13, 1987) a u t h o r i z e d an i n v e s t i g a t i o n of a l l l i n e a m e n t s .
The Utah County G e o l o g i s t had t h e r e s p o n s i b i l i t y t o l o c a t e
e x p l o r a t o r y t r e n c h e s and make t h e i n t e r p r e t a t i o n a s t o t h e
p r e s e n c e / l o c a t i o n of any f a u l t s found.
The s c o p e of t h i s i n v e s t i g a t i o n i n c l u d e d a r e v i e w of
p e r t i n e n t l i t e r a t u r e a n d a e r i a l p h o t o g r a p h s , f i e l d
r econna i s sance , and the e x c a v a t i o n , l o g g i n g , photographing , and
i n t e r p r e t a t i o n of e i g h t t r e n c h e s (Fig. 2 ) . Trench l o c a t i o n s were
s e l e c t e d d u r i n g a f i e l d r e c o n n a i s s a n c e on March 6, 1987, by t h e
Utah County G e o l o g i s t . Duane W h i t i n g of ESE, S t e v e S e v i e r of
E l b e r t a Farms , and Dale S t e p h e n s o n and C a r l C a r p e n t e r of Provo
C i t y were p re sen t when the t r e n c h e s were s i t e d .
t

COUNTY
i
9
Figure 1. Map showing the location of the study area, Section 17, T. 9 S., R. 1 W., SLBfcM, Goshen Valley, Utah. Single digit numbers refer to trenches. See text for logs and descriptions of trenches.
f

9
9
9 Figure 2. December, 1986, aerial photograph of the
study area. Lineaments are labeled Ll to LA. Trench locations are labeled 1 to 7. Scale is approximately 1:11,500.

E i g h t t r e n c h e s were e x c a v a t e d on March 24 , 2 5 , and 2 6 , 1987
( F i g . 2) a c r o s s l i n e a m e n t s L l , L 2 , a n d L 4 . L i n e a m e n t L3 h a d no
s u r f a c e e x p r e s s i o n o r t r a c e a b l e l i n e a r f e a t u r e s , and h e n c e was
n o t t r e n c h e d . Kimm H a r t y a n d S u z a n n e H e c k e r o f t h e U t a h
G e o l o g i c a l and M i n e r a l Survey l o g g e d t r e n c h # 1 (F ig . 2 ) . R o b e r t
M. R o b i s o n ( U t a h C o u n t y G e o l o g i s t ) a n d J o h n D. G a r r ( E a r t h F a x
C o n s u l t a n t s ) l o g g e d t h e o t h e r t r e n c h e s . E a r t h F a x C o n s u l t a n t s
w e r e h i r e d by E n v i r o n m e n t a l S c i e n c e a n d E n g i n e e r i n g t o
p a r t i c i p a t e i n t h e i n v e s t i g a t i o n .
TRENCH LOCATIONS AND DESCRIPTIONS
T r e n c h e s w e r e n u m b e r e d f r o m n o r t h - t o - s o u t h on t h e e a s t e r n
l i n e a m e n t ( L l , t r e n c h e s n u m b e r e d 1 t o 4 , F i g . 2 ) and f r o m south<-
t o r n o r t h on t h e w e s t e r n l i n e a m e n t (L2, t r e n c h e s numbered 5 t o 7 ,
F i g . 2 ) . The e i g h t h t r e n c h ( n u m b e r 2 a , F i g . 2) was p a r a l l e l t o
t r e n c h number 2 t o v e r i f y c o n t i n u i t y of t h e s e d i m e n t s t h r o u g h a
d i s t u r b e d a r e a . H o r i z o n t a l l e v e l l i n e s were used f o r e l e v a t i o n
c o n t r o l a n d r e f e r e n c e t o b e d d i n g a n d f e a t u r e s i n l o g g i n g
t r e n c h e s . The o r i g i n a l s c a l e of t h e t r e n c h l o g s was 1:50.
F i v e u n i t s w e r e r e c o g n i z e d i n t r e n c h number 1 a n d w e r e
c o r r e l a t e d i n a l l of t h e t r e n c h e s . A d e t a i l e d e x p l a n a t i o n of
e a c h u n i t g i v i n g t h e t y p e of d e p o s i t , t h i c k n e s s , c o l o r , t e x t u r e
and f e a t u r e s , and g e n e s i s , i s i n c l u d e d i n t h e a p p e n d i x . A
summary of t h e l o c a t i o n and p r i n c i p a l f e a t u r e s i n each t r e n c h i s
g i v e n b e l o w :
9
9
9
9
9
•
Trench Number 1. This t r e n c h was a c r o s s t h e n o r t h end of
lineament Ll (Fig. 2, Appendix A). Five s t r a t i g r a p h i c un i t s were
d e l i n e a t e d in t h i s t r ench . The c o n t i n u i t y of the beds can be
seen in t r ench log #1 (Appendix A). S t r i n g e r s of sand can be
t r a c e d through the d e p o s i t s . The f r a c t u r e s in the c l ayey
sed imen t s may be the r e s u l t of s h r i n k i n g from d e s i c c a t i o n , or
from l iquefac t ion .
Trench Number 2. This t rench was a long l ineament L4 (Fig .2) , A
t o t a l of 4 sedimentary uni t s were logged in the trench. A large
burrow(?) in the c e n t r a l p o r t i o n of the t rench made l i n e a r
c o n t i n u i t y of d e p o s i t s u n c l e a r . A second t r ench (2a, F ig . 2) was
excavated p a r a l l e l to t r ench 2 which had cont inuous bedding i n
the r eg ion of the burrow. No logs were made of t rench 2a, but
photos (not included in th i s repor t ) were taken.
Trench Number 3. A 5+ m high s c a r p was p r e sen t a t the s i t e of
t r ench number 3. A 36 m long t r e n c h was excavated ac ros s t h i s
s ca rp to ensure t h a t any f a u l t s would be d iscovered ( t rench #3,
Appendix A). Five s t r a t i g r a p h i c u n i t s were logged in t h i s
t rench.
Trench Number 4. This t r ench was l o c a t e d a t the south end of
lineament Ll (Fig. 2). Three continuous s t r a t i g r a p h i c un i t s were
found.
Trench Number 5. Trench 5 was l o c a t e d a t the south end of
l ineament L2 (Fig. 2) . Three s e d i m e n t a r y u n i t s were i d e n t i f i e d .
Unit 1 was subdivided in to u n i t s 1 and la because of the p resence

of lacus t r ine(?) gastropods in un i t la (Appendix A). Sand f i l l e d
f i s sures were common. 9 Trench Number 6. Trench number 6 was located in the central
portion of lineament L2 (Fig. 2). Three sedimentary units were
found (Appendix A). Fissures were common and most were filled
with sand. Several small ( < 2 cm) fissures were open within
unit 3.
Trench Number 7. Trench 7 (Fig. 2) was located on the north end
of lineament L2. A 3 m (9 foot) scarp was trenched approximately
11 feet deep, which revealed only eolian sand. The scarp was
apparently a dune slip face (lee slope). The trench walls were
very unstable and no logs were made of the trench. Photographs
were taken of the trench but were not included in this report. 9 DISCUSSION
Sediments and features of Pleistocene Lake Bonneville
dominate the study area. The western margin of the site is
approximately at the Provo shoreline of the lake occupied 14,000
- 15,000 years ago. Shoreline deposits are chiefly gravel which
grades eastward to offshore facies of sand, silt, and clay. Most
of the lake sediments are beneath a thin covering of sandy
Holocene alluvium and eolian material. In addition to these
surficial deposits, trenches exposed sand and gravel. Deposits
representing the transgression of Lake Bonneville about 25
thousand years ago (unit 5, Appendix); deep lake clays of the 9

t
t
t
highstand about 15 to 16 thousand years ago (units 3 and 4) and
the drop to the Provo Shoreline 15 thousand years ago, and the
regression of the lake out of the study area about 13 to 14
thousand years ago (unit la and 2). For a more complete
discussion of the history of Lake Bonneville see Currey and
Oviatt (1985).
The lineaments identified for study varied in surficial
expression and probable origin. The aerial photographs used by
Robison (1986) to identify lineaments were taken in 1959, and the
photos used by ESE were taken in 1986 photos. Lineament number 1
(Fig. 2) was less visible on the 1986 photo as compared to the
1959 photo, and was at a slightly different orientation.
Lineament number 2 (Fig. 2) was more evident on the 1986 photos.
In addition to surface faulting, possible origins of the
lineaments include grazing patterns, animal trails, fence lines,
abandoned canals or ditches, differential erosion of surficial
material, or natural drainage lines. The change in the character
of the lineaments in the 27 years between the photos may be the
result of stabilization after previous land uses, continued
erosion of natural features. Also, several sand dunes are present
roughly parallel to the lineaments.
No existing geologic or surficial maps indicate surface
fault ruptures in this area, and none were found in the
investigation. Faulting at depth has been inferred by Cordova
(1970), but no faults were extended to the ground surface.
Several trenches exhibited layers of sediments with sandr-filled
fissures with little or no offset. These fissures trended roughly
parallel to lineaments, but none were found which reached the
8

ground s u r f a c e and a r e n o t t h e c a u s e of t h e l i n e a m e n t s . The s a n d r
f i l l e d f r a c t u r e s may be t h e r e s u l t o f e i t h e r l i q u e f a c t i o n o r
d e s i c c a t i o n . I f t h e y r e s u l t e d f r o m e a r t h g u a k e - i n d u c e d
l i q u e f a c t i o n , t h e e a r t h q u a k e c a u s i n g t h e l i q u e f a c t i o n would n o t
n e c e s s a r i l y h a v e h a d a n e p i c e n t e r a t t h e l o c a t i o n of t h e
l i q u e f a c t i o n . A l a r g e e a r t h q u a k e on t h e W a s a t c h F a u l t , a b o u t 12
m i l e s e a s t , w o u l d s h a k e t h e s t u d y a r e a s u f f i c i e n t l y h a r d t o
i n d u c e l i q u e f a c t i o n when g r o u n d r w a t e r c o n d i t i o n s were f a v o r a b l e .
The e a r t h q u a k e w o u l d h a v e had t o o c c u r a f t e r d e p o s i t i o n of t h e
c l a y e y s e d i m e n t s ( u n i t 3 , A p p e n d i x A) a b o u t 1 3 , 0 0 0 t o 1 2 , 0 0 0
y e a r s a g o , b u t b e f o r e t h e w a t e r t a b l e had d r o p p e d , p o s s i b l y a b o u t
10 ,000 y e a r s a g o .
I f t h e s a n d r - f i l l e d f e a t u r e s a r e t h e r e s u l t of d e s i c c a t i o n ,
t h e n a t r i g g e r i n g e a r t h q u a k e i s n o t n e c e s s a r y . The f i s s u r e s
c o u l d h a v e f o r m e d a n y t i m e f o l l o w i n g t h e r e t r e a t o f L a k e
B o n n e v i l l e f rom t h i s l e v e l a b o u t 12 k a . S u r f a c e w a t e r o r w i n d
c o u l d h a v e c a r r i e d t h e s a n d i n t o t h e f i s s u r e s . L o c a l l y , some of
t h e f i s s u r e s were open ( + / r l cm) w i t h i n u n i t 3.
CONCLUSIONS AND RECOMMENDATIONS
The t r e n c h e s r e v e a l e d no f e a t u r e s which c o u l d be i n t e r p r e t e d
a s t e c t o n i c f a u l t s . The t r e n c h e s w e r e s u f f i c i e n t l y d e e p t o
e n c o u n t e r w e l l - b e d d e d l a t e P l e i s t o c e n e (Lake B o n n e v i l l e age) and
H o l o c e n e s e d i m e n t s i n w h i c h o f f s e t s d u e t o f a u l t i n g w o u l d h a v e
b e e n r e a d i l y a p p a r e n t . The l i n e a m e n t s m u s t be t h e r e s u l t of
p a s t l a n d u s e s , m e a n d e r i n g d r a i n a g e s , a n d / o r wind e r o s i o n a n d
d e p o s i t i o n .
9
9
9
0 Small sand f i l l e d f r a c t u r e s in t r enches may be r e s u l t of
l i q u e f a c t i o n d u r i n g t i m e s of h i g h e r ground-!-water or from
d e s i c c a t i o n as sed imen t s d r i e d . Under p re sen t c o n d i t i o n s , the
l i q u e f a c t i o n p o t e n t i a l for t h i s a rea i s very low (Anderson and
o t h e r s , 1986). There appears to be no sur face f a u l t r u p t u r e
hazard a t the s i t e , however, t r e n c h e s or o the r e x c a v a t i o n s
p roduced from t h e c o n s t r u c t i o n of t h e l a n d f i l l s h o u l d be
pe r iod ica l ly inspected by the Utah County Geologist to check for
possible fau l t s in areas not covered by th i s i nves t i ga t i on .
•
•
10
SELECTED REFERENCES 9 A n d e r s o n , L.R., Kea ton , J .R . , and B i s c h o f f , J . E . , 1 9 8 6 ,
L ique fac t i on p o t e n t i a l map for Utah County, Utah: Utah S ta te Universi ty and Dames and Moore unpublished repor t for the U.S. Geological Survey, 46 p .
Cordova, R.M., 1970, Ground water c o n d i t i o n s in Southern Utah Val ley and Goshen V a l l e y , Utah: Utah Department of N a t u r a l Resources Technical Publ ica t ion No. 28, 79 p.
Currey, D.R., and O v i a t t , C.G., 1985, D u r a t i o n s , average r a t e s , and probable causes of Lake B o n n e v i l l e expans ions , s t i l l s t a n d s , and c o n t r a c t i o n s du r ing the l a s t deep:-lake c y c l e , 32,000 to 10,000 yea r s ago: ^il Kay, P.A., and Diaz , H.F., eds . Problems of and p r o s p e c t s for p r e d i c t i n g Great S a l t Lake l e v e l s . Conference P r o c e e d i n g s , Center for P u b l i c Affairs and Administrat ion, Univers i ty of Utah, p. 9r24.
Robison,R.M., 1986a, E l b e r t a l a n d f i l l s i t e : Unpublished Utah County Planning Commission L e t t e r , 2 p.
1986b, E l b e r t a l a n d f i l l s i t e (P rovo , Utah) 9 Unpublished Utah County Planning Commission Letter, Dec, 1986, 4 p.
Whiting, Duane, 1986, Evaluation of hydrologic and seismic conditions, proposed sanitary landfill site in Goshen Valley, Utah: Unpublished report by Environmental Science and Engineering to Elberta Farms, Inc., Elberta, Utah, 55 p.
f 11

t APPENDIX
EXPLANATION FOR TRENCH LOGS
UNIT
t
DESCRIPTION
S a n d , s i l t (SP, SM, ML): some o r g a n i c m a t e r i a l , g r a v e l p r e s e n t l o c a l l y ; u n i t may be >1 m t h i c k ; l i g h t brown to t a n , Munsell c o l o r i s 2.5Y 7 / 2 (dry) t o 2.5Y 6/4 (damp); i f s and i s p r e d o m i n a n t , c o l o r may be 10YR 5 / 3 . M a t e r i a l i s e o l i a n s a n d , l o e s s a n d / o r a l l u v i u m , r o o t s a r e p r e s e n t and b u r r o w s a r e a b u n d a n t . T h i s u n i t i s t h e p r e s e n t g round su r f ace and i s p robably s t i l l being d e p o s i t e d .
Un i t l a h a s sand w i t h f e a t u r e s and c o l o r s i m i l a r t o u n i t 1. T h i s u n i t i s bedded w i t h pockets of g a s t r o p o d s , i n d i c a t i n g t h a t i t may be l a c u s t r i n e in o r i g i n and o lde r than u n i t 1, p o s s i b l y 13,000 to 14,000 yea r s ago.
In te rbedded c l a y , s i l t y c l a y and c layey s i l t , f i n e s a n d , (CL, CL-ML, SM): c l a y c o n t e n t i n c r e a s e s t o w a r d b o t t o m Of u n i t , s a n d i n c r e a s e s t o w a r d t o p of u n i t ; u n i t t h i c k n e s s may be 2.6 m; c o l o r i s g r e e n t o g r a y , l o w e r u n i t i s 5Y 5.5 to 6.1 with l a m i n a t i o n s of 2.5Y 8/2 , u n i t g rades upward to 5Y 7/2; l a m i n a t e d , may h a v e s a n d f i l l e d f r a c t u r e s l o c a l l y ; probably r e p r e s e n t s the r e g r e s s i v e d e p o s i t s of Lake B o n n e v i l l e , a b o u t 15,000 - 14,000 y e a r s a g o .
(
1 \
^
1 1
\ 1
t
Blocky clay (CH): homogeneous, maximum thickness about 1 m; brown to reddish brown 10YR 5/2r3; some laminations or mottling present; may locally have sand filled fissures. CaC03 horizon may be present at the top of unit; these deposits may represent the deep water cycle of Lake Bonneville, about 18,000 years ago.
12

I e • ^ O
.5---.
Interbedded c lay , s i l t y clay and clayey s i l t , some f i n e sand (CL, CLi-ML, SM) : c l ay c o n t e n t decreases a t the base of un i t ; resembles un i t 2 ; t h i c k n e s s i s a b o u t .9 m maximum; laminated, color i s green to gray, 5Y 6/1 with s t r e a k s of 5Y 8/1 to 7 /2 ; some sand f i l l e d f i s s u r e s p r e s e n t ; t h i s u n i t was probably depos i t ed in the deepening wa te r s of the t ransgress ion of Lake Bonnevil le , about 19,000 to 20,000 yea r s ago.
I n t e r b e d d e d g r a v e l , s a n d , (GM, SM): bedded g r a v e l , modera te ly to we l l s o r t e d in p l a c e s , maximum c l a s t s i z e 10 cm; u n i t t h i c k n e s s exceeds 1.2 m; l i g h t brown, 10YR 5/4 , a l aye r of red sand (oxidized i r o n s t a i n ) may be p r e s e n t a t the c o n t a c t between uni t 4; l iquefac t ion fea tures (small d iap i r s ) may be present a t the upper contact ; t h i s uni t may r e p r e s e n t the t r a n s g r e s s i v e g r a v e l s of Lake Bonneville, about 20,000 years ago.
9
9
9 13

I T/ ENCH * /
£•^57"
Hoy lzona l Co/oiTol L / n e
Q-roupipi £?mr^ce.
Baycl F i / le t i F issures
l!<:puefied Zone
O / r r ,
O / P.3 -PI-
t TRENCH ^2
Basf Q-you/^d Bar-I^cc
Hor / -z .onta l C o n f y o l L 3 Lirrow
%

9 f ^ £ B t
H£>pizo/ital Control L ine
9 West
9

ce. C o n t P n u i e d 3<^low
^ ' . . , . • •
." ,*", - -
...- • ' . 1 -
West
* - i"-! ,•- ' ' . ' •
T Hor jZ /on f i i l Cdn-typl L i n e
O . . I n ) H—H 1
• — r — 1 »
o / a 3 Pf %
n d 3 u r - P a c ^ WGSf-

TRENCH ^ 3
Bpis f
/lp>rizont£ii Conf ro l L / n e
(j-rao/nd 3 L
OonfPn u&d • f yo tn
C f r o u n c l SfLir
TIRE NCH 4-
Eas-t
J^p>yi2.onfal Contro l L / n e

t TRENCH ^ 5
W^et
^rr-canc
Hpfr/'ZonfpiI C o n t r o l L//?e
9 • ("» I — I — I — I -
O I z s -PI-
9 TKENCH * P>
Cf r o u n d Sur-P/acG.
Hi>riz£>/)t^i/ C o n t r o l L /n -e
Band Filled F i ssu res
%

9 B^73t
- • • . . • - A ^ A ^ » ' ^ > * > . . . . . . . . , , , , , • - " - - - l ' ' -
• • : ^ ^ s x . .,.....•- .'.•••vicAiwte8u-(a .""••'^•i .-. . * " " ' * * " - r V " " i I - • • • • - - ' ^ - - - • • ' - ' - 1 , ' y - ^ - - - . v j . . . . j a t . - ...-*.'-••• > . .
"^^^l^'^t^j^-^ ^•''t;:^^*?^'''-vv •'*"'
#
#

Appendix I

APPENDIX I
Inspection Forms
SUVSWD Bayview Class I Landfill Permit Application

Bayview Landfill Inspection Report South Utah Valley Solid Waste District
Type of Inspection: DailyAVeekly/Monthly/Quarterly/Semiannually (circle one)
Performed by: Date:
1. Structures & Roads Fences & Gates
Access Roads Ditches
Screening Berm 2. Landfill Operations
Fence & Gates Litter Control
Protective Cover Daily Cover
Intermediate Cover Final Cover Equipment
Stormwater Ditches 3. Leachate Pond
Fence & Gates Depth Gage
Liner System Influent Pipe
Gravity Sewer 4. Monitoring Facilities
Weed Control Groundwater Wells
Gas "Wells"
Overall Condition Satisfactory Needs Work*
*Specify the work needed and the timeframe.
Other Comments:
1 I SUVSWD Bayview Class I Landfill Permit Application February 2009


APPENDIX J
Seismic Analysis
SUVSWD Bayview Class I Landfill Permit Application

APPENDIX J
SEISMIC ANALYSIS FOR
SOUTH UTAH VALLEY SOLID WASTE DISTRICT BAYVIEW LANDFILL, CELL 1
ISSUED JULY 1996
PREPARED BY
HDR ENGINEERING, INC.

TABLE OF CONTENTS
Number Title Page No.
SECTION 1.0 INTRODUCTION 1-1
1.1 Purpose 1-1
1.2 Scope 1-1
SECTION 2.0 SITE CONDITIONS 2-1
2.1 Location 2-1 2.2 Soils 2-1 2.3 Geology 2-3 2.4 Seismicity 2-3 2.5 Adopted Design Values 2-10
SECTION 3.0 STATIC AND PSEUDO-STATIC STABILITY ANALYSES 3-1
3.1 Cases Considered 3-1 3.1.1 Cell 1, Stage 1 Excavation 3-1 3.1.2 Cell 1, Stage 1 Liner and Leachate Collection System 3-1 3.1.3 Cell 1, Stage 2 Excavation 3-1 3.1.4 Cell 1, Stage 2 Liner and Leachate Collection System 3-1 3.1.5 Cell 1, Stage 2 Operational Filling 3-2 3.1.6 Cell 1, Filled 3-2 3.1.7 Cell 1, Closiore Cap 3-2 3.1.8 Stormwater-Leachate Basin 3-2 3.1.9 Adopted Design Cases , 3-2
3.2 Methodology 3-3
SECTION 4.0 SITE SPECIFIC GROUND MOTIONS 4-1
4.1 Approach 4-1 4.2 Site Classification 4-1 4.3 Free Field Aceleration 4-2 4.4 Peak Acceleration at Top of Landfill 4-2
SECTION 5.0 DEFORMATION ANALYSIS 5-1
5.1 Approach 5-1 5.2 Allowable Deformation 5-1 5.3 Excavations and Fills 5-1 5.4 Liner and LCRS Systems 5-2 5.5 Closure Cap System 5-2
Seismic Evaluation i HDR Engineering, Inc. Bayview Landfill July 1996 South Utah Valley Solid Waste District

SECTION 6.0 FINDINGS AND CONCLUSIONS 6-1
6.1 Findings .....6-1 6.2 Conclusions 6-1
REFERENCES
LIST OF TABLES
Number IMfi Page No. 2.1 Summary of Regional and Site Seismicity 2-10 2.2 Soil Stratigraphy and Physical Properties 2-10 3.1 Adopted Interface Friction Values 3-4 3.2 Global Stability of Cut and Fill Slopes 3-4 3.3 Stability of Cell 1 Liner and Closure Cap Slopes 3-5 4.1 Free Field Acceleration (PGA) 4-2 5.1 Estimated Pennanent Deformations 5-1
LIST OF FIGURES
Number Title Page No. 2-1 Boring Location Plan 2-2 2-2 Geographic Location 2-4 2-3 Aquifer Cross Section G-G Goshea Valley, Utah 2-5 2-4 Probabalistic Earthquake Acceleration 2-6 2-5 Quaternary Tectonic Features and Seismicity of Utah 2-7 2-6 Quaternary Faults and Folds, Utah 2-9 3-1 Cell 1 Liner and LCRS Stability 3-6 5-1 Cell 1 Liner and LCRS Deformations 5-3
LIST OF ATTACHMENTS
A - Design Earthquake Motions B - Static and Pseudo Static Stability Analyses C - Site Seismic Response Analyses D - Seismic Deformation Analyses
% Seismic Evaluation Bayview Landfill South Utah Valley Solid Waste District
HDR Engineering, Inc. July 1996

SECTION 1.0 INTRODUCTION
1.1 Purpffge
The Bayview Landfill (the Site) is located in a Seismic Impact Zone, as defined by the State of Utah Administrative Rules (Utah Department of Environmental Quality, 1996).
This report provides analyses demonstrating that, "...all contaiimient structures...and surface water control systems are designed to resist the maximum horizontal acceleration in lithified earth material for the site."
These analyses have been conducted in accordance with the State of Utah Administrative Rules and EPA guidance presented in RCRA Subtitle D (258) Seismic Design Guidance for Municipal Solid Waste Landfill Facilities, (EPA, 1995).
1.2' Scope
The scope ofthis report includes a literature review of regional and local seismicity, demonstration analyses ofthe seismic performance ofthe Site features and a report of findings and conclusions. This report is divided into the following sections:
• Section 2 - Site Conditions - presents soils, geology and seismicity data for the Site.
• Section 3 - Static and Pseudo-Static Stability Analyses - presents stability analyses for Cell 1 components; run-on/run-off controls; and the stormwater-leachate basin.
• Section 4 - Site Specific Ground Motions - presents site specific seismic response ofthe Site soils and landfill features
• Section 5 - Deformation Analyses - presents estimates of deformations ofthe Site soils and landfill features
• Section 6 - Findings and Conclusions - discusses the impact ofthe estimated deformations on the fimction ofthe landfill features.
Seismic Evaluation I-I HDR Engineering, Inc. Bayview Landfill July 1996 South Utah Valley Solid Waste District

SECTION 2.0 SITE CONDITIONS
2.1 Location
The Site is located in Sections 17 and 18, T9S, RIW, of Utah County. The site is approximately 5.5 miles north of Elberta, Utah and directly west of state Highway 68. The approximate latitude and longitude ofthe site are 40°02'N by 111 °58'W.
2.2 Soils
Information on the site soils has been obtained fiom regional references, on-site soil borings and on-site monitoring well logs. The locations ofthe on-site borings and monitoring wells are shown on the Boring Location Plan, Figure 2-1.
The surficial soils consist of mostiy Lake Bormeville Group, Provo Formation gravel, sand, silt and clay that were deposited in Lake Bormeville during Pleistocene time (Bissell, 1963). These soils were derived fi'om erosion ofthe East Tintic Mountains and carried by streams into the ancient lake where they were deposited as beach, bar and spit deposits along the fluctuating shoreline (Hintze and Fuhriman, 1983). This fluctuating lakeshore environment created cycles of saturation and dessication, resulting m well consolidated deposits, commonly cemented with calcium carbonate (Chen and Associates, Inc., 1980).
Nine 50 feet deep soil borings were made on the site during site selection (Chen and Associates, Inc.) and site development (Rollins, Brown and Gunnell, Inc., 1983). The site-specific soil borings in the vicinity of Cell 1 indicate the soils consist of interbedded layers of dense to very dense sand (SW, SP, SC); medium dense to very dense gravel (GM, GW); and firm to very hard, low plasticity silt (ML) and clay (CL). Standard Penetration blow counts range fi'om 13 to refusal in the silts and clays; 30 to 110 in the sands; and 85 to 125 in the gravels. No stratigraphic continuity was noted among the borings (Hintze and Fuhriman, 1983).
The six shallow monitoring wells shown on Figure 2-1 were advanced to nominal depths of 75 feet (Roy F. Weston, Inc., 1994). The soil types and discontinuous stratigraphy were similar to those observed in the soil borings.
The six deep monitoring wells shown on Figure 2-1 were advanced to depths ranging from 165 to 520 feet deep to encounter the "Shallow Pleistocene Aquifer." None ofthe borings encountered bedrock. These deeper borings indicated a trend to a more cemented soil structure and coarser gravel sizes at depths below 100 feet. The boring logs and gradation data (Bissell, 1963) indicate that cobble and boulder size materials are present.
Seismic Evaluation 2-1 HDR Engineering, Inc. Bayview Landfill July 1996 South Utah Valley Solid Waste District

N
a Scale: 1"=800'
JL_ SMW-3. DMW-5
V^

«
Review of well logs summarized by the United States Geologic Survey (USGS, 1993) indicates that wells in nearby sections have been drilled to 800 feet without encountering bedrock.
Perched water table aquifers have been encoimtered within the Lake Bonneville Group deposits (Dustin and Merritt, 1980). However, culinary wells are advanced hundreds of feet deep to obtain adequate yield (USGS, 1993).
2.3 Geology
The Site is located in northwestem Goshen Valley, in the Great Basui portion of the Basin and Range Physiographic Province (Figure 2-2, after Dustin and Merritt, 1980). The eastem boundary ofthe Basin and Range Province is formed by the Wasatch Range, approximately 25 km east ofthe site (Hecker, 1993).
This Province is characterized by block faulting that has produced roughly parallel fault-block mountains that are separated by flat valley bottoms filled with alluvial and lake deposits.
The Goshen Valley is boxmded by the East Tintic Mountains on the west, Utah Lake on the north, West Moimtain on the east, and Long Ridge on the south.
A cross-section of Goshen Valley, cut as shown on Figure 2-2, is presented on Figure 2-3 (Dustin and Merritt, 1980). The bedrock at the site is interpreted to consist of Miocene Epoch conglomerates, overlying Ogliocene Epoch volcanic flow materials and conglomerates, overlying Paleozoic Era limestones and dolomites.
2.4 Seismicity
The probabilistic bedrock acceleration at the Bayview site is 0.5g (490 cm/sec ) as detennined from the U.S. Geological Siirvey Map MF-2120 (Figure 2-4, after Algermissen etal., 1990). The associated probabilistic maximum earthquake magnitude is 7,3 (Algermisson, et.al., 1982). An overview of state-wide seismicity is presented on Figure 2-5 (after Hecker, 1993). Earthquake magnitudes (M) greater than 2, as recorded during the tune period 1962-1989, are also shown on this figure.
The maximum credible earthquake (MCE) for the Bayview site carmot be determined from the probabilistic maps. These map accelerations have been established on a probability basis and often eliminate peak accelerations that are judged as having the smallest chance ofoccurrence.
Seismic Evaluation 2-3 HDR Engineering, Inc. Bayview Landfill July 1996 South Utah Valley Solid Waste District

N
®
ifivi^;^"^;
After Dustin and Merritt, 1980
Q . Profile Axis (based on well logs) Q 1
Scale
Miles
HDR Engineerhg, Inc.
Geographic Location
South Utah Valley Solid Waste District Bayview Landfill
Date
May 1996
Figure
2-2

%
r4CtD
U J £ I S
Restricting Layer Unconsolidated Deposits of Probable Pleistocene and Tertiary Ages Limestone & Shale of Probable Paleozoic Age.
Horizontal Scale P 1 2
Miles
Atfer Dustin and Merritt, 1980
HDR Engineerfrig, Ina
Aquifer Cross Section G-G Goshea Valley, Utah
South Utah Valley Solid Waste District Bayview Landfill
Data
May 1996
Figura
2-3

Scale: 1" =600,000*
After Algermissen, et.al., 1990
HDR Engineering, he.
Probabalistic Earthquake Acceleration
South Utah Valley Solid Waste District Bayview Landfill
Date
May 1996
Figure
2 - 4
3v ^ y \
Wif I \ / y > ''y^-]'! .
-'.p-4Cfl^/:xA: '• y . . '••\^., •- • .
m - A . ' ' -A'. ' ' N
100 Km J I I » 1 I—>—I—I

Krinitsky (1989) has proposed a deterministic method, which considers the capability of a fault to produce an earthquake, independent ofthe probability of occurrence or retum period. This method is based on the following premises:
• All earthquakes are caused by movement on faults.
• Whether or not a fault will produce earthquakes can be judged by the recency of previous fault movement.
• The size ofthe potential earthquake is in proportion to the size ofthe fault.
• Faults tend to produce earthquakes that are characteristic of each feult.
The MCE for a fault can be detennined from measurements of fault length and surface displacement. The intensity and acceleration at the site can then be determined from source-to-site distance-attenuation relationships.
The Site is located in the "Wasatch Front iregion," defined as the geographical area from latitude 38°55'N to 42°30'N, and from longitude 110°25'W to 113°10'W (Hecker, 1993). The average regional recurrence interval for surface-faulting earthquakes (M>6 to 6.5) within the Wasatch Front region is 125 to 300 years. However, earthquakes below this M = 6.5 threshold for surface faulting may be capable of producing damaging ground motions. Faults in the vicinity ofthe Site are shown on Figure 2-6 (after Hecker, 1993).
The design earthquakes for the Bayview site were determined using the following steps, after Krinitsky (1989):
• Detemiine capable faults in the site vicinity. Capable faults are active faults judged capable of generating felt earthquakes. The criteria established by the Nuclear Regulatory Commission (Krinitsky, 1989) and the historic tectonic data (Hecker, 1993) were used to screen the potential faults.
• Determine the Maximum Credible Earthquake (MCE) for each capable fault. As discussed previously, the size ofthe potential earthquake is in proportion to the size ofthe fault. Relationships presented in Krinitsky (1989) were used to determine the soiirce magnitude (MQ) from fault mpture length and displacement.
Determine the Modified Mercali Intensity (MMI) and maximum horizontal acceleration (MHA) ofthe MCE at the Bajrview site. Source-to-site attenuation, intensity and acceleration at the Bayview site were determined in accordance with Krinitsky (1989).
Seismic Evaluation ' 2-8 HDR Engineering, Inc. Bayview Landfill July 1996 South Utah Valley Solid Waste District

Not to Scale
After Hecker, 1993
KR HDR Engineering, Inc.
Quaternary Faults and Folds, Utah
South Utah Valley Solid Waste District Bayview Landfill
Dita
May 1996
Figure
2-6

Details of these analyses are presented in Attachment A. The results of these analyses are presented on Table 2.1.
Table 2.1 Summary of Regional and Site Seismicity
FAULT DATA Fault Name
TopliffHill Mecur East Tintic Mountains Wasatch - Provo segment Long Ridge Wasatch - Nephi segment
Distance to Site (Km)
22 24 18
24-36 14
18-21
MCE (Mo) 6.8 7.0 6.7 7.2 6.8 7.2
SITE DATA MMI
(-) VIII IX
VIII IX
VIII IX
MHA (%g) 0.30 0.30 0.38 0.40 0.47 0.50
2.5 Adopted Design Values
The regional soil stratigraphy and site-specific boring logs were reviewed to establish a design profile for use in subsequent stability analyses. Soil shear strengths were based on the laboratory soil testing program and correlations with the Standard Penetration Test results (Department ofthe Navy, 1982). Waste shear strengths were based on EPA data (EPA, 1995). The adopted stratigraphy and corresponding physical properties are summarized on Table 2.2.
DEPTH
Waste 0-100 100-800 800+
Soil Stratigra] UNIT WEIGHT
(pcf) 50 110 120 120
Table 2.2 phy and Physical Properties
COHESION (c) (psf) 150 0 0 0
FRICTION (()) (degrees)
22 40 45 45
The adopted design earthqiiake for the Bayview landfill site is a MMI = IX, with a corresponding MHA of 0.50g. This deterministic value is consistent with the probabilistic values of MQ = 7.3 and MHA = 0.50g presented by Algermisson (1982, 1990).
Seismic Evaluation Bayview Landfill South Utah Valley Solid Waste District
2-10 HDR Engineering, Inc. July 1996

%
SECTION 3.0 STATIC AND PSEUDO-STATIC STABILITY ANALYSES
3.1 Cases Considered
Stability analyses were conducted to determine the factor of safety against slope failures under static and pseudo-static loading conditions. The following landfill features, shown on Figure 2-1, were considered:
3.1.1 Cell 1. Stage 1 Excavation
Stage 1 of Cell 1 was constmcted in 1989. The cell was excavated at 1V:4H (25 percent) slopes, to a maximum depth of nominally 40 feet. There was approximately 20 feet of relief m the original ground surface topography, resulting in higher slopes in the northern and westem portions ofthe cell. These higher slopes are broken with a nominal 10 feet wide drainage bench approximately midway on the slope.
3.1.2 Cell 1. Stage 1 Liner and Leachate Collection System
The exisiting liner system for this stage consists of a 40-mil smooth High Density Polyethylene (HDPE) geomembrane sandwiched between two layers of 12 ounce per square yard nonwoven geotextile. The lower geotextile was used to provide a cushion against puncture from the imderlying granular subgrade. The upper geotextile was used to provide the tensile strength necessary to resist the forces generated by the 2 feet thick leachate collection/protective cover layer sliding down the 1 V:4H smooth HDPE surface.
3.1.3 Cell 1. Stage 2 Excavation
Stage 2 of Cell 1 is proposed for development. The proposed side slopes will match the Stage 1 grades and will consist of 1 V:4H (25%) slopes, to a maximum depth of nominally 40 feet along the westem and southem portions of tiie cell. These slopes are consistent witii Utah Admmistirative Code R315-303-4 (3), (UDEQ, 1996).
3.1.4 Cell 1. Stage 2 Liner and Leachate Collection Svstem
The proposed Stage 2 system will consist of a 60 mil smooth HDPE geomembrane over a cushion geotextile or a sand cushion layer.
The leachate collection/protective cover layer will consist of 2 feet of native dune sand. The side slope portions ofthe leachate collection/protective cover layer will be reinforced with a high strength geotextile to provide cushioning and increased side slope stability under both static and seismic loading.
Seismic Evaluation 3-1 HDR Engineering, Inc. Bayview Landfill July 1996 South Utah Valley Solid Waste District
3.1.5 Cell 1. Stage 2 Operational Filling
It is anticipated that the Stage 2 waste fills will be placed in 10 feet thick lifts, similar to the current operations for Stage 1. Fill slopes typically vary, with steeper slopes occuring at the working face. Two fill heights will be considered: 1) El. 4760+, representing a waste backfill to the initial ground surface, and 2)E1, 4780, representing approximately 20 feet ofwaste above the initial ground surface.
3.1.6 Cell 1. Filled
The proposed waste fill slopes average 5 percent from the crest at El. 4812 to a variable slope break, rangmg from El. 4800 to 4780. The side slopes are 1V:4H (25%) from the slope break to original grade. Maximum waste fill heights in Cell 1 are 90 feet above the cell bottom and 50 feet above original grade. These slopes are consistent with UtahAdministrative Code R315-303-4 (4) (UDEQ, 1996).
3.1.7 Cell 1. Closure Cap
The proposed Cell 1 final cover liner will consist of a 60 mil Low Density Polyethylene (LDPE) smooth geomembrane; overlain by 12 inches of native sand drainage material; overlain by 6 inches of vegetative cover soil. This liner system will overlay a 12 inch gas transmission layer composed of native sand soils.
3.1.8 Stormwater-Leachate Basin
The Stormwater-Leachate Basin was constmcted in 1989. The basin was excavated at 1V:3H slopes, to a maximum depth of nominally 24 feet. The basin is lined with a geotextile cushion layer and a 60 mil smooth HDPE geomembrane. A second, sacrificial 40 mil HDPE geomembrane is used for weather protection on the sideslopes. Six inches of concrete is used on the basin floor.
3.1.9 Adopted Design Cases
These features were consolidated into the following cases for analysis:
• Cell 1, excavation slopes, considering global soil stability.
Cell 1, liner and leachate collection system (LCRS), considering side slope stability
• Cell 1, Stage 2 operational filling, considermg sUding on cell floor liner and LCRS.
Seismic Evaluation 3-2 HDR Engineering, Inc. Bayview Landfill July 1996 South Utah Valley Solid Waste District

%
• Cell 1, final waste fill slopes, considering waste fill stability.
• Cell 1, closure cap, considering side slope stability
• Stormwater-leachate basin, considering global soil stability.
3.2 Methodology
Both static and pseudo-static conditions were evaluated. The generalized factor of safety against a slope failure is defmed as: F.S. = s/x, where s is the available shear strength ofthe slope and T is the shear strength required for just-stable equilibrium.
The Simplified Bishop curcular arc method was used to evaluate the global stability ofthe excavated and filled slopes. The computer program REAME (EPA, 1986) was used to conduct these analyses. This program searches for the potential failure surface which produces the lowest factor of safety. The location ofthis failure surface is a function ofthe site geometry (slope angle and height); material stratigraphy and physical properties; and loadings (weight of soil and/or waste above the failure surface).
The sliding block (wedge) metiiod (USACE, 1970) was used to evaluate the sliding stability along the bottom liner and the LCRS system. The computer program UTEXAS3 (Wright, 1991) was used to conduct these analyses. The failure surface is defined by the bottom of the cell.
The infinite slope method (USACE, 1970) was used to evaluate the stability ofthe cell liner and LCRS system and the closure cap system. Generally, the failure surfaces for these features are defined by planar interfaces with the geosynthetic components.
For a given slope geometry, the interface fiiction angle, 5, between adjacent materials normally control slope stability, with the lowest interface fiiction angle controlling overall slope stability. Adopted fiiction values for the geosynthetic interfaces are presented on Table 3.1.
A minimum static safety factor of 1.3 was adopted (EPA, 1993). The pseudo-static seismic coefficient (k ) was iterated for both the circular arc and the infinite slope analyses to determine the yield acceleration (ky) corresponding to a factor of safety of 1.0. This yield acceleration is used to estimate the cell liner, cell leachate collection system and closure cap deformations (Section 5).
Seismic Evaluation 3-3 HDR Engineering, Inc. Bayview Landfill July 1996 South Utah Valley Solid Waste District

Table 3.1
Adopted Interface Friction Values
INTERFACE
LOWER UPPER
FRICTION
ANGLE (8)
LINER AND LCRS
Soil Subgrade
Cushion Geotextile
-or- Sand Cushion
Smootii 60 mil HDPE
Cushion Geotextile
-or-Sand Cushion
Smootii 60 mil HDPE
Granular LCRS
•27"
27° 90
170
17°
CLOSURE CAP
Granular Gas Vent
Smootii 60 mil LDPE
Smootii 60 mil LDPE
Granular Cap Drain
25°
25°
The results ofthe static and pseudo-static stability analyses for the excavations and waste fills are presented in Attachment B and summarized on Table 3.2. The results indicate that the static factor of safety is adequate for the existing and proposed cut and fill slope geometry. The yield accelerations at a safety factor of 1.0 are near the the adopted peak bedrock acceleration, suggesting minimal permanent deformation (EPA, 1995). The estimated magnitude ofthis deformation is quantified in Section 5.
Table 3.2 Global Stability of Cut and FiU Slopes
FEATURE
Cell 1,1 V:4H Excavation Slopes Cell 1,1V:4H Waste Fill Slopes Stormwater-Leachate Basin, 1V:3H Slopes
STATIC FACTOR OF SAFETY
2.5+ 2.5+ 2.5+
YIELD ACCELERATION
0.52g 0.44g 0.52g
The results ofthe static and pseudo-static stability analyses for the cell liner and LCRS and the closure cap are presented in Attachment B and summarized on Table 3.3.
Seismic Evaluation Bayview Landfill South Utah Valley Solid Waste District
3-4 HDR Engmeermg, Inc. July 1996

Table 3.3 Stability of Cell 1 Liner and Closure Cap Slopes
FEATURE Side slope Imer and LCRS
Bottom Imer and LCRS
Closure Cap
5 9 17 9 17 25
F.S. Fig 3-lA Fig 3-lB
3.25 5.18 1.87
kv Fig3-1A Fig 3-lB
0.15 0.25 0.21
^regd
Fig 3-lA Fig 3-lB
None None None
Infinite slope analyses at the liner - LCRS interface indicate that the 9° and 17° interfaces will not meet the minimum static factor of safety on a 1 V:4H (14 degrees) slope.
Tensile reinforcement, similar to that used in the Stage 1 constmction, is required to provide additional resistance against both static and pseudo-seismic forces. Higher reinforcement levels will increase both the static safety factor and the yield acceleration at which permanent displacements begin. The relationship among the interface fiiction angle (5), static factor of safety (FS), yield acceleration (ky) and the required reinforcement strength (Tj qd) is shown on Figure 3-1.
% Seismic Evaluation Bayview Landfill South Utah Valley Solid Waste District
3-5 HDR Engineering, Inc. July 1996

1 5 *
3.00
2.50
o (/J
2.00 - -
"5 1 .50-^
o Lt. 1.00
0.50 - -
3.50
Figure 3 -1A 40' High IV: 4H Slope Interface Friction = 9*
0.2 0.3 0.4
Pseudo-Static Seismic Coefficent
0.5
Figure 3 - I B 40' High IV: 4H Slope Interface Friction = 17*
0.1 0.2 0.3 0.4 Pseudo-Static Seismic Coefficent
HDR Engineering; Inc.
Cell 1 Liner and LCRS Stability
South Utah Valley Solid Waste District Bayview Landfill
Date
Moy 1996
Figure
3 - 1

SECTION 4.0 SITE SPECIFIC GROUND MOTIONS
%
4.1 Approach
The MHA selected in Section 2 is the maximum horizontal acceleration in the Site bedrock and does not reflect the effect ofthe overlying soils on the horizontal acceleration developed at the ground surface or at the top ofthe closed Cell 1.
These ground motions were determined using the "Simplified Analysis" presented in EPA, 1995. This Simplified Analysis is considered appropriate for the Site, based on considerations ofthe soil stratigraphy and geology. The Simplified Andysis consists of the following steps:
• Classify the site, based on shear wave velocity in the upper 100 feet ofthe soil column.
• Estimate the free field peak ground surface acceleration (PGA), based on the site classification and the MHA in the bedrock.
• Estimate the peak acceleration at the top ofthe landfill, based on the PGA and the seismic response ofthe waste.
Details ofthis Simplified Analysis are presented in Attachment C.
4.2 Site Classification
The shear wave velocity was based on Utah Geologic Survey (UGS) experience in the area (Christensen, 1996) and the Site-specific soil borings.
The UGS has classified this area of Utah Coimty as a "hard site," generally considered as having a shear wave velocity greater than 400 meters per second (m/s).
Site-specific shear wave velocities were computed fiom the Standard Penetration Test data (N values) reported in the geotechnical investigations (Department ofthe Navy, 1982). The computed average shear wave velocity in the upper 100 feet was 386 m/s.
Based on this range in shear wave velocity, the site was classified as a medium stiff (200 to 375 m/s) to stiff (375 to 700 m/s) site (EPA, 1995). Botii classifications were carried forward for ftirther analysis.
Seismic Evaluation 4-1 HDR Engineering, Inc. Bayview Landflll July 1996 South Utah Valley Solid Waste District

4.3 Free Field Aceleration
The PGA was determined from Ihe site classification and the MHA (Section 2). Both the medium stiff and stiff classification ranges were considered. The results are presented on Table 4.1.
Table 4.1 Free Field Acceleration (PGA)
SITE CLASSIFICATION Medium Stiff Stiff
MHA 0.50 0.50
PGA 0.50 0.50
The results ofthis analysis indicate the Site soils provide little attenuation or amplification to the MHA. This is a function of both the site soils and the high MHA (EPA, 1995).
4.4 Peak Acceleration at Top of Landfill
The peak acceleration at the top ofthe landfill was determuied from the PGA and the seismic response ofthe waste mass, using the recommended "soft-soil site" ampUfication curve of Idriss (EPA, 1995).
The results ofthis analysis indicate a peak acceleration of 0.42 g at the top ofthe landfill, suggesting a slight attenuation through the waste mass.
Seismic Evaluation Bayview Landfill South Utah Valley Solid Waste District
4-2 HDR Engineering, Inc. July 1996
#

SECTION 5.0 DEFORMATION ANALYSIS
5.1 Approach
Pennanent deformations resulting from the adopted design seismic event were estimated for each ofthe landfill features identified in Section 3. Chart solutions, based on the "Newmark sliding block" method, were used to quantify these deformations.
The Newmark method is based on the premise that permanent deformations (U) accumulate along a failure surface when the acceleration m the failure mass (amsx) exceeds the yield acceleration (ky) along the failure surface. The yield acceleration and the mass acceleration for each feature are presented in Sections 3 and 4, respectively.
The results of these analyses are presented in Attachment D and discussed in the following.
5.2 Allowable Deformation
An upper limit of 30 cm.(l foot) was established as the maximum tolerable deformation for the geosynthetic components (EPA, 1995). For a 40 feet high 1V:4H slope with a slope length of 165 feet, the elongation from this maximum 1 foot of deformation would be 0.6 percent (1ft - 165ft, as a percent). The yield elongation for 60 mil smooth HDPE is nominally 12 percent (NSF, 1991), indicating adequate reserve elongation capacity.
5.3 Excavations and Fills
The permanent deformations for the Cell 1 excavations, the stormwater-leachate basin and the Cell 1 waste fill were estimated from the Makdisi and Seed chart version of the Newmark method (EPA, 1995). These estimates are presented in Table 5.1.
Table 5.1 Estimated Permanent Deformations
FEATURE Cell 1 excavations Cell 1 waste fill Stormwater-leachate basm
kv 0.52g 0.44g 0.52g
^ a x 0.50g 0.50g 0.50g
u <1 cm. <1 cm <1 cm
m The estimated deformations are minor and reflect the high yield strength along the
failure surface relative to the mass acceleration from the design earthquake event.
Seismic Evaluation Bayview Landfill South Utah Valley Solid Waste District
5-1 HDR Engineering, Inc, July 1996

5.4 Liner and LCRS Systems
The permanent deformations for the Cell 1 liner and LCRS were estimated from the Makdisi and Seed chart version ofthe Newmark method (EPA, 1995). These estimates are presented on Figure 5-1.
As shown on Figure 5-1, the 9° cushion geotextile - smooth HDPE interface requires a minimimi tensile reinforcement of 8.2 kips per linear foot (Idf) to limit permanent deformations to less than 30 cm. The 17° sand cushion - smooth HDPE interface requires a minimum tensile reinforcement of 3.5 kips per linear foot (klf) to limit permanent deformations to less than 30 cm.
5.5 Closure Cap System
The permanent deformations for the Cell 1 closure cap were estimated from the Hynes and Franklin chart version ofthe Newmark method (EPA, 1995). None ofthe estimated deformations exceeded 10 cm. No remforcement is required for this proposed clossure cap.
4
Seismic Evaluation Bayview Landfill South Utah Valley Solid Waste District
5-2 HDR Engineering, Inc. July 1996

3 4 5 6 7 8 9 Reinforcement Tension, T, (KLF)
3 4 5 6 7 8 9 10 11 12 13 Reinforcement Tension, T, (KLF)
WR Engneering, h a
Ceil 1 Liner and LCRS Deformations
South Utah Valley Solid Waste District Bayview Landfill
Dote
May 1996
Rgure
5-1

SECTION 6.0 FmDINGS AND CONCLUSIONS
6.1 Findings
The Bayview Landfill site is located in a Seismic Impact Zone. Both deterministic and probabilistic methods indicate a peak bedrock acceleration of 0.5g. The dense granular soils offer little amplification or attenuation ofthe bedrock acceleration through the overlying soil colimm.
The cut and fill slopes and run-on/run-off stmctures have adequate static factor of safety and indicate minimal pennanent deformations (U<1 cm) in response to the design seismic event.
The side slope liner and LCRS system will require a geosynthetic reinforcement to increase the static factor of safety and limit permanent deformations in response to the design seismic event. Either sand or a geotextile can be used as a cushion beneath the geomembrane.
The closure cap system has an adequate static factor of safety and indicates acceptable permanent deformation (U<10 cm) in response to the design seismic event. ; \ No reinforcement is required. ^
6.2 Conclusioi^s
These demonstration analyses indicate that the proposed Bayview landfill components are designed to resist the "maximmn horizontal acceleration" at the site.
Seismic Evaluation 6-1 HDR Engineering, Inc. Bayview Landfill July 1996 South Utah Valley Solid Waste District

9
*
REFERENCES
Bissell, H. J., (1963), I<3fe5ow2evi7/e.- Geology of Southern Utah Valley, Utah, Geological Survey Professional Paper 257-B.
Algermissen S.T. etal., (1982), Probablilistic Estimates of Maximum Acceleration and Velocity in Rock in the Contiguous United States, Open-File Report 82-1033, U.S. Geological Survey.
Algermissen S.T. etal., (1990), Probablilistic Earthquake Acceleration and Velocity Maps for the United States and Puerto Rico, Map MF-2120, U.S. Geological Survey.
Chen and Associates, Inc, (1980), "Proposed Sanitary Landfill Site, City of Provo, Utah," Job No. 130U, Chen and Associates, Inc. Salt Lake City.
Christensen, G.E., (1996), Utah Geological Survey, personal communication.
Departinent of tiie Navy, (1982), Soil Mechanics Design Manual 7.1, NAVFAC DM-7.1, Department ofthe Navy, Naval Facilities Engineering Command, Alexandria, VA.
Dustin, J.D. and Merritt, L.B., (1980), Hydrogeology of Utah Lake with Emphasis on Goshen Bay, Water Resources Bulletin 23, Utah Geological and Mineral Survey, Salt Lake City, UT.
Environmental Protection Agency, (1986), Geotechnical Analysis for Review of Dike Stability (GARDS), EPA 1600/2-86-109a, Office of Research and Development, Cincinnatti, OH.
Environmental Protection Agency, (1993), Solid Waste Disposal Facility Criteria, EPA/530/R-93-017, Office of Solid Waste and Emergency Response, Washmgton, DC.
Envfronmental Protection Agency, (1995), RCRA Subtitle D (258) Seismic Design Guidance for Municipal Solid Waste Landflll Facilities, EPA/600/R-95/051, Office of Research and Development, Washington, DC.
Hecker, S., (1993), Quaternary Tectonics of Utah With Emphasis on Earthquake-Hazard Characterization, Bulletin 127, Utah Geological Survey, Salt Lake City, Utah.
Hmtzc, L.F. and Fuhriman, D.K., (1983), "Geohydrology Stiidy of Proposed West Lake Landfill Site."
Seismic Evaluation HDR Engineering, Inc. Bayview Landfill July 1996 South Utah Valley Solid Waste District

Krinitsky, E.L., (1989)," Empirical Earthquake Ground Motions for an Engineering Site with Fault Sources: Tooele Army Deport, Utah," Bulletin ofthe Association of Engineering Geologists, Vol. XXVI, No. 3, pps. 283-308.
National Sanitation Foundation, (1991), Flexible Membrane Liners, ANSI/NSF 54-1991, NSF Intemational, Ann Arbor, MI.
Rollins, Brown and Gunnell, (1983), Letter report of Subsoil Investigation Submitted to Provo City Department of Engineers. Rollins, Brown and Guimell, Inc., Provo, Utah..
U.S. Army Corps of Engineers, (1970), Stability of Earth and Rock-Fill Dams, Engineer Manual EM 1110-2-1902, Department of tiie Army, Corps of Engineers, Office of the Chief of Engineers, Washington, DC.
U. S. Geological Survey, (1993). Selected Hydrologic Data For Southern Utah and Goshen Valleys, Utah, 1890-1922, Utah Hydrologic Data Report No. 50: prepared in cooperation with the Utah Department of Natural Resources, Division of Water Rights.
Utah Department of Environmental Quality, (1996), Solid Waste Permitting and Management Rules, Utah Administrative Code (R315-301 through 320), Revised as of February 15,1996, State of Utah, Department of Environmental Quality, Division of Solid and Hazardous Waste, Salt Lake City, UT.
Roy F. Weston, Inc., (1994), Application For A Permit To Operate A Class I Landfill. Bayview Landfill, South Utah SW District, Roy F, Weston, Inc., Denver, CO.
Wright, S.G., (1991), UTEXAS3, A Computer Program for Slope Stability Calculations, Shinoak Software, Austin, TX.
Seismic Evaluation HDR Engineering, Inc. Bayview Landflll July 1996 South Utah Valley Solid Waste District

A ATTACHMENT A DESIGN EARHTQUAKE MOTIONS

Jab)«x Na
HDR Computation
Project ^ ^ ^ v ) \ £ . N - J L^tJt^f^VV-X—
KR Subjtct \,.U-»-^'^v^.*— '^JC'VtvAxC, ^ \ / ^ , \ . A M i , T i . ' a ^
I Computed &V-55
Checked IM-Task ' S - g ^ ^ c r iS&S^CssVJ - C l Q H U i O T l w / N t ) Sheet
Date
Date
4-z«? -qt .
^ ^ ^ - 9 6
Of
<3B.J^(yrNJe:'> % \^ Ufe '^^MivJs^ oi<c.A.-e>us P=A,UC\S. ri.<iv*y^£> -sos;
Ao°vJ
\\.e.°\M
n (^^ ^«^^

Jobhkx \No.
HDR Computation ia^ I Projea I Computed
Subject Checked
Task Sheet
Date
Date
Of
Cp: ''A-qrv.os •p-^roc^^fe
%
*
« rv\6>Jc;t**>->5 f^lt-^Ki^ <SpjwjtO!i •a(>^i^c3& uji.Trw.»o. vjk.'yr '^'SvOco LMI_ ^ MJt|oie
<9 Top ^ ' /T" ' ^ ' ' ^
•> -^-sr Tit t le
•A-^. :<r^ c ^ t i - ^ : ^ ^

Uiali Cfohgicai Survey 4?
NAME OR LOCATION AGE OF MOST SLff RATE OF FEATURE RECENT MOVEMENT min^T (LocaUon No.) XlCP years (Time Period
• XlO' years ago)
Goose Creek Mountains (Caults) (6-18)
Parameter values: Quatemaiy(?)
RECURRENCE INTERVAL XIO* years (Time Period
XIO' yean ago)
DISPLACEMENT PER EVENT RUPTURE LENGTH
mete» Idlometen
- I -
Age Ciiteria : fault control of bedroclc-alluviiim contact References ; DoeOing and otheis, 1980
Grouse Creek and Dove Creek Mountains (faults) (6-19)
Parameter values: middle to late Pleistocene(7) I
Age Criteria References Comments
faulted colluvium Compton, 1972 Faults are mapped as Quateinaiy(7) (plate 1) where faulting has uplifted Pliocene to early Pleistocene gravels, and where lineaments and alignel springs suggest active faulting (Todd, 1973; this study).
Sheeprock fault zone (7-1)
Parameter values: Ute Pleistocene(7) I
Age Criteria : scarp morphology References : Bamhard and Dodge, 1988 Comments : From scarp-profile data, the Sheeprock scarps appear to be older than the TopliC HDl, Stansbuty, and Mercur
scarps (location nos. 7-7,7-10, and 7-14). Diffusion-equation modeling of the scarps, which probably represent multiple events (witb a cumulative displacement of <11.5 meters), yielded an age of about 53,000 years (Hanks and others, 19S4). Is contrast, Everitt and Kaliser (1980) concluded that scaip morphology suggests a possible Holocene age for latest faulting. The embayed character of the range front suggests a long period of iiiactivi^ preceding the recent episode of faulting (Everitt and Kaliser, 1980).
Silver Island Mountains - southeast side (fault)
(7-2)
Parameter values: 3 - 5 7 I
Age Criteria References Comments
I I 0.6 7
artifacts D.B. Madsen, written and verbal communication, 1987,1988 Lake Bonneville deposits are vertically displaced 0.6 meters across the fault. Diagnostic artifacts in faulted sediments near fault-line springs and correlations between basal spring-related peat layers and Holocene lake levels provide an estimate of the time of origin of the springs and, presumably, the time of faulting.
Cedar Valley - south end (fault)
(7-3)
Parameter values:
Age Criteria References ' Comments
late Quateniaiy(?) | | ' | 0 - & 0 0 ; C O O y^Z.
range-front morphology Anderson and Miller, 1979 Anderson and Miller (1979) indicated that Quatemaiy(7) alluvium may be displaced, and t h ^ mapped the fault as late Pleistocene (<500,000 years old), although an aerial pholo check for this study yielded no clear evidence of faulted alluvium.

s Quaternary Tectonics of Vuh
RECURRENCE-NAME OR LOCATION AGE OF MOST SLIP RATE
OF FEATURE RECENT MOVEMENT m m ^ (Location No.) XIO* years (Time Period
XIO* years ago)
Silver Island Mountains - west side (fault)
(7-4)
Parameter values: Quatemaiy(7)
fault control ot bedrock-alluvium contact Moore and Sorensen, 1979
Age Criteria: References :
Lakeside Mountains - west side (fault)
(JS)
Parameter values: Quateniaiy(?)
INTERVAL XlO'yean
(Time Period XlOi* years ago)
DISPLACEMENT PER EVENT RUPTURE LENGTH
meters kilometen
' I -
I I
%
Age Criteria : fault contrcd of bedrock-alluvium contact References : Moore and Sorensen, 1979; Young, 1955 Comments : Arabasz and others (1989) included the fault (queried as to state of activity) in a compilation of seismic sources
in the region. They reference T.P. Bamhard as having identified the feature as a lineament that be feels is probably not related to faulting because it parallels topographic contours, and thus may be a shoreline feature.
Xxxskout Pass ^ - south side (fault)
(7-6) .
Parameter values: Quatemary(7) | | |
Age Criteria : fault control of bedrock-alluviimi contact References : Moore and Sorensen, 1979
TopliC ISU fault zone (7-7)
Parameter values: /-:? late Pleistocene(7) | | | /Of OCO—/SO, b ^ J P -
Age Criteria : scaip morphology; shoreline relations References : Bamhard and Dodge, 1988 Comments : Everitt and Kaliser (1980) interpreted a lauUed alluvial fan as younger than the Bonneville shoreline, whereas
Bamhard and Dodge (1988) mapped the same surface as wave-etched and older than the Bonne\ilIe shoreline. ' From scaip-profile data, tbe Topliff Hill scarps appear to be younger than the Sheeprock, Stansbuiy, and Mercur
fault scarps (location nos. 7-1, 7-10, and 7-14). The Topliff Hill scarps show evidence fbr recurrent movement. with a cumulative maximum displacement of 5.8 meters. South of the scaips, the range-front (mapped as a Quatemaiy(7) fault, plate 1) rises in elevation, is linear and faceted, and has an active alluvial apron (Eveiitt and KaUser, 1980).
• J ' « P * M A ^ j f c / » J / r 3 » ^ , / 2 ^ ;2..

JO Quaternary Tectonics cf Utah
NAME OR LOCATION AGE OF MOST SLIP RATE OF FEATURE RECENT MOVEMENT m m ^ (Location No.) XIO^ years
Saint John Station fault zone (7-13)
Parameter values:. late Pleistocene
^1-
(Time Period "Kit? years ago)
-I-
RECURRENCE INTERVAL XIO' years (Time Period
XIO' years ago)
DISPLACEMENT PER EVENT RUPTURE LENGTH
meters kilometers
- I -
Age Criteria : presence of scaips on alluvium; relations to lacustrine features References : Bamhard and Dodge, 1988; Everiu and Kaliser, 1980 Comments : Small-displacement faults in alluvium (not shown on plate 1) lie several kilometers southeast of the Saint John
Sution fault zcme within a portion of the Tooele Army Depot and are buried beneath an unfaulted soil estimated to be older than 125,000 years (Krinltzsky, 1989: U.S. Department of the Army, 1989).
Mercur fault zone (7-14)
^ t Parameter values: late Pleistocene(7) | I C f - A f I / ( '
Age Criteria ; scarp morphology; lacustrine stratigraphy ..-• References ; Bamhard and Dodge, 1988 Comments : Reinterpretation of a trench log that was presented bv Everitt and Kaliser (19801 as evidence for posl-Bonnevllle
fanltine shows a pre-existing fault scarp buried by Bonneville transgressive deposits. A shallow trench excavated across a feature identified by Everitt and Kaliser (1980) as a fkult scaip in a post-lake teirace likewise revealed a buried pre-Bonneville fault scarp. From scarp proGle data, the Mercur scaipsrecord displacements of 1.8-5.6 meters and appear to be younger than the Sheeprock and Stansbuiy scaips (location nos. 7-1 and 7-10), but older than the Topliff Hill scarps (location no. 7-7). Faulted alluvium exposed in a mining shaft, together with an uplifted bedrock pediment, suggest a minimum of 60 meters of Quaternary displacement on tbe fault (Everitt and Kaliser, 1980).
northem Oquinh fault zone (7-15)
Parameter values: 9 - 1 3 J 0.21 - 0 J 3 'dm (<9 -13.5)
2.9-4.8 b
Age Criteria : scaip motphology; shoreline relations References : Bamhard and Dodge, 1988; Everitt and Kaliser, 1980 Comments - : Scarp morphology is more similar to the Bonneville shoreline scarps than to tbe Drum Mountains fault scarps
(location no. 8-1), which have been dated at about 9,000 years old. This suggests an age close to but not greater ihan tbe Provo shoreline, which has been offset across the fault. Compound scarps, with as much as twice the height of the single-event scarps (and with surface displacements of up to 7.3 meters), record an older, pre-Bonneville displacement modiCed by lacustrine erosion. Hanks and otheis (1984) considered the Oquirrh Mountain fault scaips to be older than the Bonneville shoreline and tentatively assigned them a poorly constrained diffusion-model age of 32,000 years. The southern half of the mapped fault Is expressed as a prominent break in slope at the base of the range front,-where Bamhard and Dodge (1988) found no direct evidence of post-Bonneville faulting. However, Tooker and Roberts (1938) mapped several short faults in Bonneville and post-BonnevilIe(7) deposits at the north end of tbe range-front embayment Because the calculated slip rate is based on scaip height rather than displacement, the values may be too high by a factor of two. Youngs and others (1987, in press) inferred a slip rate of 0.1-02 m m ^ for the fault.
f ^ ..K^ fffrsf , . ^ ^ ;?.

Utah Geological Survey 55
RECURRENCE -NAME OR LOCATION AGE OF MOST SUP RATE INTERVAL DISPLACEMENT
OF FEATURE RECENT MOVEMENT m m ^ XIO* years PER EVENT RUPTURE LENGTH (Location No.) XlO'yean (Time Period (Time Period metecs kilometen
XlO^ yean ago) XIO' yean ago)
i
East Tintic Mountains - west side (faults)
(8-16)
Parameter values: middle to late Pleistocene | . | \ -4- • ' 9
Age Criteria : scaip morphology References : Bucknam and Anderson, 1979a
. Comments : Alluvial scarps appear on aerial photos as Isolated, highly dissected renmants surrounded bv several different ayes of unfaulted alluvium and appear to be among Xiit oldest in westem Utah. Steep faceted bedrock spun iiortb and south of Silver City (Goode, 1959) suggest active uplift north of the scarps. In addition, faults in alluvium (not shown on plate 1) were observed northwest of Eureka, about 2 kilometers east of the range front (Goode, 1959). Anderson and Miller (1979) mapped buried Quatemaiy(?) faults extending to the north and south of the alluvial scarps. These faults and faults that form bedrock-alluvium contacts at the south end of the East Tintic Mountains (Mortis, 1987) are mapped es Quatemary(7) on plate 1. On the east side of the mountain ranpe. faults in pre-Bonneville alluvium (not shown on plate 1) were recognized in a tunnel at the south end of Goshen VaUey (Goode, 1959).
Maple Grove (faults) (8-17)
Parameter values: late Pleistocene(?) I l l
Age Criteria : scarp morphology; fault control of bedrock-alluvium contact References : Bucknam and Anderson, 1979a; Oviatt, 1992 Comments : Crestal rounding and dissection suggest that fault scaips are older than the Bonneville shoreline. The steepness
of scarp slopes (up to 47°) is attributed to the coarseness of the alluvium. Evidence of Holocene faulting, present in scarps to the north and south, was not noted for the Maple Grove scarps. The scarps represent displacements of up to 12 meten.
Scipio (Caults) (8-18)
Parameter values: late Pleistocene ^ | | |
Age Criteria: scarp morphology References : Bucknam and Anderson, 1979a; Osfatt, 1992 Conmients : Evidence of Holocene faulting, present in scarps to the north and south, is not seen in the subdued morphology
of the Scipio fault scaips. Faults mapped as Quateniaiy(7) in age on plate 1 are concealed vall^-fiU structures.
%

82 Quaternary Tectonics of Utah
NAME OR LOCATION AGE OF MOST , SUP RATE OF FEATURE RECENT MOVEMENT mmfyr XlO'yean (Location No.) XlO'yean (Time Period (Tune Period
XIO' yean ago) XIO' yean ago)
RECURRENCE INTERVAL DISPLACEMENT
PER EVENT meten
RUPTURE LENGTH kilometen
Towanta Flat graben (12-2)
Parameter values: 130-500
-1-
I I (130-500) On
Age Criteria : soil development; cobble weathering References : Martin and othen, 1985; Nelson and Weisser, 1985 Comments : Some worken (Hansen, 1969a, 1969b; Utah Geological and Mineral Survey, 1977) have assigned late Pleistocene
and Holocene ages to the scarps, based on estimated ages of faulted deposits and the freshness of the scarps. Nelson and Weisser (1985) concluded that there b no significant net tectonic displacement across the graben (although the throw across bidividual scarps has been Zl-2.6 meten per event). This lack of net slip, together with an orientation that diffen from planes deCned by microseismicity, the limited extent of tbe scarps, and an average recurrence interval that is less than half as long as tbe time since the most recent event, suggests that the faults may not have a seismogenic origin and may not be capable of signiCcant future surface-rupturing events. A reported late Pleistocene fault east of Tabiona that lies along the projected strike of the Towanta Flat faults (Ritzma, referenced in Anderson and Miller, 1979) shows no displacement in bedrock. An anomakjus linear drainage used to infer the presence of the fault (Rit^na, referenced in Martin and othen, 1985) is apparently a strike stream. '
Wasatch fault zone - Provo segment
(12-3)
Parameter values:
Age Criteria References Comments
OJ - 0.6 e
' 1 I
1.1 - 1 3 (<S3)
1.0 -1.7 ' (<15)
2.4 (<53)
I 1.5-3.0 n 69S
I I
'^Q TL; lacustrine stratigraphy Lund and othen, 1991; Machette, 1989, in press; Machette and othen, 1991,1992 Based on £ault geometry and apparent recency of movement as indicated by scarp morphology, Machette and othen (1986) tentative^ subdivided the Provo segment (as originally proposed by Schwartz and Coppersmith, 1984) into three subsegments (from north to south, the American Fork, Provo "restricted sense," and Spanish Fork). However, based on the timing of the last two events deciphered Ccom trench studies, the entire length of the Wasatch fault zone in Utah Valley appean to be a single segment (Machette, 1989, b press; Lund and othen, 1991; Machette and othen, 1991). The penultimate event occuned about 2,600-3,000 yean ago; based on results from the northem end of the segment (at American Fork), the prior two events occurred about 5,300 and 5,500-8,000 yean ago. A conflicting chronology of faulting fhim a site near tbe southem boundary of the segment (at Water Canyon, where two events have occurred in the last 1,000 yean) m ^ be explained by spatial overiap of the Nephi and Provo segments, whereby events bom both segments are recorded at the site (Machette, 1989, in press; Ostenaa, 1990). The slip-rate and recunence data are from the American Fork site, where rates of activity appear to have been constant during post-Bonneville time. However, at the Hobble Creek site (east of Spanish Fork), there is two-to-three times more displacement recorded in Bonneville transgressive deposits than in Provo-age regressive deposits. T\venty to thirty meten of displacement in Just a few thousand yean represents slip lates as high as 10 min^ and may be related to tbe presence of Lake Bonneville. Six or seven post-Frovo events are inferred to have occurred at the site, yielding an average recurrence interval of 1,700-2,600 years. The Woodland Hills splay of the Spanish Fork subsegment has evidence for three or four events, totaling 3 meten of displacement, in about the past 130,000 yean, yielding a slip rate of 0.01-0.02 mtn/yr and an average recurrence interval of about 40,000-65,000 yean. Movement on tbe splay apparently occun during only some of the events on the main fault, although tbe most recent event on tbe spU^ occurred about 1,000 yean ago and may be correlative with the most recent event on the main fault. Movement on a couple of short subsidiary faults at the northern end of Utah Valley appears to have occurred during, and nay be related to, the recession of Lake Bonneville.

88 Quaternary Tectonics ef Utah
NAME OR LOCATION AGE OF MOST SUP RATE OF FEATURE RECENT MOVEMENT m m ^ (Location No.) XIO* yean (Time Period
' XIO^ yean ago)
RECURRENCE INTERVAL XlO'yean (Time Period
XIO' yean ago)
IBISPLACEMENT PER EVENT
meten RUPTURE LENGTH
kilometen
East Canyon fault - southern segment
G2-17)
Parameter values late Quatemaiy(7) 12 7
Age Criteria : lange-front moipbology References : Sullivan, Ndson, and othen, 1988 Comments : For Ihe purpose of seismic-hazaid assessment, values for slip rate, recurrence Interval, and single-event
displacemeiit are infened to be similar to those calculated for the Morgan fault (location no. 11-18), based on similarities in fault length and escarpment morphology. The estimated fnarimiim credible earthquake for the fault is 6Ji-<.75 (MJ.
Bear River fault zone (12-18)
Parameter values: 2.4 7 e
I 05-2 .7 7 I 2 3 - Z4-1- 7
I (<4.« < l - S + n 34-40
«
Age Criteria: **C References : West, 1988,1989, in press Comments : The Bear River t^ult zone. (BRF3^ extends from southeast of Evanston, Vi^omhig'to the Uinta Mountains in
Utah, where it ends at a complex Juncture with the North Flank fault. The trend of scaips at the southem end of the zone is shaip^ discordant viitb the main, northerly trend of faulting, perhaps due to the buttressing effect of the Uinta Mountains. The fault lies between the leading edges of the Absaroka and Darby-Hogsbadc thrust faults and appean to be a new (Holocene) feature superimposed on older thrust-belt stmcture. The independent seismic potential of the Absaroka and Darby-Hogsback faults is unclear. A 5<kilometer-long Holocene scarp (tbe Martin Randi scarp), together with at least 10 kilometen of related surface warping, lies west of the BRFZ in Wyoming and is coincident with the Absaroka thrust. The age of most recent movement on this bult is consistent >mth that on the BRFZ, suggesting that it represents movement that is simultaneous and sympathetic with that on tbe main fault zone. Scarp hdghts and tectonic displacements increase markedly &om north to south along the BRFZ. The southernmost scarp, which displaces Pinedale glacial deposits, is 15+ meten high, suggesting that it may have formed from more than two Holocene events. The range in slip rates reflects the range in displacement along the fault zon& Fault-activity paiameten for the BRFZ are comparable to values fbr the Wasatdi fault zone (see location nos. 6-6,11-22,12-3,12-6, and 13-21). There is no evidence to suggest that the BRFZ is segmented. Documented ages of faulting (4,600 and -2,400 yean ago) are considered to be piaTimiup estintates because the residence times of organic matter in the dated soils have not been incorporated into tbe ages. The youthfulness of faulting is demonstrated by tbe presence of beheaded and revened drainages, sag ponds, and displacements in the youngest flood-plain deposits. Northem portions of the BRFZ in Utah are expressed only as drainage lineaments or are obscured by recent landsliding. Assuming that it is planar and basement-penetrating, the BRFZ may be capable of producing earthquakes as large as 7.S (M^.
Utah Lake (faults and folds) (12-19)
I Parameter values: latest Pleistocene to HoIocene(7) |
Age Criteria : lacustrine stratigraphy; deptb lo faulted sediments References : Brimhall and Merritt, 1981 Comments : Fault locations, based on widely spaced seismic-reflection transects, are uncertain. Acoustical profiles show a
penistent 8-15 meter-deep layer identified as the Provo Formation that is displaced from <2 to 5 meten across individual faults and folds beneath the lake. Machette (1989, in press) interpreted the layer as lake bottom sediments probably deposited during the regressive phase of Lake Bonneville The reflection profiles suggest that dispbcements decrease upward in strata above the marker horizon and occur within several meten of the lake bottom.
%
*?;

jjiah Geological Survey 89
NAME OR LOCATION AGE OF MOST SLIP RATE OF FEATURE RECENT MOVEMENT mnvyr (Location No.) XIO' yean (Time Period
XIO^ yean ago)
RECURRENCE INTERVAL DISPLACEMENT XlO'yeaB PER EVENT RUPTURE LENGTH (Tune Period meten kilometen
Xio ' yean ago)
Salt Creek area (fold) (13-1)
Parameter values: Quatemaiy(7)
Age Criteria : deposit characteristics References : Witkind and Spiinkel, 1982 Comments : Pleistocene(7) deposits are tilted northwestward oa the flank of a small diapirie fold.
Juab Vallqr - west side (faults)
(13-2)
Parameter values: late Quatemaiy | | |
Age Criteria : presence of scarps on alluvium References : R.M. Robison, written communication, 1989; Sullivan and Baltzer, 1986 Comments : The scarps, which show a cumulative displacement of —1 meter, are most likely tectonic, but alternatively may be
related to lateral spreading. Although not defined by a bedrock escarpment, a fault has been inferred along tht east side of Juab Valley near the contact between Tertiary volcanic rocks and unconsolidated valley fill The east-dipping fault is thought to intersect the Wasatch fault zone well above the seismogenic crust and thus to be antithetic to the Wasatch fault zone and nol an independent seismic source.
Long Ridge - west side (fault)
(13-3)
Parameter values: middle to late'Pleistocene(7) | | |
Age Criteria ; presence of scaips on alluvium References : Meibos, 1983 Comments : The fault both cuts and is covered by 'oldei" unconsolidated alluvium and forms the contact between bedrock and
alluvium along much of its length.
Long Ridge - northwest side (fault)
(13-4)
Parameter values: Quatemary(7)
Age Criteria : range-front morphology References : Sullivan and Baltzer, 1986
/o /PUTS a)

94 Quaternary Tectonics of Ulah
NAME OR LOCATION AGE OF MOST SLIP RATE OF FEATURE RECENT MOVEMENT mm/yr (Location Na ) XIO? yean (Time Period
XIO^ yean ago)
Price River area (faults) (13-19)
Parameter values Quateniaiy(7)
• I -
-RECURIfflNCE J INTERVAL DISPLACEMENT XlO^yean PER EVENT RUPTURE LENGTH (Time Period meten kilometen
XIO' yean ago)
I I
Age Criteria : geomorphic position; structural setting; presence of lineaments References : Howard and others, 1978; Osterwald and othen, 1981 Comments : Some faults within the zone displace pre-Wisconsui-age pediments less than 2 meten. Most are normal faults
that dip steeply or vertically. Stniaural relations indicate that tbe Gault zone forms the crest of a broad, collapsed anticline. The fault zone is similar in trend, pattern, and length to &ults along the aest of the Moab-Spanish Vall^ anticline (primarily location no. 18-2), although it is not as strongly developed. The faults are inferred to be related to a salt anticline at the northem margin of the Paradox basin. Earty to middle Pl^tocene pedimenu north of the fault zone steepen sharply at the base of the Book Cliffs and may be warped due to elastic rebound of the Mancos Shale during erosional unloading and/or monoclinal folding (not indicated on plate 1). The ancestral course of Whitmore Canyon (near Suniiyside) also appean (o be warped.
Japanese and Cal V a l l ^ (faults) (13-20)
Parameter values: middle to late Pleistocene I I Age Criteria : scarp morphology; fault control of bedrock-alluvium contact; basin closure References : Anderson and othen, 1978; Oviatt, 1992; WiUis, 1991; Witkind and others, 1987 Comments : Alluvial scaips are up to 4 meten high. The pattem of faulUng in Japanese Vall^ suggested to V^tkind and
othen (1987) that the graben-fonned vall^ may be a collapse feature, peifaaps telated to dissolution of salt from the underiying Aiapien Shale. However, Willis (1991) interpreted the faults as basin-range-type extensional faults.
Wasatch fault zone - Nephi segment
(13-21)
Parameter values:
Age Criteria: References : Comments :
0 3 - 0 J 7 e I 0 .8 -137 | 1.7-2.77 | 1 . 4 -2Jn | 42J . ^ S e o - S f e e w p J (<5.5 7) 1 ( < 5 J 7 ) I I
^^C; scaip morphology Jackson, 1991; Machette and others, 1991,1992; Schwartz and Coppenmith, 1984 Scarp morphology and contmui^ suggest vety recent displacement (—300-500 yean ago), although a combuiation of " C and TL dates suggest an age of about 1,200 yean for Ihe most recent event. Schwartz and Coppenmith (1984) determined that the penultimate event occurred before about 4,000 yean ago, whereas Jackson (1991) constrained the event between about 3,000 and 3,500 yean ago. The third-to-last «vent may have occuired between 4,000 and 4,500 yean ago (Jackson, 1991). Thus, actual middle to late Holocene recurrence intervals may vaiy froin less than 1,000 yean to more than 3,000 yean. Three middle to late Holocene events post-date a late Pleistocene(7) fan at the southem end of the segment (at Red Canyon), suggesting a possible hiatus in faulting activity during latest Pleistocene to early Holocene time (Jackson, 1991). The range in displacement-per-event and slip-rate values reflects a systematic decrease in slip between the middle (larger values) and southern end (smaller values) of tbe segment. The Benjamin fault, which extends into Utah Vall^, may be the northem extension of the Neplu segment (wbiiA would then lotal about 50 kilometers In length). Sediments of the Provo phase of the Bonneville lake cyde are offset as much as 2 meten along this fault (Machette, 1989, in press). There is a 15-kilometer-Iong gap in Holocene faulting between the Nephi segment and the Levan segment to the south. Faults associated with young scarps north of the town of Nephi are probably continuous with near-surface faults in the town Uentified from seismic-reflection data (Crone and Harding, 1984b). A number of small faults ni Quatemaiy deposits have been identified on the western Qaiik of the Gunnison Plateau east of Nephi (not shown on plate 1; Biek, 1991).
%

JobNa Na
HDR Computation KR I Project
Subjea
Task
I Computed
Checked
Sheet
Date
Of
c2. U)e:f^sii-fftJs. A / C ^ gyg c^pAScjSr f ^ u u r ^
J . / c/ iC i z ^ ^ ^/&^' 4—1 7 4-2- 'BBiJO(i~j
Cl
I
i
>9 •J3tti
X ^ ^ ^ X
s£ i < vs !<. <i ^~•
fsl t o t«l
i ^ ^ I i I vS
o vs K
t r "?.
1 VJ\
^ ^ 4 ^
r-
>i t<
3 <i
^ ^
i 5
\0
I
ifi
1-
mhl r- ^ ::5 -.o 4 P \ -r \ \ * » r fl. * TJ SD "IS
. ^ 8J3 03
s g 7J a i 1 7.0
1 ~ ^, «-5
6.0
-
^ 4 . ...--
_
•
\ y y »
^
c
/
^ / • . / ^
• / • ^ - " • ' ^ . ! . j / . ^ ^ ^
. • • . ^ ^
y " ^ 7 y** 'A
/ * \ /
*
— 1 1 L
• 1/i . ^ » • t d r ^ • , ^ * V ••• •
1 I
. r . f
E * - A ' TO tSTlMATE UAOHmiOt:
«-a 'TO MTiMATi nupTOne
10 60 100 500
LENSTH OF SURFACE RUPTURE, N KILOMETERS
Fisurt 4-1. RaUtion ol length of M J H M * niptur* to Hrthqualw magnltiid* (Benllli, Muk, ond Lionkuihpar
6.0 6.5 7.0 7.3 B.0
EARTHQUAKE MAGNTTUDE Outs)
FIgur* 4-2. Roktlon of mnlfflum nirioe* dlaplmmMit te Mrthqtuka mognltud* (Bonttti^ Mark,: Ll«ika«np«r 1U4) .

JsbNa Na
^fDR Computation^ i3i [Project
Subject
Task
I Computed [Date
Checked Date
Sheet Of
3 J>Sy=e^f~iitJS a^ /cr S i r B
TT
^ ^ ^ W J ^ - ^ "SoO -j S O.--A?-0^ o ^ ^ j S p 1 . , Bf^ O = > J O ;
50 PERCSNTtl-e C ^ J
1.0
z Q
a: K UJ GJ O.t ( J CJ c
cc Z o *» o.ot
a X .
I 1 I I I I 1 — 1 1 1 1 I I I I TT
' • " " I ' I I I I I I I
M = 5.0
I l l 1 1—L
DISTANCE , KM Figure 31. Joyner and Boore (1981) magnitude-distance chare acceleration, mean.
8 4 PSHCENTtl-E C " / + c r ^
DISTANCE , KM
Figure 33. Joyner and Boore (1981) magnitude-distance charr acceleration, mean and SD.
?=* . \ jL \ j r " t i >CTK 'taxTc. ' \ ) g t » -
%
^A.' tv.r 3S> wlfe.vAe
U*v\& yy&&€
\ko .^ i i i> ^(-^^^g^ 0.\6
o.to
,o.zf
0.30
0.56 a.40
0.^0 •
CJ'.:>E. a a - 0 . 5 0 c, (<?-^0 c ^ l u A ) A r I B M J ^ ' ^ S'/TC

ATTACHMENT B STATIC AND PSEUDO STATIC STABILITY ANALYSES

JobNa iNo.
HDR Computation ^
I Project ' 5 » > f \ J \ B > J l > . U D p > t —
Subject \-t>A::^"^\\Jc.. •3£\-&v\'>c^ ^ N / K \ - ^ V Y \ P V \
Computed
Checked
Sheet
Ig jLt i
^ ^
\
[Date S-^N-*^^
Date 4 - t / - * i C
%
*\ (!cf3fi6 Cf ^ 6 ( 4 i e e ^ 6 s I S*.fc <_ T:H of Sjix^ fr,»j> ^xv--^i'wiL. " MKAs. ' t H mro-z-iqo2..
"be^oTNgNT op ^ fcc^AVj. I i q ' ^
6) GsosvLki-Rii-gav- "^EiEfr-^i-c^ \v> 6T>rviL.- . SS^'S.N^->.'«H « ^ ^WoT* - \jkVieB Surges
' N G ^
^'^^
\ "^ar^x^ ' p ^ - ^ ' •\v-fc. ' ^ VAb:^eip-L(!i.i_ p'w>'^:&g:]\'^^
4nto-vu<io X ^ tA tM^ t>c;s.t.pji.t3V'"SM->
o- loO '?!f 4 0 "
45
x K ^ - ^ ' t c b "tevise-jXSk^ i>.Mt>s,-'svofS (&p*>v L_
S U s O e ^ VOiTSS-fKCc
u»-i«e-l i-c-t-ts
if
\
QJUl.St^tw/^ feeo^V-TV.'JE.
C»^-wo. G,L5\|e(\-\ 'Se.V'- ^ o I'.v.v. •Stvftcft.- L5s>S:
Ow^riious
CJCivC\^=>U. 'b

JobNa NoL
HDR Computation KR Project
Subject
Task
Computed
Checked
Sheet
y
2 -
Date
Date
Of
•2.. ^Ax fx-p^ esT - w-vtvy
. 2..^
r '"'-f,, .
0 _
. \
\ o
X. ^ ^ " ^ ^ ^ ^ ^ ^ ^
-
1 1 1 1 U
Eusf "O.&Z '
1 ^ 0 . \ O.li O . ^ OJif V . S C>.!a
#

f « •
BAVUIEU Lfl[fl)FILL CELL 1 PHASE 2 CUT SLOPE STABILITY File! PH2CS$ Hydpaulic Condition ?: User Defined Consolidated M i n e d Soil PapaHeteps Factor of Safety = 2.46, Failure Center: ( 628 , 4948 ), Radius: 224
J^5>. . f .
UoS
dluo-
<w.wo
\ - V lOpef f
P.-<)>
o p.Z. 0.3
<se.uL- i .
4-iz.e. ( ^ *4-o*
4nis
. ( 273 , 4590 ) . SCALE .: 1 inch = 78.00001 feet .

********************************************************************* * *
* G A R D S S U M M A R Y * * *
* Project: BAYVIEW LANDFILL CELL 1 PHASE 2 CUT SLOPE STABILITY * * File: PH2CSS * * * * GARDS Version 2.00 * * developed by * * Departinent of Civil and Environmental Engineering * * University of Cincinnati * * under contract to * * U.S. Envirorimental Protection Agency * Land Pollution Control Division * * Hazardous Waste Engineering Research Laboratory * * * ************************************************************************
*
************************************************************************ * Site Characteristics * ************************************************************************ * r m ^ it * The seismic coefficient is . 0.1G<. °\jj *
* The design earthquake magnitude is 7.20 * * * * The maximum flood elevation in this case is 0 • * * * * The elevation of the seasonal high ground water is. . 0 * * * * The design waste elevation in the cell is . . . . . . 0 * * * * The soil number representing the clay liner is. . . . 0 * * * ************************************************************************

* * * * * * * * * * * * * * * * * * * * * * * * * * * * * * * * * * * * * * * * * * * * * * * * * * * * * * * * * * * * * * * * * * * * * * * * * Sec t ion Geometry * * * * * * * * * * * * * * * * * * * * * * * * * * * * * * * * * * * * * * * * * * * * * * * * * * * * * * * * * * * * * * * * * * * * * * * * * * *
* The number of soil boundary lines for this section is 2 *
* * * * *_ * * * * * *
Line 1 Point
1 2
X
0 1140
4660 4660
Line 2 Point
1 2 3 4
X
0 500 640 1140
4760 4760 4725 4715
* * * * -* * * * * * *
************************************************************************
%

************************************************************************ * Soil 1 Properties * ************************************************************************ * *
* Unconsolidated Consolidated Consolidated * * Undrained Undrained Drained *
* Cohesion 0 0 0 (Ib/sq.ft) * * Phi Angle 0 0 40 (degrees) * * * * * * Unit Weight 110.000 (Ib/cu.ft) * * Clay Content 0.000 (%) * * Overconsolidation Ratio . . . . 0.000 * * Initial Void Ratio 0.000 * * Compression Index 0.000 * * Recompression Index 0.000 * * Permeability 0.000 (ft/yr) * * Median Grain Size 0.000 (mm) * * Plasticity Index 0.000 (%) * * Liguid Limit . . . 0.000 (%) * * Standard Penetration Number . . 0.000 (blows/ft) * ************************************************************************

************************************************************************
* User Defined * * Piezometric Surface for Hydraulic Condition * * 7: User Defined * ************************************************************************ * *
* Point X y * * *
* 1 0 4660 * * 2 1140 4660 * ************************************************************************
%

* * * * * * * * * * * * * * * * * * * * * * * * * * * * * * * * * * * * * * * * * * * * * * * * * * * * * * * * * * * * * * * * * * * * * * * * * * •ie
* * * * *** * * * * * * * * * * * * * *
R O T A T I O N A L F A I L U R E R E S
Automatic Grid Search
U L T S * * * * 4-
The slopes were analyzed for failure arcs having centers in * areas defined by the following parallelograms: *
********************************************************************* m l .
Slope 1
Co-ord. Point 1 Point 2 Point 3
X 500 640 675 y 4769 4734 4795
The number of divisions between points 1 and 2 The number of divisions between points 2 and 3 The X—increment used in the search was . . . The Y—increment used in the search was . . .
were were
Point 4
535 4830
4 4 10 10
* * * * * *
_ * * * * * * *
* * * * * * * * * * * * * * * * * * * * * * * * * * * * * * * * * * * * * * * * * * * * * * * * * * * * * * * * * * * * * * * * * * * * * * * *

%
************************************************************************ * *
* R O T A T I O N A L F A I L U R E R E S U L T S * * . * ************************************************************************ * *
* Hydraulic Condition 7: User Defined * * *
* Consolidated Drained (CD) Case * * Seismic Coefficient =0.10 *
* * * * * * * * * * * * * * * * * * * * * * *
s a f e t y Fac to r
2.46 2.46 2.46 2 .46 2,46 2.46 2.46 2.47 2.47 2.47 2.47 2.47 2.47 2.48 2.48 2.48 2.49 2.49 2 .50
F a i l u r e Radius
223.8 221.3 226.2 218.9 216.4 . 224.3 214.0 211.6 209.1 223.2 208.6 206.1 217.9 198.4 209.6 188.6 178.9 210.1 169.1
X-Co-ord
620.0 620.0 620.0 620.0 620.0 622.5 620.0 620.0 620.0 617.5 617.5 615.0 615.0 615.0 622.5 615.0 615.0 625.0 615.0
Y-Co-ord
4947.5 4945.0 4950.0 4942.5 4940.0 4947.5 4937.5 4935.0 4932.5 4947.5 4932.5 4932.5 4942.5 4922.5 4932.5 4912.5 4902.5 4932.5 4892.5
*
* * * * * * * * * * * * * * * * * * * * *
************************************************************************
• »

JobNa Na
HDR Computation
If Project
I Subject
Task
3.
3.1 ,iK/iTsi.>— - S U o p e e ; M?^-'
I Computed
Checked y /
Sheet
KR Date
Date
-^H
Of
~ \
• ^ k / f = . c5eo-e^
te3 M\L SK^QaXH: '-^J<'~
CUOrt i toA SSoTiSVY>''-£
•A'
A
• j , ^ \v.if^\vj\T^ -Su=i^ \'S\=.t<S> I QjsYN'jUes- seviNV.'.o.r.A, v^l F s B - i t o - S \ B . " \ I C - C X ^ > ^ ^ '
/ - S i r '
Tpe»-if
o t o
_/^H^'
W= Y-tt, L -r I f= Y ^ L -^ ^ p r - ^ 11^ 7" IOO
VJSJT
• ^ 1 . 0
)^-r
K*-f
(iSA V-.-AA^^^i"^ ( 1 . 0 -^ <!.•».-T 'V ;vi.uf

JobNa Na
HDR Computation
1 Project
Subject
Task
I Computed
Checked
Sheet
KR Date
Date
Of
%
BAYVIEW LANDFILL CELL 1 PHASE 2 LINER & LCRS SLOPE STABILITY
STATIC AND PSEUDO-STATIC ANALYSES (INFINITE SLOPE METHOD)
SLOPE PROPERTIES
• height slope length
LCRS PROPERTIES thickness density
INTERFACE FRICTIO friction
40.0 14.0 165.3
2.0 100.0
N 9.0
(ft.) (degrees) (ft)
(ft) (pcf)
(degrees)
•
&eoTeu:riv^ (kiLSvV cr 1 ' 1
FACTOR OF SAFETY | Treinf (klO 0.0 1.0 2.0 3.0 4.0 5.0 7.5 10.0 12.6 15.0
Seismic Coefficient, (-) 0
0.64 0.76 0.69 1.01 1.14 1.26 1.57 1.89 2.20 2.51
0.1 0.45 0.54 0.63 0.71 0.80 0.89 1.11 1.33 1.65 1.78
0.2 0.35 0.42 0.48 0.55 0.62 0.69 0.86 1.03 1.20 1.37
0.3 0.28
• 0.34 0.40 0.45 0.51 0.56 0.70 0.84 0.98 1.12
0.4 0.24 0.29 0.33 0.38 0.43 0.47 0.59 0.71 0.83 0.95
0.5 0.21 0.25 0.29 0.33 0.37 0.41 0.51 0.61 0.72 0.82

JobNa No.
HDR Computation KR Project
Subject
Task
Computed
Checked
Sheet
Date
Date
Of
3.00
2.50 =H:
2.00
IU
u. < (0 . u. o DC
g s
1.50
1.00
0.50
0.00 0.1 0.2 0.3
SEISMIC COEFFICIENT
0.4 0.5
m

JobNa Na
HDR Computation KR IProject
Subject
Task
Computed
Checked
Sheet
Oate
Date
Of
«
BAYVIEW LANDFILL CELL 1 LINER AND LCRS CAP SLOPE STABILITY STATIC AND PSEUDO-STATIC ANALYSES
(INFINITE SLOPE METHOD) .
SLOPE PROPERTIES height slope length
LCRS PROPERTIES thickness density
INTERFACE FRICTIO friction
40.0 14.0 165.3
2.0 100.0
N 17.0
(ft.) (degrees) (ft)
(ft) (pcf)
(degrees) SMJt 1 CJuSS^.Ven^
FACTOR OF SAFETY Treinf (klf) 0.0 1.0 2.0 3.0 4.0 5.0 7.5 10.0 12.5 15.0
Seismic Coefficient, (-) 0
1.23 1.35 1.48 1.60 1.73 1.85 2.16 2.48 2.79 3.10
0.1 0.87 0.96 1.04 1.13 1.22 1.31 1.53 1.75 1.97 2.19
0.2 0.67 0.74 0.81 0.88 0.94 1.01 1.18 1.36 1.53 1.70
0.3 0.55 0.60 0.66 0.71 0.77 0.83 0.97 1.11 1.24 1.38
1 0.4 0.46 0.51 0.56 0.60 0.65 0.70 0.82 0.93 1.05 1.17
0.5 0.40 0.44 0.48 0.52 0.56 0.60 0.71 0.81 0.91 1.01
m

JobNa Na
HDR Computation
Project
Subject
Task
KR (Computed Date
Checked Oate
Sheet Of
3.50
0.1 0.2 0.3
SEISMIC COEFFICIENT
k®^e>."i-°
0.4 0.6

Job No. Na
HDR Computation
IProject [Computed
Subject Checked y
Task Sheet
KR Date
I Date
Of
t
' i 4&00 _
r
4-100 — I —
Zoo - 1 -
4 e o Uco Scao . lc>eo - * - >
%

JobNa Na
HDR Computation
[Project
Subject
Task
[Computed
Checked ^
Sheet
KR Date
Oate
Of
•f-VLJL- G i VT6^4-
/ . z e
O.S4-
^
0
0.1
O.L
0 . ^
PiL-L- ® 4lSC>
5-=\T
/.Z-d.
f ^ lu^Ca 4-74S

HEADING Bayview Landfill Cell 1 Sliding During Operational Filling @ 4764 Geotextile Interface/Seismic Coeff varies/OF64G.DAT
PROFILE LINiES 1 I Waste Fill to 4764 225 4764 615 4764 865 4714
2 2 Side Slope LCRS 0 4764 225 4764 365 4724
3 3 Bottom LCRS 365 4724 865 4714 999 4714
MATERIAL PROPERTIES 1 Waste Fill 50 C
150 22 N 2 Side Slope LCRS /'ivicAAAX>g«> s<£>H <,\-e>CseT^ 100 ^ C
0 24 N . 3 Bottom LCRS /er€oT'5Scn^'^-=fc- COL-S*4-\<5-^ ) 100 ^ ' ^ C
0 9 N
^sucsiKiex- Kv-joY ec L-^^^~^
%
ANALYSIS N 217 4764 365 4722 863 4712 865 4714
Seismic ^) T - -:. z_ t ho 0.4 1 ^ — v - f ^ J ^ ^ ^ ^f-^ 3 p s ^ \ . ^ ' 3
Procedure C 0.0
COMPUTE

UTEXAS3 - VER. 1.107 - 10/13/91 - (C) 1985-1991 S. G. WRIGHT Date: 5:16:1996 Time: 10:46:18 Input file: of64g.dat
TABLE NO. 1 0 t * t ' l i * t * * * * * $ i * * * * * * * * * * * * * * * * * * i t * * * t t * * * * * *
* COMPUTER PROGRAM DESIGNATION - UTEXAS3 * * Originally Coded By Stephen G. Wright * •VersionNo. 1.107 * * Last Revision Date 10/13/91 • * (C) Copyright 1985-1991 S. G. Wright * * All R i^ t s Reserved * t * i H r * * * t * * * 1 f * i l H f i t i i H f * * * i ¥ - ¥ i ^ i l r ^ i i l t t * * * * * * * * * * * * * - *
* * * RESULTS OF COMPUTATIONS PERFORMED USING THIS COMPUTER * * PROGRAM SHOULD NOT BE USED FOR DESIGN PURPOSES UNLESS THEY • •HAVE BEEN VERIFIED BY INDEPENDENT ANALYSES, EXPERIMENTAL * * DATA OR FIELD EXPERIENCE. THE USER SHOULD UNDERSTAND THE • * ALGORITHMS AND ANALYTICAL PROCEDURES USED IN THE COMPUTER • * PROGRAM AND MUST HAVE READ ALL DOCUMENTATION FOR THIS • * PROGRAM BEFORE ATTEMPTING ITS USE. * * >•> * NEITHER THE UNIVERSITY OF TEXAS NOR STEPHEN G.WRIGHT* * MAKE OR ASSUME LL^BILITY FOR ANY WARRANTIES, EXPRESSED OR * * IMPLIED, CONCERNING THE ACCURACY, RELL\BILnY, USEFULNESS • • O R ADAPTABILITY OF THIS COMPUTER PROGRAM. *
UTEXAS3 - VER. 1.107 - 10/13/91 - (C) 1985-1991 S. G. WRIGHT Date: 5:16:1996 Time: 10:46:18 Input file: of64g.dat Bayview Landfill Cell 1 Sliding.DuTing Operational Filling @ 4764 Geotextile Interface/Seismic Coeff varies/OF64G.DAT
TABLE NO. 2
* NEW PROFILE LINE DATA •
PROFILE LINE 1 - MATERIAL TYPE = 1 Waste Fill to 4764
Point X Y
1 225.000 4764.000 2 615.000 4764.000 3 865.000 4714.000
PROFILE UNE 2 - MATERIAL TYPE = 2 Side Slope LCI^
Point X Y

%
1 .000 4764.000 2 225.000 4764.000 3 365.000 4724.000
PROFILE LINE 3 - MATERL\L TYPE = 3 Bottom LCRS
Point X Y
1 365.000 4724.000 2 865.000 4714.000 3 999.000 4714.000
All new profile lines defined - No old lines retained UTEXAS3 - VER. 1.107 - 10/13/91 - (C) 1985-1991 S. G. WRIGHT Date: 5:16:1996 Time: 10:46:18 Input file: of64g.dat
Bayview Landfill CeU 1 Sliding During Operational Filling @ 4764 Geotextile Interface/Seismic Coeff varies/OF64G.DAT
TABLE NO. 3
* NEW MATERIAL PROPERTY DATA - CONVENTTONAL/FIRST-STAGE COMPUTATIONS
t ****1 t* .*** i t******* t f**** t*%t i t»** i* t*** t f t i t i t i ** t i***** l t t ****** i***** i^********
DATA FOR MATERL\L TYPE 1 Waste Fill
Unit weight of material = 50.000
CONVENTIONAL GSOTROPIC) SHEAR STRENGTHS Cohesion 150.000 Friction angle 22.000 degrees
No (or zero) pore water pressures
DATA FOR MATERIAL TYPE 2 Side Slope LCRS
Unit weight of material = 100.000
CONVENTIONAL (ISOTROPIC) SHEAR STRENGTHS Cohesion .000 Friction angle 24.000 degrees
No (or zero) pore water pressures
DATA FOR MATERL^L TYPE 3 Bottom LCRS
Unit weight of material °= 100.000

CONVENTIONAL QSOTROPIC) SHEAR STRENGTHS Cohesion r - .000 Friction angle 9.000 degrees
No (pr zero) pore water pressures
All new material properties defined - No old data retained UTEXAS3 - VER. 1.107 - 10/13/91 • (C) 1985-1991 S. G. WRIGHT Date: 5:16:1996 Time: 10:46:18 Input file: of64g.dat Bayview LandfiU CeU 1 Sliding During Operational Filling @ 4764 Geotextile Interface/Seismic Coeflf varies/OF64G.DAT
TABLE NO. 15
* NEW ANALYSIS/COMPUTATION DATA *
Noncircular Shear SuTface(s)
Computations Perfonned for Single Shear Sur&ce
Shear Surface Coordinates -
Point X Y
1 217.000 4764.000
2 365.000 4722.000 3 863.000 4712.000 4 . 865.000 4714.000
Procedure used to compute the factor of safety: CORPS Specified side force inclination = .00 degrees
THE FOLLOWING REPRESENT EITHER DEFAULT OR PREVIOUSLY DEFINED VALUES:
Initial trial estimate for tiie factor of safety = 3.000
Maximum number of iterations allowed for calculating the factor of safety = 40
Allowed force imbalance for convergence = 100.000
AUowed moment imbalance for convergence = 100.000
Number of increments for slice subdivision = 30
Depth of water in crack = .000
Unit weight of water in crack = 62.400
Seismic coefficient c .000

%
Conventional (single-stage) computations to be perfonned UTEXAS3 - VER. 1.107 -10/13/91 - (C) 1985-1991 S. G. WRIGHT Date: 5:16:1996 Time: 10:46:18 Input file: of64g.dat Bayview LandfiU CeU 1 SUding During Operational FUling @ 4764 Geotextile Inter&ce/Seismic Coeff varies/OF64G.DAT
TABLE NO. 16
* NEW SLOPE GEOMETRY DATA • ***************************
NOTE - NO DATA WERE INPUT, SLOPE GEOMETRY DATA WERE GENERATED BY THE PROGRAM
Slope Coordinates -
Point X Y
1 .000 4764.000 2 .225.000 4764.000 3 615.000 4764.000 4 865.000 4714.000 5 999.000 4714.000
UTEXAS3 - VER. 1.107 - 10/13/91 - (C) 1985-1991 S. G. WRIGHT Date: 5:16:1996 Time: 10:46:18 Input fUe: of64g.dat Bayview LandfiU CeU 1 SUding During Operational FUling @ 4764 Geotextile Interface/Seismic Coeff varies/OF64G.DAT
TABLE NO. 26 i k i t ^ i i f t t ^ ^ t i t * * * * ^ ^ * * * * * * * * * * * * * * * * * * * * * * * * * * * * * * * * * * * * * * * * * * * * * * *
* Coordinate, Weigiht, Strengdi and Pore Water Pressure • * Information for Individual SUces for Conventional * * Computations or First Stage of Multi-Stage Computations. * * (Infonnation is for tiie Critical Shear Surface in the * * Case ofan Automatic Search.) *
ice Mati. Friction Pore Weight Type Cohesion Angle Pressure
908.2 2 .00 24.00 .0
7359.9 2 .00 24.00 .0
12997.1 2 .00 24.00 .0
18634.3 2 .00 24.00 .0
24271.5 2 .00 24.00 .0
SUce No. X
217.0 1 221.0
225.0 2 235.0
245.0 3 255.0
265.0 4 275.0
285.0 5 295.0
305.0
Sl Y
4764.0 4762.9
4761.7 4758.9 4756.1 4753.2 4750.4 4747.5
4744.7 4741.9 4739.0

6 315.0 4736.2 29908.7 2 325.0 4733.4
7 335.0 4730.5 35545.9 2 345.0 4727.7
8 355.0 4724.8 41182.1 2 365.0 4722.0
9 375.4 4721.8 46051.6 3 385.8 4721.6
10 396.3 4721.4 46490.5 3 406.7 4721.2
11 417.1 4721.0 46927.4 3 427.5 4720.7
13 437.9 4720.5 47365.8 3 448.3 4720.3
13 458.8 4720.1 47802.8 3 469.2 4719.9
14 479.6 4719.7 48241.7 3 490.0 4719.5
15 500.4 4719.3 48678.1 3 510.8 4719.1
16 521.3 4718.9 49117.1 3 531.7 4718.7
17 542.1 4718.4 49553.9 3 552.5 4718.2
18 562.9 4718.0 49992.3 3 573.3 4717.8
19 583.8 4717.6 50429.2 3 594.2 4717.4
20 604.6 4717.2 50866.1 3 615.0 4717.0
21 625.3 4716.8 48754.4 3 635.7 4716.6
UTEXAS3 - VER. 1.107 - 10/13/91 - (C) 1985-1991 S. G. WRIGHT Date: 5:16:1996 Time: 10:46:18 Input fUe: of64g.dat Bsyview LandfiU Cell 1 Sliding During Operational FUUng @ 4764 Geotextile Interface/Seismic Coeff varies/OF64G.DAT
TABLE NO. 26
* Coordinate, Weight, Strength and Pore Water Pressure * * Information for Individual SUces for Conventional * * Computations or First Stage of Multi-Stage Computations. * * (Information is for the Critical Shear Surface in tiie * * Case ofan Automatic Search.) * **************************************************************
SU(« SUce Mati. Friction Pore No. X Y Weight Type Cohesion Angle Pressure
635.7 4716.6 23 646.0 4716.4 44913.7 3 .00 9.00 .0
656.3 4716.1 23 666.7 4715.9 41073.5 3 .00 9.00 .0
.00
.00
.00
.00
.00
.00
.00
.00
.00
.00
.00
.00
.00
.00
.00
.00
24.00
24.00
24.00
9.00
9.00
9.00
9.00
9.00
9.00
9.00
9.00
9.00
9.00
9.00
9.00
9.00
.0
.0
.0
.0
.0
.0
.0
.0
.0
.0
.0
.0
.0
.0
.0
.0

677.0 4715.7 24 687.3 4715.5 37232.8 3
697.7 4715.3 25 708.0 4715.1 33392.6 3
718.3 4714.9 26 728.7 4714.7 29551.9 3
739.0 4714.5 27 749.3 4714.3 25711.8 3
759.7 4714.1 28 770.0 4713,9 21871.1 3
780,3 4713.7 29 790.7 4713,5 18030.9 3
801.0 4713,2 30 811.3 4713.0 14190.2 3
821.7 4712.8 31 832.0 4712.6 10350.0 3
842.3 4712.4 32 852.7 4712.2 6509.2 3
863.0 4712.0 33 864.0 4713.0 222.0 3
865.0 4714.0 UTEXAS3 - VER. 1.107 -10/13/91 - (C) 1985-1991 S. G. WRIGHT Date: 5:16:1996 Time: 10:46:18 Input file: of64g.dat Bayview LandfiU CeU 1 SUding During Operational FUling @ 4764 Geotextile Interface/Seismic Coeff varies/OF64G.DAT
.00
.00
.00
.00
.00
.00
.00
.00
.00
00
9.00
9.00
9.00
9.00
9.00
9.00
9.00
9.00
9.00
9.00
.0
.0
.0
.0
.0
.0
.0
.0
.0
.0
TABLE NO. 27 iim****n!****$L***nt****m***************ii****f ******************* * Seismic Forces and Forces Due to Sur&ce Pressures for * * Individual SUces for Conventional Computations or the * * First Stage of Multi-Stage Computations. * * (Infonnation is for the Critical Shear Surface in the * * Case ofan Automatic Search.) * *************************************************************
%
FORCES DUE TO SURFACE PRESSURES Yfor
iismic Normal Shear Y
SUce Seismic No. X
1 221.0 2 235.0 3 255.0 4 275.0 5 295.0 6 315.0 7 335.0 8 355.0 9 375.4 10 396.3 11 417.1 12 437.9 13 458.8
Force
0. 0. 0. 0. 0. 0. 0. 0. 0. 0. 0. 0. 0.
Seismic Force
4763.4 4761.0 4757.9 4754.9 4752.1 4749.2 4746.3 4743.5 4742.0 4741.8 4741.6 4741.4 4741.1
Normal Force
0. 0. 0. 0. 0. 0. 0. 0. 0. 0. 0. 0. 0.
Shear Force
0. 0. 0. 0. 0. 0. 0. 0. 0. 0. 0. 0. 0.
.0
.0
.0
.0
.0
.0
.0
.0
.0 .0 .0 .0 .0
X
.0
.0
.0
.0
.0
.0
.0
.0
.0 .0 .0 .0 .0

14 15 16 17 18 19 20 21 22 23 24 25 26 27 28 29 30 31 32 33
479.6 500.4 521.3 542.1 562.9 583.8 604.6 625.3 646.0 666.7 687.3 708.0 728.7 749.3 770.0 790.7 811.3 832.0 852.7 864.0
0. 0. 0. 0. 0. 0. 0. 0. 0. 0. 0. 0. 0. 0. 0. 0. 0. 0. 0. 0.
4740.9 4740.7 4740.5 4740.3 4740.1 4739.9 4739.7 4738.4 4736.2 4733.9 4731.6 4729.4 4727.1 4724.9 4722.6 4720.4 47182 4716.0 4714.0 4713.6
0. 0. 0. 0. 0. 0. 0. 0. 0. 0. 0. 0. 0. 0. 0. 0. 0. 0. 0. 0.
0. 0. 0. 0. 0. 0. 0. 0. 0. 0. 0. 0. 0. 0. 0. 0. 0. 0. 0. 0.
.0
.0
.0
.0
.0
.0
.0
.0
.0
.0
.0
.0
.0
.0
.0
.0
.0
.0
.0
.0
.0
.0
.0
.0
.0
.0
.0
.0
.0
.0
.0
.0
.0
.0
.0
.0
.0
.0
.0
.0 UTEXAS3 - VER. 1.107 - 10/13/91 - (C) 1985-1991 S. G. WRIGHT
Date: 5:16:1996 Time: 10:46:18 Input file: of64g.dat Bayview Landfill CeU 1 Sliding During Operational FUling @ 4764 Geotextile Interface/Seismic Coeff varies/OF64G.DAT
TABLE NO. 29 ****************************************************************** * INFORMATION GENERATED DURING ITERATIVE SOLUTION FOR THE FACTOR * • OF SAFETY BY THE CORPS OF ENGINEERS MODIFIED SWEDISH PROCEDURE • * * * * * * t , : ) i ^ 1 t - t H f , t * * * * * * * * * * * * * * * * * l t * * * * * * * * * * * * * * * * * * * * * * * * * * * * * * * ^ * * *
Trial Factor Force Imbalance Iteration of Safety (lbs.) DELTA-F
1
2
3
4
3.00000
3.32297
3.36087
336130
-.790E-+O4
-.758E+03
-.843E+01
-.219E-02
.323
.379E-01
.431E-03
.112E-06
Factor of Safety 3.361 Side Force Inclination .00 Number of Iterations 4 UTEXAS3 - VER. 1.107 -10/13/91 - (C) 1985-1991 S. G. WRIGHT
Date: 5:16:1996 Time: 10:46:18 Input fUe: of54g.dat Bayview LandfiU CeU 1 Sliding During Operational FUling @ 4764 Geotextile Interface/Seismic Coeff varies/OF64G.DAT
TABLE NO. 38 * * * * * * * * * * * * * * * * * * * * * * * * * * * * * * * * * * * * * * * * * * * * * * * * * * * * ^ i ^ i * * * * * * * * i ,

%
* Final Results for Stresses Along the Shear Surface * * (Results for Critical Shear Sur&ce in Case of a SearcL) * * * * * * * * * * * * * * * * * * * * * * * * * * * * * * * * * * * * * * * * * * * * * * i ^ i H H H , * * * * ^ ^ , ^ t t * * * *
CORPS OF ENGINEERS' PROCEDURE USED TO COMPUTE FACTOR OF SAFETY Factor of Safety = 3.361
— — VALUES AT CENTER OF BASE OF SLICE-
Total Effective Slice Nonnal Normal Shear No. X-center Y-center Stress Stress Stress
1 221.0 4762.9 109.4 109.4 14.5 2 235.0 4758.9 354.7 354.7 47.0 3 255.0 4753.2 626.3 626.3 83.0 4 275.0 4747.5 898,0 898.0 118.9 5 295.0 4741.9 1169.6 1169.6 154.9 6 315.0 4736.2 1441.3 1441.3 190.9 7 335.0 4730.5 1712.9 1712.9 226.9 8 355.0 4724.8 1984.5 1984.5 262.9 9 375.4 4721.8 2208.4 2208.4 104.1 10 396.3 4721.4 2229.4 2229.4 105.1 11 417.1 4721.0 2250.4 2250.4 106.0 12 437.9 4720.5 2271.4 2271.4 107.0 13 458.8 4720.1 2292.4 2292.4 108.0 14 479.6 4719.7 2313.4 2313.4 109.0 15 500.4 4719.3 2334.3 2334,3 110.0 16 521.3 4718.9 2355.4 2355.4 111.0 17 542.1 4718.4 2376.3 2376.3 112.0 18 562.9 4718.0 2397.4 2397.4 113.0 19 583.8 4717,6 2418.3 2418.3 114.0 20 604.6 4717.2 2439.3 2439.3 114.9 21 625.3 4716.8 2356.9 2356.9 111.1 22 646.0 4716.4 217U 2171.2 102.3 23 666.7 4715.9 1985.5 1985.5 93.6 24 687,3 4715,5 1799.9 1799.9 84.8 25 708.0 4715.1 1614.2 1614.2 76.1 26 728.7 4714.7 1428.6 1428.6 67.3 27 749.3 4714.3 1242.9 1242.9 58.6 28 770.0 4713.9 1057J 1057.3 49.8 29 790.7 4713.5 871.6 871.6 41.1 30 811.3 4713.0 686.0 686.0 32.3 31 832.0 4712.6 500.3 500.3 23.6 32 852.7 4712.2 314.7 314.7 14.8 33 864.0 4713.0 116.5 116.5 5.5
CHECK SUMS - (ALL SHOULD BE SMALL) SUM OF FORCES IN VERTICAL DIRECTION = .02 (= .215E-01)
SHOULD NOT EXCEED . lOOE+03 SUM OF FORCES IN HORIZONTAL DIRECTION = .00 (= .179E-02)
SHOULD NOT EXCEED .lOOE+03 SHEAR STTIENGTH/SHEAR FORCE CHECK-SUM = ,01 (= .999E-02)

SHOULD NOT EXCEED .100E403 UTEXAS3 - VER. 1.107 - 10/13/91 • (C) 1985-1991 S. G. WRIGHT
Date: 5:16:1996 Time: 10:46:18 Input fUe: of64g.dat Bayview LandfiU CeU 1 SUding During Operational Filling @ 4764 GeotextUe Interface/Seismic Coeff varies/OF64G.DAT
TABLE NO. 39 * * * * * * * * * * * * * * * * * * * * * * * * * * * * * * * * * * * * * * * * * * * * * * * - ^ - i f i ^ i f * * * * * * * * * * t f * *
* Final Results for Side Forces and Stresses Between SUces. * * (Results for Critical Shear Surface in Case of a Search.) * * * * * * * * * * * * * * * * * * * * * * * * * * * * * * * * * * * * * * * * * * * * * * * * * * * : t * * * * * * * * * * * * *
CORPS OF ENGINEERS' PROCEDURE USED TO COMPUTE FACTOR OF SAFETY Factor of Safety = 3.361
VALUES AT RIGHT SIDE OF SLICE —
Side Force Slice Side Inclination
No. X-Right Force (degrees)
1 2 3 4 5 6 7 8 9 10 11 12 13 14 15 16 17 18 19 20 21 22 23 24 25 26 27 28 29 30 31 32
225.0 245.0 265.0 285.0 305.0 325.0 345.0 365.0 385.8 406.7 427.5 448.3 469.2 490.0 510.8 531.7 552.5 573.3 594.2 615.0 635.7 656.3 677.0 697.7 718.3 739.0 759.7 780.3 801.0 821.7 842.3 863.0
132. 1206. 3102. 5819. 9359. 13721. 18906. 24910. 23666. 22411. 21143. 19864. 18573. 17270. 15955. 14629. 13290. 11940. 10578. 9201. 7884. 6671. 5561. 4555. 3653. 2855. 2161. 1570. 1083. 700. 420. 244.
.00 .00 .00 .00 .00 .00 .00 .00 .00 .00 .00 .00 .00 .00 .00 .00 .00 .00 .00 .00 .00 .00 .00 .00 .00 .00 .00 .00 .00 .00 .00 .00

33 865.0 0. .00
END-OF-FILE ENCOUNTERED WHILE READING COMMAND WORDS - END OF PROBLEM(S) ASSUMED
%
m

HEADING Bayview Landfill CeU 1 SUding During Operational FUling @ 4764 Sand Interface/Seismic Coeff varies/OF64S.DAT
PROFILE LINES 1 1 Waste FUl to 4764 225 4764 615 4764 865 4714 .
2 2 Side Slope LCRS 0 4764 225 4764 365 4724
3 3 Bottom LCRS 365 4724 865 4714 999 4714
MATERIAL PROPERTIES 1 Waste FUl 50 C
150 22 N . 2 Side Slope LCRS ' ^(VJCUAEIS^ g.\j55 ^^joPe. "^ ) 100 ^ C
0 24 N 3 Bottom LCRS [ So> .Si:> OVA.- JVA JVSN 1 0 0 *• •"
C 0 17
N
ANALYSIS /''SUiwiiNifa ^S-c^ei U=.p.ej"^ N 217 4764 365 4722 863 4712 865 4714 •
Seismic f L|J^ 0.3 _-=— IT'E .A^^S" Oj o.l ^erpi. - p ?=S ^ Woo
Procedure C 0.0
COMPUTE .

%
•
UTEXAS3 - VER. 1.107 - 10/13/91 - (C) 1985-1991 S. G. WRIGHT Date: 5:16:1996 Time: 10:59:10 Input file: ofe4s.dat
TABLE NO. 1 ****************************************** * COMPUTER PROGRAM DESIGNATION - UTEXAS3 • * Originally Coded By Stephen G, Wright * * VersionNo. 1.107 * * Last Revision Date 10/13/91 • * (C) Copyright 1985-1991 S. G. Wright • * AU R i ^ t s Reserved • ******************************************
************************************************************** * . . *
* RESULTS OF COMPUTATTONS PERFORMED USING THIS COMPUTER • * PROGRAM SHOULD NOT BE USED FOR DESIGN PURPOSES UNLESS THEY • * HAVE BiEEN VERIFIED BY INDEPENDENT ANALYSES, EXPERIMENTAL * * DATA OR FIELD EXPERIENCE. THE USER SHOULD UNDERSTAJJD THE * * ALGORITHMS AND ANALYTICAL PROCEDURES USED IN THE COMPUTER * * PROGRAM AND MUST HAVE READ ALL DOCUMENTATION FOR THIS * •PROGRAM BEFORE ATTEMPTING ITS USE. *
* NEITHER THE UNIVERSITY OF TEXAS NOR STEPHEN G.WRIGHT* * MAKE OR ASSUME LL^BILITY FOR ANY WARRANTIES, EXPRESSED OR * * IMPLIED, CONCERNING THE ACCURACY, RELIABBLITY, USEFULNESS • * OR ADAPTABILITY OF THIS COMPUTER PROGRAM. * * * ************************************************************** UTEXAS3 - VER. 1.107 -10/13/91 - (C) 1985-1991 S. G. WRIGHT
Date: 5:16:1996 Time: 10:59:10 Input file: of64s.dat Bayview LandfiU CeU I SUding During Operational Filling @ 4764 , GeotextUe Interface/Seismic Coeff varies/OF64G.DAT
TABLE NO. 2 ************************* * NEW PROFILE LINE DATA * *************************
PROFILE LINE 1 - MATERIAL TYPE = 1 Waste FUl to 4764
Point X Y
1 225.000 4764.000 2 615.000 4764.000 3 865.000 4714.000
PROFILE LINE 2 - MATERLVL TYPE = 2 Side Slope LCRS
Point X Y

*
1 .000 4764.000 2 225.000 4764.000 3 365.000 4724.000
PROFILE LINE 3 - MATERIAL TYPE = 3 Bottom LCRS
Point X Y
1 . 365.000 4724.000 2 865.000 4714.000 3 999.000 4714.000
AU new profile lines defined - No old Unes retained UTEXAS3 - VER. 1.107 - 10/13/91 - (C) 1985-1991 S. G. WRIGHT
Date: 5:16:1996 Time: 10:59:10 Input fUe: of64s.dat Bayview LandfiU CeU 1 Sliding During Operational FiUing @ 4764 Geotextile Interface/Seismic Coeff varies/OF64G.DAT
TABLE NO. 3 * * * * * * * * * * * * * * * * * * * * * * * * * * * * * * * * * * * * * * * * * * * * * * * i t * * i ^ * * , ^ i t ^ i ^ * * i H ^ ^ i , H H i * * * * *
* NEW MATERL\L PROPERTY DATA - CONVENTTONAL/FIRST-STAGE COMPUTATIONS
* * * * * * * * * * * * * * * * * * * * * * * * * * * * * * * * * * * * * * * * * * * i t * * * t ^ 1 H , ^ f ^ i i t ^ ^ ^ i * * i ^ ^ i ^ i t ^ ^ ^ ^ i f ^ i i ^
DATA FOR MATERIAL TYPE 1 Waste FUl
Unit weight of material = 50.000 j
I CONVENTIONAL (ISOTROPIC) SHEAR STRENGTHS Cohesion 150.000 Friction angle 22.000 degrees
No (or zero) pore water pressures
DATA FOR MATERIAL TYPE 2 Side Slope LCRS
Unit weight of material = 100.000
CONVENTIONAL (ISOTROPIC) SHEAR STRENGTHS Cohesion .000 Friction angle 24.000 degrees
No (or zero) pore water pressures
DATA FOR MATERIAL TYPE 3 Bottom LCRS
Unit weight of material = 100.000

«
CONVENTIONAL GSOTROPIC) SHEAR STRENGTHS Cohesion .000 Friction angle 17.000 degrees
No (or zero) pore water pressures
AU new material properties defined - No old data re tmed UTEXAS3 - VER. 1,107 - 10/13/91 - (C) 1985-1991 S, G, WRIGHT Date: 5:16:1996 Time: 10:59:10 Input file: of64s,dat
Bayview LandfiU CeU 1 SUding During Operational FiUing @ 4764 Geotextile Interface/Seismic Coeff varies/OF64G,DAT
TABLE NO, 15 ********************************* • NEW ANALYSIS/COMPUTATION DATA • *********************************
Noncircular Shear Surface(s)
Computations Performed for Single Shear Sur&ce
Shear Surface Coordinates -
Point X Y
1 217,000 4764,000 2 365.000 4722.000 3 863.000 4712.000 4 865.000 4714.000
Procedure used to compute the factor of safety: CORPS Specified side force inclination = .00 degrees
THE FOLLOWING REPRESENT EITHER DEFAULT OR PREVIOUSLY DEFINED VALUES:
Initial trial estimate for the factor of safety =" 3.000
Maximum number of iterations aUowed for calculating the factor of safety >= 40
Allowed force imbalance for convergence = 100.000
AUowed moment imbalance for convergence = 100.000
Number of increments for sUce subdivision " 30
Deptii of water in crack = .000
Unit weight of water in crack = 62.400
Seismic coefficient = .000

Conventional (single-stage) computations to be performed UTEXAS3 - VER. 1.107 - 10/13/91 - (C) 1985-1991 S. G. WRIGHT Date: 5:16:1996 Time: 10:59:10 Inputfile:of64s.dat
Bayview LandfUl CeU 1 SUding During Operational FUling @ 4764 Geotextile Inter&ce/Seismic Coeff varies/OF64G.DAT
TABLE NO. 16 *************************** * NEW SLOPE GEOMETRY DATA * ***************************
NOTE - NO DATA WERE INPUT, SLOPE GEOMETRY DATA WERE GENERATED BY THE PROGRAM
Slope Coordinates -
Point X Y
1 .000 4764.000 2 225.000 4764.000 3 615.000 4764.000 4 865.000 4714.000 5 999.000 4714.000
UTEXAS3 - VER. 1.107 - 10/13/91 - (C) 1985-1991 S. G. WRIGHT (I Date: 5:16:1996 Time: 10:59:10 Input file: of64s.dat V Bayview Landfill CeU 1 Sliding Ehiring Operational FiUing @ 4764 Geotextile Interface/Seismic Coeff varies/OF64G.DAT
TABLE NO. 26 *****************************************t********************
* Coordinate, Weight, Strengdi and Pore Water Pressure * * Information for Individual SUces for Conventional * * Computations or First Stage of Multi-Stage Computations. * * (Information is for die Critical Shear Surface in tiie * * Case of an Automatic Search.) * * * * * * * * * * * * i ^ * * * * * * * * * * * * * * * * * * * * * * * * * * * * i t ^ ^ * * * * * t , * * * * * i i , * * t i i t i * * ^
ice Mati. Friction Pore Weight Type Cohesion Angle Pressure
908.2 2 .00 24.00 .0
7359.9 2 .00 24.00 .0
12997.1 2 .00 24.00 .0
18634J 2 .00 24.00 .0
24271.5 2 .00 24.00 .0
Slice No. X
217.0 1 221.0
225.0 2 235.0
245.0 3 255.0
265.0 4 275.0
285.0 5 295.0
305.0
Sll Y
4764.0 4762.9 4761.7 4758.9 4756.1 4753.2 4750.4 4747.5 4744.7 4741.9 4739,0

t
•
6 315.0 4736.2 29908.7 2 325.0 4733.4
7 335.0 4730.5 35545.9 2 345.0 4727.7
8 355.0 4724.8 41182.1 2 365.0 4722.0
9 375.4 4721.8 46051.6 3 385.8 4721.6
10 396.3 4721.4 46490.5 3 406.7 4721.2
11 417,1 4721.0 46927.4 3 427.5 4720.7
12 437.9 4720.5 47365.8 3 448.3 4720.3
13 458.8 4720.1 47802.8 3 469.2 4719.9
14 479.6 4719.7 48241.7 3 490.0 4719.5
15 500.4 4719,3 48678,1 3 510.8 4719.1
16 521,3 4718,9 49117,1 3 531,7 4718.7
17 542,1 4718.4 49553.9 3 552.5 4718.2
18 562.9 4718.0 49992.3 3 573.3 4717,8
19 583.8 4717.6 50429.2 3 594.2 4717.4
20 604.6 4717.2 50866.1 3 615.0 4717.0
21 625.3 4716.8 48754.4 3 635.7 4716.6
UTEXAS3 - VER. 1,107 - 10/13/91 - (C) 1985-1991 S, G, WRIGHT Date: 5:16:1996 Time: 10:59:10 Input file: of64s.dat Bayview LandfiU CeU 1 Slidmg During Operational Filling @ 4764 Geotextile Interface/Seismic Coeff varies/OF64G.DAT
TABLE NO. 26 ************************************************************** * Coordmate, Weight, Strength and Pore Water Pressure * * Information for Individual SUces for Conventional * * Computations or First Stage of Multi-Stage Computations. * * (Information is for the Critical Shear Surface m the * * Case ofan Automatic Search.) • * * * * * * * * * * * * * * * * * * * * * * * * * * * * * * * * * * * * * * * * * * * * * * * * * * * l t ^ l H t ^ l l f * ^ ^ L * *
SUce SUce Mati. Friction Pore No. X Y Weight Type Cohesion Angle Pressure
635.7 4716.6 22 646.0 4716.4 44913.7 3 ,00 17.00 .0
656.3 4716.1 23 666.7 4715.9 41073.5 3 .00 17.00 .0
.00
.00
.00
,00
.00
.00
.00
.00
.00
.00
.00
.00
.00
.00
.00
.00
24.00
24.00
24.00
17.00
17.00
17.00
17.00
17.00
17.00
17.00
17.00
17.00
17.00
17.00
17.00
17.00
.0
,0
.0
.0
.0
.0
.0
.0
.0
.0
.0
.0
.0
.0
.0
.0

.00
.00
.00
.00
.00
.00
.00
.00
.00
.00
17.00
17.00
17.00
17.00
17.00
17.00
17.00
17.00
17.00
17.00
.0
.0
.0
.0
.0
.0
.0
.0
.0
.0
677.0 4715.7 24 687.3 4715.5 37232.8 3
697.7 4715.3 25 708.0 4715.1 33392.6 3
718.3 4714.9 26 728.7 4714.7 29551.9 3
739.0 4714.5 27 749.3 4714.3 25711.8 3
759.7 4714.1 28 770.0 4713.9 21871.1 3
780.3 4713.7 29 790.7 4713.5 18030.9 3
801,0 4713.2 30 811.3 4713.0 14190.2 3
821.7 4712.8 31 832.0 4712.6 10350.0 3
842.3 4712.4 32 852.7 4712.2 6509.2 3
863.0 4712.0 33 864.0 4713.0 222,0 3
865.0 4714.0 UTEXAS3 - VER. 1.107 - 10/13/91 - (C) 1985-1991 S. G. WRIGHT Date: 5:16:1996 Time: 10:59:10 Input file: of64s.dat Bayview LandfiU CeU 1 SUding During Operational FUling @ 4764 GeotextUe Interface/Seismic Coeff varies/OF64G.DAT
TABLE NO. 27 * * * * * * * * * * * * * * * * * * * * * * * * * * * * * * * * * * * * * * * * * * * * * * * * * * * * * * * * i i i * * * *
* Seismic Forces and Forces Due to Surfece Pressures for • * Individual SUces for Conventional Computations or the * * First Stage of Multi-Stage Computations. * * (Information is for the Critical Shear Surface in the * * Case ofan Automatic Search.) * * * * * * * * * * * * * * * * * * * * * * * * * * * * * * * * * * * * * * * i f t r * i H i * * * * t f H i i ^ t i ^ * * * * i n t i * * *
FORCES DUE TO SURFACE PRESSURES Yfor
SUce . Seismic Seismic Normal Shear No. X Force Force Force Force X Y
1 2 3 4 5 6 7 8 9 10 11 12 13
221.0 235.0 255.0 275.0 295.0 315.0 335.0 355.0 375.4 396.3 417.1 437.9 458.8
0. 0. 0. 0. 0. 0. 0. 0. 0. 0. 0. 0. 0.
4763.4 4761.0 4757.9 4754.9 4752.1 4749.2 4746.3 4743.5 4742.0 4741.8 4741.6 4741.4 4741.1
0. 0. 0. 0. 0. 0. 0. 0. 0. 0. 0. 0. 0.
0. 0. 0. 0. 0. 0. 0. 0. 0. 0. 0. 0. 0.
.0
.0
.0
.0
.0 ,0 .0 ,0 .0 .0 ,0 .0 .0
.0
.0
.0
.0
.0
.0
.0
.0
.0 .0 .0 .0 .0
#

14 IS 16 17 18 19 20 21 22 23 24 25 26 27 28 29 30 31 32 33
479.6 500.4 521.3 542.1 562.9 583.8 604.6 625.3 646.0 666.7 687.3 708.0 728.7 7493 770.0 790.7 811.3 832.0 852.7 864.0
0. 0. 0. 0. 0. 0. 0. 0. 0. 0. 0. 0. 0. 0. 0. 0. 0. 0. 0. 0.
4740.9 4740.7 4740.5 4740.3 4740.1 4739.9 4739,7 4738.4 4736,2 4733,9 4731,6 4729,4 4727.1 4724,9 4722,6 4720,4 47182 4716.0 4714.0 4713.6
0. 0. 0. 0. 0. 0. 0. 0. 0. 0. 0. 0. 0. 0. 0. 0. 0. 0. 0. 0,
0, 0, 0, 0, 0, 0, 0. 0. 0. 0. 0. 0. 0. 0. 0. 0. 0. 0. 0. 0.
.0
.0
.0
.0
.0
.0
.0
.0
.0
.0
.0 ,0 .0 .0 .0 .0 .0 .0 .0 .0
.0
.0
.0
.0
.0
.0
.0
.0
.0
.0
.0
.0
.0
.0
.0
.0
.0 ,0 ,0 ,0
%
UTEXAS3 - VER. 1.107 - 10/13/91 - (C) 1985-1991 S. G. WRIGHT Date: 5:16:1996 Time; 10:59:10 Input file: of64s.dat
Bayview LandfiU CeU 1 SUding During Operational FiUing @ 4764 Geotextile Interface/Seismic Coeff varies/OF64G.DAT
TABLE NO. 29 ***************************************************^^tt***********
* INFORMATION GENERATED DURING ITERATIVE SOLUTION FOR THE FACTOR * * OF SAFETY BY THE CORPS OF ENGINEERS MODIFIED SWEDISH PROCEDURE • * * * * * * ^ * * * ^ * * * * * * * l t ^ * * * * * * * * , ^ ^ * 1 ^ * * ^ * ^ , * * * * * * * * * * * * * l ^ * ^ , ^ l , ^ ^ l ^ * * * l ^ l ^ ^ * * * *
Trial Factor Force Imbalance Iteration of Safety (UJS.) DELTA-F
1 3.00000 -.527E+05 1.34 Reduced value - Delta was too large 500
2 3.50000 -.358E405 1.23 Reduced value - Delta was too large 500
3 4.00000 -.231E+05 1.04 Reduced value - Delta was too large 500
4 4.50000 -.132E-K)5 .749 Reduced value - Delta was too large 500
5 5.00000 -.526E+04 .368
6 5.36843 -.359E+03 .290E-01
7 5.39738 -.193E-H)1 .157E-03
8 5.39754 .360E-01 -.294E-05
Factor of Safety 5.398 Side Force Inclination .00 Number of Iterations 8 UTEXAS3 - VER. 1.107 - 10/13/91 - (C) 1985-1991 S. G. WRIGHT Date: 5:16:1996 Time: 10:59:10 Input file: of64s.dat Bayview LandfiU CeU 1 SUding During Operational FUUng @ 4764 GeotextUe Interface/Seismic Coeff varies/OF64G.DAT
TABLE NO. 38 ^ i * * * i t t , ^ t * * * * * * * * * * * * * * * * * * * * * * * * * * * * * * * * * * * * * * * * * * * * * * * * * * * * * * *
* Final Results for Stresses Along the Shear Surface * * (Results for Critical Shear Surfece m Case of a Search.) * ***************************************************************
CORPS OF ENGINEERS' PROCEDURE USED TO COMPUTE FACTOR OF SAFETY Factor of Safety = 5.398
VALUES AT CENTER OF BASE OF SLICE-
Total Effective Slice Normal Normal Shear No. X-center Y-center Stress Stress Stress
1 2 3 4 5 6 7 8 9 10 11 12 13 14 15 16 17 18 19 20 21 22 23 24 25 26 27 28 29
221.0 235.0 255.0 275.0 295.0 315.0 335.0 355.0 375.4 396.3 417.1 437.9 458.8 479.6 500.4 521.3 542.1 562.9 583.8 604.6 625.3 646.0 666.7 687.3 708.0 728.7 749.3 770.0 790.7
4762.9 4758.9 4753.2 4747.5 4741.9 4736.2 4730.5 4724.8 4721.8 4721.4 4721.0 4720.5 4720.1 4719.7 4719.3 4718.9 4718.4 4718.0 4717.6 4717.2 4716.8 4716.4 4715.9 4715.5 4715.1 4714.7 47143 4713.9 4713.5
110.9 359.6 635.0 910.4 1185.8 1461.2 1736.6 2012.0 2208.0 2229.0 2250.0 2271.0 2291.9 2313.0 2333.9 2354.9 2375.9 2396.9 2417.9 2438.8 2356.4 2170.8 1985.2 1799.5 1613.9 14283 1242.7 1057.1 871.5
110.9 359.6 635.0 910.4 1185.8 1461.2 1736.6 2012.0 2208.0 7?.?,9.0 2250.0 2271.0 2291.9 2313.0 2333.9 2354.9 2375.9 2396.9 2417.9 2438.8 2356.4 2170.8 1985.2 1799.5 1613.9 14283 1242.7 1057.1 871.5
9.2 29.7 52.4 75.1 97.8 120.5 1433 166.0 125.1 126.3 127.4 128.6 129.8 131.0 132.2 133.4 134.6 135.8 137.0 138.1 133.5 123.0 112.4 101.9 91.4 80.9 70.4 59.9
49.4

%
30 31 32 33
8113 832.0 852.7 864.0
4713,0 4712,6 4712.2 4713.0
685.8 500.2 314,6 117,7
685,8 500,2 314,6 117,7
38.8 283 17.8 6.7
CHECK SUMS - (ALL SHOULD BE SMALL) SUM OF FORCES IN VERTICAL DIRECTION = .03 (= .259E-01)
SHOULD NOT EXCEED ,100E-H)3 SUM OF FORCES IN HORIZONTAL DIRECTION = ,00 (= ,218E-02)
SHOULD NOT EXCEED ,100E-K)3 SHEAR STRENGTH/SHEAR FORCE CHECK-SUM = ,06 (= ,564E-01)
SHOULD NOT EXCEED ,100E+03 UTEXAS3 - VER. 1.107 - 10/13/91 - (C) 1985-1991 S. G. WMGHT Date: 5:16:1996 Time: 10:59:10 Input file: of64s.dat Bayview LandfUl CeU 1 Sliding During Operational FUUng @ 4764 Geotextile Interfece/Seismic Coeff varies/OF64G.DAT
TABLE NO. 39 **************************************************************** * Final Results for Side Forces and Stresses Between SUces. * * (Results for Critical Shear Surface in Case of a Search.) * ****************************************************************
CORPS OF ENGINEERS' PROCEDURE USED TO COMPUTE FACTOR OF SAFETY Factor of Safety = 5398
VALUES AT RIGHT SIDE OF SLICE —
SUce No.
1 2 3 4 5 6 7 8 9 10 11 12 13 14 15 16 17 18 19 20
Side Force Side Inclination
X-Rigjit Force
225.0 245.0 265.0 285.0 3.05.0 325.0 345.0 365.0 385.8 406.7 427,5 4483 469,2 490,0 510,8 531,7 552,5 5733 594,2 615,0
179, 1626. 4183, 7848, 12622, 18505, 25497, 33595. 31914. 30216. 28503. 26773. 25028. 23266. 21489. 19695. 17886. 16060. 14219. 12358.
(degrees)
.00 .00 .00 .00 .00 .00 .00 .00 .00 .00 .00 .00 .00 .00 .00 ,00 ,00 .00 .00 ,00

21 22 23 24 25 26 27 28 29 30 31 32 33
635,7 656,3 677,0 697,7 7183 739.0 759,7 7803 801,0 821,7 8423 863,0 865,0
10577, 8937, 7437, 6078, 4858. 3779. 2840. 2041, 1383. 865. 487. 249. 0.
.00 .00 .00 .00 .00 .00 .00 .00 .00
.00
.00
.00 .00
END-OF-FILE ENCOUNTERED WHILE READING COMMAND WORDS - END OF PROBLEM(S) ASSUMED
4

t»
HEADING Bayview LandfiU CeU 1 Sliding During Operational FiUing @ 4780 Geotextile Interfece/Seismic Coeff varies/OF80G.DAT
PROFILE LINES 1 1 Waste FUl to 4764 225 4764 275 4780 665 4780 865 4714
2 2 Side Slope LCRS 0 4764
225 4764 365 4724
3 3 Bottom LCRS 365 4724 865 4714 999 4714
MATERL\L PROPERTIES 1 Waste FUl 50 C
150 22 N 2 Side Slope LCRS 100 C
0 24 N 3 Bottom LCRS 100 C
0 9 N
ANALYSIS N 217 4764 365 4722 863 4712 865 4714
Seismic 0.2
Procedure C 0.0
COMPUTE .

UTEXAS3 -'VEK 1.107 -10/13/91 - (C) 1985-1991 S. G. WRIGHT Date: 5:16:1996 Time: 11:13:51 Input file: of80g.dat
TABLE NO. 1 ****************************************** * COMPUTER PROGRAM DESIGNATION - UTEXAS3 * * OrigmaUy Coded By Stephen G. Wright • •VersionNo. 1.107 * * Last Revision Date 10/13/91 * * (C) Copyright 1985-1991 S. G. Wright * * All Ri^ ts Reserved * ******************************************
* * * * * * * * * * * * * * * * * * * * * * * * * * * * * * * * * * * * * * * * * * * * * * * * * * * * * * * * * * * * i ^ 4
* * * RESULTS OF COMPUTATTONS PERFORMED USING THIS COMPUTER • * PROGRAM SHOULD NOT BE USED FOR DESIGN PURPOSES UNLESS THEY * * HAVE BEEN VERIFIED BY INDEPENDENT ANALYSES, EXPERIMENTAL • •DATA OR FIELD EXPERIENCE. THE USER SHOULD UNDERSTAND THE * * ALGORITHMS AND ANALYTICAL PROCEDURES USED IN THE COMPUTER * * PROGRAM AND MUST HAVE READ ALL DOCUMENTATION FOR THIS * * PROGRAM BEFORE ATTEMPTTNG ITS USE. *
* NEITHER THE UNIVERSITY OF TEXAS NOR STEPHEN G.WRIGHT* * MAKE OR ASSUME LIABILITY FOR ANY WARRANTIES, EXPRESSED OR * * IMPLIED, CONCERNING THE ACCURACY, RELL^ILITY, USEFULNESS * * OR ADAPTABILITY OF THIS COMPUTER PROGRAM. *
************************************************************** UTEXAS3 - VER. 1.107 - 10/13/91 - (C) 1985-1991 S. G. WRIGHT
Date: 5:16:1996 Time: 11:13:51 Input fUe: of80g.dat Bayview LandfiU CeU 1 SUding During Operational Filling @ 4780 Geotextile Interfece/Seismic Coeff varies/OF80G.DAT
TABLE NO. 2 ************************* * NEW PROFILE LINE DATA • *************************
PROFILE LINE 1 - MATERLVL TYPE = 1 Waste FiU to 4764
PoiQt X Y
1 225.000 4764.000 2 275.000 4780.000 3 • 665.000 4780.000 4 865.000 4714.000
PROFILE LINE 2 - MATERIAL TYPE = 2 Side Slope LCRS

%
*
m
Point X Y
1 .000 4764.000 2 225.000 4764.000 3 365.000 4724.000
PROFtt-E LINE 3 - MATERLU. TYPE = 3 Bottom LCRS
Point X Y
1 365.000 4724.000 2 865.000 4714.000 3 999.000 4714.000
All new profile lines defined - No old Unes retained UTEXAS3 - VER. 1.107 - 10/13/91 - (C) 1985-1991 S. G. WRIGHT
Date: 5:16:1996 Time: 11:13:51 Input fUe: of80g.dat Bayview LandfiU CeU 1 Sliding-During Operational FiUing @ 4780 Geotextile Interface/Seismic Coeff varies/OF80G.DAT
TABLE NO. 3 * * * * * * * * * * * * * * * * * * * * * * * * * * * * * * * * * * * * * * * * * * * * * * * * * * * * * * * * * * * t i * * * * * * * * * *
* NEW MATERIAL PROPERTY DATA - CONVENTTONAL/FIRST-STAGE COMPUTATIONS
* * * * * * * * * * * * * * * * * * * * * * * * * * * * * * * * * * * * * * * * * * * * * * * * * * * * * * * * ^ ^ , t ^ t i t * * * * * * * *
DATA FOR MATERIAL TYPE 1 Waste FiU
Unit weight of material = 50.000
CONVENTIONAL aSOTROPIC) SHEAR STRENGTHS Cohesion - - 150.000 Friction angle 22.000 degrees
No (or zero) pore water pressures
DATA FOR MATERIAL TYPE 2 Side Slope LCRS
Unit weight of material = 100.000
CONVENTIONAL aSOTROPIC) SHEAR STRENGTHS Cohesion ,000 Friction angle 24,000 degrees
No (or zero) pore water pressures
DATA FOR MATERL\L TYPE 3 Bottom LCRS
Unit weight of material = 100.000
CONVENTIONAL (ISOTROPIC) SHEAR STRENGTHS Cohesion .000 Friction angle 9.000 degrees
No (or zero) pore water pressures
AU new material properties defined - No old data retained UTEXAS3 - VER. 1.107 - 10/13/91 - (C) 1985-1991 S. G. WRIGHT
Date: 5:16:1996 Time: 11:13:51 Input file: of80g.dat Bayview LandfiU CeU 1 SUding During Operational FUling @ 4780 Geotextile Interface/Seismic Coeff varies/OF80GJ)AT
TABLE NO. 15 ********************************* * NEW ANALYSIS/COMPUTATION DATA • *********************************
Noncircular Shear Surfece(s)
Computations Performed for Smgle Shear Surface
Shear Surface Coordinates -
Point X Y
1 217.000 4764.000 2 365.000 4722.000 3 863.000 4712.000 4 865.000 4714.000
Procedure used to compute die fector of safety: CORPS i Specified side force inclination = .00 degrees
THE FOLLOWING REPRESENT EITHER DEFAULT OR PREVIOUSLY DEFINED VALUES:
Initial trial estimate for the factor of safety = 3.000
Maximum number of iterations aUowed for calculating die factor of safety °= 40
AUowed force imbalance for convergence <= 100.000
AUowed moment imbalance for convergence = 100.000
Number of increments for sUce subdivision = 30
Depth of water in crack « .000
Unit weight ofwater in crack = 62.400

%
Seismic coefficient = .000
Conventional (single-stage) computations to be performed UTEXAS3 - VER. 1.107 -10/13/91 - (C) 1985-1991 S. G. WRIGHT Date: 5:16:1996 Time: 11:13:51 Input file: of80g.dat Bayview LandfiU CeU 1 SUding During Operational FUUng @ 4780 Geotextile Interface/Seismic Coeff varies/OF80GJ)AT
TABLE NO. 16 *************************** * NEW SLOPE GEOMETRY DATA * ***************************
NOTE - NO DATA WERE INPUT, SLOPE GEOMETRY DATA WERE GENERATED BY THE PROGRAM
Slope Coordinates -
Point X Y
1 .000 4764.000 2 225.000 4764.000 3 275.000 4780.000 4 665.000 4780.000 5 865.000 4714.000 6 999.000 4714.000
UTEXAS3 - VER. 1.107 -10/13/91 - (Q 1985-1991 S. G. WRIGHT Date: 5:16:1996 Time: 11:13:51 Ii^iut fUe: ofSOg.dat Bayview LandfiU CeU 1 Sliding During Operational FiUing @ 4780 Geotextile Interface/Seismic Coeff varies/OF80G.DAT
TABLE NO. 26 ************************************************************** * Coordinate, Weight, Strengtii and Pore Water Pressure • * Information for Individual SUces for Conventional * * Computations or First Stage of Multi-Stage Computations. * * (Information is for the Critical Shear Surface in tiie * * Case of an Automatic Search.) * **************************************************************
Slice SUce Mati. Friction Pore No. X Y Weight Type Cohesion Angle Pressure
217.0 4764.0 1 221.0 4762.9 9082 2 .00 24.00 .0
225.0 4761.7 2 2333 4759.4 7963.5 2 .00 24.00 .0
241.7 4757.0 3 250.0 4754.6 16322.0 2 .00 24.00 .0
2583 47523 4 266.7 4749.9 24681,8 2 .00 24.00 ,0
275,0 4747,5

5 284.0 4745.0 33453.4 2 293.0 4742.4
6 302.0 4739.9 38018.0 2 311.0 47373
7 320.0 4734.8 42584.3 2 329.0 47322
8 338.0 4729.7 47149,4 2 347.0 4727,1
9 356,0 4724.6 51715.7 2 365.0 4722.0
10 375.7 4721.8 64516.4 3 386.4 4721.6
11 397.1 4721.4 64979.9 3 407.9 4721.1
12 418.6 4720.9 65441.9 3 429.3 4720.7
13 440.0 4720.5 65905.4 3 450.7 47203
14 461.4 4720.1 66366.8 3 472.1 4719.8
15 482.9 4719.6 66830.8 3 493.6 4719.4
16 504.3 47192 67292.4 3 515.0 4719.0
17 525.7 4718.8 67755.9 3 536.4 4718.6
18 547.1 47183 682173 3 557.9 4718.1
19 568.6 4717.9 68681.4 3 579.3 4717.7
20 590.0 4717.5 69142.8 3 600.7 47173
21 611.4 4717.1 696063 3 622.1 4716.8
UTEXAS3 - VER, 1.107 - 10/13/91 - (C) 1985-1991 S. G. WRIGHT Date: 5:16:1996 Time: 11:13:51 Input file: of80g.dat Bayview LandfiU CeU 1 SUding During Operational FUUng @ 4780 GeotextUe Interface/Seismic Coeff varies/OF80G.DAT
TABLE NO. 26 * * * * * * * * * * * * * * * * * * * * * * * * * * * * * * * * * * * * * * * * * * * * * * * * * * * * * * * * * * i ^ t * *
* Coordinate, Weight, Strength and Pore Water Pressure * * Information for Individual SUces for Conventional * * Computations or First Stage of Multi-Stage Computations. * * (Information is for tiie Critical Shear Surface in tiie * * C a s e o f a n A u t o m a t i c S e a r c h . ) * * * * * * * * * * * * * * * * * * * * * * * * * * * * * * * * * * * * * * * * * * * * * * * * * * * * m * * * * * * * * * *
SUce SUce Mati. Friction Pore No. X Y Weight Type Cohesion Angle Pressure
622.1 4716.8 22 632.9 4716.6 700682 3 .00 9.00 .0
.00
,00
,00
.00
.00
.00
.00
.00
.00
.00
.00
.00
.00
.00
.00
.00
.00
24.00
24.00
24.00
24.00
24.00
9.00
9.00
9.00
9.00
9.00
9.00
9.00
9.00
9.00
9.00
9.00
9.00
.0
,0
.0
.0
.0
.0
,0
.0
.0
.0
.0
.0
.0
.0
.0
.0
.0

643.6 4716.4 23 654.3 47162 70532.6 3
665.0 4716.0 24 674.9 4715,8 62350.1 3
684.8 4715.6 25 694,7 4715,4 56276,7 3
704.6 47152 26 714.5 4715.0 50202.8 3
724.4 4714.8 27 7343 4714.6 44128.9 3
7442 4714.4 28 754.1 47142 38055.5 3
764.0 4714.0 29 773.9 4713.8 31981.6 3
783.8 4713.6 30 793.7 4713.4 25907.7 3
803.6 47132 31 813.5 4713.0 198343 3
823.4 4712.8 32 833.3 4712.6 13760.4 3
8432 4712.4 33 853.1 47122 7689.0 3
863.0 4712.0 34 864.0 4713.0 235.0 3
865.0 4714.0 UTEXAS3 - VER. 1.107 -10/13/91 - (C) 1985-1991 S. G. WRIGHT Date: 5:16:1996 Time: 11:13:51 Input file: ofS0g.dat Bayview LandfiU CeU 1 SUding During Operational FiUing @ 4780 GeotextUe Interfece/Seismic Coeff varies/OF80G,DAT
,00
.00
.00
.00
.00
.00
.00
.00
,00
,00
,00
00
9.00
9.00
9.00
9.00
9.00
9.00
9.00
9.00
9.00
9.00
9.00
9.00
.0
.0
.0
,0
,0
.0
,0
.0
,0
,0
.0
,0
TABLE NO. 27 ************************************************************* * Seismic Forces and Forces Due to Surface Pressures for * * Individual SUces for Conventional Computations or the * * First Stage of Multi-Stage Computations. * * (Information is for the Critical Shear Surface in the * * Case of an Automatic Search.) * * * * * * * * * * * * * * * * * * * * ^ * * * * * * * * * * * * * * * * * * * * * * * * * * * * * * * * * * * * i , * * * *
FORCES DUE TO SURFACE PRESSURES Yfor
SUce Seismic Seismic Normal Shear No. X Force Force Force Force X Y
%
1 2 3 4 5 6 7 8 9
221.0 233.3 250.0 266.7 284.0 302.0 320.0 338.0 356.0
0. 0. 0. 0. 0. 0. 0. 0. 0.
4763.4 4762.4 4762.5 4762.7 4761,5 4759,0 4756.4 4753.9 47513
0. 0. 0. 0. 0. 0. 0. 0. 0.
0. 0. 0. 0. 0. 0. 0. 0. 0.
.0
.0
.0
.0
.0
.0
.0
.0
.0
.0
.0
.0
.0 ,0 .0 .0 .0 .0

10
n 12 13 14 15 16 17 18 19 20 21 22 23 24 25 26 27 28 29 30 31 32 33 34
375.7 397.1 418.6 440.0 461.4 482.9 5043 525.7 547.1 568.6 590.0 611.4 632.9 6543 674.9 694.7 714.5 7343 754.1 773.9 793.7 813.5 8333 853.1 864.0
0. 0. 0. 0. 0. 0. 0. 0. 0. 0. 0. 0. 0. 0. 0. 0. 0. 0. 0. 0. 0. 0. 0. 0. 0.
4750.0 4749.7 4749.5 4749,3 4749,1 4748,9 4748,7 4748,4 47482 4748.0 4747.8 4747.6 4747.4 4747.1 47453 4741.8 4738.4 4734.9 4731.5 4728.0 4724.6 47212 4717,8 4714,6 4713,6
0. 0. 0. 0. 0. 0. 0. 0. 0. 0. 0. 0. 0. 0. 0. 0. 0. 0. 0. 0. 0. 0. 0. 0. 0.
0. 0. 0. 0, 0. 0. 0. 0. 0. 0. 0. 0. 0. 0. 0. 0. 0. 0. 0. 0. 0. 0. 0. 0. 0.
.0
.0 ,0 .0 .0 .0 .0 .0 .0 .0 .0 .0 ,0 ,0 ,0 .0 .0 .0 .0 .0 .0 .0 .0 .0 .0
,0 ,0 .0 .0 ,0 ,0 ,0 .0 .0 .0 .0 ,0 ,0 ,0 ,0 .0 ,0 ,0 ,0 ,0 ,0 ,0 ,0 ,0 ,0
UTEXAS3 - VER. 1,107 - 10/13/91 - (C) 1985-1991 S. G. WRIGHT Date: 5:16:1996 Tune: 11:13:51 Input fUe: ofSOg.dat v Bayview LandfiU CeU 1 SUdmg During Operational FUling @ 4780 Geotextile Interfece/Seismic Coeff varies/OF80G.DAT
TABLE NO. 29 t i i t * * * * * * * * * * * * * * * * * * * * * * * * * * * * * * * * * * * * * * * * * * * * * * * * * ^ : * * * * * * * * * * * * * *
* INFORMATION GENERATED DURING ITERATIVE SOLUTION FOR THE FACTOR * * OF SAFETY BY THE CORPS OF ENGINEERS MODEFIED SWEDISH PROCEDURE * i , 4 * * * * * * * * * * * * * * * * * * * * * * * * * * * * * * * * * * * * * * * * * * * * * * * i ^ * * * * * * * * i t i t i * * * * * *
Trial Factor Force Imbalance Iteration of Safety Qbs.) DELTA-F
1 . 3.00000 -.846E+04 237
2 323701 -.611E+03 .199E-01
3 325688 -.368E+01 .121E-03
4 325700 283E-01 -.933E-06
Factor of Safety 3257 Side Forte IncUnation .00 Number of Iterations 4 UTEXAS3 - VER. 1.107 - 10/13/91 - (C) 1985-1991 S. G. WRIGHT Date: 5:16:1996 Time: 11:13:51 biput file: ofSOg.dat Bayview LandfiU CeU 1 /

%
SUding During Operational FUUng @ 4780 Geotextile Interface/Seismic Coeff varies/OF80G J>AT
TABLE NO. 38 *************************************************************** * Final Results for Stresses Along the Shear Surface * * (Results for Critical Shear Surface in Case of a Search.) * ***************************************************************
CORPS OF ENGINEERS' PROCEDURE USED TO COMPUTE FACTOR OF SAFETY Factor of Safety = 3.257
VALUES AT CENTER OF BASE OF SLICE-
Total Effective SUce Normal Normal Shear No. X-center Y-center Stress Stress Stress
I 2 3 4 5 6 7 8 9 10 11 12 13 14 15 16 17 18 19 20 21 22 23 24 25 26 27 28 29 30 31 32 33 34
221.0 233.3 250.0 266.7 284.0 302.0 320.0 338.0 356.0 375.7 397.1 418.6 440.0 461,4 482.9 504.3 525.7 547.1 568.6 590.0 611.4 632.9 6543 674.9 694.7 714.5 734.3 754.1 773.9 793.7 813.5 8333 853.1 864.0
4762.9 4759.4 4754.6 4749.9 4745,0 4739.9 4734.8 4729.7 4724.6 4721.8 4721.4 4720.9 4720.5 4720.1 4719.6 47192 4718.8 47183 4717.9 4717.5 4717.1 4716.6 47162 4715.8 4715.4 4715.0 4714.6 47142 4713.8 4713.4 4713.0 4712,6 4712,2 4713,0
1093 460,0 942.8 1425.6 1789.1 20332 2277.5 2521.6 2765.8 3007.8 3029.4 3051.0 3072.6 3094.1 3115.7 31372 3158.9 3180.4 3202.0 3223.5 3245.1 3266.7 32883 3145.9 2839.5 2533.0 2226.6 1920.1 1613.7 13072 1000.8 6943 387.9 123.5
1093 460.0 942.8 1425.6 1789.1 20332 2277.5 2521.6 2765.8 3007.8 3029.4 3051.0 3072.6 3094.1 3115.7 31372 3158.9 3180.4 3202.0 3223.5 3245.1 3266.7 3288.3 3145.9 2839.5 2533.0 2226.6 1920.1 1613.7 13072 1000.8 694.3 387.9 123.5
14.9 62.9 128.9 194.9 244.6 277.9 3113 344.7 378.1 1463 1473 148.4 149.4 150.5 151.5 152.6 153.6 154.7 155.7 156.8 157.8 158.9 159.9 153.0 138.1 1232 1083 93.4 78.5 63.6 48.7
33.8 18.9 6.0
•I

CHECK SUMS - (ALL SHOULD BE SMALL) SUM OF FORCES IN VERTICAL DIRECTION = .03 (= 335E-01)
SHOULD NOT EXCEED .lOOE+03 SUM OF FORCES IN HORIZONTAL DIRECTTON = .00 (= 316E-02)
SHOULD NOT EXCEED .lOOE+03 SHEAR STRENGTH/SHEAR FORCE CHECK-SUM = .06 (= .625E-01)
SHOULD NOT EXCEED .lOOE+03 UTEXAS3 - VER. 1.107 - 10/13/91 - (C) 1985-1991 S. G. WRIGHT
Date: 5:16:1996 Time: 11:13:51 Input fiile: of80g.dat Bayview LandfiU CeU 1 SUding During Operational FUUng @ 4780 Geotextile Interfece/Seismic Coeff varies/OF80G.DAT
TABLE NO. 39 **************************************************************** • Final Results for Side Forces and Stresses Between SUces. * * (Results for Critical Shear Surface in Case of a Search.) • * * * * * * * * * * * * * * * * * * * * * * * * * * * * * * * * * * * * * * * * * * * * * * * * * * * * * * * * * * i ^ * * * ^ m
CORPS OF ENGINEERS' PROCEDURE USED TO COMPUTE FACTOR OF SAFETY Factor of Safety = 3.257
VALUES AT RIGHT SIDE OF SLICE —
Side Force SUce Side Inclination
No. X-Right Force (degrees)
1 2 3 4 5 6 7 8 9 10 11 12 13 14 15 16 17 18 19 20 21 22 23 24 25 26
?7,5.0 241.7 258.3 275.0 293.0 311.0 329.0 347.0 365.0 386.4 407.9 4293 450.7 472.1 493.6 515.0 536.4 557.9 5793 600.7 622.1 643.6 665.0 684.8 704.6 724.4
129. 1256. 3567. 7062. 11798. 17181. 23210. 29886. 37210. 35370. 33516. 31650. 29770. 27876. 25970. 24050. 22118. 20172. 18212. 16240. 14254. 1?,?,56. 10248. 8470. 6864. 5432.
.00 .00 .00 .00 .00 .00 .00 .00 .00 .00 .00 .00 .00 .00 .00 .00 .00 .00 .00 .00 .00 .00 .00 .00 .00 .00

27 28 29 30 31 32 33 34
7442 764.0 783.8 803.6 823.4 8432 863.0 865.0
4173. 3088. 2175. 1436. 870. 478. 259. 0.
,00 ,00 ,00 ,00 ,00 .00 .00
.00
END-OF-FILE ENCOUNTERED WHILE READING COMMAND WORDS - END OF PROBLEM(S) ASSUMED
%

HEADING Bayview Landfill CeU 1 SUdmg During Operational FUling @ 4780 Sand Interface/Seismic Coeff varies/OF80S.DAT
PROFILE LINES 1 1 Waste FiU to 4764 225 4764 275 4780 665 4780 865 4714
2 2 Side Slope LCRS 0 4764
225 4764 . 365 4724
3 3 Bottom LCRS 365 4724 865 4714 999 4714
MATERIAL PROPERTIES 1 Waste FUl 50 C
150 22 N 2 Side Slope LCRS 100 C
0 24 N 3 Bottom LCRS 100 C
0 17 N
ANALYSIS • N 217 -4764 365 4722 863 4712 865 4714
Seismic 0.30
Procedure C 0.0
COMPUTE

UTEXAS3 - VER. 1.107 -10/13/91 - (C) 1985-1991 S. G. WRIGHT Date: 5:16:1996 Time: 11:18:48 Input file: ofSOs.dat
TABLE NO. 1 ***************************************** COMPUTER PROGRAM DESIGNATION - UTEXAS3 * OriginaUy Coded By Stephen G. Wright * VersionNo. 1.107 * Last Revision Date 10/13/91 * (C) Copyright 1985-1991 S,G, Wright • All R i^ t s Reserved * *****************************************
************************************************************* *
RESULTS OF COMPUTATIONS PERFORMED USING THIS COMPUTER * PROGRAM SHOULD NOT BE USED FOR DESIGN PURPOSES UNLESS THEY * HAVE BEEN VERIFIED BY INDEPENDENT ANALYSES/EXPERIMENTAL • DATA OR FIELD EXPERIENCE, THE USER SHOULD UNDERSTAND THE • ALGORITHMS AND ANALYTICAL PROCEDURES USED IN THE COMPUTER * PROGRAM AND MUST HAVE READ ALL DOCUMENTATION FOR THIS * PROGRAM BEFORE ATTEMPTING ITS USE. *
* NEITHER THE UNIVERSITY OF TEXAS NOR STEPHEN G. WRIGHT *
MAKE OR ASSUME LL\BILrTY FOR ANY WARRANTIES, EXPRESSED OR * IMPLIED, CONCERNING THE ACCURACY, RELIABILITY, USEFULNESS • OR ADAPTABILITY OF THIS COMPUTER PROGRAM. •
* *************************************************************
UTEXAS3 - VER. 1.107 - 10/13/91 - (C) 1985-1991 S. G. WRIGHT Date: 5:16:1996 Time: 11:18:48 Input file: ofSOs.dat
Bayview LandfUl CeU 1 SUding During Operational FUUng @ 4780 Sand hiterface/Seismic Coeff varies/OF80S.DAT
TABLE NO. 2 ************************* * NEW PROFILE LINE DATA • *************************
PROFTLELINE 1 - MATERL\L TYPE = 1 Waste FiU to 4764
Point X Y
1 2 3
225.000 275.000 665.000 865.000
4764.000 4780.000 4780.000 4714.000
%
PROFILE LINE 2-Side Slope LCRS
MATERIAL TYPE = 2

Point X Y
1 .000 4764.000 2 225.000 4764.000 3 365.000 4724.000
PROFUJBLINE 3-MATERIALTYPE = 3 Bottom LCRS
Point X Y
1 365.000 4724.000 2 865.000 4714.000 3 999.000 4714.000
AU new profile lines defined - No old lines retamed UTEXAS3 - VER. 1.107 - 10/13/91 - (C) 1985-1991 S. G. WRIGHT
Date: 5:16:1996 Time: 11:18:48 Input file: of80s.dat Bayview LandfiU CeU 1 SUding During Operational FUUng @ 4780 Sand Interface/Seismic Coeff varies/OF80S.DAT
TABLE NO. 3 * * * * * * * * * * * * * * * * * * * * * * * * * * * * * * * * * * * * * * * * * * , t i * * * * * * * * * * * * * * * * * * * * * * * * * * *
* NEW MATERIAL PROPERTY DATA - CONVENTTONAL/FIRST-STAGE COMPUTATTONS
* * * * * * * * * * * * * * * * * * * * * * * * * * * * * * * * * * * * * * 1 f ^ ^ ^ i ^ : t ^ ^ , i ^ H * i H , * ^ i * * * i H i * * * * * * * * * * * *
DATA FOR MATERIAL TYPE 1 Waste FUl
Unit weight of material = 50.000
CONVENTIONAL (ISOTROPIC) SHEAR STRENGTHS Cohesion 150.000 Friction angle 22.000 degrees
No (or zero) pore water pressures
DATA FOR MATERIAL TYPE 2 Side Slope LCRS
Unit weight of material = 100.000
CONVENTIONAL (ISOTROPIC) SHEAR STRENGTHS Cohesion .000 Friction angle 24.000 degrees
No (or zero) pore water pressures
DATA FOR MATERIAL TYPE 3 Bottom LCRS
Unit weight of material = 100.000

%
CONVENTIONAL GSOTROPIC) SHEAR STRENGTHS Cohesion .000 Friction angle 17.000 degrees
No (or zero) pore water pressures
AU new material properties defined - No old data retained UTEXAS3 - VER. 1,107 -10/13/91 - (C) 1985-1991 S, G, WRIGHT
Date: 5:16:1996 Time: 11:18:48 Input file: ofSOs.dat Bayview LandfiU CeU 1 SUding'During Operational FUUng @ 4780 Sand Interface/Seismic Coeff varies/OF80S.DAT
TABLE NO. 15 ********************************* • NEW ANALYSIS/COMPUTATION DATA • *********************************
Noncircular Shear Surface(s)
Computations Performed for Single Shear Surface
Shear Surfece Coordinates -
Point X Y
1 217.000 4764.000 2 365.000 4722.000 3 863.000 4712.000 2 365.000 4722.000 |
I
4 865.000 4714.000 '
Procedure used to compute tiie fector of safety: CORPS Specified side force inclination = .00 degrees
THE FOLLOWING REPRESENT EITHER DEFAULT OR PREVIOUSLY DEFINED VALUES:
Initial trial estimate for the fector of safety = 3.000
Maximum number of iterations aUowed for calculating tiie fector of safety = 40
AUowed force imbalance for convergence = 100.000
Allowed moment imbalance for convergence = 100.000
Number of mcrements for sUce subdivision = 30
Depth of water in crack = .000
Unit weigiht of water in crack - 62.400

Seismic coefficient = .000
Conventional (single-stage) computations to be performed UTEXAS3 - VER. 1.107 - 10/13/91 - (C) 1985-1991S. G. WRIGHT Date: 5:16:1996 Tune: 11:18:48 Input file: ofSOs.dat
Bayview LandfiU CeU 1 Sliding During Operational FiUing @ 4780 Sand iiterface/Seismic Coeff varies/OF80S.DAT
TABLE NO. 16 *************************** * NEW SLOPE GEOMETHY DATA • ***************************
NOTE - NO DATA WERE INPUT, SLOPE GEOMETRY DATA WERE GENERATED BY THE PROGRAM
Slope Coordinates -
Point X Y
1 .000 4764,000 2 225.000 4764.000 3 275.000 4780.000 4 .665.000 4780.000 5 865.000 4714.000 6 999.000 4714.000
UTEXAS3 - VER. 1.107 -10/13/91 - (C) 1985-1991 S. G. WRIGHT Date: 5:16:1996 Time: 11:18:48 Input file: ofSOs.dat
Bayview Landfill CeU 1 SUding During Operational FiUing @ 4780 Sand Interfece/Seismic Coeff varies/OF80S.DAT
TABLE NO. 26 * * * * * * * * * * * * * * * * * * * * * * * * * * * * * * * * * * * * * * * * * * * * * * * * * : ^ * * * * * * * * t f * * *
* Coordinate, Weight, Strengtii and Pore Water Pressure • * Infonnation for Individual SUces for Conventional * * Computations or First Stage of Multi-Stage Computations. * * (Information is for die Critical Shear Surfece in the * * Case ofan Automatic Search.) * * * * * * * * * * * * * * * * * * * * * * * * * * * * * * * * * * * * * * * * * * t , * * * * * * * * * * * * * * * * * * * *
ice Mati. Friction Pore Weight Type Cohesion Angle Pressure
9082 2 .00 24.00 .0
7963.5 2 .00 24.00 .0
16322.0 2 .00 24.00 .0
24681.8 2 .00 24.00 .0
SUce ' No. X
217.0 1 221.0
225.0 2 2333
241.7 3 250.0
2583 4 266.7
275.0
Sli Y
4764.0 4762.9 4761.7 4759.4 4757.0 4754.6 4752.3 4749.9 4747.5
9
5 284.0 4745.0 33453.4 2 293.0 4742.4
6 302.0 4739.9 38018.0 2 311.0 47373
7 320.0 4734.8 42584.3 2 329.0 47322
8 338.0 4729.7 47149.4 2 347.0 4727.1
9 356.0 4724.6 51715.7 2 365.0 4722.0
10 375.7 4721.8 64516.4 3 386.4 4721.6
11 397.1 4721.4 64979.9 3 407.9 4721.1
12 418.6 4720.9 65441.9 3 429.3 4720.7
13 440.0 4720.5 65905.4 3 450.7 47203
14 461.4 4720.1 66366.8 3 472.1 4719.8
15 482.9 4719.6 66830.8 3 493.6 4719,4
16 504.3 47192 67292.4 3 515.0 4719,0
17 525,7 4718.8 67755.9 3 536.4 4718.6
18 547.1 47183 682173 3 557.9 4718.1
19 568.6 4717.9 68681.4 3 579.3 4717.7
20 590.0 4717.5 69142.8 3 600.7 4717.3
21 611.4 4717.1 696063 3 622.1 4716.8
UTEXAS3 - VER. 1.107 - 10/13/91 - (C) 1985-1991 S. G. WRIGHT Date: 5:16:1996 Time: 11:18:48. Inputfile: ofSOs.dat Bayview LandfiU CeU 1 SUdmg During Operational FUUng @ 4780 Sand Interface/Seismic Coeff varies/OF80SJ3AT
TABLE NO. 26 ************************************************************** * Coordinate, Weight, Strengtii and Pore Water Pressure * * Information for Individual Slices for Conventional * * Computations or First Stage of Multi-Stage Computations. * * (Information is for the Critical Shear Surface in tiie * * Case of an Automatic Search.) * **************************************************************
SUce SUce MatL Friction Pore No. X Y Weight Type Cohesion Angle Pressure
622.1 4716.8 22 632.9 4716.6 70068.2 3 .00 17.00 .0
.00
.00
,00
,00
,00
,00
,00
,00
.00
.00
.00
.00
.00
.00
.00
.00
.00
24.00
24.00
24.00
24.00
24.00
17.00
17.00
17.00
17.00
17.00
17.00
17.00
17.00
17.00
17.00
17.00
17.00
,0
.0
.0
.0
.0
.0
.0
.0
.0
.0
.0
.0
.0
.0
.0
.0
.0
643.6 4716.4 23 6543 47162 70532.6 3
665.0 4716.0 24 674.9 4715.8 62350.1 3
684.8 4715.6 25 694.7 4715.4 56276.7 3
704.6 47152 26 714.5 4715.0 50202.8 3
724.4 4714.8 27 734.3 4714.6 44128.9 3
7442 4714.4 28 754.1 4714.2 38055.5 3
764.0 4714.0 29 773.9 4713.8 31981.6 3
783.8 4713.6 30 793.7 4713.4 25907.7 3
803.6 47132 31 813.5 4713.0 198343 3
823.4 4712.8 32 833.3 4712.6 13760.4 3
8432 4712.4 33 853.1 47122 7689.0 3
863.0 4712.0 34 864.0 4713.0 235.0 3
865.0 4714.0 UTEXAS3 - VER. 1.107 - 10/13/91 - (C) 1985-1991 S. G. WRIGHT Date: 5:16:1996 Time: 11:18:48 Input fUe: of80s.dat Bayview LandfiU CeU 1 SUding During Operational FUling @ 4780 Sand Interface/Seismic Coeff varies/OF80S.DAT
.00
.00
.00
.00
.00
.00
.00
.00
.00
.00
.00
.00
17.00
17.00
17.00
17.00
17.00
17.00
17.00
17.00
17.00
17.00
17.00
17.00
.0
.0
.0
.0
.0
.0
.0
,0
.0
.0
.0
.0
TABLE NO. 27 ^ i i t * * * * * * * * * * * * * * * * * * * * * * * * * * * * * * * * * * * * * * * * * * * * * * * * * * * * * * * * * * *
• Seismic Forces and Forces Due to Surfece Pressures for * • Individual SUces for Conventional Computations or the * • First Stage of MuM-Stage Computations. * • (Uiformation is for the Critical Shear Surface m the * • Case of an Automatic Search.) * 1 ^ * * * * * * * * * * * * * * * * * * * * * * * * * * * * * * * * * * * * * * * * * * * * * * * * * * * * * * * * * * * *
FORCES DUE TO SURFACE PRESSURES Yfor
SUce Seismic Seismic Normal Shear No. X Force Force Force Force X Y
1 2 3 4 5 6 7 8 9
221.0 2333 250.0 266.7 284.0 302.0 320.0 338.0 356.0
0. 0. 0. 0. 0. 0. 0. 0. 0.
4763.4 4762.4 4762.5 4762,7 4761,5 4759.0 4756.4 4753.9 47513
0. 0. 0. 0. 0. 0. 0. 0. 0.
0. 0. 0. 0. 0. 0. 0. 0. 0.
.0
.0
.0
.0
.0
.0
.0
.0
.0
.0
.0
.0
.0
.0
.0
.0 ,0 .0
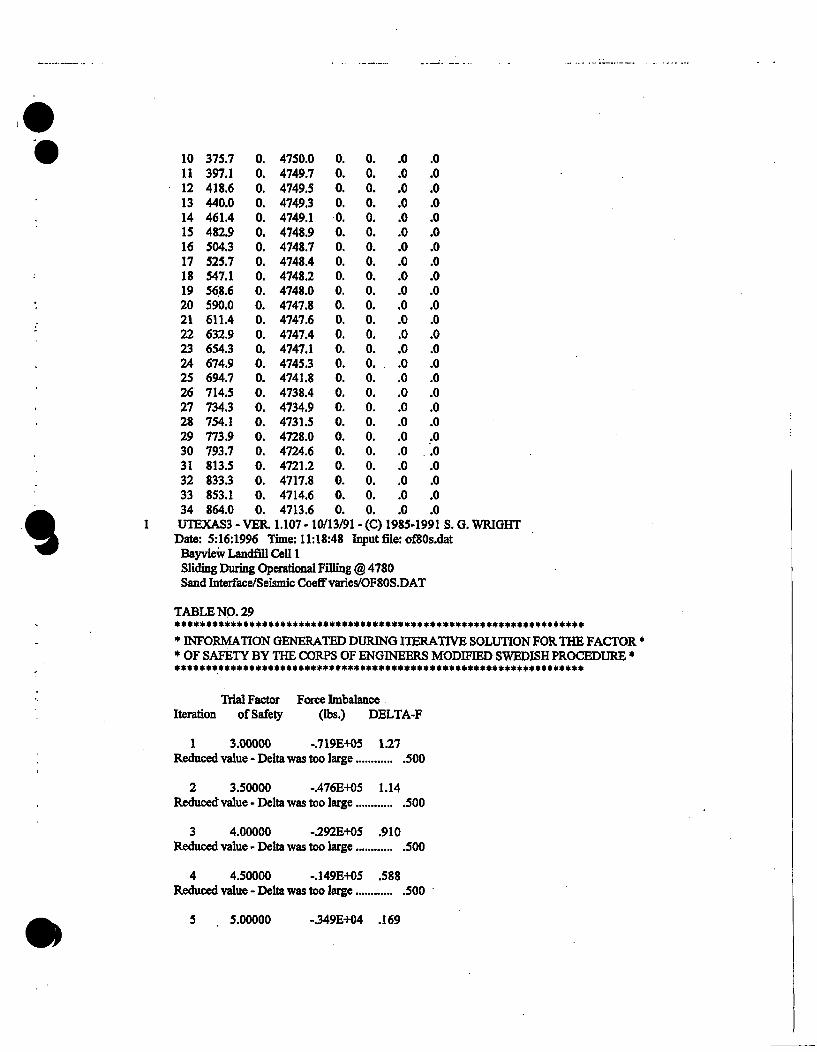
«
10 11 12 13 14 15 16 17 18 19 20 21 22 23 24 25 26 27 28 29 30 31 32 33 34
375,7 397,1 418.6 440,0 461.4 482.9 504.3 525.7 547.1 568.6 590.0 611.4 632.9 654.3 674.9 694.7 714.5 734.3 754.1 773.9 793.7 813.5 8333 853.1 864.0
0. 0. 0. 0. 0. 0. 0. 0. 0. 0. 0. 0. 0. 0. 0. 0. 0. 0. 0. 0, 0, 0. 0. 0. 0.
4750.0 4749.7 4749.5 4749.3 4749.1 4748.9 4748.7 4748.4 47482 4748.0 4747.8 4747.6 4747.4 4747.1 4745.3 4741.8 4738.4 4734.9 4731.5 4728.0 4724.6 47212 4717.8 4714.6 4713.6
0. 0. 0. 0. 0. 0. 0. 0. 0. 0. 0. 0. 0. 0. 0. 0. 0. 0. 0. 0. 0. 0. 0. 0. 0.
0. 0. 0. 0, 0, 0, 0, 0. 0. 0, 0. 0. 0. 0. 0. 0. 0. 0. 0. 0. 0. 0. 0. 0. 0.
.0
.0 ,0 .0 ,0 ,0 .0 ,0 .0 .0 .0 .0 .0 .0 .0 .0 .0 .0 .0 .0 .0 .0 .0 .0 .0
.0
.0
.0 ,0 .0 ,0 .0 ,0 .0 ,0 .0 ,0 .0 ,0 ,0 ,0 ,0 ,0 .0 .0 .0 .0 ,0 .0 .0
m
UTEXAS3 - VER. 1.107 -10/13/91 - (C) 1985-1991 S. G. WRIGHT Date: 5:16:1996 Time: 11:18:48 Input file: of80s.dat
Bayview LandfiU CeU 1 Sliding During Operational FiUing @ 4780 Sand iQterface/Seismic Coeff varies/OF80S.DAT
TABLE NO. 29 ****************************************************************** • INFORMATION GENERATED DURING ITERATIVE SOLUTION FOR THE FACTOR • • OF SAFETY BY THE CORPS OF ENGINEERS MODIFIED SWEDISH PROCEDURE * ******************************************************************
Trial Factor Force Imbalance Iteration of Safety (lbs.) DELTA-F
1 3.00000 -.719E-K)5 1.27 Reduced value - Delta was too large 500
2 3.50000 -.476E+05 1.14 Reduced value - Delta was too large 500
3 4.00000 -292E+05 ,910 Reduced value - Deha was too large 500
4 4.50000 -.149E-K)5 .588 Reduced value - Delta was too large 500
5 5.00000 -349E+04 .169

5,16912 -,113E+03 ,587E-02
5,17499 .141E+00 ,734E-05
Factor of Safety 5,175 Side Force Inclination ,00 Number of Iterations 7 UTEXAS3 - VER. 1,107 -10/13/91 - (C) 1985-1991 S. G. WRIGHT Date: 5:16:1996 Time: 11:18:48 Input file: ofSOs.dat Bayview LandfiU CeU 1 SUding During Operational Filling @ 4780 Sand Interface/Seismic Coeff varies/OF80S.DAT
TABLE NO. 38 * * i ^ * * * * * * * * * * * * * * * * * * * * * * * * * * * * * * * * * * * * * * * * * * * * * * * * * * * * * * * * * * * *
* Final Results fbr Stresses Along tiie Shear Surfece * * (Results for Critical Shear Surface in Case of a Search.) * ***************************************************************
CORPS OF ENGINEERS' PROCEDURE USED TO COMPUTE FACTOR OF SAFETY Factor of Safety = 5.175
VALUES AT CENTER OF BASE OF SLICE-
Total Effective SUce Normal Normal Shear No. X-center Y-center Stress Stress Stress
1 2 3 4 5 6 7 8 9 10 11 12 13 14 15 16 17 18 19 20 21 22 23 24 25 26
221.0 233.3 250.0 266.7 284.0 302.0 320.0 338.0 356.0 375.7 397.1 418.6 440.0 461.4 482.9 5043 525.7 547.1 568.6 590.0 611.4 632.9 654.3 674.9 694.7 714.5
4762.9 4759.4 4754.6 4749.9 4745.0 4739.9 4734.8 4729.7 4724.6 4721.8 4721.4 4720.9 4720.5 4720.1 4719.6 47192 4718.8 4718.3 4717.9 4717.5 4717.1 4716.6 47162 4715.8 4715.4 4715.0
110.8 466.4 956.0 1445.6 18142 2061.8 2309.4 2557.0 2804.6 30072 3028.8 30503 3071.9 3093.5 3115.1 3136.6 31582 3179.7 32013 3222.8 3244.4 3266.0 3287.6 31453 2838.9 2532.5
110.8 466.4 956.0 1445.6 18142 2061.8 2309.4 2557.0 2804.6 30072 3028.8 3050.3 3071.9 3093.5 3115.1 3136.6 31582 3179.7 32013 3222.8 3244.4 3266.0 3287,6 31453 2838,9 2532.5
9.5 40.1 822 124.4 156.1 177.4 198.7 220.0 2413 177.7 178.9 1802 181.5 182.8 184.0 1853 186.6 187.9 189,1 190,4 191.7 192.9 1942 185.8 167.7 149.6

27 7343 4714.6 2226.1 2226.1 131.5 28 754.1 47142 1919.7 1919.7 113.4 29 773.9 4713.8 16133 16133 953 30 793.7 4713.4 1306.9 1306.9 772 31 813.5 4713.0 1000.5 1000.5 59.1 32 8333 4712.6 694.1 694.1 41.0 33 853.1 47122 387.9 387,9 22.9 34 864.0 4713.0 124.9 124.9 7.4
CHECK SUMS - (ALL SHOULD BE SMALL) SUM OF FORCES IN VERTICAL DIRECTION = ,04 (= 383E-01)
SHOULD NOT EXCEED ,100E403 SUM.OF FORCES IN HORIZONTAL DIRECTION = .00 (= 304E-02)
SHOULD NOT EXCEED . lOOE+03 SHEAR STRENGTH/SHEAR FORCE CHECK-SUM = .13 (= .130E+00)
SHOULD NOT EXCEED .lOOE+03 UTEXAS3 - VER, 1.107 - 10/13/91 - (C) 1985-1991 S. G. WRIGHT Date: 5:16:1996 Time: 11:18:48 Input fUe: ofSOs.dat Bayview Landfill CeU I SUding During Operational FiUing @ 4780 Sand Interfece/Seismic Coeff varies/OF80S.DAT
TABLE NO. 39 **************************************************************** * Final Results for Side Forces and Stresses Between SUces. * * (Results for Critical Shear Surfece in Case of a Search.) * ****************************************************************
CORPS OF ENGINEERS' PROCEDURE USED TO COMPUTE FACTOR OF SAFETY Factor of Safety = 5.175
VALUES AT RIGHT SIDE OF SLICE —
Side Force SUce Side IncUnation No. X-Right Force (degrees)
m
1 2 3 4 5 6 7 8 9 10 11 12 13 14 15 16
225.0 241.7 2583 275.0 293.0 311.0 329.0 347.0 365.0 386.4 407.9 429.3 450.7 472.1 493.6 515.0
175. 1712. 4863. 9628, 16085, 23424, 31643. 40745. 50730. 48216. 45685. 43135. 40568. 37982. 35379. 32757.
.00 ,00 ,00 ,00 ,00 ,00 ,00 .00 .00 .00 .00 .00 .00 .00 .00 .00

17 18 19 20 21 22 23 24 25 26 27 28 29 30 31 32 33 34
536,4 557.9 579.3 600.7 622.1 643.6 665.0 684.8 704.6 724.4 744.2 764.0 783.8 803.6 823.4 8432 863.0 865.0
30118. 27460. 24784. 22091. 19379. 16650. 13907. 11478. 9285. 7329. 5610. 4127. 2881. 1872. 1099. 563. 264. 0.
.00
.00 ,00 ,00 .00 ,00 ,00 ,00 ,00 .00 .00 .00 .00 .00 .00 .00 .00 .00
END-OF-FILE ENCOUNTERED WHILE READING COMMAND WORDS - END OF PROBLEM(S) ASSUMED
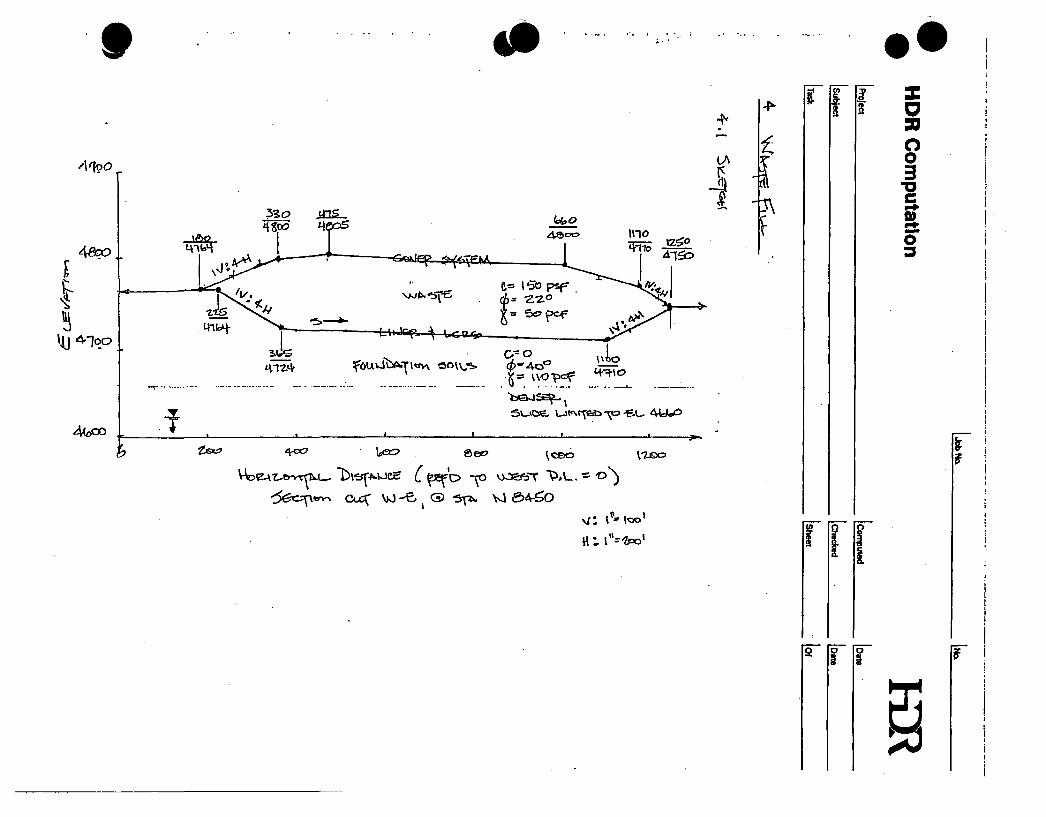
t A0
Aloo
ASoo,. I i
23o fM5 (ebO
6 = •2.-2.°
iUS O - O
-I ino
E ^ O
4<oOO ^ f » ^ec3 4«p \j30 g©o ^ceo vzeo
t I
* ' 3 \
Z
o o o 3
• D
C t - f
fi)
o
(0
I
o

UpbNa \Nex.
HDR Computation
IProject
Subject
Task
4.Z
4.3
Computed
Checked
Sheet
F-^ '- -z.s-t-
KR Date
Oate
Of
^ 7 ^ i 2 , / T i / ^ J 5 i / ^ e c t ^ t o - STAf iC P ' - S f ^ ^ S,A/rV= a'yiii./:<7'VTj- 45- -f-.. I . I h J /
^^ 0.fO
L« 0.44-
o O.l o.z 0.5 0,4- 0.6

t #
BflVVIEi LANDFILL CELL 1 CLOSURE CAP Hydpaulic Condition 7: lisev M i n e d
F i l e : ClCCSl
4(^D T h h / .S"oi«_3
. ( 78 , 4394 ) . SCALE .: 1 inch = ISO fep t

BAVVIEU LANDFILL CELL 1 CLOSURE CAP File'. ClCCSi Hydraulic Condition 7; User Defined Consolidated Drained Soil Papaneteps Factor of Safety = 2.88, Failure Center: ( 247 i 4913 ) , Radius: 150
fVA'Sfe
C&\tfl\ ^ _ .
fn>tJ SoiL£.
I jr S o p ^
. ^ U >
. ( 83 , 4Si98 ) SCALE .: 1 i n c h = 70.61313191 f e e t

%
* * * * * * * * * * * * * * * * * * * * * * * * * * * * * * * * * * * * * * * * * * * * * * * * * * * * * * * * * * * * * * * * * * * * G A R D S S U M M A R Y * * *
* Project: BAYVIEW LANDFILL CELL 1 CLOSURE CAP * * File: C1CCS1 * * * * GARDS Version 2.00 * * developed by * * Department of Civil and Environmental Engineering * * University of Cincinnati * * under contract to * * U.S. Environmental Protection Agency * * Land Pollution Control Division * * Hazardous Waste Engineering Research Laboratory * * * ************************************************************************
************************************************************************
* Site Characteristics * ************************************************************************
* The seismic coefficient is . 0.1(>|TOO.SO* * (. * * The design earthquake magnitude is 7.20 * * *
* The maximum flood elevation in this case is 0 * * *
* The elevation of the seasonal high ground water is. . 0 * * *
* The design waste elevation in the cell is 0 * * *
* The soil number representing the clay liner is. . . . 0 * * * ************************************************************************

* * * * * * * * * * * * * * * * * * * * * * * * * * * * * * * * * * * * * * * * * * * * * * * * * * * * * * * * * * * * * * * * * * * * * * * * * Sec t ion Geometry * * * * * * * * * * * * * * * * * * * * * * * * * * * * * * * * * * * * * * * * * * * * * * * * * * * * * * * * * * * * * * * * * * * * * * * * * * *
* The number of soil boundary lines for this section is 3 *
* * * * *-* * * * * * * *-* * * * * * * * * *
Point
1 2
0 1500
Line 1 Point X Y * - *
4660 * 4660 *
*
Line 2 Point X Y * * * * * * *
.: *
Line 3 Point X Y * _. *
4764 * 4764 * 4800 * 4805 * 4800 * 4770 * 4750 * 4750 *
************************************************************************
Point
1 2 3 4 5
Point
1 2 3 4 5 6 7 8
180 225 365 1100 1250
4764 4764 4724 4710 4750
0 180 330 475 660 1170 1250 1500

************************************************************************
* Soil 1 Properties * ************************************************************************ * * * * * * *_ * * * * * * * * * * * *
Unconsolidated Consolidated Consolidated Undrained Undrained Drained
Cohesion Phi Angle
0 0
0 0
0 40
(Ib/sq.ft) (degrees)
unit Weight 110 Clay Content Overconsolidation Ratio . . Initial Void Ratio . . . . Compression Index . . . . . Recompression Index . . . . Permeability Median Grain Size Plasticity Index Liqxiid Limit Standard Penetration Number
000 000 000 000 000 000 000 000 000
0.000 0.000
0. 0. 0. 0. 0. 0. 0. 0.
(Ib/cu.ft) (%)
(ft/yr) (mm) (%) (%) (blows/ft)
* * * * * * * * * *
• * * * * * * * * *
************************************************************************
t ************************************************************************ * Soil 2 Properties * ************************************************************************ * *
* Unconsolidated Consolidated Consolidated * * Undrained Undrained Drained * * *
* Cohesion 0 0 150 . (Ib/sq.ft) * * Phi Angle 0 0 22 (degrees) * * . * * * * unit Weight 50.000 (Ib/cu.ft) * * Clay Content 0.000 (%) * * Overconsolidation Ratio . . . . 0.000 * * initial Void Ratio 0.000 * * Compression Index 0.000 * * Recompression Index 0.000 * * Permeability 0.000 (ft/yr) * * Median Grain Size 0.000 (mm) * * Plasticity Index . 0.000 (%) * * Liquid Limit 0.000 (%) * * Standard Penetration Number . . 0.000 (blows/ft) * ************************************************************************
m

************************************************************************
* User Defined * * Piezometric Surface for Hydraulic Condition * * 7: User Defined * ************************************************************************ * *
* Point X Y *
* 1 0 4660 * * 2 1500 4660 * ************************************************************************
•

«
************************************************************************ * *
* R O T A T I O N A L F A I L U R E R E S U L T S * * *
* Automatic Grid Search * * * * The slopes were analyzed for failure arcs having centers in * * areas defined by the following parallelograms: * ************************************************************************ * * * * * * * *_ * * * * * * *_ * * * * * *
Co-ord.
X Y
Point 1
330 4809
Slope 1
Point 2
180 4773
Point 3
144 4836
Point 4
294 4872
Co-ord.
X Y
Point 1
1170 4775
Slope 2
Point 2
1250 4755
Point 3
1270 4790
Point 4
1190 4810
The number of divisions between points 1 and 2 were 4 The number of divisions between points 2 and 3 were 4 The X-increment used in the search was 10 The Y-increment used in the search was 10
* * * * * * * -* * * * * * * .* * * * * * *
************************************************************************
«

************************************************************************ * *
* R O T A T I O N A L F A I L U R E R E S U L T S * * * ************************************************************************ * *
* Hydraulic Condition 7: User Defined * * * * * * * * * * * * * * * * * * * * * * * * * * * * * * * * * * * * * *
************************************************************************
* * * *_ * * * * * * * * * * * * * * * * * * * * * * * * * * * * * * * * *
Safety Factor
2.08 2.08 2.08 2.08 2.08 2.09 2.09 2.10 2.12 2.13 2.14 2.18 2.19 2.19 2.21 2.24 2.27 2.36 2.36 2.36 2.39 2.39 2.42 2.42 2.42 2.43 2.45 2.47 2.49 2.49
Consolidated Drained (CD) Case Seismic Coefficient = 0.10
Failure Radius
150.0 147.5 152.4 159.7 140.2 149.5 150.5 130.4 120.7 148.0 110.9 101.1 99.2 99.2 97.2 151.9 82.0 90.8 93.2 88.4 91.3 . 90.3 89.8 80.0 64.9 99.6 70.3 100.7 60.5 60.5
X-Co-ord
246.5 246.5 246.5 246.5 246.5 249.0 244.0 246.5 246.5 256.5 246.5 246.5 256.5 256.5 266.5 236.5 265.5 1215.0 1215.0 1215.0 1217.5 1212.5 1210.0 1210.0 274.5 1210.0 1210.0 294.0 1210.0 1210.0
y-Co-ord
4913.0 4910.5 4915.5 4923.0 4903.0 4913.0 4913.0 4893.0 4883.0 4913.0 4873.0 4863.0 4863.0 4863.0 4863.0 4913.0 4847.3 4835.0 4837.5 4832.5 4835.0 4835.0 4835.0 4825.0 4831.5 4845.0 4815.0 4872.0 4805.0 4805.0

m
* * * * * * * * * * * * * * * * * * * * * * * * * * * * * * * * * * * * * * * * * * * * * * * * * * * * * * * * * * * * * * * * * * * * * * * * * * * G A R D S S U M M A R Y * * * * File: C1CCS1 Date: 05-02-1996 Time: 19:15:57 * * Project: BAYVIEW LANDFILL CELL 1 CLOSURE CAP * * Hydraulic Condition 7: User Defined * * * * *
* Rotational Failure Analysis Safety Factor * * . * * Unconsolidated Undrained Case Not Run * * Consolidated Undrained Case Not Run * * Consolidated Drained Case 2.08 * * * * Translational Failure Analysis. . . . . . Not Run * * : * * Settlement Analysis Not Run * * :. * * Liquefaction Analysis Not Run * ************************************************************************

JobNa Na
HDR Computation
Project
Subject
Task
I Computed
Checked
Sheet
KR Date
Date
Of
(^ ^ C ^ j / \ - UffiTG^ LsA^^'f^^^f^ ^^c iSr id
^ . / S::^^ZM
\% -A to' IV-
\ \
- iV; 5.4 v\
M t ^
y .
\
4 o fA,»_ V A n ^ ^ ei_ 4-t4o
WT-tvscD'
Jf. ^.
o.sz.
O 0 . \ o 0,-7p 0 . 3 0 , O.VO O.'iaO 0 , loO

• 4)9
BAVUIEI^ LANDFILL LEACHATE POND STABILITV File: LPCSSl Hydraulic Condition 7: User Defined Consolidated Drained Soil Paraneters Factor of Safety = 2.38i Failure Center: ( 168 , 4756 ) , Radius: 141
MAO
I "Wo p t f - o
^ * 4 - o »
(-28 , 4517 )
- ^ -0.1
a-X. 0-3 Q1.4-. Q....S. Qi..
se. t ^ \ j&.
Wf kZZ .1-03 0.8^
_4Wc
M=>Ar
SCALE .: 1 inch = 50 fee.t

************************************************************************ * *
* G A R D S S U M M A R Y * * *
* Project: BAYVIEW LANDFILL LEACHATE POND STABILITY * * File: LPCSSl * * * * GARDS Version 2.00 * * developed by * * Department of Civil and Environmental Engineering * * University of Cincinnati * * under contract to * * U.S. Environmental Protection Agency * * Land Pollution Control Division * * Hazardous Waste Engineering Research Laboratory * * * ************************************************************************
************************************************************************ * Site Characteristics * ************************************************************************ * ^'ItJC^V * / • M l
jo.i * The seismic coefficient is 0•''Oyt, (, *
* I. ' * * The design earthquake magnitude is 7.20 * * *
* The maximum flood elevation in this case is 0 * * *
* The elevation of the seasonal high ground water is. . 0 * * *
* The design waste elevation in the cell is 0 * * *
* The soil number representing the clay liner is. . . . 0 * * * ************************************************************************

* * * * * * * * * * * * * * * * * * * * * * * * * * * * * * * * * * * * * * * * * * * * * * * * * * * * * * * * * * * * * * * * * * * * * * * * * Section Geometry * * * * * * * * * * * * * * * * * * * * * * * * * * * * * * * * * * * * * * * * * * * * * * * * * * * * * * * * * * * * * * * * * * * * * * * * * * * * The number of soil boundary lines for this section is 2 * * *
* Line 1 Point • X Y * * . *
* 1 0 4500 * * 2 500 4500 * * . *
* Line 2 Point X Y * * — * * 1 0 4640 * * 2 100 4640 * * 3 115 4635 * * 4 125 4635 * * 5 182 4616 * * 6 282 4616 * * 7 354 4640 * * 8 500 4640 * ************************************************************************
<i^

* * * * * * * * * * * * * * * * * * * * * * * * * * * * * * * * * * * * * * * * * * * * * * * * * * * * * * * * * * * * * * * * * * * * * * * * * Soil 1 Properties * * * * * * * * * * * * * * * * * * * * * * * * * * * * * * * * * * * * * * * * * * * * * * * * * * * * * * * * * * * * * * * * * * * * * * * * * * *
* Unconsolidated Consolidated Consolidated * * Undrained Undrained Drained * * *
* Cohesion 0 0 0 (Ib/sq.ft) * * Phi Angle 0 0 40 (degrees) * * . * * Unit Weight 110.000 (Ib/cu.ft) * * Clay Content 0.000 (%) * * Overconsolidation Ratio . . . . 0.000 * * Initial Void Ratio 0.000 * * Compression Index 0.000 * * Recompression Index 0.000 * * Permeability . 0.000 (ft/yr) * * Median Grain Size 0.000 (mm) * * Plasticity Index 0.000 (%) * * Liquid Limit 0.000 (%) * * Standard Penetration Number . . 0.000 (blows/ft) * ************************************************************************

************************************************************************
* User Defined * * Piezometric Surface for Hydraulic Condition * * 7: User Defined * ************************************************************************ * *
* Point X Y * * . *
* 1 0 4500 * * 2 500 4500 * ************************************************************************
m
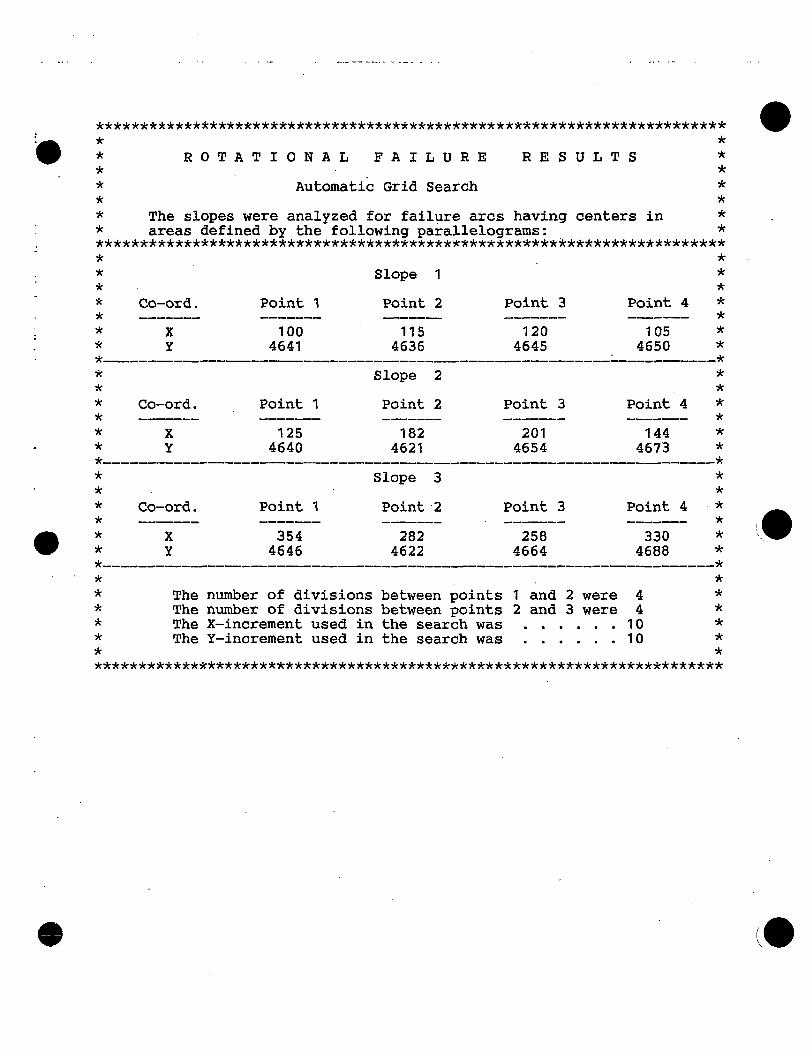
* * * * * * * * * * * * * * * * * * * * * * * * * * * * * * * * * * * * * * * * * * * * * * * * * * * * * * * * * * * * * * * * * * * * * * * * * * * * * * * *** * * * * * * * * * * * * * * * * * * * * * * * * * * * *
R O T A T I O N A L F A I L U R E
Automatic Grid Search
R E S U L T S * * * * *
The slopes were analyzed for failure arcs having centers in * areas defined by the following parallelograms: *
********************************************************************* a.
Co-ord.
X Y
Co-ord.
X Y
Co-ord.
X Y
The The The The
Point 1
100 4641
Point 1
125 4640
Point 1
354 4646
Slope 1
Point 2
115 4636
Slope 2
Point 2
182 4621
Slope 3
Point 2
282 4622
number of divisions between points number of divisions between points X-increment used in the search was Y-increment used in the search was
Point 3
120 4645
Point 3
201 4654
Point 3
258 4664
1 and 2 2 and 3
were were
Point
105 4650
Point
144 4673
Point
330 4688
4 4 10 10
4
4
4
* * *
* *
_ * * * * * * *
_ * * * * * * *
_ * * * * * * *
* * * * * * * * * * * * * * * * * * * * * * * * * * * * * * * * * * * * * * * * * * * * * * * * * * * * * * * * * * * * * * * * * * * * * * * *
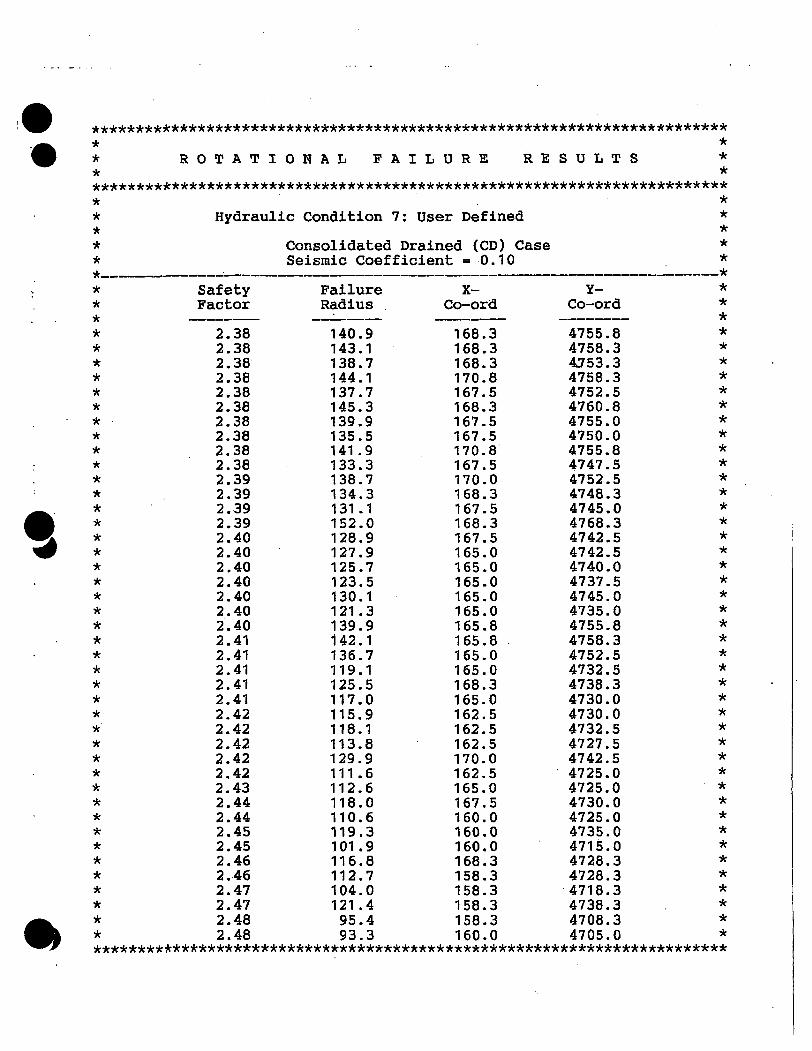
************************************************************************ * * * R O T A T I O N A L F A I L U R E R E S U L T S * * * ************************************************************************ * * * Hydraulic Condition 7: User Defined * * *
* Consolidated Drained (CD) Case * * Seismic Coefficient =0.10 *
.*
m
* * * * * * * * * * * * * * * * * * * * * * * * * * * * * * * * * * * * * * * * * * * * *
Safe ty Fac to r
2.38 2.38 2.38 2.38 2.38 2.38 2.38 2.38 2.38 2.38 2.39 2.39 2.39 2.39 2.40 2.40 2.40 2.40 2.40 2.40 2.40 2.41 2.41 2.41 2.41 2.41 2.42 2.42 2.42 2.42 2.42 2.43 2.44 2.44 2.45 2.45 2.46 2.46 2.47 2.47 2.48 2.48
F a i l u r e Radius
140.9 143.1 138.7 144.1 137.7 145.3 139.9 135.5 141.9 133.3 138.7 134.3 131.1 152.0 128.9 127.9 125.7 123.5 130.1 121.3 139.9 142.1 136.7 119.1 125.5 117.0 115.9 118.1 113.8 129.9 111.6 112.6 118.0 110.6 119.3 101.9 116.8 112.7 104.0 121.4
95.4 93.3
X -Co-ord
168.3 168.3 168.3 170.8 167.5 168.3 167.5 167.5 170.8 167.5 170.0 168.3 167.5 168.3 167.5 165.0 165.0 165.0 165.0 165.0 165.8 165.8 165.0 165.0 168.3 165.0 162.5 162.5 162.5 170.0 162.5 165.0 167.5 160.0 160.0 160.0 168.3 158.3 158.3 158.3 158.3 160.0
Y -Co-ord
4755.8 4758.3 4J53.3 4758.3 4752.5 4760.8 4755.0 4750.0 4755.8 4747.5 4752.5 4748.3 4745.0 4768.3 4742,5 4742.5 4740.0 4737.5 4745.0 4735.0 4755.8 4758.3 4752.5 4732.5 4738.3 4730.0 4730.0 4732.5 4727.5 4742.5 4725.0 4725.0 4730.0 4725.0 4735.0 4715.0 4728.3 4728.3 4718.3 4738.3 4708.3 4705.0
* * * * * * * * * * * * * * * * * * * * * * * * * * * * * * * * * * * * * * * * * * * * *
************************************************************************

************************************************************************ * *
* G A R D S S U M M A R Y * * * * File: LPCSSl Date: 05-02-1996 Time: 19:36:43 * * Project: BAYVIEW LANDFILL LEACHATE POND STABILITY * * Hydraulic Condition 7: User Defined * * * * .: *
* Rotational Failure Analysis Safety Factor * * . * * Unconsolidated Undrained Case Not Run * * Consolidated Undrained Case Not Run * * Consolidated Drained Case 2.38 * * : *
* Translat ional Fa i lure Analysis Not Run * * * * Settlement Analysis Not Run * * .: * * Liquefaction Analysis Not Run * ************************************************************************

Job^kk Na
HDR Computation
IProject
Subject
Task
IW/.^'iio'
4i4e?i
KR Computed
Checked
Sheet
Date
Date
Of
5" . Z_ U s x ^ / r ^ j t J i J & . S u o p e / r ^ E . ' v U G d . &crr \Si I i>&_ S & / s m f e j i T y -
' ^ ^ f j [ : i ^ A J s o i i _ - ^ ^ ' ^
V ^
\
« >

JobNa ^kll
HDR Computation
IProject Computed
[Subject Checked
Task I Sheet
KR Date
Date
Of
BAYVIEW LANDFILL CELL 1 CLOSURE CAP SLOPE STABILITY
STATIC AND PSEUDO-STATIC ANALYSES (INFINITE SLOPE METHOD)
SLOPE PROPERTIES height slope length
LCRS PROPERTIES thickness density
40.0 14.0 165.3
1.5 100.0
INTERFACE FRICTION friction 25.0
(ft.) (degrees) (ft)
(ft) (pcf).
(degrees)
FACTOR OF SAFETY | Treinf (klf) 0.0 1.0 2.0 3.0 4.0 5.0 7.5 10.0 12.5 15.0
Seismic Coefficient, (-) | 0
1.87 2.04 Z20 2.37 2.54 2.70 3.12 3.54 3.95 4.37
0.1 1.32 144 1.56 1.68 1.79 1.91 2.21 2.50 2.80 3.09
0.2 1.02 1.12 1.21 1.30 1.39 1.48 1.71 1.94 2.16 2.39
0.3 0.83 0.91 0.98 1.06 1.13 1.21 1.39 1.58 1.76 1.95
0.4 0.70 0.77 0.83 0.89 0.96 1.02 1.18 1.33 1.49 1.65
0.5 0.61 0.66 0.72 0.77 0.83 0.88 1.02 1.15 1.29 1.43

Jobrfck Na
HDR Computation
I Project
Subject
Task
Computed
Checked
Sheet
KR Date
Date
Of
4.50
«
• »
0.1 0.2 0.3
SEISMIC COEFFICIENT
0.4 0.5

ATTACHMENT C SITE SEISMIC RESPONSE ANALYSES

JobNa Na
HDR Computation
Project ^ j ! i>Js l \€ iNJ Lf^K^v^i^sJL-
KR Subject LKVi^^SyvA ^ "S ic V^J-OO ^sJ^Ju io tcyVOA
[computed ' ' ^ . U ? ^ . [Date ? - / . - f f c
Checked P ^ iDate 6 - f - ^4 t
Task S g e 'Setst-tic ' ^ ^ J S J X ^ - ^ , |>A^\^^J££> Sheet Of
J^^^v^
• >
V _ l l
fhy^ ^ ^ c z o,5
'r/sf = -Zy-M-^/> - ZoEO*'V = S.4^^to ' %=-
•=» /^07v^ i ^ A
^ / & S . «*^ X/O /i- :^ . %.
= / Z 7 D ft /rseo ^ 35fe /•y.3«o

JobNa Na
HDR Computation
I Project
Subjeq
Task
KR Computed Date
Checked Date
Sheet Of
SpecJaJ Study Soft Medium Stiff. Stiff Rock
AVFRACT .SroJAR WA-VE VELOCTry
Less than 100 m/s 100 to 200 m/s 200 to 375 m/s. 375 to 700 m/s
(330ft/s) ; (330 to 660 ft/s) I (600 to 1,230 ft/s)^ (1,230 to 2,300 ft/s j (
Greater than 700 m/s ( 2,300 ft/s)
-\/e
2 . / fvt- ./^/a^/u.rt^ -S-pfi^ Son... ( ^ S : F ' A )
^ . S
A(/f4 * o, $ o ^
0,.5£? A /*=^:s. ^y ;^ /^ > L<:y25 ev /-u.4.Ti<=v^

JobNa Na
HDR Computation
\i Project Computed
Subject Checked
Task Sheet
KR Date
Oate
Of
a
0.8
0-7
0.6
0-5
0.4
A on Landfill — Recorded i ^ ^ Landfills — Non—Linear Analyses \ a Soft Ground Sites - Recorded
Idriss (1990) — Recommended
1979 Montenegro Ei .
-^1989 Loma Prlcta Eq.
-1985 Mexico City Eq I ) < I I I 1 I I ' ' ' ' I ' ' ' ' I ' ' ' ' I ' ' < ' I
0.1 0.2 0.3 0.4 0 .5 0.6 PEAK OUTCROP ACCELERATION - a
omax (g)
• » U £ ^ T ^ A ~ ^'"^^/f- f ^ 2 _ C-t-oju-e-e c:A.p GVALU.A.TI'SYX

ATTACHMENT D SEISMIC DEFORMATION ANALYSES

JobNa Na
HDR Computation
Project S>. . -4v ivc.vO U w O X S ^ v
KR I Computed ?..\-_ri>. Date
Subject L-*«>-'ty\\_A^ 'Sg\-s*A.u:^ ^^^^^jukA^rv^ Checked jm- D a t e ^ - ^ ' " l i
Task " S e t - S ^ - t t g , ' i : )epDg-»s l> : f i ' av^ M J A - ' - H t ^ ' S Sheet Of
%
•• (ieiA- a. (L/Vjo%oue-e c-trf3
G-ScvOio - - ^ T i v p t - tJJ'ft.pVk.-i'W- N- iJ f t .u j^ i je ' i . (^^^/k<:>i<r«N=i\T E,")
- C?. 4-'Z.( ipc^ GA.joSvJ- je- C i ^ f
• u s e h fu / Je i i * f j z . A t J ' i ^ ^ i ' ^ / ^ p . / n A j J e r \ T l ^ f i p t - A e j a / n s n T ^ S M T V
^ p s - 4,-S" oy= p c f ^ ^ yFfefi- C<J^^u^e«• <i.Ap
£/A t-t^A?E: b/AO£-A<=crt1«'-7-^

JobNa Na
HDR Computation KR IProject Computed Date
Sutject
Task
Checked Date
Sheet Of
lOOOj
k.. / y ''Nnoi
Figure 6.6 Makdisi and Seed Penuancnt Displacement Chart (Makdisi and Seed, 1978). ^ p , LioCjZ. y vjj.^i'e; t^^l.^
123

JobNa ^
HDR Computation
Project
Subject
Taafc
«
Computed
Checked
Sheet
C 7<z.
a o i
-h^-^TT-rl...,).,,.!,,,I[,.7^^71:77:^7^7 I t I I I ITTI miinii|iii7Tiwlriii|ji!il7
O . l
Yi«fd AccderotJoo / Maximum Accderot ion
KR Date
Date
Of
/CDO
foo
--J/o 1-0
T r- 1
L.
r
L
I i i i I
Figure 6.5 HyT« and J M d i n Permanera Seismic Displacement Chart (Hynes and Franklm, 1984). ^ ^ ^ :^^^^ . ^ ^ - r , ^ ^
122

JobNa Na
HDR Computation KR Project Computed Date
Subject Checked Date
Task Sheet 4 Of
.O te.v_A- \ -€,'fti^>A^> \,av\
ft*\o4 "
o . Sz, & ( fCNrkcM.**, *-.* ^ ^ " ^ 2 , 2 . ^
o . 6 0 ^
( >.vrkc*iwW«:n"f C- J * t - . t -^
^ .
a vuuuf'
V / C M -^ 2ya e-fr, ( . M ^ i ^ h i s r ^ SeSb Ot.i.p.'/S p p . H ~ 1 . 2 . )
1.0 L t i J ^ f L c ^ S
=f
I
z I
A.
\o
F6 t>OCC\c
0.fc4-
t .zo
2.G\
^ ^ . / OOWnJ^
Uf,
UK
O.bO
0-36
O.D-i
O.bO
Ao
^ - 1
s e e : AtTKcA ej
,^ao>ri j/ji:_h,%; y 5SS> ^Lu^av#' y=%ya_ A/.^ 7.Z
1

LtobNa Na
HDR Computation
Projea
KR Computed Date
«
Subject
Task
. -.- ..._
3 . 0
&\-f
1
t
5
r
lo
'\-~>.o
1.9^
f.4;5
1.60
1.75
2.«i?
3.10
0==e^:A^ncs>i*rt_ Jn i - j^^
o.pf o.iz-'S'
C7./fo
©.•Z.Z-
o.?sr 0-4-'S'
0-0
Cheeked
Sheet
O.I5>
<?.z.5
O.SZ,
£7.37
0-44-
o . t o
0.71
5
a < ^
' ^ C P
£ o
4 o
3o
22-
3
Date
Of
te»«\iK£*^
5t^eL& BarHM.5
A .
1
,
" " ' '
.?./ <s> EC 4--rcA-
5= cj,^
= ^ . s * : ?
(J - 3 0 (L^ ^ 3 o Om CS - / O c ty ± 3<P ^ /
J.2. ^ ^ ^ f'7«r£?
r-- f / = / 7 '
SurviL^ - O . S'O
7^ fdn,^ " O, Z^/O. SO ' O. SO
U sr /5)<=/.i ^ 3 o <=^

JobNa NG
HDR Computation
Project
Subject
Task
Computed
Checked
Sheet
KR Date
Oate
Of
3.ca.
O.Co.-
L , / J e ^ •!• L.d: .^s
o
G? . °: ( o r ; Iz. »5
t) y 1- 3 ^ \<:> \\ \Z-

JobNa Na
HDR Computation
Project Computed
Subject Checked
Task Sheet
KR Date
Date
Of
4 . 0 'oJ>A^Tp£ Vs .u j ^
%
h = (Uio4-=-
h,-OtjtM4.
O . A ^ ^
O.fe.^
o^-^V 0. 6 0
• D. 6& .
( X M a 4 - 0" ^ "^S. toriV csi (V^svcr C , " P ^ ^
. ^ C<>-"^ ?.SV\tJ3J4-'£>
0 i^i-f
I
i -
S'
I.C
\<?
o.iz 0.2i:>
o.$o
0.54-
o.sr o.4^.
o.^-t-
o.zz a ^2
O.ft O.&f
o.fa
/ .oo
I-f- .
<-\<:> 1
"ls£fon.t-t U'^wAfii
^ \ O o i v \
J

JobNa Na
HDR Computation
Project Computed
Subject Checked
Task Sheet 8
KR Date
Date
Of
u ^ / d ^ 3<?<SH ( A44>i6/£.f" -f S5i2) /ijJ^^/e p=op. M - y.'Z-)
4

Appendix K

APPENDIX K
Leachate Generation Calculations
SUVSWD Bayview Class I Landfill Permit Application

APPENDIX K
LEACHATE GENERATION CALCULATIONS
SUVSWD Bayview Class I Landfill Permit Application
Submitted March 2009
Prepared By:
HDR ENGINEERING, INC.

APPENDIX K - LEACHATE GENERATION CALCULATIONS
INTRODUCTION
All assumptions and calculations used to obtain the hydraulic head on top ofthe Flexible
Membrane Liner (FML) are included in this appendix, as well as the Hydrologic Evaluation of
Landfill Performance (HELP) model results. Leachate includes stormwater that has come into
contact with waste or daily cover.
The following is a list of attachments:
K-1: Accumulated Run-off from Cell 2, Stage 1 and Stage 2
K-2: Leachate Generation/Hydraulic Head on Liner
K-3: Flow Capacity ofthe Leachate Collection Pipe
1 I SUVSWD Bayview Class I Landfill Permit Application March 2009

APPENDIX K
ATTACHMENT 1:
ACCUMULATED RUN-OFF FROM CELL 2,
STAGE 1 AND STAGE 2

Jobrki Na
HDR Computation I T ] ] R
fagx/ieu) Land-fi l l ico.p.ted K D 6 wio/^5h'b 6if(^ Ordinaac \c..c.ec 7 ^ w. ^/2-//o^
I Project
I Subject
Task
Kamh2r (CN)) ^-for bire ^\(P \^ ^ l isee LEF,sO- Us^ CKJ ol^ l>0 otvicK \oc,rea5to ran- (A
?A\r\V^\ rorrv-.CL a^-ueor P4-hour ^+or/n- a+,
•fef C€ll a. b feVirmM- u.s\na^ Table ,3,a! (^eF.a,
< *\p^ Inches

n^j5
Oioup
^
B C D
TnfiltiTition RUE fm-Zhr)
0.3-O.45
0.15-0.30 -0.05-0.15
O-O.05
Tettme'
Y or .sandy loam J Sill loam or loam Sandy clay loam Oay loam,
sUty clay loam, sandy clay, silty clay, or clay
a^F. 2.
•Reproducsd from U.S. Soil Comcrvadon Service (1986).

' • • ; . s . ^ ' • ^ f ^ ..f.-- • -
TABLE 3.19 CURVE NUMBERS f=OR ANTECEDENT MOISTURE CONDITION II , ^'a.p. 2.
Use
Urtwi
Cultivated agricultuiB lands
Cover TVpe
. Fully developed Opea space (lawns, parks)
Impervious areas parking, roofs, paved toads)
Dirt roads Urban districts
(paved driveways.
Commercial and business Industrial
Developing areas
1 Fallow ' Row u u p i
Small grain
i
Qose-secded legumes or rotation meadow
"•
Treatinent
-
Straight row Straight row Contoured Contoured Contoured and terraced Contoured and terraced Straight row Straight row Contoured Contoured Contoured and Cenaced Contoured and terraced Straight row Straight row Contoured Contoured Contoured and terraced Contoured and terraced
Hydrologic Condition
. Poor (cover <50%) Fail Ciood (grass cover > 7 5 * )
< ^ A ) - - . \
Poor Good Poor Good Poor Good
" Poor Good Poor . Good Poor Good Poor Good Poor Good Poor . Good
Hydrologic
A
68 49 39
98 72 . :
29
V " V ^
67 70 65 66 62 65
. 63 . 63
61 61 59 66 58 64 55 63 51
B
79 69 61
98 82 '
92 88 86
86 81 78 79 75 74 71 76-
•75 74 73
' 72 70 77 72 75 69 73 67
soil group
C
86 79 74
98 87
94 91
.9.1
91 88
85 84 82 80 78 84 83 82 81 79 78 85 81 83 78 80 76
D
89 84 80.
98 • .89
95 93 94
94 91 89 88
,86 82 81 88 87 '
85 84
. 82 81 89 85 85 . 83 83 80

^'^16
eEF.^
TaHt 3.Q\ Runoff Depth (in.) for Curve Number of:
Rainfall
1.0 1.2 1.4 1.6 1.8 2.0 2.5 . 3.0 3.5 4.0 4.5 5.0 6.0 7.0 8.0 9.0
10.0 11.0 12.0 13.0 14.0 15.0
40
0.00 0.00 0.00 0.00 0.00 0.00 0.00 0.00 0.02 0.06 0.14 0.24 0.50 0.84 1.25 1.71 2J3 2.78 3.38 4.00 4.65 5.33
45
0.00 0.00 0.00 0.00 0.00 0.00 0.00 0.02 0.08 0.18 0.30 0.44 0.80 1.24 1.74 2.29 2.89 3.52 4.19 4.89 5.62 6.36
50
0.00 0.00 0.00 0.00 0.00 0.00 0.02 0.09 0.20
• 0.33 0.50 0.69 1.14 1.68 7 75 2.88 3.56 4.26 5.00 5.76 6.55 7.35
55
0.00 0.00 0.00 0.00 0.00 0.02 0.08 0.19 0.35 0:53 0.74 0.98 1.52 2.12 2.78 3.49 4.23 5.00
.5.79 6.61 7.44 8.29
60
0.00 0.00 0.00 0.01 0.03 0.06 0.11 0.33 0.53 0.76 1.02 1.30 1.92 2.60 3.33 4.10 '4.90 5.72 6.56 7.42 8.30 9.19
65
0.00 0.00 0.02 0.05 0.09 0.14 0.30 0.51 0.75 1.03 1.33 1.65 2.35 3.10 3.89 4.72 5.56 6.43 7.32 8.21 .9.12 10.04
70
0.00 0.03 0.06 0.11 0.17 0.24 0.46 0.71 1.01 1.33 1.67 2.04 2.81 3.62 4.46 5.33 6.22 7.13 8.05 8.98 9.91
10.85
75
0.03 0.07 0.13 0.20 0.29 0.38 ,0.65- -'0.96 1.30 1.67 2.05 2.45 3.28 4.15 5.04 5.95 6.88 7.81 8.76 9.71
10.67 11.63
8 0 ^
0.08 0.15 0.24 0 34 o.-t^-,
T ^ 0.89 J
TS-1.6* 2.04 2.46 2.89 3.78 , 4.69 5.63 6.57 7.52 8.48 9.45
10.42 11.39 12.37
85
0.17 0.27 0.39 0.52 0.65 0.30
1 1.18 1.59 2.02-2.46 2.91 3.37 4.30 5.25 6.21 7;i8 8.16 9.13
10.11 11.10 12.08 13.07
90
0.32 0.46 0.61 0.76 0.93 1.09 1.53 1.98 2.45 2.92 3.40 3.88 4.85 5.82 6.81 7.79 8.78 9.77
10.76 11.76 12.75 13.74
95
0.56 0.74 0.92 1.11 1.29 1.43 1.96 2.45 2.94 3.43 3.92 4.42 5.41 6.41 7.40 8.40 9.40
10.39 11.39 12.39 13.39 14.39
98
0.79 0.99 1.18 1.38 1.58 1.77 2.27 2.77 3.27 3.77 4.26 4.76
,5.76 6.76 7.76 8.76 9.76
10.76 11.76 12.76 13.76 14.76
Interpolate the values shown to obtain nmoff depths for ^ s or rainfall amounts ix3t shown. Source: U.S. Soil Conscrvatioo Service (1986).

APPENDIX K
ATTACHMENT 2:
LEACHATE GENERATION / HYDAULIC HEAD ON LINER

JobNa No.
HDR Computation
I Project £a(\\j\ej(0 UndAW U^Ap.iSiri- p CnWprJY ^ r\i, \em
I Computed UL Date
Checked ^JlAA" •J) Date ^f-Z-l/o-^
laskLearhd-k Cn^Mjfa^onIWw\f^(^\\(- [ ndon l(|Yjishee. Of ' 3 5 '
C ll a Kas tx -ftjitxl arm ^proyinnaklu "S^ocr es
cons ider^ iP\ +^e Hudro\oa\c ^vaiua-hot^o4-Lan(Uv\\ ^a^orrfYXJOCt iW lP^ rncdfl. "The-( i t>-V^O (xu^ ot CaU SL uo\\\ hoAje. Co life ov ax)prox\ nrAol-eli,
C\) one acre ijj>U\ on \r\\^a.i r\- t (>f lO-fee-
l3")on^ oLCf uji-Mn \50.f£,e-^ .o^ uoasV^ a n d
COne ^cr^ 1:5 a^ed as 4he (^e-faalVa/e(k_.-^oran
-Vo obVa\n re^uiH^ 4^oranu ar ZL-O ^
W u3eH'elV u&uo (51+4+ifi londi-fiU loca+lon.
prec'ipi+^+iorv i5.-f' ^or 6a i^ uate Ci.4u, H-VIK +o bimWocV^ 50 aea/5 erf- r^(n.%l( ^^Lllirfo or\ 4^^

JobNa Na
HDR Computation T T L J ^
BdU,\/]-Pu) La/VJ-f l i l | c o t n p . t e d ; < O G | D a t e / ^ / a 3 / 0 3 I Project
subject \j(ycV\ah> f n l h r - f i o n "Si^fs-Verrv. Icheed V ^ JDe ^A'^/-^ Task • I Sheet g? |of 0 Z )
1
(Xfd per ^fa/^6t o-f a ^^S5 (5 0 and. I -, r sf -' • " '
^a i i Late C i ^ lt> lbinch^$. ^ r

5/a^
Fairfield R£F.i^. County: Utili Lititude: 40*16' Lanptude: 112*05- Bentioii: 4230 feet Period: 19S0-1992-
Jan F«fa Uae Apr May J u l Jul A m Sap Oct
Hacard high tomp Raeard low tomp
SS 88 78 65 100 18 4- -20 -23 -38
' i t a t i i m a ^ ^ ^ a : . 2 7 m a 3 ^ ^ BjSjjd' Naiiiui'inntrfaU 972 8.2 S'.'8 Recwd miY snow 27.0 28.5 13.0 Rteafd dlY mow 12.0 .1.2,0 7.0 ^SyTtwa^ra tMrr i ^ -a tr.j^fe36i-^
2.1 0.3 0.0 0.0 0.0 0.0 l i * .6 8.8 38.2 20.0 4.0 0.0 0.0 0.0 0.5 6.0 18.0 32.0 32.0 8.0 4.0 0.0 0.0 0.0 0.5 4.0 10.0 10.5 •. 12.0
Wr:^S^i!SMS'3^M^^^^o^Ma7m^i*i^o^Si^MBi'
y
*FercaiUc of period with dao: SSS for tcs^ieatun, 71% far pndpintiaa, I9X fornorw&U.
/

Job No. No.
HDR Computation T T ^ T ?
I project
I Subject
Task Sheet
3.0 ^6\\ cu cl Lajaer \Ma^
\^^(XM\\ \OJAQX 4upes and 5011 ^-ex•tufe5 in4l)e HELP frtxiel \ jdw useS. 4or 4^c feUouoinq condifions:
Cond\-V\oA. ±
i£)" c ^ daUa coxjejf ("Te.x+arc ( X vo" o- uja -Ve lT€.y+are te)
CoadiViorv Sl
5^" 0^ \ OL-k.rai di' i dcLOLe (.T^K+are i V
5o\\ \mejr vOQjTt aW a-feam^ +0 b e sarVara.ted.at ^ VAQ- V:)eQt\or\\r\(l cP 4-He t>'\pna\a-V\on -for bo4-h condiWons. Base,cLo?i Dau^^ Co\x.n\J.'t>Q\^A.^)a'^^-Hm^ a m BAorqa ^^co\j^a ^peciaL'!>c.rs/\c^ Ui^fHcf. r^cord^5, W^ ^ i d lAisie moisture con-een-i -for 4ri/3

JobNa No.
HDR Computation
I Project Eyitix/i jA^ Ldnd-Ptl I Computed
.bjec. Lpan]rxh. r nI l^cfIOAJ :$u,^Vm Task
Checked
m. Sheet ^ 01 ai
bvL vj \cvr\-V c uoa^VO^ \P\\Vva.\ rc\o\ Wv e. consent ba
e5-V\naaA^^.das -foWouost
© rr\o\^V vjure. conWvV b u \X)\ amc " uO C ^ /pto)
XA = drvL cim^\Va o?- voai4^ ^ ^ ^ ^^^^'
© - .\^ ' A\ ^ba.u
^Q^' ot La-Vey l Drainaa^
<L V
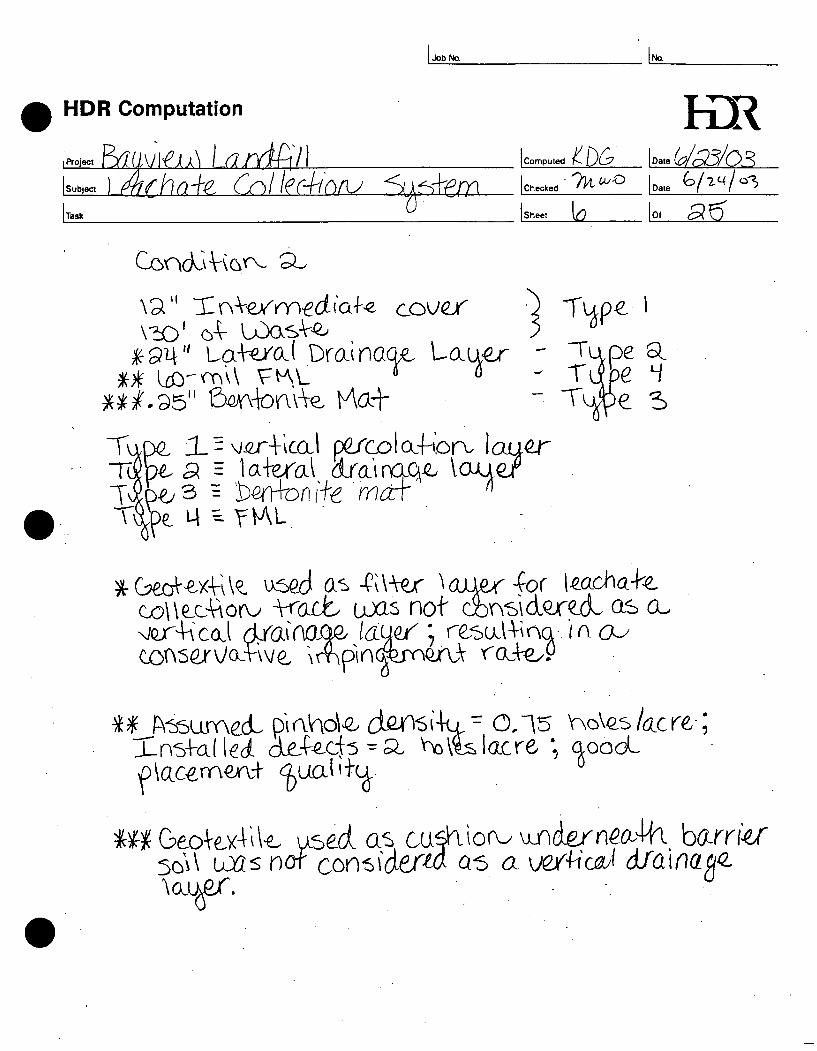
JobNa Na
HDR Computation J T T ^
.Project B<ra\y]^n\ I nni f^ l ] ico.p.ed, D6 \o..U/;^/o.'^ I Subject ^hn-i-f. CnHec-^ioru ^ i p b ^ m Icnecked TK^Q |,3te (:>/i^h^ [Task I Sheet j ^ |ot <$? W
CondAVvGrv. SL
;(^9H" La-^-^/ai Drai naae U a a e r -- T
Ti p . «a = \aW(x\ d/ainaq^. loue?
TSI)^ H ^ f m
Go\\e.oUotv -Koob axis no ' cbnsidored as o \;Qr+Aca.l d/ainom /dU^ ; resalA^m /A 6u ccA5ervya.V\ve \rfipin(&rnm> roi eyP
^ _f S5arY ed piahd'O. d<^^i+a'^ 0,15 V\oVcs/acre ; O-nsfad^dl de^-k-d^^a. v o\<Jslacr6 ; aoooL D\(ic-evr\Qjod o^oal ' ia
* « G6oVe.y-lU^ u s e d a s cufKiorv. ujndernfa>lfi b a r r i o 5o\\ u:^s nor considdTw a^ a \jQ/h(j2u\ dfainacji

YI-1 / a^
TABLE 4. DEFAULT SOIL, WASTE, AND GEOSYNTHEHC CHARACTERISTICS ^-^^t^p. ^
HELP
1
2
3
4
5
6 •
7.
8
9
10
11
12
.13»
14
15
16
17
1 8 *
19
20
21
22
23
24
25
26
27
28
29
30
31
32
33
34
Qassification
USDA
CoS
5
FS
LS
UPS
SL
FSL
L SiL
SCL
CL
SiCL
SC
Sic
c
USCS
SP
sw-SW
SM.
SM
SM,
SM
ML
ML
SC
CL
CL
SC
CH
CH
Baniei So3
Bentonite Mai (0.6 cm)
Municipal Waste (gOOlb/ytPorSnkgAn^)
Municipal Waste (channeling and dead zones)
Drainage Net (0.5 cm)
Gravel
L '
SiL'
SCL"
CL-
SiCL'
SC"
S iC
C
ML
ML
SC
CL
CL
SC
CH
CH
Coal-Buming Eleclric Plant , Fly Ash"
Coal-Buming Electric Plant Bottom Ash*
Municipal Incinenlar HyAsh"
Fine Copper Slag'
Drainage Net (0.6 cm)
Total Porosity
vol/vol
0.417
0.437
0.457
0.437
0.457
0.453
0.473
0.463
0.501
0 J 9 8
0.464
0.471
0.430
0.479
0.475
0.427
0.750
0.671
0.168
0.850
0 J 9 7
0.419
0.461
0365
0.437
0.445
0.400
0.452
0.451
0341
0.578
0.450
0375
0.850
Field Capacity
voIAol
0.045
0.062
0.083
0.105
0.131
0.190
0 i 2 2
0.232
0.284
0J44
0310
0342
0321
0371
0378
0.418
0.747
0.292
0.073
0.010
0.032
0307
0360
0305
0373
0393
0366
0.411
0.419
0.187
0IJ76
0.116
0J355
0.010
WDting Point
vol/vol
0.018
0.024
0.033
0.047
0.058
0.085
0.104
0.116
0.135
0.136
0.1 S7
0.210
0.221
0251
0.265
0367
0.400
0.077
0.019
0.005
0.013
0.180
0203
0202
0266
0277
0288
0311
0332
0D47
0JQ25
0.049
0.020
0.0CS
Saturated Hydraulic
Conductjvi^
cm/sec
1.0x10-'
5.8x10*
3.1xia*
1.7x10-'
1.0x10-'
72x10"' i
52x10^
3.7x10*
15x10^
12x10*
6.4x10' 1 4 2 x 1 0 '
33x10^
2.5x10'
1.7x10'
1.0x10'
3.0x10*
1.0x10'
1.0x10'
1.0x10^'
3.0x10'
15x10 '
9.0x10*
2.7x10*
3.6x10*
15x10*
7.8x10'
12x10*
6.8xlO'
5.0x10'
4.1xlO'
1.0x10'
4.1x10'
33x10"
Moderately Compacted (Continued)

pa., /ae"
TABLE 4 (continued). DEFAULT SOIL, WASTE, AND GEOSYNTHETIC CHARACTERISTICS f E P. a_
Classification
HELP
. 35 •
36
37
38.
39
40
41
42
Geomembrane Material
High Density Polyethylene (HDPE)
Low Density Polyethylene (LDPE)
Polyvinyl Chloride (PVC)
Butyl Rubber
Chlorinated Polyethylene (CPE)
Hypalon or Chloroiulfonatcd Polyethylene (CSPE)
Ethylene-Propylene Diene Monomer (EPDM)
Neoprene
Total Porosity
vol/vol
(conclude
Field Ca.pacity
vol/vol
d)
Wilting Point
vol/vol
Saturated Hydraulic
Conductivity
cm/icc
^OxlOr"
4.0x10-"
2.0x10""
1.0x10-"
4.0xlO-«
3.0x10-" 1
2-0x10-" 1 3.0x10-" 1

JobNa No.
HDR Computation T n T y ^ '
,Hroject ^ C \ ) J A ) \ I ^ U Q L A A ^ l S^\ \ |con,pu.ed \<iDCl WlnlQ jC^^
[subject L P a ^ h f l 4 - g . r . n ( l P . r 4 - \ Q A f S i p + f ^ m [checked - ;^ / -^g loate ^ A ^ / ^ 3
Task Sheet R lo ^6^
330 ee.-V a.+ S^?o ^lope. o:nd. \\~io 4 edr ct-f 3 7
VVe. (lra\r\ G<2- pa-^hu^oja ^ 4i\e. ma.v:imam d-rainaae
v_ E ^^oo^e^-^ / -I ^
bas^dcru \oop\r\arr\e/t^ r^-k,s-promv a. 9S*?o
For HELP Mcdel ^ \.\1C) -PeeVo. '!p?d s\ope uo\l\ b^u^ed,
^roorv ^rhe, VA^LP roo(le^ ^-^^ -toWguJioci,
Cond.\Viof\ i
lcx.cre. o/eo. uj Vtv \o' c^ uoas-Vc c sA. ^" o^ daiiu
- U ->\ope ^ O '' /(i«u \ paqe IT).

Job No. Noi
HDR Computation I T ] R
IPtoiect F ) Q 1 l\ i \QX k~) L O J n A - ^ i ( Icornp^ed )^ l y ; \o...( / Q 3 IQ 3
I Subject pnr^a-p, OD\\n4i^r\ ^nM- fm [checked 7H^^ lo3.e 6>M^ Task Sheet U lo pe^
A acr^ (3/ oL UJ\'VK i3C5' 0^ \jda.%-\ and IQ; ^-f. , inWm^Siafe cover-for CL dLramaaia pa44iu)!mo4
U.O Ola innana \)q>lK o-C i4ivirda.li'c (4-eact
tpa. noni^^) it) aQprcxinna+eiuL O ' " " (^^ Her €acK
^u6V^rr>^ approaches 0 -P^^-TKb it:) kss+h(iA , ,

******************************************************************************* ****************************************************************************** * * * * ** * * ** ** ** * *
HYDROLOGIC EVALUATION OF LANDFILL PERFORMANCE HELP MODEL VERSION 3.07 (1 NOVEMBER 1997)
DEVELOPED BY ENVIRONMENTAL LABORATORY USAE WATERWAYS EXPERIMENT STATION
FOR USEPA RISK REDUCTION ENGINEERING LABORATORY
**
* * * * ****************************************************************************** * * * * * * * * * * * * * * * * * * * * * * * * * * * * * * * * * * * * * * * * * * * * * * * * * * * * * * * * * * * * * * *.*.* -k-k-k-k-k-k-k-k-k-k^-k-k
PRECIPITATION DATA FILE: TEMPERATURE DATA FILE: SOLAR RADIATION DATA FILE: EVAPOTRANSPIRATION DATA: SOIL AND DESIGN DATA FILE: OUTPUT DATA FILE:
C:\HELP3\SUV\WET5_AV.D4 C:\HELP3\SUV\FAIRFIED.D7 C:\HELP3\SUV\SLCDFLT.D13 C:\HELP3\SUV\SLCDFLT.Dil C:\HELP3\SUV\BVIEW1YR.Dl0 C:\HELP3\SUV\BVIEW1YR.OUT
TIME: 11:14 DATE: 6/26/2003
******************************************************************************
TITLE: Bayview Cell#2 Year 1
******************************************************************************
'NOTE: INITIAL MOISTURE CONTENT OF THE LAYERS AND SNOW WATER WERE SPECIFIED BY THE USER.
LAYER 1
TYPE 1 - VERTICAL PERCOLATION LAYER MATERIAL TEXTURE NUMBER 6
THICKNESS = 6.00 INCHES POROSITY = 0.453 0 VOL/VOL FIELD CAPACITY = 0.1900 VOL/VOL WILTING POINT = • 0.0850 VOL/VOL INITIAL SOIL WATER CONTENT = 0.1900 VOL/VOL EFFECTIVE SAT. HYD. COND. = 0.720000011000E-03 CM/SEC
P- ^ d 6

LAYER 2
TYPE 1 - VERTICAL PERCOLATION LAYER MATERIAL TEXTURE NUMBER 18
THICKNESS POROSITY FIELD CAPACITY WILTING POINT INITIAL SOIL WATER CONTENT EFFECTIVE SAT. HYD. COND.
12 0.00 INCHES 0.6710 VOL/VOL 0.2920 VOL/VOL 0.077 0 VOL/VOL 0.1100 VOL/VOL
0.100000005000E-02 CM/SEC
LAYER
TYPE 2 - LATERAL DRAINAGE LAYER MATERIAL TEXTURE NUMBER 6
24.00 THICKNESS POROSITY FIELD CAPACITY WILTING POINT INITIAL SOIL WATER CONTENT EFFECTIVE SAT. HYD. COND. SLOPE DRAINAGE LENGTH
INCHES 0.4530 VOL/VOL 0.1900 VOL/VOL 0.0850 VOL/VOL 0.1900 VOL/VOL
0.720000011000E-03 CM/SEC 3.00 PERCENT
117 0.0 FEET
LAYER' 4
TYPE 4 - FLEXIBLE MEMBRANE LINER MATERIAL TEXTURE NUMBER 35
0.0 6 INCHES THICKNESS POROSITY FIELD CAPACITY WILTING POINT INITIAL SOIL WATER CONTENT = EFFECTIVE SAT. HYD. COND. = 0 FML PINHOLE DENSITY FML INSTALLATION DEFECTS FML PLACEMENT QUALITY = 3
0.0000 VOL/VOL 0.0000 VOL/VOL 0.0000 VOL/VOL 0.0000 VOL/VOL
.199999996000E-12 CM/SEC 0.75 HOLES/ACRE 2.00 HOLES/ACRE
- GOOD
p-\^)a6

LAYER 5
TYPE 3 - BARRIER SOIL LINER MATERIAL TEXTURE NUMBER 17
THICKNESS = 0.25 INCHES POROSITY = 0.7500 VOL/VOL FIELD CAPACITY = 0.7470 VOL/VOL WILTING POINT = 0.4000 VOL/VOL INITIAL SOIL WATER CONTENT = 0.7500 VOL/VOL EFFECTIVE SAT. HYD. COND. = 0.300000003000E-08 CM/SEC
GENERAL DESIGN AND EVAPORATIVE ZONE DATA
NOTE: SCS RUNOFF CURVE NUMBER WAS USER-SPECIFIED.
SCS RUNOFF CURVE NUMBER FRACTION OF AREA ALLOWING RUNOFF AREA PROJECTED ON HORIZONTAL PLANE EVAPORATIVE ZONE DEPTH INITIAL WATER IN EVAPORATIVE ZONE UPPER LIMIT OF EVAPORATIVE STORAGE LOWER LIMIT OF EVAPORATIVE STORAGE INITIAL SNOW WATER INITIAL WATER IN LAYER MATERIALS TOTAL INITIAL WATER TOTAL SUBSURFACE INFLOW
77 0 1
16. 2, 9, 1, 2,
19. 21. 0,
.00
.0
.000
.0
.240
.428
.280
.000
.087
.087 ,00
PERCENT ACRES INCHES INCHES INCHES INCHES INCHES INCHES INCHES INCHES/YEAR
EVAPOTRANSPIRATION AND WEATHER DATA
NOTE: EVAPOTRANSPIRATION DATA WAS OBTAINED FROM SALT LAKE CITY UTAH
STATION LATITUDE MAXIMUM LEAF AREA INDEX START OF GROWING SEASON (JULIAN DATE) END OF GROWING SEASON (JULIAN DATE) EVAPORATIVE ZONE DEPTH AVERAGE•ANNUAL WIND SPEED AVERAGE 1ST QUARTER RELATIVE HUMIDITY AVERAGE 2ND QUARTER RELATIVE HUMIDITY AVERAGE 3RD QUARTER RELATIVE HUMIDITY AVERAGE 4TH QUARTER RELATIVE HUMIDITY
40.76 0.00 117 289
16.0 8.80 67.00 48.00 39.00 65.00
DEGREES
INCHES MPH % % % %
NOTE: PRECIPITATION DATA WAS SYNTHETICALLY GENERATED USING COEFFICIENTS FOR SALT LAKE CITY UTAH
?• 1 %
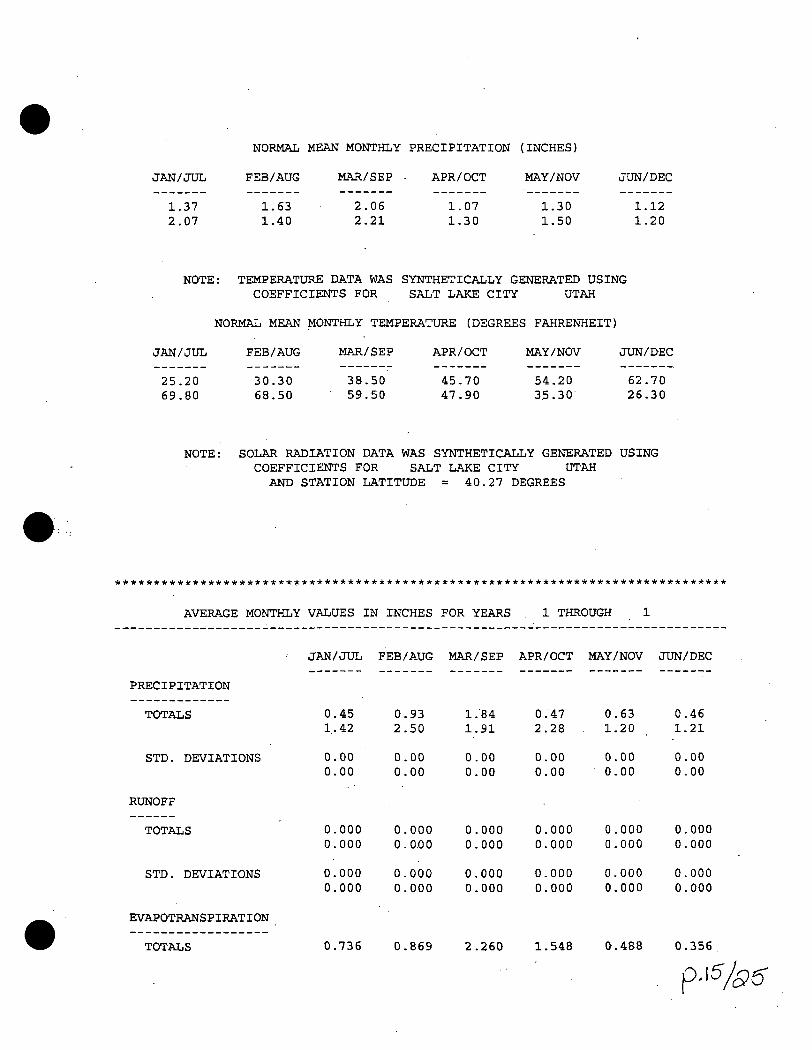
JAN/JUL
1.37 2.07
NORMAL MEAN MONTHLY PRECIPITATION (INCHES)
FEB/AUG MAR/SEP . APR/OCT MAY/NOV
1.63 1.40
2.06 2.21
1.07 1.30
1.30 1.50
JUN/DEC
1.12 1.20
NOTE: TEMPERATURE DATA WAS SYNTHETICALLY GENERATED USING COEFFICIENTS FOR SALT LAKE CITY UTAH
NORMAL MEAN MONTHLY TEMPERATURE (DEGREES FAHRENHEIT)
JAN/JUL FEB/AUG MAR/SEP APR/OCT MAY/NOV JUN/DEC
25.20 69.80
30.30 68.50
38.50 59.50
45.70 47.90
54.20 35.30
62.70 26.30
NOTE: SOLAR RADIATION DATA WAS SYNTHETICALLY GENERATED USING COEFFICIENTS FOR SALT LAKE CITY UTAH AND STATION LATITUDE = 40.27 DEGREES
*******************************************************************************
AVERAGE MONTHLY VALUES IN INCHES FOR YEARS 1 THROUGH
JAN/JUL FEB/AUG MAR/SEP APR/OCT MAY/NOV JUN/DEC
PRECIPITATION
TOTALS
STD. DEVIATIONS
0.45 1.42
0.00 0.00
0.93 2.50
0.00 0.00
1.84 1.91
0.00 0.00
0.47 2.28
0.00 0.00
0.63 1.20
0.00 0.00
0.46 1.21
0.00 0.00
RUNOFF
TOTALS
STD. DEVIATIONS
EVAPOTRANSPIRATION
TOTALS
0, 0,
0, 0,
0,
.000
.000
,000 .000
.736
0. 0,
0. 0,
0.
.000
.000
,000 .000
.869
0, 0,
0, 0,
2
.000
.000
.000
.000
.260
0, 0,
0. 0,
1,
.000
.000
,000 .000
.548
0, 0.
0, 0.
0,
.000
.000
,000 .000
.488
0, 0,
0, 0,
0,
.000 ,000
,000 ,000
.356
p-I^^S"
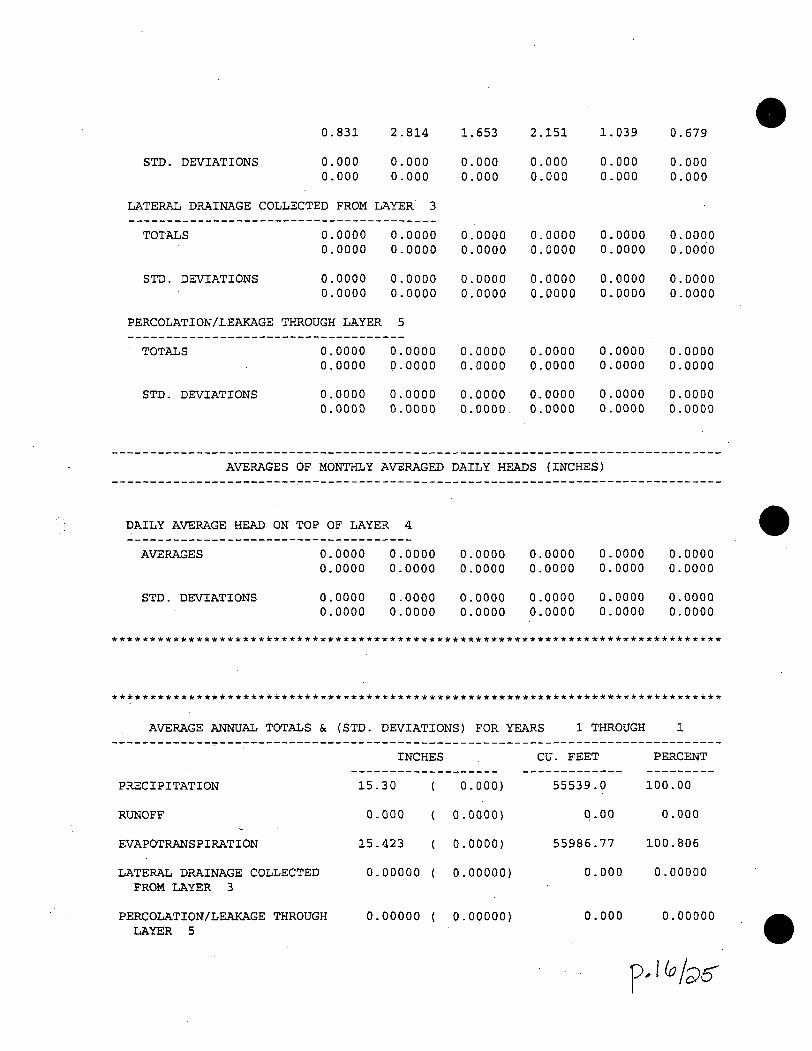
0.831 2.814 1.653 2.151 1.039 0.679
STD. DEVIATIONS 0.000 0.000 0.000 0.000 0.000 0.000
0 . 0 0 0 0 . 0 0 0 0 . 0 0 0 0 . 0 0 0 0 . 0 0 0 0 . 0 0 0
LATERAL DRAINAGE COLLECTED FROM LAYER' 3
TOTALS 0.0000 0.0000 0.0000 0.0000 0.0000 0.0000
0.0000 0.0000 0.0000 0.0000 0.0000 0.0000 STD. DEVIATIONS 0.0000 0.0000 0.0000 0.0000 0.0000 0.0000
0.0000 0.0000 0.0000 0.0000 0.0000 0.0000
PERCOLATION/LEAKAGE THROUGH LAYER 5
TOTALS 0.0000 0.0000 0.0000 0.0000 0.0000 0.0000
0.0000 0.0000 0.0000 0.0000 0.0000 0.0000 STD. DEVIATIONS 0.0000 0.0000 0.0000 0.0000 0.0000 0.0000
0.0000 0.0000 0.0000. 0.0000 0.0000 0.0000
AVERAGES OF MONTHLY AVERAGED DAILY HEADS (INCHES)
DAILY AVERAGE HEAD ON TOP OF LAYER 4
AVERAGES 0.0000 0.0000 0.0000 0.0000 0.0000 0.0000 0.0000 0.0000 0.0000 0.0000 0.0000 0.0000
STD. DEVIATIONS 0.0000 0.0000 0.0000 0.0000 0.0000 0.0000 0.0000 0.0000 0.0000 0.0000 0.0000 0.0000
*******************************************************************************
*******************************************************************************
AVERAGE ANNUAL TOTALS & (STD. DEVIATIONS) FOR YEARS 1 THROUGH 1
INCHES CU. FEET PERCENT
PRECIPITATION 15.30 ( 0.000) 55539.0 100.00
RUNOFF 0.000 ( 0.0000) 0.00 0.000
EVAPOTRANSPIRATION 15.423 ( 0.0000) 55986.77 100.806
LATERAL DRAINAGE COLLECTED 0.00000 ( 0.00000) 0.000 0.00000 FROM LAYER 3
PERCOLATION/LEAKAGE THROUGH 0.00000 ( 0.00000) 0.000 0.00000 LAYER 5
p'^^/s)6'
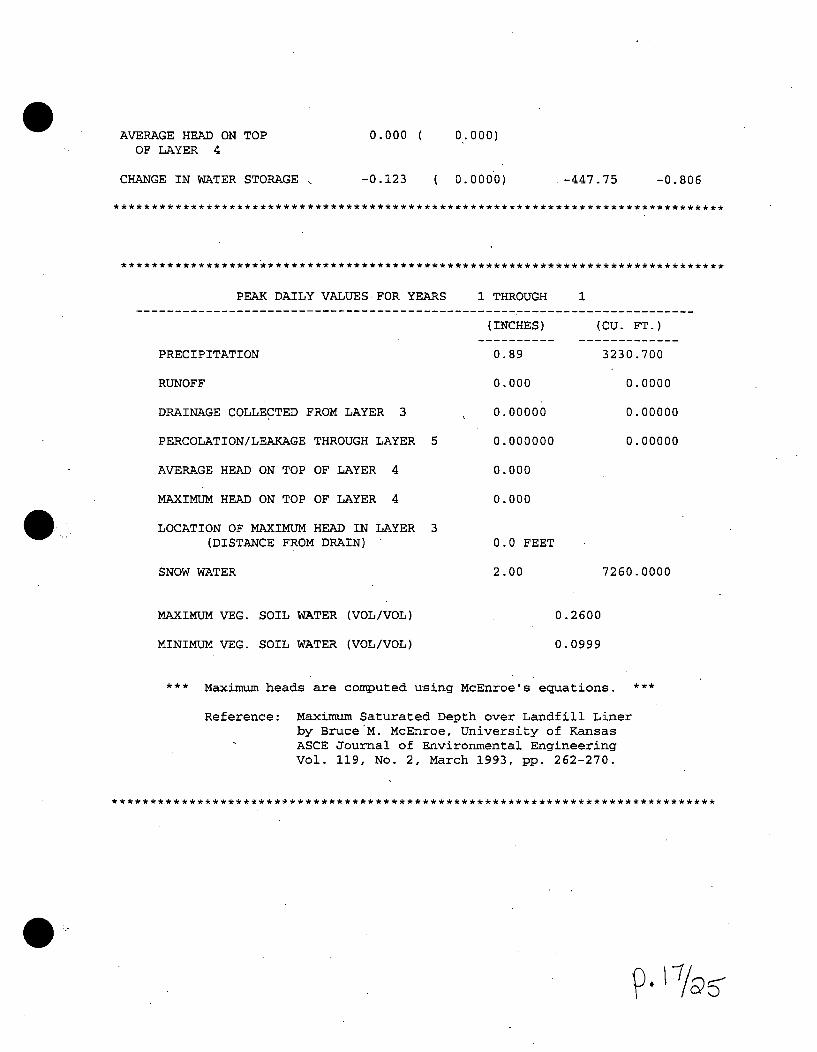
AVERAGE HEAD ON TOP OF LAYER 4
CHANGE IN WATER STORAGE .,
0.000 0.000)
-0.123 ( 0.0000) -447.75 -0.806
*******************************************************************************
******************************************************************************
PEAK DAILY VALUES FOR YEARS 1 THROUGH 1
PRECIPITATION
RUNOFF
DRAINAGE COLLECTED FROM LAYER 3
PERCOLATION/LEAKAGE THROUGH LAYER 5
AVERAGE HEAD ON TOP OF LAYER 4
MAXIMUM HEAD ON TOP OF LAYER 4
LOCATION OF MAXIMUM HEAD IN LAYER 3 (DISTANCE FROM DRAIN) '
SNOW WATER
(INCHES)
0.89
0.000
0.00000
0.000000
0.000
0.000
0.0 FEET
2.00
(CU. FT.)
3230.700
0.0000
0.00000
0.00000
7260.0000
MAXIMUM VEG. SOIL WATER (VOL/VOL)
MINIMUM VEG. SOIL WATER (VOL/VOL)
0.2600
0.0999
'** Maximum heads are computed using McEnroe's equations. ***
Reference: Maximum Saturated Depth over Landfill Liner by Bruce M. McEnroe, University of Kansas ASCE Journal of Environmental Engineering Vol. 119, No. 2, March 1993, pp. 262-270.
******************************************************************************
P-'7s^

* * * * * * * * * * * * * * * * * * * * * * * * * * * * * * * * * * * * * * * * * * * * * * * * * * * * *
FINAL WATER STORAGE AT END OF YEAR 1
LAYER
1
2
3
4
5
(INCHES)
1.5758
14.4955
4.5600
0.0000
0.1875
(VOL/VOL)
0.2626
0.1208
0.1900
0.0000
0.7500
SNOW WATER 0 . 1 4 5
* * * * * * * * * * * * * * * * * * * * * * * * * * * * * * * * * * * * * * * * * * * * * * * * * * * * * * * * * * * * * * * * * * * * * * * * * * * * * * * * * * * * * * * * * * * * * * * * * * * * * * * * * * * * * * * * * * * * * * * * * * * * * * * * * * * * * * * * * * * * * * * * * * * * * * * * * * * *
•p-'%5

****************************************************************************** ****************************************************************************** ** ** ** ** ** ** * * **
HYDROLOGIC EVALUATION OF LANDFILL PERFORMANCE HELP MODEL VERSION 3.07 (1 NOVEMBER 1997) DEVELOPED BY ENVIRONMENTAL LABORATORY USAE WATERWAYS EXPERIMENT STATION
FOR USEPA RISK REDUCTION ENGINEERING LABORATORY
** ** ** ** ** **
** ** ** ** ****************************************************************************** ******************************************************************************
PRECIPITATION DATA FILE: TEMPERATURE DATA FILE: SOLAR RADIATION DATA FILE: EVAPOTRANSPIRATION DATA: SOIL AND DESIGN DATA FILE: OUTPUT DATA FILE:
C:\HELP3\SUV\BVPRECP.D4 C:\HELP3\SUV\BVTEMP.D7 C:\HELP3\SUV\BVRAD.D13 C:\HELP3\SUV\BVEVAP.Dil C:\HELP3\SUV\BAYVIEW3.D10 C:\HELP3\SUV\BAYVIEW3.OUT
TIME: 11:20 DATE: 6/26/2003
******************************************************************************
TITLE: Bayview Cell#2 Year 5
******************************************************************************
NOTE: INITIAL MOISTURE CONTENT OF THE LAYERS AND SNOW WATER WERE SPECIFIED BY THE USER.
LAYER 1
TYPE 1 - VERTICAL PERCOLATION LAYER MATERIAL TEXTURE NUMBER 6
THICKNESS = 12.00 INCHES POROSITY = 0.4530 VOL/VOL FIELD CAPACITY = 0.1900 VOL/VOL WILTING POINT = 0.0850 VOL/VOL INITIAL SOIL WATER CONTENT = 0.1900 VOL/VOL EFFECTIVE SAT. HYD. COND. = 0.720000011000E-03 CM/SEC
?-i^/a5

LAYER 2
TYPE 1 - VERTICAL PERCOLATION LAYER MATERIAL TEXTURE NUMBER 18
THICKNESS = 1560.00 INCHES POROSITY = 0.6710 VOL/VOL FIELD CAPACITY = 0.2920 VOL/VOL WILTING POINT = 0.0770 VOL/VOL INITIAL SOIL WATER CONTENT = 0.1100 VOL/VOL EFFECTIVE SAT. HYD. COND. = 0.100000005000E-02 CM/SEC
LAYER 3
TYPE 2 - LATERAL DRAINAGE LAYER MATERIAL TEXTURE NUMBER 6
24.00 THICKNESS POROSITY FIELD CAPACITY WILTING POINT INITIAL SOIL WATER CONTENT = EFFECTIVE SAT. HYD. COND. SLOPE DRAINAGE LENGTH
INCHES 0.4530 VOL/VOL 0.19 0 0 VOL/VOL 0.0850 VOL/VOL 0.1900 VOL/VOL
0.720000011000E-03 CM/SEC 3.00 PERCENT
1170.0 FEET
LAYER 4
TYPE 4 - FLEXIBLE MEMBRANE LINER MATERIAL TEXTURE NUMBER 35
0.06 INCHES THICKNESS POROSITY FIELD CAPACITY WILTING POINT INITIAL SOIL WATER CONTENT = EFFECTIVE SAT. HYD. COND. = 0 FML PINHOLE DENSITY FML INSTALLATION DEFECTS FML PLACEMENT QUALITY = 3
0.0000 VOL/VOL 0.0000 VOL/VOL 0.0000 VOL/VOL 0.0000 VOL/VOL
199999996000E-12 CM/SEC 0.75 HOLES/ACRE 2.00 HOLES/ACRE
- GOOD
p- ^ I Q 6

LAYER 5
TYPE 3 - BARRIER SOIL LINER MATERIAL TEXTURE NUMBER 17
THICKNESS = 0.25 INCHES POROSITY = 0.7500 VOL/VOL FIELD CAPACITY = 0.7470 VOL/VOL WILTING POINT = 0.4000 VOL/VOL INITIAL SOIL WATER CONTENT = 0.7500 VOL/VOL EFFECTIVE SAT. HYD. COND. = 0.300000003000E-08 CM/SEC
GENERAL DESIGN AND EVAPORATIVE ZONE DATA
NOTE: SCS RUNOFF CURVE NUMBER WAS USER-SPECIFIED.
SCS RUNOFF CURVE NUMBER FRACTION OF AREA ALLOWING RUNOFF AREA PROJECTED ON HORIZONTAL PLANE EVAPORATIVE ZONE DEPTH INITIAL WATER IN EVAPORATIVE ZONE UPPER LIMIT OF EVAPORATIVE STORAGE LOWER LIMIT OF EVAPORATIVE STORAGE INITIAL SNOW WATER INITIAL WATER IN LAYER MATERIALS TOTAL INITIAL WATER TOTAL SUBSURFACE INFLOW
77, 0, 1,
16, 2, 8, 1, 2,
178. 180.
0,
.00
.0
.000
.0
.720
.120
.328
.000
.628 ,628 ,00
PERCENT ACRES INCHES INCHES INCHES INCHES INCHES INCHES INCHES INCHES/YEAR
EVAPOTRANSPIRATION AND WEATHER DATA
NOTE: EVAPOTRANSPIRATION DATA WAS OBTAINED FROM SALT LAKE CITY UTAH
STATION LATITUDE MAXIMUM LEAF AREA INDEX START OF GROWING SEASON (JULIAN DATE) END OF GROWING SEASON (JULIAN DATE) EVAPORATIVE ZONE DEPTH AVERAGE ANNUAL WIND SPEED AVERAGE 1ST QUARTER RELATIVE HUMIDITY AVERAGE 2ND QUARTER RELATIVE HUMIDITY AVERAGE 3RD QUARTER RELATIVE HUMIDITY AVERAGE 4TH QUARTER RELATIVE HUMIDITY
40.76 DEGREES 0.00 117 289
16.0 INCHES 8.80 MPH 67.00 % 48.00 % 39.00 % 65.00 %
NOTE: PRECIPITATION DATA WAS SYNTHETICALLY GENERATED USING COEFFICIENTS FOR SALT LAKE CITY UTAH
p-'^'/P^

JAN/JUL
1.35 0.72
NORMAL MEAN MONTHLY PRECIPITATION (INCHES)
FEB/AUG MAR/SEP APR/OCT MAY/NOV
1.33 0.92
1.72 0.89
2.21 1.14
1.47 1.22
JUN/DEC
0.97 1.37
NOTE: TEMPERATURE DATA WAS SYNTHETICALLY GENERATED USING COEFFICIENTS FOR SALT LAKE CITY UTAH
NORMAL MEAN MONTHLY TEMPERATURE (DEGREES FAHRENHEIT)
JAN/JUL FEB/AUG MAR/SEP APR/OCT MAY/NOV JUN/DEC
28.60 77.50
34.10 74.90
40.70 65.00.
49.20 53.00
58.80 39.70
68.30 30.30
NOTE: SOLAR RADIATION DATA WAS SYNTHETICALLY GENERATED USING COEFFICIENTS FOR SALT LAKE CITY UTAH AND STATION LATITUDE = 40.27 DEGREES
*******************************************************************************
AVERAGE MONTHLY VALUES IN INCHES FOR YEARS 1 THROUGH 30
JAN/JUL FEB/AUG MAR/SEP APR/OCT MAY/NOV JUN/DEC
PRECIPITATION
TOTALS
STD. DEVIATIONS
RUNOFF
TOTALS
STD. DEVIATIONS
EVAPOTRANSPIRATION
TOTALS
1 .16 0 . 6 9
0 . 6 0 0 . 4 8
1 . 2 0 0 . 8 5
0 . 5 4 0 . 8 0
1 .95 0 . 8 4
0 . 7 7 0 . 6 1
2 . 0 4 1 . 0 5
0 . 8 7 0 . 8 2
1 .30 1 . 3 1
0 . 6 8 0 . 7 3
1 .03 1 .46
0 . 7 4 0 . 5 9
0, 0,
0, 0,
,000 .000
.000 ,000
0, 0,
0 0,
.000
.000
.000
.000
0. 0,
0, 0,
.000
.000
.000
.000
0. 0,
0, 0,
,000 ,000
,000 .000
0, 0,
0, 0,
.000
.000
.000
.000
0, 0,
0, 0,
,000 .000
.000
.000
0.572 0.673 2.225 2 .301 1.525 1.048
. ^l96

0.706 0.840 0.789 0.922 0.823 0.763
STD. DEVIATIONS
LATERAL DRAINAGE COLLECTED FROM LAYER 3
TOTALS
STD. DEVIATIONS
PERCOLATION/LEAKAGE THROUGH LAYER 5
0.258 0.495
0.379 0.809
0.644 0.590
0.918 0.662
0.694 0.363
0.719 0.199
0. 0,
0. 0,
.0000 ,0000
.0000
.0000
0, 0.
0, 0.
.0000
.0000
.0000
.0000
0, 0,
0, 0,
.0000
.0000
.0000
.0000
0, 0,
0, 0.
.0000
.0000
.0000
.0000
0. 0.
0. 0,
,0000 ,0000
.0000
.0000
0, 0,
0, 0,
.0000
.0000
.0000
.0000
TOTALS
STD. DEVIATIONS
0.0000 0.0000
0.0000 0.0000
0.0000 0.0000
0.0000 0.0000
0.0000 0.0000
0.0000 0.0000
0.0000 0.0000
0.0000 0.0000
0.0000 0.0000
0.0000 0.0000
0.0000 0.0000
0.0000 0.0000
AVERAGES OF MONTHLY AVERAGED DAILY HEADS (INCHES)
DAILY AVERAGE HEAD ON TOP OF LAYER 4
AVERAGES
STD. DEVIATIONS
0.0000 0.0000
0.0000 0.0000
0.0000 0.0000
0.0000 0.0000
0.0000 0.0000
0.0000 0.0000
0.0000 0.0000
0.0000 0.0000
0.0000 0.0000
0.0000 0.0000
0.0000 0.0000
0.0000 O.OOOO
*******************************************************************************
*******************************************************************************
AVERAGE ANNUAL TOTALS & (STD. DEVIATIONS) FOR YEARS 1 THROUGH 30
PRECIPITATION
RUNOFF
EVAPOTRANSPIRATION
LATERAL DRAINAGE COLLECTED FROM LAYER 3
PERCOLATION/LEAKAGE THROUGH LAYER 5
INCHES
14.88 ( 2.435)
0.000 ( 0.0000)
13.186 ( 2.0492)
0.00000 ( 0.00000)
0.00000 ( 0.00000)
CU. FEET
54009.6
0.00
47864.84
0.000
0.000
PERCENT
100.00
0.000
88.623
0.00000
0.00000
p.^^P^'

AVERAGE HEAD ON TOP OF LAYER 4
CHANGE IN WATER STORAGE
0.000 ( 0.000)
1.693 ( 1.1317) 6144.74 11.377
*******************************************************************************
******************************************************************************
PEAK DAILY VALUES FOR YEARS 1 THROUGH 30
PRECIPITATION
RUNOFF
DRAINAGE COLLECTED FROM LAYER 3
PERCOLATION/LEAKAGE THROUGH LAYER 5
AVERAGE HEAD ON TOP OF LAYER 4
MAXIMUM HEAD ON TOP OF LAYER 4
LOCATION OF MAXIMUM HEAD IN LAYER 3 (DISTANCE FROM DRAIN)
SNOW WATER
(INCHES)
1.66
0.000
0.00000
0.000000
0.000
0.000
0.0 FEET
2.96
(CU. FT.)
6025.800
0.0000
0.00000
0.00000
10733.1621
MAXIMUM VEG. SOIL WATER (VOL/VOL)
MINIMUM VEG. SOIL WATER (VOL/VOL)
0.4143
0.0830
*** Maximum heads are computed using McEnroe's equations. *
Reference: Maximum Saturated Depth over Landfill Liner by Bruce M. McEnroe, University of Kansas ASCE Journal of Environmental Engineering Vol. 119, No. 2, March 1993, pp. 2 62-27 0.
******************************************************************************
.9

i t * * * * * * * * * * * * * * * * * * * * * * * * * - * * * * * * * * * * * * * * * * * * * * * * * * * * * * *
FINAL WATER STORAGE AT END OF YEAR 30
LAYER
1
2
3
4
5
(INCHES)
2.6547
224.0082
4.5600
0.0000
0.1875
(VOL/VOL)
0.2212
0.1436
0.1900
0.0000
0.7500
SNOW WATER 0.000
****************************************************************************** ******************************************************************************
Y-^ l96

APPENDIX K
ATTACHMENT 3:
FLOW CAPACITY OF THE LEACHATE COLLECTION PIPE

Job No. Na
HDR Computation J x ] R
pWfiAMJ Landl-ilj^ . ico.p.edKlY; I Q ^ ^ M ^ - ^ i n - ^ \A^(Y\a\p Cn]lpr- nn ^ii^if/n [checked TiiuJ \ . ' H/o^
\ou cam\\\\c \iaska\t (ijcA\pi% <\. Pine Ishee. \ |o Q^
I Project
I Subject
Task
ba5ejLor\ ]Aou(\r\\f\.A' ^ aixaJioru- 4li^-flou3c6ip(:?/' ^ ^or OL 3 mcKJ \mchme pine of\ a. 9% ^ \ o ^ r ^
Ttve HELP m(xk\ ou.\pu^ C\C-Q ' pas. 19-^5) in^ica-fes ^a-V o^^llqiH^ \c(xchai'e^u)in b' . n^^^-fm-for, t \Wj cd^iiiofv ^mlu^fo^- "tn^eforc. a % \ncK plp U3il 1 be able -+o h ^ d l ^ +hc p^oi -P-looJ coi^^ JLA ampl^ -fac-]or or ^e^ki .
Hou3<2Air 5+ormoca-kr #\^+ com^3 infe conitict uoi4K t^olid (joa +c ordaUu covjer \t:) +apicaUu^Pouo^+o
l ocha-fe a3\iec-^bA ^u^t^f^. Cor.+amin&± (X- ^ ^-brmooa4er ujvW \:)C rrftrv\nni^^ Du- fce;e)\n.Oi-Hie^fi^c ^ c e ai) t)mal( as por)S\ble and tn placm(| 5oil cpue/ Qf\ all La35lre.'-PlllM!- orc/a^ ro+ odsmwiu moQ uiiU^eA
t)\r\ce +1 ^ uXl6- e 16 ncH- a-P4 idd conaci+a t^^h^ Pi^S^'^ \(\ 4A e \and^i\\ a/\^ #^^ soil co\J^i^ nQrt aUrarecL^ ^0rL \^ a. icuad. po\ejn \CL -Tor 4^5^ comr:anen-\' fo ab^rb am. hofy dAu ron-tamina-icc; uDa-fer 4+\x+m(m •\A-fil4raf \r\\o +ne %nrf n^ oei^ Hi5+or/cai pr'ac+lc^ d+Vhc t>iU has i hoton 44n -i-+fie leaChdf^^oH^-por-/
Idichafe aen^ofe^ ^6 uj-eli as 4^^ ccnw+si-ormcoa-te^
Adld V\onaWu.t)0\\ terms uoill k:)Z vn(k\(\kxa'e(l o(fwiwr

Job No. 3608
Computation g||Pro/ec«_
(0
System
Bayview Landfill
cc UJ
d
Leachate and Contaminated Water Plan
Component Leachate Collection System
Task Pipe capacity
Computed
Date
Reviewed
Date
kdf
Jul-03
^M^LO
<5- 'Z^-c)^
Purpose
Find
Given
Solution
Assumptions
Equations
Calculation
Using Manning's equation, calculate pipe capacity of leachate headers.
Description
Pipe capacity
Variable Units
Q gal/day
Description Pipe diameter [in] Slope [ft/ft] roughness coefficient
Value Source 8 leachate pipe diameter
0.02 design value 0.02 HDPE pipe
Description Pipe capacity
Value Comment 719,824 gallons/day
Use Manning's Equation
Q = h ^ AR^^^S^^ equation 1
n
A = cross-sectional area [ft ]
n = Manning's roughness coefficient
R = hydraulic radius [ft]
S = slope [ft/ft]
Q = flow [cfs]
Description
solve for area solve for perimeter solve for R solve for Q convert to gal/day
Equation A = 7tr^
P = 7td
R = A / P
equation 1 above
1 cfs = 646,272 gpd
Comment Value Verification [SF]
[ft] [ft] [cfs]
[gpd]
0.349
2.094 0.166666667
1.114
719,824
Sheet 2 of 2

Appendix L

APPENDIX L
STORMWATER / EVAPORATION POND
SUVSWD Bayview Class I Landfill Permit Application
Submitted IMarch 2009
Prepared By:
HDR ENGINEERING, INC.

INTRODUCTION
In its current design, runoff and leachate from Cell 1, Cell 2 Stage 1, and the windrow operation are contained in the existing leachate pond. However, the pond is not dual lined and does not have leak detection, both of which are now required for leachate ponds. Because ofthis, a new leachate pond will be constructed as part ofthe permit renewal. The new pond will take leachate and stormwater from all of Cell 1 and Cell 2, and the existing pond will continue to take runoff from the windrow operation due to the less stringent requirements of retaining runoff from windrow operations.
The new pond will be dual-lined with leak detection. The liner system will consist of (starting at surface of pond): 60-mil UV-resistant HDPE liner, geonet, second 60-mil HDPE liner, non-woven geotextile, and compacted subgrade. As part of the leak detection system, an 8" HPDE pipe will be installed below the top 60-mil liner and will extend to a sump which will be located in the bottom of pond. The pipe will have a perforated end at the sump so that moisture can enter and the pipe will be used for access to the sump to test for moisture.
The design for the new leachate pond was performed by assuming the largest ofthe three remaining stage areas in Cell 2, would be contributing runoff to the pond. This assumption was made because Stage 1 is already receiving waste and receives daily cover, decreasing the amount of runoff generated from that stage, and the remaining stages will be developed separately as the other stages are filled. The largest remaining stage in Cell 2 is Stage 3, which has an area of 23.5 acres. The design storm used for the pond design is the 25-year, 24-hour storm. Information for the rainfall amount ofthis storm was taken from the National Oceanic and Atmospheric Administration (NOAA) Atlas 14 rainfall data. From the NOAA 14 data, the 25-year, 24-hour precipitation amount is 1.81 inches. (See attached)
The bottom ofthe proposed pond is at elevation 4634 feet (NGVD '29 datum) and the top ofthe pond is at elevation 4646 feet. The invert elevation ofthe leachate drain line is 4642.0, which is 4 feet below the top of pond elevation. The pond volume was calculated using the average area method and calculating the volume below the invert of the leachate drain line. These calculations are included as part of Appendix L. Based on these calculations, the required pond volume is 154,008 ft and the pond volume provided is 187,069 ft^. Therefore, the pond is sufficient to hold the 25-year, 24-hour storm with 4 feet of freeboard.
March 2009 SUVSWD Bayview Class I Landfill Permit Application 11

KR\ Matty Solutions
Project:
Subject:
Task:
Bayview Landfill
Hydrologic Analysis
Leachate Fbnd VolunE Calculations
Computed:
Ctiecked:
RLR Date:
Date:
1/9/2009
Job#:
Leachate pond volume required was calculated using the largest stage area in Cell 2 (Stage 3). The design storm for the leachate pond is the 25-year, 24-hour storm. The pond was designed to hold the entire 25-year, 24-hour storm.
25-yr, 24-hr Precip. = 1.81 in From NOAA Altas 14 Point Precipitation Frequency Estimates (See attactied)
Volume Required
Largest Stage
3
Area (Ac), A
23.5
25-yr, 24-hr Precip. (in.)
1.81
Volume Required'^'
(ac-ft) 3.54
Volume Required
(ft')
154,402
Volume Provided
Elevation
4634
4636
4638
4640
4642
Area (ft^)
13,297
17,761
22,851
28,652
35,244
Avg. Area (ft^)
15,529
20,306
25,752
31,948
Depth (ft)
2
2
2
2
Volume Provided
(ft')
31,058
40,612
51,503
63,896
Cumulative Volume Provided
(ft')
31,058
71,670
123,173
187,069
Volume Provided Volume Required
Balance
187,069 154,402 32,667
Volume Provided > Volume Required
(1) Vrequired = (P25,24*A)/12

POINT PRECIPITATION FREQUENCY ESTIMATES FROM NOAA ATLAS 14
Utah 40.036799 N 111.968129 W 4688 feet IVom "Prctipilnlion-Fitttiucncy Alias of thi United Stales" NOAA Atlas 14, Volume I, Version 4
G.M. Bonniii, D. MaiHii. B. Lin, T. Paraybok. M.Yekla, and D. Riley NOAA, National Wenilicr Service, Silvcf Spring, Maryland, 2006
Kxliacled: Tliu Nov 20 2008
- ^
Confidence Limits [ Seasonality [ Location Maps ]( Other Info. GIS data Maps Docs c Precipitation Frequency Estimates (inches)
ARI* (years)
1
2
5
10
25
50
100
200
500
1000
5 min
0.12
0.15
0.20
0.26
0.34
0.41
0.49
0.59
0.74
0.88
•These precipitation ( Please refer to NOAA
10 <nin
0.17
0.22
0.31
0.39
0.51
0.62 1
0.75
0.90
1.13
1.34 1
equency Alias I ' le
15 niin
0.22 i
0.28
0.39
0.48
0.63
0.77
0.93
1.11
1.41
1.66
estimates )ocument
30 mill
0.29
0.37
0.52
0.65
0.85
1.04
1.25
1.50
1.89
2.24
60 min
0.36
0.46
0.64
0.80
1.05
1.28
1.55
1.86
2.34
2.77
120 min
0.44
0.55
0.73
0.90
1.16
1.39
1.66
1.98
2.47
2.92
3,.hr
0.49
0.62
0.79
0.95
1.20
1.41
1.67
2.00
2.50
2.94
.6111-
0.62
0.77
0.95
l.ll
1.33
1.53
1.76
2.04
2.52
2.97
12hr
0.77
0.94
1.15
1.31
1.55
24Jir
0.94
1.16
1.38
1.57
1.81
1.73 2.00
1.93 2.19
2.17 2.38
2.57 2.62
3.00 3.03
48 hr
1.04
1,27
1.52
1.72
2.00
2.21
2.42
2.64
2,92
3.14
4 day 1.20
1.46
1.75
2.00
2.34
2.60
2.88
3.16
3,54
3.83
ate based on a pMlaiSuratJonienes. ARI Is the Average Recurrence Interval. for more informalion. NOTE: Formatting forces estimates near zero to appear as zero.
7 day
1.36
1.67
1.99
2,25
2.59
2.86
3.12
3.38
3.72
3.97
10 clay 1.49
1.83
2.16
2.44
2,79
3.05
3.30
3.55
3.86
4.08
20 day
1.93
2.37
2.79
3.13
3.55
3,85
4.13
4,39
4.71
4.92
30 day
2.26
2,77
3,27
3.66
4.17
4,54
4,90
5.24
5.66
5.95
45 day
2.80
3.41
3.99
4.44
4.99
5.37
5.72
6.03
6.36
6.56
(
3
3
4
5
5
6
6
6
7
7
* Upper bound ofthe 90% confidence interval Precipitation Frequency Estimates (inches)
ARI** (years)
1
2
5
10
25
50
100
200
500
1000
5 min
0.14
0.17
0.24
0.30
0.40
0.48
0.59
0.72
0.92
1.10 The upper bound of
"These precipitation
Please refer to NOAA
10 min
0.20
0.26
0.36
0.46
0.60
0.74
0.90
1.09
1.40
1.68 he confid requency
Mlas 14 D
15 min
0.25
0.32
0.45
0.57
0.75
0.92
1.11
1.35
1.73
2.08 ;nce inten estimates
octirticnl
30 min
0.34
0.44
0.61
0.76
1.01
1.23
1.50
1.82
2.33
2.81 /alatSOy are base
or more Ir
60 min
0.42
0.54
0,75
0.95
1.25
1.52
1.85
2.25
2.89
3.47
120 min
0.50
0.63
0.84
1.03
1.33
1.61
1.95
2.35
2.99
3.60
3 hr
0.56
0.70
0,90
1.07
1.36
1.63
1.97
2.37
3.02
3.64
6 hr
0.69
0.85
1.05
1.22
1.48
1.71
1.98
2.39
3.05
3.67
12 hr
0.84
1,03
1.25
1.43
1.70
1.91
2.15
2.44
3.08
3.71
24 hr
1.01
1.24
1.48
1,68
1.94
2.15
2.35
2.56
3,11
3.75
48 hr
1.11
1.36
1.63
1.84
2.14
2.37
2.60
2.84
3.16
3.78
4 day
1.29
1.57
1.89
2.14
2.50
2.79
3.09
3.39
3.82
4.15 confidence level is the value which 5% ol the simulated quantile values for a g
1 on a partial duration series. ARI is the Average Recurrence Interval.
fomiation. NOTE: Formatting prevents estimates near zero to appear as zero.
7 day
1.46
1.78
2,12
2.39
2.75
3.03
3.32
3.60
3.97
4.25 ven frequ
10 day
1.59
1.95
2.30
2.58
2,95
3.22
3.49
3,76
4.10
4,35
20 day
2.06
2.52
2.97
3,31
3.75
4.06
4.37
4.65
5.00
5.23
30 day
2.40
2,94
3.46
3.87
4.40
4.79
5.17
5.54
6.01
6,33
45 day
2.97
3.62
4.22
4.67
5.25
5.64
6.00
6.32
6,67
6.87
«
3
4
4
5
6
6
6
7
7
7 5ncy are greaterthan.
* Lower bound of the 90% confidence interval Precipitation Frequency Estimates (inches)
ARI** (years)
5 min
1 0 niin
IS min
30 min
60 min
120 min
3 hr
6 hr
12 hr
24 hr
48 hr
4 day
7 day
10 day
20 day
30 day
45 day c
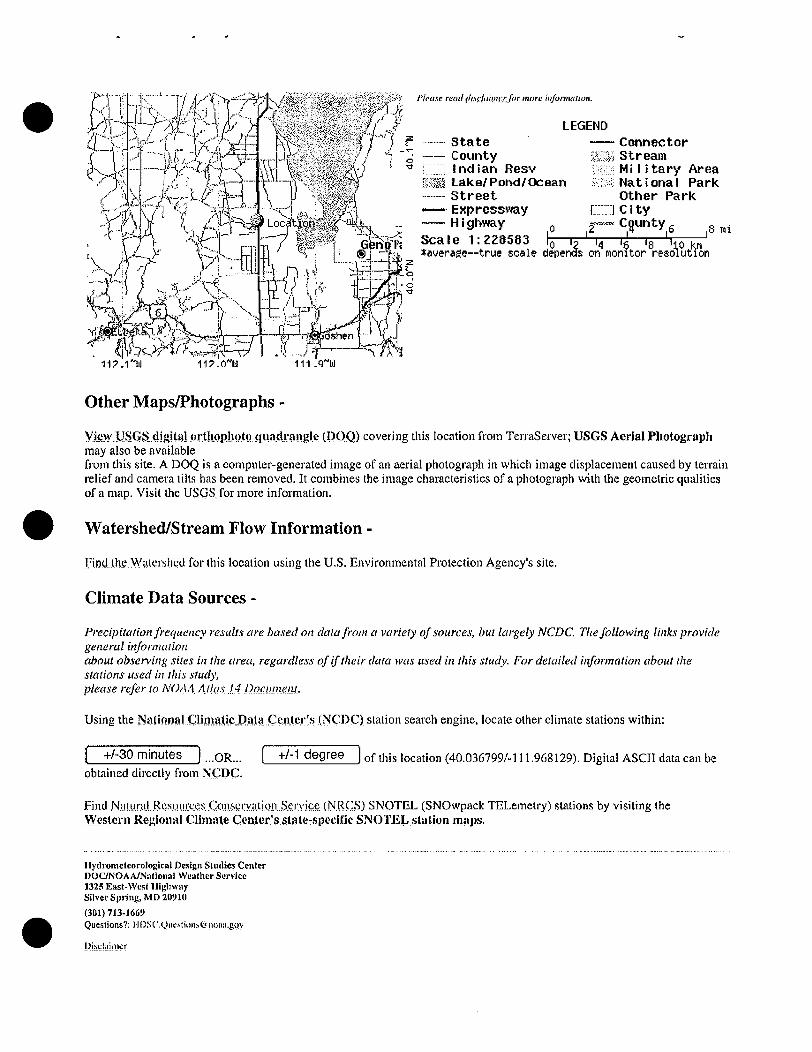
r - l l;" •" K \"l ,•'-"•«';'^>-"^"-A'"'|-. /ikm!^-?iV:^W!^ffi^fMf^f&f Plemc raid tllsdi
^ / r - - ' - • I - - " " ' ' ' r i '-•••J- .^-4 l i * ^ - (^^,;.^•^••^.•;•••^••1^^;V^'•>^•-;•-;:C'•;.•,•;<•:.l•:•;ir••-L V - .
..iiSiil^ .. .... ' \ h . Sl 'W^
I ' •-' """K>-hi")' ^ J K " ' ^ - ;
hM""- -h^-w-<
i - A . •:' (• V'i...>:,, \ r i - . , . % y - A \
\<:hii.'.>VjJ'<'i' inore information.
LEGEND
/ -H
i
V
Loc.
County f ;:; indlart Resv i i i i Lalte/Pond/Ocean
S t ree t — — Expressway
Highway ^ Scale 1:228583
Connector i g i stream viiisi Mi I i t a ry Area K.M National Park
Other Park r:: J c i ty
^ ».,>5n/C.:#^ I J?.....if-— -rfb
-r, I Kis*' 1. Gfehf!)'!-! :f^""' '•'•<-"vi«o IQ 12 14 Ig 18 Ho km J ' H i M ® I ""/'-i. *average-~true scale detJends on nonitor resolution
i i ? . i ' ' i i j 117.0~lil r 111 .q~ti]
' f
Other Maps/Photographs -
yicM^USGS ligital ortluiplwMQ qiiatlra (POQ) covering this location fiom TenaSetvei; USGS Aerial Pliotograph may also be available from this site. A DOQ is a computer-generated image of an aerial photograph in which image displacement caused by terraiti relief and camera tilts has been removed. It combines the image characteristics of a photograph wilh the geometric qualities of a map. Visit the USGS. for more information.
Watershed/Stream Flow Information -
Find.lheAValcishcd for this location using the U.S. Environmental Protection Agency's site.
Climate Data Sources -
Precipitation frequency results are based on data from a variety of sources, but largely NCDC. Tlie foUowing links provide gene ra I info rival ion about observing sites in the area, regai-dle.ss of if their data -was used in this study. For detailed information about the stations used in this study, please refer to NO/\,\ Ajla.f 14 DocwMiXl-
Using the Nalional ClimaticJDataC (>fCPC) station search engine, locate other climate .stations within:
[ +A30 minutes ) ...QR... [ +/-1 degree ] of this location (40.036799/-111.968129). Digital ASCII data can be obtained directly from NCPC.
Find NaUiral Rcsouix.'es.Cgnsci;ya (NRCSJ SNOTEL (SNOwpack TELemetry) stations by visiting the Westei"!! Reyionai Cliinale Cenler's state-spccitic SNOTEL .station majis.
Hy(1i'omctcoroloi;ical Design Studies Center DOC/NOAA/Natioiuil Wtatlier Service 1325 East-We.sl Higliway Silver Spring, MD 20910
(301)713-166!) Questions?: IJiJ.SC.Qin'.siikJM. te.noiui.Bov
Dlscl.iinicr

Appendix M

#
APPENDIX M
Runon-Runoff Calculations
SUVSWD Bayview Class I Landfill Permit Application

APPENDIX M
RUN-ON / RUN-OFF CALCULATIONS
SUVSWD Bayview Class I Landfill Permit Application
Submitted March 2009
Prepared By:
HDR ENGINEERING, INC.

INTRODUCTION
The run-on/run-off calculations were performed to determine the size of drainage ditches
required to control run-on and run-off flows. The run-on/run-off peak flows were calculated
using the Rational Method:
Q = CiA where Q = Run-off flow (ft^/sec)
C = Run-off Coefficient / = rainfall intensity (in/hr)
A = Area contributing to run-off (acres)
The run-off coefficient, C, was multiplied by the run-off coefficient adjustment factor, Cf, of 1.1
to adjust the rational method for a recurrence interval of 25 years.
Once the run-on/run-off flows were calculated, the capacity of the ditch designed to carry the
run-on/run-off was calculated using Manning's Equation:
Q = h ^ A R " ' S " ' n
where Q = Maximum capacity of ditch (ft^/sec) rt = Maiming's roughness coefficient
A ~ Cross-sectional area of ditch (ft ) R = Hydraulic radius (A/wetted perimeter) (ft) 5= slope of ditch (ft/ft)
If the capacity ofthe ditch exceeds the run-on/run-off flow, then the ditch is adequate.
The first set of calculations shown in Appendix M, Attachment 1 is for the run-on from Cell 1
onto Cell 2 and fi-om Cell 2 onto Cell 1. The map on page 4 of Attachment M-1 shows the
portion of Cell 1 that is directed towards Cell 2 and the portion of Cell 2 that will be directed to
Cell 1 after closure with final cover in place. The ditch that will be constructed to go between
Cell 1 and Cell 2 will direct the run-on to the north and south to existing drainage channels. The
final cover on Cell 1 and Cell 2 will be overlaid with short grass prairie, which has a Marming's
roughness coefficient, n, of 0.15, This was considered to be cultivated land on a rural catchment,
so a value of 0.30 was chosen as the basic factor for the run-off coefficient, C.
1 I SUVSWD Bayview Class I Landfill Pemiit Application March 2009

The second set of calculations shown in Appendix M, Attachment 2 is for the run-off from the
areas of Stage 1 and Stage 2 in Cell 2 prior to installation ofthe final cap. The calculations were
done for the design of drainage ditches which will be constructed aroimd the perimeter of Stages
1 and 2. The run-off was calculated as if Cell 2 were filled to capacity prior to installation ofthe
final cap as a worst-case scenario so that the ditches can be constructed as Cell 2 is filled and
will not need to be redesigned. A Marming's roughness coefficient of 0.027 (earth with weeds)
was used for the channel design and a run-off coefficient (C-value) of 0.30 was used for run-off
calculations (undeveloped land). Because the diversion ditches around Stages 1 and 2 will not
continue around Stages 3 and 4 until these stages are constructed, the ditches will outfall to the
sump in Stage 2,
2 I SUVSWD Bayview Class I Landfill Permit Application March 2009

APPENDIX M
ATTACHMENT 1:
REQUIRED CAPACITY OF DRAINAGE DITCH FOR RUN-OFF

JobNa No.
HDR Computation T T ^ R
oiec. |3aiK\/\-eAA^ L r ? j r \ ( i f i l i [computed W^^Jr)'^ I Subject I Checked [Date
Task Sheet Of 9±
Q-CJL^
l i n ^ e K)or4^er dl(/ec-HoK ,#] ^mximati^ orto^ wot
12a^d- ^a 2jd.\ Oi rano-f-f cce-fdcmi cJr drainaq^ dur^ oc cxy\\'ua.k(U land /s 0.3G, Thit> \t> maUipfi^d^ba a W^£/iccj Qadot" o-P /./ -for 0. rec^^'^mci in^e/vaLof 95 &e^s^-.o m ^ coeW\c(cr\-(- o^ drainaQQ.,C, i^ 0 .^3 ,
5-7 ^ \o deiejrir\i^^ ram-fad init/isUu^^ \\m^ o-f coir\cm'faMor\ :hc^
"^c- Q.oo-?(nL)!' n^ MoLr\f\inQ' yoaq^n€5S coe-f( \Ci A-l-

Chapter 5 - Hydrology Section 6 - Peak Discharge using the Rational Method
Table 5.6-3: Runoff coefficient adjustment factors for Rational Method
Recurrence Inter/al (years)
IS 50 100
^r 1.1 1.2 1.25
The Rational formula now becomes Equation 5.6-4.
n-CC,IA 360
,5.6-4
r
5.6.6 Procedure for Rational Method
The general procedure for estimating the peak discharge for a watershed using the Rational Method is as follows: • . .
(1) Determine the watershed area in hectares.
(2) With consideration for future characteristics ofthe watershed, detennine the time of concentration as defmed in Section 5.5.
(3) Assure consistency with the assumptions and limitations for application ofthe Rational Method.
(4) According to the locality in Texas and the design firequency, extract the rainfall IDF coefficients e, b, and d values firom the list shown in Appendix 5-2.
(5) Using Equation 5.6-2, calculate rainfall intensity.
(6) With consideration for future characteristics ofthe watershed, select or develop appropriate runoff coefficients for the watershed. Where the watershed comprises more than one characteristic, C values for each area segment must be estimated individually. A weighted C value then may be estimated using Equation 5.6-5.
C = -!^ m
.5.6-5
where: C = weighted runoff coefficient n = nth subarea
m = number of subareas C„ = nmoffcoefficient forn"" subarea
V

Job No. No.
HDR Computation
Jiect
Subject
p)aij\i\?AA) land-Cii Computed Date
KR Checked Date
Task Sheet 3 01 Al
A,^9U.^5 \ f ^ / v ^ o Z l i l \ - ^-a\s acres
^af
c^wa a ^ ^ ^
r^a l
A;,.r3-y'^ fa'' I ^oo" i £ '3,W-
' U.- H cLcre^
- 3 3 6 6Lcr- s l.a=
l 'Q\o^ ^ \ '^A acre<?.
1,5 ? 31.H^ i a - ^ / j J O l i i ^ l - 9,0? acrc5
\ \ n '
Cdl 2
: 9 M ^ acres
To+al - l b a c r ^ s

< FLCW DXtECtCOKJ

Job No. No.
HDR Computation
^ I Computed
I Subject Checked
Task Sheet b
L - 500'
Date
KR Date
Of ^ 1
"ShorV amss pra i r ie .
C\")-'(.04>
^a_r-^ace cLescnifAr^iOfv^ - ^ V A O ^ V ( \ rass !^ ra \ r ie j
T c r U -- _ T nV' ^^,\ •:c , o l q 3u:x5v SISOOCH.I^VS^
~t7; , ^ u ^ i ^k . - .OO oSL
3t<)0\i 3WD0 1~ 1 )
CWoufxrveiV ^ \ o ^ a
S - l?c .". \ / - - \ .U ^Vsec -?rorr\ ^ - f . SL

Job No No.
HDR Computation
rojen
I Subject
Task
O
[Computed
Checked
Sheet
OlOJX^ei Fl0(jO (corv-Vir\u£(0
1 1
1- ^ JOn^-R- : . 1 ^
Date
KR Date
Of -2-
^ I Vvr / Uor ru.t o - orA CeU \ )
•?xxf>e()v G>r\ ^ef.^5 Q-uecur and \oo-ueQjr Vhoux ^Vorm. \s
X^-S^-tl- 3^-Kr \j(x\ae ^forrv precp\Va_V\on'-^re^ue/?Ca rnops
XH - ^ ' V 3^'Kr \/6Ll\ e ^forri precip(-f(i-lion -i^^aenca maf)5
Xj i ^ \rvbet loo-ur (^hrpr€6p4dion-?r^(>aOTa m^Xp-IS)
Vs-0-005 ^0.^55-Io.i(o.V\-o3 - . Ma^^ iache^

p^-^/a
TABLE 12.S RATIONAL RUNOFF COEFFICIENT EEF.I a. Urtan Cuchments
General Description Surface
City Suburban business Industrial
Residential multiunics Housing estates Bungalows
Paiks, cenaeteries
0.7-0.9 0.5-0.7 0.5-0.9
0.6-0.7 0.4-0.6 0.3-0.5
0.1-0.3
Asplialt paving 0.7-0.9 Roofs 0.7-0.9 Lawn heavy soil
> r slope 0.25-0.35 . 2 - r 0.18-0.22
<2* 0.13-0.17 Lawn sandy soil
>7* 0.15-0.2 2 - r 0.10-0.15 <2° 0.05-0.10
b. Rural Catchments (las than 10 km )
Ground Cover
Bare surface Giassland Cultivated land Timber
Basic Factor
0.40 0^5
t. "-gJ
Corrections: Add or Subtract
Slope < 5%: -0.05 Slope > 10%: +0.05 Reojincnce interval < 20 yr —0.05 Recurrence interval > 50 yr +0.05
Mean annual precipitation > 900 mm: +0.03
Table 3-L—Kougimess coefficients (Manning 's n) for sheet flow,.
Surface description N EEF.a
Smcx>th surfaces (concrete, asphalt, gravel, or
bare soil) : O.Oll
Fallow (no residue) \ 0.05
Cultivated soils:
Residue cover $20% 0.06 Residue cover >20% 0.17
Grass: Short grass prairie 0.15 ' Dense grasses* 0J24 Bermudagiass 0.41
Range (natural) 0.13'
Woods:' Light underbrush 0.40 Dense underbrush OM
'The n values are a composite of infonnation compiled by Engman (1986). ^Includes spedes such as weeping lovegrass, bluegrass, buffalo grass, blue grama grass, and native grass mixtures. 'When selecting n, consider c")ver to a height of about 0.1 ft This is the only part of the plant cuver that will obstruct sheet flow.
y

r Vi
o
a> CO S -
o o J -
03
VI-^M^
^EF. a-
.50 -
?n ~ . t u
.10 -
~ ^ -
— ^ nfi —
04 —
n9 — • V'-
m .U i —
nnt^ — UUD ""
" " ^
—-
—
/
I
—
^—
'—
r /
/ r
• " • •
—-:::::;i _.. ,5 ^ : - . . : / I ^B 4Wi ^ ^ - ^ - - - -
2 _ _ / ^^ .Z
„ 2_.i ^^ . r r . [ . / / > / _ _
^/>^4^ . / /
JLM-^--.. 3^-: : : . . . . . /l / ' LD .I_.i.... L,?^ J . . . .
Z„_ , 2 4 /
lllllllllll/ i:::E;-=-.i:?
/ / ' ^
:::: i : v:.\ _ i . . . . .. - , ./
^ / : : : : :z: : i : : : : . _ > _ . ^
•• b -f 1 - - ! = -\\ i ' - .z " \ \ r-
,
,
.. J_
1 / 1 i l l
w tUd:
_ -
- -
— —
- • —
- -
1 20
Average velocnxy, f t / sec
Figure 3-1.—Average velocities for estimating travel time for shallow concentrated flow.

114 113 112 111 110 109
NOAA ATLAS 2, Voliinn VI PrepHr«d bx U.S. Dipirt fncnt irf Commtre* NBtlonHlOnanic i nd Atmospheric AdtniniBtnitlpil Natlonil Wsathsr Sirvictv offica of Hydnilocy Prepared for U.S. Department of Aerlculturo, Soil Conservation Service, Engineering Division
^-J i= i%:
-142
•41
-40
-39
-38
UTAH I 10 0 10 20 SD 4(1
MILES
Figure 25
ISOPLUVIflLS OF Z-YR 24-HR PRECIPITATION IN TENTHS OF AN INCH
-37
114 113 112 111 110 109
^ TO
Xi 1>J
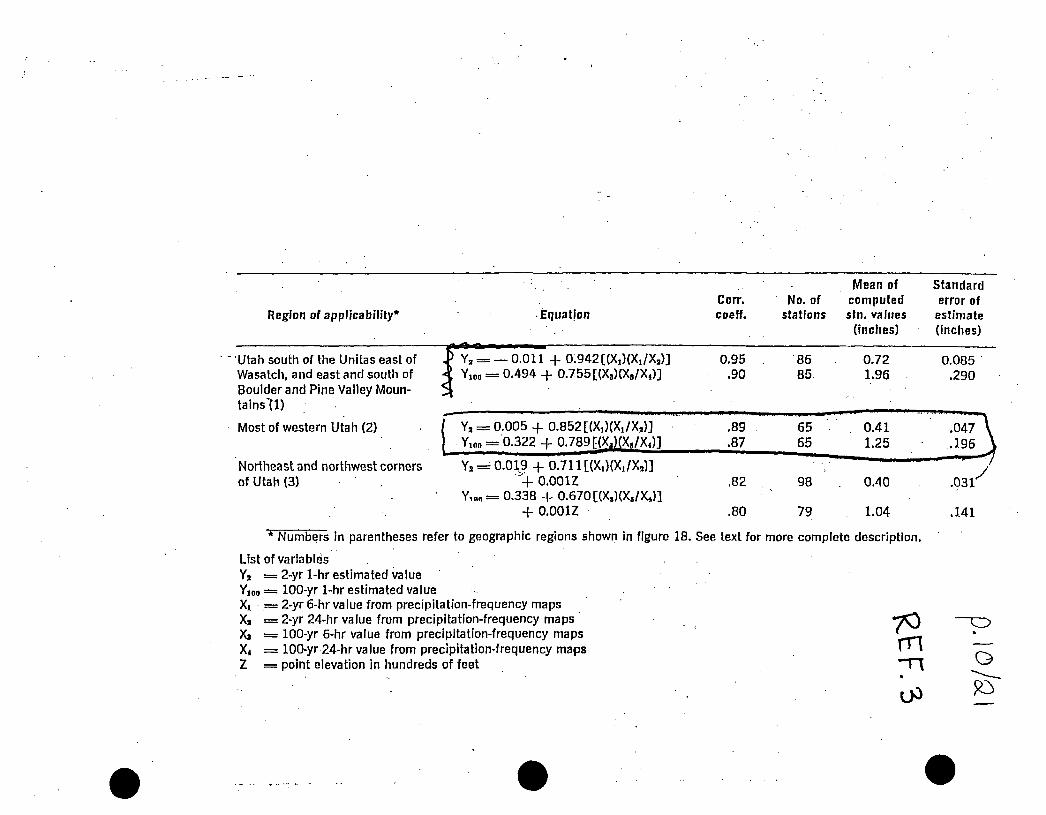
Region of applicability*
Utah south of the Unitas east of Wasatch, and east and south of Boulder and Pine Valley l\^oun-tains'd)
Most of western Utah (2)
Northeast and northwest corners of Utah (3)
Equation Corr. coeff.
No. of stations
Mean of computed stn. values
(inciies I irt n
- 0.011 -f 0.942 [(X,)(X,/Xj)] 0.95 0.494 + 0.755 [(Xa)(X,/X,)] .90
86 85
0.72 1.96
Y, = 0.005 + 0.852 [(X,)(Xi/X,)] Y,oo = 0.322 + 0.789 F(X,)(X,/X,)]
.89
.87
Ya = 0.019 + 0.711[(X,)X,/X,)] ' + O.OOIZ
Y,„„ = 0.338 + 0.670 [(X,)(X,/X,)] + O.OOIZ
.82
.80
65 65
98
79
0.41 1.25
0.40
1.04
* Numbers in parentheses refer to geographic regions shown in figure 18. See text for more complete description.
List of variables Y I = 2 - y r 1-hr estimated value Yioo == 100-yr 1-hr estimated value Xl == 2-yr 6-hr value from precipitation-frequency maps
= 2-yr 24-hr value from precipitation-frequency maps = 100-yr 6-hr value from precipitation-frequency maps = 100-yr 24-hr value from precipitation-frequency maps = point elevation in hundreds of feet
Standard error of
estimate (inches)
X, X, X« Z
70 m
0.085 .290

7^
Sa B^ (Si

113 112 ni no
l i i i i m t i i 11117 I
NOAA ATLAS 2, Voiume VI Pripgftd by U-S. Depertment 9/ Cwrmtrct NationBlOceanlcandAtmospliericAdminletnition Netional Weather Service, Office of hfydrolciy
' Prepared for U.S. Department of Agriculture. Sou Conservation Sirvke, Englnearfng Dlvitlon
-42
-40
UTAH ID 0 ID 2D 30 40
-39
-38
MILES
Figure 19
ISOPLUVIALS OF Z-YR 6-HR PRECIPITATION IN TENTHS OF AN INCH
-37
114 113 112 in 110 109
- X ) 7^
^ CI

-C) 7 ^
^ ? ^ ^t ; .

114 113 n2 111 110 109
NOAA ATLAS 2 , Volume VI Prepared by U.S. Department of Commerce National Oceanic end Atmospheric Admimstret ion National Weather Service, Off ice of H y d r o i o j r f r«pared for U.S. Dapartment of AericuJture, Soil Conservation Ssrvice, EnglneerinE Division

[Job No. No.
HDR Computation T T K R
\/wx) Land^-^ai ico..p.e. k.. ^ 1 6 ' ^ jject
Subject ^ I Checked Date
T.sv-Y" rY>0 o i C(y^CP/lA/rrflQrV,-&)r C P . I I ^ Isheet 1 5 lof Q_
5a/'face^ D^^cnp-Horo - Shor l ar^55 p^airio r\ ' 0.16 ' U300 ' -X =n^oi(nLT''^=_.Qai(r^j5^-^noO''^^
^hallooj concmho-'ltcL-?louj (t:>ud(xk-(loud)
^a^-(ac^ (:i^5cn/>^o/i.-^hor+ arass prairie
5, - 0.05 V- 3.1? " /s (-kotro ^Ef.S) u5\oa 5-0.05 -?or unfWed ^ ^ 0
Tr, V L - _ _ L a O — ^ - 0.OOP3
X . - L_ r- I O A ' ^—^ - O'OCni
V^-? ^/3^c (-Pvorn EEF. 5^ UiS\n(\ 15^ ^^5 ^or unpa'^ed ^Oi\j
3 ^ V 31^0(3,(^-^^5)
P

Job No. No.
HDR Computation T T T ?
•ieet R a a V \ P h ) L ( l m - ( ] ( ( |cofT,pu.,d loate 5 / C ^
I Subject I Checked |Date
Task Sheet
3 C0V 3^00CMn6%~)
l k io! a.
TcTarfxL ^.^\'S1^+ .0093-^ .O01~i -h.C( iq-= . 5bL:'Q hr/^Q nnir\ I ( hr .
T^- 33.qb min (-Tor runoH-^^om c^il g_
0 ' conce/A^ro^iorv ^o be usedl is ^ ^ J I mm. (-C€)r Q IN
B d ^ ^ on R.er. 3^-r>aurt b'. PreopHa+ioru d m f h ver-5U5 r^-hiira p^fod^-for ^^\\cA-(hxroMpY^ (5e^ p^a£ IM)
50--nin s h r m ^ ^ e . va\uecy^ .l'i mu^^b^, (xppliecL^fo
''M. io a 35-n^dy I-hour
6 ^D\orm \5 0 - ^ .
.'. (kfih ai 0 p6\tri -Par '^6-moj^ H -rriin sioi- rr?--
m ^ \ " - ,z^ I I

l f l 1 - t
l - »
ro
( N
• " o
o>
CO
• r ^
t o
l O
"9-
_
u
^
Ion
Dep
th
1 2
iclp
lli
0
I • 2l
-
-
-
-
-
-
-
-
-
-
-
_ r . •
-— --
-
5
f
10
1
1
25
I
v . ^ y -
i -50
-
-_
-
-
• -
-
-
-
-
-
. — .
— -
-
100
Return Period in Yean, Partial-Duration Series
Figure 6. Precipitation depth versus retum period jor partial-duration series.

T«ble 1.—Five, 10-. 15-pcrlods
and 30-aliiute ratios for 2- and lOO-year return
Keglon No.
1 2 3 4
5 6 7
8
Region
Coastal. Korthwest Interior Northwest Rocky Mountains-North Front Face and High
Plains-North Great Basin Rocky Mountains-South Front Face and High
Plains-South Southwest Deserts
2-Year 5
.30
.35
.38
.39
.34
.35
.33
.34
Retu 10
Ratios to m Pe 15
alnutea
.45
.53
.57
.58
.51
.54
.51
.51
.56
.64
.68
.69
.61
.65
.62
.62
rlod 30
.73
.81
.84
.85
.81
.83
.83
.82
1 Hour 100-Year Return P
5
.36
.37
.35
.37
.34
.32
.29
.30
10 15 minutes
.53
.56
.55
.56
.52
.50
.46
.46
.64
.67
.67
.69
.63
.62
.59
.59
erlod 30
.82
.85
.84
.87
.84
.81
.81
.80
The final consideration waa conparablllty to Inforiaatlon for locations adjacent to the study area. Taking such Information Into account accoi>-pLlshed two goals. First, It contributed to the degree of consistency and continuity between this study and other reports. Second, It provided additional Insight Into the variation of the ratios In this report, providing anchors, so to speak, at the study area boundaries. For areas east of the study region, ve compared our results to Frederick et al. (1977) and for California we related our results to Frederick and Killer (1979). Xn addition, we developed frequency estimates for several stations with ahort-duratloci data in surrounding states. Fourteen stations were analyzed .for this purpoae, 10 In the Plains States and 4 In California. Host of these stations were close enough to be directly comparable to adjacent stations within the study area, vrhlle a few were chosen at greater distances from the boundaries to provide some Idea of Che trend In ratios leading up to the study area.
It was concluded that the ratios In this report were consistent with previous studies. The final ratios are listed In Table 1. A comparison between these ratios and those from NOAA Atlas 2 and Heather Bureau (1953, 1954) is shown In Table 2.
6. APFLICAIIOH OF RATIOS
The ratios derived In Che above analyals are based on stations whose elevations tended to be In Che lower sections of each region. To .eic-trapolate these statistics to imich higher elevations would be a questionable undertaking, because of the complex effects of slope, funnellng, and rain shadows that often occur In these areas. As such, the ratios are noc applicable to all elevations within each region, but rather to a general range of elevations. The ranges of applicable elevation, approximately 3,000 to 3,500 ft in most areas, are summarized In table 3. In a few cases, areas are excluded that contain stations Included In the analysis. The regional ratios were reviewed In light of this fact, and It was determined that no adjustments were necessary.
Areas of non-appllcabillty, baaed on elevation and location considerations, are shown In figure 1 as shaded areas. These areas are based primarily on smoothed contour maps of Che western
%
Table 2.—Ratios compared to other reports
Dur. (mln)
5 10 15 30
*.
1
This ^ Report
.34
.52
.64
.82
Ratio to NOAA
Atlas 2
.29
.45
.57
.79
L Hour Weather Bur. (1953, 1954)
.32
.49
.59
.78
^
Averaged over all regions and for all retum periods
Note: Comparisons are for illustrative purposes only. Each report covers a different geographic area, and averaging Is done without regard to size of region or specific return periods Involved.
Table 3.—iippllcable eleraCiona within reglona
Region No.
1 2 3 4 5 6 7 8
0-2500 50-3000
2000-5000 2000-5000 3500-7000 4500-8000 4000-7500 3000-6500
Generally Applicable elevations (ft)
Columbia Basin to 2500-5500 SE N to 4000-7000 S N to 4000-7000 S
N to 3500-7000 S N to 3500-7000 S mountains to 100-3500 deserts
states. ' Due Co Che generalized naCure of Che concours, Chere are Isolaced secclons, primarily at tbe edge of shaded areas, where the ratios night be applicable. Conversely, there are isolaced peaks and high elevations which are noc shown OS part of any shaded areas, but which may, In fact, be non-applicable areas.
139

Job No. No.
HDR Computation T T T ?
j jec i
I Subject ^ [Cheeked
Task Sheet B \^-2l
Vho-i i^^ '^ o ^ erf C i \ X ojnd s. -Mn^_jVraA) l \ ^
be. fuur\-o-tt- ^^om C^ib i ^md ^ ^oJr -hcuod^ irv A A ^0u-Maexrx dieJtcWoA d^T^he A"i-fcK , buv4^a4
^Vou) hoL3 noi- beer\ corApafai. TV\^ -fiou:) compukcL W -Ui^ Uc)r4'hu)0xdLdir^.c?^(or^ \s a. C(5r\s<2x\/c4\\jt \iO\\JL-k)r VAQ. 4\OU^ VAei:(d(r\Q ^OUcVHuoLrd. 'lAC'e^ 4Y e. -souAVv por4ioA has les? corvVi buL-ViOQ arCoo U\G^ A^e r\or4V\ por-hbrVTKer-^ u))U b^ \ & ^ - -IOLO \r\ \><\t 't.ovxAh 9orV\ of\. ^o -H f d>Wa df^icvti^d w ^ fve Uou3 m ^ - ^ nor-m par-hbn io\\\ be CLCchpki\o\Q
A=^ar^^ ,. ,. r(, ^ ^ WocLraalic radras (.Tj n = H(&hniAa roaQiine53 coe-^ici6ri+

Job No. No.
HDR Computation
I Subject
KR 1 Computed loate ^ / O ^
Checked
Ta$k Sheet g?g)
Date
Of ^
DAo:\uaA^ \>\VcK. OLp(n:\Vu Ccon-Vinu<rO
^- ' 0.OO6 . ^ r T
^\^c-e Vi e ccLp(XcikA o- 4M.C djTcl^^ i^ ar^a^er ^hdn (he OLmoun-r of -f/oco 4^a f ooi 11 be , ruAnino o -( o-f odl JL curd ^^i' SLj 4 h a n -Vhis d^A-cK con-C i iArcd-ibiv
DroL naon DlVcK Co^ft<^(rfv^^.^
•^a&l- dJdSjjrx-k) SCdiC'

E-EF.q ?f^/3i
#
TABLE 5.6. V i i t i i s OF THE EOUGSNESS "CosmciEUT
Type of cViBT>Tiel and description
C. ErCAVATEB OB D R E B G E P
a. Earth, str&ight snd uniform 1. (31ea.li, recently completed 2. Qean, after weathering 3. Gravel, uniform section, clean i . With short grass, few weeds
6. Earth, winding and sluggish 1. No vegetation 2. Grass, some weeds 3. Dense weeds or aquatic plants in
deep channels 4. Earth bottom and rubble sides S. Stony bottom and weedy banks 6. Cobble bottom and clean sides
c. Dragline-excavated or dredged 1. No vegetation . 2. Light brush on banks
d. Rock wits 1. Smooth and tiniform 2. Jagged and irregular
«. P>ioy inr l« xint. rrioilTt.*;"**!, wo .^^c pn^l
brush uncut 1, Dense weeds, high M flow depth 2. Clean bottom, brush on sides 3. iSfl.me, highest stage of flow 4. Dense brush, high stage
l^inimum
0.016 0.018 0.022 0.022
0.023 0.025 0.030
0.028 0.025 0.030
0.025 0.035
0.025 0.035
0.050 0.040 0.045 0.080
n (cpnHnued)
Normal
0.018 0.022 0.025 0.027
0.025 0.030 0.035
0.030 0.035 0.040
• 0.028 0.050
0.035 0.040
_
o.oso 0.()S0 0.070 0.100
MaxiEQum
/ 0.02) 0.025 0.030 0.033
0.030 0.033 0.040
0.035 0.040 0.050
0.033 0.060
0.040 0.050
0.120 0.080 O.IIO 0.140
y

APPENDIX M
ATTACHMENT 2:
REQUIRED CAPACITY FOR SURFACE WATER DIVERSION DITCH

KRI Project: Bayview Landfill Conputed: FILR Date: 1/9/2009
O N E C O M P A N Y Subject: Run-olf calculations
Many Solutions *" Task: Deternine Row Rates using Rational Mathod
D A - 1 : Cell 2 - Diversion Ditch a r o u n d Stage 1 (Final Contours)
Rational Equatinn Parameters
Drainage Area (A) = 12.61 ac
Time of Concentratinn - l^-sfe) V = kS°
Eq. 7.11 from UDOT Manual: Roadway Drainage, Hydrology (See Attached)
Eq. 7.12 from UDOT Manual: Roadway Drainage, Hydrology (See Attached)
Segment 1:
Therefore,
Segment 2:
Therefore,
where: tc= Time of concentration (min) V= Velocity (ft/s)
L= Length of segment (ft) S= Slope (%)
k= Intercept coefficient from Table 7-10 from UDOT Manual: Roadway Drainage, Hydrology (See Attached)
L= 395 ft
S= 9.5%
k= 1.61
V= 5.0 ft/s
tc= 1.33 min
1^ 1770 ft
S= 3.3%
k= 1.61
V= 2.9 ft/s
tc= 10.09 min
(Assume shallow, concentrated flow)
(Assume shallow, concentrated flow)
Totaltc= 11.41 min
Rainfall intensity (i> for 25-vear storm
Fortc= 11.41 min
i25= 3.00 in/hr (From IDF curves from NOAA Atlas 14 (See attached))
Rainfall Runoff Cneffirient
C= 0.30 (C value for unimproved area from Table 7-24 from UDOT Manual of Instmction (See attached))
Frequency Factor fnr Rational Formula
C,= 1.1 (Frequency Factor for 25-year recurrence intemval, from Table 7-21 from UDOT Manual of Instruction)
Discharge Calculation
Q=C*Cf*l*A
I Q25= 12 cfTH

Projecf. Bayview LandiB RLR Date; 1/9/2009
K)R O N E C O M P A N Y Subject: IRun-off calculations
Many Solutions ^" Tasit: Deterrrine Ftow Rates using Ratpnal Lbthod
DA-2 : Cell 2 - Diversion Ditch a r o u n d Stage 2 (Final Contours)
Rational Eouation Parameters
Drainage Area (A) = 20.96 ac
Time of Concentration t. =l?^'=l;fe) V = k S " ^
Eq. 7.11 from UDOT Manual: Roadway Drainage, Hydrology (See Attached)
Eq. 7.12 from UDOT Manual: Roadway Drainage, Hydrology (See Attached)
where: tc= Timeof concentralion (min) V= Velocity (ft/s)
D= Length of segment (ft) S= Slope (%)
k= Intercept coefficient from Table 7-10 from UDOT Manual: Roadway Drainage, Hydrology (See Attached)
Segment 1:
Therefore,
Segment 2:
Therefore,
L= 400 ft
S= 9.5%
k= 1.61
V= 5.0 ft/s
tc= 1.34 min
L= 2275 fl
S= 2.3%
k= 1.61
V= 2.4 ft/s
tc= 15.53 min
(Assume shallow, concentrated flow)
(Assume shallow, concentrated flow)
Total tc= 16.87 min
Rainfall intensity fi) for 25-vear slorm
For tc= 16.87 min
!«= 2.50 in/hr
Rainfall Runoff Coefficient
C= 0.30
Frequency Factor for Rational Formula
Cf= 1.1
(From IDF curves from NOAA Atlas 14 (See attached))
(C value for unimproved area from Table 7-24 from UDOT Manual of Instruction (See attached))
(Frequency Factor for 25-year recurrence intemval, from Table 7-21 from UDOT Manual of Instruction (See attached))
Discharge Calculation
Q=C*C,*1*A
I Q25= 17 cfs

Par-bial duration based Point IDF Curves - Version: 4 40.036799 H 111.968129 14 4688 ft
c \ C
•F •rH
E 0; -P C
o •P
o i. 0.
10
3 £
1 0.7
0!3 0.2
.1 .07 .05
.03
.02
.01
.001 c
. 1 - 1
1 i n
£: • i H
1 G> •r-t
H - l - l
1 ITJ l - H
c • rH
1 CSJ CO
c • l - l
s 1
m vD
c • I H
1 CS ON
e 1
CU 1 - 1
i . X
1 CO
s. X
Tl-
i . i . X JC 1 1
so CO
Dur^
£. X
1 CU . . -1
S-JZ 1
00 ^ - 4
t i o n
i . X 1
Tf w
i . s: 1
CO
i . s: 1
00 •^
3 it
1 CO
m 3 <TJ (Tl
T J T J 1 1
• * ID
IP flj TJ
r
: j i it
•rs 1
o » H
3 i tt\
TJ 1
ITJ l - H
:T> ftl
T5 1
o cu
D'l
m TJ 1
(S CO
m flj
TJ
IO •*
ZJi flj
T5 1
<S5 SO
Mon Dec 03 11:39:13 £068
Average Recurrence Interval <years> i - y e .3 r £-year •j-year 10-year £5-year
-*-H--B--M-
100-year
500-year —f-1000-gear -B-

UDOT l\4anual of Instruction ~ Roadway Drainage (Customary Units), Hydrology 7-41
In Equation 7.9, i depends on tc and te is not initially known. Therefore, the computation of tc is an iterative process. An initial estimate of tc is assumed and used to obtain i from the intensity-duration-frequency curve for the locality. The tc is computed from Equation 7.9 and used to check the initial value of i. If they are not the same, then the process is repeated until two successive tc estimates are the same.
7.18.4.2 Velocity Method
The velocity method can be used to estimate travel times for sheet flow, shallow concentrated flow, pipe flow or channel flow. It is based on the concept that the travel time (TO for a flow segment is a function of the length of flow (L) and the velocity (V):
^ T. = — (7.10) ^ ' 60V
in which Ti, L and V have units of minutes, meters and meters/second, respectively. The travel time is computed for the principal flow path. Where the principal fiow path consists of segments that have different slopes or land covers, the principal flow path should be divided into segments and Equation 7.10 used for each flow segment. The time of concentration is then the sum of travel times:
-> tc=2T, :=Z ^ L,
: 1 i = 1 l60Vi,
in which k is the number of segments and the subscript i refers to the flow segment.
(7.11)
The velocity of Equation 7.10 is a function ofthe type of flow (overland, sheet, rill and gully flow, channel flow, pipe flow), the roughness of the flow path, and the slope of the flow path. Some methods also include a rainfall index such as the 2-yr, 24-hour rainfall depth. A number of methods have been developed for estimating the velocity.
After short distances, sheet flow tends to concentrate in rills and then gullies of increasing proportions. Such flow is usually referred to as shallow concentrated flow. The velocity of such flow can be estimated using an empirical relationship between the velocity and the slope:
V = k S " (7.12)
in which V is the velocity (ft/s) and S is the slope (%). The value of k is a function of the land cover, with values for selected land covers given in Table 7-10.
7.18.4.3 Open Channels
Open channels are assumed to begin where surveyed cross section information has been obtained, where channels are visible on aerial photographs or where blue lines (indicating streams) appear on USGS quadrangle sheets. Manning's equation or water surface profile information can be used to estimate average flow velocity. Average fiow velocity is usually determined for bankfull condition.

7-42 UDOT Manual of Instruction - Roadway Drainage (Customary Units), Hydrology
TABLE 7-10 Intercept Coefficients for Velocity vs. Slope Relationship of Equation 7.12
-">
K
0.25
0.5
0,7
0.9
1.0
1.5
1.61
2.0
Land Cover/Flow Regime
Forest with heavy ground litter; hay meadow (overland flow)
Trash fallow or minimum tillage cultivation; contour or strip cropped; woodland (overland flow)
Short grass pasture (overland flow)
Cultivated straight row (overland flow)
Nearly bare and unfilled (overland flow); alluvial fans In western mountain regions
Grassed waterway (shallow concentrated flow)
Unpaved (shallow concentrated flow)
Paved area (shallow concentrated flow); small upland gullies
Manning's equation is:
V =
where: V = average velocity, ft/s R = hydraulic radius, ft (equal to /WVP) A = cross sectional flow area, ft^ WP = wetted perimeter, ft S = slope ofthe hydraulic grade line, ft/ft n = Manning's roughness coefficient
After average velocity is computed using Equation 7.13, Tt for the channel segment can be estimated using Equation 7.10.
7.18.4.4 Reservoir or Lake
Sometimes, it is necessary to compute a Tc for a watershed having a relatively large body of water in the flow path. In such cases, Tc is computed to the upstream end of the lake or reservoir and, for the body of water, the travel time is computed using the Equation:
Vw = ( g D „ r (7.14)
where: Vw = the wave velocity across the water, ft/s g = 32.2 ft/s^ Dm = mean depth of lake or reservoir, ft
Generally, V^ will be high (8 to 30 ft/s).
One must not overlook the fact that Equation 7.14 only provides for estimating travel time across the lake and for the inflow hydrograph to the lake's outlet. It does not account for the
(7.13)

7-66 UDOT Manual of Instruction - Roadway Drainage (Customary Units), Hydrology
C = runoff coefficient representing a ratio of runoff to rainfall
I = average rainfall intensity for a duration equal to the time of concentration for a selected return period, in/h
A = drainage area tributary to the design location, ha
7.23.5 Infrequent Storm
The coefficients given in Tables 7-23 through 7-25 are applicable for storms of 5-yr to 10-yr frequencies. Less frequent, higher intensity storms will require modification of the coefficient because infiltration and other losses have a proportionally smaller effect on runoff Reference (19). The adjustment of the Rational method for use with major storms can be made by multiplying the right side of the Rational formula by a frequency factor Cf. The Rational formula now becomes:
Q = CCflA (7.16)
Cf values are listed in Table 7-21.
TABLE 7-21 — Frequency Factors for Rational Formula
Recurrence Interval • ears)
> 25 50 100
c, 1.1 1.2 1.25
The product of Cf times C shall not exceed 1.0.
TABLE 7-22 — Hydrologic Soils Groups For
Example for Orange County, North Carolina
Series Name AltaVista Appling
Cecil Chewada
Hydrologic Groups C B B C
Series Name Herndon Hiwassee
Iredell Lignum
Hydrologic Groups B B D C
TABLE 7-23 — Recommended Coefficient of Runoff for Pervious Surfaces (By Selected Hydrologic Soil Groupings and Slope Ranges)
Slope Flat
(0%-1%) Average
(2% - 6%) Steep
(Over 6%)
A
0.04 - 0.09
0.09-0.14
0.13-0.18
B
0.07-0.12
0.12-0.17
0.18-0.24
C
0.11-0.16
0.16-0.21
0.23-0.31
D
0.15-0.20
0.20-0.25
0.28-0.38
Source: (Example from Storm Drainage Design Manual, Erie and Niagara Counties Regional Planning Board)

UDOT Manual of Instruction - Road'way Drainage (Customary Units), Hydrology 7-67
TABLE 7-24 — Recommended Coefficient of Runoff Values (For Various Selected Land Uses)
Description of Area Business: Downtown areas Neighborhood areas Residential: Single-family areas
Multi units, detached Multi units, attached Suburban
Residential (0.5 ha lots or more) Apartment dwelling areas industrial: Light areas
Heavy areas Parks, cemeteries Playgrounds Railroad yard areas Unimproved areas
Runoff Coefficients 0.70-0.95 0.50-0.70 0.30-0.50 0.40-0.60 0.60-0,75 0.25-0,40 0.30-0.45 0.50-0.70 0.50-0.80 0.60-0.90 0.10-0.25 0.20 - 0.40 0.20-0.40 0.10-0.30
Source: Reference (3).
TABLE 7-25 — Coefficients for Composite Runoff Analysis
Surface Streets: Asphalt
Concrete Drives and walks Roofs
Runoff Coefficients 0.70-0.95 0.80-0.95 0.75-0.85 0.75-0.95
Source: Reference (3).
7.23.6 Procedures
The results of using the Rational formula to estimate peak discharges are very sensitive to the parameters used, especially time of concentration and runoff coefficient. The designer must use good engineering judgment in estimating values that are used in the method. Following is a discussion ofthe different variables used in the Rational method.
7.23.6.1 Time of Concentration
The time of concentration is the time required for w ater to flow from the hydraulically most remote point of the drainage area to the point under investigation. Use of the Rational formula requires the time of concentration (tc) for each design point within the drainage basin. The duration of rainfall is then set equal to the time of concentration and is used to estimate the design average rainfall intensity (I). For a specific drainage basin, the time of concentration consists of an inlet time plus the time of flow in a closed conduit or open channel to the design point. Inlet time is the time required for runoff to flow over the surface to the nearest inlet and is primarily a function of the length of overland flow, the slope of the drainage basin and surface cover. Pipe or open channel flow time can be estimated from the hydraulic properties of the conduit or channel.
To obtain the total time of concentration, the pipe or open channel flow time must be calculated and added to the inlet time. After first determining the average flow velocity in the pipe or channel, the travel time is obtained by dividing velocity into the pipe or channel length.

W o r k s h e e t f o r D ivers ion D i t c i i a r o u n d Cel l 2
Project Description
Friction Method
Solve For
InpMt^Pata; •;;.;;:VV:;
Roughness Coefficient
Channel Slope
Normal Depth
Left Side Slope
Right Side Slope
;Results^ :c:;";it/; ^
Discharge
Flow Area
Wetted Perimeter
Top Width
Critical Depth
Critical Slope
Velocity
Velocity Head
Specific Energy
Froude Number
Flow Type
GVF Input Data,,
Downstream Depth
Length
Number Of Steps
•i3A/F;0ijfpiS;Data^
Upstream Depth
Profile Description
Profile Headless
Downstream Velocity
Upstream Velocity
Normal Depth
Critical Depth
Channel Slope
Critical Slope
Manning Formula
Discharge
: V . . • . . . • : . : • . . : : . . . . . . . . . . ,
Subcritical
0.027
0.00500
1.00
50.00
4.00
66.08
27.00
54.13
54.00
0.82
0.01434
2.45
0.09
1.09
0.61
ft/ft
ft
ft/ft H:V)
ft/ft H:V)
cfs
ft'
ft
ft
ft
ft/ft
ft/s
ft
ft
0.00 ft
0.00 ft
0
0.00 ft
0.00 ft
Infinity ft/s
Infinity ft/s
1.00 ft
0.82 ft
0.00500 ft/ft
0.01434 ft/ft
ira/2009 1:11:43 PM Bentley Systems, Inc. Haestad Methods Solution Center Bentley FlowMaster [08.01.068.00]
27 Siemens Company Drive Suito 200 W Walertown.CT 06795 USA +1-203-755-1666 Page l o f 1

Cross Sect ion for Diversion Ditch around Cell 2
Project Description : :
Friction Method
Solve For
I n p u t D a t a ;/•:•;•:;•; ^•••:v:..S\^
Roughness Coefficient
Channel Slope
Normal Depth
Left Side Slope
Right Side Slope
Discharge
Crcws - ebtlon ::lmage;::
Manning Formula
Discharge
0.027
0.00500 ft/ft
1.00 ft
50.00 ft/ft (H:V)
4.00 ft/ft (H:V)
66.08 cfs
V:10 1 \ , H:1
1/9/2009 1:13:40 PM Bentley Systems, Inc. Haestad Methods Solution Center Bentley FlowMaster [08.01.068.00]
27 Siemens Company Drive Suite 200 W Watertown,CT 06795 USA+1-203-755-1666 Page 1 of 1

UDOT Manual of Instruction - Roadway Drainage (Customary Units), Channels 8-13
TABLE 8-2 — Values of Manning's Roughness Coefficient n (Uniform Flow)
Type of Channel and Description EXCAVATED OR DREDGED 1. Earth, straight and uniforrp
a. Clean, recently completed b. Clean, after weathering c. Gravel, uniform section, clean
—^ d. With short grass, few weeds 2. Earth, winding and sluggish
a. No vegetation b. Grass, some weeds c. Dense weeds or aquatic plans in deep channels d. Earth bottom and rubble sides e. Stony bottom and weedy sides f. Cobble bottom and clean sides
3. Dragline-excavated or dredged a. No vegetation b. Light brush on banks
4. Rock cuts a. Smooth and uniform b. Jagged and irregular
5. Channels not maintained, weeds and brush uncut a. Dense weeds, high as flow depth b. Clean bottom, brush on sides c. Same, highest stage of flow d. Dense brush, high stage
NATURAL STREAMS 1. Minor streams (top width at flood stage < 30 m)
a. Streams on Plain 1) Clean, straight, full stage, no rifts or deep pools 2) Same as above, but more stones/weeds 3) Clean, winding, some pools/shoals 4) Same as above, but some weeds/stones 5) Same as above, lower stages, more ineffective
slopes and sections 6) Same as 4, but more stones 7) Sluggish reaches, weedy, deep pools 8) Very weedy reaches, deep pools, or floodways with
heavy stand of timber and underbrush b. Mountain streams, no vegetation in channel, banks
usually steep, trees and brush along banks submerged at high stages 1) Bottom: gravels, cobbles and few boulders 2) Bottom: cobbles with large boulders
Minimum
0.016 0.018 0.022 0.022
0.023 0.025 0.030 0.025 0.025 0.030
0.025 0.035
0.025 0.035
0.050 0.040 0.045 0.080
0.025 0.030 0.033 0.035 0.040
0.045 0.050 0.075
0.030 0.040
Normal
0.018 0.022 0.025
f 0.027J
0.025 0.030 0.035 0.030 0.035 0.040
0.028 0.050
0.035 0.040
0.080 0.050 0.070 0.100
0.030 0.035 0.040 0.045 0.048
0.050 0.070 0.100
0.040 0.050
Maximum
0.020 0.025 0.030 0.033
0,030 0.033 0.040 0.035 0.045 0.050
0.033 0.060
0.040 0.050
0.120 0.080 0.110 0.140
0.033 0.040 0.045 0.050 0.055
0.060 0.080 0.150
0.050 0.070

LEGEND
— DRAINAGE AREA BOUNDARY
— FLOW PATH
SOUTH UTAH VALLEY SOLID WASTE DISTRICT
CELL 2 FINAL CONTOURS DRAINAGE MAP
N
m 0 200 400
SCALE IN FEET
DATE
1
FKHIRE
- 9 - 0 9
M-1

Appendix N

APPENDIX N
Closure Cap Equivalency
SUVSWD Bayview Class I Landfill Pernnit Application

1 K l K L E I N F E L D E R
METEORIC WATER INFILTRATION STUDY SOUTH UTAH VALLEY LANDFILL
(BAYVIEW LANDFILL) UTAH COUNTY, UTAH
For:
HDR Engineering, Inc.
September 9, 2003
This document was prepared far use only by th« client, only for tht purposes stated, and within « reasonable time from issuance. Noncommercial, educational and scientific use of this report by regulatory' agencies is regarded as .1 "fair use" and not a violation of copyright. Regulatory agencies may make additional copies of this document for internal use. Copies may also be made available to the public as required by law. The reprint must acknowledge the copyright and Indicate that permission to reprint has been received.
HDR/26515.001,'SLC3R082 Page i of iii September 9, 2003 Copyright 2003 Kleinfelder, Inc.

I J f ) KLEINFELDER
A Report Prepared For:
JVIr. Dick Sprague HDR Engineering, Inc. 303 East ] 7'*' Avenue, Suite 300 Denver, CO 80203-1256
METEORIC WATER INFILTRATION STUDY SOUTH UTAH VALLEY LANDFILL (BAYVIEW LANDFILL) UTAH COUNTY, UTAH
File No.; 26515.00]
Prepared By:
(g.0^ ^ Brian]. Peck,R.G. Hydrogeologist
lee Zollinger, P.G Senior Geologist
KLELNFELDER, INC. 849 West LeVoy Drive, Suite 200 Taylorsville, UT 84123 (801)261-3336
September 9, 2003
H D R ; 2 6 5 I 5 . 0 0 1 / S L C 3 R 0 8 2 Page ii of iii Scpiember 9, 2003 Copyright 2003 Kleinfelder, Inc.

1
o
1 ^ K L E I N F E L D E R
TABLE OF CONTENTS
SECTION PAGE
1. LNTRODUCTION 1
2. MODEL CODE SELECTION 2
3. CLIMATIC CONDITIONS ...1 4
4. SOIL HYDRAULIC PROPERTIES 5 4.1 Properties ofthe In-Place Cap 5
4.2 Properties ofthe Prescriptive Cap 6
5. HYDRUS-2D MODEL DESIGN 7
6. HYDRUS-2D INFILTRATION SIMULATIONS 9 6.1 Average Climatic Conditions 9
6.2 Wettest (Worst-Case) Climatic Conditions 10
7. CONCLUSIONS II
8. LIMITATIONS ...12
9. REFERENCES 13
TABLES
1 Average Precipitation and Five Wettest Years on Record, Elberta, Utah 2 Unsaturated Hydraulic Parameters for Bayview Landflll Samples 3 General Unsaturated Hydraulic Parameters from Literature 4 Summary of Hydraulic Properties used for Prescriptive Cap Simulations 5 Summary of Model ResuUs
FIGURES
1 Site Vicinity Map 2 Soil Sample Location Map
APPENDICES
A Laboratory Report B Site Specific Frost Depth Calculations C Source Material Investigation Letter and Grain Size Distribution Figure D Application for Authorization to Use
HDRy26515.001/SLC3R082 Page iii of iii September 9, 2003 Copyright 2003 Kleinfelder, Inc.

1 ^ K L E I N F E L D E R
1. INTRODUCTION
Bayview Landfill, also called the South Utah Valley Landfill, is located approximately 5 miles
north of Elberta, Utah, along State Road 68 (Figure 1). This landfill is a Class 1 municipal solid
waste landfill and began accepting solid waste in 1990. Cell 1 is scheduled for closure during the
next year, and the South Utah Valley Solid Waste District wishes to consider modifying their
permit to include closure with an evaporative cap. Recent studies have shown that appropriate
evajX)rative caps out-perform standard clay caps in arid environments because they are less prone
to desiccation, cracking, and frost damage when compared to traditional thin clay caps. South
Utah Valley Solid Waste District would like to take advantage of long-term benefits offered by this
type of altemative cap.
The following report describes our assessment of expected long-term meteoric water infiltration or
seepage rates through an evaporative cap at Bayview Landfill constructed fi^om on-site soils.
Infiltration is defined as precipitation minus surface run-off, evaporation and plant transpiration.
The net infiltration rate multiplied by the clay cap area is the net seepage volume that may
contribute to foimation of leachate. Expected infiltration rates were established by using the
HYDRUS-2D saturated'unsaturated flow model (Version 2.0; Simunek and van Genuchten,
1999). Infiltration rates \vere determined for the standard regulatory prescribed cap and for the
proposed site-specific cap materials. The prescriptive cap simulation was constructed using clay
and silty clay materials, expected to have the lowest permeabilities. Infiltration processes are
rarely saturated, however. Unsaturated soil hydraulic properties are highly non-Jinear functions of
the pressure head (pressure head is also termed 'matric potential' and 'capillary sucfion'). Soil
moisture or saturation and hydraulic conductivity are both a function of pressure head. These three
variables interact fo control the movement of soil moisture in the vadose or unsaturated zone. To
simulate the behavior of a hypothetical prescripfive cap under the climatic conditions at the
Bayview Landfill, a bracketing range of unsaturated soil parameters were selected. The resulfing
prescriptive cap infiltration rates are then compared to the infiltration rates modeled for the actual
on-site materials.
HDR/26515.001/SLC3R082 Page lof 14 September 9,2003 Copyright 2003 Kleinfelder, Inc.
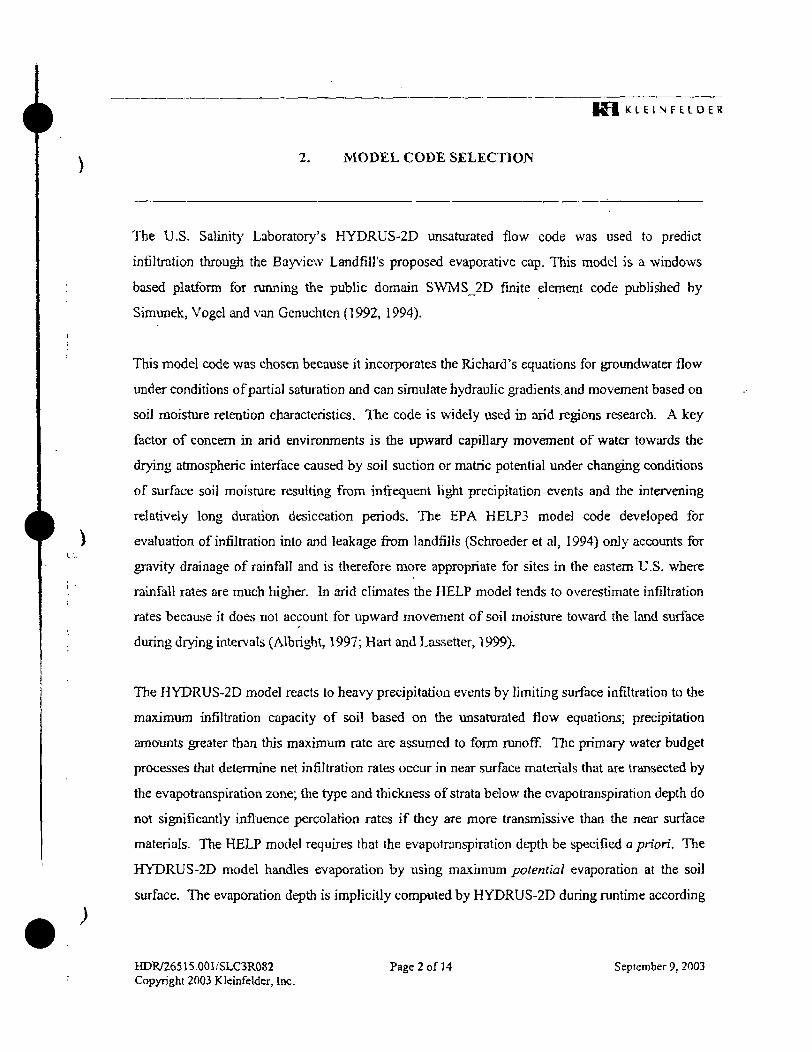
i K H K L E I N F E L D E R
2. MODEL CODE SELECTION
The U.S. Salinity Laboratory's HYDRUS-2D unsaturated flow code was used to predict
infiltration through the Bayview Landfill's proposed evaporative cap. This model is a windows
based platform for running the public domain SWTVlS_2D finite element code published by
Simunek, Vogel and van Genuchten (1992, 1994).
This model code was chosen because it incorporates the Richard's equations for groundwater flow
under conditions of partial saturation and can simulate hydraulic gradients.and movement based on
soil moisture retention characteristics. The code is widely used in arid regions research. A key
factor of concem in arid environments is the upward capillary movement of water towards the
drying atmospheric interface caused by soil suction or matric potential under changing conditions
of surface soil moisture resulting from infrequent light precipitation events and the intervening
relatively long duration desiccation periods. The EPA HELP3 model code developed for
evaluation of infiltration into and leakage from landfills (Schroeder et al, 1994) only accounts for
gravity drainage of rainfall and is therefore more appropriate for sites in the eastem U.S. where
rainfall rates are much higher. In arid climates the HELP model tends to overestimate infiltration
rates because it does not account for upward movement of soil moisture toward the land surface
during drying inter\^als (Albright, 1997; Hart and Lassetter, 1999).
The H YDRUS-2D model reacts to heavy precipitation events by limiting surface infiltration to the
maximum infiltration capacity of soil based on the unsaturated flow equations; precipitation
amounts greater than this maximum rate are assumed to form runoff. The primary water budget
processes that determine net infiltration rates occur in near surface materials that are transected by
the evapotranspiration zone; the type and thickness of strata below the evapotranspiration depth do
not significantly influence percolation rates if they are more transmissive than the near surface
materials. The HELP model requires that the evapotranspiration depth be specified a priori. The.
HYDRUS-2D model handles evaporation by using maximum potential evaporation at the soil
surface. The evaporation depth is implicitly computed by HyDRUS-2D during runtime according
IrLDR/26515.001/SLC3R082 Page 2 of 14 September 9, 2003 Copyright 2003 Kleinfelder, Inz.

1 ^ K L E I N F E L D E R
to the unsaturated flow equation. The user specifies the potential maximum evaporation rate and
the simulation code computes movement of water based on saturated and'or unsaturated hydraulic
gradients that depend on antecedent moisture conditions.
HDR/265I5.001/SLC3R082 Page 3 of 14 September 9, 2003 Copyright 2003 Kleinfelder, Inc.
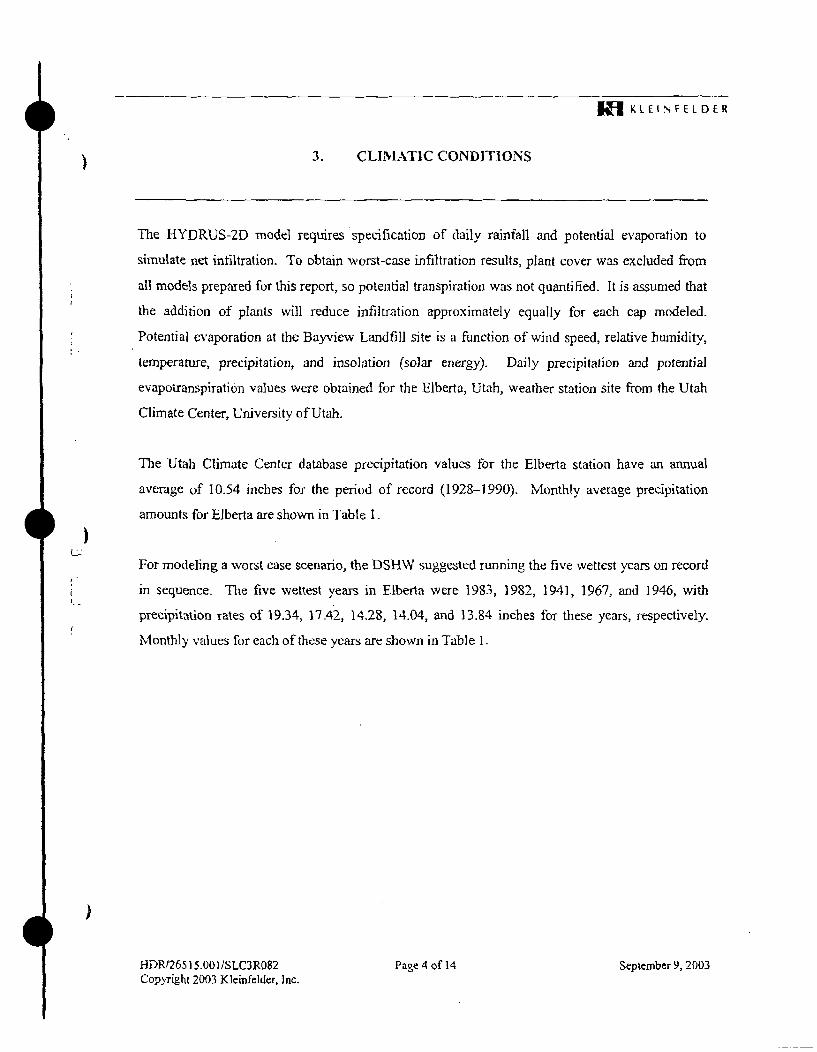
i U P I KLEINFELDER
CLIM.VTIC CONDITIONS
The HYDRUS-2D model requires specification of daily rainfall and potential evaporation to
simulate net infiltration. To obtain worst-case infiltration resuUs, plant cover was excluded from
all models prepared for this report, so potential transpiration was not quantified. It is assumed that
the addition of plants will reduce infiltration approximately equally for each cap modeled.
Potential evaporation at the Bayview Landfill site is a function of wind speed, relative humidity,
temperature, precipitation, and insolation (solar energy). Daily precipitation and potential
evapotranspiration values were obtained for the Elberta, Utah, weather station site from the Utah
Cfimate Center, University of Utah.
1^ L_-
The Utah Climate Center database precipitation values for the Elberta station have an annual
average of 10.54 inches for the period of record (1928-1990), Monthly average precipitation
amounts for Elberta are shown in Table 1.
For modeling a worst case scenario, the DSHW suggested running the five wettest years on record
in sequence. Tlie five wettest years in Elberta were 1983, 1982, 1941, 1967, and 1946, with
precipitettion rales of 19.34, 17.42, 14.28, 14.04, and 13.84 inches for these years, respectively.
Monthly values for each of these years are shown in Table 1.
HDR/26515.001/SLC3R082 Copyrighl 2003 Kleinfelder, Inc.
Page 4 of 14 September 9, 2003

I f l KLEINFELDER
SOIL HYDRAULIC PROPERTIES
Partial saturation or unsaturated flow hydraulic properties include the effective porosity, the
saturated and residual water capacity, the saturated hydraulic conductivity, and the matric potential
versus water content curve that is summarized by the van Genuchten soil moisture retention
parameters. Effective porosity is the maximum amount of water that fully saturated soil can store.
Matric potential is the physical property of a porous medium to attract water as a result of capillary
and adsorption processes. The residual capacity of a soil is the virtually irreduci'ble amount of
water in soil tliat has been exposed to desiccating conditions for a long period of time; it is defined
as having a matric potential of-15 bar, which is a pressure of about -153 meters of water. The
negative pressure is a convention for describing conditions of partial saturation; the pressure is
equal to the absolute hydraulic pressure required to drive the water firom a sample. The van
Genuchten parameters describe the shape ofthe soil matric potential (capillary suction) curve as a
function of volumetric soil moisture. From this is derived (he hydraulic conductivity versus soil
moisture curve using the equations of Mualem (1976).
4.1 PROPERTIES OF THE IN-PLACE CAP
Unsaturated hydraulic analyses were conducted on samples of potential cap materials collected
fi"om the Bayview Landfill site. Four soil samples were collected from representative locations on
February 18, 2003. These samples were selected based on the range of observed soil types at the
Landfill. The soil satnple locations are shown ou Figure 2, The samples are described as follows:
Sample ID BVLF-l
BVLF-2
BVLF-3
BVLF-4
Loca t ion :
Soil berm
Soil stockpile
Soil stockpile
In-situ bonom of cell 2
•JT, Soil Descr ip t ion . . ,
Red-yellow sandy silt (SM)
Olive-brown silty sand (SM)
Olive-brown silty sand (SM)
Red-brown silty sand (SP-SM) referred to as "mud stone" or "hardpan"
• - Genei'ial GdiripactioD ' Uncompacted
Somewhat compacted by equipment during placement
Somewhat compacted by equipment during placement
In-situ compaction
HDR'26515.00]/SLC3R082 Copyright 2003 Kleinfelder, Inc.
Page 5 of 14 September 9, 2003

i
4
l f l KLEINFELDER
The saturated hydraulic conductivity for the four samples ranges from 1.3 x 10"' to 3.8 x 10"*
cm'sec, with the hydrauhc conductivity of the olive-brown silty sand (BVL F-2 and -3) ranging
fi-om 1.3 X 10' to 3.8 X 10" . Other parameters are summarized in Table 2. The laboratory report is
included in Appendix A.
4.2 PROPERTIES OF THE PRESCRIPTIVE CAP
Unsaturated flow parameters • were estimated for the regulatory prescriptive cap assuming the
prescriptive cap would be a clay material (see Table 3). Uncertainty regarding exactiy which soil
texture best approximates the low-permeability portion of the prescriptive cap material led to an
approach involving three soil types which bracket the low-permeability portion of the most
probable analogue. Three soil types were chosen that exhibited the lowest saturated hydraulic
conductivities; these are silty clay, silty clay loam and sandy clay. The hydraulic parameters for
these soils range fi-om 5.6x10"^ to 3,3x10' . The low-permeability layer was then covered with a
28-inch sandy loam topsoil to protect the low permeability layer from fi-ost damage. Site specific
fi-ost depth infotmation is presented in Appendi.x B. Soil textures used for modeling are shown in
Table 4.
The Solid Waste Rules also specify that the permeability ofthe prescriptive caps be lower than the
permeability ofthe bottom liner. The bottom liner for Cell 1 consists of an HDPE synthetic liner
placed on underlying native soil (a sandy silt lo silty sand). The effective permeability ofthis liner
system was calculated using equations developed by J J . Giroud and R. Bonaparte, 1989- To be
conservative, we assumed tliat the soil under the HDPE liner is a coarse sand, the liner makes good
contact with the underiying soil, and that the installation quality was good to excellent (one small,
circular hole per acre). We also assumed that up to 1 foot of leachate could be standing on the
liner, creating a vertical head. These assumptions were input into Giroud and Bonaparte's
equations, and the resulting predicted liner leakage rate is 470 gal/acre/day, or approximately 16
cm/year.
HDRy26515.001/SLC3R082 Page 6 of 14 September 9, 2003 Cop>Tight 2003 Kleinfelder, Inc.

,)
I f l KLEINFELDER
HYDRUS-2D MODEL DESIGN
The HYDRUS-2D finite element model was discretized in the manner of a soil column test, with
one-dimensional flow from the atmospheric boundary- condition at the top ofthe column to a fi-ee-
drainage boundary at the bottom of the column. The height ofthe column was specified to be 215
cm using 50 rows and variable cell sizes from 0.5 to 5 cm. Row height was specified to be 0.5 cm
at land surface, at the seepage face, and at each side of a soil texture interface. The uppermost
boundary was specified to be an atmospheric boundary with daily time-variable records for rainfall
and evaporation potential. Water leaves the model system by gravity drainage fi-om the fi-ee
drainage boundary when it is fully saturated. The amount of water draining from the drainage
boundary was used to quantify the net amount of water infiltrating into die landfill waste.
The model for the prescriptive cap was designed to include a 71 cm (28 inch) thick topsoil layer at
the surface, underlain by 45 cm (18 inches) of clay cap material, with the base of the model domain
) consisting of 94 cm (37.5 inches) of sand to simulate the landfill waste material. A summary ofthe
materials used in the prescriptive cap simulations is shown in Table 5.
The model for the actual cap was designed to include a 5 cm (2 inch) tliick topsoil layer consistent
with normal surface disturbance, underlain by 81 cm (32 inches) of cap material, with the base of
the model consisting of 130 cm (51 inches) of the sand/waste layer. The thickness of the
evaporative cap was selected after running several models of various thicknesses to better
understand the balance between promoting maximum evaporation (by using of a thinner cap to
maintain moisture close to the evaporative surface) and providing sufficient storage for
precipitation (by using of a thicker cap that doesn't become saturated and allow breakthrough.)
The initial soil moisture pressure, an important variable influencing short term seepage rates, was
specified to be in equilibrium throughout the soil column with a -50 cm matric potential specified
at the base of the model domain for all model runs. This pressure is slightly dryer than the
subsequent dynamic equilibrium moisture at the base ofthe model. Net infiltration of rainfall at
the land surface during the five wettest year sequence is more accurately quantified by having the
HDR/26515.001/SLC3R082 Page 7 of 14 September 9, 2003 Copyright 2003 Kleinfelder, Inc.

I f l KLEINFELDER
water content at near-equilibrium levels at the base of the soil column. Model predictions of
infilti-ation rates are sensitive to the initial soil moisture values, but the long-term dynamic
equilibrium infiltration rates are not affected by antecedent soil moisture.
Transpiration was not included in the model due to the relatively small percentage that it
constitutes relative to evaporation potential and the fact that parameters for soil moisture uptake
rates for desert shrabs and grasses are poorly documented. One study reports plant transpiration as
contributing three percent ofthe total evapotranspiration potential in Jean, Nevada, and 32 percent
for good grass cover on a landfill in Elko, Nevada (Albright, 1997). Excluding plant transpiration
is a conservative choice that tends to increase the predicted net infiltration rates. Similar plant
growth is e.\pected on both prescriptive and proposed evaporative caps, so making a comparison
between performance of these caps should not be significantly affected by the presence or absence
of vegetation.
HDRy26515.001/SLC3R082 Page 8 of 14 September 9,2003 Copyright 2003 Kleinfelder, Inc.

I f l KLEINFELDER
HYDRUS-2D INFILTRATION SIMULATIONS
Three prescriptive cap design scenarios were evaluated based upon different soil textures for the
18-inch thick clay cap material. Four actual cap scenarios were evaluated based on measured soil
properties. The models were run both for average climatic conditions, and for the five wettest
years in sequence (beginning at equilibrium with the average years). Infiltration rates were
calculated for both average conditions and each ofthe five wettest years.
6.1 AVERAGE CLIMATIC CONDITIONS
Under average (normal) climatic conditions observed in nearby Elberta, Utah, the prescriptive
caps allow an average of 4.14 to 4.65 cm of infiltration to occur each year. Under the same
climatic conditions, evaporative caps constructed of the four potential soils assessed for use at
Bayview Landfill allow 2.63 to 6.55 cm of infiltration to occur each year. The olive-brown silty
sand material that has been stockpiled at the site (samples BVLFl and BVLF2) is expected to
allow infiltration rates of 2.63 to 4.12 cm/year. These results are shown on Table 5. A graph
depicting these results is shown below.
infiltration for Average Rainfall
.«>^ .ri>^ . . ! . « •
^.-^ ^.- '
. \ . 1 . . 'b ^6.
< ^ ^ t , ^ ^ < ^ ^ ^ ^ "
Type of Cap
HDR/26515.001/SLC3R082 Copyright 2003 Kleinfelder, Inc.
Page 9 of 14 September 9,2003

I f l KLEINFELDER
6.2 WETTEST (WORST-CASE) CLIMATIC CONDITIONS
Under an assumed worst-case climatic condition where the five wettest years on record at
Elberta, Utah were to occur sequentially, the three modeled prescriptive caps would allow
infiltration at rales ranging from 6.49 to 18.12 cm/year. Under the same climatic conditions,
evaporative caps constructed of the four potential soils assessed for use at Bayview Landfill
allow 3.63 to 20 cm of infiltration per year. The olive-brown silty sand material that has been
stockpiled at the site is associated with infiltration rates of 3.63 to 12.17 cm/year. These results
are shown on Table 5. A graph depicting these results is shown below.
Infiltration for Wettest Years
Prescrip 1
Prescrip 2
Prescrip 3
BVLF1
BVLF2
BVLF3
BVLF4
^'^ ^ - .vO"' o.e. ,4 ^ ^ ^ ^ ^ # ^^^ ^^^ v ^ ^ > ^ * ^ " ^ > ^ * ^ ^ ' ^
^C^^ r ^ ^ ^ < ^
Type of Year
HDR/'26515,001/SLC3R082 Copyright 2003 Kleinfelder, Inc.
Page 10 of 14 September 9, 2003

I f l KLEINFELDER
CONCLUSIONS
Based on unsaturated flow modeling, it appears that a 34-inch evaporative cap, constructed from
the olive-brown silty sand material available at Bayview Landfill, will perform as well or better
than the hypothetical prescriptive cap under the arid conditions that exist in the area. The
proposed evaporative cap performed as well as the prescriptive cap during both the worst case
"wet" years, and during normal (dry) years. Both the prescriptive cap and the proposed
evaporative cap have much lower predicted infiltration rates (less than 7 cm/year) than the
leakage rate ofthe bottom liner (16 cm/year). Therefore, both caps satisfy the requirement ofthe
Solid Waste Rules that the cap be no more permeable than the liner.
To provide a more detailed description ofthe proposed capping material and provide quantitative
criteria for identifying these materials in the field, Kleinfelder perfonned a source material
investigation in May 2003 (Kleinfelder 2003). A summary of criteria that may be used to
identify suitable material (materials that are represented by BVLF-2 and BVF-3) is included in
Appendix C.
HDR/26515.001/SLC3R082 Page 11 of 14 Scpiember 9,2003 Copyright 2003 Kleinfelder, Inc.

i I f l KLEINFELDER
8. LIMITATIONS
The unsaturated groundwater model described in this report was used to predict infiltration rates
based upon estimates of the regulatory prescriptive cap unsaturated hydraulic parameters and
laboratory analyses of the on-site materials. The accuracy of infiltration rate estimates resulting
from numerical models is entirely dependant upon the validity of the hydraulic parameters used
to construct the model. The simulated infiltration rates are sensitive to the unsaturated flow
parameters. These and other subsurface hydraulic parameters generally exhibit spatial
heterogeneity. Therefore, simulated infiltration rates are considered to be best estimates and not
precise predictions of actual field infiltration rates. No on-site hydraulic testing was performed
for this project by Kleinfelder, Jnc. Field tests are available which would reduce the level of
uncertainty associated with estimating subsurface hydraulic properties.
This study was performed and findings obtained in substantial conformance with the engineering
practice that exists within the area at the time of our investigation and includes professional
opinions and judgements. We base this report on information derived fi:om data in available
literature and our knowledge of and experience in the local area. This report does not provide a
warranty as to variable subsurface conditions which may exist and applies only to the specific
area that was investigated. In addition, one should recognize that definition and evaluation of
subsurface geologic and hydrogeologic conditions is a difficult and inexact art. Geologists and
hydrogeologists must occasionally make general judgements leading to conclusions with
incomplete knowledge of the geologic history, subsurface conditions and hydraulic
characteristics present. No warranty, express or implied, is made.
HDR/26515.001/SLC3R082 Page 12 of 14 September 9,2003 Copyright 2003 Kleinfelder, Inc.

I f l KLEINFELDER
9. REFERENCES
Albright, William, 1997, Application of the HYDRUS-2D Model to Landfill Cover Design in the State of Nevada, Water Resources Center, Desert Research Institute, Publication No. 41153, prepared for Nevada Department of Conservation and Natural Resources, Division of Environmental Protection, Solid Waste Branch, Bureau of Waste Management, January, 1997,18 p.
Carsel, R.F., and Parrish, R.S., 198S, Developing Joint Probability Distributions of Soil-Water Retention Characteristics, Water Resources Research, 24 (5), pp. 755-769.
Daniel B. Stephens & Associates. Inc., 2003, laboratory analysis sheets for Bayview Landfill soil samples including: Predicted Water Retention Curves (Pressure Head vs. Moisture Content), Relative Hydraulic Conductivity vs. Moisture Content, Relative Hydraulic Conductivity vs. Pressure Head, Moisture Retention Data (Hanging Column/Pressure Plate/Thennocouple'Relative Humidity Box), Particle Size Characteristics, Particle Size Analyses (Dry Sieve, Wet Sieve and Hydrometer), Satijrated Hydraulic Conductivity Tests, Atterburg Tests, Initial Moistiare Content, Dry Bulk Density, Wet Bulk Density, Calculated Porosity, and Percent Saturation.
EPA, ]990, A Subtitle D Landfill Application Manual for the Multimedia Exposure Assessment Model (MultiMed), by Susan Sharp-Hansen, Constance Travers, Paul Hummel, AQUA TERRA Consultants, Mountain View, Califomia, and Terry Allison, Computer Sciences Corporation, Athens Georgia, August, 1990; EPA Contract 68-03-3513, Project Monitor Gerard Laniak.
Giroud, J.P. and R. Bonaparte, 1989. "Leakage Through Liners Constructed with Geomembranes, Part I," Geomembrane Liners, Geotextiles and Geomembranes, 8,1:27-67.
Hart, B., and Lassetter, W., 1999, Numerical Modeling of Heap Leach, Tailings and Waste Rock Facility Cover Alternatives, In Closure. Remediation & Management of Precious Metals Heap Leach Facilities, edited by D. Kosich and G, Miller, Center for Environmental Sciences and Engineering, University of Nevada, Reno.
Kleinfelder, 2003. Source Material Investigation, Soutii Utah Valley Landfill (Bayview Landfill), July 10,2003, File No, 30268,001.
Mualem, Y., 1976, A new model for predicting the hydraulic conductivity of unsaturated porous media. Water Resources Research, 12(3), 513-522.
Schroeder, P.R., Dozier, T.S.. Zappi, PA., McEnroe, B.M., Sjostrom, J.W., and Peyton, R.L., 1994, The Hydrologic Evaluation of Landfill Performance (HELP) Model, Environmental Laboratory, U.S. Army Corps of Engineers, Waterways Experiment Station, Vicksburg, MS 39180-6199, with the Risk Reduction Engineering Laboratory,
HDR;26515.00I/SLC3R082 Page 13 of 14 September 9, 2003 Copyright 2003 Kleinfelder, Inc.

I f l KLEINFELDER
Office of Research and Development, U.S. Environmental Protection Agency, Cincirmati, Ohio, EPA/'600/R-94/168b
Simunek, J.T. Vogel, T. and van Genuchten, M.T., 1992, The SWMS2D code for simulating •water flow and solute transport in V,vo-dimensional variably saturated media. Version l .J; Research Report No, 126, U,S. Salinity Laboratory, U.S, Department of Agriculture, Agriculture Research Station, Riverside, Califomia.
Simunek. J.T. Vogel, T. and van Genuchten, M.T, 1994, The SWMS_2D code for simulating water flow and solute transport in two-dimensional variably saturated media. Version L l ; Research Report No. 136, U.S. Salinity Laboratory, U.S. Department of Agriculture, Agriculture Research Station, Riverside, Califomia.
Simunek, J.T., and van Genuchten, M.T., 1999, The HYDRUS-2D software package for simulating water flow and solute transport in tv^o-dimensional variably saturated media. Version 2.0, U.S. Salinity Laboratory, U.S. Department of Agriculture, Agriculture Research Station, Riverside, Califomia.
van Genuchten, M.T, 1980, A closed form equation for predicting the hydraulic conductivity of unsaturated soils, Soil Science Society of America Journal 44:892-898.
HDR;26515.001/SLC3R082 Page 14 of 14 September 9. 2003 Copyright 2003 Kleinfelder, Inc.

I f l KLEINFELDER
T.ABLE 1 Average Precipitation and Five Wettest Years on Record (inches)
Elberta, Utah
xMonth Jan
• Feb
. Mar Apr May Jun
. Jul Aug Sep Oct.;:
• • • • N o v ' . ' / -
Dec: Sum: ,.
Average . .81 .84 .99 1.03 1.03 0.73 0.8 0.94 0.72 1.01 0.86 0.81 10.54
/ . ;Preclpitatiott(iiich«) i'ciivsfl .1983
1.24 2.00 2.30 1.32 1,67 0.89 0.82 2.11 1.76 0.57 2.69 1.97
19.34
1982 ;;: 1.12 0.33 1.12 0.41 1.66 0.57 3-67 0.38 5.30 1.46 0.73 0.67
17.42
••''- - M i k m 0.53 1.42 1.66 1.25 0.64 1.75 1.07 0.85 0.54 2.71 0.46 1.40
14.28
^m&^^^:$: |^^967'^'lv^
3.89 0.23 0.74 0.88 2.52 2.44 2,04 0,15 0.58 0.39 0,94 1,24
14.04
i'S^c^-::r/::B^^:i Wi:i^^^'''^-
1,04 0.11 0.88 1.46 1.68
0 0.72 1.27
0 3,96 1.84 0.88 13.84
Date from Utviversiiy of Ulah, Utah Climate Center, Elberta Station Period ofRecord (1/1/1928 to 12/31/90) Station: Elberta, Utah
HDR/265I5.OO1/SLC3R082 Copyright 2003 Kleinfelder, Inc.
September 9, 2003

I f l KLEINFELDER
TABLE 2 Unsaturated Hydraulic Parameters for Bayview LandfiU Samples
Sample-Name.
BVLF-1
BVLF-2
BVLF-3^
BVLF-4
, -Sample .. Description
Sandy Silt (MH)
Silty Sand (SM)
Silty Sand (SM)
Silty Sand (SM)
'- "'-:'- ' W ' ^
Otiier-:^:?;
Red yellow
Olive brown
Olive brown
Red to brown
^•ia5i:e(Sntent ' ^--i-
iSaituration
0,6671
0.4035
0.3846
0.5395
' - • ' : •:-••*! . ; " „ . ' , ^ -
Residuial
0,000
0.000
0.000
0.020
. .Satiiratei*;. : .Hydraulic Gbndifctivity
(cm/sec): •
4.1 xlO'^
3,8x10"*
1.3x10-^
1.3 xlO-
—; CakiidatedV:.: van Genuchtea. ^rparamet;ersV.^ Alpha (i/cm)
0.0051
0.0062
0.0071
0.0470
• • n , : ' '
1.35
1.30
1.27
1.36
Note; These values reported by Daniel B. Stephens and Associates, Inc.
TABLE 3 General Unsaturated Hydraulic Parameters from Literature
^^^^'sliStw;:-/;••.: :\;i-|«;Loamj; saiid ..•..• -. * a T S « ^ # i < f ^ H t : \ - - :•.•• ; r Sj'.TfSandy loam--
pSiia giy-Mmv--
W^^M>fmi ' ^ ' . • , .» - . . ' / ^ ! f - , - ; ' :* i rX-V' '» ; '•• ' • - ' . " •
=:.^^^ii§iS^'i.>:;.'
^ - Ifei ibam;-. ::"
s^i^tcW:^: V--'•.=i- 'W-3-. 'v-.; ' i-- .--.--- - . . . - . •
;i;jSiIty;(EIay;Lpam
'''WM^:^''':' •'•""^-•sSty^iay-.--
Satui^atibh
0.43
0.41
0.41
0.39
0.43
036
0.45
0.41
0.46
0.43
0.38
036
0.045
0.057
0.065
0.100
0.078
0.070
0.067
0.095
0.034
0.089
0.068
0.070
•liSiSaturated 7\ iliyaraiii^^:^
5JScm/sec>;X;
83 xlO'
4.1 xlO-'
1.2x10'^
3.6x10^
2.9x10"*
33x10-^
13x10""
•7.2x10-^
6.9x10-^
1.9x10"^
5.6x10-^
5.6x10"*^
; : '..van Genuchten ,. '•t-r-\ /Vrvv parametersift^^^i^-^-?."::;>;Aipfia?:;#:.
0.145
0.124
0.075
0.059
0.036
0.027
0.020
0,019
0.016
0.010
0.008
0.005
i3'."jCri;:;?/.'l'.:-'-: ."7.' .:"-''•-. • - ^ ; ' ^ r - • . - i • i V . ' : • - • • ; • a ; - • '•
2,68
2.28
1,89
1,48
1.56
1.23
1.41
131
137
1-23
1.09
1.09
Mote: Source: Carsel and Parrish (1988) Values are averages of hundreds of samples for each soil type.
HDR/26S15.001/SLC3R082 Copyright 2003 Kleinfelder, Inc.
September 9,2003

I f l KLEINFELDER
TABLE 4 Summary of Hydraulic Properties used for Prescriptive Cap Simulations
^\p;teg,CpiiteiatSS51
safiiratioii Resiaiial
#Saitiiraite®i 4>yait.GenucB.tett:c' g^paraiingters>^g
Topsoil 0,41 0.065 1.2x10" 0.075 1.89
ClayCap(l) 0.36 0.070 5.6x10'' 0.005 1.09
Clay Cap(2) 0.43 0,089 1.9x10 5 0,010 1,23
Clay Cap(3) 0.36 0.070 33 xlO"- 0.027 1.23
Fill material 0.43 0.045 83x10" 0,145 2-68
HDR/26515.001/SLC3R082 Copyright 2003 Kleinfelder, Inc.
September 9, 2003

I f l KLEINFELDER
TABLE 5 Summary of Model Results
Scieiaairio
rAimuatlnfilti-aitfon. Rate; foc r^?.; ^^iSw^ft!esii^ar5f^*K^^^ ^?j:fem/year)fj\t;(IMches/yeaF)j
"Average-Annual Jnfiltr^tioiii ^ijRate for 5,normaEyeary.«5: H' (cm/yeary'^'^;(incl i ^ t ^ ^
Prescriptive Caps
Presc-1 Sandy Loam (28")
Silty Clay cap (18") Sand'* (37,5")
6.49 to
13.85
2.56 to
5.45 4,14 1,63
Presc -2 Sandy Loam (28")
Silty Clay Loam cap (18") Sand* (37.5")
6.84 to
18.12
2,69 to
7,13 4.65 1.83
Presc -3 Sandy Loam (28")
Sandy Clay cap (18") Sand* (37,5")
7.22 to
17,78
2.84 to
7,00 4.53 1.78
Evaporative Cap
BV-1 Sandy Loam (2")
Sample Tl-D (32") Sand* (51")
9.9 to
19.65
3-9 to
7.74 6.55 2.58
BV-2 Sandy Loam (2")
Sample T2-Da (32") Sand* (51")
3.63 to
7.07
1.43 to
2.78 2.63 1.04
BV-3 Sandy Loam (2")
Sample T2-Db (32") Sand* (51")
6.23 to
12.17
2.45 to
4.79 4.12 1.62
BV^ Sandy Loam (2")
Sample T5-D (32") Sand*(51")
8.78 to
19.99
3.46 to
7.S7 5.88 231
* "Sand" layer simulates the porous waste materials in the landfill.
HDRy26515.001 /SLC3R082 Copyright 2003 Kleinfelder, Inc.
September 9,2003

f0091r-
'W.
%r-
..'l^;'^.;, ' ' i / ' l f Vt,.- I
- v / "
^ ' - O O J l ' ^ •
' \ . CMo
^ CM
I
^1--
l--\
• '~(J- *- L' II
^ I t - ' 4; ,> :::-ov > . r "^—•-, A
" " ' " • » • ^ ' ' i ' - -
1!=,-* H
•I ' ,
II " J-
J • 1
8
z Q
\-UJ Ul UL o
CM U l
o
o o
173 UJ _ )
< z
9 UJ fe
z [r o>
UJ z Q r i ^ UJ - J ! 5 OT
.. S m > < z . tr S UJ to o UJ 5 CD t CD O D Q.
a. (N O
o n a
Ul Q: D o
o
o = Z
ro =
0. <
z o < u o Ol
t
D>
.c -S S >>
- ' X nf , j= o -C-
O Q-S c
Q: LU Q _ l
LU
U-
UJ
S 3 Z

LEGEND
BVLF-3 8 ) Appraxlmale Soil Sample Location
0 25Cr 500-
Approximate Scale: r = 600'
KLE INFELDER
Projod Number 26515.001
SLC3dl55.(lwg
Bayview Meteoric Infiltration Study Approximately 5.6 Miles North of Elberta Elberta. Utah
SOIL SAIVIPLE LOCATION MAP
FIGURE
2

March 13,2003
Ms. Renee ZoUjnger Kleinfelder 2677 East Parley's Way Salt Lake Citj-, UT 84109-1617 (801)466-6769
;i '"V
Dear Ms. Zollinger:
Enclosed is the final report for the Kleinfelder (Bayview LF) job #26515.001. Please review this report and provide any coranients as samples will be held for a maximum of 30 days. After 30 days samples will be retumed or disposed of in an appropriate manner.
All testing results were evaluated subjectively for cottsistency and reasonableness, and the results appear to be reasonably representative ofthe material tested. However, DBS&A does not assume any responsibility fox interpretations or analyses based on the data enclosed, nor can we guarantee that these data are fully representative of the undisturbed materials at tlie field site. We recommend that careful evaluation of these laboratory results be made for your particular application.
We are pleased to provide this ser\-ice to Kleinfelder and look forward to future laboratory testing on other projects. If you have any questions about the enclosed data, please do nol hesitate to call.
Sincerely,
DANIEL B. STEPHENS & ASSOCIATES, INC.
Jaiiiel O'Dowd Enclosure
L.\L.^I'W;il)l nu.l.'; oc Llcinlcl.lcr.IJi.'vic.i LRCnvci Lcllenloc
Danie l B. Stephens <t Asiocialcs , I n c .
602O Academy NE, Suit* 100 505-82J-9400
Alhiiquerc)ue. NM 87109 FAX 50S-822-8B77

D a n i e l B . S t e p h e n s & A s s o c i a t e s , I n c .
Summary of Tests Performed
Laboratory Sample Number
BLUF-1
BLUF-2
BLUF-3
BLUM
Initial Sol)
Properties'
(0, Pd. *)
X
X
X
X
Saturated
Hydraulic
Conductivity^
CH
X
X
X
X
FH
|i.<oisture
Characteristics'"
HC
X
^
X
X
PP
X
X
X
X
TH WP
X
X
X
X
RH
X
X
X
X
Unaaturaled
Hydraulic
Conductivity
X
X
X
X
Particle
Size'
DS WS _H Effective Porosity
Particle Density
Air Pemieability
1/3, 15 Bar
Poinls and
Water Holding
Capacity
Atterberg Limits
Proctor Compaction
' 6 = ^ CH ' HC ' DS
ln(tial moisture content, pd = Dry tjulk density, ^ = Calculated pofosity = Constant head, FH = falling head = Hanging colurno, PP = Pressure plale, TH = Thermocouple psychromeler, WP = Water activity meter, RH "= Relative humidity box = Dry sieve, WS = Wet sieve, H = Hydrometer

D an i e l B . S l c p l i e n s £ A s s o c i a t c s , I n c .
Summary of Saturated Hydraulic Conductivi ty Tests
Sampie Number
Ksat
(cm/sec)
4.1 E-05
3.8E-06
1.3E-05
1.3E-03
Method of Analysis
Constant Head Falling Head
X
X
X
X
BLUF-1
BLUF-2
BLUF-3
BLUF-4 "1

D a n ie I B . S t e p h e n s & A s s o c i a t e s , I n c .
Summary of Initial ^Aoistur& Content, Dry Buik Density Wet Bulk Density and Calculated Porosity
Initial Moisture Content Dry Bulk Wet Bulk Calculated
Sample Number Gravimetric
(%. g/g)
35.0
18.6
13.4
17.1
Volumetric
(%, cm'/cm^)
29.3
27.2
21.2
21.7
Density (g/cm^)
. 0.84
1.46
1.58
1.27
Density
(g/cm")
1.13
1.74
1.79
1.49
Porosit
(%)
68.4
44.7
40.4
52.0
BLUF-1
BLUF-2
BLUF-3
BLUF-4

D a n i e l B . S t e p h e n s &. A s s o c i a t e s , I n c .
' ) Summary of Moisture Characteristics
of the Initial Drainage Curve
Sampie Number
BLUF-1
BLUF-2
BLUF-3
LJ BLUF^
Pressure Head (-cm water)
0 21 49
150 510
16623 851293
0 21 49
150 510
7445 851293
0 21 49
"150 510
17541 851293
0 10 43 80
510 9892
851293
Moisture Conte (%, cm^/cm^)
66.9 65.6 63.4 60.4 43.4 15.3 2.5
40.1 39.6 38.0 37.3 25.2 14.1 2.7
38.2 37.8 36.3 34.4 24.6 11.7 2.5
54.6 48.3 41.7 30.8 18.5 8.1 2.9

D a n i e l B . S t e p h e n s & A s s o c i a t e s , I n c .
Summary of Calculated Unsaturated Hydraulic Properties
Sample Number
BLUF-1
BLUF-2
BLUF-3
BLUF^
a (cm"')
0.0051
0.0062
0.0071
0.0470
N (dimensionless)
1.3508
1.2957
1.2714
1.3613
e,
o'.oooo
0.0000
0.0000
0.0200
e.
0.6671
0.4035
0.3&46
0.5395
'1 1
i . J
o

Raw Laboratory Data ) and Graphical Plots
i
i f
: )

D a n i e l B . S t e p h e t t s & A s s o c i a t e s , I n c .
Summary of Initial Moisture Content, Dry Bulk Density Wet Bulk Density and Calculated Porosity
Initial Moisture Content Dry Bulk Wet Bulk Calculated ''
'•
-''"-
.t
Sample Number
BLUF-1
BLUF-2
BLUF-3
• BLUF^
Gravimetric
(%. g/g)
35.0
18.6
13.4
17.1
Volumetric
(% cm^/cm^)
29.3
27.2
21.2
21.7
Density
(g/cm^)
0.84
1.46
1.58
1.27
Density
(g/cm^)
1.13
1.74
1.79
1-49
Porosity
(%)
68.4
44.7
40.4
52.0

D a n i e l B . S i e p h efts & A s i o ci a t c s , J n c .
Data for Initial Moisture Content, Bulk Density, Porosity, and Percent Saturation
• i
Job Name: Kleinfelder Job Number. WR03.0035.00
Sample Number. BLUF-1 Ring Number NA
Depth: NA
Test Date: 2-Feb-03
Field weight* of sample (g).- 98.15 Tare weight, ring (g).' 36.57
Tare weight, cap/plate/epoxy (g); 0.00
Dry weight of sampie (g).' 45.63 Sampfe volume err?): 54.44
Assumed particle density: 2.65
Initial Volumetric Moisture Content (% vol): 29.3
Initial Gravimetric Moisture Content (% g/g); 35.0
Dry bulk density (glcrr?): 0.84
Wet bulk density (QICVT?): 1.13
Calculated Porosity (% vol): 68.4
Percent Saturation: 42.9
Comments:
* WeigUt including tares
Laboratory analysis by: Wl. Devine Data entered by: D. O'Dowd
Checked by: D. O'Dowd

f '
i l TT
n'
D a n i e l B. S t e p h e n s & A s s o c i a t e s , I n c .
Data for Initial Moisture Content, Bulk Density, Porosity, and Percent Saturation
Job Name: Kleinfelder Job Number. WR03.0035.00
Sample Number: BLUF-2 Ring Number. NA
• Depth: NA
Test Date: 2-Feb-03
Field weight* of sample (g): 122.60 Tare weight, ring (g): 34.07
Tare weight, cap/p/afe/epoxy (g): 0.00
Dry weight of sample (g): 74.67 Sample volume (cm^): 50.99
Assumed particle density: 2.65
o Initial Volumetric Moisture Content (% vol): 27.2
Initial Gravimetric Moisture Content (% g/g): 18.6
Dry bulk density g/cm^; 1.46
Wet bulk density (g/cm^): 1.74
Calculated Porosity (% vol): 44.7
Percent Saturation: 60.8
Comments:
' Weight including tares
I
4
Laboratory analysis by: M. Devine Dafa entered by: D. O'Dowd
Checked by: D. O'Dowd

D a n i e l B . S t e p h e n s & A s s o c i a t e s , I n c .
Data for Initial Moisture Content, Bulk Density, Porosity, and Percent Saturation
Job Name: Kleinfelder Job Number. WR03.0035.D0
Sample Numben BLUF-3 Ring Number NA
Depth: NA
Test Date: 2-Feb-03
Field weight* of sample (g). Tare weight, ring (g)
Tare weight, cap/piate/epoxy (g)
156.11 41.93 O.OO
Dry weight of sample (g): 100.70 Sample volume (cm^): 63.72
Assumed particle density: 2.65
Initial Volumetric Moisture Content % vol): 21.2
Initial Gravimetric Moisture Content % g/g): 13.4
Dry bulk density (g/cm^): 1.58
Wet bulk density (g/cm^: 1.79
Calculated Porosity (% vol): 40.4
Percent Saturation: 52.4
Comments:
* Weight including tares
Laboratory anaJysis by: Wl. Devine Dafa entered by: D. O'Dowd
Checked by: D. O'Dowd

D a n i e l B . S t e p h e n s & A s s o c i a t e s , I n c .
Data for Initial Moisture Content, Bulk Density, Porosity, and Percent Saturation
;i
Job Name: Kleinfelder Job Number WR03.0035,00
Sample Number BLUF-4 Ring Number NA
Depth: NA
Test Date: 2-Feb-03
Field weight' of sample (g) 7ans weight, ring (g)
Tare weight, cap/plate/epoxy <g)
126.63 39.39 0.00
Dry weight of sample (g): 76.24 Sample volume (cm^): 59.97
Assumed particle density: 2.65
o Initial Volumetric Moisture Content (% vol): 21.7
Initial Gravimetric Moisture Content (% g/g): 17.1
Dry bulk density (g/cm^: 1.27
Wet bulk density (glcm^- 1.49
Calculated Porosity % vol): 52.0
Percent Saturation: 41.7
I
V..J
o
Comments:
* Weight including tares
Laboratory analysis by: M. Devine Dafa entered by: D. O'Dowd
Checked by: D. O'Dowd

D a n i c l B . S t e p h e n s & A s s o c i a t e s , I n c .
Summary of Saturated Hydraul ic Conductivity Tests
Sample Number
Ksat
(cm/sec)
Method of Analysis
Constant Head Falling Head
2
BLUF-1
BLUF-2
BLUF-3
BLUF-4
4.1 E-05
3.8E-D6
1.3E-05
1.3E-03
X
X
X
X

D a n i e l B . S t e p h e n s & A s s o c i a t e s , I n c .
S a t u r a t e d H y d r a u l i c C o n d u c t i v i t y
Constant Head Method
Job name: Kleinfelder
Job number WR03.0035.00
Sample number. BLUF-1
Ring number. NA
Deptfi; NA
Type of water used: TAP
Collection vessel tare (g): 11.81
Sample length (cm): 2.97
Sample diameter (cm): 4.84
Sample x-sectionaf ansa (cm^): 18.36
fy Date
Temp Head Q-Hare Q Elapsed Ksat Ksat@20°C
Tinie (°C) (cm) (g) (cm^) time (sec) (cm/sec) (cm/sec)
Tes t#1 : 26-Feb-03 26-Feb-03
Test # 2 : 27-Feb-03 27-Feb-03
Test # 3 : 27-Feb-03 27-Feb-03
12:50.43 13:00:04
'
08:53:42 09:11:51
10:45:38 10:59:48
18.5 12.8
18.5
18.5
12.8
12.8
13.6
15.2
14.4
1.8
3.4
2.6
561 4.0E-O5 4.1E-05
1089 3.9e-05 4.0E-05
850 3.9E-05 4.0E-05
Average Ksat (cm/sec): 4.1 E-05
Comments:
Laboratory analysis by: D. O'Dowd
Dafa entered by: D. O'Dowd
Checked by: D. O'Dowd

D a n i e l B . S t e p h e n s & A s s o c i a t e s , I n c .
Sa tu ra ted H y d r a u l i c C o n d u c t i v i t y
Constant Head Mettiotd
Job name: Kleinfelder
Job number WR03.0035.00
Sample number BLUF-2
Ring number NA
Depth: NA
Type of water used: TAP
Collection vessel tare ig): 11.81
Sample length (cm): 2.77
Sample diameter (cm): 4.84
Sample x-sectionaf area (cm^): 18.42
r V
Date Time Temp Head Q-»-Tare Q Elapsed Ksat Ksiat@20°C
C O cm) (g) (cm^) time (sec) (cm/sec) (cm/sec)
Tes t#1 : 27-Feb-03 08:54:06 27-Feb-03 09:12:45
18.5 14.6 12.3 0.4 1119 4.1 E-06 4.3E-06
Test #2 : 27-Feb-03 10:45:11 27-Feb-03 12:26:06
18.5 14.6 13.9 Z1 6055 3.6E-06 3.7E-^6
Test # 3: 28-Feb-03 10:07:39 2B-Feb.03 10:29:22
18.0 14.6 12.2 0.4 1303 3.4E-06 3.5E-06
Comments:
Average Ksat (cm/sec): 3.8E-06
Laboratory analysis by: D. G'Dowd
Data entered by: D. O'Dowd
Checked by: D. O'Dowd

D a n i e l B . S t e p h e n s &. A s s o c i a t e s , I n c .
Saturated Hydraulic Conductivity Constant Head Method
Job name: Kleinfelder
Job number WR03.0035.00
Sample number BLUF-3
Ring number NA
Depffj: NA
Type of water used: TAP
Collection vessel tare (g): 10.71
Sample length (cm): 3.41
Sample diameter (cm): 4.88
Sample x-sectional area (cm^): 18.67
f ' V
I J -
'T : 1.
" "3
)
Date
Tes t#1 : 27-Feb-03 27-Feb-03
Test # 2 : 27-Feb-03 27-Feb-03
Test# 3: 28-Feb-03 28-Feb-03
Time
.08:54:12 09:12:17
10:45:48 12:23:41
10:05:05 10:26:10
Temp
CO
18.5
18.5
18.0
Head Q + Tare Q Elapsed Ksat Ksat@20°C
(cm) (g) (cm^) time (sec) (cm/sec) (cm/sec)
13.2 11.7 1.0 1085 1.2E-05 1.3E-05
13.2 15.8 5.1 5873 1.2E-05 1.2E-05
13.2 11.9 1.2 1265 1.3E-05 1.3E-05
Average Ksat (cm/sec): 1.3E-05
Comments:
i\
Laboraiory analysis by: D. O'Dowd
Dafa entered by: D. O'Dowd
Checked by: D. O'Dowd

D a n i e l B . S t e p h e n s A A s s o c i a t e s , I n c .
Saturated Hydraulic Conductivity Constant Head Method
Job n.ame: Kleinfelder
Job number WR03.0035.00
Sample number BLUF-4
Ring number NA
Depth: NA
Type of water used: TAP
Collection vessel tare (g): 11.93
Sample length (cm): 3.22
Sample diameter (cm): 4.87
Sample x-sectional area (cm^): 18.64
Date
Temp Head Q-i-Tare Q Elapsed Ksat Ksat@20''C
Time (°C) (cm) (9) (cm) time (sec) (cm/sec) (cm/sec)
Test#1: 27-Feb-03 27-Feb-03
Test #2 : 27-Feb-03 27-Feb-03
Test #3 : 28-Feb-03 28-Feb-03
08:54:23 09:10:02
10:44.50 10:58:17
10:04:07 10:15:02
18.5
18.5
6.8
6.8
18.0 6.8
59.7 47.7
53.6 41.7
43.0 31.1
939 1.3E-03 1.3E-03
807 1.3E-03 1.3E-03
655 1.2E-03 1.3E-03
Comments:
Average Ksat (cm/sec): 1.3E-03
Laboratory analysis by: D. O'Dowd
Dafa entered by: D. O'Dowd
Checked by: D. O'Dowd

D a n i e l B . S t e p h e n s i£ A s s o c i a t e s , I n c .
Summary of Moisture Characteristics ofthe Initial Drainage Curve
rr
-
• | »
r-
B -
. i
V
i
.—'
1
1 1
J
^
. . : ' ,
Sample Number
BLUF-1
.
BLUF-2
BLUF-3
~
BLUF-4
Pressure Head (-cm water)
0 21 49
150 510
16623 851293
0 21 49
150 510
7445 851293
0 21 49
150 510
17541 851293
0 10 43 80
510 9892'
851293
Moisture Content (%, cm^/cm^)
66.9 65.6 63.4 60.4 43.4 15.3
2.5
40.1 39.6 38.0 37.3 25.2 14.1 2.7
38.2 37.8 36.3 34.4 24.6 11.7 2.5
54.6 48.3 41.7 30.8 18.5 8.1 2.9

D a t t i e l B . S t e p h e n s <t A s s o c i a t e s , I n c .
Summary of Calculated Unsaturated Hydraulic Properties
Sample Number
BLUF-1
BLUF-2
BLUF-3
BLUF-4
a (cm"')
0.0051
0.0062
0.0071
0.0470
N (dimensionless)
1.3508
1.2957
1.2714
1.3613
Or
0.0000
0.0000
0.0000
0.0200
6s
0.6671
0.4035
0.3846
0.5395

D a n i e l B . S t e p h e n s & A s s o c i a t e s , I n c .
Moisture Retention Data Hanging Column/Pressure Platefrhermocouple
(Main Drainagfe Curve)
Job Name: Kleinfelder Job Number WR03.0035.00
Sample Number BLUF-1 Ring Number NA
Depff?: NA
Dry wt. of sample (g): 45.63 Tare vrt., screen & damp (g): 25.32
Tans ivf., ring (g): 36.57 Tare wt, epoxy (g): 0.00
Sample volume (cm^): 54.44
Saturated weight'at 0 cm tension (g): 143.92 Volume ofwafer^ in saturated sample (cm*): 36.40
Saturated moisture content (% vol): 66.86 Sample bulk density (g/cm^): 0.84
•1
i Hanging column:
Pressure plate:
Date/Time 28-Feb-03 /14:00 03-Mar-O3 /12:30 05-Mar-03/15:30 07-Mar-03/15.00
10-Mar-03/13:00
Weigtit* (9)
143.92 143.25 142.04 140.38
131.13
Matric Potential
(-cm water) 0.00
21.00 49.00 150.00
509.90
Moisture Content^ (% vol) 66.86 65.63 63.41 60.36
43.37
Comments:
* Weight Including tares ^ Assumed density of water is 1.0 glen?
. 1
Laboratory analysis by: D. O'Dowd Dafa entered by: D. O'Dowd
Checked by: D. O'Dowd

D a n i e l B . S t e p h e n s & A s s o c i a t e s , I n c .
Moisture Retention Data Water Activity Meter/Relative Humidity Box
(Main Drainage Curve)
Job Name: Kleinfelder Job Number WR03.0035.00
Sample Number BLUF-1 Ring Numtier NA
Depth: NA
1
Dry weight* of water activity meter sample (g): 134.62 Tare ive/g/jf,/ar (g): 113.64
Sample bulk density (g/cm'): 0.84
Date/Time
Matric Moisture Weight* Potential Content^
(g) (-cm water) (% vol) IVafer Acf/wfy Meter 26-Feb-03/13:30 138.68 16622.7 15.28
Dry weight* of relative humidity box sample (g): 65.04 Tare weight (g): 40.93
*\-Sample bulk density (g/cm ); 0.84
Date/Time
Matric Moisture Weight* Potential Content^
(g) (-cm water) (% vol)
Relative humidity box: O3-Mar-03 /12:30 65.75 851293 2.46
Comments:
* Weight inducjing tares ^ Assumed density of water is 1.0 glen?
Laboratory analysis by: D. O'Dowd Dafa enfened by: D. O'Dowd
Checked by: D. O'Dowd
t;. '

D a n i e l B . S t e p h e n s & A s s o c i a t e s , I n c .
1.E- 06
1.E+05 :
1.E+04
a
E o
"g 1.E+03 o X
3 m o a
I.E-t-02
1.E+01 -
1.E+00
<i
Water Retention Data Points Sample Number BLUF-1
-
-
:
-
X
-
•
• •
'
i - i i
• i : •
i i i i •
• Hanging c»1umn
* Pressure plate
• Thermocxiuple
•Water aclivity meter
XRhbox
•
•
- ^ • . W - r -
-
10 20 30 40 50 60 70 80
Moisture Content (%,cm^/cm^)

D a n i e l B . S t e p h e n s «t A s s o c i a t e s , I n c .
Predicted Water Retention Curve and Data Points Sample Numben BLUF-1
I.E-t-06
"t ].
1.E+05 -
1.E+04
a a ? E u
"g 1.E-f03 0)
I CD
CA « a) D-
1.E+02
1,E+01
1.E+00
10
: x\ ; : .; ; : . i
Ur.
.,-L-
1 1
1 '
1 •
/•
- i \ i ;
• : N v ! i H Hanging c»lumn A Pressure plate • Thertnotxrtjpie • Water activity meter X Rh box
Predicted curve
1—
1—
1—
1
i i i i i
i : ; : : : ! : : • • •
j ' - ' - . ' '. ! : : ! • • 1 . . ' .
- —- F : i 1 1 T r 1 -r- :—.^ - r • : . ', ; 1 1 : 1—
•
v i :
: ^ :
-i 1
•
1, i . , - ,—.—1
20 30 40 50 60 70
Moisture Content (%,cm^/cm^)
80

D a n i e l B . S t e p h e n s & A s s o c i a t e s , I n c .
Plot of Relative Hydraulic Conductivity vs Moisture Content Sample Number BLUF-1
I.E-t-00
1.E-01
1.E-02 :
I ' i
t • ,
y . .
r
- )
f
\
> u D
T3 C o O o 3 a •D >. J. a > 9
1.E-03
1.E-04
1.E-05
Q: 1.E-05
1.E-07
1.E-08
1.E-09
Moisture Content (7o,cm /cm )

D a n i e l B . S t e p h e n s tt A s s o c i a t e s , I n c .
Plot of Hydraulic Conductivity vs Moisture Content Sample Numben BLUF-1
1.E+00
1.E-01
\ -a 1.E-06
1.E-11
1.E-12
) Moisture Content (%,cm^/cm^)

D a n i e l B . S t e p h e n s & A s s o c i a t e s , I n c .
Plot of Relative Hydraulic Conductivity vs Pres:sure Head Sample Number. BLUF-1
1.E+00
1.E-09
,r 1.E-03 1.E-02 1.E-01 1,E• 00 1.E+01 1.E+02 1.E• 03 1.E- 04 1.E+05 1.E+G6
Pressure Head (-cm v/ater)

D a n i e l B . S t e p h e n s & A s s o c i a t e s , I n c .
Plot of Hydraulic Conductivity vs Pressure Head Sampie Number BLUF-1
I.E-fOO
1.E-01 .
i! I L
1.E-11
1.E-12
1.E-03 1.E-02 1.E-01 1.E-I-00 1.E-4-01 1.E-H02 1.E+03 1.E+04 1.E-<-05 1.E+06
Pressure Head (-cm water) I J.

D a n i e l B . S t e p h e n s <£ A s s o c i a t e s , I n c .
Moisture Retention Data Hanging Column/Pressure Plate/Themiocouple
(Main Drainage Curve)
Job Name: Kleinfelder Job Number WR03.0035.00
Sample Number BLUF-2 Ring Number NA
Deptfj: NA
Drywt. of sample (g): 74.67 Tare wt , screen & clamp (g): 25.33
Tans wt., ring (g): 34.07 TatB wt., epoxy (g): 0.00
Sample volume (cm'): 50.99
:]
Saturated weight* at 0 cm tension (g): 154.52 Vo/umeofwafer^ in saturated sampfe (cm): 20.45
Saturated moisture content (% vol): 40.11 Sample bulk density (g/cxT?): 1.46
Matric Weight* Potential
Date/Time (g) (-cm water)
• ) Corriments:
* Weight including tares ^ Assumed density ot water is 1.0 glcrr?
Moisture Content^ (% vol)
Hanging column:
Pressure plate:
28-Feb-03/14:00 03-Mar-03/12:30 05-Mar-03/15:30 07-Mar-03 /15:00
10-Mar-03/13.00
154.52 154.24 153.47 153.07
146.94
0.00 21.00 49.00 150.00
509.90
40.11 39.56 38.05 37.26
25.24
Laboratory analysis by: D. O'Dowd Data entered by: D. O'Dowd
Checked by: D. O'Dowd

D a n i e l B . S t e p h e n s & A s s o c i a t e s , I n c .
Moisture Retention Data Water Activity AAeterlRelative Humidity Box
(Main Drainage Curve)
Job Name: Kleinfelder Job Number WR03.0035.00
Sample Number BLUF-2 Ring Number NA
Depth: NA
Dry we/gf7t* of water act/wfy meter sampte (g): 154.86 Tare weigfjf, jar (g); 121.47
Sample bulk density (glcm^): 1.46
' \ .
Dale/Time Weight*
(9)
Matric Potential
IVaferActivify Meter 27-Feb-03/10:00 158.08 7444.5
Moisture Content' '
(-cm water) (% vol) 14.12
• )
Dry weight* of relative humidity box sample (g): 71.00 Tare we/gfjf (g): 42.11
Sample bulk-density glcrr?): 1.46
Date/Time
Matric Moisture Weight* Potential Content^
(g) (-cm water) (% vol)
Relative humidity box: 03-Mar-03 /12:30 , 71.53 851293
Comments:
' Weight including tares ^ Assumed density of water is 1.0 glar?
2.73
Laboratory analysis by: D. O'Dowd Data entered by: D. O'Dowd
Checked by: D. O'Dowd

D a n i e l B . S t e p h e n s & A s s o c i a t e s , I n c .
Water Retention Data Points Sampie Numben BLUF-2
1.E+06
f xi
1.E-(-05
1.E+04 -
tt
? E o 1
"S 1.E-<-03 o I o 3 tn
i. a
1.E-I-02 -
1.E+01
1.E+00 '
: X • : ; • ;
1 1
' I
tl
ti
• l-)anging column
A Pressure plate
• Thermocouple
• Water activity meter
XRhbox
•
i • • :
•i
^ — . ,- : i 1 , , — j 1 ; 1 1 , • — . .. 1 r ^
10 20 30 40 50 60
Moisture Content (%,cm^/cm"')

D a n i e l B . S t e p h e n s & A s s o c i a t e s , I n c .
Predicted Water Retention Curve and Data Points Sample Numben BLUF-2
^. l--^UtD -T
1.E+05 :
1.E+04 :
5 ? E y
1
"S 1.E- 03 -0) X a
0) lA
£ a
1.E+02 -
1.E+01 -
1.E+00
\ | 1 i 1
\ 1 1 \ *
-
• Hanging column A Pressure plale • Thermocouple • Water activity meter X Rh box
Predicted curve
A \ . ;
\ •
Mil J
10 20 30 40 50 60
Moisture Content (%,cm'/cm^)

D a n i e l B . S t e p h e n s & A s s o c i a t e s , I n c .
Plot of Relative Hydraulic Conductivity vs Moisture Content • Sampfe Number BLUF-2
1.E+00
1.E-01
-->.
) 1
10 20 30 40 50 60
Moisture Content (%,cm^/cm^)

D a n i e l B. S t e p h e n s & A s s o c i a t e s , I n c .
Plot of Hydraulic Conductivity vs Moisture Content Sample Numben BLUF-2
1 .E-HOO
1.E-01
1.E-02
1.E-03
0)
E
1.E-04 .
1.E-05 J
o 3 TJ 1. r 0 o u
• •§ . 1
E-06
E-07
-a
1.E-03 4
1.E-09
1.E-10
1.E-11
1.E-12 1- . 10 20 30 40 50 60
Moisture Content (%,cm^/cm^)

D a n i e l B . S t e p h e n s & A s s o c i a t e s , I n c .
Plot of Relative Hydraulic Conductivity vs Pressure Head Sample Numben BLUF-2
1.E+00
• ) I
1.E-08
1.E-09
1.E-03 1.E-02 I.E^OI 1.E-1-00 I.E-i-01 I.E-t-02 I.E-i-03 1.E-»-04 I.E-i-05 1.E+05
Pressure Head (-cm water)

D a n i e l B. S t e p h e n s & A s s o c i a t e s , I n c .
Plot of Hydraul ic Conduct iv i ty vs Pressure Head
Sample Number BLUF-2
I.E-t-OO
1.E-03 1.E-02 1.E-01 1.E• 00 1.E- 01 1.E+02 1.E+03 1.E+04 1.E+05 I.E-t-06
Pressure Head (-cm water)
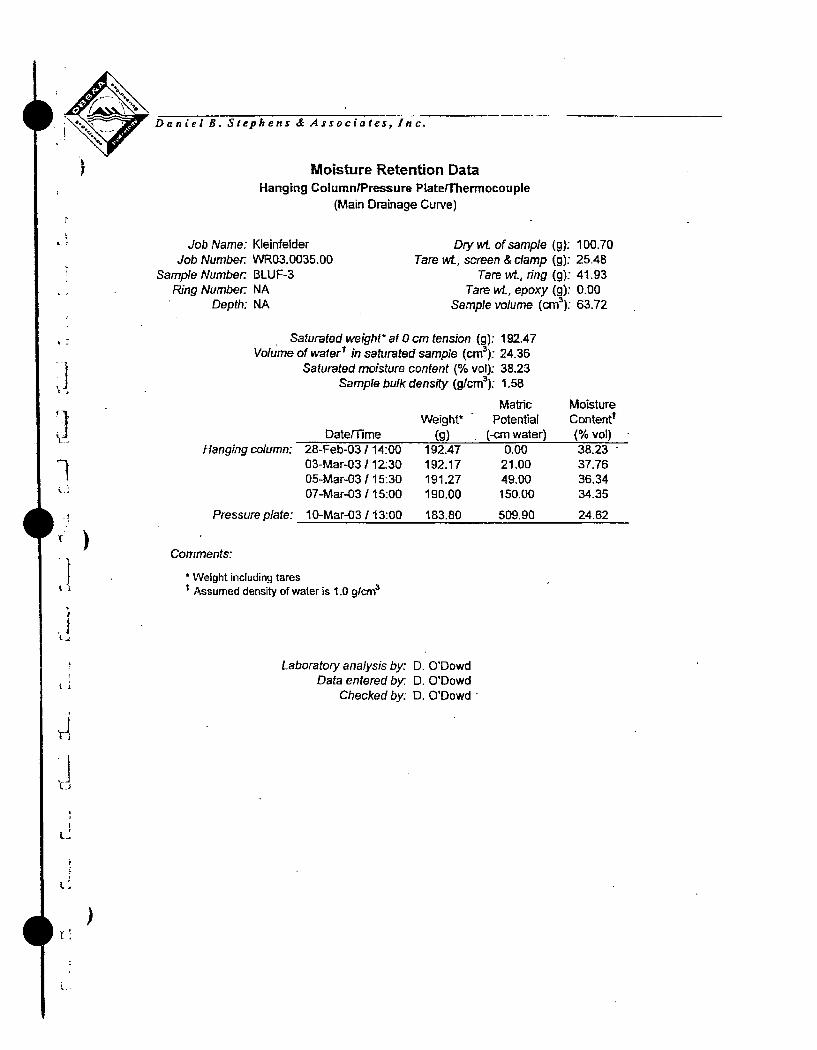
D a n i e l B . S t e p h e n s & A s s o c i a t e s , I n c .
Moisture Retention Data Hanging Column/Pressure Plate/Thermocouple
(Main Drainage Curve)
Job Name: Kleinfelder Job Number WR03.0035.00
Sample Number BLUF-3 Ring Number NA
Depth: NA
Dry wL of sample (g); 100.70 Tare wt. screen & clamp (g): 25.48
Tare wt., ring (g): 41.93 Tare wt., epoxy (g): 0.00
Sample volume or?): 63.72
3 1
o
Saturated weight* at 0 cm tension (g): 192.47 Volume of water^ in saturated sample cn?): 24.36
Saturated moisture content (% vol): 38.23 Sample bulk density (g/cm'): 1,58
Hanging column:
Pressure plate:
Date/Time 28-Feb-03/14:00 03-Mar-03/12:30 05-Mar-03/15:30 07-Mar-03/15:00
10-Mar-03/13:00
Weight* '
(9) 192.47 192.17 191.27 190.00
183.80
Matric Potential
(-cm water) 0.00 21.00 49.00 150.00
509.90
Moisture Content^ (% vol) 38.23 • 37.76 36.34 34.35
24.62
Comments:
* Weight including tares ^ Assumed density of water is 1.0 glen?
Laboratory analysis by: D. O'Dowd Dafa entered by: D. O'Dowd
Checked by: D. O'Dowd
L..

D a n i e l B . S t e p h e n s £. A s s o c i a t e s , I n c .
Moisture Retention Data Water Activity Meter/Relative Humidity Box
(Main Drainage Curve)
Job Name: Kleinfelder Job Number WR03.0035.00
Sample Number BLUF-3 Fiing Number NA
Depth: NA
: )
H:
Dry weigfjf* of wafer acfn/Sy meter samp/e (g): 141.82 Tare weight, jar (g): 111.56
Sample bulk density Qlcrc?): 1.58
Date/Time
Matric Moisture Weight* Potential Content^
(g) (-cm water) (% vol) Water Activity Meter 27-Feb-03 / 09:50 144.06 17540.6 11.70
Dry weight* of relative humidity box sample (g): 85.94 Tare weight (g): 40.78
Sample bulk density glcrr?): 1.58
Date/Time
Matric Moisture Weight* Potential Content^
(g) (-cm water) (% vol)
Relative humidity box: 03-Mar-03 /12:30 86.67 851293 2.53
Comments:
' Weight including tares
^ Assumed density of waler is 1.0 glcrr?
Laboratory analysis by: 0. O'Dowd Dafa entered by: D. O'Dowd
Checked by: D. O'Dowd

D a n i e l B . S t e p h e n s & A s s o c i a t e s , I n c .
Water Retention Data Points Sample Number BLUF-3
i.n-t-uo T
I.E-t-05 -.
1.E-1-04 :
<D
t E o 1
•g I.E-I-03 -0) I 2 3 (ff (0 ffl 1 -
a
I.E-t-02
1.E-f01
1 .E-HOO
X ; i i : i .
i • L... ..; ...; i i i
1 1 • Hanging column
A Pressure plale
• Thermocouple
• Water activity meter
XRhbox
i A i i
[ m l
• i
; : i [ , [
A- . - . - . i '•• . , , ! , , , . J ^ . - i - - ^ . ^ ^ 10 20 30 40 50 60
Moisture Content (7o,cm^/cm^)

D a n i e l B . S t e p h e n s <fe A s s o c i a t e s , I n c .
;i
L,
t /
Predicted Water Retention Curve and Data Points Samp/eWumber BLUF-3
10
1.E+05 :
1.E-t-04 -
a
£ o 1
"S 1.E+03-ffl I ffl 3 m 0) (D
%. a
1.E+02 :
1.E+01
I.E-HOO
^ \
K*
:
j i
i i
• Hanging column A Pressure plate • Thermocouple
• Water activity meter
X Rhbox Predicted curve
A S .
hi ; - i — , — • — I , — - . — 1 — • — I
;. ;
20 30 40
Moisture Content (%,cm^/cm^)
50 60

r ' •
r -
^ j
I
• )
1
D a n i e l B . S t e p h e n s i A s s o c i a t e s , I n c .
Plot of Relative Hydraulic Conductivity vs Moisture Content Sample Number BLUF-3
LE-t-OO ,
1.E-01 4
1.E-09
Moisture Content (%,cm /cm )

D a n i e l B . S t e p h e n s JL A s s o c i a t e s , I n c .
;i
I.E-t-OO
1 .E-01
1.E-02 --
1.E-03
1.E-04 J
1
• )
1.E-12
Plot of Hydraulic Conductivity vs Moisture Content Sample Number BLUF-3
Moisture Content (7o,cm /cm )

.-i
D a n i e l B . S t e p h e n s & A s s o c i a t e s , I n c .
Plot of Relative Hydraulic Conductivity vs Pressure Head Sample Number BLUF-3
I.E-t-OO
1.E-01 -.-
1.E-02 :
^ 1.E-03
o 3
TJ 0 1.E-04 O
3 n
">. 1.E-05
o
JS ID
0^ 1.E-05
1.E-07
1.E-08
1.E-09
! ; : "--.v^ .' ; : ;
1.E-03 1.E-02 1,E-01 I.E-t-OO 1.E-f01 1.E-i-02 I.E-t-03 I.E-i-04 I.E-i-05 1.E-t-06
Pressure Head (-cm water)

D a n i e l s . S t e p h e n s & A s s o c i a t e s , I n c .
1.E+00
1.E-D1-4
1.E-02
1.E-03
1.E-12
Plot of Hydraulic Conductivity vs Pressure Head Sample Number BLUF-3
• ' i \ 1.E-03 1.E-02 1.E-01 I.E+OO I.E-t-01 I.E-t-02 1.Et-03 1.E-H04 1.E-+05 1.E+06
Pressure Head -cm water)

D a n i e l B . S t e p h e n s <t A s s o c i a t e s , I n c .
Moisture Retention Data Hanging Column/Pressure Piate/Thermocouple
(Main Drainage Curve)
Job Wame: Kleinfelder Job Number WR03.0035.00
Sampte Number BLUF-4 Ring Number NA
Depth: NA
Dry wt. of sampfe (g): 76.24 Tare wt., screen & clamp (g): 25.84
Tare wi.. ring (g): 39.39 Tare wt., epoxy (g): 0.00
Sampte volume or?): 59.97
I ' \
• )
Saturated Vi/eight* at 0 cm tension (g): 174.24 Volume ofwater'^ in saturated sample cn?): 32.77
Safurafecf moisture content % vol): 54.64 Sample bulk density (g/cm'): 1.27
Hanging column:
Pressure plate:
Date/Time 28-Feb-03 /14:00 03-Mar-03/12:30 05-Mar-03/15:30 07-Mar-03/15:00
10-Mar-03/13:00
Weight* (9)
174.24 170.46 166.48 159.94
152.54
Matric Potential
(-cm water) 0.00 10.00 43.00 80.00
509.90
Moisture Content^ (% vol) 54.64 48.34 41.70 30.80
18.46
Comments:
' Weight including tares ^ Assumed density of water is 1.0 glcsr?
.'•
Laboratory analysis by: D. O'Dowd Dafa entered by: D. O'Dowd
Checked by: D. O'Dowd

D a n ie I B . S t e p h e n s A A s s o c i a t e s , I n c .
Moisture Retention Data Water Activity Meter/Relative HumicJity Box
(Main Drainage Curve)
Job Name: Kleinfelder Job Number WR03.0035.00
Sample Number BLUF-4 Ring Number NA
DepOt: NA
. J ' 1
I
Dry weight* of water activity meter sample (g): 140.98 Tare weight, jar g): 116.07
Sample bulk density glen?): 1.27
Date/Time
Matric Moisture Weight* Potential Contenf"
(g) (-cm water) (% vol) WaferAct/v/fy Meter 28-Feb-03/10:30 142.56 9892.1 8.06
' )
Dry weight* of relative humidity box sample (g): 71.69 Tare weight (g); 44.95
Sample bulk density gtcn?): 1.27
Dale/Time
Matric Moisture Weight* Potential Content^
(g) (-cm water) (% vol)
Relative humidity box: 03-Mar-03 /12:30 72.31 851293 2.93
Comments:
* Weight including tares ^ Assumed density of water is 1.0 gfar?
Laboratory analysis by: D. O'Dowd Dafa entered by: D. O'Dowd
Checked by: D. O'Dowd

D a n i e l B . S t e p h e n s & A s s o c i a t e s , I n c .
Water Retention Data Points
Sample Numben BLUF-4
1.E4-06
I.E-t-05
I.E-t-04
n
E o
"S I.E- 03 o
X
3 0) (0 a
I.E-t-02
1.E+01
.^. 1.E-I-00 -!
0
: X i ; i ; ;
i i i i i
i i i i
: m Hanging column
A Pressure plate
• Thermocouple
• Water activity meter
XRhbox
——
1—
1—
1
1.
1.
11
1
1 1
1 L
II
II
•
I
'. -. '- ' -
i
4 10 20 30 40
Moisture Content (%,cm^/cm^)
50 60

D a n i e l B . S t e p h e n s & A s s o c i a t e s , I n c .
Predicted Water Retention Curve and Data Points
Sample Number BLUF-4
I.E-t-06
l.E-t-05
I.E-I-04
? E o I
"S I.E-i-03 o X
3 (0 (0 o
I.E-t-02
1.E-t-01
1.E+00 •!
10 20 30
11 ; \
^
•
. ! •. , , ,
\ ! :
-i 1 — r 1 - c - ; [ 1 —1 1
• Hanging column A Pressure plate • Thermocouple • Water activity meter X Rhbox
Predicted curve
m \ .
•
: 1 -. i ^ — I B - I ^
40 50 60
Moisture Content (%,cm^/cm^)

D a n i e l B . S t e p h e n s & A s s o c i a t e s , I n c .
Plot of Relative Hydraulic Conductivity vs Moisture Content Sample Number BLUF-4
I.E-t-OO
1.E-01
2
• \
I
H
H
1.E-09 4
Moisture Content ("/o.cm'/cm )

D a n i e l B . S t e p h e n s & A s s o c i a t e s , I n c .
Plot of Hydraulic Conductivity vs Moisture Content Sample Numben BLUF-4
1.E-I-00
1.E-01 =
...J:
1
1.E-11
10 20 30 40 50 60
Moisture Content (%,cm^/cm^

D a n i e l B . S t e p h e n s & A s s o c i a t e s , I n c .
P|ot of Relative Hydraulic Conductivity vs Pressure Head Sample Numben BLUF-4
\
. ]
1
.1
I.E-t-OO
1.E-01 :
1.E-02
1.E-03
o 3 T3
O 1.E-04 O o "3 a t .
> 1.E-05
> _M
0)
^ 1.E-06
1.E-07
1.E-08 :
1.E-09
:
;
i l l i \ • ^
l i l i M l
i^ 1.E-03 1.E-02 1.E-01 I.E-t-OO I.E-i-01 I.E-^02 1.E-t-03 I.E-t-04 I.E-i-05 1.E-h06
Pressure Head (-cm water)

D a n i e l B . S t e p h e n s & A s s o c i a t e s , I n c .
Plot of Hydraulic Conductivity vs Pressure Head Sample Numben BLUF-4
I.E-t-OO
1.E-01 .
J
1.E-12 i J 1.E-03 1.E-02 1.E-01 I.E-t-OO 1.E-t-01 I.E-t-02 1.E-f03 I.E-i-04 I.E-i-05 1.E-t-06
Pressure Head (-cm water)

o
I
L:
Laboratory Tests and Methods

D a n i e l B. S t e p h e n s i A s s o c i a t e s , I n c .
: )
Methods
Dry Bulk Density:
MoisUife Content
Ksat
ASTWD 4531-91
ASTM D 22tS-92
Calculated Porosity Klute, A 1986. Porosty. Chp.18-2.1, pp. 444-445, in A. Klute (ed.). Methods of Soil Analysis, American Sociely of Agronomy, Madison, Wl
Constant Head: ASTM D 2434-68 (93)
Hanging Column Method Klute, A. 1985. Porosty. Chp.26, in A, Klute (ed.). Methods of Soil Analysis, American Society of Agronomy, Madison, WI
Pressure Plate Method ASTM D 2325-65 (94)
Water Potential Method Dane, H. Jacob and G. Clark Topp. 2002. Chp.3. pp. 663-665. in J. H. Dane and G. C. Topp (ed.), Methods of Sof Analysis, American Society of Agronomy, Madison, Wl
Relative Humidity Box Klute, A. 1986. Porosty. Chp.26. In A. Klute (ed), Methods of Soil Analysis. American Society of Agronomy, Madison, Wl
Calc. Kunsat Soil Sd . Soc. Am. J. 1980 44:892-898

D a n i e l B . S t e p h e n s & A s s o c i a t e s , I n c .
1.E+06
1.E-K15 -
I.E-t-04 -
o a
E o
"S 1-E+03 o X
3 (A n o
1.E-I-02
I.E-I-01
I.E-t-OO
< >
Predicted Water Retention Curve and Data Points Sample Number BLUF-4
10
-
•
•
J
J
1
\ i i i .'
• Hanging column A Pressure plate • Theimocouple • • Water activity meter X Rhbox
Predicted curve
20 30 40
Moisture Content (%,cm^/cm^)
50 60

D a n i e l B . S t e p h e n s & A s s o c i a t e s , I n c .
Plot of Relati've Hydraulic Conductivity vs Moisture Content Sample Numben BLUF-4
I.E-t-OO ^
1.E-01
1
A
Moisture Content (%,cm^/cm'')
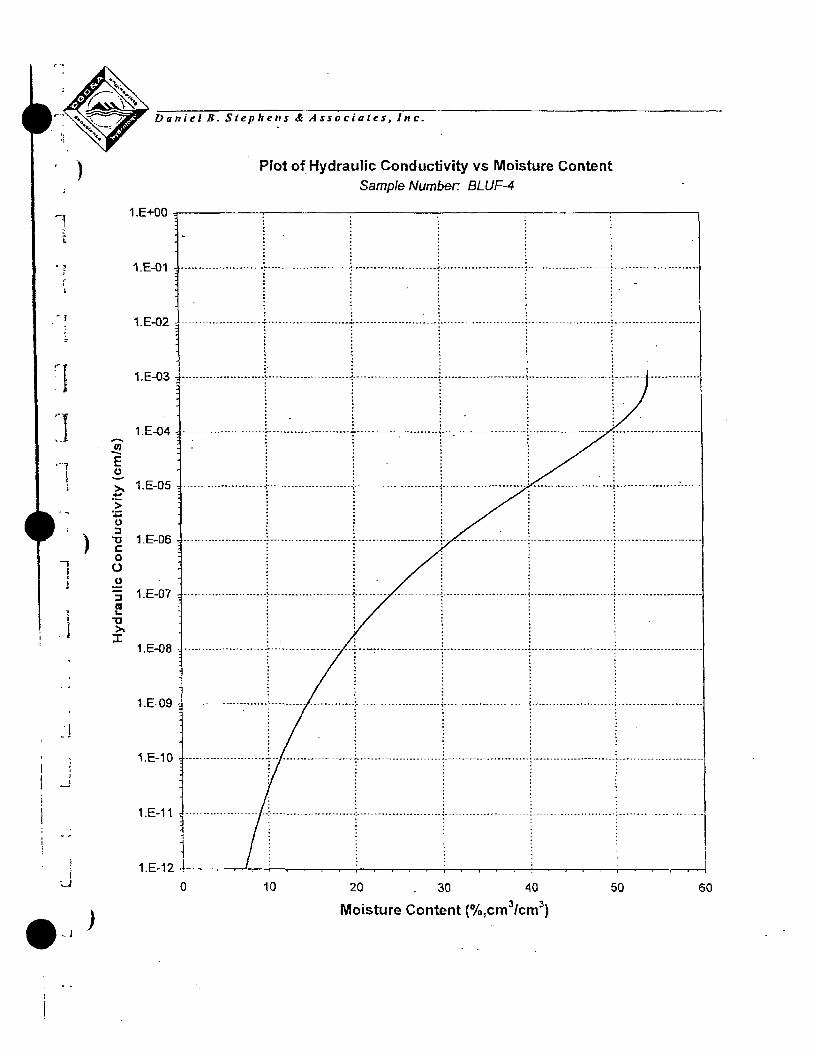
D a n i e l B . S t e p h e n s <£ A s s o c i a t e s , I n c .
Plot of Hydraulic Conductivity vs Moisture Content Sample Numben BLUF-4
I.E-t-OO
1.E-01
1.E-02 4
1.E-03 .
«]
E o
>» .»
*> •3 U 3 •n c o O li 3 a t . •a
X
1.E-04
1.E-05 .
1.E-06
u
Moisture Content (%,cm^/cm^)

D a n i e l s . S t e p h e n s & A s s o c i a t e s , I n c .
Plot of Relative Hydraulic Conductivity vs Pressure Head Sample Numben BLUF-4
1.E-V00
1.E-03 1.E-02 1.E-01 I.E-t-OO I.E-i-01 I.E-t-02 I.E-t-03 I.E-^04 1.E-t-05 I.E-i-05
Pressure Head -cm water)

D a n i e l B. S t e p h e n s & A s s o c i a t e s , I n c .
Plot of Hydraulic Conductivity vs Pressure Head
Sample Numben BLUF-4
1.E+00
1.E-01
<r
1.E-12 •i I I- J 1.E-03 1.E-02 1.E-01 I.E-t-OO I.E-f-01 1.E-t-02 I.E-i-03 I.E-t-04 l.E-t-05 1.E+06
Pressure Head (-cm water)

Bayview Landfiii Frost Depth Calculation
. Elberta, Utah NOAA Data 1951 -1980
Dry Density 94 Moisture Content 13
Freezing Index (degree day) 880 Mean Annual Air Temperature (deg F) 50.3
Vo (deg F) 24.6 Vs(degF) 7.0
Length ol Analysis Freezing Period (day) 125
Latent Heat of Fustion 'L" CBty/ff S) 1752.3 Volumetric Heat "C" (Btu/ft/degF) 25.145
Thennal Conductivity of Soil (Btum'^2/hr/degF/in) 0.6
Alpha (Vo/Vs) 3.5
Fusion Parameter "mu' 0.10
=free2ing index/length of freezing
Correction Coefficient 'lamtxia* 0.62
=C*VsA.
chart
z= Lambda * ((48'F)/(L7k))'S).5
z = 2.36 feet
z = 28.3 inches
U t i O T H •^ "2-<D — ' ^ O '-^cX^,

state a'nd Station Name
Utah BRYCE CANYON NP HDQ CAPITOL REEF NATL MON CEDAR CITY FAA AP COTTONWOOD WEIR // COVE FORT // DEER CREEK DAM DESERET DESERT EXP RANGE DUGWAY ECHO DAM ELBERTA EPHRAIM SORENSENS FLD ESCALANTE FAIRFIELD FARMINGTON USU FLD STA FERRON FILLMORE FORT DUCHESNE GARFIELD GR_EEN RIVER AVN HANKSVILLE HEBER HIAWATHA JENSEN KANAB LAKETOWN LAVERKIN LEVAN LOA LOGAN UTAH STATE UNIV MANTI MEXiCAN HAT MILFORD WSO MOAB 4 NW
Air Freezing Index- USA Method (Base 32° Fahrenheit)
station Number •
421006
• 421171
_421267_
421759
421792
422057
422101
422116
422257
422385
422418
422578
422592
422696
42272S
42279B
42282a
422996
423097
"42341B
423611"
423809
423896
424342
424S0B
424856
"424968
425065
425148
425166
425402
425582
425554
Lat. (De9. -
Mln.)
Long. (D.g. •
Mln.)
Elev. IftttI
N3739 N3817 N3742 N4037 N3836 N4024 N3917 N3836 N4Q11 N4058 N3957 N3921 N3746 N4Q16 N4101 N30O5 N3857 N4017 N4043 N3900 N3822 N4031 N3929 N4022 N3703 N4149 N3712 N3933 N3824 N4145 N3915 N3709 N3826
W11210 W11115 W11306 W11147 W11235 W11132 W11239 W11345 W11256 W11126 \N^^^57 W11135 W11136 W11205 W11154 W1110B W11219 W10952 W11212 W11010 W11043 W11125 W11101 W10921 Wil 232 W11119 W11316 W11152 W11139 W11149 W11138 W10952 W11301
7915 5500 5620 4950 5980 5270 4585 5252 4340 5500 4690 5560 5810 4876 4340 5925 5160 4990 4310 4070 4308 5580 7230 4720 4985 5988 3200 5300 7045 4785 5740 4270 5028
425733 N3a36 W10936 3965
Mean Anniral Temp. (»F)
53.6
47.8
43.5
49.2
49.0
51.4
47.0
49.4
46.6
51.2
47.7
51.2
44.7
45.2
45.4
54.6
42.0
58.6
47.6
66.6
Air Freezing Index Return Periods (°F-Days) & Associated Probabilities (%)
1.1-Year (10V.)
1.2 Year (20%)
2 Year (60%)
2.S Year (50%)
3.3 Year irov.)
6 Year (B0%)
10 Year (90%)
20 Year (95%)
25 Year (9«%)
50 Year (98%)
100 Year (99%)
606 60 80 50 158 464 168 136 114 379 113 297 114 271 76 318 79 627 68 180 122 414 405 570 13 523
175 397 225 214 15 149 36
743 100 125 80 231 614 249 212 178 498 177 405 173 375 123 428 127 846 109 274 194 644 521 782 24 678
254 513 322 297 35 226
1010
217 248 165 407 936 453 416 344 753 347 560 324 614 253 670 257 1332
223 516 390 822 760 1261
59 1001
20 445 754 5S4 485 118
68 420
1090
263 293_
198 468 1039 524 491 405
1173
317 345 235 537 1150
605 578
833 410 730 378 692 302 748 306 1489
266 603 463 910 834 1419
73 1102
26 511 830 634 547 159
176 489 222
475 920 482 616 440 779 360 833 363 1661
316 702 548 1005 914 1592
91 1211
33 584 911 722 616 212 568 278
1270 387 411 283 621 1281
705 686 562 1023
572 923 516 883 432 935 435 1866
379 826 655 1117
1007
1798 115 1338
44 674 1005
829 696 269 666
1399 493 509 355 743 1464
850 849
1503
590 596 420 847 1814
976
693 1165
708 1071
629 1032
543 1077
544 2153
475 1008
817 1273
1134
2091
152 1514
61 804 1136
984 815 422
355 •811
992
1532
620 622 439 878 1658 1014
607 1282
828 1195
728 1156
641 1195
640 2392
560 1167
961 1401
1238
2336
188 1657
78 915 1242 1116
914 558 936
1035
842 1313
864 1231
1615
708 699 497 968 1783
1123
1162
1689
791 721 "551'
1050 1895
1223
943
I' 969
757 1192
671 1229
670 2462
586 1214
1004
1438
1268 2408
199 1699
83 948 1273 1155
943 602
478 595 974 831
1335
843 1297
760 1328
756 2662
663 1354
1132
1543
1354
2614 232 1817
100 1044
1360 1288
1026
740 1084
743
1280
1037
T555^i 1068
T,Pt^ K. IS<
1428
923 1392
842 1416
J37_ 2841 734 1482 1252
1638
1429
2B00
263 1921
116 1131
1438 1371
1101
880 1185
850
Footnotes: * Probability of occurrence less than indicatad probability (Value=0)
" No Freezing Index Values Recorded during 1951-80 period (Value=0) 79 Prepared by NOAA - Nalional Climatic Data Center

X
^
V % o
I • J
-> ( o-
i
^
I
Q-I
L i j |
h 0 u.
i
CM

le K L E I N F E L D E R An ejnp/c>>'ce Qanitd company
July 31, 2003 File No.: 30268.001
Mr. Terry Wamer HDR Engineering, Inc. 3995 South 700 East, Suite 100 Salt Lake City, UT 84107
Subject: Source Material Investigation South Utali VaUey Landfill (Baj-view LandFiIl) Utah County, Utah
Dear Mr. Wamer:
In conjunction with KJeinfelder's report dated July I, 2003, we are providing tlie following information to summarize the findings of our report.
Identification of Suitable Material Based on laboratory testing and modeling, as presented in Kleinfelder's Meteoric Water Infiltration Study, one of the predominant soils at Bay\'iew LandfiU has been identified as an acceptable material for the CeU 1 protective cap. This soil is classified as a silty sand (SM) to sandy silt (ML), and is generally olive brown in color. Based on numerous tests performed on this proposed capping material, this material can generally be characterized by the following grain-sizes:
Sieve Size No. 4 (1/4 inch) No. 40 No. 60 No. 200
Percent Passing 95 - 100% 70-100% 60-95% 30-70%
Other materials present at the site differ significantly from this gradation criteria and are generally easy to screen out based on field logging and gradation tests.
Location of Suitable Material The proposed suitable cap material was found in the stockpile north of Cell 1 and in the floor ofthe excavation for Cell 2. In the Uiree borings drilled in the stockpile north of Cell 1, we found one 5-foot thick layer in B-3, and a few other pockets of material tlial did not meet these specifications.
We investigated the materials immediately below the stockpile north of Cell 1 and beneath the dune sand south of Cell 2 and found only^some pockets of material suitable for construction ofthe protective cap layer in those locations.
HDR/30268.001/SLC3L290 Page 1 of 2 July 31,2003 Cop>Tigiit 2003 Kleinfelder, Inc.
KLEINFELDER 2G77 East iV leys Vvay, Salt Lake City, UT 841Q'.M017 ^80•.! 4n6-6"<.0 180',) .>6b-6TaS fax

Two test pits excavated within Cell 2 contained 6 to 7 feet ofthe suitable cap material.
We recommend tliat lenses or pockets encountered within the stockpile or under Cell 2 that do not fall within the gradation criteria identified above be excluded fi'oin use in tiie protective cap layer unless further testing and analysis is performed to evaluate their suitability.
Kleinfelder appreciates this opportunity to assist you. If you have any questions regarding this report please do not hesitate to contact us at (801) 466-6769.
Respectfiilly,
KLEINFELDER, INC.
Renee Zollinger, P.G. Senior Geologist
Scott Davis, P.E, Geotechnical Division Manager
cc: Mike Oden, HDR Engineering Richard Henry, South Utah Valley Solid Waste District
HDR/3026S.OOi/SLC3L290 Page2of2 July 31,2003 Copyright 2003 Kleinfelder, Inc.
KLEINFELDER 2677 East Parley's Way, SaltLake City, UT 34109-1617 (SOU 46C--f'7f,o (H01) 466-6788 fax

S I E V E A N A L Y S I S
GRAVEL
coarse rine
SAND
coarse mtdiun Tine
H Y D R O M E T E R
SILT CLAY
1.5" 3/4" 3/8" #4 I ^ . 1
U.S. STANDARD SIEVE SIZES
#10 #16 #30 #60 #100 #200
1 0.1 GRAIN SIZE (mm)
Symbol
•
CD
Sample Depth (ft) USCS Soil Description USCS Ciassirication
,J
Si
m KLEINFELDER
PROJECT NO. GRAIN SIZE DISTRIBUTION
FIGURE
B-1

• 1
0
0
;]
J
H P I K L E I N F E L D E R
APPLICATION FOR AUTHORIZATION TO USE Meteoric Water Infiltration Study
South Utah Valley Landfill CBayview Landfill) Utah Countv, Utah
Report originally prepared for HDR Engineerins, Inc.
File Number: 26515.001 ReportDate: September 9. 2003
KLEINFELDER, INC. 849 West LeVoy Drive, Suite 200 Taylorsville, UT 84123 (801) 261-3336 (801) 261-3306
To Whom It May Concem:
Applicant understands and agrees that (he above-referenced report for the subject site is a copyrighted document, that Kleinfelder, Inc. is the copyrighl owner and that unauthorized use or copying of the report for the subject site is strictly prohibited without the express written permission of Kleinfelder, Inc. Applicant understands that Kleinfelder, Inc. may wjtlihold such pemtission at its sole discretion, or grant permission upon such terms and conditions as il deems acceptable.
By signing below, the Rching Parties agree to the same terms and conditions as Kleinfelder's original client, including any limitations of liability' or indcniait>- obligations. Tbe original ser^ice$ agreement may be obtained from the original client identified above or from Kleinfelder, upon request.
To be Completed bv Applicant
'. • ' • " - - ' ^ • - " ••' . B y : " - "
(company name) (Print Name)
(address)
(city, state, zip) Title:
Date:
(Sipiaiure)
(telephone) (FAX)
By:
. To be Completed bv Kleinfelder. Inc.
Approved for reuse with applicant agreeirig to above terms and concurrence by original client. Additional fees are estimated at $ -'' _ .
Disapproved, report needs to be updated.
• Date: Kleinfelder, Inc.
RETURN COMPLETED FORM TO KLEINFELDER
HDR/265 ] 5.001 /SLC3R082 Copyright 2003 Kleinfelder, Inc.
September 9, 2003

i
)
APPENDIX N
Attachment N-1
Addendum to Closure Cap Equivalency Report
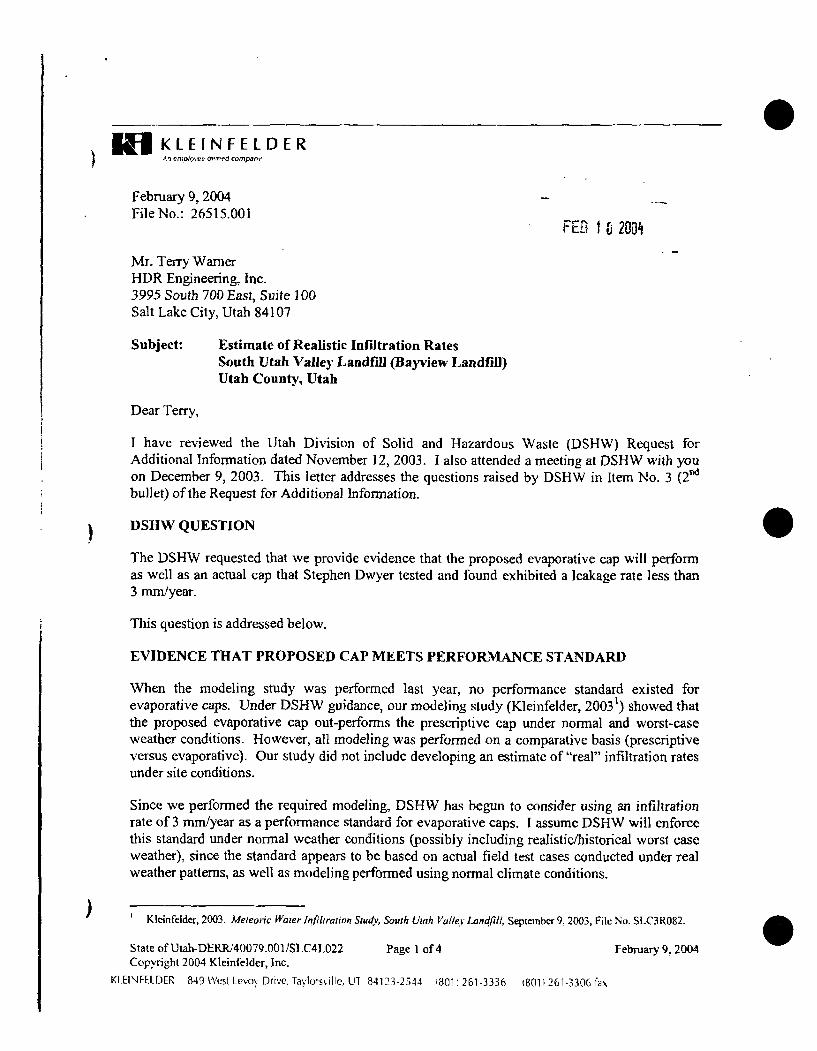
K L E I N F E L D E R
February 9,2004 - _ File No.: 26515.001
FEB 0 200^
Mr. Terry Wamer HDR Engineering, Inc. 3995 South 700 East, Suite 100 Salt Lake City, Utah 84107
Subject: Estimate of Realistic Infiltration Rates South Utah Valley Landfill (Bayview LandfiU) Utah County, Utah
Dear Terry,
I have reviewed the Utah Division of Solid and Hazardous Waste (DSHW) Request for Additional Infonnation dated November 12, 2003. I also attended a meeting at DSHW with you on December 9, 2003. This letter addresses the questions raised by DSHW in Item No. 3 (2"^ bullet) ofthe Request for Additional Information.
DSHW QUESTION
The DSHW requested that we provide evidence that the proposed evaporative cap will perform £is well as an actual cap that Stephen Dwyer tested and found exhibited a leakage rate less than 3 mm/year.
This question is addressed below.
EVIDENCE THAT PROPOSED CAP MEETS PERFORMANCE STANDARD
WTien the modeling study was performed last year, no performance standard existed for evaporative caps. Under DSHW guidance, our modeling study (Kleinfelder, 2003') showed that the proposed evaporative cap out-performs the prescriptive cap under normal and worst-case weather conditions. However, all modeling was performed on a comparative basis (prescriptive versus evaporative). Our study did not include developing an estimate of "real" infiltration rates under site conditions.
Since we performed the required modeling, DSHW has begun to consider using an infiltration rate of 3 mm/year as a performance standard for evaporative caps. I assume DSHW will enforce this standard under normal weather conditions (possibly including realistic/historical worst case weather), since the standard appears to be based on actual field test cases conducted under real weather pattems, as well as modeling performed using normal climate conditions.
' Kleinfelder, 2003. Meteoric Waier Infiliralion Study, Soulh Uitih Valley Landfill, September 9, 2003, File No. SLC3R082.
State of Utah-DERR.'40079.001 ,'SLC4L022 Page 1 of 4 February 9,2004 Copyright 2004 Kleinfelder, Jnc.
KLEINFELDER 849 WW Levoy Drive, Taylorsville, UT S412. -2.S44 '301)261-3336 i80ll 26[-3305 fax

I have looked at the studies of "real" infiltration rates suggested by DSHW, compared these studies to our modeling study, and have concluded that the proposed evaporative cap at Bayview Landfill will meet the performance standard being considered by DSHW for the following
reasons:
All studies 1 reviewed demonstrated that the evaporative caps out-perform prescriptive caps. This information is in agreement with our modeling study, where, under identical worst-case (conservative) assumptions, the proposed evaporative cap allowed less infiltration than the prescriptive cap.
This result is summarized below.
Prescriptive Cap
Evaporative Cap
Range of Infiltration Rates
Normal Climate
41.4 to 46.5 mm/yr
26.3 to 41.2 mnvyr
Hypothetical Worst Case Rainfall
138.5 to] 81.2 mm/yr
70.7 to 121.7 mm/yr
Field studies performed by Stephen Dwyer (Dwyer, 2000 ) quoted "real" (observed) prescriptive cap infiltration rates that average 4.82 mm/year compared to "real" evaporative cap infiltration rales that average 0.19 mm/year. The observed (Dwyer) and modeled prescriptive (Kleinfelder) caps should have similar rates, but the rates measured in the field differ from our modeled rates by an order of magnitude because: our model omitted the mitigating effects of plant transpiration; our modeled rates are based on conser\'ative choices for cell size, boundary types, initial saturation, etc., used in "building" the numerical model; our modei used hypothetical high rainfall (greater than observed in historical records) to evaluate worst case perfoimance; and our modeled "normal" rainfall is approximately 3 times higher than actual rainfall in the Dwyer study.
If our conservative assumptions increased the modeled prescriptive cap infiltration rate by an order of magnitude over Dwyer's results, they probably also increased our evaporative cap infiltration rates by an order of magnitude. Therefore, it appears that under more realistic assumptions, our modeled infiltration rates for the evaporative cap would have been around 2 to 4 mm/year.
The studies we reviewed consistently demonstrate that, in practice, evaporative caps allow about 10 times less moisture to infiltrate than do prescripti^'e caps. We made one modeling assumption on our evaporative cap that "overruled" the model's predication for producing that result. We added a 2-inch hypothetical "topsoil" layer to the top of the modeled evaporative cap that allowed excess water storage in an attempt to simulate a loosened ground surface produced by wind erosion. In our experience, adding a loose, organic topsoil significantly
Dwyer, el a!., 2000, H-'aler Balance Dalajrum ihe Allernalive Landfill Co\'er Demonslration.
State of Utah-DERR7'40079.001/SLC4L022 Page 2 of 4 Copyright 2004 Kleinfelder, Inc.
KLEINFELDER 84y West Lo\w\ Drive, T,i\ior.s\ ilje, DT 8412.3-2544 ',8011 261-3j3r, 8Q1 2f)l-330f) lax
Febniarv 9. 2004
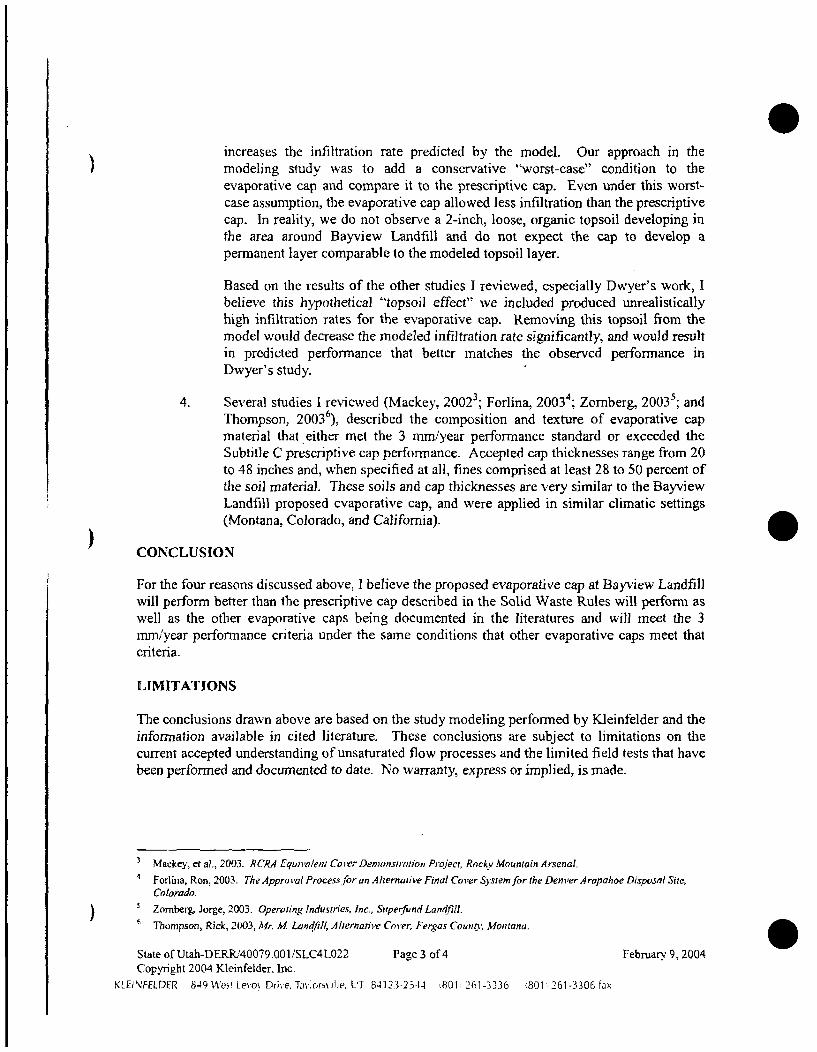
increases the infiltration rate predicted by the model. Our approach in the modeling study was to add a conservative "worst-case" condition to the evaporative cap and compare it to the prescriptive cap. Even under this worst-case assumption, the evaporative cap allowed less infiltration than the prescriptive cap. In reality, we do not obser\'e a 2-inch, loose, organic topsoil developing in the area around Bayview Landfill and do not expect the cap to develop a permanent layer comparable to the modeled topsoil layer.
Based on the results of the other studies I reviewed, especially Dwyer's work, I believe this hypothetical "topsoil effect" we included produced unrealistically high infiltration rates for the evaporative cap. Removing this topsoil from the model would decrease the modeled infiltration rate significantly, and would result in predicted performance that better matches the observed performance in Dwyer's study.
4. Several studies 1 reviewed (Mackey, 2002^ Foriina, 2003'*; Zomberg, 2003^; and Thompson, 2003^), described the composition and texture of evaporative cap material that either met the 3 mm/year performance standard or exceeded the Subtitle C prescriptive cap performance. Accepted cap thicknesses range from 20 to 48 inches and, when specified at all, fines comprised at least 28 to 50 percent of the soil material. These soils and cap thicknesses are very similar to the Bayview Landfill proposed evaporative cap, and were applied in similar climatic settings (Montana, Colorado, and Califomia).
CONCLUSION
For the four reasons discussed above, ] believe the proposed evaporative cap at Bayview Landfill will perform better than the prescriptive cap described in the Solid Waste Rules will perform as well as the other evaporative caps being documented in the literatures and will meet the 3 xnmi''ycaT performance criteria under the same conditions that other evaporative caps meet that criteria.
LIMITATIONS
The conclusions drawn above are based on the study modeling performed by Kleinfelder and the information available in cited literature. These conclusions are subject to limitations on the current accepted understanding of unsaturated flow processes and the limited field tests that have been perfonned and documented to date. No warranty, express or implied, is made.
' Mackey, et al., 200.1 HCRA Equivalent Cover Demomslrniion Projecl, Rocky Mountain Arsenal.
•* Foriina, Ron, 2003. The Approval Process fi>r an Aliernaiiw Final Cover Sysiemforthe Denver Arapahoe Disposal Site, Colorado.
' Zomberg, Jorge, 2003. Operaiirig Industries, Inc., Superfiind Landfill.
' Thompson, Rick, 2003, Mr. M. Landfill, Ahemative Cover, Fergas County, Montana.
State of Utah-DERR'40079.001/SLC4L022 Page 3 of 4 February 9 ,2004 Cop\Tight 2004 Kleinfelder. Inc.
KLEINFELDER S49 Wvit le\-o\ Drive, T.ivlors\ jl)e, L'T 8412.3-254^ iSDI: 261-3336 :801 • 261-3306 fax

i I appreciate this opportunity to assist you. Please do not hesitate to call me if you have questions or need additional information.
Sincerely,
KLEINFELDER, INC.
Renee Zollinger, R.G. Regional Manager
cc. Mike Oden, HDR Engineering, Inc. Dick Sprague, HDR Engineering, Inc. Richard Henry, South Utah Valley Landfill
State of Uiah-DERR'40079.001/SLC4L022 Page 4 of 4 Febraary 9,2004 Copmght 2004 Kleinfelder, Inc.
KLFlSiPELDER 849 West Le\o\ Dii\(j Tavlorsville, LT 8412 3-2544 .801' 261 -3336 ,801 • 201-3306 fax

Appendix O

APPENDIX O
Construction Quality Assurance Plan
SUVSWD Bayview Class I Landfill Permit Application

Appendix O: Construction Quality Assurance Plan
SUVSWD Bayview Class I Landfill Permit Application
Preparetd for Bayview Landfill
South Utah Valley Solid Waste District SpringviUe, Utah
Prepared by HDR Engineering, Inc.
3995 South 700 East, Suite 100 Salt Lake City, UT 84107
March 2009

Contents
Contents
1.0 INTRODUCTION 1
2.0 CQA AND CQC T E A M 2
3.0 INSPECTION, SAMPLING, AND TESTING 4
3.1 Subgrade 4
3.2 Geotextiles 4
3.3 Geosynthetic Clay Liner (GCL) 4 3.3.1 Pre-installation 5 3.3.2 Delivery, Storage, and Handling 6 3.3.3 Installation 7
3.4 Geomembranes 8 3.4.1 Trial Seams 9 3.4.2 Non-Destructive Seam Testing 9 3.4.3 Destructive Seam Testing 10 3.4.4 Geomembrane CQA Observation 10
3.5 Leachate Collection Systems 11 3.5.1 Protective Cover/Leachate Collection and Pipe Bedding
Materials 11 3.5.2 Construction 12
3.6 Electrical Integrity Survey 12
3.7 Final Cover Systems 13
3.8 Surveying 13
4.0 DOCUMENTATION AND CORRECTIVE ACTION 15
4.1 Corrective Action 15
4.2 Documentation 15
Tables
Table 3-1. Material Testing Methods and Frequency 4 Table 3-2. Standard Tests on GCL Material 6
Attachments
Attachment 0 -1 : Example Forms for Cell Construction and Closure
Attachment 0-2: Final Cover Grain Size Distribution
March 2009 SUVSWD Bayview Class I Landfill Permit Application

Appendix O: Construction Quality Assurance Plan
1 1.0 Introduction
2 The Construction Quality Assurance Plan (CQAP) will document that the constructed unit
3 meets or exceeds all design criteria contained in the permit, issued by the Utah Department of
4 Environmental Quality (UDEQ). The CQAP describes: 1) observations, inspections, tests and
5 measurements to be performed; 2) roles and responsibilities of various parties in performing
6 Construction Quality Assurance (CQA) and Construction Quality Control (CQC); and 3)
7 documentation, record keeping and certifications.
8 The procedures described below are tailored to the Bayview Landflll Disposal Site (Site) and
9 are in part excerpted or adopted from EPA/540/R-92/073 Technical Guidance Document,
10 EPA 530-R-93-017 Technical Manual - Solid Waste Disposal Facility Criteria and
11 EPA/600/R-93/182 Technical Guidance Document. The specific site components addressed
12 include:
13 1. Subgrade;
14 2. Geotextiles;
15 3. Geosynthetic Clay Liners;
16 4. Geomembranes;
17 5. Leachate Collection Systems; and
18 6. Final Cover Systems.
19 CQA consists of a planned series of observations and tests used to provide quantitative criteria
20 with which to accept the fmal product. CQC is an ongoing process of measuring and controlling the
21 characteristics ofthe product in order to meet manufacturer or project specifications.
22 CQC is a production tool that is employed by the manufacturer of materials and by the contractor
23 installing the materials at the site. CQA, by contrast, is a verification tool employed by the South
24 Utah Valley Solid Waste District (SUVSWD) to ensure that the materials and installation meet
25 project specifications. CQC is performed independently ofthe CQA. For example, while a
26 geomembrane liner installer will perform CQC testing of field seams, the CQA program will
27 require independent CQA testing of those same seams by a third-party inspector.
March 2009 SUVSWD Bayview Class I Landfill Permit Application

Appendix O: Construction Quality Assurance Plan
1 2.0 CQA and CQC Team
2 The CQAP will be implemented under the supervision of a Utah registered professional engineer.
3 The SUVSWD will designate a registered professional engineer to oversee the execution of
4 the CQAP and related field and testing activities. The SUVSWD will also designate a lead
5 individual who will be identified as the CQA officer. The SUVSWD may elect to utilize
6 contract firms for monitoring, observation and testing services.
7 The CQAP and CQC plan will be implemented through inspection activities that include
8 visual observations, field testing, and evaluation ofthe test data. Inspection activities will
9 typically be concerned with four separate functions:
10 • Quality Control (QC) inspection by the manufacturer to provide an in-process
11 measure ofthe product quality and its conformance with the project plans and
12 specifications. Typically, the manufacturer will be required to provide QC test
13 results to certify that the product conforms to project plans and specifications.
14 • Construction Quality Control (CQC) inspection by the contractor to provide an in
15 process measure of construction quality and conformance with the project plans and
16 specifications, thereby allowing the contractor to correct the construction process
17 if the quality ofthe product is not meeting the specifications and plans.
18 • Construction Quality Assurance (CQA) testing by the SUVSWD (Acceptance
19 Inspection) performed usually through the third-party testing firm to provide a
20 measure ofthe final product quality and its conformance with project plans and
21 specifications.
22 • Regulatory Inspection or documentation review, if required, to verify that the
23 final product conforms with all applicable codes and regulations.
24 The responsibilities ofthe SUVSWD's CQA officer and the CQA officer's staff vary by physical
25 component being constructed. The persoimel will be assigned responsibilities based upon
26 knowledge and competence to perform CQA in a specific area. Prior to starting an activity, the
27 CQA officers or individuals within the CQA officer's staff will be identified so that the
28 SUVSWD, UDEQ or others can verify that individual's qualifications.
29 Activities ofthe CQA officer are essential to document quality of construction. The CQA
30 officer's responsibihties and those ofthe CQA officer's staff members may include:
31 • Communicating with the contractor;
32 • Interpreting and clarifying project drawings and specifications with the designer,
33 SUVSWD and contractor;
Appendix O: Construction Quality Assurance Plan March 2009

Appendix O: Construction Quality Assurance Plan
1 • Recommending acceptance or rejection by the SUVSWD of work completed by the
2 construction contractor;
3 • Submitting blind samples (e.g., duplicates and blanks) for analysis by the
4 contractor's testing staffer one or more independent laboratories, as applicable;
5 • Notifying SUVSWD of construction quality problems not resolved on-site in a
6 timely manner;
7 • Observing the testing equipment, personnel, and procedures used by the construction
8 contractor to check for detrimentally significant changes over time;
9 • Reviewing the construction contractor's quality control recording, maintenance,
10 summary, and interpretations of test data for accuracy and appropriateness; and
11 • Reporting to the SUVSWD on monitoring results.
12 The SUVSWD will have the authority to stop work or reject work if problems or deficiencies are
13 encountered.
March 2009 SUVSWD Bayview Class I Landfill Permit Application

Appendix O: Construction Quality Assurance Plan K. i*m<'M-.^^^<lt:-rO»'Sa.L-ili'MM.>~.2.t£.'«'^3t^^ttJi
3.0 Inspection, Sampling, and Testing
2
3
4
5
6
7
8
9
10
1)
The foUowing is an overview of CQA and CQC activities, by major physical components, to be
undertaken before, during or after constmction. Reference should be made throughout this
discussion to Table 0-1 for a more detailed list of major material testing methods and frequency.
Table O-1 frequency for protective cover material may be adjusted based upon final material
sources, field observations, and results of testing during construction. Additional QC, CQC, and
CQA provisions and standards are anticipated to be included in final construction plans and
specifications and for minor system components. Final construction plans and specifications will
further delineate sampling strategies, including methods of determining sample locations,
frequency of sampling, acceptance and rejection criteria, and methods of implementing corrective
measures.
13
14
3.1 Subgrade
Final constmction plans and specifications along with contractors CQC program will address
preparation and compaction of subgrade material to the required bearing strength.
15 3.2 Geotextiles
16 Prior to installation, the contractor, material installer, and CQA person will inspect the subgrade to
17 certify its adequacy. During construction, geotextile placement, including coverage and 12-inch
18 minimum overlap and anchorage, will be observed and documented. In addition to field
19 observations, geotextile sampling and testing for tensile strength and AOS may be performed to
20 document that the geotextile meets the design specifications.
21
22
23
24
3.3 Geosynthetic Clay Liner (GCL)
This section includes the requirements for selection, installation, and protection of geosynthetic
clay liner (GCL).
Table 3-1. Material Testing Methods and Frequency
Material Tested Parameter Test Method
Hydraulic Conductivity ASTM D2434 4 per material type
Borrow Source for Protective Cover / Leachate Material
Fines ASTM D422
Minimum Testing Frequency
1 per 3,000 cubic yards
Appendix O: Construction Quality Assurance Plan March 2009

Appendix O: Construct ion Quality Assurance Plan
Granular Layers
Geomembrane
Piping
% Coarse/Fines (Pipe Bedding Layer surrounding leachate collection pipe only)
Total Thickness
Soil Placement/Compaction
Material Thickness
Leaking Seam
Defect/Punctures
Shear
Peel
Leakage on non-pressure
Alignment
ASTM 0 1 3 6
Measurement
Visual Observation
ASTMD1593/D5199
Vacuum testing or pressure testing
Visual inspection
G R I G M 1 3
GRIGM13
Low pressure air
Visual Observation
1 per 1,500 yd ^
4 per acre
Full Coverage
once per roll
100% of all field welded seams
100% of all seams and liner surface
Minimum 500 feet plus twice daily during in.stallation
Minimum 500 feet plus twice daily during installatinn
All non-slotted sections
All sections of pipe
1 Notes; Tests listed are for major components. Additional material standards and CQC/CQA tests will be specified in final design 2 including CQC and CQA for other components of the construction. Storage handling preservation and transport of soil samples will be done 3 in accordance with ASTM D 4220.
4 3.3.1 Pre-installation
5 The following must be submitted to the CQA personnel for approval prior to GCL deployment.
6 • The supplier or GCL manufacturer results for standard tests described in Table
7 0-2.
8 • Written verification that the GCL meets the properties listed in Table 0-2.
9 • Written certification that the GCL manufacturer has continuously inspected each 10 roll of GCL for the presence of needles and other defects and found GCL to be 11 defect free.
12 • Written certification from the GCL manufacturer that the bentonite will not shift
13 during transportation or installation thereby causing thin spots in the body ofthe
14 G C L .
15 • Quality control certificates signed by a responsible party of the GCL
16 manufacturer for each roll delivered to the site. Each certificate will include roll
17 identification numbers and results of all quality control tests. At a minimum,
18 results will be given for tests corresponding to Table 0-2, The bentonite and
19 textile suppliers will each certify the respective properties under the
20 Manufacturer's Quality Control. The GCL manufacturer will also perform the
March 2009 SUVSWD Bayview Class I Landfi l l Permit Appl icat ion

Appendix O: Construct ion Quality Assurance Plan L.1irL.'^ .^ :u^. .^- .v
bentonite tests described under the Manufacturer's Quality Control and third-party tests.
Tab le 3-2. S t a n d a r d Tes ts o n G C L Mater ia l
TEST ITEM TYPE OF TEST STANDARD
TEST METHOD FREQUENCY OF TESTING
4
5 6 7 8 9
10 11 12 13
14
15
16
17
18
19
Manufacturer's Bentonite(A) Free Swell(A) Quality Control
Fluid Loss(A)
Geotextile Grab Tensile Strength(B)
Mass/Unit Area
GCL Product Grab Tensile Strength(B)
Conformance Testing by 3rd Party Independent Laboratory
Clay Mass/Unit Area(C)
Permeability(D)
Lap Joint Permeability(D)(F)
GCL Product Clay Mass/Unit Area(C)
Permeability(D)(F)
Direct Shear (F)(G)
ASTM D 5890 per 50 tons and every truck or railcar
ASTM D 5891 per 50 tons and every truck or railcar
ASTM D 4632 per 200,000 ft2
ASTM D 5261 per 200,000 ft2
ASTM D 4632 per 200,000 ft2
ASTM D 5993 per 40,000 ft2
ASTM D 5084 per week for each production line(E)
ASTM D 5084 Per each material and lap type
ASTM D 5993 at least 1 test per 100,000 ft2 and ASTM D 4354 procedure A
ASTM D 5084 per 100,000 ft2
ASTM D 5321 Per GCL/adjoining material type
Notes: A - Tests to be performed on bentonite before incorporation into GCL. Free swell shall have a minimum test value of 24 ml. Fluid loss will have a maximum value of 18 ml.
B - For geotextile backed products only. Geotextiles will meet minimum manufacturer's criteria. C - Minimum test value of 0.8 Ib./ft^ on an oven dry basis (zero percent moisture).
D -1 X 10° m /m /sec or as required by the permit,
E - Report last 20 permeability values, ending on production data of supplied GCL.
F - Test at confining/consolidating pressures simulating field conditions.
G - Not applicable for slopes of 7H: IV or flatter. Testing must be on material in hydrated state unless GCL is to include geomembrane on both sides of GCL.
3.3.2 Delivery, Storage, and Handling
Packing and Shipping
The GCL will be supplied in rolls wrapped individually in relatively impermeable and opaque
protective covers. The GCL rolls will be marked with the following information:
• Manufacturer's name;
• Product Identification;
Appendix O: Construct ion Quality Assurance Plan March 2009

Appendix O: Construction Quality Assurance Plan
1 • Roll number;
2 • Roll dimensions;
3 • Roll weight.
4 Storage and Protection
5 The rolls will be stored on-site by the Contractor until installed. After Contractor
6 mobilization, he will store and protect GCL from dirt, water, ultraviolet light exposure, and
7 other sources of damage. He will also preserve the integrity and readability of GCL roll
8 labels. Rolls must not be stacked higher than recommended by the manufacturer to preclude
9 thinning of bentonite at contact points.
10 3.3.3 Installation
11 The GCL will be handled in a manner to ensure that it is not damaged as recommended by the
12 GCL manufacturer. At a minimum, the following will by complied with:
13 • On slopes, anchor the GCL securely and deploy it down the slope in a controlled
14 manner.
15 • WeighttheGCL with sandbags or equivalent in the presence of wind.
16 • Cut GCL with a cutter (hook blade), scissors, or other approved device. Protect
17 adjacent materials from potential damage due to cutting of GCL.
18 • Prevent damage to underlying layers during placement of GCL.
19 • During GCL deployment, do not entrap in or beneath GCL, stones, trash, or 20 moisture that could damage GCL. 21 • Visually examine entire GCL surface. Ensure no potentially harmfiil foreign
22 objects, such as needles, are present.
23 • Do not place GCL in the rain or at times of impending rain.
24 • Do not place GCL in areas of ponded water.
25 • Replace GCL that is hydrated before placement of overlying geomembrane and 26 cover soil.
27 • In general, only deploy GCL that can be covered during that day by
28 geomembrane.
29 • For needle-punched GCLs, add granular bentonite to the overlapped areas at the
30 manufacture's specified rate.
31 • Avoid dragging GCL on the subgrade.
March 2009 SUVSWD Bayview Class I Landfill Permit Application

Appendix O: Construction Quality Assurance Plan
1 • Vehicular traffic other than low contact pressure vehicles such as smooth-tired
2 ATV's or golf carts must not be allowed on deployed GCL.
3 • Installation personnel must not smoke or wear damaging shoes when working on
4 GCL.
5 Overlaps
6 The GCL must be overlapped to the manufacturer's recommendations, which will vary according
7 to seam location and climatic conditions. For needle-punched GCLs, apply granular bentonite to
8 overlapped area at a rate required by the manufacturer. At sumps, overlap GCLs at least 1 foot. At
9 the bottom ofthe collection sumps, two layers of GCL and two layers of 60-mil HDPE are
10 required as shown on the plans. Avoid placing seams on top of underlying seams.
11 In general, horizontal seams and mid-slope anchor trenches are not allowed on side slopes.
12 However, if prohibitive slope lengths cannot otherwise be overcome, the CQA personnel may
13 approve a glue-bonded seam.
14 Defects and Repairs
15 Repair all flaws or damaged areas by placing a patch ofthe same material extending at least 1
16 foot beyond the flaw or damaged area. Add granular bentonite to the overlapped edges ofthe
17 patch at the manufacturer's specified rate.
18 3.4 Geomembranes
19 Source testing and material quality control testing will be performed prior to material
20 installation. These CQC steps involve manufacture, fabrication, storage at the factory,
21 shipment and storage at the Site ofthe geomembrane and geotextiles. Manufacturers will be
22 required to certify thickness, width, length as well as chemical/resin formulation and material
23 properties in accordance with GRI Test Method GM 13. Manufacturers will be required to
24 submit information demonstrating testing of any factory fabricated seams. Information may
25 be required on factory storage and shipment where concems are identified. At the site,
26 records will be maintained on any material received (especially material received in damaged
27 condition) and on on-site storage and handling practices. Lining materials delivered to the site
28 will be inspected for damage by the installer, unloaded, and stored. Materials will be stored in
29 accordance with the manufacturer's recommendation. The storage will be such that:
30 • Unloading of rolls at the job site's temporary storage location will be such that no
31 damage to the lining materials occur;
32 • Pushing, sliding or dragging of rolls of lining materials will not be permitted;
33 • Temporary storage at the job site will be in an area where standing water cannot 34 accumulate at any time;
Appendix O: Construction Quality Assurance Plan March 2009

Appendix O: Construction Quality Assurance Plan
1 • The ground surface will be suitably prepared such that no stones or other rough
2 objects which could damage the lining materials are present;
3 • Temporary storage of rolls of lining materials in the field will not be so high that
4 crushing ofthe core or flattening ofthe rolls occur; and
5 • Suitable means of securing the rolls will be used such that shifting, abrasion or
6 other adverse movement does not occur.
7 Prior to installation, the contractor, material installer, and CQA person will inspect the
8 geomembrane to certify its adequacy. During deployment, the CQA personnel, the installer,
9 and possibly the manufacturer's representative will observe the layout, ballasting, seaming
10 and covering. Records will be maintained to verify proper panel layout, weather related
11 impacts (e.g. wind) and material handling. Once deployed, the entire roll or panel will be
12 inspected for blemishes, scratches, and imperfections. The CQA person will spot check
13 material thickness and observe field seaming and seam testing.
14 Installation of geomembrane liners will be in conformance with a quality assurance/quality
15 control plan. Tests performed to evaluate the integrity of geomembrane seams will be both
16 "destructive" and "non-destructive." All seams failing the non-destructive or destructive tests
17 will be repaired.
18 3.4.1 Trial Seams
19 Trial seams will be done twice daily during installation to demonstrate pre-quaUfying experience
20 for personnel, equipment and procedures. Trial seams will be performed on the identical
21 geomembrane material under the same climatic conditions as the actual field production seams will
22 be made. Trial seams will also be made whenever personnel or equipment are changed, and when
23 climatic conditions reflect wide changes in geomembrane temperature or when other conditions
24 occur that could affect seam quality.
25 3.4.2 Non-Destructive Seam Testing
26 Non-destructive test methods will be conducted in the field on an in-place geomembrane. These
27 test methods determine the integrity ofthe geomembrane field seams. All seams will be non-
28 destmctively tested. Non-destructive test methods may include vacuum box, or pressurized dual
29 seam tests. Seam sections that fail non-destructive tests will be carefully delineated, patched or re-
30 seamed, and retested. For failing fiision welds, the outer seam lip may be extmsion fillet-welded to
31 the parent sheet or cap stripped over the entire edge. For failing extmsion welds, a cap strip repair
32 will be used. All repaired areas will be non-destmctively tested by vacuum box methods. Large
33 patches or re-seamed areas may be subjected to destmctive test procedures for quality assurance
34 purposes. The fmal plans and specifications will describe the degree to which non-destmctive and
35 destmctive test methods will be used in evaluating failed portions of non-destmctive seam tests.
36 For the 60-mil HDPE, double-wedge thermal seams will be pressure tested at a maximum of 30
March 2009 SUVSWD Bayview Class I Landfill Permit Application

Appendix O: Construction Quality Assurance Plan >:SSSSI^!7II73^)r!^-vJSAWw35^SArr
1 pounds per square inch (psi) with no more than a 3 psi pressure drop over a 5 minute time period.
2 Tests will occur over a 100 to 1,000 foot distance. Other fusion-welded seams will be tested with a
3 2.5-psi vacuum box. Other testing will conform to recommendations ofthe Geosynthetic Research
4 Institute, as applicable.
5 3.4.3 Destructive Seam Testing
6 Quality control testing of geomembranes generally includes peel and shear testing of trial weld
7 sections prior to commencing seaming activities and at periodic intervals throughout the day.
8 Additionally, destmctive peel and shear field tests are performed on samples from portions ofthe
9 installed seams. Whenever possible, samples will be taken from within the anchor trench area.
10 Quality assurance testing will generally require that an independent laboratory perform peel and
11 shear tests of samples from installed seams. The samples will be collected fi'om the anchor trench
12 or in areas of suspect quality. HDPE seams will generally be tested at intervals equivalent to one
13 sample per every 300 to 400 feet of installed seam for extmsion welds, and every 500 feet for
14 fijsion-welded seams.
15 For dual hot wedge seams in HDPE, both the inner and outer seam may be subjected to destmctive
] 6 shear tests at the independent laboratory. Destmctive samples of installed seam welds will
17 generally be cut into several pieces and distributed to:
18 • The installer to perform CQC testing;
19 • The SUVSWD to retain and appropriately catalog or archive; and
20 " A n independent laboratory for CQA peel and shear tesfing.
21 Minimum shear strength based on five out of five samples tested for wedge and extrusion weld
22 seams on the 60-mil HDPE will be 120 pounds per inch in width. Minimum peel strengths for
23 wedge and extmsion weld seams on the 60-mil HDPE will be 78 pounds per inch of width. All
24 failures on the five samples must be film tear bond (FTB).
25 If the test resuhs for a seam sample do not pass the acceptance/rejection criteria, then samples will
26 be cut from the same field seam on both sides ofthe rejected sample location. Samples will be
27 collected and tested until the area limits ofthe low quality seam are defined. Failed seams will be
28 cap-stripped over the length ofthe rejected seam. All re-seamed or patched areas will be non-
29 destmctively tested, and approximately 10 percent of all repairs will be destmctively tested.
30 3.4.4 Geomembrane CQA Observation
31 The responsibilities ofthe constmcfion quality assurance (CQA) personnel for the installation of
32 the geomembrane are:
33 • Observation and documentation of the liner storage area and the liners in storage,
34 and handling of the liner as the panels are positioned on site;
10 Appendix O: Construction Quality Assurance Plan March 2009

Appendix O: Construction Quality Assurance Plan 1 OSr-
J • Observation of seam overlap, seam preparation prior to seaming, and geotextile
2 or GCL underlying the liner;
3 • Observation of destmctive testing conducted on welds prior to seaming;
4 • Observation of destmctive seam sampling, submission ofthe samples to an 5 independent testing laboratory, and review of results for conformance to 6 specifications;
7 • Observation of all seams and panels for defects due to manufacturing and/or
8 handling and placement;
9 • Observation of all pipe penetrations, boots, and welds in the liner; and
10 • Preparation of reports indicating sampling conducted and sampling results,
11 locations of destmctive samples, locations of patches, locations of seams
12 constmcted, and any problems encountered during installation. The final panel
13 plan indicating panel layout, seams, test locations and repairs will be provided by
14 the geomembrane installer, as a CQC requirement.
15 Protective soil cover (including leachate collection media) will be placed over the geomembrane
16 1 iner as soon as practicable.
17 3.5 Leachate Collection Systems
18 The purpose of leachate collection system CQA is to document that the system constmction is in
19 accordance with the design plans and specifications. Prior to constmction, materials will be
20 inspected to confirm that they meet the constmction plans and specifications. These include:
21 • Protective cover/leachate collection and pipe bedding materials;
22 • Pipe size, materials, and perforations; and
23 • Mechanical, electrical, and monitoring equipment (if utilized).
24 3.5.1 Protective Cover/Leachate Collection and Pipe Bedding Materials
25 Source quality control testing will be performed on stockpiled materials proposed for use in the
26 protective cover/leachate collection layer to define the material properties. Source testing includes
27 grain size and laboratory hydraulic conductivity in accordance with ASTM D422 and ASTM
28 D2434, respectively.
29 The Contractor will perform source quality control tests on each principal type or combination of
30 material proposed for use as pipe bedding material to assure compUance with specified
31 requirements.
32 Production testing of protective cover/leachate collection material and pipe bedding material will
33 be in accordance with Table O-1.
March 2009 SUVSWD Bayview Class I Landfill Permit Application 11

Appendix O: Construction Quality Assurance Plan :.*Mc.Jm.-%-dJix t z u " .
1 3.5.2 Construction
2 The leachate collection system foundation will be inspected and surveyed upon its completion to
3 verily that it has proper grading and is firee of debris and hquids.
4 During constmction, the following activities, as appropriate, will be observed and documented:
5 • Protective cover/leachate collection placement including material quality and 6 thickness. Equipment operating on the final layer thickness will be limited to low 7 ground pressures in accordance with the project specifications.
8 • Pipe installation including location, configuration, grades, joints, and final
9 flushing.
10 • Pipe bedding placement including protecfion of underlying liners, thickness,
11 overlap with filter fabrics, and weather conditions. Damage to the underlying
12 geomembrane will be repaired and documented in accordance with the project
13 specifications.
14 • Geotextile placement including coverage and 12-inch minimum overlap.
15 In addition to field observations, field and laboratory testing may be performed to document that
16 the materials meet the design specifications. These activities will be documented and should
17 include testing of pipes for leaks, obstmctions, and alignments.
18 The protective cover/leachate collection layer and the pipe bedding material will not be compacted,
19 except as a result of placement methods. No minimum density specification is required.
20 Upon completion of constmction, each component will be inspected to identify any damage that
21 may have occurred during its installation, or during constmction of another component (e.g., pipe
22 cmshing during placement of Protective Cover/Leachate CoUection layer). Any damage that does
23 occur will be repaired; and these corrective measures documented in the CQA records.
24 Surveying techniques and visual observation will be used to determine total thickness of Protective
25 Cover/Leachate Collection layer.
26 3.6 Electrical Integrity Survey
27 After the completion ofthe liner and protective cover/leachate collection system installation, an
28 electrical integrity survey will be performed to locate potential leaks in the liner. For this test, an
29 electric potential will be applied between the protective cover/leachate collection system and the
30 subgrade beneath the liner components. If a leak is present, current will flow through the liner at
31 the location ofthe leak. Holes as small as 2 mm can be detected within a few centimeters under
32 two feet of cover. The entire lined area, bottom and sidewall, will be tested using this technique.
33 This testing method is especially useful in locating leaks or damage that occurs during placement
34 of the protective cover. If any leaks are identified during this process, the protective cover/leachate
12 Appendix O: Construction Quality Assurance Plan March 2009

Appendix O: Construction Quality Assurance Plan
1 collection material will be carefully removed, and the leak located and repaired using standard
2 repair and testing procedures. The results of the electrical survey, including any repair
3 documentation will be included in the Final Certification Report.
4 A qualifled testing firm will be contracted to perform this survey. A detailed plan of operations
5 will be prepared by the testing firm and presented to the CQA officer prior to commencing liner
6 installation.
7 3.7 Final Cover Systems
8 A 34-inch evaporative cap constmcted fi-om moderately compacted olive-brown silty sand will be
9 used as the final cover system for the Bayview landflll. One compaction test will be performed for
10 each 10,000 square feet of surface area for each lift ofthe fmal cover. Compaction ofthe fmal
11 cover material will be between 75% and 85% ofthe maximum dry density with a moisture content
12 dry of optimum.
13 CQA personnel will also sample the soil to be used for the fmal cover and perform a grain size
14 distribution analysis in advance of cover placement. If the grain size distribution falls within the
15 range identified on Figure B-1 in the July 31,2003 letter fi'om Kleinfelder (see Attachment 0-2 at
16 the end ofthis Appendix), then the material will be considered suitable for use in the final cover. A
17 grain size distribution test will be performed for every 5,000 cubic yards of cover material to be
18 placed, and will be performed sufficiently in advance of placement so as to not hinder constmction
19 activities. Results of all tests will be recorded on forms similar to those found in Attachment O-l at
20 the end of Appendix O. Since the material to be used for final cover will be tested in advance for
21 grain size, third-party CQA personnel will be present as needed to test for compaction on each lift
22 at the frequency discussed above and so that cover placement operations are not intermpted.
23 The required thickness ofthe protective cover will be verified by survey methods on an established
24 grid system with not less than one verification point per 10,000 square feet of surface.
25 3.8 Surveying
26 A SUVSWD surveying crew or an independent crew under the supervision of a registered land
27 surveyor wiU perform aU major constmction staking activities. All constmction staking will be
28 performed utilizing conventional constmction layout practices. Site control will be provided by the
29 permanent site control points already established on site. All site control points are tied into the
30 state plane coordinate system as well as the site project coordinate system. During constmction, the
31 survey crew will determine elevation and obtain locations and elevations of as-built features. No
32 stakes will be allowed in the liner, protective cover or fmal cover systems except as required to
33 document potential erosion ofthe fmal cover system as discussed in Section 6.1 of Part II.
34 Surveys wiU be used to confirm total thickness of layers during placement of cover materials.
35 Surveying will include enough points to adequately determine the uniformity ofthe layer thickness.
March 2009 SUVSWD Bayview Class I Landfill Permit Application 13

Appendix O: Construction Quality Assurance Plan
1 The average distance between survey points will be 100 feet. For multi-lifVmulti-layer 2 constmction, visual observation and field measurements will be used to confirm layer thickness. 3 Measurements will be performed using surveying, excavated samples or other measuring
4 techniques. At regular intervals, record drawings ofthe newly constmcted features and the areas 5 filled will be prepared. The record drawings will document the fmal location, size, and elevation of 6 the constmcted features within the site. The record drawings wall become part ofthe fmal 7 constmction certification report.
14 Appendix O: Construction Quality Assurance Plan March 2009

Appendix O: Construction Quality Assurance Plan
1 4.0 DOCUMENTATION AND CORRECTIVE ACTION
2 Ongoing QC, CQC and CQA are designed to minimize deficient work and provide for corrective
3 action prior to completion ofan activity. The record-keeping and on-site observation activities are
4 further designed to provide documentation of compliance or non-compliance, and corrective
5 action.
6 4.1 Corrective Action
7 For work or physical components that do not satisfy plans and specifications, the general actions
8 may include:
9 • Removal and replacement; and
10 • Altemate welding or patching for geosynthetic components.
11 Along with the final constmction plans and specification, the CQC and CQA programs and 12 personnel will identify the deficiency and its extent. They will also ultimately defme the form or 13 extent of corrective action required.
14 If materials are found to deviate fi"om specified standards, they will either be rejected or their
15 suitability demonstrated by additional testing and analysis. A goal ofthis CQAP is to prevent the
16 inclusion and subsequent removal of defective or inappropriate materials by providing an orderly
17 process of checks prior to fmal installation.
18 4.2 Documentation
19 Documentation will be used to demonstrate the quality of materials and the condition and manner
20 of installation. The overall documentation will include:
21 • Detailed plans and specifications (final design);
22 • Contractor shop drawings and material certification reports, with an engineer's
23 review;
24 • Records of on-site observation, via the CQA officer or the CQA officer's staff;
25 • Material laboratory test results, both by contractor and independent laboratory;
26 • On-site test results; and
27 • Final Certification Report.
28 The final certification report will include observations, test results, sampling locations, 29 locations of blue tops in the final cover, corrective measures performed, and other 30 information required to certify that the CQAP has been carried out and that constmction
March 2009 SUVSWD Bayview Class I Landfill Permit Application 15

Appendix O: Construction Quality Assurance Plan
1 meets or exceeds the design criteria and specifications in the permit. Example forms for 2 recording observations and data collected during the QA/QC process for cell constmction and 3 closure are included as Attachment 0-1 at the end ofthis Appendix. The final report will be
4 submitted to the UDEQ.
5
6
7
9
10
11
12
13
14
15
16
17
18
19
20
21
22
23
24
25
26
27
28
16 Appendix O: Construction Quality Assurance Plan March 2009

APPENDIX O
ATTACHMENT o-l:
EXAMPLE FORMS FOR CELL CONSTRUCTION

CERTIFICATE OF ACCEPTANCE OF SOIL SUBGRADE
Geosynthetic Installer Proiect: Bayview Landfill Address Location: Utah Countv
Owner: South Utah Vallev Solid Waste District
I, the Undersigned, the duly authorized representative of do hereby accept the soil subgrade surface bounded by
as an acceptable surface on which to install and shall be responsible for maintaining its integrity and suitability in accordance with the project specifications from this date to the completion ofthe installation.
Name Signature Title Date
Certificate accepted by CQA Manager:
Name Signature Title Date
Certificate accepted by Owner:
Name Signature Title Date

Panel Number
Geo!
Roll Number
textile Panel Placement
Date Installed Overlap Confirmation
Side End

Project Name: Bavview Landfill
GCL Panel Placement
Panel Number Roll Number Date Installed Overlap Confirmation
Side End

Sheet No. of
CQA PANEL INSPECTION FORM
PROJECT NAME: Bayview Landfill
PROJECT NO.:
CONTRACTOR:
DATE PLACED
PANEL NO.
GEOMEMBRANE TYPE:
INSTALLER:
SUBGRADE CONDITION
WEATHER CONDITIONS
DEPLOYMENT METHOD:
SHOW PROJECT NORTH
Panel No.: Date Defect : Defect Description
Repair ' '•- Dat^'!- • Repair Type
Approved By
Panel Length
Panel Width
Panel Area
Roll Number
Technician Comments

Date Page of_
SMOOTH / TEXTURED GEOMEMBRANE PANEL PLACEMENT SUMMARY
Date Time Panel
Number Roll
Number Length (feet)
Width (feet)
Area (SF)
Average Thickness
(MILS) Comments

Sheet No. of
CQA SEAM INSPECTION FORM 1 PROJECT NAME Bayvlew Landfill
PROJECT NO.
CONTRACTOR
INSTALLER
WELDING TECH.
TYPE OF WELDER
DATE WELDED
SEAM NO. 1
SEAM LENGTH
COMMENTS
WELDING UNIT NO.
TIME WELDED
QUALITY ASSURANCE SUMMARY 1. VACUUM BOX TEST
Zone Length Date
Tested QC
Technicians Initials :
Numnber of Defects Found
Date Repairs Made
Date Retested
Date Inspected
and Approved
2. AIR PRESSURE TESTING |
start Start
Pressure (psi)
End Time
End Pressure
(psi) Zone Length
(feet)
Pressure Loss (psi)
Approved (Y/N)
If No, Corrective
Action Approved
By
LEGEND 1 Zone 1
Air Pressure Zone Repair Needed Repair
Completed Repair Tested Repair
Approved Destructive
Sample Cap Strip
Repair
3. SEAM REPAIRS (PATCHES) |
Repair No. Defect Type Date/NDTType Approved By
Panel No.
Panel No.

Client
Date
Project
Project Location
Project Number
Defect CocJe:
SUVSWD Technician
Bayview Landfill Sheet:
Density:
BO - Burn Out
BS - Boot Skirt
CO - Change of Overlap
CR - Crease
D - Installation Damage
DP - Destructive Sample
EE - Earthwork Equipment
Ext - Extension
FS - Failed Seam 10 - insufficient Overlap
Textured
HDPE
Smooth
VLDPE
MD - Manufacturer's Damage
PT - Pressure Test Cut
SI - Soil Irregularity
SL - Slag on Textured
T - Panel Intersection
VL - Vacuum Test Leak
WD - Wind Damage
WR - Wrinkle
WS - Welder Restart Other -
_Mil
LLDPE
Repair Type:
B - Bead
C-Cap
P - Patch
Geomembrane Repair Log Repair
# Seam/ Panel
Location East/South Code Date
Machine # Time Type Size Tech Test Date
g %

APPENDIX O
ATTACHMENT 0-2:
FINAL COVER GRAIN SIZE DISTRIBUTION
AND
EXAMPLE FORMS FOR FINAL COVER CONSTRUCTION

Final Cover Material - Grain Size Distribution
Test Location Depth Date Test# Pass or Fail
Attach copies of grain size distribution tests.

Project Name: Bayview Landfill
Final Cover Placement - Compaction Tests
Test Location Lift Date Compaction % Pass or Fail


APPENDIX P
Cell 2 Geosynthetic Analysis
SUVSWD Bayview^ Class I Landfill Permit Application

%
•:y\';y-:y--y-^^
ISSUED JULY 1996
PICPARED BY
HDR ENGINEERING, INC

TABLE OF CONTENTS
Calculation Title AttaghmgntNO-
Liner Slope Stability P-1
Liner System Stresses P-2
Anchor Trench Design. P-3
HDPE Geomembrane Puncture Resistance P-4
Geotextile Penneability and Filtration P-5
Piping Strength/Deflection P-6

ATTACHMENT P-1
LINER SLOPE STABILITY
«

JobNa Na
HDR Computation
Subject
Task
ii
mm I
i
KRt U A O « ? . ^ U : : ^ ' ^ ~bes.tCs»-i
L \N5D> *S-C>pg: ^°^^ABaV^-^'^
Computed
Checked
TZiLA^
/ 4 ^ Sheet i
Data (^/?^
loate 9 - / ^ ' f 6
Of
• / Considerat ion: StaMitv of Soil Cover - Verify that materials cveilying the geosynthetic system mO not sUde. Use USACE 2-wedge slope stabflity method.
' References: (a) Ricfaardson and Koemer, Gtosynthetie Deagn Gtddance for Hazardous Waste Landfai Cells and Siaface Impoundmenis, EFA/600/2-87/097.
(b) Geosynthetic Research Institute, Stability Anafysis ofMuUilined Slopes in LandfiU AppUtMtions, GRI Report 8.
(c) Koemer, Designing wiOi GeosynOtetics, 3ed., 1994.
. 3 Required Material Properties
GS.-GS or GS:Soa friction, 5
Value Test
Direct Shear
Standard
ASTM D5321
^ Analysis Procedure:
O AlK.xX'
" « « . i \ (eK^%iit j,Aju^ « O fifc. k O k e ^ v O
( i ) S O L - N / 6 ysec- f . S . . B H ^ T e j A I - - 4 * ^ t ^ - € t z - t g J ^
1. Assume FS
2. Find P from
y_ Wl(laii»iiii/PS)-t-(e. /FS)n>/rinP) cBsa - (iacUtatt^ / FS)
3. Find N2 from
N2 a (W2)cosp - Fsin(a-^
4. F i n d 82 from
S2 = (W2)sin0 • Pcos(a-|3
5. Calculate FS from
fS-(N2)bnCr -t-c^rOt/sfaip)
S2
6. R e p e a t S teps 2-5 w i t h N e w F S , O i e c k i n g fo r C o n v e r g e n c e o n FS

JobNa Na
HDR Computation KR IProject
Subject
Taak
I Computed Data
Checlced Data
Sheet Of
.6 INTERFACE FRICnON VALUES
%
. INT
1 2 3 4 5 6 7 8 9 10
UPPER COMPONENT
(S»^6*^uj_«*^ U c ^ e * •
^igivjf: e^cre^pr^^-e-t O N s v ^ Sw\w.yA ' . Jc^?^
kjvj. (luLSc i«»v\ 6fee>•^»a^v* . 1
LOWER COMPONENT
V N W Q J Ti^iof 6['SDiejmve IjO iv\.\,\_ Sivvotsyvk ^^Vi^S
Mv)0 CUxiHitjv^ S^sspajm^ Stovw &>-os.-&j52Jb.icse
\
REF
UCT
U T urr u r
.
INTERFACE FRICT[ON
- 2 . 1 " q o ^ q ' -»*-•zr[°
.
* Critical value for stabiliQ^ analysis
.7 PROGRAM INPUT
Parameter
Height of cover soil Width of cover soil at bottom Finished slope angle /'iVi 4- • Liner slope angle Soil friction angle 0^ Interfece friction angle Unit weight of soil Saturated unit weight of soil Total surcharge load Thickness of submerged soil Seismic coefBcient (-z^ Available tension force in system
Units
ft ft.
deg deg deg deg pcf pcf plf ft. • -plf
Trial No. 1 1
40 & . ^
\ ^ 1^ ^ i p ^ P
\oo
ue \'Soo
I O.Vio
0
2 •
3 4 5 6 7 8
v ^

JobNa Na
HDR Computation KR IProject I Computed Date
Subject Checked Date
Task Sheet Of
~ \
o p , - J S K U I S CU^SVtV*-^
j o o o
tA '^ viuT
V)v«pj6 (^ = pveoiM-s^pt- •?eis«v\ic oEse^j^te-trj-
f^ p-^ r Ctv^^SJ
v ^
• ^
^ ?&
VUJT

JobNa Na
« HDR Computation
IProject I Computed
Subject Checked
Task Sheet
KR Date
Date
A=. Of
BAYVIEW LANDFILL CELL 1 LINER AND LCRS CAP SLOPE STABILITY STATIC AND PSEUDO-STATIC ANALYSES
(INFINITE SLOPE W
SLOPE PROPERTIES height slope length
LCRS PROPERTIES thickness density
INTERFACE FRICTIO friction
40.0 14.0 165.3
2.0 100.0
N 9.0
(ft) (degrees) (ft)
(ft) (pcf)
(degrees)
ETHOD) 1
FACTOR OF SAFETY Treinf (klf) 0.0 1.0 2.0 3.0 4.0 5.0 7.5 10.0 12.5 15.0
Seismic Coefficient, (-) 0
0.64 0.76 0.89 1.01 1.14 1.26 1.57 1.89 2.20 2.51
0.1 0.45 0.54 0.63 0.71 0.80 0.89 1.11 1.33 1.55 1.78
0.2 0.35 0.42 0.48 0.55 0.62 0.69 0.86 1.03 1.20 1.37
0.3 0.28 0.34 0.40 0.45 0.51 0.56 0.70 0.84 0.98 1.12
0.4 0.24 0.29 0.33 0.38 0.43 0.47 0.59 . 0.71 0.83 0.95
0.5 0.21 0.25 0.29 0.33 0.37 0.41 0.51 0.61 0.72 0.82
*

Job^kx Na
HDR Computation
IProject
[Subject
Task
Computed
Checked
Sheet 5"
KR Date
Date
Of
3.00
0.1 0.2 0.3
SEISMIC COEFFICIENT
0.4 0.5

JobNa Na
\ HDR Computation KR I Project Computed Date
Subject Checked Date
Task Sheet Of
o ( A \-
• ^ S " (o S P <=f <o f/ l2_ »5
\€0 1.
C 7 I 3 ^ ^ ^ ^ ^ 9 t o , ;
<€L/'Jf^c^c-err,^rJ' iS-f^io-^ 5 7 " . CKJ-f=)
i z - (=S f*4

JobNa Na
HDR Computation KR I Project I Computed Date
Subject Checked Date
Task Sheet i- Of
'° QjJ^CMi. ^ l -l-UJgfcXjg htef i t<3a
J'.vi. , ' . - J , i _ - . . . . - . ..
' ' : : ' • • ' • ' - k ' . ; , . - ' - .
. :^- , iZ,-".ntl-- iv^-:J- . v*-^' t^^SS^'jC*^;
******* LIMIT EQUILIBRIUM ANALYSIS OF COVER SOIL *******
*************************************************************
*************************************************************
************************ DATA *************************
*************************************************************
HEIGHT OF COVER SOIL: 40
WIDTH OF COVER SOIL AT BOTTOM:
FINISHED SLOPE ANGLE (DEGREES):
LINER SLOPE ANGLE (DEGREES):
SOIL FRICTION ANGLE [DEGRES):
INTERFACE FRICTION ANGLE(DEGREES):
UNIT WEIGHT OF SOIL (Ib/cu ft):
SATURATED UNIT WEIGHT OF SOIL (Ib/cu ft)
TOTAL SURCHARGE LOAD (lb): 1500
THICKNESS OF SUBMERGED SOIL:
SEISMIC COEFFICIENT: .16
AVAILABLE TENSION FORCE IN LINER:
8 . 2
14
14
32
9 . .
100
C x f : s»/v<rts-^-\ v V b ^
- ^
115
KA SstSPMO A»-)tiL^'&\e3 MitSSS?.. j=&p. /.<(•= 5oe*A
*************************************************************
******************** FACTORS OF SAFETY ********************
*************************************************************
CASE
SELF-WEIGHT OF SOIL
SELF-WEIGHT + SURCHARGE
SELF-WEIGHT + SEEPAGE
SELF-WEIGHT + SURCHARGE + SEEPAGE
SELF-WEIGHT + SEISMICITY
SELF-WEIGHT + SURCHARGE + SEISMICITY
SELF-WEIGHT + SURCHARGE + SEEPAGE + SEISMICITY
FACTOR OP SAFETY
0.720
0.528
0.532
0.431
0.428
0.320

Job t to Na
%
HDR Computation
[Project
Subject
Task
KR I Computed Oete
Checked
Sheet
; - 4 ) S ^ ; ,*A.'.*.i'-v.f.»^-''-CA' •
Date
3 Of
CASH FAILCKB BBIGHT
SBLF-WEIGET OF SOIL 9.840
SSI1F-HSI6BT -f StJRCHASGB 8.010
SELF-WEISSr + SEEPAGE 5.610
SELF-WBIGBT + SURSEASGS + SEEPAGE 4.430
SELF-HEIGHT + SEISMICITV 3.350
SELF-HEIGHT •)• SCRCEAXGE -i- SEISMICITY < 2.044
SELF-HEIGHT + SCRCHARGE + SEEPAGE + SEISMICITY < 2.044
«^«**«•«****»••••**••**•*•••*•*******•*•*********************
3i'# M#l«Si'Sf' ' ' ''J'- ^ ^ ^ ****** TENSION FORCES POR SAFETY FACTORS EQUAL TO 1.0 ••••** •k_ .',„ -.••. '..* -'. •.-••.-. ^ ^ ^ ^ ^ ^ ^ ^ ^ ^ ^ ^ ^ ^ ^ ^ ^ ^ ^ ^ ^ ^ » » j j ^ ^ j * * » * * * * * # » * * * * * * # * * * # * « * * # * * * * * * * * * *
• : . \ i ^ * " ' c
CASE
SELF-HEIGHT OF SOIL
SELF-HEIGHT -h SXJRCRARGE
SELF-HEIGHT .f SEEPAGE
SELF-HEIGHT + SURCHARGE + SEEPAGE
SELF-HEIGHT -t- SEISMICITY
SELF-HEIGHT + SURCHARGE + SEISMICITY
SELF-HEIGHT + SURCHARGE + SEEPAGE + SEISMICITY
TENSION FORCE (lb/ft)
2180.926
2313.289
4039.125
4171.489
7502.S87
7877.018
10136.543
****••*•**•**•*••••••••••••••*••*•***«*•*••*•*******•*»••****
**************** caiOSEN FACTORS OF SAFETY *****************
*************************************************************
CASE
SELF-HEIGHT OF SOIL
SELF-HEIGHT + SURCHARGE
SELF-HEIGHT + SEEPAGE
SELF-HEIGHT + SURCHARGE + SEEPAGE
FACTOR OF SAFETY
1
1
1
1
300 - <
300
300
300
i : :•:-:•:

JobNa Na
HDR Computation KR [Project
Subject
Task
I Computed
Checked
Sheet
Date
Date
Of
SELF-HEIGHT + SEISMICITY 1.000
SELF-HEIGHT + SURCHARGE + SEISMICITY 1.000
SBLF-WSIGHT + SURCHARGE *• SEEPAGE + SEISMICITY 1.000
******************************************************
*«•• MAXIMUM HEIGHTS FOR CHOSEN SAFETY FACTORS •••**
Ci)>u-= "SooM -^w. WsiO.^^^
CASE
SELF-HEIGHT OF SOIL
SELF-HEIGHT + SURCHARGE
SELF-HEIGHT -* SEEPAGE
SELF-HEIGHT + SURSHARGE + SEEPAGE
SELF-HEIGHT + SEISMICITY
SELF-HEIGHT + SURCHARGE + SEISMICITY
SELF-HEIGHT + SURCHARGE + SEEPAGE + SEISMICITY
MAXIMUM HEIGHT
5.670
3.840
3.853
2.530
3.350
< 2.044
< ' 2.044
» ************************************************************* ****** TENSION FORCES FO R ' ^ A P E T Y FACTORS EQUAL TO 1.0 •***«**
****»•****•**•*•••*******•*••**•****•*•*«•********•«********«
CASE
SELF-HEIGHT OF SOIL
SELF-HEIGHT + SURCHARGE
SELF-WEIGHT + SEEPAGE
SELF-WE-iGHT + SURCHARGE + SEEPAGE
SELF-HEIGHT -i- SEISMICITY
SELF-WEIGHT + SURCHARGE + SEISMICITY
SELF-WEIGHT + SOHCHftRGE + SEEPAGE + SEISMICITY
•t-•;'•:
-..-* • TENSION FORCE (lb/ft)
3482.095 N j ^ . Sj-^asD ^ ^ Vv!>f\ht'fe ^V-Cpg....
3667.654
5045.737
5231.29E
75q2_.5B7
7877.018
10136.543
• • • - ' - , ^ -
_v/."^....-.$A "^^^ f o ^ vOPcrviTE" 3 ^ ^ * « .
v i C ? •oJXfv.WvtAU' ^
J I -
'!<.--•>...-.' • ' • ' ' • • ' " • , ' ' . * • • '

\
JobNa Na
HDR Computation KR [Project I Computed Date
Subject Checked Dete
Task Sheet Of
U fea^ C^C^ un ^
T ^ o : = «'\ 2-=o * / ^

ATTACHMENT P-2
LINER SYSTEM STRESSES

%
HDR Computation KR I Project "uM^lt5lJ UdJh^VJU ( JSJU. \ . ^NeiC 2-
Subject
Task
mm AWWIHGV
'. fiaSaSM!
I *
f , \ v ^ ,^^^^<.\f^f^
L^OE^ Sc^'^fgK "SJHZJC 'sJg. ^
[computed
Checked
Sheet
\2-'U:=>
/ ^ i ^ /
Date '/ 'y.fe
Date ? - / f ^ 4
Of
• / Consideration: Tensile stresses - Detennine the Factor of Safely against tensile stresses developed in geosynthetics due to unbalanced ficiction forces.
• 2 References: (a) Richardson and Koemer, Geosynthetic Design Gtddance for Hazardous Wasu LandfUl Cells and Surface Impoundments, EFA/600y2-87/097.
(b) Koemer, Designing widi Geosynthetics, Sed., 1994
. 3 Required Material Properties
GS:GS or GS:Soil friction, 8 Lx^5>> .E0>Jf. <STT
Geosynthetic tensile strength, T a s t v j ^ < ^
_aMSfcfcssv\_is:(..- ..:
Value Test
Direct Shear
Wide-Width
Standard
ASTM D5321
ASTM D4885
• 4" Analysis Procedure:
( l ) C O ^ H J P K K ! ^ Tg»JS tUE $ p e J 6 S & l O Gtfeo»M«OT*tt:^g- C«v.>t>ev>iCKT
T - l ^ j - W ' L - t L - W ' I .
TsC-t'O^-na^o. ^Y-H • eosa
^•i C^+T* H" eo* ai • no Bl
\;f"UCrti-Cj)+T*H-eosO'(t«So-«
t u VJswiopt
<W iSM-L «r KB i r t t rw T»tL'W'L .
(b)Viu< V'S> l.fiil—'"ti^iciteftit-tJbaetinWIiml. (c) i rv>\>H aqr bo.'crc l.wWckdcfcadenteTniM
. ta i fS. lMtg-W-L-T- fvW-L
(t"^ t^e-tCfe-Kxw^g K>Ju«"Jtie>t-g " ^ O s * * ^ * ^ &B^Sl4•>^T»e^vc- da^>.p<moJ^
«£u. fe)-(^)
^ 5 - CTluijoco
^ B c r o
( • ) ' ^ S ^ p e K f ts^gps 1- ^ ^=°e- u = » j i ^ efejs.^t^ \iJ •i.vir<^>-\

JobNa t4a
HDR Computation Km IProject I Computed Dale
Subject
Task
Checked Date
Sheet Of 3
.S Sn^^ iH ^ ^ ^ 5
VI
\ ' O.\lo^ -Tks
/Cf \ ^
t^.
f r <= y ^ c e o 'uf . -SiO \J^
^ \ < N ^
H-4^'
"^^a.^ = ^ '?ci<i. 5n<(\c^ WIL - 1,
^fV'^ '
o o o
^.fWs "
"1,^&3 'wf + -35,coo ' ^ • 0^\^
— -Z.\-i ' ^ /u f V"
-c: ' ^ - ^ - ^
S-OU,3*>'Lf -^

JobNa Na
% HDR Computation
IProject
Subject
Task
^ u
5 , o - \ \ •* /u^ >^
I Computed
Checked
Sheet
KR Date
Date
Of
#
Sg\'SvAVC- T s
• l ^ S>ov^_^ v ,^ r T f e : ^ J P = < i s C ^
o

ATTACHMENT P-3
ANCHOR TRENCH DESIGN

I jobNa Na
HDR Computation
Project i W v S t J l A v J l S F v r J U .
Subject
•M i l l saagq 'Z^iMUtj
5i?2S ,
-mm I
J
#
KR Ceuo \ , tJTT Ae 2- I Computed ^ C - 2 ^ Oate fcy%
Uv^KSafL. " V ^ ' SVSnO Ich^dced P ? ^ loate l - f ^ ^ ^ j
Task ^^»K^CUo^" ' ^C j5UC3t< . [Sheet / Of 4-
/ Consideration: £MkAl£M25^fi£.-^*.t«aLjLT«\u*Ma« ^APA^.TY F.^ F M L P L A C K O i i J V l L « i « a * lk,M«H«aA<;e ^ - u F i ^ j i i a A T i - u * .
i i - \ ( S
.3 Required Material Properties
• j « i L r a i c T i ' U AMqLE:
D<llt HtC Hawiua
Range Test
T t l l A ^ l A L
Standard
4 Analysis Procedure:
( O P t F i u e f U j ^ H « i . ^ A B l A & L f i >
- t H B £ P M t i - < Lcui^TX , L
H o g i Z o f c j T A L ^ i j ^ » g
• M » > T E « i A l .
-5» i» . U u i T ' - * ' « i ' ' T j V ^ 3
T % 1 - T ^ u S
( D ^ V . » ^ - S . u ^ T i u a S
g:rMjifff<rt AJNKHXK
* V * fkUC-MaQ
Km>J«^"Tiit»J«H
K'-K;»«K.

JobNa Na
HDR Computation
I Project
Subject
Task
Computed
Checked
Sheet
KR< Date
Date
Of ^
.s- Stt^sj-cH
er GRAva SURFACE IS 15' WIDE - ^
TYPE 1 GEOTEXTILE \ . / AND GEOMEMBRANE ANCHOR TRENCH^ X ' / ANCHOR TRENCH
- 2 ' PROTECTIVE COVER/ LEACHATE COLLECTION MATERIAL
-TOE OF SLOPE
TYPE 1 GEOTEXTILE (UPPER CUSHION)
GEOMEMBRANE TYPE 2 GEOTEXTILE (LOWER CUSHION)
SECTION r 1 NO SCALE I c - g
TYPE 2 GEOTEXTILE (UPPER CUSHION)
GEOMEMBRANE TYPE 2 GEOTEXTILE (LOWER CUSHION)
Si^-^:^5> Arv/di^:5g5 /JhicA^je: MiKli/nti i , tq f -^ss. /hJ cSJeosv-zv/TTweTZcs ,
L / ; ^ . / h ^ / / M A c ^ /O-J^iLMs/S- J E J ^ A / C J I " SAfetoVv-' A - ^ O I / ^
J '
K
X-
\(^^ NO ^ / ^ ^
«.u.
b\JL'£. T O ' t ^ \ ^ \ . t H j ^ ^
v ^ c"p'rv^ ffvv, ^AO

jobr«L Ma
%
HDR Computation
Project
Subject
Task
I Computed
Checked
Sheet
KR Date
Date
Of 4 -
f t> - T f / l ^ c a j Z i
SKv^e. s.akS- 'Y f^^^^V**^ "*^T^ " (.tfeS. t . ^ TSi^-f Gq"
V,
"p^ = 'F3LJ+ f \_
f o ^ U
i p r
(?7
J22s>f>ir
•770 p r '
i ^ ' i f i r
3( -2. p r
l -Si tJ^2^= 0.4-7
rr -

JobNa Na
HDR Computation KR^ [Project
Subject
Task
I Computed
Checked
Sheet 4~
Date
Date
Of 4 -
L i t e " f S " U \ 0 - p 3 \ t j £ «x^-kjAo(f^ npjt&VOcjJ. M=rMO>'SX' -ces-S^AlC-e^fCYvT
= Uio » &^-2JOO "^f^Jr

ATTACHMENT P-4
HDPE GEOMEMBRANE PUNCTURE RESISTANCE
%

JobNa
HDR Computation
[Project
Is Subject
, i A i A « i a i n «
c f t i L u w w
KR* I Computed g J - &
^
Checked
Sheet [Task Vaspe. 6ge.ov^He^2jMOgi."v(jo,.: grujgg ggg^^-aT^QiLe'
IDate T H b
Date 7-/ 'y-<»^
Of
.?> / S S O ' B . A/JAT^. "T^ia-f
A^^ry^^e Ma^ Ace.
(/A(.ue T**^ Sie.)/e,
Af f i / T foo
y4S7^ O^UfhA-ZZ.
4- At/Ao^sis J^oc£2>uiz£ :
( i ) 7:>€re.iz.Hfje G S J O T S ^ L . ^ A/ffns/Afusfi.
f ^ j o w 0«Mc>6^..k^>A o f
^*<^*: : C H (CmS fm&uj-) *• MSA ^ uuirs A/te AJCM£S
er
3 ° ^ '
Figtirc
Mass / Unit Area (ozJ sq. yd.)
9(a) - Effect of Nonwoven Needle Ptinched Geotextile Mass / Unit Area

% 0 ^
GRAIN SIZE ANALYSIS CURVES
U.S. SlondaiJ Sitva Optalnsi In Inthii
, „ 0 3 7 VA 1 '/H V, V,
80 -
. ? An - -
._ 60 - . * >• •Jt
J. 5 0 - -e
S 4 0 - -•
in -
• -
•1
'
'
I
1
1 1 1
-
1 i J O 1
-
-t ! i
•
I 1
i
;
' * ' * ^ ' "
• •
i
i
j
1
j i
IOO s o 10 5 I
I
Wet Uni t Weight
Drv Unit Weight
Void R a t i o
P o r o s i t y
S p e c i f i c G r a v i t y
Hydrau l i c Grad i en t
C o e f f i c i e n t of P e r m e a b i l i t y
liniraura Dens i ty Mi
U.S. Sloiidord Slivt Nunbiii
20 3b 4 0 \ S O 70 100 140 2 0 0
r = -**^
'^^ L N
' si
. \ 1
s ^ ' \
N
^
Vs A \ \ \
4
\ \ ' \ i \
sA i \ \ \
V \Vi \A\
Vll\ 1 ,
\ : \ \
\ ' v \ -
\ \
\ ; \ \ - -
\ N
. _ -
1 1 ^ 1
• \\l I
3
V**
^
1
1 Lt:,^-1
sfpr-s-^ II
•
•
1
10
3 0
3 0
40 5 3
n 0
50 2 • a-
6 0 "^
7 0
ao
9 0
IOO
O.S o.l 0.074 \ 0.01 O.OOS 0.001
Orain Size In Mllllmetert
ixlmum Dens i ty
Remarks L^-^^SA^V?^ «CN-=*»rSfc.
D r i l l Hole No. • i j rccv.9\uS Sample No. \-A- ^"^
Sample Depth: G>^s> ' s£v« 'F>v-5S3
F i e l d Blow Count Mtk
P r o j e c t : ~B».v^vievO \.iA.Sti^\>->—
Date : Job No. • — •
- • - < . .
i ^ 1
~"

JobNa hk]^
HDR Computation
[Project Computed
Subject Checked
Task Sheet
KR!» Date
Date
Of
/ 44 -
1^
<c) beree-MiOfc -e ts?ju\\£gt> ofeo-^e^ts H^«=;«=, | twLiSA. f jzov^ ^s \Ao6.fA?t
Vk| ^ ' IZ. ©=r/$a *v. o ^ —<i -

%
ATTACHMENT P-5
GEOTEXTILE PERMEABILITY AND FILTRATION

JobNa Na
HDR Computation KR< Project D^^^^/vc>J Lu»..aT^tu.- ( C e u - \ tKi 'QS.'Z. Computed 1Z^V- j> I Date 7/qC,
Subject Lg^k^aVA'T^ G O U J & C A ^ O V N ' ^ V ^ T S H Checked IML Date l - - / * t ^ (
Task Of
j^(y«iiNM(ii J
U ^ g - t ) NNt>T\, - (!yeD"VeSTSV-fc . Q^-Hgfe^gtV-'^V^V fiC^^Ap.'*^ [sheet /
2 ^ e o ' t t . T*AtTu'v^2«^.
/ ^ e r b e f j l^Miit^
Jlppa/eriV 0^»,^a S%t« I '^ r
V#^«a&6
T ^ O
TeST
51 eve
^ArmD»
.4- KK^^JJJI^^ 'RbocSbvk^:
(tl) _S/^)|Ai^g_^^gvV222JL^i5S:^2IIL.^:i^Si£i.
Mw 0.002 IMS
lESSTMANlOXOAy.
M» ' 0.00> DimAM) d«.0.e7Siniil
use a TO a MCICS OF F M SAND BCTIVEEN
etQTg«Tt.e «S /> FJi tR FPU THC SAW)
FROM soa. FKOnRTCSl
TESTS ,
O..-C 21 iwii ^ l o ^
USS THAN n r . F»es. THAW M »
liiOBtTHAM»oy.e«Aml
FAWMI3 lit* Cc * 3). WETtmiBH c t . . , ^ ,n^ uastiyHoffue
' • " T O O a T A M C i .
o« j» j ;
aTHANUr . / •••" I^IJHSTAIIE U K S T M O t T U ES. ANO LESS / VSOt. *«HI«I*|T0 iM»oy.(Mwn. \ J , , ice.j «<!«.»
• M m n t A AmjCATIOM \ FWORS us t STflABHT U C
4.ami4 ^ ^
:D/MED«JM e.>. u f t A , I \ m r . •i,<es7.i
\ BHISE O w 2Cu<i;.. Do- esxi
^ 3 ) 6v/^V-Xu>.-\^ G t e t g ^ e ^ r \ > . £ "V^L^-^^A&^^-^xM ^ P a ^ \ t r v - i > t ^ ^
^ ^ (ic.-1.5 ^ U I ^ ^ W J L S

« # • ^
GRAIN SIZE ANALYSIS CURVES
U.S. l lanJaid SUv* Opinlnfi In lackit 1 l
. . . 3 2 W, 1 % 'A ' / . 4 . 1 0 . 2
1 0 - -
.9 AO - -
s .a
5 5 0 -
e 5 4 0 - -
•
0 - -
J T
'
—
' .
I
1
1
,
1 1 1 --L
1
1 1 1
1
,
• * ^
•
i
I
i i
U.S. Standard SUv* Nunbiii
0 30 4 0 \ S 0 70 100 140 3 0 0
' - " ^ ^
• - ^ ^ * <
4 ^
K V
>
— i
v r Vv r \ \ \
\ 1
\ \ ' \ \ s\j \
\ \
\i\M \\u
\i \ i \ \ 1 I
\ ' 1 \ i \ :
V \
\ ' \V" ' : \ \
1"" \
n \ 1\
\
\
- a T \ V
1
'
•5NA
\ i'^
\
' (* i . i . , ^ )
sfprn- 1
\
•
'
•
! P
ercent Coorie
r by W
eig
ht
' i o o 50 10 S 1 0.5 0.1 0.074 \ 0.01 0 .005 0.001
Oroln Slie In Mllltmeteri
M Wet Unit Weight
Drv Uni t Weieht
Void R a t i o
P o r o s i t y
S p e c i f i c Grav i ty
Hydrau l i c Grad i en t
C o e f f i c i e n t of P e r m e a b l l i t v
Inlmum Dens i ty Ma xlmum Dens i ty
Remarics L-* ^ "SSUA**. «!tXfk.«*trSe»
D r i l l Hole No. -^ocv^pMje Sample No. \ - ^ ^ T .
Sample Depth: GpA£> '^=CVP'\T»V..^S»
F i e l d Blow Count Si*k
P r o j e c t : "Bi^v^vJevO U.cSs>f\v-i.^
Da te : Job No. •—
- ~-~^J i l '1
l

•MAY.-24 '96 (FRI ) 15 = 58 PSI SLC TEL:801 487 3 3 1 2 5 /
MfiY 24 ' 9 6 04T5§P)5l
TESTS FOR:
Professional Seivice Industries, Inc. Pittsburgh Testing l.aboratory Division
Wassicti Ehvlroninental, Inc Mr. Les Pennlngion 2251 West California Ave. Salt Laka Cit/, UT S4104
PROJECT: Various Projaete
DATE: May 13,1996 PROJECT NO.: 706-60040-2
*
SUBJECT: Test of Samples submitted 5/7/96 UBNO.: 706-2131
Pemieablfity
Shear Cohesion in tons/sq. ft. Apparent Angle of Friction
U.S. STAND.
SIEVE SIZE
1 3/8"
1 ^ II ^ i *^
#30
#50
.#100
#200
Liquid fimlt
Plastic Umit
Plastic Index
SS#1
100
100
99
97
94
88
81
41
NP
NP
NP
SS#2
100
100
98
96
63
43
NP
NP
NP
sslng, by Welj
8S93
100
100
98
78
35
6.8
NP
NP
NP
Tht
Project SpeclflcaUon
S5«4
100
100
99
98
92
84
76
44
NP
NP
NP
1
1 1
LOOSE CONSOUDATED 1.906 ft/day 0.034 Wday 6.7x10"* cm/sec 3.3 x 10^ cm/sec
SS#l SS#2 ?S#3 c=0 c«0 c=0 0=38" ^ 3 3 " 9=32*
MEauLis MB ^nuciOLC ONLT IO sHcmc SUtflXS TCSTce. nr^int^niatmmamaiixmt.asm'rmmju.wmeuT I M i n M PttWHSOl BT fVL MS.
H99p9cUvny %ubmlBad, Professional Sanriee Industrhs, Inc.
Donald P. Katteiman Distr ict obnsQBf
SS *4. c*0 •=36"
<3 loose. 2>f
2S65 South West Temple Street • Sah Lake City, UT 64115 • 801/494-8827 • Fax 601/487-3312

iJobNa Na
\
%
HDR Computation t T ^ R
I Project I Computed [Date
I Subject Checked
Task Sheet Of
. 5 ^4 t .y5 /5»
L e s s -ywirJ lo% fitJe^ f <£fUit, * 5 \
id\o5» d " ^ CUJ
^^(QoAfi^zstie) 0.(e„„^ IP.OSS/,^ O.OZIM., ? . 3 <7.Zf»,*,
^M-Sf=> C f - S e l d O . O i r 2.Z. A b f « < ^
i ^ ^ ^ 3 ~ Ctnif^rJiicy c^^^>Ei::>
^ c ^ A(iSZ5. ^ tSA/^ ; - ; ^ ^ . n p = Z > . ^ A.fe C j e s w S * < ^ ^ )
•=• /. r-^ O* ooofo 7 On/sec^
= C>.CC)/ ez j^ l -b&^

Job^kx Not
HDR Computation
IProject
I Subject
Task
I
KR^ I Computed Date
Checked Date
Sheet Of
zf- /td/Mfu T j ^ p ^ To /q5 /[*sY\)/\/tS\/ElJ
o . o ' ^ ' S ' ^e^^ /MJ/J/IMUM
- / T^icviL- 7c?-^=>j /loT^ ujwjte^-/ ^5-eYfe)£r)(-es /-Mi4i i b - ^ 0 . ^ ioc. Oi >
^ a r 6^ ^ (D.S" -/' j ec^
O U i ^ 4 . S^«5St<^y5oc ie bp-zS^-i/JASre *<p/ io«< iA/ '«no T " * ? ^

t
ATTACHMENT P-6
PIPING STRENGTH/DEFLECTION
%

HDR Computation
Project ^^vjvJievJ Lt>'>- "£s \\;t_ CJCXA^ \. ^ "S^Nata " ^
Subject
Task
•
K R . L^;?i.t>
^ • v j S t ^
"fipstOxsx "^rgsjs^C:,TV^ I t3€.^\J£c^'ovN
1 Computed
Ichecksd
R-Li>
J ^ i ^
1 Sheet 1
Date
D . , . 7 , / ^ - ^ ^
Of
, \ C - W W S I ' f e C ^ ikp-^^Tt* ; L A I C ' S VNP\4.i<=» • S ] [ t e S W i 6 i - W « | t « ^ : ^ . S C . Y y e v ^
5 CeaV. I^^u 'V^»*^. V A I - U * Ten
(l.«vcp.
fA"€.-p%o&
4 ^vJMLsvtivs ' ^ o c E ^ u ^ :
For TRENCH CONOITION:
" v • B^c jCo* q , C „ .
-LL-L " *- i . Sell llnar ) t \
2 K | t
C^,,,-.K,il«/«ai
Mf
.IJ ^ m
Weale fil l 4,*«»il(H,|
i-L_L -Baektltl(ui)
For PROJECTING CONDITION:
Waile mi (tahl H|
8 i /ae^^ . Q . >yzi/z a,
"T^ V — U l e e f V.B.ekf . l . ( ,
Backfill (oil
f»» V%tC^v P i t * * '
^ % e i i " Ap .p i (T^

y mt id
i
%
o.5S1Ef-lr <^ )
(C»r -b. ^ ^ \T4)
mM3L4 Avenge VUMa«fMeduk»«l sel neeeaomrrerMtWFtatt lanpe OallecMl)
SoQ t)>p»t^ beddbf aaterid gJaffleJ OlMfflnrtfwi a b n f n l
Fbarsniaed Mil* (U. > 80)t Soila with teadfans te talfb plaatfe.
i l7CailH.CH-MK
n9»«tiiaelioiIa(U.< SO) EoOa with SMdfanB tB ae plaMkitr
CL, ML, i l U a , iritb I H * tbm 2 M cnnMEnJoadfotidM
narfiaiaad aeib dJL < EQ> aofla with aaiUiia to ne i i lm Iril j
CL, ML, U U X , irtth a m t h n 2SS coetaa^aiaat peftida
Coui*««iMd aeOi with Saaa GBI, GC. Ste SC coniiiaB mere
t l iaBl3»fia«
Ceam.(nin*d ioiliiRth I i t th er BO
OW, GP, SW, SP* oataiae l<a> tiiaBl2%fbMa
Cnahcdrsdi '
AccuncriBtamaff«aBia|e j
r far degraa «f CDBpactte efbadaiag; BA^
ttaoved
1 aiciit. <aB»
»«eler.
idati«e
MMmta, 1 «Bw tea
Vttttar. >9B%
prattor. >70»
SO
100
* " i 1000*'
«a
200
400
/lOOO
^ 3000
*:«
400
1000
3000
3000
* 1 •
1000
2000
3000
3000
s0.S •

JobNa Na
HDR Computation KRi [Project
I Subject
Task
[Computed
Checked
Sheet
Date
Date
Of
. 5 Sksj-cJi
TYPE 2 GEOTEXTILE PLACED DIRECTLY ON
.SYNTHETIC UNER
I ' - t f PROTECTIVE COVER/LEACHATE COLLECTON MATERIAL
SEE SECTION 6 / C - 3 FOR ELEVATIONS
T • H \ A j b ! S \ e = < S ) o ' AGGREGATE
BACKFILL . _ ,
8- AGGREGATE OVER ^ = ^ / ^ TYPE 2 GEOTEXTILE
60 MIL HDPE GEOMEMBRANE
TYPE 2 GEOTEXTILE PLACED DIRECTIY ON PREPARED SUBGRADE
ar PVC LEACHATE COLLECTION PIPE
NOTE: _ GEOTEXTILE FABRIC TO TOTALLY ENCASE
AGGREGATE BACKFILL - OVERLAP A MIN. OF 12* ON TOP
AJ & s r v ^ u : ^ Pyf^c^tuf-iLU- -t- (xJi(i--s>fS • ts rp .^^s^3 cry, ^ i />s-
/ , , -ZfOJi.^'fzf^.') O b ^ / - < • ^ O.g'S- ^
a..' O. I(ef
• Z . Q.K^^-C^t . ) U - e- = 0.12. ^

JobNa Na
%
HDR Computation KR IProject Computed
I Subject Checked
Tesk Sheet - j ^
Date
Date
Of
Q>4<J i^ j - f ^ f L . p i p ^ - p i £ ^ 2 ^ / 2 . 4 y 7 ^ ^
%
T A B L E 5 P e r f o r a t i o n * ^
Nominal Diameter,
In.
Minimum Rows'
ofPerfo-ratkms
Hole Size-* Hole Spacing^
in. In.
4 2 4.8 to 9.7 Vi»tO% 82.55 ±6.35 3V4±V4 6 4 4.8 to 9.7 Vis to % 82.55^6.35 3V4±V4 6 4 4.8 to 9.7 VntoVt 82.55 ±6.35 3V4±V4 -*
*• Combinatksn of hole size'and spacing of holes shal provkle a nMmum Inlet -area greater than 0^200 In.*/tt of p ^ (that Is, V i e * , holes at 3 * . center would pennit a 0.22064).' area).
O^C^t.l) = Afi^i
Ap-ip* ~ C-A ^n 'rw . (T^
Aj>tt>^ ?" ' J I>= ^et? o . I ^ Fh/i- Sea TO
" 7 •• | />JV-- / ^
= 34-^4-. • ^
/ ^ 4 - . o >^/'

JobNa Na
HDR Computation HRi [Project
Subject
Task
I Computed
Checked
Sheet s-
Date
Date
Of
(i>^ (UsyvJ -jS- p i pe Sifisx-fess.
'Oh^ ^ * f . o o " e. ' -fj>o^ (yyo / > s / /^6— / ^ « ^ ^
A-5
( 4-^ Z2,>J) ^
3 i - ^ -W ^ / « -
(2, ) CisnAj>.<:^ ^e^pi-cc/Tcx
- ^. QoS- • "g-^- ^ ^ \ c o
6V1-
v ^
U-b^ So'-e^^-^ '^ ; ^ ">s lo


APPENDIX Q
Conceptual Gas Extraction System
SUVSWD Bayview Class I Landfill Pernnit Application

Appendix Q: Conceptual Gas Extraction System
SUVSWD Bayview Class i Landfiii Permit Application
Prepared for Bayview Landfill
South Utah Valley Solid Waste District SpringviUe, Utah
Prepared by HDR Engineering, Inc.
3995 South 700 East, Suite 100 Salt Lake City, UT 84107
March 2009

Contents ..:MUJ.'*.- *Lv::a., •in-- ...A.* • i-atijcj
Contents
1.0 BACKGROUND 1
2.0 GAS GENERATION 2
3.0 GAS COLLECTION SYSTEM 4
4.0 PIPE SIZING 7
Attachments
Q-l: Cell 1 Gas Collection System Layout
Q-2: Radius of Influence Calculation
Q-3: Peak Gas Production
Q-4: Five-Year Non-Methane Organic Compounds Emissions Estimate
Report (Kleinfelder, 2006)
March 2009 SUVSWD Bayview Class I Landfill Permit Application j i

1.0 Background
1.0 Bacl^ground
2 Regulations require that landfills that produce over 50 Mg of non-methane
3 organic compounds (NMOC) must have a landfill gas collection and control
4 system installed. It is not anticipated that Cell 1 ofthe Bayview landfill will
5 exceed this benchmark even when it is filled to capacity. (See calculation Q-l at
6 the end ofthis appendix.) At some future time, SUVSWD will collect the
7 landfill gas with an active system utilizing a blower to create a negative pressure,
8 or vacuum, in the landfill cell and extract the gas that is produced. The collected
9 gas would then be combusted in a candlestick-type flare.
March 2009 SUVSWD Bayview Class I Landfill Permit Application j 1

2.0 Gas Generation
1 2.0 Gas Generation
2 Landfill gas generation is estimated for the landfill using the Scholl Canyon
3 model. This model is a first order, single stage model that assumes that the gas
4 production rate from a given mass ofwaste is at its peak upon initial waste
5 placement, after a negligible lag time during which anaerobic conditions are
6 established in the landfill. Therefore, peak gas generation from the landflll cell
7 would occur at closure. Gas production is then assumed to decrease
8 exponentially as the organic matter in the landfill decomposes. The following
9 equation summarizes the model.
Q,j ^ = 2LoR[e~'" - e~'") Equation 2
10
11
12
13 Where:
14 Qifg = landfill gas generation rate at time t, [m3/yr]
15 Lo = potential methane generation capacity ofthe refuse, [m3/Mg]
16 R = average annual refuse acceptance rate during active life, [Mg/yr]
17 k = methane generation constant, [1/yr]
18 c = time since landflll closure, [yrs], (c=0 for an active landfill)
19 t = time since initial refuse placement, [yr].
20
21 Using this equation, the landfill gas generation rate is 7,272,828 cubic meters /
22 year, which equates to approximately 488 cubic feet / minute (cfm). (Since Cell
23 1 is not closed, c = 0, and e-kc = 1.0). The EPA's guidance document EPA-
24 450/3-90-01 la, Air Emissions firom Municipal Solid Waste Landfills -
25 Background Information for Proposed Standards and Guidelines suggests a
26 conservative value of 100 for Lo and 0.04 for the k value for these calculations.
27 A k value of 0.03 was used instead to account for the much drier climate at the
28 Bayview Landflll site.
29 Calculation Q-2 is included at the end ofthis appendix. As a check, gas
30 generation was calculated on a yearly basis for the waste received during that
31 year. A first order decay rate was used to calculate gas generation from the waste
32 for subsequent years. The gas generation for each year is then added to predict
33 the total gas generated from all waste received. This calculation (Q-3) is
2 I SUVSWD Bayview Class I Landfill Permit Application March 2009

2.0 Gas Generation
m included at the end ofthis appendix and predicts a peak flow of 494 cubic feet
per minute (cfm), which is reasonably close to the amount of 488 cfm predicted
in calculation Q-2.
4 An updated gas generation estimate was prepared by Klienfelder, Inc. in 2006
5 and is included in Attachment Q-4 at the end ofthis appendix. Their report
6 modeled gas generation at the Bayview Landfill site through 2010. The actual in-
7 place waste, plus two future growth scenarios were modeled. Gas production
8 remained below the 50 Mg of NMOC threshold for all model runs through the
9 year 2010. Therefore, the Bayview Landfill does not anticipate the need to install
10 the gas extraction system during that period. The landfill, however, will continue
11 gas monitoring and reporting to the State.
March 2009 SUVSWD Bayview Class I Landfill Pemfiit Application | 3

3.0 Gas Collection System
3.0 Gas Coilection System
2 The first step to designing a gas collection system is determining the type of
3 wells to be used to collect the landfill gas. Since the entire area of Cell 1
4 (approximately 33 acres) is near final grade, it was determined that the Cell 1
5 area would have vertical wells drilled through the waste.
6 The vertical well radius of infiuence (ROI) was calculated using techniques
7 outlined in the EPA guidance document referenced above. The following
8 equation is used to determine the radius of influence.
9
10 Q „ x D e s i g n C a p ] ' ^ r t =
11 V ^ P refused gen ^ a ) EqUafion 1
12
13 Where:
14 Ra = Radius of Influence, [m]
15 Qw = Gas flow rate / well, [m3/yr)
16 L = Landfill Depth, [m]
17 Pref = Refuse Density, [Mg/m3]
18 Qgen = Peak generation rate, [m3/yr]
19 Ea = Fractional collection efficiency
20 DesignCap == Design Capacity [Mg
21
22 Using this equation, the ROI was determined to be 139 feet. This calculation
23 (Equation 1 on Q-2), with assumptions, is provided at the end ofthis appendix.
24 This radius determines the extraction well spacing. An effective landflll gas
25 collection system will cover the entire area of Cell 1.
26 Using the calculated ROI, vertical wells were laid out as shown in Figure Q-l.
27 The well radius was reduced along the side slopes to account for the more
28 shallow depths encountered. This increases the well density along the side
29 slopes. The size ofthe perforations along the well casing in the side slope wells
30 may also be varied to achieve greater collection efficiency.
31
4 I SUVSWD Bayview Class I Landfill Permit Application March 2009

3.0 Gas Collection System
m Flare location is the next issue to be resolved. The flare location is currently
proposed to be in the vicinity of the existing leachate drain line in the northeast
3 comer of Cell 1. This location will be convenient in the event that it is decided to
4 use the same flare for Cell 2 when all or portions of it are closed. Additional
5 blowers may be required to transmit landfill gas to the flare from Cell 2. This
6 will be evaluated during subsequent design phases. See Figure 2 (Part IV) for the
7 location of Cell 2 in relation to Cell 1.
8 Following well layout, the gas collection header was designed. The main design
9 criterion for the header is to maintain a minimum 5% slope to promote positive
10 drainage of gas condensate over the lifetime ofthe site. This slope takes into
11 account the gradual settlement ofthe landfill over time. Utilizing the existing
12 leachate collection system to manage gas condensate was another key concem.
13 The header loops around Cell 1 and connects to the gas flare station.
14 Additional condensate sumps will be necessary at low points along the header.
15 As mentioned, whenever possible, the condensate will be routed into the leachate
16 collection system. However, some dedicated condensate sumps will be necessary
17 in order to maintain a minimum of 5% slope on all gas collection lines.
#
Each well is designed to be connected to a gas collection node by a system of
entrenched laterals. These small diameter laterals extend from the wellhead for
several individual wells and are collected at a node for ease of monitoring and
21 calibration. These nodes are then connected by a larger diameter sub-header to
22 the main gas header system. Each lateral is also designed with a minimum 5%
23 slope to promote condensate drainage. Whenever possible, each lateral should
24 also be installed with a minimum two foot cover. It may be necessary during
25 constmction for some laterals to be installed with less than two feet of cover to
26 maintain the 5% slope criteria. Figure Q-l shows the proposed lateral/sub-
27 header/header layout for the landfill.
28 All laterals, sub headers, and headers will be constmcted of high-density
29 polyethylene (HDPE) pipe. Gas collection wells will be constmcted of either
30 HDPE or PVC pipes. Pipes were sized to maintain a minimum head drop across
31 the system to allow the blower to extract gas from the entire collection system.
32 Should part ofthe collection system be disconnected for maintenance, the blower
33 will still have the capacity to collect gas from the remainder ofthe system. A
34 blower with a capacity to produce 60-inches of water column vacuum is
35 proposed for the site.
March 2009 SUVSWD Bayview Class I Landfill Permit Application j 5

3.0 Gas Collection System
1 Calculation Q-2 is included at the end ofthis appendix. As a check, gas
2 generation was calculated on a yearly basis for the waste received during that
3 year. A first order decay rate was used to calculate gas generation from the waste
4 for subsequent years. The gas generation for each year is then added to predict
5 the total gas generated firom all waste received. This calculation (Q-3) is
6 included at the end ofthis appendix and predicts a peak flow of 494 cubic feet
7 per minute (cfm), which is reasonably close to the amount of 488 cfm predicted
8 in calculation Q-2.
6 I SUVSWD Bayview Class I Landfill Permit Application March 2009

4.0 Pipe Sizing
4.0 Pipe Sizing
2 When sizing the pipes for the gas system, the furthest point from the flare was
3 chosen as the starting point. The cumulative flow from the starting point to the
4 flare (in both directions) was used to size the header pipeline. The size ofthe
5 header varies between sub-headers in order to handle the additional flow of gas at
6 that location in the system. Then, the flow from each node was used to size each
7 sub-header pipeline.
9 A form ofthe Mueller equation was used to calculate the pressure drop in each
10 section of pipe:
1
M7J
13
Where:
15 AP = Change in Pressure
16 L = length of pipe (feet)
17 G = specific gravity (air = 1)
18 F = gas flow rate (ft3/hr)
19 d = pipe intemal diameter (inches)
20
21 All pipes were designed to have a cumulative pressure drop of less than 30-
22 inches, leaving 30-inches of vacuum at the farthest pipe location to extract gas
23 from the cell. In the event that a pipe in the system malfiinctions, the blower will
24 still be able to collect gas from the majority ofthe system until repairs can be
25 made.
March 2009 SUVSWD Bayview Class I Landflll Permit Application | 7

APPENDIX Q
ATTACHMENT Q-l:
CELL 1 GAS COLLECTION SYSTEM LAYOUT

N
100 200
SCALE IN FEET
LEGEND
-» » »
S5
HEADER
CELL BOUNDARY
LATERAL
FLOW OUTSIDE CELL BOUNDARY
SUBHEADER
CONDENSATE LINE
WELL WITH 130' ROI
WELL WITH 72'ROt
WELL WITH 50 'ROI
FLARE LOCATION
CONDENSATE SUMP
NODE
NOTES!
1. R O I - RADIUS OF INFLUENCE
2 . CONTOURS SHOWN FOR CELLS LAND 2 ARE PROPOSED FINAL ELEVATIONS
FOR iNFORMATION ONLY
HDR Engineering, Inc. 17111 Pres ton Road Suite 2 0 0 Dallas, Texas 7 5 2 4 8
Resp. Engr.
Pro]. U9f.
Projecl Umoger
M. ODEN ArcNtecl
Ci.il
EleelricDl
Dtsign.ii
K. GREEN
n.C/PfDceas
Struelurd
Drown By
K. GREEN
SOUTH UTAH VALLEY SOLID WASTE DISTRICT
BAYVIEW LANDFILL PERMIT MODIFICATION
CELL 1 - GAS COLLECTION
SYSTEM LAYOUT
°°'* AUGUST, 2003 scole
AS SHOWN
Pro>cl Ko.
03879-143
Figure No.
Q-1
ISSUE
0

APPENDIX Q
ATTACHMENT Q-2:
RADIUS OF INFLUENCE CALCULATIONS

Job A/0. 3608 Calc No. Q-2
Compytation \Project Bayview Landfill Cell 1 Gas Collection Design
System Landfill Gas Collection System
Component Vertical Well Spacing
Task Radius of Influence Calculation
Computed
Date
kdf
6/26/2003
Reviewed
Date
Purpose
Find
Given
Solution
Assumptions
Equations
Solve for the gas well radius of influence using equations provided in EPA's document, Air Emissions from Municipal Solid Waste Landfills - Background Information for Proposed Standards and Guidelines.
Description Variable . " Uriits Radius of Influence feet
Description
Design Capacity
Avg. Annual Acceptance, R
Methane Gen. Potential, L,,
Gas Generation Constant, k
Value ; ;. Source;
1,659,232 [tons], client supplied 100,350 [Mg/yr], client supplied
100 [m^/Mg], test values
0.03 [1/yr], test values
Description Value Comment Radius of Influence 139 feet
Waste in Place Density
Gas Flow Rate
Landfill age at closure
Collection Efficiency
Landfill Depth, L
r R„ =
Q . X DesignCap
^^PrefuseQgen'^a )
^Yi
1300 Ibs/cy, client supplied value 0.04 m /min/ m of landfill depth, EPA Gas Background Document
15 years, client supplied value
100% assumed for purposes ofthis calculation
1 [m], unit convention for flow/meter
Where: Ra = Radius of Influence, [m]
Qw = Gas flow rate / well, [m^/yr)
L = Landfill Depth, [m] Equation 1
Source: EPA Gas Background Doc.
Equation 2
Source: EPA Gas Background Doc.
Pref = Refuse Density, [Mg/m ]
Qgen = Peak generation rate, [m^/yr]
Eg = Fractional collection efficiency
DesignCap = Design Capacity [Mg
Where: Qgen = Peak generation rate [m /yr]
LQ = Methane generation potential [m^/Mg refuse]
R = Average annual acceptance rate [Mg/yr]
k = Gas generation rate constant [1/yr]
t = landflll age at closure, [yr]
Class I Landfill Permit Modification Bayview Landfill South Utah Valley Solid Waste District
Revision 0 Appendix Q; Calc. Q-2
September 2003 Page 1

\ Job No. 3608 Calc No. Q-2
# \ProJect
omputation Bayview Landfill Cell 1 Gas Collection Design
System
Component
Task
Calculation
Landfill Gas Collection System
Vertical Well Spacing
Radius of infiuence Calculation
Description
Gas Flow Rate
Assume Value
Convert to yearly
Design Capacity
Design Capacity
Convert to Mg
Refuse Density Convert to Mg/m^
Peal( Generation Rate
.Determine peak rate
Convert to cfm
Radius of Influence Solve for Rg
Convert to feet
Equation
from EPA Gas Document
525,600 min/yr
Given Value
1 ton = .9072 Mg
Given value 1 Ib/cy = .000593 Mg/m^
Equation 2 above 1 ft^/min = 14,895 m^lyr
Equation 1 above
1 m = 3.28 ft
Comment
Computed
Date
kdf
6/26/2003
Reviewed
Date
Value Units
0.04 m /min-m
21,024 m V - m
1,659,232 tons
1,505,255 Mg
1,300 Ibs/cy
0.771
7,272,828 m V
488 cfm
42.4 m
139 ft
Class I Landfill Permit Modification Bayview Landfill South Utah Valley Solid Waste District
Revision 0 Appendix Q; Calc. Q-2
September 2003 Page 2

APPENDIX Q
ATTACHMENT Q-3:
PEAK GAS PRODUCTION

Q-3
Bayview Landfill Gas Generation Estimates
0 1 2 3 4 5 6 7 8 9 10 11 12 13 14 15 16 17 18 19 20 21 22 23 24 25 26 27 28 29 30
Year 1990 1991 1992 1993 1994 1995 1996 1997 1998 1999 2000 2001 2002 2003 2004 2005 2006 2007 2008 2009 2010 2011 2012 2013 2014 2015 2016 2017 2018 2019 2020
Tons Received
32,713 82,841 92,045 96,899 106,641 105,746 108,305 119,391 126,661 124,286 127,031 126,664 130,790 136,584 142,635
0 0 0 0 0 0 0 0 0 0 0 0 0 0 0 0
Cumulative Tons 32,713 115,554 207,599 304,498 411,139 516,885 625,190 744,581 871,242 995,528
1,122,559 1,249,223 1,380,013 1,516,597 1,659,232 1,659,232 1,659,232 1,659,232 1,659,232 1,659,232 1,659,232 1,659,232 1,659,232 1,659,232 1,659,232 1,659,232 1,659,232 1,659,232 1,659,232 1,659,232 1,659,232
Megagrams Received
29,677 75,153 83,503 87,907 96,745 95,933 98,254 108,312 114,907 112,752 115,243 114,910 118,653 123,909 129,398
0 0 0 0 0 0 0 0 0 0 0 0 0 0 0 0
Cumulative Megagrams
29,677 104,831 188,334 276,241 372,985 468,918 567,172 675,484 790,391 903,143
1,018,386 1,133,295 1,251,948 1,375,857 1,505,255 1,505,255 1,505,255 1,505,255 1,505,255 1,505,255 1,505,255 1,505,255 1,505,255 1,505,255 1,505,255 1,505,255 1,505,255 1,505,255 1,505,255 1,505,255 1,505,255
Landfill Gas
Produced (cfm)
11.6 21.4 72.1 104.4 139.1 172.6 205.9 242.2 280.0 315.8 351.5 386.1 421.1 457.1 494.2 479.6 465.5 451.7 438.4 425.4 412.8 400.6 388.8 377.3 366.1 355.3 344.8 334.6 324.7 315.1 305.8
Methane Produced (cfm)
5.8 10.7 36.1 52.2 69.6 86.3 102.9 121.1 140.0 157.9 175.8 193.1 210.6 228.6 247.1 239.8 232.7 225.9 219.2 212.7 206.4 200.3 194.4 188.6 183.1 177.7 172.4 167.3 162.4 157.6 152.9
Page 1 of 2

Q-3
Bayview Landfill Gas Production
600
500
400
o 300
200
100
^ V ' ^ ' ,^iJ-W • •'•=-« I i l l I I
1990 1995 2000 2005 2010 2015 2020 2025 2030 2035 2040 2045 2O50
Year
•Landfill Gas - - - Methane
Page 1

APPENDIX Q
ATTACHMENT Q-4:
FIVE-YEAR NON-METHANE ORGANIC COMPOUNDS EMISSIONS
ESTIMATE REPORT (KLEINFELDER, 2006)

SOUTH UTAH VALLEY SOLID WASTE DISTRICT BAYVIEW LANDFILL
FIVE-YEAR NON-METHANE ORGANIC COMPOUNDS EMISSIONS ESTIMATE REPORT
For: South Utah Valley Solid Waste District P.O. Box 507
SpringviUe, Utah 84663
September 11, 2006
Copyright 2006 Kleinfelder, Ino. All Rights Reserved
UNAUTHORIZED USE OR COPYING OF THIS DOCUMENT IS STRICTLY PROHIBITED BY ANYONE OTHER THAN THE CLIENT FOR THE SPECIFIC PROJECT.
SUVSWD/41232.008/SLC6R008 Page i of iii September 11, 2006 Copyright 2006 Kleinfelder, Inc.
A report prepared for:
South Utah Valley Solid Waste District P.O. Box 507 SpringviUe, Utah 84663-0507
SOUTH UTAH VALLEY SOLID WASTE DISTRICT BAYVIEW LANDFILL FIVE-YEAR NON-METHANE ORGANIC COMPOUNDS EMISSIONS ESTIMATE REPORT
File No.: 41232.008
Prepared by:
Mark Hooyer Senior Scientist
Kerry L. Ruebelmann, P.G. Environmental Division Manager
KLEINFELDER, INC. 849 West Levoy Drive, Suite 200 Taylorsville, UT 84123-2544 (801)261-3336
September 11, 2006
SUVSWD/41232.008/SLC6R008 Page ii of iii September 11, 2006 Copyright 2006 Kleinfelder, Inc.

TABLE OF CONTENTS
SECTION PAGE
1. EXECUTIVE SUMMARY 1
2. INTRODUCTION 3 2.1 Overview 3 2.2 Source Description 3
3. NMOC EMISSION ESTIMATE METHODOLOGY 5 3.1 Existing Waste in Place 5 3.2 Projected Waste in Place 6 3.3 Description of LandGEM Model 8
4. NMOC EMISSION ESTIMATES 10
5. SUMMARY 11
6. LIMITATIONS 12
7. REFERENCES 13
TABLES
1 Estimated NMOC Emissions 2 2 Historical Waste Acceptance Rates (1991-2005) 5 3 Estimated Waste Acceptance 7 4 Estimated NMOC Emissions 10
CHART
1 Waste in Place Estimates vs. Time 7
APPENDIX
Report from the Scenario 3 LandGEM model run
SUVSWD/41232.008/SLC6R008 Copyright 2006 Kleinfelder, Inc.
P a g e iii of i September 11, 2006

EXECUTIVE SUMMARY
The South Utah Valley Solid Waste District (SUVSWD) is submitting this five-year
estimate for non-methane organic compound (NMOC) emissions at the Bayview Landfill
(Landfill) as required by the Utah Air Rules R307-221 and the Federal Regulations 40
CFR Part 60, Subpart WWW, Standards of Performance for Municipal Solid Waste
Landfills, (Subpart WWW), Section 60.757(b)(1)(ii). If the estimated NMOC emission
rate is less than 50 megagrams (Mg) per year in each of the next five consecutive
years, the owner or operator of the landfill may submit an estimate of the NMOC
emission rate for the next five-year period in lieu of annual reports. This report contains
NMOC emissions estimates for the five-year period beginning January 1, 2006 and
ending December 31, 2010.
The Landfill Gas Emissions Model (LandGEM) Version 3.02 was used to estimate
NMOC emissions. As a variable for LandGEM, the estimated waste in place (WIP) for
the next five years was calculated using three scenarios:
1. Projected WIP values based on historic waste acceptance data;
2. Projected WIP based on an expected county population growth rate of 3.9
percent annually; and
3. Projected WIP based on a conservative county population growth rate of 10
percent annually.
NMOC emissions were modeled with LandGEM with the WIP values from the three
scenarios. NMOC emissions estimates from the three model runs are shown below.
SUVSWD/41232.008/SLC6R008 Page 1 of 13 September 11, 2006 Copyright 2006 Kleinfelder, Inc.

TABLE 1 ESTIMATED NMOC EMISSIONS
(Mg)
| ' ; :^ear J
2006 2007 2008 2009 2010
•"'' Sceniriqjpne: Best Fit Wojectiori
' .:-§f;Actual WIP ^ 35.1 37.5 39.8 42.1 44.4
.^'Scenario Two:-; Pdipulatiori tirowth
35.1 37.6 40.2 42.9 45.6
Scenairio"f Hree: U Population Growth
,Ratei ip.d% 35.1 37.8 40.8 44.1 47.7
NMOC emissions based upon a population growth rate of 10 percent resulted in the
highest estimate; however, this estimate does not exceed 50 Mg/year for any of the next
five years. Therefore, the estimated NMOC emissions indicate that NMOC emissions
will be below 50 Mg/year for the years 2006 through 2010. Actual waste acceptance
over the next five years is not expected to exceed the conservative value of the 10
percent growth rate presented in scenario three of this report. If waste acceptance
rates exceed a 10 percent annual increase for any of the next five years, the Landfill will
either revise this five-year estimate, or revert back to an annual report, either of which
are allowed by Subpart WWW.
Tier 2 landfill gas testing results are valid for a five-year period, after which new data
must be obtained. NMOC testing will be repeated in 2010, and another five-year
estimate of NMOC emissions report will be generated in the year 2011.
SUVSWD/41232.008/SLC6R008 Copyright 2006 Kleinfelder, Inc.
Page 2 of 13 September 11, 2006

INTRODUCTION
2.1 OVERVIEW
The South Utah Valley Solid Waste District (SUVSWD) is submitting this five-year
estimate for non-methane organic compound (NMOC) emissions at the Bayview Landfill
(Landfill) as required by Utah Air Rules R307-221 and the Federal Regulations 40 CFR
Part 60, Subpart WWW, Standards of Performance for Municipal Solid Waste Landfills,
(Subpart WWW), Section 60.757(b)(1)(ii). Subpart WWW states that "if the estimated
NMOC emission rate as reported in the annual report to the Administrator is less than
50 megagrams (Mg) per year in each of the next five consecutive years, the owner or
operator may elect to submit and estimate of the NMOC emission rate for the next five-
year period in lieu of the annual report." The SUVSWD has elected to submit a five-
year estimate of projected NMOC emissions in lieu of the annual report. This report
contains NMOC emissions estimates for the five-year period beginning January 1, 2006
and ending December 31, 2010. Historical waste in place and projected waste in place
for 2006-2016 were used to estimate NMOC emissions for 2006 through 2010.
2.2 SOURCE DESCRIPTION
The Bayview Landfill is an active Class I municipal solid waste (MSW) landfill owned
and managed by SUVSWD. The Landfill site is on approximately 600 acres (243
hectares) located at 10800 South State Route 68 in Elberta, Utah County, Utah. The
facility has an estimated design capacity of 18.1 million Mg\ and is therefore subject to
provisions of Subpart WWW, Section 60.752, which applies to all landfills with a design
capacity of 2.5 million Mg.
^ 1 megagram is equivalent to 1 metric ton.
SUVSWD/41232.008/SLC6R008 Page 3 of 13 September 11, 2006 Copyright 2006 Kleinfelder, Inc.

The Landfill is currently comprised of two waste disposal cells, labeled as Cell 1 and
Cell 2. Cell 1 covers 32 acres (12.9 hectares) and contains approximately 1.1 million
Mg of potentially methane-producing waste. Cell 1 began receiving waste in February
1991, and is currently undergoing permanent closure. Cell 2 began receiving waste in
January 2005. It covers 80 acres (32.4 hectares) and has an approximate overall
design capacity of 6.4 million Mg. For this project, NMOC emissions are not estimated
for Cell 2, because it does not contain waste over two years of age and therefore does
meet the sampling requirements of Subpart WWW.
SUVSWD conducted Tier 2 landfill gas testing on Cell 1 on November 1 and 2, 2005, to
calculate the site-specific value for the concentration of non-methane organic
compounds (CNMOC) contained in the landfill gas generated at the site. Sampling
conformed to techniques and methods described in the Test Protocol approved for this
project by the UDAQ (Kleinfelder, 2005a). The site-specific CNMOC value was calculated
using Tier 2 testing methodology as provided in Section 60.754(a)(3) of Subpart WWW.
The site-specific value for CNMOC as hexane calculated in this testing event is 1,017
parts per million by volume (ppmv). This value is used for NMOC emissions estimations
for this report. A full test report describing test procedures and results was submitted to
the UDAQ on December 16, 2005 (Kleinfelder, 2005b).
SUVSWD/41232.008/SLC6R008 Page 4 of 13 September 11, 2006 Copyright 2006 Kleinfelder, Inc.

NMOC EMISSION ESTIMATE METHODOLOGY
3.1 EXISTING WASTE IN PLACE
Landfill emissions vary depending on site-specific characteristics, including the quantity
of waste in place (WIP). The Bayview Landfill began accepting waste in 1991. Waste
acceptance rates for the years 1991 through 2005 are shown in Table 2. These rates
are based on scalehouse records of standard ("short") tons received per year, and
converted to metric tons or Mg to be consistent with units used in Subpart WWW. The
Bayview Landfill waste acceptance rate is increasing approximately 1 to 2 percent per
year.
TABLE 2 HISTORIC WASTE ACCEPTANCE RATES
(1991-2005)
':->l :': 1991
1992
1993
1994
1995
1996
1997
1998
1999
2000
2001
2002
2003
2004
2005
Abcfeptarice : : - ',Rate;;:. -
: (Mg/ i^ary; : •
65,500
78,500
86,000
95,000
100,000
103,000
105,000
113,000
122,000
131,000
119,686
119,206
124,234
125,141
126,049
;wiF>*^at "Start ': : : -o f : :Y^r?^ ;•:•
;•; ;•; : ;6^fg; .v-r .
0 65,500
144,000
230,000
325,000
425,000
528,000
633,000
746,000
868,000
999,000
1,118,686
1,237,892
1,362,127
1,487,268
WIP estimated at the start of each calendar year.
SUVSWD/41232.008/SLC6R008 Copyright 2006 Kleinfelder, Inc.
Page 5 of 13 September 11, 2006

3.2 PROJECTED WASTE IN PLACE
Future WIP amounts have been estimated using three scenarios:
1. Projected WIP values based on historic WIP data;
2. Projected WIP based on an expected county population growth rate; and
3. Projected WIP based on a conservative county population growth rate.
The WIP for each year is calculated by adding the waste acceptance rate to the existing
WIP. The three future WIP estimates are used to calculate the NMOC emissions
estimates generated for this report.
For scenario one, historic WIP data was plotted versus time represented as blue dots
on Chart 1. A best-fit approximation of that data is a curve, which was projected
through the year 2016, and is shown on Chart 1. The waste acceptance rate of this
curve is increasing 5 percent per year, which is larger than the current waste
acceptance rate of 1 to 2 percent. Projected WIP estimations calculated using this
method are shown in the Table 3 and are represented by the blue line in Chart 1.
The second scenario for estimating waste acceptance rates was based on county
population growth rates. Kleinfelder contacted the local municipal planning
organization, Mountainland Association of Governments (MAG). MAG reported the
population of Southern Utah County is expected to grow at an average annual rate of
3.9 percent per year for the next 25 years. Therefore, the waste acceptance rate was
assumed to also increase at a rate of 3.9 percent per year. The projected WIP for this
scenario is provided in Table 3 and is represented by the green diamonds on Chart 1.
The third scenario for estimating waste acceptance rates was based on an assumed
county population growth rate of 10 percent per year to provide a highly conservative or
"worst case" estimation of NMOC emissions from the Landfill. The projected WIP is
provided in Table 3 and is represented by the red squares on Chart 1.
SUVSWD/41232.008/SLC6R008 Page 6 of 13 September 11, 2006 Copyright 2006 Kleinfelder, Inc.

TABLE 3 ESTIMATED WASTE ACCEPTANCE RATE AND WASTE IN PLACE
year
j ; • » ! • . , . , ••
2006 2007
2008 2009 2010 2011 2012 2013 2014 2015 2016
; Scenaiirip One: ; . . Best fit.Projection of .,
,:S:'fi Actual WIP ; Waste-
Acceptance Rate
(Mg/year): 145,214
149,543 153,872
158,201 162,529 166,858 171,187
175,516 179,845 184,173 188,502
Estimated
1,702,668 1,847,882 1,997,425 2,151,297 2,309,498 2,472,027
2,638,885 2,810,072 2,985,588 3,165,433 3,349,606
1 V SciBriario J )N6 I Z , V Population GVowtli; Riatie I : ' •^••:,. . i ^^ :9%.- : ' : ' - ' : • ' ^ -
-Wa6te r Acceptance
Rate ;(Mg/year)
130,965 136,073 141,379 146,893 152,622 158,574
164,759 171,184
177,860 184,797 192,004
Estimated
: ; (Mg) : ;
1,613,317 1,744,282 1,880,354 2,021,734 2,168,627 2,321,249
2,479,823 2,644,582 2,815,766 2,993,626 3,178,423
• , Sc0nariip Thre^: > Population Growth RateJ
'r :.•;;-, :=viO:0%-'v:-- v r ' :
Waste r Acceptance
/Rate ; (Mg/year)/
138,654 152,519 167,771
184,548 203,003 223,303 245,634 270,197 297,217
326,939 359,633
^ • . I ' l > • • , ' • • • - • • • »
; Estimated, WIPv . (Mg); .
1,613,317 1,751,971
1,904,490 2,072,261 2,256,810 2,459,813
2,683,116 2,928,750 3,198,947 3,496,164
3,823,103
CHART 1 WASTE IN PLACE ESTIMATES VS. TIME
4000000
3500000
3000000 " « •
E S o) 2500000 CQ
S g 2000000 -
ol
•^ 1500000
1 1000000
500000
o l 19
O Waste in place
O Projected Waste in Place--Growth Rate=3.9%
D Projected Waste in Place-Growth Rate=10.0%
- = Projected Best Fit of Waste in Place
? • - , , .
D
Ul
• . .
V : , : ' , : ^
J-J, vi i;|;.j;^:' i'%.''^<'|'.|;.|^^^
••.•i\ .i ''^ .-'!> - '•si '^i ^^Ki%-^^0^,SS^t^%^^ .'a''r
91 1996 2001 2006 Year
. ^ ^ • ' . ' . '
V-- ••••' . 1 * ' " " ^ ' ^ . ' ' A ' i .
2011 2016
SUVSWD/41232.008/SLC6R008 Copyright 2006 Kleinfelder, Inc.
Page 7 of 13 September 11, 2006

3.3 DESCRIPTION OF LANDGEM MODEL
The Landfill Gas Emissions Model (LandGEM) Version 3.02 was used to estimate
NMOC emissions. The following equation^ is used by LandGEM to calculate the total
NMOC emission rate from the Landfill:
f l " I M \ I \
M,,oc = Z Z ^ 4 -^k^'^(C^^„c)(3.6xl0-') 1=1 ;=0.1 V
Definitions of the variables in the equation and the values used for each variable for this
model are as follows:
• MNMOC = Total NMOC emission rate from the Landfill, in Mg per year;
• k = methane generation rate constant, per year. The methane generation
rate used for this report was 0.02 per year, which is the Clean Air Act (CAA)
Arid Area default. The Bayview Landfill is considered an arid area landfill
because it is located in a region that receives less than 25 inches of rainfall
per year, as defined in section 60.754(a)(1) of Subpart WWW;
• Lo = methane generation potential in cubic meters per megagram (m^/Mg)
solid waste. The default value of 170 m /Mg was used for this model, as
provided in section 60.754(a)(1) of Subpart WWW;
Mi= mass of solid waste in the i' section in Mg. This is the WIP at the Landfill
and includes estimated WIP as calculated using the three scenarios
described above;
2 This equation is a modified version of the equation currently provided in Subpart WWW, and used in previous versions of LandGEM, which integrates NMOC emissions over each year. The modified equation shown above integrates emissions over a 0.1-year time increment. This revision is considered an improvement over previous calculation methodology. Approval to use this equation in place of the equation specified in Subpart WWW was obtained by Kleinfelder from Mr James Chapman of the UDAQ on January 18, 2006.
SUVSWD/41232.008/SLC6R008 Page 8 of 13 September 11, 2006 Copyright 2006 Kleinfelder, Inc.

ti = age of the i" section in years. The Landfill began accepting waste in
1991. NMOC estimations in this report are for the years 2006-2010, the 15'
and 20"^ years of landfill operation, respectively. Therefore, for the model, a
value of 20 years was used for tf, and
CNMOC = Concentration of NMOC in ppmv as hexane. Tier 2 testing at the
Landfill was conducted in November 2005. The value of CNMOC calculated at
that time was 1017 ppmv as hexane (Kleinfelder, 2005b).
SUVSWD/41232.008/SLC6R008 Page 9 of 13 September 11, 2006 Copyright 2006 Kleinfelder, Inc.

4. NMOC EMISSION ESTIMATES
NMOC emissions were modeled with LandGEM for the three scenarios as described
above. NMOC emissions estimates from the three model runs are shown below in
Table 4.
TABLE 4 ESTIMATED NMOC EMISSIONS
(Mg)
J # a r •
2006 2007 2008 2009 2010
Sceriario 1: : Beist Fit of Projected
Historical Data 35.1 37.5 39.8 42.1 44.4
!.. Scenario2: r QrowtiiRat0 = 3.9%^
35.1 37.6 40.2 42.9 45.6
i :^Sceriario 3: Growth Rate = 10.6f/o
35.1 37.8 40.8 44.1 47.7
A report from the LandGEM model run based on scenario three (10 percent growth rate)
is provided in the Appendix A.
SUVSWD/41232.008/SLC6R008 Copyright 2006 Kleinfelder, Inc.
Page 10 of 13 September 11,2006

SUMMARY
NMOC emissions based upon a population growth rate of 10 percent resulted in the
highest estimate; however, this estimate does not exceed 50 Mg/year for any of the five
years. Therefore, the estimated NMOC emissions indicate that NMOC emissions will
be below 50 Mg/year for the years 2006 through 2010. In accordance with section
60.757 (b) (1) (ii) of Subpart WWW, if the actual WIP exceeds the estimated WIP in any
year reported in this estimate, a revised five-year estimate will be submitted to the
administrator. Alternatively, SUVSWD may revert back to the filing of annual NMOC
emission reports.
Tier 2 landfill gas testing data is valid for five years, and testing will be repeated again in
2010. Another five-year estimate of NMOC emissions will be generated for the 5-year
period beginning January 1, 2011.
SUVSWD/41232.008/SLC6R008 Page 11 of 13 September 11, 2006 Copyright 2006 Kleinfelder, Inc.

6. LIMITATIONS
The data and interpretations contained in this monitoring report have been presented in
accordance with generally accepted standards of care and practice that currently exist
within the industry in this geographic region at this time. It should be recognized that
the evaluation of landfill gas is an inexact science. Judgments leading to conclusions
and recommendations are generally made with an incomplete knowledge of the
subsurface and/or historic conditions applicable to the site; Kleinfelder has relied upon
information presented by SUVSWD in order to define the scope of work followed for this
project. More detailed, focused, and/or extensive studies including additional
subsurface assessments can tend to reduce the inherent uncertainties associated with
evaluation of environmental conditions.
Since site activities and regulations beyond our control may change at any time after the
completion of this report, our observations, findings, and opinions can be considered
valid only as of the date of the field activities performed at the Landfill. Kleinfelder
assumes no responsibility or liability whatsoever for any claim, loss of property value,
damage, or injury that results from our identification of potentially detrimental conditions
that may be presented in our findings. No warranty, either expressed or implied, is
made.
SUVSWD/41232.008/SLC6R008 Page 12 of 13 September 11, 2006 Copyright 2006 Kleinfelder, Inc.

REFERENCES
Kleinfelder. (2005). Protocol for Tier 2 Landfill Gas Testing at Bayview Landfill, Elberta, Utah. Proposed Test Dates: November 1-2, 2005. Salt Lake City, Utah. SUVSWD/41212.008/SLC5R153.
Kleinfelder. (2005). Report of Tier 2 Landfill Gas Testing Sampling Dates: November 1-2, 2005 Bayview Landfill, Elberta, Utah. Salt Lake City, Utah. SUVSWD/41212.008/SLC5R193.
Mountainland Association of Governments. (2006). Utah Counties Population-2000//2005//2010//2015//2020//2030//2040//2050. http://www.mountainland.org/Demographics/Population_Data/Future_Projections /Utah%20Counties%20-%20State.pdf
US Environmental Protection Agency. (1996). New Source Performance Standards, Subpart WWW. 40 CFR, Part 60.
SUVSWD/41232.008/SLC6R008 Page 13 of 13 September 11, 2006 Copyright 2006 Kleinfelder, Inc.


APPENDIX R
Compost Operations Plan
SUVSWD Bayview Class I Landfill Pernnit Application
Permanent Composting Facility
Operating Plan
SUVSWD Bayview Class I Landfill
Permit Application
Prepared for Bayview Landfill
South Utah Valley Solid Waste District SpringviUe, Utah
Prepared by HDR Engineering, Inc.
3995 South 700 East, Suite 100 Salt Lake City, UT 84107
March 2009

SUVSWD Bayview Class I Landfill Permit Applicafion
Contents
1.0 PURPOSE OF PLAN 1
2.0 SITE PERSONNEL 2
3.0 SITE PLAN 3
4.0 WINDROW PROCESS 4
5.0 EQUIPMENT 5
6.0 WINDROW CONSTRUCTION 6
7.0 INPUT MATERIALS 7
8.0 GROUNDWATER MONITORING 9
9.0 SPECIAL PRECAUTIONS 10
10,0 WINDROW MONITORING 11
11.0 FINISHED COMPOST USE/DISPOSAL 13
12.0 DRAINAGE AND STORM WATER RUNOFF 14
13.0 SAFETY 15
14.0 CLOSURE AND POST-CLOSURE 16
ATTACHMENT R - l : EXAMPLE FORMS FOR RECORD KEEPING 17
ATTACHMENT R - 2: SOLID WASTE COMPOST FACILITY ANNUAL
REPORT FORM 19
ATTACHMENT R - 3: DRAINAGE CALCULATIONS 20
March 19,2009 Permanent Composting Facility Operating Plan | i

SUVSWD Bayview Class I Landfill Permit Application
#
1.0 Purpose of Plan
2 This Plan of Operations describes the methods for managing and operating the
3 SUVSWD Permanent Composting Facility at the Bayview Landfill. This Plan of
4 Operations is required for compliance with Utah Department of Environmental
5 Quality (UDEQ) Solid and Hazardous Waste Division Regulation R315-312-2,
6 Recycling and Composting Requirements. Once the Permanent Composting
7 Facility is constructed, this plan will replace the Temporary Composting Facility
8 Operation Plan currently included as Appendix R in the Permit Renewal
9 Application submitted in October 2003.
10 This Plan of Operations presents a description of composting equipment, input
11 material, and procedures utilized at the composting facility. The plan also
12 addresses equipment, monitoring, composting schedules, odor and vector control,
13 and special precautions. The Composting Facility will be located directly south
14 ofthe existing leachate pond and east ofthe eastern-most boundary of proposed
15 Cell 2, as shown in Figure R-l. Two types of composting are envisioned. One
16 will combine biosolids, yard waste, waste beverages, and food products as the
feedstock. The other will utilize only yard waste material, waste beverages and
food products. The compost that includes biosolids will be constructed into
19 windrows on an asphalt pad approximately 6 inches thick. The pad will be built
20 in two phases, with the first phase being approximately 4 acres and the second
21 phase being approximately 5 acres for a total of approximately 9 acres of area for
22 windrows. Initially, the first 4 acres ofthe windrow pad will be paved and will
23 be used for windrows containing biosolids. At that time, the majority ofthe
24 remaining 5 acres will not be paved and will be used for windrows containing
25 only non-biosolids feedstocks, or as a storage area for ground yard waste, or
26 compost curing, or screening. This Operating Plan references the Plan of
27 Operations for the Bayview Landfill which can be found as Appendix S in the
28 Class I Landfill Permit Renewal Application submitted in October 2003.
March 2009 Permanent Composting Facility Operating Plan | 1

SUVSWD Bayview Class I Landfill Permit Application
1 2.0 Site Personnel
2 The Composting Facility will be open 44 hours per week, eight hours per day,
3 Monday through Friday and one-half day on Saturday. The employees operating
4 the Composting Facility will be the landflll foreman, one composting equipment
5 operator, and one other fiill-time temporary employee during the summer. The
6 actual number of employees utilized for composting operations will vary with the
7 amount of feedstock material received. The landfill foreman will be responsible
8 for training all employees in safety and fire protection practices. He or she will
9 also be responsible for the training of employees in the inspection and
10 identification of unauthorized wastes. There will be other on-site employees at
11 the Bayview Landfill as described in Appendix S ofthe Permit Renewal
12 application (October 2003), Section 2.3.3, Landfill Personnel. Landfill Personnel
13 will assist as needed to maintain the site, including any regrading or repair ofthe
14 compost operating surfaces. Communication and coordination between landfill
15 and composting operations will be necessary to achieve uninterrupted operations
16 of each facility, and will be the responsibility of the compost foreman and the
17 landfill foreman.
2 I Permanent Composting Facility Operating Plan March 2009

SUVSWD Bayview Class I Landfill Permit Application
3.0 Site Plan
2 A Site Plan for the Permanent Composting Facility is attached as Figure R-l. It
3 includes the proposed location of the windrow area, curing area, ground yard
4 waste storage, biosolids storage, fiiture location of stormwater catch basin (if
5 constructed) and waste liquids storage (if constructed). Basic drainage pattems
6 are also reflected.
March 2009 Permanent Composting Facility Operating Plan | 3

SUVSWD Bayview Class I Landfill Permit Application
1 4.0 Windrow Process
2 The proposed composting operation will utilize a windrow process. Windrow
3 processing is a method of controlled, aerobic decomposition of organic material.
4 A carefially controlled windrow process balances oxygen, water, carbon and
5 nitrogen (C:N) in the feedstocks to support beneficial microorganisms. The
6 biological activity raises the temperature of the windrow to kill pathogens, seeds
7 and spores. Compost operators must manage windrows to maintain conditions
8 that meet state compost disinfection standards, and federal biosolids disinfection
9 standards if biosolids are included in the feedstock. A typical windrow process
10 consists ofthe following elements.
11 1. Feedstock receiving, grinding, blending, and misting (if necessary for
12 dust control);
13 2. Windrow formation, turning, watering, and monitoring;
14 3. Addition of biosolids to biologically active windrows (optional);
15 4. Active windrow management to achieve disinfection standards;
16 5. Static pile curing and stabilization;
17 6. Product screening, and possible recycling of larger material, called
18 "overs";
19 7. Product blending, coloring, and bagging (optional);
20 8. End product storage, sales, and distribution of bulk product, bagged 21 product, or both.
22 Grinding of tree trimmings, grass clippings, and other wood material will
23 continue to take place at either the (closed) Spanish Forks Landfill or the
24 SpringviUe Transfer Station using an existing tub grinder. If necessary, wood
25 material will be debagged before it is ground so there will be little or no plastic
26 material in the feedstock. A magnet located at the grinding operation pulls out
27 all ofthe ferrous material (nails, wire, etc.) Spotters at the grinding area will
28 visually inspect several randomly selected loads per day to watch for
29 unacceptable material; therefore, the ground material will be free of unacceptable
30 wastes and contamination when it arrives at the composting facility.
31 Biosolids will be delivered to the facility as needed to create windrows with a
32 balanced C:N ratio. A paved area on the windrow pad will be available to store
33 temporarily up to one weeks worth of biosolids if sufficient yard waste is not
34 available to create a windrow. Only Class A or Class B biosolids will be utilized
35 in the compost operation.
4 I Permanent Composting Facility Operating Plan March 2009

SUVSWD Bayview Class I Landfill Permit Application
5.0 Equipment
2 Equipment utilized at the Permanent Composting Facility will be as follows, or
3 equivalent. Altemate equipment may be used as conditions dictate.
4 • Windrow Tumer - Scarab 1994- Model #18^50; VIN#0200SB, 2800
5 tons per hour
6 • Deck Screen - Roadmnner 1998- Model # CCS 14; 250 cubic yards per
7 hour
8 • Front-end Loader-John Deere 2003-Model #TC544;VIN#
9 DWTC54H586370; 1200 cubic yards per hour
10 • Water Tmck- 4000 gallon tank; 200 gpm pump.
March 2009 Permanent Composting Facility Operating Plan j 5

SUVSWD Bayview Class I Landfill Permit Applicafion
1 6.0 Windrow Construction
2 Windrows will be formed initially using the front-end loader. They will be tumed
3 periodically using the windrow tumer. This model of windrow tumer forms
4 windrows that are approximately 18-feet wide, 8-feet tall, and have a 4-feet wide
5 top. The cross-sectional area ofthe windrows will be approximately 88 square
6 feet. The length ofthe windrows will vary, depending on the quantity of
7 feedstock processed and processing time. Windrows will be arranged no closer
8 than 15 feet apart to allow movement of the windrow tumer, front-end loader and
9 water tmck.
6 I Permanent Composting Facility Operating Plan March 2009

SUVSWD Bayview Class I Landflll Permit Application
m
# 37
7.0 Input Materials
2 The materials that will be used in the composting operation are tree trimmings,
3 grass clippings, and wood material. Other non-hazardous organic waste
4 materials such as agricultural waste and food processing waste may also be used.
5 Class A or Class B biosolids from the Provo Wastewater Treatment Plant or
6 other sources may also be included as a feedstock.
7 A balance of carbon and nitrogen is required to support proper biological activity
8 to achieve good product without causing unacceptable odors during processing.
9 A mix ratio by volume of between 1:2 and 1:5 biosolids to other organic high
10 carbon materials such as wood is needed to achieve a proper balance of carbon to
11 nitrogen (C:N) of at least 30:1 by weight. The method of measuring and
12 proportioning input materials will be by a visual volume estimate (per bucket
13 load).
14 The Class B biosolids hauled from the Provo Wastewater Treatment Plant will
15 have been anaerobically digested, dewatered using polymers and centrifuges, and
16 will contain approximately 2 1 % to 23% solids for a total of approximately 1450
dry tons of biosolids per year and a total of approximately 8000 wet cubic yards
per year or 6000 wet tons per year. If biosolids from any other source are
19 accepted for processing, the estimated quantity and composition will be reported
20 to the UDEQ DSHW prior to the acceptance of the material for composting.
21 Tree trimmings, grass clippings, wood material, and other similar high-carbon
22 material will be solicited in quantities as appropriate to provide enough available
23 carbon to maintain a high enough C:N ratio to support proper decomposition
24 without nuisance conditions. Any excess wood may be used directly for erosion
25 control and top dressing on the landflll. It may also be composted or removed
26 from the site and sold.
27 Water used to add moisture will be provided from a storage tank on-site, which
28 stores groundwater from the on-site culinary well. In the event that the
29 stormwater catch basin and/or container cmshing pad are constmcted in the
30 future, they will provide another source ofliquid to be added to the windrows.
31 Maintaining proper moisture in the windrows is important to support
32 microbiological decomposition. When water is needed in the windrows, on-site
33 staff will spray the windrows using a water tmck. During and after the seven-day
34 minimum period of pathogen reduction, only water from the culinary well or
35 mnoff that has not come in contact with biosolids will be used to add moisture to
windrows or curing or storage piles.
March 2009 Permanent Composting Facility Operating Plan j 7

SUVSWD Bayview Class I Landfill Permit Application
1 Additionally, the District may constmct a container-cmshing pad in the fiiture,
2 which will be located directly to the south ofthe windrow area. The pad will be
3 used to cmsh containers that contain liquid or semi-solid material brought to the
4 landflll for disposal. This may be from product that does not meet specification
5 for sale to consumers or that is out-of-date. The containers will be cmshed,
6 allowing the contents to drain into a buried storage tank for later withdrawal and
7 used for adding moisture to aid in the compost process. Since this liquid has not
8 been exposed to pathogens, it may be used before or after pathogen reduction.
9 The cmshed containers will then be taken to the landfill for disposal or recycled
10 as appropriate.
11 Bulk liquids, which may be brought to the site, will be sprayed directly on the
12 windrows or stored in on-site storage tanks for use at a later time. Bulk liquids
13 are not permitted for disposal at the landfill.
8 I Permanent Composting Facility Operating Plan March 2009

SUVSWD Bayview Class I Landfill Permit Application
8.0 Groundwater Monitoring
2 One deep groundwater monitoring well (DMW-6) is currently located
3 downgradient ofthe Composting Facility, as shown in Figure R-l. The
4 monitoring well will monitor the water quality after it passes beneath the
5 windrow area. This groundwater monitoring well is designed to detect any
6 contamination resulting from the composting operation.
March 2009 Permanent Composting Facility Operating Plan j 9

SUVSWD Bayview Class I Landfill Permit Application
9.0 Special Precautions
2 Rain will not be a hindrance to composting because composting requires the
3 addition of moisture due to the fact that the process is exothermic. Heat generated
4 by microbiological activity causes evaporation of water on a continual basis.
5 Therefore, it will be necessary to add water. The heat of decomposition will
6 mitigate the effects of snow and freezing weather on the material while it is being
7 processed on-site. An operator will be available at all times when feedstocks are
8 being delivered to monitor for unacceptable materials, and to take any action to
9 maintain active, aerobic composting in cold weather, such as adjustments in
10 feedstock ratios, frequency of tuming or watering.
11 Windrows and curing piles will be crowned to shed rainfall. The windrow pad
12 will be graded at approximately a 2% slope toward a northward-draining valley
13 between the Phase I and Phase II areas. In addition, the pad will be sloped
14 approximately 0.25%) north toward the leachate pond located north ofthe
15 windrow area. The northward draining valley will be sloped at 0.5%) to convey
16 the 25-year storm from both phases. Biosolids will be stored on Phase I of the
17 asphalt pad. When needed, biosolids will be incorporated into the windrows as
18 they are being formed.
10 I Permanent Composting Facility Operating Plan March 2009

SUVSWD Bayview Class I Landfill Permit Application
€
m
10.0 Windrow Monitoring
2 As required by federal regulations, to achieve Class A pathogen reduction of
3 biosolids using the windrow composting method, the biosolids must maintain a
4 minimum temperature of 55 degrees Celsius or higher for a period of at least 15
5 days. During the time the windrow is maintained at a temperature of at least 55
6 degrees Celsius, it must be tumed a minimum of 5 times. As required to achieve
7 Class B pathogen reduction using the windrow composting method, the biosolids
8 must maintain a minimum temperature of 40 degrees Celsius or higher for a
9 period of at least 5 days. During at least 4 hours in that 5-day period, the
10 temperature in the windrow must exceed 55 degrees Celsius. UDEQ regulations
11 require the windrows to maintain a temperature between 60 and 71 degrees
12 Celsius for a period of not less than seven days. In order to meet both of these
13 requirements, it is proposed that the windrows maintain a minimum temperature
14 of 40 degrees Celsius for at least 15 days. At some point during the 15 days, the
15 temperature should exceed 55 degrees Celsius for at least 5 consecutive days and
16 be tumed at least 5 times during the same period.
It is anticipated that the complete composting cycle will entail approximately 45
to 60 days in the windrow process (active phase) and an additional 30 days in the
19 curing process (curing phase). It is the intention ofthe SUVSWD to produce
20 compost that meets standards for Class A biosolids disinfection when biosolids
21 are included in the feedstock.
22 To meet the requirements for Class A pathogen reduction, the temperature in the
23 windrows will be measured and recorded daily. Daily logs will be kept including
24 the quanfity and type of material processed. Moisture content may also be
25 measured at a frequency necessary to support proper operations. Moisture can be
26 checked just by feeling the material, or using a meter. An oxygen meter may
27 also be used as needed to ensure that piles are not becoming anaerobic. Example
28 forms to be used to record the monitoring information are included as
29 Attachment R-l .
30 Once the compost has remained in the windrows for 45 - 60 days and has met the
31 pathogen reduction requirements for time and temperature outlined above (active
32 phase), it is considered stable. At that time, it will be placed in a static pile for
33 final curing before being used. During the curing phase, the rate of oxygen
34 consumption declines to the point where tuming is no longer required. Also,
35 organic materials continue to decompose and are converted to biologically stable
humic substances. At that point, the compost is considered mature. Curing is not
required to be on a lined area. Locations for static piles will be west ofthe
38 leachate pond and possibly on areas that will be used for landfill cells in the
March 2009 Permanent Composting Facility Operating Plan | 11

SUVSWD Bayview Class I Landfill Permit Application
1 fiiture. Piles will be located so as to not interfere with ongoing compost or
2 landfill operations.
12 I Permanent Composting Facility Operating Plan March 2009

SUVSWD Bayview Class I Landfill Permit Application
11.0 FINISHED COMPOST USE/DISPOSAL
2 The final step in the production of compost is typically screening and/or coloring.
3 Although not necessary, this is usually done to increase the value ofthe product
4 by improving aesthetics. If these processes are undertaken, additional equipment
5 will be rented, leased or purchased in order to perform the needed functions.
6 Finished compost and excess wood mulch will either be hauled off-site to be
7 sold, or used on-site at the landfill for side-slope stabilization and to support
8 vegetation as an amendment to native soils. Wood removed during screening
9 may also be recycled to windrows, if necessary. Annual reports will be
10 submitted to the Utah Department of Environmental Quality. A copy ofthe
11 required forms is included as Attachment R-2.
12
March 2009 Permanent Composting Facility Operating Plan | 13

SUVSWD Bayview Class I Landfill Permit Application
12.0 DRAINAGE AND STORM WATER RUNOFF
2 In order to prevent stormwater from contaminating surface water or groundwater,
3 all composting operations utilizing biosolids will take place on an asphalt pad.
4 The first phase (Phase One) ofthe pad will be sloped to the east at a -2.0% slope
5 and the second phase (Phase Two) will be graded toward the east at a +2.0%)
6 slope creating a valley for drainage between the two phases. Additionally, the
7 enfire pad will be sloped at a -0.25% slope to the north. The first phase ofthe
8 asphalt pad will extend approximately 380 feet to the east, down the -2.0% slope,
9 and then approximately 25 feet to the east, up the +2.0% slope, to create a valley
10 for stormwater to be collected and directed to the existing leachate pond. If the
11 catch basin is constmcted in the fiiture, then the valley will drain to the catch
12 basin. The catch basin will be lined to prevent seepage into the ground. Excess
13 mnoff that is not contained in the catch basin, when constmcted, will be directed,
14 via an overflow pipe, to the existing leachate pond. The catch basin will be
15 approximately 8 feet deep with 4H: 1V sideslopes. A 6" HDPE pipe will be
16 installed 1.0 foot below the top ofthe catch basin so that any excess mnoff may
17 drain to the existing leachate pond. A 6-inch curb or berm will be installed along
18 the northem edge ofthe asphalt pad to direct mnoff to the existing leachate pond
19 or future catch basin. Drainage calculations for the peak flow can be found in
20 Attachment R-3.
21
14 I Permanent Composting Facility Operating Plan March 2009

SUVSWD Bayview Class I Landfill Permit Application
13.0 SAFETY
2 Safety training for personnel will be provided routinely and will be the
3 responsibility ofthe landfill foreman. Training will consist of how to prevent,
4 control and report fires, and proper use of equipment. See Appendix S in the
5 Landflll Permit Renewal Application (October 2003), Section 2.0, Emergency
6 Response, and Section 6.0, Contingency and Corrective Action Plans, for
7 explosion, fire, and emergency response plans. The foreman will also enforce
8 safety mles and policies and will investigate and report all accidents.
9 Lockout / tagout procedures will be followed for maintenance and cleaning of
10 onsite equipment. Smoking and public access will be prohibited. Personal
11 protective equipment will be provided to all on-site employees. This includes
12 gloves, eye protection, and ear protection. All on-site employees will be required
13 to wear steel-toed shoes and long pants. Dust masks will be available if needed.
14 Material Safety Data Sheets will be maintained on-site for all applicable
15 materials used. Employees will have access to these sheets.
16 Emergency phone numbers will be posted in the landfill office. First Aid kits
and fire extinguishers will be available in the office and on or near heavy
18 equipment, as appropriate.
19
March 2009 Permanent Composting Facility Operating Plan | 1 5

SUVSWD Bayview Class I Landfill Permit Application
14.0 CLOSURE AND POST-CLOSURE
2 Should the District desire to cease compost operations, they will remove all
3 compost piles, windrows, and any other compost material on site within 30 days
4 of closure. If the catch basin is built, it will be completely drained and any solid
5 material remaining will be properly disposed of. If necessary, any compost
6 material remaining on site will be covered and vegetated. Once the site has been
7 cleared, a plat and a statement ofthe fact that the property has been used as a
8 composting facility will be submitted to the county recorder.
9 The post-closure care and monitoring period will last for five years after closure
10 ofthe composting facility. During this time, any monitoring equipment used will
11 be maintained and any sampling and testing schedules will be followed. If cover
12 is placed over any remaining compost during closure, it will be inspected and
13 maintained during this post-closure care period.
14
15
16 I Permanent Composting Facility Operating Plan March 2009
SUVSWD Bayview Class I Landfill Permit Application
Attachment R-l : Example Forms for Record Keeping
March 2009 Permanent Composting Facility Operating Plan j 17

SUVSWD Bayview Class I Landfill Permit Application
South Utah Valley Solid Waste District
Bayview Landfill
Compost Data Form
Windrow Number / Location:
Date(s) Created:
Location Date Time Temp Comment
Location = distance along windrow; south or north side Comment = turn date; water or liquid added; unusual conditions
18 I Permanent Composting Facility Operating Plan March 2009

Appendix S
APPENDIX S
LANDFILL OPERATIONS PLAN
SUVSWD Bayview Class I Landfill Permit Application
Originally Submitted
February 2004
Modified
October 2009
Prepared By:
HDR ENGINEERING, INC.

SUVSWD Bayview Class I Landfill Permit Application - Appendix S
Table of Contents
1.0 INTRODUCTION 1
2.0 EMERGENCY RESPONSE AND BACKGROUND INFORMATION 1
2.1 Emergency Response Actions 1 2.2 Permit Requirements 2 2.3 Landfill Facilities 5
3.0 SCHEDULE OF FACILITIES CONSTRUCTION 10 4.0 SOLID WASTE HANDLING 10
4.1 Waste Acceptance 10 4.2 Waste Disposal 11 4.3 Placement of Cover Soils 11
5.0 INSPECTIONS, MONITORING, AND REPORTING 12 5.1 Inspections 12 5.2 Groundwater Monitoring 12 5.3 Landflll Gas Monitoring 14
6.0 CONTINGENCY AND CORRECTIVE ACTION PLANS 17 6.1 Fire 17 6.2 Explosion 18 6.3 Failure of Run-Off/Run-On Structures 19 6.4 Release of Explosive Gases 20 6.5 Groundwater Contamination 21
7.0 ALTERNATIVE WASTE HANDLING PROCEDURES 21
8.0 MONITORING EQUIPMENT MAINTENANCE 21
8.1 General 21 8.2 Groundwater Monitoring Wells 22 8.3 Gas Monitoring Locations 22
9.0 DISEASE VECTOR CONTROL 22 9.1 Rodent Control 23
9.2 Bird Control 24
10.0 WASTE SCREENING 24
11.0 RECYCLING 25
12.0 COMPOSTING 25
Table S-1: Recommended Frequency of Inspection of Landfill Facilities 13
Figure S-1: Utah Requirements for Groundwater Monitoring 16
Bayview Class I Landfill Permit Application Revision 2 January 2009 South Utah Valley Solid Waste District Appendix S Page i

1.0 INTRODUCTION
The purpose ofthis Operations Plan is to assist the Landfill Foreman and Landfill Operating
Persormel in conducting day-to-day operations in a manner that is consistent with the various
permit requirements, and with the design of the Bayview Landfill. Section 2 describes the
emergency response procedures applicable to the landfill, the permit conditions applicable to the
landfill, the designed facilities at the landfill, and equipment and persoimel requirements for
proper operation of the landfill. Section 3 provides a discussion of landflll facilities at the site.
Section 4 describes the procedures for handling wastes received at the landflll. Section 5
provides a schedule for conducting inspections, monitoring, and reporting for the landflll
facilities. Section 6 provides contingency plans and corrective action programs to be
implemented if emergency conditions (e.g., fire or explosion) exist, or if data indicate that
containment systems have failed. Section 7 discusses altemative waste handling and disposal
during inclement weather. Section 8 describes the maintenance of landfill monitoring equipment.
Section 9 describes routine and non-routine procedures to be implemented to control disease
vectors. Section 10 addresses waste screening to exclude regulated hazardous wastes. Sections
11 and 12 provide a discussion ofthe current and planned recycling and diversion of solid wastes
at the landfill.
2.0 EMERGENCY RESPONSE AND BACKGROUND INFORMATION
2.1 Emergency Response Actions
Landfill emergencies include: injury, dismemberment, or death of personnel; and fire, explosion,
or other catastrophic events. Because of its remote location, the landfill maintains its own
fire protection equipment, and personnel are trained in the operation of this equipment. Also
because of its remote location, injured personnel will be transported to medical facilities in
District vehicles if their condition allows movement. The Landflll Foreman, or his designee,
may request that ambulance and paramedical persormel meet the transporting vehicle enroute to
the medical facility.
Bayview Class I Landfill Permit Application Revision 2 January 2009 South Utah Valley Solid Waste District Appendix S Page 1

For other emergencies, the following list provides the phone number to access emergency
services. This list will be posted directly adjacent to each phone on the facility site within a
colorless, protective plastic cover.
Fire and Rescue 911 (801)375-3601
Hospital 911
Utah Valley Regional Medical Center (801) 371-7001
Mountain View (801)465-7190
County Fire Marshall (801) 370-8885
Sheriff (801)375-3601
District Office (801) 489-3027
In the event of any emergency, the following personnel will be notified:
Name Position/Title Work Phone
Richard Henry District Manager (801)489-3027
Scott Aitken Landfill Foreman (801)376-0197
Mark Loveless Transfer Station Foreman (801 )489-3027
Dorothy Morse Executive Secretary (801)489-3027
2.2 Permit Requirements
The Bayview Landfill is subject to both State of Utah and local Utah County requirements
controlling day-to-day operations at the landfill. The state and local requirements are discussed
below.
2.2.1 State Requirements
On October 9, 1991, the U.S. Environmental Protection Agency (EPA) published revisions to the
Criteria for Classification of Solid Waste Disposal Facilities. These regulations were developed
Bayview Class I Landfill Permit Application Revision 2 January 2009 South Utah Valley Solid Waste District Appendix S Page 2

in response to requirements of Subtitle D ofthe 1984 Hazardous and Solid Wastes Amendments
(HSWA) to the Resource Conservation and Recovery Act (RCRA) of 1976. The Subtitle D
regulations set forth minimum federal criteria for municipal solid waste landfills, including
facility design and operational requirements. The Subtitle D regulations became effective on
October 9, 1993.
Subtitle D establishes a framework for federal, state, and local govemment cooperation in
controlling the management of non-hazardous solid wastes. The federal govemment's role
within this framework is to establish the regulatory direction by providing minimum
nationwide standards for protection of human health and the environment, and by
providing technical assistance to states for planning and developing their own
environmentally sound waste management practices. However, the actual planning, direct
implementation, and enforcement of solid waste programs remains a state and local role under the
Subtitle D fi-amework.
On July 15, 1993, the Utah Department of Environmental Quality (UDEQ) issued final
Administrative Rules implementing Subtitle D at the state level. These mles, entitled Solid
Waste Permitting and Management, Rules (8315-301 through 320), have been reviewed by EPA,
and the UDEQ has received authorization from EPA to implement and enforce the solid waste
management program.
The UDEQ mles require that each landflll develop and comply with its approved Operations
Plan. The mles further specify certain operational requirements including: excluding hazardous
and bulk liquid wastes; controlling access; controlling disease vectors; controlling air discharges
and explosive gases; controlling mn-on, run-off, and surface water discharges; and maintaining
records. This Operations Plan has been developed to include the requirements ofthe UDEQ mles.
2.2.2 Utah County Requirements
During the process of permitting the Bayview Landfill site, the Utah County Board of
Adjustment enumerated 26 criteria that the landflll must meet to remain in compliance with the
Board's Conditional Use Permit. These permit conditions include the following. (Note: These
Bayview Class I Landfill Permit Application Revision 2 January 2009 South Utah Valley Solid Waste District Appendix S Page 3

permit conditions are quoted directly from the Conditional Use Permit and are provided here to
make the landfill operators aware ofthe District's obligations under the Conditional Use Pemiit.)
1. Compacted or baled garbage will be placed in trenches and covered at the end of each
day.
2. The waste will be buried away from the gravel pit area.
3. A fence will be installed surrounding each trench area at least eight (8) feet in height and
higher if found inadequate to control blowing papers.
4. After an area has been filled, it will be contoured, mulched, and reseeded as indicated by
the State Agronomist and the State Extension Service.
5. There will be a watchman on site during normal working hours.
6. The gate will be closed any time it is unattended and it must be locked. (This is the
main gate, not that around a particular area being filled.)
7. A new access road from the state highway into the deposit area will be provided as
required by the Department of Transportation.
8. The size ofthe garbage trucks will meet the requirements ofthe Utah Department of
Transportation and Utah Highway Patrol.
9. Provo City will cooperate with the State Highway Department and local residents to
prevent inordinate damage to the road during periods when the road is saturated and
subject to destmction, and comply with all state and local ordinances conforming to the
same.
10. All municipal garbage will be collected and compacted at a location other than the
landfill site and transported in covered tmcks by Provo City.
11. No buming is to be allowed at the disposal site.
12. The trenching will be done in such a manner as to protect the drainage channels in the
area as required by the State Department of Environmental Health.
13. No hazardous wastes will be deposited in the area.
14. All reasonable caution and pmdence be exercised to not dispose of any waste during any
unreasonable weather conditions.
15. All requirements in the "Code of Solid Waste Disposal Regulations" will be met.
16. Any terms of the lease held by Mr. Jacobs are protected and that Provo City
cooperates with him during lambing season to minimize the impact on his operation.
Bayview Class 1 Landfill Permit Application Revision 2 January 2009 South Utah Valley Solid Waste District Appendix S Page 4

17. No public dumping.
18. Landfill to be used only by Provo City, and if other cities were to use the landflll,
approval from the Board of Adjustment would be necessary.
19. Persormel will police the grounds outside the fence, and keep litter and garbage picked
up.
20. Rodent control must be in effect at all times as state law provides.
21. Water samples will be taken by the Department of Environmental Health from any wells
within 1500' of the disposal site prior to any dumping to determine the water
quality. Samples would be taken every six months or more often as determined by
the Department of Environmental Health.
22. The area used to begin the operation of filling must be selected to minimize the
impact on people in the surrounding area.
23. In constructing the road or roads required by the Department of Transportation to get
access to the landfill, Provo City will minimize the amount of disruption to the
environment of the area.
24. That Provo City maintain a buffer zone of at least 100' from existing state roads, homes
and premises in dumping their compacted garbage.
25. Upon noncompliance with any of these provisions Utah County will revoke said right to
the landfill.
26. Provo City will provide an annual report to the Board of Adjustment for their review as to
the progress in the engineering ofthe landflll.
These conditions will be considered the minimum criteria that the landflll operations must meet
to remain in compliance with the Conditional Use Permit.
2.3 Landfill Facilities
At the time of this permit application renewal, the Bayview Landfill consists of one 33-acre
landfill cell almost at final grade, one stormwater/leachate evaporation pond, five screening berms,
one maintenance building, and appurtenant roads, fences, and culinary and monitoring wells. In
addition, an 82-acre cell is curtently under design and will be constmcted in 15-acre increments
or stages. Figure 5 in Part IV provides a layout of the existing facilities at the Bayview
Bayview Class 1 Landfill Pennit Application Revision 2 January 2009 South Utah Valley Solid Waste District Appendix S Page 5

Landflll. Each of these facilities was anticipated in the Landflll Master Plan (HDR, 1988)
developed for the site, and is described in the following paragraphs. The landfill is also
currently equipped with various earthmoving and landfill operations equipment. The types and
numbers of pieces of equipment necessary for proper operation of the landfill are described
below.
2.3.1 Fixed Landfill Facilities
Cell 1 Stage 1 and Stage 2 have been constructed with a liner and leachate collection
system. The liner consists of a 40-mil and 60-mil high density polyethylene (HDPE)
geomembrane, respectively, sandwiched between two layers of 12-ounce polypropylene
geotextile. At the time of its construction, the liner system was covered with a 2-foot layer of
protective soil cover. The liner system and its protective soil cover are critical elements in the
landfill leachate containment system; therefore, operators will take all possible precautions to
protect the liner system. Damage to the protective soil cover will be inspected, and damage
to the liner system will be reported to the District Manager for appropriate action.
Cell 2 will also be constmcted with a liner and leachate collection system. The liner will consist
of a geosynthetic clay liner (GCL), and a 60-mil high-density polyethylene (HDPE)
geomembrane sandwiched between two layers of geotextile. The liner system will be covered by
2 feet of protective cover/leachate collection material.
For Cell 2, the leachate collection system will consist of 2 feet of permeable screened soil on
the floor of the landfill cell and a leachate collection trench that is fitted with granular fill
and a pipe. The granular fill is surrounded with filter fabric (geotextile). The leachate
collected within this system flows by gravity to a sump at the low end of the cell and pumped to
the surface, where it then flows by gravity to the on-site leachate sewer line and ultimately to the
evaporation pond. The cleanout stations on the pipeline will be inspected on a regular basis to
verify integrity.
The stormwater/leachate evaporation pond has been constructed with a liner and a protective
cover system. The liner system consists of a 60-mil HDPE geomembrane sandwiched between
Bayview Class I Landfill Permit Application Revision 2 January 2009 South Utah Valley Solid Waste District Appendix S Page 6

two layers of 12-ounce polypropylene geotextile. The liner system was covered with a 6-
inch concrete pad on the bottom and a 40-mil HDPE geomembrane on the side slopes. The
concrete pad extends approximately 3 feet (measured vertically) up the side slopes, and a
concrete access road has been constmcted to provide equipment access into the bottom of the
pond. The concrete pad is intended to allow landflll operators to enter the pond to remove
accumulated sediments as required. The concrete bottom and access road will be inspected on a
regular basis to verify the integrity of the concrete. Similarly, the 40-mil HDPE protective
liner will be inspected on a regular basis to verify its integrity. Damage to either the concrete
or HDPE protective cover materials will be reported to the District Manager for appropriate
action.
The screening berms have been constmcted to provide a visual barrier between State Highway
68 and the active landfill facilities. These screening berms also provide a partial visual barrier
between properties north and south of the site and the active landfill facilities. The District
constmcted these berms to lessen the visual impact ofthe landfill facilities on the passersby, not
as a condition of a permit.
The maintenance building consists of three equipment maintenance bays, a combined office/break
room, and restroom facilities. This building is locked when landfill operations personnel are not
on-site. The building is supplied with culinary water from the culinary well located in Section
18.
Fourteen wells have been constmcted around the landflll property to provide stations for
monitoring groundwater underlying the site. Eight of these wells were constmcted to intercept
the regional groundwater at a depth of approximately 250 feet below ground surface. The
remaining six wells were constmcted as "wet/dry" wells screened in the seasonal water table
aquifer at a depth of approximately 70 feet below ground surface. These shallow wells are
intended to provide early waming of leachate movement, if it should occur.
A 6-foot high chain link fence surrounds the site to control access to the facilities when landflll
operations personnel are not present. The main access to the site is equipped with doublewide.
Bayview Class I Landfill Permit Application Revision 2 January 2009 South Utah Valley Solid Waste District Appendix S Page 7

locking gates. These gates are locked during nonworking hours. In addition, the
stormwater/leachate evaporation pond is surrounded by a 6-foot high chain link fence and two
doublewide, locking gates. The stormwater/leachate evaporation pond gates are locked unless
landfill operations personnel are inside the fenced enclosure.
2.3.2 LandfiU Equipment
The following equipment is maintained for use at the Bayview Landfill:
Equipment
Compactor, Landfill Blade
Scraper
Dozer
Grader
Water Truck
Pickup Truck
Pickup Truck
Quan
2
2
itity Size
56,000 lb.
22 cu. yd.
5,000 gal.
VA ton
VA ton
Make/Model
Cat 823C
Cat 623E
Cat D8R
Cat 770
Ford
Ford 250
Dodge 2500
This equipment is sufficiently sized for operation ofthe Bayview Landfill. All equipment, with
the exception of the pickup truck and fire truck, is required to have an OSHA-approved safety
cab, a fire extinguisher, a first aid kit, and a backup alarm. Additional equipment may be
purchased as existing equipment approaches the end of its useful life, or as operating conditions
require.
Bayview Class 1 Landfill Pennit Application Revision 2 South Utah Valley Solid Waste District Appendix S
January 2009

2.3.3 Landfill Personnel
The following persons are responsible or available for on-site operations at the Bayview
Landfill:
• District Manager. The District Manager is responsible for: planning, design, and
construction of the landfill facilities; overall operation of the solid waste management
system, including the landfill; and production of annual environmental and financial
reports. The District Manager reports to the District's Board of Directors. The
Landflll Foreman reports directly to the District Manager.
• Landfill Foreman. The Landfill Foreman is responsible for all day-to-day
operations at the Bayview Landfill. He is responsible for: acceptance and placement of
wastes at the landfill; routine inspection ofthe facilities for compliance with permit
requirements; and coordination with the Transfer Station Foreman. The Landfill
Foreman is a certified Manager of Landflll Operations with at least 10 years of
professional experience related to landfill operations and earthwork. The Equipment
Operator(s), Spotter/Laborer(s), and any visitors report directly to the Landfill
Foreman.
• Equipment Operators. The Equipment Operator is responsible for: safe operation and
daily maintenance of equipment; visual inspection of waste loads for unauthorized or
hazardous wastes; and daily operations on the working face of the landflll. The
Equipment Operators, with the exception of apprentices, typically have 2 years of
professional experience related to landfill operations or earth work. As of July 2003,
two of the operators have in excess of two years experience and a third is nearing
completion of two years. The current apprentice operator has about one year of
experience. Equipment Operators receive training on landfill operations within 2 years
of employment. The Landfill Foreman may designate the Equipment Operator to act
in his behalf in the foreman's absence.
• Spotter/Laborer. The Spotter/Laborer is responsible for: directing traffic to the
working face; control of litter and dust generated from the landfilling operations;
assistance to the Equipment Operators; and any other tasks assigned by the Landflll
Foreman.
Bayview Class I Landfill Permit Application Revision 2 January 2009 South Utah Valley Solid Waste District Appendix S Page 9

3.0 SCHEDULE OF FACILITIES CONSTRUCTION
Landfill Cell 1 - Stage 1, the first landfill half-cell, was excavated in 1988. The soils
excavated from this half-cell were used to constmct portions of the screening berms on the
eastem and northem boundaries of the site. The geomembrane lining system for this half-
cell was installed during the fall of 1989. Essentially, the construction consisted of: excavating
the native soils, compacting the exposed soils to 95% of optimum density (Standard Proctor),
installing a geotextile to cushion the overlying geomembrane from underlying soils,
installing a 40-mil HDPE geomembrane liner, installing a geotextile to absorb side slope
tensile stresses and to transmit leachate, and placing the protective soil cover. Provo City
Corporation and design personnel (HDR Engineering, Inc.) provided constmction quality
assurance observation during the installation of the geosynthetics and during the placement of
protective cover soils.
Stage 2 of Cell 1 was similarly constmcted except that a 60-mil geomembrane was used. Cell 1
is nearing final waste grades, and closure is expected to occur in 2005.
Stage 1 of Cell 2 is anticipated to be constmcted in early 2004 and is expected to last
approximately 5 years. Soil excavation to be used as daily cover is ongoing in Cell 2, and select
material will be used as final cover on Cell 1. A portion of this select material has already been
stockpiled on-site.
As a general mle, landfill cells will be planned to be available no less than 3 months prior to
the completion of filling in the operational cell. This will allow for construction delays due to
weather, constmction contractor difficulties, or other unanticipated delays. The design, permit
review, and contractor negotiations will be planned to require approximately 1 year.
4.0 SOLID WASTE HANDLING
4.1 Waste Acceptance
All solid wastes entering the Bayview Landfill originate at the SpringviUe Transfer Station or the
City of Goshen Transfer Station. Wastes entering these transfer station facilities are pre-screened
Bayview Class I Landfill Permit Application Revision 2 January 2009 South Utah Valley Solid Waste District Appendix S Page 10
for unacceptable materials by transfer station personnel prior to compaction of the wastes.
Operations at the transfer stations are not included in this landflll Operations Plan.
Private hauler and citizen self-hauled wastes are generally not accepted at the landfill.
Occasionally special wastes will be received directly at the landflll after arrangement with the
waste generator.
4.2 Waste Disposal
Transfer trailers entering the site will be directed by landfill operations personnel to the working
face, where the driver will be instmcted to discharge the load. Landfill operations persormel
will push the solid waste up the working face using a compactor. The waste will be placed in
lifts with a loose thickness of 2 - 3 feet. After the waste has been placed in loose lifts, the
operator will run the compactor over all portions of the lift at least two times parallel with the
slope (up slope), and at least one time across the slope. There may be times in operating the
landfill when pushing uphill may be impractical or poor practice (i.e., when the first lift of
waste is placed on protective cover soil.) Equipment operators will also maintain the working
face so that it is as small as practical to allow for efficient unloading of transfer tmcks, and
placement and compaction of solid wastes.
4.3 Placement of Cover Soils
Cover soils or other approved material will be placed over solid wastes to minimize the potential
for nuisance conditions, fire, and disease vector contact with solid wastes. Nuisance conditions
include: odor generation and air discharges; blowing of plasfic and paper wastes; and other
conditions that impair the use of adjoining properties.
At the end of each working day, the landfill operations personnel will cover all solid wastes
received during that day with daily cover. The daily cover will consist of a minimum of 6 inches
of soil excavated from other portions of the landfill site. Daily cover will be placed to minimize
the nuisance, fire, and disease vector potenfial attributable to each day's waste placement. On
an infrequent basis, oversized wood chips that are generated from the composting operation
Bayview Class I Landfill Permit Application Revision 2 January 2009 South Utah Valley Solid Waste District Appendix S Page 11
are used as an altemative daily cover. The landfill operators will record the time that this
altemative daily cover is use and monitor its effectiveness. This type of daily cover would
only be placed on Mondays through Thursdays. The standard 6 inches of onsite soils will be
used on Fridays.
Whenever a portion of the landflll cell will remain in an inactive condition for an extended
period, landfill operafions personnel will place an intermediate cover over the inactive portion.
The intermediate cover will reduce the potential for wind- and water-induced erosion ofthe
cover, and reduce the production of leachate and contact stormwater within the landfill cell. The
intermediate cover will consist ofan addifional 6-inches of soil.
5.0 INSPECTIONS, MONITORING, AND REPORTING
5.1 Inspections
The Landfill Foreman is responsible for conducting and recording routine inspections of landfill
facilifies. The schedule for conducfing routine inspections is provided in Table S-1. Forms for
recording routine inspections are presented in Appendix I.
The District Manager is responsible for verifying the completeness ofthe inspection records on
a quarterly basis.
5.2 Groundwater Monitoring
5.2.1 Detection Monitoring
The District has completed the 2-year program to determine the background water quality in
each ofthe 12 monitoring wells constmcted at the landfill site. The 2-year program consisted of
bi-monthly sampling of each well. During the first year, the District sampled each well
every other month; during the second year, the District also sampled every other month,
skipping one month so that each calendar month was sampled during the 2-year program. The
results of the 2-year program are used as a baseline for each well, and subsequent groundwater
Bayview Class I Landfill Pennit Application Revision 2 January 2009 South Utah Valley Solid Waste District Appendix S Page 12

monitoring results for each well will be compared to this baseline data. Baseline data will be
collected by 2 years of sampling following the construction of new wells.
The District will continue to conduct groundwater sampling on a semi-armual basis. The District
Manager and the Landfill Foreman will coordinate the monitoring events, schedule the
timing of groundwater sampling, sample or arrange for sampling of the wells, arrange for
analysis of the groundwater samples, and arrange for interpretation of the analytical results.
The groundwater samples will be analyzed for the constituents listed in UDEQ rules (R315-
308-4) for detection monitoring. The semi-annual detection monitoring samples will be
compared to the baseline data and to ongoing averages for each well to determine if the data is
statistically different from either the baseline data or from ongoing average data for each well.
If statistically significant increases are detected in the Detection Monitoring Program, the District will
begin an Assessment Monitoring Program, as required by UDEQ mles. Appendix F contains the
District's Groundwater Quality Report and Groundwater Monitoring Plan.
Table S-1: Recommended Frequency of Inspection of Landfill Facilities
Landfill Facility
Landfill Cell
Stormwater/Leachate Pond
Other Appurtenances
Inspection
Daily and intermediate cover integrity. Stormwater and leachate collection (ponding). Run-on/run-off control integrity. Cell perimeter fence integrity.
Perimeter fence integrity. Water depth. Liner system integrity. Water volume.
Entrance/main gate integrity. Perimeter fence integrity. Monitoring well integrity. Equipment maintenance. Site road integrity. Berm integrity.
Frequency
Daily Daily Daily Daily
Daily Weekly Weekly Quarterly
Daily Weekly Monthly Monthly Quarterly Quarterly
Bayview Class 1 Landfill Permit Application Revision 2 South Utah Valley Solid Waste District Appendix S
January 2009 Page 13

5.2.2 Assessment Monitoring
If a statistically significant increase in groundwater contaminants is detected as part of the
Detection Monitoring Program, the District will initiate the following actions:
• Notify UDEQ in writing, within 14 days of obtaining laboratory results. The notification
will include identification of the constituents that have shown a statistically significant
increase.
• Enter the laboratory results into the operating record for the landflll.
• Immediately resample the groundwater in all wells, or a subset of the wells as
specified by the Executive Secretary, for all constituents listed in R315-308-4. Determine
whether a statistically significant change has occurred such that the groundwater
protection has been compromised.
• Notify UDEQ within 7 days of receipt of the results of the resampling if a statistically
significant change has occurred.
Figure S-1 summarizes the requirements imposed on the District by UDEQ regulations to define
the nature and extent of groundwater contamination, and to take corrective action if the source of
the groundwater contamination is the landflll.
5.3 Landfill Gas Monitoring
The District began a landfill gas monitoring program by conducting an initial surface survey for
combustible gases, and by purchasing a combustible gas indicator (CGI). During the initial
survey, no measurable combustible gases were detected on the site, and landfill gas monitoring
stations were established for future monitoring events.
The District will continue to conduct combustible gas monitoring at the established stations
on a quarterly basis. The District Manager and the Landfill Foreman will coordinate the gas
monitoring events with groundwater monitoring events, and will arrange for interpretation of
the monitoring results if combustible gases are detected at any station.
Bayview Class 1 Landflll Permit Application Revision 2 January 2009 South Utah Valley Solid Waste District Appendix S Page 14

If concentrations of combustible gasses exceed the standard set in the UDEQ Rules, the District
will implement the requirements imposed on the District by UDEQ regulations in effect at the
time ofthe permit or revisions ofthe permit.
Bayview Class I Landfill Permit Applicafion Revision 2 January 2009 South Utah Valley Solid Waste District Appendix S Page 15

Figure S-1: Utah Requirements for Groundwater Monitoring
Complionce X ffg Monitorina
Progrom in ^ Ploee? "
Instoll Monitoring Progrom
Conduct Detection Monitoring Program
J [ f ^ _ / B a c k g r o u n d \ No Sompling
sComplele?y
Conduct Background
Sampling
* • Notify OEO w/ i 14 Ooys
Conduct Assessment Monitoring (eicpohded Kst for 2 quarters)
Install and Somple Additional Wells
Yes
Notify OCO of Detected Compounds
w/ i 14 Ooys
Notify OEO w/ i 14 Ooys
Cotiduct Corrective Actions Assessment
(w/ i 90 Ooys)
Bayview Class I Landfill Permit Application Revision 2 South Utah Valley Solid Waste District Appendix S
January 2009 Page 16

6.0 CONTINGENCY AND CORRECTIVE ACTION PLANS
The following sections describe the contingency and corrective action plans that will be
implemented if fire, explosion, failure of mn-off/mn-on stmctures, release of explosive gases, or
contamination of groundwater occurs.
6.1 Fire
No buming of wastes is planned in the active landfill cell area. Limited buming may be planned,
permitted, and accomplished during clearing of new landfill cell constmction areas, and perimeter
fence and drainage channel maintenance. No other buming activities are planned at the
Bayview Landflll.
Two other types of fires, fires in loaded vehicles and fires in disposed wastes, must be
anticipated and response activities planned. Each of these is discussed below. The preferred
method of fighting fires in the Bayview Landflll will consist of smothering the fire with soil.
Water will contribute to the formation of leachate, and should only be used as a last
resort if the fire cannot be smothered.
6.1.1 Loaded Vehicle Fires
In the event that a transport vehicle enters the landfill site carrying a buming or smoldering load
ofwaste, landflll operations personnel will take the following actions:
• Direct the vehicle to a designated section of the landfill away from the working face.
Direct the driver to deposit his load and to clear the area as quickly as possible.
• Immediately cover the buming waste with sufficient soil to completely smother the fire.
Allow the waste to cool for several days, or longer if necessary.
• If necessary, spray equipment and the transfer vehicle with water to cool the
equipment while working the fire. This will not be necessary if the equipment is
pushing or dumping soil on the buming wastes in front of the advancing
equipment.
Bayview Class 1 Landflll Permit Application Revision 2 January 2009 South Utah Valley Solid Waste District Appendix S Page 17

• If landflll operations personnel cannot control the fire, the County Fire Marshall will be
contacted.
• Nofify the UDEQ immediately and provide written documentation within 14 days ofthe
fire.
6.1.2 Working Face/Below Cover Fire
In the event of a working face fire or a fire below cover, landfill operations personnel will take
the following actions:
• Evacuate all non-essential personnel from the area of the fire. Non-essential personnel
would include transfer truck drivers, laborers/spotters, and visitors.
• Isolate the burning material from other wastes to the extent possible. Use
compactor blades and dozers to move the burning materials away from other wastes;
this may not be possible if the fire is below cover soil.
• Immediately cover the buming waste with sufficient soil to completely smother the fire.
Allow the waste to cool for several days, or longer if necessary.
• If necessary, spray equipment and the transfer vehicle with water to cool the
equipment while working the fire. This will not be necessary if the equipment is
pushing or dumping soil on the burning wastes in front of the advancing
equipment.
• If landfill operations personnel cannot control the fire, the County Fire Marshall will
be contacted.
• Notify the UDEQ immediately and provide written documentation within 14 days of the fire.
6.2 Explosion
In the event that an explosion should occur at the landfill or in any stmcture associated with the
landfill, landfill operations personnel will take the following actions:
• Immediately evacuate the area surrounding the explosion, including any adjacent
buildings. Shut down and abandon any equipment near the explosion that is hot and
may provide an ignition source for additional explosions.
Bayview Class 1 Landfill Permit Application Revision 2 January 2009 South Utah Valley Solid Waste District Appendix S Page 18
•

• Account for all personnel. Contact the County Fire Marshall and the emergency
dispatcher (911). Contact the District Manager.
• Restrict the explosion area to any entry until emergency response personnel clear
the area.
• Notify the UDEQ immediately and provide written documentation within 14 days of the
explosion.
6.3 Failure of Run-Off/Run-On Structures
Failure of mn-off stmctures may allow the release of contaminated water into the environment.
Failure of run-on stmctures may allow stormwater to mingle with and become leachate.
Neither of these conditions is desirable.
6.3.1 Failure of Run-Off Structures
In the event that a failure of mn-off stmctures is discovered during routine or non-routine
inspections, landfill operations persoimel will take the following actions:
• As soon as practical, suspend acceptance of wastes at the landfill, if necessary, and
inform the transfer stations ofthis suspension.
• Use landfill compactor and dozer equipment to construct temporary berms to contain
the mn-off Divert the fiow of mn-off water away from surface water drainage channels.
• Resume landfilling operations as soon as possible after the mn-off is contained. Inspect
the temporary berms as frequentiy as possible, but not less frequently than once every 2
hours.
• Assess the impact of the release of mn-off as soon as practicable following the event.
Assess the need for permanent improvements in the temporary berms, or other run-off
control stmctures, as soon as practicable following control ofthe mn-off.
• Notify the UDEQ immediately and provide written documentation within 14 days of the
release event.
Bayview Class I Landfill Permit Application Revision 2 January 2009 South Utah Valley Solid Waste District Appendix S Page 19

6.3.2 Failure of Run-On Structures
Failure of mn-on control stmctures may temporarily overload the leachate collection system, but is
generally less serious than failure of mn-off confrol stmctures. In the event that failure of run-on
control structures is discovered during routine or non-routine inspections, landfill
operations personnel will take the following actions:
• Immediately mobilize landfill compactor or dozer equipment to constmct temporary
berms, swales, or other stmctures to temporarily divert surface water mn-on from the
active landfill cell. Assess the need to suspend acceptance ofwaste.
• Assess the need for permanent run-on control stmctures as soon as practicable.
• Notify the UDEQ immediately and provide written documentation within 14 days ofthe
failure event.
6.4 Release of Explosive Gases
It is unlikely that a release of explosive gas will occur from the lined Bayview Landfill cells.
However, it is possible that landflll gas concentrations will exceed the regulatory requirements
in one or more gas monitoring locations. For purposes of this contingency plan, a release is
defined as the detection of more than 25% of the lower explosive limit (LEL) in a landflll
building, or more than 100% LEL at the property boundary. The LEL is 5% by volume of
methane in air. If a release of explosive gases is detected, landfill operations personnel will
take the following actions:
• Immediately suspend landfilling operations and determine if landfill personnel or
structures are threatened. If so, personnel will be evacuated immediately, and
building doors will be opened to allow gases to escape. Notify the fransfer stations ofthe
suspension of operations.
• As soon as possible, determine if off-site buildings or other structures are
threatened. If so, immediately notify the County Fire Marshall.
• Monitor the release area, and all other landfill gas monitoring locations, until the
emergency condition has been eliminated.
Bayview Class I Landfill Permit Application Revision 2 January 2009 South Utah Valley Solid Waste District Appendix S Page 20
• Determine temporary corrective actions as soon as possible, and permanent
corrective actions as soon as practicable, following detection ofthe release.
• Notify the UDEQ immediately and provide vmtten documentation within 14 days of the
release event.
6.5 Groundwater Contamination
Contingency and corrective actions following the detection of groundwater contamination are
described in Figure S-1.
7.0 ALTERNATIVE WASTE HANDLING PROCEDURES
Landfill operations have been adapted for wet weather by constmcting an all-weather, asphalt-
paved roadway from the site entrance to the active cell. The site soils, including those used
as daily cover, consist primarily of sands and gravels. In the semi-arid climate of the
Bayview Landfill site, experience has shown that precipitation has little effect on the operation
ofthe landflll, especially given the nature of the cover soils. The District does not believe
that altemate waste handling plans are necessary for this site with respect to wet weather
operations.
All reasonable caution and prudence will be exercised to not dispose of wastes during any
unreasonable weather conditions. If unforeseen weather conditions occur, the District Manager,
or his designee, will be informed and will coordinate any changes in operations. The District
Manager will consider the system-wide requirements (including transfer station requirements) in
determining what changes, if any, need to be made in operations at the landflll.
8.0 MONITORING EQUIPMENT MAINTENANCE
8.1 General
The inspection schedule for groundwater monitoring wells and landflll gas monitoring stations is
presented in Section 5. This section describes the more detailed inspection and maintenance of
these landfill stmctures.
Bayview Class I Landfill Permit Application Revision 2 January 2009 South Utah Valley Solid Waste District Appendix S Page 21

8.2 Groundwater Monitoring Wells
All groundwater monitoring wells will be thoroughly inspected during each sampling event. The
detailed inspection will note signs of deterioration or failure of the protective steel casing, the
concrete pad and bollards, and the polyvinyl chloride (PVC) well casing and screen. If damage
is discovered, the nature of the problem will be recorded and reported to the District Manager
who will make a decision to repair, replace, or abandon the well. This decision will be
documented in the operating record for the landfill, and the required acfions will be completed
prior to the next scheduled monitoring event.
The monitoring well locations will be maintained on a routine basis. Weeds will be removed at
least every 6 months, approximately 2 weeks prior to each scheduled sampling event. During
the weed removal, landfill personnel will note any obvious indications that the well has been
damaged to allow the Landfill Foreman and the District Manager to assess the situation.
Bollards and well casing materials will be inspected during each sampling event to determine
whether painting or other routine maintenance is required.
8.3 Gas Monitoring Locations
Gas monitoring locations will be maintained on a routine basis. Weeds will be removed from the
vicinity of each monitoring location at least every 3 months, approximately 2 weeks prior to each
scheduled sampling event.
9.0 DISEASE VECTOR CONTROL
For landfills in Utah, disease vectors essentially consist of rodents and birds. This section
describes the methods that the Bayview Landfill personnel will use to control rodents and birds.
Bayview Class I Landfill Pennit Application Revision 2 January 2009 South Utah Valley Solid Waste District Appendix S Page 22

9.1 Rodent Control
The primary method of rodent control is to eliminate conditions favorable for the reproduction
of rodents through proper compaction of wastes and proper placement of daily cover. If landfill
personnel observe the presence of rodents, more frequent application of cover soils will be
considered.
If the primary method of rodent control does not produce satisfactory results, the District may
employ poisoning. A poison control program must include the following conditions:
• Poison traps must be set by experienced, professional exterminators.
• Poison traps may only be set within areas with controlled access. This means that the
trapped area must be within the site's security fencing, and the security gates must be
locked for the duration of the poisoning program whenever landfill persormel are not on-
site.
• Occupational Health and Safety Administration (OSHA) requires waming signs of
acceptable color and size to be permanently fixed to the outside of the access gate and
fencing, at spacings not to exceed 150 feet, for the duration of the poisoning
program. A minimum of one sign per side ofthe fence is required.
• Landflll personnel must conduct a daily inspection of each poison trap, and notify the
professional exterminator if dismptions of any fraps are noted.
• The professional exterminator must conduct periodic inspections ofthe poison traps.
• Written documentation ofthe poisoning program must be maintained at the maintenance
building. The documentation must include: the number and exact location(s) of the
poison traps; the name of the poison(s) (including both chemical and brand name, and a
listing of ingredients); the quantity of poison contained in each trap; and the medically
accepted antidotes or treatments for the poison(s).
• The professional exterminator must submit monthly reports to the District Manager
documenting the status of the poisoning program. The reports shall include the number
and location of traps, the quantities of poison(s) used during the past month, and any
changes in the program instituted during the past month.
Bayview Class 1 Landfill Permit Application Revision 2 January 2009 South Utah Valley Solid Waste District Appendix S Page 23

• Poison supplies shall be stored on-site in a separate, locked, and properly labeled enclosure.
Access to the poison shall be restricted to the professional exterminator and the Landfill
Foreman, or his designee.
9.2 Bird Control
As with rodent control, the primary method of controlling birds is to control the conditions
favorable to their existence. The following methods will be used as needed:
• Minimizing the size ofthe working face. This is the most effective method of controlling
birds since it reduces the area available for feeding. More frequent cover and higher
degrees of compaction of the wastes may also serve to minimize the opportunities for
feeding.
• Minimizing the accumulation of water in depressions, ponds, or other features near
the active working face. The lack of water makes a landfill a less attractive feeding
area for birds.
• Use of noise or other frightening techniques. These techniques offer short-term
reductions in the numbers of birds feeding at a landfill.
If the primary methods do not produce satisfactory results, a destmctive method of control may
need to be implemented. Destructive methods may cause harm or death to some birds, and
authorization must be obtained from local officials prior to implementing a destmctive program.
10.0 WASTE SCREENING
The primary location for screening of wastes will be the transfer stations. All transfer station
personnel will receive periodic training in detecting wastes that are prohibited for disposal at the
landflll. This training will consist of an initial training and annual refresher training. These
personnel will conduct routine inspections and random load inspections as specified in the
operations plan for the transfer stations.
Bayview Class 1 Landfill Permit Application Revision 2 January 2009 South Utah Valley Solid Waste District Appendix S Page 24

The landfill equipment operators will also receive periodic fraining in detecting prohibited
wastes. This training will consist ofan initial training and annual refresher training; however,
the landfill operational persoimel will provide secondary waste screening only.
11.0 RECYCLING
The primary location for recycling will be the transfer stations. These locations are best suited
for separating recyclable materials, and separation will be difficult or impossible after the wastes
have been compacted and loaded into over-the-road tmcks. The landflll operations personnel may
segregate tires, large and bulky wooden wastes, and similar materials upon receipt at the
landfill; however, this recycling activity is considered secondary to recycling at the transfer
stations.
12.0 COMPOSTING
A compost program utilizing yard waste and biosolids is proposed for the Bayview Landflll. A
plan of operations and permission to implement the compost operations has been submitted
under separate cover. A copy of the Plan of Operations is included with this Permit Application
as Appendix R.
Bayview Class I Landfill Permit Application Revision 2 January 2009 South Utah Valley Solid Waste District Appendix S Page 25

m •
F i led in t he Office of the Utah County Board
• - of Adjustment on Apri l 10, 1989.
ACTION BY THE BOARD OF ADJUSTMENT
Appeal No. 981 Applicant: South Utah Valley Solid Waste District
KDLES FOR HEARING AMD DECIDING APPEALS FOR SPECIAL EXCEPTIONS
When the Board of Adjustment acts under its power to hear and decide requests for special exceptions, the Board ehall comply with all the following rules and standards (Section A-7-21 of the "Utah County Zoning Ordinance"):
'^.A. The appellant shall have submitted a properly completed application for hearing. / B. The zoning ordinance specifically Identifies the special exception In question as one
which the board Is empowered to approve. C. The following standards shall be met as a prerequisite to approving any special
exception;
V
v/
1. It shall promote the public health, safety, and welfare. 2. I t shal l conform to the "character is t ics and purposes stated for the zoning
distr ict Involved and the adopted county master plan. 3. I t shall be compatible with the public interest and with the characteristics of
the surrounding area. 4. I t shall not adversely affect local property values. 5. Any standards stated in Chapter 3, Supplementary Regulations, or Chapter 5,
Regulations Within Zones, which apply to a specific special exception shall be met:
6. i t shall not result in a situation which is cost ineffective, administratively infeasible , or unduly d i f f i cu l t for the provision of e ssen t i a l services, including, but not l imited to: roads and access for emergency vehicles and residents; f i re protect ion; police protection; schools and school busing; healthful water, sewer, and storm water faci l i t ies ; and garbage removal.
D> The board shal l at tach conditions, when necessary, which work out an adjustment between the special exception and the surrounding area, including, but not limited to, the following:
1. Parking; 2. Traffic acceleration lanes; 3. On-site storm water retention faci l i t ies ; 4. Special security or fire protection facilltieB; 5. Water, sewer, and garbage faci l i t ies ; 6. Landscape screening to protect neighboring properties; 7. Requirements for the management and maintenance of the above faci l i t ies ; 8. Limited hours of operation; 9. Limited use of equipment emanating offensive noise, light, dust, or traffic.
E. The Board of Adjustment feels that the facts presented at the hearing, other than mere expressions of protest or support, warrant the granting of the appeal; the said findings of fact shall be made a part of the official record.
This request i s Granted with Condit ions for the following reasons: (granted, denied, etc.)
The Board f e l t the f a c t s presented a t the hear ing warranted g r a n t i n g the s p e c i a l except ion to modify condi t ion number 18 to allow Provo City to j o i n wi th a s p e c i a l s e rv i ce d i s t r i c t t o process so l i d waste with a f ind ing t h a t t h e r e w i l l be no change in impact by the add i t i on of a s p e c i a l s e r v i c e d i s t r i c t .
OVER
Vote Record:
m 6.
Aye Nay Abstained
Jess Green John Hall Rick Jackman Von Brockbank Ronald Last
X X X X
X
I certify that the voting record shown hereon Is correct.
H^^^tX)£L Secretary

NOT LEGIBLE FOR MICROFILM
APPENDIX
1. ' Compacted or baled garbaca will be- placed in t e.-"lC .as snd .covered at the end of each cay,
2. The waste shall be buried away from the cravel pit area;
3. A fe.".ce shall be installed surroundi.ng each trench area at least eight (8) feet in heig.ht and higher if fcunc inadequate to control blowing papers.
•4. After ar. area has been filled, it will be contoured, r.uiched, and reseeded as indicated by the State Agronomist and the Stata Extension Service.
5. There will be a watchman on site curing work hours.
6. The gate will be closed any time it is""' unattended; and it must be locked, (This is the main gate, not that around the particular area being filled.)
7. A new access road from the state highway into the deposit area will be provided as required by the Department of Transporta-
11
The size cf the garbage trucks shall meet recuire.T.snts cf the Utah Department of Tra.-ispcrtcticn and Utah Highway Patrol.
Prcvo City vill cooperate with the State Highway Departr.ent and local residents to prevent incrcinate damage to the road during periods when the read is saturated er.z subject tc destruction; and comply with ali state and local ordinances con-fcr.-ing to sar-e.
All garbage would be collected and compacted at a location other than the landfill sits end transported in covered trucks by Prcvo City,
Nc burning is to be allowed at the disposal site.

# NOT LEGIBLE FOR MICROFILM
12. The trenching shall be done in such a manner as to protect the drainage channels in the area as required by the State Deoart.ment of Environmental Health.
13. No hazardous wastes shall be deposited in the area.
14. Ali reasonable caution and prude.nce be e.xercised to not dispose of any waste during any u.nreasonable weather conditions. ' ,
15. All requirements in the "Code of Solid Waste Disposal Regulations" be met,
16. Any terms of the lease held by Mr. Jacobs be protected and that Provo City cooperate with hi.m during lambing season to minimize the impact on his operation,
17. No public dumping,
18. Landfiii to be used only by Provo City and if other cities are to use the land-fil'l, approval from the Board of Adjust-r-ment would be necessary.
19. Personnel will police the grounds outside of the fence, and keep litter and garbage picked up.
20. Rodent control must be in effect at all times as state law provides.
21. Watar samples will be taken by the Department of Environmental Health frcm any
• wells within 1500' of the disposal site prior to any dumping to determine the water quality. Samples would be taken every six months or more often as determined bv the Deoartment lOf Environmental
22. The area used to begin the operation of filling must be selected to minimize the impact on.people in the surrounding area.
23, In constructing the road or roads required by the Department of Transportation to get access to .the landfill; Provo City shall minimize the amcu.nt of disruption to the environment of the area.

NOT LEGIBLE FOR MICROFILM 25
24, That Provo City maintain a buffer zone of at least 100' from existing state roads, homes and premises in dumping their compacted garbage.
Upon noncompliance with any of these provisions Utah County may revoke said right to the landfill.
25, Provo City will provide an annual report to the Board of Adjustment for their re- , view, as to the progress in the engineering of ths landfill.

Appendix T
APPENDIX T
DRAFT Cell 1 Closure Certification Letter
SUVSWD Bayview Class I Landfill Pernnit Application

DRAFT
Mr. Richard Henry District Manager South Utah Valley Solid Waste District P.O. Box 507 SpringviUe, UT 84663-0507
Subject: Bayview Landfill Cell 1 Closure Status
Dear Mr. Henry: ..ff ^ A^
^ \ % This letter is to document the closure status of the Bayview'Landfill Gell 1. Cell 1 was constructed per design and specifications and in,accordance with the Construction Documents Project Manual (CDPM), submittea l^|the Division of Solid and^azardous Waste on September 15, 2005 as a stand-alone d^umen!f%ayview Landfill Cell 1 Closure - Construction Documents Project Manual." The^CDPM stipulated several testing procedures to be performed oT|lthe final cover systems. These requirements included: ' ^ ^ ^ ' ^ ' % ^ '
One compaction test per 10,000 square feet of surface area for each lift and theJinal cover tc^ensure comf?action is between 75% and 85% of the maxirrwn dry density;
^ n ^ ^ i n si^distribution test lor every 5,000 cubic yards of cover materilfjDiacea; •# •"
*m "•». jgoyer cap^tnickness verification once every 10,000 square feet of •w surface; \ ,,, ^
% ^ ^\ # In additionjithe approved closure plan for the Bayview Landfill requires that the final
lie-—-"*^ ' cover be seeded with shallow-rooting grasses. It is our understanding that the final cover has not yet be^er^eeded. Tfie seed mix to be used on the Cell 1 final cover is listed in
. W%. Table 1 below:
Table ^ i'Seed mix used on the final cover of Bayview "'ffe Landfill Cell 1
% Mix
0.50%
1.50%
3.50%
17.50%
17.50%
3.00%
Type of Grass
Sand Drop Seed
Alkali Sacaton
Blue Grama
Blue Bunch Wheat Grass
Indian Rice Grass
Sandberg Blue Grass

% Mix
4.00%
16.25%
16.25%
20.00%
100.00%
Type of Grass
Sheep Fescue
Slender Wheat Grass
Stream Bank Wheat Grass
Western Wheat Grass
Total
It is our opinion that the Bayview Landfill Cell 1 has been successfully constructed and, pending seeding, will be closed per the approved design. This opinion is based on the following: ^i *i;;;,
• The above seed mix will be broadcastlin the final cover during 2009.
• Compaction and grain size distribution test results ar e enclosed with this letter. All testing results vf^e within specifications.^^
h '•' % ' • To ensure cover cap thickness was adequate, it is our understanding
that PVC stands with marks indicating the required depth were inserted prior to placing final cover soWand that the methods outlined in the CDPM to indidate soil erosion stakestC'whiskers" or "blue-tops") were installed. \ \ ^ % '>'
\ * / . x '^^'•.'.-'^'•'''•---tP
The CDPM included requirements for long-term maintenance. These include inspections of the cap weekly and after each major rain event to monitor for erosion until vegetation is established. Any.»efosion of 2(iinches or more^should be regraded and reseeded as soon as possible to minimize the;size of equiprneht needed. Settlement and erosion of the final cap should be monitored w^isually inspecting for evidence of "whiskers" or "blue-topsjishbwing/through tqegap and should be performed on a weekly basis. Any bare sp(\ should be reseeded a^ecessary to establish vegetation on the cap. If any damage^to the cap is detected, it shpuld be regraded, mulched, and seeded as soon as possible.'-'-^.I^ If you have anylquestions 6r concerns, please call me at 801-743-7800.
• . # • •
Sincerely, '
Terry R. Warner, P.E.
Enclosures

, _ , _ , _ , ^ _ _ , _ i ^ _ ^ 849 West Levoy Drive, Suite 200 KLEINFELDER Salt Lake city. UT
Bright People. Right Solutions. 84123-2964
Pl 801.261.3336 f j 801.261.3306
October 13, 2008 kleinfelder.com
File No.: 49816.001
Mr. Richard Henry South Utah Valley Solid Waste District P.O. Box 507 SpringviUe, UT 84663
Subject: Summary Report for September 2008 Bayview Land Fill Cell #1 Closure Materials Testing Services
Dear Mr. Henry,
Kleinfelder West, Inc., has completed the reports for field and laboratory testing services conducted on September 24, 2008, for the above-referenced project.
The following areas of testing/inspection were conducted during the time frame noted above.
• ASTM D 1557 proctor curve report; • Sieve analysis reports; • Daily report of observations and field testing; and • Compaction testing of approximately 360,000 square-feet of Cell 1 covers
material.
If you have any questions regarding the information presented, please feel free to contact us at (801) 261-3336.
Sincerely,
KLEINFELDER WEST, INC.
i £ j ^ — '
Cff/i MarR MSgeath Seoti Btehn Operations Manager Materials Division Manager
Attachments: Nuclear Density Test Results, Lab Tests, Daily Field Report
cc: Mr. Scott Aitkin Mr. Terry Warner
SUVSWD/49816.001/SLC8L359 Page 1 of 1 October 13, 2008 Copyright 2008 Kleinfelder

REPORT of AGGREGATE PHYSICAL PROPERTIES
K L E I N F - E L D E R 9 f i ^ Pmpie. Right ScJuthm.
Project Bayview Land Fill Cell #1 Closure
Client: SUVSWD
Material Tested: Cover material
Source: N=8645.6 E=4330 Z=4788.8
Specification: Per Engineer Report
LabNo.:T08-193-P
Project No: 49816.001
Sannpied by; TMM
Tested b y : JDM ^
Reviewed b y j ^ ^ ^ ^ ^ T
Report Date: 10/10/2008
_Sample Date:
Test Date:
Curtis Parker, Lab Manager
9/24/2008
9/26/2008
SIEVE ANALYSIS ASTMC136 AASHTO T27
Slave Size
450 mm (18")
375 mm (15")
3110 mm ( i r )
250 mm (10")
225 mm (9-)
200 mm (8-)
ISO mm (6")
12S mm (5")
100 mm (4")
TS.0 mm (3")
63.0 mm (2-1/2")
B0.0 mm (2")
37.5 mm (1-1/2")
25.0 mm (1")
1S.0 mm (3/4")
12.6 mm (1/2")
9 £ mm (3/8")
B.3 mm (1/4")
4.7Smm(No.4)
2.36 mm (No. 8)
2.00 mm (No. 10)
I.ISram (No.16)
0.600 mm (No.30)
0/425mmNo.40)
0.300mm (No. 60)
0.1Bamm(No.60)
0.150mm (No.lOO)
a.07Smm(No.200)
ASTM C l 17 AASHTO T11
Moisturs Content, %
ASTMC566 AASHTO T2S5
Fractured Face, %
2laces
Fineness Modulus (FM)
ASTM C136 AASHTO T27
Aceum. % Pui ing
100 100
100 100
100 100
100 99
99
99 98
97 97
94
90
86
71 49.2
Spac inut ions
95 -100
70-100
60-95
30-70
TEST RESULTS | Sfindard
ASTM C29
AASHTO T 19
ASTM C127
AASHTO TBS
ASTM C128
AASHTO T 84
ASTM D2419
AASHTO T176
/\STM D4791
ASTM C 131
AASHTO T 96
ASTM C 535
ASTM c e a
AASHTO T 104
ASTM C142
AASHTOT112
ASTM C40
AASHTO T 21
ASTM C 123
AASHTO T 113
ASTM D. inm
AASHTO T 238
ASTM D1S57
AASHTO T 180
ASTM D4318
AASHTO T 89/90
PHYSICAL PROPERTIES
Unit W/elght
t iVoMs
Coarse
Specific
Gravity &
Absorption
Fine
Specific
Gravity &
Absorption
Sand
Equivalent
F[at&
Elongated
L.A.
Abrasion
U A .
Abrasion
Soundness
Soundness
Clay/Friable
Particles
Organic
Impurities
LIshtweight
Pieces
Direct Shear
CD
Compaction
Modified Effbrt
Liquid Umtt,
Plastic Umit &
Plasticity Index
Unit Weight, lbs./cu.fl=
Vdds, %=
Djisged D L O O K [Zl Rodded
Bulk Specffic Gravity (dry)=
Bulk Specific Gravity, SSD-
Apparent Specific Gravlty=
Absorpfion, %=
Bulk Speciflc Gravity (diy)=
Bulk Specific Gravity. SSD=
Apparent Specific Gravlty=
Absorption. %=
Sand Equivalent, %=
Flat&Elonaated,%=
Ratio=
Small Coarse Loss, 94=
Grading/ Revs.=
Large Coarse Loss, %=
Grading/ Rev».=
Coarse Soundness Loss, %»
Magnesium No. of Cycles-
Fine Soundness Loss, %=
Magnesium No. o fCydes-
Coaree Aggregate, %=
Fine Aggregate, %=
Coarse Aggregate, %=
Fine Aggregate, 'A=
Coarse Aggregate, %=
Rne Aggregate, %°
FiicBon Angle.=
Opfimum Moisture, K=
Max. Density, Ib37cu.ft.<:
Uquid Limil=
Plastic Limits
Plasticity lndex=
Rciu l ts Speclfiotton
14.5
110.2
NP
NP
NP
SUVSWD/4g816.001/SLC8M08S Copyright 2008 Kleinfelder, Inc.
lo/ioaooe

REPORT of AGGREGATE PHYSICAL PROPERTIES
K L E I N F E L D E R Br igh tP tcp l t . MghTSotutions.
Project: Bayview Land Fill Cell #1 Closure
Client: SUVSWD
Material Tested: Cover material
Source: N=8750 E=4210.5 Z=4791.5
Specification: Per Engineer Report
Lab No.: T08-ig3-1
Project No: 49816.001
Sampled by: TMM
Tested by : JDM ^
Reviewed by: C - I p f c r / ^
ReportDate: 10/1/2008
_SampIe Date:
Test Oate:
Curtis Parker, Lab Manager
9/24/2008
9/26/2008
SIEVE ANALYSIS ASTMC136 AASHTO T27
Sieve Size
450 mm (18")
375 mm (16")
3 0 t » m m ( i r )
250 mm (10")
225 nun (9")
200 mm (8")
150 mm (6")
125 mm (5")
100 mm (4")
75.0 mm (3")
63.0 mm (2-1/2")
60.0 mm (2">
37.5 mm (1-1/2")
25.0 mm (1")
U.O trim (3/4")
12.6 mm (1/2")
9.6 rnm (3/B")
6.3 mm (1/4")
4.75mm (No. 4)
2.36 mm (No. 8)
2.00 mm (No. 10]
1.18mm (No.16)
0.600 mm (No.30)
0.426Run(No.4a)
0.300nim(No.SO)
0.180mm (No. 60)
0.150mm (No.lOO)
a.075mm(No.200)
ASTM C l 17 AASHTO T l 1
Moisture Con ten t , *
/^STM C568 AASHTO T255
Fractured Face, %
2 t e e s
FineiMss Modulus (FM)
ASTM C136 AASHTO T27
Aecum. % Passing
100 100
100 100
100 100
100 100
100
99 98
98 97
94 91
87
75 65.6
SpacHlcadom
95 -100
70-100
60-95
30-70
TEST RESULTS | standard
ASTM C 29
AASHTO T I O
ASTM C 127
AASHTO TBS
ASTM C 128
AASHTO T 84
ASTM 0 2419
AASHTO T178
ASTM D4791
ASTM C131
AASHTO T 96
ASTM C 535
ASTM C88
AASHTO T104
ASTM C142
AASHTO T112
ASTM C 4 0
AASHTO T 21
ASTM C 123
AASHTO T 113
AiSTM D3080
/VASHT0T236
ASTM D15S7
AASHTO T 180
A S r U D4318
AASHTO T 8 9 « 0
PHYSICAL PROPERTIES
Unit Weight
a v o i d s
Coarse
Specific
Gravity &
Absorption
Fine
Specific
Gravity i .
Absorption
Sand
Equivalent
F lat&
Elongated
L.A.
Abrasion
L.A.
Abrasion
Soundness
Soundness
Clay/FrlabiB
Particles
Organic
Impurities
Lightweight
Pieces
Direct Shear
CD
Compaction
Modified Eftbrt
Liquid Umit,
Plastic Umit &
Plasticity Index
UnH Weight, Ibs7cu.ft»
Voids. %=
D igged Duiose (Zi Rodded
Bulk Specific Gravity (dry)^
Bulk Spedfic Gravity, SSD=
Apparent Spedfic Gravlty=
Absoiption, %=
Bulk Spedlte Gravity (<by)=
Bulk Specific Gravity. SSO=
Apparent Specific G(avity=
Absorptton, %=
Sand Equivalent. %°
Flat & Elongated, %=
RaUo=
Smali Coarse Loss, %°
Grading/ Revs.x
Large Coarse Loss, %=
Grading/ Revs.i^
Coarse Soundness Loss, %=
Magnesium No. of Cycles=
Fme Soundness Loss, %=
Magnesium No. of Cycles=
Coarse Aggregate, K =
Fine Aggregate, %=
Coarse Aggregate, % •
Rne Aggregate, %=
Coarse Aggregate. %=•
Fine Aggregate, %=
Frk:tion Angle,"
Optimum Moisture, %=
Max. Density, R)sj'cu.fL=
Uquid Umll='
PlasUcUmit=
PlasUdty lndex=
R t s u l t i Spcdf ic i t ion
1
1
SUVSWD/49ai6.001/SLC6M088 Copyright 2008 Kleinfelder. inc.
10/10/2008

K L E I N F E L D E R Bright Ptopie. K g h t SoJut/ons.
REPORT of AGGREGATE PHYSICAL PROPERTIES
Project: Bayvlev/ Land Fill Cell #1 Closure
Client: SUVSWD
Material Tested: N8128.8
Source: N=8128.8 E=4103.2 Z=4802.2
Specification: Per Engineer Report
Lab No.: T08-193-2
Project No: 49816.001
Sampled by: TMM
Tested by : JDM
Reviewed by:
Report Date: 10/10/2008
_Saniple Date:
Test Date:
Curtis Parker, Lab Manager
9/24/2008
9/26/2008
SIEVE ANALYSIS
ASTMC136 AASHTO T27
Sieve Size
490 mm (18")
375 mm (16")
300 mm (12")
250 mm (10")
225 mm (9")
200 mm (8")
ISO mm (6")
12S mm (5")
100 mm (4")
75.0 mm (3")
63.0 mm (2-1/2")
60.0 mm (2")
37.5 mm (1-1/2")
25.0 mm (1")
19.0 mm (3/4")
12.5 mm (1/2")
9.5 mm (3/8")
6.3 mm (1/4")
4.76mm (No. 4)
2,36 mm (No. 8)
2.00 mm (No. 10)
1.18mm (No.16)
0.600 mm (No.3a)
0.42Smm(No.4D)
0.300mm (No. 50)
0.180mm (No. 60)
0.150mm (No.lOO)
0.a76mm(No.200)
ASTM C l 17 AASHTO T i l
Moisture Content, %
ASTMC566 AASHTO T25S
Fractured Face, %
2 faces
Fineness Modulus (FM)
ASTM C136 AASHTO T27
Accum. % Passing
100 100
100 100
100 100
100 100
100
100 99
99 98
96 92
87
67
42.6
Spcctflcatlotift
95-100
70-100
60-95
30-70
TEST RESULTS |
Standait)
ASTM C29
AASHTO T 19
ASTM C 127
AASHTO TSS
ASTM C 128
J AASHTO T 84
ASTM D2419
AASHTO T 176
ASTM D4791
ASTM C 131
AASHTO T 96
ASTM C 535
ASTM C88
AASHTO T 104
ASTM C142
/\ASHTOT112
ASTM C40
AASHTO T 21
ASTM C 123
AASHTO T 113
ASTM D30S0
AASHTO T 236
ASTM 0 1557
AASHTO T180
ASTM D4318
AASHTO TSSraO
PHYSICAL PROPERTIES
Unit Weight
& Voids
Coarse
Specific
Gravity &
Absorption
Fine
Specific
Gravity &
Absorption
Sand
Equivalent
Flats,
Elongated
L.A.
Abrasion
L.A.
Abrasion
Soundness
Soundness
Clay/Friable
Particles
Organic
Impurities
Lightweight
Pieces
Direct Shear
CD
CompacOon
Modified Effort
Liquid U m i ^
Plastic Limit &
Plasticity Index
Unit Weight, Ibs7cu.ft=
Voids, %=
D igged D Loose 0 Rodded
Bulk Specific Gravity (dry)=
Bulk Specific Gravity, SSD=
Apparent Specific Gravity=>
Absorption. 96=
Bulk Specmc Gravity (dry)=
Bulk Specillc Gravity, SSD=
Apparent Spedfic Gra\rfty=
AbsorpUofl, %=
Sand Equivalent, %=
Flat & Elongated, %=
Rafio=
Small Coarse Loss, %=
Grading/Revs.=
Large Coarse Loss, %=
Grading/ Revs.=
Coarse Soundness Loss, %=
Magnesium No. of Cydes=
Rne Soundness Loss, %=
Magnesium No. ofCydes=
Coarse Aggregate, %=
Fire Aggregate, %=
Coarse Aggregate, %>
Fine Aggregate, %••
Coarse Aggregate, %•>
Fine Aggregate, %=
Fdcfion Angle,=
Optimum Moisture, %=
Max. Density, R»Vcu.n.=
Uquid Umit=
Plastic Umit=
Plastidty lndex»
Results SpteUlatlm
1
1
SUVSWD/49B16.001 /SLCSMOSS Copyright 2008 Kleinfelder, Inc.
10/10/2008

REPORT of AGGREGATE PHYSICAL PROPERTIES
K L E I N F E L D E R BrigfnPmfi/Altrg/itSotvtlani.
Project: Bayview Land ni l Cell #1 Closure
Client: SUVSWD
IWaterial Tested: Cover material
Source: N=8649.6 E=4332.8 Z=4788.8
Specification: Per Engineer Report
Lab No.: 108-193-3
Project No: 49816.001
Sampled by: TMM
Tested
Reviewed
ReportDate: 10/10^008
by : CT , / ^ \
by:^i<-tr7^Cr
_Sainple Date:
Test Date:
Curtis Parker, Lab Manager
9/24/2008
9/26/2008
SIEVE ANALYSIS ASTMC136 AASHTO T27
Sieve Size
460 mm (18")
376 mm (16")
300 mm (12")
250 mm (10")
225 mm (9")
200 mm (S")
150 mm (6-)
125 mm (5")
100 mm (4")
75.0 mm (3")
S3.0 mm (2-1/2")
60.0 mm ( r )
37.5 mm (1-1/2")
25.0 mm (1")
19.0 mm (3/4")
12.6 mm (1/2-)
9.6 mm (3/8")
6.3 mm (1/4")
4.75mm (No. 4)
2.36 mm (No. 8]
2.00 mm (No. 10)
1.18mm (No.16)
0.600 mm (No.30)
0.42Smm(No.40)
0.300mm (No. 60)
0.180mm (No. 60)
0.150mm (No.lOO)
0.075mm (No. 200)
ASTM C l 17 AASHTO T i l
Moisture Content, ' / .
ASTMC566 AASHTO T255
Fractured Face, %
2liaces
Hnaness Modulus (FM)
ASTM C136 AASHTO T27
Aceum. % Pissing
100 100
100 100
100 100
100 100
100
100 98
98 97
95 91
87
73 61.2
Spcc'rftcations
95-100
70-100
60-95
30-70
TEST RESULTS | Standard
ASTM C 29
AASHTO T 1 9
ASTM C127
AASHTO T 85
ASTM C 128
A A S H T 0 7 M
ASTM D2419
AASHTO T 176
ASTM D4791
ASTM C 131
AASHTO T 98
ASTM C 535
ASTM C88
AASHTO T 104
ASTM C 142
AASHTO T 112
ASTM C40
AASHTO T 21
ASTM C123
AASHTO T 113
ASTM D30SO
AASHTO T 238
ASTM D1557
AASHTO T 180
ASTM D4318
AASHTO Te9irao
PHYSICAL PROPERTIES
Unit Weight
& Voids
Coarse
Specific
Gravity <i
Absorption
Fine
Specific
Gravity &
Absorption
Sand
Equhralent
Flat&
Elongated
L A .
Abrasion
L.A.
Abrasion
Soundness
Soundness
Clay/Friable
ParUcles
Organic
Impurities
Lightweight
Pieces
Direct Shear
CD
Compaction
Modified Effort
Uquid Limit,
Plastic Umit &
Plasticity Index
UratVVdght,lbs7cu.ft=
Vdds, %=
n llggol D loose (21 Roddol
Bulk Spedfic Gravity (d>y)=
Bulk Spedfic Gravity, SSD=
Apparent Specific Gravity=
Absorption, %=
Bulk Specific Gravtly (diy)-=
B i ^ Specific Gravity. SSD=
Apparent Spedfic Gravity=
Absorplton, %=
Sand Equivalent, %=
Flats, Elongated, %=
RaBo=
Small Coarse Loss, %=
Grading/Revs.=
Large Coarse Loss, %s
Grading/ Rev3.=
Coarse Soundness Loss, %=
Magnesium No. ofCydes=
Rne Soundness Loss, %=
Magnesium No.ofCydes=
Coarse Aggregate, %»
Fine Aggregate, %=
Coarse Aggregate, %=
Fine Aggregate, %=
Coarse Aggregate, %=
Fme Aggregate, %=
Friction Angle.a
Opamum Moisture, %=
Max. Density, lbsjcu.tt.=
Liquid Limit=
Plastic Limit=
Plasticity lndex=
Rtsultm Bpeclflcation
1
1
SUVSWD/4981S.001/SLC7M088 Copyright 2008 Kleinfelder, Inc. 10/1(V2008

REPORT of AGGREGATE PHYSICAL PROPERTIES
K L E I N F E L D E R Bright Ptople. Right Sotutiota.
Project: Bayview Land Fill Cell #1 Closure
Client: SUVSWD
lUaterial Tested: Cover material
Source: N=8722.8 E=4446.3 Z=4775.2
Specification: Per Engineer Report
LabNo.:T08-193-4
Project No: 49816.001
Sampled by: TMM
Tested b y : CT
Reviewed s ^
Report Date: 10/10/2008
_Sainple Date: 9/24/2008
Test Dale: 9/26/2008
Curtis Partner, Lab Manager
SIEVE ANALYSIS
ASTMC135 AASHTO T27
Sieve Size
450 mm (18")
375 mm (15")
300 mm (12")
250 mm (10")
225 mm (9")
200 mm (8")
150 mm (6-)
125 mm (S">
100 mm (4")
75.0 mm (3")
63.0 mm (2-1/2")
60.0 mm (2")
37.5 mm (1-1/2")
25.0 mm (1")
19.0 mm (3/4")
12.5 mm (1/2")
9.6 mm (3/8")
6,3 mm (1/4")
4.76mm (No. 4)
2.36 mm (No. 8)
2.00 mm (No. 10
1.18mm (No.16)
0.600 mm (No.3D)
0.425mm (No. 40)
0.300mm (No. SO)
0.180mm (No. 60)
0.150mm (No.lOO)
0.076mm (No. 200)
ASTM C l l 7 /AASHTO T i l
Moisture Content, %
ASTM 0566 AASHTO T255
Fractured Face, %
2faces
Fineness Modulus (FM)
AiSTM 0136 AAStfTO T27
Accum. % Passing
100 100
100 100
100 100
100 100
100
99 97
97 96
91 87
82
69 49.5
Specifications
95-100
70-100
60-95
30-70
TEST RESULTS |
standard
ASTM C29
AASHTO T 19
ASTM C 127
AASHTO T 85
ASTM C 128
AASHTO T 84
ASTM D2419
AASHTO T176
ASTM D4791
ASTM C 131
AASHTO T 96
ASTM C 635
ASTM C88
AASHTO T 104
ASTM C 142
AASHTO T112
ASTM C40
AASHTO T 21
ASTM 0123
AASHTO T 113
ASTM D3080
AASHTO T 238
ASTM D 1557
AASHTO T180
ASTM D4318
/AASHTO T 89/90
PHYSICAL PROPERTIES
Unit Weight
a v o i d s
Coarse
Specific
Gravity &
Absorption
Fine
Specific
Gravity &
Absorption
Sand
Equivalent
FIat&
Elongated
L.A.
Abrasion
L A .
Abrasion
Soundness
Soundness
ClayfFriable
Particles
Organic
Impurities
Lightweight
Pieces
Direct Shear
CD
Compaction
Liquid Limn,
Plastic Limit &
Plasticity Index
Unit Weight, lbs Jtu.n=
Voids, %=
D Jigged D Loose E l Rodded
Bulk Spedfic Gravity (dry)=
Buik Spedfic Gravity, SSD=
Apparent Spedfic Gravity^
Absorption, %=
Bulk Spedfic Gravity (dry)=
Bulk Spedfic Gravity, SSD=
Apparent Spedfic Gravity^
Absoiption. %=
Sand Equivalent. %=
Flats Elongated, %=
Ration
Small Coarse Loss. %=
Grading/ Revs.=
Large Coarse Loss, %=
Grading/ Rev5.=
Coarse Soundness Loss, %=
Magnesium No.ofCydes=
Fine Soundness Loss, %=
Magnesium No.ofCydes=
Coarse Aggregate, %=
Fine Aggregate. %=
Coarse Aggregate, °h°
Fine Aggregate, %«
Coarse Aggregate, %>
Fine Aggregate, %=•
Friction Angle,=
Opfimum Moisture, % '
Max. Density, lbsycu.n.=
Uquid Umlt=
Plastic Umlt=
Plastidty lndex>
R«9ults Spsciflcation
1
SUVSWD/4g816.001/SLC7M033 Copyright 2008 Kleinfelder, Inc
10/10/2008
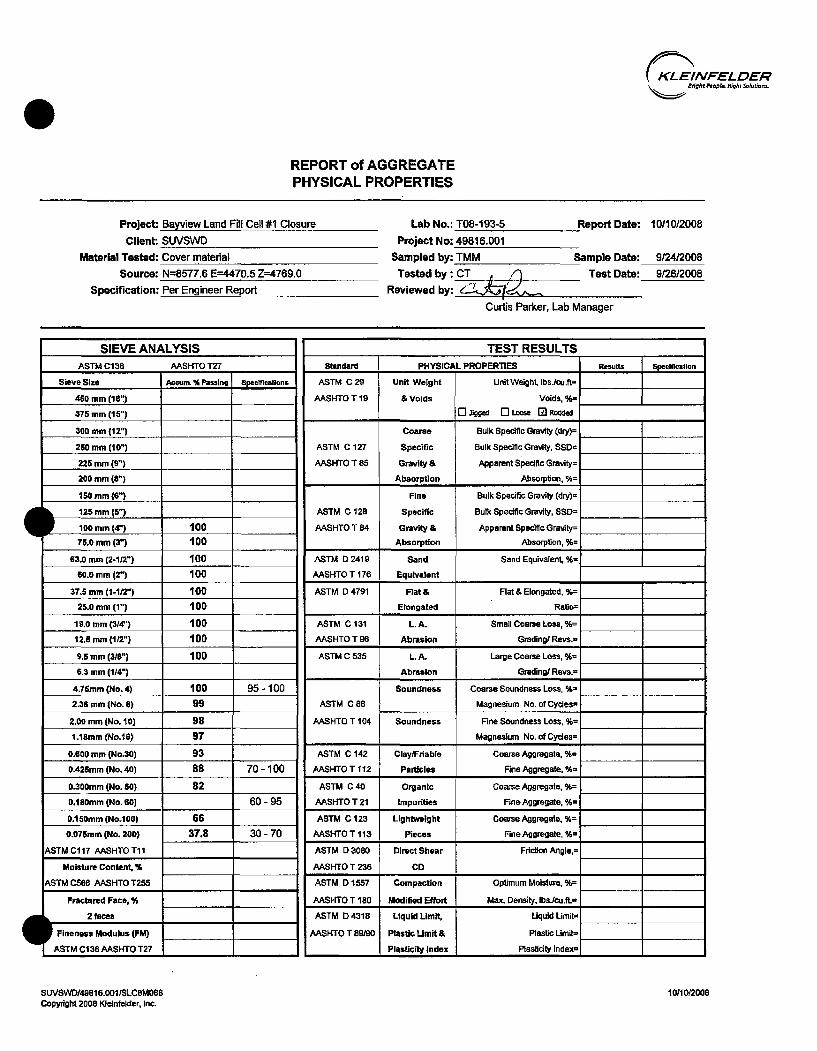
REPORT of AGGREGATE PHYSICAL PROPERTIES
K L E I N F E L D E R Bright r*opt9. Itight Sofutibnr.
Project Bayviev^ Land Fill Cell #1 Closure
Client; SUVSWD
IVIaterial Tested: Cover inaterial
Source: N=8577.6 E=4470.5 Z=4769.0
Specification: Per Engineer Report
Lab No.: T08-193-5
Project No: 49816.001
Sampled by: TMM
Tested b y : CT
Reviewed by:
Report Date: 10/10/2008
_SampleDate:
Test Date:
Curtis Partner, Lab Manager
9/24/2008
9/26/2008
M %
^
€
SIEVE ANALYSIS | ASTM 0136
Sieve Size
450 mm (18")
375 mm (IS")
300 mm (12")
250 mm (10")
225 mm (9")
200 mm (8")
160 mm (6")
^ 125 mm (5")
P 100 mm (4") 75.0 mm (3")
63.0 mm (2-1/2")
50.0 mm ( r )
37.5 mm (1-1/2")
25.0 mm (1")
19.0 mm (3/4")
12.6 mm (1/2")
9.5 mm (3/8")
6.3 mm (1/4")
4.76mm (No. 4)
2.36 mm (No. 8)
2.00 mm (No. 10)
I . ISmm (No.16)
0.600 mm (No.30)
0.425mm (No. 40)
0.300mm (No. SO)
0.1S0mm(No.6O]
0.150mm (No.100)
0.075mm (No. 200)
ASTM Cl 17 AASHTO T i l
Moisture Content, %
ASTM CB66 AASHTO T255
Fractured Face, %
L 2 faces
P Fineness Modulus (FM)
1 ASTM C136 AASHTO T27
AASHTO T27
Accum. S passing
100 100
100 100
100 100
100 100
100
100 99
98 97
93 88
82
66 37.8
Spcc'rficsHons |
95-100
70-100
60-95
30-70
TEST RESULTS | standard
ASTM C 29
AASHTO T 19
ASTM C 127
AASHTO T8S
ASTM 0 1 2 8
AASHTO T 84
ASTM D2419
AASHTO T 176
1 ASTM D 4791
1 ASTM C131 1 AASHTO T 96
1 ASTM C 535
ASTM 0 88
AASHTO T 104
1 ASTM C142
1 AASHTO T 112
I ASTM C40
1 AASHTO T 21
1 ASTM C123
1 AASHTO T113
1 ASTM D3080
AASHTO T 236
ASTM D 1557
AASHTO T 180
1 ASTM D4318
AASHTO T 89/90
PHYSICAL PROPERTIES
Unit Weight
a v o i d s
Coarse
Specific
Gravity &
Absorption
Fins
Specific
Gravity &
Absorption
Sand
Equivalent
Ra t s .
Elongated
L.A.
Abrasion
L A .
Abrasion
Soundness
Soundness
Clay/Friable
Particles
Organic
Impurities
Lightweight
Pieces
Direct Shear
CD
Compaction
Modified Effort
Liquid Umit ,
Plastic Limit &
Plasticity index
Unit Weight. Ibs./cu.ft=i
Voids, %-
Qj issed D Loose Q Rodded
Bulk Spedfic Gravity (dry)=
Bulk Spedfic Gravity, SSD=
Apparent Spedfic Qravity=
Absorption, %=
Bulk Specific Gravity (dry)=
Bulk Spedfic Grawty, SSD=
Apparent Spedfic Gravity=
Absorpfion, %=
Sand Equivalent, Vi=
Flat & Elongated, %=
RaBo=
Small Coarse Loss, %=
Grading/ Revs.°
Large Coarse Loss, %=
Grading/ Revs.°
Coarse Soundness Loss, %=
Magnesium No. o fCydes-
Rne Soundness Loss, %=
Magnesium No. of Cycles-
Coarse Aggregate. %-
Rne Aggregate, %=
Coarse Aggregate, %=
Rne Aggregate, %=
Coarse Aggregate, %=
Fine Aggregate, %=
Fridlor Ang!e,=
Optimum Moisture, %=
Max. Density, lb3./cu.fL-
Llquid Limits
Plasfic Limil=
RasGdty lndex=
Results Specification
1
SUVSWD/49616.001/SLC8M088 Copyright 2008 Klelnfekfer, Inc.
10/10/2008

REPORT of AGGREGATE PHYSICAL PROPERTIES
K L E I N F E L D E R Br igh tP top l t . Right Sa^utiam.
Project: Bayview Land Fill Cell #1 Closure
Client: SUVSWD
IVIaterial Tested: Cover material
Source: N=8269.5 E=4491.3 Z=4774.8
Specification: Per Engineer Report
LabNo.:T08-193-6
Project No: 49816.001
Sampled by: TMM
Tested by : CT
Reviewed by:
Curtis Parker,
ReportDate: 10/10/2008
_Sample Date:
Test Date:
Lab Manager
9/24/2008 9/26/2008
SIEVE ANALYSIS |
ASTM C138
Sieve Size
450 mm (18")
375 mm (1S')
300 mm (12")
250 mm (10")
225 mm (9")
200 mm (8")
150 mm (6")
125 mm (5")
100 mm (4")
75.0 mm (3")
63.0 mm (2-1/2")
50.0 mm (2")
37.5 mm (1-1/2")
25.0 mm (1")
19.0 mm (3/4")
12.5 mm (1/2")
9.5 mm (3/8")
6.3 mm t l /4")
4.75mm (No. 4)
2.36 mm (No. 8)
2.00 mm (No. 10)
1.18mm (No.16)
0.600 mm (No.30)
0.425mm (No. 40)
0.300mm (No. 60)
0.180mm (No. 60)
0.160mm (No.100)
0.07Smm(No.200)
ASTM C l l 7 AASHTO T i l
Moistu re Content, %
ASTM C566 AASHTO T255
Fractured Face, %
2 faces
Fineness Modulus (FM)
ASTM C136 AASHTO T27
AASHTO T27
Accum. % Paulns
100 100
100 100
100 100
100 100
100
100 100
100 99
95 90
86
75
56.9
Specif ication!
95-100
70-100
60-95
30-70
TEST RESULTS j standard
ASTM C 29
AASHTO T 19
ASTM C 127
AASHTO T BS
ASTM C 128
AASHTO T 84
ASTM D 2419
AASHTO T 176
ASTM D4791
ASTM C131
AASHTO T 96
ASTM C 535
ASTM c e a
AASHTO T 104
ASTM C 142
AASHTO T 112
ASTM C40
AASHTO T 21
ASTM C 123
/1ASHT0T113
ASTM 0 3080
AASHTO T 236
ASTM D 1557
AASHTO T 180
ASTM D4318
/WSHTOT 89/90
PHYSICAL PROPERTIES
Unit Weight
& Voids
Coarse
Specific
Gravity &
Absorption
Fine
Specific
Gravity &
Absorption
Sand
Equivalent
Flats,
Elongated
L A .
Abrasion
L A .
Abrasion
Soundness
Soundness
Clay/Friable
Particles
Organic
Impurities
Ughtweight
Pieces
Direct Shear
CD
Compaction
Modified Effort
Liquid Limit,
Plastic Limit &
Plasticity Index
Unit Weight, lbs7ciJ.fl=
Voids. %=
D Jigged D Loose El Rodded
Bulk Spedfic Gravity (dry)=
Bulk Spedfic Gravity, SSD=
/Apparent Spedfic Grav1ty=
Absorpfion, %=
Bulk Specific Gravity (dry)=
Bulk Spedfic Gravity, SSD=
Apparent Spedfic Gravily=
Absorption, %=
Sand Equivalent, %=
Flat & Elongated, %=
Rafio=
Small Coarse Loss. %=
Grading/ Revs.=
Large Coarse Loss, %=
Grading/ Revs.=
Coarse Soundness Loss, %=
Magnesium No. of Cycles=
Fine Soundness Loss, %=
Magnesium No. ofCycles=
Coarse Aggregate, %=
Fine Aggregate, %=•
Coaise Aggregate, %=
Rne Aggregate, %=
Coarse Aggregate, %=
Fine Aggregate. %=
Fricfion Angle."
Optimum Moisture, %=
Max. Density, lbsycu.n.=
Liquid Umit=
Plasfic Umtl=
Plasfidty lndex=
R H U I U Spaclfleatjon
SUVSWDy49816.Q01/SLC8M088 Copyright 2007 Kleinfelder, Inc.
10/100008

REPORT of AGGREGATE PHYSICAL PROPERTIES
K L E I N F E L D E R BrightPteptg. Rightioiutiara.
Project: Bayview Land Fill Cell #1 Closure
Client: SUVSWD
Material Tested: Cover material
Source: N=8367.1 E=4593.1 Z=476S.9
Specification: Per Engineer Report
Lab No.: T08-193-7
Project No: 49816.001
Sampled by: TMM
Tested by : CT ^
Reviewed by: ( ^D^^J i f p ' J J - ^
ReportDate: 10/10/2008
_SampleDate:
Test Date:
Curtis Parlcer, Lab Manager
9/24/2008
9/26/2008
1 SIEVE ANALYSIS | ASTM C136
Sieve Size
450 mm (18")
376 mm (16")
300 mm (12")
250 mm (10")
225 mm (9")
200 mm (8")
150 mm (6")
125 mm (8")
100 mm (4")
75.0 mm (3")
63.0 mm (2-1/2")
50.0 mm (2")
37.5 mm (1-1/2")
1 26.0 mm (1")
19.0 mm (3/4")
12.6 mm (1/2")
9.5 mm (3/8")
6.3 mm (1/4")
4.75mm (No. 4)
1 2.36 mm (No. 8)
2.00 mm (No. 10)
I . ISmm (No.16)
0.600 mm (No.30)
0425mm (No. 40)
0.300mm (No. 60)
0.180mm (No. 60)
0.150mm (No.lOO)
0.076mm (No. 200)
ASTMC117 AASHTO T11
Moisture Content, %
; A S T M C566 AASHTO T255
j Fractured Face, K
2(aces
Fineness Modulus (FM)
ASTM C136 AASHTO T27
/SiASHTOT27
Accum. % PusintI
1 0 0
1 0 0
1 0 0
1 0 0
1 0 0
1 0 0
9 9
9 9
9 9
9 9
9 7
9 6
9 5
9 2
89
8 6
7 9
6 9 . 4
Spccmcilians
9 5 - 1 0 0
7 0 - 1 0 0
6 0 - 9 5
3 0 - 7 0
TEST RESULTS | Standard
ASTM C29
AASHTO T 19
ASTM C 127
AAShfTO T 85
ASTM C 128
AASHTO T 84
ASTM D 2419
AASHTO T176
ASTM D4791
i ASTM C131
AASHTO T 96
ASTM C 535
ASTM C88
AASHTO T104
ASTM 0 1 4 2
AASHTO T 112
ASTM C40
AASHTO T 21
ASTM C 123
/WSHT0T113
ASTM D 3080
AASHTO T 236
ASTM D 1557
AASHTO T 180
ASTM D4318
AASHTO T89ffl0
PHYSICAL PROPERTIES
Unit Weight
a v o i d s
Coarse
Specific
Gravity &
Absorption
Fine
Specific
Gravity &
Absorption
Sand
Equivalent
Flats,
Elongated
L.A.
Abrasion
L A .
Abrasion
Soundness
Soundness
Clay/Friable
Particles
Organic
Impurities
Lightweight
Pieces
Direct Shear
CD
Compaction
Modified Effort
Liquid Limit,
Plastic Umit &
Plasticity index
Unit Weight, lbs Vcu.fN
Voids. %=
a Jigged D Loos« El Rodded
Bulk Spedfic Gravity (dry)=
Bulk Spedfic Gravity, SSD=
Apparent Spedfic GrBvity=
Absorpfion, %=
Bulk Specific Gravity (dry)»
Bulk Spedfic Gravity, SSD=
Apparent Spedfic Gravity^
Absorpfion. %=
Sand Equivalent. %-
Flat & Elongated, %=
Ratio=
Small Coarse Loss. %=
Grading/ Revs.=
Large Coarse Loss, %=
Grading/ Revs.=
Coarse Soundness Loss, %=
Magnesium No. ofCydes=
Fine Soundness Loss. %»
Magnesium No. o f C y d e s '
Coarse Aggregate, %"
Fine Aggregate, %=
Coarse Aggregate, %=
Fine Aggregate, %=
Coarse Aggregate, %=
Fine Aggregate, %=
Fricfion Angie,'^
Opfimum Moisture, %=
Max. Density. Ibs7cu.tt.=
Liquid Llmit=
Plasfic Umit=
Plasfidty lndex=
R H U H I Sptcificitlon
1
1
SUVSVVD/49818.001/SLC8M088 Copyright 2008 Kleinfelder, Ina
10/10/2008

K L E I N F E L D E R fright Ptopl*. Mght Solutions.
REPORT of AGGREGATE PHYSICAL PROPERTIES
Project: Bayview Land Fill Cell #1 Closure
Client: SUVSWD
Material Tested: Cover material
Source: N=8899.2 E=4537.8 2=4754.8
Specification: Per Engineer Report
Lab No.: T08-193-8
Project No: 49816.001 Sampled by: TMM
Tested by : CT
Reviewed by: /_
Report Date: 10/10/2008
_Sample Date:
Test Date:
Curtis Parker, Lab Manager
9/24/2008
9/26/2008
SIEVE ANALYSIS
ASTMC136 AASHTO T27
Sieve Size
450 mm (IS")
375 mm (15")
300 mm (12")
250 mm (10")
22S mm (9")
200 mm (8")
160 mm (6")
126 mm (6">
100 mm (4")
76.0 mm (3")
63.0 mm (2-1/2")
50.0 mm (2")
37.5 mm (1-1/2")
1 25.0 mm (1")
19.0 mm (3/4")
12.5 mm (1/2")
9.5 mm (3/8")
6.3 mm (1/4")
4.75mm (No. 4)
I 2.36 mm (No. 8)
2.00 mm (No. 10)
I.IBmm (No.16)
0.600 mm (No.30)
1 042Smm(No.40)
1 0.30Qmm (No. 50)
1 D,180mm (No. 60)
0.150mm (No.lOO)
0.075mm (No. 200)
ASTMC117/\ASHT0T11
Moisture Content, %
ASTMC566 /\ASHTOT255
Fractured Face ,«
2 faces
Fineness Modulus (FM)
ASTM C136 AASHTO T27
Accum. % Passing
100 100
100 100
100 100
100 100
100
100 99
99 99
97 92
86
67
42.9
Spccificilions 1
95-100
70 -100
60-95
30-70
TEST RESULTS standard
ASTM C 2 9
AASHTO T 19
ASTM C127
AASHTO T 85
ASTM C 128
AASHTO T 84
F A S T M D2419
AASHTO T 176
1 ASTM D4791
1 ASTM C131 AASHTO T 96
ASTM C 535
ASTM 0 88
AASHTO T104
ASTM C142
AASHTO T112
ASTM C40
AASHTO T 21
ASTM C123
/AASHTO T 113
ASTM D3D80
AASHTO T 238
• ASTM D 1557
/>ASHTOT180
[ ASTM D4318
AASHTO T 89/90
PHYSICAL PROPERTIES
Unit Weight
& Voids
Coarse
Specific
Gravity &
Absorption
Fine
Specific
Gravity &
Absorption
Sand
Equivalent
FIat&
Elongated
L.A.
Abrasion
L.A.
Abrasion
Soundness
Soundness
Clay/Friable
Particles
Organic
Impurities
Lightweight
Pieces
Direct Shear
CD
Compaction
Modlfled Effort
Liquid Limit,
Plastie L imi ts.
Plasticity Index
Unit Weight, ibs./cu.n=
Voids, %=
D digged D Loose [3 Rodded
Bulk Spedfic Gravity (diy)=
Buik Spedlic Gravity, SSD=
Apparent Spedfic Gravity=
Absorption, %=
Bulk Spedfic Gravity (diy)°
Bulk Spedfic Gravity, SSD=
Apparent Spedfic Gravity^
Absorption, %=
Sand Equivalent. %=
Flats Elongated, %=
Ratio=
Small Coarse Loss, %=
Grading/ Revs.»
Large Coarse Loss, %=
Grading/ Revs.=
Coarse Soundness Loss. %=
Magnesium No.ofCydes=
Fine Soundness Loss. %=
Magnesium No.ofCydes=
Coarse Aggregate. %=
Fine Aggregate, %=
Coarse Aggregate, K =
Fine Aggregate, %=
Coarse Aggregate, %=
Fine Aggregate, %=
Friction Angle.=
Optimum Moisture, %=
Max. Density, 1bsJcu.n.=
Liquid Limits
Plastic Limits
Plasticity lndex=
Results Spcdfication
SUVSWD/49818.001/SLC8M 088 Copyright 2008 KlelnfeMer, Inc.
10/10/2008

KLEINF-ELaSR Bright Peofile. Right Soluttom.
Job Name; BayvewLand Fill Cell 1 Closure
Nuclear Gauae Densitv Test Data Sheet
Job Number: 49816.001 Technician: TM l\^egeath
Remarks:
z
1 1A 1B 2A 2B 3A 3B 4A 48 5A 5B 6A 6B 7A 7B 8A 88 SA 98
10A 108 IIA 11B 12A 12B 13A
i 9/24/2008 9/24/2008 9/24/2008 9/24/2008 9/24/2008 9/24/2008 9/24/2008 9/24/2008 9/24/2008 9/24/2008 9/24/2008 9/24/2008 9/24/2008 9/24/2008 9/24/2008 9/24/2008 9/24/2008 9/24/2008 9/24/2008 9/24/2008 9/24/2008 9/24/2008 9/24/2008 9/24/2008 9/24/2008
Test Identification and Location Cell #1 Cover Material N8750E4210.5 Mode 12" N8750E4210.5 Mode 6' N8610E4230.8 Mode 12" N8610 E4230.8 Mode 6" N8424.5E4248.5 Mode 12" N8424.5E4248.5 Mpde6" N8242.4E4194.2 Mode 12" N8242.4E4194.2 Mode 6" N8128.8E4103.2 Mode 12' N8128.8E4103.2 Mode 6" N8157E 4283.8 Mode 12° N8157E 4283.8 Mode 6' N8239E4354,6 Mode 12" N8239E4354.6 Mode 6" N8345.7 E4340.1 Mode 12" N8345.7 E4340.1 Mode 6" N8486.1 E4343.5 Mode 12" N8486.1E4343.5Mode6" N8649.6E4392.8 Mode 12" N8649.6E4392.8 Mode6" N8843.2E4392.4 Mode 12" N8843.2E4392.4 Mode6' N8722.8E4446.3 Mode12" N8722.8E4446.3Mode6" N8577.6E4470.5Mode12»
to
1 1
92.7 95.0 84.4 78.6 95,7 95.3 109.7 105.6 99.0 94.6 97.7 92,9 85.9 79.3 87.1 82.2 93.1 96.2 97.7 95.9 99.4 95.4 90.0 94.2 96.0
g
1 IU
4791.5
4793.9
4794.3
4797.7
4802.2
4792.8
4788.9
4789.7
4789,2
4788,8
4783.9
4775.2
4769.0
1 o
i 9.6 9.9 10.2 10.5 12.8 12.2 7.2 7.9 8.5 11.0 9.2 10.0 11.5 13.4 10.4 10.7 9.0 9.0 5.5 5.8 10.1 10.5 8.1 8.1 7.6
o
84.6 86.4 76.6 71.1 84.8 84.9 102.3 97.9 90.4 85.2 89.4 84.4 77.0 69.9 78.9 74.3 85.5 88.3 92.6 90.7 90.4 86.-3 83.2 87.2 89.2
E Z
T08-193P T08-193P T08-193P T08-193P T08-193P T08-193P T08-193P T08-193P T08-193P T08-193P T08-193P T08-193P T08-193P T08-193P T08-193P T08-193P T08-193P T08-193P T08-193P T08-193P T08-193P T08-193P T08-193P T08-193P T08-193P
Max
imum
Den
sity
(p
cf)
110.2 110.2 110.2 110.2 110.2 110.2 110.2 110.2 110.2 110.2 110.2 110.2 110.2 110.2 110.2 110.2 110.2 110.2 110.2 110.2 110.2 110.2 110.2 110.2 110.2
Mea
sure
d C
ompa
ctio
n
(%)
77 78 70 65 77 77 93 89 82 77 81 77 70 63 72 67 78 80 84 82 82 78 75 79 81
Spe
cifie
d C
ompa
ctio
n
75-85 75-85 75-85 75^5 75-85 75-85 75-85 75-85 75-85 75-85 75-85 75-85 75-85 75-85 75-86 75-85 75-85 75-85 75-85 75-85 75-85 75-85 75-85 75-85 75-85
Remarks
Pass Pass Fail Fail
Pass Pass Pass Pass Pass Pass Pass Pass Fall Fail Fail Fail
Pass Pass Pass Pass Pass Pass Pass Pass Pass
SUVSWP/TBD.OO 1/SLC8MXXX Copyright 2008 Kleinfelder 10/10/2008

K L E / N r E L D E R Bright People. Right Solutlom,
Job Name: Bayvew Land Fill Cell 1 Closure
Nuclear Gauge Density Test Data Slieet
Job Number 49816.001 Technician: TM Megeath
Remarks:
d z
1 13B 14A 14B 15A 15B 16A 16B 17A 17B 18A 188 19A 19B 20A 20B
1 9/24/2008 9/24/2008 9/24/2008 9/24/2008 9/24/2008 9/24/2008 9/24/2008 9/24/2008 9/24/2008 9/24/2008 9/24/2008 9/24/2008 9/24/2008 9/24/2008 9/24/2008
Test Identification and Location N8577.6 E4470.5 Mode 6" N8373.0E4481.9 Mode12" N8373.0E4481.9 ModeB" N8269.5E4491.3 Mode 12" N8269.5E4491,3 Mode 6" N8367.1 E4593.1 Mode 12" N8367.1 E4593.1 Mode 6" N8508.4E4539.1 Mode 12" N8508.4E4539.1 Mode 6" N8689.2E4572,7 Mode 12" N8689.2E4572,7 Mode 6° N8791.3E4555.6 Mode 12" N8791.3E4555.6 Mode 6" N8899.2E4537.8Mode12" N8899.2E4537,8 Mode 6"
in
g
1 97.9 98.0 95.6 88.9 93.0 94.0 92.6 104.0 101.8 103.3 99.9 100.7 98.8 100.7 98.1
c
4775.1
4774.8
4765.9
4758.1
4763.3
4753.9
4754.8
1
6.8 9.6 10.3 10.6 10.2 13.0 13.2 6.6 6.8 10.3 10.9 8.3 8.4 14.0 15.4
91.7 89.9 86.7 80.4 84.4 83.2 81.8 97.6 95.3 93,6 90,0 93.0 91.2 87.7 85,0
u .a E
T08-193P T08-193P T08-193P T08-193P T08-193P T08-193P T08-193P T08-193P T08-193P T08-193P T08-193P T08-193P T08-193P T08-193P T08-193P
Max
imum
Den
sity
(p
cf)
110.2 110.2 110.2 110.2 110.2 110.2 110.2 110.2 110.2 110.2 110.2 110.2 110.2 110,2 110,2
Mea
sure
d C
ompa
ctio
n (%
)
83 82 79 73 77 75 74 89 86 85 82 84 83 80 77
Spe
cifie
d C
ompa
ctio
n
(%)
75-86 75-85 75-85 7M5 75-85 75-85 75-85 75-85 75-85 75-85 75-85 75-85 75-85 75-85 75-85
Remarks Pass Pass Pass Fail
Pass Pass Fall
Pass Pass Pass Pass Pass Pass Pass Pass
Average 6" depth result: 77.7
Average 12" depth result: 79.4
SUVSWP/TBD.001/SLC8MXXX Copyright 2008 Kleinfelder 10/10/2008

KLEINFELDER Bright People. Right Solutions.
Daily Field Report-Soils Project Name £ i a f V i e e O l . , / ^ Q ' / / / C / ^ o r o r e Date
Project No. ¥f^fC. OO/
' 7 / j r / o ^ BIdg. Permit No..
Project Address ^^.^S/SSTA ( . f r A f f
Client S C f i y S o J - ^ Contractor S ^ l / ^ ' ^ ' ^
Equipment Observed
Weather JOt^ f i t
DFR/Report No.
Time Anived ^ r « J O
Time Departed / ' > ^ ^
Travel Time ^ / D
Reviewed By_ J ^ ^ ^ J Date Reviewed,
MI leaoe / T t P
Density Tests Performed On:
n Compacted Subgrade
D Excavated Subgrade
D Engineered Fill
n Trench Backfiii
a Wall Backfilf
D Pavement Subgrade
D Pavement Baserocl<
Eaher(specHy)^>«g/- ^ ^
Nuniber of Density Tests:
Performed
Passed
Failed
. Requiring Retest
Pending Lab Results
. Other (specify)
Possible Reason(s) for Failing Tests:
D I nsufflclent Compaction
D Excessive Moisture
D Insufficient Moisture
D Unstable Subgrade
D Unsuitable Material
n Unl<nown
D Other (specify)
Observations/Remarks:
p*^ifi/sijy£/el^i T w raa^ i r tui^-fyrrof p/<fr/'efi <aayay;
r£ofl-HfS. k : A ' s 7Z6 '~ /VC ' / i f i / O C ^ r a r v f f c / . H ' ( / O r . S f c f M i i i P / ^ . 6 Mtcdd iS t£ i r» t ^ ^ ^ v^
^ ^
- r t ^ - ^ ^ t S • f f f - ^ l n ' t . l < x r ^ A f ^ S J / l i t y € t J ' J ^ t ^ S ^ \ / J r ^ £ > ^ f t ^ f f > ^ o f T i y v p a r f r v ^ -ja S € . > t ^ j i t - f i » 4
Representing
Page . 7 — of: ' y C / U . y t^e^ j i^ ' / ' i f Kleinfelder Representative/flhnt Hams 0,ln
Wit^.(il REV 05/08
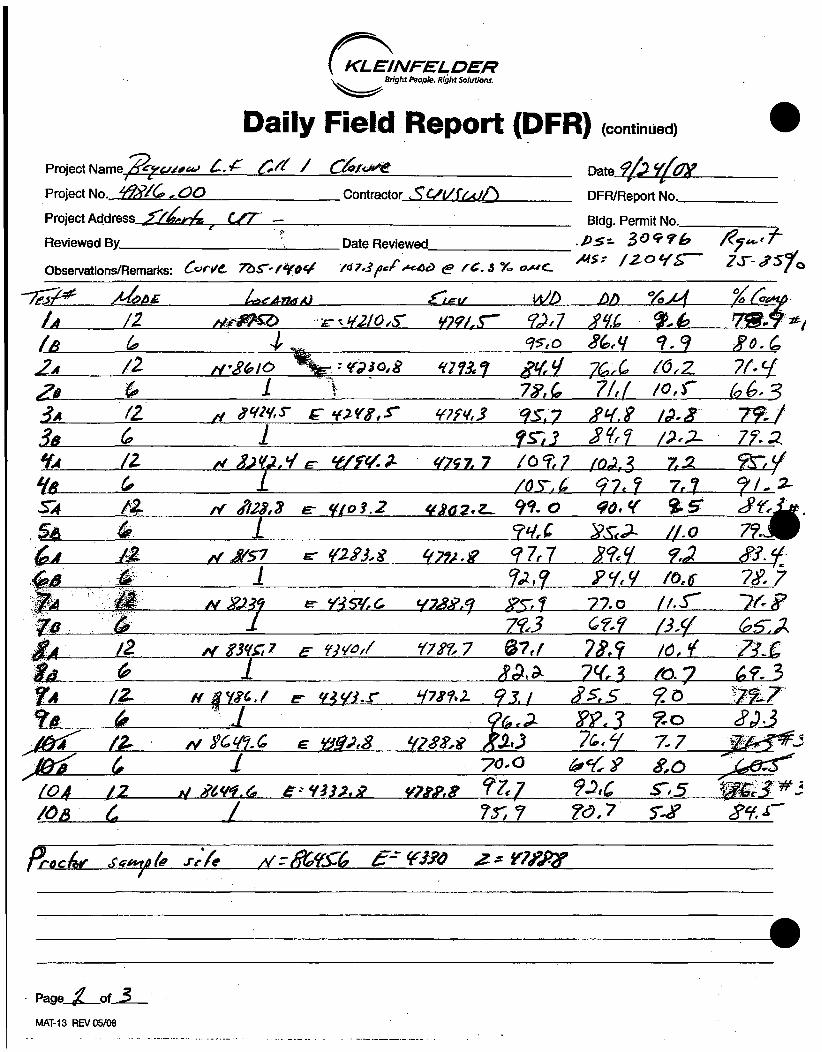
K L E I N F E L D E R Bright People, Kight Solutions.
Daily Project Name Xy»^y^<^ ^ - > ^ ^ / ^ / C%/oi^e
Report (DFR) (continued)
Date
Project No. ^ ^ / C , 0 0
Project Address f / 4 ^ j r A ^ t y T —
Reviewed By.
. Contractor S C y t / r / ^ j P \
9/?Yf(^
_ Date Reviewed.
DFR/Report No._
BIdg. Permit No.
,>i-Observations/Remarks: C^rt/C T b S - ' f ^ p ^ y<i7,3fcfA<^c><s^<^-&y-o^C. ^ ^ ' 1 ^ ^ * ^ ^ Z ^ - < ? ^ J ( .
l^
2 A .
IZ M ^ ^ ^ -^^¥2/0.5- ¥ 7 ^ / . ^ 9X7 ^ U g l ^ i ^s,o 8 M ? . ? ^O-C
/2 H^iCpjO ^?io.B ^7Wf gf/.^ ycr c ^o.2_ yr-'-f ^ ^ 7S',Q 7f,( / o X (oG - ^ fl ^ ^^^f.y ^ ^xY^.r ^?fi/,s 9^.1 ^^.jp ts.:^ 79, f 3A. G fS^,? t ^ f r f / ^ r P - 7?^ 3. *fA J l ^ ^ J ¥ 2 , ^ ^ ¥/f( / . :^ </7<il.l ^C>%7 fo^^l z ^ ^ 1 /
^ 7 roy.^ 9717 Zrj " U ^ ^
7 ? M ^ ^ ^ S 7 BT ^ 2 ^ j . i ^ ? f j . ^ 9 7 r l ^9<^ 9,2 ^ S . f
I ?^,y p y . y io,(f 7^ 7 M ^ S ^ f YH^rO H 2 S ^ ^ S , 1 77, o /AsT 2 ^ 1 #
793 Cf^9 /3</ &i^.X tZ Af gSHf,7 £- W O . / Y7Sf.7 ^ 7 t f 7i'>f 1 6 . i 7 ^ X
EL i^ /^^.^ 7y^^ / o j ^ ^ f^ viYi.r H78%x. f^/ B^.S f .o 'm.-T tA. >y|yy-^
l ^ / ^ N S>Cc/%C g '^^JieS ^7SS.^ P^. ? ^-o i ^ 7(-'^ 7.7 m * : ^ ^
^ ^ ^ i yO'O i ^ ^ . f 8 , 0 ^ L ^ e : ^
CQ4 iz. ^ 6<M.c, £'<in2,s? v? s>.g 9LJ 9:>.C ^^3 ^ ^ T ^ i /M_ X Tr ,7 TO, 7 r ^ S^.^'
f r c c^ Ssfi^fi (e s r / e V r ^ ^ r ^ g ^ ' ^ <f^90 ^ ^ r7<^g^
Page / of 3
MAT-13 REV 05/08

K L E I N F E L D E R Bright People. Kght Solutions.
Daily Field Report (DFR) (continued)
"^yfOr^ccf L F C^f/ / ^ /« t<J»^^ Project Name_
Project No. ^ 9 j ? f C > . 0 / ) /
Date
. Contractor f ^ U \ / S U L / 7 >
7/ / o ^ DFR/Report No..
Project Address £^ /he ' i r ^ L / T ^
Reviewed By
BIdg. Permit No._
Date Reviewed
Otisertfations/Remarks:
/£^1 -ff- Ay/fi/iF: /.firmuiA) £^-£V Wd DD y>/29^h2^ s : m ^ ^ ' ^ H?8i' 1 99."f p , H
Jk X f<r, B(>rS /o.r Sa,^ /z Ki^^T^.S ^ f(/ic.% ^yps.z 90'0 ^X;? jp./ ?^^^^
12 A. J-/IA J^ M SS77.G g yy?o..r yp/i f.o f^<o EZA 7M. /M. J. 97 f ?f, 7 /JfA ^ Afi ?3.o r ^m.9 ^77s,i ^r^.o ^9, J
^Q,7 J_ 9<r,<^ jo^ tioj' J Z . /y ^J?C%:r ^ 'TfV^S H77tS P ^ . ^ J O^V /Q.L ^f^^^
2 m ^ O ^ y : / f o , 2 2P.7 /GJ -
^
J2^ - j ^ n<^7.t e VTf3,/ y76y.f f^.o SI.2 /I.o ^ 7 ^ ^ ^ I Q2.Q ^ L ^ 13.2. 7 ^ . 3
j ^ ^^B,H /T Vr^fY ¥ 7 r h / Id^.D 97,C CC 1 / 6A^ ? J : J L ^ cJrgRJP
N^Cpf^'Zr ^ 9 ^ 7 : ^ 7 y7r:?,J ^<y3,? f j ^ ^ ^ l # | ^
i ff./ f&to /rt. f rfi?? / U
% si ?79/,3 e vss-s ,!. y7^7 fnn.7 ^i.^> J>,-?
^ i^j^ fJi^ tiJC-Jx^ JZ- M nmr?.^ £-H^>7.ii 97$r,ji /m.7 ^^^2 /.^^
X f<fY ^3";o AXy^ /y.j?
Page_3 of_3_
MAT-13 REV 05/08

K L E I N F E L D E R
Construction Observation Report
Project Name L j f - f u u t * ) f t n ^ u i M f f Z / / / C a o * r f S W o f i - .
Client 5 U V S v O D Project No. _ ¥ 9 f f Q , 0 0
Project Location ^ f b f i r T a L f ^
Contractor Su\/rS^tJJZi
Reviewed by -
BIdg. Permit No . .
Date Reviewed _
Date 7 / ^ ? / i > , y DFR N o . • - .
Time Arrived J J - ' l ^ O .
Time Departed ( l ' . . ' . . iO.
Travel Time —*
IVpe of Observations D Masonry D Batch plant D Foundations D Concrete
D Welding D Reinforcement Steel D Fireproofing B ^ o i l
n Bolting n Pre-Post Tensioned Tendon D Metal Decking • Other
Documents Referenced n O f / C/i^rtteert^tj /TMJ-^ /%ea ' ,*•e^*.•/I' jt/emo«./ r / ^J * , / A/o</ ^ a ^
m m a r y - , , 4 ^ * = f ^ / ^ J <=* " r - f /g 7 ^ ««<»<?/ / ^ ( f . ^ * n / / / i r y i r u * _ S r . t : f / A f h f t ^ fJu't-fCt S c / ] / J u f d i t < ^
C</tir-t44H/- C r re t ^C* /ay i O t u i n r uUe-Ht f - f / ^ / i .
' A - t n ^ l t M t j J e a t ^ e ^ t a / - A eta - / ^ f ^ ^ j L / ' " ^ / Z e J j _ ^ , ^ ^ - . M J S / J l ^ £ j > ^ j S - ^ - j C t t ( J f r - / K < ?^/Tr_</.
• .'arg«y- . / k / 7 ^ / ^ c ^ /J2. ' -f C ' \ - /ej j /x <icjiAn:A-^e£- ^ f A> u i*J i i !a*2 fj^c^cx/ce/ffss^
^<y/i. / /ffcf ft£. ^ 7 " / ' f 6.^g-% /^y^.,ca^$fk/y •^r.-f^J^. fCA e^/!c.fcAg/ ruKx/j:.
^ 7 ? ? J - - / y 7 / f / a 7 . i ^ ^ ' f x . , a / i ( Q f C j : ^ ^ ^ ^ r - ^ J X r £ > ^ u L ^ . / r M A ^ J .
~ 7 ^ a r r ^ i ^ J t luaJ s ^ r f i z U r J / . ^ J ^ ^ ^ y4^? l4<f /O ^ T S y ( \ y * < , ^ < ^ * j j , ^ o ¥ ^ J ^ . fiUtie j e ^
l76r<i.cCe»cy A O ^ C ^ ^ y c ^ t * J C r U - J / r / J ^ n>irt*^ A t " J j e e r n c y r L^ tCa'J^ tMJ 7^ C^ A^ l / i c ta^C^^ b y
-r •n <rVt;gi^ f / L / t y i f - p t t a J /
svo CD ' ® ( ^ (2> ( S ) ^
N3 t -*—B—B~( -®—&-J -ree y - IOC
Report items comply 0 Report items incomplete D Report items comply witln„e(cepfions
Acknowledged by ^ ^ f j ^ A M - * ' ' - ^ ^ Representing
Page ( of J L
Sccirj^t^£i Kleinfelder Representative Signatur&
tyi- f7?r<=^ ^u^ihc^ Kleinfelder Representative Print Name
-Jnf

-MM" %MZ FILE NO
JOB NAME
DATE
TECH
TEST LOCATIONS SELEaED BY.- T ~ < < ^ y ^
COMPACTION CONTROL Q DENSITY TESTING Q ^
\i.,jtj L ^ u i e r / ^ l l f ^ a / /Tnrtffr-NUCLEAR DENSI^tflELD FORM
K L E I N F E L D E R
RESULTS REPORTED T j
S^SoT^ J l - / / < f t 4
/ > ^ » ^ UJrif^rurr-uaeu
MILEAGE
HOURS _
WEATHER P . ^ - Si, i t ^ f Z M -
?'<r STANDARD COUNT
Density ^ ^ 2 . 2 . F
Hotsture / 2 . i f 2
i +• IA 01
1—
/
V ^
z N f
3
X i V r 1 c
\
7 \
1
f Z "
( /
r z ' 0 "
l l "
CP"
IZ"
6 "
11"
G" / 2 "
& "
fL- '
G "
Approximate Locat ion
G'/'f / k/esf x fo^e. 3 ' Cou^ir
tn c a
3
/ /^ Is^
/0J (>
0Yr3
tOH.J
nr ^^ .5 -
9S.C
r ' 7Mn 2?-^
9r-7 fS,2.
V.s
n ?
Depth
below
FSG (ft)
0 \
/
. /
Moisture
Percentage
7.?
?./
i,T
LZ
^ . i
10.2
».f
^f 4.ir'
6.2
^ . ^
S.i
77
?.7
C
9H.Z
91.9
f 7 9
?^7 7(,.f
7S.I
PCS
Ps:r
SC7 /r-n 9 ?6.¥
^7?
j y j "
> 3 u
3
/y/v 107.1
I \
)
(
j 1 \
)
(
/
\
V
\
\
/
/ /
\
\
)
/
\
^
C o U a o.
c -a o
1 - B
l/l s
2:^ 15-25
f l
9?r
71
6^
^ f
S'O
^ /
?f
3>Y
^Y ?0
77 1 V
Remarks
/S / /
F.: /
F . : /
F.J
F^:/
F.:7
JL.S
P..
f t i t
P,u
/L, A, 4., / « .
J-29 SHEET / oJ ^

FILE NO
JOB
DATE
TECH
E ^ 7 - ^ ? - o s r -- 7 - v ^ ^ ^ ^ ^ r ^ A ^
TEST LOCATIONS SELECTED BY:.
COMPAaiON CONTROL D
NUCLEAR DENSITY FIELD FORM
K L E I N F E L D E R
RESULTS REPORTED TO
Saf^ ArJ^/^ fe*~^ C < / r r t f ,
DENSITY TESTING B - ' ^
MILEAGE
HOURS - ^S. WEATHER P.C. X 4 l V g < r
STANDARD COUNT
Density % ^ Z 2 . ^
Moisture / Z S 9 : 2
r • H r ^
- •
Test No.
2 \
^
^
10
sl.
r \ - 1 1
( vl/
- X t r -
01 • o
£
/ 2 "
G'
rz"
6 "
^2''
^ ' '
/ ^ "
-/ ' ' ti? ^
tt" fkL
- i f i ^—
ar/1 Approximate Locat ion
UJe j / - S/oae. P ' / ^ e r 1
••
tn c 01
a
*> V
92.S
9(.7
9C.Y
% ^
1/0,2-
107.7
Depth
below
fSG (ft)
0
\
/
^
I I
Moisture
Percentage
^ . ^
^ ?
9 e
s:z
^ J
( .G
tA C 0)
a
^x.^
^ t 9 '
9/:?
9f.:s'
70B/f
lO/'O
A'/ i ^''4.
i 01
> L. 3 U
70J--
\
)
\
w ve
E 3
£
5
iot.Z
^
/
(
V /
c o
• r -+> u
s.
PO
19
P^
P^
97
9Y
3 i <f
c 0> • -
•r - 4.> " ^ O
s l BL O
l/> U
Tf-Sf
\
f /
v /
Remarks
/^y vl' '
F.:f
F.:f
F-//
F^:J
j -2g SHEET