
Appendix L – Revised Groundwater Modelling Report | NT EPA
270
L Appendix L – Revised Groundwater Modelling Report
-
Upload
khangminh22 -
Category
Documents
-
view
4 -
download
0
Transcript of Appendix L – Revised Groundwater Modelling Report | NT EPA

LAppendix L – Revised Groundwater
Modelling Report
D09814A25 December 2017
McArthur River Mining Pty Ltd 2017 MRM EIS Supplementary
Updated Groundwater Impact Assessment
Final Report
McArthur River Mining Pty Ltd
Supplementary EIS
Site Groundwater
Report
171218 R MRM EIS
Supplementary_GW.docx
Page i
D09814A25 December 2017
EXECUTIVE SUMMARY
This report provides an update of the groundwater assessment completed for the McArthur
River Mine EIS. An assessment of potential groundwater responses to the operations and
proposed management strategies is presented for the Life of Mine and closure scenarios based
on predictions from an improved and re-calibrated numerical groundwater flow and
contaminant transport model. Groundwater impacts are again considered in terms of
dewatering, seepage through overburden emplacement facilities (with a focus on the NOEF),
seepage from water management dams and the Tailings Storage Facility. The corresponding
and integrated Surface Water Impact Assessment, allows MRM to predict and manage the
impacts on the groundwater and surface water system during Life of Mine and closure.
Several important improvements are contained in the proposed project plan and are
considered in this report. The most notable being the changes arising from the predicted NOEF
response, due to a change in the proposed final cover, an alternate modelling approach, and
the final void closure plan. These changes will have long term benefits at MRM and will reduce
loads to the receiving environments.
MRM has undertaken further hydrogeological characterisation for the purposes of improving
the understanding of the site groundwater systems and processes. The program included
further geological characterisation and modelling of the site, additional field geophysics, re-
interpretation of historical data, drilling and hydraulic testing of monitoring bores and sampling
of groundwater for chemical analysis to supplement the existing groundwater information for
the project site. The new data generated from the field program was integrated with the
information presented in the Draft EIS site geological and hydrogeological datasets to refine the
site-wide conceptual hydrogeological model and update the numerical model. Key updates to
the model apart from the project changes were focused on the re-interpreted geological
structures, particularly for the Bald Hills Fault system and the updated hydrogeological
information provided by ongoing field characterisation from MRM’s field program.
The numerical groundwater modelling was completed in MODFLOW using SURFACT and
integrates with both surface water, NOEF unsaturated flow and pit lake (limnology) modelling.
The updated model was calibrated to heads, fluxes and sulphate concentrations over the
monitoring period 2006 to 2014. The calibrated model was again used to simulate the
groundwater responses to life of mine and closure for a period of 1,000 years.
The modeling indicated that groundwater can be impacted by migration of contaminants from
mine sources and natural mineralised sources through aquifer pathways, and aquifer
drawdown as a result of open cut dewatering. As per the Draft EIS, impacts from dewatering
that were assessed include reduction of baseflow and the potential for drawdown at
waterholes. The contaminants of concern that were assessed include sulphate, lead, zinc,
cadmium and arsenic.
A focus of the supplementary modelling was to assess the sensitivity of results to changing
conditions or ranges in the field-determined parameters adopted for the numerical model. This
McArthur River Mining Pty Ltd
Supplementary EIS
Site Groundwater
Report
171218 R MRM EIS
Supplementary_GW.docx
Page ii
D09814A25 December 2017
involved several alternate simulations completed to better contextualise the contaminant
transport and attenuation processes for the MRM site. Sensitivity analysis included
consideration of the impact of several alternatives for the NOEF (changing the final cover
design, and alternate NOEF foundation conditions), varying aquifer parameters (particularly for
the units associated with the geological structures across the site) and contaminant transport.
The key results from the supplementary EIS groundwater assessment are:
� A focus of the EIS Supplementary was to reduce the contaminant loads arising from the
NOEF through consideration of alternative covers, and as indicated in the concurrent
NOEF Flow and Water Quality report (KCB, 2017), proposed geosynthetic liner (GSL)
cover system reduces cumulative loads to groundwater significantly by a factor of five or
more for sulphate and zinc over the next 100 years, compared to the previously
proposed compacted clay liner (CCL) cover system.
� Dewatering of the open cut pit during operation will largely drain the bedrock aquifer
adjacent to the McArthur River and Barney Creek Diversion Channels, therefore,
reducing baseflow to these structures during the operational phase. After closure, the
rapidly recovering pit lake, as well as rainfall recharge processes allows the bedrock
aquifer hydraulic head to rebound and re-establish a hydraulic connection with the
diversions.
� To mitigate sulphate loads to the Surprise Creek system from the Tailings Storage
Facility (TSF), an interception trench will be constructed on the northern side of the TSF.
Modelling has indicated that this will reduce the loads to Surprise Creek while this
trench is operational. At closure the TSF is removed and will therefore remove loads
from this facility to both Surprise Creek and downstream at the Barney Channel in the
longer term.
� Predicted changes to water levels and flows are of similar magnitude to those reported
by the Draft EIS and previously by the Phase 3 Groundwater Assessment. These include
baseflow discharges to creeks, rivers and diversions that will change due to seepage
from the mine overburden facilities and dewatering of the expanding open cut
operation.
� As indicated in the draft EIS, sulphate plumes are predicted to arise down-gradient of
the NOEF, TSF, and unlined water management facilities during the life of mine
simulations. The loads are primarily associated with long-term seepage from the NOEF
migrating through weathered and fractured bedrock and reporting to the diversion;
modeling results support the benefits of the proposed geosynthetic cover system in
reducing groundwater-driven loads to the receiving surface water.
� As per the Draft EIS, the highest sulphate loads to Barney Creek diversion occur during
closure once aquifer conditions have recovered following mine pit lake rebound. This is
primarily associated with seepage from the NOEF migrating through weathered and
fractured bedrock reporting to the diversion, and will be captured in the Barney Creek
Sumps as required.

McArthur River Mining Pty Ltd
Supplementary EIS
Site Groundwater
Report
171218 R MRM EIS
Supplementary_GW.docx
Page iii
D09814A25 December 2017
� Metal loads are limited by the maintenance of neutral conditions and by the measures
in place to limit infiltration into the NOEF, i.e. the proposed cover system and NOEF
design and construction.
MRM’s focus for water management is protection of water quality downstream of the site at
SW11. To evaluate environmental impacts from groundwater discharge to surface water
bodies, the predicted groundwater baseflow fluxes and loads throughout Life of Mine and
closure from the model, including the various sensitivity assessments, have been integrated
into the site-wide water quality model. From this integration, MRM has developed monitoring,
mitigation and management plans for mine waste and water. Details of these plans are
included in the main reports for the Draft EIS and Supplementary EIS documents.
McArthur River Mining Pty Ltd
Supplementary EIS
Site Groundwater
Report
TABLE OF CONTENTS
171218R MRM EIS Supplementary_GW.docx
Page ii
D09814A25 December 2017
1 INTRODUCTION ................................................................................................................. 1
1.1 Project Background ............................................................................................ 1
1.2 Scope of Work .................................................................................................... 3
1.3 Structure of the report ....................................................................................... 3
1.4 Project changes since the Draft EIS .................................................................... 3
1.5 Integration of multiple models ........................................................................... 4
2 UPDATED GROUNDWATER MODEL ................................................................................... 9
2.1 Groundwater model setting ............................................................................... 9
2.2 Model Code ........................................................................................................ 9
2.3 Model Lateral Extents ......................................................................................... 9
2.4 Units and Datum ............................................................................................... 11
2.5 Updated Geology and Hydrogeology ............................................................... 11
2.5.1 Geological Review of MRM 2016 ....................................................... 11
2.6 Natural Mineralisation at McArthur River Mine ............................................... 19
2.7 Expected Behaviour of Groundwater ............................................................... 26
2.8 Model Layers .................................................................................................... 30
2.9 Representing Fractured Media ......................................................................... 31
2.10 Model Exclusions, Assumptions and Limitations .............................................. 31
2.11 Updated Groundwater Modelling Calibration .................................................. 32
2.11.1 Calibration Process, Targets and Metrics .......................................... 32
2.12 Updated Calibration Results and Statistics ....................................................... 33
2.12.1 Transient Calibration Model (2006 to 2014) ..................................... 33
2.12.2 2006 to 2014 groundwater mass transport model ............................ 54
2.13 Approach to Life of Mine simulations .............................................................. 59
2.13.1 Stress periods .................................................................................... 59
2.13.2 Contaminants of Concern .................................................................. 59
2.13.3 Pit drains ............................................................................................ 59
2.13.4 Recharge ............................................................................................ 59
2.13.5 Climate Change .................................................................................. 60
2.13.6 Seepage ............................................................................................. 60
2.13.7 OEF seepage ...................................................................................... 60
2.14 Approach to Site-wide Closure Groundwater Modelling ................................. 61
2.14.1 Stress Periods and Model Scenarios .................................................. 61
2.14.2 Contaminants of Concern .................................................................. 62
2.14.3 Pit ....................................................................................................... 62
2.14.4 Mine Pit Lake Recovery ..................................................................... 62
McArthur River Mining Pty Ltd
Supplementary EIS
Site Groundwater
Report
TABLE OF CONTENTS (continued)
171218R MRM EIS Supplementary_GW.docx
Page iii
D09814A25 December 2017
2.14.5 Production borefields ........................................................................ 62
2.14.6 Recharge ............................................................................................ 62
2.14.7 Seepage ............................................................................................. 62
3 UPDATED GROUNDWATER MODELLING RESULTS .......................................................... 64
3.1 Life of Mine Simulations ................................................................................... 64
3.1.1 Baseflow estimates to creeks and rivers ........................................... 64
3.1.2 Pit inflow ............................................................................................ 66
Pit inflows are similar to the values observed in the Draft EIS case. ................ 66
3.1.3 Plume extents for Sulphate ............................................................... 66
3.1.4 Plume extents for metals ................................................................... 67
3.1.5 Load estimates to creeks and rivers .................................................. 74
3.1.6 Uncertainty of Load Estimates and Plume Development .................. 76
3.1.7 1-Dimensional Reactive Transport Modelling ................................... 84
3.1.8 Groundwater Inflows ......................................................................... 96
3.1.9 Drawdown beneath Djirrinmini waterhole ........................................ 96
3.1.10 Plume extents for Sulphate and metals ............................................. 96
3.1.11 Water Budget .................................................................................... 97
3.1.12 Summary ............................................................................................ 98
3.2 Closure Simulations .......................................................................................... 98
3.2.1 Baseflow estimates to creeks and rivers ........................................... 98
3.2.2 Plume extents for Sulphate ............................................................. 102
3.2.3 Plume extents for Metals ................................................................ 106
3.2.4 Load Estimates to Creeks and Rivers ............................................... 110
3.2.5 Groundwater inflows ....................................................................... 115
3.2.6 Comparison of Closure Predictions to Expected Groundwater
Behaviour ......................................................................................... 116
3.2.7 Additional sensitivity runs with mitigation ...................................... 117
4 DISCUSSION ON RESULTS AND SENSITIVITY ASSESSMENTS COMPARED TO EIS
SUBMISSION .................................................................................................................. 119
5 CLOSING ........................................................................................................................ 122
List of Tables
Table 1-1 Summary of interactions between models ......................................................... 6
Table 2-1 Summary of model layers .................................................................................. 31
Table 2-2 Summary of transient model calibration metrics: 2006 to 2014 ....................... 34
Table 2-3 Summary of transient model water balance for a representative wet month
(December 2011) of the transient calibration ................................................... 35
McArthur River Mining Pty Ltd
Supplementary EIS
Site Groundwater
Report
TABLE OF CONTENTS (continued)
171218R MRM EIS Supplementary_GW.docx
Page iv
D09814A25 December 2017
Table 2-4 Summary of transient model water balance for a representative dry month
(September 2011) of the transient calibration .................................................. 35
Table 2-5 Calibration Models “Trial-and-Error” sensitivity ............................................... 37
Table 2-6 Calibration statistics for various model iterations ............................................. 38
Table 2-7 Recalibrated values of model parameters for new fault zones ......................... 38
Table 2-8 Summary of baseflow influences and reliability ................................................ 45
Table 2-9 Calibrated hydraulic conductivity and storage values ....................................... 52
Table 2-10 Sulphate source terms applied to calibration simulation from 2006 to 2014 ... 59
Table 2-11 OEF seepage assumptions for life of mine ........................................................ 60
Table 3-1 Physical, hydraulic and mass transport properties used in 1D analytical model
........................................................................................................................... 76
Table 3-2 Water quality parameters (in mg/L except for pH and Eh) used in the PHREEQC
models ............................................................................................................... 85
Table 3-3 Aquifer mineralogy used in the PHREEQC models ............................................ 86
Table 3-4 Aquifer parameters and partition coefficients used in the model .................... 87
List of Figures
Figure 1 Site Location and General Arrangement ............................................................. 2
Figure 2 Schematic of model interactions used for the assessment ................................. 5
Figure 3 MODFLOW SURFACT model area showing active and inactive cells. ................ 10
Figure 4 Structural framework of the greater mining region, McArthur River (Logan,
2017).................................................................................................................. 13
Figure 5 ERI traverses (GHD 2016, from Logan, 2017) .................................................... 14
Figure 6 ERI traverses along the Barney Diversion (Logan, 2017 based on GHD, 2016) . 14
Figure 7 ERI and location of the 2016 drill holes (MRM,2017) ........................................ 16
Figure 8 ERI traverse Line 1 and drill holes completed in 2016 (MRM, 2017) ................ 16
Figure 9 Update of Model Layers 5- 8 ............................................................................. 18
Figure 10 Interpreted features across the site (KCB – Draft EIS, 2017) ............................. 20
Figure 11 Distribution of the Interpreted HYC Pyritic Shale (after Williams, 1978), location
of other mapped mineralisation, and 2016 sulphate levels in groundwater .... 21
Figure 12 Regional Extent of the HYC Pyritic Shale (after Williams, 1978) ........................ 22
Figure 13 Historical Stream Samples for site (Pb data 1969 to 1988) ............................... 24
Figure 14 Historical Stream Samples for site (Zn data 1969 to 1988) ............................... 24
Figure 15 Historical Soil Geochemical Samples for site (Pb data 1969 to 1994) ............... 25
Figure 16 Historical Soil Geochemical Samples for site (Zn data 1969 to 1994) ............... 26
Figure 17 Scatter plot of modelled versus observed heads for the calibration model
simulation .......................................................................................................... 34
Figure 18 Representative dry stress period and wet stress period for comparison of
model inflows and outflows .............................................................................. 36
Figure 19 The sensitivity of calibration models ................................................................. 38
McArthur River Mining Pty Ltd
Supplementary EIS
Site Groundwater
Report
TABLE OF CONTENTS (continued)
171218R MRM EIS Supplementary_GW.docx
Page v
D09814A25 December 2017
Figure 20 Modelled versus observed hydrographs for representative bores for the model
calibration simulation ........................................................................................ 44
Figure 21 Baseflow reaches defined for the project site (consistent with WRM, 2017). .. 48
Figure 22 Model-predicted baseflow during the calibration period 2006-2014 for Surprise
Creek and Barney Creek diversion ..................................................................... 49
Figure 23 Model-predicted baseflow during the calibration period 2006-2014 for Barney
Creek ................................................................................................................. 49
Figure 24 Model-predicted baseflow for 2006-2014 for unnamed creek ......................... 50
Figure 25 Model-predicted baseflow during the calibration period 2006-2014 for
McArthur River and diversion (Initial year values part of model conditioning) 50
Figure 26 Model-predicted baseflow during the calibration period 2006-2014 for Glyde
River and Bull Creek .......................................................................................... 51
Figure 27 Fault and fault corridor parameterisation in Layer 5 and Layer 8 of the upper
bedrock profile .................................................................................................. 53
Figure 28 Calibrated model sulphate loads reporting to Surprise Creek and Barney
diversion ............................................................................................................ 54
Figure 29 Calibrated model sulphate loads reporting to Barney Creek ............................ 55
Figure 30 Calibrated model sulphate loads reporting to unnamed creek ......................... 55
Figure 31 Calibrated model sulphate loads reporting to McArthur River and diversion .. 56
Figure 32 Modelled versus observed sulphate concentrations for representative bores for
the model calibration simulation ...................................................................... 58
Figure 33 Time-series of TSF seepage rates applied to the life of mine model simulations
........................................................................................................................... 61
Figure 34 Life of mine monthly baseflow predictions for Surprise Creek and Barney Creek
diversion ............................................................................................................ 64
Figure 35 Life of mine monthly baseflow predictions for Barney Creek ........................... 65
Figure 36 Life of mine monthly baseflow predictions for McArthur River ........................ 65
Figure 37 Pit inflows over the life of mine and into closure .............................................. 66
Figure 38 Predicted sulphate concentrations in the overburden at four select periods of
the life of mine .................................................................................................. 68
Figure 39 Predicted sulphate concentrations in the weathered bedrock at four select
periods of the life of mine ................................................................................. 69
Figure 40 Predicted sulphate concentrations in the upper bedrock at four select periods
of the life of mine .............................................................................................. 70
Figure 41 Predicted zinc concentrations in the overburden at four select periods of the
life of mine ......................................................................................................... 71
Figure 42 Predicted zinc concentrations in the weathered bedrock at four select periods
of the life of mine .............................................................................................. 72
Figure 43 Predicted zinc concentrations in the upper bedrock at four select periods of the
life of mine ......................................................................................................... 73
Figure 44 Life of mine monthly sulphate load predictions for Surprise Creek and Barney
Creek diversion .................................................................................................. 74
McArthur River Mining Pty Ltd
Supplementary EIS
Site Groundwater
Report
TABLE OF CONTENTS (continued)
171218R MRM EIS Supplementary_GW.docx
Page vi
D09814A25 December 2017
Figure 45 Life of mine monthly sulphate load predictions for Barney Creek .................... 75
Figure 46 Life of mine monthly sulphate load predictions for McArthur River ................. 75
Figure 47 Sulphate concentration breakthrough at the Barney Creek diversion for base
2067 models ...................................................................................................... 78
Figure 48 Stochastic output for breakthrough sulphate concentrations (in mg/L) at the
Barney Creek diversion using the modified Domenico equation ...................... 79
Figure 49 Stochastic output for breakthrough sulphate concentrations (in mg/L) at the
Barney Creek diversion using the modified Domenico equation, with an
additional module to take account of recharge dilution effects ....................... 79
Figure 50 Stochastic output for sulphate load (in kg/day) using the modified Domenico
equation ............................................................................................................ 80
Figure 51 Tornado sensitivity chart for the stochastic Domenico analytical assessment.
The output is load to the Barney Creek diversion (in kg/day). .......................... 80
Figure 52 Stochastic output for breakthrough sulphate concentrations (in mg/L) at the
diversion using the modified Domenico equation for 100 year simulation ...... 81
Figure 53 Stochastic output for breakthrough sulphate concentrations (in mg/L) at the
diversion using the modified Domenico equation, with an additional module to
take account of recharge dilution effects – for 100 year simulation ................. 82
Figure 54 Stochastic output for sulphate load (in kg/day) at the diversion using the
modified Domenico equation – for 100 year simulation ................................... 82
Figure 55 Tornado sensitivity chart for the stochastic Domenico analytical assessment for
the 100 year simulation. The output is load to the diversion (in kg/day). ........ 83
Figure 56 Stochastic output for sulphate load (in kg/day) at the diversion using the
modified Domenico equation – for 1000 year simulation ................................. 83
Figure 57 Stochastic output for zinc concentration (in mg/L) at the Barney Creek diversion
using the modified Domenico equation – for 1000 year simulation ................. 84
Figure 58 Schematic of the PHREEQC model construction. At each stage of transport
through the column the water quality is in equilibrium with the aquifer
mineralogy and the surface sorption sites ........................................................ 87
Figure 59 Calibrated model bromide concentrations at different times........................... 88
Figure 60 Predicted sulphate breakthrough curve at an observation point 500 m from the
plume source ..................................................................................................... 89
Figure 61 Predicted concentrations after 20 years for arsenic, cadmium, lead and zinc
compared by varying KD values and the solid substrate (between maximum and
minimum values). Note the logarithmic scale. Bromide, a conservative species
used as a tracer in the models, is included for comparison .............................. 90
Figure 62 Predicted concentrations after 100 years for arsenic, cadmium, lead and zinc
compared by varying KD values and the solid substrate (between maximum and
minimum values). Note the logarithmic scale. Bromide, a conservative species
used as a tracer in the models, is included for comparison .............................. 91
Figure 63 Predicted concentrations after 20 years for arsenic, cadmium, lead and zinc
compared using the minimum KD values, minimum solid substrate and 95th
McArthur River Mining Pty Ltd
Supplementary EIS
Site Groundwater
Report
TABLE OF CONTENTS (continued)
171218R MRM EIS Supplementary_GW.docx
Page vii
D09814A25 December 2017
percentile NOEF input water quality. Note the logarithmic scale. Bromide, a
conservative species used as a tracer in the models, is included for comparison
........................................................................................................................... 92
Figure 64 PHREEQC modelled 1-dimensional reactive transport concentrations after 1 to
20 years for arsenic, cadmium, lead and zinc. Also shown are the
concentrations of the conservative bromide tracer at these time intervals ..... 93
Figure 65 Geochemist’s Workbench modelled 1-dimensional reactive transport
concentrations after 1 to 20 years for arsenic, cadmium, lead and zinc. Also
shown are the concentrations of the conservative bromide tracer at these time
intervals ............................................................................................................. 94
Figure 66 Modflow SURFACT variation /sensitivity of Kd .................................................. 94
Figure 67 2017 SO4 concentrations (EcoLogical, 2017) ..................................................... 95
Figure 68 2017 Zn concentrations (EcoLogical, 2017) ....................................................... 95
Figure 69 Production profile predicted for life of mine .................................................... 96
Figure 70 Water budget summary for December 2037 stress period ............................... 98
Figure 71 TSF Operations period and first 100 years of closure: baseflow predictions for
Surprise Creek and Barney Creek diversion ....................................................... 99
Figure 72 Long-term closure: baseflow predictions for Surprise Creek and Barney Creek
diversion .......................................................................................................... 100
Figure 73 TSF Operations period and first 100 years of closure: baseflow predictions for
Barney Creek ................................................................................................... 100
Figure 74 Long-term closure: baseflow predictions for Barney Creek ............................ 101
Figure 75 TSF Operations period and first 100 years of closure: baseflow predictions for
McArthur River ................................................................................................ 101
Figure 76 Long-term closure: baseflow predictions for McArthur River ......................... 102
Figure 77 Predicted sulphate concentrations in the overburden at the end of mining
(2037), once the pit lake has recovered (2067), 120 years closure (2167) and
1000 years closure (3048) ............................................................................... 103
Figure 78 Predicted sulphate concentrations in the weathered bedrock at the end of
mining (2037), once the pit lake has recovered (2067), 120 years closure (2167)
and 1000 years closure (3048) ........................................................................ 104
Figure 79 Predicted sulphate concentrations in the upper bedrock at the end of mining
(2037), once the pit lake has recovered (2067), 120 years closure (2167) and
1000 years closure (3048) ............................................................................... 105
Figure 80 Predicted zinc concentrations in the overburden at the end of mining (2037),
once the pit lake has recovered (2067), 120 years closure (2167) and 1000
years closure (3048) ........................................................................................ 107
Figure 81 Predicted zinc concentrations in the weathered bedrock at the end of mining
(2037), once the pit lake has recovered (2067), 120 years closure (2167) and
1000 years closure (3048) ............................................................................... 108
McArthur River Mining Pty Ltd
Supplementary EIS
Site Groundwater
Report
TABLE OF CONTENTS (continued)
171218R MRM EIS Supplementary_GW.docx
Page viii
D09814A25 December 2017
Figure 82 Predicted zinc concentrations in the upper bedrock at the end of mining (2037),
once the pit lake has recovered (2067), 120 years closure (2167) and 1000
years closure (3048) ........................................................................................ 109
Figure 83 TSF Operations period and first 100 years of closure: sulphate load predictions
for Surprise Creek and Barney Creek diversion ............................................... 110
Figure 84 Long-term closure: sulphate load predictions for Surprise Creek and Barney
Creek diversion ................................................................................................ 111
Figure 85 TSF Operations period and first 100 years of closure: sulphate load predictions
for Barney Creek .............................................................................................. 111
Figure 86 Long-term closure: sulphate load predictions for Barney Creek ..................... 112
Figure 87 TSF Operations period and first 100 years of closure: sulphate load predictions
for McArthur River .......................................................................................... 112
Figure 88 Long-term closure: sulphate load predictions for McArthur River .................. 113
Figure 89 Comparison of projected loads to Barney Diversion in the first 100 years after
pit rebound ...................................................................................................... 113
Figure 89 Long-term closure: zinc load predictions for Surprise Creek and Barney Creek
diversion .......................................................................................................... 114
Figure 90 Long-term closure: zinc load predictions for McArthur River ......................... 114
Figure 91 Water Production profile predicted for closure and early closure .................. 115
List of Appendices
Appendix I Sensitivity Analysis Results
Appendix II Updated TSF Interception Trench Modelling
Appendix III Options for NOEF Plume Interception
McArthur River Mining Pty Ltd
Supplementary EIS
Site Groundwater
Report
171218R MRM EIS Supplementary_GW.docx
Page 1
D09814A25 December 2017
1 Introduction
Klohn Crippen Berger Ltd (KCB) is pleased to provide this report to McArthur River Mining (MRM)
presenting the results of hydrogeology and geochemical studies undertaken to inform the
Supplementary EIS. This work was undertaken to assess contaminant seepage from various site
sources under current and future conditions, and to assess the predicted effectiveness of
proposed site-wide mine waste and water management strategies. The results of this work have
been provided as input for the broader site water balance and surface water impact assessment
being conducted by other consultants.
1.1 Project Background
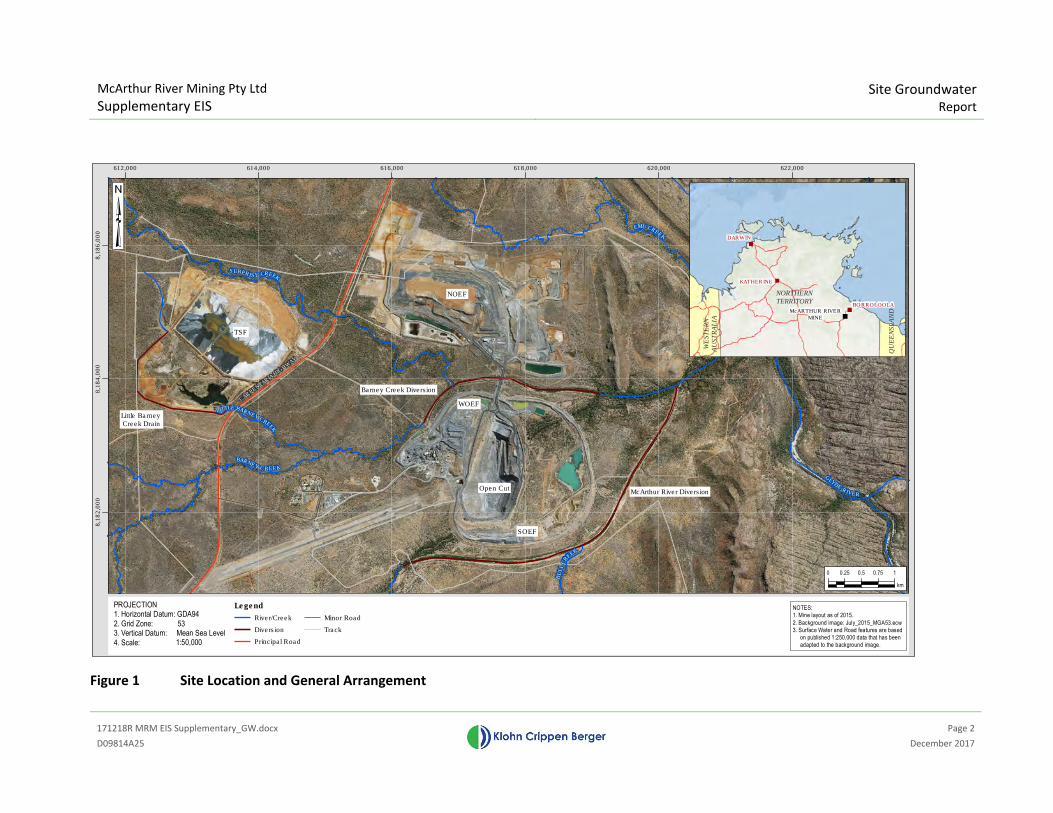
McArthur River Mine (MRM) is located approximately 720 km south-east of Darwin in the Gulf
Region of the Northern Territory. Mining operations consist of an open-cut mining operation, ore
processing plant, overburden and tailings storage facilities, supporting logistical infrastructure
and, external to the mine area, the Bing Bong Loading Facility (BBLF). The mine targets a large
deposit of multi-seam zinc-lead-silver ore through the current open cut, and previously through
underground extraction techniques.
An Environmental Impact Statement (EIS) was prepared for the MRM underground operation in
1992. The underground operation commenced in 1994, with the first shipment of concentrate
commencing in mid-1995. Up until 2006, MRM was solely an underground operation producing
around 333,000 dry metric tonnes per annum (dmtpa) of bulk lead-zinc-silver concentrate for
overseas and domestic markets (MRM, 2015). The operation expanded to include an open cut
operation following the completion of the 2005 EIS process for the Phase 2 Project (Phase 2). The
MRM Phase 3 Development Project was later approved by the Northern Territory Government in
2013. The Phase 3 project will sustain the long-term future of MRM through extending the life of
This report should be read in conjunction with MRM Draft EIS Hydrogeology Final Report
(KCB, 2017) which provides the background, supporting data, conceptual models and approach to
modelling of the site during operations and closure. In addition, further modelling of the NOEF
using the Tough2 multi-phase modelling software that models both fluid and heat flow for various
states of saturation and accounts for the movement of gaseous and liquid phases, their transport
of latent and sensible heat, and phase transitions between liquid and vapor has been used to
provide an update of flows for a variety of final covers. Tough2 daily water balance results have
been directly linked to GoldSim (supported by PHREEQC and Geochemists Workbench) to
simulate geochemical reactions, loading and the resultant flows and loads of dissolved
contaminants to surface water (toe seeps) and groundwater over the life of mine and closure.
Mine Pit Lake water quality simulations have been updated to account for the proposed final pit
closure arrangement; this includes in-pit placement of the tailings, collection and transfer of NOEF
surface flows after placement, accelerated filling of the pit to submerge mine waste and tailings
placed in the pit, the reactive pit wall materials and consideration of a surface water flows into
and out of the mine pit lake. The potential hydrodynamic changes from these flows have been
included in the Mine Pit Lake water quality assessments to account for the stratification and water
quality changes.
A map of the site location and general infrastructure arrangement is provided in Figure 1.
McArthur River Mining Pty Ltd
Supplementary EIS
Site Groundwater
Report
171218R MRM EIS Supplementary_GW.docx
Page 2
D09814A25 December 2017
Figure 1 Site Location and General Arrangement
GLYDE
RIVER
EMU CREEK
MCARTHURRIVER
BU
LL
CR
EEK
BARNEY C REEK
LITTLE BARNEY CREEK
SURPRI SE CREEK
CARPENTAR
IA H
IGHW
AY
612,000 614,000 616,000 618,000 620,000 622,000
8,1
82
,00
08,1
84
,00
08,1
86
,00
0
0 0.25 0.5 0.75 1
km
PROJECTION1. Horizontal Datum: GDA942. Grid Zone: 533. Vertical Datum: Mean Sea Level
4. Scale: 1:50,000
NOTES:
1. Mine layout as of 2015.
2. Background image: July_2015_MGA53.ecw
3. Surface Water and Road features are based
on published 1:250,000 data that has been
adapted to the background image.
Legend
River/Creek
Diversion
Principal Road
Minor Road
Track
NOEF
Open Cut
TSF
Barney Creek Diversion
McArthur River Diversion
McARTHUR RIVER
MINE
NORTHERN
TERRITORY
QU
EE
NS
LA
ND
WE
ST
ER
N
AU
ST
RA
LIA
KATHERINE
BORROLOOLA
DARWIN
Little Barney Creek Drain
WOEF
SOEF
McArthur River Mining Pty Ltd
Supplementary EIS
Site Groundwater
Report
171218R MRM EIS Supplementary_GW.docx
Page 3
D09814A25 December 2017
1.2 Scope of Work
This project was undertaken to support the Supplementary EIS, and provides MRM with an
estimate of existing and potential groundwater impacts as a consequence of historical and
planned mining operations. To achieve this, the existing site-wide numerical groundwater model
for the MRM site was modified using data and information obtained since the first submission,
this allowed for an updated and recalibrated, and modified from the original Draft EIS submission.
The update of the site-wide groundwater numerical model was based on a revised conceptual
interpretation of the hydrogeological setting of the site. Specific scope items to support the Draft
Supplementary EIS submission included:
1. Further groundwater modelling to address the changes to the project, including the
updated results from the Tough2/GoldSim modelling, provision of further data on metal
attenuation and to address comments raised within the review process of the EIS.
2. Undertaking Tough2 modelling to provide a dynamic water balance and water quality from
the NOEF over life of mine and closure for a variety of scenarios.
3. Undertaking further GoldSim water quality modelling to model water quality from the
NOEF over the life of mine and closure for a variety of scenarios.
4. Undertaking further mine pit lake water quality modelling to provide water qualities
associated with the proposed Mine Pit Lake closure scenario.
1.3 Structure of the report
The report is subdivided into sections as follows:
1. A brief overview of the site;
2. A summary of the updates and changes to the numerical groundwater model;
3. Results of the updated groundwater model;
4. A summary of results, sensitivities and proposed additions to the monitoring and
management plans previously provided in the 2017 Draft EIS submission.
1.4 Project changes since the Draft EIS
The Project changes since the Draft EIS include (Glencore, 2017):
� Open cut domain:
� Incorporation of greater flexibility in the final void closure process and provision of
further clarity on the decision-making process.
� NOEF domain:
� Substitution of the proposed Compacted Clay Layer (CCL) within the NOEF cover
system with a geo-synthetic liner (GSL) for improved performance and greater
consistency;
� Adjustment of the upper NOEF batter slope from a 1V:2.5H slope to a 1V:3H slope to
provide a greater geotechnical factor of safety;
� Optimisation of the NOEF cover system above the GSL to address revised cover system
construction and performance requirements;
McArthur River Mining Pty Ltd
Supplementary EIS
Site Groundwater
Report
171218R MRM EIS Supplementary_GW.docx
Page 4
D09814A25 December 2017
� Optimisation of the NOEF basal CCL thickness to 250mm rather than 500mm based on
improved performance achieved by GSL in the cover system;
� Minor modification of stockpile/ borrow locations to the north of the NOEF;
� Minor modification to the NOEF south eastern boundary to facilitate water
management system infrastructure.
� TSF domain:
� Reconfiguration of the Cell 3 Water Management Dam (WMD) and Process Water Dam
(PWD), essentially swapping their previously proposed locations;
� Incorporation of a HPDE liner to the base of the Cell 3 WMD;
These changes have all been taken into account in this report on site groundwater.
1.5 Integration of multiple models
The water environment at MRM is complex and requires consideration of a variety of sources and
flow types. To provide robust simulations of these interactions during mine life and closure
requires a variety of specialist models to be used conjunctively to provide sufficient detail so that
the changes conditions over time can assessed. The sequence of models is needed to cover the
variety of spatial and temporal domains as well as the physico-chemical processes that cannot be
simulated in sufficient detail by any single modelling code. Since there is interaction and transfers
between these models, the models were linked by using common input data and interactively
using the results from one set of models (for example the groundwater model feeding into the
surface water, waterways model) and allowing feedback between models to occur.
A series of individual models were constructed to address the specific issues within a holistic
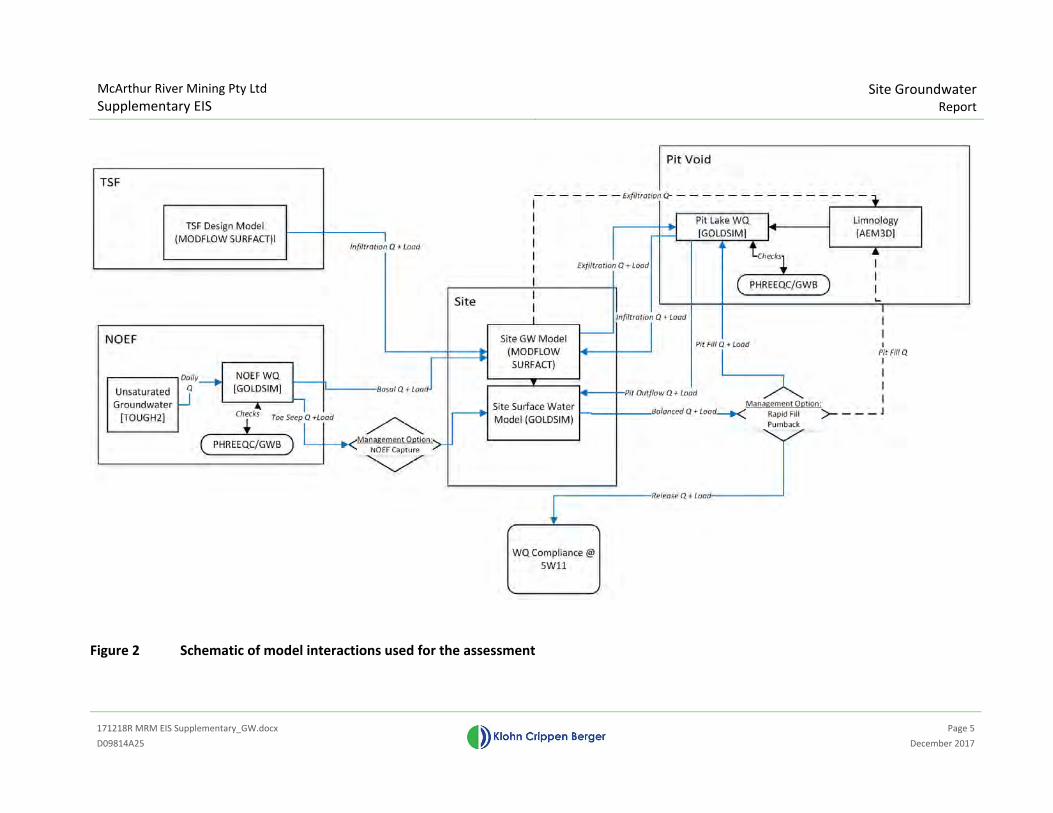
watershed and mine site framework (See Figure 2) in a similar manner to approaches followed by
other complex mine sites; see Vandenberg et al, 2016 as an example). The project has used
detailed unsaturated flow modelling in a variable temperature for the NOEF (Tough2) to link to
water quality models (GoldSim/PHREEQC simulations of the daily water quality changes) and to
the groundwater model (Modflow SURFACT). The groundwater modelling results, in terms of base
flow and loads, leaving the system have been integrated into the surface water flow and
contaminant transport model (with consideration of bank storage), which then have provided
flows and contaminant loads to the hydrodynamic modeling and final void water quality models.
For numerical stability, hydrodynamic models require timesteps of seconds at key periods but the
longer-term stratification trends provide important information for the final void water quality
modelling. Through this approach, sufficient detail is provided by a model that is specifically
constructed and well-suited for each aspect of the water system, in a manner that is consistent
across the disciplines required to inform the Supplementary EIS and that allows the various
interactions to be considered.
McArthur River Mining Pty Ltd
Supplementary EIS
Site Groundwater
Report
171218R MRM EIS Supplementary_GW.docx
Page 5
D09814A25 December 2017
Figure 2 Schematic of model interactions used for the assessment
McArthur River Mining Pty Ltd
Supplementary EIS
Site Groundwater
Report
171218R MRM EIS Supplementary_GW.docx
Page 6
D09814A25 December 2017
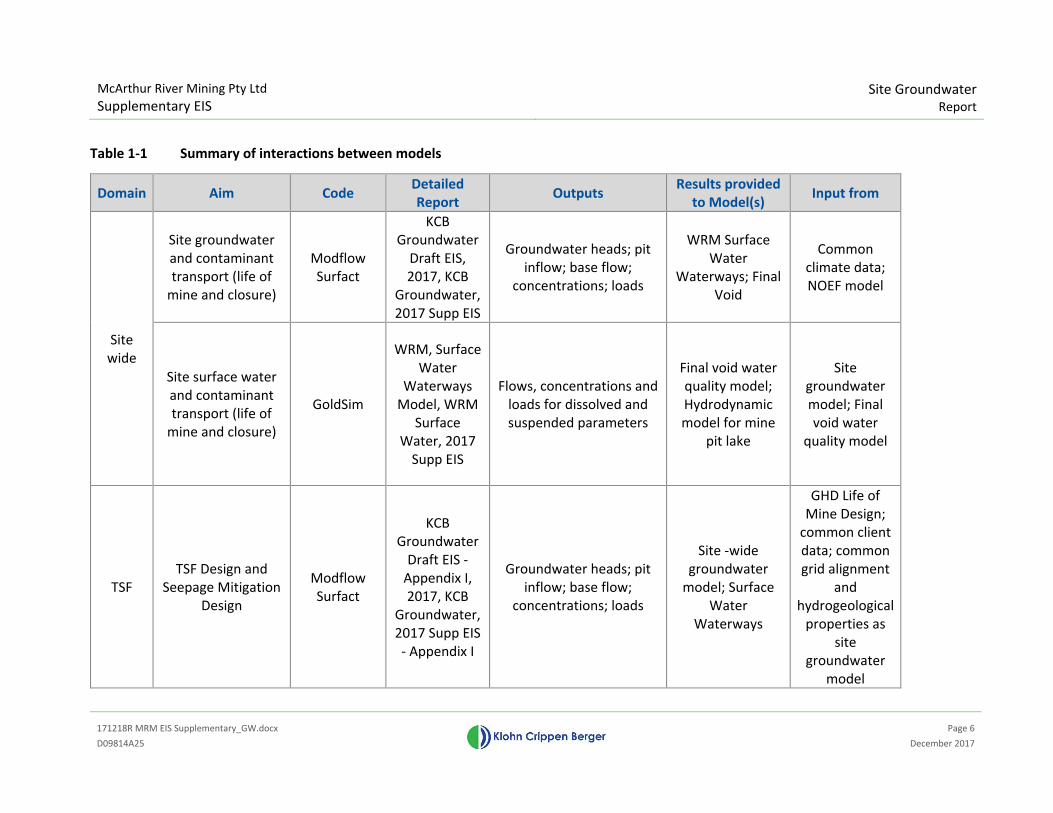
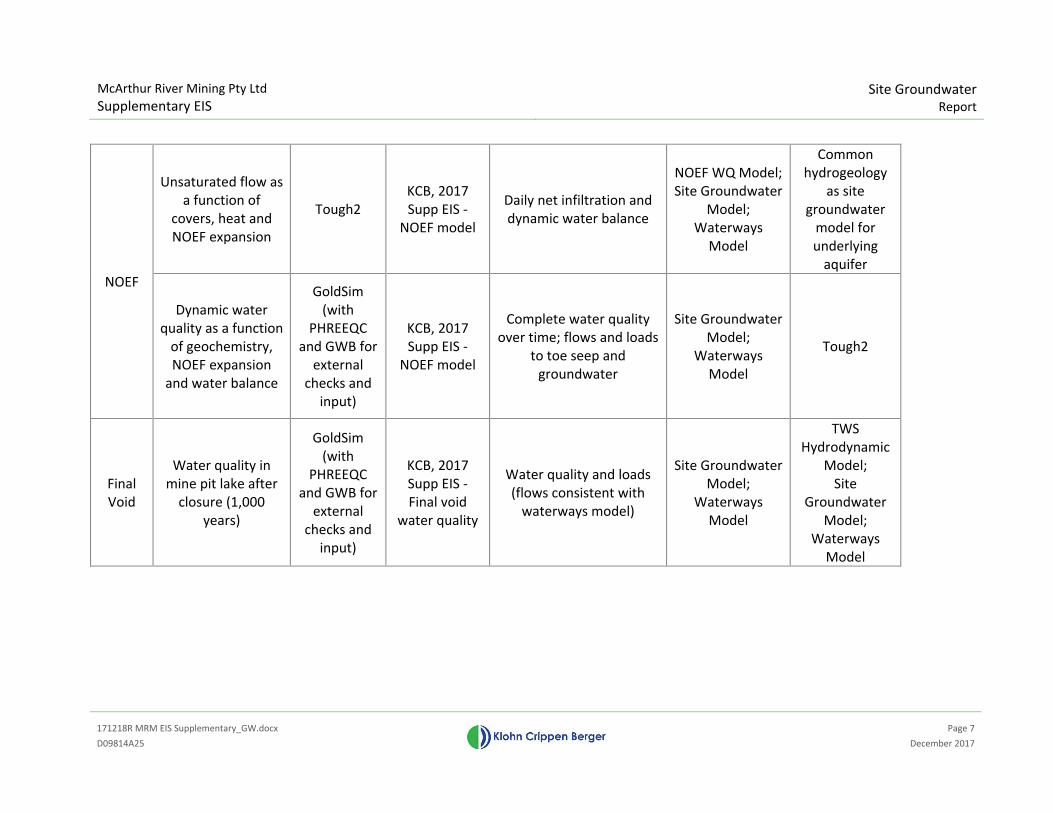
Table 1-1 Summary of interactions between models
Domain Aim Code Detailed
Report Outputs
Results provided
to Model(s) Input from
Site
wide
Site groundwater
and contaminant
transport (life of
mine and closure)
Modflow
Surfact
KCB
Groundwater
Draft EIS,
2017, KCB
Groundwater,
2017 Supp EIS
Groundwater heads; pit
inflow; base flow;
concentrations; loads
WRM Surface
Water
Waterways; Final
Void
Common
climate data;
NOEF model
Site surface water
and contaminant
transport (life of
mine and closure)
GoldSim
WRM, Surface
Water
Waterways
Model, WRM
Surface
Water, 2017
Supp EIS
Flows, concentrations and
loads for dissolved and
suspended parameters
Final void water
quality model;
Hydrodynamic
model for mine
pit lake
Site
groundwater
model; Final
void water
quality model
TSF
TSF Design and
Seepage Mitigation
Design
Modflow
Surfact
KCB
Groundwater
Draft EIS -
Appendix I,
2017, KCB
Groundwater,
2017 Supp EIS
- Appendix I
Groundwater heads; pit
inflow; base flow;
concentrations; loads
Site -wide
groundwater
model; Surface
Water
Waterways
GHD Life of
Mine Design;
common client
data; common
grid alignment
and
hydrogeological
properties as
site
groundwater
model
McArthur River Mining Pty Ltd
Supplementary EIS
Site Groundwater
Report
171218R MRM EIS Supplementary_GW.docx
Page 7
D09814A25 December 2017
NOEF
Unsaturated flow as
a function of
covers, heat and
NOEF expansion
Tough2
KCB, 2017
Supp EIS -
NOEF model
Daily net infiltration and
dynamic water balance
NOEF WQ Model;
Site Groundwater
Model;
Waterways
Model
Common
hydrogeology
as site
groundwater
model for
underlying
aquifer
Dynamic water
quality as a function
of geochemistry,
NOEF expansion
and water balance
GoldSim
(with
PHREEQC
and GWB for
external
checks and
input)
KCB, 2017
Supp EIS -
NOEF model
Complete water quality
over time; flows and loads
to toe seep and
groundwater
Site Groundwater
Model;
Waterways
Model
Tough2
Final
Void
Water quality in
mine pit lake after
closure (1,000
years)
GoldSim
(with
PHREEQC
and GWB for
external
checks and
input)
KCB, 2017
Supp EIS -
Final void
water quality
Water quality and loads
(flows consistent with
waterways model)
Site Groundwater
Model;
Waterways
Model
TWS
Hydrodynamic
Model;
Site
Groundwater
Model;
Waterways
Model

McArthur River Mining Pty Ltd
Supplementary EIS
Site Groundwater
Report
171218R MRM EIS Supplementary_GW.docx
Page 8
D09814A25 December 2017
Establish water and
energy balance for
varying pit flow
scenarios and
determine
stratification/mixing
AEM3D
TWS, 2017
Supp EIS -
Hydrodynamic
Model
Mixing depths and
stratification over time
Mine pit lake
Water Quality
Model
Waterways
Model

McArthur River Mining Pty Ltd
Supplementary EIS
Site Groundwater
Report
171218R MRM EIS Supplementary_GW.docx
Page 9
D09814A25 December 2017
2 UPDATED GROUNDWATER MODEL
2.1 Groundwater model setting
The groundwater model objectives for the Supplementary EIS remain unchanged from the Draft
EIS (KCB,2017; MRM, 2017):
� Assess changes to site-wide groundwater flow patterns due to seepage from mine
infrastructure including the OEFs, water management dams and the TSF.
� Assess the rate of groundwater seepage and fate of contaminants of concern
(sulphate, zinc, arsenic, cadmium and lead) released from mine sources relative to
sensitive receptors.
� Predict baseflow to site-wide creeks and rivers during current conditions, life of mine
and closure.
� Predict load to site-wide creeks and rivers during current conditions, life of mine and
closure.
� Assess the influence of open cut dewatering and closure mine pit lake filling.
2.2 Model Code
MODFLOW-SURFACT Version 4.0 (HydroGeoLogic, 2016) was again used as the model code to
simulate groundwater flow at the MRM site. The MODFLOW-SURFACT code is based on the
modular groundwater flow code MODFLOW, and contains robust methods and simulation
capabilities to handle complex variably saturated flow and transport processes using the pseudo-
soil function.
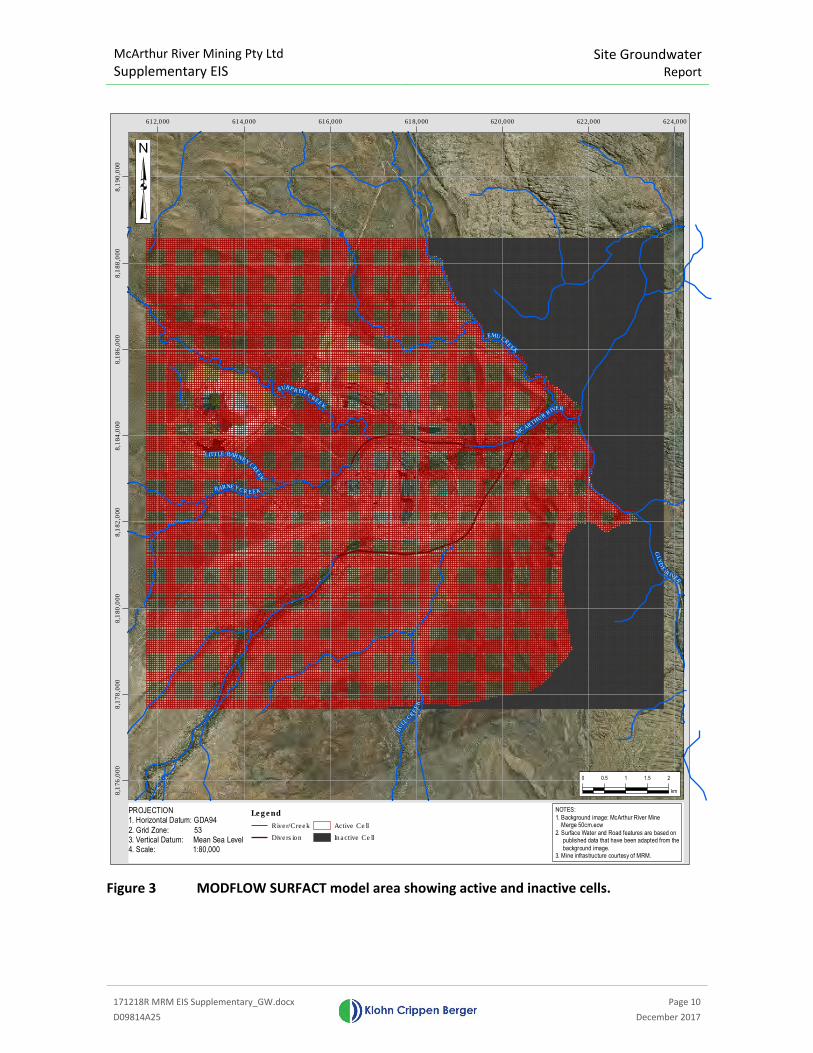
2.3 Model Lateral Extents
The model domain is unchanged and extends 12.0 km west-to-east and 10.95 km south-to-north
(Figure 3) and covers an active area of 100,214,630 m2 (100 km2). The model is based on a 50 x 50
metre grid with 240 columns and 219 rows across 14 model layers. The model has 563,346 active
model cells.
McArthur River Mining Pty Ltd
Supplementary EIS
Site Groundwater
Report
171218R MRM EIS Supplementary_GW.docx
Page 10
D09814A25 December 2017
Figure 3 MODFLOW SURFACT model area showing active and inactive cells.
MCARTHUR
RIVER
LITTLE BARNEYCR
EEK
EMU CR
E
EK
GLY
DE
R IVER
BU
LLC
RE
EK
BARNEY CR EEK
SURPR ISEC
REEK
612,000 614,000 616,000 618,000 620,000 622,000 624,0008,1
76
,000
8,1
78
,000
8,1
80
,000
8,1
82
,000
8,1
84
,000
8,1
86
,000
8,1
88
,000
8,1
90
,000
0 0.5 1 1.5 2
km
Legend
River/Creek
Diversion
Active Cell
Inactive Cell
NOTES:
1. Background image: McArthur River Mine Merge 50cm.ecw
2. Surface Water and Road features are based on published data that have been adapted from the
background image.3. Mine infrastructure courtesy of MRM.
PROJECTION1. Horizontal Datum: GDA94
2. Grid Zone: 533. Vertical Datum: Mean Sea Level4. Scale: 1:80,000
McArthur River Mining Pty Ltd
Supplementary EIS
Site Groundwater
Report
171218R MRM EIS Supplementary_GW.docx
Page 11
D09814A25 December 2017
Major mine operational areas and other natural features of importance represented in the model
are:
� The underground workings
� The LOM open cut
� The Tailings Storage Facility (TSF)
� The NOEF
� All water management dams with leakage rates of greater than 1 L/s
� Emu, Donkey and MIMEX production borefields
� Djirrinmini water hole
� The McArthur River palaeochannel
� McArthur River and diversion
� Ephemeral creeks including Barney Creek and diversion, Surprise Creek, Emu Creek,
Bull Creek, and Glyde River.
2.4 Units and Datum
The time unit for the model is days and the length unit is metres. The horizontal datum for the
project is GDA94 and the projection is MGA Zone 53. The vertical datum is the Australian Height
Datum (AHD) in metres.
2.5 Updated Geology and Hydrogeology
2.5.1 Geological Review of MRM 2016
MRM undertook a project in 2016 to further define the geology and structure of the greater
mining region. Previously the focus was within the mine area and HYC deposit only; however, to
support MRM’s Draft EIS and Supplementary EIS and subsequent future models, it was important
to delineate geological structure and lithology. The principal objective of the 2016/17 geological
and geophysical review was to examine historical data and information culminating in the
construction of a 3D geological interpreted model. This review utilised the following data types;
� Geophysical surveys, in particular airborne QESTEM and magnetics, and ground
MIMDAS and seismic surveys.
� Exploration drill logs and core photographs – located at the Mt Isa exploration office.
� Underground drilling and geological mapping.
� Reports and previous studies including Golder Associates and BFP.
The geological update was also focussed on determining geological features which could impact
groundwater flows and further assist with MRM’s hydrogeological characterisation (MRM, 2017).
After review by Glencore it was concluded that most lithological interpretations were reasonable,

McArthur River Mining Pty Ltd
Supplementary EIS
Site Groundwater
Report
171218R MRM EIS Supplementary_GW.docx
Page 12
D09814A25 December 2017
however some gaps in the understanding of the structural geology framework on site warranted
investigation.
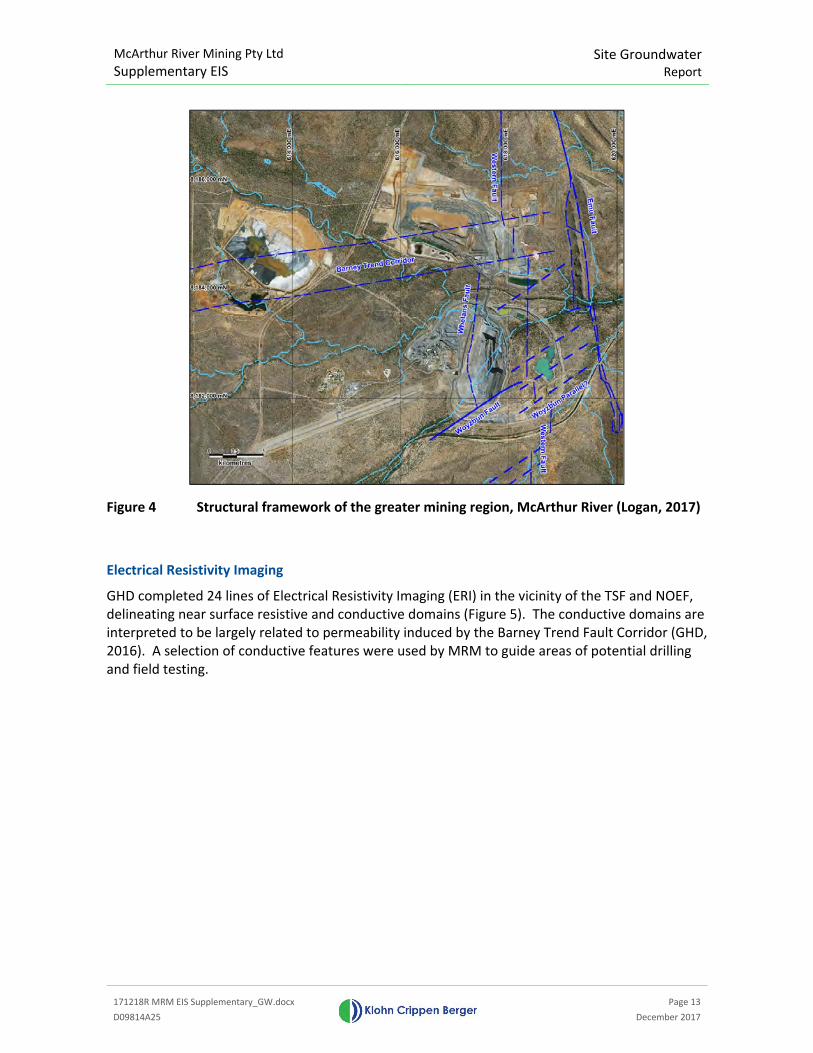
The review (Logan 2017) addressed the large scale structural framework and the nature of the
faults comprising the framework. The review highlighted six dominant structural features (Figure
4) with the potential to impact on groundwater movement.
� The Emu Fault is the major regional fault in the McArthur area. It is characterised by horst
blocks of Masterton Sandstone, displaced upwards from the base of the McArthur Group.
Seismic data suggest the fault comprises several near vertical faults, is about 150 metres
wide, is deeply weathered, has a low density and is porous with respect to the surrounding
rocks (Golder Associates, 2004). The Emu Fault contact has not been characterised in as
much detail as other structures in terms of groundwater hydraulics, and future works are
planned to drill and investigate the lateral and vertical hydraulic gradients on this contact.
Currently, the available data suggests that the Emu Fault system is a flow barrier across the
fault which is likely to have an enhanced high lateral flow component (MRM, 2017).
� The Western Fault is a series of north-south trending thrusts which dip steeply towards the
east. It abuts the Cooley Dolomite with the HYC Pyritic Shale, the latter host to the bedded
lead and zinc mineralisation. The Cooley Dolomite comprises the Western Fault Block,
which is bounded on the west by the Western Fault and on the east by the Emu Fault.
Previous drilling programs have indicated that the Western Fault, within MRMs levee wall,
has low hydraulic permeability.
� The Western Fault is coincident with the “Cooley Breccia”, interpreted to be a tectonic
breccia formed along the reverse fault planes. The breccia matrix has been interpreted to
be a sedimentary chemical precipitate rather than true matrix sediment. The Cooley
Breccia texture has primarily been re-healed by carbonates and has low hydraulic
conductivity and permeability.
� The Barney Trend is a dominant east-west trending fault corridor which dislocates the
Western Fault, but probably not the Emu Fault. It is interpreted to comprise a series of
north side down steps. Cooley style brecciation and alteration, and lead and zinc
mineralisation occur along the corridor in outcrop and drill hole. The 2016 ERI data
suggest that the faults are conductive, inferring they are porous and/or permeable
(MRM, 2017). The corridor passes beneath the TSF and NOEF.
� Exposures of the Woyzbun Fault in the open cut, underground mine, and drill hole
intersections show a narrow tight fault with minimal gouge or infill. This normal fault,
which dips between 75° to 85° to the south-east, has a throw of approximately 100m, with
the south block down (Logan, 2017).
� Whelans Fault trends north-south with an east side down sense of movement. It is at a
high angle to bedding in the southern wall of the open pit, but appears to be migrate into
the bedding planes of the steeply dipping clay beds of the Teena and WFold Shale in the
northern end of the open pit (Logan, 2017).
� The Woyzbun parallel faults have been identified in several of the historical geophysical
data sets examined in 2017 geological review. Further work is required to confirm their
geometry and significance.
McArthur River Mining Pty Ltd
Supplementary EIS
Site Groundwater
Report
171218R MRM EIS Supplementary_GW.docx
Page 13
D09814A25 December 2017
Figure 4 Structural framework of the greater mining region, McArthur River (Logan, 2017)
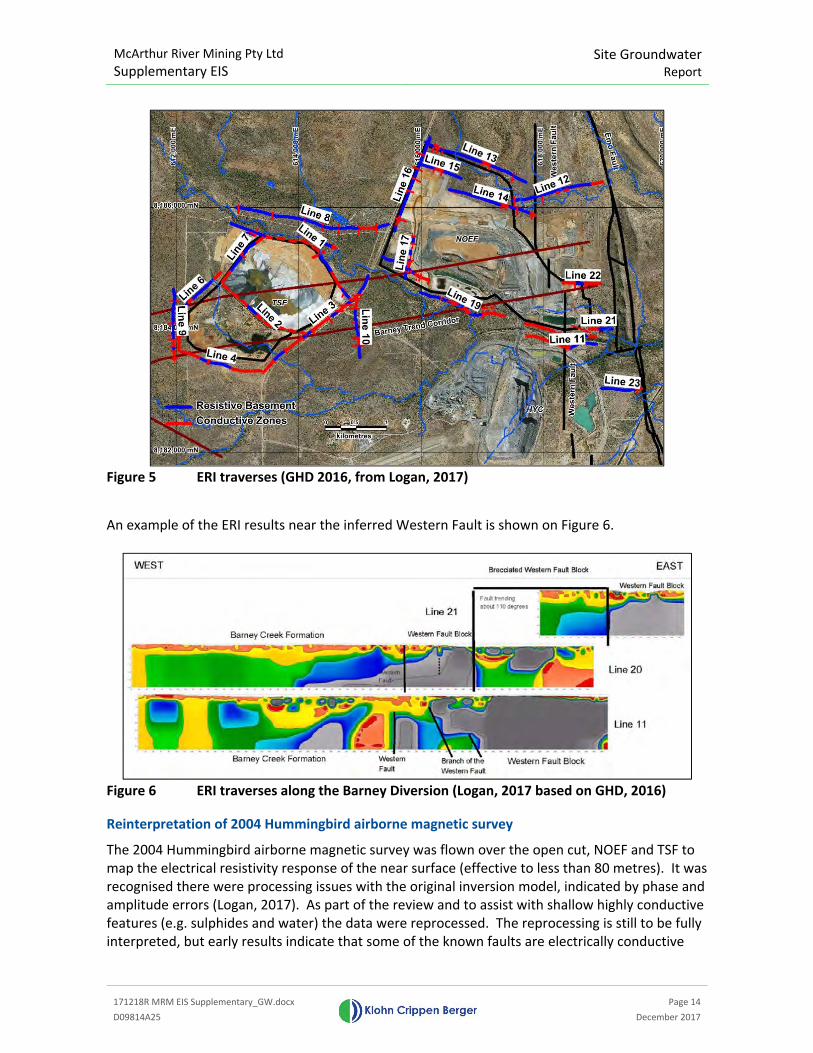
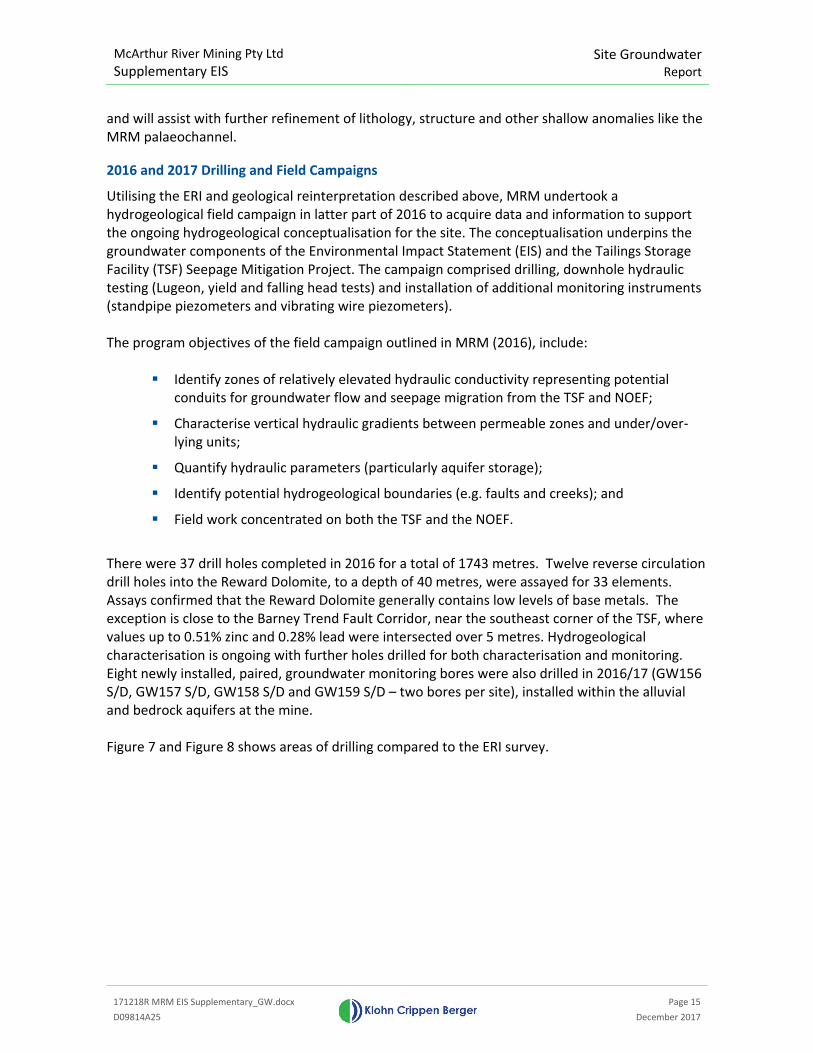
Electrical Resistivity Imaging
GHD completed 24 lines of Electrical Resistivity Imaging (ERI) in the vicinity of the TSF and NOEF,
delineating near surface resistive and conductive domains (Figure 5). The conductive domains are
interpreted to be largely related to permeability induced by the Barney Trend Fault Corridor (GHD,
2016). A selection of conductive features were used by MRM to guide areas of potential drilling
and field testing.
McArthur River Mining Pty Ltd
Supplementary EIS
Site Groundwater
Report
171218R MRM EIS Supplementary_GW.docx
Page 14
D09814A25 December 2017
Figure 5 ERI traverses (GHD 2016, from Logan, 2017)
An example of the ERI results near the inferred Western Fault is shown on Figure 6.
Figure 6 ERI traverses along the Barney Diversion (Logan, 2017 based on GHD, 2016)
Reinterpretation of 2004 Hummingbird airborne magnetic survey
The 2004 Hummingbird airborne magnetic survey was flown over the open cut, NOEF and TSF to
map the electrical resistivity response of the near surface (effective to less than 80 metres). It was
recognised there were processing issues with the original inversion model, indicated by phase and
amplitude errors (Logan, 2017). As part of the review and to assist with shallow highly conductive
features (e.g. sulphides and water) the data were reprocessed. The reprocessing is still to be fully
interpreted, but early results indicate that some of the known faults are electrically conductive
McArthur River Mining Pty Ltd
Supplementary EIS
Site Groundwater
Report
171218R MRM EIS Supplementary_GW.docx
Page 15
D09814A25 December 2017
and will assist with further refinement of lithology, structure and other shallow anomalies like the
MRM palaeochannel.
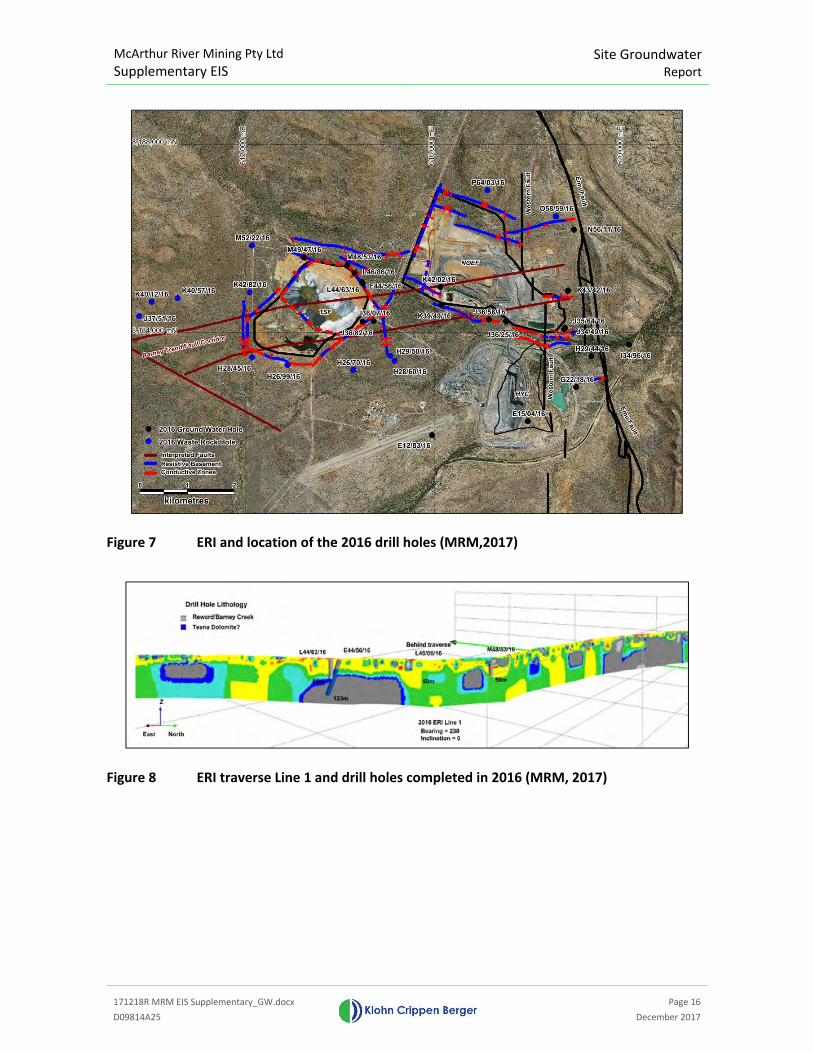
2016 and 2017 Drilling and Field Campaigns
Utilising the ERI and geological reinterpretation described above, MRM undertook a
hydrogeological field campaign in latter part of 2016 to acquire data and information to support
the ongoing hydrogeological conceptualisation for the site. The conceptualisation underpins the
groundwater components of the Environmental Impact Statement (EIS) and the Tailings Storage
Facility (TSF) Seepage Mitigation Project. The campaign comprised drilling, downhole hydraulic
testing (Lugeon, yield and falling head tests) and installation of additional monitoring instruments
(standpipe piezometers and vibrating wire piezometers).
The program objectives of the field campaign outlined in MRM (2016), include:
� Identify zones of relatively elevated hydraulic conductivity representing potential
conduits for groundwater flow and seepage migration from the TSF and NOEF;
� Characterise vertical hydraulic gradients between permeable zones and under/over‐
lying units;
� Quantify hydraulic parameters (particularly aquifer storage);
� Identify potential hydrogeological boundaries (e.g. faults and creeks); and
� Field work concentrated on both the TSF and the NOEF.
There were 37 drill holes completed in 2016 for a total of 1743 metres. Twelve reverse circulation
drill holes into the Reward Dolomite, to a depth of 40 metres, were assayed for 33 elements.
Assays confirmed that the Reward Dolomite generally contains low levels of base metals. The
exception is close to the Barney Trend Fault Corridor, near the southeast corner of the TSF, where
values up to 0.51% zinc and 0.28% lead were intersected over 5 metres. Hydrogeological
characterisation is ongoing with further holes drilled for both characterisation and monitoring.
Eight newly installed, paired, groundwater monitoring bores were also drilled in 2016/17 (GW156
S/D, GW157 S/D, GW158 S/D and GW159 S/D – two bores per site), installed within the alluvial
and bedrock aquifers at the mine.
Figure 7 and Figure 8 shows areas of drilling compared to the ERI survey.
McArthur River Mining Pty Ltd
Supplementary EIS
Site Groundwater
Report
171218R MRM EIS Supplementary_GW.docx
Page 16
D09814A25 December 2017
Figure 7 ERI and location of the 2016 drill holes (MRM,2017)
Figure 8 ERI traverse Line 1 and drill holes completed in 2016 (MRM, 2017)

McArthur River Mining Pty Ltd
Supplementary EIS
Site Groundwater
Report
171218R MRM EIS Supplementary_GW.docx
Page 17
D09814A25 December 2017
Updated 3D Geological Model
Glencore compiled a 3D geological model (using Leapfrog Geo 4.0) for the MRM lease area, for
inclusion in future EIS models and assist with future drilling targets. The model integrated varied
data types such as drill hole information, surface mapping, interpreted cross sections and
processed geophysical data, generated by the 2016 geological review. The extended HYC model
covers an area approximately 19km EW x 15km NW, and extends to a vertical depth of 1.7km.
Due to the level of detail available for modelling, the confidence level of the geological output is
understandably highly variable. Therefore, a 25m x 25m x 25m block model was also constructed
in Leapfrog/GEMS to integrate the confidence levels provided by the various data sources
(Glencore, 2017). MRM is using this model to assist in the conceptualisation as it can be
interrogated to determine the confidence relative to the accuracy and precision of the geological
interpretation at a given location.
The lithology and structure used to build this model, was used to support the Supplementary EIS
groundwater modelling by KCB and at that time was considered our best approximation of the
geological settings at MRM (MRM, 2017).
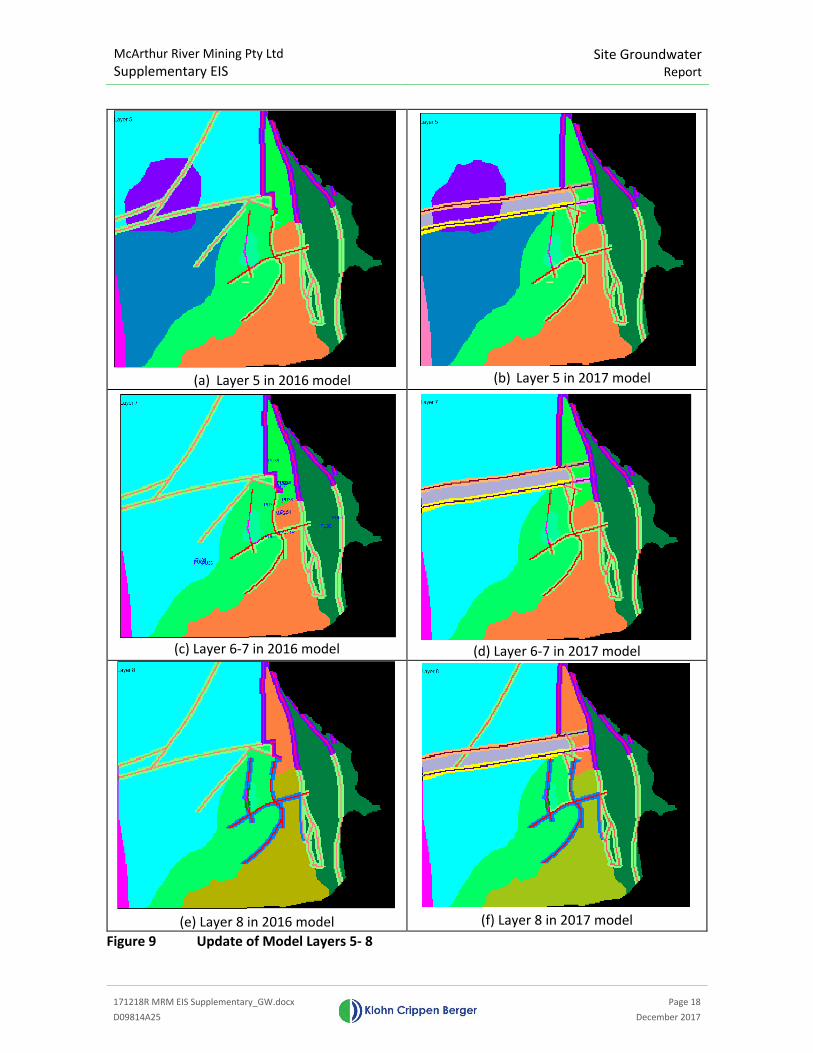
Based on the updated geological understanding, the Bald Hill fault zone was extended to include
two parallel faults, about 700 m apart, oriented around 800 NE towards EMU faults, running
through the footprint of TSF and NOEF.
McArthur River Mining Pty Ltd
Supplementary EIS
Site Groundwater
Report
171218R MRM EIS Supplementary_GW.docx
Page 18
D09814A25 December 2017
(a) Layer 5 in 2016 model
(b) Layer 5 in 2017 model
(c) Layer 6-7 in 2016 model
(d) Layer 6-7 in 2017 model
(e) Layer 8 in 2016 model (f) Layer 8 in 2017 model
Figure 9 Update of Model Layers 5- 8
McArthur River Mining Pty Ltd
Supplementary EIS
Site Groundwater
Report
171218R MRM EIS Supplementary_GW.docx
Page 19
D09814A25 December 2017
2.6 Natural Mineralisation at McArthur River Mine
In the Draft EIS, KCB included a short discussion on potential mineralised zones (KCB, 2017). To
further support the observations of areas on the site where groundwater quality has naturally
elevated concentrations, the Draft EIS section is included in this report and supported by further
information provided by the detailed review of the available geological information commissioned
by MRM (Logan, 2017).
2.6.1 Mineralised zones
The MRM deposit was discovered in the 1950s and originally named ‘Here’s Your Chance’ (HYC).
Mineralisation in the area of the mine covers approximately 2 km2. The HYC deposit is comprised
of eight discrete zinc and lead sulphide-rich siltstone horizons largely associated with the presence
of the HYC Pyritic Shale. The total thickness of the mineralised package is around 55 metres and
varies in depth from 0 to 400 metres below the surface. The bedding strike is approximately
north-south and the mineralised beds thin towards the north as waste inter-beds thicken.
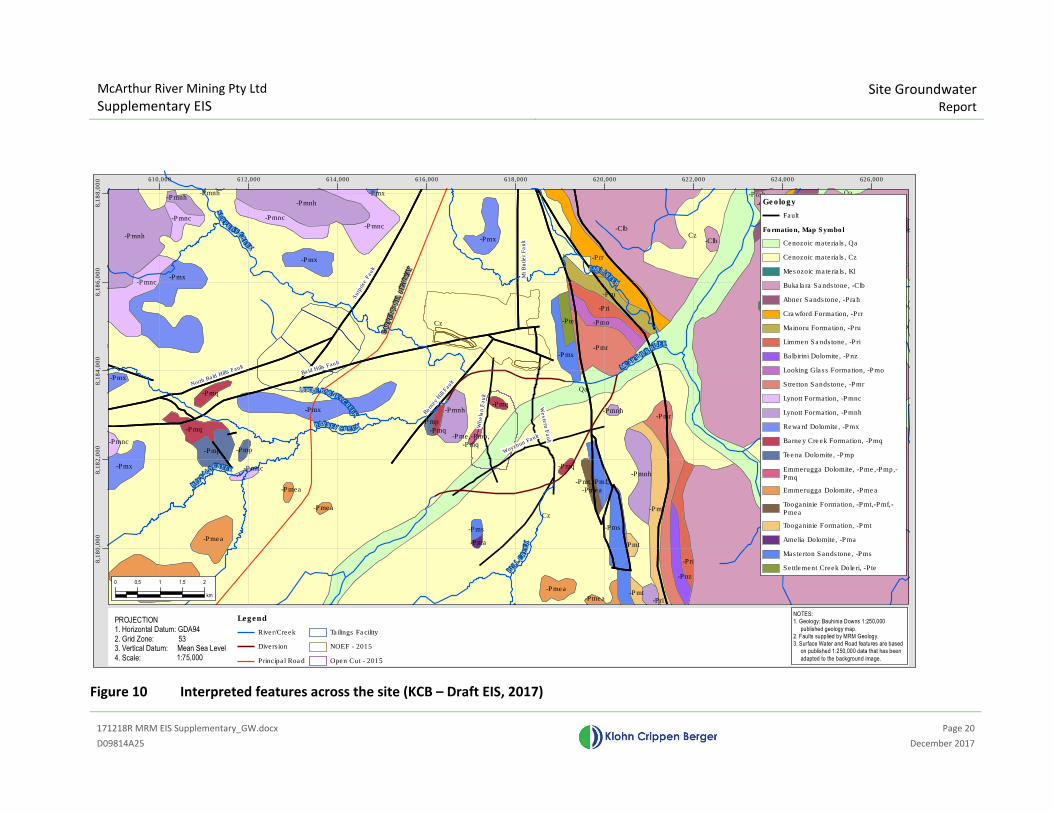
The complete extent of the HYC Pyritic Shale extends beyond the proposed open cut extent, and
the potential for this system to affect hydrogeology needs to be considered further. In the area
east of the mine bounded by the McArthur River Diversion in the south, and the Barney Creek
Diversion in the north, lies a zone of several potential natural sources of sulphate (Figure 11).
Within this area are:
� Previously interpreted subcrop of the HYC Pyritic Shale, which also strikes across the
HYC Orebody and current mine.
� A number of satellite sulphide deposits and hence potential sources of sulphate. These
include Cooley I and II, and Ridge I & II. A review of pre-mining soil geochemistry has
indicated a correlation between higher zones of Copper, Lead and Zinc and the
occurrences of these satellite deposits. Measured sulphate concentrations in
groundwater are also high (in excess of 2,000 mg/L) in these areas occupied by the
satellite deposits.
� The alignment of the McArthur River Diversion east of 618,500 is superimposed on
what appears to be the original alignment of Bull Creek. Upstream, Bull Creek strikes
parallel to the interpreted subcrop of the HYC Pyritic Shale.
McArthur River Mining Pty Ltd
Supplementary EIS
Site Groundwater
Report
171218R MRM EIS Supplementary_GW.docx
Page 20
D09814A25 December 2017
Figure 10 Interpreted features across the site (KCB – Draft EIS, 2017)
SU
R
PRISEC
RE
EK
MCARTHURRIVER
LITTLE BARNEYC
REE
K
GLY
DE
RIVER
EMUCRE
EK
BULL
CR
EE
K
BARNEY CREEK
BUF
FAL O
CREEK
Qa
-Pmnh
-Pmnh
Cz
Cz
-Clb
-Clb
-Clb
-Clb
-Clb
-Clb
-Prr
-Pmnc
-Prah
-Prah-Pmnh
Qa
Qa
Cz
-Pmx
-Clb-Prr
-Pmnh
-Pmx
-Pmnc-Pmnc
Qa
Qa
-Clb
-Pmnc
-Pmx
-Pru
-Pmx
Kl-Pri
-Pte -Pmo
-Pms-Pmr
-Pmx
-Pmq
-Pmx -Pmnh-Pmq
-Pmr-Pmnh
-Pmq
-Pmp-Pmq
-Pmt
-Pme,-Pmp,-Pmq-Pmnc
-Pmnh
-Pmp -PmpCz
-Pmx
-Pms
-Pmq
-Pmt,-Pmf,-Pmea
-Pri
-Pmnc
-Pmea
-Pnz
-Pmea
-Pmea
-Pms
-Pmt-Pma
-Pmea-Pmea
-Pmt-Pmea -Pri
Mt B
utle
r F
au
lt
Bar
ney
Hill F
ault
Surp
rise F
ault
North Bald Hills FaultBald Hills Fault
Wh
ela
n F
au
lt
Weste
rn F
ault
Woyzbun Fault
CA
RP
EN
TA
RIA
H
IGH
WA
Y
610,000 612,000 614,000 616,000 618,000 620,000 622,000 624,000 626,000
8,1
80
,00
08,1
82
,00
08,1
84
,00
08,1
86
,00
08,1
88
,00
0
0 0.5 1 1.5 2
km
Legend
River/Creek
Diversion
Principal Road
Tailings Facility
NOEF - 2015
Open Cut - 2015
PROJECTION1. Horizontal Datum: GDA94
2. Grid Zone: 533. Vertical Datum: Mean Sea Level
4. Scale: 1:75,000
NOTES:
1. Geology: Bauhinia Downs 1:250,000
published geology map.
2. Faults supplied by MRM Geology.
3. Surface Water and Road features are based
on published 1:250,000 data that has been
adapted to the background image.
Geology
Fault
Formation, Map Symbol
Cenozoic materials, Qa
Cenozoic materials, Cz
Mesozoic materials, Kl
Bukalara Sandstone, -Clb
Abner Sandstone, -Prah
Crawford Formation, -Prr
Mainoru Formation, -Pru
Limmen Sandstone, -Pri
Balbirini Dolomite, -Pnz
Looking Glass Formation, -Pmo
Stretton Sandstone, -Pmr
Lynott Formation, -Pmnc
Lynott Formation, -Pmnh
Reward Dolomite, -Pmx
Barney Creek Formation, -Pmq
Teena Dolomite, -Pmp
Emmerugga Dolomite, -Pme,-Pmp,-Pmq
Emmerugga Dolomite, -Pmea
Tooganinie Formation, -Pmt,-Pmf,-Pmea
Tooganinie Formation, -Pmt
Amelia Dolomite, -Pma
Masterton Sandstone, -Pms
Settlement Creek Doleri, -Pte
McArthur River Mining Pty Ltd
Supplementary EIS Site Groundwater
Report
171218R MRM EIS Supplementary_GW.docx
Page 21
D09814A25 December 2017
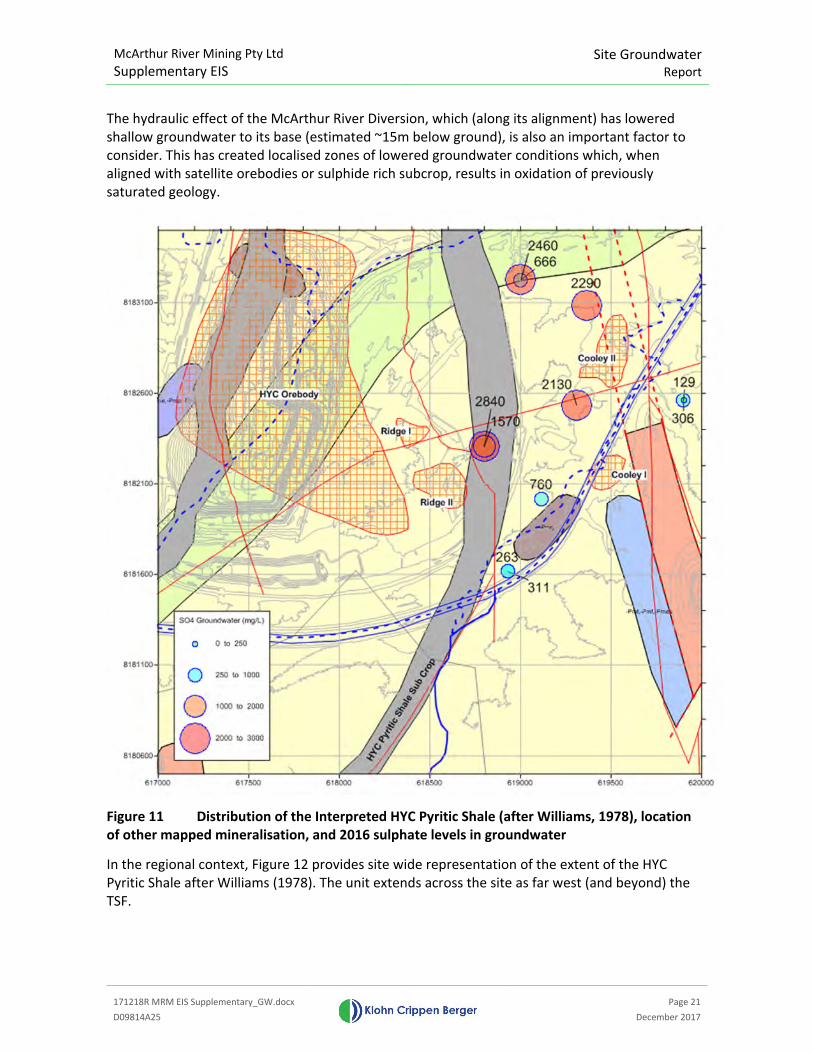
The hydraulic effect of the McArthur River Diversion, which (along its alignment) has lowered
shallow groundwater to its base (estimated ~15m below ground), is also an important factor to
consider. This has created localised zones of lowered groundwater conditions which, when
aligned with satellite orebodies or sulphide rich subcrop, results in oxidation of previously
saturated geology.
Figure 11 Distribution of the Interpreted HYC Pyritic Shale (after Williams, 1978), location
of other mapped mineralisation, and 2016 sulphate levels in groundwater
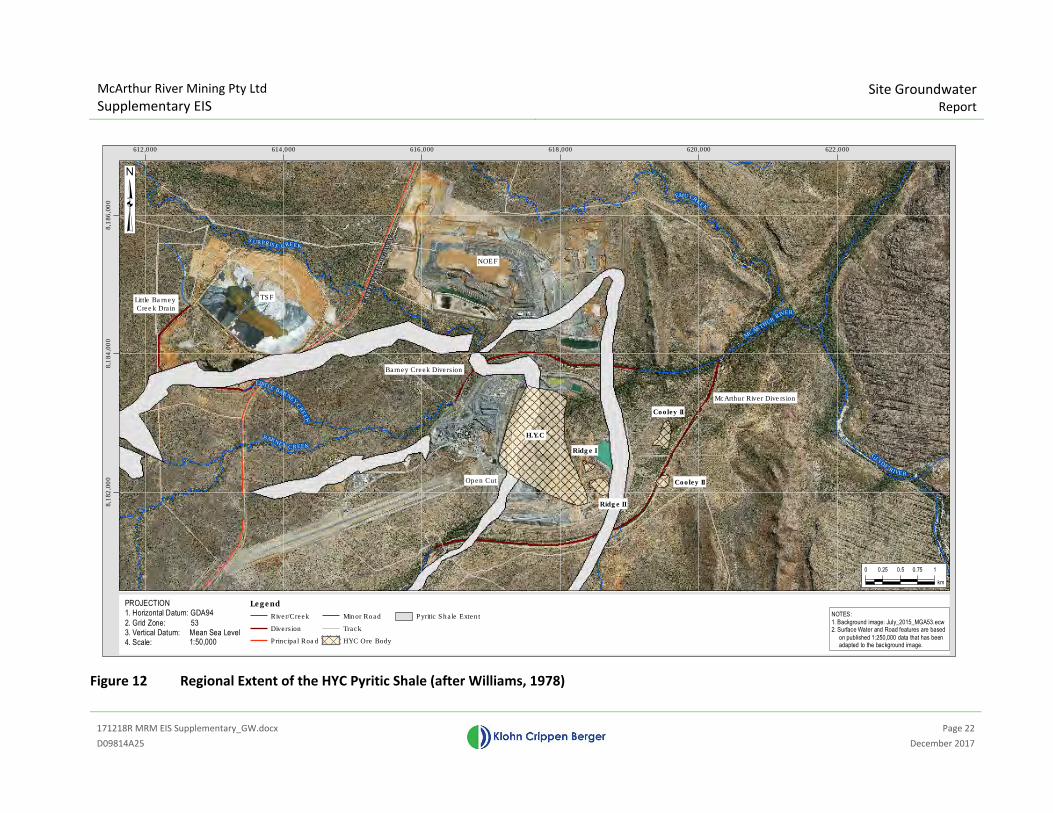
In the regional context, Figure 12 provides site wide representation of the extent of the HYC
Pyritic Shale after Williams (1978). The unit extends across the site as far west (and beyond) the
TSF.
McArthur River Mining Pty Ltd
Supplementary EIS
Site Groundwater
Report
171218R MRM EIS Supplementary_GW.docx
Page 22
D09814A25 December 2017
Figure 12 Regional Extent of the HYC Pyritic Shale (after Williams, 1978)
CA
RP
EN
TA
RIA
HIG
HW
AY
EMU CREEK
GLYDE
RIVER
MCARTHURRIVER
LITTLE BARNEYC
RE
EK
BARNEY CREEK
S URPRISE CREEK
612,000 614,000 616,000 618,000 620,000 622,000
8,1
82
,00
08,1
84
,00
08,1
86
,00
0
0 0.25 0.5 0.75 1
km
PROJECTION1. Horizontal Datum: GDA94
2. Grid Zone: 533. Vertical Datum: Mean Sea Level4. Scale: 1:50,000
NOTES:
1. Background image: July_2015_MGA53.ecw2. Surface Water and Road features are based
on published 1:250,000 data that has been adapted to the background image.
Legend
River/Creek
Diversion
Principal Road
Minor Road
Track
HYC Ore Body
Pyritic Shale Extent
NOEF
Open Cut
TSF
Barney Creek Diversion
McArthur River Diversion
Little Barney Creek Drain
Cooley II
Cooley II
Ridge II
Ridge I
H.Y.C

McArthur River Mining Pty Ltd
Supplementary EIS
Site Groundwater
Report
171218R MRM EIS Supplementary_GW.docx
Page 23
D09814A25 December 2017
Historical Soil Geochemistry Data
In 2016 MRM commissioned a project to investigate the historical soil, rock and auger sampling
conducted within and adjacent to the current Mineral Lease (Logan, 2016). This large data set
largely pre-dates MRM mining activities. While these samples cover a large area, varying methods
of analysis and temporal spread are present.
The available soil geochemistry data indicates that sulphate-generating metals in shallow soil,
rivers and outcrop existed pre-mining. At least eight occurrences of lead and zinc mineralisation
were known in the McArthur River region, prior to Mount Isa Mines’ arrival in 1955 (Murray,
1954). Within McArthur River Mining’s mineral leases outcropping sulphide and secondary lead
and zinc mineralisation is documented from the Bulburra, Barney Hill and Cooley Lead prospects.
These were actively eroding and contributing lead and zinc into the soil and stream profiles.
At Bulburra the principle mineralised outcrop formed a 6 metre high hill covering an estimated
area of 5,570 square metres. Outcropping mineralisation comprises galena, sphalerite, cerussite,
smithsonite and hydrozincite with minor pyrite (Murray, 1954; Beresford, 1957). There were
small pits at the prospect and it was drilled during 1952 (Beresford, 1957).
Murray (1954) documents “slugs” of galena occurring in Barney Creek (near the Barney and
Surprise Creek junction), and indicates the prospect was drilled in 1912. A second area of
outcropping galena is documented in Bull Creek, which could be the Cooley I Lead Prospect.
Between 1955 and 1963 Mount Isa Mines and the Bureau of Mineral Resources (now Geoscience
Australia) completed semi-qualitative stream, soil and bedrock sampling within an east-west strip
across the mineral leases, extending from the Emu Fault to west of the mineral leases. The
sampling identified lead and zinc anomalies at the known prospects and discovered areas of
previously unknown mineralisation at W-Fold, Teena and Reward prospects.
Mount Isa Mines completed stream sediment surveys across the mineral leases in 1969, 1981 and
1988 (Figures 13 and 14). The samples were assayed for lead, zinc and copper. Anomalous lead
and zinc, and elevated copper occur along the Barney Trend, specifically in streams draining
Barney Hill, WFold prospect and the southern side of the TSF.
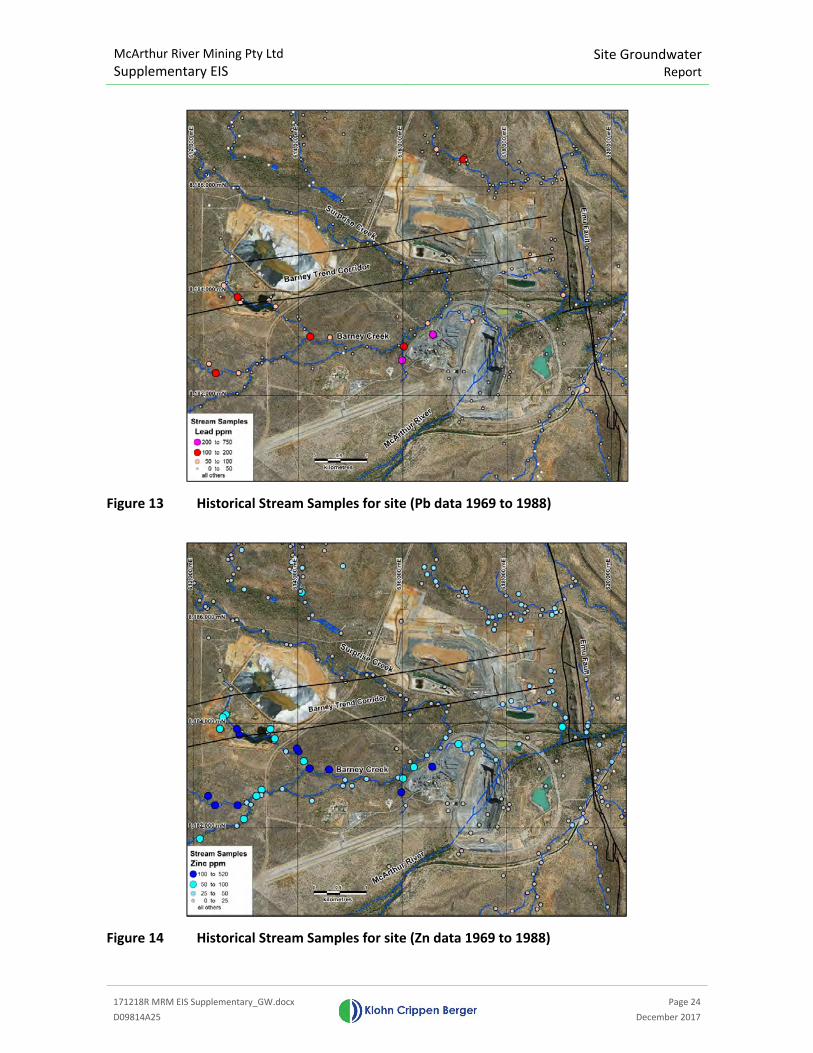
McArthur River Mining Pty Ltd
Supplementary EIS
Site Groundwater
Report
171218R MRM EIS Supplementary_GW.docx
Page 24
D09814A25 December 2017
Figure 13 Historical Stream Samples for site (Pb data 1969 to 1988)
Figure 14 Historical Stream Samples for site (Zn data 1969 to 1988)
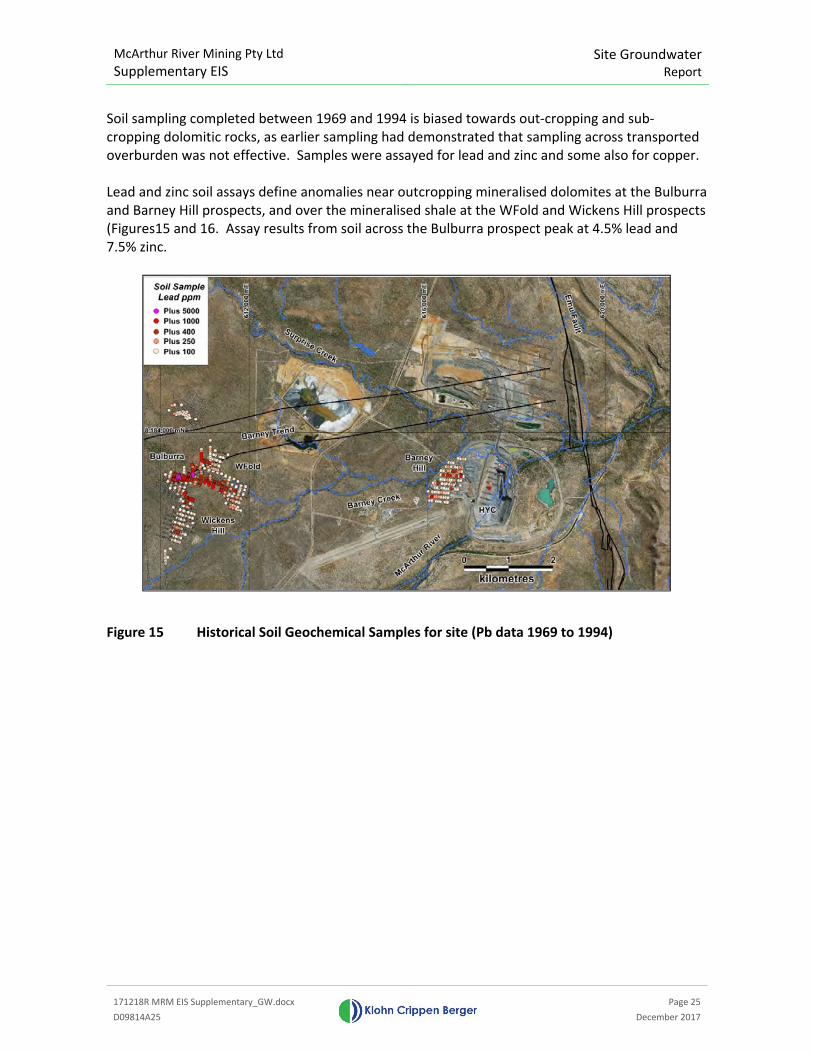
McArthur River Mining Pty Ltd
Supplementary EIS
Site Groundwater
Report
171218R MRM EIS Supplementary_GW.docx
Page 25
D09814A25 December 2017
Soil sampling completed between 1969 and 1994 is biased towards out-cropping and sub-
cropping dolomitic rocks, as earlier sampling had demonstrated that sampling across transported
overburden was not effective. Samples were assayed for lead and zinc and some also for copper.
Lead and zinc soil assays define anomalies near outcropping mineralised dolomites at the Bulburra
and Barney Hill prospects, and over the mineralised shale at the WFold and Wickens Hill prospects
(Figures15 and 16. Assay results from soil across the Bulburra prospect peak at 4.5% lead and
7.5% zinc.
Figure 15 Historical Soil Geochemical Samples for site (Pb data 1969 to 1994)
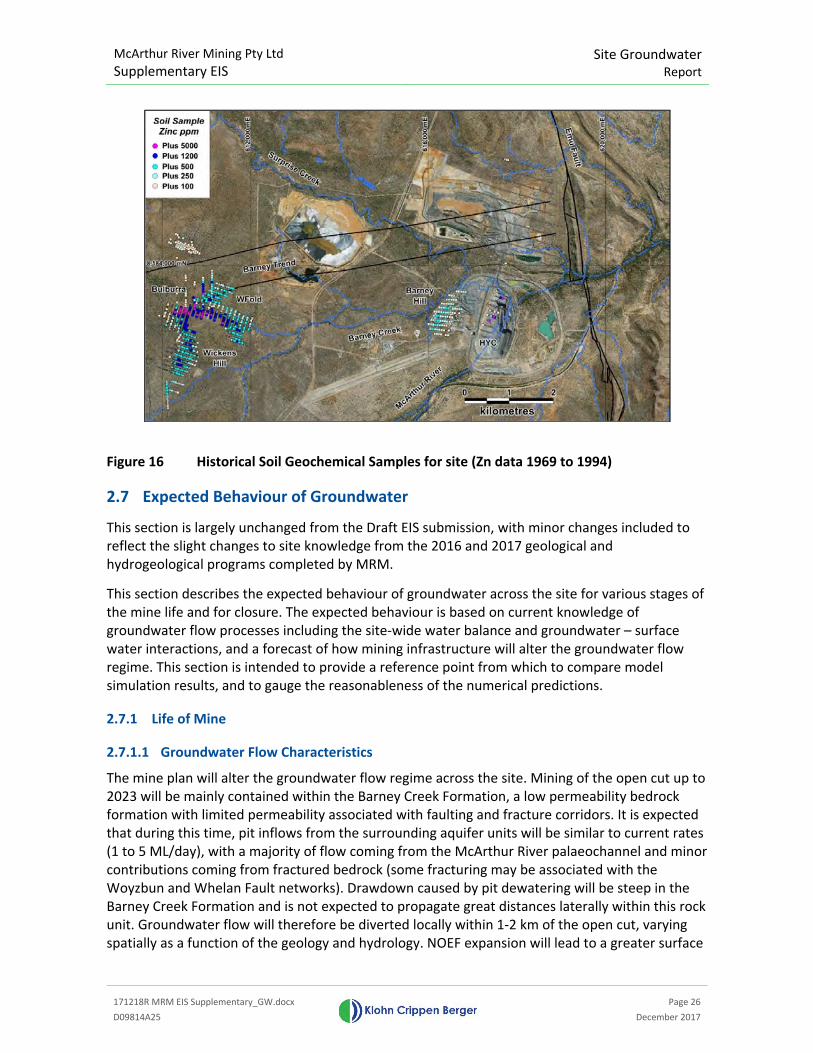
McArthur River Mining Pty Ltd
Supplementary EIS
Site Groundwater
Report
171218R MRM EIS Supplementary_GW.docx
Page 26
D09814A25 December 2017
Figure 16 Historical Soil Geochemical Samples for site (Zn data 1969 to 1994)
2.7 Expected Behaviour of Groundwater
This section is largely unchanged from the Draft EIS submission, with minor changes included to
reflect the slight changes to site knowledge from the 2016 and 2017 geological and
hydrogeological programs completed by MRM.
This section describes the expected behaviour of groundwater across the site for various stages of
the mine life and for closure. The expected behaviour is based on current knowledge of
groundwater flow processes including the site-wide water balance and groundwater – surface
water interactions, and a forecast of how mining infrastructure will alter the groundwater flow
regime. This section is intended to provide a reference point from which to compare model
simulation results, and to gauge the reasonableness of the numerical predictions.
2.7.1 Life of Mine
2.7.1.1 Groundwater Flow Characteristics
The mine plan will alter the groundwater flow regime across the site. Mining of the open cut up to
2023 will be mainly contained within the Barney Creek Formation, a low permeability bedrock
formation with limited permeability associated with faulting and fracture corridors. It is expected
that during this time, pit inflows from the surrounding aquifer units will be similar to current rates
(1 to 5 ML/day), with a majority of flow coming from the McArthur River palaeochannel and minor
contributions coming from fractured bedrock (some fracturing may be associated with the
Woyzbun and Whelan Fault networks). Drawdown caused by pit dewatering will be steep in the
Barney Creek Formation and is not expected to propagate great distances laterally within this rock
unit. Groundwater flow will therefore be diverted locally within 1-2 km of the open cut, varying
spatially as a function of the geology and hydrology. NOEF expansion will lead to a greater surface
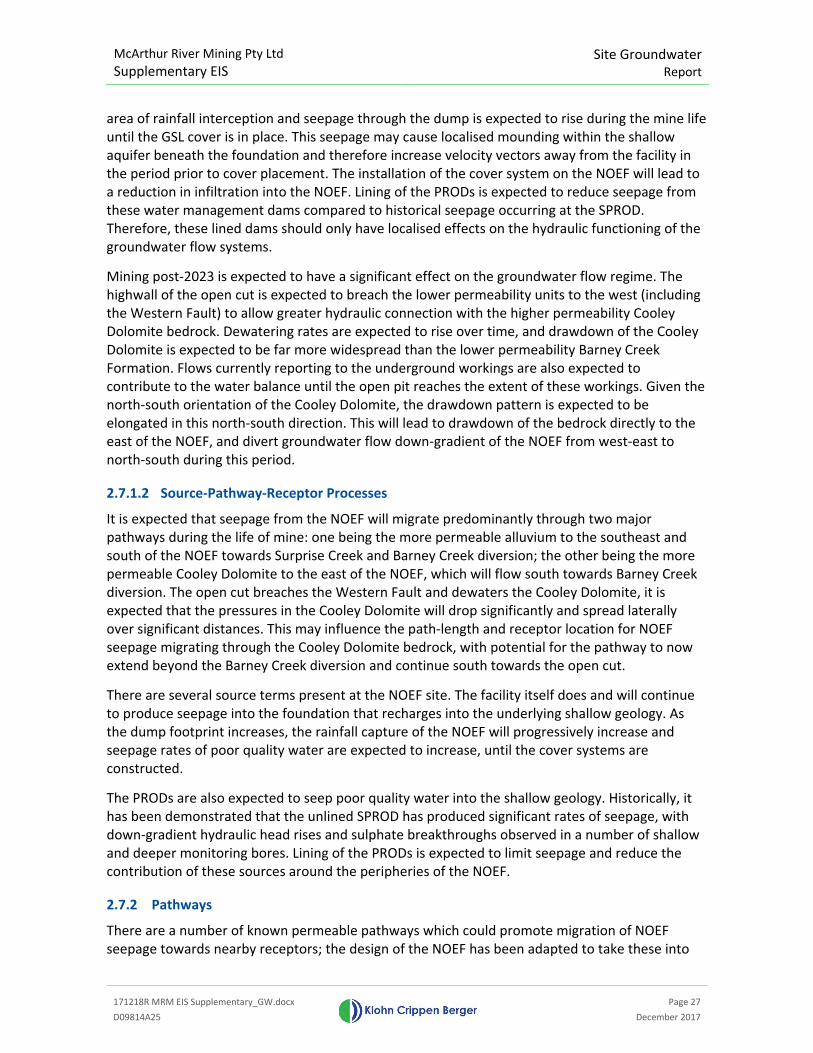
McArthur River Mining Pty Ltd
Supplementary EIS
Site Groundwater
Report
171218R MRM EIS Supplementary_GW.docx
Page 27
D09814A25 December 2017
area of rainfall interception and seepage through the dump is expected to rise during the mine life
until the GSL cover is in place. This seepage may cause localised mounding within the shallow
aquifer beneath the foundation and therefore increase velocity vectors away from the facility in
the period prior to cover placement. The installation of the cover system on the NOEF will lead to
a reduction in infiltration into the NOEF. Lining of the PRODs is expected to reduce seepage from
these water management dams compared to historical seepage occurring at the SPROD.
Therefore, these lined dams should only have localised effects on the hydraulic functioning of the
groundwater flow systems.
Mining post-2023 is expected to have a significant effect on the groundwater flow regime. The
highwall of the open cut is expected to breach the lower permeability units to the west (including
the Western Fault) to allow greater hydraulic connection with the higher permeability Cooley
Dolomite bedrock. Dewatering rates are expected to rise over time, and drawdown of the Cooley
Dolomite is expected to be far more widespread than the lower permeability Barney Creek
Formation. Flows currently reporting to the underground workings are also expected to
contribute to the water balance until the open pit reaches the extent of these workings. Given the
north-south orientation of the Cooley Dolomite, the drawdown pattern is expected to be
elongated in this north-south direction. This will lead to drawdown of the bedrock directly to the
east of the NOEF, and divert groundwater flow down-gradient of the NOEF from west-east to
north-south during this period.
2.7.1.2 Source-Pathway-Receptor Processes
It is expected that seepage from the NOEF will migrate predominantly through two major
pathways during the life of mine: one being the more permeable alluvium to the southeast and
south of the NOEF towards Surprise Creek and Barney Creek diversion; the other being the more
permeable Cooley Dolomite to the east of the NOEF, which will flow south towards Barney Creek
diversion. The open cut breaches the Western Fault and dewaters the Cooley Dolomite, it is
expected that the pressures in the Cooley Dolomite will drop significantly and spread laterally
over significant distances. This may influence the path-length and receptor location for NOEF
seepage migrating through the Cooley Dolomite bedrock, with potential for the pathway to now
extend beyond the Barney Creek diversion and continue south towards the open cut.
There are several source terms present at the NOEF site. The facility itself does and will continue
to produce seepage into the foundation that recharges into the underlying shallow geology. As
the dump footprint increases, the rainfall capture of the NOEF will progressively increase and
seepage rates of poor quality water are expected to increase, until the cover systems are
constructed.
The PRODs are also expected to seep poor quality water into the shallow geology. Historically, it
has been demonstrated that the unlined SPROD has produced significant rates of seepage, with
down-gradient hydraulic head rises and sulphate breakthroughs observed in a number of shallow
and deeper monitoring bores. Lining of the PRODs is expected to limit seepage and reduce the
contribution of these sources around the peripheries of the NOEF.
2.7.2 Pathways
There are a number of known permeable pathways which could promote migration of NOEF
seepage towards nearby receptors; the design of the NOEF has been adapted to take these into
McArthur River Mining Pty Ltd
Supplementary EIS
Site Groundwater
Report
171218R MRM EIS Supplementary_GW.docx
Page 28
D09814A25 December 2017
account and to limit the migration of seepage and contaminants. In the shallow overburden, there
are three former drainage systems which contain more permeable unconsolidated sands and
gravels in an interconnected arrangement such that preferential flowpaths are likely. The three
drainage systems are situated in the northeast, southeast and southern extents of the NOEF. The
shallow weathered bedrock is also likely to promote migration of NOEF seepage. The Cooley
Dolomite bedrock, the Western Fault and the fracture network associated with the Western Fault
are situated to the east of the NOEF and are also potential long-term pathways for seepage
migration. The bedrock aquifer/fracture network can sustain a number of production bores and
which confirms aquifer permeability and interconnectivity.
Based on WRM’s water budget analysis, seepage from the historical SPROD has been at rates in
exceedance of 20 L/s, and this seepage will have created localised mounding of the water table in
the shallow hydrostratigraphic units below the dam. This elevated water table will create higher
hydraulic gradients down-gradient of the facility and therefore increase velocity of groundwater
away from the dam. The regional groundwater flow system is generally west to east, with some
localised movement southwards from SPROD towards Barney Creek diversion (this divergence of
flow is likely related to both the influence of the diversion as a discharge feature as well as the
influence of the pit dewatering directly to the south). It is expected that the predominance of
seepage will flow to the east of SPROD (under natural gradients) and to the southeast towards
Barney Creek diversion. Flows from the SPROD to groundwater are expected to decrease over the
immediate to long-term once SPROD is lined with HDPE.
2.7.3 Receptors
The primary receptors for NOEF seepage are Surprise Creek to the southwest of the facility and
Barney Creek diversion to the south and southwest of the facility. These two creeks represent the
lowest points in the topography surrounding the NOEF and existing hydraulic gradients orient
pathlines towards these surface water features. Groundwater levels to the northeast of the NOEF
are up to 5m lower than the topography along Emu Creek to the east. This indicates that
groundwater is not likely discharging as baseflow to the east where Emu Creek trends along the
Bukalara Plateau, but would likely pass underneath Emu creek and flow to the south towards the
McArthur River. The conceptual model indicates that groundwater within the Cooley Dolomite is
currently discharging to the Emu borefield and further south to the Barney Creek diversion. As
mining progresses, dewatering and development of drawdown in the south of the site, will further
promote flow to the south towards these creeks. If significant mounding where to occur in the
northeast, then hydraulic connection may be established. However, given the high permeability of
the Cooley Dolomite aquifer it is highly unlikely that significant mounding in this aquifer will occur.
2.7.3.1 Groundwater – Surface Water Interactions
Natural Inflows
Natural inflows through wet season rainfall recharge and river recharge are expected to be
maintained throughout the life of mine.
Mine-derived Inflows
Seepage to groundwater from the TSF and NOEF are predicted to increase during the life of mine
(OKC, 2016; KCB, 2017) adding impacted water into the groundwater system. Mitigation
McArthur River Mining Pty Ltd
Supplementary EIS
Site Groundwater
Report
171218R MRM EIS Supplementary_GW.docx
Page 29
D09814A25 December 2017
measures in the form of low permeability covers and an engineered lower permeability base for
the NOEF as well as seepage interception between the TSF and Surprise Creek will reduce the
flows and contaminant loads from these facilities during operations.
Groundwater Outflows
It is expected that the groundwater outflow budget will transition during the life of mine.
Evapotranspiration and surface water baseflow discharge will dominate prior to 2023. Post-2023
pit dewatering rates are expected to increase, and the drawdown will lead to changes in pressure
relationships below Barney Creek diversion and McArthur River diversion. This may act to reduce
surface water – groundwater interactions during this period, and therefore lead to a decrease in
baseflow discharge at the Barney Creek diversion and McArthur River diversion. A lowering of the
groundwater table in the east of the site may also lead to a minor reduction in evapotranspiration
losses. Groundwater exiting the site will continue to occur through the McArthur River channel
down-gradient of the site as well as underlying alluvium, weathered bedrock and bedrock in close
proximity to the channel. However, the relative proportion will be diminished post-2023 as pit
dewatering will dominate groundwater outflow.
2.7.4 End of Operations
2.7.4.1 Groundwater Flow Characteristics
The proposed GSL cover system established on the completed stages of the NOEF will greatly
reduce foundation seepage from the facility during the closure period (see KCB, 2017 NOEF
Modelling) and therefore result in less seepage to the groundwater system compared to the
operations period. Partial filling of the open cut with tailings and then filling of the remaining void
with surface water will reverse the open cut dynamics from a major sink, depending on the level
to which the pit is managed and the pit closure scenario. The regional drawdown will equilibrate
back to a new equilibrium post-mining more rapidly owing to the dynamic infilling of the mine pit
lake. There will be a return to site-wide west to east groundwater flow processes, with some
potential for short duration flow-through from the mine pit lake to down-gradient aquifers to the
east of the mine void. With pit dewatering no longer dominating the water budget, there is
expected to be a return to the pre-mining conditions.
2.7.4.2 Source-Pathway-Receptor Processes
It is expected that seepage from the NOEF will continue to migrate predominantly through two
major pathways during the closure period: one being the more permeable alluvium to the
southeast and south of the NOEF towards Surprise Creek and Barney Creek diversion; the other
being the more permeable Cooley Dolomite to the east of the NOEF, which will flow south
towards Barney Creek diversion. It is expected that drawdown in the Cooley Dolomite will recover
over a period of decades owing to rainfall recharge. As the Cooley Dolomite recovers, it is
expected that a hydraulic connection between the Cooley Dolomite and the Barney Creek
diversion will be re-established. When this hydraulic connection is established, the seepage
pathway from the NOEF will become shorter and Barney Creek diversion will again become the
primary receptor for down-gradient NOEF seepage.
McArthur River Mining Pty Ltd
Supplementary EIS
Site Groundwater
Report
171218R MRM EIS Supplementary_GW.docx
Page 30
D09814A25 December 2017
2.7.5 Closure- Long-term
2.7.5.1 Groundwater Flow Characteristics
Long-term performance of the cover system on the NOEF will limit seepage to the groundwater
system and allow the regional west-east groundwater flow system to dominate as per pre-mining
conditions. The mine pit lake will behave as a variable flow-through system, acting as a constant
head recharge source to the McArthur River palaeochannel and down-gradient weathered
bedrock and fractured rock, in periods when the elevation of the mine pit lake is higher than these
units. The proposed spillways will control the seasonal variation in the open cut. Long-term, there
is not expected to be significant residual drawdown in the aquifers situated around the
peripheries of the mine pit lake, and only minor loss to groundwater under the proposed closure
case. Site-wide west to east groundwater flow processes will dominate. With a recovery of
aquifers post-mining, there is expected to be a return to the pre-mining conditions where
groundwater exits the system at the McArthur River.
2.7.5.2 Source-Pathway-Receptor Processes
It is expected that seepage from the NOEF will continue to migrate predominantly through two
major pathways during the closure period. The first of these will be the more permeable alluvium
to the southeast and south of the NOEF towards Surprise Creek and Barney Creek diversion; the
other being the more permeable Cooley Dolomite to the east of the NOEF, which will flow south
towards Barney Creek diversion. With the Cooley Dolomite recovering, it is expected that a
hydraulic connection between the Cooley Dolomite and the Barney Creek diversion will be re-
established and Barney Creek diversion will again become the primary receptor for down-gradient
NOEF seepage.
2.8 Model Layers
The model was vertically discretized into 14 layers to represent different aquifers, aquitards and
mining features. Table 2-1 presents a summary of the individual model layers and the various
hydrostratigraphic units and mine features that they represent. Originally, the groundwater flow
model had 12 layers, however, during early runs of the mass transport model it was decided to
further discretize the upper bedrock layer (layer 5) into three layers to better simulate the
transport of mass through the upper bedrock aquifer. The layers and structure have been
amended since the Draft EIS, based on the update geological understanding of the site.
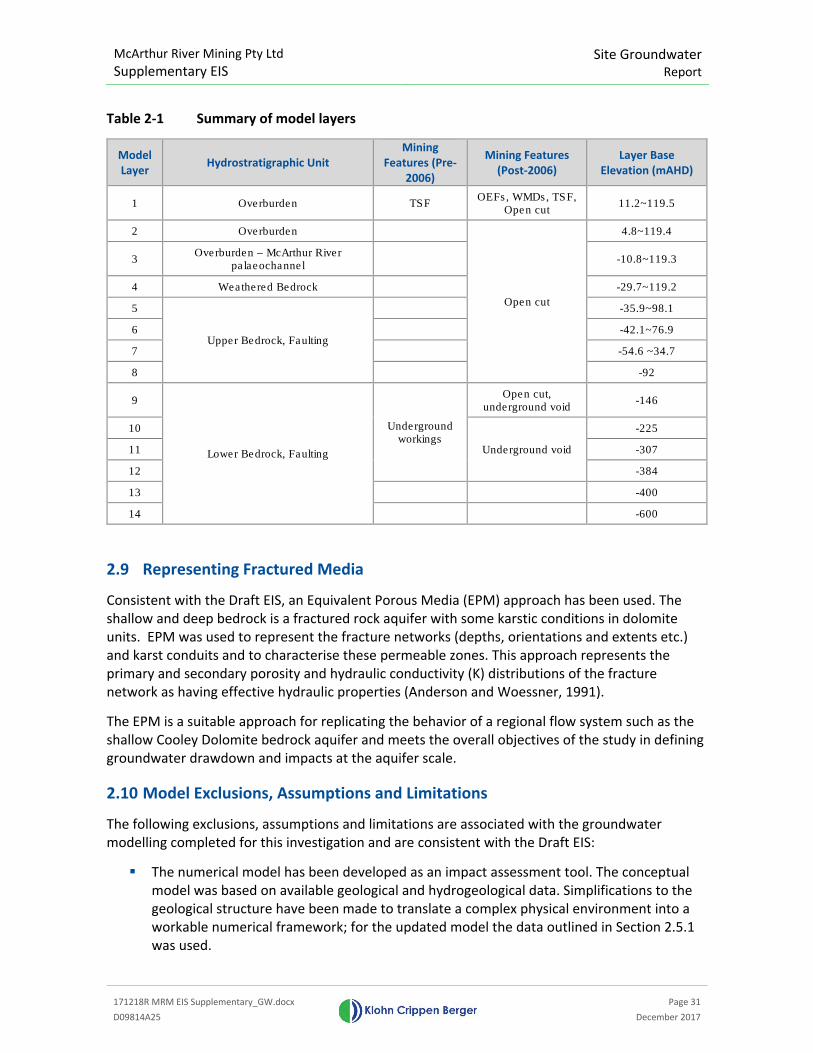
McArthur River Mining Pty Ltd
Supplementary EIS
Site Groundwater
Report
171218R MRM EIS Supplementary_GW.docx
Page 31
D09814A25 December 2017
Table 2-1 Summary of model layers
Model
Layer Hydrostratigraphic Unit
Mining
Features (Pre-
2006)
Mining Features
(Post-2006)
Layer Base
Elevation (mAHD)
1 Overburden TSF OEFs, WMDs, TSF,
Open cut 11.2~119.5
2 Overburden
Open cut
4.8~119.4
3 Overburden – McArthur River
palaeochannel -10.8~119.3
4 Weathered Bedrock -29.7~119.2
5
Upper Bedrock, Faulting
-35.9~98.1
6 -42.1~76.9
7 -54.6 ~34.7
8 -92
9
Lower Bedrock, Faulting
Underground workings
Open cut, underground void
-146
10
Underground void
-225
11 -307
12 -384
13 -400
14 -600
2.9 Representing Fractured Media
Consistent with the Draft EIS, an Equivalent Porous Media (EPM) approach has been used. The
shallow and deep bedrock is a fractured rock aquifer with some karstic conditions in dolomite
units. EPM was used to represent the fracture networks (depths, orientations and extents etc.)
and karst conduits and to characterise these permeable zones. This approach represents the
primary and secondary porosity and hydraulic conductivity (K) distributions of the fracture
network as having effective hydraulic properties (Anderson and Woessner, 1991).
The EPM is a suitable approach for replicating the behavior of a regional flow system such as the
shallow Cooley Dolomite bedrock aquifer and meets the overall objectives of the study in defining
groundwater drawdown and impacts at the aquifer scale.
2.10 Model Exclusions, Assumptions and Limitations
The following exclusions, assumptions and limitations are associated with the groundwater
modelling completed for this investigation and are consistent with the Draft EIS:
� The numerical model has been developed as an impact assessment tool. The conceptual
model was based on available geological and hydrogeological data. Simplifications to the
geological structure have been made to translate a complex physical environment into a
workable numerical framework; for the updated model the data outlined in Section 2.5.1
was used.
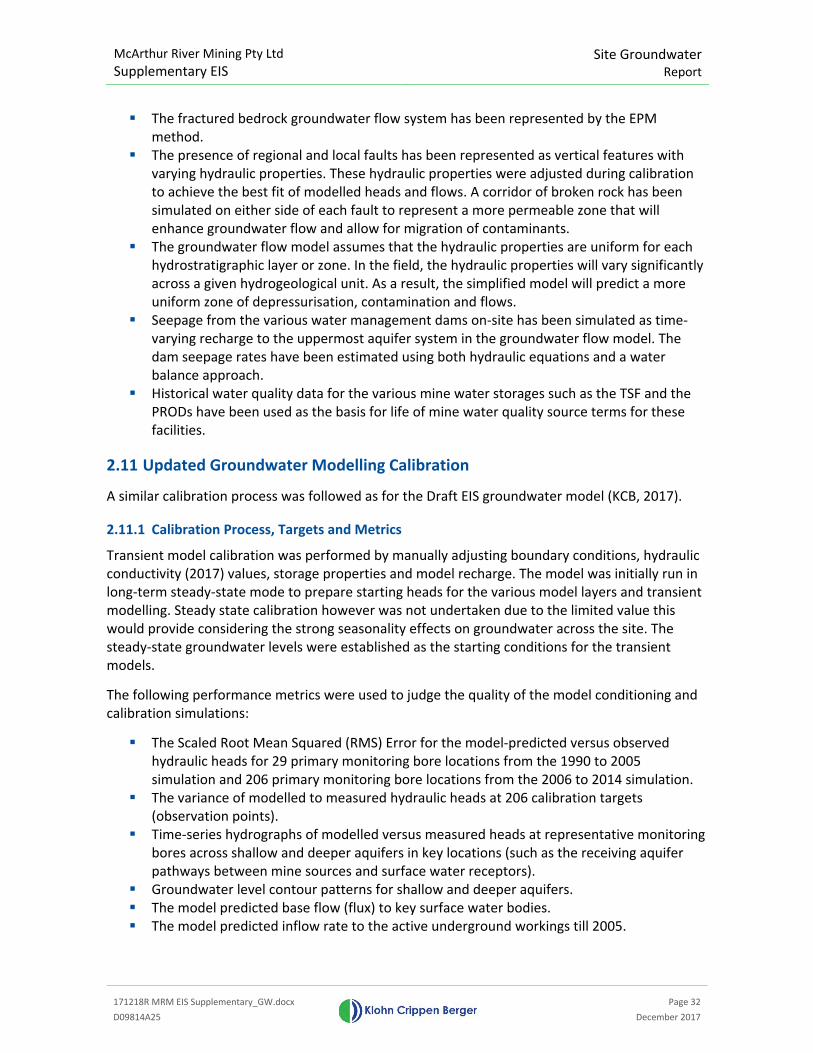
McArthur River Mining Pty Ltd
Supplementary EIS
Site Groundwater
Report
171218R MRM EIS Supplementary_GW.docx
Page 32
D09814A25 December 2017
� The fractured bedrock groundwater flow system has been represented by the EPM
method.
� The presence of regional and local faults has been represented as vertical features with
varying hydraulic properties. These hydraulic properties were adjusted during calibration
to achieve the best fit of modelled heads and flows. A corridor of broken rock has been
simulated on either side of each fault to represent a more permeable zone that will
enhance groundwater flow and allow for migration of contaminants.
� The groundwater flow model assumes that the hydraulic properties are uniform for each
hydrostratigraphic layer or zone. In the field, the hydraulic properties will vary significantly
across a given hydrogeological unit. As a result, the simplified model will predict a more
uniform zone of depressurisation, contamination and flows.
� Seepage from the various water management dams on-site has been simulated as time-
varying recharge to the uppermost aquifer system in the groundwater flow model. The
dam seepage rates have been estimated using both hydraulic equations and a water
balance approach.
� Historical water quality data for the various mine water storages such as the TSF and the
PRODs have been used as the basis for life of mine water quality source terms for these
facilities.
2.11 Updated Groundwater Modelling Calibration
A similar calibration process was followed as for the Draft EIS groundwater model (KCB, 2017).
2.11.1 Calibration Process, Targets and Metrics
Transient model calibration was performed by manually adjusting boundary conditions, hydraulic
conductivity (2017) values, storage properties and model recharge. The model was initially run in
long-term steady-state mode to prepare starting heads for the various model layers and transient
modelling. Steady state calibration however was not undertaken due to the limited value this
would provide considering the strong seasonality effects on groundwater across the site. The
steady-state groundwater levels were established as the starting conditions for the transient
models.
The following performance metrics were used to judge the quality of the model conditioning and
calibration simulations:
� The Scaled Root Mean Squared (RMS) Error for the model-predicted versus observed
hydraulic heads for 29 primary monitoring bore locations from the 1990 to 2005
simulation and 206 primary monitoring bore locations from the 2006 to 2014 simulation.
� The variance of modelled to measured hydraulic heads at 206 calibration targets
(observation points).
� Time-series hydrographs of modelled versus measured heads at representative monitoring
bores across shallow and deeper aquifers in key locations (such as the receiving aquifer
pathways between mine sources and surface water receptors).
� Groundwater level contour patterns for shallow and deeper aquifers.
� The model predicted base flow (flux) to key surface water bodies.
� The model predicted inflow rate to the active underground workings till 2005.
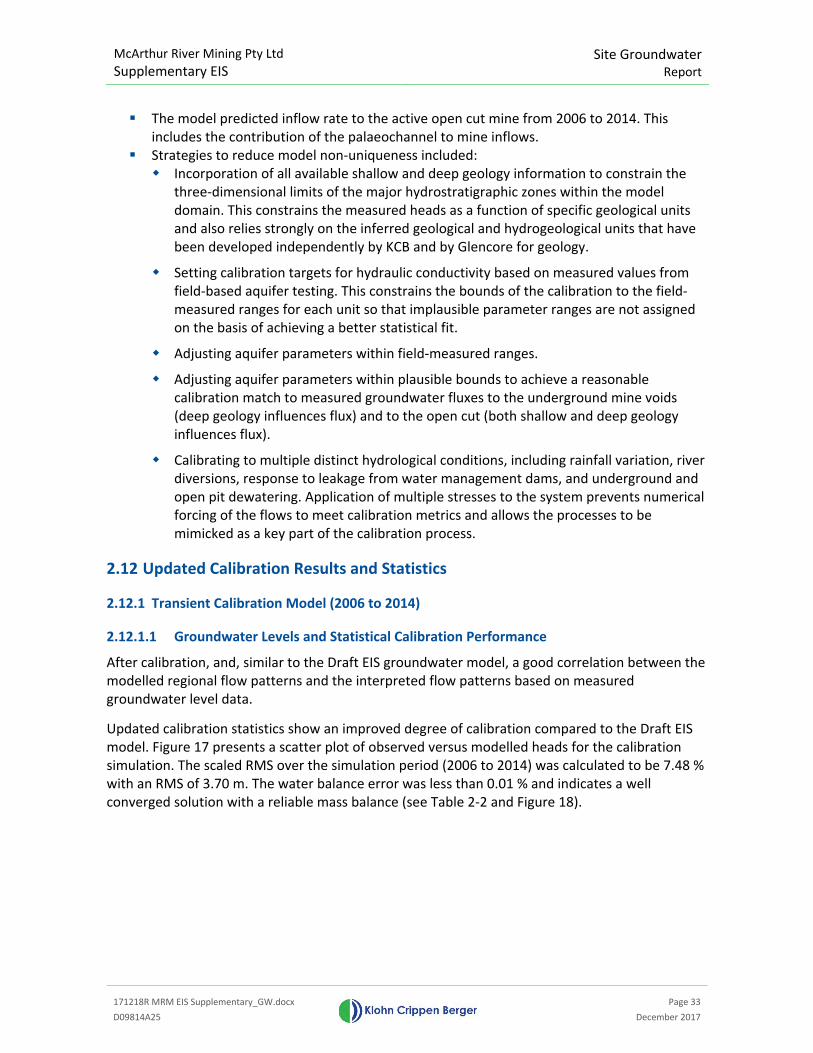
McArthur River Mining Pty Ltd
Supplementary EIS
Site Groundwater
Report
171218R MRM EIS Supplementary_GW.docx
Page 33
D09814A25 December 2017
� The model predicted inflow rate to the active open cut mine from 2006 to 2014. This
includes the contribution of the palaeochannel to mine inflows.
� Strategies to reduce model non-uniqueness included:
� Incorporation of all available shallow and deep geology information to constrain the
three-dimensional limits of the major hydrostratigraphic zones within the model
domain. This constrains the measured heads as a function of specific geological units
and also relies strongly on the inferred geological and hydrogeological units that have
been developed independently by KCB and by Glencore for geology.
� Setting calibration targets for hydraulic conductivity based on measured values from
field-based aquifer testing. This constrains the bounds of the calibration to the field-
measured ranges for each unit so that implausible parameter ranges are not assigned
on the basis of achieving a better statistical fit.
� Adjusting aquifer parameters within field-measured ranges.
� Adjusting aquifer parameters within plausible bounds to achieve a reasonable
calibration match to measured groundwater fluxes to the underground mine voids
(deep geology influences flux) and to the open cut (both shallow and deep geology
influences flux).
� Calibrating to multiple distinct hydrological conditions, including rainfall variation, river
diversions, response to leakage from water management dams, and underground and
open pit dewatering. Application of multiple stresses to the system prevents numerical
forcing of the flows to meet calibration metrics and allows the processes to be
mimicked as a key part of the calibration process.
2.12 Updated Calibration Results and Statistics
2.12.1 Transient Calibration Model (2006 to 2014)
2.12.1.1 Groundwater Levels and Statistical Calibration Performance
After calibration, and, similar to the Draft EIS groundwater model, a good correlation between the
modelled regional flow patterns and the interpreted flow patterns based on measured
groundwater level data.
Updated calibration statistics show an improved degree of calibration compared to the Draft EIS
model. Figure 17 presents a scatter plot of observed versus modelled heads for the calibration
simulation. The scaled RMS over the simulation period (2006 to 2014) was calculated to be 7.48 %
with an RMS of 3.70 m. The water balance error was less than 0.01 % and indicates a well
converged solution with a reliable mass balance (see Table 2-2 and Figure 18).
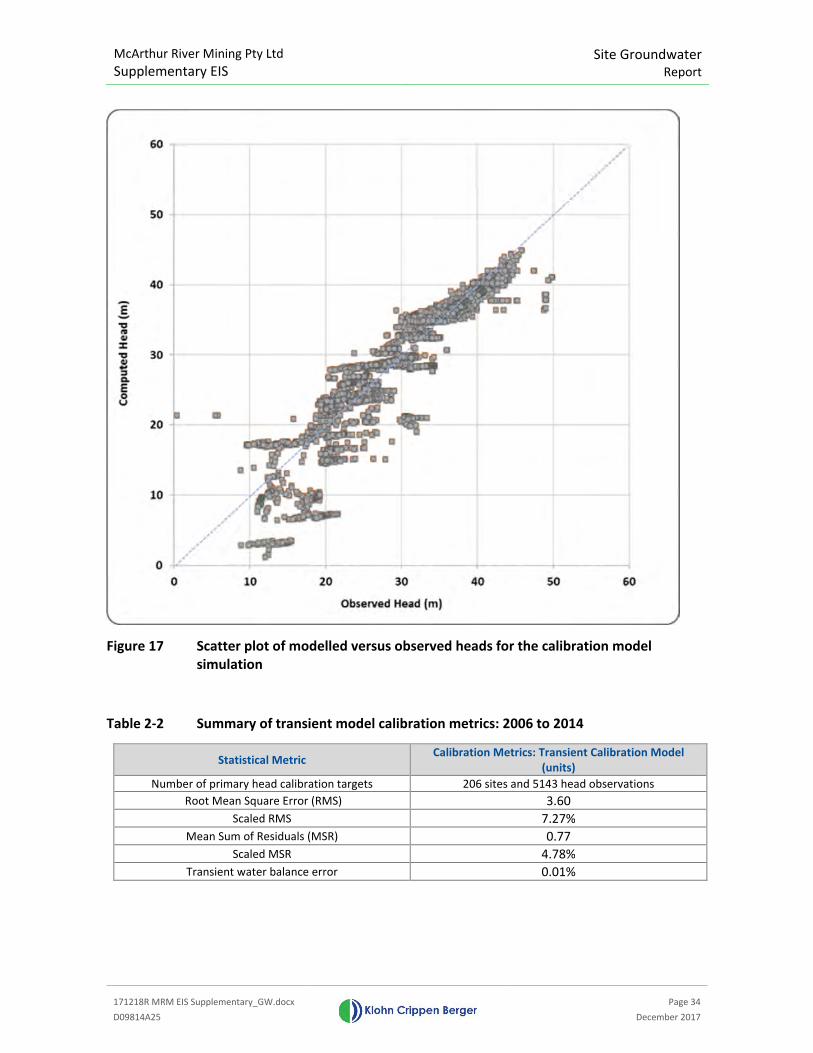
McArthur River Mining Pty Ltd
Supplementary EIS Site Groundwater
Report
171218R MRM EIS Supplementary_GW.docx
Page 34
D09814A25 December 2017
Figure 17 Scatter plot of modelled versus observed heads for the calibration model
simulation
Table 2-2 Summary of transient model calibration metrics: 2006 to 2014
Statistical Metric Calibration Metrics: Transient Calibration Model
(units)
Number of primary head calibration targets 206 sites and 5143 head observations
Root Mean Square Error (RMS) 3.60
Scaled RMS 7.27%
Mean Sum of Residuals (MSR) 0.77
Scaled MSR 4.78%
Transient water balance error 0.01%
McArthur River Mining Pty Ltd
Supplementary EIS
Site Groundwater
Report
171218R MRM EIS Supplementary_GW.docx
Page 35
D09814A25 December 2017
Table 2-3 Summary of transient model water balance for a representative wet month
(December 2011) of the transient calibration
Water Budget Component Inflow (m3/day) Outflow (m3/day)
Storage 621.3 24,796.6
Constant Head 16,841.7 257.1
Bores 0 9,888.51
Drains 0 10,490.1
Recharge 45,372.8 18,047.72
ET 0 15,191.8
River leakage 11,781.9 5,394.5
General Head Boundary 9,451.8 0
TOTAL 84,069.4 84,066.3 1Includes pumping from the underground vent shaft. 2Recharge outflow is rejected recharge where water would pond above surface if the extra recharge were forced into
the model.
Table 2-4 Summary of transient model water balance for a representative dry month
(September 2011) of the transient calibration
Water Budget Component Inflow (m3/day) Outflow (m3/day)
Storage 9228.7 1405.4
Constant Head 17296.8 65.2
Bores 0.0 11772.311
Drains 0.0 8629.3
Recharge 6323.1 10836.222
ET 0.0 11849.8
River leakage 3026.8 2746.6
General Head Boundary 11428.4 0.0
TOTAL 47303.9 47304.8 1Includes pumping from the underground vent shaft. 2Recharge outflow is rejected recharge where water would pond above surface if the extra recharge were forced into
the model.
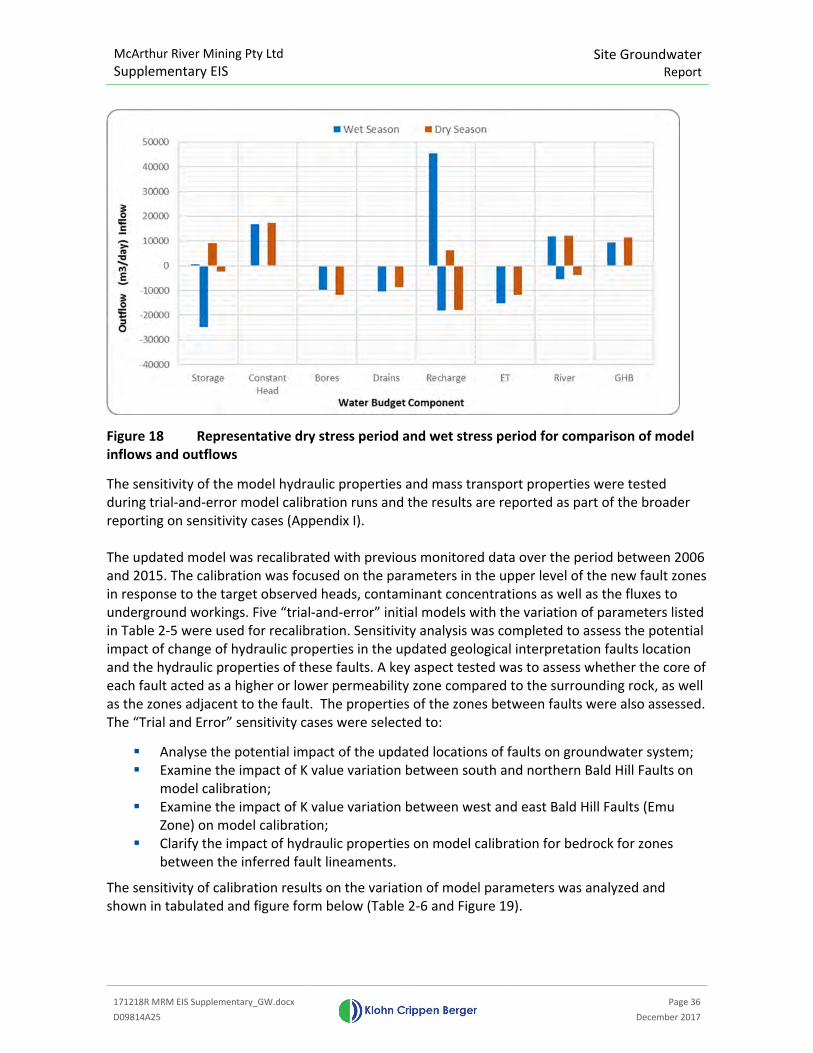
McArthur River Mining Pty Ltd
Supplementary EIS Site Groundwater
Report
171218R MRM EIS Supplementary_GW.docx
Page 36
D09814A25 December 2017
Figure 18 Representative dry stress period and wet stress period for comparison of model
inflows and outflows
The sensitivity of the model hydraulic properties and mass transport properties were tested
during trial-and-error model calibration runs and the results are reported as part of the broader
reporting on sensitivity cases (Appendix I).
The updated model was recalibrated with previous monitored data over the period between 2006
and 2015. The calibration was focused on the parameters in the upper level of the new fault zones
in response to the target observed heads, contaminant concentrations as well as the fluxes to
underground workings. Five “trial-and-error” initial models with the variation of parameters listed
in Table 2-5 were used for recalibration. Sensitivity analysis was completed to assess the potential
impact of change of hydraulic properties in the updated geological interpretation faults location
and the hydraulic properties of these faults. A key aspect tested was to assess whether the core of
each fault acted as a higher or lower permeability zone compared to the surrounding rock, as well
as the zones adjacent to the fault. The properties of the zones between faults were also assessed.
The “Trial and Error” sensitivity cases were selected to:
� Analyse the potential impact of the updated locations of faults on groundwater system;
� Examine the impact of K value variation between south and northern Bald Hill Faults on
model calibration;
� Examine the impact of K value variation between west and east Bald Hill Faults (Emu
Zone) on model calibration;
� Clarify the impact of hydraulic properties on model calibration for bedrock for zones
between the inferred fault lineaments.
The sensitivity of calibration results on the variation of model parameters was analyzed and
shown in tabulated and figure form below (Table 2-6 and Figure 19).
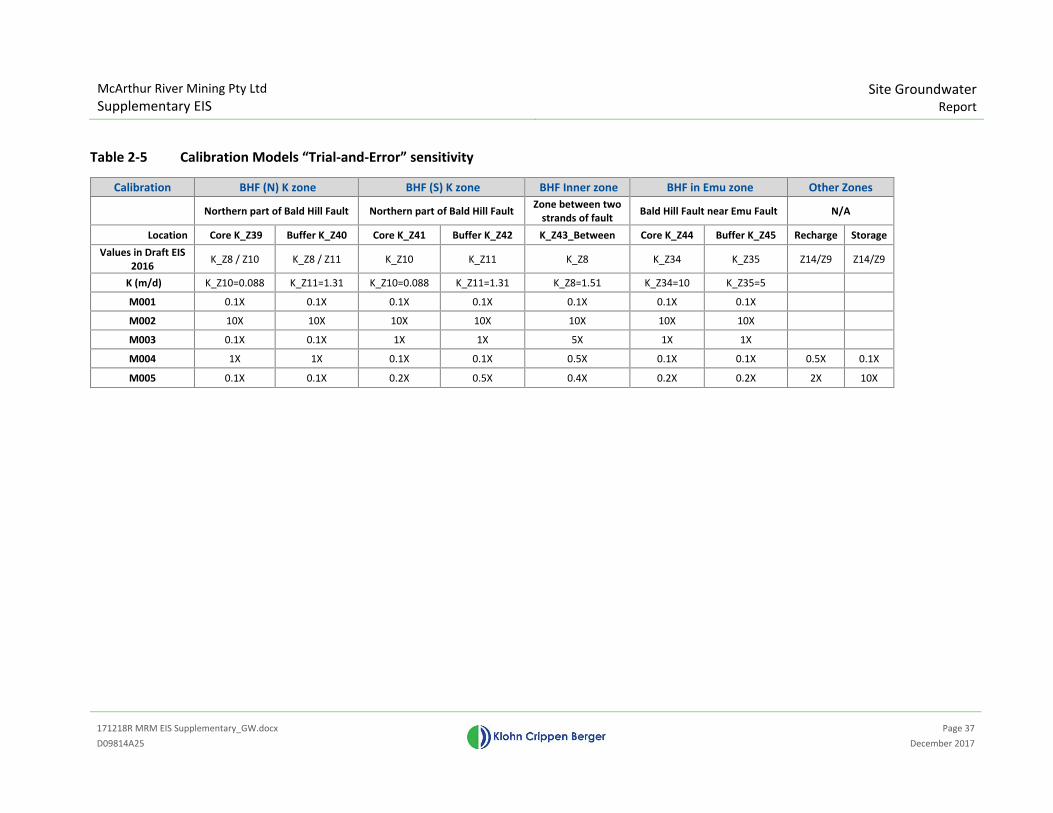
McArthur River Mining Pty Ltd
Supplementary EIS
Site Groundwater
Report
171218R MRM EIS Supplementary_GW.docx
Page 37
D09814A25 December 2017
Table 2-5 Calibration Models “Trial-and-Error” sensitivity
Calibration BHF (N) K zone BHF (S) K zone BHF Inner zone BHF in Emu zone Other Zones
Northern part of Bald Hill Fault Northern part of Bald Hill Fault Zone between two
strands of fault Bald Hill Fault near Emu Fault N/A
Location Core K_Z39 Buffer K_Z40 Core K_Z41 Buffer K_Z42 K_Z43_Between Core K_Z44 Buffer K_Z45 Recharge Storage
Values in Draft EIS
2016 K_Z8 / Z10 K_Z8 / Z11 K_Z10 K_Z11 K_Z8 K_Z34 K_Z35 Z14/Z9 Z14/Z9
K (m/d) K_Z10=0.088 K_Z11=1.31 K_Z10=0.088 K_Z11=1.31 K_Z8=1.51 K_Z34=10 K_Z35=5
M001 0.1X 0.1X 0.1X 0.1X 0.1X 0.1X 0.1X
M002 10X 10X 10X 10X 10X 10X 10X
M003 0.1X 0.1X 1X 1X 5X 1X 1X
M004 1X 1X 0.1X 0.1X 0.5X 0.1X 0.1X 0.5X 0.1X
M005 0.1X 0.1X 0.2X 0.5X 0.4X 0.2X 0.2X 2X 10X
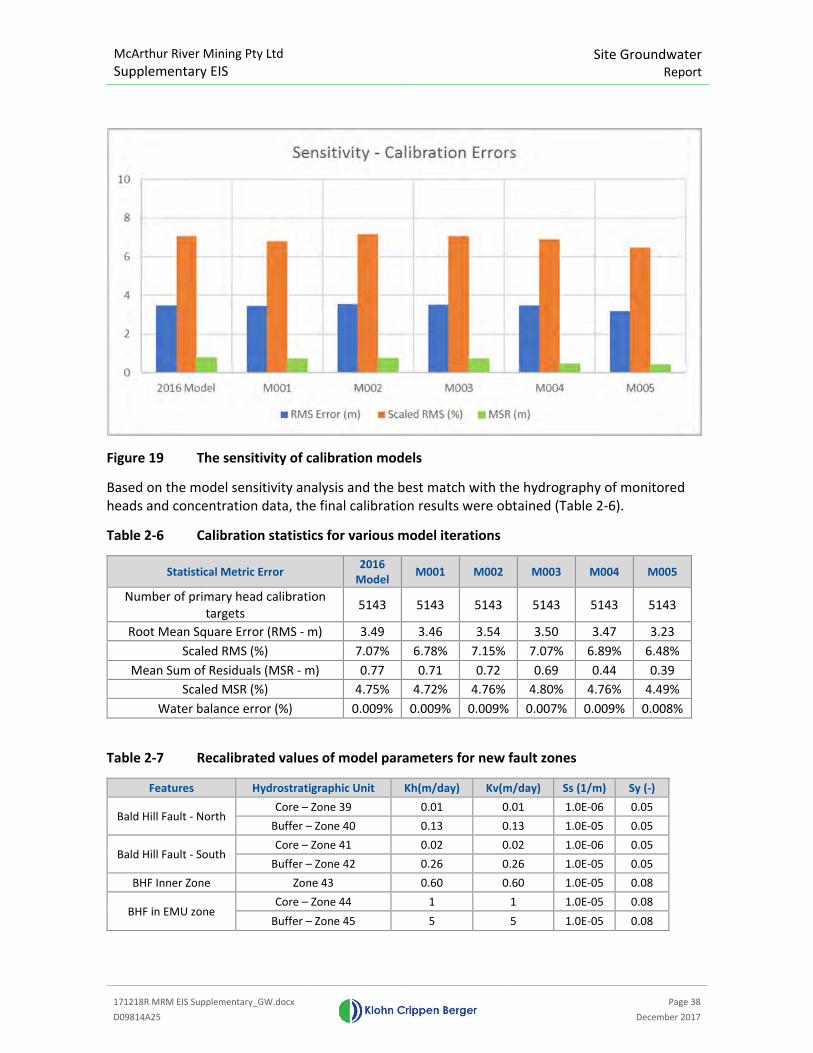
McArthur River Mining Pty Ltd
Supplementary EIS Site Groundwater
Report
171218R MRM EIS Supplementary_GW.docx
Page 38
D09814A25 December 2017
Figure 19 The sensitivity of calibration models
Based on the model sensitivity analysis and the best match with the hydrography of monitored
heads and concentration data, the final calibration results were obtained (Table 2-6).
Table 2-6 Calibration statistics for various model iterations
Statistical Metric Error 2016
Model M001 M002 M003 M004 M005
Number of primary head calibration
targets 5143 5143 5143 5143 5143 5143
Root Mean Square Error (RMS - m) 3.49 3.46 3.54 3.50 3.47 3.23
Scaled RMS (%) 7.07% 6.78% 7.15% 7.07% 6.89% 6.48%
Mean Sum of Residuals (MSR - m) 0.77 0.71 0.72 0.69 0.44 0.39
Scaled MSR (%) 4.75% 4.72% 4.76% 4.80% 4.76% 4.49%
Water balance error (%) 0.009% 0.009% 0.009% 0.007% 0.009% 0.008%
Table 2-7 Recalibrated values of model parameters for new fault zones
Features Hydrostratigraphic Unit Kh(m/day) Kv(m/day) Ss (1/m) Sy (-)
Bald Hill Fault - North Core – Zone 39 0.01 0.01 1.0E-06 0.05
Buffer – Zone 40 0.13 0.13 1.0E-05 0.05
Bald Hill Fault - South Core – Zone 41 0.02 0.02 1.0E-06 0.05
Buffer – Zone 42 0.26 0.26 1.0E-05 0.05
BHF Inner Zone Zone 43 0.60 0.60 1.0E-05 0.08
BHF in EMU zone Core – Zone 44 1 1 1.0E-05 0.08
Buffer – Zone 45 5 5 1.0E-05 0.08

McArthur River Mining Pty Ltd
Supplementary EIS
Site Groundwater
Report
171218R MRM EIS Supplementary_GW.docx
Page 39
D09814A25 December 2017
2.12.1.2 Updated Transient Calibration Hydrographs
Figure 20 presents modelled versus observed water level hydrographs for selected monitoring
bores across the 2006 to 2014 simulation period. A reasonable correlation has been achieved for
bores at the TSF (e.g. Bores GW92A, GW62, GW20A), around the perimeter of the NOEF (e.g.
GW133S, GW105, GW124D), south of SPROD (e.g. GW65S, GW64D), south of SEPROD (e.g.
GW88D, GW102), the Barney Creek Plain (e.g. GW109) and Djirrinmini (e.g. GW74).
The assessment of calibration performance using transient hydrographs compares model
predicted output with measured data for a total of 38 sites. Monitoring locations with brief or
incomplete temporal records were not included in the presentation of hydrographs but were
included in the statistical analysis for completeness.
Calibration locations are again compared for six broad zones:
1. The perimeter of the TSF with 11 bores selected in the western, northern and eastern
perimeters at different aquifer depths.
2. Around the perimeter of the NOEF with 11 bores selected in the western, northern and
eastern perimeters at different aquifer depths.
3. Down-gradient of the SPROD and SEPROD with 8 bores selected at different aquifer depths.
4. At Djirrinmini waterhole with 4 bores selected at different aquifer depths.
5. Within the Barney Creek plain with two bores selected.
6. Within the mining area with two bores selected.
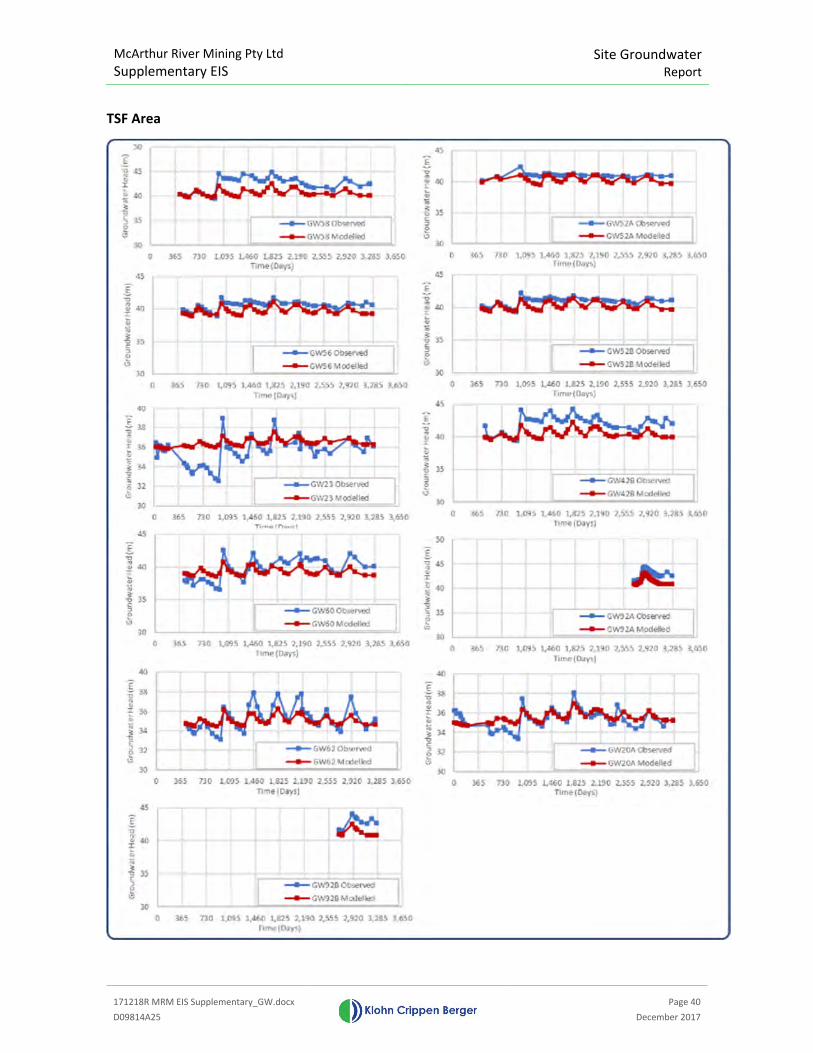
McArthur River Mining Pty Ltd
Supplementary EIS Site Groundwater
Report
171218R MRM EIS Supplementary_GW.docx
Page 40
D09814A25 December 2017
TSF Area
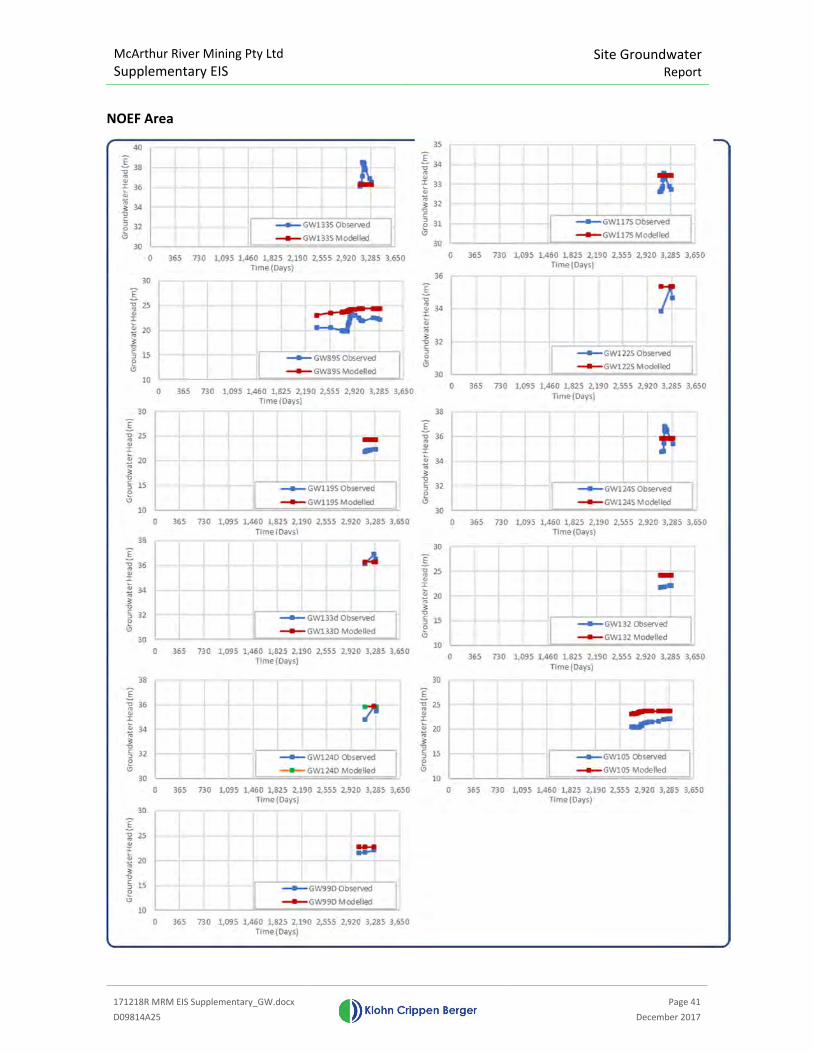
McArthur River Mining Pty Ltd
Supplementary EIS Site Groundwater
Report
171218R MRM EIS Supplementary_GW.docx
Page 41
D09814A25 December 2017
NOEF Area
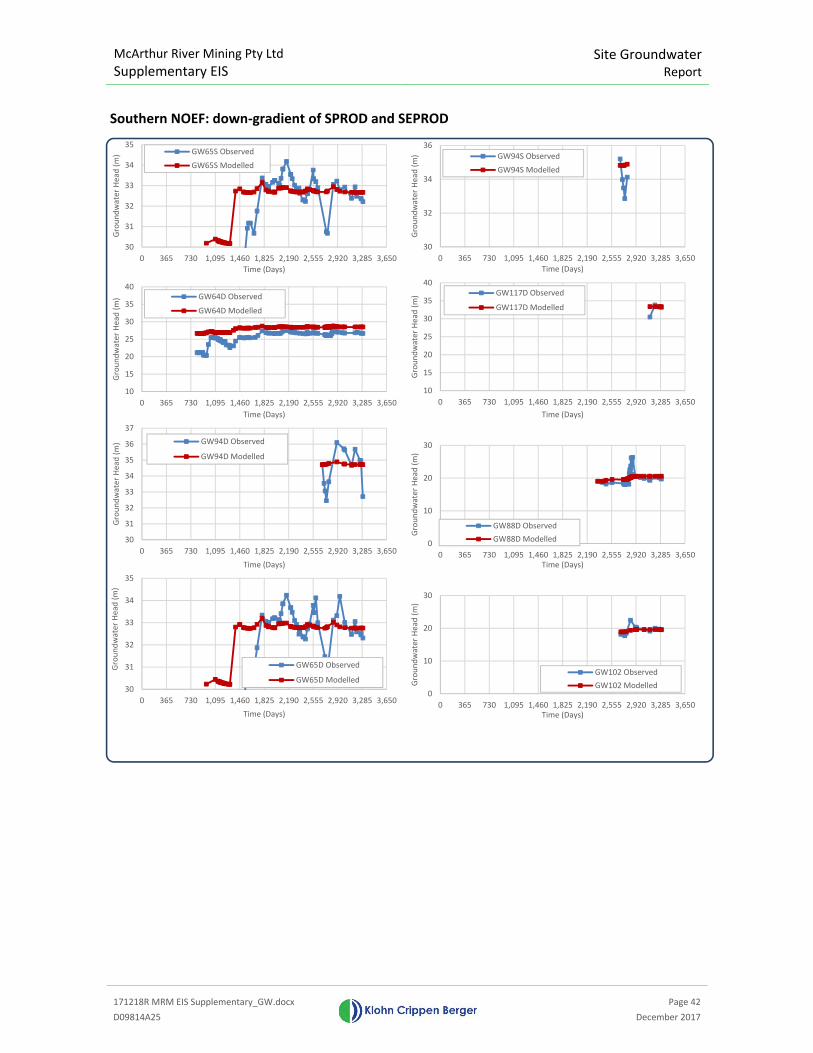
McArthur River Mining Pty Ltd
Supplementary EIS
Site Groundwater
Report
171218R MRM EIS Supplementary_GW.docx
Page 42
D09814A25 December 2017
Southern NOEF: down-gradient of SPROD and SEPROD
30
31
32
33
34
35
0 365 730 1,095 1,460 1,825 2,190 2,555 2,920 3,285 3,650
Gro
un
dw
ate
r H
ea
d (
m)
Time (Days)
GW65S Observed
GW65S Modelled
30
32
34
36
0 365 730 1,095 1,460 1,825 2,190 2,555 2,920 3,285 3,650
Gro
un
dw
ate
r H
ea
d (
m)
Time (Days)
GW94S Observed
GW94S Modelled
10
15
20
25
30
35
40
0 365 730 1,095 1,460 1,825 2,190 2,555 2,920 3,285 3,650
Gro
un
dw
ate
r H
ea
d (
m)
Time (Days)
GW64D Observed
GW64D Modelled
10
15
20
25
30
35
40
0 365 730 1,095 1,460 1,825 2,190 2,555 2,920 3,285 3,650
Gro
un
dw
ate
r H
ea
d (
m)
Time (Days)
GW117D Observed
GW117D Modelled
30
31
32
33
34
35
36
37
0 365 730 1,095 1,460 1,825 2,190 2,555 2,920 3,285 3,650
Gro
un
dw
ate
r H
ea
d (
m)
Time (Days)
GW94D Observed
GW94D Modelled
0
10
20
30
0 365 730 1,095 1,460 1,825 2,190 2,555 2,920 3,285 3,650
Gro
un
dw
ate
r H
ea
d (
m)
Time (Days)
GW88D Observed
GW88D Modelled
30
31
32
33
34
35
0 365 730 1,095 1,460 1,825 2,190 2,555 2,920 3,285 3,650
Gro
un
dw
ate
r H
ea
d (
m)
Time (Days)
GW65D Observed
GW65D Modelled
0
10
20
30
0 365 730 1,095 1,460 1,825 2,190 2,555 2,920 3,285 3,650
Gro
un
dw
ate
r H
ea
d (
m)
Time (Days)
GW102 Observed
GW102 Modelled
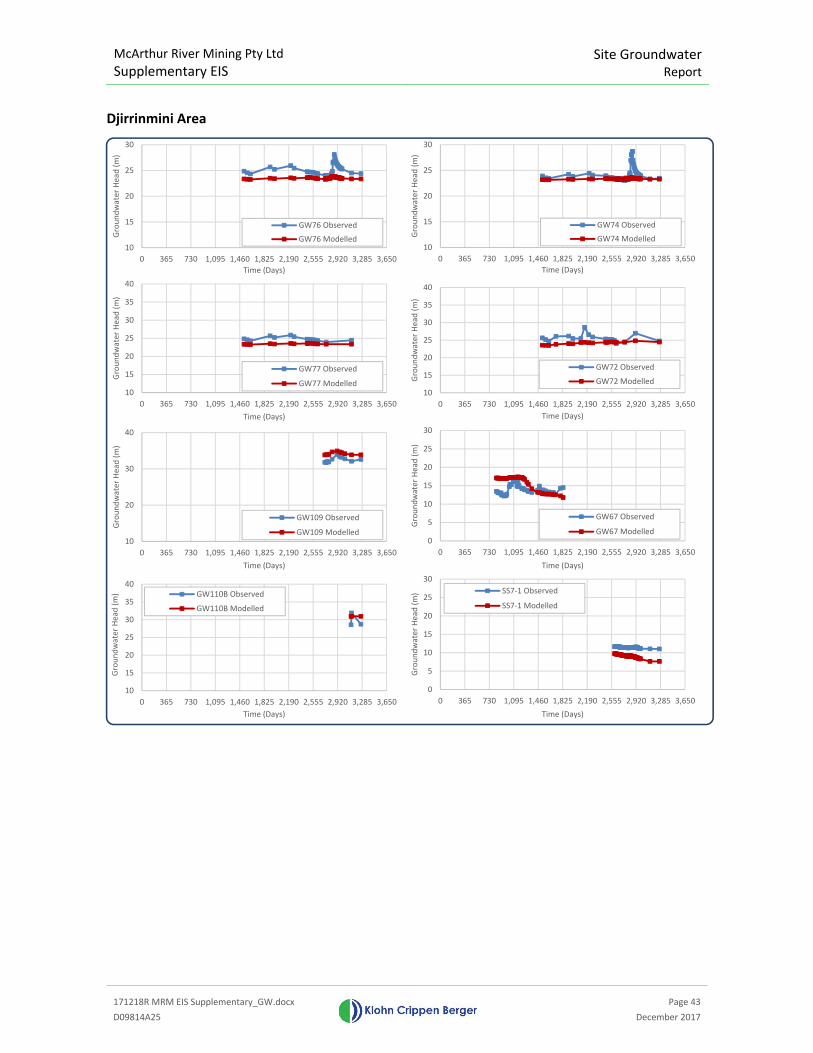
McArthur River Mining Pty Ltd
Supplementary EIS
Site Groundwater
Report
171218R MRM EIS Supplementary_GW.docx
Page 43
D09814A25 December 2017
Djirrinmini Area
10
15
20
25
30
0 365 730 1,095 1,460 1,825 2,190 2,555 2,920 3,285 3,650
Gro
un
dw
ate
r H
ea
d (
m)
Time (Days)
GW76 Observed
GW76 Modelled10
15
20
25
30
0 365 730 1,095 1,460 1,825 2,190 2,555 2,920 3,285 3,650
Gro
un
dw
ate
r H
ea
d (
m)
Time (Days)
GW74 Observed
GW74 Modelled
10
15
20
25
30
35
40
0 365 730 1,095 1,460 1,825 2,190 2,555 2,920 3,285 3,650
Gro
un
dw
ate
r H
ea
d (
m)
Time (Days)
GW77 Observed
GW77 Modelled10
15
20
25
30
35
40
0 365 730 1,095 1,460 1,825 2,190 2,555 2,920 3,285 3,650
Gro
un
dw
ate
r H
ea
d (
m)
Time (Days)
GW72 Observed
GW72 Modelled
10
20
30
40
0 365 730 1,095 1,460 1,825 2,190 2,555 2,920 3,285 3,650
Gro
un
dw
ate
r H
ea
d (
m)
Time (Days)
GW109 Observed
GW109 Modelled0
5
10
15
20
25
30
0 365 730 1,095 1,460 1,825 2,190 2,555 2,920 3,285 3,650
Gro
un
dw
ate
r H
ea
d (
m)
Time (Days)
GW67 Observed
GW67 Modelled
10
15
20
25
30
35
40
0 365 730 1,095 1,460 1,825 2,190 2,555 2,920 3,285 3,650
Gro
un
dw
ate
r H
ea
d (
m)
Time (Days)
GW110B Observed
GW110B Modelled
0
5
10
15
20
25
30
0 365 730 1,095 1,460 1,825 2,190 2,555 2,920 3,285 3,650
Gro
un
dw
ate
r H
ea
d (
m)
Time (Days)
SS7-1 Observed
SS7-1 Modelled
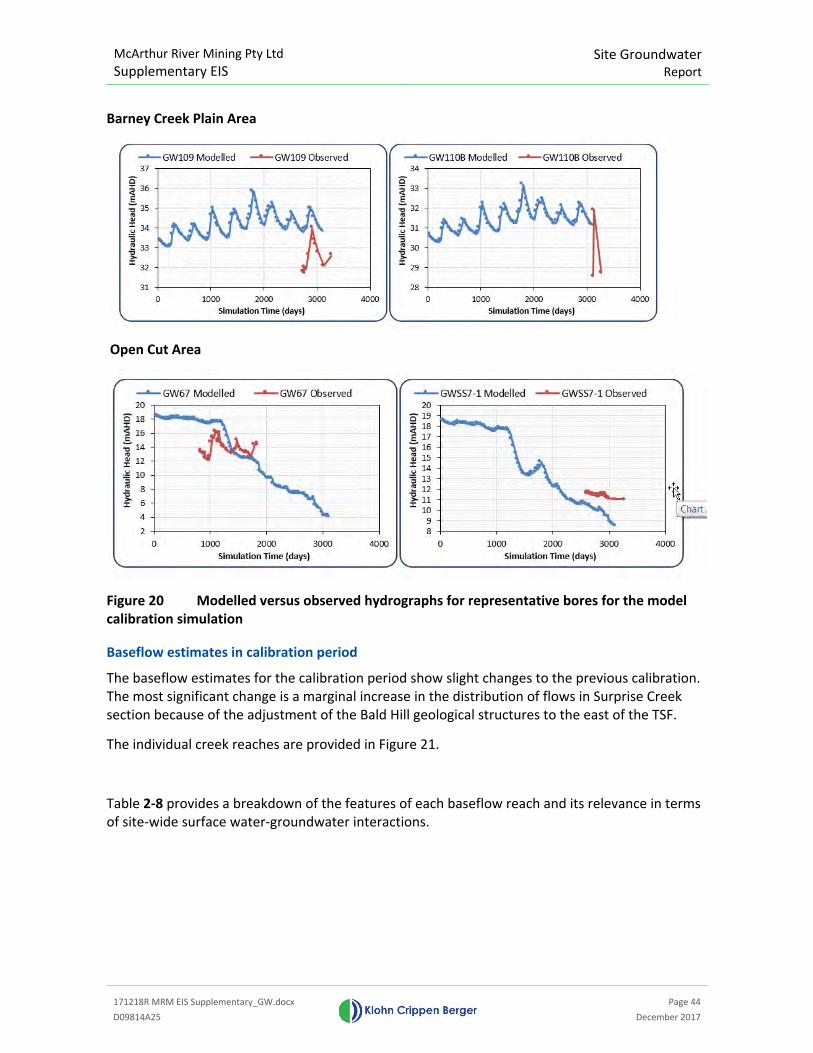
McArthur River Mining Pty Ltd
Supplementary EIS
Site Groundwater
Report
171218R MRM EIS Supplementary_GW.docx
Page 44
D09814A25 December 2017
Barney Creek Plain Area
Open Cut Area
Figure 20 Modelled versus observed hydrographs for representative bores for the model
calibration simulation
Baseflow estimates in calibration period
The baseflow estimates for the calibration period show slight changes to the previous calibration.
The most significant change is a marginal increase in the distribution of flows in Surprise Creek
section because of the adjustment of the Bald Hill geological structures to the east of the TSF.
The individual creek reaches are provided in Figure 21.
Table 2-8 provides a breakdown of the features of each baseflow reach and its relevance in terms
of site-wide surface water-groundwater interactions.
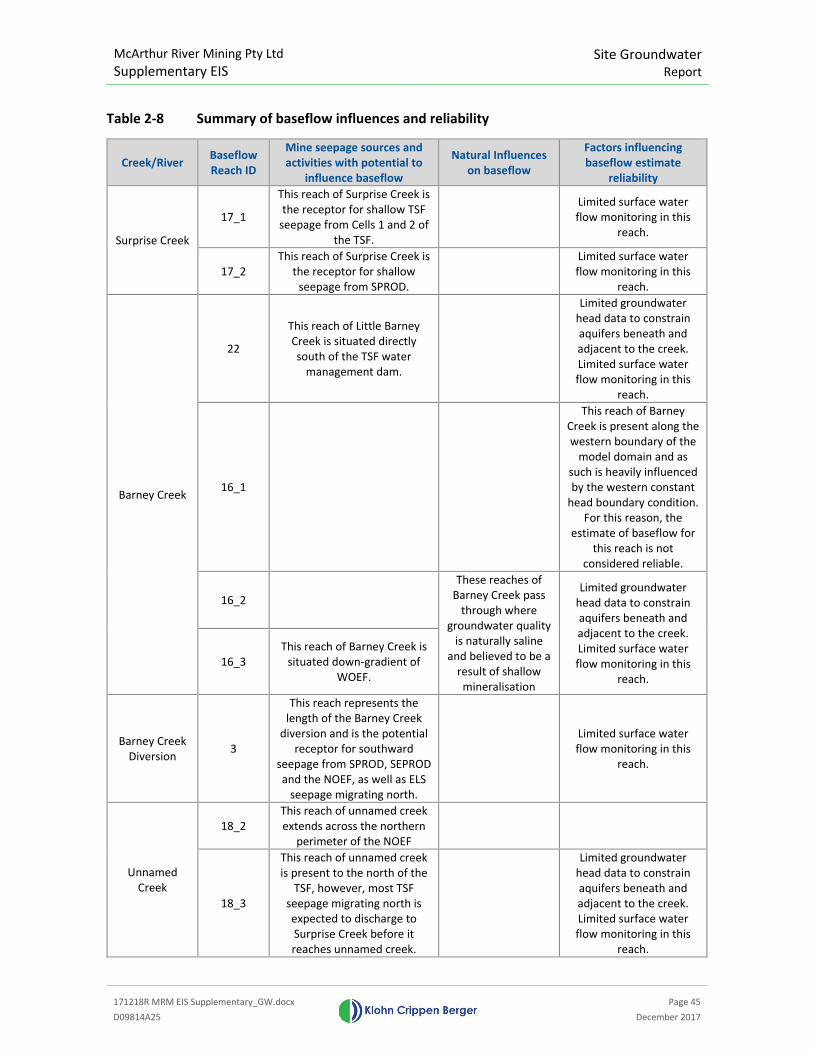
McArthur River Mining Pty Ltd
Supplementary EIS
Site Groundwater
Report
171218R MRM EIS Supplementary_GW.docx
Page 45
D09814A25 December 2017
Table 2-8 Summary of baseflow influences and reliability
Creek/River Baseflow
Reach ID
Mine seepage sources and
activities with potential to
influence baseflow
Natural Influences
on baseflow
Factors influencing
baseflow estimate
reliability
Surprise Creek
17_1
This reach of Surprise Creek is
the receptor for shallow TSF
seepage from Cells 1 and 2 of
the TSF.
Limited surface water
flow monitoring in this
reach.
17_2
This reach of Surprise Creek is
the receptor for shallow
seepage from SPROD.
Limited surface water
flow monitoring in this
reach.
Barney Creek
22
This reach of Little Barney
Creek is situated directly
south of the TSF water
management dam.
Limited groundwater
head data to constrain
aquifers beneath and
adjacent to the creek.
Limited surface water
flow monitoring in this
reach.
16_1
This reach of Barney
Creek is present along the
western boundary of the
model domain and as
such is heavily influenced
by the western constant
head boundary condition.
For this reason, the
estimate of baseflow for
this reach is not
considered reliable.
16_2
These reaches of
Barney Creek pass
through where
groundwater quality
is naturally saline
and believed to be a
result of shallow
mineralisation
Limited groundwater
head data to constrain
aquifers beneath and
adjacent to the creek.
Limited surface water
flow monitoring in this
reach.
16_3
This reach of Barney Creek is
situated down-gradient of
WOEF.
Barney Creek
Diversion 3
This reach represents the
length of the Barney Creek
diversion and is the potential
receptor for southward
seepage from SPROD, SEPROD
and the NOEF, as well as ELS
seepage migrating north.
Limited surface water
flow monitoring in this
reach.
Unnamed
Creek
18_2
This reach of unnamed creek
extends across the northern
perimeter of the NOEF
18_3
This reach of unnamed creek
is present to the north of the
TSF, however, most TSF
seepage migrating north is
expected to discharge to
Surprise Creek before it
reaches unnamed creek.
Limited groundwater
head data to constrain
aquifers beneath and
adjacent to the creek.
Limited surface water
flow monitoring in this
reach.
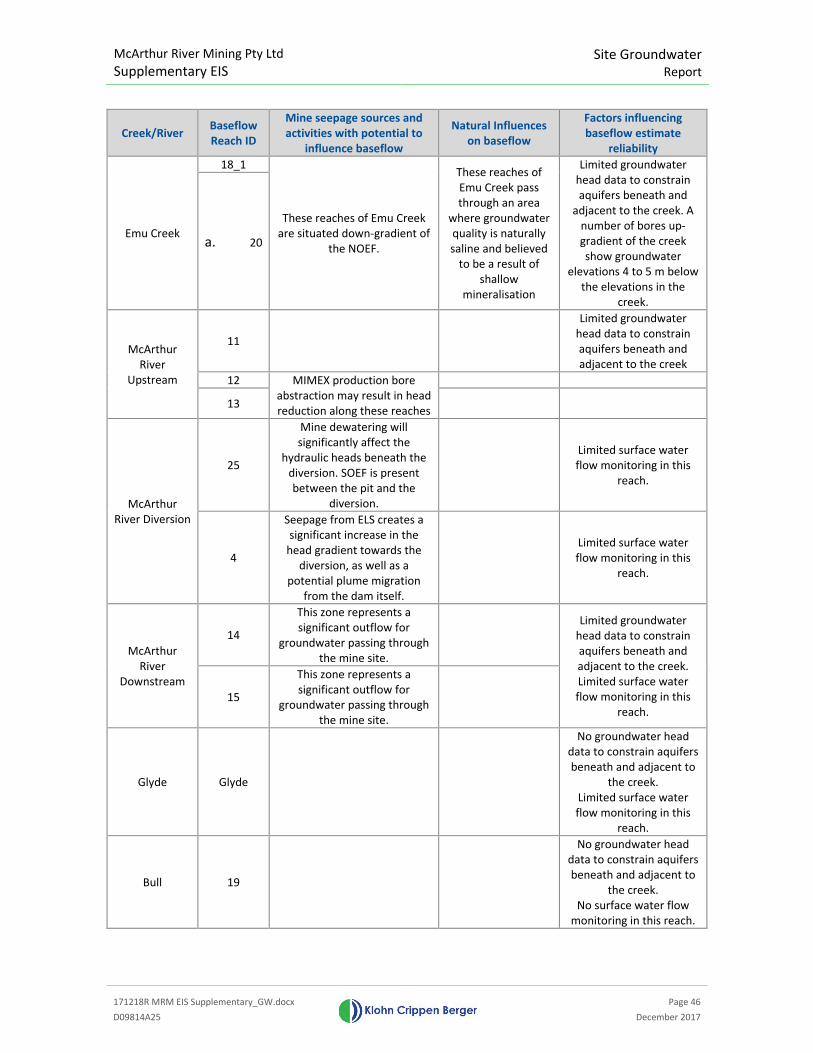
McArthur River Mining Pty Ltd
Supplementary EIS
Site Groundwater
Report
171218R MRM EIS Supplementary_GW.docx
Page 46
D09814A25 December 2017
Creek/River Baseflow
Reach ID
Mine seepage sources and
activities with potential to
influence baseflow
Natural Influences
on baseflow
Factors influencing
baseflow estimate
reliability
Emu Creek
18_1
These reaches of Emu Creek
are situated down-gradient of
the NOEF.
These reaches of
Emu Creek pass
through an area
where groundwater
quality is naturally
saline and believed
to be a result of
shallow
mineralisation
Limited groundwater
head data to constrain
aquifers beneath and
adjacent to the creek. A
number of bores up-
gradient of the creek
show groundwater
elevations 4 to 5 m below
the elevations in the
creek.
a. 20
McArthur
River
Upstream
11
Limited groundwater
head data to constrain
aquifers beneath and
adjacent to the creek
12 MIMEX production bore
abstraction may result in head
reduction along these reaches
13
McArthur
River Diversion
25
Mine dewatering will
significantly affect the
hydraulic heads beneath the
diversion. SOEF is present
between the pit and the
diversion.
Limited surface water
flow monitoring in this
reach.
4
Seepage from ELS creates a
significant increase in the
head gradient towards the
diversion, as well as a
potential plume migration
from the dam itself.
Limited surface water
flow monitoring in this
reach.
McArthur
River
Downstream
14
This zone represents a
significant outflow for
groundwater passing through
the mine site.
Limited groundwater
head data to constrain
aquifers beneath and
adjacent to the creek.
Limited surface water
flow monitoring in this
reach.
15
This zone represents a
significant outflow for
groundwater passing through
the mine site.
Glyde Glyde
No groundwater head
data to constrain aquifers
beneath and adjacent to
the creek.
Limited surface water
flow monitoring in this
reach.
Bull 19
No groundwater head
data to constrain aquifers
beneath and adjacent to
the creek.
No surface water flow
monitoring in this reach.

McArthur River Mining Pty Ltd
Supplementary EIS
Site Groundwater
Report
171218R MRM EIS Supplementary_GW.docx
Page 47
D09814A25 December 2017
Modelled baseflow for Emu Creek within the model domain is zero, consistent with the
conceptual model and measurements of groundwater levels on site.
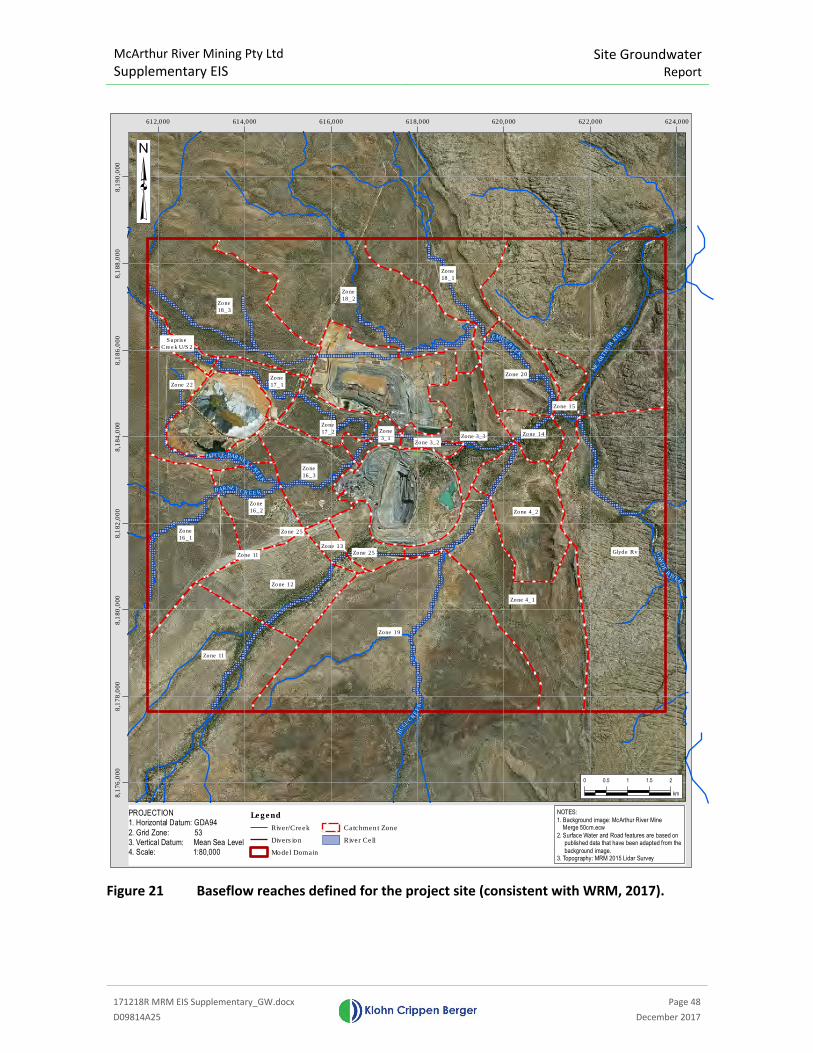
McArthur River Mining Pty Ltd
Supplementary EIS
Site Groundwater
Report
171218R MRM EIS Supplementary_GW.docx
Page 48
D09814A25 December 2017
Figure 21 Baseflow reaches defined for the project site (consistent with WRM, 2017).
MC
AR
TH
UR
RIV
E
R
LITTLE BARNEYCR
EEK
EMUCR
EEK
GLY
DE
RIVER
BU
LLC
RE
EK
BARNEY CR EEK
Zone 19
Zone 14
Zone
18_2
Zone
17_2
Zone
16_1
Glyde Rv
Zone
17_1
Zone 15
Zone
16_2
Zone 3_3
Zone 20
Zone 12
Zone
16_3
Zone 4_1
Zone 22
Zone 11
Zone 11
Zone 13
Zone
18_3
Zone 25
Zone 25
Suprise
Creek U/S2
Zone
3_1Zone 3_2
Zone 4_2
Zone
18_1
612,000 614,000 616,000 618,000 620,000 622,000 624,0008,1
76
,000
8,1
78
,000
8,1
80
,000
8,1
82
,000
8,1
84
,000
8,1
86
,000
8,1
88
,000
8,1
90
,000
0 0.5 1 1.5 2
km
Legend
River/Creek
Diversion
Model Domain
Catchment Zone
River Cell
NOTES:
1. Background image: McArthur River Mine Merge 50cm.ecw
2. Surface Water and Road features are based on published data that have been adapted from the
background image.3. Topography: MRM 2015 Lidar Survey
PROJECTION1. Horizontal Datum: GDA94
2. Grid Zone: 533. Vertical Datum: Mean Sea Level4. Scale: 1:80,000
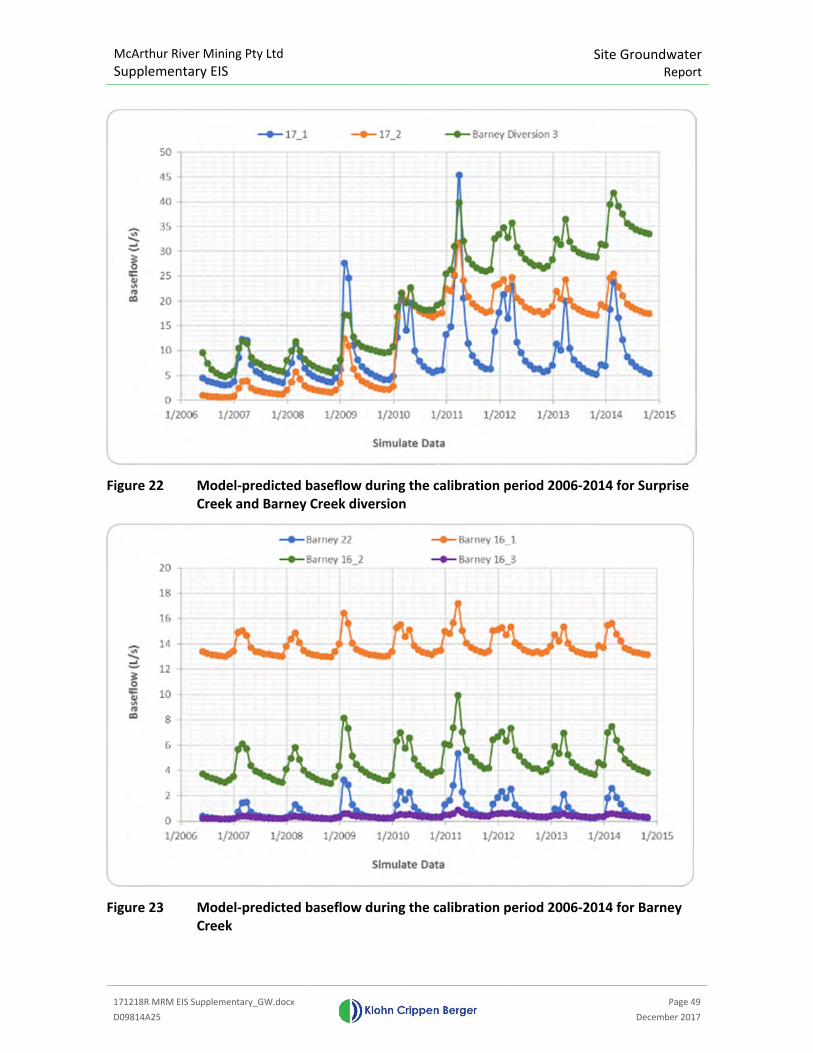
McArthur River Mining Pty Ltd
Supplementary EIS Site Groundwater
Report
171218R MRM EIS Supplementary_GW.docx
Page 49
D09814A25 December 2017
Figure 22 Model-predicted baseflow during the calibration period 2006-2014 for Surprise
Creek and Barney Creek diversion
Figure 23 Model-predicted baseflow during the calibration period 2006-2014 for Barney
Creek
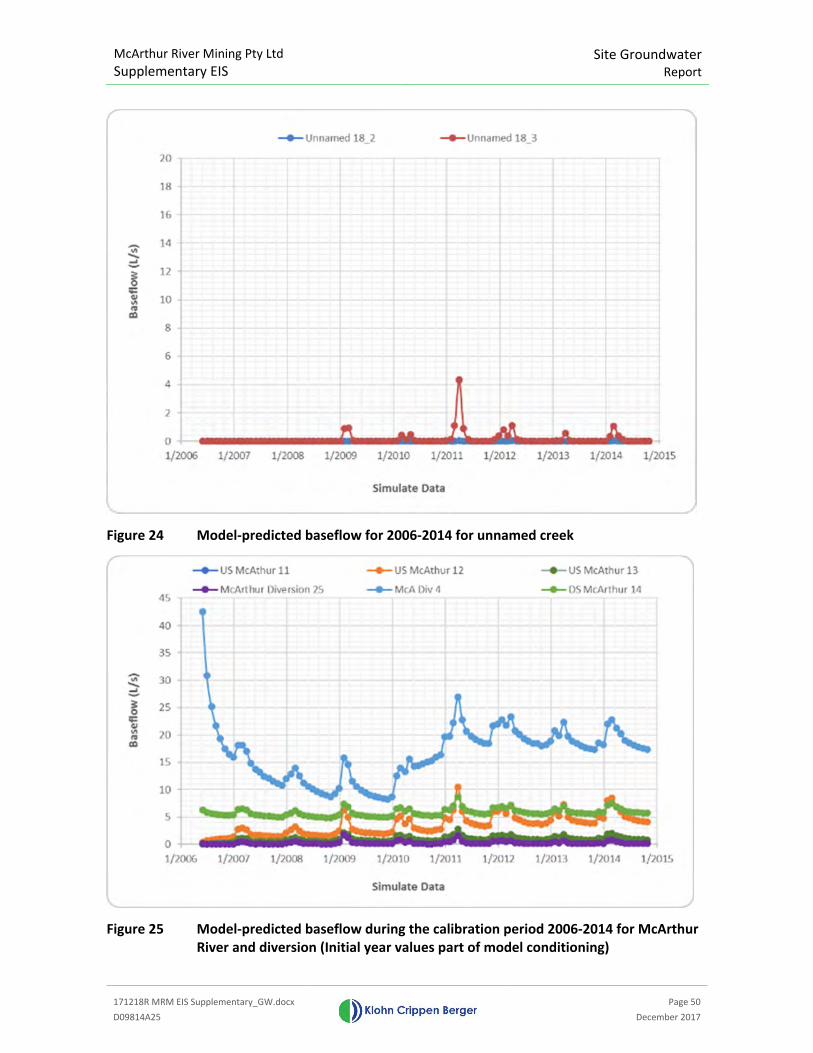
McArthur River Mining Pty Ltd
Supplementary EIS Site Groundwater
Report
171218R MRM EIS Supplementary_GW.docx
Page 50
D09814A25 December 2017
Figure 24 Model-predicted baseflow for 2006-2014 for unnamed creek
Figure 25 Model-predicted baseflow during the calibration period 2006-2014 for McArthur
River and diversion (Initial year values part of model conditioning)
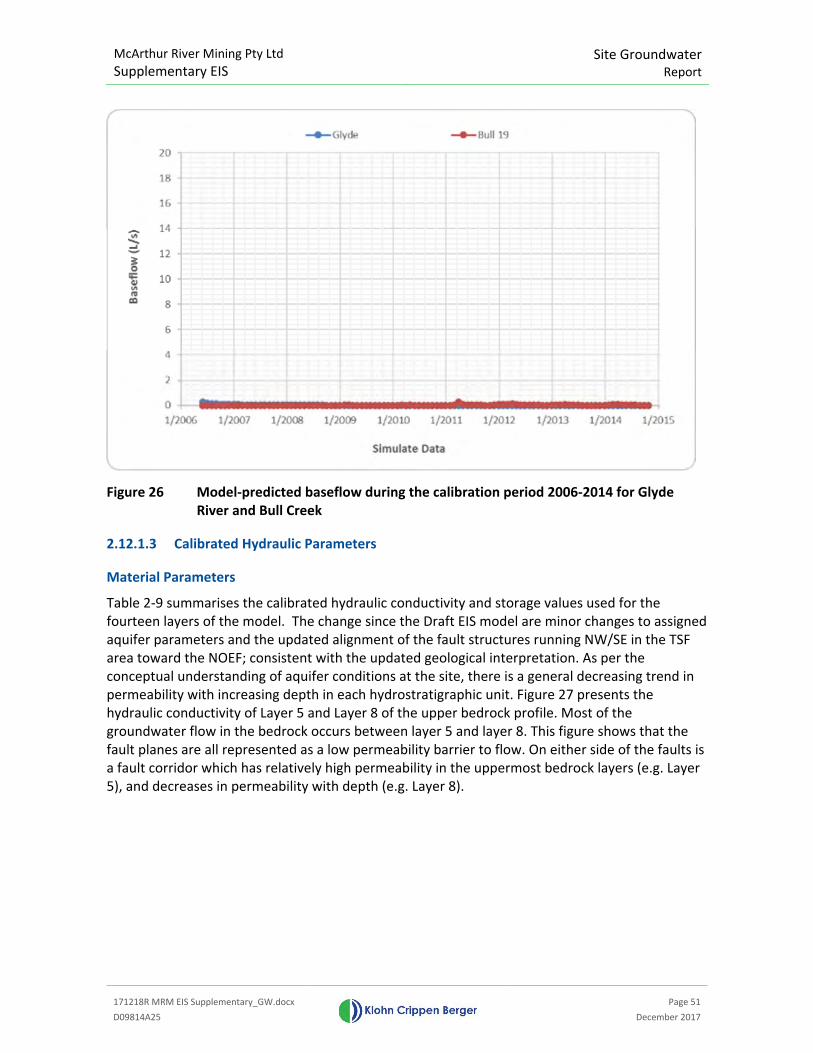
McArthur River Mining Pty Ltd
Supplementary EIS Site Groundwater
Report
171218R MRM EIS Supplementary_GW.docx
Page 51
D09814A25 December 2017
Figure 26 Model-predicted baseflow during the calibration period 2006-2014 for Glyde
River and Bull Creek
2.12.1.3 Calibrated Hydraulic Parameters
Material Parameters
Table 2-9 summarises the calibrated hydraulic conductivity and storage values used for the
fourteen layers of the model. The change since the Draft EIS model are minor changes to assigned
aquifer parameters and the updated alignment of the fault structures running NW/SE in the TSF
area toward the NOEF; consistent with the updated geological interpretation. As per the
conceptual understanding of aquifer conditions at the site, there is a general decreasing trend in
permeability with increasing depth in each hydrostratigraphic unit. Figure 27 presents the
hydraulic conductivity of Layer 5 and Layer 8 of the upper bedrock profile. Most of the
groundwater flow in the bedrock occurs between layer 5 and layer 8. This figure shows that the
fault planes are all represented as a low permeability barrier to flow. On either side of the faults is
a fault corridor which has relatively high permeability in the uppermost bedrock layers (e.g. Layer
5), and decreases in permeability with depth (e.g. Layer 8).
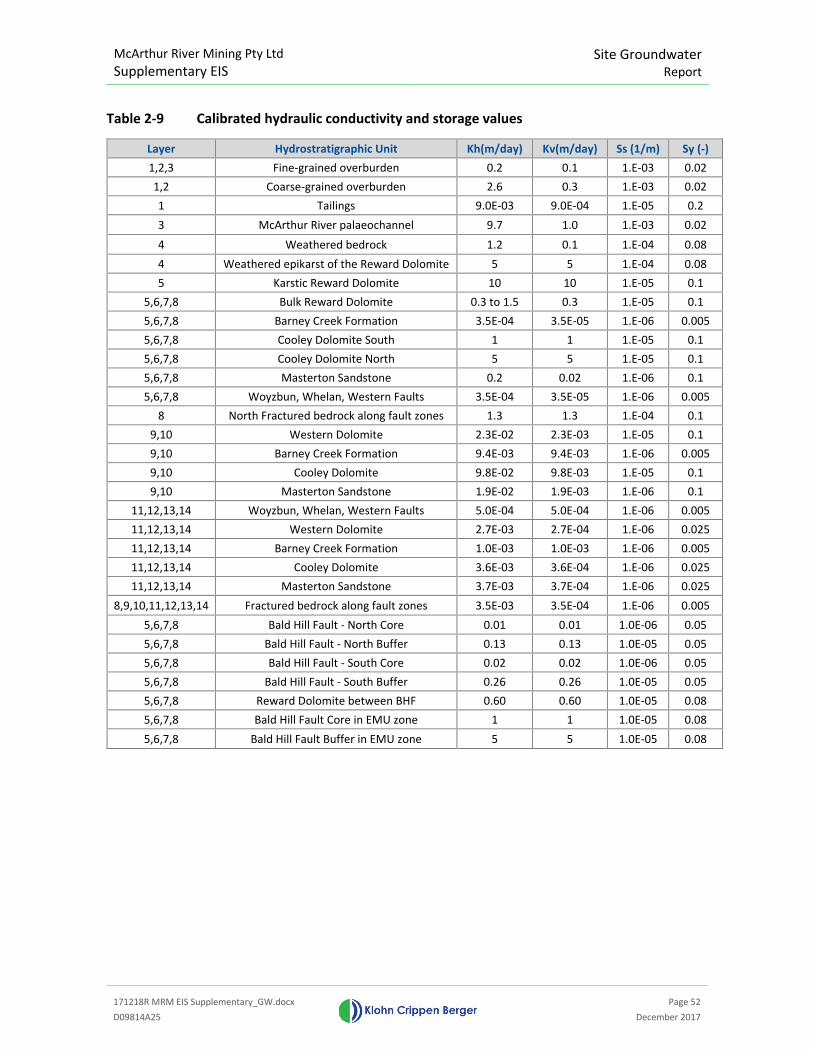
McArthur River Mining Pty Ltd
Supplementary EIS
Site Groundwater
Report
171218R MRM EIS Supplementary_GW.docx
Page 52
D09814A25 December 2017
Table 2-9 Calibrated hydraulic conductivity and storage values
Layer Hydrostratigraphic Unit Kh(m/day) Kv(m/day) Ss (1/m) Sy (-)
1,2,3 Fine-grained overburden 0.2 0.1 1.E-03 0.02
1,2 Coarse-grained overburden 2.6 0.3 1.E-03 0.02
1 Tailings 9.0E-03 9.0E-04 1.E-05 0.2
3 McArthur River palaeochannel 9.7 1.0 1.E-03 0.02
4 Weathered bedrock 1.2 0.1 1.E-04 0.08
4 Weathered epikarst of the Reward Dolomite 5 5 1.E-04 0.08
5 Karstic Reward Dolomite 10 10 1.E-05 0.1
5,6,7,8 Bulk Reward Dolomite 0.3 to 1.5 0.3 1.E-05 0.1
5,6,7,8 Barney Creek Formation 3.5E-04 3.5E-05 1.E-06 0.005
5,6,7,8 Cooley Dolomite South 1 1 1.E-05 0.1
5,6,7,8 Cooley Dolomite North 5 5 1.E-05 0.1
5,6,7,8 Masterton Sandstone 0.2 0.02 1.E-06 0.1
5,6,7,8 Woyzbun, Whelan, Western Faults 3.5E-04 3.5E-05 1.E-06 0.005
8 North Fractured bedrock along fault zones 1.3 1.3 1.E-04 0.1
9,10 Western Dolomite 2.3E-02 2.3E-03 1.E-05 0.1
9,10 Barney Creek Formation 9.4E-03 9.4E-03 1.E-06 0.005
9,10 Cooley Dolomite 9.8E-02 9.8E-03 1.E-05 0.1
9,10 Masterton Sandstone 1.9E-02 1.9E-03 1.E-06 0.1
11,12,13,14 Woyzbun, Whelan, Western Faults 5.0E-04 5.0E-04 1.E-06 0.005
11,12,13,14 Western Dolomite 2.7E-03 2.7E-04 1.E-06 0.025
11,12,13,14 Barney Creek Formation 1.0E-03 1.0E-03 1.E-06 0.005
11,12,13,14 Cooley Dolomite 3.6E-03 3.6E-04 1.E-06 0.025
11,12,13,14 Masterton Sandstone 3.7E-03 3.7E-04 1.E-06 0.025
8,9,10,11,12,13,14 Fractured bedrock along fault zones 3.5E-03 3.5E-04 1.E-06 0.005
5,6,7,8 Bald Hill Fault - North Core 0.01 0.01 1.0E-06 0.05
5,6,7,8 Bald Hill Fault - North Buffer 0.13 0.13 1.0E-05 0.05
5,6,7,8 Bald Hill Fault - South Core 0.02 0.02 1.0E-06 0.05
5,6,7,8 Bald Hill Fault - South Buffer 0.26 0.26 1.0E-05 0.05
5,6,7,8 Reward Dolomite between BHF 0.60 0.60 1.0E-05 0.08
5,6,7,8 Bald Hill Fault Core in EMU zone 1 1 1.0E-05 0.08
5,6,7,8 Bald Hill Fault Buffer in EMU zone 5 5 1.0E-05 0.08
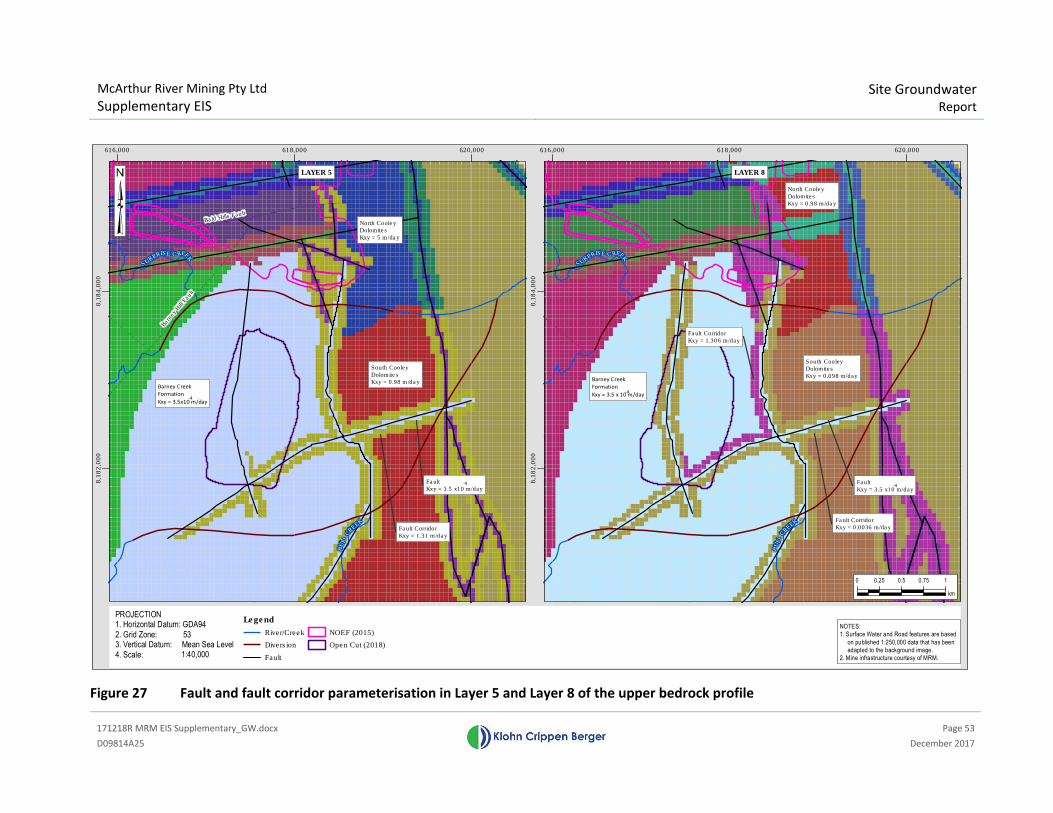
McArthur River Mining Pty Ltd
Supplementary EIS
Site Groundwater
Report
171218R MRM EIS Supplementary_GW.docx
Page 53
D09814A25 December 2017
Figure 27 Fault and fault corridor parameterisation in Layer 5 and Layer 8 of the upper bedrock profile
BU
LL
C
REEK
SURPRISE CREEK
616,000 618,000 620,000
8,1
82
,00
08,1
84
,00
0
BU
LL
C
REEK
SURPRISE CREEK
Bar
ney
Hill F
ault
Bald Hills Fault
616,000 618,000 620,000
8,1
82
,00
08,1
84
,00
0
0 0.25 0.5 0.75 1
km
PROJECTION1. Horizontal Datum: GDA94
2. Grid Zone: 533. Vertical Datum: Mean Sea Level
4. Scale: 1:40,000
NOTES:
1. Surface Water and Road features are based
on published 1:250,000 data that has been
adapted to the background image.
2. Mine infrastructure courtesy of MRM.
Legend
River/Creek
Diversion
Fault
NOEF (2015)
Open Cut (2018)
LAYER 5 LAYER 8
North CooleyDolomites
Kxy = 5 m/day
South Cooley
DolomitesKxy = 0.98 m/day
Fault
Kxy = 3.5 x10 m/day-4
Fault Corridor
Kxy = 1.31 m/day
Fault
Kxy = 3.5 x10 m/day-4
Barney Creek
Formation
Kxy = 3.5x10 m/day-4
Barney Creek
Formation
Kxy = 3.5 x 10 m/day
Fault CorridorKxy = 0.0036 m/day
North Cooley
Dolomites
Kxy = 0.98 m/day
South CooleyDolomites
Kxy = 0.098 m/day
-4
Fault Corridor
Kxy = 1.306 m/day
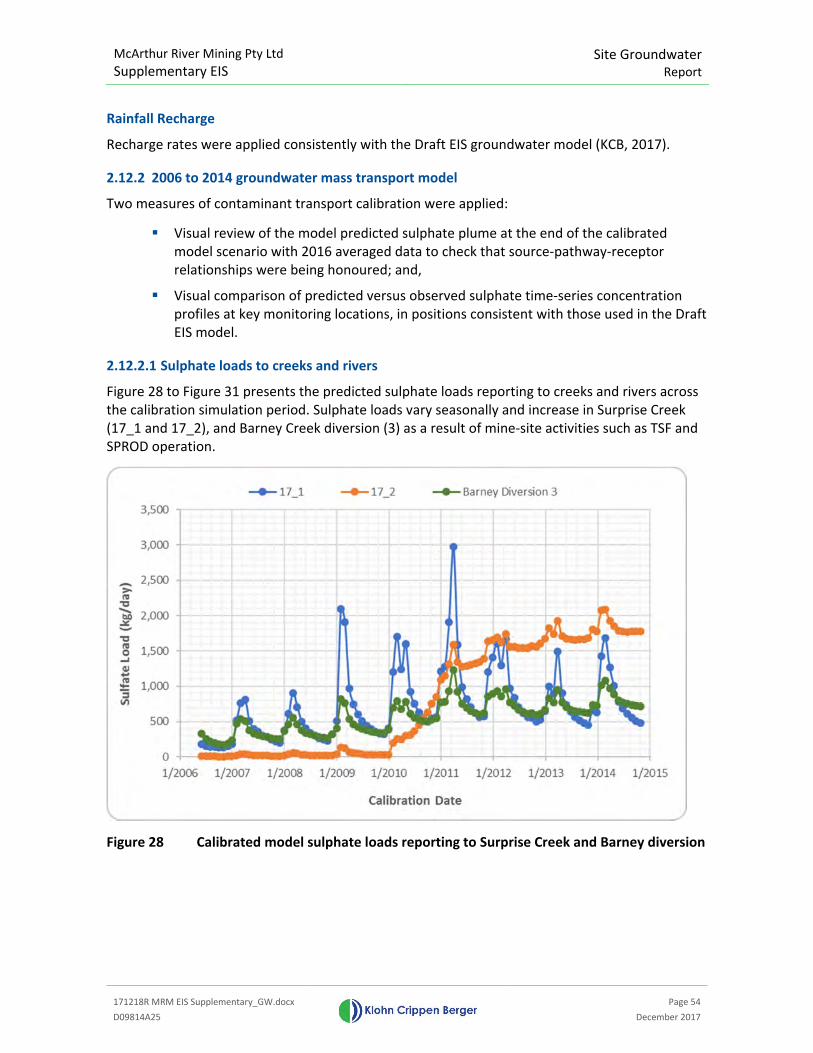
McArthur River Mining Pty Ltd
Supplementary EIS Site Groundwater
Report
171218R MRM EIS Supplementary_GW.docx
Page 54
D09814A25 December 2017
Rainfall Recharge
Recharge rates were applied consistently with the Draft EIS groundwater model (KCB, 2017).
2.12.2 2006 to 2014 groundwater mass transport model
Two measures of contaminant transport calibration were applied:
� Visual review of the model predicted sulphate plume at the end of the calibrated
model scenario with 2016 averaged data to check that source-pathway-receptor
relationships were being honoured; and,
� Visual comparison of predicted versus observed sulphate time-series concentration
profiles at key monitoring locations, in positions consistent with those used in the Draft
EIS model.
2.12.2.1 Sulphate loads to creeks and rivers
Figure 28 to Figure 31 presents the predicted sulphate loads reporting to creeks and rivers across
the calibration simulation period. Sulphate loads vary seasonally and increase in Surprise Creek
(17_1 and 17_2), and Barney Creek diversion (3) as a result of mine-site activities such as TSF and
SPROD operation.
Figure 28 Calibrated model sulphate loads reporting to Surprise Creek and Barney diversion
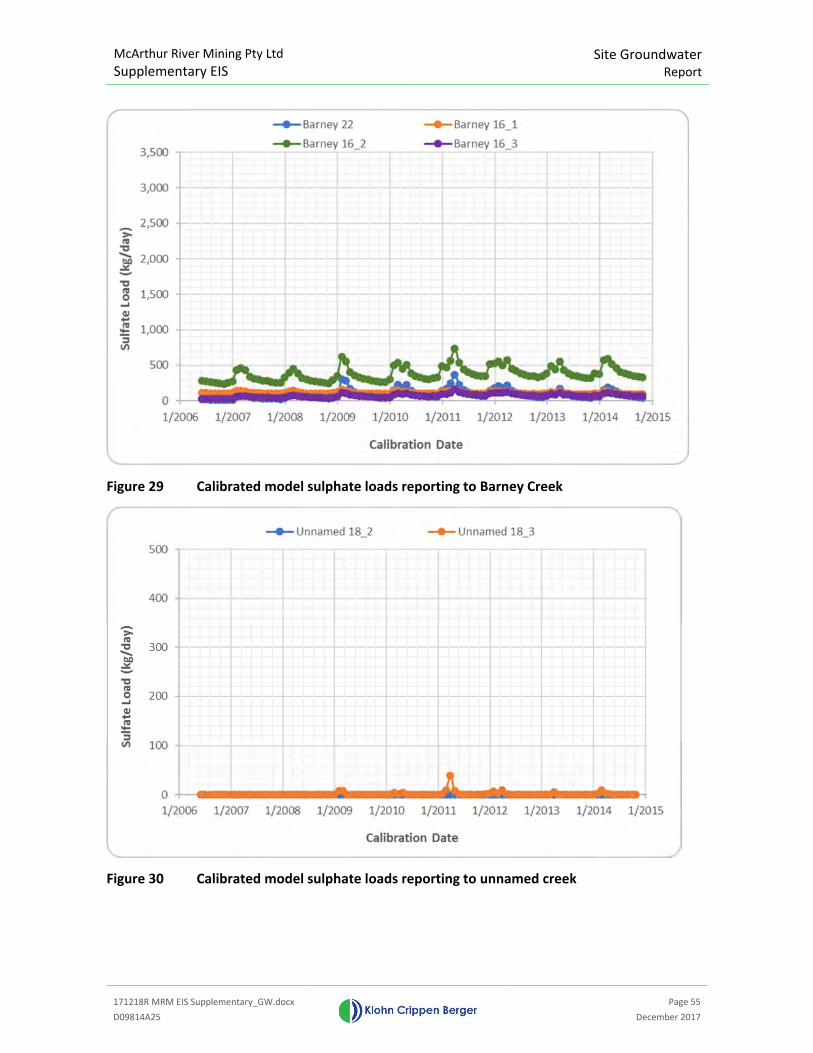
McArthur River Mining Pty Ltd
Supplementary EIS Site Groundwater
Report
171218R MRM EIS Supplementary_GW.docx
Page 55
D09814A25 December 2017
Figure 29 Calibrated model sulphate loads reporting to Barney Creek
Figure 30 Calibrated model sulphate loads reporting to unnamed creek
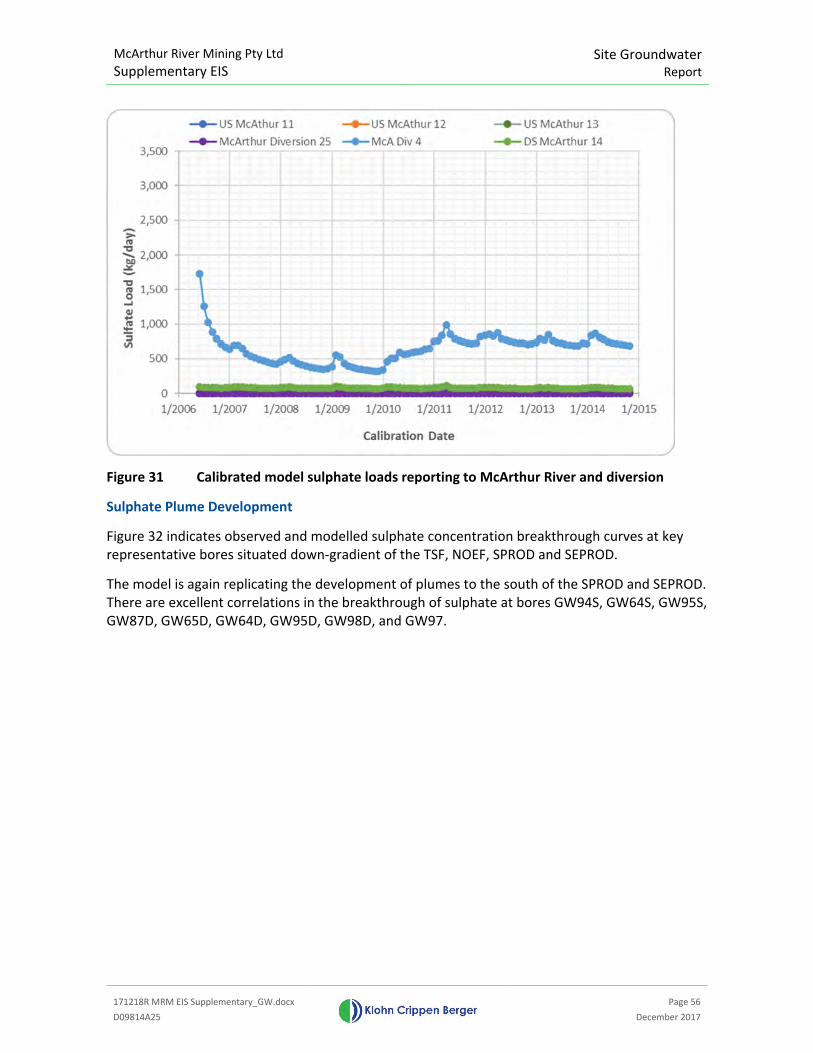
McArthur River Mining Pty Ltd
Supplementary EIS Site Groundwater
Report
171218R MRM EIS Supplementary_GW.docx
Page 56
D09814A25 December 2017
Figure 31 Calibrated model sulphate loads reporting to McArthur River and diversion
Sulphate Plume Development
Figure 32 indicates observed and modelled sulphate concentration breakthrough curves at key
representative bores situated down-gradient of the TSF, NOEF, SPROD and SEPROD.
The model is again replicating the development of plumes to the south of the SPROD and SEPROD.
There are excellent correlations in the breakthrough of sulphate at bores GW94S, GW64S, GW95S,
GW87D, GW65D, GW64D, GW95D, GW98D, and GW97.
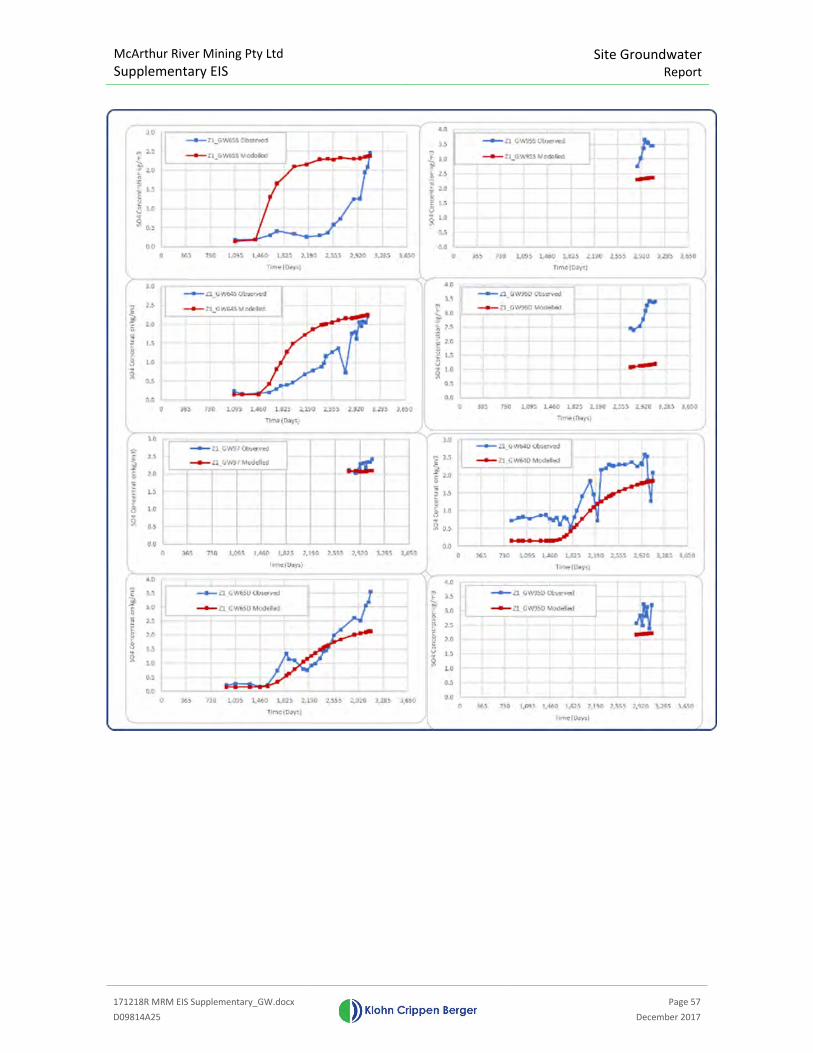
McArthur River Mining Pty Ltd
Supplementary EIS Site Groundwater
Report
171218R MRM EIS Supplementary_GW.docx
Page 57
D09814A25 December 2017
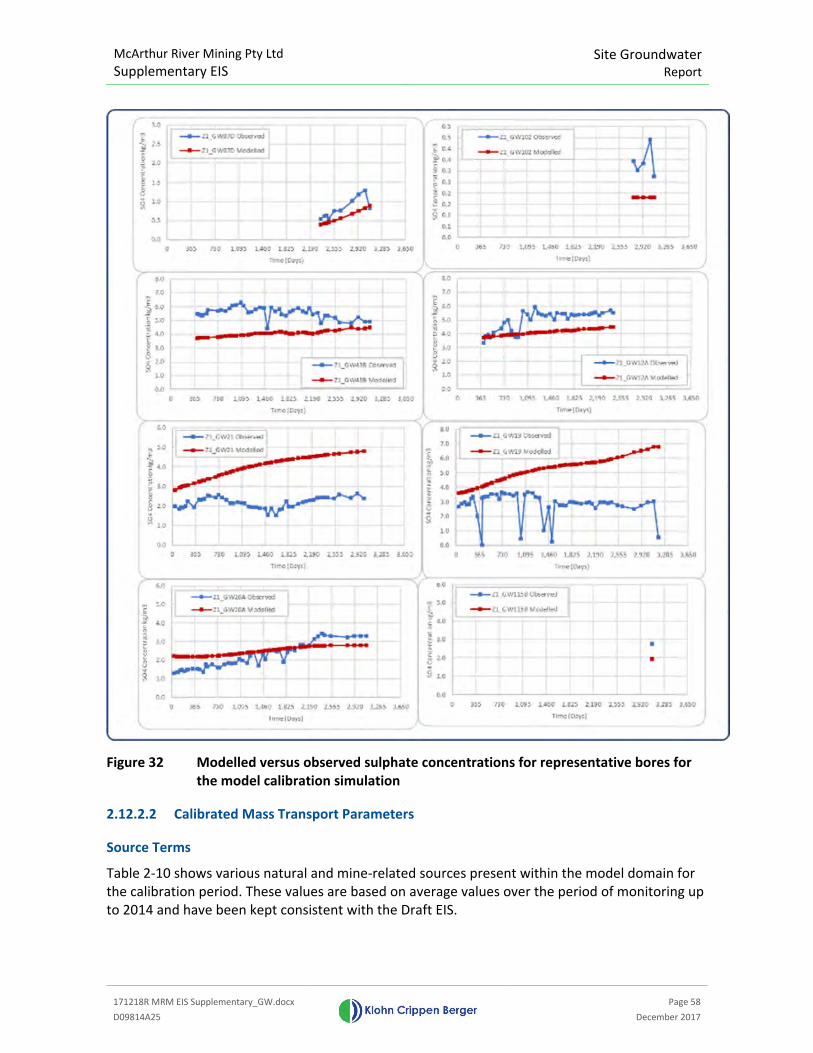
McArthur River Mining Pty Ltd
Supplementary EIS Site Groundwater
Report
171218R MRM EIS Supplementary_GW.docx
Page 58
D09814A25 December 2017
Figure 32 Modelled versus observed sulphate concentrations for representative bores for
the model calibration simulation
2.12.2.2 Calibrated Mass Transport Parameters
Source Terms
Table 2-10 shows various natural and mine-related sources present within the model domain for
the calibration period. These values are based on average values over the period of monitoring up
to 2014 and have been kept consistent with the Draft EIS.

McArthur River Mining Pty Ltd
Supplementary EIS
Site Groundwater
Report
171218R MRM EIS Supplementary_GW.docx
Page 59
D09814A25 December 2017
Table 2-10 Sulphate source terms applied to calibration simulation from 2006 to 2014
Sulphate Source Concentration (mg/L)
TSF Cells 1 and 2 15,000
Barney Creek mineralised zone 2,500
Emu Creek mineralised zone 1500
Cooley mineralised zone 600-2,000
NOEF 12,000
SPROD 2,500
SPSD 3,500
SEPROD 5,200
WOEF 6,500
ELS 2,300
VDD 2,100
OMR 530
2.13 Approach to Life of Mine simulations
Life of mine (LOM) model runs were established for the period 2015 to 2037 to represent the
transient conditions of the mine as defined by the project description snapshots for 2018, 2022,
2027, 2032 and 2037. These have been kept consistent with the Draft EIS.
2.13.1 Stress periods
The model was simulated at monthly stress periods for the LOM period. The monthly stress
periods allow seasonal recharge rates to be applied to the model such that baseflow discharge to
creeks and rivers adequately represented the wet and dry season conditions, including the
transition periods between seasons.
2.13.2 Contaminants of Concern
Sulphate, zinc, arsenic, cadmium and lead were modelled as parameters of interest, consistent
with the Draft EIS.
2.13.3 Pit drains
Pit shell snapshots were provided by MRM for 2018, 2022, 2027, 2032 and 2037 for the
progressively expanding open cut mine. The open pit was modelled as drain cells placed across all
model layers which exist between the base of the open cut and the ground surface, for each time
snapshot in the project description. The same approach was applied as for the Draft EIS.
At the completion of mining (and after tailings have been placed in-pit), drain cells were
deactivated and the material properties of the void reinstated as a high storage value (Specific
Yield of 0.99) and a high hydraulic conductivity of 100 m/day in the pit void above the tailings. This
is consistent with the Draft EIS.
2.13.4 Recharge
Natural recharge rates were applied at the calibrated infiltration rates, consistent with the Draft
EIS. The long-term 125 year SILO climate dataset was used to define monthly average values for
recharge.
McArthur River Mining Pty Ltd
Supplementary EIS
Site Groundwater
Report
171218R MRM EIS Supplementary_GW.docx
Page 60
D09814A25 December 2017
2.13.5 Climate Change
Climate change projections for MRM were developed by WRM (2016). These have been applied
consistently for the groundwater modelling assessments as per the Draft EIS (Appendix D of the
Draft EIS).
2.13.6 Seepage
2.13.6.1 Water management dam seepage
Monthly time-varying seepage rates were provided for each water management dam for the LOM
(see WRM, 2017). The seepage rates were applied directly to the water table as time-varying
recharge with a source term for each contaminant of concern. This approach is deemed
conservative from a mass transport perspective, as all of the load seeping from each dam is input
directly to the aquifer without any loss in the unsaturated zone
2.13.7 OEF seepage
There are five major OEFs in the mining area over the LOM: NOEF, SOEF, WOEF, EOEF PAF(HW)
and LGO. Table 2-11 summarises the OEFs that have been modelled and the assumptions for
seepage and water quality.
Table 2-11 OEF seepage assumptions for life of mine
OEF
Net
percolation
(% of rainfall)
Foundation
seepage Toe seepage
Source of
foundation
seepage
water quality
Start time End Time
NOEF
Based on
TOUGH2
foundation
seepage
Assigned
based on
TOUGH2
Assigned
based on
TOUGH2
NOEF Water
Quality Model
results
LOM Permanent
SOEF 35% 50% of NP 50% of NP
NOEF Water
Quality Model
results
2015 2042
WOEF
25% from
2006 to 2042;
6% from 2042
onwards after
cover
100% of NP -
NOEF Water
Quality Model
results
LOM Permanent
EOEF
PAF(HW) 5.5% 50% of NP 50% of NP
NOEF Water
Quality Model
results
2019 2042
LGO 15% 50% of NP 50% of NP
NOEF Water
Quality Model
results
2022 2038
2.13.7.1 TSF seepage
Monthly time-varying seepage rates for the LOM were extracted from the TSF seepage mitigation
design groundwater model for Cell 1 and Cell 2 of the TSF, as well as the water management dams
(Figure 33). Details of this modelling are documented in Appendix II of the Draft EIS. Seepage from
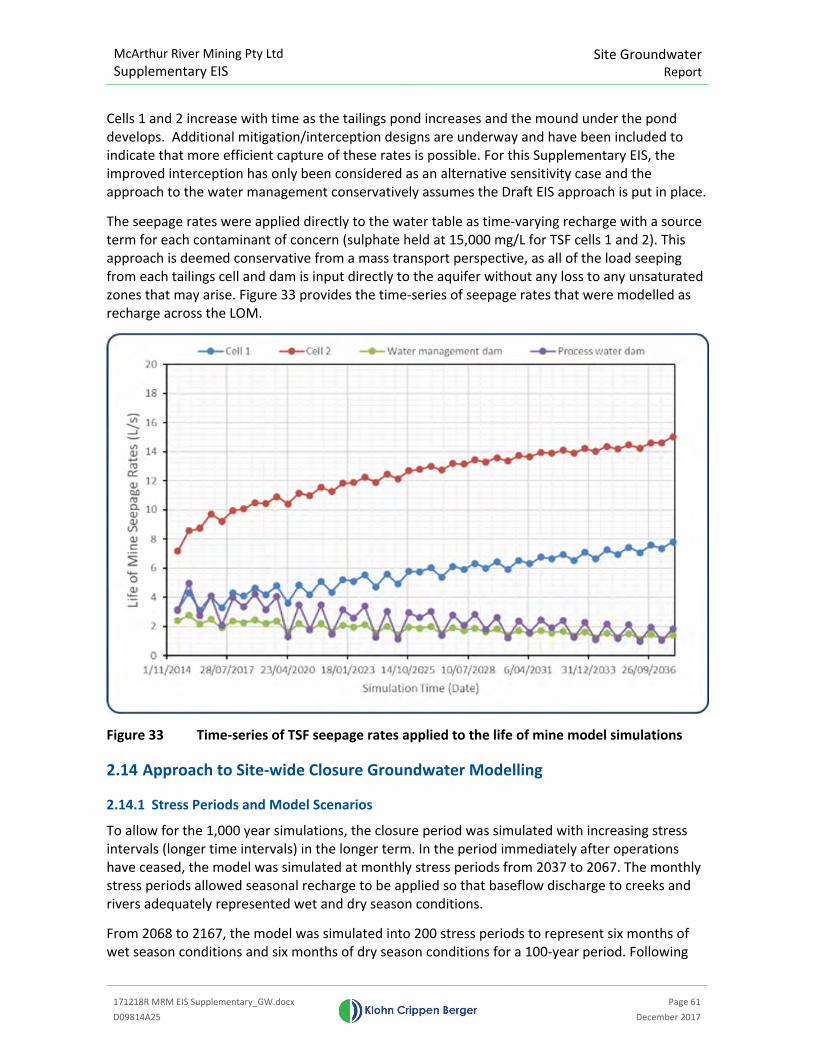
McArthur River Mining Pty Ltd
Supplementary EIS Site Groundwater
Report
171218R MRM EIS Supplementary_GW.docx
Page 61
D09814A25 December 2017
Cells 1 and 2 increase with time as the tailings pond increases and the mound under the pond
develops. Additional mitigation/interception designs are underway and have been included to
indicate that more efficient capture of these rates is possible. For this Supplementary EIS, the
improved interception has only been considered as an alternative sensitivity case and the
approach to the water management conservatively assumes the Draft EIS approach is put in place.
The seepage rates were applied directly to the water table as time-varying recharge with a source
term for each contaminant of concern (sulphate held at 15,000 mg/L for TSF cells 1 and 2). This
approach is deemed conservative from a mass transport perspective, as all of the load seeping
from each tailings cell and dam is input directly to the aquifer without any loss to any unsaturated
zones that may arise. Figure 33 provides the time-series of seepage rates that were modelled as
recharge across the LOM.
Figure 33 Time-series of TSF seepage rates applied to the life of mine model simulations
2.14 Approach to Site-wide Closure Groundwater Modelling
2.14.1 Stress Periods and Model Scenarios
To allow for the 1,000 year simulations, the closure period was simulated with increasing stress
intervals (longer time intervals) in the longer term. In the period immediately after operations
have ceased, the model was simulated at monthly stress periods from 2037 to 2067. The monthly
stress periods allowed seasonal recharge to be applied so that baseflow discharge to creeks and
rivers adequately represented wet and dry season conditions.
From 2068 to 2167, the model was simulated into 200 stress periods to represent six months of
wet season conditions and six months of dry season conditions for a 100-year period. Following
McArthur River Mining Pty Ltd
Supplementary EIS
Site Groundwater
Report
171218R MRM EIS Supplementary_GW.docx
Page 62
D09814A25 December 2017
this 100-year closure simulation a final long-term simulation was run from 2168 to 3048, to
present results for the 1,000 years of closure. The rest of the long-term simulation is consistent
with the Draft EIS model (KCB, 2017) and considers the changes to the groundwater environment,
ongoing contaminant migration (which includes consideration of diffusion over the entire
simulation period).
2.14.2 Contaminants of Concern
Sulphate, zinc, arsenic, cadmium and lead were again modelled for the closure simulations.
2.14.3 Pit
Active dewatering of the open cut was simulated with pit drains until 2047. After tailings
placement, the open cut drains are switched off and the pit is modelled as an open void with a
high permeability (100 m/day in the void above the tailings) and high storage (SY of 0.99).
2.14.4 Mine Pit Lake Recovery
A time-varying constant head boundary was activated at the base of the open cut void to match
the recovering mine pit lake level that was modelled in the GoldSim final void model. This
included iterations between the final void model and the groundwater model to align heads and
groundwater inflow rates between the models. A seasonally variable mine pit lake was modelled
from 2048 to 2167. After 2168, the mine pit lake level was held constant at ~16.9 mAHD (based on
the water ways and final void model); the final void model and the waterways model provide the
detailed water balance after this period.
2.14.5 Production borefields
The borefields are considered to be decommissioned in 2037.
2.14.6 Recharge
The values used were the same as the Draft EIS model. For the closure simulation, the climate
sequence was consistent with the base case climatic sequence used for the surface water (WRM,
2017) modelling; this is consistent with the final void modelling.
2.14.7 Seepage
2.14.7.1 Water management dam seepage
Water management is consistent with the Draft EIS groundwater model, apart from the changes
to the WMD and PWD adjacent to the TSF. These facilities have been modelled consistently with
the design values for liners and seepage (see WRM, 2017).
2.14.7.2 OEF seepage other than the NOEF
Values used in the Draft EIS model have been implemented for this round of modelling.
2.14.7.3 TSF seepage
Monthly time-varying seepage for the closure period was extracted from the updated TSF seepage
mitigation design groundwater model for the TSF, as well as the water management dams (KCB,

McArthur River Mining Pty Ltd
Supplementary EIS
Site Groundwater
Report
171218R MRM EIS Supplementary_GW.docx
Page 63
D09814A25 December 2017
2016). These seepage rates take account of the decreasing decant pond height as tailings is
reprocessed and disposed of in the open cut. Post-2047, the model simulations assume that the
tailings have been completely removed and that natural recharge conditions return once the area
has been rehabilitated.
The seepage rates from 2038 to 2047 were applied directly to the water table as time-varying
recharge with a source term for each contaminant of concern.
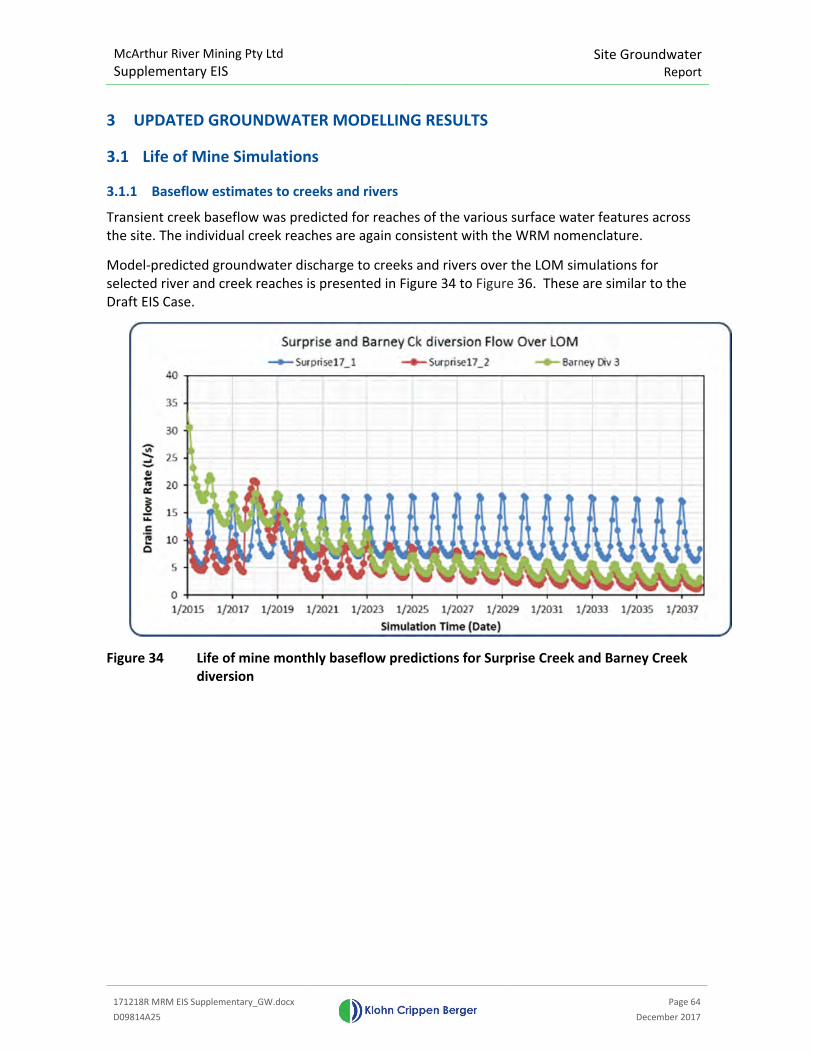
McArthur River Mining Pty Ltd
Supplementary EIS Site Groundwater
Report
171218R MRM EIS Supplementary_GW.docx
Page 64
D09814A25 December 2017
3 UPDATED GROUNDWATER MODELLING RESULTS
3.1 Life of Mine Simulations
3.1.1 Baseflow estimates to creeks and rivers
Transient creek baseflow was predicted for reaches of the various surface water features across
the site. The individual creek reaches are again consistent with the WRM nomenclature.
Model-predicted groundwater discharge to creeks and rivers over the LOM simulations for
selected river and creek reaches is presented in Figure 34 to Figure 36. These are similar to the
Draft EIS Case.
Figure 34 Life of mine monthly baseflow predictions for Surprise Creek and Barney Creek
diversion
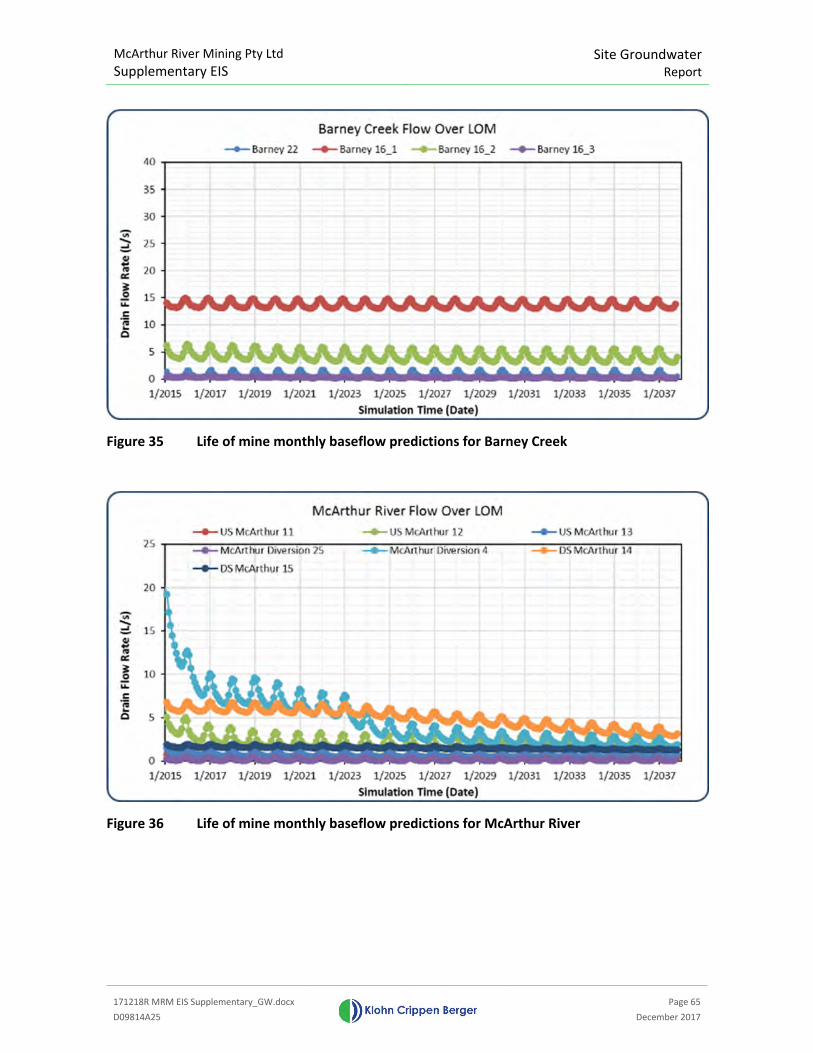
McArthur River Mining Pty Ltd
Supplementary EIS Site Groundwater
Report
171218R MRM EIS Supplementary_GW.docx
Page 65
D09814A25 December 2017
Figure 35 Life of mine monthly baseflow predictions for Barney Creek
Figure 36 Life of mine monthly baseflow predictions for McArthur River
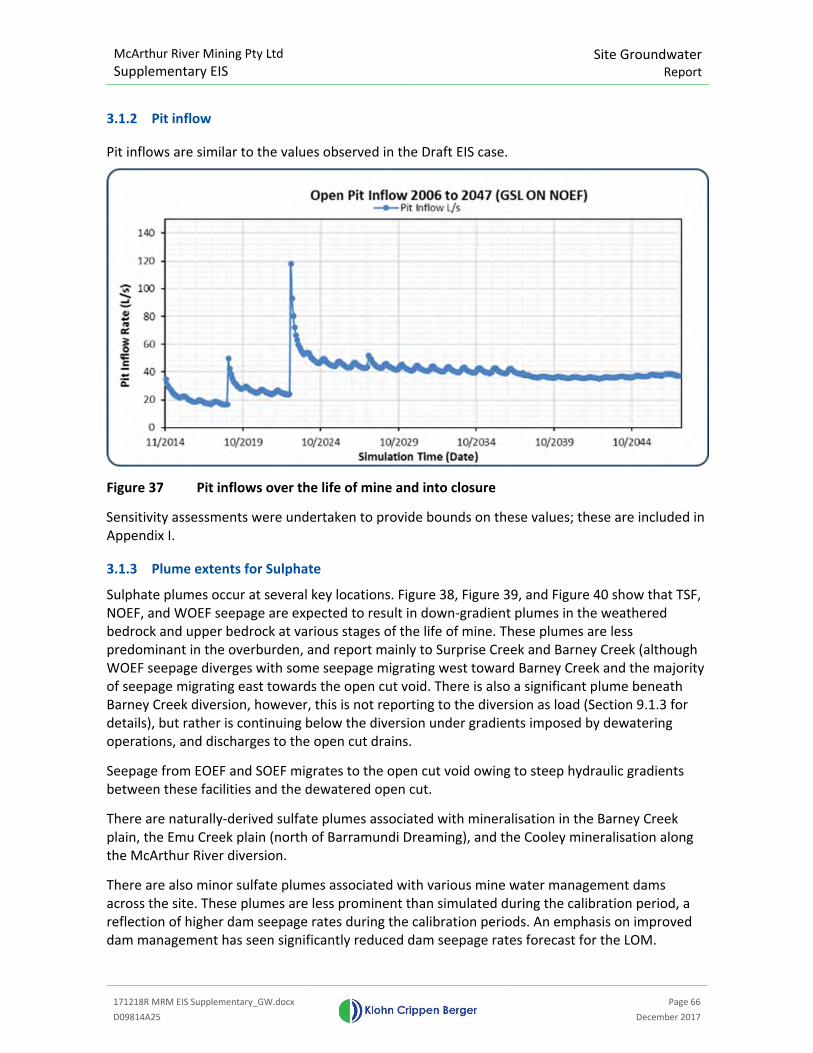
McArthur River Mining Pty Ltd
Supplementary EIS Site Groundwater
Report
171218R MRM EIS Supplementary_GW.docx
Page 66
D09814A25 December 2017
3.1.2 Pit inflow
Pit inflows are similar to the values observed in the Draft EIS case.
Figure 37 Pit inflows over the life of mine and into closure
Sensitivity assessments were undertaken to provide bounds on these values; these are included in
Appendix I.
3.1.3 Plume extents for Sulphate
Sulphate plumes occur at several key locations. Figure 38, Figure 39, and Figure 40 show that TSF,
NOEF, and WOEF seepage are expected to result in down-gradient plumes in the weathered
bedrock and upper bedrock at various stages of the life of mine. These plumes are less
predominant in the overburden, and report mainly to Surprise Creek and Barney Creek (although
WOEF seepage diverges with some seepage migrating west toward Barney Creek and the majority
of seepage migrating east towards the open cut void. There is also a significant plume beneath
Barney Creek diversion, however, this is not reporting to the diversion as load (Section 9.1.3 for
details), but rather is continuing below the diversion under gradients imposed by dewatering
operations, and discharges to the open cut drains.
Seepage from EOEF and SOEF migrates to the open cut void owing to steep hydraulic gradients
between these facilities and the dewatered open cut.
There are naturally-derived sulfate plumes associated with mineralisation in the Barney Creek
plain, the Emu Creek plain (north of Barramundi Dreaming), and the Cooley mineralisation along
the McArthur River diversion.
There are also minor sulfate plumes associated with various mine water management dams
across the site. These plumes are less prominent than simulated during the calibration period, a
reflection of higher dam seepage rates during the calibration periods. An emphasis on improved
dam management has seen significantly reduced dam seepage rates forecast for the LOM.

McArthur River Mining Pty Ltd
Supplementary EIS
Site Groundwater
Report
171218R MRM EIS Supplementary_GW.docx
Page 67
D09814A25 December 2017
3.1.4 Plume extents for metals
The migration of the contaminants of concern will be primarily controlled by advection and
dispersion within the aquifer pathways. Sulphate is a conservative parameter (i.e. not assumed to
be subject to reaction processes and attenuation) and as such its plume migration will represent
the maximum extents for the given source-pathway-receptor model. The metal parameters (As,
Cd, Pb and Zn), however, are attenuated in the aquifer matrix during migration through the
aquifer pathway and therefore, their plume extents are contracted in comparison to sulphate. To
illustrate the influence of attenuation, select LOM snapshots of the Zn1 plume have been
presented in Figure 41, Figure 42, and Figure 43. Comparison of sulphate plumes (Figure 38 to
Figure 40 ) with the migration of Zn (Figure 41 to Figure 43) shows that the sulphate plume has
migrated from the various mine sources (TSF, NOEF) to the down-gradient creeks and rivers
relatively quickly (i.e. in the order of several years), while the metal plumes have not migrated far
beyond the original sources during mining operations in the same period.
Additional contour plots to show concentrations over time are provided in Appendix IV for:
� Sulphate in the overburden and weathered bedrock every decade up to 2100.
� Sulphate in the upper and lower bedrock at 2030, 2050 and 2100 (reduced intervals due to
lower rates of migration in these deeper units).
� Zinc in the overburden and weathered bedrock every decade up to 2100.
� Zinc in the upper and lower bedrock at 2030, 2050 and 2100 (reduced intervals due to
lower rates of migration in these deeper units).
1 Zinc has the lowest Kd values of the four metals modelled, and as such will show the onset of plume migration
before the other three metals, as As, Cd and Pb all exhibit a greater tendency to sorb, based on the site-specific Kd
values.
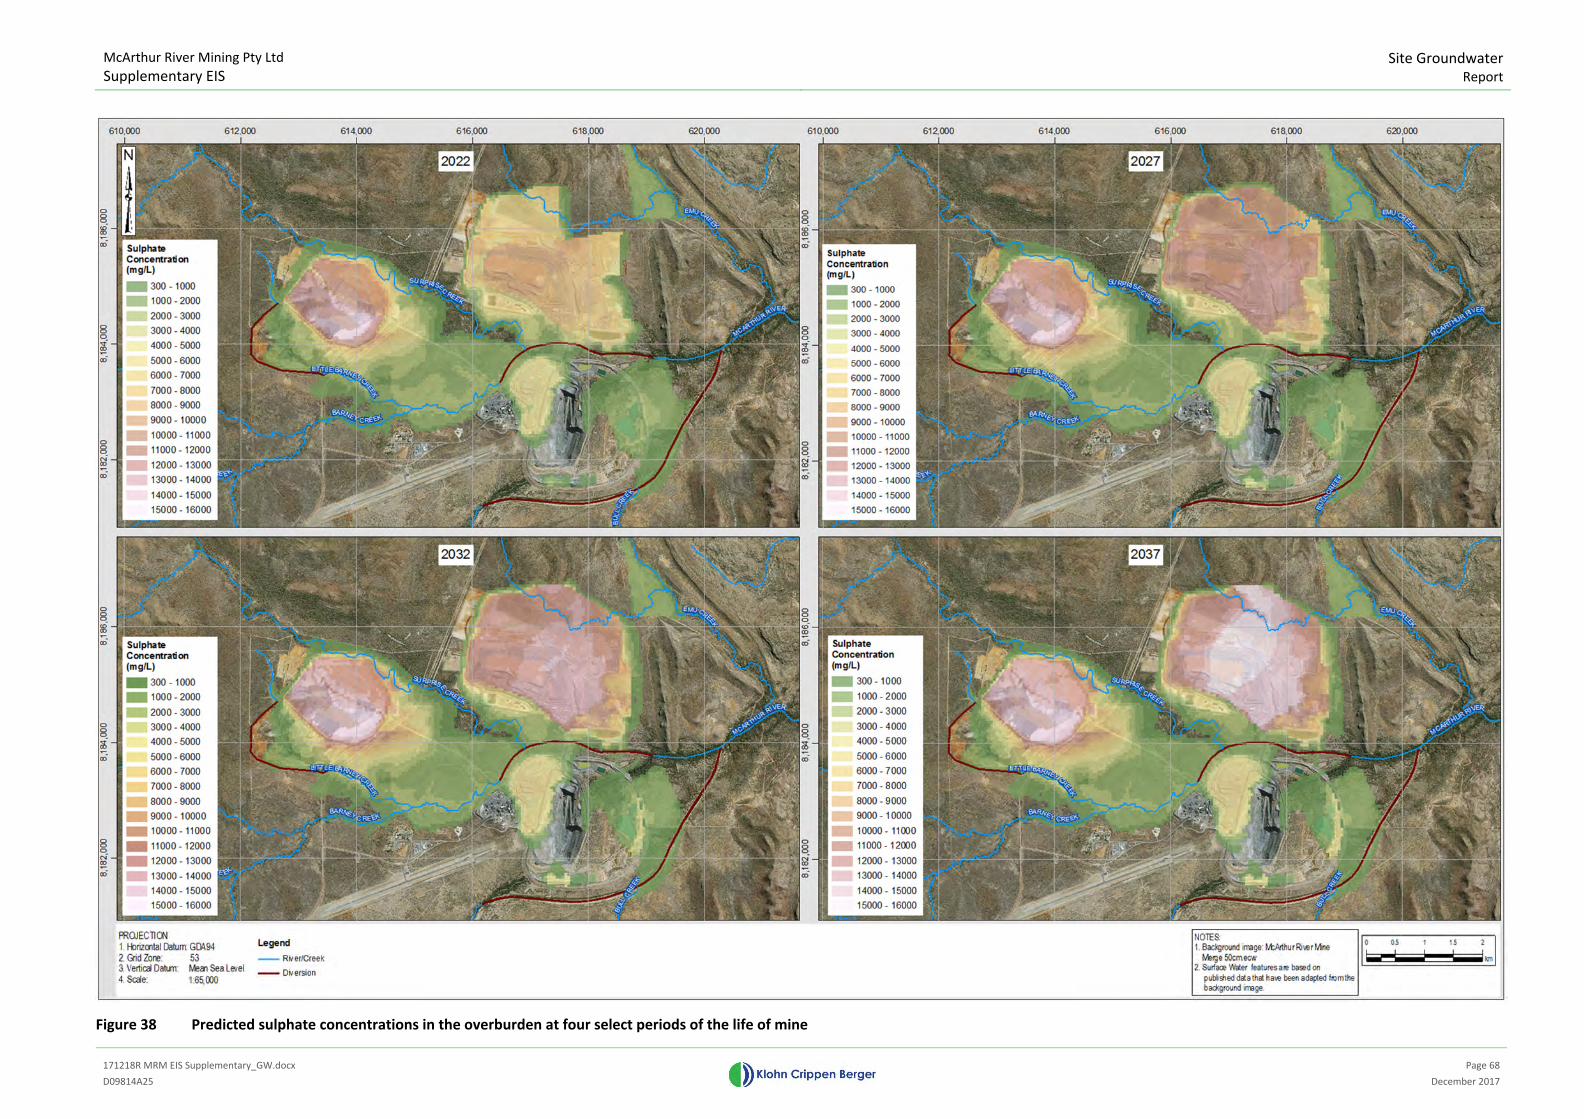
McArthur River Mining Pty Ltd
Supplementary EIS
Site Groundwater
Report
171218R MRM EIS Supplementary_GW.docx
Page 68
D09814A25 December 2017
Figure 38 Predicted sulphate concentrations in the overburden at four select periods of the life of mine
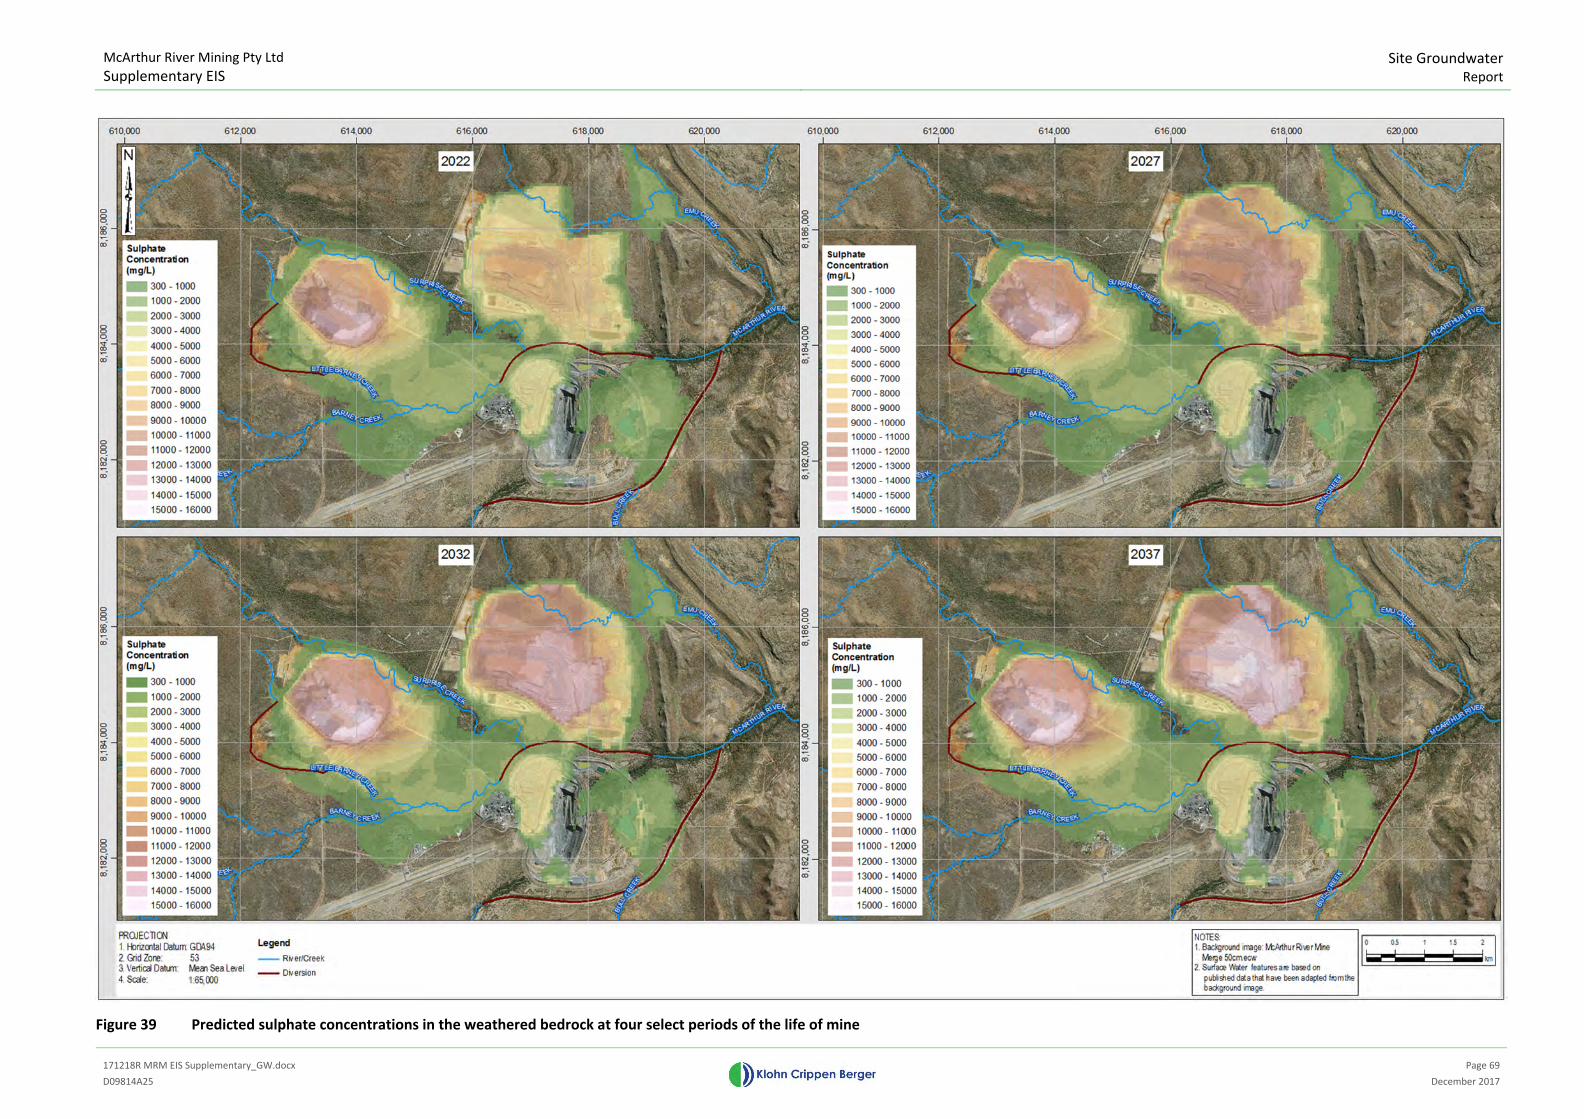
McArthur River Mining Pty Ltd
Supplementary EIS
Site Groundwater
Report
171218R MRM EIS Supplementary_GW.docx
Page 69
D09814A25 December 2017
Figure 39 Predicted sulphate concentrations in the weathered bedrock at four select periods of the life of mine
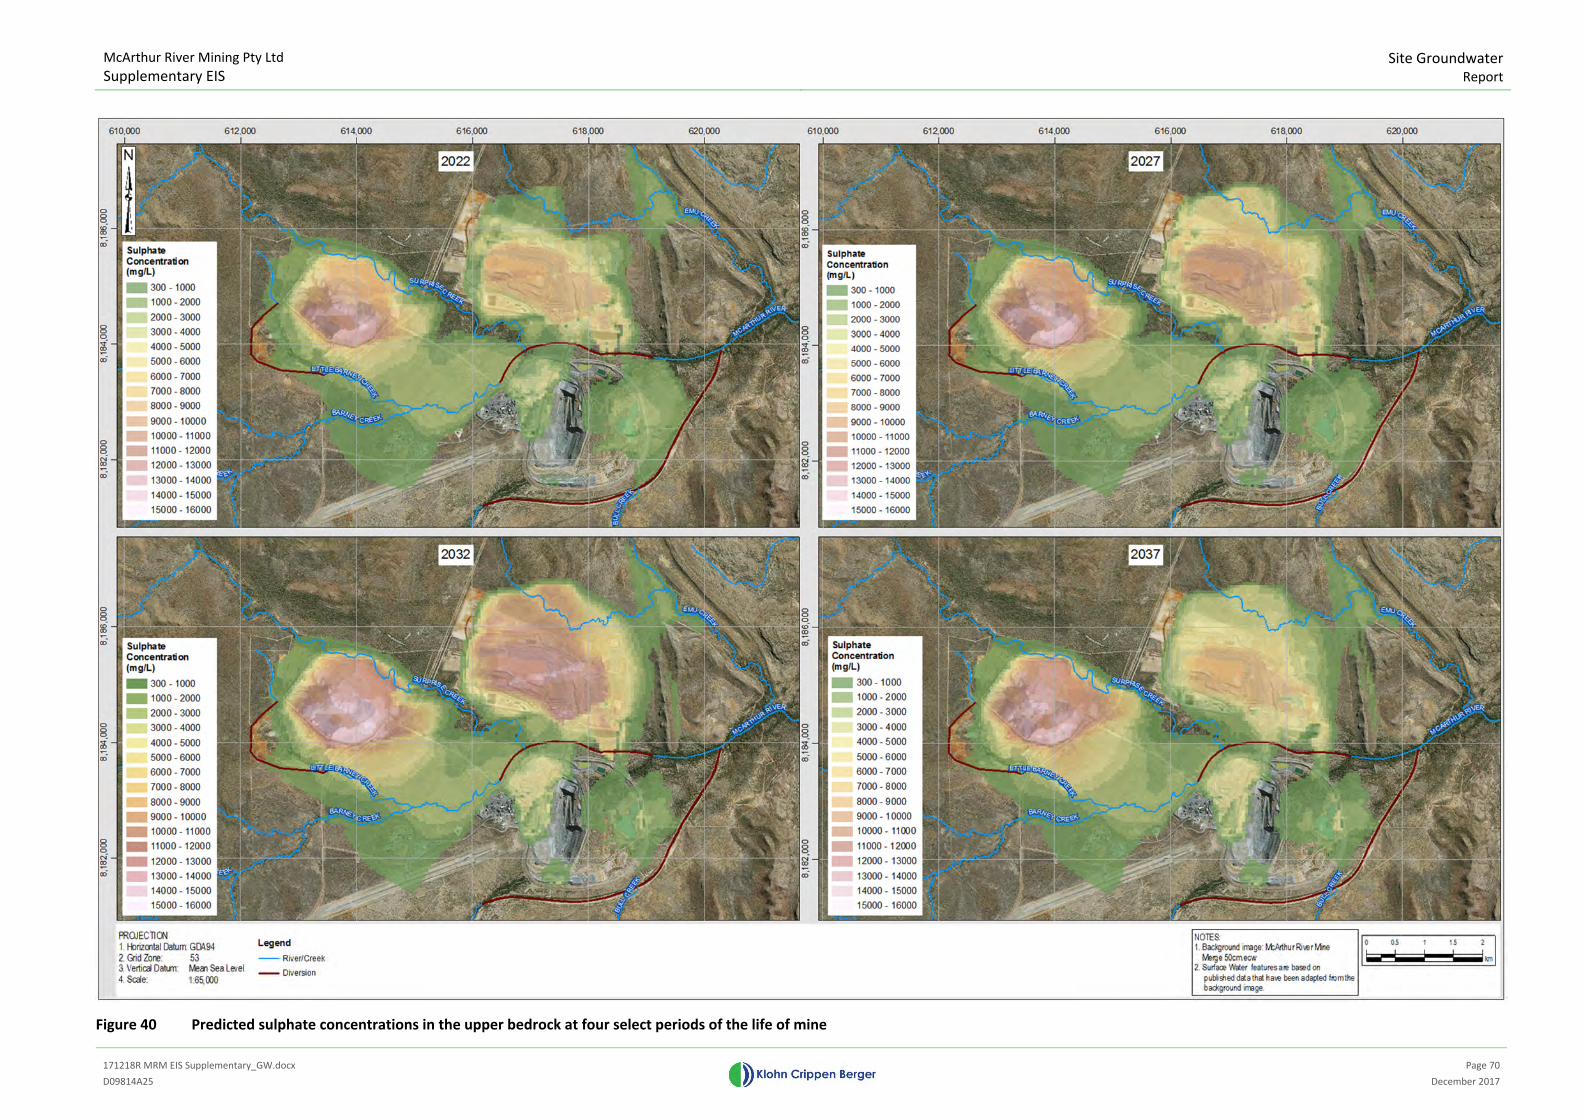
McArthur River Mining Pty Ltd
Supplementary EIS
Site Groundwater
Report
171218R MRM EIS Supplementary_GW.docx
Page 70
D09814A25 December 2017
Figure 40 Predicted sulphate concentrations in the upper bedrock at four select periods of the life of mine
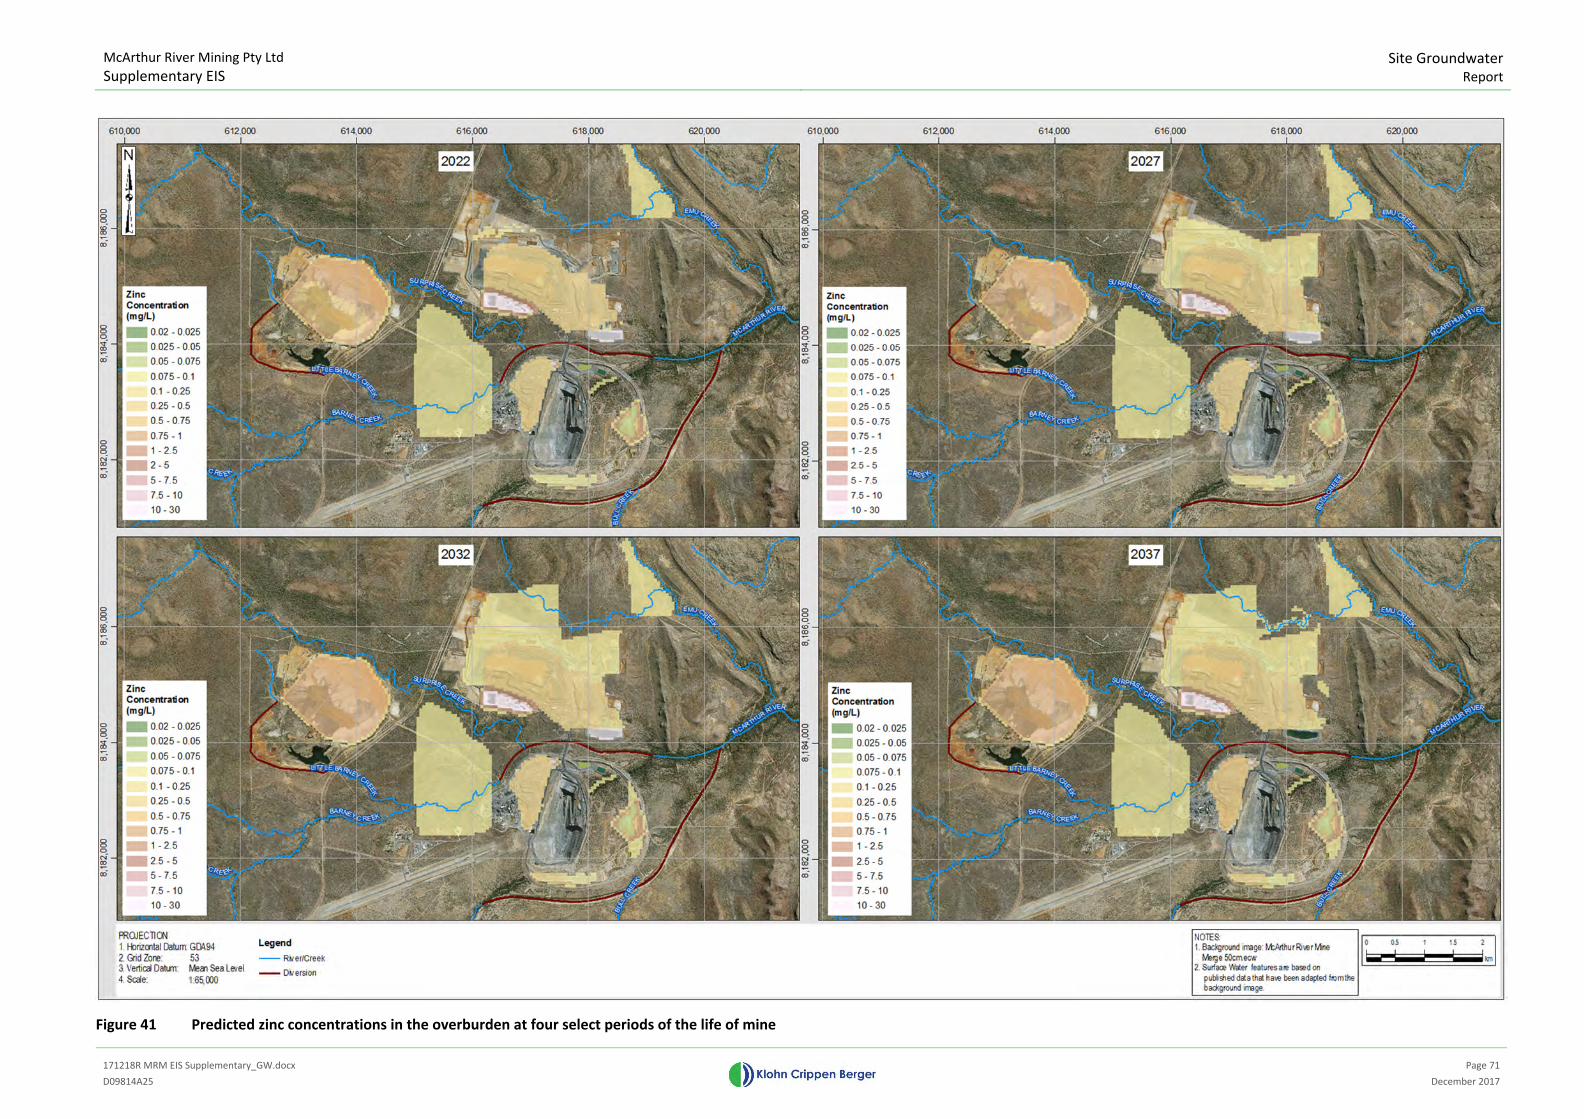
McArthur River Mining Pty Ltd
Supplementary EIS
Site Groundwater
Report
171218R MRM EIS Supplementary_GW.docx
Page 71
D09814A25 December 2017
Figure 41 Predicted zinc concentrations in the overburden at four select periods of the life of mine
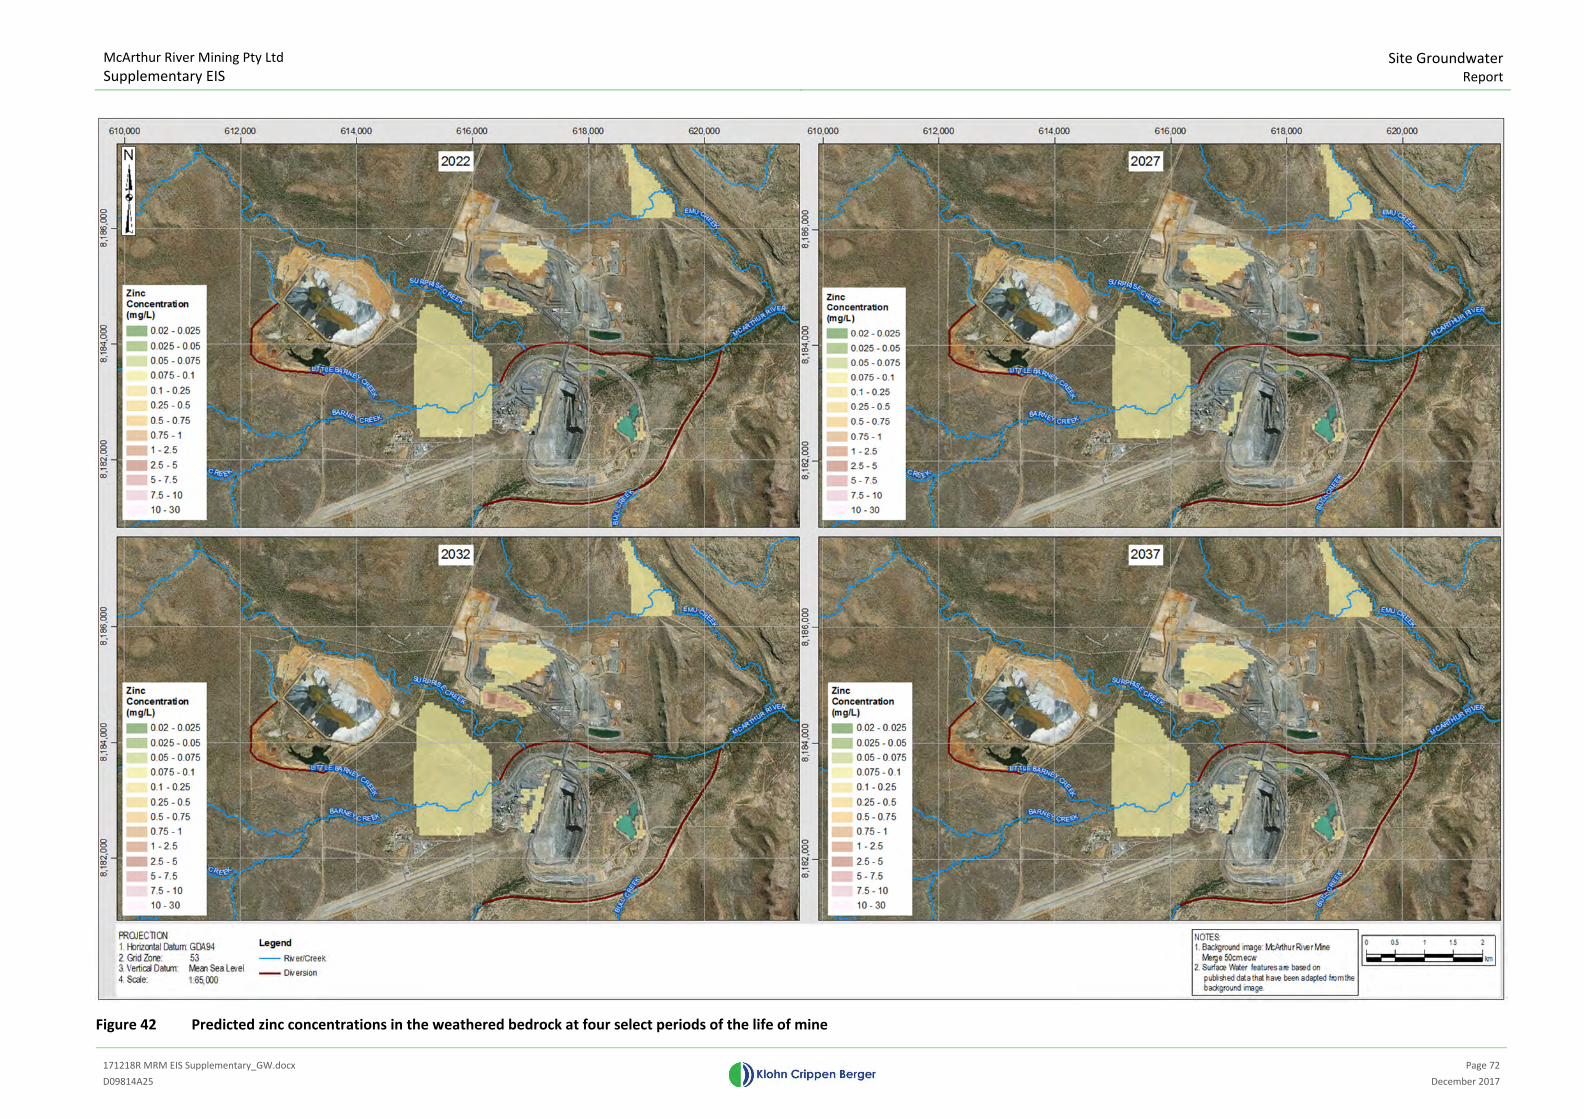
McArthur River Mining Pty Ltd
Supplementary EIS
Site Groundwater
Report
171218R MRM EIS Supplementary_GW.docx
Page 72
D09814A25 December 2017
Figure 42 Predicted zinc concentrations in the weathered bedrock at four select periods of the life of mine
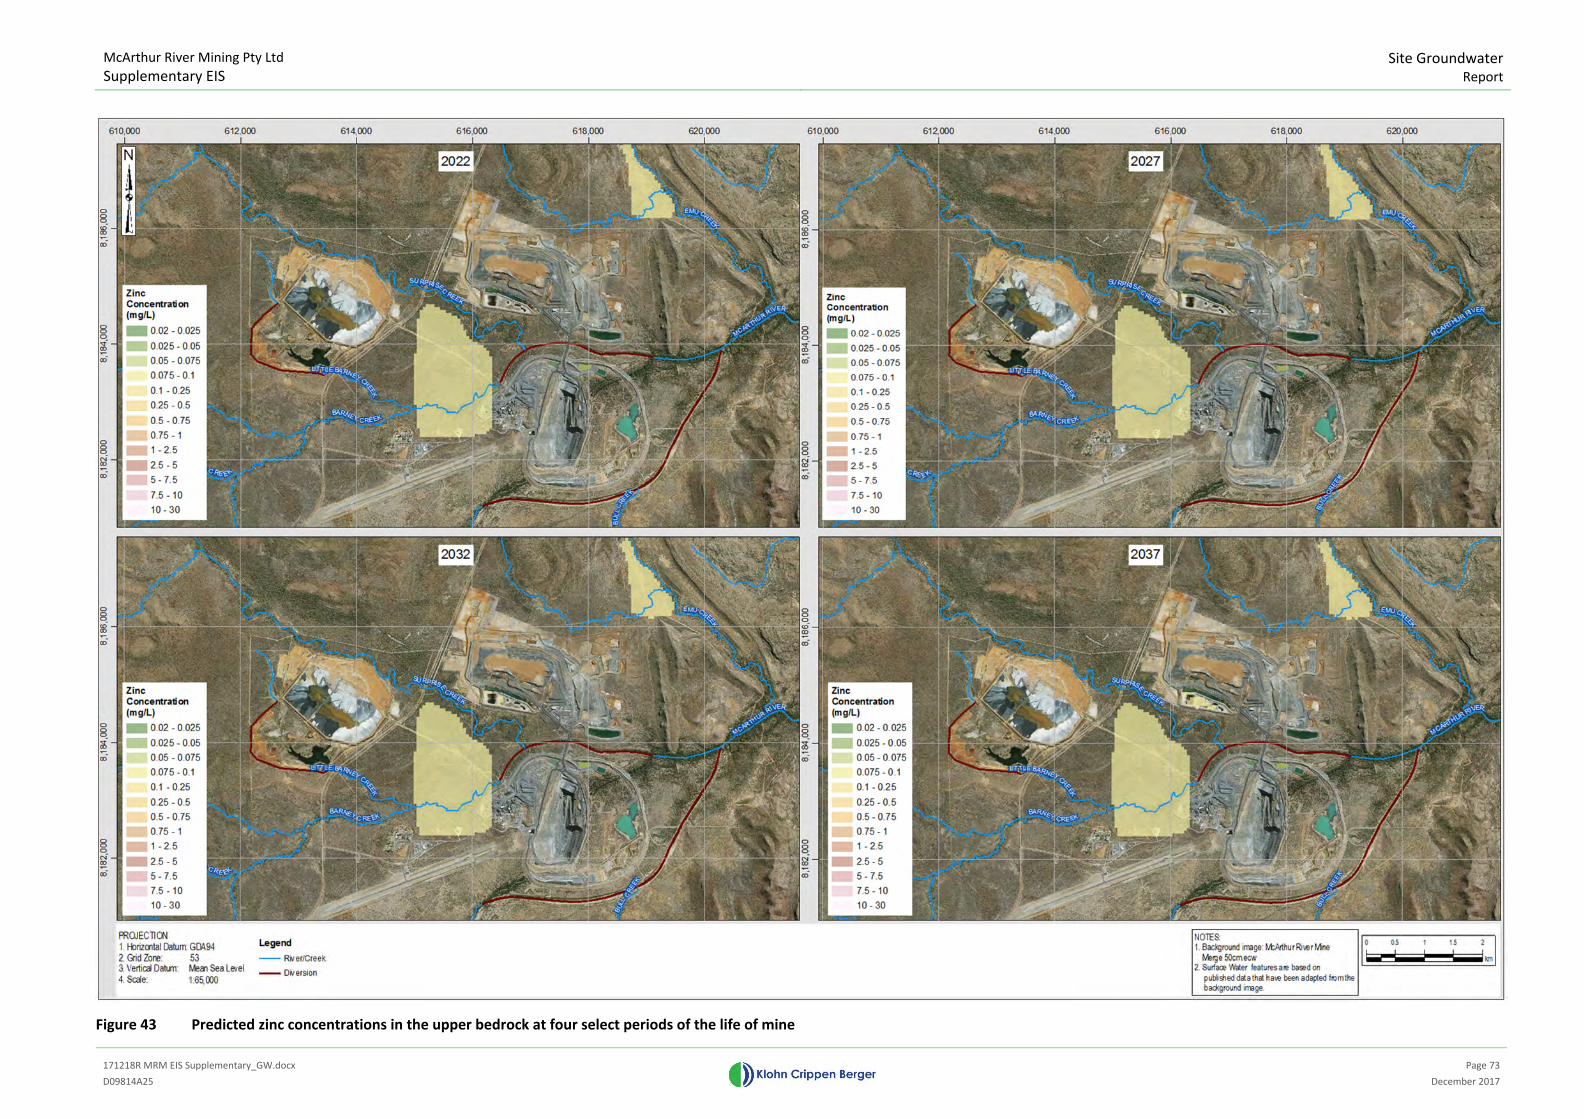
McArthur River Mining Pty Ltd
Supplementary EIS
Site Groundwater
Report
171218R MRM EIS Supplementary_GW.docx
Page 73
D09814A25 December 2017
Figure 43 Predicted zinc concentrations in the upper bedrock at four select periods of the life of mine
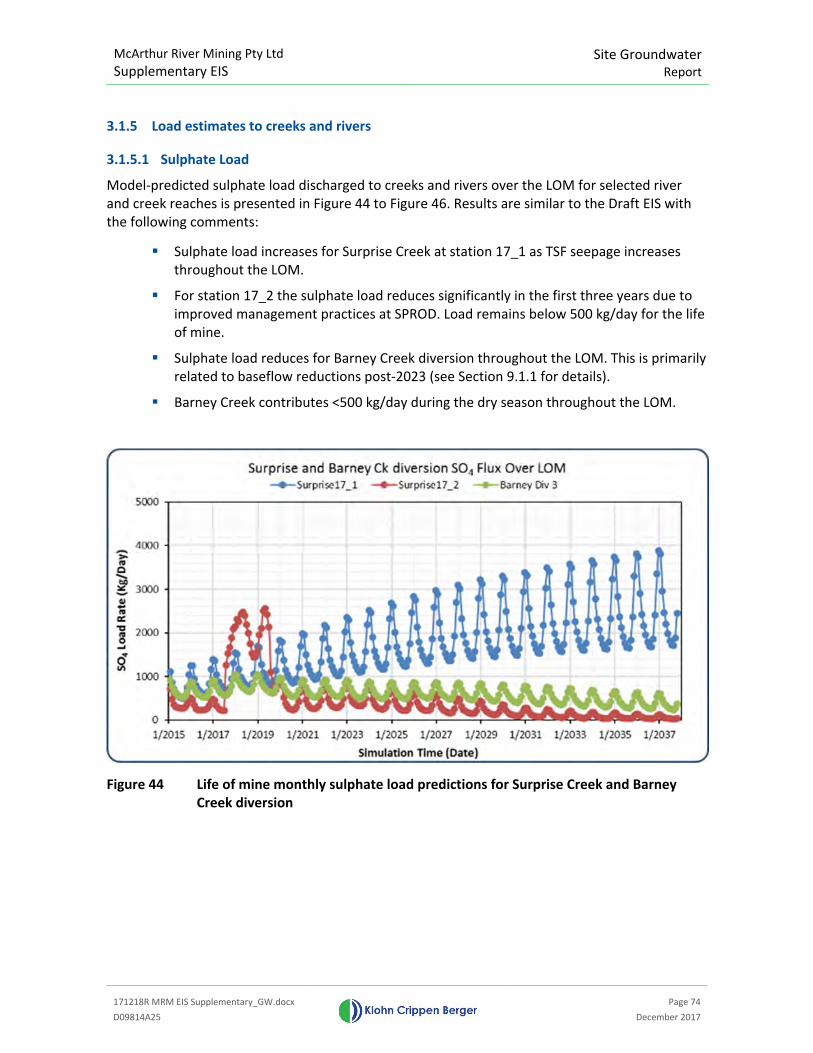
McArthur River Mining Pty Ltd
Supplementary EIS Site Groundwater
Report
171218R MRM EIS Supplementary_GW.docx
Page 74
D09814A25 December 2017
3.1.5 Load estimates to creeks and rivers
3.1.5.1 Sulphate Load
Model-predicted sulphate load discharged to creeks and rivers over the LOM for selected river
and creek reaches is presented in Figure 44 to Figure 46. Results are similar to the Draft EIS with
the following comments:
� Sulphate load increases for Surprise Creek at station 17_1 as TSF seepage increases
throughout the LOM.
� For station 17_2 the sulphate load reduces significantly in the first three years due to
improved management practices at SPROD. Load remains below 500 kg/day for the life
of mine.
� Sulphate load reduces for Barney Creek diversion throughout the LOM. This is primarily
related to baseflow reductions post-2023 (see Section 9.1.1 for details).
� Barney Creek contributes <500 kg/day during the dry season throughout the LOM.
Figure 44 Life of mine monthly sulphate load predictions for Surprise Creek and Barney
Creek diversion
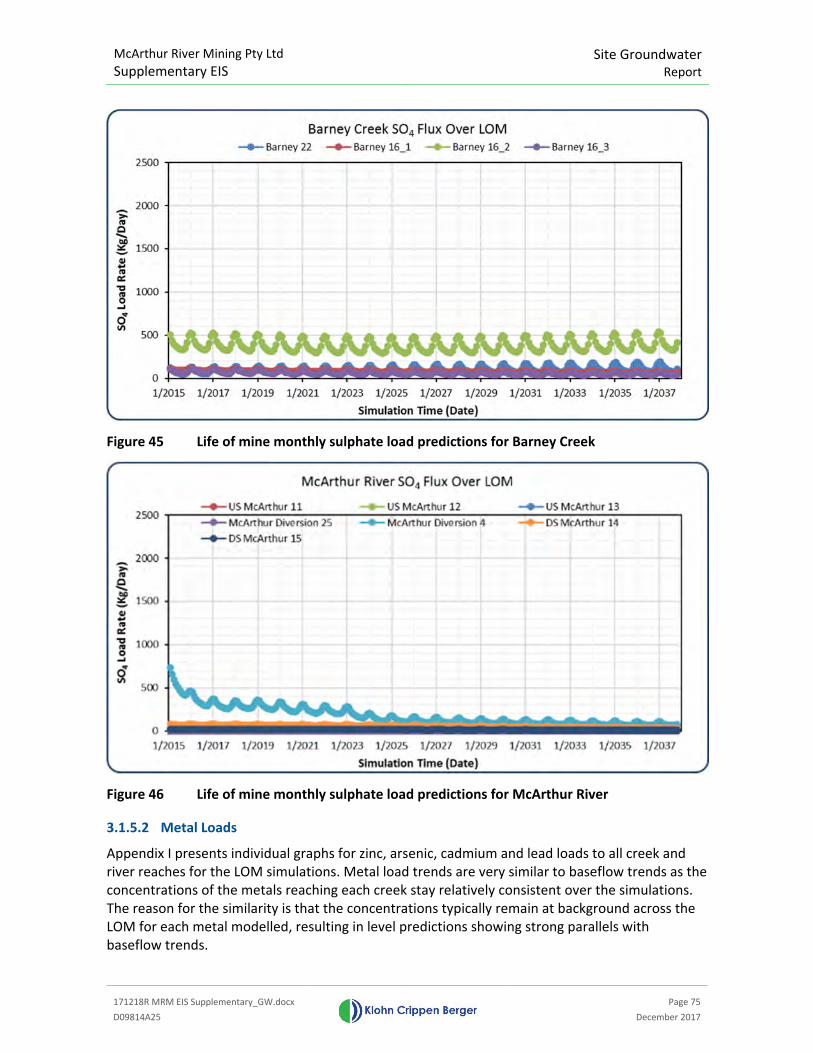
McArthur River Mining Pty Ltd
Supplementary EIS Site Groundwater
Report
171218R MRM EIS Supplementary_GW.docx
Page 75
D09814A25 December 2017
Figure 45 Life of mine monthly sulphate load predictions for Barney Creek
Figure 46 Life of mine monthly sulphate load predictions for McArthur River
3.1.5.2 Metal Loads
Appendix I presents individual graphs for zinc, arsenic, cadmium and lead loads to all creek and
river reaches for the LOM simulations. Metal load trends are very similar to baseflow trends as the
concentrations of the metals reaching each creek stay relatively consistent over the simulations.
The reason for the similarity is that the concentrations typically remain at background across the
LOM for each metal modelled, resulting in level predictions showing strong parallels with
baseflow trends.
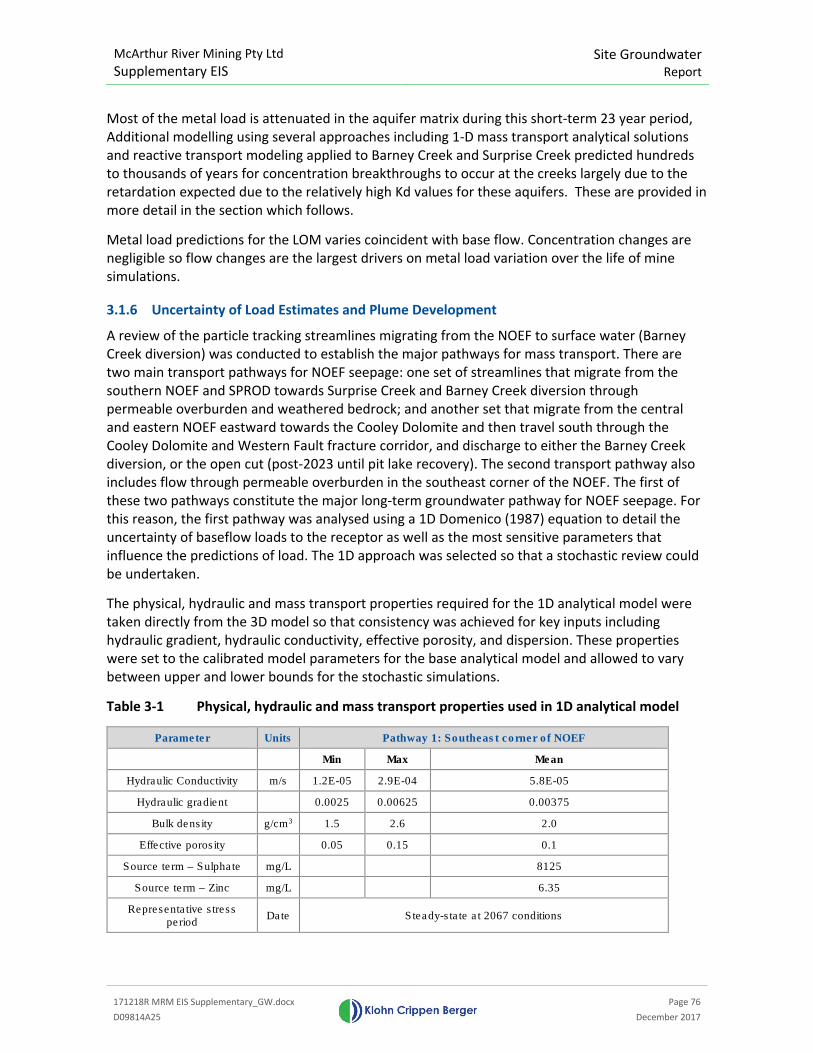
McArthur River Mining Pty Ltd
Supplementary EIS
Site Groundwater
Report
171218R MRM EIS Supplementary_GW.docx
Page 76
D09814A25 December 2017
Most of the metal load is attenuated in the aquifer matrix during this short-term 23 year period,
Additional modelling using several approaches including 1-D mass transport analytical solutions
and reactive transport modeling applied to Barney Creek and Surprise Creek predicted hundreds
to thousands of years for concentration breakthroughs to occur at the creeks largely due to the
retardation expected due to the relatively high Kd values for these aquifers. These are provided in
more detail in the section which follows.
Metal load predictions for the LOM varies coincident with base flow. Concentration changes are
negligible so flow changes are the largest drivers on metal load variation over the life of mine
simulations.
3.1.6 Uncertainty of Load Estimates and Plume Development
A review of the particle tracking streamlines migrating from the NOEF to surface water (Barney
Creek diversion) was conducted to establish the major pathways for mass transport. There are
two main transport pathways for NOEF seepage: one set of streamlines that migrate from the
southern NOEF and SPROD towards Surprise Creek and Barney Creek diversion through
permeable overburden and weathered bedrock; and another set that migrate from the central
and eastern NOEF eastward towards the Cooley Dolomite and then travel south through the
Cooley Dolomite and Western Fault fracture corridor, and discharge to either the Barney Creek
diversion, or the open cut (post-2023 until pit lake recovery). The second transport pathway also
includes flow through permeable overburden in the southeast corner of the NOEF. The first of
these two pathways constitute the major long-term groundwater pathway for NOEF seepage. For
this reason, the first pathway was analysed using a 1D Domenico (1987) equation to detail the
uncertainty of baseflow loads to the receptor as well as the most sensitive parameters that
influence the predictions of load. The 1D approach was selected so that a stochastic review could
be undertaken.
The physical, hydraulic and mass transport properties required for the 1D analytical model were
taken directly from the 3D model so that consistency was achieved for key inputs including
hydraulic gradient, hydraulic conductivity, effective porosity, and dispersion. These properties
were set to the calibrated model parameters for the base analytical model and allowed to vary
between upper and lower bounds for the stochastic simulations.
Table 3-1 Physical, hydraulic and mass transport properties used in 1D analytical model
Parameter Units Pathway 1: Southeast corner of NOEF
Min Max Mean
Hydraulic Conductivity m/s 1.2E-05 2.9E-04 5.8E-05
Hydraulic gradient 0.0025 0.00625 0.00375
Bulk density g/cm3 1.5 2.6 2.0
Effective porosity 0.05 0.15 0.1
Source term – Sulphate mg/L 8125
Source term – Zinc mg/L 6.35
Representative stress period
Date Steady-state at 2067 conditions
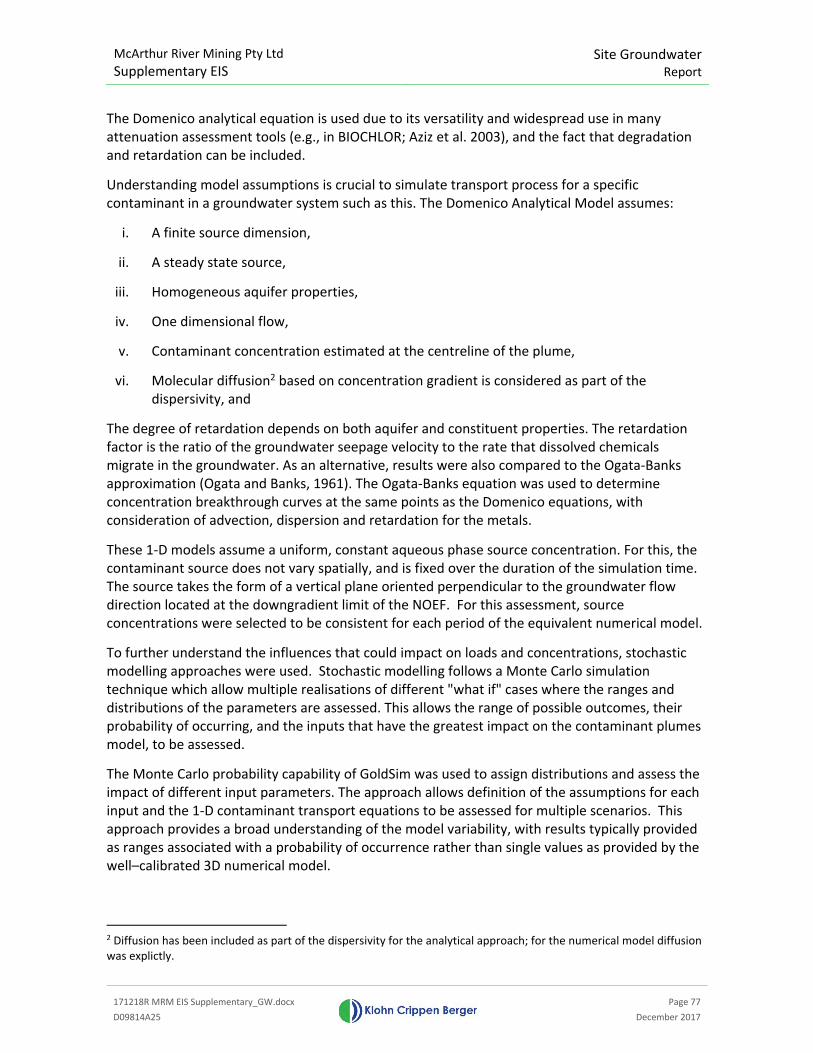
McArthur River Mining Pty Ltd
Supplementary EIS
Site Groundwater
Report
171218R MRM EIS Supplementary_GW.docx
Page 77
D09814A25 December 2017
The Domenico analytical equation is used due to its versatility and widespread use in many
attenuation assessment tools (e.g., in BIOCHLOR; Aziz et al. 2003), and the fact that degradation
and retardation can be included.
Understanding model assumptions is crucial to simulate transport process for a specific
contaminant in a groundwater system such as this. The Domenico Analytical Model assumes:
i. A finite source dimension,
ii. A steady state source,
iii. Homogeneous aquifer properties,
iv. One dimensional flow,
v. Contaminant concentration estimated at the centreline of the plume,
vi. Molecular diffusion2 based on concentration gradient is considered as part of the
dispersivity, and
The degree of retardation depends on both aquifer and constituent properties. The retardation
factor is the ratio of the groundwater seepage velocity to the rate that dissolved chemicals
migrate in the groundwater. As an alternative, results were also compared to the Ogata-Banks
approximation (Ogata and Banks, 1961). The Ogata-Banks equation was used to determine
concentration breakthrough curves at the same points as the Domenico equations, with
consideration of advection, dispersion and retardation for the metals.
These 1-D models assume a uniform, constant aqueous phase source concentration. For this, the
contaminant source does not vary spatially, and is fixed over the duration of the simulation time.
The source takes the form of a vertical plane oriented perpendicular to the groundwater flow
direction located at the downgradient limit of the NOEF. For this assessment, source
concentrations were selected to be consistent for each period of the equivalent numerical model.
To further understand the influences that could impact on loads and concentrations, stochastic
modelling approaches were used. Stochastic modelling follows a Monte Carlo simulation
technique which allow multiple realisations of different "what if" cases where the ranges and
distributions of the parameters are assessed. This allows the range of possible outcomes, their
probability of occurring, and the inputs that have the greatest impact on the contaminant plumes
model, to be assessed.
The Monte Carlo probability capability of GoldSim was used to assign distributions and assess the
impact of different input parameters. The approach allows definition of the assumptions for each
input and the 1-D contaminant transport equations to be assessed for multiple scenarios. This
approach provides a broad understanding of the model variability, with results typically provided
as ranges associated with a probability of occurrence rather than single values as provided by the
well–calibrated 3D numerical model.
2 Diffusion has been included as part of the dispersivity for the analytical approach; for the numerical model diffusion
was explictly.
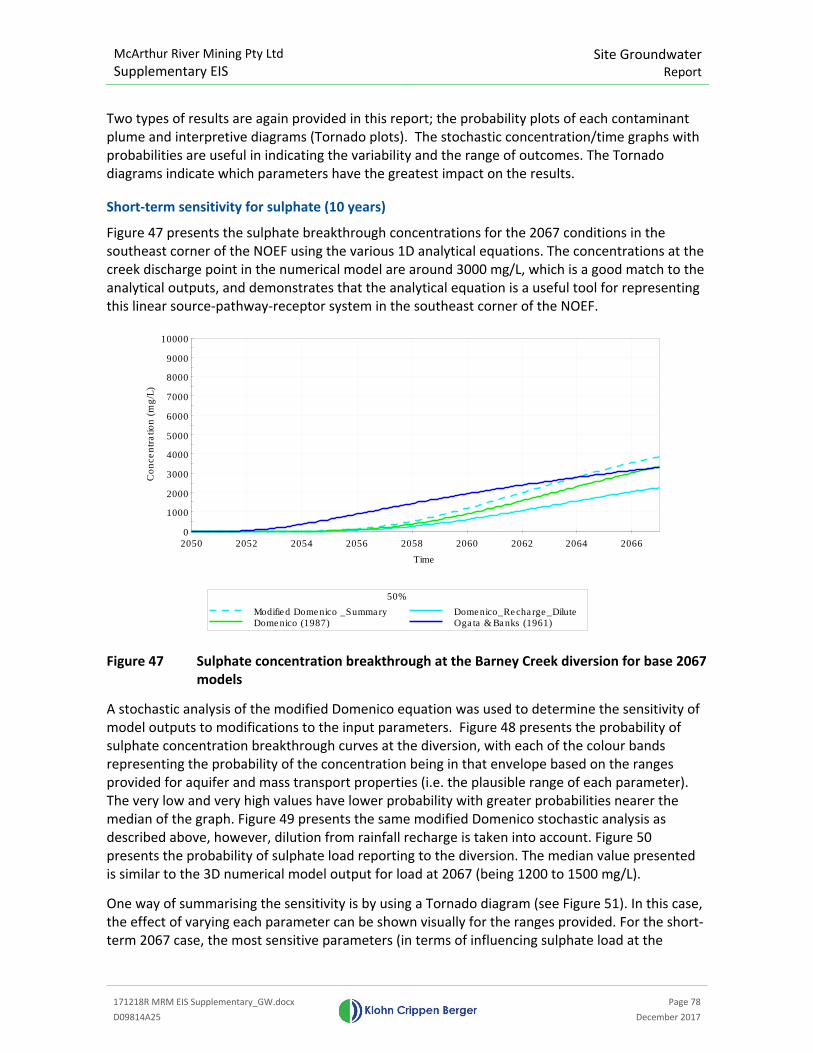
McArthur River Mining Pty Ltd
Supplementary EIS
Site Groundwater
Report
171218R MRM EIS Supplementary_GW.docx
Page 78
D09814A25 December 2017
Two types of results are again provided in this report; the probability plots of each contaminant
plume and interpretive diagrams (Tornado plots). The stochastic concentration/time graphs with
probabilities are useful in indicating the variability and the range of outcomes. The Tornado
diagrams indicate which parameters have the greatest impact on the results.
Short-term sensitivity for sulphate (10 years)
Figure 47 presents the sulphate breakthrough concentrations for the 2067 conditions in the
southeast corner of the NOEF using the various 1D analytical equations. The concentrations at the
creek discharge point in the numerical model are around 3000 mg/L, which is a good match to the
analytical outputs, and demonstrates that the analytical equation is a useful tool for representing
this linear source-pathway-receptor system in the southeast corner of the NOEF.
Figure 47 Sulphate concentration breakthrough at the Barney Creek diversion for base 2067
models
A stochastic analysis of the modified Domenico equation was used to determine the sensitivity of
model outputs to modifications to the input parameters. Figure 48 presents the probability of
sulphate concentration breakthrough curves at the diversion, with each of the colour bands
representing the probability of the concentration being in that envelope based on the ranges
provided for aquifer and mass transport properties (i.e. the plausible range of each parameter).
The very low and very high values have lower probability with greater probabilities nearer the
median of the graph. Figure 49 presents the same modified Domenico stochastic analysis as
described above, however, dilution from rainfall recharge is taken into account. Figure 50
presents the probability of sulphate load reporting to the diversion. The median value presented
is similar to the 3D numerical model output for load at 2067 (being 1200 to 1500 mg/L).
One way of summarising the sensitivity is by using a Tornado diagram (see Figure 51). In this case,
the effect of varying each parameter can be shown visually for the ranges provided. For the short-
term 2067 case, the most sensitive parameters (in terms of influencing sulphate load at the
0
1000
2000
3000
4000
5000
6000
7000
8000
9000
10000
2050 2052 2054 2056 2058 2060 2062 2064 2066
Co
nce
ntr
atio
n (
mg
/L)
Time
50%
Modified Domenico _Summary Domenico_Recharge_DiluteDomenico (1987) Ogata & Banks (1961)
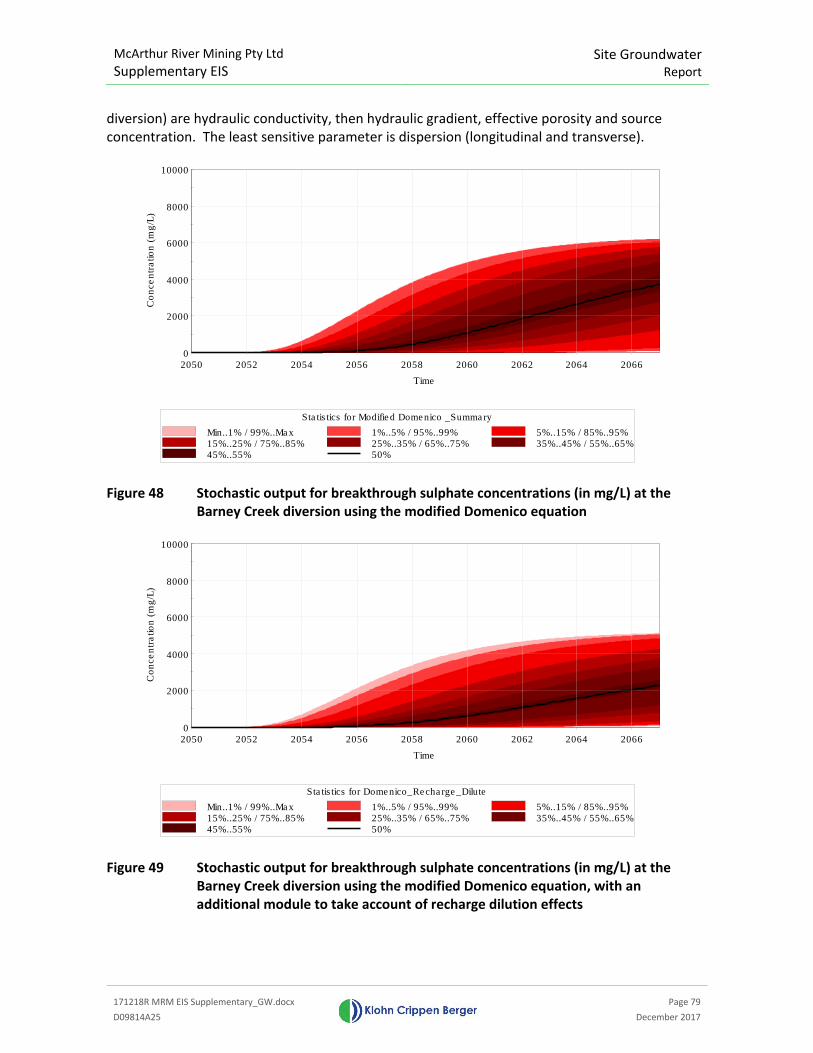
McArthur River Mining Pty Ltd
Supplementary EIS
Site Groundwater
Report
171218R MRM EIS Supplementary_GW.docx
Page 79
D09814A25 December 2017
diversion) are hydraulic conductivity, then hydraulic gradient, effective porosity and source
concentration. The least sensitive parameter is dispersion (longitudinal and transverse).
Figure 48 Stochastic output for breakthrough sulphate concentrations (in mg/L) at the
Barney Creek diversion using the modified Domenico equation
Figure 49 Stochastic output for breakthrough sulphate concentrations (in mg/L) at the
Barney Creek diversion using the modified Domenico equation, with an
additional module to take account of recharge dilution effects
0
2000
4000
6000
8000
10000
2050 2052 2054 2056 2058 2060 2062 2064 2066
Co
nce
ntr
atio
n (
mg
/L)
Time
Statistics for Modified Domenico _Summary
Min..1% / 99%..Max 1%..5% / 95%..99% 5%..15% / 85%..95%15%..25% / 75%..85% 25%..35% / 65%..75% 35%..45% / 55%..65%45%..55% 50%
0
2000
4000
6000
8000
10000
2050 2052 2054 2056 2058 2060 2062 2064 2066
Co
nce
ntr
atio
n (
mg
/L)
Time
Statistics for Domenico_Recharge_Dilute
Min..1% / 99%..Max 1%..5% / 95%..99% 5%..15% / 85%..95%15%..25% / 75%..85% 25%..35% / 65%..75% 35%..45% / 55%..65%45%..55% 50%
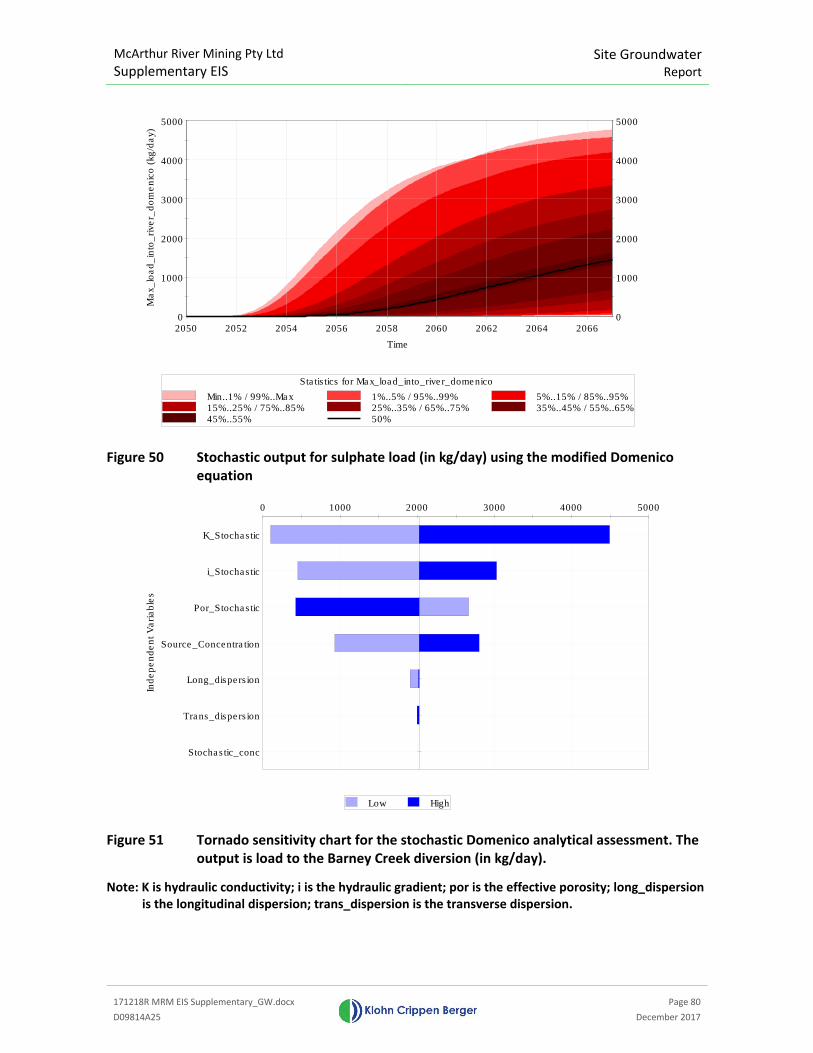
McArthur River Mining Pty Ltd
Supplementary EIS
Site Groundwater
Report
171218R MRM EIS Supplementary_GW.docx
Page 80
D09814A25 December 2017
Figure 50 Stochastic output for sulphate load (in kg/day) using the modified Domenico
equation
Figure 51 Tornado sensitivity chart for the stochastic Domenico analytical assessment. The
output is load to the Barney Creek diversion (in kg/day).
Note: K is hydraulic conductivity; i is the hydraulic gradient; por is the effective porosity; long_dispersion
is the longitudinal dispersion; trans_dispersion is the transverse dispersion.
0
1000
2000
3000
4000
5000
2050 2052 2054 2056 2058 2060 2062 2064 2066
Ma
x_
loa
d_
into
_ri
ve
r_d
om
en
ico
(kg
/da
y)
Time
0
1000
2000
3000
4000
5000
Statistics for Max_load_into_river_domenico
Min..1% / 99%..Max 1%..5% / 95%..99% 5%..15% / 85%..95%15%..25% / 75%..85% 25%..35% / 65%..75% 35%..45% / 55%..65%45%..55% 50%
0 1000 2000 3000 4000 5000
Stochastic_conc
Trans_dispersion
Long_dispersion
Source_Concentration
Por_Stochastic
i_Stochastic
K_Stochastic
Ind
ep
en
de
nt
Va
ria
ble
s
Low High
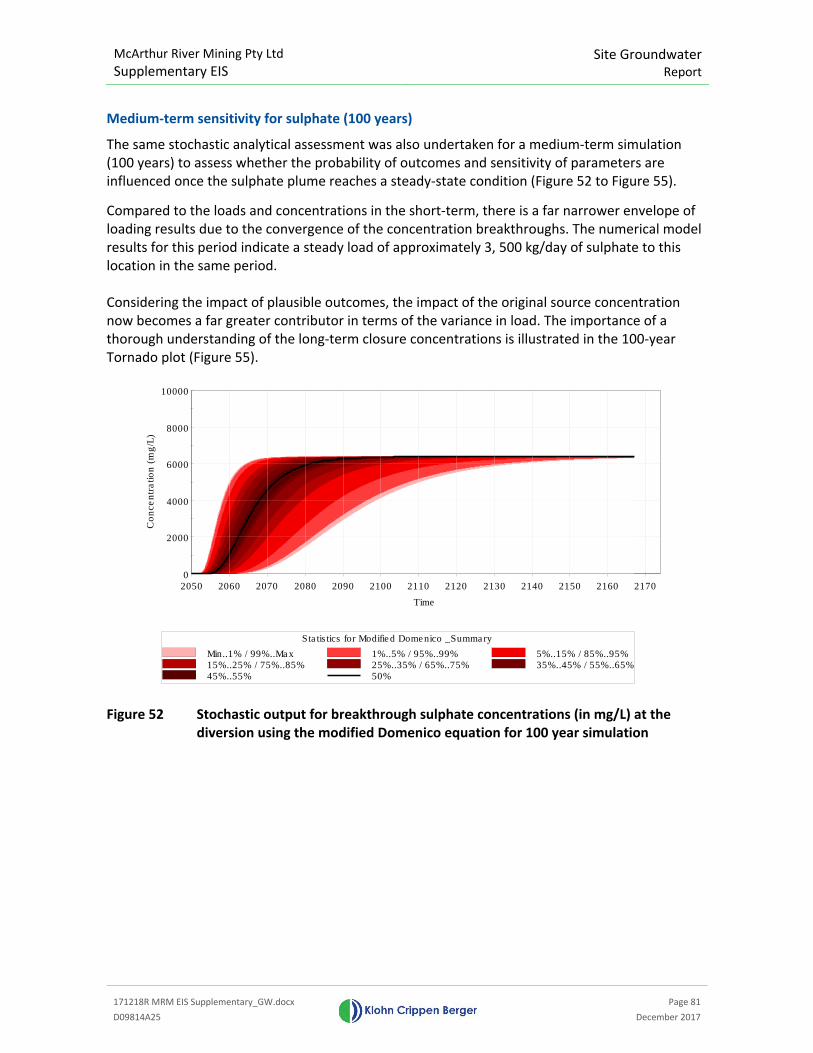
McArthur River Mining Pty Ltd
Supplementary EIS
Site Groundwater
Report
171218R MRM EIS Supplementary_GW.docx
Page 81
D09814A25 December 2017
Medium-term sensitivity for sulphate (100 years)
The same stochastic analytical assessment was also undertaken for a medium-term simulation
(100 years) to assess whether the probability of outcomes and sensitivity of parameters are
influenced once the sulphate plume reaches a steady-state condition (Figure 52 to Figure 55).
Compared to the loads and concentrations in the short-term, there is a far narrower envelope of
loading results due to the convergence of the concentration breakthroughs. The numerical model
results for this period indicate a steady load of approximately 3, 500 kg/day of sulphate to this
location in the same period.
Considering the impact of plausible outcomes, the impact of the original source concentration
now becomes a far greater contributor in terms of the variance in load. The importance of a
thorough understanding of the long-term closure concentrations is illustrated in the 100-year
Tornado plot (Figure 55).
Figure 52 Stochastic output for breakthrough sulphate concentrations (in mg/L) at the
diversion using the modified Domenico equation for 100 year simulation
0
2000
4000
6000
8000
10000
2050 2060 2070 2080 2090 2100 2110 2120 2130 2140 2150 2160 2170
Co
nce
ntr
atio
n (
mg
/L)
Time
Statistics for Modified Domenico _Summary
Min..1% / 99%..Max 1%..5% / 95%..99% 5%..15% / 85%..95%15%..25% / 75%..85% 25%..35% / 65%..75% 35%..45% / 55%..65%45%..55% 50%
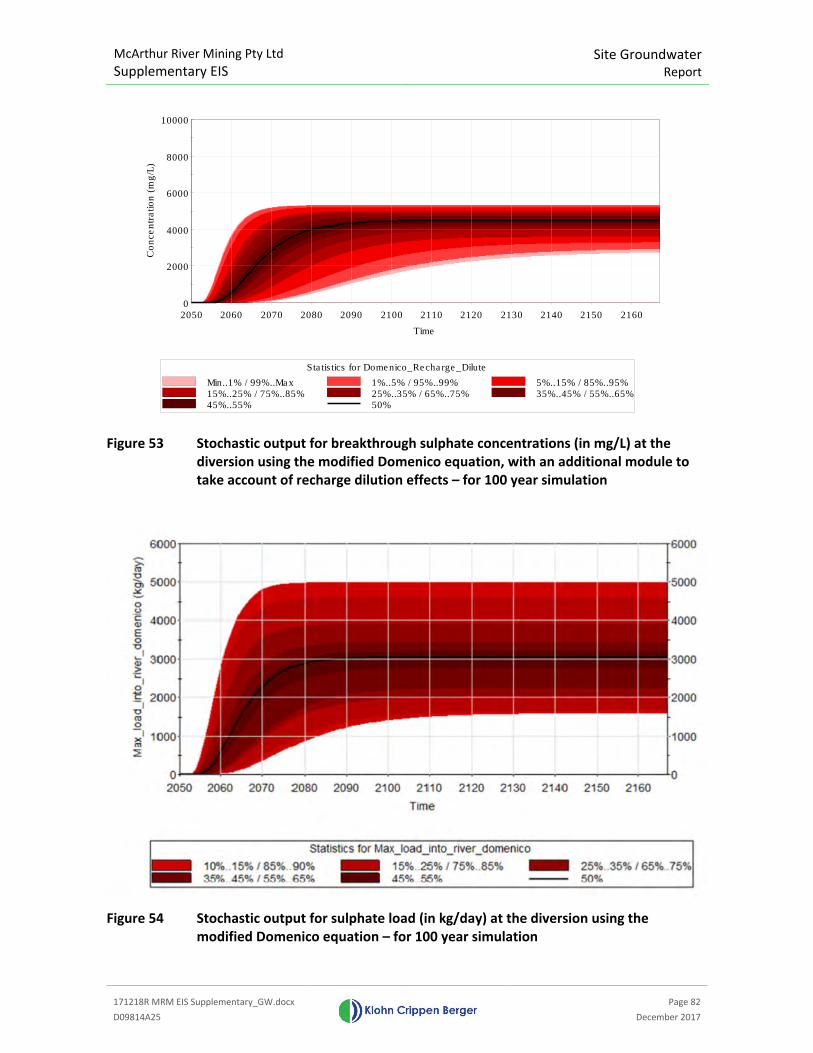
McArthur River Mining Pty Ltd
Supplementary EIS Site Groundwater
Report
171218R MRM EIS Supplementary_GW.docx
Page 82
D09814A25 December 2017
Figure 53 Stochastic output for breakthrough sulphate concentrations (in mg/L) at the
diversion using the modified Domenico equation, with an additional module to
take account of recharge dilution effects – for 100 year simulation
Figure 54 Stochastic output for sulphate load (in kg/day) at the diversion using the
modified Domenico equation – for 100 year simulation
0
2000
4000
6000
8000
10000
2050 2060 2070 2080 2090 2100 2110 2120 2130 2140 2150 2160
Co
nce
ntr
atio
n (
mg
/L)
Time
Statistics for Domenico_Recharge_Dilute
Min..1% / 99%..Max 1%..5% / 95%..99% 5%..15% / 85%..95%15%..25% / 75%..85% 25%..35% / 65%..75% 35%..45% / 55%..65%45%..55% 50%
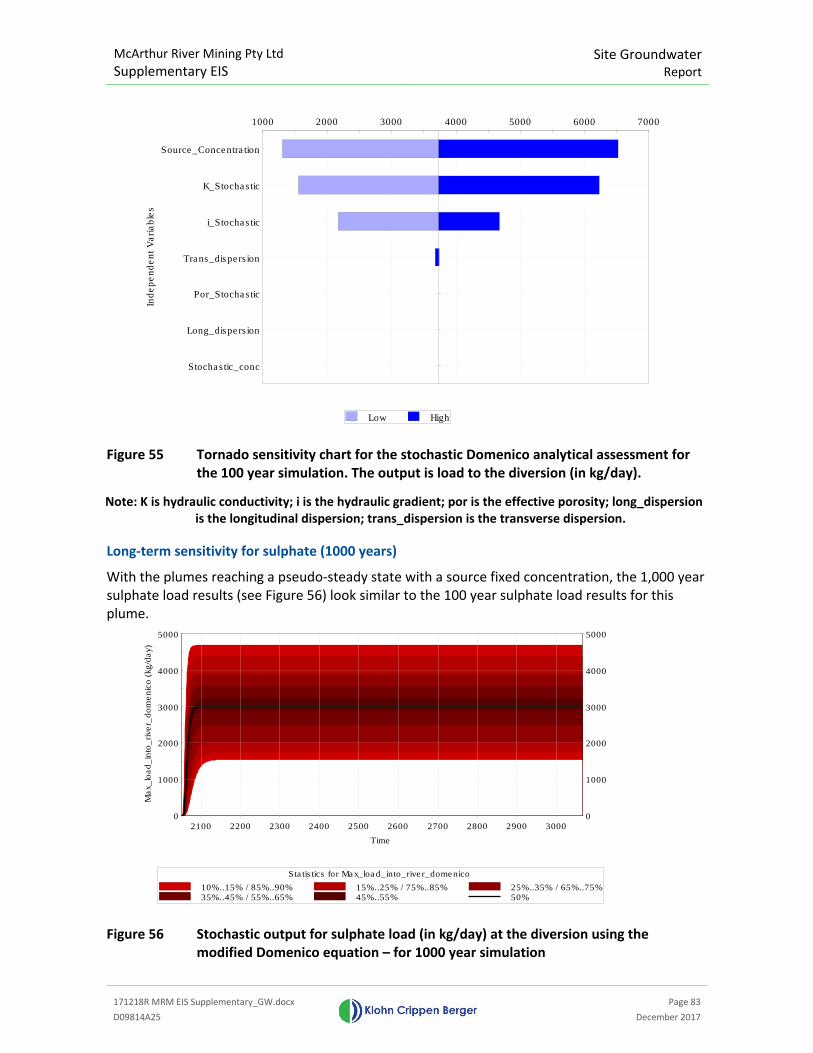
McArthur River Mining Pty Ltd
Supplementary EIS
Site Groundwater
Report
171218R MRM EIS Supplementary_GW.docx
Page 83
D09814A25 December 2017
Figure 55 Tornado sensitivity chart for the stochastic Domenico analytical assessment for
the 100 year simulation. The output is load to the diversion (in kg/day).
Note: K is hydraulic conductivity; i is the hydraulic gradient; por is the effective porosity; long_dispersion
is the longitudinal dispersion; trans_dispersion is the transverse dispersion.
Long-term sensitivity for sulphate (1000 years)
With the plumes reaching a pseudo-steady state with a source fixed concentration, the 1,000 year
sulphate load results (see Figure 56) look similar to the 100 year sulphate load results for this
plume.
Figure 56 Stochastic output for sulphate load (in kg/day) at the diversion using the
modified Domenico equation – for 1000 year simulation
1000 2000 3000 4000 5000 6000 7000
Stochastic_conc
Long_dispersion
Por_Stochastic
Trans_dispersion
i_Stochastic
K_Stochastic
Source_ConcentrationIn
de
pe
nd
en
t V
ari
ab
les
Low High
0
1000
2000
3000
4000
5000
2100 2200 2300 2400 2500 2600 2700 2800 2900 3000
Max_lo
ad_in
to_river_
dom
enic
o (
kg/d
ay)
Time
0
1000
2000
3000
4000
5000
Statistics for Max_load_into_river_domenico
10%..15% / 85%..90% 15%..25% / 75%..85% 25%..35% / 65%..75%35%..45% / 55%..65% 45%..55% 50%
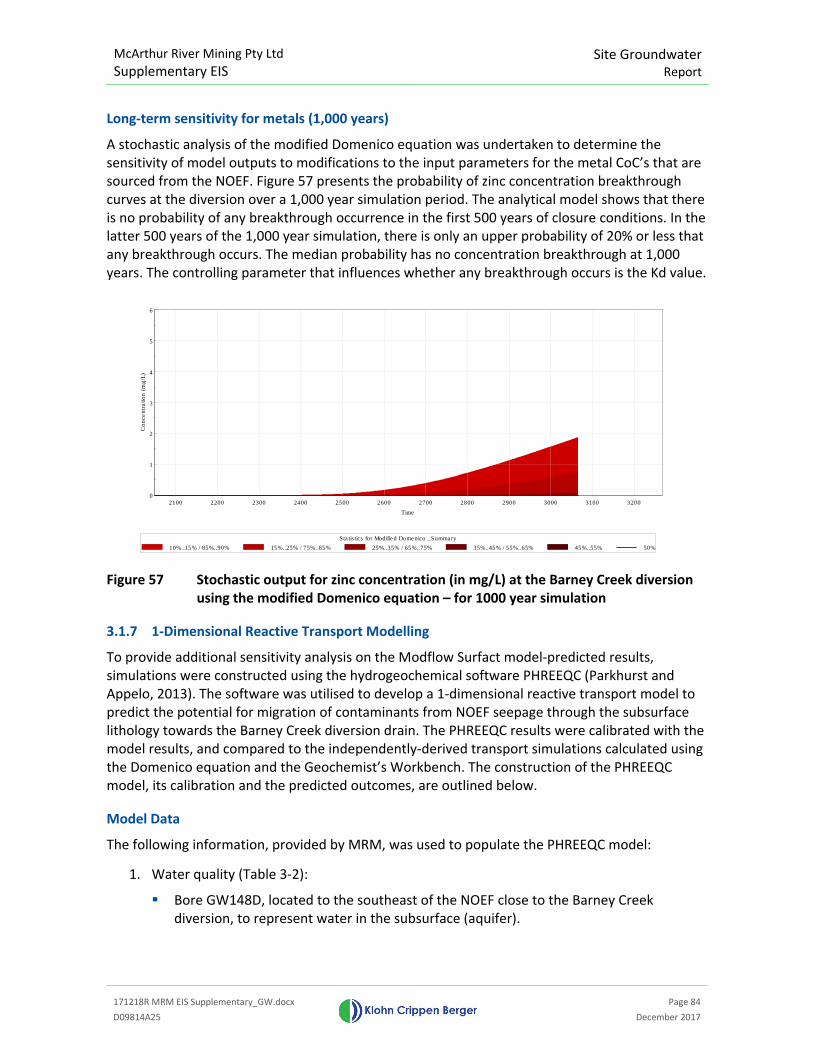
McArthur River Mining Pty Ltd
Supplementary EIS
Site Groundwater
Report
171218R MRM EIS Supplementary_GW.docx
Page 84
D09814A25 December 2017
Long-term sensitivity for metals (1,000 years)
A stochastic analysis of the modified Domenico equation was undertaken to determine the
sensitivity of model outputs to modifications to the input parameters for the metal CoC’s that are
sourced from the NOEF. Figure 57 presents the probability of zinc concentration breakthrough
curves at the diversion over a 1,000 year simulation period. The analytical model shows that there
is no probability of any breakthrough occurrence in the first 500 years of closure conditions. In the
latter 500 years of the 1,000 year simulation, there is only an upper probability of 20% or less that
any breakthrough occurs. The median probability has no concentration breakthrough at 1,000
years. The controlling parameter that influences whether any breakthrough occurs is the Kd value.
Figure 57 Stochastic output for zinc concentration (in mg/L) at the Barney Creek diversion
using the modified Domenico equation – for 1000 year simulation
3.1.7 1-Dimensional Reactive Transport Modelling
To provide additional sensitivity analysis on the Modflow Surfact model-predicted results,
simulations were constructed using the hydrogeochemical software PHREEQC (Parkhurst and
Appelo, 2013). The software was utilised to develop a 1-dimensional reactive transport model to
predict the potential for migration of contaminants from NOEF seepage through the subsurface
lithology towards the Barney Creek diversion drain. The PHREEQC results were calibrated with the
model results, and compared to the independently-derived transport simulations calculated using
the Domenico equation and the Geochemist’s Workbench. The construction of the PHREEQC
model, its calibration and the predicted outcomes, are outlined below.
Model Data
The following information, provided by MRM, was used to populate the PHREEQC model:
1. Water quality (Table 3-2):
� Bore GW148D, located to the southeast of the NOEF close to the Barney Creek
diversion, to represent water in the subsurface (aquifer).
0
1
2
3
4
5
6
2100 2200 2300 2400 2500 2600 2700 2800 2900 3000 3100 3200
Co
nce
ntr
atio
n (
mg
/L)
Time
Statistics for Modified Domenico _Summary
10%..15% / 85%..90% 15%..25% / 75%..85% 25%..35% / 65%..75% 35%..45% / 55%..65% 45%..55% 50%
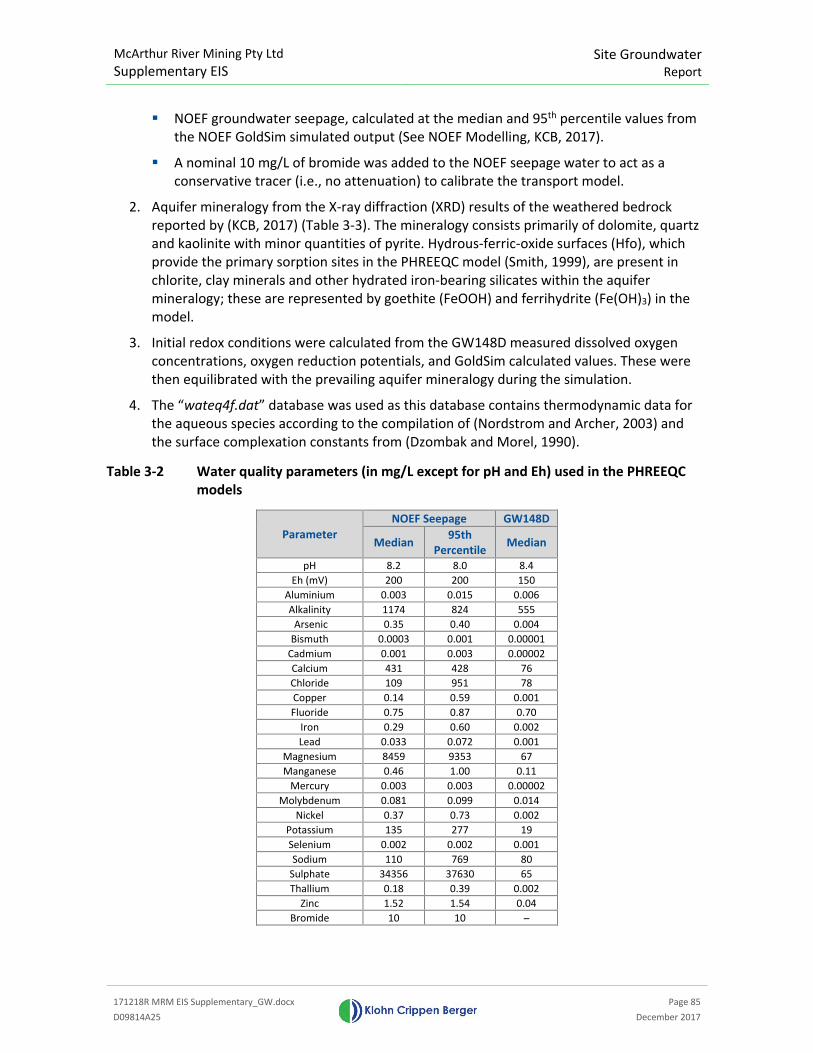
McArthur River Mining Pty Ltd
Supplementary EIS
Site Groundwater
Report
171218R MRM EIS Supplementary_GW.docx
Page 85
D09814A25 December 2017
� NOEF groundwater seepage, calculated at the median and 95th percentile values from
the NOEF GoldSim simulated output (See NOEF Modelling, KCB, 2017).
� A nominal 10 mg/L of bromide was added to the NOEF seepage water to act as a
conservative tracer (i.e., no attenuation) to calibrate the transport model.
2. Aquifer mineralogy from the X-ray diffraction (XRD) results of the weathered bedrock
reported by (KCB, 2017) (Table 3-3). The mineralogy consists primarily of dolomite, quartz
and kaolinite with minor quantities of pyrite. Hydrous-ferric-oxide surfaces (Hfo), which
provide the primary sorption sites in the PHREEQC model (Smith, 1999), are present in
chlorite, clay minerals and other hydrated iron-bearing silicates within the aquifer
mineralogy; these are represented by goethite (FeOOH) and ferrihydrite (Fe(OH)3) in the
model.
3. Initial redox conditions were calculated from the GW148D measured dissolved oxygen
concentrations, oxygen reduction potentials, and GoldSim calculated values. These were
then equilibrated with the prevailing aquifer mineralogy during the simulation.
4. The “wateq4f.dat” database was used as this database contains thermodynamic data for
the aqueous species according to the compilation of (Nordstrom and Archer, 2003) and
the surface complexation constants from (Dzombak and Morel, 1990).
Table 3-2 Water quality parameters (in mg/L except for pH and Eh) used in the PHREEQC
models
Parameter
NOEF Seepage GW148D
Median 95th
Percentile Median
pH 8.2 8.0 8.4
Eh (mV) 200 200 150
Aluminium 0.003 0.015 0.006
Alkalinity 1174 824 555
Arsenic 0.35 0.40 0.004
Bismuth 0.0003 0.001 0.00001
Cadmium 0.001 0.003 0.00002
Calcium 431 428 76
Chloride 109 951 78
Copper 0.14 0.59 0.001
Fluoride 0.75 0.87 0.70
Iron 0.29 0.60 0.002
Lead 0.033 0.072 0.001
Magnesium 8459 9353 67
Manganese 0.46 1.00 0.11
Mercury 0.003 0.003 0.00002
Molybdenum 0.081 0.099 0.014
Nickel 0.37 0.73 0.002
Potassium 135 277 19
Selenium 0.002 0.002 0.001
Sodium 110 769 80
Sulphate 34356 37630 65
Thallium 0.18 0.39 0.002
Zinc 1.52 1.54 0.04
Bromide 10 10 ̶
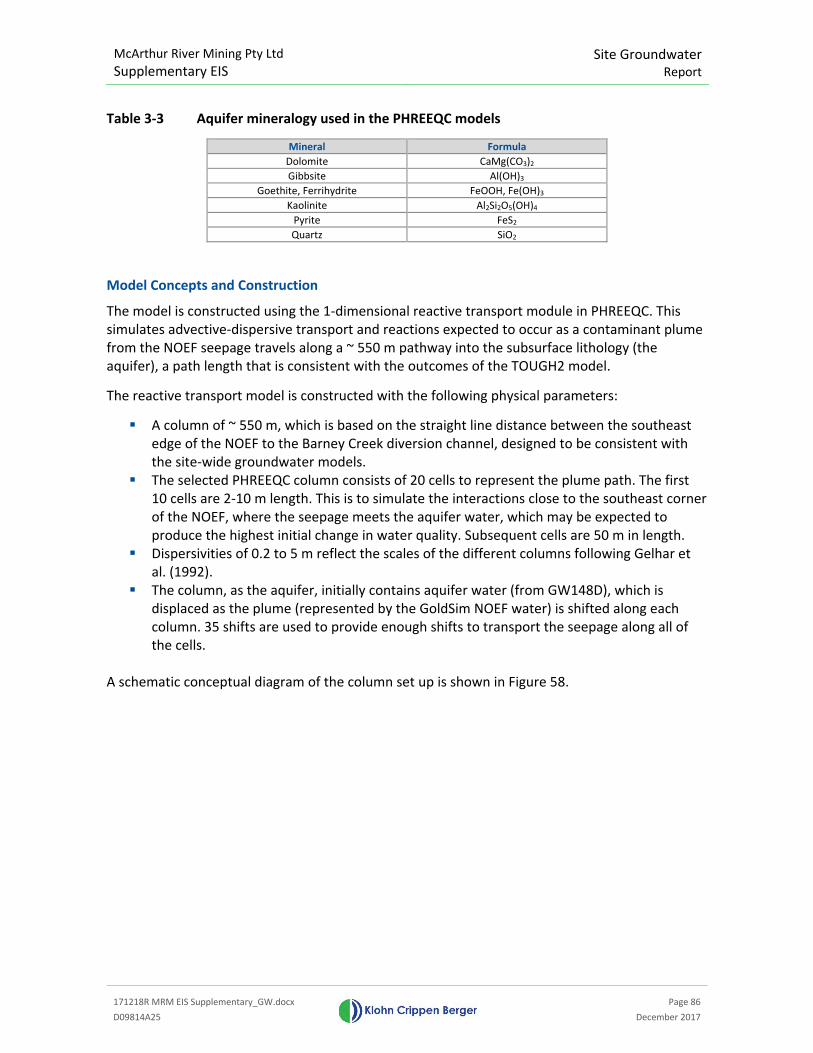
McArthur River Mining Pty Ltd
Supplementary EIS
Site Groundwater
Report
171218R MRM EIS Supplementary_GW.docx
Page 86
D09814A25 December 2017
Table 3-3 Aquifer mineralogy used in the PHREEQC models
Mineral Formula
Dolomite CaMg(CO3)2
Gibbsite Al(OH)3
Goethite, Ferrihydrite FeOOH, Fe(OH)3
Kaolinite Al2Si2O5(OH)4
Pyrite FeS2
Quartz SiO2
Model Concepts and Construction
The model is constructed using the 1-dimensional reactive transport module in PHREEQC. This
simulates advective-dispersive transport and reactions expected to occur as a contaminant plume
from the NOEF seepage travels along a ~ 550 m pathway into the subsurface lithology (the
aquifer), a path length that is consistent with the outcomes of the TOUGH2 model.
The reactive transport model is constructed with the following physical parameters:
� A column of ~ 550 m, which is based on the straight line distance between the southeast
edge of the NOEF to the Barney Creek diversion channel, designed to be consistent with
the site-wide groundwater models.
� The selected PHREEQC column consists of 20 cells to represent the plume path. The first
10 cells are 2-10 m length. This is to simulate the interactions close to the southeast corner
of the NOEF, where the seepage meets the aquifer water, which may be expected to
produce the highest initial change in water quality. Subsequent cells are 50 m in length.
� Dispersivities of 0.2 to 5 m reflect the scales of the different columns following Gelhar et
al. (1992).
� The column, as the aquifer, initially contains aquifer water (from GW148D), which is
displaced as the plume (represented by the GoldSim NOEF water) is shifted along each
column. 35 shifts are used to provide enough shifts to transport the seepage along all of
the cells.
A schematic conceptual diagram of the column set up is shown in Figure 58.
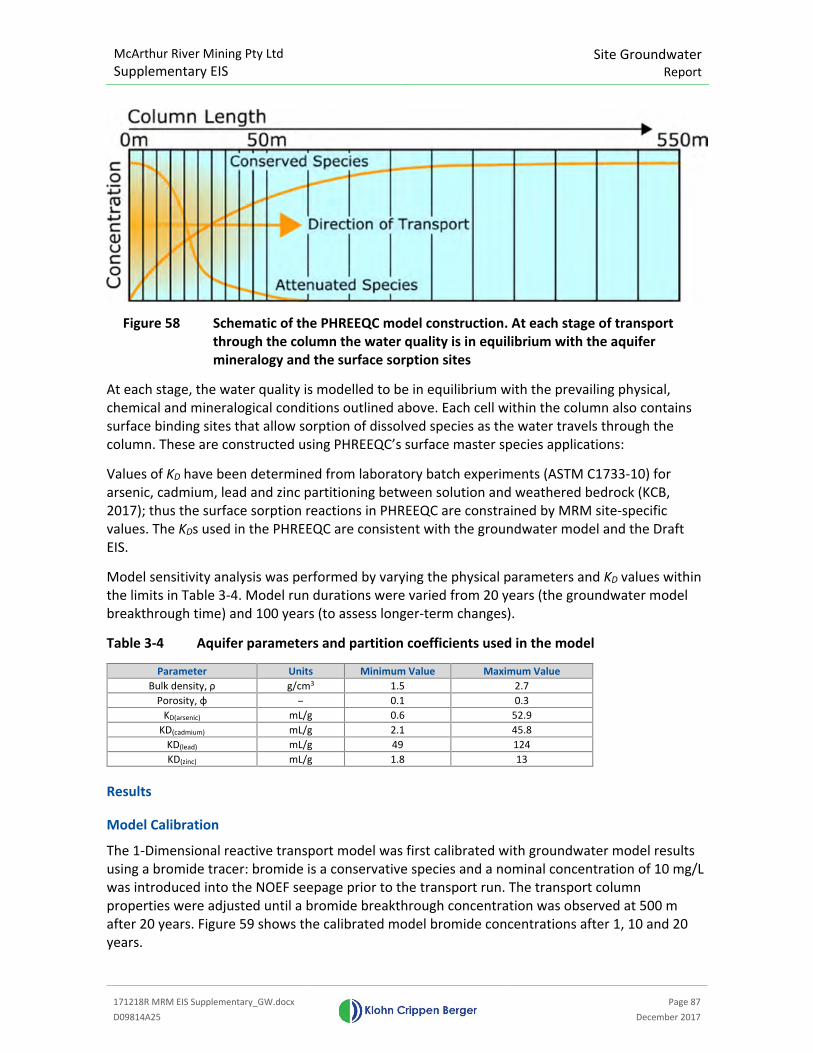
McArthur River Mining Pty Ltd
Supplementary EIS Site Groundwater
Report
171218R MRM EIS Supplementary_GW.docx
Page 87
D09814A25 December 2017
Figure 58 Schematic of the PHREEQC model construction. At each stage of transport
through the column the water quality is in equilibrium with the aquifer
mineralogy and the surface sorption sites
At each stage, the water quality is modelled to be in equilibrium with the prevailing physical,
chemical and mineralogical conditions outlined above. Each cell within the column also contains
surface binding sites that allow sorption of dissolved species as the water travels through the
column. These are constructed using PHREEQC’s surface master species applications:
Values of KD have been determined from laboratory batch experiments (ASTM C1733-10) for
arsenic, cadmium, lead and zinc partitioning between solution and weathered bedrock (KCB,
2017); thus the surface sorption reactions in PHREEQC are constrained by MRM site-specific
values. The KDs used in the PHREEQC are consistent with the groundwater model and the Draft
EIS.
Model sensitivity analysis was performed by varying the physical parameters and KD values within
the limits in Table 3-4. Model run durations were varied from 20 years (the groundwater model
breakthrough time) and 100 years (to assess longer-term changes).
Table 3-4 Aquifer parameters and partition coefficients used in the model
Parameter Units Minimum Value Maximum Value
Bulk density, ρ g/cm3 1.5 2.7
Porosity, φ ̶ 0.1 0.3
KD(arsenic) mL/g 0.6 52.9
KD(cadmium) mL/g 2.1 45.8
KD(lead) mL/g 49 124
KD(zinc) mL/g 1.8 13
Results
Model Calibration
The 1-Dimensional reactive transport model was first calibrated with groundwater model results
using a bromide tracer: bromide is a conservative species and a nominal concentration of 10 mg/L
was introduced into the NOEF seepage prior to the transport run. The transport column
properties were adjusted until a bromide breakthrough concentration was observed at 500 m
after 20 years. Figure 59 shows the calibrated model bromide concentrations after 1, 10 and 20
years.
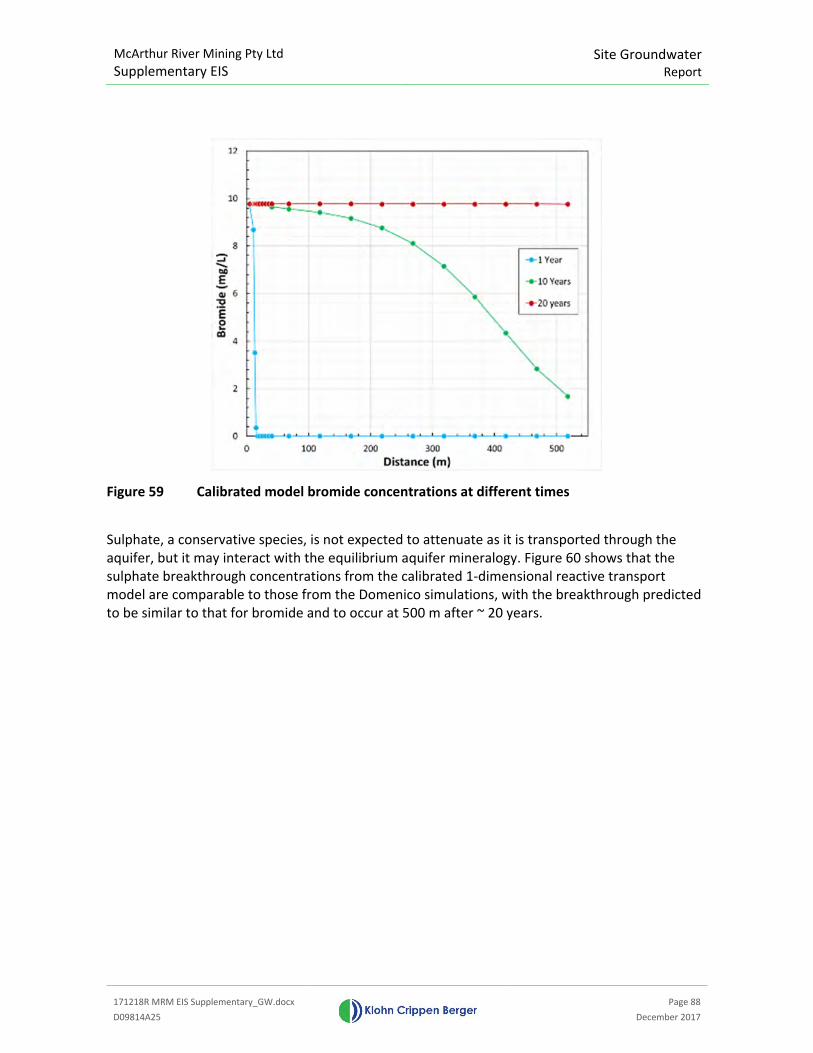
McArthur River Mining Pty Ltd
Supplementary EIS Site Groundwater
Report
171218R MRM EIS Supplementary_GW.docx
Page 88
D09814A25 December 2017
Figure 59 Calibrated model bromide concentrations at different times
Sulphate, a conservative species, is not expected to attenuate as it is transported through the
aquifer, but it may interact with the equilibrium aquifer mineralogy. Figure 60 shows that the
sulphate breakthrough concentrations from the calibrated 1-dimensional reactive transport
model are comparable to those from the Domenico simulations, with the breakthrough predicted
to be similar to that for bromide and to occur at 500 m after ~ 20 years.
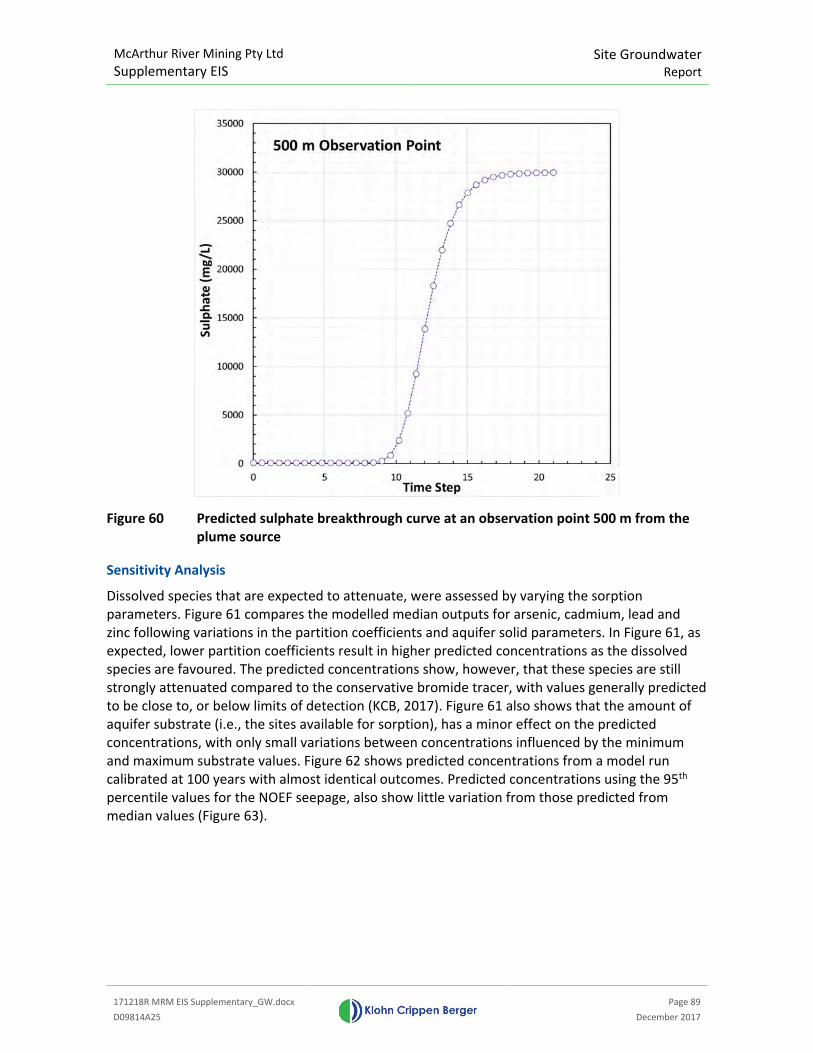
McArthur River Mining Pty Ltd
Supplementary EIS Site Groundwater
Report
171218R MRM EIS Supplementary_GW.docx
Page 89
D09814A25 December 2017
Figure 60 Predicted sulphate breakthrough curve at an observation point 500 m from the
plume source
Sensitivity Analysis
Dissolved species that are expected to attenuate, were assessed by varying the sorption
parameters. Figure 61 compares the modelled median outputs for arsenic, cadmium, lead and
zinc following variations in the partition coefficients and aquifer solid parameters. In Figure 61, as
expected, lower partition coefficients result in higher predicted concentrations as the dissolved
species are favoured. The predicted concentrations show, however, that these species are still
strongly attenuated compared to the conservative bromide tracer, with values generally predicted
to be close to, or below limits of detection (KCB, 2017). Figure 61 also shows that the amount of
aquifer substrate (i.e., the sites available for sorption), has a minor effect on the predicted
concentrations, with only small variations between concentrations influenced by the minimum
and maximum substrate values. Figure 62 shows predicted concentrations from a model run
calibrated at 100 years with almost identical outcomes. Predicted concentrations using the 95th
percentile values for the NOEF seepage, also show little variation from those predicted from
median values (Figure 63).
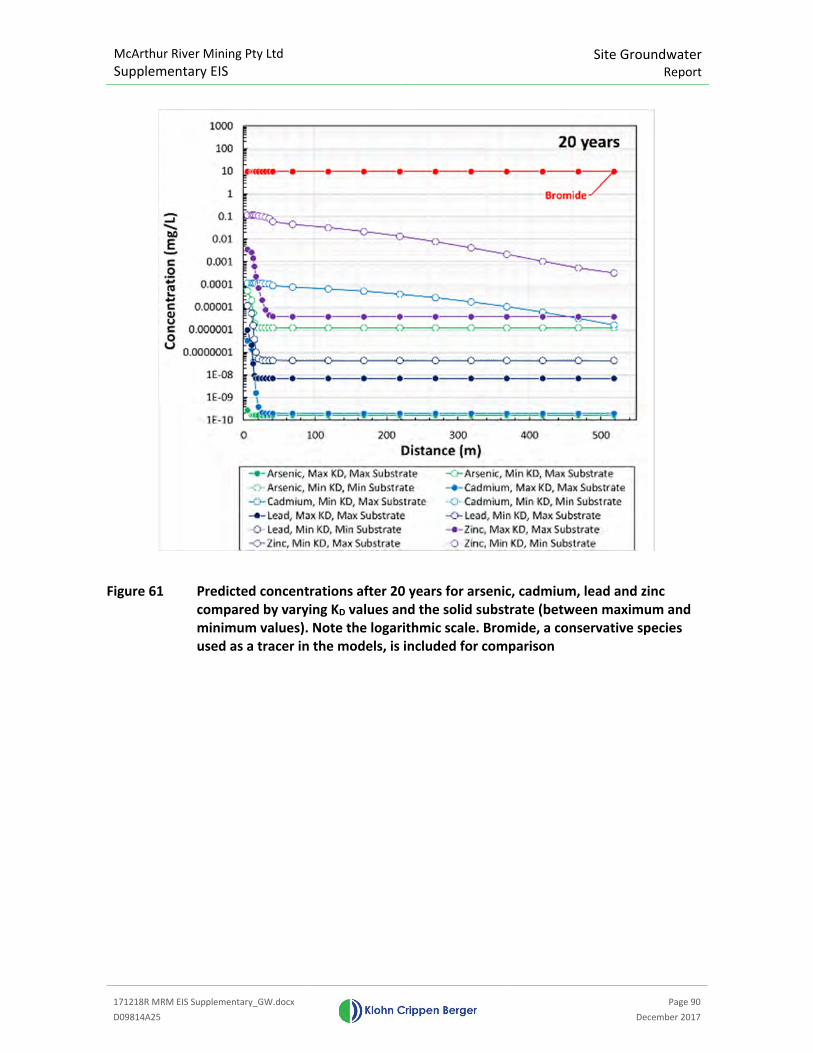
McArthur River Mining Pty Ltd
Supplementary EIS Site Groundwater
Report
171218R MRM EIS Supplementary_GW.docx
Page 90
D09814A25 December 2017
Figure 61 Predicted concentrations after 20 years for arsenic, cadmium, lead and zinc
compared by varying KD values and the solid substrate (between maximum and
minimum values). Note the logarithmic scale. Bromide, a conservative species
used as a tracer in the models, is included for comparison
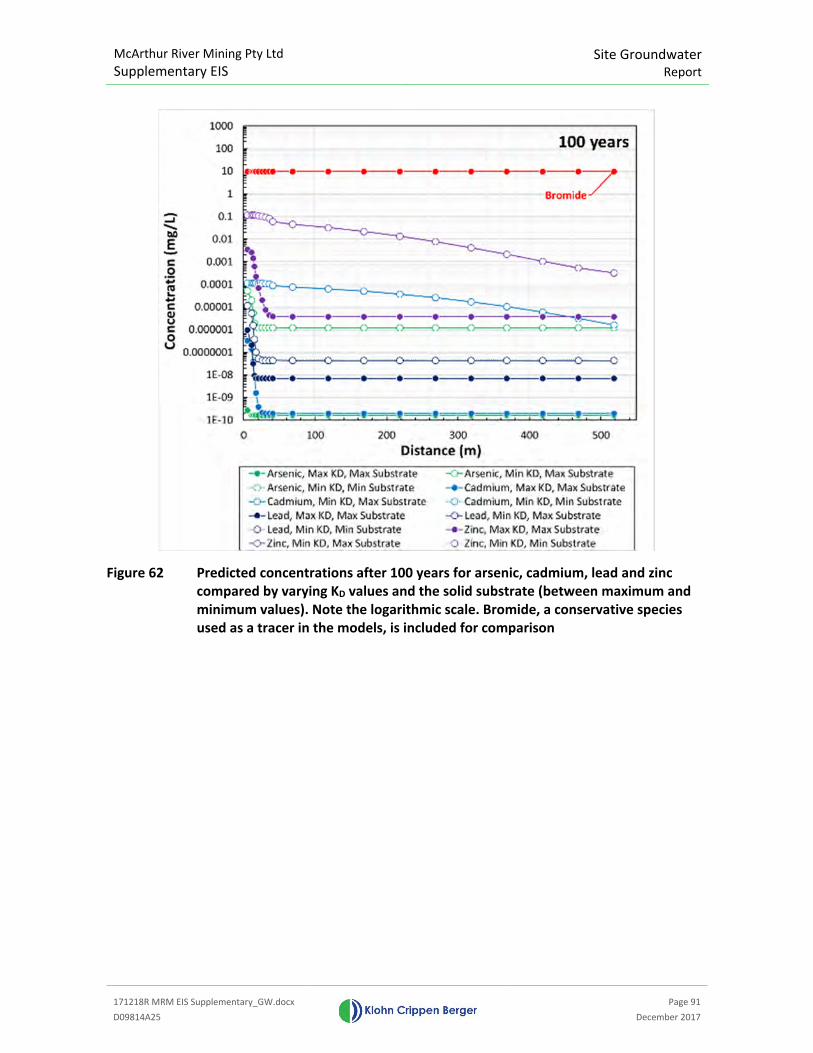
McArthur River Mining Pty Ltd
Supplementary EIS Site Groundwater
Report
171218R MRM EIS Supplementary_GW.docx
Page 91
D09814A25 December 2017
Figure 62 Predicted concentrations after 100 years for arsenic, cadmium, lead and zinc
compared by varying KD values and the solid substrate (between maximum and
minimum values). Note the logarithmic scale. Bromide, a conservative species
used as a tracer in the models, is included for comparison
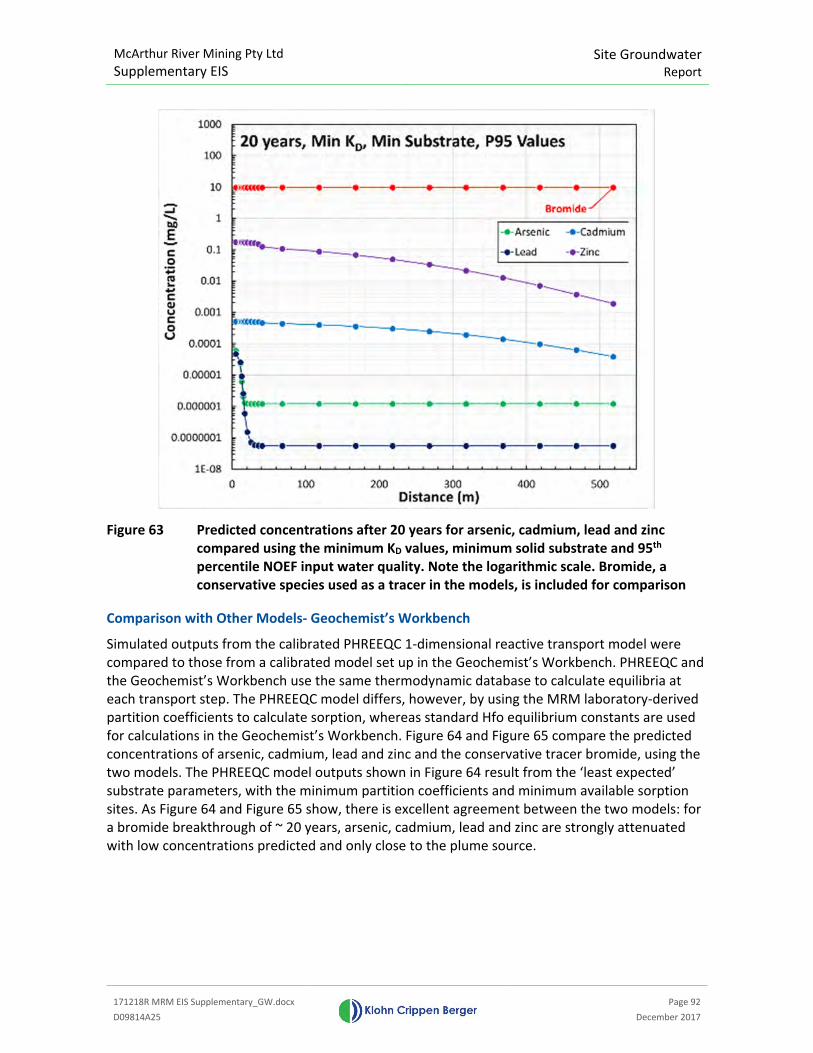
McArthur River Mining Pty Ltd
Supplementary EIS Site Groundwater
Report
171218R MRM EIS Supplementary_GW.docx
Page 92
D09814A25 December 2017
Figure 63 Predicted concentrations after 20 years for arsenic, cadmium, lead and zinc
compared using the minimum KD values, minimum solid substrate and 95th
percentile NOEF input water quality. Note the logarithmic scale. Bromide, a
conservative species used as a tracer in the models, is included for comparison
Comparison with Other Models- Geochemist’s Workbench
Simulated outputs from the calibrated PHREEQC 1-dimensional reactive transport model were
compared to those from a calibrated model set up in the Geochemist’s Workbench. PHREEQC and
the Geochemist’s Workbench use the same thermodynamic database to calculate equilibria at
each transport step. The PHREEQC model differs, however, by using the MRM laboratory-derived
partition coefficients to calculate sorption, whereas standard Hfo equilibrium constants are used
for calculations in the Geochemist’s Workbench. Figure 64 and Figure 65 compare the predicted
concentrations of arsenic, cadmium, lead and zinc and the conservative tracer bromide, using the
two models. The PHREEQC model outputs shown in Figure 64 result from the ‘least expected’
substrate parameters, with the minimum partition coefficients and minimum available sorption
sites. As Figure 64 and Figure 65 show, there is excellent agreement between the two models: for
a bromide breakthrough of ~ 20 years, arsenic, cadmium, lead and zinc are strongly attenuated
with low concentrations predicted and only close to the plume source.
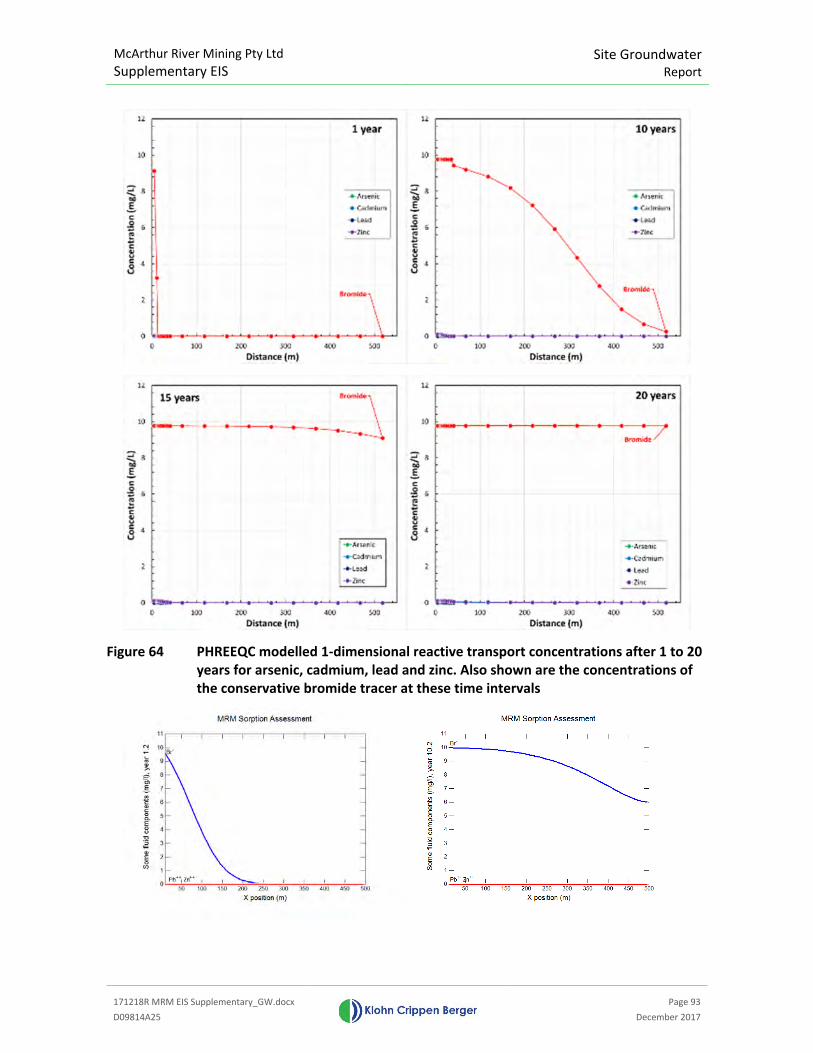
McArthur River Mining Pty Ltd
Supplementary EIS Site Groundwater
Report
171218R MRM EIS Supplementary_GW.docx
Page 93
D09814A25 December 2017
Figure 64 PHREEQC modelled 1-dimensional reactive transport concentrations after 1 to 20
years for arsenic, cadmium, lead and zinc. Also shown are the concentrations of
the conservative bromide tracer at these time intervals
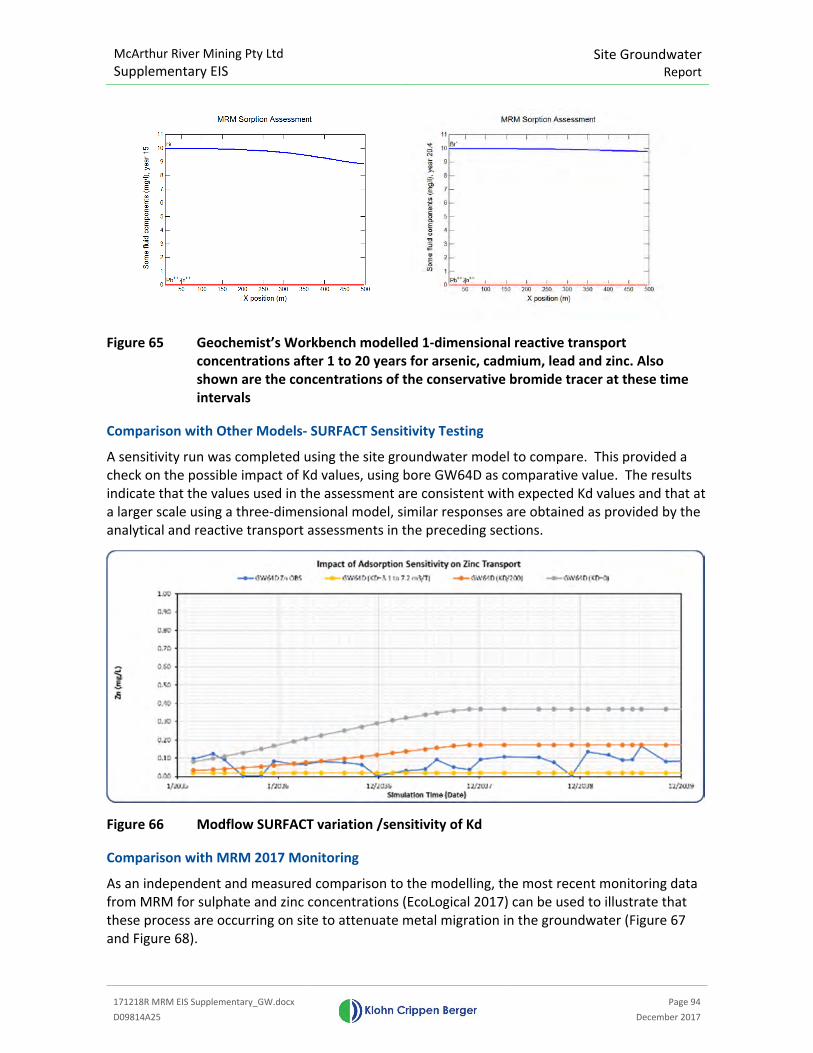
McArthur River Mining Pty Ltd
Supplementary EIS Site Groundwater
Report
171218R MRM EIS Supplementary_GW.docx
Page 94
D09814A25 December 2017
Figure 65 Geochemist’s Workbench modelled 1-dimensional reactive transport
concentrations after 1 to 20 years for arsenic, cadmium, lead and zinc. Also
shown are the concentrations of the conservative bromide tracer at these time
intervals
Comparison with Other Models- SURFACT Sensitivity Testing
A sensitivity run was completed using the site groundwater model to compare. This provided a
check on the possible impact of Kd values, using bore GW64D as comparative value. The results
indicate that the values used in the assessment are consistent with expected Kd values and that at
a larger scale using a three-dimensional model, similar responses are obtained as provided by the
analytical and reactive transport assessments in the preceding sections.
Figure 66 Modflow SURFACT variation /sensitivity of Kd
Comparison with MRM 2017 Monitoring
As an independent and measured comparison to the modelling, the most recent monitoring data
from MRM for sulphate and zinc concentrations (EcoLogical 2017) can be used to illustrate that
these process are occurring on site to attenuate metal migration in the groundwater (Figure 67
and Figure 68).
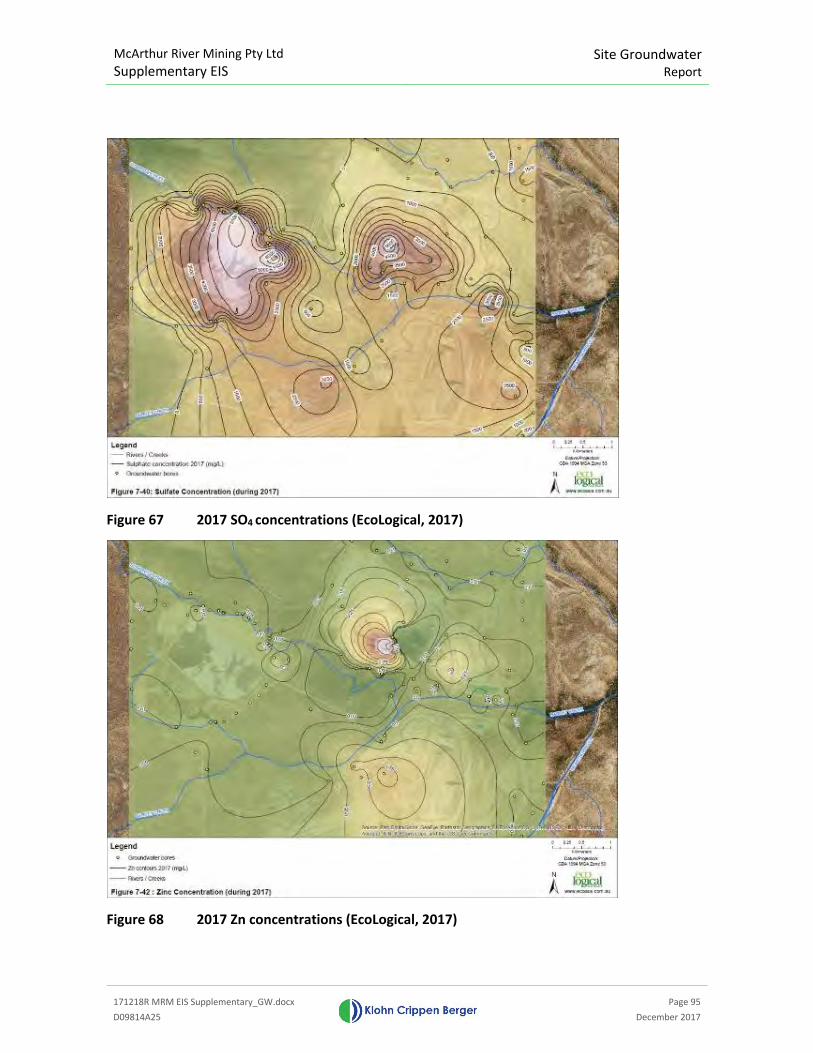
McArthur River Mining Pty Ltd
Supplementary EIS
Site Groundwater
Report
171218R MRM EIS Supplementary_GW.docx
Page 95
D09814A25 December 2017
Figure 67 2017 SO4 concentrations (EcoLogical, 2017)
Figure 68 2017 Zn concentrations (EcoLogical, 2017)
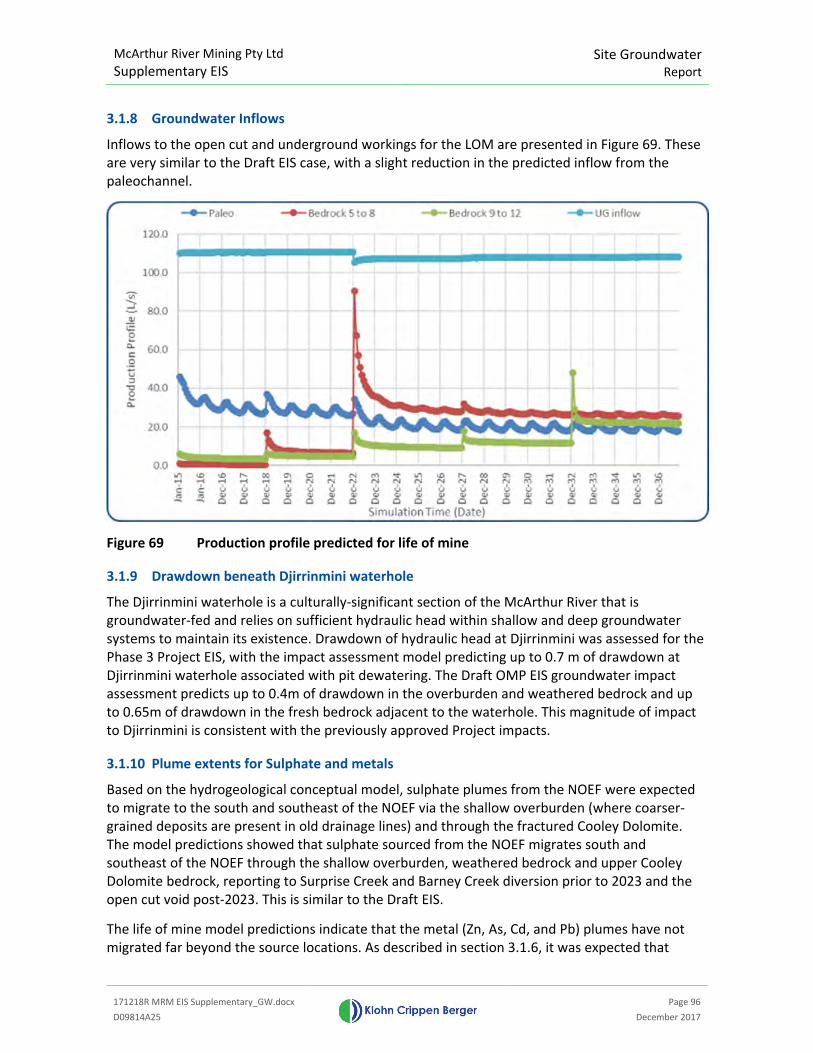
McArthur River Mining Pty Ltd
Supplementary EIS Site Groundwater
Report
171218R MRM EIS Supplementary_GW.docx
Page 96
D09814A25 December 2017
3.1.8 Groundwater Inflows
Inflows to the open cut and underground workings for the LOM are presented in Figure 69. These
are very similar to the Draft EIS case, with a slight reduction in the predicted inflow from the
paleochannel.
Figure 69 Production profile predicted for life of mine
3.1.9 Drawdown beneath Djirrinmini waterhole
The Djirrinmini waterhole is a culturally-significant section of the McArthur River that is
groundwater-fed and relies on sufficient hydraulic head within shallow and deep groundwater
systems to maintain its existence. Drawdown of hydraulic head at Djirrinmini was assessed for the
Phase 3 Project EIS, with the impact assessment model predicting up to 0.7 m of drawdown at
Djirrinmini waterhole associated with pit dewatering. The Draft OMP EIS groundwater impact
assessment predicts up to 0.4m of drawdown in the overburden and weathered bedrock and up
to 0.65m of drawdown in the fresh bedrock adjacent to the waterhole. This magnitude of impact
to Djirrinmini is consistent with the previously approved Project impacts.
3.1.10 Plume extents for Sulphate and metals
Based on the hydrogeological conceptual model, sulphate plumes from the NOEF were expected
to migrate to the south and southeast of the NOEF via the shallow overburden (where coarser-
grained deposits are present in old drainage lines) and through the fractured Cooley Dolomite.
The model predictions showed that sulphate sourced from the NOEF migrates south and
southeast of the NOEF through the shallow overburden, weathered bedrock and upper Cooley
Dolomite bedrock, reporting to Surprise Creek and Barney Creek diversion prior to 2023 and the
open cut void post-2023. This is similar to the Draft EIS.
The life of mine model predictions indicate that the metal (Zn, As, Cd, and Pb) plumes have not
migrated far beyond the source locations. As described in section 3.1.6, it was expected that

McArthur River Mining Pty Ltd
Supplementary EIS
Site Groundwater
Report
171218R MRM EIS Supplementary_GW.docx
Page 97
D09814A25 December 2017
natural attenuation processes would greatly restrict the migration of the metal plumes in the
aquifer pathways.
3.1.10.1 Load reporting to creeks and rivers
Sulphate load reduces for Barney Creek diversion throughout the LOM, relating primarily to a
reduction in baseflow rates post-2023 during the operational period. The sulphate plume front
extents and concentrations migrating from the NOEF through the overburden, weathered bedrock
and shallow bedrock increase during the life of mine, however the receptor shifts from the Barney
Creek diversion to the open cut, leading to an extension of the plume further south to the open
cut void.
Sulphate load progressively increases throughout life of mine for the reach of Surprise Creek that
is adjacent to the TSF. This is expected as shallow seepage from the TSF will increase as the facility
develops, and the bulk of this seepage passes through the permeable shallow strata and reports
to Surprise Creek in the immediate north. This reach of Surprise Creek flows during the dry
season, whereas there is no flow immediately up-gradient and down-gradient of the TSF. These
current field observations support the conceptual and numerical models, in that shallow seepage
will sustain dry season flows in the immediate reach that passes the TSF. To mitigate these loads,
an interception trench is proposed (see Draft EIS). The results used for the impact assessment
consider the influence of the mitigation as described in the Draft EIS.
3.1.11 Water Budget
Figure 70 presents the water budget for the last stress period (December 2027) in the 2023-2027
life of mine simulation. The water budget shows that the dominant inflow is recharge and aquifer
throughflow, followed by the injection of water that reports to the underground workings through
a general head boundary condition. There is a commensurate abstraction of this underground
inflow via pumping well abstraction out of the underground void. The major natural outflows from
the model are evapotranspiration, rejected recharge and baseflow discharge to ephemeral creeks
(represented by drains). For the selected stress period there was a 1.16% error in the overall
water balance.
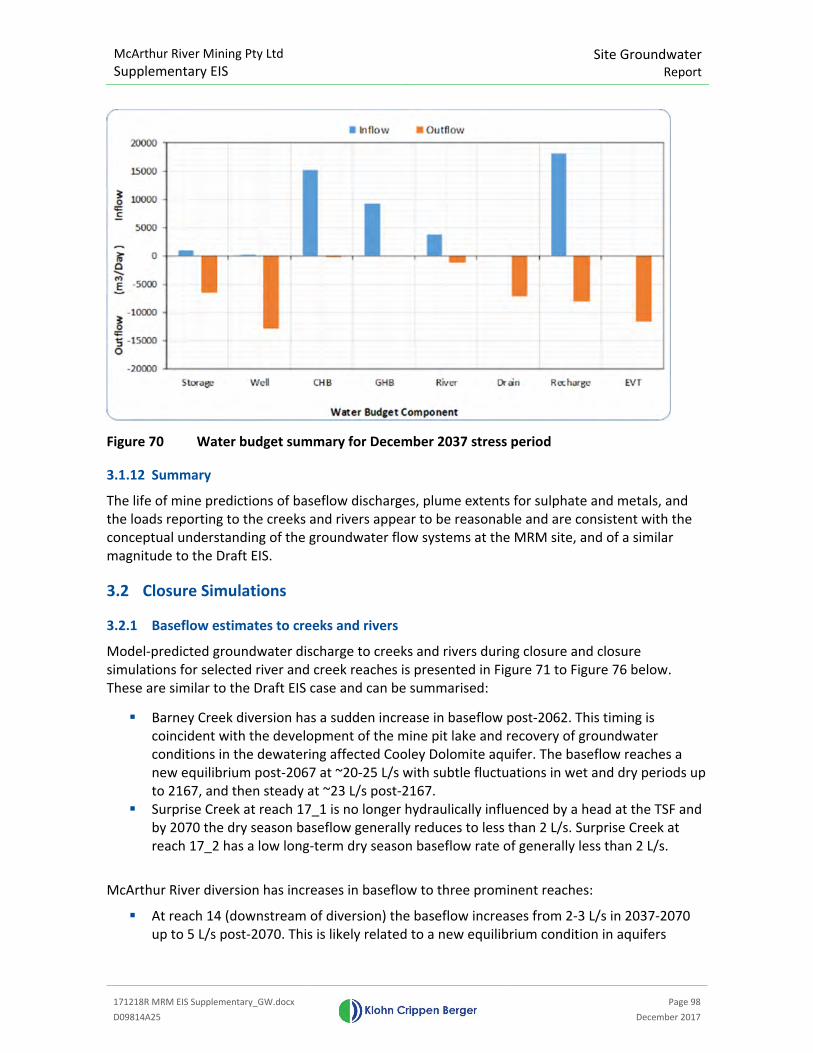
McArthur River Mining Pty Ltd
Supplementary EIS Site Groundwater
Report
171218R MRM EIS Supplementary_GW.docx
Page 98
D09814A25 December 2017
Figure 70 Water budget summary for December 2037 stress period
3.1.12 Summary
The life of mine predictions of baseflow discharges, plume extents for sulphate and metals, and
the loads reporting to the creeks and rivers appear to be reasonable and are consistent with the
conceptual understanding of the groundwater flow systems at the MRM site, and of a similar
magnitude to the Draft EIS.
3.2 Closure Simulations
3.2.1 Baseflow estimates to creeks and rivers
Model-predicted groundwater discharge to creeks and rivers during closure and closure
simulations for selected river and creek reaches is presented in Figure 71 to Figure 76 below.
These are similar to the Draft EIS case and can be summarised:
� Barney Creek diversion has a sudden increase in baseflow post-2062. This timing is
coincident with the development of the mine pit lake and recovery of groundwater
conditions in the dewatering affected Cooley Dolomite aquifer. The baseflow reaches a
new equilibrium post-2067 at ~20-25 L/s with subtle fluctuations in wet and dry periods up
to 2167, and then steady at ~23 L/s post-2167.
� Surprise Creek at reach 17_1 is no longer hydraulically influenced by a head at the TSF and
by 2070 the dry season baseflow generally reduces to less than 2 L/s. Surprise Creek at
reach 17_2 has a low long-term dry season baseflow rate of generally less than 2 L/s.
McArthur River diversion has increases in baseflow to three prominent reaches:
� At reach 14 (downstream of diversion) the baseflow increases from 2-3 L/s in 2037-2070
up to 5 L/s post-2070. This is likely related to a new equilibrium condition in aquifers
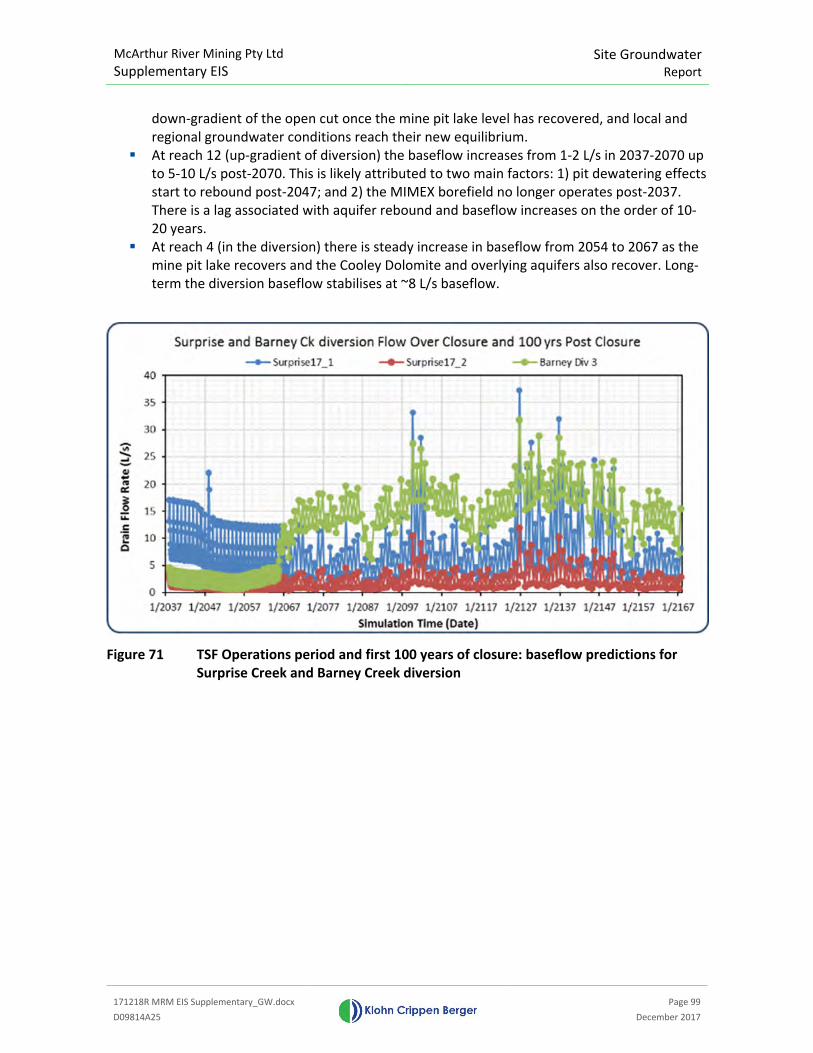
McArthur River Mining Pty Ltd
Supplementary EIS Site Groundwater
Report
171218R MRM EIS Supplementary_GW.docx
Page 99
D09814A25 December 2017
down-gradient of the open cut once the mine pit lake level has recovered, and local and
regional groundwater conditions reach their new equilibrium.
� At reach 12 (up-gradient of diversion) the baseflow increases from 1-2 L/s in 2037-2070 up
to 5-10 L/s post-2070. This is likely attributed to two main factors: 1) pit dewatering effects
start to rebound post-2047; and 2) the MIMEX borefield no longer operates post-2037.
There is a lag associated with aquifer rebound and baseflow increases on the order of 10-
20 years.
� At reach 4 (in the diversion) there is steady increase in baseflow from 2054 to 2067 as the
mine pit lake recovers and the Cooley Dolomite and overlying aquifers also recover. Long-
term the diversion baseflow stabilises at ~8 L/s baseflow.
Figure 71 TSF Operations period and first 100 years of closure: baseflow predictions for
Surprise Creek and Barney Creek diversion
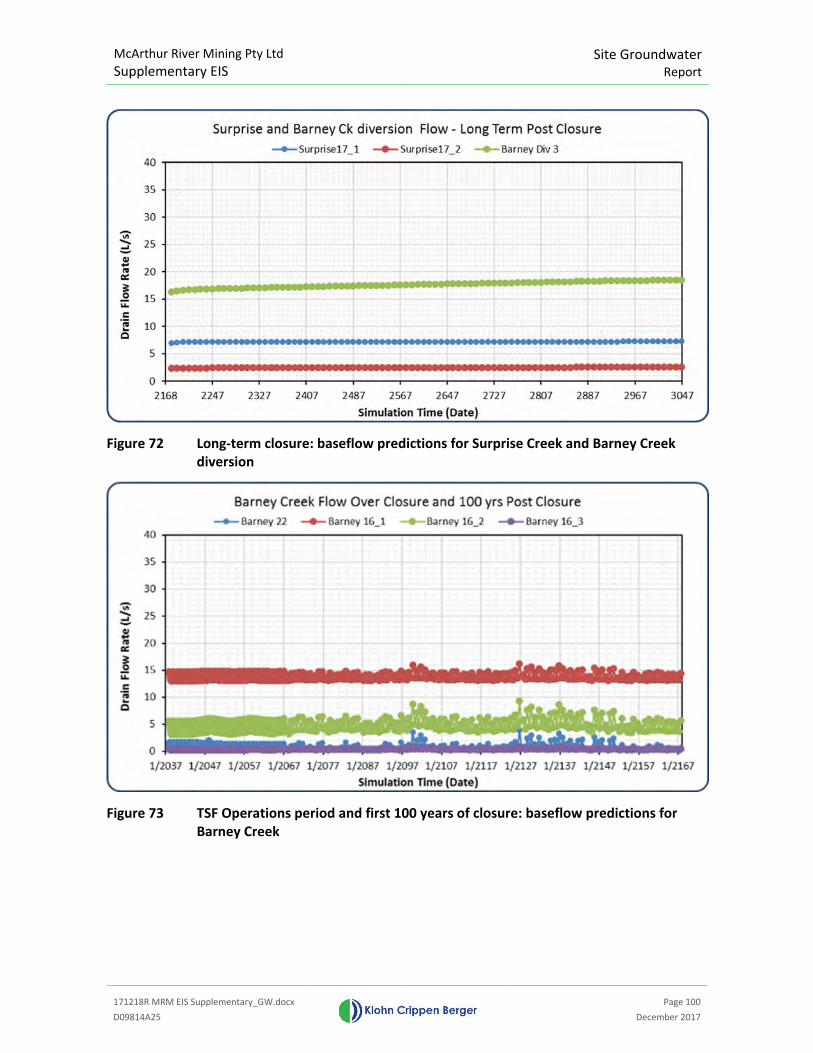
McArthur River Mining Pty Ltd
Supplementary EIS Site Groundwater
Report
171218R MRM EIS Supplementary_GW.docx
Page 100
D09814A25 December 2017
Figure 72 Long-term closure: baseflow predictions for Surprise Creek and Barney Creek
diversion
Figure 73 TSF Operations period and first 100 years of closure: baseflow predictions for
Barney Creek
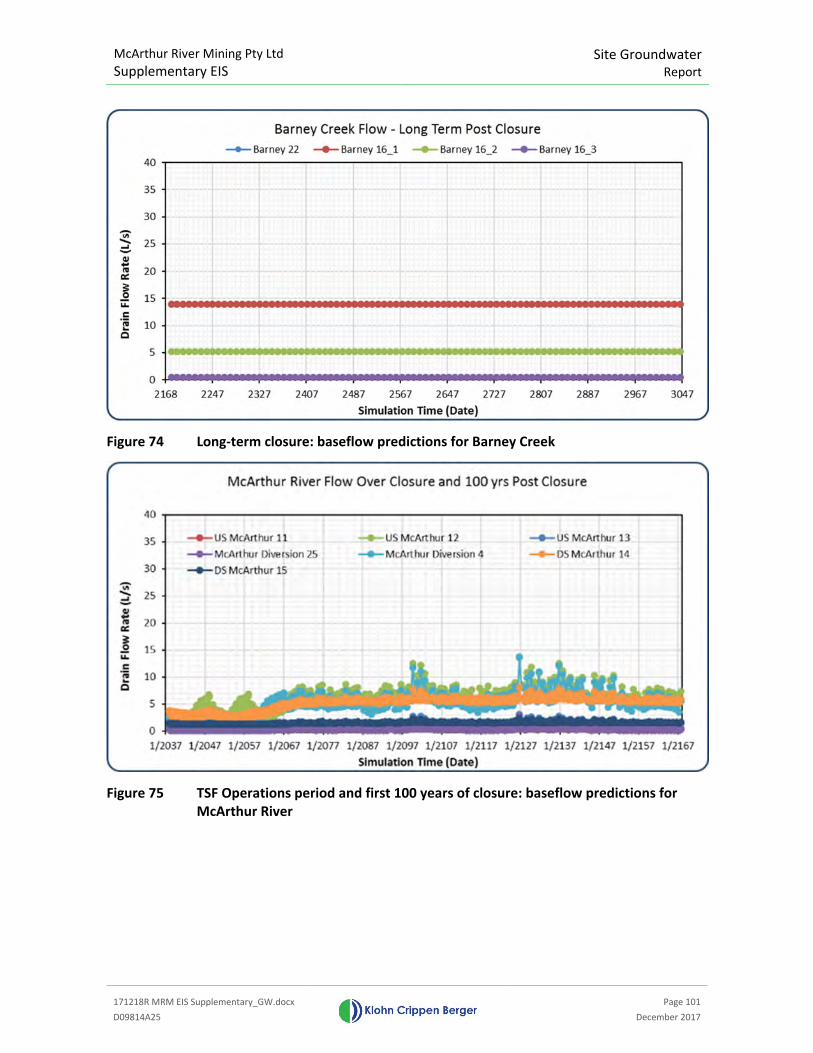
McArthur River Mining Pty Ltd
Supplementary EIS Site Groundwater
Report
171218R MRM EIS Supplementary_GW.docx
Page 101
D09814A25 December 2017
Figure 74 Long-term closure: baseflow predictions for Barney Creek
Figure 75 TSF Operations period and first 100 years of closure: baseflow predictions for
McArthur River
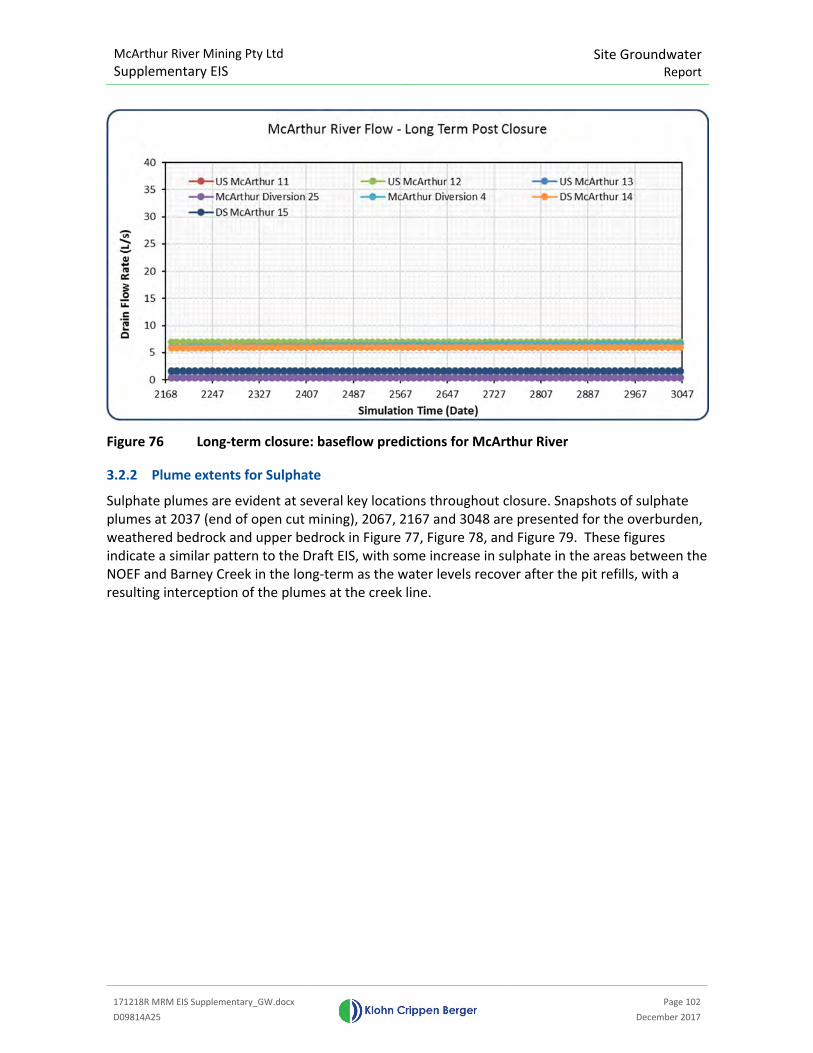
McArthur River Mining Pty Ltd
Supplementary EIS Site Groundwater
Report
171218R MRM EIS Supplementary_GW.docx
Page 102
D09814A25 December 2017
Figure 76 Long-term closure: baseflow predictions for McArthur River
3.2.2 Plume extents for Sulphate
Sulphate plumes are evident at several key locations throughout closure. Snapshots of sulphate
plumes at 2037 (end of open cut mining), 2067, 2167 and 3048 are presented for the overburden,
weathered bedrock and upper bedrock in Figure 77, Figure 78, and Figure 79. These figures
indicate a similar pattern to the Draft EIS, with some increase in sulphate in the areas between the
NOEF and Barney Creek in the long-term as the water levels recover after the pit refills, with a
resulting interception of the plumes at the creek line.
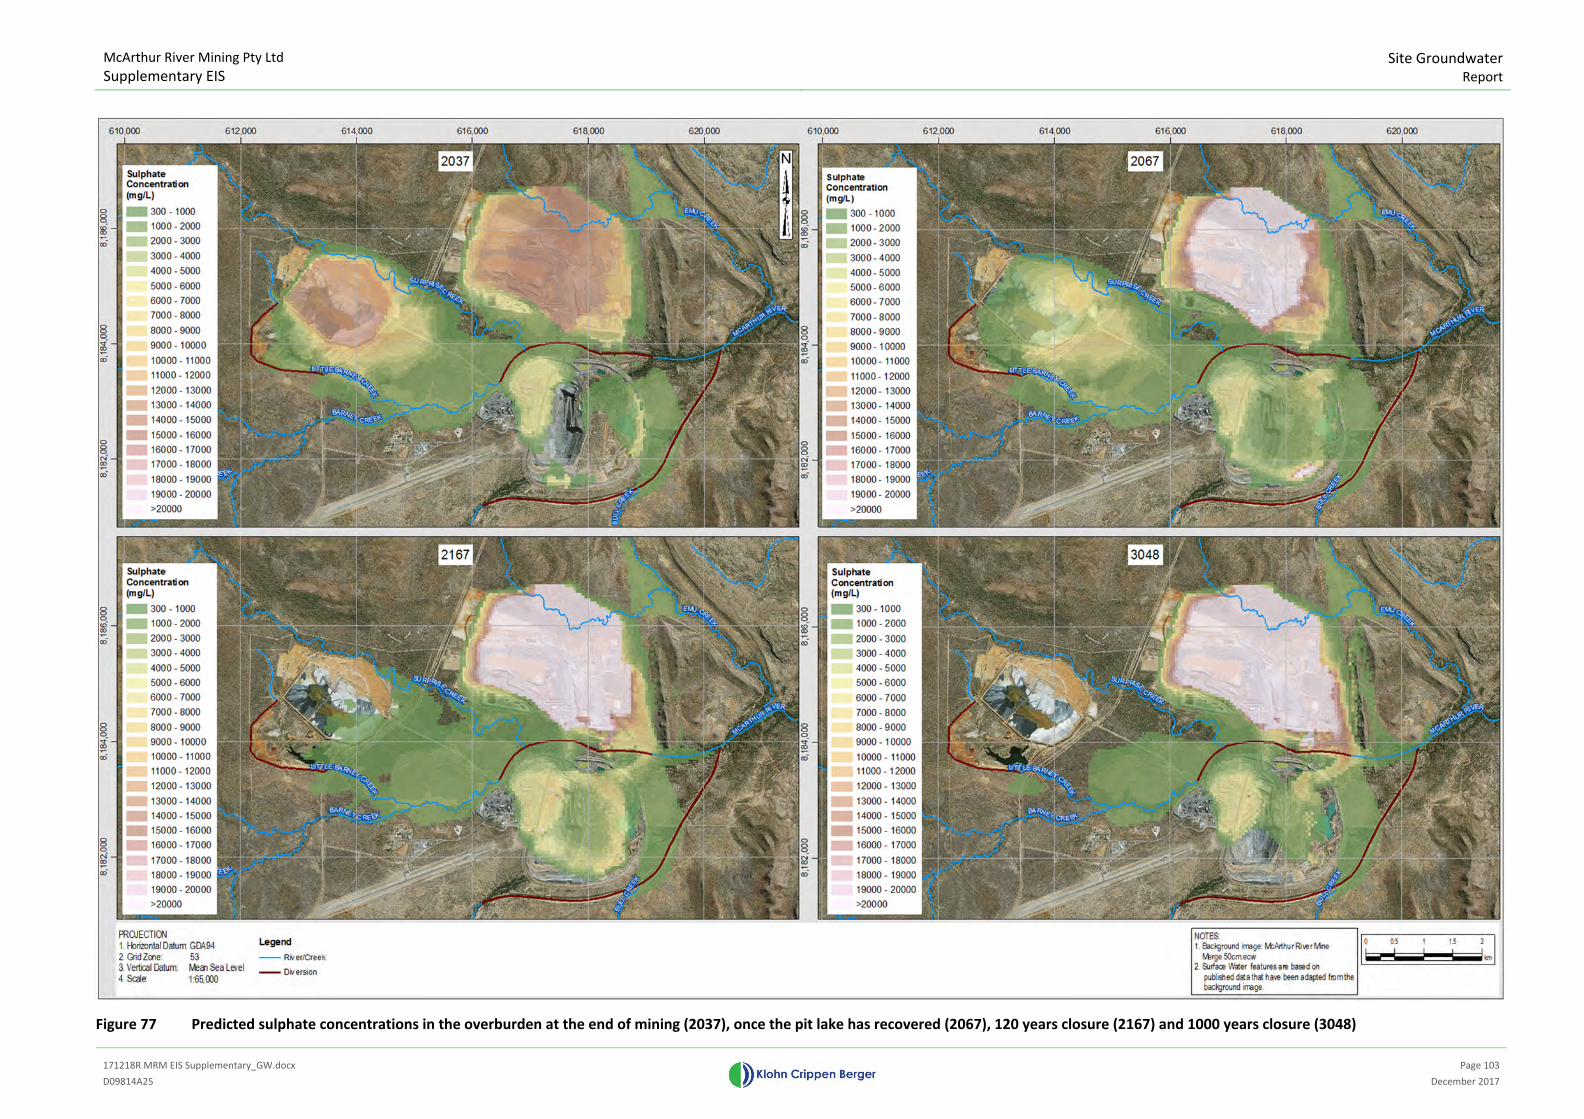
McArthur River Mining Pty Ltd
Supplementary EIS
Site Groundwater
Report
171218R MRM EIS Supplementary_GW.docx
Page 103
D09814A25 December 2017
Figure 77 Predicted sulphate concentrations in the overburden at the end of mining (2037), once the pit lake has recovered (2067), 120 years closure (2167) and 1000 years closure (3048)
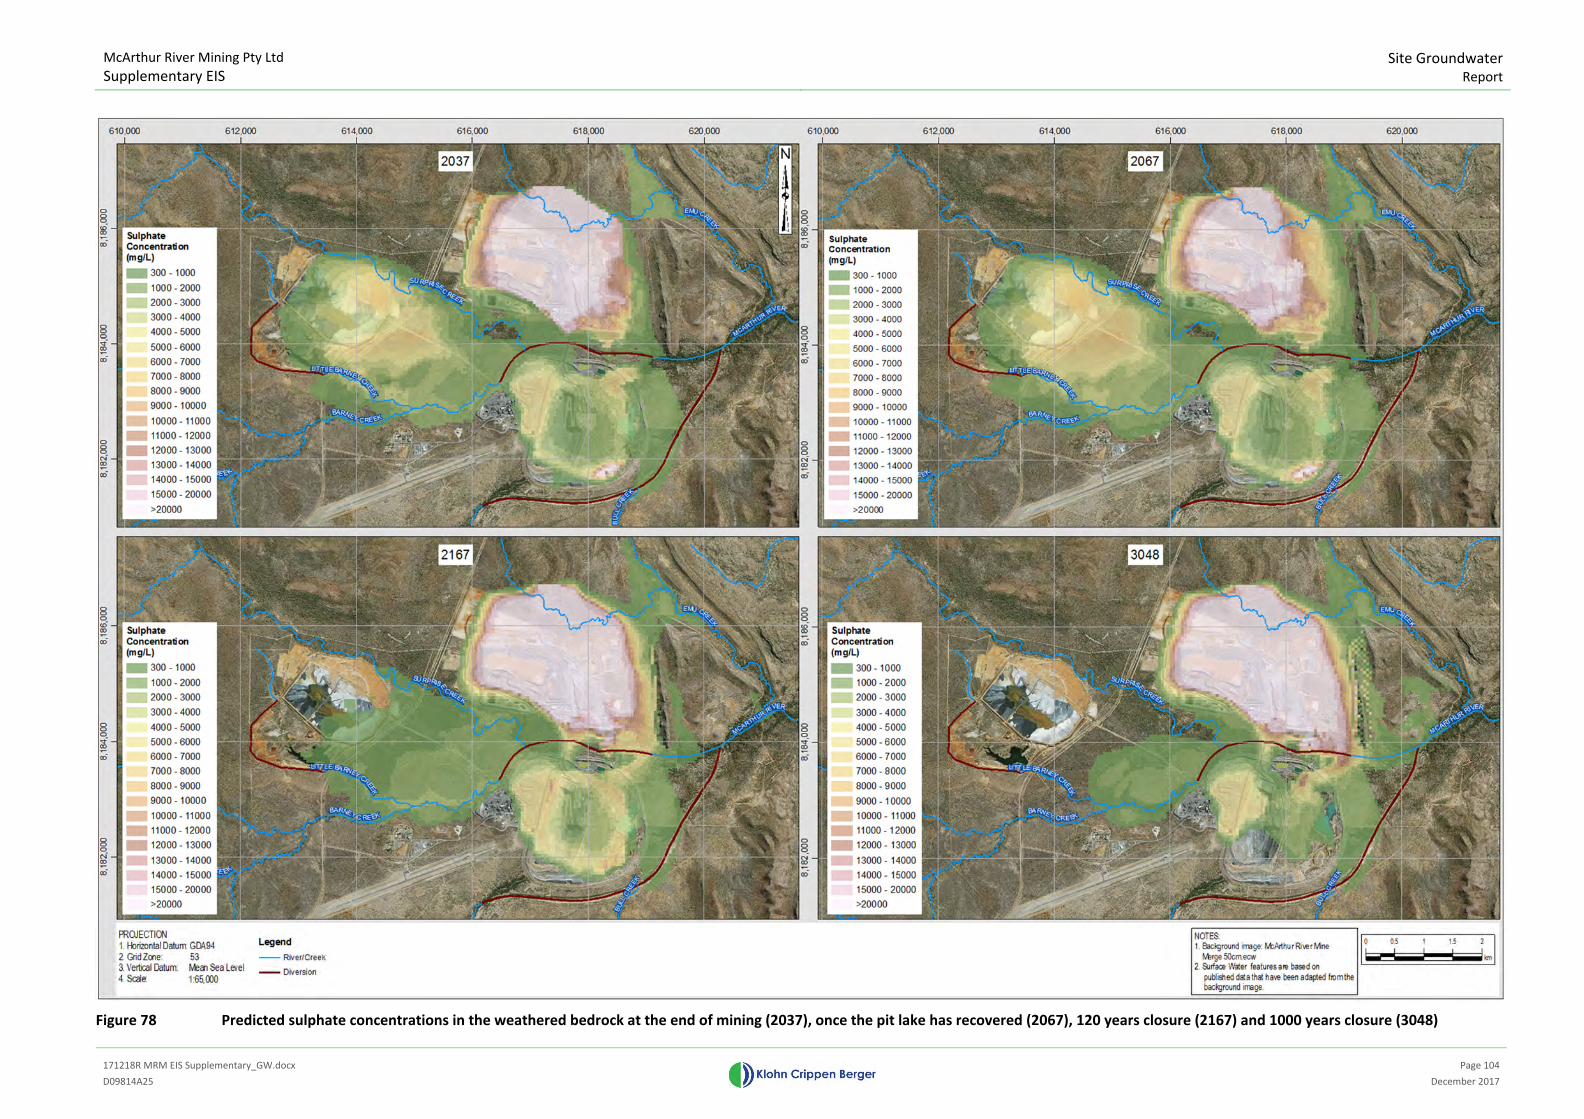
McArthur River Mining Pty Ltd
Supplementary EIS
Site Groundwater
Report
171218R MRM EIS Supplementary_GW.docx
Page 104
D09814A25 December 2017
Figure 78 Predicted sulphate concentrations in the weathered bedrock at the end of mining (2037), once the pit lake has recovered (2067), 120 years closure (2167) and 1000 years closure (3048)
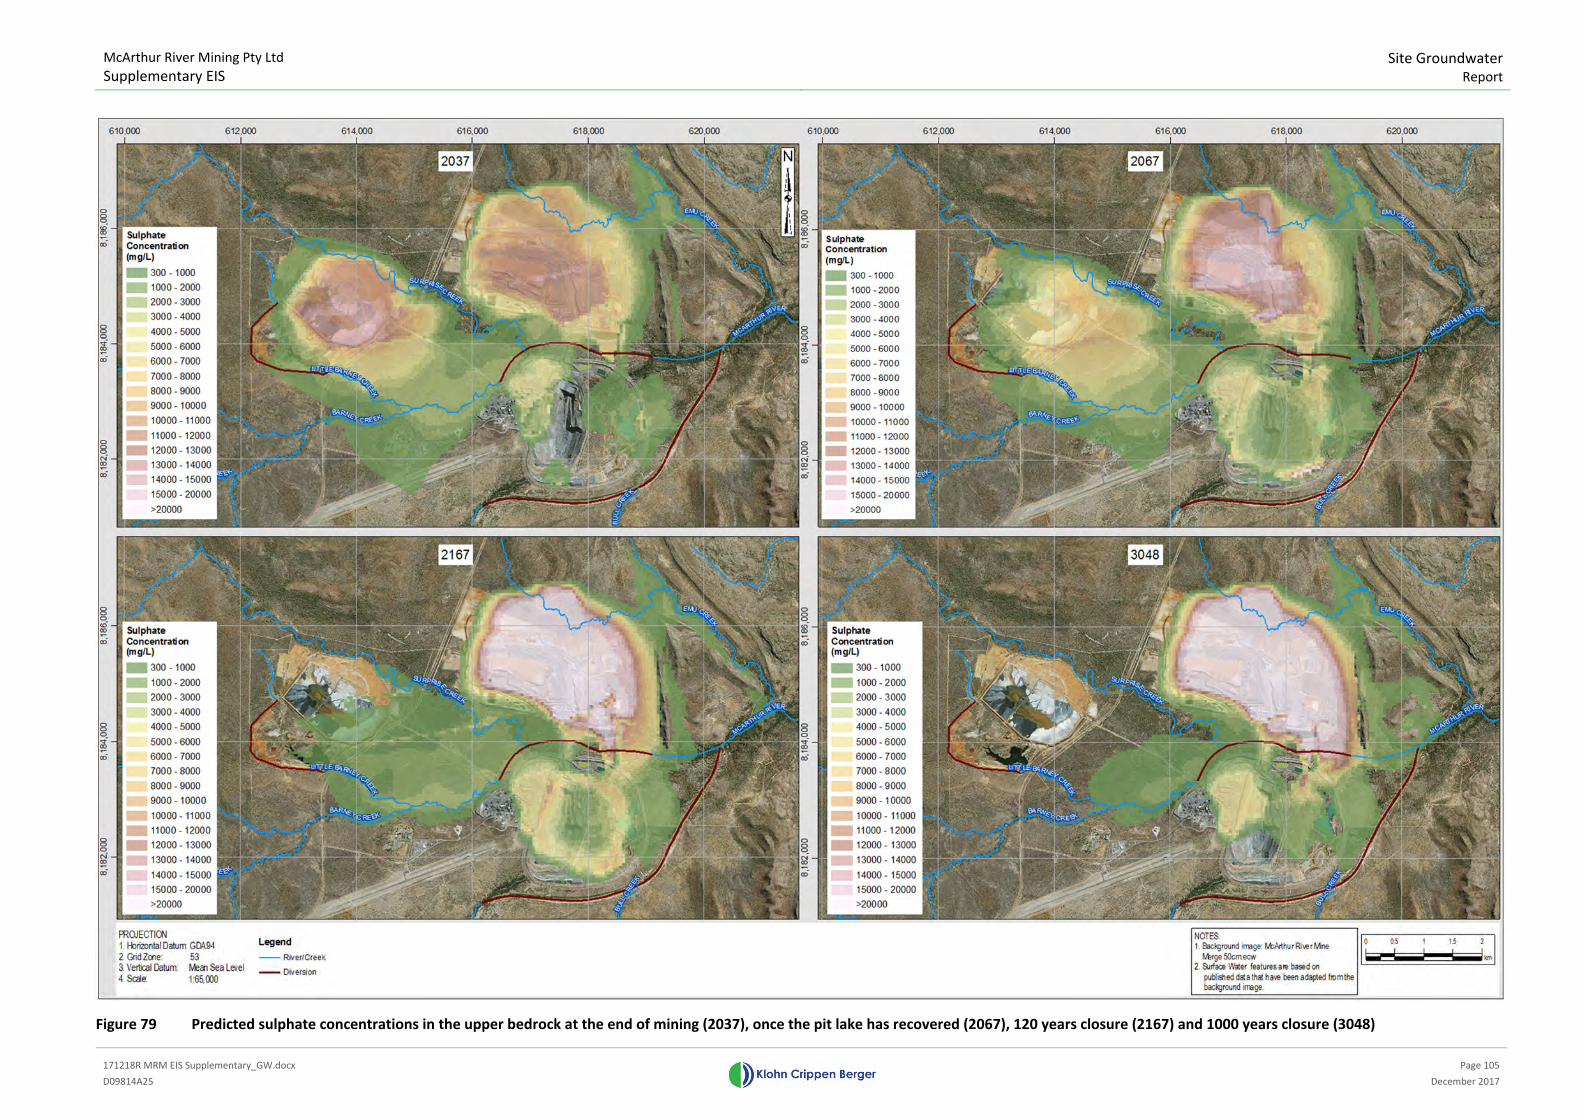
McArthur River Mining Pty Ltd
Supplementary EIS
Site Groundwater
Report
171218R MRM EIS Supplementary_GW.docx
Page 105
D09814A25 December 2017
Figure 79 Predicted sulphate concentrations in the upper bedrock at the end of mining (2037), once the pit lake has recovered (2067), 120 years closure (2167) and 1000 years closure (3048)

McArthur River Mining Pty Ltd
Supplementary EIS
Site Groundwater
Report
171218R MRM EIS Supplementary_GW.docx
Page 106
D09814A25 December 2017
3.2.3 Plume extents for Metals
Metals continue to be attenuated during closure with a progressive increase in the spatial (lateral
and vertical) extent of the plumes. Zinc plume maps have again been used to show the indicative
extent of the metal migration between the sources and the receptors during various time
snapshots throughout closure. Figure 80, Figure 81, and Figure 82 show the zinc plumes at 2037,
2067, 2167 and 3048 for the overburden, weathered bedrock and upper bedrock. It is evident
from these figures that metal migration is a much slower process than sulphate migration, and
that the 1,000-year closure snapshot starts to show the extents of the metal plumes from source
to receptor. The closure simulations are based on Tough2/GoldSim results.
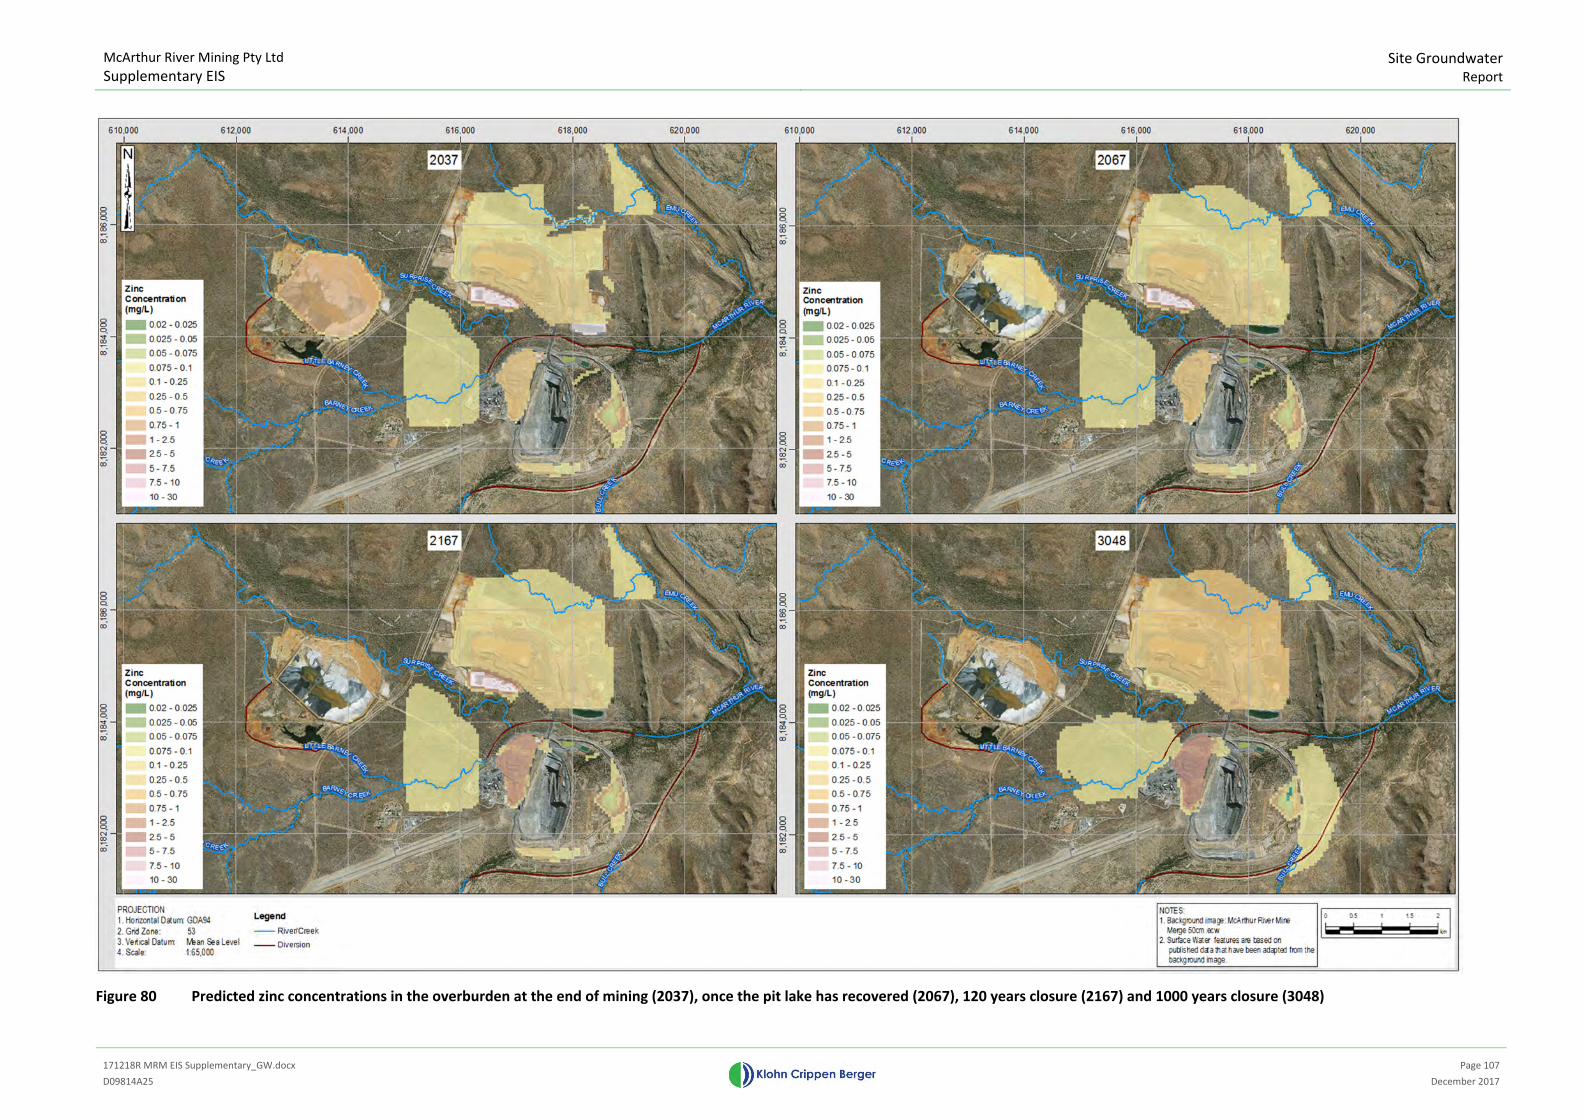
McArthur River Mining Pty Ltd
Supplementary EIS
Site Groundwater
Report
171218R MRM EIS Supplementary_GW.docx
Page 107
D09814A25 December 2017
Figure 80 Predicted zinc concentrations in the overburden at the end of mining (2037), once the pit lake has recovered (2067), 120 years closure (2167) and 1000 years closure (3048)
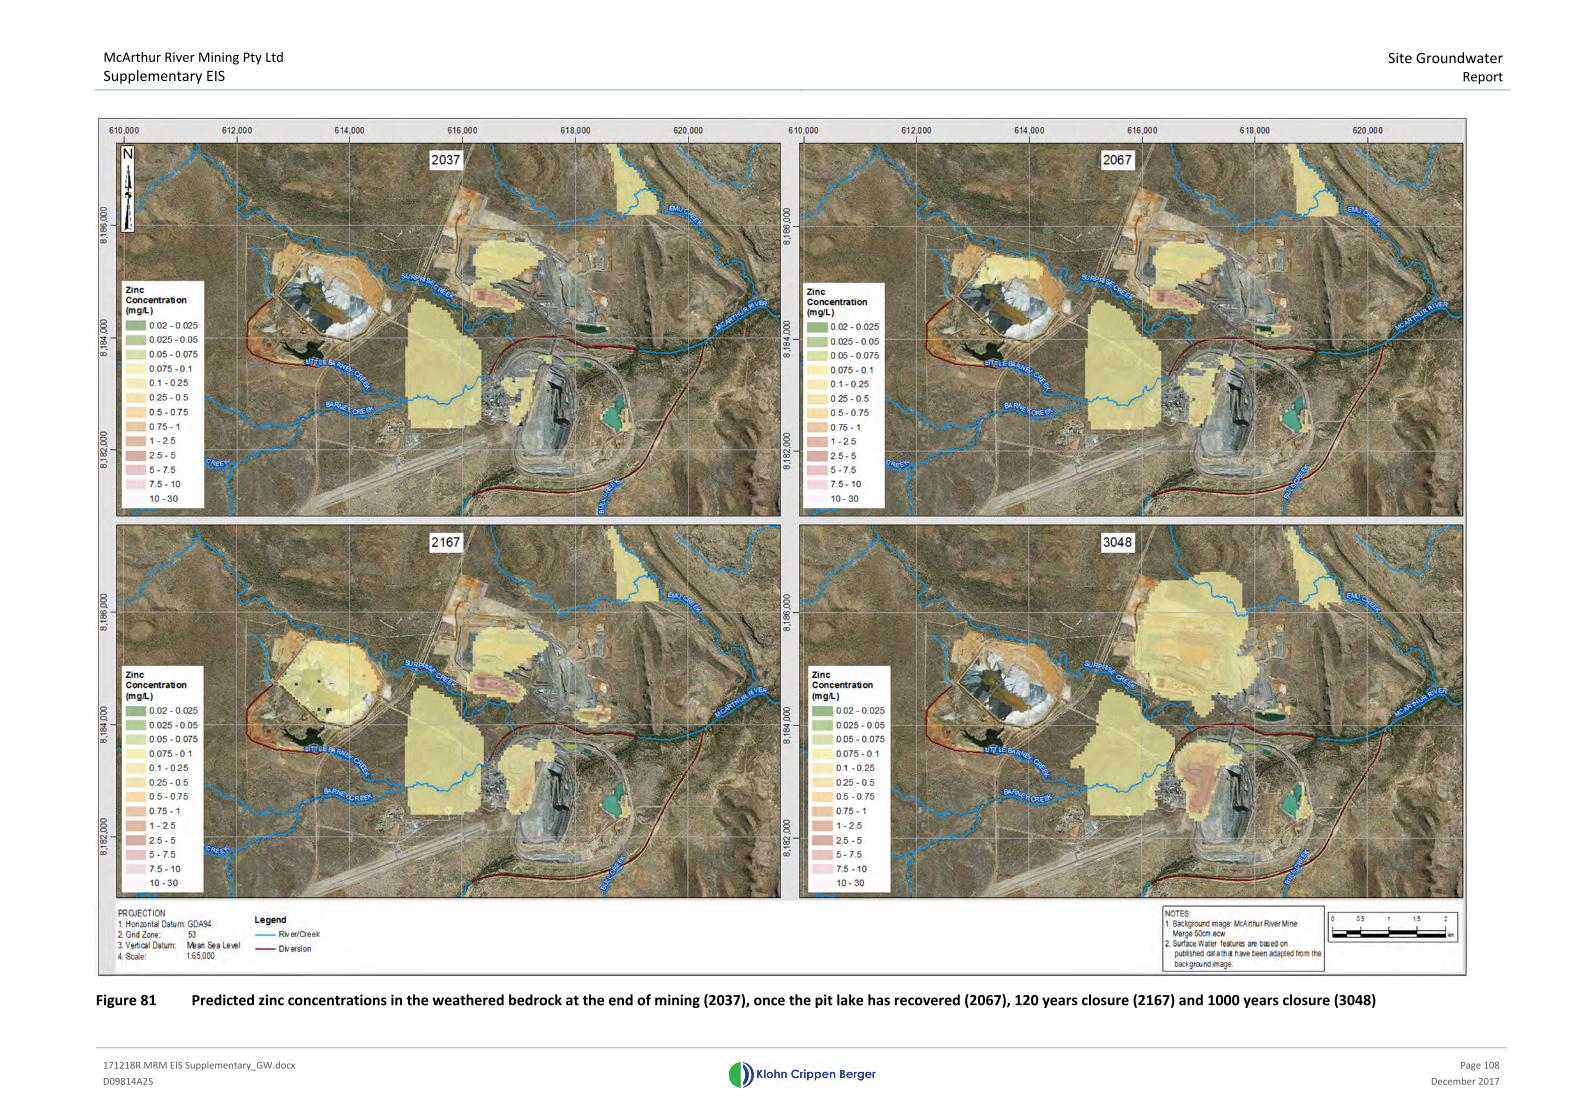
McArthur River Mining Pty Ltd
Supplementary EIS
Site Groundwater
Report
171218R MRM EIS Supplementary_GW.docx
Page 108
D09814A25 December 2017
Figure 81 Predicted zinc concentrations in the weathered bedrock at the end of mining (2037), once the pit lake has recovered (2067), 120 years closure (2167) and 1000 years closure (3048)
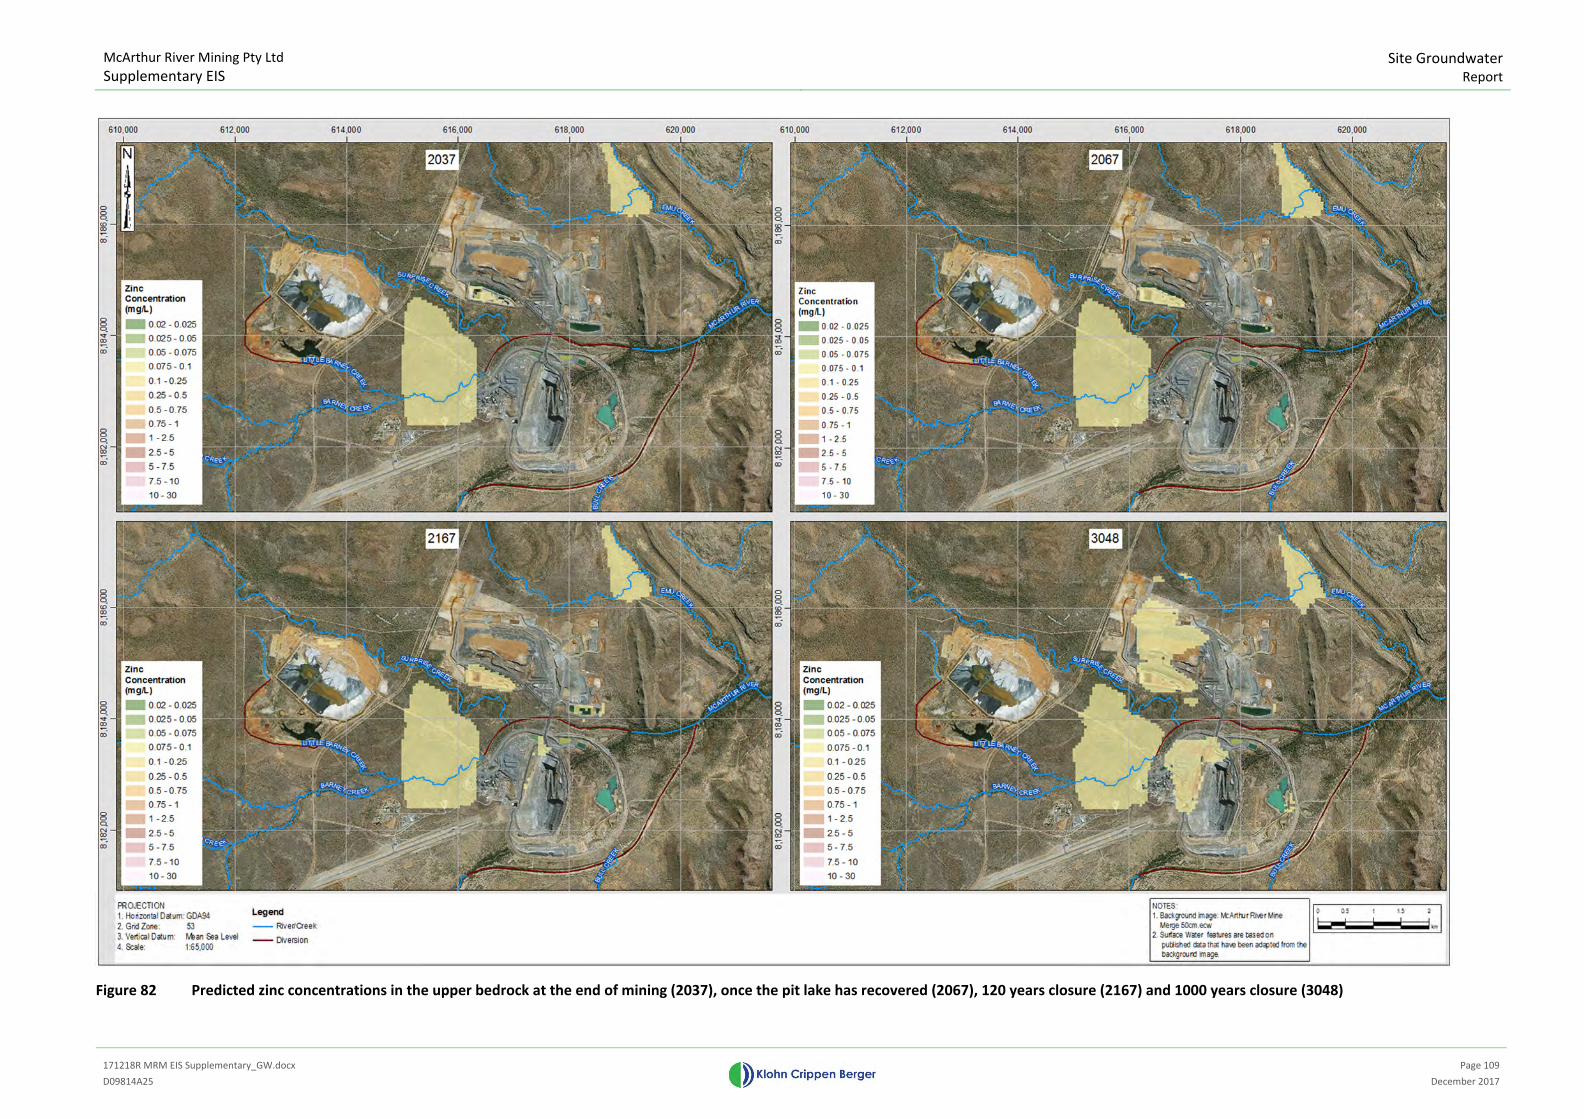
McArthur River Mining Pty Ltd
Supplementary EIS
Site Groundwater
Report
171218R MRM EIS Supplementary_GW.docx
Page 109
D09814A25 December 2017
Figure 82 Predicted zinc concentrations in the upper bedrock at the end of mining (2037), once the pit lake has recovered (2067), 120 years closure (2167) and 1000 years closure (3048)
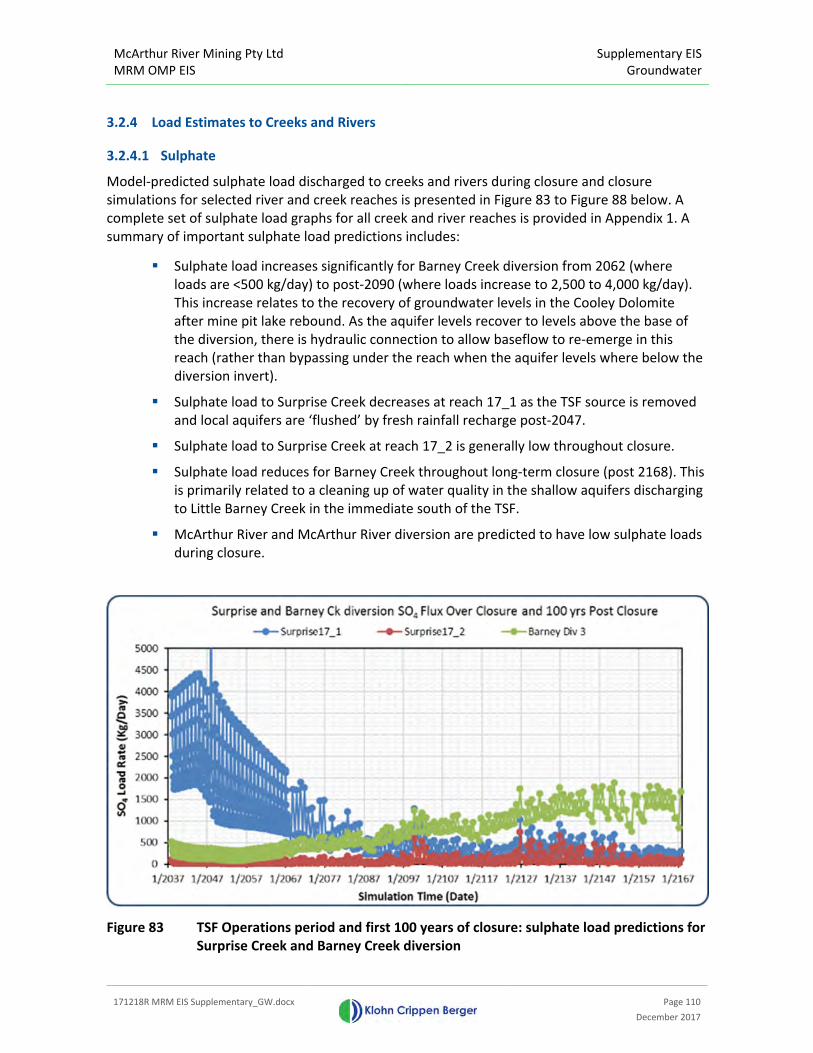
McArthur River Mining Pty Ltd
MRM OMP EIS
Supplementary EIS
Groundwater
171218R MRM EIS Supplementary_GW.docx
Page 110
December 2017
3.2.4 Load Estimates to Creeks and Rivers
3.2.4.1 Sulphate
Model-predicted sulphate load discharged to creeks and rivers during closure and closure
simulations for selected river and creek reaches is presented in Figure 83 to Figure 88 below. A
complete set of sulphate load graphs for all creek and river reaches is provided in Appendix 1. A
summary of important sulphate load predictions includes:
� Sulphate load increases significantly for Barney Creek diversion from 2062 (where
loads are <500 kg/day) to post-2090 (where loads increase to 2,500 to 4,000 kg/day).
This increase relates to the recovery of groundwater levels in the Cooley Dolomite
after mine pit lake rebound. As the aquifer levels recover to levels above the base of
the diversion, there is hydraulic connection to allow baseflow to re-emerge in this
reach (rather than bypassing under the reach when the aquifer levels where below the
diversion invert).
� Sulphate load to Surprise Creek decreases at reach 17_1 as the TSF source is removed
and local aquifers are ‘flushed’ by fresh rainfall recharge post-2047.
� Sulphate load to Surprise Creek at reach 17_2 is generally low throughout closure.
� Sulphate load reduces for Barney Creek throughout long-term closure (post 2168). This
is primarily related to a cleaning up of water quality in the shallow aquifers discharging
to Little Barney Creek in the immediate south of the TSF.
� McArthur River and McArthur River diversion are predicted to have low sulphate loads
during closure.
Figure 83 TSF Operations period and first 100 years of closure: sulphate load predictions for
Surprise Creek and Barney Creek diversion
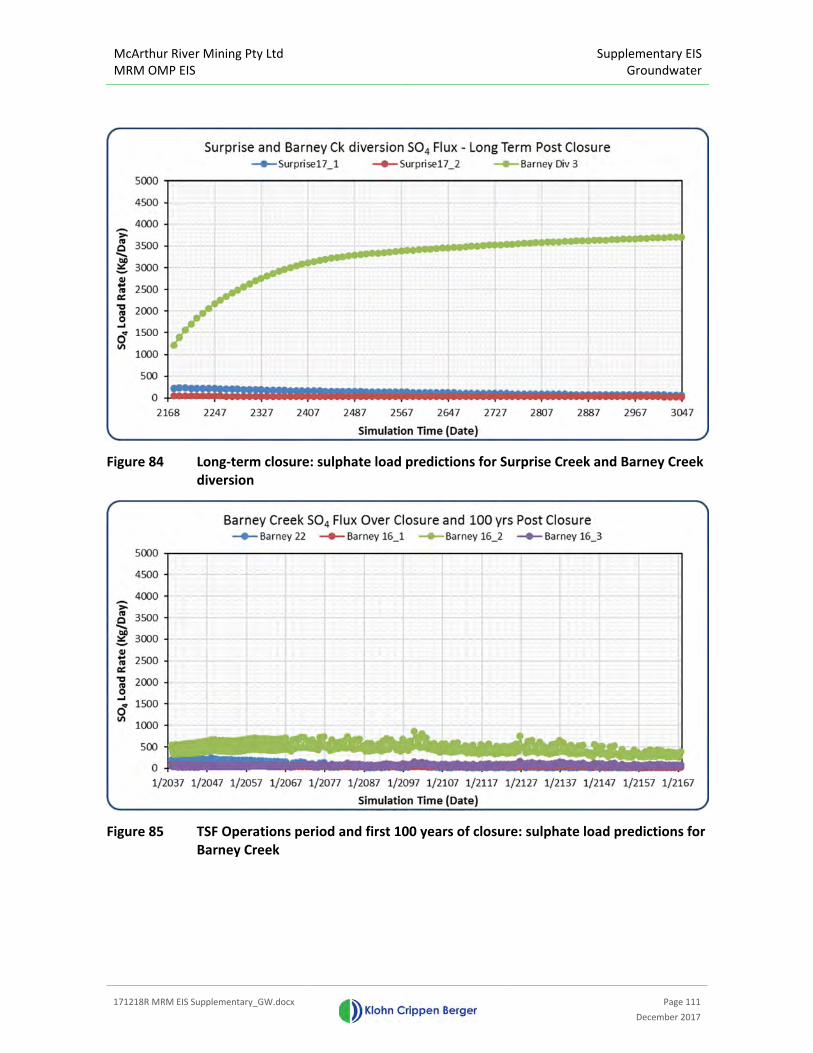
McArthur River Mining Pty Ltd
MRM OMP EIS
Supplementary EIS
Groundwater
171218R MRM EIS Supplementary_GW.docx
Page 111
December 2017
Figure 84 Long-term closure: sulphate load predictions for Surprise Creek and Barney Creek
diversion
Figure 85 TSF Operations period and first 100 years of closure: sulphate load predictions for
Barney Creek
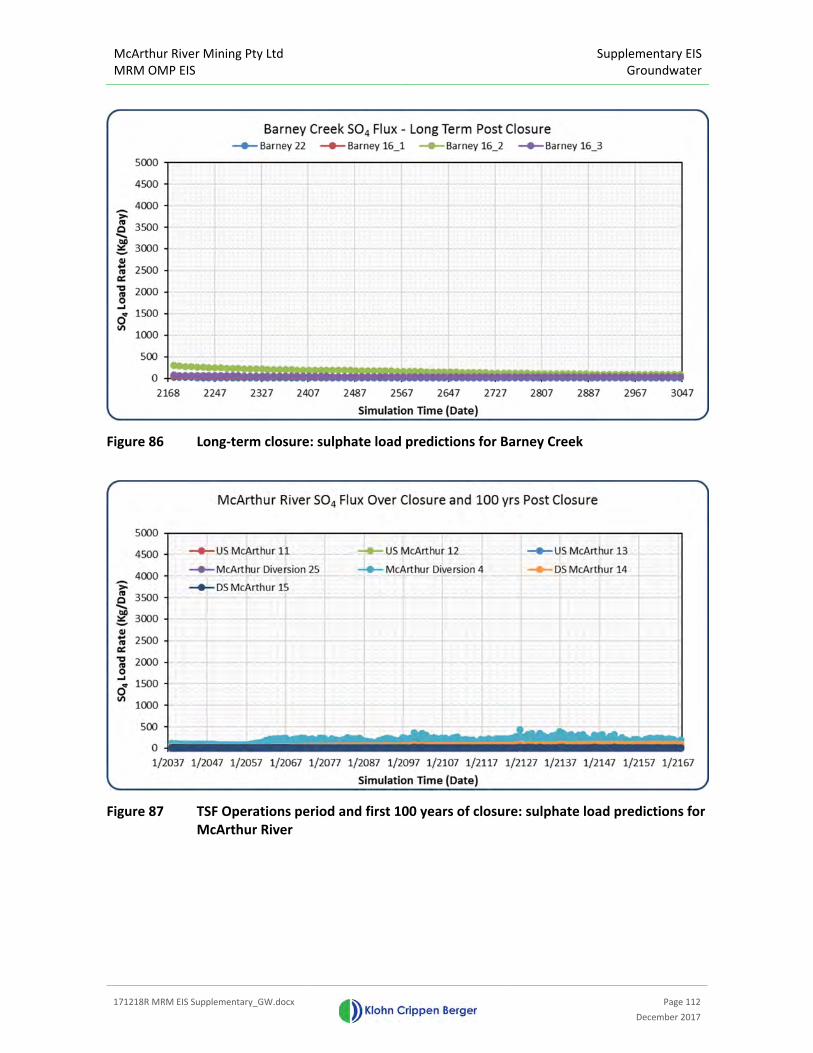
McArthur River Mining Pty Ltd
MRM OMP EIS
Supplementary EIS
Groundwater
171218R MRM EIS Supplementary_GW.docx
Page 112
December 2017
Figure 86 Long-term closure: sulphate load predictions for Barney Creek
Figure 87 TSF Operations period and first 100 years of closure: sulphate load predictions for
McArthur River
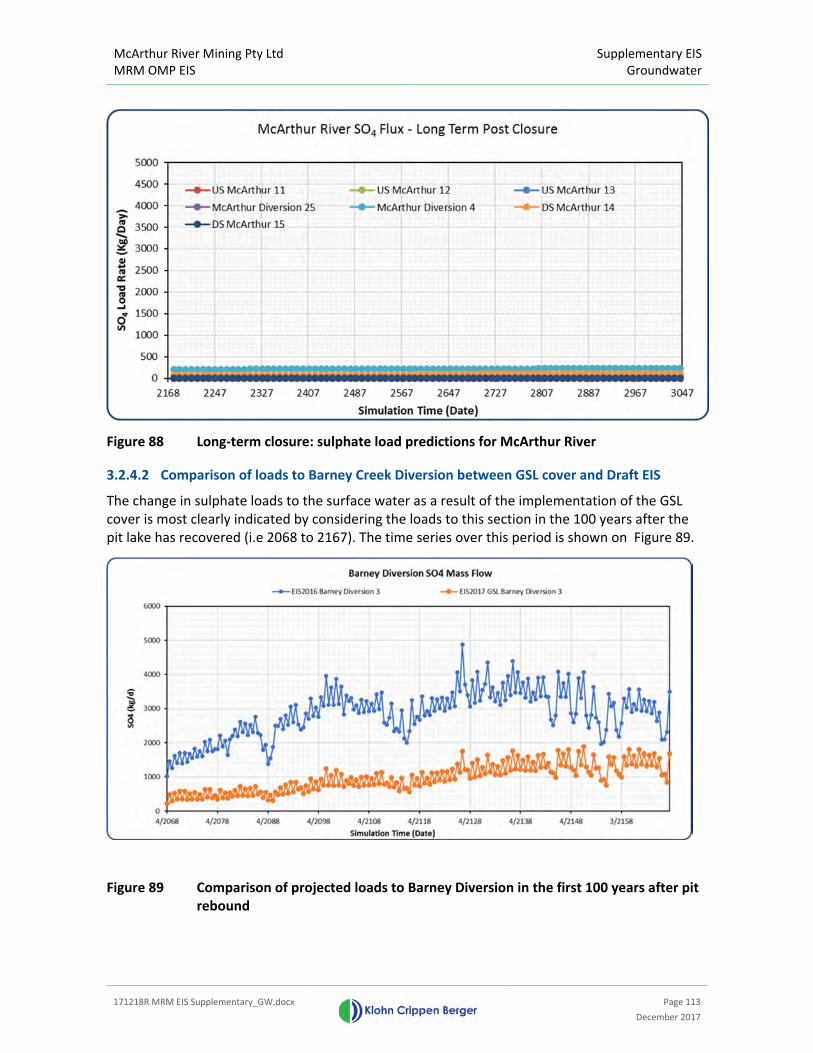
McArthur River Mining Pty Ltd
MRM OMP EIS
Supplementary EIS
Groundwater
171218R MRM EIS Supplementary_GW.docx
Page 113
December 2017
Figure 88 Long-term closure: sulphate load predictions for McArthur River
3.2.4.2 Comparison of loads to Barney Creek Diversion between GSL cover and Draft EIS
The change in sulphate loads to the surface water as a result of the implementation of the GSL
cover is most clearly indicated by considering the loads to this section in the 100 years after the
pit lake has recovered (i.e 2068 to 2167). The time series over this period is shown on Figure 89.
Figure 89 Comparison of projected loads to Barney Diversion in the first 100 years after pit
rebound
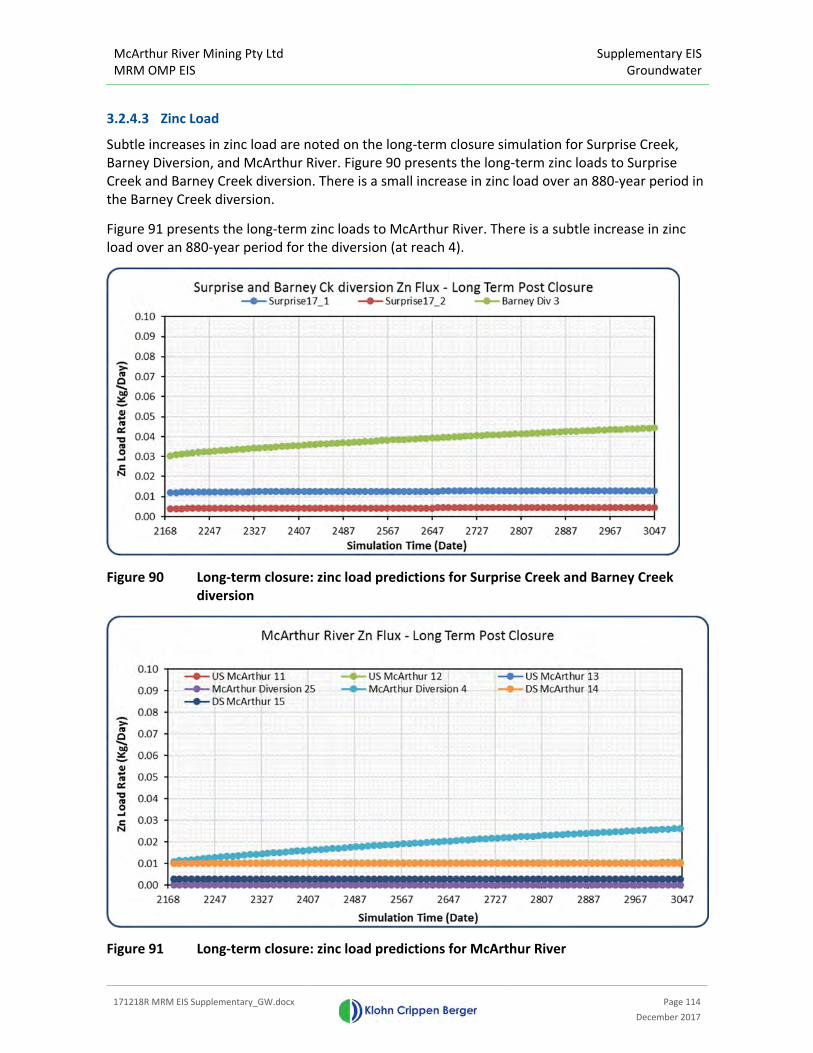
McArthur River Mining Pty Ltd
MRM OMP EIS
Supplementary EIS
Groundwater
171218R MRM EIS Supplementary_GW.docx
Page 114
December 2017
3.2.4.3 Zinc Load
Subtle increases in zinc load are noted on the long-term closure simulation for Surprise Creek,
Barney Diversion, and McArthur River. Figure 90 presents the long-term zinc loads to Surprise
Creek and Barney Creek diversion. There is a small increase in zinc load over an 880-year period in
the Barney Creek diversion.
Figure 91 presents the long-term zinc loads to McArthur River. There is a subtle increase in zinc
load over an 880-year period for the diversion (at reach 4).
Figure 90 Long-term closure: zinc load predictions for Surprise Creek and Barney Creek
diversion
Figure 91 Long-term closure: zinc load predictions for McArthur River
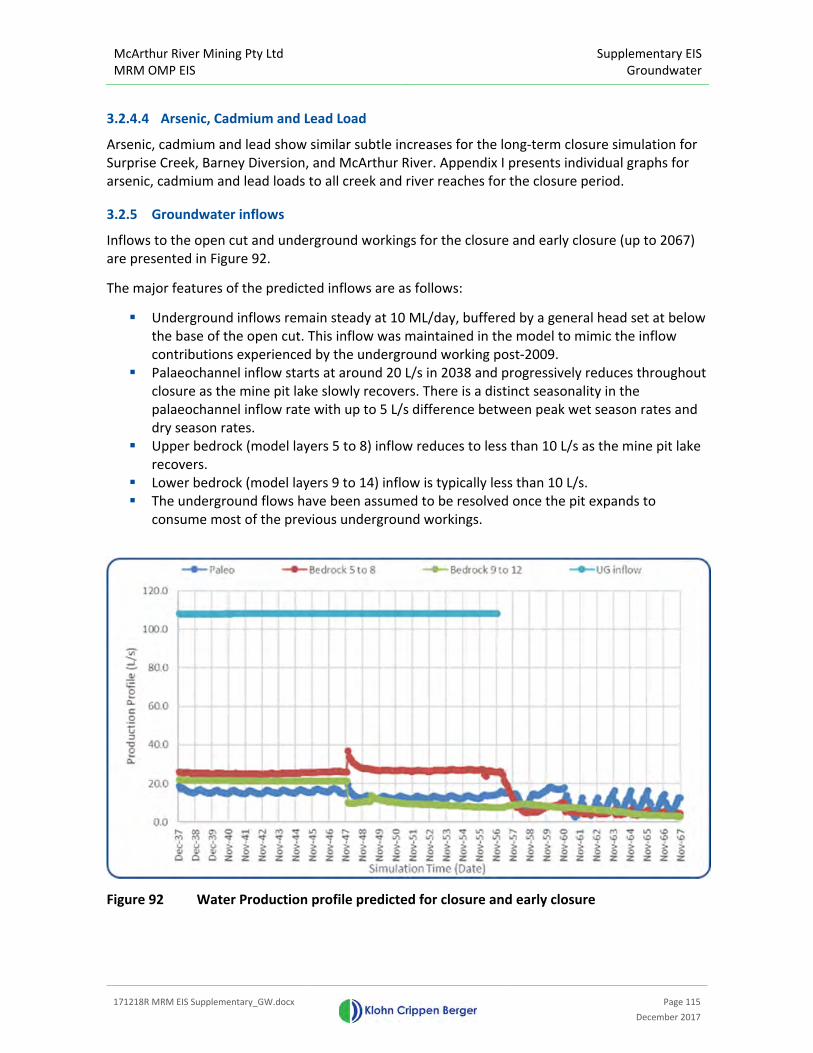
McArthur River Mining Pty Ltd
MRM OMP EIS
Supplementary EIS
Groundwater
171218R MRM EIS Supplementary_GW.docx
Page 115
December 2017
3.2.4.4 Arsenic, Cadmium and Lead Load
Arsenic, cadmium and lead show similar subtle increases for the long-term closure simulation for
Surprise Creek, Barney Diversion, and McArthur River. Appendix I presents individual graphs for
arsenic, cadmium and lead loads to all creek and river reaches for the closure period.
3.2.5 Groundwater inflows
Inflows to the open cut and underground workings for the closure and early closure (up to 2067)
are presented in Figure 92.
The major features of the predicted inflows are as follows:
� Underground inflows remain steady at 10 ML/day, buffered by a general head set at below
the base of the open cut. This inflow was maintained in the model to mimic the inflow
contributions experienced by the underground working post-2009.
� Palaeochannel inflow starts at around 20 L/s in 2038 and progressively reduces throughout
closure as the mine pit lake slowly recovers. There is a distinct seasonality in the
palaeochannel inflow rate with up to 5 L/s difference between peak wet season rates and
dry season rates.
� Upper bedrock (model layers 5 to 8) inflow reduces to less than 10 L/s as the mine pit lake
recovers.
� Lower bedrock (model layers 9 to 14) inflow is typically less than 10 L/s.
� The underground flows have been assumed to be resolved once the pit expands to
consume most of the previous underground workings.
Figure 92 Water Production profile predicted for closure and early closure

McArthur River Mining Pty Ltd
MRM OMP EIS
Supplementary EIS
Groundwater
171218R MRM EIS Supplementary_GW.docx
Page 116
December 2017
3.2.6 Comparison of Closure Predictions to Expected Groundwater Behaviour
This section of the report compares the model predictions for closure with expected groundwater
behaviour, which is largely based on site knowledge used to develop the site conceptual
hydrogeological model.
3.2.6.1 Baseflow Discharges
The most significant prediction for closure baseflow discharge is the appreciable increase in
baseflow in the Barney Creek diversion post-2062. This increase is consistent with the conceptual
understanding of groundwater-surface water interactions influenced by dewatering of the
permeable Cooley Dolomite shallow bedrock (which causes hydraulic disconnection between the
shallow groundwater and the diversion). Post-mining recovery of drawdown is expedited by the
rapid infilling of the Mine Pit Lake. By 2070, the groundwater flow system has reached a quasi-
steady-state condition with stable groundwater levels, baseflow discharge rates and sulphate
loads to the surface water systems. The long-term equilibrium of ~23 L/s (baseflow to Barney
Creek diversion) shows that the contribution of NOEF seepage has increased the baseflow
discharge rate in comparison to pre-2014 conditions. This is reasonable as the seepage
contribution from NOEF will lead to an increased hydraulic gradient facilitated by the short path-
length between the NOEF and the diversion.
Without continued seepage from the TSF, Surprise Creek baseflow discharge rates are reduced for
the long-term closure condition. This is considered to be a reasonable prediction, as it backs the
conceptual understanding that the TSF currently supports baseflow discharge to Surprise Creek,
and the creek is mainly dry in the dry season directly up-gradient and down-gradient of the TSF
(where the influence of TSF seepage is not present).
The McArthur River diversion baseflow discharge rates are predicted to recover during the closure
period and sustain the new equilibrium levels for the long-term closure condition. This recovery in
baseflow is conceptually sound since pit dewatering effects will be reversed post-mining and
groundwater elevations will rise and re-establish gradients towards the river/diversion and
increase baseflow.
3.2.6.2 Plume extents for sulphate
The sulphate plume originating at the TSF flushes out progressively from 2067 to 3048. This is a
rational prediction given that: i) the TSF source is removed from 2037 to 2047; ii) 1,000 years of
rainfall recharge will force the plume to push through the aquifer pathway and report to the
nearest down-gradient receptor; iii) sulphate is a conservative parameter and will tend to not be
subject to reaction processes and attenuation, and as such, will readily migrate through a given
source-pathway-receptor system.
The NOEF contributes long-term sulphate-rich seepage to the groundwater systems situated
down-gradient of the NOEF. The long-term sulphate plume concentrates to the southeast of the
NOEF in an area between the Haul Bridge and Barramundi Dreaming up-gradient of the Barney
Creek diversion. The long-term plume extents are consistent with the conceptual model for
groundwater flow systems at this part of the site:
� Seepage from the NOEF is reduced during the closure period due to the effectiveness of
the cover system.
McArthur River Mining Pty Ltd
MRM OMP EIS
Supplementary EIS
Groundwater
171218R MRM EIS Supplementary_GW.docx
Page 117
December 2017
� The reduction in seepage leads to a re-instatement of dominant west-to-east flow
conditions under the facility.
� Recovery of the regional drawdowns associated with the open cut remove the driving
gradient from north-to-south between the NOEF and the open cut.
� Groundwater seepage from the NOEF should, therefore, migrate to the east and southeast
of the facility and discharge to the lowest point in the topography – being the Barney
Creek diversion. Therefore, the plume should be logically concentrated in the southeast
corner of the NOEF.
3.2.6.3 Plume extents for metals
Metal plumes emerge from the NOEF and TSF over the 1,000-year closure simulations. These
plumes are much slower in their migration than the conservative sulphate species, which is
attributed to natural attenuation to the aquifer matrix. The following observations are made from
the current site knowledge which support this delay in metal plume emergence:
5. The TSF and NOEF plumes are expected to stay neutral.
6. There is relatively high iron content and clay content in the units underlying the two
sources (TSF and NOEF) facilitating an abundance of sorption surfaces for attenuation to
occur.
7. Laboratory analysis of field samples have determined Kd values that support point 2
above.
8. Field monitoring through MRM’s groundwater monitoring program has shown that there is
strong attenuation of metals, and to date, there is no metal plume coincident with the
current sulphate plume.
3.2.6.4 Load reporting to creeks and rivers
Sulphate load increases at the Barney Creek diversion commensurate with the re-establishment of
hydraulic connection between the aquifer and the diversion, and a marked increase in baseflow
discharge post-2062. As described above, this increase in baseflow and load is consistent with the
understanding of groundwater flow processes at the site. Given that the long-term sulphate
source term for NOEF seepage is high, it makes sense that the plume concentrations would not
decrease over the long term.
Subtle increases in zinc load are noted in the long-term closure simulation for Surprise Creek,
Barney diversion, and McArthur River. Arsenic, cadmium and lead show similar subtle increases
for the long-term closure simulation for Surprise Creek, Barney Diversion, and McArthur River.
Dissolved metal plumes may develop over very long periods of time (thousands of years and
greater) but breakthrough of more conservative contaminants like sulphate would be expected to
indicate development of preferential pathways and act as an early warning system for the metal
plumes.
3.2.7 Additional sensitivity runs with mitigation
Two additional mitigation scenarios have been considered. Appendix 2 provides the results of
additional modelling for an updated interception trench for the TSF/Surprise Creek system, while
Appendix 3 provides an outline of potential groundwater interception in the area between the
NOEF and Barney Creek (based on the Draft EIS results with a CCL cover). These results

McArthur River Mining Pty Ltd
MRM OMP EIS
Supplementary EIS
Groundwater
171218R MRM EIS Supplementary_GW.docx
Page 118
December 2017
demonstrate the effectiveness of the potential mitigation strategies, which, if deemed to be
necessary, would be effective in reducing loads reaching the Barney Creek diversion.
These options can be implemented, if required, but do not form part of the base case, as the
surface water modelling results with the groundwater and other results included have provided
the basis for the water management plans proposed to be implemented to meet the water quality
objectives of the downstream monitoring point in the McArthur River (see WRM, 2017).
McArthur River Mining Pty Ltd
MRM OMP EIS
Supplementary EIS
Groundwater
171218R MRM EIS Supplementary_GW.docx
Page 119
December 2017
4 DISCUSSION ON RESULTS AND SENSITIVITY ASSESSMENTS COMPARED TO EIS
SUBMISSION
The modelling presented in this report has been undertaken to include specific updates to MRM’s
proposed project plan and to address feedback received subsequent to the Draft EIS submission.
While most of the conceptual understanding of the site is largely consistent with the Draft EIS
reporting, several changes to the approach have been included in the modelling to better reflect
the expected site conditions over the life of mine and into closure. The most significant changes
relate to the how the NOEF water balance has been simulated and the resultant water quality
from this facility under conditions of elevated temperatures and low water content. In addition,
the final void water quality modelling approach has accounted for the establishment of
stratification in the mine pit lake over time, under variety of flow conditions. As previously, the
outcomes from all of these models has been used conjunctively in the surface water modelling
and broader impact assessments that have been completed for this Supplementary EIS
submission.
A further change to the report, has been the more explicit consideration of alternative scenarios
and completion of sensitivity analyses in the various models. The impact on calibration of altering
the permeabilities has been indicated in Section 2. A key consideration has been the potential for
metal migration and a detailed section has been included which considers several different
approaches (ranging from simplified 1-D analytical models to reactive transport models with
different hydrogeochemical codes) to better assess the potential for metal attenuation and metal
migration. This assessment indicated that based on the site characterisation and consistent with
MRM’s groundwater monitoring results, under neutral conditions metal attenuation will continue
to play an important role in reducing the mobility of the metals of concern in the aquifers. The
modelling of the NOEF (See separated report on the NOEF water quality, KCB, 2017) suggest that
neutral conditions are expected over the long-term duration of the simulations.
Further sensitivity results that have been included in this regard for the Supplementary EIS include
(see Appendix 1 for details of these assessments):
� Inclusion of a variety of alternative scenarios for the NOEF modelling to provide a broad
understanding of a range of potential outcomes. While the proposed base case will be a
GSL integrated into the cover, with a low permeability engineered base, several
alternatives to this were considered, including assessment of a partial cover failure of the
GSL (which would then act more like a compacted clay liner) and several iterations of
alternative engineered bases. Both the flows and resultant water quality and contaminant
loads were assessed for these cases; more importantly the more extreme case has been
included in a surface water modelling sensitivity assessment so that an appropriate water
management plan could be developed to allow for this extreme eventuality as part of
MRM’s adaptive management approach.
� As indicated in the concurrent NOEF Flow and Water Quality report (KCB, 2017), proposed
geosynthetic liner (GSL) cover system reduces cumulative loads to groundwater
significantly by a factor of five or more for sulphate and zinc over the next 100 years,
compared to the previously proposed compacted clay liner (CCL) cover system
� Several iterations of the water quality modelling for the NOEF have been considered. The
most important of these (apart from the changes to the cover which impact on reactivity,
McArthur River Mining Pty Ltd
MRM OMP EIS
Supplementary EIS
Groundwater
171218R MRM EIS Supplementary_GW.docx
Page 120
December 2017
water quality and loads) were assessments which consider scenarios under which acid
leachate/seepage may arise in NOEF. A case where one of the High PAF zones completely
acidifies has been considered to assess the change to loads to groundwater, as well as a
case where the proportion of PAF material is doubled in the NOEF. These results have
again been considered in the broader context of the site so that sufficient contingency is
available in the management plans should these conditions unexpectedly arise.
The transient calibration of the updated model provided a sound basis for the predictive
simulations:
� Transient predicted heads are replicated in trend and elevation to measured hydrograph
data, and show strong prediction of the seasonal effects on groundwater across the model
domain. This head response to dam seepage from the PRODs is replicated in terms of
timing and magnitude of head change.
� Dewatering rates predicted during the conditioning model (underground) and calibration
model (open cut) match observed and anecdotal dewatering rates over the same period.
� Statistical assessment of model calibration has improved since the Draft EIS, exceeds
industry standard, and supports the visual calibration performance observed in the
hydrographs.
� Baseflow predictions mimic dry and wet season conditions, respecting the ephemeral
nature of these systems.
� Predicted changes to water levels and flows are of similar magnitude to those reported by
the Draft EIS and previously by the Phase 3 Groundwater Assessment. These include
baseflow discharges to creeks, rivers and diversions that will change due to seepage from
the mine overburden facilities and dewatering of the expanding open cut operation.
� Predicted sulphate plumes are consistent with the site understanding with respect to
source-pathway-receptor relationships, with conservative levels of sulphate being
predicted and natural sources of sulphate generation being included in the transient
simulations. Inferred flow directions and plume migrations are consistent with the
conceptual source-pathway-receptor model for the site.
� Acceptable calibration performance and sound translation of the conceptual setting into
the numerical environment are both considered to have been achieved with this model.
Groundwater modelling results indicate similar responses to those outlined in the Draft EIS. The
most significant changes are due to the updated structural geology and more importantly the
updated understanding of the long-term response of the NOEF from the Tough2 and associated
water quality modelling.
Contaminant transport modelling has been completed for a variety of scenarios related to options
for the management of NOEF. The outcomes from these scenarios are changes to flows and
especially concentrations and loads that report to receptors, with the MRM surface water system
the most important of these. All of these results have been considered in the surface water
assessments and management plans to cover the range of results (other than just the base case)
developed by MRM to protect water quality downstream of the site. While sulphate
concentrations are expected to continue to increase due to the high concentrations expected
from the NOEF, concerns about long-term metal migration have been addressed through

McArthur River Mining Pty Ltd
MRM OMP EIS
Supplementary EIS
Groundwater
171218R MRM EIS Supplementary_GW.docx
Page 121
December 2017
modelling of various flow and NOEF scenarios and the sensitivity analysis described above. For
these metals, with zinc used as an example, the Kd value is the controlling influence on the long-
term migration and emergence of a plume at the receptor. Using field-derived values of Kd, there
is little to no breakthrough of Zn at the receptors for the selected aquifer pathways, in the closure
design period.
The major impact to surface water systems is again predicted at the Barney Creek diversion during
closure. Sulphate loads into this section of the creek, are predicted to increase from <500 kg/day
at closure to between 2500-4000 kg/day 20 years after operations closure. The increase in load is
primarily associated with long-term seepage from the NOEF migrating through weathered and
fractured bedrock reporting to the diversion (as previously reported in the Draft EIS). The
proposed NOEF design with a low permeability GSL as part of the cover system and the
engineered base greatly restricts the loads emanating from the NOEF and reaching the creek,
however a generous allowance for defects has been included to provide some conservatism to the
results. Dewatering of the open cut during operations results in a gradient towards the open cut
in the bedrock aquifer in the vicinity of the diversion, therefore, reducing baseflow to the
diversion during mining, and drawing the contaminant plume below the level of the diversion (see
Draft EIS reporting, KCB, 2017). After operations, the engineered rapid recovery pit lake water
level, supported by natural recharge to the aquifers, allows the bedrock aquifer hydraulic head to
rebound and re-establish a hydraulic connection with the diversion.
A subtle increase in metal load (e.g. Zinc load at Barney diversion increases from 0.04 to 0.05
kg/day over 1000 years) is also predicted in the Barney Creek diversion after 400 years of closure.
This delayed plume migration to the diversion is a result of the sorption of the metals in the
aquifer matrix; this is consistent with current site observations and the results from the Draft EIS.
There is an increase in sulphate load reporting to Surprise Creek during the life of mine. This
increase is associated with tailings seepage migrating a short distance north towards Surprise
Creek, in spite of the proposed interception trench put in place to capture the majority of the
load. This sulphate load diminishes during closure as the tailings is removed and placed in-pit.
After approximately 100 years the sulphate load in Surprise Creek is reduced from 2,000 kg/day
back to <500 kg/day. An alternative and more effective mitigation plan is currently in the design
phase and this should act to limit the loads to Surprise Creek further.
The hydrological impact assessment completed by WRM, considers the environmental impact of
baseflow discharge loads for sulphate and metals, particularly in the dry season when the
baseflow constitutes the major surface water flow component.
Closure waste and water management for the site was considered in an integrated manner. By
considering the same scenarios and drivers on water volumes and water quality using the
groundwater model, the mine pit lake model and the site-wide surface water quality model, a
holistic assessment of the closure impacts has been obtained. The results have been used by
WRM to develop water management strategies that limit the impact on downstream surface
water for the 1,000 year periods simulated (WRM, 2017).
McArthur River Mining Pty Ltd
MRM OMP EIS
Supplementary EIS
Groundwater
171218R MRM EIS Supplementary_GW.docx
Page 122
December 2017
5 CLOSING
All water quality modelling is inherently based upon a number of assumptions that reduce the
number of governing factors to manageable proportions given the typical limitations in availability
of site-specific data and information. Based upon the assumptions listed in this report and in
agreement with MRM, the water quality predictions presented herein should be viewed at a level
of accuracy required to assess the likelihood of large scale changes or applicable mine effluent
quality guidelines being exceeded, rather than the results being intended as a precise estimation
of all parameter concentrations over the 1,000 year closure period.
This report is an instrument of service of Klohn Crippen Berger Ltd. The report has been prepared
for the exclusive use of McArthur River Mining Pty Ltd (Client) for the specific application to the
MRM EIS. The report's contents may not be relied upon by any other party without the express
written permission of Klohn Crippen Berger. In this report, Klohn Crippen Berger has endeavoured
to comply with generally-accepted professional practice common to the local area. Klohn Crippen
Berger makes no warranty, express or implied.
KLOHN CRIPPEN BERGER LTD.
Brent Usher, PhD. PrSciNat Chris Langton, PGeo
Project Manager, Senior Hydrogeochemist & Associate Senior Reviewer, Principal Hydrogeologist
McArthur River Mining Pty Ltd
Supplementary EIS
Site Groundwater
Report
171218R MRM EIS Supplementary_GW.docx
Page 123
D09814A25 December 2017
REFERENCES
Australian Groundwater & Environmental Consultants, 2011. Review of Groundwater Inflow to Pit
and Proposed Mitigation Options, McArthur River Mine. Report prepared for Hatch
Associates Pty Ltd, May 2011.
Aziz C.E., Newell C.J., Gonzales J.R., Haas P., Clement T.P. and Y-W. Sun. 2000. BIOCHLOR Version 1.0 User’s Manual. EPA/600/R-00/008.
Bethke, C. M. 2008. “The Board of Trustees of the University of Illinois (2008) The Geochemists
Workbench Programmes Rxn.” Act2, Tact, SpecE8, Aqplot, React, Gtplot, X1t, X2t, and Xtplot.
Debye P and Hückel E (1923) Zur Theorie der Elektrolyte.- Phys.Z.; 24: pp 185-206.
Connell Hatch. 2007. Detailed Design Report, Barney Creek Haul Road Bridge – McArthur River
Mine Expansion. Report submitted to Xstrata Zinc Pty Ltd, 1 June 2007.
Crabb, D M, 1956, “Geochemical Survey 1956”, Appendix I to “Report on Bauhinia and McArthur
River Areas NT – Field Season 1956” Report to Mt Isa Mines Ltd, February, 1957.
Domenico P.A. and G.A. Robbins. 1985. A new method of contaminant plume analysis. Ground Water, Vol. 23, No. 4, pp. 476–485.
Domenico P.A. 1987. An Analytical Model for Multidimensional Transport of a Decaying Contaminant Species. Journal of Hydrology, Vol. 91, pp. 49-58.
Eco Logical Australia (2017). McArthur River Mining Groundwater, Surface Water & Fluvial
Sediment Monitoring Report 2016/17. Prepared for McArthur River Mining, Glencore
Elberling Bo and Damgaard Lars Riis (2001) Microscale measurements of oxygen diffusion and
consumption in subaqueous sulfide tailings, In Geochimica et Cosmochimica Acta, Volume
65, Issue 12
ESI, 2016. Groundwater Vistas Version 6.59 Build 2.
GHD, 2017. MRM 2016 ERI Survey. Report to MRM, November 2017.
Gleisner M 2005. Quantification of mineral weathering rates in sulfidic mine tailings under water-
saturated conditions. PhD thesis. Stockholm University, Faculty of Science, Department of
Geology and Geochemistry.
Glencore, 2017. Project Definition for Supplementary EIS.
Goldsim Techonology Group 2011. Goldsim Version 11.1 User’s Guide’ Volumes 1 and 2, Goldsim
Technology Group, Issaquah, Washington USA, May 2014.
HydroGeoLogic, 2016. MODHMS/MODFLOW-SURFACT: A comprehensive MODFLOW-based
Hydrologic Modelling System.
Hatch, 2011a. Review of Seepage Mitigation Options. Report prepared for Xstrata Zinc, 26 July
2011.
Hatch, 2011b. Water Balance Review. Report prepared for Xstrata Zinc, 26 May 2011.
KCB, 2016. MRM groundwater Report: Monitoring Report 2014-2016. Report prepared for MRM,
9 September 2016.
KCB, 2017. MRM Draft EIS Groundwater Impact Assessment Report Report prepared for MRM,
February 2017.
McArthur River Mining Pty Ltd
Supplementary EIS
Site Groundwater
Report
171218R MRM EIS Supplementary_GW.docx
Page 124
D09814A25 December 2017
Langmiur (1997). Aqueous Environmental Geochemistry. PRENTICE HALL Upper Saddle River, New
Jersey 07458.
Lapakko KA (1994) Subaqueous disposal of mine waste: laboratory investigation. Bureau of Mines
Special Publication, SP 06 A-94, pp 270–278
Limousin et al (2007). Sorption isotherms: A review on physical bases, modelling and
measurement. Applied Geochemistry, v22, p249–275.
Logan, R (2017) Summary of Geological Investigations completed at MRM during 2016. Report
prepared for McArthur River Mine.
Murray, W J, 1964, Background information on the HYC Lead-Zinc Deposit, McArthur River,
Northern Territory, Carpentaria Exploration Company Pty Ltd, Technical Report No 80.
Murray, W J, 1975, McArthur River HYC lead-zinc and related deposits, NT., The Australian
Institute of Mining and Metallurgy, Monograph Series, No 5, pp329-339.
MEND (1989) SUBAQUEOUS DISPOSAL OF REACTIVE MINE WASTES: AN OVERVIEW. MEND Project
2.11.1a
Parkhurst, D.L., Appelo, C.A.J., 2013. Description of input and examples for PHREEQC version 3 - A
computer program for speciation, batch-reaction, one-dimensional transport, and inverse
geochemical
Pruess, K., C.M. Oldenburg, and G.J. Moridis. 2012. TOUGH2 user’s guide, Version 2. Revised ed.
Rep. LBNL-43134. Lawrence Berkeley Natl. Lab., Berkeley, CA.
http://esd.lbl.gov/files/research/projects/tough/documentation/
TOUGH2_V2_Users_Guide.pdf (accessed August 2014).
RPS. 2012a. Shallow Groundwater Investigation, McArthur River Mine. Report prepared for
Xstrata Zinc, 4 December 2012.
RPS. 2012b. Groundwater Modelling of Seepage from MRM SEPROD. Report prepared for AMDD
and METSERVE, 16 July 2012.
RPS. 2013a. McArthur River Mine, Deep Groundwater Investigation. Report prepared for Xstrata
Zinc, 8 April 2013.
RPS. 2013b. McArthur River Mine Site-wide Groundwater Model. Report prepared for Xstrata
Zinc, 15 November 2013.
Rutqvist, J. & O. Stephansson. 2003. “The Role of Hydromechanical Coupling in Fractured Rock
Engineering.” Hydrogeology Journal. 11(1): 7-40.
Smith, J.W. 1972. Bauhinia Downs, Northern Territory: 1:250,000 Geological Series - Explanatory
Notes. SE5303. Bureau of Mineral Resources, Geology and Geophysics, Canberra.
USEPA (1999a). UNDERSTANDING VARIATION IN PARTITION COEFFICIENT, Kd, VALUES, Volume I:
The Kd Model, Methods of Measurement, and Application of Chemical Reaction Codes.
McArthur River Mining Pty Ltd
Supplementary EIS
Site Groundwater
Report
171218R MRM EIS Supplementary_GW.docx
Page 125
D09814A25 December 2017
USEPA (1999b). UNDERSTANDING VARIATION IN PARTITION COEFFICIENT, Kd, VALUES, Volume II:
Review of Geochemistry and Available Kd Values for Cadmium, Cesium, Chromium, Lead,
Plutonium, Radon, Strontium, Thorium, Tritium (3H), and Uranium.
USEPA (2004). UNDERSTANDING VARIATION IN PARTITION COEFFICIENT, Kd, VALUES, Volume III:
Review of Geochemistry and Available Kd Values for Americium, Arsenic, Curium, Iodine,
Neptunium, Radium, and Technetium.
URS. 2004. McArthur River Mine, Tailings Storage Facility Rehabilitation – Cell 1 Concept Design.
Report submitted to Xstrata McArthur River Mines, 10 December 2004.
URS. 2005a. MRM Expansion EIS – Groundwater Investigations to Determine the Potential Impacts
of Dewatering. Report submitted to Xstrata Plc, 29 April 2005.
URS. 2005b. Groundwater and Surface Water Investigations of the McArthur River. Report
prepared for Xstrata Plc, 9 December 2005.
URS. 2006. Simulation of Proposed Tailings Storage Facility to Assess Potential Seepage Impacts,
McArthur River Mine. Report submitted to Xstrata Plc, 20 June 2006.
URS. 2012. MRM Phase 3 Development Project EIS – Groundwater. Report prepared for Mining &
Energy Technical Services Pty Ltd, 16 January 2012.
Tropical Water Solutions, 2017 McArthur River Mine open cut: 3D Hydrodynamic Modelling for a
Mine Pit Lake System. November 2017.
Vandenberg, J.A., Herrell, M., Faithful, J.W. et al. Mine Water Environ (2016) 35: 350.
https://doi.org/10.1007/s10230-015-0337-5
WRM Water and Environment (2017). Surface water impact assessment for the McArthur River
Mine Overburden Management Project Environmental Impact Statement. Report prepared
for METServe on behalf of McArthur River Mining. Brisbane: WRM Water and
Environment, pp.1-443.
WRM Water and Environment (2017). Updated Base Case Waterways model impact assessment
for the MRM OMP EIS

McArthur River Mining Pty Ltd
Supplementary EIS Site Groundwater
Report
171218R MRM EIS Supplementary_GW.docx
D09814A25 December 2017
APPENDIX I
Sensitivity Results
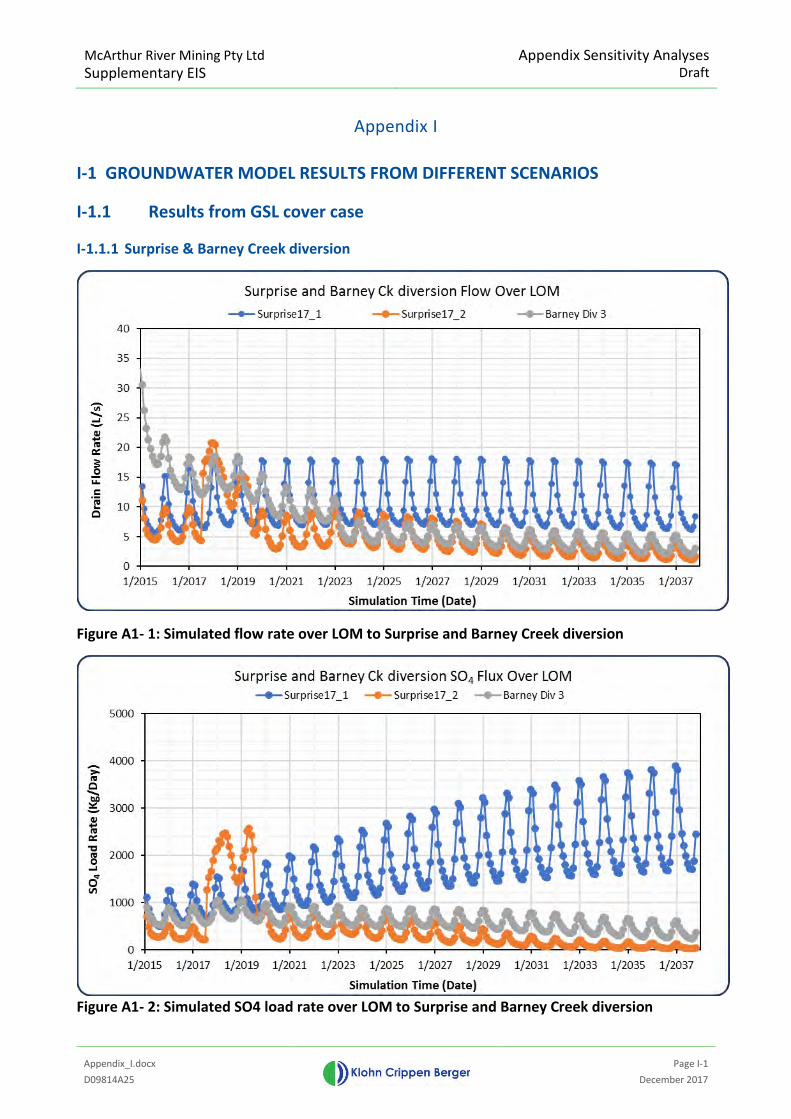
McArthur River Mining Pty Ltd Supplementary EIS
Appendix Sensitivity Analyses Draft
Appendix_I.docx
Page I-1
D09814A25 December 2017
Appendix I
I-1 GROUNDWATER MODEL RESULTS FROM DIFFERENT SCENARIOS
I-1.1 Results from GSL cover case
I-1.1.1 Surprise & Barney Creek diversion
Figure A1- 1: Simulated flow rate over LOM to Surprise and Barney Creek diversion
Figure A1- 2: Simulated SO4 load rate over LOM to Surprise and Barney Creek diversion
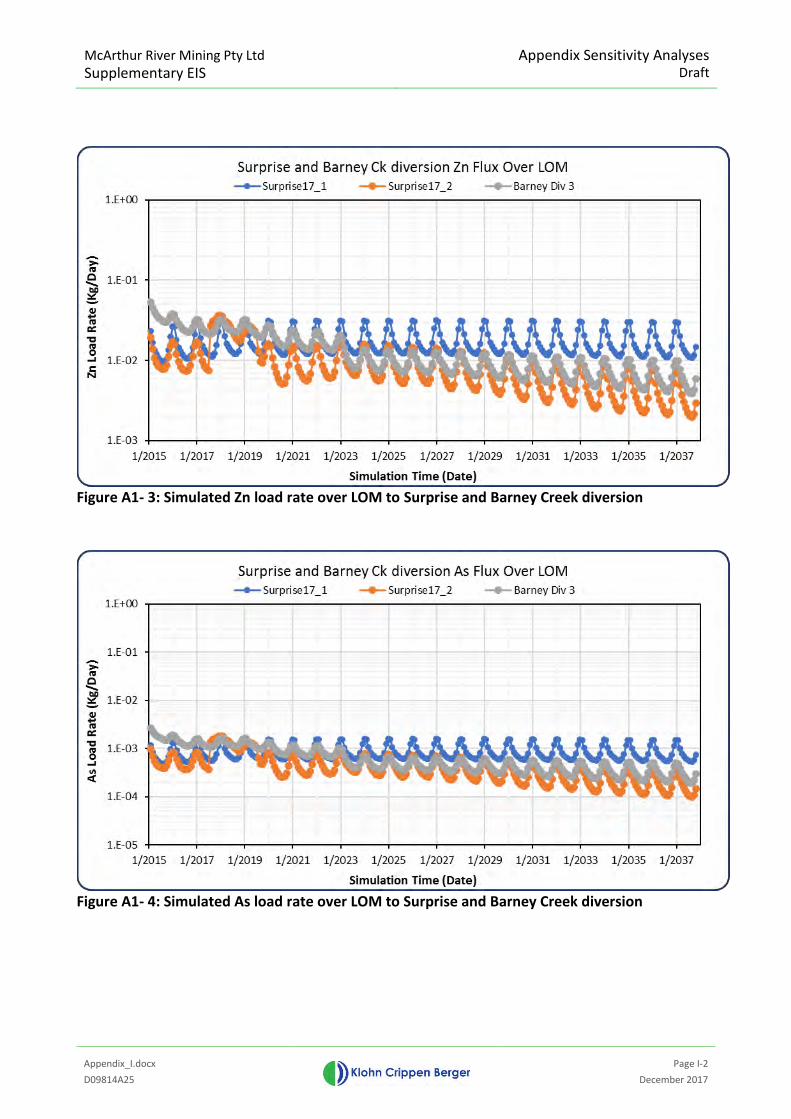
McArthur River Mining Pty Ltd Supplementary EIS
Appendix Sensitivity Analyses Draft
Appendix_I.docx
Page I-2
D09814A25 December 2017
Figure A1- 3: Simulated Zn load rate over LOM to Surprise and Barney Creek diversion
Figure A1- 4: Simulated As load rate over LOM to Surprise and Barney Creek diversion
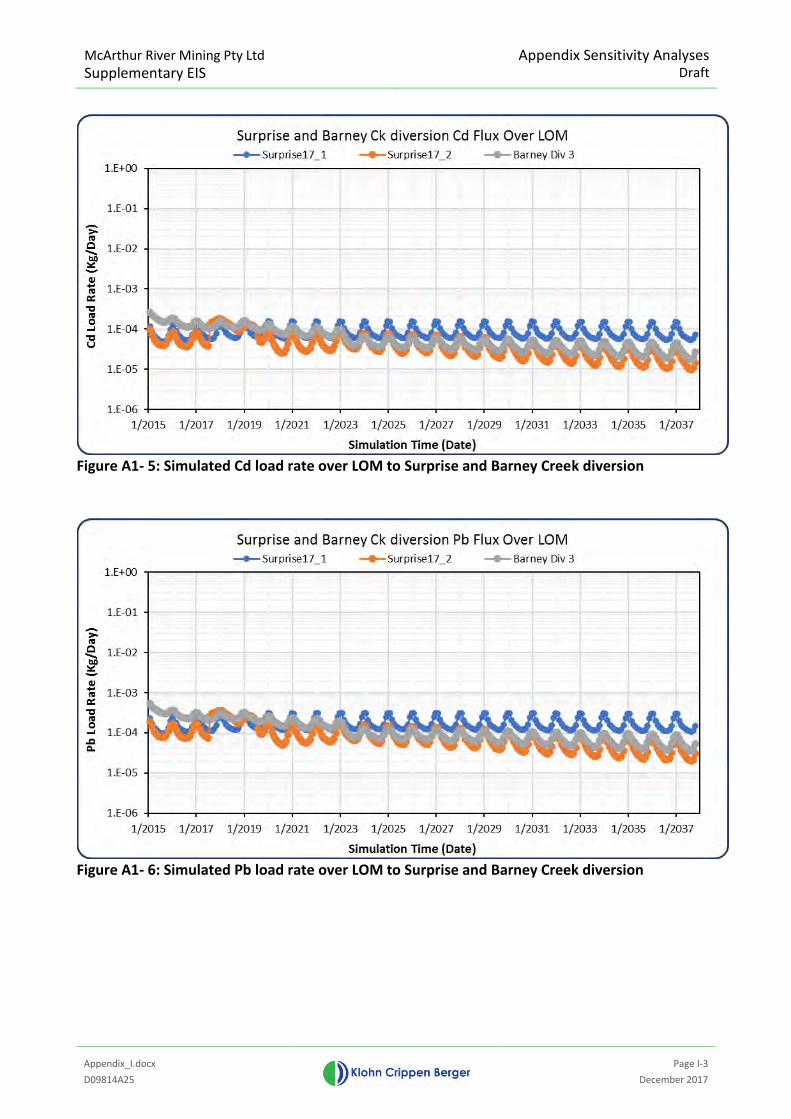
McArthur River Mining Pty Ltd Supplementary EIS
Appendix Sensitivity Analyses Draft
Appendix_I.docx
Page I-3
D09814A25 December 2017
Figure A1- 5: Simulated Cd load rate over LOM to Surprise and Barney Creek diversion
Figure A1- 6: Simulated Pb load rate over LOM to Surprise and Barney Creek diversion
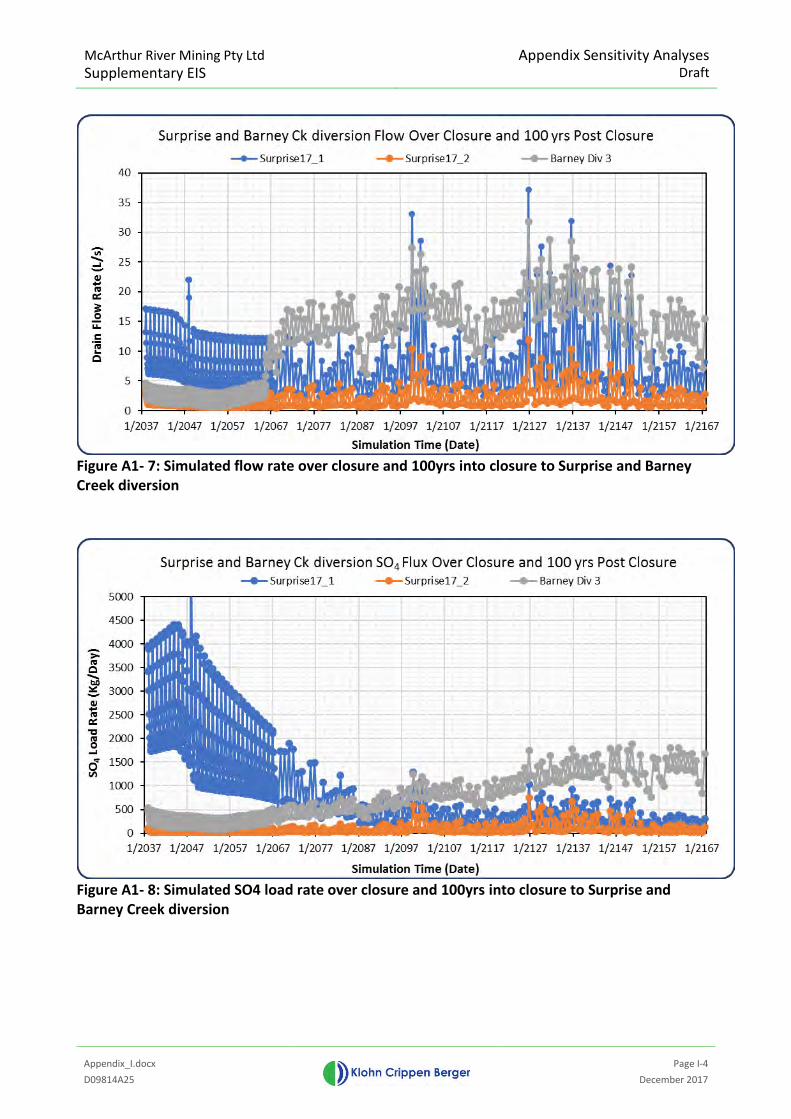
McArthur River Mining Pty Ltd Supplementary EIS
Appendix Sensitivity Analyses Draft
Appendix_I.docx
Page I-4
D09814A25 December 2017
Figure A1- 7: Simulated flow rate over closure and 100yrs into closure to Surprise and Barney Creek diversion
Figure A1- 8: Simulated SO4 load rate over closure and 100yrs into closure to Surprise and Barney Creek diversion
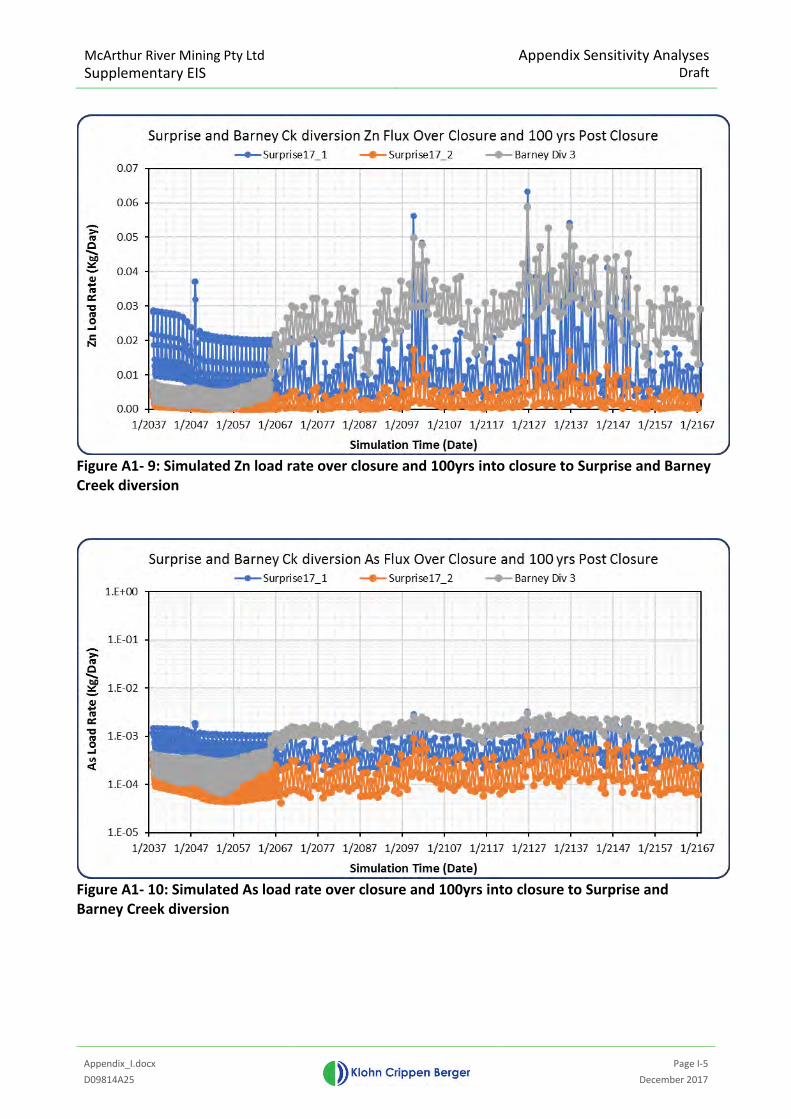
McArthur River Mining Pty Ltd Supplementary EIS
Appendix Sensitivity Analyses Draft
Appendix_I.docx
Page I-5
D09814A25 December 2017
Figure A1- 9: Simulated Zn load rate over closure and 100yrs into closure to Surprise and Barney Creek diversion
Figure A1- 10: Simulated As load rate over closure and 100yrs into closure to Surprise and Barney Creek diversion
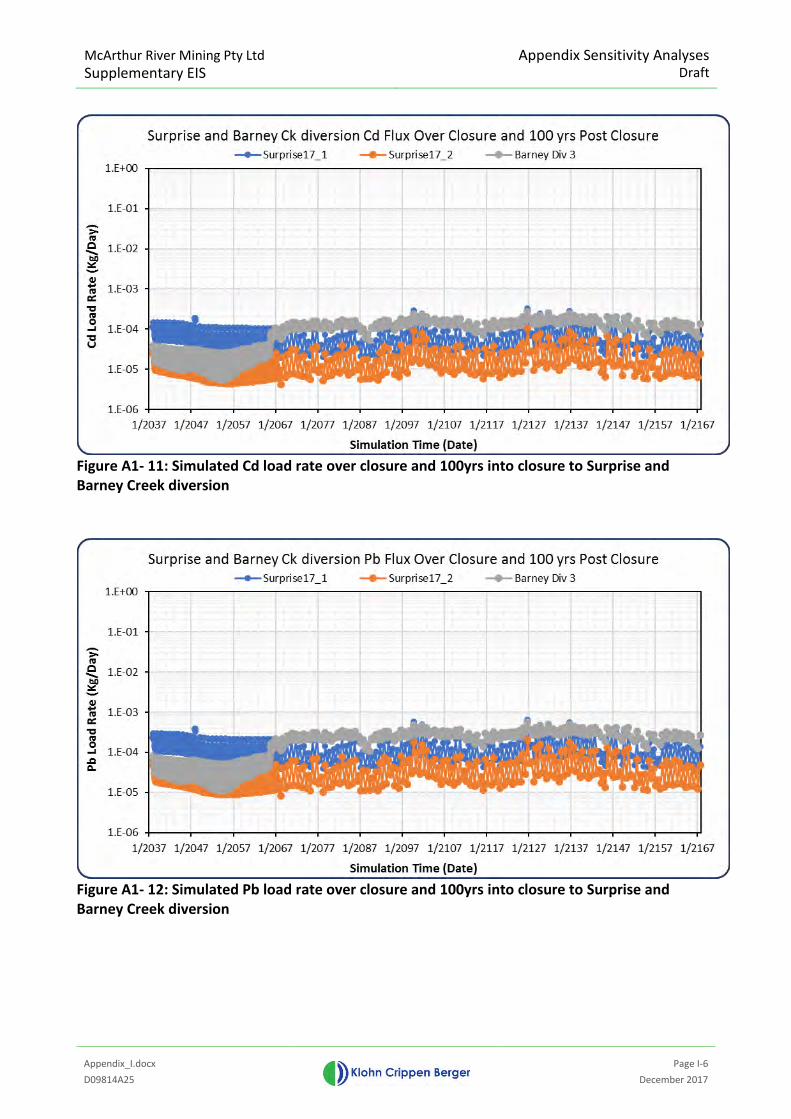
McArthur River Mining Pty Ltd Supplementary EIS
Appendix Sensitivity Analyses Draft
Appendix_I.docx
Page I-6
D09814A25 December 2017
Figure A1- 11: Simulated Cd load rate over closure and 100yrs into closure to Surprise and Barney Creek diversion
Figure A1- 12: Simulated Pb load rate over closure and 100yrs into closure to Surprise and Barney Creek diversion
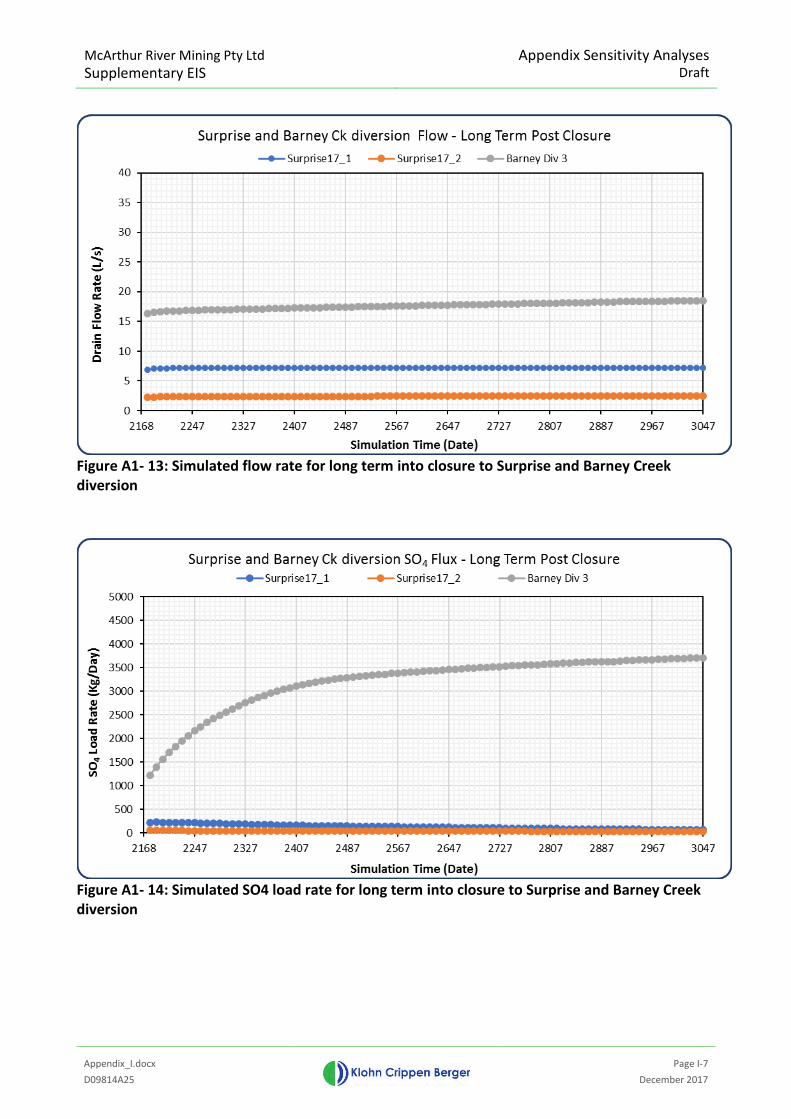
McArthur River Mining Pty Ltd Supplementary EIS
Appendix Sensitivity Analyses Draft
Appendix_I.docx
Page I-7
D09814A25 December 2017
Figure A1- 13: Simulated flow rate for long term into closure to Surprise and Barney Creek diversion
Figure A1- 14: Simulated SO4 load rate for long term into closure to Surprise and Barney Creek diversion
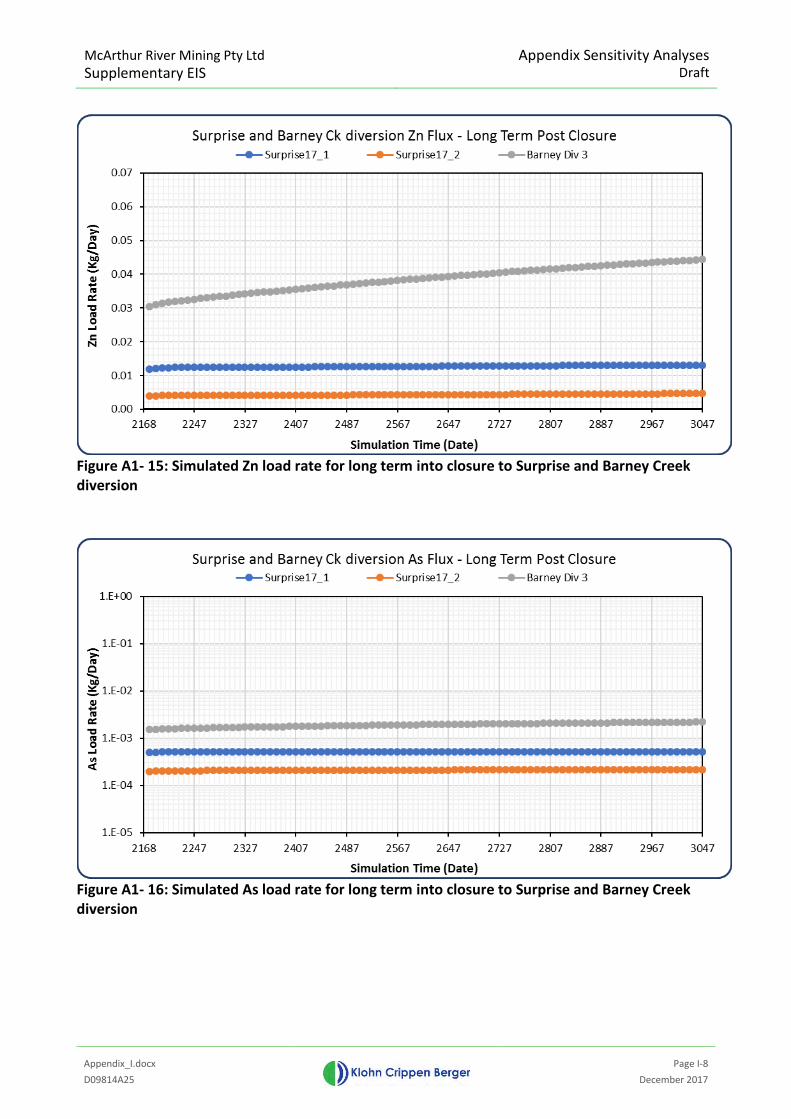
McArthur River Mining Pty Ltd Supplementary EIS
Appendix Sensitivity Analyses Draft
Appendix_I.docx
Page I-8
D09814A25 December 2017
Figure A1- 15: Simulated Zn load rate for long term into closure to Surprise and Barney Creek diversion
Figure A1- 16: Simulated As load rate for long term into closure to Surprise and Barney Creek diversion
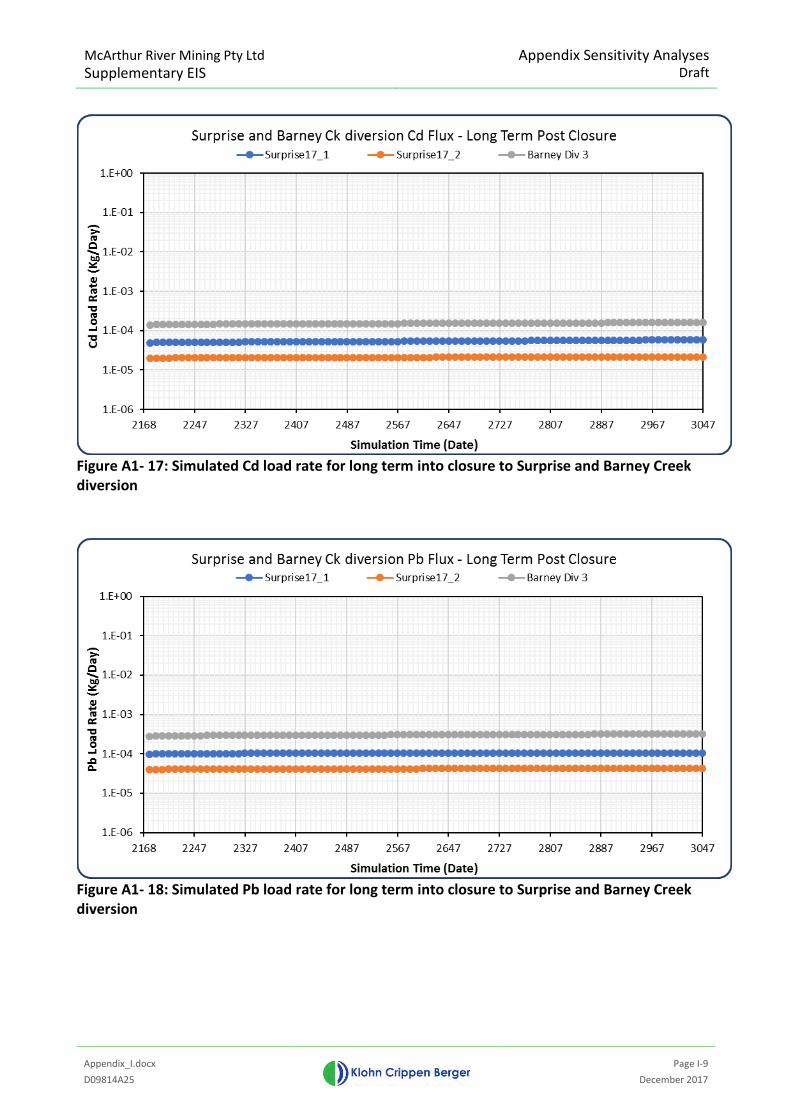
McArthur River Mining Pty Ltd Supplementary EIS
Appendix Sensitivity Analyses Draft
Appendix_I.docx
Page I-9
D09814A25 December 2017
Figure A1- 17: Simulated Cd load rate for long term into closure to Surprise and Barney Creek diversion
Figure A1- 18: Simulated Pb load rate for long term into closure to Surprise and Barney Creek diversion
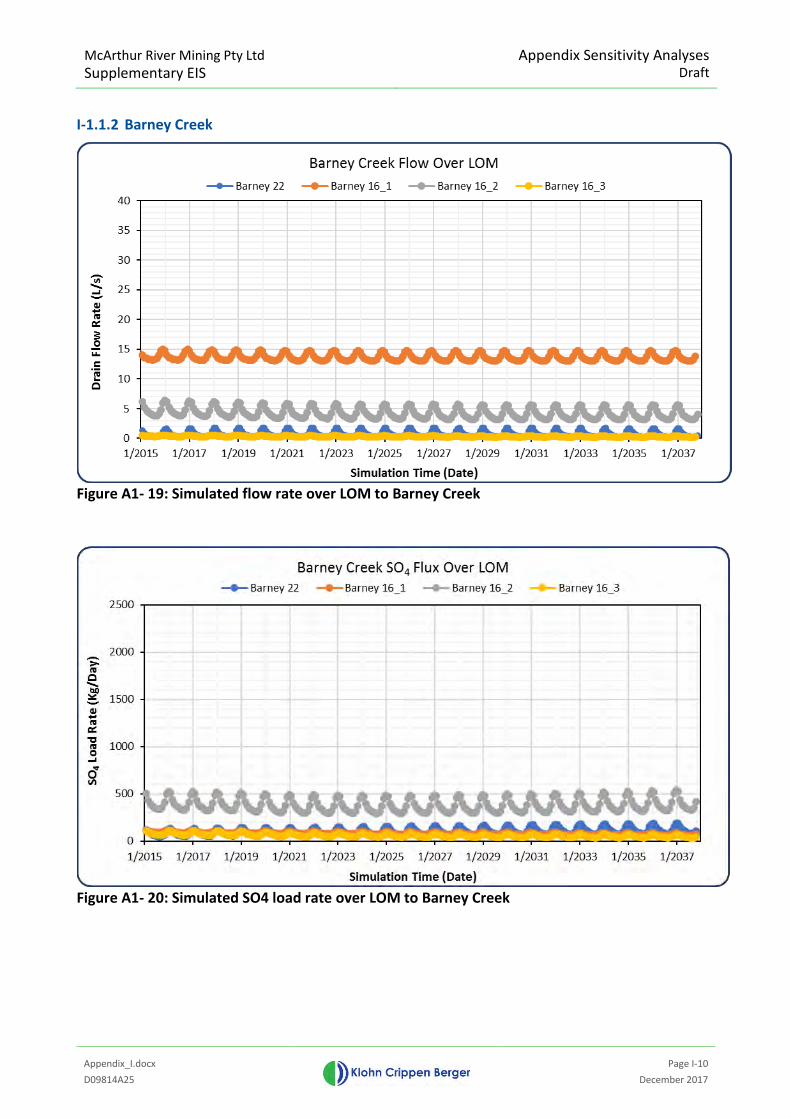
McArthur River Mining Pty Ltd Supplementary EIS
Appendix Sensitivity Analyses Draft
Appendix_I.docx
Page I-10
D09814A25 December 2017
I-1.1.2 Barney Creek
Figure A1- 19: Simulated flow rate over LOM to Barney Creek
Figure A1- 20: Simulated SO4 load rate over LOM to Barney Creek

McArthur River Mining Pty Ltd Supplementary EIS
Appendix Sensitivity Analyses Draft
Appendix_I.docx
Page I-11
D09814A25 December 2017
Figure A1- 21: Simulated Zn load rate over LOM to Barney Creek
Figure A1- 22: Simulated As load rate over LOM to Barney Creek
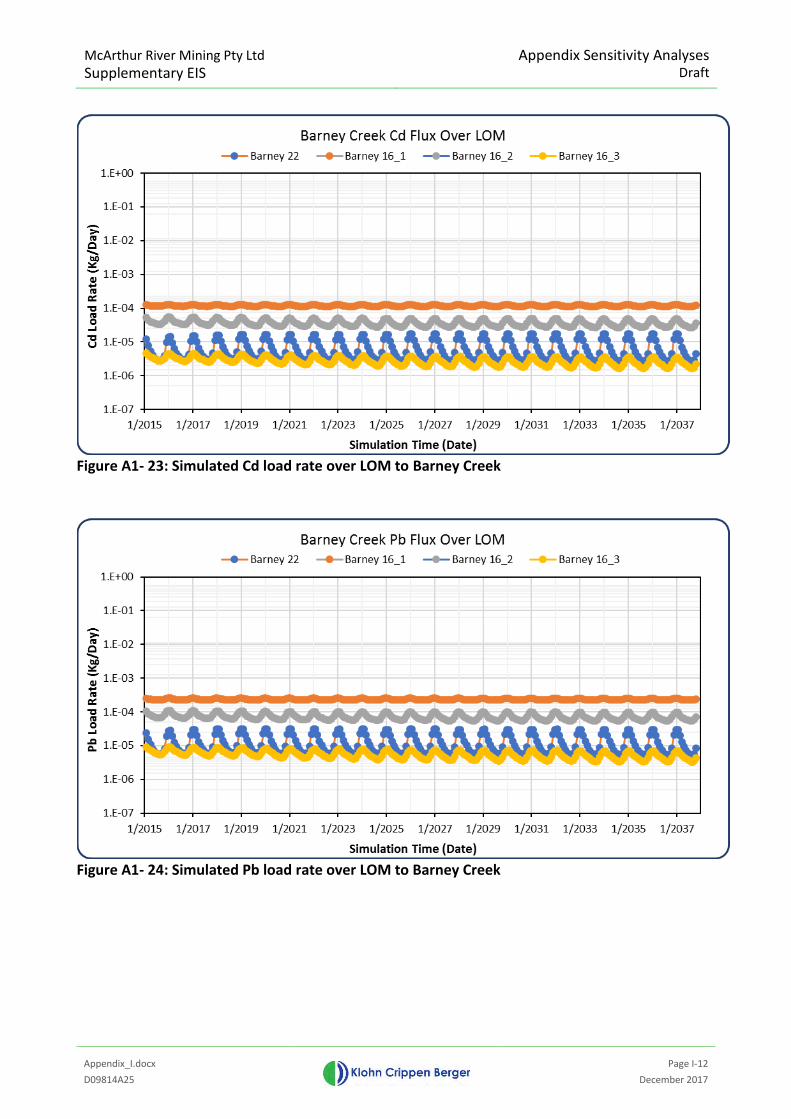
McArthur River Mining Pty Ltd Supplementary EIS
Appendix Sensitivity Analyses Draft
Appendix_I.docx
Page I-12
D09814A25 December 2017
Figure A1- 23: Simulated Cd load rate over LOM to Barney Creek
Figure A1- 24: Simulated Pb load rate over LOM to Barney Creek
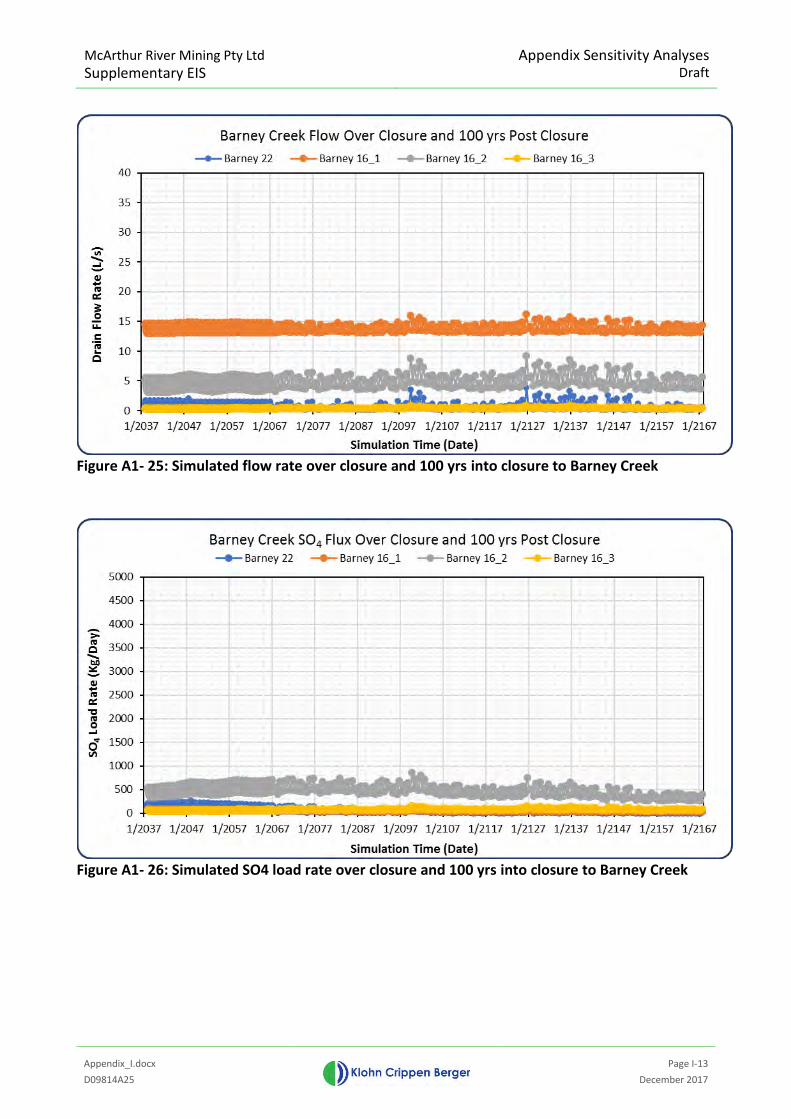
McArthur River Mining Pty Ltd Supplementary EIS
Appendix Sensitivity Analyses Draft
Appendix_I.docx
Page I-13
D09814A25 December 2017
Figure A1- 25: Simulated flow rate over closure and 100 yrs into closure to Barney Creek
Figure A1- 26: Simulated SO4 load rate over closure and 100 yrs into closure to Barney Creek
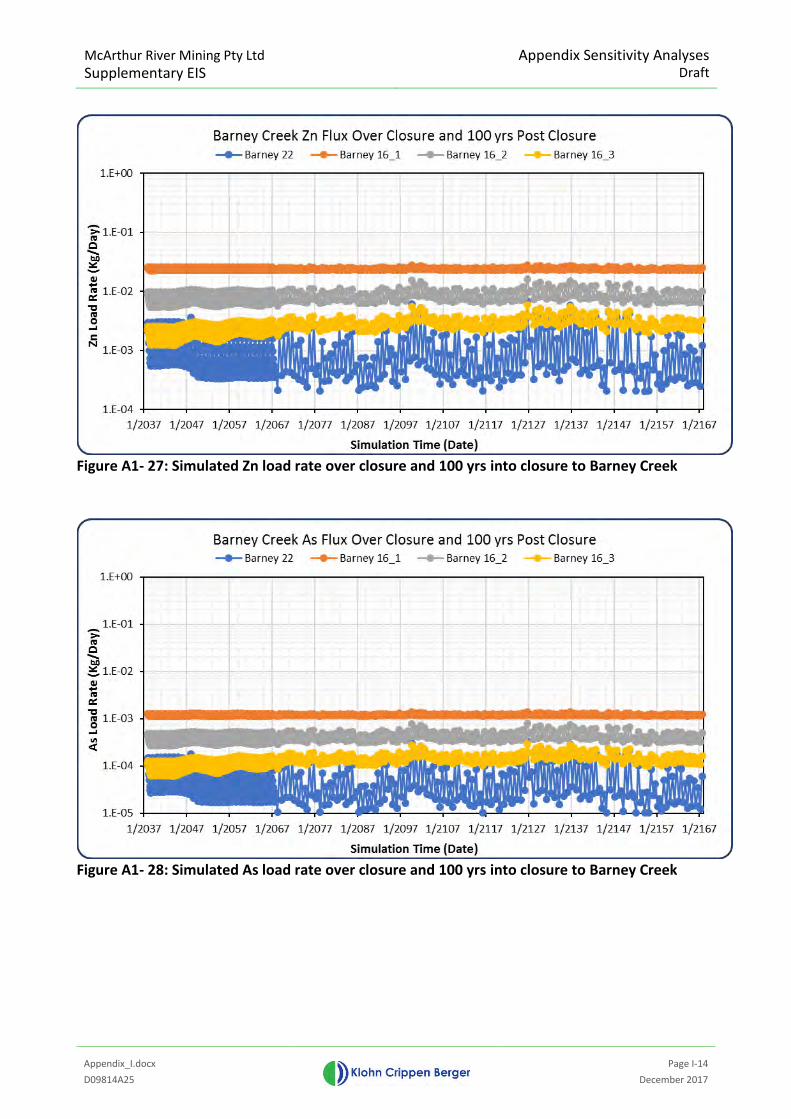
McArthur River Mining Pty Ltd Supplementary EIS
Appendix Sensitivity Analyses Draft
Appendix_I.docx
Page I-14
D09814A25 December 2017
Figure A1- 27: Simulated Zn load rate over closure and 100 yrs into closure to Barney Creek
Figure A1- 28: Simulated As load rate over closure and 100 yrs into closure to Barney Creek
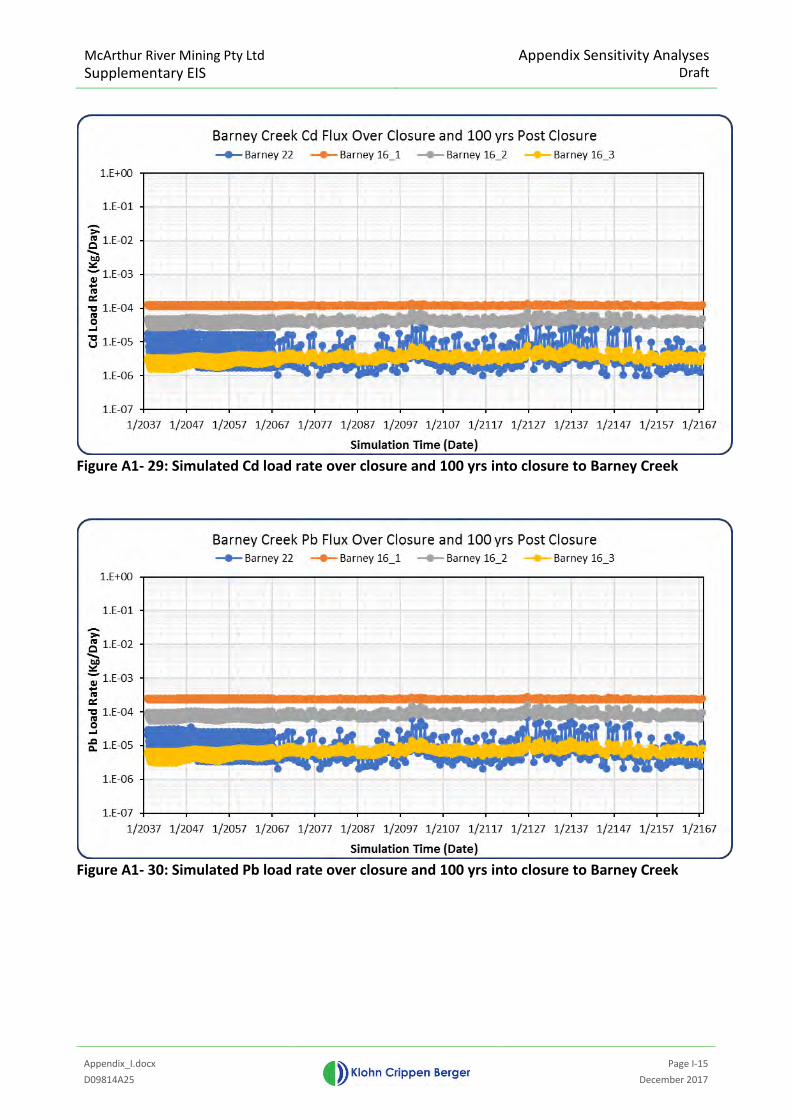
McArthur River Mining Pty Ltd Supplementary EIS
Appendix Sensitivity Analyses Draft
Appendix_I.docx
Page I-15
D09814A25 December 2017
Figure A1- 29: Simulated Cd load rate over closure and 100 yrs into closure to Barney Creek
Figure A1- 30: Simulated Pb load rate over closure and 100 yrs into closure to Barney Creek
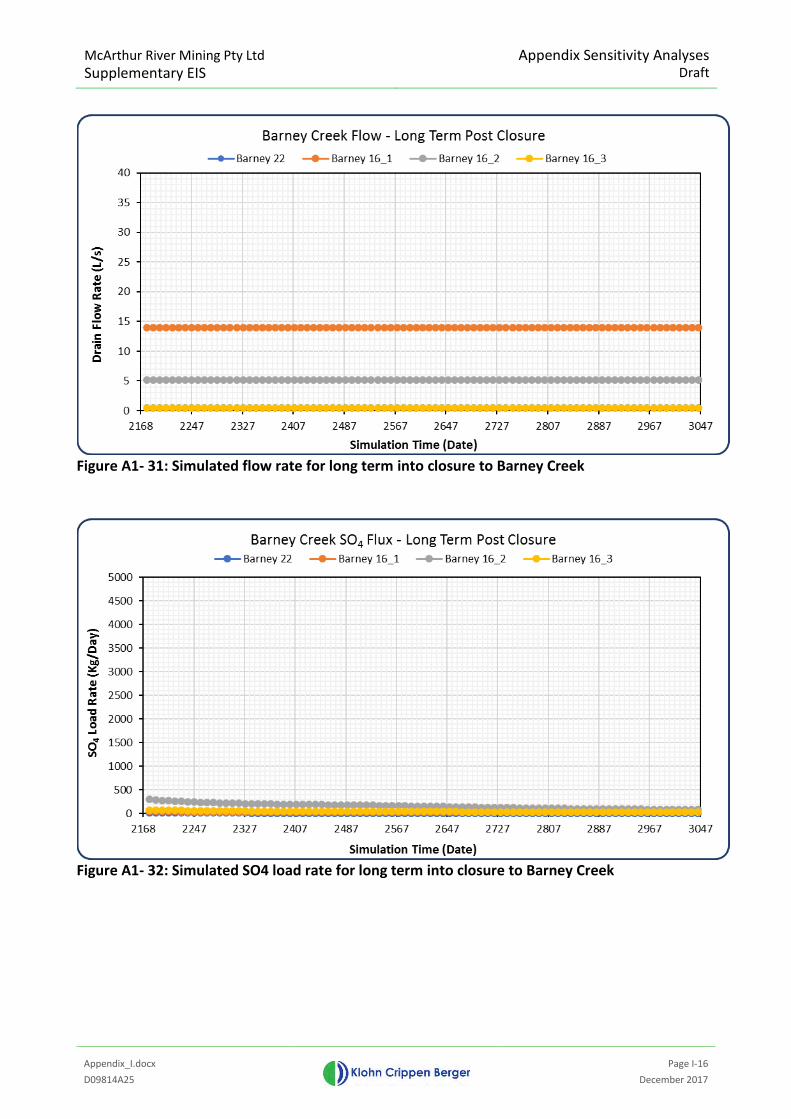
McArthur River Mining Pty Ltd Supplementary EIS
Appendix Sensitivity Analyses Draft
Appendix_I.docx
Page I-16
D09814A25 December 2017
Figure A1- 31: Simulated flow rate for long term into closure to Barney Creek
Figure A1- 32: Simulated SO4 load rate for long term into closure to Barney Creek
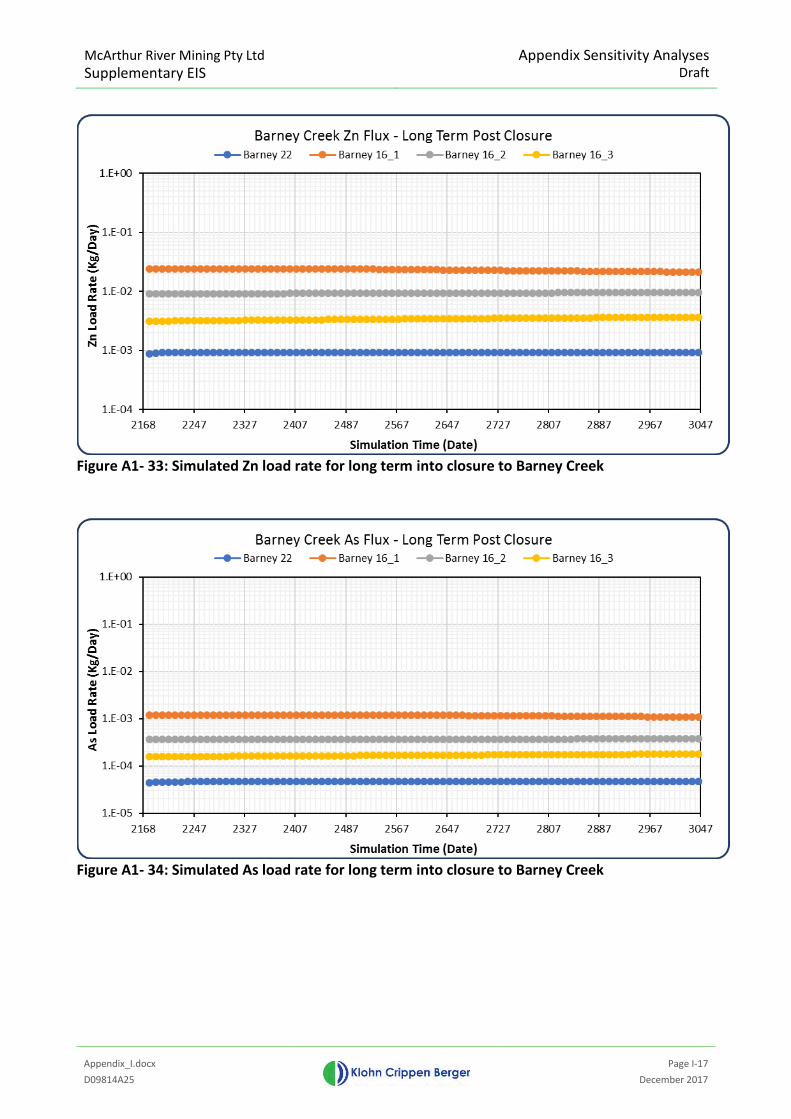
McArthur River Mining Pty Ltd Supplementary EIS
Appendix Sensitivity Analyses Draft
Appendix_I.docx
Page I-17
D09814A25 December 2017
Figure A1- 33: Simulated Zn load rate for long term into closure to Barney Creek
Figure A1- 34: Simulated As load rate for long term into closure to Barney Creek
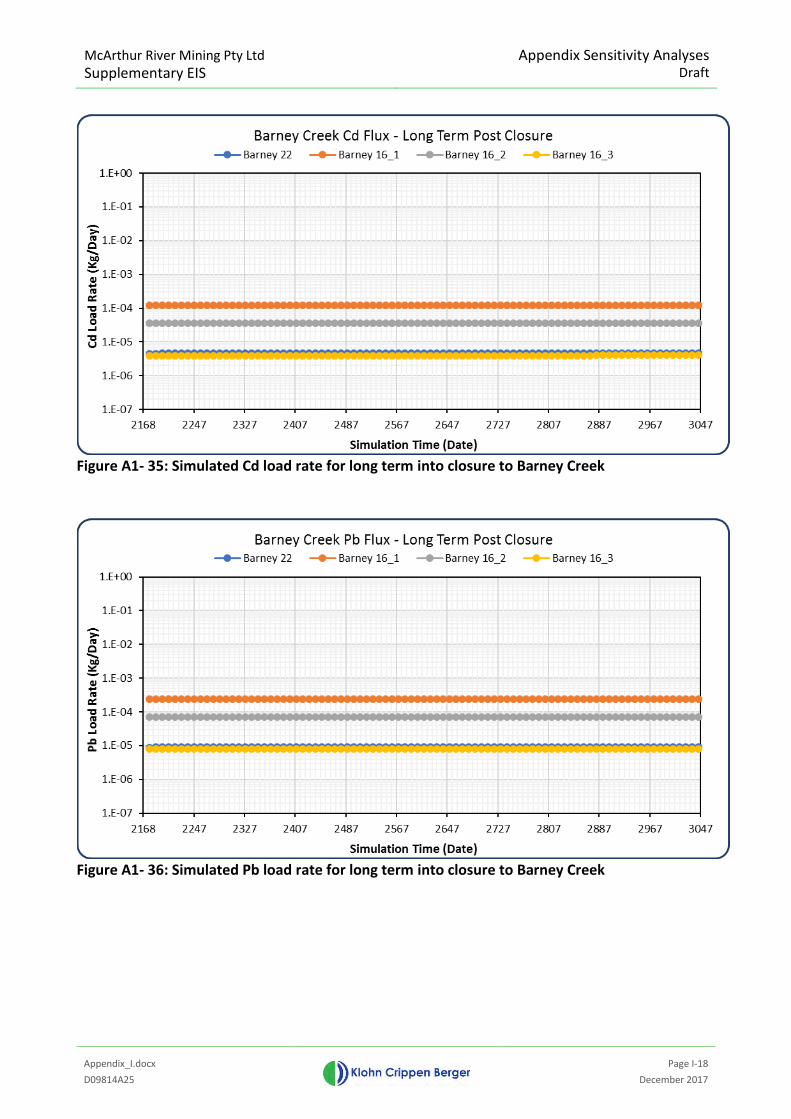
McArthur River Mining Pty Ltd Supplementary EIS
Appendix Sensitivity Analyses Draft
Appendix_I.docx
Page I-18
D09814A25 December 2017
Figure A1- 35: Simulated Cd load rate for long term into closure to Barney Creek
Figure A1- 36: Simulated Pb load rate for long term into closure to Barney Creek
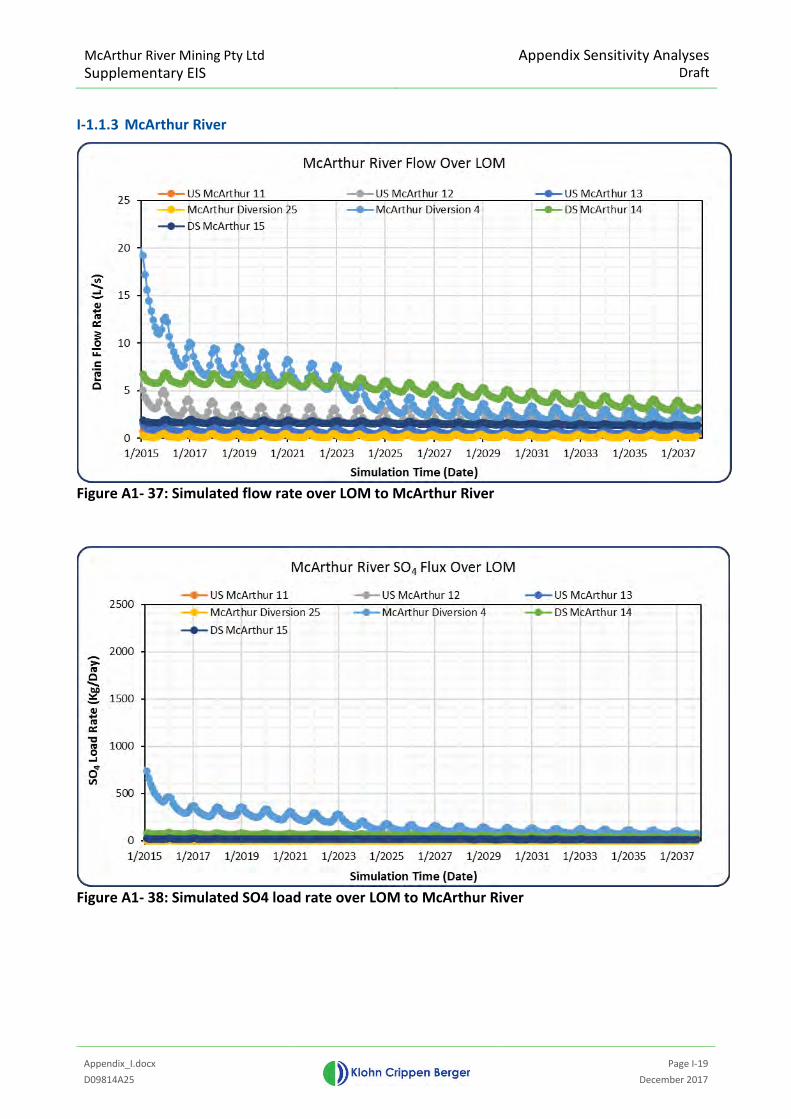
McArthur River Mining Pty Ltd Supplementary EIS
Appendix Sensitivity Analyses Draft
Appendix_I.docx
Page I-19
D09814A25 December 2017
I-1.1.3 McArthur River
Figure A1- 37: Simulated flow rate over LOM to McArthur River
Figure A1- 38: Simulated SO4 load rate over LOM to McArthur River

McArthur River Mining Pty Ltd Supplementary EIS
Appendix Sensitivity Analyses Draft
Appendix_I.docx
Page I-20
D09814A25 December 2017
Figure A1- 39: Simulated Zn load rate over LOM to McArthur River
Figure A1- 40: Simulated As load rate over LOM to McArthur River
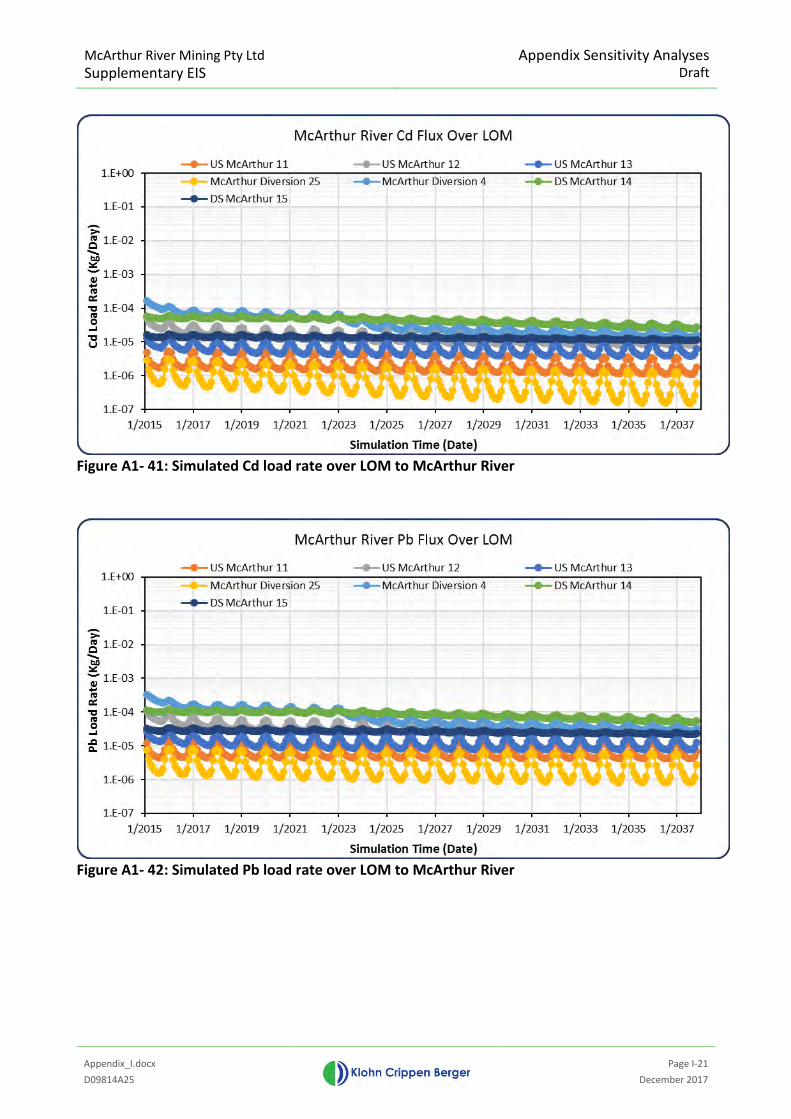
McArthur River Mining Pty Ltd Supplementary EIS
Appendix Sensitivity Analyses Draft
Appendix_I.docx
Page I-21
D09814A25 December 2017
Figure A1- 41: Simulated Cd load rate over LOM to McArthur River
Figure A1- 42: Simulated Pb load rate over LOM to McArthur River
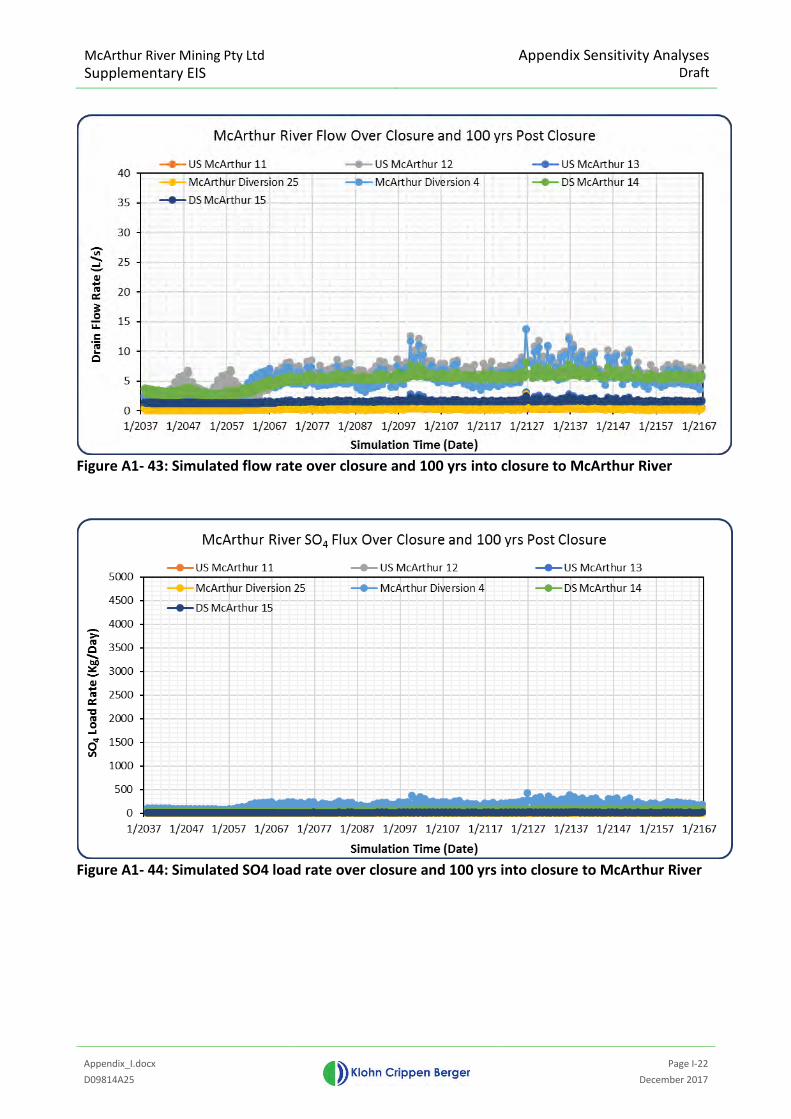
McArthur River Mining Pty Ltd Supplementary EIS
Appendix Sensitivity Analyses Draft
Appendix_I.docx
Page I-22
D09814A25 December 2017
Figure A1- 43: Simulated flow rate over closure and 100 yrs into closure to McArthur River
Figure A1- 44: Simulated SO4 load rate over closure and 100 yrs into closure to McArthur River
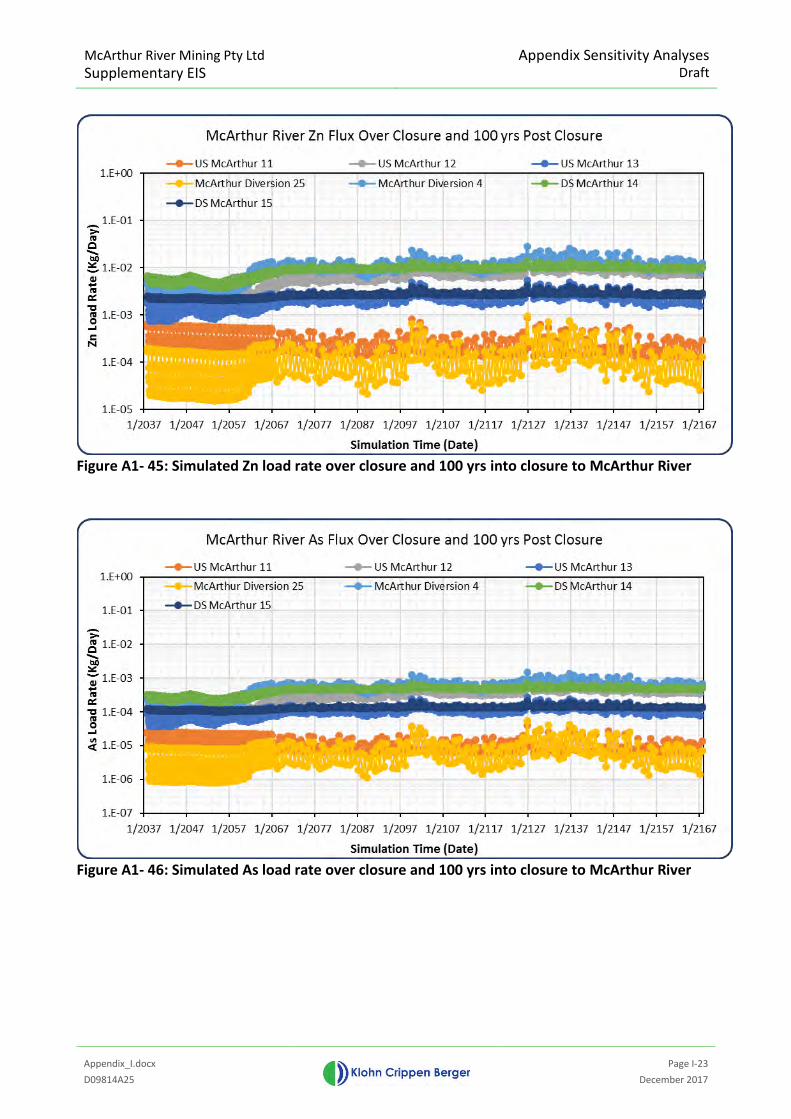
McArthur River Mining Pty Ltd Supplementary EIS
Appendix Sensitivity Analyses Draft
Appendix_I.docx
Page I-23
D09814A25 December 2017
Figure A1- 45: Simulated Zn load rate over closure and 100 yrs into closure to McArthur River
Figure A1- 46: Simulated As load rate over closure and 100 yrs into closure to McArthur River
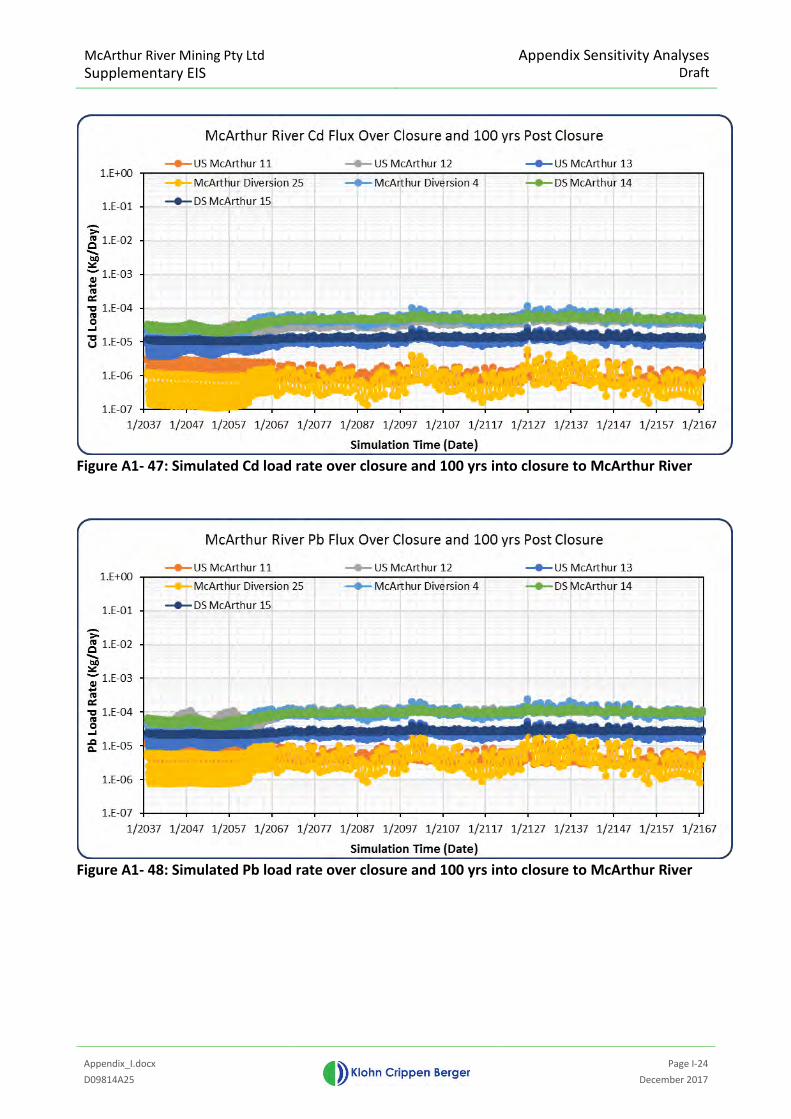
McArthur River Mining Pty Ltd Supplementary EIS
Appendix Sensitivity Analyses Draft
Appendix_I.docx
Page I-24
D09814A25 December 2017
Figure A1- 47: Simulated Cd load rate over closure and 100 yrs into closure to McArthur River
Figure A1- 48: Simulated Pb load rate over closure and 100 yrs into closure to McArthur River
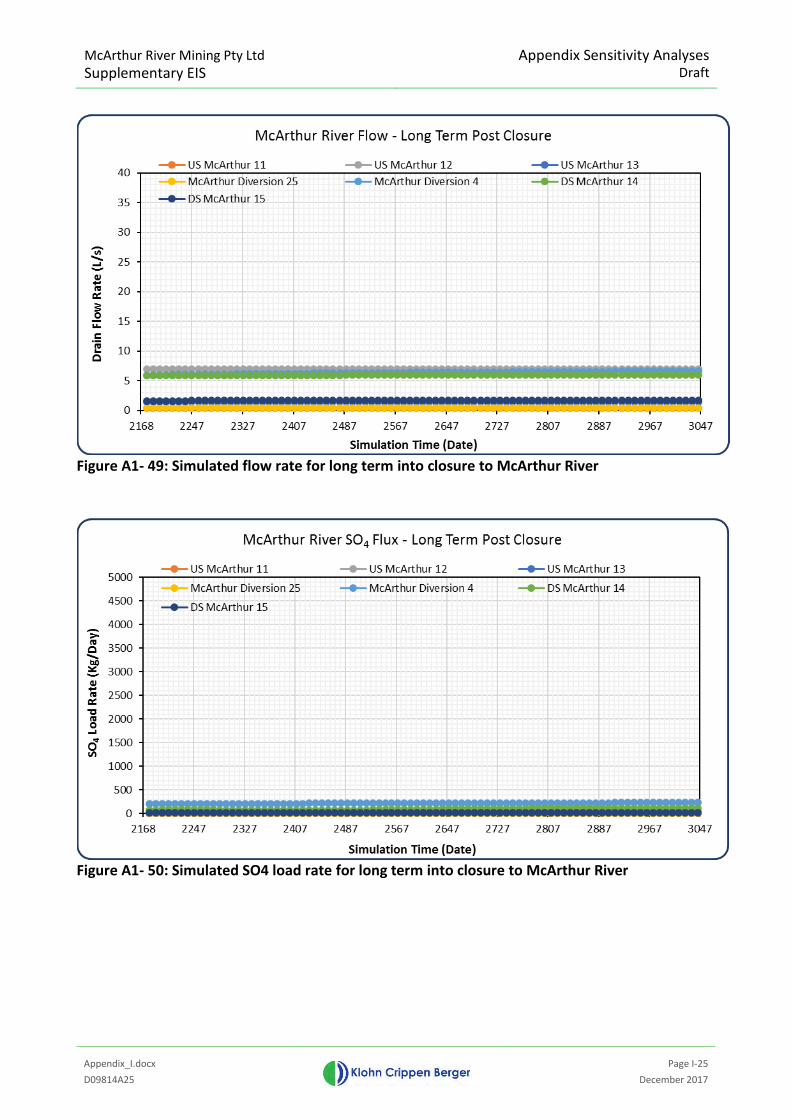
McArthur River Mining Pty Ltd Supplementary EIS
Appendix Sensitivity Analyses Draft
Appendix_I.docx
Page I-25
D09814A25 December 2017
Figure A1- 49: Simulated flow rate for long term into closure to McArthur River
Figure A1- 50: Simulated SO4 load rate for long term into closure to McArthur River
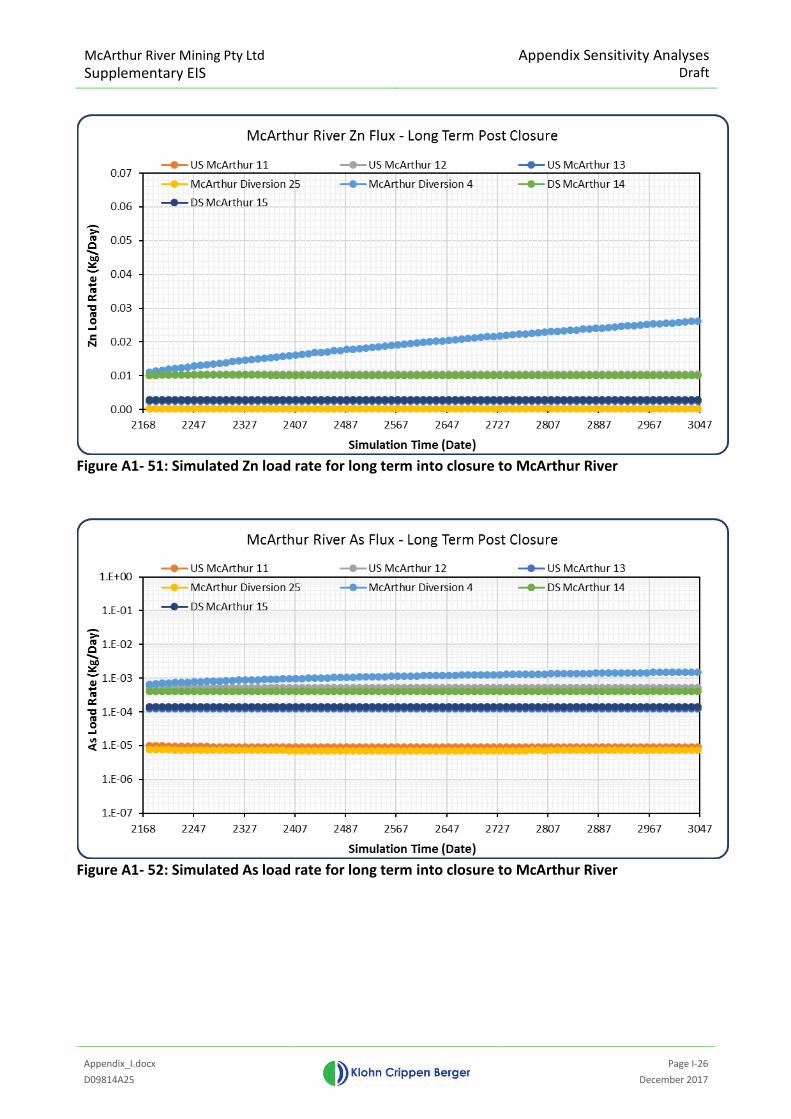
McArthur River Mining Pty Ltd Supplementary EIS
Appendix Sensitivity Analyses Draft
Appendix_I.docx
Page I-26
D09814A25 December 2017
Figure A1- 51: Simulated Zn load rate for long term into closure to McArthur River
Figure A1- 52: Simulated As load rate for long term into closure to McArthur River
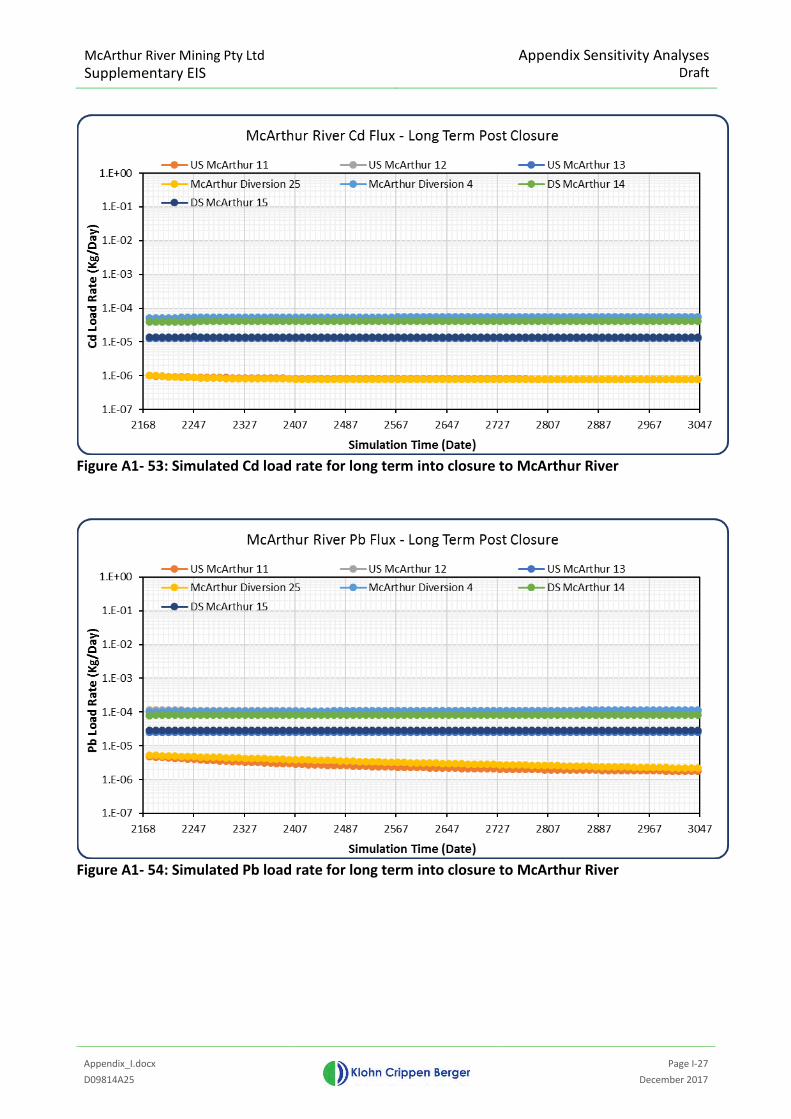
McArthur River Mining Pty Ltd Supplementary EIS
Appendix Sensitivity Analyses Draft
Appendix_I.docx
Page I-27
D09814A25 December 2017
Figure A1- 53: Simulated Cd load rate for long term into closure to McArthur River
Figure A1- 54: Simulated Pb load rate for long term into closure to McArthur River
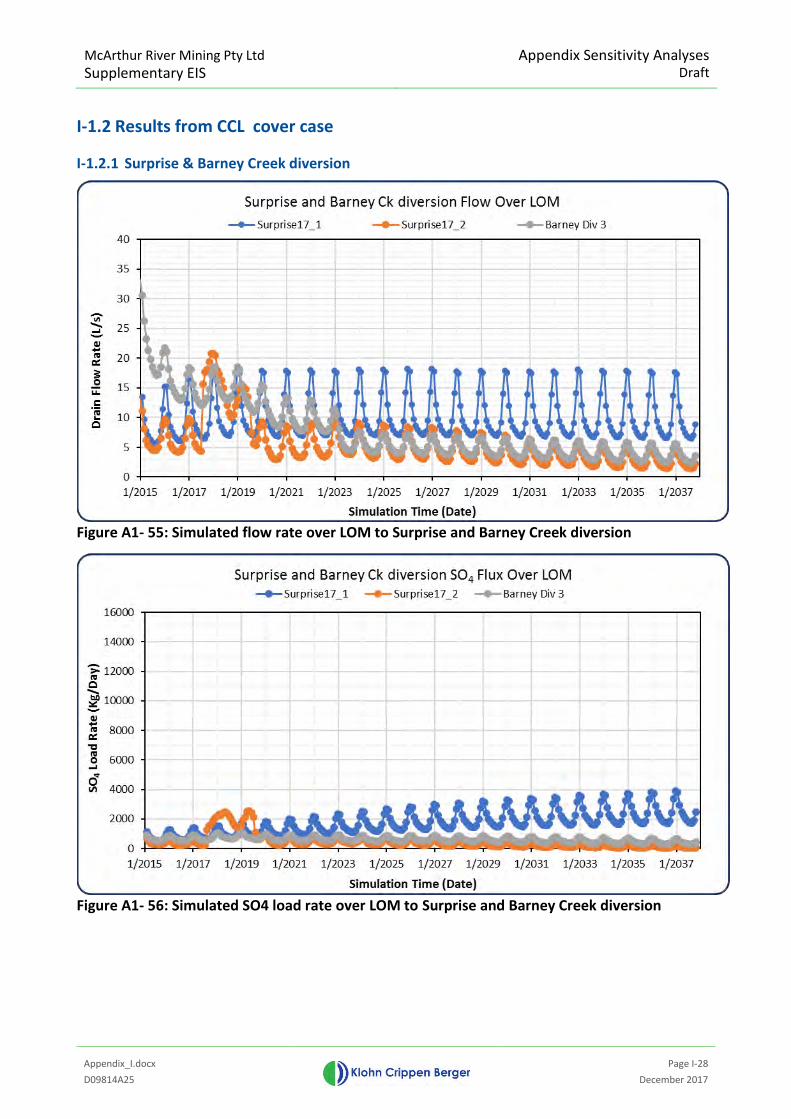
McArthur River Mining Pty Ltd Supplementary EIS
Appendix Sensitivity Analyses Draft
Appendix_I.docx
Page I-28
D09814A25 December 2017
I-1.2 Results from CCL cover case
I-1.2.1 Surprise & Barney Creek diversion
Figure A1- 55: Simulated flow rate over LOM to Surprise and Barney Creek diversion
Figure A1- 56: Simulated SO4 load rate over LOM to Surprise and Barney Creek diversion
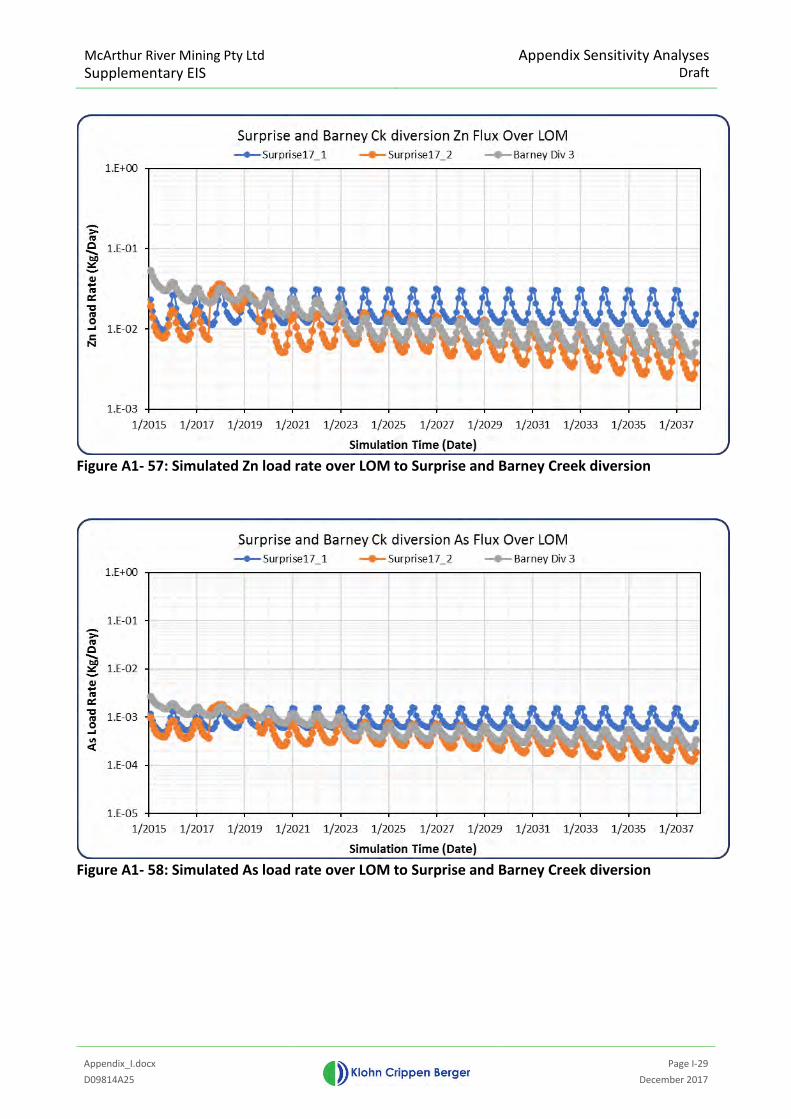
McArthur River Mining Pty Ltd Supplementary EIS
Appendix Sensitivity Analyses Draft
Appendix_I.docx
Page I-29
D09814A25 December 2017
Figure A1- 57: Simulated Zn load rate over LOM to Surprise and Barney Creek diversion
Figure A1- 58: Simulated As load rate over LOM to Surprise and Barney Creek diversion
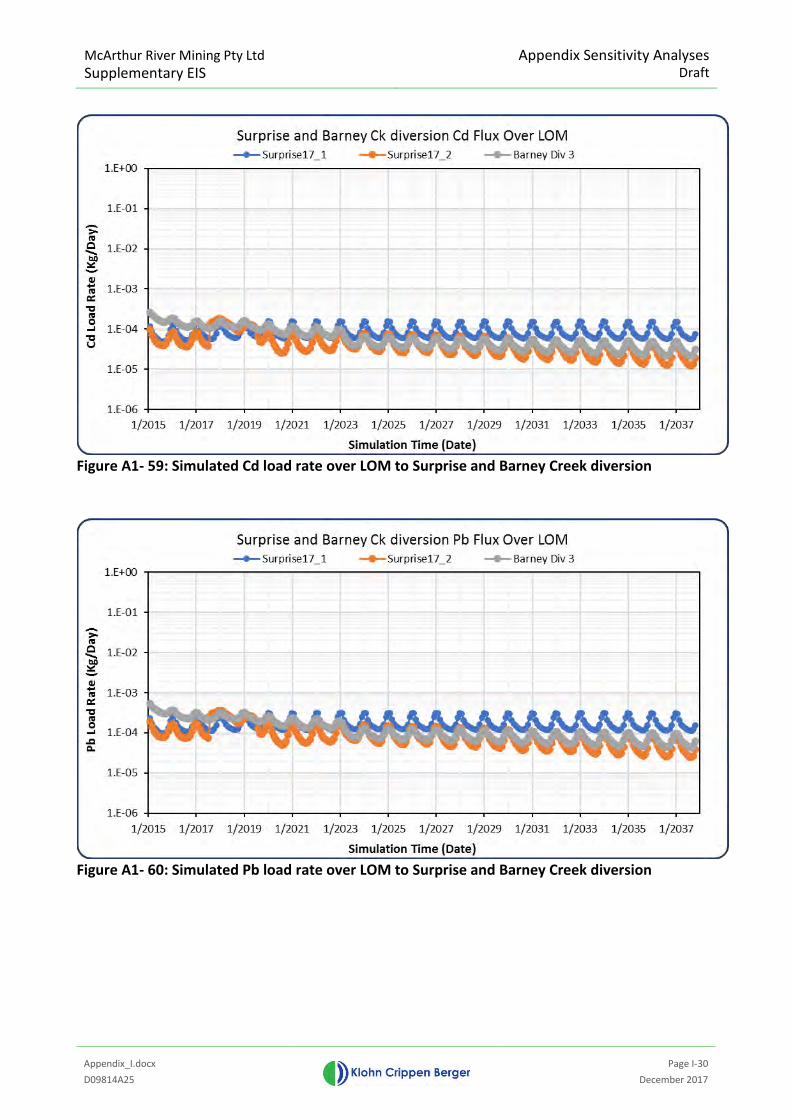
McArthur River Mining Pty Ltd Supplementary EIS
Appendix Sensitivity Analyses Draft
Appendix_I.docx
Page I-30
D09814A25 December 2017
Figure A1- 59: Simulated Cd load rate over LOM to Surprise and Barney Creek diversion
Figure A1- 60: Simulated Pb load rate over LOM to Surprise and Barney Creek diversion
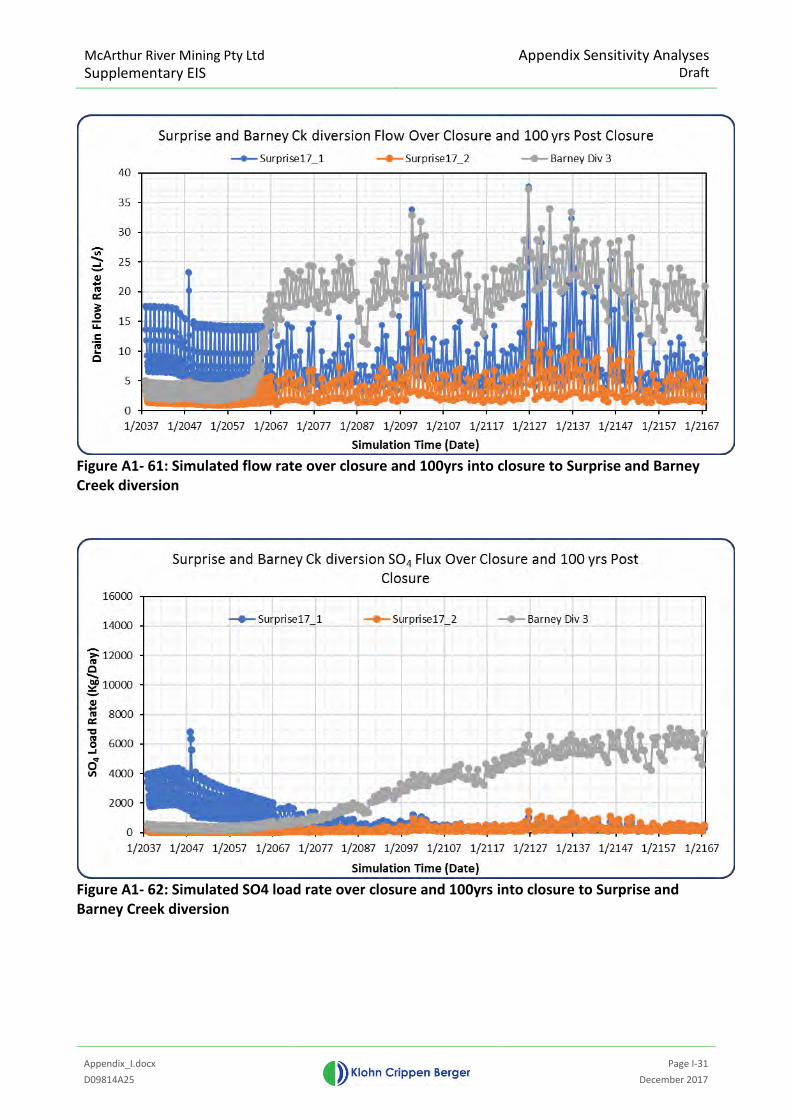
McArthur River Mining Pty Ltd Supplementary EIS
Appendix Sensitivity Analyses Draft
Appendix_I.docx
Page I-31
D09814A25 December 2017
Figure A1- 61: Simulated flow rate over closure and 100yrs into closure to Surprise and Barney Creek diversion
Figure A1- 62: Simulated SO4 load rate over closure and 100yrs into closure to Surprise and Barney Creek diversion
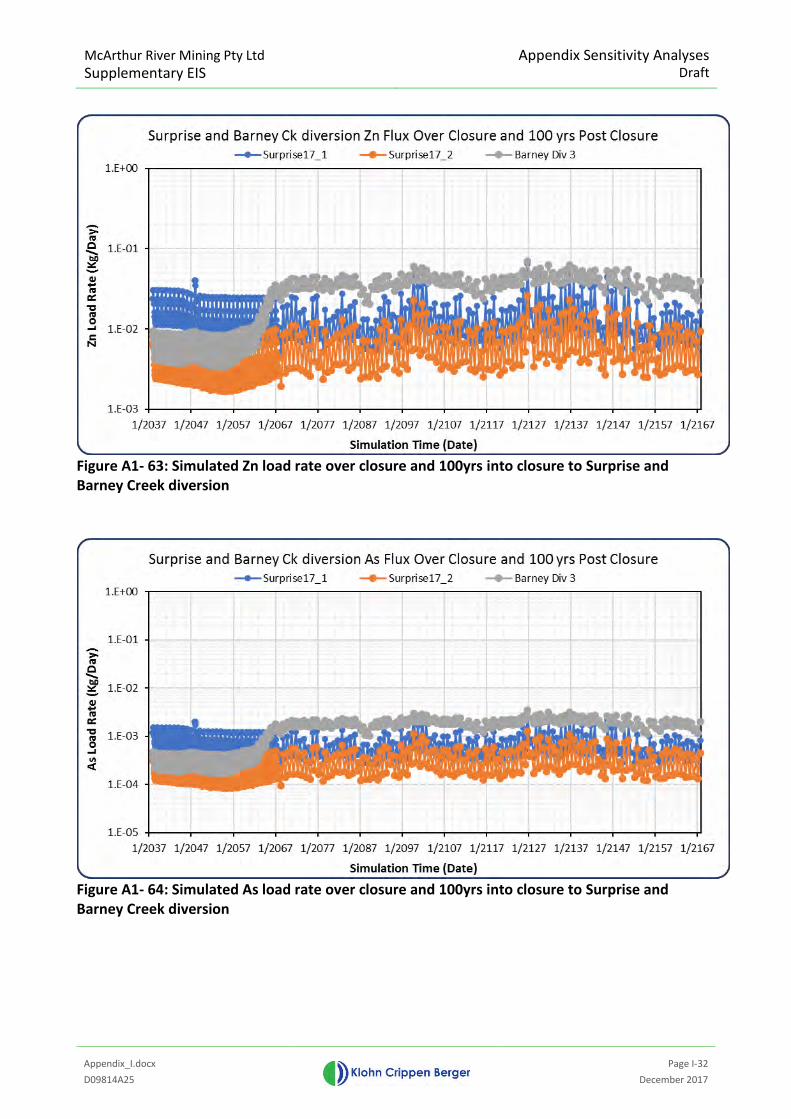
McArthur River Mining Pty Ltd Supplementary EIS
Appendix Sensitivity Analyses Draft
Appendix_I.docx
Page I-32
D09814A25 December 2017
Figure A1- 63: Simulated Zn load rate over closure and 100yrs into closure to Surprise and Barney Creek diversion
Figure A1- 64: Simulated As load rate over closure and 100yrs into closure to Surprise and Barney Creek diversion
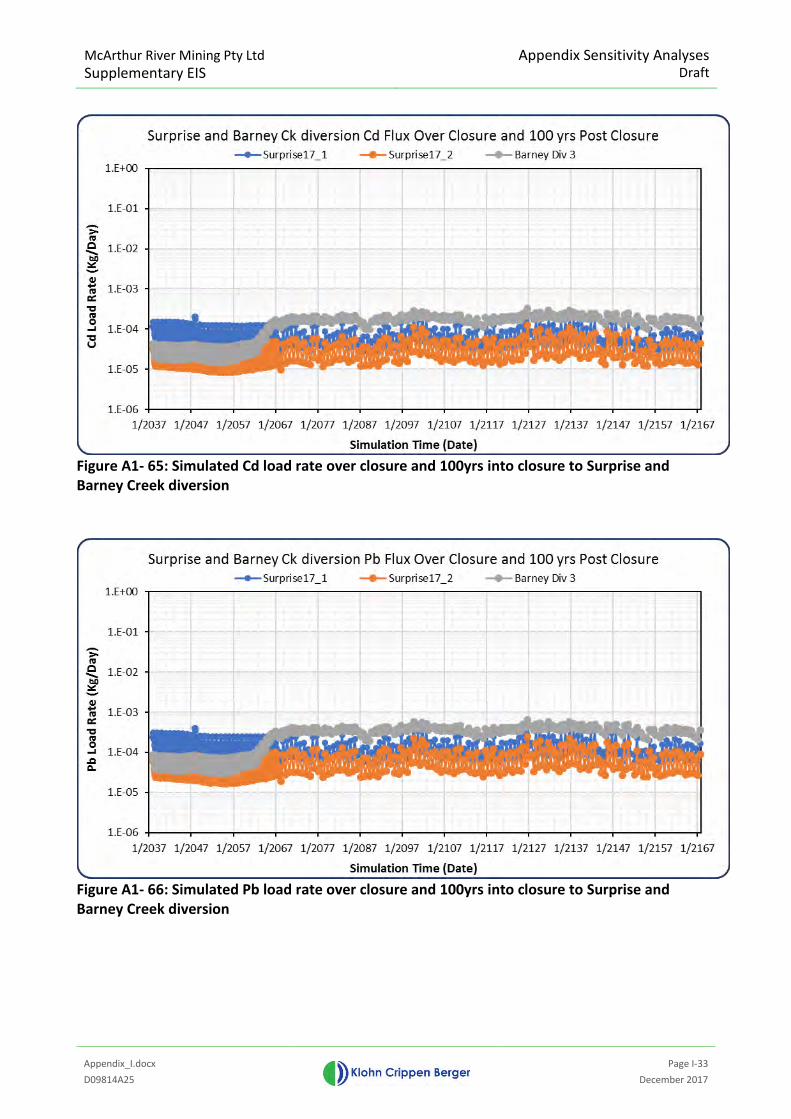
McArthur River Mining Pty Ltd Supplementary EIS
Appendix Sensitivity Analyses Draft
Appendix_I.docx
Page I-33
D09814A25 December 2017
Figure A1- 65: Simulated Cd load rate over closure and 100yrs into closure to Surprise and Barney Creek diversion
Figure A1- 66: Simulated Pb load rate over closure and 100yrs into closure to Surprise and Barney Creek diversion
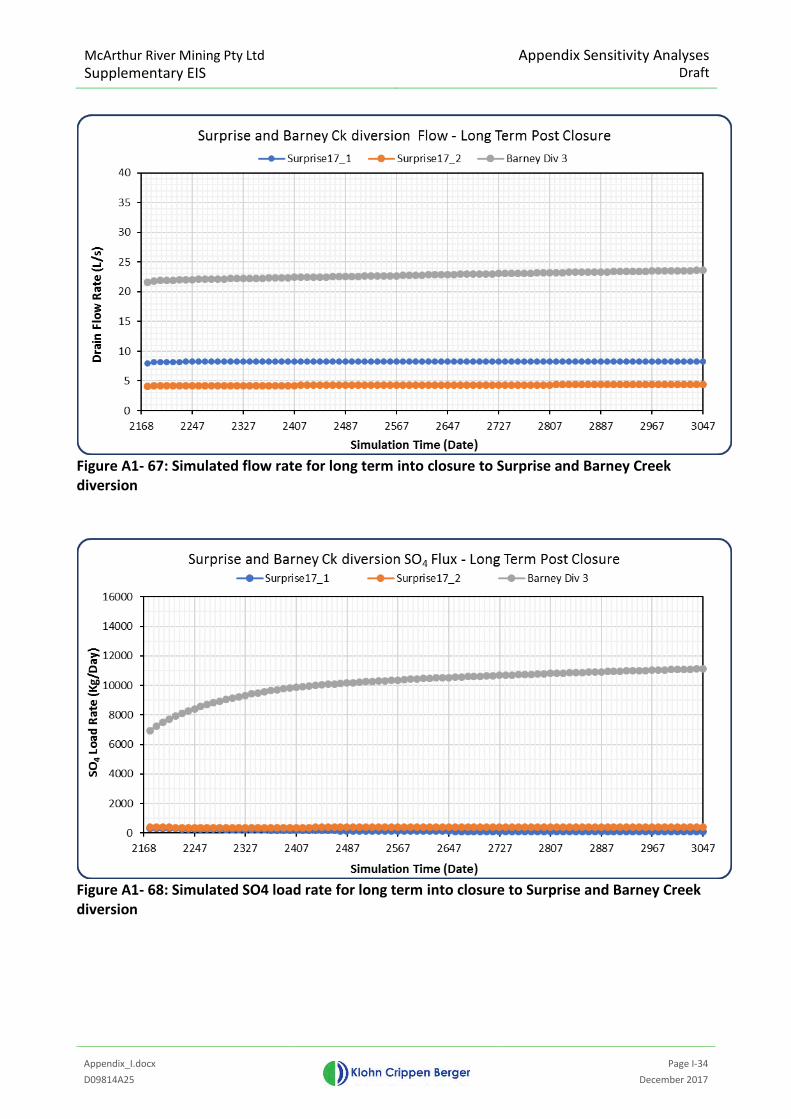
McArthur River Mining Pty Ltd Supplementary EIS
Appendix Sensitivity Analyses Draft
Appendix_I.docx
Page I-34
D09814A25 December 2017
Figure A1- 67: Simulated flow rate for long term into closure to Surprise and Barney Creek diversion
Figure A1- 68: Simulated SO4 load rate for long term into closure to Surprise and Barney Creek diversion
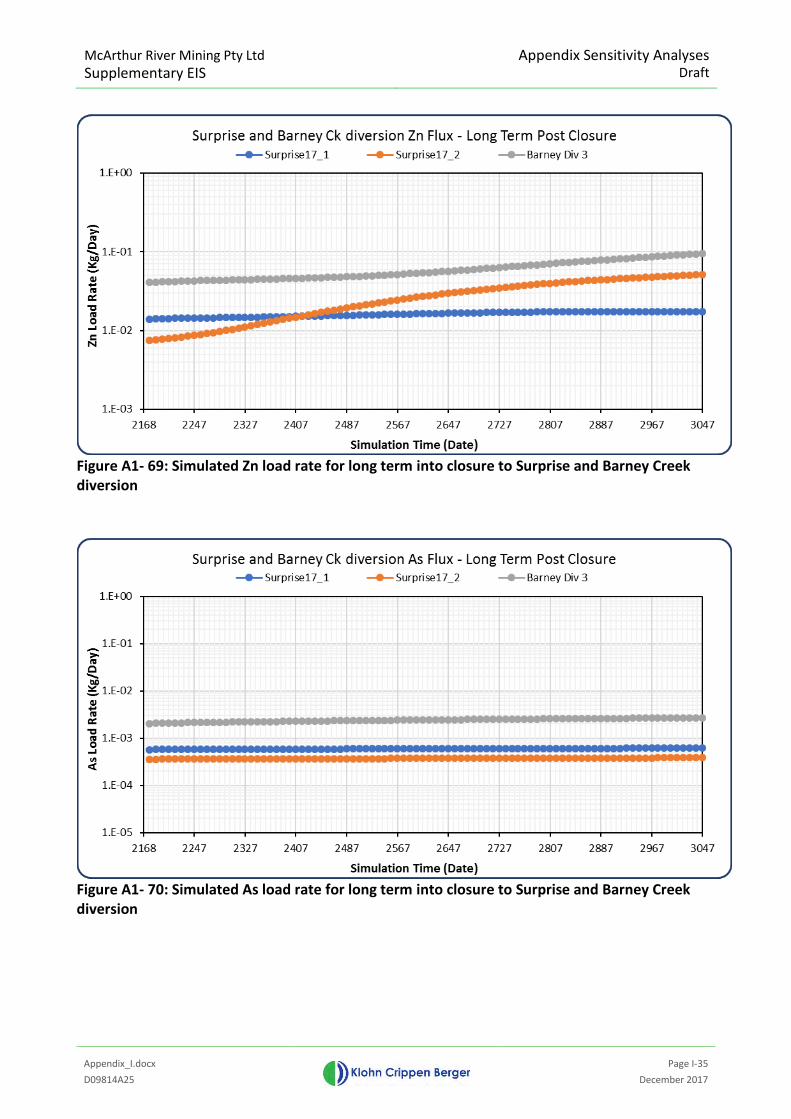
McArthur River Mining Pty Ltd Supplementary EIS
Appendix Sensitivity Analyses Draft
Appendix_I.docx
Page I-35
D09814A25 December 2017
Figure A1- 69: Simulated Zn load rate for long term into closure to Surprise and Barney Creek diversion
Figure A1- 70: Simulated As load rate for long term into closure to Surprise and Barney Creek diversion
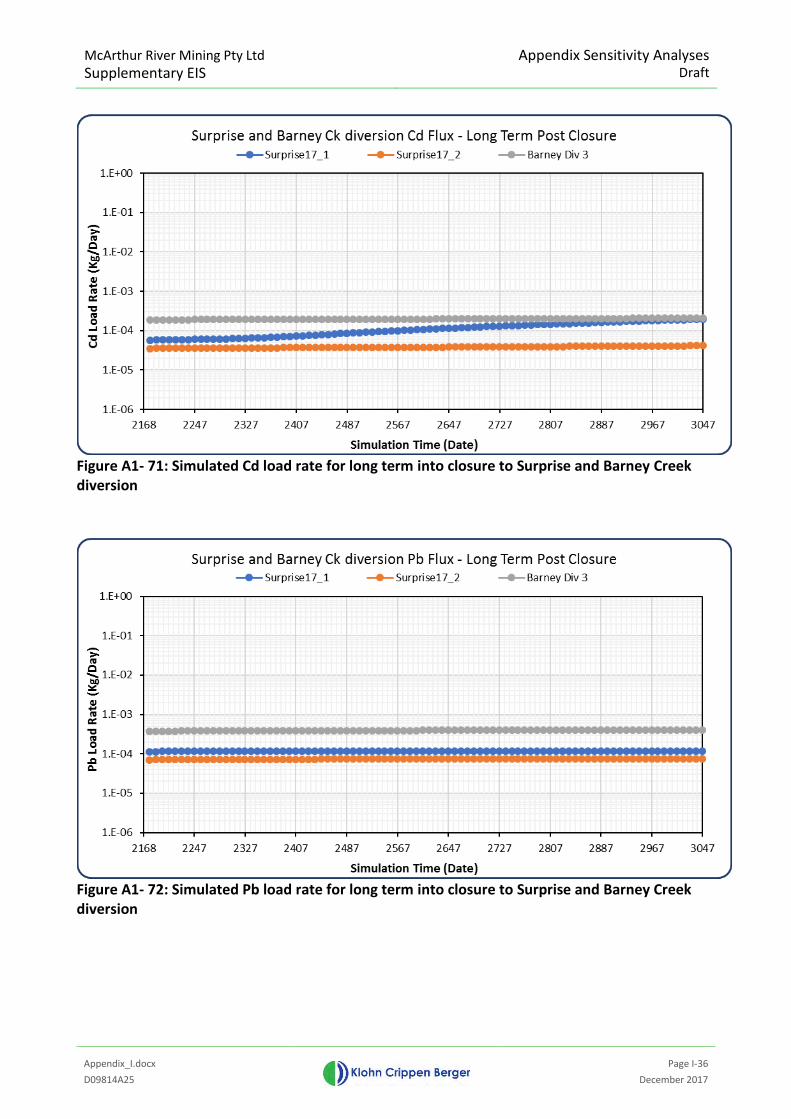
McArthur River Mining Pty Ltd Supplementary EIS
Appendix Sensitivity Analyses Draft
Appendix_I.docx
Page I-36
D09814A25 December 2017
Figure A1- 71: Simulated Cd load rate for long term into closure to Surprise and Barney Creek diversion
Figure A1- 72: Simulated Pb load rate for long term into closure to Surprise and Barney Creek diversion
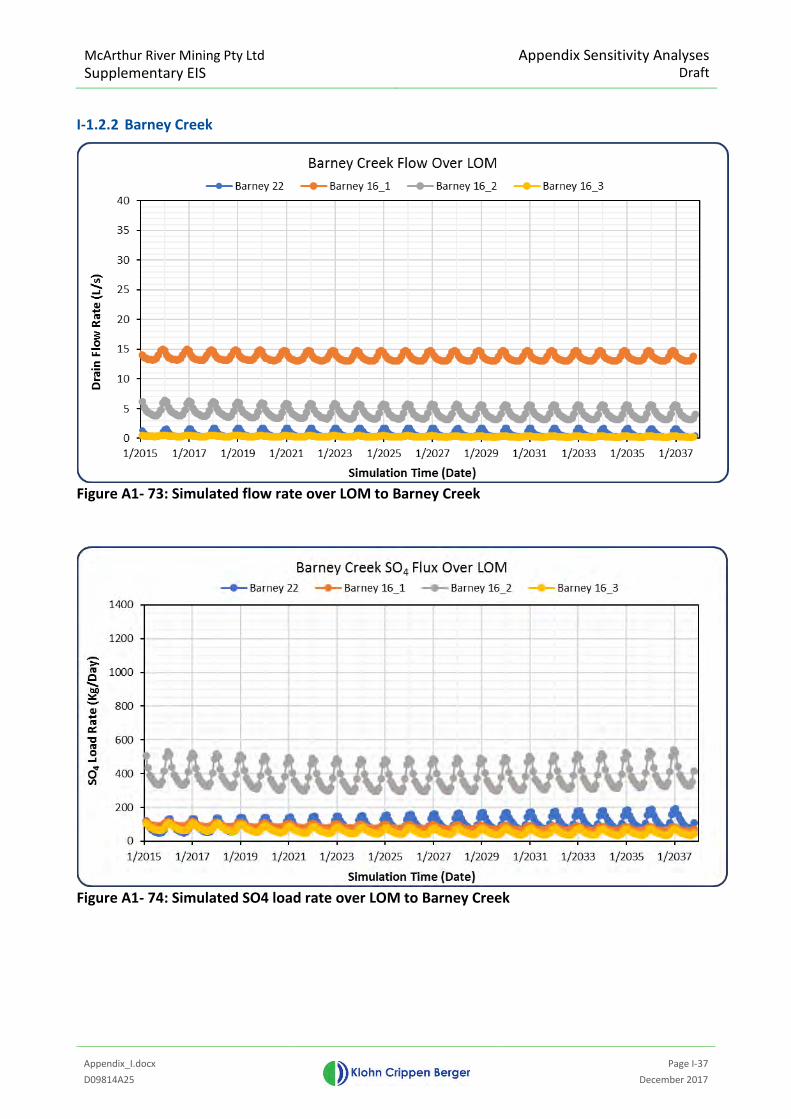
McArthur River Mining Pty Ltd Supplementary EIS
Appendix Sensitivity Analyses Draft
Appendix_I.docx
Page I-37
D09814A25 December 2017
I-1.2.2 Barney Creek
Figure A1- 73: Simulated flow rate over LOM to Barney Creek
Figure A1- 74: Simulated SO4 load rate over LOM to Barney Creek
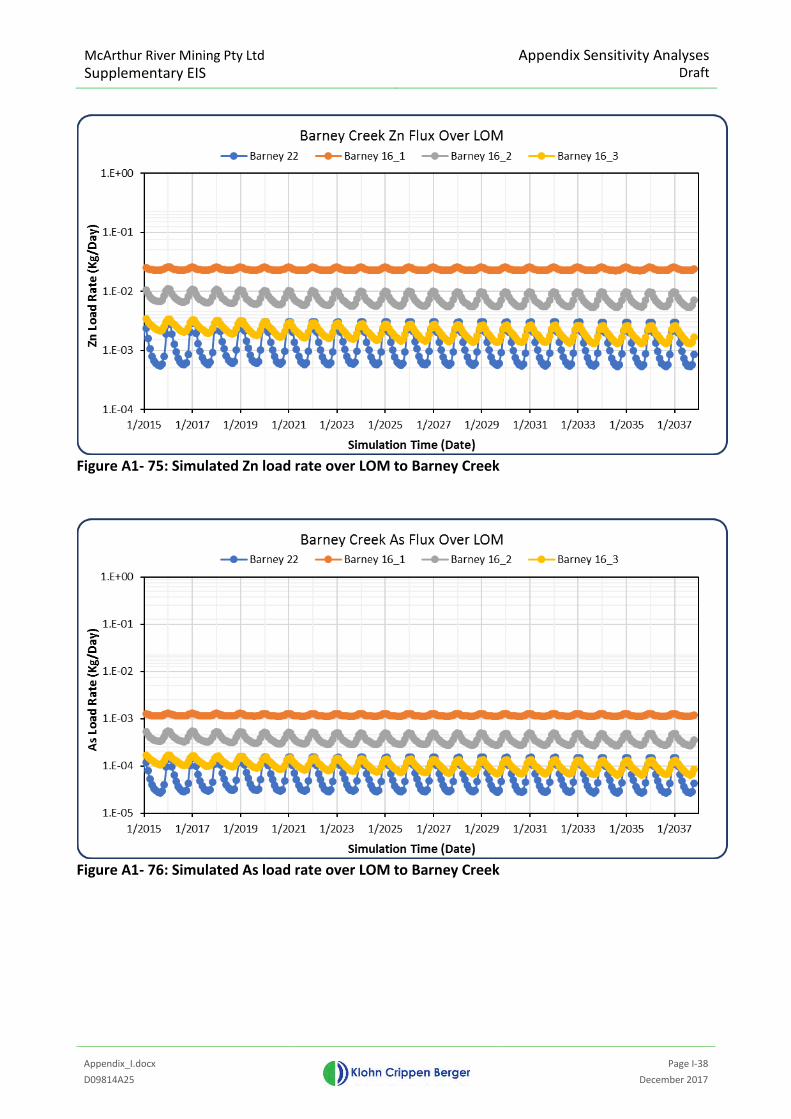
McArthur River Mining Pty Ltd Supplementary EIS
Appendix Sensitivity Analyses Draft
Appendix_I.docx
Page I-38
D09814A25 December 2017
Figure A1- 75: Simulated Zn load rate over LOM to Barney Creek
Figure A1- 76: Simulated As load rate over LOM to Barney Creek
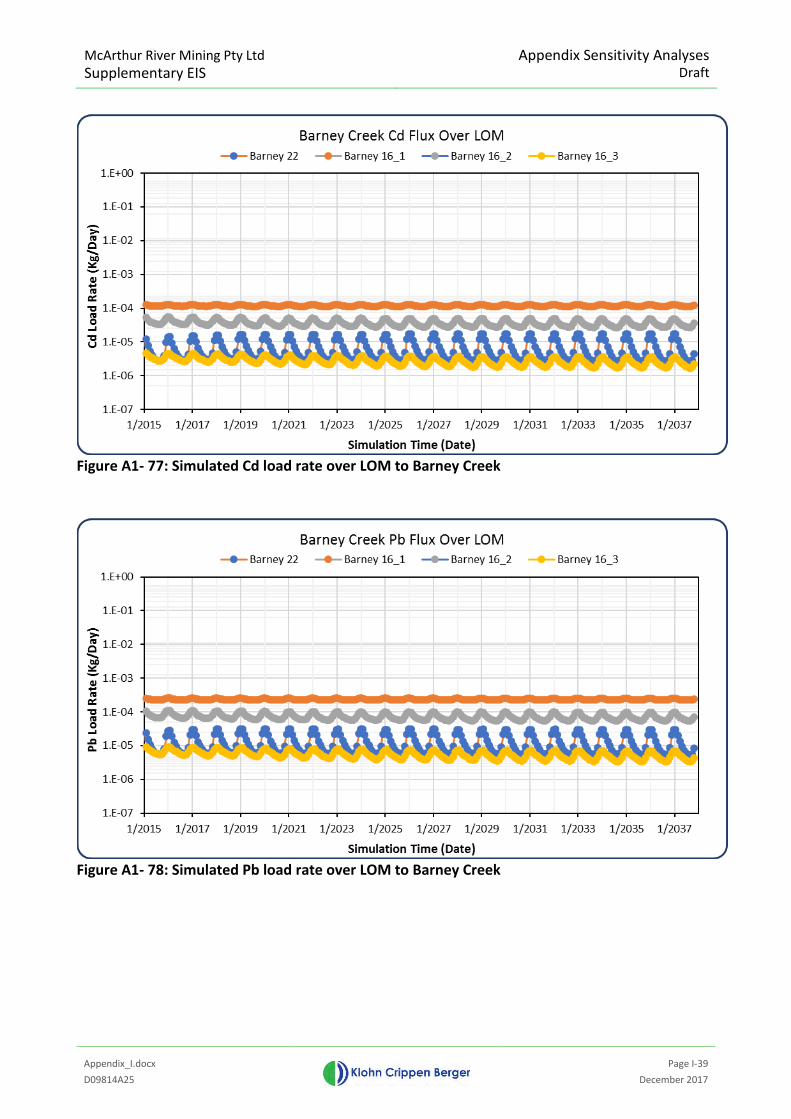
McArthur River Mining Pty Ltd Supplementary EIS
Appendix Sensitivity Analyses Draft
Appendix_I.docx
Page I-39
D09814A25 December 2017
Figure A1- 77: Simulated Cd load rate over LOM to Barney Creek
Figure A1- 78: Simulated Pb load rate over LOM to Barney Creek
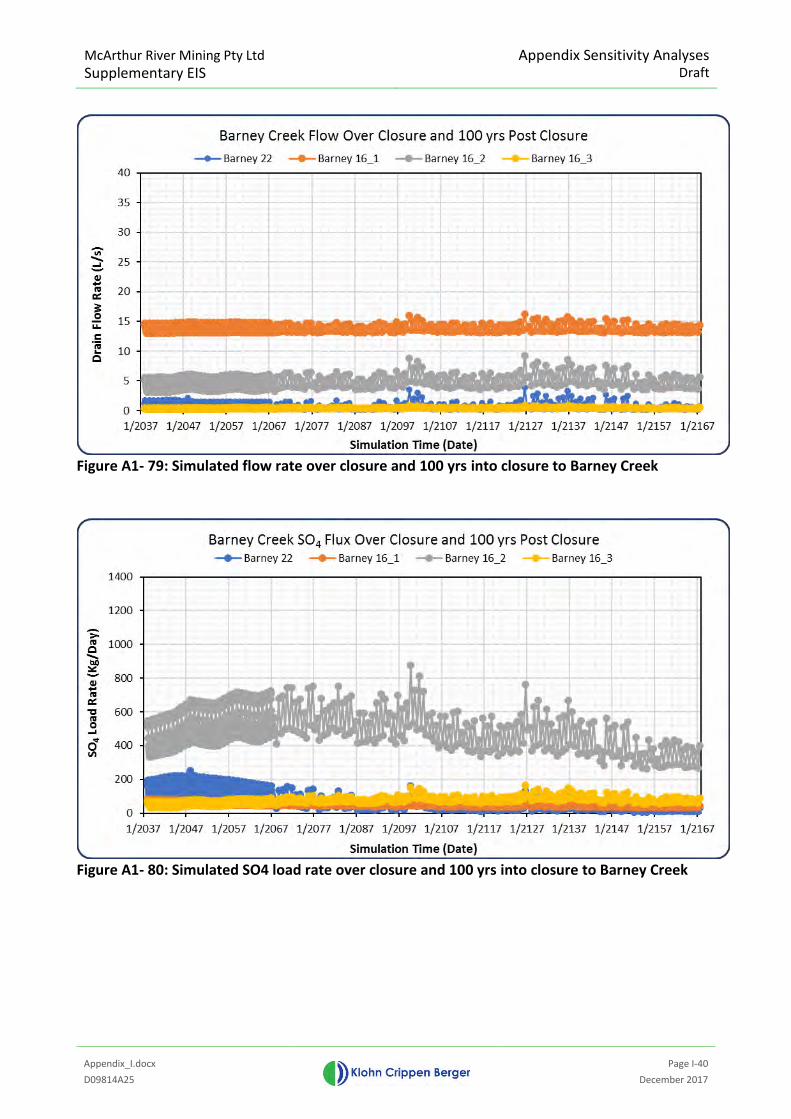
McArthur River Mining Pty Ltd Supplementary EIS
Appendix Sensitivity Analyses Draft
Appendix_I.docx
Page I-40
D09814A25 December 2017
Figure A1- 79: Simulated flow rate over closure and 100 yrs into closure to Barney Creek
Figure A1- 80: Simulated SO4 load rate over closure and 100 yrs into closure to Barney Creek
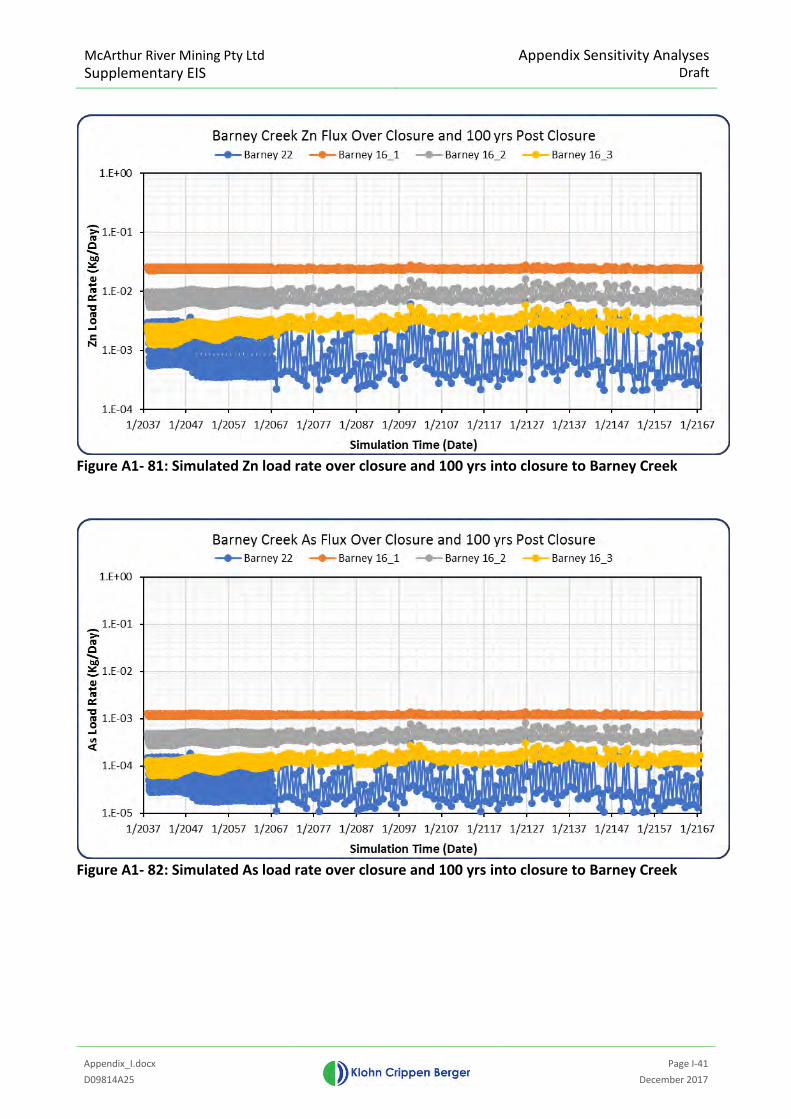
McArthur River Mining Pty Ltd Supplementary EIS
Appendix Sensitivity Analyses Draft
Appendix_I.docx
Page I-41
D09814A25 December 2017
Figure A1- 81: Simulated Zn load rate over closure and 100 yrs into closure to Barney Creek
Figure A1- 82: Simulated As load rate over closure and 100 yrs into closure to Barney Creek
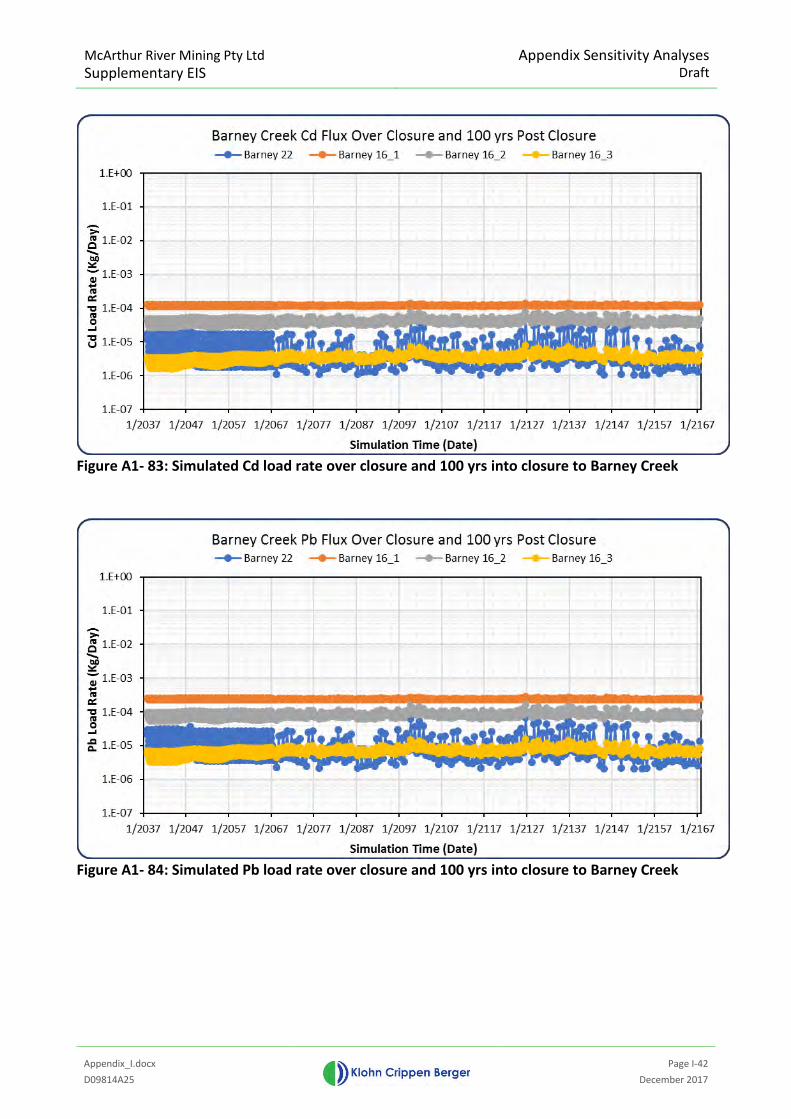
McArthur River Mining Pty Ltd Supplementary EIS
Appendix Sensitivity Analyses Draft
Appendix_I.docx
Page I-42
D09814A25 December 2017
Figure A1- 83: Simulated Cd load rate over closure and 100 yrs into closure to Barney Creek
Figure A1- 84: Simulated Pb load rate over closure and 100 yrs into closure to Barney Creek
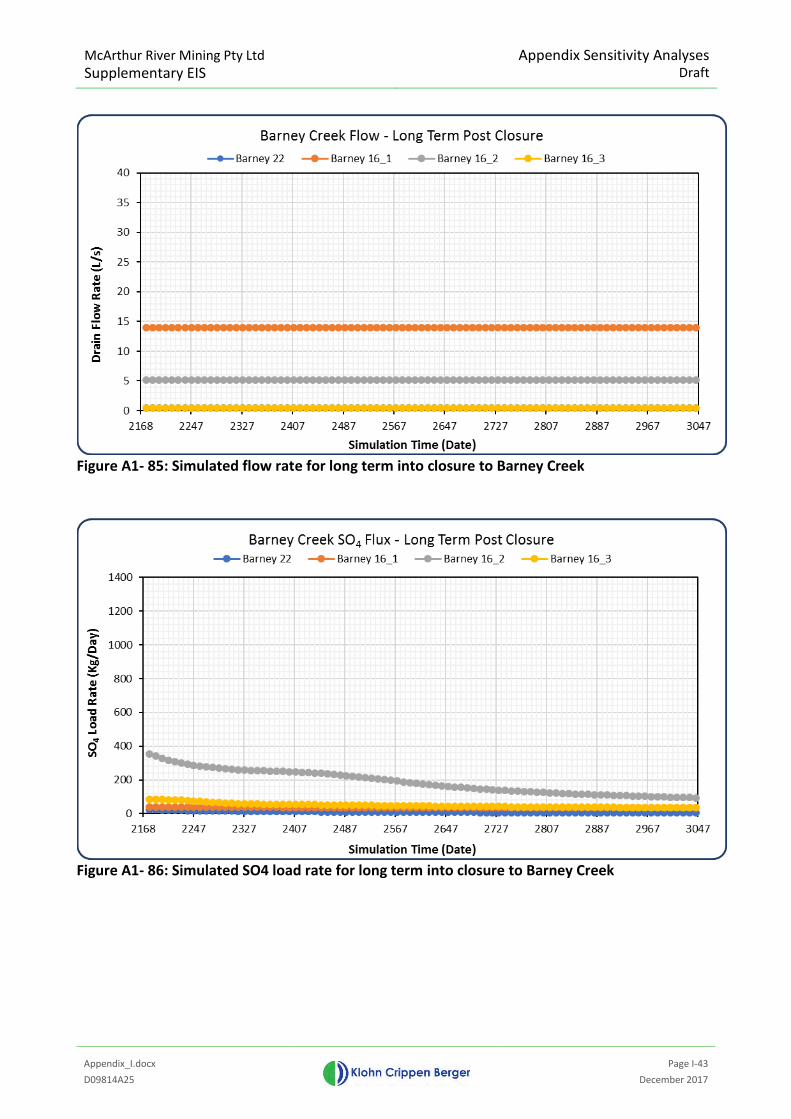
McArthur River Mining Pty Ltd Supplementary EIS
Appendix Sensitivity Analyses Draft
Appendix_I.docx
Page I-43
D09814A25 December 2017
Figure A1- 85: Simulated flow rate for long term into closure to Barney Creek
Figure A1- 86: Simulated SO4 load rate for long term into closure to Barney Creek
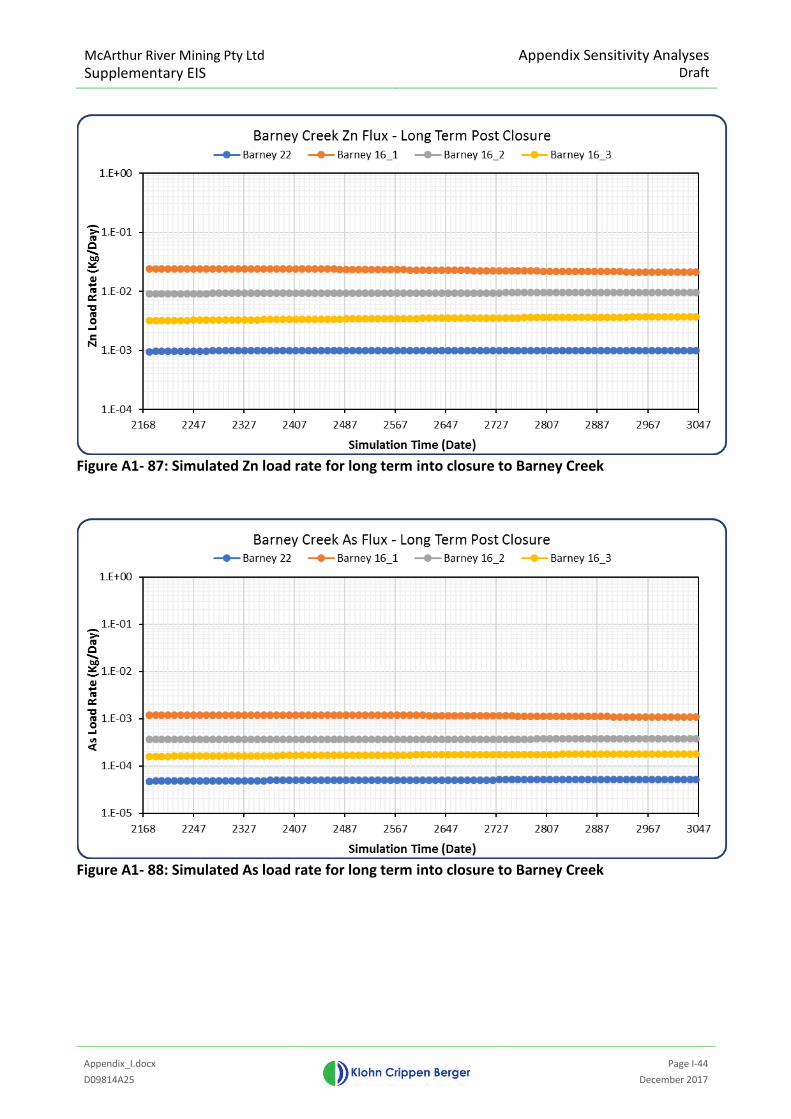
McArthur River Mining Pty Ltd Supplementary EIS
Appendix Sensitivity Analyses Draft
Appendix_I.docx
Page I-44
D09814A25 December 2017
Figure A1- 87: Simulated Zn load rate for long term into closure to Barney Creek
Figure A1- 88: Simulated As load rate for long term into closure to Barney Creek
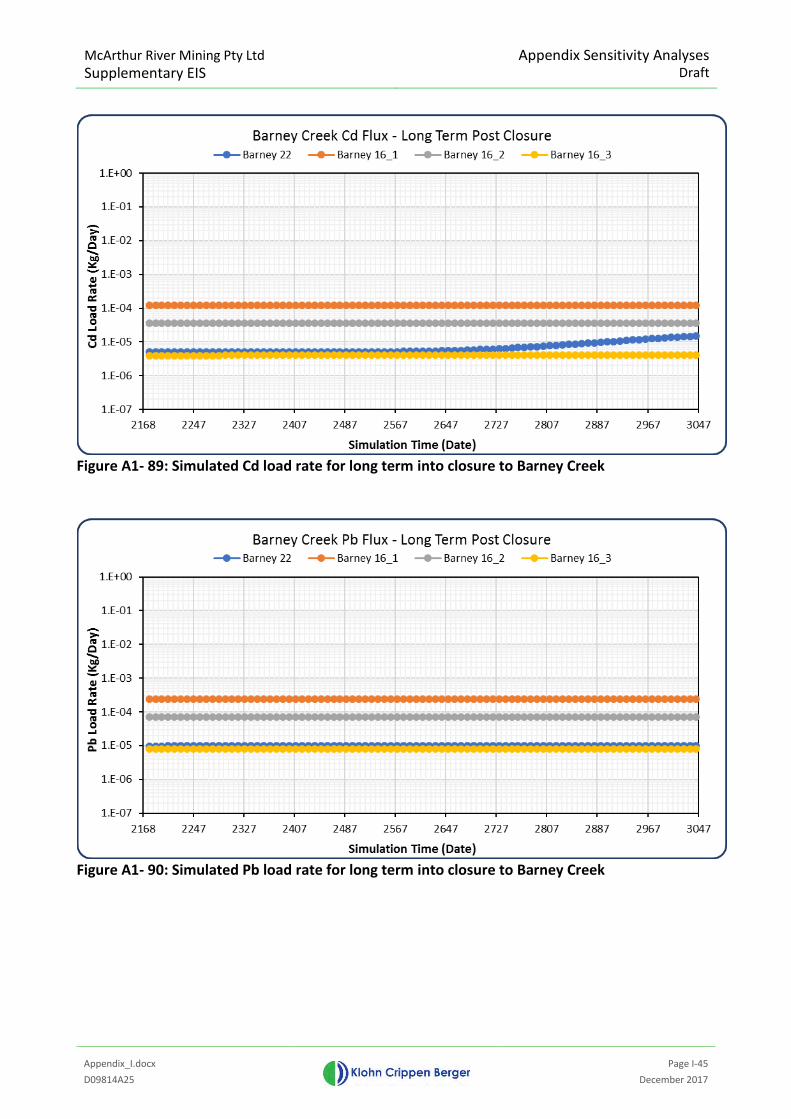
McArthur River Mining Pty Ltd Supplementary EIS
Appendix Sensitivity Analyses Draft
Appendix_I.docx
Page I-45
D09814A25 December 2017
Figure A1- 89: Simulated Cd load rate for long term into closure to Barney Creek
Figure A1- 90: Simulated Pb load rate for long term into closure to Barney Creek
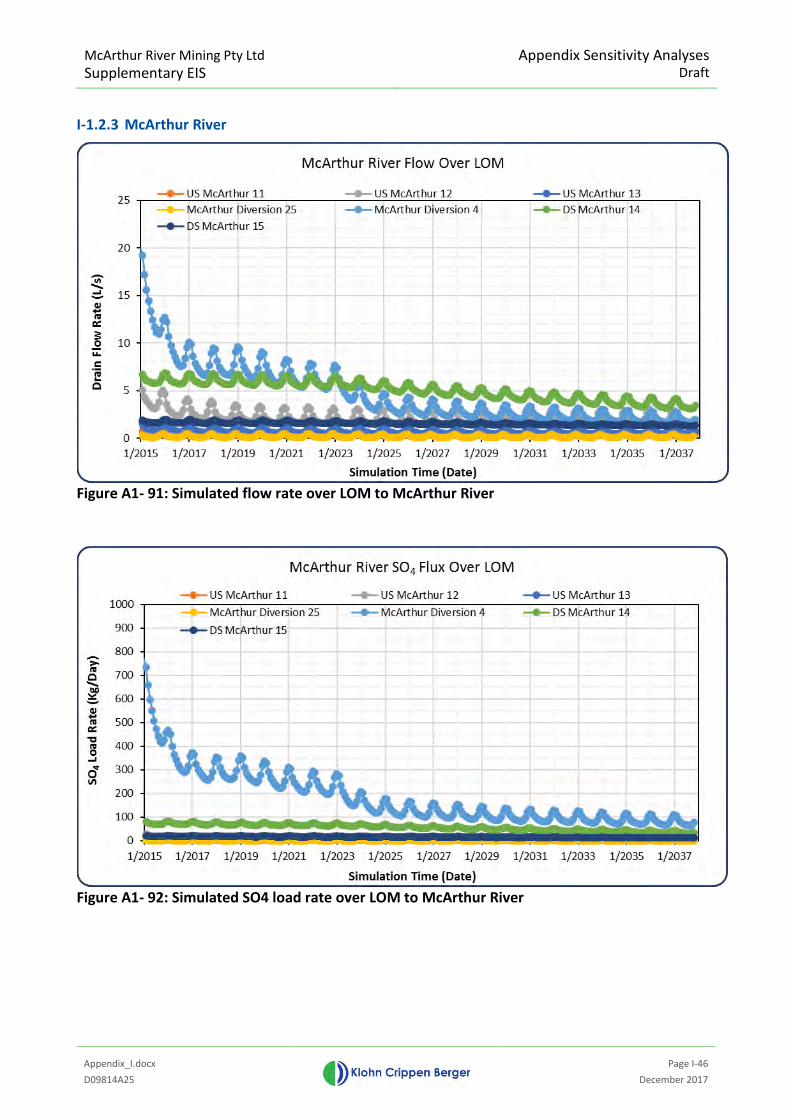
McArthur River Mining Pty Ltd Supplementary EIS
Appendix Sensitivity Analyses Draft
Appendix_I.docx
Page I-46
D09814A25 December 2017
I-1.2.3 McArthur River
Figure A1- 91: Simulated flow rate over LOM to McArthur River
Figure A1- 92: Simulated SO4 load rate over LOM to McArthur River
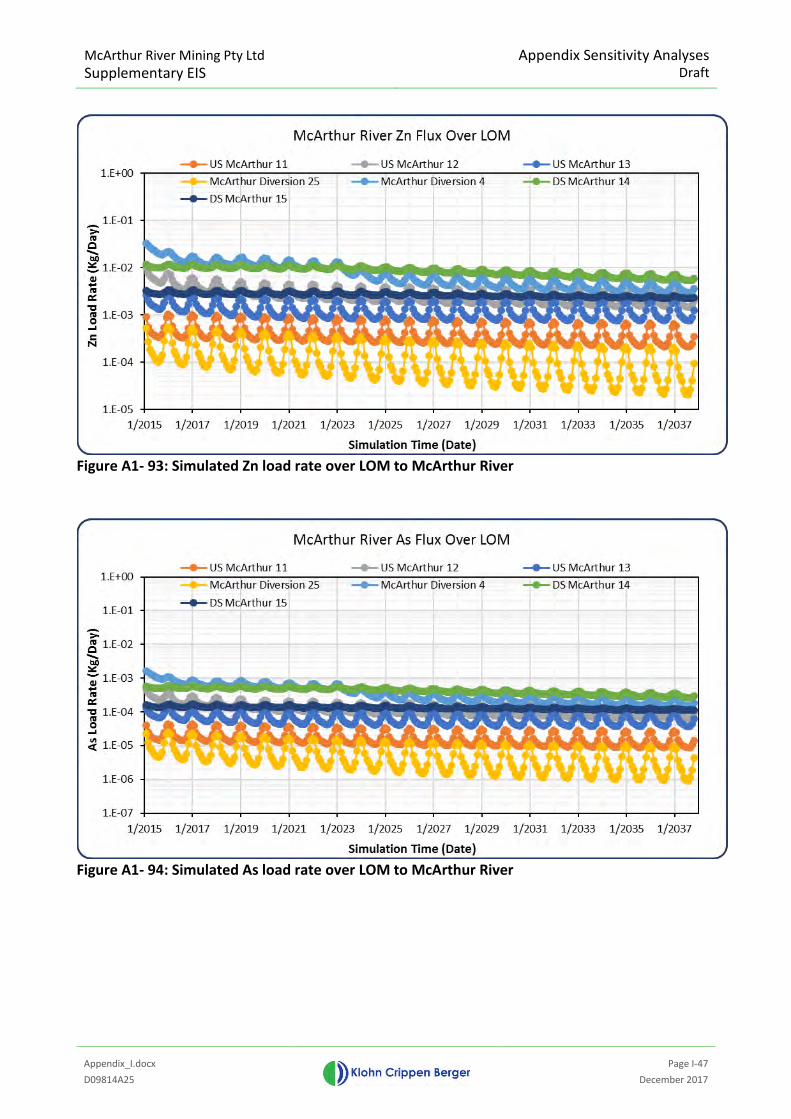
McArthur River Mining Pty Ltd Supplementary EIS
Appendix Sensitivity Analyses Draft
Appendix_I.docx
Page I-47
D09814A25 December 2017
Figure A1- 93: Simulated Zn load rate over LOM to McArthur River
Figure A1- 94: Simulated As load rate over LOM to McArthur River
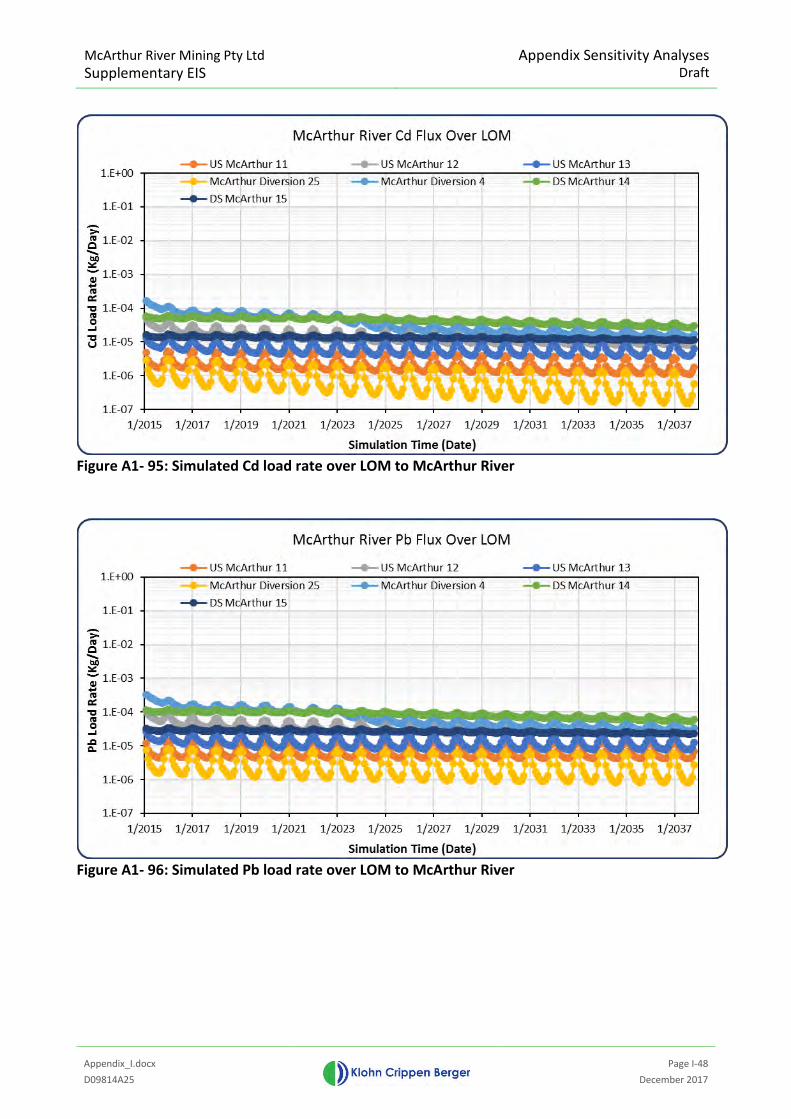
McArthur River Mining Pty Ltd Supplementary EIS
Appendix Sensitivity Analyses Draft
Appendix_I.docx
Page I-48
D09814A25 December 2017
Figure A1- 95: Simulated Cd load rate over LOM to McArthur River
Figure A1- 96: Simulated Pb load rate over LOM to McArthur River
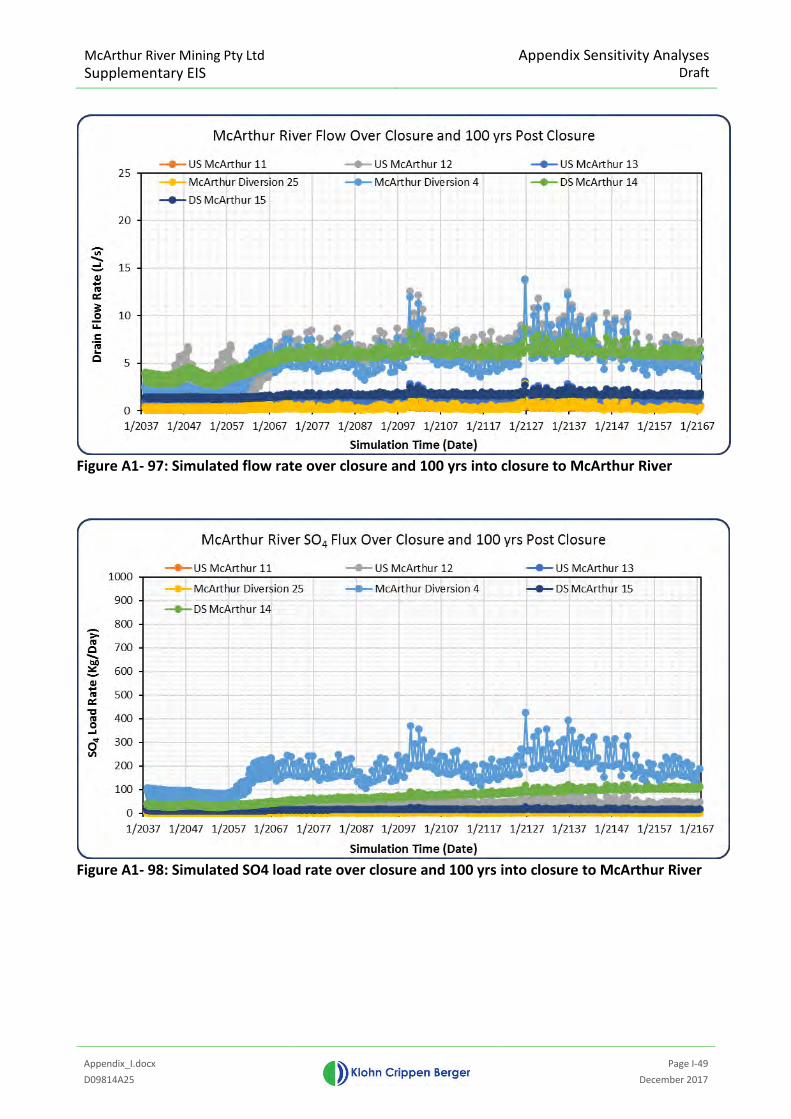
McArthur River Mining Pty Ltd Supplementary EIS
Appendix Sensitivity Analyses Draft
Appendix_I.docx
Page I-49
D09814A25 December 2017
Figure A1- 97: Simulated flow rate over closure and 100 yrs into closure to McArthur River
Figure A1- 98: Simulated SO4 load rate over closure and 100 yrs into closure to McArthur River
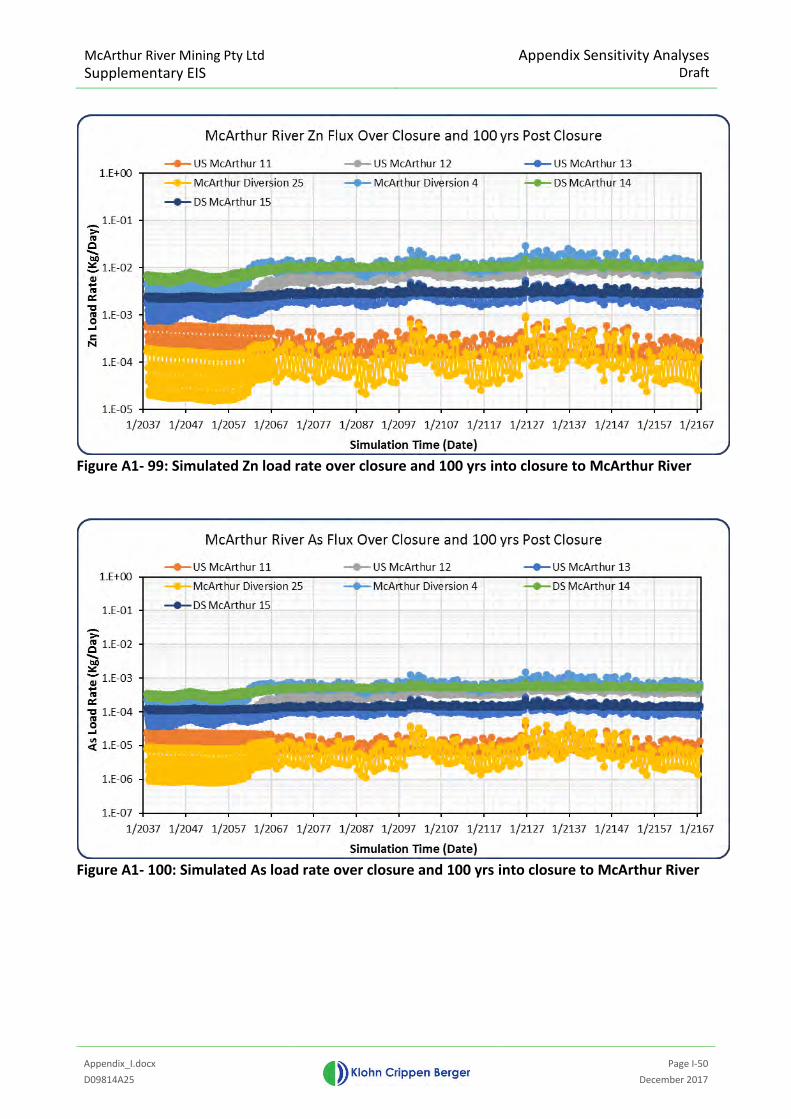
McArthur River Mining Pty Ltd Supplementary EIS
Appendix Sensitivity Analyses Draft
Appendix_I.docx
Page I-50
D09814A25 December 2017
Figure A1- 99: Simulated Zn load rate over closure and 100 yrs into closure to McArthur River
Figure A1- 100: Simulated As load rate over closure and 100 yrs into closure to McArthur River
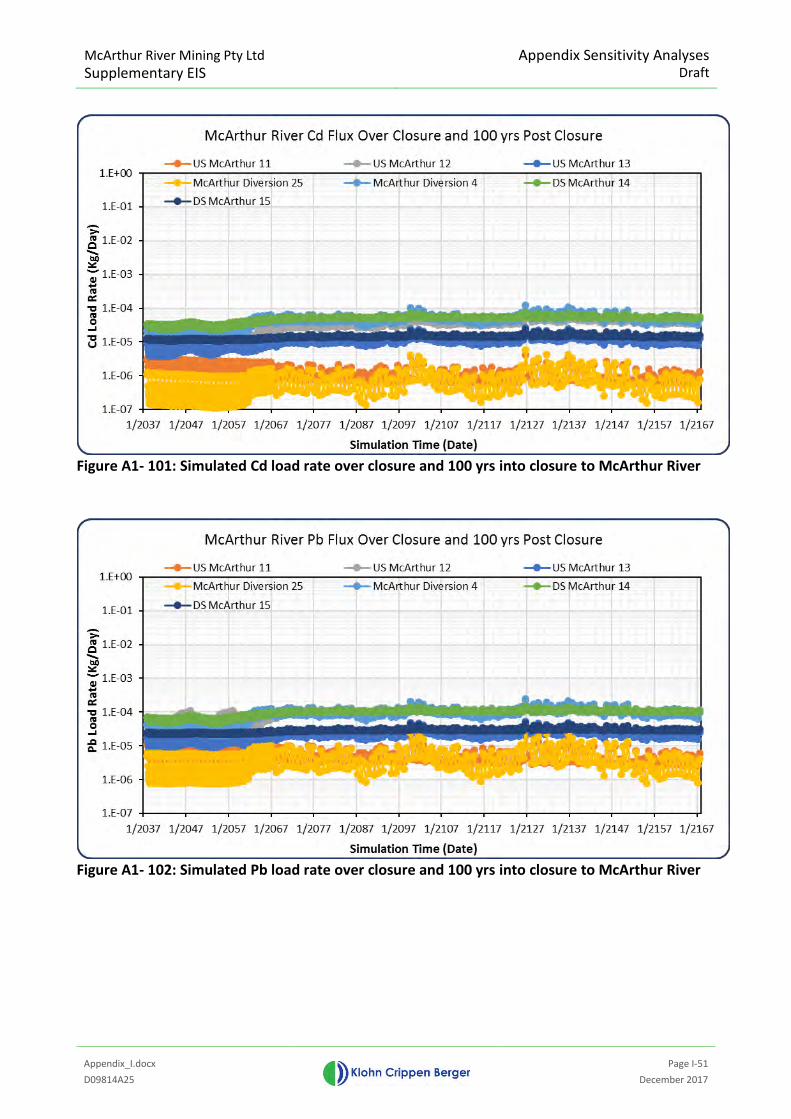
McArthur River Mining Pty Ltd Supplementary EIS
Appendix Sensitivity Analyses Draft
Appendix_I.docx
Page I-51
D09814A25 December 2017
Figure A1- 101: Simulated Cd load rate over closure and 100 yrs into closure to McArthur River
Figure A1- 102: Simulated Pb load rate over closure and 100 yrs into closure to McArthur River
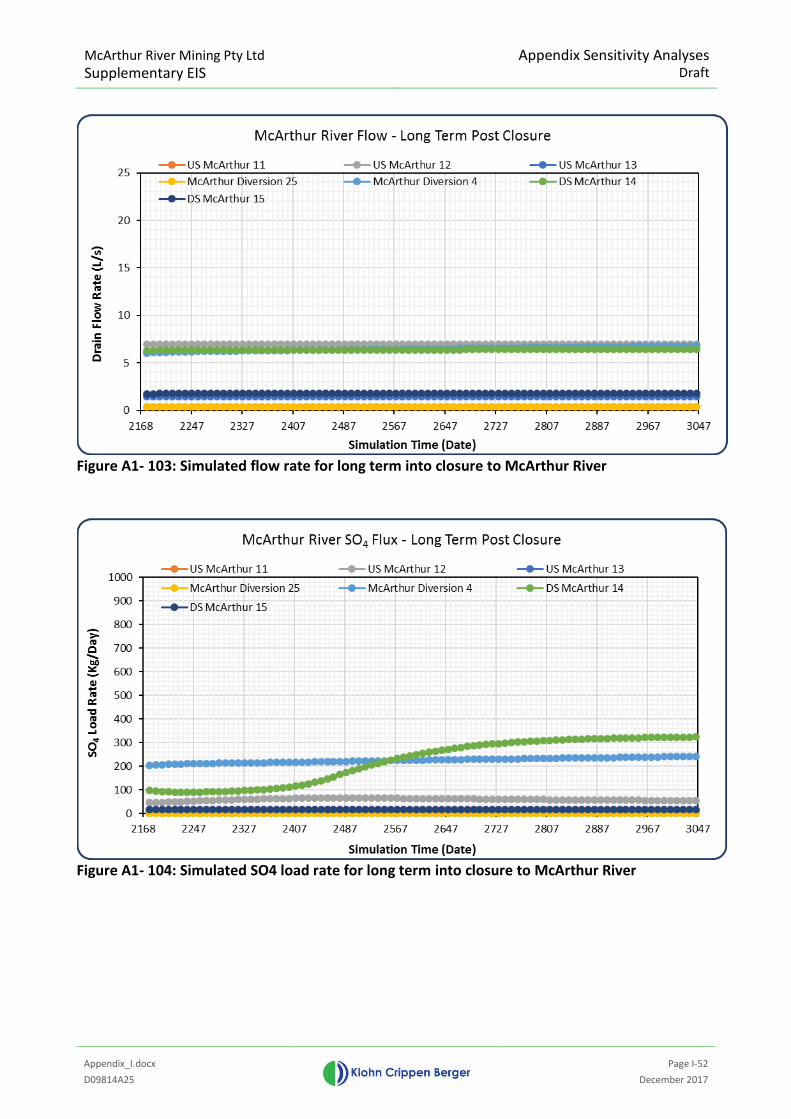
McArthur River Mining Pty Ltd Supplementary EIS
Appendix Sensitivity Analyses Draft
Appendix_I.docx
Page I-52
D09814A25 December 2017
Figure A1- 103: Simulated flow rate for long term into closure to McArthur River
Figure A1- 104: Simulated SO4 load rate for long term into closure to McArthur River
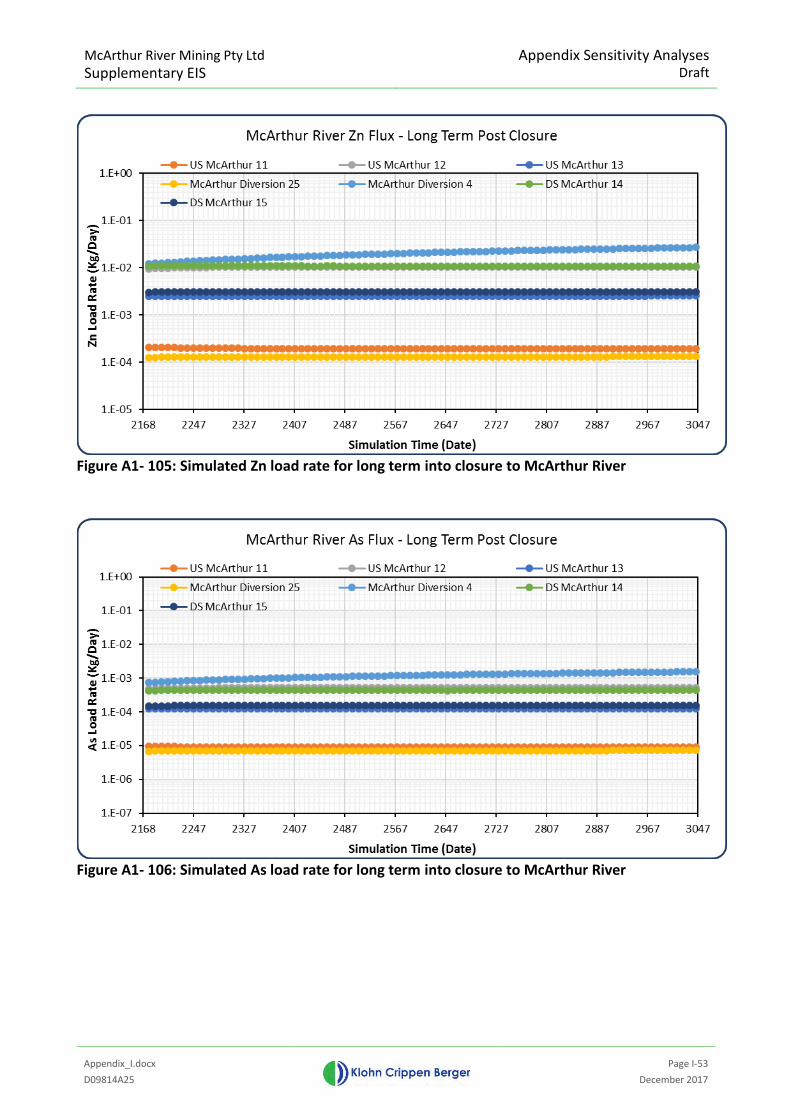
McArthur River Mining Pty Ltd Supplementary EIS
Appendix Sensitivity Analyses Draft
Appendix_I.docx
Page I-53
D09814A25 December 2017
Figure A1- 105: Simulated Zn load rate for long term into closure to McArthur River
Figure A1- 106: Simulated As load rate for long term into closure to McArthur River
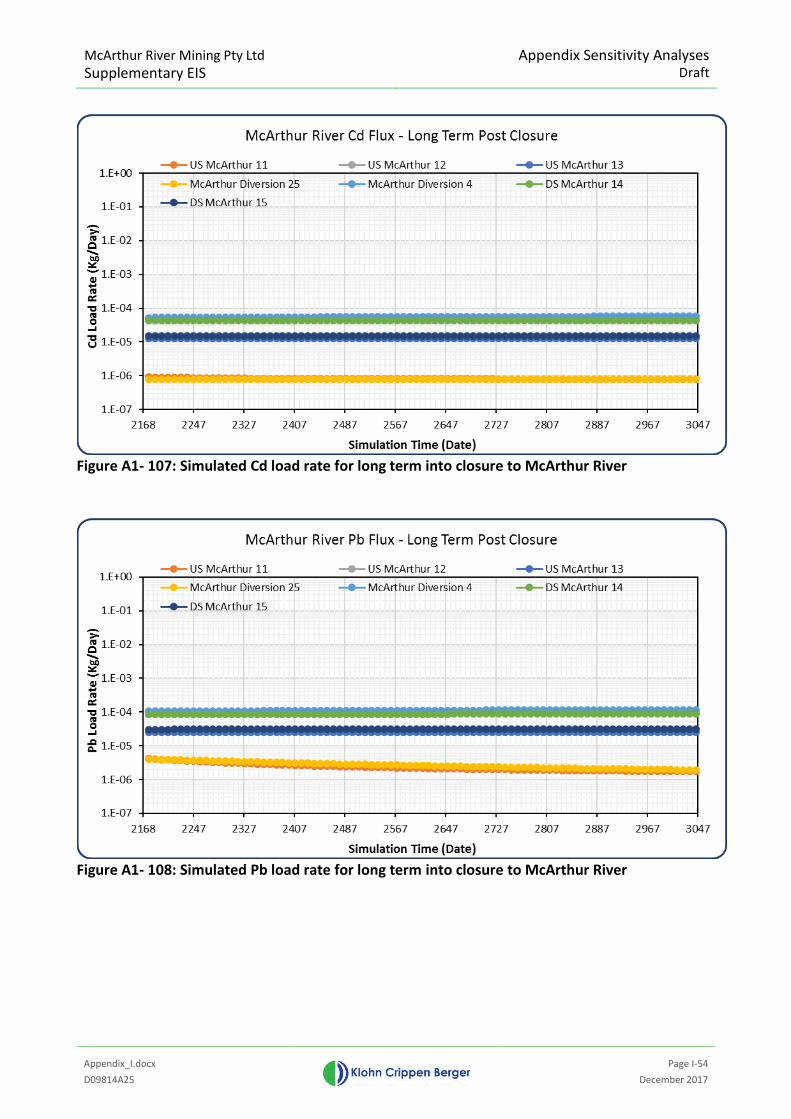
McArthur River Mining Pty Ltd Supplementary EIS
Appendix Sensitivity Analyses Draft
Appendix_I.docx
Page I-54
D09814A25 December 2017
Figure A1- 107: Simulated Cd load rate for long term into closure to McArthur River
Figure A1- 108: Simulated Pb load rate for long term into closure to McArthur River

McArthur River Mining Pty Ltd
Supplementary EIS Site Groundwater
Report
171218R MRM EIS Supplementary_GW.docx
D09814A25 December 2017
APPENDIX II
Updated TSF Interception Trench Modelling
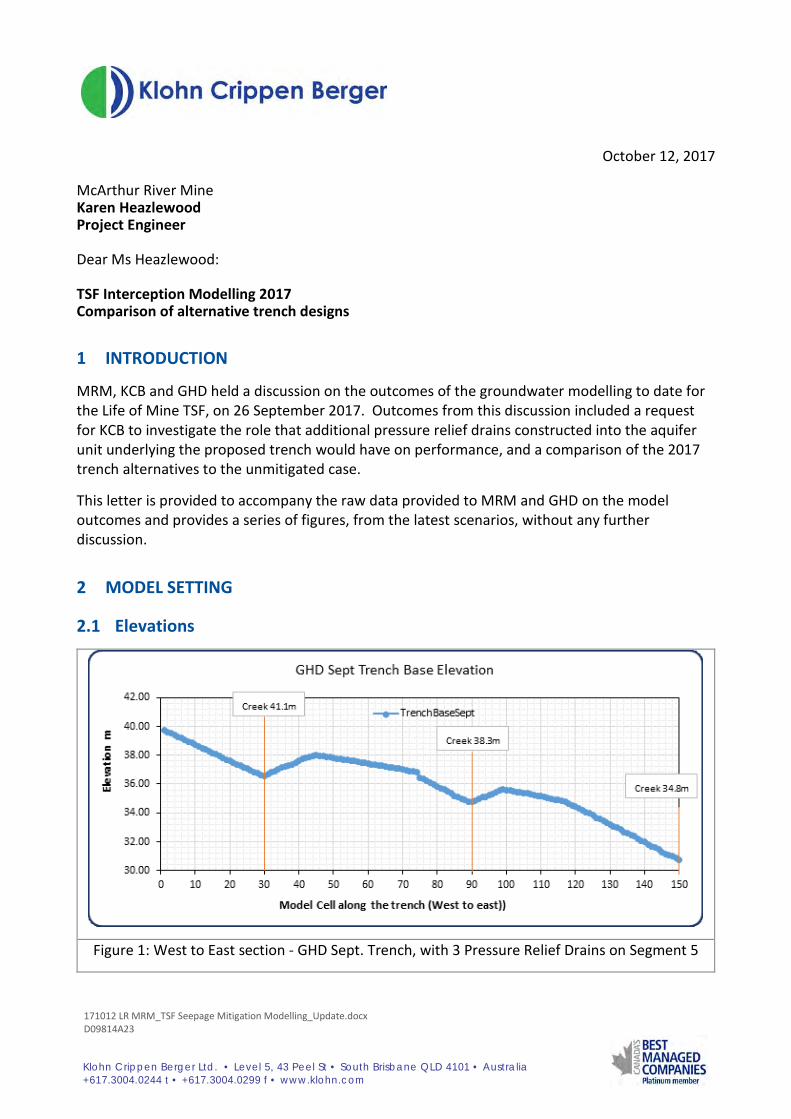
171012 LR MRM_TSF Seepage Mitigation Modelling_Update.docx D09814A23
Klohn Crippen Berger Ltd. • Level 5, 43 Peel St • South Brisbane QLD 4101 • Australia +617.3004.0244 t • +617.3004.0299 f • www.klohn.com
October 12, 2017
McArthur River Mine Karen Heazlewood Project Engineer Dear Ms Heazlewood: TSF Interception Modelling 2017 Comparison of alternative trench designs
1 INTRODUCTION
MRM, KCB and GHD held a discussion on the outcomes of the groundwater modelling to date for the Life of Mine TSF, on 26 September 2017. Outcomes from this discussion included a request for KCB to investigate the role that additional pressure relief drains constructed into the aquifer unit underlying the proposed trench would have on performance, and a comparison of the 2017 trench alternatives to the unmitigated case.
This letter is provided to accompany the raw data provided to MRM and GHD on the model outcomes and provides a series of figures, from the latest scenarios, without any further discussion.
2 MODEL SETTING
2.1 Elevations
Figure 1: West to East section - GHD Sept. Trench, with 3 Pressure Relief Drains on Segment 5
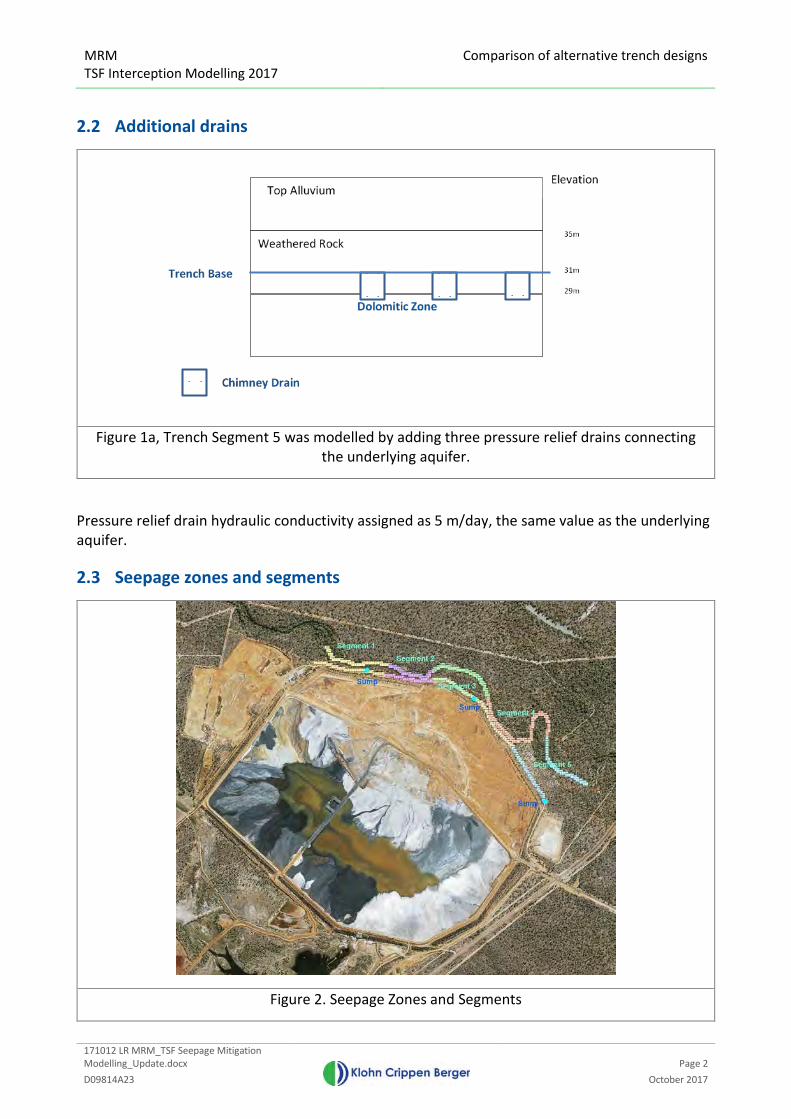
MRM TSF Interception Modelling 2017
Comparison of alternative trench designs
171012 LR MRM_TSF Seepage Mitigation Modelling_Update.docx
Page 2 D09814A23 October 2017
2.2 Additional drains
Figure 1a, Trench Segment 5 was modelled by adding three pressure relief drains connecting the underlying aquifer.
Pressure relief drain hydraulic conductivity assigned as 5 m/day, the same value as the underlying aquifer.
2.3 Seepage zones and segments
Figure 2. Seepage Zones and Segments
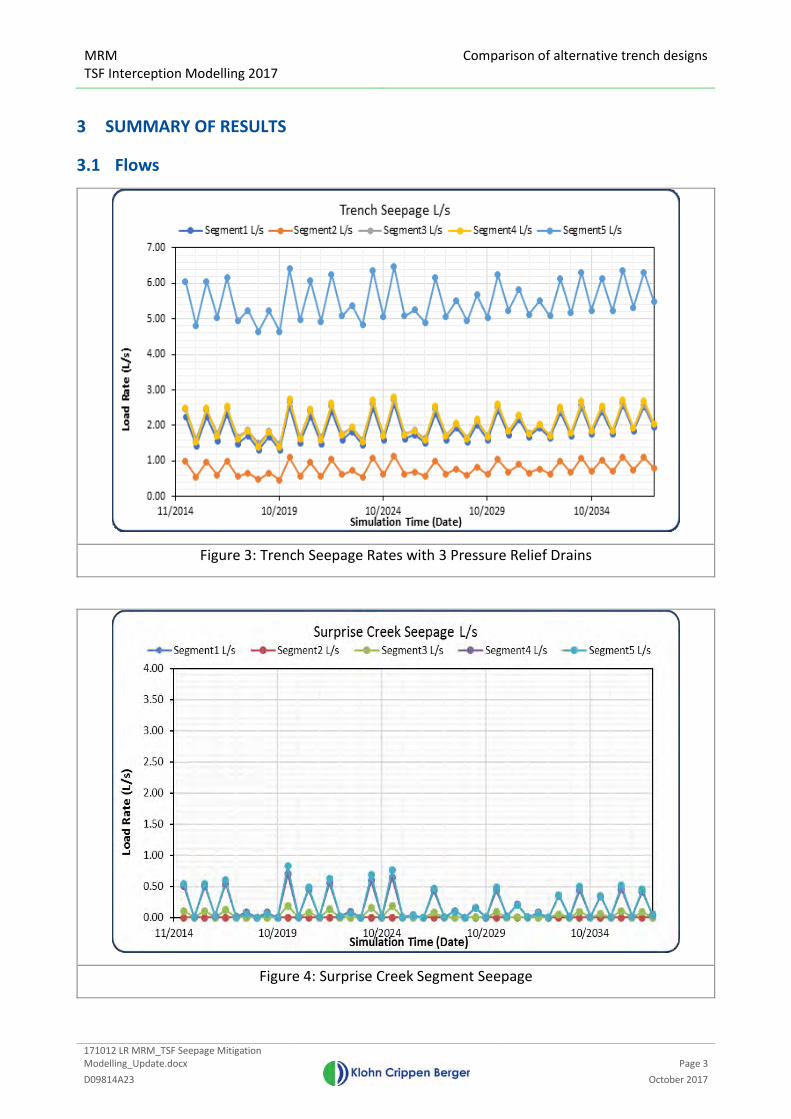
MRM TSF Interception Modelling 2017
Comparison of alternative trench designs
171012 LR MRM_TSF Seepage Mitigation Modelling_Update.docx
Page 3 D09814A23 October 2017
3 SUMMARY OF RESULTS
3.1 Flows
Figure 3: Trench Seepage Rates with 3 Pressure Relief Drains
Figure 4: Surprise Creek Segment Seepage
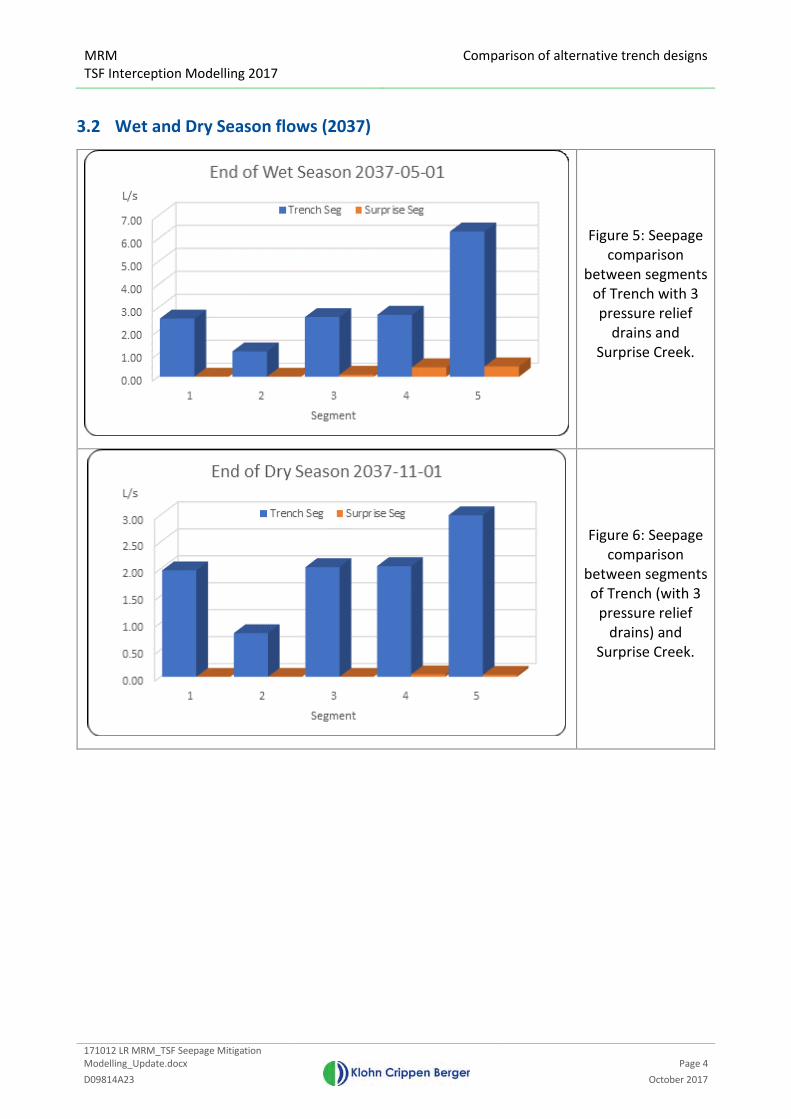
MRM TSF Interception Modelling 2017
Comparison of alternative trench designs
171012 LR MRM_TSF Seepage Mitigation Modelling_Update.docx
Page 4 D09814A23 October 2017
3.2 Wet and Dry Season flows (2037)
Figure 5: Seepage comparison
between segments of Trench with 3 pressure relief
drains and Surprise Creek.
Figure 6: Seepage comparison
between segments of Trench (with 3
pressure relief drains) and
Surprise Creek.
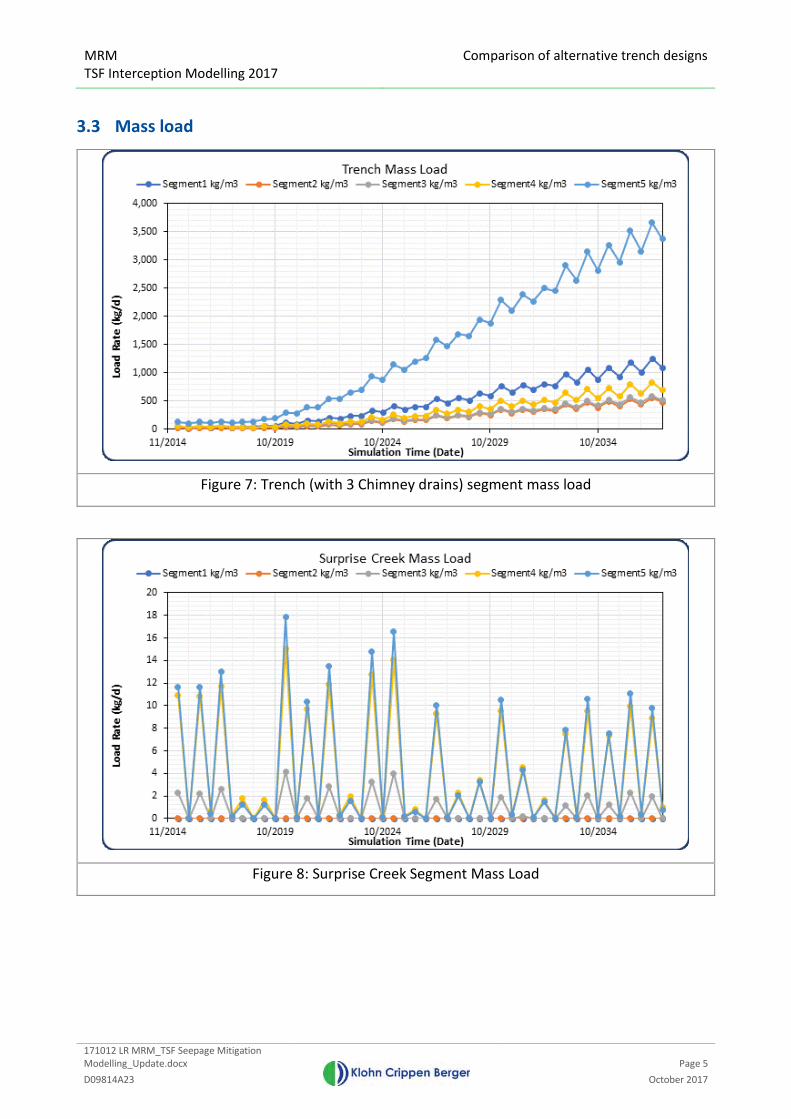
MRM TSF Interception Modelling 2017
Comparison of alternative trench designs
171012 LR MRM_TSF Seepage Mitigation Modelling_Update.docx
Page 5 D09814A23 October 2017
3.3 Mass load
Figure 7: Trench (with 3 Chimney drains) segment mass load
Figure 8: Surprise Creek Segment Mass Load
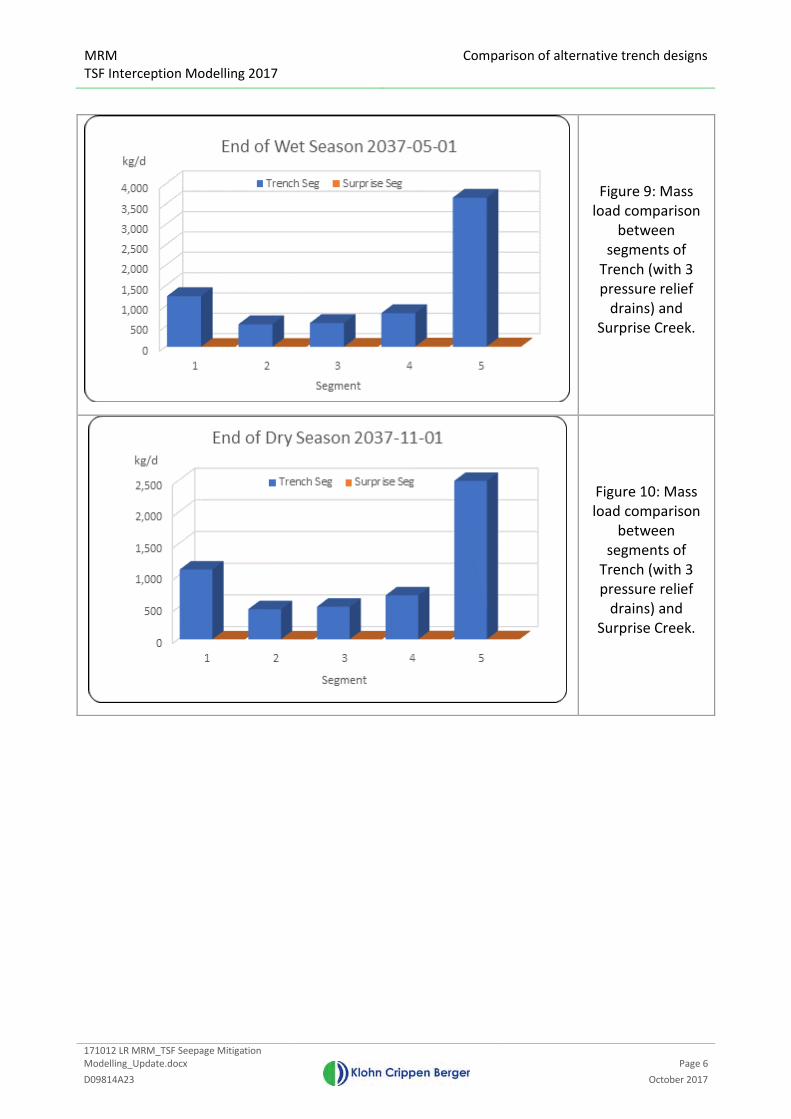
MRM TSF Interception Modelling 2017
Comparison of alternative trench designs
171012 LR MRM_TSF Seepage Mitigation Modelling_Update.docx
Page 6 D09814A23 October 2017
Figure 9: Mass load comparison
between segments of
Trench (with 3 pressure relief
drains) and Surprise Creek.
Figure 10: Mass load comparison
between segments of
Trench (with 3 pressure relief
drains) and Surprise Creek.
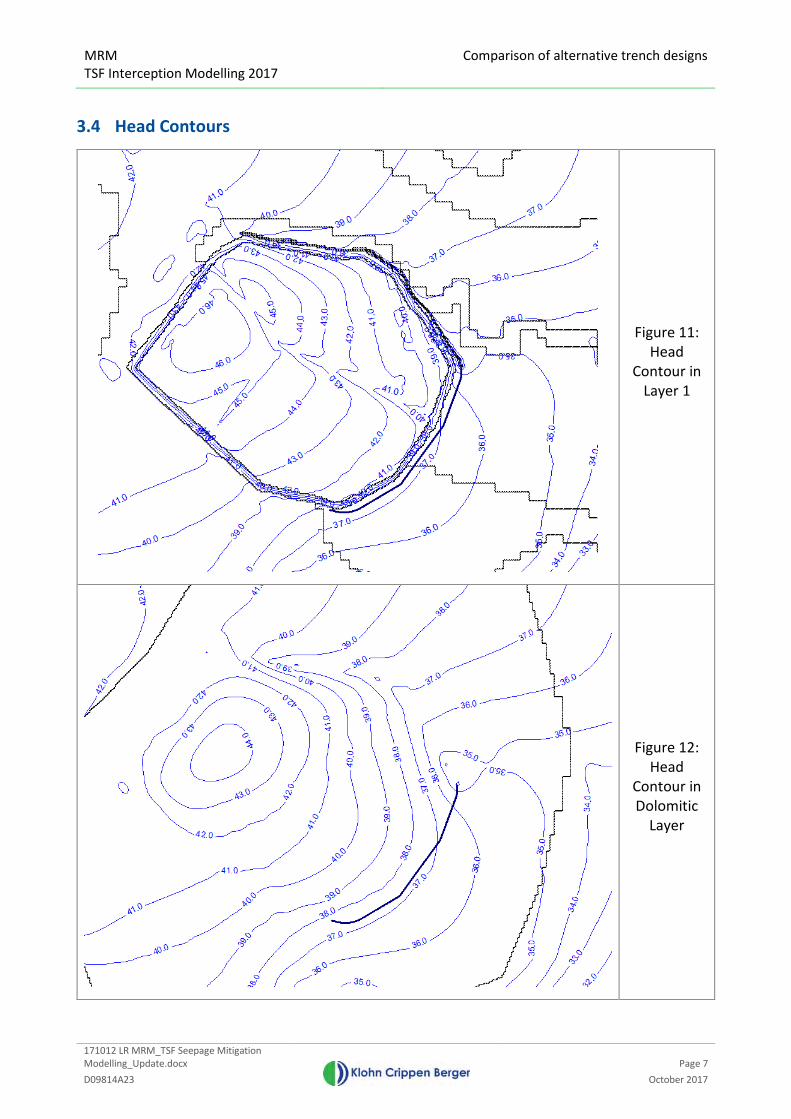
MRM TSF Interception Modelling 2017
Comparison of alternative trench designs
171012 LR MRM_TSF Seepage Mitigation Modelling_Update.docx
Page 7 D09814A23 October 2017
3.4 Head Contours
Figure 11: Head
Contour in Layer 1
Figure 12: Head
Contour in Dolomitic
Layer
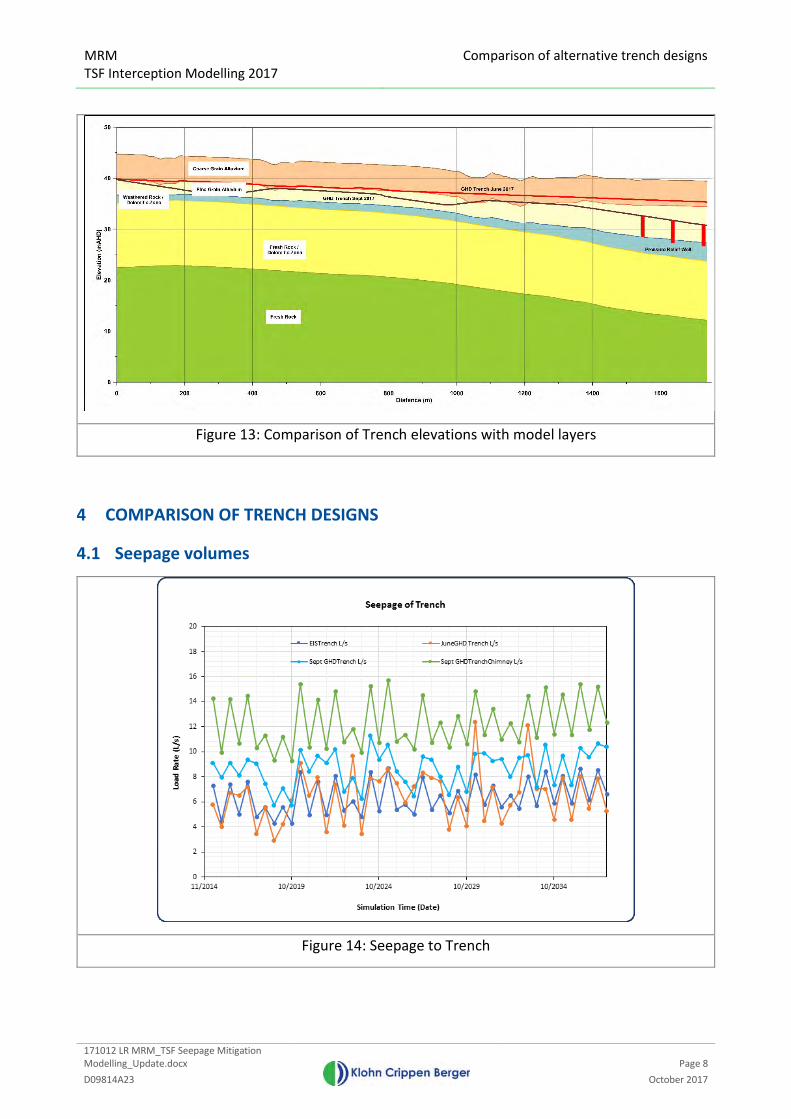
MRM TSF Interception Modelling 2017
Comparison of alternative trench designs
171012 LR MRM_TSF Seepage Mitigation Modelling_Update.docx
Page 8 D09814A23 October 2017
Figure 13: Comparison of Trench elevations with model layers
4 COMPARISON OF TRENCH DESIGNS
4.1 Seepage volumes
Figure 14: Seepage to Trench
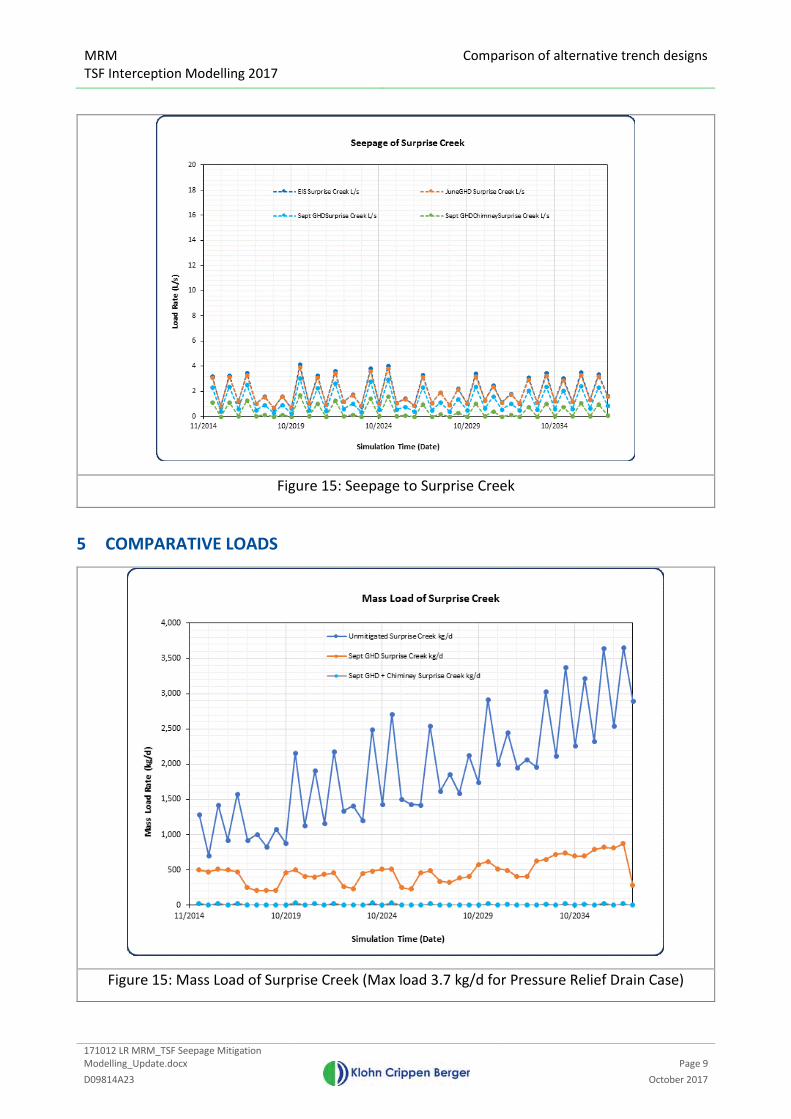
MRM TSF Interception Modelling 2017
Comparison of alternative trench designs
171012 LR MRM_TSF Seepage Mitigation Modelling_Update.docx
Page 9 D09814A23 October 2017
Figure 15: Seepage to Surprise Creek
5 COMPARATIVE LOADS
Figure 15: Mass Load of Surprise Creek (Max load 3.7 kg/d for Pressure Relief Drain Case)

MRM TSF Interception Modelling 2017
Comparison of alternative trench designs
171012 LR MRM_TSF Seepage Mitigation Modelling_Update.docx
Page 10 D09814A23 October 2017
6 CLOSURE
This report is an instrument of service of Klohn Crippen Berger Ltd. The report has been prepared for the exclusive use of McArthur River Mines (Client) for the specific application to the 2017 TSF Seepage Modelling project. The report's contents may not be relied upon by any other party without the express written permission of Klohn Crippen Berger. In this report, Klohn Crippen Berger has endeavoured to comply with generally-accepted professional practice common to the local area. Klohn Crippen Berger makes no warranty, express or implied.
Yours truly,
KLOHN CRIPPEN BERGER LTD.
Brent Usher, PhD, PrSciNat Senior Hydrogeochemist and Associate
GW:BU

McArthur River Mining Pty Ltd
Supplementary EIS Site Groundwater
Report
171218R MRM EIS Supplementary_GW.docx
D09814A25 December 2017
APPENDIX III
Options for NOEF Plume Interception
170215LR_NIRB Concept Mitigation.docx
D09814A10
Klohn Crippen Berger Ltd. • www.klohn.com
February 15, 2017
McArthur River Mining Pty Ltd
PO Box 36821,
Winnellie, NT
0821
Mr. Gary Taylor Environmental Manager: MRM Dear Mr. Taylor MRM NOEF EIS Overburden Management EIS: NOEF Mitigation Concept Modelling Letter Report
Please find enclosed KCB’s letter report summarising the groundwater modelling assessment of
GHD’s concept design for an interception trench situated immediately down-gradient of the
southern and eastern perimeters of the NOEF. We understand that these assessments are
required for the NOEF Independent Review Board (NIRB) to assess the efficacy of the proposed
interception trench.
1 INTRODUCTION
KCB built and calibrated a numerical groundwater model for the MRM site that was used for the
2017 OMP EIS (KCB, 2017). The model was developed in MODFLOW-SURFACT Version 4.0
(HydroGeoLogic, 2016), and has both groundwater flow and mass transport capabilities. For the
OMP EIS the model was used in transient simulation mode to predict changes to groundwater
conditions, including variation in baseflow and load contributions during life of mine, closure and
long-term post-closure.
We understand that the NIRB have reviewed KCB’s groundwater impact assessment report and
GHD’s concept design for an interception trench down-gradient of the NOEF, and are seeking to
understand the hydraulic effectiveness of GHD’s proposed concept design.
Given the expedited timeframes for the NIRB to present the impact assessment to DME, it was
agreed between the NIRB and KCB that the existing groundwater model would be used, without
changes to the model grid. The model would be used to assess the conceptual effectiveness of the
interception trench to capture NOEF seepage predicted to occur in the southeast corner of the
NOEF and discharge to either the pit or the Barney Creek diversion. This letter report summarises
the outcomes of the proposed interception trench mitigation scenarios.
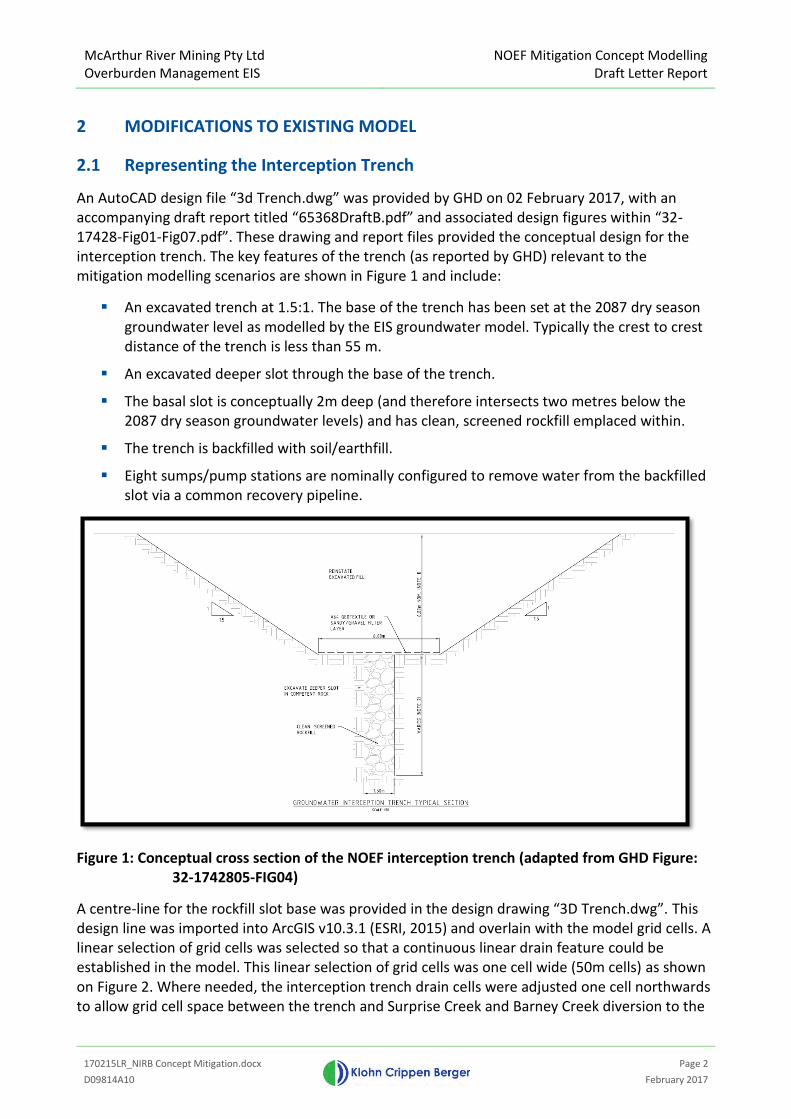
McArthur River Mining Pty Ltd Overburden Management EIS
NOEF Mitigation Concept Modelling Draft Letter Report
170215LR_NIRB Concept Mitigation.docx
Page 2
D09814A10 February 2017
2 MODIFICATIONS TO EXISTING MODEL
2.1 Representing the Interception Trench
An AutoCAD design file “3d Trench.dwg” was provided by GHD on 02 February 2017, with an accompanying draft report titled “65368DraftB.pdf” and associated design figures within “32-17428-Fig01-Fig07.pdf”. These drawing and report files provided the conceptual design for the interception trench. The key features of the trench (as reported by GHD) relevant to the mitigation modelling scenarios are shown in Figure 1 and include:
An excavated trench at 1.5:1. The base of the trench has been set at the 2087 dry season groundwater level as modelled by the EIS groundwater model. Typically the crest to crest distance of the trench is less than 55 m.
An excavated deeper slot through the base of the trench.
The basal slot is conceptually 2m deep (and therefore intersects two metres below the 2087 dry season groundwater levels) and has clean, screened rockfill emplaced within.
The trench is backfilled with soil/earthfill.
Eight sumps/pump stations are nominally configured to remove water from the backfilled slot via a common recovery pipeline.
Figure 1: Conceptual cross section of the NOEF interception trench (adapted from GHD Figure: 32-1742805-FIG04)
A centre-line for the rockfill slot base was provided in the design drawing “3D Trench.dwg”. This design line was imported into ArcGIS v10.3.1 (ESRI, 2015) and overlain with the model grid cells. A linear selection of grid cells was selected so that a continuous linear drain feature could be established in the model. This linear selection of grid cells was one cell wide (50m cells) as shown on Figure 2. Where needed, the interception trench drain cells were adjusted one cell northwards to allow grid cell space between the trench and Surprise Creek and Barney Creek diversion to the

McArthur River Mining Pty Ltd
Overburden Management EIS
NOEF Mitigation Concept Modelling
Draft Letter Report
170215LR_NIRB Concept Mitigation.docx
Page 3
D09814A10 February 2017
immediate south. This was deemed necessary to allow for potential reversal of groundwater flow
from the south of the diversion to flow under the diversion and report to the trench, and to
prevent creek flows from directly reporting to the trench.
The existing model mesh cell size of 50m x 50m was used. Ideally, the model mesh would be
modified to allow more accurate representation of the actual scale of the interception trench,
however, this would have taken significant effort in terms of adjusting adjacent boundary
conditions for creeks, rivers, and diversions, which would necessitate model recalibration. It was
agreed between KCB, MRM and the NIRB that for the current assessment, these changes would
not be required for the model.
The reference head for each individual interception trench drain cell was inferred from the
nearest point on the centre line of the base of the rockfill slot. For this conceptual design
modelling, it was assumed that the drains are able to remove all water from within the rockfill. In
reality, a head will develop within the basal slot. The reference head was then correlated with the
top and bottom of each model layer to determine each drain’s model layer. The geology
intersected by the base of the drains varied from overburden in Layer 2 to upper bedrock in Layer
5.
The conductance of each drain cell was calculated based on the cell length (50m), the slot width
(1.5m width of slot) and height of the drainage slot (2m), as well as a Kz for the clean rockfill. A Kz
of 10 m/day was assumed to allow ready inflow to the trench at this conceptual stage of design.
2.2 Zone Budget Updates
Groundwater Vistas zone budget requires hydrostratigraphic zones to be established for each
zone of interest. For the mitigation modelling scenarios, new zones were established as follows:
� The model cells directly up-gradient of the interception trench (to quantify flow from NOEF
towards trench).
� The model cells directly underneath the trench (to quantify trench underflow and vertical
flow upwards to the trench).
� The trench cells themselves.
� The model cells directly down-gradient of the interception trench (to quantify NOEF
seepage bypassing the trench and reversal of down-gradient flow towards the trench).
2.3 Mass Transport Modifications
The mass transport functionality in MODFLOW SURFACT was modified to model only a single
dissolved constituent, sulphate, which is the most conservative component considered in the
OMP EIS groundwater impact assessment.
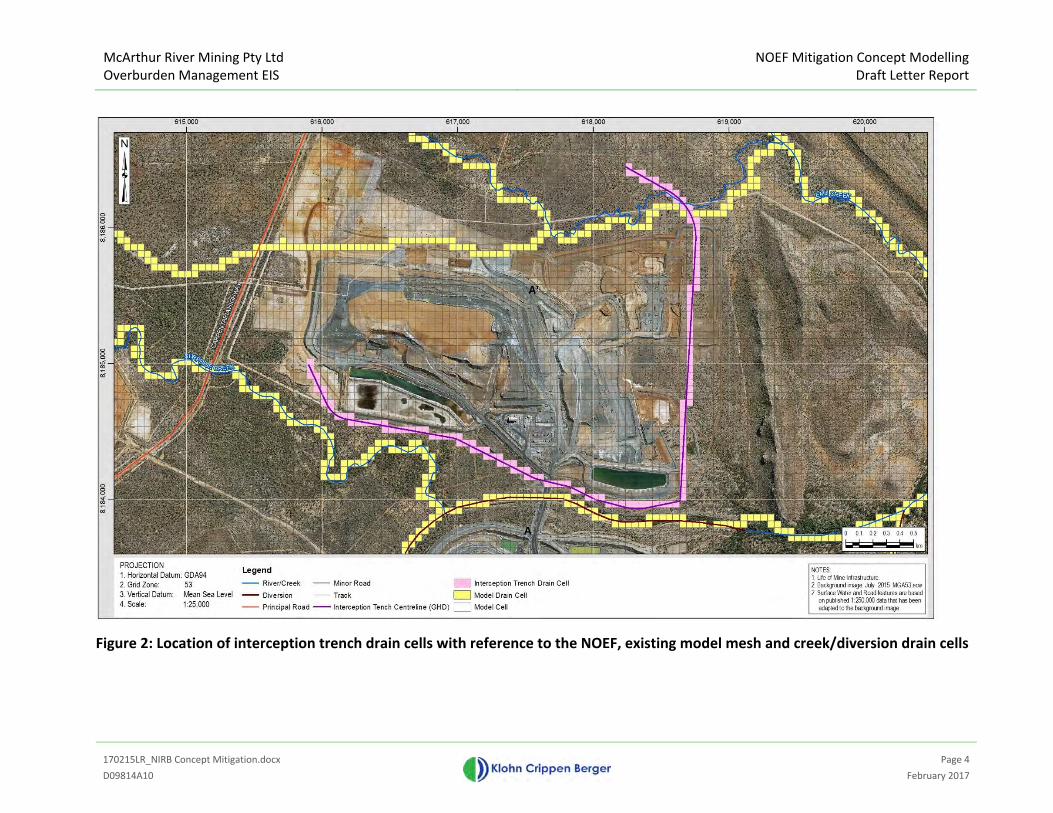
McArthur River Mining Pty Ltd
Overburden Management EIS
NOEF Mitigation Concept Modelling
Draft Letter Report
170215LR_NIRB Concept Mitigation.docx
Page 4
D09814A10 February 2017
Figure 2: Location of interception trench drain cells with reference to the NOEF, existing model mesh and creek/diversion drain cells
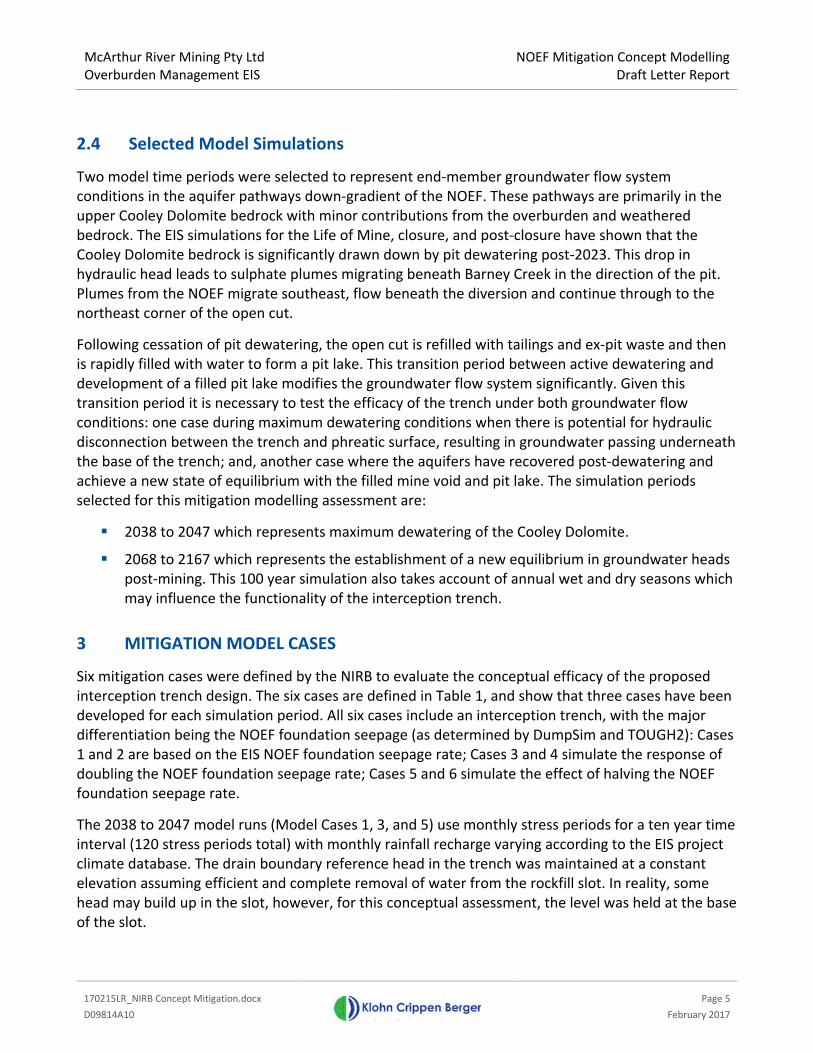
McArthur River Mining Pty Ltd
Overburden Management EIS
NOEF Mitigation Concept Modelling
Draft Letter Report
170215LR_NIRB Concept Mitigation.docx
Page 5
D09814A10 February 2017
2.4 Selected Model Simulations
Two model time periods were selected to represent end-member groundwater flow system
conditions in the aquifer pathways down-gradient of the NOEF. These pathways are primarily in the
upper Cooley Dolomite bedrock with minor contributions from the overburden and weathered
bedrock. The EIS simulations for the Life of Mine, closure, and post-closure have shown that the
Cooley Dolomite bedrock is significantly drawn down by pit dewatering post-2023. This drop in
hydraulic head leads to sulphate plumes migrating beneath Barney Creek in the direction of the pit.
Plumes from the NOEF migrate southeast, flow beneath the diversion and continue through to the
northeast corner of the open cut.
Following cessation of pit dewatering, the open cut is refilled with tailings and ex-pit waste and then
is rapidly filled with water to form a pit lake. This transition period between active dewatering and
development of a filled pit lake modifies the groundwater flow system significantly. Given this
transition period it is necessary to test the efficacy of the trench under both groundwater flow
conditions: one case during maximum dewatering conditions when there is potential for hydraulic
disconnection between the trench and phreatic surface, resulting in groundwater passing underneath
the base of the trench; and, another case where the aquifers have recovered post-dewatering and
achieve a new state of equilibrium with the filled mine void and pit lake. The simulation periods
selected for this mitigation modelling assessment are:
� 2038 to 2047 which represents maximum dewatering of the Cooley Dolomite.
� 2068 to 2167 which represents the establishment of a new equilibrium in groundwater heads
post-mining. This 100 year simulation also takes account of annual wet and dry seasons which
may influence the functionality of the interception trench.
3 MITIGATION MODEL CASES
Six mitigation cases were defined by the NIRB to evaluate the conceptual efficacy of the proposed
interception trench design. The six cases are defined in Table 1, and show that three cases have been
developed for each simulation period. All six cases include an interception trench, with the major
differentiation being the NOEF foundation seepage (as determined by DumpSim and TOUGH2): Cases
1 and 2 are based on the EIS NOEF foundation seepage rate; Cases 3 and 4 simulate the response of
doubling the NOEF foundation seepage rate; Cases 5 and 6 simulate the effect of halving the NOEF
foundation seepage rate.
The 2038 to 2047 model runs (Model Cases 1, 3, and 5) use monthly stress periods for a ten year time
interval (120 stress periods total) with monthly rainfall recharge varying according to the EIS project
climate database. The drain boundary reference head in the trench was maintained at a constant
elevation assuming efficient and complete removal of water from the rockfill slot. In reality, some
head may build up in the slot, however, for this conceptual assessment, the level was held at the base
of the slot.
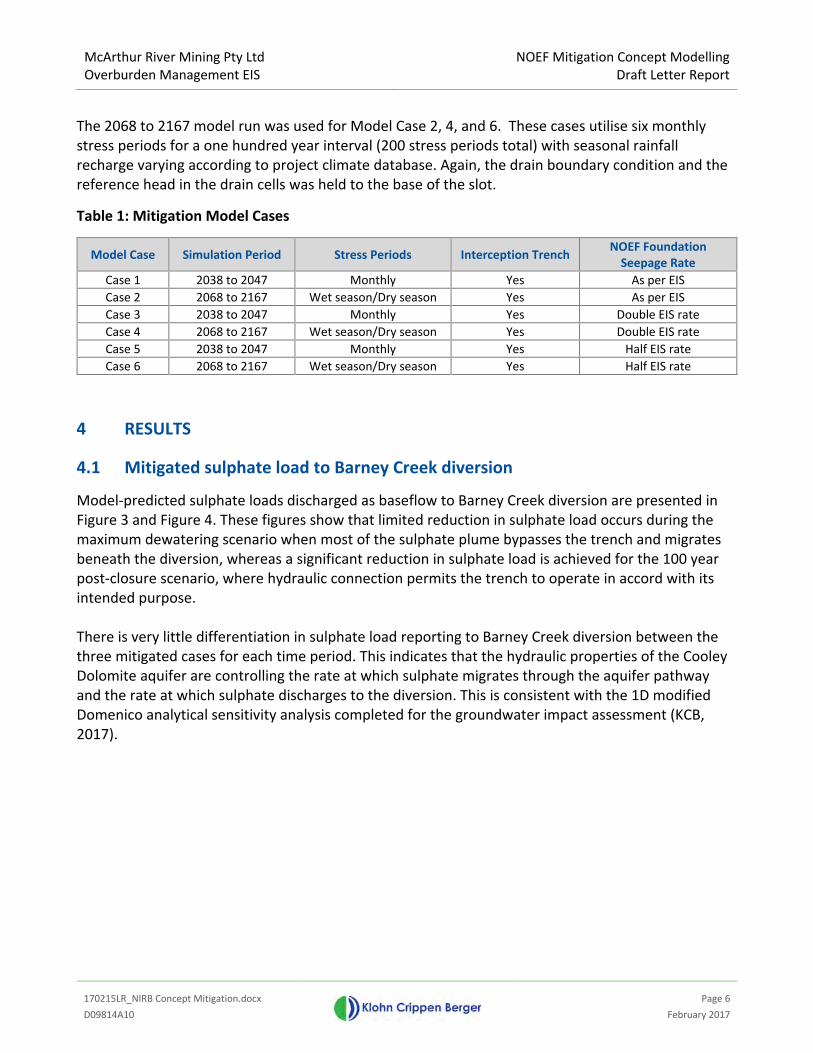
McArthur River Mining Pty Ltd
Overburden Management EIS
NOEF Mitigation Concept Modelling
Draft Letter Report
170215LR_NIRB Concept Mitigation.docx
Page 6
D09814A10 February 2017
The 2068 to 2167 model run was used for Model Case 2, 4, and 6. These cases utilise six monthly
stress periods for a one hundred year interval (200 stress periods total) with seasonal rainfall
recharge varying according to project climate database. Again, the drain boundary condition and the
reference head in the drain cells was held to the base of the slot.
Table 1: Mitigation Model Cases
Model Case Simulation Period Stress Periods Interception Trench NOEF Foundation
Seepage Rate
Case 1 2038 to 2047 Monthly Yes As per EIS
Case 2 2068 to 2167 Wet season/Dry season Yes As per EIS
Case 3 2038 to 2047 Monthly Yes Double EIS rate
Case 4 2068 to 2167 Wet season/Dry season Yes Double EIS rate
Case 5 2038 to 2047 Monthly Yes Half EIS rate
Case 6 2068 to 2167 Wet season/Dry season Yes Half EIS rate
4 RESULTS
4.1 Mitigated sulphate load to Barney Creek diversion
Model-predicted sulphate loads discharged as baseflow to Barney Creek diversion are presented in
Figure 3 and Figure 4. These figures show that limited reduction in sulphate load occurs during the
maximum dewatering scenario when most of the sulphate plume bypasses the trench and migrates
beneath the diversion, whereas a significant reduction in sulphate load is achieved for the 100 year
post-closure scenario, where hydraulic connection permits the trench to operate in accord with its
intended purpose.
There is very little differentiation in sulphate load reporting to Barney Creek diversion between the
three mitigated cases for each time period. This indicates that the hydraulic properties of the Cooley
Dolomite aquifer are controlling the rate at which sulphate migrates through the aquifer pathway
and the rate at which sulphate discharges to the diversion. This is consistent with the 1D modified
Domenico analytical sensitivity analysis completed for the groundwater impact assessment (KCB,
2017).
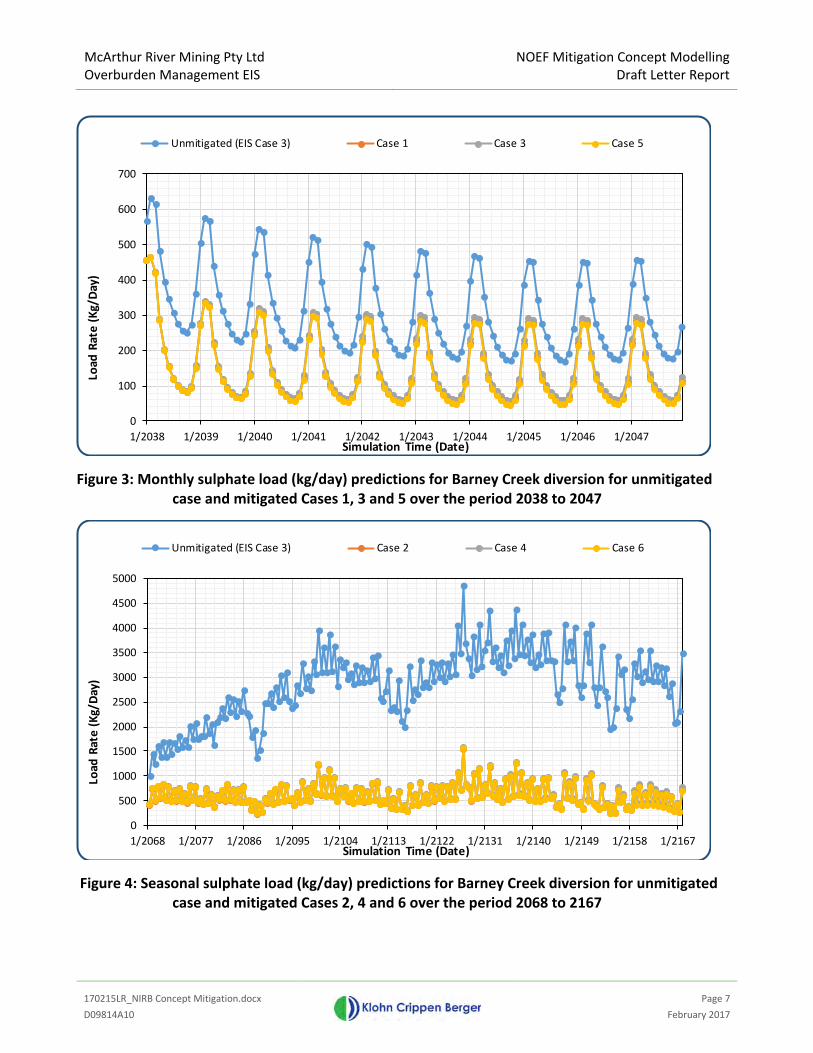
McArthur River Mining Pty Ltd
Overburden Management EIS
NOEF Mitigation Concept Modelling
Draft Letter Report
170215LR_NIRB Concept Mitigation.docx
Page 7
D09814A10 February 2017
Figure 3: Monthly sulphate load (kg/day) predictions for Barney Creek diversion for unmitigated
case and mitigated Cases 1, 3 and 5 over the period 2038 to 2047
Figure 4: Seasonal sulphate load (kg/day) predictions for Barney Creek diversion for unmitigated
case and mitigated Cases 2, 4 and 6 over the period 2068 to 2167
0
100
200
300
400
500
600
700
1/2038 1/2039 1/2040 1/2041 1/2042 1/2043 1/2044 1/2045 1/2046 1/2047
Lo
ad
Ra
te (
Kg
/D
ay
)
Simulation Time (Date)
Unmitigated (EIS Case 3) Case 1 Case 3 Case 5
0
500
1000
1500
2000
2500
3000
3500
4000
4500
5000
1/2068 1/2077 1/2086 1/2095 1/2104 1/2113 1/2122 1/2131 1/2140 1/2149 1/2158 1/2167
Lo
ad
Ra
te (
Kg
/D
ay
)
Simulation Time (Date)
Unmitigated (EIS Case 3) Case 2 Case 4 Case 6
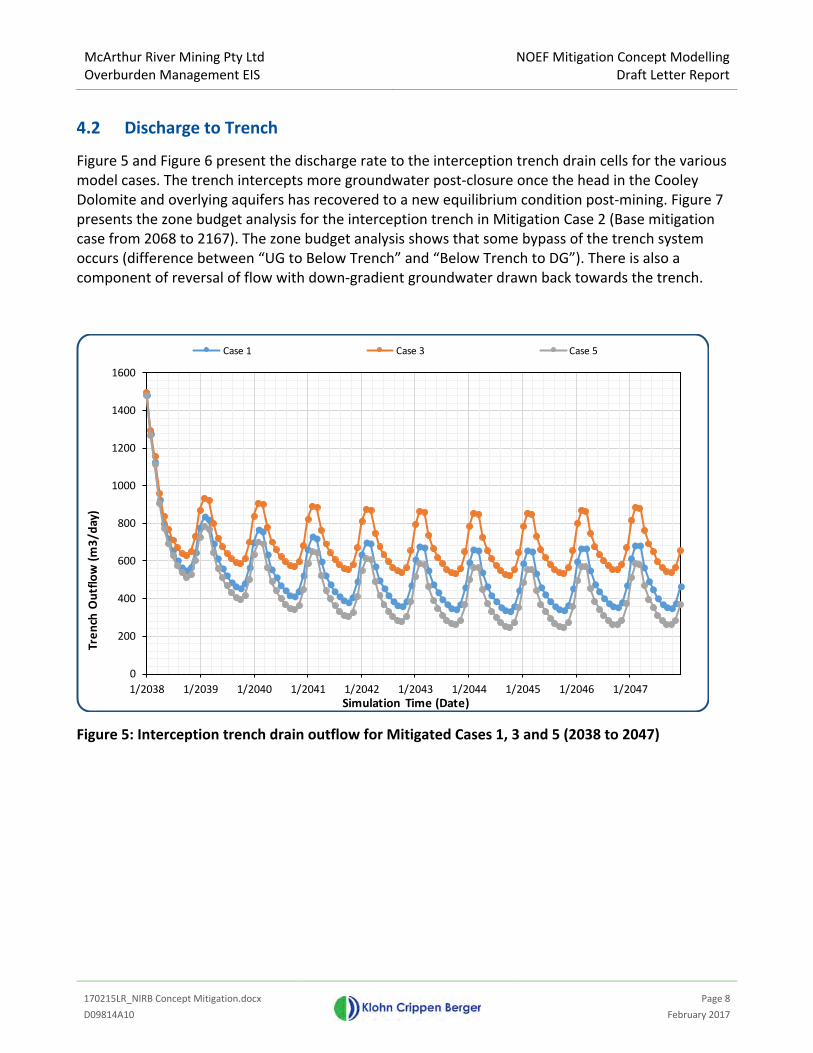
McArthur River Mining Pty Ltd
Overburden Management EIS
NOEF Mitigation Concept Modelling
Draft Letter Report
170215LR_NIRB Concept Mitigation.docx
Page 8
D09814A10 February 2017
4.2 Discharge to Trench
Figure 5 and Figure 6 present the discharge rate to the interception trench drain cells for the various
model cases. The trench intercepts more groundwater post-closure once the head in the Cooley
Dolomite and overlying aquifers has recovered to a new equilibrium condition post-mining. Figure 7
presents the zone budget analysis for the interception trench in Mitigation Case 2 (Base mitigation
case from 2068 to 2167). The zone budget analysis shows that some bypass of the trench system
occurs (difference between “UG to Below Trench” and “Below Trench to DG”). There is also a
component of reversal of flow with down-gradient groundwater drawn back towards the trench.
Figure 5: Interception trench drain outflow for Mitigated Cases 1, 3 and 5 (2038 to 2047)
0
200
400
600
800
1000
1200
1400
1600
1/2038 1/2039 1/2040 1/2041 1/2042 1/2043 1/2044 1/2045 1/2046 1/2047
Tre
nch
Ou
tflo
w (
m3
/d
ay
)
Simulation Time (Date)
Case 1 Case 3 Case 5
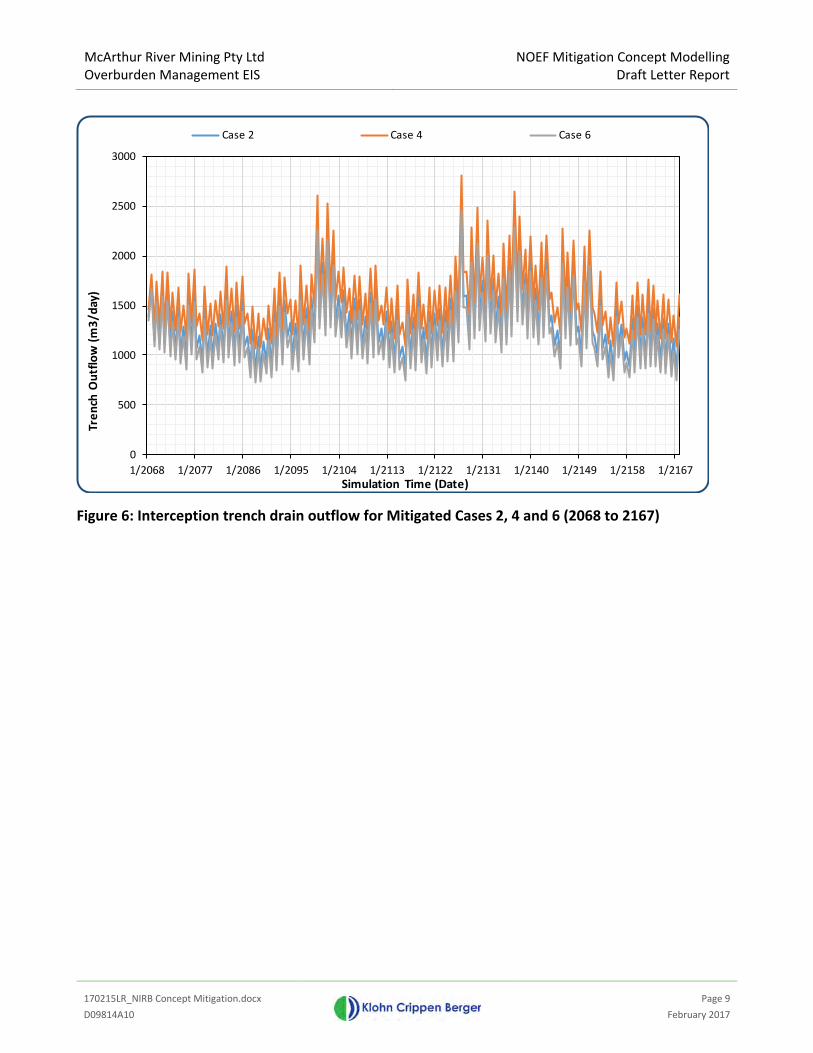
McArthur River Mining Pty Ltd
Overburden Management EIS
NOEF Mitigation Concept Modelling
Draft Letter Report
170215LR_NIRB Concept Mitigation.docx
Page 9
D09814A10 February 2017
Figure 6: Interception trench drain outflow for Mitigated Cases 2, 4 and 6 (2068 to 2167)
0
500
1000
1500
2000
2500
3000
1/2068 1/2077 1/2086 1/2095 1/2104 1/2113 1/2122 1/2131 1/2140 1/2149 1/2158 1/2167
Tre
nch
Ou
tflo
w (
m3
/d
ay
)
Simulation Time (Date)
Case 2 Case 4 Case 6
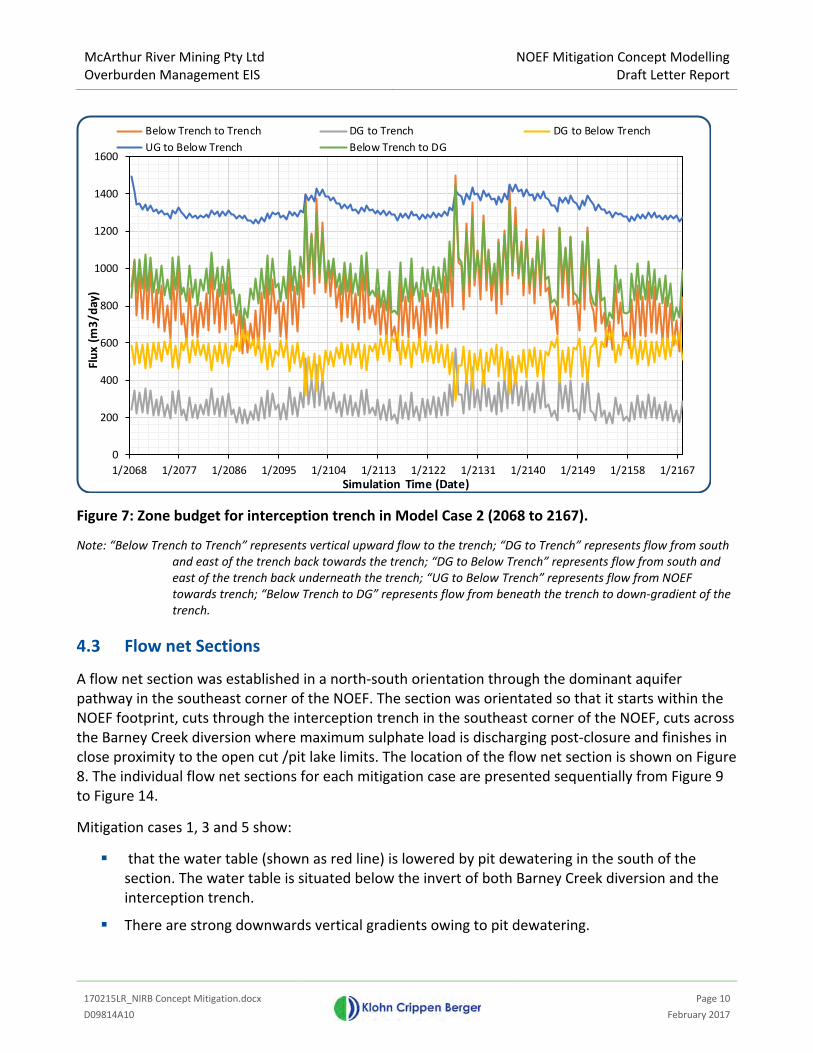
McArthur River Mining Pty Ltd
Overburden Management EIS
NOEF Mitigation Concept Modelling
Draft Letter Report
170215LR_NIRB Concept Mitigation.docx
Page 10
D09814A10 February 2017
Figure 7: Zone budget for interception trench in Model Case 2 (2068 to 2167).
Note: “Below Trench to Trench” represents vertical upward flow to the trench; “DG to Trench” represents flow from south
and east of the trench back towards the trench; “DG to Below Trench” represents flow from south and
east of the trench back underneath the trench; “UG to Below Trench” represents flow from NOEF
towards trench; “Below Trench to DG” represents flow from beneath the trench to down-gradient of the
trench.
4.3 Flow net Sections
A flow net section was established in a north-south orientation through the dominant aquifer
pathway in the southeast corner of the NOEF. The section was orientated so that it starts within the
NOEF footprint, cuts through the interception trench in the southeast corner of the NOEF, cuts across
the Barney Creek diversion where maximum sulphate load is discharging post-closure and finishes in
close proximity to the open cut /pit lake limits. The location of the flow net section is shown on Figure
8. The individual flow net sections for each mitigation case are presented sequentially from Figure 9
to Figure 14.
Mitigation cases 1, 3 and 5 show:
� that the water table (shown as red line) is lowered by pit dewatering in the south of the
section. The water table is situated below the invert of both Barney Creek diversion and the
interception trench.
� There are strong downwards vertical gradients owing to pit dewatering.
0
200
400
600
800
1000
1200
1400
1600
1/2068 1/2077 1/2086 1/2095 1/2104 1/2113 1/2122 1/2131 1/2140 1/2149 1/2158 1/2167
Flu
x (
m3
/d
ay
)
Simulation Time (Date)
Below Trench to Trench DG to Trench DG to Below Trench
UG to Below Trench Below Trench to DG

McArthur River Mining Pty Ltd
Overburden Management EIS
NOEF Mitigation Concept Modelling
Draft Letter Report
170215LR_NIRB Concept Mitigation.docx
Page 11
D09814A10 February 2017
� NOEF seepage has a dominant lateral flow component in the Cooley Dolomite underneath the
NOEF itself.
Mitigation cases 2, 4 and 6 show:
� Pit lake throughflow drives lateral groundwater flow north towards the Barney Creek
diversion.
� There is a reversal of flow with groundwater that previously would have discharged to the
diversion being drawn north towards the interception drain.
� NOEF seepage flowpaths are directed towards the interception trench.
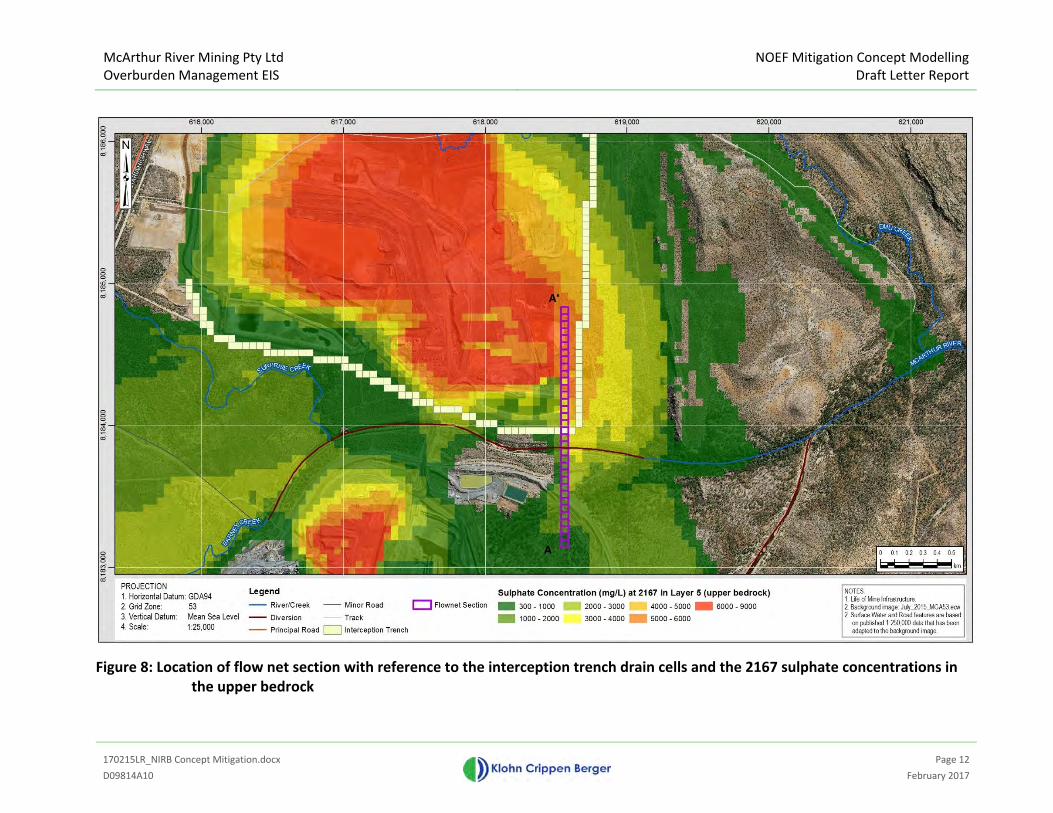
McArthur River Mining Pty Ltd
Overburden Management EIS
NOEF Mitigation Concept Modelling
Draft Letter Report
170215LR_NIRB Concept Mitigation.docx
Page 12
D09814A10 February 2017
Figure 8: Location of flow net section with reference to the interception trench drain cells and the 2167 sulphate concentrations in
the upper bedrock
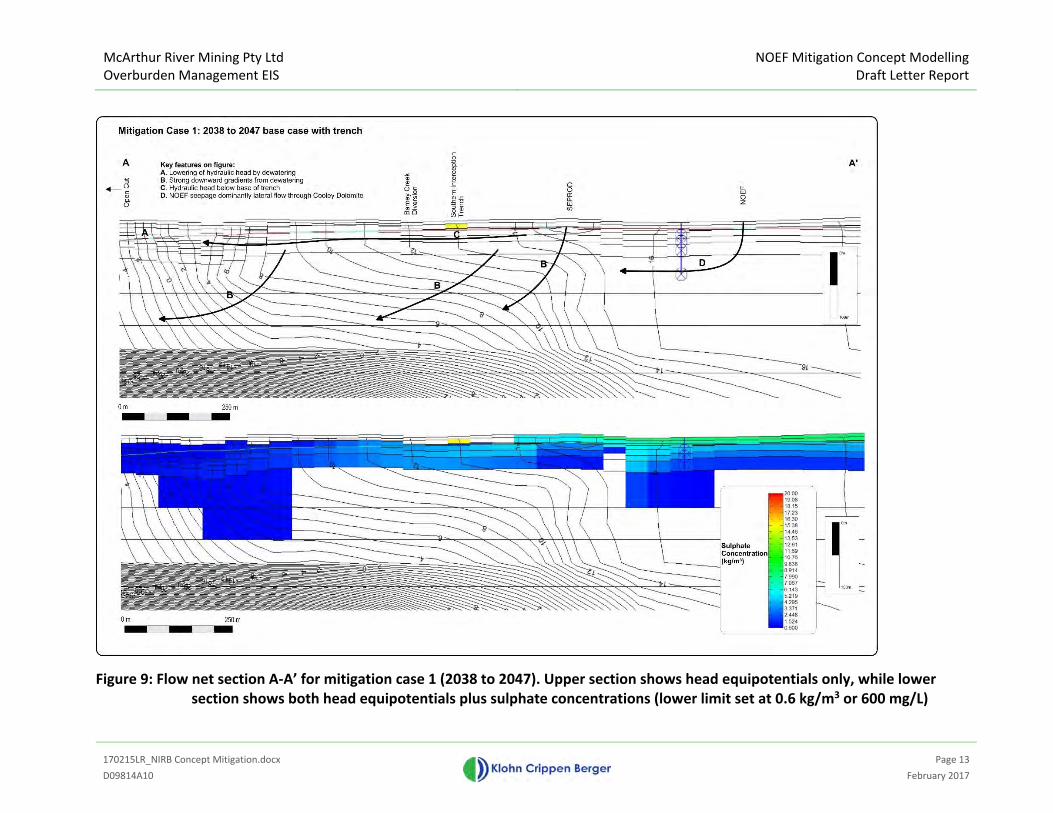
McArthur River Mining Pty Ltd
Overburden Management EIS
NOEF Mitigation Concept Modelling
Draft Letter Report
170215LR_NIRB Concept Mitigation.docx
Page 13
D09814A10 February 2017
Figure 9: Flow net section A-A’ for mitigation case 1 (2038 to 2047). Upper section shows head equipotentials only, while lower
section shows both head equipotentials plus sulphate concentrations (lower limit set at 0.6 kg/m3 or 600 mg/L)
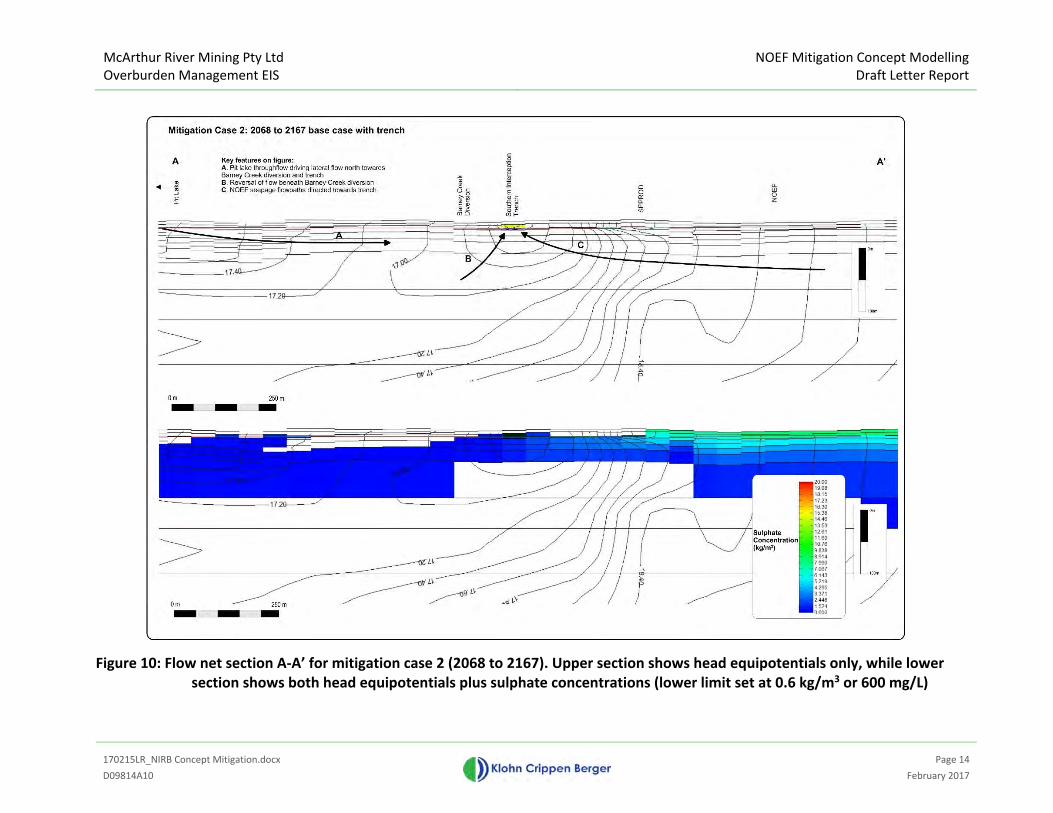
McArthur River Mining Pty Ltd
Overburden Management EIS
NOEF Mitigation Concept Modelling
Draft Letter Report
170215LR_NIRB Concept Mitigation.docx
Page 14
D09814A10 February 2017
Figure 10: Flow net section A-A’ for mitigation case 2 (2068 to 2167). Upper section shows head equipotentials only, while lower
section shows both head equipotentials plus sulphate concentrations (lower limit set at 0.6 kg/m3 or 600 mg/L)
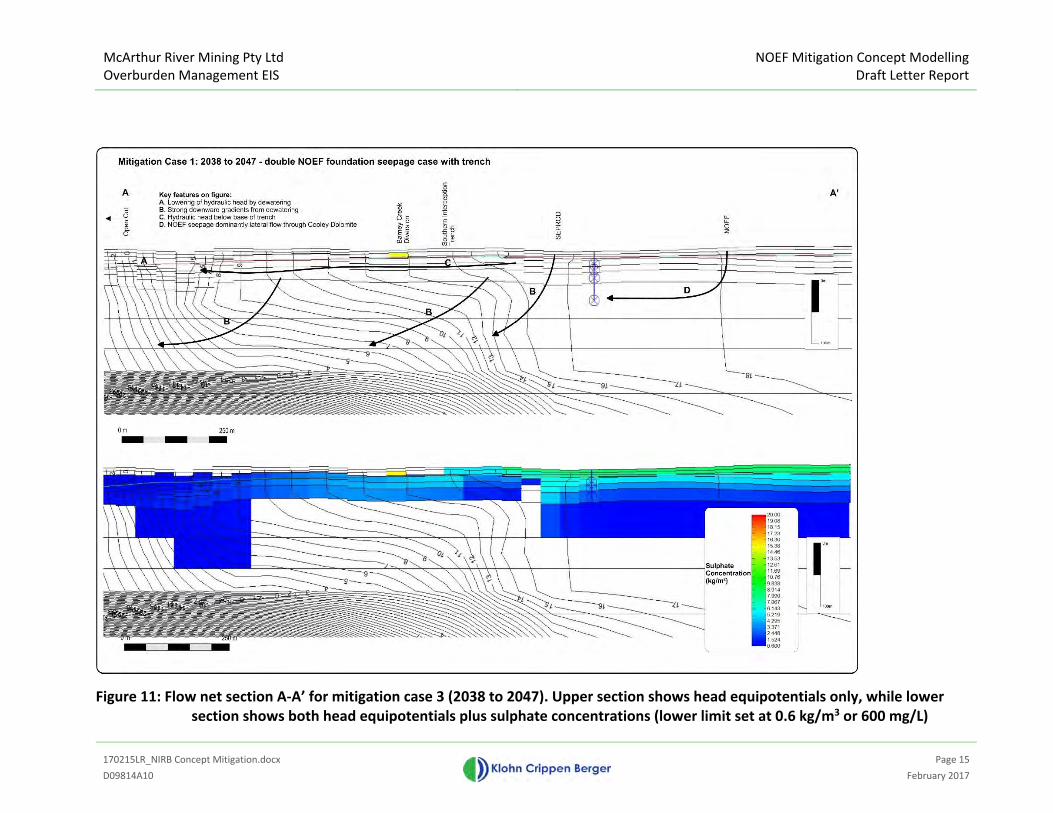
McArthur River Mining Pty Ltd
Overburden Management EIS
NOEF Mitigation Concept Modelling
Draft Letter Report
170215LR_NIRB Concept Mitigation.docx
Page 15
D09814A10 February 2017
Figure 11: Flow net section A-A’ for mitigation case 3 (2038 to 2047). Upper section shows head equipotentials only, while lower
section shows both head equipotentials plus sulphate concentrations (lower limit set at 0.6 kg/m3 or 600 mg/L)
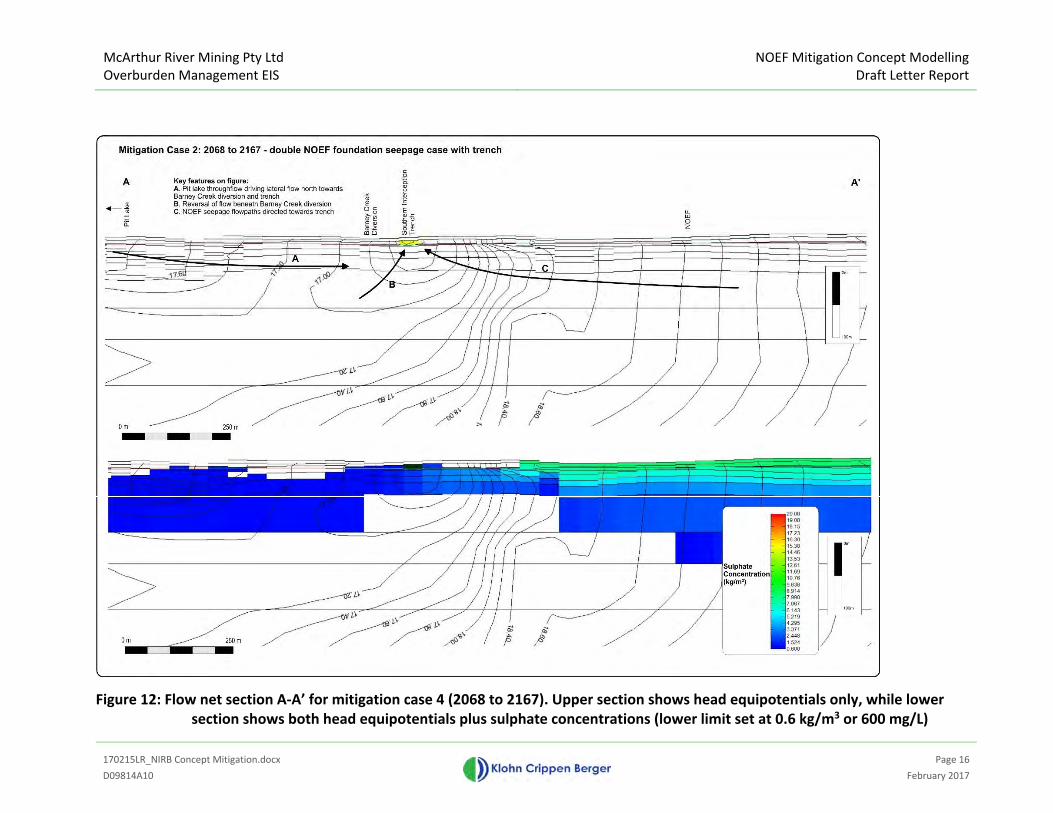
McArthur River Mining Pty Ltd
Overburden Management EIS
NOEF Mitigation Concept Modelling
Draft Letter Report
170215LR_NIRB Concept Mitigation.docx
Page 16
D09814A10 February 2017
Figure 12: Flow net section A-A’ for mitigation case 4 (2068 to 2167). Upper section shows head equipotentials only, while lower
section shows both head equipotentials plus sulphate concentrations (lower limit set at 0.6 kg/m3 or 600 mg/L)
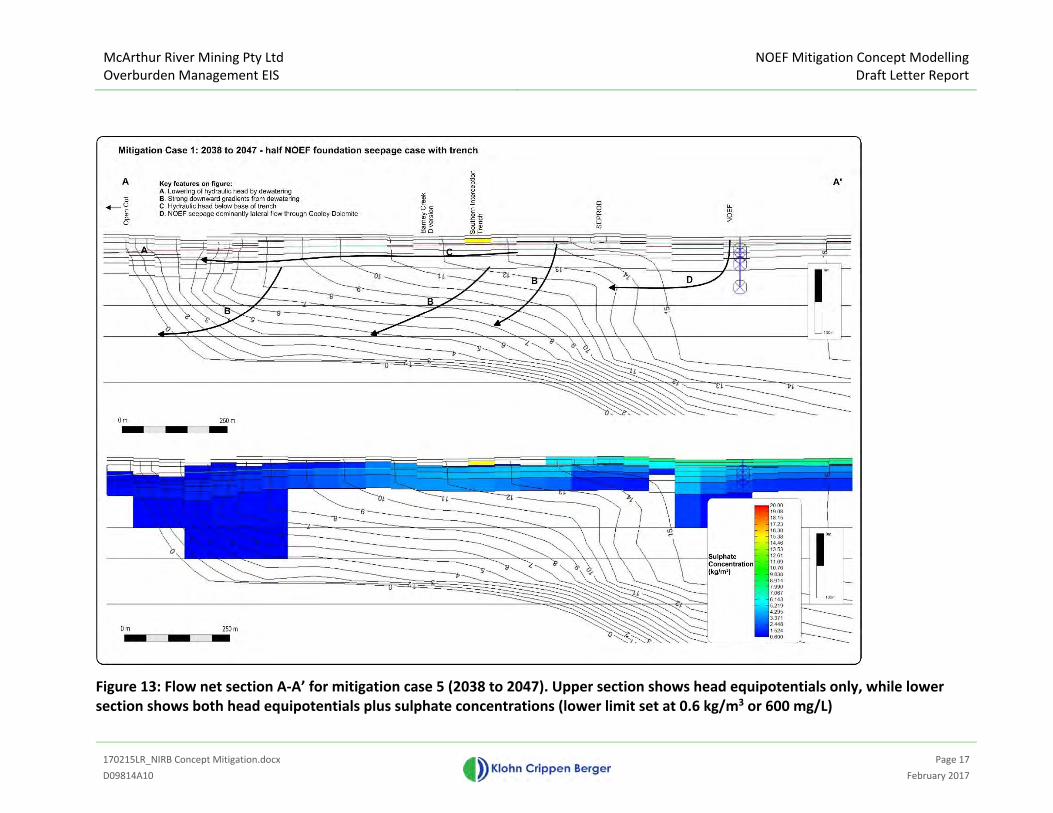
McArthur River Mining Pty Ltd
Overburden Management EIS
NOEF Mitigation Concept Modelling
Draft Letter Report
170215LR_NIRB Concept Mitigation.docx
Page 17
D09814A10 February 2017
Figure 13: Flow net section A-A’ for mitigation case 5 (2038 to 2047). Upper section shows head equipotentials only, while lower
section shows both head equipotentials plus sulphate concentrations (lower limit set at 0.6 kg/m3 or 600 mg/L)
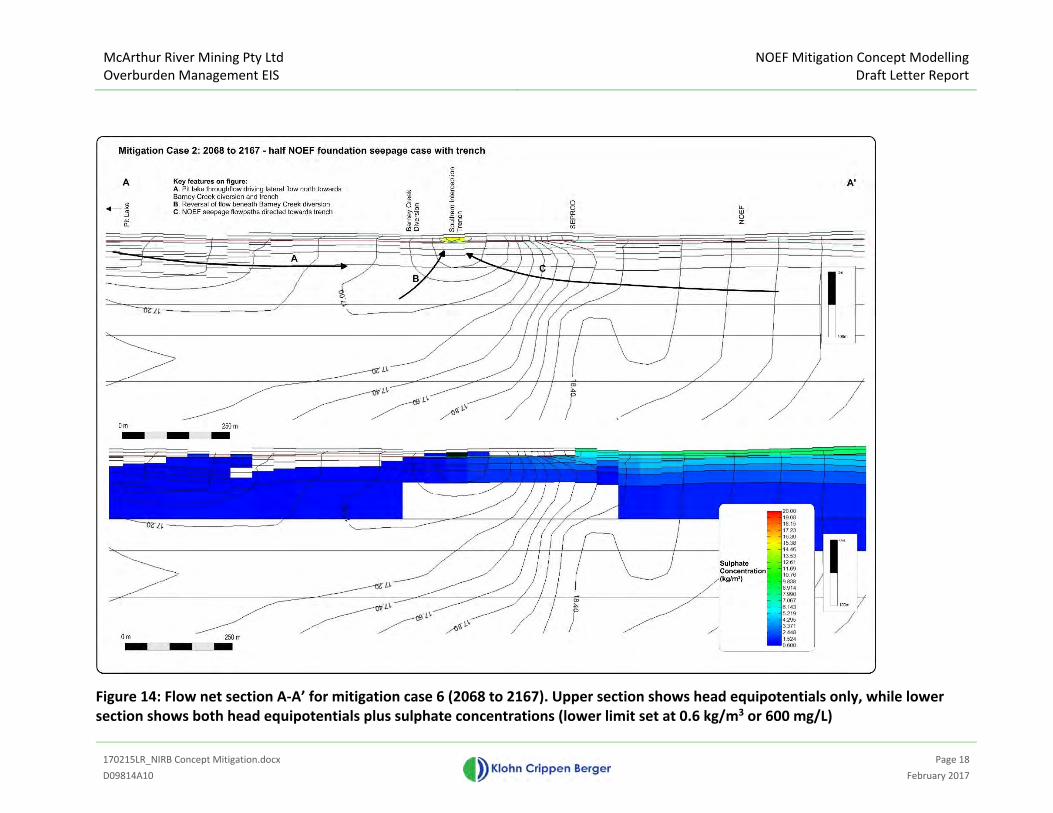
McArthur River Mining Pty Ltd
Overburden Management EIS
NOEF Mitigation Concept Modelling
Draft Letter Report
170215LR_NIRB Concept Mitigation.docx
Page 18
D09814A10 February 2017
Figure 14: Flow net section A-A’ for mitigation case 6 (2068 to 2167). Upper section shows head equipotentials only, while lower
section shows both head equipotentials plus sulphate concentrations (lower limit set at 0.6 kg/m3 or 600 mg/L)
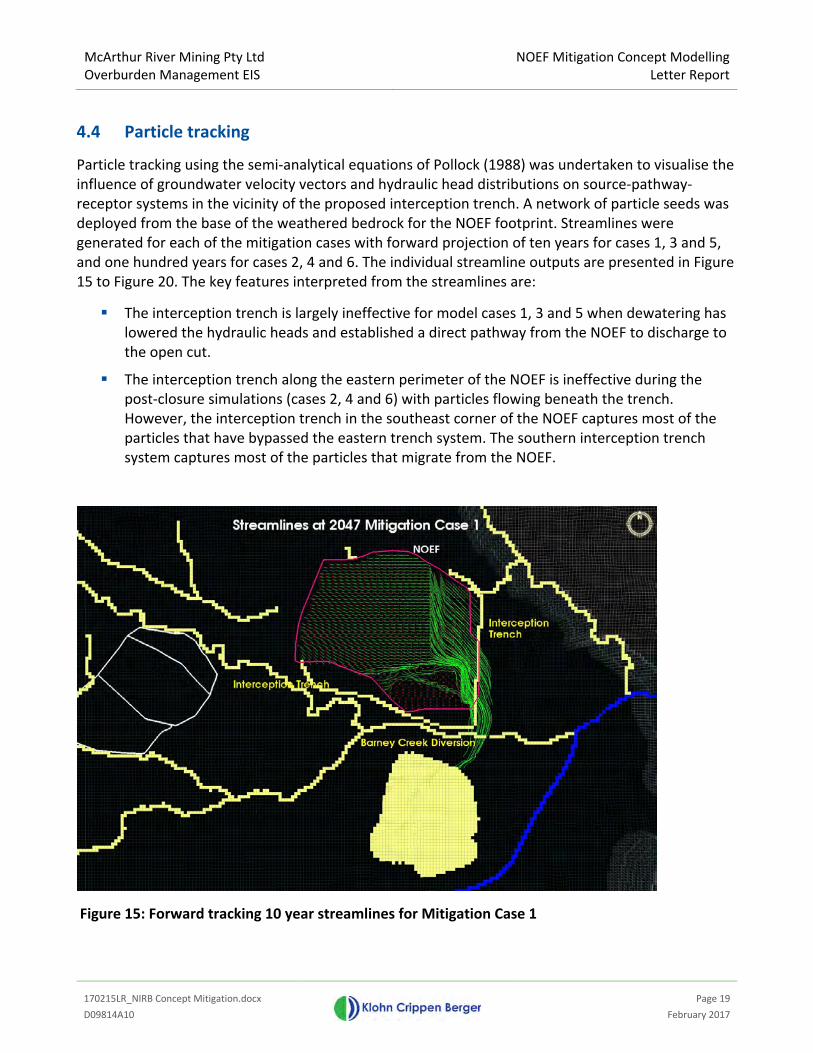
McArthur River Mining Pty Ltd
Overburden Management EIS
NOEF Mitigation Concept Modelling
Letter Report
170215LR_NIRB Concept Mitigation.docx
Page 19
D09814A10 February 2017
4.4 Particle tracking
Particle tracking using the semi-analytical equations of Pollock (1988) was undertaken to visualise the
influence of groundwater velocity vectors and hydraulic head distributions on source-pathway-
receptor systems in the vicinity of the proposed interception trench. A network of particle seeds was
deployed from the base of the weathered bedrock for the NOEF footprint. Streamlines were
generated for each of the mitigation cases with forward projection of ten years for cases 1, 3 and 5,
and one hundred years for cases 2, 4 and 6. The individual streamline outputs are presented in Figure
15 to Figure 20. The key features interpreted from the streamlines are:
� The interception trench is largely ineffective for model cases 1, 3 and 5 when dewatering has
lowered the hydraulic heads and established a direct pathway from the NOEF to discharge to
the open cut.
� The interception trench along the eastern perimeter of the NOEF is ineffective during the
post-closure simulations (cases 2, 4 and 6) with particles flowing beneath the trench.
However, the interception trench in the southeast corner of the NOEF captures most of the
particles that have bypassed the eastern trench system. The southern interception trench
system captures most of the particles that migrate from the NOEF.
Figure 15: Forward tracking 10 year streamlines for Mitigation Case 1
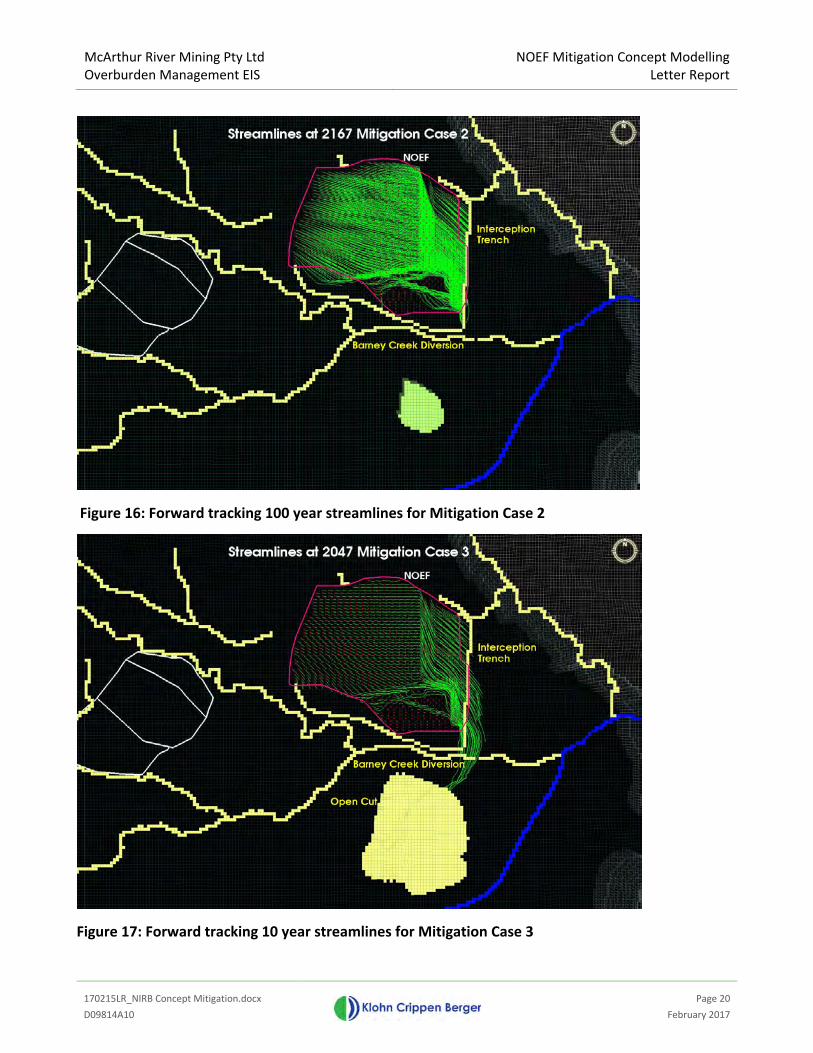
McArthur River Mining Pty Ltd
Overburden Management EIS
NOEF Mitigation Concept Modelling
Letter Report
170215LR_NIRB Concept Mitigation.docx
Page 20
D09814A10 February 2017
Figure 16: Forward tracking 100 year streamlines for Mitigation Case 2
Figure 17: Forward tracking 10 year streamlines for Mitigation Case 3
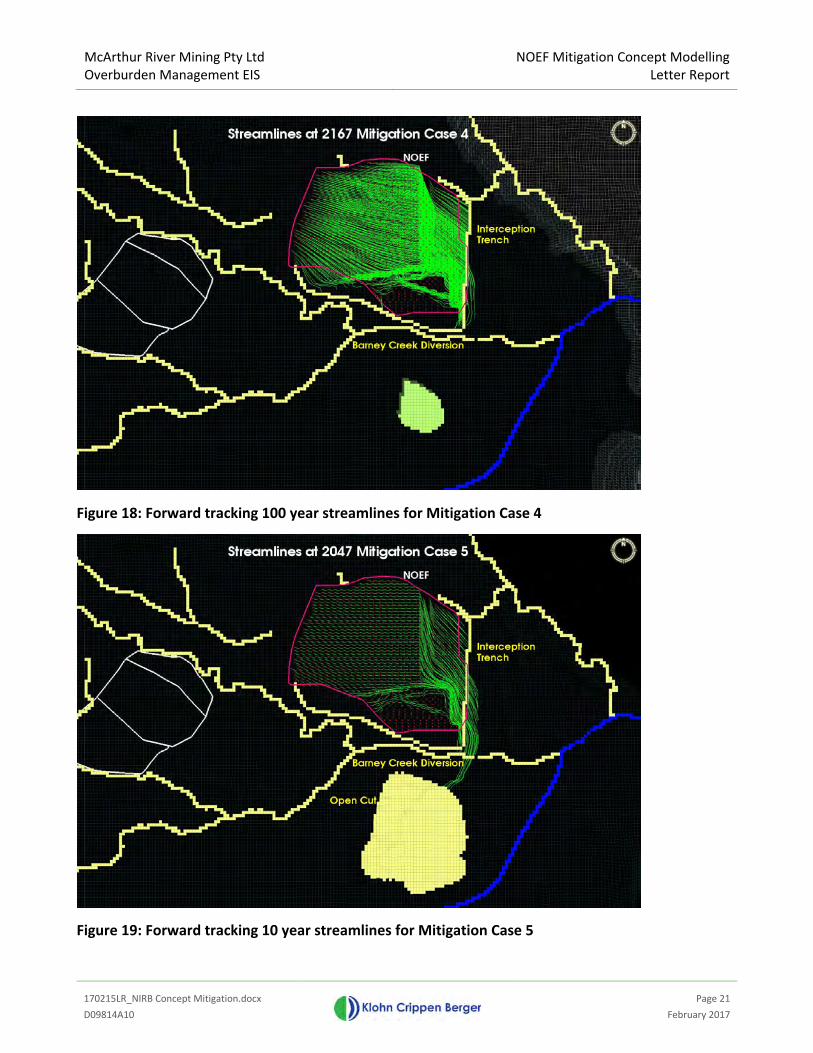
McArthur River Mining Pty Ltd
Overburden Management EIS
NOEF Mitigation Concept Modelling
Letter Report
170215LR_NIRB Concept Mitigation.docx
Page 21
D09814A10 February 2017
Figure 18: Forward tracking 100 year streamlines for Mitigation Case 4
Figure 19: Forward tracking 10 year streamlines for Mitigation Case 5
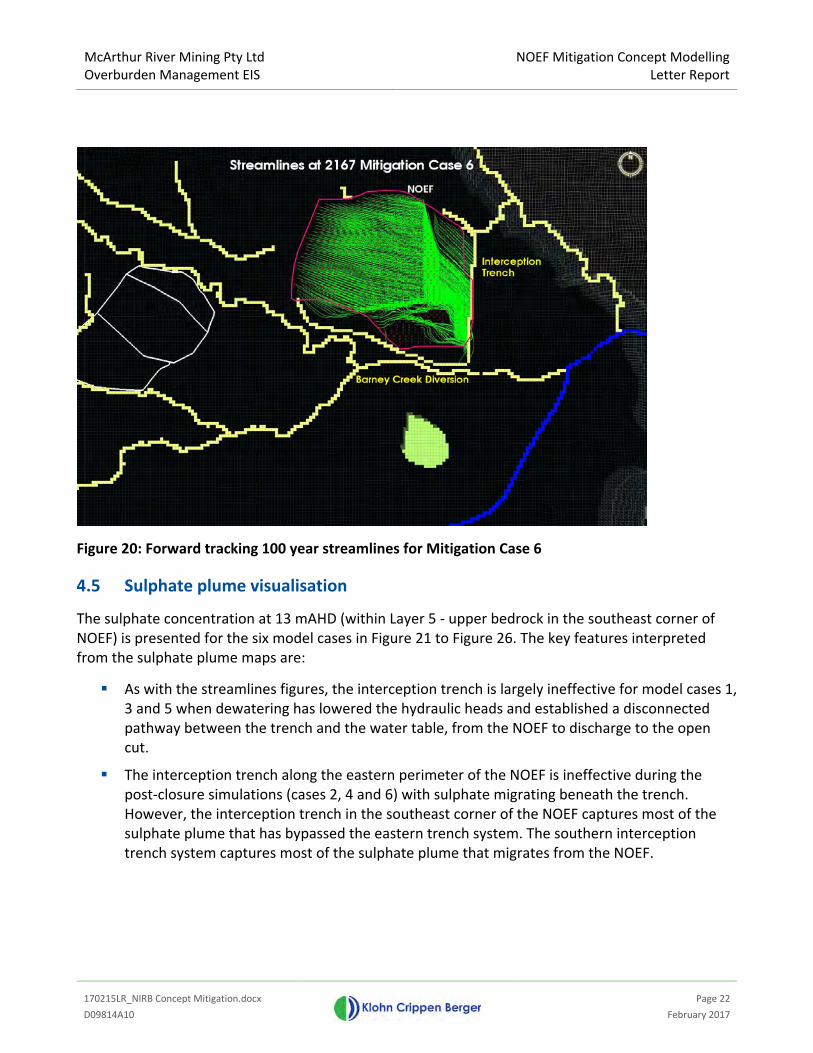
McArthur River Mining Pty Ltd
Overburden Management EIS
NOEF Mitigation Concept Modelling
Letter Report
170215LR_NIRB Concept Mitigation.docx
Page 22
D09814A10 February 2017
Figure 20: Forward tracking 100 year streamlines for Mitigation Case 6
4.5 Sulphate plume visualisation
The sulphate concentration at 13 mAHD (within Layer 5 - upper bedrock in the southeast corner of
NOEF) is presented for the six model cases in Figure 21 to Figure 26. The key features interpreted
from the sulphate plume maps are:
� As with the streamlines figures, the interception trench is largely ineffective for model cases 1,
3 and 5 when dewatering has lowered the hydraulic heads and established a disconnected
pathway between the trench and the water table, from the NOEF to discharge to the open
cut.
� The interception trench along the eastern perimeter of the NOEF is ineffective during the
post-closure simulations (cases 2, 4 and 6) with sulphate migrating beneath the trench.
However, the interception trench in the southeast corner of the NOEF captures most of the
sulphate plume that has bypassed the eastern trench system. The southern interception
trench system captures most of the sulphate plume that migrates from the NOEF.
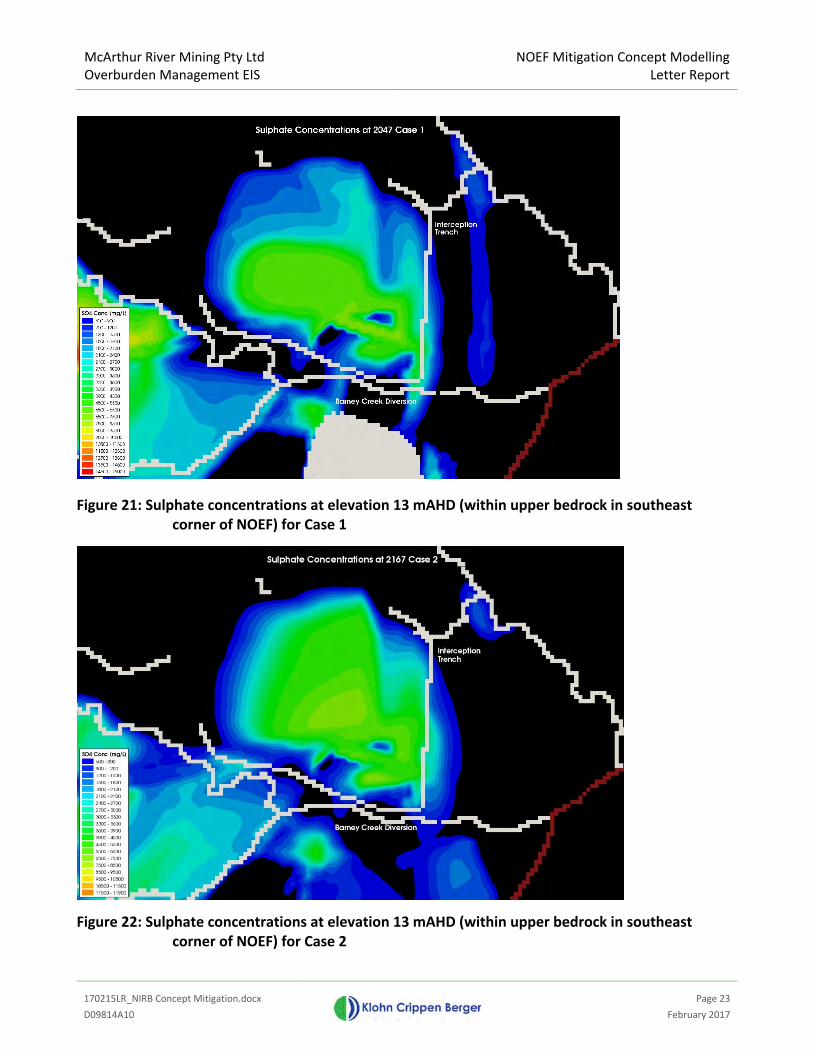
McArthur River Mining Pty Ltd
Overburden Management EIS
NOEF Mitigation Concept Modelling
Letter Report
170215LR_NIRB Concept Mitigation.docx
Page 23
D09814A10 February 2017
Figure 21: Sulphate concentrations at elevation 13 mAHD (within upper bedrock in southeast
corner of NOEF) for Case 1
Figure 22: Sulphate concentrations at elevation 13 mAHD (within upper bedrock in southeast
corner of NOEF) for Case 2
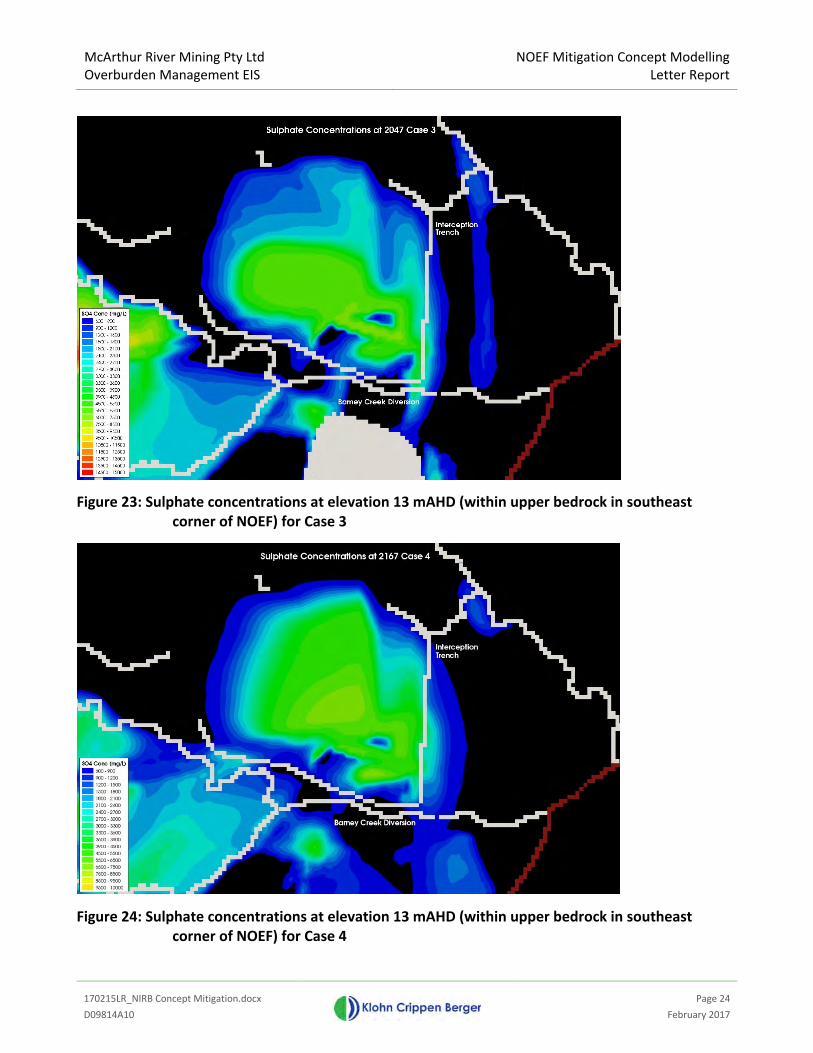
McArthur River Mining Pty Ltd
Overburden Management EIS
NOEF Mitigation Concept Modelling
Letter Report
170215LR_NIRB Concept Mitigation.docx
Page 24
D09814A10 February 2017
Figure 23: Sulphate concentrations at elevation 13 mAHD (within upper bedrock in southeast
corner of NOEF) for Case 3
Figure 24: Sulphate concentrations at elevation 13 mAHD (within upper bedrock in southeast
corner of NOEF) for Case 4
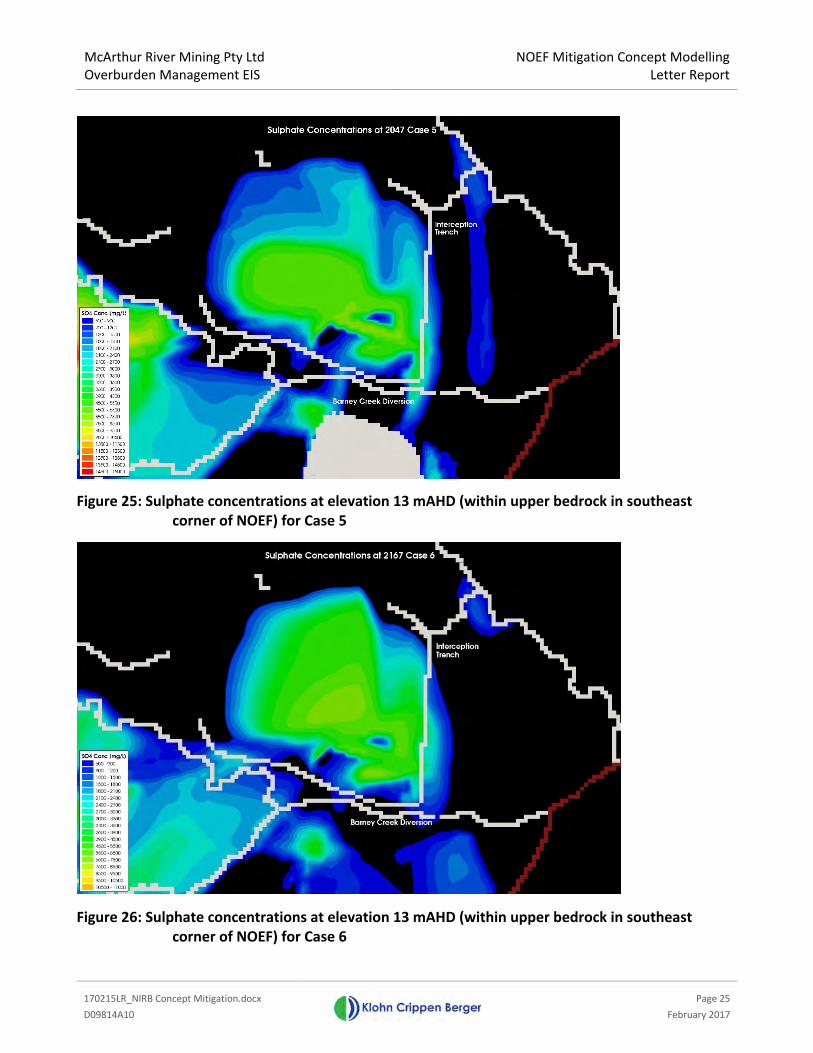
McArthur River Mining Pty Ltd
Overburden Management EIS
NOEF Mitigation Concept Modelling
Letter Report
170215LR_NIRB Concept Mitigation.docx
Page 25
D09814A10 February 2017
Figure 25: Sulphate concentrations at elevation 13 mAHD (within upper bedrock in southeast
corner of NOEF) for Case 5
Figure 26: Sulphate concentrations at elevation 13 mAHD (within upper bedrock in southeast
corner of NOEF) for Case 6
McArthur River Mining Pty Ltd
Overburden Management EIS
NOEF Mitigation Concept Modelling
Letter Report
170215LR_NIRB Concept Mitigation.docx
Page 26
D09814A10 February 2017
5 LIMITATIONS AND ASSUMPTIONS
The following limitations and assumptions associated with the mitigation modelling assessment are
noted:
� This modelling should be regarded as an indicative simulation of the conceptual design. Detail
of the interception system has been broadly approximated using the existing EIS model.
� Only modelling two snapshot simulations is not a true indication of progressive capture of the
sulphate plume. Using this snapshot approach there is no conditioning of heads or
concentrations from the time of construction onwards. Rather, the trench is assumed to
become instantaneously active at the start of each model simulation, and highly efficient in its
performance. To conceptually assess the efficacy of the mitigation system, this snapshot
approach is conservative (i.e. the trench would likely impact water levels sooner than shown
in this modelling).
� The interception trench is coarsely represented with the existing 50m x 50m grid cells. For
design, further discretisation of the model grid in the vicinity of the trench will be required to
more accurately represent this feature.
� The EIS groundwater model was built to represent source-pathway-receptor systems at a
catchment scale. For this reason, the equivalent porous media (EPM) method used to
represent zones of fracturing and for karstic features in the Cooley Dolomite/Reward
Dolomite was deemed to be appropriate. EPM is suitable at this catchment-scale because it
represents the broad pathway from source to receptor. However, for local-scale problems,
EPM may be less suitable. If significant fracture zones or solution cavities at depth within the
Cooley Dolomite are a primary conduit for NOEF seepage, there is a potential for seepage to
migrate under the trench through one or more of these features. During design of the trench,
investigations on the nature of the Cooley Dolomite system would provide a better
understanding of the physical and hydraulic nature of the preferential flow systems within this
aquifer pathway.
� The reference head in the rockfill slot was assumed to be at the base of the slot. In reality,
there will be a head of water in the rockfill which will influence the performance of the drain.
Depending on the underlying aquifer conditions, sections of head in the drain may locally
discharge back into the regional system.
� The vertical permeability of the trench system has been assumed to be sufficient for
groundwater to migrate without limitation to the trench, under the influence of the hydraulic
gradients.
� The trench capture performance is assumed to be highly efficient in the current model
simulations. No reduction in capture rate was accounted for natural processes such as
siltation of the rockfill and precipitation on the rockfill and material immediately surrounding
the trench.

McArthur River Mining Pty Ltd
Overburden Management EIS
NOEF Mitigation Concept Modelling
Letter Report
170215LR_NIRB Concept Mitigation.docx
Page 27
D09814A10 February 2017
6 CLOSING
This letter report is an instrument of service of Klohn Crippen Berger Ltd. The report has been
prepared for the exclusive use of McArthur River Mine (Client) for the specific application to the 2017
EIS. The report's contents may not be relied upon by any other party without the express written
permission of Klohn Crippen Berger. In this report, Klohn Crippen Berger has endeavoured to comply
with generally-accepted professional practice common to the local area. Klohn Crippen Berger makes
no warranty, express or implied.
Yours truly,
KLOHN CRIPPEN BERGER LTD
Brent Usher, PhD
Geosciences Manager/ Project Manager
170620LR_Concept_Mitigation_Update.docx D09814A10
Klohn Crippen Berger Ltd. • www.klohn.com
June 19, 2017
McArthur River Mining Pty Ltd PO Box 36821, Winnellie, NT 0821 Mr. Jamie Hacker MRM 2017 EIS Dear Mr. Hacker MRM NOEF EIS Overburden Management EIS: NOEF Mitigation Concept Modelling- June 2017 Update At MRM’s request, KCB completed modelling of GHD’s concept design for an interception trench situated immediately down-gradient of the southern and eastern perimeters of the NOEF in January/February 2017. In May 2017, the NOEF Independent Review Board (NIRB) requested further groundwater modelling to assess the efficacy of the proposed interception trench.
This letter reports provides a summary of the updated modelling, summarising the groundwater modelling assessment of MRM/GHD’s updated concept designs for plume interception down-gradient of the southern and eastern perimeters of the NOEF.
1 INTRODUCTION
KCB built and calibrated a numerical groundwater model for the MRM site that was used for the 2017 OMP EIS (KCB, 2017). The model was developed in MODFLOW-SURFACT Version 4.0 (HydroGeoLogic, 2016), and has both groundwater flow and mass transport capabilities. For the OMP EIS the model was used in transient simulation mode to predict changes to groundwater conditions, including variation in baseflow and load contributions during life of mine, closure and long-term post-closure.
To meet the immediate time frames of NIRB’s initial submissions to the regulators, it was agreed the KCB’s EIS model would be used without refinement to assess the conceptual effectiveness of the interception trench to capture NOEF seepage predicted to occur in the southeast corner of the NOEF and discharge to either the pit or the Barney Creek diversion.
In May 2017, the NIRB requested further modelling to be undertaken, to include the following tasks:
1. Refine the EIS model grid to optimise the model response with the proposed interception trench and additional collection bores.
It was agreed that the grid would be refined as far as is practical, in the area surrounding the proposed trench to a grid spacing of ~ 12.5 m and adjacent to the trench to ~ 6m.
McArthur River Mining Pty Ltd Overburden Management EIS
NOEF Mitigation Concept Modelling
170620LR_Concept_Mitigation_Update.docx
Page 2
D09814A10 June 2017
2. Re-run the refined model for similar conditions that were considered in KCB’s “NOEF Mitigation Concept Modelling Draft Letter Report” (15 February 2017).
3. Assess the sensitivity of these results by halving and doubling the hydraulic conductivity of the fault zone to the east of the NOEF.
4. Account for interception of the predicted deeper water table conditions in the southeast area by modelling selectively located collection bores.
From this provide an indication of the location, depths and abstraction rates required to contain seepage during operations.
5. Assess the fate of the COPC loadings that may by-pass the interception system after operations.
2 MODELLING APPROACH
As previously, KCB has modelled the interception ditch using a drain boundary condition inserted into the refined model mesh (grid cells refined to 12.5 m resolution and 6.25 m) along the proposed drain alignment. The proposed pumping interception wells located downstream of the drain alignment would be positioned based on the initial results. As previously, the drain condition extends across the gaps in the ditch, working on the assumption that interception well pumping will be successful in reducing the phreatic surface to the specified water elevation in the drain adjacent to these locations.
To reduce model simulation run times, contaminant transport modelling was limited to sulphate (SO4) as a conservative ion. Particle tracking showing streamlines has been used to assess seepage pathways and drain capture efficiency. In addition, for each of the simulations, sulphate loads and fluxes for the reach of the Barney Channel previously reported on, as well as to the trench have been extracted from the model for each model run provided.
2.1 Model Simulation Periods
For consistency, KCB proposed that the same periods modelled previously were repeated. Two time periods were modelled:
2038 to 2047 – this period represents a time when dewatering of the open pit is at a maximum stress state and groundwater elevations in the Cooley Dolomite have been lowered causing a degree of disconnection between the NOEF seepage and Barney Channel, leading to reduced flow from the NOEF directly to Barney Channel in this period.
2068 to 2167 – to reflect the groundwater conditions after pit lake development and groundwater levels have recovered to near steady state conditions in the NOEF footprint area. This model simulation period will provide an indication of the interception performance of the trench for the post-closure condition, and any loads reporting to Barney Channel.
These existing transient scenarios include seasonality in the rainfall recharge relationship in accordance with the EIS climate data set. The 2038 to 2047 model uses monthly stress periods for
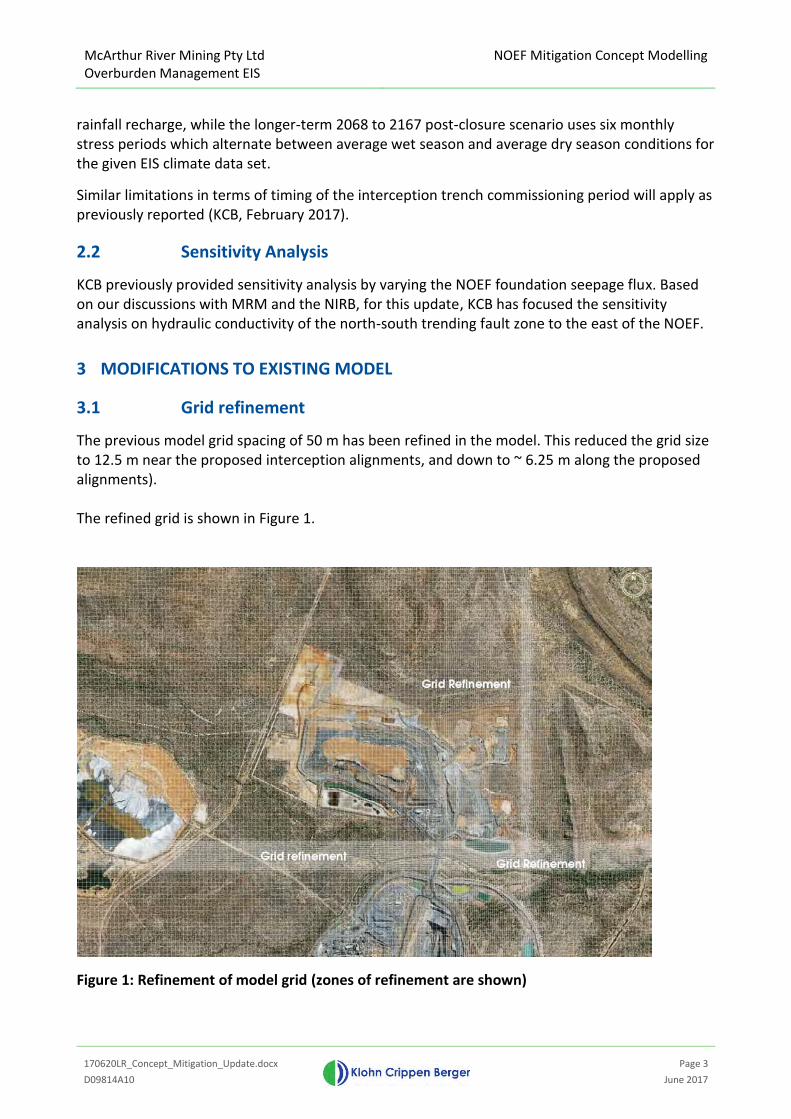
McArthur River Mining Pty Ltd Overburden Management EIS
NOEF Mitigation Concept Modelling
170620LR_Concept_Mitigation_Update.docx
Page 3
D09814A10 June 2017
rainfall recharge, while the longer-term 2068 to 2167 post-closure scenario uses six monthly stress periods which alternate between average wet season and average dry season conditions for the given EIS climate data set.
Similar limitations in terms of timing of the interception trench commissioning period will apply as previously reported (KCB, February 2017).
2.2 Sensitivity Analysis
KCB previously provided sensitivity analysis by varying the NOEF foundation seepage flux. Based on our discussions with MRM and the NIRB, for this update, KCB has focused the sensitivity analysis on hydraulic conductivity of the north-south trending fault zone to the east of the NOEF.
3 MODIFICATIONS TO EXISTING MODEL
3.1 Grid refinement
The previous model grid spacing of 50 m has been refined in the model. This reduced the grid size to 12.5 m near the proposed interception alignments, and down to ~ 6.25 m along the proposed alignments). The refined grid is shown in Figure 1.
Figure 1: Refinement of model grid (zones of refinement are shown)

McArthur River Mining Pty Ltd Overburden Management EIS
NOEF Mitigation Concept Modelling
170620LR_Concept_Mitigation_Update.docx
Page 4
D09814A10 June 2017
3.2 Representing the interception system
The interception system was represented as reported previously (KCB, 2017), using the alignments and .dxf files provided to KCB by GHD in May 2017. The same assumptions used previously have been included. Additional options simulated for the May 2017 round of modelling included abstraction bores. These were modelled with specific locations and with drain elevations included to simulate the reduction in water level to a specified elevation/depth below surface. Where bores are included in the main alignment to mimic the impact of an equivalent trench, the elevation of the drains were set to approximately the proposed trench invert elevation. For the deeper capture bores, the depth was iterative and based on the hydrogeological conditions and the predicted depths of the major flow lines obtained from the unmitigated EIS model case for sulphate.
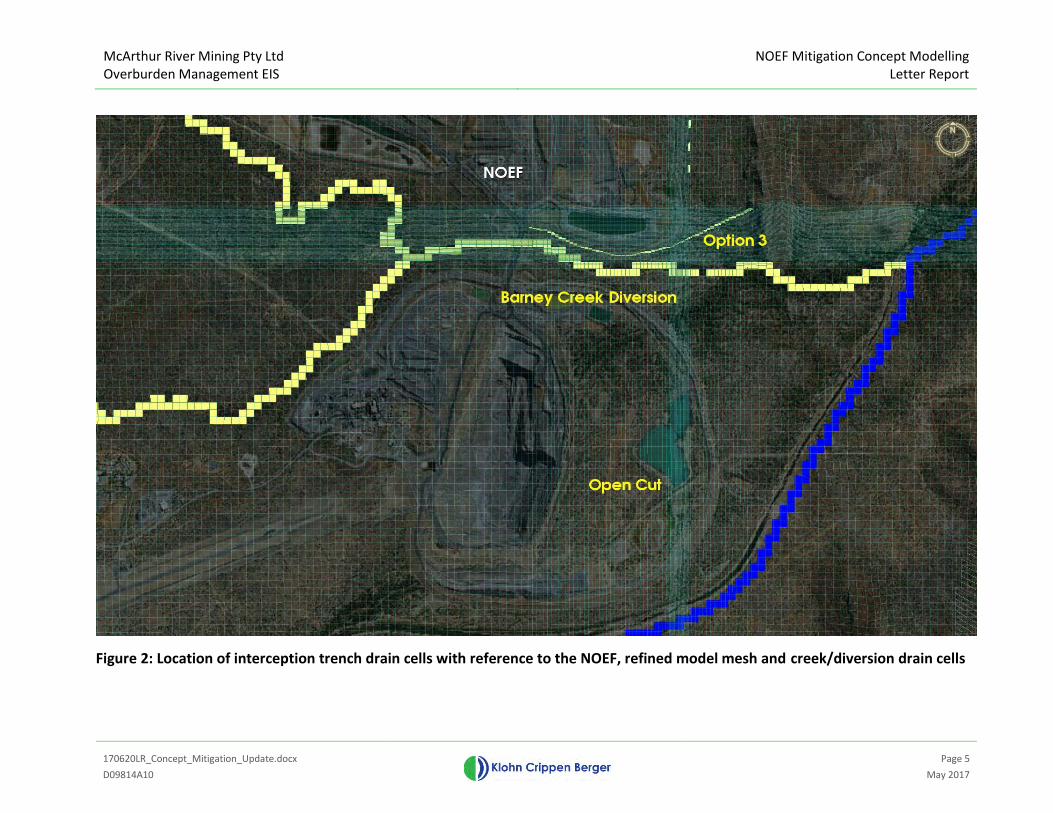
McArthur River Mining Pty Ltd Overburden Management EIS
NOEF Mitigation Concept Modelling Letter Report
170620LR_Concept_Mitigation_Update.docx
Page 5
D09814A10 May 2017
Figure 2: Location of interception trench drain cells with reference to the NOEF, refined model mesh and creek/diversion drain cells
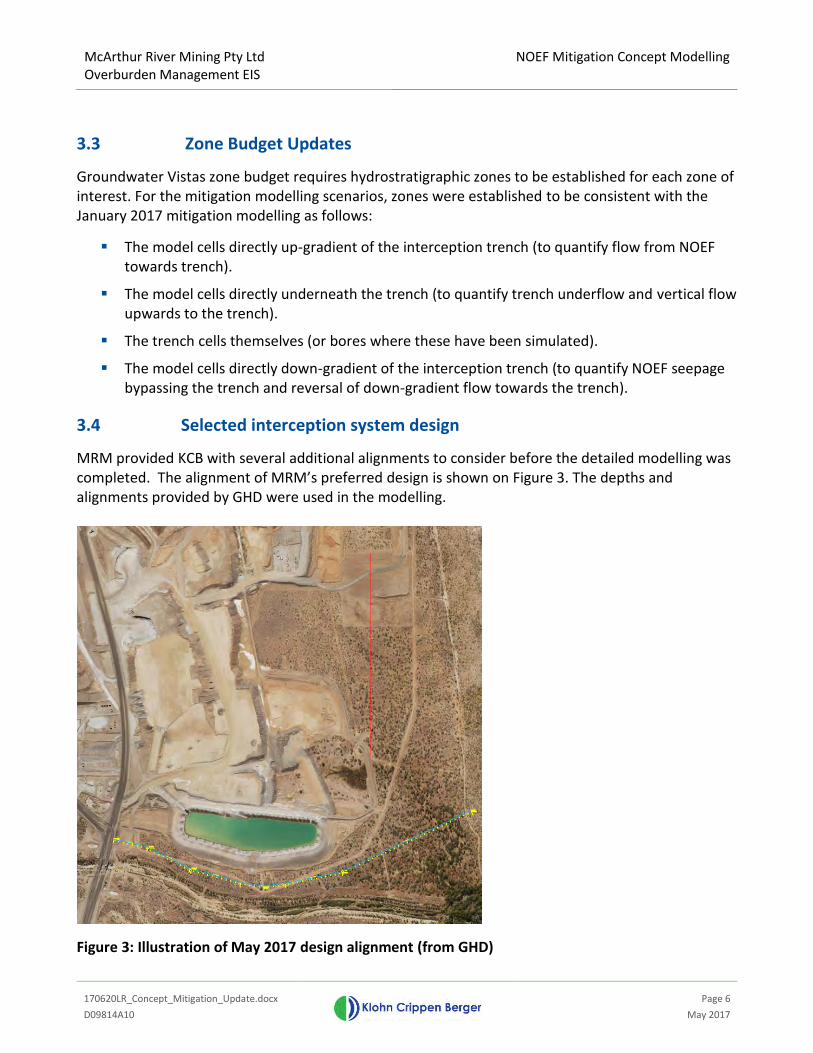
McArthur River Mining Pty Ltd Overburden Management EIS
NOEF Mitigation Concept Modelling
170620LR_Concept_Mitigation_Update.docx
Page 6
D09814A10 May 2017
3.3 Zone Budget Updates
Groundwater Vistas zone budget requires hydrostratigraphic zones to be established for each zone of interest. For the mitigation modelling scenarios, zones were established to be consistent with the January 2017 mitigation modelling as follows:
The model cells directly up-gradient of the interception trench (to quantify flow from NOEF towards trench).
The model cells directly underneath the trench (to quantify trench underflow and vertical flow upwards to the trench).
The trench cells themselves (or bores where these have been simulated).
The model cells directly down-gradient of the interception trench (to quantify NOEF seepage bypassing the trench and reversal of down-gradient flow towards the trench).
3.4 Selected interception system design
MRM provided KCB with several additional alignments to consider before the detailed modelling was completed. The alignment of MRM’s preferred design is shown on Figure 3. The depths and alignments provided by GHD were used in the modelling.
Figure 3: Illustration of May 2017 design alignment (from GHD)
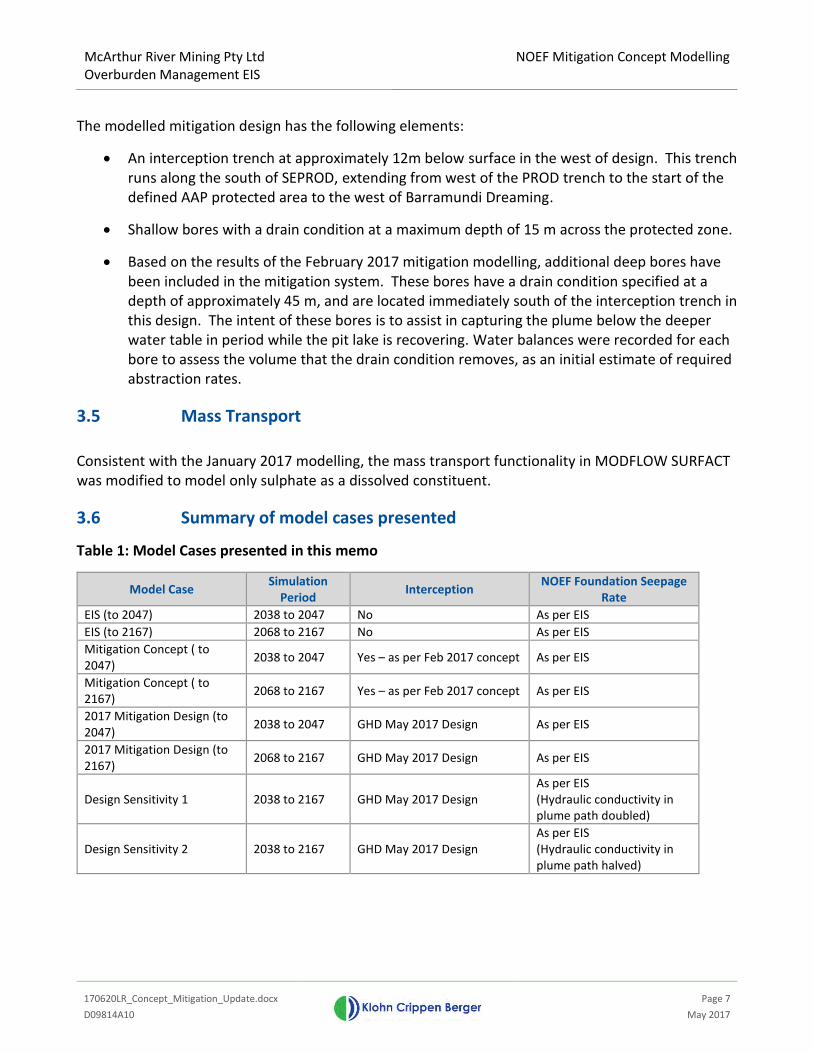
McArthur River Mining Pty Ltd Overburden Management EIS
NOEF Mitigation Concept Modelling
170620LR_Concept_Mitigation_Update.docx
Page 7
D09814A10 May 2017
The modelled mitigation design has the following elements:
An interception trench at approximately 12m below surface in the west of design. This trench runs along the south of SEPROD, extending from west of the PROD trench to the start of the defined AAP protected area to the west of Barramundi Dreaming.
Shallow bores with a drain condition at a maximum depth of 15 m across the protected zone.
Based on the results of the February 2017 mitigation modelling, additional deep bores have been included in the mitigation system. These bores have a drain condition specified at a depth of approximately 45 m, and are located immediately south of the interception trench in this design. The intent of these bores is to assist in capturing the plume below the deeper water table in period while the pit lake is recovering. Water balances were recorded for each bore to assess the volume that the drain condition removes, as an initial estimate of required abstraction rates.
3.5 Mass Transport
Consistent with the January 2017 modelling, the mass transport functionality in MODFLOW SURFACT was modified to model only sulphate as a dissolved constituent.
3.6 Summary of model cases presented
Table 1: Model Cases presented in this memo
Model Case Simulation
Period Interception
NOEF Foundation Seepage Rate
EIS (to 2047) 2038 to 2047 No As per EIS
EIS (to 2167) 2068 to 2167 No As per EIS
Mitigation Concept ( to 2047)
2038 to 2047 Yes – as per Feb 2017 concept As per EIS
Mitigation Concept ( to 2167)
2068 to 2167 Yes – as per Feb 2017 concept As per EIS
2017 Mitigation Design (to 2047)
2038 to 2047 GHD May 2017 Design As per EIS
2017 Mitigation Design (to 2167)
2068 to 2167 GHD May 2017 Design As per EIS
Design Sensitivity 1 2038 to 2167 GHD May 2017 Design As per EIS (Hydraulic conductivity in plume path doubled)
Design Sensitivity 2 2038 to 2167 GHD May 2017 Design As per EIS (Hydraulic conductivity in plume path halved)
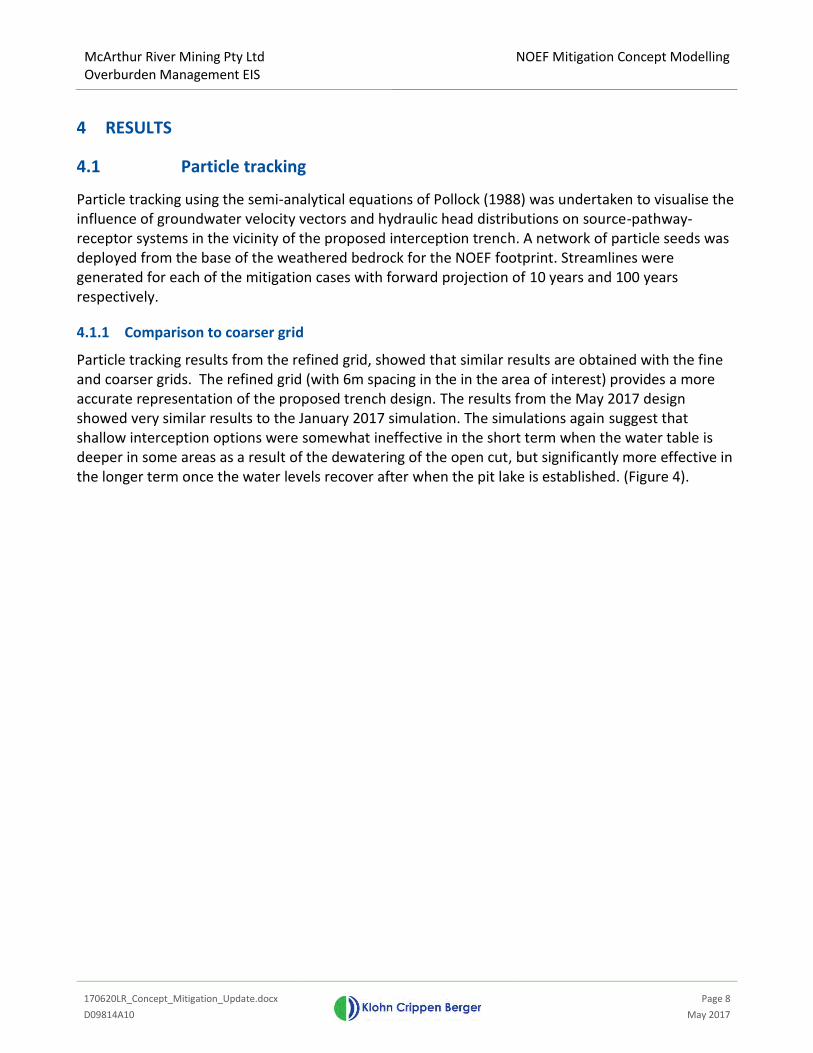
McArthur River Mining Pty Ltd Overburden Management EIS
NOEF Mitigation Concept Modelling
170620LR_Concept_Mitigation_Update.docx
Page 8
D09814A10 May 2017
4 RESULTS
4.1 Particle tracking
Particle tracking using the semi-analytical equations of Pollock (1988) was undertaken to visualise the influence of groundwater velocity vectors and hydraulic head distributions on source-pathway-receptor systems in the vicinity of the proposed interception trench. A network of particle seeds was deployed from the base of the weathered bedrock for the NOEF footprint. Streamlines were generated for each of the mitigation cases with forward projection of 10 years and 100 years respectively.
4.1.1 Comparison to coarser grid
Particle tracking results from the refined grid, showed that similar results are obtained with the fine and coarser grids. The refined grid (with 6m spacing in the in the area of interest) provides a more accurate representation of the proposed trench design. The results from the May 2017 design showed very similar results to the January 2017 simulation. The simulations again suggest that shallow interception options were somewhat ineffective in the short term when the water table is deeper in some areas as a result of the dewatering of the open cut, but significantly more effective in the longer term once the water levels recover after when the pit lake is established. (Figure 4).
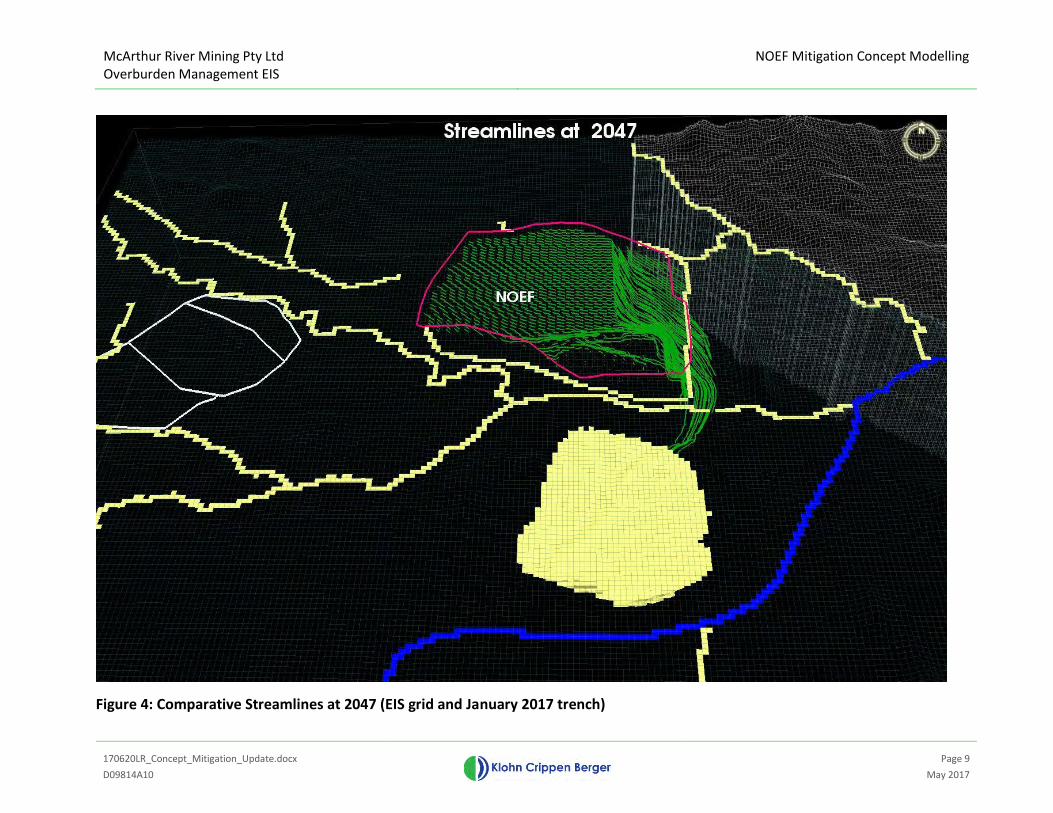
McArthur River Mining Pty Ltd Overburden Management EIS
NOEF Mitigation Concept Modelling
170620LR_Concept_Mitigation_Update.docx
Page 9
D09814A10 May 2017
Figure 4: Comparative Streamlines at 2047 (EIS grid and January 2017 trench)
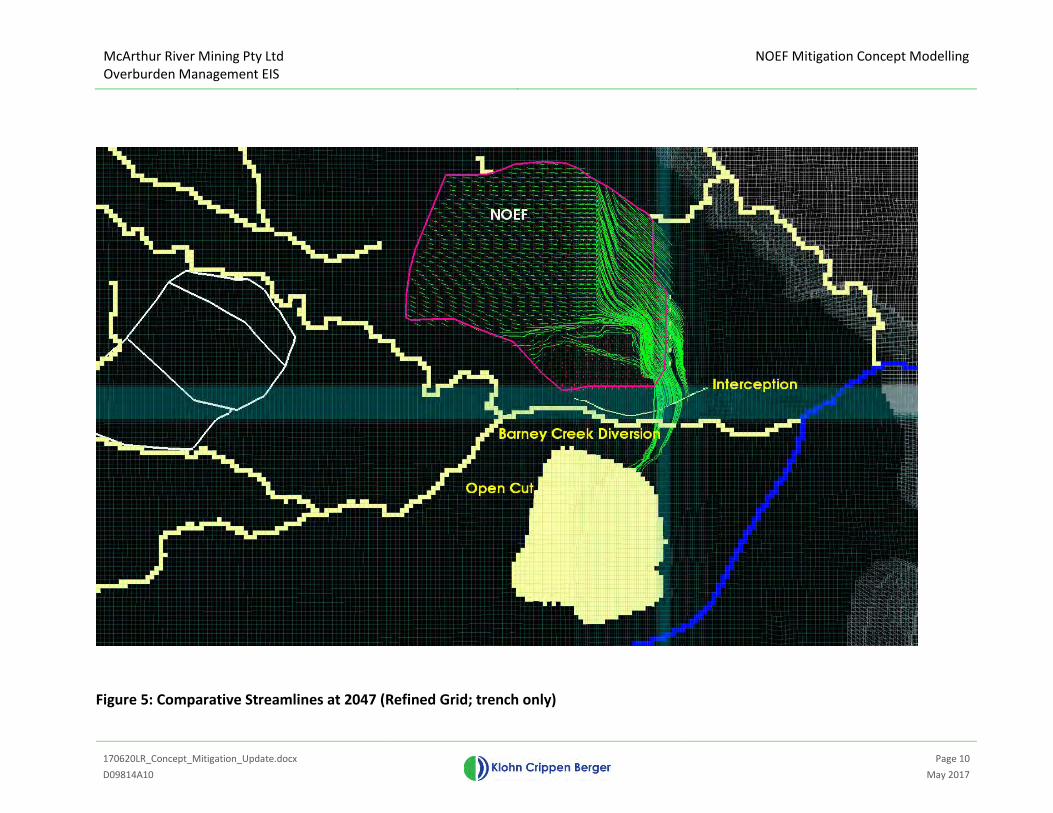
McArthur River Mining Pty Ltd Overburden Management EIS
NOEF Mitigation Concept Modelling
170620LR_Concept_Mitigation_Update.docx
Page 10
D09814A10 May 2017
Figure 5: Comparative Streamlines at 2047 (Refined Grid; trench only)
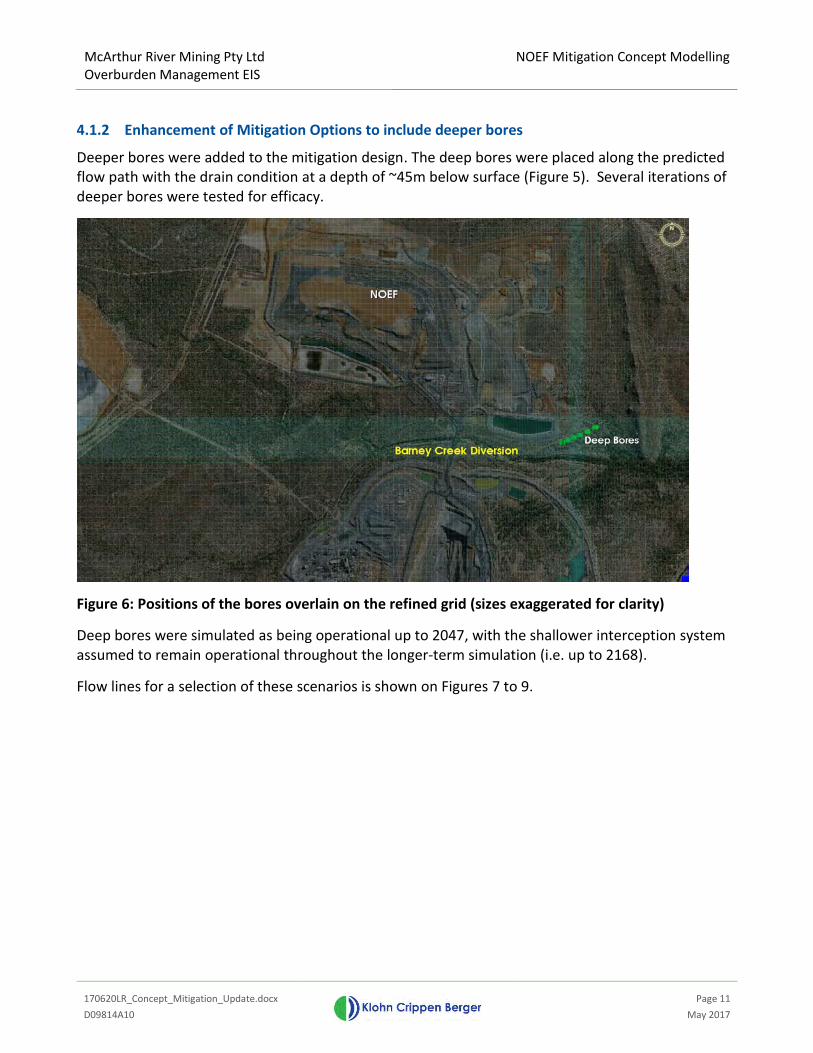
McArthur River Mining Pty Ltd Overburden Management EIS
NOEF Mitigation Concept Modelling
170620LR_Concept_Mitigation_Update.docx
Page 11
D09814A10 May 2017
4.1.2 Enhancement of Mitigation Options to include deeper bores
Deeper bores were added to the mitigation design. The deep bores were placed along the predicted flow path with the drain condition at a depth of ~45m below surface (Figure 5). Several iterations of deeper bores were tested for efficacy.
Figure 6: Positions of the bores overlain on the refined grid (sizes exaggerated for clarity)
Deep bores were simulated as being operational up to 2047, with the shallower interception system assumed to remain operational throughout the longer-term simulation (i.e. up to 2168).
Flow lines for a selection of these scenarios is shown on Figures 7 to 9.
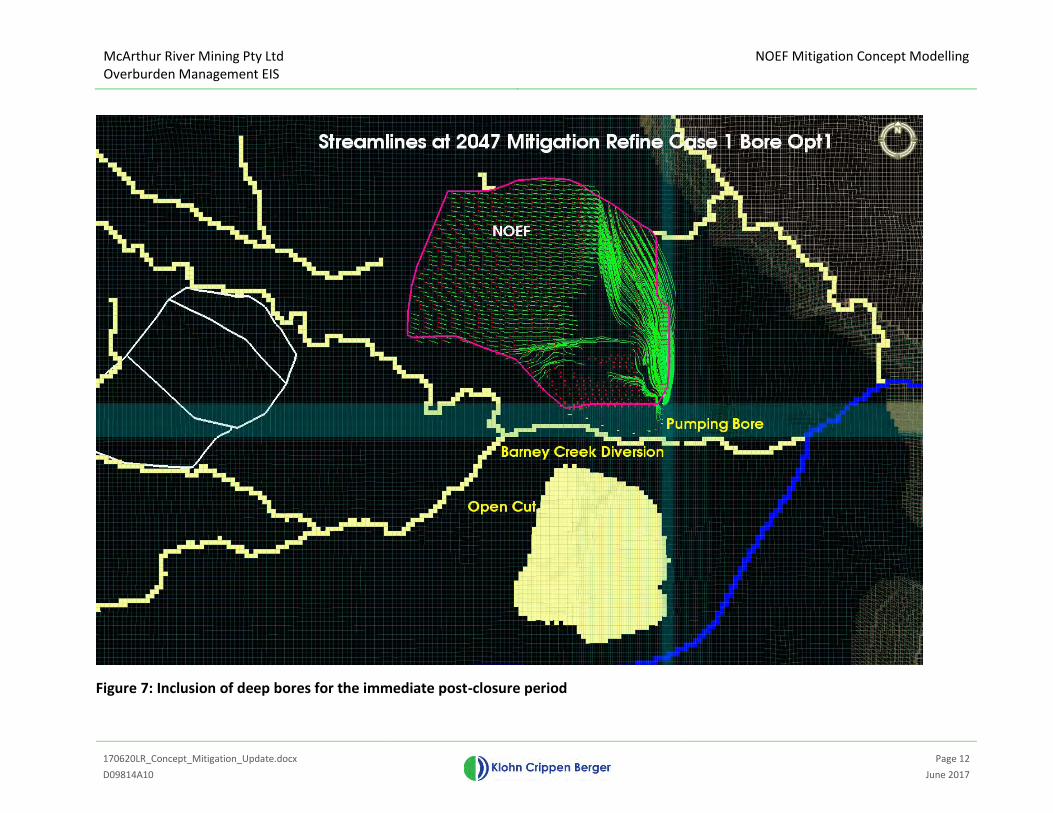
McArthur River Mining Pty Ltd Overburden Management EIS
NOEF Mitigation Concept Modelling
170620LR_Concept_Mitigation_Update.docx
Page 12
D09814A10 June 2017
Figure 7: Inclusion of deep bores for the immediate post-closure period
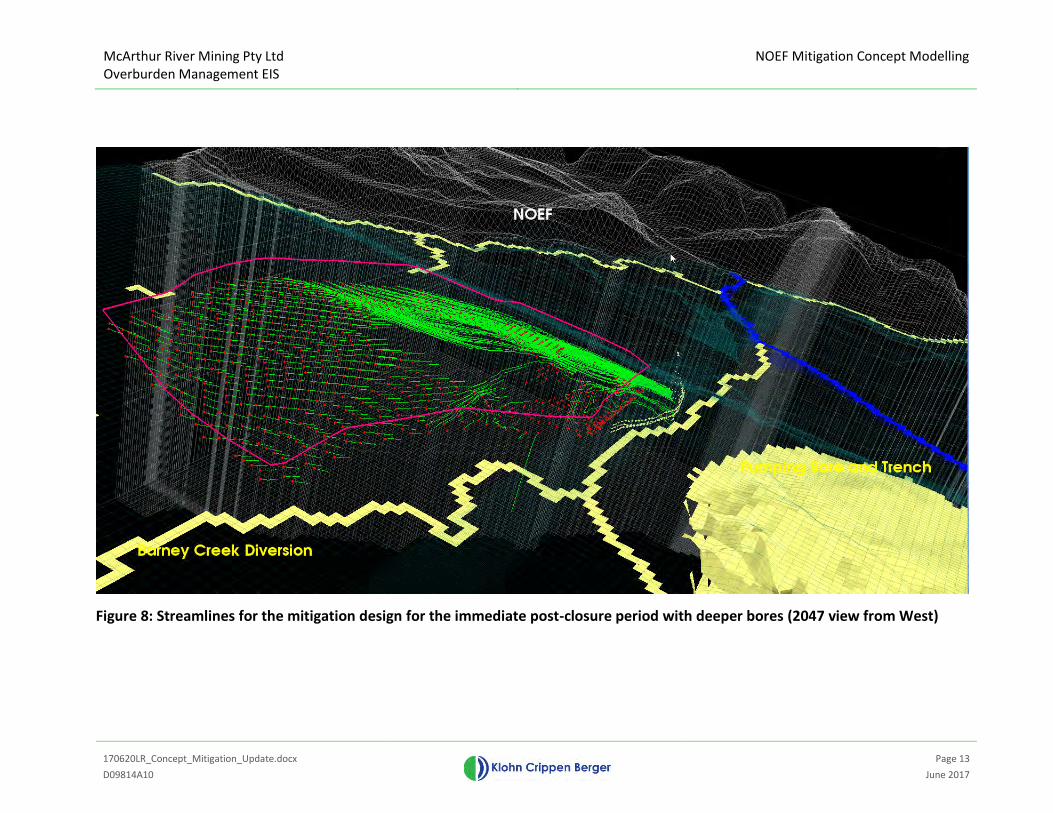
McArthur River Mining Pty Ltd Overburden Management EIS
NOEF Mitigation Concept Modelling
170620LR_Concept_Mitigation_Update.docx
Page 13
D09814A10 June 2017
Figure 8: Streamlines for the mitigation design for the immediate post-closure period with deeper bores (2047 view from West)
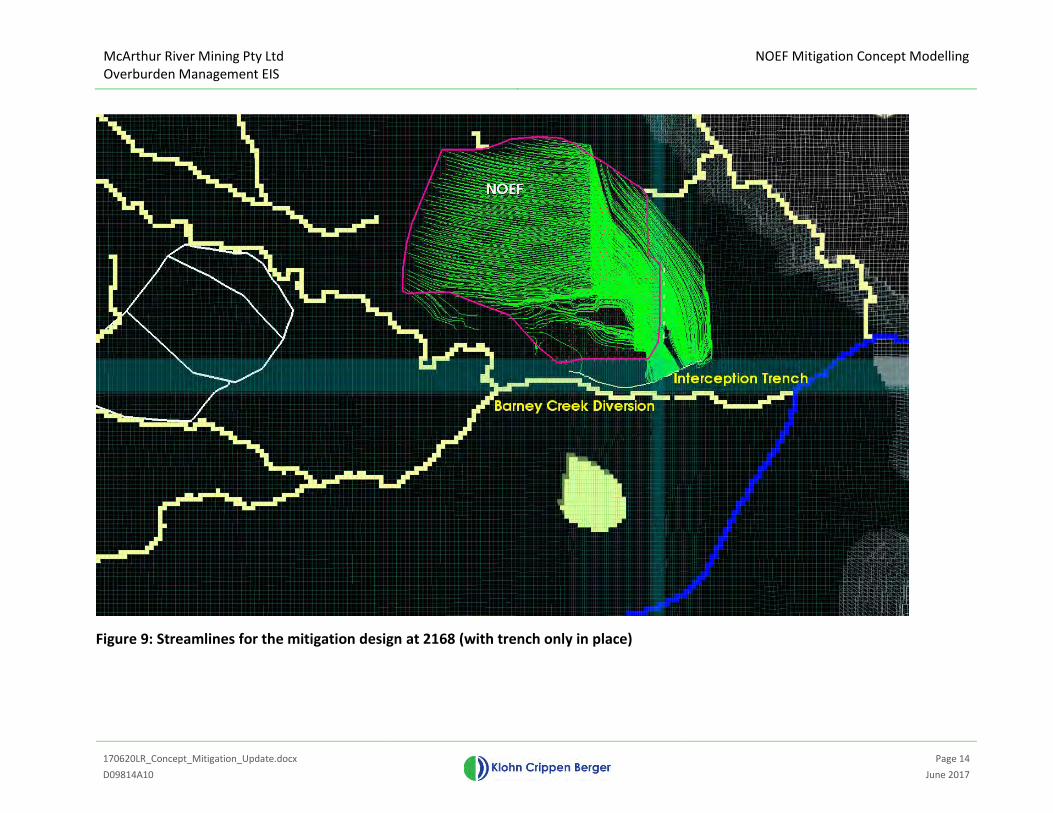
McArthur River Mining Pty Ltd Overburden Management EIS
NOEF Mitigation Concept Modelling
170620LR_Concept_Mitigation_Update.docx
Page 14
D09814A10 June 2017
Figure 9: Streamlines for the mitigation design at 2168 (with trench only in place)
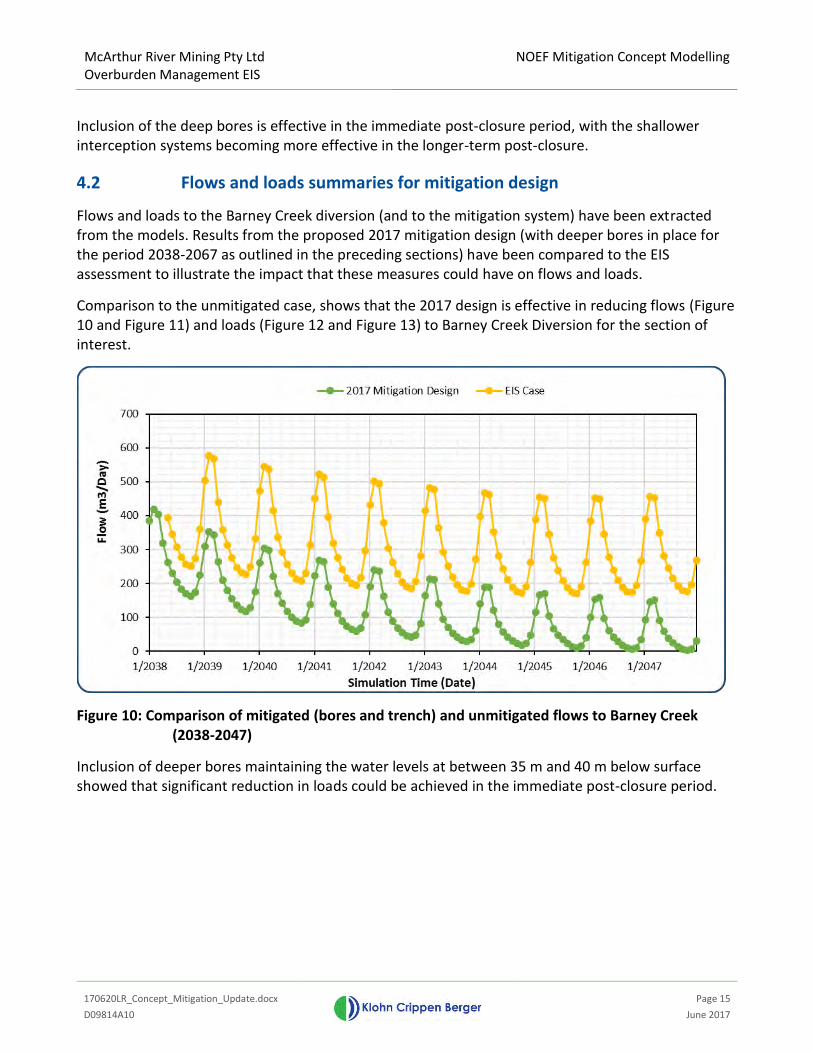
McArthur River Mining Pty Ltd Overburden Management EIS
NOEF Mitigation Concept Modelling
170620LR_Concept_Mitigation_Update.docx
Page 15
D09814A10 June 2017
Inclusion of the deep bores is effective in the immediate post-closure period, with the shallower interception systems becoming more effective in the longer-term post-closure.
4.2 Flows and loads summaries for mitigation design
Flows and loads to the Barney Creek diversion (and to the mitigation system) have been extracted from the models. Results from the proposed 2017 mitigation design (with deeper bores in place for the period 2038-2067 as outlined in the preceding sections) have been compared to the EIS assessment to illustrate the impact that these measures could have on flows and loads.
Comparison to the unmitigated case, shows that the 2017 design is effective in reducing flows (Figure 10 and Figure 11) and loads (Figure 12 and Figure 13) to Barney Creek Diversion for the section of interest.
Figure 10: Comparison of mitigated (bores and trench) and unmitigated flows to Barney Creek (2038-2047)
Inclusion of deeper bores maintaining the water levels at between 35 m and 40 m below surface showed that significant reduction in loads could be achieved in the immediate post-closure period.
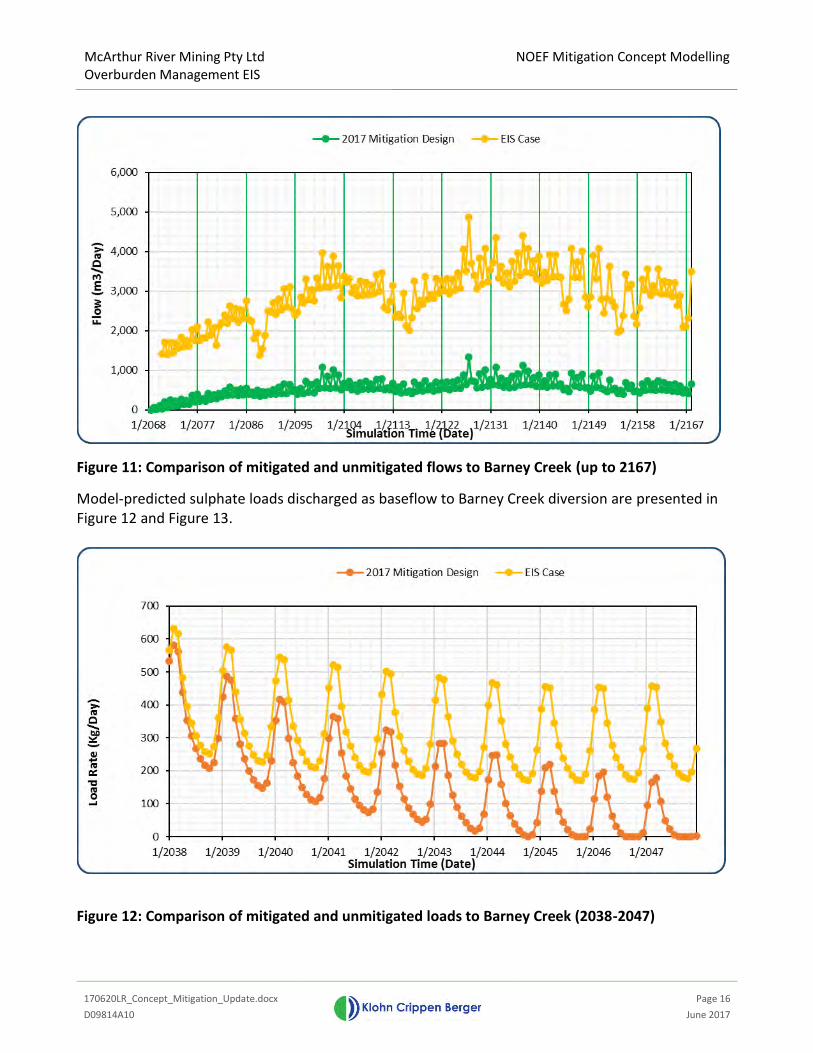
McArthur River Mining Pty Ltd Overburden Management EIS
NOEF Mitigation Concept Modelling
170620LR_Concept_Mitigation_Update.docx
Page 16
D09814A10 June 2017
Figure 11: Comparison of mitigated and unmitigated flows to Barney Creek (up to 2167)
Model-predicted sulphate loads discharged as baseflow to Barney Creek diversion are presented in Figure 12 and Figure 13.
Figure 12: Comparison of mitigated and unmitigated loads to Barney Creek (2038-2047)
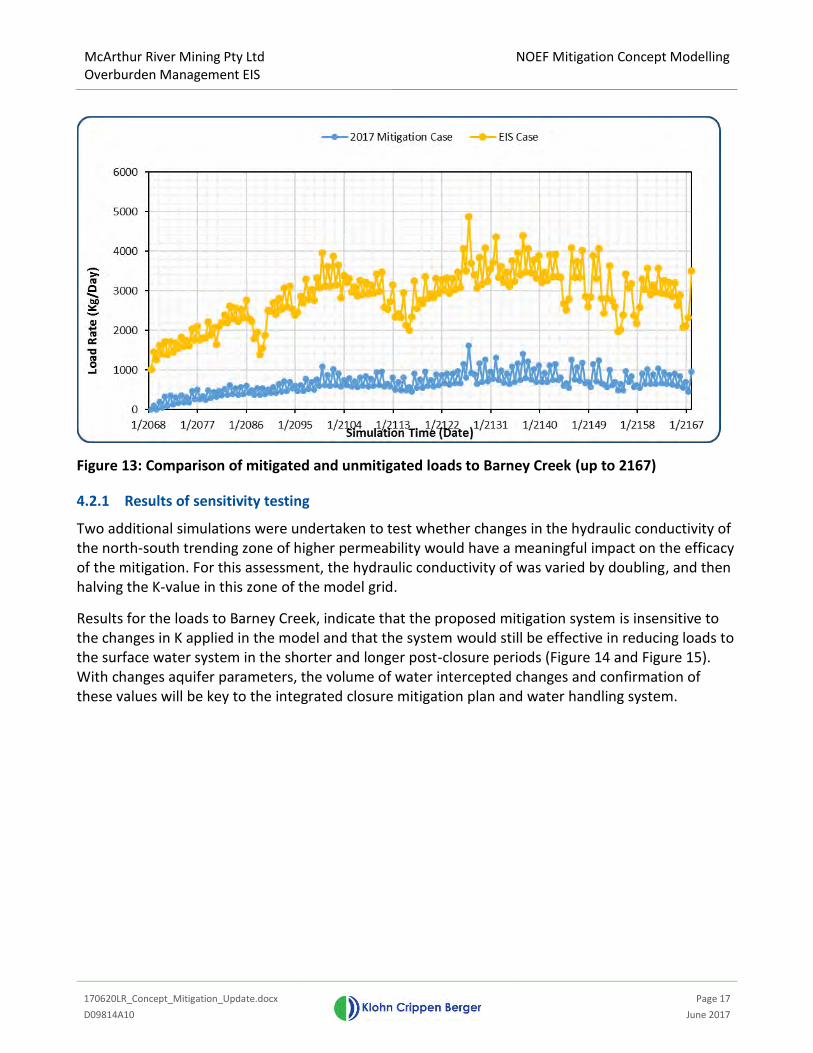
McArthur River Mining Pty Ltd Overburden Management EIS
NOEF Mitigation Concept Modelling
170620LR_Concept_Mitigation_Update.docx
Page 17
D09814A10 June 2017
Figure 13: Comparison of mitigated and unmitigated loads to Barney Creek (up to 2167)
4.2.1 Results of sensitivity testing
Two additional simulations were undertaken to test whether changes in the hydraulic conductivity of the north-south trending zone of higher permeability would have a meaningful impact on the efficacy of the mitigation. For this assessment, the hydraulic conductivity of was varied by doubling, and then halving the K-value in this zone of the model grid.
Results for the loads to Barney Creek, indicate that the proposed mitigation system is insensitive to the changes in K applied in the model and that the system would still be effective in reducing loads to the surface water system in the shorter and longer post-closure periods (Figure 14 and Figure 15). With changes aquifer parameters, the volume of water intercepted changes and confirmation of these values will be key to the integrated closure mitigation plan and water handling system.
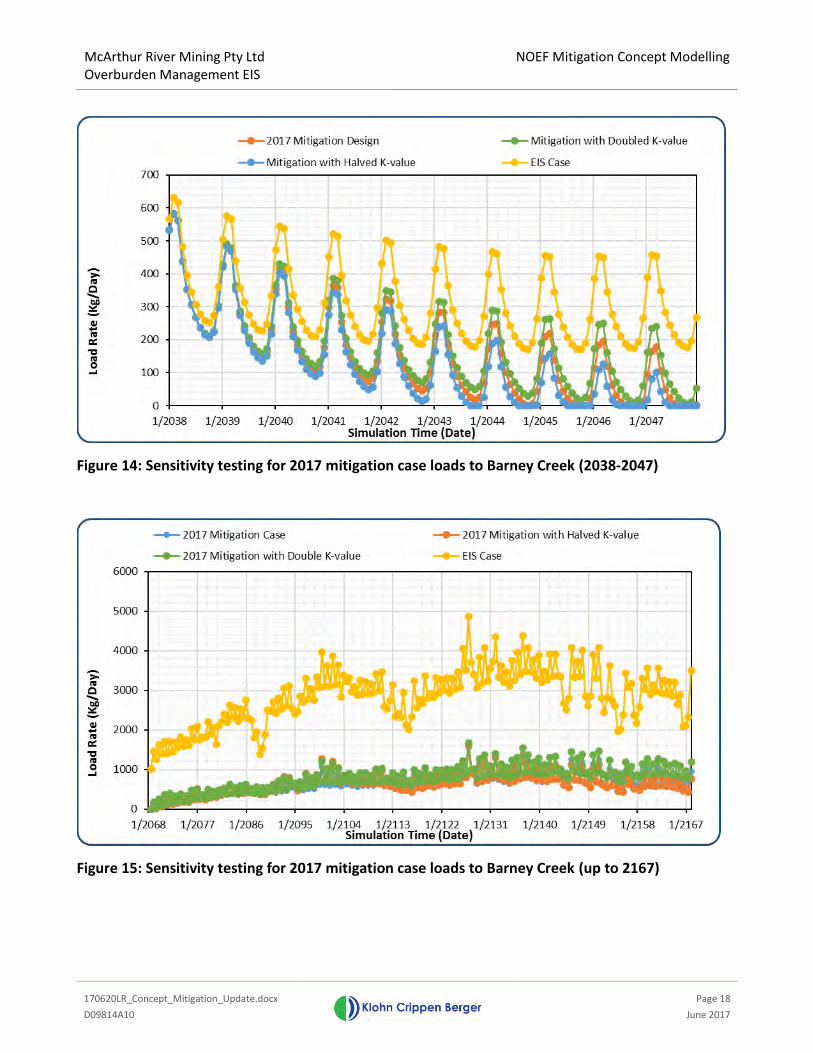
McArthur River Mining Pty Ltd Overburden Management EIS
NOEF Mitigation Concept Modelling
170620LR_Concept_Mitigation_Update.docx
Page 18
D09814A10 June 2017
Figure 14: Sensitivity testing for 2017 mitigation case loads to Barney Creek (2038-2047)
Figure 15: Sensitivity testing for 2017 mitigation case loads to Barney Creek (up to 2167)
McArthur River Mining Pty Ltd Overburden Management EIS
NOEF Mitigation Concept Modelling
170620LR_Concept_Mitigation_Update.docx
Page 19
D09814A10 June 2017
5 DISCUSSION
Key aspects from modelling using the refined grid and May 2017 mitigation design include:
Modelling with the refined grid provides more precise inclusion of the mitigation design. The unmitigated results from the EIS model and the refined model results show that model grid refinement does not change the model results to any significant degree.
During the early post-closure period (~ 2047), shallow interception options have limited effect as the flow lines are deeper than the proposed interception, i.e. a significant portion of seepage flows south, below the invert of the Barney Creek Diversion.
The trench/shallow bores are significantly more effective in post-closure, after the pit lake is established.
Inclusion of deeper bores in the model suggests interception pumping will be effective in mitigating the plume in the early post-closure period. Drain cells were included to simulate pumping to achieve water level depths of ~ 45 m were simulated.
Deeper bores could also be used to good effect in the closure period. The practical implications of continued pumping of deep bores after closure will need to be weighed up against the reduction in loads.
Conceptually, the 2017 mitigation design indicates that significant reduction in load to Barney Creek Diversion can be achieved. In the shorter-term (prior to pit lake rebound), deeper bores in combination with the shallow interception are also effective at reducing loads to the Barney Diversion.
Sensitivity analysis suggests that the hydraulic conductivity of the north-south structure influences the results but that the proposed mitigation option would still be effective.
6 LIMITATIONS AND ASSUMPTIONS
The following limitations and assumptions associated with the mitigation modelling assessment are noted:
This modelling should be regarded as an indicative simulation of the conceptual design. Detail of the interception system has been broadly approximated.
Only modelling two snapshot simulations is not a true indication of progressive capture of the sulphate plume. Using this snapshot approach there is no conditioning of heads or concentrations from the time of construction onwards. Rather, the trench/bore is assumed to become instantaneously active at the start of each model simulation, and highly efficient in its performance. To conceptually assess the efficacy of the mitigation system, this snapshot approach is conservative (i.e. the trench would likely impact water levels sooner than shown in this modelling).
McArthur River Mining Pty Ltd Overburden Management EIS
NOEF Mitigation Concept Modelling
170620LR_Concept_Mitigation_Update.docx
Page 20
D09814A10 June 2017
The EIS groundwater model was built to represent source-pathway-receptor systems at a catchment scale. For this reason, the equivalent porous media (EPM) method used to represent zones of fracturing and for karstic features in the Cooley Dolomite/Reward Dolomite was deemed to be appropriate. EPM is suitable at this catchment-scale because it represents the broad pathway from source to receptor. However, for local-scale problems, EPM may be less suitable. If significant fracture zones or solution cavities at depth within the Cooley Dolomite are a primary conduit for NOEF seepage, there is a potential for seepage to migrate under the trench through one or more of these features. During design of the mitigation system, investigations on the nature of the Cooley Dolomite system would provide a better understanding of the physical and hydraulic nature of the preferential flow systems within this aquifer pathway.
The reference head in the rockfill slot was assumed to be at the base of the slot for the trenches. In reality, there will be a head of water in the rockfill which will influence the performance of the drain. Depending on the underlying aquifer conditions, sections of head in the drain may locally discharge back into the regional system.
The vertical permeability of the trench system has been assumed to be sufficient for groundwater to migrate without limitation to the trench, under the influence of the hydraulic gradients.
The trench capture performance is assumed to be highly efficient in the current model simulations. No reduction in capture rate was accounted for natural processes such as siltation of the rockfill and precipitation on the rockfill and material immediately surrounding the trench.
No optimisation of the options has been undertaken, and the results presents are provided with the specifications from GHD, and/or agreed to between KCB and MRM. It is expected that further reductions in loads can be obtained by changing depths or rates of pumping from these options.

McArthur River Mining Pty Ltd Overburden Management EIS
NOEF Mitigation Concept Modelling
170620LR_Concept_Mitigation_Update.docx
Page 21
D09814A10 June 2017
7 CLOSING
This letter report is an instrument of service of Klohn Crippen Berger Ltd. The report has been prepared for the exclusive use of McArthur River Mine (Client) for the specific application to the 2017 EIS. The report's contents may not be relied upon by any other party without the express written permission of Klohn Crippen Berger. In this report, Klohn Crippen Berger has endeavoured to comply with generally-accepted professional practice common to the local area. Klohn Crippen Berger makes no warranty, express or implied.
Yours truly,
KLOHN CRIPPEN BERGER LTD
Brent Usher, PhD Geosciences Manager/ Project Manager

McArthur River Mining Ltd
MRM OMP EIS
2017 EIS Supplementary
171215DR Appendix IV Concentration Figures
GSL Model.docx Page -1
D09814A25 December 2017
APPENDIX IV
GSL case concentration plots: Multiple aquifers & smaller intervals up to 2100
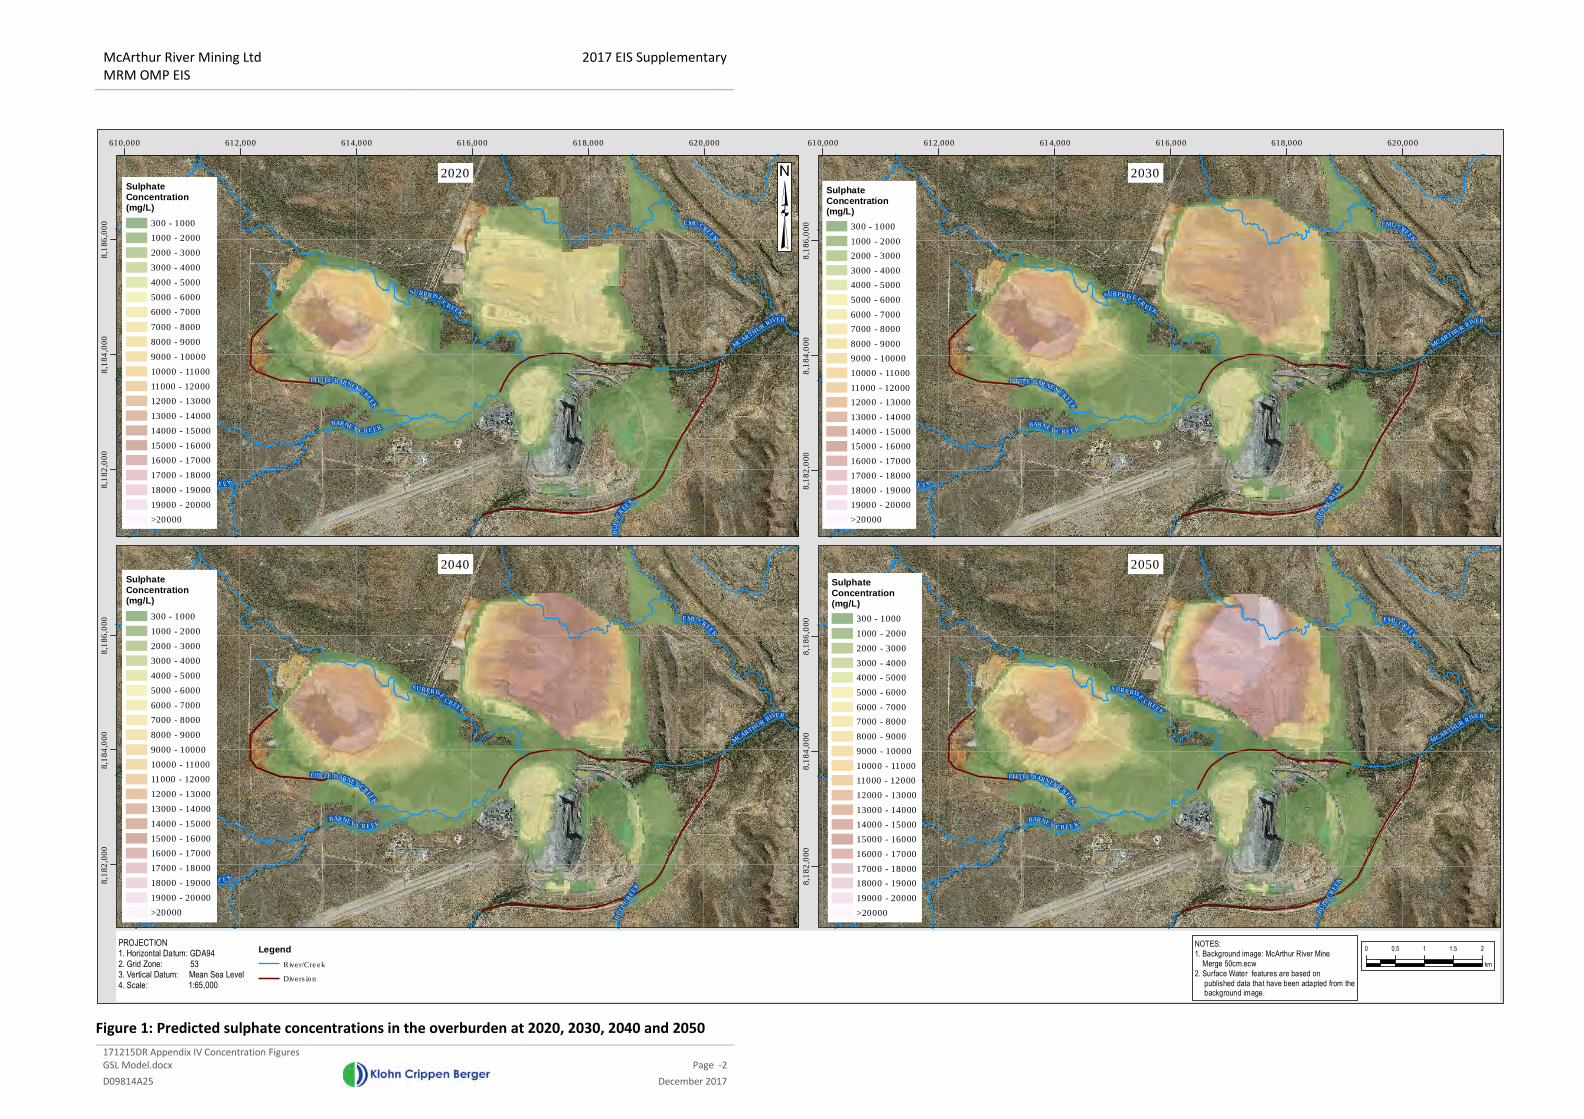
McArthur River Mining Ltd
MRM OMP EIS
2017 EIS Supplementary
171215DR Appendix IV Concentration Figures
GSL Model.docx
Page -2
D09814A25 December 2017
Figure 1: Predicted sulphate concentrations in the overburden at 2020, 2030, 2040 and 2050
SURPRISE
C
REEK
MCARTHUR
RIVER
BU
LL
CR
EE
K
BARNEYCREEK
EMUCREE
K
LITTLE BARNEYCR
EEK
BU
F
FALO CRE E K
610,000 612,000 614,000 616,000 618,000 620,000
8,1
82
,000
8,1
84
,000
8,1
86
,000
0 0.5 1 1.5 2
km
NOTES:
1. Background image: McArthur River Mine
Merge 50cm.ecw
2. Surface Water features are based on
published data that have been adapted from the background image.
Legend
River/Creek
Diversion
SURPRISE
CREEK
MCARTHUR
RIVER
BU
LL
CR
EEK
BARNEYCREEK
LITTLE BARNEYCR
EEK
EMUCREE
K
BU
F
FALO
CREEK
8,1
82
,000
8,1
84
,000
8,1
86
,000
SURPRISE
CREEK
MCARTHUR
RIVER
BU
LL
CR
EE
K
BARNEYCREEK
LITTLE BARNEYCR
EEK
EMUCREEK
BU
F
FALO CRE E K
8,1
82
,000
8,1
84
,000
8,1
86
,000
SURPRISECR
EEK
MCARTHUR
RIVER
BU
LL
CR
EEK
BARNEY CRE EK
EMUCREEK
LITTLE BARNEYCR
EE
K
BU
F
FALO CRE EK
610,000 612,000 614,000 616,000 618,000 620,000
8,1
82
,000
8,1
84
,000
8,1
86
,000
PROJECTION1. Horizontal Datum: GDA94
2. Grid Zone: 533. Vertical Datum: Mean Sea Level
4. Scale: 1:65,000
2020 2030
20502040
SulphateConcentration(mg/L)
300 - 1000
1000 - 2000
2000 - 3000
3000 - 4000
4000 - 5000
5000 - 6000
6000 - 7000
7000 - 8000
8000 - 9000
9000 - 10000
10000 - 11000
11000 - 12000
12000 - 13000
13000 - 14000
14000 - 15000
15000 - 16000
16000 - 17000
17000 - 18000
18000 - 19000
19000 - 20000
>20000
SulphateConcentration(mg/L)
300 - 1000
1000 - 2000
2000 - 3000
3000 - 4000
4000 - 5000
5000 - 6000
6000 - 7000
7000 - 8000
8000 - 9000
9000 - 10000
10000 - 11000
11000 - 12000
12000 - 13000
13000 - 14000
14000 - 15000
15000 - 16000
16000 - 17000
17000 - 18000
18000 - 19000
19000 - 20000
>20000
SulphateConcentration(mg/L)
300 - 1000
1000 - 2000
2000 - 3000
3000 - 4000
4000 - 5000
5000 - 6000
6000 - 7000
7000 - 8000
8000 - 9000
9000 - 10000
10000 - 11000
11000 - 12000
12000 - 13000
13000 - 14000
14000 - 15000
15000 - 16000
16000 - 17000
17000 - 18000
18000 - 19000
19000 - 20000
>20000
SulphateConcentration(mg/L)
300 - 1000
1000 - 2000
2000 - 3000
3000 - 4000
4000 - 5000
5000 - 6000
6000 - 7000
7000 - 8000
8000 - 9000
9000 - 10000
10000 - 11000
11000 - 12000
12000 - 13000
13000 - 14000
14000 - 15000
15000 - 16000
16000 - 17000
17000 - 18000
18000 - 19000
19000 - 20000
>20000
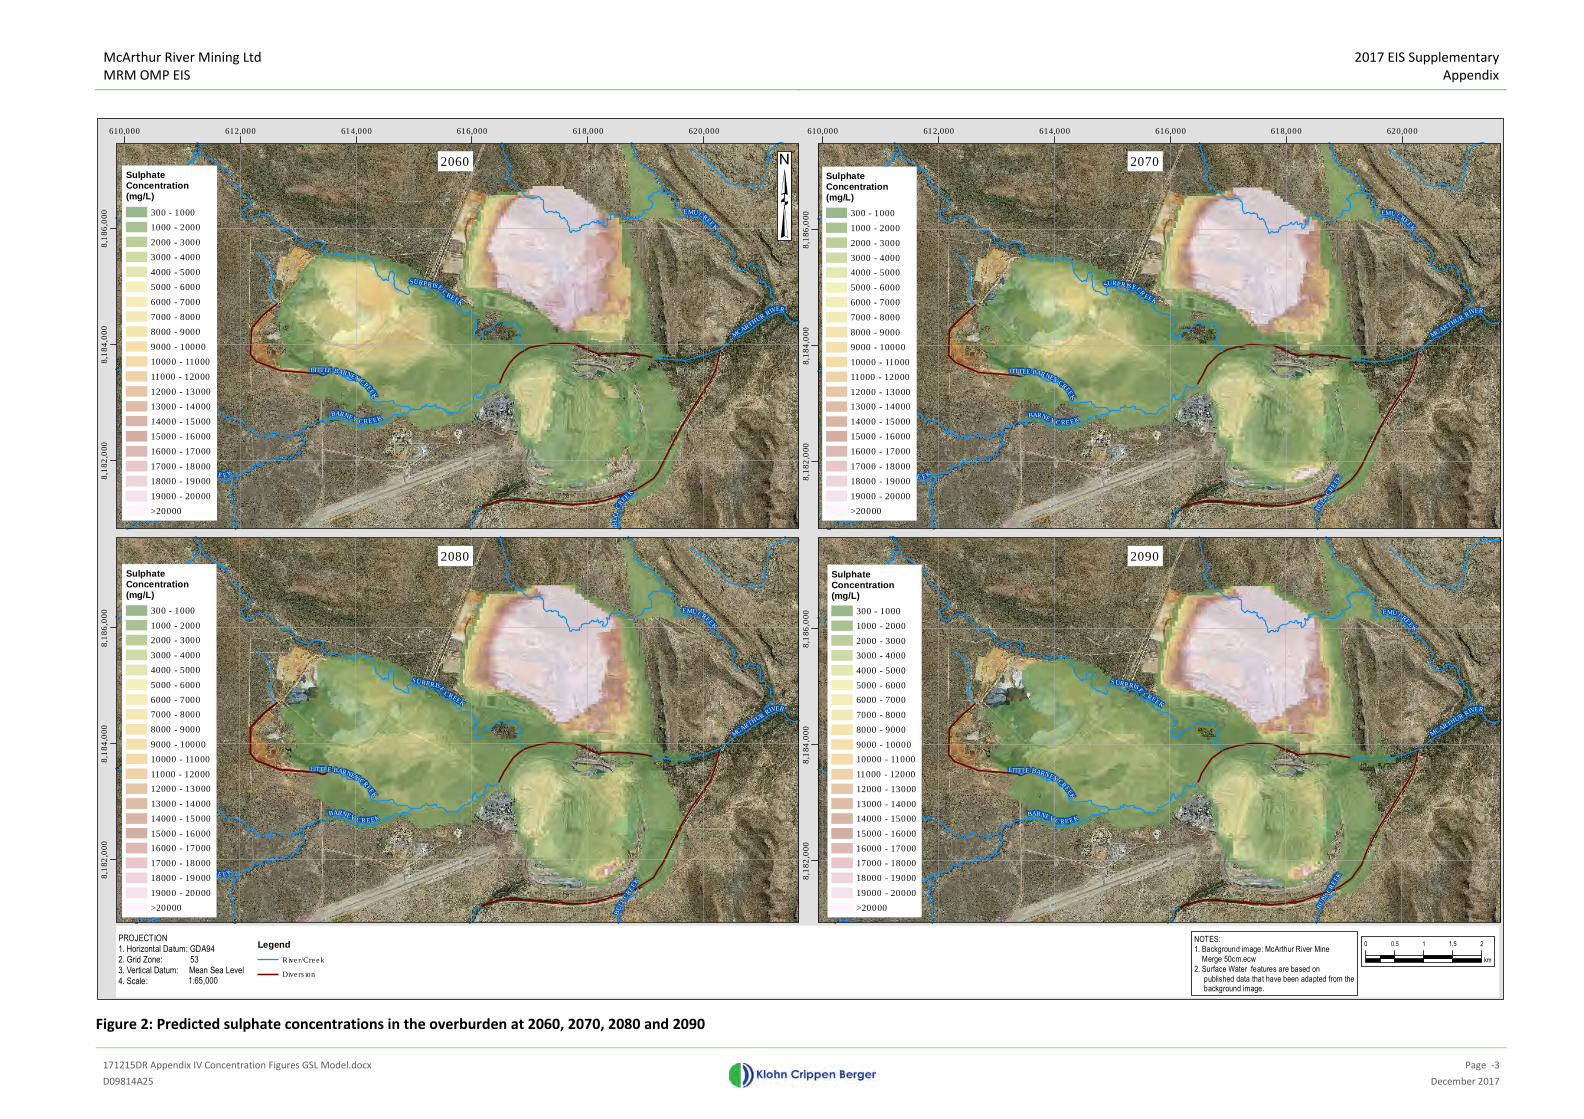
McArthur River Mining Ltd
MRM OMP EIS
2017 EIS Supplementary
Appendix
171215DR Appendix IV Concentration Figures GSL Model.docx
Page -3
D09814A25 December 2017
Figure 2: Predicted sulphate concentrations in the overburden at 2060, 2070, 2080 and 2090
SURPRISE
C
REEK
MCARTHUR
RIVER
BU
LL
CR
EE
K
BARNEYCREEK
EMUCREE
K
LITTLE BARNEYCR
EEK
BU
F
FALO CRE E K
610,000 612,000 614,000 616,000 618,000 620,000
8,1
82
,000
8,1
84
,000
8,1
86
,000
0 0.5 1 1.5 2
km
NOTES:
1. Background image: McArthur River Mine
Merge 50cm.ecw
2. Surface Water features are based on
published data that have been adapted from the background image.
Legend
River/Creek
Diversion
SURPRISE
CREEK
MCARTHUR
RIVER
BU
LL
CR
EEK
BARNEYCREEK
LITTLE BARNEYCR
EEK
EMUCREE
K
BU
FFA
LOCREEK
8,1
82
,000
8,1
84
,000
8,1
86
,000
SURPRISE
CREEK
MCARTHUR
RIVER
BU
LL
CR
EE
K
BARNEYCREEK
LITTLE BARNEYCR
EEK
EMUCREEK
BU
F
FALO CRE E K
8,1
82
,000
8,1
84
,000
8,1
86
,000
SURPRISECR
EEK
MCARTHUR
RIVER
BU
LL
CR
EEK
BARNEY CRE EK
EMUCREEK
LITTLE BARNEYCR
EE
K
BU
F
FALO CRE EK
610,000 612,000 614,000 616,000 618,000 620,000
8,1
82
,000
8,1
84
,000
8,1
86
,000
PROJECTION1. Horizontal Datum: GDA942. Grid Zone: 533. Vertical Datum: Mean Sea Level
4. Scale: 1:65,000
2060 2070
20902080
SulphateConcentration(mg/L)
300 - 1000
1000 - 2000
2000 - 3000
3000 - 4000
4000 - 5000
5000 - 6000
6000 - 7000
7000 - 8000
8000 - 9000
9000 - 10000
10000 - 11000
11000 - 12000
12000 - 13000
13000 - 14000
14000 - 15000
15000 - 16000
16000 - 17000
17000 - 18000
18000 - 19000
19000 - 20000
>20000
SulphateConcentration(mg/L)
300 - 1000
1000 - 2000
2000 - 3000
3000 - 4000
4000 - 5000
5000 - 6000
6000 - 7000
7000 - 8000
8000 - 9000
9000 - 10000
10000 - 11000
11000 - 12000
12000 - 13000
13000 - 14000
14000 - 15000
15000 - 16000
16000 - 17000
17000 - 18000
18000 - 19000
19000 - 20000
>20000
SulphateConcentration(mg/L)
300 - 1000
1000 - 2000
2000 - 3000
3000 - 4000
4000 - 5000
5000 - 6000
6000 - 7000
7000 - 8000
8000 - 9000
9000 - 10000
10000 - 11000
11000 - 12000
12000 - 13000
13000 - 14000
14000 - 15000
15000 - 16000
16000 - 17000
17000 - 18000
18000 - 19000
19000 - 20000
>20000
SulphateConcentration(mg/L)
300 - 1000
1000 - 2000
2000 - 3000
3000 - 4000
4000 - 5000
5000 - 6000
6000 - 7000
7000 - 8000
8000 - 9000
9000 - 10000
10000 - 11000
11000 - 12000
12000 - 13000
13000 - 14000
14000 - 15000
15000 - 16000
16000 - 17000
17000 - 18000
18000 - 19000
19000 - 20000
>20000

McArthur River Mining Ltd
MRM OMP EIS
2017 EIS Supplementary
Appendix
171215DR Appendix IV Concentration Figures GSL Model.docx
Page -4
D09814A25 December 2017
Figure 3: Predicted sulphate concentrations in the overburden at 2100
SURPRISE
C
REEK
MCARTHUR
RIVER
BU
LL
CR
EE
K
BARNEYCREEK
EMUCREE
K
LITTLE BARNEYCR
EEK
BU
F
FALO CRE E K
610,000 612,000 614,000 616,000 618,000 620,000
8,1
82
,000
8,1
84
,000
8,1
86
,000
0 0.5 1 1.5 2
km
NOTES:
1. Background image: McArthur River Mine
Merge 50cm.ecw
2. Surface Water features are based on
published data that have been adapted from the background image.
Legend
River/Creek
Diversion
PROJECTION1. Horizontal Datum: GDA942. Grid Zone: 533. Vertical Datum: Mean Sea Level
4. Scale: 1:65,000
2100SulphateConcentration(mg/L)
300 - 1000
1000 - 2000
2000 - 3000
3000 - 4000
4000 - 5000
5000 - 6000
6000 - 7000
7000 - 8000
8000 - 9000
9000 - 10000
10000 - 11000
11000 - 12000
12000 - 13000
13000 - 14000
14000 - 15000
15000 - 16000
16000 - 17000
17000 - 18000
18000 - 19000
19000 - 20000
>20000
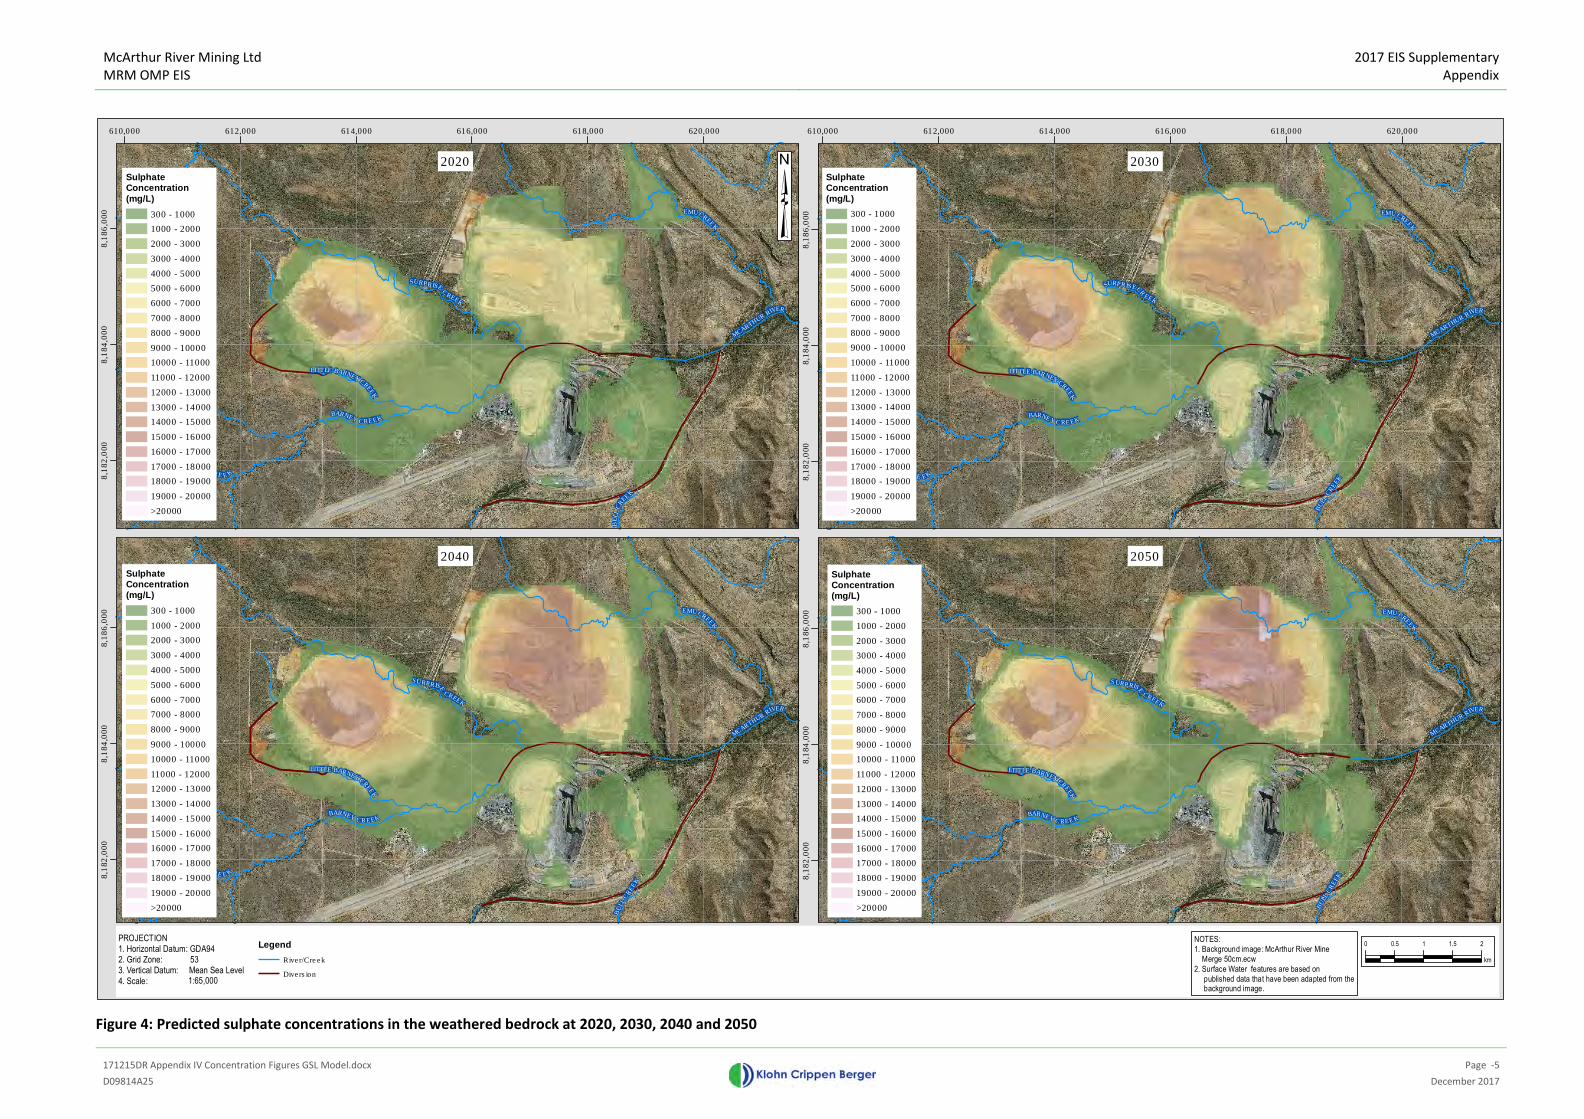
McArthur River Mining Ltd
MRM OMP EIS
2017 EIS Supplementary
Appendix
171215DR Appendix IV Concentration Figures GSL Model.docx
Page -5
D09814A25 December 2017
Figure 4: Predicted sulphate concentrations in the weathered bedrock at 2020, 2030, 2040 and 2050
SURPRISE
C
REEK
MCARTHUR
RIVER
BU
LL
CR
EE
K
BARNEYCREEK
EMUCREE
K
LITTLE BARNEYCR
EEK
BU
F
FALO CRE E K
610,000 612,000 614,000 616,000 618,000 620,000
8,1
82
,000
8,1
84
,000
8,1
86
,000
0 0.5 1 1.5 2
km
NOTES:
1. Background image: McArthur River Mine
Merge 50cm.ecw
2. Surface Water features are based on
published data that have been adapted from the background image.
Legend
River/Creek
Diversion
SURPRISE
CREEK
MCARTHUR
RIVER
BU
LL
CR
EEK
BARNEYCREEK
LITTLE BARNEYCR
EEK
EMUCREE
K
BU
FFA
LOCREEK
8,1
82
,000
8,1
84
,000
8,1
86
,000
SURPRISE
CREEK
MCARTHUR
RIVER
BU
LL
CR
EE
K
BARNEYCREEK
LITTLE BARNEYCR
EEK
EMUCREEK
BU
F
FALO CRE E K
8,1
82
,000
8,1
84
,000
8,1
86
,000
SURPRISECR
EEK
MCARTHUR
RIVER
BU
LL
CR
EEK
BARNEY CRE EK
EMUCREEK
LITTLE BARNEYCR
EE
K
BU
F
FALO CRE EK
610,000 612,000 614,000 616,000 618,000 620,000
8,1
82
,000
8,1
84
,000
8,1
86
,000
PROJECTION1. Horizontal Datum: GDA942. Grid Zone: 533. Vertical Datum: Mean Sea Level
4. Scale: 1:65,000
2020 2030
20502040
SulphateConcentration(mg/L)
300 - 1000
1000 - 2000
2000 - 3000
3000 - 4000
4000 - 5000
5000 - 6000
6000 - 7000
7000 - 8000
8000 - 9000
9000 - 10000
10000 - 11000
11000 - 12000
12000 - 13000
13000 - 14000
14000 - 15000
15000 - 16000
16000 - 17000
17000 - 18000
18000 - 19000
19000 - 20000
>20000
SulphateConcentration(mg/L)
300 - 1000
1000 - 2000
2000 - 3000
3000 - 4000
4000 - 5000
5000 - 6000
6000 - 7000
7000 - 8000
8000 - 9000
9000 - 10000
10000 - 11000
11000 - 12000
12000 - 13000
13000 - 14000
14000 - 15000
15000 - 16000
16000 - 17000
17000 - 18000
18000 - 19000
19000 - 20000
>20000
SulphateConcentration(mg/L)
300 - 1000
1000 - 2000
2000 - 3000
3000 - 4000
4000 - 5000
5000 - 6000
6000 - 7000
7000 - 8000
8000 - 9000
9000 - 10000
10000 - 11000
11000 - 12000
12000 - 13000
13000 - 14000
14000 - 15000
15000 - 16000
16000 - 17000
17000 - 18000
18000 - 19000
19000 - 20000
>20000
SulphateConcentration(mg/L)
300 - 1000
1000 - 2000
2000 - 3000
3000 - 4000
4000 - 5000
5000 - 6000
6000 - 7000
7000 - 8000
8000 - 9000
9000 - 10000
10000 - 11000
11000 - 12000
12000 - 13000
13000 - 14000
14000 - 15000
15000 - 16000
16000 - 17000
17000 - 18000
18000 - 19000
19000 - 20000
>20000
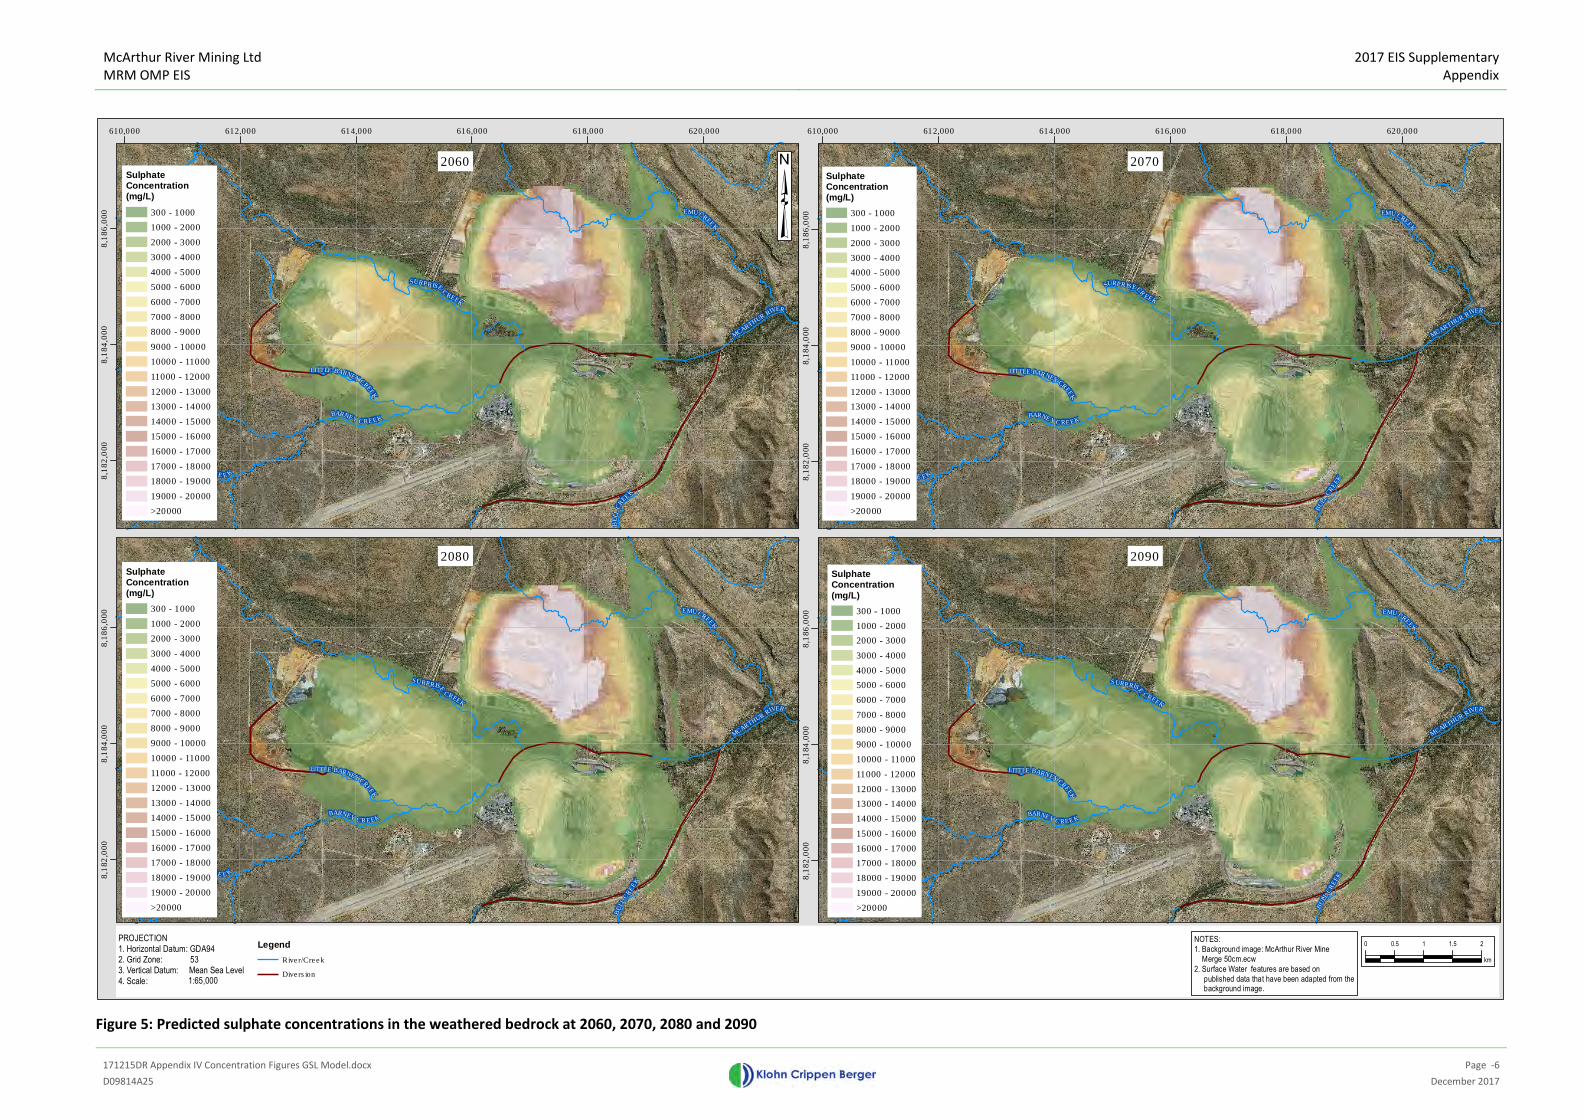
McArthur River Mining Ltd
MRM OMP EIS
2017 EIS Supplementary
Appendix
171215DR Appendix IV Concentration Figures GSL Model.docx
Page -6
D09814A25 December 2017
Figure 5: Predicted sulphate concentrations in the weathered bedrock at 2060, 2070, 2080 and 2090
SURPRISE
C
REEK
MCARTHUR
RIVER
BU
LL
CR
EE
K
BARNEYCREEK
EMUCREE
K
LITTLE BARNEYCR
EEK
BU
F
FALO CRE E K
610,000 612,000 614,000 616,000 618,000 620,000
8,1
82
,000
8,1
84
,000
8,1
86
,000
0 0.5 1 1.5 2
km
NOTES:
1. Background image: McArthur River Mine
Merge 50cm.ecw
2. Surface Water features are based on
published data that have been adapted from the background image.
Legend
River/Creek
Diversion
SURPRISE
CREEK
MCARTHUR
RIVER
BU
LL
CR
EEK
BARNEYCREEK
LITTLE BARNEYCR
EEK
EMUCREE
K
BU
FFA
LOCREEK
8,1
82
,000
8,1
84
,000
8,1
86
,000
SURPRISE
CREEK
MCARTHUR
RIVER
BU
LL
CR
EE
K
BARNEYCREEK
LITTLE BARNEYCR
EEK
EMUCREEK
BU
F
FALO CRE E K
8,1
82
,000
8,1
84
,000
8,1
86
,000
SURPRISECR
EEK
MCARTHUR
RIVER
BU
LL
CR
EEK
BARNEY CRE EK
EMUCREEK
LITTLE BARNEYCR
EE
K
BU
F
FALO CRE EK
610,000 612,000 614,000 616,000 618,000 620,000
8,1
82
,000
8,1
84
,000
8,1
86
,000
PROJECTION1. Horizontal Datum: GDA942. Grid Zone: 533. Vertical Datum: Mean Sea Level
4. Scale: 1:65,000
2060 2070
20902080
SulphateConcentration(mg/L)
300 - 1000
1000 - 2000
2000 - 3000
3000 - 4000
4000 - 5000
5000 - 6000
6000 - 7000
7000 - 8000
8000 - 9000
9000 - 10000
10000 - 11000
11000 - 12000
12000 - 13000
13000 - 14000
14000 - 15000
15000 - 16000
16000 - 17000
17000 - 18000
18000 - 19000
19000 - 20000
>20000
SulphateConcentration(mg/L)
300 - 1000
1000 - 2000
2000 - 3000
3000 - 4000
4000 - 5000
5000 - 6000
6000 - 7000
7000 - 8000
8000 - 9000
9000 - 10000
10000 - 11000
11000 - 12000
12000 - 13000
13000 - 14000
14000 - 15000
15000 - 16000
16000 - 17000
17000 - 18000
18000 - 19000
19000 - 20000
>20000
SulphateConcentration(mg/L)
300 - 1000
1000 - 2000
2000 - 3000
3000 - 4000
4000 - 5000
5000 - 6000
6000 - 7000
7000 - 8000
8000 - 9000
9000 - 10000
10000 - 11000
11000 - 12000
12000 - 13000
13000 - 14000
14000 - 15000
15000 - 16000
16000 - 17000
17000 - 18000
18000 - 19000
19000 - 20000
>20000
SulphateConcentration(mg/L)
300 - 1000
1000 - 2000
2000 - 3000
3000 - 4000
4000 - 5000
5000 - 6000
6000 - 7000
7000 - 8000
8000 - 9000
9000 - 10000
10000 - 11000
11000 - 12000
12000 - 13000
13000 - 14000
14000 - 15000
15000 - 16000
16000 - 17000
17000 - 18000
18000 - 19000
19000 - 20000
>20000
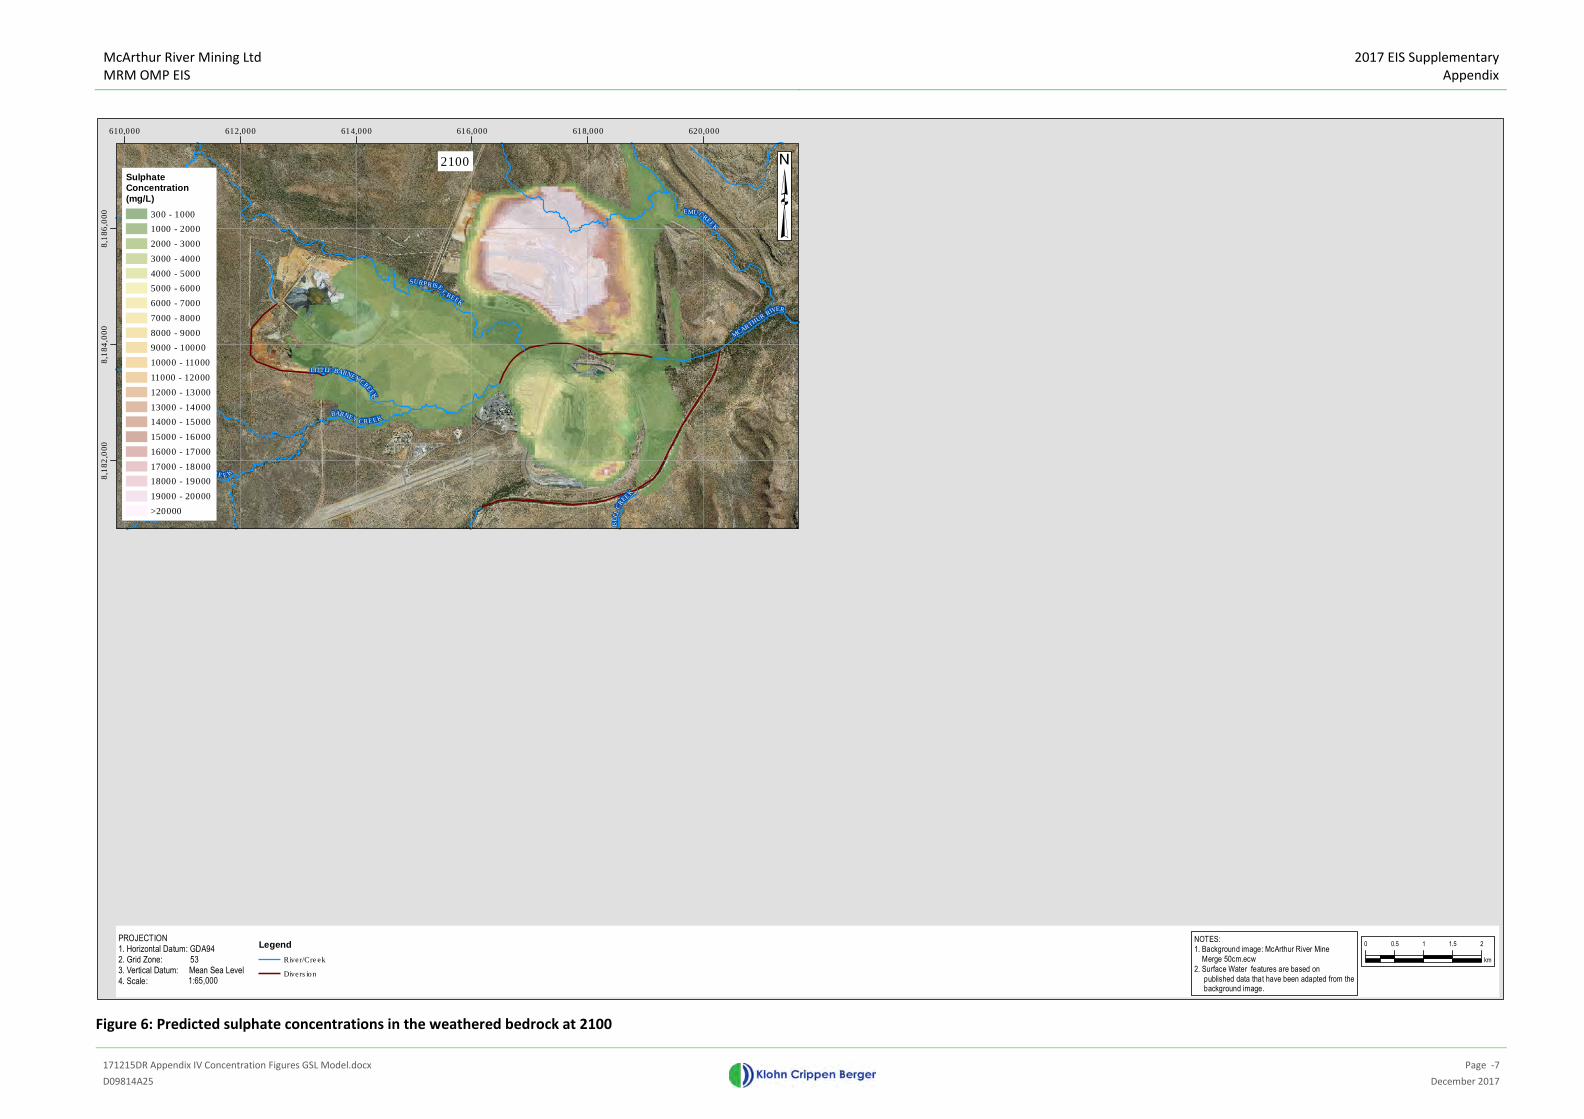
McArthur River Mining Ltd
MRM OMP EIS
2017 EIS Supplementary
Appendix
171215DR Appendix IV Concentration Figures GSL Model.docx
Page -7
D09814A25 December 2017
Figure 6: Predicted sulphate concentrations in the weathered bedrock at 2100
SURPRISE
C
REEK
MCARTHUR
RIVER
BU
LL
CR
EE
K
BARNEYCREEK
EMUCREE
K
LITTLE BARNEYCR
EEK
BU
F
FALO CRE E K
610,000 612,000 614,000 616,000 618,000 620,000
8,1
82
,000
8,1
84
,000
8,1
86
,000
0 0.5 1 1.5 2
km
NOTES:
1. Background image: McArthur River Mine
Merge 50cm.ecw
2. Surface Water features are based on
published data that have been adapted from the background image.
Legend
River/Creek
Diversion
PROJECTION1. Horizontal Datum: GDA942. Grid Zone: 533. Vertical Datum: Mean Sea Level
4. Scale: 1:65,000
2100SulphateConcentration(mg/L)
300 - 1000
1000 - 2000
2000 - 3000
3000 - 4000
4000 - 5000
5000 - 6000
6000 - 7000
7000 - 8000
8000 - 9000
9000 - 10000
10000 - 11000
11000 - 12000
12000 - 13000
13000 - 14000
14000 - 15000
15000 - 16000
16000 - 17000
17000 - 18000
18000 - 19000
19000 - 20000
>20000
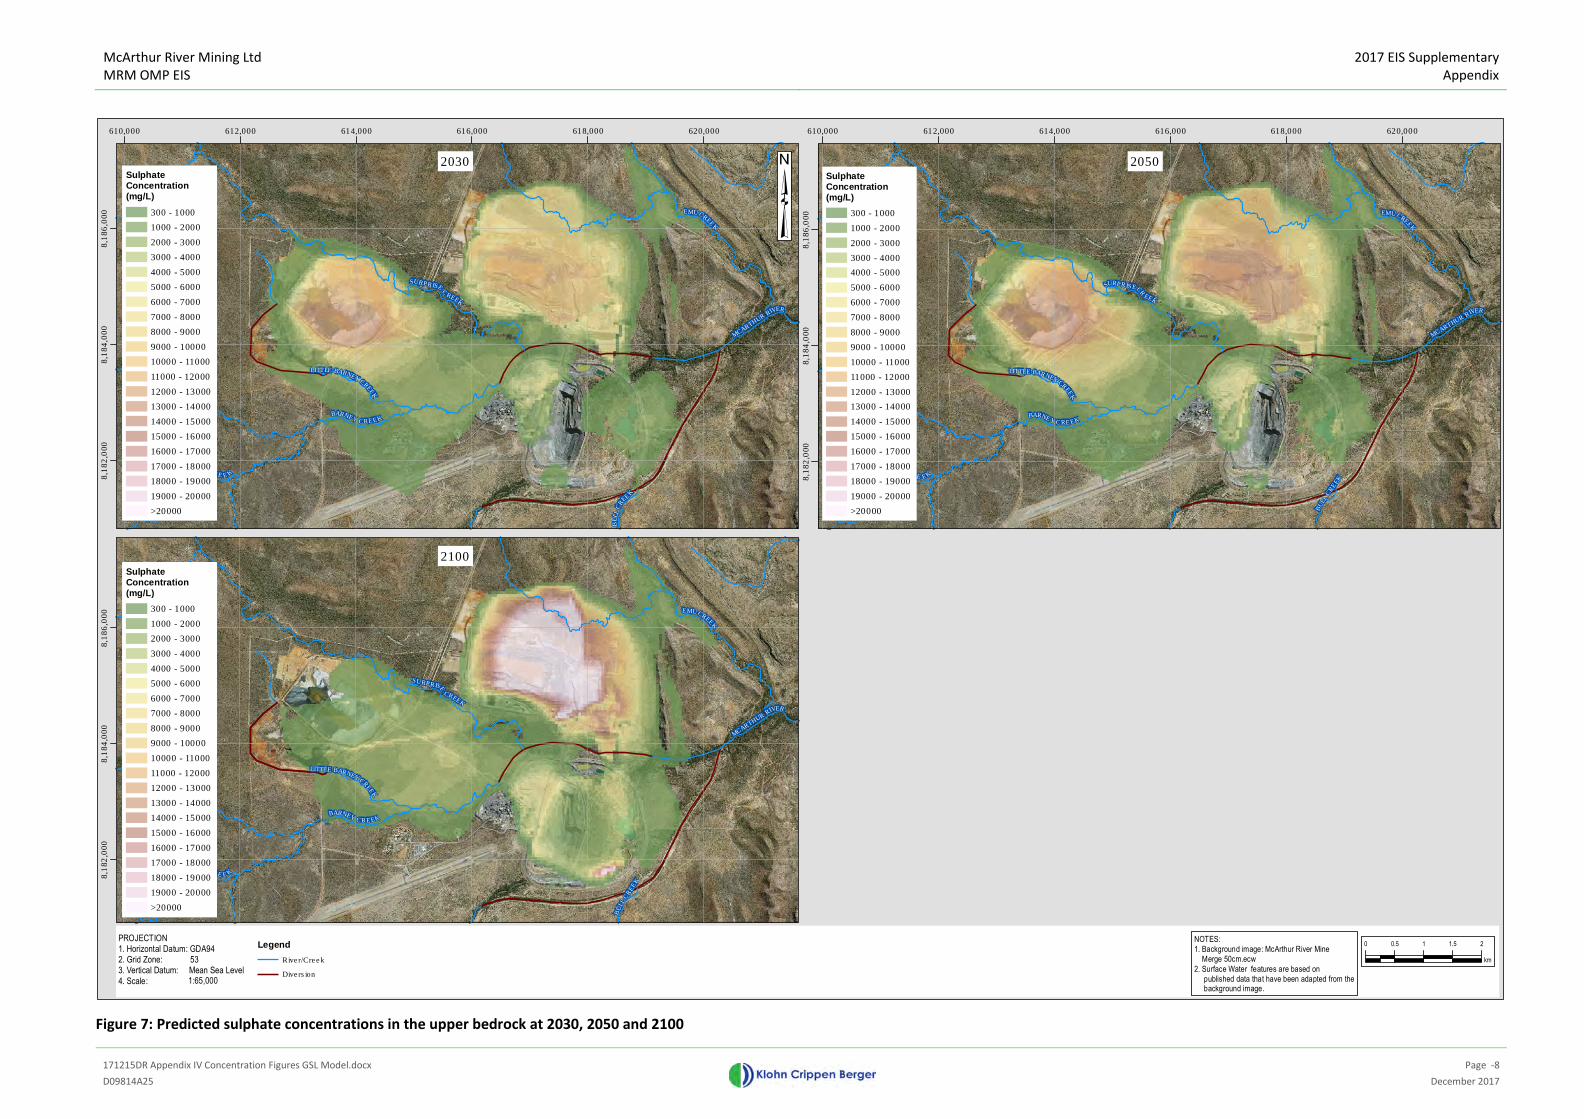
McArthur River Mining Ltd
MRM OMP EIS
2017 EIS Supplementary
Appendix
171215DR Appendix IV Concentration Figures GSL Model.docx
Page -8
D09814A25 December 2017
Figure 7: Predicted sulphate concentrations in the upper bedrock at 2030, 2050 and 2100
SURPRISE
C
REEK
MCARTHUR
RIVER
BU
LL
CR
EE
K
BARNEYCREEK
EMUCREE
K
LITTLE BARNEYCR
EEK
BU
F
FALO CRE E K
610,000 612,000 614,000 616,000 618,000 620,000
8,1
82
,000
8,1
84
,000
8,1
86
,000
0 0.5 1 1.5 2
km
NOTES:
1. Background image: McArthur River Mine
Merge 50cm.ecw
2. Surface Water features are based on
published data that have been adapted from the background image.
Legend
River/Creek
Diversion
SURPRISE
CREEK
MCARTHUR
RIVER
BU
LL
CR
EE
K
BARNEYCREEK
LITTLE BARNEYCR
EEK
EMUCREEK
BU
F
FALO CRE E K
8,1
82
,000
8,1
84
,000
8,1
86
,000
SURPRISECR
EEK
MCARTHUR
RIVER
BU
LL
CR
EEK
BARNEY CRE EK
EMUCREEK
LITTLE BARNEYCR
EE
K
BU
F
FALO CRE EK
610,000 612,000 614,000 616,000 618,000 620,000
8,1
82
,000
8,1
84
,000
8,1
86
,000
PROJECTION1. Horizontal Datum: GDA942. Grid Zone: 533. Vertical Datum: Mean Sea Level
4. Scale: 1:65,000
2030 2050
2100
SulphateConcentration(mg/L)
300 - 1000
1000 - 2000
2000 - 3000
3000 - 4000
4000 - 5000
5000 - 6000
6000 - 7000
7000 - 8000
8000 - 9000
9000 - 10000
10000 - 11000
11000 - 12000
12000 - 13000
13000 - 14000
14000 - 15000
15000 - 16000
16000 - 17000
17000 - 18000
18000 - 19000
19000 - 20000
>20000
SulphateConcentration(mg/L)
300 - 1000
1000 - 2000
2000 - 3000
3000 - 4000
4000 - 5000
5000 - 6000
6000 - 7000
7000 - 8000
8000 - 9000
9000 - 10000
10000 - 11000
11000 - 12000
12000 - 13000
13000 - 14000
14000 - 15000
15000 - 16000
16000 - 17000
17000 - 18000
18000 - 19000
19000 - 20000
>20000
SulphateConcentration(mg/L)
300 - 1000
1000 - 2000
2000 - 3000
3000 - 4000
4000 - 5000
5000 - 6000
6000 - 7000
7000 - 8000
8000 - 9000
9000 - 10000
10000 - 11000
11000 - 12000
12000 - 13000
13000 - 14000
14000 - 15000
15000 - 16000
16000 - 17000
17000 - 18000
18000 - 19000
19000 - 20000
>20000
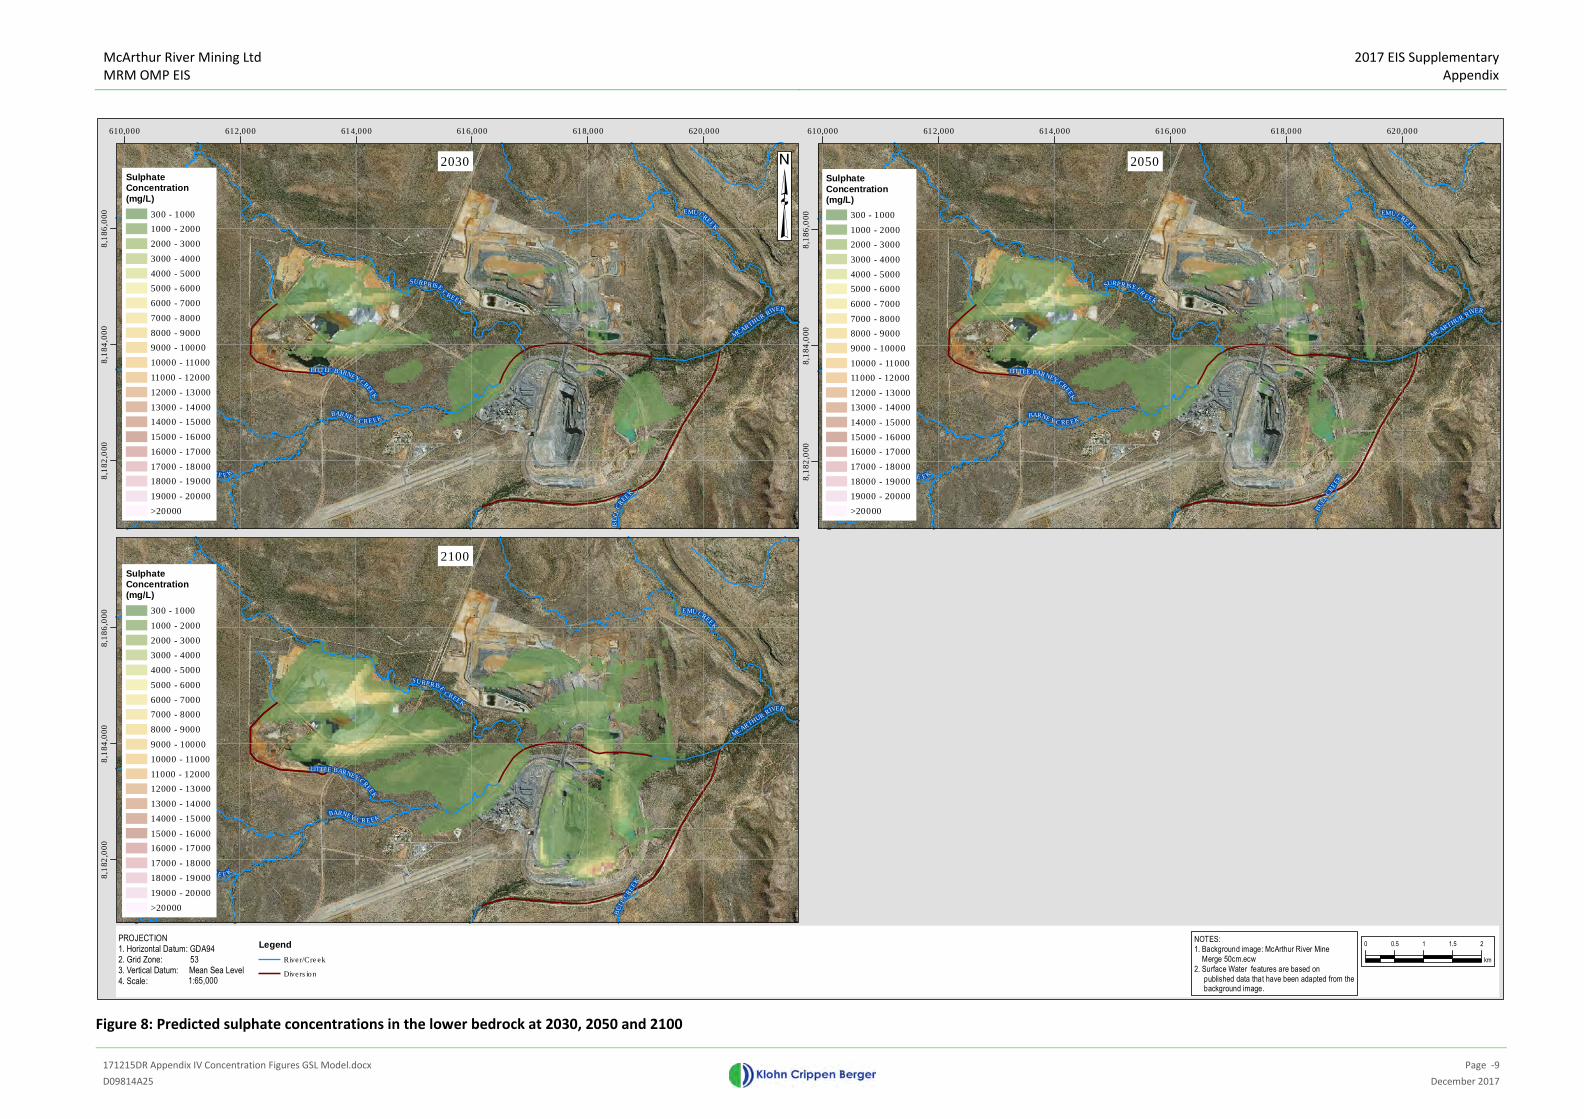
McArthur River Mining Ltd
MRM OMP EIS
2017 EIS Supplementary
Appendix
171215DR Appendix IV Concentration Figures GSL Model.docx
Page -9
D09814A25 December 2017
Figure 8: Predicted sulphate concentrations in the lower bedrock at 2030, 2050 and 2100
SURPRISE
C
REEK
MCARTHUR
RIVER
BU
LL
CR
EE
K
BARNEYCREEK
EMUCREE
K
LITTLE BARNEYCR
EEK
BU
F
FALO CRE E K
610,000 612,000 614,000 616,000 618,000 620,000
8,1
82
,000
8,1
84
,000
8,1
86
,000
0 0.5 1 1.5 2
km
NOTES:
1. Background image: McArthur River Mine
Merge 50cm.ecw
2. Surface Water features are based on
published data that have been adapted from the background image.
Legend
River/Creek
Diversion
SURPRISE
CREEK
MCARTHUR
RIVER
BU
LL
CR
EE
K
BARNEYCREEK
LITTLE BARNEYCR
EEK
EMUCREEK
BU
F
FALO CRE E K
8,1
82
,000
8,1
84
,000
8,1
86
,000
SURPRISECR
EEK
MCARTHUR
RIVER
BU
LL
CR
EEK
BARNEY CRE EK
EMUCREEK
LITTLE BARNEYCR
EE
K
BU
F
FALO CRE EK
610,000 612,000 614,000 616,000 618,000 620,000
8,1
82
,000
8,1
84
,000
8,1
86
,000
PROJECTION1. Horizontal Datum: GDA942. Grid Zone: 533. Vertical Datum: Mean Sea Level
4. Scale: 1:65,000
2030 2050
2100
SulphateConcentration(mg/L)
300 - 1000
1000 - 2000
2000 - 3000
3000 - 4000
4000 - 5000
5000 - 6000
6000 - 7000
7000 - 8000
8000 - 9000
9000 - 10000
10000 - 11000
11000 - 12000
12000 - 13000
13000 - 14000
14000 - 15000
15000 - 16000
16000 - 17000
17000 - 18000
18000 - 19000
19000 - 20000
>20000
SulphateConcentration(mg/L)
300 - 1000
1000 - 2000
2000 - 3000
3000 - 4000
4000 - 5000
5000 - 6000
6000 - 7000
7000 - 8000
8000 - 9000
9000 - 10000
10000 - 11000
11000 - 12000
12000 - 13000
13000 - 14000
14000 - 15000
15000 - 16000
16000 - 17000
17000 - 18000
18000 - 19000
19000 - 20000
>20000
SulphateConcentration(mg/L)
300 - 1000
1000 - 2000
2000 - 3000
3000 - 4000
4000 - 5000
5000 - 6000
6000 - 7000
7000 - 8000
8000 - 9000
9000 - 10000
10000 - 11000
11000 - 12000
12000 - 13000
13000 - 14000
14000 - 15000
15000 - 16000
16000 - 17000
17000 - 18000
18000 - 19000
19000 - 20000
>20000
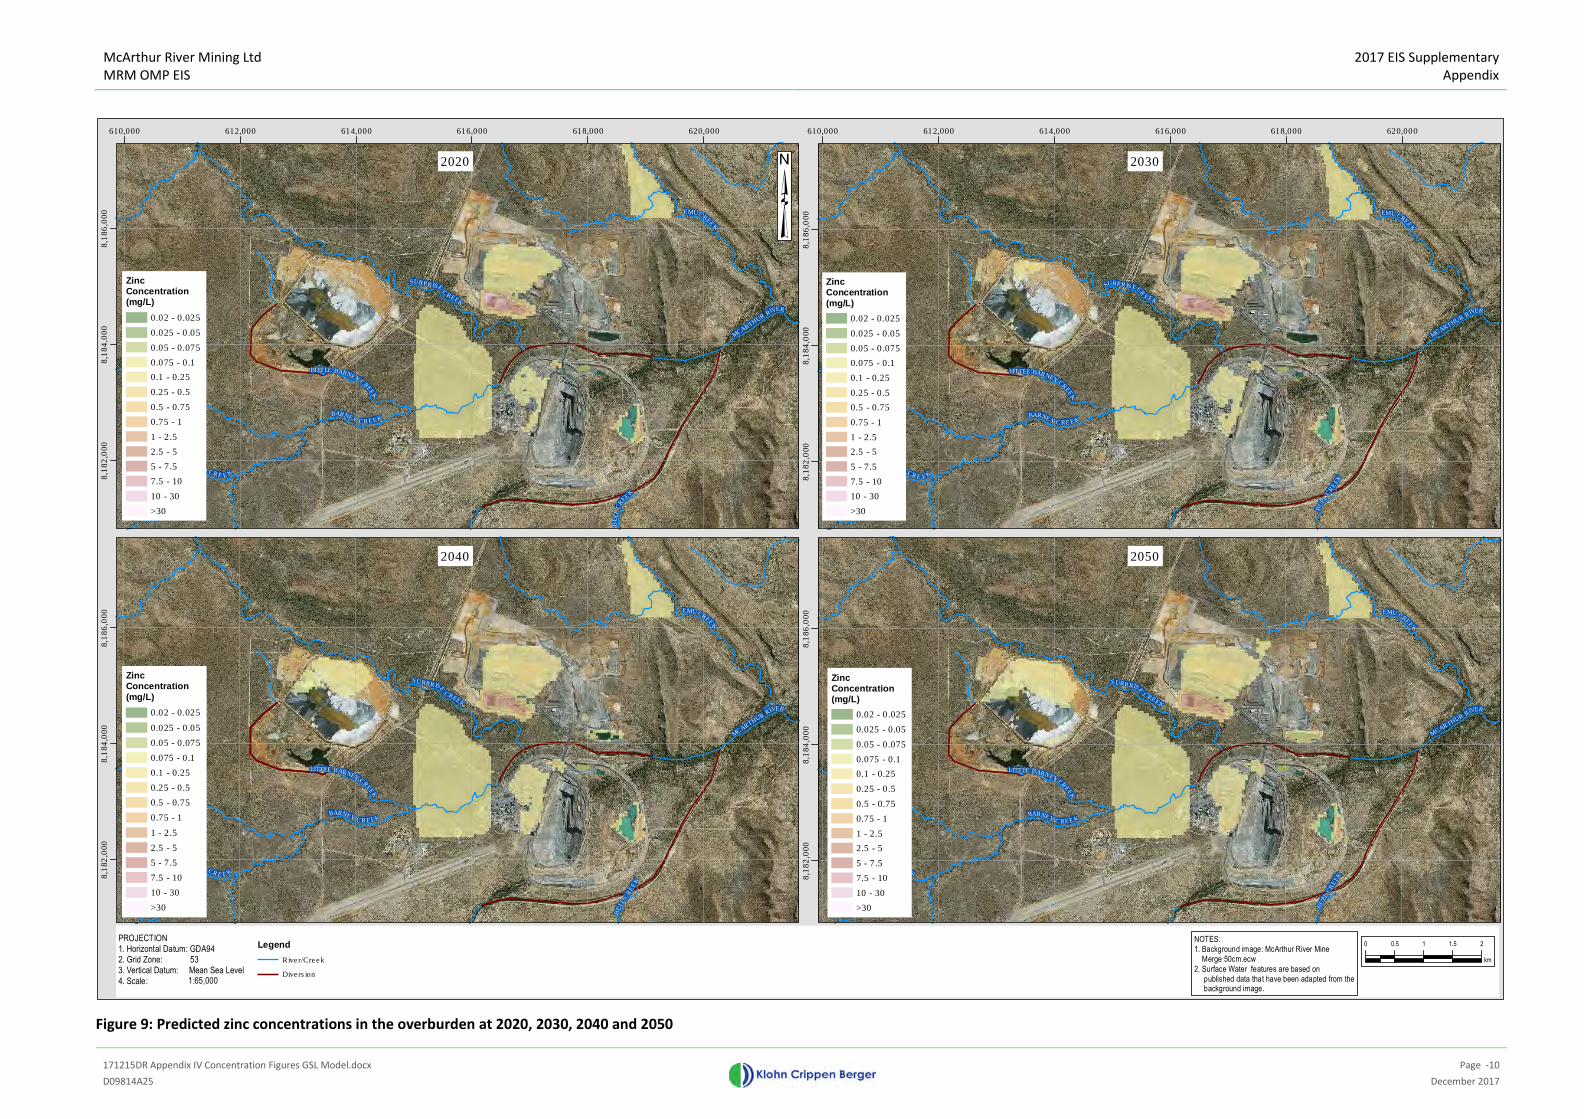
McArthur River Mining Ltd
MRM OMP EIS
2017 EIS Supplementary
Appendix
171215DR Appendix IV Concentration Figures GSL Model.docx
Page -10
D09814A25 December 2017
Figure 9: Predicted zinc concentrations in the overburden at 2020, 2030, 2040 and 2050
SURPRISE
C
REEK
MCARTHUR
RIVER
BU
LL
CR
EE
K
BARNEYCREEK
EMUCREE
K
LITTLE BARNEYCR
EEK
BU
F
FALO CRE E K
610,000 612,000 614,000 616,000 618,000 620,000
8,1
82
,000
8,1
84
,000
8,1
86
,000
0 0.5 1 1.5 2
km
NOTES:
1. Background image: McArthur River Mine
Merge 50cm.ecw
2. Surface Water features are based on
published data that have been adapted from the background image.
Legend
River/Creek
Diversion
SURPRISE
CREEK
MCARTHUR
RIVER
BU
LL
CR
EEK
BARNEYCREEK
LITTLE BARNEYCR
EEK
EMUCREE
K
BU
FFA
LOCREEK
8,1
82
,000
8,1
84
,000
8,1
86
,000
SURPRISE
CREEK
MCARTHUR
RIVER
BU
LL
CR
EE
K
BARNEYCREEK
LITTLE BARNEYCR
EEK
EMUCREEK
BU
F
FALO CRE E K
8,1
82
,000
8,1
84
,000
8,1
86
,000
SURPRISECR
EEK
MCARTHUR
RIVER
BU
LL
CR
EEK
BARNEY CRE EK
EMUCREEK
LITTLE BARNEYCR
EE
K
BU
F
FALO CRE EK
610,000 612,000 614,000 616,000 618,000 620,000
8,1
82
,000
8,1
84
,000
8,1
86
,000
PROJECTION1. Horizontal Datum: GDA942. Grid Zone: 533. Vertical Datum: Mean Sea Level
4. Scale: 1:65,000
2020 2030
20502040
ZincConcentration(mg/L)
0.02 - 0.025
0.025 - 0.05
0.05 - 0.075
0.075 - 0.1
0.1 - 0.25
0.25 - 0.5
0.5 - 0.75
0.75 - 1
1 - 2.5
2.5 - 5
5 - 7.5
7.5 - 10
10 - 30
>30
ZincConcentration(mg/L)
0.02 - 0.025
0.025 - 0.05
0.05 - 0.075
0.075 - 0.1
0.1 - 0.25
0.25 - 0.5
0.5 - 0.75
0.75 - 1
1 - 2.5
2.5 - 5
5 - 7.5
7.5 - 10
10 - 30
>30
ZincConcentration(mg/L)
0.02 - 0.025
0.025 - 0.05
0.05 - 0.075
0.075 - 0.1
0.1 - 0.25
0.25 - 0.5
0.5 - 0.75
0.75 - 1
1 - 2.5
2.5 - 5
5 - 7.5
7.5 - 10
10 - 30
>30
ZincConcentration(mg/L)
0.02 - 0.025
0.025 - 0.05
0.05 - 0.075
0.075 - 0.1
0.1 - 0.25
0.25 - 0.5
0.5 - 0.75
0.75 - 1
1 - 2.5
2.5 - 5
5 - 7.5
7.5 - 10
10 - 30
>30
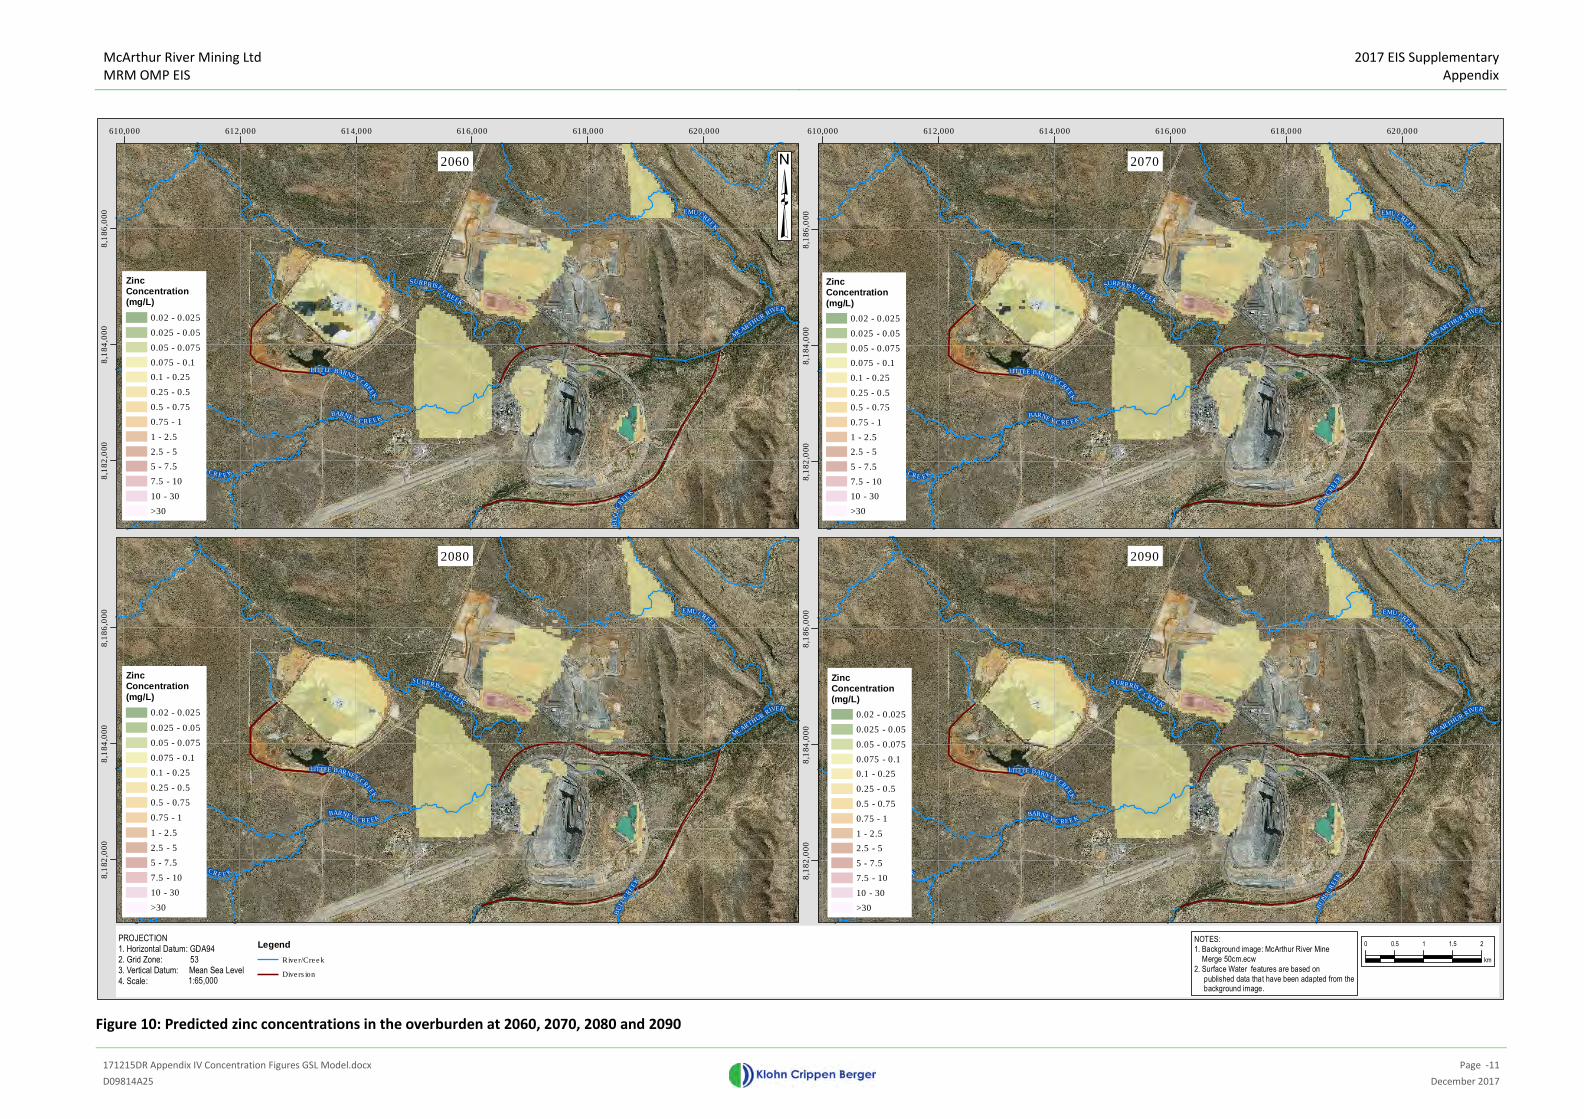
McArthur River Mining Ltd
MRM OMP EIS
2017 EIS Supplementary
Appendix
171215DR Appendix IV Concentration Figures GSL Model.docx
Page -11
D09814A25 December 2017
Figure 10: Predicted zinc concentrations in the overburden at 2060, 2070, 2080 and 2090
SURPRISE
C
REEK
MCARTHUR
RIVER
BU
LL
CR
EE
K
BARNEYCREEK
EMUCREE
K
LITTLE BARNEYCR
EEK
BU
F
FALO CRE E K
610,000 612,000 614,000 616,000 618,000 620,000
8,1
82
,000
8,1
84
,000
8,1
86
,000
0 0.5 1 1.5 2
km
NOTES:
1. Background image: McArthur River Mine
Merge 50cm.ecw
2. Surface Water features are based on
published data that have been adapted from the background image.
Legend
River/Creek
Diversion
SURPRISE
CREEK
MCARTHUR
RIVER
BU
LL
CR
EEK
BARNEYCREEK
LITTLE BARNEYCR
EEK
EMUCREE
K
BU
FFA
LOCREEK
8,1
82
,000
8,1
84
,000
8,1
86
,000
SURPRISE
CREEK
MCARTHUR
RIVER
BU
LL
CR
EE
K
BARNEYCREEK
LITTLE BARNEYCR
EEK
EMUCREEK
BU
F
FALO CRE E K
8,1
82
,000
8,1
84
,000
8,1
86
,000
SURPRISECR
EEK
MCARTHUR
RIVER
BU
LL
CR
EEK
BARNEY CRE EK
EMUCREEK
LITTLE BARNEYCR
EE
K
BU
F
FALO CRE EK
610,000 612,000 614,000 616,000 618,000 620,000
8,1
82
,000
8,1
84
,000
8,1
86
,000
PROJECTION1. Horizontal Datum: GDA942. Grid Zone: 533. Vertical Datum: Mean Sea Level
4. Scale: 1:65,000
2060 2070
20902080
ZincConcentration(mg/L)
0.02 - 0.025
0.025 - 0.05
0.05 - 0.075
0.075 - 0.1
0.1 - 0.25
0.25 - 0.5
0.5 - 0.75
0.75 - 1
1 - 2.5
2.5 - 5
5 - 7.5
7.5 - 10
10 - 30
>30
ZincConcentration(mg/L)
0.02 - 0.025
0.025 - 0.05
0.05 - 0.075
0.075 - 0.1
0.1 - 0.25
0.25 - 0.5
0.5 - 0.75
0.75 - 1
1 - 2.5
2.5 - 5
5 - 7.5
7.5 - 10
10 - 30
>30
ZincConcentration(mg/L)
0.02 - 0.025
0.025 - 0.05
0.05 - 0.075
0.075 - 0.1
0.1 - 0.25
0.25 - 0.5
0.5 - 0.75
0.75 - 1
1 - 2.5
2.5 - 5
5 - 7.5
7.5 - 10
10 - 30
>30
ZincConcentration(mg/L)
0.02 - 0.025
0.025 - 0.05
0.05 - 0.075
0.075 - 0.1
0.1 - 0.25
0.25 - 0.5
0.5 - 0.75
0.75 - 1
1 - 2.5
2.5 - 5
5 - 7.5
7.5 - 10
10 - 30
>30
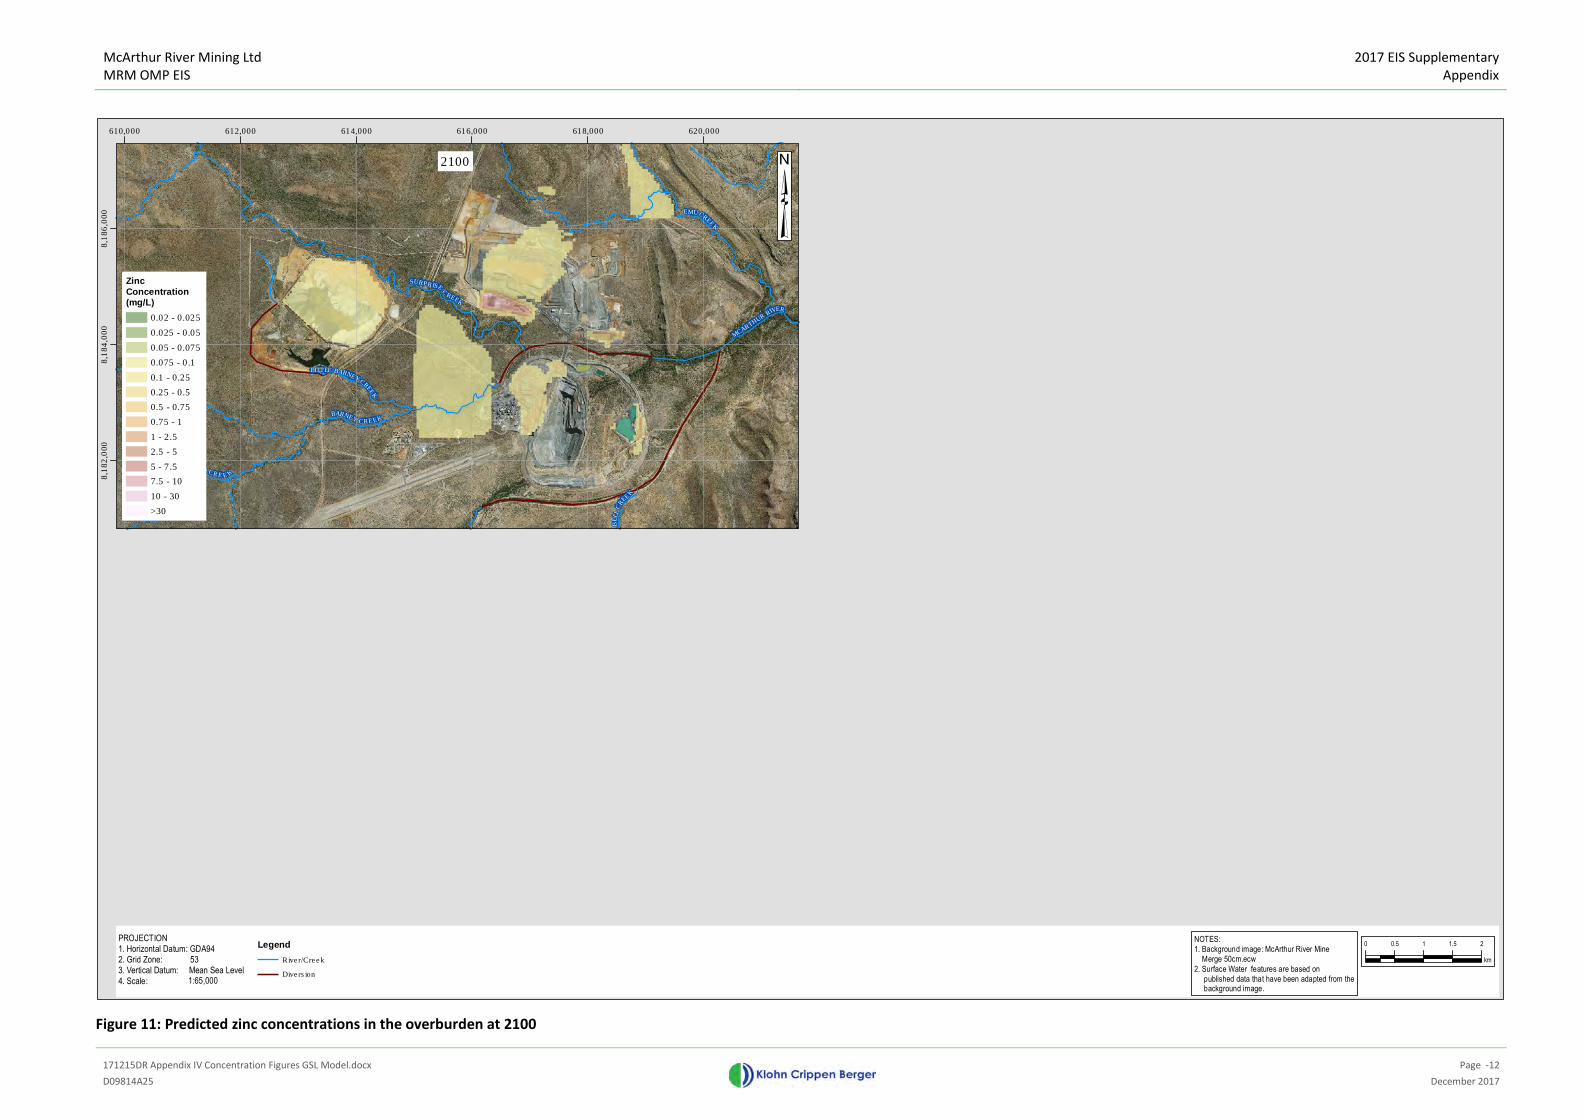
McArthur River Mining Ltd
MRM OMP EIS
2017 EIS Supplementary
Appendix
171215DR Appendix IV Concentration Figures GSL Model.docx
Page -12
D09814A25 December 2017
Figure 11: Predicted zinc concentrations in the overburden at 2100
SURPRISE
C
REEK
MCARTHUR
RIVER
BU
LL
CR
EE
K
BARNEYCREEK
EMUCREE
K
LITTLE BARNEYCR
EEK
BU
F
FALO CRE E K
610,000 612,000 614,000 616,000 618,000 620,000
8,1
82
,000
8,1
84
,000
8,1
86
,000
0 0.5 1 1.5 2
km
NOTES:
1. Background image: McArthur River Mine
Merge 50cm.ecw
2. Surface Water features are based on
published data that have been adapted from the background image.
Legend
River/Creek
Diversion
PROJECTION1. Horizontal Datum: GDA942. Grid Zone: 533. Vertical Datum: Mean Sea Level
4. Scale: 1:65,000
2100
ZincConcentration(mg/L)
0.02 - 0.025
0.025 - 0.05
0.05 - 0.075
0.075 - 0.1
0.1 - 0.25
0.25 - 0.5
0.5 - 0.75
0.75 - 1
1 - 2.5
2.5 - 5
5 - 7.5
7.5 - 10
10 - 30
>30
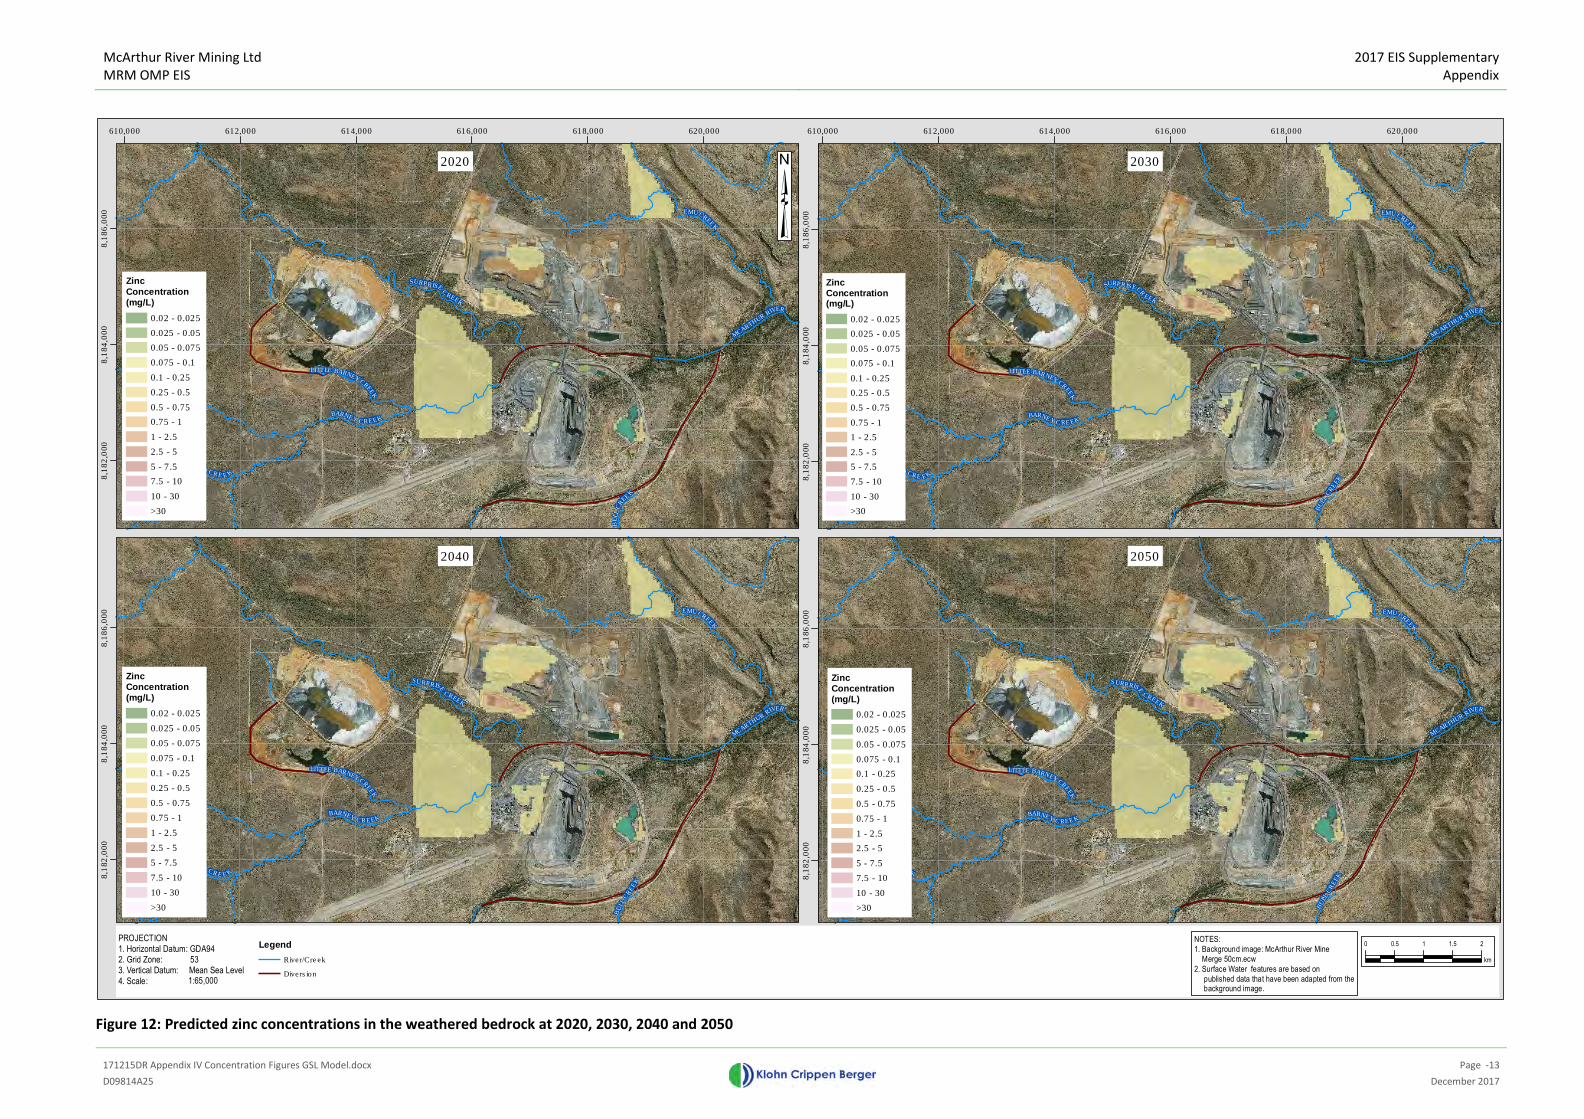
McArthur River Mining Ltd
MRM OMP EIS
2017 EIS Supplementary
Appendix
171215DR Appendix IV Concentration Figures GSL Model.docx
Page -13
D09814A25 December 2017
Figure 12: Predicted zinc concentrations in the weathered bedrock at 2020, 2030, 2040 and 2050
SURPRISE
C
REEK
MCARTHUR
RIVER
BU
LL
CR
EE
K
BARNEYCREEK
EMUCREE
K
LITTLE BARNEYCR
EEK
BU
F
FALO CRE E K
610,000 612,000 614,000 616,000 618,000 620,000
8,1
82
,000
8,1
84
,000
8,1
86
,000
0 0.5 1 1.5 2
km
NOTES:
1. Background image: McArthur River Mine
Merge 50cm.ecw
2. Surface Water features are based on
published data that have been adapted from the background image.
Legend
River/Creek
Diversion
SURPRISE
CREEK
MCARTHUR
RIVER
BU
LL
CR
EEK
BARNEYCREEK
LITTLE BARNEYCR
EEK
EMUCREE
K
BU
FFA
LOCREEK
8,1
82
,000
8,1
84
,000
8,1
86
,000
SURPRISE
CREEK
MCARTHUR
RIVER
BU
LL
CR
EE
K
BARNEYCREEK
LITTLE BARNEYCR
EEK
EMUCREEK
BU
F
FALO CRE E K
8,1
82
,000
8,1
84
,000
8,1
86
,000
SURPRISECR
EEK
MCARTHUR
RIVER
BU
LL
CR
EEK
BARNEY CRE EK
EMUCREEK
LITTLE BARNEYCR
EE
K
BU
F
FALO CRE EK
610,000 612,000 614,000 616,000 618,000 620,000
8,1
82
,000
8,1
84
,000
8,1
86
,000
PROJECTION1. Horizontal Datum: GDA942. Grid Zone: 533. Vertical Datum: Mean Sea Level
4. Scale: 1:65,000
2020 2030
20502040
ZincConcentration(mg/L)
0.02 - 0.025
0.025 - 0.05
0.05 - 0.075
0.075 - 0.1
0.1 - 0.25
0.25 - 0.5
0.5 - 0.75
0.75 - 1
1 - 2.5
2.5 - 5
5 - 7.5
7.5 - 10
10 - 30
>30
ZincConcentration(mg/L)
0.02 - 0.025
0.025 - 0.05
0.05 - 0.075
0.075 - 0.1
0.1 - 0.25
0.25 - 0.5
0.5 - 0.75
0.75 - 1
1 - 2.5
2.5 - 5
5 - 7.5
7.5 - 10
10 - 30
>30
ZincConcentration(mg/L)
0.02 - 0.025
0.025 - 0.05
0.05 - 0.075
0.075 - 0.1
0.1 - 0.25
0.25 - 0.5
0.5 - 0.75
0.75 - 1
1 - 2.5
2.5 - 5
5 - 7.5
7.5 - 10
10 - 30
>30
ZincConcentration(mg/L)
0.02 - 0.025
0.025 - 0.05
0.05 - 0.075
0.075 - 0.1
0.1 - 0.25
0.25 - 0.5
0.5 - 0.75
0.75 - 1
1 - 2.5
2.5 - 5
5 - 7.5
7.5 - 10
10 - 30
>30

McArthur River Mining Ltd
MRM OMP EIS
2017 EIS Supplementary
Appendix
171215DR Appendix IV Concentration Figures GSL Model.docx
Page -14
D09814A25 December 2017
Figure 13: Predicted zinc concentrations in the weathered bedrock at 2060, 2070, 2080 and 2090
SURPRISE
C
REEK
MCARTHUR
RIVER
BU
LL
CR
EE
K
BARNEYCREEK
EMUCREE
K
LITTLE BARNEYCR
EEK
BU
F
FALO CRE E K
610,000 612,000 614,000 616,000 618,000 620,000
8,1
82
,000
8,1
84
,000
8,1
86
,000
0 0.5 1 1.5 2
km
NOTES:
1. Background image: McArthur River Mine
Merge 50cm.ecw
2. Surface Water features are based on
published data that have been adapted from the background image.
Legend
River/Creek
Diversion
SURPRISE
CREEK
MCARTHUR
RIVER
BU
LL
CR
EEK
BARNEYCREEK
LITTLE BARNEYCR
EEK
EMUCREE
K
BU
FFA
LOCREEK
8,1
82
,000
8,1
84
,000
8,1
86
,000
SURPRISE
CREEK
MCARTHUR
RIVER
BU
LL
CR
EE
K
BARNEYCREEK
LITTLE BARNEYCR
EEK
EMUCREEK
BU
F
FALO CRE E K
8,1
82
,000
8,1
84
,000
8,1
86
,000
SURPRISECR
EEK
MCARTHUR
RIVER
BU
LL
CR
EEK
BARNEY CRE EK
EMUCREEK
LITTLE BARNEYCR
EE
K
BU
F
FALO CRE EK
610,000 612,000 614,000 616,000 618,000 620,000
8,1
82
,000
8,1
84
,000
8,1
86
,000
PROJECTION1. Horizontal Datum: GDA942. Grid Zone: 533. Vertical Datum: Mean Sea Level
4. Scale: 1:65,000
2060 2070
20902080
ZincConcentration(mg/L)
0.02 - 0.025
0.025 - 0.05
0.05 - 0.075
0.075 - 0.1
0.1 - 0.25
0.25 - 0.5
0.5 - 0.75
0.75 - 1
1 - 2.5
2.5 - 5
5 - 7.5
7.5 - 10
10 - 30
>30
ZincConcentration(mg/L)
0.02 - 0.025
0.025 - 0.05
0.05 - 0.075
0.075 - 0.1
0.1 - 0.25
0.25 - 0.5
0.5 - 0.75
0.75 - 1
1 - 2.5
2.5 - 5
5 - 7.5
7.5 - 10
10 - 30
>30
ZincConcentration(mg/L)
0.02 - 0.025
0.025 - 0.05
0.05 - 0.075
0.075 - 0.1
0.1 - 0.25
0.25 - 0.5
0.5 - 0.75
0.75 - 1
1 - 2.5
2.5 - 5
5 - 7.5
7.5 - 10
10 - 30
>30
ZincConcentration(mg/L)
0.02 - 0.025
0.025 - 0.05
0.05 - 0.075
0.075 - 0.1
0.1 - 0.25
0.25 - 0.5
0.5 - 0.75
0.75 - 1
1 - 2.5
2.5 - 5
5 - 7.5
7.5 - 10
10 - 30
>30

McArthur River Mining Ltd
MRM OMP EIS
2017 EIS Supplementary
Appendix
171215DR Appendix IV Concentration Figures GSL Model.docx
Page -15
D09814A25 December 2017
Figure 14: Predicted zinc concentrations in the weathered bedrock at 2100
SURPRISE
C
REEK
MCARTHUR
RIVER
BU
LL
CR
EE
K
BARNEYCREEK
EMUCREE
K
LITTLE BARNEYCR
EEK
BU
F
FALO CRE E K
610,000 612,000 614,000 616,000 618,000 620,000
8,1
82
,000
8,1
84
,000
8,1
86
,000
0 0.5 1 1.5 2
km
NOTES:
1. Background image: McArthur River Mine
Merge 50cm.ecw
2. Surface Water features are based on
published data that have been adapted from the background image.
Legend
River/Creek
Diversion
PROJECTION1. Horizontal Datum: GDA942. Grid Zone: 533. Vertical Datum: Mean Sea Level
4. Scale: 1:65,000
2100SulphateConcentration(mg/L)
300 - 1000
1000 - 2000
2000 - 3000
3000 - 4000
4000 - 5000
5000 - 6000
6000 - 7000
7000 - 8000
8000 - 9000
9000 - 10000
10000 - 11000
11000 - 12000
12000 - 13000
13000 - 14000
14000 - 15000
15000 - 16000
16000 - 17000
17000 - 18000
18000 - 19000
19000 - 20000
>20000
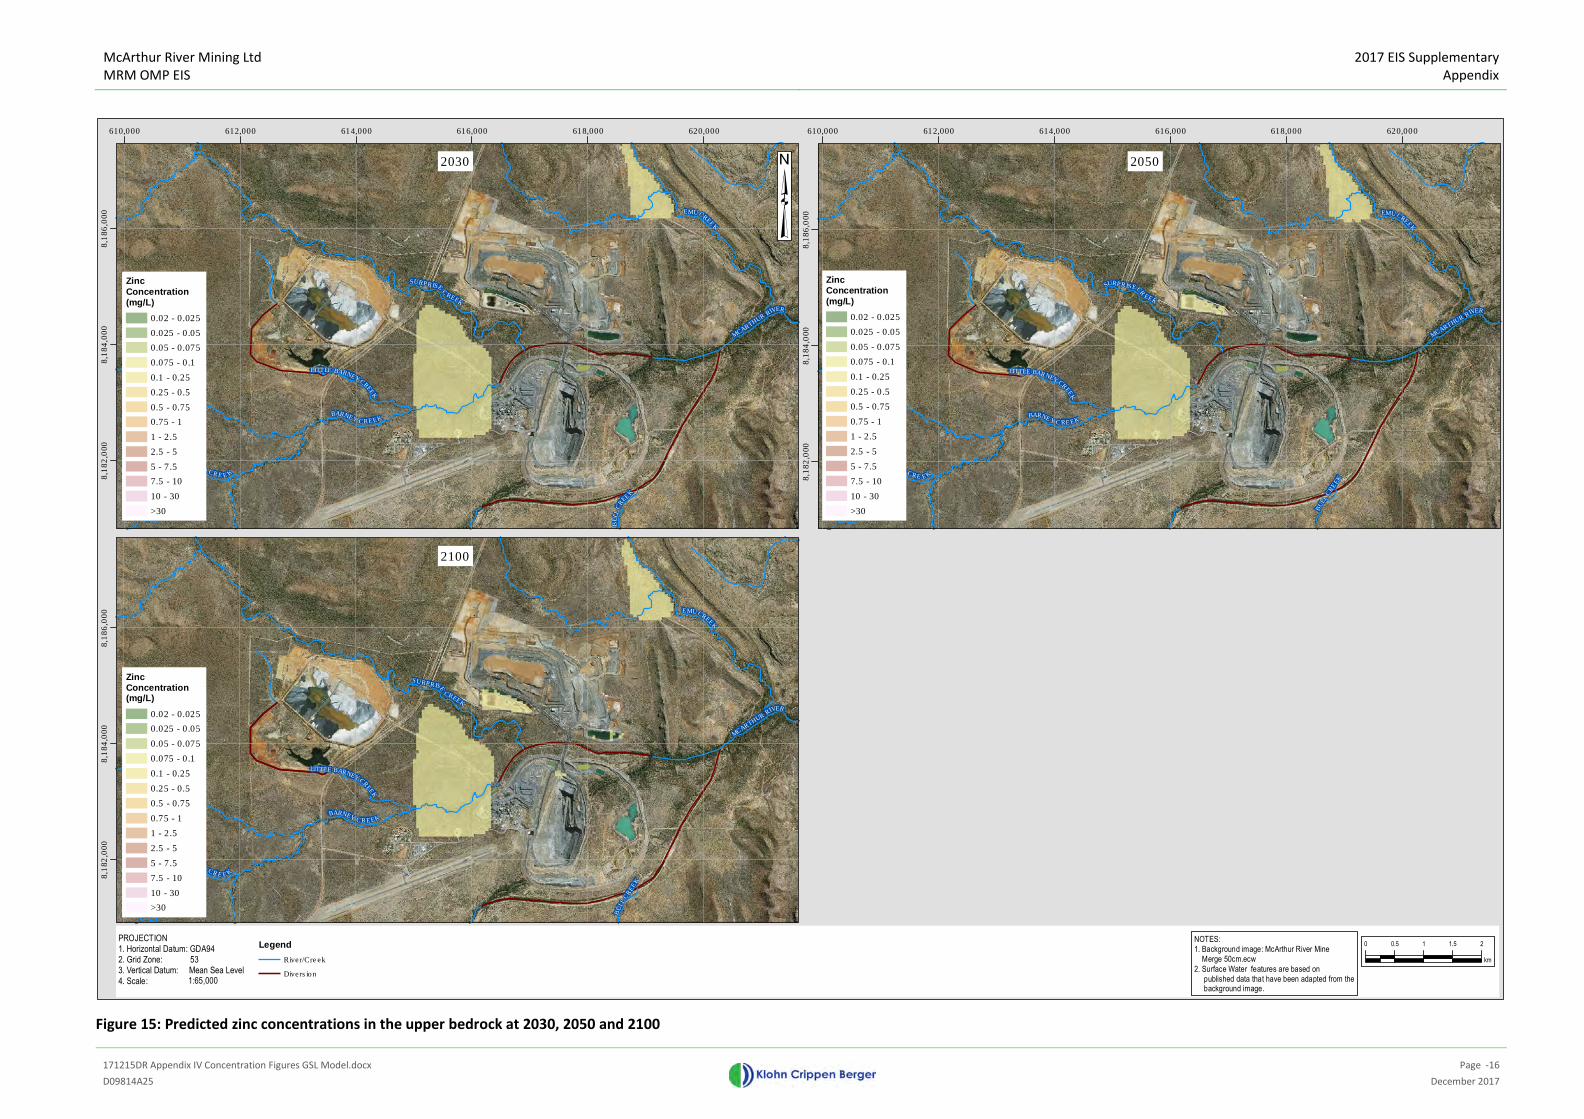
McArthur River Mining Ltd
MRM OMP EIS
2017 EIS Supplementary
Appendix
171215DR Appendix IV Concentration Figures GSL Model.docx
Page -16
D09814A25 December 2017
Figure 15: Predicted zinc concentrations in the upper bedrock at 2030, 2050 and 2100
SURPRISE
C
REEK
MCARTHUR
RIVER
BU
LL
CR
EE
K
BARNEYCREEK
EMUCREE
K
LITTLE BARNEYCR
EEK
BU
F
FALO CRE E K
610,000 612,000 614,000 616,000 618,000 620,000
8,1
82
,000
8,1
84
,000
8,1
86
,000
0 0.5 1 1.5 2
km
NOTES:
1. Background image: McArthur River Mine
Merge 50cm.ecw
2. Surface Water features are based on
published data that have been adapted from the background image.
Legend
River/Creek
Diversion
SURPRISE
CREEK
MCARTHUR
RIVER
BU
LL
CR
EE
K
BARNEYCREEK
LITTLE BARNEYCR
EEK
EMUCREEK
BU
F
FALO CRE E K
8,1
82
,000
8,1
84
,000
8,1
86
,000
SURPRISECR
EEK
MCARTHUR
RIVER
BU
LL
CR
EEK
BARNEY CRE EK
EMUCREEK
LITTLE BARNEYCR
EE
K
BU
F
FALO CRE EK
610,000 612,000 614,000 616,000 618,000 620,000
8,1
82
,000
8,1
84
,000
8,1
86
,000
PROJECTION1. Horizontal Datum: GDA942. Grid Zone: 533. Vertical Datum: Mean Sea Level
4. Scale: 1:65,000
2030 2050
2100
ZincConcentration(mg/L)
0.02 - 0.025
0.025 - 0.05
0.05 - 0.075
0.075 - 0.1
0.1 - 0.25
0.25 - 0.5
0.5 - 0.75
0.75 - 1
1 - 2.5
2.5 - 5
5 - 7.5
7.5 - 10
10 - 30
>30
ZincConcentration(mg/L)
0.02 - 0.025
0.025 - 0.05
0.05 - 0.075
0.075 - 0.1
0.1 - 0.25
0.25 - 0.5
0.5 - 0.75
0.75 - 1
1 - 2.5
2.5 - 5
5 - 7.5
7.5 - 10
10 - 30
>30
ZincConcentration(mg/L)
0.02 - 0.025
0.025 - 0.05
0.05 - 0.075
0.075 - 0.1
0.1 - 0.25
0.25 - 0.5
0.5 - 0.75
0.75 - 1
1 - 2.5
2.5 - 5
5 - 7.5
7.5 - 10
10 - 30
>30
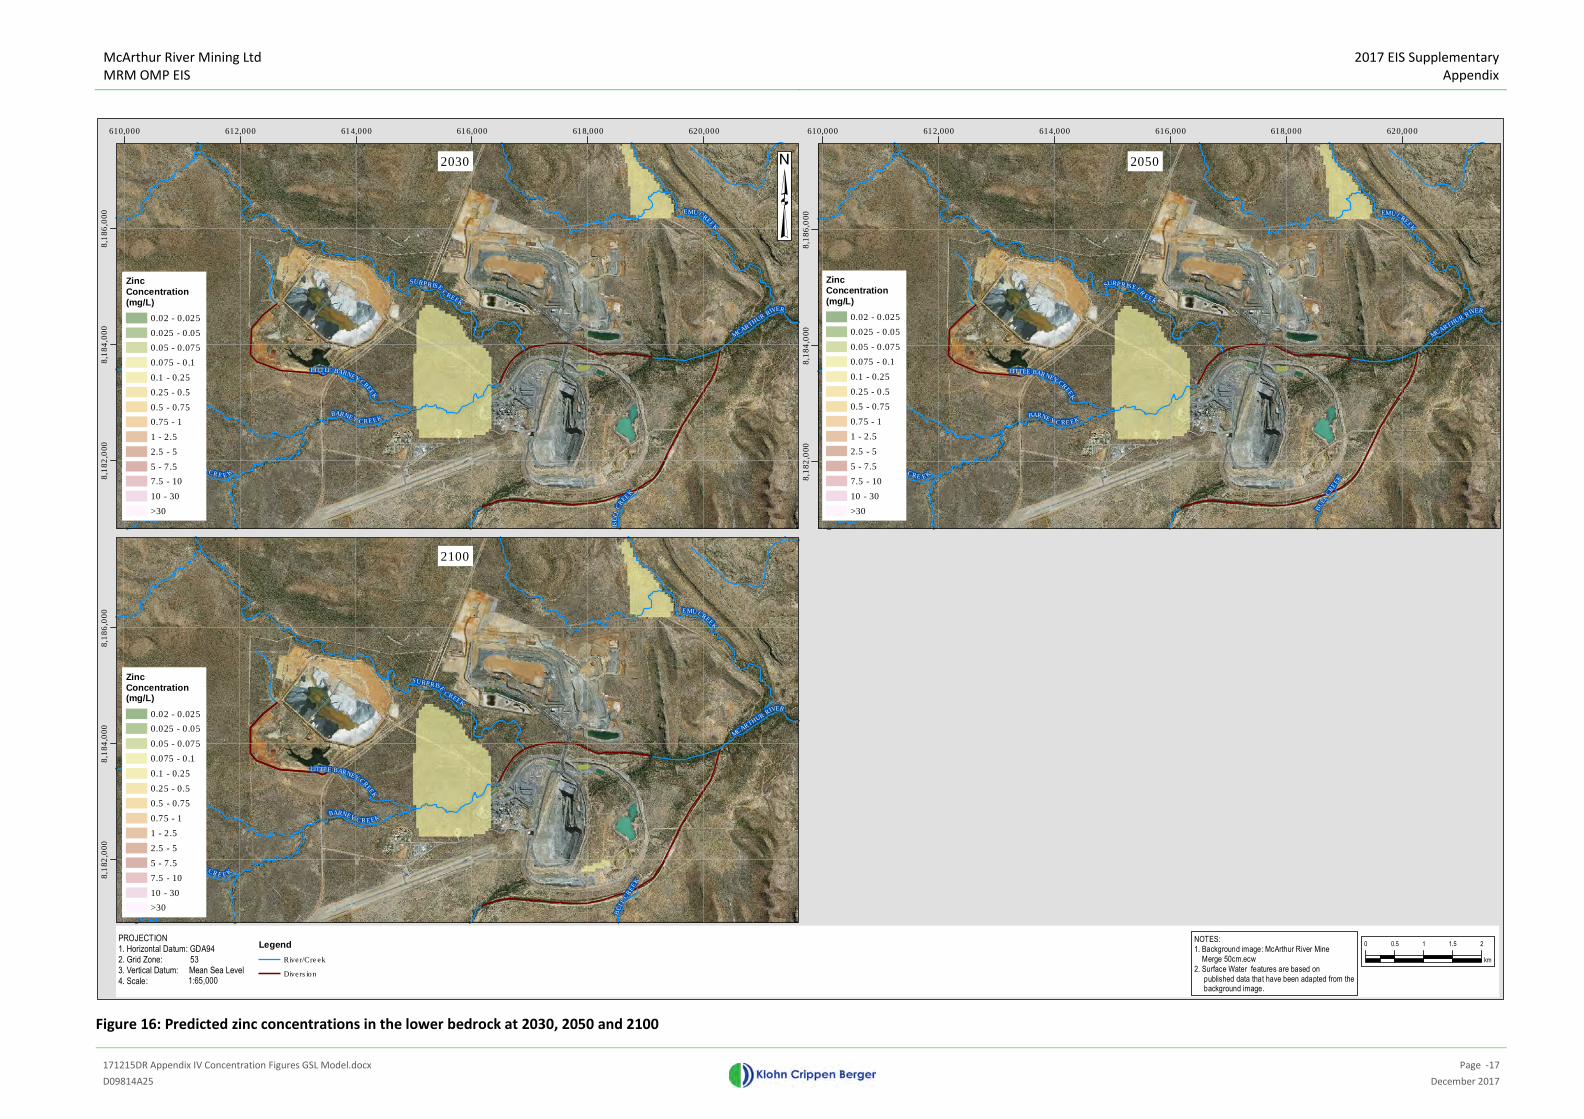
McArthur River Mining Ltd
MRM OMP EIS
2017 EIS Supplementary
Appendix
171215DR Appendix IV Concentration Figures GSL Model.docx
Page -17
D09814A25 December 2017
Figure 16: Predicted zinc concentrations in the lower bedrock at 2030, 2050 and 2100
SURPRISE
C
REEK
MCARTHUR
RIVER
BU
LL
CR
EE
K
BARNEYCREEK
EMUCREE
K
LITTLE BARNEYCR
EEK
BU
F
FALO CRE E K
610,000 612,000 614,000 616,000 618,000 620,000
8,1
82
,000
8,1
84
,000
8,1
86
,000
0 0.5 1 1.5 2
km
NOTES:
1. Background image: McArthur River Mine
Merge 50cm.ecw
2. Surface Water features are based on
published data that have been adapted from the background image.
Legend
River/Creek
Diversion
SURPRISE
CREEK
MCARTHUR
RIVER
BU
LL
CR
EE
K
BARNEYCREEK
LITTLE BARNEYCR
EEK
EMUCREEK
BU
F
FALO CRE E K
8,1
82
,000
8,1
84
,000
8,1
86
,000
SURPRISECR
EEK
MCARTHUR
RIVER
BU
LL
CR
EEK
BARNEY CRE EK
EMUCREEK
LITTLE BARNEYCR
EE
K
BU
F
FALO CRE EK
610,000 612,000 614,000 616,000 618,000 620,000
8,1
82
,000
8,1
84
,000
8,1
86
,000
PROJECTION1. Horizontal Datum: GDA942. Grid Zone: 533. Vertical Datum: Mean Sea Level
4. Scale: 1:65,000
2030 2050
2100
ZincConcentration(mg/L)
0.02 - 0.025
0.025 - 0.05
0.05 - 0.075
0.075 - 0.1
0.1 - 0.25
0.25 - 0.5
0.5 - 0.75
0.75 - 1
1 - 2.5
2.5 - 5
5 - 7.5
7.5 - 10
10 - 30
>30
ZincConcentration(mg/L)
0.02 - 0.025
0.025 - 0.05
0.05 - 0.075
0.075 - 0.1
0.1 - 0.25
0.25 - 0.5
0.5 - 0.75
0.75 - 1
1 - 2.5
2.5 - 5
5 - 7.5
7.5 - 10
10 - 30
>30
ZincConcentration(mg/L)
0.02 - 0.025
0.025 - 0.05
0.05 - 0.075
0.075 - 0.1
0.1 - 0.25
0.25 - 0.5
0.5 - 0.75
0.75 - 1
1 - 2.5
2.5 - 5
5 - 7.5
7.5 - 10
10 - 30
>30