Appendix C: Calculation Methodology for Cost Goals
14
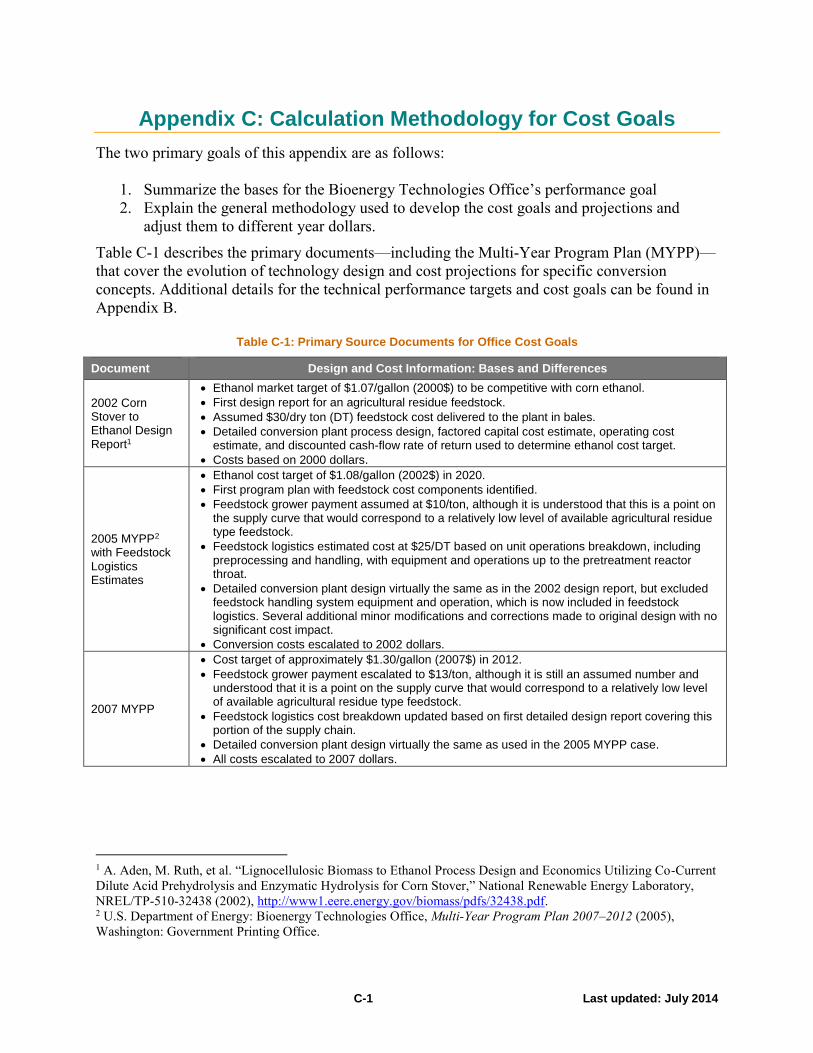
C-1 Last updated: July 2014 Appendix C: Calculation Methodology for Cost Goals The two primary goals of this appendix are as follows: 1. Summarize the bases for the Bioenergy Technologies Office’s performance goal 2. Explain the general methodology used to develop the cost goals and projections and adjust them to different year dollars. Table C-1 describes the primary documents—including the Multi-Year Program Plan (MYPP)— that cover the evolution of technology design and cost projections for specific conversion concepts. Additional details for the technical performance targets and cost goals can be found in Appendix B. Table C-1: Primary Source Documents for Office Cost Goals Document Design and Cost Information: Bases and Differences 2002 Corn Stover to Ethanol Design Report 1 Ethanol market target of $1.07/gallon (2000$) to be competitive with corn ethanol. First design report for an agricultural residue feedstock. Assumed $30/dry ton (DT) feedstock cost delivered to the plant in bales. Detailed conversion plant process design, factored capital cost estimate, operating cost estimate, and discounted cash-flow rate of return used to determine ethanol cost target. Costs based on 2000 dollars. 2005 MYPP 2 with Feedstock Logistics Estimates Ethanol cost target of $1.08/gallon (2002$) in 2020. First program plan with feedstock cost components identified. Feedstock grower payment assumed at $10/ton, although it is understood that this is a point on the supply curve that would correspond to a relatively low level of available agricultural residue type feedstock. Feedstock logistics estimated cost at $25/DT based on unit operations breakdown, including preprocessing and handling, with equipment and operations up to the pretreatment reactor throat. Detailed conversion plant design virtually the same as in the 2002 design report, but excluded feedstock handling system equipment and operation, which is now included in feedstock logistics. Several additional minor modifications and corrections made to original design with no significant cost impact. Conversion costs escalated to 2002 dollars. 2007 MYPP Cost target of approximately $1.30/gallon (2007$) in 2012. Feedstock grower payment escalated to $13/ton, although it is still an assumed number and understood that it is a point on the supply curve that would correspond to a relatively low level of available agricultural residue type feedstock. Feedstock logistics cost breakdown updated based on first detailed design report covering this portion of the supply chain. Detailed conversion plant design virtually the same as used in the 2005 MYPP case. All costs escalated to 2007 dollars. 1 A. Aden, M. Ruth, et al. “Lignocellulosic Biomass to Ethanol Process Design and Economics Utilizing Co-Current Dilute Acid Prehydrolysis and Enzymatic Hydrolysis for Corn Stover,” National Renewable Energy Laboratory, NREL/TP-510-32438 (2002), http://www1.eere.energy.gov/biomass/pdfs/32438.pdf. 2 U.S. Department of Energy: Bioenergy Technologies Office, Multi-Year Program Plan 2007–2012 (2005), Washington: Government Printing Office.
-
Upload
khangminh22 -
Category
Documents
-
view
0 -
download
0
Transcript of Appendix C: Calculation Methodology for Cost Goals
C-1 Last updated: July 2014
Appendix C: Calculation Methodology for Cost Goals
The two primary goals of this appendix are as follows:
1. Summarize the bases for the Bioenergy Technologies Office’s performance goal
2. Explain the general methodology used to develop the cost goals and projections and
adjust them to different year dollars.
Table C-1 describes the primary documents—including the Multi-Year Program Plan (MYPP)—
that cover the evolution of technology design and cost projections for specific conversion
concepts. Additional details for the technical performance targets and cost goals can be found in
Appendix B.
Table C-1: Primary Source Documents for Office Cost Goals
Document Design and Cost Information: Bases and Differences
2002 Corn Stover to Ethanol Design Report1
Ethanol market target of $1.07/gallon (2000$) to be competitive with corn ethanol.
First design report for an agricultural residue feedstock.
Assumed $30/dry ton (DT) feedstock cost delivered to the plant in bales.
Detailed conversion plant process design, factored capital cost estimate, operating cost estimate, and discounted cash-flow rate of return used to determine ethanol cost target.
Costs based on 2000 dollars.
2005 MYPP2 with Feedstock Logistics Estimates
Ethanol cost target of $1.08/gallon (2002$) in 2020.
First program plan with feedstock cost components identified.
Feedstock grower payment assumed at $10/ton, although it is understood that this is a point on the supply curve that would correspond to a relatively low level of available agricultural residue type feedstock.
Feedstock logistics estimated cost at $25/DT based on unit operations breakdown, including preprocessing and handling, with equipment and operations up to the pretreatment reactor throat.
Detailed conversion plant design virtually the same as in the 2002 design report, but excluded feedstock handling system equipment and operation, which is now included in feedstock logistics. Several additional minor modifications and corrections made to original design with no significant cost impact.
Conversion costs escalated to 2002 dollars.
2007 MYPP
Cost target of approximately $1.30/gallon (2007$) in 2012.
Feedstock grower payment escalated to $13/ton, although it is still an assumed number and understood that it is a point on the supply curve that would correspond to a relatively low level of available agricultural residue type feedstock.
Feedstock logistics cost breakdown updated based on first detailed design report covering this portion of the supply chain.
Detailed conversion plant design virtually the same as used in the 2005 MYPP case.
All costs escalated to 2007 dollars.
1 A. Aden, M. Ruth, et al. “Lignocellulosic Biomass to Ethanol Process Design and Economics Utilizing Co-Current
Dilute Acid Prehydrolysis and Enzymatic Hydrolysis for Corn Stover,” National Renewable Energy Laboratory,
NREL/TP-510-32438 (2002), http://www1.eere.energy.gov/biomass/pdfs/32438.pdf. 2 U.S. Department of Energy: Bioenergy Technologies Office, Multi-Year Program Plan 2007–2012 (2005),
Washington: Government Printing Office.
Appendix C: Calculation Methodology for Cost Goals
C-2 Last updated: July 2014
Document Design and Cost Information: Bases and Differences
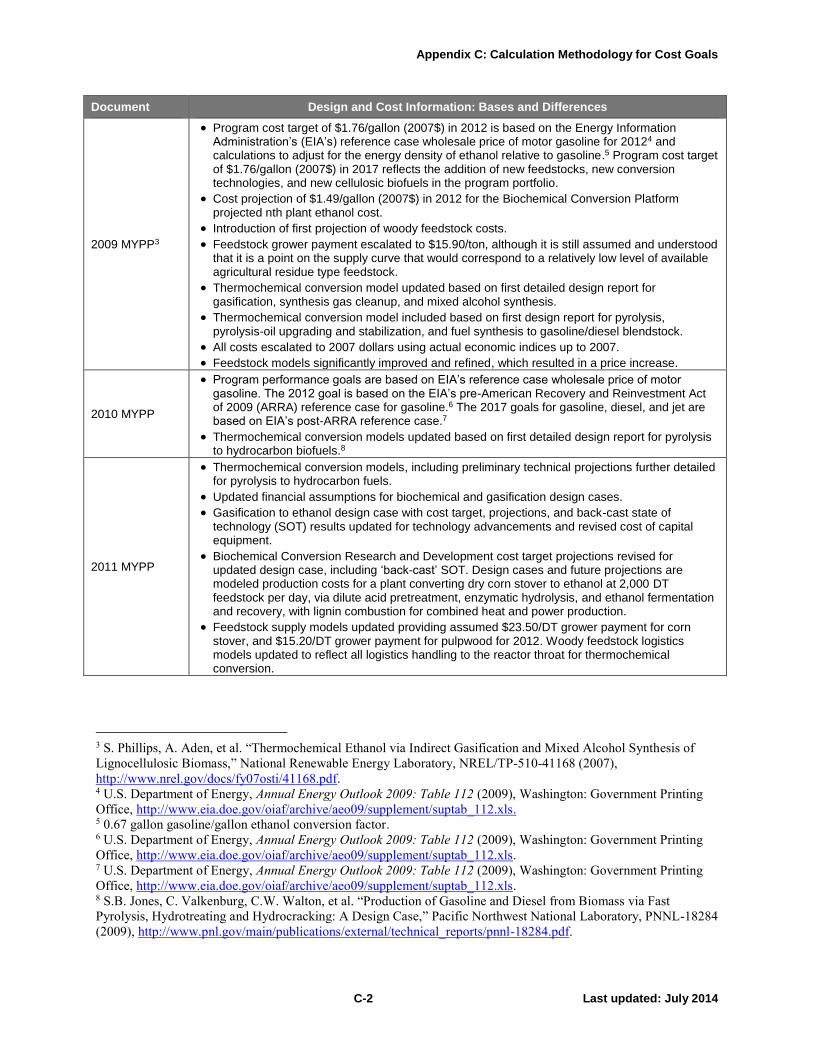
2009 MYPP3
Program cost target of $1.76/gallon (2007$) in 2012 is based on the Energy Information Administration’s (EIA’s) reference case wholesale price of motor gasoline for 20124 and calculations to adjust for the energy density of ethanol relative to gasoline.5 Program cost target of $1.76/gallon (2007$) in 2017 reflects the addition of new feedstocks, new conversion technologies, and new cellulosic biofuels in the program portfolio.
Cost projection of $1.49/gallon (2007$) in 2012 for the Biochemical Conversion Platform projected nth plant ethanol cost.
Introduction of first projection of woody feedstock costs.
Feedstock grower payment escalated to $15.90/ton, although it is still assumed and understood that it is a point on the supply curve that would correspond to a relatively low level of available agricultural residue type feedstock.
Thermochemical conversion model updated based on first detailed design report for gasification, synthesis gas cleanup, and mixed alcohol synthesis.
Thermochemical conversion model included based on first design report for pyrolysis, pyrolysis-oil upgrading and stabilization, and fuel synthesis to gasoline/diesel blendstock.
All costs escalated to 2007 dollars using actual economic indices up to 2007.
Feedstock models significantly improved and refined, which resulted in a price increase.
2010 MYPP
Program performance goals are based on EIA’s reference case wholesale price of motor gasoline. The 2012 goal is based on the EIA’s pre-American Recovery and Reinvestment Act of 2009 (ARRA) reference case for gasoline.6 The 2017 goals for gasoline, diesel, and jet are based on EIA’s post-ARRA reference case.7
Thermochemical conversion models updated based on first detailed design report for pyrolysis to hydrocarbon biofuels.8
2011 MYPP
Thermochemical conversion models, including preliminary technical projections further detailed for pyrolysis to hydrocarbon fuels.
Updated financial assumptions for biochemical and gasification design cases.
Gasification to ethanol design case with cost target, projections, and back-cast state of technology (SOT) results updated for technology advancements and revised cost of capital equipment.
Biochemical Conversion Research and Development cost target projections revised for updated design case, including ‘back-cast’ SOT. Design cases and future projections are modeled production costs for a plant converting dry corn stover to ethanol at 2,000 DT feedstock per day, via dilute acid pretreatment, enzymatic hydrolysis, and ethanol fermentation and recovery, with lignin combustion for combined heat and power production.
Feedstock supply models updated providing assumed $23.50/DT grower payment for corn stover, and $15.20/DT grower payment for pulpwood for 2012. Woody feedstock logistics models updated to reflect all logistics handling to the reactor throat for thermochemical conversion.
3 S. Phillips, A. Aden, et al. “Thermochemical Ethanol via Indirect Gasification and Mixed Alcohol Synthesis of
Lignocellulosic Biomass,” National Renewable Energy Laboratory, NREL/TP-510-41168 (2007),
http://www.nrel.gov/docs/fy07osti/41168.pdf. 4 U.S. Department of Energy, Annual Energy Outlook 2009: Table 112 (2009), Washington: Government Printing
Office, http://www.eia.doe.gov/oiaf/archive/aeo09/supplement/suptab_112.xls. 5 0.67 gallon gasoline/gallon ethanol conversion factor. 6 U.S. Department of Energy, Annual Energy Outlook 2009: Table 112 (2009), Washington: Government Printing
Office, http://www.eia.doe.gov/oiaf/archive/aeo09/supplement/suptab_112.xls. 7 U.S. Department of Energy, Annual Energy Outlook 2009: Table 112 (2009), Washington: Government Printing
Office, http://www.eia.doe.gov/oiaf/archive/aeo09/supplement/suptab_112.xls. 8 S.B. Jones, C. Valkenburg, C.W. Walton, et al. “Production of Gasoline and Diesel from Biomass via Fast
Pyrolysis, Hydrotreating and Hydrocracking: A Design Case,” Pacific Northwest National Laboratory, PNNL-18284
(2009), http://www.pnl.gov/main/publications/external/technical_reports/pnnl-18284.pdf.
Appendix C: Calculation Methodology for Cost Goals
C-3 Last updated: July 2014
Document Design and Cost Information: Bases and Differences
2012 MYPP
The Program’s 2017 performance goals are based on EIA’s reference case projections for the wholesale price of gasoline, diesel, and jet fuel.9
Updated financial assumptions and cost indexes for calculating cost goals.
Algae cost goals added for the Algae Lipid Upgrading pathway based on 2012 technical report.10
2014 MYPP
Thermochemical conversion cost goals revised based on updated design report for fast pyrolysis and upgrading to hydrocarbon biofuels.11
Biochemical conversion interim cost goal based on first detailed design report for biological conversion of sugars to hydrocarbon biofuels.12
Feedstocks cost goals were revised to $80/DM ton, including both grower payment and logistics, based on updated cost projections that incorporate the need for higher volumes and the need to address feedstock quality.
Office’s Performance Goal: Calculation Methodology
The Office’s performance goals are based on commercial viability, specifically the Energy
Information Administration’s (EIA’s) oil price outlook for future motor gasoline, diesel, and jet
wholesale prices. The underlying assumptions include the following:
Refinery gate production cost of gasoline can be compared to the biorefinery production
cost of biomass-based renewable gasoline and ethanol (adjusted for Btu content).
Similarly, refinery gate production cost of diesel and jet fuel can be compared to the
biorefinery production cost of biomass-based renewable diesel and jet fuel.
Downstream distribution costs are excluded as are subsidies and tax incentives.
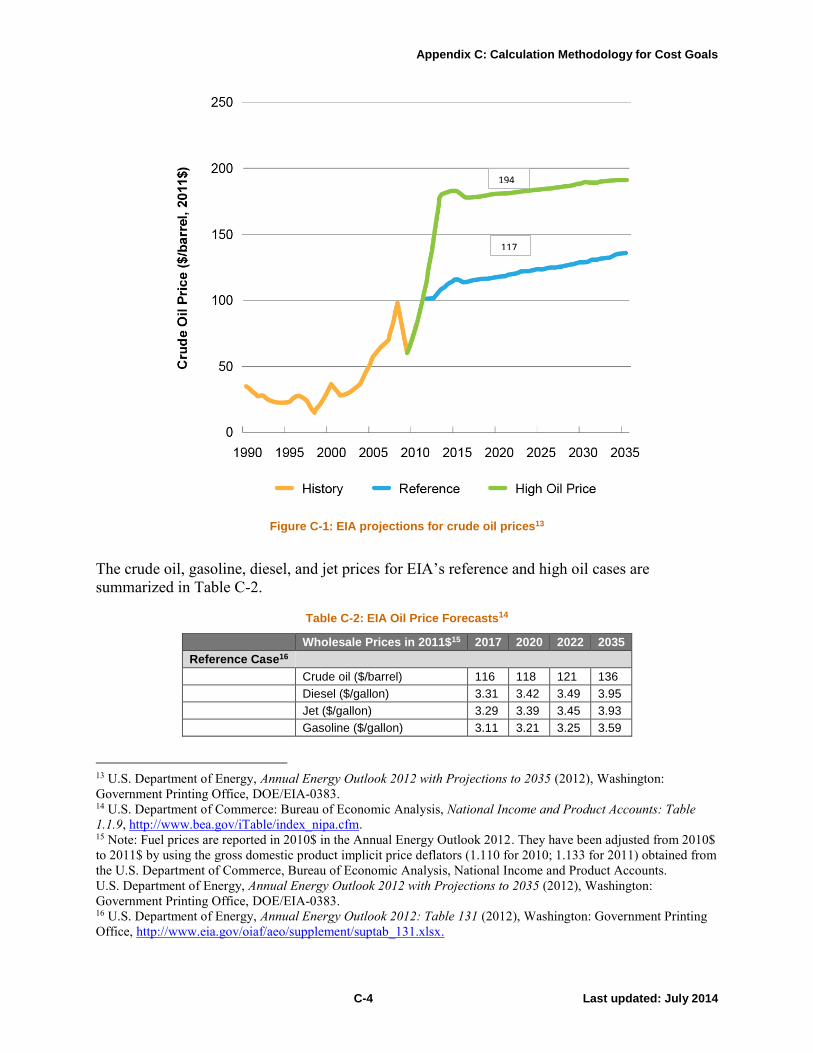
The historical crude oil prices and EIA projections are presented in Figure C-1.
9 U.S. Department of Energy, Annual Energy Outlook 2012: Table 131 (2012), Washington: Government Printing
Office, http://www.eia.gov/oiaf/aeo/supplement/suptab_131.xlsx. 10 Davis et al. “Renewable Diesel from Algal Lipids: An Integrated Baseline for Cost, Emissions, and Resource
Potential from a Harmonized Model,” Argonne National Laboratory, ANL/ESD/12-4, National Renewable Energy
Laboratory, NREL/TP-5100-55431, and Pacific Northwest National Laboratory, PNNL-21437 (2013),
http://www.nrel.gov/docs/fy12osti/55431.pdf. 11 Jones et al. “Process Design and Economics for the Conversion of Lignocellulosic Biomass to Hydrocarbon
Fuels,” Pacific Northwest National Laboratory, PNNL-23053 (2013),
http://www.pnnl.gov/main/publications/external/technical_reports/PNNL-23053.pdf. 12 Davis et al. “Process Design and Economics for the Conversion of Lignocellulosic Biomass to Hydrocarbons:
Dilute-Acid and Enzymatic Deconstruction of Biomass to Sugars and Biological Conversion of Sugars to
Hydrocarbons,” National Renewable Energy Laboratory, NREL/TP-5100-60223 (2013),
http://www.nrel.gov/docs/fy14osti/60223.pdf.
Appendix C: Calculation Methodology for Cost Goals
C-4 Last updated: July 2014
Figure C-1: EIA projections for crude oil prices13
The crude oil, gasoline, diesel, and jet prices for EIA’s reference and high oil cases are
summarized in Table C-2.
Table C-2: EIA Oil Price Forecasts14
Wholesale Prices in 2011$15 2017 2020 2022 2035
Reference Case16
Crude oil ($/barrel) 116 118 121 136
Diesel ($/gallon) 3.31 3.42 3.49 3.95
Jet ($/gallon) 3.29 3.39 3.45 3.93
Gasoline ($/gallon) 3.11 3.21 3.25 3.59
13 U.S. Department of Energy, Annual Energy Outlook 2012 with Projections to 2035 (2012), Washington:
Government Printing Office, DOE/EIA-0383. 14 U.S. Department of Commerce: Bureau of Economic Analysis, National Income and Product Accounts: Table
1.1.9, http://www.bea.gov/iTable/index_nipa.cfm. 15 Note: Fuel prices are reported in 2010$ in the Annual Energy Outlook 2012. They have been adjusted from 2010$
to 2011$ by using the gross domestic product implicit price deflators (1.110 for 2010; 1.133 for 2011) obtained from
the U.S. Department of Commerce, Bureau of Economic Analysis, National Income and Product Accounts.
U.S. Department of Energy, Annual Energy Outlook 2012 with Projections to 2035 (2012), Washington:
Government Printing Office, DOE/EIA-0383. 16 U.S. Department of Energy, Annual Energy Outlook 2012: Table 131 (2012), Washington: Government Printing
Office, http://www.eia.gov/oiaf/aeo/supplement/suptab_131.xlsx.
194
117
Appendix C: Calculation Methodology for Cost Goals
C-5 Last updated: July 2014
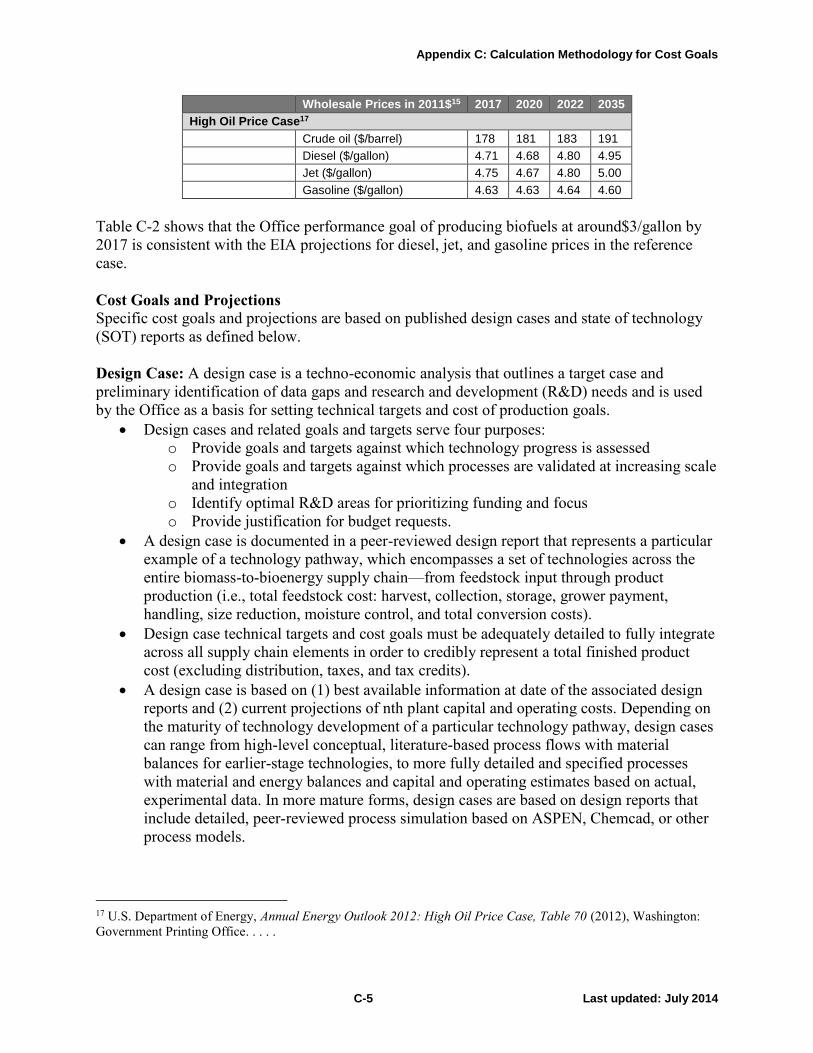
Wholesale Prices in 2011$15 2017 2020 2022 2035
High Oil Price Case17
Crude oil ($/barrel) 178 181 183 191
Diesel ($/gallon) 4.71 4.68 4.80 4.95
Jet ($/gallon) 4.75 4.67 4.80 5.00
Gasoline ($/gallon) 4.63 4.63 4.64 4.60
Table C-2 shows that the Office performance goal of producing biofuels at around$3/gallon by
2017 is consistent with the EIA projections for diesel, jet, and gasoline prices in the reference
case.
Cost Goals and Projections
Specific cost goals and projections are based on published design cases and state of technology
(SOT) reports as defined below.
Design Case: A design case is a techno-economic analysis that outlines a target case and
preliminary identification of data gaps and research and development (R&D) needs and is used
by the Office as a basis for setting technical targets and cost of production goals.
Design cases and related goals and targets serve four purposes:
o Provide goals and targets against which technology progress is assessed
o Provide goals and targets against which processes are validated at increasing scale
and integration
o Identify optimal R&D areas for prioritizing funding and focus
o Provide justification for budget requests.
A design case is documented in a peer-reviewed design report that represents a particular
example of a technology pathway, which encompasses a set of technologies across the
entire biomass-to-bioenergy supply chain—from feedstock input through product
production (i.e., total feedstock cost: harvest, collection, storage, grower payment,
handling, size reduction, moisture control, and total conversion costs).
Design case technical targets and cost goals must be adequately detailed to fully integrate
across all supply chain elements in order to credibly represent a total finished product
cost (excluding distribution, taxes, and tax credits).
A design case is based on (1) best available information at date of the associated design
reports and (2) current projections of nth plant capital and operating costs. Depending on
the maturity of technology development of a particular technology pathway, design cases
can range from high-level conceptual, literature-based process flows with material
balances for earlier-stage technologies, to more fully detailed and specified processes
with material and energy balances and capital and operating estimates based on actual,
experimental data. In more mature forms, design cases are based on design reports that
include detailed, peer-reviewed process simulation based on ASPEN, Chemcad, or other
process models.
17 U.S. Department of Energy, Annual Energy Outlook 2012: High Oil Price Case, Table 70 (2012), Washington:
Government Printing Office. . . . .

Appendix C: Calculation Methodology for Cost Goals
C-6 Last updated: July 2014
As technology development progresses, design cases generally become more detailed and
are reconfigured, which results in changes to technical targets and cost goals to reflect
advances in the R&D knowledge base.
Over the time span from initial to final design case for a given technology pathway, the
range of uncertainty around the associated technical targets and cost estimates is expected
to decrease.
State of Technology: An SOT assessment is a periodic (usually annual) assessment of the status
of technology development for a biomass to biofuels/products pathway. An SOT assesses
progress within and across relevant technology areas based on actual experimental results
relative to technical targets and cost goals from design cases and includes technical, economic,
and environmental criteria as available.
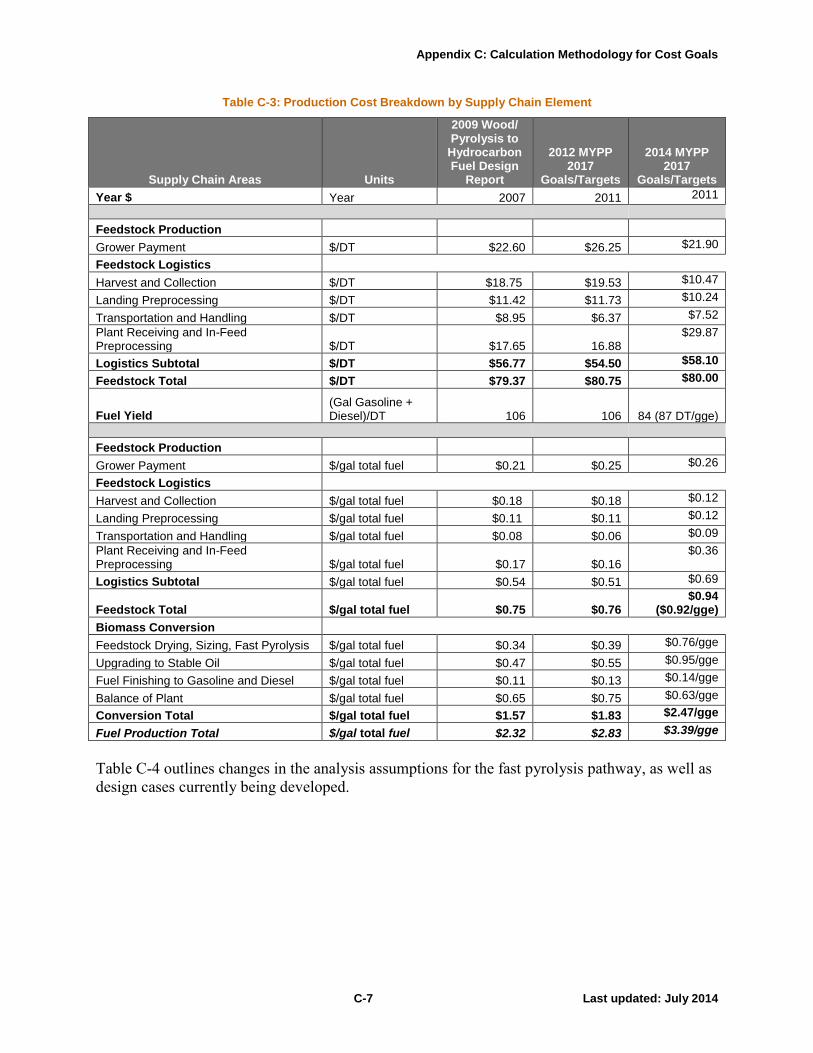
Table C-3 shows the cost breakdown of the projected cost goals for the fast pyrolysis pathway as
a result of updating the dollar year from 2007 to 2011 and adjusting other key assumptions, as
shown in Table C-4. It also shows the changes resulting from the updated fast pyrolysis design
report.18 The cost components are based on the first three major elements of the biomass-to-
biofuels supply chain (feedstock production, feedstock logistics, and biomass conversion) and
their associated sub-elements.
The costs for feedstock production are based on simulated feedstock supply curves developed
and published in the U.S. Billion-Ton Update.19 This analysis projects feedstock production
scenarios based on a series of factors that impact feedstock production decisions. The supply
curves project the amount of feedstock produced at various market prices for each of several
feedstock categories identified in Table B-1. The grower payment in Tables B-3 and C-3 reflects
the component of the total feedstock cost paid to the producer. This grower payment corresponds
to the estimated average price required to procure total volumes available using U.S. Billion-Ton
data, e.g., Figure 2-9.
The projected production cost goals represent mature technology processing costs, which means
that the capital and operating costs are assumed to be for an “nth plant,” where several plants
have been built and are operating successfully, no longer requiring increased costs for risk
financing, longer startups, under performance, and other costs associated with pioneer plants.
18 Jones et al. “Process Design and Economics for the Conversion of Lignocellulosic Biomass to Hydrocarbon
Fuels,” Pacific Northwest National Laboratory, PNNL-23053 (2013),
http://www.pnnl.gov/main/publications/external/technical_reports/PNNL-23053.pdf. 19 Robert Perlack, Bryce Stokes, et al. “U.S. Billion-Ton Update: Biomass Supply for a Bioenergy and Bioproducts
Industry,” Oak Ridge National Laboratory, ORNL/TM-2011/224 (2011),
http://www1.eere.energy.gov/biomass/pdfs/billion_ton_update.pdf.
Appendix C: Calculation Methodology for Cost Goals
C-7 Last updated: July 2014
Table C-3: Production Cost Breakdown by Supply Chain Element
Supply Chain Areas Units
2009 Wood/ Pyrolysis to
Hydrocarbon Fuel Design
Report
2012 MYPP 2017
Goals/Targets
2014 MYPP
2017 Goals/Targets
Year $ Year 2007 2011 2011
Feedstock Production
Grower Payment $/DT $22.60 $26.25 $21.90
Feedstock Logistics
Harvest and Collection $/DT $18.75 $19.53 $10.47
Landing Preprocessing $/DT $11.42 $11.73 $10.24
Transportation and Handling $/DT $8.95 $6.37 $7.52
Plant Receiving and In-Feed Preprocessing $/DT $17.65 16.88
$29.87
Logistics Subtotal $/DT $56.77 $54.50 $58.10
Feedstock Total $/DT $79.37 $80.75 $80.00
Fuel Yield (Gal Gasoline + Diesel)/DT 106 106 84 (87 DT/gge)
Feedstock Production
Grower Payment $/gal total fuel $0.21 $0.25 $0.26
Feedstock Logistics
Harvest and Collection $/gal total fuel $0.18 $0.18 $0.12
Landing Preprocessing $/gal total fuel $0.11 $0.11 $0.12
Transportation and Handling $/gal total fuel $0.08 $0.06 $0.09
Plant Receiving and In-Feed Preprocessing $/gal total fuel $0.17 $0.16
$0.36
Logistics Subtotal $/gal total fuel $0.54 $0.51 $0.69
Feedstock Total $/gal total fuel $0.75 $0.76 $0.94
($0.92/gge)
Biomass Conversion
Feedstock Drying, Sizing, Fast Pyrolysis $/gal total fuel $0.34 $0.39 $0.76/gge
Upgrading to Stable Oil $/gal total fuel $0.47 $0.55 $0.95/gge
Fuel Finishing to Gasoline and Diesel $/gal total fuel $0.11 $0.13 $0.14/gge
Balance of Plant $/gal total fuel $0.65 $0.75 $0.63/gge
Conversion Total $/gal total fuel $1.57 $1.83 $2.47/gge
Fuel Production Total $/gal total fuel $2.32 $2.83 $3.39/gge
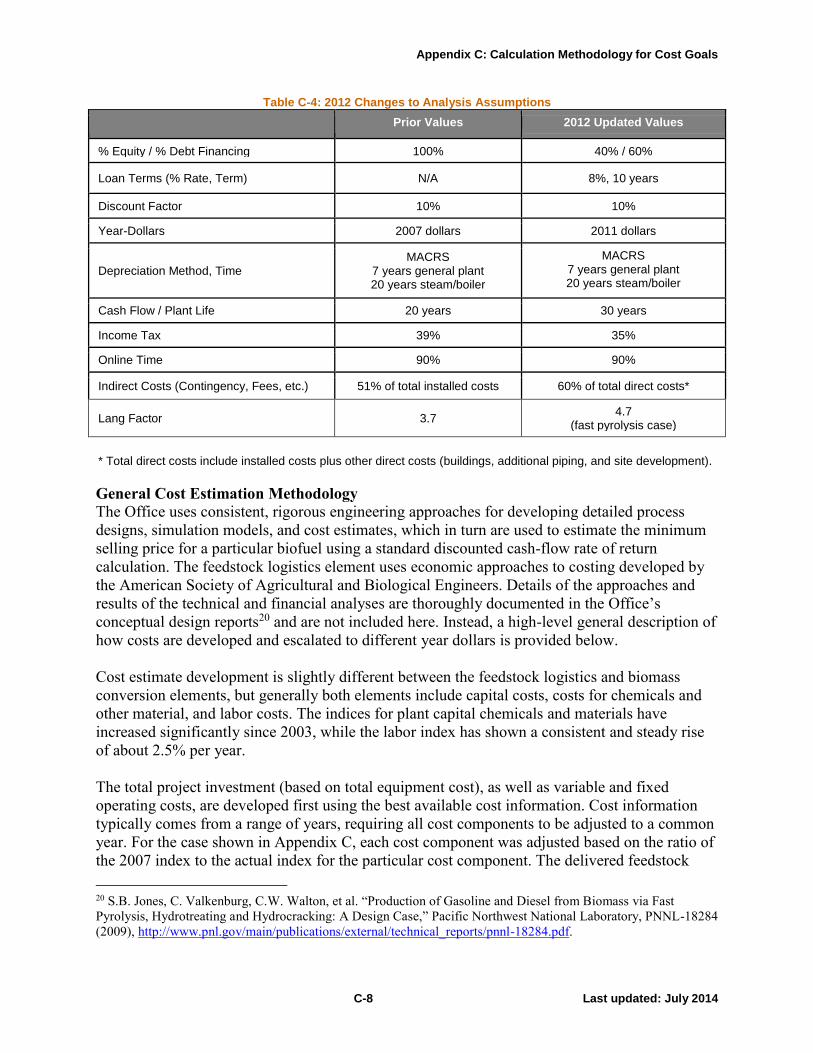
Table C-4 outlines changes in the analysis assumptions for the fast pyrolysis pathway, as well as
design cases currently being developed.
Appendix C: Calculation Methodology for Cost Goals
C-8 Last updated: July 2014
Table C-4: 2012 Changes to Analysis Assumptions
Prior Values 2012 Updated Values
% Equity / % Debt Financing 100% 40% / 60%
Loan Terms (% Rate, Term) N/A 8%, 10 years
Discount Factor 10% 10%
Year-Dollars 2007 dollars 2011 dollars
Depreciation Method, Time MACRS
7 years general plant 20 years steam/boiler
MACRS 7 years general plant 20 years steam/boiler (if exporting electricity)
Cash Flow / Plant Life 20 years 30 years
Income Tax 39% 35%
Online Time 90% 90%
Indirect Costs (Contingency, Fees, etc.) 51% of total installed costs 60% of total direct costs*
Lang Factor 3.7 4.7
(fast pyrolysis case)
* Total direct costs include installed costs plus other direct costs (buildings, additional piping, and site development).
General Cost Estimation Methodology
The Office uses consistent, rigorous engineering approaches for developing detailed process
designs, simulation models, and cost estimates, which in turn are used to estimate the minimum
selling price for a particular biofuel using a standard discounted cash-flow rate of return
calculation. The feedstock logistics element uses economic approaches to costing developed by
the American Society of Agricultural and Biological Engineers. Details of the approaches and
results of the technical and financial analyses are thoroughly documented in the Office’s
conceptual design reports20 and are not included here. Instead, a high-level general description of
how costs are developed and escalated to different year dollars is provided below.
Cost estimate development is slightly different between the feedstock logistics and biomass
conversion elements, but generally both elements include capital costs, costs for chemicals and
other material, and labor costs. The indices for plant capital chemicals and materials have
increased significantly since 2003, while the labor index has shown a consistent and steady rise
of about 2.5% per year.
The total project investment (based on total equipment cost), as well as variable and fixed
operating costs, are developed first using the best available cost information. Cost information
typically comes from a range of years, requiring all cost components to be adjusted to a common
year. For the case shown in Appendix C, each cost component was adjusted based on the ratio of
the 2007 index to the actual index for the particular cost component. The delivered feedstock
20 S.B. Jones, C. Valkenburg, C.W. Walton, et al. “Production of Gasoline and Diesel from Biomass via Fast
Pyrolysis, Hydrotreating and Hydrocracking: A Design Case,” Pacific Northwest National Laboratory, PNNL-18284
(2009), http://www.pnl.gov/main/publications/external/technical_reports/pnnl-18284.pdf.
Appendix C: Calculation Methodology for Cost Goals
C-9 Last updated: July 2014
cost was treated as an operating cost for the biomass conversion facility. With these costs, a
discounted cash-flow analysis of the conversion facility was carried out to determine the selling
price of fuel when the net present value of the project is zero.
Total Project Investment Estimates and Cost Escalation
The Office design reports include detailed equipment lists with sizes and costs, as well as details
on how the purchase costs of all equipment were determined. For the feedstock logistics element,
some of the equipment, such as harvesters and trucks, do not require additional installation cost;
however, other logistics equipment and the majority of the conversion facility equipment will be
installed.
For the types of conceptual designs the Office carries out, a “factored” approach is used. Once
the installed equipment cost has been determined from the purchased cost and the installation
factor, it can be indexed to the project year being considered. The purchase cost of each piece of
equipment has a year associated with it. The purchased cost year will be indexed to the year of
interest using the Chemical Engineering Plant Cost Index.
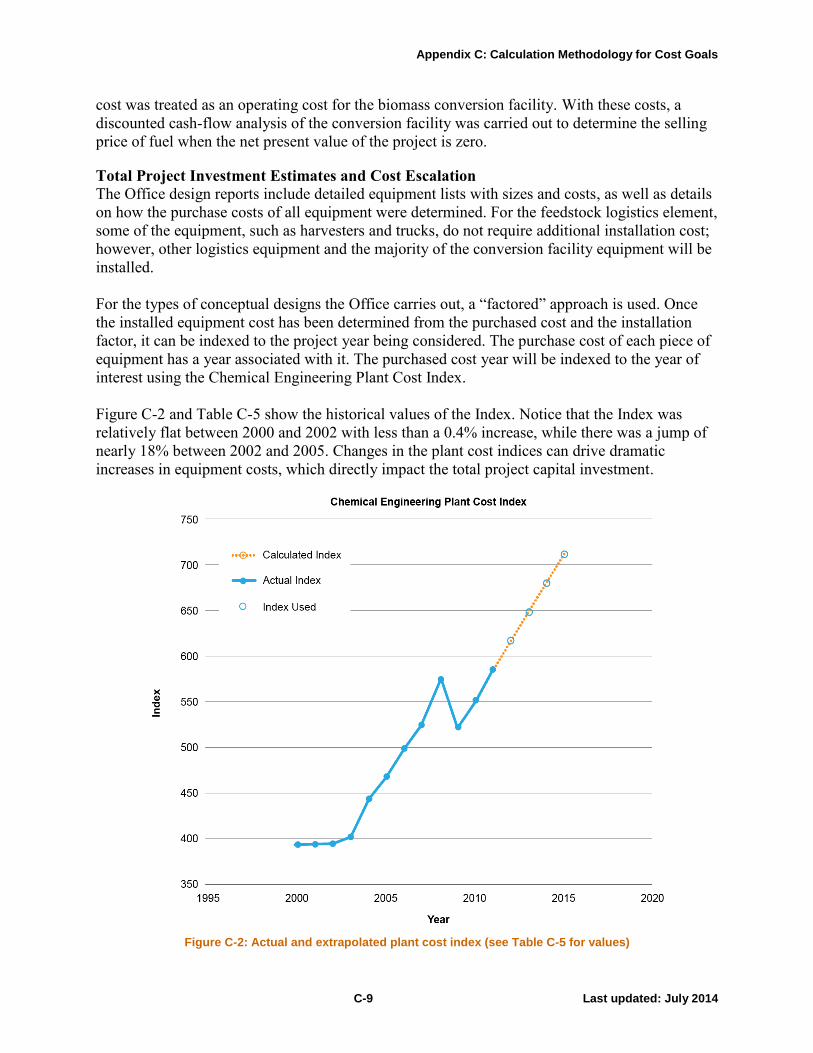
Figure C-2 and Table C-5 show the historical values of the Index. Notice that the Index was
relatively flat between 2000 and 2002 with less than a 0.4% increase, while there was a jump of
nearly 18% between 2002 and 2005. Changes in the plant cost indices can drive dramatic
increases in equipment costs, which directly impact the total project capital investment.
Figure C-2: Actual and extrapolated plant cost index (see Table C-5 for values)
Appendix C: Calculation Methodology for Cost Goals
C-10 Last updated: July 2014
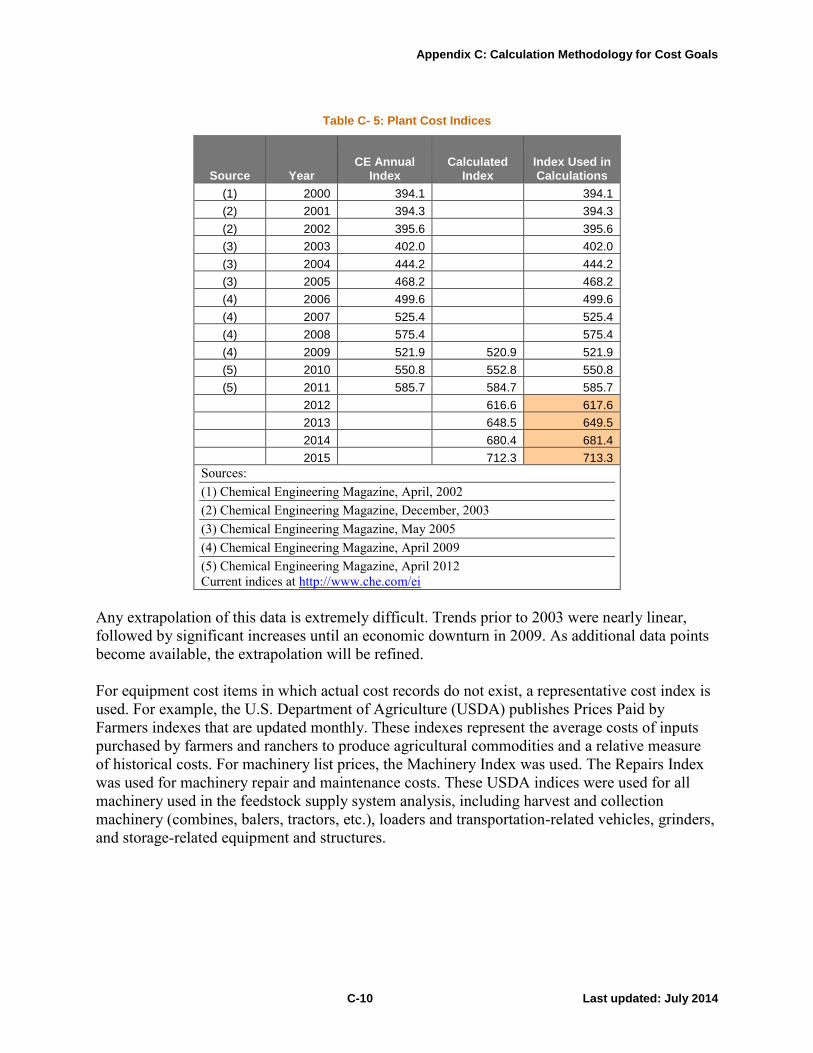
Table C- 5: Plant Cost Indices
Source Year CE Annual
Index Calculated
Index Index Used in Calculations
(1) 2000 394.1 394.1
(2) 2001 394.3 394.3
(2) 2002 395.6 395.6
(3) 2003 402.0 402.0
(3) 2004 444.2 444.2
(3) 2005 468.2 468.2
(4) 2006 499.6 499.6
(4) 2007 525.4 525.4
(4) 2008 575.4 575.4
(4) 2009 521.9 520.9 521.9
(5) 2010 550.8 552.8 550.8
(5) 2011 585.7 584.7 585.7
2012 616.6 617.6
2013 648.5 649.5
2014 680.4 681.4
2015 712.3 713.3
Sources:
(1) Chemical Engineering Magazine, April, 2002
(2) Chemical Engineering Magazine, December, 2003
(3) Chemical Engineering Magazine, May 2005
(4) Chemical Engineering Magazine, April 2009
(5) Chemical Engineering Magazine, April 2012
Current indices at http://www.che.com/ei
Any extrapolation of this data is extremely difficult. Trends prior to 2003 were nearly linear,
followed by significant increases until an economic downturn in 2009. As additional data points
become available, the extrapolation will be refined.
For equipment cost items in which actual cost records do not exist, a representative cost index is
used. For example, the U.S. Department of Agriculture (USDA) publishes Prices Paid by
Farmers indexes that are updated monthly. These indexes represent the average costs of inputs
purchased by farmers and ranchers to produce agricultural commodities and a relative measure
of historical costs. For machinery list prices, the Machinery Index was used. The Repairs Index
was used for machinery repair and maintenance costs. These USDA indices were used for all
machinery used in the feedstock supply system analysis, including harvest and collection
machinery (combines, balers, tractors, etc.), loaders and transportation-related vehicles, grinders,
and storage-related equipment and structures.
Appendix C: Calculation Methodology for Cost Goals
C-11 Last updated: July 2014
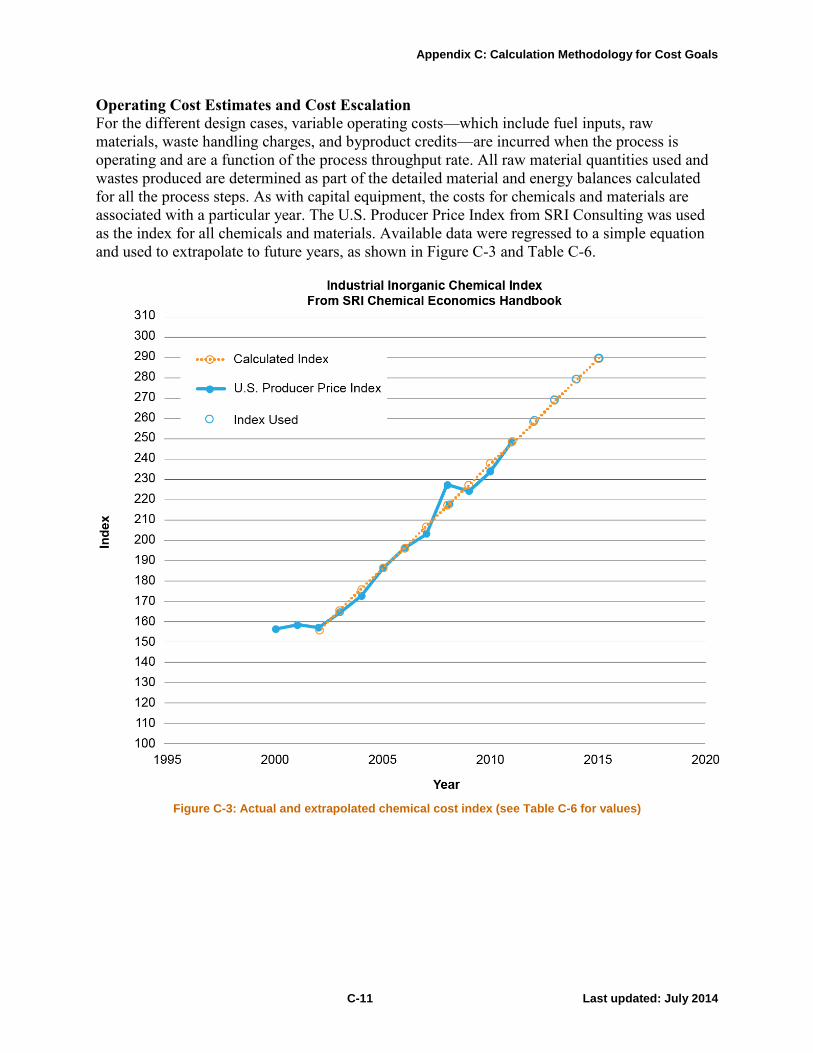
Operating Cost Estimates and Cost Escalation
For the different design cases, variable operating costs—which include fuel inputs, raw
materials, waste handling charges, and byproduct credits—are incurred when the process is
operating and are a function of the process throughput rate. All raw material quantities used and
wastes produced are determined as part of the detailed material and energy balances calculated
for all the process steps. As with capital equipment, the costs for chemicals and materials are
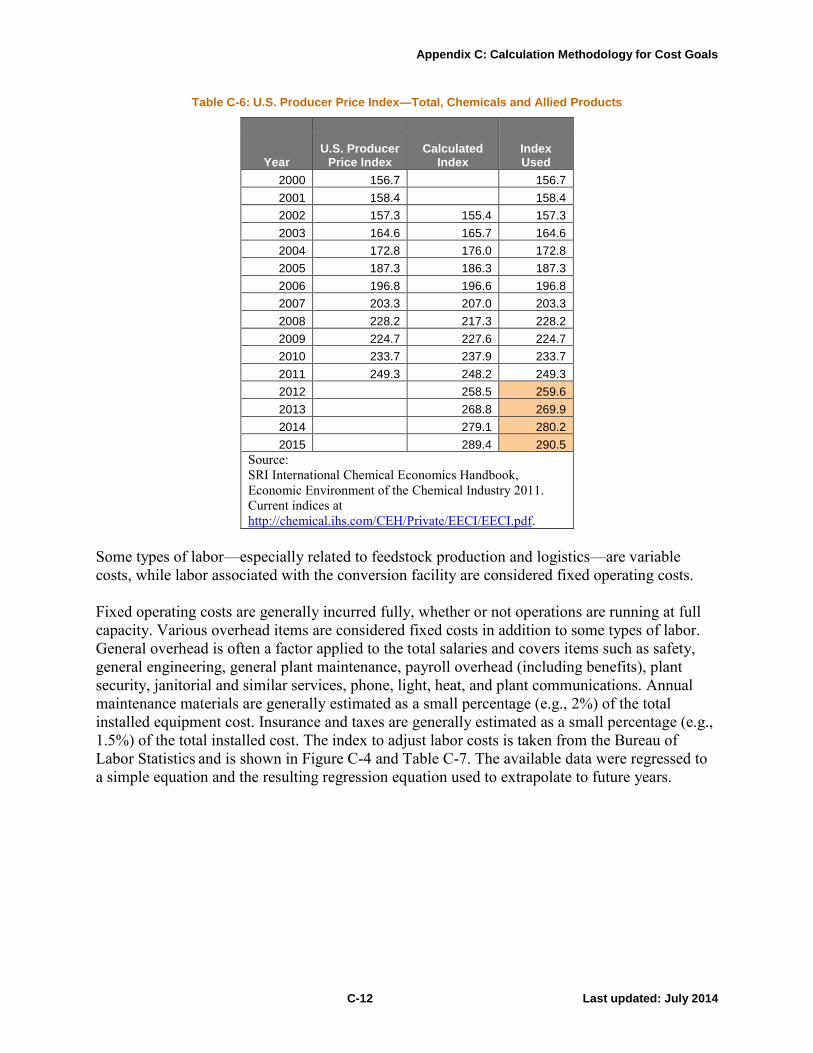
associated with a particular year. The U.S. Producer Price Index from SRI Consulting was used
as the index for all chemicals and materials. Available data were regressed to a simple equation
and used to extrapolate to future years, as shown in Figure C-3 and Table C-6.
Figure C-3: Actual and extrapolated chemical cost index (see Table C-6 for values)
Appendix C: Calculation Methodology for Cost Goals
C-12 Last updated: July 2014
Table C-6: U.S. Producer Price Index—Total, Chemicals and Allied Products
Year U.S. Producer
Price Index Calculated
Index Index Used
2000 156.7 156.7
2001 158.4 158.4
2002 157.3 155.4 157.3
2003 164.6 165.7 164.6
2004 172.8 176.0 172.8
2005 187.3 186.3 187.3
2006 196.8 196.6 196.8
2007 203.3 207.0 203.3
2008 228.2 217.3 228.2
2009 224.7 227.6 224.7
2010 233.7 237.9 233.7
2011 249.3 248.2 249.3
2012 258.5 259.6
2013 268.8 269.9
2014 279.1 280.2
2015 289.4 290.5
Source:
SRI International Chemical Economics Handbook,
Economic Environment of the Chemical Industry 2011.
Current indices at
http://chemical.ihs.com/CEH/Private/EECI/EECI.pdf.
Some types of labor—especially related to feedstock production and logistics—are variable
costs, while labor associated with the conversion facility are considered fixed operating costs.
Fixed operating costs are generally incurred fully, whether or not operations are running at full
capacity. Various overhead items are considered fixed costs in addition to some types of labor.
General overhead is often a factor applied to the total salaries and covers items such as safety,
general engineering, general plant maintenance, payroll overhead (including benefits), plant
security, janitorial and similar services, phone, light, heat, and plant communications. Annual
maintenance materials are generally estimated as a small percentage (e.g., 2%) of the total
installed equipment cost. Insurance and taxes are generally estimated as a small percentage (e.g.,
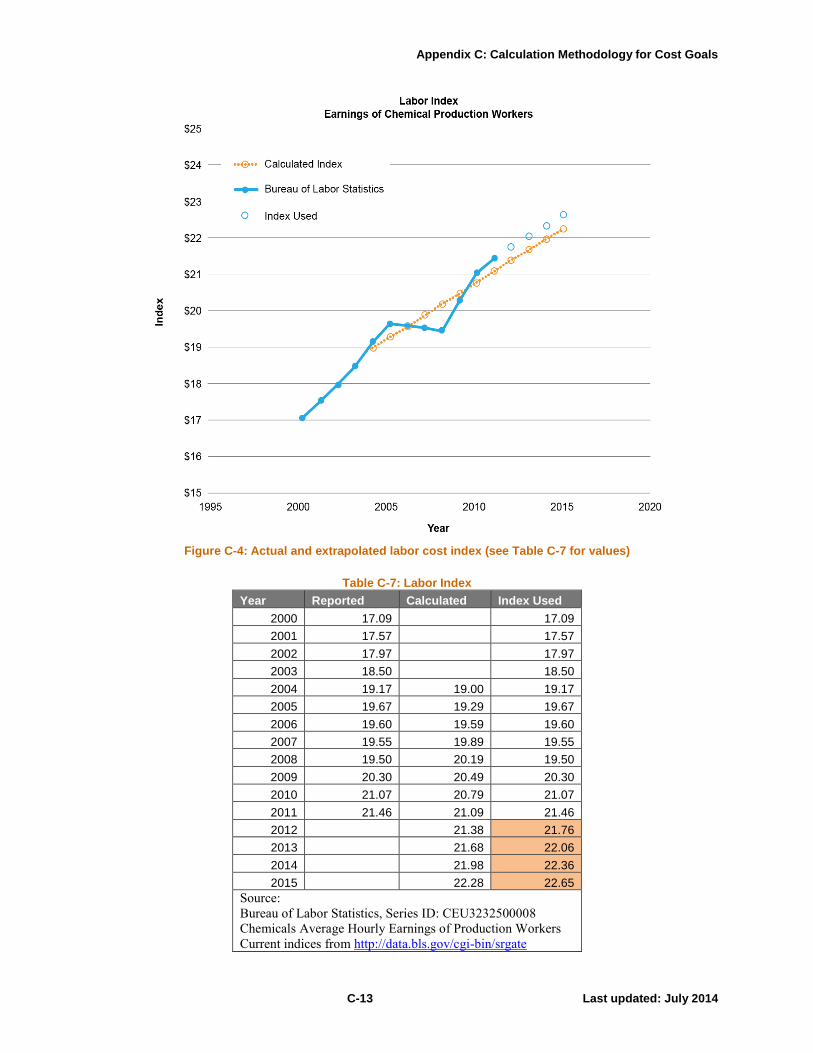
1.5%) of the total installed cost. The index to adjust labor costs is taken from the Bureau of
Labor Statistics
and is shown in Figure C-4 and Table C-7. The available data were regressed to
a simple equation and the resulting regression equation used to extrapolate to future years.
Appendix C: Calculation Methodology for Cost Goals
C-13 Last updated: July 2014
Figure C-4: Actual and extrapolated labor cost index (see Table C-7 for values)
Table C-7: Labor Index
Year Reported Calculated Index Used
2000 17.09 17.09
2001 17.57 17.57
2002 17.97 17.97
2003 18.50 18.50
2004 19.17 19.00 19.17
2005 19.67 19.29 19.67
2006 19.60 19.59 19.60
2007 19.55 19.89 19.55
2008 19.50 20.19 19.50
2009 20.30 20.49 20.30
2010 21.07 20.79 21.07
2011 21.46 21.09 21.46
2012 21.38 21.76
2013 21.68 22.06
2014 21.98 22.36
2015 22.28 22.65
Source:
Bureau of Labor Statistics, Series ID: CEU3232500008
Chemicals Average Hourly Earnings of Production Workers
Current indices from http://data.bls.gov/cgi-bin/srgate

Appendix C: Calculation Methodology for Cost Goals
C-14 Last updated: July 2014
Discounted Cash-Flow Analysis and the Selling Cost of Ethanol
Once the two major cost areas—total project investment and operating costs—have been
determined, a discounted cash-flow analysis can be used to determine the minimum selling price
per gallon of biofuel produced. The discounted cash-flow analysis program iterates on the selling
cost of the biofuel until the net present value of the project is zero. This analysis requires that the
discount rate, depreciation method, income tax rates, plant life, and construction startup duration
be specified. The Office has developed a standard set of assumptions for use in the discounted
cash-flow analysis.