APPENDIX 1: STUDY AREA - Pembrokeshire County Council
414
South West Wales Regional Retail Study APPENDIX 1: STUDY AREA
-
Upload
khangminh22 -
Category
Documents
-
view
1 -
download
0
Transcript of APPENDIX 1: STUDY AREA - Pembrokeshire County Council
South West Wales Regional Retail Study
APPENDIX 1: STUDY AREA
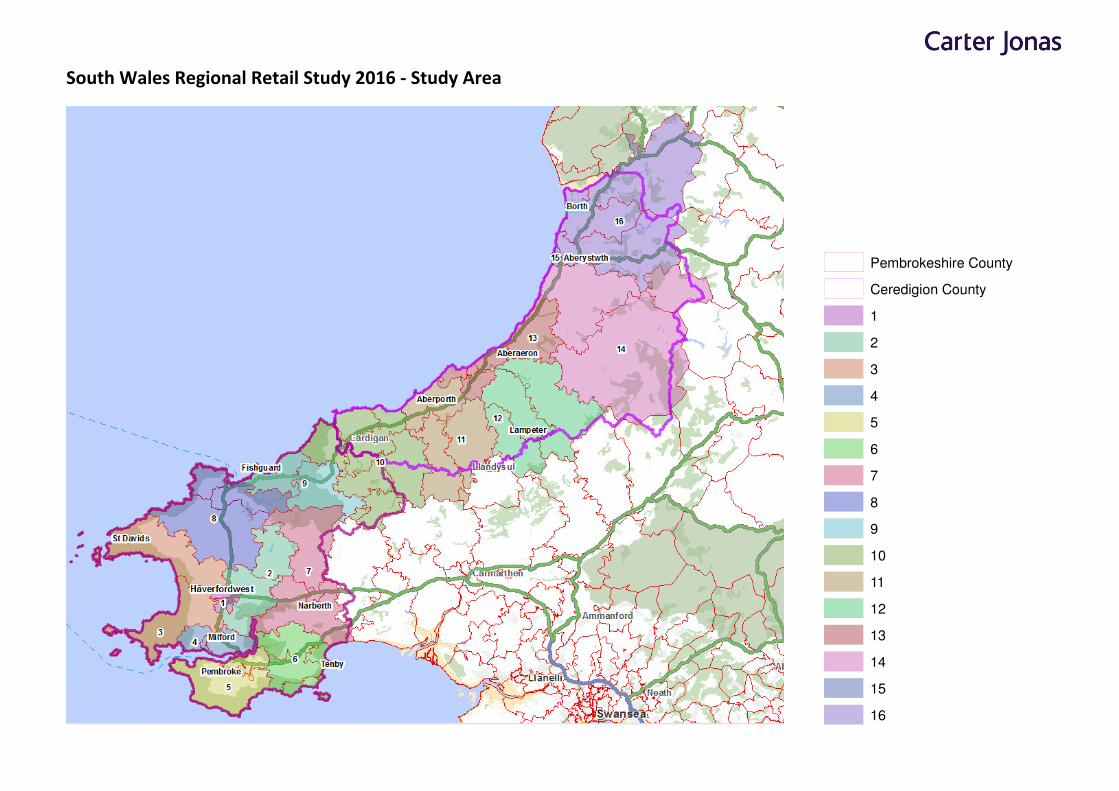
South Wales Regional Retail Study 2016 - Study Area
Pembrokeshire County
Ceredigion County
1
2
3
4
5
6
7
8
9
10
11
12
13
14
15
16

South West Wales Regional Retail Study
APPENDIX 2: CONVENIENCE GOODS MARKET SHARES
South West Wales Regional Retail Study 2016Convenience Market Shares
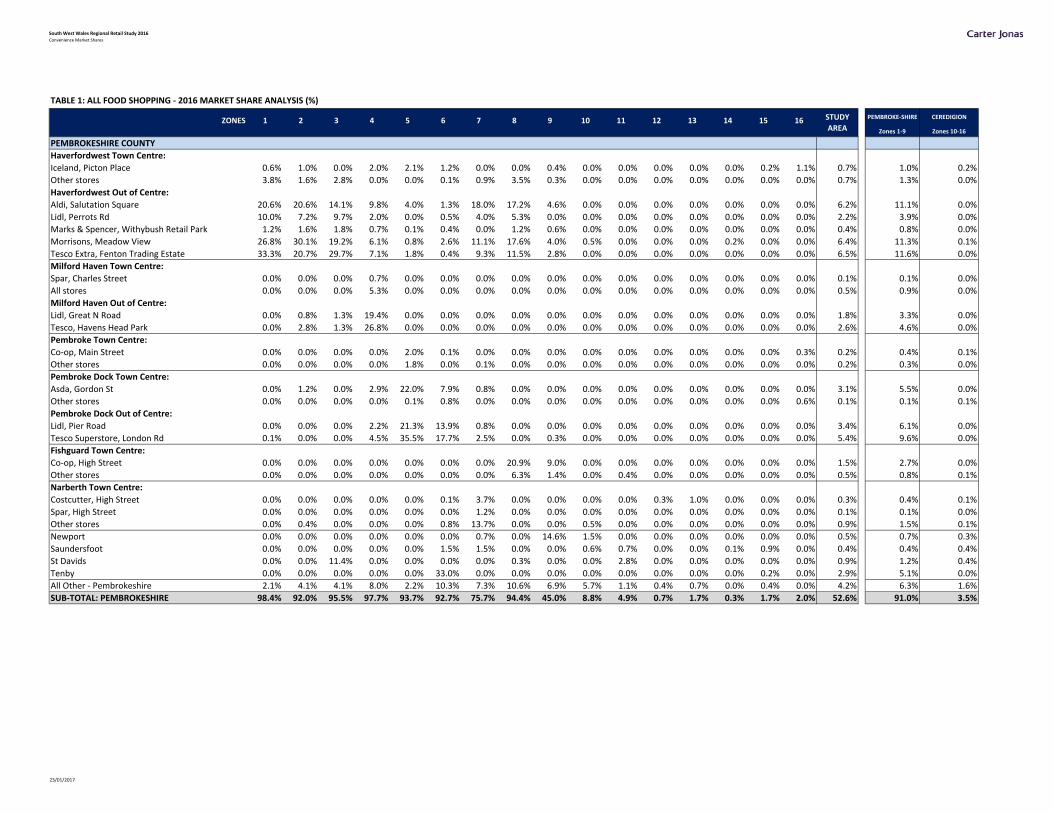
TABLE 1: ALL FOOD SHOPPING ‐ 2016 MARKET SHARE ANALYSIS (%)
ZONES 1 2 3 4 5 6 7 8 9 10 11 12 13 14 15 16Zones 1‐9 Zones 10‐16
PEMBROKESHIRE COUNTY
Haverfordwest Town Centre:
Iceland, Picton Place 0.6% 1.0% 0.0% 2.0% 2.1% 1.2% 0.0% 0.0% 0.4% 0.0% 0.0% 0.0% 0.0% 0.0% 0.2% 1.1% 0.7% 1.0% 0.2%
Other stores 3.8% 1.6% 2.8% 0.0% 0.0% 0.1% 0.9% 3.5% 0.3% 0.0% 0.0% 0.0% 0.0% 0.0% 0.0% 0.0% 0.7% 1.3% 0.0%
Haverfordwest Out of Centre:
Aldi, Salutation Square 20.6% 20.6% 14.1% 9.8% 4.0% 1.3% 18.0% 17.2% 4.6% 0.0% 0.0% 0.0% 0.0% 0.0% 0.0% 0.0% 6.2% 11.1% 0.0%
Lidl, Perrots Rd 10.0% 7.2% 9.7% 2.0% 0.0% 0.5% 4.0% 5.3% 0.0% 0.0% 0.0% 0.0% 0.0% 0.0% 0.0% 0.0% 2.2% 3.9% 0.0%
Marks & Spencer, Withybush Retail Park 1.2% 1.6% 1.8% 0.7% 0.1% 0.4% 0.0% 1.2% 0.6% 0.0% 0.0% 0.0% 0.0% 0.0% 0.0% 0.0% 0.4% 0.8% 0.0%
Morrisons, Meadow View 26.8% 30.1% 19.2% 6.1% 0.8% 2.6% 11.1% 17.6% 4.0% 0.5% 0.0% 0.0% 0.0% 0.2% 0.0% 0.0% 6.4% 11.3% 0.1%
Tesco Extra, Fenton Trading Estate 33.3% 20.7% 29.7% 7.1% 1.8% 0.4% 9.3% 11.5% 2.8% 0.0% 0.0% 0.0% 0.0% 0.0% 0.0% 0.0% 6.5% 11.6% 0.0%
Milford Haven Town Centre:
Spar, Charles Street 0.0% 0.0% 0.0% 0.7% 0.0% 0.0% 0.0% 0.0% 0.0% 0.0% 0.0% 0.0% 0.0% 0.0% 0.0% 0.0% 0.1% 0.1% 0.0%
All stores 0.0% 0.0% 0.0% 5.3% 0.0% 0.0% 0.0% 0.0% 0.0% 0.0% 0.0% 0.0% 0.0% 0.0% 0.0% 0.0% 0.5% 0.9% 0.0%
Milford Haven Out of Centre:
Lidl, Great N Road 0.0% 0.8% 1.3% 19.4% 0.0% 0.0% 0.0% 0.0% 0.0% 0.0% 0.0% 0.0% 0.0% 0.0% 0.0% 0.0% 1.8% 3.3% 0.0%
Tesco, Havens Head Park 0.0% 2.8% 1.3% 26.8% 0.0% 0.0% 0.0% 0.0% 0.0% 0.0% 0.0% 0.0% 0.0% 0.0% 0.0% 0.0% 2.6% 4.6% 0.0%
Pembroke Town Centre:
Co‐op, Main Street 0.0% 0.0% 0.0% 0.0% 2.0% 0.1% 0.0% 0.0% 0.0% 0.0% 0.0% 0.0% 0.0% 0.0% 0.0% 0.3% 0.2% 0.4% 0.1%
Other stores 0.0% 0.0% 0.0% 0.0% 1.8% 0.0% 0.1% 0.0% 0.0% 0.0% 0.0% 0.0% 0.0% 0.0% 0.0% 0.0% 0.2% 0.3% 0.0%
Pembroke Dock Town Centre:
Asda, Gordon St 0.0% 1.2% 0.0% 2.9% 22.0% 7.9% 0.8% 0.0% 0.0% 0.0% 0.0% 0.0% 0.0% 0.0% 0.0% 0.0% 3.1% 5.5% 0.0%
Other stores 0.0% 0.0% 0.0% 0.0% 0.1% 0.8% 0.0% 0.0% 0.0% 0.0% 0.0% 0.0% 0.0% 0.0% 0.0% 0.6% 0.1% 0.1% 0.1%
Pembroke Dock Out of Centre:
Lidl, Pier Road 0.0% 0.0% 0.0% 2.2% 21.3% 13.9% 0.8% 0.0% 0.0% 0.0% 0.0% 0.0% 0.0% 0.0% 0.0% 0.0% 3.4% 6.1% 0.0%
Tesco Superstore, London Rd 0.1% 0.0% 0.0% 4.5% 35.5% 17.7% 2.5% 0.0% 0.3% 0.0% 0.0% 0.0% 0.0% 0.0% 0.0% 0.0% 5.4% 9.6% 0.0%
Fishguard Town Centre:
Co‐op, High Street 0.0% 0.0% 0.0% 0.0% 0.0% 0.0% 0.0% 20.9% 9.0% 0.0% 0.0% 0.0% 0.0% 0.0% 0.0% 0.0% 1.5% 2.7% 0.0%
Other stores 0.0% 0.0% 0.0% 0.0% 0.0% 0.0% 0.0% 6.3% 1.4% 0.0% 0.4% 0.0% 0.0% 0.0% 0.0% 0.0% 0.5% 0.8% 0.1%
Narberth Town Centre:
Costcutter, High Street 0.0% 0.0% 0.0% 0.0% 0.0% 0.1% 3.7% 0.0% 0.0% 0.0% 0.0% 0.3% 1.0% 0.0% 0.0% 0.0% 0.3% 0.4% 0.1%
Spar, High Street 0.0% 0.0% 0.0% 0.0% 0.0% 0.0% 1.2% 0.0% 0.0% 0.0% 0.0% 0.0% 0.0% 0.0% 0.0% 0.0% 0.1% 0.1% 0.0%
Other stores 0.0% 0.4% 0.0% 0.0% 0.0% 0.8% 13.7% 0.0% 0.0% 0.5% 0.0% 0.0% 0.0% 0.0% 0.0% 0.0% 0.9% 1.5% 0.1%
Newport 0.0% 0.0% 0.0% 0.0% 0.0% 0.0% 0.7% 0.0% 14.6% 1.5% 0.0% 0.0% 0.0% 0.0% 0.0% 0.0% 0.5% 0.7% 0.3%
Saundersfoot 0.0% 0.0% 0.0% 0.0% 0.0% 1.5% 1.5% 0.0% 0.0% 0.6% 0.7% 0.0% 0.0% 0.1% 0.9% 0.0% 0.4% 0.4% 0.4%
St Davids 0.0% 0.0% 11.4% 0.0% 0.0% 0.0% 0.0% 0.3% 0.0% 0.0% 2.8% 0.0% 0.0% 0.0% 0.0% 0.0% 0.9% 1.2% 0.4%
Tenby 0.0% 0.0% 0.0% 0.0% 0.0% 33.0% 0.0% 0.0% 0.0% 0.0% 0.0% 0.0% 0.0% 0.0% 0.2% 0.0% 2.9% 5.1% 0.0%
All Other ‐ Pembrokeshire 2.1% 4.1% 4.1% 8.0% 2.2% 10.3% 7.3% 10.6% 6.9% 5.7% 1.1% 0.4% 0.7% 0.0% 0.4% 0.0% 4.2% 6.3% 1.6%
SUB‐TOTAL: PEMBROKESHIRE 98.4% 92.0% 95.5% 97.7% 93.7% 92.7% 75.7% 94.4% 45.0% 8.8% 4.9% 0.7% 1.7% 0.3% 1.7% 2.0% 52.6% 91.0% 3.5%
STUDY
AREA
PEMBROKE‐SHIRE CEREDIGION
23/01/2017

South West Wales Regional Retail Study 2016Convenience Market Shares
ZONES 1 2 3 4 5 6 7 8 9 10 11 12 13 14 15 16STUDY
AREAPEMBROKE‐SHIRE
Zones 1‐9
CEREDIGION
Zones 10‐16
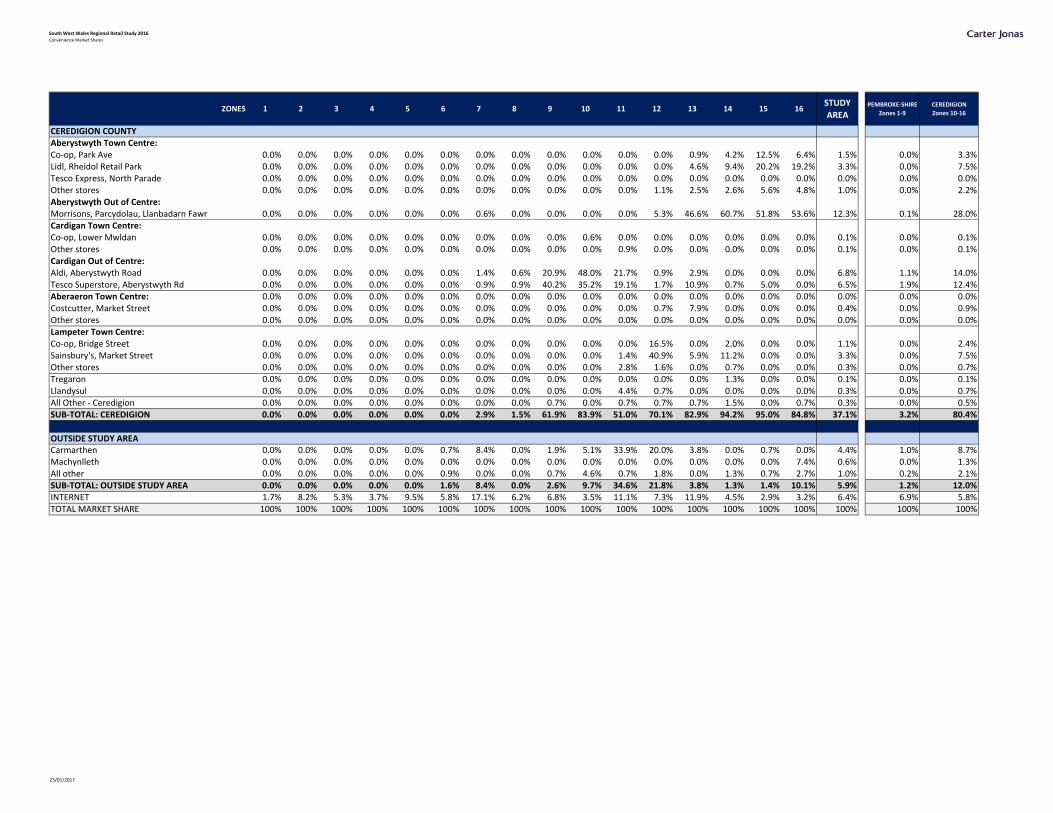
CEREDIGION COUNTYAberystwyth Town Centre:Co‐op, Park Ave 0.0% 0.0% 0.0% 0.0% 0.0% 0.0% 0.0% 0.0% 0.0% 0.0% 0.0% 0.0% 0.5% 8.1% 13.8% 8.5% 1.9% 0.0% 4.2%Lidl, Rheidol Retail Park 0.0% 0.0% 0.0% 0.0% 0.0% 0.0% 0.0% 0.0% 0.0% 0.0% 0.0% 0.3% 7.3% 13.4% 20.3% 17.7% 3.5% 0.0% 8.0%Tesco Express, North Parade 0.0% 0.0% 0.0% 0.0% 0.0% 0.0% 0.0% 0.0% 0.0% 0.0% 0.0% 0.0% 0.0% 0.0% 1.7% 0.8% 0.2% 0.0% 0.4%Other stores 0.0% 0.0% 0.0% 0.0% 0.0% 0.0% 0.0% 0.0% 0.0% 0.0% 0.0% 0.6% 4.9% 7.8% 16.4% 9.7% 2.3% 0.0% 5.3%Aberystwyth Out of Centre:Morrisons, Parcydolau, Llanbadarn Fawr 0.0% 0.0% 0.0% 0.1% 0.0% 0.0% 0.4% 0.0% 0.0% 0.0% 0.1% 3.9% 30.4% 40.8% 37.8% 37.8% 8.6% 0.1% 19.5%Cardigan Town Centre:Co‐op, Lower Mwldan 0.0% 0.0% 0.0% 0.0% 0.0% 0.0% 0.0% 0.0% 0.5% 0.5% 0.0% 0.0% 0.0% 0.0% 0.0% 0.0% 0.1% 0.0% 0.1%Other stores 0.0% 0.0% 0.0% 0.0% 0.0% 0.0% 0.0% 0.0% 0.8% 3.4% 4.2% 0.1% 0.0% 0.0% 0.0% 0.0% 0.6% 0.0% 1.3%Cardigan Out of Centre:Aldi, Aberystwyth Road 0.0% 0.0% 0.0% 0.0% 0.0% 0.0% 1.2% 0.6% 17.5% 38.2% 14.5% 0.8% 2.7% 0.1% 0.0% 0.0% 5.3% 0.9% 10.8%Tesco Superstore, Aberystwyth Rd 0.0% 0.0% 0.0% 0.0% 0.0% 0.0% 0.5% 0.5% 28.6% 32.0% 14.5% 1.1% 7.4% 0.4% 4.0% 0.0% 5.4% 1.4% 10.5%Aberaeron Town Centre:Costcutter, Market Street 0.0% 0.0% 0.0% 0.0% 0.0% 0.0% 0.0% 0.0% 0.0% 0.0% 0.0% 0.4% 11.3% 0.0% 0.0% 0.0% 0.5% 0.0% 1.2%Other stores 0.0% 0.0% 0.0% 0.0% 0.0% 0.0% 0.0% 0.0% 0.0% 0.0% 1.7% 0.8% 5.2% 0.0% 0.0% 0.0% 0.4% 0.0% 0.8%Lampeter Town Centre:Co‐op, Bridge Street 0.0% 0.0% 0.0% 0.0% 0.0% 0.0% 0.0% 0.0% 0.0% 0.0% 1.3% 21.3% 1.6% 2.8% 0.0% 0.0% 1.5% 0.0% 3.5%Sainsbury's, Market Street 0.0% 0.0% 0.0% 0.0% 0.0% 0.0% 0.4% 0.0% 0.0% 0.1% 2.0% 36.2% 4.4% 7.2% 0.0% 0.0% 2.8% 0.0% 6.4%Other stores 0.0% 0.0% 0.0% 0.0% 0.0% 0.0% 0.0% 0.0% 0.0% 0.0% 1.8% 6.2% 0.0% 1.6% 0.0% 0.0% 0.5% 0.0% 1.2%Tregaron 0.0% 0.0% 0.0% 0.0% 0.0% 0.0% 0.0% 0.0% 0.0% 0.0% 0.0% 0.0% 0.3% 4.5% 0.0% 0.0% 0.2% 0.0% 0.5%Llandysul 0.0% 0.7% 0.0% 0.0% 0.0% 0.0% 0.3% 0.0% 0.0% 0.0% 10.6% 0.4% 0.0% 0.0% 0.2% 0.0% 0.7% 0.1% 1.5%All Other ‐ Ceredigion 0.2% 0.0% 0.0% 0.0% 0.0% 0.0% 1.4% 0.0% 0.4% 1.2% 6.2% 3.2% 6.2% 5.8% 0.7% 7.2% 1.9% 0.2% 4.1%
SUB‐TOTAL: CEREDIGION 0.2% 0.7% 0.0% 0.1% 0.0% 0.0% 4.2% 1.1% 47.8% 75.5% 57.0% 75.5% 82.2% 92.6% 94.9% 81.7% 36.3% 2.7% 79.3%
OUTSIDE STUDY AREACarmarthen 0.0% 0.1% 0.0% 0.0% 0.0% 1.0% 7.0% 0.0% 1.7% 4.3% 26.6% 15.4% 4.6% 0.2% 0.4% 0.2% 3.6% 0.9% 7.1%Machynlleth 0.0% 1.0% 0.0% 0.0% 0.0% 0.0% 1.1% 0.3% 0.0% 0.0% 0.0% 0.0% 0.0% 0.0% 0.2% 10.4% 0.9% 0.2% 1.8%All other 0.0% 1.3% 0.1% 0.0% 0.0% 2.5% 1.1% 0.3% 1.2% 9.3% 4.9% 2.6% 3.1% 3.3% 0.7% 3.7% 2.3% 0.7% 4.4%SUB‐TOTAL: OUTSIDE STUDY AREA 0.0% 2.4% 0.1% 0.0% 0.0% 3.4% 9.1% 0.6% 3.0% 13.6% 31.4% 18.0% 7.7% 3.4% 1.3% 14.3% 6.8% 1.8% 13.3%INTERNET 1.4% 4.9% 4.4% 2.2% 6.3% 3.8% 11.0% 3.9% 4.2% 2.1% 6.7% 5.8% 8.5% 3.7% 2.2% 1.9% 4.3% 4.5% 4.0%TOTAL MARKET SHARE 100% 100% 100% 100% 100% 100% 100% 100% 100% 100% 100% 100% 100% 100% 100% 100% 100% 100% 100%
23/01/2017

South West Wales Regional Retail Study 2016Convenience Market Shares
TABLE 2: MAIN FOOD SHOPPING ‐ 2016 MARKET SHARE ANALYSIS (%)
ZONES 1 2 3 4 5 6 7 8 9 10 11 12 13 14 15 16
Zones 1‐9 Zones 10‐16
PEMBROKESHIRE COUNTYHaverfordwest Town Centre:Iceland, Picton Place 0.0% 0.7% 0.0% 3.1% 3.1% 1.9% 0.0% 0.0% 0.7% 0.0% 0.0% 0.0% 0.0% 0.0% 0.0% 1.0% 0.8% 1.4% 0.2%Other stores 0.9% 0.0% 0.0% 0.0% 0.0% 0.0% 0.8% 3.1% 0.0% 0.0% 0.0% 0.0% 0.0% 0.0% 0.0% 0.0% 0.3% 0.5% 0.0%Haverfordwest Out of Centre:Aldi, Salutation Square 24.9% 17.7% 21.1% 11.9% 4.3% 1.6% 26.2% 24.5% 6.8% 0.0% 0.0% 0.0% 0.0% 0.0% 0.0% 0.0% 8.0% 14.3% 0.0%Lidl, Perrots Rd 6.6% 7.5% 8.4% 0.8% 0.0% 0.0% 5.4% 4.4% 0.0% 0.0% 0.0% 0.0% 0.0% 0.0% 0.0% 0.0% 1.8% 3.1% 0.0%Marks & Spencer, Withybush Retail Park 0.6% 1.0% 0.7% 0.8% 0.0% 0.0% 0.0% 0.6% 0.7% 0.0% 0.0% 0.0% 0.0% 0.0% 0.0% 0.0% 0.2% 0.4% 0.0%Morrisons, Meadow View 28.1% 33.2% 23.2% 7.7% 0.8% 3.3% 12.8% 21.0% 3.5% 0.6% 0.0% 0.0% 0.0% 0.0% 0.0% 0.0% 7.3% 12.9% 0.1%Tesco Extra, Fenton Trading Estate 37.2% 25.0% 35.1% 9.6% 3.1% 0.0% 9.9% 16.6% 3.3% 0.0% 0.0% 0.0% 0.0% 0.0% 0.0% 0.0% 7.9% 14.1% 0.0%Milford Haven Town Centre:Spar, Charles Street 0.0% 0.0% 0.0% 0.0% 0.0% 0.0% 0.0% 0.0% 0.0% 0.0% 0.0% 0.0% 0.0% 0.0% 0.0% 0.0% 0.0% 0.0% 0.0%All stores 0.0% 0.0% 0.0% 0.0% 0.0% 0.0% 0.0% 0.0% 0.0% 0.0% 0.0% 0.0% 0.0% 0.0% 0.0% 0.0% 0.0% 0.0% 0.0%Milford Haven Out of Centre:Lidl, Great N Road 0.0% 0.9% 1.5% 17.9% 0.0% 0.0% 0.0% 0.0% 0.0% 0.0% 0.0% 0.0% 0.0% 0.0% 0.0% 0.0% 1.7% 3.1% 0.0%Tesco, Havens Head Park 0.0% 3.7% 1.8% 31.4% 0.0% 0.0% 0.0% 0.0% 0.0% 0.0% 0.0% 0.0% 0.0% 0.0% 0.0% 0.0% 3.0% 5.4% 0.0%Pembroke Town Centre: 0.0% 0.0% 0.0% 0.0% 0.0% 0.0% 0.0% 0.0% 0.0% 0.0% 0.0% 0.0% 0.0% 0.0% 0.0% 0.0% 0.0% 0.0% 0.0%Co‐op, Main Street 0.0% 0.0% 0.0% 0.0% 0.6% 0.0% 0.0% 0.0% 0.0% 0.0% 0.0% 0.0% 0.0% 0.0% 0.0% 0.0% 0.1% 0.1% 0.0%Other stores 0.0% 0.0% 0.0% 0.0% 0.8% 0.0% 0.0% 0.0% 0.0% 0.0% 0.0% 0.0% 0.0% 0.0% 0.0% 0.0% 0.1% 0.1% 0.0%Pembroke Dock Town Centre:Asda, Gordon St 0.0% 2.0% 0.0% 3.1% 16.9% 8.4% 0.8% 0.0% 0.0% 0.0% 0.0% 0.0% 0.0% 0.0% 0.0% 0.0% 2.7% 4.8% 0.0%Other stores 0.0% 0.0% 0.0% 0.0% 0.0% 0.7% 0.0% 0.0% 0.0% 0.0% 0.0% 0.0% 0.0% 0.0% 0.0% 1.0% 0.1% 0.1% 0.2%Pembroke Dock Out of Centre:Lidl, Pier Road 0.0% 0.0% 0.0% 1.4% 24.9% 20.1% 0.8% 0.0% 0.0% 0.0% 0.0% 0.0% 0.0% 0.0% 0.0% 0.0% 4.2% 7.6% 0.0%Tesco Superstore, London Rd 0.0% 0.0% 0.0% 7.2% 35.9% 23.8% 3.7% 0.0% 0.0% 0.0% 0.0% 0.0% 0.0% 0.0% 0.0% 0.0% 6.3% 11.2% 0.0%Fishguard Town Centre:Co‐op, High Street 0.0% 0.0% 0.0% 0.0% 0.0% 0.0% 0.0% 16.9% 5.5% 0.0% 0.0% 0.0% 0.0% 0.0% 0.0% 0.0% 1.2% 2.1% 0.0%Other stores 0.0% 0.0% 0.0% 0.0% 0.0% 0.0% 0.0% 2.8% 0.7% 0.0% 0.7% 0.0% 0.0% 0.0% 0.0% 0.0% 0.2% 0.3% 0.1%Narberth Town Centre:Costcutter, High Street 0.0% 0.0% 0.0% 0.0% 0.0% 0.0% 3.2% 0.0% 0.0% 0.0% 0.0% 0.0% 0.7% 0.0% 0.0% 0.0% 0.2% 0.3% 0.1%Spar, High Street 0.0% 0.0% 0.0% 0.0% 0.0% 0.0% 0.8% 0.0% 0.0% 0.0% 0.0% 0.0% 0.0% 0.0% 0.0% 0.0% 0.0% 0.1% 0.0%Other stores 0.0% 0.0% 0.0% 0.0% 0.0% 0.7% 2.6% 0.0% 0.0% 0.0% 0.0% 0.0% 0.0% 0.0% 0.0% 0.0% 0.2% 0.4% 0.0%Newport 0.0% 0.0% 0.0% 0.0% 0.0% 0.0% 0.0% 0.0% 4.2% 0.0% 0.0% 0.0% 0.0% 0.0% 0.0% 0.0% 0.1% 0.2% 0.0%Saundersfoot 0.0% 0.0% 0.0% 0.0% 0.0% 0.0% 0.0% 0.0% 0.0% 0.0% 0.0% 0.0% 0.0% 0.0% 0.0% 0.0% 0.0% 0.0% 0.0%St Davids 0.0% 0.0% 2.9% 0.0% 0.0% 0.0% 0.0% 0.0% 0.0% 0.0% 0.9% 0.0% 0.0% 0.0% 0.0% 0.0% 0.2% 0.3% 0.1%Tenby 0.0% 0.0% 0.0% 0.0% 0.0% 26.7% 0.0% 0.0% 0.0% 0.0% 0.0% 0.0% 0.0% 0.0% 0.0% 0.0% 2.3% 4.1% 0.0%All Other ‐ Pembrokeshire 0.0% 0.0% 0.0% 1.5% 0.0% 5.4% 4.5% 2.5% 3.5% 2.3% 1.8% 0.7% 0.7% 0.0% 0.7% 0.0% 1.5% 1.9% 1.0%SUB‐TOTAL: PEMBROKESHIRE 98.3% 91.8% 94.7% 96.3% 90.5% 92.6% 71.6% 92.3% 28.7% 2.9% 3.3% 0.7% 1.3% 0.0% 0.7% 1.9% 50.6% 88.8% 1.7%
STUDY
AREAPEMBROKE‐SHIRE CEREDIGION
23/01/2017
South West Wales Regional Retail Study 2016Convenience Market Shares
ZONES 1 2 3 4 5 6 7 8 9 10 11 12 13 14 15 16STUDY
AREAPEMBROKE‐SHIRE
Zones 1‐9
CEREDIGION
Zones 10‐16
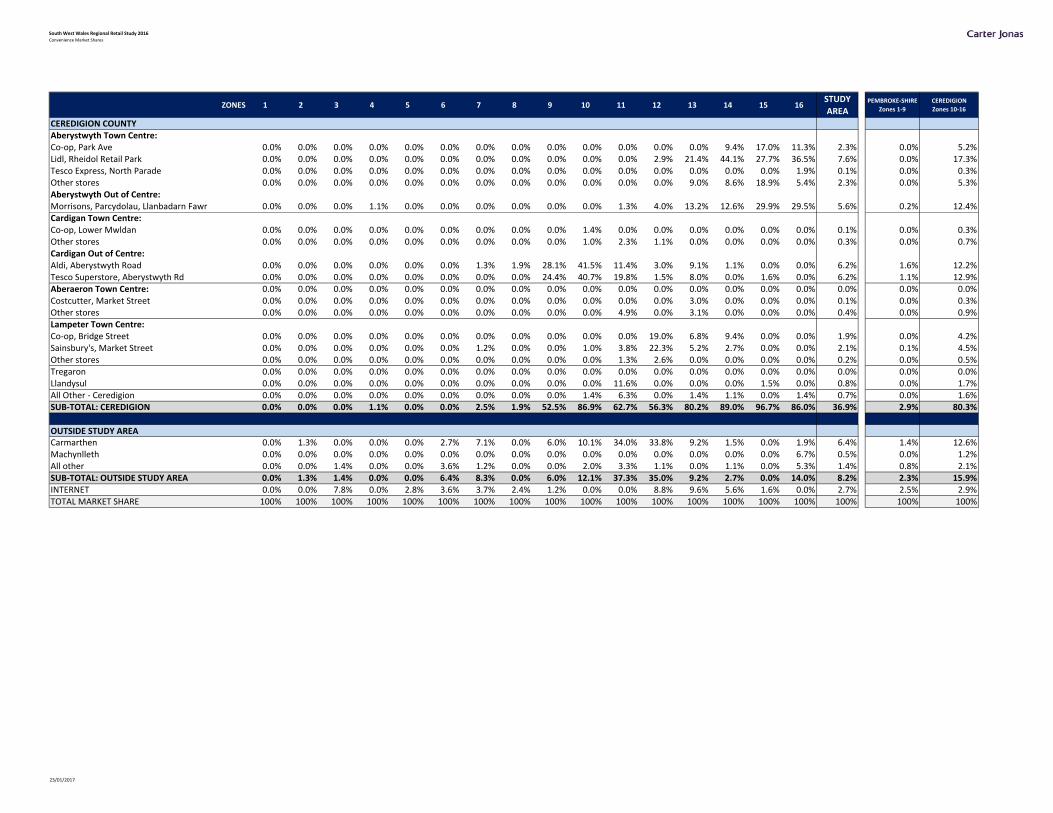
CEREDIGION COUNTYAberystwyth Town Centre:Co‐op, Park Ave 0.0% 0.0% 0.0% 0.0% 0.0% 0.0% 0.0% 0.0% 0.0% 0.0% 0.0% 0.0% 0.9% 4.2% 12.5% 6.4% 1.5% 0.0% 3.3%Lidl, Rheidol Retail Park 0.0% 0.0% 0.0% 0.0% 0.0% 0.0% 0.0% 0.0% 0.0% 0.0% 0.0% 0.0% 4.6% 9.4% 20.2% 19.2% 3.3% 0.0% 7.5%Tesco Express, North Parade 0.0% 0.0% 0.0% 0.0% 0.0% 0.0% 0.0% 0.0% 0.0% 0.0% 0.0% 0.0% 0.0% 0.0% 0.0% 0.0% 0.0% 0.0% 0.0%Other stores 0.0% 0.0% 0.0% 0.0% 0.0% 0.0% 0.0% 0.0% 0.0% 0.0% 0.0% 1.1% 2.5% 2.6% 5.6% 4.8% 1.0% 0.0% 2.2%Aberystwyth Out of Centre:Morrisons, Parcydolau, Llanbadarn Fawr 0.0% 0.0% 0.0% 0.0% 0.0% 0.0% 0.6% 0.0% 0.0% 0.0% 0.0% 5.3% 46.6% 60.7% 51.8% 53.6% 12.3% 0.1% 28.0%Cardigan Town Centre:Co‐op, Lower Mwldan 0.0% 0.0% 0.0% 0.0% 0.0% 0.0% 0.0% 0.0% 0.0% 0.6% 0.0% 0.0% 0.0% 0.0% 0.0% 0.0% 0.1% 0.0% 0.1%Other stores 0.0% 0.0% 0.0% 0.0% 0.0% 0.0% 0.0% 0.0% 0.0% 0.0% 0.9% 0.0% 0.0% 0.0% 0.0% 0.0% 0.1% 0.0% 0.1%Cardigan Out of Centre:Aldi, Aberystwyth Road 0.0% 0.0% 0.0% 0.0% 0.0% 0.0% 1.4% 0.6% 20.9% 48.0% 21.7% 0.9% 2.9% 0.0% 0.0% 0.0% 6.8% 1.1% 14.0%Tesco Superstore, Aberystwyth Rd 0.0% 0.0% 0.0% 0.0% 0.0% 0.0% 0.9% 0.9% 40.2% 35.2% 19.1% 1.7% 10.9% 0.7% 5.0% 0.0% 6.5% 1.9% 12.4%Aberaeron Town Centre: 0.0% 0.0% 0.0% 0.0% 0.0% 0.0% 0.0% 0.0% 0.0% 0.0% 0.0% 0.0% 0.0% 0.0% 0.0% 0.0% 0.0% 0.0% 0.0%Costcutter, Market Street 0.0% 0.0% 0.0% 0.0% 0.0% 0.0% 0.0% 0.0% 0.0% 0.0% 0.0% 0.7% 7.9% 0.0% 0.0% 0.0% 0.4% 0.0% 0.9%Other stores 0.0% 0.0% 0.0% 0.0% 0.0% 0.0% 0.0% 0.0% 0.0% 0.0% 0.0% 0.0% 0.0% 0.0% 0.0% 0.0% 0.0% 0.0% 0.0%Lampeter Town Centre:Co‐op, Bridge Street 0.0% 0.0% 0.0% 0.0% 0.0% 0.0% 0.0% 0.0% 0.0% 0.0% 0.0% 16.5% 0.0% 2.0% 0.0% 0.0% 1.1% 0.0% 2.4%Sainsbury's, Market Street 0.0% 0.0% 0.0% 0.0% 0.0% 0.0% 0.0% 0.0% 0.0% 0.0% 1.4% 40.9% 5.9% 11.2% 0.0% 0.0% 3.3% 0.0% 7.5%Other stores 0.0% 0.0% 0.0% 0.0% 0.0% 0.0% 0.0% 0.0% 0.0% 0.0% 2.8% 1.6% 0.0% 0.7% 0.0% 0.0% 0.3% 0.0% 0.7%Tregaron 0.0% 0.0% 0.0% 0.0% 0.0% 0.0% 0.0% 0.0% 0.0% 0.0% 0.0% 0.0% 0.0% 1.3% 0.0% 0.0% 0.1% 0.0% 0.1%Llandysul 0.0% 0.0% 0.0% 0.0% 0.0% 0.0% 0.0% 0.0% 0.0% 0.0% 4.4% 0.7% 0.0% 0.0% 0.0% 0.0% 0.3% 0.0% 0.7%All Other ‐ Ceredigion 0.0% 0.0% 0.0% 0.0% 0.0% 0.0% 0.0% 0.0% 0.7% 0.0% 0.7% 0.7% 0.7% 1.5% 0.0% 0.7% 0.3% 0.0% 0.5%SUB‐TOTAL: CEREDIGION 0.0% 0.0% 0.0% 0.0% 0.0% 0.0% 2.9% 1.5% 61.9% 83.9% 51.0% 70.1% 82.9% 94.2% 95.0% 84.8% 37.1% 3.2% 80.4%
OUTSIDE STUDY AREACarmarthen 0.0% 0.0% 0.0% 0.0% 0.0% 0.7% 8.4% 0.0% 1.9% 5.1% 33.9% 20.0% 3.8% 0.0% 0.7% 0.0% 4.4% 1.0% 8.7%Machynlleth 0.0% 0.0% 0.0% 0.0% 0.0% 0.0% 0.0% 0.0% 0.0% 0.0% 0.0% 0.0% 0.0% 0.0% 0.0% 7.4% 0.6% 0.0% 1.3%All other 0.0% 0.0% 0.0% 0.0% 0.0% 0.9% 0.0% 0.0% 0.7% 4.6% 0.7% 1.8% 0.0% 1.3% 0.7% 2.7% 1.0% 0.2% 2.1%SUB‐TOTAL: OUTSIDE STUDY AREA 0.0% 0.0% 0.0% 0.0% 0.0% 1.6% 8.4% 0.0% 2.6% 9.7% 34.6% 21.8% 3.8% 1.3% 1.4% 10.1% 5.9% 1.2% 12.0%INTERNET 1.7% 8.2% 5.3% 3.7% 9.5% 5.8% 17.1% 6.2% 6.8% 3.5% 11.1% 7.3% 11.9% 4.5% 2.9% 3.2% 6.4% 6.9% 5.8%TOTAL MARKET SHARE 100% 100% 100% 100% 100% 100% 100% 100% 100% 100% 100% 100% 100% 100% 100% 100% 100% 100% 100%
23/01/2017
South West Wales Regional Retail Study 2016Convenience Market Shares
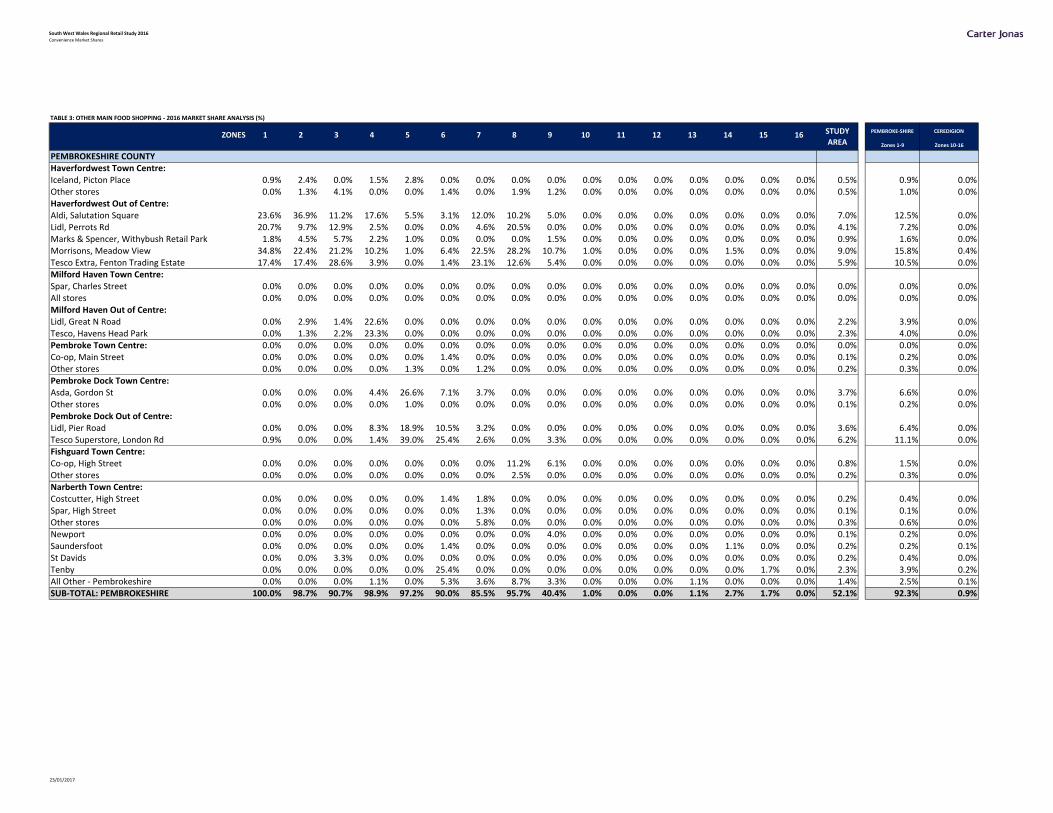
TABLE 3: OTHER MAIN FOOD SHOPPING ‐ 2016 MARKET SHARE ANALYSIS (%)
ZONES 1 2 3 4 5 6 7 8 9 10 11 12 13 14 15 16Zones 1‐9 Zones 10‐16
PEMBROKESHIRE COUNTYHaverfordwest Town Centre:Iceland, Picton Place 0.9% 2.4% 0.0% 1.5% 2.8% 0.0% 0.0% 0.0% 0.0% 0.0% 0.0% 0.0% 0.0% 0.0% 0.0% 0.0% 0.5% 0.9% 0.0%Other stores 0.0% 1.3% 4.1% 0.0% 0.0% 1.4% 0.0% 1.9% 1.2% 0.0% 0.0% 0.0% 0.0% 0.0% 0.0% 0.0% 0.5% 1.0% 0.0%Haverfordwest Out of Centre:Aldi, Salutation Square 23.6% 36.9% 11.2% 17.6% 5.5% 3.1% 12.0% 10.2% 5.0% 0.0% 0.0% 0.0% 0.0% 0.0% 0.0% 0.0% 7.0% 12.5% 0.0%Lidl, Perrots Rd 20.7% 9.7% 12.9% 2.5% 0.0% 0.0% 4.6% 20.5% 0.0% 0.0% 0.0% 0.0% 0.0% 0.0% 0.0% 0.0% 4.1% 7.2% 0.0%Marks & Spencer, Withybush Retail Park 1.8% 4.5% 5.7% 2.2% 1.0% 0.0% 0.0% 0.0% 1.5% 0.0% 0.0% 0.0% 0.0% 0.0% 0.0% 0.0% 0.9% 1.6% 0.0%Morrisons, Meadow View 34.8% 22.4% 21.2% 10.2% 1.0% 6.4% 22.5% 28.2% 10.7% 1.0% 0.0% 0.0% 0.0% 1.5% 0.0% 0.0% 9.0% 15.8% 0.4%Tesco Extra, Fenton Trading Estate 17.4% 17.4% 28.6% 3.9% 0.0% 1.4% 23.1% 12.6% 5.4% 0.0% 0.0% 0.0% 0.0% 0.0% 0.0% 0.0% 5.9% 10.5% 0.0%Milford Haven Town Centre:Spar, Charles Street 0.0% 0.0% 0.0% 0.0% 0.0% 0.0% 0.0% 0.0% 0.0% 0.0% 0.0% 0.0% 0.0% 0.0% 0.0% 0.0% 0.0% 0.0% 0.0%All stores 0.0% 0.0% 0.0% 0.0% 0.0% 0.0% 0.0% 0.0% 0.0% 0.0% 0.0% 0.0% 0.0% 0.0% 0.0% 0.0% 0.0% 0.0% 0.0%Milford Haven Out of Centre:Lidl, Great N Road 0.0% 2.9% 1.4% 22.6% 0.0% 0.0% 0.0% 0.0% 0.0% 0.0% 0.0% 0.0% 0.0% 0.0% 0.0% 0.0% 2.2% 3.9% 0.0%Tesco, Havens Head Park 0.0% 1.3% 2.2% 23.3% 0.0% 0.0% 0.0% 0.0% 0.0% 0.0% 0.0% 0.0% 0.0% 0.0% 0.0% 0.0% 2.3% 4.0% 0.0%Pembroke Town Centre: 0.0% 0.0% 0.0% 0.0% 0.0% 0.0% 0.0% 0.0% 0.0% 0.0% 0.0% 0.0% 0.0% 0.0% 0.0% 0.0% 0.0% 0.0% 0.0%Co‐op, Main Street 0.0% 0.0% 0.0% 0.0% 0.0% 1.4% 0.0% 0.0% 0.0% 0.0% 0.0% 0.0% 0.0% 0.0% 0.0% 0.0% 0.1% 0.2% 0.0%Other stores 0.0% 0.0% 0.0% 0.0% 1.3% 0.0% 1.2% 0.0% 0.0% 0.0% 0.0% 0.0% 0.0% 0.0% 0.0% 0.0% 0.2% 0.3% 0.0%Pembroke Dock Town Centre:Asda, Gordon St 0.0% 0.0% 0.0% 4.4% 26.6% 7.1% 3.7% 0.0% 0.0% 0.0% 0.0% 0.0% 0.0% 0.0% 0.0% 0.0% 3.7% 6.6% 0.0%Other stores 0.0% 0.0% 0.0% 0.0% 1.0% 0.0% 0.0% 0.0% 0.0% 0.0% 0.0% 0.0% 0.0% 0.0% 0.0% 0.0% 0.1% 0.2% 0.0%Pembroke Dock Out of Centre:Lidl, Pier Road 0.0% 0.0% 0.0% 8.3% 18.9% 10.5% 3.2% 0.0% 0.0% 0.0% 0.0% 0.0% 0.0% 0.0% 0.0% 0.0% 3.6% 6.4% 0.0%Tesco Superstore, London Rd 0.9% 0.0% 0.0% 1.4% 39.0% 25.4% 2.6% 0.0% 3.3% 0.0% 0.0% 0.0% 0.0% 0.0% 0.0% 0.0% 6.2% 11.1% 0.0%Fishguard Town Centre:Co‐op, High Street 0.0% 0.0% 0.0% 0.0% 0.0% 0.0% 0.0% 11.2% 6.1% 0.0% 0.0% 0.0% 0.0% 0.0% 0.0% 0.0% 0.8% 1.5% 0.0%Other stores 0.0% 0.0% 0.0% 0.0% 0.0% 0.0% 0.0% 2.5% 0.0% 0.0% 0.0% 0.0% 0.0% 0.0% 0.0% 0.0% 0.2% 0.3% 0.0%Narberth Town Centre:Costcutter, High Street 0.0% 0.0% 0.0% 0.0% 0.0% 1.4% 1.8% 0.0% 0.0% 0.0% 0.0% 0.0% 0.0% 0.0% 0.0% 0.0% 0.2% 0.4% 0.0%Spar, High Street 0.0% 0.0% 0.0% 0.0% 0.0% 0.0% 1.3% 0.0% 0.0% 0.0% 0.0% 0.0% 0.0% 0.0% 0.0% 0.0% 0.1% 0.1% 0.0%Other stores 0.0% 0.0% 0.0% 0.0% 0.0% 0.0% 5.8% 0.0% 0.0% 0.0% 0.0% 0.0% 0.0% 0.0% 0.0% 0.0% 0.3% 0.6% 0.0%Newport 0.0% 0.0% 0.0% 0.0% 0.0% 0.0% 0.0% 0.0% 4.0% 0.0% 0.0% 0.0% 0.0% 0.0% 0.0% 0.0% 0.1% 0.2% 0.0%Saundersfoot 0.0% 0.0% 0.0% 0.0% 0.0% 1.4% 0.0% 0.0% 0.0% 0.0% 0.0% 0.0% 0.0% 1.1% 0.0% 0.0% 0.2% 0.2% 0.1%St Davids 0.0% 0.0% 3.3% 0.0% 0.0% 0.0% 0.0% 0.0% 0.0% 0.0% 0.0% 0.0% 0.0% 0.0% 0.0% 0.0% 0.2% 0.4% 0.0%Tenby 0.0% 0.0% 0.0% 0.0% 0.0% 25.4% 0.0% 0.0% 0.0% 0.0% 0.0% 0.0% 0.0% 0.0% 1.7% 0.0% 2.3% 3.9% 0.2%All Other ‐ Pembrokeshire 0.0% 0.0% 0.0% 1.1% 0.0% 5.3% 3.6% 8.7% 3.3% 0.0% 0.0% 0.0% 1.1% 0.0% 0.0% 0.0% 1.4% 2.5% 0.1%SUB‐TOTAL: PEMBROKESHIRE 100.0% 98.7% 90.7% 98.9% 97.2% 90.0% 85.5% 95.7% 40.4% 1.0% 0.0% 0.0% 1.1% 2.7% 1.7% 0.0% 52.1% 92.3% 0.9%
STUDY
AREA
PEMBROKE‐SHIRE CEREDIGION
23/01/2017
South West Wales Regional Retail Study 2016Convenience Market Shares
ZONES 1 2 3 4 5 6 7 8 9 10 11 12 13 14 15 16STUDY
AREAPEMBROKE‐SHIRE
Zones 1‐9
CEREDIGION
Zones 10‐16
CEREDIGION COUNTYAberystwyth Town Centre:Co‐op, Park Ave 0.0% 0.0% 0.0% 0.0% 0.0% 0.0% 0.0% 0.0% 0.0% 0.0% 0.0% 0.0% 0.0% 9.4% 17.0% 11.3% 2.3% 0.0% 5.2%Lidl, Rheidol Retail Park 0.0% 0.0% 0.0% 0.0% 0.0% 0.0% 0.0% 0.0% 0.0% 0.0% 0.0% 2.9% 21.4% 44.1% 27.7% 36.5% 7.6% 0.0% 17.3%Tesco Express, North Parade 0.0% 0.0% 0.0% 0.0% 0.0% 0.0% 0.0% 0.0% 0.0% 0.0% 0.0% 0.0% 0.0% 0.0% 0.0% 1.9% 0.1% 0.0% 0.3%Other stores 0.0% 0.0% 0.0% 0.0% 0.0% 0.0% 0.0% 0.0% 0.0% 0.0% 0.0% 0.0% 9.0% 8.6% 18.9% 5.4% 2.3% 0.0% 5.3%Aberystwyth Out of Centre:Morrisons, Parcydolau, Llanbadarn Fawr 0.0% 0.0% 0.0% 1.1% 0.0% 0.0% 0.0% 0.0% 0.0% 0.0% 1.3% 4.0% 13.2% 12.6% 29.9% 29.5% 5.6% 0.2% 12.4%Cardigan Town Centre:Co‐op, Lower Mwldan 0.0% 0.0% 0.0% 0.0% 0.0% 0.0% 0.0% 0.0% 0.0% 1.4% 0.0% 0.0% 0.0% 0.0% 0.0% 0.0% 0.1% 0.0% 0.3%Other stores 0.0% 0.0% 0.0% 0.0% 0.0% 0.0% 0.0% 0.0% 0.0% 1.0% 2.3% 1.1% 0.0% 0.0% 0.0% 0.0% 0.3% 0.0% 0.7%Cardigan Out of Centre:Aldi, Aberystwyth Road 0.0% 0.0% 0.0% 0.0% 0.0% 0.0% 1.3% 1.9% 28.1% 41.5% 11.4% 3.0% 9.1% 1.1% 0.0% 0.0% 6.2% 1.6% 12.2%Tesco Superstore, Aberystwyth Rd 0.0% 0.0% 0.0% 0.0% 0.0% 0.0% 0.0% 0.0% 24.4% 40.7% 19.8% 1.5% 8.0% 0.0% 1.6% 0.0% 6.2% 1.1% 12.9%Aberaeron Town Centre: 0.0% 0.0% 0.0% 0.0% 0.0% 0.0% 0.0% 0.0% 0.0% 0.0% 0.0% 0.0% 0.0% 0.0% 0.0% 0.0% 0.0% 0.0% 0.0%Costcutter, Market Street 0.0% 0.0% 0.0% 0.0% 0.0% 0.0% 0.0% 0.0% 0.0% 0.0% 0.0% 0.0% 3.0% 0.0% 0.0% 0.0% 0.1% 0.0% 0.3%Other stores 0.0% 0.0% 0.0% 0.0% 0.0% 0.0% 0.0% 0.0% 0.0% 0.0% 4.9% 0.0% 3.1% 0.0% 0.0% 0.0% 0.4% 0.0% 0.9%Lampeter Town Centre:Co‐op, Bridge Street 0.0% 0.0% 0.0% 0.0% 0.0% 0.0% 0.0% 0.0% 0.0% 0.0% 0.0% 19.0% 6.8% 9.4% 0.0% 0.0% 1.9% 0.0% 4.2%Sainsbury's, Market Street 0.0% 0.0% 0.0% 0.0% 0.0% 0.0% 1.2% 0.0% 0.0% 1.0% 3.8% 22.3% 5.2% 2.7% 0.0% 0.0% 2.1% 0.1% 4.5%Other stores 0.0% 0.0% 0.0% 0.0% 0.0% 0.0% 0.0% 0.0% 0.0% 0.0% 1.3% 2.6% 0.0% 0.0% 0.0% 0.0% 0.2% 0.0% 0.5%Tregaron 0.0% 0.0% 0.0% 0.0% 0.0% 0.0% 0.0% 0.0% 0.0% 0.0% 0.0% 0.0% 0.0% 0.0% 0.0% 0.0% 0.0% 0.0% 0.0%Llandysul 0.0% 0.0% 0.0% 0.0% 0.0% 0.0% 0.0% 0.0% 0.0% 0.0% 11.6% 0.0% 0.0% 0.0% 1.5% 0.0% 0.8% 0.0% 1.7%All Other ‐ Ceredigion 0.0% 0.0% 0.0% 0.0% 0.0% 0.0% 0.0% 0.0% 0.0% 1.4% 6.3% 0.0% 1.4% 1.1% 0.0% 1.4% 0.7% 0.0% 1.6%SUB‐TOTAL: CEREDIGION 0.0% 0.0% 0.0% 1.1% 0.0% 0.0% 2.5% 1.9% 52.5% 86.9% 62.7% 56.3% 80.2% 89.0% 96.7% 86.0% 36.9% 2.9% 80.3%
OUTSIDE STUDY AREACarmarthen 0.0% 1.3% 0.0% 0.0% 0.0% 2.7% 7.1% 0.0% 6.0% 10.1% 34.0% 33.8% 9.2% 1.5% 0.0% 1.9% 6.4% 1.4% 12.6%Machynlleth 0.0% 0.0% 0.0% 0.0% 0.0% 0.0% 0.0% 0.0% 0.0% 0.0% 0.0% 0.0% 0.0% 0.0% 0.0% 6.7% 0.5% 0.0% 1.2%All other 0.0% 0.0% 1.4% 0.0% 0.0% 3.6% 1.2% 0.0% 0.0% 2.0% 3.3% 1.1% 0.0% 1.1% 0.0% 5.3% 1.4% 0.8% 2.1%SUB‐TOTAL: OUTSIDE STUDY AREA 0.0% 1.3% 1.4% 0.0% 0.0% 6.4% 8.3% 0.0% 6.0% 12.1% 37.3% 35.0% 9.2% 2.7% 0.0% 14.0% 8.2% 2.3% 15.9%INTERNET 0.0% 0.0% 7.8% 0.0% 2.8% 3.6% 3.7% 2.4% 1.2% 0.0% 0.0% 8.8% 9.6% 5.6% 1.6% 0.0% 2.7% 2.5% 2.9%TOTAL MARKET SHARE 100% 100% 100% 100% 100% 100% 100% 100% 100% 100% 100% 100% 100% 100% 100% 100% 100% 100% 100%
23/01/2017

South West Wales Regional Retail Study 2016Convenience Market Shares
TABLE 4: TOP UP FOOD SHOPPING ‐ 2016 MARKET SHARE ANALYSIS (%)
ZONES 1 2 3 4 5 6 7 8 9 10 11 12 13 14 15 16Zones 1‐9 Zones 10‐16
PEMBROKESHIRE COUNTYHaverfordwest Town Centre:Iceland, Picton Place 0.9% 0.0% 0.0% 0.0% 0.0% 0.0% 0.0% 0.0% 0.0% 0.0% 0.0% 0.0% 0.0% 0.0% 0.9% 0.0% 0.1% 0.1% 0.1%Other stores 8.3% 5.8% 9.8% 0.0% 0.0% 0.0% 1.0% 3.2% 1.1% 0.0% 0.0% 0.0% 0.0% 0.0% 0.0% 0.0% 1.5% 2.8% 0.0%Haverfordwest Out of Centre:Aldi, Salutation Square 8.3% 21.8% 1.6% 1.5% 1.4% 0.0% 1.4% 6.2% 0.0% 0.0% 0.0% 0.0% 0.0% 0.0% 0.0% 0.0% 2.0% 3.6% 0.0%Lidl, Perrots Rd 9.2% 3.9% 10.2% 2.6% 0.0% 1.1% 0.0% 1.6% 0.0% 0.0% 0.0% 0.0% 0.0% 0.0% 0.0% 0.0% 1.7% 3.0% 0.0%Marks & Spencer, Withybush Retail Park 1.8% 0.0% 2.1% 0.0% 0.0% 0.0% 0.0% 1.5% 0.0% 0.0% 0.0% 0.0% 0.0% 0.0% 0.0% 0.0% 0.3% 0.6% 0.0%Morrisons, Meadow View 27.6% 25.7% 6.5% 2.6% 0.0% 0.0% 4.0% 3.2% 2.6% 0.0% 0.0% 0.0% 0.0% 0.0% 0.0% 0.0% 3.6% 6.3% 0.0%Tesco Extra, Fenton Trading Estate 36.6% 14.4% 21.3% 4.6% 0.0% 1.4% 5.2% 1.6% 1.5% 0.0% 0.0% 0.0% 0.0% 0.0% 0.0% 0.0% 4.9% 8.7% 0.0%Milford Haven Town Centre:Spar, Charles Street 0.0% 0.0% 0.0% 2.2% 0.0% 0.0% 0.0% 0.0% 0.0% 0.0% 0.0% 0.0% 0.0% 0.0% 0.0% 0.0% 0.2% 0.4% 0.0%All stores 0.0% 0.0% 0.0% 16.0% 0.0% 0.0% 0.0% 0.0% 0.0% 0.0% 0.0% 0.0% 0.0% 0.0% 0.0% 0.0% 1.4% 2.5% 0.0%Milford Haven Out of Centre:Lidl, Great N Road 0.0% 0.0% 1.6% 21.2% 0.0% 0.0% 0.0% 0.0% 0.0% 0.0% 0.0% 0.0% 0.0% 0.0% 0.0% 0.0% 2.0% 3.5% 0.0%Tesco, Havens Head Park 0.0% 2.0% 0.0% 16.8% 0.0% 0.0% 0.0% 0.0% 0.0% 0.0% 0.0% 0.0% 0.0% 0.0% 0.0% 0.0% 1.6% 2.8% 0.0%Pembroke Town Centre: 0.0% 0.0% 0.0% 0.0% 0.0% 0.0% 0.0% 0.0% 0.0% 0.0% 0.0% 0.0% 0.0% 0.0% 0.0% 0.0% 0.0% 0.0% 0.0%Co‐op, Main Street 0.0% 0.0% 0.0% 0.0% 6.9% 0.0% 0.0% 0.0% 0.0% 0.0% 0.0% 0.0% 0.0% 0.0% 0.0% 1.6% 0.8% 1.1% 0.3%Other stores 0.0% 0.0% 0.0% 0.0% 3.7% 0.0% 0.0% 0.0% 0.0% 0.0% 0.0% 0.0% 0.0% 0.0% 0.0% 0.0% 0.3% 0.6% 0.0%Pembroke Dock Town Centre:Asda, Gordon St 0.0% 0.0% 0.0% 1.4% 34.3% 5.0% 0.0% 0.0% 0.0% 0.0% 0.0% 0.0% 0.0% 0.0% 0.0% 0.0% 3.8% 6.7% 0.0%Other stores 0.0% 0.0% 0.0% 0.0% 0.0% 0.0% 0.0% 0.0% 0.0% 0.0% 0.0% 0.0% 0.0% 0.0% 0.0% 0.0% 0.0% 0.0% 0.0%Pembroke Dock Out of Centre:Lidl, Pier Road 0.0% 0.0% 0.0% 2.5% 11.1% 2.1% 0.0% 0.0% 0.0% 0.0% 0.0% 0.0% 0.0% 0.0% 0.0% 0.0% 1.4% 2.6% 0.0%Tesco Superstore, London Rd 0.0% 0.0% 0.0% 0.0% 35.7% 4.3% 0.0% 0.0% 0.0% 0.0% 0.0% 0.0% 0.0% 0.0% 0.0% 0.0% 3.7% 6.6% 0.0%Fishguard Town Centre:Co‐op, High Street 0.0% 0.0% 0.0% 0.0% 0.0% 0.0% 0.0% 37.9% 6.4% 0.0% 0.0% 0.0% 0.0% 0.0% 0.0% 0.0% 2.5% 4.5% 0.0%Other stores 0.0% 0.0% 0.0% 0.0% 0.0% 0.0% 0.0% 11.9% 3.2% 0.0% 0.0% 0.0% 0.0% 0.0% 0.0% 0.0% 0.8% 1.5% 0.0%Narberth Town Centre:Costcutter, High Street 0.0% 0.0% 0.0% 0.0% 0.0% 0.0% 1.3% 0.0% 0.0% 0.0% 0.0% 1.5% 2.8% 0.0% 0.0% 0.0% 0.3% 0.1% 0.5%Spar, High Street 0.0% 0.0% 0.0% 0.0% 0.0% 0.0% 1.3% 0.0% 0.0% 0.0% 0.0% 0.0% 0.0% 0.0% 0.0% 0.0% 0.1% 0.1% 0.0%Other stores 0.0% 0.0% 0.0% 0.0% 0.0% 0.0% 43.4% 0.0% 0.0% 0.0% 0.0% 0.0% 0.0% 0.0% 0.0% 0.0% 2.3% 4.2% 0.0%Newport 0.0% 0.0% 0.0% 0.0% 0.0% 0.0% 0.0% 0.0% 46.0% 0.0% 0.0% 0.0% 0.0% 0.0% 0.0% 0.0% 1.1% 2.0% 0.0%Saundersfoot 0.0% 0.0% 0.0% 0.0% 0.0% 2.5% 7.6% 0.0% 0.0% 3.2% 3.4% 0.0% 0.0% 0.0% 4.5% 0.0% 1.4% 1.1% 1.8%St Davids 0.0% 0.0% 32.2% 0.0% 0.0% 0.0% 0.0% 0.0% 0.0% 0.0% 0.0% 0.0% 0.0% 0.0% 0.0% 0.0% 1.9% 3.4% 0.0%Tenby 0.0% 0.0% 0.0% 0.0% 0.0% 45.9% 0.0% 0.0% 0.0% 0.0% 0.0% 0.0% 0.0% 0.0% 0.0% 0.0% 4.0% 7.1% 0.0%All Other ‐ Pembrokeshire 5.6% 15.5% 12.4% 28.5% 7.0% 28.4% 16.2% 31.3% 17.2% 21.4% 0.0% 0.0% 1.0% 0.0% 0.0% 0.0% 12.6% 18.6% 4.9%SUB‐TOTAL: PEMBROKESHIRE 98.2% 89.2% 97.9% 100.0% 100.0% 90.7% 81.5% 98.5% 78.0% 24.6% 3.4% 1.5% 3.8% 0.0% 5.5% 1.6% 56.4% 94.6% 7.5%
STUDY
AREAPEMBROKE‐SHIRE CEREDIGION
23/01/2017
South West Wales Regional Retail Study 2016Convenience Market Shares
ZONES 1 2 3 4 5 6 7 8 9 10 11 12 13 14 15 16STUDY
AREAPEMBROKE‐SHIRE
Zones 1‐9
CEREDIGION
Zones 10‐16
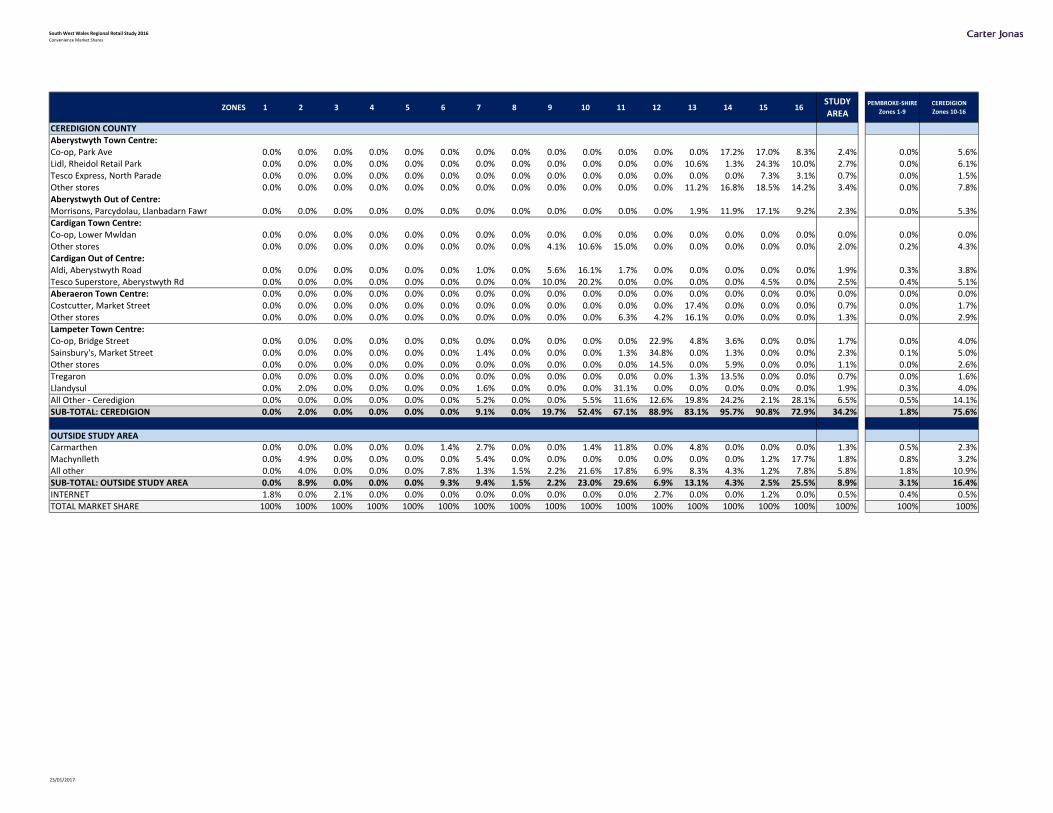
CEREDIGION COUNTYAberystwyth Town Centre:Co‐op, Park Ave 0.0% 0.0% 0.0% 0.0% 0.0% 0.0% 0.0% 0.0% 0.0% 0.0% 0.0% 0.0% 0.0% 17.2% 17.0% 8.3% 2.4% 0.0% 5.6%Lidl, Rheidol Retail Park 0.0% 0.0% 0.0% 0.0% 0.0% 0.0% 0.0% 0.0% 0.0% 0.0% 0.0% 0.0% 10.6% 1.3% 24.3% 10.0% 2.7% 0.0% 6.1%Tesco Express, North Parade 0.0% 0.0% 0.0% 0.0% 0.0% 0.0% 0.0% 0.0% 0.0% 0.0% 0.0% 0.0% 0.0% 0.0% 7.3% 3.1% 0.7% 0.0% 1.5%Other stores 0.0% 0.0% 0.0% 0.0% 0.0% 0.0% 0.0% 0.0% 0.0% 0.0% 0.0% 0.0% 11.2% 16.8% 18.5% 14.2% 3.4% 0.0% 7.8%Aberystwyth Out of Centre:Morrisons, Parcydolau, Llanbadarn Fawr 0.0% 0.0% 0.0% 0.0% 0.0% 0.0% 0.0% 0.0% 0.0% 0.0% 0.0% 0.0% 1.9% 11.9% 17.1% 9.2% 2.3% 0.0% 5.3%Cardigan Town Centre:Co‐op, Lower Mwldan 0.0% 0.0% 0.0% 0.0% 0.0% 0.0% 0.0% 0.0% 0.0% 0.0% 0.0% 0.0% 0.0% 0.0% 0.0% 0.0% 0.0% 0.0% 0.0%Other stores 0.0% 0.0% 0.0% 0.0% 0.0% 0.0% 0.0% 0.0% 4.1% 10.6% 15.0% 0.0% 0.0% 0.0% 0.0% 0.0% 2.0% 0.2% 4.3%Cardigan Out of Centre:Aldi, Aberystwyth Road 0.0% 0.0% 0.0% 0.0% 0.0% 0.0% 1.0% 0.0% 5.6% 16.1% 1.7% 0.0% 0.0% 0.0% 0.0% 0.0% 1.9% 0.3% 3.8%Tesco Superstore, Aberystwyth Rd 0.0% 0.0% 0.0% 0.0% 0.0% 0.0% 0.0% 0.0% 10.0% 20.2% 0.0% 0.0% 0.0% 0.0% 4.5% 0.0% 2.5% 0.4% 5.1%Aberaeron Town Centre: 0.0% 0.0% 0.0% 0.0% 0.0% 0.0% 0.0% 0.0% 0.0% 0.0% 0.0% 0.0% 0.0% 0.0% 0.0% 0.0% 0.0% 0.0% 0.0%Costcutter, Market Street 0.0% 0.0% 0.0% 0.0% 0.0% 0.0% 0.0% 0.0% 0.0% 0.0% 0.0% 0.0% 17.4% 0.0% 0.0% 0.0% 0.7% 0.0% 1.7%Other stores 0.0% 0.0% 0.0% 0.0% 0.0% 0.0% 0.0% 0.0% 0.0% 0.0% 6.3% 4.2% 16.1% 0.0% 0.0% 0.0% 1.3% 0.0% 2.9%Lampeter Town Centre:Co‐op, Bridge Street 0.0% 0.0% 0.0% 0.0% 0.0% 0.0% 0.0% 0.0% 0.0% 0.0% 0.0% 22.9% 4.8% 3.6% 0.0% 0.0% 1.7% 0.0% 4.0%Sainsbury's, Market Street 0.0% 0.0% 0.0% 0.0% 0.0% 0.0% 1.4% 0.0% 0.0% 0.0% 1.3% 34.8% 0.0% 1.3% 0.0% 0.0% 2.3% 0.1% 5.0%Other stores 0.0% 0.0% 0.0% 0.0% 0.0% 0.0% 0.0% 0.0% 0.0% 0.0% 0.0% 14.5% 0.0% 5.9% 0.0% 0.0% 1.1% 0.0% 2.6%Tregaron 0.0% 0.0% 0.0% 0.0% 0.0% 0.0% 0.0% 0.0% 0.0% 0.0% 0.0% 0.0% 1.3% 13.5% 0.0% 0.0% 0.7% 0.0% 1.6%Llandysul 0.0% 2.0% 0.0% 0.0% 0.0% 0.0% 1.6% 0.0% 0.0% 0.0% 31.1% 0.0% 0.0% 0.0% 0.0% 0.0% 1.9% 0.3% 4.0%All Other ‐ Ceredigion 0.0% 0.0% 0.0% 0.0% 0.0% 0.0% 5.2% 0.0% 0.0% 5.5% 11.6% 12.6% 19.8% 24.2% 2.1% 28.1% 6.5% 0.5% 14.1%SUB‐TOTAL: CEREDIGION 0.0% 2.0% 0.0% 0.0% 0.0% 0.0% 9.1% 0.0% 19.7% 52.4% 67.1% 88.9% 83.1% 95.7% 90.8% 72.9% 34.2% 1.8% 75.6%
OUTSIDE STUDY AREACarmarthen 0.0% 0.0% 0.0% 0.0% 0.0% 1.4% 2.7% 0.0% 0.0% 1.4% 11.8% 0.0% 4.8% 0.0% 0.0% 0.0% 1.3% 0.5% 2.3%Machynlleth 0.0% 4.9% 0.0% 0.0% 0.0% 0.0% 5.4% 0.0% 0.0% 0.0% 0.0% 0.0% 0.0% 0.0% 1.2% 17.7% 1.8% 0.8% 3.2%All other 0.0% 4.0% 0.0% 0.0% 0.0% 7.8% 1.3% 1.5% 2.2% 21.6% 17.8% 6.9% 8.3% 4.3% 1.2% 7.8% 5.8% 1.8% 10.9%SUB‐TOTAL: OUTSIDE STUDY AREA 0.0% 8.9% 0.0% 0.0% 0.0% 9.3% 9.4% 1.5% 2.2% 23.0% 29.6% 6.9% 13.1% 4.3% 2.5% 25.5% 8.9% 3.1% 16.4%INTERNET 1.8% 0.0% 2.1% 0.0% 0.0% 0.0% 0.0% 0.0% 0.0% 0.0% 0.0% 2.7% 0.0% 0.0% 1.2% 0.0% 0.5% 0.4% 0.5%TOTAL MARKET SHARE 100% 100% 100% 100% 100% 100% 100% 100% 100% 100% 100% 100% 100% 100% 100% 100% 100% 100% 100%
23/01/2017
South West Wales Regional Retail Study 2016Convenience Market Shares
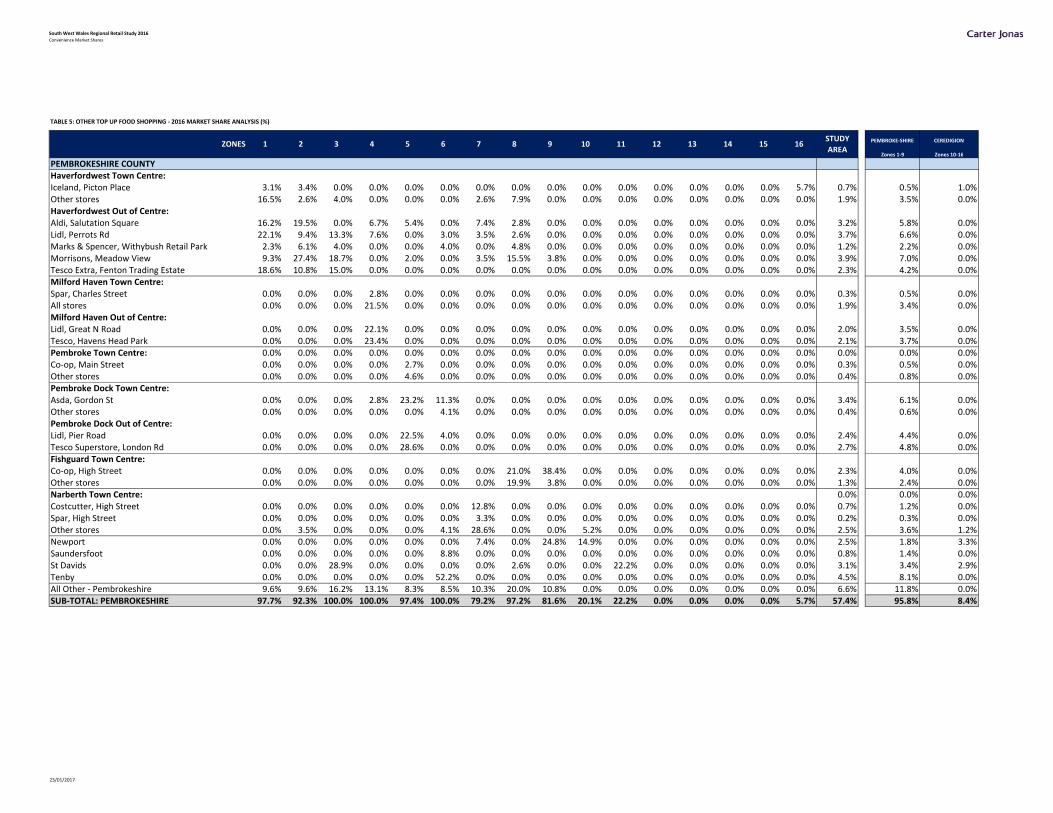
TABLE 5: OTHER TOP UP FOOD SHOPPING ‐ 2016 MARKET SHARE ANALYSIS (%)
ZONES 1 2 3 4 5 6 7 8 9 10 11 12 13 14 15 16Zones 1‐9 Zones 10‐16
PEMBROKESHIRE COUNTYHaverfordwest Town Centre:Iceland, Picton Place 3.1% 3.4% 0.0% 0.0% 0.0% 0.0% 0.0% 0.0% 0.0% 0.0% 0.0% 0.0% 0.0% 0.0% 0.0% 5.7% 0.7% 0.5% 1.0%Other stores 16.5% 2.6% 4.0% 0.0% 0.0% 0.0% 2.6% 7.9% 0.0% 0.0% 0.0% 0.0% 0.0% 0.0% 0.0% 0.0% 1.9% 3.5% 0.0%Haverfordwest Out of Centre:Aldi, Salutation Square 16.2% 19.5% 0.0% 6.7% 5.4% 0.0% 7.4% 2.8% 0.0% 0.0% 0.0% 0.0% 0.0% 0.0% 0.0% 0.0% 3.2% 5.8% 0.0%Lidl, Perrots Rd 22.1% 9.4% 13.3% 7.6% 0.0% 3.0% 3.5% 2.6% 0.0% 0.0% 0.0% 0.0% 0.0% 0.0% 0.0% 0.0% 3.7% 6.6% 0.0%Marks & Spencer, Withybush Retail Park 2.3% 6.1% 4.0% 0.0% 0.0% 4.0% 0.0% 4.8% 0.0% 0.0% 0.0% 0.0% 0.0% 0.0% 0.0% 0.0% 1.2% 2.2% 0.0%Morrisons, Meadow View 9.3% 27.4% 18.7% 0.0% 2.0% 0.0% 3.5% 15.5% 3.8% 0.0% 0.0% 0.0% 0.0% 0.0% 0.0% 0.0% 3.9% 7.0% 0.0%Tesco Extra, Fenton Trading Estate 18.6% 10.8% 15.0% 0.0% 0.0% 0.0% 0.0% 0.0% 0.0% 0.0% 0.0% 0.0% 0.0% 0.0% 0.0% 0.0% 2.3% 4.2% 0.0%Milford Haven Town Centre:Spar, Charles Street 0.0% 0.0% 0.0% 2.8% 0.0% 0.0% 0.0% 0.0% 0.0% 0.0% 0.0% 0.0% 0.0% 0.0% 0.0% 0.0% 0.3% 0.5% 0.0%All stores 0.0% 0.0% 0.0% 21.5% 0.0% 0.0% 0.0% 0.0% 0.0% 0.0% 0.0% 0.0% 0.0% 0.0% 0.0% 0.0% 1.9% 3.4% 0.0%Milford Haven Out of Centre:Lidl, Great N Road 0.0% 0.0% 0.0% 22.1% 0.0% 0.0% 0.0% 0.0% 0.0% 0.0% 0.0% 0.0% 0.0% 0.0% 0.0% 0.0% 2.0% 3.5% 0.0%Tesco, Havens Head Park 0.0% 0.0% 0.0% 23.4% 0.0% 0.0% 0.0% 0.0% 0.0% 0.0% 0.0% 0.0% 0.0% 0.0% 0.0% 0.0% 2.1% 3.7% 0.0%Pembroke Town Centre: 0.0% 0.0% 0.0% 0.0% 0.0% 0.0% 0.0% 0.0% 0.0% 0.0% 0.0% 0.0% 0.0% 0.0% 0.0% 0.0% 0.0% 0.0% 0.0%Co‐op, Main Street 0.0% 0.0% 0.0% 0.0% 2.7% 0.0% 0.0% 0.0% 0.0% 0.0% 0.0% 0.0% 0.0% 0.0% 0.0% 0.0% 0.3% 0.5% 0.0%Other stores 0.0% 0.0% 0.0% 0.0% 4.6% 0.0% 0.0% 0.0% 0.0% 0.0% 0.0% 0.0% 0.0% 0.0% 0.0% 0.0% 0.4% 0.8% 0.0%Pembroke Dock Town Centre:Asda, Gordon St 0.0% 0.0% 0.0% 2.8% 23.2% 11.3% 0.0% 0.0% 0.0% 0.0% 0.0% 0.0% 0.0% 0.0% 0.0% 0.0% 3.4% 6.1% 0.0%Other stores 0.0% 0.0% 0.0% 0.0% 0.0% 4.1% 0.0% 0.0% 0.0% 0.0% 0.0% 0.0% 0.0% 0.0% 0.0% 0.0% 0.4% 0.6% 0.0%Pembroke Dock Out of Centre:Lidl, Pier Road 0.0% 0.0% 0.0% 0.0% 22.5% 4.0% 0.0% 0.0% 0.0% 0.0% 0.0% 0.0% 0.0% 0.0% 0.0% 0.0% 2.4% 4.4% 0.0%Tesco Superstore, London Rd 0.0% 0.0% 0.0% 0.0% 28.6% 0.0% 0.0% 0.0% 0.0% 0.0% 0.0% 0.0% 0.0% 0.0% 0.0% 0.0% 2.7% 4.8% 0.0%Fishguard Town Centre:Co‐op, High Street 0.0% 0.0% 0.0% 0.0% 0.0% 0.0% 0.0% 21.0% 38.4% 0.0% 0.0% 0.0% 0.0% 0.0% 0.0% 0.0% 2.3% 4.0% 0.0%Other stores 0.0% 0.0% 0.0% 0.0% 0.0% 0.0% 0.0% 19.9% 3.8% 0.0% 0.0% 0.0% 0.0% 0.0% 0.0% 0.0% 1.3% 2.4% 0.0%Narberth Town Centre: 0.0% 0.0% 0.0%Costcutter, High Street 0.0% 0.0% 0.0% 0.0% 0.0% 0.0% 12.8% 0.0% 0.0% 0.0% 0.0% 0.0% 0.0% 0.0% 0.0% 0.0% 0.7% 1.2% 0.0%Spar, High Street 0.0% 0.0% 0.0% 0.0% 0.0% 0.0% 3.3% 0.0% 0.0% 0.0% 0.0% 0.0% 0.0% 0.0% 0.0% 0.0% 0.2% 0.3% 0.0%Other stores 0.0% 3.5% 0.0% 0.0% 0.0% 4.1% 28.6% 0.0% 0.0% 5.2% 0.0% 0.0% 0.0% 0.0% 0.0% 0.0% 2.5% 3.6% 1.2%Newport 0.0% 0.0% 0.0% 0.0% 0.0% 0.0% 7.4% 0.0% 24.8% 14.9% 0.0% 0.0% 0.0% 0.0% 0.0% 0.0% 2.5% 1.8% 3.3%Saundersfoot 0.0% 0.0% 0.0% 0.0% 0.0% 8.8% 0.0% 0.0% 0.0% 0.0% 0.0% 0.0% 0.0% 0.0% 0.0% 0.0% 0.8% 1.4% 0.0%St Davids 0.0% 0.0% 28.9% 0.0% 0.0% 0.0% 0.0% 2.6% 0.0% 0.0% 22.2% 0.0% 0.0% 0.0% 0.0% 0.0% 3.1% 3.4% 2.9%Tenby 0.0% 0.0% 0.0% 0.0% 0.0% 52.2% 0.0% 0.0% 0.0% 0.0% 0.0% 0.0% 0.0% 0.0% 0.0% 0.0% 4.5% 8.1% 0.0%All Other ‐ Pembrokeshire 9.6% 9.6% 16.2% 13.1% 8.3% 8.5% 10.3% 20.0% 10.8% 0.0% 0.0% 0.0% 0.0% 0.0% 0.0% 0.0% 6.6% 11.8% 0.0%SUB‐TOTAL: PEMBROKESHIRE 97.7% 92.3% 100.0% 100.0% 97.4% 100.0% 79.2% 97.2% 81.6% 20.1% 22.2% 0.0% 0.0% 0.0% 0.0% 5.7% 57.4% 95.8% 8.4%
STUDY
AREAPEMBROKE‐SHIRE CEREDIGION
23/01/2017

South West Wales Regional Retail Study 2016Convenience Market Shares
ZONES 1 2 3 4 5 6 7 8 9 10 11 12 13 14 15 16STUDY
AREAPEMBROKE‐SHIRE
Zones 1‐9
CEREDIGION
Zones 10‐16
CEREDIGION COUNTYAberystwyth Town Centre:Co‐op, Park Ave 0.0% 0.0% 0.0% 0.0% 0.0% 0.0% 0.0% 0.0% 0.0% 0.0% 0.0% 0.0% 0.0% 12.0% 11.9% 19.0% 2.7% 0.0% 6.2%Lidl, Rheidol Retail Park 0.0% 0.0% 0.0% 0.0% 0.0% 0.0% 0.0% 0.0% 0.0% 0.0% 0.0% 0.0% 2.8% 31.2% 5.5% 5.1% 2.3% 0.0% 5.3%Tesco Express, North Parade 0.0% 0.0% 0.0% 0.0% 0.0% 0.0% 0.0% 0.0% 0.0% 0.0% 0.0% 0.0% 0.0% 0.0% 2.4% 0.0% 0.1% 0.0% 0.3%Other stores 0.0% 0.0% 0.0% 0.0% 0.0% 0.0% 0.0% 0.0% 0.0% 0.0% 0.0% 0.0% 2.8% 20.0% 74.6% 33.9% 8.0% 0.0% 18.2%Aberystwyth Out of Centre:Morrisons, Parcydolau, Llanbadarn Fawr 0.0% 0.0% 0.0% 0.0% 0.0% 0.0% 0.0% 0.0% 0.0% 0.0% 0.0% 2.9% 6.6% 7.3% 3.3% 8.7% 1.6% 0.0% 3.8%Cardigan Town Centre:Co‐op, Lower Mwldan 0.0% 0.0% 0.0% 0.0% 0.0% 0.0% 0.0% 0.0% 4.9% 0.0% 0.0% 0.0% 0.0% 0.0% 0.0% 0.0% 0.1% 0.2% 0.0%Other stores 0.0% 0.0% 0.0% 0.0% 0.0% 0.0% 0.0% 0.0% 0.0% 11.9% 4.5% 0.0% 0.0% 0.0% 0.0% 0.0% 1.4% 0.0% 3.2%Cardigan Out of Centre:Aldi, Aberystwyth Road 0.0% 0.0% 0.0% 0.0% 0.0% 0.0% 0.0% 0.0% 9.8% 20.1% 0.0% 0.0% 0.0% 0.0% 0.0% 0.0% 2.2% 0.4% 4.5%Tesco Superstore, Aberystwyth Rd 0.0% 0.0% 0.0% 0.0% 0.0% 0.0% 0.0% 0.0% 0.0% 27.9% 10.5% 0.0% 0.0% 0.0% 0.0% 0.0% 3.3% 0.0% 7.6%Aberaeron Town Centre: 0.0% 0.0% 0.0% 0.0% 0.0% 0.0% 0.0% 0.0% 0.0% 0.0% 0.0% 0.0% 0.0% 0.0% 0.0% 0.0% 0.0% 0.0% 0.0%Costcutter, Market Street 0.0% 0.0% 0.0% 0.0% 0.0% 0.0% 0.0% 0.0% 0.0% 0.0% 0.0% 0.0% 28.0% 0.0% 0.0% 0.0% 1.2% 0.0% 2.7%Other stores 0.0% 0.0% 0.0% 0.0% 0.0% 0.0% 0.0% 0.0% 0.0% 0.0% 0.0% 0.0% 16.6% 0.0% 0.0% 0.0% 0.7% 0.0% 1.6%Lampeter Town Centre:Co‐op, Bridge Street 0.0% 0.0% 0.0% 0.0% 0.0% 0.0% 0.0% 0.0% 0.0% 0.0% 12.9% 48.7% 0.0% 0.0% 0.0% 0.0% 3.6% 0.0% 8.3%Sainsbury's, Market Street 0.0% 0.0% 0.0% 0.0% 0.0% 0.0% 0.0% 0.0% 0.0% 0.0% 5.8% 24.8% 3.7% 0.0% 0.0% 0.0% 2.0% 0.0% 4.5%Other stores 0.0% 0.0% 0.0% 0.0% 0.0% 0.0% 0.0% 0.0% 0.0% 0.0% 0.0% 20.7% 0.0% 0.0% 0.0% 0.0% 1.2% 0.0% 2.8%Tregaron 0.0% 0.0% 0.0% 0.0% 0.0% 0.0% 0.0% 0.0% 0.0% 0.0% 0.0% 0.0% 0.0% 10.2% 0.0% 0.0% 0.5% 0.0% 1.1%Llandysul 0.0% 2.6% 0.0% 0.0% 0.0% 0.0% 0.0% 0.0% 0.0% 0.0% 5.8% 0.0% 0.0% 0.0% 0.0% 0.0% 0.4% 0.1% 0.8%All Other ‐ Ceredigion 2.3% 0.0% 0.0% 0.0% 0.0% 0.0% 3.8% 0.0% 0.0% 0.0% 28.0% 2.9% 17.3% 0.0% 2.4% 9.8% 3.7% 0.6% 7.7%SUB‐TOTAL: CEREDIGION 2.3% 2.6% 0.0% 0.0% 0.0% 0.0% 3.8% 0.0% 14.7% 59.8% 67.5% 100.0% 77.8% 80.6% 100.0% 76.5% 35.2% 1.4% 78.5%
OUTSIDE STUDY AREACarmarthen 0.0% 0.0% 0.0% 0.0% 0.0% 0.0% 6.7% 0.0% 0.0% 0.0% 4.5% 0.0% 4.2% 0.0% 0.0% 0.0% 0.8% 0.6% 1.0%Machynlleth 0.0% 0.0% 0.0% 0.0% 0.0% 0.0% 0.0% 2.8% 0.0% 0.0% 0.0% 0.0% 0.0% 0.0% 0.0% 17.8% 1.5% 0.3% 3.1%All other 0.0% 5.2% 0.0% 0.0% 0.0% 0.0% 6.8% 0.0% 3.8% 20.1% 5.8% 0.0% 14.3% 15.4% 0.0% 0.0% 4.3% 1.1% 8.3%SUB‐TOTAL: OUTSIDE STUDY AREA 0.0% 5.2% 0.0% 0.0% 0.0% 0.0% 13.5% 2.8% 3.8% 20.1% 10.3% 0.0% 18.6% 15.4% 0.0% 17.8% 6.6% 2.0% 12.4%INTERNET 0.0% 0.0% 0.0% 0.0% 2.6% 0.0% 3.5% 0.0% 0.0% 0.0% 0.0% 0.0% 3.7% 4.0% 0.0% 0.0% 0.8% 0.8% 0.8%TOTAL MARKET SHARE 100% 100% 100% 100% 100% 100% 100% 100% 100% 100% 100% 100% 100% 100% 100% 100% 100% 100% 100%
23/01/2017
South West Wales Regional Retail Study
APPENDIX 3: COMPARISON GOODS MARKET SHARES
South Wales Regional Retail Study 2016Comparison Goods Market Shares
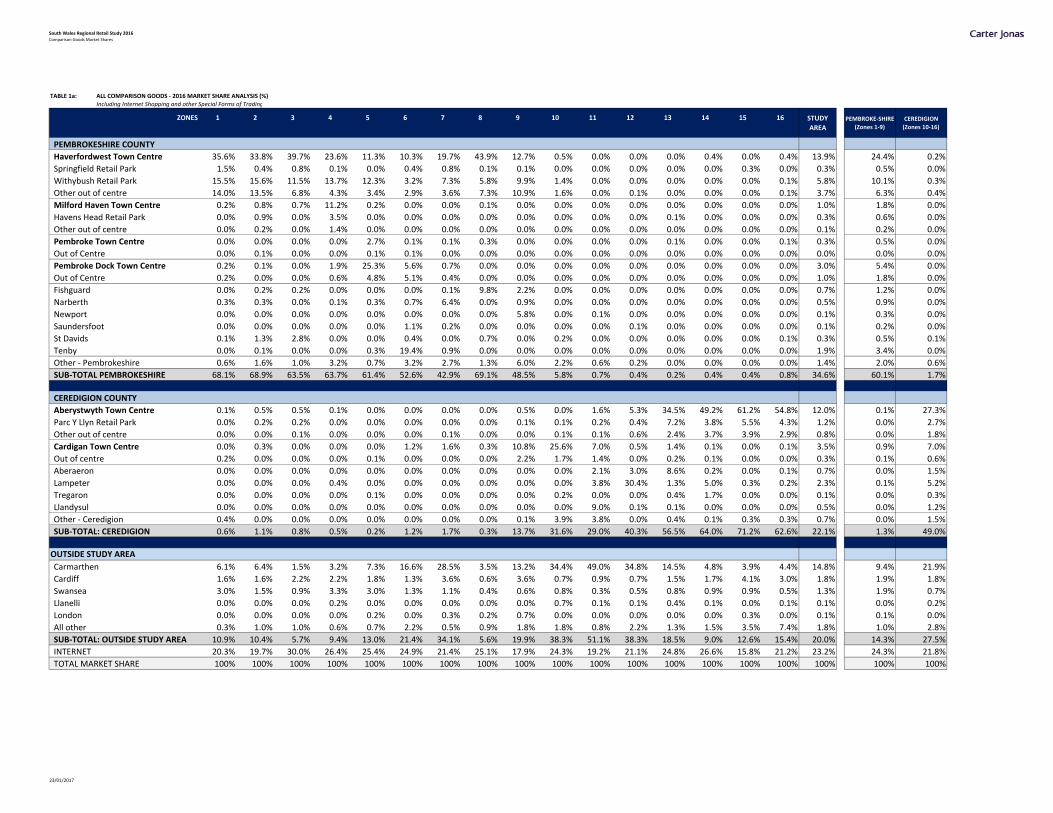
TABLE 1a: ALL COMPARISON GOODS ‐ 2016 MARKET SHARE ANALYSIS (%)Including Internet Shopping and other Special Forms of Trading
ZONES 1 2 3 4 5 6 7 8 9 10 11 12 13 14 15 16
PEMBROKESHIRE COUNTY
Haverfordwest Town Centre 35.6% 33.8% 39.7% 23.6% 11.3% 10.3% 19.7% 43.9% 12.7% 0.5% 0.0% 0.0% 0.0% 0.4% 0.0% 0.4% 13.9% 24.4% 0.2%
Springfield Retail Park 1.5% 0.4% 0.8% 0.1% 0.0% 0.4% 0.8% 0.1% 0.1% 0.0% 0.0% 0.0% 0.0% 0.0% 0.3% 0.0% 0.3% 0.5% 0.0%
Withybush Retail Park 15.5% 15.6% 11.5% 13.7% 12.3% 3.2% 7.3% 5.8% 9.9% 1.4% 0.0% 0.0% 0.0% 0.0% 0.0% 0.1% 5.8% 10.1% 0.3%
Other out of centre 14.0% 13.5% 6.8% 4.3% 3.4% 2.9% 3.6% 7.3% 10.9% 1.6% 0.0% 0.1% 0.0% 0.0% 0.0% 0.1% 3.7% 6.3% 0.4%
Milford Haven Town Centre 0.2% 0.8% 0.7% 11.2% 0.2% 0.0% 0.0% 0.1% 0.0% 0.0% 0.0% 0.0% 0.0% 0.0% 0.0% 0.0% 1.0% 1.8% 0.0%
Havens Head Retail Park 0.0% 0.9% 0.0% 3.5% 0.0% 0.0% 0.0% 0.0% 0.0% 0.0% 0.0% 0.0% 0.1% 0.0% 0.0% 0.0% 0.3% 0.6% 0.0%
Other out of centre 0.0% 0.2% 0.0% 1.4% 0.0% 0.0% 0.0% 0.0% 0.0% 0.0% 0.0% 0.0% 0.0% 0.0% 0.0% 0.0% 0.1% 0.2% 0.0%
Pembroke Town Centre 0.0% 0.0% 0.0% 0.0% 2.7% 0.1% 0.1% 0.3% 0.0% 0.0% 0.0% 0.0% 0.1% 0.0% 0.0% 0.1% 0.3% 0.5% 0.0%
Out of Centre 0.0% 0.1% 0.0% 0.0% 0.1% 0.1% 0.0% 0.0% 0.0% 0.0% 0.0% 0.0% 0.0% 0.0% 0.0% 0.0% 0.0% 0.0% 0.0%
Pembroke Dock Town Centre 0.2% 0.1% 0.0% 1.9% 25.3% 5.6% 0.7% 0.0% 0.0% 0.0% 0.0% 0.0% 0.0% 0.0% 0.0% 0.0% 3.0% 5.4% 0.0%
Out of Centre 0.2% 0.0% 0.0% 0.6% 4.8% 5.1% 0.4% 0.0% 0.0% 0.0% 0.0% 0.0% 0.0% 0.0% 0.0% 0.0% 1.0% 1.8% 0.0%
Fishguard 0.0% 0.2% 0.2% 0.0% 0.0% 0.0% 0.1% 9.8% 2.2% 0.0% 0.0% 0.0% 0.0% 0.0% 0.0% 0.0% 0.7% 1.2% 0.0%
Narberth 0.3% 0.3% 0.0% 0.1% 0.3% 0.7% 6.4% 0.0% 0.9% 0.0% 0.0% 0.0% 0.0% 0.0% 0.0% 0.0% 0.5% 0.9% 0.0%
Newport 0.0% 0.0% 0.0% 0.0% 0.0% 0.0% 0.0% 0.0% 5.8% 0.0% 0.1% 0.0% 0.0% 0.0% 0.0% 0.0% 0.1% 0.3% 0.0%
Saundersfoot 0.0% 0.0% 0.0% 0.0% 0.0% 1.1% 0.2% 0.0% 0.0% 0.0% 0.0% 0.1% 0.0% 0.0% 0.0% 0.0% 0.1% 0.2% 0.0%
St Davids 0.1% 1.3% 2.8% 0.0% 0.0% 0.4% 0.0% 0.7% 0.0% 0.2% 0.0% 0.0% 0.0% 0.0% 0.0% 0.1% 0.3% 0.5% 0.1%
Tenby 0.0% 0.1% 0.0% 0.0% 0.3% 19.4% 0.9% 0.0% 0.0% 0.0% 0.0% 0.0% 0.0% 0.0% 0.0% 0.0% 1.9% 3.4% 0.0%
Other ‐ Pembrokeshire 0.6% 1.6% 1.0% 3.2% 0.7% 3.2% 2.7% 1.3% 6.0% 2.2% 0.6% 0.2% 0.0% 0.0% 0.0% 0.0% 1.4% 2.0% 0.6%
SUB‐TOTAL PEMBROKESHIRE 68.1% 68.9% 63.5% 63.7% 61.4% 52.6% 42.9% 69.1% 48.5% 5.8% 0.7% 0.4% 0.2% 0.4% 0.4% 0.8% 34.6% 60.1% 1.7%
CEREDIGION COUNTY
Aberystwyth Town Centre 0.1% 0.5% 0.5% 0.1% 0.0% 0.0% 0.0% 0.0% 0.5% 0.0% 1.6% 5.3% 34.5% 49.2% 61.2% 54.8% 12.0% 0.1% 27.3%
Parc Y Llyn Retail Park 0.0% 0.2% 0.2% 0.0% 0.0% 0.0% 0.0% 0.0% 0.1% 0.1% 0.2% 0.4% 7.2% 3.8% 5.5% 4.3% 1.2% 0.0% 2.7%
Other out of centre 0.0% 0.0% 0.1% 0.0% 0.0% 0.0% 0.1% 0.0% 0.0% 0.1% 0.1% 0.6% 2.4% 3.7% 3.9% 2.9% 0.8% 0.0% 1.8%
Cardigan Town Centre 0.0% 0.3% 0.0% 0.0% 0.0% 1.2% 1.6% 0.3% 10.8% 25.6% 7.0% 0.5% 1.4% 0.1% 0.0% 0.1% 3.5% 0.9% 7.0%
Out of centre 0.2% 0.0% 0.0% 0.0% 0.1% 0.0% 0.0% 0.0% 2.2% 1.7% 1.4% 0.0% 0.2% 0.1% 0.0% 0.0% 0.3% 0.1% 0.6%
Aberaeron 0.0% 0.0% 0.0% 0.0% 0.0% 0.0% 0.0% 0.0% 0.0% 0.0% 2.1% 3.0% 8.6% 0.2% 0.0% 0.1% 0.7% 0.0% 1.5%
Lampeter 0.0% 0.0% 0.0% 0.4% 0.0% 0.0% 0.0% 0.0% 0.0% 0.0% 3.8% 30.4% 1.3% 5.0% 0.3% 0.2% 2.3% 0.1% 5.2%
Tregaron 0.0% 0.0% 0.0% 0.0% 0.1% 0.0% 0.0% 0.0% 0.0% 0.2% 0.0% 0.0% 0.4% 1.7% 0.0% 0.0% 0.1% 0.0% 0.3%
Llandysul 0.0% 0.0% 0.0% 0.0% 0.0% 0.0% 0.0% 0.0% 0.0% 0.0% 9.0% 0.1% 0.1% 0.0% 0.0% 0.0% 0.5% 0.0% 1.2%
Other ‐ Ceredigion 0.4% 0.0% 0.0% 0.0% 0.0% 0.0% 0.0% 0.0% 0.1% 3.9% 3.8% 0.0% 0.4% 0.1% 0.3% 0.3% 0.7% 0.0% 1.5%
SUB‐TOTAL: CEREDIGION 0.6% 1.1% 0.8% 0.5% 0.2% 1.2% 1.7% 0.3% 13.7% 31.6% 29.0% 40.3% 56.5% 64.0% 71.2% 62.6% 22.1% 1.3% 49.0%
OUTSIDE STUDY AREA
Carmarthen 6.1% 6.4% 1.5% 3.2% 7.3% 16.6% 28.5% 3.5% 13.2% 34.4% 49.0% 34.8% 14.5% 4.8% 3.9% 4.4% 14.8% 9.4% 21.9%
Cardiff 1.6% 1.6% 2.2% 2.2% 1.8% 1.3% 3.6% 0.6% 3.6% 0.7% 0.9% 0.7% 1.5% 1.7% 4.1% 3.0% 1.8% 1.9% 1.8%
Swansea 3.0% 1.5% 0.9% 3.3% 3.0% 1.3% 1.1% 0.4% 0.6% 0.8% 0.3% 0.5% 0.8% 0.9% 0.9% 0.5% 1.3% 1.9% 0.7%
Llanelli 0.0% 0.0% 0.0% 0.2% 0.0% 0.0% 0.0% 0.0% 0.0% 0.7% 0.1% 0.1% 0.4% 0.1% 0.0% 0.1% 0.1% 0.0% 0.2%
London 0.0% 0.0% 0.0% 0.0% 0.2% 0.0% 0.3% 0.2% 0.7% 0.0% 0.0% 0.0% 0.0% 0.0% 0.3% 0.0% 0.1% 0.1% 0.0%
All other 0.3% 1.0% 1.0% 0.6% 0.7% 2.2% 0.5% 0.9% 1.8% 1.8% 0.8% 2.2% 1.3% 1.5% 3.5% 7.4% 1.8% 1.0% 2.8%
SUB‐TOTAL: OUTSIDE STUDY AREA 10.9% 10.4% 5.7% 9.4% 13.0% 21.4% 34.1% 5.6% 19.9% 38.3% 51.1% 38.3% 18.5% 9.0% 12.6% 15.4% 20.0% 14.3% 27.5%
INTERNET 20.3% 19.7% 30.0% 26.4% 25.4% 24.9% 21.4% 25.1% 17.9% 24.3% 19.2% 21.1% 24.8% 26.6% 15.8% 21.2% 23.2% 24.3% 21.8%
TOTAL MARKET SHARE 100% 100% 100% 100% 100% 100% 100% 100% 100% 100% 100% 100% 100% 100% 100% 100% 100% 100% 100%
STUDY
AREAPEMBROKE‐SHIRE
(Zones 1‐9)
CEREDIGION
(Zones 10‐16)
23/01/2017
South Wales Regional Retail Study 2016Comparison Goods Market Shares
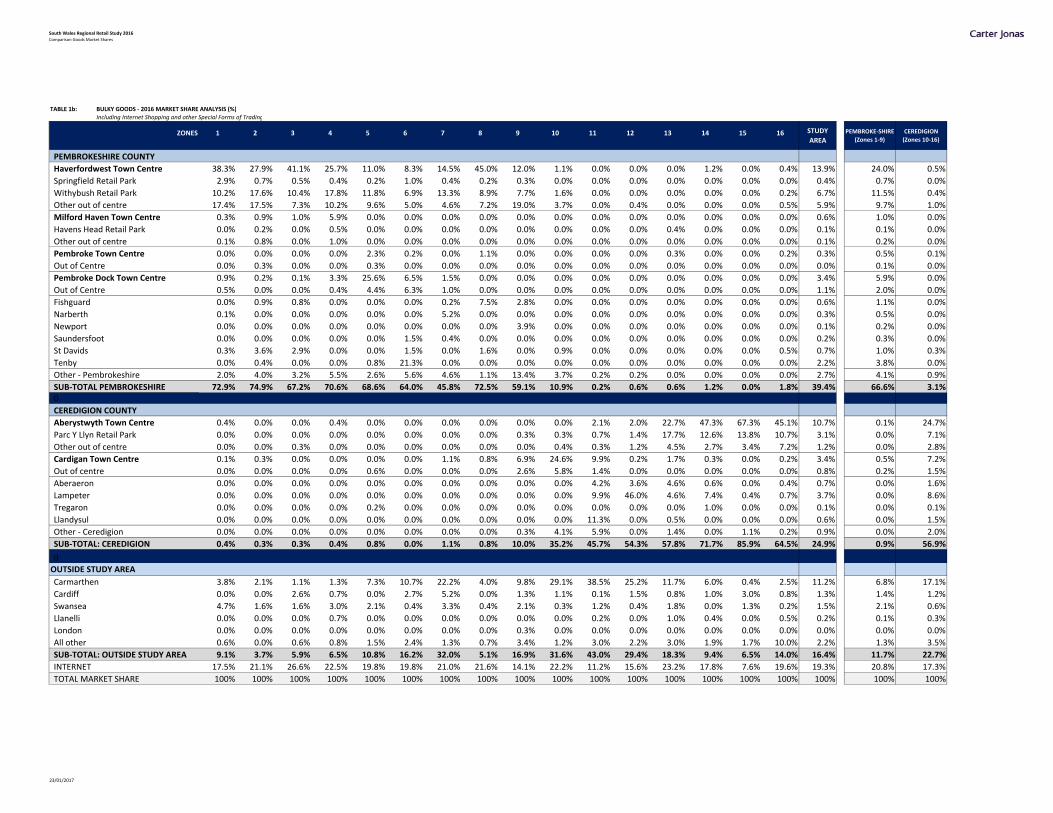
TABLE 1b: BULKY GOODS ‐ 2016 MARKET SHARE ANALYSIS (%)Including Internet Shopping and other Special Forms of Trading
ZONES 1 2 3 4 5 6 7 8 9 10 11 12 13 14 15 16
PEMBROKESHIRE COUNTY
Haverfordwest Town Centre 38.3% 27.9% 41.1% 25.7% 11.0% 8.3% 14.5% 45.0% 12.0% 1.1% 0.0% 0.0% 0.0% 1.2% 0.0% 0.4% 13.9% 24.0% 0.5%
Springfield Retail Park 2.9% 0.7% 0.5% 0.4% 0.2% 1.0% 0.4% 0.2% 0.3% 0.0% 0.0% 0.0% 0.0% 0.0% 0.0% 0.0% 0.4% 0.7% 0.0%
Withybush Retail Park 10.2% 17.6% 10.4% 17.8% 11.8% 6.9% 13.3% 8.9% 7.7% 1.6% 0.0% 0.0% 0.0% 0.0% 0.0% 0.2% 6.7% 11.5% 0.4%
Other out of centre 17.4% 17.5% 7.3% 10.2% 9.6% 5.0% 4.6% 7.2% 19.0% 3.7% 0.0% 0.4% 0.0% 0.0% 0.0% 0.5% 5.9% 9.7% 1.0%
Milford Haven Town Centre 0.3% 0.9% 1.0% 5.9% 0.0% 0.0% 0.0% 0.0% 0.0% 0.0% 0.0% 0.0% 0.0% 0.0% 0.0% 0.0% 0.6% 1.0% 0.0%
Havens Head Retail Park 0.0% 0.2% 0.0% 0.5% 0.0% 0.0% 0.0% 0.0% 0.0% 0.0% 0.0% 0.0% 0.4% 0.0% 0.0% 0.0% 0.1% 0.1% 0.0%
Other out of centre 0.1% 0.8% 0.0% 1.0% 0.0% 0.0% 0.0% 0.0% 0.0% 0.0% 0.0% 0.0% 0.0% 0.0% 0.0% 0.0% 0.1% 0.2% 0.0%
Pembroke Town Centre 0.0% 0.0% 0.0% 0.0% 2.3% 0.2% 0.0% 1.1% 0.0% 0.0% 0.0% 0.0% 0.3% 0.0% 0.0% 0.2% 0.3% 0.5% 0.1%
Out of Centre 0.0% 0.3% 0.0% 0.0% 0.3% 0.0% 0.0% 0.0% 0.0% 0.0% 0.0% 0.0% 0.0% 0.0% 0.0% 0.0% 0.0% 0.1% 0.0%
Pembroke Dock Town Centre 0.9% 0.2% 0.1% 3.3% 25.6% 6.5% 1.5% 0.0% 0.0% 0.0% 0.0% 0.0% 0.0% 0.0% 0.0% 0.0% 3.4% 5.9% 0.0%
Out of Centre 0.5% 0.0% 0.0% 0.4% 4.4% 6.3% 1.0% 0.0% 0.0% 0.0% 0.0% 0.0% 0.0% 0.0% 0.0% 0.0% 1.1% 2.0% 0.0%
Fishguard 0.0% 0.9% 0.8% 0.0% 0.0% 0.0% 0.2% 7.5% 2.8% 0.0% 0.0% 0.0% 0.0% 0.0% 0.0% 0.0% 0.6% 1.1% 0.0%
Narberth 0.1% 0.0% 0.0% 0.0% 0.0% 0.0% 5.2% 0.0% 0.0% 0.0% 0.0% 0.0% 0.0% 0.0% 0.0% 0.0% 0.3% 0.5% 0.0%
Newport 0.0% 0.0% 0.0% 0.0% 0.0% 0.0% 0.0% 0.0% 3.9% 0.0% 0.0% 0.0% 0.0% 0.0% 0.0% 0.0% 0.1% 0.2% 0.0%
Saundersfoot 0.0% 0.0% 0.0% 0.0% 0.0% 1.5% 0.4% 0.0% 0.0% 0.0% 0.0% 0.0% 0.0% 0.0% 0.0% 0.0% 0.2% 0.3% 0.0%
St Davids 0.3% 3.6% 2.9% 0.0% 0.0% 1.5% 0.0% 1.6% 0.0% 0.9% 0.0% 0.0% 0.0% 0.0% 0.0% 0.5% 0.7% 1.0% 0.3%
Tenby 0.0% 0.4% 0.0% 0.0% 0.8% 21.3% 0.0% 0.0% 0.0% 0.0% 0.0% 0.0% 0.0% 0.0% 0.0% 0.0% 2.2% 3.8% 0.0%
Other ‐ Pembrokeshire 2.0% 4.0% 3.2% 5.5% 2.6% 5.6% 4.6% 1.1% 13.4% 3.7% 0.2% 0.2% 0.0% 0.0% 0.0% 0.0% 2.7% 4.1% 0.9%
SUB‐TOTAL PEMBROKESHIRE 72.9% 74.9% 67.2% 70.6% 68.6% 64.0% 45.8% 72.5% 59.1% 10.9% 0.2% 0.6% 0.6% 1.2% 0.0% 1.8% 39.4% 66.6% 3.1%0
CEREDIGION COUNTY
Aberystwyth Town Centre 0.4% 0.0% 0.0% 0.4% 0.0% 0.0% 0.0% 0.0% 0.0% 0.0% 2.1% 2.0% 22.7% 47.3% 67.3% 45.1% 10.7% 0.1% 24.7%
Parc Y Llyn Retail Park 0.0% 0.0% 0.0% 0.0% 0.0% 0.0% 0.0% 0.0% 0.3% 0.3% 0.7% 1.4% 17.7% 12.6% 13.8% 10.7% 3.1% 0.0% 7.1%
Other out of centre 0.0% 0.0% 0.3% 0.0% 0.0% 0.0% 0.0% 0.0% 0.0% 0.4% 0.3% 1.2% 4.5% 2.7% 3.4% 7.2% 1.2% 0.0% 2.8%
Cardigan Town Centre 0.1% 0.3% 0.0% 0.0% 0.0% 0.0% 1.1% 0.8% 6.9% 24.6% 9.9% 0.2% 1.7% 0.3% 0.0% 0.2% 3.4% 0.5% 7.2%
Out of centre 0.0% 0.0% 0.0% 0.0% 0.6% 0.0% 0.0% 0.0% 2.6% 5.8% 1.4% 0.0% 0.0% 0.0% 0.0% 0.0% 0.8% 0.2% 1.5%
Aberaeron 0.0% 0.0% 0.0% 0.0% 0.0% 0.0% 0.0% 0.0% 0.0% 0.0% 4.2% 3.6% 4.6% 0.6% 0.0% 0.4% 0.7% 0.0% 1.6%
Lampeter 0.0% 0.0% 0.0% 0.0% 0.0% 0.0% 0.0% 0.0% 0.0% 0.0% 9.9% 46.0% 4.6% 7.4% 0.4% 0.7% 3.7% 0.0% 8.6%
Tregaron 0.0% 0.0% 0.0% 0.0% 0.2% 0.0% 0.0% 0.0% 0.0% 0.0% 0.0% 0.0% 0.0% 1.0% 0.0% 0.0% 0.1% 0.0% 0.1%
Llandysul 0.0% 0.0% 0.0% 0.0% 0.0% 0.0% 0.0% 0.0% 0.0% 0.0% 11.3% 0.0% 0.5% 0.0% 0.0% 0.0% 0.6% 0.0% 1.5%
Other ‐ Ceredigion 0.0% 0.0% 0.0% 0.0% 0.0% 0.0% 0.0% 0.0% 0.3% 4.1% 5.9% 0.0% 1.4% 0.0% 1.1% 0.2% 0.9% 0.0% 2.0%
SUB‐TOTAL: CEREDIGION 0.4% 0.3% 0.3% 0.4% 0.8% 0.0% 1.1% 0.8% 10.0% 35.2% 45.7% 54.3% 57.8% 71.7% 85.9% 64.5% 24.9% 0.9% 56.9%
0
OUTSIDE STUDY AREA
Carmarthen 3.8% 2.1% 1.1% 1.3% 7.3% 10.7% 22.2% 4.0% 9.8% 29.1% 38.5% 25.2% 11.7% 6.0% 0.4% 2.5% 11.2% 6.8% 17.1%
Cardiff 0.0% 0.0% 2.6% 0.7% 0.0% 2.7% 5.2% 0.0% 1.3% 1.1% 0.1% 1.5% 0.8% 1.0% 3.0% 0.8% 1.3% 1.4% 1.2%
Swansea 4.7% 1.6% 1.6% 3.0% 2.1% 0.4% 3.3% 0.4% 2.1% 0.3% 1.2% 0.4% 1.8% 0.0% 1.3% 0.2% 1.5% 2.1% 0.6%
Llanelli 0.0% 0.0% 0.0% 0.7% 0.0% 0.0% 0.0% 0.0% 0.0% 0.0% 0.2% 0.0% 1.0% 0.4% 0.0% 0.5% 0.2% 0.1% 0.3%
London 0.0% 0.0% 0.0% 0.0% 0.0% 0.0% 0.0% 0.0% 0.3% 0.0% 0.0% 0.0% 0.0% 0.0% 0.0% 0.0% 0.0% 0.0% 0.0%
All other 0.6% 0.0% 0.6% 0.8% 1.5% 2.4% 1.3% 0.7% 3.4% 1.2% 3.0% 2.2% 3.0% 1.9% 1.7% 10.0% 2.2% 1.3% 3.5%
SUB‐TOTAL: OUTSIDE STUDY AREA 9.1% 3.7% 5.9% 6.5% 10.8% 16.2% 32.0% 5.1% 16.9% 31.6% 43.0% 29.4% 18.3% 9.4% 6.5% 14.0% 16.4% 11.7% 22.7%
INTERNET 17.5% 21.1% 26.6% 22.5% 19.8% 19.8% 21.0% 21.6% 14.1% 22.2% 11.2% 15.6% 23.2% 17.8% 7.6% 19.6% 19.3% 20.8% 17.3%
TOTAL MARKET SHARE 100% 100% 100% 100% 100% 100% 100% 100% 100% 100% 100% 100% 100% 100% 100% 100% 100% 100% 100%
CEREDIGION
(Zones 10‐16)
STUDY
AREAPEMBROKE‐SHIRE
(Zones 1‐9)
23/01/2017
South Wales Regional Retail Study 2016Comparison Goods Market Shares
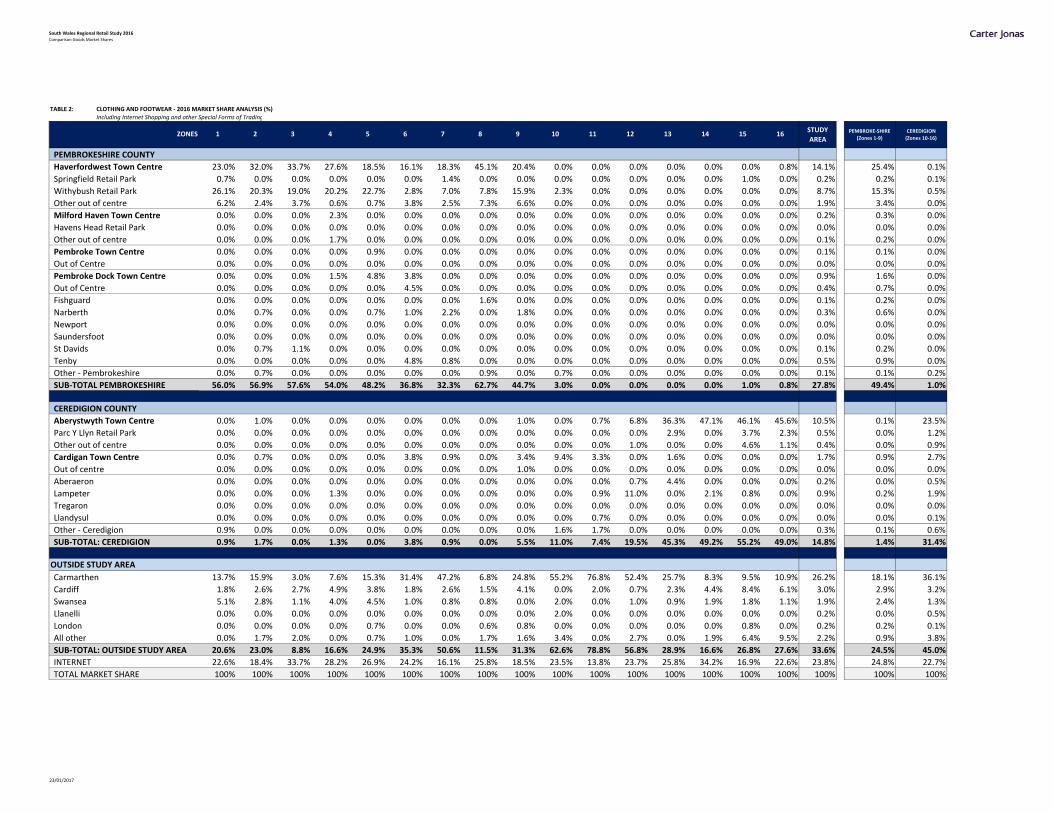
TABLE 2: CLOTHING AND FOOTWEAR ‐ 2016 MARKET SHARE ANALYSIS (%)Including Internet Shopping and other Special Forms of Trading
ZONES 1 2 3 4 5 6 7 8 9 10 11 12 13 14 15 16
PEMBROKESHIRE COUNTY
Haverfordwest Town Centre 23.0% 32.0% 33.7% 27.6% 18.5% 16.1% 18.3% 45.1% 20.4% 0.0% 0.0% 0.0% 0.0% 0.0% 0.0% 0.8% 14.1% 25.4% 0.1%
Springfield Retail Park 0.7% 0.0% 0.0% 0.0% 0.0% 0.0% 1.4% 0.0% 0.0% 0.0% 0.0% 0.0% 0.0% 0.0% 1.0% 0.0% 0.2% 0.2% 0.1%
Withybush Retail Park 26.1% 20.3% 19.0% 20.2% 22.7% 2.8% 7.0% 7.8% 15.9% 2.3% 0.0% 0.0% 0.0% 0.0% 0.0% 0.0% 8.7% 15.3% 0.5%
Other out of centre 6.2% 2.4% 3.7% 0.6% 0.7% 3.8% 2.5% 7.3% 6.6% 0.0% 0.0% 0.0% 0.0% 0.0% 0.0% 0.0% 1.9% 3.4% 0.0%
Milford Haven Town Centre 0.0% 0.0% 0.0% 2.3% 0.0% 0.0% 0.0% 0.0% 0.0% 0.0% 0.0% 0.0% 0.0% 0.0% 0.0% 0.0% 0.2% 0.3% 0.0%
Havens Head Retail Park 0.0% 0.0% 0.0% 0.0% 0.0% 0.0% 0.0% 0.0% 0.0% 0.0% 0.0% 0.0% 0.0% 0.0% 0.0% 0.0% 0.0% 0.0% 0.0%
Other out of centre 0.0% 0.0% 0.0% 1.7% 0.0% 0.0% 0.0% 0.0% 0.0% 0.0% 0.0% 0.0% 0.0% 0.0% 0.0% 0.0% 0.1% 0.2% 0.0%
Pembroke Town Centre 0.0% 0.0% 0.0% 0.0% 0.9% 0.0% 0.0% 0.0% 0.0% 0.0% 0.0% 0.0% 0.0% 0.0% 0.0% 0.0% 0.1% 0.1% 0.0%
Out of Centre 0.0% 0.0% 0.0% 0.0% 0.0% 0.0% 0.0% 0.0% 0.0% 0.0% 0.0% 0.0% 0.0% 0.0% 0.0% 0.0% 0.0% 0.0% 0.0%
Pembroke Dock Town Centre 0.0% 0.0% 0.0% 1.5% 4.8% 3.8% 0.0% 0.0% 0.0% 0.0% 0.0% 0.0% 0.0% 0.0% 0.0% 0.0% 0.9% 1.6% 0.0%
Out of Centre 0.0% 0.0% 0.0% 0.0% 0.0% 4.5% 0.0% 0.0% 0.0% 0.0% 0.0% 0.0% 0.0% 0.0% 0.0% 0.0% 0.4% 0.7% 0.0%
Fishguard 0.0% 0.0% 0.0% 0.0% 0.0% 0.0% 0.0% 1.6% 0.0% 0.0% 0.0% 0.0% 0.0% 0.0% 0.0% 0.0% 0.1% 0.2% 0.0%
Narberth 0.0% 0.7% 0.0% 0.0% 0.7% 1.0% 2.2% 0.0% 1.8% 0.0% 0.0% 0.0% 0.0% 0.0% 0.0% 0.0% 0.3% 0.6% 0.0%
Newport 0.0% 0.0% 0.0% 0.0% 0.0% 0.0% 0.0% 0.0% 0.0% 0.0% 0.0% 0.0% 0.0% 0.0% 0.0% 0.0% 0.0% 0.0% 0.0%
Saundersfoot 0.0% 0.0% 0.0% 0.0% 0.0% 0.0% 0.0% 0.0% 0.0% 0.0% 0.0% 0.0% 0.0% 0.0% 0.0% 0.0% 0.0% 0.0% 0.0%
St Davids 0.0% 0.7% 1.1% 0.0% 0.0% 0.0% 0.0% 0.0% 0.0% 0.0% 0.0% 0.0% 0.0% 0.0% 0.0% 0.0% 0.1% 0.2% 0.0%
Tenby 0.0% 0.0% 0.0% 0.0% 0.0% 4.8% 0.8% 0.0% 0.0% 0.0% 0.0% 0.0% 0.0% 0.0% 0.0% 0.0% 0.5% 0.9% 0.0%
Other ‐ Pembrokeshire 0.0% 0.7% 0.0% 0.0% 0.0% 0.0% 0.0% 0.9% 0.0% 0.7% 0.0% 0.0% 0.0% 0.0% 0.0% 0.0% 0.1% 0.1% 0.2%
SUB‐TOTAL PEMBROKESHIRE 56.0% 56.9% 57.6% 54.0% 48.2% 36.8% 32.3% 62.7% 44.7% 3.0% 0.0% 0.0% 0.0% 0.0% 1.0% 0.8% 27.8% 49.4% 1.0%
CEREDIGION COUNTY
Aberystwyth Town Centre 0.0% 1.0% 0.0% 0.0% 0.0% 0.0% 0.0% 0.0% 1.0% 0.0% 0.7% 6.8% 36.3% 47.1% 46.1% 45.6% 10.5% 0.1% 23.5%
Parc Y Llyn Retail Park 0.0% 0.0% 0.0% 0.0% 0.0% 0.0% 0.0% 0.0% 0.0% 0.0% 0.0% 0.0% 2.9% 0.0% 3.7% 2.3% 0.5% 0.0% 1.2%
Other out of centre 0.0% 0.0% 0.0% 0.0% 0.0% 0.0% 0.0% 0.0% 0.0% 0.0% 0.0% 1.0% 0.0% 0.0% 4.6% 1.1% 0.4% 0.0% 0.9%
Cardigan Town Centre 0.0% 0.7% 0.0% 0.0% 0.0% 3.8% 0.9% 0.0% 3.4% 9.4% 3.3% 0.0% 1.6% 0.0% 0.0% 0.0% 1.7% 0.9% 2.7%
Out of centre 0.0% 0.0% 0.0% 0.0% 0.0% 0.0% 0.0% 0.0% 1.0% 0.0% 0.0% 0.0% 0.0% 0.0% 0.0% 0.0% 0.0% 0.0% 0.0%
Aberaeron 0.0% 0.0% 0.0% 0.0% 0.0% 0.0% 0.0% 0.0% 0.0% 0.0% 0.0% 0.7% 4.4% 0.0% 0.0% 0.0% 0.2% 0.0% 0.5%
Lampeter 0.0% 0.0% 0.0% 1.3% 0.0% 0.0% 0.0% 0.0% 0.0% 0.0% 0.9% 11.0% 0.0% 2.1% 0.8% 0.0% 0.9% 0.2% 1.9%
Tregaron 0.0% 0.0% 0.0% 0.0% 0.0% 0.0% 0.0% 0.0% 0.0% 0.0% 0.0% 0.0% 0.0% 0.0% 0.0% 0.0% 0.0% 0.0% 0.0%
Llandysul 0.0% 0.0% 0.0% 0.0% 0.0% 0.0% 0.0% 0.0% 0.0% 0.0% 0.7% 0.0% 0.0% 0.0% 0.0% 0.0% 0.0% 0.0% 0.1%
Other ‐ Ceredigion 0.9% 0.0% 0.0% 0.0% 0.0% 0.0% 0.0% 0.0% 0.0% 1.6% 1.7% 0.0% 0.0% 0.0% 0.0% 0.0% 0.3% 0.1% 0.6%
SUB‐TOTAL: CEREDIGION 0.9% 1.7% 0.0% 1.3% 0.0% 3.8% 0.9% 0.0% 5.5% 11.0% 7.4% 19.5% 45.3% 49.2% 55.2% 49.0% 14.8% 1.4% 31.4%
OUTSIDE STUDY AREA
Carmarthen 13.7% 15.9% 3.0% 7.6% 15.3% 31.4% 47.2% 6.8% 24.8% 55.2% 76.8% 52.4% 25.7% 8.3% 9.5% 10.9% 26.2% 18.1% 36.1%
Cardiff 1.8% 2.6% 2.7% 4.9% 3.8% 1.8% 2.6% 1.5% 4.1% 0.0% 2.0% 0.7% 2.3% 4.4% 8.4% 6.1% 3.0% 2.9% 3.2%
Swansea 5.1% 2.8% 1.1% 4.0% 4.5% 1.0% 0.8% 0.8% 0.0% 2.0% 0.0% 1.0% 0.9% 1.9% 1.8% 1.1% 1.9% 2.4% 1.3%
Llanelli 0.0% 0.0% 0.0% 0.0% 0.0% 0.0% 0.0% 0.0% 0.0% 2.0% 0.0% 0.0% 0.0% 0.0% 0.0% 0.0% 0.2% 0.0% 0.5%
London 0.0% 0.0% 0.0% 0.0% 0.7% 0.0% 0.0% 0.6% 0.8% 0.0% 0.0% 0.0% 0.0% 0.0% 0.8% 0.0% 0.2% 0.2% 0.1%
All other 0.0% 1.7% 2.0% 0.0% 0.7% 1.0% 0.0% 1.7% 1.6% 3.4% 0.0% 2.7% 0.0% 1.9% 6.4% 9.5% 2.2% 0.9% 3.8%
SUB‐TOTAL: OUTSIDE STUDY AREA 20.6% 23.0% 8.8% 16.6% 24.9% 35.3% 50.6% 11.5% 31.3% 62.6% 78.8% 56.8% 28.9% 16.6% 26.8% 27.6% 33.6% 24.5% 45.0%
INTERNET 22.6% 18.4% 33.7% 28.2% 26.9% 24.2% 16.1% 25.8% 18.5% 23.5% 13.8% 23.7% 25.8% 34.2% 16.9% 22.6% 23.8% 24.8% 22.7%
TOTAL MARKET SHARE 100% 100% 100% 100% 100% 100% 100% 100% 100% 100% 100% 100% 100% 100% 100% 100% 100% 100% 100%
PEMBROKE‐SHIRE
(Zones 1‐9)
CEREDIGION
(Zones 10‐16)
STUDY
AREA
23/01/2017

South Wales Regional Retail Study 2016Comparison Goods Market Shares
TABLE 3: RECORDING MEDIA ‐ 2016 MARKET SHARE ANALYSIS (%)Including Internet Shopping and other Special Forms of Trading
ZONES 1 2 3 4 5 6 7 8 9 10 11 12 13 14 15 16
PEMBROKESHIRE COUNTY
Haverfordwest Town Centre 25.6% 20.0% 9.5% 10.4% 3.1% 2.0% 2.4% 9.2% 4.2% 0.0% 0.0% 0.0% 0.0% 0.0% 0.0% 0.0% 5.3% 9.1% 0.0%
Springfield Retail Park 0.0% 0.0% 0.0% 0.0% 0.0% 0.0% 0.0% 0.0% 0.0% 0.0% 0.0% 0.0% 0.0% 0.0% 0.0% 0.0% 0.0% 0.0% 0.0%
Withybush Retail Park 0.0% 2.1% 0.0% 0.0% 3.0% 0.0% 0.0% 1.0% 0.0% 0.0% 0.0% 0.0% 0.0% 0.0% 0.0% 0.0% 0.4% 0.7% 0.0%
Other out of centre 24.6% 13.6% 5.4% 5.8% 1.4% 0.0% 9.3% 2.4% 4.7% 0.0% 0.0% 0.0% 0.0% 0.0% 0.0% 0.0% 3.9% 6.7% 0.0%
Milford Haven Town Centre 0.0% 0.0% 0.0% 3.7% 0.0% 0.0% 0.0% 0.0% 0.0% 0.0% 0.0% 0.0% 0.0% 0.0% 0.0% 0.0% 0.3% 0.6% 0.0%
Havens Head Retail Park 0.0% 4.6% 0.0% 2.1% 0.0% 0.0% 0.0% 0.0% 0.0% 0.0% 0.0% 0.0% 0.0% 0.0% 0.0% 0.0% 0.3% 0.6% 0.0%
Other out of centre 0.0% 0.0% 0.0% 4.2% 0.0% 0.0% 0.0% 0.0% 0.0% 0.0% 0.0% 0.0% 0.0% 0.0% 0.0% 0.0% 0.4% 0.7% 0.0%
Pembroke Town Centre 0.0% 0.0% 0.0% 0.0% 0.0% 0.0% 0.0% 0.0% 0.0% 0.0% 0.0% 0.0% 0.0% 0.0% 0.0% 0.0% 0.0% 0.0% 0.0%
Out of Centre 0.0% 0.0% 0.0% 0.0% 3.0% 0.0% 0.0% 0.0% 0.0% 0.0% 0.0% 0.0% 1.5% 0.0% 0.0% 0.0% 0.4% 0.5% 0.1%
Pembroke Dock Town Centre 0.0% 0.0% 0.0% 0.0% 0.0% 0.0% 0.0% 0.0% 0.0% 0.0% 0.0% 0.0% 0.0% 0.0% 0.0% 0.0% 0.0% 0.0% 0.0%
Out of Centre 1.7% 0.0% 0.0% 4.3% 16.8% 7.0% 0.0% 0.0% 0.0% 0.0% 0.0% 0.0% 0.0% 0.0% 0.0% 0.0% 2.9% 5.0% 0.0%
Fishguard 0.0% 0.0% 0.0% 0.0% 0.0% 0.0% 0.0% 5.0% 2.4% 0.0% 0.0% 0.0% 0.0% 0.0% 0.0% 0.0% 0.3% 0.6% 0.0%
Narberth 0.0% 0.0% 0.0% 0.0% 0.0% 0.0% 1.6% 0.0% 0.0% 0.0% 0.0% 0.0% 0.0% 0.0% 0.0% 0.0% 0.1% 0.1% 0.0%
Newport 0.0% 0.0% 0.0% 0.0% 0.0% 0.0% 0.0% 0.0% 1.6% 0.0% 0.0% 0.0% 0.0% 0.0% 0.0% 0.0% 0.0% 0.1% 0.0%
Saundersfoot 0.0% 0.0% 0.0% 0.0% 0.0% 0.0% 0.0% 0.0% 0.0% 0.0% 0.0% 0.0% 0.0% 0.0% 0.0% 0.0% 0.0% 0.0% 0.0%
St Davids 0.0% 0.0% 0.0% 0.0% 0.0% 0.0% 0.0% 0.0% 0.0% 0.0% 0.0% 0.0% 0.0% 0.0% 0.0% 0.0% 0.0% 0.0% 0.0%
Tenby 0.0% 0.0% 0.0% 0.0% 0.0% 0.0% 0.0% 0.0% 0.0% 0.0% 0.0% 0.0% 0.0% 0.0% 0.0% 0.0% 0.0% 0.0% 0.0%
Other ‐ Pembrokeshire 1.3% 0.0% 0.0% 0.0% 0.0% 14.3% 1.6% 0.0% 3.6% 0.0% 0.0% 0.0% 0.0% 0.0% 0.0% 0.0% 1.6% 2.8% 0.0%
SUB‐TOTAL PEMBROKESHIRE 53.3% 40.2% 15.0% 30.5% 27.2% 23.2% 14.9% 17.7% 16.5% 0.0% 0.0% 0.0% 1.5% 0.0% 0.0% 0.0% 16.0% 27.4% 0.1%0
CEREDIGION COUNTY
Aberystwyth Town Centre 0.0% 0.0% 0.0% 0.0% 0.0% 0.0% 0.0% 0.0% 0.0% 0.0% 1.8% 3.2% 10.5% 18.9% 21.3% 32.9% 5.6% 0.0% 13.3%
Parc Y Llyn Retail Park 0.0% 0.0% 0.0% 0.0% 0.0% 0.0% 0.0% 0.0% 0.0% 0.0% 0.0% 0.0% 1.4% 0.0% 0.0% 0.0% 0.1% 0.0% 0.1%
Other out of centre 0.0% 0.0% 0.0% 0.0% 0.0% 0.0% 0.0% 0.0% 0.0% 0.0% 0.0% 0.0% 2.9% 4.7% 12.8% 3.6% 1.5% 0.0% 3.6%
Cardigan Town Centre 0.0% 0.0% 0.0% 0.0% 0.0% 0.0% 0.0% 1.0% 5.2% 8.0% 1.5% 0.0% 1.1% 0.0% 0.0% 0.0% 1.0% 0.3% 2.0%
Out of centre 0.0% 0.0% 0.0% 0.0% 0.0% 0.0% 0.0% 0.0% 5.8% 0.0% 7.1% 0.0% 0.0% 0.0% 0.0% 0.0% 0.5% 0.2% 0.8%
Aberaeron 0.0% 0.0% 0.0% 0.0% 0.0% 0.0% 0.0% 0.0% 0.0% 0.0% 0.0% 0.0% 5.4% 0.0% 0.0% 0.0% 0.2% 0.0% 0.5%
Lampeter 0.0% 0.0% 0.0% 0.0% 0.0% 0.0% 0.0% 0.0% 0.0% 0.0% 0.0% 8.9% 0.0% 1.6% 0.0% 0.0% 0.5% 0.0% 1.2%
Tregaron 0.0% 0.0% 0.0% 0.0% 0.0% 0.0% 0.0% 0.0% 0.0% 0.0% 0.0% 0.0% 0.0% 0.0% 0.0% 0.0% 0.0% 0.0% 0.0%
Llandysul 0.0% 0.0% 0.0% 0.0% 0.0% 0.0% 0.0% 0.0% 0.0% 0.0% 0.0% 0.0% 0.0% 0.0% 0.0% 0.0% 0.0% 0.0% 0.0%
Other ‐ Ceredigion 0.0% 0.0% 0.0% 0.0% 0.0% 0.0% 0.0% 0.0% 0.0% 0.0% 0.0% 0.0% 0.0% 0.0% 0.0% 0.0% 0.0% 0.0% 0.0%
SUB‐TOTAL: CEREDIGION 0.0% 0.0% 0.0% 0.0% 0.0% 0.0% 0.0% 1.0% 11.0% 8.0% 10.4% 12.1% 21.4% 25.1% 34.1% 36.6% 9.3% 0.5% 21.6%
0
OUTSIDE STUDY AREA
Carmarthen 0.0% 0.0% 0.0% 0.0% 0.0% 1.5% 6.0% 2.4% 9.4% 12.2% 20.0% 13.3% 3.1% 0.0% 9.3% 0.0% 4.3% 1.3% 8.4%
Cardiff 0.0% 4.1% 1.6% 0.0% 1.3% 0.0% 0.0% 0.0% 4.6% 1.7% 0.0% 0.0% 0.0% 0.0% 0.0% 0.0% 0.6% 0.8% 0.4%
Swansea 0.0% 0.0% 0.0% 0.0% 2.7% 0.0% 0.0% 0.0% 2.1% 0.0% 1.2% 3.2% 1.4% 0.0% 0.0% 0.0% 0.6% 0.5% 0.7%
Llanelli 0.0% 0.0% 0.0% 0.0% 0.0% 0.0% 0.0% 0.0% 0.0% 0.0% 0.0% 0.0% 0.0% 0.0% 0.0% 0.0% 0.0% 0.0% 0.0%
London 0.0% 0.0% 0.0% 0.0% 0.0% 0.0% 0.0% 0.0% 0.0% 0.0% 0.0% 0.0% 0.0% 0.0% 0.0% 0.0% 0.0% 0.0% 0.0%
All other 0.0% 0.0% 0.0% 1.6% 0.0% 0.0% 0.0% 0.0% 0.0% 0.0% 0.0% 0.0% 0.0% 0.0% 1.5% 0.0% 0.3% 0.3% 0.3%
SUB‐TOTAL: OUTSIDE STUDY AREA 0.0% 4.1% 1.6% 1.6% 4.1% 1.5% 6.0% 2.4% 16.1% 13.9% 21.1% 16.5% 4.6% 0.0% 10.7% 0.0% 5.7% 2.9% 9.7%
INTERNET 46.7% 55.7% 83.5% 67.9% 68.7% 75.3% 79.0% 78.9% 56.4% 78.1% 68.5% 71.4% 72.6% 74.9% 55.2% 63.4% 68.9% 69.2% 68.6%
TOTAL MARKET SHARE 100% 100% 100% 100% 100% 100% 100% 100% 100% 100% 100% 100% 100% 100% 100% 100% 100% 100% 100%
PEMBROKE‐SHIRE
(Zones 1‐9)
CEREDIGION
(Zones 10‐16)
STUDY
AREA
23/01/2017

South Wales Regional Retail Study 2016Comparison Goods Market Shares
TABLE 4: AUDIO VISUAL‐ 2016 MARKET SHARE ANALYSIS (%)Including Internet Shopping and other Special Forms of Trading
ZONES 1 2 3 4 5 6 7 8 9 10 11 12 13 14 15 16
PEMBROKESHIRE COUNTY
Haverfordwest Town Centre 48.6% 37.5% 38.9% 33.5% 15.9% 16.6% 17.7% 39.4% 12.8% 1.9% 0.0% 0.0% 0.0% 0.0% 0.0% 0.0% 16.8% 28.6% 0.4%
Springfield Retail Park 3.5% 0.0% 1.3% 0.0% 0.0% 1.2% 0.7% 0.0% 0.0% 0.0% 0.0% 0.0% 0.0% 0.0% 0.0% 0.0% 0.5% 0.8% 0.0%
Withybush Retail Park 3.7% 5.8% 3.8% 17.7% 12.5% 6.6% 3.8% 8.3% 2.0% 0.0% 0.0% 0.0% 0.0% 0.0% 0.0% 0.0% 4.8% 8.3% 0.0%
Other out of centre 14.3% 19.7% 10.3% 7.2% 10.2% 7.2% 4.0% 4.3% 16.5% 3.7% 0.0% 0.0% 0.0% 0.0% 0.0% 0.0% 5.8% 9.4% 0.8%
Milford Haven Town Centre 0.7% 0.8% 0.0% 0.9% 0.0% 0.0% 0.0% 0.0% 0.0% 0.0% 0.0% 0.0% 0.0% 0.0% 0.0% 0.0% 0.2% 0.3% 0.0%
Havens Head Retail Park 0.0% 0.0% 0.0% 0.0% 0.0% 0.0% 0.0% 0.0% 0.0% 0.0% 0.0% 0.0% 0.0% 0.0% 0.0% 0.0% 0.0% 0.0% 0.0%
Other out of centre 0.0% 0.0% 0.0% 0.0% 0.0% 0.0% 0.0% 0.0% 0.0% 0.0% 0.0% 0.0% 0.0% 0.0% 0.0% 0.0% 0.0% 0.0% 0.0%
Pembroke Town Centre 0.0% 0.0% 0.0% 0.0% 1.1% 0.0% 0.0% 0.0% 0.0% 0.0% 0.0% 0.0% 1.0% 0.0% 0.0% 0.0% 0.1% 0.2% 0.1%
Out of Centre 0.0% 0.0% 0.0% 0.0% 0.8% 0.0% 0.0% 0.0% 0.0% 0.0% 0.0% 0.0% 0.0% 0.0% 0.0% 0.0% 0.1% 0.1% 0.0%
Pembroke Dock Town Centre 0.0% 0.0% 0.0% 0.9% 15.7% 4.7% 0.0% 0.0% 0.0% 0.0% 0.0% 0.0% 0.0% 0.0% 0.0% 0.0% 2.1% 3.6% 0.0%
Out of Centre 0.0% 0.0% 0.0% 0.9% 3.2% 3.6% 0.7% 0.0% 0.0% 0.0% 0.0% 0.0% 0.0% 0.0% 0.0% 0.0% 0.8% 1.4% 0.0%
Fishguard 0.0% 0.0% 0.0% 0.0% 0.0% 0.0% 0.0% 0.9% 0.0% 0.0% 0.0% 0.0% 0.0% 0.0% 0.0% 0.0% 0.1% 0.1% 0.0%
Narberth 0.0% 0.0% 0.0% 0.0% 0.0% 0.0% 0.7% 0.0% 0.0% 0.0% 0.0% 0.0% 0.0% 0.0% 0.0% 0.0% 0.0% 0.1% 0.0%
Newport 0.0% 0.0% 0.0% 0.0% 0.0% 0.0% 0.0% 0.0% 1.0% 0.0% 0.0% 0.0% 0.0% 0.0% 0.0% 0.0% 0.0% 0.0% 0.0%
Saundersfoot 0.0% 0.0% 0.0% 0.0% 0.0% 0.0% 0.0% 0.0% 0.0% 0.0% 0.0% 0.0% 0.0% 0.0% 0.0% 0.0% 0.0% 0.0% 0.0%
St Davids 0.0% 0.0% 0.0% 0.0% 0.0% 0.0% 0.0% 0.0% 0.0% 0.0% 0.0% 0.0% 0.0% 0.0% 0.0% 0.0% 0.0% 0.0% 0.0%
Tenby 0.0% 0.0% 0.0% 0.0% 0.0% 2.6% 0.0% 0.0% 0.0% 0.0% 0.0% 0.0% 0.0% 0.0% 0.0% 0.0% 0.3% 0.5% 0.0%
Other ‐ Pembrokeshire 0.0% 3.3% 0.0% 0.0% 0.0% 3.8% 2.7% 0.0% 25.1% 5.4% 0.0% 0.0% 0.0% 0.0% 0.0% 0.0% 1.7% 2.0% 1.2%
SUB‐TOTAL PEMBROKESHIRE 70.7% 67.1% 54.3% 61.0% 59.3% 46.1% 30.3% 52.9% 57.2% 10.9% 0.0% 0.0% 1.0% 0.0% 0.0% 0.0% 33.3% 55.3% 2.4%0
CEREDIGION COUNTY
Aberystwyth Town Centre 0.0% 0.0% 0.0% 0.7% 0.0% 0.0% 0.0% 0.0% 0.0% 0.0% 1.2% 2.0% 29.5% 29.3% 59.2% 44.4% 10.5% 0.1% 25.0%
Parc Y Llyn Retail Park 0.0% 0.0% 0.0% 0.0% 0.0% 0.0% 0.0% 0.0% 0.0% 1.1% 1.8% 2.0% 24.5% 27.1% 23.7% 10.5% 4.8% 0.0% 11.6%
Other out of centre 0.0% 0.0% 0.0% 0.0% 0.0% 0.0% 0.0% 0.0% 0.0% 0.0% 1.1% 0.0% 2.4% 0.0% 5.4% 11.6% 1.5% 0.0% 3.7%
Cardigan Town Centre 0.0% 0.8% 0.0% 0.0% 0.0% 0.0% 0.0% 0.0% 5.4% 9.6% 4.8% 0.0% 0.0% 0.0% 0.0% 0.0% 1.2% 0.2% 2.6%
Out of centre 0.0% 0.0% 0.0% 0.0% 0.0% 0.0% 0.0% 0.0% 1.0% 1.7% 1.0% 0.0% 0.0% 0.0% 0.0% 0.0% 0.2% 0.0% 0.5%
Aberaeron 0.0% 0.0% 0.0% 0.0% 0.0% 0.0% 0.0% 0.0% 0.0% 0.0% 0.0% 0.0% 0.0% 0.0% 0.0% 0.0% 0.0% 0.0% 0.0%
Lampeter 0.0% 0.0% 0.0% 0.0% 0.0% 0.0% 0.0% 0.0% 0.0% 0.0% 8.6% 30.4% 6.7% 9.4% 0.9% 0.0% 2.5% 0.0% 6.1%
Tregaron 0.0% 0.0% 0.0% 0.0% 0.0% 0.0% 0.0% 0.0% 0.0% 0.0% 0.0% 0.0% 0.0% 0.0% 0.0% 0.0% 0.0% 0.0% 0.0%
Llandysul 0.0% 0.0% 0.0% 0.0% 0.0% 0.0% 0.0% 0.0% 0.0% 0.0% 4.9% 0.0% 0.0% 0.0% 0.0% 0.0% 0.2% 0.0% 0.5%
Other ‐ Ceredigion 0.0% 0.0% 0.0% 0.0% 0.0% 0.0% 0.0% 0.0% 1.0% 4.2% 8.0% 0.0% 0.0% 0.0% 0.0% 0.0% 0.8% 0.0% 1.8%
SUB‐TOTAL: CEREDIGION 0.0% 0.8% 0.0% 0.7% 0.0% 0.0% 0.0% 0.0% 7.3% 16.6% 31.4% 34.3% 63.1% 65.9% 89.3% 66.5% 21.8% 0.4% 51.7%
OUTSIDE STUDY AREA
Carmarthen 2.1% 4.6% 0.0% 1.6% 6.7% 12.3% 15.5% 0.0% 13.0% 32.1% 46.2% 27.1% 5.5% 4.1% 0.0% 0.0% 10.1% 5.9% 15.9%
Cardiff 0.0% 0.0% 1.9% 0.0% 0.0% 0.9% 1.9% 0.0% 1.3% 0.0% 0.0% 2.0% 0.9% 0.0% 0.0% 0.0% 0.5% 0.6% 0.3%
Swansea 3.7% 0.0% 0.0% 0.0% 0.0% 0.0% 0.0% 0.0% 0.0% 1.0% 0.0% 0.0% 0.0% 0.0% 0.0% 0.0% 0.4% 0.4% 0.2%
Llanelli 0.0% 0.0% 0.0% 0.0% 0.0% 0.0% 0.0% 0.0% 0.0% 0.0% 0.0% 0.0% 0.0% 0.0% 0.0% 0.0% 0.0% 0.0% 0.0%
London 0.0% 0.0% 0.0% 0.0% 0.0% 0.0% 0.0% 0.0% 1.0% 0.0% 0.0% 0.0% 0.0% 0.0% 0.0% 0.0% 0.0% 0.0% 0.0%
All other 1.0% 0.0% 0.0% 0.0% 1.7% 1.3% 0.0% 0.0% 0.0% 0.0% 0.0% 0.0% 0.0% 0.0% 0.0% 3.3% 0.7% 0.6% 0.7%
SUB‐TOTAL: OUTSIDE STUDY AREA 6.7% 4.6% 1.9% 1.6% 8.4% 14.5% 17.4% 0.0% 15.3% 33.1% 46.2% 29.1% 6.5% 4.1% 0.0% 3.3% 11.6% 7.6% 17.1%
INTERNET 22.6% 27.6% 43.8% 36.8% 32.3% 39.4% 52.3% 47.1% 20.2% 39.3% 22.5% 36.5% 29.4% 30.0% 10.7% 30.2% 33.3% 36.7% 28.7%
TOTAL MARKET SHARE 100% 100% 100% 100% 100% 100% 100% 100% 100% 100% 100% 100% 100% 100% 100% 100% 100% 100% 100%
PEMBROKE‐SHIRE
(Zones 1‐9)
CEREDIGION
(Zones 10‐16)
STUDY
AREA
23/01/2017
South Wales Regional Retail Study 2016Comparison Goods Market Shares
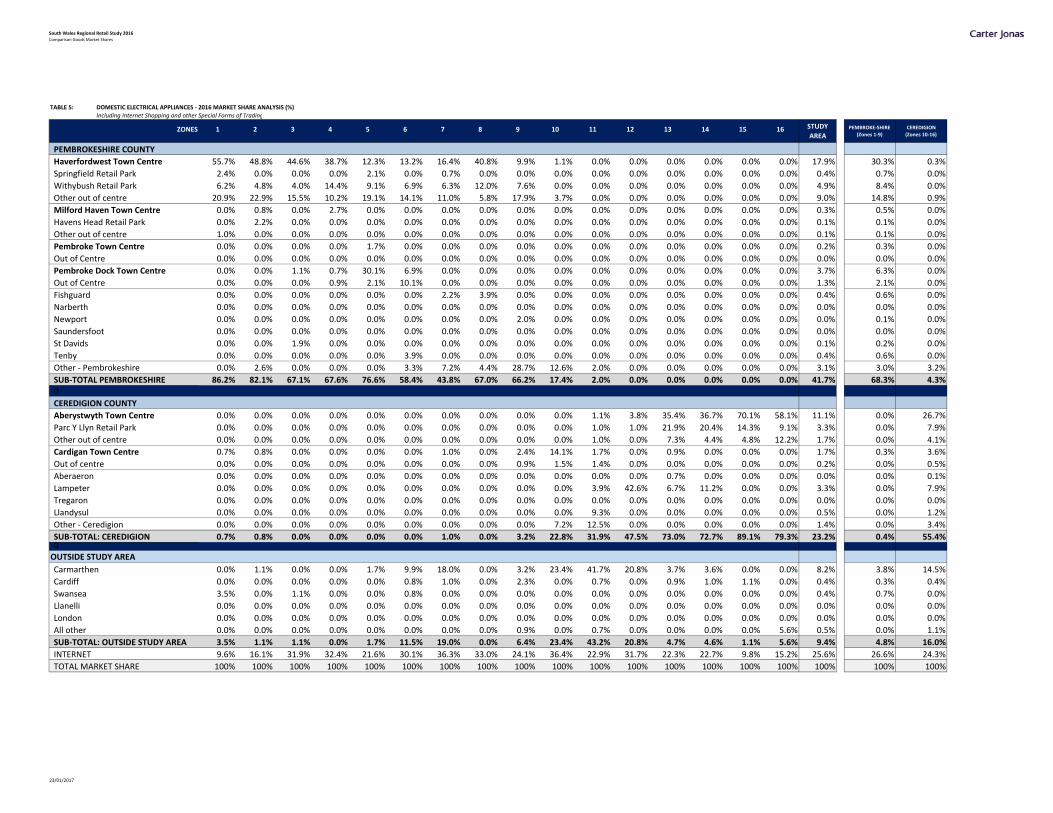
TABLE 5: DOMESTIC ELECTRICAL APPLIANCES ‐ 2016 MARKET SHARE ANALYSIS (%)Including Internet Shopping and other Special Forms of Trading
ZONES 1 2 3 4 5 6 7 8 9 10 11 12 13 14 15 16
PEMBROKESHIRE COUNTY
Haverfordwest Town Centre 55.7% 48.8% 44.6% 38.7% 12.3% 13.2% 16.4% 40.8% 9.9% 1.1% 0.0% 0.0% 0.0% 0.0% 0.0% 0.0% 17.9% 30.3% 0.3%
Springfield Retail Park 2.4% 0.0% 0.0% 0.0% 2.1% 0.0% 0.7% 0.0% 0.0% 0.0% 0.0% 0.0% 0.0% 0.0% 0.0% 0.0% 0.4% 0.7% 0.0%
Withybush Retail Park 6.2% 4.8% 4.0% 14.4% 9.1% 6.9% 6.3% 12.0% 7.6% 0.0% 0.0% 0.0% 0.0% 0.0% 0.0% 0.0% 4.9% 8.4% 0.0%
Other out of centre 20.9% 22.9% 15.5% 10.2% 19.1% 14.1% 11.0% 5.8% 17.9% 3.7% 0.0% 0.0% 0.0% 0.0% 0.0% 0.0% 9.0% 14.8% 0.9%
Milford Haven Town Centre 0.0% 0.8% 0.0% 2.7% 0.0% 0.0% 0.0% 0.0% 0.0% 0.0% 0.0% 0.0% 0.0% 0.0% 0.0% 0.0% 0.3% 0.5% 0.0%
Havens Head Retail Park 0.0% 2.2% 0.0% 0.0% 0.0% 0.0% 0.0% 0.0% 0.0% 0.0% 0.0% 0.0% 0.0% 0.0% 0.0% 0.0% 0.1% 0.1% 0.0%
Other out of centre 1.0% 0.0% 0.0% 0.0% 0.0% 0.0% 0.0% 0.0% 0.0% 0.0% 0.0% 0.0% 0.0% 0.0% 0.0% 0.0% 0.1% 0.1% 0.0%
Pembroke Town Centre 0.0% 0.0% 0.0% 0.0% 1.7% 0.0% 0.0% 0.0% 0.0% 0.0% 0.0% 0.0% 0.0% 0.0% 0.0% 0.0% 0.2% 0.3% 0.0%
Out of Centre 0.0% 0.0% 0.0% 0.0% 0.0% 0.0% 0.0% 0.0% 0.0% 0.0% 0.0% 0.0% 0.0% 0.0% 0.0% 0.0% 0.0% 0.0% 0.0%
Pembroke Dock Town Centre 0.0% 0.0% 1.1% 0.7% 30.1% 6.9% 0.0% 0.0% 0.0% 0.0% 0.0% 0.0% 0.0% 0.0% 0.0% 0.0% 3.7% 6.3% 0.0%
Out of Centre 0.0% 0.0% 0.0% 0.9% 2.1% 10.1% 0.0% 0.0% 0.0% 0.0% 0.0% 0.0% 0.0% 0.0% 0.0% 0.0% 1.3% 2.1% 0.0%
Fishguard 0.0% 0.0% 0.0% 0.0% 0.0% 0.0% 2.2% 3.9% 0.0% 0.0% 0.0% 0.0% 0.0% 0.0% 0.0% 0.0% 0.4% 0.6% 0.0%
Narberth 0.0% 0.0% 0.0% 0.0% 0.0% 0.0% 0.0% 0.0% 0.0% 0.0% 0.0% 0.0% 0.0% 0.0% 0.0% 0.0% 0.0% 0.0% 0.0%
Newport 0.0% 0.0% 0.0% 0.0% 0.0% 0.0% 0.0% 0.0% 2.0% 0.0% 0.0% 0.0% 0.0% 0.0% 0.0% 0.0% 0.0% 0.1% 0.0%
Saundersfoot 0.0% 0.0% 0.0% 0.0% 0.0% 0.0% 0.0% 0.0% 0.0% 0.0% 0.0% 0.0% 0.0% 0.0% 0.0% 0.0% 0.0% 0.0% 0.0%
St Davids 0.0% 0.0% 1.9% 0.0% 0.0% 0.0% 0.0% 0.0% 0.0% 0.0% 0.0% 0.0% 0.0% 0.0% 0.0% 0.0% 0.1% 0.2% 0.0%
Tenby 0.0% 0.0% 0.0% 0.0% 0.0% 3.9% 0.0% 0.0% 0.0% 0.0% 0.0% 0.0% 0.0% 0.0% 0.0% 0.0% 0.4% 0.6% 0.0%
Other ‐ Pembrokeshire 0.0% 2.6% 0.0% 0.0% 0.0% 3.3% 7.2% 4.4% 28.7% 12.6% 2.0% 0.0% 0.0% 0.0% 0.0% 0.0% 3.1% 3.0% 3.2%
SUB‐TOTAL PEMBROKESHIRE 86.2% 82.1% 67.1% 67.6% 76.6% 58.4% 43.8% 67.0% 66.2% 17.4% 2.0% 0.0% 0.0% 0.0% 0.0% 0.0% 41.7% 68.3% 4.3%0
CEREDIGION COUNTY
Aberystwyth Town Centre 0.0% 0.0% 0.0% 0.0% 0.0% 0.0% 0.0% 0.0% 0.0% 0.0% 1.1% 3.8% 35.4% 36.7% 70.1% 58.1% 11.1% 0.0% 26.7%
Parc Y Llyn Retail Park 0.0% 0.0% 0.0% 0.0% 0.0% 0.0% 0.0% 0.0% 0.0% 0.0% 1.0% 1.0% 21.9% 20.4% 14.3% 9.1% 3.3% 0.0% 7.9%
Other out of centre 0.0% 0.0% 0.0% 0.0% 0.0% 0.0% 0.0% 0.0% 0.0% 0.0% 1.0% 0.0% 7.3% 4.4% 4.8% 12.2% 1.7% 0.0% 4.1%
Cardigan Town Centre 0.7% 0.8% 0.0% 0.0% 0.0% 0.0% 1.0% 0.0% 2.4% 14.1% 1.7% 0.0% 0.9% 0.0% 0.0% 0.0% 1.7% 0.3% 3.6%
Out of centre 0.0% 0.0% 0.0% 0.0% 0.0% 0.0% 0.0% 0.0% 0.9% 1.5% 1.4% 0.0% 0.0% 0.0% 0.0% 0.0% 0.2% 0.0% 0.5%
Aberaeron 0.0% 0.0% 0.0% 0.0% 0.0% 0.0% 0.0% 0.0% 0.0% 0.0% 0.0% 0.0% 0.7% 0.0% 0.0% 0.0% 0.0% 0.0% 0.1%
Lampeter 0.0% 0.0% 0.0% 0.0% 0.0% 0.0% 0.0% 0.0% 0.0% 0.0% 3.9% 42.6% 6.7% 11.2% 0.0% 0.0% 3.3% 0.0% 7.9%
Tregaron 0.0% 0.0% 0.0% 0.0% 0.0% 0.0% 0.0% 0.0% 0.0% 0.0% 0.0% 0.0% 0.0% 0.0% 0.0% 0.0% 0.0% 0.0% 0.0%
Llandysul 0.0% 0.0% 0.0% 0.0% 0.0% 0.0% 0.0% 0.0% 0.0% 0.0% 9.3% 0.0% 0.0% 0.0% 0.0% 0.0% 0.5% 0.0% 1.2%
Other ‐ Ceredigion 0.0% 0.0% 0.0% 0.0% 0.0% 0.0% 0.0% 0.0% 0.0% 7.2% 12.5% 0.0% 0.0% 0.0% 0.0% 0.0% 1.4% 0.0% 3.4%
SUB‐TOTAL: CEREDIGION 0.7% 0.8% 0.0% 0.0% 0.0% 0.0% 1.0% 0.0% 3.2% 22.8% 31.9% 47.5% 73.0% 72.7% 89.1% 79.3% 23.2% 0.4% 55.4%0
OUTSIDE STUDY AREA
Carmarthen 0.0% 1.1% 0.0% 0.0% 1.7% 9.9% 18.0% 0.0% 3.2% 23.4% 41.7% 20.8% 3.7% 3.6% 0.0% 0.0% 8.2% 3.8% 14.5%
Cardiff 0.0% 0.0% 0.0% 0.0% 0.0% 0.8% 1.0% 0.0% 2.3% 0.0% 0.7% 0.0% 0.9% 1.0% 1.1% 0.0% 0.4% 0.3% 0.4%
Swansea 3.5% 0.0% 1.1% 0.0% 0.0% 0.8% 0.0% 0.0% 0.0% 0.0% 0.0% 0.0% 0.0% 0.0% 0.0% 0.0% 0.4% 0.7% 0.0%
Llanelli 0.0% 0.0% 0.0% 0.0% 0.0% 0.0% 0.0% 0.0% 0.0% 0.0% 0.0% 0.0% 0.0% 0.0% 0.0% 0.0% 0.0% 0.0% 0.0%
London 0.0% 0.0% 0.0% 0.0% 0.0% 0.0% 0.0% 0.0% 0.0% 0.0% 0.0% 0.0% 0.0% 0.0% 0.0% 0.0% 0.0% 0.0% 0.0%
All other 0.0% 0.0% 0.0% 0.0% 0.0% 0.0% 0.0% 0.0% 0.9% 0.0% 0.7% 0.0% 0.0% 0.0% 0.0% 5.6% 0.5% 0.0% 1.1%
SUB‐TOTAL: OUTSIDE STUDY AREA 3.5% 1.1% 1.1% 0.0% 1.7% 11.5% 19.0% 0.0% 6.4% 23.4% 43.2% 20.8% 4.7% 4.6% 1.1% 5.6% 9.4% 4.8% 16.0%
INTERNET 9.6% 16.1% 31.9% 32.4% 21.6% 30.1% 36.3% 33.0% 24.1% 36.4% 22.9% 31.7% 22.3% 22.7% 9.8% 15.2% 25.6% 26.6% 24.3%
TOTAL MARKET SHARE 100% 100% 100% 100% 100% 100% 100% 100% 100% 100% 100% 100% 100% 100% 100% 100% 100% 100% 100%
CEREDIGION
(Zones 10‐16)
STUDY
AREAPEMBROKE‐SHIRE
(Zones 1‐9)
23/01/2017
South Wales Regional Retail Study 2016Comparison Goods Market Shares
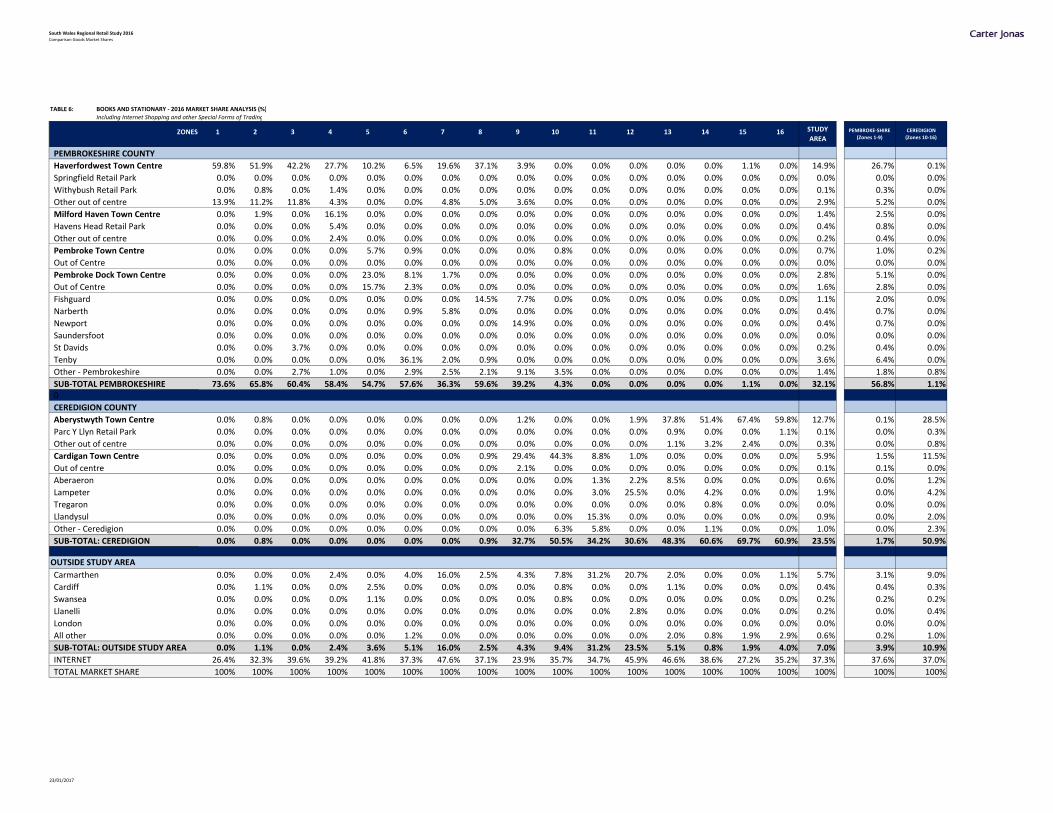
TABLE 6: BOOKS AND STATIONARY ‐ 2016 MARKET SHARE ANALYSIS (%)Including Internet Shopping and other Special Forms of Trading
ZONES 1 2 3 4 5 6 7 8 9 10 11 12 13 14 15 16
PEMBROKESHIRE COUNTY
Haverfordwest Town Centre 59.8% 51.9% 42.2% 27.7% 10.2% 6.5% 19.6% 37.1% 3.9% 0.0% 0.0% 0.0% 0.0% 0.0% 1.1% 0.0% 14.9% 26.7% 0.1%
Springfield Retail Park 0.0% 0.0% 0.0% 0.0% 0.0% 0.0% 0.0% 0.0% 0.0% 0.0% 0.0% 0.0% 0.0% 0.0% 0.0% 0.0% 0.0% 0.0% 0.0%
Withybush Retail Park 0.0% 0.8% 0.0% 1.4% 0.0% 0.0% 0.0% 0.0% 0.0% 0.0% 0.0% 0.0% 0.0% 0.0% 0.0% 0.0% 0.1% 0.3% 0.0%
Other out of centre 13.9% 11.2% 11.8% 4.3% 0.0% 0.0% 4.8% 5.0% 3.6% 0.0% 0.0% 0.0% 0.0% 0.0% 0.0% 0.0% 2.9% 5.2% 0.0%
Milford Haven Town Centre 0.0% 1.9% 0.0% 16.1% 0.0% 0.0% 0.0% 0.0% 0.0% 0.0% 0.0% 0.0% 0.0% 0.0% 0.0% 0.0% 1.4% 2.5% 0.0%
Havens Head Retail Park 0.0% 0.0% 0.0% 5.4% 0.0% 0.0% 0.0% 0.0% 0.0% 0.0% 0.0% 0.0% 0.0% 0.0% 0.0% 0.0% 0.4% 0.8% 0.0%
Other out of centre 0.0% 0.0% 0.0% 2.4% 0.0% 0.0% 0.0% 0.0% 0.0% 0.0% 0.0% 0.0% 0.0% 0.0% 0.0% 0.0% 0.2% 0.4% 0.0%
Pembroke Town Centre 0.0% 0.0% 0.0% 0.0% 5.7% 0.9% 0.0% 0.0% 0.0% 0.8% 0.0% 0.0% 0.0% 0.0% 0.0% 0.0% 0.7% 1.0% 0.2%
Out of Centre 0.0% 0.0% 0.0% 0.0% 0.0% 0.0% 0.0% 0.0% 0.0% 0.0% 0.0% 0.0% 0.0% 0.0% 0.0% 0.0% 0.0% 0.0% 0.0%
Pembroke Dock Town Centre 0.0% 0.0% 0.0% 0.0% 23.0% 8.1% 1.7% 0.0% 0.0% 0.0% 0.0% 0.0% 0.0% 0.0% 0.0% 0.0% 2.8% 5.1% 0.0%
Out of Centre 0.0% 0.0% 0.0% 0.0% 15.7% 2.3% 0.0% 0.0% 0.0% 0.0% 0.0% 0.0% 0.0% 0.0% 0.0% 0.0% 1.6% 2.8% 0.0%
Fishguard 0.0% 0.0% 0.0% 0.0% 0.0% 0.0% 0.0% 14.5% 7.7% 0.0% 0.0% 0.0% 0.0% 0.0% 0.0% 0.0% 1.1% 2.0% 0.0%
Narberth 0.0% 0.0% 0.0% 0.0% 0.0% 0.9% 5.8% 0.0% 0.0% 0.0% 0.0% 0.0% 0.0% 0.0% 0.0% 0.0% 0.4% 0.7% 0.0%
Newport 0.0% 0.0% 0.0% 0.0% 0.0% 0.0% 0.0% 0.0% 14.9% 0.0% 0.0% 0.0% 0.0% 0.0% 0.0% 0.0% 0.4% 0.7% 0.0%
Saundersfoot 0.0% 0.0% 0.0% 0.0% 0.0% 0.0% 0.0% 0.0% 0.0% 0.0% 0.0% 0.0% 0.0% 0.0% 0.0% 0.0% 0.0% 0.0% 0.0%
St Davids 0.0% 0.0% 3.7% 0.0% 0.0% 0.0% 0.0% 0.0% 0.0% 0.0% 0.0% 0.0% 0.0% 0.0% 0.0% 0.0% 0.2% 0.4% 0.0%
Tenby 0.0% 0.0% 0.0% 0.0% 0.0% 36.1% 2.0% 0.9% 0.0% 0.0% 0.0% 0.0% 0.0% 0.0% 0.0% 0.0% 3.6% 6.4% 0.0%
Other ‐ Pembrokeshire 0.0% 0.0% 2.7% 1.0% 0.0% 2.9% 2.5% 2.1% 9.1% 3.5% 0.0% 0.0% 0.0% 0.0% 0.0% 0.0% 1.4% 1.8% 0.8%
SUB‐TOTAL PEMBROKESHIRE 73.6% 65.8% 60.4% 58.4% 54.7% 57.6% 36.3% 59.6% 39.2% 4.3% 0.0% 0.0% 0.0% 0.0% 1.1% 0.0% 32.1% 56.8% 1.1%0
CEREDIGION COUNTY
Aberystwyth Town Centre 0.0% 0.8% 0.0% 0.0% 0.0% 0.0% 0.0% 0.0% 1.2% 0.0% 0.0% 1.9% 37.8% 51.4% 67.4% 59.8% 12.7% 0.1% 28.5%
Parc Y Llyn Retail Park 0.0% 0.0% 0.0% 0.0% 0.0% 0.0% 0.0% 0.0% 0.0% 0.0% 0.0% 0.0% 0.9% 0.0% 0.0% 1.1% 0.1% 0.0% 0.3%
Other out of centre 0.0% 0.0% 0.0% 0.0% 0.0% 0.0% 0.0% 0.0% 0.0% 0.0% 0.0% 0.0% 1.1% 3.2% 2.4% 0.0% 0.3% 0.0% 0.8%
Cardigan Town Centre 0.0% 0.0% 0.0% 0.0% 0.0% 0.0% 0.0% 0.9% 29.4% 44.3% 8.8% 1.0% 0.0% 0.0% 0.0% 0.0% 5.9% 1.5% 11.5%
Out of centre 0.0% 0.0% 0.0% 0.0% 0.0% 0.0% 0.0% 0.0% 2.1% 0.0% 0.0% 0.0% 0.0% 0.0% 0.0% 0.0% 0.1% 0.1% 0.0%
Aberaeron 0.0% 0.0% 0.0% 0.0% 0.0% 0.0% 0.0% 0.0% 0.0% 0.0% 1.3% 2.2% 8.5% 0.0% 0.0% 0.0% 0.6% 0.0% 1.2%
Lampeter 0.0% 0.0% 0.0% 0.0% 0.0% 0.0% 0.0% 0.0% 0.0% 0.0% 3.0% 25.5% 0.0% 4.2% 0.0% 0.0% 1.9% 0.0% 4.2%
Tregaron 0.0% 0.0% 0.0% 0.0% 0.0% 0.0% 0.0% 0.0% 0.0% 0.0% 0.0% 0.0% 0.0% 0.8% 0.0% 0.0% 0.0% 0.0% 0.0%
Llandysul 0.0% 0.0% 0.0% 0.0% 0.0% 0.0% 0.0% 0.0% 0.0% 0.0% 15.3% 0.0% 0.0% 0.0% 0.0% 0.0% 0.9% 0.0% 2.0%
Other ‐ Ceredigion 0.0% 0.0% 0.0% 0.0% 0.0% 0.0% 0.0% 0.0% 0.0% 6.3% 5.8% 0.0% 0.0% 1.1% 0.0% 0.0% 1.0% 0.0% 2.3%
SUB‐TOTAL: CEREDIGION 0.0% 0.8% 0.0% 0.0% 0.0% 0.0% 0.0% 0.9% 32.7% 50.5% 34.2% 30.6% 48.3% 60.6% 69.7% 60.9% 23.5% 1.7% 50.9%
OUTSIDE STUDY AREA
Carmarthen 0.0% 0.0% 0.0% 2.4% 0.0% 4.0% 16.0% 2.5% 4.3% 7.8% 31.2% 20.7% 2.0% 0.0% 0.0% 1.1% 5.7% 3.1% 9.0%
Cardiff 0.0% 1.1% 0.0% 0.0% 2.5% 0.0% 0.0% 0.0% 0.0% 0.8% 0.0% 0.0% 1.1% 0.0% 0.0% 0.0% 0.4% 0.4% 0.3%
Swansea 0.0% 0.0% 0.0% 0.0% 1.1% 0.0% 0.0% 0.0% 0.0% 0.8% 0.0% 0.0% 0.0% 0.0% 0.0% 0.0% 0.2% 0.2% 0.2%
Llanelli 0.0% 0.0% 0.0% 0.0% 0.0% 0.0% 0.0% 0.0% 0.0% 0.0% 0.0% 2.8% 0.0% 0.0% 0.0% 0.0% 0.2% 0.0% 0.4%
London 0.0% 0.0% 0.0% 0.0% 0.0% 0.0% 0.0% 0.0% 0.0% 0.0% 0.0% 0.0% 0.0% 0.0% 0.0% 0.0% 0.0% 0.0% 0.0%
All other 0.0% 0.0% 0.0% 0.0% 0.0% 1.2% 0.0% 0.0% 0.0% 0.0% 0.0% 0.0% 2.0% 0.8% 1.9% 2.9% 0.6% 0.2% 1.0%
SUB‐TOTAL: OUTSIDE STUDY AREA 0.0% 1.1% 0.0% 2.4% 3.6% 5.1% 16.0% 2.5% 4.3% 9.4% 31.2% 23.5% 5.1% 0.8% 1.9% 4.0% 7.0% 3.9% 10.9%
INTERNET 26.4% 32.3% 39.6% 39.2% 41.8% 37.3% 47.6% 37.1% 23.9% 35.7% 34.7% 45.9% 46.6% 38.6% 27.2% 35.2% 37.3% 37.6% 37.0%
TOTAL MARKET SHARE 100% 100% 100% 100% 100% 100% 100% 100% 100% 100% 100% 100% 100% 100% 100% 100% 100% 100% 100%
PEMBROKE‐SHIRE
(Zones 1‐9)
CEREDIGION
(Zones 10‐16)
STUDY
AREA
23/01/2017

South Wales Regional Retail Study 2016Comparison Goods Market Shares
TABLE 7: GAMES, TOYS, HOBBIES, PETS, ETC ‐ 2016 MARKET SHARE ANALYSIS (%)Including Internet Shopping and other Special Forms of Trading
ZONES 1 2 3 4 5 6 7 8 9 10 11 12 13 14 15 16
PEMBROKESHIRE COUNTY
Haverfordwest Town Centre 34.0% 24.9% 41.2% 20.0% 7.8% 10.6% 25.6% 46.3% 6.9% 0.0% 0.0% 0.0% 0.0% 0.0% 0.0% 0.0% 13.5% 23.4% 0.0%
Springfield Retail Park 1.9% 1.5% 4.1% 0.0% 0.0% 1.2% 1.0% 0.0% 0.0% 0.0% 0.0% 0.0% 0.0% 0.0% 0.0% 0.0% 0.6% 1.0% 0.0%
Withybush Retail Park 12.2% 16.8% 7.7% 9.4% 6.7% 0.0% 6.2% 0.0% 7.3% 0.0% 0.0% 0.0% 0.0% 0.0% 0.0% 0.0% 3.8% 6.6% 0.0%
Other out of centre 16.6% 27.2% 7.9% 1.2% 2.7% 1.2% 0.0% 10.2% 18.8% 4.4% 0.0% 0.0% 0.0% 0.0% 0.0% 0.0% 4.5% 7.0% 1.0%
Milford Haven Town Centre 0.0% 0.0% 0.0% 13.5% 1.3% 0.0% 0.0% 0.0% 0.0% 0.0% 0.0% 0.0% 0.0% 0.0% 0.0% 0.0% 1.3% 2.3% 0.0%
Havens Head Retail Park 0.0% 3.3% 0.0% 5.9% 0.0% 0.0% 0.0% 0.0% 0.0% 0.0% 0.0% 0.0% 0.0% 0.0% 0.0% 0.0% 0.6% 1.1% 0.0%
Other out of centre 0.0% 0.0% 0.0% 0.0% 0.0% 0.0% 0.0% 0.0% 0.0% 0.0% 0.0% 0.0% 0.0% 0.0% 0.0% 0.0% 0.0% 0.0% 0.0%
Pembroke Town Centre 0.0% 0.0% 0.0% 0.0% 2.7% 0.0% 1.0% 0.0% 0.0% 0.0% 0.0% 0.0% 0.0% 0.0% 0.0% 0.0% 0.3% 0.5% 0.0%
Out of Centre 0.0% 0.0% 0.0% 0.0% 0.0% 0.0% 0.0% 0.0% 0.0% 0.0% 0.0% 0.0% 0.0% 0.0% 0.0% 0.0% 0.0% 0.0% 0.0%
Pembroke Dock Town Centre 0.0% 0.0% 0.0% 1.2% 31.9% 4.9% 1.3% 0.0% 0.0% 0.0% 0.0% 0.0% 0.0% 0.0% 0.0% 0.0% 3.7% 6.4% 0.0%
Out of Centre 0.0% 0.0% 0.0% 0.0% 10.6% 5.3% 0.0% 0.0% 0.0% 0.0% 0.0% 0.0% 0.0% 0.0% 0.0% 0.0% 1.5% 2.6% 0.0%
Fishguard 0.0% 0.0% 0.0% 0.0% 0.0% 0.0% 0.0% 7.5% 2.5% 0.0% 0.0% 0.0% 0.0% 0.0% 0.0% 0.0% 0.5% 0.9% 0.0%
Narberth 0.8% 0.0% 0.0% 0.0% 0.0% 1.2% 3.7% 0.0% 0.0% 0.0% 0.0% 0.0% 0.0% 0.0% 0.0% 0.0% 0.4% 0.6% 0.0%
Newport 0.0% 0.0% 0.0% 0.0% 0.0% 0.0% 0.0% 0.0% 8.5% 0.0% 0.0% 0.0% 0.0% 0.0% 0.0% 0.0% 0.2% 0.4% 0.0%
Saundersfoot 0.0% 0.0% 0.0% 0.0% 0.0% 1.2% 0.0% 0.0% 0.0% 0.0% 0.0% 0.0% 0.0% 0.0% 0.0% 0.0% 0.1% 0.2% 0.0%
St Davids 0.0% 0.0% 0.0% 0.0% 0.0% 0.0% 0.0% 2.1% 0.0% 0.0% 0.0% 0.0% 0.0% 0.0% 0.0% 0.0% 0.1% 0.2% 0.0%
Tenby 0.0% 0.0% 0.0% 0.0% 0.0% 16.4% 1.3% 0.0% 0.0% 0.0% 0.0% 0.0% 0.0% 0.0% 0.0% 0.0% 1.6% 2.8% 0.0%
Other ‐ Pembrokeshire 0.0% 1.6% 0.0% 4.2% 0.0% 4.7% 6.0% 1.2% 4.9% 2.4% 0.0% 0.0% 0.0% 0.0% 0.0% 0.0% 1.6% 2.4% 0.6%SUB‐TOTAL PEMBROKESHIRE 65.5% 75.3% 60.9% 55.4% 63.7% 46.9% 46.1% 67.3% 49.0% 6.8% 0.0% 0.0% 0.0% 0.0% 0.0% 0.0% 34.3% 58.4% 1.6%
CEREDIGION COUNTY
Aberystwyth Town Centre 0.0% 1.2% 3.5% 0.0% 0.0% 0.0% 0.0% 0.0% 0.0% 0.0% 2.5% 11.8% 44.0% 41.3% 57.0% 63.7% 12.4% 0.4% 28.8%
Parc Y Llyn Retail Park 0.0% 1.6% 1.6% 0.0% 0.0% 0.0% 0.0% 0.0% 0.0% 0.0% 0.0% 0.0% 6.4% 4.4% 5.7% 2.9% 1.1% 0.3% 2.3%
Other out of centre 0.0% 0.0% 0.0% 0.0% 0.0% 0.0% 0.0% 0.0% 0.0% 0.0% 0.0% 0.0% 6.2% 12.2% 3.2% 3.0% 1.2% 0.0% 2.9%
Cardigan Town Centre 0.0% 0.0% 0.0% 0.0% 0.0% 0.0% 2.5% 0.0% 9.7% 19.9% 8.3% 1.7% 0.0% 0.0% 0.0% 0.0% 2.9% 0.6% 6.0%
Out of centre 1.1% 0.0% 0.0% 0.0% 0.0% 0.0% 0.0% 0.0% 3.3% 1.2% 1.5% 0.0% 0.0% 0.0% 0.0% 0.0% 0.4% 0.3% 0.5%
Aberaeron 0.0% 0.0% 0.0% 0.0% 0.0% 0.0% 0.0% 0.0% 0.0% 0.0% 1.7% 2.6% 4.9% 0.0% 0.0% 0.0% 0.4% 0.0% 1.0%
Lampeter 0.0% 0.0% 0.0% 0.0% 0.0% 0.0% 0.0% 0.0% 0.0% 0.0% 2.6% 24.7% 0.0% 2.2% 0.0% 0.0% 1.6% 0.0% 3.9%
Tregaron 0.0% 0.0% 0.0% 0.0% 0.0% 0.0% 0.0% 0.0% 0.0% 1.2% 0.0% 0.0% 0.0% 0.0% 0.0% 0.0% 0.1% 0.0% 0.0%
Llandysul 0.0% 0.0% 0.0% 0.0% 0.0% 0.0% 0.0% 0.0% 0.0% 0.0% 15.9% 0.0% 0.0% 0.0% 0.0% 0.0% 0.9% 0.0% 2.1%
Other ‐ Ceredigion 0.0% 0.0% 0.0% 0.0% 0.0% 0.0% 0.0% 0.0% 0.0% 2.7% 0.0% 0.0% 0.0% 0.0% 0.0% 0.0% 0.3% 0.0% 0.6%
SUB‐TOTAL: CEREDIGION 1.1% 2.7% 5.1% 0.0% 0.0% 0.0% 2.5% 0.0% 13.0% 24.9% 32.5% 40.8% 61.4% 60.1% 65.9% 69.6% 21.3% 1.6% 48.2%
OUTSIDE STUDY AREA
Carmarthen 3.2% 0.0% 0.0% 0.0% 1.4% 6.8% 20.1% 0.0% 9.1% 27.3% 29.7% 30.5% 12.0% 0.9% 1.4% 0.0% 9.0% 4.0% 15.7%
Cardiff 1.1% 1.2% 1.2% 0.0% 0.0% 0.0% 4.2% 0.0% 6.0% 1.2% 0.0% 0.0% 2.9% 0.0% 1.4% 0.0% 0.9% 1.0% 0.7%
Swansea 0.0% 0.0% 0.0% 5.4% 2.7% 6.1% 0.0% 0.0% 0.0% 0.0% 0.0% 0.0% 0.0% 1.3% 0.0% 0.0% 1.4% 2.2% 0.1%
Llanelli 0.0% 0.0% 0.0% 0.0% 0.0% 0.0% 0.0% 0.0% 0.0% 0.0% 0.0% 0.0% 0.0% 0.0% 0.0% 0.0% 0.0% 0.0% 0.0%
London 0.0% 0.0% 0.0% 0.0% 0.0% 0.0% 0.0% 0.0% 0.0% 0.0% 0.0% 0.0% 0.0% 0.0% 0.0% 0.0% 0.0% 0.0% 0.0%
All other 0.0% 0.0% 0.0% 0.0% 0.0% 1.7% 0.0% 0.0% 0.0% 0.0% 0.0% 0.0% 0.0% 0.9% 0.0% 1.1% 0.3% 0.3% 0.3%
SUB‐TOTAL: OUTSIDE STUDY AREA 4.2% 1.2% 1.2% 5.4% 4.0% 14.5% 24.3% 0.0% 15.1% 28.5% 29.7% 30.5% 14.9% 3.1% 2.7% 1.1% 11.5% 7.4% 16.9%
INTERNET 29.1% 20.9% 32.8% 39.3% 32.3% 38.6% 27.1% 32.7% 22.9% 39.8% 37.8% 28.7% 23.7% 36.8% 31.4% 29.2% 32.9% 32.6% 33.3%
TOTAL MARKET SHARE 100% 100% 100% 100% 100% 100% 100% 100% 100% 100% 100% 100% 100% 100% 100% 100% 100% 100% 100%
PEMBROKE‐SHIRE
(Zones 1‐9)
CEREDIGION
(Zones 10‐16)
STUDY
AREA
23/01/2017

South Wales Regional Retail Study 2016Comparison Goods Market Shares
TABLE 8: FURNITURE, CARPETS, FLOOR COVERINGS & SOFT FURNISHINGS ‐ 2016 MARKET SHARE ANALYSIS (%)Including Internet Shopping and other Special Forms of Trading
ZONES 1 2 3 4 5 6 7 8 9 10 11 12 13 14 15 16
PEMBROKESHIRE COUNTY
Haverfordwest Town Centre 30.1% 23.4% 39.1% 22.9% 8.0% 3.9% 10.3% 45.1% 10.8% 1.3% 0.0% 0.0% 0.0% 2.8% 0.0% 1.0% 12.1% 20.7% 0.8%
Springfield Retail Park 0.0% 0.0% 0.0% 0.0% 0.0% 0.0% 0.0% 0.0% 0.0% 0.0% 0.0% 0.0% 0.0% 0.0% 0.0% 0.0% 0.0% 0.0% 0.0%
Withybush Retail Park 6.0% 12.0% 7.5% 9.9% 4.1% 5.1% 12.6% 2.4% 9.6% 3.2% 0.0% 0.0% 0.0% 0.0% 0.0% 0.0% 4.3% 7.0% 0.7%
Other out of centre 16.7% 10.3% 3.7% 11.6% 6.5% 1.7% 5.4% 7.5% 21.4% 5.8% 0.0% 1.0% 0.0% 0.0% 0.0% 0.0% 5.2% 8.1% 1.4%
Milford Haven Town Centre 0.0% 1.4% 1.7% 9.5% 0.0% 0.0% 0.0% 0.0% 0.0% 0.0% 0.0% 0.0% 0.0% 0.0% 0.0% 0.0% 0.9% 1.6% 0.0%
Havens Head Retail Park 0.0% 0.0% 0.0% 0.0% 0.0% 0.0% 0.0% 0.0% 0.0% 0.0% 0.0% 0.0% 0.9% 0.0% 0.0% 0.0% 0.0% 0.0% 0.1%
Other out of centre 0.0% 0.0% 0.0% 0.0% 0.0% 0.0% 0.0% 0.0% 0.0% 0.0% 0.0% 0.0% 0.0% 0.0% 0.0% 0.0% 0.0% 0.0% 0.0%
Pembroke Town Centre 0.0% 0.0% 0.0% 0.0% 3.7% 0.0% 0.0% 2.6% 0.0% 0.0% 0.0% 0.0% 0.0% 0.0% 0.0% 0.0% 0.5% 0.9% 0.0%
Out of Centre 0.0% 0.0% 0.0% 0.0% 0.0% 0.0% 0.0% 0.0% 0.0% 0.0% 0.0% 0.0% 0.0% 0.0% 0.0% 0.0% 0.0% 0.0% 0.0%
Pembroke Dock Town Centre 2.2% 0.0% 0.0% 3.8% 36.0% 3.5% 2.5% 0.0% 0.0% 0.0% 0.0% 0.0% 0.0% 0.0% 0.0% 0.0% 4.2% 7.4% 0.0%
Out of Centre 0.8% 0.0% 0.0% 0.0% 5.5% 2.4% 0.0% 0.0% 0.0% 0.0% 0.0% 0.0% 0.0% 0.0% 0.0% 0.0% 0.8% 1.4% 0.0%
Fishguard 0.0% 2.2% 1.4% 0.0% 0.0% 0.0% 0.0% 12.1% 4.0% 0.0% 0.0% 0.0% 0.0% 0.0% 0.0% 0.0% 1.0% 1.8% 0.0%
Narberth 0.0% 0.0% 0.0% 0.0% 0.0% 0.0% 8.5% 0.0% 0.0% 0.0% 0.0% 0.0% 0.0% 0.0% 0.0% 0.0% 0.5% 0.8% 0.0%
Newport 0.0% 0.0% 0.0% 0.0% 0.0% 0.0% 0.0% 0.0% 5.0% 0.0% 0.0% 0.0% 0.0% 0.0% 0.0% 0.0% 0.1% 0.2% 0.0%
Saundersfoot 0.0% 0.0% 0.0% 0.0% 0.0% 0.0% 0.0% 0.0% 0.0% 0.0% 0.0% 0.0% 0.0% 0.0% 0.0% 0.0% 0.0% 0.0% 0.0%
St Davids 0.8% 9.0% 3.3% 0.0% 0.0% 3.7% 0.0% 3.7% 0.0% 2.2% 0.0% 0.0% 0.0% 0.0% 0.0% 1.2% 1.5% 2.0% 0.7%
Tenby 0.0% 1.1% 0.0% 0.0% 2.0% 43.3% 0.0% 0.0% 0.0% 0.0% 0.0% 0.0% 0.0% 0.0% 0.0% 0.0% 4.3% 7.5% 0.0%
Other ‐ Pembrokeshire 4.9% 7.0% 7.0% 11.9% 6.3% 9.9% 7.7% 1.2% 4.5% 1.0% 0.0% 0.0% 0.0% 0.0% 0.0% 0.0% 4.2% 7.2% 0.2%
SUB‐TOTAL PEMBROKESHIRE 61.3% 66.4% 63.7% 69.6% 72.2% 73.5% 46.9% 74.7% 55.2% 13.4% 0.0% 1.0% 0.9% 2.8% 0.0% 2.2% 39.5% 66.6% 4.0%
CEREDIGION COUNTY
Aberystwyth Town Centre 0.0% 0.0% 0.0% 0.0% 0.0% 0.0% 0.0% 0.0% 0.0% 0.0% 2.8% 2.3% 18.2% 53.4% 69.2% 42.7% 10.6% 0.0% 24.5%
Parc Y Llyn Retail Park 0.0% 0.0% 0.0% 0.0% 0.0% 0.0% 0.0% 0.0% 0.0% 0.0% 0.0% 1.3% 10.4% 4.0% 6.2% 7.9% 1.7% 0.0% 3.8%
Other out of centre 0.0% 0.0% 0.0% 0.0% 0.0% 0.0% 0.0% 0.0% 0.0% 1.0% 0.0% 1.3% 2.0% 3.5% 1.4% 3.5% 0.8% 0.0% 1.8%
Cardigan Town Centre 0.0% 0.0% 0.0% 0.0% 0.0% 0.0% 1.4% 1.8% 6.4% 28.6% 15.1% 0.0% 0.9% 0.0% 0.0% 0.0% 4.0% 0.6% 8.5%
Out of centre 0.0% 0.0% 0.0% 0.0% 1.4% 0.0% 0.0% 0.0% 2.8% 0.0% 1.1% 0.0% 0.0% 0.0% 0.0% 0.0% 0.3% 0.3% 0.1%
Aberaeron 0.0% 0.0% 0.0% 0.0% 0.0% 0.0% 0.0% 0.0% 0.0% 0.0% 7.0% 6.2% 7.4% 1.3% 0.0% 1.0% 1.2% 0.0% 2.8%
Lampeter 0.0% 0.0% 0.0% 0.0% 0.0% 0.0% 0.0% 0.0% 0.0% 0.0% 16.6% 54.3% 3.8% 5.7% 0.0% 1.2% 4.6% 0.0% 10.5%
Tregaron 0.0% 0.0% 0.0% 0.0% 0.0% 0.0% 0.0% 0.0% 0.0% 0.0% 0.0% 0.0% 0.0% 0.0% 0.0% 0.0% 0.0% 0.0% 0.0%
Llandysul 0.0% 0.0% 0.0% 0.0% 0.0% 0.0% 0.0% 0.0% 0.0% 0.0% 16.6% 0.0% 1.1% 0.0% 0.0% 0.0% 1.0% 0.0% 2.3%
Other ‐ Ceredigion 0.0% 0.0% 0.0% 0.0% 0.0% 0.0% 0.0% 0.0% 0.0% 1.3% 2.5% 0.0% 3.4% 0.0% 2.9% 0.0% 0.6% 0.0% 1.3%
SUB‐TOTAL: CEREDIGION 0.0% 0.0% 0.0% 0.0% 1.4% 0.0% 1.4% 1.8% 9.2% 30.8% 61.7% 65.5% 47.2% 68.0% 79.7% 56.3% 24.6% 0.9% 55.7%
OUTSIDE STUDY AREA
Carmarthen 7.6% 1.6% 2.6% 1.0% 4.6% 4.2% 23.2% 6.2% 8.3% 30.7% 23.9% 20.2% 14.5% 5.8% 0.0% 5.0% 10.3% 6.1% 15.7%
Cardiff 0.0% 0.0% 4.9% 1.8% 0.0% 5.9% 11.1% 0.0% 1.8% 2.7% 0.0% 2.3% 1.1% 2.2% 7.5% 1.9% 2.8% 2.9% 2.5%
Swansea 7.8% 4.0% 3.7% 7.3% 5.0% 0.8% 8.0% 0.9% 5.0% 0.0% 2.9% 1.0% 4.3% 0.0% 3.3% 0.0% 3.2% 4.6% 1.3%
Llanelli 0.0% 0.0% 0.0% 1.8% 0.0% 0.0% 0.0% 0.0% 0.0% 0.0% 0.0% 0.0% 2.3% 1.0% 0.0% 1.2% 0.4% 0.3% 0.6%
London 0.0% 0.0% 0.0% 0.0% 0.0% 0.0% 0.0% 0.0% 0.0% 0.0% 0.0% 0.0% 0.0% 0.0% 0.0% 0.0% 0.0% 0.0% 0.0%
All other 0.8% 0.0% 1.1% 1.9% 2.4% 5.1% 2.1% 1.2% 7.6% 2.9% 5.7% 3.4% 6.0% 4.5% 4.3% 17.2% 4.2% 2.4% 6.6%
SUB‐TOTAL: OUTSIDE STUDY AREA 16.2% 5.6% 12.3% 13.9% 12.0% 16.0% 44.4% 8.2% 22.7% 36.3% 32.5% 26.9% 28.2% 13.5% 15.0% 25.4% 20.8% 16.3% 26.7%
INTERNET 22.4% 28.0% 24.0% 16.5% 14.5% 10.5% 7.3% 15.3% 12.9% 19.5% 5.8% 6.7% 23.7% 15.7% 5.2% 16.1% 15.1% 16.1% 13.7%
TOTAL MARKET SHARE 100% 100% 100% 100% 100% 100% 100% 100% 100% 100% 100% 100% 100% 100% 100% 100% 100% 100% 100%
PEMBROKE‐SHIRE
(Zones 1‐9)
CEREDIGION
(Zones 10‐16)
STUDY
AREA
23/01/2017
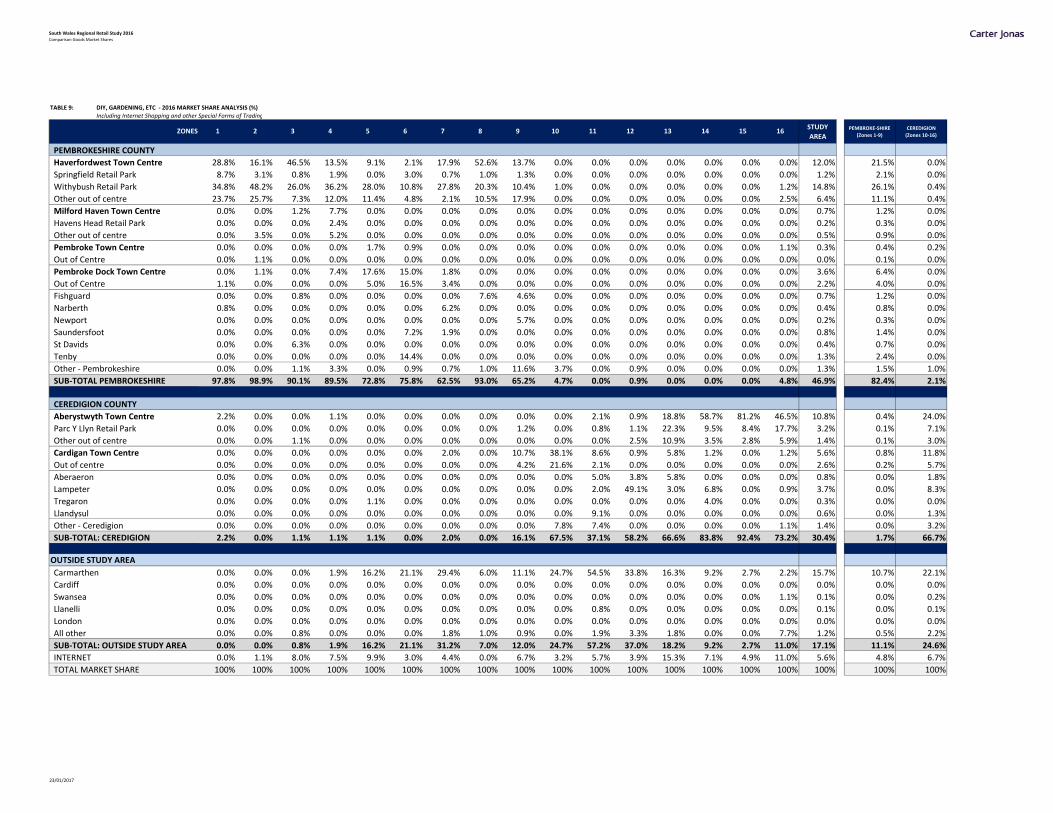
South Wales Regional Retail Study 2016Comparison Goods Market Shares
TABLE 9: DIY, GARDENING, ETC ‐ 2016 MARKET SHARE ANALYSIS (%)Including Internet Shopping and other Special Forms of Trading
ZONES 1 2 3 4 5 6 7 8 9 10 11 12 13 14 15 16
PEMBROKESHIRE COUNTY
Haverfordwest Town Centre 28.8% 16.1% 46.5% 13.5% 9.1% 2.1% 17.9% 52.6% 13.7% 0.0% 0.0% 0.0% 0.0% 0.0% 0.0% 0.0% 12.0% 21.5% 0.0%
Springfield Retail Park 8.7% 3.1% 0.8% 1.9% 0.0% 3.0% 0.7% 1.0% 1.3% 0.0% 0.0% 0.0% 0.0% 0.0% 0.0% 0.0% 1.2% 2.1% 0.0%
Withybush Retail Park 34.8% 48.2% 26.0% 36.2% 28.0% 10.8% 27.8% 20.3% 10.4% 1.0% 0.0% 0.0% 0.0% 0.0% 0.0% 1.2% 14.8% 26.1% 0.4%
Other out of centre 23.7% 25.7% 7.3% 12.0% 11.4% 4.8% 2.1% 10.5% 17.9% 0.0% 0.0% 0.0% 0.0% 0.0% 0.0% 2.5% 6.4% 11.1% 0.4%
Milford Haven Town Centre 0.0% 0.0% 1.2% 7.7% 0.0% 0.0% 0.0% 0.0% 0.0% 0.0% 0.0% 0.0% 0.0% 0.0% 0.0% 0.0% 0.7% 1.2% 0.0%
Havens Head Retail Park 0.0% 0.0% 0.0% 2.4% 0.0% 0.0% 0.0% 0.0% 0.0% 0.0% 0.0% 0.0% 0.0% 0.0% 0.0% 0.0% 0.2% 0.3% 0.0%
Other out of centre 0.0% 3.5% 0.0% 5.2% 0.0% 0.0% 0.0% 0.0% 0.0% 0.0% 0.0% 0.0% 0.0% 0.0% 0.0% 0.0% 0.5% 0.9% 0.0%
Pembroke Town Centre 0.0% 0.0% 0.0% 0.0% 1.7% 0.9% 0.0% 0.0% 0.0% 0.0% 0.0% 0.0% 0.0% 0.0% 0.0% 1.1% 0.3% 0.4% 0.2%
Out of Centre 0.0% 1.1% 0.0% 0.0% 0.0% 0.0% 0.0% 0.0% 0.0% 0.0% 0.0% 0.0% 0.0% 0.0% 0.0% 0.0% 0.0% 0.1% 0.0%
Pembroke Dock Town Centre 0.0% 1.1% 0.0% 7.4% 17.6% 15.0% 1.8% 0.0% 0.0% 0.0% 0.0% 0.0% 0.0% 0.0% 0.0% 0.0% 3.6% 6.4% 0.0%
Out of Centre 1.1% 0.0% 0.0% 0.0% 5.0% 16.5% 3.4% 0.0% 0.0% 0.0% 0.0% 0.0% 0.0% 0.0% 0.0% 0.0% 2.2% 4.0% 0.0%
Fishguard 0.0% 0.0% 0.8% 0.0% 0.0% 0.0% 0.0% 7.6% 4.6% 0.0% 0.0% 0.0% 0.0% 0.0% 0.0% 0.0% 0.7% 1.2% 0.0%
Narberth 0.8% 0.0% 0.0% 0.0% 0.0% 0.0% 6.2% 0.0% 0.0% 0.0% 0.0% 0.0% 0.0% 0.0% 0.0% 0.0% 0.4% 0.8% 0.0%
Newport 0.0% 0.0% 0.0% 0.0% 0.0% 0.0% 0.0% 0.0% 5.7% 0.0% 0.0% 0.0% 0.0% 0.0% 0.0% 0.0% 0.2% 0.3% 0.0%
Saundersfoot 0.0% 0.0% 0.0% 0.0% 0.0% 7.2% 1.9% 0.0% 0.0% 0.0% 0.0% 0.0% 0.0% 0.0% 0.0% 0.0% 0.8% 1.4% 0.0%
St Davids 0.0% 0.0% 6.3% 0.0% 0.0% 0.0% 0.0% 0.0% 0.0% 0.0% 0.0% 0.0% 0.0% 0.0% 0.0% 0.0% 0.4% 0.7% 0.0%
Tenby 0.0% 0.0% 0.0% 0.0% 0.0% 14.4% 0.0% 0.0% 0.0% 0.0% 0.0% 0.0% 0.0% 0.0% 0.0% 0.0% 1.3% 2.4% 0.0%
Other ‐ Pembrokeshire 0.0% 0.0% 1.1% 3.3% 0.0% 0.9% 0.7% 1.0% 11.6% 3.7% 0.0% 0.9% 0.0% 0.0% 0.0% 0.0% 1.3% 1.5% 1.0%
SUB‐TOTAL PEMBROKESHIRE 97.8% 98.9% 90.1% 89.5% 72.8% 75.8% 62.5% 93.0% 65.2% 4.7% 0.0% 0.9% 0.0% 0.0% 0.0% 4.8% 46.9% 82.4% 2.1%
CEREDIGION COUNTY
Aberystwyth Town Centre 2.2% 0.0% 0.0% 1.1% 0.0% 0.0% 0.0% 0.0% 0.0% 0.0% 2.1% 0.9% 18.8% 58.7% 81.2% 46.5% 10.8% 0.4% 24.0%
Parc Y Llyn Retail Park 0.0% 0.0% 0.0% 0.0% 0.0% 0.0% 0.0% 0.0% 1.2% 0.0% 0.8% 1.1% 22.3% 9.5% 8.4% 17.7% 3.2% 0.1% 7.1%
Other out of centre 0.0% 0.0% 1.1% 0.0% 0.0% 0.0% 0.0% 0.0% 0.0% 0.0% 0.0% 2.5% 10.9% 3.5% 2.8% 5.9% 1.4% 0.1% 3.0%
Cardigan Town Centre 0.0% 0.0% 0.0% 0.0% 0.0% 0.0% 2.0% 0.0% 10.7% 38.1% 8.6% 0.9% 5.8% 1.2% 0.0% 1.2% 5.6% 0.8% 11.8%
Out of centre 0.0% 0.0% 0.0% 0.0% 0.0% 0.0% 0.0% 0.0% 4.2% 21.6% 2.1% 0.0% 0.0% 0.0% 0.0% 0.0% 2.6% 0.2% 5.7%
Aberaeron 0.0% 0.0% 0.0% 0.0% 0.0% 0.0% 0.0% 0.0% 0.0% 0.0% 5.0% 3.8% 5.8% 0.0% 0.0% 0.0% 0.8% 0.0% 1.8%
Lampeter 0.0% 0.0% 0.0% 0.0% 0.0% 0.0% 0.0% 0.0% 0.0% 0.0% 2.0% 49.1% 3.0% 6.8% 0.0% 0.9% 3.7% 0.0% 8.3%
Tregaron 0.0% 0.0% 0.0% 0.0% 1.1% 0.0% 0.0% 0.0% 0.0% 0.0% 0.0% 0.0% 0.0% 4.0% 0.0% 0.0% 0.3% 0.0% 0.0%
Llandysul 0.0% 0.0% 0.0% 0.0% 0.0% 0.0% 0.0% 0.0% 0.0% 0.0% 9.1% 0.0% 0.0% 0.0% 0.0% 0.0% 0.6% 0.0% 1.3%
Other ‐ Ceredigion 0.0% 0.0% 0.0% 0.0% 0.0% 0.0% 0.0% 0.0% 0.0% 7.8% 7.4% 0.0% 0.0% 0.0% 0.0% 1.1% 1.4% 0.0% 3.2%
SUB‐TOTAL: CEREDIGION 2.2% 0.0% 1.1% 1.1% 1.1% 0.0% 2.0% 0.0% 16.1% 67.5% 37.1% 58.2% 66.6% 83.8% 92.4% 73.2% 30.4% 1.7% 66.7%
OUTSIDE STUDY AREA
Carmarthen 0.0% 0.0% 0.0% 1.9% 16.2% 21.1% 29.4% 6.0% 11.1% 24.7% 54.5% 33.8% 16.3% 9.2% 2.7% 2.2% 15.7% 10.7% 22.1%
Cardiff 0.0% 0.0% 0.0% 0.0% 0.0% 0.0% 0.0% 0.0% 0.0% 0.0% 0.0% 0.0% 0.0% 0.0% 0.0% 0.0% 0.0% 0.0% 0.0%
Swansea 0.0% 0.0% 0.0% 0.0% 0.0% 0.0% 0.0% 0.0% 0.0% 0.0% 0.0% 0.0% 0.0% 0.0% 0.0% 1.1% 0.1% 0.0% 0.2%
Llanelli 0.0% 0.0% 0.0% 0.0% 0.0% 0.0% 0.0% 0.0% 0.0% 0.0% 0.8% 0.0% 0.0% 0.0% 0.0% 0.0% 0.1% 0.0% 0.1%
London 0.0% 0.0% 0.0% 0.0% 0.0% 0.0% 0.0% 0.0% 0.0% 0.0% 0.0% 0.0% 0.0% 0.0% 0.0% 0.0% 0.0% 0.0% 0.0%
All other 0.0% 0.0% 0.8% 0.0% 0.0% 0.0% 1.8% 1.0% 0.9% 0.0% 1.9% 3.3% 1.8% 0.0% 0.0% 7.7% 1.2% 0.5% 2.2%
SUB‐TOTAL: OUTSIDE STUDY AREA 0.0% 0.0% 0.8% 1.9% 16.2% 21.1% 31.2% 7.0% 12.0% 24.7% 57.2% 37.0% 18.2% 9.2% 2.7% 11.0% 17.1% 11.1% 24.6%
INTERNET 0.0% 1.1% 8.0% 7.5% 9.9% 3.0% 4.4% 0.0% 6.7% 3.2% 5.7% 3.9% 15.3% 7.1% 4.9% 11.0% 5.6% 4.8% 6.7%
TOTAL MARKET SHARE 100% 100% 100% 100% 100% 100% 100% 100% 100% 100% 100% 100% 100% 100% 100% 100% 100% 100% 100%
PEMBROKE‐SHIRE
(Zones 1‐9)
CEREDIGION
(Zones 10‐16)
STUDY
AREA
23/01/2017

South Wales Regional Retail Study 2016Comparison Goods Market Shares
TABLE 10: PERSONAL CARE ‐ 2016 MARKET SHARE ANALYSIS (%)Including Internet Shopping and other Special Forms of Trading
ZONES 1 2 3 4 5 6 7 8 9 10 11 12 13 14 15 16
PEMBROKESHIRE COUNTY
Haverfordwest Town Centre 54.5% 52.4% 60.3% 17.8% 6.5% 7.2% 32.2% 46.1% 9.9% 2.0% 0.0% 0.0% 0.0% 0.0% 0.0% 0.0% 16.5% 28.7% 0.4%
Springfield Retail Park 1.0% 0.0% 0.0% 0.0% 0.0% 0.0% 0.9% 0.0% 0.0% 0.0% 0.0% 0.0% 0.0% 0.0% 0.0% 0.0% 0.1% 0.2% 0.0%
Withybush Retail Park 15.6% 10.0% 5.7% 10.0% 8.8% 4.5% 5.0% 7.5% 6.4% 0.7% 0.0% 0.0% 0.0% 0.0% 0.0% 0.0% 4.8% 8.3% 0.1%
Other out of centre 19.5% 19.4% 17.4% 6.8% 2.1% 2.1% 10.0% 7.5% 8.5% 0.0% 0.0% 0.0% 0.0% 0.0% 0.0% 0.0% 5.1% 8.9% 0.0%
Milford Haven Town Centre 1.7% 2.7% 1.2% 34.4% 0.0% 0.0% 0.0% 0.9% 0.0% 0.0% 0.0% 0.0% 0.0% 0.0% 0.0% 0.0% 3.4% 6.1% 0.0%
Havens Head Retail Park 0.0% 2.1% 0.0% 13.8% 0.0% 0.0% 0.0% 0.0% 0.0% 0.0% 0.0% 0.0% 0.0% 0.0% 0.0% 0.0% 1.3% 2.3% 0.0%
Other out of centre 0.0% 0.0% 0.0% 2.8% 0.0% 0.0% 0.0% 0.0% 0.0% 0.0% 0.0% 0.0% 0.0% 0.0% 0.0% 0.0% 0.3% 0.4% 0.0%
Pembroke Town Centre 0.0% 0.0% 0.0% 0.0% 4.9% 0.7% 0.0% 0.0% 0.0% 0.0% 0.0% 0.0% 0.0% 0.0% 0.0% 0.0% 0.5% 0.9% 0.0%
Out of Centre 0.0% 0.0% 0.0% 0.0% 0.0% 0.7% 0.0% 0.0% 0.0% 0.0% 0.0% 0.0% 0.0% 0.0% 0.0% 0.0% 0.1% 0.1% 0.0%
Pembroke Dock Town Centre 0.0% 0.0% 0.0% 1.5% 54.0% 9.1% 0.9% 0.0% 0.0% 0.0% 0.0% 0.0% 0.0% 0.0% 0.0% 0.0% 6.2% 10.9% 0.0%
Out of Centre 0.0% 0.0% 0.0% 4.1% 7.0% 6.8% 1.6% 0.0% 0.0% 0.0% 0.0% 0.0% 0.0% 0.0% 0.0% 0.0% 1.8% 3.1% 0.0%
Fishguard 0.0% 0.0% 0.0% 0.0% 0.0% 0.0% 0.0% 32.5% 5.0% 0.0% 0.0% 0.0% 0.0% 0.0% 0.0% 0.0% 2.1% 3.7% 0.0%
Narberth 0.0% 0.0% 0.0% 0.0% 0.0% 0.0% 11.2% 0.0% 0.0% 0.0% 0.0% 0.0% 0.0% 0.0% 0.0% 0.0% 0.6% 1.0% 0.0%
Newport 0.0% 0.0% 0.0% 0.0% 0.0% 0.0% 0.0% 0.0% 12.2% 0.0% 0.0% 0.0% 0.0% 0.0% 0.0% 0.0% 0.3% 0.5% 0.0%
Saundersfoot 0.0% 0.0% 0.0% 0.0% 0.0% 1.8% 0.0% 0.0% 0.0% 0.0% 0.0% 0.8% 0.0% 0.0% 0.0% 0.0% 0.2% 0.3% 0.1%
St Davids 0.0% 0.0% 5.1% 0.0% 0.0% 0.0% 0.0% 0.0% 0.0% 0.0% 0.0% 0.0% 0.0% 0.0% 0.0% 0.0% 0.3% 0.5% 0.0%
Tenby 0.0% 0.0% 0.0% 0.0% 0.7% 42.2% 0.9% 0.0% 0.0% 0.0% 0.0% 0.0% 0.0% 0.0% 0.0% 0.0% 4.0% 7.1% 0.0%
Other ‐ Pembrokeshire 0.0% 0.0% 0.0% 3.4% 0.0% 2.9% 1.8% 0.9% 3.2% 1.6% 0.0% 0.8% 0.0% 0.0% 0.0% 0.0% 1.0% 1.4% 0.4%
SUB‐TOTAL PEMBROKESHIRE 92.2% 86.6% 89.7% 94.6% 84.2% 78.0% 64.7% 95.4% 45.2% 4.3% 0.0% 1.6% 0.0% 0.0% 0.0% 0.0% 48.4% 84.4% 1.1%
CEREDIGION COUNTY
Aberystwyth Town Centre 0.0% 0.0% 0.0% 0.0% 0.0% 0.0% 0.0% 0.0% 1.0% 0.0% 2.4% 3.4% 43.4% 60.9% 83.9% 76.3% 16.7% 0.0% 38.5%
Parc Y Llyn Retail Park 0.0% 0.0% 0.0% 0.0% 0.0% 0.0% 0.0% 0.0% 0.0% 0.0% 0.0% 0.0% 3.7% 0.9% 1.5% 2.5% 0.5% 0.0% 1.1%
Other out of centre 0.0% 0.0% 0.0% 0.0% 0.0% 0.0% 0.7% 0.0% 0.0% 0.0% 0.0% 0.0% 2.6% 8.6% 4.7% 0.8% 0.9% 0.1% 2.0%
Cardigan Town Centre 0.0% 0.0% 0.0% 0.0% 0.0% 0.0% 5.7% 0.0% 21.9% 69.3% 12.6% 0.8% 0.7% 0.0% 0.0% 0.0% 7.9% 1.4% 16.6%
Out of centre 0.0% 0.0% 0.0% 0.0% 0.0% 0.0% 0.0% 0.0% 5.9% 0.0% 5.5% 0.0% 0.0% 0.7% 0.0% 0.0% 0.4% 0.2% 0.7%
Aberaeron 0.0% 0.0% 0.0% 0.0% 0.0% 0.0% 0.0% 0.0% 0.0% 0.0% 1.8% 8.5% 24.9% 0.0% 0.0% 0.0% 1.5% 0.0% 3.5%
Lampeter 0.0% 0.0% 0.0% 0.0% 0.0% 0.0% 0.0% 0.0% 0.0% 0.0% 2.9% 62.5% 0.7% 9.6% 0.0% 0.0% 4.1% 0.0% 9.4%
Tregaron 0.0% 0.0% 0.0% 0.0% 0.0% 0.0% 0.0% 0.0% 0.0% 0.0% 0.0% 0.0% 3.7% 4.6% 0.0% 0.0% 0.3% 0.0% 0.1%
Llandysul 0.0% 0.0% 0.0% 0.0% 0.0% 0.0% 0.0% 0.0% 0.0% 0.0% 13.3% 0.8% 0.0% 0.0% 0.0% 0.0% 0.7% 0.0% 1.7%
Other ‐ Ceredigion 0.0% 0.0% 0.0% 0.0% 0.0% 0.0% 0.0% 0.0% 0.0% 8.9% 3.7% 0.0% 0.0% 0.7% 0.0% 0.0% 1.0% 0.0% 2.4%SUB‐TOTAL: CEREDIGION 0.0% 0.0% 0.0% 0.0% 0.0% 0.0% 6.4% 0.0% 28.8% 78.2% 42.2% 76.0% 79.8% 86.1% 90.1% 79.6% 34.2% 1.7% 76.8%
OUTSIDE STUDY AREA
Carmarthen 0.7% 0.0% 0.0% 0.6% 0.0% 5.5% 18.1% 0.0% 6.8% 10.0% 46.8% 14.9% 4.2% 2.7% 0.7% 1.1% 6.2% 3.0% 10.6%
Cardiff 3.5% 0.9% 0.0% 0.9% 1.0% 0.0% 0.0% 0.0% 5.8% 0.7% 0.0% 0.0% 0.0% 0.0% 2.0% 3.6% 1.1% 1.0% 1.1%
Swansea 0.0% 0.0% 0.0% 0.0% 1.0% 0.0% 0.0% 0.0% 1.1% 0.0% 0.0% 0.0% 0.0% 0.9% 0.0% 0.0% 0.2% 0.2% 0.1%
Llanelli 0.0% 0.0% 0.0% 0.0% 0.0% 0.0% 0.0% 0.0% 0.0% 0.0% 0.0% 0.0% 0.0% 0.0% 0.0% 0.0% 0.0% 0.0% 0.0%
London 0.0% 0.0% 0.0% 0.0% 0.0% 0.0% 0.0% 0.0% 0.0% 0.0% 0.0% 0.0% 0.0% 0.0% 0.0% 0.0% 0.0% 0.0% 0.0%
All other 0.0% 0.9% 0.0% 0.0% 0.0% 5.5% 0.0% 0.9% 3.9% 0.9% 0.0% 2.3% 1.7% 0.9% 0.7% 9.3% 1.8% 1.2% 2.6%
SUB‐TOTAL: OUTSIDE STUDY AREA 4.2% 1.9% 0.0% 1.5% 2.0% 10.9% 18.1% 0.9% 17.6% 11.6% 46.8% 17.1% 6.0% 4.6% 3.5% 14.0% 9.3% 5.4% 14.4%
INTERNET 3.6% 11.5% 10.3% 3.8% 13.8% 11.1% 10.8% 3.7% 8.5% 5.9% 11.0% 5.3% 14.2% 9.3% 6.5% 6.4% 8.2% 8.6% 7.7%
TOTAL MARKET SHARE 100% 100% 100% 100% 100% 100% 100% 100% 100% 100% 100% 100% 100% 100% 100% 100% 100% 100% 100%
PEMBROKE‐SHIRE
(Zones 1‐9)
CEREDIGION
(Zones 10‐16)
STUDY
AREA
23/01/2017
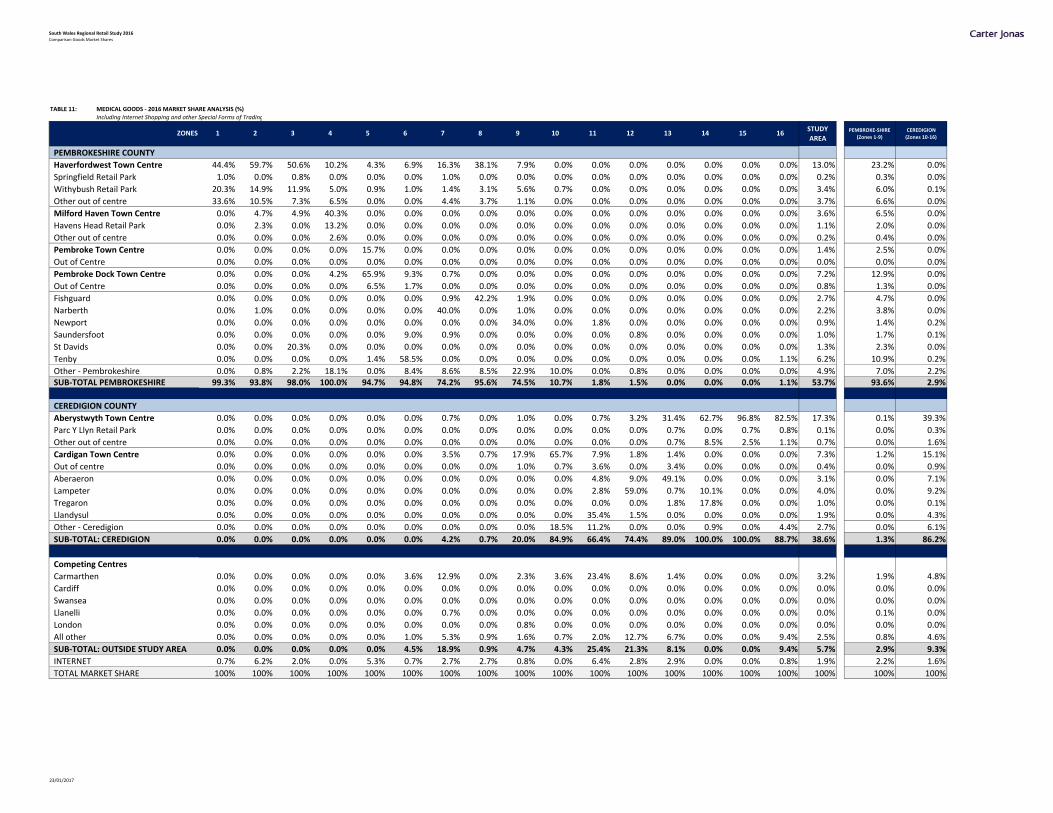
South Wales Regional Retail Study 2016Comparison Goods Market Shares
TABLE 11: MEDICAL GOODS ‐ 2016 MARKET SHARE ANALYSIS (%)Including Internet Shopping and other Special Forms of Trading
ZONES 1 2 3 4 5 6 7 8 9 10 11 12 13 14 15 16
PEMBROKESHIRE COUNTY
Haverfordwest Town Centre 44.4% 59.7% 50.6% 10.2% 4.3% 6.9% 16.3% 38.1% 7.9% 0.0% 0.0% 0.0% 0.0% 0.0% 0.0% 0.0% 13.0% 23.2% 0.0%
Springfield Retail Park 1.0% 0.0% 0.8% 0.0% 0.0% 0.0% 1.0% 0.0% 0.0% 0.0% 0.0% 0.0% 0.0% 0.0% 0.0% 0.0% 0.2% 0.3% 0.0%
Withybush Retail Park 20.3% 14.9% 11.9% 5.0% 0.9% 1.0% 1.4% 3.1% 5.6% 0.7% 0.0% 0.0% 0.0% 0.0% 0.0% 0.0% 3.4% 6.0% 0.1%
Other out of centre 33.6% 10.5% 7.3% 6.5% 0.0% 0.0% 4.4% 3.7% 1.1% 0.0% 0.0% 0.0% 0.0% 0.0% 0.0% 0.0% 3.7% 6.6% 0.0%
Milford Haven Town Centre 0.0% 4.7% 4.9% 40.3% 0.0% 0.0% 0.0% 0.0% 0.0% 0.0% 0.0% 0.0% 0.0% 0.0% 0.0% 0.0% 3.6% 6.5% 0.0%
Havens Head Retail Park 0.0% 2.3% 0.0% 13.2% 0.0% 0.0% 0.0% 0.0% 0.0% 0.0% 0.0% 0.0% 0.0% 0.0% 0.0% 0.0% 1.1% 2.0% 0.0%
Other out of centre 0.0% 0.0% 0.0% 2.6% 0.0% 0.0% 0.0% 0.0% 0.0% 0.0% 0.0% 0.0% 0.0% 0.0% 0.0% 0.0% 0.2% 0.4% 0.0%
Pembroke Town Centre 0.0% 0.0% 0.0% 0.0% 15.7% 0.0% 0.0% 0.0% 0.0% 0.0% 0.0% 0.0% 0.0% 0.0% 0.0% 0.0% 1.4% 2.5% 0.0%
Out of Centre 0.0% 0.0% 0.0% 0.0% 0.0% 0.0% 0.0% 0.0% 0.0% 0.0% 0.0% 0.0% 0.0% 0.0% 0.0% 0.0% 0.0% 0.0% 0.0%
Pembroke Dock Town Centre 0.0% 0.0% 0.0% 4.2% 65.9% 9.3% 0.7% 0.0% 0.0% 0.0% 0.0% 0.0% 0.0% 0.0% 0.0% 0.0% 7.2% 12.9% 0.0%
Out of Centre 0.0% 0.0% 0.0% 0.0% 6.5% 1.7% 0.0% 0.0% 0.0% 0.0% 0.0% 0.0% 0.0% 0.0% 0.0% 0.0% 0.8% 1.3% 0.0%
Fishguard 0.0% 0.0% 0.0% 0.0% 0.0% 0.0% 0.9% 42.2% 1.9% 0.0% 0.0% 0.0% 0.0% 0.0% 0.0% 0.0% 2.7% 4.7% 0.0%
Narberth 0.0% 1.0% 0.0% 0.0% 0.0% 0.0% 40.0% 0.0% 1.0% 0.0% 0.0% 0.0% 0.0% 0.0% 0.0% 0.0% 2.2% 3.8% 0.0%
Newport 0.0% 0.0% 0.0% 0.0% 0.0% 0.0% 0.0% 0.0% 34.0% 0.0% 1.8% 0.0% 0.0% 0.0% 0.0% 0.0% 0.9% 1.4% 0.2%
Saundersfoot 0.0% 0.0% 0.0% 0.0% 0.0% 9.0% 0.9% 0.0% 0.0% 0.0% 0.0% 0.8% 0.0% 0.0% 0.0% 0.0% 1.0% 1.7% 0.1%
St Davids 0.0% 0.0% 20.3% 0.0% 0.0% 0.0% 0.0% 0.0% 0.0% 0.0% 0.0% 0.0% 0.0% 0.0% 0.0% 0.0% 1.3% 2.3% 0.0%
Tenby 0.0% 0.0% 0.0% 0.0% 1.4% 58.5% 0.0% 0.0% 0.0% 0.0% 0.0% 0.0% 0.0% 0.0% 0.0% 1.1% 6.2% 10.9% 0.2%
Other ‐ Pembrokeshire 0.0% 0.8% 2.2% 18.1% 0.0% 8.4% 8.6% 8.5% 22.9% 10.0% 0.0% 0.8% 0.0% 0.0% 0.0% 0.0% 4.9% 7.0% 2.2%SUB‐TOTAL PEMBROKESHIRE 99.3% 93.8% 98.0% 100.0% 94.7% 94.8% 74.2% 95.6% 74.5% 10.7% 1.8% 1.5% 0.0% 0.0% 0.0% 1.1% 53.7% 93.6% 2.9%
CEREDIGION COUNTY
Aberystwyth Town Centre 0.0% 0.0% 0.0% 0.0% 0.0% 0.0% 0.7% 0.0% 1.0% 0.0% 0.7% 3.2% 31.4% 62.7% 96.8% 82.5% 17.3% 0.1% 39.3%
Parc Y Llyn Retail Park 0.0% 0.0% 0.0% 0.0% 0.0% 0.0% 0.0% 0.0% 0.0% 0.0% 0.0% 0.0% 0.7% 0.0% 0.7% 0.8% 0.1% 0.0% 0.3%
Other out of centre 0.0% 0.0% 0.0% 0.0% 0.0% 0.0% 0.0% 0.0% 0.0% 0.0% 0.0% 0.0% 0.7% 8.5% 2.5% 1.1% 0.7% 0.0% 1.6%
Cardigan Town Centre 0.0% 0.0% 0.0% 0.0% 0.0% 0.0% 3.5% 0.7% 17.9% 65.7% 7.9% 1.8% 1.4% 0.0% 0.0% 0.0% 7.3% 1.2% 15.1%
Out of centre 0.0% 0.0% 0.0% 0.0% 0.0% 0.0% 0.0% 0.0% 1.0% 0.7% 3.6% 0.0% 3.4% 0.0% 0.0% 0.0% 0.4% 0.0% 0.9%
Aberaeron 0.0% 0.0% 0.0% 0.0% 0.0% 0.0% 0.0% 0.0% 0.0% 0.0% 4.8% 9.0% 49.1% 0.0% 0.0% 0.0% 3.1% 0.0% 7.1%
Lampeter 0.0% 0.0% 0.0% 0.0% 0.0% 0.0% 0.0% 0.0% 0.0% 0.0% 2.8% 59.0% 0.7% 10.1% 0.0% 0.0% 4.0% 0.0% 9.2%
Tregaron 0.0% 0.0% 0.0% 0.0% 0.0% 0.0% 0.0% 0.0% 0.0% 0.0% 0.0% 0.0% 1.8% 17.8% 0.0% 0.0% 1.0% 0.0% 0.1%
Llandysul 0.0% 0.0% 0.0% 0.0% 0.0% 0.0% 0.0% 0.0% 0.0% 0.0% 35.4% 1.5% 0.0% 0.0% 0.0% 0.0% 1.9% 0.0% 4.3%
Other ‐ Ceredigion 0.0% 0.0% 0.0% 0.0% 0.0% 0.0% 0.0% 0.0% 0.0% 18.5% 11.2% 0.0% 0.0% 0.9% 0.0% 4.4% 2.7% 0.0% 6.1%
SUB‐TOTAL: CEREDIGION 0.0% 0.0% 0.0% 0.0% 0.0% 0.0% 4.2% 0.7% 20.0% 84.9% 66.4% 74.4% 89.0% 100.0% 100.0% 88.7% 38.6% 1.3% 86.2%
Competing Centres
Carmarthen 0.0% 0.0% 0.0% 0.0% 0.0% 3.6% 12.9% 0.0% 2.3% 3.6% 23.4% 8.6% 1.4% 0.0% 0.0% 0.0% 3.2% 1.9% 4.8%
Cardiff 0.0% 0.0% 0.0% 0.0% 0.0% 0.0% 0.0% 0.0% 0.0% 0.0% 0.0% 0.0% 0.0% 0.0% 0.0% 0.0% 0.0% 0.0% 0.0%
Swansea 0.0% 0.0% 0.0% 0.0% 0.0% 0.0% 0.0% 0.0% 0.0% 0.0% 0.0% 0.0% 0.0% 0.0% 0.0% 0.0% 0.0% 0.0% 0.0%
Llanelli 0.0% 0.0% 0.0% 0.0% 0.0% 0.0% 0.7% 0.0% 0.0% 0.0% 0.0% 0.0% 0.0% 0.0% 0.0% 0.0% 0.0% 0.1% 0.0%
London 0.0% 0.0% 0.0% 0.0% 0.0% 0.0% 0.0% 0.0% 0.8% 0.0% 0.0% 0.0% 0.0% 0.0% 0.0% 0.0% 0.0% 0.0% 0.0%
All other 0.0% 0.0% 0.0% 0.0% 0.0% 1.0% 5.3% 0.9% 1.6% 0.7% 2.0% 12.7% 6.7% 0.0% 0.0% 9.4% 2.5% 0.8% 4.6%
SUB‐TOTAL: OUTSIDE STUDY AREA 0.0% 0.0% 0.0% 0.0% 0.0% 4.5% 18.9% 0.9% 4.7% 4.3% 25.4% 21.3% 8.1% 0.0% 0.0% 9.4% 5.7% 2.9% 9.3%
INTERNET 0.7% 6.2% 2.0% 0.0% 5.3% 0.7% 2.7% 2.7% 0.8% 0.0% 6.4% 2.8% 2.9% 0.0% 0.0% 0.8% 1.9% 2.2% 1.6%
TOTAL MARKET SHARE 100% 100% 100% 100% 100% 100% 100% 100% 100% 100% 100% 100% 100% 100% 100% 100% 100% 100% 100%
PEMBROKE‐SHIRE
(Zones 1‐9)
CEREDIGION
(Zones 10‐16)
STUDY
AREA
23/01/2017
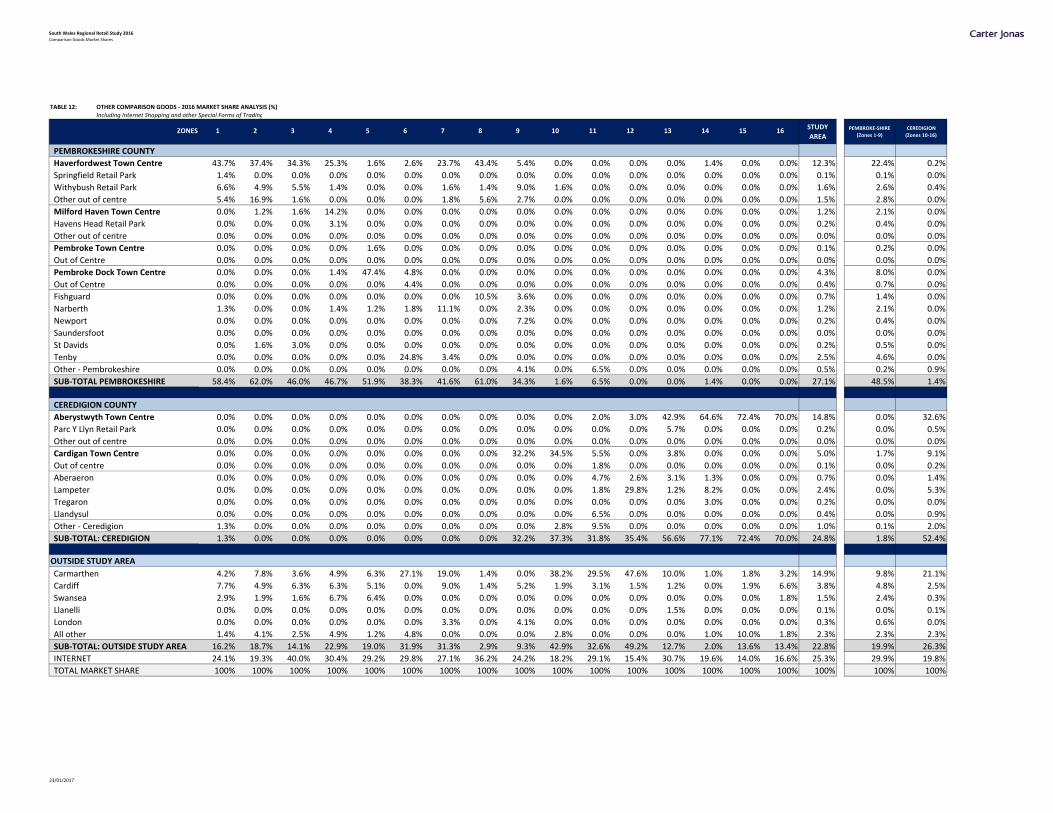
South Wales Regional Retail Study 2016Comparison Goods Market Shares
TABLE 12: OTHER COMPARISON GOODS ‐ 2016 MARKET SHARE ANALYSIS (%)Including Internet Shopping and other Special Forms of Trading
ZONES 1 2 3 4 5 6 7 8 9 10 11 12 13 14 15 16
PEMBROKESHIRE COUNTY
Haverfordwest Town Centre 43.7% 37.4% 34.3% 25.3% 1.6% 2.6% 23.7% 43.4% 5.4% 0.0% 0.0% 0.0% 0.0% 1.4% 0.0% 0.0% 12.3% 22.4% 0.2%
Springfield Retail Park 1.4% 0.0% 0.0% 0.0% 0.0% 0.0% 0.0% 0.0% 0.0% 0.0% 0.0% 0.0% 0.0% 0.0% 0.0% 0.0% 0.1% 0.1% 0.0%
Withybush Retail Park 6.6% 4.9% 5.5% 1.4% 0.0% 0.0% 1.6% 1.4% 9.0% 1.6% 0.0% 0.0% 0.0% 0.0% 0.0% 0.0% 1.6% 2.6% 0.4%
Other out of centre 5.4% 16.9% 1.6% 0.0% 0.0% 0.0% 1.8% 5.6% 2.7% 0.0% 0.0% 0.0% 0.0% 0.0% 0.0% 0.0% 1.5% 2.8% 0.0%
Milford Haven Town Centre 0.0% 1.2% 1.6% 14.2% 0.0% 0.0% 0.0% 0.0% 0.0% 0.0% 0.0% 0.0% 0.0% 0.0% 0.0% 0.0% 1.2% 2.1% 0.0%
Havens Head Retail Park 0.0% 0.0% 0.0% 3.1% 0.0% 0.0% 0.0% 0.0% 0.0% 0.0% 0.0% 0.0% 0.0% 0.0% 0.0% 0.0% 0.2% 0.4% 0.0%
Other out of centre 0.0% 0.0% 0.0% 0.0% 0.0% 0.0% 0.0% 0.0% 0.0% 0.0% 0.0% 0.0% 0.0% 0.0% 0.0% 0.0% 0.0% 0.0% 0.0%
Pembroke Town Centre 0.0% 0.0% 0.0% 0.0% 1.6% 0.0% 0.0% 0.0% 0.0% 0.0% 0.0% 0.0% 0.0% 0.0% 0.0% 0.0% 0.1% 0.2% 0.0%
Out of Centre 0.0% 0.0% 0.0% 0.0% 0.0% 0.0% 0.0% 0.0% 0.0% 0.0% 0.0% 0.0% 0.0% 0.0% 0.0% 0.0% 0.0% 0.0% 0.0%
Pembroke Dock Town Centre 0.0% 0.0% 0.0% 1.4% 47.4% 4.8% 0.0% 0.0% 0.0% 0.0% 0.0% 0.0% 0.0% 0.0% 0.0% 0.0% 4.3% 8.0% 0.0%
Out of Centre 0.0% 0.0% 0.0% 0.0% 0.0% 4.4% 0.0% 0.0% 0.0% 0.0% 0.0% 0.0% 0.0% 0.0% 0.0% 0.0% 0.4% 0.7% 0.0%
Fishguard 0.0% 0.0% 0.0% 0.0% 0.0% 0.0% 0.0% 10.5% 3.6% 0.0% 0.0% 0.0% 0.0% 0.0% 0.0% 0.0% 0.7% 1.4% 0.0%
Narberth 1.3% 0.0% 0.0% 1.4% 1.2% 1.8% 11.1% 0.0% 2.3% 0.0% 0.0% 0.0% 0.0% 0.0% 0.0% 0.0% 1.2% 2.1% 0.0%
Newport 0.0% 0.0% 0.0% 0.0% 0.0% 0.0% 0.0% 0.0% 7.2% 0.0% 0.0% 0.0% 0.0% 0.0% 0.0% 0.0% 0.2% 0.4% 0.0%
Saundersfoot 0.0% 0.0% 0.0% 0.0% 0.0% 0.0% 0.0% 0.0% 0.0% 0.0% 0.0% 0.0% 0.0% 0.0% 0.0% 0.0% 0.0% 0.0% 0.0%
St Davids 0.0% 1.6% 3.0% 0.0% 0.0% 0.0% 0.0% 0.0% 0.0% 0.0% 0.0% 0.0% 0.0% 0.0% 0.0% 0.0% 0.2% 0.5% 0.0%
Tenby 0.0% 0.0% 0.0% 0.0% 0.0% 24.8% 3.4% 0.0% 0.0% 0.0% 0.0% 0.0% 0.0% 0.0% 0.0% 0.0% 2.5% 4.6% 0.0%
Other ‐ Pembrokeshire 0.0% 0.0% 0.0% 0.0% 0.0% 0.0% 0.0% 0.0% 4.1% 0.0% 6.5% 0.0% 0.0% 0.0% 0.0% 0.0% 0.5% 0.2% 0.9%
SUB‐TOTAL PEMBROKESHIRE 58.4% 62.0% 46.0% 46.7% 51.9% 38.3% 41.6% 61.0% 34.3% 1.6% 6.5% 0.0% 0.0% 1.4% 0.0% 0.0% 27.1% 48.5% 1.4%
CEREDIGION COUNTY
Aberystwyth Town Centre 0.0% 0.0% 0.0% 0.0% 0.0% 0.0% 0.0% 0.0% 0.0% 0.0% 2.0% 3.0% 42.9% 64.6% 72.4% 70.0% 14.8% 0.0% 32.6%
Parc Y Llyn Retail Park 0.0% 0.0% 0.0% 0.0% 0.0% 0.0% 0.0% 0.0% 0.0% 0.0% 0.0% 0.0% 5.7% 0.0% 0.0% 0.0% 0.2% 0.0% 0.5%
Other out of centre 0.0% 0.0% 0.0% 0.0% 0.0% 0.0% 0.0% 0.0% 0.0% 0.0% 0.0% 0.0% 0.0% 0.0% 0.0% 0.0% 0.0% 0.0% 0.0%
Cardigan Town Centre 0.0% 0.0% 0.0% 0.0% 0.0% 0.0% 0.0% 0.0% 32.2% 34.5% 5.5% 0.0% 3.8% 0.0% 0.0% 0.0% 5.0% 1.7% 9.1%
Out of centre 0.0% 0.0% 0.0% 0.0% 0.0% 0.0% 0.0% 0.0% 0.0% 0.0% 1.8% 0.0% 0.0% 0.0% 0.0% 0.0% 0.1% 0.0% 0.2%
Aberaeron 0.0% 0.0% 0.0% 0.0% 0.0% 0.0% 0.0% 0.0% 0.0% 0.0% 4.7% 2.6% 3.1% 1.3% 0.0% 0.0% 0.7% 0.0% 1.4%
Lampeter 0.0% 0.0% 0.0% 0.0% 0.0% 0.0% 0.0% 0.0% 0.0% 0.0% 1.8% 29.8% 1.2% 8.2% 0.0% 0.0% 2.4% 0.0% 5.3%
Tregaron 0.0% 0.0% 0.0% 0.0% 0.0% 0.0% 0.0% 0.0% 0.0% 0.0% 0.0% 0.0% 0.0% 3.0% 0.0% 0.0% 0.2% 0.0% 0.0%
Llandysul 0.0% 0.0% 0.0% 0.0% 0.0% 0.0% 0.0% 0.0% 0.0% 0.0% 6.5% 0.0% 0.0% 0.0% 0.0% 0.0% 0.4% 0.0% 0.9%
Other ‐ Ceredigion 1.3% 0.0% 0.0% 0.0% 0.0% 0.0% 0.0% 0.0% 0.0% 2.8% 9.5% 0.0% 0.0% 0.0% 0.0% 0.0% 1.0% 0.1% 2.0%
SUB‐TOTAL: CEREDIGION 1.3% 0.0% 0.0% 0.0% 0.0% 0.0% 0.0% 0.0% 32.2% 37.3% 31.8% 35.4% 56.6% 77.1% 72.4% 70.0% 24.8% 1.8% 52.4%
OUTSIDE STUDY AREA
Carmarthen 4.2% 7.8% 3.6% 4.9% 6.3% 27.1% 19.0% 1.4% 0.0% 38.2% 29.5% 47.6% 10.0% 1.0% 1.8% 3.2% 14.9% 9.8% 21.1%
Cardiff 7.7% 4.9% 6.3% 6.3% 5.1% 0.0% 9.0% 1.4% 5.2% 1.9% 3.1% 1.5% 1.2% 0.0% 1.9% 6.6% 3.8% 4.8% 2.5%
Swansea 2.9% 1.9% 1.6% 6.7% 6.4% 0.0% 0.0% 0.0% 0.0% 0.0% 0.0% 0.0% 0.0% 0.0% 0.0% 1.8% 1.5% 2.4% 0.3%
Llanelli 0.0% 0.0% 0.0% 0.0% 0.0% 0.0% 0.0% 0.0% 0.0% 0.0% 0.0% 0.0% 1.5% 0.0% 0.0% 0.0% 0.1% 0.0% 0.1%
London 0.0% 0.0% 0.0% 0.0% 0.0% 0.0% 3.3% 0.0% 4.1% 0.0% 0.0% 0.0% 0.0% 0.0% 0.0% 0.0% 0.3% 0.6% 0.0%
All other 1.4% 4.1% 2.5% 4.9% 1.2% 4.8% 0.0% 0.0% 0.0% 2.8% 0.0% 0.0% 0.0% 1.0% 10.0% 1.8% 2.3% 2.3% 2.3%
SUB‐TOTAL: OUTSIDE STUDY AREA 16.2% 18.7% 14.1% 22.9% 19.0% 31.9% 31.3% 2.9% 9.3% 42.9% 32.6% 49.2% 12.7% 2.0% 13.6% 13.4% 22.8% 19.9% 26.3%
INTERNET 24.1% 19.3% 40.0% 30.4% 29.2% 29.8% 27.1% 36.2% 24.2% 18.2% 29.1% 15.4% 30.7% 19.6% 14.0% 16.6% 25.3% 29.9% 19.8%
TOTAL MARKET SHARE 100% 100% 100% 100% 100% 100% 100% 100% 100% 100% 100% 100% 100% 100% 100% 100% 100% 100% 100%
PEMBROKE‐SHIRE
(Zones 1‐9)
CEREDIGION
(Zones 10‐16)
STUDY
AREA
23/01/2017
South West Wales Regional Retail Study
APPENDIX 4: POPULATION & EXPENDITURE
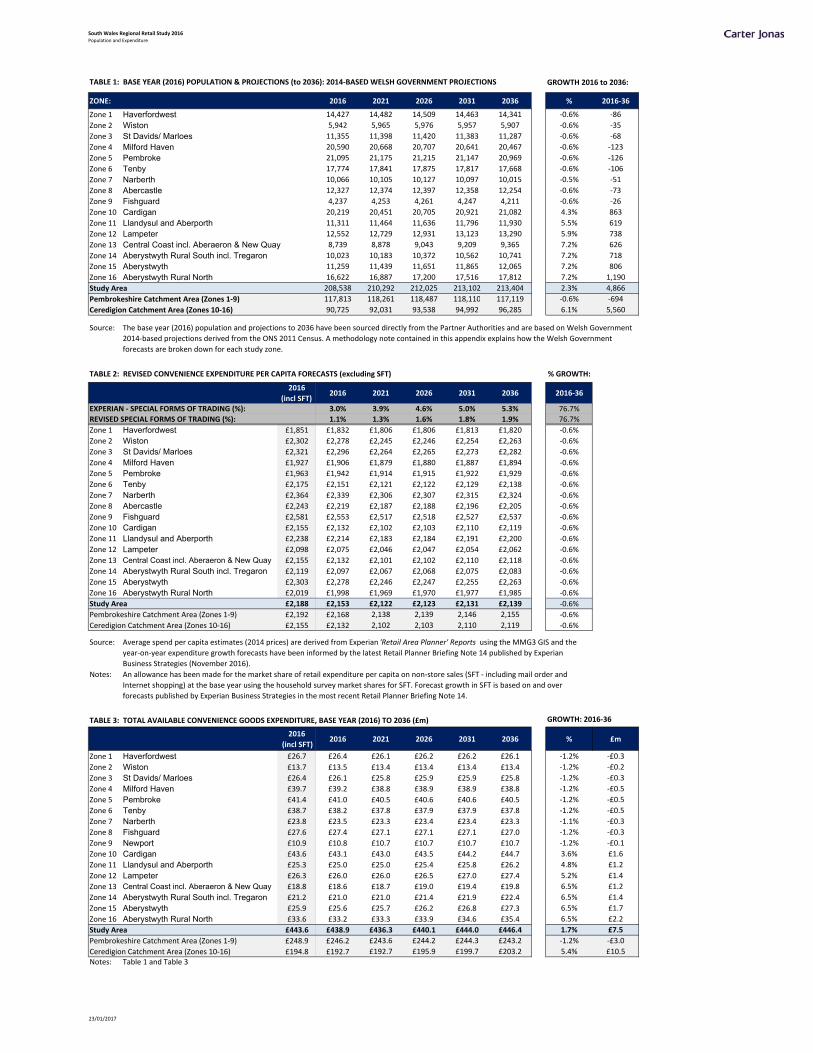
South Wales Regional Retail Study 2016Population and Expenditure
GROWTH 2016 to 2036:
ZONE: 2016 2021 2026 2031 2036 % 2016‐36
Zone 1 Haverfordwest 14,427 14,482 14,509 14,463 14,341 ‐0.6% ‐86
Zone 2 Wiston 5,942 5,965 5,976 5,957 5,907 ‐0.6% ‐35
Zone 3 St Davids/ Marloes 11,355 11,398 11,420 11,383 11,287 ‐0.6% ‐68
Zone 4 Milford Haven 20,590 20,668 20,707 20,641 20,467 ‐0.6% ‐123
Zone 5 Pembroke 21,095 21,175 21,215 21,147 20,969 ‐0.6% ‐126
Zone 6 Tenby 17,774 17,841 17,875 17,817 17,668 ‐0.6% ‐106
Zone 7 Narberth 10,066 10,105 10,127 10,097 10,015 ‐0.5% ‐51
Zone 8 Abercastle 12,327 12,374 12,397 12,358 12,254 ‐0.6% ‐73
Zone 9 Fishguard 4,237 4,253 4,261 4,247 4,211 ‐0.6% ‐26
Zone 10 Cardigan 20,219 20,451 20,705 20,921 21,082 4.3% 863
Zone 11 Llandysul and Aberporth 11,311 11,464 11,636 11,796 11,930 5.5% 619
Zone 12 Lampeter 12,552 12,729 12,931 13,123 13,290 5.9% 738
Zone 13 Central Coast incl. Aberaeron & New Quay 8,739 8,878 9,043 9,209 9,365 7.2% 626
Zone 14 Aberystwyth Rural South incl. Tregaron 10,023 10,183 10,372 10,562 10,741 7.2% 718
Zone 15 Aberystwyth 11,259 11,439 11,651 11,865 12,065 7.2% 806
Zone 16 Aberystwyth Rural North 16,622 16,887 17,200 17,516 17,812 7.2% 1,190
Study Area 208,538 210,292 212,025 213,102 213,404 2.3% 4,866
Pembrokeshire Catchment Area (Zones 1‐9) 117,813 118,261 118,487 118,110 117,119 ‐0.6% ‐694
Ceredigion Catchment Area (Zones 10‐16) 90,725 92,031 93,538 94,992 96,285 6.1% 5,560
Source:
TABLE 2: REVISED CONVENIENCE EXPENDITURE PER CAPITA FORECASTS (excluding SFT) % GROWTH:
2016
(incl SFT)2016 2021 2026 2031 2036 2016‐36
EXPERIAN ‐ SPECIAL FORMS OF TRADING (%): 3.0% 3.9% 4.6% 5.0% 5.3% 76.7%
REVISED SPECIAL FORMS OF TRADING (%): 1.1% 1.3% 1.6% 1.8% 1.9% 76.7%
Zone 1 Haverfordwest £1,851 £1,832 £1,806 £1,806 £1,813 £1,820 ‐0.6%
Zone 2 Wiston £2,302 £2,278 £2,245 £2,246 £2,254 £2,263 ‐0.6%
Zone 3 St Davids/ Marloes £2,321 £2,296 £2,264 £2,265 £2,273 £2,282 ‐0.6%
Zone 4 Milford Haven £1,927 £1,906 £1,879 £1,880 £1,887 £1,894 ‐0.6%
Zone 5 Pembroke £1,963 £1,942 £1,914 £1,915 £1,922 £1,929 ‐0.6%
Zone 6 Tenby £2,175 £2,151 £2,121 £2,122 £2,129 £2,138 ‐0.6%
Zone 7 Narberth £2,364 £2,339 £2,306 £2,307 £2,315 £2,324 ‐0.6%
Zone 8 Abercastle £2,243 £2,219 £2,187 £2,188 £2,196 £2,205 ‐0.6%
Zone 9 Fishguard £2,581 £2,553 £2,517 £2,518 £2,527 £2,537 ‐0.6%
Zone 10 Cardigan £2,155 £2,132 £2,102 £2,103 £2,110 £2,119 ‐0.6%
Zone 11 Llandysul and Aberporth £2,238 £2,214 £2,183 £2,184 £2,191 £2,200 ‐0.6%
Zone 12 Lampeter £2,098 £2,075 £2,046 £2,047 £2,054 £2,062 ‐0.6%
Zone 13 Central Coast incl. Aberaeron & New Quay £2,155 £2,132 £2,101 £2,102 £2,110 £2,118 ‐0.6%
Zone 14 Aberystwyth Rural South incl. Tregaron £2,119 £2,097 £2,067 £2,068 £2,075 £2,083 ‐0.6%
Zone 15 Aberystwyth £2,303 £2,278 £2,246 £2,247 £2,255 £2,263 ‐0.6%
Zone 16 Aberystwyth Rural North £2,019 £1,998 £1,969 £1,970 £1,977 £1,985 ‐0.6%
Study Area £2,188 £2,153 £2,122 £2,123 £2,131 £2,139 ‐0.6%
Pembrokeshire Catchment Area (Zones 1‐9) £2,192 £2,168 2,138 2,139 2,146 2,155 ‐0.6%
Ceredigion Catchment Area (Zones 10‐16) £2,155 £2,132 2,102 2,103 2,110 2,119 ‐0.6%
Source:
Notes:
GROWTH: 2016‐36
2016
(incl SFT)2016 2021 2026 2031 2036 % £m
Zone 1 Haverfordwest £26.7 £26.4 £26.1 £26.2 £26.2 £26.1 ‐1.2% ‐£0.3
Zone 2 Wiston £13.7 £13.5 £13.4 £13.4 £13.4 £13.4 ‐1.2% ‐£0.2
Zone 3 St Davids/ Marloes £26.4 £26.1 £25.8 £25.9 £25.9 £25.8 ‐1.2% ‐£0.3
Zone 4 Milford Haven £39.7 £39.2 £38.8 £38.9 £38.9 £38.8 ‐1.2% ‐£0.5
Zone 5 Pembroke £41.4 £41.0 £40.5 £40.6 £40.6 £40.5 ‐1.2% ‐£0.5
Zone 6 Tenby £38.7 £38.2 £37.8 £37.9 £37.9 £37.8 ‐1.2% ‐£0.5
Zone 7 Narberth £23.8 £23.5 £23.3 £23.4 £23.4 £23.3 ‐1.1% ‐£0.3
Zone 8 Fishguard £27.6 £27.4 £27.1 £27.1 £27.1 £27.0 ‐1.2% ‐£0.3
Zone 9 Newport £10.9 £10.8 £10.7 £10.7 £10.7 £10.7 ‐1.2% ‐£0.1
Zone 10 Cardigan £43.6 £43.1 £43.0 £43.5 £44.2 £44.7 3.6% £1.6
Zone 11 Llandysul and Aberporth £25.3 £25.0 £25.0 £25.4 £25.8 £26.2 4.8% £1.2
Zone 12 Lampeter £26.3 £26.0 £26.0 £26.5 £27.0 £27.4 5.2% £1.4
Zone 13 Central Coast incl. Aberaeron & New Quay £18.8 £18.6 £18.7 £19.0 £19.4 £19.8 6.5% £1.2
Zone 14 Aberystwyth Rural South incl. Tregaron £21.2 £21.0 £21.0 £21.4 £21.9 £22.4 6.5% £1.4
Zone 15 Aberystwyth £25.9 £25.6 £25.7 £26.2 £26.8 £27.3 6.5% £1.7
Zone 16 Aberystwyth Rural North £33.6 £33.2 £33.3 £33.9 £34.6 £35.4 6.5% £2.2
Study Area £443.6 £438.9 £436.3 £440.1 £444.0 £446.4 1.7% £7.5
Pembrokeshire Catchment Area (Zones 1‐9) £248.9 £246.2 £243.6 £244.2 £244.3 £243.2 ‐1.2% ‐£3.0
Ceredigion Catchment Area (Zones 10‐16) £194.8 £192.7 £192.7 £195.9 £199.7 £203.2 5.4% £10.5
Notes: Table 1 and Table 3
TABLE 1: BASE YEAR (2016) POPULATION & PROJECTIONS (to 2036): 2014‐BASED WELSH GOVERNMENT PROJECTIONS
Average spend per capita estimates (2014 prices) are derived from Experian 'Retail Area Planner' Reports using the MMG3 GIS and the
year‐on‐year expenditure growth forecasts have been informed by the latest Retail Planner Briefing Note 14 published by Experian
Business Strategies (November 2016).
An allowance has been made for the market share of retail expenditure per capita on non‐store sales (SFT ‐ including mail order and
Internet shopping) at the base year using the household survey market shares for SFT. Forecast growth in SFT is based on and over
forecasts published by Experian Business Strategies in the most recent Retail Planner Briefing Note 14.
The base year (2016) population and projections to 2036 have been sourced directly from the Partner Authorities and are based on Welsh Government
2014‐based projections derived from the ONS 2011 Census. A methodology note contained in this appendix explains how the Welsh Government
forecasts are broken down for each study zone.
TABLE 3: TOTAL AVAILABLE CONVENIENCE GOODS EXPENDITURE, BASE YEAR (2016) TO 2036 (£m)
23/01/2017
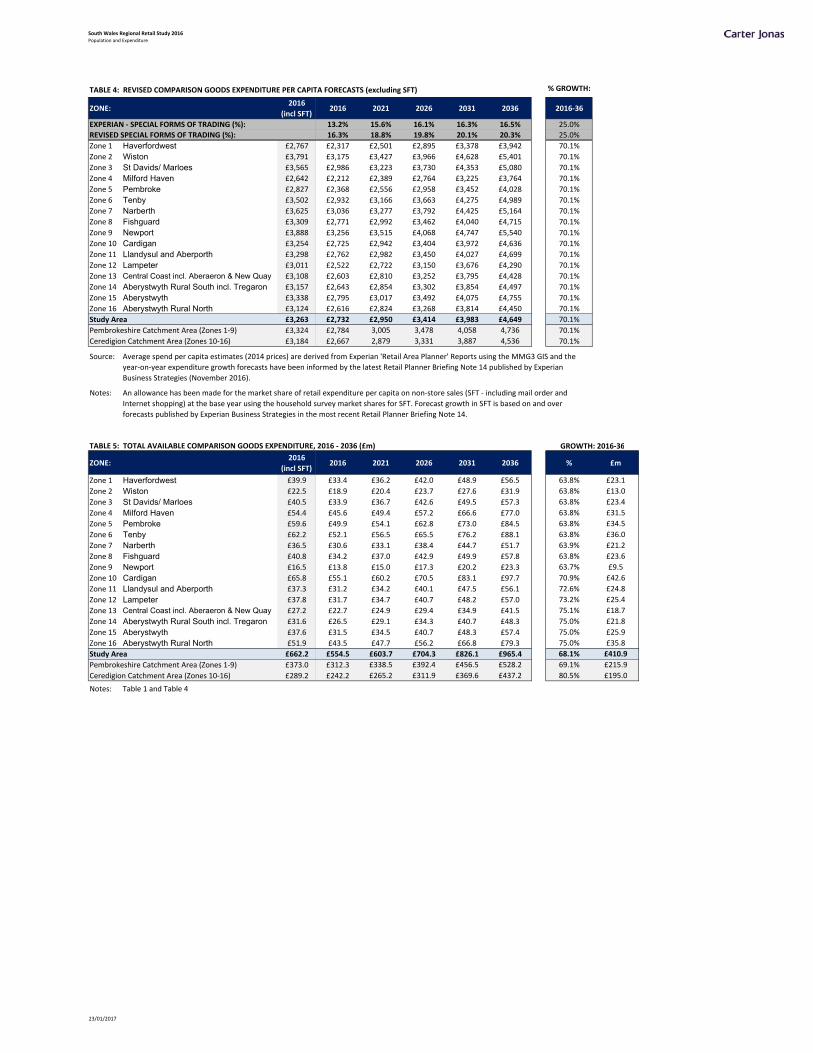
South Wales Regional Retail Study 2016Population and Expenditure
% GROWTH:
ZONE:2016
(incl SFT)2016 2021 2026 2031 2036 2016‐36
EXPERIAN ‐ SPECIAL FORMS OF TRADING (%): 13.2% 15.6% 16.1% 16.3% 16.5% 25.0%
REVISED SPECIAL FORMS OF TRADING (%): 16.3% 18.8% 19.8% 20.1% 20.3% 25.0%
Zone 1 Haverfordwest £2,767 £2,317 £2,501 £2,895 £3,378 £3,942 70.1%
Zone 2 Wiston £3,791 £3,175 £3,427 £3,966 £4,628 £5,401 70.1%
Zone 3 St Davids/ Marloes £3,565 £2,986 £3,223 £3,730 £4,353 £5,080 70.1%
Zone 4 Milford Haven £2,642 £2,212 £2,389 £2,764 £3,225 £3,764 70.1%
Zone 5 Pembroke £2,827 £2,368 £2,556 £2,958 £3,452 £4,028 70.1%
Zone 6 Tenby £3,502 £2,932 £3,166 £3,663 £4,275 £4,989 70.1%
Zone 7 Narberth £3,625 £3,036 £3,277 £3,792 £4,425 £5,164 70.1%
Zone 8 Fishguard £3,309 £2,771 £2,992 £3,462 £4,040 £4,715 70.1%
Zone 9 Newport £3,888 £3,256 £3,515 £4,068 £4,747 £5,540 70.1%
Zone 10 Cardigan £3,254 £2,725 £2,942 £3,404 £3,972 £4,636 70.1%
Zone 11 Llandysul and Aberporth £3,298 £2,762 £2,982 £3,450 £4,027 £4,699 70.1%
Zone 12 Lampeter £3,011 £2,522 £2,722 £3,150 £3,676 £4,290 70.1%
Zone 13 Central Coast incl. Aberaeron & New Quay £3,108 £2,603 £2,810 £3,252 £3,795 £4,428 70.1%
Zone 14 Aberystwyth Rural South incl. Tregaron £3,157 £2,643 £2,854 £3,302 £3,854 £4,497 70.1%
Zone 15 Aberystwyth £3,338 £2,795 £3,017 £3,492 £4,075 £4,755 70.1%
Zone 16 Aberystwyth Rural North £3,124 £2,616 £2,824 £3,268 £3,814 £4,450 70.1%
Study Area £3,263 £2,732 £2,950 £3,414 £3,983 £4,649 70.1%
Pembrokeshire Catchment Area (Zones 1‐9) £3,324 £2,784 3,005 3,478 4,058 4,736 70.1%
Ceredigion Catchment Area (Zones 10‐16) £3,184 £2,667 2,879 3,331 3,887 4,536 70.1%
Source:
Notes:
TABLE 5: TOTAL AVAILABLE COMPARISON GOODS EXPENDITURE, 2016 ‐ 2036 (£m)
ZONE:2016
(incl SFT)2016 2021 2026 2031 2036 % £m
Zone 1 Haverfordwest £39.9 £33.4 £36.2 £42.0 £48.9 £56.5 63.8% £23.1
Zone 2 Wiston £22.5 £18.9 £20.4 £23.7 £27.6 £31.9 63.8% £13.0
Zone 3 St Davids/ Marloes £40.5 £33.9 £36.7 £42.6 £49.5 £57.3 63.8% £23.4
Zone 4 Milford Haven £54.4 £45.6 £49.4 £57.2 £66.6 £77.0 63.8% £31.5
Zone 5 Pembroke £59.6 £49.9 £54.1 £62.8 £73.0 £84.5 63.8% £34.5
Zone 6 Tenby £62.2 £52.1 £56.5 £65.5 £76.2 £88.1 63.8% £36.0
Zone 7 Narberth £36.5 £30.6 £33.1 £38.4 £44.7 £51.7 63.9% £21.2
Zone 8 Fishguard £40.8 £34.2 £37.0 £42.9 £49.9 £57.8 63.8% £23.6
Zone 9 Newport £16.5 £13.8 £15.0 £17.3 £20.2 £23.3 63.7% £9.5
Zone 10 Cardigan £65.8 £55.1 £60.2 £70.5 £83.1 £97.7 70.9% £42.6
Zone 11 Llandysul and Aberporth £37.3 £31.2 £34.2 £40.1 £47.5 £56.1 72.6% £24.8
Zone 12 Lampeter £37.8 £31.7 £34.7 £40.7 £48.2 £57.0 73.2% £25.4
Zone 13 Central Coast incl. Aberaeron & New Quay £27.2 £22.7 £24.9 £29.4 £34.9 £41.5 75.1% £18.7
Zone 14 Aberystwyth Rural South incl. Tregaron £31.6 £26.5 £29.1 £34.3 £40.7 £48.3 75.0% £21.8
Zone 15 Aberystwyth £37.6 £31.5 £34.5 £40.7 £48.3 £57.4 75.0% £25.9
Zone 16 Aberystwyth Rural North £51.9 £43.5 £47.7 £56.2 £66.8 £79.3 75.0% £35.8
Study Area £662.2 £554.5 £603.7 £704.3 £826.1 £965.4 68.1% £410.9
Pembrokeshire Catchment Area (Zones 1‐9) £373.0 £312.3 £338.5 £392.4 £456.5 £528.2 69.1% £215.9
Ceredigion Catchment Area (Zones 10‐16) £289.2 £242.2 £265.2 £311.9 £369.6 £437.2 80.5% £195.0
Notes: Table 1 and Table 4
Average spend per capita estimates (2014 prices) are derived from Experian 'Retail Area Planner' Reports using the MMG3 GIS and the
year‐on‐year expenditure growth forecasts have been informed by the latest Retail Planner Briefing Note 14 published by Experian
Business Strategies (November 2016).
An allowance has been made for the market share of retail expenditure per capita on non‐store sales (SFT ‐ including mail order and
Internet shopping) at the base year using the household survey market shares for SFT. Forecast growth in SFT is based on and over
forecasts published by Experian Business Strategies in the most recent Retail Planner Briefing Note 14.
GROWTH: 2016‐36
TABLE 4: REVISED COMPARISON GOODS EXPENDITURE PER CAPITA FORECASTS (excluding SFT)
23/01/2017
South West Wales Regional Retail Study
APPENDIX 5: FORECAST CONVENIENCE GOODS TURNOVER

South Wales Regional Retail Study 2016Forecast Convenience Goods Turnover
TABLE 1: ALL CONVENIENCE GOODS ‐ 2016 MARKET SHARE ANALYSIS (%): EXCLUDING EXPENDITURE ON SPECIAL FORMS OF TRADING
Zones: 1 2 3 4 5 6 7 8 9 10 11 12 13 14 15 16 TOTAL
PEMBROKESHIRE COUNTY
Haverfordwest Town Centre:
Iceland, Picton Place 0.6% 1.0% 0.0% 2.0% 2.3% 1.2% 0.0% 0.0% 0.4% 0.0% 0.0% 0.0% 0.0% 0.0% 0.2% 1.2% 0.7%
Other stores 3.9% 1.6% 2.9% 0.0% 0.0% 0.1% 1.0% 3.6% 0.4% 0.0% 0.0% 0.0% 0.0% 0.0% 0.0% 0.0% 0.8%
Haversfordwest Out of Centre:
Aldi, Salutation Square 20.9% 21.7% 14.7% 10.1% 4.2% 1.3% 20.2% 17.9% 4.8% 0.0% 0.0% 0.0% 0.0% 0.0% 0.0% 0.0% 6.5%
Lidl, Perrots Rd 10.2% 7.5% 10.2% 2.1% 0.0% 0.5% 4.5% 5.5% 0.0% 0.0% 0.0% 0.0% 0.0% 0.0% 0.0% 0.0% 2.3%
Marks & Spencer, Withybush Retail Park 1.2% 1.7% 1.9% 0.7% 0.1% 0.4% 0.0% 1.2% 0.6% 0.0% 0.0% 0.0% 0.0% 0.0% 0.0% 0.0% 0.4%
Morrisons, Meadow View 27.1% 31.6% 20.1% 6.3% 0.9% 2.7% 12.5% 18.3% 4.2% 0.5% 0.0% 0.0% 0.0% 0.2% 0.0% 0.0% 6.7%
Tesco Extra, Fenton Trading Estate 33.7% 21.8% 31.0% 7.2% 2.0% 0.4% 10.4% 12.0% 2.9% 0.0% 0.0% 0.0% 0.0% 0.0% 0.0% 0.0% 6.8%
Milford Haven Town Centre:
Spar, Charles Street 0.0% 0.0% 0.0% 0.7% 0.0% 0.0% 0.0% 0.0% 0.0% 0.0% 0.0% 0.0% 0.0% 0.0% 0.0% 0.0% 0.1%
All stores 0.0% 0.0% 0.0% 5.5% 0.0% 0.0% 0.0% 0.0% 0.0% 0.0% 0.0% 0.0% 0.0% 0.0% 0.0% 0.0% 0.5%
Milford Haven Out of Centre:
Lidl, Great N Road 0.0% 0.9% 1.4% 19.9% 0.0% 0.0% 0.0% 0.0% 0.0% 0.0% 0.0% 0.0% 0.0% 0.0% 0.0% 0.0% 1.9%
Tesco, Havens Head Park 0.0% 2.9% 1.4% 27.5% 0.0% 0.0% 0.0% 0.0% 0.0% 0.0% 0.0% 0.0% 0.0% 0.0% 0.0% 0.0% 2.6%
Pembroke Town Centre:
Co‐op, Main Street 0.0% 0.0% 0.0% 0.0% 2.2% 0.1% 0.0% 0.0% 0.0% 0.0% 0.0% 0.0% 0.0% 0.0% 0.0% 0.3% 0.2%
Other stores 0.0% 0.0% 0.0% 0.0% 1.9% 0.0% 0.1% 0.0% 0.0% 0.0% 0.0% 0.0% 0.0% 0.0% 0.0% 0.0% 0.2%
Pembroke Dock Town Centre:
Asda, Gordon St 0.0% 1.3% 0.0% 2.9% 23.4% 8.2% 0.9% 0.0% 0.0% 0.0% 0.0% 0.0% 0.0% 0.0% 0.0% 0.0% 3.3%
Other stores 0.0% 0.0% 0.0% 0.0% 0.1% 0.9% 0.0% 0.0% 0.0% 0.0% 0.0% 0.0% 0.0% 0.0% 0.0% 0.6% 0.1%
Pembroke Dock Out of Centre:
Lidl, Pier Road 0.0% 0.0% 0.0% 2.2% 22.7% 14.5% 0.9% 0.0% 0.0% 0.0% 0.0% 0.0% 0.0% 0.0% 0.0% 0.0% 3.6%
Tesco Superstore, London Rd 0.1% 0.0% 0.0% 4.6% 37.8% 18.4% 2.8% 0.0% 0.3% 0.0% 0.0% 0.0% 0.0% 0.0% 0.0% 0.0% 5.7%
Fishguard Town Centre:
Co‐op, High Street 0.0% 0.0% 0.0% 0.0% 0.0% 0.0% 0.0% 21.8% 9.4% 0.0% 0.0% 0.0% 0.0% 0.0% 0.0% 0.0% 1.6%
Other stores 0.0% 0.0% 0.0% 0.0% 0.0% 0.0% 0.0% 6.6% 1.5% 0.0% 0.4% 0.0% 0.0% 0.0% 0.0% 0.0% 0.5%
0.0% 0.0% 0.0% 0.0% 0.0% 0.1% 4.1% 0.0% 0.0% 0.0% 0.0% 0.3% 1.1% 0.0% 0.0% 0.0% 0.3%
0.0% 0.0% 0.0% 0.0% 0.0% 0.0% 1.4% 0.0% 0.0% 0.0% 0.0% 0.0% 0.0% 0.0% 0.0% 0.0% 0.1%
Narberth Town Centre: Costcutter, High Street
Spar, High Street Other
stores 0.0% 0.4% 0.0% 0.0% 0.0% 0.9% 15.4% 0.0% 0.0% 0.5% 0.0% 0.0% 0.0% 0.0% 0.0% 0.0% 1.0%
Newport 0.0% 0.0% 0.0% 0.0% 0.0% 0.0% 0.8% 0.0% 15.2% 1.5% 0.0% 0.0% 0.0% 0.0% 0.0% 0.0% 0.6%
Saundersfoot 0.0% 0.0% 0.0% 0.0% 0.0% 1.6% 1.7% 0.0% 0.0% 0.6% 0.7% 0.0% 0.0% 0.1% 0.9% 0.0% 0.4%
St Davids 0.0% 0.0% 11.9% 0.0% 0.0% 0.0% 0.0% 0.3% 0.0% 0.0% 2.9% 0.0% 0.0% 0.0% 0.0% 0.0% 0.9%
Tenby 0.0% 0.0% 0.0% 0.0% 0.0% 34.3% 0.0% 0.0% 0.0% 0.0% 0.0% 0.0% 0.0% 0.0% 0.2% 0.0% 3.0%
All Other ‐ Pembrokeshire 2.1% 4.3% 4.3% 8.2% 2.4% 10.7% 8.2% 11.1% 7.2% 5.8% 1.1% 0.5% 0.8% 0.0% 0.4% 0.0% 4.4%
SUB‐TOTAL: PEMBROKESHIRE 99.8% 96.8% 99.8% 99.9% 100.0% 96.4% 85.0% 98.3% 47.0% 9.0% 5.2% 0.8% 1.8% 0.3% 1.7% 2.1% 55.0%
23/01/2017
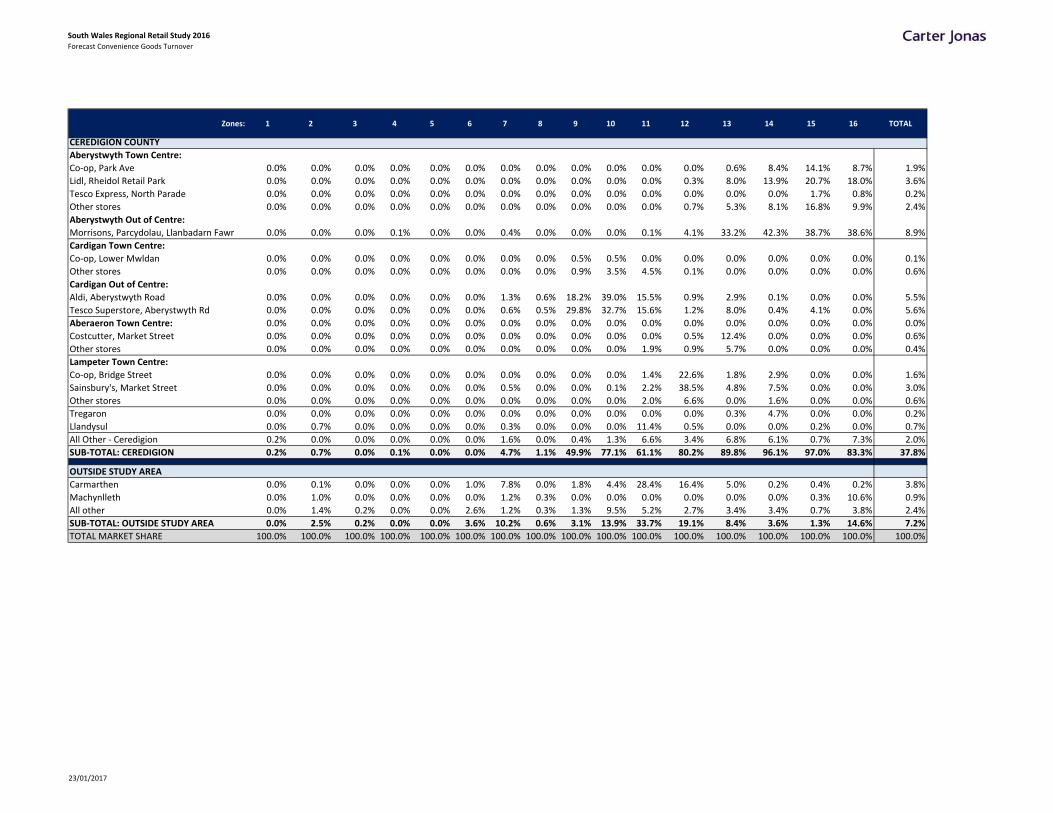
South Wales Regional Retail Study 2016Forecast Convenience Goods Turnover
Zones: 1 2 3 4 5 6 7 8 9 10 11 12 13 14 15 16 TOTAL
CEREDIGION COUNTY
Aberystwyth Town Centre:
Co‐op, Park Ave 0.0% 0.0% 0.0% 0.0% 0.0% 0.0% 0.0% 0.0% 0.0% 0.0% 0.0% 0.0% 0.6% 8.4% 14.1% 8.7% 1.9%
Lidl, Rheidol Retail Park 0.0% 0.0% 0.0% 0.0% 0.0% 0.0% 0.0% 0.0% 0.0% 0.0% 0.0% 0.3% 8.0% 13.9% 20.7% 18.0% 3.6%
Tesco Express, North Parade 0.0% 0.0% 0.0% 0.0% 0.0% 0.0% 0.0% 0.0% 0.0% 0.0% 0.0% 0.0% 0.0% 0.0% 1.7% 0.8% 0.2%
Other stores 0.0% 0.0% 0.0% 0.0% 0.0% 0.0% 0.0% 0.0% 0.0% 0.0% 0.0% 0.7% 5.3% 8.1% 16.8% 9.9% 2.4%
Aberystwyth Out of Centre:
Morrisons, Parcydolau, Llanbadarn Fawr 0.0% 0.0% 0.0% 0.1% 0.0% 0.0% 0.4% 0.0% 0.0% 0.0% 0.1% 4.1% 33.2% 42.3% 38.7% 38.6% 8.9%
Cardigan Town Centre:
Co‐op, Lower Mwldan 0.0% 0.0% 0.0% 0.0% 0.0% 0.0% 0.0% 0.0% 0.5% 0.5% 0.0% 0.0% 0.0% 0.0% 0.0% 0.0% 0.1%
Other stores 0.0% 0.0% 0.0% 0.0% 0.0% 0.0% 0.0% 0.0% 0.9% 3.5% 4.5% 0.1% 0.0% 0.0% 0.0% 0.0% 0.6%
Cardigan Out of Centre:
Aldi, Aberystwyth Road 0.0% 0.0% 0.0% 0.0% 0.0% 0.0% 1.3% 0.6% 18.2% 39.0% 15.5% 0.9% 2.9% 0.1% 0.0% 0.0% 5.5%
Tesco Superstore, Aberystwyth Rd 0.0% 0.0% 0.0% 0.0% 0.0% 0.0% 0.6% 0.5% 29.8% 32.7% 15.6% 1.2% 8.0% 0.4% 4.1% 0.0% 5.6%
Aberaeron Town Centre: 0.0% 0.0% 0.0% 0.0% 0.0% 0.0% 0.0% 0.0% 0.0% 0.0% 0.0% 0.0% 0.0% 0.0% 0.0% 0.0% 0.0%
Costcutter, Market Street 0.0% 0.0% 0.0% 0.0% 0.0% 0.0% 0.0% 0.0% 0.0% 0.0% 0.0% 0.5% 12.4% 0.0% 0.0% 0.0% 0.6%
Other stores 0.0% 0.0% 0.0% 0.0% 0.0% 0.0% 0.0% 0.0% 0.0% 0.0% 1.9% 0.9% 5.7% 0.0% 0.0% 0.0% 0.4%
Lampeter Town Centre:
Co‐op, Bridge Street 0.0% 0.0% 0.0% 0.0% 0.0% 0.0% 0.0% 0.0% 0.0% 0.0% 1.4% 22.6% 1.8% 2.9% 0.0% 0.0% 1.6%
Sainsbury's, Market Street 0.0% 0.0% 0.0% 0.0% 0.0% 0.0% 0.5% 0.0% 0.0% 0.1% 2.2% 38.5% 4.8% 7.5% 0.0% 0.0% 3.0%
Other stores 0.0% 0.0% 0.0% 0.0% 0.0% 0.0% 0.0% 0.0% 0.0% 0.0% 2.0% 6.6% 0.0% 1.6% 0.0% 0.0% 0.6%
Tregaron 0.0% 0.0% 0.0% 0.0% 0.0% 0.0% 0.0% 0.0% 0.0% 0.0% 0.0% 0.0% 0.3% 4.7% 0.0% 0.0% 0.2%
Llandysul 0.0% 0.7% 0.0% 0.0% 0.0% 0.0% 0.3% 0.0% 0.0% 0.0% 11.4% 0.5% 0.0% 0.0% 0.2% 0.0% 0.7%
All Other ‐ Ceredigion 0.2% 0.0% 0.0% 0.0% 0.0% 0.0% 1.6% 0.0% 0.4% 1.3% 6.6% 3.4% 6.8% 6.1% 0.7% 7.3% 2.0%
SUB‐TOTAL: CEREDIGION 0.2% 0.7% 0.0% 0.1% 0.0% 0.0% 4.7% 1.1% 49.9% 77.1% 61.1% 80.2% 89.8% 96.1% 97.0% 83.3% 37.8%
OUTSIDE STUDY AREA
Carmarthen 0.0% 0.1% 0.0% 0.0% 0.0% 1.0% 7.8% 0.0% 1.8% 4.4% 28.4% 16.4% 5.0% 0.2% 0.4% 0.2% 3.8%
Machynlleth 0.0% 1.0% 0.0% 0.0% 0.0% 0.0% 1.2% 0.3% 0.0% 0.0% 0.0% 0.0% 0.0% 0.0% 0.3% 10.6% 0.9%
All other 0.0% 1.4% 0.2% 0.0% 0.0% 2.6% 1.2% 0.3% 1.3% 9.5% 5.2% 2.7% 3.4% 3.4% 0.7% 3.8% 2.4%
SUB‐TOTAL: OUTSIDE STUDY AREA 0.0% 2.5% 0.2% 0.0% 0.0% 3.6% 10.2% 0.6% 3.1% 13.9% 33.7% 19.1% 8.4% 3.6% 1.3% 14.6% 7.2%
TOTAL MARKET SHARE 100.0% 100.0% 100.0% 100.0% 100.0% 100.0% 100.0% 100.0% 100.0% 100.0% 100.0% 100.0% 100.0% 100.0% 100.0% 100.0% 100.0%
23/01/2017

South Wales Regional Retail Study 2016Forecast Convenience Goods Turnover
TABLE 2: ALL CONVENIENCE GOODS ‐ 2016 MARKET SHARE ANALYSIS OF EXPENDITURE FLOWS (£M)
Zones: 1 2 3 4 5 6 7 8 9 10 11 12 13 14 15 16 TOTAL
TOTAL AVAILABLE EXPENDITURE (£m): £26.4 £13.5 £26.1 £39.2 £41.0 £38.2 £23.5 £27.4 £10.8 £43.1 £25.0 £26.0 £18.6 £21.0 £25.6 £33.2 £438.9
PEMBROKESHIRE COUNTY
Haverfordwest Town Centre:
Iceland, Picton Place £0.2 £0.1 £0.0 £0.8 £0.9 £0.5 £0.0 £0.0 £0.0 £0.0 £0.0 £0.0 £0.0 £0.0 £0.0 £0.4 £3.0
Other stores £1.0 £0.2 £0.8 £0.0 £0.0 £0.1 £0.2 £1.0 £0.0 £0.0 £0.0 £0.0 £0.0 £0.0 £0.0 £0.0 £3.3
Haversfordwest Out of Centre:
Aldi, Salutation Square £5.5 £2.9 £3.8 £4.0 £1.7 £0.5 £4.7 £4.9 £0.5 £0.0 £0.0 £0.0 £0.0 £0.0 £0.0 £0.0 £28.6
Lidl, Perrots Rd £2.7 £1.0 £2.6 £0.8 £0.0 £0.2 £1.1 £1.5 £0.0 £0.0 £0.0 £0.0 £0.0 £0.0 £0.0 £0.0 £9.9
Marks & Spencer, Withybush Retail Park £0.3 £0.2 £0.5 £0.3 £0.0 £0.2 £0.0 £0.3 £0.1 £0.0 £0.0 £0.0 £0.0 £0.0 £0.0 £0.0 £1.9
Morrisons, Meadow View £7.2 £4.3 £5.2 £2.5 £0.4 £1.0 £2.9 £5.0 £0.5 £0.2 £0.0 £0.0 £0.0 £0.0 £0.0 £0.0 £29.2
Tesco Extra, Fenton Trading Estate £8.9 £2.9 £8.1 £2.8 £0.8 £0.2 £2.5 £3.3 £0.3 £0.0 £0.0 £0.0 £0.0 £0.0 £0.0 £0.0 £29.8
Milford Haven Town Centre:
Spar, Charles Street £0.0 £0.0 £0.0 £0.3 £0.0 £0.0 £0.0 £0.0 £0.0 £0.0 £0.0 £0.0 £0.0 £0.0 £0.0 £0.0 £0.3
All stores £0.0 £0.0 £0.0 £2.1 £0.0 £0.0 £0.0 £0.0 £0.0 £0.0 £0.0 £0.0 £0.0 £0.0 £0.0 £0.0 £2.1
Milford Haven Out of Centre:
Lidl, Great N Road £0.0 £0.1 £0.4 £7.8 £0.0 £0.0 £0.0 £0.0 £0.0 £0.0 £0.0 £0.0 £0.0 £0.0 £0.0 £0.0 £8.3
Tesco, Havens Head Park £0.0 £0.4 £0.4 £10.8 £0.0 £0.0 £0.0 £0.0 £0.0 £0.0 £0.0 £0.0 £0.0 £0.0 £0.0 £0.0 £11.5
Pembroke Town Centre:
Co‐op, Main Street £0.0 £0.0 £0.0 £0.0 £0.9 £0.1 £0.0 £0.0 £0.0 £0.0 £0.0 £0.0 £0.0 £0.0 £0.0 £0.1 £1.0
Other stores £0.0 £0.0 £0.0 £0.0 £0.8 £0.0 £0.0 £0.0 £0.0 £0.0 £0.0 £0.0 £0.0 £0.0 £0.0 £0.0 £0.8
Pembroke Dock Town Centre:
Asda, Gordon St £0.0 £0.2 £0.0 £1.1 £9.6 £3.1 £0.2 £0.0 £0.0 £0.0 £0.0 £0.0 £0.0 £0.0 £0.0 £0.0 £14.3
Other stores £0.0 £0.0 £0.0 £0.0 £0.0 £0.3 £0.0 £0.0 £0.0 £0.0 £0.0 £0.0 £0.0 £0.0 £0.0 £0.2 £0.6
Pembroke Dock Out of Centre:
Lidl, Pier Road £0.0 £0.0 £0.0 £0.9 £9.3 £5.5 £0.2 £0.0 £0.0 £0.0 £0.0 £0.0 £0.0 £0.0 £0.0 £0.0 £15.9
Tesco Superstore, London Rd £0.0 £0.0 £0.0 £1.8 £15.5 £7.0 £0.7 £0.0 £0.0 £0.0 £0.0 £0.0 £0.0 £0.0 £0.0 £0.0 £25.1
Fishguard Town Centre:
Co‐op, High Street £0.0 £0.0 £0.0 £0.0 £0.0 £0.0 £0.0 £6.0 £1.0 £0.0 £0.0 £0.0 £0.0 £0.0 £0.0 £0.0 £7.0
Other stores £0.0 £0.0 £0.0 £0.0 £0.0 £0.0 £0.0 £1.8 £0.2 £0.0 £0.1 £0.0 £0.0 £0.0 £0.0 £0.0 £2.1
£0.0 £0.0 £0.0 £0.0 £0.0 £0.1 £1.0 £0.0 £0.0 £0.0 £0.0 £0.1 £0.2 £0.0 £0.0 £0.0 £1.3
£0.0 £0.0 £0.0 £0.0 £0.0 £0.0 £0.3 £0.0 £0.0 £0.0 £0.0 £0.0 £0.0 £0.0 £0.0 £0.0 £0.3
Narberth Town Centre: Costcutter, High Street
Spar, High Street Other
stores £0.0 £0.1 £0.0 £0.0 £0.0 £0.3 £3.6 £0.0 £0.0 £0.2 £0.0 £0.0 £0.0 £0.0 £0.0 £0.0 £4.2
Newport £0.0 £0.0 £0.0 £0.0 £0.0 £0.0 £0.2 £0.0 £1.6 £0.7 £0.0 £0.0 £0.0 £0.0 £0.0 £0.0 £2.5
Saundersfoot £0.0 £0.0 £0.0 £0.0 £0.0 £0.6 £0.4 £0.0 £0.0 £0.3 £0.2 £0.0 £0.0 £0.0 £0.2 £0.0 £1.7
St Davids £0.0 £0.0 £3.1 £0.0 £0.0 £0.0 £0.0 £0.1 £0.0 £0.0 £0.7 £0.0 £0.0 £0.0 £0.0 £0.0 £3.9
Tenby £0.0 £0.0 £0.0 £0.0 £0.0 £13.1 £0.0 £0.0 £0.0 £0.0 £0.0 £0.0 £0.0 £0.0 £0.0 £0.0 £13.1
All Other ‐ Pembrokeshire £0.6 £0.6 £1.1 £3.2 £1.0 £4.1 £1.9 £3.0 £0.8 £2.5 £0.3 £0.1 £0.1 £0.0 £0.1 £0.0 £19.4
SUB‐TOTAL: PEMBROKESHIRE £26.4 £13.1 £26.0 £39.2 £41.0 £36.9 £20.0 £26.9 £5.1 £3.9 £1.3 £0.2 £0.3 £0.1 £0.4 £0.7 £241.4
23/01/2017

South Wales Regional Retail Study 2016Forecast Convenience Goods Turnover
Zones: 1 2 3 4 5 6 7 8 9 10 11 12 13 14 15 16 TOTAL
CEREDIGION COUNTY
Aberystwyth Town Centre:
Co‐op, Park Ave £0.0 £0.0 £0.0 £0.0 £0.0 £0.0 £0.0 £0.0 £0.0 £0.0 £0.0 £0.0 £0.1 £1.8 £3.6 £2.9 £8.4
Lidl, Rheidol Retail Park £0.0 £0.0 £0.0 £0.0 £0.0 £0.0 £0.0 £0.0 £0.0 £0.0 £0.0 £0.1 £1.5 £2.9 £5.3 £6.0 £15.8
Tesco Express, North Parade £0.0 £0.0 £0.0 £0.0 £0.0 £0.0 £0.0 £0.0 £0.0 £0.0 £0.0 £0.0 £0.0 £0.0 £0.4 £0.3 £0.7
Other stores £0.0 £0.0 £0.0 £0.0 £0.0 £0.0 £0.0 £0.0 £0.0 £0.0 £0.0 £0.2 £1.0 £1.7 £4.3 £3.3 £10.5
Aberystwyth Out of Centre:
Morrisons, Parcydolau, Llanbadarn Fawr £0.0 £0.0 £0.0 £0.0 £0.0 £0.0 £0.1 £0.0 £0.0 £0.0 £0.0 £1.1 £6.2 £8.9 £9.9 £12.8 £39.0
Cardigan Town Centre:
Co‐op, Lower Mwldan £0.0 £0.0 £0.0 £0.0 £0.0 £0.0 £0.0 £0.0 £0.1 £0.2 £0.0 £0.0 £0.0 £0.0 £0.0 £0.0 £0.3
Other stores £0.0 £0.0 £0.0 £0.0 £0.0 £0.0 £0.0 £0.0 £0.1 £1.5 £1.1 £0.0 £0.0 £0.0 £0.0 £0.0 £2.8
Cardigan Out of Centre:
Aldi, Aberystwyth Road £0.0 £0.0 £0.0 £0.0 £0.0 £0.0 £0.3 £0.2 £2.0 £16.8 £3.9 £0.2 £0.5 £0.0 £0.0 £0.0 £23.9
Tesco Superstore, Aberystwyth Rd £0.0 £0.0 £0.0 £0.0 £0.0 £0.0 £0.1 £0.1 £3.2 £14.1 £3.9 £0.3 £1.5 £0.1 £1.1 £0.0 £24.5
Aberaeron Town Centre:
Costcutter, Market Street £0.0 £0.0 £0.0 £0.0 £0.0 £0.0 £0.0 £0.0 £0.0 £0.0 £0.0 £0.1 £2.3 £0.0 £0.0 £0.0 £2.4
Other stores £0.0 £0.0 £0.0 £0.0 £0.0 £0.0 £0.0 £0.0 £0.0 £0.0 £0.5 £0.2 £1.1 £0.0 £0.0 £0.0 £1.8
Lampeter Town Centre:
Co‐op, Bridge Street £0.0 £0.0 £0.0 £0.0 £0.0 £0.0 £0.0 £0.0 £0.0 £0.0 £0.3 £5.9 £0.3 £0.6 £0.0 £0.0 £7.2
Sainsbury's, Market Street £0.0 £0.0 £0.0 £0.0 £0.0 £0.0 £0.1 £0.0 £0.0 £0.0 £0.5 £10.0 £0.9 £1.6 £0.0 £0.0 £13.2
Other stores £0.0 £0.0 £0.0 £0.0 £0.0 £0.0 £0.0 £0.0 £0.0 £0.0 £0.5 £1.7 £0.0 £0.3 £0.0 £0.0 £2.5
Tregaron £0.0 £0.0 £0.0 £0.0 £0.0 £0.0 £0.0 £0.0 £0.0 £0.0 £0.0 £0.0 £0.1 £1.0 £0.0 £0.0 £1.0
Llandysul £0.0 £0.1 £0.0 £0.0 £0.0 £0.0 £0.1 £0.0 £0.0 £0.0 £2.8 £0.1 £0.0 £0.0 £0.0 £0.0 £3.2
All Other ‐ Ceredigion £0.1 £0.0 £0.0 £0.0 £0.0 £0.0 £0.4 £0.0 £0.0 £0.5 £1.7 £0.9 £1.3 £1.3 £0.2 £2.4 £8.7
SUB‐TOTAL: CEREDIGION £0.1 £0.1 £0.0 £0.0 £0.0 £0.0 £1.1 £0.3 £5.4 £33.2 £15.3 £20.9 £16.7 £20.2 £24.9 £27.7 £165.9
OUTSIDE STUDY AREA
Carmarthen £0.0 £0.0 £0.0 £0.0 £0.0 £0.4 £1.8 £0.0 £0.2 £1.9 £7.1 £4.3 £0.9 £0.0 £0.1 £0.1 £16.9
Machynlleth £0.0 £0.1 £0.0 £0.0 £0.0 £0.0 £0.3 £0.1 £0.0 £0.0 £0.0 £0.0 £0.0 £0.0 £0.1 £3.5 £4.1
All other £0.0 £0.2 £0.0 £0.0 £0.0 £1.0 £0.3 £0.1 £0.1 £4.1 £1.3 £0.7 £0.6 £0.7 £0.2 £1.3 £10.6
SUB‐TOTAL: OUTSIDE STUDY AREA £0.0 £0.3 £0.0 £0.0 £0.0 £1.4 £2.4 £0.2 £0.3 £6.0 £8.4 £5.0 £1.6 £0.8 £0.3 £4.8 £31.6
TOTAL MARKET SHARE £26.4 £13.5 £26.1 £39.2 £41.0 £38.2 £23.5 £27.4 £10.8 £43.1 £25.0 £26.0 £18.6 £21.0 £25.6 £33.2 £438.9
23/01/2017
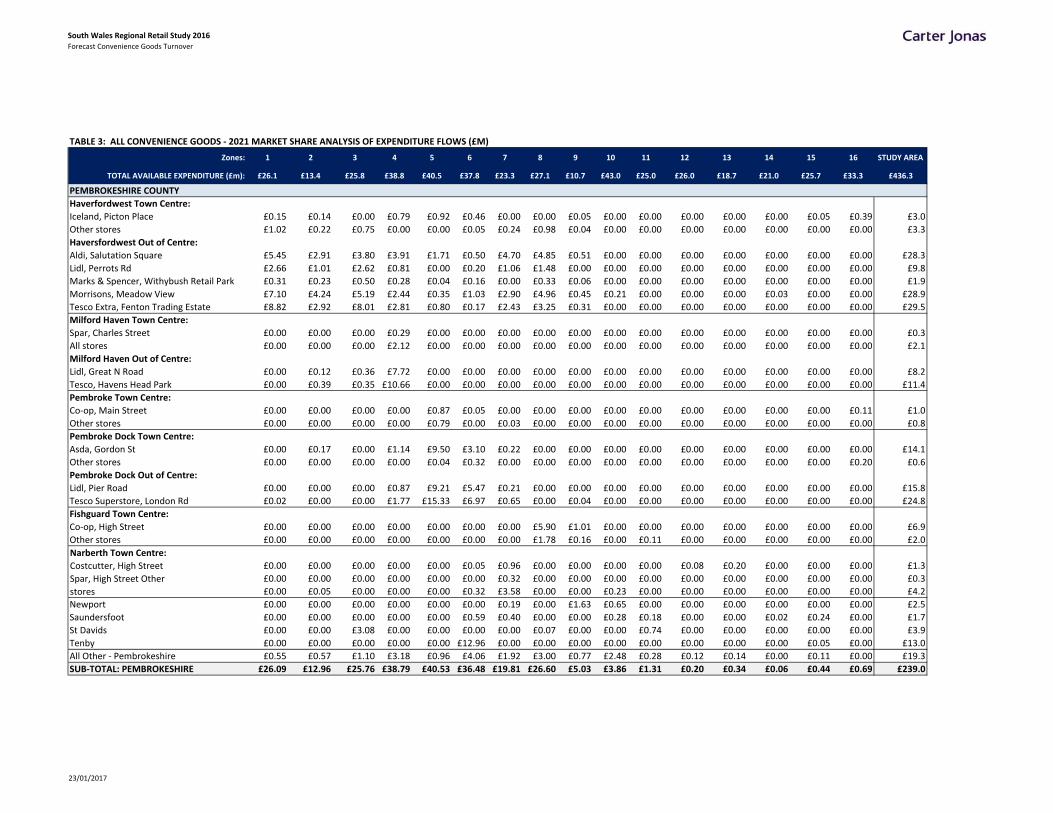
South Wales Regional Retail Study 2016Forecast Convenience Goods Turnover
TABLE 3: ALL CONVENIENCE GOODS ‐ 2021 MARKET SHARE ANALYSIS OF EXPENDITURE FLOWS (£M)
Zones: 1 2 3 4 5 6 7 8 9 10 11 12 13 14 15 16 STUDY AREA
TOTAL AVAILABLE EXPENDITURE (£m): £26.1 £13.4 £25.8 £38.8 £40.5 £37.8 £23.3 £27.1 £10.7 £43.0 £25.0 £26.0 £18.7 £21.0 £25.7 £33.3 £436.3
PEMBROKESHIRE COUNTY
Haverfordwest Town Centre:
Iceland, Picton Place £0.15 £0.14 £0.00 £0.79 £0.92 £0.46 £0.00 £0.00 £0.05 £0.00 £0.00 £0.00 £0.00 £0.00 £0.05 £0.39 £3.0
Other stores £1.02 £0.22 £0.75 £0.00 £0.00 £0.05 £0.24 £0.98 £0.04 £0.00 £0.00 £0.00 £0.00 £0.00 £0.00 £0.00 £3.3
Haversfordwest Out of Centre:
Aldi, Salutation Square £5.45 £2.91 £3.80 £3.91 £1.71 £0.50 £4.70 £4.85 £0.51 £0.00 £0.00 £0.00 £0.00 £0.00 £0.00 £0.00 £28.3
Lidl, Perrots Rd £2.66 £1.01 £2.62 £0.81 £0.00 £0.20 £1.06 £1.48 £0.00 £0.00 £0.00 £0.00 £0.00 £0.00 £0.00 £0.00 £9.8
Marks & Spencer, Withybush Retail Park £0.31 £0.23 £0.50 £0.28 £0.04 £0.16 £0.00 £0.33 £0.06 £0.00 £0.00 £0.00 £0.00 £0.00 £0.00 £0.00 £1.9
Morrisons, Meadow View £7.10 £4.24 £5.19 £2.44 £0.35 £1.03 £2.90 £4.96 £0.45 £0.21 £0.00 £0.00 £0.00 £0.03 £0.00 £0.00 £28.9
Tesco Extra, Fenton Trading Estate £8.82 £2.92 £8.01 £2.81 £0.80 £0.17 £2.43 £3.25 £0.31 £0.00 £0.00 £0.00 £0.00 £0.00 £0.00 £0.00 £29.5
Milford Haven Town Centre:
Spar, Charles Street £0.00 £0.00 £0.00 £0.29 £0.00 £0.00 £0.00 £0.00 £0.00 £0.00 £0.00 £0.00 £0.00 £0.00 £0.00 £0.00 £0.3
All stores £0.00 £0.00 £0.00 £2.12 £0.00 £0.00 £0.00 £0.00 £0.00 £0.00 £0.00 £0.00 £0.00 £0.00 £0.00 £0.00 £2.1
Milford Haven Out of Centre:
Lidl, Great N Road £0.00 £0.12 £0.36 £7.72 £0.00 £0.00 £0.00 £0.00 £0.00 £0.00 £0.00 £0.00 £0.00 £0.00 £0.00 £0.00 £8.2
Tesco, Havens Head Park £0.00 £0.39 £0.35 £10.66 £0.00 £0.00 £0.00 £0.00 £0.00 £0.00 £0.00 £0.00 £0.00 £0.00 £0.00 £0.00 £11.4
Pembroke Town Centre:
Co‐op, Main Street £0.00 £0.00 £0.00 £0.00 £0.87 £0.05 £0.00 £0.00 £0.00 £0.00 £0.00 £0.00 £0.00 £0.00 £0.00 £0.11 £1.0
Other stores £0.00 £0.00 £0.00 £0.00 £0.79 £0.00 £0.03 £0.00 £0.00 £0.00 £0.00 £0.00 £0.00 £0.00 £0.00 £0.00 £0.8
Pembroke Dock Town Centre:
Asda, Gordon St £0.00 £0.17 £0.00 £1.14 £9.50 £3.10 £0.22 £0.00 £0.00 £0.00 £0.00 £0.00 £0.00 £0.00 £0.00 £0.00 £14.1
Other stores £0.00 £0.00 £0.00 £0.00 £0.04 £0.32 £0.00 £0.00 £0.00 £0.00 £0.00 £0.00 £0.00 £0.00 £0.00 £0.20 £0.6
Pembroke Dock Out of Centre:
Lidl, Pier Road £0.00 £0.00 £0.00 £0.87 £9.21 £5.47 £0.21 £0.00 £0.00 £0.00 £0.00 £0.00 £0.00 £0.00 £0.00 £0.00 £15.8
Tesco Superstore, London Rd £0.02 £0.00 £0.00 £1.77 £15.33 £6.97 £0.65 £0.00 £0.04 £0.00 £0.00 £0.00 £0.00 £0.00 £0.00 £0.00 £24.8
Fishguard Town Centre:
Co‐op, High Street £0.00 £0.00 £0.00 £0.00 £0.00 £0.00 £0.00 £5.90 £1.01 £0.00 £0.00 £0.00 £0.00 £0.00 £0.00 £0.00 £6.9
Other stores £0.00 £0.00 £0.00 £0.00 £0.00 £0.00 £0.00 £1.78 £0.16 £0.00 £0.11 £0.00 £0.00 £0.00 £0.00 £0.00 £2.0
£0.00 £0.00 £0.00 £0.00 £0.00 £0.05 £0.96 £0.00 £0.00 £0.00 £0.00 £0.08 £0.20 £0.00 £0.00 £0.00 £1.3
£0.00 £0.00 £0.00 £0.00 £0.00 £0.00 £0.32 £0.00 £0.00 £0.00 £0.00 £0.00 £0.00 £0.00 £0.00 £0.00 £0.3
Narberth Town Centre: Costcutter, High Street
Spar, High Street Other
stores £0.00 £0.05 £0.00 £0.00 £0.00 £0.32 £3.58 £0.00 £0.00 £0.23 £0.00 £0.00 £0.00 £0.00 £0.00 £0.00 £4.2
Newport £0.00 £0.00 £0.00 £0.00 £0.00 £0.00 £0.19 £0.00 £1.63 £0.65 £0.00 £0.00 £0.00 £0.00 £0.00 £0.00 £2.5
Saundersfoot £0.00 £0.00 £0.00 £0.00 £0.00 £0.59 £0.40 £0.00 £0.00 £0.28 £0.18 £0.00 £0.00 £0.02 £0.24 £0.00 £1.7
St Davids £0.00 £0.00 £3.08 £0.00 £0.00 £0.00 £0.00 £0.07 £0.00 £0.00 £0.74 £0.00 £0.00 £0.00 £0.00 £0.00 £3.9
Tenby £0.00 £0.00 £0.00 £0.00 £0.00 £12.96 £0.00 £0.00 £0.00 £0.00 £0.00 £0.00 £0.00 £0.00 £0.05 £0.00 £13.0
All Other ‐ Pembrokeshire £0.55 £0.57 £1.10 £3.18 £0.96 £4.06 £1.92 £3.00 £0.77 £2.48 £0.28 £0.12 £0.14 £0.00 £0.11 £0.00 £19.3
SUB‐TOTAL: PEMBROKESHIRE £26.09 £12.96 £25.76 £38.79 £40.53 £36.48 £19.81 £26.60 £5.03 £3.86 £1.31 £0.20 £0.34 £0.06 £0.44 £0.69 £239.0
23/01/2017
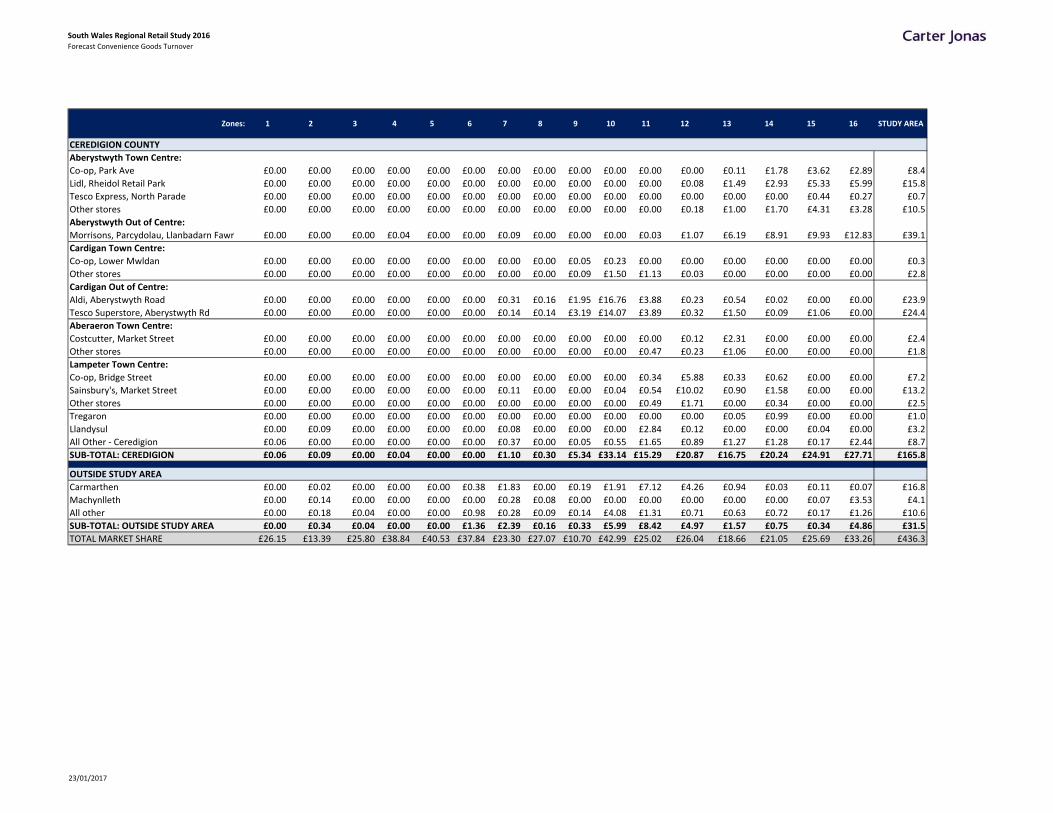
South Wales Regional Retail Study 2016Forecast Convenience Goods Turnover
Zones: 1 2 3 4 5 6 7 8 9 10 11 12 13 14 15 16 STUDY AREA
CEREDIGION COUNTY
Aberystwyth Town Centre:
Co‐op, Park Ave £0.00 £0.00 £0.00 £0.00 £0.00 £0.00 £0.00 £0.00 £0.00 £0.00 £0.00 £0.00 £0.11 £1.78 £3.62 £2.89 £8.4
Lidl, Rheidol Retail Park £0.00 £0.00 £0.00 £0.00 £0.00 £0.00 £0.00 £0.00 £0.00 £0.00 £0.00 £0.08 £1.49 £2.93 £5.33 £5.99 £15.8
Tesco Express, North Parade £0.00 £0.00 £0.00 £0.00 £0.00 £0.00 £0.00 £0.00 £0.00 £0.00 £0.00 £0.00 £0.00 £0.00 £0.44 £0.27 £0.7
Other stores £0.00 £0.00 £0.00 £0.00 £0.00 £0.00 £0.00 £0.00 £0.00 £0.00 £0.00 £0.18 £1.00 £1.70 £4.31 £3.28 £10.5
Aberystwyth Out of Centre:
Morrisons, Parcydolau, Llanbadarn Fawr £0.00 £0.00 £0.00 £0.04 £0.00 £0.00 £0.09 £0.00 £0.00 £0.00 £0.03 £1.07 £6.19 £8.91 £9.93 £12.83 £39.1
Cardigan Town Centre:
Co‐op, Lower Mwldan £0.00 £0.00 £0.00 £0.00 £0.00 £0.00 £0.00 £0.00 £0.05 £0.23 £0.00 £0.00 £0.00 £0.00 £0.00 £0.00 £0.3
Other stores £0.00 £0.00 £0.00 £0.00 £0.00 £0.00 £0.00 £0.00 £0.09 £1.50 £1.13 £0.03 £0.00 £0.00 £0.00 £0.00 £2.8
Cardigan Out of Centre:
Aldi, Aberystwyth Road £0.00 £0.00 £0.00 £0.00 £0.00 £0.00 £0.31 £0.16 £1.95 £16.76 £3.88 £0.23 £0.54 £0.02 £0.00 £0.00 £23.9
Tesco Superstore, Aberystwyth Rd £0.00 £0.00 £0.00 £0.00 £0.00 £0.00 £0.14 £0.14 £3.19 £14.07 £3.89 £0.32 £1.50 £0.09 £1.06 £0.00 £24.4
Aberaeron Town Centre:
Costcutter, Market Street £0.00 £0.00 £0.00 £0.00 £0.00 £0.00 £0.00 £0.00 £0.00 £0.00 £0.00 £0.12 £2.31 £0.00 £0.00 £0.00 £2.4
Other stores £0.00 £0.00 £0.00 £0.00 £0.00 £0.00 £0.00 £0.00 £0.00 £0.00 £0.47 £0.23 £1.06 £0.00 £0.00 £0.00 £1.8
Lampeter Town Centre:
Co‐op, Bridge Street £0.00 £0.00 £0.00 £0.00 £0.00 £0.00 £0.00 £0.00 £0.00 £0.00 £0.34 £5.88 £0.33 £0.62 £0.00 £0.00 £7.2
Sainsbury's, Market Street £0.00 £0.00 £0.00 £0.00 £0.00 £0.00 £0.11 £0.00 £0.00 £0.04 £0.54 £10.02 £0.90 £1.58 £0.00 £0.00 £13.2
Other stores £0.00 £0.00 £0.00 £0.00 £0.00 £0.00 £0.00 £0.00 £0.00 £0.00 £0.49 £1.71 £0.00 £0.34 £0.00 £0.00 £2.5
Tregaron £0.00 £0.00 £0.00 £0.00 £0.00 £0.00 £0.00 £0.00 £0.00 £0.00 £0.00 £0.00 £0.05 £0.99 £0.00 £0.00 £1.0
Llandysul £0.00 £0.09 £0.00 £0.00 £0.00 £0.00 £0.08 £0.00 £0.00 £0.00 £2.84 £0.12 £0.00 £0.00 £0.04 £0.00 £3.2
All Other ‐ Ceredigion £0.06 £0.00 £0.00 £0.00 £0.00 £0.00 £0.37 £0.00 £0.05 £0.55 £1.65 £0.89 £1.27 £1.28 £0.17 £2.44 £8.7
SUB‐TOTAL: CEREDIGION £0.06 £0.09 £0.00 £0.04 £0.00 £0.00 £1.10 £0.30 £5.34 £33.14 £15.29 £20.87 £16.75 £20.24 £24.91 £27.71 £165.8
OUTSIDE STUDY AREA
Carmarthen £0.00 £0.02 £0.00 £0.00 £0.00 £0.38 £1.83 £0.00 £0.19 £1.91 £7.12 £4.26 £0.94 £0.03 £0.11 £0.07 £16.8
Machynlleth £0.00 £0.14 £0.00 £0.00 £0.00 £0.00 £0.28 £0.08 £0.00 £0.00 £0.00 £0.00 £0.00 £0.00 £0.07 £3.53 £4.1
All other £0.00 £0.18 £0.04 £0.00 £0.00 £0.98 £0.28 £0.09 £0.14 £4.08 £1.31 £0.71 £0.63 £0.72 £0.17 £1.26 £10.6
SUB‐TOTAL: OUTSIDE STUDY AREA £0.00 £0.34 £0.04 £0.00 £0.00 £1.36 £2.39 £0.16 £0.33 £5.99 £8.42 £4.97 £1.57 £0.75 £0.34 £4.86 £31.5
TOTAL MARKET SHARE £26.15 £13.39 £25.80 £38.84 £40.53 £37.84 £23.30 £27.07 £10.70 £42.99 £25.02 £26.04 £18.66 £21.05 £25.69 £33.26 £436.3
23/01/2017
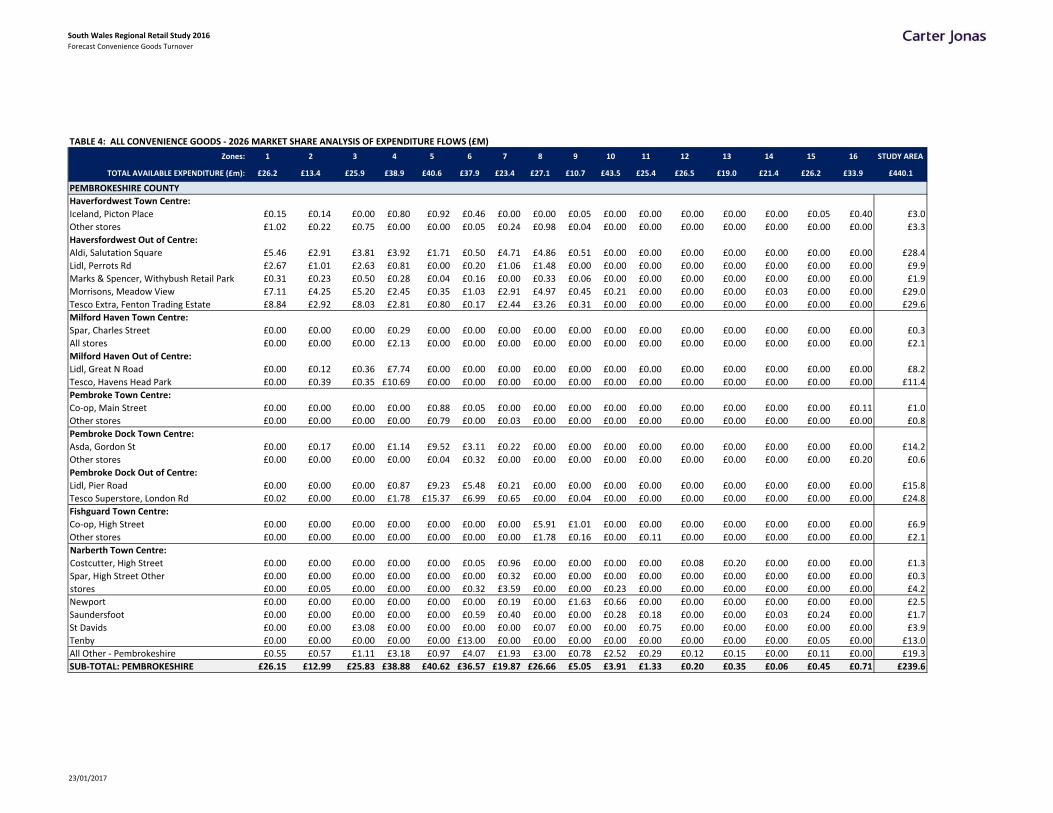
South Wales Regional Retail Study 2016Forecast Convenience Goods Turnover
TABLE 4: ALL CONVENIENCE GOODS ‐ 2026 MARKET SHARE ANALYSIS OF EXPENDITURE FLOWS (£M)
Zones: 1 2 3 4 5 6 7 8 9 10 11 12 13 14 15 16 STUDY AREA
TOTAL AVAILABLE EXPENDITURE (£m): £26.2 £13.4 £25.9 £38.9 £40.6 £37.9 £23.4 £27.1 £10.7 £43.5 £25.4 £26.5 £19.0 £21.4 £26.2 £33.9 £440.1
PEMBROKESHIRE COUNTY
Haverfordwest Town Centre:
Iceland, Picton Place £0.15 £0.14 £0.00 £0.80 £0.92 £0.46 £0.00 £0.00 £0.05 £0.00 £0.00 £0.00 £0.00 £0.00 £0.05 £0.40 £3.0
Other stores £1.02 £0.22 £0.75 £0.00 £0.00 £0.05 £0.24 £0.98 £0.04 £0.00 £0.00 £0.00 £0.00 £0.00 £0.00 £0.00 £3.3
Haversfordwest Out of Centre:
Aldi, Salutation Square £5.46 £2.91 £3.81 £3.92 £1.71 £0.50 £4.71 £4.86 £0.51 £0.00 £0.00 £0.00 £0.00 £0.00 £0.00 £0.00 £28.4
Lidl, Perrots Rd £2.67 £1.01 £2.63 £0.81 £0.00 £0.20 £1.06 £1.48 £0.00 £0.00 £0.00 £0.00 £0.00 £0.00 £0.00 £0.00 £9.9
Marks & Spencer, Withybush Retail Park £0.31 £0.23 £0.50 £0.28 £0.04 £0.16 £0.00 £0.33 £0.06 £0.00 £0.00 £0.00 £0.00 £0.00 £0.00 £0.00 £1.9
Morrisons, Meadow View £7.11 £4.25 £5.20 £2.45 £0.35 £1.03 £2.91 £4.97 £0.45 £0.21 £0.00 £0.00 £0.00 £0.03 £0.00 £0.00 £29.0
Tesco Extra, Fenton Trading Estate £8.84 £2.92 £8.03 £2.81 £0.80 £0.17 £2.44 £3.26 £0.31 £0.00 £0.00 £0.00 £0.00 £0.00 £0.00 £0.00 £29.6
Milford Haven Town Centre:
Spar, Charles Street £0.00 £0.00 £0.00 £0.29 £0.00 £0.00 £0.00 £0.00 £0.00 £0.00 £0.00 £0.00 £0.00 £0.00 £0.00 £0.00 £0.3
All stores £0.00 £0.00 £0.00 £2.13 £0.00 £0.00 £0.00 £0.00 £0.00 £0.00 £0.00 £0.00 £0.00 £0.00 £0.00 £0.00 £2.1
Milford Haven Out of Centre:
Lidl, Great N Road £0.00 £0.12 £0.36 £7.74 £0.00 £0.00 £0.00 £0.00 £0.00 £0.00 £0.00 £0.00 £0.00 £0.00 £0.00 £0.00 £8.2
Tesco, Havens Head Park £0.00 £0.39 £0.35 £10.69 £0.00 £0.00 £0.00 £0.00 £0.00 £0.00 £0.00 £0.00 £0.00 £0.00 £0.00 £0.00 £11.4
Pembroke Town Centre:
Co‐op, Main Street £0.00 £0.00 £0.00 £0.00 £0.88 £0.05 £0.00 £0.00 £0.00 £0.00 £0.00 £0.00 £0.00 £0.00 £0.00 £0.11 £1.0
Other stores £0.00 £0.00 £0.00 £0.00 £0.79 £0.00 £0.03 £0.00 £0.00 £0.00 £0.00 £0.00 £0.00 £0.00 £0.00 £0.00 £0.8
Pembroke Dock Town Centre:
Asda, Gordon St £0.00 £0.17 £0.00 £1.14 £9.52 £3.11 £0.22 £0.00 £0.00 £0.00 £0.00 £0.00 £0.00 £0.00 £0.00 £0.00 £14.2
Other stores £0.00 £0.00 £0.00 £0.00 £0.04 £0.32 £0.00 £0.00 £0.00 £0.00 £0.00 £0.00 £0.00 £0.00 £0.00 £0.20 £0.6
Pembroke Dock Out of Centre:
Lidl, Pier Road £0.00 £0.00 £0.00 £0.87 £9.23 £5.48 £0.21 £0.00 £0.00 £0.00 £0.00 £0.00 £0.00 £0.00 £0.00 £0.00 £15.8
Tesco Superstore, London Rd £0.02 £0.00 £0.00 £1.78 £15.37 £6.99 £0.65 £0.00 £0.04 £0.00 £0.00 £0.00 £0.00 £0.00 £0.00 £0.00 £24.8
Fishguard Town Centre:
Co‐op, High Street £0.00 £0.00 £0.00 £0.00 £0.00 £0.00 £0.00 £5.91 £1.01 £0.00 £0.00 £0.00 £0.00 £0.00 £0.00 £0.00 £6.9
Other stores £0.00 £0.00 £0.00 £0.00 £0.00 £0.00 £0.00 £1.78 £0.16 £0.00 £0.11 £0.00 £0.00 £0.00 £0.00 £0.00 £2.1
£0.00 £0.00 £0.00 £0.00 £0.00 £0.05 £0.96 £0.00 £0.00 £0.00 £0.00 £0.08 £0.20 £0.00 £0.00 £0.00 £1.3
£0.00 £0.00 £0.00 £0.00 £0.00 £0.00 £0.32 £0.00 £0.00 £0.00 £0.00 £0.00 £0.00 £0.00 £0.00 £0.00 £0.3
Narberth Town Centre: Costcutter, High Street
Spar, High Street Other
stores £0.00 £0.05 £0.00 £0.00 £0.00 £0.32 £3.59 £0.00 £0.00 £0.23 £0.00 £0.00 £0.00 £0.00 £0.00 £0.00 £4.2
Newport £0.00 £0.00 £0.00 £0.00 £0.00 £0.00 £0.19 £0.00 £1.63 £0.66 £0.00 £0.00 £0.00 £0.00 £0.00 £0.00 £2.5
Saundersfoot £0.00 £0.00 £0.00 £0.00 £0.00 £0.59 £0.40 £0.00 £0.00 £0.28 £0.18 £0.00 £0.00 £0.03 £0.24 £0.00 £1.7
St Davids £0.00 £0.00 £3.08 £0.00 £0.00 £0.00 £0.00 £0.07 £0.00 £0.00 £0.75 £0.00 £0.00 £0.00 £0.00 £0.00 £3.9
Tenby £0.00 £0.00 £0.00 £0.00 £0.00 £13.00 £0.00 £0.00 £0.00 £0.00 £0.00 £0.00 £0.00 £0.00 £0.05 £0.00 £13.0
All Other ‐ Pembrokeshire £0.55 £0.57 £1.11 £3.18 £0.97 £4.07 £1.93 £3.00 £0.78 £2.52 £0.29 £0.12 £0.15 £0.00 £0.11 £0.00 £19.3
SUB‐TOTAL: PEMBROKESHIRE £26.15 £12.99 £25.83 £38.88 £40.62 £36.57 £19.87 £26.66 £5.05 £3.91 £1.33 £0.20 £0.35 £0.06 £0.45 £0.71 £239.6
23/01/2017

South Wales Regional Retail Study 2016Forecast Convenience Goods Turnover
Zones: 1 2 3 4 5 6 7 8 9 10 11 12 13 14 15 16 STUDY AREA
CEREDIGION COUNTY
Aberystwyth Town Centre:
Co‐op, Park Ave £0.00 £0.00 £0.00 £0.00 £0.00 £0.00 £0.00 £0.00 £0.00 £0.00 £0.00 £0.00 £0.11 £1.81 £3.69 £2.94 £8.5
Lidl, Rheidol Retail Park £0.00 £0.00 £0.00 £0.00 £0.00 £0.00 £0.00 £0.00 £0.00 £0.00 £0.00 £0.08 £1.52 £2.99 £5.43 £6.11 £16.1
Tesco Express, North Parade £0.00 £0.00 £0.00 £0.00 £0.00 £0.00 £0.00 £0.00 £0.00 £0.00 £0.00 £0.00 £0.00 £0.00 £0.45 £0.28 £0.7
Other stores £0.00 £0.00 £0.00 £0.00 £0.00 £0.00 £0.00 £0.00 £0.00 £0.00 £0.00 £0.18 £1.02 £1.73 £4.39 £3.34 £10.7
Aberystwyth Out of Centre:
Morrisons, Parcydolau, Llanbadarn Fawr £0.00 £0.00 £0.00 £0.04 £0.00 £0.00 £0.09 £0.00 £0.00 £0.00 £0.03 £1.09 £6.30 £9.08 £10.12 £13.07 £39.8
Cardigan Town Centre:
Co‐op, Lower Mwldan £0.00 £0.00 £0.00 £0.00 £0.00 £0.00 £0.00 £0.00 £0.05 £0.23 £0.00 £0.00 £0.00 £0.00 £0.00 £0.00 £0.3
Other stores £0.00 £0.00 £0.00 £0.00 £0.00 £0.00 £0.00 £0.00 £0.09 £1.52 £1.15 £0.03 £0.00 £0.00 £0.00 £0.00 £2.8
Cardigan Out of Centre:
Aldi, Aberystwyth Road £0.00 £0.00 £0.00 £0.00 £0.00 £0.00 £0.31 £0.16 £1.96 £16.97 £3.94 £0.24 £0.56 £0.03 £0.00 £0.00 £24.2
Tesco Superstore, Aberystwyth Rd £0.00 £0.00 £0.00 £0.00 £0.00 £0.00 £0.14 £0.14 £3.20 £14.25 £3.95 £0.32 £1.53 £0.09 £1.08 £0.00 £24.7
Aberaeron Town Centre:
Costcutter, Market Street £0.00 £0.00 £0.00 £0.00 £0.00 £0.00 £0.00 £0.00 £0.00 £0.00 £0.00 £0.12 £2.35 £0.00 £0.00 £0.00 £2.5
Other stores £0.00 £0.00 £0.00 £0.00 £0.00 £0.00 £0.00 £0.00 £0.00 £0.00 £0.48 £0.23 £1.08 £0.00 £0.00 £0.00 £1.8
Lampeter Town Centre:
Co‐op, Bridge Street £0.00 £0.00 £0.00 £0.00 £0.00 £0.00 £0.00 £0.00 £0.00 £0.00 £0.35 £5.97 £0.34 £0.63 £0.00 £0.00 £7.3
Sainsbury's, Market Street £0.00 £0.00 £0.00 £0.00 £0.00 £0.00 £0.11 £0.00 £0.00 £0.04 £0.55 £10.18 £0.91 £1.61 £0.00 £0.00 £13.4
Other stores £0.00 £0.00 £0.00 £0.00 £0.00 £0.00 £0.00 £0.00 £0.00 £0.00 £0.50 £1.74 £0.00 £0.35 £0.00 £0.00 £2.6
Tregaron £0.00 £0.00 £0.00 £0.00 £0.00 £0.00 £0.00 £0.00 £0.00 £0.00 £0.00 £0.00 £0.05 £1.00 £0.00 £0.00 £1.1
Llandysul £0.00 £0.09 £0.00 £0.00 £0.00 £0.00 £0.08 £0.00 £0.00 £0.00 £2.89 £0.12 £0.00 £0.00 £0.04 £0.00 £3.2
All Other ‐ Ceredigion £0.06 £0.00 £0.00 £0.00 £0.00 £0.00 £0.37 £0.00 £0.05 £0.55 £1.68 £0.91 £1.30 £1.30 £0.18 £2.49 £8.9
SUB‐TOTAL: CEREDIGION £0.06 £0.09 £0.00 £0.04 £0.00 £0.00 £1.10 £0.31 £5.35 £33.57 £15.52 £21.21 £17.07 £20.62 £25.38 £28.23 £168.6
OUTSIDE STUDY AREA
Carmarthen £0.00 £0.02 £0.00 £0.00 £0.00 £0.38 £1.83 £0.00 £0.19 £1.93 £7.23 £4.33 £0.95 £0.03 £0.11 £0.07 £17.1
Machynlleth £0.00 £0.14 £0.00 £0.00 £0.00 £0.00 £0.28 £0.08 £0.00 £0.00 £0.00 £0.00 £0.00 £0.00 £0.07 £3.59 £4.2
All other £0.00 £0.18 £0.04 £0.00 £0.00 £0.98 £0.28 £0.09 £0.14 £4.14 £1.33 £0.72 £0.64 £0.73 £0.17 £1.29 £10.7
SUB‐TOTAL: OUTSIDE STUDY AREA £0.00 £0.34 £0.04 £0.00 £0.00 £1.36 £2.39 £0.17 £0.33 £6.07 £8.55 £5.05 £1.60 £0.77 £0.35 £4.95 £32.0
TOTAL MARKET SHARE £26.21 £13.42 £25.87 £38.93 £40.62 £37.93 £23.36 £27.13 £10.73 £43.54 £25.41 £26.46 £19.01 £21.45 £26.18 £33.89 £440.1
23/01/2017
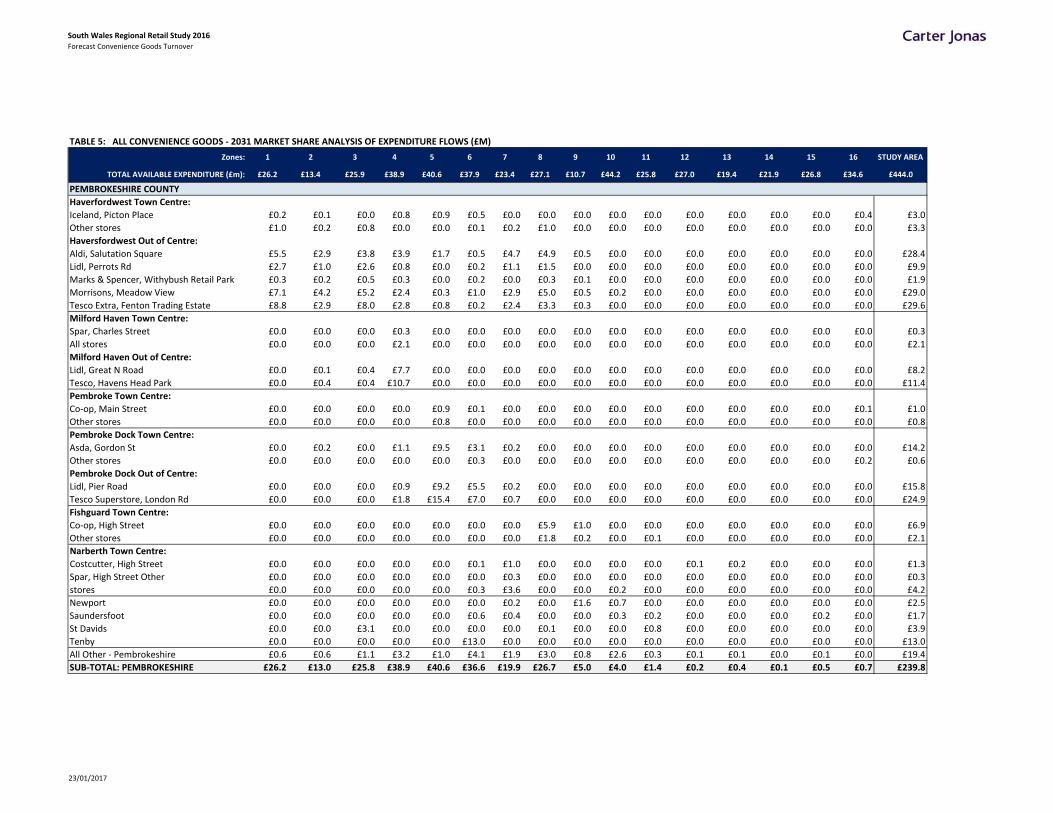
South Wales Regional Retail Study 2016Forecast Convenience Goods Turnover
TABLE 5: ALL CONVENIENCE GOODS ‐ 2031 MARKET SHARE ANALYSIS OF EXPENDITURE FLOWS (£M)
Zones: 1 2 3 4 5 6 7 8 9 10 11 12 13 14 15 16 STUDY AREA
TOTAL AVAILABLE EXPENDITURE (£m): £26.2 £13.4 £25.9 £38.9 £40.6 £37.9 £23.4 £27.1 £10.7 £44.2 £25.8 £27.0 £19.4 £21.9 £26.8 £34.6 £444.0
PEMBROKESHIRE COUNTY
Haverfordwest Town Centre:
Iceland, Picton Place £0.2 £0.1 £0.0 £0.8 £0.9 £0.5 £0.0 £0.0 £0.0 £0.0 £0.0 £0.0 £0.0 £0.0 £0.0 £0.4 £3.0
Other stores £1.0 £0.2 £0.8 £0.0 £0.0 £0.1 £0.2 £1.0 £0.0 £0.0 £0.0 £0.0 £0.0 £0.0 £0.0 £0.0 £3.3
Haversfordwest Out of Centre:
Aldi, Salutation Square £5.5 £2.9 £3.8 £3.9 £1.7 £0.5 £4.7 £4.9 £0.5 £0.0 £0.0 £0.0 £0.0 £0.0 £0.0 £0.0 £28.4
Lidl, Perrots Rd £2.7 £1.0 £2.6 £0.8 £0.0 £0.2 £1.1 £1.5 £0.0 £0.0 £0.0 £0.0 £0.0 £0.0 £0.0 £0.0 £9.9
Marks & Spencer, Withybush Retail Park £0.3 £0.2 £0.5 £0.3 £0.0 £0.2 £0.0 £0.3 £0.1 £0.0 £0.0 £0.0 £0.0 £0.0 £0.0 £0.0 £1.9
Morrisons, Meadow View £7.1 £4.2 £5.2 £2.4 £0.3 £1.0 £2.9 £5.0 £0.5 £0.2 £0.0 £0.0 £0.0 £0.0 £0.0 £0.0 £29.0
Tesco Extra, Fenton Trading Estate £8.8 £2.9 £8.0 £2.8 £0.8 £0.2 £2.4 £3.3 £0.3 £0.0 £0.0 £0.0 £0.0 £0.0 £0.0 £0.0 £29.6
Milford Haven Town Centre:
Spar, Charles Street £0.0 £0.0 £0.0 £0.3 £0.0 £0.0 £0.0 £0.0 £0.0 £0.0 £0.0 £0.0 £0.0 £0.0 £0.0 £0.0 £0.3
All stores £0.0 £0.0 £0.0 £2.1 £0.0 £0.0 £0.0 £0.0 £0.0 £0.0 £0.0 £0.0 £0.0 £0.0 £0.0 £0.0 £2.1
Milford Haven Out of Centre:
Lidl, Great N Road £0.0 £0.1 £0.4 £7.7 £0.0 £0.0 £0.0 £0.0 £0.0 £0.0 £0.0 £0.0 £0.0 £0.0 £0.0 £0.0 £8.2
Tesco, Havens Head Park £0.0 £0.4 £0.4 £10.7 £0.0 £0.0 £0.0 £0.0 £0.0 £0.0 £0.0 £0.0 £0.0 £0.0 £0.0 £0.0 £11.4
Pembroke Town Centre:
Co‐op, Main Street £0.0 £0.0 £0.0 £0.0 £0.9 £0.1 £0.0 £0.0 £0.0 £0.0 £0.0 £0.0 £0.0 £0.0 £0.0 £0.1 £1.0
Other stores £0.0 £0.0 £0.0 £0.0 £0.8 £0.0 £0.0 £0.0 £0.0 £0.0 £0.0 £0.0 £0.0 £0.0 £0.0 £0.0 £0.8
Pembroke Dock Town Centre:
Asda, Gordon St £0.0 £0.2 £0.0 £1.1 £9.5 £3.1 £0.2 £0.0 £0.0 £0.0 £0.0 £0.0 £0.0 £0.0 £0.0 £0.0 £14.2
Other stores £0.0 £0.0 £0.0 £0.0 £0.0 £0.3 £0.0 £0.0 £0.0 £0.0 £0.0 £0.0 £0.0 £0.0 £0.0 £0.2 £0.6
Pembroke Dock Out of Centre:
Lidl, Pier Road £0.0 £0.0 £0.0 £0.9 £9.2 £5.5 £0.2 £0.0 £0.0 £0.0 £0.0 £0.0 £0.0 £0.0 £0.0 £0.0 £15.8
Tesco Superstore, London Rd £0.0 £0.0 £0.0 £1.8 £15.4 £7.0 £0.7 £0.0 £0.0 £0.0 £0.0 £0.0 £0.0 £0.0 £0.0 £0.0 £24.9
Fishguard Town Centre:
Co‐op, High Street £0.0 £0.0 £0.0 £0.0 £0.0 £0.0 £0.0 £5.9 £1.0 £0.0 £0.0 £0.0 £0.0 £0.0 £0.0 £0.0 £6.9
Other stores £0.0 £0.0 £0.0 £0.0 £0.0 £0.0 £0.0 £1.8 £0.2 £0.0 £0.1 £0.0 £0.0 £0.0 £0.0 £0.0 £2.1
£0.0 £0.0 £0.0 £0.0 £0.0 £0.1 £1.0 £0.0 £0.0 £0.0 £0.0 £0.1 £0.2 £0.0 £0.0 £0.0 £1.3
£0.0 £0.0 £0.0 £0.0 £0.0 £0.0 £0.3 £0.0 £0.0 £0.0 £0.0 £0.0 £0.0 £0.0 £0.0 £0.0 £0.3
Narberth Town Centre: Costcutter, High Street
Spar, High Street Other
stores £0.0 £0.0 £0.0 £0.0 £0.0 £0.3 £3.6 £0.0 £0.0 £0.2 £0.0 £0.0 £0.0 £0.0 £0.0 £0.0 £4.2
Newport £0.0 £0.0 £0.0 £0.0 £0.0 £0.0 £0.2 £0.0 £1.6 £0.7 £0.0 £0.0 £0.0 £0.0 £0.0 £0.0 £2.5
Saundersfoot £0.0 £0.0 £0.0 £0.0 £0.0 £0.6 £0.4 £0.0 £0.0 £0.3 £0.2 £0.0 £0.0 £0.0 £0.2 £0.0 £1.7
St Davids £0.0 £0.0 £3.1 £0.0 £0.0 £0.0 £0.0 £0.1 £0.0 £0.0 £0.8 £0.0 £0.0 £0.0 £0.0 £0.0 £3.9
Tenby £0.0 £0.0 £0.0 £0.0 £0.0 £13.0 £0.0 £0.0 £0.0 £0.0 £0.0 £0.0 £0.0 £0.0 £0.0 £0.0 £13.0
All Other ‐ Pembrokeshire £0.6 £0.6 £1.1 £3.2 £1.0 £4.1 £1.9 £3.0 £0.8 £2.6 £0.3 £0.1 £0.1 £0.0 £0.1 £0.0 £19.4
SUB‐TOTAL: PEMBROKESHIRE £26.2 £13.0 £25.8 £38.9 £40.6 £36.6 £19.9 £26.7 £5.0 £4.0 £1.4 £0.2 £0.4 £0.1 £0.5 £0.7 £239.8
23/01/2017
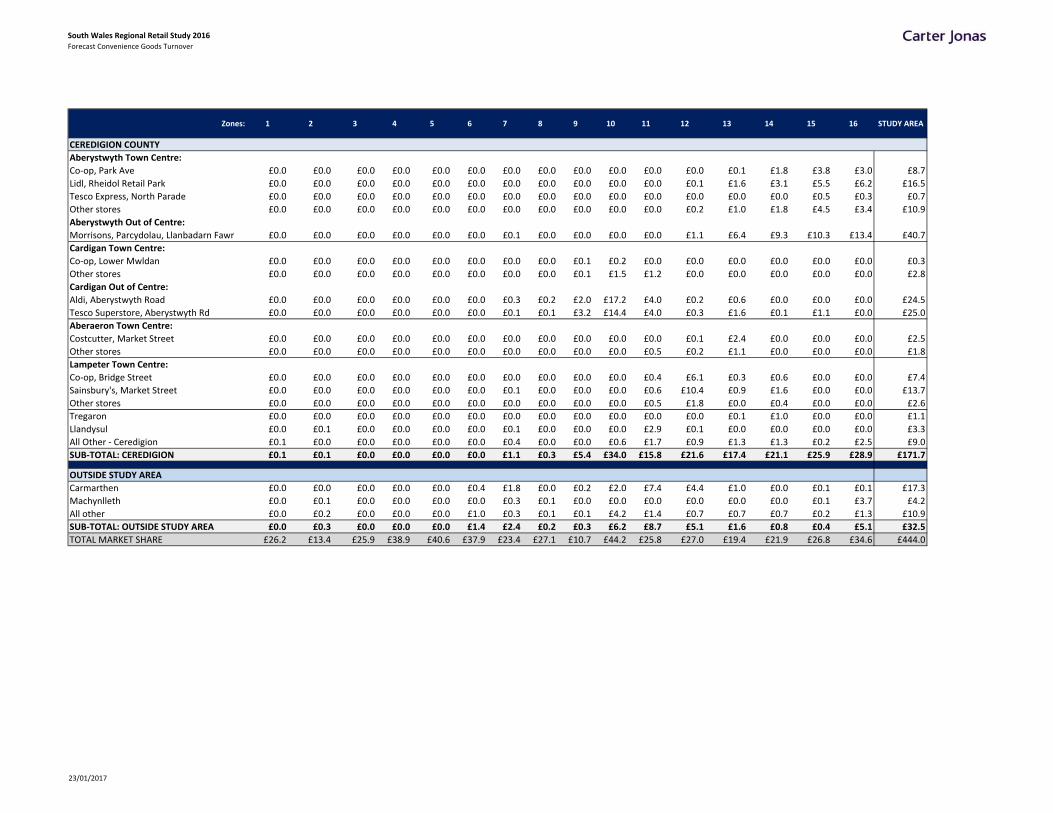
South Wales Regional Retail Study 2016Forecast Convenience Goods Turnover
Zones: 1 2 3 4 5 6 7 8 9 10 11 12 13 14 15 16 STUDY AREA
CEREDIGION COUNTY
Aberystwyth Town Centre:
Co‐op, Park Ave £0.0 £0.0 £0.0 £0.0 £0.0 £0.0 £0.0 £0.0 £0.0 £0.0 £0.0 £0.0 £0.1 £1.8 £3.8 £3.0 £8.7
Lidl, Rheidol Retail Park £0.0 £0.0 £0.0 £0.0 £0.0 £0.0 £0.0 £0.0 £0.0 £0.0 £0.0 £0.1 £1.6 £3.1 £5.5 £6.2 £16.5
Tesco Express, North Parade £0.0 £0.0 £0.0 £0.0 £0.0 £0.0 £0.0 £0.0 £0.0 £0.0 £0.0 £0.0 £0.0 £0.0 £0.5 £0.3 £0.7
Other stores £0.0 £0.0 £0.0 £0.0 £0.0 £0.0 £0.0 £0.0 £0.0 £0.0 £0.0 £0.2 £1.0 £1.8 £4.5 £3.4 £10.9
Aberystwyth Out of Centre:
Morrisons, Parcydolau, Llanbadarn Fawr £0.0 £0.0 £0.0 £0.0 £0.0 £0.0 £0.1 £0.0 £0.0 £0.0 £0.0 £1.1 £6.4 £9.3 £10.3 £13.4 £40.7
Cardigan Town Centre:
Co‐op, Lower Mwldan £0.0 £0.0 £0.0 £0.0 £0.0 £0.0 £0.0 £0.0 £0.1 £0.2 £0.0 £0.0 £0.0 £0.0 £0.0 £0.0 £0.3
Other stores £0.0 £0.0 £0.0 £0.0 £0.0 £0.0 £0.0 £0.0 £0.1 £1.5 £1.2 £0.0 £0.0 £0.0 £0.0 £0.0 £2.8
Cardigan Out of Centre:
Aldi, Aberystwyth Road £0.0 £0.0 £0.0 £0.0 £0.0 £0.0 £0.3 £0.2 £2.0 £17.2 £4.0 £0.2 £0.6 £0.0 £0.0 £0.0 £24.5
Tesco Superstore, Aberystwyth Rd £0.0 £0.0 £0.0 £0.0 £0.0 £0.0 £0.1 £0.1 £3.2 £14.4 £4.0 £0.3 £1.6 £0.1 £1.1 £0.0 £25.0
Aberaeron Town Centre:
Costcutter, Market Street £0.0 £0.0 £0.0 £0.0 £0.0 £0.0 £0.0 £0.0 £0.0 £0.0 £0.0 £0.1 £2.4 £0.0 £0.0 £0.0 £2.5
Other stores £0.0 £0.0 £0.0 £0.0 £0.0 £0.0 £0.0 £0.0 £0.0 £0.0 £0.5 £0.2 £1.1 £0.0 £0.0 £0.0 £1.8
Lampeter Town Centre:
Co‐op, Bridge Street £0.0 £0.0 £0.0 £0.0 £0.0 £0.0 £0.0 £0.0 £0.0 £0.0 £0.4 £6.1 £0.3 £0.6 £0.0 £0.0 £7.4
Sainsbury's, Market Street £0.0 £0.0 £0.0 £0.0 £0.0 £0.0 £0.1 £0.0 £0.0 £0.0 £0.6 £10.4 £0.9 £1.6 £0.0 £0.0 £13.7
Other stores £0.0 £0.0 £0.0 £0.0 £0.0 £0.0 £0.0 £0.0 £0.0 £0.0 £0.5 £1.8 £0.0 £0.4 £0.0 £0.0 £2.6
Tregaron £0.0 £0.0 £0.0 £0.0 £0.0 £0.0 £0.0 £0.0 £0.0 £0.0 £0.0 £0.0 £0.1 £1.0 £0.0 £0.0 £1.1
Llandysul £0.0 £0.1 £0.0 £0.0 £0.0 £0.0 £0.1 £0.0 £0.0 £0.0 £2.9 £0.1 £0.0 £0.0 £0.0 £0.0 £3.3
All Other ‐ Ceredigion £0.1 £0.0 £0.0 £0.0 £0.0 £0.0 £0.4 £0.0 £0.0 £0.6 £1.7 £0.9 £1.3 £1.3 £0.2 £2.5 £9.0
SUB‐TOTAL: CEREDIGION £0.1 £0.1 £0.0 £0.0 £0.0 £0.0 £1.1 £0.3 £5.4 £34.0 £15.8 £21.6 £17.4 £21.1 £25.9 £28.9 £171.7
OUTSIDE STUDY AREA
Carmarthen £0.0 £0.0 £0.0 £0.0 £0.0 £0.4 £1.8 £0.0 £0.2 £2.0 £7.4 £4.4 £1.0 £0.0 £0.1 £0.1 £17.3
Machynlleth £0.0 £0.1 £0.0 £0.0 £0.0 £0.0 £0.3 £0.1 £0.0 £0.0 £0.0 £0.0 £0.0 £0.0 £0.1 £3.7 £4.2
All other £0.0 £0.2 £0.0 £0.0 £0.0 £1.0 £0.3 £0.1 £0.1 £4.2 £1.4 £0.7 £0.7 £0.7 £0.2 £1.3 £10.9
SUB‐TOTAL: OUTSIDE STUDY AREA £0.0 £0.3 £0.0 £0.0 £0.0 £1.4 £2.4 £0.2 £0.3 £6.2 £8.7 £5.1 £1.6 £0.8 £0.4 £5.1 £32.5
TOTAL MARKET SHARE £26.2 £13.4 £25.9 £38.9 £40.6 £37.9 £23.4 £27.1 £10.7 £44.2 £25.8 £27.0 £19.4 £21.9 £26.8 £34.6 £444.0
23/01/2017

South Wales Regional Retail Study 2016Forecast Convenience Goods Turnover
TABLE 6: ALL CONVENIENCE GOODS ‐ 2036 MARKET SHARE ANALYSIS OF EXPENDITURE FLOWS (£M)
Zones: 1 2 3 4 5 6 7 8 9 10 11 12 13 14 15 16 STUDY AREA
TOTAL AVAILABLE EXPENDITURE (£m): £26.1 £13.4 £25.8 £38.8 £40.5 £37.8 £23.3 £27.0 £10.7 £44.7 £26.2 £27.4 £19.8 £22.4 £27.3 £35.4 £446.4
PEMBROKESHIRE COUNTY
Haverfordwest Town Centre:
Iceland, Picton Place £0.2 £0.1 £0.0 £0.8 £0.9 £0.5 £0.0 £0.0 £0.0 £0.0 £0.0 £0.0 £0.0 £0.0 £0.1 £0.4 £3.0
Other stores £1.0 £0.2 £0.7 £0.0 £0.0 £0.1 £0.2 £1.0 £0.0 £0.0 £0.0 £0.0 £0.0 £0.0 £0.0 £0.0 £3.3
Haversfordwest Out of Centre:
Aldi, Salutation Square £5.4 £2.9 £3.8 £3.9 £1.7 £0.5 £4.7 £4.8 £0.5 £0.0 £0.0 £0.0 £0.0 £0.0 £0.0 £0.0 £28.3
Lidl, Perrots Rd £2.7 £1.0 £2.6 £0.8 £0.0 £0.2 £1.1 £1.5 £0.0 £0.0 £0.0 £0.0 £0.0 £0.0 £0.0 £0.0 £9.8
Marks & Spencer, Withybush Retail Park £0.3 £0.2 £0.5 £0.3 £0.0 £0.2 £0.0 £0.3 £0.1 £0.0 £0.0 £0.0 £0.0 £0.0 £0.0 £0.0 £1.9
Morrisons, Meadow View £7.1 £4.2 £5.2 £2.4 £0.3 £1.0 £2.9 £4.9 £0.4 £0.2 £0.0 £0.0 £0.0 £0.0 £0.0 £0.0 £28.9
Tesco Extra, Fenton Trading Estate £8.8 £2.9 £8.0 £2.8 £0.8 £0.2 £2.4 £3.2 £0.3 £0.0 £0.0 £0.0 £0.0 £0.0 £0.0 £0.0 £29.5
Milford Haven Town Centre:
Spar, Charles Street £0.0 £0.0 £0.0 £0.3 £0.0 £0.0 £0.0 £0.0 £0.0 £0.0 £0.0 £0.0 £0.0 £0.0 £0.0 £0.0 £0.3
All stores £0.0 £0.0 £0.0 £2.1 £0.0 £0.0 £0.0 £0.0 £0.0 £0.0 £0.0 £0.0 £0.0 £0.0 £0.0 £0.0 £2.1
Milford Haven Out of Centre:
Lidl, Great N Road £0.0 £0.1 £0.4 £7.7 £0.0 £0.0 £0.0 £0.0 £0.0 £0.0 £0.0 £0.0 £0.0 £0.0 £0.0 £0.0 £8.2
Tesco, Havens Head Park £0.0 £0.4 £0.4 £10.6 £0.0 £0.0 £0.0 £0.0 £0.0 £0.0 £0.0 £0.0 £0.0 £0.0 £0.0 £0.0 £11.4
Pembroke Town Centre:
Co‐op, Main Street £0.0 £0.0 £0.0 £0.0 £0.9 £0.1 £0.0 £0.0 £0.0 £0.0 £0.0 £0.0 £0.0 £0.0 £0.0 £0.1 £1.0
Other stores £0.0 £0.0 £0.0 £0.0 £0.8 £0.0 £0.0 £0.0 £0.0 £0.0 £0.0 £0.0 £0.0 £0.0 £0.0 £0.0 £0.8
Pembroke Dock Town Centre:
Asda, Gordon St £0.0 £0.2 £0.0 £1.1 £9.5 £3.1 £0.2 £0.0 £0.0 £0.0 £0.0 £0.0 £0.0 £0.0 £0.0 £0.0 £14.1
Other stores £0.0 £0.0 £0.0 £0.0 £0.0 £0.3 £0.0 £0.0 £0.0 £0.0 £0.0 £0.0 £0.0 £0.0 £0.0 £0.2 £0.6
Pembroke Dock Out of Centre:
Lidl, Pier Road £0.0 £0.0 £0.0 £0.9 £9.2 £5.5 £0.2 £0.0 £0.0 £0.0 £0.0 £0.0 £0.0 £0.0 £0.0 £0.0 £15.7
Tesco Superstore, London Rd £0.0 £0.0 £0.0 £1.8 £15.3 £7.0 £0.6 £0.0 £0.0 £0.0 £0.0 £0.0 £0.0 £0.0 £0.0 £0.0 £24.7
Fishguard Town Centre:
Co‐op, High Street £0.0 £0.0 £0.0 £0.0 £0.0 £0.0 £0.0 £5.9 £1.0 £0.0 £0.0 £0.0 £0.0 £0.0 £0.0 £0.0 £6.9
Other stores £0.0 £0.0 £0.0 £0.0 £0.0 £0.0 £0.0 £1.8 £0.2 £0.0 £0.1 £0.0 £0.0 £0.0 £0.0 £0.0 £2.1
£0.0 £0.0 £0.0 £0.0 £0.0 £0.1 £1.0 £0.0 £0.0 £0.0 £0.0 £0.1 £0.2 £0.0 £0.0 £0.0 £1.3
£0.0 £0.0 £0.0 £0.0 £0.0 £0.0 £0.3 £0.0 £0.0 £0.0 £0.0 £0.0 £0.0 £0.0 £0.0 £0.0 £0.3
Narberth Town Centre: Costcutter, High Street
Spar, High Street Other
stores £0.0 £0.0 £0.0 £0.0 £0.0 £0.3 £3.6 £0.0 £0.0 £0.2 £0.0 £0.0 £0.0 £0.0 £0.0 £0.0 £4.2
Newport £0.0 £0.0 £0.0 £0.0 £0.0 £0.0 £0.2 £0.0 £1.6 £0.7 £0.0 £0.0 £0.0 £0.0 £0.0 £0.0 £2.5
Saundersfoot £0.0 £0.0 £0.0 £0.0 £0.0 £0.6 £0.4 £0.0 £0.0 £0.3 £0.2 £0.0 £0.0 £0.0 £0.3 £0.0 £1.7
St Davids £0.0 £0.0 £3.1 £0.0 £0.0 £0.0 £0.0 £0.1 £0.0 £0.0 £0.8 £0.0 £0.0 £0.0 £0.0 £0.0 £3.9
Tenby £0.0 £0.0 £0.0 £0.0 £0.0 £12.9 £0.0 £0.0 £0.0 £0.0 £0.0 £0.0 £0.0 £0.0 £0.0 £0.0 £13.0
All Other ‐ Pembrokeshire £0.6 £0.6 £1.1 £3.2 £1.0 £4.0 £1.9 £3.0 £0.8 £2.6 £0.3 £0.1 £0.2 £0.0 £0.1 £0.0 £19.4
SUB‐TOTAL: PEMBROKESHIRE £26.0 £12.9 £25.7 £38.7 £40.5 £36.4 £19.8 £26.5 £5.0 £4.0 £1.4 £0.2 £0.4 £0.1 £0.5 £0.7 £238.9
23/01/2017

South Wales Regional Retail Study 2016Forecast Convenience Goods Turnover
Zones: 1 2 3 4 5 6 7 8 9 10 11 12 13 14 15 16 STUDY AREA
CEREDIGION COUNTY
Aberystwyth Town Centre:
Co‐op, Park Ave £0.0 £0.0 £0.0 £0.0 £0.0 £0.0 £0.0 £0.0 £0.0 £0.0 £0.0 £0.0 £0.1 £1.9 £3.8 £3.1 £8.9
Lidl, Rheidol Retail Park £0.0 £0.0 £0.0 £0.0 £0.0 £0.0 £0.0 £0.0 £0.0 £0.0 £0.0 £0.1 £1.6 £3.1 £5.7 £6.4 £16.8
Tesco Express, North Parade £0.0 £0.0 £0.0 £0.0 £0.0 £0.0 £0.0 £0.0 £0.0 £0.0 £0.0 £0.0 £0.0 £0.0 £0.5 £0.3 £0.8
Other stores £0.0 £0.0 £0.0 £0.0 £0.0 £0.0 £0.0 £0.0 £0.0 £0.0 £0.0 £0.2 £1.1 £1.8 £4.6 £3.5 £11.1
Aberystwyth Out of Centre:
Morrisons, Parcydolau, Llanbadarn Fawr £0.0 £0.0 £0.0 £0.0 £0.0 £0.0 £0.1 £0.0 £0.0 £0.0 £0.0 £1.1 £6.6 £9.5 £10.6 £13.6 £41.5
Cardigan Town Centre:
Co‐op, Lower Mwldan £0.0 £0.0 £0.0 £0.0 £0.0 £0.0 £0.0 £0.0 £0.1 £0.2 £0.0 £0.0 £0.0 £0.0 £0.0 £0.0 £0.3
Other stores £0.0 £0.0 £0.0 £0.0 £0.0 £0.0 £0.0 £0.0 £0.1 £1.6 £1.2 £0.0 £0.0 £0.0 £0.0 £0.0 £2.9
Cardigan Out of Centre:
Aldi, Aberystwyth Road £0.0 £0.0 £0.0 £0.0 £0.0 £0.0 £0.3 £0.2 £1.9 £17.4 £4.1 £0.2 £0.6 £0.0 £0.0 £0.0 £24.8
Tesco Superstore, Aberystwyth Rd £0.0 £0.0 £0.0 £0.0 £0.0 £0.0 £0.1 £0.1 £3.2 £14.6 £4.1 £0.3 £1.6 £0.1 £1.1 £0.0 £25.3
Aberaeron Town Centre:
Costcutter, Market Street £0.0 £0.0 £0.0 £0.0 £0.0 £0.0 £0.0 £0.0 £0.0 £0.0 £0.0 £0.1 £2.5 £0.0 £0.0 £0.0 £2.6
Other stores £0.0 £0.0 £0.0 £0.0 £0.0 £0.0 £0.0 £0.0 £0.0 £0.0 £0.5 £0.2 £1.1 £0.0 £0.0 £0.0 £1.9
Lampeter Town Centre:
Co‐op, Bridge Street £0.0 £0.0 £0.0 £0.0 £0.0 £0.0 £0.0 £0.0 £0.0 £0.0 £0.4 £6.2 £0.4 £0.7 £0.0 £0.0 £7.6
Sainsbury's, Market Street £0.0 £0.0 £0.0 £0.0 £0.0 £0.0 £0.1 £0.0 £0.0 £0.0 £0.6 £10.5 £1.0 £1.7 £0.0 £0.0 £13.9
Other stores £0.0 £0.0 £0.0 £0.0 £0.0 £0.0 £0.0 £0.0 £0.0 £0.0 £0.5 £1.8 £0.0 £0.4 £0.0 £0.0 £2.7
Tregaron £0.0 £0.0 £0.0 £0.0 £0.0 £0.0 £0.0 £0.0 £0.0 £0.0 £0.0 £0.0 £0.1 £1.0 £0.0 £0.0 £1.1
Llandysul £0.0 £0.1 £0.0 £0.0 £0.0 £0.0 £0.1 £0.0 £0.0 £0.0 £3.0 £0.1 £0.0 £0.0 £0.0 £0.0 £3.3
All Other ‐ Ceredigion £0.1 £0.0 £0.0 £0.0 £0.0 £0.0 £0.4 £0.0 £0.0 £0.6 £1.7 £0.9 £1.4 £1.4 £0.2 £2.6 £9.2
SUB‐TOTAL: CEREDIGION £0.1 £0.1 £0.0 £0.0 £0.0 £0.0 £1.1 £0.3 £5.3 £34.4 £16.0 £22.0 £17.8 £21.5 £26.5 £29.5 £174.6
OUTSIDE STUDY AREA
Carmarthen £0.0 £0.0 £0.0 £0.0 £0.0 £0.4 £1.8 £0.0 £0.2 £2.0 £7.5 £4.5 £1.0 £0.0 £0.1 £0.1 £17.6
Machynlleth £0.0 £0.1 £0.0 £0.0 £0.0 £0.0 £0.3 £0.1 £0.0 £0.0 £0.0 £0.0 £0.0 £0.0 £0.1 £3.7 £4.3
All other £0.0 £0.2 £0.0 £0.0 £0.0 £1.0 £0.3 £0.1 £0.1 £4.2 £1.4 £0.7 £0.7 £0.8 £0.2 £1.3 £11.0
SUB‐TOTAL: OUTSIDE STUDY AREA £0.0 £0.3 £0.0 £0.0 £0.0 £1.4 £2.4 £0.2 £0.3 £6.2 £8.8 £5.2 £1.7 £0.8 £0.4 £5.2 £32.9
TOTAL MARKET SHARE £26.1 £13.4 £25.8 £38.8 £40.5 £37.8 £23.3 £27.0 £10.7 £44.7 £26.2 £27.4 £19.8 £22.4 £27.3 £35.4 £446.4
23/01/2017
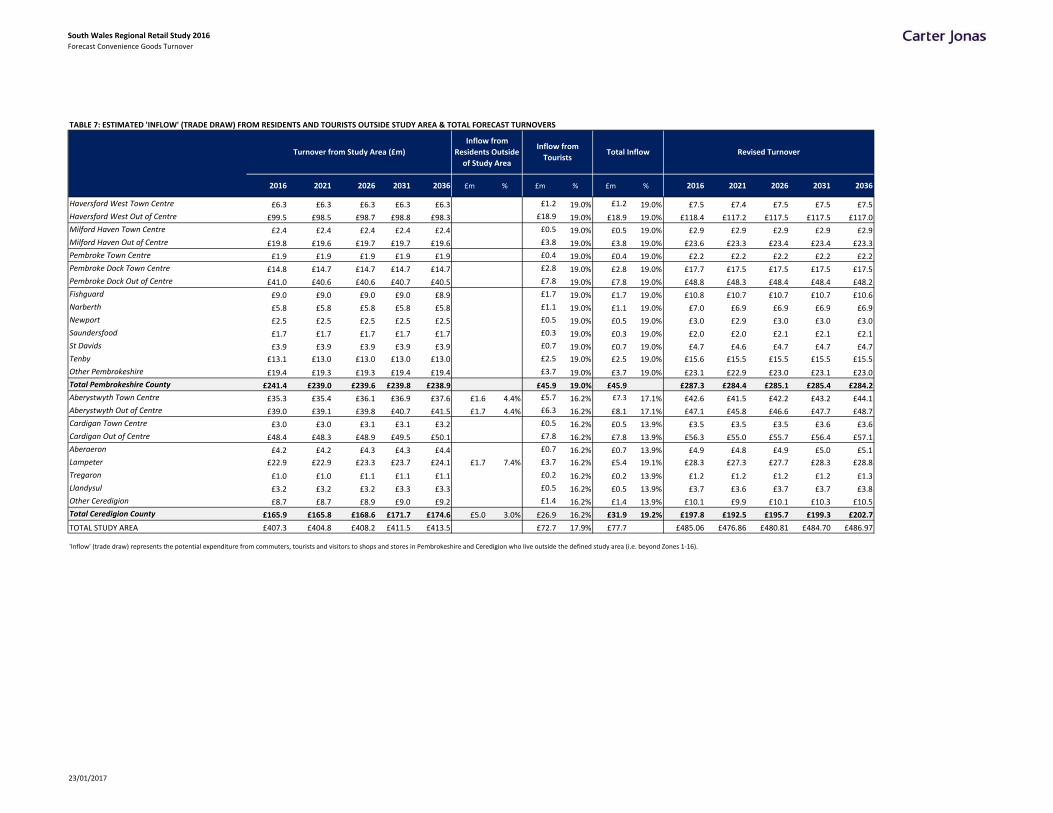
South Wales Regional Retail Study 2016Forecast Convenience Goods Turnover
TABLE 7: ESTIMATED 'INFLOW' (TRADE DRAW) FROM RESIDENTS AND TOURISTS OUTSIDE STUDY AREA & TOTAL FORECAST TURNOVERS
2016 2021 2026 2031 2036 £m % £m % £m % 2016 2021 2026 2031 2036
Haversford West Town Centre £6.3 £6.3 £6.3 £6.3 £6.3 £1.2 19.0% £1.2 19.0% £7.5 £7.4 £7.5 £7.5 £7.5
Haversford West Out of Centre £99.5 £98.5 £98.7 £98.8 £98.3 £18.9 19.0% £18.9 19.0% £118.4 £117.2 £117.5 £117.5 £117.0
Milford Haven Town Centre £2.4 £2.4 £2.4 £2.4 £2.4 £0.5 19.0% £0.5 19.0% £2.9 £2.9 £2.9 £2.9 £2.9
Milford Haven Out of Centre £19.8 £19.6 £19.7 £19.7 £19.6 £3.8 19.0% £3.8 19.0% £23.6 £23.3 £23.4 £23.4 £23.3
Pembroke Town Centre £1.9 £1.9 £1.9 £1.9 £1.9 £0.4 19.0% £0.4 19.0% £2.2 £2.2 £2.2 £2.2 £2.2
Pembroke Dock Town Centre £14.8 £14.7 £14.7 £14.7 £14.7 £2.8 19.0% £2.8 19.0% £17.7 £17.5 £17.5 £17.5 £17.5
Pembroke Dock Out of Centre £41.0 £40.6 £40.6 £40.7 £40.5 £7.8 19.0% £7.8 19.0% £48.8 £48.3 £48.4 £48.4 £48.2
Fishguard £9.0 £9.0 £9.0 £9.0 £8.9 £1.7 19.0% £1.7 19.0% £10.8 £10.7 £10.7 £10.7 £10.6
Narberth £5.8 £5.8 £5.8 £5.8 £5.8 £1.1 19.0% £1.1 19.0% £7.0 £6.9 £6.9 £6.9 £6.9
Newport £2.5 £2.5 £2.5 £2.5 £2.5 £0.5 19.0% £0.5 19.0% £3.0 £2.9 £3.0 £3.0 £3.0
Saundersfood £1.7 £1.7 £1.7 £1.7 £1.7 £0.3 19.0% £0.3 19.0% £2.0 £2.0 £2.1 £2.1 £2.1
St Davids £3.9 £3.9 £3.9 £3.9 £3.9 £0.7 19.0% £0.7 19.0% £4.7 £4.6 £4.7 £4.7 £4.7
Tenby £13.1 £13.0 £13.0 £13.0 £13.0 £2.5 19.0% £2.5 19.0% £15.6 £15.5 £15.5 £15.5 £15.5
Other Pembrokeshire £19.4 £19.3 £19.3 £19.4 £19.4 £3.7 19.0% £3.7 19.0% £23.1 £22.9 £23.0 £23.1 £23.0
Total Pembrokeshire County £241.4 £239.0 £239.6 £239.8 £238.9 £45.9 19.0% £45.9 £287.3 £284.4 £285.1 £285.4 £284.2
Aberystwyth Town Centre £35.3 £35.4 £36.1 £36.9 £37.6 £1.6 4.4% £5.7 16.2% £7.3 17.1% £42.6 £41.5 £42.2 £43.2 £44.1
Aberystwyth Out of Centre £39.0 £39.1 £39.8 £40.7 £41.5 £1.7 4.4% £6.3 16.2% £8.1 17.1% £47.1 £45.8 £46.6 £47.7 £48.7
Cardigan Town Centre £3.0 £3.0 £3.1 £3.1 £3.2 £0.5 16.2% £0.5 13.9% £3.5 £3.5 £3.5 £3.6 £3.6
Cardigan Out of Centre £48.4 £48.3 £48.9 £49.5 £50.1 £7.8 16.2% £7.8 13.9% £56.3 £55.0 £55.7 £56.4 £57.1
Aberaeron £4.2 £4.2 £4.3 £4.3 £4.4 £0.7 16.2% £0.7 13.9% £4.9 £4.8 £4.9 £5.0 £5.1
Lampeter £22.9 £22.9 £23.3 £23.7 £24.1 £1.7 7.4% £3.7 16.2% £5.4 19.1% £28.3 £27.3 £27.7 £28.3 £28.8
Tregaron £1.0 £1.0 £1.1 £1.1 £1.1 £0.2 16.2% £0.2 13.9% £1.2 £1.2 £1.2 £1.2 £1.3
Llandysul £3.2 £3.2 £3.2 £3.3 £3.3 £0.5 16.2% £0.5 13.9% £3.7 £3.6 £3.7 £3.7 £3.8
Other Ceredigion £8.7 £8.7 £8.9 £9.0 £9.2 £1.4 16.2% £1.4 13.9% £10.1 £9.9 £10.1 £10.3 £10.5
Total Ceredigion County £165.9 £165.8 £168.6 £171.7 £174.6 £5.0 3.0% £26.9 16.2% £31.9 19.2% £197.8 £192.5 £195.7 £199.3 £202.7
TOTAL STUDY AREA £407.3 £404.8 £408.2 £411.5 £413.5 £72.7 17.9% £77.7 £485.06 £476.86 £480.81 £484.70 £486.97
'Inflow' (trade draw) represents the potential expenditure from commuters, tourists and visitors to shops and stores in Pembrokeshire and Ceredigion who live outside the defined study area (i.e. beyond Zones 1‐16).
Inflow from
TouristsTotal Inflow
Inflow from
Residents Outside
of Study Area
Turnover from Study Area (£m) Revised Turnover
23/01/2017

South West Wales Regional Retail Study
APPENDIX 6: FORECAST COMPARISON GOODS TURNOVER
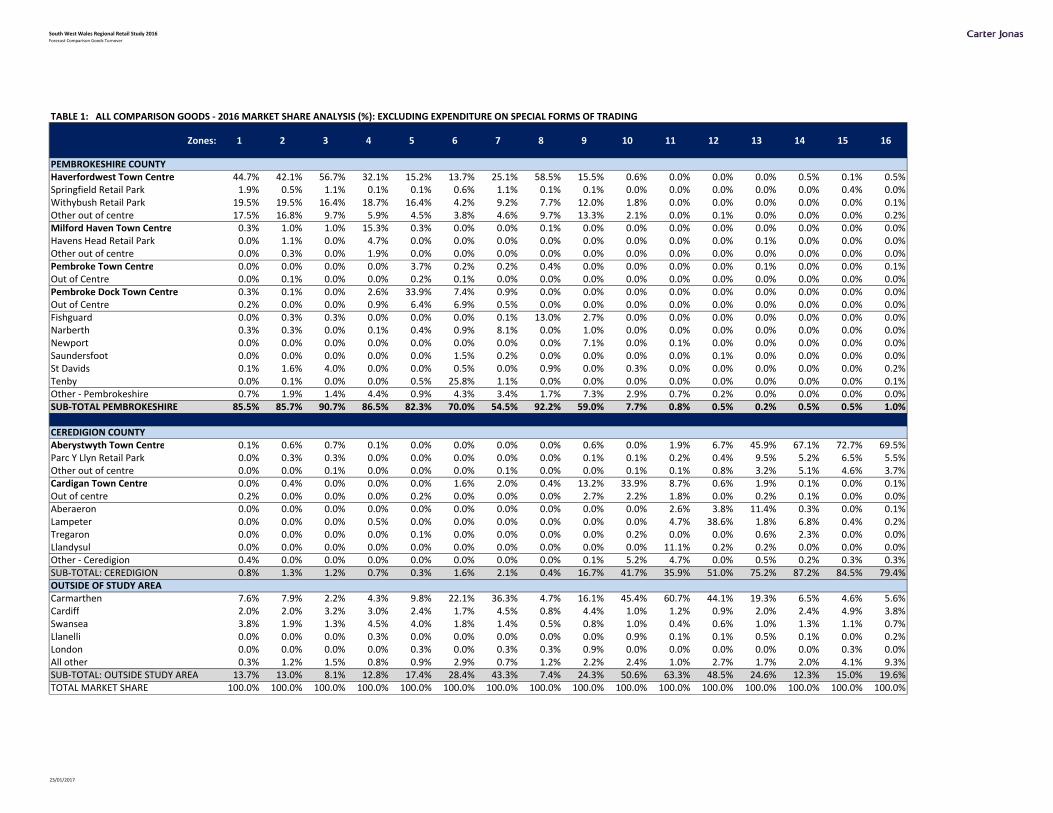
South West Wales Regional Retail Study 2016Forecast Comparison Goods Turnover
TABLE 1: ALL COMPARISON GOODS ‐ 2016 MARKET SHARE ANALYSIS (%): EXCLUDING EXPENDITURE ON SPECIAL FORMS OF TRADING
Zones: 1 2 3 4 5 6 7 8 9 10 11 12 13 14 15 16
PEMBROKESHIRE COUNTYHaverfordwest Town Centre 44.7% 42.1% 56.7% 32.1% 15.2% 13.7% 25.1% 58.5% 15.5% 0.6% 0.0% 0.0% 0.0% 0.5% 0.1% 0.5%Springfield Retail Park 1.9% 0.5% 1.1% 0.1% 0.1% 0.6% 1.1% 0.1% 0.1% 0.0% 0.0% 0.0% 0.0% 0.0% 0.4% 0.0%Withybush Retail Park 19.5% 19.5% 16.4% 18.7% 16.4% 4.2% 9.2% 7.7% 12.0% 1.8% 0.0% 0.0% 0.0% 0.0% 0.0% 0.1%Other out of centre 17.5% 16.8% 9.7% 5.9% 4.5% 3.8% 4.6% 9.7% 13.3% 2.1% 0.0% 0.1% 0.0% 0.0% 0.0% 0.2%Milford Haven Town Centre 0.3% 1.0% 1.0% 15.3% 0.3% 0.0% 0.0% 0.1% 0.0% 0.0% 0.0% 0.0% 0.0% 0.0% 0.0% 0.0%Havens Head Retail Park 0.0% 1.1% 0.0% 4.7% 0.0% 0.0% 0.0% 0.0% 0.0% 0.0% 0.0% 0.0% 0.1% 0.0% 0.0% 0.0%Other out of centre 0.0% 0.3% 0.0% 1.9% 0.0% 0.0% 0.0% 0.0% 0.0% 0.0% 0.0% 0.0% 0.0% 0.0% 0.0% 0.0%Pembroke Town Centre 0.0% 0.0% 0.0% 0.0% 3.7% 0.2% 0.2% 0.4% 0.0% 0.0% 0.0% 0.0% 0.1% 0.0% 0.0% 0.1%Out of Centre 0.0% 0.1% 0.0% 0.0% 0.2% 0.1% 0.0% 0.0% 0.0% 0.0% 0.0% 0.0% 0.0% 0.0% 0.0% 0.0%Pembroke Dock Town Centre 0.3% 0.1% 0.0% 2.6% 33.9% 7.4% 0.9% 0.0% 0.0% 0.0% 0.0% 0.0% 0.0% 0.0% 0.0% 0.0%Out of Centre 0.2% 0.0% 0.0% 0.9% 6.4% 6.9% 0.5% 0.0% 0.0% 0.0% 0.0% 0.0% 0.0% 0.0% 0.0% 0.0%Fishguard 0.0% 0.3% 0.3% 0.0% 0.0% 0.0% 0.1% 13.0% 2.7% 0.0% 0.0% 0.0% 0.0% 0.0% 0.0% 0.0%Narberth 0.3% 0.3% 0.0% 0.1% 0.4% 0.9% 8.1% 0.0% 1.0% 0.0% 0.0% 0.0% 0.0% 0.0% 0.0% 0.0%Newport 0.0% 0.0% 0.0% 0.0% 0.0% 0.0% 0.0% 0.0% 7.1% 0.0% 0.1% 0.0% 0.0% 0.0% 0.0% 0.0%Saundersfoot 0.0% 0.0% 0.0% 0.0% 0.0% 1.5% 0.2% 0.0% 0.0% 0.0% 0.0% 0.1% 0.0% 0.0% 0.0% 0.0%St Davids 0.1% 1.6% 4.0% 0.0% 0.0% 0.5% 0.0% 0.9% 0.0% 0.3% 0.0% 0.0% 0.0% 0.0% 0.0% 0.2%Tenby 0.0% 0.1% 0.0% 0.0% 0.5% 25.8% 1.1% 0.0% 0.0% 0.0% 0.0% 0.0% 0.0% 0.0% 0.0% 0.1%Other ‐ Pembrokeshire 0.7% 1.9% 1.4% 4.4% 0.9% 4.3% 3.4% 1.7% 7.3% 2.9% 0.7% 0.2% 0.0% 0.0% 0.0% 0.0%SUB‐TOTAL PEMBROKESHIRE 85.5% 85.7% 90.7% 86.5% 82.3% 70.0% 54.5% 92.2% 59.0% 7.7% 0.8% 0.5% 0.2% 0.5% 0.5% 1.0%
CEREDIGION COUNTYAberystwyth Town Centre 0.1% 0.6% 0.7% 0.1% 0.0% 0.0% 0.0% 0.0% 0.6% 0.0% 1.9% 6.7% 45.9% 67.1% 72.7% 69.5%Parc Y Llyn Retail Park 0.0% 0.3% 0.3% 0.0% 0.0% 0.0% 0.0% 0.0% 0.1% 0.1% 0.2% 0.4% 9.5% 5.2% 6.5% 5.5%Other out of centre 0.0% 0.0% 0.1% 0.0% 0.0% 0.0% 0.1% 0.0% 0.0% 0.1% 0.1% 0.8% 3.2% 5.1% 4.6% 3.7%Cardigan Town Centre 0.0% 0.4% 0.0% 0.0% 0.0% 1.6% 2.0% 0.4% 13.2% 33.9% 8.7% 0.6% 1.9% 0.1% 0.0% 0.1%Out of centre 0.2% 0.0% 0.0% 0.0% 0.2% 0.0% 0.0% 0.0% 2.7% 2.2% 1.8% 0.0% 0.2% 0.1% 0.0% 0.0%Aberaeron 0.0% 0.0% 0.0% 0.0% 0.0% 0.0% 0.0% 0.0% 0.0% 0.0% 2.6% 3.8% 11.4% 0.3% 0.0% 0.1%Lampeter 0.0% 0.0% 0.0% 0.5% 0.0% 0.0% 0.0% 0.0% 0.0% 0.0% 4.7% 38.6% 1.8% 6.8% 0.4% 0.2%Tregaron 0.0% 0.0% 0.0% 0.0% 0.1% 0.0% 0.0% 0.0% 0.0% 0.2% 0.0% 0.0% 0.6% 2.3% 0.0% 0.0%Llandysul 0.0% 0.0% 0.0% 0.0% 0.0% 0.0% 0.0% 0.0% 0.0% 0.0% 11.1% 0.2% 0.2% 0.0% 0.0% 0.0%Other ‐ Ceredigion 0.4% 0.0% 0.0% 0.0% 0.0% 0.0% 0.0% 0.0% 0.1% 5.2% 4.7% 0.0% 0.5% 0.2% 0.3% 0.3%SUB‐TOTAL: CEREDIGION 0.8% 1.3% 1.2% 0.7% 0.3% 1.6% 2.1% 0.4% 16.7% 41.7% 35.9% 51.0% 75.2% 87.2% 84.5% 79.4%OUTSIDE OF STUDY AREACarmarthen 7.6% 7.9% 2.2% 4.3% 9.8% 22.1% 36.3% 4.7% 16.1% 45.4% 60.7% 44.1% 19.3% 6.5% 4.6% 5.6%Cardiff 2.0% 2.0% 3.2% 3.0% 2.4% 1.7% 4.5% 0.8% 4.4% 1.0% 1.2% 0.9% 2.0% 2.4% 4.9% 3.8%Swansea 3.8% 1.9% 1.3% 4.5% 4.0% 1.8% 1.4% 0.5% 0.8% 1.0% 0.4% 0.6% 1.0% 1.3% 1.1% 0.7%Llanelli 0.0% 0.0% 0.0% 0.3% 0.0% 0.0% 0.0% 0.0% 0.0% 0.9% 0.1% 0.1% 0.5% 0.1% 0.0% 0.2%London 0.0% 0.0% 0.0% 0.0% 0.3% 0.0% 0.3% 0.3% 0.9% 0.0% 0.0% 0.0% 0.0% 0.0% 0.3% 0.0%All other 0.3% 1.2% 1.5% 0.8% 0.9% 2.9% 0.7% 1.2% 2.2% 2.4% 1.0% 2.7% 1.7% 2.0% 4.1% 9.3%SUB‐TOTAL: OUTSIDE STUDY AREA 13.7% 13.0% 8.1% 12.8% 17.4% 28.4% 43.3% 7.4% 24.3% 50.6% 63.3% 48.5% 24.6% 12.3% 15.0% 19.6%TOTAL MARKET SHARE 100.0% 100.0% 100.0% 100.0% 100.0% 100.0% 100.0% 100.0% 100.0% 100.0% 100.0% 100.0% 100.0% 100.0% 100.0% 100.0%
23/01/2017
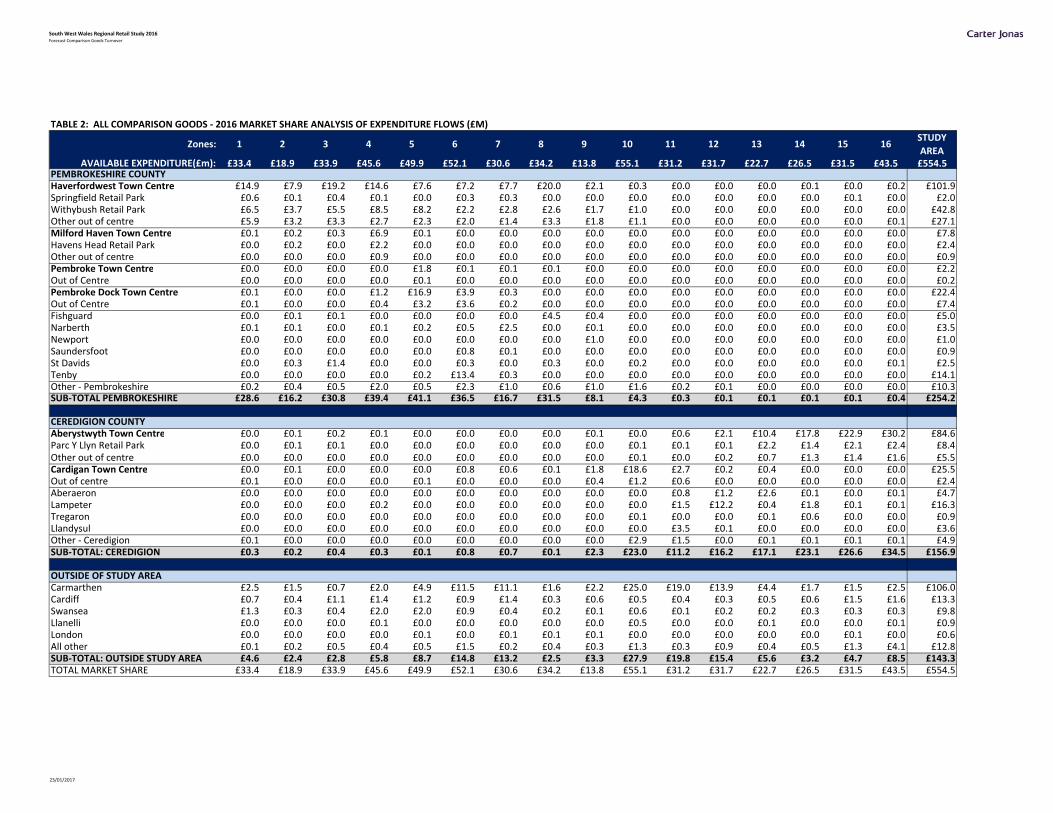
South West Wales Regional Retail Study 2016Forecast Comparison Goods Turnover
TABLE 2: ALL COMPARISON GOODS ‐ 2016 MARKET SHARE ANALYSIS OF EXPENDITURE FLOWS (£M)
Zones: 1 2 3 4 5 6 7 8 9 10 11 12 13 14 15 16STUDY
AREAAVAILABLE EXPENDITURE(£m): £33.4 £18.9 £33.9 £45.6 £49.9 £52.1 £30.6 £34.2 £13.8 £55.1 £31.2 £31.7 £22.7 £26.5 £31.5 £43.5 £554.5
PEMBROKESHIRE COUNTYHaverfordwest Town Centre £14.9 £7.9 £19.2 £14.6 £7.6 £7.2 £7.7 £20.0 £2.1 £0.3 £0.0 £0.0 £0.0 £0.1 £0.0 £0.2 £101.9Springfield Retail Park £0.6 £0.1 £0.4 £0.1 £0.0 £0.3 £0.3 £0.0 £0.0 £0.0 £0.0 £0.0 £0.0 £0.0 £0.1 £0.0 £2.0Withybush Retail Park £6.5 £3.7 £5.5 £8.5 £8.2 £2.2 £2.8 £2.6 £1.7 £1.0 £0.0 £0.0 £0.0 £0.0 £0.0 £0.0 £42.8Other out of centre £5.9 £3.2 £3.3 £2.7 £2.3 £2.0 £1.4 £3.3 £1.8 £1.1 £0.0 £0.0 £0.0 £0.0 £0.0 £0.1 £27.1Milford Haven Town Centre £0.1 £0.2 £0.3 £6.9 £0.1 £0.0 £0.0 £0.0 £0.0 £0.0 £0.0 £0.0 £0.0 £0.0 £0.0 £0.0 £7.8Havens Head Retail Park £0.0 £0.2 £0.0 £2.2 £0.0 £0.0 £0.0 £0.0 £0.0 £0.0 £0.0 £0.0 £0.0 £0.0 £0.0 £0.0 £2.4Other out of centre £0.0 £0.0 £0.0 £0.9 £0.0 £0.0 £0.0 £0.0 £0.0 £0.0 £0.0 £0.0 £0.0 £0.0 £0.0 £0.0 £0.9Pembroke Town Centre £0.0 £0.0 £0.0 £0.0 £1.8 £0.1 £0.1 £0.1 £0.0 £0.0 £0.0 £0.0 £0.0 £0.0 £0.0 £0.0 £2.2Out of Centre £0.0 £0.0 £0.0 £0.0 £0.1 £0.0 £0.0 £0.0 £0.0 £0.0 £0.0 £0.0 £0.0 £0.0 £0.0 £0.0 £0.2Pembroke Dock Town Centre £0.1 £0.0 £0.0 £1.2 £16.9 £3.9 £0.3 £0.0 £0.0 £0.0 £0.0 £0.0 £0.0 £0.0 £0.0 £0.0 £22.4Out of Centre £0.1 £0.0 £0.0 £0.4 £3.2 £3.6 £0.2 £0.0 £0.0 £0.0 £0.0 £0.0 £0.0 £0.0 £0.0 £0.0 £7.4Fishguard £0.0 £0.1 £0.1 £0.0 £0.0 £0.0 £0.0 £4.5 £0.4 £0.0 £0.0 £0.0 £0.0 £0.0 £0.0 £0.0 £5.0Narberth £0.1 £0.1 £0.0 £0.1 £0.2 £0.5 £2.5 £0.0 £0.1 £0.0 £0.0 £0.0 £0.0 £0.0 £0.0 £0.0 £3.5Newport £0.0 £0.0 £0.0 £0.0 £0.0 £0.0 £0.0 £0.0 £1.0 £0.0 £0.0 £0.0 £0.0 £0.0 £0.0 £0.0 £1.0Saundersfoot £0.0 £0.0 £0.0 £0.0 £0.0 £0.8 £0.1 £0.0 £0.0 £0.0 £0.0 £0.0 £0.0 £0.0 £0.0 £0.0 £0.9St Davids £0.0 £0.3 £1.4 £0.0 £0.0 £0.3 £0.0 £0.3 £0.0 £0.2 £0.0 £0.0 £0.0 £0.0 £0.0 £0.1 £2.5Tenby £0.0 £0.0 £0.0 £0.0 £0.2 £13.4 £0.3 £0.0 £0.0 £0.0 £0.0 £0.0 £0.0 £0.0 £0.0 £0.0 £14.1Other ‐ Pembrokeshire £0.2 £0.4 £0.5 £2.0 £0.5 £2.3 £1.0 £0.6 £1.0 £1.6 £0.2 £0.1 £0.0 £0.0 £0.0 £0.0 £10.3SUB‐TOTAL PEMBROKESHIRE £28.6 £16.2 £30.8 £39.4 £41.1 £36.5 £16.7 £31.5 £8.1 £4.3 £0.3 £0.1 £0.1 £0.1 £0.1 £0.4 £254.2
CEREDIGION COUNTYAberystwyth Town Centre £0.0 £0.1 £0.2 £0.1 £0.0 £0.0 £0.0 £0.0 £0.1 £0.0 £0.6 £2.1 £10.4 £17.8 £22.9 £30.2 £84.6Parc Y Llyn Retail Park £0.0 £0.1 £0.1 £0.0 £0.0 £0.0 £0.0 £0.0 £0.0 £0.1 £0.1 £0.1 £2.2 £1.4 £2.1 £2.4 £8.4Other out of centre £0.0 £0.0 £0.0 £0.0 £0.0 £0.0 £0.0 £0.0 £0.0 £0.1 £0.0 £0.2 £0.7 £1.3 £1.4 £1.6 £5.5Cardigan Town Centre £0.0 £0.1 £0.0 £0.0 £0.0 £0.8 £0.6 £0.1 £1.8 £18.6 £2.7 £0.2 £0.4 £0.0 £0.0 £0.0 £25.5Out of centre £0.1 £0.0 £0.0 £0.0 £0.1 £0.0 £0.0 £0.0 £0.4 £1.2 £0.6 £0.0 £0.0 £0.0 £0.0 £0.0 £2.4Aberaeron £0.0 £0.0 £0.0 £0.0 £0.0 £0.0 £0.0 £0.0 £0.0 £0.0 £0.8 £1.2 £2.6 £0.1 £0.0 £0.1 £4.7Lampeter £0.0 £0.0 £0.0 £0.2 £0.0 £0.0 £0.0 £0.0 £0.0 £0.0 £1.5 £12.2 £0.4 £1.8 £0.1 £0.1 £16.3Tregaron £0.0 £0.0 £0.0 £0.0 £0.0 £0.0 £0.0 £0.0 £0.0 £0.1 £0.0 £0.0 £0.1 £0.6 £0.0 £0.0 £0.9Llandysul £0.0 £0.0 £0.0 £0.0 £0.0 £0.0 £0.0 £0.0 £0.0 £0.0 £3.5 £0.1 £0.0 £0.0 £0.0 £0.0 £3.6Other ‐ Ceredigion £0.1 £0.0 £0.0 £0.0 £0.0 £0.0 £0.0 £0.0 £0.0 £2.9 £1.5 £0.0 £0.1 £0.1 £0.1 £0.1 £4.9SUB‐TOTAL: CEREDIGION £0.3 £0.2 £0.4 £0.3 £0.1 £0.8 £0.7 £0.1 £2.3 £23.0 £11.2 £16.2 £17.1 £23.1 £26.6 £34.5 £156.9
OUTSIDE OF STUDY AREACarmarthen £2.5 £1.5 £0.7 £2.0 £4.9 £11.5 £11.1 £1.6 £2.2 £25.0 £19.0 £13.9 £4.4 £1.7 £1.5 £2.5 £106.0Cardiff £0.7 £0.4 £1.1 £1.4 £1.2 £0.9 £1.4 £0.3 £0.6 £0.5 £0.4 £0.3 £0.5 £0.6 £1.5 £1.6 £13.3Swansea £1.3 £0.3 £0.4 £2.0 £2.0 £0.9 £0.4 £0.2 £0.1 £0.6 £0.1 £0.2 £0.2 £0.3 £0.3 £0.3 £9.8Llanelli £0.0 £0.0 £0.0 £0.1 £0.0 £0.0 £0.0 £0.0 £0.0 £0.5 £0.0 £0.0 £0.1 £0.0 £0.0 £0.1 £0.9London £0.0 £0.0 £0.0 £0.0 £0.1 £0.0 £0.1 £0.1 £0.1 £0.0 £0.0 £0.0 £0.0 £0.0 £0.1 £0.0 £0.6All other £0.1 £0.2 £0.5 £0.4 £0.5 £1.5 £0.2 £0.4 £0.3 £1.3 £0.3 £0.9 £0.4 £0.5 £1.3 £4.1 £12.8SUB‐TOTAL: OUTSIDE STUDY AREA £4.6 £2.4 £2.8 £5.8 £8.7 £14.8 £13.2 £2.5 £3.3 £27.9 £19.8 £15.4 £5.6 £3.2 £4.7 £8.5 £143.3TOTAL MARKET SHARE £33.4 £18.9 £33.9 £45.6 £49.9 £52.1 £30.6 £34.2 £13.8 £55.1 £31.2 £31.7 £22.7 £26.5 £31.5 £43.5 £554.5
23/01/2017
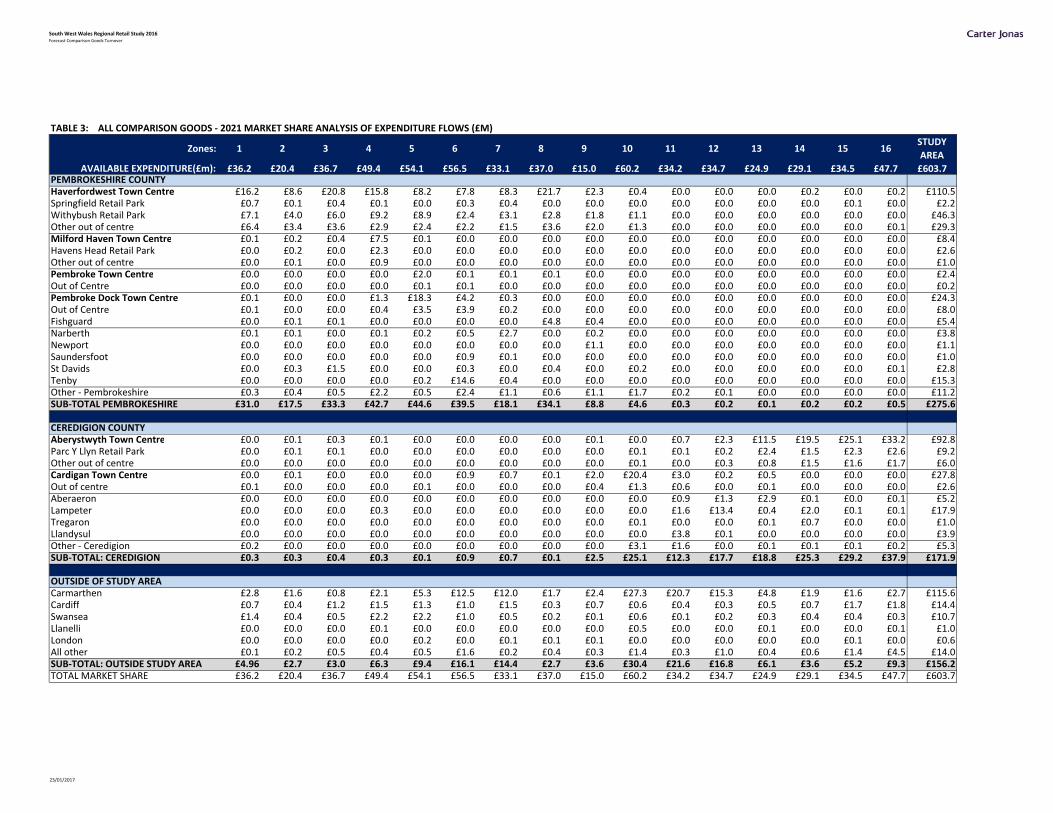
South West Wales Regional Retail Study 2016Forecast Comparison Goods Turnover
TABLE 3: ALL COMPARISON GOODS ‐ 2021 MARKET SHARE ANALYSIS OF EXPENDITURE FLOWS (£M)
Zones: 1 2 3 4 5 6 7 8 9 10 11 12 13 14 15 16STUDY
AREA
AVAILABLE EXPENDITURE(£m): £36.2 £20.4 £36.7 £49.4 £54.1 £56.5 £33.1 £37.0 £15.0 £60.2 £34.2 £34.7 £24.9 £29.1 £34.5 £47.7 £603.7PEMBROKESHIRE COUNTYHaverfordwest Town Centre £16.2 £8.6 £20.8 £15.8 £8.2 £7.8 £8.3 £21.7 £2.3 £0.4 £0.0 £0.0 £0.0 £0.2 £0.0 £0.2 £110.5Springfield Retail Park £0.7 £0.1 £0.4 £0.1 £0.0 £0.3 £0.4 £0.0 £0.0 £0.0 £0.0 £0.0 £0.0 £0.0 £0.1 £0.0 £2.2Withybush Retail Park £7.1 £4.0 £6.0 £9.2 £8.9 £2.4 £3.1 £2.8 £1.8 £1.1 £0.0 £0.0 £0.0 £0.0 £0.0 £0.0 £46.3Other out of centre £6.4 £3.4 £3.6 £2.9 £2.4 £2.2 £1.5 £3.6 £2.0 £1.3 £0.0 £0.0 £0.0 £0.0 £0.0 £0.1 £29.3Milford Haven Town Centre £0.1 £0.2 £0.4 £7.5 £0.1 £0.0 £0.0 £0.0 £0.0 £0.0 £0.0 £0.0 £0.0 £0.0 £0.0 £0.0 £8.4Havens Head Retail Park £0.0 £0.2 £0.0 £2.3 £0.0 £0.0 £0.0 £0.0 £0.0 £0.0 £0.0 £0.0 £0.0 £0.0 £0.0 £0.0 £2.6Other out of centre £0.0 £0.1 £0.0 £0.9 £0.0 £0.0 £0.0 £0.0 £0.0 £0.0 £0.0 £0.0 £0.0 £0.0 £0.0 £0.0 £1.0Pembroke Town Centre £0.0 £0.0 £0.0 £0.0 £2.0 £0.1 £0.1 £0.1 £0.0 £0.0 £0.0 £0.0 £0.0 £0.0 £0.0 £0.0 £2.4Out of Centre £0.0 £0.0 £0.0 £0.0 £0.1 £0.1 £0.0 £0.0 £0.0 £0.0 £0.0 £0.0 £0.0 £0.0 £0.0 £0.0 £0.2Pembroke Dock Town Centre £0.1 £0.0 £0.0 £1.3 £18.3 £4.2 £0.3 £0.0 £0.0 £0.0 £0.0 £0.0 £0.0 £0.0 £0.0 £0.0 £24.3Out of Centre £0.1 £0.0 £0.0 £0.4 £3.5 £3.9 £0.2 £0.0 £0.0 £0.0 £0.0 £0.0 £0.0 £0.0 £0.0 £0.0 £8.0Fishguard £0.0 £0.1 £0.1 £0.0 £0.0 £0.0 £0.0 £4.8 £0.4 £0.0 £0.0 £0.0 £0.0 £0.0 £0.0 £0.0 £5.4Narberth £0.1 £0.1 £0.0 £0.1 £0.2 £0.5 £2.7 £0.0 £0.2 £0.0 £0.0 £0.0 £0.0 £0.0 £0.0 £0.0 £3.8Newport £0.0 £0.0 £0.0 £0.0 £0.0 £0.0 £0.0 £0.0 £1.1 £0.0 £0.0 £0.0 £0.0 £0.0 £0.0 £0.0 £1.1Saundersfoot £0.0 £0.0 £0.0 £0.0 £0.0 £0.9 £0.1 £0.0 £0.0 £0.0 £0.0 £0.0 £0.0 £0.0 £0.0 £0.0 £1.0St Davids £0.0 £0.3 £1.5 £0.0 £0.0 £0.3 £0.0 £0.4 £0.0 £0.2 £0.0 £0.0 £0.0 £0.0 £0.0 £0.1 £2.8Tenby £0.0 £0.0 £0.0 £0.0 £0.2 £14.6 £0.4 £0.0 £0.0 £0.0 £0.0 £0.0 £0.0 £0.0 £0.0 £0.0 £15.3Other ‐ Pembrokeshire £0.3 £0.4 £0.5 £2.2 £0.5 £2.4 £1.1 £0.6 £1.1 £1.7 £0.2 £0.1 £0.0 £0.0 £0.0 £0.0 £11.2SUB‐TOTAL PEMBROKESHIRE £31.0 £17.5 £33.3 £42.7 £44.6 £39.5 £18.1 £34.1 £8.8 £4.6 £0.3 £0.2 £0.1 £0.2 £0.2 £0.5 £275.6
CEREDIGION COUNTYAberystwyth Town Centre £0.0 £0.1 £0.3 £0.1 £0.0 £0.0 £0.0 £0.0 £0.1 £0.0 £0.7 £2.3 £11.5 £19.5 £25.1 £33.2 £92.8Parc Y Llyn Retail Park £0.0 £0.1 £0.1 £0.0 £0.0 £0.0 £0.0 £0.0 £0.0 £0.1 £0.1 £0.2 £2.4 £1.5 £2.3 £2.6 £9.2Other out of centre £0.0 £0.0 £0.0 £0.0 £0.0 £0.0 £0.0 £0.0 £0.0 £0.1 £0.0 £0.3 £0.8 £1.5 £1.6 £1.7 £6.0Cardigan Town Centre £0.0 £0.1 £0.0 £0.0 £0.0 £0.9 £0.7 £0.1 £2.0 £20.4 £3.0 £0.2 £0.5 £0.0 £0.0 £0.0 £27.8Out of centre £0.1 £0.0 £0.0 £0.0 £0.1 £0.0 £0.0 £0.0 £0.4 £1.3 £0.6 £0.0 £0.1 £0.0 £0.0 £0.0 £2.6Aberaeron £0.0 £0.0 £0.0 £0.0 £0.0 £0.0 £0.0 £0.0 £0.0 £0.0 £0.9 £1.3 £2.9 £0.1 £0.0 £0.1 £5.2Lampeter £0.0 £0.0 £0.0 £0.3 £0.0 £0.0 £0.0 £0.0 £0.0 £0.0 £1.6 £13.4 £0.4 £2.0 £0.1 £0.1 £17.9Tregaron £0.0 £0.0 £0.0 £0.0 £0.0 £0.0 £0.0 £0.0 £0.0 £0.1 £0.0 £0.0 £0.1 £0.7 £0.0 £0.0 £1.0Llandysul £0.0 £0.0 £0.0 £0.0 £0.0 £0.0 £0.0 £0.0 £0.0 £0.0 £3.8 £0.1 £0.0 £0.0 £0.0 £0.0 £3.9Other ‐ Ceredigion £0.2 £0.0 £0.0 £0.0 £0.0 £0.0 £0.0 £0.0 £0.0 £3.1 £1.6 £0.0 £0.1 £0.1 £0.1 £0.2 £5.3SUB‐TOTAL: CEREDIGION £0.3 £0.3 £0.4 £0.3 £0.1 £0.9 £0.7 £0.1 £2.5 £25.1 £12.3 £17.7 £18.8 £25.3 £29.2 £37.9 £171.9
OUTSIDE OF STUDY AREACarmarthen £2.8 £1.6 £0.8 £2.1 £5.3 £12.5 £12.0 £1.7 £2.4 £27.3 £20.7 £15.3 £4.8 £1.9 £1.6 £2.7 £115.6Cardiff £0.7 £0.4 £1.2 £1.5 £1.3 £1.0 £1.5 £0.3 £0.7 £0.6 £0.4 £0.3 £0.5 £0.7 £1.7 £1.8 £14.4Swansea £1.4 £0.4 £0.5 £2.2 £2.2 £1.0 £0.5 £0.2 £0.1 £0.6 £0.1 £0.2 £0.3 £0.4 £0.4 £0.3 £10.7Llanelli £0.0 £0.0 £0.0 £0.1 £0.0 £0.0 £0.0 £0.0 £0.0 £0.5 £0.0 £0.0 £0.1 £0.0 £0.0 £0.1 £1.0London £0.0 £0.0 £0.0 £0.0 £0.2 £0.0 £0.1 £0.1 £0.1 £0.0 £0.0 £0.0 £0.0 £0.0 £0.1 £0.0 £0.6All other £0.1 £0.2 £0.5 £0.4 £0.5 £1.6 £0.2 £0.4 £0.3 £1.4 £0.3 £1.0 £0.4 £0.6 £1.4 £4.5 £14.0SUB‐TOTAL: OUTSIDE STUDY AREA £4.96 £2.7 £3.0 £6.3 £9.4 £16.1 £14.4 £2.7 £3.6 £30.4 £21.6 £16.8 £6.1 £3.6 £5.2 £9.3 £156.2TOTAL MARKET SHARE £36.2 £20.4 £36.7 £49.4 £54.1 £56.5 £33.1 £37.0 £15.0 £60.2 £34.2 £34.7 £24.9 £29.1 £34.5 £47.7 £603.7
23/01/2017
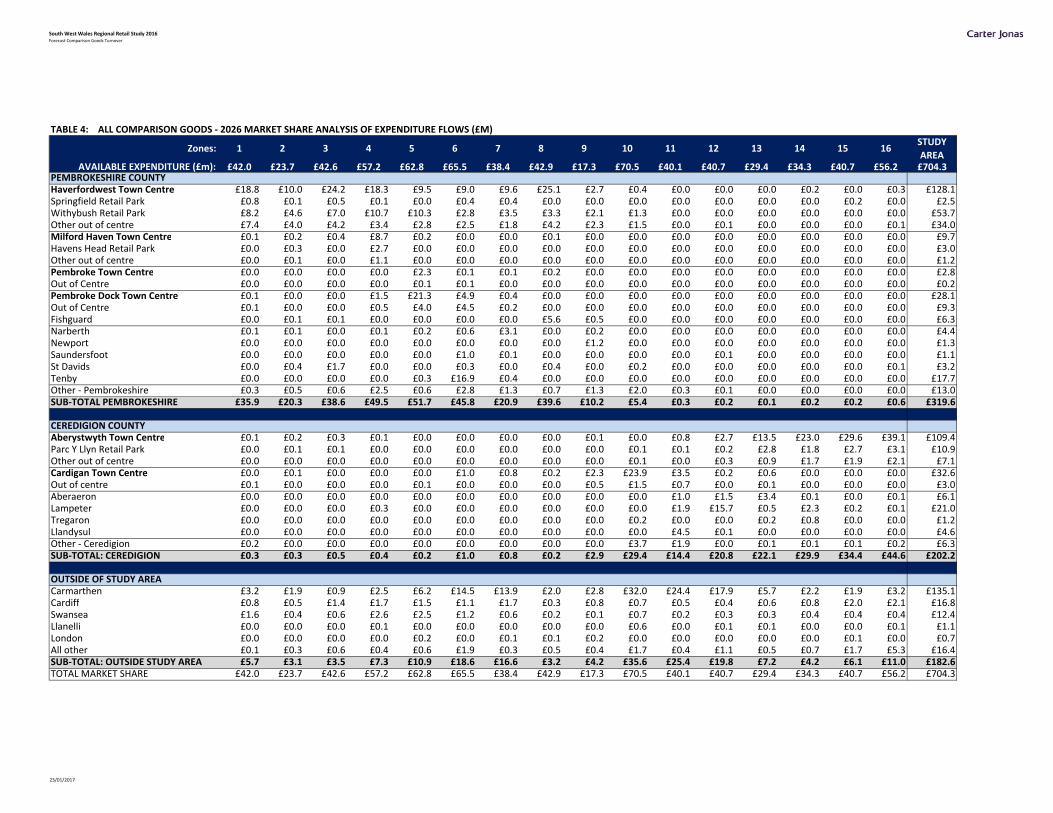
South West Wales Regional Retail Study 2016Forecast Comparison Goods Turnover
TABLE 4: ALL COMPARISON GOODS ‐ 2026 MARKET SHARE ANALYSIS OF EXPENDITURE FLOWS (£M)
Zones: 1 2 3 4 5 6 7 8 9 10 11 12 13 14 15 16STUDY
AREAAVAILABLE EXPENDITURE (£m): £42.0 £23.7 £42.6 £57.2 £62.8 £65.5 £38.4 £42.9 £17.3 £70.5 £40.1 £40.7 £29.4 £34.3 £40.7 £56.2 £704.3
PEMBROKESHIRE COUNTYHaverfordwest Town Centre £18.8 £10.0 £24.2 £18.3 £9.5 £9.0 £9.6 £25.1 £2.7 £0.4 £0.0 £0.0 £0.0 £0.2 £0.0 £0.3 £128.1Springfield Retail Park £0.8 £0.1 £0.5 £0.1 £0.0 £0.4 £0.4 £0.0 £0.0 £0.0 £0.0 £0.0 £0.0 £0.0 £0.2 £0.0 £2.5Withybush Retail Park £8.2 £4.6 £7.0 £10.7 £10.3 £2.8 £3.5 £3.3 £2.1 £1.3 £0.0 £0.0 £0.0 £0.0 £0.0 £0.0 £53.7Other out of centre £7.4 £4.0 £4.2 £3.4 £2.8 £2.5 £1.8 £4.2 £2.3 £1.5 £0.0 £0.1 £0.0 £0.0 £0.0 £0.1 £34.0Milford Haven Town Centre £0.1 £0.2 £0.4 £8.7 £0.2 £0.0 £0.0 £0.1 £0.0 £0.0 £0.0 £0.0 £0.0 £0.0 £0.0 £0.0 £9.7Havens Head Retail Park £0.0 £0.3 £0.0 £2.7 £0.0 £0.0 £0.0 £0.0 £0.0 £0.0 £0.0 £0.0 £0.0 £0.0 £0.0 £0.0 £3.0Other out of centre £0.0 £0.1 £0.0 £1.1 £0.0 £0.0 £0.0 £0.0 £0.0 £0.0 £0.0 £0.0 £0.0 £0.0 £0.0 £0.0 £1.2Pembroke Town Centre £0.0 £0.0 £0.0 £0.0 £2.3 £0.1 £0.1 £0.2 £0.0 £0.0 £0.0 £0.0 £0.0 £0.0 £0.0 £0.0 £2.8Out of Centre £0.0 £0.0 £0.0 £0.0 £0.1 £0.1 £0.0 £0.0 £0.0 £0.0 £0.0 £0.0 £0.0 £0.0 £0.0 £0.0 £0.2Pembroke Dock Town Centre £0.1 £0.0 £0.0 £1.5 £21.3 £4.9 £0.4 £0.0 £0.0 £0.0 £0.0 £0.0 £0.0 £0.0 £0.0 £0.0 £28.1Out of Centre £0.1 £0.0 £0.0 £0.5 £4.0 £4.5 £0.2 £0.0 £0.0 £0.0 £0.0 £0.0 £0.0 £0.0 £0.0 £0.0 £9.3Fishguard £0.0 £0.1 £0.1 £0.0 £0.0 £0.0 £0.0 £5.6 £0.5 £0.0 £0.0 £0.0 £0.0 £0.0 £0.0 £0.0 £6.3Narberth £0.1 £0.1 £0.0 £0.1 £0.2 £0.6 £3.1 £0.0 £0.2 £0.0 £0.0 £0.0 £0.0 £0.0 £0.0 £0.0 £4.4Newport £0.0 £0.0 £0.0 £0.0 £0.0 £0.0 £0.0 £0.0 £1.2 £0.0 £0.0 £0.0 £0.0 £0.0 £0.0 £0.0 £1.3Saundersfoot £0.0 £0.0 £0.0 £0.0 £0.0 £1.0 £0.1 £0.0 £0.0 £0.0 £0.0 £0.1 £0.0 £0.0 £0.0 £0.0 £1.1St Davids £0.0 £0.4 £1.7 £0.0 £0.0 £0.3 £0.0 £0.4 £0.0 £0.2 £0.0 £0.0 £0.0 £0.0 £0.0 £0.1 £3.2Tenby £0.0 £0.0 £0.0 £0.0 £0.3 £16.9 £0.4 £0.0 £0.0 £0.0 £0.0 £0.0 £0.0 £0.0 £0.0 £0.0 £17.7Other ‐ Pembrokeshire £0.3 £0.5 £0.6 £2.5 £0.6 £2.8 £1.3 £0.7 £1.3 £2.0 £0.3 £0.1 £0.0 £0.0 £0.0 £0.0 £13.0SUB‐TOTAL PEMBROKESHIRE £35.9 £20.3 £38.6 £49.5 £51.7 £45.8 £20.9 £39.6 £10.2 £5.4 £0.3 £0.2 £0.1 £0.2 £0.2 £0.6 £319.6
CEREDIGION COUNTYAberystwyth Town Centre £0.1 £0.2 £0.3 £0.1 £0.0 £0.0 £0.0 £0.0 £0.1 £0.0 £0.8 £2.7 £13.5 £23.0 £29.6 £39.1 £109.4Parc Y Llyn Retail Park £0.0 £0.1 £0.1 £0.0 £0.0 £0.0 £0.0 £0.0 £0.0 £0.1 £0.1 £0.2 £2.8 £1.8 £2.7 £3.1 £10.9Other out of centre £0.0 £0.0 £0.0 £0.0 £0.0 £0.0 £0.0 £0.0 £0.0 £0.1 £0.0 £0.3 £0.9 £1.7 £1.9 £2.1 £7.1Cardigan Town Centre £0.0 £0.1 £0.0 £0.0 £0.0 £1.0 £0.8 £0.2 £2.3 £23.9 £3.5 £0.2 £0.6 £0.0 £0.0 £0.0 £32.6Out of centre £0.1 £0.0 £0.0 £0.0 £0.1 £0.0 £0.0 £0.0 £0.5 £1.5 £0.7 £0.0 £0.1 £0.0 £0.0 £0.0 £3.0Aberaeron £0.0 £0.0 £0.0 £0.0 £0.0 £0.0 £0.0 £0.0 £0.0 £0.0 £1.0 £1.5 £3.4 £0.1 £0.0 £0.1 £6.1Lampeter £0.0 £0.0 £0.0 £0.3 £0.0 £0.0 £0.0 £0.0 £0.0 £0.0 £1.9 £15.7 £0.5 £2.3 £0.2 £0.1 £21.0Tregaron £0.0 £0.0 £0.0 £0.0 £0.0 £0.0 £0.0 £0.0 £0.0 £0.2 £0.0 £0.0 £0.2 £0.8 £0.0 £0.0 £1.2Llandysul £0.0 £0.0 £0.0 £0.0 £0.0 £0.0 £0.0 £0.0 £0.0 £0.0 £4.5 £0.1 £0.0 £0.0 £0.0 £0.0 £4.6Other ‐ Ceredigion £0.2 £0.0 £0.0 £0.0 £0.0 £0.0 £0.0 £0.0 £0.0 £3.7 £1.9 £0.0 £0.1 £0.1 £0.1 £0.2 £6.3SUB‐TOTAL: CEREDIGION £0.3 £0.3 £0.5 £0.4 £0.2 £1.0 £0.8 £0.2 £2.9 £29.4 £14.4 £20.8 £22.1 £29.9 £34.4 £44.6 £202.2
OUTSIDE OF STUDY AREACarmarthen £3.2 £1.9 £0.9 £2.5 £6.2 £14.5 £13.9 £2.0 £2.8 £32.0 £24.4 £17.9 £5.7 £2.2 £1.9 £3.2 £135.1Cardiff £0.8 £0.5 £1.4 £1.7 £1.5 £1.1 £1.7 £0.3 £0.8 £0.7 £0.5 £0.4 £0.6 £0.8 £2.0 £2.1 £16.8Swansea £1.6 £0.4 £0.6 £2.6 £2.5 £1.2 £0.6 £0.2 £0.1 £0.7 £0.2 £0.3 £0.3 £0.4 £0.4 £0.4 £12.4Llanelli £0.0 £0.0 £0.0 £0.1 £0.0 £0.0 £0.0 £0.0 £0.0 £0.6 £0.0 £0.1 £0.1 £0.0 £0.0 £0.1 £1.1London £0.0 £0.0 £0.0 £0.0 £0.2 £0.0 £0.1 £0.1 £0.2 £0.0 £0.0 £0.0 £0.0 £0.0 £0.1 £0.0 £0.7All other £0.1 £0.3 £0.6 £0.4 £0.6 £1.9 £0.3 £0.5 £0.4 £1.7 £0.4 £1.1 £0.5 £0.7 £1.7 £5.3 £16.4SUB‐TOTAL: OUTSIDE STUDY AREA £5.7 £3.1 £3.5 £7.3 £10.9 £18.6 £16.6 £3.2 £4.2 £35.6 £25.4 £19.8 £7.2 £4.2 £6.1 £11.0 £182.6TOTAL MARKET SHARE £42.0 £23.7 £42.6 £57.2 £62.8 £65.5 £38.4 £42.9 £17.3 £70.5 £40.1 £40.7 £29.4 £34.3 £40.7 £56.2 £704.3
23/01/2017
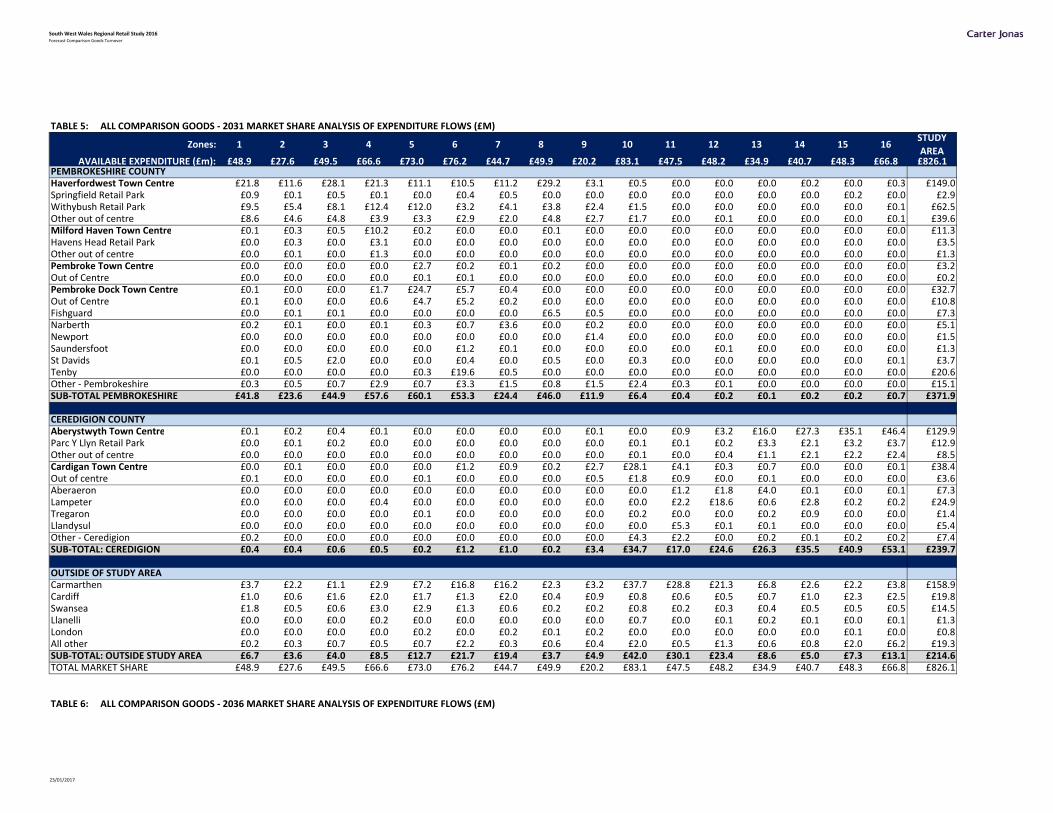
South West Wales Regional Retail Study 2016Forecast Comparison Goods Turnover
TABLE 5: ALL COMPARISON GOODS ‐ 2031 MARKET SHARE ANALYSIS OF EXPENDITURE FLOWS (£M)
Zones: 1 2 3 4 5 6 7 8 9 10 11 12 13 14 15 16STUDY
AREAAVAILABLE EXPENDITURE (£m): £48.9 £27.6 £49.5 £66.6 £73.0 £76.2 £44.7 £49.9 £20.2 £83.1 £47.5 £48.2 £34.9 £40.7 £48.3 £66.8 £826.1
PEMBROKESHIRE COUNTYHaverfordwest Town Centre £21.8 £11.6 £28.1 £21.3 £11.1 £10.5 £11.2 £29.2 £3.1 £0.5 £0.0 £0.0 £0.0 £0.2 £0.0 £0.3 £149.0Springfield Retail Park £0.9 £0.1 £0.5 £0.1 £0.0 £0.4 £0.5 £0.0 £0.0 £0.0 £0.0 £0.0 £0.0 £0.0 £0.2 £0.0 £2.9Withybush Retail Park £9.5 £5.4 £8.1 £12.4 £12.0 £3.2 £4.1 £3.8 £2.4 £1.5 £0.0 £0.0 £0.0 £0.0 £0.0 £0.1 £62.5Other out of centre £8.6 £4.6 £4.8 £3.9 £3.3 £2.9 £2.0 £4.8 £2.7 £1.7 £0.0 £0.1 £0.0 £0.0 £0.0 £0.1 £39.6Milford Haven Town Centre £0.1 £0.3 £0.5 £10.2 £0.2 £0.0 £0.0 £0.1 £0.0 £0.0 £0.0 £0.0 £0.0 £0.0 £0.0 £0.0 £11.3Havens Head Retail Park £0.0 £0.3 £0.0 £3.1 £0.0 £0.0 £0.0 £0.0 £0.0 £0.0 £0.0 £0.0 £0.0 £0.0 £0.0 £0.0 £3.5Other out of centre £0.0 £0.1 £0.0 £1.3 £0.0 £0.0 £0.0 £0.0 £0.0 £0.0 £0.0 £0.0 £0.0 £0.0 £0.0 £0.0 £1.3Pembroke Town Centre £0.0 £0.0 £0.0 £0.0 £2.7 £0.2 £0.1 £0.2 £0.0 £0.0 £0.0 £0.0 £0.0 £0.0 £0.0 £0.0 £3.2Out of Centre £0.0 £0.0 £0.0 £0.0 £0.1 £0.1 £0.0 £0.0 £0.0 £0.0 £0.0 £0.0 £0.0 £0.0 £0.0 £0.0 £0.2Pembroke Dock Town Centre £0.1 £0.0 £0.0 £1.7 £24.7 £5.7 £0.4 £0.0 £0.0 £0.0 £0.0 £0.0 £0.0 £0.0 £0.0 £0.0 £32.7Out of Centre £0.1 £0.0 £0.0 £0.6 £4.7 £5.2 £0.2 £0.0 £0.0 £0.0 £0.0 £0.0 £0.0 £0.0 £0.0 £0.0 £10.8Fishguard £0.0 £0.1 £0.1 £0.0 £0.0 £0.0 £0.0 £6.5 £0.5 £0.0 £0.0 £0.0 £0.0 £0.0 £0.0 £0.0 £7.3Narberth £0.2 £0.1 £0.0 £0.1 £0.3 £0.7 £3.6 £0.0 £0.2 £0.0 £0.0 £0.0 £0.0 £0.0 £0.0 £0.0 £5.1Newport £0.0 £0.0 £0.0 £0.0 £0.0 £0.0 £0.0 £0.0 £1.4 £0.0 £0.0 £0.0 £0.0 £0.0 £0.0 £0.0 £1.5Saundersfoot £0.0 £0.0 £0.0 £0.0 £0.0 £1.2 £0.1 £0.0 £0.0 £0.0 £0.0 £0.1 £0.0 £0.0 £0.0 £0.0 £1.3St Davids £0.1 £0.5 £2.0 £0.0 £0.0 £0.4 £0.0 £0.5 £0.0 £0.3 £0.0 £0.0 £0.0 £0.0 £0.0 £0.1 £3.7Tenby £0.0 £0.0 £0.0 £0.0 £0.3 £19.6 £0.5 £0.0 £0.0 £0.0 £0.0 £0.0 £0.0 £0.0 £0.0 £0.0 £20.6Other ‐ Pembrokeshire £0.3 £0.5 £0.7 £2.9 £0.7 £3.3 £1.5 £0.8 £1.5 £2.4 £0.3 £0.1 £0.0 £0.0 £0.0 £0.0 £15.1SUB‐TOTAL PEMBROKESHIRE £41.8 £23.6 £44.9 £57.6 £60.1 £53.3 £24.4 £46.0 £11.9 £6.4 £0.4 £0.2 £0.1 £0.2 £0.2 £0.7 £371.9
CEREDIGION COUNTYAberystwyth Town Centre £0.1 £0.2 £0.4 £0.1 £0.0 £0.0 £0.0 £0.0 £0.1 £0.0 £0.9 £3.2 £16.0 £27.3 £35.1 £46.4 £129.9Parc Y Llyn Retail Park £0.0 £0.1 £0.2 £0.0 £0.0 £0.0 £0.0 £0.0 £0.0 £0.1 £0.1 £0.2 £3.3 £2.1 £3.2 £3.7 £12.9Other out of centre £0.0 £0.0 £0.0 £0.0 £0.0 £0.0 £0.0 £0.0 £0.0 £0.1 £0.0 £0.4 £1.1 £2.1 £2.2 £2.4 £8.5Cardigan Town Centre £0.0 £0.1 £0.0 £0.0 £0.0 £1.2 £0.9 £0.2 £2.7 £28.1 £4.1 £0.3 £0.7 £0.0 £0.0 £0.1 £38.4Out of centre £0.1 £0.0 £0.0 £0.0 £0.1 £0.0 £0.0 £0.0 £0.5 £1.8 £0.9 £0.0 £0.1 £0.0 £0.0 £0.0 £3.6Aberaeron £0.0 £0.0 £0.0 £0.0 £0.0 £0.0 £0.0 £0.0 £0.0 £0.0 £1.2 £1.8 £4.0 £0.1 £0.0 £0.1 £7.3Lampeter £0.0 £0.0 £0.0 £0.4 £0.0 £0.0 £0.0 £0.0 £0.0 £0.0 £2.2 £18.6 £0.6 £2.8 £0.2 £0.2 £24.9Tregaron £0.0 £0.0 £0.0 £0.0 £0.1 £0.0 £0.0 £0.0 £0.0 £0.2 £0.0 £0.0 £0.2 £0.9 £0.0 £0.0 £1.4Llandysul £0.0 £0.0 £0.0 £0.0 £0.0 £0.0 £0.0 £0.0 £0.0 £0.0 £5.3 £0.1 £0.1 £0.0 £0.0 £0.0 £5.4Other ‐ Ceredigion £0.2 £0.0 £0.0 £0.0 £0.0 £0.0 £0.0 £0.0 £0.0 £4.3 £2.2 £0.0 £0.2 £0.1 £0.2 £0.2 £7.4SUB‐TOTAL: CEREDIGION £0.4 £0.4 £0.6 £0.5 £0.2 £1.2 £1.0 £0.2 £3.4 £34.7 £17.0 £24.6 £26.3 £35.5 £40.9 £53.1 £239.7
OUTSIDE OF STUDY AREACarmarthen £3.7 £2.2 £1.1 £2.9 £7.2 £16.8 £16.2 £2.3 £3.2 £37.7 £28.8 £21.3 £6.8 £2.6 £2.2 £3.8 £158.9Cardiff £1.0 £0.6 £1.6 £2.0 £1.7 £1.3 £2.0 £0.4 £0.9 £0.8 £0.6 £0.5 £0.7 £1.0 £2.3 £2.5 £19.8Swansea £1.8 £0.5 £0.6 £3.0 £2.9 £1.3 £0.6 £0.2 £0.2 £0.8 £0.2 £0.3 £0.4 £0.5 £0.5 £0.5 £14.5Llanelli £0.0 £0.0 £0.0 £0.2 £0.0 £0.0 £0.0 £0.0 £0.0 £0.7 £0.0 £0.1 £0.2 £0.1 £0.0 £0.1 £1.3London £0.0 £0.0 £0.0 £0.0 £0.2 £0.0 £0.2 £0.1 £0.2 £0.0 £0.0 £0.0 £0.0 £0.0 £0.1 £0.0 £0.8All other £0.2 £0.3 £0.7 £0.5 £0.7 £2.2 £0.3 £0.6 £0.4 £2.0 £0.5 £1.3 £0.6 £0.8 £2.0 £6.2 £19.3SUB‐TOTAL: OUTSIDE STUDY AREA £6.7 £3.6 £4.0 £8.5 £12.7 £21.7 £19.4 £3.7 £4.9 £42.0 £30.1 £23.4 £8.6 £5.0 £7.3 £13.1 £214.6TOTAL MARKET SHARE £48.9 £27.6 £49.5 £66.6 £73.0 £76.2 £44.7 £49.9 £20.2 £83.1 £47.5 £48.2 £34.9 £40.7 £48.3 £66.8 £826.1
TABLE 6: ALL COMPARISON GOODS ‐ 2036 MARKET SHARE ANALYSIS OF EXPENDITURE FLOWS (£M)
23/01/2017
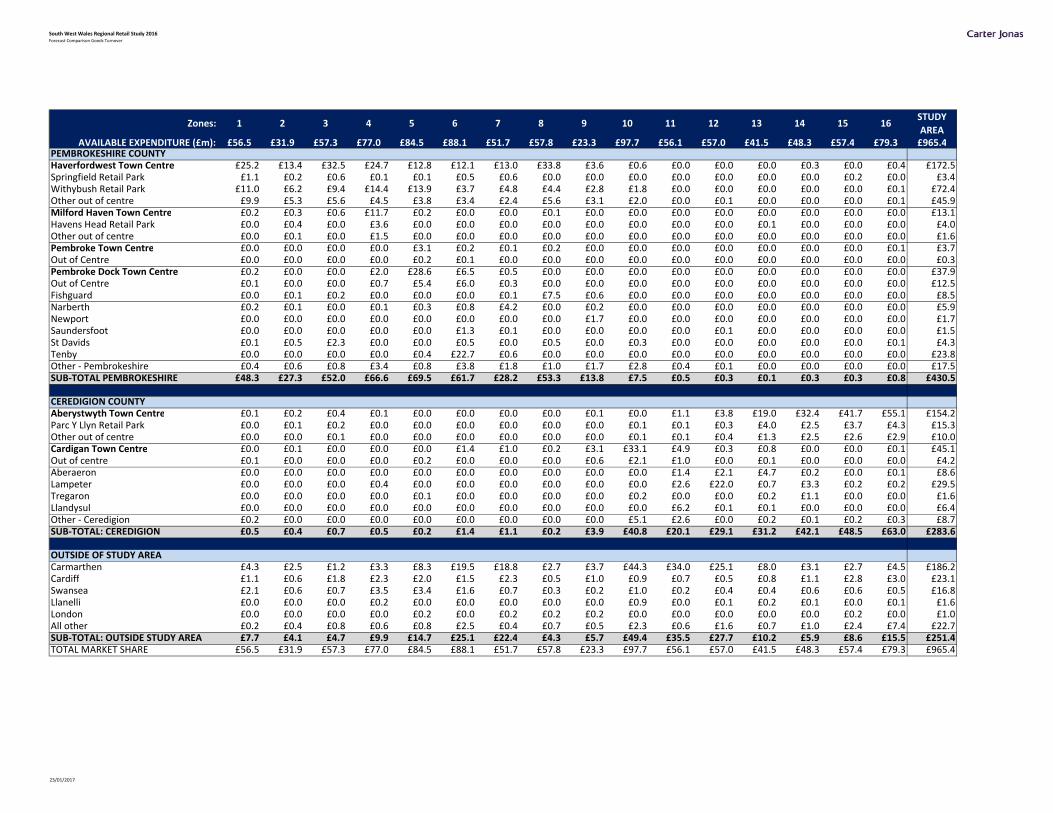
South West Wales Regional Retail Study 2016Forecast Comparison Goods Turnover
Zones: 1 2 3 4 5 6 7 8 9 10 11 12 13 14 15 16STUDY
AREAAVAILABLE EXPENDITURE (£m): £56.5 £31.9 £57.3 £77.0 £84.5 £88.1 £51.7 £57.8 £23.3 £97.7 £56.1 £57.0 £41.5 £48.3 £57.4 £79.3 £965.4
PEMBROKESHIRE COUNTYHaverfordwest Town Centre £25.2 £13.4 £32.5 £24.7 £12.8 £12.1 £13.0 £33.8 £3.6 £0.6 £0.0 £0.0 £0.0 £0.3 £0.0 £0.4 £172.5Springfield Retail Park £1.1 £0.2 £0.6 £0.1 £0.1 £0.5 £0.6 £0.0 £0.0 £0.0 £0.0 £0.0 £0.0 £0.0 £0.2 £0.0 £3.4Withybush Retail Park £11.0 £6.2 £9.4 £14.4 £13.9 £3.7 £4.8 £4.4 £2.8 £1.8 £0.0 £0.0 £0.0 £0.0 £0.0 £0.1 £72.4Other out of centre £9.9 £5.3 £5.6 £4.5 £3.8 £3.4 £2.4 £5.6 £3.1 £2.0 £0.0 £0.1 £0.0 £0.0 £0.0 £0.1 £45.9Milford Haven Town Centre £0.2 £0.3 £0.6 £11.7 £0.2 £0.0 £0.0 £0.1 £0.0 £0.0 £0.0 £0.0 £0.0 £0.0 £0.0 £0.0 £13.1Havens Head Retail Park £0.0 £0.4 £0.0 £3.6 £0.0 £0.0 £0.0 £0.0 £0.0 £0.0 £0.0 £0.0 £0.1 £0.0 £0.0 £0.0 £4.0Other out of centre £0.0 £0.1 £0.0 £1.5 £0.0 £0.0 £0.0 £0.0 £0.0 £0.0 £0.0 £0.0 £0.0 £0.0 £0.0 £0.0 £1.6Pembroke Town Centre £0.0 £0.0 £0.0 £0.0 £3.1 £0.2 £0.1 £0.2 £0.0 £0.0 £0.0 £0.0 £0.0 £0.0 £0.0 £0.1 £3.7Out of Centre £0.0 £0.0 £0.0 £0.0 £0.2 £0.1 £0.0 £0.0 £0.0 £0.0 £0.0 £0.0 £0.0 £0.0 £0.0 £0.0 £0.3Pembroke Dock Town Centre £0.2 £0.0 £0.0 £2.0 £28.6 £6.5 £0.5 £0.0 £0.0 £0.0 £0.0 £0.0 £0.0 £0.0 £0.0 £0.0 £37.9Out of Centre £0.1 £0.0 £0.0 £0.7 £5.4 £6.0 £0.3 £0.0 £0.0 £0.0 £0.0 £0.0 £0.0 £0.0 £0.0 £0.0 £12.5Fishguard £0.0 £0.1 £0.2 £0.0 £0.0 £0.0 £0.1 £7.5 £0.6 £0.0 £0.0 £0.0 £0.0 £0.0 £0.0 £0.0 £8.5Narberth £0.2 £0.1 £0.0 £0.1 £0.3 £0.8 £4.2 £0.0 £0.2 £0.0 £0.0 £0.0 £0.0 £0.0 £0.0 £0.0 £5.9Newport £0.0 £0.0 £0.0 £0.0 £0.0 £0.0 £0.0 £0.0 £1.7 £0.0 £0.0 £0.0 £0.0 £0.0 £0.0 £0.0 £1.7Saundersfoot £0.0 £0.0 £0.0 £0.0 £0.0 £1.3 £0.1 £0.0 £0.0 £0.0 £0.0 £0.1 £0.0 £0.0 £0.0 £0.0 £1.5St Davids £0.1 £0.5 £2.3 £0.0 £0.0 £0.5 £0.0 £0.5 £0.0 £0.3 £0.0 £0.0 £0.0 £0.0 £0.0 £0.1 £4.3Tenby £0.0 £0.0 £0.0 £0.0 £0.4 £22.7 £0.6 £0.0 £0.0 £0.0 £0.0 £0.0 £0.0 £0.0 £0.0 £0.0 £23.8Other ‐ Pembrokeshire £0.4 £0.6 £0.8 £3.4 £0.8 £3.8 £1.8 £1.0 £1.7 £2.8 £0.4 £0.1 £0.0 £0.0 £0.0 £0.0 £17.5SUB‐TOTAL PEMBROKESHIRE £48.3 £27.3 £52.0 £66.6 £69.5 £61.7 £28.2 £53.3 £13.8 £7.5 £0.5 £0.3 £0.1 £0.3 £0.3 £0.8 £430.5
CEREDIGION COUNTYAberystwyth Town Centre £0.1 £0.2 £0.4 £0.1 £0.0 £0.0 £0.0 £0.0 £0.1 £0.0 £1.1 £3.8 £19.0 £32.4 £41.7 £55.1 £154.2Parc Y Llyn Retail Park £0.0 £0.1 £0.2 £0.0 £0.0 £0.0 £0.0 £0.0 £0.0 £0.1 £0.1 £0.3 £4.0 £2.5 £3.7 £4.3 £15.3Other out of centre £0.0 £0.0 £0.1 £0.0 £0.0 £0.0 £0.0 £0.0 £0.0 £0.1 £0.1 £0.4 £1.3 £2.5 £2.6 £2.9 £10.0Cardigan Town Centre £0.0 £0.1 £0.0 £0.0 £0.0 £1.4 £1.0 £0.2 £3.1 £33.1 £4.9 £0.3 £0.8 £0.0 £0.0 £0.1 £45.1Out of centre £0.1 £0.0 £0.0 £0.0 £0.2 £0.0 £0.0 £0.0 £0.6 £2.1 £1.0 £0.0 £0.1 £0.0 £0.0 £0.0 £4.2Aberaeron £0.0 £0.0 £0.0 £0.0 £0.0 £0.0 £0.0 £0.0 £0.0 £0.0 £1.4 £2.1 £4.7 £0.2 £0.0 £0.1 £8.6Lampeter £0.0 £0.0 £0.0 £0.4 £0.0 £0.0 £0.0 £0.0 £0.0 £0.0 £2.6 £22.0 £0.7 £3.3 £0.2 £0.2 £29.5Tregaron £0.0 £0.0 £0.0 £0.0 £0.1 £0.0 £0.0 £0.0 £0.0 £0.2 £0.0 £0.0 £0.2 £1.1 £0.0 £0.0 £1.6Llandysul £0.0 £0.0 £0.0 £0.0 £0.0 £0.0 £0.0 £0.0 £0.0 £0.0 £6.2 £0.1 £0.1 £0.0 £0.0 £0.0 £6.4Other ‐ Ceredigion £0.2 £0.0 £0.0 £0.0 £0.0 £0.0 £0.0 £0.0 £0.0 £5.1 £2.6 £0.0 £0.2 £0.1 £0.2 £0.3 £8.7SUB‐TOTAL: CEREDIGION £0.5 £0.4 £0.7 £0.5 £0.2 £1.4 £1.1 £0.2 £3.9 £40.8 £20.1 £29.1 £31.2 £42.1 £48.5 £63.0 £283.6
OUTSIDE OF STUDY AREACarmarthen £4.3 £2.5 £1.2 £3.3 £8.3 £19.5 £18.8 £2.7 £3.7 £44.3 £34.0 £25.1 £8.0 £3.1 £2.7 £4.5 £186.2Cardiff £1.1 £0.6 £1.8 £2.3 £2.0 £1.5 £2.3 £0.5 £1.0 £0.9 £0.7 £0.5 £0.8 £1.1 £2.8 £3.0 £23.1Swansea £2.1 £0.6 £0.7 £3.5 £3.4 £1.6 £0.7 £0.3 £0.2 £1.0 £0.2 £0.4 £0.4 £0.6 £0.6 £0.5 £16.8Llanelli £0.0 £0.0 £0.0 £0.2 £0.0 £0.0 £0.0 £0.0 £0.0 £0.9 £0.0 £0.1 £0.2 £0.1 £0.0 £0.1 £1.6London £0.0 £0.0 £0.0 £0.0 £0.2 £0.0 £0.2 £0.2 £0.2 £0.0 £0.0 £0.0 £0.0 £0.0 £0.2 £0.0 £1.0All other £0.2 £0.4 £0.8 £0.6 £0.8 £2.5 £0.4 £0.7 £0.5 £2.3 £0.6 £1.6 £0.7 £1.0 £2.4 £7.4 £22.7SUB‐TOTAL: OUTSIDE STUDY AREA £7.7 £4.1 £4.7 £9.9 £14.7 £25.1 £22.4 £4.3 £5.7 £49.4 £35.5 £27.7 £10.2 £5.9 £8.6 £15.5 £251.4TOTAL MARKET SHARE £56.5 £31.9 £57.3 £77.0 £84.5 £88.1 £51.7 £57.8 £23.3 £97.7 £56.1 £57.0 £41.5 £48.3 £57.4 £79.3 £965.4
23/01/2017
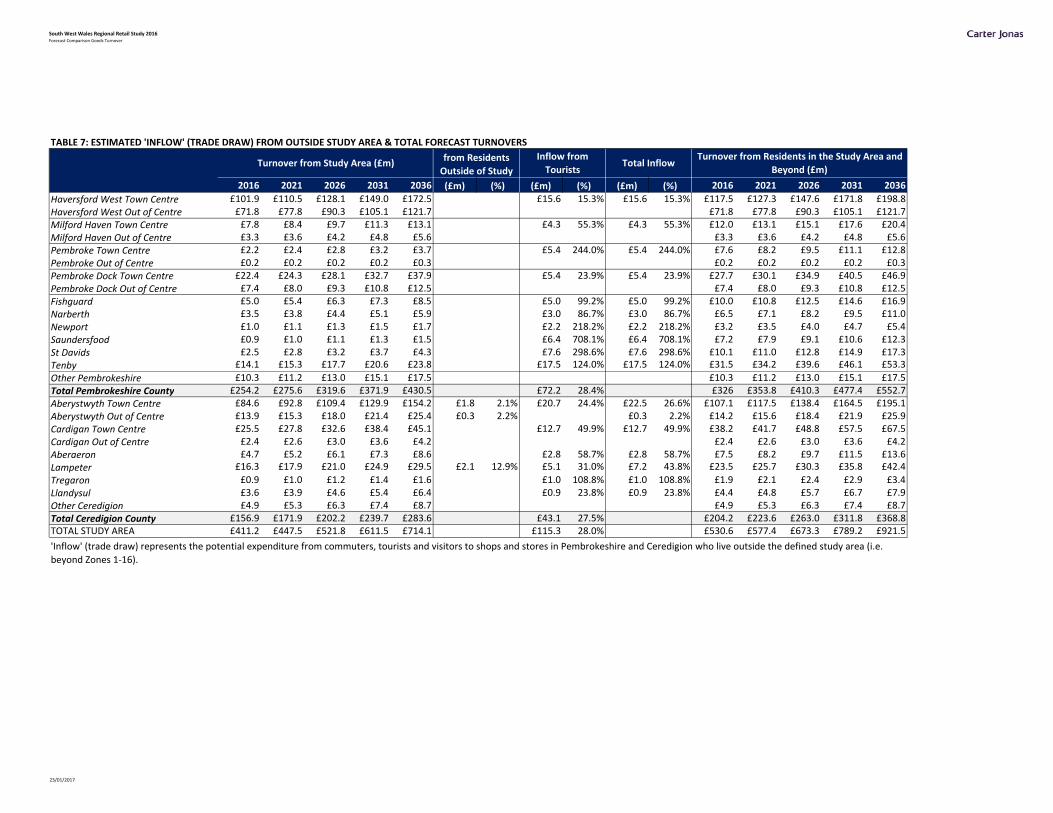
South West Wales Regional Retail Study 2016Forecast Comparison Goods Turnover
TABLE 7: ESTIMATED 'INFLOW' (TRADE DRAW) FROM OUTSIDE STUDY AREA & TOTAL FORECAST TURNOVERS
2016 2021 2026 2031 2036 (£m) (%) (£m) (%) (£m) (%) 2016 2021 2026 2031 2036
Haversford West Town Centre £101.9 £110.5 £128.1 £149.0 £172.5 £15.6 15.3% £15.6 15.3% £117.5 £127.3 £147.6 £171.8 £198.8
Haversford West Out of Centre £71.8 £77.8 £90.3 £105.1 £121.7 £71.8 £77.8 £90.3 £105.1 £121.7
Milford Haven Town Centre £7.8 £8.4 £9.7 £11.3 £13.1 £4.3 55.3% £4.3 55.3% £12.0 £13.1 £15.1 £17.6 £20.4
Milford Haven Out of Centre £3.3 £3.6 £4.2 £4.8 £5.6 £3.3 £3.6 £4.2 £4.8 £5.6
Pembroke Town Centre £2.2 £2.4 £2.8 £3.2 £3.7 £5.4 244.0% £5.4 244.0% £7.6 £8.2 £9.5 £11.1 £12.8
Pembroke Out of Centre £0.2 £0.2 £0.2 £0.2 £0.3 £0.2 £0.2 £0.2 £0.2 £0.3
Pembroke Dock Town Centre £22.4 £24.3 £28.1 £32.7 £37.9 £5.4 23.9% £5.4 23.9% £27.7 £30.1 £34.9 £40.5 £46.9
Pembroke Dock Out of Centre £7.4 £8.0 £9.3 £10.8 £12.5 £7.4 £8.0 £9.3 £10.8 £12.5
Fishguard £5.0 £5.4 £6.3 £7.3 £8.5 £5.0 99.2% £5.0 99.2% £10.0 £10.8 £12.5 £14.6 £16.9
Narberth £3.5 £3.8 £4.4 £5.1 £5.9 £3.0 86.7% £3.0 86.7% £6.5 £7.1 £8.2 £9.5 £11.0
Newport £1.0 £1.1 £1.3 £1.5 £1.7 £2.2 218.2% £2.2 218.2% £3.2 £3.5 £4.0 £4.7 £5.4
Saundersfood £0.9 £1.0 £1.1 £1.3 £1.5 £6.4 708.1% £6.4 708.1% £7.2 £7.9 £9.1 £10.6 £12.3
St Davids £2.5 £2.8 £3.2 £3.7 £4.3 £7.6 298.6% £7.6 298.6% £10.1 £11.0 £12.8 £14.9 £17.3
Tenby £14.1 £15.3 £17.7 £20.6 £23.8 £17.5 124.0% £17.5 124.0% £31.5 £34.2 £39.6 £46.1 £53.3
Other Pembrokeshire £10.3 £11.2 £13.0 £15.1 £17.5 £10.3 £11.2 £13.0 £15.1 £17.5
Total Pembrokeshire County £254.2 £275.6 £319.6 £371.9 £430.5 £72.2 28.4% £326 £353.8 £410.3 £477.4 £552.7
Aberystwyth Town Centre £84.6 £92.8 £109.4 £129.9 £154.2 £1.8 2.1% £20.7 24.4% £22.5 26.6% £107.1 £117.5 £138.4 £164.5 £195.1
Aberystwyth Out of Centre £13.9 £15.3 £18.0 £21.4 £25.4 £0.3 2.2% £0.3 2.2% £14.2 £15.6 £18.4 £21.9 £25.9
Cardigan Town Centre £25.5 £27.8 £32.6 £38.4 £45.1 £12.7 49.9% £12.7 49.9% £38.2 £41.7 £48.8 £57.5 £67.5
Cardigan Out of Centre £2.4 £2.6 £3.0 £3.6 £4.2 £2.4 £2.6 £3.0 £3.6 £4.2
Aberaeron £4.7 £5.2 £6.1 £7.3 £8.6 £2.8 58.7% £2.8 58.7% £7.5 £8.2 £9.7 £11.5 £13.6
Lampeter £16.3 £17.9 £21.0 £24.9 £29.5 £2.1 12.9% £5.1 31.0% £7.2 43.8% £23.5 £25.7 £30.3 £35.8 £42.4
Tregaron £0.9 £1.0 £1.2 £1.4 £1.6 £1.0 108.8% £1.0 108.8% £1.9 £2.1 £2.4 £2.9 £3.4
Llandysul £3.6 £3.9 £4.6 £5.4 £6.4 £0.9 23.8% £0.9 23.8% £4.4 £4.8 £5.7 £6.7 £7.9
Other Ceredigion £4.9 £5.3 £6.3 £7.4 £8.7 £4.9 £5.3 £6.3 £7.4 £8.7
Total Ceredigion County £156.9 £171.9 £202.2 £239.7 £283.6 £43.1 27.5% £204.2 £223.6 £263.0 £311.8 £368.8TOTAL STUDY AREA £411.2 £447.5 £521.8 £611.5 £714.1 £115.3 28.0% £530.6 £577.4 £673.3 £789.2 £921.5
'Inflow' (trade draw) represents the potential expenditure from commuters, tourists and visitors to shops and stores in Pembrokeshire and Ceredigion who live outside the defined study area (i.e.
beyond Zones 1‐16).
Inflow from
TouristsTurnover from Study Area (£m)
p
from Residents
Outside of Study
Turnover from Residents in the Study Area and
Beyond (£m)Total Inflow
23/01/2017
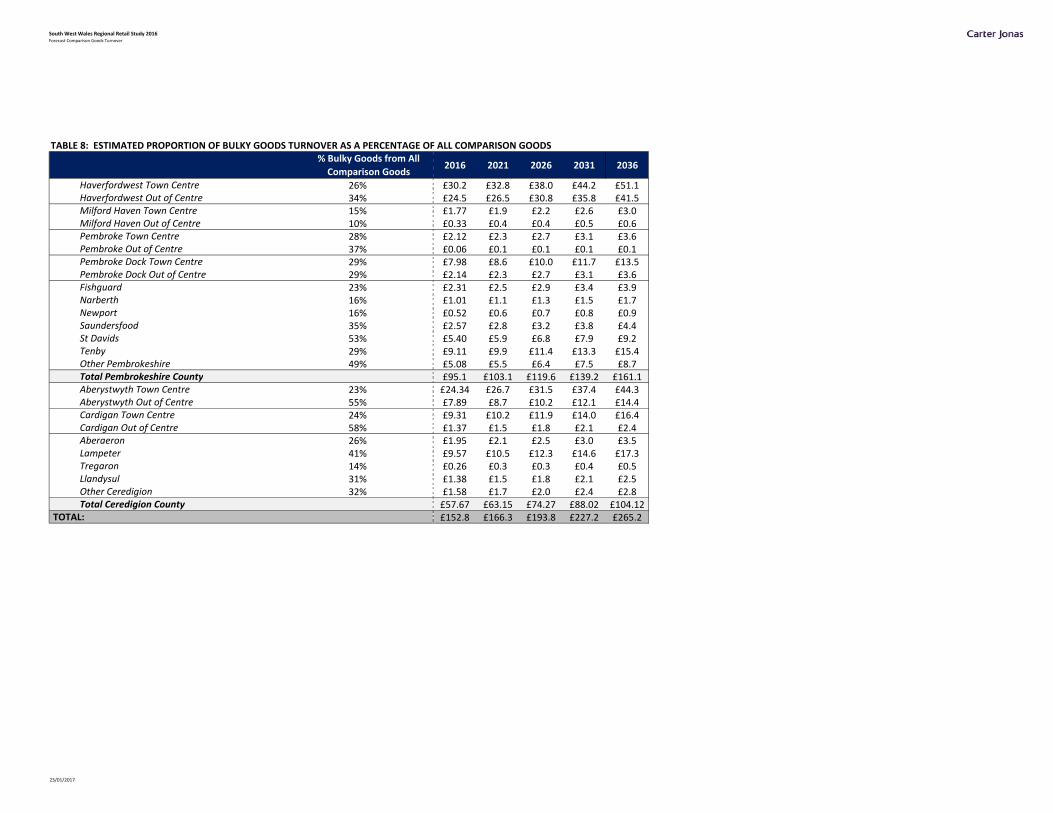
South West Wales Regional Retail Study 2016Forecast Comparison Goods Turnover
TABLE 8: ESTIMATED PROPORTION OF BULKY GOODS TURNOVER AS A PERCENTAGE OF ALL COMPARISON GOODS
2016 2021 2026 2031 2036
Haverfordwest Town Centre 26% £30.2 £32.8 £38.0 £44.2 £51.1Haverfordwest Out of Centre 34% £24.5 £26.5 £30.8 £35.8 £41.5Milford Haven Town Centre 15% £1.77 £1.9 £2.2 £2.6 £3.0Milford Haven Out of Centre 10% £0.33 £0.4 £0.4 £0.5 £0.6Pembroke Town Centre 28% £2.12 £2.3 £2.7 £3.1 £3.6Pembroke Out of Centre 37% £0.06 £0.1 £0.1 £0.1 £0.1Pembroke Dock Town Centre 29% £7.98 £8.6 £10.0 £11.7 £13.5Pembroke Dock Out of Centre 29% £2.14 £2.3 £2.7 £3.1 £3.6Fishguard 23% £2.31 £2.5 £2.9 £3.4 £3.9Narberth 16% £1.01 £1.1 £1.3 £1.5 £1.7Newport 16% £0.52 £0.6 £0.7 £0.8 £0.9Saundersfood 35% £2.57 £2.8 £3.2 £3.8 £4.4St Davids 53% £5.40 £5.9 £6.8 £7.9 £9.2Tenby 29% £9.11 £9.9 £11.4 £13.3 £15.4Other Pembrokeshire 49% £5.08 £5.5 £6.4 £7.5 £8.7Total Pembrokeshire County £95.1 £103.1 £119.6 £139.2 £161.1Aberystwyth Town Centre 23% £24.34 £26.7 £31.5 £37.4 £44.3Aberystwyth Out of Centre 55% £7.89 £8.7 £10.2 £12.1 £14.4Cardigan Town Centre 24% £9.31 £10.2 £11.9 £14.0 £16.4Cardigan Out of Centre 58% £1.37 £1.5 £1.8 £2.1 £2.4Aberaeron 26% £1.95 £2.1 £2.5 £3.0 £3.5Lampeter 41% £9.57 £10.5 £12.3 £14.6 £17.3Tregaron 14% £0.26 £0.3 £0.3 £0.4 £0.5Llandysul 31% £1.38 £1.5 £1.8 £2.1 £2.5Other Ceredigion 32% £1.58 £1.7 £2.0 £2.4 £2.8Total Ceredigion County £57.67 £63.15 £74.27 £88.02 £104.12
TOTAL: £152.8 £166.3 £193.8 £227.2 £265.2
% Bulky Goods from All
Comparison Goods
23/01/2017
South West Wales Regional Retail Study
APPENDIX 7: COMMITTED RETAIL DEVELOPMENT
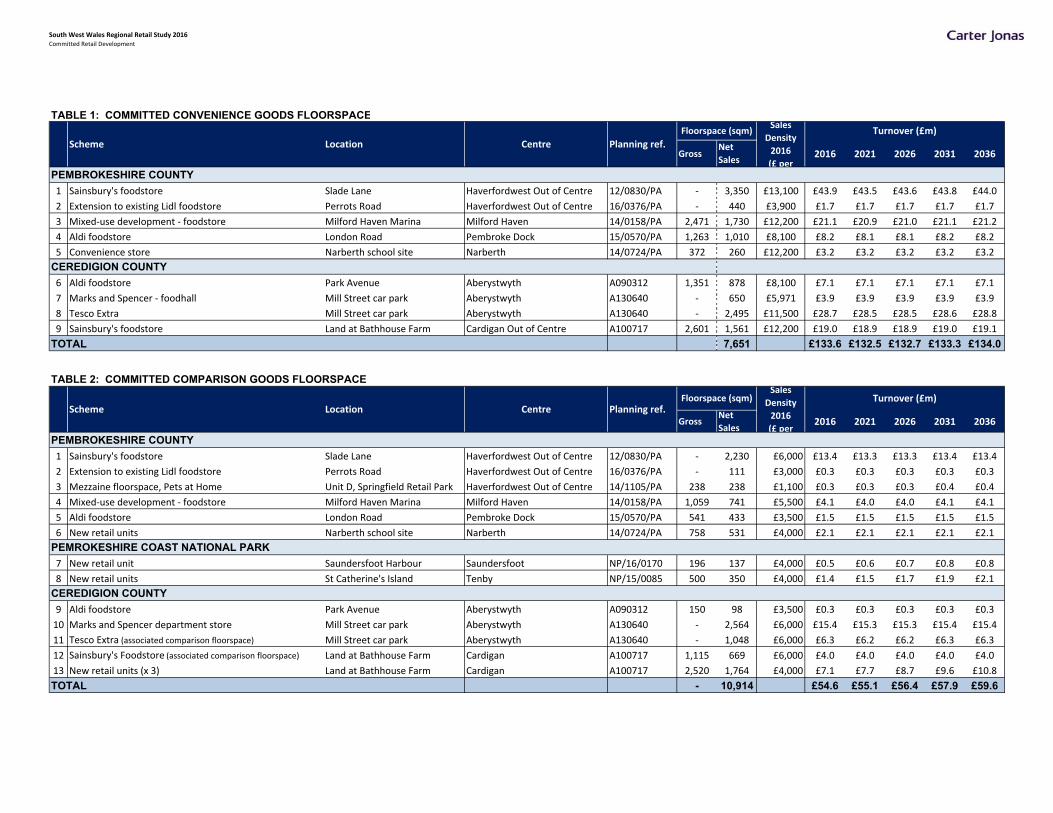
South West Wales Regional Retail Study 2016Committed Retail Development
TABLE 1: COMMITTED CONVENIENCE GOODS FLOORSPACE
GrossNet
Sales 2016 2021 2026 2031 2036
PEMBROKESHIRE COUNTY
1 Sainsbury's foodstore Slade Lane Haverfordwest Out of Centre 12/0830/PA ‐ 3,350 £13,100 £43.9 £43.5 £43.6 £43.8 £44.0
2 Extension to existing Lidl foodstore Perrots Road Haverfordwest Out of Centre 16/0376/PA ‐ 440 £3,900 £1.7 £1.7 £1.7 £1.7 £1.7
3 Mixed‐use development ‐ foodstore Milford Haven Marina Milford Haven 14/0158/PA 2,471 1,730 £12,200 £21.1 £20.9 £21.0 £21.1 £21.2
4 Aldi foodstore London Road Pembroke Dock 15/0570/PA 1,263 1,010 £8,100 £8.2 £8.1 £8.1 £8.2 £8.2
5 Convenience store Narberth school site Narberth 14/0724/PA 372 260 £12,200 £3.2 £3.2 £3.2 £3.2 £3.2
CEREDIGION COUNTY
6 Aldi foodstore Park Avenue Aberystwyth A090312 1,351 878 £8,100 £7.1 £7.1 £7.1 £7.1 £7.1
7 Marks and Spencer ‐ foodhall Mill Street car park Aberystwyth A130640 ‐ 650 £5,971 £3.9 £3.9 £3.9 £3.9 £3.9
8 Tesco Extra Mill Street car park Aberystwyth A130640 ‐ 2,495 £11,500 £28.7 £28.5 £28.5 £28.6 £28.8
9 Sainsbury's foodstore Land at Bathhouse Farm Cardigan Out of Centre A100717 2,601 1,561 £12,200 £19.0 £18.9 £18.9 £19.0 £19.1
TOTAL 7,651 £133.6 £132.5 £132.7 £133.3 £134.0
TABLE 2: COMMITTED COMPARISON GOODS FLOORSPACE
GrossNet
Sales 2016 2021 2026 2031 2036
PEMBROKESHIRE COUNTY
1 Sainsbury's foodstore Slade Lane Haverfordwest Out of Centre 12/0830/PA ‐ 2,230 £6,000 £13.4 £13.3 £13.3 £13.4 £13.4
2 Extension to existing Lidl foodstore Perrots Road Haverfordwest Out of Centre 16/0376/PA ‐ 111 £3,000 £0.3 £0.3 £0.3 £0.3 £0.3
3 Mezzaine floorspace, Pets at Home Unit D, Springfield Retail Park Haverfordwest Out of Centre 14/1105/PA 238 238 £1,100 £0.3 £0.3 £0.3 £0.4 £0.4
4 Mixed‐use development ‐ foodstore Milford Haven Marina Milford Haven 14/0158/PA 1,059 741 £5,500 £4.1 £4.0 £4.0 £4.1 £4.1
5 Aldi foodstore London Road Pembroke Dock 15/0570/PA 541 433 £3,500 £1.5 £1.5 £1.5 £1.5 £1.5
6 New retail units Narberth school site Narberth 14/0724/PA 758 531 £4,000 £2.1 £2.1 £2.1 £2.1 £2.1
PEMROKESHIRE COAST NATIONAL PARK
7 New retail unit Saundersfoot Harbour Saundersfoot NP/16/0170 196 137 £4,000 £0.5 £0.6 £0.7 £0.8 £0.8
8 New retail units St Catherine's Island Tenby NP/15/0085 500 350 £4,000 £1.4 £1.5 £1.7 £1.9 £2.1
CEREDIGION COUNTY
9 Aldi foodstore Park Avenue Aberystwyth A090312 150 98 £3,500 £0.3 £0.3 £0.3 £0.3 £0.3
10 Marks and Spencer department store Mill Street car park Aberystwyth A130640 ‐ 2,564 £6,000 £15.4 £15.3 £15.3 £15.4 £15.4
11 Tesco Extra (associated comparison floorspace) Mill Street car park Aberystwyth A130640 ‐ 1,048 £6,000 £6.3 £6.2 £6.2 £6.3 £6.3
12 Sainsbury's Foodstore (associated comparison floorspace) Land at Bathhouse Farm Cardigan A100717 1,115 669 £6,000 £4.0 £4.0 £4.0 £4.0 £4.0
13 New retail units (x 3) Land at Bathhouse Farm Cardigan A100717 2,520 1,764 £4,000 £7.1 £7.7 £8.7 £9.6 £10.8
TOTAL - 10,914 £54.6 £55.1 £56.4 £57.9 £59.6
Location
Sales
Density
2016
(£ per
Planning ref.
Planning ref.Centre
Centre
Floorspace (sqm)
Floorspace (sqm) Turnover (£m)Sales
Density
2016
(£ per
Scheme Location
Turnover (£m)
Scheme

South West Wales Regional Retail Study
APPENDIX 8A: FORECAST CONVENIENCE GOODS CAPACITY – PEMBROKESHIRE COUNTY & PEMBROKESHIRE COAST NATIONAL PARK
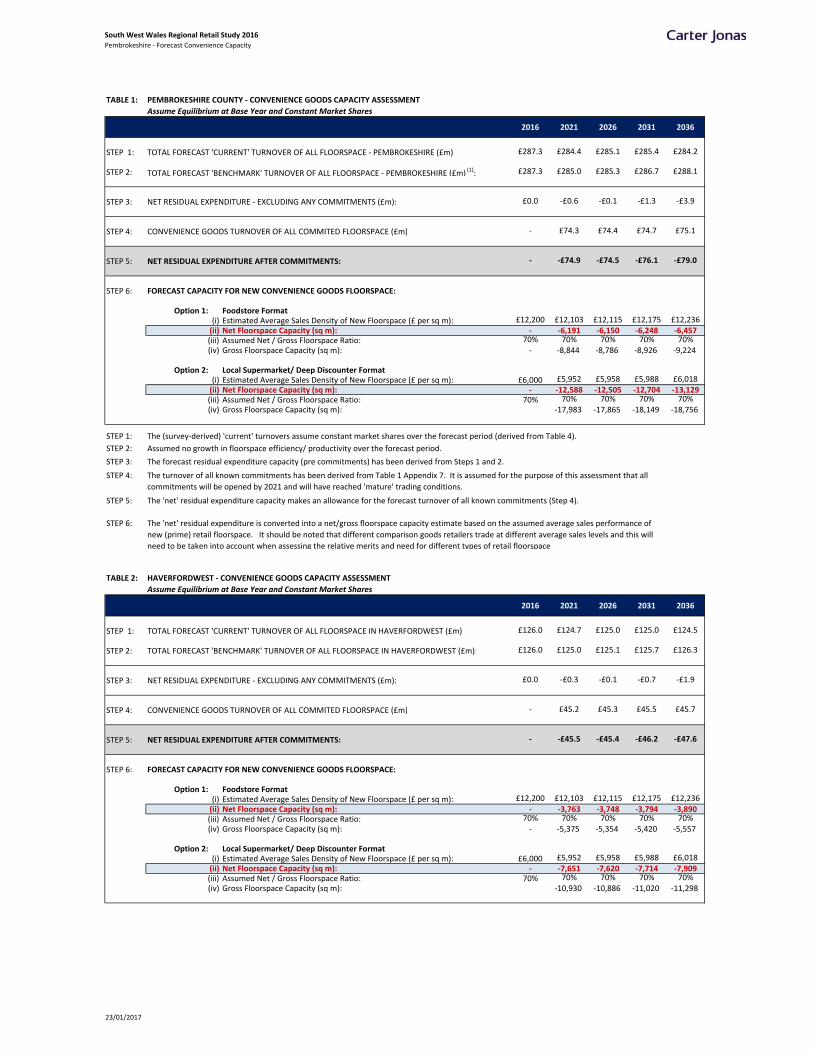
South West Wales Regional Retail Study 2016Pembrokeshire ‐ Forecast Convenience Capacity
TABLE 1: PEMBROKESHIRE COUNTY ‐ CONVENIENCE GOODS CAPACITY ASSESSMENT
Assume Equilibrium at Base Year and Constant Market Shares
2016 2021 2026 2031 2036
STEP 1: TOTAL FORECAST 'CURRENT' TURNOVER OF ALL FLOORSPACE ‐ PEMBROKESHIRE (£m): £287.3 £284.4 £285.1 £285.4 £284.2
STEP 2: TOTAL FORECAST 'BENCHMARK' TURNOVER OF ALL FLOORSPACE ‐ PEMBROKESHIRE (£m) (1): £287.3 £285.0 £285.3 £286.7 £288.1
STEP 3: NET RESIDUAL EXPENDITURE ‐ EXCLUDING ANY COMMITMENTS (£m): £0.0 ‐£0.6 ‐£0.1 ‐£1.3 ‐£3.9
STEP 4: CONVENIENCE GOODS TURNOVER OF ALL COMMITED FLOORSPACE (£m) ‐ £74.3 £74.4 £74.7 £75.1
STEP 5: NET RESIDUAL EXPENDITURE AFTER COMMITMENTS: ‐ ‐£74.9 ‐£74.5 ‐£76.1 ‐£79.0
STEP 6: FORECAST CAPACITY FOR NEW CONVENIENCE GOODS FLOORSPACE:
Option 1: Foodstore Format(i) Estimated Average Sales Density of New Floorspace (£ per sq m): £12,200 £12,103 £12,115 £12,175 £12,236(ii) Net Floorspace Capacity (sq m): ‐ ‐6,191 ‐6,150 ‐6,248 ‐6,457(iii) Assumed Net / Gross Floorspace Ratio: 70% 70% 70% 70% 70%(iv) Gross Floorspace Capacity (sq m): ‐ ‐8,844 ‐8,786 ‐8,926 ‐9,224
Option 2: Local Supermarket/ Deep Discounter Format(i) Estimated Average Sales Density of New Floorspace (£ per sq m): £6,000 £5,952 £5,958 £5,988 £6,018(ii) Net Floorspace Capacity (sq m): ‐ ‐12,588 ‐12,505 ‐12,704 ‐13,129(iii) Assumed Net / Gross Floorspace Ratio: 70% 70% 70% 70% 70%(iv) Gross Floorspace Capacity (sq m): ‐17,983 ‐17,865 ‐18,149 ‐18,756
STEP 1:
STEP 2:
STEP 3:
STEP 4:
STEP 5:
STEP 6:
TABLE 2: HAVERFORDWEST ‐ CONVENIENCE GOODS CAPACITY ASSESSMENT
Assume Equilibrium at Base Year and Constant Market Shares
2016 2021 2026 2031 2036
STEP 1: TOTAL FORECAST 'CURRENT' TURNOVER OF ALL FLOORSPACE IN HAVERFORDWEST (£m): £126.0 £124.7 £125.0 £125.0 £124.5
STEP 2: TOTAL FORECAST 'BENCHMARK' TURNOVER OF ALL FLOORSPACE IN HAVERFORDWEST (£m): £126.0 £125.0 £125.1 £125.7 £126.3
STEP 3: NET RESIDUAL EXPENDITURE ‐ EXCLUDING ANY COMMITMENTS (£m): £0.0 ‐£0.3 ‐£0.1 ‐£0.7 ‐£1.9
STEP 4: CONVENIENCE GOODS TURNOVER OF ALL COMMITED FLOORSPACE (£m) ‐ £45.2 £45.3 £45.5 £45.7
STEP 5: NET RESIDUAL EXPENDITURE AFTER COMMITMENTS: ‐ ‐£45.5 ‐£45.4 ‐£46.2 ‐£47.6
STEP 6: FORECAST CAPACITY FOR NEW CONVENIENCE GOODS FLOORSPACE:
Option 1: Foodstore Format(i) Estimated Average Sales Density of New Floorspace (£ per sq m): £12,200 £12,103 £12,115 £12,175 £12,236(ii) Net Floorspace Capacity (sq m): ‐ ‐3,763 ‐3,748 ‐3,794 ‐3,890(iii) Assumed Net / Gross Floorspace Ratio: 70% 70% 70% 70% 70%(iv) Gross Floorspace Capacity (sq m): ‐ ‐5,375 ‐5,354 ‐5,420 ‐5,557
Option 2: Local Supermarket/ Deep Discounter Format(i) Estimated Average Sales Density of New Floorspace (£ per sq m): £6,000 £5,952 £5,958 £5,988 £6,018(ii) Net Floorspace Capacity (sq m): ‐ ‐7,651 ‐7,620 ‐7,714 ‐7,909(iii) Assumed Net / Gross Floorspace Ratio: 70% 70% 70% 70% 70%(iv) Gross Floorspace Capacity (sq m): ‐10,930 ‐10,886 ‐11,020 ‐11,298
The turnover of all known commitments has been derived from Table 1 Appendix 7. It is assumed for the purpose of this assessment that all
commitments will be opened by 2021 and will have reached 'mature' trading conditions.
The 'net' residual expenditure capacity makes an allowance for the forecast turnover of all known commitments (Step 4).
The 'net' residual expenditure is converted into a net/gross floorspace capacity estimate based on the assumed average sales performance of
new (prime) retail floorspace. It should be noted that different comparison goods retailers trade at different average sales levels and this will
need to be taken into account when assessing the relative merits and need for different types of retail floorspace
The (survey‐derived) 'current' turnovers assume constant market shares over the forecast period (derived from Table 4).
Assumed no growth in floorspace efficiency/ productivity over the forecast period.
The forecast residual expenditure capacity (pre commitments) has been derived from Steps 1 and 2.
23/01/2017
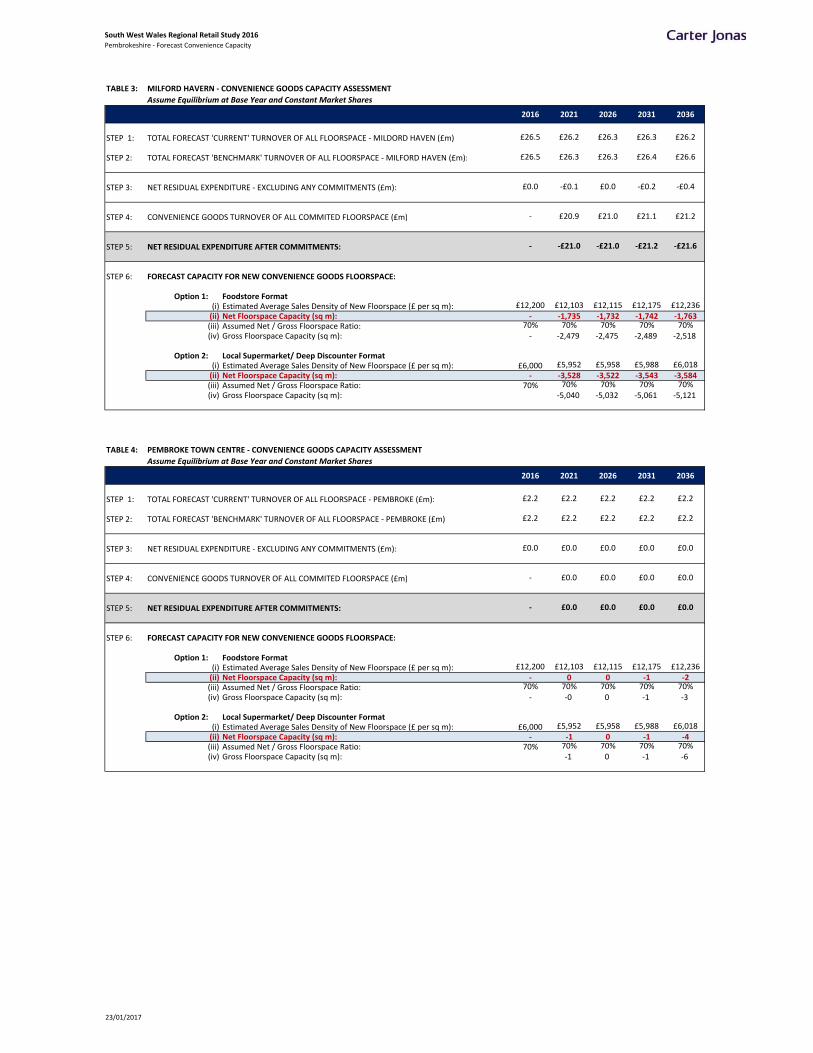
South West Wales Regional Retail Study 2016Pembrokeshire ‐ Forecast Convenience Capacity
TABLE 3: MILFORD HAVERN ‐ CONVENIENCE GOODS CAPACITY ASSESSMENT
Assume Equilibrium at Base Year and Constant Market Shares
2016 2021 2026 2031 2036
STEP 1: TOTAL FORECAST 'CURRENT' TURNOVER OF ALL FLOORSPACE ‐ MILDORD HAVEN (£m): £26.5 £26.2 £26.3 £26.3 £26.2
STEP 2: TOTAL FORECAST 'BENCHMARK' TURNOVER OF ALL FLOORSPACE ‐ MILFORD HAVEN (£m): £26.5 £26.3 £26.3 £26.4 £26.6
STEP 3: NET RESIDUAL EXPENDITURE ‐ EXCLUDING ANY COMMITMENTS (£m): £0.0 ‐£0.1 £0.0 ‐£0.2 ‐£0.4
STEP 4: CONVENIENCE GOODS TURNOVER OF ALL COMMITED FLOORSPACE (£m) ‐ £20.9 £21.0 £21.1 £21.2
STEP 5: NET RESIDUAL EXPENDITURE AFTER COMMITMENTS: ‐ ‐£21.0 ‐£21.0 ‐£21.2 ‐£21.6
STEP 6: FORECAST CAPACITY FOR NEW CONVENIENCE GOODS FLOORSPACE:
Option 1: Foodstore Format(i) Estimated Average Sales Density of New Floorspace (£ per sq m): £12,200 £12,103 £12,115 £12,175 £12,236(ii) Net Floorspace Capacity (sq m): ‐ ‐1,735 ‐1,732 ‐1,742 ‐1,763(iii) Assumed Net / Gross Floorspace Ratio: 70% 70% 70% 70% 70%(iv) Gross Floorspace Capacity (sq m): ‐ ‐2,479 ‐2,475 ‐2,489 ‐2,518
Option 2: Local Supermarket/ Deep Discounter Format(i) Estimated Average Sales Density of New Floorspace (£ per sq m): £6,000 £5,952 £5,958 £5,988 £6,018(ii) Net Floorspace Capacity (sq m): ‐ ‐3,528 ‐3,522 ‐3,543 ‐3,584(iii) Assumed Net / Gross Floorspace Ratio: 70% 70% 70% 70% 70%(iv) Gross Floorspace Capacity (sq m): ‐5,040 ‐5,032 ‐5,061 ‐5,121
TABLE 4: PEMBROKE TOWN CENTRE ‐ CONVENIENCE GOODS CAPACITY ASSESSMENT
Assume Equilibrium at Base Year and Constant Market Shares
2016 2021 2026 2031 2036
STEP 1: TOTAL FORECAST 'CURRENT' TURNOVER OF ALL FLOORSPACE ‐ PEMBROKE (£m): £2.2 £2.2 £2.2 £2.2 £2.2
STEP 2: TOTAL FORECAST 'BENCHMARK' TURNOVER OF ALL FLOORSPACE ‐ PEMBROKE (£m): £2.2 £2.2 £2.2 £2.2 £2.2
STEP 3: NET RESIDUAL EXPENDITURE ‐ EXCLUDING ANY COMMITMENTS (£m): £0.0 £0.0 £0.0 £0.0 £0.0
STEP 4: CONVENIENCE GOODS TURNOVER OF ALL COMMITED FLOORSPACE (£m) ‐ £0.0 £0.0 £0.0 £0.0
STEP 5: NET RESIDUAL EXPENDITURE AFTER COMMITMENTS: ‐ £0.0 £0.0 £0.0 £0.0
STEP 6: FORECAST CAPACITY FOR NEW CONVENIENCE GOODS FLOORSPACE:
Option 1: Foodstore Format(i) Estimated Average Sales Density of New Floorspace (£ per sq m): £12,200 £12,103 £12,115 £12,175 £12,236(ii) Net Floorspace Capacity (sq m): ‐ 0 0 ‐1 ‐2(iii) Assumed Net / Gross Floorspace Ratio: 70% 70% 70% 70% 70%(iv) Gross Floorspace Capacity (sq m): ‐ ‐0 0 ‐1 ‐3
Option 2: Local Supermarket/ Deep Discounter Format(i) Estimated Average Sales Density of New Floorspace (£ per sq m): £6,000 £5,952 £5,958 £5,988 £6,018(ii) Net Floorspace Capacity (sq m): ‐ ‐1 0 ‐1 ‐4(iii) Assumed Net / Gross Floorspace Ratio: 70% 70% 70% 70% 70%(iv) Gross Floorspace Capacity (sq m): ‐1 0 ‐1 ‐6
23/01/2017
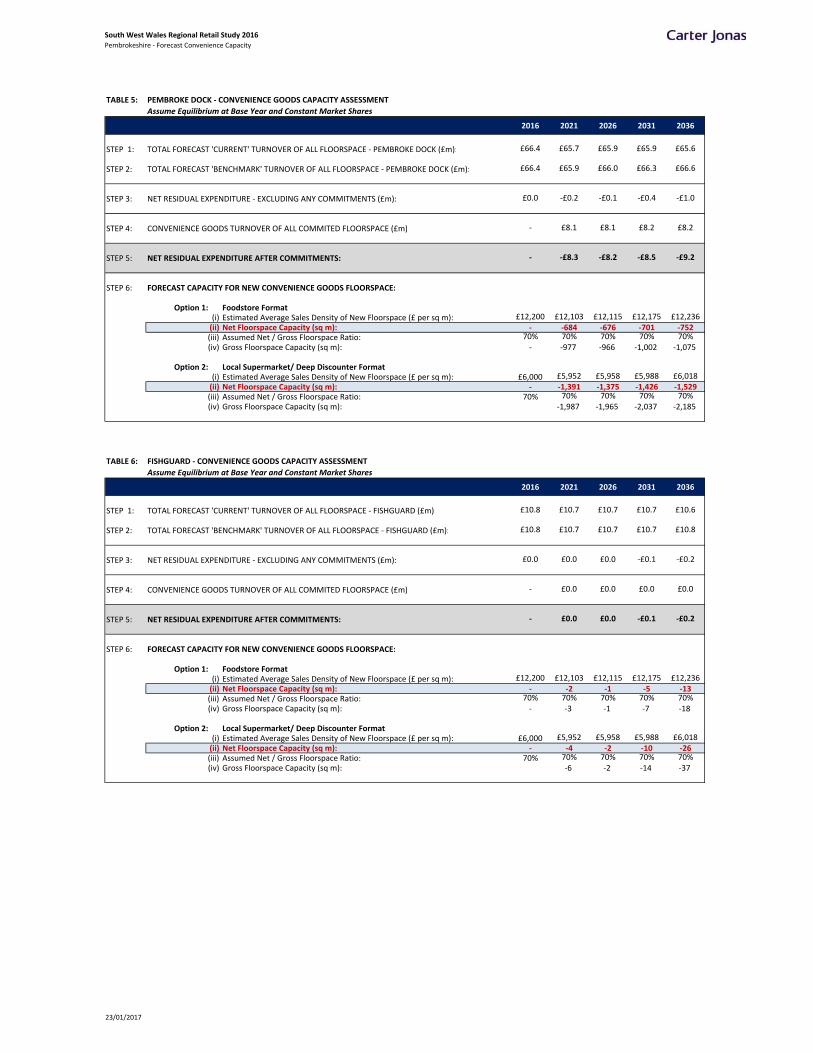
South West Wales Regional Retail Study 2016Pembrokeshire ‐ Forecast Convenience Capacity
TABLE 5: PEMBROKE DOCK ‐ CONVENIENCE GOODS CAPACITY ASSESSMENT
Assume Equilibrium at Base Year and Constant Market Shares
2016 2021 2026 2031 2036
STEP 1: TOTAL FORECAST 'CURRENT' TURNOVER OF ALL FLOORSPACE ‐ PEMBROKE DOCK (£m): £66.4 £65.7 £65.9 £65.9 £65.6
STEP 2: TOTAL FORECAST 'BENCHMARK' TURNOVER OF ALL FLOORSPACE ‐ PEMBROKE DOCK (£m): £66.4 £65.9 £66.0 £66.3 £66.6
STEP 3: NET RESIDUAL EXPENDITURE ‐ EXCLUDING ANY COMMITMENTS (£m): £0.0 ‐£0.2 ‐£0.1 ‐£0.4 ‐£1.0
STEP 4: CONVENIENCE GOODS TURNOVER OF ALL COMMITED FLOORSPACE (£m) ‐ £8.1 £8.1 £8.2 £8.2
STEP 5: NET RESIDUAL EXPENDITURE AFTER COMMITMENTS: ‐ ‐£8.3 ‐£8.2 ‐£8.5 ‐£9.2
STEP 6: FORECAST CAPACITY FOR NEW CONVENIENCE GOODS FLOORSPACE:
Option 1: Foodstore Format(i) Estimated Average Sales Density of New Floorspace (£ per sq m): £12,200 £12,103 £12,115 £12,175 £12,236(ii) Net Floorspace Capacity (sq m): ‐ ‐684 ‐676 ‐701 ‐752(iii) Assumed Net / Gross Floorspace Ratio: 70% 70% 70% 70% 70%(iv) Gross Floorspace Capacity (sq m): ‐ ‐977 ‐966 ‐1,002 ‐1,075
Option 2: Local Supermarket/ Deep Discounter Format(i) Estimated Average Sales Density of New Floorspace (£ per sq m): £6,000 £5,952 £5,958 £5,988 £6,018(ii) Net Floorspace Capacity (sq m): ‐ ‐1,391 ‐1,375 ‐1,426 ‐1,529(iii) Assumed Net / Gross Floorspace Ratio: 70% 70% 70% 70% 70%(iv) Gross Floorspace Capacity (sq m): ‐1,987 ‐1,965 ‐2,037 ‐2,185
TABLE 6: FISHGUARD ‐ CONVENIENCE GOODS CAPACITY ASSESSMENT
Assume Equilibrium at Base Year and Constant Market Shares
2016 2021 2026 2031 2036
STEP 1: TOTAL FORECAST 'CURRENT' TURNOVER OF ALL FLOORSPACE ‐ FISHGUARD (£m): £10.8 £10.7 £10.7 £10.7 £10.6
STEP 2: TOTAL FORECAST 'BENCHMARK' TURNOVER OF ALL FLOORSPACE ‐ FISHGUARD (£m): £10.8 £10.7 £10.7 £10.7 £10.8
STEP 3: NET RESIDUAL EXPENDITURE ‐ EXCLUDING ANY COMMITMENTS (£m): £0.0 £0.0 £0.0 ‐£0.1 ‐£0.2
STEP 4: CONVENIENCE GOODS TURNOVER OF ALL COMMITED FLOORSPACE (£m) ‐ £0.0 £0.0 £0.0 £0.0
STEP 5: NET RESIDUAL EXPENDITURE AFTER COMMITMENTS: ‐ £0.0 £0.0 ‐£0.1 ‐£0.2
STEP 6: FORECAST CAPACITY FOR NEW CONVENIENCE GOODS FLOORSPACE:
Option 1: Foodstore Format(i) Estimated Average Sales Density of New Floorspace (£ per sq m): £12,200 £12,103 £12,115 £12,175 £12,236(ii) Net Floorspace Capacity (sq m): ‐ ‐2 ‐1 ‐5 ‐13(iii) Assumed Net / Gross Floorspace Ratio: 70% 70% 70% 70% 70%(iv) Gross Floorspace Capacity (sq m): ‐ ‐3 ‐1 ‐7 ‐18
Option 2: Local Supermarket/ Deep Discounter Format(i) Estimated Average Sales Density of New Floorspace (£ per sq m): £6,000 £5,952 £5,958 £5,988 £6,018(ii) Net Floorspace Capacity (sq m): ‐ ‐4 ‐2 ‐10 ‐26(iii) Assumed Net / Gross Floorspace Ratio: 70% 70% 70% 70% 70%(iv) Gross Floorspace Capacity (sq m): ‐6 ‐2 ‐14 ‐37
23/01/2017

South West Wales Regional Retail Study 2016Pembrokeshire ‐ Forecast Convenience Capacity
TABLE 7: NARBERTH ‐ CONVENIENCE GOODS CAPACITY ASSESSMENT
Assume Equilibrium at Base Year and Constant Market Shares
2016 2021 2026 2031 2036
STEP 1: TOTAL FORECAST 'CURRENT' TURNOVER OF ALL FLOORSPACE ‐ NARBERTH (£m): £7.0 £6.9 £6.9 £6.9 £6.9
STEP 2: TOTAL FORECAST 'BENCHMARK' TURNOVER OF ALL FLOORSPACE ‐ NARBERTH (£m): £7.0 £6.9 £6.9 £6.9 £7.0
STEP 3: NET RESIDUAL EXPENDITURE ‐ EXCLUDING ANY COMMITMENTS (£m): £0.0 £0.0 £0.0 £0.0 ‐£0.1
STEP 4: CONVENIENCE GOODS TURNOVER OF ALL COMMITED FLOORSPACE (£m) ‐ £3.2 £3.2 £3.2 £3.2
STEP 5: NET RESIDUAL EXPENDITURE AFTER COMMITMENTS: ‐ ‐£3.2 ‐£3.1 ‐£3.2 ‐£3.3
STEP 6: FORECAST CAPACITY FOR NEW CONVENIENCE GOODS FLOORSPACE:
Option 1: Foodstore Format(i) Estimated Average Sales Density of New Floorspace (£ per sq m): £12,200 £12,103 £12,115 £12,175 £12,236(ii) Net Floorspace Capacity (sq m): ‐ ‐261 ‐260 ‐261 ‐266(iii) Assumed Net / Gross Floorspace Ratio: 70% 70% 70% 70% 70%(iv) Gross Floorspace Capacity (sq m): ‐ ‐373 ‐371 ‐373 ‐379
Option 2: Local Supermarket/ Deep Discounter Format(i) Estimated Average Sales Density of New Floorspace (£ per sq m): £6,000 £5,952 £5,958 £5,988 £6,018(ii) Net Floorspace Capacity (sq m): ‐ ‐531 ‐528 ‐531 ‐540(iii) Assumed Net / Gross Floorspace Ratio: 70% 70% 70% 70% 70%(iv) Gross Floorspace Capacity (sq m): ‐759 ‐754 ‐759 ‐772
TABLE 8: NEWPORT ‐ CONVENIENCE GOODS CAPACITY ASSESSMENT
Assume Equilibrium at Base Year and Constant Market Shares
2016 2021 2026 2031 2036
STEP 1: TOTAL FORECAST 'CURRENT' TURNOVER OF ALL FLOORSPACE ‐ NEWPORT (£m): £3.0 £2.9 £3.0 £3.0 £3.0
STEP 2: TOTAL FORECAST 'BENCHMARK' TURNOVER OF ALL FLOORSPACE ‐ NEWPORT (£m): £3.0 £2.9 £3.0 £3.0 £3.0
STEP 3: NET RESIDUAL EXPENDITURE ‐ EXCLUDING ANY COMMITMENTS (£m): £0.0 £0.0 £0.0 £0.0 £0.0
STEP 4: CONVENIENCE GOODS TURNOVER OF ALL COMMITED FLOORSPACE (£m) ‐ £0.0 £0.0 £0.0 £0.0
STEP 5: NET RESIDUAL EXPENDITURE AFTER COMMITMENTS: ‐ £0.0 £0.0 £0.0 £0.0
STEP 6: FORECAST CAPACITY FOR NEW CONVENIENCE GOODS FLOORSPACE:
Option 1: Foodstore Format(i) Estimated Average Sales Density of New Floorspace (£ per sq m): £12,200 £12,103 £12,115 £12,175 £12,236(ii) Net Floorspace Capacity (sq m): ‐ 0 1 1 ‐1(iii) Assumed Net / Gross Floorspace Ratio: 70% 70% 70% 70% 70%(iv) Gross Floorspace Capacity (sq m): ‐ ‐0 1 1 ‐1
Option 2: Local Supermarket/ Deep Discounter Format(i) Estimated Average Sales Density of New Floorspace (£ per sq m): £6,000 £5,952 £5,958 £5,988 £6,018(ii) Net Floorspace Capacity (sq m): ‐ 0 2 1 ‐1(iii) Assumed Net / Gross Floorspace Ratio: 70% 70% 70% 70% 70%(iv) Gross Floorspace Capacity (sq m): ‐0 3 2 ‐2
23/01/2017
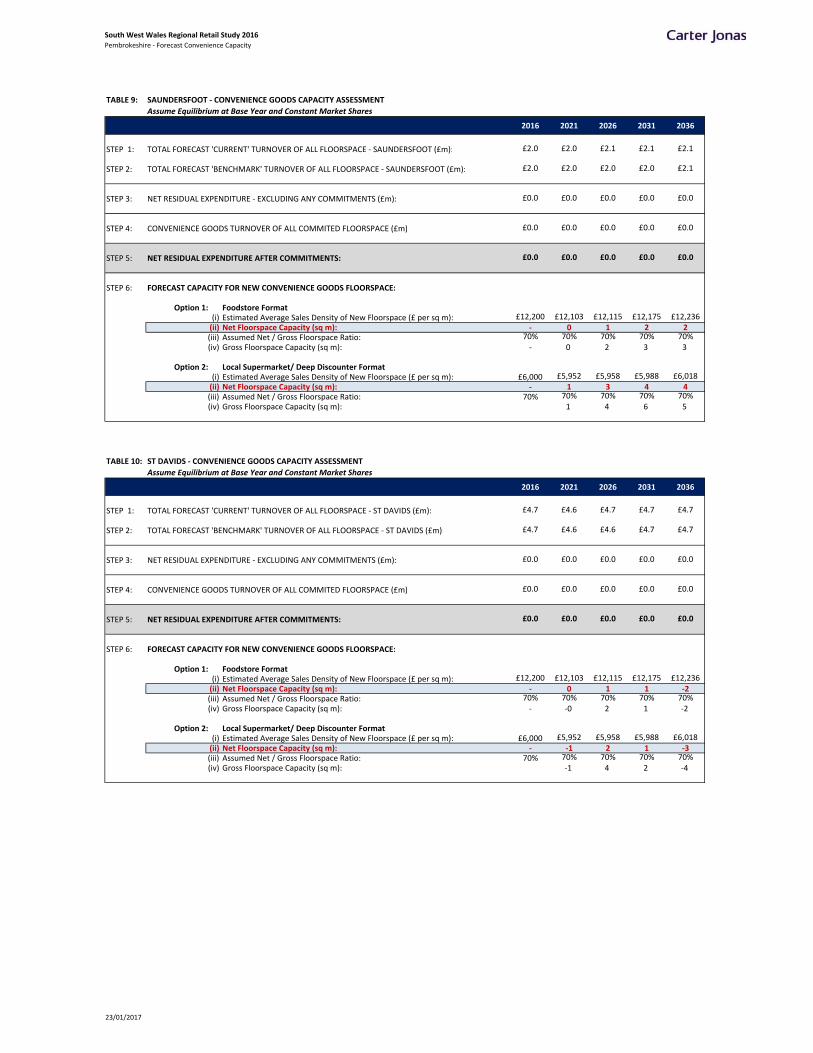
South West Wales Regional Retail Study 2016Pembrokeshire ‐ Forecast Convenience Capacity
TABLE 9: SAUNDERSFOOT ‐ CONVENIENCE GOODS CAPACITY ASSESSMENT
Assume Equilibrium at Base Year and Constant Market Shares
2016 2021 2026 2031 2036
STEP 1: TOTAL FORECAST 'CURRENT' TURNOVER OF ALL FLOORSPACE ‐ SAUNDERSFOOT (£m): £2.0 £2.0 £2.1 £2.1 £2.1
STEP 2: TOTAL FORECAST 'BENCHMARK' TURNOVER OF ALL FLOORSPACE ‐ SAUNDERSFOOT (£m): £2.0 £2.0 £2.0 £2.0 £2.1
STEP 3: NET RESIDUAL EXPENDITURE ‐ EXCLUDING ANY COMMITMENTS (£m): £0.0 £0.0 £0.0 £0.0 £0.0
STEP 4: CONVENIENCE GOODS TURNOVER OF ALL COMMITED FLOORSPACE (£m) £0.0 £0.0 £0.0 £0.0 £0.0
STEP 5: NET RESIDUAL EXPENDITURE AFTER COMMITMENTS: £0.0 £0.0 £0.0 £0.0 £0.0
STEP 6: FORECAST CAPACITY FOR NEW CONVENIENCE GOODS FLOORSPACE:
Option 1: Foodstore Format(i) Estimated Average Sales Density of New Floorspace (£ per sq m): £12,200 £12,103 £12,115 £12,175 £12,236(ii) Net Floorspace Capacity (sq m): ‐ 0 1 2 2(iii) Assumed Net / Gross Floorspace Ratio: 70% 70% 70% 70% 70%(iv) Gross Floorspace Capacity (sq m): ‐ 0 2 3 3
Option 2: Local Supermarket/ Deep Discounter Format(i) Estimated Average Sales Density of New Floorspace (£ per sq m): £6,000 £5,952 £5,958 £5,988 £6,018(ii) Net Floorspace Capacity (sq m): ‐ 1 3 4 4(iii) Assumed Net / Gross Floorspace Ratio: 70% 70% 70% 70% 70%(iv) Gross Floorspace Capacity (sq m): 1 4 6 5
TABLE 10: ST DAVIDS ‐ CONVENIENCE GOODS CAPACITY ASSESSMENT
Assume Equilibrium at Base Year and Constant Market Shares
2016 2021 2026 2031 2036
STEP 1: TOTAL FORECAST 'CURRENT' TURNOVER OF ALL FLOORSPACE ‐ ST DAVIDS (£m): £4.7 £4.6 £4.7 £4.7 £4.7
STEP 2: TOTAL FORECAST 'BENCHMARK' TURNOVER OF ALL FLOORSPACE ‐ ST DAVIDS (£m): £4.7 £4.6 £4.6 £4.7 £4.7
STEP 3: NET RESIDUAL EXPENDITURE ‐ EXCLUDING ANY COMMITMENTS (£m): £0.0 £0.0 £0.0 £0.0 £0.0
STEP 4: CONVENIENCE GOODS TURNOVER OF ALL COMMITED FLOORSPACE (£m) £0.0 £0.0 £0.0 £0.0 £0.0
STEP 5: NET RESIDUAL EXPENDITURE AFTER COMMITMENTS: £0.0 £0.0 £0.0 £0.0 £0.0
STEP 6: FORECAST CAPACITY FOR NEW CONVENIENCE GOODS FLOORSPACE:
Option 1: Foodstore Format(i) Estimated Average Sales Density of New Floorspace (£ per sq m): £12,200 £12,103 £12,115 £12,175 £12,236(ii) Net Floorspace Capacity (sq m): ‐ 0 1 1 ‐2(iii) Assumed Net / Gross Floorspace Ratio: 70% 70% 70% 70% 70%(iv) Gross Floorspace Capacity (sq m): ‐ ‐0 2 1 ‐2
Option 2: Local Supermarket/ Deep Discounter Format(i) Estimated Average Sales Density of New Floorspace (£ per sq m): £6,000 £5,952 £5,958 £5,988 £6,018(ii) Net Floorspace Capacity (sq m): ‐ ‐1 2 1 ‐3(iii) Assumed Net / Gross Floorspace Ratio: 70% 70% 70% 70% 70%(iv) Gross Floorspace Capacity (sq m): ‐1 4 2 ‐4
23/01/2017
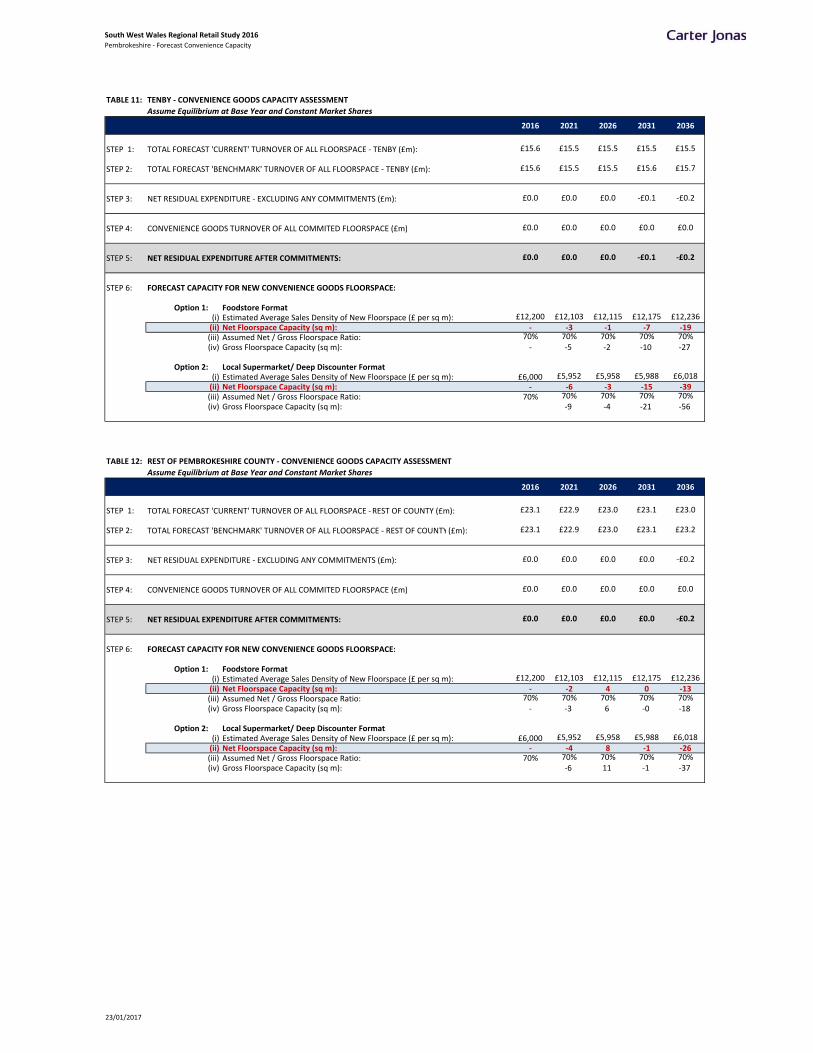
South West Wales Regional Retail Study 2016Pembrokeshire ‐ Forecast Convenience Capacity
TABLE 11: TENBY ‐ CONVENIENCE GOODS CAPACITY ASSESSMENT
Assume Equilibrium at Base Year and Constant Market Shares
2016 2021 2026 2031 2036
STEP 1: TOTAL FORECAST 'CURRENT' TURNOVER OF ALL FLOORSPACE ‐ TENBY (£m): £15.6 £15.5 £15.5 £15.5 £15.5
STEP 2: TOTAL FORECAST 'BENCHMARK' TURNOVER OF ALL FLOORSPACE ‐ TENBY (£m): £15.6 £15.5 £15.5 £15.6 £15.7
STEP 3: NET RESIDUAL EXPENDITURE ‐ EXCLUDING ANY COMMITMENTS (£m): £0.0 £0.0 £0.0 ‐£0.1 ‐£0.2
STEP 4: CONVENIENCE GOODS TURNOVER OF ALL COMMITED FLOORSPACE (£m) £0.0 £0.0 £0.0 £0.0 £0.0
STEP 5: NET RESIDUAL EXPENDITURE AFTER COMMITMENTS: £0.0 £0.0 £0.0 ‐£0.1 ‐£0.2
STEP 6: FORECAST CAPACITY FOR NEW CONVENIENCE GOODS FLOORSPACE:
Option 1: Foodstore Format(i) Estimated Average Sales Density of New Floorspace (£ per sq m): £12,200 £12,103 £12,115 £12,175 £12,236(ii) Net Floorspace Capacity (sq m): ‐ ‐3 ‐1 ‐7 ‐19(iii) Assumed Net / Gross Floorspace Ratio: 70% 70% 70% 70% 70%(iv) Gross Floorspace Capacity (sq m): ‐ ‐5 ‐2 ‐10 ‐27
Option 2: Local Supermarket/ Deep Discounter Format(i) Estimated Average Sales Density of New Floorspace (£ per sq m): £6,000 £5,952 £5,958 £5,988 £6,018(ii) Net Floorspace Capacity (sq m): ‐ ‐6 ‐3 ‐15 ‐39(iii) Assumed Net / Gross Floorspace Ratio: 70% 70% 70% 70% 70%(iv) Gross Floorspace Capacity (sq m): ‐9 ‐4 ‐21 ‐56
TABLE 12: REST OF PEMBROKESHIRE COUNTY ‐ CONVENIENCE GOODS CAPACITY ASSESSMENT
Assume Equilibrium at Base Year and Constant Market Shares
2016 2021 2026 2031 2036
STEP 1: TOTAL FORECAST 'CURRENT' TURNOVER OF ALL FLOORSPACE ‐ REST OF COUNTY (£m): £23.1 £22.9 £23.0 £23.1 £23.0
STEP 2: TOTAL FORECAST 'BENCHMARK' TURNOVER OF ALL FLOORSPACE ‐ REST OF COUNTY (£m): £23.1 £22.9 £23.0 £23.1 £23.2
STEP 3: NET RESIDUAL EXPENDITURE ‐ EXCLUDING ANY COMMITMENTS (£m): £0.0 £0.0 £0.0 £0.0 ‐£0.2
STEP 4: CONVENIENCE GOODS TURNOVER OF ALL COMMITED FLOORSPACE (£m) £0.0 £0.0 £0.0 £0.0 £0.0
STEP 5: NET RESIDUAL EXPENDITURE AFTER COMMITMENTS: £0.0 £0.0 £0.0 £0.0 ‐£0.2
STEP 6: FORECAST CAPACITY FOR NEW CONVENIENCE GOODS FLOORSPACE:
Option 1: Foodstore Format(i) Estimated Average Sales Density of New Floorspace (£ per sq m): £12,200 £12,103 £12,115 £12,175 £12,236(ii) Net Floorspace Capacity (sq m): ‐ ‐2 4 0 ‐13(iii) Assumed Net / Gross Floorspace Ratio: 70% 70% 70% 70% 70%(iv) Gross Floorspace Capacity (sq m): ‐ ‐3 6 ‐0 ‐18
Option 2: Local Supermarket/ Deep Discounter Format(i) Estimated Average Sales Density of New Floorspace (£ per sq m): £6,000 £5,952 £5,958 £5,988 £6,018(ii) Net Floorspace Capacity (sq m): ‐ ‐4 8 ‐1 ‐26(iii) Assumed Net / Gross Floorspace Ratio: 70% 70% 70% 70% 70%(iv) Gross Floorspace Capacity (sq m): ‐6 11 ‐1 ‐37
23/01/2017
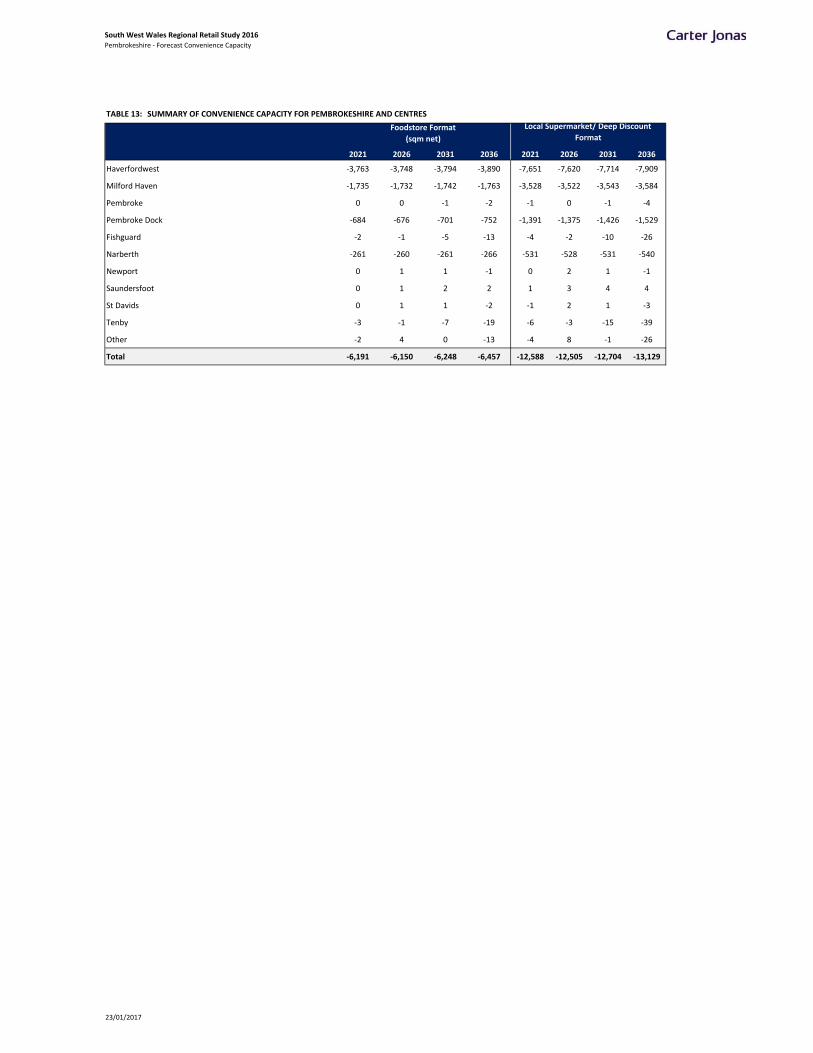
South West Wales Regional Retail Study 2016Pembrokeshire ‐ Forecast Convenience Capacity
TABLE 13: SUMMARY OF CONVENIENCE CAPACITY FOR PEMBROKESHIRE AND CENTRES
2021 2026 2031 2036 2021 2026 2031 2036
Haverfordwest ‐3,763 ‐3,748 ‐3,794 ‐3,890 ‐7,651 ‐7,620 ‐7,714 ‐7,909
Milford Haven ‐1,735 ‐1,732 ‐1,742 ‐1,763 ‐3,528 ‐3,522 ‐3,543 ‐3,584
Pembroke 0 0 ‐1 ‐2 ‐1 0 ‐1 ‐4
Pembroke Dock ‐684 ‐676 ‐701 ‐752 ‐1,391 ‐1,375 ‐1,426 ‐1,529
Fishguard ‐2 ‐1 ‐5 ‐13 ‐4 ‐2 ‐10 ‐26
Narberth ‐261 ‐260 ‐261 ‐266 ‐531 ‐528 ‐531 ‐540
Newport 0 1 1 ‐1 0 2 1 ‐1
Saundersfoot 0 1 2 2 1 3 4 4
St Davids 0 1 1 ‐2 ‐1 2 1 ‐3
Tenby ‐3 ‐1 ‐7 ‐19 ‐6 ‐3 ‐15 ‐39
Other ‐2 4 0 ‐13 ‐4 8 ‐1 ‐26
Total ‐6,191 ‐6,150 ‐6,248 ‐6,457 ‐12,588 ‐12,505 ‐12,704 ‐13,129
Foodstore Format
(sqm net)
Local Supermarket/ Deep Discount
Format
23/01/2017

South West Wales Regional Retail Study
APPENDIX 8B: ALTERNATIVE FORECAST CONVENIENCE GOODS CAPACITY – PEMBROKESHIRE COUNTY & PEMBROKESHIRE COAST NATIONAL PARK
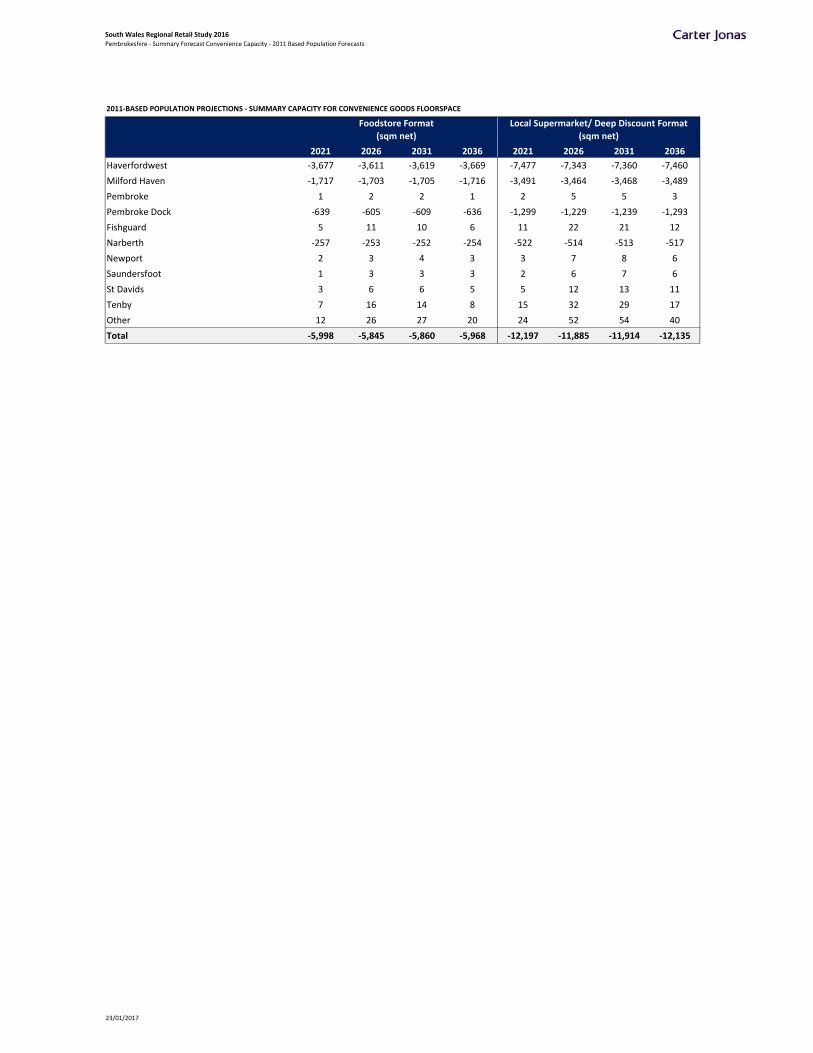
South Wales Regional Retail Study 2016Pembrokeshire ‐ Summary Forecast Convenience Capacity ‐ 2011 Based Population Forecasts
2011‐BASED POPULATION PROJECTIONS ‐ SUMMARY CAPACITY FOR CONVENIENCE GOODS FLOORSPACE
2021 2026 2031 2036 2021 2026 2031 2036
Haverfordwest ‐3,677 ‐3,611 ‐3,619 ‐3,669 ‐7,477 ‐7,343 ‐7,360 ‐7,460
Milford Haven ‐1,717 ‐1,703 ‐1,705 ‐1,716 ‐3,491 ‐3,464 ‐3,468 ‐3,489
Pembroke 1 2 2 1 2 5 5 3
Pembroke Dock ‐639 ‐605 ‐609 ‐636 ‐1,299 ‐1,229 ‐1,239 ‐1,293
Fishguard 5 11 10 6 11 22 21 12
Narberth ‐257 ‐253 ‐252 ‐254 ‐522 ‐514 ‐513 ‐517
Newport 2 3 4 3 3 7 8 6
Saundersfoot 1 3 3 3 2 6 7 6
St Davids 3 6 6 5 5 12 13 11
Tenby 7 16 14 8 15 32 29 17
Other 12 26 27 20 24 52 54 40
Total ‐5,998 ‐5,845 ‐5,860 ‐5,968 ‐12,197 ‐11,885 ‐11,914 ‐12,135
Foodstore Format
(sqm net)
Local Supermarket/ Deep Discount Format
(sqm net)
23/01/2017

South West Wales Regional Retail Study
APPENDIX 9A: FORECAST CONVENIENCE GOODS CAPACITY – CEREDIGION COUNTY
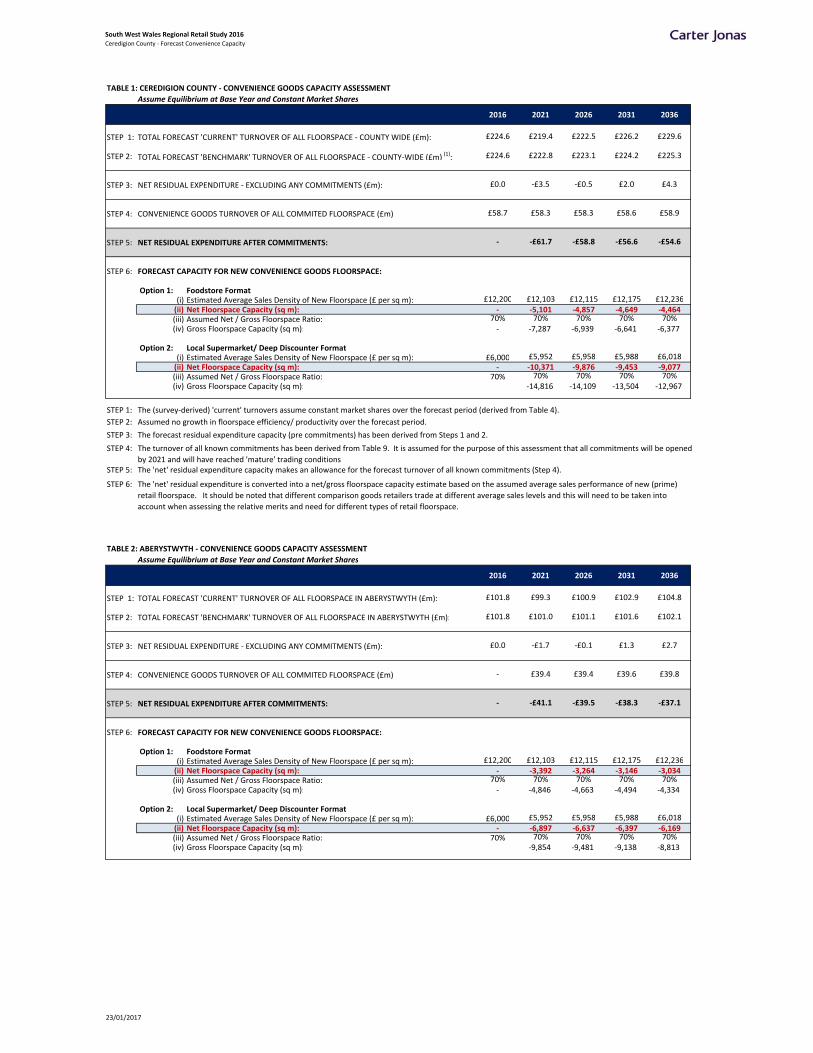
South West Wales Regional Retail Study 2016Ceredigion County ‐ Forecast Convenience Capacity
TABLE 1: CEREDIGION COUNTY ‐ CONVENIENCE GOODS CAPACITY ASSESSMENT
Assume Equilibrium at Base Year and Constant Market Shares
2016 2021 2026 2031 2036
STEP 1: TOTAL FORECAST 'CURRENT' TURNOVER OF ALL FLOORSPACE ‐ COUNTY WIDE (£m): £224.6 £219.4 £222.5 £226.2 £229.6
STEP 2: TOTAL FORECAST 'BENCHMARK' TURNOVER OF ALL FLOORSPACE ‐ COUNTY‐WIDE (£m) (1): £224.6 £222.8 £223.1 £224.2 £225.3
STEP 3: NET RESIDUAL EXPENDITURE ‐ EXCLUDING ANY COMMITMENTS (£m): £0.0 ‐£3.5 ‐£0.5 £2.0 £4.3
STEP 4: CONVENIENCE GOODS TURNOVER OF ALL COMMITED FLOORSPACE (£m) £58.7 £58.3 £58.3 £58.6 £58.9
STEP 5: NET RESIDUAL EXPENDITURE AFTER COMMITMENTS: ‐ ‐£61.7 ‐£58.8 ‐£56.6 ‐£54.6
STEP 6: FORECAST CAPACITY FOR NEW CONVENIENCE GOODS FLOORSPACE:
Option 1: Foodstore Format(i) Estimated Average Sales Density of New Floorspace (£ per sq m): £12,200 £12,103 £12,115 £12,175 £12,236(ii) Net Floorspace Capacity (sq m): ‐ ‐5,101 ‐4,857 ‐4,649 ‐4,464(iii) Assumed Net / Gross Floorspace Ratio: 70% 70% 70% 70% 70%(iv) Gross Floorspace Capacity (sq m): ‐ ‐7,287 ‐6,939 ‐6,641 ‐6,377
Option 2: Local Supermarket/ Deep Discounter Format(i) Estimated Average Sales Density of New Floorspace (£ per sq m): £6,000 £5,952 £5,958 £5,988 £6,018(ii) Net Floorspace Capacity (sq m): ‐ ‐10,371 ‐9,876 ‐9,453 ‐9,077(iii) Assumed Net / Gross Floorspace Ratio: 70% 70% 70% 70% 70%(iv) Gross Floorspace Capacity (sq m): ‐14,816 ‐14,109 ‐13,504 ‐12,967
STEP 1:
STEP 2:
STEP 3:
STEP 4:
STEP 5:
STEP 6:
TABLE 2: ABERYSTWYTH ‐ CONVENIENCE GOODS CAPACITY ASSESSMENT
Assume Equilibrium at Base Year and Constant Market Shares
2016 2021 2026 2031 2036
STEP 1: TOTAL FORECAST 'CURRENT' TURNOVER OF ALL FLOORSPACE IN ABERYSTWYTH (£m): £101.8 £99.3 £100.9 £102.9 £104.8
STEP 2: TOTAL FORECAST 'BENCHMARK' TURNOVER OF ALL FLOORSPACE IN ABERYSTWYTH (£m): £101.8 £101.0 £101.1 £101.6 £102.1
STEP 3: NET RESIDUAL EXPENDITURE ‐ EXCLUDING ANY COMMITMENTS (£m): £0.0 ‐£1.7 ‐£0.1 £1.3 £2.7
STEP 4: CONVENIENCE GOODS TURNOVER OF ALL COMMITED FLOORSPACE (£m) ‐ £39.4 £39.4 £39.6 £39.8
STEP 5: NET RESIDUAL EXPENDITURE AFTER COMMITMENTS: ‐ ‐£41.1 ‐£39.5 ‐£38.3 ‐£37.1
STEP 6: FORECAST CAPACITY FOR NEW CONVENIENCE GOODS FLOORSPACE:
Option 1: Foodstore Format(i) Estimated Average Sales Density of New Floorspace (£ per sq m): £12,200 £12,103 £12,115 £12,175 £12,236(ii) Net Floorspace Capacity (sq m): ‐ ‐3,392 ‐3,264 ‐3,146 ‐3,034(iii) Assumed Net / Gross Floorspace Ratio: 70% 70% 70% 70% 70%(iv) Gross Floorspace Capacity (sq m): ‐ ‐4,846 ‐4,663 ‐4,494 ‐4,334
Option 2: Local Supermarket/ Deep Discounter Format(i) Estimated Average Sales Density of New Floorspace (£ per sq m): £6,000 £5,952 £5,958 £5,988 £6,018(ii) Net Floorspace Capacity (sq m): ‐ ‐6,897 ‐6,637 ‐6,397 ‐6,169(iii) Assumed Net / Gross Floorspace Ratio: 70% 70% 70% 70% 70%(iv) Gross Floorspace Capacity (sq m): ‐9,854 ‐9,481 ‐9,138 ‐8,813
The 'net' residual expenditure capacity makes an allowance for the forecast turnover of all known commitments (Step 4).
The 'net' residual expenditure is converted into a net/gross floorspace capacity estimate based on the assumed average sales performance of new (prime)
retail floorspace. It should be noted that different comparison goods retailers trade at different average sales levels and this will need to be taken into
account when assessing the relative merits and need for different types of retail floorspace.
The (survey‐derived) 'current' turnovers assume constant market shares over the forecast period (derived from Table 4).
Assumed no growth in floorspace efficiency/ productivity over the forecast period.
The forecast residual expenditure capacity (pre commitments) has been derived from Steps 1 and 2.
The turnover of all known commitments has been derived from Table 9. It is assumed for the purpose of this assessment that all commitments will be opened
by 2021 and will have reached 'mature' trading conditions
23/01/2017
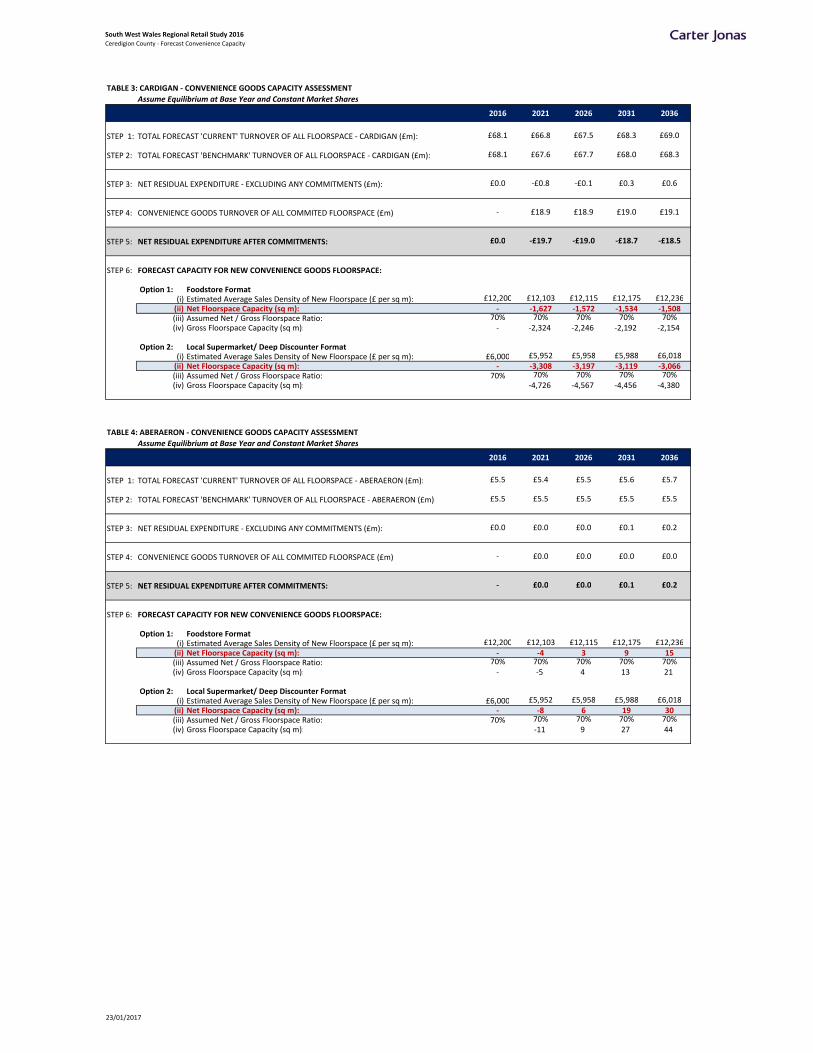
South West Wales Regional Retail Study 2016Ceredigion County ‐ Forecast Convenience Capacity
TABLE 3: CARDIGAN ‐ CONVENIENCE GOODS CAPACITY ASSESSMENT
Assume Equilibrium at Base Year and Constant Market Shares
2016 2021 2026 2031 2036
STEP 1: TOTAL FORECAST 'CURRENT' TURNOVER OF ALL FLOORSPACE ‐ CARDIGAN (£m): £68.1 £66.8 £67.5 £68.3 £69.0
STEP 2: TOTAL FORECAST 'BENCHMARK' TURNOVER OF ALL FLOORSPACE ‐ CARDIGAN (£m): £68.1 £67.6 £67.7 £68.0 £68.3
STEP 3: NET RESIDUAL EXPENDITURE ‐ EXCLUDING ANY COMMITMENTS (£m): £0.0 ‐£0.8 ‐£0.1 £0.3 £0.6
STEP 4: CONVENIENCE GOODS TURNOVER OF ALL COMMITED FLOORSPACE (£m) ‐ £18.9 £18.9 £19.0 £19.1
STEP 5: NET RESIDUAL EXPENDITURE AFTER COMMITMENTS: £0.0 ‐£19.7 ‐£19.0 ‐£18.7 ‐£18.5
STEP 6: FORECAST CAPACITY FOR NEW CONVENIENCE GOODS FLOORSPACE:
Option 1: Foodstore Format(i) Estimated Average Sales Density of New Floorspace (£ per sq m): £12,200 £12,103 £12,115 £12,175 £12,236(ii) Net Floorspace Capacity (sq m): ‐ ‐1,627 ‐1,572 ‐1,534 ‐1,508(iii) Assumed Net / Gross Floorspace Ratio: 70% 70% 70% 70% 70%(iv) Gross Floorspace Capacity (sq m): ‐ ‐2,324 ‐2,246 ‐2,192 ‐2,154
Option 2: Local Supermarket/ Deep Discounter Format(i) Estimated Average Sales Density of New Floorspace (£ per sq m): £6,000 £5,952 £5,958 £5,988 £6,018(ii) Net Floorspace Capacity (sq m): ‐ ‐3,308 ‐3,197 ‐3,119 ‐3,066(iii) Assumed Net / Gross Floorspace Ratio: 70% 70% 70% 70% 70%(iv) Gross Floorspace Capacity (sq m): ‐4,726 ‐4,567 ‐4,456 ‐4,380
TABLE 4: ABERAERON ‐ CONVENIENCE GOODS CAPACITY ASSESSMENT
Assume Equilibrium at Base Year and Constant Market Shares
2016 2021 2026 2031 2036
STEP 1: TOTAL FORECAST 'CURRENT' TURNOVER OF ALL FLOORSPACE ‐ ABERAERON (£m): £5.5 £5.4 £5.5 £5.6 £5.7
STEP 2: TOTAL FORECAST 'BENCHMARK' TURNOVER OF ALL FLOORSPACE ‐ ABERAERON (£m): £5.5 £5.5 £5.5 £5.5 £5.5
STEP 3: NET RESIDUAL EXPENDITURE ‐ EXCLUDING ANY COMMITMENTS (£m): £0.0 £0.0 £0.0 £0.1 £0.2
STEP 4: CONVENIENCE GOODS TURNOVER OF ALL COMMITED FLOORSPACE (£m) ‐ £0.0 £0.0 £0.0 £0.0
STEP 5: NET RESIDUAL EXPENDITURE AFTER COMMITMENTS: ‐ £0.0 £0.0 £0.1 £0.2
STEP 6: FORECAST CAPACITY FOR NEW CONVENIENCE GOODS FLOORSPACE:
Option 1: Foodstore Format(i) Estimated Average Sales Density of New Floorspace (£ per sq m): £12,200 £12,103 £12,115 £12,175 £12,236(ii) Net Floorspace Capacity (sq m): ‐ ‐4 3 9 15(iii) Assumed Net / Gross Floorspace Ratio: 70% 70% 70% 70% 70%(iv) Gross Floorspace Capacity (sq m): ‐ ‐5 4 13 21
Option 2: Local Supermarket/ Deep Discounter Format(i) Estimated Average Sales Density of New Floorspace (£ per sq m): £6,000 £5,952 £5,958 £5,988 £6,018(ii) Net Floorspace Capacity (sq m): ‐ ‐8 6 19 30(iii) Assumed Net / Gross Floorspace Ratio: 70% 70% 70% 70% 70%(iv) Gross Floorspace Capacity (sq m): ‐11 9 27 44
23/01/2017
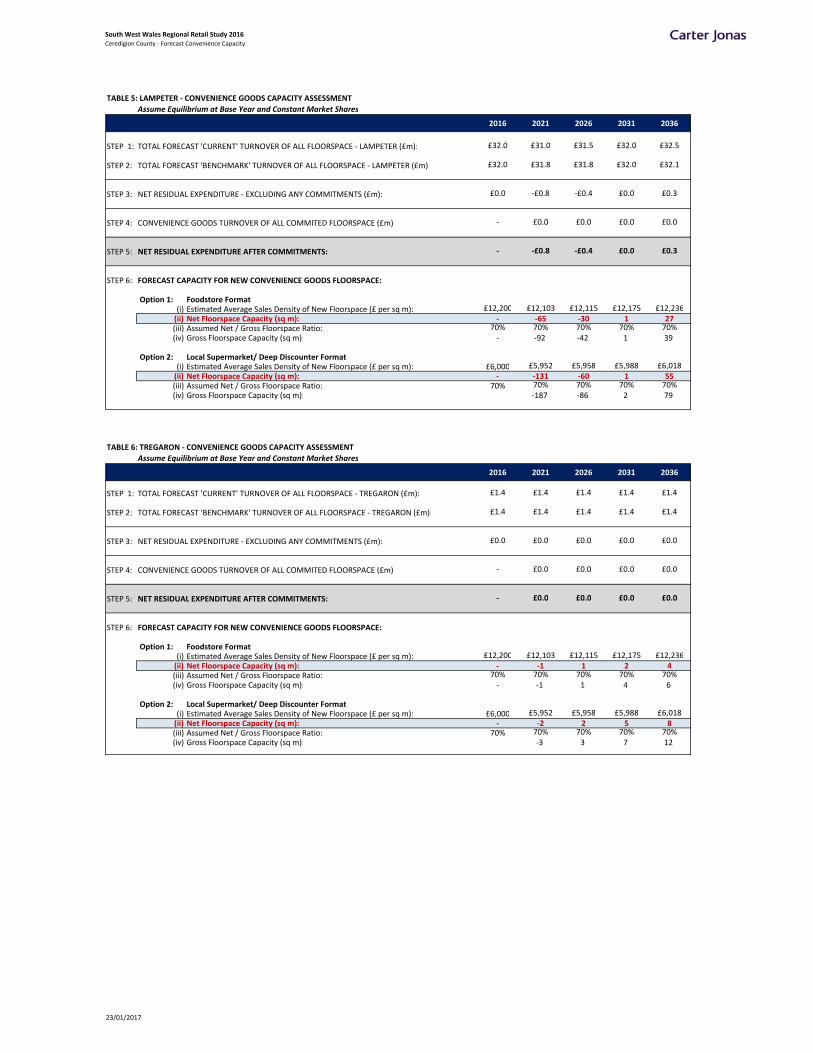
South West Wales Regional Retail Study 2016Ceredigion County ‐ Forecast Convenience Capacity
TABLE 5: LAMPETER ‐ CONVENIENCE GOODS CAPACITY ASSESSMENT
Assume Equilibrium at Base Year and Constant Market Shares
2016 2021 2026 2031 2036
STEP 1: TOTAL FORECAST 'CURRENT' TURNOVER OF ALL FLOORSPACE ‐ LAMPETER (£m): £32.0 £31.0 £31.5 £32.0 £32.5
STEP 2: TOTAL FORECAST 'BENCHMARK' TURNOVER OF ALL FLOORSPACE ‐ LAMPETER (£m): £32.0 £31.8 £31.8 £32.0 £32.1
STEP 3: NET RESIDUAL EXPENDITURE ‐ EXCLUDING ANY COMMITMENTS (£m): £0.0 ‐£0.8 ‐£0.4 £0.0 £0.3
STEP 4: CONVENIENCE GOODS TURNOVER OF ALL COMMITED FLOORSPACE (£m) ‐ £0.0 £0.0 £0.0 £0.0
STEP 5: NET RESIDUAL EXPENDITURE AFTER COMMITMENTS: ‐ ‐£0.8 ‐£0.4 £0.0 £0.3
STEP 6: FORECAST CAPACITY FOR NEW CONVENIENCE GOODS FLOORSPACE:
Option 1: Foodstore Format(i) Estimated Average Sales Density of New Floorspace (£ per sq m): £12,200 £12,103 £12,115 £12,175 £12,236(ii) Net Floorspace Capacity (sq m): ‐ ‐65 ‐30 1 27(iii) Assumed Net / Gross Floorspace Ratio: 70% 70% 70% 70% 70%(iv) Gross Floorspace Capacity (sq m): ‐ ‐92 ‐42 1 39
Option 2: Local Supermarket/ Deep Discounter Format(i) Estimated Average Sales Density of New Floorspace (£ per sq m): £6,000 £5,952 £5,958 £5,988 £6,018(ii) Net Floorspace Capacity (sq m): ‐ ‐131 ‐60 1 55(iii) Assumed Net / Gross Floorspace Ratio: 70% 70% 70% 70% 70%(iv) Gross Floorspace Capacity (sq m): ‐187 ‐86 2 79
TABLE 6: TREGARON ‐ CONVENIENCE GOODS CAPACITY ASSESSMENT
Assume Equilibrium at Base Year and Constant Market Shares
2016 2021 2026 2031 2036
STEP 1: TOTAL FORECAST 'CURRENT' TURNOVER OF ALL FLOORSPACE ‐ TREGARON (£m): £1.4 £1.4 £1.4 £1.4 £1.4
STEP 2: TOTAL FORECAST 'BENCHMARK' TURNOVER OF ALL FLOORSPACE ‐ TREGARON (£m): £1.4 £1.4 £1.4 £1.4 £1.4
STEP 3: NET RESIDUAL EXPENDITURE ‐ EXCLUDING ANY COMMITMENTS (£m): £0.0 £0.0 £0.0 £0.0 £0.0
STEP 4: CONVENIENCE GOODS TURNOVER OF ALL COMMITED FLOORSPACE (£m) ‐ £0.0 £0.0 £0.0 £0.0
STEP 5: NET RESIDUAL EXPENDITURE AFTER COMMITMENTS: ‐ £0.0 £0.0 £0.0 £0.0
STEP 6: FORECAST CAPACITY FOR NEW CONVENIENCE GOODS FLOORSPACE:
Option 1: Foodstore Format(i) Estimated Average Sales Density of New Floorspace (£ per sq m): £12,200 £12,103 £12,115 £12,175 £12,236(ii) Net Floorspace Capacity (sq m): ‐ ‐1 1 2 4(iii) Assumed Net / Gross Floorspace Ratio: 70% 70% 70% 70% 70%(iv) Gross Floorspace Capacity (sq m): ‐ ‐1 1 4 6
Option 2: Local Supermarket/ Deep Discounter Format(i) Estimated Average Sales Density of New Floorspace (£ per sq m): £6,000 £5,952 £5,958 £5,988 £6,018(ii) Net Floorspace Capacity (sq m): ‐ ‐2 2 5 8(iii) Assumed Net / Gross Floorspace Ratio: 70% 70% 70% 70% 70%(iv) Gross Floorspace Capacity (sq m): ‐3 3 7 12
23/01/2017

South West Wales Regional Retail Study 2016Ceredigion County ‐ Forecast Convenience Capacity
TABLE 7: LLANDYSUL ‐ CONVENIENCE GOODS CAPACITY ASSESSMENT
Assume Equilibrium at Base Year and Constant Market Shares
2016 2021 2026 2031 2036
STEP 1: TOTAL FORECAST 'CURRENT' TURNOVER OF ALL FLOORSPACE ‐ LLANDYSUL (£m): £4.2 £4.1 £4.2 £4.2 £4.3
STEP 2: TOTAL FORECAST 'BENCHMARK' TURNOVER OF ALL FLOORSPACE ‐ LLANDYSUL (£m): £4.2 £4.2 £4.2 £4.2 £4.2
STEP 3: NET RESIDUAL EXPENDITURE ‐ EXCLUDING ANY COMMITMENTS (£m): £0.0 £0.0 £0.0 £0.0 £0.1
STEP 4: CONVENIENCE GOODS TURNOVER OF ALL COMMITED FLOORSPACE (£m) ‐ £0.0 £0.0 £0.0 £0.0
STEP 5: NET RESIDUAL EXPENDITURE AFTER COMMITMENTS: ‐ £0.0 £0.0 £0.0 £0.1
STEP 6: FORECAST CAPACITY FOR NEW CONVENIENCE GOODS FLOORSPACE:
Option 1: Foodstore Format(i) Estimated Average Sales Density of New Floorspace (£ per sq m): £12,200 £12,103 £12,115 £12,175 £12,236(ii) Net Floorspace Capacity (sq m): ‐ ‐4 1 4 6(iii) Assumed Net / Gross Floorspace Ratio: 70% 70% 70% 70% 70%(iv) Gross Floorspace Capacity (sq m): ‐ ‐5 1 5 9
Option 2: Local Supermarket/ Deep Discounter Format(i) Estimated Average Sales Density of New Floorspace (£ per sq m): £6,000 £5,952 £5,958 £5,988 £6,018(ii) Net Floorspace Capacity (sq m): ‐ ‐7 1 8 13(iii) Assumed Net / Gross Floorspace Ratio: 70% 70% 70% 70% 70%(iv) Gross Floorspace Capacity (sq m): ‐10 2 11 19
TABLE 8: REST OF CEREDIGION COUNTY ‐ CONVENIENCE GOODS CAPACITY ASSESSMENT
Assume Equilibrium at Base Year and Constant Market Shares
2016 2021 2026 2031 2036
STEP 1: TOTAL FORECAST 'CURRENT' TURNOVER OF ALL FLOORSPACE ‐ REST OF CEREDIGION (£m): £11.6 £11.4 £11.5 £11.7 £11.9
STEP 2: TOTAL FORECAST 'BENCHMARK' TURNOVER OF ALL FLOORSPACE ‐ REST OF CEREDIGION (£m): £11.6 £11.5 £11.5 £11.5 £11.6
STEP 3: NET RESIDUAL EXPENDITURE ‐ EXCLUDING ANY COMMITMENTS (£m): £0.0 ‐£0.1 £0.1 £0.2 £0.3
STEP 4: CONVENIENCE GOODS TURNOVER OF ALL COMMITED FLOORSPACE (£m) ‐ £0.0 £0.0 £0.0 £0.0
STEP 5: NET RESIDUAL EXPENDITURE AFTER COMMITMENTS: ‐ ‐£0.1 £0.1 £0.2 £0.3
STEP 6: FORECAST CAPACITY FOR NEW CONVENIENCE GOODS FLOORSPACE:
Option 1: Foodstore Format(i) Estimated Average Sales Density of New Floorspace (£ per sq m): £12,200 £12,103 £12,115 £12,175 £12,236(ii) Net Floorspace Capacity (sq m): ‐ ‐9 4 15 25(iii) Assumed Net / Gross Floorspace Ratio: 70% 70% 70% 70% 70%(iv) Gross Floorspace Capacity (sq m): ‐ ‐12 6 22 36
Option 2: Local Supermarket/ Deep Discounter Format(i) Estimated Average Sales Density of New Floorspace (£ per sq m): £6,000 £5,952 £5,958 £5,988 £6,018(ii) Net Floorspace Capacity (sq m): ‐ ‐18 8 31 51(iii) Assumed Net / Gross Floorspace Ratio: 70% 70% 70% 70% 70%(iv) Gross Floorspace Capacity (sq m): ‐25 12 44 73
23/01/2017
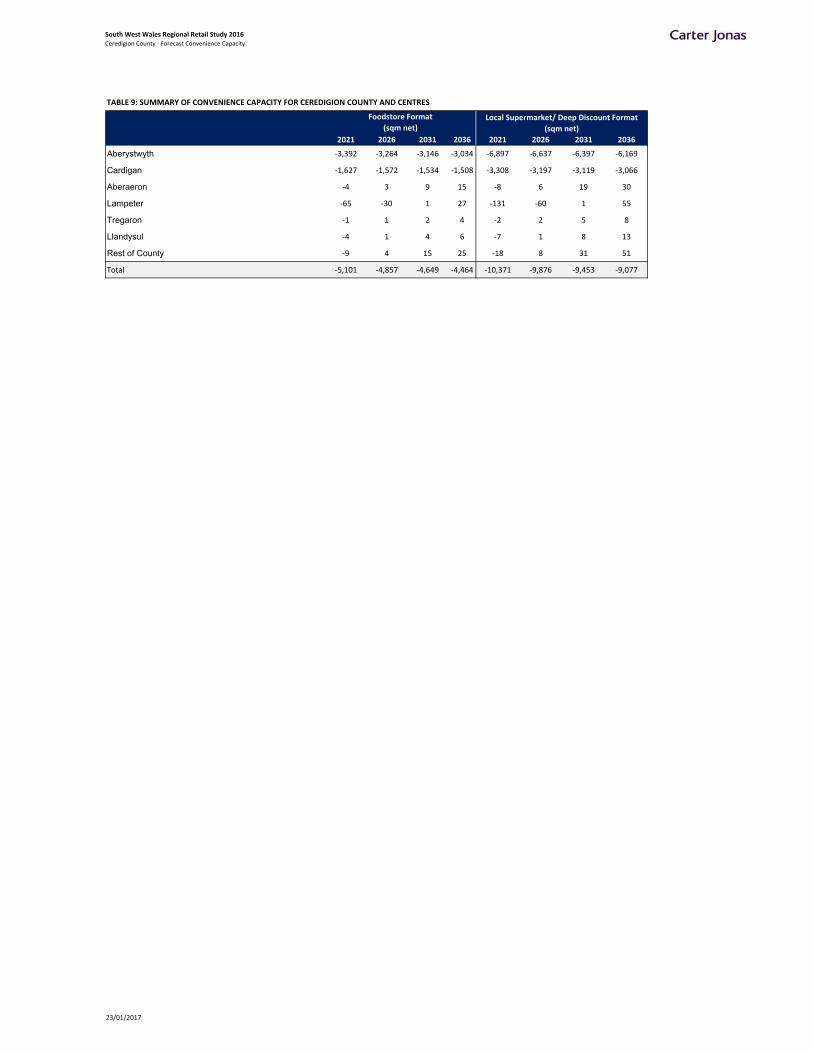
South West Wales Regional Retail Study 2016Ceredigion County ‐ Forecast Convenience Capacity
TABLE 9: SUMMARY OF CONVENIENCE CAPACITY FOR CEREDIGION COUNTY AND CENTRES
2021 2026 2031 2036 2021 2026 2031 2036
Aberystwyth ‐3,392 ‐3,264 ‐3,146 ‐3,034 ‐6,897 ‐6,637 ‐6,397 ‐6,169
Cardigan ‐1,627 ‐1,572 ‐1,534 ‐1,508 ‐3,308 ‐3,197 ‐3,119 ‐3,066
Aberaeron ‐4 3 9 15 ‐8 6 19 30
Lampeter ‐65 ‐30 1 27 ‐131 ‐60 1 55
Tregaron ‐1 1 2 4 ‐2 2 5 8
Llandysul ‐4 1 4 6 ‐7 1 8 13
Rest of County ‐9 4 15 25 ‐18 8 31 51
Total ‐5,101 ‐4,857 ‐4,649 ‐4,464 ‐10,371 ‐9,876 ‐9,453 ‐9,077
Foodstore Format
(sqm net)Local Supermarket/ Deep Discount Format
(sqm net)
23/01/2017

South West Wales Regional Retail Study
APPENDIX 9B: FORECAST CONVENIENCE GOODS CAPACITY – CEREDIGION COUNTY

South Wales Regional Retail Study 2016Ceredigion County ‐ Forecast Convenience Capacity ‐ 2011 Based Population Projections
2011‐BASED POPULATION PROJECTIONS ‐ SUMMARY CAPACITY FOR CONVENIENCE GOODS FLOORSPACE
2021 2026 2031 2036 2021 2026 2031 2036
Aberystwyth ‐3,419 ‐3,327 ‐3,270 ‐3,242 ‐6,952 ‐6,766 ‐6,650 ‐6,593
Cardigan ‐1,617 ‐1,559 ‐1,528 ‐1,516 ‐3,287 ‐3,169 ‐3,107 ‐3,083
Aberaeron ‐5 0 4 5 ‐10 1 8 11
Lampeter ‐63 ‐30 ‐8 5 ‐129 ‐61 ‐16 11
Tregaron ‐1 0 1 1 ‐3 0 2 2
Llandysul ‐3 2 5 7 ‐5 4 10 14
Rest of County ‐10 1 8 11 ‐20 2 16 23
Total ‐5,117 ‐4,912 ‐4,789 ‐4,728 ‐10,405 ‐9,989 ‐9,738 ‐9,614
Foodstore Format
(sqm net)
Local Supermarket/ Deep Discount Format
(sqm net)
23/01/2017
South West Wales Regional Retail Study
APPENDIX 10A: FORECAST COMPARISON GOODS CAPACITY – PEMBROKESHIRE COUNTY & PEMBROKESHIRE COAST NATIONAL PARK
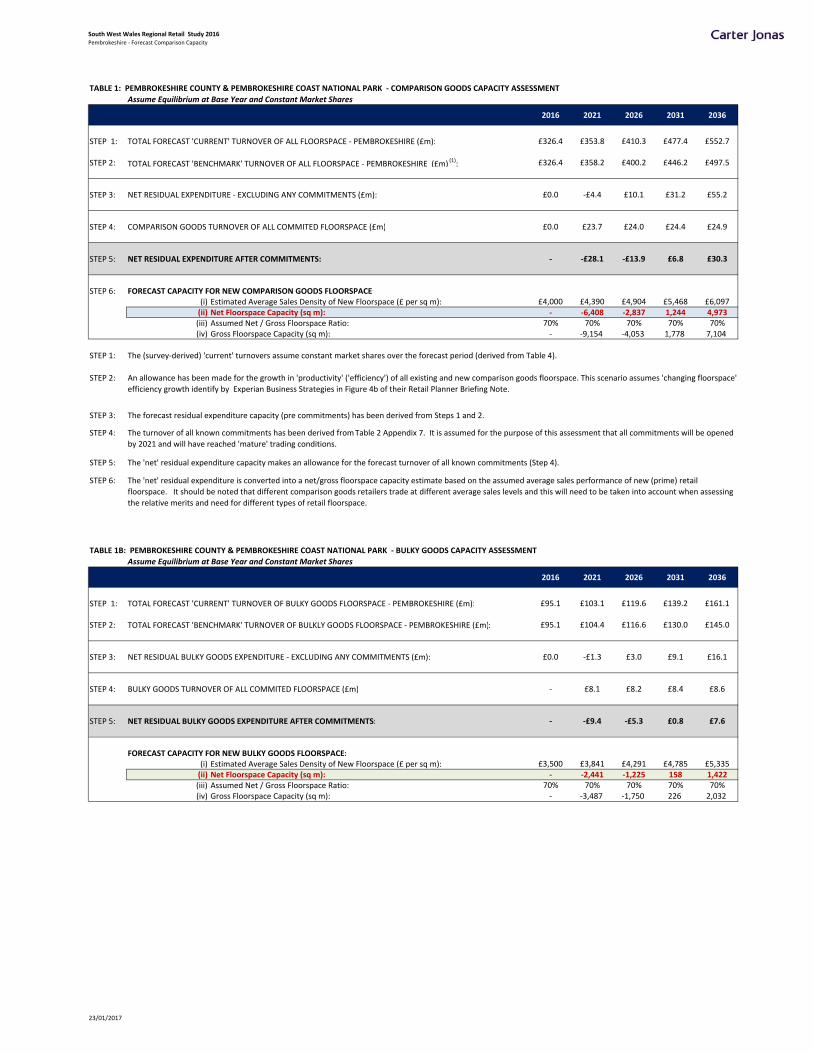
South West Wales Regional Retail Study 2016Pembrokeshire ‐ Forecast Comparison Capacity
TABLE 1: PEMBROKESHIRE COUNTY & PEMBROKESHIRE COAST NATIONAL PARK ‐ COMPARISON GOODS CAPACITY ASSESSMENT
Assume Equilibrium at Base Year and Constant Market Shares
2016 2021 2026 2031 2036
STEP 1: TOTAL FORECAST 'CURRENT' TURNOVER OF ALL FLOORSPACE ‐ PEMBROKESHIRE (£m): £326.4 £353.8 £410.3 £477.4 £552.7
STEP 2: TOTAL FORECAST 'BENCHMARK' TURNOVER OF ALL FLOORSPACE ‐ PEMBROKESHIRE (£m) (1): £326.4 £358.2 £400.2 £446.2 £497.5
STEP 3: NET RESIDUAL EXPENDITURE ‐ EXCLUDING ANY COMMITMENTS (£m): £0.0 ‐£4.4 £10.1 £31.2 £55.2
STEP 4: COMPARISON GOODS TURNOVER OF ALL COMMITED FLOORSPACE (£m) £0.0 £23.7 £24.0 £24.4 £24.9
STEP 5: NET RESIDUAL EXPENDITURE AFTER COMMITMENTS: ‐ ‐£28.1 ‐£13.9 £6.8 £30.3
STEP 6: FORECAST CAPACITY FOR NEW COMPARISON GOODS FLOORSPACE:(i) Estimated Average Sales Density of New Floorspace (£ per sq m): £4,000 £4,390 £4,904 £5,468 £6,097(ii) Net Floorspace Capacity (sq m): ‐ ‐6,408 ‐2,837 1,244 4,973(iii) Assumed Net / Gross Floorspace Ratio: 70% 70% 70% 70% 70%(iv) Gross Floorspace Capacity (sq m): ‐ ‐9,154 ‐4,053 1,778 7,104
STEP 1:
STEP 2:
STEP 3:
STEP 4:
STEP 5:
STEP 6:
TABLE 1B: PEMBROKESHIRE COUNTY & PEMBROKESHIRE COAST NATIONAL PARK ‐ BULKY GOODS CAPACITY ASSESSMENT
Assume Equilibrium at Base Year and Constant Market Shares
2016 2021 2026 2031 2036
STEP 1: TOTAL FORECAST 'CURRENT' TURNOVER OF BULKY GOODS FLOORSPACE ‐ PEMBROKESHIRE (£m): £95.1 £103.1 £119.6 £139.2 £161.1
STEP 2: TOTAL FORECAST 'BENCHMARK' TURNOVER OF BULKLY GOODS FLOORSPACE ‐ PEMBROKESHIRE (£m): £95.1 £104.4 £116.6 £130.0 £145.0
STEP 3: NET RESIDUAL BULKY GOODS EXPENDITURE ‐ EXCLUDING ANY COMMITMENTS (£m): £0.0 ‐£1.3 £3.0 £9.1 £16.1
STEP 4: BULKY GOODS TURNOVER OF ALL COMMITED FLOORSPACE (£m) ‐ £8.1 £8.2 £8.4 £8.6
STEP 5: NET RESIDUAL BULKY GOODS EXPENDITURE AFTER COMMITMENTS: ‐ ‐£9.4 ‐£5.3 £0.8 £7.6
FORECAST CAPACITY FOR NEW BULKY GOODS FLOORSPACE:(i) Estimated Average Sales Density of New Floorspace (£ per sq m): £3,500 £3,841 £4,291 £4,785 £5,335(ii) Net Floorspace Capacity (sq m): ‐ ‐2,441 ‐1,225 158 1,422(iii) Assumed Net / Gross Floorspace Ratio: 70% 70% 70% 70% 70%(iv) Gross Floorspace Capacity (sq m): ‐ ‐3,487 ‐1,750 226 2,032
The 'net' residual expenditure is converted into a net/gross floorspace capacity estimate based on the assumed average sales performance of new (prime) retail
floorspace. It should be noted that different comparison goods retailers trade at different average sales levels and this will need to be taken into account when assessing
the relative merits and need for different types of retail floorspace.
The (survey‐derived) 'current' turnovers assume constant market shares over the forecast period (derived from Table 4).
An allowance has been made for the growth in 'productivity' ('efficiency') of all existing and new comparison goods floorspace. This scenario assumes 'changing floorspace'
efficiency growth identify by Experian Business Strategies in Figure 4b of their Retail Planner Briefing Note.
The forecast residual expenditure capacity (pre commitments) has been derived from Steps 1 and 2.
The turnover of all known commitments has been derived from Table 2 Appendix 7. It is assumed for the purpose of this assessment that all commitments will be opened
by 2021 and will have reached 'mature' trading conditions.
The 'net' residual expenditure capacity makes an allowance for the forecast turnover of all known commitments (Step 4).
23/01/2017
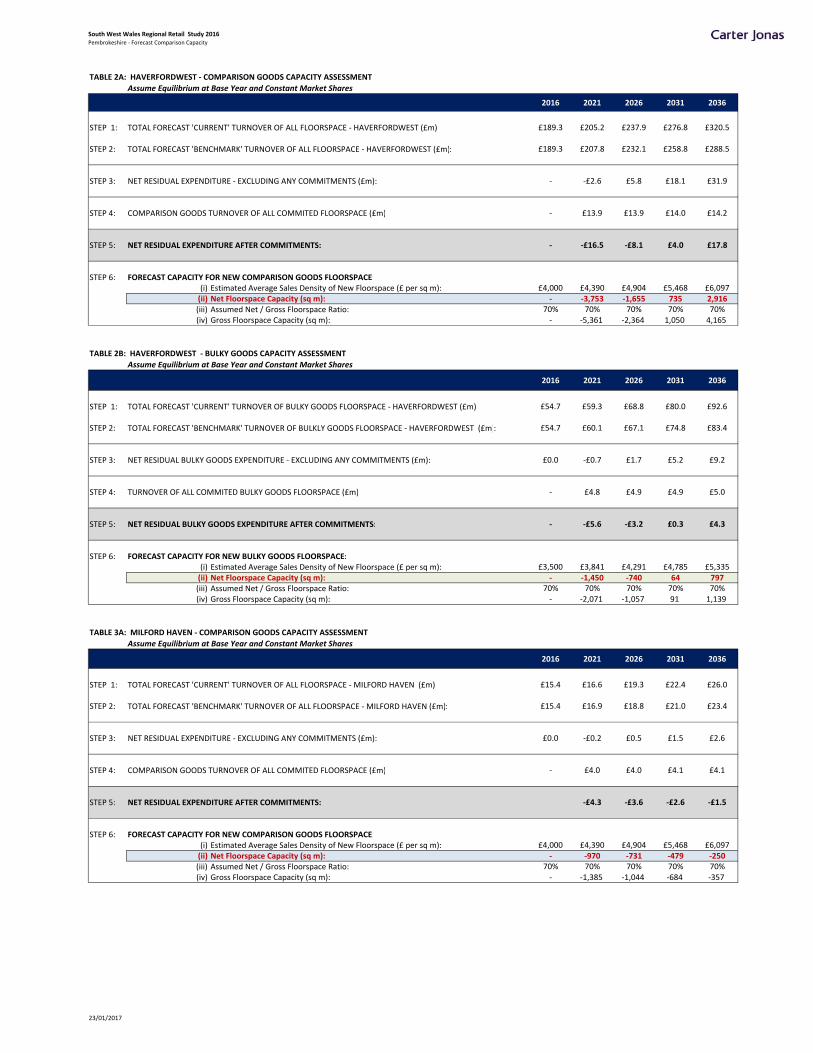
South West Wales Regional Retail Study 2016Pembrokeshire ‐ Forecast Comparison Capacity
TABLE 2A: HAVERFORDWEST ‐ COMPARISON GOODS CAPACITY ASSESSMENT
Assume Equilibrium at Base Year and Constant Market Shares
2016 2021 2026 2031 2036
STEP 1: TOTAL FORECAST 'CURRENT' TURNOVER OF ALL FLOORSPACE ‐ HAVERFORDWEST (£m): £189.3 £205.2 £237.9 £276.8 £320.5
STEP 2: TOTAL FORECAST 'BENCHMARK' TURNOVER OF ALL FLOORSPACE ‐ HAVERFORDWEST (£m): £189.3 £207.8 £232.1 £258.8 £288.5
STEP 3: NET RESIDUAL EXPENDITURE ‐ EXCLUDING ANY COMMITMENTS (£m): ‐ ‐£2.6 £5.8 £18.1 £31.9
STEP 4: COMPARISON GOODS TURNOVER OF ALL COMMITED FLOORSPACE (£m) ‐ £13.9 £13.9 £14.0 £14.2
STEP 5: NET RESIDUAL EXPENDITURE AFTER COMMITMENTS: ‐ ‐£16.5 ‐£8.1 £4.0 £17.8
STEP 6: FORECAST CAPACITY FOR NEW COMPARISON GOODS FLOORSPACE:(i) Estimated Average Sales Density of New Floorspace (£ per sq m): £4,000 £4,390 £4,904 £5,468 £6,097(ii) Net Floorspace Capacity (sq m): ‐ ‐3,753 ‐1,655 735 2,916(iii) Assumed Net / Gross Floorspace Ratio: 70% 70% 70% 70% 70%(iv) Gross Floorspace Capacity (sq m): ‐ ‐5,361 ‐2,364 1,050 4,165
TABLE 2B: HAVERFORDWEST ‐ BULKY GOODS CAPACITY ASSESSMENT
Assume Equilibrium at Base Year and Constant Market Shares
2016 2021 2026 2031 2036
STEP 1: TOTAL FORECAST 'CURRENT' TURNOVER OF BULKY GOODS FLOORSPACE ‐ HAVERFORDWEST (£m): £54.7 £59.3 £68.8 £80.0 £92.6
STEP 2: TOTAL FORECAST 'BENCHMARK' TURNOVER OF BULKLY GOODS FLOORSPACE ‐ HAVERFORDWEST (£m): £54.7 £60.1 £67.1 £74.8 £83.4
STEP 3: NET RESIDUAL BULKY GOODS EXPENDITURE ‐ EXCLUDING ANY COMMITMENTS (£m): £0.0 ‐£0.7 £1.7 £5.2 £9.2
STEP 4: TURNOVER OF ALL COMMITED BULKY GOODS FLOORSPACE (£m) ‐ £4.8 £4.9 £4.9 £5.0
STEP 5: NET RESIDUAL BULKY GOODS EXPENDITURE AFTER COMMITMENTS: ‐ ‐£5.6 ‐£3.2 £0.3 £4.3
STEP 6: FORECAST CAPACITY FOR NEW BULKY GOODS FLOORSPACE:(i) Estimated Average Sales Density of New Floorspace (£ per sq m): £3,500 £3,841 £4,291 £4,785 £5,335(ii) Net Floorspace Capacity (sq m): ‐ ‐1,450 ‐740 64 797(iii) Assumed Net / Gross Floorspace Ratio: 70% 70% 70% 70% 70%(iv) Gross Floorspace Capacity (sq m): ‐ ‐2,071 ‐1,057 91 1,139
TABLE 3A: MILFORD HAVEN ‐ COMPARISON GOODS CAPACITY ASSESSMENT
Assume Equilibrium at Base Year and Constant Market Shares
2016 2021 2026 2031 2036
STEP 1: TOTAL FORECAST 'CURRENT' TURNOVER OF ALL FLOORSPACE ‐ MILFORD HAVEN (£m): £15.4 £16.6 £19.3 £22.4 £26.0
STEP 2: TOTAL FORECAST 'BENCHMARK' TURNOVER OF ALL FLOORSPACE ‐ MILFORD HAVEN (£m): £15.4 £16.9 £18.8 £21.0 £23.4
STEP 3: NET RESIDUAL EXPENDITURE ‐ EXCLUDING ANY COMMITMENTS (£m): £0.0 ‐£0.2 £0.5 £1.5 £2.6
STEP 4: COMPARISON GOODS TURNOVER OF ALL COMMITED FLOORSPACE (£m) ‐ £4.0 £4.0 £4.1 £4.1
STEP 5: NET RESIDUAL EXPENDITURE AFTER COMMITMENTS: ‐£4.3 ‐£3.6 ‐£2.6 ‐£1.5
STEP 6: FORECAST CAPACITY FOR NEW COMPARISON GOODS FLOORSPACE:(i) Estimated Average Sales Density of New Floorspace (£ per sq m): £4,000 £4,390 £4,904 £5,468 £6,097(ii) Net Floorspace Capacity (sq m): ‐ ‐970 ‐731 ‐479 ‐250(iii) Assumed Net / Gross Floorspace Ratio: 70% 70% 70% 70% 70%(iv) Gross Floorspace Capacity (sq m): ‐ ‐1,385 ‐1,044 ‐684 ‐357
23/01/2017
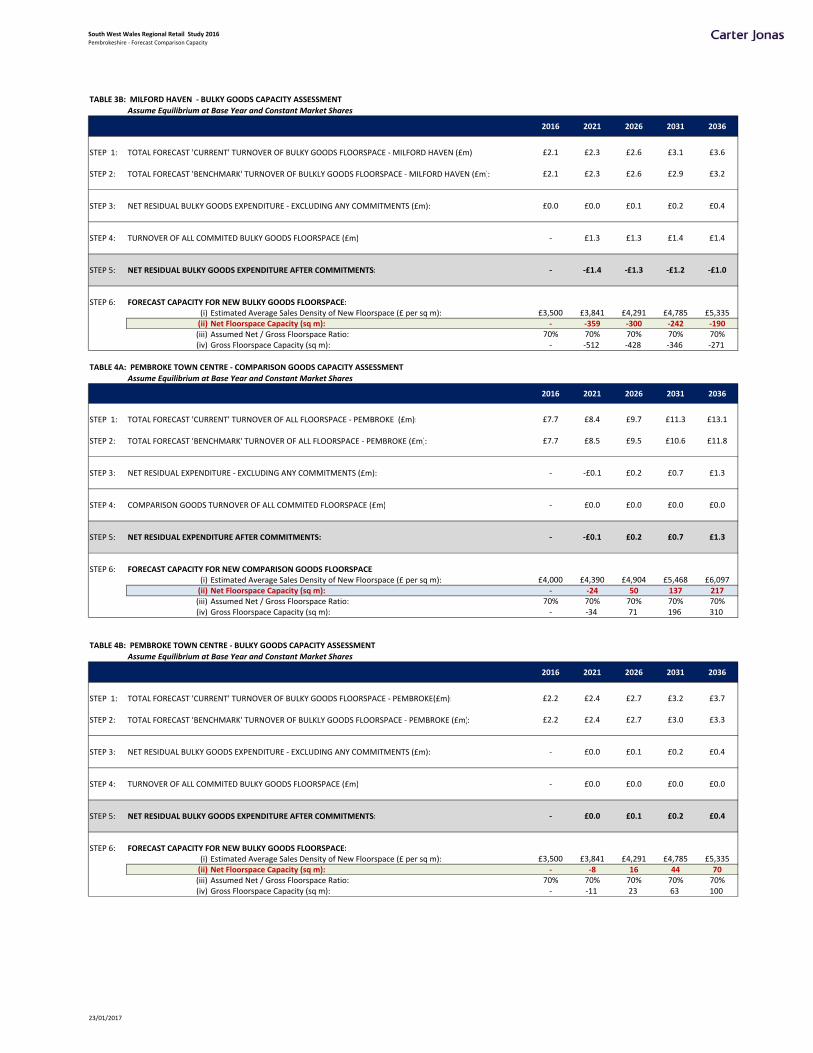
South West Wales Regional Retail Study 2016Pembrokeshire ‐ Forecast Comparison Capacity
TABLE 3B: MILFORD HAVEN ‐ BULKY GOODS CAPACITY ASSESSMENT
Assume Equilibrium at Base Year and Constant Market Shares
2016 2021 2026 2031 2036
STEP 1: TOTAL FORECAST 'CURRENT' TURNOVER OF BULKY GOODS FLOORSPACE ‐ MILFORD HAVEN (£m): £2.1 £2.3 £2.6 £3.1 £3.6
STEP 2: TOTAL FORECAST 'BENCHMARK' TURNOVER OF BULKLY GOODS FLOORSPACE ‐ MILFORD HAVEN (£m): £2.1 £2.3 £2.6 £2.9 £3.2
STEP 3: NET RESIDUAL BULKY GOODS EXPENDITURE ‐ EXCLUDING ANY COMMITMENTS (£m): £0.0 £0.0 £0.1 £0.2 £0.4
STEP 4: TURNOVER OF ALL COMMITED BULKY GOODS FLOORSPACE (£m) ‐ £1.3 £1.3 £1.4 £1.4
STEP 5: NET RESIDUAL BULKY GOODS EXPENDITURE AFTER COMMITMENTS: ‐ ‐£1.4 ‐£1.3 ‐£1.2 ‐£1.0
STEP 6: FORECAST CAPACITY FOR NEW BULKY GOODS FLOORSPACE:(i) Estimated Average Sales Density of New Floorspace (£ per sq m): £3,500 £3,841 £4,291 £4,785 £5,335(ii) Net Floorspace Capacity (sq m): ‐ ‐359 ‐300 ‐242 ‐190(iii) Assumed Net / Gross Floorspace Ratio: 70% 70% 70% 70% 70%(iv) Gross Floorspace Capacity (sq m): ‐ ‐512 ‐428 ‐346 ‐271
TABLE 4A: PEMBROKE TOWN CENTRE ‐ COMPARISON GOODS CAPACITY ASSESSMENT
Assume Equilibrium at Base Year and Constant Market Shares
2016 2021 2026 2031 2036
STEP 1: TOTAL FORECAST 'CURRENT' TURNOVER OF ALL FLOORSPACE ‐ PEMBROKE (£m): £7.7 £8.4 £9.7 £11.3 £13.1
STEP 2: TOTAL FORECAST 'BENCHMARK' TURNOVER OF ALL FLOORSPACE ‐ PEMBROKE (£m): £7.7 £8.5 £9.5 £10.6 £11.8
STEP 3: NET RESIDUAL EXPENDITURE ‐ EXCLUDING ANY COMMITMENTS (£m): ‐ ‐£0.1 £0.2 £0.7 £1.3
STEP 4: COMPARISON GOODS TURNOVER OF ALL COMMITED FLOORSPACE (£m) ‐ £0.0 £0.0 £0.0 £0.0
STEP 5: NET RESIDUAL EXPENDITURE AFTER COMMITMENTS: ‐ ‐£0.1 £0.2 £0.7 £1.3
STEP 6: FORECAST CAPACITY FOR NEW COMPARISON GOODS FLOORSPACE:(i) Estimated Average Sales Density of New Floorspace (£ per sq m): £4,000 £4,390 £4,904 £5,468 £6,097(ii) Net Floorspace Capacity (sq m): ‐ ‐24 50 137 217(iii) Assumed Net / Gross Floorspace Ratio: 70% 70% 70% 70% 70%(iv) Gross Floorspace Capacity (sq m): ‐ ‐34 71 196 310
TABLE 4B: PEMBROKE TOWN CENTRE ‐ BULKY GOODS CAPACITY ASSESSMENT
Assume Equilibrium at Base Year and Constant Market Shares
2016 2021 2026 2031 2036
STEP 1: TOTAL FORECAST 'CURRENT' TURNOVER OF BULKY GOODS FLOORSPACE ‐ PEMBROKE(£m): £2.2 £2.4 £2.7 £3.2 £3.7
STEP 2: TOTAL FORECAST 'BENCHMARK' TURNOVER OF BULKLY GOODS FLOORSPACE ‐ PEMBROKE (£m): £2.2 £2.4 £2.7 £3.0 £3.3
STEP 3: NET RESIDUAL BULKY GOODS EXPENDITURE ‐ EXCLUDING ANY COMMITMENTS (£m): ‐ £0.0 £0.1 £0.2 £0.4
STEP 4: TURNOVER OF ALL COMMITED BULKY GOODS FLOORSPACE (£m) ‐ £0.0 £0.0 £0.0 £0.0
STEP 5: NET RESIDUAL BULKY GOODS EXPENDITURE AFTER COMMITMENTS: ‐ £0.0 £0.1 £0.2 £0.4
STEP 6: FORECAST CAPACITY FOR NEW BULKY GOODS FLOORSPACE:(i) Estimated Average Sales Density of New Floorspace (£ per sq m): £3,500 £3,841 £4,291 £4,785 £5,335(ii) Net Floorspace Capacity (sq m): ‐ ‐8 16 44 70(iii) Assumed Net / Gross Floorspace Ratio: 70% 70% 70% 70% 70%(iv) Gross Floorspace Capacity (sq m): ‐ ‐11 23 63 100
23/01/2017
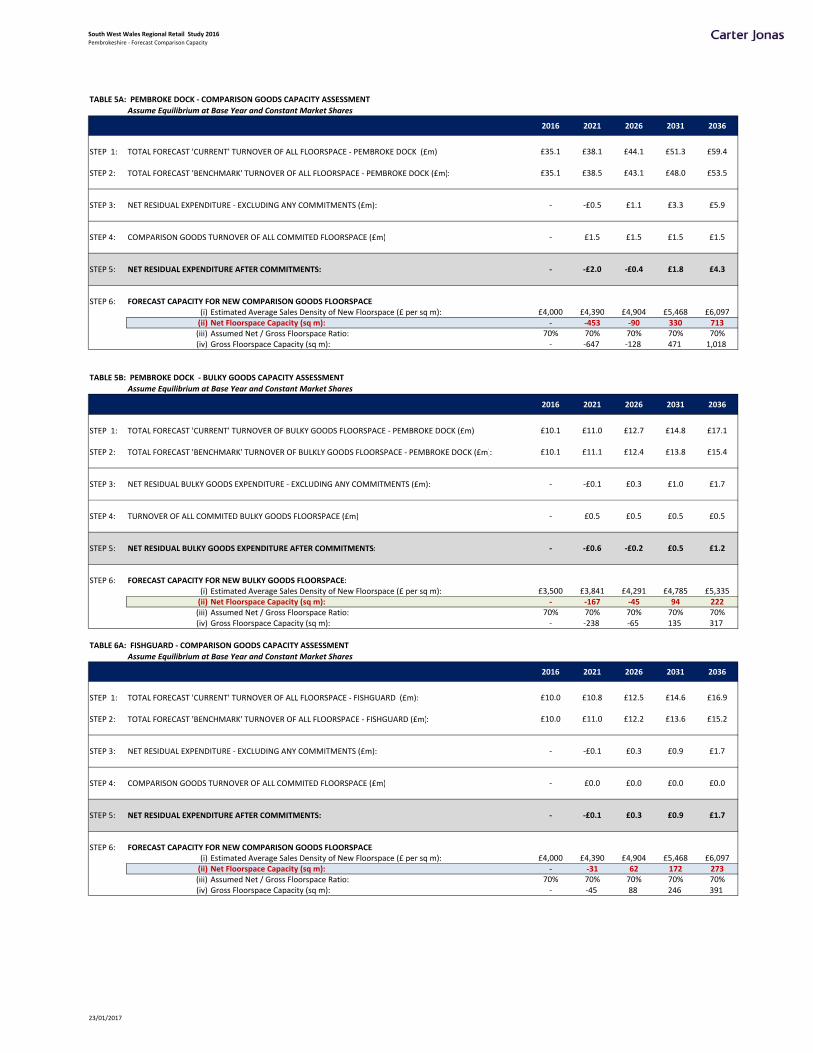
South West Wales Regional Retail Study 2016Pembrokeshire ‐ Forecast Comparison Capacity
TABLE 5A: PEMBROKE DOCK ‐ COMPARISON GOODS CAPACITY ASSESSMENT
Assume Equilibrium at Base Year and Constant Market Shares
2016 2021 2026 2031 2036
STEP 1: TOTAL FORECAST 'CURRENT' TURNOVER OF ALL FLOORSPACE ‐ PEMBROKE DOCK (£m): £35.1 £38.1 £44.1 £51.3 £59.4
STEP 2: TOTAL FORECAST 'BENCHMARK' TURNOVER OF ALL FLOORSPACE ‐ PEMBROKE DOCK (£m): £35.1 £38.5 £43.1 £48.0 £53.5
STEP 3: NET RESIDUAL EXPENDITURE ‐ EXCLUDING ANY COMMITMENTS (£m): ‐ ‐£0.5 £1.1 £3.3 £5.9
STEP 4: COMPARISON GOODS TURNOVER OF ALL COMMITED FLOORSPACE (£m) ‐ £1.5 £1.5 £1.5 £1.5
STEP 5: NET RESIDUAL EXPENDITURE AFTER COMMITMENTS: ‐ ‐£2.0 ‐£0.4 £1.8 £4.3
STEP 6: FORECAST CAPACITY FOR NEW COMPARISON GOODS FLOORSPACE:(i) Estimated Average Sales Density of New Floorspace (£ per sq m): £4,000 £4,390 £4,904 £5,468 £6,097(ii) Net Floorspace Capacity (sq m): ‐ ‐453 ‐90 330 713(iii) Assumed Net / Gross Floorspace Ratio: 70% 70% 70% 70% 70%(iv) Gross Floorspace Capacity (sq m): ‐ ‐647 ‐128 471 1,018
TABLE 5B: PEMBROKE DOCK ‐ BULKY GOODS CAPACITY ASSESSMENT
Assume Equilibrium at Base Year and Constant Market Shares
2016 2021 2026 2031 2036
STEP 1: TOTAL FORECAST 'CURRENT' TURNOVER OF BULKY GOODS FLOORSPACE ‐ PEMBROKE DOCK (£m): £10.1 £11.0 £12.7 £14.8 £17.1
STEP 2: TOTAL FORECAST 'BENCHMARK' TURNOVER OF BULKLY GOODS FLOORSPACE ‐ PEMBROKE DOCK (£m): £10.1 £11.1 £12.4 £13.8 £15.4
STEP 3: NET RESIDUAL BULKY GOODS EXPENDITURE ‐ EXCLUDING ANY COMMITMENTS (£m): ‐ ‐£0.1 £0.3 £1.0 £1.7
STEP 4: TURNOVER OF ALL COMMITED BULKY GOODS FLOORSPACE (£m) ‐ £0.5 £0.5 £0.5 £0.5
STEP 5: NET RESIDUAL BULKY GOODS EXPENDITURE AFTER COMMITMENTS: ‐ ‐£0.6 ‐£0.2 £0.5 £1.2
STEP 6: FORECAST CAPACITY FOR NEW BULKY GOODS FLOORSPACE:(i) Estimated Average Sales Density of New Floorspace (£ per sq m): £3,500 £3,841 £4,291 £4,785 £5,335(ii) Net Floorspace Capacity (sq m): ‐ ‐167 ‐45 94 222(iii) Assumed Net / Gross Floorspace Ratio: 70% 70% 70% 70% 70%(iv) Gross Floorspace Capacity (sq m): ‐ ‐238 ‐65 135 317
TABLE 6A: FISHGUARD ‐ COMPARISON GOODS CAPACITY ASSESSMENT
Assume Equilibrium at Base Year and Constant Market Shares
2016 2021 2026 2031 2036
STEP 1: TOTAL FORECAST 'CURRENT' TURNOVER OF ALL FLOORSPACE ‐ FISHGUARD (£m): £10.0 £10.8 £12.5 £14.6 £16.9
STEP 2: TOTAL FORECAST 'BENCHMARK' TURNOVER OF ALL FLOORSPACE ‐ FISHGUARD (£m): £10.0 £11.0 £12.2 £13.6 £15.2
STEP 3: NET RESIDUAL EXPENDITURE ‐ EXCLUDING ANY COMMITMENTS (£m): ‐ ‐£0.1 £0.3 £0.9 £1.7
STEP 4: COMPARISON GOODS TURNOVER OF ALL COMMITED FLOORSPACE (£m) ‐ £0.0 £0.0 £0.0 £0.0
STEP 5: NET RESIDUAL EXPENDITURE AFTER COMMITMENTS: ‐ ‐£0.1 £0.3 £0.9 £1.7
STEP 6: FORECAST CAPACITY FOR NEW COMPARISON GOODS FLOORSPACE:(i) Estimated Average Sales Density of New Floorspace (£ per sq m): £4,000 £4,390 £4,904 £5,468 £6,097(ii) Net Floorspace Capacity (sq m): ‐ ‐31 62 172 273(iii) Assumed Net / Gross Floorspace Ratio: 70% 70% 70% 70% 70%(iv) Gross Floorspace Capacity (sq m): ‐ ‐45 88 246 391
23/01/2017
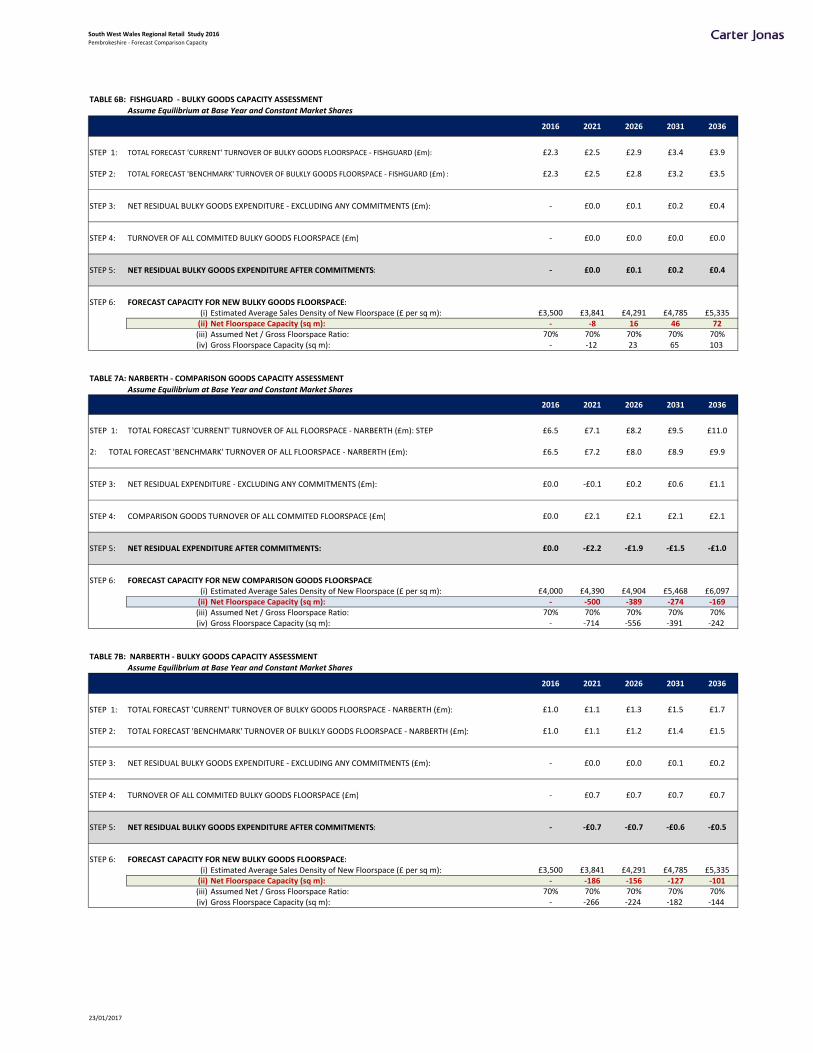
South West Wales Regional Retail Study 2016Pembrokeshire ‐ Forecast Comparison Capacity
TABLE 6B: FISHGUARD ‐ BULKY GOODS CAPACITY ASSESSMENT
Assume Equilibrium at Base Year and Constant Market Shares
2016 2021 2026 2031 2036
STEP 1: TOTAL FORECAST 'CURRENT' TURNOVER OF BULKY GOODS FLOORSPACE ‐ FISHGUARD (£m): £2.3 £2.5 £2.9 £3.4 £3.9
STEP 2: TOTAL FORECAST 'BENCHMARK' TURNOVER OF BULKLY GOODS FLOORSPACE ‐ FISHGUARD (£m) : £2.3 £2.5 £2.8 £3.2 £3.5
STEP 3: NET RESIDUAL BULKY GOODS EXPENDITURE ‐ EXCLUDING ANY COMMITMENTS (£m): ‐ £0.0 £0.1 £0.2 £0.4
STEP 4: TURNOVER OF ALL COMMITED BULKY GOODS FLOORSPACE (£m) ‐ £0.0 £0.0 £0.0 £0.0
STEP 5: NET RESIDUAL BULKY GOODS EXPENDITURE AFTER COMMITMENTS: ‐ £0.0 £0.1 £0.2 £0.4
STEP 6: FORECAST CAPACITY FOR NEW BULKY GOODS FLOORSPACE:(i) Estimated Average Sales Density of New Floorspace (£ per sq m): £3,500 £3,841 £4,291 £4,785 £5,335(ii) Net Floorspace Capacity (sq m): ‐ ‐8 16 46 72(iii) Assumed Net / Gross Floorspace Ratio: 70% 70% 70% 70% 70%(iv) Gross Floorspace Capacity (sq m): ‐ ‐12 23 65 103
TABLE 7A: NARBERTH ‐ COMPARISON GOODS CAPACITY ASSESSMENT
Assume Equilibrium at Base Year and Constant Market Shares
2016 2021 2026 2031 2036
£6.5 £7.1 £8.2 £9.5 £11.0STEP 1: TOTAL FORECAST 'CURRENT' TURNOVER OF ALL FLOORSPACE ‐ NARBERTH (£m): STEP
2: TOTAL FORECAST 'BENCHMARK' TURNOVER OF ALL FLOORSPACE ‐ NARBERTH (£m): £6.5 £7.2 £8.0 £8.9 £9.9
STEP 3: NET RESIDUAL EXPENDITURE ‐ EXCLUDING ANY COMMITMENTS (£m): £0.0 ‐£0.1 £0.2 £0.6 £1.1
STEP 4: COMPARISON GOODS TURNOVER OF ALL COMMITED FLOORSPACE (£m) £0.0 £2.1 £2.1 £2.1 £2.1
STEP 5: NET RESIDUAL EXPENDITURE AFTER COMMITMENTS: £0.0 ‐£2.2 ‐£1.9 ‐£1.5 ‐£1.0
STEP 6: FORECAST CAPACITY FOR NEW COMPARISON GOODS FLOORSPACE:(i) Estimated Average Sales Density of New Floorspace (£ per sq m): £4,000 £4,390 £4,904 £5,468 £6,097(ii) Net Floorspace Capacity (sq m): ‐ ‐500 ‐389 ‐274 ‐169(iii) Assumed Net / Gross Floorspace Ratio: 70% 70% 70% 70% 70%(iv) Gross Floorspace Capacity (sq m): ‐ ‐714 ‐556 ‐391 ‐242
TABLE 7B: NARBERTH ‐ BULKY GOODS CAPACITY ASSESSMENT
Assume Equilibrium at Base Year and Constant Market Shares
2016 2021 2026 2031 2036
STEP 1: TOTAL FORECAST 'CURRENT' TURNOVER OF BULKY GOODS FLOORSPACE ‐ NARBERTH (£m): £1.0 £1.1 £1.3 £1.5 £1.7
STEP 2: TOTAL FORECAST 'BENCHMARK' TURNOVER OF BULKLY GOODS FLOORSPACE ‐ NARBERTH (£m): £1.0 £1.1 £1.2 £1.4 £1.5
STEP 3: NET RESIDUAL BULKY GOODS EXPENDITURE ‐ EXCLUDING ANY COMMITMENTS (£m): ‐ £0.0 £0.0 £0.1 £0.2
STEP 4: TURNOVER OF ALL COMMITED BULKY GOODS FLOORSPACE (£m) ‐ £0.7 £0.7 £0.7 £0.7
STEP 5: NET RESIDUAL BULKY GOODS EXPENDITURE AFTER COMMITMENTS: ‐ ‐£0.7 ‐£0.7 ‐£0.6 ‐£0.5
STEP 6: FORECAST CAPACITY FOR NEW BULKY GOODS FLOORSPACE:(i) Estimated Average Sales Density of New Floorspace (£ per sq m): £3,500 £3,841 £4,291 £4,785 £5,335(ii) Net Floorspace Capacity (sq m): ‐ ‐186 ‐156 ‐127 ‐101(iii) Assumed Net / Gross Floorspace Ratio: 70% 70% 70% 70% 70%(iv) Gross Floorspace Capacity (sq m): ‐ ‐266 ‐224 ‐182 ‐144
23/01/2017
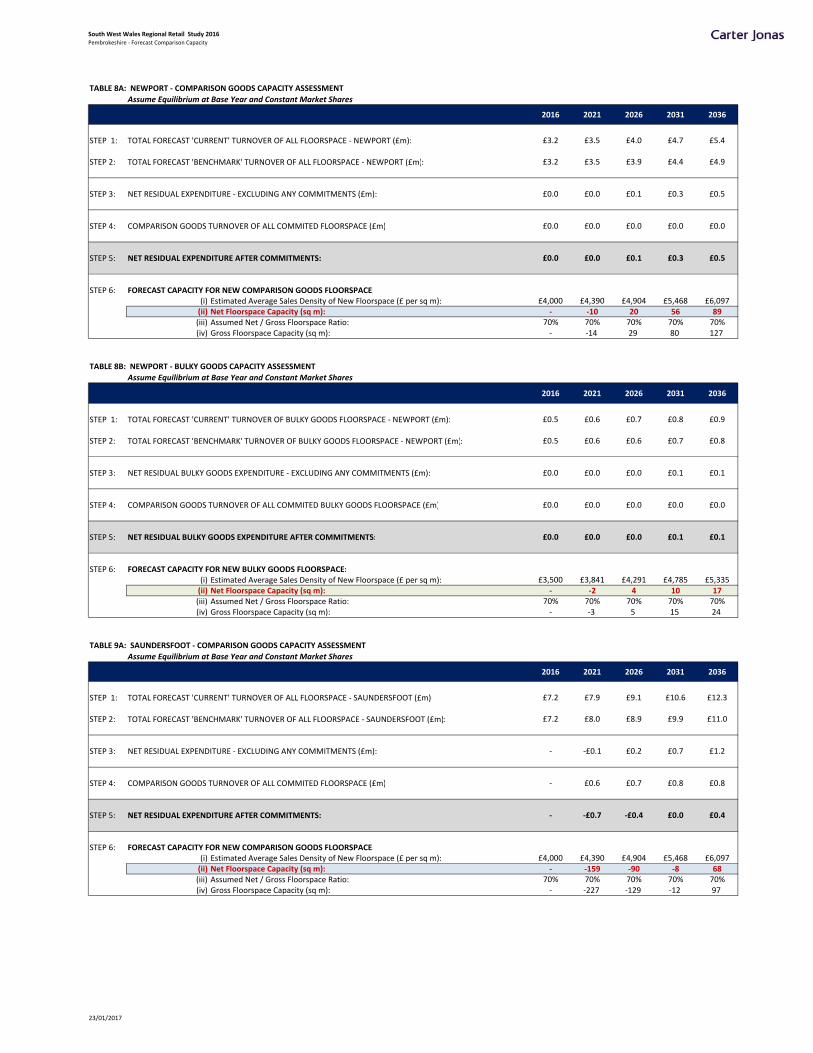
South West Wales Regional Retail Study 2016Pembrokeshire ‐ Forecast Comparison Capacity
TABLE 8A: NEWPORT ‐ COMPARISON GOODS CAPACITY ASSESSMENT
Assume Equilibrium at Base Year and Constant Market Shares
2016 2021 2026 2031 2036
STEP 1: TOTAL FORECAST 'CURRENT' TURNOVER OF ALL FLOORSPACE ‐ NEWPORT (£m): £3.2 £3.5 £4.0 £4.7 £5.4
STEP 2: TOTAL FORECAST 'BENCHMARK' TURNOVER OF ALL FLOORSPACE ‐ NEWPORT (£m): £3.2 £3.5 £3.9 £4.4 £4.9
STEP 3: NET RESIDUAL EXPENDITURE ‐ EXCLUDING ANY COMMITMENTS (£m): £0.0 £0.0 £0.1 £0.3 £0.5
STEP 4: COMPARISON GOODS TURNOVER OF ALL COMMITED FLOORSPACE (£m) £0.0 £0.0 £0.0 £0.0 £0.0
STEP 5: NET RESIDUAL EXPENDITURE AFTER COMMITMENTS: £0.0 £0.0 £0.1 £0.3 £0.5
STEP 6: FORECAST CAPACITY FOR NEW COMPARISON GOODS FLOORSPACE:(i) Estimated Average Sales Density of New Floorspace (£ per sq m): £4,000 £4,390 £4,904 £5,468 £6,097(ii) Net Floorspace Capacity (sq m): ‐ ‐10 20 56 89(iii) Assumed Net / Gross Floorspace Ratio: 70% 70% 70% 70% 70%(iv) Gross Floorspace Capacity (sq m): ‐ ‐14 29 80 127
TABLE 8B: NEWPORT ‐ BULKY GOODS CAPACITY ASSESSMENT
Assume Equilibrium at Base Year and Constant Market Shares
2016 2021 2026 2031 2036
STEP 1: TOTAL FORECAST 'CURRENT' TURNOVER OF BULKY GOODS FLOORSPACE ‐ NEWPORT (£m): £0.5 £0.6 £0.7 £0.8 £0.9
STEP 2: TOTAL FORECAST 'BENCHMARK' TURNOVER OF BULKY GOODS FLOORSPACE ‐ NEWPORT (£m): £0.5 £0.6 £0.6 £0.7 £0.8
STEP 3: NET RESIDUAL BULKY GOODS EXPENDITURE ‐ EXCLUDING ANY COMMITMENTS (£m): £0.0 £0.0 £0.0 £0.1 £0.1
STEP 4: COMPARISON GOODS TURNOVER OF ALL COMMITED BULKY GOODS FLOORSPACE (£m) £0.0 £0.0 £0.0 £0.0 £0.0
STEP 5: NET RESIDUAL BULKY GOODS EXPENDITURE AFTER COMMITMENTS: £0.0 £0.0 £0.0 £0.1 £0.1
STEP 6: FORECAST CAPACITY FOR NEW BULKY GOODS FLOORSPACE:(i) Estimated Average Sales Density of New Floorspace (£ per sq m): £3,500 £3,841 £4,291 £4,785 £5,335(ii) Net Floorspace Capacity (sq m): ‐ ‐2 4 10 17(iii) Assumed Net / Gross Floorspace Ratio: 70% 70% 70% 70% 70%(iv) Gross Floorspace Capacity (sq m): ‐ ‐3 5 15 24
TABLE 9A: SAUNDERSFOOT ‐ COMPARISON GOODS CAPACITY ASSESSMENT
Assume Equilibrium at Base Year and Constant Market Shares
2016 2021 2026 2031 2036
STEP 1: TOTAL FORECAST 'CURRENT' TURNOVER OF ALL FLOORSPACE ‐ SAUNDERSFOOT (£m): £7.2 £7.9 £9.1 £10.6 £12.3
STEP 2: TOTAL FORECAST 'BENCHMARK' TURNOVER OF ALL FLOORSPACE ‐ SAUNDERSFOOT (£m): £7.2 £8.0 £8.9 £9.9 £11.0
STEP 3: NET RESIDUAL EXPENDITURE ‐ EXCLUDING ANY COMMITMENTS (£m): ‐ ‐£0.1 £0.2 £0.7 £1.2
STEP 4: COMPARISON GOODS TURNOVER OF ALL COMMITED FLOORSPACE (£m) ‐ £0.6 £0.7 £0.8 £0.8
STEP 5: NET RESIDUAL EXPENDITURE AFTER COMMITMENTS: ‐ ‐£0.7 ‐£0.4 £0.0 £0.4
STEP 6: FORECAST CAPACITY FOR NEW COMPARISON GOODS FLOORSPACE:(i) Estimated Average Sales Density of New Floorspace (£ per sq m): £4,000 £4,390 £4,904 £5,468 £6,097(ii) Net Floorspace Capacity (sq m): ‐ ‐159 ‐90 ‐8 68(iii) Assumed Net / Gross Floorspace Ratio: 70% 70% 70% 70% 70%(iv) Gross Floorspace Capacity (sq m): ‐ ‐227 ‐129 ‐12 97
23/01/2017
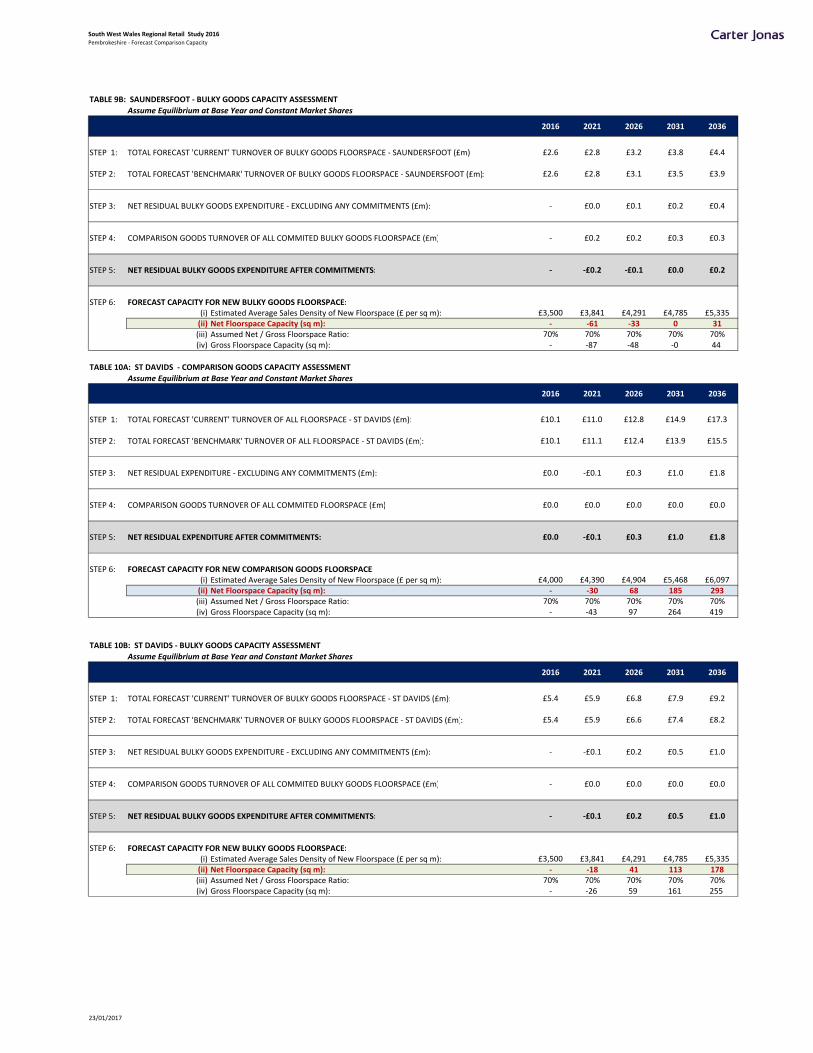
South West Wales Regional Retail Study 2016Pembrokeshire ‐ Forecast Comparison Capacity
TABLE 9B: SAUNDERSFOOT ‐ BULKY GOODS CAPACITY ASSESSMENT
Assume Equilibrium at Base Year and Constant Market Shares
2016 2021 2026 2031 2036
STEP 1: TOTAL FORECAST 'CURRENT' TURNOVER OF BULKY GOODS FLOORSPACE ‐ SAUNDERSFOOT (£m): £2.6 £2.8 £3.2 £3.8 £4.4
STEP 2: TOTAL FORECAST 'BENCHMARK' TURNOVER OF BULKY GOODS FLOORSPACE ‐ SAUNDERSFOOT (£m): £2.6 £2.8 £3.1 £3.5 £3.9
STEP 3: NET RESIDUAL BULKY GOODS EXPENDITURE ‐ EXCLUDING ANY COMMITMENTS (£m): ‐ £0.0 £0.1 £0.2 £0.4
STEP 4: COMPARISON GOODS TURNOVER OF ALL COMMITED BULKY GOODS FLOORSPACE (£m) ‐ £0.2 £0.2 £0.3 £0.3
STEP 5: NET RESIDUAL BULKY GOODS EXPENDITURE AFTER COMMITMENTS: ‐ ‐£0.2 ‐£0.1 £0.0 £0.2
STEP 6: FORECAST CAPACITY FOR NEW BULKY GOODS FLOORSPACE:(i) Estimated Average Sales Density of New Floorspace (£ per sq m): £3,500 £3,841 £4,291 £4,785 £5,335(ii) Net Floorspace Capacity (sq m): ‐ ‐61 ‐33 0 31(iii) Assumed Net / Gross Floorspace Ratio: 70% 70% 70% 70% 70%(iv) Gross Floorspace Capacity (sq m): ‐ ‐87 ‐48 ‐0 44
TABLE 10A: ST DAVIDS ‐ COMPARISON GOODS CAPACITY ASSESSMENT
Assume Equilibrium at Base Year and Constant Market Shares
2016 2021 2026 2031 2036
STEP 1: TOTAL FORECAST 'CURRENT' TURNOVER OF ALL FLOORSPACE ‐ ST DAVIDS (£m): £10.1 £11.0 £12.8 £14.9 £17.3
STEP 2: TOTAL FORECAST 'BENCHMARK' TURNOVER OF ALL FLOORSPACE ‐ ST DAVIDS (£m): £10.1 £11.1 £12.4 £13.9 £15.5
STEP 3: NET RESIDUAL EXPENDITURE ‐ EXCLUDING ANY COMMITMENTS (£m): £0.0 ‐£0.1 £0.3 £1.0 £1.8
STEP 4: COMPARISON GOODS TURNOVER OF ALL COMMITED FLOORSPACE (£m) £0.0 £0.0 £0.0 £0.0 £0.0
STEP 5: NET RESIDUAL EXPENDITURE AFTER COMMITMENTS: £0.0 ‐£0.1 £0.3 £1.0 £1.8
STEP 6: FORECAST CAPACITY FOR NEW COMPARISON GOODS FLOORSPACE:(i) Estimated Average Sales Density of New Floorspace (£ per sq m): £4,000 £4,390 £4,904 £5,468 £6,097(ii) Net Floorspace Capacity (sq m): ‐ ‐30 68 185 293(iii) Assumed Net / Gross Floorspace Ratio: 70% 70% 70% 70% 70%(iv) Gross Floorspace Capacity (sq m): ‐ ‐43 97 264 419
TABLE 10B: ST DAVIDS ‐ BULKY GOODS CAPACITY ASSESSMENT
Assume Equilibrium at Base Year and Constant Market Shares
2016 2021 2026 2031 2036
STEP 1: TOTAL FORECAST 'CURRENT' TURNOVER OF BULKY GOODS FLOORSPACE ‐ ST DAVIDS (£m): £5.4 £5.9 £6.8 £7.9 £9.2
STEP 2: TOTAL FORECAST 'BENCHMARK' TURNOVER OF BULKY GOODS FLOORSPACE ‐ ST DAVIDS (£m): £5.4 £5.9 £6.6 £7.4 £8.2
STEP 3: NET RESIDUAL BULKY GOODS EXPENDITURE ‐ EXCLUDING ANY COMMITMENTS (£m): ‐ ‐£0.1 £0.2 £0.5 £1.0
STEP 4: COMPARISON GOODS TURNOVER OF ALL COMMITED BULKY GOODS FLOORSPACE (£m) ‐ £0.0 £0.0 £0.0 £0.0
STEP 5: NET RESIDUAL BULKY GOODS EXPENDITURE AFTER COMMITMENTS: ‐ ‐£0.1 £0.2 £0.5 £1.0
STEP 6: FORECAST CAPACITY FOR NEW BULKY GOODS FLOORSPACE:(i) Estimated Average Sales Density of New Floorspace (£ per sq m): £3,500 £3,841 £4,291 £4,785 £5,335(ii) Net Floorspace Capacity (sq m): ‐ ‐18 41 113 178(iii) Assumed Net / Gross Floorspace Ratio: 70% 70% 70% 70% 70%(iv) Gross Floorspace Capacity (sq m): ‐ ‐26 59 161 255
23/01/2017
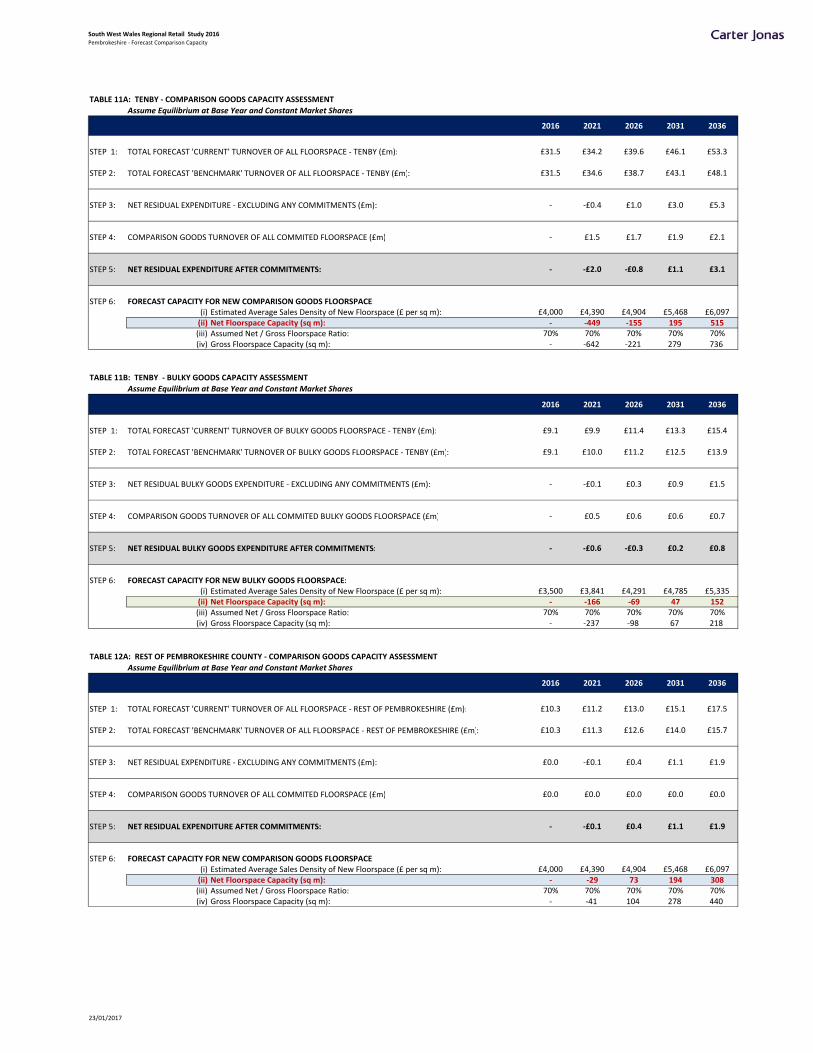
South West Wales Regional Retail Study 2016Pembrokeshire ‐ Forecast Comparison Capacity
TABLE 11A: TENBY ‐ COMPARISON GOODS CAPACITY ASSESSMENT
Assume Equilibrium at Base Year and Constant Market Shares
2016 2021 2026 2031 2036
STEP 1: TOTAL FORECAST 'CURRENT' TURNOVER OF ALL FLOORSPACE ‐ TENBY (£m): £31.5 £34.2 £39.6 £46.1 £53.3
STEP 2: TOTAL FORECAST 'BENCHMARK' TURNOVER OF ALL FLOORSPACE ‐ TENBY (£m): £31.5 £34.6 £38.7 £43.1 £48.1
STEP 3: NET RESIDUAL EXPENDITURE ‐ EXCLUDING ANY COMMITMENTS (£m): ‐ ‐£0.4 £1.0 £3.0 £5.3
STEP 4: COMPARISON GOODS TURNOVER OF ALL COMMITED FLOORSPACE (£m) ‐ £1.5 £1.7 £1.9 £2.1
STEP 5: NET RESIDUAL EXPENDITURE AFTER COMMITMENTS: ‐ ‐£2.0 ‐£0.8 £1.1 £3.1
STEP 6: FORECAST CAPACITY FOR NEW COMPARISON GOODS FLOORSPACE:(i) Estimated Average Sales Density of New Floorspace (£ per sq m): £4,000 £4,390 £4,904 £5,468 £6,097(ii) Net Floorspace Capacity (sq m): ‐ ‐449 ‐155 195 515(iii) Assumed Net / Gross Floorspace Ratio: 70% 70% 70% 70% 70%(iv) Gross Floorspace Capacity (sq m): ‐ ‐642 ‐221 279 736
TABLE 11B: TENBY ‐ BULKY GOODS CAPACITY ASSESSMENT
Assume Equilibrium at Base Year and Constant Market Shares
2016 2021 2026 2031 2036
STEP 1: TOTAL FORECAST 'CURRENT' TURNOVER OF BULKY GOODS FLOORSPACE ‐ TENBY (£m): £9.1 £9.9 £11.4 £13.3 £15.4
STEP 2: TOTAL FORECAST 'BENCHMARK' TURNOVER OF BULKY GOODS FLOORSPACE ‐ TENBY (£m): £9.1 £10.0 £11.2 £12.5 £13.9
STEP 3: NET RESIDUAL BULKY GOODS EXPENDITURE ‐ EXCLUDING ANY COMMITMENTS (£m): ‐ ‐£0.1 £0.3 £0.9 £1.5
STEP 4: COMPARISON GOODS TURNOVER OF ALL COMMITED BULKY GOODS FLOORSPACE (£m) ‐ £0.5 £0.6 £0.6 £0.7
STEP 5: NET RESIDUAL BULKY GOODS EXPENDITURE AFTER COMMITMENTS: ‐ ‐£0.6 ‐£0.3 £0.2 £0.8
STEP 6: FORECAST CAPACITY FOR NEW BULKY GOODS FLOORSPACE:(i) Estimated Average Sales Density of New Floorspace (£ per sq m): £3,500 £3,841 £4,291 £4,785 £5,335(ii) Net Floorspace Capacity (sq m): ‐ ‐166 ‐69 47 152(iii) Assumed Net / Gross Floorspace Ratio: 70% 70% 70% 70% 70%(iv) Gross Floorspace Capacity (sq m): ‐ ‐237 ‐98 67 218
TABLE 12A: REST OF PEMBROKESHIRE COUNTY ‐ COMPARISON GOODS CAPACITY ASSESSMENT
Assume Equilibrium at Base Year and Constant Market Shares
2016 2021 2026 2031 2036
STEP 1: TOTAL FORECAST 'CURRENT' TURNOVER OF ALL FLOORSPACE ‐ REST OF PEMBROKESHIRE (£m): £10.3 £11.2 £13.0 £15.1 £17.5
STEP 2: TOTAL FORECAST 'BENCHMARK' TURNOVER OF ALL FLOORSPACE ‐ REST OF PEMBROKESHIRE (£m): £10.3 £11.3 £12.6 £14.0 £15.7
STEP 3: NET RESIDUAL EXPENDITURE ‐ EXCLUDING ANY COMMITMENTS (£m): £0.0 ‐£0.1 £0.4 £1.1 £1.9
STEP 4: COMPARISON GOODS TURNOVER OF ALL COMMITED FLOORSPACE (£m) £0.0 £0.0 £0.0 £0.0 £0.0
STEP 5: NET RESIDUAL EXPENDITURE AFTER COMMITMENTS: ‐ ‐£0.1 £0.4 £1.1 £1.9
STEP 6: FORECAST CAPACITY FOR NEW COMPARISON GOODS FLOORSPACE:(i) Estimated Average Sales Density of New Floorspace (£ per sq m): £4,000 £4,390 £4,904 £5,468 £6,097(ii) Net Floorspace Capacity (sq m): ‐ ‐29 73 194 308(iii) Assumed Net / Gross Floorspace Ratio: 70% 70% 70% 70% 70%(iv) Gross Floorspace Capacity (sq m): ‐ ‐41 104 278 440
23/01/2017
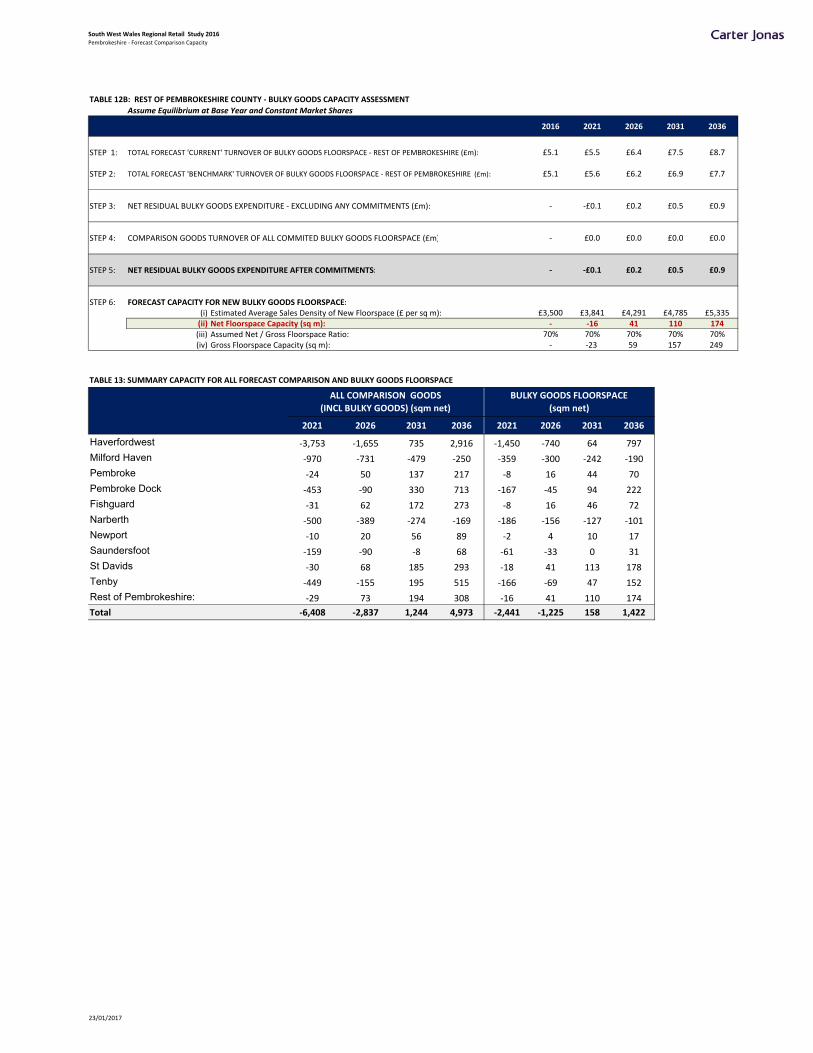
South West Wales Regional Retail Study 2016Pembrokeshire ‐ Forecast Comparison Capacity
TABLE 12B: REST OF PEMBROKESHIRE COUNTY ‐ BULKY GOODS CAPACITY ASSESSMENT
Assume Equilibrium at Base Year and Constant Market Shares
2016 2021 2026 2031 2036
STEP 1: TOTAL FORECAST 'CURRENT' TURNOVER OF BULKY GOODS FLOORSPACE ‐ REST OF PEMBROKESHIRE (£m): £5.1 £5.5 £6.4 £7.5 £8.7
STEP 2: TOTAL FORECAST 'BENCHMARK' TURNOVER OF BULKY GOODS FLOORSPACE ‐ REST OF PEMBROKESHIRE (£m): £5.1 £5.6 £6.2 £6.9 £7.7
STEP 3: NET RESIDUAL BULKY GOODS EXPENDITURE ‐ EXCLUDING ANY COMMITMENTS (£m): ‐ ‐£0.1 £0.2 £0.5 £0.9
STEP 4: COMPARISON GOODS TURNOVER OF ALL COMMITED BULKY GOODS FLOORSPACE (£m) ‐ £0.0 £0.0 £0.0 £0.0
STEP 5: NET RESIDUAL BULKY GOODS EXPENDITURE AFTER COMMITMENTS: ‐ ‐£0.1 £0.2 £0.5 £0.9
STEP 6: FORECAST CAPACITY FOR NEW BULKY GOODS FLOORSPACE:(i) Estimated Average Sales Density of New Floorspace (£ per sq m): £3,500 £3,841 £4,291 £4,785 £5,335(ii) Net Floorspace Capacity (sq m): ‐ ‐16 41 110 174(iii) Assumed Net / Gross Floorspace Ratio: 70% 70% 70% 70% 70%(iv) Gross Floorspace Capacity (sq m): ‐ ‐23 59 157 249
TABLE 13: SUMMARY CAPACITY FOR ALL FORECAST COMPARISON AND BULKY GOODS FLOORSPACE
2021 2026 2031 2036 2021 2026 2031 2036
Haverfordwest ‐3,753 ‐1,655 735 2,916 ‐1,450 ‐740 64 797
Milford Haven ‐970 ‐731 ‐479 ‐250 ‐359 ‐300 ‐242 ‐190
Pembroke ‐24 50 137 217 ‐8 16 44 70
Pembroke Dock ‐453 ‐90 330 713 ‐167 ‐45 94 222
Fishguard ‐31 62 172 273 ‐8 16 46 72
Narberth ‐500 ‐389 ‐274 ‐169 ‐186 ‐156 ‐127 ‐101
Newport ‐10 20 56 89 ‐2 4 10 17
Saundersfoot ‐159 ‐90 ‐8 68 ‐61 ‐33 0 31
St Davids ‐30 68 185 293 ‐18 41 113 178
Tenby ‐449 ‐155 195 515 ‐166 ‐69 47 152
Rest of Pembrokeshire: ‐29 73 194 308 ‐16 41 110 174
Total ‐6,408 ‐2,837 1,244 4,973 ‐2,441 ‐1,225 158 1,422
ALL COMPARISON GOODS
(INCL BULKY GOODS) (sqm net)
BULKY GOODS FLOORSPACE
(sqm net)
23/01/2017

South West Wales Regional Retail Study
APPENDIX 10B: FORECAST COMPARISON GOODS CAPACITY – PEMBROKESHIRE COUNTY & PEMBROKESHIRE COAST NATIONAL PARK
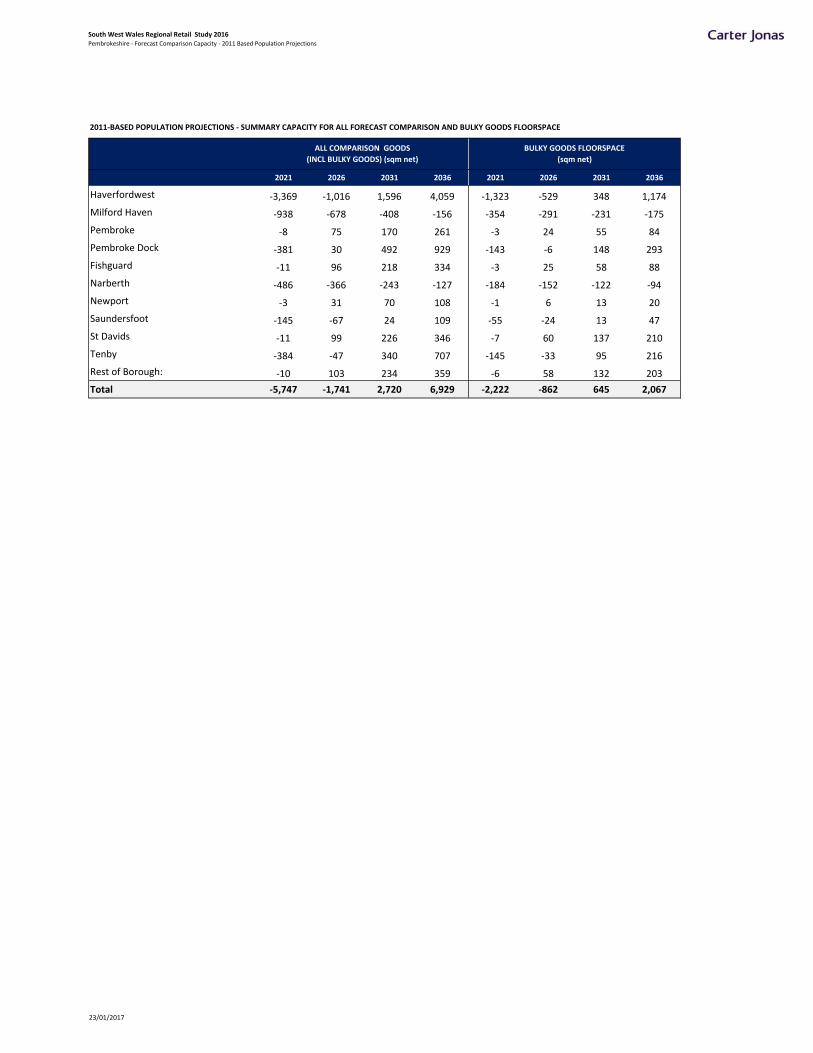
South West Wales Regional Retail Study 2016Pembrokeshire ‐ Forecast Comparison Capacity ‐ 2011 Based Population Projections
2011‐BASED POPULATION PROJECTIONS ‐ SUMMARY CAPACITY FOR ALL FORECAST COMPARISON AND BULKY GOODS FLOORSPACE
2021 2026 2031 2036 2021 2026 2031 2036
Haverfordwest ‐3,369 ‐1,016 1,596 4,059 ‐1,323 ‐529 348 1,174
Milford Haven ‐938 ‐678 ‐408 ‐156 ‐354 ‐291 ‐231 ‐175
Pembroke ‐8 75 170 261 ‐3 24 55 84
Pembroke Dock ‐381 30 492 929 ‐143 ‐6 148 293
Fishguard ‐11 96 218 334 ‐3 25 58 88
Narberth ‐486 ‐366 ‐243 ‐127 ‐184 ‐152 ‐122 ‐94
Newport ‐3 31 70 108 ‐1 6 13 20
Saundersfoot ‐145 ‐67 24 109 ‐55 ‐24 13 47
St Davids ‐11 99 226 346 ‐7 60 137 210
Tenby ‐384 ‐47 340 707 ‐145 ‐33 95 216
Rest of Borough: ‐10 103 234 359 ‐6 58 132 203
Total ‐5,747 ‐1,741 2,720 6,929 ‐2,222 ‐862 645 2,067
ALL COMPARISON GOODS
(INCL BULKY GOODS) (sqm net)
BULKY GOODS FLOORSPACE
(sqm net)
23/01/2017

South West Wales Regional Retail Study
APPENDIX 11A: FORECAST COMPARISON GOODS CAPACITY – CEREDIGION COUNTY
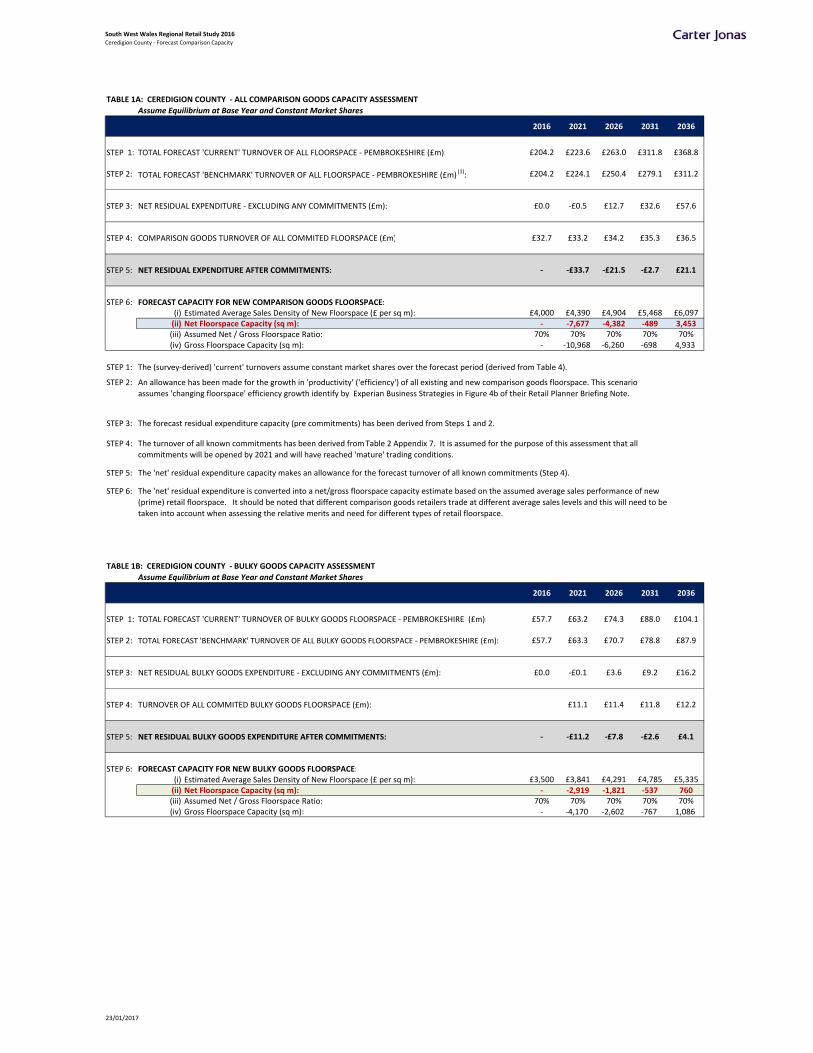
South West Wales Regional Retail Study 2016Ceredigion County ‐ Forecast Comparison Capacity
TABLE 1A: CEREDIGION COUNTY ‐ ALL COMPARISON GOODS CAPACITY ASSESSMENT
Assume Equilibrium at Base Year and Constant Market Shares
2016 2021 2026 2031 2036
STEP 1: TOTAL FORECAST 'CURRENT' TURNOVER OF ALL FLOORSPACE ‐ PEMBROKESHIRE (£m): £204.2 £223.6 £263.0 £311.8 £368.8
STEP 2: TOTAL FORECAST 'BENCHMARK' TURNOVER OF ALL FLOORSPACE ‐ PEMBROKESHIRE (£m) (1): £204.2 £224.1 £250.4 £279.1 £311.2
STEP 3: NET RESIDUAL EXPENDITURE ‐ EXCLUDING ANY COMMITMENTS (£m): £0.0 ‐£0.5 £12.7 £32.6 £57.6
STEP 4: COMPARISON GOODS TURNOVER OF ALL COMMITED FLOORSPACE (£m) £32.7 £33.2 £34.2 £35.3 £36.5
STEP 5: NET RESIDUAL EXPENDITURE AFTER COMMITMENTS: ‐ ‐£33.7 ‐£21.5 ‐£2.7 £21.1
STEP 6: FORECAST CAPACITY FOR NEW COMPARISON GOODS FLOORSPACE:(i) Estimated Average Sales Density of New Floorspace (£ per sq m): £4,000 £4,390 £4,904 £5,468 £6,097(ii) Net Floorspace Capacity (sq m): ‐ ‐7,677 ‐4,382 ‐489 3,453(iii) Assumed Net / Gross Floorspace Ratio: 70% 70% 70% 70% 70%(iv) Gross Floorspace Capacity (sq m): ‐ ‐10,968 ‐6,260 ‐698 4,933
STEP 1:
STEP 2:
STEP 3:
STEP 4:
STEP 5:
STEP 6:
TABLE 1B: CEREDIGION COUNTY ‐ BULKY GOODS CAPACITY ASSESSMENT
Assume Equilibrium at Base Year and Constant Market Shares
2016 2021 2026 2031 2036
STEP 1: TOTAL FORECAST 'CURRENT' TURNOVER OF BULKY GOODS FLOORSPACE ‐ PEMBROKESHIRE (£m): £57.7 £63.2 £74.3 £88.0 £104.1
STEP 2: TOTAL FORECAST 'BENCHMARK' TURNOVER OF ALL BULKY GOODS FLOORSPACE ‐ PEMBROKESHIRE (£m): £57.7 £63.3 £70.7 £78.8 £87.9
STEP 3: NET RESIDUAL BULKY GOODS EXPENDITURE ‐ EXCLUDING ANY COMMITMENTS (£m): £0.0 ‐£0.1 £3.6 £9.2 £16.2
STEP 4: TURNOVER OF ALL COMMITED BULKY GOODS FLOORSPACE (£m): £11.1 £11.4 £11.8 £12.2
STEP 5: NET RESIDUAL BULKY GOODS EXPENDITURE AFTER COMMITMENTS: ‐ ‐£11.2 ‐£7.8 ‐£2.6 £4.1
STEP 6: FORECAST CAPACITY FOR NEW BULKY GOODS FLOORSPACE:(i) Estimated Average Sales Density of New Floorspace (£ per sq m): £3,500 £3,841 £4,291 £4,785 £5,335(ii) Net Floorspace Capacity (sq m): ‐ ‐2,919 ‐1,821 ‐537 760(iii) Assumed Net / Gross Floorspace Ratio: 70% 70% 70% 70% 70%(iv) Gross Floorspace Capacity (sq m): ‐ ‐4,170 ‐2,602 ‐767 1,086
The 'net' residual expenditure capacity makes an allowance for the forecast turnover of all known commitments (Step 4).
The 'net' residual expenditure is converted into a net/gross floorspace capacity estimate based on the assumed average sales performance of new
(prime) retail floorspace. It should be noted that different comparison goods retailers trade at different average sales levels and this will need to be
taken into account when assessing the relative merits and need for different types of retail floorspace.
The (survey‐derived) 'current' turnovers assume constant market shares over the forecast period (derived from Table 4).
An allowance has been made for the growth in 'productivity' ('efficiency') of all existing and new comparison goods floorspace. This scenario
assumes 'changing floorspace' efficiency growth identify by Experian Business Strategies in Figure 4b of their Retail Planner Briefing Note.
The forecast residual expenditure capacity (pre commitments) has been derived from Steps 1 and 2.
The turnover of all known commitments has been derived from Table 2 Appendix 7. It is assumed for the purpose of this assessment that all
commitments will be opened by 2021 and will have reached 'mature' trading conditions.
23/01/2017
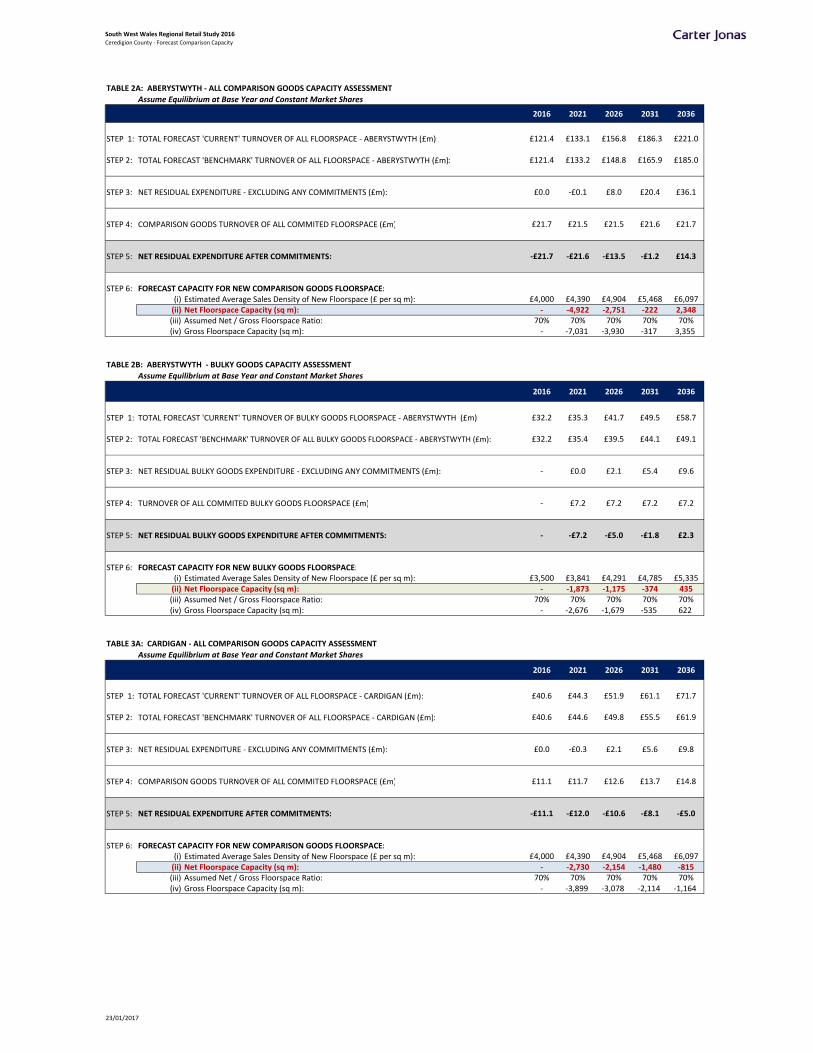
South West Wales Regional Retail Study 2016Ceredigion County ‐ Forecast Comparison Capacity
TABLE 2A: ABERYSTWYTH ‐ ALL COMPARISON GOODS CAPACITY ASSESSMENT
Assume Equilibrium at Base Year and Constant Market Shares
2016 2021 2026 2031 2036
STEP 1: TOTAL FORECAST 'CURRENT' TURNOVER OF ALL FLOORSPACE ‐ ABERYSTWYTH (£m): £121.4 £133.1 £156.8 £186.3 £221.0
STEP 2: TOTAL FORECAST 'BENCHMARK' TURNOVER OF ALL FLOORSPACE ‐ ABERYSTWYTH (£m): £121.4 £133.2 £148.8 £165.9 £185.0
STEP 3: NET RESIDUAL EXPENDITURE ‐ EXCLUDING ANY COMMITMENTS (£m): £0.0 ‐£0.1 £8.0 £20.4 £36.1
STEP 4: COMPARISON GOODS TURNOVER OF ALL COMMITED FLOORSPACE (£m) £21.7 £21.5 £21.5 £21.6 £21.7
STEP 5: NET RESIDUAL EXPENDITURE AFTER COMMITMENTS: ‐£21.7 ‐£21.6 ‐£13.5 ‐£1.2 £14.3
STEP 6: FORECAST CAPACITY FOR NEW COMPARISON GOODS FLOORSPACE:(i) Estimated Average Sales Density of New Floorspace (£ per sq m): £4,000 £4,390 £4,904 £5,468 £6,097(ii) Net Floorspace Capacity (sq m): ‐ ‐4,922 ‐2,751 ‐222 2,348(iii) Assumed Net / Gross Floorspace Ratio: 70% 70% 70% 70% 70%(iv) Gross Floorspace Capacity (sq m): ‐ ‐7,031 ‐3,930 ‐317 3,355
TABLE 2B: ABERYSTWYTH ‐ BULKY GOODS CAPACITY ASSESSMENT
Assume Equilibrium at Base Year and Constant Market Shares
2016 2021 2026 2031 2036
STEP 1: TOTAL FORECAST 'CURRENT' TURNOVER OF BULKY GOODS FLOORSPACE ‐ ABERYSTWYTH (£m): £32.2 £35.3 £41.7 £49.5 £58.7
STEP 2: TOTAL FORECAST 'BENCHMARK' TURNOVER OF ALL BULKY GOODS FLOORSPACE ‐ ABERYSTWYTH (£m): £32.2 £35.4 £39.5 £44.1 £49.1
STEP 3: NET RESIDUAL BULKY GOODS EXPENDITURE ‐ EXCLUDING ANY COMMITMENTS (£m): ‐ £0.0 £2.1 £5.4 £9.6
STEP 4: TURNOVER OF ALL COMMITED BULKY GOODS FLOORSPACE (£m) ‐ £7.2 £7.2 £7.2 £7.2
STEP 5: NET RESIDUAL BULKY GOODS EXPENDITURE AFTER COMMITMENTS: ‐ ‐£7.2 ‐£5.0 ‐£1.8 £2.3
STEP 6: FORECAST CAPACITY FOR NEW BULKY GOODS FLOORSPACE:(i) Estimated Average Sales Density of New Floorspace (£ per sq m): £3,500 £3,841 £4,291 £4,785 £5,335(ii) Net Floorspace Capacity (sq m): ‐ ‐1,873 ‐1,175 ‐374 435(iii) Assumed Net / Gross Floorspace Ratio: 70% 70% 70% 70% 70%(iv) Gross Floorspace Capacity (sq m): ‐ ‐2,676 ‐1,679 ‐535 622
TABLE 3A: CARDIGAN ‐ ALL COMPARISON GOODS CAPACITY ASSESSMENT
Assume Equilibrium at Base Year and Constant Market Shares
2016 2021 2026 2031 2036
STEP 1: TOTAL FORECAST 'CURRENT' TURNOVER OF ALL FLOORSPACE ‐ CARDIGAN (£m): £40.6 £44.3 £51.9 £61.1 £71.7
STEP 2: TOTAL FORECAST 'BENCHMARK' TURNOVER OF ALL FLOORSPACE ‐ CARDIGAN (£m): £40.6 £44.6 £49.8 £55.5 £61.9
STEP 3: NET RESIDUAL EXPENDITURE ‐ EXCLUDING ANY COMMITMENTS (£m): £0.0 ‐£0.3 £2.1 £5.6 £9.8
STEP 4: COMPARISON GOODS TURNOVER OF ALL COMMITED FLOORSPACE (£m) £11.1 £11.7 £12.6 £13.7 £14.8
STEP 5: NET RESIDUAL EXPENDITURE AFTER COMMITMENTS: ‐£11.1 ‐£12.0 ‐£10.6 ‐£8.1 ‐£5.0
STEP 6: FORECAST CAPACITY FOR NEW COMPARISON GOODS FLOORSPACE:(i) Estimated Average Sales Density of New Floorspace (£ per sq m): £4,000 £4,390 £4,904 £5,468 £6,097(ii) Net Floorspace Capacity (sq m): ‐ ‐2,730 ‐2,154 ‐1,480 ‐815(iii) Assumed Net / Gross Floorspace Ratio: 70% 70% 70% 70% 70%(iv) Gross Floorspace Capacity (sq m): ‐ ‐3,899 ‐3,078 ‐2,114 ‐1,164
23/01/2017
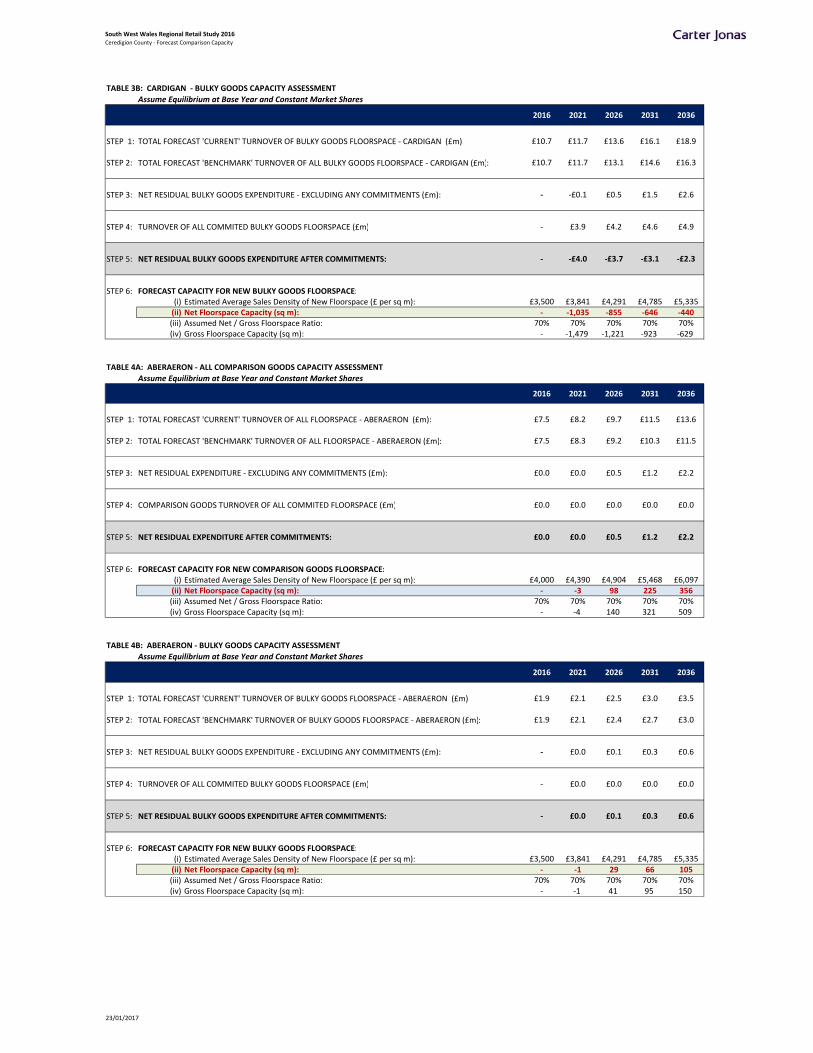
South West Wales Regional Retail Study 2016Ceredigion County ‐ Forecast Comparison Capacity
TABLE 3B: CARDIGAN ‐ BULKY GOODS CAPACITY ASSESSMENT
Assume Equilibrium at Base Year and Constant Market Shares
2016 2021 2026 2031 2036
STEP 1: TOTAL FORECAST 'CURRENT' TURNOVER OF BULKY GOODS FLOORSPACE ‐ CARDIGAN (£m): £10.7 £11.7 £13.6 £16.1 £18.9
STEP 2: TOTAL FORECAST 'BENCHMARK' TURNOVER OF ALL BULKY GOODS FLOORSPACE ‐ CARDIGAN (£m): £10.7 £11.7 £13.1 £14.6 £16.3
STEP 3: NET RESIDUAL BULKY GOODS EXPENDITURE ‐ EXCLUDING ANY COMMITMENTS (£m): ‐ ‐£0.1 £0.5 £1.5 £2.6
STEP 4: TURNOVER OF ALL COMMITED BULKY GOODS FLOORSPACE (£m) ‐ £3.9 £4.2 £4.6 £4.9
STEP 5: NET RESIDUAL BULKY GOODS EXPENDITURE AFTER COMMITMENTS: ‐ ‐£4.0 ‐£3.7 ‐£3.1 ‐£2.3
STEP 6: FORECAST CAPACITY FOR NEW BULKY GOODS FLOORSPACE:(i) Estimated Average Sales Density of New Floorspace (£ per sq m): £3,500 £3,841 £4,291 £4,785 £5,335(ii) Net Floorspace Capacity (sq m): ‐ ‐1,035 ‐855 ‐646 ‐440(iii) Assumed Net / Gross Floorspace Ratio: 70% 70% 70% 70% 70%(iv) Gross Floorspace Capacity (sq m): ‐ ‐1,479 ‐1,221 ‐923 ‐629
TABLE 4A: ABERAERON ‐ ALL COMPARISON GOODS CAPACITY ASSESSMENT
Assume Equilibrium at Base Year and Constant Market Shares
2016 2021 2026 2031 2036
STEP 1: TOTAL FORECAST 'CURRENT' TURNOVER OF ALL FLOORSPACE ‐ ABERAERON (£m): £7.5 £8.2 £9.7 £11.5 £13.6
STEP 2: TOTAL FORECAST 'BENCHMARK' TURNOVER OF ALL FLOORSPACE ‐ ABERAERON (£m): £7.5 £8.3 £9.2 £10.3 £11.5
STEP 3: NET RESIDUAL EXPENDITURE ‐ EXCLUDING ANY COMMITMENTS (£m): £0.0 £0.0 £0.5 £1.2 £2.2
STEP 4: COMPARISON GOODS TURNOVER OF ALL COMMITED FLOORSPACE (£m) £0.0 £0.0 £0.0 £0.0 £0.0
STEP 5: NET RESIDUAL EXPENDITURE AFTER COMMITMENTS: £0.0 £0.0 £0.5 £1.2 £2.2
STEP 6: FORECAST CAPACITY FOR NEW COMPARISON GOODS FLOORSPACE:(i) Estimated Average Sales Density of New Floorspace (£ per sq m): £4,000 £4,390 £4,904 £5,468 £6,097(ii) Net Floorspace Capacity (sq m): ‐ ‐3 98 225 356(iii) Assumed Net / Gross Floorspace Ratio: 70% 70% 70% 70% 70%(iv) Gross Floorspace Capacity (sq m): ‐ ‐4 140 321 509
TABLE 4B: ABERAERON ‐ BULKY GOODS CAPACITY ASSESSMENT
Assume Equilibrium at Base Year and Constant Market Shares
2016 2021 2026 2031 2036
STEP 1: TOTAL FORECAST 'CURRENT' TURNOVER OF BULKY GOODS FLOORSPACE ‐ ABERAERON (£m): £1.9 £2.1 £2.5 £3.0 £3.5
STEP 2: TOTAL FORECAST 'BENCHMARK' TURNOVER OF BULKY GOODS FLOORSPACE ‐ ABERAERON (£m): £1.9 £2.1 £2.4 £2.7 £3.0
STEP 3: NET RESIDUAL BULKY GOODS EXPENDITURE ‐ EXCLUDING ANY COMMITMENTS (£m): ‐ £0.0 £0.1 £0.3 £0.6
STEP 4: TURNOVER OF ALL COMMITED BULKY GOODS FLOORSPACE (£m) ‐ £0.0 £0.0 £0.0 £0.0
STEP 5: NET RESIDUAL BULKY GOODS EXPENDITURE AFTER COMMITMENTS: ‐ £0.0 £0.1 £0.3 £0.6
STEP 6: FORECAST CAPACITY FOR NEW BULKY GOODS FLOORSPACE:(i) Estimated Average Sales Density of New Floorspace (£ per sq m): £3,500 £3,841 £4,291 £4,785 £5,335(ii) Net Floorspace Capacity (sq m): ‐ ‐1 29 66 105(iii) Assumed Net / Gross Floorspace Ratio: 70% 70% 70% 70% 70%(iv) Gross Floorspace Capacity (sq m): ‐ ‐1 41 95 150
23/01/2017
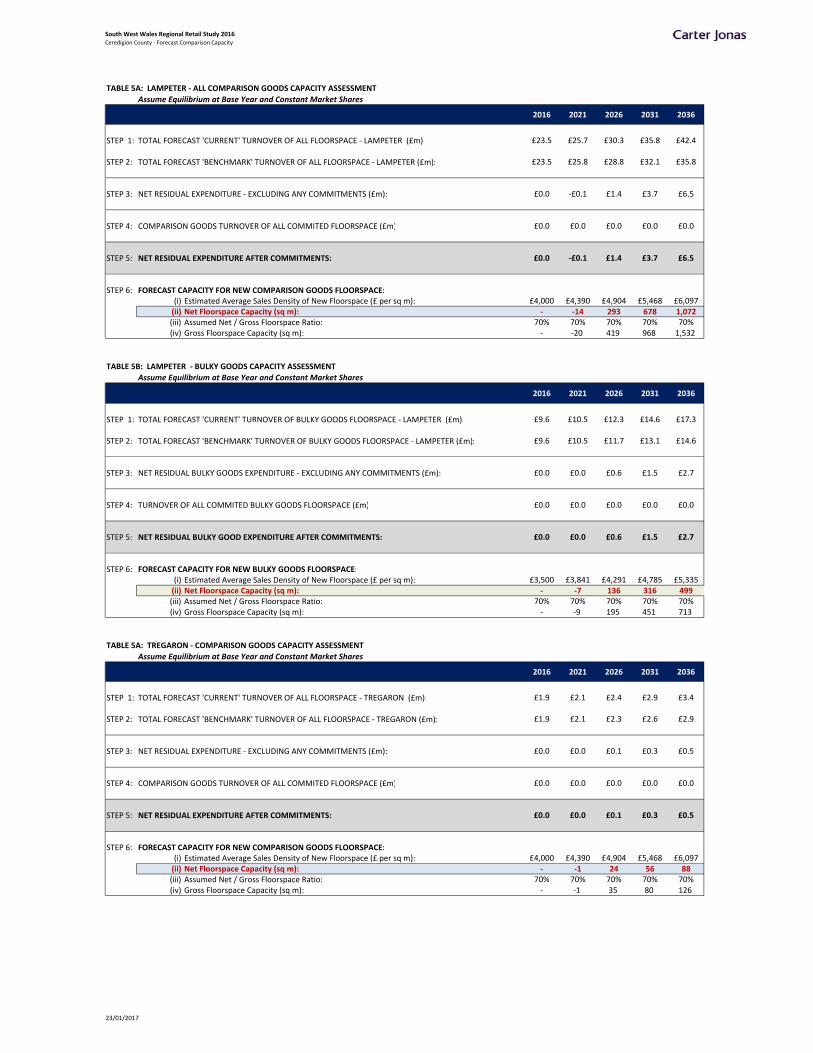
South West Wales Regional Retail Study 2016Ceredigion County ‐ Forecast Comparison Capacity
TABLE 5A: LAMPETER ‐ ALL COMPARISON GOODS CAPACITY ASSESSMENT
Assume Equilibrium at Base Year and Constant Market Shares
2016 2021 2026 2031 2036
STEP 1: TOTAL FORECAST 'CURRENT' TURNOVER OF ALL FLOORSPACE ‐ LAMPETER (£m): £23.5 £25.7 £30.3 £35.8 £42.4
STEP 2: TOTAL FORECAST 'BENCHMARK' TURNOVER OF ALL FLOORSPACE ‐ LAMPETER (£m): £23.5 £25.8 £28.8 £32.1 £35.8
STEP 3: NET RESIDUAL EXPENDITURE ‐ EXCLUDING ANY COMMITMENTS (£m): £0.0 ‐£0.1 £1.4 £3.7 £6.5
STEP 4: COMPARISON GOODS TURNOVER OF ALL COMMITED FLOORSPACE (£m) £0.0 £0.0 £0.0 £0.0 £0.0
STEP 5: NET RESIDUAL EXPENDITURE AFTER COMMITMENTS: £0.0 ‐£0.1 £1.4 £3.7 £6.5
STEP 6: FORECAST CAPACITY FOR NEW COMPARISON GOODS FLOORSPACE:(i) Estimated Average Sales Density of New Floorspace (£ per sq m): £4,000 £4,390 £4,904 £5,468 £6,097(ii) Net Floorspace Capacity (sq m): ‐ ‐14 293 678 1,072(iii) Assumed Net / Gross Floorspace Ratio: 70% 70% 70% 70% 70%(iv) Gross Floorspace Capacity (sq m): ‐ ‐20 419 968 1,532
TABLE 5B: LAMPETER ‐ BULKY GOODS CAPACITY ASSESSMENT
Assume Equilibrium at Base Year and Constant Market Shares
2016 2021 2026 2031 2036
STEP 1: TOTAL FORECAST 'CURRENT' TURNOVER OF BULKY GOODS FLOORSPACE ‐ LAMPETER (£m): £9.6 £10.5 £12.3 £14.6 £17.3
STEP 2: TOTAL FORECAST 'BENCHMARK' TURNOVER OF BULKY GOODS FLOORSPACE ‐ LAMPETER (£m): £9.6 £10.5 £11.7 £13.1 £14.6
STEP 3: NET RESIDUAL BULKY GOODS EXPENDITURE ‐ EXCLUDING ANY COMMITMENTS (£m): £0.0 £0.0 £0.6 £1.5 £2.7
STEP 4: TURNOVER OF ALL COMMITED BULKY GOODS FLOORSPACE (£m) £0.0 £0.0 £0.0 £0.0 £0.0
STEP 5: NET RESIDUAL BULKY GOOD EXPENDITURE AFTER COMMITMENTS: £0.0 £0.0 £0.6 £1.5 £2.7
STEP 6: FORECAST CAPACITY FOR NEW BULKY GOODS FLOORSPACE:(i) Estimated Average Sales Density of New Floorspace (£ per sq m): £3,500 £3,841 £4,291 £4,785 £5,335(ii) Net Floorspace Capacity (sq m): ‐ ‐7 136 316 499(iii) Assumed Net / Gross Floorspace Ratio: 70% 70% 70% 70% 70%(iv) Gross Floorspace Capacity (sq m): ‐ ‐9 195 451 713
TABLE 5A: TREGARON ‐ COMPARISON GOODS CAPACITY ASSESSMENT
Assume Equilibrium at Base Year and Constant Market Shares
2016 2021 2026 2031 2036
STEP 1: TOTAL FORECAST 'CURRENT' TURNOVER OF ALL FLOORSPACE ‐ TREGARON (£m): £1.9 £2.1 £2.4 £2.9 £3.4
STEP 2: TOTAL FORECAST 'BENCHMARK' TURNOVER OF ALL FLOORSPACE ‐ TREGARON (£m): £1.9 £2.1 £2.3 £2.6 £2.9
STEP 3: NET RESIDUAL EXPENDITURE ‐ EXCLUDING ANY COMMITMENTS (£m): £0.0 £0.0 £0.1 £0.3 £0.5
STEP 4: COMPARISON GOODS TURNOVER OF ALL COMMITED FLOORSPACE (£m) £0.0 £0.0 £0.0 £0.0 £0.0
STEP 5: NET RESIDUAL EXPENDITURE AFTER COMMITMENTS: £0.0 £0.0 £0.1 £0.3 £0.5
STEP 6: FORECAST CAPACITY FOR NEW COMPARISON GOODS FLOORSPACE:(i) Estimated Average Sales Density of New Floorspace (£ per sq m): £4,000 £4,390 £4,904 £5,468 £6,097(ii) Net Floorspace Capacity (sq m): ‐ ‐1 24 56 88(iii) Assumed Net / Gross Floorspace Ratio: 70% 70% 70% 70% 70%(iv) Gross Floorspace Capacity (sq m): ‐ ‐1 35 80 126
23/01/2017
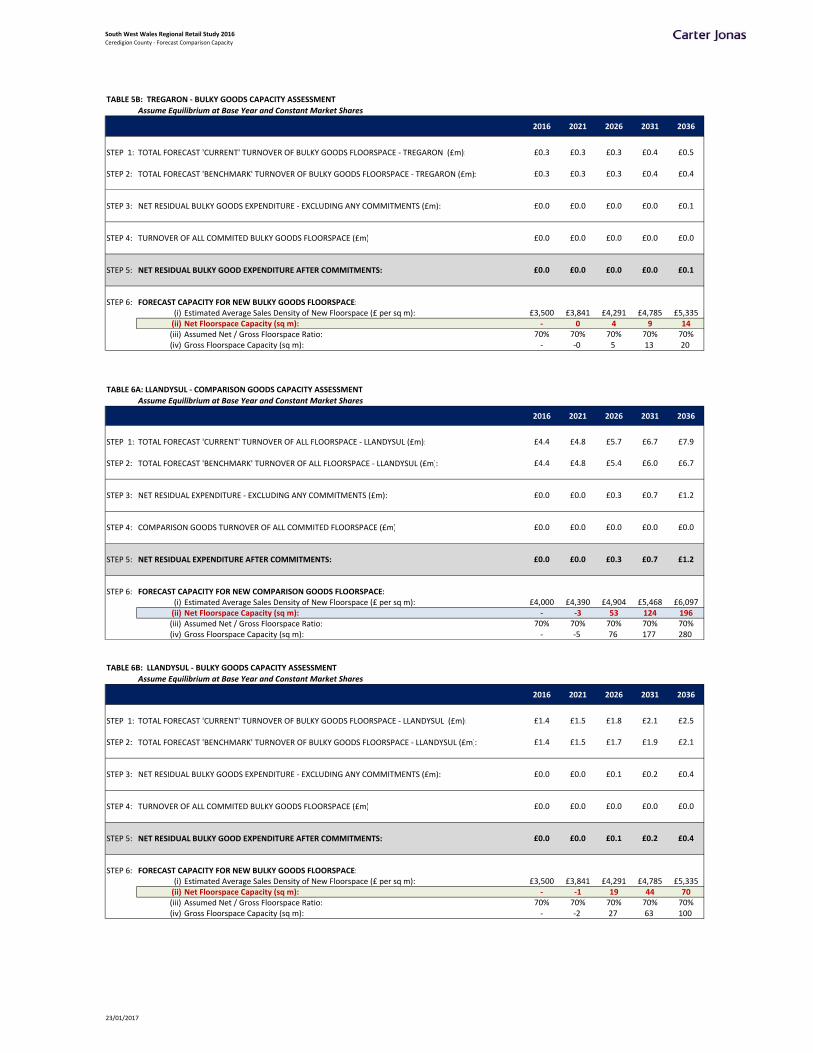
South West Wales Regional Retail Study 2016Ceredigion County ‐ Forecast Comparison Capacity
TABLE 5B: TREGARON ‐ BULKY GOODS CAPACITY ASSESSMENT
Assume Equilibrium at Base Year and Constant Market Shares
2016 2021 2026 2031 2036
STEP 1: TOTAL FORECAST 'CURRENT' TURNOVER OF BULKY GOODS FLOORSPACE ‐ TREGARON (£m): £0.3 £0.3 £0.3 £0.4 £0.5
STEP 2: TOTAL FORECAST 'BENCHMARK' TURNOVER OF BULKY GOODS FLOORSPACE ‐ TREGARON (£m): £0.3 £0.3 £0.3 £0.4 £0.4
STEP 3: NET RESIDUAL BULKY GOODS EXPENDITURE ‐ EXCLUDING ANY COMMITMENTS (£m): £0.0 £0.0 £0.0 £0.0 £0.1
STEP 4: TURNOVER OF ALL COMMITED BULKY GOODS FLOORSPACE (£m) £0.0 £0.0 £0.0 £0.0 £0.0
STEP 5: NET RESIDUAL BULKY GOOD EXPENDITURE AFTER COMMITMENTS: £0.0 £0.0 £0.0 £0.0 £0.1
STEP 6: FORECAST CAPACITY FOR NEW BULKY GOODS FLOORSPACE:(i) Estimated Average Sales Density of New Floorspace (£ per sq m): £3,500 £3,841 £4,291 £4,785 £5,335(ii) Net Floorspace Capacity (sq m): ‐ 0 4 9 14(iii) Assumed Net / Gross Floorspace Ratio: 70% 70% 70% 70% 70%(iv) Gross Floorspace Capacity (sq m): ‐ ‐0 5 13 20
TABLE 6A: LLANDYSUL ‐ COMPARISON GOODS CAPACITY ASSESSMENT
Assume Equilibrium at Base Year and Constant Market Shares
2016 2021 2026 2031 2036
STEP 1: TOTAL FORECAST 'CURRENT' TURNOVER OF ALL FLOORSPACE ‐ LLANDYSUL (£m): £4.4 £4.8 £5.7 £6.7 £7.9
STEP 2: TOTAL FORECAST 'BENCHMARK' TURNOVER OF ALL FLOORSPACE ‐ LLANDYSUL (£m): £4.4 £4.8 £5.4 £6.0 £6.7
STEP 3: NET RESIDUAL EXPENDITURE ‐ EXCLUDING ANY COMMITMENTS (£m): £0.0 £0.0 £0.3 £0.7 £1.2
STEP 4: COMPARISON GOODS TURNOVER OF ALL COMMITED FLOORSPACE (£m) £0.0 £0.0 £0.0 £0.0 £0.0
STEP 5: NET RESIDUAL EXPENDITURE AFTER COMMITMENTS: £0.0 £0.0 £0.3 £0.7 £1.2
STEP 6: FORECAST CAPACITY FOR NEW COMPARISON GOODS FLOORSPACE:(i) Estimated Average Sales Density of New Floorspace (£ per sq m): £4,000 £4,390 £4,904 £5,468 £6,097(ii) Net Floorspace Capacity (sq m): ‐ ‐3 53 124 196(iii) Assumed Net / Gross Floorspace Ratio: 70% 70% 70% 70% 70%(iv) Gross Floorspace Capacity (sq m): ‐ ‐5 76 177 280
TABLE 6B: LLANDYSUL ‐ BULKY GOODS CAPACITY ASSESSMENT
Assume Equilibrium at Base Year and Constant Market Shares
2016 2021 2026 2031 2036
STEP 1: TOTAL FORECAST 'CURRENT' TURNOVER OF BULKY GOODS FLOORSPACE ‐ LLANDYSUL (£m): £1.4 £1.5 £1.8 £2.1 £2.5
STEP 2: TOTAL FORECAST 'BENCHMARK' TURNOVER OF BULKY GOODS FLOORSPACE ‐ LLANDYSUL (£m): £1.4 £1.5 £1.7 £1.9 £2.1
STEP 3: NET RESIDUAL BULKY GOODS EXPENDITURE ‐ EXCLUDING ANY COMMITMENTS (£m): £0.0 £0.0 £0.1 £0.2 £0.4
STEP 4: TURNOVER OF ALL COMMITED BULKY GOODS FLOORSPACE (£m) £0.0 £0.0 £0.0 £0.0 £0.0
STEP 5: NET RESIDUAL BULKY GOOD EXPENDITURE AFTER COMMITMENTS: £0.0 £0.0 £0.1 £0.2 £0.4
STEP 6: FORECAST CAPACITY FOR NEW BULKY GOODS FLOORSPACE:(i) Estimated Average Sales Density of New Floorspace (£ per sq m): £3,500 £3,841 £4,291 £4,785 £5,335(ii) Net Floorspace Capacity (sq m): ‐ ‐1 19 44 70(iii) Assumed Net / Gross Floorspace Ratio: 70% 70% 70% 70% 70%(iv) Gross Floorspace Capacity (sq m): ‐ ‐2 27 63 100
23/01/2017
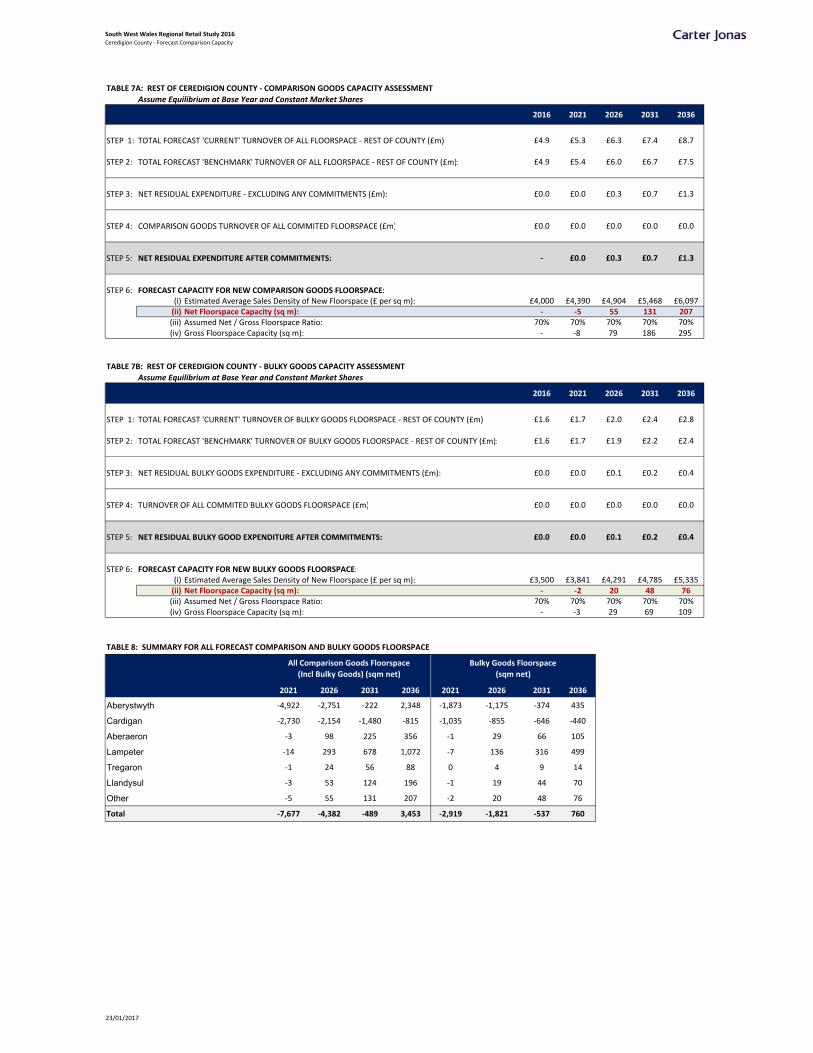
South West Wales Regional Retail Study 2016Ceredigion County ‐ Forecast Comparison Capacity
TABLE 7A: REST OF CEREDIGION COUNTY ‐ COMPARISON GOODS CAPACITY ASSESSMENT
Assume Equilibrium at Base Year and Constant Market Shares
2016 2021 2026 2031 2036
STEP 1: TOTAL FORECAST 'CURRENT' TURNOVER OF ALL FLOORSPACE ‐ REST OF COUNTY (£m): £4.9 £5.3 £6.3 £7.4 £8.7
STEP 2: TOTAL FORECAST 'BENCHMARK' TURNOVER OF ALL FLOORSPACE ‐ REST OF COUNTY (£m): £4.9 £5.4 £6.0 £6.7 £7.5
STEP 3: NET RESIDUAL EXPENDITURE ‐ EXCLUDING ANY COMMITMENTS (£m): £0.0 £0.0 £0.3 £0.7 £1.3
STEP 4: COMPARISON GOODS TURNOVER OF ALL COMMITED FLOORSPACE (£m) £0.0 £0.0 £0.0 £0.0 £0.0
STEP 5: NET RESIDUAL EXPENDITURE AFTER COMMITMENTS: ‐ £0.0 £0.3 £0.7 £1.3
STEP 6: FORECAST CAPACITY FOR NEW COMPARISON GOODS FLOORSPACE:(i) Estimated Average Sales Density of New Floorspace (£ per sq m): £4,000 £4,390 £4,904 £5,468 £6,097(ii) Net Floorspace Capacity (sq m): ‐ ‐5 55 131 207(iii) Assumed Net / Gross Floorspace Ratio: 70% 70% 70% 70% 70%(iv) Gross Floorspace Capacity (sq m): ‐ ‐8 79 186 295
TABLE 7B: REST OF CEREDIGION COUNTY ‐ BULKY GOODS CAPACITY ASSESSMENT
Assume Equilibrium at Base Year and Constant Market Shares
2016 2021 2026 2031 2036
STEP 1: TOTAL FORECAST 'CURRENT' TURNOVER OF BULKY GOODS FLOORSPACE ‐ REST OF COUNTY (£m): £1.6 £1.7 £2.0 £2.4 £2.8
STEP 2: TOTAL FORECAST 'BENCHMARK' TURNOVER OF BULKY GOODS FLOORSPACE ‐ REST OF COUNTY (£m): £1.6 £1.7 £1.9 £2.2 £2.4
STEP 3: NET RESIDUAL BULKY GOODS EXPENDITURE ‐ EXCLUDING ANY COMMITMENTS (£m): £0.0 £0.0 £0.1 £0.2 £0.4
STEP 4: TURNOVER OF ALL COMMITED BULKY GOODS FLOORSPACE (£m) £0.0 £0.0 £0.0 £0.0 £0.0
STEP 5: NET RESIDUAL BULKY GOOD EXPENDITURE AFTER COMMITMENTS: £0.0 £0.0 £0.1 £0.2 £0.4
STEP 6: FORECAST CAPACITY FOR NEW BULKY GOODS FLOORSPACE:(i) Estimated Average Sales Density of New Floorspace (£ per sq m): £3,500 £3,841 £4,291 £4,785 £5,335(ii) Net Floorspace Capacity (sq m): ‐ ‐2 20 48 76(iii) Assumed Net / Gross Floorspace Ratio: 70% 70% 70% 70% 70%(iv) Gross Floorspace Capacity (sq m): ‐ ‐3 29 69 109
TABLE 8: SUMMARY FOR ALL FORECAST COMPARISON AND BULKY GOODS FLOORSPACE
2021 2026 2031 2036 2021 2026 2031 2036
Aberystwyth ‐4,922 ‐2,751 ‐222 2,348 ‐1,873 ‐1,175 ‐374 435
Cardigan ‐2,730 ‐2,154 ‐1,480 ‐815 ‐1,035 ‐855 ‐646 ‐440
Aberaeron ‐3 98 225 356 ‐1 29 66 105
Lampeter ‐14 293 678 1,072 ‐7 136 316 499
Tregaron ‐1 24 56 88 0 4 9 14
Llandysul ‐3 53 124 196 ‐1 19 44 70
Other ‐5 55 131 207 ‐2 20 48 76
Total ‐7,677 ‐4,382 ‐489 3,453 ‐2,919 ‐1,821 ‐537 760
All Comparison Goods Floorspace
(Incl Bulky Goods) (sqm net)
Bulky Goods Floorspace
(sqm net)
23/01/2017
South West Wales Regional Retail Study
APPENDIX 11B: FORECAST COMPARISON GOODS CAPACITY – CEREDIGION COUNTY
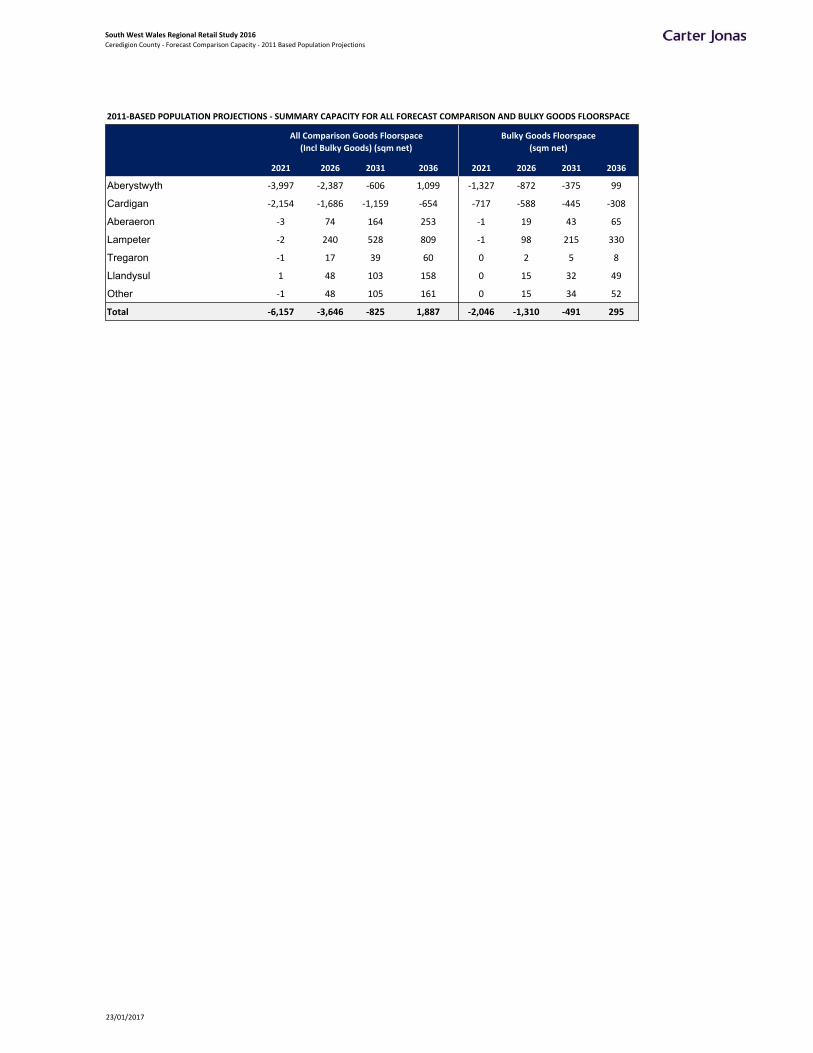
South West Wales Regional Retail Study 2016Ceredigion County ‐ Forecast Comparison Capacity ‐ 2011 Based Population Projections
2011‐BASED POPULATION PROJECTIONS ‐ SUMMARY CAPACITY FOR ALL FORECAST COMPARISON AND BULKY GOODS FLOORSPACE
2021 2026 2031 2036 2021 2026 2031 2036
Aberystwyth ‐3,997 ‐2,387 ‐606 1,099 ‐1,327 ‐872 ‐375 99
Cardigan ‐2,154 ‐1,686 ‐1,159 ‐654 ‐717 ‐588 ‐445 ‐308
Aberaeron ‐3 74 164 253 ‐1 19 43 65
Lampeter ‐2 240 528 809 ‐1 98 215 330
Tregaron ‐1 17 39 60 0 2 5 8
Llandysul 1 48 103 158 0 15 32 49
Other ‐1 48 105 161 0 15 34 52
Total ‐6,157 ‐3,646 ‐825 1,887 ‐2,046 ‐1,310 ‐491 295
All Comparison Goods Floorspace
(Incl Bulky Goods) (sqm net)
Bulky Goods Floorspace
(sqm net)
23/01/2017
South West Wales Regional Retail Study
APPENDIX 15A: HOUSEHOLD TELEPHONE INTERVIEW SURVEY (WEIGHTED) RESULTS – PART 1: ZONES 1 TO 8

by Zone (Weighted, Part 1) South Wales Retail Study Page 1
Weighted: for Carter Jonas August 2016
Total Zone 1 Zone 2 Zone 3 Zone 4 Zone 5 Zone 6 Zone 7 Zone 8
Column %ges. 020716 NEMS market research
Q01 In which store or shopping centre do you NORMALLY shop at for all your household’s main food and grocery shopping needs (i.e. primarily bulk trolley purchases)?
Aldi, Aberystwyth Road, Cardigan
6.4% 103 0.0% 0 0.0% 0 0.0% 0 0.0% 0 0.0% 0 0.0% 0 1.4% 1 0.6% 1
Aldi, Salutation Square, Haverfordwest
7.7% 124 24.9% 26 17.7% 7 21.1% 18 11.9% 18 4.3% 7 1.6% 2 26.2% 20 24.5% 23
Aldi, Stephens Way, Carmarthen
1.9% 30 0.0% 0 0.0% 0 0.0% 0 0.0% 0 0.0% 0 0.0% 0 2.9% 2 0.0% 0
Asda, Gordon St, Pembroke Dock
2.7% 43 0.0% 0 2.0% 1 0.0% 0 3.1% 5 16.9% 26 8.4% 11 0.8% 1 0.0% 0
C.K's Supermarket, New Street, St Davids
0.2% 3 0.0% 0 0.0% 0 2.9% 3 0.0% 0 0.0% 0 0.0% 0 0.0% 0 0.0% 0
C.K's Supermarket, WaunFawr, Aberyswyth
0.1% 1 0.0% 0 0.0% 0 0.0% 0 0.0% 0 0.0% 0 0.0% 0 0.0% 0 0.0% 0
C.K's Supermarket, WestStreet, Fishguard
0.1% 2 0.0% 0 0.0% 0 0.0% 0 0.0% 0 0.0% 0 0.0% 0 0.0% 0 1.3% 1
Co-op, Bridge Street, Lampeter
1.1% 17 0.0% 0 0.0% 0 0.0% 0 0.0% 0 0.0% 0 0.0% 0 0.0% 0 0.0% 0
Co-op, Carmarthen Road, Kilgetty
0.3% 5 0.0% 0 0.0% 0 0.0% 0 0.0% 0 0.0% 0 2.9% 4 1.4% 1 0.0% 0
Co-op, Carmarthen Road, Kilgetty
0.3% 5 0.0% 0 0.0% 0 0.0% 0 0.0% 0 0.0% 0 1.8% 2 3.1% 2 0.0% 0
Co-op, High Street, Fishguard
1.1% 18 0.0% 0 0.0% 0 0.0% 0 0.0% 0 0.0% 0 0.0% 0 0.0% 0 16.9% 16
Co-op, High Street, Machynlleth
0.7% 12 0.0% 0 0.0% 0 0.0% 0 0.0% 0 0.0% 0 0.0% 0 0.0% 0 0.0% 0
Co-op, High Street, Neyland 0.2% 3 0.0% 0 0.0% 0 0.0% 0 1.5% 2 0.0% 0 0.0% 0 0.0% 0 0.0% 0Co-op, Lower Mwldan,
Cardigan 0.1% 1 0.0% 0 0.0% 0 0.0% 0 0.0% 0 0.0% 0 0.0% 0 0.0% 0 0.0% 0
Co-op, Main Street, Pembroke
0.1% 1 0.0% 0 0.0% 0 0.0% 0 0.0% 0 0.6% 1 0.0% 0 0.0% 0 0.0% 0
Co-op, Park Ave, Aberystwyth
1.6% 26 0.0% 0 0.0% 0 0.0% 0 0.0% 0 0.0% 0 0.0% 0 0.0% 0 0.0% 0
Costcutter, High Street, Narberth
0.2% 3 0.0% 0 0.0% 0 0.0% 0 0.0% 0 0.0% 0 0.0% 0 3.2% 2 0.0% 0
Iceland, Picton Place, Haverfordwest
0.9% 14 0.0% 0 0.7% 0 0.0% 0 3.1% 5 3.1% 5 1.9% 3 0.0% 0 0.0% 0
Lidl, Great N Road, Milford Haven
1.8% 29 0.0% 0 0.9% 0 1.5% 1 17.9% 27 0.0% 0 0.0% 0 0.0% 0 0.0% 0
Lidl, Perrots Rd, Haverfordwest
1.7% 27 6.6% 7 7.5% 3 8.4% 7 0.8% 1 0.0% 0 0.0% 0 5.4% 4 4.4% 4
Lidl, Pier Road, Pembroke Dock
4.2% 68 0.0% 0 0.0% 0 0.0% 0 1.4% 2 24.9% 38 19.9% 27 0.8% 1 0.0% 0
Lidl, Priory Street, Carmarthen
0.3% 5 0.0% 0 0.0% 0 0.0% 0 0.0% 0 0.0% 0 0.0% 0 0.0% 0 0.0% 0
Lidl, Rheidol Retail Park, Aberyswyth
3.7% 60 0.0% 0 0.0% 0 0.0% 0 0.0% 0 0.0% 0 0.0% 0 0.0% 0 0.0% 0
Morrisons, Meadow View, Haverfordwest
7.0% 112 28.1% 29 33.2% 14 23.2% 20 7.7% 12 0.8% 1 3.3% 4 12.8% 10 21.0% 20
Morrisons, Parc Pensarn, Carmarthen
0.8% 14 0.0% 0 0.0% 0 0.0% 0 0.0% 0 0.0% 0 0.0% 0 1.6% 1 0.0% 0
Morrisons, Parcydolau, Llanbadarn Fawr, Aberyswyth
13.4% 215 0.0% 0 0.0% 0 0.0% 0 0.0% 0 0.0% 0 0.0% 0 0.6% 0 0.0% 0
Morrisons, Pool Road, Newton (Powys)
0.2% 3 0.0% 0 0.0% 0 0.0% 0 0.0% 0 0.0% 0 0.0% 0 0.0% 0 0.0% 0
Sainsbury's, Market Street, Lampeter
3.3% 52 0.0% 0 0.0% 0 0.0% 0 0.0% 0 0.0% 0 0.0% 0 0.0% 0 0.0% 0
Sainsbury's, Upper Park Road, Tenby
2.2% 36 0.0% 0 0.0% 0 0.0% 0 0.0% 0 0.0% 0 26.5% 36 0.0% 0 0.0% 0
Spar, Long Mains, Pembroke 0.0% 1 0.0% 0 0.0% 0 0.0% 0 0.0% 0 0.0% 0 0.0% 0 0.0% 0 0.0% 0Spar, North Road, Cardigan 0.1% 1 0.0% 0 0.0% 0 0.0% 0 0.0% 0 0.0% 0 0.0% 0 0.0% 0 0.0% 0Tesco Express, The Parrog,
Goodwick 0.1% 2 0.0% 0 0.0% 0 0.0% 0 0.0% 0 0.0% 0 0.0% 0 0.0% 0 1.7% 2
Tesco Express, The Parrog, Goodwick
0.1% 1 0.0% 0 0.0% 0 0.0% 0 0.0% 0 0.0% 0 0.0% 0 0.0% 0 0.9% 1
Tesco Extra, Fenton Trading Estate, Haverfordwest
7.7% 123 37.2% 39 25.0% 11 35.1% 30 9.6% 15 3.1% 5 0.0% 0 9.9% 8 16.6% 16
Tesco Extra, Morfa Lane, Carmarthen
1.1% 18 0.0% 0 0.0% 0 0.0% 0 0.0% 0 0.0% 0 0.7% 1 3.9% 3 0.0% 0
Tesco Superstore, Aberystwyth Rd, Cardigan
6.1% 99 0.0% 0 0.0% 0 0.0% 0 0.0% 0 0.0% 0 0.0% 0 0.9% 1 0.9% 1
Tesco Superstore, London 6.3% 101 0.0% 0 0.0% 0 0.0% 0 7.2% 11 35.9% 55 23.7% 32 3.7% 3 0.0% 0
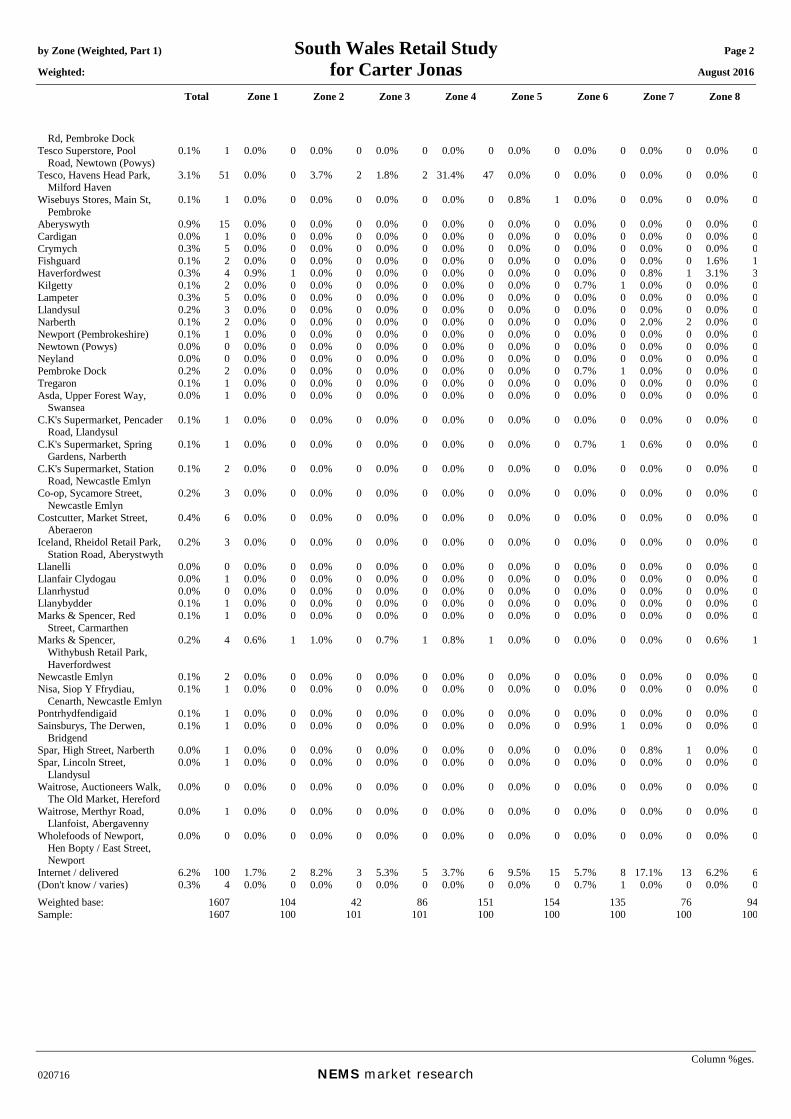
by Zone (Weighted, Part 1) South Wales Retail Study Page 2
Weighted: for Carter Jonas August 2016
Total Zone 1 Zone 2 Zone 3 Zone 4 Zone 5 Zone 6 Zone 7 Zone 8
Column %ges. 020716 NEMS market research
0.1% 1 0.0% 0 0.0% 0 0.0% 0 0.0% 0 0.0% 0 0.0% 0 0.0% 0 0.0% 0
3.1% 51 0.0% 0 3.7% 2 1.8% 2 31.4% 47 0.0% 0 0.0% 0 0.0% 0 0.0% 0
0.1% 1 0.0% 0 0.0% 0 0.0% 0 0.0% 0 0.8% 1 0.0% 0 0.0% 0 0.0% 0
0.9% 15 0.0% 0 0.0% 0 0.0% 0 0.0% 0 0.0% 0 0.0% 0 0.0% 0 0.0% 00.0% 1 0.0% 0 0.0% 0 0.0% 0 0.0% 0 0.0% 0 0.0% 0 0.0% 0 0.0% 00.3% 5 0.0% 0 0.0% 0 0.0% 0 0.0% 0 0.0% 0 0.0% 0 0.0% 0 0.0% 00.1% 2 0.0% 0 0.0% 0 0.0% 0 0.0% 0 0.0% 0 0.0% 0 0.0% 0 1.6% 10.3% 4 0.9% 1 0.0% 0 0.0% 0 0.0% 0 0.0% 0 0.0% 0 0.8% 1 3.1% 30.1% 2 0.0% 0 0.0% 0 0.0% 0 0.0% 0 0.0% 0 0.7% 1 0.0% 0 0.0% 00.3% 5 0.0% 0 0.0% 0 0.0% 0 0.0% 0 0.0% 0 0.0% 0 0.0% 0 0.0% 00.2% 3 0.0% 0 0.0% 0 0.0% 0 0.0% 0 0.0% 0 0.0% 0 0.0% 0 0.0% 00.1% 2 0.0% 0 0.0% 0 0.0% 0 0.0% 0 0.0% 0 0.0% 0 2.0% 2 0.0% 00.1% 1 0.0% 0 0.0% 0 0.0% 0 0.0% 0 0.0% 0 0.0% 0 0.0% 0 0.0% 00.0% 0 0.0% 0 0.0% 0 0.0% 0 0.0% 0 0.0% 0 0.0% 0 0.0% 0 0.0% 00.0% 0 0.0% 0 0.0% 0 0.0% 0 0.0% 0 0.0% 0 0.0% 0 0.0% 0 0.0% 00.2% 2 0.0% 0 0.0% 0 0.0% 0 0.0% 0 0.0% 0 0.7% 1 0.0% 0 0.0% 00.1% 1 0.0% 0 0.0% 0 0.0% 0 0.0% 0 0.0% 0 0.0% 0 0.0% 0 0.0% 0
Rd, Pembroke Dock Tesco Superstore, Pool
Road, Newtown (Powys) Tesco, Havens Head Park,
Milford Haven Wisebuys Stores, Main St,
Pembroke Aberyswyth Cardigan Crymych Fishguard Haverfordwest Kilgetty Lampeter Llandysul Narberth Newport (Pembrokeshire) Newtown (Powys) Neyland Pembroke Dock Tregaron Asda, Upper Forest Way,
Swansea 0.0% 1 0.0% 0 0.0% 0 0.0% 0 0.0% 0 0.0% 0 0.0% 0 0.0% 0 0.0% 0
C.K's Supermarket, Pencader Road, Llandysul
0.1% 1 0.0% 0 0.0% 0 0.0% 0 0.0% 0 0.0% 0 0.0% 0 0.0% 0 0.0% 0
C.K's Supermarket, Spring Gardens, Narberth
0.1% 1 0.0% 0 0.0% 0 0.0% 0 0.0% 0 0.0% 0 0.7% 1 0.6% 0 0.0% 0
C.K's Supermarket, Station Road, Newcastle Emlyn
0.1% 2 0.0% 0 0.0% 0 0.0% 0 0.0% 0 0.0% 0 0.0% 0 0.0% 0 0.0% 0
Co-op, Sycamore Street, Newcastle Emlyn
0.2% 3 0.0% 0 0.0% 0 0.0% 0 0.0% 0 0.0% 0 0.0% 0 0.0% 0 0.0% 0
Costcutter, Market Street, Aberaeron
0.4% 6 0.0% 0 0.0% 0 0.0% 0 0.0% 0 0.0% 0 0.0% 0 0.0% 0 0.0% 0
Iceland, Rheidol Retail Park, Station Road, Aberystwyth
0.2% 3 0.0% 0 0.0% 0 0.0% 0 0.0% 0 0.0% 0 0.0% 0 0.0% 0 0.0% 0
Llanelli 0.0% 0 0.0% 0 0.0% 0 0.0% 0 0.0% 0 0.0% 0 0.0% 0 0.0% 0 0.0% 0Llanfair Clydogau 0.0% 1 0.0% 0 0.0% 0 0.0% 0 0.0% 0 0.0% 0 0.0% 0 0.0% 0 0.0% 0Llanrhystud 0.0% 0 0.0% 0 0.0% 0 0.0% 0 0.0% 0 0.0% 0 0.0% 0 0.0% 0 0.0% 0Llanybydder 0.1% 1 0.0% 0 0.0% 0 0.0% 0 0.0% 0 0.0% 0 0.0% 0 0.0% 0 0.0% 0Marks & Spencer, Red
Street, Carmarthen 0.1% 1 0.0% 0 0.0% 0 0.0% 0 0.0% 0 0.0% 0 0.0% 0 0.0% 0 0.0% 0
Marks & Spencer, Withybush Retail Park, Haverfordwest
0.2% 4 0.6% 1 1.0% 0 0.7% 1 0.8% 1 0.0% 0 0.0% 0 0.0% 0 0.6% 1
Newcastle Emlyn 0.1% 2 0.0% 0 0.0% 0 0.0% 0 0.0% 0 0.0% 0 0.0% 0 0.0% 0 0.0% 0Nisa, Siop Y Ffrydiau,
Cenarth, Newcastle Emlyn 0.1% 1 0.0% 0 0.0% 0 0.0% 0 0.0% 0 0.0% 0 0.0% 0 0.0% 0 0.0% 0
Pontrhydfendigaid 0.1% 1 0.0% 0 0.0% 0 0.0% 0 0.0% 0 0.0% 0 0.0% 0 0.0% 0 0.0% 0Sainsburys, The Derwen,
Bridgend 0.1% 1 0.0% 0 0.0% 0 0.0% 0 0.0% 0 0.0% 0 0.9% 1 0.0% 0 0.0% 0
Spar, High Street, Narberth 0.0% 1 0.0% 0 0.0% 0 0.0% 0 0.0% 0 0.0% 0 0.0% 0 0.8% 1 0.0% 0Spar, Lincoln Street,
Llandysul 0.0% 1 0.0% 0 0.0% 0 0.0% 0 0.0% 0 0.0% 0 0.0% 0 0.0% 0 0.0% 0
Waitrose, Auctioneers Walk, The Old Market, Hereford
0.0% 0 0.0% 0 0.0% 0 0.0% 0 0.0% 0 0.0% 0 0.0% 0 0.0% 0 0.0% 0
Waitrose, Merthyr Road, Llanfoist, Abergavenny
0.0% 1 0.0% 0 0.0% 0 0.0% 0 0.0% 0 0.0% 0 0.0% 0 0.0% 0 0.0% 0
Wholefoods of Newport, Hen Bopty / East Street, Newport
0.0% 0 0.0% 0 0.0% 0 0.0% 0 0.0% 0 0.0% 0 0.0% 0 0.0% 0 0.0% 0
Internet / delivered 6.2% 100 1.7% 2 8.2% 3 5.3% 5 3.7% 6 9.5% 15 5.7% 8 17.1% 13 6.2% 6(Don't know / varies) 0.3% 4 0.0% 0 0.0% 0 0.0% 0 0.0% 0 0.0% 0 0.7% 1 0.0% 0 0.0% 0Weighted base: 1607 104 42 86 151 154 135 76 94Sample: 1607 100 101 101 100 100 100 100 100
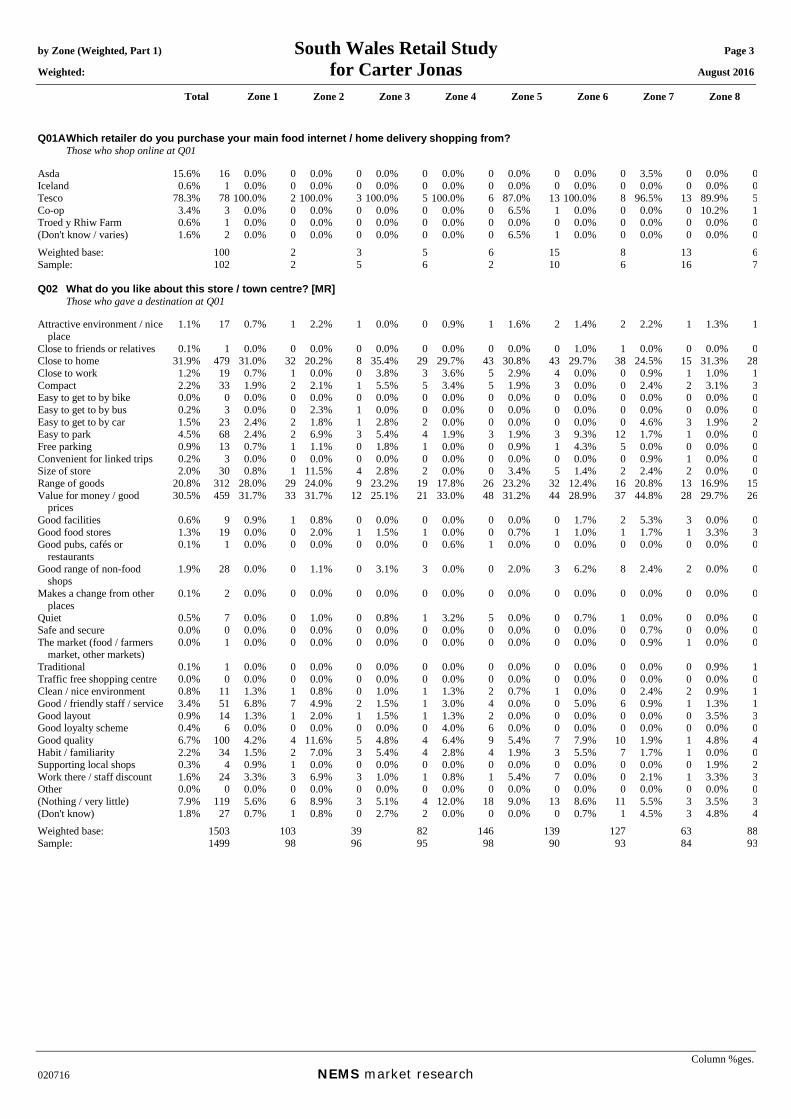
by Zone (Weighted, Part 1) South Wales Retail Study Page 3 Weighted: for Carter Jonas August 2016
Total Zone 1 Zone 2 Zone 3 Zone 4 Zone 5 Zone 6 Zone 7 Zone 8
Column %ges. 020716 NEMS market research
Q01A Which retailer do you purchase your main food internet / home delivery shopping from? Those who shop online at Q01 Asda 15.6% 16 0.0% 0 0.0% 0 0.0% 0 0.0% 0 0.0% 0 0.0% 0 3.5% 0 0.0% 0Iceland 0.6% 1 0.0% 0 0.0% 0 0.0% 0 0.0% 0 0.0% 0 0.0% 0 0.0% 0 0.0% 0Tesco 78.3% 78 100.0% 2 100.0% 3 100.0% 5 100.0% 6 87.0% 13 100.0% 8 96.5% 13 89.9% 5Co-op 3.4% 3 0.0% 0 0.0% 0 0.0% 0 0.0% 0 6.5% 1 0.0% 0 0.0% 0 10.2% 1Troed y Rhiw Farm 0.6% 1 0.0% 0 0.0% 0 0.0% 0 0.0% 0 0.0% 0 0.0% 0 0.0% 0 0.0% 0(Don't know / varies) 1.6% 2 0.0% 0 0.0% 0 0.0% 0 0.0% 0 6.5% 1 0.0% 0 0.0% 0 0.0% 0Weighted base: 100 2 3 5 6 15 8 13 6Sample: 102 2 5 6 2 10 6 16 7 Q02 What do you like about this store / town centre? [MR] Those who gave a destination at Q01 Attractive environment / nice
place 1.1% 17 0.7% 1 2.2% 1 0.0% 0 0.9% 1 1.6% 2 1.4% 2 2.2% 1 1.3% 1
Close to friends or relatives 0.1% 1 0.0% 0 0.0% 0 0.0% 0 0.0% 0 0.0% 0 1.0% 1 0.0% 0 0.0% 0Close to home 31.9% 479 31.0% 32 20.2% 8 35.4% 29 29.7% 43 30.8% 43 29.7% 38 24.5% 15 31.3% 28Close to work 1.2% 19 0.7% 1 0.0% 0 3.8% 3 3.6% 5 2.9% 4 0.0% 0 0.9% 1 1.0% 1Compact 2.2% 33 1.9% 2 2.1% 1 5.5% 5 3.4% 5 1.9% 3 0.0% 0 2.4% 2 3.1% 3Easy to get to by bike 0.0% 0 0.0% 0 0.0% 0 0.0% 0 0.0% 0 0.0% 0 0.0% 0 0.0% 0 0.0% 0Easy to get to by bus 0.2% 3 0.0% 0 2.3% 1 0.0% 0 0.0% 0 0.0% 0 0.0% 0 0.0% 0 0.0% 0Easy to get to by car 1.5% 23 2.4% 2 1.8% 1 2.8% 2 0.0% 0 0.0% 0 0.0% 0 4.6% 3 1.9% 2Easy to park 4.5% 68 2.4% 2 6.9% 3 5.4% 4 1.9% 3 1.9% 3 9.3% 12 1.7% 1 0.0% 0Free parking 0.9% 13 0.7% 1 1.1% 0 1.8% 1 0.0% 0 0.9% 1 4.3% 5 0.0% 0 0.0% 0Convenient for linked trips 0.2% 3 0.0% 0 0.0% 0 0.0% 0 0.0% 0 0.0% 0 0.0% 0 0.9% 1 0.0% 0Size of store 2.0% 30 0.8% 1 11.5% 4 2.8% 2 0.0% 0 3.4% 5 1.4% 2 2.4% 2 0.0% 0Range of goods 20.8% 312 28.0% 29 24.0% 9 23.2% 19 17.8% 26 23.2% 32 12.4% 16 20.8% 13 16.9% 15Value for money / good
prices 30.5% 459 31.7% 33 31.7% 12 25.1% 21 33.0% 48 31.2% 44 28.9% 37 44.8% 28 29.7% 26
Good facilities 0.6% 9 0.9% 1 0.8% 0 0.0% 0 0.0% 0 0.0% 0 1.7% 2 5.3% 3 0.0% 0Good food stores 1.3% 19 0.0% 0 2.0% 1 1.5% 1 0.0% 0 0.7% 1 1.0% 1 1.7% 1 3.3% 3Good pubs, cafés or
restaurants 0.1% 1 0.0% 0 0.0% 0 0.0% 0 0.6% 1 0.0% 0 0.0% 0 0.0% 0 0.0% 0
Good range of non-food shops
1.9% 28 0.0% 0 1.1% 0 3.1% 3 0.0% 0 2.0% 3 6.2% 8 2.4% 2 0.0% 0
Makes a change from other places
0.1% 2 0.0% 0 0.0% 0 0.0% 0 0.0% 0 0.0% 0 0.0% 0 0.0% 0 0.0% 0
Quiet 0.5% 7 0.0% 0 1.0% 0 0.8% 1 3.2% 5 0.0% 0 0.7% 1 0.0% 0 0.0% 0Safe and secure 0.0% 0 0.0% 0 0.0% 0 0.0% 0 0.0% 0 0.0% 0 0.0% 0 0.7% 0 0.0% 0The market (food / farmers
market, other markets) 0.0% 1 0.0% 0 0.0% 0 0.0% 0 0.0% 0 0.0% 0 0.0% 0 0.9% 1 0.0% 0
Traditional 0.1% 1 0.0% 0 0.0% 0 0.0% 0 0.0% 0 0.0% 0 0.0% 0 0.0% 0 0.9% 1Traffic free shopping centre 0.0% 0 0.0% 0 0.0% 0 0.0% 0 0.0% 0 0.0% 0 0.0% 0 0.0% 0 0.0% 0Clean / nice environment 0.8% 11 1.3% 1 0.8% 0 1.0% 1 1.3% 2 0.7% 1 0.0% 0 2.4% 2 0.9% 1Good / friendly staff / service 3.4% 51 6.8% 7 4.9% 2 1.5% 1 3.0% 4 0.0% 0 5.0% 6 0.9% 1 1.3% 1Good layout 0.9% 14 1.3% 1 2.0% 1 1.5% 1 1.3% 2 0.0% 0 0.0% 0 0.0% 0 3.5% 3Good loyalty scheme 0.4% 6 0.0% 0 0.0% 0 0.0% 0 4.0% 6 0.0% 0 0.0% 0 0.0% 0 0.0% 0Good quality 6.7% 100 4.2% 4 11.6% 5 4.8% 4 6.4% 9 5.4% 7 7.9% 10 1.9% 1 4.8% 4Habit / familiarity 2.2% 34 1.5% 2 7.0% 3 5.4% 4 2.8% 4 1.9% 3 5.5% 7 1.7% 1 0.0% 0Supporting local shops 0.3% 4 0.9% 1 0.0% 0 0.0% 0 0.0% 0 0.0% 0 0.0% 0 0.0% 0 1.9% 2Work there / staff discount 1.6% 24 3.3% 3 6.9% 3 1.0% 1 0.8% 1 5.4% 7 0.0% 0 2.1% 1 3.3% 3Other 0.0% 0 0.0% 0 0.0% 0 0.0% 0 0.0% 0 0.0% 0 0.0% 0 0.0% 0 0.0% 0(Nothing / very little) 7.9% 119 5.6% 6 8.9% 3 5.1% 4 12.0% 18 9.0% 13 8.6% 11 5.5% 3 3.5% 3(Don't know) 1.8% 27 0.7% 1 0.8% 0 2.7% 2 0.0% 0 0.0% 0 0.7% 1 4.5% 3 4.8% 4Weighted base: 1503 103 39 82 146 139 127 63 88Sample: 1499 98 96 95 98 90 93 84 93
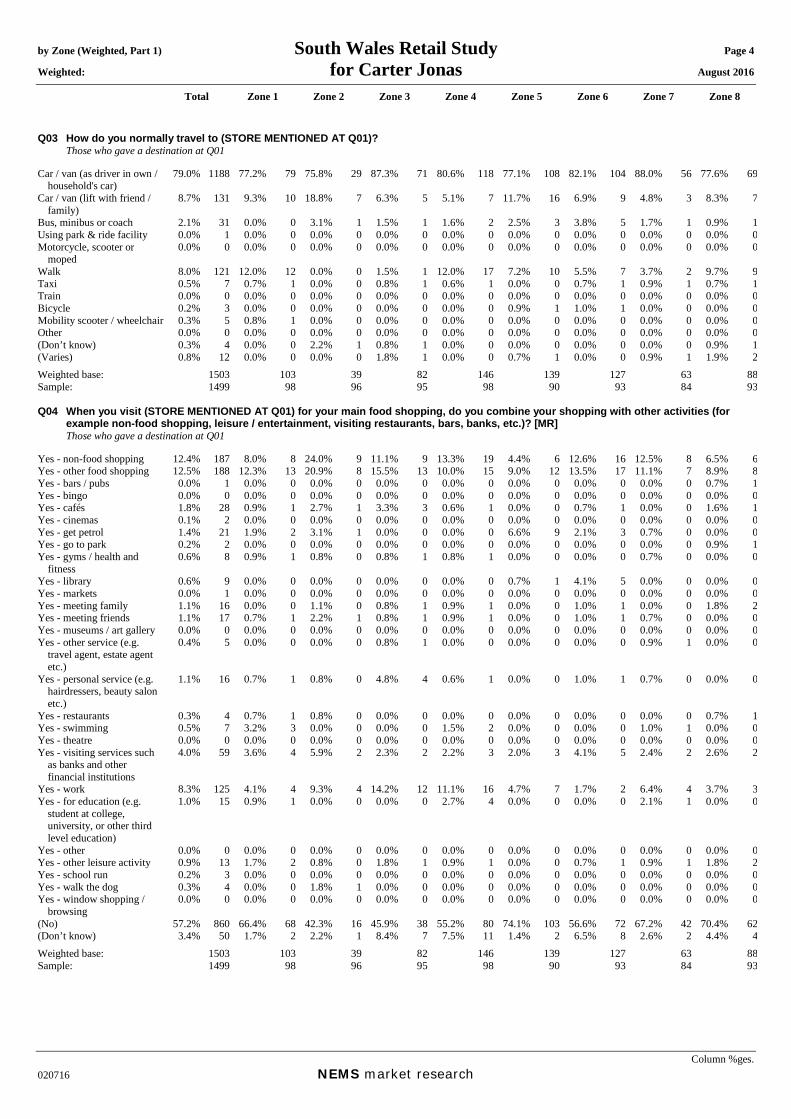
by Zone (Weighted, Part 1) South Wales Retail Study Page 4 Weighted: for Carter Jonas August 2016
Total Zone 1 Zone 2 Zone 3 Zone 4 Zone 5 Zone 6 Zone 7 Zone 8
Column %ges. 020716 NEMS market research
Q03 How do you normally travel to (STORE MENTIONED AT Q01)? Those who gave a destination at Q01 Car / van (as driver in own /
household's car) 79.0% 1188 77.2% 79 75.8% 29 87.3% 71 80.6% 118 77.1% 108 82.1% 104 88.0% 56 77.6% 69
Car / van (lift with friend / family)
8.7% 131 9.3% 10 18.8% 7 6.3% 5 5.1% 7 11.7% 16 6.9% 9 4.8% 3 8.3% 7
Bus, minibus or coach 2.1% 31 0.0% 0 3.1% 1 1.5% 1 1.6% 2 2.5% 3 3.8% 5 1.7% 1 0.9% 1Using park & ride facility 0.0% 1 0.0% 0 0.0% 0 0.0% 0 0.0% 0 0.0% 0 0.0% 0 0.0% 0 0.0% 0Motorcycle, scooter or
moped 0.0% 0 0.0% 0 0.0% 0 0.0% 0 0.0% 0 0.0% 0 0.0% 0 0.0% 0 0.0% 0
Walk 8.0% 121 12.0% 12 0.0% 0 1.5% 1 12.0% 17 7.2% 10 5.5% 7 3.7% 2 9.7% 9Taxi 0.5% 7 0.7% 1 0.0% 0 0.8% 1 0.6% 1 0.0% 0 0.7% 1 0.9% 1 0.7% 1Train 0.0% 0 0.0% 0 0.0% 0 0.0% 0 0.0% 0 0.0% 0 0.0% 0 0.0% 0 0.0% 0Bicycle 0.2% 3 0.0% 0 0.0% 0 0.0% 0 0.0% 0 0.9% 1 1.0% 1 0.0% 0 0.0% 0Mobility scooter / wheelchair 0.3% 5 0.8% 1 0.0% 0 0.0% 0 0.0% 0 0.0% 0 0.0% 0 0.0% 0 0.0% 0Other 0.0% 0 0.0% 0 0.0% 0 0.0% 0 0.0% 0 0.0% 0 0.0% 0 0.0% 0 0.0% 0(Don’t know) 0.3% 4 0.0% 0 2.2% 1 0.8% 1 0.0% 0 0.0% 0 0.0% 0 0.0% 0 0.9% 1(Varies) 0.8% 12 0.0% 0 0.0% 0 1.8% 1 0.0% 0 0.7% 1 0.0% 0 0.9% 1 1.9% 2Weighted base: 1503 103 39 82 146 139 127 63 88Sample: 1499 98 96 95 98 90 93 84 93 Q04 When you visit (STORE MENTIONED AT Q01) for your main food shopping, do you combine your shopping with other activities (for
example non-food shopping, leisure / entertainment, visiting restaurants, bars, banks, etc.)? [MR] Those who gave a destination at Q01 Yes - non-food shopping 12.4% 187 8.0% 8 24.0% 9 11.1% 9 13.3% 19 4.4% 6 12.6% 16 12.5% 8 6.5% 6Yes - other food shopping 12.5% 188 12.3% 13 20.9% 8 15.5% 13 10.0% 15 9.0% 12 13.5% 17 11.1% 7 8.9% 8Yes - bars / pubs 0.0% 1 0.0% 0 0.0% 0 0.0% 0 0.0% 0 0.0% 0 0.0% 0 0.0% 0 0.7% 1Yes - bingo 0.0% 0 0.0% 0 0.0% 0 0.0% 0 0.0% 0 0.0% 0 0.0% 0 0.0% 0 0.0% 0Yes - cafés 1.8% 28 0.9% 1 2.7% 1 3.3% 3 0.6% 1 0.0% 0 0.7% 1 0.0% 0 1.6% 1Yes - cinemas 0.1% 2 0.0% 0 0.0% 0 0.0% 0 0.0% 0 0.0% 0 0.0% 0 0.0% 0 0.0% 0Yes - get petrol 1.4% 21 1.9% 2 3.1% 1 0.0% 0 0.0% 0 6.6% 9 2.1% 3 0.7% 0 0.0% 0Yes - go to park 0.2% 2 0.0% 0 0.0% 0 0.0% 0 0.0% 0 0.0% 0 0.0% 0 0.0% 0 0.9% 1Yes - gyms / health and
fitness 0.6% 8 0.9% 1 0.8% 0 0.8% 1 0.8% 1 0.0% 0 0.0% 0 0.7% 0 0.0% 0
Yes - library 0.6% 9 0.0% 0 0.0% 0 0.0% 0 0.0% 0 0.7% 1 4.1% 5 0.0% 0 0.0% 0Yes - markets 0.0% 1 0.0% 0 0.0% 0 0.0% 0 0.0% 0 0.0% 0 0.0% 0 0.0% 0 0.0% 0Yes - meeting family 1.1% 16 0.0% 0 1.1% 0 0.8% 1 0.9% 1 0.0% 0 1.0% 1 0.0% 0 1.8% 2Yes - meeting friends 1.1% 17 0.7% 1 2.2% 1 0.8% 1 0.9% 1 0.0% 0 1.0% 1 0.7% 0 0.0% 0Yes - museums / art gallery 0.0% 0 0.0% 0 0.0% 0 0.0% 0 0.0% 0 0.0% 0 0.0% 0 0.0% 0 0.0% 0Yes - other service (e.g.
travel agent, estate agent etc.)
0.4% 5 0.0% 0 0.0% 0 0.8% 1 0.0% 0 0.0% 0 0.0% 0 0.9% 1 0.0% 0
Yes - personal service (e.g. hairdressers, beauty salon etc.)
1.1% 16 0.7% 1 0.8% 0 4.8% 4 0.6% 1 0.0% 0 1.0% 1 0.7% 0 0.0% 0
Yes - restaurants 0.3% 4 0.7% 1 0.8% 0 0.0% 0 0.0% 0 0.0% 0 0.0% 0 0.0% 0 0.7% 1Yes - swimming 0.5% 7 3.2% 3 0.0% 0 0.0% 0 1.5% 2 0.0% 0 0.0% 0 1.0% 1 0.0% 0Yes - theatre 0.0% 0 0.0% 0 0.0% 0 0.0% 0 0.0% 0 0.0% 0 0.0% 0 0.0% 0 0.0% 0Yes - visiting services such
as banks and other financial institutions
4.0% 59 3.6% 4 5.9% 2 2.3% 2 2.2% 3 2.0% 3 4.1% 5 2.4% 2 2.6% 2
Yes - work 8.3% 125 4.1% 4 9.3% 4 14.2% 12 11.1% 16 4.7% 7 1.7% 2 6.4% 4 3.7% 3Yes - for education (e.g.
student at college, university, or other third level education)
1.0% 15 0.9% 1 0.0% 0 0.0% 0 2.7% 4 0.0% 0 0.0% 0 2.1% 1 0.0% 0
Yes - other 0.0% 0 0.0% 0 0.0% 0 0.0% 0 0.0% 0 0.0% 0 0.0% 0 0.0% 0 0.0% 0Yes - other leisure activity 0.9% 13 1.7% 2 0.8% 0 1.8% 1 0.9% 1 0.0% 0 0.7% 1 0.9% 1 1.8% 2Yes - school run 0.2% 3 0.0% 0 0.0% 0 0.0% 0 0.0% 0 0.0% 0 0.0% 0 0.0% 0 0.0% 0Yes - walk the dog 0.3% 4 0.0% 0 1.8% 1 0.0% 0 0.0% 0 0.0% 0 0.0% 0 0.0% 0 0.0% 0Yes - window shopping /
browsing 0.0% 0 0.0% 0 0.0% 0 0.0% 0 0.0% 0 0.0% 0 0.0% 0 0.0% 0 0.0% 0
(No) 57.2% 860 66.4% 68 42.3% 16 45.9% 38 55.2% 80 74.1% 103 56.6% 72 67.2% 42 70.4% 62(Don’t know) 3.4% 50 1.7% 2 2.2% 1 8.4% 7 7.5% 11 1.4% 2 6.5% 8 2.6% 2 4.4% 4Weighted base: 1503 103 39 82 146 139 127 63 88Sample: 1499 98 96 95 98 90 93 84 93
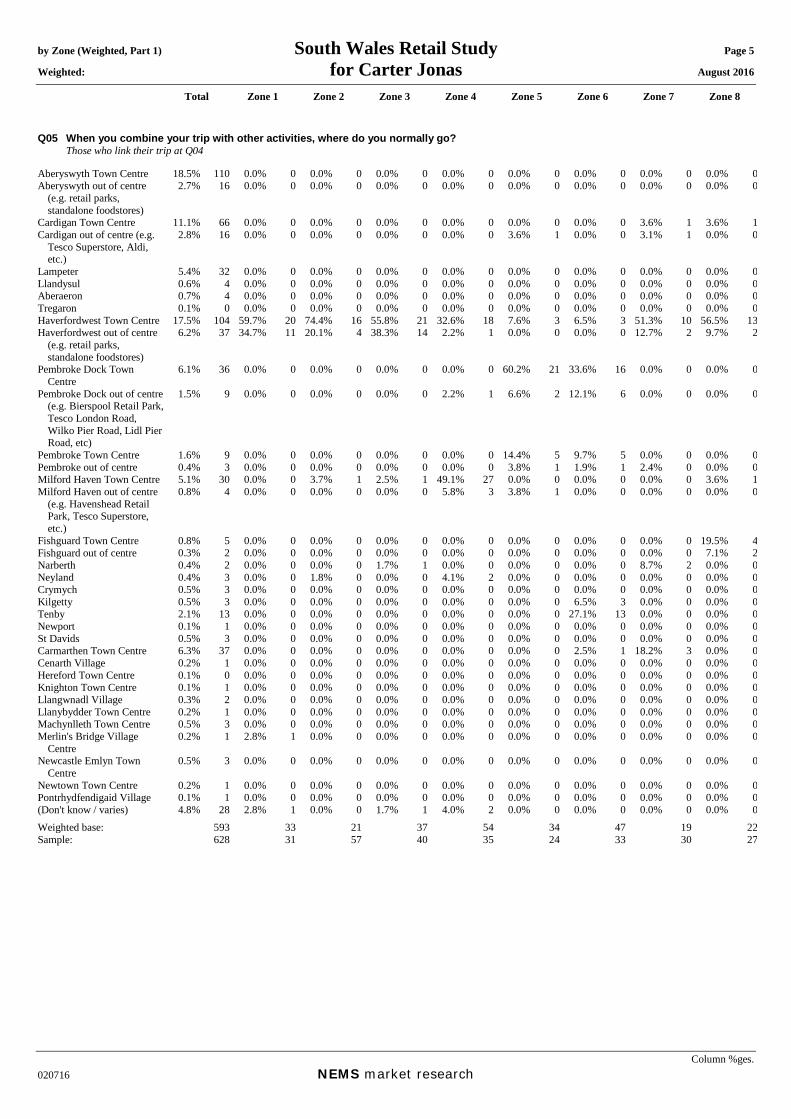
by Zone (Weighted, Part 1) South Wales Retail Study Page 5
Weighted: for Carter Jonas August 2016
Total Zone 1 Zone 2 Zone 3 Zone 4 Zone 5 Zone 6 Zone 7 Zone 8
Column %ges. 020716 NEMS market research
Q05 When you combine your trip with other activities, where do you normally go? Those who link their trip at Q04
Aberyswyth Town Centre 18.5% 110 0.0% 0 0.0% 0 0.0% 0 0.0% 0 0.0% 0 0.0% 0 0.0% 0 0.0% 0Aberyswyth out of centre
(e.g. retail parks, standalone foodstores)
2.7% 16 0.0% 0 0.0% 0 0.0% 0 0.0% 0 0.0% 0 0.0% 0 0.0% 0 0.0% 0
Cardigan Town Centre 11.1% 66 0.0% 0 0.0% 0 0.0% 0 0.0% 0 0.0% 0 0.0% 0 3.6% 1 3.6% 1Cardigan out of centre (e.g.
Tesco Superstore, Aldi, etc.)
2.8% 16 0.0% 0 0.0% 0 0.0% 0 0.0% 0 3.6% 1 0.0% 0 3.1% 1 0.0% 0
Lampeter 5.4% 32 0.0% 0 0.0% 0 0.0% 0 0.0% 0 0.0% 0 0.0% 0 0.0% 0 0.0% 0Llandysul 0.6% 4 0.0% 0 0.0% 0 0.0% 0 0.0% 0 0.0% 0 0.0% 0 0.0% 0 0.0% 0Aberaeron 0.7% 4 0.0% 0 0.0% 0 0.0% 0 0.0% 0 0.0% 0 0.0% 0 0.0% 0 0.0% 0Tregaron 0.1% 0 0.0% 0 0.0% 0 0.0% 0 0.0% 0 0.0% 0 0.0% 0 0.0% 0 0.0% 0Haverfordwest Town Centre 17.5% 104 59.7% 20 74.4% 16 55.8% 21 32.6% 18 7.6% 3 6.5% 3 51.3% 10 56.5% 13Haverfordwest out of centre
(e.g. retail parks, standalone foodstores)
6.2% 37 34.7% 11 20.1% 4 38.3% 14 2.2% 1 0.0% 0 0.0% 0 12.7% 2 9.7% 2
Pembroke Dock Town Centre
6.1% 36 0.0% 0 0.0% 0 0.0% 0 0.0% 0 60.2% 21 33.6% 16 0.0% 0 0.0% 0
Pembroke Dock out of centre (e.g. Bierspool Retail Park, Tesco London Road, Wilko Pier Road, Lidl Pier Road, etc)
1.5% 9 0.0% 0 0.0% 0 0.0% 0 2.2% 1 6.6% 2 12.1% 6 0.0% 0 0.0% 0
Pembroke Town Centre 1.6% 9 0.0% 0 0.0% 0 0.0% 0 0.0% 0 14.4% 5 9.7% 5 0.0% 0 0.0% 0Pembroke out of centre 0.4% 3 0.0% 0 0.0% 0 0.0% 0 0.0% 0 3.8% 1 1.9% 1 2.4% 0 0.0% 0Milford Haven Town Centre 5.1% 30 0.0% 0 3.7% 1 2.5% 1 49.1% 27 0.0% 0 0.0% 0 0.0% 0 3.6% 1Milford Haven out of centre
(e.g. Havenshead Retail Park, Tesco Superstore, etc.)
0.8% 4 0.0% 0 0.0% 0 0.0% 0 5.8% 3 3.8% 1 0.0% 0 0.0% 0 0.0% 0
0.8% 5 0.0% 0 0.0% 0 0.0% 0 0.0% 0 0.0% 0 0.0% 0 0.0% 0 19.5% 40.3% 2 0.0% 0 0.0% 0 0.0% 0 0.0% 0 0.0% 0 0.0% 0 0.0% 0 7.1% 20.4% 2 0.0% 0 0.0% 0 1.7% 1 0.0% 0 0.0% 0 0.0% 0 8.7% 2 0.0% 00.4% 3 0.0% 0 1.8% 0 0.0% 0 4.1% 2 0.0% 0 0.0% 0 0.0% 0 0.0% 00.5% 3 0.0% 0 0.0% 0 0.0% 0 0.0% 0 0.0% 0 0.0% 0 0.0% 0 0.0% 00.5% 3 0.0% 0 0.0% 0 0.0% 0 0.0% 0 0.0% 0 6.5% 3 0.0% 0 0.0% 02.1% 13 0.0% 0 0.0% 0 0.0% 0 0.0% 0 0.0% 0 27.1% 13 0.0% 0 0.0% 00.1% 1 0.0% 0 0.0% 0 0.0% 0 0.0% 0 0.0% 0 0.0% 0 0.0% 0 0.0% 00.5% 3 0.0% 0 0.0% 0 0.0% 0 0.0% 0 0.0% 0 0.0% 0 0.0% 0 0.0% 06.3% 37 0.0% 0 0.0% 0 0.0% 0 0.0% 0 0.0% 0 2.5% 1 18.2% 3 0.0% 00.2% 1 0.0% 0 0.0% 0 0.0% 0 0.0% 0 0.0% 0 0.0% 0 0.0% 0 0.0% 00.1% 0 0.0% 0 0.0% 0 0.0% 0 0.0% 0 0.0% 0 0.0% 0 0.0% 0 0.0% 00.1% 1 0.0% 0 0.0% 0 0.0% 0 0.0% 0 0.0% 0 0.0% 0 0.0% 0 0.0% 00.3% 2 0.0% 0 0.0% 0 0.0% 0 0.0% 0 0.0% 0 0.0% 0 0.0% 0 0.0% 00.2% 1 0.0% 0 0.0% 0 0.0% 0 0.0% 0 0.0% 0 0.0% 0 0.0% 0 0.0% 00.5% 3 0.0% 0 0.0% 0 0.0% 0 0.0% 0 0.0% 0 0.0% 0 0.0% 0 0.0% 00.2% 1 2.8% 1 0.0% 0 0.0% 0 0.0% 0 0.0% 0 0.0% 0 0.0% 0 0.0% 0
0.5% 3 0.0% 0 0.0% 0 0.0% 0 0.0% 0 0.0% 0 0.0% 0 0.0% 0 0.0% 0
0.2% 1 0.0% 0 0.0% 0 0.0% 0 0.0% 0 0.0% 0 0.0% 0 0.0% 0 0.0% 00.1% 1 0.0% 0 0.0% 0 0.0% 0 0.0% 0 0.0% 0 0.0% 0 0.0% 0 0.0% 04.8% 28 2.8% 1 0.0% 0 1.7% 1 4.0% 2 0.0% 0 0.0% 0 0.0% 0 0.0% 0
593 33 21 37 54 34 47 19 22
Fishguard Town Centre Fishguard out of centre Narberth Neyland Crymych Kilgetty Tenby Newport St Davids Carmarthen Town Centre Cenarth Village Hereford Town Centre Knighton Town Centre Llangwnadl Village Llanybydder Town Centre Machynlleth Town Centre Merlin's Bridge Village
Centre Newcastle Emlyn Town
Centre Newtown Town Centre Pontrhydfendigaid Village (Don't know / varies) Weighted base: Sample: 628 31 57 40 35 24 33 30 27
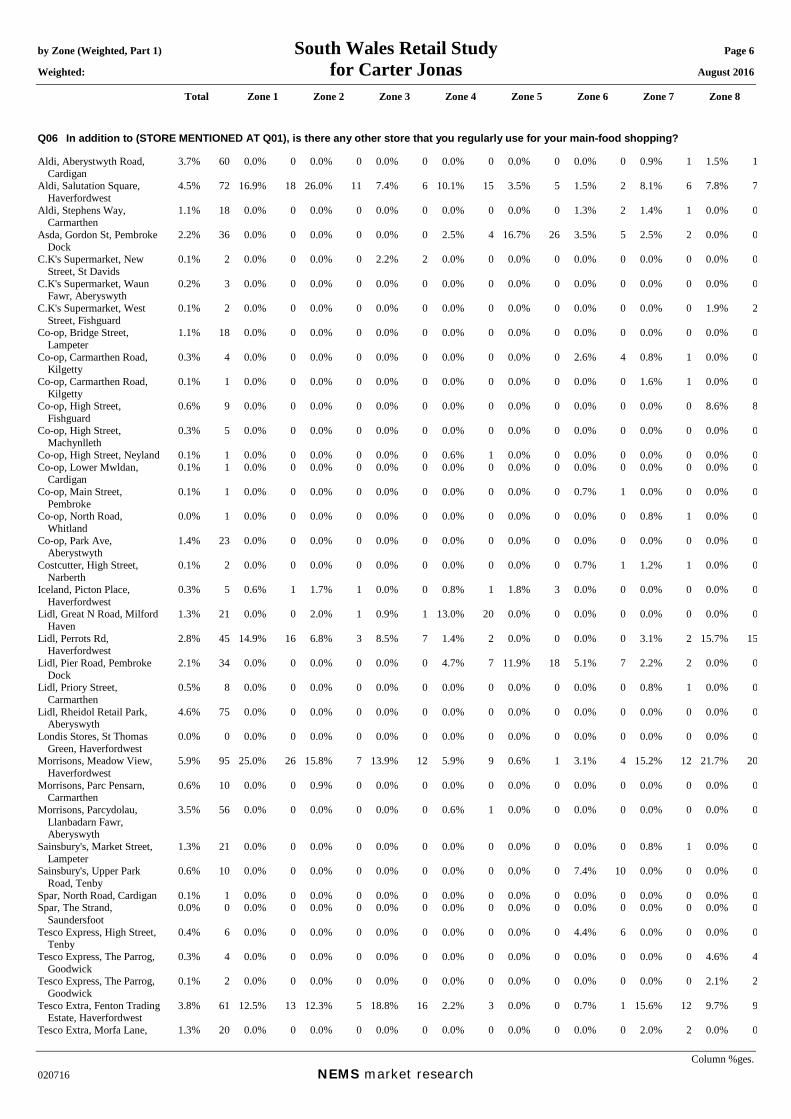
by Zone (Weighted, Part 1) South Wales Retail Study Page 6 Weighted: for Carter Jonas August 2016
Total Zone 1 Zone 2 Zone 3 Zone 4 Zone 5 Zone 6 Zone 7 Zone 8
Column %ges. 020716 NEMS market research
Q06 In addition to (STORE MENTIONED AT Q01), is there any other store that you regularly use for your main-food shopping? Aldi, Aberystwyth Road,
Cardigan 3.7% 60 0.0% 0 0.0% 0 0.0% 0 0.0% 0 0.0% 0 0.0% 0 0.9% 1 1.5% 1
Aldi, Salutation Square, Haverfordwest
4.5% 72 16.9% 18 26.0% 11 7.4% 6 10.1% 15 3.5% 5 1.5% 2 8.1% 6 7.8% 7
Aldi, Stephens Way, Carmarthen
1.1% 18 0.0% 0 0.0% 0 0.0% 0 0.0% 0 0.0% 0 1.3% 2 1.4% 1 0.0% 0
Asda, Gordon St, Pembroke Dock
2.2% 36 0.0% 0 0.0% 0 0.0% 0 2.5% 4 16.7% 26 3.5% 5 2.5% 2 0.0% 0
C.K's Supermarket, New Street, St Davids
0.1% 2 0.0% 0 0.0% 0 2.2% 2 0.0% 0 0.0% 0 0.0% 0 0.0% 0 0.0% 0
C.K's Supermarket, Waun Fawr, Aberyswyth
0.2% 3 0.0% 0 0.0% 0 0.0% 0 0.0% 0 0.0% 0 0.0% 0 0.0% 0 0.0% 0
C.K's Supermarket, West Street, Fishguard
0.1% 2 0.0% 0 0.0% 0 0.0% 0 0.0% 0 0.0% 0 0.0% 0 0.0% 0 1.9% 2
Co-op, Bridge Street, Lampeter
1.1% 18 0.0% 0 0.0% 0 0.0% 0 0.0% 0 0.0% 0 0.0% 0 0.0% 0 0.0% 0
Co-op, Carmarthen Road, Kilgetty
0.3% 4 0.0% 0 0.0% 0 0.0% 0 0.0% 0 0.0% 0 2.6% 4 0.8% 1 0.0% 0
Co-op, Carmarthen Road, Kilgetty
0.1% 1 0.0% 0 0.0% 0 0.0% 0 0.0% 0 0.0% 0 0.0% 0 1.6% 1 0.0% 0
Co-op, High Street, Fishguard
0.6% 9 0.0% 0 0.0% 0 0.0% 0 0.0% 0 0.0% 0 0.0% 0 0.0% 0 8.6% 8
Co-op, High Street, Machynlleth
0.3% 5 0.0% 0 0.0% 0 0.0% 0 0.0% 0 0.0% 0 0.0% 0 0.0% 0 0.0% 0
Co-op, High Street, Neyland 0.1% 1 0.0% 0 0.0% 0 0.0% 0 0.6% 1 0.0% 0 0.0% 0 0.0% 0 0.0% 0Co-op, Lower Mwldan,
Cardigan 0.1% 1 0.0% 0 0.0% 0 0.0% 0 0.0% 0 0.0% 0 0.0% 0 0.0% 0 0.0% 0
Co-op, Main Street, Pembroke
0.1% 1 0.0% 0 0.0% 0 0.0% 0 0.0% 0 0.0% 0 0.7% 1 0.0% 0 0.0% 0
Co-op, North Road, Whitland
0.0% 1 0.0% 0 0.0% 0 0.0% 0 0.0% 0 0.0% 0 0.0% 0 0.8% 1 0.0% 0
Co-op, Park Ave, Aberystwyth
1.4% 23 0.0% 0 0.0% 0 0.0% 0 0.0% 0 0.0% 0 0.0% 0 0.0% 0 0.0% 0
Costcutter, High Street, Narberth
0.1% 2 0.0% 0 0.0% 0 0.0% 0 0.0% 0 0.0% 0 0.7% 1 1.2% 1 0.0% 0
Iceland, Picton Place, Haverfordwest
0.3% 5 0.6% 1 1.7% 1 0.0% 0 0.8% 1 1.8% 3 0.0% 0 0.0% 0 0.0% 0
Lidl, Great N Road, Milford Haven
1.3% 21 0.0% 0 2.0% 1 0.9% 1 13.0% 20 0.0% 0 0.0% 0 0.0% 0 0.0% 0
Lidl, Perrots Rd, Haverfordwest
2.8% 45 14.9% 16 6.8% 3 8.5% 7 1.4% 2 0.0% 0 0.0% 0 3.1% 2 15.7% 15
Lidl, Pier Road, Pembroke Dock
2.1% 34 0.0% 0 0.0% 0 0.0% 0 4.7% 7 11.9% 18 5.1% 7 2.2% 2 0.0% 0
Lidl, Priory Street, Carmarthen
0.5% 8 0.0% 0 0.0% 0 0.0% 0 0.0% 0 0.0% 0 0.0% 0 0.8% 1 0.0% 0
Lidl, Rheidol Retail Park, Aberyswyth
4.6% 75 0.0% 0 0.0% 0 0.0% 0 0.0% 0 0.0% 0 0.0% 0 0.0% 0 0.0% 0
Londis Stores, St Thomas Green, Haverfordwest
0.0% 0 0.0% 0 0.0% 0 0.0% 0 0.0% 0 0.0% 0 0.0% 0 0.0% 0 0.0% 0
Morrisons, Meadow View, Haverfordwest
5.9% 95 25.0% 26 15.8% 7 13.9% 12 5.9% 9 0.6% 1 3.1% 4 15.2% 12 21.7% 20
Morrisons, Parc Pensarn, Carmarthen
0.6% 10 0.0% 0 0.9% 0 0.0% 0 0.0% 0 0.0% 0 0.0% 0 0.0% 0 0.0% 0
Morrisons, Parcydolau, Llanbadarn Fawr, Aberyswyth
3.5% 56 0.0% 0 0.0% 0 0.0% 0 0.6% 1 0.0% 0 0.0% 0 0.0% 0 0.0% 0
Sainsbury's, Market Street, Lampeter
1.3% 21 0.0% 0 0.0% 0 0.0% 0 0.0% 0 0.0% 0 0.0% 0 0.8% 1 0.0% 0
Sainsbury's, Upper Park Road, Tenby
0.6% 10 0.0% 0 0.0% 0 0.0% 0 0.0% 0 0.0% 0 7.4% 10 0.0% 0 0.0% 0
Spar, North Road, Cardigan 0.1% 1 0.0% 0 0.0% 0 0.0% 0 0.0% 0 0.0% 0 0.0% 0 0.0% 0 0.0% 0Spar, The Strand,
Saundersfoot 0.0% 0 0.0% 0 0.0% 0 0.0% 0 0.0% 0 0.0% 0 0.0% 0 0.0% 0 0.0% 0
Tesco Express, High Street, Tenby
0.4% 6 0.0% 0 0.0% 0 0.0% 0 0.0% 0 0.0% 0 4.4% 6 0.0% 0 0.0% 0
Tesco Express, The Parrog, Goodwick
0.3% 4 0.0% 0 0.0% 0 0.0% 0 0.0% 0 0.0% 0 0.0% 0 0.0% 0 4.6% 4
Tesco Express, The Parrog, Goodwick
0.1% 2 0.0% 0 0.0% 0 0.0% 0 0.0% 0 0.0% 0 0.0% 0 0.0% 0 2.1% 2
Tesco Extra, Fenton Trading Estate, Haverfordwest
3.8% 61 12.5% 13 12.3% 5 18.8% 16 2.2% 3 0.0% 0 0.7% 1 15.6% 12 9.7% 9
Tesco Extra, Morfa Lane, 1.3% 20 0.0% 0 0.0% 0 0.0% 0 0.0% 0 0.0% 0 0.0% 0 2.0% 2 0.0% 0

by Zone (Weighted, Part 1) South Wales Retail Study Page 7
Weighted: for Carter Jonas August 2016
Total Zone 1 Zone 2 Zone 3 Zone 4 Zone 5 Zone 6 Zone 7 Zone 8
Column %ges. 020716 NEMS market research
Carmarthen Tesco Superstore,
Aberystwyth Rd, Cardigan 3.8% 61 0.0% 0 0.0% 0 0.0% 0 0.0% 0 0.0% 0 0.0% 0 0.0% 0 0.0% 0
Tesco Superstore, London Rd, Pembroke Dock
3.6% 58 0.6% 1 0.0% 0 0.0% 0 0.8% 1 24.5% 38 12.4% 17 1.7% 1 0.0% 0
Tesco, Havens Head Park, Milford Haven
1.4% 22 0.0% 0 0.9% 0 1.5% 1 13.3% 20 0.0% 0 0.0% 0 0.0% 0 0.0% 0
Wisebuys Stores, Main St, Pembroke
0.0% 1 0.0% 0 0.0% 0 0.0% 0 0.0% 0 0.0% 0 0.0% 0 0.8% 1 0.0% 0
Aberaeron 0.3% 4 0.0% 0 0.0% 0 0.0% 0 0.0% 0 0.0% 0 0.0% 0 0.0% 0 0.0% 0Aberyswyth 0.5% 9 0.0% 0 0.0% 0 0.0% 0 0.0% 0 0.0% 0 0.0% 0 0.0% 0 0.0% 0Borth 0.1% 1 0.0% 0 0.0% 0 0.0% 0 0.0% 0 0.0% 0 0.0% 0 0.0% 0 0.0% 0Cardigan 0.1% 1 0.0% 0 0.0% 0 0.0% 0 0.0% 0 0.0% 0 0.0% 0 0.0% 0 0.0% 0Cardigan 0.1% 2 0.0% 0 0.0% 0 0.0% 0 0.0% 0 0.0% 0 0.0% 0 0.0% 0 0.0% 0Crymych 0.0% 1 0.0% 0 0.0% 0 0.0% 0 0.0% 0 0.0% 0 0.0% 0 0.0% 0 0.0% 0
0.3% 5 0.0% 0 0.9% 0 2.7% 2 0.0% 0 0.0% 0 0.7% 1 0.0% 0 1.4% 10.1% 2 0.0% 0 0.0% 0 0.0% 0 0.0% 0 0.0% 0 0.0% 0 0.0% 0 0.0% 00.3% 4 0.0% 0 0.0% 0 0.0% 0 0.0% 0 0.0% 0 0.0% 0 0.0% 0 0.0% 00.1% 2 0.0% 0 0.0% 0 0.0% 0 0.0% 0 0.0% 0 0.0% 0 2.3% 2 0.0% 00.0% 0 0.0% 0 0.0% 0 0.0% 0 0.0% 0 0.0% 0 0.0% 0 0.0% 0 0.0% 00.1% 1 0.0% 0 0.0% 0 0.0% 0 0.0% 0 0.8% 1 0.0% 0 0.0% 0 0.0% 00.1% 1 0.0% 0 0.0% 0 0.0% 0 0.0% 0 0.6% 1 0.0% 0 0.0% 0 0.0% 00.1% 2 0.0% 0 0.0% 0 0.0% 0 0.0% 0 0.0% 0 0.0% 0 0.0% 0 0.0% 0
Haverfordwest Lampeter Llandysul Narberth Newport (Pembrokeshire) Pembroke Pembroke Dock Asda, Capital Retail Park,
Leckwith Road, Cardiff Brynhoffnant 0.1% 2 0.0% 0 0.0% 0 0.0% 0 0.0% 0 0.0% 0 0.0% 0 0.0% 0 0.0% 0C.K's Supermarket, Pencader
Road, Llandysul0.2% 3 0.0% 0 0.0% 0 0.0% 0 0.0% 0 0.0% 0 0.0% 0 0.0% 0 0.0% 0
C.K's Supermarket, Spring Gardens, Narberth
0.1% 1 0.0% 0 0.0% 0 0.0% 0 0.0% 0 0.0% 0 0.0% 0 1.6% 1 0.0% 0
C.K's Supermarket, Station Road, Newcastle Emlyn
0.1% 1 0.0% 0 0.0% 0 0.0% 0 0.0% 0 0.0% 0 0.0% 0 0.0% 0 0.0% 0
Carmarthen 0.3% 4 0.0% 0 0.0% 0 0.0% 0 0.0% 0 0.0% 0 0.0% 0 0.0% 0 0.0% 0Church Stoke 0.0% 1 0.0% 0 0.0% 0 0.0% 0 0.0% 0 0.0% 0 0.0% 0 0.0% 0 0.0% 0Co-op, Heywood Lane,
Tenby 0.1% 2 0.0% 0 0.0% 0 0.0% 0 0.0% 0 0.0% 0 0.7% 1 0.0% 0 0.0% 0
Co-op, Sycamore Street, Newcastle Emlyn
0.1% 2 0.0% 0 0.0% 0 0.0% 0 0.0% 0 0.0% 0 0.0% 0 0.0% 0 0.0% 0
Costcutter, Market Street, Aberaeron
0.1% 1 0.0% 0 0.0% 0 0.0% 0 0.0% 0 0.0% 0 0.0% 0 0.0% 0 0.0% 0
Cwmcerrig Farm, Gorslas, Llanelli
0.0% 1 0.0% 0 0.0% 0 0.0% 0 0.0% 0 0.0% 0 0.0% 0 0.0% 0 0.0% 0
Hereford 0.0% 0 0.0% 0 0.0% 0 0.0% 0 0.0% 0 0.0% 0 0.0% 0 0.0% 0 0.0% 0Iceland, Rheidol Retail Park,
Station Road, Aberystwyth 0.8% 13 0.0% 0 0.0% 0 0.0% 0 0.0% 0 0.0% 0 0.0% 0 0.0% 0 0.0% 0
Lidl, Bridgend Retail Park, Bridgend
0.1% 1 0.0% 0 0.0% 0 0.0% 0 0.0% 0 0.0% 0 0.9% 1 0.0% 0 0.0% 0
Llanarth 0.0% 1 0.0% 0 0.0% 0 0.0% 0 0.0% 0 0.0% 0 0.0% 0 0.0% 0 0.0% 0Marks & Spencer, Red
Street, Carmarthen 0.2% 3 0.0% 0 0.0% 0 0.0% 0 0.0% 0 0.0% 0 0.0% 0 0.6% 0 0.0% 0
Marks & Spencer, Withybush Retail Park, Haverfordwest
0.6% 9 1.3% 1 3.2% 1 3.8% 3 1.2% 2 0.6% 1 0.0% 0 0.0% 0 0.0% 0
Morrisons, Ty-Glas Road, Cardiff
0.1% 1 0.0% 0 0.0% 0 0.0% 0 0.0% 0 0.0% 0 0.9% 1 0.0% 0 0.0% 0
Newcastle Emlyn 0.1% 1 0.0% 0 0.0% 0 0.0% 0 0.0% 0 0.0% 0 0.0% 0 0.0% 0 0.0% 0Sainsburys, Meole Brace
Retail Park, Hereford Road, Shrewsbury
0.1% 1 0.0% 0 0.0% 0 0.0% 0 0.0% 0 0.0% 0 0.0% 0 0.0% 0 0.0% 0
Spar, High Street, Narberth 0.0% 1 0.0% 0 0.0% 0 0.0% 0 0.0% 0 0.0% 0 0.0% 0 0.9% 1 0.0% 0Tesco Express, Brewery
Terrace, Saundersfoot 0.1% 1 0.0% 0 0.0% 0 0.0% 0 0.0% 0 0.0% 0 0.7% 1 0.0% 0 0.0% 0
Tesco Express, North Parade, Aberystwyth
0.1% 2 0.0% 0 0.0% 0 0.0% 0 0.0% 0 0.0% 0 0.0% 0 0.0% 0 0.0% 0
Tesco Extra, Pontardulais Road, Cadle, Swansea
0.1% 1 0.0% 0 0.0% 0 0.9% 1 0.0% 0 0.0% 0 0.0% 0 0.0% 0 0.0% 0
Waitrose, Morningside Road, Edinburgh
0.1% 2 0.0% 0 0.0% 0 0.0% 0 0.0% 0 0.0% 0 0.0% 0 0.0% 0 0.0% 0
Wholefoods of Newport, Hen Bopty / East Street, Newport
0.0% 0 0.0% 0 0.0% 0 0.0% 0 0.0% 0 0.0% 0 0.0% 0 0.0% 0 0.0% 0
Internet / delivered 1.6% 26 0.0% 0 0.0% 0 5.1% 4 0.0% 0 1.8% 3 1.8% 2 2.5% 2 1.8% 2(Don't know / varies) 0.9% 14 0.0% 0 0.0% 0 1.9% 2 0.0% 0 0.0% 0 0.7% 1 1.4% 1 0.9% 1(Nowhere else) 37.4% 601 28.2% 29 29.4% 12 32.5% 28 42.7% 65 37.2% 57 50.3% 68 31.2% 24 22.4% 21Weighted base: 1607 104 42 86 151 154 135 76 94

by Zone (Weighted, Part 1) South Wales Retail Study Page 8 Weighted: for Carter Jonas August 2016
Total Zone 1 Zone 2 Zone 3 Zone 4 Zone 5 Zone 6 Zone 7 Zone 8
Column %ges. 020716 NEMS market research
Sample: 1607 100 101 101 100 100 100 100 100 Q06A Which internet / home delivery retailer do you also use for your main food shopping? Those who shop online at Q06 Asda 34.7% 9 0.0% 0 0.0% 0 59.2% 3 0.0% 0 0.0% 0 100.0% 2 31.1% 1 0.0% 0Tesco 53.9% 14 0.0% 0 0.0% 0 40.8% 2 0.0% 0 0.0% 0 0.0% 0 68.9% 1 100.0% 2Suma 0.9% 0 0.0% 0 0.0% 0 0.0% 0 0.0% 0 0.0% 0 0.0% 0 0.0% 0 0.0% 0(Don't know / varies) 10.6% 3 0.0% 0 0.0% 0 0.0% 0 0.0% 0 100.0% 3 0.0% 0 0.0% 0 0.0% 0Weighted base: 26 0 0 4 0 3 2 2 2Sample: 18 0 0 3 0 1 2 2 1
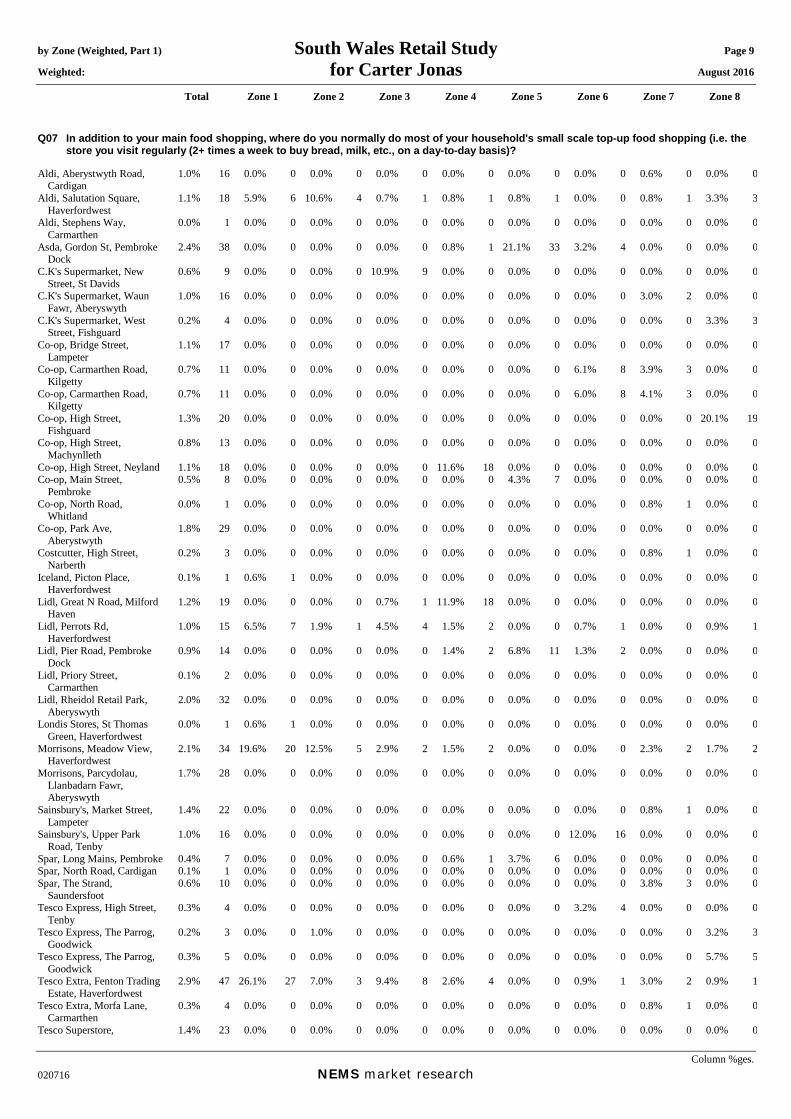
by Zone (Weighted, Part 1) South Wales Retail Study Page 9 Weighted: for Carter Jonas August 2016
Total Zone 1 Zone 2 Zone 3 Zone 4 Zone 5 Zone 6 Zone 7 Zone 8
Column %ges. 020716 NEMS market research
Q07 In addition to your main food shopping, where do you normally do most of your household's small scale top-up food shopping (i.e. the store you visit regularly (2+ times a week to buy bread, milk, etc., on a day-to-day basis)?
Aldi, Aberystwyth Road,
Cardigan 1.0% 16 0.0% 0 0.0% 0 0.0% 0 0.0% 0 0.0% 0 0.0% 0 0.6% 0 0.0% 0
Aldi, Salutation Square, Haverfordwest
1.1% 18 5.9% 6 10.6% 4 0.7% 1 0.8% 1 0.8% 1 0.0% 0 0.8% 1 3.3% 3
Aldi, Stephens Way, Carmarthen
0.0% 1 0.0% 0 0.0% 0 0.0% 0 0.0% 0 0.0% 0 0.0% 0 0.0% 0 0.0% 0
Asda, Gordon St, Pembroke Dock
2.4% 38 0.0% 0 0.0% 0 0.0% 0 0.8% 1 21.1% 33 3.2% 4 0.0% 0 0.0% 0
C.K's Supermarket, New Street, St Davids
0.6% 9 0.0% 0 0.0% 0 10.9% 9 0.0% 0 0.0% 0 0.0% 0 0.0% 0 0.0% 0
C.K's Supermarket, Waun Fawr, Aberyswyth
1.0% 16 0.0% 0 0.0% 0 0.0% 0 0.0% 0 0.0% 0 0.0% 0 3.0% 2 0.0% 0
C.K's Supermarket, West Street, Fishguard
0.2% 4 0.0% 0 0.0% 0 0.0% 0 0.0% 0 0.0% 0 0.0% 0 0.0% 0 3.3% 3
Co-op, Bridge Street, Lampeter
1.1% 17 0.0% 0 0.0% 0 0.0% 0 0.0% 0 0.0% 0 0.0% 0 0.0% 0 0.0% 0
Co-op, Carmarthen Road, Kilgetty
0.7% 11 0.0% 0 0.0% 0 0.0% 0 0.0% 0 0.0% 0 6.1% 8 3.9% 3 0.0% 0
Co-op, Carmarthen Road, Kilgetty
0.7% 11 0.0% 0 0.0% 0 0.0% 0 0.0% 0 0.0% 0 6.0% 8 4.1% 3 0.0% 0
Co-op, High Street, Fishguard
1.3% 20 0.0% 0 0.0% 0 0.0% 0 0.0% 0 0.0% 0 0.0% 0 0.0% 0 20.1% 19
Co-op, High Street, Machynlleth
0.8% 13 0.0% 0 0.0% 0 0.0% 0 0.0% 0 0.0% 0 0.0% 0 0.0% 0 0.0% 0
Co-op, High Street, Neyland 1.1% 18 0.0% 0 0.0% 0 0.0% 0 11.6% 18 0.0% 0 0.0% 0 0.0% 0 0.0% 0Co-op, Main Street,
Pembroke 0.5% 8 0.0% 0 0.0% 0 0.0% 0 0.0% 0 4.3% 7 0.0% 0 0.0% 0 0.0% 0
Co-op, North Road, Whitland
0.0% 1 0.0% 0 0.0% 0 0.0% 0 0.0% 0 0.0% 0 0.0% 0 0.8% 1 0.0% 0
Co-op, Park Ave, Aberystwyth
1.8% 29 0.0% 0 0.0% 0 0.0% 0 0.0% 0 0.0% 0 0.0% 0 0.0% 0 0.0% 0
Costcutter, High Street, Narberth
0.2% 3 0.0% 0 0.0% 0 0.0% 0 0.0% 0 0.0% 0 0.0% 0 0.8% 1 0.0% 0
Iceland, Picton Place, Haverfordwest
0.1% 1 0.6% 1 0.0% 0 0.0% 0 0.0% 0 0.0% 0 0.0% 0 0.0% 0 0.0% 0
Lidl, Great N Road, Milford Haven
1.2% 19 0.0% 0 0.0% 0 0.7% 1 11.9% 18 0.0% 0 0.0% 0 0.0% 0 0.0% 0
Lidl, Perrots Rd, Haverfordwest
1.0% 15 6.5% 7 1.9% 1 4.5% 4 1.5% 2 0.0% 0 0.7% 1 0.0% 0 0.9% 1
Lidl, Pier Road, Pembroke Dock
0.9% 14 0.0% 0 0.0% 0 0.0% 0 1.4% 2 6.8% 11 1.3% 2 0.0% 0 0.0% 0
Lidl, Priory Street, Carmarthen
0.1% 2 0.0% 0 0.0% 0 0.0% 0 0.0% 0 0.0% 0 0.0% 0 0.0% 0 0.0% 0
Lidl, Rheidol Retail Park, Aberyswyth
2.0% 32 0.0% 0 0.0% 0 0.0% 0 0.0% 0 0.0% 0 0.0% 0 0.0% 0 0.0% 0
Londis Stores, St Thomas Green, Haverfordwest
0.0% 1 0.6% 1 0.0% 0 0.0% 0 0.0% 0 0.0% 0 0.0% 0 0.0% 0 0.0% 0
Morrisons, Meadow View, Haverfordwest
2.1% 34 19.6% 20 12.5% 5 2.9% 2 1.5% 2 0.0% 0 0.0% 0 2.3% 2 1.7% 2
Morrisons, Parcydolau, Llanbadarn Fawr, Aberyswyth
1.7% 28 0.0% 0 0.0% 0 0.0% 0 0.0% 0 0.0% 0 0.0% 0 0.0% 0 0.0% 0
Sainsbury's, Market Street, Lampeter
1.4% 22 0.0% 0 0.0% 0 0.0% 0 0.0% 0 0.0% 0 0.0% 0 0.8% 1 0.0% 0
Sainsbury's, Upper Park Road, Tenby
1.0% 16 0.0% 0 0.0% 0 0.0% 0 0.0% 0 0.0% 0 12.0% 16 0.0% 0 0.0% 0
Spar, Long Mains, Pembroke 0.4% 7 0.0% 0 0.0% 0 0.0% 0 0.6% 1 3.7% 6 0.0% 0 0.0% 0 0.0% 0Spar, North Road, Cardigan 0.1% 1 0.0% 0 0.0% 0 0.0% 0 0.0% 0 0.0% 0 0.0% 0 0.0% 0 0.0% 0Spar, The Strand,
Saundersfoot 0.6% 10 0.0% 0 0.0% 0 0.0% 0 0.0% 0 0.0% 0 0.0% 0 3.8% 3 0.0% 0
Tesco Express, High Street, Tenby
0.3% 4 0.0% 0 0.0% 0 0.0% 0 0.0% 0 0.0% 0 3.2% 4 0.0% 0 0.0% 0
Tesco Express, The Parrog, Goodwick
0.2% 3 0.0% 0 1.0% 0 0.0% 0 0.0% 0 0.0% 0 0.0% 0 0.0% 0 3.2% 3
Tesco Express, The Parrog, Goodwick
0.3% 5 0.0% 0 0.0% 0 0.0% 0 0.0% 0 0.0% 0 0.0% 0 0.0% 0 5.7% 5
Tesco Extra, Fenton Trading Estate, Haverfordwest
2.9% 47 26.1% 27 7.0% 3 9.4% 8 2.6% 4 0.0% 0 0.9% 1 3.0% 2 0.9% 1
Tesco Extra, Morfa Lane, Carmarthen
0.3% 4 0.0% 0 0.0% 0 0.0% 0 0.0% 0 0.0% 0 0.0% 0 0.8% 1 0.0% 0
Tesco Superstore, 1.4% 23 0.0% 0 0.0% 0 0.0% 0 0.0% 0 0.0% 0 0.0% 0 0.0% 0 0.0% 0

by Zone (Weighted, Part 1) South Wales Retail Study Page 10
Weighted: for Carter Jonas August 2016
Total Zone 1 Zone 2 Zone 3 Zone 4 Zone 5 Zone 6 Zone 7 Zone 8
Column %ges. 020716 NEMS market research
Aberystwyth Rd, Cardigan Tesco Superstore, London
Rd, Pembroke Dock 2.3% 38 0.0% 0 0.0% 0 0.0% 0 0.0% 0 22.1% 34 2.7% 4 0.0% 0 0.0% 0
Tesco Superstore, Pool Road, Newtown (Powys)
0.1% 1 0.0% 0 0.0% 0 0.0% 0 0.0% 0 0.0% 0 0.0% 0 0.0% 0 0.0% 0
Tesco, Havens Head Park, Milford Haven
0.9% 15 0.0% 0 1.0% 0 0.0% 0 9.4% 14 0.0% 0 0.0% 0 0.0% 0 0.0% 0
Aberaeron 0.8% 13 0.0% 0 0.0% 0 0.0% 0 0.0% 0 0.0% 0 0.0% 0 0.0% 0 0.0% 0Aberyswyth 1.9% 31 0.0% 0 0.0% 0 0.0% 0 0.0% 0 0.0% 0 0.0% 0 0.0% 0 0.0% 0Borth 0.3% 5 0.0% 0 0.0% 0 0.0% 0 0.0% 0 0.0% 0 0.0% 0 0.0% 0 0.0% 0Cardigan 0.6% 10 0.0% 0 0.0% 0 0.0% 0 0.0% 0 0.0% 0 0.0% 0 0.0% 0 0.0% 0Cardigan 0.4% 7 0.0% 0 0.0% 0 0.0% 0 0.0% 0 0.0% 0 0.0% 0 0.0% 0 0.0% 0Crymych 1.2% 19 0.0% 0 0.0% 0 0.0% 0 0.0% 0 0.0% 0 0.0% 0 0.0% 0 0.0% 0Fishguard 0.2% 3 0.0% 0 0.0% 0 0.0% 0 0.0% 0 0.0% 0 0.0% 0 0.0% 0 3.1% 3Goodwick 0.1% 1 0.0% 0 0.0% 0 0.0% 0 0.0% 0 0.0% 0 0.0% 0 0.0% 0 0.9% 1Haverfordwest 0.8% 13 5.3% 6 2.8% 1 4.4% 4 0.0% 0 0.0% 0 0.0% 0 0.6% 0 1.7% 2Johnston 0.1% 1 0.0% 0 0.7% 0 1.0% 1 0.0% 0 0.0% 0 0.0% 0 0.0% 0 0.0% 0Kilgetty 0.1% 2 0.0% 0 0.0% 0 0.0% 0 0.0% 0 0.0% 0 1.3% 2 0.0% 0 0.0% 0Lampeter 0.7% 11 0.0% 0 0.0% 0 0.0% 0 0.0% 0 0.0% 0 0.0% 0 0.0% 0 0.0% 0Letterson 0.4% 6 0.0% 0 0.0% 0 0.0% 0 0.0% 0 0.0% 0 0.0% 0 0.0% 0 6.8% 6Llandysul 0.7% 11 0.0% 0 1.0% 0 0.0% 0 0.0% 0 0.0% 0 0.0% 0 0.9% 1 0.0% 0
0.4% 7 0.0% 0 2.4% 1 0.0% 0 0.0% 0 0.0% 0 0.0% 0 3.1% 2 0.0% 00.8% 14 0.0% 0 0.0% 0 0.0% 0 8.9% 14 0.0% 0 0.0% 0 0.0% 0 0.0% 00.7% 11 0.0% 0 0.0% 0 0.0% 0 0.0% 0 0.0% 0 0.0% 0 15.1% 11 0.0% 00.3% 4 0.0% 0 0.0% 0 0.0% 0 0.0% 0 0.0% 0 0.0% 0 0.0% 0 0.0% 00.1% 1 0.0% 0 0.0% 0 0.0% 0 0.0% 0 0.0% 0 0.0% 0 0.0% 0 0.8% 10.4% 6 0.0% 0 0.0% 0 0.0% 0 3.7% 6 0.0% 0 0.0% 0 0.0% 0 0.0% 00.1% 1 0.0% 0 0.0% 0 0.0% 0 0.0% 0 0.6% 1 0.0% 0 0.0% 0 0.0% 00.1% 1 0.0% 0 0.0% 0 1.7% 1 0.0% 0 0.0% 0 0.0% 0 0.0% 0 0.0% 00.3% 5 0.0% 0 0.0% 0 0.0% 0 0.0% 0 0.0% 0 0.0% 0 0.0% 0 0.0% 00.2% 3 0.0% 0 0.0% 0 0.0% 0 0.0% 0 0.0% 0 0.0% 0 0.0% 0 0.0% 00.2% 4 0.0% 0 0.0% 0 0.0% 0 0.0% 0 0.0% 0 0.0% 0 0.0% 0 0.0% 0
Machynlleth Milford Haven Narberth Newport (Pembrokeshire) Newtown (Powys) Neyland Pembroke St Davids Tregaron Blaenffos Bronant Brynhoffnant 0.2% 3 0.0% 0 0.0% 0 0.0% 0 0.0% 0 0.0% 0 0.0% 0 0.0% 0 0.0% 0C.K's Supermarket, New
Street, St Davids 0.1% 1 0.0% 0 0.0% 0 1.7% 1 0.0% 0 0.0% 0 0.0% 0 0.0% 0 0.0% 0
C.K's Supermarket, Pencader Road, Llandysul
0.3% 4 0.0% 0 0.0% 0 0.0% 0 0.0% 0 0.0% 0 0.0% 0 0.0% 0 0.0% 0
C.K's Supermarket, Spring Gardens, Narberth
0.5% 8 0.0% 0 0.0% 0 0.0% 0 0.0% 0 0.0% 0 0.0% 0 10.2% 8 0.0% 0
C.K's Supermarket, Station Road, Newcastle Emlyn
0.6% 9 0.0% 0 0.0% 0 0.0% 0 0.0% 0 0.0% 0 0.0% 0 0.0% 0 0.0% 0
Carmarthen 0.1% 2 0.0% 0 0.0% 0 0.0% 0 0.0% 0 0.0% 0 0.9% 1 0.0% 0 0.0% 0Cenarth 0.3% 4 0.0% 0 0.0% 0 0.0% 0 0.0% 0 0.0% 0 0.0% 0 0.0% 0 0.0% 0Ceredigion 0.1% 1 0.0% 0 0.0% 0 0.0% 0 0.0% 0 0.0% 0 0.0% 0 0.0% 0 0.0% 0Co-op, Heywood Lane,
Tenby 0.9% 14 0.0% 0 0.0% 0 0.0% 0 0.0% 0 0.0% 0 10.1% 14 0.0% 0 0.0% 0
Co-op, Penparcau Road, Penparcau
0.1% 2 0.0% 0 0.0% 0 0.0% 0 0.0% 0 0.0% 0 0.0% 0 0.0% 0 0.0% 0
Co-op, Sycamore Street, Newcastle Emlyn
0.1% 2 0.0% 0 0.0% 0 0.0% 0 0.0% 0 0.0% 0 0.0% 0 0.0% 0 0.0% 0
Costcutter, Market Street, Aberaeron
0.5% 8 0.0% 0 0.0% 0 0.0% 0 0.0% 0 0.0% 0 0.0% 0 0.0% 0 0.0% 0
Costcutter, Uplands Square, New Quay
0.3% 4 0.0% 0 0.0% 0 0.0% 0 0.0% 0 0.0% 0 0.0% 0 0.0% 0 0.0% 0
Cross Inn 0.2% 3 0.0% 0 0.0% 0 0.0% 0 0.0% 0 0.0% 0 0.0% 0 0.0% 0 0.0% 0Crosswell 0.0% 0 0.0% 0 0.0% 0 0.0% 0 0.0% 0 0.0% 0 0.0% 0 0.0% 0 0.0% 0Cwmcerrig Farm, Gorslas,
Llanelli 0.0% 1 0.0% 0 0.0% 0 0.0% 0 0.0% 0 0.0% 0 0.0% 0 0.0% 0 0.0% 0
Dinas Cross 0.1% 1 0.0% 0 0.0% 0 0.0% 0 0.0% 0 0.0% 0 0.0% 0 0.0% 0 0.0% 0Felinfach 0.3% 4 0.0% 0 0.0% 0 0.0% 0 0.0% 0 0.0% 0 0.0% 0 0.0% 0 0.0% 0Ffostrasol 0.1% 1 0.0% 0 0.0% 0 0.0% 0 0.0% 0 0.0% 0 0.0% 0 0.0% 0 0.0% 0Hook 0.1% 1 0.0% 0 1.9% 1 0.0% 0 0.0% 0 0.0% 0 0.0% 0 0.0% 0 0.0% 0Iceland, Rheidol Retail Park,
Station Road, Aberystwyth 0.3% 5 0.0% 0 0.0% 0 0.0% 0 0.0% 0 0.0% 0 0.0% 0 0.0% 0 0.0% 0
Lamphey 0.1% 1 0.0% 0 0.0% 0 0.0% 0 0.0% 0 0.6% 1 0.0% 0 0.0% 0 0.0% 0Llanarth 0.1% 1 0.0% 0 0.0% 0 0.0% 0 0.0% 0 0.0% 0 0.0% 0 0.0% 0 0.0% 0Llanddewi Brefi 0.1% 2 0.0% 0 0.0% 0 0.0% 0 0.0% 0 0.0% 0 0.0% 0 0.0% 0 0.0% 0Llanfair Clydogau 0.1% 1 0.0% 0 0.0% 0 0.0% 0 0.0% 0 0.0% 0 0.0% 0 0.0% 0 0.0% 0Llanfarian 0.0% 0 0.0% 0 0.0% 0 0.0% 0 0.0% 0 0.0% 0 0.0% 0 0.0% 0 0.0% 0Llangeitho 0.1% 1 0.0% 0 0.0% 0 0.0% 0 0.0% 0 0.0% 0 0.0% 0 0.0% 0 0.0% 0Llangrannog 0.0% 1 0.0% 0 0.0% 0 0.0% 0 0.0% 0 0.0% 0 0.0% 0 0.0% 0 0.0% 0Llangwm 0.1% 2 0.0% 0 3.3% 1 0.7% 1 0.0% 0 0.0% 0 0.0% 0 0.0% 0 0.0% 0Llangwyryfon 0.0% 1 0.0% 0 0.0% 0 0.0% 0 0.0% 0 0.0% 0 0.0% 0 0.0% 0 0.0% 0Llanilar 0.2% 2 0.0% 0 0.0% 0 0.0% 0 0.0% 0 0.0% 0 0.0% 0 0.0% 0 0.0% 0
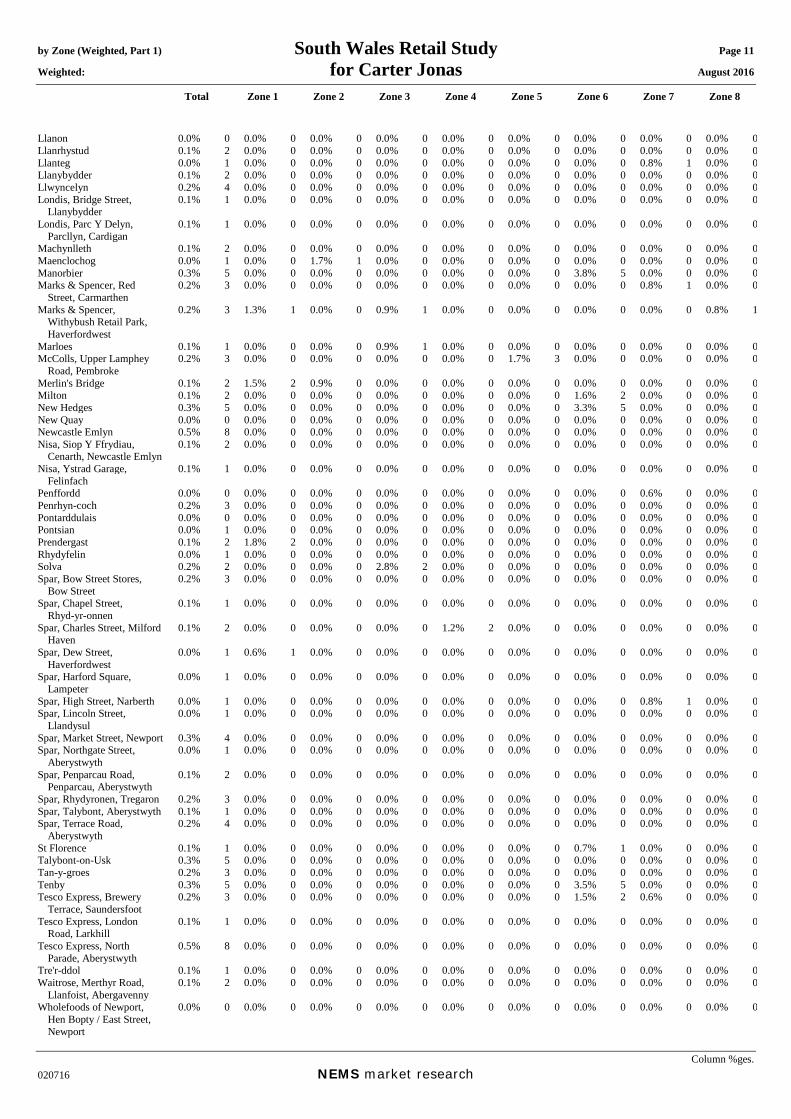
by Zone (Weighted, Part 1) South Wales Retail Study Page 11 Weighted: for Carter Jonas August 2016
Total Zone 1 Zone 2 Zone 3 Zone 4 Zone 5 Zone 6 Zone 7 Zone 8
Column %ges. 020716 NEMS market research
Llanon 0.0% 0 0.0% 0 0.0% 0 0.0% 0 0.0% 0 0.0% 0 0.0% 0 0.0% 0 0.0% 0Llanrhystud 0.1% 2 0.0% 0 0.0% 0 0.0% 0 0.0% 0 0.0% 0 0.0% 0 0.0% 0 0.0% 0Llanteg 0.0% 1 0.0% 0 0.0% 0 0.0% 0 0.0% 0 0.0% 0 0.0% 0 0.8% 1 0.0% 0Llanybydder 0.1% 2 0.0% 0 0.0% 0 0.0% 0 0.0% 0 0.0% 0 0.0% 0 0.0% 0 0.0% 0Llwyncelyn 0.2% 4 0.0% 0 0.0% 0 0.0% 0 0.0% 0 0.0% 0 0.0% 0 0.0% 0 0.0% 0Londis, Bridge Street,
Llanybydder 0.1% 1 0.0% 0 0.0% 0 0.0% 0 0.0% 0 0.0% 0 0.0% 0 0.0% 0 0.0% 0
Londis, Parc Y Delyn, Parcllyn, Cardigan
0.1% 1 0.0% 0 0.0% 0 0.0% 0 0.0% 0 0.0% 0 0.0% 0 0.0% 0 0.0% 0
Machynlleth 0.1% 2 0.0% 0 0.0% 0 0.0% 0 0.0% 0 0.0% 0 0.0% 0 0.0% 0 0.0% 0Maenclochog 0.0% 1 0.0% 0 1.7% 1 0.0% 0 0.0% 0 0.0% 0 0.0% 0 0.0% 0 0.0% 0Manorbier 0.3% 5 0.0% 0 0.0% 0 0.0% 0 0.0% 0 0.0% 0 3.8% 5 0.0% 0 0.0% 0Marks & Spencer, Red
Street, Carmarthen 0.2% 3 0.0% 0 0.0% 0 0.0% 0 0.0% 0 0.0% 0 0.0% 0 0.8% 1 0.0% 0
Marks & Spencer, Withybush Retail Park, Haverfordwest
0.2% 3 1.3% 1 0.0% 0 0.9% 1 0.0% 0 0.0% 0 0.0% 0 0.0% 0 0.8% 1
Marloes 0.1% 1 0.0% 0 0.0% 0 0.9% 1 0.0% 0 0.0% 0 0.0% 0 0.0% 0 0.0% 0McColls, Upper Lamphey
Road, Pembroke 0.2% 3 0.0% 0 0.0% 0 0.0% 0 0.0% 0 1.7% 3 0.0% 0 0.0% 0 0.0% 0
Merlin's Bridge 0.1% 2 1.5% 2 0.9% 0 0.0% 0 0.0% 0 0.0% 0 0.0% 0 0.0% 0 0.0% 0Milton 0.1% 2 0.0% 0 0.0% 0 0.0% 0 0.0% 0 0.0% 0 1.6% 2 0.0% 0 0.0% 0New Hedges 0.3% 5 0.0% 0 0.0% 0 0.0% 0 0.0% 0 0.0% 0 3.3% 5 0.0% 0 0.0% 0New Quay 0.0% 0 0.0% 0 0.0% 0 0.0% 0 0.0% 0 0.0% 0 0.0% 0 0.0% 0 0.0% 0Newcastle Emlyn 0.5% 8 0.0% 0 0.0% 0 0.0% 0 0.0% 0 0.0% 0 0.0% 0 0.0% 0 0.0% 0Nisa, Siop Y Ffrydiau,
Cenarth, Newcastle Emlyn 0.1% 2 0.0% 0 0.0% 0 0.0% 0 0.0% 0 0.0% 0 0.0% 0 0.0% 0 0.0% 0
Nisa, Ystrad Garage, Felinfach
0.1% 1 0.0% 0 0.0% 0 0.0% 0 0.0% 0 0.0% 0 0.0% 0 0.0% 0 0.0% 0
Penffordd 0.0% 0 0.0% 0 0.0% 0 0.0% 0 0.0% 0 0.0% 0 0.0% 0 0.6% 0 0.0% 0Penrhyn-coch 0.2% 3 0.0% 0 0.0% 0 0.0% 0 0.0% 0 0.0% 0 0.0% 0 0.0% 0 0.0% 0Pontarddulais 0.0% 0 0.0% 0 0.0% 0 0.0% 0 0.0% 0 0.0% 0 0.0% 0 0.0% 0 0.0% 0Pontsian 0.0% 1 0.0% 0 0.0% 0 0.0% 0 0.0% 0 0.0% 0 0.0% 0 0.0% 0 0.0% 0Prendergast 0.1% 2 1.8% 2 0.0% 0 0.0% 0 0.0% 0 0.0% 0 0.0% 0 0.0% 0 0.0% 0Rhydyfelin 0.0% 1 0.0% 0 0.0% 0 0.0% 0 0.0% 0 0.0% 0 0.0% 0 0.0% 0 0.0% 0Solva 0.2% 2 0.0% 0 0.0% 0 2.8% 2 0.0% 0 0.0% 0 0.0% 0 0.0% 0 0.0% 0Spar, Bow Street Stores,
Bow Street 0.2% 3 0.0% 0 0.0% 0 0.0% 0 0.0% 0 0.0% 0 0.0% 0 0.0% 0 0.0% 0
Spar, Chapel Street, Rhyd-yr-onnen
0.1% 1 0.0% 0 0.0% 0 0.0% 0 0.0% 0 0.0% 0 0.0% 0 0.0% 0 0.0% 0
Spar, Charles Street, Milford Haven
0.1% 2 0.0% 0 0.0% 0 0.0% 0 1.2% 2 0.0% 0 0.0% 0 0.0% 0 0.0% 0
Spar, Dew Street, Haverfordwest
0.0% 1 0.6% 1 0.0% 0 0.0% 0 0.0% 0 0.0% 0 0.0% 0 0.0% 0 0.0% 0
Spar, Harford Square, Lampeter
0.0% 1 0.0% 0 0.0% 0 0.0% 0 0.0% 0 0.0% 0 0.0% 0 0.0% 0 0.0% 0
Spar, High Street, Narberth 0.0% 1 0.0% 0 0.0% 0 0.0% 0 0.0% 0 0.0% 0 0.0% 0 0.8% 1 0.0% 0Spar, Lincoln Street,
Llandysul 0.0% 1 0.0% 0 0.0% 0 0.0% 0 0.0% 0 0.0% 0 0.0% 0 0.0% 0 0.0% 0
Spar, Market Street, Newport 0.3% 4 0.0% 0 0.0% 0 0.0% 0 0.0% 0 0.0% 0 0.0% 0 0.0% 0 0.0% 0Spar, Northgate Street,
Aberystwyth 0.0% 1 0.0% 0 0.0% 0 0.0% 0 0.0% 0 0.0% 0 0.0% 0 0.0% 0 0.0% 0
Spar, Penparcau Road, Penparcau, Aberystwyth
0.1% 2 0.0% 0 0.0% 0 0.0% 0 0.0% 0 0.0% 0 0.0% 0 0.0% 0 0.0% 0
Spar, Rhydyronen, Tregaron 0.2% 3 0.0% 0 0.0% 0 0.0% 0 0.0% 0 0.0% 0 0.0% 0 0.0% 0 0.0% 0Spar, Talybont, Aberystwyth 0.1% 1 0.0% 0 0.0% 0 0.0% 0 0.0% 0 0.0% 0 0.0% 0 0.0% 0 0.0% 0Spar, Terrace Road,
Aberystwyth 0.2% 4 0.0% 0 0.0% 0 0.0% 0 0.0% 0 0.0% 0 0.0% 0 0.0% 0 0.0% 0
St Florence 0.1% 1 0.0% 0 0.0% 0 0.0% 0 0.0% 0 0.0% 0 0.7% 1 0.0% 0 0.0% 0Talybont-on-Usk 0.3% 5 0.0% 0 0.0% 0 0.0% 0 0.0% 0 0.0% 0 0.0% 0 0.0% 0 0.0% 0Tan-y-groes 0.2% 3 0.0% 0 0.0% 0 0.0% 0 0.0% 0 0.0% 0 0.0% 0 0.0% 0 0.0% 0Tenby 0.3% 5 0.0% 0 0.0% 0 0.0% 0 0.0% 0 0.0% 0 3.5% 5 0.0% 0 0.0% 0Tesco Express, Brewery
Terrace, Saundersfoot 0.2% 3 0.0% 0 0.0% 0 0.0% 0 0.0% 0 0.0% 0 1.5% 2 0.6% 0 0.0% 0
Tesco Express, London Road, Larkhill
0.1% 1 0.0% 0 0.0% 0 0.0% 0 0.0% 0 0.0% 0 0.0% 0 0.0% 0 0.0% 0
Tesco Express, North Parade, Aberystwyth
0.5% 8 0.0% 0 0.0% 0 0.0% 0 0.0% 0 0.0% 0 0.0% 0 0.0% 0 0.0% 0
Tre'r-ddol 0.1% 1 0.0% 0 0.0% 0 0.0% 0 0.0% 0 0.0% 0 0.0% 0 0.0% 0 0.0% 0Waitrose, Merthyr Road,
Llanfoist, Abergavenny 0.1% 2 0.0% 0 0.0% 0 0.0% 0 0.0% 0 0.0% 0 0.0% 0 0.0% 0 0.0% 0
Wholefoods of Newport, Hen Bopty / East Street, Newport
0.0% 0 0.0% 0 0.0% 0 0.0% 0 0.0% 0 0.0% 0 0.0% 0 0.0% 0 0.0% 0
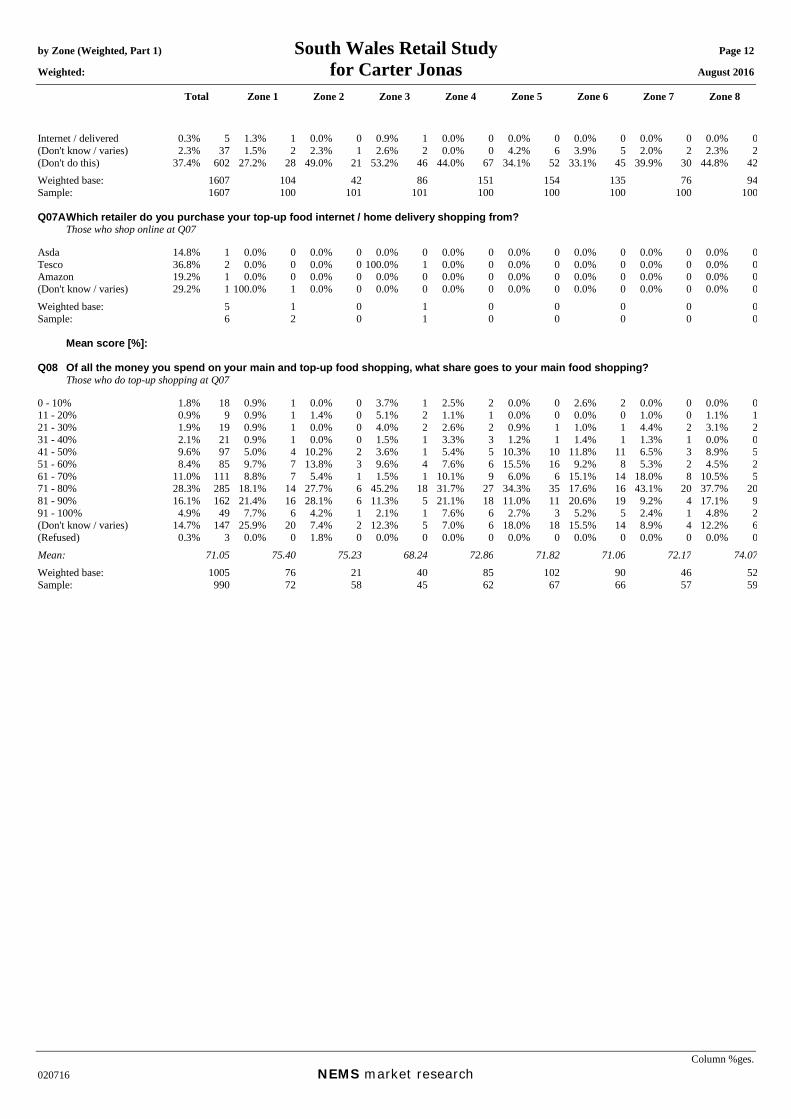
by Zone (Weighted, Part 1) South Wales Retail Study Page 12 Weighted: for Carter Jonas August 2016
Total Zone 1 Zone 2 Zone 3 Zone 4 Zone 5 Zone 6 Zone 7 Zone 8
Column %ges. 020716 NEMS market research
Internet / delivered 0.3% 5 1.3% 1 0.0% 0 0.9% 1 0.0% 0 0.0% 0 0.0% 0 0.0% 0 0.0% 0(Don't know / varies) 2.3% 37 1.5% 2 2.3% 1 2.6% 2 0.0% 0 4.2% 6 3.9% 5 2.0% 2 2.3% 2(Don't do this) 37.4% 602 27.2% 28 49.0% 21 53.2% 46 44.0% 67 34.1% 52 33.1% 45 39.9% 30 44.8% 42Weighted base: 1607 104 42 86 151 154 135 76 94Sample: 1607 100 101 101 100 100 100 100 100 Q07A Which retailer do you purchase your top-up food internet / home delivery shopping from? Those who shop online at Q07 Asda 14.8% 1 0.0% 0 0.0% 0 0.0% 0 0.0% 0 0.0% 0 0.0% 0 0.0% 0 0.0% 0Tesco 36.8% 2 0.0% 0 0.0% 0 100.0% 1 0.0% 0 0.0% 0 0.0% 0 0.0% 0 0.0% 0Amazon 19.2% 1 0.0% 0 0.0% 0 0.0% 0 0.0% 0 0.0% 0 0.0% 0 0.0% 0 0.0% 0(Don't know / varies) 29.2% 1 100.0% 1 0.0% 0 0.0% 0 0.0% 0 0.0% 0 0.0% 0 0.0% 0 0.0% 0Weighted base: 5 1 0 1 0 0 0 0 0Sample: 6 2 0 1 0 0 0 0 0 Mean score [%]: Q08 Of all the money you spend on your main and top-up food shopping, what share goes to your main food shopping? Those who do top-up shopping at Q07 0 - 10% 1.8% 18 0.9% 1 0.0% 0 3.7% 1 2.5% 2 0.0% 0 2.6% 2 0.0% 0 0.0% 011 - 20% 0.9% 9 0.9% 1 1.4% 0 5.1% 2 1.1% 1 0.0% 0 0.0% 0 1.0% 0 1.1% 121 - 30% 1.9% 19 0.9% 1 0.0% 0 4.0% 2 2.6% 2 0.9% 1 1.0% 1 4.4% 2 3.1% 231 - 40% 2.1% 21 0.9% 1 0.0% 0 1.5% 1 3.3% 3 1.2% 1 1.4% 1 1.3% 1 0.0% 041 - 50% 9.6% 97 5.0% 4 10.2% 2 3.6% 1 5.4% 5 10.3% 10 11.8% 11 6.5% 3 8.9% 551 - 60% 8.4% 85 9.7% 7 13.8% 3 9.6% 4 7.6% 6 15.5% 16 9.2% 8 5.3% 2 4.5% 261 - 70% 11.0% 111 8.8% 7 5.4% 1 1.5% 1 10.1% 9 6.0% 6 15.1% 14 18.0% 8 10.5% 571 - 80% 28.3% 285 18.1% 14 27.7% 6 45.2% 18 31.7% 27 34.3% 35 17.6% 16 43.1% 20 37.7% 2081 - 90% 16.1% 162 21.4% 16 28.1% 6 11.3% 5 21.1% 18 11.0% 11 20.6% 19 9.2% 4 17.1% 991 - 100% 4.9% 49 7.7% 6 4.2% 1 2.1% 1 7.6% 6 2.7% 3 5.2% 5 2.4% 1 4.8% 2(Don't know / varies) 14.7% 147 25.9% 20 7.4% 2 12.3% 5 7.0% 6 18.0% 18 15.5% 14 8.9% 4 12.2% 6(Refused) 0.3% 3 0.0% 0 1.8% 0 0.0% 0 0.0% 0 0.0% 0 0.0% 0 0.0% 0 0.0% 0Mean: 71.05 75.40 75.23 68.24 72.86 71.82 71.06 72.17 74.07Weighted base: 1005 76 21 40 85 102 90 46 52Sample: 990 72 58 45 62 67 66 57 59
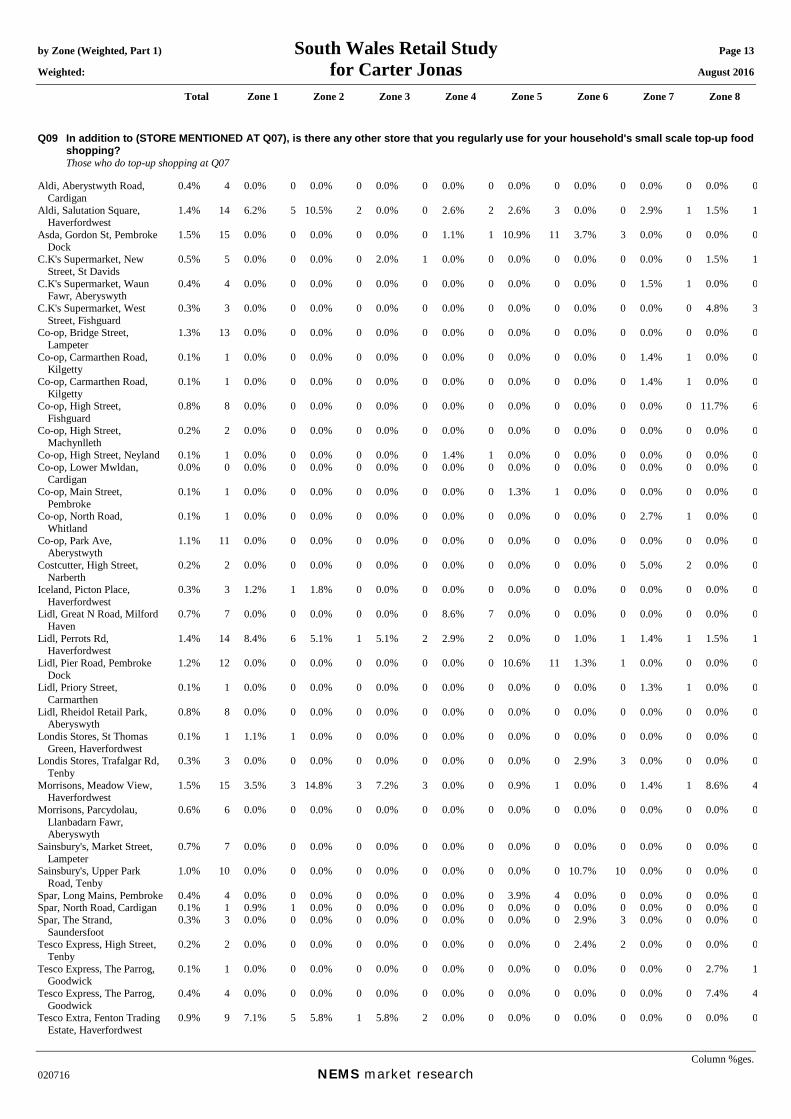
by Zone (Weighted, Part 1) South Wales Retail Study Page 13 Weighted: for Carter Jonas August 2016
Total Zone 1 Zone 2 Zone 3 Zone 4 Zone 5 Zone 6 Zone 7 Zone 8
Column %ges. 020716 NEMS market research
Q09 In addition to (STORE MENTIONED AT Q07), is there any other store that you regularly use for your household's small scale top-up food shopping?
Those who do top-up shopping at Q07 Aldi, Aberystwyth Road,
Cardigan 0.4% 4 0.0% 0 0.0% 0 0.0% 0 0.0% 0 0.0% 0 0.0% 0 0.0% 0 0.0% 0
Aldi, Salutation Square, Haverfordwest
1.4% 14 6.2% 5 10.5% 2 0.0% 0 2.6% 2 2.6% 3 0.0% 0 2.9% 1 1.5% 1
Asda, Gordon St, Pembroke Dock
1.5% 15 0.0% 0 0.0% 0 0.0% 0 1.1% 1 10.9% 11 3.7% 3 0.0% 0 0.0% 0
C.K's Supermarket, New Street, St Davids
0.5% 5 0.0% 0 0.0% 0 2.0% 1 0.0% 0 0.0% 0 0.0% 0 0.0% 0 1.5% 1
C.K's Supermarket, Waun Fawr, Aberyswyth
0.4% 4 0.0% 0 0.0% 0 0.0% 0 0.0% 0 0.0% 0 0.0% 0 1.5% 1 0.0% 0
C.K's Supermarket, West Street, Fishguard
0.3% 3 0.0% 0 0.0% 0 0.0% 0 0.0% 0 0.0% 0 0.0% 0 0.0% 0 4.8% 3
Co-op, Bridge Street, Lampeter
1.3% 13 0.0% 0 0.0% 0 0.0% 0 0.0% 0 0.0% 0 0.0% 0 0.0% 0 0.0% 0
Co-op, Carmarthen Road, Kilgetty
0.1% 1 0.0% 0 0.0% 0 0.0% 0 0.0% 0 0.0% 0 0.0% 0 1.4% 1 0.0% 0
Co-op, Carmarthen Road, Kilgetty
0.1% 1 0.0% 0 0.0% 0 0.0% 0 0.0% 0 0.0% 0 0.0% 0 1.4% 1 0.0% 0
Co-op, High Street, Fishguard
0.8% 8 0.0% 0 0.0% 0 0.0% 0 0.0% 0 0.0% 0 0.0% 0 0.0% 0 11.7% 6
Co-op, High Street, Machynlleth
0.2% 2 0.0% 0 0.0% 0 0.0% 0 0.0% 0 0.0% 0 0.0% 0 0.0% 0 0.0% 0
Co-op, High Street, Neyland 0.1% 1 0.0% 0 0.0% 0 0.0% 0 1.4% 1 0.0% 0 0.0% 0 0.0% 0 0.0% 0Co-op, Lower Mwldan,
Cardigan 0.0% 0 0.0% 0 0.0% 0 0.0% 0 0.0% 0 0.0% 0 0.0% 0 0.0% 0 0.0% 0
Co-op, Main Street, Pembroke
0.1% 1 0.0% 0 0.0% 0 0.0% 0 0.0% 0 1.3% 1 0.0% 0 0.0% 0 0.0% 0
Co-op, North Road, Whitland
0.1% 1 0.0% 0 0.0% 0 0.0% 0 0.0% 0 0.0% 0 0.0% 0 2.7% 1 0.0% 0
Co-op, Park Ave, Aberystwyth
1.1% 11 0.0% 0 0.0% 0 0.0% 0 0.0% 0 0.0% 0 0.0% 0 0.0% 0 0.0% 0
Costcutter, High Street, Narberth
0.2% 2 0.0% 0 0.0% 0 0.0% 0 0.0% 0 0.0% 0 0.0% 0 5.0% 2 0.0% 0
Iceland, Picton Place, Haverfordwest
0.3% 3 1.2% 1 1.8% 0 0.0% 0 0.0% 0 0.0% 0 0.0% 0 0.0% 0 0.0% 0
Lidl, Great N Road, Milford Haven
0.7% 7 0.0% 0 0.0% 0 0.0% 0 8.6% 7 0.0% 0 0.0% 0 0.0% 0 0.0% 0
Lidl, Perrots Rd, Haverfordwest
1.4% 14 8.4% 6 5.1% 1 5.1% 2 2.9% 2 0.0% 0 1.0% 1 1.4% 1 1.5% 1
Lidl, Pier Road, Pembroke Dock
1.2% 12 0.0% 0 0.0% 0 0.0% 0 0.0% 0 10.6% 11 1.3% 1 0.0% 0 0.0% 0
Lidl, Priory Street, Carmarthen
0.1% 1 0.0% 0 0.0% 0 0.0% 0 0.0% 0 0.0% 0 0.0% 0 1.3% 1 0.0% 0
Lidl, Rheidol Retail Park, Aberyswyth
0.8% 8 0.0% 0 0.0% 0 0.0% 0 0.0% 0 0.0% 0 0.0% 0 0.0% 0 0.0% 0
Londis Stores, St Thomas Green, Haverfordwest
0.1% 1 1.1% 1 0.0% 0 0.0% 0 0.0% 0 0.0% 0 0.0% 0 0.0% 0 0.0% 0
Londis Stores, Trafalgar Rd, Tenby
0.3% 3 0.0% 0 0.0% 0 0.0% 0 0.0% 0 0.0% 0 2.9% 3 0.0% 0 0.0% 0
Morrisons, Meadow View, Haverfordwest
1.5% 15 3.5% 3 14.8% 3 7.2% 3 0.0% 0 0.9% 1 0.0% 0 1.4% 1 8.6% 4
Morrisons, Parcydolau, Llanbadarn Fawr, Aberyswyth
0.6% 6 0.0% 0 0.0% 0 0.0% 0 0.0% 0 0.0% 0 0.0% 0 0.0% 0 0.0% 0
Sainsbury's, Market Street, Lampeter
0.7% 7 0.0% 0 0.0% 0 0.0% 0 0.0% 0 0.0% 0 0.0% 0 0.0% 0 0.0% 0
Sainsbury's, Upper Park Road, Tenby
1.0% 10 0.0% 0 0.0% 0 0.0% 0 0.0% 0 0.0% 0 10.7% 10 0.0% 0 0.0% 0
Spar, Long Mains, Pembroke 0.4% 4 0.0% 0 0.0% 0 0.0% 0 0.0% 0 3.9% 4 0.0% 0 0.0% 0 0.0% 0Spar, North Road, Cardigan 0.1% 1 0.9% 1 0.0% 0 0.0% 0 0.0% 0 0.0% 0 0.0% 0 0.0% 0 0.0% 0Spar, The Strand,
Saundersfoot 0.3% 3 0.0% 0 0.0% 0 0.0% 0 0.0% 0 0.0% 0 2.9% 3 0.0% 0 0.0% 0
Tesco Express, High Street, Tenby
0.2% 2 0.0% 0 0.0% 0 0.0% 0 0.0% 0 0.0% 0 2.4% 2 0.0% 0 0.0% 0
Tesco Express, The Parrog, Goodwick
0.1% 1 0.0% 0 0.0% 0 0.0% 0 0.0% 0 0.0% 0 0.0% 0 0.0% 0 2.7% 1
Tesco Express, The Parrog, Goodwick
0.4% 4 0.0% 0 0.0% 0 0.0% 0 0.0% 0 0.0% 0 0.0% 0 0.0% 0 7.4% 4
Tesco Extra, Fenton Trading Estate, Haverfordwest
0.9% 9 7.1% 5 5.8% 1 5.8% 2 0.0% 0 0.0% 0 0.0% 0 0.0% 0 0.0% 0
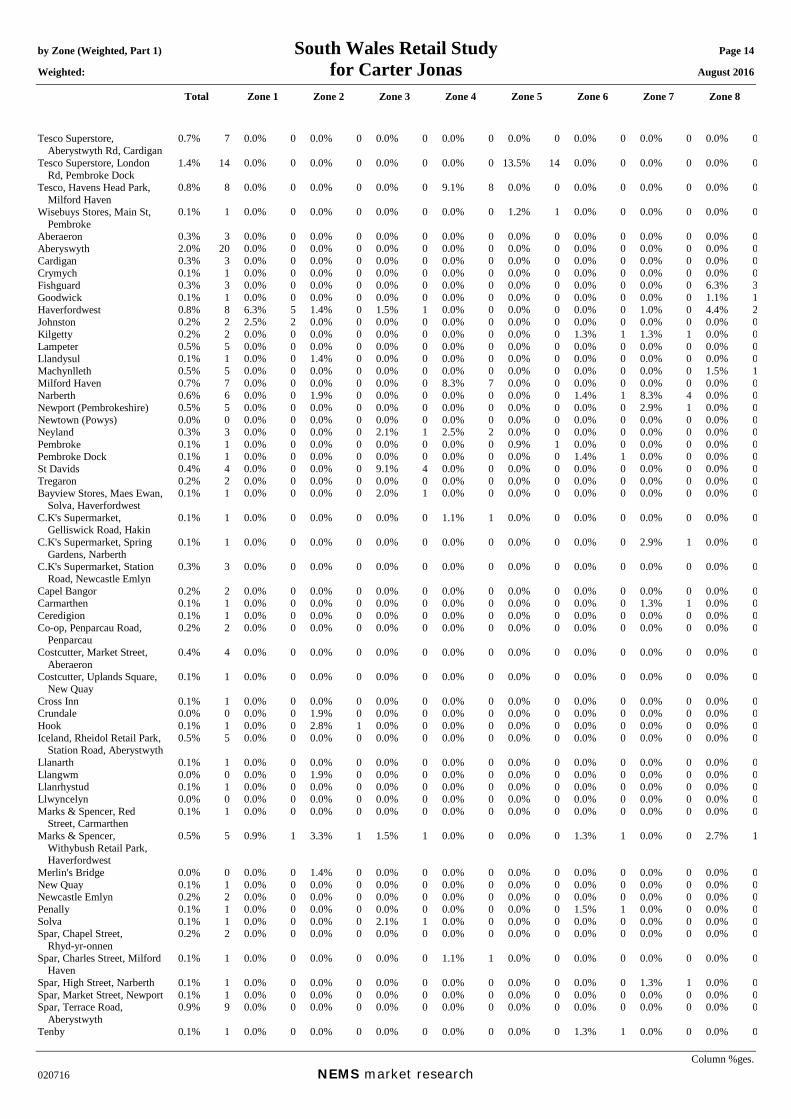
by Zone (Weighted, Part 1) South Wales Retail Study Page 14
Weighted: for Carter Jonas August 2016
Total Zone 1 Zone 2 Zone 3 Zone 4 Zone 5 Zone 6 Zone 7 Zone 8
Column %ges. 020716 NEMS market research
0.7% 7 0.0% 0 0.0% 0 0.0% 0 0.0% 0 0.0% 0 0.0% 0 0.0% 0 0.0% 0
1.4% 14 0.0% 0 0.0% 0 0.0% 0 0.0% 0 13.5% 14 0.0% 0 0.0% 0 0.0% 0
0.8% 8 0.0% 0 0.0% 0 0.0% 0 9.1% 8 0.0% 0 0.0% 0 0.0% 0 0.0% 0
0.1% 1 0.0% 0 0.0% 0 0.0% 0 0.0% 0 1.2% 1 0.0% 0 0.0% 0 0.0% 0
0.3% 3 0.0% 0 0.0% 0 0.0% 0 0.0% 0 0.0% 0 0.0% 0 0.0% 0 0.0% 02.0% 20 0.0% 0 0.0% 0 0.0% 0 0.0% 0 0.0% 0 0.0% 0 0.0% 0 0.0% 00.3% 3 0.0% 0 0.0% 0 0.0% 0 0.0% 0 0.0% 0 0.0% 0 0.0% 0 0.0% 00.1% 1 0.0% 0 0.0% 0 0.0% 0 0.0% 0 0.0% 0 0.0% 0 0.0% 0 0.0% 00.3% 3 0.0% 0 0.0% 0 0.0% 0 0.0% 0 0.0% 0 0.0% 0 0.0% 0 6.3% 30.1% 1 0.0% 0 0.0% 0 0.0% 0 0.0% 0 0.0% 0 0.0% 0 0.0% 0 1.1% 10.8% 8 6.3% 5 1.4% 0 1.5% 1 0.0% 0 0.0% 0 0.0% 0 1.0% 0 4.4% 20.2% 2 2.5% 2 0.0% 0 0.0% 0 0.0% 0 0.0% 0 0.0% 0 0.0% 0 0.0% 00.2% 2 0.0% 0 0.0% 0 0.0% 0 0.0% 0 0.0% 0 1.3% 1 1.3% 1 0.0% 00.5% 5 0.0% 0 0.0% 0 0.0% 0 0.0% 0 0.0% 0 0.0% 0 0.0% 0 0.0% 00.1% 1 0.0% 0 1.4% 0 0.0% 0 0.0% 0 0.0% 0 0.0% 0 0.0% 0 0.0% 00.5% 5 0.0% 0 0.0% 0 0.0% 0 0.0% 0 0.0% 0 0.0% 0 0.0% 0 1.5% 10.7% 7 0.0% 0 0.0% 0 0.0% 0 8.3% 7 0.0% 0 0.0% 0 0.0% 0 0.0% 00.6% 6 0.0% 0 1.9% 0 0.0% 0 0.0% 0 0.0% 0 1.4% 1 8.3% 4 0.0% 00.5% 5 0.0% 0 0.0% 0 0.0% 0 0.0% 0 0.0% 0 0.0% 0 2.9% 1 0.0% 00.0% 0 0.0% 0 0.0% 0 0.0% 0 0.0% 0 0.0% 0 0.0% 0 0.0% 0 0.0% 00.3% 3 0.0% 0 0.0% 0 2.1% 1 2.5% 2 0.0% 0 0.0% 0 0.0% 0 0.0% 00.1% 1 0.0% 0 0.0% 0 0.0% 0 0.0% 0 0.9% 1 0.0% 0 0.0% 0 0.0% 00.1% 1 0.0% 0 0.0% 0 0.0% 0 0.0% 0 0.0% 0 1.4% 1 0.0% 0 0.0% 00.4% 4 0.0% 0 0.0% 0 9.1% 4 0.0% 0 0.0% 0 0.0% 0 0.0% 0 0.0% 00.2% 2 0.0% 0 0.0% 0 0.0% 0 0.0% 0 0.0% 0 0.0% 0 0.0% 0 0.0% 0
Tesco Superstore, Aberystwyth Rd, Cardigan
Tesco Superstore, London Rd, Pembroke Dock
Tesco, Havens Head Park, Milford Haven
Wisebuys Stores, Main St, Pembroke
Aberaeron Aberyswyth Cardigan Crymych Fishguard Goodwick Haverfordwest Johnston Kilgetty Lampeter Llandysul Machynlleth Milford Haven Narberth Newport (Pembrokeshire) Newtown (Powys) Neyland Pembroke Pembroke Dock St Davids Tregaron Bayview Stores, Maes Ewan,
Solva, Haverfordwest 0.1% 1 0.0% 0 0.0% 0 2.0% 1 0.0% 0 0.0% 0 0.0% 0 0.0% 0 0.0% 0
C.K's Supermarket,Gelliswick Road, Hakin
0.1% 1 0.0% 0 0.0% 0 0.0% 0 1.1% 1 0.0% 0 0.0% 0 0.0% 0 0.0% 0
C.K's Supermarket, Spring Gardens, Narberth
0.1% 1 0.0% 0 0.0% 0 0.0% 0 0.0% 0 0.0% 0 0.0% 0 2.9% 1 0.0% 0
C.K's Supermarket, Station Road, Newcastle Emlyn
0.3% 3 0.0% 0 0.0% 0 0.0% 0 0.0% 0 0.0% 0 0.0% 0 0.0% 0 0.0% 0
Capel Bangor 0.2% 2 0.0% 0 0.0% 0 0.0% 0 0.0% 0 0.0% 0 0.0% 0 0.0% 0 0.0% 0Carmarthen 0.1% 1 0.0% 0 0.0% 0 0.0% 0 0.0% 0 0.0% 0 0.0% 0 1.3% 1 0.0% 0Ceredigion 0.1% 1 0.0% 0 0.0% 0 0.0% 0 0.0% 0 0.0% 0 0.0% 0 0.0% 0 0.0% 0Co-op, Penparcau Road,
Penparcau 0.2% 2 0.0% 0 0.0% 0 0.0% 0 0.0% 0 0.0% 0 0.0% 0 0.0% 0 0.0% 0
Costcutter, Market Street, Aberaeron
0.4% 4 0.0% 0 0.0% 0 0.0% 0 0.0% 0 0.0% 0 0.0% 0 0.0% 0 0.0% 0
Costcutter, Uplands Square, New Quay
0.1% 1 0.0% 0 0.0% 0 0.0% 0 0.0% 0 0.0% 0 0.0% 0 0.0% 0 0.0% 0
Cross Inn 0.1% 1 0.0% 0 0.0% 0 0.0% 0 0.0% 0 0.0% 0 0.0% 0 0.0% 0 0.0% 0Crundale 0.0% 0 0.0% 0 1.9% 0 0.0% 0 0.0% 0 0.0% 0 0.0% 0 0.0% 0 0.0% 0Hook 0.1% 1 0.0% 0 2.8% 1 0.0% 0 0.0% 0 0.0% 0 0.0% 0 0.0% 0 0.0% 0Iceland, Rheidol Retail Park,
Station Road, Aberystwyth 0.5% 5 0.0% 0 0.0% 0 0.0% 0 0.0% 0 0.0% 0 0.0% 0 0.0% 0 0.0% 0
Llanarth 0.1% 1 0.0% 0 0.0% 0 0.0% 0 0.0% 0 0.0% 0 0.0% 0 0.0% 0 0.0% 0Llangwm 0.0% 0 0.0% 0 1.9% 0 0.0% 0 0.0% 0 0.0% 0 0.0% 0 0.0% 0 0.0% 0Llanrhystud 0.1% 1 0.0% 0 0.0% 0 0.0% 0 0.0% 0 0.0% 0 0.0% 0 0.0% 0 0.0% 0Llwyncelyn 0.0% 0 0.0% 0 0.0% 0 0.0% 0 0.0% 0 0.0% 0 0.0% 0 0.0% 0 0.0% 0Marks & Spencer, Red
Street, Carmarthen 0.1% 1 0.0% 0 0.0% 0 0.0% 0 0.0% 0 0.0% 0 0.0% 0 0.0% 0 0.0% 0
Marks & Spencer, Withybush Retail Park, Haverfordwest
0.5% 5 0.9% 1 3.3% 1 1.5% 1 0.0% 0 0.0% 0 1.3% 1 0.0% 0 2.7% 1
Merlin's Bridge 0.0% 0 0.0% 0 1.4% 0 0.0% 0 0.0% 0 0.0% 0 0.0% 0 0.0% 0 0.0% 0New Quay 0.1% 1 0.0% 0 0.0% 0 0.0% 0 0.0% 0 0.0% 0 0.0% 0 0.0% 0 0.0% 0Newcastle Emlyn 0.2% 2 0.0% 0 0.0% 0 0.0% 0 0.0% 0 0.0% 0 0.0% 0 0.0% 0 0.0% 0Penally 0.1% 1 0.0% 0 0.0% 0 0.0% 0 0.0% 0 0.0% 0 1.5% 1 0.0% 0 0.0% 0Solva 0.1% 1 0.0% 0 0.0% 0 2.1% 1 0.0% 0 0.0% 0 0.0% 0 0.0% 0 0.0% 0Spar, Chapel Street,
Rhyd-yr-onnen 0.2% 2 0.0% 0 0.0% 0 0.0% 0 0.0% 0 0.0% 0 0.0% 0 0.0% 0 0.0% 0
Spar, Charles Street, Milford Haven
0.1% 1 0.0% 0 0.0% 0 0.0% 0 1.1% 1 0.0% 0 0.0% 0 0.0% 0 0.0% 0
Spar, High Street, Narberth 0.1% 1 0.0% 0 0.0% 0 0.0% 0 0.0% 0 0.0% 0 0.0% 0 1.3% 1 0.0% 0Spar, Market Street, Newport 0.1% 1 0.0% 0 0.0% 0 0.0% 0 0.0% 0 0.0% 0 0.0% 0 0.0% 0 0.0% 0Spar, Terrace Road,
Aberystwyth 0.9% 9 0.0% 0 0.0% 0 0.0% 0 0.0% 0 0.0% 0 0.0% 0 0.0% 0 0.0% 0
Tenby 0.1% 1 0.0% 0 0.0% 0 0.0% 0 0.0% 0 0.0% 0 1.3% 1 0.0% 0 0.0% 0
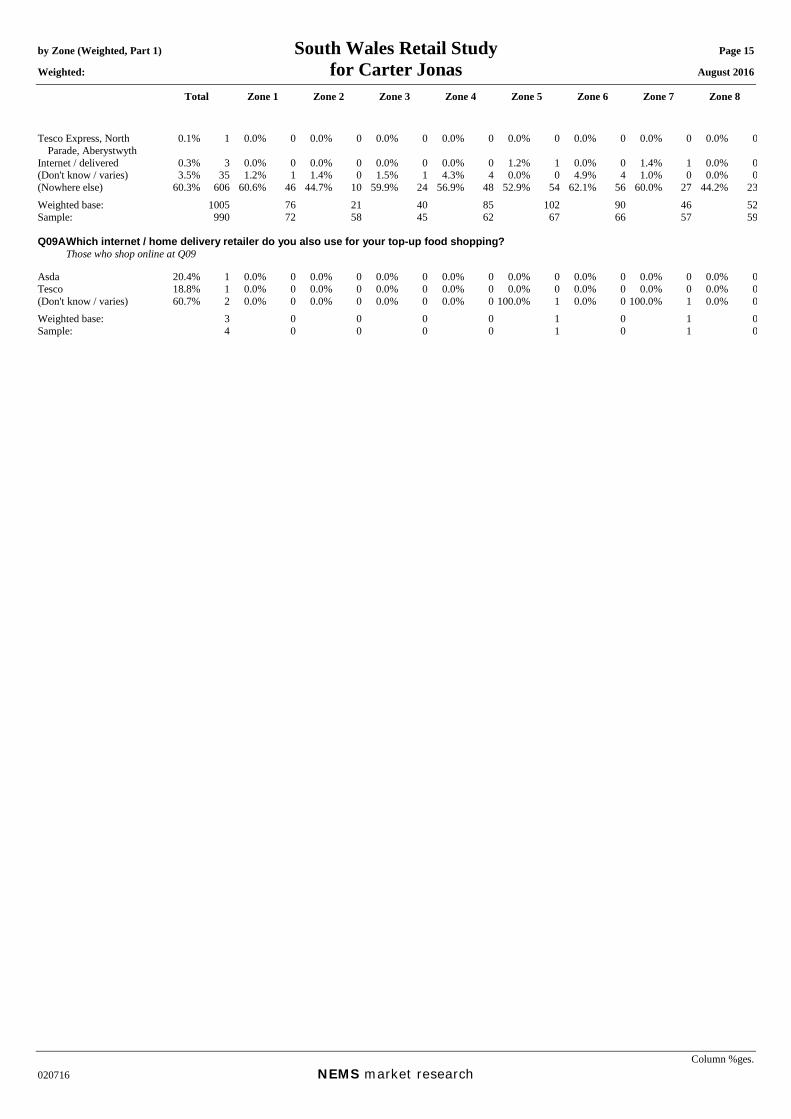
by Zone (Weighted, Part 1) South Wales Retail Study Page 15 Weighted: for Carter Jonas August 2016
Total Zone 1 Zone 2 Zone 3 Zone 4 Zone 5 Zone 6 Zone 7 Zone 8
Column %ges. 020716 NEMS market research
Tesco Express, North Parade, Aberystwyth
0.1% 1 0.0% 0 0.0% 0 0.0% 0 0.0% 0 0.0% 0 0.0% 0 0.0% 0 0.0% 0
Internet / delivered 0.3% 3 0.0% 0 0.0% 0 0.0% 0 0.0% 0 1.2% 1 0.0% 0 1.4% 1 0.0% 0(Don't know / varies) 3.5% 35 1.2% 1 1.4% 0 1.5% 1 4.3% 4 0.0% 0 4.9% 4 1.0% 0 0.0% 0(Nowhere else) 60.3% 606 60.6% 46 44.7% 10 59.9% 24 56.9% 48 52.9% 54 62.1% 56 60.0% 27 44.2% 23Weighted base: 1005 76 21 40 85 102 90 46 52Sample: 990 72 58 45 62 67 66 57 59 Q09A Which internet / home delivery retailer do you also use for your top-up food shopping? Those who shop online at Q09 Asda 20.4% 1 0.0% 0 0.0% 0 0.0% 0 0.0% 0 0.0% 0 0.0% 0 0.0% 0 0.0% 0Tesco 18.8% 1 0.0% 0 0.0% 0 0.0% 0 0.0% 0 0.0% 0 0.0% 0 0.0% 0 0.0% 0(Don't know / varies) 60.7% 2 0.0% 0 0.0% 0 0.0% 0 0.0% 0 100.0% 1 0.0% 0 100.0% 1 0.0% 0Weighted base: 3 0 0 0 0 1 0 1 0Sample: 4 0 0 0 0 1 0 1 0

by Zone (Weighted, Part 1) South Wales Retail Study Page 16 Weighted: for Carter Jonas August 2016
Total Zone 1 Zone 2 Zone 3 Zone 4 Zone 5 Zone 6 Zone 7 Zone 8
Column %ges. 020716 NEMS market research
Q10 In which ONE town centre, freestanding store or retail park do you do most of your household's shopping for mens, womens, childrens and baby clothing and footwear (fashion items - not sports clothing and footwear)?
Aberaeron 0.2% 3 0.0% 0 0.0% 0 0.0% 0 0.0% 0 0.0% 0 0.0% 0 0.0% 0 0.0% 0Aberyswyth out of centre
(where retail park is not named)
0.4% 6 0.0% 0 0.0% 0 0.0% 0 0.0% 0 0.0% 0 0.0% 0 0.0% 0 0.0% 0
Aberyswyth Town Centre 10.2% 163 0.0% 0 0.0% 0 0.0% 0 0.0% 0 0.0% 0 0.0% 0 0.0% 0 0.0% 0Borth 0.1% 1 0.8% 1 0.0% 0 0.0% 0 0.0% 0 0.0% 0 0.0% 0 0.0% 0 0.0% 0Cardiff Town Centre 2.9% 46 1.7% 2 2.6% 1 2.4% 2 4.7% 7 3.6% 5 1.6% 2 2.5% 2 1.5% 1Cardigan out of centre
(where retail park is not named)
0.0% 0 0.0% 0 0.0% 0 0.0% 0 0.0% 0 0.0% 0 0.0% 0 0.0% 0 0.0% 0
Cardigan Town Centre 1.5% 23 0.0% 0 0.7% 0 0.0% 0 0.0% 0 0.0% 0 3.3% 5 0.9% 1 0.0% 0Carmarthen out of centre
(where retail park is not named)
0.5% 8 0.0% 0 0.0% 0 0.0% 0 0.0% 0 0.0% 0 0.0% 0 0.0% 0 0.9% 1
Carmarthen Town Centre 22.3% 358 13.2% 14 15.5% 7 2.7% 2 7.4% 11 14.4% 22 27.9% 38 45.4% 35 5.7% 5Crymych 0.1% 1 0.0% 0 0.0% 0 0.0% 0 0.0% 0 0.0% 0 0.0% 0 0.0% 0 0.0% 0Fishguard 0.1% 1 0.0% 0 0.0% 0 0.0% 0 0.0% 0 0.0% 0 0.0% 0 0.0% 0 1.6% 1Haverfordwest out of centre
(where retail park is not named)
1.4% 22 2.8% 3 2.3% 1 2.4% 2 0.6% 1 0.6% 1 3.3% 5 1.8% 1 7.1% 7
Haverfordwest Town Centre 13.0% 209 22.2% 23 31.3% 13 30.3% 26 26.7% 40 17.4% 27 13.4% 18 17.0% 13 43.9% 41Kilgetty 0.0% 0 0.0% 0 0.7% 0 0.0% 0 0.0% 0 0.0% 0 0.0% 0 0.0% 0 0.0% 0Lampeter 0.9% 15 0.0% 0 0.0% 0 0.0% 0 1.2% 2 0.0% 0 0.0% 0 0.0% 0 0.0% 0Llandysul 0.0% 1 0.0% 0 0.0% 0 0.0% 0 0.0% 0 0.0% 0 0.0% 0 0.0% 0 0.0% 0Milford Haven out of centre
(where retail park is not named)
0.2% 3 0.0% 0 0.0% 0 0.0% 0 1.7% 3 0.0% 0 0.0% 0 0.0% 0 0.0% 0
Milford Haven Town Centre 0.2% 3 0.0% 0 0.0% 0 0.0% 0 2.3% 3 0.0% 0 0.0% 0 0.0% 0 0.0% 0Narberth 0.3% 5 0.0% 0 0.7% 0 0.0% 0 0.0% 0 0.6% 1 0.9% 1 2.2% 2 0.0% 0Newtown (Powys) 0.0% 1 0.0% 0 0.0% 0 0.0% 0 0.0% 0 0.0% 0 0.0% 0 0.0% 0 0.0% 0Pembroke Dock Central 0.8% 14 0.0% 0 0.0% 0 0.0% 0 1.4% 2 4.5% 7 3.3% 5 0.0% 0 0.0% 0Pembroke Town Centre 0.1% 1 0.0% 0 0.0% 0 0.0% 0 0.0% 0 0.8% 1 0.0% 0 0.0% 0 0.0% 0St Davids 0.1% 1 0.0% 0 0.7% 0 1.0% 1 0.0% 0 0.0% 0 0.0% 0 0.0% 0 0.0% 0Swansea City Centre 1.9% 30 4.9% 5 2.8% 1 1.0% 1 3.9% 6 4.2% 7 0.9% 1 0.8% 1 0.8% 1Tenby 0.4% 6 0.0% 0 0.0% 0 0.0% 0 0.0% 0 0.0% 0 4.3% 6 0.8% 1 0.0% 0Bridge Meadow Retail Park,
Haverfordwest 0.1% 1 0.9% 1 0.0% 0 0.0% 0 0.0% 0 0.0% 0 0.0% 0 0.6% 0 0.0% 0
Parc Fforest-fach, Swansea 0.0% 1 0.0% 0 0.0% 0 0.0% 0 0.0% 0 0.0% 0 0.0% 0 0.0% 0 0.0% 0Parc Pensarn Retail Park,
Myrtle Hill, Carmarthen 0.3% 5 0.0% 0 0.0% 0 0.0% 0 0.0% 0 0.0% 0 0.0% 0 0.0% 0 0.0% 0
Parc Pensarn, Carmarthen 0.1% 2 0.0% 0 0.0% 0 0.0% 0 0.0% 0 0.0% 0 0.0% 0 0.0% 0 0.0% 0Parc Y Llyn Retail Park,
Aberystwyth 0.5% 8 0.0% 0 0.0% 0 0.0% 0 0.0% 0 0.0% 0 0.0% 0 0.0% 0 0.0% 0
Pembrokeshire Retail Park, London Road, Pembroke Dock
0.3% 5 0.0% 0 0.0% 0 0.0% 0 0.0% 0 0.0% 0 4.0% 5 0.0% 0 0.0% 0
Riverside Quay, Haverfordwest
0.1% 2 0.0% 0 0.0% 0 0.0% 0 0.0% 0 0.0% 0 0.9% 1 0.6% 0 0.0% 0
Springfield Retail Park, Haverfordwest
0.2% 3 0.6% 1 0.0% 0 0.0% 0 0.0% 0 0.0% 0 0.0% 0 1.4% 1 0.0% 0
St Stephens Way, Carmarthen
0.1% 2 0.0% 0 0.0% 0 0.0% 0 0.0% 0 0.0% 0 0.0% 0 0.0% 0 0.0% 0
Trostre Retail Park, Llanelli 0.2% 3 0.0% 0 0.0% 0 0.0% 0 0.0% 0 0.0% 0 0.0% 0 0.0% 0 0.0% 0Western Avenue Retail Park,
Cardiff 0.0% 1 0.0% 0 0.0% 0 0.0% 0 0.0% 0 0.0% 0 0.0% 0 0.0% 0 0.0% 0
Withybush Retail Park, Haverfordwest
8.4% 135 25.1% 26 19.9% 8 17.1% 15 19.6% 30 21.3% 33 2.5% 3 6.7% 5 7.6% 7
Ystwyth Retail Park, Aberystwyth
0.2% 3 0.0% 0 1.0% 0 0.0% 0 0.0% 0 0.0% 0 0.0% 0 0.0% 0 0.0% 0
Abroad 0.1% 1 0.0% 0 0.0% 0 0.7% 1 0.0% 0 0.0% 0 0.0% 0 0.0% 0 0.8% 1Birmingham 0.1% 1 0.0% 0 0.0% 0 0.0% 0 0.0% 0 0.0% 0 0.0% 0 0.0% 0 0.0% 0Bournemouth 0.1% 2 0.0% 0 0.0% 0 0.0% 0 0.0% 0 0.0% 0 0.0% 0 0.0% 0 0.0% 0Bridgend 0.1% 2 0.0% 0 0.0% 0 0.0% 0 0.0% 0 0.0% 0 0.0% 0 0.0% 0 0.0% 0Bridgend Designer Outlet,
Bridgend 0.1% 2 0.0% 0 1.7% 1 0.0% 0 0.0% 0 0.0% 0 0.0% 0 0.0% 0 0.9% 1
Bristol 0.3% 5 0.0% 0 0.0% 0 0.0% 0 0.0% 0 0.0% 0 0.0% 0 0.0% 0 0.0% 0Central London 0.2% 2 0.0% 0 0.0% 0 0.0% 0 0.0% 0 0.6% 1 0.0% 0 0.0% 0 0.6% 1Cheltenham 0.0% 1 0.0% 0 0.0% 0 0.0% 0 0.0% 0 0.0% 0 0.0% 0 0.0% 0 0.0% 0Chester 0.2% 3 0.0% 0 0.0% 0 0.0% 0 0.0% 0 0.0% 0 0.0% 0 0.0% 0 0.0% 0Clynderwen 0.1% 1 0.0% 0 0.0% 0 0.0% 0 0.0% 0 0.0% 0 0.0% 0 0.0% 0 0.9% 1Croydon 0.0% 0 0.0% 0 0.0% 0 0.0% 0 0.0% 0 0.0% 0 0.0% 0 0.0% 0 0.0% 0
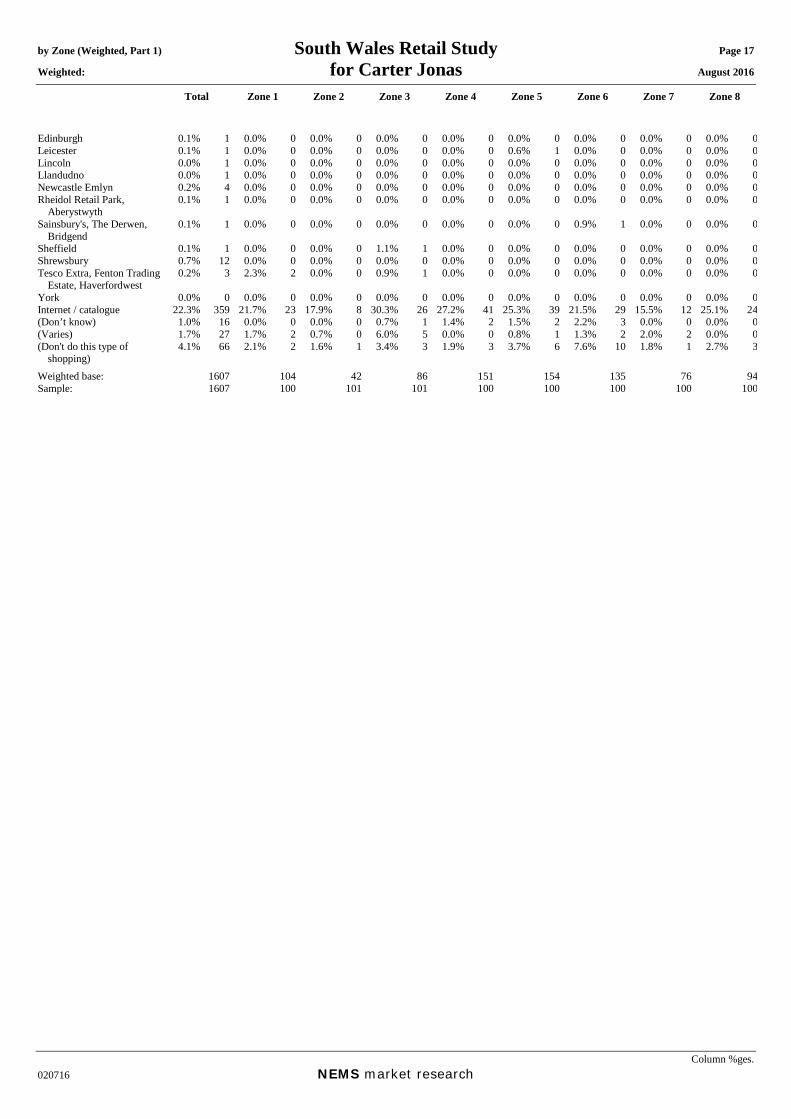
by Zone (Weighted, Part 1) South Wales Retail Study Page 17 Weighted: for Carter Jonas August 2016
Total Zone 1 Zone 2 Zone 3 Zone 4 Zone 5 Zone 6 Zone 7 Zone 8
Column %ges. 020716 NEMS market research
Edinburgh 0.1% 1 0.0% 0 0.0% 0 0.0% 0 0.0% 0 0.0% 0 0.0% 0 0.0% 0 0.0% 0Leicester 0.1% 1 0.0% 0 0.0% 0 0.0% 0 0.0% 0 0.6% 1 0.0% 0 0.0% 0 0.0% 0Lincoln 0.0% 1 0.0% 0 0.0% 0 0.0% 0 0.0% 0 0.0% 0 0.0% 0 0.0% 0 0.0% 0Llandudno 0.0% 1 0.0% 0 0.0% 0 0.0% 0 0.0% 0 0.0% 0 0.0% 0 0.0% 0 0.0% 0Newcastle Emlyn 0.2% 4 0.0% 0 0.0% 0 0.0% 0 0.0% 0 0.0% 0 0.0% 0 0.0% 0 0.0% 0Rheidol Retail Park,
Aberystwyth 0.1% 1 0.0% 0 0.0% 0 0.0% 0 0.0% 0 0.0% 0 0.0% 0 0.0% 0 0.0% 0
Sainsbury's, The Derwen, Bridgend
0.1% 1 0.0% 0 0.0% 0 0.0% 0 0.0% 0 0.0% 0 0.9% 1 0.0% 0 0.0% 0
Sheffield 0.1% 1 0.0% 0 0.0% 0 1.1% 1 0.0% 0 0.0% 0 0.0% 0 0.0% 0 0.0% 0Shrewsbury 0.7% 12 0.0% 0 0.0% 0 0.0% 0 0.0% 0 0.0% 0 0.0% 0 0.0% 0 0.0% 0Tesco Extra, Fenton Trading
Estate, Haverfordwest 0.2% 3 2.3% 2 0.0% 0 0.9% 1 0.0% 0 0.0% 0 0.0% 0 0.0% 0 0.0% 0
York 0.0% 0 0.0% 0 0.0% 0 0.0% 0 0.0% 0 0.0% 0 0.0% 0 0.0% 0 0.0% 0Internet / catalogue 22.3% 359 21.7% 23 17.9% 8 30.3% 26 27.2% 41 25.3% 39 21.5% 29 15.5% 12 25.1% 24(Don’t know) 1.0% 16 0.0% 0 0.0% 0 0.7% 1 1.4% 2 1.5% 2 2.2% 3 0.0% 0 0.0% 0(Varies) 1.7% 27 1.7% 2 0.7% 0 6.0% 5 0.0% 0 0.8% 1 1.3% 2 2.0% 2 0.0% 0(Don't do this type of
shopping) 4.1% 66 2.1% 2 1.6% 1 3.4% 3 1.9% 3 3.7% 6 7.6% 10 1.8% 1 2.7% 3
Weighted base: 1607 104 42 86 151 154 135 76 94Sample: 1607 100 101 101 100 100 100 100 100
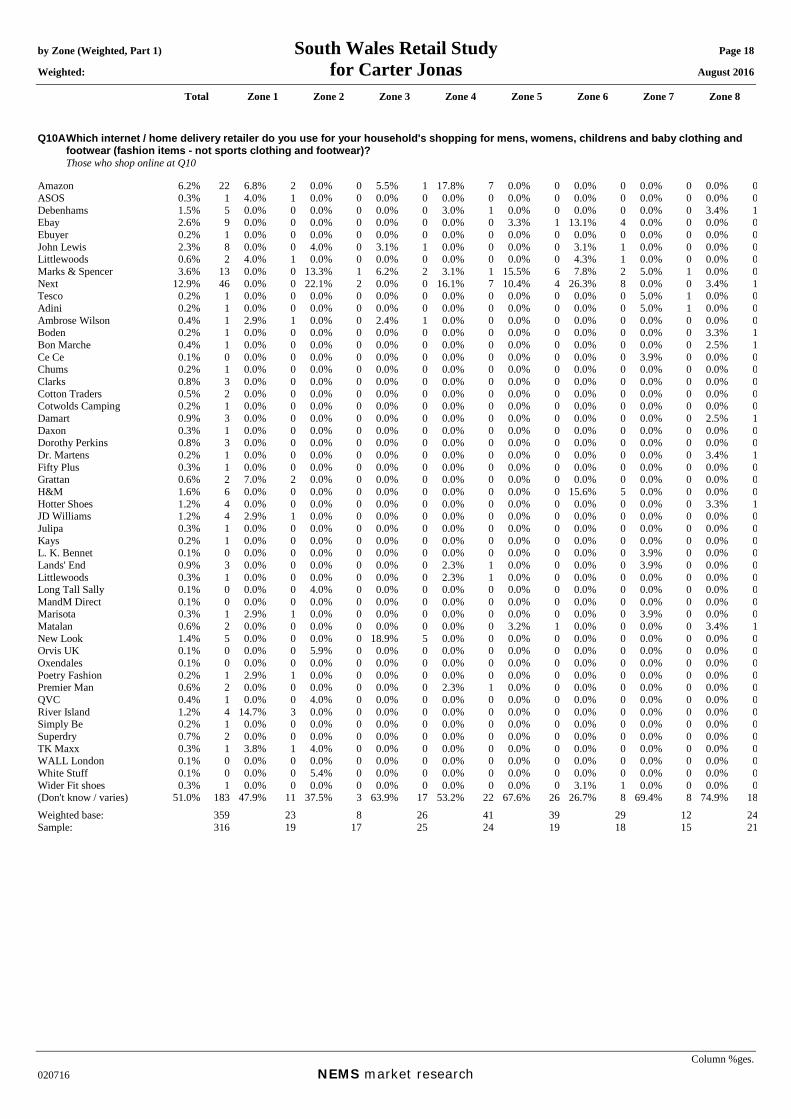
by Zone (Weighted, Part 1) South Wales Retail Study Page 18 Weighted: for Carter Jonas August 2016
Total Zone 1 Zone 2 Zone 3 Zone 4 Zone 5 Zone 6 Zone 7 Zone 8
Column %ges. 020716 NEMS market research
Q10A Which internet / home delivery retailer do you use for your household's shopping for mens, womens, childrens and baby clothing and footwear (fashion items - not sports clothing and footwear)?
Those who shop online at Q10 Amazon 6.2% 22 6.8% 2 0.0% 0 5.5% 1 17.8% 7 0.0% 0 0.0% 0 0.0% 0 0.0% 0ASOS 0.3% 1 4.0% 1 0.0% 0 0.0% 0 0.0% 0 0.0% 0 0.0% 0 0.0% 0 0.0% 0Debenhams 1.5% 5 0.0% 0 0.0% 0 0.0% 0 3.0% 1 0.0% 0 0.0% 0 0.0% 0 3.4% 1Ebay 2.6% 9 0.0% 0 0.0% 0 0.0% 0 0.0% 0 3.3% 1 13.1% 4 0.0% 0 0.0% 0Ebuyer 0.2% 1 0.0% 0 0.0% 0 0.0% 0 0.0% 0 0.0% 0 0.0% 0 0.0% 0 0.0% 0John Lewis 2.3% 8 0.0% 0 4.0% 0 3.1% 1 0.0% 0 0.0% 0 3.1% 1 0.0% 0 0.0% 0Littlewoods 0.6% 2 4.0% 1 0.0% 0 0.0% 0 0.0% 0 0.0% 0 4.3% 1 0.0% 0 0.0% 0Marks & Spencer 3.6% 13 0.0% 0 13.3% 1 6.2% 2 3.1% 1 15.5% 6 7.8% 2 5.0% 1 0.0% 0Next 12.9% 46 0.0% 0 22.1% 2 0.0% 0 16.1% 7 10.4% 4 26.3% 8 0.0% 0 3.4% 1Tesco 0.2% 1 0.0% 0 0.0% 0 0.0% 0 0.0% 0 0.0% 0 0.0% 0 5.0% 1 0.0% 0Adini 0.2% 1 0.0% 0 0.0% 0 0.0% 0 0.0% 0 0.0% 0 0.0% 0 5.0% 1 0.0% 0Ambrose Wilson 0.4% 1 2.9% 1 0.0% 0 2.4% 1 0.0% 0 0.0% 0 0.0% 0 0.0% 0 0.0% 0Boden 0.2% 1 0.0% 0 0.0% 0 0.0% 0 0.0% 0 0.0% 0 0.0% 0 0.0% 0 3.3% 1Bon Marche 0.4% 1 0.0% 0 0.0% 0 0.0% 0 0.0% 0 0.0% 0 0.0% 0 0.0% 0 2.5% 1Ce Ce 0.1% 0 0.0% 0 0.0% 0 0.0% 0 0.0% 0 0.0% 0 0.0% 0 3.9% 0 0.0% 0Chums 0.2% 1 0.0% 0 0.0% 0 0.0% 0 0.0% 0 0.0% 0 0.0% 0 0.0% 0 0.0% 0Clarks 0.8% 3 0.0% 0 0.0% 0 0.0% 0 0.0% 0 0.0% 0 0.0% 0 0.0% 0 0.0% 0Cotton Traders 0.5% 2 0.0% 0 0.0% 0 0.0% 0 0.0% 0 0.0% 0 0.0% 0 0.0% 0 0.0% 0Cotwolds Camping 0.2% 1 0.0% 0 0.0% 0 0.0% 0 0.0% 0 0.0% 0 0.0% 0 0.0% 0 0.0% 0Damart 0.9% 3 0.0% 0 0.0% 0 0.0% 0 0.0% 0 0.0% 0 0.0% 0 0.0% 0 2.5% 1Daxon 0.3% 1 0.0% 0 0.0% 0 0.0% 0 0.0% 0 0.0% 0 0.0% 0 0.0% 0 0.0% 0Dorothy Perkins 0.8% 3 0.0% 0 0.0% 0 0.0% 0 0.0% 0 0.0% 0 0.0% 0 0.0% 0 0.0% 0Dr. Martens 0.2% 1 0.0% 0 0.0% 0 0.0% 0 0.0% 0 0.0% 0 0.0% 0 0.0% 0 3.4% 1Fifty Plus 0.3% 1 0.0% 0 0.0% 0 0.0% 0 0.0% 0 0.0% 0 0.0% 0 0.0% 0 0.0% 0Grattan 0.6% 2 7.0% 2 0.0% 0 0.0% 0 0.0% 0 0.0% 0 0.0% 0 0.0% 0 0.0% 0H&M 1.6% 6 0.0% 0 0.0% 0 0.0% 0 0.0% 0 0.0% 0 15.6% 5 0.0% 0 0.0% 0Hotter Shoes 1.2% 4 0.0% 0 0.0% 0 0.0% 0 0.0% 0 0.0% 0 0.0% 0 0.0% 0 3.3% 1JD Williams 1.2% 4 2.9% 1 0.0% 0 0.0% 0 0.0% 0 0.0% 0 0.0% 0 0.0% 0 0.0% 0Julipa 0.3% 1 0.0% 0 0.0% 0 0.0% 0 0.0% 0 0.0% 0 0.0% 0 0.0% 0 0.0% 0Kays 0.2% 1 0.0% 0 0.0% 0 0.0% 0 0.0% 0 0.0% 0 0.0% 0 0.0% 0 0.0% 0L. K. Bennet 0.1% 0 0.0% 0 0.0% 0 0.0% 0 0.0% 0 0.0% 0 0.0% 0 3.9% 0 0.0% 0Lands' End 0.9% 3 0.0% 0 0.0% 0 0.0% 0 2.3% 1 0.0% 0 0.0% 0 3.9% 0 0.0% 0Littlewoods 0.3% 1 0.0% 0 0.0% 0 0.0% 0 2.3% 1 0.0% 0 0.0% 0 0.0% 0 0.0% 0Long Tall Sally 0.1% 0 0.0% 0 4.0% 0 0.0% 0 0.0% 0 0.0% 0 0.0% 0 0.0% 0 0.0% 0MandM Direct 0.1% 0 0.0% 0 0.0% 0 0.0% 0 0.0% 0 0.0% 0 0.0% 0 0.0% 0 0.0% 0Marisota 0.3% 1 2.9% 1 0.0% 0 0.0% 0 0.0% 0 0.0% 0 0.0% 0 3.9% 0 0.0% 0Matalan 0.6% 2 0.0% 0 0.0% 0 0.0% 0 0.0% 0 3.2% 1 0.0% 0 0.0% 0 3.4% 1New Look 1.4% 5 0.0% 0 0.0% 0 18.9% 5 0.0% 0 0.0% 0 0.0% 0 0.0% 0 0.0% 0Orvis UK 0.1% 0 0.0% 0 5.9% 0 0.0% 0 0.0% 0 0.0% 0 0.0% 0 0.0% 0 0.0% 0Oxendales 0.1% 0 0.0% 0 0.0% 0 0.0% 0 0.0% 0 0.0% 0 0.0% 0 0.0% 0 0.0% 0Poetry Fashion 0.2% 1 2.9% 1 0.0% 0 0.0% 0 0.0% 0 0.0% 0 0.0% 0 0.0% 0 0.0% 0Premier Man 0.6% 2 0.0% 0 0.0% 0 0.0% 0 2.3% 1 0.0% 0 0.0% 0 0.0% 0 0.0% 0QVC 0.4% 1 0.0% 0 4.0% 0 0.0% 0 0.0% 0 0.0% 0 0.0% 0 0.0% 0 0.0% 0River Island 1.2% 4 14.7% 3 0.0% 0 0.0% 0 0.0% 0 0.0% 0 0.0% 0 0.0% 0 0.0% 0Simply Be 0.2% 1 0.0% 0 0.0% 0 0.0% 0 0.0% 0 0.0% 0 0.0% 0 0.0% 0 0.0% 0Superdry 0.7% 2 0.0% 0 0.0% 0 0.0% 0 0.0% 0 0.0% 0 0.0% 0 0.0% 0 0.0% 0TK Maxx 0.3% 1 3.8% 1 4.0% 0 0.0% 0 0.0% 0 0.0% 0 0.0% 0 0.0% 0 0.0% 0WALL London 0.1% 0 0.0% 0 0.0% 0 0.0% 0 0.0% 0 0.0% 0 0.0% 0 0.0% 0 0.0% 0White Stuff 0.1% 0 0.0% 0 5.4% 0 0.0% 0 0.0% 0 0.0% 0 0.0% 0 0.0% 0 0.0% 0Wider Fit shoes 0.3% 1 0.0% 0 0.0% 0 0.0% 0 0.0% 0 0.0% 0 3.1% 1 0.0% 0 0.0% 0(Don't know / varies) 51.0% 183 47.9% 11 37.5% 3 63.9% 17 53.2% 22 67.6% 26 26.7% 8 69.4% 8 74.9% 18Weighted base: 359 23 8 26 41 39 29 12 24Sample: 316 19 17 25 24 19 18 15 21
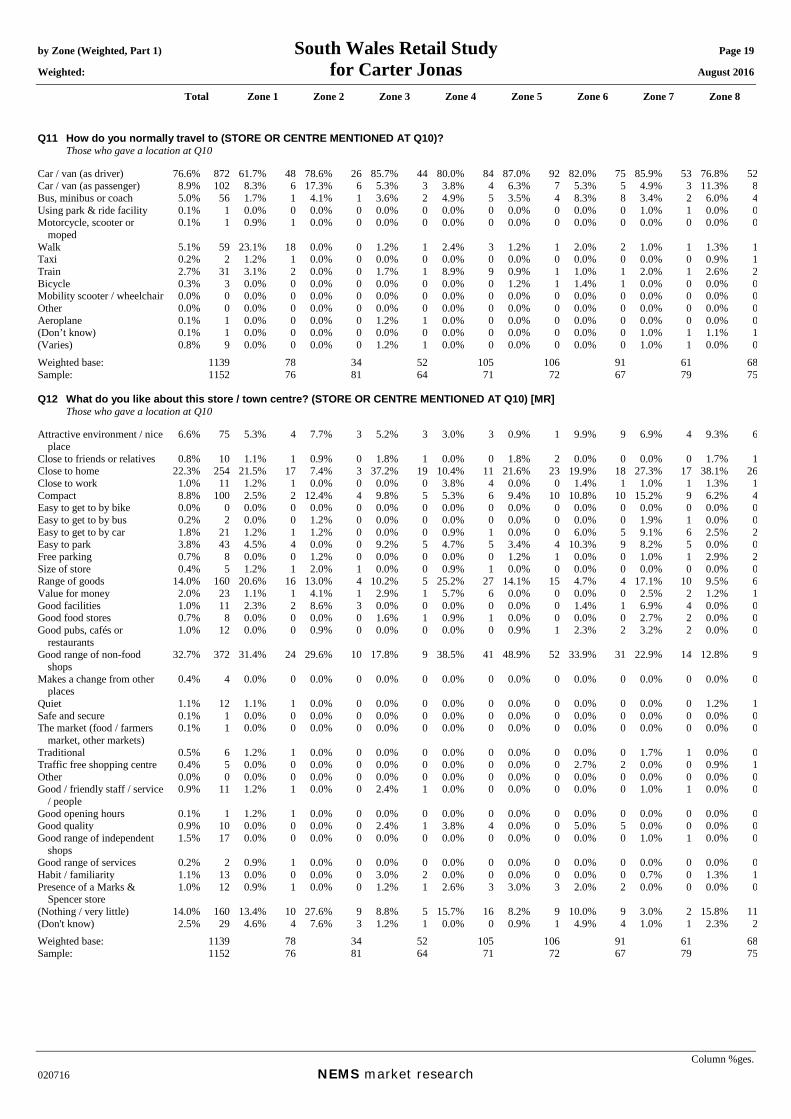
by Zone (Weighted, Part 1) South Wales Retail Study Page 19 Weighted: for Carter Jonas August 2016
Total Zone 1 Zone 2 Zone 3 Zone 4 Zone 5 Zone 6 Zone 7 Zone 8
Column %ges. 020716 NEMS market research
Q11 How do you normally travel to (STORE OR CENTRE MENTIONED AT Q10)? Those who gave a location at Q10 Car / van (as driver) 76.6% 872 61.7% 48 78.6% 26 85.7% 44 80.0% 84 87.0% 92 82.0% 75 85.9% 53 76.8% 52Car / van (as passenger) 8.9% 102 8.3% 6 17.3% 6 5.3% 3 3.8% 4 6.3% 7 5.3% 5 4.9% 3 11.3% 8Bus, minibus or coach 5.0% 56 1.7% 1 4.1% 1 3.6% 2 4.9% 5 3.5% 4 8.3% 8 3.4% 2 6.0% 4Using park & ride facility 0.1% 1 0.0% 0 0.0% 0 0.0% 0 0.0% 0 0.0% 0 0.0% 0 1.0% 1 0.0% 0Motorcycle, scooter or
moped 0.1% 1 0.9% 1 0.0% 0 0.0% 0 0.0% 0 0.0% 0 0.0% 0 0.0% 0 0.0% 0
Walk 5.1% 59 23.1% 18 0.0% 0 1.2% 1 2.4% 3 1.2% 1 2.0% 2 1.0% 1 1.3% 1Taxi 0.2% 2 1.2% 1 0.0% 0 0.0% 0 0.0% 0 0.0% 0 0.0% 0 0.0% 0 0.9% 1Train 2.7% 31 3.1% 2 0.0% 0 1.7% 1 8.9% 9 0.9% 1 1.0% 1 2.0% 1 2.6% 2Bicycle 0.3% 3 0.0% 0 0.0% 0 0.0% 0 0.0% 0 1.2% 1 1.4% 1 0.0% 0 0.0% 0Mobility scooter / wheelchair 0.0% 0 0.0% 0 0.0% 0 0.0% 0 0.0% 0 0.0% 0 0.0% 0 0.0% 0 0.0% 0Other 0.0% 0 0.0% 0 0.0% 0 0.0% 0 0.0% 0 0.0% 0 0.0% 0 0.0% 0 0.0% 0Aeroplane 0.1% 1 0.0% 0 0.0% 0 1.2% 1 0.0% 0 0.0% 0 0.0% 0 0.0% 0 0.0% 0(Don’t know) 0.1% 1 0.0% 0 0.0% 0 0.0% 0 0.0% 0 0.0% 0 0.0% 0 1.0% 1 1.1% 1(Varies) 0.8% 9 0.0% 0 0.0% 0 1.2% 1 0.0% 0 0.0% 0 0.0% 0 1.0% 1 0.0% 0Weighted base: 1139 78 34 52 105 106 91 61 68Sample: 1152 76 81 64 71 72 67 79 75 Q12 What do you like about this store / town centre? (STORE OR CENTRE MENTIONED AT Q10) [MR] Those who gave a location at Q10 Attractive environment / nice
place 6.6% 75 5.3% 4 7.7% 3 5.2% 3 3.0% 3 0.9% 1 9.9% 9 6.9% 4 9.3% 6
Close to friends or relatives 0.8% 10 1.1% 1 0.9% 0 1.8% 1 0.0% 0 1.8% 2 0.0% 0 0.0% 0 1.7% 1Close to home 22.3% 254 21.5% 17 7.4% 3 37.2% 19 10.4% 11 21.6% 23 19.9% 18 27.3% 17 38.1% 26Close to work 1.0% 11 1.2% 1 0.0% 0 0.0% 0 3.8% 4 0.0% 0 1.4% 1 1.0% 1 1.3% 1Compact 8.8% 100 2.5% 2 12.4% 4 9.8% 5 5.3% 6 9.4% 10 10.8% 10 15.2% 9 6.2% 4Easy to get to by bike 0.0% 0 0.0% 0 0.0% 0 0.0% 0 0.0% 0 0.0% 0 0.0% 0 0.0% 0 0.0% 0Easy to get to by bus 0.2% 2 0.0% 0 1.2% 0 0.0% 0 0.0% 0 0.0% 0 0.0% 0 1.9% 1 0.0% 0Easy to get to by car 1.8% 21 1.2% 1 1.2% 0 0.0% 0 0.9% 1 0.0% 0 6.0% 5 9.1% 6 2.5% 2Easy to park 3.8% 43 4.5% 4 0.0% 0 9.2% 5 4.7% 5 3.4% 4 10.3% 9 8.2% 5 0.0% 0Free parking 0.7% 8 0.0% 0 1.2% 0 0.0% 0 0.0% 0 1.2% 1 0.0% 0 1.0% 1 2.9% 2Size of store 0.4% 5 1.2% 1 2.0% 1 0.0% 0 0.9% 1 0.0% 0 0.0% 0 0.0% 0 0.0% 0Range of goods 14.0% 160 20.6% 16 13.0% 4 10.2% 5 25.2% 27 14.1% 15 4.7% 4 17.1% 10 9.5% 6Value for money 2.0% 23 1.1% 1 4.1% 1 2.9% 1 5.7% 6 0.0% 0 0.0% 0 2.5% 2 1.2% 1Good facilities 1.0% 11 2.3% 2 8.6% 3 0.0% 0 0.0% 0 0.0% 0 1.4% 1 6.9% 4 0.0% 0Good food stores 0.7% 8 0.0% 0 0.0% 0 1.6% 1 0.9% 1 0.0% 0 0.0% 0 2.7% 2 0.0% 0Good pubs, cafés or
restaurants 1.0% 12 0.0% 0 0.9% 0 0.0% 0 0.0% 0 0.9% 1 2.3% 2 3.2% 2 0.0% 0
Good range of non-food shops
32.7% 372 31.4% 24 29.6% 10 17.8% 9 38.5% 41 48.9% 52 33.9% 31 22.9% 14 12.8% 9
Makes a change from other places
0.4% 4 0.0% 0 0.0% 0 0.0% 0 0.0% 0 0.0% 0 0.0% 0 0.0% 0 0.0% 0
Quiet 1.1% 12 1.1% 1 0.0% 0 0.0% 0 0.0% 0 0.0% 0 0.0% 0 0.0% 0 1.2% 1Safe and secure 0.1% 1 0.0% 0 0.0% 0 0.0% 0 0.0% 0 0.0% 0 0.0% 0 0.0% 0 0.0% 0The market (food / farmers
market, other markets) 0.1% 1 0.0% 0 0.0% 0 0.0% 0 0.0% 0 0.0% 0 0.0% 0 0.0% 0 0.0% 0
Traditional 0.5% 6 1.2% 1 0.0% 0 0.0% 0 0.0% 0 0.0% 0 0.0% 0 1.7% 1 0.0% 0Traffic free shopping centre 0.4% 5 0.0% 0 0.0% 0 0.0% 0 0.0% 0 0.0% 0 2.7% 2 0.0% 0 0.9% 1Other 0.0% 0 0.0% 0 0.0% 0 0.0% 0 0.0% 0 0.0% 0 0.0% 0 0.0% 0 0.0% 0Good / friendly staff / service
/ people 0.9% 11 1.2% 1 0.0% 0 2.4% 1 0.0% 0 0.0% 0 0.0% 0 1.0% 1 0.0% 0
Good opening hours 0.1% 1 1.2% 1 0.0% 0 0.0% 0 0.0% 0 0.0% 0 0.0% 0 0.0% 0 0.0% 0Good quality 0.9% 10 0.0% 0 0.0% 0 2.4% 1 3.8% 4 0.0% 0 5.0% 5 0.0% 0 0.0% 0Good range of independent
shops 1.5% 17 0.0% 0 0.0% 0 0.0% 0 0.0% 0 0.0% 0 0.0% 0 1.0% 1 0.0% 0
Good range of services 0.2% 2 0.9% 1 0.0% 0 0.0% 0 0.0% 0 0.0% 0 0.0% 0 0.0% 0 0.0% 0Habit / familiarity 1.1% 13 0.0% 0 0.0% 0 3.0% 2 0.0% 0 0.0% 0 0.0% 0 0.7% 0 1.3% 1Presence of a Marks &
Spencer store 1.0% 12 0.9% 1 0.0% 0 1.2% 1 2.6% 3 3.0% 3 2.0% 2 0.0% 0 0.0% 0
(Nothing / very little) 14.0% 160 13.4% 10 27.6% 9 8.8% 5 15.7% 16 8.2% 9 10.0% 9 3.0% 2 15.8% 11(Don't know) 2.5% 29 4.6% 4 7.6% 3 1.2% 1 0.0% 0 0.9% 1 4.9% 4 1.0% 1 2.3% 2Weighted base: 1139 78 34 52 105 106 91 61 68Sample: 1152 76 81 64 71 72 67 79 75
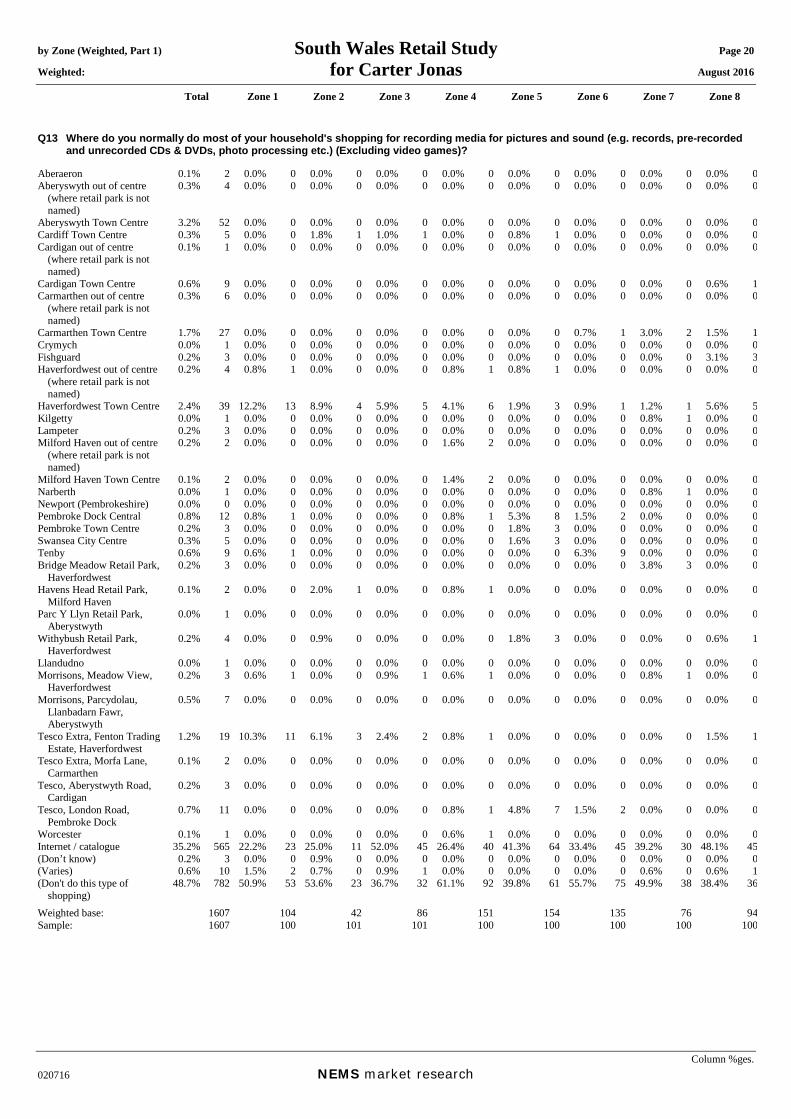
by Zone (Weighted, Part 1) South Wales Retail Study Page 20 Weighted: for Carter Jonas August 2016
Total Zone 1 Zone 2 Zone 3 Zone 4 Zone 5 Zone 6 Zone 7 Zone 8
Column %ges. 020716 NEMS market research
Q13 Where do you normally do most of your household's shopping for recording media for pictures and sound (e.g. records, pre-recorded and unrecorded CDs & DVDs, photo processing etc.) (Excluding video games)?
Aberaeron 0.1% 2 0.0% 0 0.0% 0 0.0% 0 0.0% 0 0.0% 0 0.0% 0 0.0% 0 0.0% 0Aberyswyth out of centre
(where retail park is not named)
0.3% 4 0.0% 0 0.0% 0 0.0% 0 0.0% 0 0.0% 0 0.0% 0 0.0% 0 0.0% 0
Aberyswyth Town Centre 3.2% 52 0.0% 0 0.0% 0 0.0% 0 0.0% 0 0.0% 0 0.0% 0 0.0% 0 0.0% 0Cardiff Town Centre 0.3% 5 0.0% 0 1.8% 1 1.0% 1 0.0% 0 0.8% 1 0.0% 0 0.0% 0 0.0% 0Cardigan out of centre
(where retail park is not named)
0.1% 1 0.0% 0 0.0% 0 0.0% 0 0.0% 0 0.0% 0 0.0% 0 0.0% 0 0.0% 0
Cardigan Town Centre 0.6% 9 0.0% 0 0.0% 0 0.0% 0 0.0% 0 0.0% 0 0.0% 0 0.0% 0 0.6% 1Carmarthen out of centre
(where retail park is not named)
0.3% 6 0.0% 0 0.0% 0 0.0% 0 0.0% 0 0.0% 0 0.0% 0 0.0% 0 0.0% 0
Carmarthen Town Centre 1.7% 27 0.0% 0 0.0% 0 0.0% 0 0.0% 0 0.0% 0 0.7% 1 3.0% 2 1.5% 1Crymych 0.0% 1 0.0% 0 0.0% 0 0.0% 0 0.0% 0 0.0% 0 0.0% 0 0.0% 0 0.0% 0Fishguard 0.2% 3 0.0% 0 0.0% 0 0.0% 0 0.0% 0 0.0% 0 0.0% 0 0.0% 0 3.1% 3Haverfordwest out of centre
(where retail park is not named)
0.2% 4 0.8% 1 0.0% 0 0.0% 0 0.8% 1 0.8% 1 0.0% 0 0.0% 0 0.0% 0
Haverfordwest Town Centre 2.4% 39 12.2% 13 8.9% 4 5.9% 5 4.1% 6 1.9% 3 0.9% 1 1.2% 1 5.6% 5Kilgetty 0.0% 1 0.0% 0 0.0% 0 0.0% 0 0.0% 0 0.0% 0 0.0% 0 0.8% 1 0.0% 0Lampeter 0.2% 3 0.0% 0 0.0% 0 0.0% 0 0.0% 0 0.0% 0 0.0% 0 0.0% 0 0.0% 0Milford Haven out of centre
(where retail park is not named)
0.2% 2 0.0% 0 0.0% 0 0.0% 0 1.6% 2 0.0% 0 0.0% 0 0.0% 0 0.0% 0
Milford Haven Town Centre 0.1% 2 0.0% 0 0.0% 0 0.0% 0 1.4% 2 0.0% 0 0.0% 0 0.0% 0 0.0% 0Narberth 0.0% 1 0.0% 0 0.0% 0 0.0% 0 0.0% 0 0.0% 0 0.0% 0 0.8% 1 0.0% 0Newport (Pembrokeshire) 0.0% 0 0.0% 0 0.0% 0 0.0% 0 0.0% 0 0.0% 0 0.0% 0 0.0% 0 0.0% 0Pembroke Dock Central 0.8% 12 0.8% 1 0.0% 0 0.0% 0 0.8% 1 5.3% 8 1.5% 2 0.0% 0 0.0% 0Pembroke Town Centre 0.2% 3 0.0% 0 0.0% 0 0.0% 0 0.0% 0 1.8% 3 0.0% 0 0.0% 0 0.0% 0Swansea City Centre 0.3% 5 0.0% 0 0.0% 0 0.0% 0 0.0% 0 1.6% 3 0.0% 0 0.0% 0 0.0% 0Tenby 0.6% 9 0.6% 1 0.0% 0 0.0% 0 0.0% 0 0.0% 0 6.3% 9 0.0% 0 0.0% 0Bridge Meadow Retail Park,
Haverfordwest 0.2% 3 0.0% 0 0.0% 0 0.0% 0 0.0% 0 0.0% 0 0.0% 0 3.8% 3 0.0% 0
Havens Head Retail Park, Milford Haven
0.1% 2 0.0% 0 2.0% 1 0.0% 0 0.8% 1 0.0% 0 0.0% 0 0.0% 0 0.0% 0
Parc Y Llyn Retail Park, Aberystwyth
0.0% 1 0.0% 0 0.0% 0 0.0% 0 0.0% 0 0.0% 0 0.0% 0 0.0% 0 0.0% 0
Withybush Retail Park, Haverfordwest
0.2% 4 0.0% 0 0.9% 0 0.0% 0 0.0% 0 1.8% 3 0.0% 0 0.0% 0 0.6% 1
Llandudno 0.0% 1 0.0% 0 0.0% 0 0.0% 0 0.0% 0 0.0% 0 0.0% 0 0.0% 0 0.0% 0Morrisons, Meadow View,
Haverfordwest 0.2% 3 0.6% 1 0.0% 0 0.9% 1 0.6% 1 0.0% 0 0.0% 0 0.8% 1 0.0% 0
Morrisons, Parcydolau, Llanbadarn Fawr, Aberystwyth
0.5% 7 0.0% 0 0.0% 0 0.0% 0 0.0% 0 0.0% 0 0.0% 0 0.0% 0 0.0% 0
Tesco Extra, Fenton Trading Estate, Haverfordwest
1.2% 19 10.3% 11 6.1% 3 2.4% 2 0.8% 1 0.0% 0 0.0% 0 0.0% 0 1.5% 1
Tesco Extra, Morfa Lane, Carmarthen
0.1% 2 0.0% 0 0.0% 0 0.0% 0 0.0% 0 0.0% 0 0.0% 0 0.0% 0 0.0% 0
Tesco, Aberystwyth Road, Cardigan
0.2% 3 0.0% 0 0.0% 0 0.0% 0 0.0% 0 0.0% 0 0.0% 0 0.0% 0 0.0% 0
Tesco, London Road, Pembroke Dock
0.7% 11 0.0% 0 0.0% 0 0.0% 0 0.8% 1 4.8% 7 1.5% 2 0.0% 0 0.0% 0
Worcester 0.1% 1 0.0% 0 0.0% 0 0.0% 0 0.6% 1 0.0% 0 0.0% 0 0.0% 0 0.0% 0Internet / catalogue 35.2% 565 22.2% 23 25.0% 11 52.0% 45 26.4% 40 41.3% 64 33.4% 45 39.2% 30 48.1% 45(Don’t know) 0.2% 3 0.0% 0 0.9% 0 0.0% 0 0.0% 0 0.0% 0 0.0% 0 0.0% 0 0.0% 0(Varies) 0.6% 10 1.5% 2 0.7% 0 0.9% 1 0.0% 0 0.0% 0 0.0% 0 0.6% 0 0.6% 1(Don't do this type of
shopping) 48.7% 782 50.9% 53 53.6% 23 36.7% 32 61.1% 92 39.8% 61 55.7% 75 49.9% 38 38.4% 36
Weighted base: 1607 104 42 86 151 154 135 76 94Sample: 1607 100 101 101 100 100 100 100 100

by Zone (Weighted, Part 1) South Wales Retail Study Page 21 Weighted: for Carter Jonas August 2016
Total Zone 1 Zone 2 Zone 3 Zone 4 Zone 5 Zone 6 Zone 7 Zone 8
Column %ges. 020716 NEMS market research
Q13A Which internet / home delivery retailer do you use for your household's shopping for recording media for pictures and sound (e.g. records, pre-recorded and unrecorded CDs & DVDs, unexposed films for photographic use, etc. ) (Excluding video games)?
Those who shop online at Q13 Amazon 71.9% 406 62.0% 14 74.0% 8 82.5% 37 56.4% 23 70.6% 45 57.7% 26 84.7% 25 77.7% 35Argos 0.2% 1 0.0% 0 0.0% 0 0.0% 0 0.0% 0 0.0% 0 2.0% 1 0.0% 0 0.0% 0Ebay 4.0% 23 8.3% 2 3.9% 0 1.8% 1 14.9% 6 1.9% 1 8.5% 4 0.0% 0 1.8% 1HMV 0.9% 5 0.0% 0 3.9% 0 0.0% 0 3.0% 1 0.0% 0 0.0% 0 0.0% 0 0.0% 0John Lewis 0.1% 1 0.0% 0 0.0% 0 0.0% 0 0.0% 0 0.0% 0 0.0% 0 0.0% 0 1.3% 1Tesco 0.3% 2 0.0% 0 0.0% 0 0.0% 0 0.0% 0 0.0% 0 0.0% 0 0.0% 0 0.0% 0Apple 3.2% 18 0.0% 0 0.0% 0 1.9% 1 0.0% 0 4.3% 3 8.4% 4 4.0% 1 0.0% 0Morrisons 0.1% 1 0.0% 0 0.0% 0 0.0% 0 0.0% 0 0.0% 0 0.0% 0 0.0% 0 0.0% 0Play 0.4% 2 0.0% 0 0.0% 0 0.0% 0 0.0% 0 0.0% 0 2.7% 1 0.0% 0 0.0% 0(Don't know / varies) 19.0% 107 29.7% 7 18.3% 2 13.8% 6 25.7% 10 23.1% 15 20.6% 9 11.3% 3 19.3% 9Weighted base: 565 23 11 45 40 64 45 30 45Sample: 469 24 23 45 20 35 26 33 37
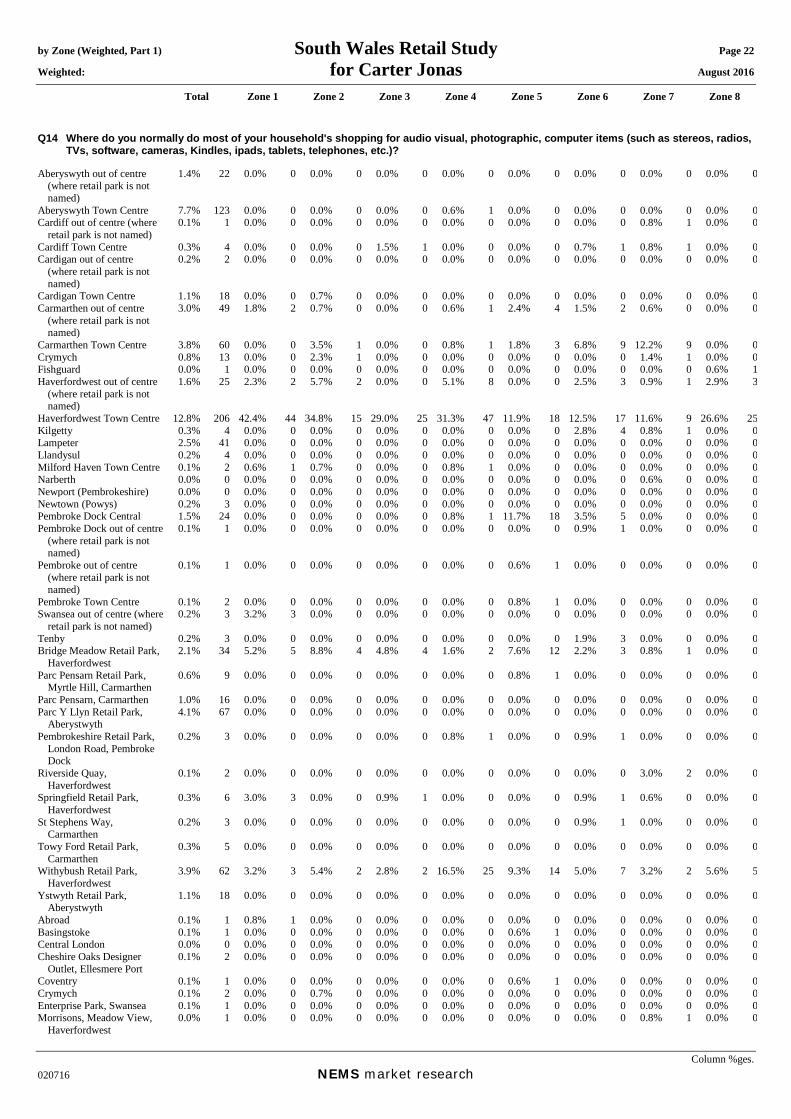
by Zone (Weighted, Part 1) South Wales Retail Study Page 22 Weighted: for Carter Jonas August 2016
Total Zone 1 Zone 2 Zone 3 Zone 4 Zone 5 Zone 6 Zone 7 Zone 8
Column %ges. 020716 NEMS market research
Q14 Where do you normally do most of your household's shopping for audio visual, photographic, computer items (such as stereos, radios, TVs, software, cameras, Kindles, ipads, tablets, telephones, etc.)?
Aberyswyth out of centre
(where retail park is not named)
1.4% 22 0.0% 0 0.0% 0 0.0% 0 0.0% 0 0.0% 0 0.0% 0 0.0% 0 0.0% 0
Aberyswyth Town Centre 7.7% 123 0.0% 0 0.0% 0 0.0% 0 0.6% 1 0.0% 0 0.0% 0 0.0% 0 0.0% 0Cardiff out of centre (where
retail park is not named) 0.1% 1 0.0% 0 0.0% 0 0.0% 0 0.0% 0 0.0% 0 0.0% 0 0.8% 1 0.0% 0
Cardiff Town Centre 0.3% 4 0.0% 0 0.0% 0 1.5% 1 0.0% 0 0.0% 0 0.7% 1 0.8% 1 0.0% 0Cardigan out of centre
(where retail park is not named)
0.2% 2 0.0% 0 0.0% 0 0.0% 0 0.0% 0 0.0% 0 0.0% 0 0.0% 0 0.0% 0
Cardigan Town Centre 1.1% 18 0.0% 0 0.7% 0 0.0% 0 0.0% 0 0.0% 0 0.0% 0 0.0% 0 0.0% 0Carmarthen out of centre
(where retail park is not named)
3.0% 49 1.8% 2 0.7% 0 0.0% 0 0.6% 1 2.4% 4 1.5% 2 0.6% 0 0.0% 0
Carmarthen Town Centre 3.8% 60 0.0% 0 3.5% 1 0.0% 0 0.8% 1 1.8% 3 6.8% 9 12.2% 9 0.0% 0Crymych 0.8% 13 0.0% 0 2.3% 1 0.0% 0 0.0% 0 0.0% 0 0.0% 0 1.4% 1 0.0% 0Fishguard 0.0% 1 0.0% 0 0.0% 0 0.0% 0 0.0% 0 0.0% 0 0.0% 0 0.0% 0 0.6% 1Haverfordwest out of centre
(where retail park is not named)
1.6% 25 2.3% 2 5.7% 2 0.0% 0 5.1% 8 0.0% 0 2.5% 3 0.9% 1 2.9% 3
Haverfordwest Town Centre 12.8% 206 42.4% 44 34.8% 15 29.0% 25 31.3% 47 11.9% 18 12.5% 17 11.6% 9 26.6% 25Kilgetty 0.3% 4 0.0% 0 0.0% 0 0.0% 0 0.0% 0 0.0% 0 2.8% 4 0.8% 1 0.0% 0Lampeter 2.5% 41 0.0% 0 0.0% 0 0.0% 0 0.0% 0 0.0% 0 0.0% 0 0.0% 0 0.0% 0Llandysul 0.2% 4 0.0% 0 0.0% 0 0.0% 0 0.0% 0 0.0% 0 0.0% 0 0.0% 0 0.0% 0Milford Haven Town Centre 0.1% 2 0.6% 1 0.7% 0 0.0% 0 0.8% 1 0.0% 0 0.0% 0 0.0% 0 0.0% 0Narberth 0.0% 0 0.0% 0 0.0% 0 0.0% 0 0.0% 0 0.0% 0 0.0% 0 0.6% 0 0.0% 0Newport (Pembrokeshire) 0.0% 0 0.0% 0 0.0% 0 0.0% 0 0.0% 0 0.0% 0 0.0% 0 0.0% 0 0.0% 0Newtown (Powys) 0.2% 3 0.0% 0 0.0% 0 0.0% 0 0.0% 0 0.0% 0 0.0% 0 0.0% 0 0.0% 0Pembroke Dock Central 1.5% 24 0.0% 0 0.0% 0 0.0% 0 0.8% 1 11.7% 18 3.5% 5 0.0% 0 0.0% 0Pembroke Dock out of centre
(where retail park is not named)
0.1% 1 0.0% 0 0.0% 0 0.0% 0 0.0% 0 0.0% 0 0.9% 1 0.0% 0 0.0% 0
Pembroke out of centre (where retail park is not named)
0.1% 1 0.0% 0 0.0% 0 0.0% 0 0.0% 0 0.6% 1 0.0% 0 0.0% 0 0.0% 0
Pembroke Town Centre 0.1% 2 0.0% 0 0.0% 0 0.0% 0 0.0% 0 0.8% 1 0.0% 0 0.0% 0 0.0% 0Swansea out of centre (where
retail park is not named) 0.2% 3 3.2% 3 0.0% 0 0.0% 0 0.0% 0 0.0% 0 0.0% 0 0.0% 0 0.0% 0
Tenby 0.2% 3 0.0% 0 0.0% 0 0.0% 0 0.0% 0 0.0% 0 1.9% 3 0.0% 0 0.0% 0Bridge Meadow Retail Park,
Haverfordwest 2.1% 34 5.2% 5 8.8% 4 4.8% 4 1.6% 2 7.6% 12 2.2% 3 0.8% 1 0.0% 0
Parc Pensarn Retail Park, Myrtle Hill, Carmarthen
0.6% 9 0.0% 0 0.0% 0 0.0% 0 0.0% 0 0.8% 1 0.0% 0 0.0% 0 0.0% 0
Parc Pensarn, Carmarthen 1.0% 16 0.0% 0 0.0% 0 0.0% 0 0.0% 0 0.0% 0 0.0% 0 0.0% 0 0.0% 0Parc Y Llyn Retail Park,
Aberystwyth 4.1% 67 0.0% 0 0.0% 0 0.0% 0 0.0% 0 0.0% 0 0.0% 0 0.0% 0 0.0% 0
Pembrokeshire Retail Park, London Road, Pembroke Dock
0.2% 3 0.0% 0 0.0% 0 0.0% 0 0.8% 1 0.0% 0 0.9% 1 0.0% 0 0.0% 0
Riverside Quay, Haverfordwest
0.1% 2 0.0% 0 0.0% 0 0.0% 0 0.0% 0 0.0% 0 0.0% 0 3.0% 2 0.0% 0
Springfield Retail Park, Haverfordwest
0.3% 6 3.0% 3 0.0% 0 0.9% 1 0.0% 0 0.0% 0 0.9% 1 0.6% 0 0.0% 0
St Stephens Way, Carmarthen
0.2% 3 0.0% 0 0.0% 0 0.0% 0 0.0% 0 0.0% 0 0.9% 1 0.0% 0 0.0% 0
Towy Ford Retail Park, Carmarthen
0.3% 5 0.0% 0 0.0% 0 0.0% 0 0.0% 0 0.0% 0 0.0% 0 0.0% 0 0.0% 0
Withybush Retail Park, Haverfordwest
3.9% 62 3.2% 3 5.4% 2 2.8% 2 16.5% 25 9.3% 14 5.0% 7 3.2% 2 5.6% 5
Ystwyth Retail Park, Aberystwyth
1.1% 18 0.0% 0 0.0% 0 0.0% 0 0.0% 0 0.0% 0 0.0% 0 0.0% 0 0.0% 0
Abroad 0.1% 1 0.8% 1 0.0% 0 0.0% 0 0.0% 0 0.0% 0 0.0% 0 0.0% 0 0.0% 0Basingstoke 0.1% 1 0.0% 0 0.0% 0 0.0% 0 0.0% 0 0.6% 1 0.0% 0 0.0% 0 0.0% 0Central London 0.0% 0 0.0% 0 0.0% 0 0.0% 0 0.0% 0 0.0% 0 0.0% 0 0.0% 0 0.0% 0Cheshire Oaks Designer
Outlet, Ellesmere Port 0.1% 2 0.0% 0 0.0% 0 0.0% 0 0.0% 0 0.0% 0 0.0% 0 0.0% 0 0.0% 0
Coventry 0.1% 1 0.0% 0 0.0% 0 0.0% 0 0.0% 0 0.6% 1 0.0% 0 0.0% 0 0.0% 0Crymych 0.1% 2 0.0% 0 0.7% 0 0.0% 0 0.0% 0 0.0% 0 0.0% 0 0.0% 0 0.0% 0Enterprise Park, Swansea 0.1% 1 0.0% 0 0.0% 0 0.0% 0 0.0% 0 0.0% 0 0.0% 0 0.0% 0 0.0% 0Morrisons, Meadow View,
Haverfordwest 0.0% 1 0.0% 0 0.0% 0 0.0% 0 0.0% 0 0.0% 0 0.0% 0 0.8% 1 0.0% 0
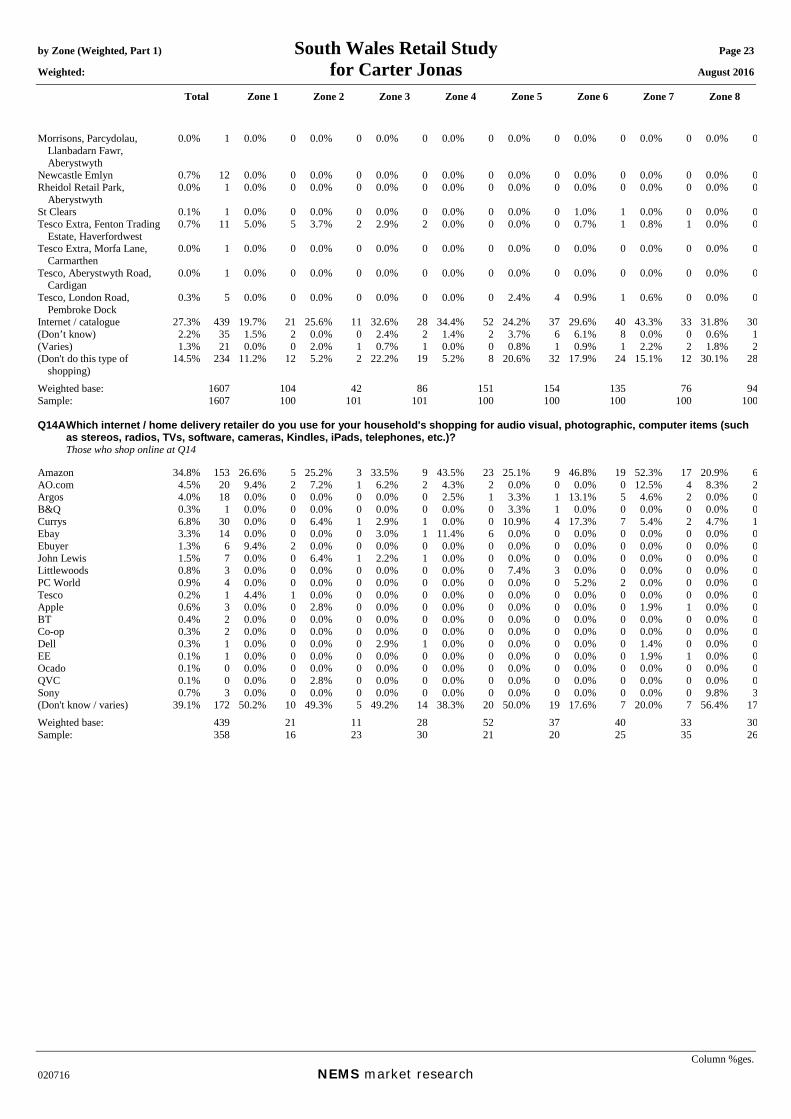
by Zone (Weighted, Part 1) South Wales Retail Study Page 23 Weighted: for Carter Jonas August 2016
Total Zone 1 Zone 2 Zone 3 Zone 4 Zone 5 Zone 6 Zone 7 Zone 8
Column %ges. 020716 NEMS market research
Morrisons, Parcydolau, Llanbadarn Fawr, Aberystwyth
0.0% 1 0.0% 0 0.0% 0 0.0% 0 0.0% 0 0.0% 0 0.0% 0 0.0% 0 0.0% 0
Newcastle Emlyn 0.7% 12 0.0% 0 0.0% 0 0.0% 0 0.0% 0 0.0% 0 0.0% 0 0.0% 0 0.0% 0Rheidol Retail Park,
Aberystwyth 0.0% 1 0.0% 0 0.0% 0 0.0% 0 0.0% 0 0.0% 0 0.0% 0 0.0% 0 0.0% 0
St Clears 0.1% 1 0.0% 0 0.0% 0 0.0% 0 0.0% 0 0.0% 0 1.0% 1 0.0% 0 0.0% 0Tesco Extra, Fenton Trading
Estate, Haverfordwest 0.7% 11 5.0% 5 3.7% 2 2.9% 2 0.0% 0 0.0% 0 0.7% 1 0.8% 1 0.0% 0
Tesco Extra, Morfa Lane, Carmarthen
0.0% 1 0.0% 0 0.0% 0 0.0% 0 0.0% 0 0.0% 0 0.0% 0 0.0% 0 0.0% 0
Tesco, Aberystwyth Road, Cardigan
0.0% 1 0.0% 0 0.0% 0 0.0% 0 0.0% 0 0.0% 0 0.0% 0 0.0% 0 0.0% 0
Tesco, London Road, Pembroke Dock
0.3% 5 0.0% 0 0.0% 0 0.0% 0 0.0% 0 2.4% 4 0.9% 1 0.6% 0 0.0% 0
Internet / catalogue 27.3% 439 19.7% 21 25.6% 11 32.6% 28 34.4% 52 24.2% 37 29.6% 40 43.3% 33 31.8% 30(Don’t know) 2.2% 35 1.5% 2 0.0% 0 2.4% 2 1.4% 2 3.7% 6 6.1% 8 0.0% 0 0.6% 1(Varies) 1.3% 21 0.0% 0 2.0% 1 0.7% 1 0.0% 0 0.8% 1 0.9% 1 2.2% 2 1.8% 2(Don't do this type of
shopping) 14.5% 234 11.2% 12 5.2% 2 22.2% 19 5.2% 8 20.6% 32 17.9% 24 15.1% 12 30.1% 28
Weighted base: 1607 104 42 86 151 154 135 76 94Sample: 1607 100 101 101 100 100 100 100 100 Q14A Which internet / home delivery retailer do you use for your household's shopping for audio visual, photographic, computer items (such
as stereos, radios, TVs, software, cameras, Kindles, iPads, telephones, etc.)? Those who shop online at Q14 Amazon 34.8% 153 26.6% 5 25.2% 3 33.5% 9 43.5% 23 25.1% 9 46.8% 19 52.3% 17 20.9% 6AO.com 4.5% 20 9.4% 2 7.2% 1 6.2% 2 4.3% 2 0.0% 0 0.0% 0 12.5% 4 8.3% 2Argos 4.0% 18 0.0% 0 0.0% 0 0.0% 0 2.5% 1 3.3% 1 13.1% 5 4.6% 2 0.0% 0B&Q 0.3% 1 0.0% 0 0.0% 0 0.0% 0 0.0% 0 3.3% 1 0.0% 0 0.0% 0 0.0% 0Currys 6.8% 30 0.0% 0 6.4% 1 2.9% 1 0.0% 0 10.9% 4 17.3% 7 5.4% 2 4.7% 1Ebay 3.3% 14 0.0% 0 0.0% 0 3.0% 1 11.4% 6 0.0% 0 0.0% 0 0.0% 0 0.0% 0Ebuyer 1.3% 6 9.4% 2 0.0% 0 0.0% 0 0.0% 0 0.0% 0 0.0% 0 0.0% 0 0.0% 0John Lewis 1.5% 7 0.0% 0 6.4% 1 2.2% 1 0.0% 0 0.0% 0 0.0% 0 0.0% 0 0.0% 0Littlewoods 0.8% 3 0.0% 0 0.0% 0 0.0% 0 0.0% 0 7.4% 3 0.0% 0 0.0% 0 0.0% 0PC World 0.9% 4 0.0% 0 0.0% 0 0.0% 0 0.0% 0 0.0% 0 5.2% 2 0.0% 0 0.0% 0Tesco 0.2% 1 4.4% 1 0.0% 0 0.0% 0 0.0% 0 0.0% 0 0.0% 0 0.0% 0 0.0% 0Apple 0.6% 3 0.0% 0 2.8% 0 0.0% 0 0.0% 0 0.0% 0 0.0% 0 1.9% 1 0.0% 0BT 0.4% 2 0.0% 0 0.0% 0 0.0% 0 0.0% 0 0.0% 0 0.0% 0 0.0% 0 0.0% 0Co-op 0.3% 2 0.0% 0 0.0% 0 0.0% 0 0.0% 0 0.0% 0 0.0% 0 0.0% 0 0.0% 0Dell 0.3% 1 0.0% 0 0.0% 0 2.9% 1 0.0% 0 0.0% 0 0.0% 0 1.4% 0 0.0% 0EE 0.1% 1 0.0% 0 0.0% 0 0.0% 0 0.0% 0 0.0% 0 0.0% 0 1.9% 1 0.0% 0Ocado 0.1% 0 0.0% 0 0.0% 0 0.0% 0 0.0% 0 0.0% 0 0.0% 0 0.0% 0 0.0% 0QVC 0.1% 0 0.0% 0 2.8% 0 0.0% 0 0.0% 0 0.0% 0 0.0% 0 0.0% 0 0.0% 0Sony 0.7% 3 0.0% 0 0.0% 0 0.0% 0 0.0% 0 0.0% 0 0.0% 0 0.0% 0 9.8% 3(Don't know / varies) 39.1% 172 50.2% 10 49.3% 5 49.2% 14 38.3% 20 50.0% 19 17.6% 7 20.0% 7 56.4% 17Weighted base: 439 21 11 28 52 37 40 33 30Sample: 358 16 23 30 21 20 25 35 26

by Zone (Weighted, Part 1) South Wales Retail Study Page 24 Weighted: for Carter Jonas August 2016
Total Zone 1 Zone 2 Zone 3 Zone 4 Zone 5 Zone 6 Zone 7 Zone 8
Column %ges. 020716 NEMS market research
Q15 Where do you normally do most of your household's shopping for all other domestic electrical goods including small domestic electrical appliances (such as irons, kettles, fans, coffee makers, food mixers) and white goods (fridges, freezers, dishwashers) and smaller etc)?
Aberaeron 0.0% 0 0.0% 0 0.0% 0 0.0% 0 0.0% 0 0.0% 0 0.0% 0 0.0% 0 0.0% 0Aberyswyth out of centre
(where retail park is not named)
1.9% 30 0.0% 0 0.0% 0 0.0% 0 0.0% 0 0.0% 0 0.0% 0 0.0% 0 0.0% 0
Aberyswyth Town Centre 10.3% 166 0.0% 0 0.0% 0 0.0% 0 0.0% 0 0.0% 0 0.0% 0 0.0% 0 0.0% 0Cardiff Town Centre 0.3% 4 0.0% 0 0.0% 0 0.0% 0 0.0% 0 0.0% 0 0.7% 1 0.8% 1 0.0% 0Cardigan out of centre
(where retail park is not named)
0.2% 3 0.0% 0 0.0% 0 0.0% 0 0.0% 0 0.0% 0 0.0% 0 0.0% 0 0.0% 0
Cardigan Town Centre 1.4% 22 0.6% 1 0.7% 0 0.0% 0 0.0% 0 0.0% 0 0.0% 0 0.8% 1 0.0% 0Carmarthen out of centre
(where retail park is not named)
2.6% 42 0.0% 0 0.0% 0 0.0% 0 0.0% 0 0.6% 1 0.9% 1 1.8% 1 0.0% 0
Carmarthen Town Centre 2.7% 43 0.0% 0 0.0% 0 0.0% 0 0.0% 0 0.0% 0 4.3% 6 12.7% 10 0.0% 0Crymych 1.7% 28 0.0% 0 2.4% 1 0.0% 0 0.0% 0 0.0% 0 0.0% 0 4.2% 3 0.0% 0Fishguard 0.3% 4 0.0% 0 0.0% 0 0.0% 0 0.0% 0 0.0% 0 0.0% 0 1.7% 1 3.1% 3Haverfordwest out of centre
(where retail park is not named)
2.9% 47 3.6% 4 5.2% 2 0.9% 1 7.6% 12 3.5% 5 7.4% 10 2.1% 2 4.6% 4
Haverfordwest Town Centre 14.3% 230 49.6% 52 44.8% 19 39.2% 34 34.2% 52 10.4% 16 10.5% 14 12.6% 10 32.3% 30Kilgetty 0.3% 5 0.0% 0 0.0% 0 0.0% 0 0.0% 0 0.0% 0 2.8% 4 1.6% 1 0.0% 0Lampeter 3.2% 51 0.0% 0 0.0% 0 0.0% 0 0.0% 0 0.0% 0 0.0% 0 0.0% 0 0.0% 0Letterson 0.2% 3 0.0% 0 0.0% 0 0.0% 0 0.0% 0 0.0% 0 0.0% 0 0.0% 0 2.7% 3Llandysul 0.5% 8 0.0% 0 0.0% 0 0.0% 0 0.0% 0 0.0% 0 0.0% 0 0.0% 0 0.0% 0Machynlleth Town Centre 0.2% 3 0.0% 0 0.0% 0 0.0% 0 0.0% 0 0.0% 0 0.0% 0 0.0% 0 0.0% 0Milford Haven out of centre
(where retail park is not named)
0.1% 1 0.9% 1 0.0% 0 0.0% 0 0.0% 0 0.0% 0 0.0% 0 0.0% 0 0.0% 0
Milford Haven Town Centre 0.3% 4 0.0% 0 0.7% 0 0.0% 0 2.5% 4 0.0% 0 0.0% 0 0.0% 0 0.0% 0Newport (Pembrokeshire) 0.0% 1 0.0% 0 0.0% 0 0.0% 0 0.0% 0 0.0% 0 0.0% 0 0.0% 0 0.0% 0Newtown (Powys) 0.3% 4 0.0% 0 0.0% 0 0.0% 0 0.0% 0 0.0% 0 0.0% 0 0.0% 0 0.0% 0Neyland 0.1% 1 0.0% 0 0.0% 0 0.0% 0 0.0% 0 0.0% 0 0.0% 0 0.0% 0 0.0% 0Pembroke Dock Central 3.0% 49 0.0% 0 0.0% 0 0.9% 1 0.6% 1 25.3% 39 6.0% 8 0.0% 0 0.0% 0Pembroke Dock out of centre
(where retail park is not named)
0.7% 11 0.0% 0 0.0% 0 0.0% 0 0.0% 0 1.8% 3 5.8% 8 0.0% 0 0.0% 0
Pembroke Town Centre 0.1% 2 0.0% 0 0.0% 0 0.0% 0 0.0% 0 1.5% 2 0.0% 0 0.0% 0 0.0% 0St Davids 0.1% 1 0.0% 0 0.0% 0 1.7% 1 0.0% 0 0.0% 0 0.0% 0 0.0% 0 0.0% 0Swansea out of centre (where
retail park is not named) 0.2% 3 3.2% 3 0.0% 0 0.0% 0 0.0% 0 0.0% 0 0.0% 0 0.0% 0 0.0% 0
Swansea City Centre 0.1% 2 0.0% 0 0.0% 0 0.9% 1 0.0% 0 0.0% 0 0.7% 1 0.0% 0 0.0% 0Tenby 0.3% 5 0.0% 0 0.0% 0 0.0% 0 0.0% 0 0.0% 0 3.4% 5 0.0% 0 0.0% 0Bridge Meadow Retail Park,
Haverfordwest 3.9% 62 14.7% 15 11.6% 5 12.7% 11 1.6% 2 12.6% 19 4.8% 7 0.8% 1 0.0% 0
Capital Shopping Centre, Cardiff
0.0% 0 0.0% 0 0.0% 0 0.0% 0 0.0% 0 0.0% 0 0.0% 0 0.0% 0 0.0% 0
Havens Head Retail Park, Milford Haven
0.1% 1 0.0% 0 2.0% 1 0.0% 0 0.0% 0 0.0% 0 0.0% 0 0.0% 0 0.0% 0
Parc Pensarn Retail Park, Myrtle Hill, Carmarthen
0.5% 8 0.0% 0 0.0% 0 0.0% 0 0.0% 0 0.8% 1 0.9% 1 0.0% 0 0.0% 0
Parc Pensarn, Carmarthen 1.1% 17 0.0% 0 1.0% 0 0.0% 0 0.0% 0 0.0% 0 2.6% 3 0.0% 0 0.0% 0Parc Y Llyn Retail Park,
Aberystwyth 3.3% 53 0.0% 0 0.0% 0 0.0% 0 0.0% 0 0.0% 0 0.0% 0 0.0% 0 0.0% 0
Pembrokeshire Retail Park, London Road, Pembroke Dock
0.2% 4 0.0% 0 0.0% 0 0.0% 0 0.8% 1 0.0% 0 1.9% 3 0.0% 0 0.0% 0
Riverside Quay, Haverfordwest
0.2% 3 0.9% 1 0.0% 0 0.0% 0 0.6% 1 0.0% 0 0.9% 1 0.6% 0 0.0% 0
Springfield Retail Park, Haverfordwest
0.3% 5 2.1% 2 0.0% 0 0.0% 0 0.0% 0 1.8% 3 0.0% 0 0.6% 0 0.0% 0
St Stephens Way, Carmarthen
0.2% 3 0.0% 0 0.0% 0 0.0% 0 0.0% 0 0.0% 0 0.0% 0 0.0% 0 0.0% 0
Withybush Retail Park, Haverfordwest
4.1% 65 5.7% 6 4.4% 2 3.5% 3 13.0% 20 7.7% 12 6.0% 8 5.0% 4 9.5% 9
Ystwyth Retail Park, Aberystwyth
1.4% 23 0.0% 0 0.0% 0 0.0% 0 0.0% 0 0.0% 0 0.0% 0 0.0% 0 0.0% 0
Chester 0.1% 2 0.0% 0 0.0% 0 0.0% 0 0.0% 0 0.0% 0 0.0% 0 0.0% 0 0.0% 0Crymych 0.1% 2 0.0% 0 0.0% 0 0.0% 0 0.0% 0 0.0% 0 0.0% 0 0.0% 0 0.8% 1Newcastle Emlyn 1.2% 20 0.0% 0 0.0% 0 0.0% 0 0.0% 0 0.0% 0 0.0% 0 0.0% 0 0.0% 0Rheidol Retail Park, 0.1% 2 0.0% 0 0.0% 0 0.0% 0 0.0% 0 0.0% 0 0.0% 0 0.0% 0 0.0% 0
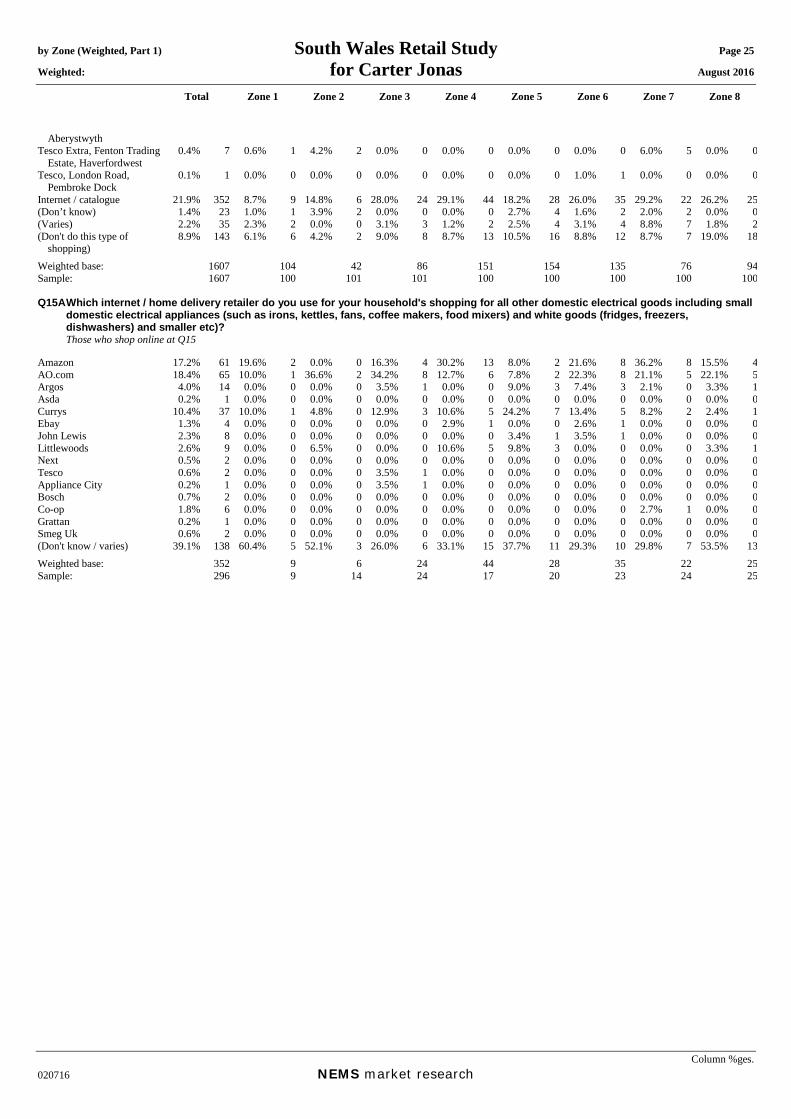
by Zone (Weighted, Part 1) South Wales Retail Study Page 25 Weighted: for Carter Jonas August 2016
Total Zone 1 Zone 2 Zone 3 Zone 4 Zone 5 Zone 6 Zone 7 Zone 8
Column %ges. 020716 NEMS market research
Aberystwyth Tesco Extra, Fenton Trading
Estate, Haverfordwest 0.4% 7 0.6% 1 4.2% 2 0.0% 0 0.0% 0 0.0% 0 0.0% 0 6.0% 5 0.0% 0
Tesco, London Road, Pembroke Dock
0.1% 1 0.0% 0 0.0% 0 0.0% 0 0.0% 0 0.0% 0 1.0% 1 0.0% 0 0.0% 0
Internet / catalogue 21.9% 352 8.7% 9 14.8% 6 28.0% 24 29.1% 44 18.2% 28 26.0% 35 29.2% 22 26.2% 25(Don’t know) 1.4% 23 1.0% 1 3.9% 2 0.0% 0 0.0% 0 2.7% 4 1.6% 2 2.0% 2 0.0% 0(Varies) 2.2% 35 2.3% 2 0.0% 0 3.1% 3 1.2% 2 2.5% 4 3.1% 4 8.8% 7 1.8% 2(Don't do this type of
shopping) 8.9% 143 6.1% 6 4.2% 2 9.0% 8 8.7% 13 10.5% 16 8.8% 12 8.7% 7 19.0% 18
Weighted base: 1607 104 42 86 151 154 135 76 94Sample: 1607 100 101 101 100 100 100 100 100 Q15A Which internet / home delivery retailer do you use for your household's shopping for all other domestic electrical goods including small
domestic electrical appliances (such as irons, kettles, fans, coffee makers, food mixers) and white goods (fridges, freezers, dishwashers) and smaller etc)?
Those who shop online at Q15 Amazon 17.2% 61 19.6% 2 0.0% 0 16.3% 4 30.2% 13 8.0% 2 21.6% 8 36.2% 8 15.5% 4AO.com 18.4% 65 10.0% 1 36.6% 2 34.2% 8 12.7% 6 7.8% 2 22.3% 8 21.1% 5 22.1% 5Argos 4.0% 14 0.0% 0 0.0% 0 3.5% 1 0.0% 0 9.0% 3 7.4% 3 2.1% 0 3.3% 1Asda 0.2% 1 0.0% 0 0.0% 0 0.0% 0 0.0% 0 0.0% 0 0.0% 0 0.0% 0 0.0% 0Currys 10.4% 37 10.0% 1 4.8% 0 12.9% 3 10.6% 5 24.2% 7 13.4% 5 8.2% 2 2.4% 1Ebay 1.3% 4 0.0% 0 0.0% 0 0.0% 0 2.9% 1 0.0% 0 2.6% 1 0.0% 0 0.0% 0John Lewis 2.3% 8 0.0% 0 0.0% 0 0.0% 0 0.0% 0 3.4% 1 3.5% 1 0.0% 0 0.0% 0Littlewoods 2.6% 9 0.0% 0 6.5% 0 0.0% 0 10.6% 5 9.8% 3 0.0% 0 0.0% 0 3.3% 1Next 0.5% 2 0.0% 0 0.0% 0 0.0% 0 0.0% 0 0.0% 0 0.0% 0 0.0% 0 0.0% 0Tesco 0.6% 2 0.0% 0 0.0% 0 3.5% 1 0.0% 0 0.0% 0 0.0% 0 0.0% 0 0.0% 0Appliance City 0.2% 1 0.0% 0 0.0% 0 3.5% 1 0.0% 0 0.0% 0 0.0% 0 0.0% 0 0.0% 0Bosch 0.7% 2 0.0% 0 0.0% 0 0.0% 0 0.0% 0 0.0% 0 0.0% 0 0.0% 0 0.0% 0Co-op 1.8% 6 0.0% 0 0.0% 0 0.0% 0 0.0% 0 0.0% 0 0.0% 0 2.7% 1 0.0% 0Grattan 0.2% 1 0.0% 0 0.0% 0 0.0% 0 0.0% 0 0.0% 0 0.0% 0 0.0% 0 0.0% 0Smeg Uk 0.6% 2 0.0% 0 0.0% 0 0.0% 0 0.0% 0 0.0% 0 0.0% 0 0.0% 0 0.0% 0(Don't know / varies) 39.1% 138 60.4% 5 52.1% 3 26.0% 6 33.1% 15 37.7% 11 29.3% 10 29.8% 7 53.5% 13Weighted base: 352 9 6 24 44 28 35 22 25Sample: 296 9 14 24 17 20 23 24 25
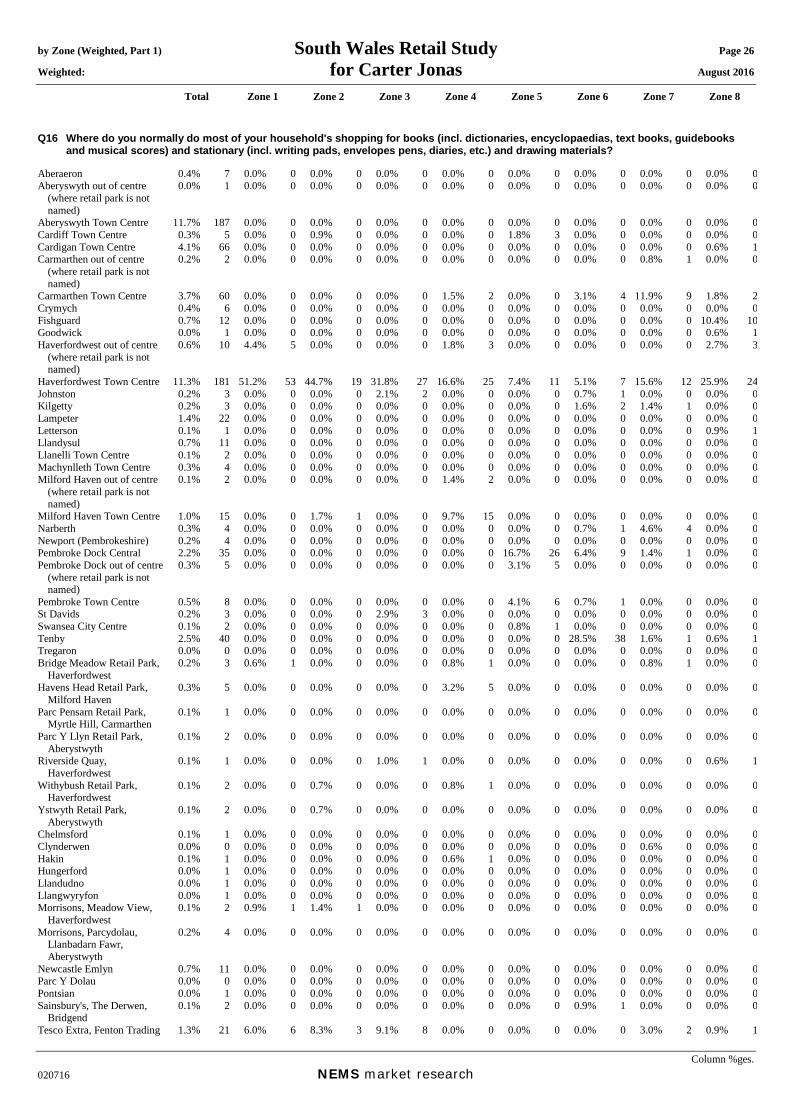
by Zone (Weighted, Part 1) South Wales Retail Study Page 26 Weighted: for Carter Jonas August 2016
Total Zone 1 Zone 2 Zone 3 Zone 4 Zone 5 Zone 6 Zone 7 Zone 8
Column %ges. 020716 NEMS market research
Q16 Where do you normally do most of your household's shopping for books (incl. dictionaries, encyclopaedias, text books, guidebooks and musical scores) and stationary (incl. writing pads, envelopes pens, diaries, etc.) and drawing materials?
Aberaeron 0.4% 7 0.0% 0 0.0% 0 0.0% 0 0.0% 0 0.0% 0 0.0% 0 0.0% 0 0.0% 0Aberyswyth out of centre
(where retail park is not named)
0.0% 1 0.0% 0 0.0% 0 0.0% 0 0.0% 0 0.0% 0 0.0% 0 0.0% 0 0.0% 0
Aberyswyth Town Centre 11.7% 187 0.0% 0 0.0% 0 0.0% 0 0.0% 0 0.0% 0 0.0% 0 0.0% 0 0.0% 0Cardiff Town Centre 0.3% 5 0.0% 0 0.9% 0 0.0% 0 0.0% 0 1.8% 3 0.0% 0 0.0% 0 0.0% 0Cardigan Town Centre 4.1% 66 0.0% 0 0.0% 0 0.0% 0 0.0% 0 0.0% 0 0.0% 0 0.0% 0 0.6% 1Carmarthen out of centre
(where retail park is not named)
0.2% 2 0.0% 0 0.0% 0 0.0% 0 0.0% 0 0.0% 0 0.0% 0 0.8% 1 0.0% 0
Carmarthen Town Centre 3.7% 60 0.0% 0 0.0% 0 0.0% 0 1.5% 2 0.0% 0 3.1% 4 11.9% 9 1.8% 2Crymych 0.4% 6 0.0% 0 0.0% 0 0.0% 0 0.0% 0 0.0% 0 0.0% 0 0.0% 0 0.0% 0Fishguard 0.7% 12 0.0% 0 0.0% 0 0.0% 0 0.0% 0 0.0% 0 0.0% 0 0.0% 0 10.4% 10Goodwick 0.0% 1 0.0% 0 0.0% 0 0.0% 0 0.0% 0 0.0% 0 0.0% 0 0.0% 0 0.6% 1Haverfordwest out of centre
(where retail park is not named)
0.6% 10 4.4% 5 0.0% 0 0.0% 0 1.8% 3 0.0% 0 0.0% 0 0.0% 0 2.7% 3
Haverfordwest Town Centre 11.3% 181 51.2% 53 44.7% 19 31.8% 27 16.6% 25 7.4% 11 5.1% 7 15.6% 12 25.9% 24Johnston 0.2% 3 0.0% 0 0.0% 0 2.1% 2 0.0% 0 0.0% 0 0.7% 1 0.0% 0 0.0% 0Kilgetty 0.2% 3 0.0% 0 0.0% 0 0.0% 0 0.0% 0 0.0% 0 1.6% 2 1.4% 1 0.0% 0Lampeter 1.4% 22 0.0% 0 0.0% 0 0.0% 0 0.0% 0 0.0% 0 0.0% 0 0.0% 0 0.0% 0Letterson 0.1% 1 0.0% 0 0.0% 0 0.0% 0 0.0% 0 0.0% 0 0.0% 0 0.0% 0 0.9% 1Llandysul 0.7% 11 0.0% 0 0.0% 0 0.0% 0 0.0% 0 0.0% 0 0.0% 0 0.0% 0 0.0% 0Llanelli Town Centre 0.1% 2 0.0% 0 0.0% 0 0.0% 0 0.0% 0 0.0% 0 0.0% 0 0.0% 0 0.0% 0Machynlleth Town Centre 0.3% 4 0.0% 0 0.0% 0 0.0% 0 0.0% 0 0.0% 0 0.0% 0 0.0% 0 0.0% 0Milford Haven out of centre
(where retail park is not named)
0.1% 2 0.0% 0 0.0% 0 0.0% 0 1.4% 2 0.0% 0 0.0% 0 0.0% 0 0.0% 0
Milford Haven Town Centre 1.0% 15 0.0% 0 1.7% 1 0.0% 0 9.7% 15 0.0% 0 0.0% 0 0.0% 0 0.0% 0Narberth 0.3% 4 0.0% 0 0.0% 0 0.0% 0 0.0% 0 0.0% 0 0.7% 1 4.6% 4 0.0% 0Newport (Pembrokeshire) 0.2% 4 0.0% 0 0.0% 0 0.0% 0 0.0% 0 0.0% 0 0.0% 0 0.0% 0 0.0% 0Pembroke Dock Central 2.2% 35 0.0% 0 0.0% 0 0.0% 0 0.0% 0 16.7% 26 6.4% 9 1.4% 1 0.0% 0Pembroke Dock out of centre
(where retail park is not named)
0.3% 5 0.0% 0 0.0% 0 0.0% 0 0.0% 0 3.1% 5 0.0% 0 0.0% 0 0.0% 0
Pembroke Town Centre 0.5% 8 0.0% 0 0.0% 0 0.0% 0 0.0% 0 4.1% 6 0.7% 1 0.0% 0 0.0% 0St Davids 0.2% 3 0.0% 0 0.0% 0 2.9% 3 0.0% 0 0.0% 0 0.0% 0 0.0% 0 0.0% 0Swansea City Centre 0.1% 2 0.0% 0 0.0% 0 0.0% 0 0.0% 0 0.8% 1 0.0% 0 0.0% 0 0.0% 0Tenby 2.5% 40 0.0% 0 0.0% 0 0.0% 0 0.0% 0 0.0% 0 28.5% 38 1.6% 1 0.6% 1Tregaron 0.0% 0 0.0% 0 0.0% 0 0.0% 0 0.0% 0 0.0% 0 0.0% 0 0.0% 0 0.0% 0Bridge Meadow Retail Park,
Haverfordwest 0.2% 3 0.6% 1 0.0% 0 0.0% 0 0.8% 1 0.0% 0 0.0% 0 0.8% 1 0.0% 0
Havens Head Retail Park, Milford Haven
0.3% 5 0.0% 0 0.0% 0 0.0% 0 3.2% 5 0.0% 0 0.0% 0 0.0% 0 0.0% 0
Parc Pensarn Retail Park, Myrtle Hill, Carmarthen
0.1% 1 0.0% 0 0.0% 0 0.0% 0 0.0% 0 0.0% 0 0.0% 0 0.0% 0 0.0% 0
Parc Y Llyn Retail Park, Aberystwyth
0.1% 2 0.0% 0 0.0% 0 0.0% 0 0.0% 0 0.0% 0 0.0% 0 0.0% 0 0.0% 0
Riverside Quay, Haverfordwest
0.1% 1 0.0% 0 0.0% 0 1.0% 1 0.0% 0 0.0% 0 0.0% 0 0.0% 0 0.6% 1
Withybush Retail Park, Haverfordwest
0.1% 2 0.0% 0 0.7% 0 0.0% 0 0.8% 1 0.0% 0 0.0% 0 0.0% 0 0.0% 0
Ystwyth Retail Park, Aberystwyth
0.1% 2 0.0% 0 0.7% 0 0.0% 0 0.0% 0 0.0% 0 0.0% 0 0.0% 0 0.0% 0
Chelmsford 0.1% 1 0.0% 0 0.0% 0 0.0% 0 0.0% 0 0.0% 0 0.0% 0 0.0% 0 0.0% 0Clynderwen 0.0% 0 0.0% 0 0.0% 0 0.0% 0 0.0% 0 0.0% 0 0.0% 0 0.6% 0 0.0% 0Hakin 0.1% 1 0.0% 0 0.0% 0 0.0% 0 0.6% 1 0.0% 0 0.0% 0 0.0% 0 0.0% 0Hungerford 0.0% 1 0.0% 0 0.0% 0 0.0% 0 0.0% 0 0.0% 0 0.0% 0 0.0% 0 0.0% 0Llandudno 0.0% 1 0.0% 0 0.0% 0 0.0% 0 0.0% 0 0.0% 0 0.0% 0 0.0% 0 0.0% 0Llangwyryfon 0.0% 1 0.0% 0 0.0% 0 0.0% 0 0.0% 0 0.0% 0 0.0% 0 0.0% 0 0.0% 0Morrisons, Meadow View,
Haverfordwest 0.1% 2 0.9% 1 1.4% 1 0.0% 0 0.0% 0 0.0% 0 0.0% 0 0.0% 0 0.0% 0
Morrisons, Parcydolau, Llanbadarn Fawr, Aberystwyth
0.2% 4 0.0% 0 0.0% 0 0.0% 0 0.0% 0 0.0% 0 0.0% 0 0.0% 0 0.0% 0
Newcastle Emlyn 0.7% 11 0.0% 0 0.0% 0 0.0% 0 0.0% 0 0.0% 0 0.0% 0 0.0% 0 0.0% 0Parc Y Dolau 0.0% 0 0.0% 0 0.0% 0 0.0% 0 0.0% 0 0.0% 0 0.0% 0 0.0% 0 0.0% 0Pontsian 0.0% 1 0.0% 0 0.0% 0 0.0% 0 0.0% 0 0.0% 0 0.0% 0 0.0% 0 0.0% 0Sainsbury's, The Derwen,
Bridgend 0.1% 2 0.0% 0 0.0% 0 0.0% 0 0.0% 0 0.0% 0 0.9% 1 0.0% 0 0.0% 0
Tesco Extra, Fenton Trading 1.3% 21 6.0% 6 8.3% 3 9.1% 8 0.0% 0 0.0% 0 0.0% 0 3.0% 2 0.9% 1

by Zone (Weighted, Part 1) South Wales Retail Study Page 27 Weighted: for Carter Jonas August 2016
Total Zone 1 Zone 2 Zone 3 Zone 4 Zone 5 Zone 6 Zone 7 Zone 8
Column %ges. 020716 NEMS market research
Estate, Haverfordwest Tesco Extra, Morfa Lane,
Carmarthen 0.2% 3 0.0% 0 0.0% 0 0.0% 0 0.0% 0 0.0% 0 0.0% 0 0.0% 0 0.0% 0
Tesco, Aberystwyth Road, Cardigan
0.0% 1 0.0% 0 0.0% 0 0.0% 0 0.0% 0 0.0% 0 0.0% 0 0.0% 0 0.0% 0
Tesco, London Road, Pembroke Dock
0.9% 15 0.0% 0 0.0% 0 0.0% 0 0.0% 0 8.3% 13 1.8% 2 0.0% 0 0.0% 0
Internet / catalogue 28.6% 460 22.6% 24 27.8% 12 30.7% 27 23.4% 35 30.3% 47 29.4% 40 37.9% 29 26.6% 25(Don’t know) 0.5% 8 0.0% 0 0.0% 0 0.0% 0 0.0% 0 0.0% 0 0.7% 1 1.2% 1 1.4% 1(Varies) 2.5% 40 0.0% 0 0.0% 0 5.0% 4 3.5% 5 2.4% 4 1.9% 3 2.0% 2 5.5% 5(Don't do this type of
shopping) 19.7% 317 14.3% 15 13.8% 6 17.3% 15 36.7% 56 25.0% 39 18.6% 25 17.3% 13 21.5% 20
Weighted base: 1607 104 42 86 151 154 135 76 94Sample: 1607 100 101 101 100 100 100 100 100 Q16A Which internet / home delivery retailer do you use for your household's shopping for books (incl. dictionaries, encyclopaedias, text
books, guidebooks and musical scores) and stationery (incl. writing pads, envelopes pens, diaries, etc.) and drawing materials? Those who shop online at Q16 Amazon 82.9% 381 93.3% 22 73.3% 9 68.8% 18 93.0% 33 88.0% 41 75.9% 30 88.4% 26 72.2% 18Ebay 0.7% 3 0.0% 0 0.0% 0 0.0% 0 0.0% 0 0.0% 0 6.6% 3 0.0% 0 0.0% 0Staples 0.2% 1 0.0% 0 2.5% 0 0.0% 0 0.0% 0 0.0% 0 0.0% 0 0.0% 0 0.0% 0Tesco 0.6% 3 0.0% 0 0.0% 0 3.1% 1 0.0% 0 0.0% 0 0.0% 0 0.0% 0 0.0% 0WHSmith 0.2% 1 0.0% 0 7.3% 1 0.0% 0 0.0% 0 0.0% 0 0.0% 0 0.0% 0 0.0% 0Kobo 0.5% 2 0.0% 0 0.0% 0 0.0% 0 0.0% 0 0.0% 0 0.0% 0 0.0% 0 0.0% 0People's Friend 0.1% 0 0.0% 0 2.5% 0 0.0% 0 0.0% 0 0.0% 0 0.0% 0 0.0% 0 0.0% 0Play 0.2% 1 0.0% 0 0.0% 0 0.0% 0 0.0% 0 0.0% 0 0.0% 0 0.0% 0 0.0% 0The Book People 0.3% 1 0.0% 0 0.0% 0 0.0% 0 0.0% 0 0.0% 0 0.0% 0 0.0% 0 0.0% 0The Works 0.3% 1 0.0% 0 0.0% 0 0.0% 0 0.0% 0 0.0% 0 3.1% 1 0.0% 0 0.0% 0Viking Direct 0.7% 3 0.0% 0 3.5% 0 0.0% 0 0.0% 0 0.0% 0 0.0% 0 0.0% 0 0.0% 0(Don't know / varies) 13.4% 62 6.7% 2 10.8% 1 28.2% 7 7.0% 2 12.0% 6 14.5% 6 11.6% 3 27.8% 7Weighted base: 460 24 12 27 35 47 40 29 25Sample: 403 17 23 31 21 29 22 33 26

by Zone (Weighted, Part 1) South Wales Retail Study Page 28 Weighted: for Carter Jonas August 2016
Total Zone 1 Zone 2 Zone 3 Zone 4 Zone 5 Zone 6 Zone 7 Zone 8
Column %ges. 020716 NEMS market research
Q17 Where do you normally do most of your household’s shopping for games & toys; pets and pet products; hobby items; sport clothing / footwear and equipment; camping goods; bicycles; and musical instruments?
Aberaeron 0.2% 4 0.0% 0 0.0% 0 0.0% 0 0.0% 0 0.0% 0 0.0% 0 0.0% 0 0.0% 0Aberyswyth out of centre
(where retail park is not named)
0.7% 12 0.0% 0 0.0% 0 0.0% 0 0.0% 0 0.0% 0 0.0% 0 0.0% 0 0.0% 0
Aberyswyth Town Centre 7.7% 124 0.0% 0 0.0% 0 0.0% 0 0.0% 0 0.0% 0 0.0% 0 0.0% 0 0.0% 0Cardiff Town Centre 0.5% 8 0.8% 1 0.7% 0 0.7% 1 0.0% 0 0.0% 0 0.0% 0 2.5% 2 0.0% 0Cardigan out of centre
(where retail park is not named)
0.2% 3 0.9% 1 0.0% 0 0.0% 0 0.0% 0 0.0% 0 0.0% 0 0.0% 0 0.0% 0
Cardigan Town Centre 1.9% 30 0.0% 0 0.0% 0 0.0% 0 0.0% 0 0.0% 0 0.0% 0 1.5% 1 0.0% 0Carmarthen out of centre
(where retail park is not named)
0.4% 6 0.0% 0 0.0% 0 0.0% 0 0.0% 0 0.8% 1 0.0% 0 1.7% 1 0.0% 0
Carmarthen Town Centre 4.7% 76 2.5% 3 0.0% 0 0.0% 0 0.0% 0 0.0% 0 3.7% 5 10.5% 8 0.0% 0Crymych 0.2% 4 0.0% 0 0.0% 0 0.0% 0 0.0% 0 0.0% 0 0.0% 0 0.6% 0 0.0% 0Fishguard 0.3% 5 0.0% 0 0.0% 0 0.0% 0 0.0% 0 0.0% 0 0.0% 0 0.0% 0 5.2% 5Goodwick 0.0% 1 0.0% 0 0.0% 0 0.0% 0 0.0% 0 0.0% 0 0.0% 0 0.0% 0 0.8% 1Haverfordwest out of centre
(where retail park is not named)
2.1% 34 8.7% 9 8.2% 3 3.8% 3 0.8% 1 1.7% 3 0.0% 0 0.0% 0 6.3% 6
Haverfordwest Town Centre 8.4% 135 26.6% 28 15.2% 6 24.6% 21 13.8% 21 4.9% 7 5.8% 8 15.5% 12 32.2% 30Johnston 0.2% 3 0.0% 0 1.0% 0 0.0% 0 1.5% 2 0.0% 0 0.0% 0 0.0% 0 0.0% 0Kilgetty 0.3% 5 0.0% 0 0.0% 0 0.0% 0 0.0% 0 0.0% 0 2.6% 4 2.2% 2 0.0% 0Lampeter 1.0% 15 0.0% 0 0.0% 0 0.0% 0 0.0% 0 0.0% 0 0.0% 0 0.0% 0 0.0% 0Llandysul 0.5% 9 0.0% 0 0.0% 0 0.0% 0 0.0% 0 0.0% 0 0.0% 0 0.0% 0 0.0% 0Milford Haven Town Centre 1.0% 15 0.0% 0 0.0% 0 0.0% 0 9.3% 14 0.8% 1 0.0% 0 0.0% 0 0.0% 0Narberth 0.2% 3 0.6% 1 0.0% 0 0.0% 0 0.0% 0 0.0% 0 0.7% 1 2.2% 2 0.0% 0Newport (Pembrokeshire) 0.1% 2 0.0% 0 0.0% 0 0.0% 0 0.0% 0 0.0% 0 0.0% 0 0.0% 0 0.0% 0Neyland 0.1% 2 0.0% 0 0.0% 0 0.0% 0 1.4% 2 0.0% 0 0.0% 0 0.0% 0 0.0% 0Pembroke Dock Central 2.2% 36 0.0% 0 0.0% 0 0.0% 0 0.8% 1 19.8% 30 2.7% 4 0.8% 1 0.0% 0Pembroke Dock out of centre
(where retail park is not named)
0.1% 1 0.0% 0 0.0% 0 0.0% 0 0.0% 0 0.0% 0 0.7% 1 0.0% 0 0.0% 0
Pembroke Town Centre 0.2% 3 0.0% 0 0.0% 0 0.0% 0 0.0% 0 1.6% 3 0.0% 0 0.6% 0 0.0% 0Saundersfoot 0.1% 1 0.0% 0 0.0% 0 0.0% 0 0.0% 0 0.0% 0 0.7% 1 0.0% 0 0.0% 0St Davids 0.1% 1 0.0% 0 0.0% 0 0.0% 0 0.0% 0 0.0% 0 0.0% 0 0.0% 0 1.4% 1Swansea City Centre 0.5% 8 0.0% 0 0.0% 0 0.0% 0 3.1% 5 1.6% 3 0.0% 0 0.0% 0 0.0% 0Tenby 0.8% 13 0.0% 0 0.0% 0 0.0% 0 0.0% 0 0.0% 0 9.0% 12 0.8% 1 0.0% 0Tregaron 0.1% 1 0.0% 0 0.0% 0 0.0% 0 0.0% 0 0.0% 0 0.0% 0 0.0% 0 0.0% 0Bridge Meadow Retail Park,
Haverfordwest 0.1% 1 0.9% 1 1.0% 0 0.0% 0 0.0% 0 0.0% 0 0.0% 0 0.0% 0 0.0% 0
Havens Head Retail Park, Milford Haven
0.4% 7 0.0% 0 2.0% 1 0.0% 0 4.1% 6 0.0% 0 0.0% 0 0.0% 0 0.0% 0
Parc Fforest-fach, Swansea 0.1% 1 0.0% 0 0.0% 0 0.0% 0 0.6% 1 0.0% 0 0.0% 0 0.0% 0 0.0% 0Parc Pensarn Retail Park,
Myrtle Hill, Carmarthen 0.2% 3 0.0% 0 0.0% 0 0.0% 0 0.0% 0 0.0% 0 0.0% 0 0.0% 0 0.0% 0
Parc Pensarn, Carmarthen 0.1% 1 0.0% 0 0.0% 0 0.0% 0 0.0% 0 0.0% 0 0.0% 0 0.0% 0 0.0% 0Parc Tawe, Swansea 0.3% 5 0.0% 0 0.0% 0 0.0% 0 0.0% 0 0.0% 0 3.3% 5 0.0% 0 0.0% 0Parc Y Llyn Retail Park,
Aberystwyth 0.5% 8 0.0% 0 0.0% 0 0.0% 0 0.0% 0 0.0% 0 0.0% 0 0.0% 0 0.0% 0
Springfield Retail Park, Haverfordwest
0.3% 5 1.5% 2 0.9% 0 2.4% 2 0.0% 0 0.0% 0 0.7% 1 0.6% 0 0.0% 0
St Stephens Way, Carmarthen
0.1% 1 0.0% 0 0.0% 0 0.0% 0 0.0% 0 0.0% 0 0.0% 0 0.0% 0 0.0% 0
Withybush Retail Park, Haverfordwest
2.4% 39 9.6% 10 10.3% 4 4.6% 4 6.5% 10 4.2% 6 0.0% 0 3.8% 3 0.0% 0
Ystwyth Retail Park, Aberystwyth
0.9% 14 0.0% 0 0.7% 0 2.1% 2 0.0% 0 0.0% 0 0.0% 0 0.0% 0 0.0% 0
Central Retail Park, Aberystwyth
0.2% 3 0.0% 0 1.0% 0 0.9% 1 0.0% 0 0.0% 0 0.0% 0 0.0% 0 0.0% 0
Cilgerran 0.0% 0 0.0% 0 0.0% 0 0.0% 0 0.0% 0 0.0% 0 0.0% 0 0.0% 0 0.0% 0Clynderwen 0.0% 1 0.0% 0 0.0% 0 0.0% 0 0.0% 0 0.0% 0 0.0% 0 0.8% 1 0.0% 0Hereford 0.0% 0 0.0% 0 0.0% 0 0.0% 0 0.0% 0 0.0% 0 0.0% 0 0.0% 0 0.0% 0Morrisons, Meadow View,
Haverfordwest 0.2% 3 0.0% 0 2.6% 1 0.0% 0 0.0% 0 0.0% 0 0.7% 1 0.0% 0 0.8% 1
Morrisons, Parcydolau, Llanbadarn Fawr, Aberystwyth
0.1% 2 0.0% 0 0.0% 0 0.0% 0 0.0% 0 0.0% 0 0.0% 0 0.0% 0 0.0% 0
Newcastle Emlyn 0.2% 3 0.0% 0 0.0% 0 0.0% 0 0.0% 0 0.0% 0 0.0% 0 0.0% 0 0.0% 0Oldbury 0.1% 1 0.0% 0 0.0% 0 0.0% 0 0.0% 0 0.0% 0 0.0% 0 0.0% 0 0.0% 0Rheidol Retail Park, 0.1% 1 0.0% 0 0.0% 0 0.0% 0 0.0% 0 0.0% 0 0.0% 0 0.0% 0 0.0% 0
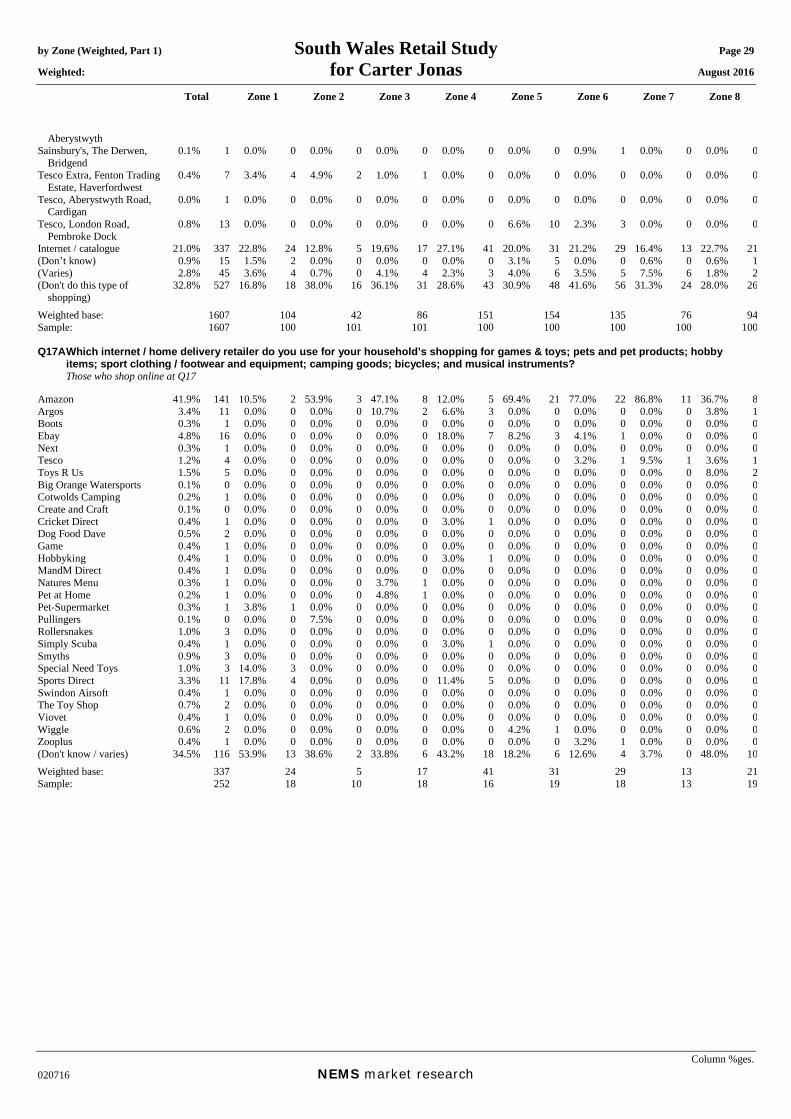
by Zone (Weighted, Part 1) South Wales Retail Study Page 29 Weighted: for Carter Jonas August 2016
Total Zone 1 Zone 2 Zone 3 Zone 4 Zone 5 Zone 6 Zone 7 Zone 8
Column %ges. 020716 NEMS market research
Aberystwyth Sainsbury's, The Derwen,
Bridgend 0.1% 1 0.0% 0 0.0% 0 0.0% 0 0.0% 0 0.0% 0 0.9% 1 0.0% 0 0.0% 0
Tesco Extra, Fenton Trading Estate, Haverfordwest
0.4% 7 3.4% 4 4.9% 2 1.0% 1 0.0% 0 0.0% 0 0.0% 0 0.0% 0 0.0% 0
Tesco, Aberystwyth Road, Cardigan
0.0% 1 0.0% 0 0.0% 0 0.0% 0 0.0% 0 0.0% 0 0.0% 0 0.0% 0 0.0% 0
Tesco, London Road, Pembroke Dock
0.8% 13 0.0% 0 0.0% 0 0.0% 0 0.0% 0 6.6% 10 2.3% 3 0.0% 0 0.0% 0
Internet / catalogue 21.0% 337 22.8% 24 12.8% 5 19.6% 17 27.1% 41 20.0% 31 21.2% 29 16.4% 13 22.7% 21(Don’t know) 0.9% 15 1.5% 2 0.0% 0 0.0% 0 0.0% 0 3.1% 5 0.0% 0 0.6% 0 0.6% 1(Varies) 2.8% 45 3.6% 4 0.7% 0 4.1% 4 2.3% 3 4.0% 6 3.5% 5 7.5% 6 1.8% 2(Don't do this type of
shopping) 32.8% 527 16.8% 18 38.0% 16 36.1% 31 28.6% 43 30.9% 48 41.6% 56 31.3% 24 28.0% 26
Weighted base: 1607 104 42 86 151 154 135 76 94Sample: 1607 100 101 101 100 100 100 100 100 Q17A Which internet / home delivery retailer do you use for your household’s shopping for games & toys; pets and pet products; hobby
items; sport clothing / footwear and equipment; camping goods; bicycles; and musical instruments? Those who shop online at Q17 Amazon 41.9% 141 10.5% 2 53.9% 3 47.1% 8 12.0% 5 69.4% 21 77.0% 22 86.8% 11 36.7% 8Argos 3.4% 11 0.0% 0 0.0% 0 10.7% 2 6.6% 3 0.0% 0 0.0% 0 0.0% 0 3.8% 1Boots 0.3% 1 0.0% 0 0.0% 0 0.0% 0 0.0% 0 0.0% 0 0.0% 0 0.0% 0 0.0% 0Ebay 4.8% 16 0.0% 0 0.0% 0 0.0% 0 18.0% 7 8.2% 3 4.1% 1 0.0% 0 0.0% 0Next 0.3% 1 0.0% 0 0.0% 0 0.0% 0 0.0% 0 0.0% 0 0.0% 0 0.0% 0 0.0% 0Tesco 1.2% 4 0.0% 0 0.0% 0 0.0% 0 0.0% 0 0.0% 0 3.2% 1 9.5% 1 3.6% 1Toys R Us 1.5% 5 0.0% 0 0.0% 0 0.0% 0 0.0% 0 0.0% 0 0.0% 0 0.0% 0 8.0% 2Big Orange Watersports 0.1% 0 0.0% 0 0.0% 0 0.0% 0 0.0% 0 0.0% 0 0.0% 0 0.0% 0 0.0% 0Cotwolds Camping 0.2% 1 0.0% 0 0.0% 0 0.0% 0 0.0% 0 0.0% 0 0.0% 0 0.0% 0 0.0% 0Create and Craft 0.1% 0 0.0% 0 0.0% 0 0.0% 0 0.0% 0 0.0% 0 0.0% 0 0.0% 0 0.0% 0Cricket Direct 0.4% 1 0.0% 0 0.0% 0 0.0% 0 3.0% 1 0.0% 0 0.0% 0 0.0% 0 0.0% 0Dog Food Dave 0.5% 2 0.0% 0 0.0% 0 0.0% 0 0.0% 0 0.0% 0 0.0% 0 0.0% 0 0.0% 0Game 0.4% 1 0.0% 0 0.0% 0 0.0% 0 0.0% 0 0.0% 0 0.0% 0 0.0% 0 0.0% 0Hobbyking 0.4% 1 0.0% 0 0.0% 0 0.0% 0 3.0% 1 0.0% 0 0.0% 0 0.0% 0 0.0% 0MandM Direct 0.4% 1 0.0% 0 0.0% 0 0.0% 0 0.0% 0 0.0% 0 0.0% 0 0.0% 0 0.0% 0Natures Menu 0.3% 1 0.0% 0 0.0% 0 3.7% 1 0.0% 0 0.0% 0 0.0% 0 0.0% 0 0.0% 0Pet at Home 0.2% 1 0.0% 0 0.0% 0 4.8% 1 0.0% 0 0.0% 0 0.0% 0 0.0% 0 0.0% 0Pet-Supermarket 0.3% 1 3.8% 1 0.0% 0 0.0% 0 0.0% 0 0.0% 0 0.0% 0 0.0% 0 0.0% 0Pullingers 0.1% 0 0.0% 0 7.5% 0 0.0% 0 0.0% 0 0.0% 0 0.0% 0 0.0% 0 0.0% 0Rollersnakes 1.0% 3 0.0% 0 0.0% 0 0.0% 0 0.0% 0 0.0% 0 0.0% 0 0.0% 0 0.0% 0Simply Scuba 0.4% 1 0.0% 0 0.0% 0 0.0% 0 3.0% 1 0.0% 0 0.0% 0 0.0% 0 0.0% 0Smyths 0.9% 3 0.0% 0 0.0% 0 0.0% 0 0.0% 0 0.0% 0 0.0% 0 0.0% 0 0.0% 0Special Need Toys 1.0% 3 14.0% 3 0.0% 0 0.0% 0 0.0% 0 0.0% 0 0.0% 0 0.0% 0 0.0% 0Sports Direct 3.3% 11 17.8% 4 0.0% 0 0.0% 0 11.4% 5 0.0% 0 0.0% 0 0.0% 0 0.0% 0Swindon Airsoft 0.4% 1 0.0% 0 0.0% 0 0.0% 0 0.0% 0 0.0% 0 0.0% 0 0.0% 0 0.0% 0The Toy Shop 0.7% 2 0.0% 0 0.0% 0 0.0% 0 0.0% 0 0.0% 0 0.0% 0 0.0% 0 0.0% 0Viovet 0.4% 1 0.0% 0 0.0% 0 0.0% 0 0.0% 0 0.0% 0 0.0% 0 0.0% 0 0.0% 0Wiggle 0.6% 2 0.0% 0 0.0% 0 0.0% 0 0.0% 0 4.2% 1 0.0% 0 0.0% 0 0.0% 0Zooplus 0.4% 1 0.0% 0 0.0% 0 0.0% 0 0.0% 0 0.0% 0 3.2% 1 0.0% 0 0.0% 0(Don't know / varies) 34.5% 116 53.9% 13 38.6% 2 33.8% 6 43.2% 18 18.2% 6 12.6% 4 3.7% 0 48.0% 10Weighted base: 337 24 5 17 41 31 29 13 21Sample: 252 18 10 18 16 19 18 13 19
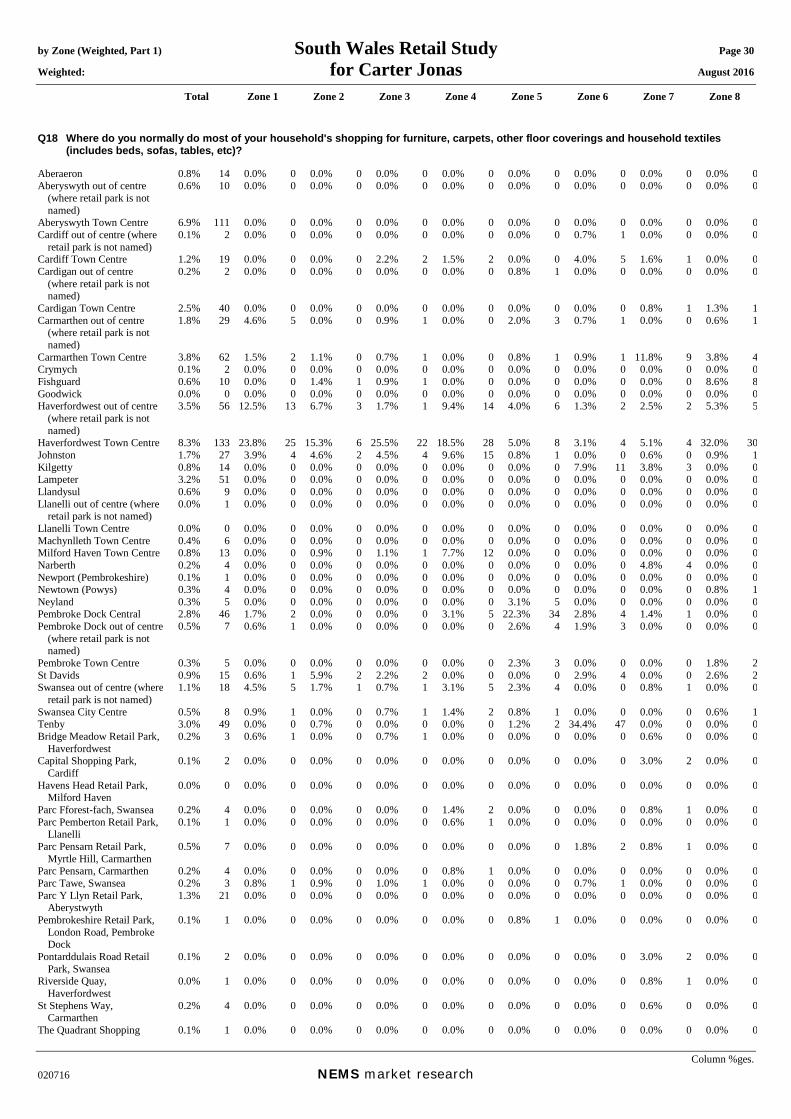
by Zone (Weighted, Part 1) South Wales Retail Study Page 30 Weighted: for Carter Jonas August 2016
Total Zone 1 Zone 2 Zone 3 Zone 4 Zone 5 Zone 6 Zone 7 Zone 8
Column %ges. 020716 NEMS market research
Q18 Where do you normally do most of your household's shopping for furniture, carpets, other floor coverings and household textiles (includes beds, sofas, tables, etc)?
Aberaeron 0.8% 14 0.0% 0 0.0% 0 0.0% 0 0.0% 0 0.0% 0 0.0% 0 0.0% 0 0.0% 0Aberyswyth out of centre
(where retail park is not named)
0.6% 10 0.0% 0 0.0% 0 0.0% 0 0.0% 0 0.0% 0 0.0% 0 0.0% 0 0.0% 0
Aberyswyth Town Centre 6.9% 111 0.0% 0 0.0% 0 0.0% 0 0.0% 0 0.0% 0 0.0% 0 0.0% 0 0.0% 0Cardiff out of centre (where
retail park is not named) 0.1% 2 0.0% 0 0.0% 0 0.0% 0 0.0% 0 0.0% 0 0.7% 1 0.0% 0 0.0% 0
Cardiff Town Centre 1.2% 19 0.0% 0 0.0% 0 2.2% 2 1.5% 2 0.0% 0 4.0% 5 1.6% 1 0.0% 0Cardigan out of centre
(where retail park is not named)
0.2% 2 0.0% 0 0.0% 0 0.0% 0 0.0% 0 0.8% 1 0.0% 0 0.0% 0 0.0% 0
Cardigan Town Centre 2.5% 40 0.0% 0 0.0% 0 0.0% 0 0.0% 0 0.0% 0 0.0% 0 0.8% 1 1.3% 1Carmarthen out of centre
(where retail park is not named)
1.8% 29 4.6% 5 0.0% 0 0.9% 1 0.0% 0 2.0% 3 0.7% 1 0.0% 0 0.6% 1
Carmarthen Town Centre 3.8% 62 1.5% 2 1.1% 0 0.7% 1 0.0% 0 0.8% 1 0.9% 1 11.8% 9 3.8% 4Crymych 0.1% 2 0.0% 0 0.0% 0 0.0% 0 0.0% 0 0.0% 0 0.0% 0 0.0% 0 0.0% 0Fishguard 0.6% 10 0.0% 0 1.4% 1 0.9% 1 0.0% 0 0.0% 0 0.0% 0 0.0% 0 8.6% 8Goodwick 0.0% 0 0.0% 0 0.0% 0 0.0% 0 0.0% 0 0.0% 0 0.0% 0 0.0% 0 0.0% 0Haverfordwest out of centre
(where retail park is not named)
3.5% 56 12.5% 13 6.7% 3 1.7% 1 9.4% 14 4.0% 6 1.3% 2 2.5% 2 5.3% 5
Haverfordwest Town Centre 8.3% 133 23.8% 25 15.3% 6 25.5% 22 18.5% 28 5.0% 8 3.1% 4 5.1% 4 32.0% 30Johnston 1.7% 27 3.9% 4 4.6% 2 4.5% 4 9.6% 15 0.8% 1 0.0% 0 0.6% 0 0.9% 1Kilgetty 0.8% 14 0.0% 0 0.0% 0 0.0% 0 0.0% 0 0.0% 0 7.9% 11 3.8% 3 0.0% 0Lampeter 3.2% 51 0.0% 0 0.0% 0 0.0% 0 0.0% 0 0.0% 0 0.0% 0 0.0% 0 0.0% 0Llandysul 0.6% 9 0.0% 0 0.0% 0 0.0% 0 0.0% 0 0.0% 0 0.0% 0 0.0% 0 0.0% 0Llanelli out of centre (where
retail park is not named) 0.0% 1 0.0% 0 0.0% 0 0.0% 0 0.0% 0 0.0% 0 0.0% 0 0.0% 0 0.0% 0
Llanelli Town Centre 0.0% 0 0.0% 0 0.0% 0 0.0% 0 0.0% 0 0.0% 0 0.0% 0 0.0% 0 0.0% 0Machynlleth Town Centre 0.4% 6 0.0% 0 0.0% 0 0.0% 0 0.0% 0 0.0% 0 0.0% 0 0.0% 0 0.0% 0Milford Haven Town Centre 0.8% 13 0.0% 0 0.9% 0 1.1% 1 7.7% 12 0.0% 0 0.0% 0 0.0% 0 0.0% 0Narberth 0.2% 4 0.0% 0 0.0% 0 0.0% 0 0.0% 0 0.0% 0 0.0% 0 4.8% 4 0.0% 0Newport (Pembrokeshire) 0.1% 1 0.0% 0 0.0% 0 0.0% 0 0.0% 0 0.0% 0 0.0% 0 0.0% 0 0.0% 0Newtown (Powys) 0.3% 4 0.0% 0 0.0% 0 0.0% 0 0.0% 0 0.0% 0 0.0% 0 0.0% 0 0.8% 1Neyland 0.3% 5 0.0% 0 0.0% 0 0.0% 0 0.0% 0 3.1% 5 0.0% 0 0.0% 0 0.0% 0Pembroke Dock Central 2.8% 46 1.7% 2 0.0% 0 0.0% 0 3.1% 5 22.3% 34 2.8% 4 1.4% 1 0.0% 0Pembroke Dock out of centre
(where retail park is not named)
0.5% 7 0.6% 1 0.0% 0 0.0% 0 0.0% 0 2.6% 4 1.9% 3 0.0% 0 0.0% 0
Pembroke Town Centre 0.3% 5 0.0% 0 0.0% 0 0.0% 0 0.0% 0 2.3% 3 0.0% 0 0.0% 0 1.8% 2St Davids 0.9% 15 0.6% 1 5.9% 2 2.2% 2 0.0% 0 0.0% 0 2.9% 4 0.0% 0 2.6% 2Swansea out of centre (where
retail park is not named) 1.1% 18 4.5% 5 1.7% 1 0.7% 1 3.1% 5 2.3% 4 0.0% 0 0.8% 1 0.0% 0
Swansea City Centre 0.5% 8 0.9% 1 0.0% 0 0.7% 1 1.4% 2 0.8% 1 0.0% 0 0.0% 0 0.6% 1Tenby 3.0% 49 0.0% 0 0.7% 0 0.0% 0 0.0% 0 1.2% 2 34.4% 47 0.0% 0 0.0% 0Bridge Meadow Retail Park,
Haverfordwest 0.2% 3 0.6% 1 0.0% 0 0.7% 1 0.0% 0 0.0% 0 0.0% 0 0.6% 0 0.0% 0
Capital Shopping Park, Cardiff
0.1% 2 0.0% 0 0.0% 0 0.0% 0 0.0% 0 0.0% 0 0.0% 0 3.0% 2 0.0% 0
Havens Head Retail Park, Milford Haven
0.0% 0 0.0% 0 0.0% 0 0.0% 0 0.0% 0 0.0% 0 0.0% 0 0.0% 0 0.0% 0
Parc Fforest-fach, Swansea 0.2% 4 0.0% 0 0.0% 0 0.0% 0 1.4% 2 0.0% 0 0.0% 0 0.8% 1 0.0% 0Parc Pemberton Retail Park,
Llanelli 0.1% 1 0.0% 0 0.0% 0 0.0% 0 0.6% 1 0.0% 0 0.0% 0 0.0% 0 0.0% 0
Parc Pensarn Retail Park, Myrtle Hill, Carmarthen
0.5% 7 0.0% 0 0.0% 0 0.0% 0 0.0% 0 0.0% 0 1.8% 2 0.8% 1 0.0% 0
Parc Pensarn, Carmarthen 0.2% 4 0.0% 0 0.0% 0 0.0% 0 0.8% 1 0.0% 0 0.0% 0 0.0% 0 0.0% 0Parc Tawe, Swansea 0.2% 3 0.8% 1 0.9% 0 1.0% 1 0.0% 0 0.0% 0 0.7% 1 0.0% 0 0.0% 0Parc Y Llyn Retail Park,
Aberystwyth 1.3% 21 0.0% 0 0.0% 0 0.0% 0 0.0% 0 0.0% 0 0.0% 0 0.0% 0 0.0% 0
Pembrokeshire Retail Park, London Road, Pembroke Dock
0.1% 1 0.0% 0 0.0% 0 0.0% 0 0.0% 0 0.8% 1 0.0% 0 0.0% 0 0.0% 0
Pontarddulais Road Retail Park, Swansea
0.1% 2 0.0% 0 0.0% 0 0.0% 0 0.0% 0 0.0% 0 0.0% 0 3.0% 2 0.0% 0
Riverside Quay, Haverfordwest
0.0% 1 0.0% 0 0.0% 0 0.0% 0 0.0% 0 0.0% 0 0.0% 0 0.8% 1 0.0% 0
St Stephens Way, Carmarthen
0.2% 4 0.0% 0 0.0% 0 0.0% 0 0.0% 0 0.0% 0 0.0% 0 0.6% 0 0.0% 0
The Quadrant Shopping 0.1% 1 0.0% 0 0.0% 0 0.0% 0 0.0% 0 0.0% 0 0.0% 0 0.0% 0 0.0% 0

by Zone (Weighted, Part 1) South Wales Retail Study Page 31 Weighted: for Carter Jonas August 2016
Total Zone 1 Zone 2 Zone 3 Zone 4 Zone 5 Zone 6 Zone 7 Zone 8
Column %ges. 020716 NEMS market research
Centre, Swansea Towy Ford Retail Park,
Carmarthen 0.1% 2 0.0% 0 0.0% 0 0.0% 0 0.0% 0 0.0% 0 0.0% 0 0.0% 0 0.0% 0
Trostre Retail Park, Llanelli 0.2% 3 0.0% 0 0.0% 0 0.0% 0 0.8% 1 0.0% 0 0.0% 0 0.0% 0 0.0% 0Withybush Retail Park,
Haverfordwest 2.9% 46 4.7% 5 7.8% 3 4.9% 4 8.0% 12 2.5% 4 4.0% 5 7.2% 5 1.7% 2
Ystwyth Retail Park, Aberystwyth
0.7% 12 0.0% 0 0.0% 0 0.0% 0 0.0% 0 0.0% 0 0.0% 0 0.0% 0 0.0% 0
Chester 0.1% 1 0.0% 0 0.0% 0 0.0% 0 0.0% 0 0.0% 0 0.0% 0 0.0% 0 0.0% 0Chester Retail Park, Chester 0.2% 3 0.0% 0 0.0% 0 0.0% 0 0.0% 0 0.0% 0 0.0% 0 0.0% 0 0.0% 0Cross Hands 0.9% 14 0.0% 0 0.0% 0 0.0% 0 0.6% 1 1.5% 2 4.0% 5 0.0% 0 0.0% 0Cross Hands Retail Park,
Cross Hands 0.2% 3 0.6% 1 0.0% 0 0.7% 1 0.0% 0 0.0% 0 0.0% 0 0.6% 0 0.0% 0
Dre-fach Felindre 0.1% 2 0.0% 0 0.0% 0 0.0% 0 0.0% 0 0.0% 0 0.0% 0 0.0% 0 0.0% 0Edinburgh 0.0% 1 0.0% 0 0.0% 0 0.0% 0 0.0% 0 0.0% 0 0.0% 0 0.0% 0 0.0% 0Felindre 0.1% 1 0.0% 0 0.0% 0 0.0% 0 0.0% 0 0.0% 0 0.0% 0 0.0% 0 0.0% 0Hafren Furnishers, Llangurig
Road, Llanidloes 0.2% 3 0.0% 0 0.0% 0 0.0% 0 0.0% 0 0.0% 0 0.0% 0 0.0% 0 0.0% 0
Havering 0.1% 2 0.0% 0 0.0% 0 0.0% 0 0.0% 0 0.0% 0 0.0% 0 0.0% 0 0.0% 0Hereford 0.0% 0 0.0% 0 0.0% 0 0.0% 0 0.0% 0 0.0% 0 0.0% 0 0.0% 0 0.0% 0Ikea, Ferry Road, Cardiff 0.3% 5 0.0% 0 0.0% 0 1.0% 1 0.0% 0 0.0% 0 0.0% 0 1.7% 1 0.0% 0Kidderminster 0.1% 1 0.0% 0 0.0% 0 0.0% 0 0.0% 0 0.0% 0 0.0% 0 0.0% 0 0.0% 0Llanidloes 0.4% 7 0.0% 0 0.0% 0 0.0% 0 0.0% 0 0.0% 0 0.0% 0 0.0% 0 0.0% 0Merry Hill, Brierley Hill 0.1% 1 0.0% 0 0.0% 0 0.0% 0 0.0% 0 0.0% 0 0.0% 0 0.0% 0 0.0% 0Newcastle Emlyn 0.2% 3 0.0% 0 0.0% 0 0.0% 0 0.0% 0 0.0% 0 0.0% 0 0.0% 0 0.0% 0Port Talbot 0.1% 1 0.0% 0 0.0% 0 0.0% 0 0.0% 0 0.0% 0 0.0% 0 0.0% 0 0.0% 0Sainsbury's, The Derwen,
Bridgend 0.1% 1 0.0% 0 0.0% 0 0.0% 0 0.0% 0 0.0% 0 0.0% 0 0.0% 0 0.0% 0
Stoke-on-Trent 0.0% 0 0.0% 0 0.0% 0 0.0% 0 0.0% 0 0.0% 0 0.0% 0 0.6% 0 0.0% 0Treharris 0.1% 1 0.0% 0 0.0% 0 0.0% 0 0.9% 1 0.0% 0 0.0% 0 0.0% 0 0.0% 0Internet / catalogue 10.6% 170 17.7% 19 18.3% 8 15.7% 14 13.3% 20 9.0% 14 8.3% 11 4.2% 3 10.9% 10(Don’t know) 4.2% 68 3.8% 4 7.7% 3 5.1% 4 1.2% 2 4.0% 6 2.5% 3 4.6% 4 1.7% 2(Varies) 5.3% 86 4.4% 5 1.4% 1 6.7% 6 6.5% 10 9.9% 15 4.0% 5 10.6% 8 1.8% 2(Don't do this type of
shopping) 21.4% 343 12.8% 13 25.5% 11 23.0% 20 11.4% 17 24.3% 37 14.0% 19 27.8% 21 25.7% 24
Weighted base: 1607 104 42 86 151 154 135 76 94Sample: 1607 100 101 101 100 100 100 100 100 Q18A Which internet / home delivery retailer do you use for your household's shopping for furniture, carpets, other floor coverings and
household textiles (includes beds, sofas, tables, etc)? Those who shop online at Q18 Amazon 7.5% 13 10.4% 2 24.5% 2 0.0% 0 23.1% 5 0.0% 0 21.0% 2 18.7% 1 0.0% 0Argos 2.7% 5 0.0% 0 0.0% 0 0.0% 0 0.0% 0 6.9% 1 23.3% 3 18.7% 1 0.0% 0Ebay 7.6% 13 0.0% 0 0.0% 0 0.0% 0 6.0% 1 34.4% 5 0.0% 0 0.0% 0 0.0% 0Ikea 0.7% 1 0.0% 0 0.0% 0 0.0% 0 0.0% 0 0.0% 0 0.0% 0 0.0% 0 0.0% 0John Lewis 3.0% 5 0.0% 0 0.0% 0 0.0% 0 6.3% 1 0.0% 0 0.0% 0 14.4% 0 0.0% 0Littlewoods 1.4% 2 0.0% 0 0.0% 0 0.0% 0 0.0% 0 0.0% 0 0.0% 0 0.0% 0 0.0% 0Next 9.8% 17 14.0% 3 5.0% 0 0.0% 0 0.0% 0 29.3% 4 0.0% 0 0.0% 0 0.0% 0Tesco 0.7% 1 0.0% 0 0.0% 0 0.0% 0 0.0% 0 0.0% 0 11.0% 1 0.0% 0 0.0% 0Bed World 0.8% 1 0.0% 0 0.0% 0 0.0% 0 0.0% 0 0.0% 0 0.0% 0 0.0% 0 0.0% 0Carpetright 0.4% 1 0.0% 0 0.0% 0 0.0% 0 0.0% 0 0.0% 0 0.0% 0 0.0% 0 0.0% 0DFS 0.8% 1 0.0% 0 0.0% 0 0.0% 0 0.0% 0 0.0% 0 0.0% 0 0.0% 0 0.0% 0Flooring Direct 1.3% 2 0.0% 0 0.0% 0 0.0% 0 0.0% 0 0.0% 0 0.0% 0 0.0% 0 0.0% 0Furnituredirectory 0.2% 0 0.0% 0 5.0% 0 0.0% 0 0.0% 0 0.0% 0 0.0% 0 0.0% 0 0.0% 0Grattan 0.4% 1 0.0% 0 0.0% 0 0.0% 0 0.0% 0 0.0% 0 0.0% 0 0.0% 0 0.0% 0Mattressman 0.4% 1 0.0% 0 0.0% 0 0.0% 0 0.0% 0 0.0% 0 0.0% 0 19.5% 1 0.0% 0QVC 0.6% 1 0.0% 0 3.9% 0 0.0% 0 0.0% 0 0.0% 0 0.0% 0 0.0% 0 7.5% 1Secret Sales 1.3% 2 0.0% 0 0.0% 0 0.0% 0 0.0% 0 0.0% 0 0.0% 0 0.0% 0 0.0% 0SofaSofa 0.8% 1 0.0% 0 0.0% 0 0.0% 0 0.0% 0 0.0% 0 0.0% 0 0.0% 0 0.0% 0Studio 1.0% 2 0.0% 0 0.0% 0 0.0% 0 0.0% 0 0.0% 0 0.0% 0 0.0% 0 16.6% 2Tonys Textiles 0.3% 1 0.0% 0 0.0% 0 0.0% 0 0.0% 0 0.0% 0 0.0% 0 0.0% 0 0.0% 0Very 3.6% 6 0.0% 0 0.0% 0 0.0% 0 0.0% 0 0.0% 0 11.0% 1 0.0% 0 0.0% 0Zara 0.9% 1 0.0% 0 0.0% 0 0.0% 0 0.0% 0 0.0% 0 0.0% 0 0.0% 0 0.0% 0(Don't know / varies) 53.9% 92 75.6% 14 61.6% 5 100.0% 14 64.5% 13 29.3% 4 33.8% 4 28.7% 1 75.9% 8Weighted base: 170 19 8 14 20 14 11 3 10Sample: 136 11 15 13 10 6 7 6 10
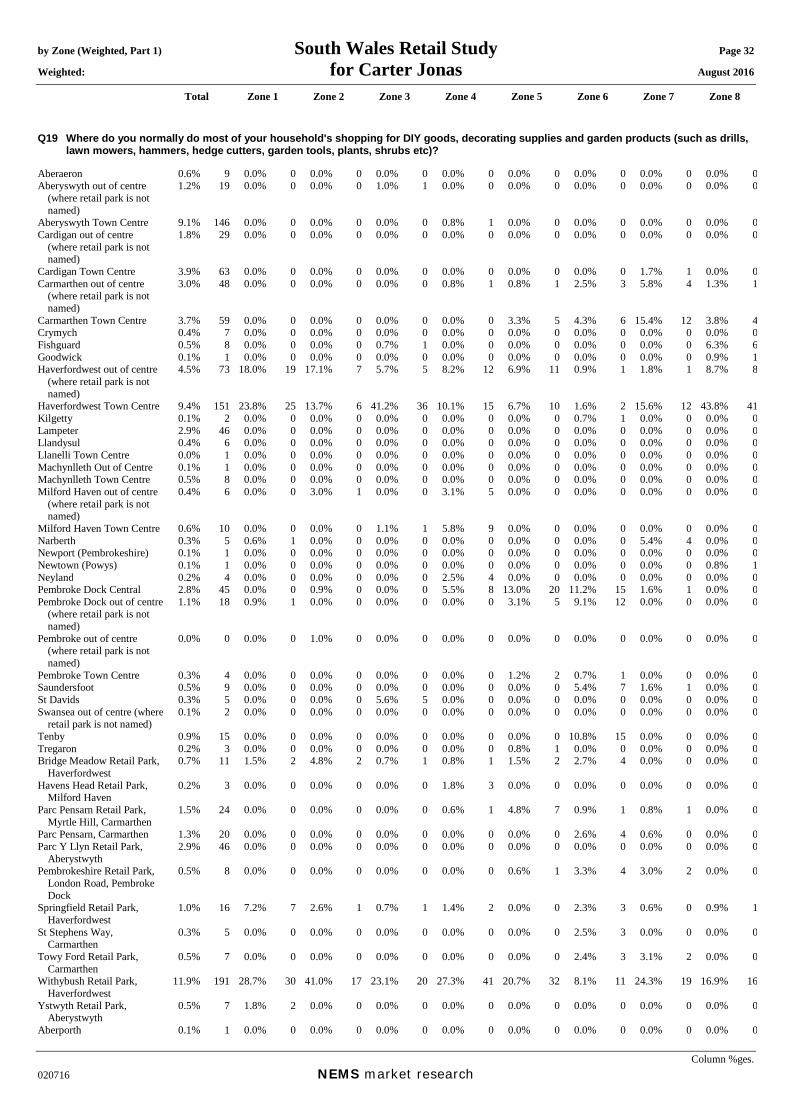
by Zone (Weighted, Part 1) South Wales Retail Study Page 32 Weighted: for Carter Jonas August 2016
Total Zone 1 Zone 2 Zone 3 Zone 4 Zone 5 Zone 6 Zone 7 Zone 8
Column %ges. 020716 NEMS market research
Q19 Where do you normally do most of your household's shopping for DIY goods, decorating supplies and garden products (such as drills, lawn mowers, hammers, hedge cutters, garden tools, plants, shrubs etc)?
Aberaeron 0.6% 9 0.0% 0 0.0% 0 0.0% 0 0.0% 0 0.0% 0 0.0% 0 0.0% 0 0.0% 0Aberyswyth out of centre
(where retail park is not named)
1.2% 19 0.0% 0 0.0% 0 1.0% 1 0.0% 0 0.0% 0 0.0% 0 0.0% 0 0.0% 0
Aberyswyth Town Centre 9.1% 146 0.0% 0 0.0% 0 0.0% 0 0.8% 1 0.0% 0 0.0% 0 0.0% 0 0.0% 0Cardigan out of centre
(where retail park is not named)
1.8% 29 0.0% 0 0.0% 0 0.0% 0 0.0% 0 0.0% 0 0.0% 0 0.0% 0 0.0% 0
Cardigan Town Centre 3.9% 63 0.0% 0 0.0% 0 0.0% 0 0.0% 0 0.0% 0 0.0% 0 1.7% 1 0.0% 0Carmarthen out of centre
(where retail park is not named)
3.0% 48 0.0% 0 0.0% 0 0.0% 0 0.8% 1 0.8% 1 2.5% 3 5.8% 4 1.3% 1
Carmarthen Town Centre 3.7% 59 0.0% 0 0.0% 0 0.0% 0 0.0% 0 3.3% 5 4.3% 6 15.4% 12 3.8% 4Crymych 0.4% 7 0.0% 0 0.0% 0 0.0% 0 0.0% 0 0.0% 0 0.0% 0 0.0% 0 0.0% 0Fishguard 0.5% 8 0.0% 0 0.0% 0 0.7% 1 0.0% 0 0.0% 0 0.0% 0 0.0% 0 6.3% 6Goodwick 0.1% 1 0.0% 0 0.0% 0 0.0% 0 0.0% 0 0.0% 0 0.0% 0 0.0% 0 0.9% 1Haverfordwest out of centre
(where retail park is not named)
4.5% 73 18.0% 19 17.1% 7 5.7% 5 8.2% 12 6.9% 11 0.9% 1 1.8% 1 8.7% 8
Haverfordwest Town Centre 9.4% 151 23.8% 25 13.7% 6 41.2% 36 10.1% 15 6.7% 10 1.6% 2 15.6% 12 43.8% 41Kilgetty 0.1% 2 0.0% 0 0.0% 0 0.0% 0 0.0% 0 0.0% 0 0.7% 1 0.0% 0 0.0% 0Lampeter 2.9% 46 0.0% 0 0.0% 0 0.0% 0 0.0% 0 0.0% 0 0.0% 0 0.0% 0 0.0% 0Llandysul 0.4% 6 0.0% 0 0.0% 0 0.0% 0 0.0% 0 0.0% 0 0.0% 0 0.0% 0 0.0% 0Llanelli Town Centre 0.0% 1 0.0% 0 0.0% 0 0.0% 0 0.0% 0 0.0% 0 0.0% 0 0.0% 0 0.0% 0Machynlleth Out of Centre 0.1% 1 0.0% 0 0.0% 0 0.0% 0 0.0% 0 0.0% 0 0.0% 0 0.0% 0 0.0% 0Machynlleth Town Centre 0.5% 8 0.0% 0 0.0% 0 0.0% 0 0.0% 0 0.0% 0 0.0% 0 0.0% 0 0.0% 0Milford Haven out of centre
(where retail park is not named)
0.4% 6 0.0% 0 3.0% 1 0.0% 0 3.1% 5 0.0% 0 0.0% 0 0.0% 0 0.0% 0
Milford Haven Town Centre 0.6% 10 0.0% 0 0.0% 0 1.1% 1 5.8% 9 0.0% 0 0.0% 0 0.0% 0 0.0% 0Narberth 0.3% 5 0.6% 1 0.0% 0 0.0% 0 0.0% 0 0.0% 0 0.0% 0 5.4% 4 0.0% 0Newport (Pembrokeshire) 0.1% 1 0.0% 0 0.0% 0 0.0% 0 0.0% 0 0.0% 0 0.0% 0 0.0% 0 0.0% 0Newtown (Powys) 0.1% 1 0.0% 0 0.0% 0 0.0% 0 0.0% 0 0.0% 0 0.0% 0 0.0% 0 0.8% 1Neyland 0.2% 4 0.0% 0 0.0% 0 0.0% 0 2.5% 4 0.0% 0 0.0% 0 0.0% 0 0.0% 0Pembroke Dock Central 2.8% 45 0.0% 0 0.9% 0 0.0% 0 5.5% 8 13.0% 20 11.2% 15 1.6% 1 0.0% 0Pembroke Dock out of centre
(where retail park is not named)
1.1% 18 0.9% 1 0.0% 0 0.0% 0 0.0% 0 3.1% 5 9.1% 12 0.0% 0 0.0% 0
Pembroke out of centre (where retail park is not named)
0.0% 0 0.0% 0 1.0% 0 0.0% 0 0.0% 0 0.0% 0 0.0% 0 0.0% 0 0.0% 0
Pembroke Town Centre 0.3% 4 0.0% 0 0.0% 0 0.0% 0 0.0% 0 1.2% 2 0.7% 1 0.0% 0 0.0% 0Saundersfoot 0.5% 9 0.0% 0 0.0% 0 0.0% 0 0.0% 0 0.0% 0 5.4% 7 1.6% 1 0.0% 0St Davids 0.3% 5 0.0% 0 0.0% 0 5.6% 5 0.0% 0 0.0% 0 0.0% 0 0.0% 0 0.0% 0Swansea out of centre (where
retail park is not named) 0.1% 2 0.0% 0 0.0% 0 0.0% 0 0.0% 0 0.0% 0 0.0% 0 0.0% 0 0.0% 0
Tenby 0.9% 15 0.0% 0 0.0% 0 0.0% 0 0.0% 0 0.0% 0 10.8% 15 0.0% 0 0.0% 0Tregaron 0.2% 3 0.0% 0 0.0% 0 0.0% 0 0.0% 0 0.8% 1 0.0% 0 0.0% 0 0.0% 0Bridge Meadow Retail Park,
Haverfordwest 0.7% 11 1.5% 2 4.8% 2 0.7% 1 0.8% 1 1.5% 2 2.7% 4 0.0% 0 0.0% 0
Havens Head Retail Park, Milford Haven
0.2% 3 0.0% 0 0.0% 0 0.0% 0 1.8% 3 0.0% 0 0.0% 0 0.0% 0 0.0% 0
Parc Pensarn Retail Park, Myrtle Hill, Carmarthen
1.5% 24 0.0% 0 0.0% 0 0.0% 0 0.6% 1 4.8% 7 0.9% 1 0.8% 1 0.0% 0
Parc Pensarn, Carmarthen 1.3% 20 0.0% 0 0.0% 0 0.0% 0 0.0% 0 0.0% 0 2.6% 4 0.6% 0 0.0% 0Parc Y Llyn Retail Park,
Aberystwyth 2.9% 46 0.0% 0 0.0% 0 0.0% 0 0.0% 0 0.0% 0 0.0% 0 0.0% 0 0.0% 0
Pembrokeshire Retail Park, London Road, Pembroke Dock
0.5% 8 0.0% 0 0.0% 0 0.0% 0 0.0% 0 0.6% 1 3.3% 4 3.0% 2 0.0% 0
Springfield Retail Park, Haverfordwest
1.0% 16 7.2% 7 2.6% 1 0.7% 1 1.4% 2 0.0% 0 2.3% 3 0.6% 0 0.9% 1
St Stephens Way, Carmarthen
0.3% 5 0.0% 0 0.0% 0 0.0% 0 0.0% 0 0.0% 0 2.5% 3 0.0% 0 0.0% 0
Towy Ford Retail Park, Carmarthen
0.5% 7 0.0% 0 0.0% 0 0.0% 0 0.0% 0 0.0% 0 2.4% 3 3.1% 2 0.0% 0
Withybush Retail Park, Haverfordwest
11.9% 191 28.7% 30 41.0% 17 23.1% 20 27.3% 41 20.7% 32 8.1% 11 24.3% 19 16.9% 16
Ystwyth Retail Park, Aberystwyth
0.5% 7 1.8% 2 0.0% 0 0.0% 0 0.0% 0 0.0% 0 0.0% 0 0.0% 0 0.0% 0
Aberporth 0.1% 1 0.0% 0 0.0% 0 0.0% 0 0.0% 0 0.0% 0 0.0% 0 0.0% 0 0.0% 0
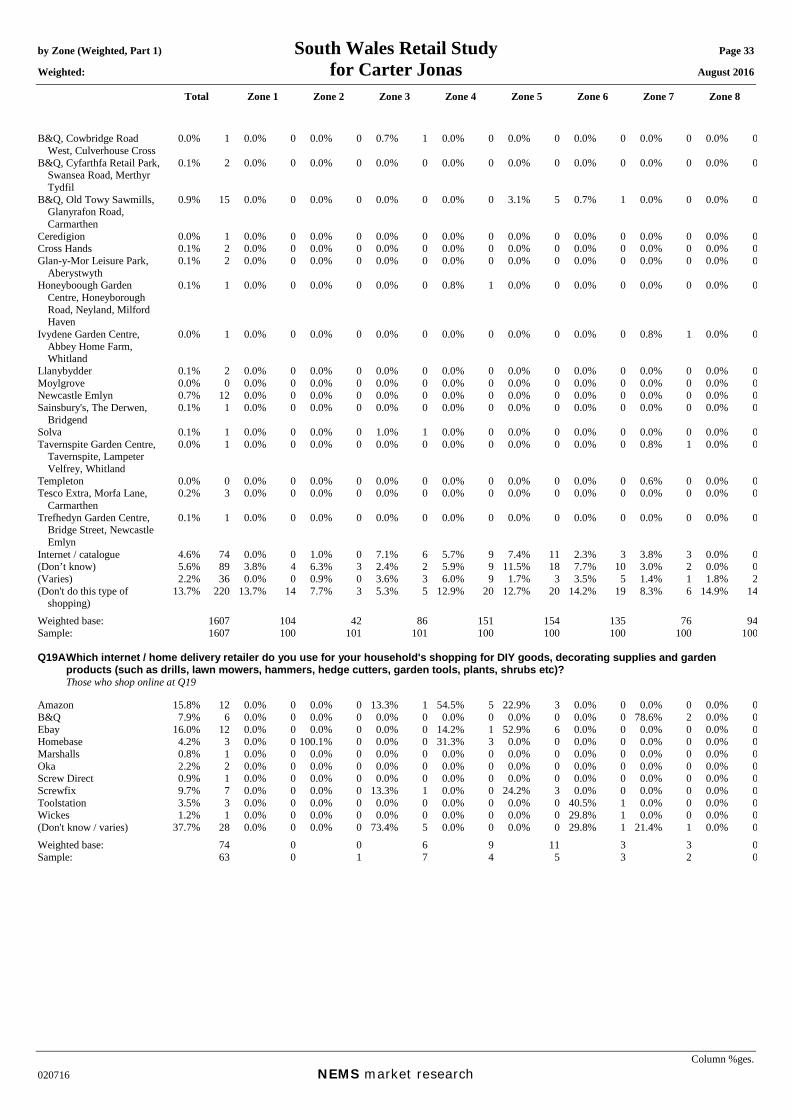
by Zone (Weighted, Part 1) South Wales Retail Study Page 33 Weighted: for Carter Jonas August 2016
Total Zone 1 Zone 2 Zone 3 Zone 4 Zone 5 Zone 6 Zone 7 Zone 8
Column %ges. 020716 NEMS market research
B&Q, Cowbridge Road West, Culverhouse Cross
0.0% 1 0.0% 0 0.0% 0 0.7% 1 0.0% 0 0.0% 0 0.0% 0 0.0% 0 0.0% 0
B&Q, Cyfarthfa Retail Park, Swansea Road, Merthyr Tydfil
0.1% 2 0.0% 0 0.0% 0 0.0% 0 0.0% 0 0.0% 0 0.0% 0 0.0% 0 0.0% 0
B&Q, Old Towy Sawmills, Glanyrafon Road, Carmarthen
0.9% 15 0.0% 0 0.0% 0 0.0% 0 0.0% 0 3.1% 5 0.7% 1 0.0% 0 0.0% 0
Ceredigion 0.0% 1 0.0% 0 0.0% 0 0.0% 0 0.0% 0 0.0% 0 0.0% 0 0.0% 0 0.0% 0Cross Hands 0.1% 2 0.0% 0 0.0% 0 0.0% 0 0.0% 0 0.0% 0 0.0% 0 0.0% 0 0.0% 0Glan-y-Mor Leisure Park,
Aberystwyth 0.1% 2 0.0% 0 0.0% 0 0.0% 0 0.0% 0 0.0% 0 0.0% 0 0.0% 0 0.0% 0
Honeyboough Garden Centre, Honeyborough Road, Neyland, Milford Haven
0.1% 1 0.0% 0 0.0% 0 0.0% 0 0.8% 1 0.0% 0 0.0% 0 0.0% 0 0.0% 0
Ivydene Garden Centre, Abbey Home Farm, Whitland
0.0% 1 0.0% 0 0.0% 0 0.0% 0 0.0% 0 0.0% 0 0.0% 0 0.8% 1 0.0% 0
Llanybydder 0.1% 2 0.0% 0 0.0% 0 0.0% 0 0.0% 0 0.0% 0 0.0% 0 0.0% 0 0.0% 0Moylgrove 0.0% 0 0.0% 0 0.0% 0 0.0% 0 0.0% 0 0.0% 0 0.0% 0 0.0% 0 0.0% 0Newcastle Emlyn 0.7% 12 0.0% 0 0.0% 0 0.0% 0 0.0% 0 0.0% 0 0.0% 0 0.0% 0 0.0% 0Sainsbury's, The Derwen,
Bridgend 0.1% 1 0.0% 0 0.0% 0 0.0% 0 0.0% 0 0.0% 0 0.0% 0 0.0% 0 0.0% 0
Solva 0.1% 1 0.0% 0 0.0% 0 1.0% 1 0.0% 0 0.0% 0 0.0% 0 0.0% 0 0.0% 0Tavernspite Garden Centre,
Tavernspite, Lampeter Velfrey, Whitland
0.0% 1 0.0% 0 0.0% 0 0.0% 0 0.0% 0 0.0% 0 0.0% 0 0.8% 1 0.0% 0
Templeton 0.0% 0 0.0% 0 0.0% 0 0.0% 0 0.0% 0 0.0% 0 0.0% 0 0.6% 0 0.0% 0Tesco Extra, Morfa Lane,
Carmarthen 0.2% 3 0.0% 0 0.0% 0 0.0% 0 0.0% 0 0.0% 0 0.0% 0 0.0% 0 0.0% 0
Trefhedyn Garden Centre, Bridge Street, Newcastle Emlyn
0.1% 1 0.0% 0 0.0% 0 0.0% 0 0.0% 0 0.0% 0 0.0% 0 0.0% 0 0.0% 0
Internet / catalogue 4.6% 74 0.0% 0 1.0% 0 7.1% 6 5.7% 9 7.4% 11 2.3% 3 3.8% 3 0.0% 0(Don’t know) 5.6% 89 3.8% 4 6.3% 3 2.4% 2 5.9% 9 11.5% 18 7.7% 10 3.0% 2 0.0% 0(Varies) 2.2% 36 0.0% 0 0.9% 0 3.6% 3 6.0% 9 1.7% 3 3.5% 5 1.4% 1 1.8% 2(Don't do this type of
shopping) 13.7% 220 13.7% 14 7.7% 3 5.3% 5 12.9% 20 12.7% 20 14.2% 19 8.3% 6 14.9% 14
Weighted base: 1607 104 42 86 151 154 135 76 94Sample: 1607 100 101 101 100 100 100 100 100 Q19A Which internet / home delivery retailer do you use for your household's shopping for DIY goods, decorating supplies and garden
products (such as drills, lawn mowers, hammers, hedge cutters, garden tools, plants, shrubs etc)? Those who shop online at Q19 Amazon 15.8% 12 0.0% 0 0.0% 0 13.3% 1 54.5% 5 22.9% 3 0.0% 0 0.0% 0 0.0% 0B&Q 7.9% 6 0.0% 0 0.0% 0 0.0% 0 0.0% 0 0.0% 0 0.0% 0 78.6% 2 0.0% 0Ebay 16.0% 12 0.0% 0 0.0% 0 0.0% 0 14.2% 1 52.9% 6 0.0% 0 0.0% 0 0.0% 0Homebase 4.2% 3 0.0% 0 100.1% 0 0.0% 0 31.3% 3 0.0% 0 0.0% 0 0.0% 0 0.0% 0Marshalls 0.8% 1 0.0% 0 0.0% 0 0.0% 0 0.0% 0 0.0% 0 0.0% 0 0.0% 0 0.0% 0Oka 2.2% 2 0.0% 0 0.0% 0 0.0% 0 0.0% 0 0.0% 0 0.0% 0 0.0% 0 0.0% 0Screw Direct 0.9% 1 0.0% 0 0.0% 0 0.0% 0 0.0% 0 0.0% 0 0.0% 0 0.0% 0 0.0% 0Screwfix 9.7% 7 0.0% 0 0.0% 0 13.3% 1 0.0% 0 24.2% 3 0.0% 0 0.0% 0 0.0% 0Toolstation 3.5% 3 0.0% 0 0.0% 0 0.0% 0 0.0% 0 0.0% 0 40.5% 1 0.0% 0 0.0% 0Wickes 1.2% 1 0.0% 0 0.0% 0 0.0% 0 0.0% 0 0.0% 0 29.8% 1 0.0% 0 0.0% 0(Don't know / varies) 37.7% 28 0.0% 0 0.0% 0 73.4% 5 0.0% 0 0.0% 0 29.8% 1 21.4% 1 0.0% 0Weighted base: 74 0 0 6 9 11 3 3 0Sample: 63 0 1 7 4 5 3 2 0
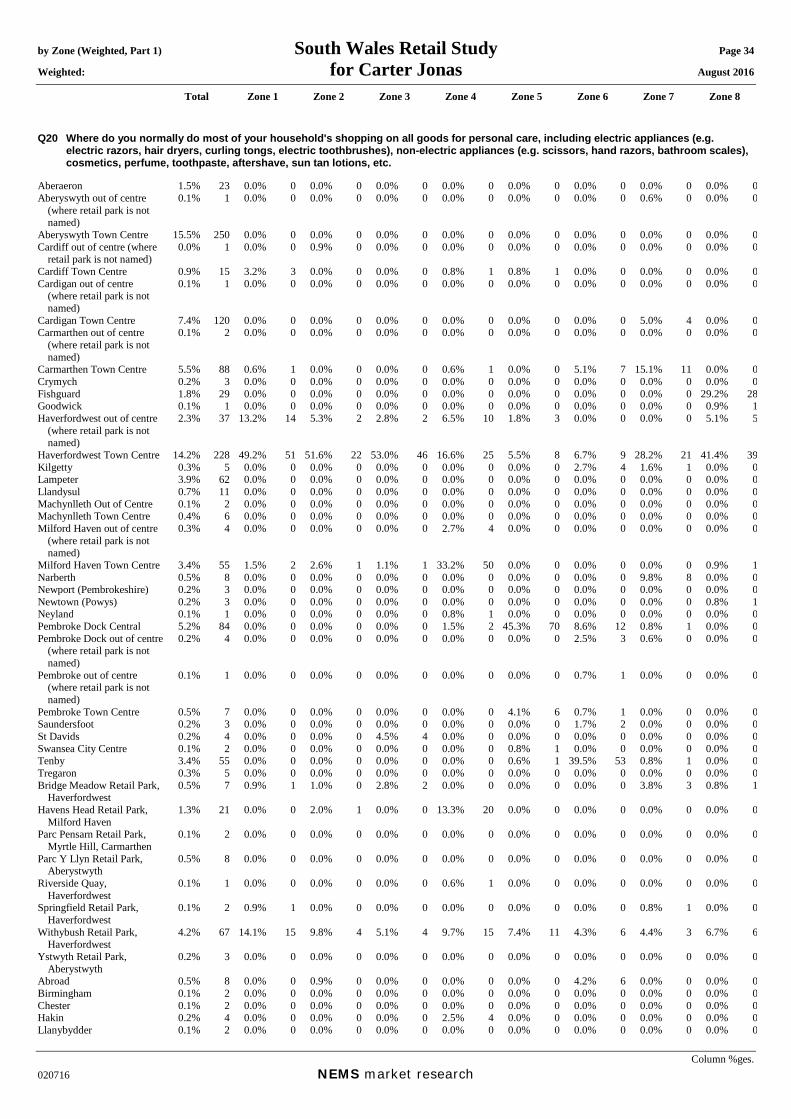
by Zone (Weighted, Part 1) South Wales Retail Study Page 34 Weighted: for Carter Jonas August 2016
Total Zone 1 Zone 2 Zone 3 Zone 4 Zone 5 Zone 6 Zone 7 Zone 8
Column %ges. 020716 NEMS market research
Q20 Where do you normally do most of your household's shopping on all goods for personal care, including electric appliances (e.g. electric razors, hair dryers, curling tongs, electric toothbrushes), non-electric appliances (e.g. scissors, hand razors, bathroom scales), cosmetics, perfume, toothpaste, aftershave, sun tan lotions, etc.
Aberaeron 1.5% 23 0.0% 0 0.0% 0 0.0% 0 0.0% 0 0.0% 0 0.0% 0 0.0% 0 0.0% 0Aberyswyth out of centre
(where retail park is not named)
0.1% 1 0.0% 0 0.0% 0 0.0% 0 0.0% 0 0.0% 0 0.0% 0 0.6% 0 0.0% 0
Aberyswyth Town Centre 15.5% 250 0.0% 0 0.0% 0 0.0% 0 0.0% 0 0.0% 0 0.0% 0 0.0% 0 0.0% 0Cardiff out of centre (where
retail park is not named) 0.0% 1 0.0% 0 0.9% 0 0.0% 0 0.0% 0 0.0% 0 0.0% 0 0.0% 0 0.0% 0
Cardiff Town Centre 0.9% 15 3.2% 3 0.0% 0 0.0% 0 0.8% 1 0.8% 1 0.0% 0 0.0% 0 0.0% 0Cardigan out of centre
(where retail park is not named)
0.1% 1 0.0% 0 0.0% 0 0.0% 0 0.0% 0 0.0% 0 0.0% 0 0.0% 0 0.0% 0
Cardigan Town Centre 7.4% 120 0.0% 0 0.0% 0 0.0% 0 0.0% 0 0.0% 0 0.0% 0 5.0% 4 0.0% 0Carmarthen out of centre
(where retail park is not named)
0.1% 2 0.0% 0 0.0% 0 0.0% 0 0.0% 0 0.0% 0 0.0% 0 0.0% 0 0.0% 0
Carmarthen Town Centre 5.5% 88 0.6% 1 0.0% 0 0.0% 0 0.6% 1 0.0% 0 5.1% 7 15.1% 11 0.0% 0Crymych 0.2% 3 0.0% 0 0.0% 0 0.0% 0 0.0% 0 0.0% 0 0.0% 0 0.0% 0 0.0% 0Fishguard 1.8% 29 0.0% 0 0.0% 0 0.0% 0 0.0% 0 0.0% 0 0.0% 0 0.0% 0 29.2% 28Goodwick 0.1% 1 0.0% 0 0.0% 0 0.0% 0 0.0% 0 0.0% 0 0.0% 0 0.0% 0 0.9% 1Haverfordwest out of centre
(where retail park is not named)
2.3% 37 13.2% 14 5.3% 2 2.8% 2 6.5% 10 1.8% 3 0.0% 0 0.0% 0 5.1% 5
Haverfordwest Town Centre 14.2% 228 49.2% 51 51.6% 22 53.0% 46 16.6% 25 5.5% 8 6.7% 9 28.2% 21 41.4% 39Kilgetty 0.3% 5 0.0% 0 0.0% 0 0.0% 0 0.0% 0 0.0% 0 2.7% 4 1.6% 1 0.0% 0Lampeter 3.9% 62 0.0% 0 0.0% 0 0.0% 0 0.0% 0 0.0% 0 0.0% 0 0.0% 0 0.0% 0Llandysul 0.7% 11 0.0% 0 0.0% 0 0.0% 0 0.0% 0 0.0% 0 0.0% 0 0.0% 0 0.0% 0Machynlleth Out of Centre 0.1% 2 0.0% 0 0.0% 0 0.0% 0 0.0% 0 0.0% 0 0.0% 0 0.0% 0 0.0% 0Machynlleth Town Centre 0.4% 6 0.0% 0 0.0% 0 0.0% 0 0.0% 0 0.0% 0 0.0% 0 0.0% 0 0.0% 0Milford Haven out of centre
(where retail park is not named)
0.3% 4 0.0% 0 0.0% 0 0.0% 0 2.7% 4 0.0% 0 0.0% 0 0.0% 0 0.0% 0
Milford Haven Town Centre 3.4% 55 1.5% 2 2.6% 1 1.1% 1 33.2% 50 0.0% 0 0.0% 0 0.0% 0 0.9% 1Narberth 0.5% 8 0.0% 0 0.0% 0 0.0% 0 0.0% 0 0.0% 0 0.0% 0 9.8% 8 0.0% 0Newport (Pembrokeshire) 0.2% 3 0.0% 0 0.0% 0 0.0% 0 0.0% 0 0.0% 0 0.0% 0 0.0% 0 0.0% 0Newtown (Powys) 0.2% 3 0.0% 0 0.0% 0 0.0% 0 0.0% 0 0.0% 0 0.0% 0 0.0% 0 0.8% 1Neyland 0.1% 1 0.0% 0 0.0% 0 0.0% 0 0.8% 1 0.0% 0 0.0% 0 0.0% 0 0.0% 0Pembroke Dock Central 5.2% 84 0.0% 0 0.0% 0 0.0% 0 1.5% 2 45.3% 70 8.6% 12 0.8% 1 0.0% 0Pembroke Dock out of centre
(where retail park is not named)
0.2% 4 0.0% 0 0.0% 0 0.0% 0 0.0% 0 0.0% 0 2.5% 3 0.6% 0 0.0% 0
Pembroke out of centre (where retail park is not named)
0.1% 1 0.0% 0 0.0% 0 0.0% 0 0.0% 0 0.0% 0 0.7% 1 0.0% 0 0.0% 0
Pembroke Town Centre 0.5% 7 0.0% 0 0.0% 0 0.0% 0 0.0% 0 4.1% 6 0.7% 1 0.0% 0 0.0% 0Saundersfoot 0.2% 3 0.0% 0 0.0% 0 0.0% 0 0.0% 0 0.0% 0 1.7% 2 0.0% 0 0.0% 0St Davids 0.2% 4 0.0% 0 0.0% 0 4.5% 4 0.0% 0 0.0% 0 0.0% 0 0.0% 0 0.0% 0Swansea City Centre 0.1% 2 0.0% 0 0.0% 0 0.0% 0 0.0% 0 0.8% 1 0.0% 0 0.0% 0 0.0% 0Tenby 3.4% 55 0.0% 0 0.0% 0 0.0% 0 0.0% 0 0.6% 1 39.5% 53 0.8% 1 0.0% 0Tregaron 0.3% 5 0.0% 0 0.0% 0 0.0% 0 0.0% 0 0.0% 0 0.0% 0 0.0% 0 0.0% 0Bridge Meadow Retail Park,
Haverfordwest 0.5% 7 0.9% 1 1.0% 0 2.8% 2 0.0% 0 0.0% 0 0.0% 0 3.8% 3 0.8% 1
Havens Head Retail Park, Milford Haven
1.3% 21 0.0% 0 2.0% 1 0.0% 0 13.3% 20 0.0% 0 0.0% 0 0.0% 0 0.0% 0
Parc Pensarn Retail Park, Myrtle Hill, Carmarthen
0.1% 2 0.0% 0 0.0% 0 0.0% 0 0.0% 0 0.0% 0 0.0% 0 0.0% 0 0.0% 0
Parc Y Llyn Retail Park, Aberystwyth
0.5% 8 0.0% 0 0.0% 0 0.0% 0 0.0% 0 0.0% 0 0.0% 0 0.0% 0 0.0% 0
Riverside Quay, Haverfordwest
0.1% 1 0.0% 0 0.0% 0 0.0% 0 0.6% 1 0.0% 0 0.0% 0 0.0% 0 0.0% 0
Springfield Retail Park, Haverfordwest
0.1% 2 0.9% 1 0.0% 0 0.0% 0 0.0% 0 0.0% 0 0.0% 0 0.8% 1 0.0% 0
Withybush Retail Park, Haverfordwest
4.2% 67 14.1% 15 9.8% 4 5.1% 4 9.7% 15 7.4% 11 4.3% 6 4.4% 3 6.7% 6
Ystwyth Retail Park, Aberystwyth
0.2% 3 0.0% 0 0.0% 0 0.0% 0 0.0% 0 0.0% 0 0.0% 0 0.0% 0 0.0% 0
Abroad 0.5% 8 0.0% 0 0.9% 0 0.0% 0 0.0% 0 0.0% 0 4.2% 6 0.0% 0 0.0% 0Birmingham 0.1% 2 0.0% 0 0.0% 0 0.0% 0 0.0% 0 0.0% 0 0.0% 0 0.0% 0 0.0% 0Chester 0.1% 2 0.0% 0 0.0% 0 0.0% 0 0.0% 0 0.0% 0 0.0% 0 0.0% 0 0.0% 0Hakin 0.2% 4 0.0% 0 0.0% 0 0.0% 0 2.5% 4 0.0% 0 0.0% 0 0.0% 0 0.0% 0Llanybydder 0.1% 2 0.0% 0 0.0% 0 0.0% 0 0.0% 0 0.0% 0 0.0% 0 0.0% 0 0.0% 0
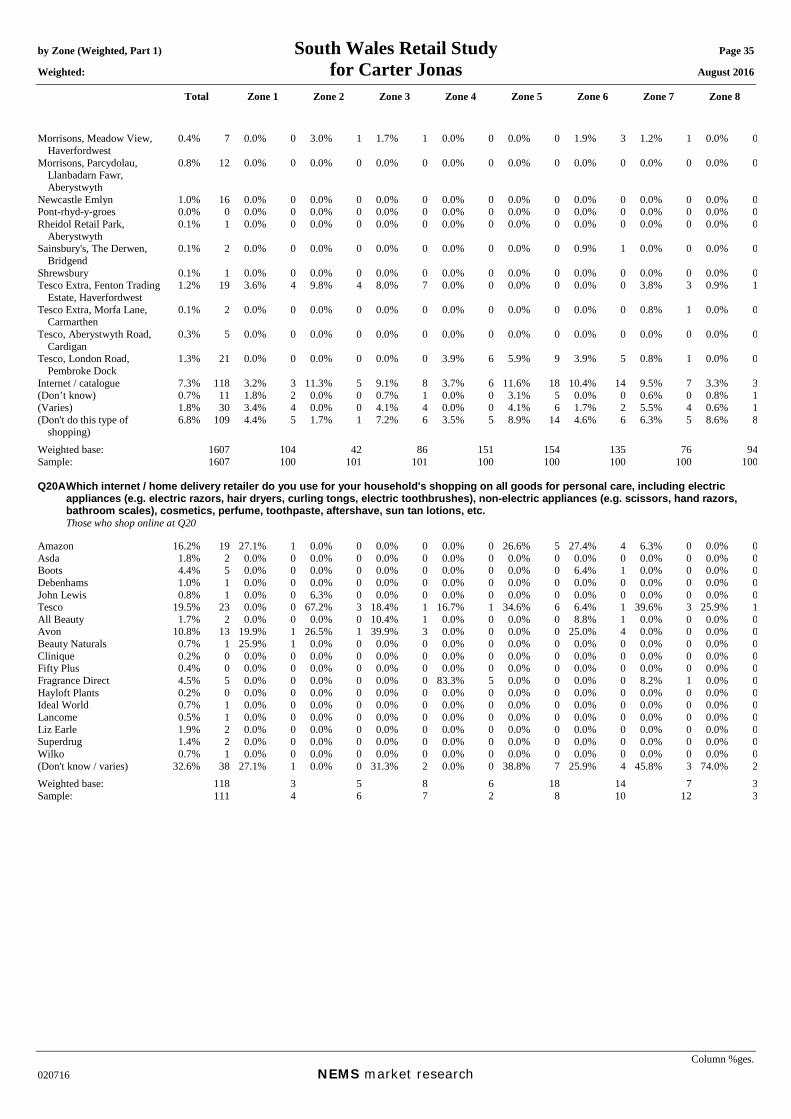
by Zone (Weighted, Part 1) South Wales Retail Study Page 35 Weighted: for Carter Jonas August 2016
Total Zone 1 Zone 2 Zone 3 Zone 4 Zone 5 Zone 6 Zone 7 Zone 8
Column %ges. 020716 NEMS market research
Morrisons, Meadow View, Haverfordwest
0.4% 7 0.0% 0 3.0% 1 1.7% 1 0.0% 0 0.0% 0 1.9% 3 1.2% 1 0.0% 0
Morrisons, Parcydolau, Llanbadarn Fawr, Aberystwyth
0.8% 12 0.0% 0 0.0% 0 0.0% 0 0.0% 0 0.0% 0 0.0% 0 0.0% 0 0.0% 0
Newcastle Emlyn 1.0% 16 0.0% 0 0.0% 0 0.0% 0 0.0% 0 0.0% 0 0.0% 0 0.0% 0 0.0% 0Pont-rhyd-y-groes 0.0% 0 0.0% 0 0.0% 0 0.0% 0 0.0% 0 0.0% 0 0.0% 0 0.0% 0 0.0% 0Rheidol Retail Park,
Aberystwyth 0.1% 1 0.0% 0 0.0% 0 0.0% 0 0.0% 0 0.0% 0 0.0% 0 0.0% 0 0.0% 0
Sainsbury's, The Derwen, Bridgend
0.1% 2 0.0% 0 0.0% 0 0.0% 0 0.0% 0 0.0% 0 0.9% 1 0.0% 0 0.0% 0
Shrewsbury 0.1% 1 0.0% 0 0.0% 0 0.0% 0 0.0% 0 0.0% 0 0.0% 0 0.0% 0 0.0% 0Tesco Extra, Fenton Trading
Estate, Haverfordwest 1.2% 19 3.6% 4 9.8% 4 8.0% 7 0.0% 0 0.0% 0 0.0% 0 3.8% 3 0.9% 1
Tesco Extra, Morfa Lane, Carmarthen
0.1% 2 0.0% 0 0.0% 0 0.0% 0 0.0% 0 0.0% 0 0.0% 0 0.8% 1 0.0% 0
Tesco, Aberystwyth Road, Cardigan
0.3% 5 0.0% 0 0.0% 0 0.0% 0 0.0% 0 0.0% 0 0.0% 0 0.0% 0 0.0% 0
Tesco, London Road, Pembroke Dock
1.3% 21 0.0% 0 0.0% 0 0.0% 0 3.9% 6 5.9% 9 3.9% 5 0.8% 1 0.0% 0
Internet / catalogue 7.3% 118 3.2% 3 11.3% 5 9.1% 8 3.7% 6 11.6% 18 10.4% 14 9.5% 7 3.3% 3(Don’t know) 0.7% 11 1.8% 2 0.0% 0 0.7% 1 0.0% 0 3.1% 5 0.0% 0 0.6% 0 0.8% 1(Varies) 1.8% 30 3.4% 4 0.0% 0 4.1% 4 0.0% 0 4.1% 6 1.7% 2 5.5% 4 0.6% 1(Don't do this type of
shopping) 6.8% 109 4.4% 5 1.7% 1 7.2% 6 3.5% 5 8.9% 14 4.6% 6 6.3% 5 8.6% 8
Weighted base: 1607 104 42 86 151 154 135 76 94Sample: 1607 100 101 101 100 100 100 100 100 Q20A Which internet / home delivery retailer do you use for your household's shopping on all goods for personal care, including electric
appliances (e.g. electric razors, hair dryers, curling tongs, electric toothbrushes), non-electric appliances (e.g. scissors, hand razors, bathroom scales), cosmetics, perfume, toothpaste, aftershave, sun tan lotions, etc.
Those who shop online at Q20 Amazon 16.2% 19 27.1% 1 0.0% 0 0.0% 0 0.0% 0 26.6% 5 27.4% 4 6.3% 0 0.0% 0Asda 1.8% 2 0.0% 0 0.0% 0 0.0% 0 0.0% 0 0.0% 0 0.0% 0 0.0% 0 0.0% 0Boots 4.4% 5 0.0% 0 0.0% 0 0.0% 0 0.0% 0 0.0% 0 6.4% 1 0.0% 0 0.0% 0Debenhams 1.0% 1 0.0% 0 0.0% 0 0.0% 0 0.0% 0 0.0% 0 0.0% 0 0.0% 0 0.0% 0John Lewis 0.8% 1 0.0% 0 6.3% 0 0.0% 0 0.0% 0 0.0% 0 0.0% 0 0.0% 0 0.0% 0Tesco 19.5% 23 0.0% 0 67.2% 3 18.4% 1 16.7% 1 34.6% 6 6.4% 1 39.6% 3 25.9% 1All Beauty 1.7% 2 0.0% 0 0.0% 0 10.4% 1 0.0% 0 0.0% 0 8.8% 1 0.0% 0 0.0% 0Avon 10.8% 13 19.9% 1 26.5% 1 39.9% 3 0.0% 0 0.0% 0 25.0% 4 0.0% 0 0.0% 0Beauty Naturals 0.7% 1 25.9% 1 0.0% 0 0.0% 0 0.0% 0 0.0% 0 0.0% 0 0.0% 0 0.0% 0Clinique 0.2% 0 0.0% 0 0.0% 0 0.0% 0 0.0% 0 0.0% 0 0.0% 0 0.0% 0 0.0% 0Fifty Plus 0.4% 0 0.0% 0 0.0% 0 0.0% 0 0.0% 0 0.0% 0 0.0% 0 0.0% 0 0.0% 0Fragrance Direct 4.5% 5 0.0% 0 0.0% 0 0.0% 0 83.3% 5 0.0% 0 0.0% 0 8.2% 1 0.0% 0Hayloft Plants 0.2% 0 0.0% 0 0.0% 0 0.0% 0 0.0% 0 0.0% 0 0.0% 0 0.0% 0 0.0% 0Ideal World 0.7% 1 0.0% 0 0.0% 0 0.0% 0 0.0% 0 0.0% 0 0.0% 0 0.0% 0 0.0% 0Lancome 0.5% 1 0.0% 0 0.0% 0 0.0% 0 0.0% 0 0.0% 0 0.0% 0 0.0% 0 0.0% 0Liz Earle 1.9% 2 0.0% 0 0.0% 0 0.0% 0 0.0% 0 0.0% 0 0.0% 0 0.0% 0 0.0% 0Superdrug 1.4% 2 0.0% 0 0.0% 0 0.0% 0 0.0% 0 0.0% 0 0.0% 0 0.0% 0 0.0% 0Wilko 0.7% 1 0.0% 0 0.0% 0 0.0% 0 0.0% 0 0.0% 0 0.0% 0 0.0% 0 0.0% 0(Don't know / varies) 32.6% 38 27.1% 1 0.0% 0 31.3% 2 0.0% 0 38.8% 7 25.9% 4 45.8% 3 74.0% 2Weighted base: 118 3 5 8 6 18 14 7 3Sample: 111 4 6 7 2 8 10 12 3
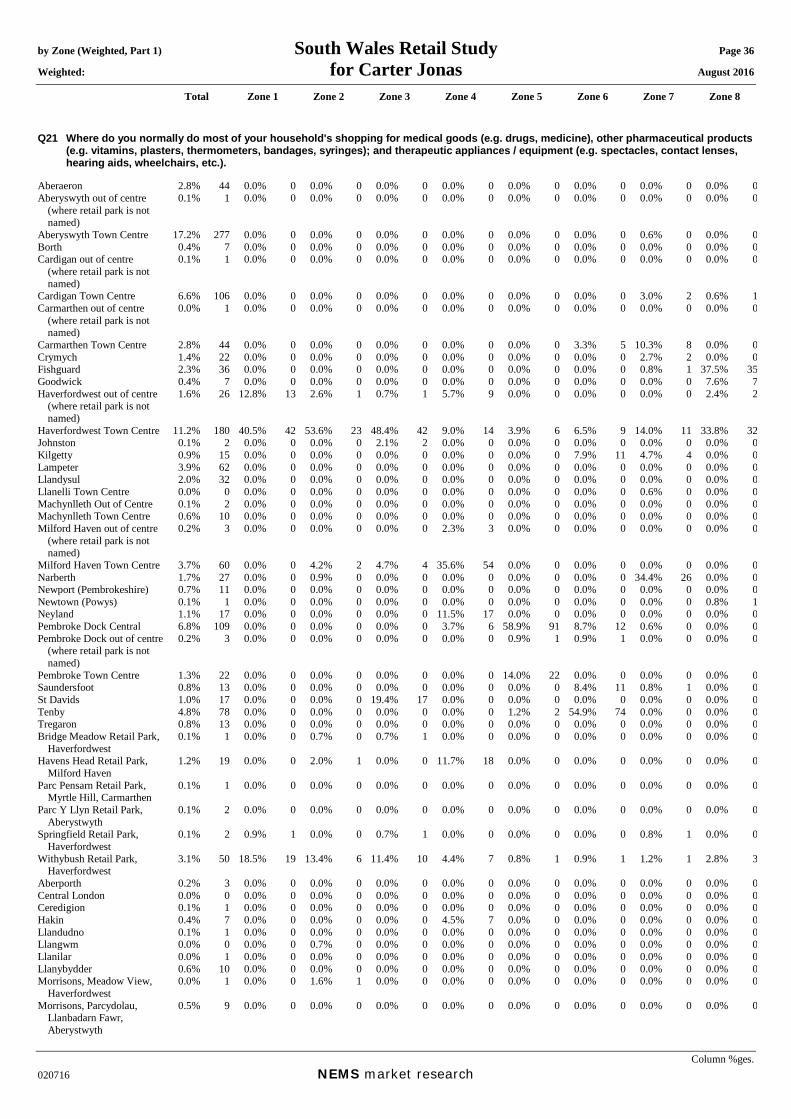
by Zone (Weighted, Part 1) South Wales Retail Study Page 36 Weighted: for Carter Jonas August 2016
Total Zone 1 Zone 2 Zone 3 Zone 4 Zone 5 Zone 6 Zone 7 Zone 8
Column %ges. 020716 NEMS market research
Q21 Where do you normally do most of your household's shopping for medical goods (e.g. drugs, medicine), other pharmaceutical products (e.g. vitamins, plasters, thermometers, bandages, syringes); and therapeutic appliances / equipment (e.g. spectacles, contact lenses, hearing aids, wheelchairs, etc.).
Aberaeron 2.8% 44 0.0% 0 0.0% 0 0.0% 0 0.0% 0 0.0% 0 0.0% 0 0.0% 0 0.0% 0Aberyswyth out of centre
(where retail park is not named)
0.1% 1 0.0% 0 0.0% 0 0.0% 0 0.0% 0 0.0% 0 0.0% 0 0.0% 0 0.0% 0
Aberyswyth Town Centre 17.2% 277 0.0% 0 0.0% 0 0.0% 0 0.0% 0 0.0% 0 0.0% 0 0.6% 0 0.0% 0Borth 0.4% 7 0.0% 0 0.0% 0 0.0% 0 0.0% 0 0.0% 0 0.0% 0 0.0% 0 0.0% 0Cardigan out of centre
(where retail park is not named)
0.1% 1 0.0% 0 0.0% 0 0.0% 0 0.0% 0 0.0% 0 0.0% 0 0.0% 0 0.0% 0
Cardigan Town Centre 6.6% 106 0.0% 0 0.0% 0 0.0% 0 0.0% 0 0.0% 0 0.0% 0 3.0% 2 0.6% 1Carmarthen out of centre
(where retail park is not named)
0.0% 1 0.0% 0 0.0% 0 0.0% 0 0.0% 0 0.0% 0 0.0% 0 0.0% 0 0.0% 0
Carmarthen Town Centre 2.8% 44 0.0% 0 0.0% 0 0.0% 0 0.0% 0 0.0% 0 3.3% 5 10.3% 8 0.0% 0Crymych 1.4% 22 0.0% 0 0.0% 0 0.0% 0 0.0% 0 0.0% 0 0.0% 0 2.7% 2 0.0% 0Fishguard 2.3% 36 0.0% 0 0.0% 0 0.0% 0 0.0% 0 0.0% 0 0.0% 0 0.8% 1 37.5% 35Goodwick 0.4% 7 0.0% 0 0.0% 0 0.0% 0 0.0% 0 0.0% 0 0.0% 0 0.0% 0 7.6% 7Haverfordwest out of centre
(where retail park is not named)
1.6% 26 12.8% 13 2.6% 1 0.7% 1 5.7% 9 0.0% 0 0.0% 0 0.0% 0 2.4% 2
Haverfordwest Town Centre 11.2% 180 40.5% 42 53.6% 23 48.4% 42 9.0% 14 3.9% 6 6.5% 9 14.0% 11 33.8% 32Johnston 0.1% 2 0.0% 0 0.0% 0 2.1% 2 0.0% 0 0.0% 0 0.0% 0 0.0% 0 0.0% 0Kilgetty 0.9% 15 0.0% 0 0.0% 0 0.0% 0 0.0% 0 0.0% 0 7.9% 11 4.7% 4 0.0% 0Lampeter 3.9% 62 0.0% 0 0.0% 0 0.0% 0 0.0% 0 0.0% 0 0.0% 0 0.0% 0 0.0% 0Llandysul 2.0% 32 0.0% 0 0.0% 0 0.0% 0 0.0% 0 0.0% 0 0.0% 0 0.0% 0 0.0% 0Llanelli Town Centre 0.0% 0 0.0% 0 0.0% 0 0.0% 0 0.0% 0 0.0% 0 0.0% 0 0.6% 0 0.0% 0Machynlleth Out of Centre 0.1% 2 0.0% 0 0.0% 0 0.0% 0 0.0% 0 0.0% 0 0.0% 0 0.0% 0 0.0% 0Machynlleth Town Centre 0.6% 10 0.0% 0 0.0% 0 0.0% 0 0.0% 0 0.0% 0 0.0% 0 0.0% 0 0.0% 0Milford Haven out of centre
(where retail park is not named)
0.2% 3 0.0% 0 0.0% 0 0.0% 0 2.3% 3 0.0% 0 0.0% 0 0.0% 0 0.0% 0
Milford Haven Town Centre 3.7% 60 0.0% 0 4.2% 2 4.7% 4 35.6% 54 0.0% 0 0.0% 0 0.0% 0 0.0% 0Narberth 1.7% 27 0.0% 0 0.9% 0 0.0% 0 0.0% 0 0.0% 0 0.0% 0 34.4% 26 0.0% 0Newport (Pembrokeshire) 0.7% 11 0.0% 0 0.0% 0 0.0% 0 0.0% 0 0.0% 0 0.0% 0 0.0% 0 0.0% 0Newtown (Powys) 0.1% 1 0.0% 0 0.0% 0 0.0% 0 0.0% 0 0.0% 0 0.0% 0 0.0% 0 0.8% 1Neyland 1.1% 17 0.0% 0 0.0% 0 0.0% 0 11.5% 17 0.0% 0 0.0% 0 0.0% 0 0.0% 0Pembroke Dock Central 6.8% 109 0.0% 0 0.0% 0 0.0% 0 3.7% 6 58.9% 91 8.7% 12 0.6% 0 0.0% 0Pembroke Dock out of centre
(where retail park is not named)
0.2% 3 0.0% 0 0.0% 0 0.0% 0 0.0% 0 0.9% 1 0.9% 1 0.0% 0 0.0% 0
Pembroke Town Centre 1.3% 22 0.0% 0 0.0% 0 0.0% 0 0.0% 0 14.0% 22 0.0% 0 0.0% 0 0.0% 0Saundersfoot 0.8% 13 0.0% 0 0.0% 0 0.0% 0 0.0% 0 0.0% 0 8.4% 11 0.8% 1 0.0% 0St Davids 1.0% 17 0.0% 0 0.0% 0 19.4% 17 0.0% 0 0.0% 0 0.0% 0 0.0% 0 0.0% 0Tenby 4.8% 78 0.0% 0 0.0% 0 0.0% 0 0.0% 0 1.2% 2 54.9% 74 0.0% 0 0.0% 0Tregaron 0.8% 13 0.0% 0 0.0% 0 0.0% 0 0.0% 0 0.0% 0 0.0% 0 0.0% 0 0.0% 0Bridge Meadow Retail Park,
Haverfordwest 0.1% 1 0.0% 0 0.7% 0 0.7% 1 0.0% 0 0.0% 0 0.0% 0 0.0% 0 0.0% 0
Havens Head Retail Park, Milford Haven
1.2% 19 0.0% 0 2.0% 1 0.0% 0 11.7% 18 0.0% 0 0.0% 0 0.0% 0 0.0% 0
Parc Pensarn Retail Park, Myrtle Hill, Carmarthen
0.1% 1 0.0% 0 0.0% 0 0.0% 0 0.0% 0 0.0% 0 0.0% 0 0.0% 0 0.0% 0
Parc Y Llyn Retail Park, Aberystwyth
0.1% 2 0.0% 0 0.0% 0 0.0% 0 0.0% 0 0.0% 0 0.0% 0 0.0% 0 0.0% 0
Springfield Retail Park, Haverfordwest
0.1% 2 0.9% 1 0.0% 0 0.7% 1 0.0% 0 0.0% 0 0.0% 0 0.8% 1 0.0% 0
Withybush Retail Park, Haverfordwest
3.1% 50 18.5% 19 13.4% 6 11.4% 10 4.4% 7 0.8% 1 0.9% 1 1.2% 1 2.8% 3
Aberporth 0.2% 3 0.0% 0 0.0% 0 0.0% 0 0.0% 0 0.0% 0 0.0% 0 0.0% 0 0.0% 0Central London 0.0% 0 0.0% 0 0.0% 0 0.0% 0 0.0% 0 0.0% 0 0.0% 0 0.0% 0 0.0% 0Ceredigion 0.1% 1 0.0% 0 0.0% 0 0.0% 0 0.0% 0 0.0% 0 0.0% 0 0.0% 0 0.0% 0Hakin 0.4% 7 0.0% 0 0.0% 0 0.0% 0 4.5% 7 0.0% 0 0.0% 0 0.0% 0 0.0% 0Llandudno 0.1% 1 0.0% 0 0.0% 0 0.0% 0 0.0% 0 0.0% 0 0.0% 0 0.0% 0 0.0% 0Llangwm 0.0% 0 0.0% 0 0.7% 0 0.0% 0 0.0% 0 0.0% 0 0.0% 0 0.0% 0 0.0% 0Llanilar 0.0% 1 0.0% 0 0.0% 0 0.0% 0 0.0% 0 0.0% 0 0.0% 0 0.0% 0 0.0% 0Llanybydder 0.6% 10 0.0% 0 0.0% 0 0.0% 0 0.0% 0 0.0% 0 0.0% 0 0.0% 0 0.0% 0Morrisons, Meadow View,
Haverfordwest 0.0% 1 0.0% 0 1.6% 1 0.0% 0 0.0% 0 0.0% 0 0.0% 0 0.0% 0 0.0% 0
Morrisons, Parcydolau, Llanbadarn Fawr, Aberystwyth
0.5% 9 0.0% 0 0.0% 0 0.0% 0 0.0% 0 0.0% 0 0.0% 0 0.0% 0 0.0% 0
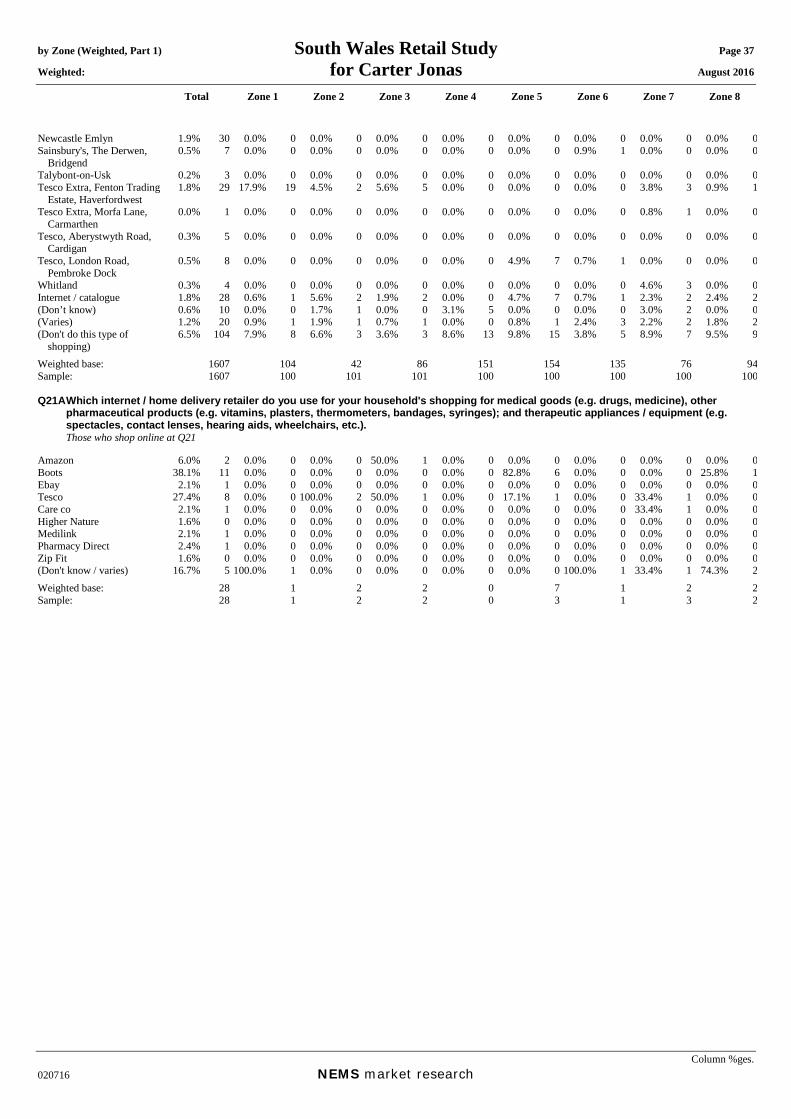
by Zone (Weighted, Part 1) South Wales Retail Study Page 37 Weighted: for Carter Jonas August 2016
Total Zone 1 Zone 2 Zone 3 Zone 4 Zone 5 Zone 6 Zone 7 Zone 8
Column %ges. 020716 NEMS market research
Newcastle Emlyn 1.9% 30 0.0% 0 0.0% 0 0.0% 0 0.0% 0 0.0% 0 0.0% 0 0.0% 0 0.0% 0Sainsbury's, The Derwen,
Bridgend 0.5% 7 0.0% 0 0.0% 0 0.0% 0 0.0% 0 0.0% 0 0.9% 1 0.0% 0 0.0% 0
Talybont-on-Usk 0.2% 3 0.0% 0 0.0% 0 0.0% 0 0.0% 0 0.0% 0 0.0% 0 0.0% 0 0.0% 0Tesco Extra, Fenton Trading
Estate, Haverfordwest 1.8% 29 17.9% 19 4.5% 2 5.6% 5 0.0% 0 0.0% 0 0.0% 0 3.8% 3 0.9% 1
Tesco Extra, Morfa Lane, Carmarthen
0.0% 1 0.0% 0 0.0% 0 0.0% 0 0.0% 0 0.0% 0 0.0% 0 0.8% 1 0.0% 0
Tesco, Aberystwyth Road, Cardigan
0.3% 5 0.0% 0 0.0% 0 0.0% 0 0.0% 0 0.0% 0 0.0% 0 0.0% 0 0.0% 0
Tesco, London Road, Pembroke Dock
0.5% 8 0.0% 0 0.0% 0 0.0% 0 0.0% 0 4.9% 7 0.7% 1 0.0% 0 0.0% 0
Whitland 0.3% 4 0.0% 0 0.0% 0 0.0% 0 0.0% 0 0.0% 0 0.0% 0 4.6% 3 0.0% 0Internet / catalogue 1.8% 28 0.6% 1 5.6% 2 1.9% 2 0.0% 0 4.7% 7 0.7% 1 2.3% 2 2.4% 2(Don’t know) 0.6% 10 0.0% 0 1.7% 1 0.0% 0 3.1% 5 0.0% 0 0.0% 0 3.0% 2 0.0% 0(Varies) 1.2% 20 0.9% 1 1.9% 1 0.7% 1 0.0% 0 0.8% 1 2.4% 3 2.2% 2 1.8% 2(Don't do this type of
shopping) 6.5% 104 7.9% 8 6.6% 3 3.6% 3 8.6% 13 9.8% 15 3.8% 5 8.9% 7 9.5% 9
Weighted base: 1607 104 42 86 151 154 135 76 94Sample: 1607 100 101 101 100 100 100 100 100 Q21A Which internet / home delivery retailer do you use for your household's shopping for medical goods (e.g. drugs, medicine), other
pharmaceutical products (e.g. vitamins, plasters, thermometers, bandages, syringes); and therapeutic appliances / equipment (e.g. spectacles, contact lenses, hearing aids, wheelchairs, etc.).
Those who shop online at Q21 Amazon 6.0% 2 0.0% 0 0.0% 0 50.0% 1 0.0% 0 0.0% 0 0.0% 0 0.0% 0 0.0% 0Boots 38.1% 11 0.0% 0 0.0% 0 0.0% 0 0.0% 0 82.8% 6 0.0% 0 0.0% 0 25.8% 1Ebay 2.1% 1 0.0% 0 0.0% 0 0.0% 0 0.0% 0 0.0% 0 0.0% 0 0.0% 0 0.0% 0Tesco 27.4% 8 0.0% 0 100.0% 2 50.0% 1 0.0% 0 17.1% 1 0.0% 0 33.4% 1 0.0% 0Care co 2.1% 1 0.0% 0 0.0% 0 0.0% 0 0.0% 0 0.0% 0 0.0% 0 33.4% 1 0.0% 0Higher Nature 1.6% 0 0.0% 0 0.0% 0 0.0% 0 0.0% 0 0.0% 0 0.0% 0 0.0% 0 0.0% 0Medilink 2.1% 1 0.0% 0 0.0% 0 0.0% 0 0.0% 0 0.0% 0 0.0% 0 0.0% 0 0.0% 0Pharmacy Direct 2.4% 1 0.0% 0 0.0% 0 0.0% 0 0.0% 0 0.0% 0 0.0% 0 0.0% 0 0.0% 0Zip Fit 1.6% 0 0.0% 0 0.0% 0 0.0% 0 0.0% 0 0.0% 0 0.0% 0 0.0% 0 0.0% 0(Don't know / varies) 16.7% 5 100.0% 1 0.0% 0 0.0% 0 0.0% 0 0.0% 0 100.0% 1 33.4% 1 74.3% 2Weighted base: 28 1 2 2 0 7 1 2 2Sample: 28 1 2 2 0 3 1 3 2
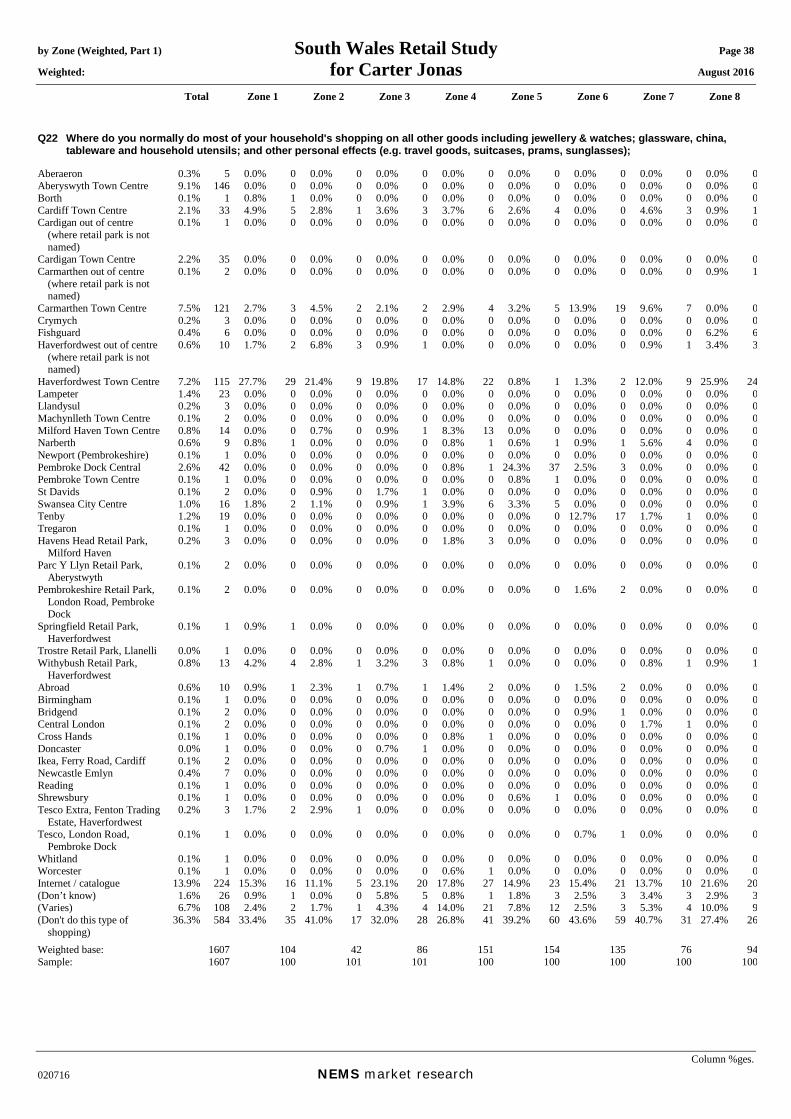
by Zone (Weighted, Part 1) South Wales Retail Study Page 38 Weighted: for Carter Jonas August 2016
Total Zone 1 Zone 2 Zone 3 Zone 4 Zone 5 Zone 6 Zone 7 Zone 8
Column %ges. 020716 NEMS market research
Q22 Where do you normally do most of your household's shopping on all other goods including jewellery & watches; glassware, china, tableware and household utensils; and other personal effects (e.g. travel goods, suitcases, prams, sunglasses);
Aberaeron 0.3% 5 0.0% 0 0.0% 0 0.0% 0 0.0% 0 0.0% 0 0.0% 0 0.0% 0 0.0% 0Aberyswyth Town Centre 9.1% 146 0.0% 0 0.0% 0 0.0% 0 0.0% 0 0.0% 0 0.0% 0 0.0% 0 0.0% 0Borth 0.1% 1 0.8% 1 0.0% 0 0.0% 0 0.0% 0 0.0% 0 0.0% 0 0.0% 0 0.0% 0Cardiff Town Centre 2.1% 33 4.9% 5 2.8% 1 3.6% 3 3.7% 6 2.6% 4 0.0% 0 4.6% 3 0.9% 1Cardigan out of centre
(where retail park is not named)
0.1% 1 0.0% 0 0.0% 0 0.0% 0 0.0% 0 0.0% 0 0.0% 0 0.0% 0 0.0% 0
Cardigan Town Centre 2.2% 35 0.0% 0 0.0% 0 0.0% 0 0.0% 0 0.0% 0 0.0% 0 0.0% 0 0.0% 0Carmarthen out of centre
(where retail park is not named)
0.1% 2 0.0% 0 0.0% 0 0.0% 0 0.0% 0 0.0% 0 0.0% 0 0.0% 0 0.9% 1
Carmarthen Town Centre 7.5% 121 2.7% 3 4.5% 2 2.1% 2 2.9% 4 3.2% 5 13.9% 19 9.6% 7 0.0% 0Crymych 0.2% 3 0.0% 0 0.0% 0 0.0% 0 0.0% 0 0.0% 0 0.0% 0 0.0% 0 0.0% 0Fishguard 0.4% 6 0.0% 0 0.0% 0 0.0% 0 0.0% 0 0.0% 0 0.0% 0 0.0% 0 6.2% 6Haverfordwest out of centre
(where retail park is not named)
0.6% 10 1.7% 2 6.8% 3 0.9% 1 0.0% 0 0.0% 0 0.0% 0 0.9% 1 3.4% 3
Haverfordwest Town Centre 7.2% 115 27.7% 29 21.4% 9 19.8% 17 14.8% 22 0.8% 1 1.3% 2 12.0% 9 25.9% 24Lampeter 1.4% 23 0.0% 0 0.0% 0 0.0% 0 0.0% 0 0.0% 0 0.0% 0 0.0% 0 0.0% 0Llandysul 0.2% 3 0.0% 0 0.0% 0 0.0% 0 0.0% 0 0.0% 0 0.0% 0 0.0% 0 0.0% 0Machynlleth Town Centre 0.1% 2 0.0% 0 0.0% 0 0.0% 0 0.0% 0 0.0% 0 0.0% 0 0.0% 0 0.0% 0Milford Haven Town Centre 0.8% 14 0.0% 0 0.7% 0 0.9% 1 8.3% 13 0.0% 0 0.0% 0 0.0% 0 0.0% 0Narberth 0.6% 9 0.8% 1 0.0% 0 0.0% 0 0.8% 1 0.6% 1 0.9% 1 5.6% 4 0.0% 0Newport (Pembrokeshire) 0.1% 1 0.0% 0 0.0% 0 0.0% 0 0.0% 0 0.0% 0 0.0% 0 0.0% 0 0.0% 0Pembroke Dock Central 2.6% 42 0.0% 0 0.0% 0 0.0% 0 0.8% 1 24.3% 37 2.5% 3 0.0% 0 0.0% 0Pembroke Town Centre 0.1% 1 0.0% 0 0.0% 0 0.0% 0 0.0% 0 0.8% 1 0.0% 0 0.0% 0 0.0% 0St Davids 0.1% 2 0.0% 0 0.9% 0 1.7% 1 0.0% 0 0.0% 0 0.0% 0 0.0% 0 0.0% 0Swansea City Centre 1.0% 16 1.8% 2 1.1% 0 0.9% 1 3.9% 6 3.3% 5 0.0% 0 0.0% 0 0.0% 0Tenby 1.2% 19 0.0% 0 0.0% 0 0.0% 0 0.0% 0 0.0% 0 12.7% 17 1.7% 1 0.0% 0Tregaron 0.1% 1 0.0% 0 0.0% 0 0.0% 0 0.0% 0 0.0% 0 0.0% 0 0.0% 0 0.0% 0Havens Head Retail Park,
Milford Haven 0.2% 3 0.0% 0 0.0% 0 0.0% 0 1.8% 3 0.0% 0 0.0% 0 0.0% 0 0.0% 0
Parc Y Llyn Retail Park, Aberystwyth
0.1% 2 0.0% 0 0.0% 0 0.0% 0 0.0% 0 0.0% 0 0.0% 0 0.0% 0 0.0% 0
Pembrokeshire Retail Park, London Road, Pembroke Dock
0.1% 2 0.0% 0 0.0% 0 0.0% 0 0.0% 0 0.0% 0 1.6% 2 0.0% 0 0.0% 0
Springfield Retail Park, Haverfordwest
0.1% 1 0.9% 1 0.0% 0 0.0% 0 0.0% 0 0.0% 0 0.0% 0 0.0% 0 0.0% 0
Trostre Retail Park, Llanelli 0.0% 1 0.0% 0 0.0% 0 0.0% 0 0.0% 0 0.0% 0 0.0% 0 0.0% 0 0.0% 0Withybush Retail Park,
Haverfordwest 0.8% 13 4.2% 4 2.8% 1 3.2% 3 0.8% 1 0.0% 0 0.0% 0 0.8% 1 0.9% 1
Abroad 0.6% 10 0.9% 1 2.3% 1 0.7% 1 1.4% 2 0.0% 0 1.5% 2 0.0% 0 0.0% 0Birmingham 0.1% 1 0.0% 0 0.0% 0 0.0% 0 0.0% 0 0.0% 0 0.0% 0 0.0% 0 0.0% 0Bridgend 0.1% 2 0.0% 0 0.0% 0 0.0% 0 0.0% 0 0.0% 0 0.9% 1 0.0% 0 0.0% 0Central London 0.1% 2 0.0% 0 0.0% 0 0.0% 0 0.0% 0 0.0% 0 0.0% 0 1.7% 1 0.0% 0Cross Hands 0.1% 1 0.0% 0 0.0% 0 0.0% 0 0.8% 1 0.0% 0 0.0% 0 0.0% 0 0.0% 0Doncaster 0.0% 1 0.0% 0 0.0% 0 0.7% 1 0.0% 0 0.0% 0 0.0% 0 0.0% 0 0.0% 0Ikea, Ferry Road, Cardiff 0.1% 2 0.0% 0 0.0% 0 0.0% 0 0.0% 0 0.0% 0 0.0% 0 0.0% 0 0.0% 0Newcastle Emlyn 0.4% 7 0.0% 0 0.0% 0 0.0% 0 0.0% 0 0.0% 0 0.0% 0 0.0% 0 0.0% 0Reading 0.1% 1 0.0% 0 0.0% 0 0.0% 0 0.0% 0 0.0% 0 0.0% 0 0.0% 0 0.0% 0Shrewsbury 0.1% 1 0.0% 0 0.0% 0 0.0% 0 0.0% 0 0.6% 1 0.0% 0 0.0% 0 0.0% 0Tesco Extra, Fenton Trading
Estate, Haverfordwest 0.2% 3 1.7% 2 2.9% 1 0.0% 0 0.0% 0 0.0% 0 0.0% 0 0.0% 0 0.0% 0
Tesco, London Road, Pembroke Dock
0.1% 1 0.0% 0 0.0% 0 0.0% 0 0.0% 0 0.0% 0 0.7% 1 0.0% 0 0.0% 0
Whitland 0.1% 1 0.0% 0 0.0% 0 0.0% 0 0.0% 0 0.0% 0 0.0% 0 0.0% 0 0.0% 0Worcester 0.1% 1 0.0% 0 0.0% 0 0.0% 0 0.6% 1 0.0% 0 0.0% 0 0.0% 0 0.0% 0Internet / catalogue 13.9% 224 15.3% 16 11.1% 5 23.1% 20 17.8% 27 14.9% 23 15.4% 21 13.7% 10 21.6% 20(Don’t know) 1.6% 26 0.9% 1 0.0% 0 5.8% 5 0.8% 1 1.8% 3 2.5% 3 3.4% 3 2.9% 3(Varies) 6.7% 108 2.4% 2 1.7% 1 4.3% 4 14.0% 21 7.8% 12 2.5% 3 5.3% 4 10.0% 9(Don't do this type of
shopping) 36.3% 584 33.4% 35 41.0% 17 32.0% 28 26.8% 41 39.2% 60 43.6% 59 40.7% 31 27.4% 26
Weighted base: 1607 104 42 86 151 154 135 76 94Sample: 1607 100 101 101 100 100 100 100 100
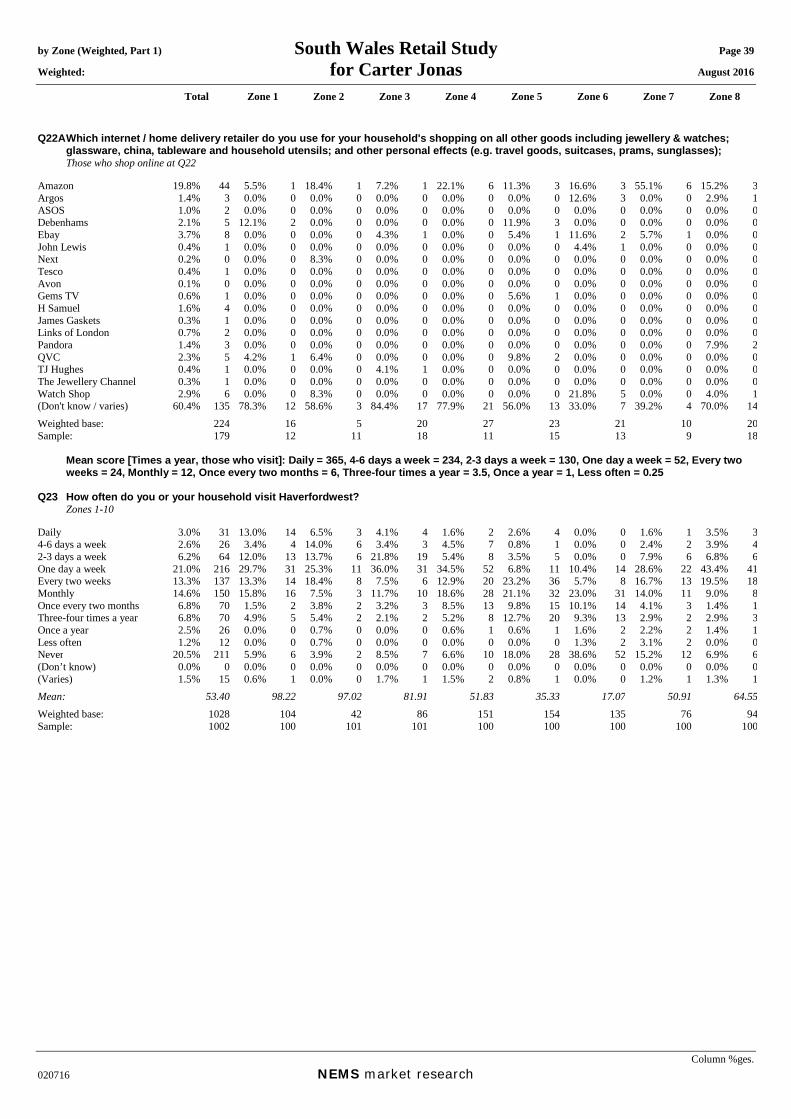
by Zone (Weighted, Part 1) South Wales Retail Study Page 39 Weighted: for Carter Jonas August 2016
Total Zone 1 Zone 2 Zone 3 Zone 4 Zone 5 Zone 6 Zone 7 Zone 8
Column %ges. 020716 NEMS market research
Q22A Which internet / home delivery retailer do you use for your household's shopping on all other goods including jewellery & watches; glassware, china, tableware and household utensils; and other personal effects (e.g. travel goods, suitcases, prams, sunglasses);
Those who shop online at Q22 Amazon 19.8% 44 5.5% 1 18.4% 1 7.2% 1 22.1% 6 11.3% 3 16.6% 3 55.1% 6 15.2% 3Argos 1.4% 3 0.0% 0 0.0% 0 0.0% 0 0.0% 0 0.0% 0 12.6% 3 0.0% 0 2.9% 1ASOS 1.0% 2 0.0% 0 0.0% 0 0.0% 0 0.0% 0 0.0% 0 0.0% 0 0.0% 0 0.0% 0Debenhams 2.1% 5 12.1% 2 0.0% 0 0.0% 0 0.0% 0 11.9% 3 0.0% 0 0.0% 0 0.0% 0Ebay 3.7% 8 0.0% 0 0.0% 0 4.3% 1 0.0% 0 5.4% 1 11.6% 2 5.7% 1 0.0% 0John Lewis 0.4% 1 0.0% 0 0.0% 0 0.0% 0 0.0% 0 0.0% 0 4.4% 1 0.0% 0 0.0% 0Next 0.2% 0 0.0% 0 8.3% 0 0.0% 0 0.0% 0 0.0% 0 0.0% 0 0.0% 0 0.0% 0Tesco 0.4% 1 0.0% 0 0.0% 0 0.0% 0 0.0% 0 0.0% 0 0.0% 0 0.0% 0 0.0% 0Avon 0.1% 0 0.0% 0 0.0% 0 0.0% 0 0.0% 0 0.0% 0 0.0% 0 0.0% 0 0.0% 0Gems TV 0.6% 1 0.0% 0 0.0% 0 0.0% 0 0.0% 0 5.6% 1 0.0% 0 0.0% 0 0.0% 0H Samuel 1.6% 4 0.0% 0 0.0% 0 0.0% 0 0.0% 0 0.0% 0 0.0% 0 0.0% 0 0.0% 0James Gaskets 0.3% 1 0.0% 0 0.0% 0 0.0% 0 0.0% 0 0.0% 0 0.0% 0 0.0% 0 0.0% 0Links of London 0.7% 2 0.0% 0 0.0% 0 0.0% 0 0.0% 0 0.0% 0 0.0% 0 0.0% 0 0.0% 0Pandora 1.4% 3 0.0% 0 0.0% 0 0.0% 0 0.0% 0 0.0% 0 0.0% 0 0.0% 0 7.9% 2QVC 2.3% 5 4.2% 1 6.4% 0 0.0% 0 0.0% 0 9.8% 2 0.0% 0 0.0% 0 0.0% 0TJ Hughes 0.4% 1 0.0% 0 0.0% 0 4.1% 1 0.0% 0 0.0% 0 0.0% 0 0.0% 0 0.0% 0The Jewellery Channel 0.3% 1 0.0% 0 0.0% 0 0.0% 0 0.0% 0 0.0% 0 0.0% 0 0.0% 0 0.0% 0Watch Shop 2.9% 6 0.0% 0 8.3% 0 0.0% 0 0.0% 0 0.0% 0 21.8% 5 0.0% 0 4.0% 1(Don't know / varies) 60.4% 135 78.3% 12 58.6% 3 84.4% 17 77.9% 21 56.0% 13 33.0% 7 39.2% 4 70.0% 14Weighted base: 224 16 5 20 27 23 21 10 20Sample: 179 12 11 18 11 15 13 9 18 Mean score [Times a year, those who visit]: Daily = 365, 4-6 days a week = 234, 2-3 days a week = 130, One day a week = 52, Every two
weeks = 24, Monthly = 12, Once every two months = 6, Three-four times a year = 3.5, Once a year = 1, Less often = 0.25 Q23 How often do you or your household visit Haverfordwest? Zones 1-10 Daily 3.0% 31 13.0% 14 6.5% 3 4.1% 4 1.6% 2 2.6% 4 0.0% 0 1.6% 1 3.5% 34-6 days a week 2.6% 26 3.4% 4 14.0% 6 3.4% 3 4.5% 7 0.8% 1 0.0% 0 2.4% 2 3.9% 42-3 days a week 6.2% 64 12.0% 13 13.7% 6 21.8% 19 5.4% 8 3.5% 5 0.0% 0 7.9% 6 6.8% 6One day a week 21.0% 216 29.7% 31 25.3% 11 36.0% 31 34.5% 52 6.8% 11 10.4% 14 28.6% 22 43.4% 41Every two weeks 13.3% 137 13.3% 14 18.4% 8 7.5% 6 12.9% 20 23.2% 36 5.7% 8 16.7% 13 19.5% 18Monthly 14.6% 150 15.8% 16 7.5% 3 11.7% 10 18.6% 28 21.1% 32 23.0% 31 14.0% 11 9.0% 8Once every two months 6.8% 70 1.5% 2 3.8% 2 3.2% 3 8.5% 13 9.8% 15 10.1% 14 4.1% 3 1.4% 1Three-four times a year 6.8% 70 4.9% 5 5.4% 2 2.1% 2 5.2% 8 12.7% 20 9.3% 13 2.9% 2 2.9% 3Once a year 2.5% 26 0.0% 0 0.7% 0 0.0% 0 0.6% 1 0.6% 1 1.6% 2 2.2% 2 1.4% 1Less often 1.2% 12 0.0% 0 0.7% 0 0.0% 0 0.0% 0 0.0% 0 1.3% 2 3.1% 2 0.0% 0Never 20.5% 211 5.9% 6 3.9% 2 8.5% 7 6.6% 10 18.0% 28 38.6% 52 15.2% 12 6.9% 6(Don’t know) 0.0% 0 0.0% 0 0.0% 0 0.0% 0 0.0% 0 0.0% 0 0.0% 0 0.0% 0 0.0% 0(Varies) 1.5% 15 0.6% 1 0.0% 0 1.7% 1 1.5% 2 0.8% 1 0.0% 0 1.2% 1 1.3% 1Mean: 53.40 98.22 97.02 81.91 51.83 35.33 17.07 50.91 64.55Weighted base: 1028 104 42 86 151 154 135 76 94Sample: 1002 100 101 101 100 100 100 100 100

by Zone (Weighted, Part 1) South Wales Retail Study Page 40 Weighted: for Carter Jonas August 2016
Total Zone 1 Zone 2 Zone 3 Zone 4 Zone 5 Zone 6 Zone 7 Zone 8
Column %ges. 020716 NEMS market research
Q24A In order of importance, what are your two main reasons for visiting Haverfordwest Town Centre? Main reason: Zones 1-10 and those who visit Haverfordwest town centre at Q23 Food shopping 31.4% 256 26.7% 26 35.9% 15 45.9% 36 25.1% 35 12.8% 16 20.8% 17 62.2% 40 54.8% 48Non-food shopping 38.9% 318 36.4% 36 26.3% 11 19.6% 15 41.9% 59 66.6% 84 56.3% 47 18.6% 12 24.2% 21To visit bars / pubs 0.7% 6 0.9% 1 1.0% 0 0.0% 0 3.3% 5 0.0% 0 0.0% 0 0.0% 0 0.0% 0To visit cafés / restaurants 2.0% 17 1.8% 2 1.0% 0 0.8% 1 4.2% 6 4.8% 6 0.0% 0 0.0% 0 0.9% 1To visit personal service
providers (e.g. hairdressers, beauty salon etc.)
0.5% 4 0.0% 0 2.4% 1 2.6% 2 0.0% 0 0.0% 0 0.0% 0 0.0% 0 1.5% 1
To visit financial services such as banks and other financial institutions
5.3% 43 19.8% 19 12.6% 5 8.3% 7 4.2% 6 0.0% 0 1.1% 1 2.6% 2 4.1% 4
To visit other service providers (e.g. travel agent, estate agent etc.)
0.3% 3 0.0% 0 0.0% 0 0.0% 0 0.0% 0 0.0% 0 1.1% 1 1.0% 1 0.0% 0
To visit public services (e.g. medical or dentist appointment, library, job centre, community centre, etc)
6.5% 53 2.4% 2 2.5% 1 8.7% 7 5.9% 8 2.8% 4 9.0% 7 0.7% 0 2.5% 2
To get petrol 0.0% 0 0.0% 0 0.0% 0 0.0% 0 0.0% 0 0.0% 0 0.0% 0 0.0% 0 0.0% 0To visit the cinema 0.1% 1 0.0% 0 0.0% 0 0.0% 0 0.0% 0 0.8% 1 0.0% 0 0.0% 0 0.0% 0To visit a park 0.0% 0 0.0% 0 0.0% 0 0.0% 0 0.0% 0 0.0% 0 0.0% 0 0.0% 0 0.0% 0To visit the swimming pool 0.0% 0 0.0% 0 0.0% 0 0.0% 0 0.0% 0 0.0% 0 0.0% 0 0.0% 0 0.0% 0To visit other gyms / health
and fitness facilities 0.0% 0 0.0% 0 0.7% 0 0.0% 0 0.0% 0 0.0% 0 0.0% 0 0.0% 0 0.0% 0
To visit the library 0.0% 0 0.0% 0 0.0% 0 0.0% 0 0.0% 0 0.0% 0 0.0% 0 0.0% 0 0.0% 0To visit museums / art
gallery 0.0% 0 0.0% 0 0.0% 0 0.0% 0 0.0% 0 0.0% 0 0.0% 0 0.0% 0 0.0% 0
To visit the theatre or musical venues
0.0% 0 0.0% 0 0.0% 0 0.0% 0 0.0% 0 0.0% 0 0.0% 0 0.0% 0 0.0% 0
To visit night time venues e.g. nightclub
0.0% 0 0.0% 0 0.0% 0 0.0% 0 0.0% 0 0.0% 0 0.0% 0 0.0% 0 0.0% 0
For other leisure activities 1.0% 8 0.0% 0 2.0% 1 1.8% 1 0.7% 1 2.0% 3 1.1% 1 0.7% 0 0.0% 0To shop at the market(s) 0.6% 5 3.9% 4 0.7% 0 0.0% 0 0.0% 0 0.0% 0 0.0% 0 0.0% 0 0.0% 0To meet family 1.1% 9 0.7% 1 0.0% 0 0.0% 0 1.7% 2 0.0% 0 1.5% 1 2.0% 1 1.5% 1To meet friends 1.1% 9 2.2% 2 1.0% 0 1.0% 1 1.6% 2 0.0% 0 0.0% 0 2.0% 1 0.7% 1To visit the theatre 0.0% 0 0.0% 0 0.0% 0 0.0% 0 0.0% 0 0.0% 0 0.0% 0 0.0% 0 0.0% 0For work (i.e. place of work) 5.0% 41 2.7% 3 11.4% 5 10.5% 8 3.6% 5 8.1% 10 1.5% 1 4.5% 3 4.6% 4For business (e.g. attend a
business appointment) 0.1% 0 0.0% 0 0.0% 0 0.0% 0 0.0% 0 0.0% 0 0.0% 0 0.0% 0 0.0% 0
For education as a student (e.g. student at college, university, or other third level education)
0.3% 2 0.0% 0 0.0% 0 0.0% 0 0.7% 1 0.0% 0 0.0% 0 2.0% 1 0.0% 0
To access public transport for onward travel (e.g. train station, bus station)
0.0% 0 0.0% 0 0.0% 0 0.0% 0 0.0% 0 0.0% 0 0.0% 0 0.0% 0 0.0% 0
Other 0.0% 0 0.0% 0 0.0% 0 0.0% 0 0.0% 0 0.0% 0 0.0% 0 0.0% 0 0.0% 0As part of a day out / for a
day out / something different
1.5% 12 0.0% 0 0.0% 0 0.0% 0 0.0% 0 0.0% 0 2.6% 2 0.0% 0 0.0% 0
Browsing / window shopping 1.2% 10 0.7% 1 2.5% 1 0.0% 0 1.5% 2 1.0% 1 1.1% 1 0.9% 1 3.5% 3(Don't know / varies) 1.5% 13 0.0% 0 0.0% 0 0.8% 1 5.1% 7 0.0% 0 1.4% 1 1.8% 1 1.6% 1(Nothing / nothing further) 0.9% 7 1.8% 2 0.0% 0 0.0% 0 0.7% 1 1.0% 1 2.5% 2 1.0% 1 0.0% 0Weighted base: 817 98 41 79 141 126 83 65 88Sample: 822 97 98 93 94 80 65 83 94

by Zone (Weighted, Part 1) South Wales Retail Study Page 41 Weighted: for Carter Jonas August 2016
Total Zone 1 Zone 2 Zone 3 Zone 4 Zone 5 Zone 6 Zone 7 Zone 8
Column %ges. 020716 NEMS market research
Q24B In order of importance, what are your two main reasons for visiting Haverfordwest Town Centre? Secondary reason: Those who gave a reason at Q24A Food shopping 12.8% 102 10.7% 10 7.1% 3 17.7% 14 8.5% 11 18.5% 23 20.2% 16 13.6% 9 15.2% 13Non-food shopping 24.4% 195 21.3% 21 28.8% 12 39.7% 31 28.7% 38 18.6% 23 20.4% 16 29.1% 18 24.3% 21To visit bars / pubs 0.7% 6 3.9% 4 0.7% 0 0.8% 1 0.0% 0 0.0% 0 0.0% 0 0.0% 0 0.0% 0To visit cafés / restaurants 6.2% 49 8.1% 8 7.4% 3 4.1% 3 9.8% 13 4.3% 5 3.4% 3 0.9% 1 5.2% 5To visit personal service
providers (e.g. hairdressers, beauty salon etc.)
0.6% 5 1.6% 2 1.7% 1 0.0% 0 2.0% 3 0.0% 0 0.0% 0 0.0% 0 0.0% 0
To visit financial services such as banks and other financial institutions
2.4% 19 4.2% 4 11.3% 5 2.2% 2 2.0% 3 0.8% 1 1.5% 1 4.3% 3 0.9% 1
To visit other service providers (e.g. travel agent, estate agent etc.)
0.6% 5 0.0% 0 1.5% 1 4.1% 3 0.7% 1 0.0% 0 0.0% 0 0.0% 0 0.0% 0
To visit public services (e.g. medical or dentist appointment, library, job centre, community centre, etc)
3.3% 26 0.9% 1 4.6% 2 4.7% 4 3.0% 4 5.7% 7 3.8% 3 2.4% 2 1.4% 1
To get petrol 0.0% 0 0.0% 0 0.0% 0 0.0% 0 0.0% 0 0.0% 0 0.0% 0 0.0% 0 0.0% 0To visit the cinema 0.0% 0 0.0% 0 0.0% 0 0.0% 0 0.0% 0 0.0% 0 0.0% 0 0.0% 0 0.0% 0To visit a park 0.0% 0 0.0% 0 0.0% 0 0.0% 0 0.0% 0 0.0% 0 0.0% 0 0.0% 0 0.0% 0To visit the swimming pool 0.0% 0 0.0% 0 1.0% 0 0.0% 0 0.0% 0 0.0% 0 0.0% 0 0.0% 0 0.0% 0To visit other gyms / health
and fitness facilities 0.5% 4 0.9% 1 0.0% 0 0.0% 0 0.0% 0 0.0% 0 0.0% 0 0.0% 0 3.4% 3
To visit the library 0.0% 0 0.0% 0 0.0% 0 0.0% 0 0.0% 0 0.0% 0 0.0% 0 0.0% 0 0.0% 0To visit museums / art
gallery 0.0% 0 0.0% 0 0.0% 0 0.0% 0 0.0% 0 0.0% 0 0.0% 0 0.0% 0 0.0% 0
To visit the theatre or musical venues
0.0% 0 0.0% 0 0.0% 0 0.0% 0 0.0% 0 0.0% 0 0.0% 0 0.0% 0 0.0% 0
To visit night time venues e.g. nightclub
0.0% 0 0.0% 0 0.0% 0 0.0% 0 0.0% 0 0.0% 0 0.0% 0 0.0% 0 0.0% 0
For other leisure activities 1.6% 13 4.1% 4 1.0% 0 4.3% 3 1.0% 1 0.0% 0 1.5% 1 1.0% 1 0.0% 0To shop at the market(s) 0.4% 3 0.0% 0 0.7% 0 0.8% 1 0.7% 1 0.0% 0 0.0% 0 0.0% 0 0.0% 0To meet family 0.5% 4 0.0% 0 0.0% 0 0.8% 1 0.0% 0 0.0% 0 0.0% 0 3.6% 2 1.6% 1To meet friends 0.8% 7 0.9% 1 1.1% 0 0.0% 0 1.0% 1 0.0% 0 1.1% 1 0.0% 0 3.6% 3To visit the theatre 0.0% 0 0.0% 0 0.0% 0 0.0% 0 0.0% 0 0.0% 0 0.0% 0 0.0% 0 0.0% 0For work (i.e. place of work) 1.6% 12 0.0% 0 2.0% 1 0.8% 1 0.9% 1 1.0% 1 0.0% 0 1.7% 1 7.1% 6For business (e.g. attend a
business appointment) 0.0% 0 0.0% 0 0.0% 0 0.0% 0 0.0% 0 0.0% 0 0.0% 0 0.0% 0 0.0% 0
For education as a student (e.g. student at college, university, or other third level education)
0.3% 2 0.0% 0 0.0% 0 0.0% 0 0.0% 0 0.8% 1 0.0% 0 2.1% 1 0.0% 0
To access public transport for onward travel (e.g. train station, bus station)
0.1% 1 0.0% 0 0.0% 0 1.1% 1 0.0% 0 0.0% 0 0.0% 0 0.0% 0 0.0% 0
Other 0.0% 0 0.0% 0 0.0% 0 0.0% 0 0.0% 0 0.0% 0 0.0% 0 0.0% 0 0.0% 0As part of a day out / for a
day out / something different
0.4% 3 0.9% 1 0.0% 0 0.0% 0 1.0% 1 0.0% 0 0.0% 0 0.0% 0 0.0% 0
Browsing / window shopping 0.8% 7 0.7% 1 1.7% 1 1.0% 1 0.9% 1 1.0% 1 0.0% 0 0.9% 1 0.0% 0(Don't know / varies) 0.6% 4 0.0% 0 0.0% 0 1.0% 1 0.0% 0 0.0% 0 0.0% 0 0.0% 0 0.9% 1(Nothing / nothing further) 41.4% 330 41.6% 40 29.5% 12 16.8% 13 40.0% 53 49.3% 62 48.1% 38 40.2% 25 36.4% 31Weighted base: 798 97 41 78 133 125 80 63 86Sample: 803 95 98 92 90 79 62 80 92

by Zone (Weighted, Part 1) South Wales Retail Study Page 42 Weighted: for Carter Jonas August 2016
Total Zone 1 Zone 2 Zone 3 Zone 4 Zone 5 Zone 6 Zone 7 Zone 8
Column %ges. 020716 NEMS market research
Q24X In order of importance, what are your two main reasons for visiting Haverfordwest Town Centre? Any mention: [MR] Zones 1-10 and those who visit Haverfordwest town centre at Q23 Food shopping 43.8% 358 37.2% 37 43.0% 17 63.4% 50 33.1% 47 31.1% 39 40.2% 33 75.4% 49 69.8% 61Non-food shopping 62.8% 513 57.4% 56 55.2% 22 59.0% 47 69.0% 98 85.0% 107 75.9% 63 46.8% 30 48.1% 42To visit bars / pubs 1.4% 12 4.7% 5 1.7% 1 0.8% 1 3.3% 5 0.0% 0 0.0% 0 0.0% 0 0.0% 0To visit cafés / restaurants 8.1% 66 9.7% 10 8.4% 3 4.9% 4 13.4% 19 9.1% 11 3.3% 3 0.9% 1 6.0% 5To visit personal service
providers (e.g. hairdressers, beauty salon etc.)
1.1% 9 1.6% 2 4.1% 2 2.6% 2 1.9% 3 0.0% 0 0.0% 0 0.0% 0 1.5% 1
To visit financial services such as banks and other financial institutions
7.6% 62 23.9% 24 24.0% 10 10.4% 8 6.0% 9 0.8% 1 2.5% 2 6.8% 4 5.0% 4
To visit other service providers (e.g. travel agent, estate agent etc.)
0.9% 8 0.0% 0 1.5% 1 4.1% 3 0.7% 1 0.0% 0 1.1% 1 1.0% 1 0.0% 0
To visit public services (e.g. medical or dentist appointment, library, job centre, community centre, etc)
9.7% 80 3.4% 3 7.0% 3 13.3% 11 8.8% 12 8.5% 11 12.6% 10 3.0% 2 3.8% 3
To get petrol 0.0% 0 0.0% 0 0.0% 0 0.0% 0 0.0% 0 0.0% 0 0.0% 0 0.0% 0 0.0% 0To visit the cinema 0.1% 1 0.0% 0 0.0% 0 0.0% 0 0.0% 0 0.8% 1 0.0% 0 0.0% 0 0.0% 0To visit a park 0.0% 0 0.0% 0 0.0% 0 0.0% 0 0.0% 0 0.0% 0 0.0% 0 0.0% 0 0.0% 0To visit the swimming pool 0.0% 0 0.0% 0 1.0% 0 0.0% 0 0.0% 0 0.0% 0 0.0% 0 0.0% 0 0.0% 0To visit other gyms / health
and fitness facilities 0.5% 4 0.9% 1 0.7% 0 0.0% 0 0.0% 0 0.0% 0 0.0% 0 0.0% 0 3.4% 3
To visit the library 0.0% 0 0.0% 0 0.0% 0 0.0% 0 0.0% 0 0.0% 0 0.0% 0 0.0% 0 0.0% 0To visit museums / art
gallery 0.0% 0 0.0% 0 0.0% 0 0.0% 0 0.0% 0 0.0% 0 0.0% 0 0.0% 0 0.0% 0
To visit the theatre or musical venues
0.0% 0 0.0% 0 0.0% 0 0.0% 0 0.0% 0 0.0% 0 0.0% 0 0.0% 0 0.0% 0
To visit night time venues e.g. nightclub
0.0% 0 0.0% 0 0.0% 0 0.0% 0 0.0% 0 0.0% 0 0.0% 0 0.0% 0 0.0% 0
For other leisure activities 2.5% 21 4.1% 4 2.9% 1 6.1% 5 1.6% 2 2.0% 3 2.6% 2 1.7% 1 0.0% 0To shop at the market(s) 0.9% 8 3.9% 4 1.5% 1 0.8% 1 0.7% 1 0.0% 0 0.0% 0 0.0% 0 0.0% 0To meet family 1.6% 13 0.7% 1 0.0% 0 0.8% 1 1.7% 2 0.0% 0 1.5% 1 5.6% 4 3.1% 3To meet friends 1.9% 15 3.2% 3 2.1% 1 1.0% 1 2.5% 3 0.0% 0 1.1% 1 2.0% 1 4.2% 4To visit the theatre 0.0% 0 0.0% 0 0.0% 0 0.0% 0 0.0% 0 0.0% 0 0.0% 0 0.0% 0 0.0% 0For work (i.e. place of work) 6.6% 54 2.7% 3 13.4% 5 11.3% 9 4.4% 6 9.2% 12 1.5% 1 6.1% 4 11.5% 10For business (e.g. attend a
business appointment) 0.1% 0 0.0% 0 0.0% 0 0.0% 0 0.0% 0 0.0% 0 0.0% 0 0.0% 0 0.0% 0
For education as a student (e.g. student at college, university, or other third level education)
0.6% 5 0.0% 0 0.0% 0 0.0% 0 0.7% 1 0.8% 1 0.0% 0 4.1% 3 0.0% 0
To access public transport for onward travel (e.g. train station, bus station)
0.1% 1 0.0% 0 0.0% 0 1.1% 1 0.0% 0 0.0% 0 0.0% 0 0.0% 0 0.0% 0
Other 0.0% 0 0.0% 0 0.0% 0 0.0% 0 0.0% 0 0.0% 0 0.0% 0 0.0% 0 0.0% 0As part of a day out / for a
day out / something different
1.8% 15 0.9% 1 0.0% 0 0.0% 0 0.9% 1 0.0% 0 2.6% 2 0.0% 0 0.0% 0
Browsing / window shopping 2.0% 16 1.4% 1 4.2% 2 1.0% 1 2.4% 3 2.1% 3 1.1% 1 1.8% 1 3.5% 3Weighted base: 817 98 41 79 141 126 83 65 88Sample: 822 97 98 93 94 80 65 83 94

by Zone (Weighted, Part 1) South Wales Retail Study Page 43 Weighted: for Carter Jonas August 2016
Total Zone 1 Zone 2 Zone 3 Zone 4 Zone 5 Zone 6 Zone 7 Zone 8
Column %ges. 020716 NEMS market research
Q25 What do you like about Haverfordwest Town Centre? [MR] Zones 1-10 and those who visit Haverfordwest town centre at Q23 Attractive environment / nice
place 7.4% 60 11.3% 11 11.0% 4 5.3% 4 5.7% 8 3.8% 5 10.6% 9 6.1% 4 6.2% 5
Close to friends or relatives 0.3% 3 0.0% 0 0.0% 0 0.0% 0 0.0% 0 0.8% 1 0.0% 0 0.0% 0 0.7% 1Close to home 18.8% 153 20.6% 20 10.1% 4 37.6% 30 17.2% 24 11.6% 15 5.9% 5 24.4% 16 39.5% 35Close to work 1.2% 9 0.0% 0 0.0% 0 3.3% 3 3.7% 5 0.8% 1 0.0% 0 1.0% 1 0.0% 0Compact 5.6% 46 3.9% 4 7.1% 3 4.2% 3 4.8% 7 2.5% 3 13.7% 11 12.1% 8 3.1% 3Easy to get to by bike 0.0% 0 0.0% 0 0.0% 0 0.0% 0 0.0% 0 0.0% 0 0.0% 0 0.0% 0 0.0% 0Easy to get to by bus 0.1% 1 0.0% 0 1.0% 0 0.0% 0 0.0% 0 0.0% 0 0.0% 0 0.0% 0 0.0% 0Easy to get to by car 2.1% 17 2.0% 2 0.0% 0 0.8% 1 2.6% 4 0.8% 1 0.0% 0 1.8% 1 0.9% 1Easy to park 3.0% 25 0.0% 0 2.9% 1 1.9% 1 5.1% 7 2.0% 3 10.0% 8 3.3% 2 0.0% 0Good facilities 0.1% 1 0.0% 0 0.0% 0 0.8% 1 0.0% 0 0.0% 0 0.0% 0 0.0% 0 0.0% 0Good food stores 2.3% 18 0.0% 0 2.7% 1 0.8% 1 6.1% 9 0.0% 0 4.2% 4 3.5% 2 0.9% 1Good pubs, cafés or
restaurants 2.2% 18 0.0% 0 0.0% 0 4.1% 3 1.6% 2 2.5% 3 2.2% 2 3.5% 2 0.0% 0
Good range of non-food shops
17.4% 142 0.9% 1 5.7% 2 7.7% 6 28.8% 41 37.7% 48 20.4% 17 14.3% 9 9.3% 8
Makes a change from other places
0.7% 6 0.0% 0 0.0% 0 0.0% 0 0.9% 1 0.0% 0 0.0% 0 0.0% 0 0.0% 0
Quiet 1.0% 8 2.5% 2 1.0% 0 0.0% 0 0.0% 0 0.8% 1 1.5% 1 0.0% 0 0.0% 0Safe and secure 0.1% 1 0.0% 0 0.0% 0 0.8% 1 0.0% 0 0.0% 0 0.0% 0 0.0% 0 0.0% 0The market 1.1% 9 2.0% 2 4.4% 2 2.9% 2 0.0% 0 0.0% 0 1.1% 1 0.9% 1 0.0% 0Traditional 0.9% 7 0.9% 1 0.0% 0 3.7% 3 0.9% 1 0.8% 1 0.0% 0 0.7% 0 0.9% 1Traffic free shopping centre 0.4% 3 0.0% 0 1.0% 0 0.0% 0 0.9% 1 0.0% 0 0.0% 0 0.0% 0 0.0% 0Other 0.0% 0 0.0% 0 0.0% 0 0.0% 0 0.0% 0 0.0% 0 0.0% 0 0.0% 0 0.0% 0Cheap / free parking 0.3% 2 0.0% 0 0.0% 0 0.0% 0 0.0% 0 0.0% 0 0.0% 0 0.7% 0 0.0% 0Familiarity / habit 0.6% 5 0.0% 0 0.0% 0 0.0% 0 1.3% 2 0.0% 0 1.4% 1 0.7% 0 1.3% 1Friendly people / nice
atmosphere 1.1% 9 2.5% 2 1.0% 0 3.9% 3 0.0% 0 0.8% 1 0.0% 0 0.9% 1 1.8% 2
Good leisure facilities / things to do
0.9% 7 0.0% 0 0.7% 0 0.0% 0 0.0% 0 3.8% 5 1.5% 1 0.0% 0 0.0% 0
Good opening hours 0.2% 1 0.0% 0 0.0% 0 0.0% 0 0.9% 1 0.0% 0 0.0% 0 0.0% 0 0.0% 0Good prices 0.4% 3 0.0% 0 0.0% 0 0.0% 0 0.0% 0 0.0% 0 0.0% 0 0.0% 0 3.4% 3Good range of independent
shops 1.3% 11 0.9% 1 6.4% 3 1.6% 1 0.0% 0 3.8% 5 1.5% 1 0.0% 0 0.0% 0
Good range of services 0.6% 5 0.0% 0 0.7% 0 0.0% 0 0.0% 0 0.0% 0 0.0% 0 0.0% 0 0.0% 0(Nothing / very little) 39.5% 323 57.8% 57 54.9% 22 32.7% 26 36.5% 52 31.8% 40 36.3% 30 35.6% 23 37.4% 33(Don't know) 3.6% 29 1.6% 2 4.6% 2 3.3% 3 2.5% 3 4.3% 5 8.0% 7 2.0% 1 0.9% 1Weighted base: 817 98 41 79 141 126 83 65 88Sample: 822 97 98 93 94 80 65 83 94
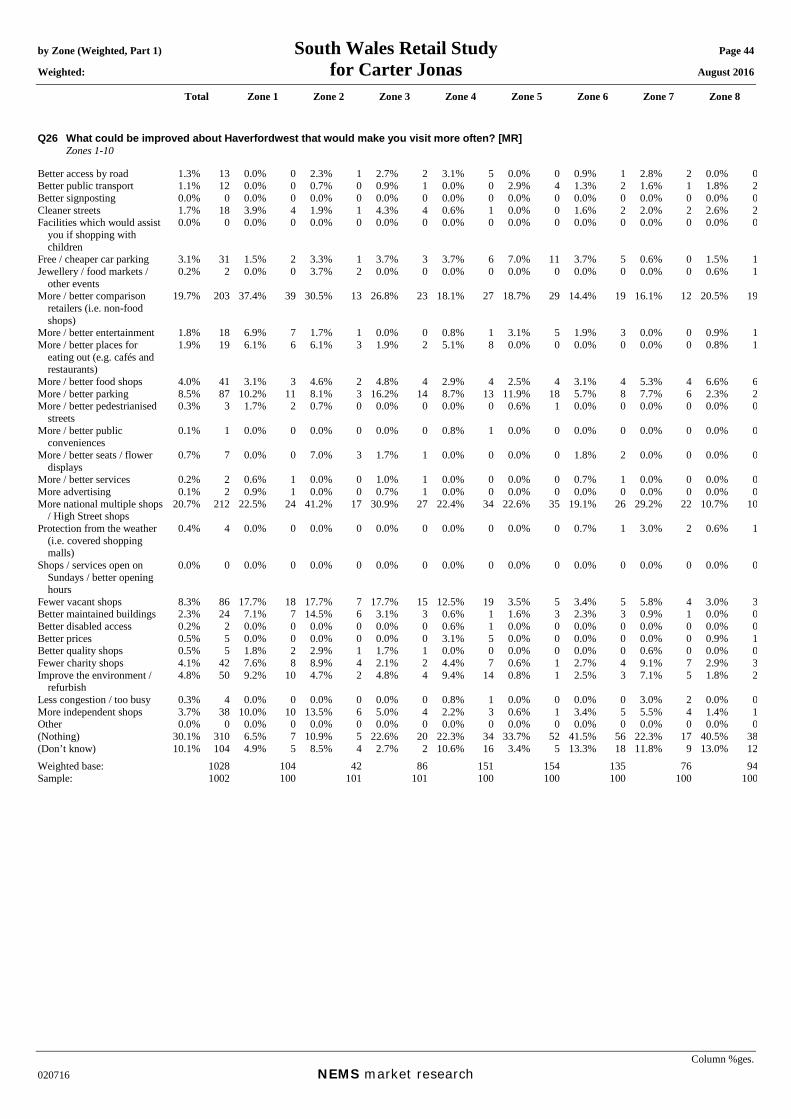
by Zone (Weighted, Part 1) South Wales Retail Study Page 44 Weighted: for Carter Jonas August 2016
Total Zone 1 Zone 2 Zone 3 Zone 4 Zone 5 Zone 6 Zone 7 Zone 8
Column %ges. 020716 NEMS market research
Q26 What could be improved about Haverfordwest that would make you visit more often? [MR] Zones 1-10 Better access by road 1.3% 13 0.0% 0 2.3% 1 2.7% 2 3.1% 5 0.0% 0 0.9% 1 2.8% 2 0.0% 0Better public transport 1.1% 12 0.0% 0 0.7% 0 0.9% 1 0.0% 0 2.9% 4 1.3% 2 1.6% 1 1.8% 2Better signposting 0.0% 0 0.0% 0 0.0% 0 0.0% 0 0.0% 0 0.0% 0 0.0% 0 0.0% 0 0.0% 0Cleaner streets 1.7% 18 3.9% 4 1.9% 1 4.3% 4 0.6% 1 0.0% 0 1.6% 2 2.0% 2 2.6% 2Facilities which would assist
you if shopping with children
0.0% 0 0.0% 0 0.0% 0 0.0% 0 0.0% 0 0.0% 0 0.0% 0 0.0% 0 0.0% 0
Free / cheaper car parking 3.1% 31 1.5% 2 3.3% 1 3.7% 3 3.7% 6 7.0% 11 3.7% 5 0.6% 0 1.5% 1Jewellery / food markets /
other events 0.2% 2 0.0% 0 3.7% 2 0.0% 0 0.0% 0 0.0% 0 0.0% 0 0.0% 0 0.6% 1
More / better comparison retailers (i.e. non-food shops)
19.7% 203 37.4% 39 30.5% 13 26.8% 23 18.1% 27 18.7% 29 14.4% 19 16.1% 12 20.5% 19
More / better entertainment 1.8% 18 6.9% 7 1.7% 1 0.0% 0 0.8% 1 3.1% 5 1.9% 3 0.0% 0 0.9% 1More / better places for
eating out (e.g. cafés and restaurants)
1.9% 19 6.1% 6 6.1% 3 1.9% 2 5.1% 8 0.0% 0 0.0% 0 0.0% 0 0.8% 1
More / better food shops 4.0% 41 3.1% 3 4.6% 2 4.8% 4 2.9% 4 2.5% 4 3.1% 4 5.3% 4 6.6% 6More / better parking 8.5% 87 10.2% 11 8.1% 3 16.2% 14 8.7% 13 11.9% 18 5.7% 8 7.7% 6 2.3% 2More / better pedestrianised
streets 0.3% 3 1.7% 2 0.7% 0 0.0% 0 0.0% 0 0.6% 1 0.0% 0 0.0% 0 0.0% 0
More / better public conveniences
0.1% 1 0.0% 0 0.0% 0 0.0% 0 0.8% 1 0.0% 0 0.0% 0 0.0% 0 0.0% 0
More / better seats / flower displays
0.7% 7 0.0% 0 7.0% 3 1.7% 1 0.0% 0 0.0% 0 1.8% 2 0.0% 0 0.0% 0
More / better services 0.2% 2 0.6% 1 0.0% 0 1.0% 1 0.0% 0 0.0% 0 0.7% 1 0.0% 0 0.0% 0More advertising 0.1% 2 0.9% 1 0.0% 0 0.7% 1 0.0% 0 0.0% 0 0.0% 0 0.0% 0 0.0% 0More national multiple shops
/ High Street shops 20.7% 212 22.5% 24 41.2% 17 30.9% 27 22.4% 34 22.6% 35 19.1% 26 29.2% 22 10.7% 10
Protection from the weather (i.e. covered shopping malls)
0.4% 4 0.0% 0 0.0% 0 0.0% 0 0.0% 0 0.0% 0 0.7% 1 3.0% 2 0.6% 1
Shops / services open on Sundays / better opening hours
0.0% 0 0.0% 0 0.0% 0 0.0% 0 0.0% 0 0.0% 0 0.0% 0 0.0% 0 0.0% 0
Fewer vacant shops 8.3% 86 17.7% 18 17.7% 7 17.7% 15 12.5% 19 3.5% 5 3.4% 5 5.8% 4 3.0% 3Better maintained buildings 2.3% 24 7.1% 7 14.5% 6 3.1% 3 0.6% 1 1.6% 3 2.3% 3 0.9% 1 0.0% 0Better disabled access 0.2% 2 0.0% 0 0.0% 0 0.0% 0 0.6% 1 0.0% 0 0.0% 0 0.0% 0 0.0% 0Better prices 0.5% 5 0.0% 0 0.0% 0 0.0% 0 3.1% 5 0.0% 0 0.0% 0 0.0% 0 0.9% 1Better quality shops 0.5% 5 1.8% 2 2.9% 1 1.7% 1 0.0% 0 0.0% 0 0.0% 0 0.6% 0 0.0% 0Fewer charity shops 4.1% 42 7.6% 8 8.9% 4 2.1% 2 4.4% 7 0.6% 1 2.7% 4 9.1% 7 2.9% 3Improve the environment /
refurbish 4.8% 50 9.2% 10 4.7% 2 4.8% 4 9.4% 14 0.8% 1 2.5% 3 7.1% 5 1.8% 2
Less congestion / too busy 0.3% 4 0.0% 0 0.0% 0 0.0% 0 0.8% 1 0.0% 0 0.0% 0 3.0% 2 0.0% 0More independent shops 3.7% 38 10.0% 10 13.5% 6 5.0% 4 2.2% 3 0.6% 1 3.4% 5 5.5% 4 1.4% 1Other 0.0% 0 0.0% 0 0.0% 0 0.0% 0 0.0% 0 0.0% 0 0.0% 0 0.0% 0 0.0% 0(Nothing) 30.1% 310 6.5% 7 10.9% 5 22.6% 20 22.3% 34 33.7% 52 41.5% 56 22.3% 17 40.5% 38(Don’t know) 10.1% 104 4.9% 5 8.5% 4 2.7% 2 10.6% 16 3.4% 5 13.3% 18 11.8% 9 13.0% 12Weighted base: 1028 104 42 86 151 154 135 76 94Sample: 1002 100 101 101 100 100 100 100 100

by Zone (Weighted, Part 1) South Wales Retail Study Page 45 Weighted: for Carter Jonas August 2016
Total Zone 1 Zone 2 Zone 3 Zone 4 Zone 5 Zone 6 Zone 7 Zone 8
Column %ges. 020716 NEMS market research
Mean score [Times a year, those who visit]: Daily = 365, 4-6 days a week = 234, 2-3 days a week = 130, One day a week = 52, Every two weeks = 24, Monthly = 12, Once every two months = 6, Three-four times a year = 3.5, Once a year = 1, Less often = 0.25
Q27 How often do you or your household visit Milford Haven Town Centre for shopping and other town centre services? Zones 1-5 & 7-9 Daily 2.4% 18 0.0% 0 2.0% 1 1.1% 1 10.5% 16 0.0% 0 0.0% 0 0.0% 0 0.0% 04-6 days a week 1.0% 7 0.0% 0 0.0% 0 0.0% 0 4.8% 7 0.0% 0 0.0% 0 0.0% 0 0.0% 02-3 days a week 3.5% 26 0.0% 0 1.8% 1 0.7% 1 16.3% 25 0.0% 0 0.0% 0 0.0% 0 0.0% 0One day a week 5.4% 40 2.4% 2 2.4% 1 7.9% 7 16.6% 25 2.9% 4 0.0% 0 0.0% 0 0.0% 0Every two weeks 3.5% 26 0.8% 1 3.7% 2 1.7% 1 7.2% 11 3.9% 6 0.0% 0 3.0% 2 3.1% 3Monthly 5.6% 42 8.7% 9 7.0% 3 7.3% 6 5.1% 8 7.8% 12 0.0% 0 0.8% 1 2.3% 2Once every two months 2.7% 20 4.4% 5 2.1% 1 2.0% 2 5.0% 8 1.2% 2 0.0% 0 0.6% 0 2.7% 3Three-four times a year 3.6% 26 6.3% 7 12.4% 5 3.8% 3 1.6% 2 4.1% 6 0.0% 0 2.2% 2 0.8% 1Once a year 3.4% 25 4.9% 5 3.8% 2 3.1% 3 3.7% 6 2.3% 3 0.0% 0 2.2% 2 5.1% 5Less often 0.7% 5 1.5% 2 0.0% 0 0.0% 0 0.0% 0 1.4% 2 0.0% 0 1.2% 1 0.6% 1Never 66.2% 491 70.2% 73 64.8% 27 63.8% 55 29.1% 44 73.5% 113 0.0% 0 87.7% 67 85.3% 80(Don’t know) 0.6% 4 0.0% 0 0.0% 0 1.1% 1 0.0% 0 1.4% 2 0.0% 0 1.7% 1 0.0% 0(Varies) 1.4% 10 0.9% 1 0.0% 0 7.5% 6 0.0% 0 1.5% 2 0.0% 0 0.6% 0 0.0% 0Mean: 63.45 10.44 38.09 38.32 115.70 15.31 0.00 9.56 8.67Weighted base: 742 104 42 86 151 154 0 76 94Sample: 802 100 101 101 100 100 0 100 100

by Zone (Weighted, Part 1) South Wales Retail Study Page 46 Weighted: for Carter Jonas August 2016
Total Zone 1 Zone 2 Zone 3 Zone 4 Zone 5 Zone 6 Zone 7 Zone 8
Column %ges. 020716 NEMS market research
Q28A In order of importance, what are your two main reasons for visiting Milford Haven Town Centre? Main reason: Zones 1-5 & 7-9 and those who visit Milford Haven town centre at Q27 Food shopping 20.4% 51 7.9% 2 4.8% 1 23.5% 7 36.5% 39 2.3% 1 0.0% 0 6.4% 1 0.0% 0Non-food shopping 31.7% 79 48.0% 15 26.3% 4 29.8% 9 21.4% 23 54.6% 22 0.0% 0 4.9% 0 33.8% 5To visit bars / pubs 0.0% 0 0.0% 0 0.0% 0 0.0% 0 0.0% 0 0.0% 0 0.0% 0 0.0% 0 0.0% 0To visit cafés / restaurants 8.4% 21 16.4% 5 2.0% 0 0.0% 0 8.7% 9 10.9% 4 0.0% 0 4.9% 0 10.1% 1To visit personal service
providers (e.g. hairdressers, beauty salon etc.)
2.4% 6 0.0% 0 7.4% 1 4.7% 1 2.9% 3 0.0% 0 0.0% 0 4.9% 0 0.0% 0
To visit financial services such as banks and other financial institutions
5.1% 13 2.8% 1 5.2% 1 8.4% 3 8.0% 9 0.0% 0 0.0% 0 0.0% 0 0.0% 0
To visit other service providers (e.g. travel agent, estate agent etc.)
1.3% 3 0.0% 0 7.5% 1 0.0% 0 2.1% 2 0.0% 0 0.0% 0 0.0% 0 0.0% 0
To visit public services (e.g. medical or dentist appointment, library, job centre, community centre, etc)
5.0% 13 2.9% 1 7.4% 1 2.6% 1 4.0% 4 5.4% 2 0.0% 0 25.7% 2 0.0% 0
To get petrol 0.0% 0 0.0% 0 0.0% 0 0.0% 0 0.0% 0 0.0% 0 0.0% 0 0.0% 0 0.0% 0To visit the cinema 1.9% 5 0.0% 0 2.6% 0 0.0% 0 0.0% 0 6.7% 3 0.0% 0 0.0% 0 12.3% 2To visit a park 0.0% 0 0.0% 0 0.0% 0 0.0% 0 0.0% 0 0.0% 0 0.0% 0 0.0% 0 0.0% 0To visit the swimming pool 0.0% 0 0.0% 0 0.0% 0 0.0% 0 0.0% 0 0.0% 0 0.0% 0 0.0% 0 0.0% 0To visit other gyms / health
and fitness facilities 0.5% 1 0.0% 0 0.0% 0 0.0% 0 1.2% 1 0.0% 0 0.0% 0 0.0% 0 0.0% 0
To visit the library 0.0% 0 0.0% 0 0.0% 0 0.0% 0 0.0% 0 0.0% 0 0.0% 0 0.0% 0 0.0% 0To visit museums / art
gallery 0.0% 0 0.0% 0 0.0% 0 0.0% 0 0.0% 0 0.0% 0 0.0% 0 0.0% 0 0.0% 0
To visit the theatre or musical venues
2.5% 6 5.7% 2 5.0% 1 0.0% 0 0.0% 0 6.2% 3 0.0% 0 12.7% 1 0.0% 0
To visit night time venues e.g. nightclub
0.0% 0 0.0% 0 0.0% 0 0.0% 0 0.0% 0 0.0% 0 0.0% 0 0.0% 0 0.0% 0
For other leisure activities 1.9% 5 0.0% 0 14.7% 2 4.0% 1 0.9% 1 0.0% 0 0.0% 0 4.9% 0 0.0% 0To shop at the market(s) 0.0% 0 0.0% 0 0.0% 0 0.0% 0 0.0% 0 0.0% 0 0.0% 0 0.0% 0 0.0% 0To meet family 3.1% 8 0.0% 0 4.6% 1 2.6% 1 0.0% 0 5.4% 2 0.0% 0 24.4% 2 12.3% 2To meet friends 5.0% 12 2.9% 1 2.0% 0 0.0% 0 6.5% 7 0.0% 0 0.0% 0 4.9% 0 27.1% 4To visit the theatre 0.3% 1 0.0% 0 0.0% 0 0.0% 0 0.0% 0 0.0% 0 0.0% 0 6.4% 1 0.0% 0For work (i.e. place of work) 4.6% 12 0.0% 0 5.8% 1 7.4% 2 6.7% 7 3.0% 1 0.0% 0 0.0% 0 0.0% 0For business (e.g. attend a
business appointment) 0.0% 0 0.0% 0 0.0% 0 0.0% 0 0.0% 0 0.0% 0 0.0% 0 0.0% 0 0.0% 0
For education as a student (e.g. student at college, university, or other third level education)
0.0% 0 0.0% 0 0.0% 0 0.0% 0 0.0% 0 0.0% 0 0.0% 0 0.0% 0 0.0% 0
To access public transport for onward travel (e.g. train station, bus station)
0.0% 0 0.0% 0 0.0% 0 0.0% 0 0.0% 0 0.0% 0 0.0% 0 0.0% 0 0.0% 0
Other 0.0% 0 0.0% 0 0.0% 0 0.0% 0 0.0% 0 0.0% 0 0.0% 0 0.0% 0 0.0% 0As part of a day out / for a
day out / something different
1.6% 4 6.2% 2 2.0% 0 2.0% 1 0.0% 0 3.0% 1 0.0% 0 0.0% 0 0.0% 0
Browsing / window shopping 1.9% 5 4.3% 1 0.0% 0 5.0% 2 1.2% 1 0.0% 0 0.0% 0 0.0% 0 4.3% 1(Don't know / varies) 0.7% 2 0.0% 0 2.7% 0 4.0% 1 0.0% 0 0.0% 0 0.0% 0 0.0% 0 0.0% 0(Nothing / nothing further) 1.6% 4 2.9% 1 0.0% 0 6.0% 2 0.0% 0 2.3% 1 0.0% 0 0.0% 0 0.0% 0Weighted base: 251 31 15 31 107 41 0 9 14Sample: 234 28 37 36 71 31 0 13 12

by Zone (Weighted, Part 1) South Wales Retail Study Page 47 Weighted: for Carter Jonas August 2016
Total Zone 1 Zone 2 Zone 3 Zone 4 Zone 5 Zone 6 Zone 7 Zone 8
Column %ges. 020716 NEMS market research
Q28B In order of importance, what are your two main reasons for visiting Milford Haven Town Centre? Secondary reason: Those who gave a reason at Q28A Food shopping 11.6% 29 0.0% 0 13.4% 2 14.0% 4 14.2% 15 17.4% 7 0.0% 0 4.9% 0 0.0% 0Non-food shopping 17.8% 44 13.4% 4 9.5% 1 26.4% 7 22.0% 24 11.7% 5 0.0% 0 0.0% 0 18.2% 3To visit bars / pubs 0.6% 2 5.2% 2 0.0% 0 0.0% 0 0.0% 0 0.0% 0 0.0% 0 0.0% 0 0.0% 0To visit cafés / restaurants 4.9% 12 2.9% 1 8.2% 1 9.3% 3 2.2% 2 4.8% 2 0.0% 0 0.0% 0 22.4% 3To visit personal service
providers (e.g. hairdressers, beauty salon etc.)
0.4% 1 0.0% 0 0.0% 0 0.0% 0 0.9% 1 0.0% 0 0.0% 0 0.0% 0 0.0% 0
To visit financial services such as banks and other financial institutions
2.7% 7 0.0% 0 0.0% 0 0.0% 0 6.2% 7 0.0% 0 0.0% 0 0.0% 0 0.0% 0
To visit other service providers (e.g. travel agent, estate agent etc.)
0.2% 0 0.0% 0 2.8% 0 0.0% 0 0.0% 0 0.0% 0 0.0% 0 0.0% 0 0.0% 0
To visit public services (e.g. medical or dentist appointment, library, job centre, community centre, etc)
1.1% 3 0.0% 0 0.0% 0 2.2% 1 2.0% 2 0.0% 0 0.0% 0 0.0% 0 0.0% 0
To get petrol 0.0% 0 0.0% 0 0.0% 0 0.0% 0 0.0% 0 0.0% 0 0.0% 0 0.0% 0 0.0% 0To visit the cinema 0.5% 1 0.0% 0 0.0% 0 0.0% 0 1.2% 1 0.0% 0 0.0% 0 0.0% 0 0.0% 0To visit a park 0.0% 0 0.0% 0 0.0% 0 0.0% 0 0.0% 0 0.0% 0 0.0% 0 0.0% 0 0.0% 0To visit the swimming pool 0.2% 0 0.0% 0 2.8% 0 0.0% 0 0.0% 0 0.0% 0 0.0% 0 0.0% 0 0.0% 0To visit other gyms / health
and fitness facilities 0.0% 0 0.0% 0 0.0% 0 0.0% 0 0.0% 0 0.0% 0 0.0% 0 0.0% 0 0.0% 0
To visit the library 0.0% 0 0.0% 0 0.0% 0 0.0% 0 0.0% 0 0.0% 0 0.0% 0 0.0% 0 0.0% 0To visit museums / art
gallery 0.0% 0 0.0% 0 0.0% 0 0.0% 0 0.0% 0 0.0% 0 0.0% 0 0.0% 0 0.0% 0
To visit the theatre or musical venues
1.0% 2 6.4% 2 2.8% 0 0.0% 0 0.0% 0 0.0% 0 0.0% 0 0.0% 0 0.0% 0
To visit night time venues e.g. nightclub
0.0% 0 0.0% 0 0.0% 0 0.0% 0 0.0% 0 0.0% 0 0.0% 0 0.0% 0 0.0% 0
For other leisure activities 1.4% 3 2.2% 1 0.0% 0 0.0% 0 2.0% 2 0.0% 0 0.0% 0 0.0% 0 4.3% 1To shop at the market(s) 0.0% 0 0.0% 0 0.0% 0 0.0% 0 0.0% 0 0.0% 0 0.0% 0 0.0% 0 0.0% 0To meet family 0.0% 0 0.0% 0 0.0% 0 0.0% 0 0.0% 0 0.0% 0 0.0% 0 0.0% 0 0.0% 0To meet friends 0.8% 2 6.4% 2 0.0% 0 0.0% 0 0.0% 0 0.0% 0 0.0% 0 0.0% 0 0.0% 0To visit the theatre 0.4% 1 0.0% 0 0.0% 0 0.0% 0 0.0% 0 2.4% 1 0.0% 0 0.0% 0 0.0% 0For work (i.e. place of work) 0.9% 2 0.0% 0 0.0% 0 3.4% 1 0.0% 0 3.3% 1 0.0% 0 0.0% 0 0.0% 0For business (e.g. attend a
business appointment) 0.0% 0 0.0% 0 0.0% 0 0.0% 0 0.0% 0 0.0% 0 0.0% 0 0.0% 0 0.0% 0
For education as a student (e.g. student at college, university, or other third level education)
0.0% 0 0.0% 0 0.0% 0 0.0% 0 0.0% 0 0.0% 0 0.0% 0 0.0% 0 0.0% 0
To access public transport for onward travel (e.g. train station, bus station)
0.0% 0 0.0% 0 0.0% 0 0.0% 0 0.0% 0 0.0% 0 0.0% 0 0.0% 0 0.0% 0
Other 0.0% 0 0.0% 0 0.0% 0 0.0% 0 0.0% 0 0.0% 0 0.0% 0 0.0% 0 0.0% 0As part of a day out / for a
day out / something different
1.4% 4 2.9% 1 0.0% 0 0.0% 0 0.9% 1 2.4% 1 0.0% 0 0.0% 0 5.6% 1
Browsing / window shopping 1.0% 3 0.0% 0 0.0% 0 0.0% 0 1.2% 1 3.3% 1 0.0% 0 0.0% 0 0.0% 0(Don't know / varies) 0.3% 1 0.0% 0 0.0% 0 2.9% 1 0.0% 0 0.0% 0 0.0% 0 0.0% 0 0.0% 0(Nothing / nothing further) 52.7% 129 60.6% 18 60.4% 9 41.7% 12 47.3% 51 54.8% 22 0.0% 0 95.1% 9 49.6% 7Weighted base: 245 30 14 28 107 40 0 9 14Sample: 225 27 36 31 71 30 0 13 12

by Zone (Weighted, Part 1) South Wales Retail Study Page 48 Weighted: for Carter Jonas August 2016
Total Zone 1 Zone 2 Zone 3 Zone 4 Zone 5 Zone 6 Zone 7 Zone 8
Column %ges. 020716 NEMS market research
Q28X In order of importance, what are your two main reasons for visiting Milford Haven Town Centre? Any mention: [MR] Zones 1-5 & 7-9 and those who visit Milford Haven town centre at Q27 Food shopping 31.8% 80 7.9% 2 17.8% 3 36.1% 11 50.6% 54 19.4% 8 0.0% 0 11.3% 1 0.0% 0Non-food shopping 49.1% 123 61.1% 19 35.5% 5 53.5% 17 43.4% 47 66.0% 27 0.0% 0 4.9% 0 52.0% 7To visit bars / pubs 0.6% 2 5.1% 2 0.0% 0 0.0% 0 0.0% 0 0.0% 0 0.0% 0 0.0% 0 0.0% 0To visit cafés / restaurants 13.2% 33 19.2% 6 10.0% 1 8.4% 3 10.9% 12 15.6% 6 0.0% 0 4.9% 0 32.5% 4To visit personal service
providers (e.g. hairdressers, beauty salon etc.)
2.8% 7 0.0% 0 7.4% 1 4.7% 1 3.8% 4 0.0% 0 0.0% 0 4.9% 0 0.0% 0
To visit financial services such as banks and other financial institutions
7.8% 20 2.8% 1 5.2% 1 8.4% 3 14.2% 15 0.0% 0 0.0% 0 0.0% 0 0.0% 0
To visit other service providers (e.g. travel agent, estate agent etc.)
1.5% 4 0.0% 0 10.2% 2 0.0% 0 2.1% 2 0.0% 0 0.0% 0 0.0% 0 0.0% 0
To visit public services (e.g. medical or dentist appointment, library, job centre, community centre, etc)
6.1% 15 2.9% 1 7.4% 1 4.6% 1 6.0% 6 5.4% 2 0.0% 0 25.7% 2 0.0% 0
To get petrol 0.0% 0 0.0% 0 0.0% 0 0.0% 0 0.0% 0 0.0% 0 0.0% 0 0.0% 0 0.0% 0To visit the cinema 2.4% 6 0.0% 0 2.6% 0 0.0% 0 1.2% 1 6.7% 3 0.0% 0 0.0% 0 12.3% 2To visit a park 0.0% 0 0.0% 0 0.0% 0 0.0% 0 0.0% 0 0.0% 0 0.0% 0 0.0% 0 0.0% 0To visit the swimming pool 0.2% 0 0.0% 0 2.7% 0 0.0% 0 0.0% 0 0.0% 0 0.0% 0 0.0% 0 0.0% 0To visit other gyms / health
and fitness facilities 0.5% 1 0.0% 0 0.0% 0 0.0% 0 1.2% 1 0.0% 0 0.0% 0 0.0% 0 0.0% 0
To visit the library 0.0% 0 0.0% 0 0.0% 0 0.0% 0 0.0% 0 0.0% 0 0.0% 0 0.0% 0 0.0% 0To visit museums / art
gallery 0.0% 0 0.0% 0 0.0% 0 0.0% 0 0.0% 0 0.0% 0 0.0% 0 0.0% 0 0.0% 0
To visit the theatre or musical venues
3.4% 9 11.9% 4 7.8% 1 0.0% 0 0.0% 0 6.2% 3 0.0% 0 12.7% 1 0.0% 0
To visit night time venues e.g. nightclub
0.0% 0 0.0% 0 0.0% 0 0.0% 0 0.0% 0 0.0% 0 0.0% 0 0.0% 0 0.0% 0
For other leisure activities 3.3% 8 2.1% 1 14.7% 2 4.0% 1 2.9% 3 0.0% 0 0.0% 0 4.9% 0 4.3% 1To shop at the market(s) 0.0% 0 0.0% 0 0.0% 0 0.0% 0 0.0% 0 0.0% 0 0.0% 0 0.0% 0 0.0% 0To meet family 3.1% 8 0.0% 0 4.6% 1 2.6% 1 0.0% 0 5.4% 2 0.0% 0 24.4% 2 12.3% 2To meet friends 5.7% 14 9.1% 3 2.0% 0 0.0% 0 6.5% 7 0.0% 0 0.0% 0 4.9% 0 27.1% 4To visit the theatre 0.7% 2 0.0% 0 0.0% 0 0.0% 0 0.0% 0 2.3% 1 0.0% 0 6.4% 1 0.0% 0For work (i.e. place of work) 5.5% 14 0.0% 0 5.8% 1 10.4% 3 6.7% 7 6.2% 3 0.0% 0 0.0% 0 0.0% 0For business (e.g. attend a
business appointment) 0.0% 0 0.0% 0 0.0% 0 0.0% 0 0.0% 0 0.0% 0 0.0% 0 0.0% 0 0.0% 0
For education as a student (e.g. student at college, university, or other third level education)
0.0% 0 0.0% 0 0.0% 0 0.0% 0 0.0% 0 0.0% 0 0.0% 0 0.0% 0 0.0% 0
To access public transport for onward travel (e.g. train station, bus station)
0.0% 0 0.0% 0 0.0% 0 0.0% 0 0.0% 0 0.0% 0 0.0% 0 0.0% 0 0.0% 0
Other 0.0% 0 0.0% 0 0.0% 0 0.0% 0 0.0% 0 0.0% 0 0.0% 0 0.0% 0 0.0% 0As part of a day out / for a
day out / something different
3.0% 8 9.0% 3 2.0% 0 2.0% 1 0.9% 1 5.4% 2 0.0% 0 0.0% 0 5.6% 1
Browsing / window shopping 2.9% 7 4.3% 1 0.0% 0 5.0% 2 2.4% 3 3.2% 1 0.0% 0 0.0% 0 4.3% 1Weighted base: 251 31 15 31 107 41 0 9 14Sample: 234 28 37 36 71 31 0 13 12
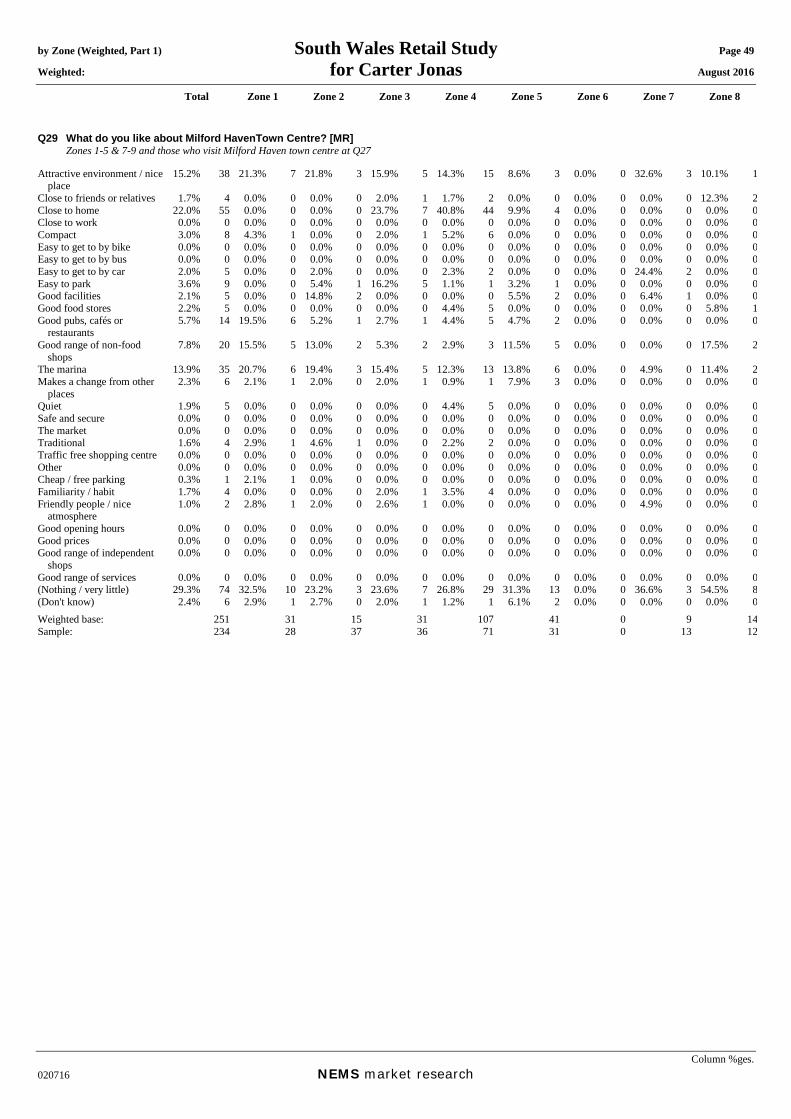
by Zone (Weighted, Part 1) South Wales Retail Study Page 49 Weighted: for Carter Jonas August 2016
Total Zone 1 Zone 2 Zone 3 Zone 4 Zone 5 Zone 6 Zone 7 Zone 8
Column %ges. 020716 NEMS market research
Q29 What do you like about Milford HavenTown Centre? [MR] Zones 1-5 & 7-9 and those who visit Milford Haven town centre at Q27 Attractive environment / nice
place 15.2% 38 21.3% 7 21.8% 3 15.9% 5 14.3% 15 8.6% 3 0.0% 0 32.6% 3 10.1% 1
Close to friends or relatives 1.7% 4 0.0% 0 0.0% 0 2.0% 1 1.7% 2 0.0% 0 0.0% 0 0.0% 0 12.3% 2Close to home 22.0% 55 0.0% 0 0.0% 0 23.7% 7 40.8% 44 9.9% 4 0.0% 0 0.0% 0 0.0% 0Close to work 0.0% 0 0.0% 0 0.0% 0 0.0% 0 0.0% 0 0.0% 0 0.0% 0 0.0% 0 0.0% 0Compact 3.0% 8 4.3% 1 0.0% 0 2.0% 1 5.2% 6 0.0% 0 0.0% 0 0.0% 0 0.0% 0Easy to get to by bike 0.0% 0 0.0% 0 0.0% 0 0.0% 0 0.0% 0 0.0% 0 0.0% 0 0.0% 0 0.0% 0Easy to get to by bus 0.0% 0 0.0% 0 0.0% 0 0.0% 0 0.0% 0 0.0% 0 0.0% 0 0.0% 0 0.0% 0Easy to get to by car 2.0% 5 0.0% 0 2.0% 0 0.0% 0 2.3% 2 0.0% 0 0.0% 0 24.4% 2 0.0% 0Easy to park 3.6% 9 0.0% 0 5.4% 1 16.2% 5 1.1% 1 3.2% 1 0.0% 0 0.0% 0 0.0% 0Good facilities 2.1% 5 0.0% 0 14.8% 2 0.0% 0 0.0% 0 5.5% 2 0.0% 0 6.4% 1 0.0% 0Good food stores 2.2% 5 0.0% 0 0.0% 0 0.0% 0 4.4% 5 0.0% 0 0.0% 0 0.0% 0 5.8% 1Good pubs, cafés or
restaurants 5.7% 14 19.5% 6 5.2% 1 2.7% 1 4.4% 5 4.7% 2 0.0% 0 0.0% 0 0.0% 0
Good range of non-food shops
7.8% 20 15.5% 5 13.0% 2 5.3% 2 2.9% 3 11.5% 5 0.0% 0 0.0% 0 17.5% 2
The marina 13.9% 35 20.7% 6 19.4% 3 15.4% 5 12.3% 13 13.8% 6 0.0% 0 4.9% 0 11.4% 2Makes a change from other
places 2.3% 6 2.1% 1 2.0% 0 2.0% 1 0.9% 1 7.9% 3 0.0% 0 0.0% 0 0.0% 0
Quiet 1.9% 5 0.0% 0 0.0% 0 0.0% 0 4.4% 5 0.0% 0 0.0% 0 0.0% 0 0.0% 0Safe and secure 0.0% 0 0.0% 0 0.0% 0 0.0% 0 0.0% 0 0.0% 0 0.0% 0 0.0% 0 0.0% 0The market 0.0% 0 0.0% 0 0.0% 0 0.0% 0 0.0% 0 0.0% 0 0.0% 0 0.0% 0 0.0% 0Traditional 1.6% 4 2.9% 1 4.6% 1 0.0% 0 2.2% 2 0.0% 0 0.0% 0 0.0% 0 0.0% 0Traffic free shopping centre 0.0% 0 0.0% 0 0.0% 0 0.0% 0 0.0% 0 0.0% 0 0.0% 0 0.0% 0 0.0% 0Other 0.0% 0 0.0% 0 0.0% 0 0.0% 0 0.0% 0 0.0% 0 0.0% 0 0.0% 0 0.0% 0Cheap / free parking 0.3% 1 2.1% 1 0.0% 0 0.0% 0 0.0% 0 0.0% 0 0.0% 0 0.0% 0 0.0% 0Familiarity / habit 1.7% 4 0.0% 0 0.0% 0 2.0% 1 3.5% 4 0.0% 0 0.0% 0 0.0% 0 0.0% 0Friendly people / nice
atmosphere 1.0% 2 2.8% 1 2.0% 0 2.6% 1 0.0% 0 0.0% 0 0.0% 0 4.9% 0 0.0% 0
Good opening hours 0.0% 0 0.0% 0 0.0% 0 0.0% 0 0.0% 0 0.0% 0 0.0% 0 0.0% 0 0.0% 0Good prices 0.0% 0 0.0% 0 0.0% 0 0.0% 0 0.0% 0 0.0% 0 0.0% 0 0.0% 0 0.0% 0Good range of independent
shops 0.0% 0 0.0% 0 0.0% 0 0.0% 0 0.0% 0 0.0% 0 0.0% 0 0.0% 0 0.0% 0
Good range of services 0.0% 0 0.0% 0 0.0% 0 0.0% 0 0.0% 0 0.0% 0 0.0% 0 0.0% 0 0.0% 0(Nothing / very little) 29.3% 74 32.5% 10 23.2% 3 23.6% 7 26.8% 29 31.3% 13 0.0% 0 36.6% 3 54.5% 8(Don't know) 2.4% 6 2.9% 1 2.7% 0 2.0% 1 1.2% 1 6.1% 2 0.0% 0 0.0% 0 0.0% 0Weighted base: 251 31 15 31 107 41 0 9 14Sample: 234 28 37 36 71 31 0 13 12
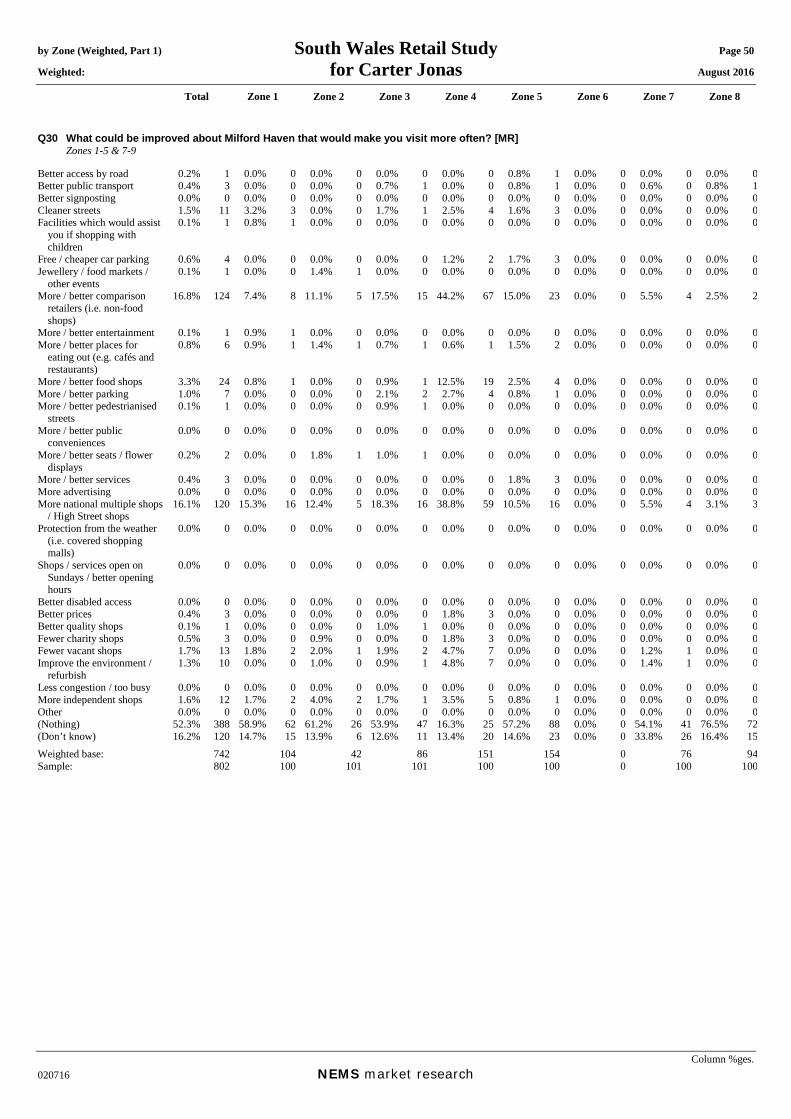
by Zone (Weighted, Part 1) South Wales Retail Study Page 50 Weighted: for Carter Jonas August 2016
Total Zone 1 Zone 2 Zone 3 Zone 4 Zone 5 Zone 6 Zone 7 Zone 8
Column %ges. 020716 NEMS market research
Q30 What could be improved about Milford Haven that would make you visit more often? [MR] Zones 1-5 & 7-9 Better access by road 0.2% 1 0.0% 0 0.0% 0 0.0% 0 0.0% 0 0.8% 1 0.0% 0 0.0% 0 0.0% 0Better public transport 0.4% 3 0.0% 0 0.0% 0 0.7% 1 0.0% 0 0.8% 1 0.0% 0 0.6% 0 0.8% 1Better signposting 0.0% 0 0.0% 0 0.0% 0 0.0% 0 0.0% 0 0.0% 0 0.0% 0 0.0% 0 0.0% 0Cleaner streets 1.5% 11 3.2% 3 0.0% 0 1.7% 1 2.5% 4 1.6% 3 0.0% 0 0.0% 0 0.0% 0Facilities which would assist
you if shopping with children
0.1% 1 0.8% 1 0.0% 0 0.0% 0 0.0% 0 0.0% 0 0.0% 0 0.0% 0 0.0% 0
Free / cheaper car parking 0.6% 4 0.0% 0 0.0% 0 0.0% 0 1.2% 2 1.7% 3 0.0% 0 0.0% 0 0.0% 0Jewellery / food markets /
other events 0.1% 1 0.0% 0 1.4% 1 0.0% 0 0.0% 0 0.0% 0 0.0% 0 0.0% 0 0.0% 0
More / better comparison retailers (i.e. non-food shops)
16.8% 124 7.4% 8 11.1% 5 17.5% 15 44.2% 67 15.0% 23 0.0% 0 5.5% 4 2.5% 2
More / better entertainment 0.1% 1 0.9% 1 0.0% 0 0.0% 0 0.0% 0 0.0% 0 0.0% 0 0.0% 0 0.0% 0More / better places for
eating out (e.g. cafés and restaurants)
0.8% 6 0.9% 1 1.4% 1 0.7% 1 0.6% 1 1.5% 2 0.0% 0 0.0% 0 0.0% 0
More / better food shops 3.3% 24 0.8% 1 0.0% 0 0.9% 1 12.5% 19 2.5% 4 0.0% 0 0.0% 0 0.0% 0More / better parking 1.0% 7 0.0% 0 0.0% 0 2.1% 2 2.7% 4 0.8% 1 0.0% 0 0.0% 0 0.0% 0More / better pedestrianised
streets 0.1% 1 0.0% 0 0.0% 0 0.9% 1 0.0% 0 0.0% 0 0.0% 0 0.0% 0 0.0% 0
More / better public conveniences
0.0% 0 0.0% 0 0.0% 0 0.0% 0 0.0% 0 0.0% 0 0.0% 0 0.0% 0 0.0% 0
More / better seats / flower displays
0.2% 2 0.0% 0 1.8% 1 1.0% 1 0.0% 0 0.0% 0 0.0% 0 0.0% 0 0.0% 0
More / better services 0.4% 3 0.0% 0 0.0% 0 0.0% 0 0.0% 0 1.8% 3 0.0% 0 0.0% 0 0.0% 0More advertising 0.0% 0 0.0% 0 0.0% 0 0.0% 0 0.0% 0 0.0% 0 0.0% 0 0.0% 0 0.0% 0More national multiple shops
/ High Street shops 16.1% 120 15.3% 16 12.4% 5 18.3% 16 38.8% 59 10.5% 16 0.0% 0 5.5% 4 3.1% 3
Protection from the weather (i.e. covered shopping malls)
0.0% 0 0.0% 0 0.0% 0 0.0% 0 0.0% 0 0.0% 0 0.0% 0 0.0% 0 0.0% 0
Shops / services open on Sundays / better opening hours
0.0% 0 0.0% 0 0.0% 0 0.0% 0 0.0% 0 0.0% 0 0.0% 0 0.0% 0 0.0% 0
Better disabled access 0.0% 0 0.0% 0 0.0% 0 0.0% 0 0.0% 0 0.0% 0 0.0% 0 0.0% 0 0.0% 0Better prices 0.4% 3 0.0% 0 0.0% 0 0.0% 0 1.8% 3 0.0% 0 0.0% 0 0.0% 0 0.0% 0Better quality shops 0.1% 1 0.0% 0 0.0% 0 1.0% 1 0.0% 0 0.0% 0 0.0% 0 0.0% 0 0.0% 0Fewer charity shops 0.5% 3 0.0% 0 0.9% 0 0.0% 0 1.8% 3 0.0% 0 0.0% 0 0.0% 0 0.0% 0Fewer vacant shops 1.7% 13 1.8% 2 2.0% 1 1.9% 2 4.7% 7 0.0% 0 0.0% 0 1.2% 1 0.0% 0Improve the environment /
refurbish 1.3% 10 0.0% 0 1.0% 0 0.9% 1 4.8% 7 0.0% 0 0.0% 0 1.4% 1 0.0% 0
Less congestion / too busy 0.0% 0 0.0% 0 0.0% 0 0.0% 0 0.0% 0 0.0% 0 0.0% 0 0.0% 0 0.0% 0More independent shops 1.6% 12 1.7% 2 4.0% 2 1.7% 1 3.5% 5 0.8% 1 0.0% 0 0.0% 0 0.0% 0Other 0.0% 0 0.0% 0 0.0% 0 0.0% 0 0.0% 0 0.0% 0 0.0% 0 0.0% 0 0.0% 0(Nothing) 52.3% 388 58.9% 62 61.2% 26 53.9% 47 16.3% 25 57.2% 88 0.0% 0 54.1% 41 76.5% 72(Don’t know) 16.2% 120 14.7% 15 13.9% 6 12.6% 11 13.4% 20 14.6% 23 0.0% 0 33.8% 26 16.4% 15Weighted base: 742 104 42 86 151 154 0 76 94Sample: 802 100 101 101 100 100 0 100 100
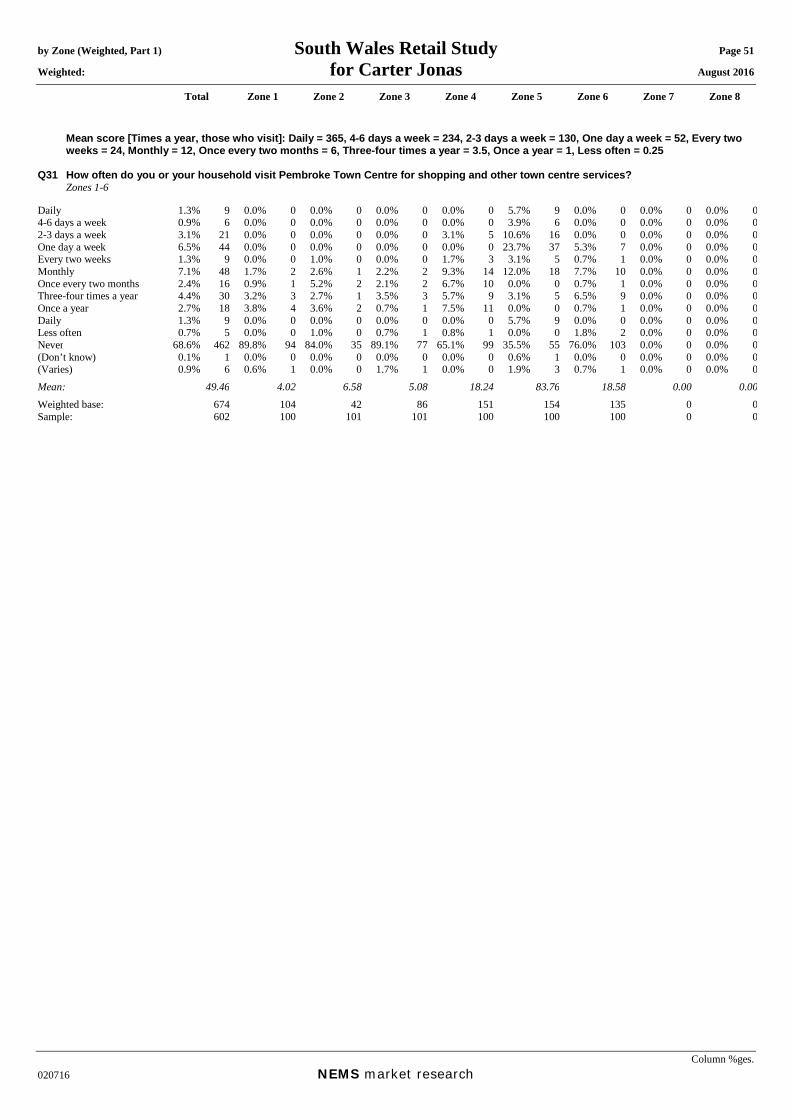
by Zone (Weighted, Part 1) South Wales Retail Study Page 51 Weighted: for Carter Jonas August 2016
Total Zone 1 Zone 2 Zone 3 Zone 4 Zone 5 Zone 6 Zone 7 Zone 8
Column %ges. 020716 NEMS market research
Mean score [Times a year, those who visit]: Daily = 365, 4-6 days a week = 234, 2-3 days a week = 130, One day a week = 52, Every two weeks = 24, Monthly = 12, Once every two months = 6, Three-four times a year = 3.5, Once a year = 1, Less often = 0.25
Q31 How often do you or your household visit Pembroke Town Centre for shopping and other town centre services? Zones 1-6 Daily 1.3% 9 0.0% 0 0.0% 0 0.0% 0 0.0% 0 5.7% 9 0.0% 0 0.0% 0 0.0% 04-6 days a week 0.9% 6 0.0% 0 0.0% 0 0.0% 0 0.0% 0 3.9% 6 0.0% 0 0.0% 0 0.0% 02-3 days a week 3.1% 21 0.0% 0 0.0% 0 0.0% 0 3.1% 5 10.6% 16 0.0% 0 0.0% 0 0.0% 0One day a week 6.5% 44 0.0% 0 0.0% 0 0.0% 0 0.0% 0 23.7% 37 5.3% 7 0.0% 0 0.0% 0Every two weeks 1.3% 9 0.0% 0 1.0% 0 0.0% 0 1.7% 3 3.1% 5 0.7% 1 0.0% 0 0.0% 0Monthly 7.1% 48 1.7% 2 2.6% 1 2.2% 2 9.3% 14 12.0% 18 7.7% 10 0.0% 0 0.0% 0Once every two months 2.4% 16 0.9% 1 5.2% 2 2.1% 2 6.7% 10 0.0% 0 0.7% 1 0.0% 0 0.0% 0Three-four times a year 4.4% 30 3.2% 3 2.7% 1 3.5% 3 5.7% 9 3.1% 5 6.5% 9 0.0% 0 0.0% 0Once a year 2.7% 18 3.8% 4 3.6% 2 0.7% 1 7.5% 11 0.0% 0 0.7% 1 0.0% 0 0.0% 0Daily 1.3% 9 0.0% 0 0.0% 0 0.0% 0 0.0% 0 5.7% 9 0.0% 0 0.0% 0 0.0% 0Less often 0.7% 5 0.0% 0 1.0% 0 0.7% 1 0.8% 1 0.0% 0 1.8% 2 0.0% 0 0.0% 0Never 68.6% 462 89.8% 94 84.0% 35 89.1% 77 65.1% 99 35.5% 55 76.0% 103 0.0% 0 0.0% 0(Don’t know) 0.1% 1 0.0% 0 0.0% 0 0.0% 0 0.0% 0 0.6% 1 0.0% 0 0.0% 0 0.0% 0(Varies) 0.9% 6 0.6% 1 0.0% 0 1.7% 1 0.0% 0 1.9% 3 0.7% 1 0.0% 0 0.0% 0Mean: 49.46 4.02 6.58 5.08 18.24 83.76 18.58 0.00 0.00Weighted base: 674 104 42 86 151 154 135 0 0Sample: 602 100 101 101 100 100 100 0 0

by Zone (Weighted, Part 1) South Wales Retail Study Page 52 Weighted: for Carter Jonas August 2016
Total Zone 1 Zone 2 Zone 3 Zone 4 Zone 5 Zone 6 Zone 7 Zone 8
Column %ges. 020716 NEMS market research
Q32A In order of importance, what are your two main reasons for visiting Pembroke Town Centre? Main reason: Zones 1-6 and those who visit Pembroke town centre at Q31 Food shopping 21.7% 46 35.2% 4 11.8% 1 0.0% 0 22.4% 12 25.5% 25 13.0% 4 0.0% 0 0.0% 0Non-food shopping 38.5% 81 31.2% 3 22.3% 2 35.9% 3 38.9% 21 41.6% 41 35.3% 11 0.0% 0 0.0% 0To visit bars / pubs 0.1% 0 0.0% 0 4.4% 0 0.0% 0 0.0% 0 0.0% 0 0.0% 0 0.0% 0 0.0% 0To visit cafés / restaurants 4.5% 9 12.6% 1 10.5% 1 0.0% 0 2.3% 1 6.2% 6 0.0% 0 0.0% 0 0.0% 0To visit personal service
providers (e.g. hairdressers, beauty salon etc.)
2.4% 5 0.0% 0 0.0% 0 0.0% 0 4.1% 2 1.9% 2 2.8% 1 0.0% 0 0.0% 0
To visit financial services such as banks and other financial institutions
12.6% 27 0.0% 0 0.0% 0 0.0% 0 1.8% 1 15.7% 16 31.4% 10 0.0% 0 0.0% 0
To visit other service providers (e.g. travel agent, estate agent etc.)
0.0% 0 0.0% 0 0.0% 0 0.0% 0 0.0% 0 0.0% 0 0.0% 0 0.0% 0 0.0% 0
To visit public services (e.g. medical or dentist appointment, library, job centre, community centre, etc)
1.0% 2 0.0% 0 0.0% 0 0.0% 0 4.2% 2 0.0% 0 0.0% 0 0.0% 0 0.0% 0
To get petrol 0.0% 0 0.0% 0 0.0% 0 0.0% 0 0.0% 0 0.0% 0 0.0% 0 0.0% 0 0.0% 0To visit the cinema 0.0% 0 0.0% 0 0.0% 0 0.0% 0 0.0% 0 0.0% 0 0.0% 0 0.0% 0 0.0% 0To visit a park 0.0% 0 0.0% 0 0.0% 0 0.0% 0 0.0% 0 0.0% 0 0.0% 0 0.0% 0 0.0% 0To visit the swimming pool 0.0% 0 0.0% 0 0.0% 0 0.0% 0 0.0% 0 0.0% 0 0.0% 0 0.0% 0 0.0% 0To visit other gyms / health
and fitness facilities 0.0% 0 0.0% 0 0.0% 0 0.0% 0 0.0% 0 0.0% 0 0.0% 0 0.0% 0 0.0% 0
To visit the library 0.0% 0 0.0% 0 0.0% 0 0.0% 0 0.0% 0 0.0% 0 0.0% 0 0.0% 0 0.0% 0To visit museums / art
gallery 0.2% 0 0.0% 0 6.7% 0 0.0% 0 0.0% 0 0.0% 0 0.0% 0 0.0% 0 0.0% 0
To visit the theatre or musical venues
0.0% 0 0.0% 0 0.0% 0 0.0% 0 0.0% 0 0.0% 0 0.0% 0 0.0% 0 0.0% 0
To visit night time venues e.g. nightclub
0.0% 0 0.0% 0 0.0% 0 0.0% 0 0.0% 0 0.0% 0 0.0% 0 0.0% 0 0.0% 0
For other leisure activities 1.2% 3 0.0% 0 6.0% 0 13.3% 1 1.8% 1 0.0% 0 0.0% 0 0.0% 0 0.0% 0To shop at the market(s) 1.5% 3 0.0% 0 0.0% 0 0.0% 0 5.9% 3 0.0% 0 0.0% 0 0.0% 0 0.0% 0To meet family 1.3% 3 0.0% 0 22.1% 1 0.0% 0 0.0% 0 1.3% 1 0.0% 0 0.0% 0 0.0% 0To meet friends 3.7% 8 0.0% 0 4.4% 0 0.0% 0 2.3% 1 2.8% 3 10.9% 4 0.0% 0 0.0% 0To visit the theatre 0.4% 1 0.0% 0 0.0% 0 8.7% 1 0.0% 0 0.0% 0 0.0% 0 0.0% 0 0.0% 0For work (i.e. place of work) 2.5% 5 0.0% 0 0.0% 0 15.4% 1 5.1% 3 1.2% 1 0.0% 0 0.0% 0 0.0% 0For business (e.g. attend a
business appointment) 0.0% 0 0.0% 0 0.0% 0 0.0% 0 0.0% 0 0.0% 0 0.0% 0 0.0% 0 0.0% 0
For education as a student (e.g. student at college, university, or other third level education)
0.0% 0 0.0% 0 0.0% 0 0.0% 0 0.0% 0 0.0% 0 0.0% 0 0.0% 0 0.0% 0
To access public transport for onward travel (e.g. train station, bus station)
0.0% 0 0.0% 0 0.0% 0 0.0% 0 0.0% 0 0.0% 0 0.0% 0 0.0% 0 0.0% 0
Other 0.0% 0 0.0% 0 0.0% 0 0.0% 0 0.0% 0 0.0% 0 0.0% 0 0.0% 0 0.0% 0As part of a day out / for a
day out / something different
1.7% 4 6.3% 1 5.8% 0 13.3% 1 2.4% 1 0.0% 0 0.0% 0 0.0% 0 0.0% 0
Browsing / window shopping 4.6% 10 14.8% 2 6.0% 0 6.7% 1 6.5% 3 3.8% 4 0.0% 0 0.0% 0 0.0% 0(Don't know / varies) 0.3% 1 0.0% 0 0.0% 0 6.7% 1 0.0% 0 0.0% 0 0.0% 0 0.0% 0 0.0% 0(Nothing / nothing further) 1.6% 3 0.0% 0 0.0% 0 0.0% 0 2.4% 1 0.0% 0 6.6% 2 0.0% 0 0.0% 0Weighted base: 211 11 7 9 53 99 32 0 0Sample: 166 12 15 12 35 69 23 0 0

by Zone (Weighted, Part 1) South Wales Retail Study Page 53 Weighted: for Carter Jonas August 2016
Total Zone 1 Zone 2 Zone 3 Zone 4 Zone 5 Zone 6 Zone 7 Zone 8
Column %ges. 020716 NEMS market research
Q32B In order of importance, what are your two main reasons for visiting Pembroke Town Centre? Secondary reason: Those who gave a reason at Q32A Food shopping 10.9% 23 0.0% 0 0.0% 0 0.0% 0 8.5% 4 17.2% 17 4.1% 1 0.0% 0 0.0% 0Non-food shopping 13.8% 29 41.5% 4 6.0% 0 0.0% 0 14.8% 8 14.5% 14 6.0% 2 0.0% 0 0.0% 0To visit bars / pubs 1.3% 3 0.0% 0 0.0% 0 0.0% 0 0.0% 0 2.8% 3 0.0% 0 0.0% 0 0.0% 0To visit cafés / restaurants 9.3% 19 8.2% 1 5.8% 0 7.1% 1 13.1% 7 7.2% 7 11.6% 4 0.0% 0 0.0% 0To visit personal service
providers (e.g. hairdressers, beauty salon etc.)
1.3% 3 0.0% 0 0.0% 0 0.0% 0 0.0% 0 2.8% 3 0.0% 0 0.0% 0 0.0% 0
To visit financial services such as banks and other financial institutions
4.2% 9 0.0% 0 0.0% 0 0.0% 0 0.0% 0 7.6% 8 3.9% 1 0.0% 0 0.0% 0
To visit other service providers (e.g. travel agent, estate agent etc.)
0.0% 0 0.0% 0 0.0% 0 0.0% 0 0.0% 0 0.0% 0 0.0% 0 0.0% 0 0.0% 0
To visit public services (e.g. medical or dentist appointment, library, job centre, community centre, etc)
1.5% 3 0.0% 0 4.4% 0 0.0% 0 0.0% 0 2.9% 3 0.0% 0 0.0% 0 0.0% 0
To get petrol 0.0% 0 0.0% 0 0.0% 0 0.0% 0 0.0% 0 0.0% 0 0.0% 0 0.0% 0 0.0% 0To visit the cinema 0.0% 0 0.0% 0 0.0% 0 0.0% 0 0.0% 0 0.0% 0 0.0% 0 0.0% 0 0.0% 0To visit a park 0.0% 0 0.0% 0 0.0% 0 0.0% 0 0.0% 0 0.0% 0 0.0% 0 0.0% 0 0.0% 0To visit the swimming pool 0.0% 0 0.0% 0 0.0% 0 0.0% 0 0.0% 0 0.0% 0 0.0% 0 0.0% 0 0.0% 0To visit other gyms / health
and fitness facilities 0.0% 0 0.0% 0 0.0% 0 0.0% 0 0.0% 0 0.0% 0 0.0% 0 0.0% 0 0.0% 0
To visit the library 0.0% 0 0.0% 0 0.0% 0 0.0% 0 0.0% 0 0.0% 0 0.0% 0 0.0% 0 0.0% 0To visit museums / art
gallery 0.0% 0 0.0% 0 0.0% 0 0.0% 0 0.0% 0 0.0% 0 0.0% 0 0.0% 0 0.0% 0
To visit the theatre or musical venues
0.0% 0 0.0% 0 0.0% 0 0.0% 0 0.0% 0 0.0% 0 0.0% 0 0.0% 0 0.0% 0
To visit night time venues e.g. nightclub
0.0% 0 0.0% 0 0.0% 0 0.0% 0 0.0% 0 0.0% 0 0.0% 0 0.0% 0 0.0% 0
For other leisure activities 0.5% 1 0.0% 0 0.0% 0 0.0% 0 1.8% 1 0.0% 0 0.0% 0 0.0% 0 0.0% 0To shop at the market(s) 0.0% 0 0.0% 0 0.0% 0 0.0% 0 0.0% 0 0.0% 0 0.0% 0 0.0% 0 0.0% 0To meet family 1.2% 2 0.0% 0 0.0% 0 0.0% 0 0.0% 0 1.2% 1 4.1% 1 0.0% 0 0.0% 0To meet friends 0.0% 0 0.0% 0 0.0% 0 0.0% 0 0.0% 0 0.0% 0 0.0% 0 0.0% 0 0.0% 0To visit the theatre 0.0% 0 0.0% 0 0.0% 0 0.0% 0 0.0% 0 0.0% 0 0.0% 0 0.0% 0 0.0% 0For work (i.e. place of work) 0.3% 1 0.0% 0 0.0% 0 7.1% 1 0.0% 0 0.0% 0 0.0% 0 0.0% 0 0.0% 0For business (e.g. attend a
business appointment) 0.0% 0 0.0% 0 0.0% 0 0.0% 0 0.0% 0 0.0% 0 0.0% 0 0.0% 0 0.0% 0
For education as a student (e.g. student at college, university, or other third level education)
0.0% 0 0.0% 0 0.0% 0 0.0% 0 0.0% 0 0.0% 0 0.0% 0 0.0% 0 0.0% 0
To access public transport for onward travel (e.g. train station, bus station)
0.0% 0 0.0% 0 0.0% 0 0.0% 0 0.0% 0 0.0% 0 0.0% 0 0.0% 0 0.0% 0
Other 0.0% 0 0.0% 0 0.0% 0 0.0% 0 0.0% 0 0.0% 0 0.0% 0 0.0% 0 0.0% 0As part of a day out / for a
day out / something different
0.2% 0 0.0% 0 6.0% 0 0.0% 0 0.0% 0 0.0% 0 0.0% 0 0.0% 0 0.0% 0
Browsing / window shopping 1.8% 4 0.0% 0 4.4% 0 14.3% 1 0.0% 0 2.3% 2 0.0% 0 0.0% 0 0.0% 0(Don't know / varies) 2.3% 5 0.0% 0 0.0% 0 0.0% 0 0.0% 0 4.8% 5 0.0% 0 0.0% 0 0.0% 0(Nothing / nothing further) 51.2% 106 50.4% 5 73.3% 5 71.4% 6 61.8% 32 36.7% 36 70.3% 21 0.0% 0 0.0% 0Weighted base: 207 11 7 9 51 99 30 0 0Sample: 162 12 15 11 34 69 21 0 0

by Zone (Weighted, Part 1) South Wales Retail Study Page 54 Weighted: for Carter Jonas August 2016
Total Zone 1 Zone 2 Zone 3 Zone 4 Zone 5 Zone 6 Zone 7 Zone 8
Column %ges. 020716 NEMS market research
Q32X In order of importance, what are your two main reasons for visiting Pembroke Town Centre? Any mention: [MR] Zones 1-6 and those who visit Pembroke town centre at Q31 Food shopping 32.4% 69 35.2% 4 11.8% 1 0.0% 0 30.6% 16 42.7% 42 16.8% 5 0.0% 0 0.0% 0Non-food shopping 52.1% 110 72.6% 8 28.3% 2 35.9% 3 53.3% 28 56.1% 56 40.9% 13 0.0% 0 0.0% 0To visit bars / pubs 1.4% 3 0.0% 0 4.4% 0 0.0% 0 0.0% 0 2.8% 3 0.0% 0 0.0% 0 0.0% 0To visit cafés / restaurants 13.6% 29 20.7% 2 16.2% 1 6.7% 1 15.1% 8 13.5% 13 10.9% 4 0.0% 0 0.0% 0To visit personal service
providers (e.g. hairdressers, beauty salon etc.)
3.7% 8 0.0% 0 0.0% 0 0.0% 0 4.1% 2 4.7% 5 2.8% 1 0.0% 0 0.0% 0
To visit financial services such as banks and other financial institutions
16.8% 35 0.0% 0 0.0% 0 0.0% 0 1.8% 1 23.3% 23 35.0% 11 0.0% 0 0.0% 0
To visit other service providers (e.g. travel agent, estate agent etc.)
0.0% 0 0.0% 0 0.0% 0 0.0% 0 0.0% 0 0.0% 0 0.0% 0 0.0% 0 0.0% 0
To visit public services (e.g. medical or dentist appointment, library, job centre, community centre, etc)
2.5% 5 0.0% 0 4.4% 0 0.0% 0 4.2% 2 2.9% 3 0.0% 0 0.0% 0 0.0% 0
To get petrol 0.0% 0 0.0% 0 0.0% 0 0.0% 0 0.0% 0 0.0% 0 0.0% 0 0.0% 0 0.0% 0To visit the cinema 0.0% 0 0.0% 0 0.0% 0 0.0% 0 0.0% 0 0.0% 0 0.0% 0 0.0% 0 0.0% 0To visit a park 0.0% 0 0.0% 0 0.0% 0 0.0% 0 0.0% 0 0.0% 0 0.0% 0 0.0% 0 0.0% 0To visit the swimming pool 0.0% 0 0.0% 0 0.0% 0 0.0% 0 0.0% 0 0.0% 0 0.0% 0 0.0% 0 0.0% 0To visit other gyms / health
and fitness facilities 0.0% 0 0.0% 0 0.0% 0 0.0% 0 0.0% 0 0.0% 0 0.0% 0 0.0% 0 0.0% 0
To visit the library 0.0% 0 0.0% 0 0.0% 0 0.0% 0 0.0% 0 0.0% 0 0.0% 0 0.0% 0 0.0% 0To visit museums / art
gallery 0.2% 0 0.0% 0 6.7% 0 0.0% 0 0.0% 0 0.0% 0 0.0% 0 0.0% 0 0.0% 0
To visit the theatre or musical venues
0.0% 0 0.0% 0 0.0% 0 0.0% 0 0.0% 0 0.0% 0 0.0% 0 0.0% 0 0.0% 0
To visit night time venues e.g. nightclub
0.0% 0 0.0% 0 0.0% 0 0.0% 0 0.0% 0 0.0% 0 0.0% 0 0.0% 0 0.0% 0
For other leisure activities 1.7% 4 0.0% 0 6.0% 0 13.3% 1 3.6% 2 0.0% 0 0.0% 0 0.0% 0 0.0% 0To shop at the market(s) 1.5% 3 0.0% 0 0.0% 0 0.0% 0 5.9% 3 0.0% 0 0.0% 0 0.0% 0 0.0% 0To meet family 2.5% 5 0.0% 0 22.1% 1 0.0% 0 0.0% 0 2.6% 3 3.8% 1 0.0% 0 0.0% 0To meet friends 3.7% 8 0.0% 0 4.4% 0 0.0% 0 2.3% 1 2.8% 3 10.9% 4 0.0% 0 0.0% 0To visit the theatre 0.4% 1 0.0% 0 0.0% 0 8.7% 1 0.0% 0 0.0% 0 0.0% 0 0.0% 0 0.0% 0For work (i.e. place of work) 2.8% 6 0.0% 0 0.0% 0 22.0% 2 5.1% 3 1.2% 1 0.0% 0 0.0% 0 0.0% 0For business (e.g. attend a
business appointment) 0.0% 0 0.0% 0 0.0% 0 0.0% 0 0.0% 0 0.0% 0 0.0% 0 0.0% 0 0.0% 0
For education as a student (e.g. student at college, university, or other third level education)
0.0% 0 0.0% 0 0.0% 0 0.0% 0 0.0% 0 0.0% 0 0.0% 0 0.0% 0 0.0% 0
To access public transport for onward travel (e.g. train station, bus station)
0.0% 0 0.0% 0 0.0% 0 0.0% 0 0.0% 0 0.0% 0 0.0% 0 0.0% 0 0.0% 0
Other 0.0% 0 0.0% 0 0.0% 0 0.0% 0 0.0% 0 0.0% 0 0.0% 0 0.0% 0 0.0% 0As part of a day out / for a
day out / something different
1.9% 4 6.3% 1 11.8% 1 13.3% 1 2.4% 1 0.0% 0 0.0% 0 0.0% 0 0.0% 0
Browsing / window shopping 6.4% 14 14.8% 2 10.5% 1 20.0% 2 6.5% 3 6.1% 6 0.0% 0 0.0% 0 0.0% 0Weighted base: 211 11 7 9 53 99 32 0 0Sample: 166 12 15 12 35 69 23 0 0

by Zone (Weighted, Part 1) South Wales Retail Study Page 55 Weighted: for Carter Jonas August 2016
Total Zone 1 Zone 2 Zone 3 Zone 4 Zone 5 Zone 6 Zone 7 Zone 8
Column %ges. 020716 NEMS market research
Q33 What do you like about Pembroke Town Centre? [MR] Zones 1-6 and those who visit Pembroke town centre at Q31 Attractive environment / nice
place 24.7% 52 49.6% 5 32.7% 2 28.7% 3 20.6% 11 27.1% 27 13.2% 4 0.0% 0 0.0% 0
Close to friends or relatives 1.3% 3 0.0% 0 22.1% 1 0.0% 0 0.0% 0 0.0% 0 3.8% 1 0.0% 0 0.0% 0Close to home 12.3% 26 0.0% 0 0.0% 0 6.7% 1 8.9% 5 17.3% 17 10.9% 4 0.0% 0 0.0% 0Close to work 4.6% 10 0.0% 0 0.0% 0 0.0% 0 0.0% 0 8.8% 9 2.8% 1 0.0% 0 0.0% 0Compact 2.2% 5 0.0% 0 0.0% 0 0.0% 0 4.1% 2 2.6% 3 0.0% 0 0.0% 0 0.0% 0Easy to get to by bike 0.0% 0 0.0% 0 0.0% 0 0.0% 0 0.0% 0 0.0% 0 0.0% 0 0.0% 0 0.0% 0Easy to get to by bus 0.0% 0 0.0% 0 0.0% 0 0.0% 0 0.0% 0 0.0% 0 0.0% 0 0.0% 0 0.0% 0Easy to get to by car 1.1% 2 0.0% 0 0.0% 0 0.0% 0 0.0% 0 2.3% 2 0.0% 0 0.0% 0 0.0% 0Easy to park 1.7% 4 0.0% 0 0.0% 0 0.0% 0 0.0% 0 1.2% 1 7.4% 2 0.0% 0 0.0% 0Good facilities 0.0% 0 0.0% 0 0.0% 0 0.0% 0 0.0% 0 0.0% 0 0.0% 0 0.0% 0 0.0% 0Good food stores 2.0% 4 0.0% 0 6.0% 0 0.0% 0 4.8% 3 1.3% 1 0.0% 0 0.0% 0 0.0% 0Good pubs, cafés or
restaurants 6.5% 14 0.0% 0 6.0% 0 8.7% 1 8.9% 5 5.3% 5 8.1% 3 0.0% 0 0.0% 0
Good range of non-food shops
13.5% 29 14.5% 2 23.2% 2 15.4% 1 22.9% 12 8.1% 8 11.9% 4 0.0% 0 0.0% 0
Makes a change from other places
1.0% 2 0.0% 0 0.0% 0 0.0% 0 4.1% 2 0.0% 0 0.0% 0 0.0% 0 0.0% 0
Quiet 1.2% 2 0.0% 0 22.1% 1 0.0% 0 0.0% 0 1.0% 1 0.0% 0 0.0% 0 0.0% 0Safe and secure 0.0% 0 0.0% 0 0.0% 0 0.0% 0 0.0% 0 0.0% 0 0.0% 0 0.0% 0 0.0% 0The market 1.5% 3 0.0% 0 0.0% 0 0.0% 0 5.9% 3 0.0% 0 0.0% 0 0.0% 0 0.0% 0Traditional 8.6% 18 6.3% 1 44.4% 3 6.7% 1 17.4% 9 4.8% 5 0.0% 0 0.0% 0 0.0% 0Traffic free shopping centre 0.0% 0 0.0% 0 0.0% 0 0.0% 0 0.0% 0 0.0% 0 0.0% 0 0.0% 0 0.0% 0Other 0.0% 0 0.0% 0 0.0% 0 0.0% 0 0.0% 0 0.0% 0 0.0% 0 0.0% 0 0.0% 0Cheap / free parking 0.6% 1 0.0% 0 0.0% 0 0.0% 0 0.0% 0 0.0% 0 3.8% 1 0.0% 0 0.0% 0Familiarity / habit 0.9% 2 0.0% 0 0.0% 0 0.0% 0 0.0% 0 1.9% 2 0.0% 0 0.0% 0 0.0% 0Friendly people / nice
atmosphere 0.6% 1 0.0% 0 0.0% 0 0.0% 0 0.0% 0 1.2% 1 0.0% 0 0.0% 0 0.0% 0
Good leisure facilities / things to do
4.1% 9 18.1% 2 6.0% 0 8.7% 1 4.1% 2 2.2% 2 3.8% 1 0.0% 0 0.0% 0
Good opening hours 0.0% 0 0.0% 0 0.0% 0 0.0% 0 0.0% 0 0.0% 0 0.0% 0 0.0% 0 0.0% 0Good prices 0.0% 0 0.0% 0 0.0% 0 0.0% 0 0.0% 0 0.0% 0 0.0% 0 0.0% 0 0.0% 0Good range of independent
shops 5.9% 12 0.0% 0 6.0% 0 0.0% 0 4.1% 2 7.3% 7 8.1% 3 0.0% 0 0.0% 0
Good range of services 2.7% 6 0.0% 0 0.0% 0 0.0% 0 2.3% 1 0.0% 0 13.9% 5 0.0% 0 0.0% 0(Nothing / very little) 24.2% 51 37.8% 4 16.2% 1 55.9% 5 20.1% 11 22.2% 22 25.2% 8 0.0% 0 0.0% 0(Don't know) 2.7% 6 0.0% 0 0.0% 0 0.0% 0 4.7% 2 2.3% 2 2.8% 1 0.0% 0 0.0% 0Weighted base: 211 11 7 9 53 99 32 0 0Sample: 166 12 15 12 35 69 23 0 0
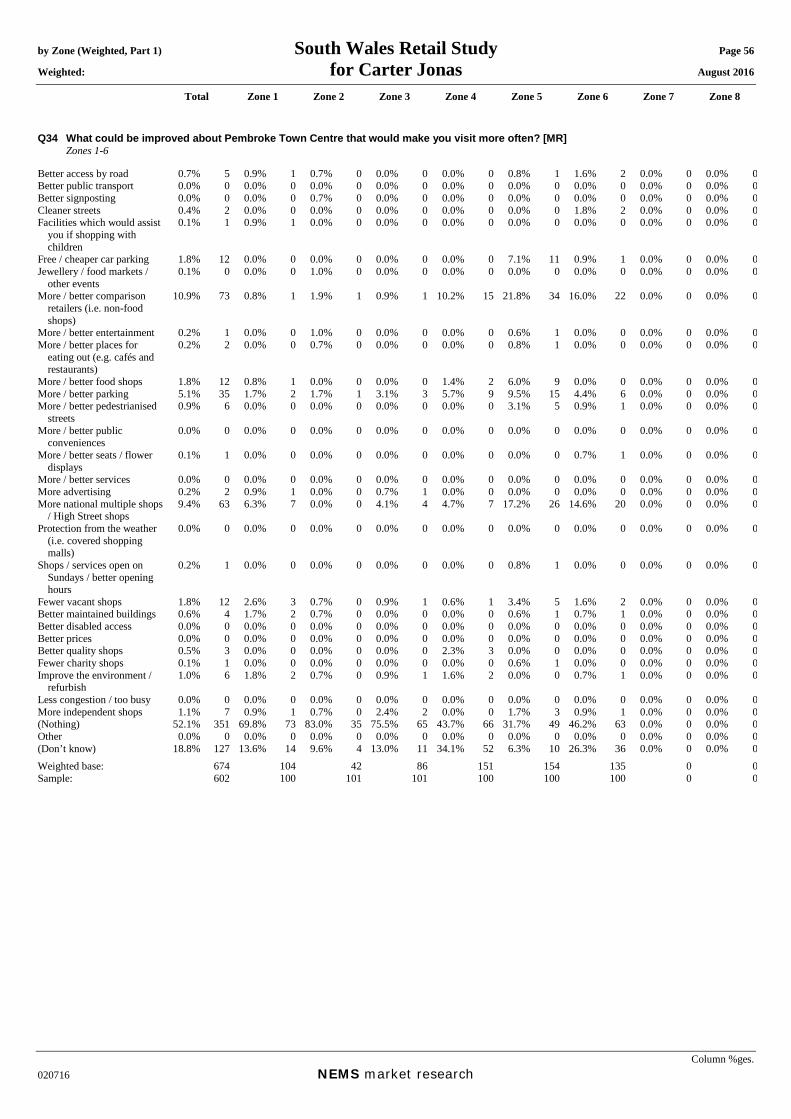
by Zone (Weighted, Part 1) South Wales Retail Study Page 56 Weighted: for Carter Jonas August 2016
Total Zone 1 Zone 2 Zone 3 Zone 4 Zone 5 Zone 6 Zone 7 Zone 8
Column %ges. 020716 NEMS market research
Q34 What could be improved about Pembroke Town Centre that would make you visit more often? [MR] Zones 1-6 Better access by road 0.7% 5 0.9% 1 0.7% 0 0.0% 0 0.0% 0 0.8% 1 1.6% 2 0.0% 0 0.0% 0Better public transport 0.0% 0 0.0% 0 0.0% 0 0.0% 0 0.0% 0 0.0% 0 0.0% 0 0.0% 0 0.0% 0Better signposting 0.0% 0 0.0% 0 0.7% 0 0.0% 0 0.0% 0 0.0% 0 0.0% 0 0.0% 0 0.0% 0Cleaner streets 0.4% 2 0.0% 0 0.0% 0 0.0% 0 0.0% 0 0.0% 0 1.8% 2 0.0% 0 0.0% 0Facilities which would assist
you if shopping with children
0.1% 1 0.9% 1 0.0% 0 0.0% 0 0.0% 0 0.0% 0 0.0% 0 0.0% 0 0.0% 0
Free / cheaper car parking 1.8% 12 0.0% 0 0.0% 0 0.0% 0 0.0% 0 7.1% 11 0.9% 1 0.0% 0 0.0% 0Jewellery / food markets /
other events 0.1% 0 0.0% 0 1.0% 0 0.0% 0 0.0% 0 0.0% 0 0.0% 0 0.0% 0 0.0% 0
More / better comparison retailers (i.e. non-food shops)
10.9% 73 0.8% 1 1.9% 1 0.9% 1 10.2% 15 21.8% 34 16.0% 22 0.0% 0 0.0% 0
More / better entertainment 0.2% 1 0.0% 0 1.0% 0 0.0% 0 0.0% 0 0.6% 1 0.0% 0 0.0% 0 0.0% 0More / better places for
eating out (e.g. cafés and restaurants)
0.2% 2 0.0% 0 0.7% 0 0.0% 0 0.0% 0 0.8% 1 0.0% 0 0.0% 0 0.0% 0
More / better food shops 1.8% 12 0.8% 1 0.0% 0 0.0% 0 1.4% 2 6.0% 9 0.0% 0 0.0% 0 0.0% 0More / better parking 5.1% 35 1.7% 2 1.7% 1 3.1% 3 5.7% 9 9.5% 15 4.4% 6 0.0% 0 0.0% 0More / better pedestrianised
streets 0.9% 6 0.0% 0 0.0% 0 0.0% 0 0.0% 0 3.1% 5 0.9% 1 0.0% 0 0.0% 0
More / better public conveniences
0.0% 0 0.0% 0 0.0% 0 0.0% 0 0.0% 0 0.0% 0 0.0% 0 0.0% 0 0.0% 0
More / better seats / flower displays
0.1% 1 0.0% 0 0.0% 0 0.0% 0 0.0% 0 0.0% 0 0.7% 1 0.0% 0 0.0% 0
More / better services 0.0% 0 0.0% 0 0.0% 0 0.0% 0 0.0% 0 0.0% 0 0.0% 0 0.0% 0 0.0% 0More advertising 0.2% 2 0.9% 1 0.0% 0 0.7% 1 0.0% 0 0.0% 0 0.0% 0 0.0% 0 0.0% 0More national multiple shops
/ High Street shops 9.4% 63 6.3% 7 0.0% 0 4.1% 4 4.7% 7 17.2% 26 14.6% 20 0.0% 0 0.0% 0
Protection from the weather (i.e. covered shopping malls)
0.0% 0 0.0% 0 0.0% 0 0.0% 0 0.0% 0 0.0% 0 0.0% 0 0.0% 0 0.0% 0
Shops / services open on Sundays / better opening hours
0.2% 1 0.0% 0 0.0% 0 0.0% 0 0.0% 0 0.8% 1 0.0% 0 0.0% 0 0.0% 0
Fewer vacant shops 1.8% 12 2.6% 3 0.7% 0 0.9% 1 0.6% 1 3.4% 5 1.6% 2 0.0% 0 0.0% 0Better maintained buildings 0.6% 4 1.7% 2 0.7% 0 0.0% 0 0.0% 0 0.6% 1 0.7% 1 0.0% 0 0.0% 0Better disabled access 0.0% 0 0.0% 0 0.0% 0 0.0% 0 0.0% 0 0.0% 0 0.0% 0 0.0% 0 0.0% 0Better prices 0.0% 0 0.0% 0 0.0% 0 0.0% 0 0.0% 0 0.0% 0 0.0% 0 0.0% 0 0.0% 0Better quality shops 0.5% 3 0.0% 0 0.0% 0 0.0% 0 2.3% 3 0.0% 0 0.0% 0 0.0% 0 0.0% 0Fewer charity shops 0.1% 1 0.0% 0 0.0% 0 0.0% 0 0.0% 0 0.6% 1 0.0% 0 0.0% 0 0.0% 0Improve the environment /
refurbish 1.0% 6 1.8% 2 0.7% 0 0.9% 1 1.6% 2 0.0% 0 0.7% 1 0.0% 0 0.0% 0
Less congestion / too busy 0.0% 0 0.0% 0 0.0% 0 0.0% 0 0.0% 0 0.0% 0 0.0% 0 0.0% 0 0.0% 0More independent shops 1.1% 7 0.9% 1 0.7% 0 2.4% 2 0.0% 0 1.7% 3 0.9% 1 0.0% 0 0.0% 0(Nothing) 52.1% 351 69.8% 73 83.0% 35 75.5% 65 43.7% 66 31.7% 49 46.2% 63 0.0% 0 0.0% 0Other 0.0% 0 0.0% 0 0.0% 0 0.0% 0 0.0% 0 0.0% 0 0.0% 0 0.0% 0 0.0% 0(Don’t know) 18.8% 127 13.6% 14 9.6% 4 13.0% 11 34.1% 52 6.3% 10 26.3% 36 0.0% 0 0.0% 0Weighted base: 674 104 42 86 151 154 135 0 0Sample: 602 100 101 101 100 100 100 0 0

by Zone (Weighted, Part 1) South Wales Retail Study Page 57 Weighted: for Carter Jonas August 2016
Total Zone 1 Zone 2 Zone 3 Zone 4 Zone 5 Zone 6 Zone 7 Zone 8
Column %ges. 020716 NEMS market research
Mean score [Times a year, those who visit]: Daily = 365, 4-6 days a week = 234, 2-3 days a week = 130, One day a week = 52, Every two weeks = 24, Monthly = 12, Once every two months = 6, Three-four times a year = 3.5, Once a year = 1, Less often = 0.25
Q35 How often do you or your household visit Pembroke Dock for shopping and other town centre services? Zones 1-6 Daily 1.4% 9 0.9% 1 0.0% 0 0.0% 0 0.0% 0 4.7% 7 0.9% 1 0.0% 0 0.0% 04-6 days a week 2.4% 16 0.0% 0 0.0% 0 0.0% 0 0.0% 0 10.4% 16 0.0% 0 0.0% 0 0.0% 02-3 days a week 4.6% 31 0.9% 1 0.0% 0 0.0% 0 0.6% 1 11.8% 18 7.9% 11 0.0% 0 0.0% 0One day a week 12.5% 84 0.6% 1 1.0% 0 0.7% 1 3.9% 6 33.3% 51 18.9% 26 0.0% 0 0.0% 0Every two weeks 5.2% 35 0.0% 0 0.0% 0 0.0% 0 7.4% 11 6.3% 10 10.5% 14 0.0% 0 0.0% 0Monthly 5.3% 36 1.7% 2 4.2% 2 0.9% 1 10.3% 16 7.4% 11 3.2% 4 0.0% 0 0.0% 0Once every two months 2.2% 15 0.0% 0 1.0% 0 1.9% 2 5.1% 8 1.5% 2 2.2% 3 0.0% 0 0.0% 0Three-four times a year 4.0% 27 0.8% 1 4.8% 2 1.8% 2 3.3% 5 2.6% 4 9.9% 13 0.0% 0 0.0% 0Once a year 3.1% 21 4.0% 4 2.6% 1 0.0% 0 9.5% 14 0.0% 0 0.7% 1 0.0% 0 0.0% 0Less often 1.0% 7 1.7% 2 0.7% 0 0.7% 1 0.8% 1 0.0% 0 2.2% 3 0.0% 0 0.0% 0Never 56.6% 381 89.4% 93 85.7% 36 93.2% 81 54.6% 83 21.4% 33 41.1% 56 0.0% 0 0.0% 0(Don’t know) 0.1% 1 0.0% 0 0.0% 0 0.7% 1 0.0% 0 0.0% 0 0.0% 0 0.0% 0 0.0% 0(Varies) 1.6% 11 0.0% 0 0.0% 0 0.0% 0 4.3% 7 0.6% 1 2.6% 3 0.0% 0 0.0% 0Mean: 60.72 46.36 8.83 10.98 15.56 98.53 47.56 0.00 0.00Weighted base: 674 104 42 86 151 154 135 0 0Sample: 602 100 101 101 100 100 100 0 0

by Zone (Weighted, Part 1) South Wales Retail Study Page 58 Weighted: for Carter Jonas August 2016
Total Zone 1 Zone 2 Zone 3 Zone 4 Zone 5 Zone 6 Zone 7 Zone 8
Column %ges. 020716 NEMS market research
Q36A In order of importance, what are your two main reasons for visiting Pembroke Dock? Main reason: Zones 1-6 and those who visit Pembroke Dock at Q35 Food shopping 62.3% 182 6.0% 1 6.5% 0 26.6% 2 52.6% 36 73.8% 89 67.8% 54 0.0% 0 0.0% 0Non-food shopping 24.7% 72 71.9% 8 50.7% 3 35.1% 2 27.8% 19 20.3% 25 19.3% 15 0.0% 0 0.0% 0To visit bars / pubs 0.1% 0 0.0% 0 5.0% 0 0.0% 0 0.0% 0 0.0% 0 0.0% 0 0.0% 0 0.0% 0To visit cafés / restaurants 0.7% 2 0.0% 0 19.7% 1 0.0% 0 0.0% 0 0.8% 1 0.0% 0 0.0% 0 0.0% 0To visit personal service
providers (e.g. hairdressers, beauty salon etc.)
0.0% 0 0.0% 0 0.0% 0 0.0% 0 0.0% 0 0.0% 0 0.0% 0 0.0% 0 0.0% 0
To visit financial services such as banks and other financial institutions
2.4% 7 0.0% 0 0.0% 0 0.0% 0 3.1% 2 3.3% 4 1.1% 1 0.0% 0 0.0% 0
To visit other service providers (e.g. travel agent, estate agent etc.)
0.4% 1 0.0% 0 0.0% 0 0.0% 0 0.0% 0 0.0% 0 1.5% 1 0.0% 0 0.0% 0
To visit public services (e.g. medical or dentist appointment, library, job centre, community centre, etc)
2.7% 8 0.0% 0 0.0% 0 0.0% 0 2.7% 2 1.8% 2 4.8% 4 0.0% 0 0.0% 0
To get petrol 0.3% 1 8.2% 1 0.0% 0 0.0% 0 0.0% 0 0.0% 0 0.0% 0 0.0% 0 0.0% 0To visit the cinema 0.0% 0 0.0% 0 0.0% 0 0.0% 0 0.0% 0 0.0% 0 0.0% 0 0.0% 0 0.0% 0To visit a park 0.0% 0 0.0% 0 0.0% 0 0.0% 0 0.0% 0 0.0% 0 0.0% 0 0.0% 0 0.0% 0To visit the swimming pool 0.0% 0 0.0% 0 0.0% 0 0.0% 0 0.0% 0 0.0% 0 0.0% 0 0.0% 0 0.0% 0To visit other gyms / health
and fitness facilities 0.0% 0 0.0% 0 0.0% 0 0.0% 0 0.0% 0 0.0% 0 0.0% 0 0.0% 0 0.0% 0
To visit the library 0.0% 0 0.0% 0 0.0% 0 0.0% 0 0.0% 0 0.0% 0 0.0% 0 0.0% 0 0.0% 0To visit museums / art
gallery 0.0% 0 0.0% 0 0.0% 0 0.0% 0 0.0% 0 0.0% 0 0.0% 0 0.0% 0 0.0% 0
To visit the theatre or musical venues
0.3% 1 0.0% 0 0.0% 0 13.8% 1 0.0% 0 0.0% 0 0.0% 0 0.0% 0 0.0% 0
To visit night time venues e.g. nightclub
0.0% 0 0.0% 0 0.0% 0 0.0% 0 0.0% 0 0.0% 0 0.0% 0 0.0% 0 0.0% 0
For other leisure activities 0.6% 2 0.0% 0 6.8% 0 0.0% 0 1.8% 1 0.0% 0 0.0% 0 0.0% 0 0.0% 0To shop at the market(s) 0.3% 1 0.0% 0 0.0% 0 0.0% 0 1.4% 1 0.0% 0 0.0% 0 0.0% 0 0.0% 0To meet family 0.4% 1 0.0% 0 0.0% 0 0.0% 0 0.0% 0 0.0% 0 1.5% 1 0.0% 0 0.0% 0To meet friends 0.7% 2 7.8% 1 5.0% 0 0.0% 0 1.4% 1 0.0% 0 0.0% 0 0.0% 0 0.0% 0To visit the theatre 0.0% 0 0.0% 0 0.0% 0 0.0% 0 0.0% 0 0.0% 0 0.0% 0 0.0% 0 0.0% 0For work (i.e. place of work) 1.6% 5 0.0% 0 0.0% 0 13.8% 1 3.7% 3 0.0% 0 1.5% 1 0.0% 0 0.0% 0For business (e.g. attend a
business appointment) 0.0% 0 0.0% 0 0.0% 0 0.0% 0 0.0% 0 0.0% 0 0.0% 0 0.0% 0 0.0% 0
For education as a student (e.g. student at college, university, or other third level education)
0.0% 0 0.0% 0 0.0% 0 0.0% 0 0.0% 0 0.0% 0 0.0% 0 0.0% 0 0.0% 0
To access public transport for onward travel (e.g. train station, bus station)
0.4% 1 0.0% 0 0.0% 0 0.0% 0 1.9% 1 0.0% 0 0.0% 0 0.0% 0 0.0% 0
Other 0.0% 0 0.0% 0 0.0% 0 0.0% 0 0.0% 0 0.0% 0 0.0% 0 0.0% 0 0.0% 0As part of a day out / for a
day out / something different
0.0% 0 0.0% 0 0.0% 0 0.0% 0 0.0% 0 0.0% 0 0.0% 0 0.0% 0 0.0% 0
Browsing / window shopping 1.4% 4 6.0% 1 0.0% 0 0.0% 0 3.6% 2 0.0% 0 1.1% 1 0.0% 0 0.0% 0(Don't know / varies) 0.0% 0 0.0% 0 0.0% 0 0.0% 0 0.0% 0 0.0% 0 0.0% 0 0.0% 0 0.0% 0(Nothing / nothing further) 0.7% 2 0.0% 0 6.5% 0 10.6% 1 0.0% 0 0.0% 0 1.1% 1 0.0% 0 0.0% 0Weighted base: 292 11 6 6 69 121 80 0 0Sample: 217 12 15 8 43 81 58 0 0

by Zone (Weighted, Part 1) South Wales Retail Study Page 59 Weighted: for Carter Jonas August 2016
Total Zone 1 Zone 2 Zone 3 Zone 4 Zone 5 Zone 6 Zone 7 Zone 8
Column %ges. 020716 NEMS market research
Q36B In order of importance, what are your two main reasons for visiting Pembroke Dock? Secondary reason: Those who gave a reason at Q36A Food shopping 3.8% 11 8.2% 1 0.0% 0 15.5% 1 5.4% 4 4.0% 5 1.2% 1 0.0% 0 0.0% 0Non-food shopping 21.2% 61 0.0% 0 0.0% 0 27.4% 1 20.7% 14 19.8% 24 27.7% 22 0.0% 0 0.0% 0To visit bars / pubs 0.1% 0 0.0% 0 7.2% 0 0.0% 0 0.0% 0 0.0% 0 0.0% 0 0.0% 0 0.0% 0To visit cafés / restaurants 3.3% 9 24.2% 3 0.0% 0 0.0% 0 1.4% 1 2.1% 3 4.2% 3 0.0% 0 0.0% 0To visit personal service
providers (e.g. hairdressers, beauty salon etc.)
0.0% 0 0.0% 0 0.0% 0 0.0% 0 0.0% 0 0.0% 0 0.0% 0 0.0% 0 0.0% 0
To visit financial services such as banks and other financial institutions
2.2% 6 0.0% 0 0.0% 0 0.0% 0 0.0% 0 5.2% 6 0.0% 0 0.0% 0 0.0% 0
To visit other service providers (e.g. travel agent, estate agent etc.)
0.4% 1 0.0% 0 0.0% 0 0.0% 0 0.0% 0 1.1% 1 0.0% 0 0.0% 0 0.0% 0
To visit public services (e.g. medical or dentist appointment, library, job centre, community centre, etc)
2.8% 8 0.0% 0 6.9% 0 0.0% 0 0.0% 0 1.6% 2 7.3% 6 0.0% 0 0.0% 0
To get petrol 0.4% 1 0.0% 0 0.0% 0 0.0% 0 0.0% 0 1.0% 1 0.0% 0 0.0% 0 0.0% 0To visit the cinema 0.0% 0 0.0% 0 0.0% 0 0.0% 0 0.0% 0 0.0% 0 0.0% 0 0.0% 0 0.0% 0To visit a park 0.0% 0 0.0% 0 0.0% 0 0.0% 0 0.0% 0 0.0% 0 0.0% 0 0.0% 0 0.0% 0To visit the swimming pool 0.0% 0 0.0% 0 0.0% 0 0.0% 0 0.0% 0 0.0% 0 0.0% 0 0.0% 0 0.0% 0To visit other gyms / health
and fitness facilities 0.0% 0 0.0% 0 0.0% 0 0.0% 0 0.0% 0 0.0% 0 0.0% 0 0.0% 0 0.0% 0
To visit the library 0.3% 1 0.0% 0 0.0% 0 0.0% 0 0.0% 0 0.8% 1 0.0% 0 0.0% 0 0.0% 0To visit museums / art
gallery 0.0% 0 0.0% 0 0.0% 0 0.0% 0 0.0% 0 0.0% 0 0.0% 0 0.0% 0 0.0% 0
To visit the theatre or musical venues
0.0% 0 0.0% 0 0.0% 0 0.0% 0 0.0% 0 0.0% 0 0.0% 0 0.0% 0 0.0% 0
To visit night time venues e.g. nightclub
0.0% 0 0.0% 0 0.0% 0 0.0% 0 0.0% 0 0.0% 0 0.0% 0 0.0% 0 0.0% 0
For other leisure activities 1.0% 3 0.0% 0 5.3% 0 11.9% 1 1.4% 1 0.0% 0 1.2% 1 0.0% 0 0.0% 0To shop at the market(s) 0.0% 0 0.0% 0 0.0% 0 0.0% 0 0.0% 0 0.0% 0 0.0% 0 0.0% 0 0.0% 0To meet family 1.3% 4 0.0% 0 0.0% 0 0.0% 0 0.0% 0 2.2% 3 1.6% 1 0.0% 0 0.0% 0To meet friends 1.7% 5 0.0% 0 0.0% 0 0.0% 0 1.9% 1 0.0% 0 4.5% 4 0.0% 0 0.0% 0To visit the theatre 0.0% 0 0.0% 0 0.0% 0 0.0% 0 0.0% 0 0.0% 0 0.0% 0 0.0% 0 0.0% 0For work (i.e. place of work) 0.9% 2 0.0% 0 0.0% 0 0.0% 0 0.0% 0 2.0% 2 0.0% 0 0.0% 0 0.0% 0For business (e.g. attend a
business appointment) 0.0% 0 0.0% 0 0.0% 0 0.0% 0 0.0% 0 0.0% 0 0.0% 0 0.0% 0 0.0% 0
For education as a student (e.g. student at college, university, or other third level education)
0.0% 0 0.0% 0 0.0% 0 0.0% 0 0.0% 0 0.0% 0 0.0% 0 0.0% 0 0.0% 0
To access public transport for onward travel (e.g. train station, bus station)
0.0% 0 0.0% 0 0.0% 0 0.0% 0 0.0% 0 0.0% 0 0.0% 0 0.0% 0 0.0% 0
Other 0.0% 0 0.0% 0 0.0% 0 0.0% 0 0.0% 0 0.0% 0 0.0% 0 0.0% 0 0.0% 0As part of a day out / for a
day out / something different
0.0% 0 0.0% 0 0.0% 0 0.0% 0 0.0% 0 0.0% 0 0.0% 0 0.0% 0 0.0% 0
Browsing / window shopping 0.0% 0 0.0% 0 0.0% 0 0.0% 0 0.0% 0 0.0% 0 0.0% 0 0.0% 0 0.0% 0(Don't know / varies) 0.9% 3 0.0% 0 0.0% 0 0.0% 0 0.0% 0 2.3% 3 0.0% 0 0.0% 0 0.0% 0(Nothing / nothing further) 59.7% 173 67.5% 7 80.6% 5 45.2% 2 69.3% 48 57.9% 70 52.4% 41 0.0% 0 0.0% 0Weighted base: 291 11 6 5 69 121 79 0 0Sample: 214 12 14 7 43 81 57 0 0

by Zone (Weighted, Part 1) South Wales Retail Study Page 60 Weighted: for Carter Jonas August 2016
Total Zone 1 Zone 2 Zone 3 Zone 4 Zone 5 Zone 6 Zone 7 Zone 8
Column %ges. 020716 NEMS market research
Q36X In order of importance, what are your two main reasons for visiting Pembroke Dock? Any mention: [MR] Zones 1-6 and those who visit Pembroke Dock at Q35 Food shopping 66.1% 193 14.2% 2 6.5% 0 40.4% 2 58.0% 40 77.7% 94 69.0% 55 0.0% 0 0.0% 0Non-food shopping 45.7% 134 71.9% 8 50.7% 3 59.6% 4 48.5% 33 40.1% 49 46.7% 37 0.0% 0 0.0% 0To visit bars / pubs 0.2% 1 0.0% 0 11.7% 1 0.0% 0 0.0% 0 0.0% 0 0.0% 0 0.0% 0 0.0% 0To visit cafés / restaurants 4.0% 12 24.2% 3 19.7% 1 0.0% 0 1.4% 1 2.9% 3 4.2% 3 0.0% 0 0.0% 0To visit personal service
providers (e.g. hairdressers, beauty salon etc.)
0.0% 0 0.0% 0 0.0% 0 0.0% 0 0.0% 0 0.0% 0 0.0% 0 0.0% 0 0.0% 0
To visit financial services such as banks and other financial institutions
4.6% 13 0.0% 0 0.0% 0 0.0% 0 3.1% 2 8.5% 10 1.1% 1 0.0% 0 0.0% 0
To visit other service providers (e.g. travel agent, estate agent etc.)
0.9% 3 0.0% 0 0.0% 0 0.0% 0 0.0% 0 1.1% 1 1.5% 1 0.0% 0 0.0% 0
To visit public services (e.g. medical or dentist appointment, library, job centre, community centre, etc)
5.5% 16 0.0% 0 6.5% 0 0.0% 0 2.7% 2 3.4% 4 12.1% 10 0.0% 0 0.0% 0
To get petrol 0.7% 2 8.2% 1 0.0% 0 0.0% 0 0.0% 0 1.0% 1 0.0% 0 0.0% 0 0.0% 0To visit the cinema 0.0% 0 0.0% 0 0.0% 0 0.0% 0 0.0% 0 0.0% 0 0.0% 0 0.0% 0 0.0% 0To visit a park 0.0% 0 0.0% 0 0.0% 0 0.0% 0 0.0% 0 0.0% 0 0.0% 0 0.0% 0 0.0% 0To visit the swimming pool 0.0% 0 0.0% 0 0.0% 0 0.0% 0 0.0% 0 0.0% 0 0.0% 0 0.0% 0 0.0% 0To visit other gyms / health
and fitness facilities 0.0% 0 0.0% 0 0.0% 0 0.0% 0 0.0% 0 0.0% 0 0.0% 0 0.0% 0 0.0% 0
To visit the library 0.3% 1 0.0% 0 0.0% 0 0.0% 0 0.0% 0 0.8% 1 0.0% 0 0.0% 0 0.0% 0To visit museums / art
gallery 0.0% 0 0.0% 0 0.0% 0 0.0% 0 0.0% 0 0.0% 0 0.0% 0 0.0% 0 0.0% 0
To visit the theatre or musical venues
0.3% 1 0.0% 0 0.0% 0 13.8% 1 0.0% 0 0.0% 0 0.0% 0 0.0% 0 0.0% 0
To visit night time venues e.g. nightclub
0.0% 0 0.0% 0 0.0% 0 0.0% 0 0.0% 0 0.0% 0 0.0% 0 0.0% 0 0.0% 0
For other leisure activities 1.5% 4 0.0% 0 11.7% 1 10.6% 1 3.1% 2 0.0% 0 1.1% 1 0.0% 0 0.0% 0To shop at the market(s) 0.3% 1 0.0% 0 0.0% 0 0.0% 0 1.4% 1 0.0% 0 0.0% 0 0.0% 0 0.0% 0To meet family 1.8% 5 0.0% 0 0.0% 0 0.0% 0 0.0% 0 2.2% 3 3.1% 2 0.0% 0 0.0% 0To meet friends 2.4% 7 7.8% 1 5.0% 0 0.0% 0 3.2% 2 0.0% 0 4.4% 4 0.0% 0 0.0% 0To visit the theatre 0.0% 0 0.0% 0 0.0% 0 0.0% 0 0.0% 0 0.0% 0 0.0% 0 0.0% 0 0.0% 0For work (i.e. place of work) 2.4% 7 0.0% 0 0.0% 0 13.8% 1 3.7% 3 2.0% 2 1.5% 1 0.0% 0 0.0% 0For business (e.g. attend a
business appointment) 0.0% 0 0.0% 0 0.0% 0 0.0% 0 0.0% 0 0.0% 0 0.0% 0 0.0% 0 0.0% 0
For education as a student (e.g. student at college, university, or other third level education)
0.0% 0 0.0% 0 0.0% 0 0.0% 0 0.0% 0 0.0% 0 0.0% 0 0.0% 0 0.0% 0
To access public transport for onward travel (e.g. train station, bus station)
0.4% 1 0.0% 0 0.0% 0 0.0% 0 1.9% 1 0.0% 0 0.0% 0 0.0% 0 0.0% 0
Other 0.0% 0 0.0% 0 0.0% 0 0.0% 0 0.0% 0 0.0% 0 0.0% 0 0.0% 0 0.0% 0As part of a day out / for a
day out / something different
0.0% 0 0.0% 0 0.0% 0 0.0% 0 0.0% 0 0.0% 0 0.0% 0 0.0% 0 0.0% 0
Browsing / window shopping 1.4% 4 6.0% 1 0.0% 0 0.0% 0 3.6% 2 0.0% 0 1.1% 1 0.0% 0 0.0% 0Weighted base: 292 11 6 6 69 121 80 0 0Sample: 217 12 15 8 43 81 58 0 0

by Zone (Weighted, Part 1) South Wales Retail Study Page 61 Weighted: for Carter Jonas August 2016
Total Zone 1 Zone 2 Zone 3 Zone 4 Zone 5 Zone 6 Zone 7 Zone 8
Column %ges. 020716 NEMS market research
Q37 What do you like about Pembroke Dock? [MR] Zones 1-6 and those who visit Pembroke Dock at Q35 Attractive environment / nice
place 3.7% 11 12.1% 1 5.0% 0 0.0% 0 2.7% 2 5.3% 6 1.1% 1 0.0% 0 0.0% 0
Close to friends or relatives 0.6% 2 0.0% 0 6.8% 0 0.0% 0 1.9% 1 0.0% 0 0.0% 0 0.0% 0 0.0% 0Close to home 26.6% 78 0.0% 0 0.0% 0 21.3% 1 16.8% 12 42.1% 51 17.5% 14 0.0% 0 0.0% 0Close to work 0.3% 1 8.2% 1 0.0% 0 0.0% 0 0.0% 0 0.0% 0 0.0% 0 0.0% 0 0.0% 0Compact 0.8% 2 0.0% 0 0.0% 0 0.0% 0 1.4% 1 1.1% 1 0.0% 0 0.0% 0 0.0% 0Easy to get to by bike 0.0% 0 0.0% 0 0.0% 0 0.0% 0 0.0% 0 0.0% 0 0.0% 0 0.0% 0 0.0% 0Easy to get to by bus 0.0% 0 0.0% 0 0.0% 0 0.0% 0 0.0% 0 0.0% 0 0.0% 0 0.0% 0 0.0% 0Easy to get to by car 0.4% 1 0.0% 0 0.0% 0 0.0% 0 0.0% 0 1.1% 1 0.0% 0 0.0% 0 0.0% 0Easy to park 2.3% 7 0.0% 0 0.0% 0 0.0% 0 5.0% 3 0.0% 0 4.2% 3 0.0% 0 0.0% 0Good facilities 1.3% 4 0.0% 0 6.8% 0 13.8% 1 1.9% 1 0.0% 0 1.5% 1 0.0% 0 0.0% 0Good food stores 8.3% 24 0.0% 0 5.0% 0 0.0% 0 4.6% 3 3.4% 4 20.8% 17 0.0% 0 0.0% 0Good pubs, cafés or
restaurants 1.3% 4 16.1% 2 20.0% 1 0.0% 0 0.0% 0 0.8% 1 0.0% 0 0.0% 0 0.0% 0
Good range of non-food shops
9.7% 28 7.8% 1 25.9% 2 21.3% 1 16.6% 11 4.4% 5 10.1% 8 0.0% 0 0.0% 0
Makes a change from other places
0.4% 1 0.0% 0 5.0% 0 0.0% 0 1.4% 1 0.0% 0 0.0% 0 0.0% 0 0.0% 0
Quiet 1.2% 3 0.0% 0 0.0% 0 0.0% 0 0.0% 0 1.8% 2 1.5% 1 0.0% 0 0.0% 0Safe and secure 0.0% 0 0.0% 0 0.0% 0 0.0% 0 0.0% 0 0.0% 0 0.0% 0 0.0% 0 0.0% 0The market 0.6% 2 0.0% 0 0.0% 0 13.8% 1 1.4% 1 0.0% 0 0.0% 0 0.0% 0 0.0% 0Traditional 0.5% 1 0.0% 0 6.5% 0 0.0% 0 1.4% 1 0.0% 0 0.0% 0 0.0% 0 0.0% 0Traffic free shopping centre 0.0% 0 0.0% 0 0.0% 0 0.0% 0 0.0% 0 0.0% 0 0.0% 0 0.0% 0 0.0% 0Other 0.0% 0 0.0% 0 0.0% 0 0.0% 0 0.0% 0 0.0% 0 0.0% 0 0.0% 0 0.0% 0Cheap / free parking 0.0% 0 0.0% 0 0.0% 0 0.0% 0 0.0% 0 0.0% 0 0.0% 0 0.0% 0 0.0% 0Familiarity / habit 2.0% 6 0.0% 0 0.0% 0 0.0% 0 0.0% 0 4.9% 6 0.0% 0 0.0% 0 0.0% 0Friendly people / nice
atmosphere 0.7% 2 0.0% 0 0.0% 0 0.0% 0 0.0% 0 1.6% 2 0.0% 0 0.0% 0 0.0% 0
Good leisure facilities / things to do
0.4% 1 0.0% 0 0.0% 0 0.0% 0 1.8% 1 0.0% 0 0.0% 0 0.0% 0 0.0% 0
Good opening hours 0.0% 0 0.0% 0 0.0% 0 0.0% 0 0.0% 0 0.0% 0 0.0% 0 0.0% 0 0.0% 0Good prices 0.7% 2 0.0% 0 0.0% 0 0.0% 0 0.0% 0 0.0% 0 2.6% 2 0.0% 0 0.0% 0Good range of independent
shops 0.0% 0 0.0% 0 0.0% 0 0.0% 0 0.0% 0 0.0% 0 0.0% 0 0.0% 0 0.0% 0
Good range of services 0.0% 0 0.0% 0 0.0% 0 0.0% 0 0.0% 0 0.0% 0 0.0% 0 0.0% 0 0.0% 0(Nothing / very little) 44.7% 131 55.9% 6 32.5% 2 40.4% 2 47.0% 32 42.5% 51 45.6% 36 0.0% 0 0.0% 0(Don't know) 2.7% 8 0.0% 0 13.2% 1 0.0% 0 6.8% 5 2.1% 3 0.0% 0 0.0% 0 0.0% 0Weighted base: 292 11 6 6 69 121 80 0 0Sample: 217 12 15 8 43 81 58 0 0

by Zone (Weighted, Part 1) South Wales Retail Study Page 62 Weighted: for Carter Jonas August 2016
Total Zone 1 Zone 2 Zone 3 Zone 4 Zone 5 Zone 6 Zone 7 Zone 8
Column %ges. 020716 NEMS market research
Q38 What could be improved about Pembroke Dock that would make you visit more often? [MR] Zones 1-6 Better access by road 0.0% 0 0.0% 0 0.0% 0 0.0% 0 0.0% 0 0.0% 0 0.0% 0 0.0% 0 0.0% 0Better public transport 0.3% 2 0.0% 0 0.0% 0 0.0% 0 0.0% 0 0.6% 1 0.9% 1 0.0% 0 0.0% 0Better signposting 0.0% 0 0.0% 0 0.0% 0 0.0% 0 0.0% 0 0.0% 0 0.0% 0 0.0% 0 0.0% 0Cleaner streets 2.6% 17 2.7% 3 0.9% 0 0.0% 0 3.7% 6 2.5% 4 3.5% 5 0.0% 0 0.0% 0Facilities which would assist
you if shopping with children
0.9% 6 0.0% 0 0.0% 0 0.0% 0 0.0% 0 3.9% 6 0.0% 0 0.0% 0 0.0% 0
Free / cheaper car parking 1.0% 7 0.0% 0 0.0% 0 0.0% 0 0.6% 1 2.3% 4 1.8% 2 0.0% 0 0.0% 0Jewellery / food markets /
other events 0.0% 0 0.0% 0 0.0% 0 0.0% 0 0.0% 0 0.0% 0 0.0% 0 0.0% 0 0.0% 0
More / better comparison retailers (i.e. non-food shops)
14.5% 98 3.9% 4 3.6% 2 0.9% 1 14.7% 22 34.3% 53 12.1% 16 0.0% 0 0.0% 0
More / better entertainment 1.1% 7 0.9% 1 0.0% 0 0.7% 1 0.0% 0 3.2% 5 0.7% 1 0.0% 0 0.0% 0More / better places for
eating out (e.g. cafés and restaurants)
2.4% 16 0.9% 1 0.0% 0 0.0% 0 0.0% 0 8.9% 14 0.9% 1 0.0% 0 0.0% 0
More / better food shops 1.8% 12 0.8% 1 0.7% 0 0.7% 1 2.9% 4 3.3% 5 0.7% 1 0.0% 0 0.0% 0More / better parking 1.1% 8 0.0% 0 0.0% 0 1.5% 1 0.6% 1 2.7% 4 0.9% 1 0.0% 0 0.0% 0More / better pedestrianised
streets 0.0% 0 0.0% 0 0.0% 0 0.0% 0 0.0% 0 0.0% 0 0.0% 0 0.0% 0 0.0% 0
More / better public conveniences
0.7% 5 0.0% 0 0.0% 0 0.0% 0 3.1% 5 0.0% 0 0.0% 0 0.0% 0 0.0% 0
More / better seats / flower displays
0.0% 0 0.0% 0 0.0% 0 0.0% 0 0.0% 0 0.0% 0 0.0% 0 0.0% 0 0.0% 0
More / better services 0.0% 0 0.0% 0 0.0% 0 0.0% 0 0.0% 0 0.0% 0 0.0% 0 0.0% 0 0.0% 0More advertising 0.9% 6 0.0% 0 0.0% 0 0.0% 0 0.8% 1 0.0% 0 3.3% 5 0.0% 0 0.0% 0More national multiple shops
/ High Street shops 12.8% 86 6.2% 6 5.8% 2 8.6% 7 8.2% 12 24.7% 38 14.2% 19 0.0% 0 0.0% 0
Protection from the weather (i.e. covered shopping malls)
0.0% 0 0.0% 0 0.0% 0 0.0% 0 0.0% 0 0.0% 0 0.0% 0 0.0% 0 0.0% 0
Address traffic congestion from car ferry
0.0% 0 0.0% 0 0.0% 0 0.0% 0 0.0% 0 0.0% 0 0.0% 0 0.0% 0 0.0% 0
Shops / services open on Sundays / better opening hours
0.1% 1 0.0% 0 0.0% 0 0.0% 0 0.0% 0 0.6% 1 0.0% 0 0.0% 0 0.0% 0
Fewer vacant shops 1.9% 13 0.0% 0 0.7% 0 0.9% 1 2.6% 4 3.1% 5 2.3% 3 0.0% 0 0.0% 0Better maintained buildings 1.3% 9 0.9% 1 1.7% 1 0.0% 0 0.0% 0 4.0% 6 0.7% 1 0.0% 0 0.0% 0Better disabled access 0.0% 0 0.0% 0 0.0% 0 0.0% 0 0.0% 0 0.0% 0 0.0% 0 0.0% 0 0.0% 0Better prices 0.4% 3 0.0% 0 3.7% 2 0.0% 0 0.0% 0 0.6% 1 0.0% 0 0.0% 0 0.0% 0Better quality shops 0.4% 3 0.0% 0 0.9% 0 0.0% 0 1.5% 2 0.0% 0 0.0% 0 0.0% 0 0.0% 0Fewer charity shops 0.0% 0 0.0% 0 0.0% 0 0.0% 0 0.0% 0 0.0% 0 0.0% 0 0.0% 0 0.0% 0Improve the environment /
refurbish 1.7% 11 0.0% 0 1.7% 1 0.9% 1 1.5% 2 2.9% 4 2.5% 3 0.0% 0 0.0% 0
Less congestion / too busy 0.1% 1 0.0% 0 0.0% 0 0.0% 0 0.6% 1 0.0% 0 0.0% 0 0.0% 0 0.0% 0More independent shops 2.0% 13 0.0% 0 0.0% 0 3.4% 3 3.7% 6 1.5% 2 1.9% 3 0.0% 0 0.0% 0Other 0.0% 0 0.0% 0 0.0% 0 0.0% 0 0.0% 0 0.0% 0 0.0% 0 0.0% 0 0.0% 0(Nothing) 49.9% 336 76.7% 80 75.3% 32 70.6% 61 43.6% 66 18.4% 28 50.9% 69 0.0% 0 0.0% 0(Don’t know) 14.8% 100 11.2% 12 10.1% 4 14.3% 12 25.2% 38 9.5% 15 13.6% 18 0.0% 0 0.0% 0Weighted base: 674 104 42 86 151 154 135 0 0Sample: 602 100 101 101 100 100 100 0 0

by Zone (Weighted, Part 1) South Wales Retail Study Page 63 Weighted: for Carter Jonas August 2016
Total Zone 1 Zone 2 Zone 3 Zone 4 Zone 5 Zone 6 Zone 7 Zone 8
Column %ges. 020716 NEMS market research
Mean score [Times a year, those who visit]: Daily = 365, 4-6 days a week = 234, 2-3 days a week = 130, One day a week = 52, Every two weeks = 24, Monthly = 12, Once every two months = 6, Three-four times a year = 3.5, Once a year = 1, Less often = 0.25
Q39 How often do you or your household visit Fishguard Town Centre for shopping and other town centre services? Zones 3 & 7-10 Daily 6.4% 28 0.0% 0 0.0% 0 0.0% 0 0.0% 0 0.0% 0 0.0% 0 0.8% 1 28.8% 274-6 days a week 1.3% 6 0.0% 0 0.0% 0 0.0% 0 0.0% 0 0.0% 0 0.0% 0 0.0% 0 6.1% 62-3 days a week 4.0% 18 0.0% 0 0.0% 0 1.9% 2 0.0% 0 0.0% 0 0.0% 0 0.0% 0 15.9% 15One day a week 4.9% 22 0.0% 0 0.0% 0 1.7% 1 0.0% 0 0.0% 0 0.0% 0 0.0% 0 13.7% 13Every two weeks 2.3% 10 0.0% 0 0.0% 0 1.7% 1 0.0% 0 0.0% 0 0.0% 0 3.0% 2 3.6% 3Monthly 4.2% 19 0.0% 0 0.0% 0 6.4% 6 0.0% 0 0.0% 0 0.0% 0 0.8% 1 1.5% 1Once every two months 2.0% 9 0.0% 0 0.0% 0 4.2% 4 0.0% 0 0.0% 0 0.0% 0 0.9% 1 2.4% 2Three-four times a year 3.0% 13 0.0% 0 0.0% 0 5.6% 5 0.0% 0 0.0% 0 0.0% 0 4.5% 3 1.3% 1Once a year 1.5% 7 0.0% 0 0.0% 0 2.2% 2 0.0% 0 0.0% 0 0.0% 0 0.8% 1 0.0% 0Less often 1.0% 4 0.0% 0 0.0% 0 0.7% 1 0.0% 0 0.0% 0 0.0% 0 0.6% 0 3.1% 3Never 67.9% 300 0.0% 0 0.0% 0 74.0% 64 0.0% 0 0.0% 0 0.0% 0 88.6% 68 18.5% 17(Don’t know) 0.2% 1 0.0% 0 0.0% 0 0.0% 0 0.0% 0 0.0% 0 0.0% 0 0.0% 0 0.8% 1(Varies) 1.3% 6 0.0% 0 0.0% 0 1.7% 1 0.0% 0 0.0% 0 0.0% 0 0.0% 0 4.3% 4Mean: 115.49 0.00 0.00 20.65 0.00 0.00 0.00 34.15 194.56Weighted base: 441 0 0 86 0 0 0 76 94Sample: 501 0 0 101 0 0 0 100 100

by Zone (Weighted, Part 1) South Wales Retail Study Page 64 Weighted: for Carter Jonas August 2016
Total Zone 1 Zone 2 Zone 3 Zone 4 Zone 5 Zone 6 Zone 7 Zone 8
Column %ges. 020716 NEMS market research
Q40A In order of importance, what are your two main reasons for visiting Fishguard Town Centre? Main reason: Zones 3 & 7-10 and those who visit Fishguard town centre at Q39 Food shopping 31.1% 44 0.0% 0 0.0% 0 2.8% 1 0.0% 0 0.0% 0 0.0% 0 0.0% 0 44.8% 34Non-food shopping 21.9% 31 0.0% 0 0.0% 0 15.7% 4 0.0% 0 0.0% 0 0.0% 0 46.4% 4 16.6% 13To visit bars / pubs 0.0% 0 0.0% 0 0.0% 0 0.0% 0 0.0% 0 0.0% 0 0.0% 0 0.0% 0 0.0% 0To visit cafés / restaurants 5.1% 7 0.0% 0 0.0% 0 6.6% 1 0.0% 0 0.0% 0 0.0% 0 7.2% 1 4.5% 3To visit personal service
providers (e.g. hairdressers, beauty salon etc.)
3.1% 4 0.0% 0 0.0% 0 5.6% 1 0.0% 0 0.0% 0 0.0% 0 0.0% 0 2.1% 2
To visit financial services such as banks and other financial institutions
2.9% 4 0.0% 0 0.0% 0 0.0% 0 0.0% 0 0.0% 0 0.0% 0 0.0% 0 5.0% 4
To visit other service providers (e.g. travel agent, estate agent etc.)
1.2% 2 0.0% 0 0.0% 0 3.8% 1 0.0% 0 0.0% 0 0.0% 0 0.0% 0 1.0% 1
To visit public services (e.g. medical or dentist appointment, library, job centre, community centre, etc)
7.9% 11 0.0% 0 0.0% 0 10.8% 2 0.0% 0 0.0% 0 0.0% 0 6.9% 1 5.9% 4
To get petrol 0.0% 0 0.0% 0 0.0% 0 0.0% 0 0.0% 0 0.0% 0 0.0% 0 0.0% 0 0.0% 0To visit the cinema 0.0% 0 0.0% 0 0.0% 0 0.0% 0 0.0% 0 0.0% 0 0.0% 0 0.0% 0 0.0% 0To visit a park 0.0% 0 0.0% 0 0.0% 0 0.0% 0 0.0% 0 0.0% 0 0.0% 0 0.0% 0 0.0% 0To visit the swimming pool 0.0% 0 0.0% 0 0.0% 0 0.0% 0 0.0% 0 0.0% 0 0.0% 0 0.0% 0 0.0% 0To visit other gyms / health
and fitness facilities 1.8% 3 0.0% 0 0.0% 0 3.6% 1 0.0% 0 0.0% 0 0.0% 0 0.0% 0 2.2% 2
To visit the library 0.0% 0 0.0% 0 0.0% 0 0.0% 0 0.0% 0 0.0% 0 0.0% 0 0.0% 0 0.0% 0To visit museums / art
gallery 0.4% 1 0.0% 0 0.0% 0 0.0% 0 0.0% 0 0.0% 0 0.0% 0 6.9% 1 0.0% 0
To visit the theatre or musical venues
0.0% 0 0.0% 0 0.0% 0 0.0% 0 0.0% 0 0.0% 0 0.0% 0 0.0% 0 0.0% 0
To visit night time venues e.g. nightclub
0.0% 0 0.0% 0 0.0% 0 0.0% 0 0.0% 0 0.0% 0 0.0% 0 0.0% 0 0.0% 0
For other leisure activities 5.9% 8 0.0% 0 0.0% 0 6.6% 1 0.0% 0 0.0% 0 0.0% 0 12.1% 1 4.3% 3To shop at the market(s) 0.4% 1 0.0% 0 0.0% 0 0.0% 0 0.0% 0 0.0% 0 0.0% 0 0.0% 0 0.0% 0To meet family 4.9% 7 0.0% 0 0.0% 0 6.6% 1 0.0% 0 0.0% 0 0.0% 0 0.0% 0 4.9% 4To meet friends 1.4% 2 0.0% 0 0.0% 0 3.6% 1 0.0% 0 0.0% 0 0.0% 0 0.0% 0 0.0% 0To visit the theatre 0.0% 0 0.0% 0 0.0% 0 0.0% 0 0.0% 0 0.0% 0 0.0% 0 0.0% 0 0.0% 0For work (i.e. place of work) 4.7% 7 0.0% 0 0.0% 0 7.4% 2 0.0% 0 0.0% 0 0.0% 0 6.9% 1 5.4% 4For business (e.g. attend a
business appointment) 0.0% 0 0.0% 0 0.0% 0 0.0% 0 0.0% 0 0.0% 0 0.0% 0 0.0% 0 0.0% 0
For education as a student (e.g. student at college, university, or other third level education)
1.8% 3 0.0% 0 0.0% 0 3.6% 1 0.0% 0 0.0% 0 0.0% 0 0.0% 0 2.2% 2
To access public transport for onward travel (e.g. train station, bus station)
0.0% 0 0.0% 0 0.0% 0 0.0% 0 0.0% 0 0.0% 0 0.0% 0 0.0% 0 0.0% 0
Other 0.0% 0 0.0% 0 0.0% 0 0.0% 0 0.0% 0 0.0% 0 0.0% 0 0.0% 0 0.0% 0As part of a day out / for a
day out / something different
1.5% 2 0.0% 0 0.0% 0 2.8% 1 0.0% 0 0.0% 0 0.0% 0 13.7% 1 0.0% 0
Browsing / window shopping 1.0% 1 0.0% 0 0.0% 0 6.4% 1 0.0% 0 0.0% 0 0.0% 0 0.0% 0 0.0% 0(Don't know / varies) 1.3% 2 0.0% 0 0.0% 0 8.4% 2 0.0% 0 0.0% 0 0.0% 0 0.0% 0 0.0% 0(Nothing / nothing further) 1.8% 3 0.0% 0 0.0% 0 5.6% 1 0.0% 0 0.0% 0 0.0% 0 0.0% 0 1.0% 1Weighted base: 141 0 0 22 0 0 0 9 77Sample: 185 0 0 30 0 0 0 12 78

by Zone (Weighted, Part 1) South Wales Retail Study Page 65 Weighted: for Carter Jonas August 2016
Total Zone 1 Zone 2 Zone 3 Zone 4 Zone 5 Zone 6 Zone 7 Zone 8
Column %ges. 020716 NEMS market research
Q40B In order of importance, what are your two main reasons for visiting Fishguard Town Centre? Secondary reason: Those who gave a reason at Q40A Food shopping 12.0% 17 0.0% 0 0.0% 0 21.3% 4 0.0% 0 0.0% 0 0.0% 0 0.0% 0 14.1% 11Non-food shopping 14.6% 20 0.0% 0 0.0% 0 10.9% 2 0.0% 0 0.0% 0 0.0% 0 0.0% 0 21.2% 16To visit bars / pubs 0.0% 0 0.0% 0 0.0% 0 0.0% 0 0.0% 0 0.0% 0 0.0% 0 0.0% 0 0.0% 0To visit cafés / restaurants 5.7% 8 0.0% 0 0.0% 0 4.2% 1 0.0% 0 0.0% 0 0.0% 0 21.7% 2 5.6% 4To visit personal service
providers (e.g. hairdressers, beauty salon etc.)
2.9% 4 0.0% 0 0.0% 0 0.0% 0 0.0% 0 0.0% 0 0.0% 0 0.0% 0 4.9% 4
To visit financial services such as banks and other financial institutions
2.6% 4 0.0% 0 0.0% 0 3.2% 1 0.0% 0 0.0% 0 0.0% 0 0.0% 0 2.8% 2
To visit other service providers (e.g. travel agent, estate agent etc.)
0.4% 1 0.0% 0 0.0% 0 0.0% 0 0.0% 0 0.0% 0 0.0% 0 0.0% 0 0.8% 1
To visit public services (e.g. medical or dentist appointment, library, job centre, community centre, etc)
3.5% 5 0.0% 0 0.0% 0 3.2% 1 0.0% 0 0.0% 0 0.0% 0 0.0% 0 3.1% 2
To get petrol 0.0% 0 0.0% 0 0.0% 0 0.0% 0 0.0% 0 0.0% 0 0.0% 0 0.0% 0 0.0% 0To visit the cinema 0.0% 0 0.0% 0 0.0% 0 0.0% 0 0.0% 0 0.0% 0 0.0% 0 0.0% 0 0.0% 0To visit a park 1.0% 1 0.0% 0 0.0% 0 0.0% 0 0.0% 0 0.0% 0 0.0% 0 0.0% 0 0.0% 0To visit the swimming pool 0.2% 0 0.0% 0 0.0% 0 0.0% 0 0.0% 0 0.0% 0 0.0% 0 0.0% 0 0.0% 0To visit other gyms / health
and fitness facilities 0.6% 1 0.0% 0 0.0% 0 0.0% 0 0.0% 0 0.0% 0 0.0% 0 0.0% 0 1.0% 1
To visit the library 0.9% 1 0.0% 0 0.0% 0 0.0% 0 0.0% 0 0.0% 0 0.0% 0 6.9% 1 0.8% 1To visit museums / art
gallery 0.0% 0 0.0% 0 0.0% 0 0.0% 0 0.0% 0 0.0% 0 0.0% 0 0.0% 0 0.0% 0
To visit the theatre or musical venues
0.6% 1 0.0% 0 0.0% 0 4.2% 1 0.0% 0 0.0% 0 0.0% 0 0.0% 0 0.0% 0
To visit night time venues e.g. nightclub
0.0% 0 0.0% 0 0.0% 0 0.0% 0 0.0% 0 0.0% 0 0.0% 0 0.0% 0 0.0% 0
For other leisure activities 3.7% 5 0.0% 0 0.0% 0 0.0% 0 0.0% 0 0.0% 0 0.0% 0 0.0% 0 6.3% 5To shop at the market(s) 1.5% 2 0.0% 0 0.0% 0 3.2% 1 0.0% 0 0.0% 0 0.0% 0 0.0% 0 0.8% 1To meet family 1.8% 3 0.0% 0 0.0% 0 0.0% 0 0.0% 0 0.0% 0 0.0% 0 0.0% 0 3.3% 3To meet friends 1.0% 1 0.0% 0 0.0% 0 3.2% 1 0.0% 0 0.0% 0 0.0% 0 0.0% 0 1.1% 1To visit the theatre 0.4% 1 0.0% 0 0.0% 0 0.0% 0 0.0% 0 0.0% 0 0.0% 0 6.9% 1 0.0% 0For work (i.e. place of work) 4.4% 6 0.0% 0 0.0% 0 0.0% 0 0.0% 0 0.0% 0 0.0% 0 0.0% 0 3.9% 3For business (e.g. attend a
business appointment) 0.0% 0 0.0% 0 0.0% 0 0.0% 0 0.0% 0 0.0% 0 0.0% 0 0.0% 0 0.0% 0
For education as a student (e.g. student at college, university, or other third level education)
0.0% 0 0.0% 0 0.0% 0 0.0% 0 0.0% 0 0.0% 0 0.0% 0 0.0% 0 0.0% 0
To access public transport for onward travel (e.g. train station, bus station)
0.0% 0 0.0% 0 0.0% 0 0.0% 0 0.0% 0 0.0% 0 0.0% 0 0.0% 0 0.0% 0
Other 0.0% 0 0.0% 0 0.0% 0 0.0% 0 0.0% 0 0.0% 0 0.0% 0 0.0% 0 0.0% 0As part of a day out / for a
day out / something different
0.0% 0 0.0% 0 0.0% 0 0.0% 0 0.0% 0 0.0% 0 0.0% 0 0.0% 0 0.0% 0
Browsing / window shopping 0.0% 0 0.0% 0 0.0% 0 0.0% 0 0.0% 0 0.0% 0 0.0% 0 0.0% 0 0.0% 0(Don't know / varies) 1.1% 2 0.0% 0 0.0% 0 0.0% 0 0.0% 0 0.0% 0 0.0% 0 0.0% 0 2.0% 2(Nothing / nothing further) 41.0% 56 0.0% 0 0.0% 0 46.4% 9 0.0% 0 0.0% 0 0.0% 0 64.6% 6 28.3% 22Weighted base: 137 0 0 19 0 0 0 9 76Sample: 177 0 0 25 0 0 0 12 77

by Zone (Weighted, Part 1) South Wales Retail Study Page 66 Weighted: for Carter Jonas August 2016
Total Zone 1 Zone 2 Zone 3 Zone 4 Zone 5 Zone 6 Zone 7 Zone 8
Column %ges. 020716 NEMS market research
Q40X In order of importance, what are your two main reasons for visiting Fishguard Town Centre? Any mention: [MR] Zones 3 & 7-10 and those who visit Fishguard town centre at Q39 Food shopping 42.7% 60 0.0% 0 0.0% 0 21.1% 5 0.0% 0 0.0% 0 0.0% 0 0.0% 0 58.8% 45Non-food shopping 36.0% 51 0.0% 0 0.0% 0 25.0% 6 0.0% 0 0.0% 0 0.0% 0 46.4% 4 37.6% 29To visit bars / pubs 0.0% 0 0.0% 0 0.0% 0 0.0% 0 0.0% 0 0.0% 0 0.0% 0 0.0% 0 0.0% 0To visit cafés / restaurants 10.7% 15 0.0% 0 0.0% 0 10.2% 2 0.0% 0 0.0% 0 0.0% 0 28.8% 3 10.1% 8To visit personal service
providers (e.g. hairdressers, beauty salon etc.)
5.9% 8 0.0% 0 0.0% 0 5.6% 1 0.0% 0 0.0% 0 0.0% 0 0.0% 0 7.0% 5
To visit financial services such as banks and other financial institutions
5.5% 8 0.0% 0 0.0% 0 2.8% 1 0.0% 0 0.0% 0 0.0% 0 0.0% 0 7.8% 6
To visit other service providers (e.g. travel agent, estate agent etc.)
1.6% 2 0.0% 0 0.0% 0 3.8% 1 0.0% 0 0.0% 0 0.0% 0 0.0% 0 1.8% 1
To visit public services (e.g. medical or dentist appointment, library, job centre, community centre, etc)
11.3% 16 0.0% 0 0.0% 0 13.6% 3 0.0% 0 0.0% 0 0.0% 0 6.9% 1 9.0% 7
To get petrol 0.0% 0 0.0% 0 0.0% 0 0.0% 0 0.0% 0 0.0% 0 0.0% 0 0.0% 0 0.0% 0To visit the cinema 0.0% 0 0.0% 0 0.0% 0 0.0% 0 0.0% 0 0.0% 0 0.0% 0 0.0% 0 0.0% 0To visit a park 0.9% 1 0.0% 0 0.0% 0 0.0% 0 0.0% 0 0.0% 0 0.0% 0 0.0% 0 0.0% 0To visit the swimming pool 0.2% 0 0.0% 0 0.0% 0 0.0% 0 0.0% 0 0.0% 0 0.0% 0 0.0% 0 0.0% 0To visit other gyms / health
and fitness facilities 2.3% 3 0.0% 0 0.0% 0 3.6% 1 0.0% 0 0.0% 0 0.0% 0 0.0% 0 3.2% 2
To visit the library 0.8% 1 0.0% 0 0.0% 0 0.0% 0 0.0% 0 0.0% 0 0.0% 0 6.9% 1 0.8% 1To visit museums / art
gallery 0.4% 1 0.0% 0 0.0% 0 0.0% 0 0.0% 0 0.0% 0 0.0% 0 6.9% 1 0.0% 0
To visit the theatre or musical venues
0.6% 1 0.0% 0 0.0% 0 3.6% 1 0.0% 0 0.0% 0 0.0% 0 0.0% 0 0.0% 0
To visit night time venues e.g. nightclub
0.0% 0 0.0% 0 0.0% 0 0.0% 0 0.0% 0 0.0% 0 0.0% 0 0.0% 0 0.0% 0
For other leisure activities 9.5% 13 0.0% 0 0.0% 0 6.6% 1 0.0% 0 0.0% 0 0.0% 0 12.1% 1 10.5% 8To shop at the market(s) 1.9% 3 0.0% 0 0.0% 0 2.8% 1 0.0% 0 0.0% 0 0.0% 0 0.0% 0 0.8% 1To meet family 6.7% 9 0.0% 0 0.0% 0 6.6% 1 0.0% 0 0.0% 0 0.0% 0 0.0% 0 8.1% 6To meet friends 2.4% 3 0.0% 0 0.0% 0 6.4% 1 0.0% 0 0.0% 0 0.0% 0 0.0% 0 1.0% 1To visit the theatre 0.4% 1 0.0% 0 0.0% 0 0.0% 0 0.0% 0 0.0% 0 0.0% 0 6.9% 1 0.0% 0For work (i.e. place of work) 9.0% 13 0.0% 0 0.0% 0 7.4% 2 0.0% 0 0.0% 0 0.0% 0 6.9% 1 9.2% 7For business (e.g. attend a
business appointment) 0.0% 0 0.0% 0 0.0% 0 0.0% 0 0.0% 0 0.0% 0 0.0% 0 0.0% 0 0.0% 0
For education as a student (e.g. student at college, university, or other third level education)
1.8% 3 0.0% 0 0.0% 0 3.6% 1 0.0% 0 0.0% 0 0.0% 0 0.0% 0 2.2% 2
To access public transport for onward travel (e.g. train station, bus station)
0.0% 0 0.0% 0 0.0% 0 0.0% 0 0.0% 0 0.0% 0 0.0% 0 0.0% 0 0.0% 0
Other 0.0% 0 0.0% 0 0.0% 0 0.0% 0 0.0% 0 0.0% 0 0.0% 0 0.0% 0 0.0% 0As part of a day out / for a
day out / something different
1.5% 2 0.0% 0 0.0% 0 2.8% 1 0.0% 0 0.0% 0 0.0% 0 13.7% 1 0.0% 0
Browsing / window shopping 1.0% 1 0.0% 0 0.0% 0 6.4% 1 0.0% 0 0.0% 0 0.0% 0 0.0% 0 0.0% 0Weighted base: 141 0 0 22 0 0 0 9 77Sample: 185 0 0 30 0 0 0 12 78

by Zone (Weighted, Part 1) South Wales Retail Study Page 67 Weighted: for Carter Jonas August 2016
Total Zone 1 Zone 2 Zone 3 Zone 4 Zone 5 Zone 6 Zone 7 Zone 8
Column %ges. 020716 NEMS market research
Q41 What do you like about Fishguard Town Centre? [MR] Zones 3 & 7-10 and those who visit Fishguard town centre at Q39 Attractive environment / nice
place 22.8% 32 0.0% 0 0.0% 0 25.0% 6 0.0% 0 0.0% 0 0.0% 0 47.9% 4 15.4% 12
Close to friends or relatives 0.9% 1 0.0% 0 0.0% 0 0.0% 0 0.0% 0 0.0% 0 0.0% 0 14.0% 1 0.0% 0Close to home 22.3% 32 0.0% 0 0.0% 0 3.6% 1 0.0% 0 0.0% 0 0.0% 0 0.0% 0 33.8% 26Close to work 0.6% 1 0.0% 0 0.0% 0 3.8% 1 0.0% 0 0.0% 0 0.0% 0 0.0% 0 0.0% 0Compact 5.8% 8 0.0% 0 0.0% 0 7.3% 2 0.0% 0 0.0% 0 0.0% 0 6.9% 1 5.6% 4Easy to get to by bike 0.0% 0 0.0% 0 0.0% 0 0.0% 0 0.0% 0 0.0% 0 0.0% 0 0.0% 0 0.0% 0Easy to get to by bus 0.2% 0 0.0% 0 0.0% 0 0.0% 0 0.0% 0 0.0% 0 0.0% 0 0.0% 0 0.0% 0Easy to get to by car 1.2% 2 0.0% 0 0.0% 0 0.0% 0 0.0% 0 0.0% 0 0.0% 0 0.0% 0 2.2% 2Easy to park 0.2% 0 0.0% 0 0.0% 0 0.0% 0 0.0% 0 0.0% 0 0.0% 0 0.0% 0 0.0% 0Good facilities 1.1% 1 0.0% 0 0.0% 0 3.8% 1 0.0% 0 0.0% 0 0.0% 0 0.0% 0 0.0% 0Good food stores 0.8% 1 0.0% 0 0.0% 0 0.0% 0 0.0% 0 0.0% 0 0.0% 0 0.0% 0 0.8% 1Good pubs, cafés or
restaurants 6.7% 9 0.0% 0 0.0% 0 6.6% 1 0.0% 0 0.0% 0 0.0% 0 0.0% 0 2.9% 2
Good range of non-food shops
4.1% 6 0.0% 0 0.0% 0 6.6% 1 0.0% 0 0.0% 0 0.0% 0 0.0% 0 2.8% 2
Makes a change from other places
1.2% 2 0.0% 0 0.0% 0 3.6% 1 0.0% 0 0.0% 0 0.0% 0 6.9% 1 0.0% 0
Quiet 6.2% 9 0.0% 0 0.0% 0 0.0% 0 0.0% 0 0.0% 0 0.0% 0 0.0% 0 9.9% 8Safe and secure 1.2% 2 0.0% 0 0.0% 0 0.0% 0 0.0% 0 0.0% 0 0.0% 0 0.0% 0 2.2% 2The market 0.6% 1 0.0% 0 0.0% 0 0.0% 0 0.0% 0 0.0% 0 0.0% 0 0.0% 0 0.0% 0Traditional 3.1% 4 0.0% 0 0.0% 0 0.0% 0 0.0% 0 0.0% 0 0.0% 0 6.9% 1 0.0% 0Traffic free shopping centre 0.0% 0 0.0% 0 0.0% 0 0.0% 0 0.0% 0 0.0% 0 0.0% 0 0.0% 0 0.0% 0Other 0.0% 0 0.0% 0 0.0% 0 0.0% 0 0.0% 0 0.0% 0 0.0% 0 0.0% 0 0.0% 0Cheap / free parking 0.0% 0 0.0% 0 0.0% 0 0.0% 0 0.0% 0 0.0% 0 0.0% 0 0.0% 0 0.0% 0Familiarity / habit 3.7% 5 0.0% 0 0.0% 0 2.8% 1 0.0% 0 0.0% 0 0.0% 0 0.0% 0 5.0% 4Friendly people / nice
atmosphere 2.0% 3 0.0% 0 0.0% 0 0.0% 0 0.0% 0 0.0% 0 0.0% 0 0.0% 0 2.6% 2
Good leisure facilities / things to do
1.2% 2 0.0% 0 0.0% 0 6.4% 1 0.0% 0 0.0% 0 0.0% 0 0.0% 0 0.0% 0
Good opening hours 0.0% 0 0.0% 0 0.0% 0 0.0% 0 0.0% 0 0.0% 0 0.0% 0 0.0% 0 0.0% 0Good prices 0.0% 0 0.0% 0 0.0% 0 0.0% 0 0.0% 0 0.0% 0 0.0% 0 0.0% 0 0.0% 0Good range of independent
shops 3.6% 5 0.0% 0 0.0% 0 8.1% 2 0.0% 0 0.0% 0 0.0% 0 6.9% 1 3.3% 2
Good range of services 0.0% 0 0.0% 0 0.0% 0 0.0% 0 0.0% 0 0.0% 0 0.0% 0 0.0% 0 0.0% 0(Nothing / very little) 26.6% 38 0.0% 0 0.0% 0 29.8% 7 0.0% 0 0.0% 0 0.0% 0 19.0% 2 29.8% 23(Don't know) 1.8% 3 0.0% 0 0.0% 0 2.8% 1 0.0% 0 0.0% 0 0.0% 0 5.3% 0 1.0% 1Weighted base: 141 0 0 22 0 0 0 9 77Sample: 185 0 0 30 0 0 0 12 78

by Zone (Weighted, Part 1) South Wales Retail Study Page 68 Weighted: for Carter Jonas August 2016
Total Zone 1 Zone 2 Zone 3 Zone 4 Zone 5 Zone 6 Zone 7 Zone 8
Column %ges. 020716 NEMS market research
Q42 What could be improved about Fishguard Town Centre that would make you visit more often? [MR] Zones 3 & 7-10 Better access by road 1.9% 9 0.0% 0 0.0% 0 0.0% 0 0.0% 0 0.0% 0 0.0% 0 0.8% 1 2.7% 3Better public transport 0.4% 2 0.0% 0 0.0% 0 0.0% 0 0.0% 0 0.0% 0 0.0% 0 0.8% 1 0.0% 0Better signposting 0.0% 0 0.0% 0 0.0% 0 0.0% 0 0.0% 0 0.0% 0 0.0% 0 0.0% 0 0.0% 0Cleaner streets 1.0% 4 0.0% 0 0.0% 0 0.9% 1 0.0% 0 0.0% 0 0.0% 0 0.0% 0 2.4% 2Facilities which would assist
you if shopping with children
0.0% 0 0.0% 0 0.0% 0 0.0% 0 0.0% 0 0.0% 0 0.0% 0 0.0% 0 0.0% 0
Free / cheaper car parking 1.1% 5 0.0% 0 0.0% 0 1.0% 1 0.0% 0 0.0% 0 0.0% 0 0.0% 0 3.7% 3Jewellery / food markets /
other events 0.3% 1 0.0% 0 0.0% 0 0.0% 0 0.0% 0 0.0% 0 0.0% 0 0.0% 0 1.5% 1
More / better comparison retailers (i.e. non-food shops)
12.4% 55 0.0% 0 0.0% 0 11.3% 10 0.0% 0 0.0% 0 0.0% 0 6.3% 5 33.9% 32
More / better entertainment 1.3% 6 0.0% 0 0.0% 0 0.9% 1 0.0% 0 0.0% 0 0.0% 0 3.8% 3 1.7% 2More / better places for
eating out (e.g. cafés and restaurants)
0.6% 3 0.0% 0 0.0% 0 0.9% 1 0.0% 0 0.0% 0 0.0% 0 0.0% 0 1.5% 1
More / better food shops 3.3% 15 0.0% 0 0.0% 0 1.5% 1 0.0% 0 0.0% 0 0.0% 0 0.0% 0 10.4% 10More / better parking 2.5% 11 0.0% 0 0.0% 0 6.4% 6 0.0% 0 0.0% 0 0.0% 0 0.0% 0 1.5% 1More / better pedestrianised
streets 0.4% 2 0.0% 0 0.0% 0 0.0% 0 0.0% 0 0.0% 0 0.0% 0 0.0% 0 1.7% 2
More / better public conveniences
0.7% 3 0.0% 0 0.0% 0 2.1% 2 0.0% 0 0.0% 0 0.0% 0 0.0% 0 0.6% 1
More / better seats / flower displays
0.2% 1 0.0% 0 0.0% 0 0.9% 1 0.0% 0 0.0% 0 0.0% 0 0.0% 0 0.0% 0
More / better services 0.0% 0 0.0% 0 0.0% 0 0.0% 0 0.0% 0 0.0% 0 0.0% 0 0.0% 0 0.0% 0More advertising 0.3% 1 0.0% 0 0.0% 0 0.7% 1 0.0% 0 0.0% 0 0.0% 0 0.0% 0 0.8% 1More national multiple shops
/ High Street shops 8.8% 39 0.0% 0 0.0% 0 4.8% 4 0.0% 0 0.0% 0 0.0% 0 6.9% 5 13.5% 13
Protection from the weather (i.e. covered shopping malls)
0.0% 0 0.0% 0 0.0% 0 0.0% 0 0.0% 0 0.0% 0 0.0% 0 0.0% 0 0.0% 0
Shops / services open on Sundays / better opening hours
0.2% 1 0.0% 0 0.0% 0 0.0% 0 0.0% 0 0.0% 0 0.0% 0 0.0% 0 0.8% 1
Fewer vacant shops 4.4% 19 0.0% 0 0.0% 0 0.0% 0 0.0% 0 0.0% 0 0.0% 0 1.4% 1 10.4% 10Better maintained buildings 0.4% 2 0.0% 0 0.0% 0 0.0% 0 0.0% 0 0.0% 0 0.0% 0 0.0% 0 2.1% 2Better disabled access 0.1% 1 0.0% 0 0.0% 0 0.0% 0 0.0% 0 0.0% 0 0.0% 0 0.8% 1 0.0% 0Better prices 0.4% 2 0.0% 0 0.0% 0 0.0% 0 0.0% 0 0.0% 0 0.0% 0 0.0% 0 1.8% 2Better quality shops 0.3% 1 0.0% 0 0.0% 0 0.0% 0 0.0% 0 0.0% 0 0.0% 0 0.0% 0 0.0% 0Fewer charity shops 0.2% 1 0.0% 0 0.0% 0 0.0% 0 0.0% 0 0.0% 0 0.0% 0 0.0% 0 0.8% 1Improve the environment /
refurbish 1.3% 6 0.0% 0 0.0% 0 2.6% 2 0.0% 0 0.0% 0 0.0% 0 0.0% 0 1.7% 2
Less congestion / too busy 0.9% 4 0.0% 0 0.0% 0 0.0% 0 0.0% 0 0.0% 0 0.0% 0 3.0% 2 1.8% 2More independent shops 1.4% 6 0.0% 0 0.0% 0 3.4% 3 0.0% 0 0.0% 0 0.0% 0 0.0% 0 0.0% 0More pubs 0.5% 2 0.0% 0 0.0% 0 0.0% 0 0.0% 0 0.0% 0 0.0% 0 0.0% 0 0.9% 1Other 0.0% 0 0.0% 0 0.0% 0 0.0% 0 0.0% 0 0.0% 0 0.0% 0 0.0% 0 0.0% 0(Nothing) 49.1% 216 0.0% 0 0.0% 0 60.8% 53 0.0% 0 0.0% 0 0.0% 0 56.0% 43 22.9% 22(Don’t know) 17.8% 79 0.0% 0 0.0% 0 14.2% 12 0.0% 0 0.0% 0 0.0% 0 26.5% 20 6.1% 6Weighted base: 441 0 0 86 0 0 0 76 94Sample: 501 0 0 101 0 0 0 100 100
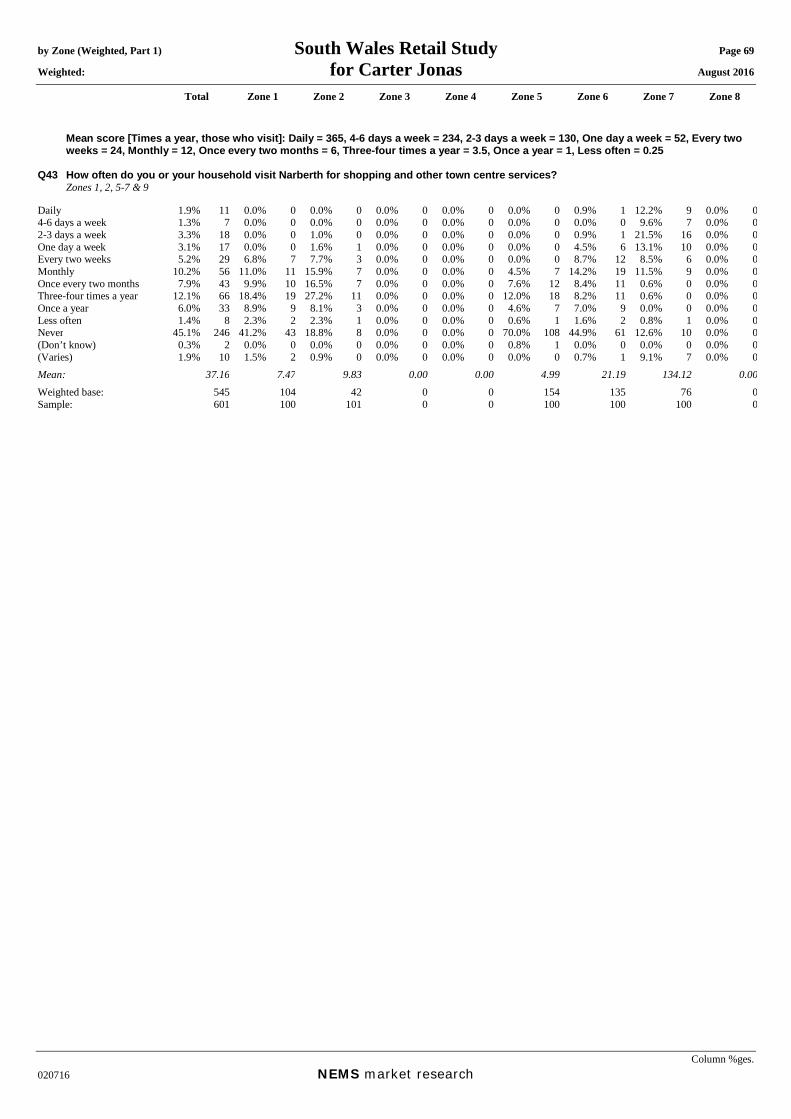
by Zone (Weighted, Part 1) South Wales Retail Study Page 69 Weighted: for Carter Jonas August 2016
Total Zone 1 Zone 2 Zone 3 Zone 4 Zone 5 Zone 6 Zone 7 Zone 8
Column %ges. 020716 NEMS market research
Mean score [Times a year, those who visit]: Daily = 365, 4-6 days a week = 234, 2-3 days a week = 130, One day a week = 52, Every two weeks = 24, Monthly = 12, Once every two months = 6, Three-four times a year = 3.5, Once a year = 1, Less often = 0.25
Q43 How often do you or your household visit Narberth for shopping and other town centre services? Zones 1, 2, 5-7 & 9 Daily 1.9% 11 0.0% 0 0.0% 0 0.0% 0 0.0% 0 0.0% 0 0.9% 1 12.2% 9 0.0% 04-6 days a week 1.3% 7 0.0% 0 0.0% 0 0.0% 0 0.0% 0 0.0% 0 0.0% 0 9.6% 7 0.0% 02-3 days a week 3.3% 18 0.0% 0 1.0% 0 0.0% 0 0.0% 0 0.0% 0 0.9% 1 21.5% 16 0.0% 0One day a week 3.1% 17 0.0% 0 1.6% 1 0.0% 0 0.0% 0 0.0% 0 4.5% 6 13.1% 10 0.0% 0Every two weeks 5.2% 29 6.8% 7 7.7% 3 0.0% 0 0.0% 0 0.0% 0 8.7% 12 8.5% 6 0.0% 0Monthly 10.2% 56 11.0% 11 15.9% 7 0.0% 0 0.0% 0 4.5% 7 14.2% 19 11.5% 9 0.0% 0Once every two months 7.9% 43 9.9% 10 16.5% 7 0.0% 0 0.0% 0 7.6% 12 8.4% 11 0.6% 0 0.0% 0Three-four times a year 12.1% 66 18.4% 19 27.2% 11 0.0% 0 0.0% 0 12.0% 18 8.2% 11 0.6% 0 0.0% 0Once a year 6.0% 33 8.9% 9 8.1% 3 0.0% 0 0.0% 0 4.6% 7 7.0% 9 0.0% 0 0.0% 0Less often 1.4% 8 2.3% 2 2.3% 1 0.0% 0 0.0% 0 0.6% 1 1.6% 2 0.8% 1 0.0% 0Never 45.1% 246 41.2% 43 18.8% 8 0.0% 0 0.0% 0 70.0% 108 44.9% 61 12.6% 10 0.0% 0(Don’t know) 0.3% 2 0.0% 0 0.0% 0 0.0% 0 0.0% 0 0.8% 1 0.0% 0 0.0% 0 0.0% 0(Varies) 1.9% 10 1.5% 2 0.9% 0 0.0% 0 0.0% 0 0.0% 0 0.7% 1 9.1% 7 0.0% 0Mean: 37.16 7.47 9.83 0.00 0.00 4.99 21.19 134.12 0.00Weighted base: 545 104 42 0 0 154 135 76 0Sample: 601 100 101 0 0 100 100 100 0

by Zone (Weighted, Part 1) South Wales Retail Study Page 70 Weighted: for Carter Jonas August 2016
Total Zone 1 Zone 2 Zone 3 Zone 4 Zone 5 Zone 6 Zone 7 Zone 8
Column %ges. 020716 NEMS market research
Q44A In order of importance, what are your two main reasons for visiting Narberth Town Centre? Main reason: Zones 1, 2, 5-7 & 9 and those who visit Narberth town centre at Q43 Food shopping 16.8% 50 10.5% 6 2.9% 1 0.0% 0 0.0% 0 2.1% 1 14.6% 11 45.4% 30 0.0% 0Non-food shopping 49.8% 149 60.6% 37 58.9% 20 0.0% 0 0.0% 0 74.0% 34 50.8% 38 15.1% 10 0.0% 0To visit bars / pubs 0.4% 1 0.0% 0 0.0% 0 0.0% 0 0.0% 0 0.0% 0 0.0% 0 0.0% 0 0.0% 0To visit cafés / restaurants 6.8% 20 10.5% 6 10.1% 3 0.0% 0 0.0% 0 10.2% 5 5.1% 4 1.6% 1 0.0% 0To visit personal service
providers (e.g. hairdressers, beauty salon etc.)
0.6% 2 0.0% 0 0.0% 0 0.0% 0 0.0% 0 0.0% 0 2.4% 2 0.0% 0 0.0% 0
To visit financial services such as banks and other financial institutions
1.8% 5 0.0% 0 0.0% 0 0.0% 0 0.0% 0 0.0% 0 0.0% 0 7.2% 5 0.0% 0
To visit other service providers (e.g. travel agent, estate agent etc.)
0.3% 1 0.0% 0 2.0% 1 0.0% 0 0.0% 0 0.0% 0 0.0% 0 0.0% 0 0.0% 0
To visit public services (e.g. medical or dentist appointment, library, job centre, community centre, etc)
4.8% 14 1.4% 1 14.2% 5 0.0% 0 0.0% 0 0.0% 0 5.1% 4 7.1% 5 0.0% 0
To get petrol 0.0% 0 0.0% 0 0.0% 0 0.0% 0 0.0% 0 0.0% 0 0.0% 0 0.0% 0 0.0% 0To visit the cinema 0.0% 0 0.0% 0 0.0% 0 0.0% 0 0.0% 0 0.0% 0 0.0% 0 0.0% 0 0.0% 0To visit a park 0.0% 0 0.0% 0 0.0% 0 0.0% 0 0.0% 0 0.0% 0 0.0% 0 0.0% 0 0.0% 0To visit the swimming pool 0.4% 1 0.0% 0 0.0% 0 0.0% 0 0.0% 0 0.0% 0 0.0% 0 1.6% 1 0.0% 0To visit other gyms / health
and fitness facilities 0.0% 0 0.0% 0 0.0% 0 0.0% 0 0.0% 0 0.0% 0 0.0% 0 0.0% 0 0.0% 0
To visit the library 0.2% 0 0.0% 0 0.0% 0 0.0% 0 0.0% 0 0.0% 0 0.0% 0 0.7% 0 0.0% 0To visit museums / art
gallery 0.2% 1 1.1% 1 0.0% 0 0.0% 0 0.0% 0 0.0% 0 0.0% 0 0.0% 0 0.0% 0
To visit the theatre or musical venues
0.4% 1 1.4% 1 1.1% 0 0.0% 0 0.0% 0 0.0% 0 0.0% 0 0.0% 0 0.0% 0
To visit night time venues e.g. nightclub
0.0% 0 0.0% 0 0.0% 0 0.0% 0 0.0% 0 0.0% 0 0.0% 0 0.0% 0 0.0% 0
For other leisure activities 0.6% 2 0.0% 0 1.2% 0 0.0% 0 0.0% 0 0.0% 0 0.0% 0 0.9% 1 0.0% 0To shop at the market(s) 0.2% 1 1.1% 1 0.0% 0 0.0% 0 0.0% 0 0.0% 0 0.0% 0 0.0% 0 0.0% 0To meet family 2.1% 6 0.0% 0 4.0% 1 0.0% 0 0.0% 0 2.1% 1 4.0% 3 0.9% 1 0.0% 0To meet friends 2.3% 7 2.2% 1 1.1% 0 0.0% 0 0.0% 0 2.7% 1 4.0% 3 0.9% 1 0.0% 0To visit the theatre 0.0% 0 0.0% 0 0.0% 0 0.0% 0 0.0% 0 0.0% 0 0.0% 0 0.0% 0 0.0% 0For work (i.e. place of work) 4.2% 13 0.0% 0 0.0% 0 0.0% 0 0.0% 0 0.0% 0 3.3% 2 15.1% 10 0.0% 0For business (e.g. attend a
business appointment) 0.3% 1 0.0% 0 0.0% 0 0.0% 0 0.0% 0 0.0% 0 1.2% 1 0.0% 0 0.0% 0
For education as a student (e.g. student at college, university, or other third level education)
0.0% 0 0.0% 0 0.0% 0 0.0% 0 0.0% 0 0.0% 0 0.0% 0 0.0% 0 0.0% 0
To access public transport for onward travel (e.g. train station, bus station)
0.0% 0 0.0% 0 0.0% 0 0.0% 0 0.0% 0 0.0% 0 0.0% 0 0.0% 0 0.0% 0
Other 0.0% 0 0.0% 0 0.0% 0 0.0% 0 0.0% 0 0.0% 0 0.0% 0 0.0% 0 0.0% 0As part of a day out / for a
day out / something different
0.9% 3 0.0% 0 0.0% 0 0.0% 0 0.0% 0 2.1% 1 1.2% 1 0.0% 0 0.0% 0
Browsing / window shopping 5.0% 15 10.2% 6 3.2% 1 0.0% 0 0.0% 0 2.8% 1 6.5% 5 1.6% 1 0.0% 0(Don't know / varies) 0.4% 1 0.0% 0 0.0% 0 0.0% 0 0.0% 0 0.0% 0 0.0% 0 1.4% 1 0.0% 0(Nothing / nothing further) 1.6% 5 1.1% 1 1.2% 0 0.0% 0 0.0% 0 4.1% 2 1.7% 1 0.7% 0 0.0% 0Weighted base: 299 61 34 0 0 46 74 67 0Sample: 375 65 81 0 0 34 56 88 0

by Zone (Weighted, Part 1) South Wales Retail Study Page 71 Weighted: for Carter Jonas August 2016
Total Zone 1 Zone 2 Zone 3 Zone 4 Zone 5 Zone 6 Zone 7 Zone 8
Column %ges. 020716 NEMS market research
Q44B In order of importance, what are your two main reasons for visiting Narberth Town Centre? Secondary reason: Those who gave a reason at Q44A Food shopping 9.2% 27 2.6% 2 4.1% 1 0.0% 0 0.0% 0 9.1% 4 10.6% 8 14.0% 9 0.0% 0Non-food shopping 16.6% 49 14.6% 9 8.9% 3 0.0% 0 0.0% 0 2.1% 1 23.7% 17 26.2% 17 0.0% 0To visit bars / pubs 2.0% 6 0.0% 0 3.5% 1 0.0% 0 0.0% 0 2.9% 1 0.0% 0 5.4% 4 0.0% 0To visit cafés / restaurants 16.3% 48 27.3% 17 34.5% 12 0.0% 0 0.0% 0 17.3% 8 6.3% 5 5.5% 4 0.0% 0To visit personal service
providers (e.g. hairdressers, beauty salon etc.)
0.3% 1 0.0% 0 0.0% 0 0.0% 0 0.0% 0 0.0% 0 1.2% 1 0.0% 0 0.0% 0
To visit financial services such as banks and other financial institutions
1.1% 3 0.0% 0 1.1% 0 0.0% 0 0.0% 0 0.0% 0 1.7% 1 2.6% 2 0.0% 0
To visit other service providers (e.g. travel agent, estate agent etc.)
0.7% 2 0.0% 0 0.0% 0 0.0% 0 0.0% 0 2.9% 1 0.0% 0 1.0% 1 0.0% 0
To visit public services (e.g. medical or dentist appointment, library, job centre, community centre, etc)
1.6% 5 1.1% 1 0.9% 0 0.0% 0 0.0% 0 0.0% 0 1.2% 1 4.1% 3 0.0% 0
To get petrol 0.0% 0 0.0% 0 0.0% 0 0.0% 0 0.0% 0 0.0% 0 0.0% 0 0.0% 0 0.0% 0To visit the cinema 0.0% 0 0.0% 0 0.0% 0 0.0% 0 0.0% 0 0.0% 0 0.0% 0 0.0% 0 0.0% 0To visit a park 0.0% 0 0.0% 0 0.0% 0 0.0% 0 0.0% 0 0.0% 0 0.0% 0 0.0% 0 0.0% 0To visit the swimming pool 0.0% 0 0.0% 0 0.0% 0 0.0% 0 0.0% 0 0.0% 0 0.0% 0 0.0% 0 0.0% 0To visit other gyms / health
and fitness facilities 0.0% 0 0.0% 0 0.0% 0 0.0% 0 0.0% 0 0.0% 0 0.0% 0 0.0% 0 0.0% 0
To visit the library 0.0% 0 0.0% 0 0.0% 0 0.0% 0 0.0% 0 0.0% 0 0.0% 0 0.0% 0 0.0% 0To visit museums / art
gallery 0.5% 2 2.5% 2 0.0% 0 0.0% 0 0.0% 0 0.0% 0 0.0% 0 0.0% 0 0.0% 0
To visit the theatre or musical venues
0.0% 0 0.0% 0 0.0% 0 0.0% 0 0.0% 0 0.0% 0 0.0% 0 0.0% 0 0.0% 0
To visit night time venues e.g. nightclub
0.5% 1 0.0% 0 0.0% 0 0.0% 0 0.0% 0 0.0% 0 0.0% 0 2.0% 1 0.0% 0
For other leisure activities 1.9% 5 3.1% 2 1.1% 0 0.0% 0 0.0% 0 2.1% 1 1.2% 1 1.7% 1 0.0% 0To shop at the market(s) 0.3% 1 0.0% 0 0.0% 0 0.0% 0 0.0% 0 0.0% 0 0.0% 0 0.7% 0 0.0% 0To meet family 1.3% 4 0.0% 0 1.1% 0 0.0% 0 0.0% 0 0.0% 0 1.7% 1 3.5% 2 0.0% 0To meet friends 2.4% 7 0.0% 0 0.9% 0 0.0% 0 0.0% 0 2.8% 1 7.1% 5 0.0% 0 0.0% 0To visit the theatre 0.0% 0 0.0% 0 0.0% 0 0.0% 0 0.0% 0 0.0% 0 0.0% 0 0.0% 0 0.0% 0For work (i.e. place of work) 0.7% 2 0.0% 0 0.9% 0 0.0% 0 0.0% 0 0.0% 0 0.0% 0 2.8% 2 0.0% 0For business (e.g. attend a
business appointment) 0.2% 0 0.0% 0 0.0% 0 0.0% 0 0.0% 0 0.0% 0 0.0% 0 0.7% 0 0.0% 0
For education as a student (e.g. student at college, university, or other third level education)
0.0% 0 0.0% 0 0.0% 0 0.0% 0 0.0% 0 0.0% 0 0.0% 0 0.0% 0 0.0% 0
To access public transport for onward travel (e.g. train station, bus station)
0.0% 0 0.0% 0 0.0% 0 0.0% 0 0.0% 0 0.0% 0 0.0% 0 0.0% 0 0.0% 0
Other 0.0% 0 0.0% 0 0.0% 0 0.0% 0 0.0% 0 0.0% 0 0.0% 0 0.0% 0 0.0% 0As part of a day out / for a
day out / something different
1.4% 4 0.0% 0 0.9% 0 0.0% 0 0.0% 0 7.9% 3 0.0% 0 0.0% 0 0.0% 0
Browsing / window shopping 0.8% 2 1.5% 1 0.0% 0 0.0% 0 0.0% 0 0.0% 0 1.2% 1 0.9% 1 0.0% 0(Don't know / varies) 1.4% 4 2.2% 1 2.5% 1 0.0% 0 0.0% 0 0.0% 0 1.7% 1 0.9% 1 0.0% 0(Nothing / nothing further) 41.0% 120 45.2% 27 39.6% 13 0.0% 0 0.0% 0 52.8% 23 42.2% 31 28.0% 18 0.0% 0Weighted base: 293 61 34 0 0 44 73 65 0Sample: 365 64 80 0 0 32 55 85 0

by Zone (Weighted, Part 1) South Wales Retail Study Page 72 Weighted: for Carter Jonas August 2016
Total Zone 1 Zone 2 Zone 3 Zone 4 Zone 5 Zone 6 Zone 7 Zone 8
Column %ges. 020716 NEMS market research
Q44X In order of importance, what are your two main reasons for visiting Narberth Town Centre? Any mention: [MR] Zones 1, 2, 5-7 & 9 and those who visit Narberth town centre at Q43 Food shopping 25.8% 77 13.1% 8 6.9% 2 0.0% 0 0.0% 0 10.8% 5 25.1% 19 59.1% 39 0.0% 0Non-food shopping 66.0% 197 75.0% 46 67.7% 23 0.0% 0 0.0% 0 76.1% 35 74.1% 55 40.8% 27 0.0% 0To visit bars / pubs 2.4% 7 0.0% 0 3.5% 1 0.0% 0 0.0% 0 2.8% 1 0.0% 0 5.3% 4 0.0% 0To visit cafés / restaurants 22.8% 68 37.5% 23 44.1% 15 0.0% 0 0.0% 0 26.8% 12 11.3% 8 6.9% 5 0.0% 0To visit personal service
providers (e.g. hairdressers, beauty salon etc.)
0.9% 3 0.0% 0 0.0% 0 0.0% 0 0.0% 0 0.0% 0 3.7% 3 0.0% 0 0.0% 0
To visit financial services such as banks and other financial institutions
2.9% 9 0.0% 0 1.1% 0 0.0% 0 0.0% 0 0.0% 0 1.7% 1 9.7% 6 0.0% 0
To visit other service providers (e.g. travel agent, estate agent etc.)
0.9% 3 0.0% 0 2.0% 1 0.0% 0 0.0% 0 2.8% 1 0.0% 0 0.9% 1 0.0% 0
To visit public services (e.g. medical or dentist appointment, library, job centre, community centre, etc)
6.3% 19 2.5% 2 15.1% 5 0.0% 0 0.0% 0 0.0% 0 6.3% 5 11.2% 7 0.0% 0
To get petrol 0.0% 0 0.0% 0 0.0% 0 0.0% 0 0.0% 0 0.0% 0 0.0% 0 0.0% 0 0.0% 0To visit the cinema 0.0% 0 0.0% 0 0.0% 0 0.0% 0 0.0% 0 0.0% 0 0.0% 0 0.0% 0 0.0% 0To visit a park 0.0% 0 0.0% 0 0.0% 0 0.0% 0 0.0% 0 0.0% 0 0.0% 0 0.0% 0 0.0% 0To visit the swimming pool 0.4% 1 0.0% 0 0.0% 0 0.0% 0 0.0% 0 0.0% 0 0.0% 0 1.6% 1 0.0% 0To visit other gyms / health
and fitness facilities 0.0% 0 0.0% 0 0.0% 0 0.0% 0 0.0% 0 0.0% 0 0.0% 0 0.0% 0 0.0% 0
To visit the library 0.2% 0 0.0% 0 0.0% 0 0.0% 0 0.0% 0 0.0% 0 0.0% 0 0.7% 0 0.0% 0To visit museums / art
gallery 0.7% 2 3.6% 2 0.0% 0 0.0% 0 0.0% 0 0.0% 0 0.0% 0 0.0% 0 0.0% 0
To visit the theatre or musical venues
0.4% 1 1.4% 1 1.1% 0 0.0% 0 0.0% 0 0.0% 0 0.0% 0 0.0% 0 0.0% 0
To visit night time venues e.g. nightclub
0.4% 1 0.0% 0 0.0% 0 0.0% 0 0.0% 0 0.0% 0 0.0% 0 2.0% 1 0.0% 0
For other leisure activities 2.4% 7 3.0% 2 2.3% 1 0.0% 0 0.0% 0 2.1% 1 1.2% 1 2.5% 2 0.0% 0To shop at the market(s) 0.5% 1 1.1% 1 0.0% 0 0.0% 0 0.0% 0 0.0% 0 0.0% 0 0.7% 0 0.0% 0To meet family 3.4% 10 0.0% 0 5.1% 2 0.0% 0 0.0% 0 2.1% 1 5.7% 4 4.3% 3 0.0% 0To meet friends 4.6% 14 2.2% 1 2.0% 1 0.0% 0 0.0% 0 5.4% 2 11.0% 8 0.9% 1 0.0% 0To visit the theatre 0.0% 0 0.0% 0 0.0% 0 0.0% 0 0.0% 0 0.0% 0 0.0% 0 0.0% 0 0.0% 0For work (i.e. place of work) 4.9% 15 0.0% 0 0.9% 0 0.0% 0 0.0% 0 0.0% 0 3.3% 2 17.8% 12 0.0% 0For business (e.g. attend a
business appointment) 0.5% 1 0.0% 0 0.0% 0 0.0% 0 0.0% 0 0.0% 0 1.2% 1 0.7% 0 0.0% 0
For education as a student (e.g. student at college, university, or other third level education)
0.0% 0 0.0% 0 0.0% 0 0.0% 0 0.0% 0 0.0% 0 0.0% 0 0.0% 0 0.0% 0
To access public transport for onward travel (e.g. train station, bus station)
0.0% 0 0.0% 0 0.0% 0 0.0% 0 0.0% 0 0.0% 0 0.0% 0 0.0% 0 0.0% 0
Other 0.0% 0 0.0% 0 0.0% 0 0.0% 0 0.0% 0 0.0% 0 0.0% 0 0.0% 0 0.0% 0As part of a day out / for a
day out / something different
2.2% 7 0.0% 0 0.9% 0 0.0% 0 0.0% 0 9.6% 4 1.2% 1 0.0% 0 0.0% 0
Browsing / window shopping 5.8% 17 11.7% 7 3.2% 1 0.0% 0 0.0% 0 2.8% 1 7.7% 6 2.5% 2 0.0% 0Weighted base: 299 61 34 0 0 46 74 67 0Sample: 375 65 81 0 0 34 56 88 0

by Zone (Weighted, Part 1) South Wales Retail Study Page 73 Weighted: for Carter Jonas August 2016
Total Zone 1 Zone 2 Zone 3 Zone 4 Zone 5 Zone 6 Zone 7 Zone 8
Column %ges. 020716 NEMS market research
Q45 What do you like about Narberth Town Centre? [MR] Zones 1, 2, 5-7 & 9 and those who visit Narberth town centre at Q43 Attractive environment / nice
place 38.9% 116 37.9% 23 39.2% 13 0.0% 0 0.0% 0 55.2% 26 29.4% 22 37.8% 25 0.0% 0
Close to friends or relatives 0.3% 1 0.0% 0 0.0% 0 0.0% 0 0.0% 0 0.0% 0 1.2% 1 0.0% 0 0.0% 0Close to home 5.3% 16 0.0% 0 0.9% 0 0.0% 0 0.0% 0 0.0% 0 1.2% 1 22.0% 15 0.0% 0Close to work 0.4% 1 0.0% 0 0.0% 0 0.0% 0 0.0% 0 0.0% 0 0.0% 0 2.0% 1 0.0% 0Compact 7.5% 22 7.5% 5 17.7% 6 0.0% 0 0.0% 0 0.0% 0 6.9% 5 8.8% 6 0.0% 0Easy to get to by bike 0.0% 0 0.0% 0 0.0% 0 0.0% 0 0.0% 0 0.0% 0 0.0% 0 0.0% 0 0.0% 0Easy to get to by bus 0.0% 0 0.0% 0 0.0% 0 0.0% 0 0.0% 0 0.0% 0 0.0% 0 0.0% 0 0.0% 0Easy to get to by car 0.6% 2 0.0% 0 1.1% 0 0.0% 0 0.0% 0 2.7% 1 0.0% 0 0.0% 0 0.0% 0Easy to park 2.9% 9 3.9% 2 3.2% 1 0.0% 0 0.0% 0 2.7% 1 2.8% 2 2.1% 1 0.0% 0Good facilities 1.0% 3 1.1% 1 1.7% 1 0.0% 0 0.0% 0 0.0% 0 2.4% 2 0.0% 0 0.0% 0Good food stores 5.0% 15 3.9% 2 3.8% 1 0.0% 0 0.0% 0 0.0% 0 8.9% 7 5.7% 4 0.0% 0Good pubs, cafés or
restaurants 6.8% 20 8.9% 5 13.3% 5 0.0% 0 0.0% 0 10.2% 5 1.2% 1 5.2% 3 0.0% 0
Good range of non-food shops
33.3% 99 32.0% 20 37.5% 13 0.0% 0 0.0% 0 26.2% 12 42.1% 31 28.8% 19 0.0% 0
Makes a change from other places
4.9% 15 3.7% 2 2.1% 1 0.0% 0 0.0% 0 15.9% 7 2.8% 2 2.3% 2 0.0% 0
Quiet 1.2% 4 2.5% 2 0.0% 0 0.0% 0 0.0% 0 2.8% 1 0.0% 0 0.0% 0 0.0% 0Safe and secure 0.4% 1 0.0% 0 0.0% 0 0.0% 0 0.0% 0 0.0% 0 0.0% 0 1.6% 1 0.0% 0The market 1.6% 5 4.6% 3 1.2% 0 0.0% 0 0.0% 0 2.1% 1 0.0% 0 0.7% 0 0.0% 0Traditional 9.1% 27 9.1% 6 13.1% 4 0.0% 0 0.0% 0 5.6% 3 6.1% 5 13.4% 9 0.0% 0Traffic free shopping centre 0.1% 0 0.0% 0 1.2% 0 0.0% 0 0.0% 0 0.0% 0 0.0% 0 0.0% 0 0.0% 0Other 0.0% 0 0.0% 0 0.0% 0 0.0% 0 0.0% 0 0.0% 0 0.0% 0 0.0% 0 0.0% 0Cheap / free parking 0.0% 0 0.0% 0 0.0% 0 0.0% 0 0.0% 0 0.0% 0 0.0% 0 0.0% 0 0.0% 0Familiarity / habit 0.0% 0 0.0% 0 0.0% 0 0.0% 0 0.0% 0 0.0% 0 0.0% 0 0.0% 0 0.0% 0Friendly people / nice
atmosphere 5.3% 16 1.4% 1 13.0% 4 0.0% 0 0.0% 0 5.4% 2 2.4% 2 9.1% 6 0.0% 0
Good leisure facilities / things to do
0.4% 1 0.0% 0 0.0% 0 0.0% 0 0.0% 0 0.0% 0 1.7% 1 0.0% 0 0.0% 0
Good opening hours 0.0% 0 0.0% 0 0.0% 0 0.0% 0 0.0% 0 0.0% 0 0.0% 0 0.0% 0 0.0% 0Good prices 0.0% 0 0.0% 0 0.0% 0 0.0% 0 0.0% 0 0.0% 0 0.0% 0 0.0% 0 0.0% 0Good range of independent
shops 25.0% 75 38.0% 23 21.0% 7 0.0% 0 0.0% 0 34.1% 16 20.0% 15 14.2% 9 0.0% 0
Good range of services 0.3% 1 1.4% 1 0.0% 0 0.0% 0 0.0% 0 0.0% 0 0.0% 0 0.0% 0 0.0% 0(Nothing / very little) 6.1% 18 7.6% 5 2.9% 1 0.0% 0 0.0% 0 0.0% 0 6.3% 5 8.2% 5 0.0% 0(Don't know) 1.2% 3 1.4% 1 1.1% 0 0.0% 0 0.0% 0 0.0% 0 1.2% 1 0.7% 0 0.0% 0Weighted base: 299 61 34 0 0 46 74 67 0Sample: 375 65 81 0 0 34 56 88 0
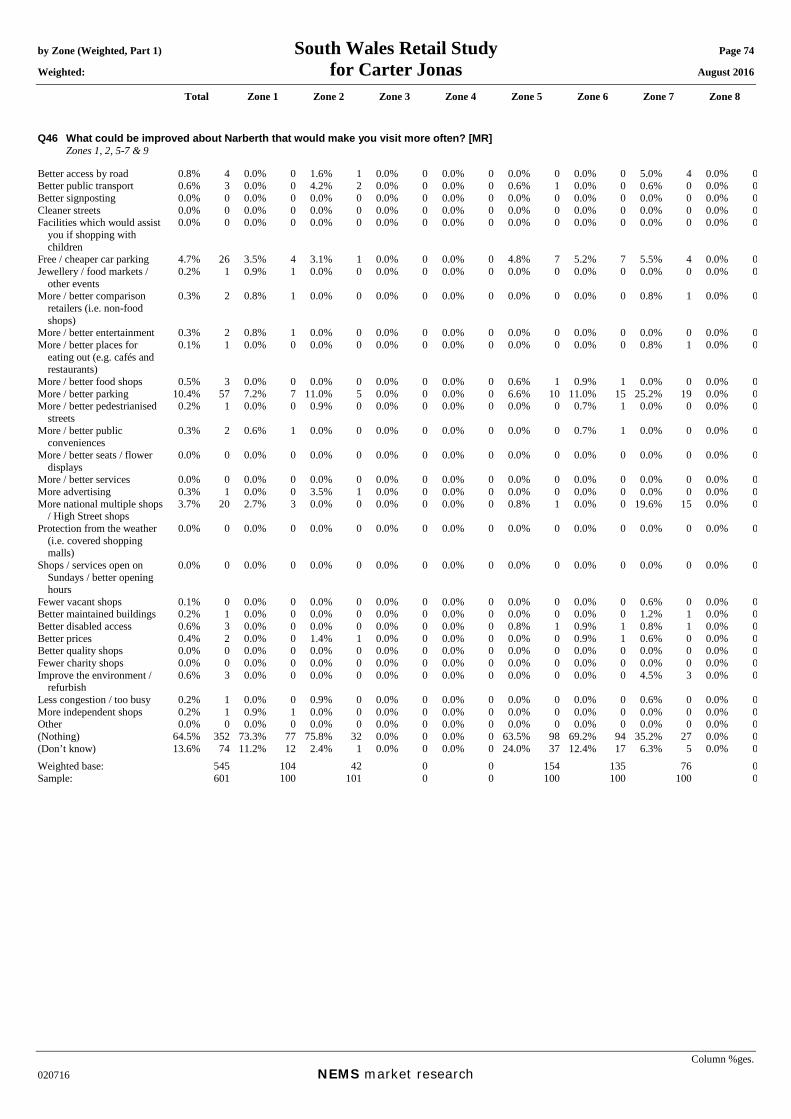
by Zone (Weighted, Part 1) South Wales Retail Study Page 74 Weighted: for Carter Jonas August 2016
Total Zone 1 Zone 2 Zone 3 Zone 4 Zone 5 Zone 6 Zone 7 Zone 8
Column %ges. 020716 NEMS market research
Q46 What could be improved about Narberth that would make you visit more often? [MR] Zones 1, 2, 5-7 & 9 Better access by road 0.8% 4 0.0% 0 1.6% 1 0.0% 0 0.0% 0 0.0% 0 0.0% 0 5.0% 4 0.0% 0Better public transport 0.6% 3 0.0% 0 4.2% 2 0.0% 0 0.0% 0 0.6% 1 0.0% 0 0.6% 0 0.0% 0Better signposting 0.0% 0 0.0% 0 0.0% 0 0.0% 0 0.0% 0 0.0% 0 0.0% 0 0.0% 0 0.0% 0Cleaner streets 0.0% 0 0.0% 0 0.0% 0 0.0% 0 0.0% 0 0.0% 0 0.0% 0 0.0% 0 0.0% 0Facilities which would assist
you if shopping with children
0.0% 0 0.0% 0 0.0% 0 0.0% 0 0.0% 0 0.0% 0 0.0% 0 0.0% 0 0.0% 0
Free / cheaper car parking 4.7% 26 3.5% 4 3.1% 1 0.0% 0 0.0% 0 4.8% 7 5.2% 7 5.5% 4 0.0% 0Jewellery / food markets /
other events 0.2% 1 0.9% 1 0.0% 0 0.0% 0 0.0% 0 0.0% 0 0.0% 0 0.0% 0 0.0% 0
More / better comparison retailers (i.e. non-food shops)
0.3% 2 0.8% 1 0.0% 0 0.0% 0 0.0% 0 0.0% 0 0.0% 0 0.8% 1 0.0% 0
More / better entertainment 0.3% 2 0.8% 1 0.0% 0 0.0% 0 0.0% 0 0.0% 0 0.0% 0 0.0% 0 0.0% 0More / better places for
eating out (e.g. cafés and restaurants)
0.1% 1 0.0% 0 0.0% 0 0.0% 0 0.0% 0 0.0% 0 0.0% 0 0.8% 1 0.0% 0
More / better food shops 0.5% 3 0.0% 0 0.0% 0 0.0% 0 0.0% 0 0.6% 1 0.9% 1 0.0% 0 0.0% 0More / better parking 10.4% 57 7.2% 7 11.0% 5 0.0% 0 0.0% 0 6.6% 10 11.0% 15 25.2% 19 0.0% 0More / better pedestrianised
streets 0.2% 1 0.0% 0 0.9% 0 0.0% 0 0.0% 0 0.0% 0 0.7% 1 0.0% 0 0.0% 0
More / better public conveniences
0.3% 2 0.6% 1 0.0% 0 0.0% 0 0.0% 0 0.0% 0 0.7% 1 0.0% 0 0.0% 0
More / better seats / flower displays
0.0% 0 0.0% 0 0.0% 0 0.0% 0 0.0% 0 0.0% 0 0.0% 0 0.0% 0 0.0% 0
More / better services 0.0% 0 0.0% 0 0.0% 0 0.0% 0 0.0% 0 0.0% 0 0.0% 0 0.0% 0 0.0% 0More advertising 0.3% 1 0.0% 0 3.5% 1 0.0% 0 0.0% 0 0.0% 0 0.0% 0 0.0% 0 0.0% 0More national multiple shops
/ High Street shops 3.7% 20 2.7% 3 0.0% 0 0.0% 0 0.0% 0 0.8% 1 0.0% 0 19.6% 15 0.0% 0
Protection from the weather (i.e. covered shopping malls)
0.0% 0 0.0% 0 0.0% 0 0.0% 0 0.0% 0 0.0% 0 0.0% 0 0.0% 0 0.0% 0
Shops / services open on Sundays / better opening hours
0.0% 0 0.0% 0 0.0% 0 0.0% 0 0.0% 0 0.0% 0 0.0% 0 0.0% 0 0.0% 0
Fewer vacant shops 0.1% 0 0.0% 0 0.0% 0 0.0% 0 0.0% 0 0.0% 0 0.0% 0 0.6% 0 0.0% 0Better maintained buildings 0.2% 1 0.0% 0 0.0% 0 0.0% 0 0.0% 0 0.0% 0 0.0% 0 1.2% 1 0.0% 0Better disabled access 0.6% 3 0.0% 0 0.0% 0 0.0% 0 0.0% 0 0.8% 1 0.9% 1 0.8% 1 0.0% 0Better prices 0.4% 2 0.0% 0 1.4% 1 0.0% 0 0.0% 0 0.0% 0 0.9% 1 0.6% 0 0.0% 0Better quality shops 0.0% 0 0.0% 0 0.0% 0 0.0% 0 0.0% 0 0.0% 0 0.0% 0 0.0% 0 0.0% 0Fewer charity shops 0.0% 0 0.0% 0 0.0% 0 0.0% 0 0.0% 0 0.0% 0 0.0% 0 0.0% 0 0.0% 0Improve the environment /
refurbish 0.6% 3 0.0% 0 0.0% 0 0.0% 0 0.0% 0 0.0% 0 0.0% 0 4.5% 3 0.0% 0
Less congestion / too busy 0.2% 1 0.0% 0 0.9% 0 0.0% 0 0.0% 0 0.0% 0 0.0% 0 0.6% 0 0.0% 0More independent shops 0.2% 1 0.9% 1 0.0% 0 0.0% 0 0.0% 0 0.0% 0 0.0% 0 0.0% 0 0.0% 0Other 0.0% 0 0.0% 0 0.0% 0 0.0% 0 0.0% 0 0.0% 0 0.0% 0 0.0% 0 0.0% 0(Nothing) 64.5% 352 73.3% 77 75.8% 32 0.0% 0 0.0% 0 63.5% 98 69.2% 94 35.2% 27 0.0% 0(Don’t know) 13.6% 74 11.2% 12 2.4% 1 0.0% 0 0.0% 0 24.0% 37 12.4% 17 6.3% 5 0.0% 0Weighted base: 545 104 42 0 0 154 135 76 0Sample: 601 100 101 0 0 100 100 100 0

by Zone (Weighted, Part 1) South Wales Retail Study Page 75 Weighted: for Carter Jonas August 2016
Total Zone 1 Zone 2 Zone 3 Zone 4 Zone 5 Zone 6 Zone 7 Zone 8
Column %ges. 020716 NEMS market research
Mean score [Times a year, those who visit]: Daily = 365, 4-6 days a week = 234, 2-3 days a week = 130, One day a week = 52, Every two weeks = 24, Monthly = 12, Once every two months = 6, Three-four times a year = 3.5, Once a year = 1, Less often = 0.25
Q47 How often do you or your household visit Tenby for shopping and other town centre services? Zones 4-7 Daily 4.4% 23 0.0% 0 0.0% 0 0.0% 0 0.0% 0 0.8% 1 16.0% 22 0.0% 0 0.0% 04-6 days a week 2.6% 13 0.0% 0 0.0% 0 0.0% 0 0.0% 0 0.8% 1 8.9% 12 0.0% 0 0.0% 02-3 days a week 3.0% 15 0.0% 0 0.0% 0 0.0% 0 0.0% 0 0.6% 1 10.3% 14 0.6% 0 0.0% 0One day a week 10.3% 53 0.0% 0 0.0% 0 0.0% 0 7.0% 11 5.1% 8 22.6% 31 5.3% 4 0.0% 0Every two weeks 3.7% 19 0.0% 0 0.0% 0 0.0% 0 0.0% 0 5.8% 9 4.1% 6 6.2% 5 0.0% 0Monthly 5.1% 26 0.0% 0 0.0% 0 0.0% 0 1.6% 2 6.4% 10 7.6% 10 4.7% 4 0.0% 0Once every two months 3.2% 17 0.0% 0 0.0% 0 0.0% 0 6.4% 10 2.9% 4 0.7% 1 2.0% 2 0.0% 0Three-four times a year 7.2% 37 0.0% 0 0.0% 0 0.0% 0 12.6% 19 7.5% 12 1.7% 2 5.6% 4 0.0% 0Once a year 7.2% 37 0.0% 0 0.0% 0 0.0% 0 18.4% 28 2.3% 3 1.3% 2 5.0% 4 0.0% 0Less often 1.5% 8 0.0% 0 0.0% 0 0.0% 0 1.8% 3 2.6% 4 0.0% 0 1.6% 1 0.0% 0Never 50.2% 259 0.0% 0 0.0% 0 0.0% 0 51.5% 78 64.6% 100 22.5% 30 67.5% 51 0.0% 0(Don’t know) 0.1% 1 0.0% 0 0.0% 0 0.0% 0 0.0% 0 0.0% 0 0.0% 0 0.9% 1 0.0% 0(Varies) 1.6% 8 0.0% 0 0.0% 0 0.0% 0 0.6% 1 0.6% 1 4.4% 6 0.6% 0 0.0% 0Mean: 69.36 0.00 0.00 0.00 10.11 31.73 145.15 19.28 0.00Weighted base: 517 0 0 0 151 154 135 76 0Sample: 400 0 0 0 100 100 100 100 0

by Zone (Weighted, Part 1) South Wales Retail Study Page 76 Weighted: for Carter Jonas August 2016
Total Zone 1 Zone 2 Zone 3 Zone 4 Zone 5 Zone 6 Zone 7 Zone 8
Column %ges. 020716 NEMS market research
Q48A In order of importance, what are your two main reasons for visiting Tenby Town Centre? Main reason: Zones 4-7 and those who visit Tenby town centre at Q47 Food shopping 12.3% 32 0.0% 0 0.0% 0 0.0% 0 0.0% 0 0.0% 0 29.7% 31 2.4% 1 0.0% 0Non-food shopping 28.7% 74 0.0% 0 0.0% 0 0.0% 0 8.1% 6 45.2% 25 37.3% 39 16.9% 4 0.0% 0To visit bars / pubs 1.2% 3 0.0% 0 0.0% 0 0.0% 0 0.0% 0 2.4% 1 1.2% 1 2.4% 1 0.0% 0To visit cafés / restaurants 7.3% 19 0.0% 0 0.0% 0 0.0% 0 12.1% 9 8.6% 5 4.5% 5 1.8% 0 0.0% 0To visit personal service
providers (e.g. hairdressers, beauty salon etc.)
0.8% 2 0.0% 0 0.0% 0 0.0% 0 0.0% 0 0.0% 0 2.0% 2 0.0% 0 0.0% 0
To visit financial services such as banks and other financial institutions
3.1% 8 0.0% 0 0.0% 0 0.0% 0 0.0% 0 0.0% 0 7.1% 7 2.5% 1 0.0% 0
To visit other service providers (e.g. travel agent, estate agent etc.)
1.2% 3 0.0% 0 0.0% 0 0.0% 0 0.0% 0 2.4% 1 1.7% 2 0.0% 0 0.0% 0
To visit public services (e.g. medical or dentist appointment, library, job centre, community centre, etc)
0.5% 1 0.0% 0 0.0% 0 0.0% 0 0.0% 0 1.7% 1 0.0% 0 1.8% 0 0.0% 0
To get petrol 0.0% 0 0.0% 0 0.0% 0 0.0% 0 0.0% 0 0.0% 0 0.0% 0 0.0% 0 0.0% 0To visit the cinema 0.0% 0 0.0% 0 0.0% 0 0.0% 0 0.0% 0 0.0% 0 0.0% 0 0.0% 0 0.0% 0To visit a park 0.0% 0 0.0% 0 0.0% 0 0.0% 0 0.0% 0 0.0% 0 0.0% 0 0.0% 0 0.0% 0To visit the swimming pool 0.0% 0 0.0% 0 0.0% 0 0.0% 0 0.0% 0 0.0% 0 0.0% 0 0.0% 0 0.0% 0To visit other gyms / health
and fitness facilities 0.0% 0 0.0% 0 0.0% 0 0.0% 0 0.0% 0 0.0% 0 0.0% 0 0.0% 0 0.0% 0
To visit the library 0.0% 0 0.0% 0 0.0% 0 0.0% 0 0.0% 0 0.0% 0 0.0% 0 0.0% 0 0.0% 0To visit museums / art
gallery 0.0% 0 0.0% 0 0.0% 0 0.0% 0 0.0% 0 0.0% 0 0.0% 0 0.0% 0 0.0% 0
To visit the theatre or musical venues
0.0% 0 0.0% 0 0.0% 0 0.0% 0 0.0% 0 0.0% 0 0.0% 0 0.0% 0 0.0% 0
To visit night time venues e.g. nightclub
0.0% 0 0.0% 0 0.0% 0 0.0% 0 0.0% 0 0.0% 0 0.0% 0 0.0% 0 0.0% 0
For other leisure activities 15.9% 41 0.0% 0 0.0% 0 0.0% 0 39.2% 29 5.8% 3 1.7% 2 29.0% 7 0.0% 0To shop at the market(s) 0.0% 0 0.0% 0 0.0% 0 0.0% 0 0.0% 0 0.0% 0 0.0% 0 0.0% 0 0.0% 0To meet family 0.7% 2 0.0% 0 0.0% 0 0.0% 0 1.3% 1 0.0% 0 0.0% 0 3.7% 1 0.0% 0To meet friends 1.1% 3 0.0% 0 0.0% 0 0.0% 0 1.7% 1 0.0% 0 0.0% 0 6.7% 2 0.0% 0To visit the theatre 0.0% 0 0.0% 0 0.0% 0 0.0% 0 0.0% 0 0.0% 0 0.0% 0 0.0% 0 0.0% 0For work (i.e. place of work) 2.9% 8 0.0% 0 0.0% 0 0.0% 0 1.7% 1 4.7% 3 3.6% 4 0.0% 0 0.0% 0For business (e.g. attend a
business appointment) 0.0% 0 0.0% 0 0.0% 0 0.0% 0 0.0% 0 0.0% 0 0.0% 0 0.0% 0 0.0% 0
For education as a student (e.g. student at college, university, or other third level education)
0.0% 0 0.0% 0 0.0% 0 0.0% 0 0.0% 0 0.0% 0 0.0% 0 0.0% 0 0.0% 0
To access public transport for onward travel (e.g. train station, bus station)
0.0% 0 0.0% 0 0.0% 0 0.0% 0 0.0% 0 0.0% 0 0.0% 0 0.0% 0 0.0% 0
Other 0.0% 0 0.0% 0 0.0% 0 0.0% 0 0.0% 0 0.0% 0 0.0% 0 0.0% 0 0.0% 0As part of a day out / for a
day out / something different
16.0% 41 0.0% 0 0.0% 0 0.0% 0 34.3% 25 18.5% 10 0.0% 0 23.7% 6 0.0% 0
Browsing / window shopping 4.4% 11 0.0% 0 0.0% 0 0.0% 0 0.0% 0 1.7% 1 8.5% 9 6.2% 2 0.0% 0(Don't know / varies) 2.0% 5 0.0% 0 0.0% 0 0.0% 0 0.0% 0 5.0% 3 1.7% 2 2.8% 1 0.0% 0(Nothing / nothing further) 1.7% 4 0.0% 0 0.0% 0 0.0% 0 1.7% 1 4.1% 2 0.9% 1 0.0% 0 0.0% 0Weighted base: 258 0 0 0 73 55 105 25 0Sample: 196 0 0 0 47 39 76 34 0

by Zone (Weighted, Part 1) South Wales Retail Study Page 77 Weighted: for Carter Jonas August 2016
Total Zone 1 Zone 2 Zone 3 Zone 4 Zone 5 Zone 6 Zone 7 Zone 8
Column %ges. 020716 NEMS market research
Q48B In order of importance, what are your two main reasons for visiting Tenby Town Centre? Secondary reason: Those who gave a reason at Q48A Food shopping 6.0% 15 0.0% 0 0.0% 0 0.0% 0 1.3% 1 1.9% 1 11.6% 12 4.5% 1 0.0% 0Non-food shopping 11.8% 29 0.0% 0 0.0% 0 0.0% 0 11.7% 8 3.8% 2 17.2% 18 5.5% 1 0.0% 0To visit bars / pubs 1.1% 3 0.0% 0 0.0% 0 0.0% 0 0.0% 0 5.5% 3 0.0% 0 0.0% 0 0.0% 0To visit cafés / restaurants 14.3% 35 0.0% 0 0.0% 0 0.0% 0 27.5% 20 11.0% 5 5.3% 5 19.4% 5 0.0% 0To visit personal service
providers (e.g. hairdressers, beauty salon etc.)
0.0% 0 0.0% 0 0.0% 0 0.0% 0 0.0% 0 0.0% 0 0.0% 0 0.0% 0 0.0% 0
To visit financial services such as banks and other financial institutions
3.1% 8 0.0% 0 0.0% 0 0.0% 0 0.0% 0 0.0% 0 7.5% 8 0.0% 0 0.0% 0
To visit other service providers (e.g. travel agent, estate agent etc.)
0.0% 0 0.0% 0 0.0% 0 0.0% 0 0.0% 0 0.0% 0 0.0% 0 0.0% 0 0.0% 0
To visit public services (e.g. medical or dentist appointment, library, job centre, community centre, etc)
0.0% 0 0.0% 0 0.0% 0 0.0% 0 0.0% 0 0.0% 0 0.0% 0 0.0% 0 0.0% 0
To get petrol 0.0% 0 0.0% 0 0.0% 0 0.0% 0 0.0% 0 0.0% 0 0.0% 0 0.0% 0 0.0% 0To visit the cinema 0.0% 0 0.0% 0 0.0% 0 0.0% 0 0.0% 0 0.0% 0 0.0% 0 0.0% 0 0.0% 0To visit a park 0.0% 0 0.0% 0 0.0% 0 0.0% 0 0.0% 0 0.0% 0 0.0% 0 0.0% 0 0.0% 0To visit the swimming pool 0.5% 1 0.0% 0 0.0% 0 0.0% 0 0.0% 0 0.0% 0 1.2% 1 0.0% 0 0.0% 0To visit other gyms / health
and fitness facilities 0.0% 0 0.0% 0 0.0% 0 0.0% 0 0.0% 0 0.0% 0 0.0% 0 0.0% 0 0.0% 0
To visit the library 0.0% 0 0.0% 0 0.0% 0 0.0% 0 0.0% 0 0.0% 0 0.0% 0 0.0% 0 0.0% 0To visit museums / art
gallery 0.0% 0 0.0% 0 0.0% 0 0.0% 0 0.0% 0 0.0% 0 0.0% 0 0.0% 0 0.0% 0
To visit the theatre or musical venues
0.0% 0 0.0% 0 0.0% 0 0.0% 0 0.0% 0 0.0% 0 0.0% 0 0.0% 0 0.0% 0
To visit night time venues e.g. nightclub
0.0% 0 0.0% 0 0.0% 0 0.0% 0 0.0% 0 0.0% 0 0.0% 0 0.0% 0 0.0% 0
For other leisure activities 4.2% 10 0.0% 0 0.0% 0 0.0% 0 6.9% 5 0.0% 0 3.3% 3 8.9% 2 0.0% 0To shop at the market(s) 0.0% 0 0.0% 0 0.0% 0 0.0% 0 0.0% 0 0.0% 0 0.0% 0 0.0% 0 0.0% 0To meet family 2.7% 7 0.0% 0 0.0% 0 0.0% 0 0.0% 0 4.5% 2 4.4% 5 0.0% 0 0.0% 0To meet friends 3.3% 8 0.0% 0 0.0% 0 0.0% 0 0.0% 0 10.0% 5 0.9% 1 9.5% 2 0.0% 0To visit the theatre 0.0% 0 0.0% 0 0.0% 0 0.0% 0 0.0% 0 0.0% 0 0.0% 0 0.0% 0 0.0% 0For work (i.e. place of work) 1.2% 3 0.0% 0 0.0% 0 0.0% 0 0.0% 0 0.0% 0 2.4% 2 1.9% 0 0.0% 0For business (e.g. attend a
business appointment) 1.8% 5 0.0% 0 0.0% 0 0.0% 0 0.0% 0 0.0% 0 4.4% 5 0.0% 0 0.0% 0
For education as a student (e.g. student at college, university, or other third level education)
0.0% 0 0.0% 0 0.0% 0 0.0% 0 0.0% 0 0.0% 0 0.0% 0 0.0% 0 0.0% 0
To access public transport for onward travel (e.g. train station, bus station)
0.0% 0 0.0% 0 0.0% 0 0.0% 0 0.0% 0 0.0% 0 0.0% 0 0.0% 0 0.0% 0
Other 0.0% 0 0.0% 0 0.0% 0 0.0% 0 0.0% 0 0.0% 0 0.0% 0 0.0% 0 0.0% 0As part of a day out / for a
day out / something different
3.1% 8 0.0% 0 0.0% 0 0.0% 0 1.7% 1 10.8% 5 0.0% 0 5.1% 1 0.0% 0
Browsing / window shopping 2.8% 7 0.0% 0 0.0% 0 0.0% 0 1.8% 1 2.5% 1 3.8% 4 2.5% 1 0.0% 0(Don't know / varies) 1.1% 3 0.0% 0 0.0% 0 0.0% 0 0.0% 0 0.0% 0 2.6% 3 0.0% 0 0.0% 0(Nothing / nothing further) 43.1% 107 0.0% 0 0.0% 0 0.0% 0 49.2% 36 49.9% 25 35.4% 36 42.9% 10 0.0% 0Weighted base: 248 0 0 0 72 50 102 24 0Sample: 188 0 0 0 46 36 73 33 0

by Zone (Weighted, Part 1) South Wales Retail Study Page 78 Weighted: for Carter Jonas August 2016
Total Zone 1 Zone 2 Zone 3 Zone 4 Zone 5 Zone 6 Zone 7 Zone 8
Column %ges. 020716 NEMS market research
Q48X In order of importance, what are your two main reasons for visiting Tenby Town Centre? Any mention: [MR] Zones 4-7 and those who visit Tenby town centre at Q47 Food shopping 18.1% 47 0.0% 0 0.0% 0 0.0% 0 1.3% 1 1.7% 1 41.0% 43 6.8% 2 0.0% 0Non-food shopping 40.0% 103 0.0% 0 0.0% 0 0.0% 0 19.6% 14 48.7% 27 54.0% 57 22.2% 6 0.0% 0To visit bars / pubs 2.3% 6 0.0% 0 0.0% 0 0.0% 0 0.0% 0 7.4% 4 1.2% 1 2.4% 1 0.0% 0To visit cafés / restaurants 21.0% 54 0.0% 0 0.0% 0 0.0% 0 39.1% 29 18.6% 10 9.7% 10 20.7% 5 0.0% 0To visit personal service
providers (e.g. hairdressers, beauty salon etc.)
0.8% 2 0.0% 0 0.0% 0 0.0% 0 0.0% 0 0.0% 0 2.0% 2 0.0% 0 0.0% 0
To visit financial services such as banks and other financial institutions
6.1% 16 0.0% 0 0.0% 0 0.0% 0 0.0% 0 0.0% 0 14.4% 15 2.5% 1 0.0% 0
To visit other service providers (e.g. travel agent, estate agent etc.)
1.2% 3 0.0% 0 0.0% 0 0.0% 0 0.0% 0 2.4% 1 1.7% 2 0.0% 0 0.0% 0
To visit public services (e.g. medical or dentist appointment, library, job centre, community centre, etc)
0.5% 1 0.0% 0 0.0% 0 0.0% 0 0.0% 0 1.7% 1 0.0% 0 1.8% 0 0.0% 0
To get petrol 0.0% 0 0.0% 0 0.0% 0 0.0% 0 0.0% 0 0.0% 0 0.0% 0 0.0% 0 0.0% 0To visit the cinema 0.0% 0 0.0% 0 0.0% 0 0.0% 0 0.0% 0 0.0% 0 0.0% 0 0.0% 0 0.0% 0To visit a park 0.0% 0 0.0% 0 0.0% 0 0.0% 0 0.0% 0 0.0% 0 0.0% 0 0.0% 0 0.0% 0To visit the swimming pool 0.5% 1 0.0% 0 0.0% 0 0.0% 0 0.0% 0 0.0% 0 1.1% 1 0.0% 0 0.0% 0To visit other gyms / health
and fitness facilities 0.0% 0 0.0% 0 0.0% 0 0.0% 0 0.0% 0 0.0% 0 0.0% 0 0.0% 0 0.0% 0
To visit the library 0.0% 0 0.0% 0 0.0% 0 0.0% 0 0.0% 0 0.0% 0 0.0% 0 0.0% 0 0.0% 0To visit museums / art
gallery 0.0% 0 0.0% 0 0.0% 0 0.0% 0 0.0% 0 0.0% 0 0.0% 0 0.0% 0 0.0% 0
To visit the theatre or musical venues
0.0% 0 0.0% 0 0.0% 0 0.0% 0 0.0% 0 0.0% 0 0.0% 0 0.0% 0 0.0% 0
To visit night time venues e.g. nightclub
0.0% 0 0.0% 0 0.0% 0 0.0% 0 0.0% 0 0.0% 0 0.0% 0 0.0% 0 0.0% 0
For other leisure activities 20.0% 51 0.0% 0 0.0% 0 0.0% 0 46.0% 34 5.8% 3 5.0% 5 37.6% 9 0.0% 0To shop at the market(s) 0.0% 0 0.0% 0 0.0% 0 0.0% 0 0.0% 0 0.0% 0 0.0% 0 0.0% 0 0.0% 0To meet family 3.3% 9 0.0% 0 0.0% 0 0.0% 0 1.3% 1 4.1% 2 4.3% 5 3.7% 1 0.0% 0To meet friends 4.3% 11 0.0% 0 0.0% 0 0.0% 0 1.7% 1 9.1% 5 0.9% 1 15.9% 4 0.0% 0To visit the theatre 0.0% 0 0.0% 0 0.0% 0 0.0% 0 0.0% 0 0.0% 0 0.0% 0 0.0% 0 0.0% 0For work (i.e. place of work) 4.0% 10 0.0% 0 0.0% 0 0.0% 0 1.7% 1 4.7% 3 5.9% 6 1.8% 0 0.0% 0For business (e.g. attend a
business appointment) 1.8% 5 0.0% 0 0.0% 0 0.0% 0 0.0% 0 0.0% 0 4.3% 5 0.0% 0 0.0% 0
For education as a student (e.g. student at college, university, or other third level education)
0.0% 0 0.0% 0 0.0% 0 0.0% 0 0.0% 0 0.0% 0 0.0% 0 0.0% 0 0.0% 0
To access public transport for onward travel (e.g. train station, bus station)
0.0% 0 0.0% 0 0.0% 0 0.0% 0 0.0% 0 0.0% 0 0.0% 0 0.0% 0 0.0% 0
Other 0.0% 0 0.0% 0 0.0% 0 0.0% 0 0.0% 0 0.0% 0 0.0% 0 0.0% 0 0.0% 0As part of a day out / for a
day out / something different
19.0% 49 0.0% 0 0.0% 0 0.0% 0 36.0% 26 28.2% 15 0.0% 0 28.6% 7 0.0% 0
Browsing / window shopping 7.1% 18 0.0% 0 0.0% 0 0.0% 0 1.7% 1 4.0% 2 12.1% 13 8.6% 2 0.0% 0Weighted base: 258 0 0 0 73 55 105 25 0Sample: 196 0 0 0 47 39 76 34 0
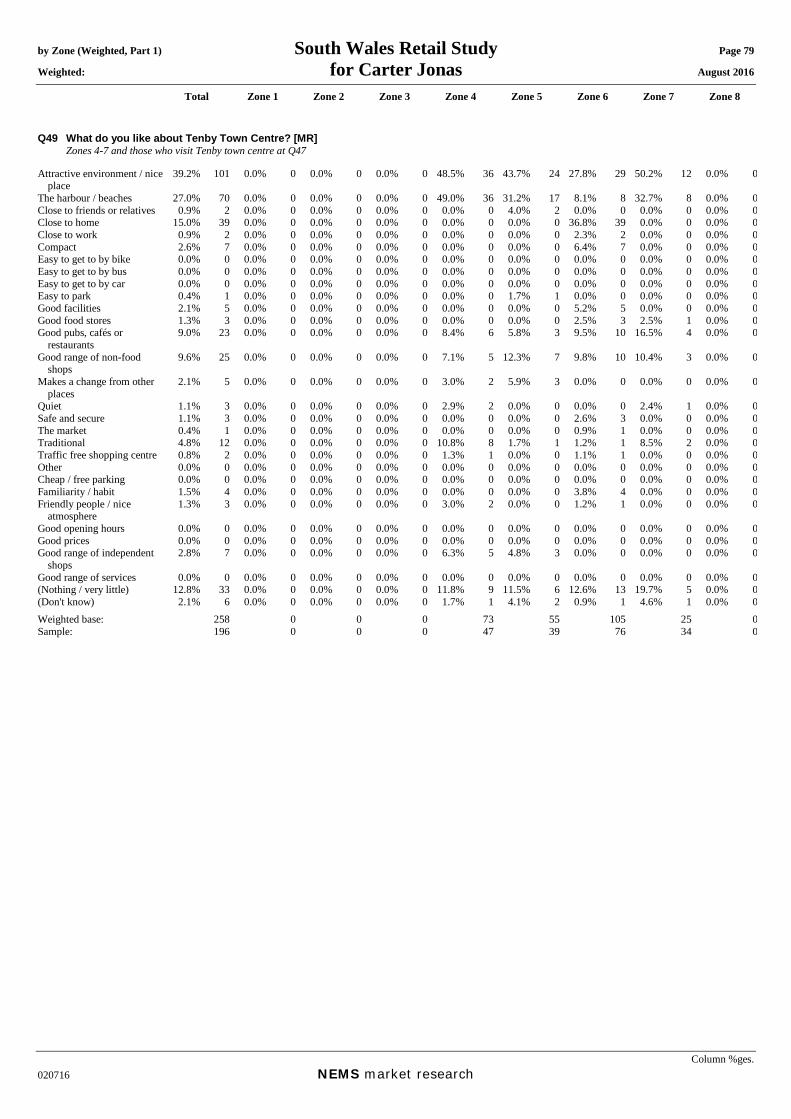
by Zone (Weighted, Part 1) South Wales Retail Study Page 79 Weighted: for Carter Jonas August 2016
Total Zone 1 Zone 2 Zone 3 Zone 4 Zone 5 Zone 6 Zone 7 Zone 8
Column %ges. 020716 NEMS market research
Q49 What do you like about Tenby Town Centre? [MR] Zones 4-7 and those who visit Tenby town centre at Q47 Attractive environment / nice
place 39.2% 101 0.0% 0 0.0% 0 0.0% 0 48.5% 36 43.7% 24 27.8% 29 50.2% 12 0.0% 0
The harbour / beaches 27.0% 70 0.0% 0 0.0% 0 0.0% 0 49.0% 36 31.2% 17 8.1% 8 32.7% 8 0.0% 0Close to friends or relatives 0.9% 2 0.0% 0 0.0% 0 0.0% 0 0.0% 0 4.0% 2 0.0% 0 0.0% 0 0.0% 0Close to home 15.0% 39 0.0% 0 0.0% 0 0.0% 0 0.0% 0 0.0% 0 36.8% 39 0.0% 0 0.0% 0Close to work 0.9% 2 0.0% 0 0.0% 0 0.0% 0 0.0% 0 0.0% 0 2.3% 2 0.0% 0 0.0% 0Compact 2.6% 7 0.0% 0 0.0% 0 0.0% 0 0.0% 0 0.0% 0 6.4% 7 0.0% 0 0.0% 0Easy to get to by bike 0.0% 0 0.0% 0 0.0% 0 0.0% 0 0.0% 0 0.0% 0 0.0% 0 0.0% 0 0.0% 0Easy to get to by bus 0.0% 0 0.0% 0 0.0% 0 0.0% 0 0.0% 0 0.0% 0 0.0% 0 0.0% 0 0.0% 0Easy to get to by car 0.0% 0 0.0% 0 0.0% 0 0.0% 0 0.0% 0 0.0% 0 0.0% 0 0.0% 0 0.0% 0Easy to park 0.4% 1 0.0% 0 0.0% 0 0.0% 0 0.0% 0 1.7% 1 0.0% 0 0.0% 0 0.0% 0Good facilities 2.1% 5 0.0% 0 0.0% 0 0.0% 0 0.0% 0 0.0% 0 5.2% 5 0.0% 0 0.0% 0Good food stores 1.3% 3 0.0% 0 0.0% 0 0.0% 0 0.0% 0 0.0% 0 2.5% 3 2.5% 1 0.0% 0Good pubs, cafés or
restaurants 9.0% 23 0.0% 0 0.0% 0 0.0% 0 8.4% 6 5.8% 3 9.5% 10 16.5% 4 0.0% 0
Good range of non-food shops
9.6% 25 0.0% 0 0.0% 0 0.0% 0 7.1% 5 12.3% 7 9.8% 10 10.4% 3 0.0% 0
Makes a change from other places
2.1% 5 0.0% 0 0.0% 0 0.0% 0 3.0% 2 5.9% 3 0.0% 0 0.0% 0 0.0% 0
Quiet 1.1% 3 0.0% 0 0.0% 0 0.0% 0 2.9% 2 0.0% 0 0.0% 0 2.4% 1 0.0% 0Safe and secure 1.1% 3 0.0% 0 0.0% 0 0.0% 0 0.0% 0 0.0% 0 2.6% 3 0.0% 0 0.0% 0The market 0.4% 1 0.0% 0 0.0% 0 0.0% 0 0.0% 0 0.0% 0 0.9% 1 0.0% 0 0.0% 0Traditional 4.8% 12 0.0% 0 0.0% 0 0.0% 0 10.8% 8 1.7% 1 1.2% 1 8.5% 2 0.0% 0Traffic free shopping centre 0.8% 2 0.0% 0 0.0% 0 0.0% 0 1.3% 1 0.0% 0 1.1% 1 0.0% 0 0.0% 0Other 0.0% 0 0.0% 0 0.0% 0 0.0% 0 0.0% 0 0.0% 0 0.0% 0 0.0% 0 0.0% 0Cheap / free parking 0.0% 0 0.0% 0 0.0% 0 0.0% 0 0.0% 0 0.0% 0 0.0% 0 0.0% 0 0.0% 0Familiarity / habit 1.5% 4 0.0% 0 0.0% 0 0.0% 0 0.0% 0 0.0% 0 3.8% 4 0.0% 0 0.0% 0Friendly people / nice
atmosphere 1.3% 3 0.0% 0 0.0% 0 0.0% 0 3.0% 2 0.0% 0 1.2% 1 0.0% 0 0.0% 0
Good opening hours 0.0% 0 0.0% 0 0.0% 0 0.0% 0 0.0% 0 0.0% 0 0.0% 0 0.0% 0 0.0% 0Good prices 0.0% 0 0.0% 0 0.0% 0 0.0% 0 0.0% 0 0.0% 0 0.0% 0 0.0% 0 0.0% 0Good range of independent
shops 2.8% 7 0.0% 0 0.0% 0 0.0% 0 6.3% 5 4.8% 3 0.0% 0 0.0% 0 0.0% 0
Good range of services 0.0% 0 0.0% 0 0.0% 0 0.0% 0 0.0% 0 0.0% 0 0.0% 0 0.0% 0 0.0% 0(Nothing / very little) 12.8% 33 0.0% 0 0.0% 0 0.0% 0 11.8% 9 11.5% 6 12.6% 13 19.7% 5 0.0% 0(Don't know) 2.1% 6 0.0% 0 0.0% 0 0.0% 0 1.7% 1 4.1% 2 0.9% 1 4.6% 1 0.0% 0Weighted base: 258 0 0 0 73 55 105 25 0Sample: 196 0 0 0 47 39 76 34 0

by Zone (Weighted, Part 1) South Wales Retail Study Page 80 Weighted: for Carter Jonas August 2016
Total Zone 1 Zone 2 Zone 3 Zone 4 Zone 5 Zone 6 Zone 7 Zone 8
Column %ges. 020716 NEMS market research
Q50 What could be improved about Tenby that would make you visit more often? [MR] Zones 4-7 Better access by road 0.9% 4 0.0% 0 0.0% 0 0.0% 0 0.0% 0 1.7% 3 1.0% 1 0.6% 0 0.0% 0Better public transport 0.4% 2 0.0% 0 0.0% 0 0.0% 0 0.0% 0 0.6% 1 0.7% 1 0.0% 0 0.0% 0Better signposting 0.2% 1 0.0% 0 0.0% 0 0.0% 0 0.0% 0 0.0% 0 0.9% 1 0.0% 0 0.0% 0Cleaner streets 1.2% 6 0.0% 0 0.0% 0 0.0% 0 0.8% 1 0.8% 1 2.3% 3 0.8% 1 0.0% 0Facilities which would assist
you if shopping with children
0.0% 0 0.0% 0 0.0% 0 0.0% 0 0.0% 0 0.0% 0 0.0% 0 0.0% 0 0.0% 0
Free / cheaper car parking 2.7% 14 0.0% 0 0.0% 0 0.0% 0 0.0% 0 4.8% 7 2.8% 4 3.8% 3 0.0% 0Jewellery / food markets /
other events 0.0% 0 0.0% 0 0.0% 0 0.0% 0 0.0% 0 0.0% 0 0.0% 0 0.0% 0 0.0% 0
More / better comparison retailers (i.e. non-food shops)
5.0% 26 0.0% 0 0.0% 0 0.0% 0 0.8% 1 1.7% 3 15.5% 21 1.6% 1 0.0% 0
More / better entertainment 0.7% 4 0.0% 0 0.0% 0 0.0% 0 0.0% 0 1.5% 2 0.7% 1 0.8% 1 0.0% 0More / better places for
eating out (e.g. cafés and restaurants)
1.3% 7 0.0% 0 0.0% 0 0.0% 0 0.0% 0 0.0% 0 4.6% 6 0.8% 1 0.0% 0
More / better food shops 2.7% 14 0.0% 0 0.0% 0 0.0% 0 0.0% 0 1.8% 3 8.2% 11 0.0% 0 0.0% 0More / better parking 12.0% 62 0.0% 0 0.0% 0 0.0% 0 7.3% 11 13.1% 20 17.8% 24 8.9% 7 0.0% 0More / better pedestrianised
streets 1.0% 5 0.0% 0 0.0% 0 0.0% 0 0.0% 0 3.1% 5 0.0% 0 0.8% 1 0.0% 0
More / better public conveniences
0.0% 0 0.0% 0 0.0% 0 0.0% 0 0.0% 0 0.0% 0 0.0% 0 0.0% 0 0.0% 0
More / better seats / flower displays
0.3% 1 0.0% 0 0.0% 0 0.0% 0 0.0% 0 0.8% 1 0.0% 0 0.0% 0 0.0% 0
More / better services 0.0% 0 0.0% 0 0.0% 0 0.0% 0 0.0% 0 0.0% 0 0.0% 0 0.0% 0 0.0% 0More advertising 0.0% 0 0.0% 0 0.0% 0 0.0% 0 0.0% 0 0.0% 0 0.0% 0 0.0% 0 0.0% 0More national multiple shops
/ High Street shops 7.1% 37 0.0% 0 0.0% 0 0.0% 0 0.8% 1 2.3% 4 21.1% 28 4.7% 4 0.0% 0
Protection from the weather (i.e. covered shopping malls)
0.0% 0 0.0% 0 0.0% 0 0.0% 0 0.0% 0 0.0% 0 0.0% 0 0.0% 0 0.0% 0
Shops / services open on Sundays / better opening hours
0.0% 0 0.0% 0 0.0% 0 0.0% 0 0.0% 0 0.0% 0 0.0% 0 0.0% 0 0.0% 0
Fewer vacant shops 0.9% 4 0.0% 0 0.0% 0 0.0% 0 0.0% 0 0.0% 0 1.6% 2 3.0% 2 0.0% 0Better maintained buildings 0.2% 1 0.0% 0 0.0% 0 0.0% 0 0.0% 0 0.0% 0 0.9% 1 0.0% 0 0.0% 0Better disabled access 0.3% 2 0.0% 0 0.0% 0 0.0% 0 0.6% 1 0.0% 0 0.0% 0 0.8% 1 0.0% 0Better prices 0.0% 0 0.0% 0 0.0% 0 0.0% 0 0.0% 0 0.0% 0 0.0% 0 0.0% 0 0.0% 0Better quality shops 0.3% 2 0.0% 0 0.0% 0 0.0% 0 0.0% 0 0.0% 0 0.7% 1 0.8% 1 0.0% 0Fewer charity shops 0.1% 1 0.0% 0 0.0% 0 0.0% 0 0.0% 0 0.0% 0 0.0% 0 0.8% 1 0.0% 0Improve the environment /
refurbish 0.1% 1 0.0% 0 0.0% 0 0.0% 0 0.0% 0 0.0% 0 0.0% 0 0.8% 1 0.0% 0
Less congestion / too busy 1.5% 8 0.0% 0 0.0% 0 0.0% 0 1.2% 2 0.8% 1 0.7% 1 4.9% 4 0.0% 0More independent shops 0.2% 1 0.0% 0 0.0% 0 0.0% 0 0.0% 0 0.0% 0 0.7% 1 0.0% 0 0.0% 0Other 0.0% 0 0.0% 0 0.0% 0 0.0% 0 0.0% 0 0.0% 0 0.0% 0 0.0% 0 0.0% 0(Nothing) 49.9% 258 0.0% 0 0.0% 0 0.0% 0 60.1% 91 55.9% 86 34.9% 47 43.9% 33 0.0% 0(Don’t know) 19.9% 103 0.0% 0 0.0% 0 0.0% 0 28.3% 43 17.8% 27 9.7% 13 25.5% 19 0.0% 0Weighted base: 517 0 0 0 151 154 135 76 0Sample: 400 0 0 0 100 100 100 100 0

by Zone (Weighted, Part 1) South Wales Retail Study Page 81 Weighted: for Carter Jonas August 2016
Total Zone 1 Zone 2 Zone 3 Zone 4 Zone 5 Zone 6 Zone 7 Zone 8
Column %ges. 020716 NEMS market research
Mean score [Times a year, those who visit]: Daily = 365, 4-6 days a week = 234, 2-3 days a week = 130, One day a week = 52, Every two weeks = 24, Monthly = 12, Once every two months = 6, Three-four times a year = 3.5, Once a year = 1, Less often = 0.25
Q51 How often do you or your household visit Newport for shopping and other town centre services? Zones 8-10 Daily 2.5% 7 0.0% 0 0.0% 0 0.0% 0 0.0% 0 0.0% 0 0.0% 0 0.0% 0 0.9% 14-6 days a week 1.0% 3 0.0% 0 0.0% 0 0.0% 0 0.0% 0 0.0% 0 0.0% 0 0.0% 0 0.0% 02-3 days a week 3.1% 9 0.0% 0 0.0% 0 0.0% 0 0.0% 0 0.0% 0 0.0% 0 0.0% 0 0.8% 1One day a week 2.3% 6 0.0% 0 0.0% 0 0.0% 0 0.0% 0 0.0% 0 0.0% 0 0.0% 0 0.9% 1Every two weeks 1.9% 5 0.0% 0 0.0% 0 0.0% 0 0.0% 0 0.0% 0 0.0% 0 0.0% 0 3.0% 3Monthly 3.9% 11 0.0% 0 0.0% 0 0.0% 0 0.0% 0 0.0% 0 0.0% 0 0.0% 0 2.3% 2Once every two months 3.4% 10 0.0% 0 0.0% 0 0.0% 0 0.0% 0 0.0% 0 0.0% 0 0.0% 0 4.0% 4Three-four times a year 6.7% 19 0.0% 0 0.0% 0 0.0% 0 0.0% 0 0.0% 0 0.0% 0 0.0% 0 7.1% 7Once a year 3.6% 10 0.0% 0 0.0% 0 0.0% 0 0.0% 0 0.0% 0 0.0% 0 0.0% 0 0.6% 1Less often 0.0% 0 0.0% 0 0.0% 0 0.0% 0 0.0% 0 0.0% 0 0.0% 0 0.0% 0 0.0% 0Never 68.9% 192 0.0% 0 0.0% 0 0.0% 0 0.0% 0 0.0% 0 0.0% 0 0.0% 0 76.5% 72(Don’t know) 1.2% 3 0.0% 0 0.0% 0 0.0% 0 0.0% 0 0.0% 0 0.0% 0 0.0% 0 3.1% 3(Varies) 1.6% 4 0.0% 0 0.0% 0 0.0% 0 0.0% 0 0.0% 0 0.0% 0 0.0% 0 0.9% 1Mean: 63.78 0.00 0.00 0.00 0.00 0.00 0.00 0.00 31.42Weighted base: 279 0 0 0 0 0 0 0 94Sample: 300 0 0 0 0 0 0 0 100

by Zone (Weighted, Part 1) South Wales Retail Study Page 82 Weighted: for Carter Jonas August 2016
Total Zone 1 Zone 2 Zone 3 Zone 4 Zone 5 Zone 6 Zone 7 Zone 8
Column %ges. 020716 NEMS market research
Q52A In order of importance, what are your two main reasons for visiting Newport Town Centre? Main reason: Zones 8-10 and those who visit Tenby town centre at Q51 Food shopping 17.5% 15 0.0% 0 0.0% 0 0.0% 0 0.0% 0 0.0% 0 0.0% 0 0.0% 0 10.6% 2Non-food shopping 20.5% 18 0.0% 0 0.0% 0 0.0% 0 0.0% 0 0.0% 0 0.0% 0 0.0% 0 23.0% 5To visit bars / pubs 0.7% 1 0.0% 0 0.0% 0 0.0% 0 0.0% 0 0.0% 0 0.0% 0 0.0% 0 2.7% 1To visit cafés / restaurants 22.8% 20 0.0% 0 0.0% 0 0.0% 0 0.0% 0 0.0% 0 0.0% 0 0.0% 0 36.0% 8To visit personal service
providers (e.g. hairdressers, beauty salon etc.)
1.0% 1 0.0% 0 0.0% 0 0.0% 0 0.0% 0 0.0% 0 0.0% 0 0.0% 0 0.0% 0
To visit financial services such as banks and other financial institutions
0.9% 1 0.0% 0 0.0% 0 0.0% 0 0.0% 0 0.0% 0 0.0% 0 0.0% 0 0.0% 0
To visit other service providers (e.g. travel agent, estate agent etc.)
0.0% 0 0.0% 0 0.0% 0 0.0% 0 0.0% 0 0.0% 0 0.0% 0 0.0% 0 0.0% 0
To visit public services (e.g. medical or dentist appointment, library, job centre, community centre, etc)
8.3% 7 0.0% 0 0.0% 0 0.0% 0 0.0% 0 0.0% 0 0.0% 0 0.0% 0 0.0% 0
To get petrol 0.0% 0 0.0% 0 0.0% 0 0.0% 0 0.0% 0 0.0% 0 0.0% 0 0.0% 0 0.0% 0To visit the cinema 0.0% 0 0.0% 0 0.0% 0 0.0% 0 0.0% 0 0.0% 0 0.0% 0 0.0% 0 0.0% 0To visit a park 0.0% 0 0.0% 0 0.0% 0 0.0% 0 0.0% 0 0.0% 0 0.0% 0 0.0% 0 0.0% 0To visit the swimming pool 0.0% 0 0.0% 0 0.0% 0 0.0% 0 0.0% 0 0.0% 0 0.0% 0 0.0% 0 0.0% 0To visit other gyms / health
and fitness facilities 0.0% 0 0.0% 0 0.0% 0 0.0% 0 0.0% 0 0.0% 0 0.0% 0 0.0% 0 0.0% 0
To visit the library 0.0% 0 0.0% 0 0.0% 0 0.0% 0 0.0% 0 0.0% 0 0.0% 0 0.0% 0 0.0% 0To visit museums / art
gallery 0.0% 0 0.0% 0 0.0% 0 0.0% 0 0.0% 0 0.0% 0 0.0% 0 0.0% 0 0.0% 0
To visit the theatre or musical venues
2.0% 2 0.0% 0 0.0% 0 0.0% 0 0.0% 0 0.0% 0 0.0% 0 0.0% 0 7.7% 2
To visit night time venues e.g. nightclub
0.0% 0 0.0% 0 0.0% 0 0.0% 0 0.0% 0 0.0% 0 0.0% 0 0.0% 0 0.0% 0
For other leisure activities 5.5% 5 0.0% 0 0.0% 0 0.0% 0 0.0% 0 0.0% 0 0.0% 0 0.0% 0 2.7% 1To shop at the market(s) 0.0% 0 0.0% 0 0.0% 0 0.0% 0 0.0% 0 0.0% 0 0.0% 0 0.0% 0 0.0% 0To meet family 0.8% 1 0.0% 0 0.0% 0 0.0% 0 0.0% 0 0.0% 0 0.0% 0 0.0% 0 0.0% 0To meet friends 1.8% 2 0.0% 0 0.0% 0 0.0% 0 0.0% 0 0.0% 0 0.0% 0 0.0% 0 2.7% 1To visit the theatre 0.0% 0 0.0% 0 0.0% 0 0.0% 0 0.0% 0 0.0% 0 0.0% 0 0.0% 0 0.0% 0For work (i.e. place of work) 7.8% 7 0.0% 0 0.0% 0 0.0% 0 0.0% 0 0.0% 0 0.0% 0 0.0% 0 7.3% 2For business (e.g. attend a
business appointment) 0.0% 0 0.0% 0 0.0% 0 0.0% 0 0.0% 0 0.0% 0 0.0% 0 0.0% 0 0.0% 0
For education as a student (e.g. student at college, university, or other third level education)
0.0% 0 0.0% 0 0.0% 0 0.0% 0 0.0% 0 0.0% 0 0.0% 0 0.0% 0 0.0% 0
To access public transport for onward travel (e.g. train station, bus station)
0.0% 0 0.0% 0 0.0% 0 0.0% 0 0.0% 0 0.0% 0 0.0% 0 0.0% 0 0.0% 0
Other 0.0% 0 0.0% 0 0.0% 0 0.0% 0 0.0% 0 0.0% 0 0.0% 0 0.0% 0 0.0% 0As part of a day out / for a
day out / something different
6.6% 6 0.0% 0 0.0% 0 0.0% 0 0.0% 0 0.0% 0 0.0% 0 0.0% 0 0.0% 0
Browsing / window shopping 1.9% 2 0.0% 0 0.0% 0 0.0% 0 0.0% 0 0.0% 0 0.0% 0 0.0% 0 7.5% 2(Don't know / varies) 0.4% 0 0.0% 0 0.0% 0 0.0% 0 0.0% 0 0.0% 0 0.0% 0 0.0% 0 0.0% 0(Nothing / nothing further) 1.7% 1 0.0% 0 0.0% 0 0.0% 0 0.0% 0 0.0% 0 0.0% 0 0.0% 0 0.0% 0Weighted base: 87 0 0 0 0 0 0 0 22Sample: 122 0 0 0 0 0 0 0 23

by Zone (Weighted, Part 1) South Wales Retail Study Page 83 Weighted: for Carter Jonas August 2016
Total Zone 1 Zone 2 Zone 3 Zone 4 Zone 5 Zone 6 Zone 7 Zone 8
Column %ges. 020716 NEMS market research
Q52B In order of importance, what are your two main reasons for visiting Newport Town Centre? Secondary reason: Those who gave a reason at Q52A Food shopping 9.0% 8 0.0% 0 0.0% 0 0.0% 0 0.0% 0 0.0% 0 0.0% 0 0.0% 0 0.0% 0Non-food shopping 8.6% 7 0.0% 0 0.0% 0 0.0% 0 0.0% 0 0.0% 0 0.0% 0 0.0% 0 7.7% 2To visit bars / pubs 0.6% 1 0.0% 0 0.0% 0 0.0% 0 0.0% 0 0.0% 0 0.0% 0 0.0% 0 0.0% 0To visit cafés / restaurants 13.1% 11 0.0% 0 0.0% 0 0.0% 0 0.0% 0 0.0% 0 0.0% 0 0.0% 0 7.1% 2To visit personal service
providers (e.g. hairdressers, beauty salon etc.)
5.7% 5 0.0% 0 0.0% 0 0.0% 0 0.0% 0 0.0% 0 0.0% 0 0.0% 0 13.3% 3
To visit financial services such as banks and other financial institutions
1.2% 1 0.0% 0 0.0% 0 0.0% 0 0.0% 0 0.0% 0 0.0% 0 0.0% 0 0.0% 0
To visit other service providers (e.g. travel agent, estate agent etc.)
0.3% 0 0.0% 0 0.0% 0 0.0% 0 0.0% 0 0.0% 0 0.0% 0 0.0% 0 0.0% 0
To visit public services (e.g. medical or dentist appointment, library, job centre, community centre, etc)
4.1% 3 0.0% 0 0.0% 0 0.0% 0 0.0% 0 0.0% 0 0.0% 0 0.0% 0 0.0% 0
To get petrol 0.0% 0 0.0% 0 0.0% 0 0.0% 0 0.0% 0 0.0% 0 0.0% 0 0.0% 0 0.0% 0To visit the cinema 0.0% 0 0.0% 0 0.0% 0 0.0% 0 0.0% 0 0.0% 0 0.0% 0 0.0% 0 0.0% 0To visit a park 0.0% 0 0.0% 0 0.0% 0 0.0% 0 0.0% 0 0.0% 0 0.0% 0 0.0% 0 0.0% 0To visit the swimming pool 0.0% 0 0.0% 0 0.0% 0 0.0% 0 0.0% 0 0.0% 0 0.0% 0 0.0% 0 0.0% 0To visit other gyms / health
and fitness facilities 0.0% 0 0.0% 0 0.0% 0 0.0% 0 0.0% 0 0.0% 0 0.0% 0 0.0% 0 0.0% 0
To visit the library 0.0% 0 0.0% 0 0.0% 0 0.0% 0 0.0% 0 0.0% 0 0.0% 0 0.0% 0 0.0% 0To visit museums / art
gallery 0.0% 0 0.0% 0 0.0% 0 0.0% 0 0.0% 0 0.0% 0 0.0% 0 0.0% 0 0.0% 0
To visit the theatre or musical venues
0.0% 0 0.0% 0 0.0% 0 0.0% 0 0.0% 0 0.0% 0 0.0% 0 0.0% 0 0.0% 0
To visit night time venues e.g. nightclub
0.0% 0 0.0% 0 0.0% 0 0.0% 0 0.0% 0 0.0% 0 0.0% 0 0.0% 0 0.0% 0
For other leisure activities 3.2% 3 0.0% 0 0.0% 0 0.0% 0 0.0% 0 0.0% 0 0.0% 0 0.0% 0 3.6% 1To shop at the market(s) 0.5% 0 0.0% 0 0.0% 0 0.0% 0 0.0% 0 0.0% 0 0.0% 0 0.0% 0 0.0% 0To meet family 1.6% 1 0.0% 0 0.0% 0 0.0% 0 0.0% 0 0.0% 0 0.0% 0 0.0% 0 6.3% 1To meet friends 2.2% 2 0.0% 0 0.0% 0 0.0% 0 0.0% 0 0.0% 0 0.0% 0 0.0% 0 7.3% 2To visit the theatre 0.0% 0 0.0% 0 0.0% 0 0.0% 0 0.0% 0 0.0% 0 0.0% 0 0.0% 0 0.0% 0For work (i.e. place of work) 0.3% 0 0.0% 0 0.0% 0 0.0% 0 0.0% 0 0.0% 0 0.0% 0 0.0% 0 0.0% 0For business (e.g. attend a
business appointment) 0.0% 0 0.0% 0 0.0% 0 0.0% 0 0.0% 0 0.0% 0 0.0% 0 0.0% 0 0.0% 0
For education as a student (e.g. student at college, university, or other third level education)
0.0% 0 0.0% 0 0.0% 0 0.0% 0 0.0% 0 0.0% 0 0.0% 0 0.0% 0 0.0% 0
To access public transport for onward travel (e.g. train station, bus station)
0.0% 0 0.0% 0 0.0% 0 0.0% 0 0.0% 0 0.0% 0 0.0% 0 0.0% 0 0.0% 0
Other 0.0% 0 0.0% 0 0.0% 0 0.0% 0 0.0% 0 0.0% 0 0.0% 0 0.0% 0 0.0% 0As part of a day out / for a
day out / something different
3.1% 3 0.0% 0 0.0% 0 0.0% 0 0.0% 0 0.0% 0 0.0% 0 0.0% 0 3.6% 1
Browsing / window shopping 3.5% 3 0.0% 0 0.0% 0 0.0% 0 0.0% 0 0.0% 0 0.0% 0 0.0% 0 0.0% 0(Don't know / varies) 0.8% 1 0.0% 0 0.0% 0 0.0% 0 0.0% 0 0.0% 0 0.0% 0 0.0% 0 0.0% 0(Nothing / nothing further) 42.3% 36 0.0% 0 0.0% 0 0.0% 0 0.0% 0 0.0% 0 0.0% 0 0.0% 0 51.1% 11Weighted base: 85 0 0 0 0 0 0 0 22Sample: 120 0 0 0 0 0 0 0 23

by Zone (Weighted, Part 1) South Wales Retail Study Page 84 Weighted: for Carter Jonas August 2016
Total Zone 1 Zone 2 Zone 3 Zone 4 Zone 5 Zone 6 Zone 7 Zone 8
Column %ges. 020716 NEMS market research
Q52X In order of importance, what are your two main reasons for visiting Newport Town Centre? Any mention: [MR] Zones 8-10 and those who visit Tenby town centre at Q51 Food shopping 26.3% 23 0.0% 0 0.0% 0 0.0% 0 0.0% 0 0.0% 0 0.0% 0 0.0% 0 10.6% 2Non-food shopping 28.9% 25 0.0% 0 0.0% 0 0.0% 0 0.0% 0 0.0% 0 0.0% 0 0.0% 0 30.7% 7To visit bars / pubs 1.3% 1 0.0% 0 0.0% 0 0.0% 0 0.0% 0 0.0% 0 0.0% 0 0.0% 0 2.7% 1To visit cafés / restaurants 35.6% 31 0.0% 0 0.0% 0 0.0% 0 0.0% 0 0.0% 0 0.0% 0 0.0% 0 43.1% 10To visit personal service
providers (e.g. hairdressers, beauty salon etc.)
6.6% 6 0.0% 0 0.0% 0 0.0% 0 0.0% 0 0.0% 0 0.0% 0 0.0% 0 13.3% 3
To visit financial services such as banks and other financial institutions
2.0% 2 0.0% 0 0.0% 0 0.0% 0 0.0% 0 0.0% 0 0.0% 0 0.0% 0 0.0% 0
To visit other service providers (e.g. travel agent, estate agent etc.)
0.3% 0 0.0% 0 0.0% 0 0.0% 0 0.0% 0 0.0% 0 0.0% 0 0.0% 0 0.0% 0
To visit public services (e.g. medical or dentist appointment, library, job centre, community centre, etc)
12.3% 11 0.0% 0 0.0% 0 0.0% 0 0.0% 0 0.0% 0 0.0% 0 0.0% 0 0.0% 0
To get petrol 0.0% 0 0.0% 0 0.0% 0 0.0% 0 0.0% 0 0.0% 0 0.0% 0 0.0% 0 0.0% 0To visit the cinema 0.0% 0 0.0% 0 0.0% 0 0.0% 0 0.0% 0 0.0% 0 0.0% 0 0.0% 0 0.0% 0To visit a park 0.0% 0 0.0% 0 0.0% 0 0.0% 0 0.0% 0 0.0% 0 0.0% 0 0.0% 0 0.0% 0To visit the swimming pool 0.0% 0 0.0% 0 0.0% 0 0.0% 0 0.0% 0 0.0% 0 0.0% 0 0.0% 0 0.0% 0To visit other gyms / health
and fitness facilities 0.0% 0 0.0% 0 0.0% 0 0.0% 0 0.0% 0 0.0% 0 0.0% 0 0.0% 0 0.0% 0
To visit the library 0.0% 0 0.0% 0 0.0% 0 0.0% 0 0.0% 0 0.0% 0 0.0% 0 0.0% 0 0.0% 0To visit museums / art
gallery 0.0% 0 0.0% 0 0.0% 0 0.0% 0 0.0% 0 0.0% 0 0.0% 0 0.0% 0 0.0% 0
To visit the theatre or musical venues
2.0% 2 0.0% 0 0.0% 0 0.0% 0 0.0% 0 0.0% 0 0.0% 0 0.0% 0 7.7% 2
To visit night time venues e.g. nightclub
0.0% 0 0.0% 0 0.0% 0 0.0% 0 0.0% 0 0.0% 0 0.0% 0 0.0% 0 0.0% 0
For other leisure activities 8.7% 7 0.0% 0 0.0% 0 0.0% 0 0.0% 0 0.0% 0 0.0% 0 0.0% 0 6.3% 1To shop at the market(s) 0.5% 0 0.0% 0 0.0% 0 0.0% 0 0.0% 0 0.0% 0 0.0% 0 0.0% 0 0.0% 0To meet family 2.4% 2 0.0% 0 0.0% 0 0.0% 0 0.0% 0 0.0% 0 0.0% 0 0.0% 0 6.3% 1To meet friends 3.9% 3 0.0% 0 0.0% 0 0.0% 0 0.0% 0 0.0% 0 0.0% 0 0.0% 0 9.9% 2To visit the theatre 0.0% 0 0.0% 0 0.0% 0 0.0% 0 0.0% 0 0.0% 0 0.0% 0 0.0% 0 0.0% 0For work (i.e. place of work) 8.0% 7 0.0% 0 0.0% 0 0.0% 0 0.0% 0 0.0% 0 0.0% 0 0.0% 0 7.3% 2For business (e.g. attend a
business appointment) 0.0% 0 0.0% 0 0.0% 0 0.0% 0 0.0% 0 0.0% 0 0.0% 0 0.0% 0 0.0% 0
For education as a student (e.g. student at college, university, or other third level education)
0.0% 0 0.0% 0 0.0% 0 0.0% 0 0.0% 0 0.0% 0 0.0% 0 0.0% 0 0.0% 0
To access public transport for onward travel (e.g. train station, bus station)
0.0% 0 0.0% 0 0.0% 0 0.0% 0 0.0% 0 0.0% 0 0.0% 0 0.0% 0 0.0% 0
Other 0.0% 0 0.0% 0 0.0% 0 0.0% 0 0.0% 0 0.0% 0 0.0% 0 0.0% 0 0.0% 0As part of a day out / for a
day out / something different
9.6% 8 0.0% 0 0.0% 0 0.0% 0 0.0% 0 0.0% 0 0.0% 0 0.0% 0 3.6% 1
Browsing / window shopping 5.4% 5 0.0% 0 0.0% 0 0.0% 0 0.0% 0 0.0% 0 0.0% 0 0.0% 0 7.5% 2Weighted base: 87 0 0 0 0 0 0 0 22Sample: 122 0 0 0 0 0 0 0 23

by Zone (Weighted, Part 1) South Wales Retail Study Page 85 Weighted: for Carter Jonas August 2016
Total Zone 1 Zone 2 Zone 3 Zone 4 Zone 5 Zone 6 Zone 7 Zone 8
Column %ges. 020716 NEMS market research
Q53 What do you like about Newport Town Centre? [MR] Zones 8-10 and those who visit Tenby town centre at Q51 Attractive environment / nice
place 41.4% 36 0.0% 0 0.0% 0 0.0% 0 0.0% 0 0.0% 0 0.0% 0 0.0% 0 59.4% 13
Close to friends or relatives 0.7% 1 0.0% 0 0.0% 0 0.0% 0 0.0% 0 0.0% 0 0.0% 0 0.0% 0 0.0% 0Close to home 6.5% 6 0.0% 0 0.0% 0 0.0% 0 0.0% 0 0.0% 0 0.0% 0 0.0% 0 0.0% 0Close to work 0.0% 0 0.0% 0 0.0% 0 0.0% 0 0.0% 0 0.0% 0 0.0% 0 0.0% 0 0.0% 0Compact 7.3% 6 0.0% 0 0.0% 0 0.0% 0 0.0% 0 0.0% 0 0.0% 0 0.0% 0 3.5% 1Easy to get to by bike 0.0% 0 0.0% 0 0.0% 0 0.0% 0 0.0% 0 0.0% 0 0.0% 0 0.0% 0 0.0% 0Easy to get to by bus 0.3% 0 0.0% 0 0.0% 0 0.0% 0 0.0% 0 0.0% 0 0.0% 0 0.0% 0 0.0% 0Easy to get to by car 0.0% 0 0.0% 0 0.0% 0 0.0% 0 0.0% 0 0.0% 0 0.0% 0 0.0% 0 0.0% 0Easy to park 0.0% 0 0.0% 0 0.0% 0 0.0% 0 0.0% 0 0.0% 0 0.0% 0 0.0% 0 0.0% 0Good facilities 1.1% 1 0.0% 0 0.0% 0 0.0% 0 0.0% 0 0.0% 0 0.0% 0 0.0% 0 0.0% 0Good food stores 1.9% 2 0.0% 0 0.0% 0 0.0% 0 0.0% 0 0.0% 0 0.0% 0 0.0% 0 0.0% 0Good pubs, cafés or
restaurants 12.6% 11 0.0% 0 0.0% 0 0.0% 0 0.0% 0 0.0% 0 0.0% 0 0.0% 0 13.5% 3
Good range of non-food shops
5.1% 4 0.0% 0 0.0% 0 0.0% 0 0.0% 0 0.0% 0 0.0% 0 0.0% 0 0.0% 0
Makes a change from other places
0.3% 0 0.0% 0 0.0% 0 0.0% 0 0.0% 0 0.0% 0 0.0% 0 0.0% 0 0.0% 0
Quiet 0.9% 1 0.0% 0 0.0% 0 0.0% 0 0.0% 0 0.0% 0 0.0% 0 0.0% 0 0.0% 0Safe and secure 0.0% 0 0.0% 0 0.0% 0 0.0% 0 0.0% 0 0.0% 0 0.0% 0 0.0% 0 0.0% 0The market 0.6% 1 0.0% 0 0.0% 0 0.0% 0 0.0% 0 0.0% 0 0.0% 0 0.0% 0 0.0% 0Traditional 13.6% 12 0.0% 0 0.0% 0 0.0% 0 0.0% 0 0.0% 0 0.0% 0 0.0% 0 2.7% 1Traffic free shopping centre 0.0% 0 0.0% 0 0.0% 0 0.0% 0 0.0% 0 0.0% 0 0.0% 0 0.0% 0 0.0% 0Other 0.0% 0 0.0% 0 0.0% 0 0.0% 0 0.0% 0 0.0% 0 0.0% 0 0.0% 0 0.0% 0Cheap / free parking 0.0% 0 0.0% 0 0.0% 0 0.0% 0 0.0% 0 0.0% 0 0.0% 0 0.0% 0 0.0% 0Familiarity / habit 2.8% 2 0.0% 0 0.0% 0 0.0% 0 0.0% 0 0.0% 0 0.0% 0 0.0% 0 0.0% 0Friendly people / nice
atmosphere 8.0% 7 0.0% 0 0.0% 0 0.0% 0 0.0% 0 0.0% 0 0.0% 0 0.0% 0 9.8% 2
Good leisure facilities / things to do
7.0% 6 0.0% 0 0.0% 0 0.0% 0 0.0% 0 0.0% 0 0.0% 0 0.0% 0 13.3% 3
Good opening hours 0.0% 0 0.0% 0 0.0% 0 0.0% 0 0.0% 0 0.0% 0 0.0% 0 0.0% 0 0.0% 0Good prices 0.0% 0 0.0% 0 0.0% 0 0.0% 0 0.0% 0 0.0% 0 0.0% 0 0.0% 0 0.0% 0Good range of independent
shops 4.7% 4 0.0% 0 0.0% 0 0.0% 0 0.0% 0 0.0% 0 0.0% 0 0.0% 0 0.0% 0
Good range of services 0.6% 1 0.0% 0 0.0% 0 0.0% 0 0.0% 0 0.0% 0 0.0% 0 0.0% 0 0.0% 0(Nothing / very little) 9.0% 8 0.0% 0 0.0% 0 0.0% 0 0.0% 0 0.0% 0 0.0% 0 0.0% 0 3.6% 1(Don't know) 6.0% 5 0.0% 0 0.0% 0 0.0% 0 0.0% 0 0.0% 0 0.0% 0 0.0% 0 4.0% 1Weighted base: 87 0 0 0 0 0 0 0 22Sample: 122 0 0 0 0 0 0 0 23
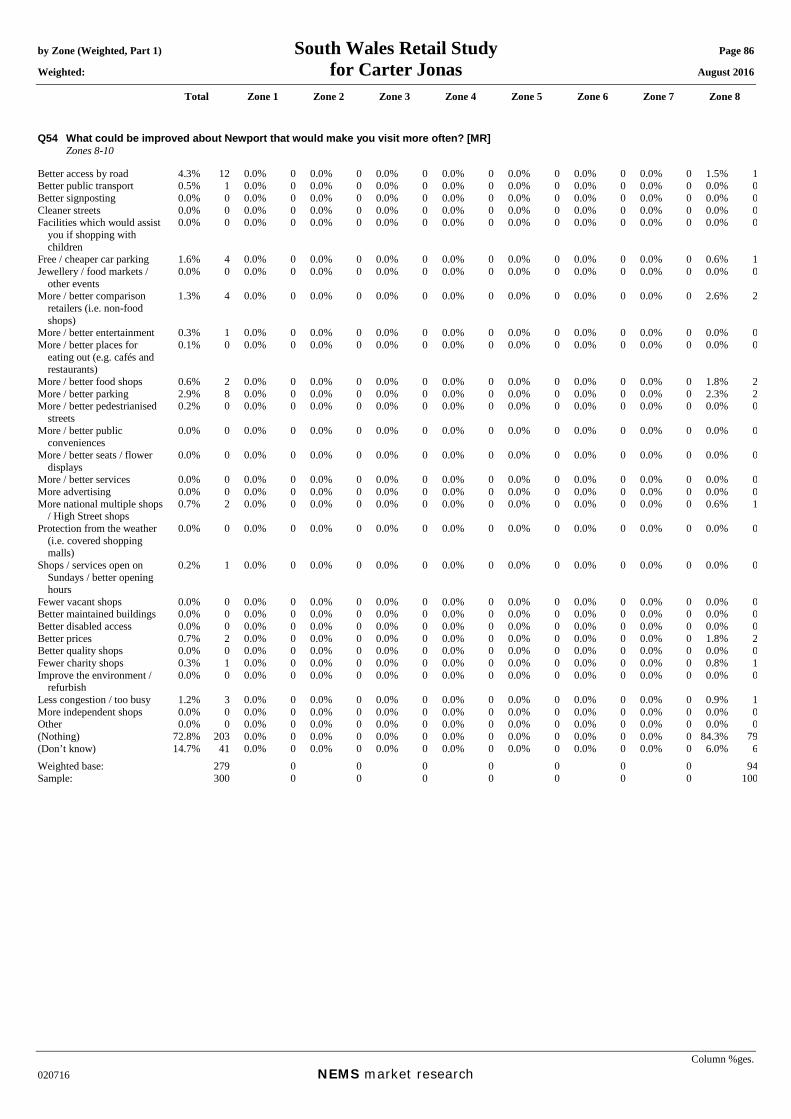
by Zone (Weighted, Part 1) South Wales Retail Study Page 86 Weighted: for Carter Jonas August 2016
Total Zone 1 Zone 2 Zone 3 Zone 4 Zone 5 Zone 6 Zone 7 Zone 8
Column %ges. 020716 NEMS market research
Q54 What could be improved about Newport that would make you visit more often? [MR] Zones 8-10 Better access by road 4.3% 12 0.0% 0 0.0% 0 0.0% 0 0.0% 0 0.0% 0 0.0% 0 0.0% 0 1.5% 1Better public transport 0.5% 1 0.0% 0 0.0% 0 0.0% 0 0.0% 0 0.0% 0 0.0% 0 0.0% 0 0.0% 0Better signposting 0.0% 0 0.0% 0 0.0% 0 0.0% 0 0.0% 0 0.0% 0 0.0% 0 0.0% 0 0.0% 0Cleaner streets 0.0% 0 0.0% 0 0.0% 0 0.0% 0 0.0% 0 0.0% 0 0.0% 0 0.0% 0 0.0% 0Facilities which would assist
you if shopping with children
0.0% 0 0.0% 0 0.0% 0 0.0% 0 0.0% 0 0.0% 0 0.0% 0 0.0% 0 0.0% 0
Free / cheaper car parking 1.6% 4 0.0% 0 0.0% 0 0.0% 0 0.0% 0 0.0% 0 0.0% 0 0.0% 0 0.6% 1Jewellery / food markets /
other events 0.0% 0 0.0% 0 0.0% 0 0.0% 0 0.0% 0 0.0% 0 0.0% 0 0.0% 0 0.0% 0
More / better comparison retailers (i.e. non-food shops)
1.3% 4 0.0% 0 0.0% 0 0.0% 0 0.0% 0 0.0% 0 0.0% 0 0.0% 0 2.6% 2
More / better entertainment 0.3% 1 0.0% 0 0.0% 0 0.0% 0 0.0% 0 0.0% 0 0.0% 0 0.0% 0 0.0% 0More / better places for
eating out (e.g. cafés and restaurants)
0.1% 0 0.0% 0 0.0% 0 0.0% 0 0.0% 0 0.0% 0 0.0% 0 0.0% 0 0.0% 0
More / better food shops 0.6% 2 0.0% 0 0.0% 0 0.0% 0 0.0% 0 0.0% 0 0.0% 0 0.0% 0 1.8% 2More / better parking 2.9% 8 0.0% 0 0.0% 0 0.0% 0 0.0% 0 0.0% 0 0.0% 0 0.0% 0 2.3% 2More / better pedestrianised
streets 0.2% 0 0.0% 0 0.0% 0 0.0% 0 0.0% 0 0.0% 0 0.0% 0 0.0% 0 0.0% 0
More / better public conveniences
0.0% 0 0.0% 0 0.0% 0 0.0% 0 0.0% 0 0.0% 0 0.0% 0 0.0% 0 0.0% 0
More / better seats / flower displays
0.0% 0 0.0% 0 0.0% 0 0.0% 0 0.0% 0 0.0% 0 0.0% 0 0.0% 0 0.0% 0
More / better services 0.0% 0 0.0% 0 0.0% 0 0.0% 0 0.0% 0 0.0% 0 0.0% 0 0.0% 0 0.0% 0More advertising 0.0% 0 0.0% 0 0.0% 0 0.0% 0 0.0% 0 0.0% 0 0.0% 0 0.0% 0 0.0% 0More national multiple shops
/ High Street shops 0.7% 2 0.0% 0 0.0% 0 0.0% 0 0.0% 0 0.0% 0 0.0% 0 0.0% 0 0.6% 1
Protection from the weather (i.e. covered shopping malls)
0.0% 0 0.0% 0 0.0% 0 0.0% 0 0.0% 0 0.0% 0 0.0% 0 0.0% 0 0.0% 0
Shops / services open on Sundays / better opening hours
0.2% 1 0.0% 0 0.0% 0 0.0% 0 0.0% 0 0.0% 0 0.0% 0 0.0% 0 0.0% 0
Fewer vacant shops 0.0% 0 0.0% 0 0.0% 0 0.0% 0 0.0% 0 0.0% 0 0.0% 0 0.0% 0 0.0% 0Better maintained buildings 0.0% 0 0.0% 0 0.0% 0 0.0% 0 0.0% 0 0.0% 0 0.0% 0 0.0% 0 0.0% 0Better disabled access 0.0% 0 0.0% 0 0.0% 0 0.0% 0 0.0% 0 0.0% 0 0.0% 0 0.0% 0 0.0% 0Better prices 0.7% 2 0.0% 0 0.0% 0 0.0% 0 0.0% 0 0.0% 0 0.0% 0 0.0% 0 1.8% 2Better quality shops 0.0% 0 0.0% 0 0.0% 0 0.0% 0 0.0% 0 0.0% 0 0.0% 0 0.0% 0 0.0% 0Fewer charity shops 0.3% 1 0.0% 0 0.0% 0 0.0% 0 0.0% 0 0.0% 0 0.0% 0 0.0% 0 0.8% 1Improve the environment /
refurbish 0.0% 0 0.0% 0 0.0% 0 0.0% 0 0.0% 0 0.0% 0 0.0% 0 0.0% 0 0.0% 0
Less congestion / too busy 1.2% 3 0.0% 0 0.0% 0 0.0% 0 0.0% 0 0.0% 0 0.0% 0 0.0% 0 0.9% 1More independent shops 0.0% 0 0.0% 0 0.0% 0 0.0% 0 0.0% 0 0.0% 0 0.0% 0 0.0% 0 0.0% 0Other 0.0% 0 0.0% 0 0.0% 0 0.0% 0 0.0% 0 0.0% 0 0.0% 0 0.0% 0 0.0% 0(Nothing) 72.8% 203 0.0% 0 0.0% 0 0.0% 0 0.0% 0 0.0% 0 0.0% 0 0.0% 0 84.3% 79(Don’t know) 14.7% 41 0.0% 0 0.0% 0 0.0% 0 0.0% 0 0.0% 0 0.0% 0 0.0% 0 6.0% 6Weighted base: 279 0 0 0 0 0 0 0 94Sample: 300 0 0 0 0 0 0 0 100

by Zone (Weighted, Part 1) South Wales Retail Study Page 87 Weighted: for Carter Jonas August 2016
Total Zone 1 Zone 2 Zone 3 Zone 4 Zone 5 Zone 6 Zone 7 Zone 8
Column %ges. 020716 NEMS market research
Mean score [Times a year, those who visit]: Daily = 365, 4-6 days a week = 234, 2-3 days a week = 130, One day a week = 52, Every two weeks = 24, Monthly = 12, Once every two months = 6, Three-four times a year = 3.5, Once a year = 1, Less often = 0.25
Q55 How often do you or your household visit Saundersfoot for shopping and other town centre services? Zones 5-7 Daily 3.3% 12 0.0% 0 0.0% 0 0.0% 0 0.0% 0 1.7% 3 5.5% 7 2.5% 2 0.0% 04-6 days a week 0.4% 2 0.0% 0 0.0% 0 0.0% 0 0.0% 0 0.0% 0 0.7% 1 0.8% 1 0.0% 02-3 days a week 1.1% 4 0.0% 0 0.0% 0 0.0% 0 0.0% 0 0.0% 0 1.5% 2 2.3% 2 0.0% 0One day a week 2.6% 10 0.0% 0 0.0% 0 0.0% 0 0.0% 0 0.8% 1 4.0% 5 3.8% 3 0.0% 0Every two weeks 3.2% 12 0.0% 0 0.0% 0 0.0% 0 0.0% 0 0.8% 1 4.0% 5 6.3% 5 0.0% 0Monthly 2.9% 11 0.0% 0 0.0% 0 0.0% 0 0.0% 0 1.2% 2 5.3% 7 2.2% 2 0.0% 0Once every two months 2.8% 10 0.0% 0 0.0% 0 0.0% 0 0.0% 0 3.2% 5 2.3% 3 2.8% 2 0.0% 0Three-four times a year 7.8% 29 0.0% 0 0.0% 0 0.0% 0 0.0% 0 4.0% 6 8.2% 11 14.7% 11 0.0% 0Once a year 3.5% 13 0.0% 0 0.0% 0 0.0% 0 0.0% 0 3.3% 5 2.7% 4 5.2% 4 0.0% 0Less often 0.8% 3 0.0% 0 0.0% 0 0.0% 0 0.0% 0 0.0% 0 0.7% 1 2.5% 2 0.0% 0Never 69.7% 255 0.0% 0 0.0% 0 0.0% 0 0.0% 0 84.8% 131 62.3% 84 52.3% 40 0.0% 0(Don’t know) 0.5% 2 0.0% 0 0.0% 0 0.0% 0 0.0% 0 0.0% 0 0.9% 1 0.9% 1 0.0% 0(Varies) 1.5% 6 0.0% 0 0.0% 0 0.0% 0 0.0% 0 0.0% 0 2.0% 3 3.7% 3 0.0% 0Mean: 60.73 0.00 0.00 0.00 0.00 48.07 79.71 42.50 0.00Weighted base: 365 0 0 0 0 154 135 76 0Sample: 300 0 0 0 0 100 100 100 0

by Zone (Weighted, Part 1) South Wales Retail Study Page 88 Weighted: for Carter Jonas August 2016
Total Zone 1 Zone 2 Zone 3 Zone 4 Zone 5 Zone 6 Zone 7 Zone 8
Column %ges. 020716 NEMS market research
Q56A In order of importance, what are your two main reasons for visiting Saundersfoot Town Centre? Main reason: Zones 5-7 and those who visit Saunderfoot town centre at Q55 Food shopping 12.7% 14 0.0% 0 0.0% 0 0.0% 0 0.0% 0 0.0% 0 22.7% 12 6.6% 2 0.0% 0Non-food shopping 15.2% 17 0.0% 0 0.0% 0 0.0% 0 0.0% 0 5.6% 1 19.6% 10 15.1% 5 0.0% 0To visit bars / pubs 0.0% 0 0.0% 0 0.0% 0 0.0% 0 0.0% 0 0.0% 0 0.0% 0 0.0% 0 0.0% 0To visit cafés / restaurants 14.1% 16 0.0% 0 0.0% 0 0.0% 0 0.0% 0 34.9% 8 6.9% 4 10.8% 4 0.0% 0To visit personal service
providers (e.g. hairdressers, beauty salon etc.)
2.0% 2 0.0% 0 0.0% 0 0.0% 0 0.0% 0 5.6% 1 1.8% 1 0.0% 0 0.0% 0
To visit financial services such as banks and other financial institutions
0.0% 0 0.0% 0 0.0% 0 0.0% 0 0.0% 0 0.0% 0 0.0% 0 0.0% 0 0.0% 0
To visit other service providers (e.g. travel agent, estate agent etc.)
0.0% 0 0.0% 0 0.0% 0 0.0% 0 0.0% 0 0.0% 0 0.0% 0 0.0% 0 0.0% 0
To visit public services (e.g. medical or dentist appointment, library, job centre, community centre, etc)
2.3% 3 0.0% 0 0.0% 0 0.0% 0 0.0% 0 0.0% 0 1.8% 1 4.5% 2 0.0% 0
To get petrol 0.0% 0 0.0% 0 0.0% 0 0.0% 0 0.0% 0 0.0% 0 0.0% 0 0.0% 0 0.0% 0To visit the cinema 0.0% 0 0.0% 0 0.0% 0 0.0% 0 0.0% 0 0.0% 0 0.0% 0 0.0% 0 0.0% 0To visit a park 0.0% 0 0.0% 0 0.0% 0 0.0% 0 0.0% 0 0.0% 0 0.0% 0 0.0% 0 0.0% 0To visit the swimming pool 0.0% 0 0.0% 0 0.0% 0 0.0% 0 0.0% 0 0.0% 0 0.0% 0 0.0% 0 0.0% 0To visit other gyms / health
and fitness facilities 0.0% 0 0.0% 0 0.0% 0 0.0% 0 0.0% 0 0.0% 0 0.0% 0 0.0% 0 0.0% 0
To visit the library 0.0% 0 0.0% 0 0.0% 0 0.0% 0 0.0% 0 0.0% 0 0.0% 0 0.0% 0 0.0% 0To visit museums / art
gallery 0.0% 0 0.0% 0 0.0% 0 0.0% 0 0.0% 0 0.0% 0 0.0% 0 0.0% 0 0.0% 0
To visit the theatre or musical venues
0.0% 0 0.0% 0 0.0% 0 0.0% 0 0.0% 0 0.0% 0 0.0% 0 0.0% 0 0.0% 0
To visit night time venues e.g. nightclub
0.0% 0 0.0% 0 0.0% 0 0.0% 0 0.0% 0 0.0% 0 0.0% 0 0.0% 0 0.0% 0
For other leisure activities 16.3% 18 0.0% 0 0.0% 0 0.0% 0 0.0% 0 0.0% 0 12.6% 6 32.1% 12 0.0% 0To shop at the market(s) 0.0% 0 0.0% 0 0.0% 0 0.0% 0 0.0% 0 0.0% 0 0.0% 0 0.0% 0 0.0% 0To meet family 3.7% 4 0.0% 0 0.0% 0 0.0% 0 0.0% 0 0.0% 0 5.9% 3 2.9% 1 0.0% 0To meet friends 1.9% 2 0.0% 0 0.0% 0 0.0% 0 0.0% 0 0.0% 0 4.1% 2 0.0% 0 0.0% 0To visit the theatre 0.0% 0 0.0% 0 0.0% 0 0.0% 0 0.0% 0 0.0% 0 0.0% 0 0.0% 0 0.0% 0For work (i.e. place of work) 6.3% 7 0.0% 0 0.0% 0 0.0% 0 0.0% 0 16.4% 4 4.8% 2 1.7% 1 0.0% 0For business (e.g. attend a
business appointment) 0.0% 0 0.0% 0 0.0% 0 0.0% 0 0.0% 0 0.0% 0 0.0% 0 0.0% 0 0.0% 0
For education as a student (e.g. student at college, university, or other third level education)
0.0% 0 0.0% 0 0.0% 0 0.0% 0 0.0% 0 0.0% 0 0.0% 0 0.0% 0 0.0% 0
To access public transport for onward travel (e.g. train station, bus station)
0.0% 0 0.0% 0 0.0% 0 0.0% 0 0.0% 0 0.0% 0 0.0% 0 0.0% 0 0.0% 0
Other 0.0% 0 0.0% 0 0.0% 0 0.0% 0 0.0% 0 0.0% 0 0.0% 0 0.0% 0 0.0% 0As part of a day out / for a
day out / something different
15.8% 18 0.0% 0 0.0% 0 0.0% 0 0.0% 0 33.5% 8 4.1% 2 21.0% 8 0.0% 0
Browsing / window shopping 8.0% 9 0.0% 0 0.0% 0 0.0% 0 0.0% 0 4.1% 1 13.1% 7 3.4% 1 0.0% 0(Don't know / varies) 0.6% 1 0.0% 0 0.0% 0 0.0% 0 0.0% 0 0.0% 0 0.0% 0 1.9% 1 0.0% 0(Nothing / nothing further) 1.2% 1 0.0% 0 0.0% 0 0.0% 0 0.0% 0 0.0% 0 2.7% 1 0.0% 0 0.0% 0Weighted base: 111 0 0 0 0 23 51 36 0Sample: 101 0 0 0 0 17 39 45 0

by Zone (Weighted, Part 1) South Wales Retail Study Page 89 Weighted: for Carter Jonas August 2016
Total Zone 1 Zone 2 Zone 3 Zone 4 Zone 5 Zone 6 Zone 7 Zone 8
Column %ges. 020716 NEMS market research
Q56B In order of importance, what are your two main reasons for visiting Saundersfoot Town Centre? Secondary reason: Those who gave a reason at Q56A Food shopping 1.8% 2 0.0% 0 0.0% 0 0.0% 0 0.0% 0 0.0% 0 0.0% 0 5.5% 2 0.0% 0Non-food shopping 11.7% 13 0.0% 0 0.0% 0 0.0% 0 0.0% 0 5.3% 1 17.5% 9 8.0% 3 0.0% 0To visit bars / pubs 2.5% 3 0.0% 0 0.0% 0 0.0% 0 0.0% 0 11.8% 3 0.0% 0 0.0% 0 0.0% 0To visit cafés / restaurants 13.7% 15 0.0% 0 0.0% 0 0.0% 0 0.0% 0 5.6% 1 14.6% 7 17.9% 6 0.0% 0To visit personal service
providers (e.g. hairdressers, beauty salon etc.)
1.4% 2 0.0% 0 0.0% 0 0.0% 0 0.0% 0 0.0% 0 1.8% 1 1.7% 1 0.0% 0
To visit financial services such as banks and other financial institutions
0.0% 0 0.0% 0 0.0% 0 0.0% 0 0.0% 0 0.0% 0 0.0% 0 0.0% 0 0.0% 0
To visit other service providers (e.g. travel agent, estate agent etc.)
0.0% 0 0.0% 0 0.0% 0 0.0% 0 0.0% 0 0.0% 0 0.0% 0 0.0% 0 0.0% 0
To visit public services (e.g. medical or dentist appointment, library, job centre, community centre, etc)
2.1% 2 0.0% 0 0.0% 0 0.0% 0 0.0% 0 0.0% 0 1.8% 1 3.7% 1 0.0% 0
To get petrol 0.0% 0 0.0% 0 0.0% 0 0.0% 0 0.0% 0 0.0% 0 0.0% 0 0.0% 0 0.0% 0To visit the cinema 0.0% 0 0.0% 0 0.0% 0 0.0% 0 0.0% 0 0.0% 0 0.0% 0 0.0% 0 0.0% 0To visit a park 0.0% 0 0.0% 0 0.0% 0 0.0% 0 0.0% 0 0.0% 0 0.0% 0 0.0% 0 0.0% 0To visit the swimming pool 0.0% 0 0.0% 0 0.0% 0 0.0% 0 0.0% 0 0.0% 0 0.0% 0 0.0% 0 0.0% 0To visit other gyms / health
and fitness facilities 0.0% 0 0.0% 0 0.0% 0 0.0% 0 0.0% 0 0.0% 0 0.0% 0 0.0% 0 0.0% 0
To visit the library 0.0% 0 0.0% 0 0.0% 0 0.0% 0 0.0% 0 0.0% 0 0.0% 0 0.0% 0 0.0% 0To visit museums / art
gallery 0.0% 0 0.0% 0 0.0% 0 0.0% 0 0.0% 0 0.0% 0 0.0% 0 0.0% 0 0.0% 0
To visit the theatre or musical venues
0.0% 0 0.0% 0 0.0% 0 0.0% 0 0.0% 0 0.0% 0 0.0% 0 0.0% 0 0.0% 0
To visit night time venues e.g. nightclub
0.0% 0 0.0% 0 0.0% 0 0.0% 0 0.0% 0 0.0% 0 0.0% 0 0.0% 0 0.0% 0
For other leisure activities 7.2% 8 0.0% 0 0.0% 0 0.0% 0 0.0% 0 5.6% 1 9.7% 5 4.7% 2 0.0% 0To shop at the market(s) 0.0% 0 0.0% 0 0.0% 0 0.0% 0 0.0% 0 0.0% 0 0.0% 0 0.0% 0 0.0% 0To meet family 0.8% 1 0.0% 0 0.0% 0 0.0% 0 0.0% 0 0.0% 0 1.8% 1 0.0% 0 0.0% 0To meet friends 0.0% 0 0.0% 0 0.0% 0 0.0% 0 0.0% 0 0.0% 0 0.0% 0 0.0% 0 0.0% 0To visit the theatre 0.0% 0 0.0% 0 0.0% 0 0.0% 0 0.0% 0 0.0% 0 0.0% 0 0.0% 0 0.0% 0For work (i.e. place of work) 1.1% 1 0.0% 0 0.0% 0 0.0% 0 0.0% 0 0.0% 0 2.4% 1 0.0% 0 0.0% 0For business (e.g. attend a
business appointment) 0.0% 0 0.0% 0 0.0% 0 0.0% 0 0.0% 0 0.0% 0 0.0% 0 0.0% 0 0.0% 0
For education as a student (e.g. student at college, university, or other third level education)
0.0% 0 0.0% 0 0.0% 0 0.0% 0 0.0% 0 0.0% 0 0.0% 0 0.0% 0 0.0% 0
To access public transport for onward travel (e.g. train station, bus station)
0.0% 0 0.0% 0 0.0% 0 0.0% 0 0.0% 0 0.0% 0 0.0% 0 0.0% 0 0.0% 0
Other 0.0% 0 0.0% 0 0.0% 0 0.0% 0 0.0% 0 0.0% 0 0.0% 0 0.0% 0 0.0% 0As part of a day out / for a
day out / something different
6.3% 7 0.0% 0 0.0% 0 0.0% 0 0.0% 0 17.3% 4 0.0% 0 7.9% 3 0.0% 0
Browsing / window shopping 0.8% 1 0.0% 0 0.0% 0 0.0% 0 0.0% 0 0.0% 0 1.8% 1 0.0% 0 0.0% 0(Don't know / varies) 2.9% 3 0.0% 0 0.0% 0 0.0% 0 0.0% 0 8.2% 2 2.5% 1 0.0% 0 0.0% 0(Nothing / nothing further) 47.6% 52 0.0% 0 0.0% 0 0.0% 0 0.0% 0 46.3% 11 46.0% 23 50.6% 18 0.0% 0Weighted base: 109 0 0 0 0 23 50 36 0Sample: 99 0 0 0 0 17 38 44 0

by Zone (Weighted, Part 1) South Wales Retail Study Page 90 Weighted: for Carter Jonas August 2016
Total Zone 1 Zone 2 Zone 3 Zone 4 Zone 5 Zone 6 Zone 7 Zone 8
Column %ges. 020716 NEMS market research
Q56X In order of importance, what are your two main reasons for visiting Saundersfoot Town Centre? Any mention: [MR] Zones 5-7 and those who visit Saunderfoot town centre at Q55 Food shopping 14.4% 16 0.0% 0 0.0% 0 0.0% 0 0.0% 0 0.0% 0 22.7% 12 12.0% 4 0.0% 0Non-food shopping 26.7% 30 0.0% 0 0.0% 0 0.0% 0 0.0% 0 10.9% 3 36.6% 19 23.0% 8 0.0% 0To visit bars / pubs 2.5% 3 0.0% 0 0.0% 0 0.0% 0 0.0% 0 11.8% 3 0.0% 0 0.0% 0 0.0% 0To visit cafés / restaurants 27.6% 31 0.0% 0 0.0% 0 0.0% 0 0.0% 0 40.4% 9 21.1% 11 28.4% 10 0.0% 0To visit personal service
providers (e.g. hairdressers, beauty salon etc.)
3.3% 4 0.0% 0 0.0% 0 0.0% 0 0.0% 0 5.6% 1 3.6% 2 1.6% 1 0.0% 0
To visit financial services such as banks and other financial institutions
0.0% 0 0.0% 0 0.0% 0 0.0% 0 0.0% 0 0.0% 0 0.0% 0 0.0% 0 0.0% 0
To visit other service providers (e.g. travel agent, estate agent etc.)
0.0% 0 0.0% 0 0.0% 0 0.0% 0 0.0% 0 0.0% 0 0.0% 0 0.0% 0 0.0% 0
To visit public services (e.g. medical or dentist appointment, library, job centre, community centre, etc)
4.3% 5 0.0% 0 0.0% 0 0.0% 0 0.0% 0 0.0% 0 3.6% 2 8.2% 3 0.0% 0
To get petrol 0.0% 0 0.0% 0 0.0% 0 0.0% 0 0.0% 0 0.0% 0 0.0% 0 0.0% 0 0.0% 0To visit the cinema 0.0% 0 0.0% 0 0.0% 0 0.0% 0 0.0% 0 0.0% 0 0.0% 0 0.0% 0 0.0% 0To visit a park 0.0% 0 0.0% 0 0.0% 0 0.0% 0 0.0% 0 0.0% 0 0.0% 0 0.0% 0 0.0% 0To visit the swimming pool 0.0% 0 0.0% 0 0.0% 0 0.0% 0 0.0% 0 0.0% 0 0.0% 0 0.0% 0 0.0% 0To visit other gyms / health
and fitness facilities 0.0% 0 0.0% 0 0.0% 0 0.0% 0 0.0% 0 0.0% 0 0.0% 0 0.0% 0 0.0% 0
To visit the library 0.0% 0 0.0% 0 0.0% 0 0.0% 0 0.0% 0 0.0% 0 0.0% 0 0.0% 0 0.0% 0To visit museums / art
gallery 0.0% 0 0.0% 0 0.0% 0 0.0% 0 0.0% 0 0.0% 0 0.0% 0 0.0% 0 0.0% 0
To visit the theatre or musical venues
0.0% 0 0.0% 0 0.0% 0 0.0% 0 0.0% 0 0.0% 0 0.0% 0 0.0% 0 0.0% 0
To visit night time venues e.g. nightclub
0.0% 0 0.0% 0 0.0% 0 0.0% 0 0.0% 0 0.0% 0 0.0% 0 0.0% 0 0.0% 0
For other leisure activities 23.4% 26 0.0% 0 0.0% 0 0.0% 0 0.0% 0 5.6% 1 22.1% 11 36.7% 13 0.0% 0To shop at the market(s) 0.0% 0 0.0% 0 0.0% 0 0.0% 0 0.0% 0 0.0% 0 0.0% 0 0.0% 0 0.0% 0To meet family 4.5% 5 0.0% 0 0.0% 0 0.0% 0 0.0% 0 0.0% 0 7.6% 4 2.9% 1 0.0% 0To meet friends 1.9% 2 0.0% 0 0.0% 0 0.0% 0 0.0% 0 0.0% 0 4.1% 2 0.0% 0 0.0% 0To visit the theatre 0.0% 0 0.0% 0 0.0% 0 0.0% 0 0.0% 0 0.0% 0 0.0% 0 0.0% 0 0.0% 0For work (i.e. place of work) 7.3% 8 0.0% 0 0.0% 0 0.0% 0 0.0% 0 16.4% 4 7.2% 4 1.7% 1 0.0% 0For business (e.g. attend a
business appointment) 0.0% 0 0.0% 0 0.0% 0 0.0% 0 0.0% 0 0.0% 0 0.0% 0 0.0% 0 0.0% 0
For education as a student (e.g. student at college, university, or other third level education)
0.0% 0 0.0% 0 0.0% 0 0.0% 0 0.0% 0 0.0% 0 0.0% 0 0.0% 0 0.0% 0
To access public transport for onward travel (e.g. train station, bus station)
0.0% 0 0.0% 0 0.0% 0 0.0% 0 0.0% 0 0.0% 0 0.0% 0 0.0% 0 0.0% 0
Other 0.0% 0 0.0% 0 0.0% 0 0.0% 0 0.0% 0 0.0% 0 0.0% 0 0.0% 0 0.0% 0As part of a day out / for a
day out / something different
22.0% 24 0.0% 0 0.0% 0 0.0% 0 0.0% 0 50.8% 12 4.1% 2 28.8% 10 0.0% 0
Browsing / window shopping 8.8% 10 0.0% 0 0.0% 0 0.0% 0 0.0% 0 4.1% 1 14.8% 8 3.4% 1 0.0% 0Weighted base: 111 0 0 0 0 23 51 36 0Sample: 101 0 0 0 0 17 39 45 0
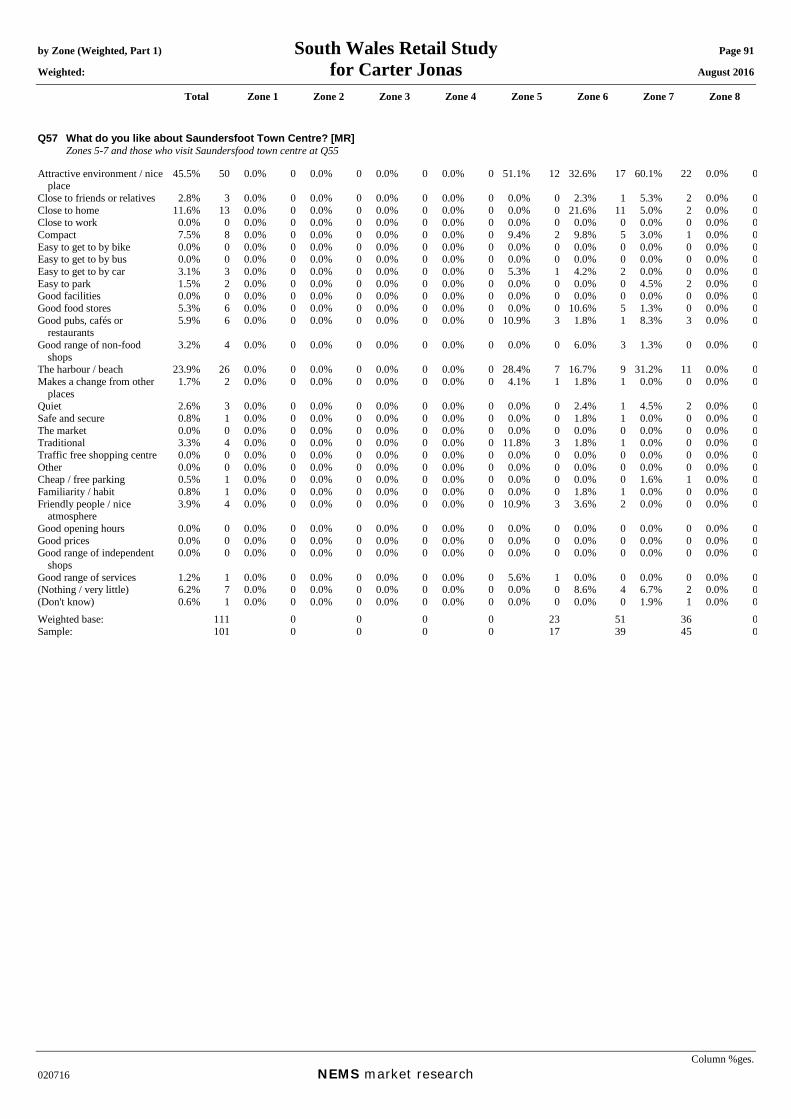
by Zone (Weighted, Part 1) South Wales Retail Study Page 91 Weighted: for Carter Jonas August 2016
Total Zone 1 Zone 2 Zone 3 Zone 4 Zone 5 Zone 6 Zone 7 Zone 8
Column %ges. 020716 NEMS market research
Q57 What do you like about Saundersfoot Town Centre? [MR] Zones 5-7 and those who visit Saundersfood town centre at Q55 Attractive environment / nice
place 45.5% 50 0.0% 0 0.0% 0 0.0% 0 0.0% 0 51.1% 12 32.6% 17 60.1% 22 0.0% 0
Close to friends or relatives 2.8% 3 0.0% 0 0.0% 0 0.0% 0 0.0% 0 0.0% 0 2.3% 1 5.3% 2 0.0% 0Close to home 11.6% 13 0.0% 0 0.0% 0 0.0% 0 0.0% 0 0.0% 0 21.6% 11 5.0% 2 0.0% 0Close to work 0.0% 0 0.0% 0 0.0% 0 0.0% 0 0.0% 0 0.0% 0 0.0% 0 0.0% 0 0.0% 0Compact 7.5% 8 0.0% 0 0.0% 0 0.0% 0 0.0% 0 9.4% 2 9.8% 5 3.0% 1 0.0% 0Easy to get to by bike 0.0% 0 0.0% 0 0.0% 0 0.0% 0 0.0% 0 0.0% 0 0.0% 0 0.0% 0 0.0% 0Easy to get to by bus 0.0% 0 0.0% 0 0.0% 0 0.0% 0 0.0% 0 0.0% 0 0.0% 0 0.0% 0 0.0% 0Easy to get to by car 3.1% 3 0.0% 0 0.0% 0 0.0% 0 0.0% 0 5.3% 1 4.2% 2 0.0% 0 0.0% 0Easy to park 1.5% 2 0.0% 0 0.0% 0 0.0% 0 0.0% 0 0.0% 0 0.0% 0 4.5% 2 0.0% 0Good facilities 0.0% 0 0.0% 0 0.0% 0 0.0% 0 0.0% 0 0.0% 0 0.0% 0 0.0% 0 0.0% 0Good food stores 5.3% 6 0.0% 0 0.0% 0 0.0% 0 0.0% 0 0.0% 0 10.6% 5 1.3% 0 0.0% 0Good pubs, cafés or
restaurants 5.9% 6 0.0% 0 0.0% 0 0.0% 0 0.0% 0 10.9% 3 1.8% 1 8.3% 3 0.0% 0
Good range of non-food shops
3.2% 4 0.0% 0 0.0% 0 0.0% 0 0.0% 0 0.0% 0 6.0% 3 1.3% 0 0.0% 0
The harbour / beach 23.9% 26 0.0% 0 0.0% 0 0.0% 0 0.0% 0 28.4% 7 16.7% 9 31.2% 11 0.0% 0Makes a change from other
places 1.7% 2 0.0% 0 0.0% 0 0.0% 0 0.0% 0 4.1% 1 1.8% 1 0.0% 0 0.0% 0
Quiet 2.6% 3 0.0% 0 0.0% 0 0.0% 0 0.0% 0 0.0% 0 2.4% 1 4.5% 2 0.0% 0Safe and secure 0.8% 1 0.0% 0 0.0% 0 0.0% 0 0.0% 0 0.0% 0 1.8% 1 0.0% 0 0.0% 0The market 0.0% 0 0.0% 0 0.0% 0 0.0% 0 0.0% 0 0.0% 0 0.0% 0 0.0% 0 0.0% 0Traditional 3.3% 4 0.0% 0 0.0% 0 0.0% 0 0.0% 0 11.8% 3 1.8% 1 0.0% 0 0.0% 0Traffic free shopping centre 0.0% 0 0.0% 0 0.0% 0 0.0% 0 0.0% 0 0.0% 0 0.0% 0 0.0% 0 0.0% 0Other 0.0% 0 0.0% 0 0.0% 0 0.0% 0 0.0% 0 0.0% 0 0.0% 0 0.0% 0 0.0% 0Cheap / free parking 0.5% 1 0.0% 0 0.0% 0 0.0% 0 0.0% 0 0.0% 0 0.0% 0 1.6% 1 0.0% 0Familiarity / habit 0.8% 1 0.0% 0 0.0% 0 0.0% 0 0.0% 0 0.0% 0 1.8% 1 0.0% 0 0.0% 0Friendly people / nice
atmosphere 3.9% 4 0.0% 0 0.0% 0 0.0% 0 0.0% 0 10.9% 3 3.6% 2 0.0% 0 0.0% 0
Good opening hours 0.0% 0 0.0% 0 0.0% 0 0.0% 0 0.0% 0 0.0% 0 0.0% 0 0.0% 0 0.0% 0Good prices 0.0% 0 0.0% 0 0.0% 0 0.0% 0 0.0% 0 0.0% 0 0.0% 0 0.0% 0 0.0% 0Good range of independent
shops 0.0% 0 0.0% 0 0.0% 0 0.0% 0 0.0% 0 0.0% 0 0.0% 0 0.0% 0 0.0% 0
Good range of services 1.2% 1 0.0% 0 0.0% 0 0.0% 0 0.0% 0 5.6% 1 0.0% 0 0.0% 0 0.0% 0(Nothing / very little) 6.2% 7 0.0% 0 0.0% 0 0.0% 0 0.0% 0 0.0% 0 8.6% 4 6.7% 2 0.0% 0(Don't know) 0.6% 1 0.0% 0 0.0% 0 0.0% 0 0.0% 0 0.0% 0 0.0% 0 1.9% 1 0.0% 0Weighted base: 111 0 0 0 0 23 51 36 0Sample: 101 0 0 0 0 17 39 45 0

by Zone (Weighted, Part 1) South Wales Retail Study Page 92 Weighted: for Carter Jonas August 2016
Total Zone 1 Zone 2 Zone 3 Zone 4 Zone 5 Zone 6 Zone 7 Zone 8
Column %ges. 020716 NEMS market research
Q58 What could be improved about Saundersfoot that would make you visit more often? [MR] Zones 5-7 Better access by road 1.0% 4 0.0% 0 0.0% 0 0.0% 0 0.0% 0 0.0% 0 1.9% 3 1.2% 1 0.0% 0Better public transport 0.1% 0 0.0% 0 0.0% 0 0.0% 0 0.0% 0 0.0% 0 0.0% 0 0.6% 0 0.0% 0Better signposting 0.0% 0 0.0% 0 0.0% 0 0.0% 0 0.0% 0 0.0% 0 0.0% 0 0.0% 0 0.0% 0Cleaner streets 0.2% 1 0.0% 0 0.0% 0 0.0% 0 0.0% 0 0.0% 0 0.0% 0 0.8% 1 0.0% 0Facilities which would assist
you if shopping with children
0.0% 0 0.0% 0 0.0% 0 0.0% 0 0.0% 0 0.0% 0 0.0% 0 0.0% 0 0.0% 0
Free / cheaper car parking 4.0% 15 0.0% 0 0.0% 0 0.0% 0 0.0% 0 4.4% 7 1.9% 3 6.9% 5 0.0% 0Jewellery / food markets /
other events 0.0% 0 0.0% 0 0.0% 0 0.0% 0 0.0% 0 0.0% 0 0.0% 0 0.0% 0 0.0% 0
More / better comparison retailers (i.e. non-food shops)
1.2% 4 0.0% 0 0.0% 0 0.0% 0 0.0% 0 0.8% 1 2.3% 3 0.0% 0 0.0% 0
More / better entertainment 0.0% 0 0.0% 0 0.0% 0 0.0% 0 0.0% 0 0.0% 0 0.0% 0 0.0% 0 0.0% 0More / better places for
eating out (e.g. cafés and restaurants)
0.0% 0 0.0% 0 0.0% 0 0.0% 0 0.0% 0 0.0% 0 0.0% 0 0.0% 0 0.0% 0
More / better food shops 0.3% 1 0.0% 0 0.0% 0 0.0% 0 0.0% 0 0.0% 0 0.9% 1 0.0% 0 0.0% 0More / better parking 6.2% 23 0.0% 0 0.0% 0 0.0% 0 0.0% 0 1.6% 2 13.3% 18 3.0% 2 0.0% 0More / better pedestrianised
streets 0.0% 0 0.0% 0 0.0% 0 0.0% 0 0.0% 0 0.0% 0 0.0% 0 0.0% 0 0.0% 0
More / better public conveniences
0.0% 0 0.0% 0 0.0% 0 0.0% 0 0.0% 0 0.0% 0 0.0% 0 0.0% 0 0.0% 0
More / better seats / flower displays
0.2% 1 0.0% 0 0.0% 0 0.0% 0 0.0% 0 0.0% 0 0.0% 0 0.8% 1 0.0% 0
More / better services 0.0% 0 0.0% 0 0.0% 0 0.0% 0 0.0% 0 0.0% 0 0.0% 0 0.0% 0 0.0% 0More advertising 0.0% 0 0.0% 0 0.0% 0 0.0% 0 0.0% 0 0.0% 0 0.0% 0 0.0% 0 0.0% 0More national multiple shops
/ High Street shops 2.6% 9 0.0% 0 0.0% 0 0.0% 0 0.0% 0 2.3% 3 1.3% 2 5.4% 4 0.0% 0
Protection from the weather (i.e. covered shopping malls)
0.0% 0 0.0% 0 0.0% 0 0.0% 0 0.0% 0 0.0% 0 0.0% 0 0.0% 0 0.0% 0
Shops / services open on Sundays / better opening hours
0.0% 0 0.0% 0 0.0% 0 0.0% 0 0.0% 0 0.0% 0 0.0% 0 0.0% 0 0.0% 0
Fewer vacant shops 0.0% 0 0.0% 0 0.0% 0 0.0% 0 0.0% 0 0.0% 0 0.0% 0 0.0% 0 0.0% 0Better maintained buildings 0.0% 0 0.0% 0 0.0% 0 0.0% 0 0.0% 0 0.0% 0 0.0% 0 0.0% 0 0.0% 0Better disabled access 0.0% 0 0.0% 0 0.0% 0 0.0% 0 0.0% 0 0.0% 0 0.0% 0 0.0% 0 0.0% 0Better prices 0.0% 0 0.0% 0 0.0% 0 0.0% 0 0.0% 0 0.0% 0 0.0% 0 0.0% 0 0.0% 0Better quality shops 0.2% 1 0.0% 0 0.0% 0 0.0% 0 0.0% 0 0.0% 0 0.0% 0 0.8% 1 0.0% 0Fewer charity shops 0.0% 0 0.0% 0 0.0% 0 0.0% 0 0.0% 0 0.0% 0 0.0% 0 0.0% 0 0.0% 0Improve the environment /
refurbish 0.4% 2 0.0% 0 0.0% 0 0.0% 0 0.0% 0 0.0% 0 0.7% 1 0.8% 1 0.0% 0
Less congestion / too busy 0.2% 1 0.0% 0 0.0% 0 0.0% 0 0.0% 0 0.0% 0 0.0% 0 0.8% 1 0.0% 0More independent shops 0.3% 1 0.0% 0 0.0% 0 0.0% 0 0.0% 0 0.0% 0 0.9% 1 0.0% 0 0.0% 0Other 0.0% 0 0.0% 0 0.0% 0 0.0% 0 0.0% 0 0.0% 0 0.0% 0 0.0% 0 0.0% 0(Nothing) 62.0% 227 0.0% 0 0.0% 0 0.0% 0 0.0% 0 64.3% 99 58.0% 78 64.3% 49 0.0% 0(Don’t know) 23.8% 87 0.0% 0 0.0% 0 0.0% 0 0.0% 0 26.6% 41 24.0% 32 17.6% 13 0.0% 0Weighted base: 365 0 0 0 0 154 135 76 0Sample: 300 0 0 0 0 100 100 100 0

by Zone (Weighted, Part 1) South Wales Retail Study Page 93 Weighted: for Carter Jonas August 2016
Total Zone 1 Zone 2 Zone 3 Zone 4 Zone 5 Zone 6 Zone 7 Zone 8
Column %ges. 020716 NEMS market research
Mean score [Times a year, those who visit]: Daily = 365, 4-6 days a week = 234, 2-3 days a week = 130, One day a week = 52, Every two weeks = 24, Monthly = 12, Once every two months = 6, Three-four times a year = 3.5, Once a year = 1, Less often = 0.25
Q59 How often do you or your household visit Aberystwyth shopping and other town centre services? Zones 10-16 Daily 5.4% 39 0.0% 0 0.0% 0 0.0% 0 0.0% 0 0.0% 0 0.0% 0 0.0% 0 0.0% 04-6 days a week 3.7% 27 0.0% 0 0.0% 0 0.0% 0 0.0% 0 0.0% 0 0.0% 0 0.0% 0 0.0% 02-3 days a week 12.2% 89 0.0% 0 0.0% 0 0.0% 0 0.0% 0 0.0% 0 0.0% 0 0.0% 0 0.0% 0One day a week 18.1% 132 0.0% 0 0.0% 0 0.0% 0 0.0% 0 0.0% 0 0.0% 0 0.0% 0 0.0% 0Every two weeks 7.8% 57 0.0% 0 0.0% 0 0.0% 0 0.0% 0 0.0% 0 0.0% 0 0.0% 0 0.0% 0Monthly 9.5% 69 0.0% 0 0.0% 0 0.0% 0 0.0% 0 0.0% 0 0.0% 0 0.0% 0 0.0% 0Once every two months 5.3% 38 0.0% 0 0.0% 0 0.0% 0 0.0% 0 0.0% 0 0.0% 0 0.0% 0 0.0% 0Three-four times a year 6.1% 45 0.0% 0 0.0% 0 0.0% 0 0.0% 0 0.0% 0 0.0% 0 0.0% 0 0.0% 0Once a year 5.7% 41 0.0% 0 0.0% 0 0.0% 0 0.0% 0 0.0% 0 0.0% 0 0.0% 0 0.0% 0Less often 1.4% 10 0.0% 0 0.0% 0 0.0% 0 0.0% 0 0.0% 0 0.0% 0 0.0% 0 0.0% 0Never 23.0% 168 0.0% 0 0.0% 0 0.0% 0 0.0% 0 0.0% 0 0.0% 0 0.0% 0 0.0% 0(Don’t know) 0.3% 2 0.0% 0 0.0% 0 0.0% 0 0.0% 0 0.0% 0 0.0% 0 0.0% 0 0.0% 0(Varies) 1.6% 12 0.0% 0 0.0% 0 0.0% 0 0.0% 0 0.0% 0 0.0% 0 0.0% 0 0.0% 0Mean: 76.20 0.00 0.00 0.00 0.00 0.00 0.00 0.00 0.00Weighted base: 730 0 0 0 0 0 0 0 0Sample: 705 0 0 0 0 0 0 0 0

by Zone (Weighted, Part 1) South Wales Retail Study Page 94 Weighted: for Carter Jonas August 2016
Total Zone 1 Zone 2 Zone 3 Zone 4 Zone 5 Zone 6 Zone 7 Zone 8
Column %ges. 020716 NEMS market research
Q60A In order of importance, what are your two main reasons for visiting Aberystwth Town Centre? Main reason: Zones 10-16 and those who visit Aberystwth town centre at Q59 Food shopping 36.8% 207 0.0% 0 0.0% 0 0.0% 0 0.0% 0 0.0% 0 0.0% 0 0.0% 0 0.0% 0Non-food shopping 21.7% 122 0.0% 0 0.0% 0 0.0% 0 0.0% 0 0.0% 0 0.0% 0 0.0% 0 0.0% 0To visit bars / pubs 0.1% 1 0.0% 0 0.0% 0 0.0% 0 0.0% 0 0.0% 0 0.0% 0 0.0% 0 0.0% 0To visit cafés / restaurants 3.4% 19 0.0% 0 0.0% 0 0.0% 0 0.0% 0 0.0% 0 0.0% 0 0.0% 0 0.0% 0To visit personal service
providers (e.g. hairdressers, beauty salon etc.)
0.5% 3 0.0% 0 0.0% 0 0.0% 0 0.0% 0 0.0% 0 0.0% 0 0.0% 0 0.0% 0
To visit financial services such as banks and other financial institutions
4.9% 27 0.0% 0 0.0% 0 0.0% 0 0.0% 0 0.0% 0 0.0% 0 0.0% 0 0.0% 0
To visit other service providers (e.g. travel agent, estate agent etc.)
0.3% 2 0.0% 0 0.0% 0 0.0% 0 0.0% 0 0.0% 0 0.0% 0 0.0% 0 0.0% 0
To visit public services (e.g. medical or dentist appointment, library, job centre, community centre, etc)
7.8% 44 0.0% 0 0.0% 0 0.0% 0 0.0% 0 0.0% 0 0.0% 0 0.0% 0 0.0% 0
To get petrol 0.1% 0 0.0% 0 0.0% 0 0.0% 0 0.0% 0 0.0% 0 0.0% 0 0.0% 0 0.0% 0To visit the cinema 0.3% 2 0.0% 0 0.0% 0 0.0% 0 0.0% 0 0.0% 0 0.0% 0 0.0% 0 0.0% 0To visit a park 0.0% 0 0.0% 0 0.0% 0 0.0% 0 0.0% 0 0.0% 0 0.0% 0 0.0% 0 0.0% 0To visit the swimming pool 0.0% 0 0.0% 0 0.0% 0 0.0% 0 0.0% 0 0.0% 0 0.0% 0 0.0% 0 0.0% 0To visit other gyms / health
and fitness facilities 0.1% 0 0.0% 0 0.0% 0 0.0% 0 0.0% 0 0.0% 0 0.0% 0 0.0% 0 0.0% 0
To visit the library 0.5% 3 0.0% 0 0.0% 0 0.0% 0 0.0% 0 0.0% 0 0.0% 0 0.0% 0 0.0% 0To visit museums / art
gallery 0.0% 0 0.0% 0 0.0% 0 0.0% 0 0.0% 0 0.0% 0 0.0% 0 0.0% 0 0.0% 0
To visit the theatre or musical venues
0.0% 0 0.0% 0 0.0% 0 0.0% 0 0.0% 0 0.0% 0 0.0% 0 0.0% 0 0.0% 0
To visit night time venues e.g. nightclub
0.0% 0 0.0% 0 0.0% 0 0.0% 0 0.0% 0 0.0% 0 0.0% 0 0.0% 0 0.0% 0
For other leisure activities 2.2% 12 0.0% 0 0.0% 0 0.0% 0 0.0% 0 0.0% 0 0.0% 0 0.0% 0 0.0% 0To shop at the market(s) 0.2% 1 0.0% 0 0.0% 0 0.0% 0 0.0% 0 0.0% 0 0.0% 0 0.0% 0 0.0% 0To meet family 1.7% 10 0.0% 0 0.0% 0 0.0% 0 0.0% 0 0.0% 0 0.0% 0 0.0% 0 0.0% 0To meet friends 2.2% 12 0.0% 0 0.0% 0 0.0% 0 0.0% 0 0.0% 0 0.0% 0 0.0% 0 0.0% 0To visit the theatre 0.1% 1 0.0% 0 0.0% 0 0.0% 0 0.0% 0 0.0% 0 0.0% 0 0.0% 0 0.0% 0For work (i.e. place of work) 9.7% 55 0.0% 0 0.0% 0 0.0% 0 0.0% 0 0.0% 0 0.0% 0 0.0% 0 0.0% 0For business (e.g. attend a
business appointment) 0.0% 0 0.0% 0 0.0% 0 0.0% 0 0.0% 0 0.0% 0 0.0% 0 0.0% 0 0.0% 0
For education as a student (e.g. student at college, university, or other third level education)
0.9% 5 0.0% 0 0.0% 0 0.0% 0 0.0% 0 0.0% 0 0.0% 0 0.0% 0 0.0% 0
To access public transport for onward travel (e.g. train station, bus station)
2.0% 11 0.0% 0 0.0% 0 0.0% 0 0.0% 0 0.0% 0 0.0% 0 0.0% 0 0.0% 0
Other 0.0% 0 0.0% 0 0.0% 0 0.0% 0 0.0% 0 0.0% 0 0.0% 0 0.0% 0 0.0% 0As part of a day out / for a
day out / something different
1.8% 10 0.0% 0 0.0% 0 0.0% 0 0.0% 0 0.0% 0 0.0% 0 0.0% 0 0.0% 0
Browsing / window shopping 0.5% 3 0.0% 0 0.0% 0 0.0% 0 0.0% 0 0.0% 0 0.0% 0 0.0% 0 0.0% 0(Don't know / varies) 1.6% 9 0.0% 0 0.0% 0 0.0% 0 0.0% 0 0.0% 0 0.0% 0 0.0% 0 0.0% 0(Nothing / nothing further) 0.7% 4 0.0% 0 0.0% 0 0.0% 0 0.0% 0 0.0% 0 0.0% 0 0.0% 0 0.0% 0Weighted base: 562 0 0 0 0 0 0 0 0Sample: 552 0 0 0 0 0 0 0 0
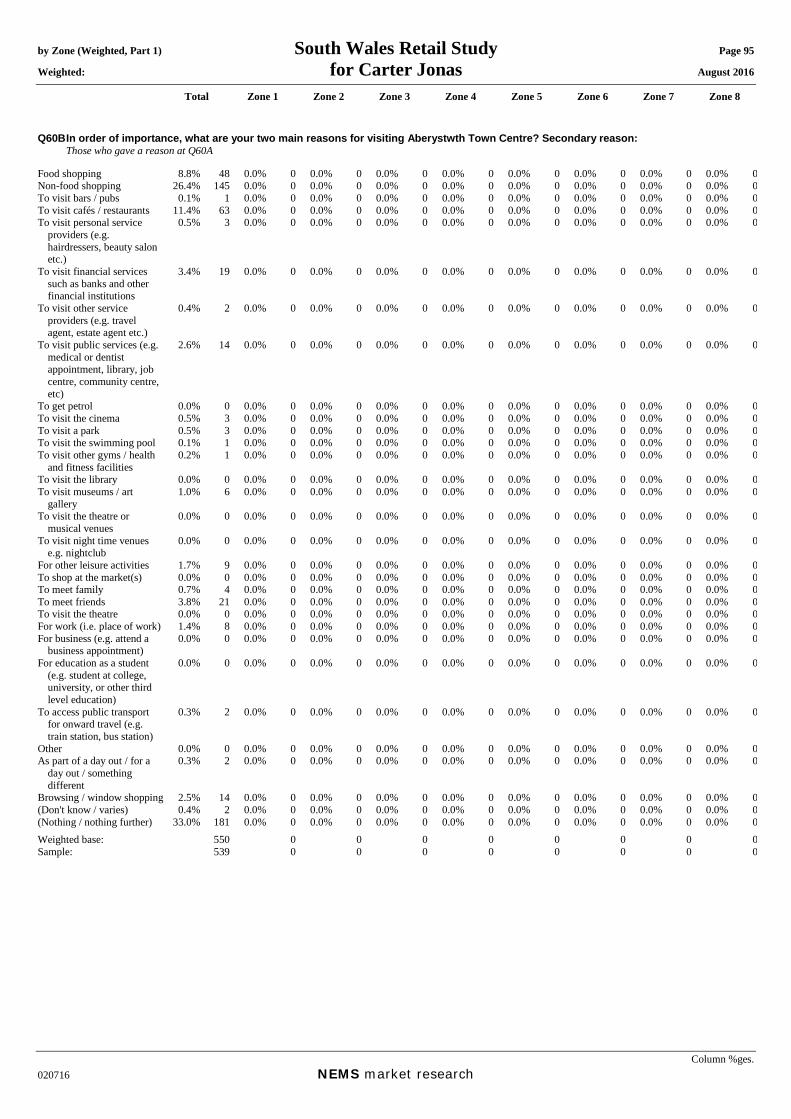
by Zone (Weighted, Part 1) South Wales Retail Study Page 95 Weighted: for Carter Jonas August 2016
Total Zone 1 Zone 2 Zone 3 Zone 4 Zone 5 Zone 6 Zone 7 Zone 8
Column %ges. 020716 NEMS market research
Q60B In order of importance, what are your two main reasons for visiting Aberystwth Town Centre? Secondary reason: Those who gave a reason at Q60A Food shopping 8.8% 48 0.0% 0 0.0% 0 0.0% 0 0.0% 0 0.0% 0 0.0% 0 0.0% 0 0.0% 0Non-food shopping 26.4% 145 0.0% 0 0.0% 0 0.0% 0 0.0% 0 0.0% 0 0.0% 0 0.0% 0 0.0% 0To visit bars / pubs 0.1% 1 0.0% 0 0.0% 0 0.0% 0 0.0% 0 0.0% 0 0.0% 0 0.0% 0 0.0% 0To visit cafés / restaurants 11.4% 63 0.0% 0 0.0% 0 0.0% 0 0.0% 0 0.0% 0 0.0% 0 0.0% 0 0.0% 0To visit personal service
providers (e.g. hairdressers, beauty salon etc.)
0.5% 3 0.0% 0 0.0% 0 0.0% 0 0.0% 0 0.0% 0 0.0% 0 0.0% 0 0.0% 0
To visit financial services such as banks and other financial institutions
3.4% 19 0.0% 0 0.0% 0 0.0% 0 0.0% 0 0.0% 0 0.0% 0 0.0% 0 0.0% 0
To visit other service providers (e.g. travel agent, estate agent etc.)
0.4% 2 0.0% 0 0.0% 0 0.0% 0 0.0% 0 0.0% 0 0.0% 0 0.0% 0 0.0% 0
To visit public services (e.g. medical or dentist appointment, library, job centre, community centre, etc)
2.6% 14 0.0% 0 0.0% 0 0.0% 0 0.0% 0 0.0% 0 0.0% 0 0.0% 0 0.0% 0
To get petrol 0.0% 0 0.0% 0 0.0% 0 0.0% 0 0.0% 0 0.0% 0 0.0% 0 0.0% 0 0.0% 0To visit the cinema 0.5% 3 0.0% 0 0.0% 0 0.0% 0 0.0% 0 0.0% 0 0.0% 0 0.0% 0 0.0% 0To visit a park 0.5% 3 0.0% 0 0.0% 0 0.0% 0 0.0% 0 0.0% 0 0.0% 0 0.0% 0 0.0% 0To visit the swimming pool 0.1% 1 0.0% 0 0.0% 0 0.0% 0 0.0% 0 0.0% 0 0.0% 0 0.0% 0 0.0% 0To visit other gyms / health
and fitness facilities 0.2% 1 0.0% 0 0.0% 0 0.0% 0 0.0% 0 0.0% 0 0.0% 0 0.0% 0 0.0% 0
To visit the library 0.0% 0 0.0% 0 0.0% 0 0.0% 0 0.0% 0 0.0% 0 0.0% 0 0.0% 0 0.0% 0To visit museums / art
gallery 1.0% 6 0.0% 0 0.0% 0 0.0% 0 0.0% 0 0.0% 0 0.0% 0 0.0% 0 0.0% 0
To visit the theatre or musical venues
0.0% 0 0.0% 0 0.0% 0 0.0% 0 0.0% 0 0.0% 0 0.0% 0 0.0% 0 0.0% 0
To visit night time venues e.g. nightclub
0.0% 0 0.0% 0 0.0% 0 0.0% 0 0.0% 0 0.0% 0 0.0% 0 0.0% 0 0.0% 0
For other leisure activities 1.7% 9 0.0% 0 0.0% 0 0.0% 0 0.0% 0 0.0% 0 0.0% 0 0.0% 0 0.0% 0To shop at the market(s) 0.0% 0 0.0% 0 0.0% 0 0.0% 0 0.0% 0 0.0% 0 0.0% 0 0.0% 0 0.0% 0To meet family 0.7% 4 0.0% 0 0.0% 0 0.0% 0 0.0% 0 0.0% 0 0.0% 0 0.0% 0 0.0% 0To meet friends 3.8% 21 0.0% 0 0.0% 0 0.0% 0 0.0% 0 0.0% 0 0.0% 0 0.0% 0 0.0% 0To visit the theatre 0.0% 0 0.0% 0 0.0% 0 0.0% 0 0.0% 0 0.0% 0 0.0% 0 0.0% 0 0.0% 0For work (i.e. place of work) 1.4% 8 0.0% 0 0.0% 0 0.0% 0 0.0% 0 0.0% 0 0.0% 0 0.0% 0 0.0% 0For business (e.g. attend a
business appointment) 0.0% 0 0.0% 0 0.0% 0 0.0% 0 0.0% 0 0.0% 0 0.0% 0 0.0% 0 0.0% 0
For education as a student (e.g. student at college, university, or other third level education)
0.0% 0 0.0% 0 0.0% 0 0.0% 0 0.0% 0 0.0% 0 0.0% 0 0.0% 0 0.0% 0
To access public transport for onward travel (e.g. train station, bus station)
0.3% 2 0.0% 0 0.0% 0 0.0% 0 0.0% 0 0.0% 0 0.0% 0 0.0% 0 0.0% 0
Other 0.0% 0 0.0% 0 0.0% 0 0.0% 0 0.0% 0 0.0% 0 0.0% 0 0.0% 0 0.0% 0As part of a day out / for a
day out / something different
0.3% 2 0.0% 0 0.0% 0 0.0% 0 0.0% 0 0.0% 0 0.0% 0 0.0% 0 0.0% 0
Browsing / window shopping 2.5% 14 0.0% 0 0.0% 0 0.0% 0 0.0% 0 0.0% 0 0.0% 0 0.0% 0 0.0% 0(Don't know / varies) 0.4% 2 0.0% 0 0.0% 0 0.0% 0 0.0% 0 0.0% 0 0.0% 0 0.0% 0 0.0% 0(Nothing / nothing further) 33.0% 181 0.0% 0 0.0% 0 0.0% 0 0.0% 0 0.0% 0 0.0% 0 0.0% 0 0.0% 0Weighted base: 550 0 0 0 0 0 0 0 0Sample: 539 0 0 0 0 0 0 0 0

by Zone (Weighted, Part 1) South Wales Retail Study Page 96 Weighted: for Carter Jonas August 2016
Total Zone 1 Zone 2 Zone 3 Zone 4 Zone 5 Zone 6 Zone 7 Zone 8
Column %ges. 020716 NEMS market research
Q60X In order of importance, what are your two main reasons for visiting Aberystwth Town Centre? Any mention: [MR] Zones 10-16 and those who visit Aberystwth town centre at Q59 Food shopping 45.5% 256 0.0% 0 0.0% 0 0.0% 0 0.0% 0 0.0% 0 0.0% 0 0.0% 0 0.0% 0Non-food shopping 47.4% 267 0.0% 0 0.0% 0 0.0% 0 0.0% 0 0.0% 0 0.0% 0 0.0% 0 0.0% 0To visit bars / pubs 0.2% 1 0.0% 0 0.0% 0 0.0% 0 0.0% 0 0.0% 0 0.0% 0 0.0% 0 0.0% 0To visit cafés / restaurants 14.5% 82 0.0% 0 0.0% 0 0.0% 0 0.0% 0 0.0% 0 0.0% 0 0.0% 0 0.0% 0To visit personal service
providers (e.g. hairdressers, beauty salon etc.)
1.0% 6 0.0% 0 0.0% 0 0.0% 0 0.0% 0 0.0% 0 0.0% 0 0.0% 0 0.0% 0
To visit financial services such as banks and other financial institutions
8.2% 46 0.0% 0 0.0% 0 0.0% 0 0.0% 0 0.0% 0 0.0% 0 0.0% 0 0.0% 0
To visit other service providers (e.g. travel agent, estate agent etc.)
0.7% 4 0.0% 0 0.0% 0 0.0% 0 0.0% 0 0.0% 0 0.0% 0 0.0% 0 0.0% 0
To visit public services (e.g. medical or dentist appointment, library, job centre, community centre, etc)
10.3% 58 0.0% 0 0.0% 0 0.0% 0 0.0% 0 0.0% 0 0.0% 0 0.0% 0 0.0% 0
To get petrol 0.1% 0 0.0% 0 0.0% 0 0.0% 0 0.0% 0 0.0% 0 0.0% 0 0.0% 0 0.0% 0To visit the cinema 0.8% 5 0.0% 0 0.0% 0 0.0% 0 0.0% 0 0.0% 0 0.0% 0 0.0% 0 0.0% 0To visit a park 0.5% 3 0.0% 0 0.0% 0 0.0% 0 0.0% 0 0.0% 0 0.0% 0 0.0% 0 0.0% 0To visit the swimming pool 0.1% 1 0.0% 0 0.0% 0 0.0% 0 0.0% 0 0.0% 0 0.0% 0 0.0% 0 0.0% 0To visit other gyms / health
and fitness facilities 0.3% 2 0.0% 0 0.0% 0 0.0% 0 0.0% 0 0.0% 0 0.0% 0 0.0% 0 0.0% 0
To visit the library 0.5% 3 0.0% 0 0.0% 0 0.0% 0 0.0% 0 0.0% 0 0.0% 0 0.0% 0 0.0% 0To visit museums / art
gallery 1.0% 6 0.0% 0 0.0% 0 0.0% 0 0.0% 0 0.0% 0 0.0% 0 0.0% 0 0.0% 0
To visit the theatre or musical venues
0.0% 0 0.0% 0 0.0% 0 0.0% 0 0.0% 0 0.0% 0 0.0% 0 0.0% 0 0.0% 0
To visit night time venues e.g. nightclub
0.0% 0 0.0% 0 0.0% 0 0.0% 0 0.0% 0 0.0% 0 0.0% 0 0.0% 0 0.0% 0
For other leisure activities 3.9% 22 0.0% 0 0.0% 0 0.0% 0 0.0% 0 0.0% 0 0.0% 0 0.0% 0 0.0% 0To shop at the market(s) 0.2% 1 0.0% 0 0.0% 0 0.0% 0 0.0% 0 0.0% 0 0.0% 0 0.0% 0 0.0% 0To meet family 2.4% 13 0.0% 0 0.0% 0 0.0% 0 0.0% 0 0.0% 0 0.0% 0 0.0% 0 0.0% 0To meet friends 5.8% 33 0.0% 0 0.0% 0 0.0% 0 0.0% 0 0.0% 0 0.0% 0 0.0% 0 0.0% 0To visit the theatre 0.1% 1 0.0% 0 0.0% 0 0.0% 0 0.0% 0 0.0% 0 0.0% 0 0.0% 0 0.0% 0For work (i.e. place of work) 11.2% 63 0.0% 0 0.0% 0 0.0% 0 0.0% 0 0.0% 0 0.0% 0 0.0% 0 0.0% 0For business (e.g. attend a
business appointment) 0.0% 0 0.0% 0 0.0% 0 0.0% 0 0.0% 0 0.0% 0 0.0% 0 0.0% 0 0.0% 0
For education as a student (e.g. student at college, university, or other third level education)
0.9% 5 0.0% 0 0.0% 0 0.0% 0 0.0% 0 0.0% 0 0.0% 0 0.0% 0 0.0% 0
To access public transport for onward travel (e.g. train station, bus station)
2.3% 13 0.0% 0 0.0% 0 0.0% 0 0.0% 0 0.0% 0 0.0% 0 0.0% 0 0.0% 0
Other 0.0% 0 0.0% 0 0.0% 0 0.0% 0 0.0% 0 0.0% 0 0.0% 0 0.0% 0 0.0% 0As part of a day out / for a
day out / something different
2.0% 11 0.0% 0 0.0% 0 0.0% 0 0.0% 0 0.0% 0 0.0% 0 0.0% 0 0.0% 0
Browsing / window shopping 3.0% 17 0.0% 0 0.0% 0 0.0% 0 0.0% 0 0.0% 0 0.0% 0 0.0% 0 0.0% 0Weighted base: 562 0 0 0 0 0 0 0 0Sample: 552 0 0 0 0 0 0 0 0
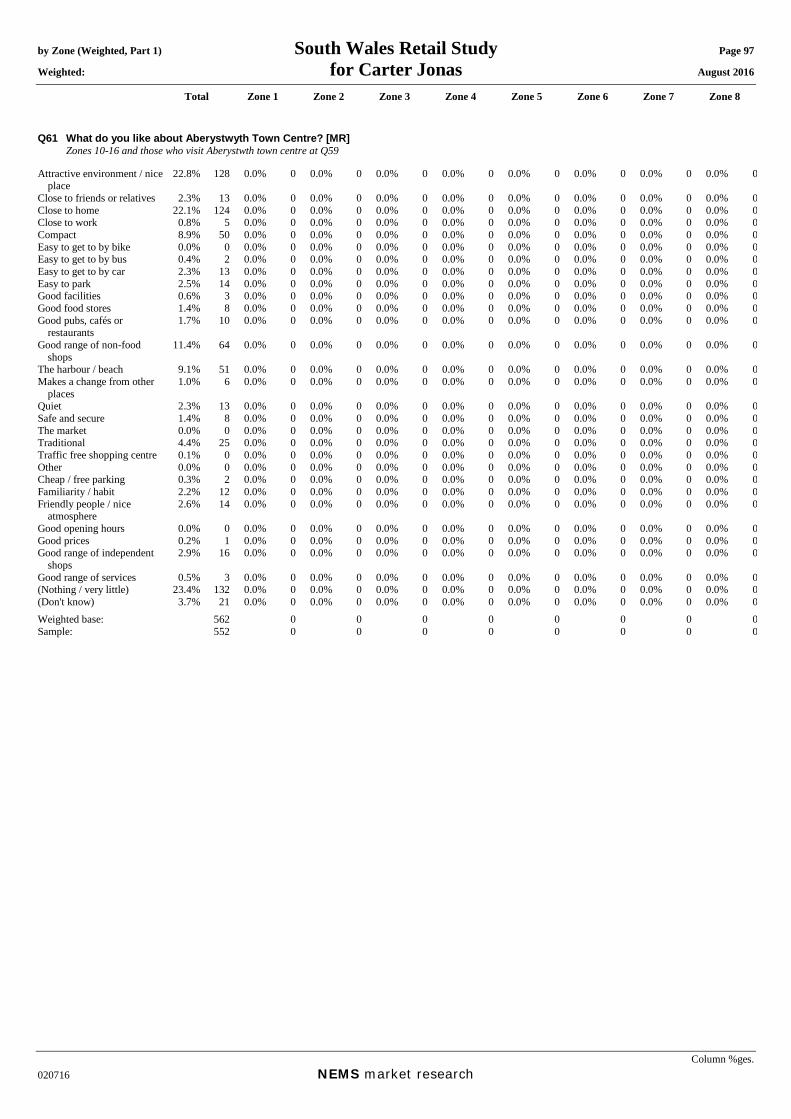
by Zone (Weighted, Part 1) South Wales Retail Study Page 97 Weighted: for Carter Jonas August 2016
Total Zone 1 Zone 2 Zone 3 Zone 4 Zone 5 Zone 6 Zone 7 Zone 8
Column %ges. 020716 NEMS market research
Q61 What do you like about Aberystwyth Town Centre? [MR] Zones 10-16 and those who visit Aberystwth town centre at Q59 Attractive environment / nice
place 22.8% 128 0.0% 0 0.0% 0 0.0% 0 0.0% 0 0.0% 0 0.0% 0 0.0% 0 0.0% 0
Close to friends or relatives 2.3% 13 0.0% 0 0.0% 0 0.0% 0 0.0% 0 0.0% 0 0.0% 0 0.0% 0 0.0% 0Close to home 22.1% 124 0.0% 0 0.0% 0 0.0% 0 0.0% 0 0.0% 0 0.0% 0 0.0% 0 0.0% 0Close to work 0.8% 5 0.0% 0 0.0% 0 0.0% 0 0.0% 0 0.0% 0 0.0% 0 0.0% 0 0.0% 0Compact 8.9% 50 0.0% 0 0.0% 0 0.0% 0 0.0% 0 0.0% 0 0.0% 0 0.0% 0 0.0% 0Easy to get to by bike 0.0% 0 0.0% 0 0.0% 0 0.0% 0 0.0% 0 0.0% 0 0.0% 0 0.0% 0 0.0% 0Easy to get to by bus 0.4% 2 0.0% 0 0.0% 0 0.0% 0 0.0% 0 0.0% 0 0.0% 0 0.0% 0 0.0% 0Easy to get to by car 2.3% 13 0.0% 0 0.0% 0 0.0% 0 0.0% 0 0.0% 0 0.0% 0 0.0% 0 0.0% 0Easy to park 2.5% 14 0.0% 0 0.0% 0 0.0% 0 0.0% 0 0.0% 0 0.0% 0 0.0% 0 0.0% 0Good facilities 0.6% 3 0.0% 0 0.0% 0 0.0% 0 0.0% 0 0.0% 0 0.0% 0 0.0% 0 0.0% 0Good food stores 1.4% 8 0.0% 0 0.0% 0 0.0% 0 0.0% 0 0.0% 0 0.0% 0 0.0% 0 0.0% 0Good pubs, cafés or
restaurants 1.7% 10 0.0% 0 0.0% 0 0.0% 0 0.0% 0 0.0% 0 0.0% 0 0.0% 0 0.0% 0
Good range of non-food shops
11.4% 64 0.0% 0 0.0% 0 0.0% 0 0.0% 0 0.0% 0 0.0% 0 0.0% 0 0.0% 0
The harbour / beach 9.1% 51 0.0% 0 0.0% 0 0.0% 0 0.0% 0 0.0% 0 0.0% 0 0.0% 0 0.0% 0Makes a change from other
places 1.0% 6 0.0% 0 0.0% 0 0.0% 0 0.0% 0 0.0% 0 0.0% 0 0.0% 0 0.0% 0
Quiet 2.3% 13 0.0% 0 0.0% 0 0.0% 0 0.0% 0 0.0% 0 0.0% 0 0.0% 0 0.0% 0Safe and secure 1.4% 8 0.0% 0 0.0% 0 0.0% 0 0.0% 0 0.0% 0 0.0% 0 0.0% 0 0.0% 0The market 0.0% 0 0.0% 0 0.0% 0 0.0% 0 0.0% 0 0.0% 0 0.0% 0 0.0% 0 0.0% 0Traditional 4.4% 25 0.0% 0 0.0% 0 0.0% 0 0.0% 0 0.0% 0 0.0% 0 0.0% 0 0.0% 0Traffic free shopping centre 0.1% 0 0.0% 0 0.0% 0 0.0% 0 0.0% 0 0.0% 0 0.0% 0 0.0% 0 0.0% 0Other 0.0% 0 0.0% 0 0.0% 0 0.0% 0 0.0% 0 0.0% 0 0.0% 0 0.0% 0 0.0% 0Cheap / free parking 0.3% 2 0.0% 0 0.0% 0 0.0% 0 0.0% 0 0.0% 0 0.0% 0 0.0% 0 0.0% 0Familiarity / habit 2.2% 12 0.0% 0 0.0% 0 0.0% 0 0.0% 0 0.0% 0 0.0% 0 0.0% 0 0.0% 0Friendly people / nice
atmosphere 2.6% 14 0.0% 0 0.0% 0 0.0% 0 0.0% 0 0.0% 0 0.0% 0 0.0% 0 0.0% 0
Good opening hours 0.0% 0 0.0% 0 0.0% 0 0.0% 0 0.0% 0 0.0% 0 0.0% 0 0.0% 0 0.0% 0Good prices 0.2% 1 0.0% 0 0.0% 0 0.0% 0 0.0% 0 0.0% 0 0.0% 0 0.0% 0 0.0% 0Good range of independent
shops 2.9% 16 0.0% 0 0.0% 0 0.0% 0 0.0% 0 0.0% 0 0.0% 0 0.0% 0 0.0% 0
Good range of services 0.5% 3 0.0% 0 0.0% 0 0.0% 0 0.0% 0 0.0% 0 0.0% 0 0.0% 0 0.0% 0(Nothing / very little) 23.4% 132 0.0% 0 0.0% 0 0.0% 0 0.0% 0 0.0% 0 0.0% 0 0.0% 0 0.0% 0(Don't know) 3.7% 21 0.0% 0 0.0% 0 0.0% 0 0.0% 0 0.0% 0 0.0% 0 0.0% 0 0.0% 0Weighted base: 562 0 0 0 0 0 0 0 0Sample: 552 0 0 0 0 0 0 0 0

by Zone (Weighted, Part 1) South Wales Retail Study Page 98 Weighted: for Carter Jonas August 2016
Total Zone 1 Zone 2 Zone 3 Zone 4 Zone 5 Zone 6 Zone 7 Zone 8
Column %ges. 020716 NEMS market research
Q62 What could be improved about Aberystwyth that would make you visit more often? [MR] Zones 10-16 Better access by road 3.4% 25 0.0% 0 0.0% 0 0.0% 0 0.0% 0 0.0% 0 0.0% 0 0.0% 0 0.0% 0Better public transport 2.7% 19 0.0% 0 0.0% 0 0.0% 0 0.0% 0 0.0% 0 0.0% 0 0.0% 0 0.0% 0Better signposting 0.9% 7 0.0% 0 0.0% 0 0.0% 0 0.0% 0 0.0% 0 0.0% 0 0.0% 0 0.0% 0Cleaner streets 2.4% 17 0.0% 0 0.0% 0 0.0% 0 0.0% 0 0.0% 0 0.0% 0 0.0% 0 0.0% 0Facilities which would assist
you if shopping with children
1.7% 12 0.0% 0 0.0% 0 0.0% 0 0.0% 0 0.0% 0 0.0% 0 0.0% 0 0.0% 0
Free / cheaper car parking 2.7% 20 0.0% 0 0.0% 0 0.0% 0 0.0% 0 0.0% 0 0.0% 0 0.0% 0 0.0% 0Jewellery / food markets /
other events 0.0% 0 0.0% 0 0.0% 0 0.0% 0 0.0% 0 0.0% 0 0.0% 0 0.0% 0 0.0% 0
More / better comparison retailers (i.e. non-food shops)
12.9% 94 0.0% 0 0.0% 0 0.0% 0 0.0% 0 0.0% 0 0.0% 0 0.0% 0 0.0% 0
More / better entertainment 1.4% 10 0.0% 0 0.0% 0 0.0% 0 0.0% 0 0.0% 0 0.0% 0 0.0% 0 0.0% 0More / better places for
eating out (e.g. cafés and restaurants)
1.2% 9 0.0% 0 0.0% 0 0.0% 0 0.0% 0 0.0% 0 0.0% 0 0.0% 0 0.0% 0
More / better food shops 3.1% 23 0.0% 0 0.0% 0 0.0% 0 0.0% 0 0.0% 0 0.0% 0 0.0% 0 0.0% 0More / better parking 15.4% 112 0.0% 0 0.0% 0 0.0% 0 0.0% 0 0.0% 0 0.0% 0 0.0% 0 0.0% 0More / better pedestrianised
streets 0.5% 4 0.0% 0 0.0% 0 0.0% 0 0.0% 0 0.0% 0 0.0% 0 0.0% 0 0.0% 0
More / better public conveniences
0.5% 4 0.0% 0 0.0% 0 0.0% 0 0.0% 0 0.0% 0 0.0% 0 0.0% 0 0.0% 0
More / better seats / flower displays
0.9% 7 0.0% 0 0.0% 0 0.0% 0 0.0% 0 0.0% 0 0.0% 0 0.0% 0 0.0% 0
More / better services 0.0% 0 0.0% 0 0.0% 0 0.0% 0 0.0% 0 0.0% 0 0.0% 0 0.0% 0 0.0% 0More advertising 0.4% 3 0.0% 0 0.0% 0 0.0% 0 0.0% 0 0.0% 0 0.0% 0 0.0% 0 0.0% 0More national multiple shops
/ High Street shops 16.4% 120 0.0% 0 0.0% 0 0.0% 0 0.0% 0 0.0% 0 0.0% 0 0.0% 0 0.0% 0
Protection from the weather (i.e. covered shopping malls)
0.3% 2 0.0% 0 0.0% 0 0.0% 0 0.0% 0 0.0% 0 0.0% 0 0.0% 0 0.0% 0
Shops / services open on Sundays / better opening hours
0.4% 3 0.0% 0 0.0% 0 0.0% 0 0.0% 0 0.0% 0 0.0% 0 0.0% 0 0.0% 0
Better disabled access 0.6% 5 0.0% 0 0.0% 0 0.0% 0 0.0% 0 0.0% 0 0.0% 0 0.0% 0 0.0% 0Better prices 0.0% 0 0.0% 0 0.0% 0 0.0% 0 0.0% 0 0.0% 0 0.0% 0 0.0% 0 0.0% 0Better quality shops 0.9% 7 0.0% 0 0.0% 0 0.0% 0 0.0% 0 0.0% 0 0.0% 0 0.0% 0 0.0% 0Fewer charity shops 1.2% 9 0.0% 0 0.0% 0 0.0% 0 0.0% 0 0.0% 0 0.0% 0 0.0% 0 0.0% 0Fewer vacant shops 1.7% 12 0.0% 0 0.0% 0 0.0% 0 0.0% 0 0.0% 0 0.0% 0 0.0% 0 0.0% 0Improve the environment /
refurbish 0.6% 4 0.0% 0 0.0% 0 0.0% 0 0.0% 0 0.0% 0 0.0% 0 0.0% 0 0.0% 0
Less congestion / too busy 0.4% 3 0.0% 0 0.0% 0 0.0% 0 0.0% 0 0.0% 0 0.0% 0 0.0% 0 0.0% 0More independent shops 2.4% 18 0.0% 0 0.0% 0 0.0% 0 0.0% 0 0.0% 0 0.0% 0 0.0% 0 0.0% 0Other 0.0% 0 0.0% 0 0.0% 0 0.0% 0 0.0% 0 0.0% 0 0.0% 0 0.0% 0 0.0% 0(Nothing) 38.7% 283 0.0% 0 0.0% 0 0.0% 0 0.0% 0 0.0% 0 0.0% 0 0.0% 0 0.0% 0(Don’t know) 8.4% 61 0.0% 0 0.0% 0 0.0% 0 0.0% 0 0.0% 0 0.0% 0 0.0% 0 0.0% 0Weighted base: 730 0 0 0 0 0 0 0 0Sample: 705 0 0 0 0 0 0 0 0

by Zone (Weighted, Part 1) South Wales Retail Study Page 99 Weighted: for Carter Jonas August 2016
Total Zone 1 Zone 2 Zone 3 Zone 4 Zone 5 Zone 6 Zone 7 Zone 8
Column %ges. 020716 NEMS market research
Mean score [Times a year, those who visit]: Daily = 365, 4-6 days a week = 234, 2-3 days a week = 130, One day a week = 52, Every two weeks = 24, Monthly = 12, Once every two months = 6, Three-four times a year = 3.5, Once a year = 1, Less often = 0.25
Q63 How often do you or your household visit Aberaeron for your shopping and other town centre services? Zones 10-16 Daily 1.0% 7 0.0% 0 0.0% 0 0.0% 0 0.0% 0 0.0% 0 0.0% 0 0.0% 0 0.0% 04-6 days a week 0.8% 6 0.0% 0 0.0% 0 0.0% 0 0.0% 0 0.0% 0 0.0% 0 0.0% 0 0.0% 02-3 days a week 4.0% 29 0.0% 0 0.0% 0 0.0% 0 0.0% 0 0.0% 0 0.0% 0 0.0% 0 0.0% 0One day a week 6.7% 49 0.0% 0 0.0% 0 0.0% 0 0.0% 0 0.0% 0 0.0% 0 0.0% 0 0.0% 0Every two weeks 5.0% 36 0.0% 0 0.0% 0 0.0% 0 0.0% 0 0.0% 0 0.0% 0 0.0% 0 0.0% 0Monthly 9.9% 73 0.0% 0 0.0% 0 0.0% 0 0.0% 0 0.0% 0 0.0% 0 0.0% 0 0.0% 0Once every two months 7.4% 54 0.0% 0 0.0% 0 0.0% 0 0.0% 0 0.0% 0 0.0% 0 0.0% 0 0.0% 0Three-four times a year 13.1% 96 0.0% 0 0.0% 0 0.0% 0 0.0% 0 0.0% 0 0.0% 0 0.0% 0 0.0% 0Once a year 4.6% 34 0.0% 0 0.0% 0 0.0% 0 0.0% 0 0.0% 0 0.0% 0 0.0% 0 0.0% 0Less often 0.7% 5 0.0% 0 0.0% 0 0.0% 0 0.0% 0 0.0% 0 0.0% 0 0.0% 0 0.0% 0Never 43.6% 319 0.0% 0 0.0% 0 0.0% 0 0.0% 0 0.0% 0 0.0% 0 0.0% 0 0.0% 0(Don’t know) 0.3% 2 0.0% 0 0.0% 0 0.0% 0 0.0% 0 0.0% 0 0.0% 0 0.0% 0 0.0% 0(Varies) 2.9% 21 0.0% 0 0.0% 0 0.0% 0 0.0% 0 0.0% 0 0.0% 0 0.0% 0 0.0% 0Mean: 32.82 0.00 0.00 0.00 0.00 0.00 0.00 0.00 0.00Weighted base: 730 0 0 0 0 0 0 0 0Sample: 705 0 0 0 0 0 0 0 0

by Zone (Weighted, Part 1) South Wales Retail Study Page 100 Weighted: for Carter Jonas August 2016
Total Zone 1 Zone 2 Zone 3 Zone 4 Zone 5 Zone 6 Zone 7 Zone 8
Column %ges. 020716 NEMS market research
Q64A In order of importance, what are your two main reasons for visiting Aberaeron Town Centre? Main reason: Zones 10-16 and those who visit Aberaeron town centre at Q63 Food shopping 12.1% 50 0.0% 0 0.0% 0 0.0% 0 0.0% 0 0.0% 0 0.0% 0 0.0% 0 0.0% 0Non-food shopping 19.2% 79 0.0% 0 0.0% 0 0.0% 0 0.0% 0 0.0% 0 0.0% 0 0.0% 0 0.0% 0To visit bars / pubs 1.4% 6 0.0% 0 0.0% 0 0.0% 0 0.0% 0 0.0% 0 0.0% 0 0.0% 0 0.0% 0To visit cafés / restaurants 23.3% 96 0.0% 0 0.0% 0 0.0% 0 0.0% 0 0.0% 0 0.0% 0 0.0% 0 0.0% 0To visit personal service
providers (e.g. hairdressers, beauty salon etc.)
0.3% 1 0.0% 0 0.0% 0 0.0% 0 0.0% 0 0.0% 0 0.0% 0 0.0% 0 0.0% 0
To visit financial services such as banks and other financial institutions
2.2% 9 0.0% 0 0.0% 0 0.0% 0 0.0% 0 0.0% 0 0.0% 0 0.0% 0 0.0% 0
To visit other service providers (e.g. travel agent, estate agent etc.)
0.9% 4 0.0% 0 0.0% 0 0.0% 0 0.0% 0 0.0% 0 0.0% 0 0.0% 0 0.0% 0
To visit public services (e.g. medical or dentist appointment, library, job centre, community centre, etc)
3.4% 14 0.0% 0 0.0% 0 0.0% 0 0.0% 0 0.0% 0 0.0% 0 0.0% 0 0.0% 0
To get petrol 0.0% 0 0.0% 0 0.0% 0 0.0% 0 0.0% 0 0.0% 0 0.0% 0 0.0% 0 0.0% 0To visit the cinema 0.2% 1 0.0% 0 0.0% 0 0.0% 0 0.0% 0 0.0% 0 0.0% 0 0.0% 0 0.0% 0To visit a park 0.1% 1 0.0% 0 0.0% 0 0.0% 0 0.0% 0 0.0% 0 0.0% 0 0.0% 0 0.0% 0To visit the swimming pool 0.0% 0 0.0% 0 0.0% 0 0.0% 0 0.0% 0 0.0% 0 0.0% 0 0.0% 0 0.0% 0To visit other gyms / health
and fitness facilities 1.8% 7 0.0% 0 0.0% 0 0.0% 0 0.0% 0 0.0% 0 0.0% 0 0.0% 0 0.0% 0
To visit the library 0.3% 1 0.0% 0 0.0% 0 0.0% 0 0.0% 0 0.0% 0 0.0% 0 0.0% 0 0.0% 0To visit museums / art
gallery 0.2% 1 0.0% 0 0.0% 0 0.0% 0 0.0% 0 0.0% 0 0.0% 0 0.0% 0 0.0% 0
To visit the theatre or musical venues
0.0% 0 0.0% 0 0.0% 0 0.0% 0 0.0% 0 0.0% 0 0.0% 0 0.0% 0 0.0% 0
To visit night time venues e.g. nightclub
0.0% 0 0.0% 0 0.0% 0 0.0% 0 0.0% 0 0.0% 0 0.0% 0 0.0% 0 0.0% 0
For other leisure activities 10.0% 41 0.0% 0 0.0% 0 0.0% 0 0.0% 0 0.0% 0 0.0% 0 0.0% 0 0.0% 0To shop at the market(s) 0.0% 0 0.0% 0 0.0% 0 0.0% 0 0.0% 0 0.0% 0 0.0% 0 0.0% 0 0.0% 0To meet family 3.7% 15 0.0% 0 0.0% 0 0.0% 0 0.0% 0 0.0% 0 0.0% 0 0.0% 0 0.0% 0To meet friends 4.0% 16 0.0% 0 0.0% 0 0.0% 0 0.0% 0 0.0% 0 0.0% 0 0.0% 0 0.0% 0To visit the theatre 0.0% 0 0.0% 0 0.0% 0 0.0% 0 0.0% 0 0.0% 0 0.0% 0 0.0% 0 0.0% 0For work (i.e. place of work) 3.2% 13 0.0% 0 0.0% 0 0.0% 0 0.0% 0 0.0% 0 0.0% 0 0.0% 0 0.0% 0For business (e.g. attend a
business appointment) 0.8% 3 0.0% 0 0.0% 0 0.0% 0 0.0% 0 0.0% 0 0.0% 0 0.0% 0 0.0% 0
For education as a student (e.g. student at college, university, or other third level education)
0.2% 1 0.0% 0 0.0% 0 0.0% 0 0.0% 0 0.0% 0 0.0% 0 0.0% 0 0.0% 0
To access public transport for onward travel (e.g. train station, bus station)
0.0% 0 0.0% 0 0.0% 0 0.0% 0 0.0% 0 0.0% 0 0.0% 0 0.0% 0 0.0% 0
Other 0.0% 0 0.0% 0 0.0% 0 0.0% 0 0.0% 0 0.0% 0 0.0% 0 0.0% 0 0.0% 0As part of a day out / for a
day out / something different
6.7% 28 0.0% 0 0.0% 0 0.0% 0 0.0% 0 0.0% 0 0.0% 0 0.0% 0 0.0% 0
Browsing / window shopping 3.1% 13 0.0% 0 0.0% 0 0.0% 0 0.0% 0 0.0% 0 0.0% 0 0.0% 0 0.0% 0(Don't know / varies) 1.4% 6 0.0% 0 0.0% 0 0.0% 0 0.0% 0 0.0% 0 0.0% 0 0.0% 0 0.0% 0(Nothing / nothing further) 1.5% 6 0.0% 0 0.0% 0 0.0% 0 0.0% 0 0.0% 0 0.0% 0 0.0% 0 0.0% 0Weighted base: 412 0 0 0 0 0 0 0 0Sample: 440 0 0 0 0 0 0 0 0

by Zone (Weighted, Part 1) South Wales Retail Study Page 101 Weighted: for Carter Jonas August 2016
Total Zone 1 Zone 2 Zone 3 Zone 4 Zone 5 Zone 6 Zone 7 Zone 8
Column %ges. 020716 NEMS market research
Q64B In order of importance, what are your two main reasons for visiting Aberaeron Town Centre? Secondary reason: Those who gave a reason at Q64A Food shopping 6.2% 25 0.0% 0 0.0% 0 0.0% 0 0.0% 0 0.0% 0 0.0% 0 0.0% 0 0.0% 0Non-food shopping 13.5% 54 0.0% 0 0.0% 0 0.0% 0 0.0% 0 0.0% 0 0.0% 0 0.0% 0 0.0% 0To visit bars / pubs 1.7% 7 0.0% 0 0.0% 0 0.0% 0 0.0% 0 0.0% 0 0.0% 0 0.0% 0 0.0% 0To visit cafés / restaurants 15.9% 63 0.0% 0 0.0% 0 0.0% 0 0.0% 0 0.0% 0 0.0% 0 0.0% 0 0.0% 0To visit personal service
providers (e.g. hairdressers, beauty salon etc.)
0.0% 0 0.0% 0 0.0% 0 0.0% 0 0.0% 0 0.0% 0 0.0% 0 0.0% 0 0.0% 0
To visit financial services such as banks and other financial institutions
1.1% 4 0.0% 0 0.0% 0 0.0% 0 0.0% 0 0.0% 0 0.0% 0 0.0% 0 0.0% 0
To visit other service providers (e.g. travel agent, estate agent etc.)
0.0% 0 0.0% 0 0.0% 0 0.0% 0 0.0% 0 0.0% 0 0.0% 0 0.0% 0 0.0% 0
To visit public services (e.g. medical or dentist appointment, library, job centre, community centre, etc)
1.7% 7 0.0% 0 0.0% 0 0.0% 0 0.0% 0 0.0% 0 0.0% 0 0.0% 0 0.0% 0
To get petrol 0.0% 0 0.0% 0 0.0% 0 0.0% 0 0.0% 0 0.0% 0 0.0% 0 0.0% 0 0.0% 0To visit the cinema 0.0% 0 0.0% 0 0.0% 0 0.0% 0 0.0% 0 0.0% 0 0.0% 0 0.0% 0 0.0% 0To visit a park 0.5% 2 0.0% 0 0.0% 0 0.0% 0 0.0% 0 0.0% 0 0.0% 0 0.0% 0 0.0% 0To visit the swimming pool 0.0% 0 0.0% 0 0.0% 0 0.0% 0 0.0% 0 0.0% 0 0.0% 0 0.0% 0 0.0% 0To visit other gyms / health
and fitness facilities 0.0% 0 0.0% 0 0.0% 0 0.0% 0 0.0% 0 0.0% 0 0.0% 0 0.0% 0 0.0% 0
To visit the library 0.4% 1 0.0% 0 0.0% 0 0.0% 0 0.0% 0 0.0% 0 0.0% 0 0.0% 0 0.0% 0To visit museums / art
gallery 0.2% 1 0.0% 0 0.0% 0 0.0% 0 0.0% 0 0.0% 0 0.0% 0 0.0% 0 0.0% 0
To visit the theatre or musical venues
0.0% 0 0.0% 0 0.0% 0 0.0% 0 0.0% 0 0.0% 0 0.0% 0 0.0% 0 0.0% 0
To visit night time venues e.g. nightclub
0.0% 0 0.0% 0 0.0% 0 0.0% 0 0.0% 0 0.0% 0 0.0% 0 0.0% 0 0.0% 0
For other leisure activities 6.9% 28 0.0% 0 0.0% 0 0.0% 0 0.0% 0 0.0% 0 0.0% 0 0.0% 0 0.0% 0To shop at the market(s) 0.0% 0 0.0% 0 0.0% 0 0.0% 0 0.0% 0 0.0% 0 0.0% 0 0.0% 0 0.0% 0To meet family 2.0% 8 0.0% 0 0.0% 0 0.0% 0 0.0% 0 0.0% 0 0.0% 0 0.0% 0 0.0% 0To meet friends 2.2% 9 0.0% 0 0.0% 0 0.0% 0 0.0% 0 0.0% 0 0.0% 0 0.0% 0 0.0% 0To visit the theatre 0.2% 1 0.0% 0 0.0% 0 0.0% 0 0.0% 0 0.0% 0 0.0% 0 0.0% 0 0.0% 0For work (i.e. place of work) 1.5% 6 0.0% 0 0.0% 0 0.0% 0 0.0% 0 0.0% 0 0.0% 0 0.0% 0 0.0% 0For business (e.g. attend a
business appointment) 0.0% 0 0.0% 0 0.0% 0 0.0% 0 0.0% 0 0.0% 0 0.0% 0 0.0% 0 0.0% 0
For education as a student (e.g. student at college, university, or other third level education)
0.0% 0 0.0% 0 0.0% 0 0.0% 0 0.0% 0 0.0% 0 0.0% 0 0.0% 0 0.0% 0
To access public transport for onward travel (e.g. train station, bus station)
0.1% 1 0.0% 0 0.0% 0 0.0% 0 0.0% 0 0.0% 0 0.0% 0 0.0% 0 0.0% 0
Other 0.0% 0 0.0% 0 0.0% 0 0.0% 0 0.0% 0 0.0% 0 0.0% 0 0.0% 0 0.0% 0As part of a day out / for a
day out / something different
2.3% 9 0.0% 0 0.0% 0 0.0% 0 0.0% 0 0.0% 0 0.0% 0 0.0% 0 0.0% 0
Browsing / window shopping 2.0% 8 0.0% 0 0.0% 0 0.0% 0 0.0% 0 0.0% 0 0.0% 0 0.0% 0 0.0% 0(Don't know / varies) 1.0% 4 0.0% 0 0.0% 0 0.0% 0 0.0% 0 0.0% 0 0.0% 0 0.0% 0 0.0% 0(Nothing / nothing further) 40.8% 163 0.0% 0 0.0% 0 0.0% 0 0.0% 0 0.0% 0 0.0% 0 0.0% 0 0.0% 0Weighted base: 399 0 0 0 0 0 0 0 0Sample: 426 0 0 0 0 0 0 0 0

by Zone (Weighted, Part 1) South Wales Retail Study Page 102 Weighted: for Carter Jonas August 2016
Total Zone 1 Zone 2 Zone 3 Zone 4 Zone 5 Zone 6 Zone 7 Zone 8
Column %ges. 020716 NEMS market research
Q64X In order of importance, what are your two main reasons for visiting Aberaeron Town Centre? Any mention: [MR] Zones 10-16 and those who visit Aberaeron town centre at Q63 Food shopping 18.1% 75 0.0% 0 0.0% 0 0.0% 0 0.0% 0 0.0% 0 0.0% 0 0.0% 0 0.0% 0Non-food shopping 32.3% 133 0.0% 0 0.0% 0 0.0% 0 0.0% 0 0.0% 0 0.0% 0 0.0% 0 0.0% 0To visit bars / pubs 3.0% 12 0.0% 0 0.0% 0 0.0% 0 0.0% 0 0.0% 0 0.0% 0 0.0% 0 0.0% 0To visit cafés / restaurants 38.7% 159 0.0% 0 0.0% 0 0.0% 0 0.0% 0 0.0% 0 0.0% 0 0.0% 0 0.0% 0To visit personal service
providers (e.g. hairdressers, beauty salon etc.)
0.3% 1 0.0% 0 0.0% 0 0.0% 0 0.0% 0 0.0% 0 0.0% 0 0.0% 0 0.0% 0
To visit financial services such as banks and other financial institutions
3.2% 13 0.0% 0 0.0% 0 0.0% 0 0.0% 0 0.0% 0 0.0% 0 0.0% 0 0.0% 0
To visit other service providers (e.g. travel agent, estate agent etc.)
0.9% 4 0.0% 0 0.0% 0 0.0% 0 0.0% 0 0.0% 0 0.0% 0 0.0% 0 0.0% 0
To visit public services (e.g. medical or dentist appointment, library, job centre, community centre, etc)
5.1% 21 0.0% 0 0.0% 0 0.0% 0 0.0% 0 0.0% 0 0.0% 0 0.0% 0 0.0% 0
To get petrol 0.0% 0 0.0% 0 0.0% 0 0.0% 0 0.0% 0 0.0% 0 0.0% 0 0.0% 0 0.0% 0To visit the cinema 0.2% 1 0.0% 0 0.0% 0 0.0% 0 0.0% 0 0.0% 0 0.0% 0 0.0% 0 0.0% 0To visit a park 0.6% 3 0.0% 0 0.0% 0 0.0% 0 0.0% 0 0.0% 0 0.0% 0 0.0% 0 0.0% 0To visit the swimming pool 0.0% 0 0.0% 0 0.0% 0 0.0% 0 0.0% 0 0.0% 0 0.0% 0 0.0% 0 0.0% 0To visit other gyms / health
and fitness facilities 1.8% 7 0.0% 0 0.0% 0 0.0% 0 0.0% 0 0.0% 0 0.0% 0 0.0% 0 0.0% 0
To visit the library 0.6% 3 0.0% 0 0.0% 0 0.0% 0 0.0% 0 0.0% 0 0.0% 0 0.0% 0 0.0% 0To visit museums / art
gallery 0.3% 1 0.0% 0 0.0% 0 0.0% 0 0.0% 0 0.0% 0 0.0% 0 0.0% 0 0.0% 0
To visit the theatre or musical venues
0.0% 0 0.0% 0 0.0% 0 0.0% 0 0.0% 0 0.0% 0 0.0% 0 0.0% 0 0.0% 0
To visit night time venues e.g. nightclub
0.0% 0 0.0% 0 0.0% 0 0.0% 0 0.0% 0 0.0% 0 0.0% 0 0.0% 0 0.0% 0
For other leisure activities 16.7% 69 0.0% 0 0.0% 0 0.0% 0 0.0% 0 0.0% 0 0.0% 0 0.0% 0 0.0% 0To shop at the market(s) 0.0% 0 0.0% 0 0.0% 0 0.0% 0 0.0% 0 0.0% 0 0.0% 0 0.0% 0 0.0% 0To meet family 5.6% 23 0.0% 0 0.0% 0 0.0% 0 0.0% 0 0.0% 0 0.0% 0 0.0% 0 0.0% 0To meet friends 6.1% 25 0.0% 0 0.0% 0 0.0% 0 0.0% 0 0.0% 0 0.0% 0 0.0% 0 0.0% 0To visit the theatre 0.2% 1 0.0% 0 0.0% 0 0.0% 0 0.0% 0 0.0% 0 0.0% 0 0.0% 0 0.0% 0For work (i.e. place of work) 4.6% 19 0.0% 0 0.0% 0 0.0% 0 0.0% 0 0.0% 0 0.0% 0 0.0% 0 0.0% 0For business (e.g. attend a
business appointment) 0.8% 3 0.0% 0 0.0% 0 0.0% 0 0.0% 0 0.0% 0 0.0% 0 0.0% 0 0.0% 0
For education as a student (e.g. student at college, university, or other third level education)
0.2% 1 0.0% 0 0.0% 0 0.0% 0 0.0% 0 0.0% 0 0.0% 0 0.0% 0 0.0% 0
To access public transport for onward travel (e.g. train station, bus station)
0.1% 1 0.0% 0 0.0% 0 0.0% 0 0.0% 0 0.0% 0 0.0% 0 0.0% 0 0.0% 0
Other 0.0% 0 0.0% 0 0.0% 0 0.0% 0 0.0% 0 0.0% 0 0.0% 0 0.0% 0 0.0% 0As part of a day out / for a
day out / something different
8.9% 37 0.0% 0 0.0% 0 0.0% 0 0.0% 0 0.0% 0 0.0% 0 0.0% 0 0.0% 0
Browsing / window shopping 5.1% 21 0.0% 0 0.0% 0 0.0% 0 0.0% 0 0.0% 0 0.0% 0 0.0% 0 0.0% 0Weighted base: 412 0 0 0 0 0 0 0 0Sample: 440 0 0 0 0 0 0 0 0

by Zone (Weighted, Part 1) South Wales Retail Study Page 103 Weighted: for Carter Jonas August 2016
Total Zone 1 Zone 2 Zone 3 Zone 4 Zone 5 Zone 6 Zone 7 Zone 8
Column %ges. 020716 NEMS market research
Q65 What do you like about Aberaeron Town Centre? [MR] Zones 10-16 and those who visit Aberaeron town centre at Q63 Attractive environment / nice
place 57.7% 238 0.0% 0 0.0% 0 0.0% 0 0.0% 0 0.0% 0 0.0% 0 0.0% 0 0.0% 0
Close to friends or relatives 1.2% 5 0.0% 0 0.0% 0 0.0% 0 0.0% 0 0.0% 0 0.0% 0 0.0% 0 0.0% 0Close to home 7.8% 32 0.0% 0 0.0% 0 0.0% 0 0.0% 0 0.0% 0 0.0% 0 0.0% 0 0.0% 0Close to work 0.7% 3 0.0% 0 0.0% 0 0.0% 0 0.0% 0 0.0% 0 0.0% 0 0.0% 0 0.0% 0Compact 4.9% 20 0.0% 0 0.0% 0 0.0% 0 0.0% 0 0.0% 0 0.0% 0 0.0% 0 0.0% 0Easy to get to by bike 0.0% 0 0.0% 0 0.0% 0 0.0% 0 0.0% 0 0.0% 0 0.0% 0 0.0% 0 0.0% 0Easy to get to by bus 0.0% 0 0.0% 0 0.0% 0 0.0% 0 0.0% 0 0.0% 0 0.0% 0 0.0% 0 0.0% 0Easy to get to by car 0.4% 2 0.0% 0 0.0% 0 0.0% 0 0.0% 0 0.0% 0 0.0% 0 0.0% 0 0.0% 0Easy to park 1.7% 7 0.0% 0 0.0% 0 0.0% 0 0.0% 0 0.0% 0 0.0% 0 0.0% 0 0.0% 0Good facilities 2.0% 8 0.0% 0 0.0% 0 0.0% 0 0.0% 0 0.0% 0 0.0% 0 0.0% 0 0.0% 0Good food stores 0.7% 3 0.0% 0 0.0% 0 0.0% 0 0.0% 0 0.0% 0 0.0% 0 0.0% 0 0.0% 0Good pubs, cafés or
restaurants 7.6% 31 0.0% 0 0.0% 0 0.0% 0 0.0% 0 0.0% 0 0.0% 0 0.0% 0 0.0% 0
Good range of non-food shops
8.2% 34 0.0% 0 0.0% 0 0.0% 0 0.0% 0 0.0% 0 0.0% 0 0.0% 0 0.0% 0
The harbour / beach 19.1% 79 0.0% 0 0.0% 0 0.0% 0 0.0% 0 0.0% 0 0.0% 0 0.0% 0 0.0% 0Makes a change from other
places 5.4% 22 0.0% 0 0.0% 0 0.0% 0 0.0% 0 0.0% 0 0.0% 0 0.0% 0 0.0% 0
Quiet 4.3% 18 0.0% 0 0.0% 0 0.0% 0 0.0% 0 0.0% 0 0.0% 0 0.0% 0 0.0% 0Safe and secure 0.7% 3 0.0% 0 0.0% 0 0.0% 0 0.0% 0 0.0% 0 0.0% 0 0.0% 0 0.0% 0The market 0.6% 2 0.0% 0 0.0% 0 0.0% 0 0.0% 0 0.0% 0 0.0% 0 0.0% 0 0.0% 0Traditional 11.5% 47 0.0% 0 0.0% 0 0.0% 0 0.0% 0 0.0% 0 0.0% 0 0.0% 0 0.0% 0Traffic free shopping centre 0.0% 0 0.0% 0 0.0% 0 0.0% 0 0.0% 0 0.0% 0 0.0% 0 0.0% 0 0.0% 0Other 0.0% 0 0.0% 0 0.0% 0 0.0% 0 0.0% 0 0.0% 0 0.0% 0 0.0% 0 0.0% 0Cheap / free parking 0.5% 2 0.0% 0 0.0% 0 0.0% 0 0.0% 0 0.0% 0 0.0% 0 0.0% 0 0.0% 0Familiarity / habit 0.2% 1 0.0% 0 0.0% 0 0.0% 0 0.0% 0 0.0% 0 0.0% 0 0.0% 0 0.0% 0Friendly people / nice
atmosphere 1.5% 6 0.0% 0 0.0% 0 0.0% 0 0.0% 0 0.0% 0 0.0% 0 0.0% 0 0.0% 0
Good opening hours 0.0% 0 0.0% 0 0.0% 0 0.0% 0 0.0% 0 0.0% 0 0.0% 0 0.0% 0 0.0% 0Good prices 0.0% 0 0.0% 0 0.0% 0 0.0% 0 0.0% 0 0.0% 0 0.0% 0 0.0% 0 0.0% 0Good range of independent
shops 3.9% 16 0.0% 0 0.0% 0 0.0% 0 0.0% 0 0.0% 0 0.0% 0 0.0% 0 0.0% 0
Good range of services 0.0% 0 0.0% 0 0.0% 0 0.0% 0 0.0% 0 0.0% 0 0.0% 0 0.0% 0 0.0% 0(Nothing / very little) 6.6% 27 0.0% 0 0.0% 0 0.0% 0 0.0% 0 0.0% 0 0.0% 0 0.0% 0 0.0% 0(Don't know) 3.8% 16 0.0% 0 0.0% 0 0.0% 0 0.0% 0 0.0% 0 0.0% 0 0.0% 0 0.0% 0Weighted base: 412 0 0 0 0 0 0 0 0Sample: 440 0 0 0 0 0 0 0 0
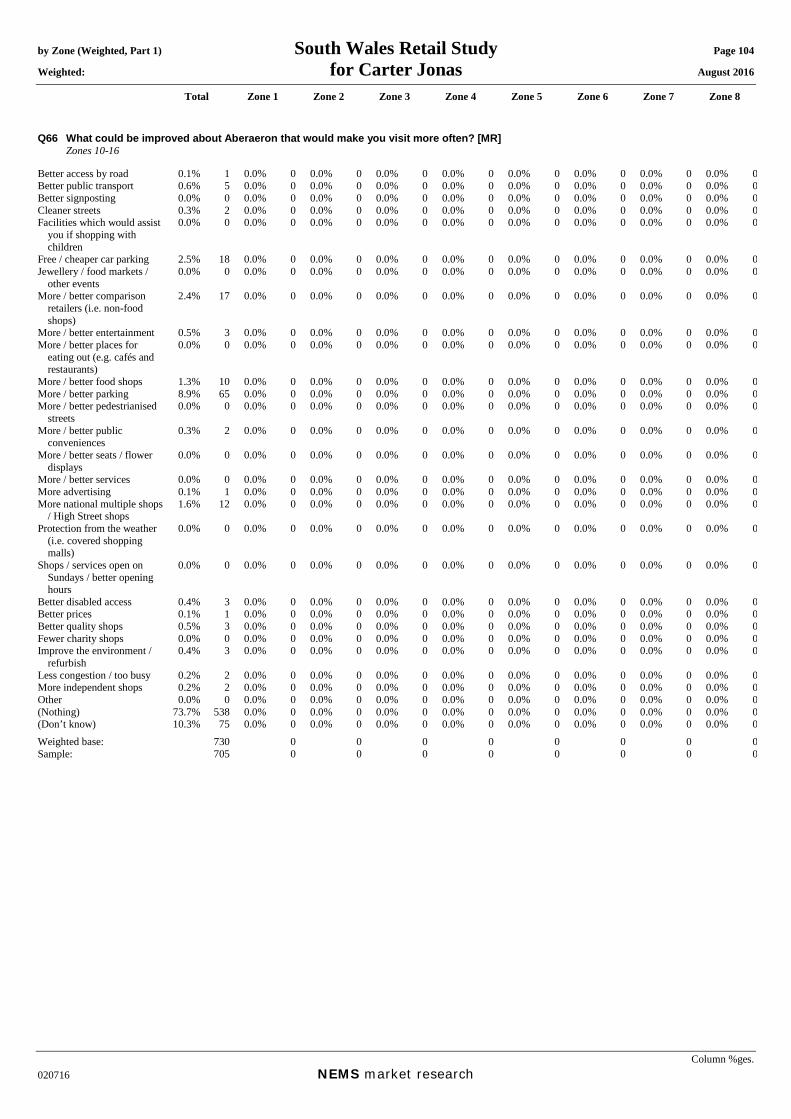
by Zone (Weighted, Part 1) South Wales Retail Study Page 104 Weighted: for Carter Jonas August 2016
Total Zone 1 Zone 2 Zone 3 Zone 4 Zone 5 Zone 6 Zone 7 Zone 8
Column %ges. 020716 NEMS market research
Q66 What could be improved about Aberaeron that would make you visit more often? [MR] Zones 10-16 Better access by road 0.1% 1 0.0% 0 0.0% 0 0.0% 0 0.0% 0 0.0% 0 0.0% 0 0.0% 0 0.0% 0Better public transport 0.6% 5 0.0% 0 0.0% 0 0.0% 0 0.0% 0 0.0% 0 0.0% 0 0.0% 0 0.0% 0Better signposting 0.0% 0 0.0% 0 0.0% 0 0.0% 0 0.0% 0 0.0% 0 0.0% 0 0.0% 0 0.0% 0Cleaner streets 0.3% 2 0.0% 0 0.0% 0 0.0% 0 0.0% 0 0.0% 0 0.0% 0 0.0% 0 0.0% 0Facilities which would assist
you if shopping with children
0.0% 0 0.0% 0 0.0% 0 0.0% 0 0.0% 0 0.0% 0 0.0% 0 0.0% 0 0.0% 0
Free / cheaper car parking 2.5% 18 0.0% 0 0.0% 0 0.0% 0 0.0% 0 0.0% 0 0.0% 0 0.0% 0 0.0% 0Jewellery / food markets /
other events 0.0% 0 0.0% 0 0.0% 0 0.0% 0 0.0% 0 0.0% 0 0.0% 0 0.0% 0 0.0% 0
More / better comparison retailers (i.e. non-food shops)
2.4% 17 0.0% 0 0.0% 0 0.0% 0 0.0% 0 0.0% 0 0.0% 0 0.0% 0 0.0% 0
More / better entertainment 0.5% 3 0.0% 0 0.0% 0 0.0% 0 0.0% 0 0.0% 0 0.0% 0 0.0% 0 0.0% 0More / better places for
eating out (e.g. cafés and restaurants)
0.0% 0 0.0% 0 0.0% 0 0.0% 0 0.0% 0 0.0% 0 0.0% 0 0.0% 0 0.0% 0
More / better food shops 1.3% 10 0.0% 0 0.0% 0 0.0% 0 0.0% 0 0.0% 0 0.0% 0 0.0% 0 0.0% 0More / better parking 8.9% 65 0.0% 0 0.0% 0 0.0% 0 0.0% 0 0.0% 0 0.0% 0 0.0% 0 0.0% 0More / better pedestrianised
streets 0.0% 0 0.0% 0 0.0% 0 0.0% 0 0.0% 0 0.0% 0 0.0% 0 0.0% 0 0.0% 0
More / better public conveniences
0.3% 2 0.0% 0 0.0% 0 0.0% 0 0.0% 0 0.0% 0 0.0% 0 0.0% 0 0.0% 0
More / better seats / flower displays
0.0% 0 0.0% 0 0.0% 0 0.0% 0 0.0% 0 0.0% 0 0.0% 0 0.0% 0 0.0% 0
More / better services 0.0% 0 0.0% 0 0.0% 0 0.0% 0 0.0% 0 0.0% 0 0.0% 0 0.0% 0 0.0% 0More advertising 0.1% 1 0.0% 0 0.0% 0 0.0% 0 0.0% 0 0.0% 0 0.0% 0 0.0% 0 0.0% 0More national multiple shops
/ High Street shops 1.6% 12 0.0% 0 0.0% 0 0.0% 0 0.0% 0 0.0% 0 0.0% 0 0.0% 0 0.0% 0
Protection from the weather (i.e. covered shopping malls)
0.0% 0 0.0% 0 0.0% 0 0.0% 0 0.0% 0 0.0% 0 0.0% 0 0.0% 0 0.0% 0
Shops / services open on Sundays / better opening hours
0.0% 0 0.0% 0 0.0% 0 0.0% 0 0.0% 0 0.0% 0 0.0% 0 0.0% 0 0.0% 0
Better disabled access 0.4% 3 0.0% 0 0.0% 0 0.0% 0 0.0% 0 0.0% 0 0.0% 0 0.0% 0 0.0% 0Better prices 0.1% 1 0.0% 0 0.0% 0 0.0% 0 0.0% 0 0.0% 0 0.0% 0 0.0% 0 0.0% 0Better quality shops 0.5% 3 0.0% 0 0.0% 0 0.0% 0 0.0% 0 0.0% 0 0.0% 0 0.0% 0 0.0% 0Fewer charity shops 0.0% 0 0.0% 0 0.0% 0 0.0% 0 0.0% 0 0.0% 0 0.0% 0 0.0% 0 0.0% 0Improve the environment /
refurbish 0.4% 3 0.0% 0 0.0% 0 0.0% 0 0.0% 0 0.0% 0 0.0% 0 0.0% 0 0.0% 0
Less congestion / too busy 0.2% 2 0.0% 0 0.0% 0 0.0% 0 0.0% 0 0.0% 0 0.0% 0 0.0% 0 0.0% 0More independent shops 0.2% 2 0.0% 0 0.0% 0 0.0% 0 0.0% 0 0.0% 0 0.0% 0 0.0% 0 0.0% 0Other 0.0% 0 0.0% 0 0.0% 0 0.0% 0 0.0% 0 0.0% 0 0.0% 0 0.0% 0 0.0% 0(Nothing) 73.7% 538 0.0% 0 0.0% 0 0.0% 0 0.0% 0 0.0% 0 0.0% 0 0.0% 0 0.0% 0(Don’t know) 10.3% 75 0.0% 0 0.0% 0 0.0% 0 0.0% 0 0.0% 0 0.0% 0 0.0% 0 0.0% 0Weighted base: 730 0 0 0 0 0 0 0 0Sample: 705 0 0 0 0 0 0 0 0

by Zone (Weighted, Part 1) South Wales Retail Study Page 105 Weighted: for Carter Jonas August 2016
Total Zone 1 Zone 2 Zone 3 Zone 4 Zone 5 Zone 6 Zone 7 Zone 8
Column %ges. 020716 NEMS market research
Mean score [Times a year, those who visit]: Daily = 365, 4-6 days a week = 234, 2-3 days a week = 130, One day a week = 52, Every two weeks = 24, Monthly = 12, Once every two months = 6, Three-four times a year = 3.5, Once a year = 1, Less often = 0.25
Q67 How often do you or your household visit Cardigan for shopping and other town centre services? Zones 8-16 Daily 2.1% 18 0.0% 0 0.0% 0 0.0% 0 0.0% 0 0.0% 0 0.0% 0 0.0% 0 0.0% 04-6 days a week 1.8% 15 0.0% 0 0.0% 0 0.0% 0 0.0% 0 0.0% 0 0.0% 0 0.0% 0 0.0% 02-3 days a week 5.0% 43 0.0% 0 0.0% 0 0.0% 0 0.0% 0 0.0% 0 0.0% 0 0.0% 0 0.9% 1One day a week 9.6% 82 0.0% 0 0.0% 0 0.0% 0 0.0% 0 0.0% 0 0.0% 0 0.0% 0 0.9% 1Every two weeks 5.1% 44 0.0% 0 0.0% 0 0.0% 0 0.0% 0 0.0% 0 0.0% 0 0.0% 0 2.1% 2Monthly 5.6% 48 0.0% 0 0.0% 0 0.0% 0 0.0% 0 0.0% 0 0.0% 0 0.0% 0 8.0% 7Once every two months 4.0% 34 0.0% 0 0.0% 0 0.0% 0 0.0% 0 0.0% 0 0.0% 0 0.0% 0 6.2% 6Three-four times a year 5.5% 47 0.0% 0 0.0% 0 0.0% 0 0.0% 0 0.0% 0 0.0% 0 0.0% 0 7.5% 7Once a year 4.0% 35 0.0% 0 0.0% 0 0.0% 0 0.0% 0 0.0% 0 0.0% 0 0.0% 0 11.0% 10Less often 1.7% 14 0.0% 0 0.0% 0 0.0% 0 0.0% 0 0.0% 0 0.0% 0 0.0% 0 1.5% 1Never 54.5% 467 0.0% 0 0.0% 0 0.0% 0 0.0% 0 0.0% 0 0.0% 0 0.0% 0 61.2% 58(Don’t know) 0.2% 2 0.0% 0 0.0% 0 0.0% 0 0.0% 0 0.0% 0 0.0% 0 0.0% 0 0.0% 0(Varies) 0.9% 8 0.0% 0 0.0% 0 0.0% 0 0.0% 0 0.0% 0 0.0% 0 0.0% 0 0.9% 1Mean: 57.86 0.00 0.00 0.00 0.00 0.00 0.00 0.00 9.90Weighted base: 857 0 0 0 0 0 0 0 94Sample: 905 0 0 0 0 0 0 0 100
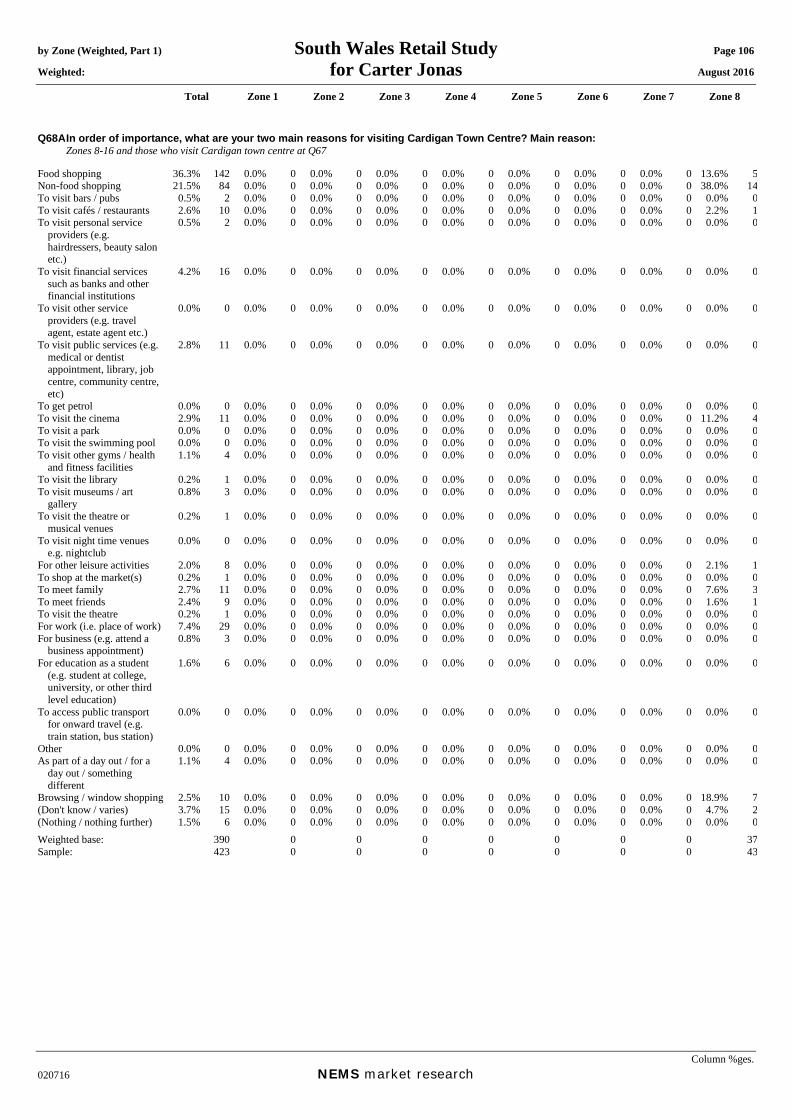
by Zone (Weighted, Part 1) South Wales Retail Study Page 106 Weighted: for Carter Jonas August 2016
Total Zone 1 Zone 2 Zone 3 Zone 4 Zone 5 Zone 6 Zone 7 Zone 8
Column %ges. 020716 NEMS market research
Q68A In order of importance, what are your two main reasons for visiting Cardigan Town Centre? Main reason: Zones 8-16 and those who visit Cardigan town centre at Q67 Food shopping 36.3% 142 0.0% 0 0.0% 0 0.0% 0 0.0% 0 0.0% 0 0.0% 0 0.0% 0 13.6% 5Non-food shopping 21.5% 84 0.0% 0 0.0% 0 0.0% 0 0.0% 0 0.0% 0 0.0% 0 0.0% 0 38.0% 14To visit bars / pubs 0.5% 2 0.0% 0 0.0% 0 0.0% 0 0.0% 0 0.0% 0 0.0% 0 0.0% 0 0.0% 0To visit cafés / restaurants 2.6% 10 0.0% 0 0.0% 0 0.0% 0 0.0% 0 0.0% 0 0.0% 0 0.0% 0 2.2% 1To visit personal service
providers (e.g. hairdressers, beauty salon etc.)
0.5% 2 0.0% 0 0.0% 0 0.0% 0 0.0% 0 0.0% 0 0.0% 0 0.0% 0 0.0% 0
To visit financial services such as banks and other financial institutions
4.2% 16 0.0% 0 0.0% 0 0.0% 0 0.0% 0 0.0% 0 0.0% 0 0.0% 0 0.0% 0
To visit other service providers (e.g. travel agent, estate agent etc.)
0.0% 0 0.0% 0 0.0% 0 0.0% 0 0.0% 0 0.0% 0 0.0% 0 0.0% 0 0.0% 0
To visit public services (e.g. medical or dentist appointment, library, job centre, community centre, etc)
2.8% 11 0.0% 0 0.0% 0 0.0% 0 0.0% 0 0.0% 0 0.0% 0 0.0% 0 0.0% 0
To get petrol 0.0% 0 0.0% 0 0.0% 0 0.0% 0 0.0% 0 0.0% 0 0.0% 0 0.0% 0 0.0% 0To visit the cinema 2.9% 11 0.0% 0 0.0% 0 0.0% 0 0.0% 0 0.0% 0 0.0% 0 0.0% 0 11.2% 4To visit a park 0.0% 0 0.0% 0 0.0% 0 0.0% 0 0.0% 0 0.0% 0 0.0% 0 0.0% 0 0.0% 0To visit the swimming pool 0.0% 0 0.0% 0 0.0% 0 0.0% 0 0.0% 0 0.0% 0 0.0% 0 0.0% 0 0.0% 0To visit other gyms / health
and fitness facilities 1.1% 4 0.0% 0 0.0% 0 0.0% 0 0.0% 0 0.0% 0 0.0% 0 0.0% 0 0.0% 0
To visit the library 0.2% 1 0.0% 0 0.0% 0 0.0% 0 0.0% 0 0.0% 0 0.0% 0 0.0% 0 0.0% 0To visit museums / art
gallery 0.8% 3 0.0% 0 0.0% 0 0.0% 0 0.0% 0 0.0% 0 0.0% 0 0.0% 0 0.0% 0
To visit the theatre or musical venues
0.2% 1 0.0% 0 0.0% 0 0.0% 0 0.0% 0 0.0% 0 0.0% 0 0.0% 0 0.0% 0
To visit night time venues e.g. nightclub
0.0% 0 0.0% 0 0.0% 0 0.0% 0 0.0% 0 0.0% 0 0.0% 0 0.0% 0 0.0% 0
For other leisure activities 2.0% 8 0.0% 0 0.0% 0 0.0% 0 0.0% 0 0.0% 0 0.0% 0 0.0% 0 2.1% 1To shop at the market(s) 0.2% 1 0.0% 0 0.0% 0 0.0% 0 0.0% 0 0.0% 0 0.0% 0 0.0% 0 0.0% 0To meet family 2.7% 11 0.0% 0 0.0% 0 0.0% 0 0.0% 0 0.0% 0 0.0% 0 0.0% 0 7.6% 3To meet friends 2.4% 9 0.0% 0 0.0% 0 0.0% 0 0.0% 0 0.0% 0 0.0% 0 0.0% 0 1.6% 1To visit the theatre 0.2% 1 0.0% 0 0.0% 0 0.0% 0 0.0% 0 0.0% 0 0.0% 0 0.0% 0 0.0% 0For work (i.e. place of work) 7.4% 29 0.0% 0 0.0% 0 0.0% 0 0.0% 0 0.0% 0 0.0% 0 0.0% 0 0.0% 0For business (e.g. attend a
business appointment) 0.8% 3 0.0% 0 0.0% 0 0.0% 0 0.0% 0 0.0% 0 0.0% 0 0.0% 0 0.0% 0
For education as a student (e.g. student at college, university, or other third level education)
1.6% 6 0.0% 0 0.0% 0 0.0% 0 0.0% 0 0.0% 0 0.0% 0 0.0% 0 0.0% 0
To access public transport for onward travel (e.g. train station, bus station)
0.0% 0 0.0% 0 0.0% 0 0.0% 0 0.0% 0 0.0% 0 0.0% 0 0.0% 0 0.0% 0
Other 0.0% 0 0.0% 0 0.0% 0 0.0% 0 0.0% 0 0.0% 0 0.0% 0 0.0% 0 0.0% 0As part of a day out / for a
day out / something different
1.1% 4 0.0% 0 0.0% 0 0.0% 0 0.0% 0 0.0% 0 0.0% 0 0.0% 0 0.0% 0
Browsing / window shopping 2.5% 10 0.0% 0 0.0% 0 0.0% 0 0.0% 0 0.0% 0 0.0% 0 0.0% 0 18.9% 7(Don't know / varies) 3.7% 15 0.0% 0 0.0% 0 0.0% 0 0.0% 0 0.0% 0 0.0% 0 0.0% 0 4.7% 2(Nothing / nothing further) 1.5% 6 0.0% 0 0.0% 0 0.0% 0 0.0% 0 0.0% 0 0.0% 0 0.0% 0 0.0% 0Weighted base: 390 0 0 0 0 0 0 0 37Sample: 423 0 0 0 0 0 0 0 43

by Zone (Weighted, Part 1) South Wales Retail Study Page 107 Weighted: for Carter Jonas August 2016
Total Zone 1 Zone 2 Zone 3 Zone 4 Zone 5 Zone 6 Zone 7 Zone 8
Column %ges. 020716 NEMS market research
Q68B In order of importance, what are your two main reasons for visiting Cardigan Town Centre? Secondary reason: Those who gave a reason at Q68A Food shopping 12.4% 46 0.0% 0 0.0% 0 0.0% 0 0.0% 0 0.0% 0 0.0% 0 0.0% 0 4.6% 2Non-food shopping 20.3% 75 0.0% 0 0.0% 0 0.0% 0 0.0% 0 0.0% 0 0.0% 0 0.0% 0 9.6% 3To visit bars / pubs 0.0% 0 0.0% 0 0.0% 0 0.0% 0 0.0% 0 0.0% 0 0.0% 0 0.0% 0 0.0% 0To visit cafés / restaurants 7.6% 28 0.0% 0 0.0% 0 0.0% 0 0.0% 0 0.0% 0 0.0% 0 0.0% 0 13.0% 5To visit personal service
providers (e.g. hairdressers, beauty salon etc.)
0.5% 2 0.0% 0 0.0% 0 0.0% 0 0.0% 0 0.0% 0 0.0% 0 0.0% 0 0.0% 0
To visit financial services such as banks and other financial institutions
5.5% 20 0.0% 0 0.0% 0 0.0% 0 0.0% 0 0.0% 0 0.0% 0 0.0% 0 0.0% 0
To visit other service providers (e.g. travel agent, estate agent etc.)
0.9% 3 0.0% 0 0.0% 0 0.0% 0 0.0% 0 0.0% 0 0.0% 0 0.0% 0 0.0% 0
To visit public services (e.g. medical or dentist appointment, library, job centre, community centre, etc)
4.2% 16 0.0% 0 0.0% 0 0.0% 0 0.0% 0 0.0% 0 0.0% 0 0.0% 0 0.0% 0
To get petrol 0.0% 0 0.0% 0 0.0% 0 0.0% 0 0.0% 0 0.0% 0 0.0% 0 0.0% 0 0.0% 0To visit the cinema 1.3% 5 0.0% 0 0.0% 0 0.0% 0 0.0% 0 0.0% 0 0.0% 0 0.0% 0 2.3% 1To visit a park 0.0% 0 0.0% 0 0.0% 0 0.0% 0 0.0% 0 0.0% 0 0.0% 0 0.0% 0 0.0% 0To visit the swimming pool 0.5% 2 0.0% 0 0.0% 0 0.0% 0 0.0% 0 0.0% 0 0.0% 0 0.0% 0 0.0% 0To visit other gyms / health
and fitness facilities 0.0% 0 0.0% 0 0.0% 0 0.0% 0 0.0% 0 0.0% 0 0.0% 0 0.0% 0 0.0% 0
To visit the library 0.5% 2 0.0% 0 0.0% 0 0.0% 0 0.0% 0 0.0% 0 0.0% 0 0.0% 0 0.0% 0To visit museums / art
gallery 0.6% 2 0.0% 0 0.0% 0 0.0% 0 0.0% 0 0.0% 0 0.0% 0 0.0% 0 2.3% 1
To visit the theatre or musical venues
0.8% 3 0.0% 0 0.0% 0 0.0% 0 0.0% 0 0.0% 0 0.0% 0 0.0% 0 0.0% 0
To visit night time venues e.g. nightclub
0.0% 0 0.0% 0 0.0% 0 0.0% 0 0.0% 0 0.0% 0 0.0% 0 0.0% 0 0.0% 0
For other leisure activities 1.3% 5 0.0% 0 0.0% 0 0.0% 0 0.0% 0 0.0% 0 0.0% 0 0.0% 0 2.2% 1To shop at the market(s) 0.5% 2 0.0% 0 0.0% 0 0.0% 0 0.0% 0 0.0% 0 0.0% 0 0.0% 0 1.7% 1To meet family 1.6% 6 0.0% 0 0.0% 0 0.0% 0 0.0% 0 0.0% 0 0.0% 0 0.0% 0 0.0% 0To meet friends 0.8% 3 0.0% 0 0.0% 0 0.0% 0 0.0% 0 0.0% 0 0.0% 0 0.0% 0 0.0% 0To visit the theatre 0.0% 0 0.0% 0 0.0% 0 0.0% 0 0.0% 0 0.0% 0 0.0% 0 0.0% 0 0.0% 0For work (i.e. place of work) 1.1% 4 0.0% 0 0.0% 0 0.0% 0 0.0% 0 0.0% 0 0.0% 0 0.0% 0 0.0% 0For business (e.g. attend a
business appointment) 0.0% 0 0.0% 0 0.0% 0 0.0% 0 0.0% 0 0.0% 0 0.0% 0 0.0% 0 0.0% 0
For education as a student (e.g. student at college, university, or other third level education)
0.3% 1 0.0% 0 0.0% 0 0.0% 0 0.0% 0 0.0% 0 0.0% 0 0.0% 0 0.0% 0
To access public transport for onward travel (e.g. train station, bus station)
0.0% 0 0.0% 0 0.0% 0 0.0% 0 0.0% 0 0.0% 0 0.0% 0 0.0% 0 0.0% 0
Other 0.0% 0 0.0% 0 0.0% 0 0.0% 0 0.0% 0 0.0% 0 0.0% 0 0.0% 0 0.0% 0As part of a day out / for a
day out / something different
1.1% 4 0.0% 0 0.0% 0 0.0% 0 0.0% 0 0.0% 0 0.0% 0 0.0% 0 4.8% 2
Browsing / window shopping 2.4% 9 0.0% 0 0.0% 0 0.0% 0 0.0% 0 0.0% 0 0.0% 0 0.0% 0 0.0% 0(Don't know / varies) 0.7% 3 0.0% 0 0.0% 0 0.0% 0 0.0% 0 0.0% 0 0.0% 0 0.0% 0 0.0% 0(Nothing / nothing further) 35.2% 130 0.0% 0 0.0% 0 0.0% 0 0.0% 0 0.0% 0 0.0% 0 0.0% 0 59.5% 21Weighted base: 369 0 0 0 0 0 0 0 35Sample: 403 0 0 0 0 0 0 0 42

by Zone (Weighted, Part 1) South Wales Retail Study Page 108 Weighted: for Carter Jonas August 2016
Total Zone 1 Zone 2 Zone 3 Zone 4 Zone 5 Zone 6 Zone 7 Zone 8
Column %ges. 020716 NEMS market research
Q68X In order of importance, what are your two main reasons for visiting Cardigan Town Centre? Any mention: [MR] Zones 8-16 and those who visit Cardigan town centre at Q67 Food shopping 48.1% 187 0.0% 0 0.0% 0 0.0% 0 0.0% 0 0.0% 0 0.0% 0 0.0% 0 18.0% 7Non-food shopping 40.7% 159 0.0% 0 0.0% 0 0.0% 0 0.0% 0 0.0% 0 0.0% 0 0.0% 0 47.2% 17To visit bars / pubs 0.5% 2 0.0% 0 0.0% 0 0.0% 0 0.0% 0 0.0% 0 0.0% 0 0.0% 0 0.0% 0To visit cafés / restaurants 9.8% 38 0.0% 0 0.0% 0 0.0% 0 0.0% 0 0.0% 0 0.0% 0 0.0% 0 14.6% 5To visit personal service
providers (e.g. hairdressers, beauty salon etc.)
1.0% 4 0.0% 0 0.0% 0 0.0% 0 0.0% 0 0.0% 0 0.0% 0 0.0% 0 0.0% 0
To visit financial services such as banks and other financial institutions
9.4% 37 0.0% 0 0.0% 0 0.0% 0 0.0% 0 0.0% 0 0.0% 0 0.0% 0 0.0% 0
To visit other service providers (e.g. travel agent, estate agent etc.)
0.9% 3 0.0% 0 0.0% 0 0.0% 0 0.0% 0 0.0% 0 0.0% 0 0.0% 0 0.0% 0
To visit public services (e.g. medical or dentist appointment, library, job centre, community centre, etc)
6.8% 26 0.0% 0 0.0% 0 0.0% 0 0.0% 0 0.0% 0 0.0% 0 0.0% 0 0.0% 0
To get petrol 0.0% 0 0.0% 0 0.0% 0 0.0% 0 0.0% 0 0.0% 0 0.0% 0 0.0% 0 0.0% 0To visit the cinema 4.2% 16 0.0% 0 0.0% 0 0.0% 0 0.0% 0 0.0% 0 0.0% 0 0.0% 0 13.4% 5To visit a park 0.0% 0 0.0% 0 0.0% 0 0.0% 0 0.0% 0 0.0% 0 0.0% 0 0.0% 0 0.0% 0To visit the swimming pool 0.4% 2 0.0% 0 0.0% 0 0.0% 0 0.0% 0 0.0% 0 0.0% 0 0.0% 0 0.0% 0To visit other gyms / health
and fitness facilities 1.1% 4 0.0% 0 0.0% 0 0.0% 0 0.0% 0 0.0% 0 0.0% 0 0.0% 0 0.0% 0
To visit the library 0.7% 3 0.0% 0 0.0% 0 0.0% 0 0.0% 0 0.0% 0 0.0% 0 0.0% 0 0.0% 0To visit museums / art
gallery 1.4% 5 0.0% 0 0.0% 0 0.0% 0 0.0% 0 0.0% 0 0.0% 0 0.0% 0 2.2% 1
To visit the theatre or musical venues
1.0% 4 0.0% 0 0.0% 0 0.0% 0 0.0% 0 0.0% 0 0.0% 0 0.0% 0 0.0% 0
To visit night time venues e.g. nightclub
0.0% 0 0.0% 0 0.0% 0 0.0% 0 0.0% 0 0.0% 0 0.0% 0 0.0% 0 0.0% 0
For other leisure activities 3.2% 13 0.0% 0 0.0% 0 0.0% 0 0.0% 0 0.0% 0 0.0% 0 0.0% 0 4.2% 2To shop at the market(s) 0.7% 3 0.0% 0 0.0% 0 0.0% 0 0.0% 0 0.0% 0 0.0% 0 0.0% 0 1.6% 1To meet family 4.2% 16 0.0% 0 0.0% 0 0.0% 0 0.0% 0 0.0% 0 0.0% 0 0.0% 0 7.6% 3To meet friends 3.2% 12 0.0% 0 0.0% 0 0.0% 0 0.0% 0 0.0% 0 0.0% 0 0.0% 0 1.6% 1To visit the theatre 0.2% 1 0.0% 0 0.0% 0 0.0% 0 0.0% 0 0.0% 0 0.0% 0 0.0% 0 0.0% 0For work (i.e. place of work) 8.4% 33 0.0% 0 0.0% 0 0.0% 0 0.0% 0 0.0% 0 0.0% 0 0.0% 0 0.0% 0For business (e.g. attend a
business appointment) 0.8% 3 0.0% 0 0.0% 0 0.0% 0 0.0% 0 0.0% 0 0.0% 0 0.0% 0 0.0% 0
For education as a student (e.g. student at college, university, or other third level education)
1.9% 7 0.0% 0 0.0% 0 0.0% 0 0.0% 0 0.0% 0 0.0% 0 0.0% 0 0.0% 0
To access public transport for onward travel (e.g. train station, bus station)
0.0% 0 0.0% 0 0.0% 0 0.0% 0 0.0% 0 0.0% 0 0.0% 0 0.0% 0 0.0% 0
Other 0.0% 0 0.0% 0 0.0% 0 0.0% 0 0.0% 0 0.0% 0 0.0% 0 0.0% 0 0.0% 0As part of a day out / for a
day out / something different
2.2% 8 0.0% 0 0.0% 0 0.0% 0 0.0% 0 0.0% 0 0.0% 0 0.0% 0 4.6% 2
Browsing / window shopping 4.8% 19 0.0% 0 0.0% 0 0.0% 0 0.0% 0 0.0% 0 0.0% 0 0.0% 0 18.9% 7Weighted base: 390 0 0 0 0 0 0 0 37Sample: 423 0 0 0 0 0 0 0 43

by Zone (Weighted, Part 1) South Wales Retail Study Page 109 Weighted: for Carter Jonas August 2016
Total Zone 1 Zone 2 Zone 3 Zone 4 Zone 5 Zone 6 Zone 7 Zone 8
Column %ges. 020716 NEMS market research
Q69 What do you like about Cardigan Town Centre? [MR] Zones 8-16 and those who visit Cardigan town centre at Q67 Attractive environment / nice
place 21.3% 83 0.0% 0 0.0% 0 0.0% 0 0.0% 0 0.0% 0 0.0% 0 0.0% 0 30.7% 11
Close to friends or relatives 0.3% 1 0.0% 0 0.0% 0 0.0% 0 0.0% 0 0.0% 0 0.0% 0 0.0% 0 1.6% 1Close to home 17.9% 70 0.0% 0 0.0% 0 0.0% 0 0.0% 0 0.0% 0 0.0% 0 0.0% 0 0.0% 0Close to work 0.0% 0 0.0% 0 0.0% 0 0.0% 0 0.0% 0 0.0% 0 0.0% 0 0.0% 0 0.0% 0Compact 5.5% 22 0.0% 0 0.0% 0 0.0% 0 0.0% 0 0.0% 0 0.0% 0 0.0% 0 8.0% 3Easy to get to by bike 0.0% 0 0.0% 0 0.0% 0 0.0% 0 0.0% 0 0.0% 0 0.0% 0 0.0% 0 0.0% 0Easy to get to by bus 0.2% 1 0.0% 0 0.0% 0 0.0% 0 0.0% 0 0.0% 0 0.0% 0 0.0% 0 0.0% 0Easy to get to by car 1.4% 5 0.0% 0 0.0% 0 0.0% 0 0.0% 0 0.0% 0 0.0% 0 0.0% 0 0.0% 0Easy to park 3.8% 15 0.0% 0 0.0% 0 0.0% 0 0.0% 0 0.0% 0 0.0% 0 0.0% 0 2.2% 1Good facilities 3.3% 13 0.0% 0 0.0% 0 0.0% 0 0.0% 0 0.0% 0 0.0% 0 0.0% 0 0.0% 0Good food stores 2.2% 9 0.0% 0 0.0% 0 0.0% 0 0.0% 0 0.0% 0 0.0% 0 0.0% 0 3.7% 1Good pubs, cafés or
restaurants 1.9% 7 0.0% 0 0.0% 0 0.0% 0 0.0% 0 0.0% 0 0.0% 0 0.0% 0 2.2% 1
Good range of non-food shops
16.1% 63 0.0% 0 0.0% 0 0.0% 0 0.0% 0 0.0% 0 0.0% 0 0.0% 0 30.3% 11
The harbour / beach 1.3% 5 0.0% 0 0.0% 0 0.0% 0 0.0% 0 0.0% 0 0.0% 0 0.0% 0 0.0% 0Makes a change from other
places 2.6% 10 0.0% 0 0.0% 0 0.0% 0 0.0% 0 0.0% 0 0.0% 0 0.0% 0 13.1% 5
Quiet 2.1% 8 0.0% 0 0.0% 0 0.0% 0 0.0% 0 0.0% 0 0.0% 0 0.0% 0 1.6% 1Safe and secure 0.0% 0 0.0% 0 0.0% 0 0.0% 0 0.0% 0 0.0% 0 0.0% 0 0.0% 0 0.0% 0The market 0.9% 4 0.0% 0 0.0% 0 0.0% 0 0.0% 0 0.0% 0 0.0% 0 0.0% 0 0.0% 0Traditional 5.1% 20 0.0% 0 0.0% 0 0.0% 0 0.0% 0 0.0% 0 0.0% 0 0.0% 0 0.0% 0Traffic free shopping centre 0.0% 0 0.0% 0 0.0% 0 0.0% 0 0.0% 0 0.0% 0 0.0% 0 0.0% 0 0.0% 0Other 0.0% 0 0.0% 0 0.0% 0 0.0% 0 0.0% 0 0.0% 0 0.0% 0 0.0% 0 0.0% 0Cheap / free parking 0.0% 0 0.0% 0 0.0% 0 0.0% 0 0.0% 0 0.0% 0 0.0% 0 0.0% 0 0.0% 0Familiarity / habit 1.1% 4 0.0% 0 0.0% 0 0.0% 0 0.0% 0 0.0% 0 0.0% 0 0.0% 0 0.0% 0Friendly people / nice
atmosphere 3.5% 14 0.0% 0 0.0% 0 0.0% 0 0.0% 0 0.0% 0 0.0% 0 0.0% 0 3.7% 1
Good opening hours 0.0% 0 0.0% 0 0.0% 0 0.0% 0 0.0% 0 0.0% 0 0.0% 0 0.0% 0 0.0% 0Good prices 0.2% 1 0.0% 0 0.0% 0 0.0% 0 0.0% 0 0.0% 0 0.0% 0 0.0% 0 0.0% 0Good range of independent
shops 2.5% 10 0.0% 0 0.0% 0 0.0% 0 0.0% 0 0.0% 0 0.0% 0 0.0% 0 2.2% 1
Good range of services 0.0% 0 0.0% 0 0.0% 0 0.0% 0 0.0% 0 0.0% 0 0.0% 0 0.0% 0 0.0% 0(Nothing / very little) 23.7% 92 0.0% 0 0.0% 0 0.0% 0 0.0% 0 0.0% 0 0.0% 0 0.0% 0 14.6% 5(Don't know) 8.8% 34 0.0% 0 0.0% 0 0.0% 0 0.0% 0 0.0% 0 0.0% 0 0.0% 0 5.3% 2Weighted base: 390 0 0 0 0 0 0 0 37Sample: 423 0 0 0 0 0 0 0 43

by Zone (Weighted, Part 1) South Wales Retail Study Page 110 Weighted: for Carter Jonas August 2016
Total Zone 1 Zone 2 Zone 3 Zone 4 Zone 5 Zone 6 Zone 7 Zone 8
Column %ges. 020716 NEMS market research
Q70 What could be improved about Cardigan that would make you visit more often? [MR] Zones 8-16 Better access by road 0.2% 1 0.0% 0 0.0% 0 0.0% 0 0.0% 0 0.0% 0 0.0% 0 0.0% 0 0.0% 0Better public transport 0.9% 8 0.0% 0 0.0% 0 0.0% 0 0.0% 0 0.0% 0 0.0% 0 0.0% 0 0.0% 0Better signposting 0.0% 0 0.0% 0 0.0% 0 0.0% 0 0.0% 0 0.0% 0 0.0% 0 0.0% 0 0.0% 0Cleaner streets 1.0% 9 0.0% 0 0.0% 0 0.0% 0 0.0% 0 0.0% 0 0.0% 0 0.0% 0 0.0% 0Facilities which would assist
you if shopping with children
0.6% 5 0.0% 0 0.0% 0 0.0% 0 0.0% 0 0.0% 0 0.0% 0 0.0% 0 0.0% 0
Free / cheaper car parking 6.1% 52 0.0% 0 0.0% 0 0.0% 0 0.0% 0 0.0% 0 0.0% 0 0.0% 0 1.9% 2Jewellery / food markets /
other events 0.1% 1 0.0% 0 0.0% 0 0.0% 0 0.0% 0 0.0% 0 0.0% 0 0.0% 0 0.0% 0
More / better comparison retailers (i.e. non-food shops)
7.0% 60 0.0% 0 0.0% 0 0.0% 0 0.0% 0 0.0% 0 0.0% 0 0.0% 0 3.8% 4
More / better entertainment 0.8% 6 0.0% 0 0.0% 0 0.0% 0 0.0% 0 0.0% 0 0.0% 0 0.0% 0 0.0% 0More / better places for
eating out (e.g. cafés and restaurants)
0.1% 1 0.0% 0 0.0% 0 0.0% 0 0.0% 0 0.0% 0 0.0% 0 0.0% 0 0.0% 0
More / better food shops 1.1% 9 0.0% 0 0.0% 0 0.0% 0 0.0% 0 0.0% 0 0.0% 0 0.0% 0 0.0% 0More / better parking 4.6% 40 0.0% 0 0.0% 0 0.0% 0 0.0% 0 0.0% 0 0.0% 0 0.0% 0 1.4% 1More / better pedestrianised
streets 0.1% 1 0.0% 0 0.0% 0 0.0% 0 0.0% 0 0.0% 0 0.0% 0 0.0% 0 0.0% 0
More / better public conveniences
0.7% 6 0.0% 0 0.0% 0 0.0% 0 0.0% 0 0.0% 0 0.0% 0 0.0% 0 0.0% 0
More / better seats / flower displays
0.1% 1 0.0% 0 0.0% 0 0.0% 0 0.0% 0 0.0% 0 0.0% 0 0.0% 0 0.0% 0
More / better services 0.4% 3 0.0% 0 0.0% 0 0.0% 0 0.0% 0 0.0% 0 0.0% 0 0.0% 0 0.0% 0More advertising 0.2% 1 0.0% 0 0.0% 0 0.0% 0 0.0% 0 0.0% 0 0.0% 0 0.0% 0 0.0% 0More national multiple shops
/ High Street shops 6.3% 54 0.0% 0 0.0% 0 0.0% 0 0.0% 0 0.0% 0 0.0% 0 0.0% 0 2.6% 2
Protection from the weather (i.e. covered shopping malls)
0.0% 0 0.0% 0 0.0% 0 0.0% 0 0.0% 0 0.0% 0 0.0% 0 0.0% 0 0.0% 0
Shops / services open on Sundays / better opening hours
0.1% 1 0.0% 0 0.0% 0 0.0% 0 0.0% 0 0.0% 0 0.0% 0 0.0% 0 0.0% 0
Better disabled access 0.2% 2 0.0% 0 0.0% 0 0.0% 0 0.0% 0 0.0% 0 0.0% 0 0.0% 0 0.0% 0Better prices 0.0% 0 0.0% 0 0.0% 0 0.0% 0 0.0% 0 0.0% 0 0.0% 0 0.0% 0 0.0% 0Better quality shops 1.1% 9 0.0% 0 0.0% 0 0.0% 0 0.0% 0 0.0% 0 0.0% 0 0.0% 0 0.0% 0Fewer charity shops 1.6% 14 0.0% 0 0.0% 0 0.0% 0 0.0% 0 0.0% 0 0.0% 0 0.0% 0 0.9% 1Fewer vacant shops 1.2% 10 0.0% 0 0.0% 0 0.0% 0 0.0% 0 0.0% 0 0.0% 0 0.0% 0 0.0% 0Improve the environment /
refurbish 1.2% 10 0.0% 0 0.0% 0 0.0% 0 0.0% 0 0.0% 0 0.0% 0 0.0% 0 0.0% 0
Less congestion / too busy 0.1% 0 0.0% 0 0.0% 0 0.0% 0 0.0% 0 0.0% 0 0.0% 0 0.0% 0 0.0% 0More independent shops 0.7% 6 0.0% 0 0.0% 0 0.0% 0 0.0% 0 0.0% 0 0.0% 0 0.0% 0 0.0% 0Other 0.0% 0 0.0% 0 0.0% 0 0.0% 0 0.0% 0 0.0% 0 0.0% 0 0.0% 0 0.0% 0(Nothing) 58.4% 500 0.0% 0 0.0% 0 0.0% 0 0.0% 0 0.0% 0 0.0% 0 0.0% 0 83.9% 79(Don’t know) 16.6% 142 0.0% 0 0.0% 0 0.0% 0 0.0% 0 0.0% 0 0.0% 0 0.0% 0 8.7% 8Weighted base: 857 0 0 0 0 0 0 0 94Sample: 905 0 0 0 0 0 0 0 100

by Zone (Weighted, Part 1) South Wales Retail Study Page 111 Weighted: for Carter Jonas August 2016
Total Zone 1 Zone 2 Zone 3 Zone 4 Zone 5 Zone 6 Zone 7 Zone 8
Column %ges. 020716 NEMS market research
Mean score [Times a year, those who visit]: Daily = 365, 4-6 days a week = 234, 2-3 days a week = 130, One day a week = 52, Every two weeks = 24, Monthly = 12, Once every two months = 6, Three-four times a year = 3.5, Once a year = 1, Less often = 0.25
Q71 How often do you or your household visit Lampeter for shopping and other town centre services? Zones 11-16 Daily 2.6% 15 0.0% 0 0.0% 0 0.0% 0 0.0% 0 0.0% 0 0.0% 0 0.0% 0 0.0% 04-6 days a week 1.3% 8 0.0% 0 0.0% 0 0.0% 0 0.0% 0 0.0% 0 0.0% 0 0.0% 0 0.0% 02-3 days a week 4.9% 29 0.0% 0 0.0% 0 0.0% 0 0.0% 0 0.0% 0 0.0% 0 0.0% 0 0.0% 0One day a week 8.8% 51 0.0% 0 0.0% 0 0.0% 0 0.0% 0 0.0% 0 0.0% 0 0.0% 0 0.0% 0Every two weeks 4.6% 26 0.0% 0 0.0% 0 0.0% 0 0.0% 0 0.0% 0 0.0% 0 0.0% 0 0.0% 0Monthly 3.5% 20 0.0% 0 0.0% 0 0.0% 0 0.0% 0 0.0% 0 0.0% 0 0.0% 0 0.0% 0Once every two months 4.3% 25 0.0% 0 0.0% 0 0.0% 0 0.0% 0 0.0% 0 0.0% 0 0.0% 0 0.0% 0Three-four times a year 6.4% 37 0.0% 0 0.0% 0 0.0% 0 0.0% 0 0.0% 0 0.0% 0 0.0% 0 0.0% 0Once a year 2.7% 16 0.0% 0 0.0% 0 0.0% 0 0.0% 0 0.0% 0 0.0% 0 0.0% 0 0.0% 0Less often 1.6% 9 0.0% 0 0.0% 0 0.0% 0 0.0% 0 0.0% 0 0.0% 0 0.0% 0 0.0% 0Never 58.0% 335 0.0% 0 0.0% 0 0.0% 0 0.0% 0 0.0% 0 0.0% 0 0.0% 0 0.0% 0(Don’t know) 0.0% 0 0.0% 0 0.0% 0 0.0% 0 0.0% 0 0.0% 0 0.0% 0 0.0% 0 0.0% 0(Varies) 1.4% 8 0.0% 0 0.0% 0 0.0% 0 0.0% 0 0.0% 0 0.0% 0 0.0% 0 0.0% 0Mean: 62.49 0.00 0.00 0.00 0.00 0.00 0.00 0.00 0.00Weighted base: 579 0 0 0 0 0 0 0 0Sample: 605 0 0 0 0 0 0 0 0

by Zone (Weighted, Part 1) South Wales Retail Study Page 112 Weighted: for Carter Jonas August 2016
Total Zone 1 Zone 2 Zone 3 Zone 4 Zone 5 Zone 6 Zone 7 Zone 8
Column %ges. 020716 NEMS market research
Q72A In order of importance, what are your two main reasons for visiting Lampeter Town Centre? Main reason: Zones 11-16 and those who visit Lampeter town centre at Q71 Food shopping 40.5% 99 0.0% 0 0.0% 0 0.0% 0 0.0% 0 0.0% 0 0.0% 0 0.0% 0 0.0% 0Non-food shopping 19.6% 48 0.0% 0 0.0% 0 0.0% 0 0.0% 0 0.0% 0 0.0% 0 0.0% 0 0.0% 0To visit bars / pubs 1.3% 3 0.0% 0 0.0% 0 0.0% 0 0.0% 0 0.0% 0 0.0% 0 0.0% 0 0.0% 0To visit cafés / restaurants 4.3% 11 0.0% 0 0.0% 0 0.0% 0 0.0% 0 0.0% 0 0.0% 0 0.0% 0 0.0% 0To visit personal service
providers (e.g. hairdressers, beauty salon etc.)
0.7% 2 0.0% 0 0.0% 0 0.0% 0 0.0% 0 0.0% 0 0.0% 0 0.0% 0 0.0% 0
To visit financial services such as banks and other financial institutions
2.5% 6 0.0% 0 0.0% 0 0.0% 0 0.0% 0 0.0% 0 0.0% 0 0.0% 0 0.0% 0
To visit other service providers (e.g. travel agent, estate agent etc.)
1.2% 3 0.0% 0 0.0% 0 0.0% 0 0.0% 0 0.0% 0 0.0% 0 0.0% 0 0.0% 0
To visit public services (e.g. medical or dentist appointment, library, job centre, community centre, etc)
5.5% 13 0.0% 0 0.0% 0 0.0% 0 0.0% 0 0.0% 0 0.0% 0 0.0% 0 0.0% 0
To get petrol 0.0% 0 0.0% 0 0.0% 0 0.0% 0 0.0% 0 0.0% 0 0.0% 0 0.0% 0 0.0% 0To visit the cinema 0.0% 0 0.0% 0 0.0% 0 0.0% 0 0.0% 0 0.0% 0 0.0% 0 0.0% 0 0.0% 0To visit a park 0.2% 0 0.0% 0 0.0% 0 0.0% 0 0.0% 0 0.0% 0 0.0% 0 0.0% 0 0.0% 0To visit the swimming pool 0.0% 0 0.0% 0 0.0% 0 0.0% 0 0.0% 0 0.0% 0 0.0% 0 0.0% 0 0.0% 0To visit other gyms / health
and fitness facilities 0.0% 0 0.0% 0 0.0% 0 0.0% 0 0.0% 0 0.0% 0 0.0% 0 0.0% 0 0.0% 0
To visit the library 0.0% 0 0.0% 0 0.0% 0 0.0% 0 0.0% 0 0.0% 0 0.0% 0 0.0% 0 0.0% 0To visit museums / art
gallery 0.0% 0 0.0% 0 0.0% 0 0.0% 0 0.0% 0 0.0% 0 0.0% 0 0.0% 0 0.0% 0
To visit the theatre or musical venues
0.0% 0 0.0% 0 0.0% 0 0.0% 0 0.0% 0 0.0% 0 0.0% 0 0.0% 0 0.0% 0
To visit night time venues e.g. nightclub
0.0% 0 0.0% 0 0.0% 0 0.0% 0 0.0% 0 0.0% 0 0.0% 0 0.0% 0 0.0% 0
For other leisure activities 2.4% 6 0.0% 0 0.0% 0 0.0% 0 0.0% 0 0.0% 0 0.0% 0 0.0% 0 0.0% 0To shop at the market(s) 0.4% 1 0.0% 0 0.0% 0 0.0% 0 0.0% 0 0.0% 0 0.0% 0 0.0% 0 0.0% 0To meet family 3.9% 10 0.0% 0 0.0% 0 0.0% 0 0.0% 0 0.0% 0 0.0% 0 0.0% 0 0.0% 0To meet friends 4.1% 10 0.0% 0 0.0% 0 0.0% 0 0.0% 0 0.0% 0 0.0% 0 0.0% 0 0.0% 0To visit the theatre 0.0% 0 0.0% 0 0.0% 0 0.0% 0 0.0% 0 0.0% 0 0.0% 0 0.0% 0 0.0% 0For work (i.e. place of work) 7.2% 18 0.0% 0 0.0% 0 0.0% 0 0.0% 0 0.0% 0 0.0% 0 0.0% 0 0.0% 0For business (e.g. attend a
business appointment) 0.6% 1 0.0% 0 0.0% 0 0.0% 0 0.0% 0 0.0% 0 0.0% 0 0.0% 0 0.0% 0
For education as a student (e.g. student at college, university, or other third level education)
1.4% 3 0.0% 0 0.0% 0 0.0% 0 0.0% 0 0.0% 0 0.0% 0 0.0% 0 0.0% 0
To access public transport for onward travel (e.g. train station, bus station)
0.0% 0 0.0% 0 0.0% 0 0.0% 0 0.0% 0 0.0% 0 0.0% 0 0.0% 0 0.0% 0
Other 0.0% 0 0.0% 0 0.0% 0 0.0% 0 0.0% 0 0.0% 0 0.0% 0 0.0% 0 0.0% 0As part of a day out / for a
day out / something different
0.3% 1 0.0% 0 0.0% 0 0.0% 0 0.0% 0 0.0% 0 0.0% 0 0.0% 0 0.0% 0
Browsing / window shopping 1.4% 3 0.0% 0 0.0% 0 0.0% 0 0.0% 0 0.0% 0 0.0% 0 0.0% 0 0.0% 0(Don't know / varies) 1.5% 4 0.0% 0 0.0% 0 0.0% 0 0.0% 0 0.0% 0 0.0% 0 0.0% 0 0.0% 0(Nothing / nothing further) 1.1% 3 0.0% 0 0.0% 0 0.0% 0 0.0% 0 0.0% 0 0.0% 0 0.0% 0 0.0% 0Weighted base: 243 0 0 0 0 0 0 0 0Sample: 271 0 0 0 0 0 0 0 0

by Zone (Weighted, Part 1) South Wales Retail Study Page 113 Weighted: for Carter Jonas August 2016
Total Zone 1 Zone 2 Zone 3 Zone 4 Zone 5 Zone 6 Zone 7 Zone 8
Column %ges. 020716 NEMS market research
Q72B In order of importance, what are your two main reasons for visiting Lampeter Town Centre? Secondary reason: Those who gave a reason at Q72A Food shopping 10.3% 24 0.0% 0 0.0% 0 0.0% 0 0.0% 0 0.0% 0 0.0% 0 0.0% 0 0.0% 0Non-food shopping 26.4% 63 0.0% 0 0.0% 0 0.0% 0 0.0% 0 0.0% 0 0.0% 0 0.0% 0 0.0% 0To visit bars / pubs 0.0% 0 0.0% 0 0.0% 0 0.0% 0 0.0% 0 0.0% 0 0.0% 0 0.0% 0 0.0% 0To visit cafés / restaurants 5.0% 12 0.0% 0 0.0% 0 0.0% 0 0.0% 0 0.0% 0 0.0% 0 0.0% 0 0.0% 0To visit personal service
providers (e.g. hairdressers, beauty salon etc.)
2.0% 5 0.0% 0 0.0% 0 0.0% 0 0.0% 0 0.0% 0 0.0% 0 0.0% 0 0.0% 0
To visit financial services such as banks and other financial institutions
7.3% 17 0.0% 0 0.0% 0 0.0% 0 0.0% 0 0.0% 0 0.0% 0 0.0% 0 0.0% 0
To visit other service providers (e.g. travel agent, estate agent etc.)
0.7% 2 0.0% 0 0.0% 0 0.0% 0 0.0% 0 0.0% 0 0.0% 0 0.0% 0 0.0% 0
To visit public services (e.g. medical or dentist appointment, library, job centre, community centre, etc)
3.1% 7 0.0% 0 0.0% 0 0.0% 0 0.0% 0 0.0% 0 0.0% 0 0.0% 0 0.0% 0
To get petrol 0.0% 0 0.0% 0 0.0% 0 0.0% 0 0.0% 0 0.0% 0 0.0% 0 0.0% 0 0.0% 0To visit the cinema 0.0% 0 0.0% 0 0.0% 0 0.0% 0 0.0% 0 0.0% 0 0.0% 0 0.0% 0 0.0% 0To visit a park 0.0% 0 0.0% 0 0.0% 0 0.0% 0 0.0% 0 0.0% 0 0.0% 0 0.0% 0 0.0% 0To visit the swimming pool 0.0% 0 0.0% 0 0.0% 0 0.0% 0 0.0% 0 0.0% 0 0.0% 0 0.0% 0 0.0% 0To visit other gyms / health
and fitness facilities 0.0% 0 0.0% 0 0.0% 0 0.0% 0 0.0% 0 0.0% 0 0.0% 0 0.0% 0 0.0% 0
To visit the library 0.3% 1 0.0% 0 0.0% 0 0.0% 0 0.0% 0 0.0% 0 0.0% 0 0.0% 0 0.0% 0To visit museums / art
gallery 0.0% 0 0.0% 0 0.0% 0 0.0% 0 0.0% 0 0.0% 0 0.0% 0 0.0% 0 0.0% 0
To visit the theatre or musical venues
0.0% 0 0.0% 0 0.0% 0 0.0% 0 0.0% 0 0.0% 0 0.0% 0 0.0% 0 0.0% 0
To visit night time venues e.g. nightclub
0.0% 0 0.0% 0 0.0% 0 0.0% 0 0.0% 0 0.0% 0 0.0% 0 0.0% 0 0.0% 0
For other leisure activities 1.0% 2 0.0% 0 0.0% 0 0.0% 0 0.0% 0 0.0% 0 0.0% 0 0.0% 0 0.0% 0To shop at the market(s) 0.0% 0 0.0% 0 0.0% 0 0.0% 0 0.0% 0 0.0% 0 0.0% 0 0.0% 0 0.0% 0To meet family 1.0% 2 0.0% 0 0.0% 0 0.0% 0 0.0% 0 0.0% 0 0.0% 0 0.0% 0 0.0% 0To meet friends 4.5% 11 0.0% 0 0.0% 0 0.0% 0 0.0% 0 0.0% 0 0.0% 0 0.0% 0 0.0% 0To visit the theatre 0.0% 0 0.0% 0 0.0% 0 0.0% 0 0.0% 0 0.0% 0 0.0% 0 0.0% 0 0.0% 0For work (i.e. place of work) 1.2% 3 0.0% 0 0.0% 0 0.0% 0 0.0% 0 0.0% 0 0.0% 0 0.0% 0 0.0% 0For business (e.g. attend a
business appointment) 0.0% 0 0.0% 0 0.0% 0 0.0% 0 0.0% 0 0.0% 0 0.0% 0 0.0% 0 0.0% 0
For education as a student (e.g. student at college, university, or other third level education)
1.1% 3 0.0% 0 0.0% 0 0.0% 0 0.0% 0 0.0% 0 0.0% 0 0.0% 0 0.0% 0
To access public transport for onward travel (e.g. train station, bus station)
0.0% 0 0.0% 0 0.0% 0 0.0% 0 0.0% 0 0.0% 0 0.0% 0 0.0% 0 0.0% 0
Other 0.0% 0 0.0% 0 0.0% 0 0.0% 0 0.0% 0 0.0% 0 0.0% 0 0.0% 0 0.0% 0As part of a day out / for a
day out / something different
1.0% 2 0.0% 0 0.0% 0 0.0% 0 0.0% 0 0.0% 0 0.0% 0 0.0% 0 0.0% 0
Browsing / window shopping 1.8% 4 0.0% 0 0.0% 0 0.0% 0 0.0% 0 0.0% 0 0.0% 0 0.0% 0 0.0% 0(Don't know / varies) 0.4% 1 0.0% 0 0.0% 0 0.0% 0 0.0% 0 0.0% 0 0.0% 0 0.0% 0 0.0% 0(Nothing / nothing further) 32.9% 78 0.0% 0 0.0% 0 0.0% 0 0.0% 0 0.0% 0 0.0% 0 0.0% 0 0.0% 0Weighted base: 237 0 0 0 0 0 0 0 0Sample: 264 0 0 0 0 0 0 0 0

by Zone (Weighted, Part 1) South Wales Retail Study Page 114 Weighted: for Carter Jonas August 2016
Total Zone 1 Zone 2 Zone 3 Zone 4 Zone 5 Zone 6 Zone 7 Zone 8
Column %ges. 020716 NEMS market research
Q72X In order of importance, what are your two main reasons for visiting Lampeter Town Centre? Any mention: [MR] Zones 11-16 and those who visit Lampeter town centre at Q71 Food shopping 50.5% 123 0.0% 0 0.0% 0 0.0% 0 0.0% 0 0.0% 0 0.0% 0 0.0% 0 0.0% 0Non-food shopping 45.3% 110 0.0% 0 0.0% 0 0.0% 0 0.0% 0 0.0% 0 0.0% 0 0.0% 0 0.0% 0To visit bars / pubs 1.3% 3 0.0% 0 0.0% 0 0.0% 0 0.0% 0 0.0% 0 0.0% 0 0.0% 0 0.0% 0To visit cafés / restaurants 9.2% 22 0.0% 0 0.0% 0 0.0% 0 0.0% 0 0.0% 0 0.0% 0 0.0% 0 0.0% 0To visit personal service
providers (e.g. hairdressers, beauty salon etc.)
2.7% 6 0.0% 0 0.0% 0 0.0% 0 0.0% 0 0.0% 0 0.0% 0 0.0% 0 0.0% 0
To visit financial services such as banks and other financial institutions
9.6% 23 0.0% 0 0.0% 0 0.0% 0 0.0% 0 0.0% 0 0.0% 0 0.0% 0 0.0% 0
To visit other service providers (e.g. travel agent, estate agent etc.)
1.8% 4 0.0% 0 0.0% 0 0.0% 0 0.0% 0 0.0% 0 0.0% 0 0.0% 0 0.0% 0
To visit public services (e.g. medical or dentist appointment, library, job centre, community centre, etc)
8.5% 21 0.0% 0 0.0% 0 0.0% 0 0.0% 0 0.0% 0 0.0% 0 0.0% 0 0.0% 0
To get petrol 0.0% 0 0.0% 0 0.0% 0 0.0% 0 0.0% 0 0.0% 0 0.0% 0 0.0% 0 0.0% 0To visit the cinema 0.0% 0 0.0% 0 0.0% 0 0.0% 0 0.0% 0 0.0% 0 0.0% 0 0.0% 0 0.0% 0To visit a park 0.2% 0 0.0% 0 0.0% 0 0.0% 0 0.0% 0 0.0% 0 0.0% 0 0.0% 0 0.0% 0To visit the swimming pool 0.0% 0 0.0% 0 0.0% 0 0.0% 0 0.0% 0 0.0% 0 0.0% 0 0.0% 0 0.0% 0To visit other gyms / health
and fitness facilities 0.0% 0 0.0% 0 0.0% 0 0.0% 0 0.0% 0 0.0% 0 0.0% 0 0.0% 0 0.0% 0
To visit the library 0.3% 1 0.0% 0 0.0% 0 0.0% 0 0.0% 0 0.0% 0 0.0% 0 0.0% 0 0.0% 0To visit museums / art
gallery 0.0% 0 0.0% 0 0.0% 0 0.0% 0 0.0% 0 0.0% 0 0.0% 0 0.0% 0 0.0% 0
To visit the theatre or musical venues
0.0% 0 0.0% 0 0.0% 0 0.0% 0 0.0% 0 0.0% 0 0.0% 0 0.0% 0 0.0% 0
To visit night time venues e.g. nightclub
0.0% 0 0.0% 0 0.0% 0 0.0% 0 0.0% 0 0.0% 0 0.0% 0 0.0% 0 0.0% 0
For other leisure activities 3.4% 8 0.0% 0 0.0% 0 0.0% 0 0.0% 0 0.0% 0 0.0% 0 0.0% 0 0.0% 0To shop at the market(s) 0.4% 1 0.0% 0 0.0% 0 0.0% 0 0.0% 0 0.0% 0 0.0% 0 0.0% 0 0.0% 0To meet family 4.9% 12 0.0% 0 0.0% 0 0.0% 0 0.0% 0 0.0% 0 0.0% 0 0.0% 0 0.0% 0To meet friends 8.5% 21 0.0% 0 0.0% 0 0.0% 0 0.0% 0 0.0% 0 0.0% 0 0.0% 0 0.0% 0To visit the theatre 0.0% 0 0.0% 0 0.0% 0 0.0% 0 0.0% 0 0.0% 0 0.0% 0 0.0% 0 0.0% 0For work (i.e. place of work) 8.4% 21 0.0% 0 0.0% 0 0.0% 0 0.0% 0 0.0% 0 0.0% 0 0.0% 0 0.0% 0For business (e.g. attend a
business appointment) 0.6% 1 0.0% 0 0.0% 0 0.0% 0 0.0% 0 0.0% 0 0.0% 0 0.0% 0 0.0% 0
For education as a student (e.g. student at college, university, or other third level education)
2.4% 6 0.0% 0 0.0% 0 0.0% 0 0.0% 0 0.0% 0 0.0% 0 0.0% 0 0.0% 0
To access public transport for onward travel (e.g. train station, bus station)
0.0% 0 0.0% 0 0.0% 0 0.0% 0 0.0% 0 0.0% 0 0.0% 0 0.0% 0 0.0% 0
Other 0.0% 0 0.0% 0 0.0% 0 0.0% 0 0.0% 0 0.0% 0 0.0% 0 0.0% 0 0.0% 0As part of a day out / for a
day out / something different
1.2% 3 0.0% 0 0.0% 0 0.0% 0 0.0% 0 0.0% 0 0.0% 0 0.0% 0 0.0% 0
Browsing / window shopping 3.2% 8 0.0% 0 0.0% 0 0.0% 0 0.0% 0 0.0% 0 0.0% 0 0.0% 0 0.0% 0Weighted base: 243 0 0 0 0 0 0 0 0Sample: 271 0 0 0 0 0 0 0 0

by Zone (Weighted, Part 1) South Wales Retail Study Page 115 Weighted: for Carter Jonas August 2016
Total Zone 1 Zone 2 Zone 3 Zone 4 Zone 5 Zone 6 Zone 7 Zone 8
Column %ges. 020716 NEMS market research
Q73 What do you like about Lampeter Town Centre? [MR] Zones 11-16 and those who visit Lampeter town centre at Q71 Attractive environment / nice
place 20.4% 50 0.0% 0 0.0% 0 0.0% 0 0.0% 0 0.0% 0 0.0% 0 0.0% 0 0.0% 0
Close to friends or relatives 5.5% 13 0.0% 0 0.0% 0 0.0% 0 0.0% 0 0.0% 0 0.0% 0 0.0% 0 0.0% 0Close to home 19.6% 48 0.0% 0 0.0% 0 0.0% 0 0.0% 0 0.0% 0 0.0% 0 0.0% 0 0.0% 0Close to work 0.0% 0 0.0% 0 0.0% 0 0.0% 0 0.0% 0 0.0% 0 0.0% 0 0.0% 0 0.0% 0Compact 6.5% 16 0.0% 0 0.0% 0 0.0% 0 0.0% 0 0.0% 0 0.0% 0 0.0% 0 0.0% 0Easy to get to by bike 0.0% 0 0.0% 0 0.0% 0 0.0% 0 0.0% 0 0.0% 0 0.0% 0 0.0% 0 0.0% 0Easy to get to by bus 0.0% 0 0.0% 0 0.0% 0 0.0% 0 0.0% 0 0.0% 0 0.0% 0 0.0% 0 0.0% 0Easy to get to by car 0.4% 1 0.0% 0 0.0% 0 0.0% 0 0.0% 0 0.0% 0 0.0% 0 0.0% 0 0.0% 0Easy to park 2.4% 6 0.0% 0 0.0% 0 0.0% 0 0.0% 0 0.0% 0 0.0% 0 0.0% 0 0.0% 0Good facilities 0.3% 1 0.0% 0 0.0% 0 0.0% 0 0.0% 0 0.0% 0 0.0% 0 0.0% 0 0.0% 0Good food stores 3.0% 7 0.0% 0 0.0% 0 0.0% 0 0.0% 0 0.0% 0 0.0% 0 0.0% 0 0.0% 0Good pubs, cafés or
restaurants 2.1% 5 0.0% 0 0.0% 0 0.0% 0 0.0% 0 0.0% 0 0.0% 0 0.0% 0 0.0% 0
Good range of non-food shops
10.8% 26 0.0% 0 0.0% 0 0.0% 0 0.0% 0 0.0% 0 0.0% 0 0.0% 0 0.0% 0
Makes a change from other places
3.2% 8 0.0% 0 0.0% 0 0.0% 0 0.0% 0 0.0% 0 0.0% 0 0.0% 0 0.0% 0
Quiet 5.1% 13 0.0% 0 0.0% 0 0.0% 0 0.0% 0 0.0% 0 0.0% 0 0.0% 0 0.0% 0Safe and secure 0.4% 1 0.0% 0 0.0% 0 0.0% 0 0.0% 0 0.0% 0 0.0% 0 0.0% 0 0.0% 0The market 0.3% 1 0.0% 0 0.0% 0 0.0% 0 0.0% 0 0.0% 0 0.0% 0 0.0% 0 0.0% 0Traditional 5.7% 14 0.0% 0 0.0% 0 0.0% 0 0.0% 0 0.0% 0 0.0% 0 0.0% 0 0.0% 0Traffic free shopping centre 0.2% 0 0.0% 0 0.0% 0 0.0% 0 0.0% 0 0.0% 0 0.0% 0 0.0% 0 0.0% 0Other 0.0% 0 0.0% 0 0.0% 0 0.0% 0 0.0% 0 0.0% 0 0.0% 0 0.0% 0 0.0% 0Cheap / free parking 0.0% 0 0.0% 0 0.0% 0 0.0% 0 0.0% 0 0.0% 0 0.0% 0 0.0% 0 0.0% 0Familiarity / habit 2.3% 6 0.0% 0 0.0% 0 0.0% 0 0.0% 0 0.0% 0 0.0% 0 0.0% 0 0.0% 0Friendly people / nice
atmosphere 2.7% 7 0.0% 0 0.0% 0 0.0% 0 0.0% 0 0.0% 0 0.0% 0 0.0% 0 0.0% 0
Good leisure facilities / things to do
1.3% 3 0.0% 0 0.0% 0 0.0% 0 0.0% 0 0.0% 0 0.0% 0 0.0% 0 0.0% 0
Good opening hours 0.0% 0 0.0% 0 0.0% 0 0.0% 0 0.0% 0 0.0% 0 0.0% 0 0.0% 0 0.0% 0Good prices 0.0% 0 0.0% 0 0.0% 0 0.0% 0 0.0% 0 0.0% 0 0.0% 0 0.0% 0 0.0% 0Good range of independent
shops 3.1% 7 0.0% 0 0.0% 0 0.0% 0 0.0% 0 0.0% 0 0.0% 0 0.0% 0 0.0% 0
Good range of services 0.2% 0 0.0% 0 0.0% 0 0.0% 0 0.0% 0 0.0% 0 0.0% 0 0.0% 0 0.0% 0(Nothing / very little) 22.3% 54 0.0% 0 0.0% 0 0.0% 0 0.0% 0 0.0% 0 0.0% 0 0.0% 0 0.0% 0(Don't know) 2.3% 6 0.0% 0 0.0% 0 0.0% 0 0.0% 0 0.0% 0 0.0% 0 0.0% 0 0.0% 0Weighted base: 243 0 0 0 0 0 0 0 0Sample: 271 0 0 0 0 0 0 0 0
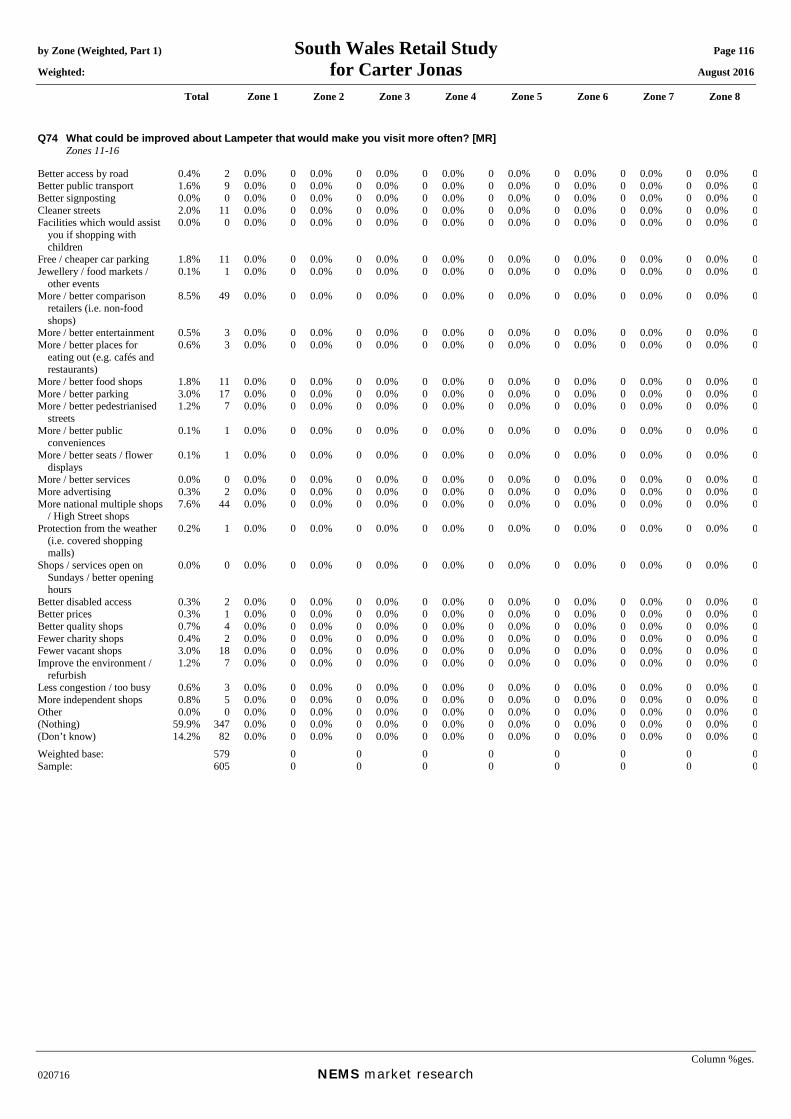
by Zone (Weighted, Part 1) South Wales Retail Study Page 116 Weighted: for Carter Jonas August 2016
Total Zone 1 Zone 2 Zone 3 Zone 4 Zone 5 Zone 6 Zone 7 Zone 8
Column %ges. 020716 NEMS market research
Q74 What could be improved about Lampeter that would make you visit more often? [MR] Zones 11-16 Better access by road 0.4% 2 0.0% 0 0.0% 0 0.0% 0 0.0% 0 0.0% 0 0.0% 0 0.0% 0 0.0% 0Better public transport 1.6% 9 0.0% 0 0.0% 0 0.0% 0 0.0% 0 0.0% 0 0.0% 0 0.0% 0 0.0% 0Better signposting 0.0% 0 0.0% 0 0.0% 0 0.0% 0 0.0% 0 0.0% 0 0.0% 0 0.0% 0 0.0% 0Cleaner streets 2.0% 11 0.0% 0 0.0% 0 0.0% 0 0.0% 0 0.0% 0 0.0% 0 0.0% 0 0.0% 0Facilities which would assist
you if shopping with children
0.0% 0 0.0% 0 0.0% 0 0.0% 0 0.0% 0 0.0% 0 0.0% 0 0.0% 0 0.0% 0
Free / cheaper car parking 1.8% 11 0.0% 0 0.0% 0 0.0% 0 0.0% 0 0.0% 0 0.0% 0 0.0% 0 0.0% 0Jewellery / food markets /
other events 0.1% 1 0.0% 0 0.0% 0 0.0% 0 0.0% 0 0.0% 0 0.0% 0 0.0% 0 0.0% 0
More / better comparison retailers (i.e. non-food shops)
8.5% 49 0.0% 0 0.0% 0 0.0% 0 0.0% 0 0.0% 0 0.0% 0 0.0% 0 0.0% 0
More / better entertainment 0.5% 3 0.0% 0 0.0% 0 0.0% 0 0.0% 0 0.0% 0 0.0% 0 0.0% 0 0.0% 0More / better places for
eating out (e.g. cafés and restaurants)
0.6% 3 0.0% 0 0.0% 0 0.0% 0 0.0% 0 0.0% 0 0.0% 0 0.0% 0 0.0% 0
More / better food shops 1.8% 11 0.0% 0 0.0% 0 0.0% 0 0.0% 0 0.0% 0 0.0% 0 0.0% 0 0.0% 0More / better parking 3.0% 17 0.0% 0 0.0% 0 0.0% 0 0.0% 0 0.0% 0 0.0% 0 0.0% 0 0.0% 0More / better pedestrianised
streets 1.2% 7 0.0% 0 0.0% 0 0.0% 0 0.0% 0 0.0% 0 0.0% 0 0.0% 0 0.0% 0
More / better public conveniences
0.1% 1 0.0% 0 0.0% 0 0.0% 0 0.0% 0 0.0% 0 0.0% 0 0.0% 0 0.0% 0
More / better seats / flower displays
0.1% 1 0.0% 0 0.0% 0 0.0% 0 0.0% 0 0.0% 0 0.0% 0 0.0% 0 0.0% 0
More / better services 0.0% 0 0.0% 0 0.0% 0 0.0% 0 0.0% 0 0.0% 0 0.0% 0 0.0% 0 0.0% 0More advertising 0.3% 2 0.0% 0 0.0% 0 0.0% 0 0.0% 0 0.0% 0 0.0% 0 0.0% 0 0.0% 0More national multiple shops
/ High Street shops 7.6% 44 0.0% 0 0.0% 0 0.0% 0 0.0% 0 0.0% 0 0.0% 0 0.0% 0 0.0% 0
Protection from the weather (i.e. covered shopping malls)
0.2% 1 0.0% 0 0.0% 0 0.0% 0 0.0% 0 0.0% 0 0.0% 0 0.0% 0 0.0% 0
Shops / services open on Sundays / better opening hours
0.0% 0 0.0% 0 0.0% 0 0.0% 0 0.0% 0 0.0% 0 0.0% 0 0.0% 0 0.0% 0
Better disabled access 0.3% 2 0.0% 0 0.0% 0 0.0% 0 0.0% 0 0.0% 0 0.0% 0 0.0% 0 0.0% 0Better prices 0.3% 1 0.0% 0 0.0% 0 0.0% 0 0.0% 0 0.0% 0 0.0% 0 0.0% 0 0.0% 0Better quality shops 0.7% 4 0.0% 0 0.0% 0 0.0% 0 0.0% 0 0.0% 0 0.0% 0 0.0% 0 0.0% 0Fewer charity shops 0.4% 2 0.0% 0 0.0% 0 0.0% 0 0.0% 0 0.0% 0 0.0% 0 0.0% 0 0.0% 0Fewer vacant shops 3.0% 18 0.0% 0 0.0% 0 0.0% 0 0.0% 0 0.0% 0 0.0% 0 0.0% 0 0.0% 0Improve the environment /
refurbish 1.2% 7 0.0% 0 0.0% 0 0.0% 0 0.0% 0 0.0% 0 0.0% 0 0.0% 0 0.0% 0
Less congestion / too busy 0.6% 3 0.0% 0 0.0% 0 0.0% 0 0.0% 0 0.0% 0 0.0% 0 0.0% 0 0.0% 0More independent shops 0.8% 5 0.0% 0 0.0% 0 0.0% 0 0.0% 0 0.0% 0 0.0% 0 0.0% 0 0.0% 0Other 0.0% 0 0.0% 0 0.0% 0 0.0% 0 0.0% 0 0.0% 0 0.0% 0 0.0% 0 0.0% 0(Nothing) 59.9% 347 0.0% 0 0.0% 0 0.0% 0 0.0% 0 0.0% 0 0.0% 0 0.0% 0 0.0% 0(Don’t know) 14.2% 82 0.0% 0 0.0% 0 0.0% 0 0.0% 0 0.0% 0 0.0% 0 0.0% 0 0.0% 0Weighted base: 579 0 0 0 0 0 0 0 0Sample: 605 0 0 0 0 0 0 0 0

by Zone (Weighted, Part 1) South Wales Retail Study Page 117 Weighted: for Carter Jonas August 2016
Total Zone 1 Zone 2 Zone 3 Zone 4 Zone 5 Zone 6 Zone 7 Zone 8
Column %ges. 020716 NEMS market research
Mean score [Times a year, those who visit]: Daily = 365, 4-6 days a week = 234, 2-3 days a week = 130, One day a week = 52, Every two weeks = 24, Monthly = 12, Once every two months = 6, Three-four times a year = 3.5, Once a year = 1, Less often = 0.25
Q75 How often do you or your household visit Tregaron for shopping and other town centre services? Zones 11-16 Daily 0.5% 3 0.0% 0 0.0% 0 0.0% 0 0.0% 0 0.0% 0 0.0% 0 0.0% 0 0.0% 04-6 days a week 0.9% 5 0.0% 0 0.0% 0 0.0% 0 0.0% 0 0.0% 0 0.0% 0 0.0% 0 0.0% 02-3 days a week 0.7% 4 0.0% 0 0.0% 0 0.0% 0 0.0% 0 0.0% 0 0.0% 0 0.0% 0 0.0% 0One day a week 1.7% 10 0.0% 0 0.0% 0 0.0% 0 0.0% 0 0.0% 0 0.0% 0 0.0% 0 0.0% 0Every two weeks 0.7% 4 0.0% 0 0.0% 0 0.0% 0 0.0% 0 0.0% 0 0.0% 0 0.0% 0 0.0% 0Monthly 1.3% 7 0.0% 0 0.0% 0 0.0% 0 0.0% 0 0.0% 0 0.0% 0 0.0% 0 0.0% 0Once every two months 1.9% 11 0.0% 0 0.0% 0 0.0% 0 0.0% 0 0.0% 0 0.0% 0 0.0% 0 0.0% 0Three-four times a year 4.2% 24 0.0% 0 0.0% 0 0.0% 0 0.0% 0 0.0% 0 0.0% 0 0.0% 0 0.0% 0Once a year 2.3% 14 0.0% 0 0.0% 0 0.0% 0 0.0% 0 0.0% 0 0.0% 0 0.0% 0 0.0% 0Less often 1.4% 8 0.0% 0 0.0% 0 0.0% 0 0.0% 0 0.0% 0 0.0% 0 0.0% 0 0.0% 0Never 84.1% 486 0.0% 0 0.0% 0 0.0% 0 0.0% 0 0.0% 0 0.0% 0 0.0% 0 0.0% 0(Don’t know) 0.2% 1 0.0% 0 0.0% 0 0.0% 0 0.0% 0 0.0% 0 0.0% 0 0.0% 0 0.0% 0(Varies) 0.3% 2 0.0% 0 0.0% 0 0.0% 0 0.0% 0 0.0% 0 0.0% 0 0.0% 0 0.0% 0Mean: 39.32 0.00 0.00 0.00 0.00 0.00 0.00 0.00 0.00Weighted base: 579 0 0 0 0 0 0 0 0Sample: 605 0 0 0 0 0 0 0 0

by Zone (Weighted, Part 1) South Wales Retail Study Page 118 Weighted: for Carter Jonas August 2016
Total Zone 1 Zone 2 Zone 3 Zone 4 Zone 5 Zone 6 Zone 7 Zone 8
Column %ges. 020716 NEMS market research
Q76A In order of importance, what are your two main reasons for visiting Tregaron Town Centre? Main reason: Zones 11-16 and those who visit Tregaron town centre at Q75 Food shopping 11.4% 10 0.0% 0 0.0% 0 0.0% 0 0.0% 0 0.0% 0 0.0% 0 0.0% 0 0.0% 0Non-food shopping 18.7% 17 0.0% 0 0.0% 0 0.0% 0 0.0% 0 0.0% 0 0.0% 0 0.0% 0 0.0% 0To visit bars / pubs 3.8% 3 0.0% 0 0.0% 0 0.0% 0 0.0% 0 0.0% 0 0.0% 0 0.0% 0 0.0% 0To visit cafés / restaurants 12.9% 12 0.0% 0 0.0% 0 0.0% 0 0.0% 0 0.0% 0 0.0% 0 0.0% 0 0.0% 0To visit personal service
providers (e.g. hairdressers, beauty salon etc.)
0.7% 1 0.0% 0 0.0% 0 0.0% 0 0.0% 0 0.0% 0 0.0% 0 0.0% 0 0.0% 0
To visit financial services such as banks and other financial institutions
3.3% 3 0.0% 0 0.0% 0 0.0% 0 0.0% 0 0.0% 0 0.0% 0 0.0% 0 0.0% 0
To visit other service providers (e.g. travel agent, estate agent etc.)
0.8% 1 0.0% 0 0.0% 0 0.0% 0 0.0% 0 0.0% 0 0.0% 0 0.0% 0 0.0% 0
To visit public services (e.g. medical or dentist appointment, library, job centre, community centre, etc)
4.4% 4 0.0% 0 0.0% 0 0.0% 0 0.0% 0 0.0% 0 0.0% 0 0.0% 0 0.0% 0
To get petrol 1.2% 1 0.0% 0 0.0% 0 0.0% 0 0.0% 0 0.0% 0 0.0% 0 0.0% 0 0.0% 0To visit the cinema 0.0% 0 0.0% 0 0.0% 0 0.0% 0 0.0% 0 0.0% 0 0.0% 0 0.0% 0 0.0% 0To visit a park 0.0% 0 0.0% 0 0.0% 0 0.0% 0 0.0% 0 0.0% 0 0.0% 0 0.0% 0 0.0% 0To visit the swimming pool 0.0% 0 0.0% 0 0.0% 0 0.0% 0 0.0% 0 0.0% 0 0.0% 0 0.0% 0 0.0% 0To visit other gyms / health
and fitness facilities 1.1% 1 0.0% 0 0.0% 0 0.0% 0 0.0% 0 0.0% 0 0.0% 0 0.0% 0 0.0% 0
To visit the library 0.0% 0 0.0% 0 0.0% 0 0.0% 0 0.0% 0 0.0% 0 0.0% 0 0.0% 0 0.0% 0To visit museums / art
gallery 2.7% 2 0.0% 0 0.0% 0 0.0% 0 0.0% 0 0.0% 0 0.0% 0 0.0% 0 0.0% 0
To visit the theatre or musical venues
0.0% 0 0.0% 0 0.0% 0 0.0% 0 0.0% 0 0.0% 0 0.0% 0 0.0% 0 0.0% 0
To visit night time venues e.g. nightclub
0.0% 0 0.0% 0 0.0% 0 0.0% 0 0.0% 0 0.0% 0 0.0% 0 0.0% 0 0.0% 0
For other leisure activities 8.8% 8 0.0% 0 0.0% 0 0.0% 0 0.0% 0 0.0% 0 0.0% 0 0.0% 0 0.0% 0To shop at the market(s) 1.0% 1 0.0% 0 0.0% 0 0.0% 0 0.0% 0 0.0% 0 0.0% 0 0.0% 0 0.0% 0To meet family 11.2% 10 0.0% 0 0.0% 0 0.0% 0 0.0% 0 0.0% 0 0.0% 0 0.0% 0 0.0% 0To meet friends 1.2% 1 0.0% 0 0.0% 0 0.0% 0 0.0% 0 0.0% 0 0.0% 0 0.0% 0 0.0% 0To visit the theatre 0.0% 0 0.0% 0 0.0% 0 0.0% 0 0.0% 0 0.0% 0 0.0% 0 0.0% 0 0.0% 0For work (i.e. place of work) 6.6% 6 0.0% 0 0.0% 0 0.0% 0 0.0% 0 0.0% 0 0.0% 0 0.0% 0 0.0% 0For business (e.g. attend a
business appointment) 0.8% 1 0.0% 0 0.0% 0 0.0% 0 0.0% 0 0.0% 0 0.0% 0 0.0% 0 0.0% 0
For education as a student (e.g. student at college, university, or other third level education)
2.6% 2 0.0% 0 0.0% 0 0.0% 0 0.0% 0 0.0% 0 0.0% 0 0.0% 0 0.0% 0
To access public transport for onward travel (e.g. train station, bus station)
1.1% 1 0.0% 0 0.0% 0 0.0% 0 0.0% 0 0.0% 0 0.0% 0 0.0% 0 0.0% 0
Other 0.0% 0 0.0% 0 0.0% 0 0.0% 0 0.0% 0 0.0% 0 0.0% 0 0.0% 0 0.0% 0As part of a day out / for a
day out / something different
1.4% 1 0.0% 0 0.0% 0 0.0% 0 0.0% 0 0.0% 0 0.0% 0 0.0% 0 0.0% 0
Browsing / window shopping 0.0% 0 0.0% 0 0.0% 0 0.0% 0 0.0% 0 0.0% 0 0.0% 0 0.0% 0 0.0% 0(Don't know / varies) 1.5% 1 0.0% 0 0.0% 0 0.0% 0 0.0% 0 0.0% 0 0.0% 0 0.0% 0 0.0% 0(Nothing / nothing further) 2.8% 3 0.0% 0 0.0% 0 0.0% 0 0.0% 0 0.0% 0 0.0% 0 0.0% 0 0.0% 0Weighted base: 92 0 0 0 0 0 0 0 0Sample: 114 0 0 0 0 0 0 0 0

by Zone (Weighted, Part 1) South Wales Retail Study Page 119 Weighted: for Carter Jonas August 2016
Total Zone 1 Zone 2 Zone 3 Zone 4 Zone 5 Zone 6 Zone 7 Zone 8
Column %ges. 020716 NEMS market research
Q76B In order of importance, what are your two main reasons for visiting Tregaron Town Centre? Secondary reason: Those who gave a reason at Q76A Food shopping 5.8% 5 0.0% 0 0.0% 0 0.0% 0 0.0% 0 0.0% 0 0.0% 0 0.0% 0 0.0% 0Non-food shopping 6.1% 5 0.0% 0 0.0% 0 0.0% 0 0.0% 0 0.0% 0 0.0% 0 0.0% 0 0.0% 0To visit bars / pubs 2.7% 2 0.0% 0 0.0% 0 0.0% 0 0.0% 0 0.0% 0 0.0% 0 0.0% 0 0.0% 0To visit cafés / restaurants 7.7% 7 0.0% 0 0.0% 0 0.0% 0 0.0% 0 0.0% 0 0.0% 0 0.0% 0 0.0% 0To visit personal service
providers (e.g. hairdressers, beauty salon etc.)
0.0% 0 0.0% 0 0.0% 0 0.0% 0 0.0% 0 0.0% 0 0.0% 0 0.0% 0 0.0% 0
To visit financial services such as banks and other financial institutions
1.9% 2 0.0% 0 0.0% 0 0.0% 0 0.0% 0 0.0% 0 0.0% 0 0.0% 0 0.0% 0
To visit other service providers (e.g. travel agent, estate agent etc.)
0.0% 0 0.0% 0 0.0% 0 0.0% 0 0.0% 0 0.0% 0 0.0% 0 0.0% 0 0.0% 0
To visit public services (e.g. medical or dentist appointment, library, job centre, community centre, etc)
1.3% 1 0.0% 0 0.0% 0 0.0% 0 0.0% 0 0.0% 0 0.0% 0 0.0% 0 0.0% 0
To get petrol 0.0% 0 0.0% 0 0.0% 0 0.0% 0 0.0% 0 0.0% 0 0.0% 0 0.0% 0 0.0% 0To visit the cinema 0.9% 1 0.0% 0 0.0% 0 0.0% 0 0.0% 0 0.0% 0 0.0% 0 0.0% 0 0.0% 0To visit a park 0.0% 0 0.0% 0 0.0% 0 0.0% 0 0.0% 0 0.0% 0 0.0% 0 0.0% 0 0.0% 0To visit the swimming pool 0.0% 0 0.0% 0 0.0% 0 0.0% 0 0.0% 0 0.0% 0 0.0% 0 0.0% 0 0.0% 0To visit other gyms / health
and fitness facilities 0.0% 0 0.0% 0 0.0% 0 0.0% 0 0.0% 0 0.0% 0 0.0% 0 0.0% 0 0.0% 0
To visit the library 0.0% 0 0.0% 0 0.0% 0 0.0% 0 0.0% 0 0.0% 0 0.0% 0 0.0% 0 0.0% 0To visit museums / art
gallery 0.5% 0 0.0% 0 0.0% 0 0.0% 0 0.0% 0 0.0% 0 0.0% 0 0.0% 0 0.0% 0
To visit the theatre or musical venues
0.0% 0 0.0% 0 0.0% 0 0.0% 0 0.0% 0 0.0% 0 0.0% 0 0.0% 0 0.0% 0
To visit night time venues e.g. nightclub
0.5% 0 0.0% 0 0.0% 0 0.0% 0 0.0% 0 0.0% 0 0.0% 0 0.0% 0 0.0% 0
For other leisure activities 4.5% 4 0.0% 0 0.0% 0 0.0% 0 0.0% 0 0.0% 0 0.0% 0 0.0% 0 0.0% 0To shop at the market(s) 0.0% 0 0.0% 0 0.0% 0 0.0% 0 0.0% 0 0.0% 0 0.0% 0 0.0% 0 0.0% 0To meet family 0.7% 1 0.0% 0 0.0% 0 0.0% 0 0.0% 0 0.0% 0 0.0% 0 0.0% 0 0.0% 0To meet friends 4.0% 4 0.0% 0 0.0% 0 0.0% 0 0.0% 0 0.0% 0 0.0% 0 0.0% 0 0.0% 0To visit the theatre 0.0% 0 0.0% 0 0.0% 0 0.0% 0 0.0% 0 0.0% 0 0.0% 0 0.0% 0 0.0% 0For work (i.e. place of work) 0.0% 0 0.0% 0 0.0% 0 0.0% 0 0.0% 0 0.0% 0 0.0% 0 0.0% 0 0.0% 0For business (e.g. attend a
business appointment) 1.1% 1 0.0% 0 0.0% 0 0.0% 0 0.0% 0 0.0% 0 0.0% 0 0.0% 0 0.0% 0
For education as a student (e.g. student at college, university, or other third level education)
1.6% 1 0.0% 0 0.0% 0 0.0% 0 0.0% 0 0.0% 0 0.0% 0 0.0% 0 0.0% 0
To access public transport for onward travel (e.g. train station, bus station)
0.0% 0 0.0% 0 0.0% 0 0.0% 0 0.0% 0 0.0% 0 0.0% 0 0.0% 0 0.0% 0
Other 0.0% 0 0.0% 0 0.0% 0 0.0% 0 0.0% 0 0.0% 0 0.0% 0 0.0% 0 0.0% 0As part of a day out / for a
day out / something different
0.0% 0 0.0% 0 0.0% 0 0.0% 0 0.0% 0 0.0% 0 0.0% 0 0.0% 0 0.0% 0
Browsing / window shopping 0.0% 0 0.0% 0 0.0% 0 0.0% 0 0.0% 0 0.0% 0 0.0% 0 0.0% 0 0.0% 0(Don't know / varies) 0.8% 1 0.0% 0 0.0% 0 0.0% 0 0.0% 0 0.0% 0 0.0% 0 0.0% 0 0.0% 0(Nothing / nothing further) 60.0% 53 0.0% 0 0.0% 0 0.0% 0 0.0% 0 0.0% 0 0.0% 0 0.0% 0 0.0% 0Weighted base: 88 0 0 0 0 0 0 0 0Sample: 109 0 0 0 0 0 0 0 0

by Zone (Weighted, Part 1) South Wales Retail Study Page 120 Weighted: for Carter Jonas August 2016
Total Zone 1 Zone 2 Zone 3 Zone 4 Zone 5 Zone 6 Zone 7 Zone 8
Column %ges. 020716 NEMS market research
Q76X In order of importance, what are your two main reasons for visiting Tregaron Town Centre? Any mention: [MR] Zones 11-16 and those who visit Tregaron town centre at Q75 Food shopping 16.9% 16 0.0% 0 0.0% 0 0.0% 0 0.0% 0 0.0% 0 0.0% 0 0.0% 0 0.0% 0Non-food shopping 24.5% 23 0.0% 0 0.0% 0 0.0% 0 0.0% 0 0.0% 0 0.0% 0 0.0% 0 0.0% 0To visit bars / pubs 6.3% 6 0.0% 0 0.0% 0 0.0% 0 0.0% 0 0.0% 0 0.0% 0 0.0% 0 0.0% 0To visit cafés / restaurants 20.3% 19 0.0% 0 0.0% 0 0.0% 0 0.0% 0 0.0% 0 0.0% 0 0.0% 0 0.0% 0To visit personal service
providers (e.g. hairdressers, beauty salon etc.)
0.7% 1 0.0% 0 0.0% 0 0.0% 0 0.0% 0 0.0% 0 0.0% 0 0.0% 0 0.0% 0
To visit financial services such as banks and other financial institutions
5.1% 5 0.0% 0 0.0% 0 0.0% 0 0.0% 0 0.0% 0 0.0% 0 0.0% 0 0.0% 0
To visit other service providers (e.g. travel agent, estate agent etc.)
0.8% 1 0.0% 0 0.0% 0 0.0% 0 0.0% 0 0.0% 0 0.0% 0 0.0% 0 0.0% 0
To visit public services (e.g. medical or dentist appointment, library, job centre, community centre, etc)
5.6% 5 0.0% 0 0.0% 0 0.0% 0 0.0% 0 0.0% 0 0.0% 0 0.0% 0 0.0% 0
To get petrol 1.2% 1 0.0% 0 0.0% 0 0.0% 0 0.0% 0 0.0% 0 0.0% 0 0.0% 0 0.0% 0To visit the cinema 0.8% 1 0.0% 0 0.0% 0 0.0% 0 0.0% 0 0.0% 0 0.0% 0 0.0% 0 0.0% 0To visit a park 0.0% 0 0.0% 0 0.0% 0 0.0% 0 0.0% 0 0.0% 0 0.0% 0 0.0% 0 0.0% 0To visit the swimming pool 0.0% 0 0.0% 0 0.0% 0 0.0% 0 0.0% 0 0.0% 0 0.0% 0 0.0% 0 0.0% 0To visit other gyms / health
and fitness facilities 1.1% 1 0.0% 0 0.0% 0 0.0% 0 0.0% 0 0.0% 0 0.0% 0 0.0% 0 0.0% 0
To visit the library 0.0% 0 0.0% 0 0.0% 0 0.0% 0 0.0% 0 0.0% 0 0.0% 0 0.0% 0 0.0% 0To visit museums / art
gallery 3.2% 3 0.0% 0 0.0% 0 0.0% 0 0.0% 0 0.0% 0 0.0% 0 0.0% 0 0.0% 0
To visit the theatre or musical venues
0.0% 0 0.0% 0 0.0% 0 0.0% 0 0.0% 0 0.0% 0 0.0% 0 0.0% 0 0.0% 0
To visit night time venues e.g. nightclub
0.5% 0 0.0% 0 0.0% 0 0.0% 0 0.0% 0 0.0% 0 0.0% 0 0.0% 0 0.0% 0
For other leisure activities 13.1% 12 0.0% 0 0.0% 0 0.0% 0 0.0% 0 0.0% 0 0.0% 0 0.0% 0 0.0% 0To shop at the market(s) 1.0% 1 0.0% 0 0.0% 0 0.0% 0 0.0% 0 0.0% 0 0.0% 0 0.0% 0 0.0% 0To meet family 11.8% 11 0.0% 0 0.0% 0 0.0% 0 0.0% 0 0.0% 0 0.0% 0 0.0% 0 0.0% 0To meet friends 5.0% 5 0.0% 0 0.0% 0 0.0% 0 0.0% 0 0.0% 0 0.0% 0 0.0% 0 0.0% 0To visit the theatre 0.0% 0 0.0% 0 0.0% 0 0.0% 0 0.0% 0 0.0% 0 0.0% 0 0.0% 0 0.0% 0For work (i.e. place of work) 6.6% 6 0.0% 0 0.0% 0 0.0% 0 0.0% 0 0.0% 0 0.0% 0 0.0% 0 0.0% 0For business (e.g. attend a
business appointment) 1.9% 2 0.0% 0 0.0% 0 0.0% 0 0.0% 0 0.0% 0 0.0% 0 0.0% 0 0.0% 0
For education as a student (e.g. student at college, university, or other third level education)
4.1% 4 0.0% 0 0.0% 0 0.0% 0 0.0% 0 0.0% 0 0.0% 0 0.0% 0 0.0% 0
To access public transport for onward travel (e.g. train station, bus station)
1.1% 1 0.0% 0 0.0% 0 0.0% 0 0.0% 0 0.0% 0 0.0% 0 0.0% 0 0.0% 0
Other 0.0% 0 0.0% 0 0.0% 0 0.0% 0 0.0% 0 0.0% 0 0.0% 0 0.0% 0 0.0% 0As part of a day out / for a
day out / something different
1.4% 1 0.0% 0 0.0% 0 0.0% 0 0.0% 0 0.0% 0 0.0% 0 0.0% 0 0.0% 0
Browsing / window shopping 0.0% 0 0.0% 0 0.0% 0 0.0% 0 0.0% 0 0.0% 0 0.0% 0 0.0% 0 0.0% 0Weighted base: 92 0 0 0 0 0 0 0 0Sample: 114 0 0 0 0 0 0 0 0

by Zone (Weighted, Part 1) South Wales Retail Study Page 121 Weighted: for Carter Jonas August 2016
Total Zone 1 Zone 2 Zone 3 Zone 4 Zone 5 Zone 6 Zone 7 Zone 8
Column %ges. 020716 NEMS market research
Q77 What do you like about Tregaron Town Centre? [MR] Zones 11-16 and those who visit Tregaron town centre at Q75 Attractive environment / nice
place 27.9% 26 0.0% 0 0.0% 0 0.0% 0 0.0% 0 0.0% 0 0.0% 0 0.0% 0 0.0% 0
Close to friends or relatives 0.0% 0 0.0% 0 0.0% 0 0.0% 0 0.0% 0 0.0% 0 0.0% 0 0.0% 0 0.0% 0Close to home 10.0% 9 0.0% 0 0.0% 0 0.0% 0 0.0% 0 0.0% 0 0.0% 0 0.0% 0 0.0% 0Close to work 0.7% 1 0.0% 0 0.0% 0 0.0% 0 0.0% 0 0.0% 0 0.0% 0 0.0% 0 0.0% 0Compact 3.7% 3 0.0% 0 0.0% 0 0.0% 0 0.0% 0 0.0% 0 0.0% 0 0.0% 0 0.0% 0Easy to get to by bike 0.0% 0 0.0% 0 0.0% 0 0.0% 0 0.0% 0 0.0% 0 0.0% 0 0.0% 0 0.0% 0Easy to get to by bus 0.0% 0 0.0% 0 0.0% 0 0.0% 0 0.0% 0 0.0% 0 0.0% 0 0.0% 0 0.0% 0Easy to get to by car 0.0% 0 0.0% 0 0.0% 0 0.0% 0 0.0% 0 0.0% 0 0.0% 0 0.0% 0 0.0% 0Easy to park 3.6% 3 0.0% 0 0.0% 0 0.0% 0 0.0% 0 0.0% 0 0.0% 0 0.0% 0 0.0% 0Good facilities 1.2% 1 0.0% 0 0.0% 0 0.0% 0 0.0% 0 0.0% 0 0.0% 0 0.0% 0 0.0% 0Good food stores 0.6% 1 0.0% 0 0.0% 0 0.0% 0 0.0% 0 0.0% 0 0.0% 0 0.0% 0 0.0% 0Good pubs, cafés or
restaurants 5.7% 5 0.0% 0 0.0% 0 0.0% 0 0.0% 0 0.0% 0 0.0% 0 0.0% 0 0.0% 0
Good range of non-food shops
1.6% 2 0.0% 0 0.0% 0 0.0% 0 0.0% 0 0.0% 0 0.0% 0 0.0% 0 0.0% 0
The harbour / beach 0.7% 1 0.0% 0 0.0% 0 0.0% 0 0.0% 0 0.0% 0 0.0% 0 0.0% 0 0.0% 0Makes a change from other
places 0.7% 1 0.0% 0 0.0% 0 0.0% 0 0.0% 0 0.0% 0 0.0% 0 0.0% 0 0.0% 0
Quiet 8.7% 8 0.0% 0 0.0% 0 0.0% 0 0.0% 0 0.0% 0 0.0% 0 0.0% 0 0.0% 0Safe and secure 0.5% 0 0.0% 0 0.0% 0 0.0% 0 0.0% 0 0.0% 0 0.0% 0 0.0% 0 0.0% 0The market 2.0% 2 0.0% 0 0.0% 0 0.0% 0 0.0% 0 0.0% 0 0.0% 0 0.0% 0 0.0% 0Traditional 21.4% 20 0.0% 0 0.0% 0 0.0% 0 0.0% 0 0.0% 0 0.0% 0 0.0% 0 0.0% 0Traffic free shopping centre 0.0% 0 0.0% 0 0.0% 0 0.0% 0 0.0% 0 0.0% 0 0.0% 0 0.0% 0 0.0% 0Other 0.0% 0 0.0% 0 0.0% 0 0.0% 0 0.0% 0 0.0% 0 0.0% 0 0.0% 0 0.0% 0Cheap / free parking 0.0% 0 0.0% 0 0.0% 0 0.0% 0 0.0% 0 0.0% 0 0.0% 0 0.0% 0 0.0% 0Familiarity / habit 0.5% 0 0.0% 0 0.0% 0 0.0% 0 0.0% 0 0.0% 0 0.0% 0 0.0% 0 0.0% 0Friendly people / nice
atmosphere 1.8% 2 0.0% 0 0.0% 0 0.0% 0 0.0% 0 0.0% 0 0.0% 0 0.0% 0 0.0% 0
Good opening hours 0.0% 0 0.0% 0 0.0% 0 0.0% 0 0.0% 0 0.0% 0 0.0% 0 0.0% 0 0.0% 0Good prices 0.0% 0 0.0% 0 0.0% 0 0.0% 0 0.0% 0 0.0% 0 0.0% 0 0.0% 0 0.0% 0Good range of independent
shops 3.7% 3 0.0% 0 0.0% 0 0.0% 0 0.0% 0 0.0% 0 0.0% 0 0.0% 0 0.0% 0
Good range of services 0.0% 0 0.0% 0 0.0% 0 0.0% 0 0.0% 0 0.0% 0 0.0% 0 0.0% 0 0.0% 0(Nothing / very little) 26.2% 24 0.0% 0 0.0% 0 0.0% 0 0.0% 0 0.0% 0 0.0% 0 0.0% 0 0.0% 0(Don't know) 9.5% 9 0.0% 0 0.0% 0 0.0% 0 0.0% 0 0.0% 0 0.0% 0 0.0% 0 0.0% 0Weighted base: 92 0 0 0 0 0 0 0 0Sample: 114 0 0 0 0 0 0 0 0

by Zone (Weighted, Part 1) South Wales Retail Study Page 122 Weighted: for Carter Jonas August 2016
Total Zone 1 Zone 2 Zone 3 Zone 4 Zone 5 Zone 6 Zone 7 Zone 8
Column %ges. 020716 NEMS market research
Q78 What could be improved about Tregaron that would make you visit more often? [MR] Zones 11-16 Better access by road 0.4% 2 0.0% 0 0.0% 0 0.0% 0 0.0% 0 0.0% 0 0.0% 0 0.0% 0 0.0% 0Better public transport 0.6% 4 0.0% 0 0.0% 0 0.0% 0 0.0% 0 0.0% 0 0.0% 0 0.0% 0 0.0% 0Better signposting 0.0% 0 0.0% 0 0.0% 0 0.0% 0 0.0% 0 0.0% 0 0.0% 0 0.0% 0 0.0% 0Cleaner streets 0.4% 2 0.0% 0 0.0% 0 0.0% 0 0.0% 0 0.0% 0 0.0% 0 0.0% 0 0.0% 0Facilities which would assist
you if shopping with children
0.3% 2 0.0% 0 0.0% 0 0.0% 0 0.0% 0 0.0% 0 0.0% 0 0.0% 0 0.0% 0
Free / cheaper car parking 0.7% 4 0.0% 0 0.0% 0 0.0% 0 0.0% 0 0.0% 0 0.0% 0 0.0% 0 0.0% 0Jewellery / food markets /
other events 0.0% 0 0.0% 0 0.0% 0 0.0% 0 0.0% 0 0.0% 0 0.0% 0 0.0% 0 0.0% 0
More / better comparison retailers (i.e. non-food shops)
2.1% 12 0.0% 0 0.0% 0 0.0% 0 0.0% 0 0.0% 0 0.0% 0 0.0% 0 0.0% 0
More / better entertainment 0.2% 1 0.0% 0 0.0% 0 0.0% 0 0.0% 0 0.0% 0 0.0% 0 0.0% 0 0.0% 0More / better places for
eating out (e.g. cafés and restaurants)
0.3% 2 0.0% 0 0.0% 0 0.0% 0 0.0% 0 0.0% 0 0.0% 0 0.0% 0 0.0% 0
More / better food shops 0.1% 1 0.0% 0 0.0% 0 0.0% 0 0.0% 0 0.0% 0 0.0% 0 0.0% 0 0.0% 0More / better parking 1.1% 6 0.0% 0 0.0% 0 0.0% 0 0.0% 0 0.0% 0 0.0% 0 0.0% 0 0.0% 0More / better pedestrianised
streets 0.0% 0 0.0% 0 0.0% 0 0.0% 0 0.0% 0 0.0% 0 0.0% 0 0.0% 0 0.0% 0
More / better public conveniences
0.0% 0 0.0% 0 0.0% 0 0.0% 0 0.0% 0 0.0% 0 0.0% 0 0.0% 0 0.0% 0
More / better seats / flower displays
0.2% 1 0.0% 0 0.0% 0 0.0% 0 0.0% 0 0.0% 0 0.0% 0 0.0% 0 0.0% 0
More / better services 0.1% 1 0.0% 0 0.0% 0 0.0% 0 0.0% 0 0.0% 0 0.0% 0 0.0% 0 0.0% 0More advertising 0.1% 1 0.0% 0 0.0% 0 0.0% 0 0.0% 0 0.0% 0 0.0% 0 0.0% 0 0.0% 0More national multiple shops
/ High Street shops 2.9% 17 0.0% 0 0.0% 0 0.0% 0 0.0% 0 0.0% 0 0.0% 0 0.0% 0 0.0% 0
Protection from the weather (i.e. covered shopping malls)
0.0% 0 0.0% 0 0.0% 0 0.0% 0 0.0% 0 0.0% 0 0.0% 0 0.0% 0 0.0% 0
Shops / services open on Sundays / better opening hours
0.0% 0 0.0% 0 0.0% 0 0.0% 0 0.0% 0 0.0% 0 0.0% 0 0.0% 0 0.0% 0
Fewer vacant shops 0.5% 3 0.0% 0 0.0% 0 0.0% 0 0.0% 0 0.0% 0 0.0% 0 0.0% 0 0.0% 0Better maintained buildings 0.2% 1 0.0% 0 0.0% 0 0.0% 0 0.0% 0 0.0% 0 0.0% 0 0.0% 0 0.0% 0Better disabled access 0.0% 0 0.0% 0 0.0% 0 0.0% 0 0.0% 0 0.0% 0 0.0% 0 0.0% 0 0.0% 0Better prices 0.0% 0 0.0% 0 0.0% 0 0.0% 0 0.0% 0 0.0% 0 0.0% 0 0.0% 0 0.0% 0Better quality shops 0.0% 0 0.0% 0 0.0% 0 0.0% 0 0.0% 0 0.0% 0 0.0% 0 0.0% 0 0.0% 0Fewer charity shops 0.0% 0 0.0% 0 0.0% 0 0.0% 0 0.0% 0 0.0% 0 0.0% 0 0.0% 0 0.0% 0Improve the environment /
refurbish 0.8% 5 0.0% 0 0.0% 0 0.0% 0 0.0% 0 0.0% 0 0.0% 0 0.0% 0 0.0% 0
Less congestion / too busy 0.2% 1 0.0% 0 0.0% 0 0.0% 0 0.0% 0 0.0% 0 0.0% 0 0.0% 0 0.0% 0More independent shops 0.4% 2 0.0% 0 0.0% 0 0.0% 0 0.0% 0 0.0% 0 0.0% 0 0.0% 0 0.0% 0Other 0.0% 0 0.0% 0 0.0% 0 0.0% 0 0.0% 0 0.0% 0 0.0% 0 0.0% 0 0.0% 0(Nothing) 66.3% 384 0.0% 0 0.0% 0 0.0% 0 0.0% 0 0.0% 0 0.0% 0 0.0% 0 0.0% 0(Don’t know) 24.5% 142 0.0% 0 0.0% 0 0.0% 0 0.0% 0 0.0% 0 0.0% 0 0.0% 0 0.0% 0Weighted base: 579 0 0 0 0 0 0 0 0Sample: 605 0 0 0 0 0 0 0 0

by Zone (Weighted, Part 1) South Wales Retail Study Page 123 Weighted: for Carter Jonas August 2016
Total Zone 1 Zone 2 Zone 3 Zone 4 Zone 5 Zone 6 Zone 7 Zone 8
Column %ges. 020716 NEMS market research
Mean score [Times a year, those who visit]: Daily = 365, 4-6 days a week = 234, 2-3 days a week = 130, One day a week = 52, Every two weeks = 24, Monthly = 12, Once every two months = 6, Three-four times a year = 3.5, Once a year = 1, Less often = 0.25
X75 How often do you or your household visit St Davids for shopping and other town centre services? Zones 3, 4 & 8 Daily 2.1% 7 0.0% 0 0.0% 0 3.8% 3 0.0% 0 0.0% 0 0.0% 0 0.0% 0 3.8% 44-6 days a week 1.1% 4 0.0% 0 0.0% 0 4.3% 4 0.0% 0 0.0% 0 0.0% 0 0.0% 0 0.0% 02-3 days a week 2.0% 7 0.0% 0 0.0% 0 7.7% 7 0.0% 0 0.0% 0 0.0% 0 0.0% 0 0.0% 0One day a week 3.0% 10 0.0% 0 0.0% 0 6.1% 5 0.0% 0 0.0% 0 0.0% 0 0.0% 0 4.9% 5Every two weeks 2.2% 7 0.0% 0 0.0% 0 4.4% 4 0.0% 0 0.0% 0 0.0% 0 0.0% 0 3.9% 4Monthly 3.7% 12 0.0% 0 0.0% 0 7.5% 6 2.9% 4 0.0% 0 0.0% 0 0.0% 0 1.6% 2Once every two months 4.7% 16 0.0% 0 0.0% 0 3.5% 3 3.7% 6 0.0% 0 0.0% 0 0.0% 0 7.4% 7Three-four times a year 6.3% 21 0.0% 0 0.0% 0 8.9% 8 4.1% 6 0.0% 0 0.0% 0 0.0% 0 7.5% 7Once a year 7.5% 25 0.0% 0 0.0% 0 4.1% 4 12.9% 19 0.0% 0 0.0% 0 0.0% 0 2.1% 2Less often 2.3% 8 0.0% 0 0.0% 0 0.9% 1 2.4% 4 0.0% 0 0.0% 0 0.0% 0 3.5% 3Never 64.7% 215 0.0% 0 0.0% 0 47.8% 41 74.0% 112 0.0% 0 0.0% 0 0.0% 0 65.4% 62(Don’t know) 0.0% 0 0.0% 0 0.0% 0 0.0% 0 0.0% 0 0.0% 0 0.0% 0 0.0% 0 0.0% 0(Varies) 0.2% 1 0.0% 0 0.0% 0 0.9% 1 0.0% 0 0.0% 0 0.0% 0 0.0% 0 0.0% 0Mean: 45.35 0.00 0.00 77.62 3.27 0.00 0.00 0.00 52.37Weighted base: 332 0 0 86 151 0 0 0 94Sample: 301 0 0 101 100 0 0 0 100

by Zone (Weighted, Part 1) South Wales Retail Study Page 124 Weighted: for Carter Jonas August 2016
Total Zone 1 Zone 2 Zone 3 Zone 4 Zone 5 Zone 6 Zone 7 Zone 8
Column %ges. 020716 NEMS market research
X76A In order of importance, what are your two main reasons for visiting St Davids Town Centre? Main reason: Zones 3, 4 & 8 and those who visit St Davids town centre at X75 Food shopping 7.8% 9 0.0% 0 0.0% 0 19.0% 9 0.0% 0 0.0% 0 0.0% 0 0.0% 0 1.8% 1Non-food shopping 24.7% 29 0.0% 0 0.0% 0 38.2% 17 15.2% 6 0.0% 0 0.0% 0 0.0% 0 17.3% 6To visit bars / pubs 0.0% 0 0.0% 0 0.0% 0 0.0% 0 0.0% 0 0.0% 0 0.0% 0 0.0% 0 0.0% 0To visit cafés / restaurants 2.7% 3 0.0% 0 0.0% 0 2.8% 1 3.2% 1 0.0% 0 0.0% 0 0.0% 0 1.8% 1To visit personal service
providers (e.g. hairdressers, beauty salon etc.)
0.5% 1 0.0% 0 0.0% 0 0.0% 0 0.0% 0 0.0% 0 0.0% 0 0.0% 0 1.8% 1
To visit financial services such as banks and other financial institutions
0.7% 1 0.0% 0 0.0% 0 1.9% 1 0.0% 0 0.0% 0 0.0% 0 0.0% 0 0.0% 0
To visit other service providers (e.g. travel agent, estate agent etc.)
0.0% 0 0.0% 0 0.0% 0 0.0% 0 0.0% 0 0.0% 0 0.0% 0 0.0% 0 0.0% 0
To visit public services (e.g. medical or dentist appointment, library, job centre, community centre, etc)
3.4% 4 0.0% 0 0.0% 0 3.3% 1 0.0% 0 0.0% 0 0.0% 0 0.0% 0 7.6% 2
To get petrol 0.0% 0 0.0% 0 0.0% 0 0.0% 0 0.0% 0 0.0% 0 0.0% 0 0.0% 0 0.0% 0To visit the cinema 0.0% 0 0.0% 0 0.0% 0 0.0% 0 0.0% 0 0.0% 0 0.0% 0 0.0% 0 0.0% 0To visit a park 0.0% 0 0.0% 0 0.0% 0 0.0% 0 0.0% 0 0.0% 0 0.0% 0 0.0% 0 0.0% 0To visit the swimming pool 0.0% 0 0.0% 0 0.0% 0 0.0% 0 0.0% 0 0.0% 0 0.0% 0 0.0% 0 0.0% 0To visit other gyms / health
and fitness facilities 0.0% 0 0.0% 0 0.0% 0 0.0% 0 0.0% 0 0.0% 0 0.0% 0 0.0% 0 0.0% 0
To visit the library 0.0% 0 0.0% 0 0.0% 0 0.0% 0 0.0% 0 0.0% 0 0.0% 0 0.0% 0 0.0% 0To visit museums / art
gallery 0.5% 1 0.0% 0 0.0% 0 1.4% 1 0.0% 0 0.0% 0 0.0% 0 0.0% 0 0.0% 0
To visit the theatre or musical venues
0.0% 0 0.0% 0 0.0% 0 0.0% 0 0.0% 0 0.0% 0 0.0% 0 0.0% 0 0.0% 0
To visit night time venues e.g. nightclub
0.0% 0 0.0% 0 0.0% 0 0.0% 0 0.0% 0 0.0% 0 0.0% 0 0.0% 0 0.0% 0
For other leisure activities 19.7% 23 0.0% 0 0.0% 0 11.4% 5 37.9% 15 0.0% 0 0.0% 0 0.0% 0 9.1% 3To shop at the market(s) 0.7% 1 0.0% 0 0.0% 0 0.0% 0 0.0% 0 0.0% 0 0.0% 0 0.0% 0 2.4% 1To meet family 3.5% 4 0.0% 0 0.0% 0 1.8% 1 6.2% 2 0.0% 0 0.0% 0 0.0% 0 2.5% 1To meet friends 7.2% 8 0.0% 0 0.0% 0 1.4% 1 11.9% 5 0.0% 0 0.0% 0 0.0% 0 9.5% 3To visit the theatre 0.0% 0 0.0% 0 0.0% 0 0.0% 0 0.0% 0 0.0% 0 0.0% 0 0.0% 0 0.0% 0For work (i.e. place of work) 4.8% 6 0.0% 0 0.0% 0 4.6% 2 0.0% 0 0.0% 0 0.0% 0 0.0% 0 10.8% 4For business (e.g. attend a
business appointment) 0.0% 0 0.0% 0 0.0% 0 0.0% 0 0.0% 0 0.0% 0 0.0% 0 0.0% 0 0.0% 0
For education as a student (e.g. student at college, university, or other third level education)
2.5% 3 0.0% 0 0.0% 0 0.0% 0 0.0% 0 0.0% 0 0.0% 0 0.0% 0 9.0% 3
To access public transport for onward travel (e.g. train station, bus station)
0.7% 1 0.0% 0 0.0% 0 0.0% 0 0.0% 0 0.0% 0 0.0% 0 0.0% 0 2.5% 1
Other 0.0% 0 0.0% 0 0.0% 0 0.0% 0 0.0% 0 0.0% 0 0.0% 0 0.0% 0 0.0% 0As part of a day out / for a
day out / something different
13.4% 16 0.0% 0 0.0% 0 6.8% 3 20.2% 8 0.0% 0 0.0% 0 0.0% 0 14.4% 5
Browsing / window shopping 2.5% 3 0.0% 0 0.0% 0 2.8% 1 0.0% 0 0.0% 0 0.0% 0 0.0% 0 5.2% 2(Don't know / varies) 2.1% 2 0.0% 0 0.0% 0 3.3% 1 2.4% 1 0.0% 0 0.0% 0 0.0% 0 0.0% 0(Nothing / nothing further) 2.7% 3 0.0% 0 0.0% 0 1.4% 1 3.1% 1 0.0% 0 0.0% 0 0.0% 0 4.2% 1Weighted base: 117 0 0 45 39 0 0 0 33Sample: 123 0 0 58 31 0 0 0 34

by Zone (Weighted, Part 1) South Wales Retail Study Page 125 Weighted: for Carter Jonas August 2016
Total Zone 1 Zone 2 Zone 3 Zone 4 Zone 5 Zone 6 Zone 7 Zone 8
Column %ges. 020716 NEMS market research
X76B In order of importance, what are your two main reasons for visiting St Davids Town Centre? Secondary reason: Those who gave a reason at X76A Food shopping 4.5% 5 0.0% 0 0.0% 0 9.8% 4 0.0% 0 0.0% 0 0.0% 0 0.0% 0 2.5% 1Non-food shopping 12.8% 14 0.0% 0 0.0% 0 9.7% 4 7.5% 3 0.0% 0 0.0% 0 0.0% 0 23.1% 7To visit bars / pubs 1.7% 2 0.0% 0 0.0% 0 1.5% 1 3.4% 1 0.0% 0 0.0% 0 0.0% 0 0.0% 0To visit cafés / restaurants 16.4% 18 0.0% 0 0.0% 0 16.3% 7 11.7% 4 0.0% 0 0.0% 0 0.0% 0 22.0% 7To visit personal service
providers (e.g. hairdressers, beauty salon etc.)
0.6% 1 0.0% 0 0.0% 0 1.5% 1 0.0% 0 0.0% 0 0.0% 0 0.0% 0 0.0% 0
To visit financial services such as banks and other financial institutions
1.8% 2 0.0% 0 0.0% 0 3.4% 1 0.0% 0 0.0% 0 0.0% 0 0.0% 0 1.9% 1
To visit other service providers (e.g. travel agent, estate agent etc.)
0.0% 0 0.0% 0 0.0% 0 0.0% 0 0.0% 0 0.0% 0 0.0% 0 0.0% 0 0.0% 0
To visit public services (e.g. medical or dentist appointment, library, job centre, community centre, etc)
2.3% 3 0.0% 0 0.0% 0 5.8% 3 0.0% 0 0.0% 0 0.0% 0 0.0% 0 0.0% 0
To get petrol 0.0% 0 0.0% 0 0.0% 0 0.0% 0 0.0% 0 0.0% 0 0.0% 0 0.0% 0 0.0% 0To visit the cinema 0.7% 1 0.0% 0 0.0% 0 0.0% 0 0.0% 0 0.0% 0 0.0% 0 0.0% 0 2.6% 1To visit a park 0.0% 0 0.0% 0 0.0% 0 0.0% 0 0.0% 0 0.0% 0 0.0% 0 0.0% 0 0.0% 0To visit the swimming pool 0.0% 0 0.0% 0 0.0% 0 0.0% 0 0.0% 0 0.0% 0 0.0% 0 0.0% 0 0.0% 0To visit other gyms / health
and fitness facilities 0.7% 1 0.0% 0 0.0% 0 1.9% 1 0.0% 0 0.0% 0 0.0% 0 0.0% 0 0.0% 0
To visit the library 0.0% 0 0.0% 0 0.0% 0 0.0% 0 0.0% 0 0.0% 0 0.0% 0 0.0% 0 0.0% 0To visit museums / art
gallery 2.1% 2 0.0% 0 0.0% 0 1.5% 1 2.5% 1 0.0% 0 0.0% 0 0.0% 0 2.6% 1
To visit the theatre or musical venues
0.8% 1 0.0% 0 0.0% 0 0.0% 0 2.5% 1 0.0% 0 0.0% 0 0.0% 0 0.0% 0
To visit night time venues e.g. nightclub
0.7% 1 0.0% 0 0.0% 0 0.0% 0 0.0% 0 0.0% 0 0.0% 0 0.0% 0 2.5% 1
For other leisure activities 1.9% 2 0.0% 0 0.0% 0 1.9% 1 3.4% 1 0.0% 0 0.0% 0 0.0% 0 0.0% 0To shop at the market(s) 0.0% 0 0.0% 0 0.0% 0 0.0% 0 0.0% 0 0.0% 0 0.0% 0 0.0% 0 0.0% 0To meet family 3.8% 4 0.0% 0 0.0% 0 4.2% 2 5.0% 2 0.0% 0 0.0% 0 0.0% 0 1.9% 1To meet friends 2.5% 3 0.0% 0 0.0% 0 1.5% 1 5.8% 2 0.0% 0 0.0% 0 0.0% 0 0.0% 0To visit the theatre 0.0% 0 0.0% 0 0.0% 0 0.0% 0 0.0% 0 0.0% 0 0.0% 0 0.0% 0 0.0% 0For work (i.e. place of work) 0.0% 0 0.0% 0 0.0% 0 0.0% 0 0.0% 0 0.0% 0 0.0% 0 0.0% 0 0.0% 0For business (e.g. attend a
business appointment) 0.0% 0 0.0% 0 0.0% 0 0.0% 0 0.0% 0 0.0% 0 0.0% 0 0.0% 0 0.0% 0
For education as a student (e.g. student at college, university, or other third level education)
0.8% 1 0.0% 0 0.0% 0 2.0% 1 0.0% 0 0.0% 0 0.0% 0 0.0% 0 0.0% 0
To access public transport for onward travel (e.g. train station, bus station)
0.6% 1 0.0% 0 0.0% 0 1.5% 1 0.0% 0 0.0% 0 0.0% 0 0.0% 0 0.0% 0
Other 0.0% 0 0.0% 0 0.0% 0 0.0% 0 0.0% 0 0.0% 0 0.0% 0 0.0% 0 0.0% 0As part of a day out / for a
day out / something different
3.3% 4 0.0% 0 0.0% 0 0.0% 0 10.0% 4 0.0% 0 0.0% 0 0.0% 0 0.0% 0
Browsing / window shopping 2.2% 2 0.0% 0 0.0% 0 0.0% 0 6.7% 2 0.0% 0 0.0% 0 0.0% 0 0.0% 0(Don't know / varies) 1.3% 1 0.0% 0 0.0% 0 3.4% 1 0.0% 0 0.0% 0 0.0% 0 0.0% 0 0.0% 0(Nothing / nothing further) 38.6% 43 0.0% 0 0.0% 0 34.4% 15 41.3% 15 0.0% 0 0.0% 0 0.0% 0 41.0% 13Weighted base: 111 0 0 43 37 0 0 0 31Sample: 116 0 0 55 29 0 0 0 32

by Zone (Weighted, Part 1) South Wales Retail Study Page 126 Weighted: for Carter Jonas August 2016
Total Zone 1 Zone 2 Zone 3 Zone 4 Zone 5 Zone 6 Zone 7 Zone 8
Column %ges. 020716 NEMS market research
X76X In order of importance, what are your two main reasons for visiting St Davids Town Centre? Any mention: [MR] Zones 3, 4 & 8 and those who visit St Davids town centre at X75 Food shopping 12.1% 14 0.0% 0 0.0% 0 28.3% 13 0.0% 0 0.0% 0 0.0% 0 0.0% 0 4.2% 1Non-food shopping 36.8% 43 0.0% 0 0.0% 0 47.5% 21 22.3% 9 0.0% 0 0.0% 0 0.0% 0 39.5% 13To visit bars / pubs 1.6% 2 0.0% 0 0.0% 0 1.4% 1 3.2% 1 0.0% 0 0.0% 0 0.0% 0 0.0% 0To visit cafés / restaurants 18.2% 21 0.0% 0 0.0% 0 18.3% 8 14.3% 6 0.0% 0 0.0% 0 0.0% 0 22.9% 7To visit personal service
providers (e.g. hairdressers, beauty salon etc.)
1.0% 1 0.0% 0 0.0% 0 1.4% 1 0.0% 0 0.0% 0 0.0% 0 0.0% 0 1.8% 1
To visit financial services such as banks and other financial institutions
2.5% 3 0.0% 0 0.0% 0 5.1% 2 0.0% 0 0.0% 0 0.0% 0 0.0% 0 1.8% 1
To visit other service providers (e.g. travel agent, estate agent etc.)
0.0% 0 0.0% 0 0.0% 0 0.0% 0 0.0% 0 0.0% 0 0.0% 0 0.0% 0 0.0% 0
To visit public services (e.g. medical or dentist appointment, library, job centre, community centre, etc)
5.5% 6 0.0% 0 0.0% 0 8.8% 4 0.0% 0 0.0% 0 0.0% 0 0.0% 0 7.6% 2
To get petrol 0.0% 0 0.0% 0 0.0% 0 0.0% 0 0.0% 0 0.0% 0 0.0% 0 0.0% 0 0.0% 0To visit the cinema 0.7% 1 0.0% 0 0.0% 0 0.0% 0 0.0% 0 0.0% 0 0.0% 0 0.0% 0 2.5% 1To visit a park 0.0% 0 0.0% 0 0.0% 0 0.0% 0 0.0% 0 0.0% 0 0.0% 0 0.0% 0 0.0% 0To visit the swimming pool 0.0% 0 0.0% 0 0.0% 0 0.0% 0 0.0% 0 0.0% 0 0.0% 0 0.0% 0 0.0% 0To visit other gyms / health
and fitness facilities 0.7% 1 0.0% 0 0.0% 0 1.8% 1 0.0% 0 0.0% 0 0.0% 0 0.0% 0 0.0% 0
To visit the library 0.0% 0 0.0% 0 0.0% 0 0.0% 0 0.0% 0 0.0% 0 0.0% 0 0.0% 0 0.0% 0To visit museums / art
gallery 2.6% 3 0.0% 0 0.0% 0 2.8% 1 2.4% 1 0.0% 0 0.0% 0 0.0% 0 2.5% 1
To visit the theatre or musical venues
0.8% 1 0.0% 0 0.0% 0 0.0% 0 2.4% 1 0.0% 0 0.0% 0 0.0% 0 0.0% 0
To visit night time venues e.g. nightclub
0.7% 1 0.0% 0 0.0% 0 0.0% 0 0.0% 0 0.0% 0 0.0% 0 0.0% 0 2.4% 1
For other leisure activities 21.5% 25 0.0% 0 0.0% 0 13.2% 6 41.1% 16 0.0% 0 0.0% 0 0.0% 0 9.1% 3To shop at the market(s) 0.7% 1 0.0% 0 0.0% 0 0.0% 0 0.0% 0 0.0% 0 0.0% 0 0.0% 0 2.4% 1To meet family 7.1% 8 0.0% 0 0.0% 0 5.8% 3 10.9% 4 0.0% 0 0.0% 0 0.0% 0 4.3% 1To meet friends 9.5% 11 0.0% 0 0.0% 0 2.8% 1 17.3% 7 0.0% 0 0.0% 0 0.0% 0 9.5% 3To visit the theatre 0.0% 0 0.0% 0 0.0% 0 0.0% 0 0.0% 0 0.0% 0 0.0% 0 0.0% 0 0.0% 0For work (i.e. place of work) 4.8% 6 0.0% 0 0.0% 0 4.6% 2 0.0% 0 0.0% 0 0.0% 0 0.0% 0 10.8% 4For business (e.g. attend a
business appointment) 0.0% 0 0.0% 0 0.0% 0 0.0% 0 0.0% 0 0.0% 0 0.0% 0 0.0% 0 0.0% 0
For education as a student (e.g. student at college, university, or other third level education)
3.2% 4 0.0% 0 0.0% 0 1.9% 1 0.0% 0 0.0% 0 0.0% 0 0.0% 0 9.0% 3
To access public transport for onward travel (e.g. train station, bus station)
1.2% 1 0.0% 0 0.0% 0 1.4% 1 0.0% 0 0.0% 0 0.0% 0 0.0% 0 2.5% 1
Other 0.0% 0 0.0% 0 0.0% 0 0.0% 0 0.0% 0 0.0% 0 0.0% 0 0.0% 0 0.0% 0As part of a day out / for a
day out / something different
16.6% 19 0.0% 0 0.0% 0 6.8% 3 29.6% 12 0.0% 0 0.0% 0 0.0% 0 14.4% 5
Browsing / window shopping 4.7% 5 0.0% 0 0.0% 0 2.8% 1 6.3% 2 0.0% 0 0.0% 0 0.0% 0 5.2% 2Weighted base: 117 0 0 45 39 0 0 0 33Sample: 123 0 0 58 31 0 0 0 34

by Zone (Weighted, Part 1) South Wales Retail Study Page 127 Weighted: for Carter Jonas August 2016
Total Zone 1 Zone 2 Zone 3 Zone 4 Zone 5 Zone 6 Zone 7 Zone 8
Column %ges. 020716 NEMS market research
X77 What do you like about St Davids Town Centre? [MR] Zones 11-16 and those who visit St Davids town centre at X75 Attractive environment / nice
place 56.8% 67 0.0% 0 0.0% 0 54.8% 25 60.9% 24 0.0% 0 0.0% 0 0.0% 0 54.8% 18
Close to friends or relatives 2.6% 3 0.0% 0 0.0% 0 4.0% 2 3.1% 1 0.0% 0 0.0% 0 0.0% 0 0.0% 0Close to home 9.7% 11 0.0% 0 0.0% 0 21.8% 10 0.0% 0 0.0% 0 0.0% 0 0.0% 0 4.8% 2Close to work 0.0% 0 0.0% 0 0.0% 0 0.0% 0 0.0% 0 0.0% 0 0.0% 0 0.0% 0 0.0% 0Compact 6.9% 8 0.0% 0 0.0% 0 5.1% 2 3.1% 1 0.0% 0 0.0% 0 0.0% 0 13.9% 5Easy to get to by bike 0.0% 0 0.0% 0 0.0% 0 0.0% 0 0.0% 0 0.0% 0 0.0% 0 0.0% 0 0.0% 0Easy to get to by bus 0.5% 1 0.0% 0 0.0% 0 1.4% 1 0.0% 0 0.0% 0 0.0% 0 0.0% 0 0.0% 0Easy to get to by car 0.0% 0 0.0% 0 0.0% 0 0.0% 0 0.0% 0 0.0% 0 0.0% 0 0.0% 0 0.0% 0Easy to park 1.6% 2 0.0% 0 0.0% 0 1.4% 1 3.1% 1 0.0% 0 0.0% 0 0.0% 0 0.0% 0Good facilities 0.7% 1 0.0% 0 0.0% 0 1.9% 1 0.0% 0 0.0% 0 0.0% 0 0.0% 0 0.0% 0Good food stores 0.5% 1 0.0% 0 0.0% 0 1.4% 1 0.0% 0 0.0% 0 0.0% 0 0.0% 0 0.0% 0Good pubs, cafés or
restaurants 5.6% 7 0.0% 0 0.0% 0 9.1% 4 6.3% 2 0.0% 0 0.0% 0 0.0% 0 0.0% 0
Good range of non-food shops
6.4% 7 0.0% 0 0.0% 0 9.0% 4 3.1% 1 0.0% 0 0.0% 0 0.0% 0 6.6% 2
The harbour / beach 3.5% 4 0.0% 0 0.0% 0 3.7% 2 0.0% 0 0.0% 0 0.0% 0 0.0% 0 7.4% 2Makes a change from other
places 5.1% 6 0.0% 0 0.0% 0 1.4% 1 13.5% 5 0.0% 0 0.0% 0 0.0% 0 0.0% 0
Quiet 4.8% 6 0.0% 0 0.0% 0 2.8% 1 8.0% 3 0.0% 0 0.0% 0 0.0% 0 3.6% 1Safe and secure 0.0% 0 0.0% 0 0.0% 0 0.0% 0 0.0% 0 0.0% 0 0.0% 0 0.0% 0 0.0% 0The market 0.0% 0 0.0% 0 0.0% 0 0.0% 0 0.0% 0 0.0% 0 0.0% 0 0.0% 0 0.0% 0Traditional 16.0% 19 0.0% 0 0.0% 0 5.8% 3 33.1% 13 0.0% 0 0.0% 0 0.0% 0 9.2% 3Traffic free shopping centre 0.0% 0 0.0% 0 0.0% 0 0.0% 0 0.0% 0 0.0% 0 0.0% 0 0.0% 0 0.0% 0Other 0.0% 0 0.0% 0 0.0% 0 0.0% 0 0.0% 0 0.0% 0 0.0% 0 0.0% 0 0.0% 0Cheap / free parking 0.0% 0 0.0% 0 0.0% 0 0.0% 0 0.0% 0 0.0% 0 0.0% 0 0.0% 0 0.0% 0Familiarity / habit 0.7% 1 0.0% 0 0.0% 0 1.9% 1 0.0% 0 0.0% 0 0.0% 0 0.0% 0 0.0% 0Friendly people / nice
atmosphere 3.1% 4 0.0% 0 0.0% 0 3.3% 1 2.4% 1 0.0% 0 0.0% 0 0.0% 0 3.6% 1
Good opening hours 0.0% 0 0.0% 0 0.0% 0 0.0% 0 0.0% 0 0.0% 0 0.0% 0 0.0% 0 0.0% 0Good prices 0.0% 0 0.0% 0 0.0% 0 0.0% 0 0.0% 0 0.0% 0 0.0% 0 0.0% 0 0.0% 0Good range of independent
shops 4.1% 5 0.0% 0 0.0% 0 6.9% 3 2.4% 1 0.0% 0 0.0% 0 0.0% 0 2.4% 1
Good range of services 0.0% 0 0.0% 0 0.0% 0 0.0% 0 0.0% 0 0.0% 0 0.0% 0 0.0% 0 0.0% 0(Nothing / very little) 13.0% 15 0.0% 0 0.0% 0 5.2% 2 21.8% 9 0.0% 0 0.0% 0 0.0% 0 13.2% 4(Don't know) 1.5% 2 0.0% 0 0.0% 0 1.4% 1 0.0% 0 0.0% 0 0.0% 0 0.0% 0 3.6% 1Weighted base: 117 0 0 45 39 0 0 0 33Sample: 123 0 0 58 31 0 0 0 34

by Zone (Weighted, Part 1) South Wales Retail Study Page 128 Weighted: for Carter Jonas August 2016
Total Zone 1 Zone 2 Zone 3 Zone 4 Zone 5 Zone 6 Zone 7 Zone 8
Column %ges. 020716 NEMS market research
X78 What could be improved about St Davids that would make you visit more often? [MR] Zones 3, 4 & 8 Better access by road 0.8% 3 0.0% 0 0.0% 0 1.7% 1 0.8% 1 0.0% 0 0.0% 0 0.0% 0 0.0% 0Better public transport 0.0% 0 0.0% 0 0.0% 0 0.0% 0 0.0% 0 0.0% 0 0.0% 0 0.0% 0 0.0% 0Better signposting 0.2% 1 0.0% 0 0.0% 0 0.7% 1 0.0% 0 0.0% 0 0.0% 0 0.0% 0 0.0% 0Cleaner streets 0.0% 0 0.0% 0 0.0% 0 0.0% 0 0.0% 0 0.0% 0 0.0% 0 0.0% 0 0.0% 0Facilities which would assist
you if shopping with children
0.0% 0 0.0% 0 0.0% 0 0.0% 0 0.0% 0 0.0% 0 0.0% 0 0.0% 0 0.0% 0
Free / cheaper car parking 0.4% 1 0.0% 0 0.0% 0 0.7% 1 0.0% 0 0.0% 0 0.0% 0 0.0% 0 0.6% 1Jewellery / food markets /
other events 0.0% 0 0.0% 0 0.0% 0 0.0% 0 0.0% 0 0.0% 0 0.0% 0 0.0% 0 0.0% 0
More / better comparison retailers (i.e. non-food shops)
1.8% 6 0.0% 0 0.0% 0 6.0% 5 0.0% 0 0.0% 0 0.0% 0 0.0% 0 0.8% 1
More / better entertainment 0.2% 1 0.0% 0 0.0% 0 0.9% 1 0.0% 0 0.0% 0 0.0% 0 0.0% 0 0.0% 0More / better places for
eating out (e.g. cafés and restaurants)
0.2% 1 0.0% 0 0.0% 0 0.9% 1 0.0% 0 0.0% 0 0.0% 0 0.0% 0 0.0% 0
More / better food shops 0.5% 2 0.0% 0 0.0% 0 1.9% 2 0.0% 0 0.0% 0 0.0% 0 0.0% 0 0.0% 0More / better parking 7.0% 23 0.0% 0 0.0% 0 12.6% 11 4.7% 7 0.0% 0 0.0% 0 0.0% 0 5.5% 5More / better pedestrianised
streets 0.0% 0 0.0% 0 0.0% 0 0.0% 0 0.0% 0 0.0% 0 0.0% 0 0.0% 0 0.0% 0
More / better public conveniences
0.0% 0 0.0% 0 0.0% 0 0.0% 0 0.0% 0 0.0% 0 0.0% 0 0.0% 0 0.0% 0
More / better seats / flower displays
0.0% 0 0.0% 0 0.0% 0 0.0% 0 0.0% 0 0.0% 0 0.0% 0 0.0% 0 0.0% 0
More / better services 0.2% 1 0.0% 0 0.0% 0 0.0% 0 0.0% 0 0.0% 0 0.0% 0 0.0% 0 0.6% 1More advertising 0.0% 0 0.0% 0 0.0% 0 0.0% 0 0.0% 0 0.0% 0 0.0% 0 0.0% 0 0.0% 0More national multiple shops
/ High Street shops 0.2% 1 0.0% 0 0.0% 0 0.7% 1 0.0% 0 0.0% 0 0.0% 0 0.0% 0 0.0% 0
Protection from the weather (i.e. covered shopping malls)
0.0% 0 0.0% 0 0.0% 0 0.0% 0 0.0% 0 0.0% 0 0.0% 0 0.0% 0 0.0% 0
Shops / services open on Sundays / better opening hours
0.2% 1 0.0% 0 0.0% 0 0.9% 1 0.0% 0 0.0% 0 0.0% 0 0.0% 0 0.0% 0
Fewer vacant shops 0.0% 0 0.0% 0 0.0% 0 0.0% 0 0.0% 0 0.0% 0 0.0% 0 0.0% 0 0.0% 0Better maintained buildings 0.2% 1 0.0% 0 0.0% 0 0.7% 1 0.0% 0 0.0% 0 0.0% 0 0.0% 0 0.0% 0Better disabled access 0.0% 0 0.0% 0 0.0% 0 0.0% 0 0.0% 0 0.0% 0 0.0% 0 0.0% 0 0.0% 0Better prices 1.5% 5 0.0% 0 0.0% 0 4.6% 4 0.6% 1 0.0% 0 0.0% 0 0.0% 0 0.0% 0Better quality shops 0.0% 0 0.0% 0 0.0% 0 0.0% 0 0.0% 0 0.0% 0 0.0% 0 0.0% 0 0.0% 0Fewer charity shops 0.0% 0 0.0% 0 0.0% 0 0.0% 0 0.0% 0 0.0% 0 0.0% 0 0.0% 0 0.0% 0Improve the environment /
refurbish 0.4% 1 0.0% 0 0.0% 0 0.0% 0 0.8% 1 0.0% 0 0.0% 0 0.0% 0 0.0% 0
Less congestion / too busy 0.6% 2 0.0% 0 0.0% 0 2.2% 2 0.0% 0 0.0% 0 0.0% 0 0.0% 0 0.0% 0More independent shops 1.1% 4 0.0% 0 0.0% 0 4.3% 4 0.0% 0 0.0% 0 0.0% 0 0.0% 0 0.0% 0Other 0.0% 0 0.0% 0 0.0% 0 0.0% 0 0.0% 0 0.0% 0 0.0% 0 0.0% 0 0.0% 0(Nothing) 68.6% 228 0.0% 0 0.0% 0 63.5% 55 61.2% 93 0.0% 0 0.0% 0 0.0% 0 85.1% 80(Don’t know) 19.6% 65 0.0% 0 0.0% 0 10.1% 9 31.9% 48 0.0% 0 0.0% 0 0.0% 0 8.8% 8Weighted base: 332 0 0 86 151 0 0 0 94Sample: 301 0 0 101 100 0 0 0 100

by Zone (Weighted, Part 1) South Wales Retail Study Page 129 Weighted: for Carter Jonas August 2016
Total Zone 1 Zone 2 Zone 3 Zone 4 Zone 5 Zone 6 Zone 7 Zone 8
Column %ges. 020716 NEMS market research
Mean score [Times a year, those who visit]: Daily = 365, 4-6 days a week = 234, 2-3 days a week = 130, One day a week = 52, Every two weeks = 24, Monthly = 12, Once every two months = 6, Three-four times a year = 3.5, Once a year = 1, Less often = 0.25
Q79 How often do you or your household visit Carmarthen for shopping? Daily 0.0% 1 0.0% 0 0.0% 0 0.0% 0 0.0% 0 0.0% 0 0.0% 0 0.0% 0 0.0% 04-6 days a week 0.1% 1 0.0% 0 0.0% 0 0.0% 0 0.0% 0 0.0% 0 0.0% 0 0.0% 0 0.0% 02-3 days a week 1.6% 25 0.9% 1 0.0% 0 2.1% 2 7.0% 11 0.8% 1 0.9% 1 2.2% 2 0.0% 0One day a week 4.2% 67 3.8% 4 0.0% 0 0.0% 0 0.8% 1 1.7% 3 1.9% 3 14.4% 11 0.0% 0Every two weeks 8.7% 140 2.5% 3 2.9% 1 1.7% 1 10.1% 15 8.8% 14 10.7% 14 15.7% 12 2.4% 2Monthly 18.1% 291 21.1% 22 13.8% 6 13.1% 11 11.9% 18 30.0% 46 24.5% 33 17.7% 14 8.1% 8Once every two months 14.2% 228 18.7% 19 16.7% 7 17.1% 15 11.2% 17 19.2% 30 15.6% 21 7.5% 6 11.8% 11Three-four times a year 16.8% 270 18.0% 19 19.3% 8 21.5% 19 15.5% 23 12.2% 19 18.8% 25 15.1% 11 19.9% 19Once a year 6.8% 109 3.6% 4 8.2% 3 9.1% 8 11.4% 17 8.1% 13 3.8% 5 6.7% 5 10.7% 10Less often 2.0% 32 2.7% 3 6.1% 3 0.0% 0 1.7% 3 1.2% 2 1.3% 2 0.8% 1 2.3% 2Never 25.4% 408 27.3% 29 31.0% 13 33.5% 29 30.4% 46 17.0% 26 19.8% 27 15.2% 12 41.0% 39(Don’t know) 0.3% 5 0.0% 0 0.0% 0 0.0% 0 0.0% 0 0.0% 0 0.0% 0 0.9% 1 0.0% 0(Varies) 1.8% 29 1.5% 2 2.0% 1 1.9% 2 0.0% 0 0.8% 1 2.6% 4 3.7% 3 3.7% 4Mean: 14.35 11.29 6.14 10.17 21.17 11.38 11.97 21.55 5.57Weighted base: 1607 104 42 86 151 154 135 76 94Sample: 1607 100 101 101 100 100 100 100 100
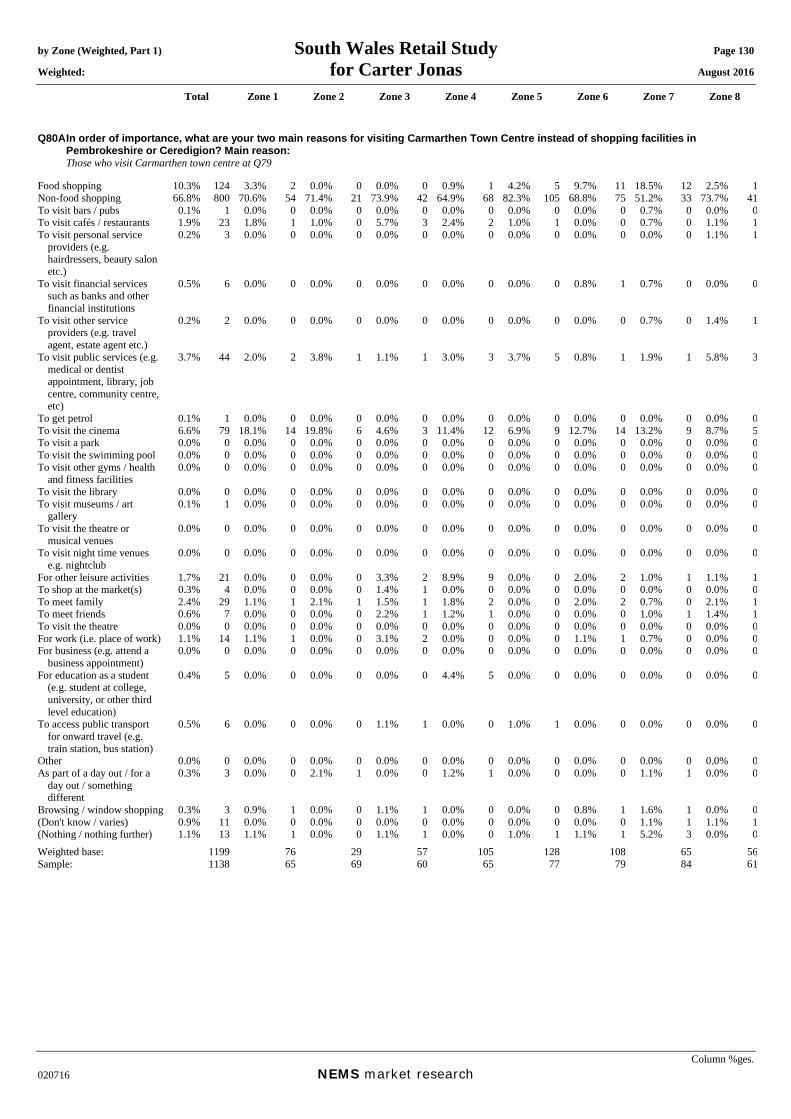
by Zone (Weighted, Part 1) South Wales Retail Study Page 130 Weighted: for Carter Jonas August 2016
Total Zone 1 Zone 2 Zone 3 Zone 4 Zone 5 Zone 6 Zone 7 Zone 8
Column %ges. 020716 NEMS market research
Q80A In order of importance, what are your two main reasons for visiting Carmarthen Town Centre instead of shopping facilities in Pembrokeshire or Ceredigion? Main reason:
Those who visit Carmarthen town centre at Q79 Food shopping 10.3% 124 3.3% 2 0.0% 0 0.0% 0 0.9% 1 4.2% 5 9.7% 11 18.5% 12 2.5% 1Non-food shopping 66.8% 800 70.6% 54 71.4% 21 73.9% 42 64.9% 68 82.3% 105 68.8% 75 51.2% 33 73.7% 41To visit bars / pubs 0.1% 1 0.0% 0 0.0% 0 0.0% 0 0.0% 0 0.0% 0 0.0% 0 0.7% 0 0.0% 0To visit cafés / restaurants 1.9% 23 1.8% 1 1.0% 0 5.7% 3 2.4% 2 1.0% 1 0.0% 0 0.7% 0 1.1% 1To visit personal service
providers (e.g. hairdressers, beauty salon etc.)
0.2% 3 0.0% 0 0.0% 0 0.0% 0 0.0% 0 0.0% 0 0.0% 0 0.0% 0 1.1% 1
To visit financial services such as banks and other financial institutions
0.5% 6 0.0% 0 0.0% 0 0.0% 0 0.0% 0 0.0% 0 0.8% 1 0.7% 0 0.0% 0
To visit other service providers (e.g. travel agent, estate agent etc.)
0.2% 2 0.0% 0 0.0% 0 0.0% 0 0.0% 0 0.0% 0 0.0% 0 0.7% 0 1.4% 1
To visit public services (e.g. medical or dentist appointment, library, job centre, community centre, etc)
3.7% 44 2.0% 2 3.8% 1 1.1% 1 3.0% 3 3.7% 5 0.8% 1 1.9% 1 5.8% 3
To get petrol 0.1% 1 0.0% 0 0.0% 0 0.0% 0 0.0% 0 0.0% 0 0.0% 0 0.0% 0 0.0% 0To visit the cinema 6.6% 79 18.1% 14 19.8% 6 4.6% 3 11.4% 12 6.9% 9 12.7% 14 13.2% 9 8.7% 5To visit a park 0.0% 0 0.0% 0 0.0% 0 0.0% 0 0.0% 0 0.0% 0 0.0% 0 0.0% 0 0.0% 0To visit the swimming pool 0.0% 0 0.0% 0 0.0% 0 0.0% 0 0.0% 0 0.0% 0 0.0% 0 0.0% 0 0.0% 0To visit other gyms / health
and fitness facilities 0.0% 0 0.0% 0 0.0% 0 0.0% 0 0.0% 0 0.0% 0 0.0% 0 0.0% 0 0.0% 0
To visit the library 0.0% 0 0.0% 0 0.0% 0 0.0% 0 0.0% 0 0.0% 0 0.0% 0 0.0% 0 0.0% 0To visit museums / art
gallery 0.1% 1 0.0% 0 0.0% 0 0.0% 0 0.0% 0 0.0% 0 0.0% 0 0.0% 0 0.0% 0
To visit the theatre or musical venues
0.0% 0 0.0% 0 0.0% 0 0.0% 0 0.0% 0 0.0% 0 0.0% 0 0.0% 0 0.0% 0
To visit night time venues e.g. nightclub
0.0% 0 0.0% 0 0.0% 0 0.0% 0 0.0% 0 0.0% 0 0.0% 0 0.0% 0 0.0% 0
For other leisure activities 1.7% 21 0.0% 0 0.0% 0 3.3% 2 8.9% 9 0.0% 0 2.0% 2 1.0% 1 1.1% 1To shop at the market(s) 0.3% 4 0.0% 0 0.0% 0 1.4% 1 0.0% 0 0.0% 0 0.0% 0 0.0% 0 0.0% 0To meet family 2.4% 29 1.1% 1 2.1% 1 1.5% 1 1.8% 2 0.0% 0 2.0% 2 0.7% 0 2.1% 1To meet friends 0.6% 7 0.0% 0 0.0% 0 2.2% 1 1.2% 1 0.0% 0 0.0% 0 1.0% 1 1.4% 1To visit the theatre 0.0% 0 0.0% 0 0.0% 0 0.0% 0 0.0% 0 0.0% 0 0.0% 0 0.0% 0 0.0% 0For work (i.e. place of work) 1.1% 14 1.1% 1 0.0% 0 3.1% 2 0.0% 0 0.0% 0 1.1% 1 0.7% 0 0.0% 0For business (e.g. attend a
business appointment) 0.0% 0 0.0% 0 0.0% 0 0.0% 0 0.0% 0 0.0% 0 0.0% 0 0.0% 0 0.0% 0
For education as a student (e.g. student at college, university, or other third level education)
0.4% 5 0.0% 0 0.0% 0 0.0% 0 4.4% 5 0.0% 0 0.0% 0 0.0% 0 0.0% 0
To access public transport for onward travel (e.g. train station, bus station)
0.5% 6 0.0% 0 0.0% 0 1.1% 1 0.0% 0 1.0% 1 0.0% 0 0.0% 0 0.0% 0
Other 0.0% 0 0.0% 0 0.0% 0 0.0% 0 0.0% 0 0.0% 0 0.0% 0 0.0% 0 0.0% 0As part of a day out / for a
day out / something different
0.3% 3 0.0% 0 2.1% 1 0.0% 0 1.2% 1 0.0% 0 0.0% 0 1.1% 1 0.0% 0
Browsing / window shopping 0.3% 3 0.9% 1 0.0% 0 1.1% 1 0.0% 0 0.0% 0 0.8% 1 1.6% 1 0.0% 0(Don't know / varies) 0.9% 11 0.0% 0 0.0% 0 0.0% 0 0.0% 0 0.0% 0 0.0% 0 1.1% 1 1.1% 1(Nothing / nothing further) 1.1% 13 1.1% 1 0.0% 0 1.1% 1 0.0% 0 1.0% 1 1.1% 1 5.2% 3 0.0% 0Weighted base: 1199 76 29 57 105 128 108 65 56Sample: 1138 65 69 60 65 77 79 84 61

by Zone (Weighted, Part 1) South Wales Retail Study Page 131 Weighted: for Carter Jonas August 2016
Total Zone 1 Zone 2 Zone 3 Zone 4 Zone 5 Zone 6 Zone 7 Zone 8
Column %ges. 020716 NEMS market research
Q80B In order of importance, what are your two main reasons for visiting Carmarthen Town Centre instead of shopping facilities in Pembrokeshire or Ceredigion? Secondary reason:
Those who gave a reason at Q80A Food shopping 7.3% 86 2.5% 2 5.1% 1 0.0% 0 3.3% 3 5.0% 6 5.8% 6 11.1% 7 1.1% 1Non-food shopping 15.2% 178 16.2% 12 11.3% 3 14.7% 8 13.3% 14 7.0% 9 12.9% 14 23.5% 14 14.8% 8To visit bars / pubs 0.3% 3 0.0% 0 0.0% 0 0.0% 0 1.2% 1 0.0% 0 0.0% 0 1.0% 1 0.0% 0To visit cafés / restaurants 11.1% 131 22.3% 17 18.1% 5 2.6% 1 27.1% 29 4.2% 5 12.9% 14 5.5% 3 6.9% 4To visit personal service
providers (e.g. hairdressers, beauty salon etc.)
0.1% 1 0.0% 0 1.0% 0 0.0% 0 0.0% 0 0.0% 0 0.0% 0 0.0% 0 0.0% 0
To visit financial services such as banks and other financial institutions
0.4% 4 0.0% 0 0.0% 0 0.0% 0 0.0% 0 0.0% 0 0.0% 0 0.0% 0 0.0% 0
To visit other service providers (e.g. travel agent, estate agent etc.)
0.2% 2 1.2% 1 1.0% 0 0.0% 0 0.9% 1 0.0% 0 0.0% 0 0.0% 0 0.0% 0
To visit public services (e.g. medical or dentist appointment, library, job centre, community centre, etc)
2.7% 31 0.0% 0 0.0% 0 1.1% 1 0.0% 0 4.8% 6 1.1% 1 0.0% 0 5.6% 3
To get petrol 0.1% 1 0.0% 0 0.0% 0 0.0% 0 0.0% 0 0.0% 0 0.0% 0 0.0% 0 0.0% 0To visit the cinema 11.8% 138 25.6% 19 13.8% 4 17.6% 10 11.8% 12 30.2% 38 16.0% 17 4.8% 3 8.3% 5To visit a park 0.0% 0 0.0% 0 0.0% 0 0.0% 0 0.0% 0 0.0% 0 0.0% 0 0.0% 0 0.0% 0To visit the swimming pool 0.0% 0 0.0% 0 0.0% 0 0.0% 0 0.0% 0 0.0% 0 0.0% 0 0.0% 0 0.0% 0To visit other gyms / health
and fitness facilities 0.1% 1 0.0% 0 0.0% 0 0.0% 0 0.0% 0 0.0% 0 0.0% 0 1.0% 1 0.0% 0
To visit the library 0.4% 5 0.0% 0 0.0% 0 0.0% 0 0.0% 0 3.8% 5 0.0% 0 0.0% 0 0.0% 0To visit museums / art
gallery 0.1% 1 0.0% 0 0.0% 0 0.0% 0 0.0% 0 0.0% 0 0.0% 0 0.0% 0 0.0% 0
To visit the theatre or musical venues
0.2% 2 0.0% 0 0.0% 0 0.0% 0 0.0% 0 0.0% 0 0.0% 0 1.0% 1 3.1% 2
To visit night time venues e.g. nightclub
0.0% 0 0.0% 0 0.0% 0 0.0% 0 0.0% 0 0.0% 0 0.0% 0 0.0% 0 0.0% 0
For other leisure activities 1.6% 19 1.2% 1 0.0% 0 0.0% 0 1.2% 1 1.0% 1 2.3% 2 2.8% 2 0.0% 0To shop at the market(s) 0.8% 9 1.2% 1 0.0% 0 0.0% 0 1.8% 2 0.0% 0 0.8% 1 1.0% 1 1.1% 1To meet family 1.3% 15 0.9% 1 0.0% 0 0.0% 0 0.0% 0 2.2% 3 0.0% 0 0.8% 0 1.1% 1To meet friends 1.3% 15 0.0% 0 1.0% 0 0.0% 0 0.9% 1 0.0% 0 0.8% 1 0.8% 0 1.1% 1To visit the theatre 0.0% 0 0.0% 0 0.0% 0 0.0% 0 0.0% 0 0.0% 0 0.0% 0 0.0% 0 0.0% 0For work (i.e. place of work) 0.5% 6 0.0% 0 0.0% 0 0.0% 0 1.2% 1 0.0% 0 0.0% 0 1.7% 1 1.4% 1For business (e.g. attend a
business appointment) 0.1% 1 0.0% 0 0.0% 0 0.0% 0 0.0% 0 0.0% 0 0.0% 0 0.8% 0 0.0% 0
For education as a student (e.g. student at college, university, or other third level education)
0.0% 0 0.0% 0 0.0% 0 0.0% 0 0.0% 0 0.0% 0 0.0% 0 0.0% 0 0.0% 0
To access public transport for onward travel (e.g. train station, bus station)
0.4% 5 0.0% 0 0.0% 0 0.0% 0 0.0% 0 0.0% 0 0.0% 0 1.0% 1 0.0% 0
Other 0.0% 0 0.0% 0 0.0% 0 0.0% 0 0.0% 0 0.0% 0 0.0% 0 0.0% 0 0.0% 0As part of a day out / for a
day out / something different
0.9% 11 2.6% 2 0.0% 0 1.4% 1 0.0% 0 2.8% 3 0.0% 0 0.0% 0 1.5% 1
Browsing / window shopping 0.8% 10 0.0% 0 0.0% 0 2.9% 2 1.2% 1 1.0% 1 0.0% 0 0.8% 0 0.0% 0(Don't know / varies) 0.9% 11 2.6% 2 0.0% 0 6.9% 4 0.0% 0 0.0% 0 0.0% 0 0.0% 0 0.0% 0(Nothing / nothing further) 41.7% 490 23.8% 18 48.6% 14 52.7% 30 36.2% 38 38.2% 48 47.3% 51 42.4% 26 54.3% 30Weighted base: 1175 75 29 57 105 127 107 61 55Sample: 1113 64 69 59 65 76 78 80 60
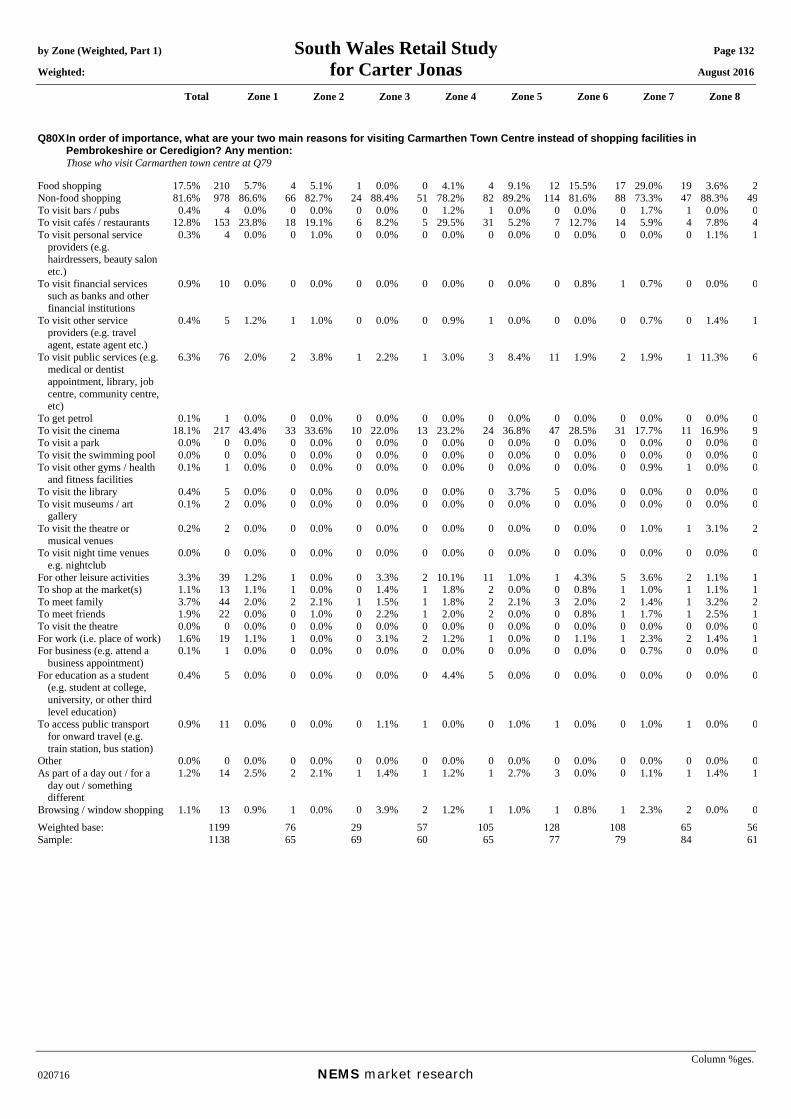
by Zone (Weighted, Part 1) South Wales Retail Study Page 132 Weighted: for Carter Jonas August 2016
Total Zone 1 Zone 2 Zone 3 Zone 4 Zone 5 Zone 6 Zone 7 Zone 8
Column %ges. 020716 NEMS market research
Q80X In order of importance, what are your two main reasons for visiting Carmarthen Town Centre instead of shopping facilities in Pembrokeshire or Ceredigion? Any mention:
Those who visit Carmarthen town centre at Q79 Food shopping 17.5% 210 5.7% 4 5.1% 1 0.0% 0 4.1% 4 9.1% 12 15.5% 17 29.0% 19 3.6% 2Non-food shopping 81.6% 978 86.6% 66 82.7% 24 88.4% 51 78.2% 82 89.2% 114 81.6% 88 73.3% 47 88.3% 49To visit bars / pubs 0.4% 4 0.0% 0 0.0% 0 0.0% 0 1.2% 1 0.0% 0 0.0% 0 1.7% 1 0.0% 0To visit cafés / restaurants 12.8% 153 23.8% 18 19.1% 6 8.2% 5 29.5% 31 5.2% 7 12.7% 14 5.9% 4 7.8% 4To visit personal service
providers (e.g. hairdressers, beauty salon etc.)
0.3% 4 0.0% 0 1.0% 0 0.0% 0 0.0% 0 0.0% 0 0.0% 0 0.0% 0 1.1% 1
To visit financial services such as banks and other financial institutions
0.9% 10 0.0% 0 0.0% 0 0.0% 0 0.0% 0 0.0% 0 0.8% 1 0.7% 0 0.0% 0
To visit other service providers (e.g. travel agent, estate agent etc.)
0.4% 5 1.2% 1 1.0% 0 0.0% 0 0.9% 1 0.0% 0 0.0% 0 0.7% 0 1.4% 1
To visit public services (e.g. medical or dentist appointment, library, job centre, community centre, etc)
6.3% 76 2.0% 2 3.8% 1 2.2% 1 3.0% 3 8.4% 11 1.9% 2 1.9% 1 11.3% 6
To get petrol 0.1% 1 0.0% 0 0.0% 0 0.0% 0 0.0% 0 0.0% 0 0.0% 0 0.0% 0 0.0% 0To visit the cinema 18.1% 217 43.4% 33 33.6% 10 22.0% 13 23.2% 24 36.8% 47 28.5% 31 17.7% 11 16.9% 9To visit a park 0.0% 0 0.0% 0 0.0% 0 0.0% 0 0.0% 0 0.0% 0 0.0% 0 0.0% 0 0.0% 0To visit the swimming pool 0.0% 0 0.0% 0 0.0% 0 0.0% 0 0.0% 0 0.0% 0 0.0% 0 0.0% 0 0.0% 0To visit other gyms / health
and fitness facilities 0.1% 1 0.0% 0 0.0% 0 0.0% 0 0.0% 0 0.0% 0 0.0% 0 0.9% 1 0.0% 0
To visit the library 0.4% 5 0.0% 0 0.0% 0 0.0% 0 0.0% 0 3.7% 5 0.0% 0 0.0% 0 0.0% 0To visit museums / art
gallery 0.1% 2 0.0% 0 0.0% 0 0.0% 0 0.0% 0 0.0% 0 0.0% 0 0.0% 0 0.0% 0
To visit the theatre or musical venues
0.2% 2 0.0% 0 0.0% 0 0.0% 0 0.0% 0 0.0% 0 0.0% 0 1.0% 1 3.1% 2
To visit night time venues e.g. nightclub
0.0% 0 0.0% 0 0.0% 0 0.0% 0 0.0% 0 0.0% 0 0.0% 0 0.0% 0 0.0% 0
For other leisure activities 3.3% 39 1.2% 1 0.0% 0 3.3% 2 10.1% 11 1.0% 1 4.3% 5 3.6% 2 1.1% 1To shop at the market(s) 1.1% 13 1.1% 1 0.0% 0 1.4% 1 1.8% 2 0.0% 0 0.8% 1 1.0% 1 1.1% 1To meet family 3.7% 44 2.0% 2 2.1% 1 1.5% 1 1.8% 2 2.1% 3 2.0% 2 1.4% 1 3.2% 2To meet friends 1.9% 22 0.0% 0 1.0% 0 2.2% 1 2.0% 2 0.0% 0 0.8% 1 1.7% 1 2.5% 1To visit the theatre 0.0% 0 0.0% 0 0.0% 0 0.0% 0 0.0% 0 0.0% 0 0.0% 0 0.0% 0 0.0% 0For work (i.e. place of work) 1.6% 19 1.1% 1 0.0% 0 3.1% 2 1.2% 1 0.0% 0 1.1% 1 2.3% 2 1.4% 1For business (e.g. attend a
business appointment) 0.1% 1 0.0% 0 0.0% 0 0.0% 0 0.0% 0 0.0% 0 0.0% 0 0.7% 0 0.0% 0
For education as a student (e.g. student at college, university, or other third level education)
0.4% 5 0.0% 0 0.0% 0 0.0% 0 4.4% 5 0.0% 0 0.0% 0 0.0% 0 0.0% 0
To access public transport for onward travel (e.g. train station, bus station)
0.9% 11 0.0% 0 0.0% 0 1.1% 1 0.0% 0 1.0% 1 0.0% 0 1.0% 1 0.0% 0
Other 0.0% 0 0.0% 0 0.0% 0 0.0% 0 0.0% 0 0.0% 0 0.0% 0 0.0% 0 0.0% 0As part of a day out / for a
day out / something different
1.2% 14 2.5% 2 2.1% 1 1.4% 1 1.2% 1 2.7% 3 0.0% 0 1.1% 1 1.4% 1
Browsing / window shopping 1.1% 13 0.9% 1 0.0% 0 3.9% 2 1.2% 1 1.0% 1 0.8% 1 2.3% 2 0.0% 0Weighted base: 1199 76 29 57 105 128 108 65 56Sample: 1138 65 69 60 65 77 79 84 61
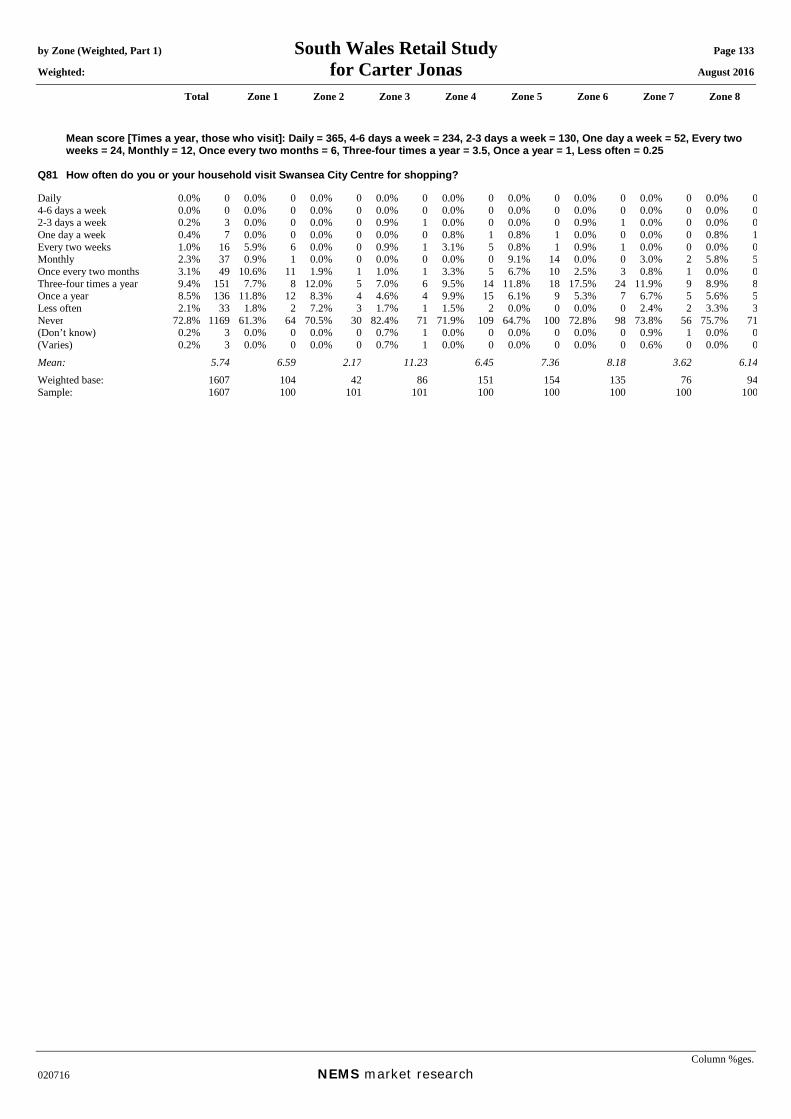
by Zone (Weighted, Part 1) South Wales Retail Study Page 133
Weighted: for Carter Jonas August 2016
Total Zone 1 Zone 2 Zone 3 Zone 4 Zone 5 Zone 6 Zone 7 Zone 8
Column %ges. 020716 NEMS market research
Mean score [Times a year, those who visit]: Daily = 365, 4-6 days a week = 234, 2-3 days a week = 130, One day a week = 52, Every two weeks = 24, Monthly = 12, Once every two months = 6, Three-four times a year = 3.5, Once a year = 1, Less often = 0.25
Q81 How often do you or your household visit Swansea City Centre for shopping?
Daily 0.0% 0 0.0% 0 0.0% 0 0.0% 0 0.0% 0 0.0% 0 0.0% 0 0.0% 0 0.0% 04-6 days a week 0.0% 0 0.0% 0 0.0% 0 0.0% 0 0.0% 0 0.0% 0 0.0% 0 0.0% 0 0.0% 02-3 days a week 0.2% 3 0.0% 0 0.0% 0 0.9% 1 0.0% 0 0.0% 0 0.9% 1 0.0% 0 0.0% 0One day a week 0.4% 7 0.0% 0 0.0% 0 0.0% 0 0.8% 1 0.8% 1 0.0% 0 0.0% 0 0.8% 1Every two weeks 1.0% 16 5.9% 6 0.0% 0 0.9% 1 3.1% 5 0.8% 1 0.9% 1 0.0% 0 0.0% 0Monthly 2.3% 37 0.9% 1 0.0% 0 0.0% 0 0.0% 0 9.1% 14 0.0% 0 3.0% 2 5.8% 5Once every two months 3.1% 49 10.6% 11 1.9% 1 1.0% 1 3.3% 5 6.7% 10 2.5% 3 0.8% 1 0.0% 0Three-four times a year 9.4% 151 7.7% 8 12.0% 5 7.0% 6 9.5% 14 11.8% 18 17.5% 24 11.9% 9 8.9% 8Once a year 8.5% 136 11.8% 12 8.3% 4 4.6% 4 9.9% 15 6.1% 9 5.3% 7 6.7% 5 5.6% 5Less often 2.1% 33 1.8% 2 7.2% 3 1.7% 1 1.5% 2 0.0% 0 0.0% 0 2.4% 2 3.3% 3Never 72.8% 1169 61.3% 64 70.5% 30 82.4% 71 71.9% 109 64.7% 100 72.8% 98 73.8% 56 75.7% 71(Don’t know) 0.2% 3 0.0% 0 0.0% 0 0.7% 1 0.0% 0 0.0% 0 0.0% 0 0.9% 1 0.0% 0(Varies) 0.2% 3 0.0% 0 0.0% 0 0.7% 1 0.0% 0 0.0% 0 0.0% 0 0.6% 0 0.0% 0Mean: 5.74 6.59 2.17 11.23 6.45 7.36 8.18 3.62 6.14Weighted base: 1607 104 42 86 151 154 135 76 94Sample: 1607 100 101 101 100 100 100 100 100

by Zone (Weighted, Part 1) South Wales Retail Study Page 134 Weighted: for Carter Jonas August 2016
Total Zone 1 Zone 2 Zone 3 Zone 4 Zone 5 Zone 6 Zone 7 Zone 8
Column %ges. 020716 NEMS market research
Q82A In order of importance, what are your two main reasons for visiting Swansea City Centre instead of shopping facilities in Pembrokeshire or Ceredigion? Main reason:
Those who visit Swansea city centre at Q79 Food shopping 2.5% 11 0.0% 0 0.0% 0 5.4% 1 2.2% 1 5.1% 3 2.5% 1 2.3% 0 0.0% 0Non-food shopping 71.5% 313 87.3% 35 74.3% 9 78.1% 12 72.9% 31 71.5% 39 67.9% 25 66.9% 13 88.0% 20To visit bars / pubs 0.0% 0 0.0% 0 0.0% 0 0.0% 0 0.0% 0 0.0% 0 0.0% 0 0.0% 0 0.0% 0To visit cafés / restaurants 1.1% 5 1.7% 1 0.0% 0 0.0% 0 0.0% 0 0.0% 0 7.1% 3 0.0% 0 3.4% 1To visit personal service
providers (e.g. hairdressers, beauty salon etc.)
0.1% 0 0.0% 0 3.6% 0 0.0% 0 0.0% 0 0.0% 0 0.0% 0 0.0% 0 0.0% 0
To visit financial services such as banks and other financial institutions
0.3% 1 0.0% 0 0.0% 0 0.0% 0 2.9% 1 0.0% 0 0.0% 0 0.0% 0 0.0% 0
To visit other service providers (e.g. travel agent, estate agent etc.)
0.0% 0 0.0% 0 0.0% 0 0.0% 0 0.0% 0 0.0% 0 0.0% 0 0.0% 0 0.0% 0
To visit public services (e.g. medical or dentist appointment, library, job centre, community centre, etc)
4.0% 17 0.0% 0 2.4% 0 8.3% 1 2.9% 1 0.0% 0 0.0% 0 3.1% 1 0.0% 0
To get petrol 0.0% 0 0.0% 0 0.0% 0 0.0% 0 0.0% 0 0.0% 0 0.0% 0 0.0% 0 0.0% 0To visit the cinema 1.1% 5 4.8% 2 0.0% 0 0.0% 0 0.0% 0 2.4% 1 0.0% 0 0.0% 0 3.5% 1To visit a park 0.0% 0 0.0% 0 0.0% 0 0.0% 0 0.0% 0 0.0% 0 0.0% 0 0.0% 0 0.0% 0To visit the swimming pool 0.0% 0 0.0% 0 0.0% 0 0.0% 0 0.0% 0 0.0% 0 0.0% 0 0.0% 0 0.0% 0To visit other gyms / health
and fitness facilities 0.0% 0 0.0% 0 0.0% 0 0.0% 0 0.0% 0 0.0% 0 0.0% 0 0.0% 0 0.0% 0
To visit the library 0.0% 0 0.0% 0 0.0% 0 0.0% 0 0.0% 0 0.0% 0 0.0% 0 0.0% 0 0.0% 0To visit museums / art
gallery 0.0% 0 0.0% 0 0.0% 0 0.0% 0 0.0% 0 0.0% 0 0.0% 0 0.0% 0 0.0% 0
To visit the theatre or musical venues
1.5% 6 0.0% 0 7.2% 1 0.0% 0 2.2% 1 2.3% 1 0.0% 0 6.6% 1 0.0% 0
To visit night time venues e.g. nightclub
0.0% 0 0.0% 0 0.0% 0 0.0% 0 0.0% 0 0.0% 0 0.0% 0 0.0% 0 0.0% 0
For other leisure activities 3.7% 16 0.0% 0 0.0% 0 0.0% 0 11.0% 5 2.4% 1 6.7% 2 14.5% 3 2.6% 1To shop at the market(s) 0.5% 2 0.0% 0 0.0% 0 0.0% 0 0.0% 0 0.0% 0 0.0% 0 0.0% 0 0.0% 0To meet family 4.0% 17 1.7% 1 3.1% 0 0.0% 0 0.0% 0 7.3% 4 6.7% 2 0.0% 0 0.0% 0To meet friends 1.0% 4 0.0% 0 0.0% 0 0.0% 0 0.0% 0 0.0% 0 5.8% 2 0.0% 0 2.6% 1To visit the theatre 0.6% 2 0.0% 0 6.9% 1 0.0% 0 0.0% 0 0.0% 0 0.0% 0 0.0% 0 0.0% 0For work (i.e. place of work) 0.2% 1 0.0% 0 0.0% 0 0.0% 0 0.0% 0 0.0% 0 0.0% 0 0.0% 0 0.0% 0For business (e.g. attend a
business appointment) 0.2% 1 0.0% 0 0.0% 0 0.0% 0 0.0% 0 0.0% 0 0.0% 0 0.0% 0 0.0% 0
For education as a student (e.g. student at college, university, or other third level education)
0.0% 0 0.0% 0 0.0% 0 0.0% 0 0.0% 0 0.0% 0 0.0% 0 0.0% 0 0.0% 0
To access public transport for onward travel (e.g. train station, bus station)
1.3% 6 0.0% 0 0.0% 0 0.0% 0 0.0% 0 0.0% 0 0.0% 0 0.0% 0 0.0% 0
Other 0.0% 0 0.0% 0 0.0% 0 0.0% 0 0.0% 0 0.0% 0 0.0% 0 0.0% 0 0.0% 0As part of a day out / for a
day out / something different
3.1% 14 0.0% 0 2.4% 0 4.1% 1 3.0% 1 9.1% 5 3.2% 1 3.1% 1 0.0% 0
Browsing / window shopping 0.5% 2 2.5% 1 0.0% 0 0.0% 0 3.0% 1 0.0% 0 0.0% 0 0.0% 0 0.0% 0(Don't know / varies) 1.3% 6 0.0% 0 0.0% 0 0.0% 0 0.0% 0 0.0% 0 0.0% 0 3.4% 1 0.0% 0(Nothing / nothing further) 1.8% 8 2.2% 1 0.0% 0 4.1% 1 0.0% 0 0.0% 0 0.0% 0 0.0% 0 0.0% 0Weighted base: 438 40 12 15 43 54 37 20 23Sample: 374 28 30 19 25 30 22 20 22

by Zone (Weighted, Part 1) South Wales Retail Study Page 135 Weighted: for Carter Jonas August 2016
Total Zone 1 Zone 2 Zone 3 Zone 4 Zone 5 Zone 6 Zone 7 Zone 8
Column %ges. 020716 NEMS market research
Q82B In order of importance, what are your two main reasons for visiting Swansea City Centre instead of shopping facilities in Pembrokeshire or Ceredigion? Secondary reason: [MR]
Those who gave a reason at Q82A Food shopping 2.9% 12 4.5% 2 0.0% 0 4.3% 1 0.0% 0 5.1% 3 3.2% 1 0.0% 0 0.0% 0Non-food shopping 12.2% 52 6.6% 3 3.1% 0 5.6% 1 18.4% 8 16.7% 9 15.8% 6 20.7% 4 9.4% 2To visit bars / pubs 0.4% 2 0.0% 0 0.0% 0 0.0% 0 0.0% 0 0.0% 0 0.0% 0 0.0% 0 0.0% 0To visit cafés / restaurants 10.2% 43 14.7% 6 31.4% 4 5.6% 1 16.8% 7 12.1% 7 10.5% 4 11.8% 2 10.0% 2To visit personal service
providers (e.g. hairdressers, beauty salon etc.)
0.1% 1 0.0% 0 0.0% 0 0.0% 0 0.0% 0 0.0% 0 0.0% 0 0.0% 0 0.0% 0
To visit financial services such as banks and other financial institutions
0.0% 0 0.0% 0 0.0% 0 0.0% 0 0.0% 0 0.0% 0 0.0% 0 0.0% 0 0.0% 0
To visit other service providers (e.g. travel agent, estate agent etc.)
0.9% 4 2.2% 1 0.0% 0 0.0% 0 0.0% 0 0.0% 0 0.0% 0 0.0% 0 0.0% 0
To visit public services (e.g. medical or dentist appointment, library, job centre, community centre, etc)
0.9% 4 2.3% 1 0.0% 0 0.0% 0 0.0% 0 0.0% 0 0.0% 0 3.1% 1 0.0% 0
To get petrol 0.0% 0 0.0% 0 0.0% 0 0.0% 0 0.0% 0 0.0% 0 0.0% 0 0.0% 0 0.0% 0To visit the cinema 1.7% 7 2.3% 1 0.0% 0 0.0% 0 0.0% 0 0.0% 0 10.5% 4 0.0% 0 0.0% 0To visit a park 0.0% 0 0.0% 0 0.0% 0 0.0% 0 0.0% 0 0.0% 0 0.0% 0 0.0% 0 0.0% 0To visit the swimming pool 0.6% 3 0.0% 0 0.0% 0 0.0% 0 0.0% 0 0.0% 0 0.0% 0 0.0% 0 3.5% 1To visit other gyms / health
and fitness facilities 0.5% 2 4.9% 2 0.0% 0 0.0% 0 0.0% 0 0.0% 0 0.0% 0 0.0% 0 0.0% 0
To visit the library 0.0% 0 0.0% 0 0.0% 0 0.0% 0 0.0% 0 0.0% 0 0.0% 0 0.0% 0 0.0% 0To visit museums / art
gallery 0.3% 1 0.0% 0 0.0% 0 0.0% 0 0.0% 0 0.0% 0 0.0% 0 0.0% 0 0.0% 0
To visit the theatre or musical venues
1.5% 6 0.0% 0 5.7% 1 0.0% 0 2.9% 1 0.0% 0 3.4% 1 0.0% 0 0.0% 0
To visit night time venues e.g. nightclub
0.0% 0 0.0% 0 0.0% 0 0.0% 0 0.0% 0 0.0% 0 0.0% 0 0.0% 0 0.0% 0
For other leisure activities 6.1% 26 15.6% 6 3.3% 0 10.2% 1 5.1% 2 5.1% 3 0.0% 0 0.0% 0 3.5% 1To shop at the market(s) 0.0% 0 0.0% 0 0.0% 0 0.0% 0 0.0% 0 0.0% 0 0.0% 0 0.0% 0 0.0% 0To meet family 4.0% 17 8.4% 3 0.0% 0 0.0% 0 0.0% 0 2.3% 1 2.5% 1 0.0% 0 7.4% 2To meet friends 1.4% 6 8.4% 3 0.0% 0 0.0% 0 0.0% 0 0.0% 0 0.0% 0 0.0% 0 0.0% 0To visit the theatre 0.2% 1 0.0% 0 6.9% 1 0.0% 0 0.0% 0 0.0% 0 0.0% 0 0.0% 0 0.0% 0For work (i.e. place of work) 0.2% 1 0.0% 0 0.0% 0 0.0% 0 0.0% 0 0.0% 0 0.0% 0 0.0% 0 3.4% 1For business (e.g. attend a
business appointment) 0.0% 0 0.0% 0 0.0% 0 0.0% 0 0.0% 0 0.0% 0 0.0% 0 0.0% 0 0.0% 0
For education as a student (e.g. student at college, university, or other third level education)
0.0% 0 0.0% 0 0.0% 0 0.0% 0 0.0% 0 0.0% 0 0.0% 0 0.0% 0 0.0% 0
To access public transport for onward travel (e.g. train station, bus station)
0.0% 0 0.0% 0 0.0% 0 0.0% 0 0.0% 0 0.0% 0 0.0% 0 0.0% 0 0.0% 0
Other 0.0% 0 0.0% 0 0.0% 0 0.0% 0 0.0% 0 0.0% 0 0.0% 0 0.0% 0 0.0% 0As part of a day out / for a
day out / something different
1.4% 6 0.0% 0 0.0% 0 0.0% 0 0.0% 0 0.0% 0 0.0% 0 0.0% 0 0.0% 0
Browsing / window shopping 0.3% 1 0.0% 0 0.0% 0 0.0% 0 0.0% 0 0.0% 0 0.0% 0 0.0% 0 0.0% 0(Don't know / varies) 0.2% 1 0.0% 0 0.0% 0 0.0% 0 0.0% 0 0.0% 0 0.0% 0 0.0% 0 0.0% 0(Nothing / nothing further) 54.1% 230 30.1% 12 49.6% 6 74.3% 11 56.9% 24 58.8% 32 54.2% 20 64.4% 12 62.8% 14Weighted base: 424 40 12 15 43 54 37 19 23Sample: 359 27 30 18 25 30 22 19 22

by Zone (Weighted, Part 1) South Wales Retail Study Page 136 Weighted: for Carter Jonas August 2016
Total Zone 1 Zone 2 Zone 3 Zone 4 Zone 5 Zone 6 Zone 7 Zone 8
Column %ges. 020716 NEMS market research
Q82X In order of importance, what are your two main reasons for visiting Swansea City Centre instead of shopping facilities in Pembrokeshire or Ceredigion? Any mention:
Those who visit Swansea city centre at Q79 Food shopping 5.3% 23 4.4% 2 0.0% 0 9.5% 1 2.2% 1 10.1% 5 5.7% 2 2.3% 0 0.0% 0Non-food shopping 83.3% 365 93.7% 38 77.5% 10 83.5% 13 91.3% 39 88.1% 48 83.7% 31 86.8% 17 97.4% 22To visit bars / pubs 0.4% 2 0.0% 0 0.0% 0 0.0% 0 0.0% 0 0.0% 0 0.0% 0 0.0% 0 0.0% 0To visit cafés / restaurants 11.0% 48 16.0% 6 31.4% 4 5.4% 1 16.8% 7 12.1% 7 17.6% 6 11.4% 2 13.4% 3To visit personal service
providers (e.g. hairdressers, beauty salon etc.)
0.2% 1 0.0% 0 3.6% 0 0.0% 0 0.0% 0 0.0% 0 0.0% 0 0.0% 0 0.0% 0
To visit financial services such as banks and other financial institutions
0.3% 1 0.0% 0 0.0% 0 0.0% 0 2.9% 1 0.0% 0 0.0% 0 0.0% 0 0.0% 0
To visit other service providers (e.g. travel agent, estate agent etc.)
0.9% 4 2.2% 1 0.0% 0 0.0% 0 0.0% 0 0.0% 0 0.0% 0 0.0% 0 0.0% 0
To visit public services (e.g. medical or dentist appointment, library, job centre, community centre, etc)
4.8% 21 2.3% 1 2.4% 0 8.3% 1 2.9% 1 0.0% 0 0.0% 0 6.1% 1 0.0% 0
To get petrol 0.0% 0 0.0% 0 0.0% 0 0.0% 0 0.0% 0 0.0% 0 0.0% 0 0.0% 0 0.0% 0To visit the cinema 2.7% 12 7.0% 3 0.0% 0 0.0% 0 0.0% 0 2.4% 1 10.5% 4 0.0% 0 3.5% 1To visit a park 0.0% 0 0.0% 0 0.0% 0 0.0% 0 0.0% 0 0.0% 0 0.0% 0 0.0% 0 0.0% 0To visit the swimming pool 0.6% 3 0.0% 0 0.0% 0 0.0% 0 0.0% 0 0.0% 0 0.0% 0 0.0% 0 3.5% 1To visit other gyms / health
and fitness facilities 0.4% 2 4.8% 2 0.0% 0 0.0% 0 0.0% 0 0.0% 0 0.0% 0 0.0% 0 0.0% 0
To visit the library 0.0% 0 0.0% 0 0.0% 0 0.0% 0 0.0% 0 0.0% 0 0.0% 0 0.0% 0 0.0% 0To visit museums / art
gallery 0.3% 1 0.0% 0 0.0% 0 0.0% 0 0.0% 0 0.0% 0 0.0% 0 0.0% 0 0.0% 0
To visit the theatre or musical venues
2.9% 13 0.0% 0 12.9% 2 0.0% 0 5.1% 2 2.3% 1 3.4% 1 6.6% 1 0.0% 0
To visit night time venues e.g. nightclub
0.0% 0 0.0% 0 0.0% 0 0.0% 0 0.0% 0 0.0% 0 0.0% 0 0.0% 0 0.0% 0
For other leisure activities 9.6% 42 15.3% 6 3.3% 0 9.8% 1 16.0% 7 7.4% 4 6.7% 2 14.5% 3 6.1% 1To shop at the market(s) 0.5% 2 0.0% 0 0.0% 0 0.0% 0 0.0% 0 0.0% 0 0.0% 0 0.0% 0 0.0% 0To meet family 7.8% 34 9.9% 4 3.1% 0 0.0% 0 0.0% 0 9.6% 5 9.2% 3 0.0% 0 7.4% 2To meet friends 2.3% 10 8.2% 3 0.0% 0 0.0% 0 0.0% 0 0.0% 0 5.8% 2 0.0% 0 2.6% 1To visit the theatre 0.8% 3 0.0% 0 13.8% 2 0.0% 0 0.0% 0 0.0% 0 0.0% 0 0.0% 0 0.0% 0For work (i.e. place of work) 0.4% 2 0.0% 0 0.0% 0 0.0% 0 0.0% 0 0.0% 0 0.0% 0 0.0% 0 3.4% 1For business (e.g. attend a
business appointment) 0.2% 1 0.0% 0 0.0% 0 0.0% 0 0.0% 0 0.0% 0 0.0% 0 0.0% 0 0.0% 0
For education as a student (e.g. student at college, university, or other third level education)
0.0% 0 0.0% 0 0.0% 0 0.0% 0 0.0% 0 0.0% 0 0.0% 0 0.0% 0 0.0% 0
To access public transport for onward travel (e.g. train station, bus station)
1.3% 6 0.0% 0 0.0% 0 0.0% 0 0.0% 0 0.0% 0 0.0% 0 0.0% 0 0.0% 0
Other 0.0% 0 0.0% 0 0.0% 0 0.0% 0 0.0% 0 0.0% 0 0.0% 0 0.0% 0 0.0% 0As part of a day out / for a
day out / something different
4.5% 20 0.0% 0 2.4% 0 4.1% 1 3.0% 1 9.1% 5 3.2% 1 3.1% 1 0.0% 0
Browsing / window shopping 0.8% 3 2.5% 1 0.0% 0 0.0% 0 3.0% 1 0.0% 0 0.0% 0 0.0% 0 0.0% 0Weighted base: 438 40 12 15 43 54 37 20 23Sample: 374 28 30 19 25 30 22 20 22 GEN Gender of respondent: Male 28.8% 463 30.0% 31 31.1% 13 28.7% 25 32.3% 49 28.6% 44 22.0% 30 33.1% 25 36.2% 34Female 71.2% 1144 70.0% 73 68.9% 29 71.3% 62 67.7% 102 71.4% 110 78.0% 105 66.9% 51 63.8% 60Weighted base: 1607 104 42 86 151 154 135 76 94Sample: 1607 100 101 101 100 100 100 100 100
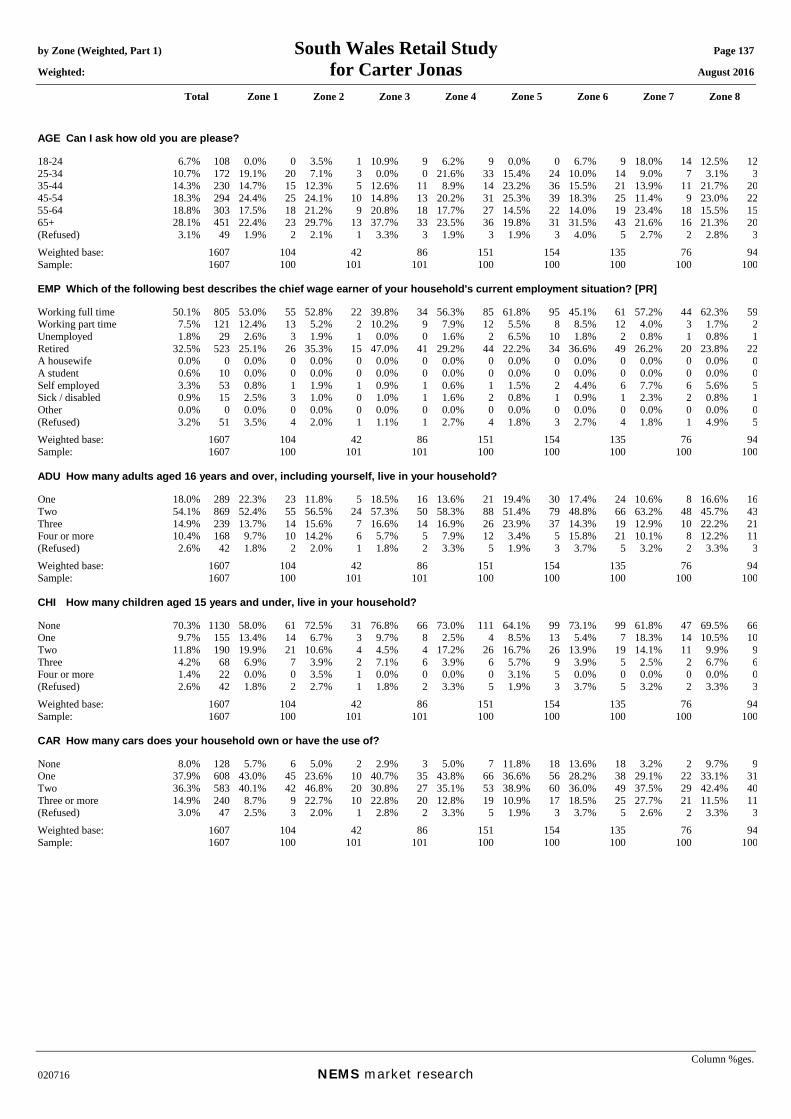
by Zone (Weighted, Part 1) South Wales Retail Study Page 137 Weighted: for Carter Jonas August 2016
Total Zone 1 Zone 2 Zone 3 Zone 4 Zone 5 Zone 6 Zone 7 Zone 8
Column %ges. 020716 NEMS market research
AGE Can I ask how old you are please? 18-24 6.7% 108 0.0% 0 3.5% 1 10.9% 9 6.2% 9 0.0% 0 6.7% 9 18.0% 14 12.5% 1225-34 10.7% 172 19.1% 20 7.1% 3 0.0% 0 21.6% 33 15.4% 24 10.0% 14 9.0% 7 3.1% 335-44 14.3% 230 14.7% 15 12.3% 5 12.6% 11 8.9% 14 23.2% 36 15.5% 21 13.9% 11 21.7% 2045-54 18.3% 294 24.4% 25 24.1% 10 14.8% 13 20.2% 31 25.3% 39 18.3% 25 11.4% 9 23.0% 2255-64 18.8% 303 17.5% 18 21.2% 9 20.8% 18 17.7% 27 14.5% 22 14.0% 19 23.4% 18 15.5% 1565+ 28.1% 451 22.4% 23 29.7% 13 37.7% 33 23.5% 36 19.8% 31 31.5% 43 21.6% 16 21.3% 20(Refused) 3.1% 49 1.9% 2 2.1% 1 3.3% 3 1.9% 3 1.9% 3 4.0% 5 2.7% 2 2.8% 3Weighted base: 1607 104 42 86 151 154 135 76 94Sample: 1607 100 101 101 100 100 100 100 100 EMP Which of the following best describes the chief wage earner of your household's current employment situation? [PR] Working full time 50.1% 805 53.0% 55 52.8% 22 39.8% 34 56.3% 85 61.8% 95 45.1% 61 57.2% 44 62.3% 59Working part time 7.5% 121 12.4% 13 5.2% 2 10.2% 9 7.9% 12 5.5% 8 8.5% 12 4.0% 3 1.7% 2Unemployed 1.8% 29 2.6% 3 1.9% 1 0.0% 0 1.6% 2 6.5% 10 1.8% 2 0.8% 1 0.8% 1Retired 32.5% 523 25.1% 26 35.3% 15 47.0% 41 29.2% 44 22.2% 34 36.6% 49 26.2% 20 23.8% 22A housewife 0.0% 0 0.0% 0 0.0% 0 0.0% 0 0.0% 0 0.0% 0 0.0% 0 0.0% 0 0.0% 0A student 0.6% 10 0.0% 0 0.0% 0 0.0% 0 0.0% 0 0.0% 0 0.0% 0 0.0% 0 0.0% 0Self employed 3.3% 53 0.8% 1 1.9% 1 0.9% 1 0.6% 1 1.5% 2 4.4% 6 7.7% 6 5.6% 5Sick / disabled 0.9% 15 2.5% 3 1.0% 0 1.0% 1 1.6% 2 0.8% 1 0.9% 1 2.3% 2 0.8% 1Other 0.0% 0 0.0% 0 0.0% 0 0.0% 0 0.0% 0 0.0% 0 0.0% 0 0.0% 0 0.0% 0(Refused) 3.2% 51 3.5% 4 2.0% 1 1.1% 1 2.7% 4 1.8% 3 2.7% 4 1.8% 1 4.9% 5Weighted base: 1607 104 42 86 151 154 135 76 94Sample: 1607 100 101 101 100 100 100 100 100 ADU How many adults aged 16 years and over, including yourself, live in your household? One 18.0% 289 22.3% 23 11.8% 5 18.5% 16 13.6% 21 19.4% 30 17.4% 24 10.6% 8 16.6% 16Two 54.1% 869 52.4% 55 56.5% 24 57.3% 50 58.3% 88 51.4% 79 48.8% 66 63.2% 48 45.7% 43Three 14.9% 239 13.7% 14 15.6% 7 16.6% 14 16.9% 26 23.9% 37 14.3% 19 12.9% 10 22.2% 21Four or more 10.4% 168 9.7% 10 14.2% 6 5.7% 5 7.9% 12 3.4% 5 15.8% 21 10.1% 8 12.2% 11(Refused) 2.6% 42 1.8% 2 2.0% 1 1.8% 2 3.3% 5 1.9% 3 3.7% 5 3.2% 2 3.3% 3Weighted base: 1607 104 42 86 151 154 135 76 94Sample: 1607 100 101 101 100 100 100 100 100 CHI How many children aged 15 years and under, live in your household? None 70.3% 1130 58.0% 61 72.5% 31 76.8% 66 73.0% 111 64.1% 99 73.1% 99 61.8% 47 69.5% 66One 9.7% 155 13.4% 14 6.7% 3 9.7% 8 2.5% 4 8.5% 13 5.4% 7 18.3% 14 10.5% 10Two 11.8% 190 19.9% 21 10.6% 4 4.5% 4 17.2% 26 16.7% 26 13.9% 19 14.1% 11 9.9% 9Three 4.2% 68 6.9% 7 3.9% 2 7.1% 6 3.9% 6 5.7% 9 3.9% 5 2.5% 2 6.7% 6Four or more 1.4% 22 0.0% 0 3.5% 1 0.0% 0 0.0% 0 3.1% 5 0.0% 0 0.0% 0 0.0% 0(Refused) 2.6% 42 1.8% 2 2.7% 1 1.8% 2 3.3% 5 1.9% 3 3.7% 5 3.2% 2 3.3% 3Weighted base: 1607 104 42 86 151 154 135 76 94Sample: 1607 100 101 101 100 100 100 100 100 CAR How many cars does your household own or have the use of? None 8.0% 128 5.7% 6 5.0% 2 2.9% 3 5.0% 7 11.8% 18 13.6% 18 3.2% 2 9.7% 9One 37.9% 608 43.0% 45 23.6% 10 40.7% 35 43.8% 66 36.6% 56 28.2% 38 29.1% 22 33.1% 31Two 36.3% 583 40.1% 42 46.8% 20 30.8% 27 35.1% 53 38.9% 60 36.0% 49 37.5% 29 42.4% 40Three or more 14.9% 240 8.7% 9 22.7% 10 22.8% 20 12.8% 19 10.9% 17 18.5% 25 27.7% 21 11.5% 11(Refused) 3.0% 47 2.5% 3 2.0% 1 2.8% 2 3.3% 5 1.9% 3 3.7% 5 2.6% 2 3.3% 3Weighted base: 1607 104 42 86 151 154 135 76 94Sample: 1607 100 101 101 100 100 100 100 100
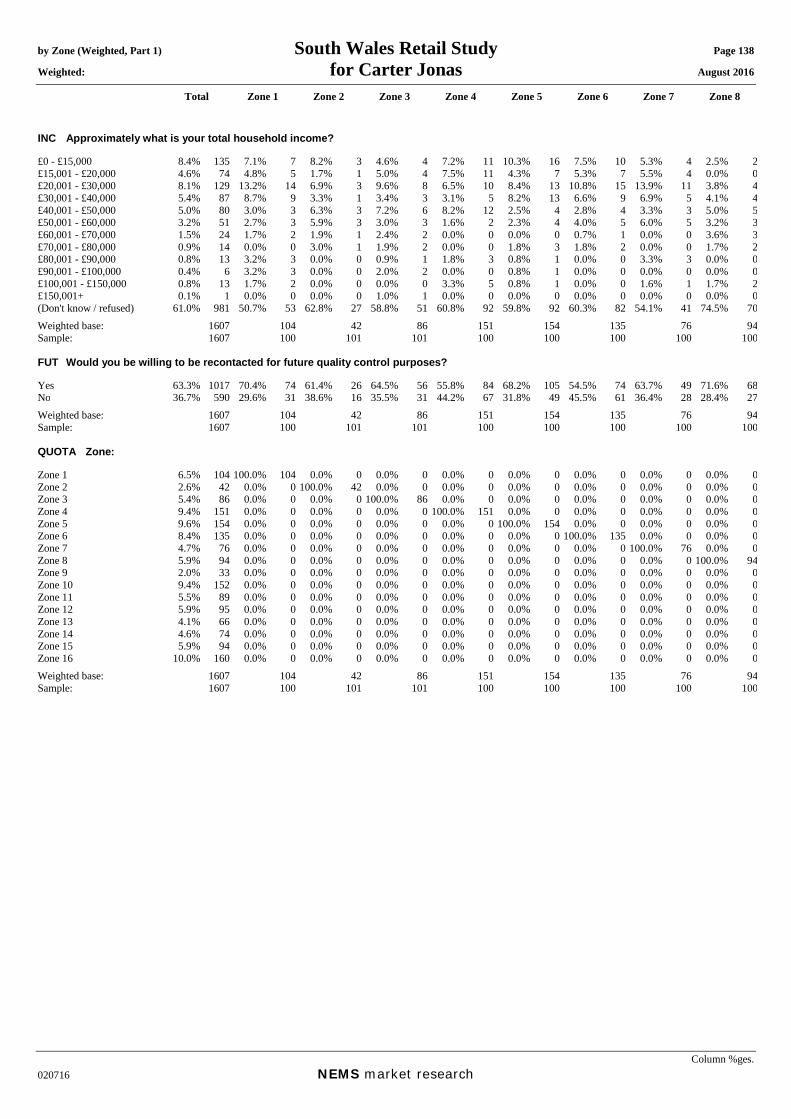
by Zone (Weighted, Part 1) South Wales Retail Study Page 138 Weighted: for Carter Jonas August 2016
Total Zone 1 Zone 2 Zone 3 Zone 4 Zone 5 Zone 6 Zone 7 Zone 8
Column %ges. 020716 NEMS market research
INC Approximately what is your total household income? £0 - £15,000 8.4% 135 7.1% 7 8.2% 3 4.6% 4 7.2% 11 10.3% 16 7.5% 10 5.3% 4 2.5% 2£15,001 - £20,000 4.6% 74 4.8% 5 1.7% 1 5.0% 4 7.5% 11 4.3% 7 5.3% 7 5.5% 4 0.0% 0£20,001 - £30,000 8.1% 129 13.2% 14 6.9% 3 9.6% 8 6.5% 10 8.4% 13 10.8% 15 13.9% 11 3.8% 4£30,001 - £40,000 5.4% 87 8.7% 9 3.3% 1 3.4% 3 3.1% 5 8.2% 13 6.6% 9 6.9% 5 4.1% 4£40,001 - £50,000 5.0% 80 3.0% 3 6.3% 3 7.2% 6 8.2% 12 2.5% 4 2.8% 4 3.3% 3 5.0% 5£50,001 - £60,000 3.2% 51 2.7% 3 5.9% 3 3.0% 3 1.6% 2 2.3% 4 4.0% 5 6.0% 5 3.2% 3£60,001 - £70,000 1.5% 24 1.7% 2 1.9% 1 2.4% 2 0.0% 0 0.0% 0 0.7% 1 0.0% 0 3.6% 3£70,001 - £80,000 0.9% 14 0.0% 0 3.0% 1 1.9% 2 0.0% 0 1.8% 3 1.8% 2 0.0% 0 1.7% 2£80,001 - £90,000 0.8% 13 3.2% 3 0.0% 0 0.9% 1 1.8% 3 0.8% 1 0.0% 0 3.3% 3 0.0% 0£90,001 - £100,000 0.4% 6 3.2% 3 0.0% 0 2.0% 2 0.0% 0 0.8% 1 0.0% 0 0.0% 0 0.0% 0£100,001 - £150,000 0.8% 13 1.7% 2 0.0% 0 0.0% 0 3.3% 5 0.8% 1 0.0% 0 1.6% 1 1.7% 2£150,001+ 0.1% 1 0.0% 0 0.0% 0 1.0% 1 0.0% 0 0.0% 0 0.0% 0 0.0% 0 0.0% 0(Don't know / refused) 61.0% 981 50.7% 53 62.8% 27 58.8% 51 60.8% 92 59.8% 92 60.3% 82 54.1% 41 74.5% 70Weighted base: 1607 104 42 86 151 154 135 76 94Sample: 1607 100 101 101 100 100 100 100 100 FUT Would you be willing to be recontacted for future quality control purposes? Yes 63.3% 1017 70.4% 74 61.4% 26 64.5% 56 55.8% 84 68.2% 105 54.5% 74 63.7% 49 71.6% 68No 36.7% 590 29.6% 31 38.6% 16 35.5% 31 44.2% 67 31.8% 49 45.5% 61 36.4% 28 28.4% 27Weighted base: 1607 104 42 86 151 154 135 76 94Sample: 1607 100 101 101 100 100 100 100 100 QUOTA Zone: Zone 1 6.5% 104 100.0% 104 0.0% 0 0.0% 0 0.0% 0 0.0% 0 0.0% 0 0.0% 0 0.0% 0Zone 2 2.6% 42 0.0% 0 100.0% 42 0.0% 0 0.0% 0 0.0% 0 0.0% 0 0.0% 0 0.0% 0Zone 3 5.4% 86 0.0% 0 0.0% 0 100.0% 86 0.0% 0 0.0% 0 0.0% 0 0.0% 0 0.0% 0Zone 4 9.4% 151 0.0% 0 0.0% 0 0.0% 0 100.0% 151 0.0% 0 0.0% 0 0.0% 0 0.0% 0Zone 5 9.6% 154 0.0% 0 0.0% 0 0.0% 0 0.0% 0 100.0% 154 0.0% 0 0.0% 0 0.0% 0Zone 6 8.4% 135 0.0% 0 0.0% 0 0.0% 0 0.0% 0 0.0% 0 100.0% 135 0.0% 0 0.0% 0Zone 7 4.7% 76 0.0% 0 0.0% 0 0.0% 0 0.0% 0 0.0% 0 0.0% 0 100.0% 76 0.0% 0Zone 8 5.9% 94 0.0% 0 0.0% 0 0.0% 0 0.0% 0 0.0% 0 0.0% 0 0.0% 0 100.0% 94Zone 9 2.0% 33 0.0% 0 0.0% 0 0.0% 0 0.0% 0 0.0% 0 0.0% 0 0.0% 0 0.0% 0Zone 10 9.4% 152 0.0% 0 0.0% 0 0.0% 0 0.0% 0 0.0% 0 0.0% 0 0.0% 0 0.0% 0Zone 11 5.5% 89 0.0% 0 0.0% 0 0.0% 0 0.0% 0 0.0% 0 0.0% 0 0.0% 0 0.0% 0Zone 12 5.9% 95 0.0% 0 0.0% 0 0.0% 0 0.0% 0 0.0% 0 0.0% 0 0.0% 0 0.0% 0Zone 13 4.1% 66 0.0% 0 0.0% 0 0.0% 0 0.0% 0 0.0% 0 0.0% 0 0.0% 0 0.0% 0Zone 14 4.6% 74 0.0% 0 0.0% 0 0.0% 0 0.0% 0 0.0% 0 0.0% 0 0.0% 0 0.0% 0Zone 15 5.9% 94 0.0% 0 0.0% 0 0.0% 0 0.0% 0 0.0% 0 0.0% 0 0.0% 0 0.0% 0Zone 16 10.0% 160 0.0% 0 0.0% 0 0.0% 0 0.0% 0 0.0% 0 0.0% 0 0.0% 0 0.0% 0Weighted base: 1607 104 42 86 151 154 135 76 94Sample: 1607 100 101 101 100 100 100 100 100
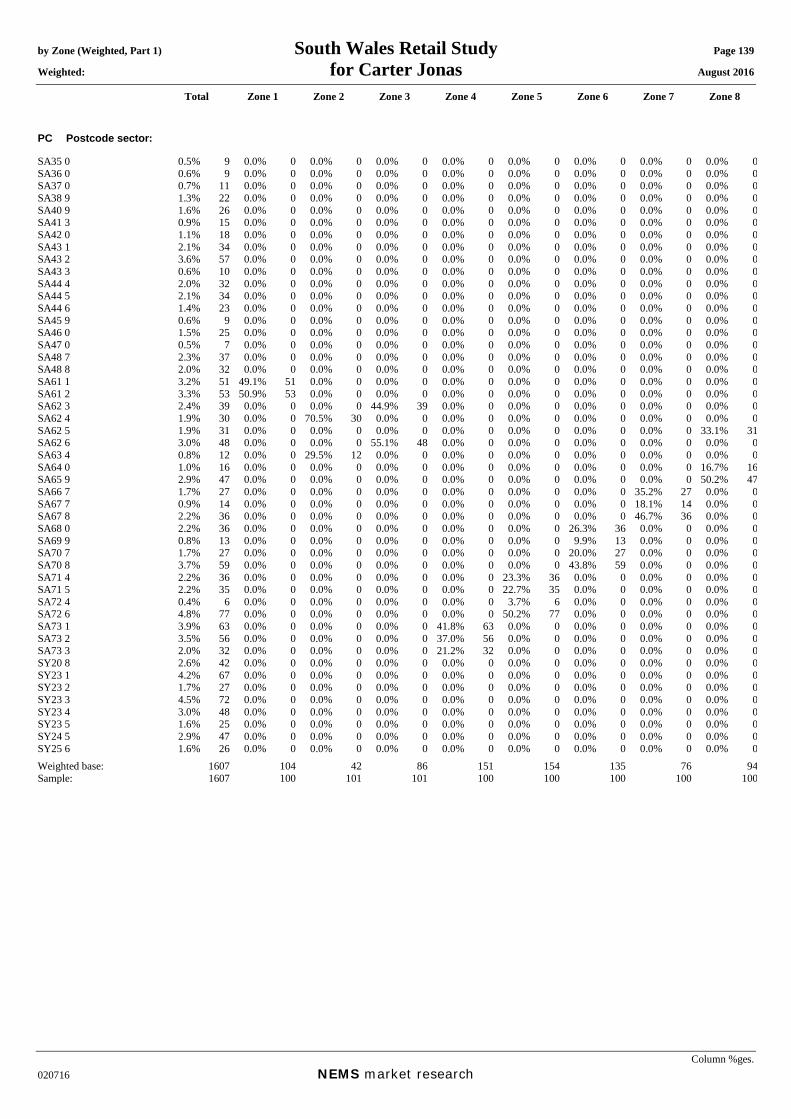
by Zone (Weighted, Part 1) South Wales Retail Study Page 139 Weighted: for Carter Jonas August 2016
Total Zone 1 Zone 2 Zone 3 Zone 4 Zone 5 Zone 6 Zone 7 Zone 8
Column %ges. 020716 NEMS market research
PC Postcode sector: SA35 0 0.5% 9 0.0% 0 0.0% 0 0.0% 0 0.0% 0 0.0% 0 0.0% 0 0.0% 0 0.0% 0SA36 0 0.6% 9 0.0% 0 0.0% 0 0.0% 0 0.0% 0 0.0% 0 0.0% 0 0.0% 0 0.0% 0SA37 0 0.7% 11 0.0% 0 0.0% 0 0.0% 0 0.0% 0 0.0% 0 0.0% 0 0.0% 0 0.0% 0SA38 9 1.3% 22 0.0% 0 0.0% 0 0.0% 0 0.0% 0 0.0% 0 0.0% 0 0.0% 0 0.0% 0SA40 9 1.6% 26 0.0% 0 0.0% 0 0.0% 0 0.0% 0 0.0% 0 0.0% 0 0.0% 0 0.0% 0SA41 3 0.9% 15 0.0% 0 0.0% 0 0.0% 0 0.0% 0 0.0% 0 0.0% 0 0.0% 0 0.0% 0SA42 0 1.1% 18 0.0% 0 0.0% 0 0.0% 0 0.0% 0 0.0% 0 0.0% 0 0.0% 0 0.0% 0SA43 1 2.1% 34 0.0% 0 0.0% 0 0.0% 0 0.0% 0 0.0% 0 0.0% 0 0.0% 0 0.0% 0SA43 2 3.6% 57 0.0% 0 0.0% 0 0.0% 0 0.0% 0 0.0% 0 0.0% 0 0.0% 0 0.0% 0SA43 3 0.6% 10 0.0% 0 0.0% 0 0.0% 0 0.0% 0 0.0% 0 0.0% 0 0.0% 0 0.0% 0SA44 4 2.0% 32 0.0% 0 0.0% 0 0.0% 0 0.0% 0 0.0% 0 0.0% 0 0.0% 0 0.0% 0SA44 5 2.1% 34 0.0% 0 0.0% 0 0.0% 0 0.0% 0 0.0% 0 0.0% 0 0.0% 0 0.0% 0SA44 6 1.4% 23 0.0% 0 0.0% 0 0.0% 0 0.0% 0 0.0% 0 0.0% 0 0.0% 0 0.0% 0SA45 9 0.6% 9 0.0% 0 0.0% 0 0.0% 0 0.0% 0 0.0% 0 0.0% 0 0.0% 0 0.0% 0SA46 0 1.5% 25 0.0% 0 0.0% 0 0.0% 0 0.0% 0 0.0% 0 0.0% 0 0.0% 0 0.0% 0SA47 0 0.5% 7 0.0% 0 0.0% 0 0.0% 0 0.0% 0 0.0% 0 0.0% 0 0.0% 0 0.0% 0SA48 7 2.3% 37 0.0% 0 0.0% 0 0.0% 0 0.0% 0 0.0% 0 0.0% 0 0.0% 0 0.0% 0SA48 8 2.0% 32 0.0% 0 0.0% 0 0.0% 0 0.0% 0 0.0% 0 0.0% 0 0.0% 0 0.0% 0SA61 1 3.2% 51 49.1% 51 0.0% 0 0.0% 0 0.0% 0 0.0% 0 0.0% 0 0.0% 0 0.0% 0SA61 2 3.3% 53 50.9% 53 0.0% 0 0.0% 0 0.0% 0 0.0% 0 0.0% 0 0.0% 0 0.0% 0SA62 3 2.4% 39 0.0% 0 0.0% 0 44.9% 39 0.0% 0 0.0% 0 0.0% 0 0.0% 0 0.0% 0SA62 4 1.9% 30 0.0% 0 70.5% 30 0.0% 0 0.0% 0 0.0% 0 0.0% 0 0.0% 0 0.0% 0SA62 5 1.9% 31 0.0% 0 0.0% 0 0.0% 0 0.0% 0 0.0% 0 0.0% 0 0.0% 0 33.1% 31SA62 6 3.0% 48 0.0% 0 0.0% 0 55.1% 48 0.0% 0 0.0% 0 0.0% 0 0.0% 0 0.0% 0SA63 4 0.8% 12 0.0% 0 29.5% 12 0.0% 0 0.0% 0 0.0% 0 0.0% 0 0.0% 0 0.0% 0SA64 0 1.0% 16 0.0% 0 0.0% 0 0.0% 0 0.0% 0 0.0% 0 0.0% 0 0.0% 0 16.7% 16SA65 9 2.9% 47 0.0% 0 0.0% 0 0.0% 0 0.0% 0 0.0% 0 0.0% 0 0.0% 0 50.2% 47SA66 7 1.7% 27 0.0% 0 0.0% 0 0.0% 0 0.0% 0 0.0% 0 0.0% 0 35.2% 27 0.0% 0SA67 7 0.9% 14 0.0% 0 0.0% 0 0.0% 0 0.0% 0 0.0% 0 0.0% 0 18.1% 14 0.0% 0SA67 8 2.2% 36 0.0% 0 0.0% 0 0.0% 0 0.0% 0 0.0% 0 0.0% 0 46.7% 36 0.0% 0SA68 0 2.2% 36 0.0% 0 0.0% 0 0.0% 0 0.0% 0 0.0% 0 26.3% 36 0.0% 0 0.0% 0SA69 9 0.8% 13 0.0% 0 0.0% 0 0.0% 0 0.0% 0 0.0% 0 9.9% 13 0.0% 0 0.0% 0SA70 7 1.7% 27 0.0% 0 0.0% 0 0.0% 0 0.0% 0 0.0% 0 20.0% 27 0.0% 0 0.0% 0SA70 8 3.7% 59 0.0% 0 0.0% 0 0.0% 0 0.0% 0 0.0% 0 43.8% 59 0.0% 0 0.0% 0SA71 4 2.2% 36 0.0% 0 0.0% 0 0.0% 0 0.0% 0 23.3% 36 0.0% 0 0.0% 0 0.0% 0SA71 5 2.2% 35 0.0% 0 0.0% 0 0.0% 0 0.0% 0 22.7% 35 0.0% 0 0.0% 0 0.0% 0SA72 4 0.4% 6 0.0% 0 0.0% 0 0.0% 0 0.0% 0 3.7% 6 0.0% 0 0.0% 0 0.0% 0SA72 6 4.8% 77 0.0% 0 0.0% 0 0.0% 0 0.0% 0 50.2% 77 0.0% 0 0.0% 0 0.0% 0SA73 1 3.9% 63 0.0% 0 0.0% 0 0.0% 0 41.8% 63 0.0% 0 0.0% 0 0.0% 0 0.0% 0SA73 2 3.5% 56 0.0% 0 0.0% 0 0.0% 0 37.0% 56 0.0% 0 0.0% 0 0.0% 0 0.0% 0SA73 3 2.0% 32 0.0% 0 0.0% 0 0.0% 0 21.2% 32 0.0% 0 0.0% 0 0.0% 0 0.0% 0SY20 8 2.6% 42 0.0% 0 0.0% 0 0.0% 0 0.0% 0 0.0% 0 0.0% 0 0.0% 0 0.0% 0SY23 1 4.2% 67 0.0% 0 0.0% 0 0.0% 0 0.0% 0 0.0% 0 0.0% 0 0.0% 0 0.0% 0SY23 2 1.7% 27 0.0% 0 0.0% 0 0.0% 0 0.0% 0 0.0% 0 0.0% 0 0.0% 0 0.0% 0SY23 3 4.5% 72 0.0% 0 0.0% 0 0.0% 0 0.0% 0 0.0% 0 0.0% 0 0.0% 0 0.0% 0SY23 4 3.0% 48 0.0% 0 0.0% 0 0.0% 0 0.0% 0 0.0% 0 0.0% 0 0.0% 0 0.0% 0SY23 5 1.6% 25 0.0% 0 0.0% 0 0.0% 0 0.0% 0 0.0% 0 0.0% 0 0.0% 0 0.0% 0SY24 5 2.9% 47 0.0% 0 0.0% 0 0.0% 0 0.0% 0 0.0% 0 0.0% 0 0.0% 0 0.0% 0SY25 6 1.6% 26 0.0% 0 0.0% 0 0.0% 0 0.0% 0 0.0% 0 0.0% 0 0.0% 0 0.0% 0Weighted base: 1607 104 42 86 151 154 135 76 94Sample: 1607 100 101 101 100 100 100 100 100
South West Wales Regional Retail Study
APPENDIX 15B: HOUSEHOLD TELEPHONE INTERVIEW SURVEY (WEIGHTED) RESULTS – PART 2: ZONES 9 TO 16
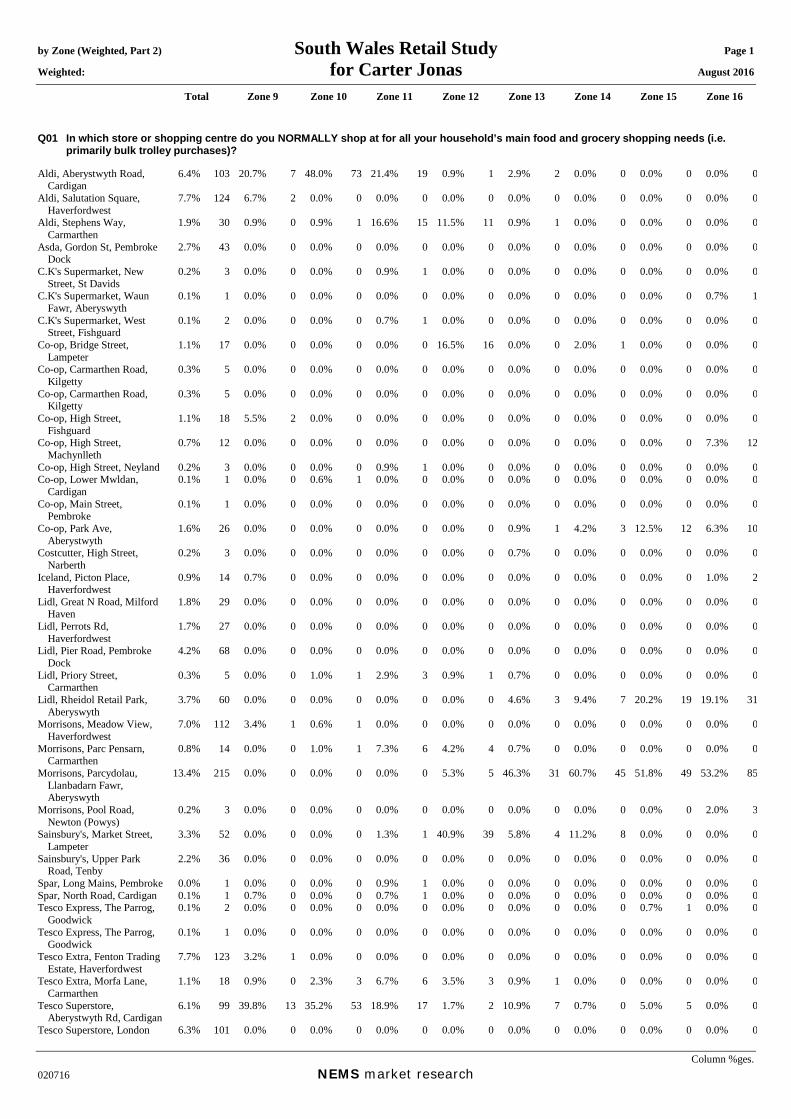
by Zone (Weighted, Part 2) South Wales Retail Study Page 1
Weighted: for Carter Jonas August 2016
Total Zone 9 Zone 10 Zone 11 Zone 12 Zone 13 Zone 14 Zone 15 Zone 16
Column %ges. 020716 NEMS market research
Q01 In which store or shopping centre do you NORMALLY shop at for all your household’s main food and grocery shopping needs (i.e. primarily bulk trolley purchases)?
Aldi, Aberystwyth Road, Cardigan
6.4% 103 20.7% 7 48.0% 73 21.4% 19 0.9% 1 2.9% 2 0.0% 0 0.0% 0 0.0% 0
Aldi, Salutation Square, Haverfordwest
7.7% 124 6.7% 2 0.0% 0 0.0% 0 0.0% 0 0.0% 0 0.0% 0 0.0% 0 0.0% 0
Aldi, Stephens Way, Carmarthen
1.9% 30 0.9% 0 0.9% 1 16.6% 15 11.5% 11 0.9% 1 0.0% 0 0.0% 0 0.0% 0
Asda, Gordon St, Pembroke Dock
2.7% 43 0.0% 0 0.0% 0 0.0% 0 0.0% 0 0.0% 0 0.0% 0 0.0% 0 0.0% 0
C.K's Supermarket, New Street, St Davids
0.2% 3 0.0% 0 0.0% 0 0.9% 1 0.0% 0 0.0% 0 0.0% 0 0.0% 0 0.0% 0
C.K's Supermarket, WaunFawr, Aberyswyth
0.1% 1 0.0% 0 0.0% 0 0.0% 0 0.0% 0 0.0% 0 0.0% 0 0.0% 0 0.7% 1
C.K's Supermarket, WestStreet, Fishguard
0.1% 2 0.0% 0 0.0% 0 0.7% 1 0.0% 0 0.0% 0 0.0% 0 0.0% 0 0.0% 0
Co-op, Bridge Street, Lampeter
1.1% 17 0.0% 0 0.0% 0 0.0% 0 16.5% 16 0.0% 0 2.0% 1 0.0% 0 0.0% 0
Co-op, Carmarthen Road, Kilgetty
0.3% 5 0.0% 0 0.0% 0 0.0% 0 0.0% 0 0.0% 0 0.0% 0 0.0% 0 0.0% 0
Co-op, Carmarthen Road, Kilgetty
0.3% 5 0.0% 0 0.0% 0 0.0% 0 0.0% 0 0.0% 0 0.0% 0 0.0% 0 0.0% 0
Co-op, High Street, Fishguard
1.1% 18 5.5% 2 0.0% 0 0.0% 0 0.0% 0 0.0% 0 0.0% 0 0.0% 0 0.0% 0
Co-op, High Street, Machynlleth
0.7% 12 0.0% 0 0.0% 0 0.0% 0 0.0% 0 0.0% 0 0.0% 0 0.0% 0 7.3% 12
Co-op, High Street, Neyland 0.2% 3 0.0% 0 0.0% 0 0.9% 1 0.0% 0 0.0% 0 0.0% 0 0.0% 0 0.0% 0Co-op, Lower Mwldan,
Cardigan 0.1% 1 0.0% 0 0.6% 1 0.0% 0 0.0% 0 0.0% 0 0.0% 0 0.0% 0 0.0% 0
Co-op, Main Street, Pembroke
0.1% 1 0.0% 0 0.0% 0 0.0% 0 0.0% 0 0.0% 0 0.0% 0 0.0% 0 0.0% 0
Co-op, Park Ave, Aberystwyth
1.6% 26 0.0% 0 0.0% 0 0.0% 0 0.0% 0 0.9% 1 4.2% 3 12.5% 12 6.3% 10
Costcutter, High Street, Narberth
0.2% 3 0.0% 0 0.0% 0 0.0% 0 0.0% 0 0.7% 0 0.0% 0 0.0% 0 0.0% 0
Iceland, Picton Place, Haverfordwest
0.9% 14 0.7% 0 0.0% 0 0.0% 0 0.0% 0 0.0% 0 0.0% 0 0.0% 0 1.0% 2
Lidl, Great N Road, Milford Haven
1.8% 29 0.0% 0 0.0% 0 0.0% 0 0.0% 0 0.0% 0 0.0% 0 0.0% 0 0.0% 0
Lidl, Perrots Rd, Haverfordwest
1.7% 27 0.0% 0 0.0% 0 0.0% 0 0.0% 0 0.0% 0 0.0% 0 0.0% 0 0.0% 0
Lidl, Pier Road, Pembroke Dock
4.2% 68 0.0% 0 0.0% 0 0.0% 0 0.0% 0 0.0% 0 0.0% 0 0.0% 0 0.0% 0
Lidl, Priory Street, Carmarthen
0.3% 5 0.0% 0 1.0% 1 2.9% 3 0.9% 1 0.7% 0 0.0% 0 0.0% 0 0.0% 0
Lidl, Rheidol Retail Park, Aberyswyth
3.7% 60 0.0% 0 0.0% 0 0.0% 0 0.0% 0 4.6% 3 9.4% 7 20.2% 19 19.1% 31
Morrisons, Meadow View, Haverfordwest
7.0% 112 3.4% 1 0.6% 1 0.0% 0 0.0% 0 0.0% 0 0.0% 0 0.0% 0 0.0% 0
Morrisons, Parc Pensarn, Carmarthen
0.8% 14 0.0% 0 1.0% 1 7.3% 6 4.2% 4 0.7% 0 0.0% 0 0.0% 0 0.0% 0
Morrisons, Parcydolau, Llanbadarn Fawr, Aberyswyth
13.4% 215 0.0% 0 0.0% 0 0.0% 0 5.3% 5 46.3% 31 60.7% 45 51.8% 49 53.2% 85
Morrisons, Pool Road, Newton (Powys)
0.2% 3 0.0% 0 0.0% 0 0.0% 0 0.0% 0 0.0% 0 0.0% 0 0.0% 0 2.0% 3
Sainsbury's, Market Street, Lampeter
3.3% 52 0.0% 0 0.0% 0 1.3% 1 40.9% 39 5.8% 4 11.2% 8 0.0% 0 0.0% 0
Sainsbury's, Upper Park Road, Tenby
2.2% 36 0.0% 0 0.0% 0 0.0% 0 0.0% 0 0.0% 0 0.0% 0 0.0% 0 0.0% 0
Spar, Long Mains, Pembroke 0.0% 1 0.0% 0 0.0% 0 0.9% 1 0.0% 0 0.0% 0 0.0% 0 0.0% 0 0.0% 0Spar, North Road, Cardigan 0.1% 1 0.7% 0 0.0% 0 0.7% 1 0.0% 0 0.0% 0 0.0% 0 0.0% 0 0.0% 0Tesco Express, The Parrog,
Goodwick 0.1% 2 0.0% 0 0.0% 0 0.0% 0 0.0% 0 0.0% 0 0.0% 0 0.7% 1 0.0% 0
Tesco Express, The Parrog, Goodwick
0.1% 1 0.0% 0 0.0% 0 0.0% 0 0.0% 0 0.0% 0 0.0% 0 0.0% 0 0.0% 0
Tesco Extra, Fenton Trading Estate, Haverfordwest
7.7% 123 3.2% 1 0.0% 0 0.0% 0 0.0% 0 0.0% 0 0.0% 0 0.0% 0 0.0% 0
Tesco Extra, Morfa Lane, Carmarthen
1.1% 18 0.9% 0 2.3% 3 6.7% 6 3.5% 3 0.9% 1 0.0% 0 0.0% 0 0.0% 0
Tesco Superstore, Aberystwyth Rd, Cardigan
6.1% 99 39.8% 13 35.2% 53 18.9% 17 1.7% 2 10.9% 7 0.7% 0 5.0% 5 0.0% 0
Tesco Superstore, London 6.3% 101 0.0% 0 0.0% 0 0.0% 0 0.0% 0 0.0% 0 0.0% 0 0.0% 0 0.0% 0
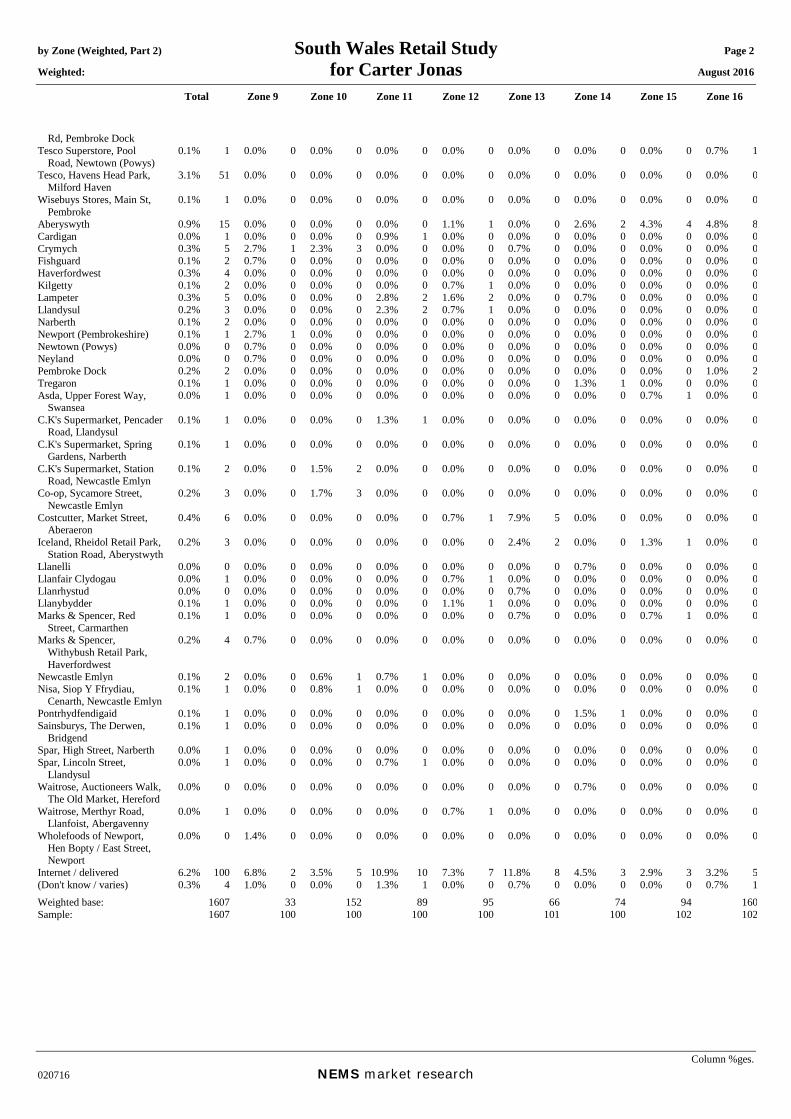
by Zone (Weighted, Part 2) South Wales Retail Study Page 2
Weighted: for Carter Jonas August 2016
Total Zone 9 Zone 10 Zone 11 Zone 12 Zone 13 Zone 14 Zone 15 Zone 16
Column %ges. 020716 NEMS market research
0.1% 1 0.0% 0 0.0% 0 0.0% 0 0.0% 0 0.0% 0 0.0% 0 0.0% 0 0.7% 1
3.1% 51 0.0% 0 0.0% 0 0.0% 0 0.0% 0 0.0% 0 0.0% 0 0.0% 0 0.0% 0
0.1% 1 0.0% 0 0.0% 0 0.0% 0 0.0% 0 0.0% 0 0.0% 0 0.0% 0 0.0% 0
0.9% 15 0.0% 0 0.0% 0 0.0% 0 1.1% 1 0.0% 0 2.6% 2 4.3% 4 4.8% 80.0% 1 0.0% 0 0.0% 0 0.9% 1 0.0% 0 0.0% 0 0.0% 0 0.0% 0 0.0% 00.3% 5 2.7% 1 2.3% 3 0.0% 0 0.0% 0 0.7% 0 0.0% 0 0.0% 0 0.0% 00.1% 2 0.7% 0 0.0% 0 0.0% 0 0.0% 0 0.0% 0 0.0% 0 0.0% 0 0.0% 00.3% 4 0.0% 0 0.0% 0 0.0% 0 0.0% 0 0.0% 0 0.0% 0 0.0% 0 0.0% 00.1% 2 0.0% 0 0.0% 0 0.0% 0 0.7% 1 0.0% 0 0.0% 0 0.0% 0 0.0% 00.3% 5 0.0% 0 0.0% 0 2.8% 2 1.6% 2 0.0% 0 0.7% 0 0.0% 0 0.0% 00.2% 3 0.0% 0 0.0% 0 2.3% 2 0.7% 1 0.0% 0 0.0% 0 0.0% 0 0.0% 00.1% 2 0.0% 0 0.0% 0 0.0% 0 0.0% 0 0.0% 0 0.0% 0 0.0% 0 0.0% 00.1% 1 2.7% 1 0.0% 0 0.0% 0 0.0% 0 0.0% 0 0.0% 0 0.0% 0 0.0% 00.0% 0 0.7% 0 0.0% 0 0.0% 0 0.0% 0 0.0% 0 0.0% 0 0.0% 0 0.0% 00.0% 0 0.7% 0 0.0% 0 0.0% 0 0.0% 0 0.0% 0 0.0% 0 0.0% 0 0.0% 00.2% 2 0.0% 0 0.0% 0 0.0% 0 0.0% 0 0.0% 0 0.0% 0 0.0% 0 1.0% 20.1% 1 0.0% 0 0.0% 0 0.0% 0 0.0% 0 0.0% 0 1.3% 1 0.0% 0 0.0% 0
Rd, Pembroke Dock Tesco Superstore, Pool
Road, Newtown (Powys) Tesco, Havens Head Park,
Milford Haven Wisebuys Stores, Main St,
Pembroke Aberyswyth Cardigan Crymych Fishguard Haverfordwest Kilgetty Lampeter Llandysul Narberth Newport (Pembrokeshire) Newtown (Powys) Neyland Pembroke Dock Tregaron Asda, Upper Forest Way,
Swansea 0.0% 1 0.0% 0 0.0% 0 0.0% 0 0.0% 0 0.0% 0 0.0% 0 0.7% 1 0.0% 0
C.K's Supermarket, Pencader Road, Llandysul
0.1% 1 0.0% 0 0.0% 0 1.3% 1 0.0% 0 0.0% 0 0.0% 0 0.0% 0 0.0% 0
C.K's Supermarket, Spring Gardens, Narberth
0.1% 1 0.0% 0 0.0% 0 0.0% 0 0.0% 0 0.0% 0 0.0% 0 0.0% 0 0.0% 0
C.K's Supermarket, Station Road, Newcastle Emlyn
0.1% 2 0.0% 0 1.5% 2 0.0% 0 0.0% 0 0.0% 0 0.0% 0 0.0% 0 0.0% 0
Co-op, Sycamore Street, Newcastle Emlyn
0.2% 3 0.0% 0 1.7% 3 0.0% 0 0.0% 0 0.0% 0 0.0% 0 0.0% 0 0.0% 0
Costcutter, Market Street, Aberaeron
0.4% 6 0.0% 0 0.0% 0 0.0% 0 0.7% 1 7.9% 5 0.0% 0 0.0% 0 0.0% 0
Iceland, Rheidol Retail Park, Station Road, Aberystwyth
0.2% 3 0.0% 0 0.0% 0 0.0% 0 0.0% 0 2.4% 2 0.0% 0 1.3% 1 0.0% 0
Llanelli 0.0% 0 0.0% 0 0.0% 0 0.0% 0 0.0% 0 0.0% 0 0.7% 0 0.0% 0 0.0% 0Llanfair Clydogau 0.0% 1 0.0% 0 0.0% 0 0.0% 0 0.7% 1 0.0% 0 0.0% 0 0.0% 0 0.0% 0Llanrhystud 0.0% 0 0.0% 0 0.0% 0 0.0% 0 0.0% 0 0.7% 0 0.0% 0 0.0% 0 0.0% 0Llanybydder 0.1% 1 0.0% 0 0.0% 0 0.0% 0 1.1% 1 0.0% 0 0.0% 0 0.0% 0 0.0% 0Marks & Spencer, Red
Street, Carmarthen 0.1% 1 0.0% 0 0.0% 0 0.0% 0 0.0% 0 0.7% 0 0.0% 0 0.7% 1 0.0% 0
Marks & Spencer, Withybush Retail Park, Haverfordwest
0.2% 4 0.7% 0 0.0% 0 0.0% 0 0.0% 0 0.0% 0 0.0% 0 0.0% 0 0.0% 0
Newcastle Emlyn 0.1% 2 0.0% 0 0.6% 1 0.7% 1 0.0% 0 0.0% 0 0.0% 0 0.0% 0 0.0% 0Nisa, Siop Y Ffrydiau,
Cenarth, Newcastle Emlyn 0.1% 1 0.0% 0 0.8% 1 0.0% 0 0.0% 0 0.0% 0 0.0% 0 0.0% 0 0.0% 0
Pontrhydfendigaid 0.1% 1 0.0% 0 0.0% 0 0.0% 0 0.0% 0 0.0% 0 1.5% 1 0.0% 0 0.0% 0Sainsburys, The Derwen,
Bridgend 0.1% 1 0.0% 0 0.0% 0 0.0% 0 0.0% 0 0.0% 0 0.0% 0 0.0% 0 0.0% 0
Spar, High Street, Narberth 0.0% 1 0.0% 0 0.0% 0 0.0% 0 0.0% 0 0.0% 0 0.0% 0 0.0% 0 0.0% 0Spar, Lincoln Street,
Llandysul 0.0% 1 0.0% 0 0.0% 0 0.7% 1 0.0% 0 0.0% 0 0.0% 0 0.0% 0 0.0% 0
Waitrose, Auctioneers Walk, The Old Market, Hereford
0.0% 0 0.0% 0 0.0% 0 0.0% 0 0.0% 0 0.0% 0 0.7% 0 0.0% 0 0.0% 0
Waitrose, Merthyr Road, Llanfoist, Abergavenny
0.0% 1 0.0% 0 0.0% 0 0.0% 0 0.7% 1 0.0% 0 0.0% 0 0.0% 0 0.0% 0
Wholefoods of Newport, Hen Bopty / East Street, Newport
0.0% 0 1.4% 0 0.0% 0 0.0% 0 0.0% 0 0.0% 0 0.0% 0 0.0% 0 0.0% 0
Internet / delivered 6.2% 100 6.8% 2 3.5% 5 10.9% 10 7.3% 7 11.8% 8 4.5% 3 2.9% 3 3.2% 5(Don't know / varies) 0.3% 4 1.0% 0 0.0% 0 1.3% 1 0.0% 0 0.7% 0 0.0% 0 0.0% 0 0.7% 1Weighted base: 1607 33 152 89 95 66 74 94 160Sample: 1607 100 100 100 100 101 100 102 102
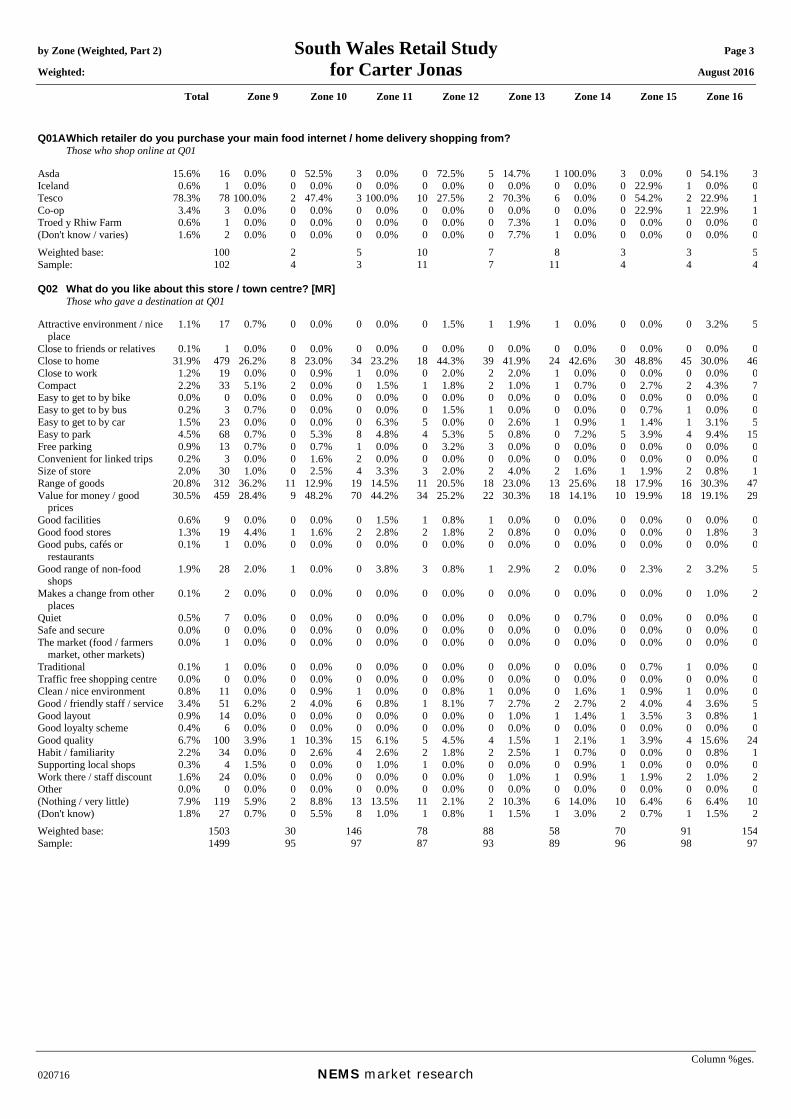
by Zone (Weighted, Part 2) South Wales Retail Study Page 3 Weighted: for Carter Jonas August 2016
Total Zone 9 Zone 10 Zone 11 Zone 12 Zone 13 Zone 14 Zone 15 Zone 16
Column %ges. 020716 NEMS market research
Q01A Which retailer do you purchase your main food internet / home delivery shopping from? Those who shop online at Q01 Asda 15.6% 16 0.0% 0 52.5% 3 0.0% 0 72.5% 5 14.7% 1 100.0% 3 0.0% 0 54.1% 3Iceland 0.6% 1 0.0% 0 0.0% 0 0.0% 0 0.0% 0 0.0% 0 0.0% 0 22.9% 1 0.0% 0Tesco 78.3% 78 100.0% 2 47.4% 3 100.0% 10 27.5% 2 70.3% 6 0.0% 0 54.2% 2 22.9% 1Co-op 3.4% 3 0.0% 0 0.0% 0 0.0% 0 0.0% 0 0.0% 0 0.0% 0 22.9% 1 22.9% 1Troed y Rhiw Farm 0.6% 1 0.0% 0 0.0% 0 0.0% 0 0.0% 0 7.3% 1 0.0% 0 0.0% 0 0.0% 0(Don't know / varies) 1.6% 2 0.0% 0 0.0% 0 0.0% 0 0.0% 0 7.7% 1 0.0% 0 0.0% 0 0.0% 0Weighted base: 100 2 5 10 7 8 3 3 5Sample: 102 4 3 11 7 11 4 4 4 Q02 What do you like about this store / town centre? [MR] Those who gave a destination at Q01 Attractive environment / nice
place 1.1% 17 0.7% 0 0.0% 0 0.0% 0 1.5% 1 1.9% 1 0.0% 0 0.0% 0 3.2% 5
Close to friends or relatives 0.1% 1 0.0% 0 0.0% 0 0.0% 0 0.0% 0 0.0% 0 0.0% 0 0.0% 0 0.0% 0Close to home 31.9% 479 26.2% 8 23.0% 34 23.2% 18 44.3% 39 41.9% 24 42.6% 30 48.8% 45 30.0% 46Close to work 1.2% 19 0.0% 0 0.9% 1 0.0% 0 2.0% 2 2.0% 1 0.0% 0 0.0% 0 0.0% 0Compact 2.2% 33 5.1% 2 0.0% 0 1.5% 1 1.8% 2 1.0% 1 0.7% 0 2.7% 2 4.3% 7Easy to get to by bike 0.0% 0 0.0% 0 0.0% 0 0.0% 0 0.0% 0 0.0% 0 0.0% 0 0.0% 0 0.0% 0Easy to get to by bus 0.2% 3 0.7% 0 0.0% 0 0.0% 0 1.5% 1 0.0% 0 0.0% 0 0.7% 1 0.0% 0Easy to get to by car 1.5% 23 0.0% 0 0.0% 0 6.3% 5 0.0% 0 2.6% 1 0.9% 1 1.4% 1 3.1% 5Easy to park 4.5% 68 0.7% 0 5.3% 8 4.8% 4 5.3% 5 0.8% 0 7.2% 5 3.9% 4 9.4% 15Free parking 0.9% 13 0.7% 0 0.7% 1 0.0% 0 3.2% 3 0.0% 0 0.0% 0 0.0% 0 0.0% 0Convenient for linked trips 0.2% 3 0.0% 0 1.6% 2 0.0% 0 0.0% 0 0.0% 0 0.0% 0 0.0% 0 0.0% 0Size of store 2.0% 30 1.0% 0 2.5% 4 3.3% 3 2.0% 2 4.0% 2 1.6% 1 1.9% 2 0.8% 1Range of goods 20.8% 312 36.2% 11 12.9% 19 14.5% 11 20.5% 18 23.0% 13 25.6% 18 17.9% 16 30.3% 47Value for money / good
prices 30.5% 459 28.4% 9 48.2% 70 44.2% 34 25.2% 22 30.3% 18 14.1% 10 19.9% 18 19.1% 29
Good facilities 0.6% 9 0.0% 0 0.0% 0 1.5% 1 0.8% 1 0.0% 0 0.0% 0 0.0% 0 0.0% 0Good food stores 1.3% 19 4.4% 1 1.6% 2 2.8% 2 1.8% 2 0.8% 0 0.0% 0 0.0% 0 1.8% 3Good pubs, cafés or
restaurants 0.1% 1 0.0% 0 0.0% 0 0.0% 0 0.0% 0 0.0% 0 0.0% 0 0.0% 0 0.0% 0
Good range of non-food shops
1.9% 28 2.0% 1 0.0% 0 3.8% 3 0.8% 1 2.9% 2 0.0% 0 2.3% 2 3.2% 5
Makes a change from other places
0.1% 2 0.0% 0 0.0% 0 0.0% 0 0.0% 0 0.0% 0 0.0% 0 0.0% 0 1.0% 2
Quiet 0.5% 7 0.0% 0 0.0% 0 0.0% 0 0.0% 0 0.0% 0 0.7% 0 0.0% 0 0.0% 0Safe and secure 0.0% 0 0.0% 0 0.0% 0 0.0% 0 0.0% 0 0.0% 0 0.0% 0 0.0% 0 0.0% 0The market (food / farmers
market, other markets) 0.0% 1 0.0% 0 0.0% 0 0.0% 0 0.0% 0 0.0% 0 0.0% 0 0.0% 0 0.0% 0
Traditional 0.1% 1 0.0% 0 0.0% 0 0.0% 0 0.0% 0 0.0% 0 0.0% 0 0.7% 1 0.0% 0Traffic free shopping centre 0.0% 0 0.0% 0 0.0% 0 0.0% 0 0.0% 0 0.0% 0 0.0% 0 0.0% 0 0.0% 0Clean / nice environment 0.8% 11 0.0% 0 0.9% 1 0.0% 0 0.8% 1 0.0% 0 1.6% 1 0.9% 1 0.0% 0Good / friendly staff / service 3.4% 51 6.2% 2 4.0% 6 0.8% 1 8.1% 7 2.7% 2 2.7% 2 4.0% 4 3.6% 5Good layout 0.9% 14 0.0% 0 0.0% 0 0.0% 0 0.0% 0 1.0% 1 1.4% 1 3.5% 3 0.8% 1Good loyalty scheme 0.4% 6 0.0% 0 0.0% 0 0.0% 0 0.0% 0 0.0% 0 0.0% 0 0.0% 0 0.0% 0Good quality 6.7% 100 3.9% 1 10.3% 15 6.1% 5 4.5% 4 1.5% 1 2.1% 1 3.9% 4 15.6% 24Habit / familiarity 2.2% 34 0.0% 0 2.6% 4 2.6% 2 1.8% 2 2.5% 1 0.7% 0 0.0% 0 0.8% 1Supporting local shops 0.3% 4 1.5% 0 0.0% 0 1.0% 1 0.0% 0 0.0% 0 0.9% 1 0.0% 0 0.0% 0Work there / staff discount 1.6% 24 0.0% 0 0.0% 0 0.0% 0 0.0% 0 1.0% 1 0.9% 1 1.9% 2 1.0% 2Other 0.0% 0 0.0% 0 0.0% 0 0.0% 0 0.0% 0 0.0% 0 0.0% 0 0.0% 0 0.0% 0(Nothing / very little) 7.9% 119 5.9% 2 8.8% 13 13.5% 11 2.1% 2 10.3% 6 14.0% 10 6.4% 6 6.4% 10(Don't know) 1.8% 27 0.7% 0 5.5% 8 1.0% 1 0.8% 1 1.5% 1 3.0% 2 0.7% 1 1.5% 2Weighted base: 1503 30 146 78 88 58 70 91 154Sample: 1499 95 97 87 93 89 96 98 97
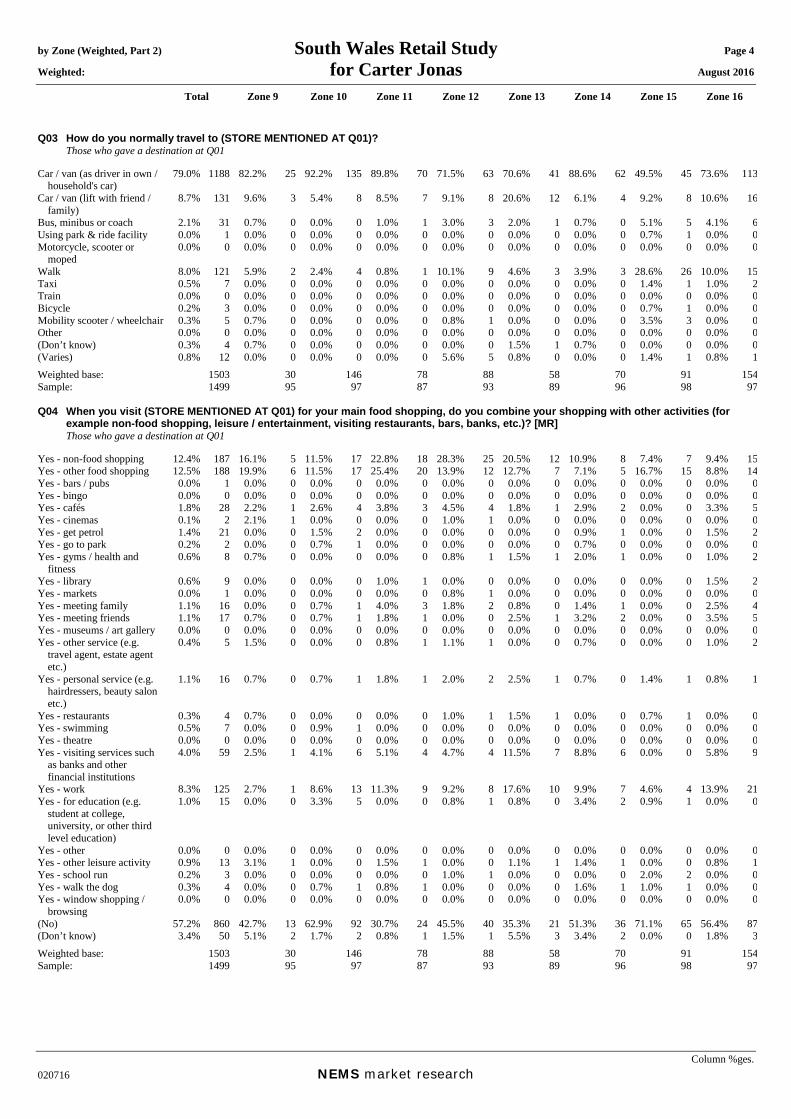
by Zone (Weighted, Part 2) South Wales Retail Study Page 4 Weighted: for Carter Jonas August 2016
Total Zone 9 Zone 10 Zone 11 Zone 12 Zone 13 Zone 14 Zone 15 Zone 16
Column %ges. 020716 NEMS market research
Q03 How do you normally travel to (STORE MENTIONED AT Q01)? Those who gave a destination at Q01 Car / van (as driver in own /
household's car) 79.0% 1188 82.2% 25 92.2% 135 89.8% 70 71.5% 63 70.6% 41 88.6% 62 49.5% 45 73.6% 113
Car / van (lift with friend / family)
8.7% 131 9.6% 3 5.4% 8 8.5% 7 9.1% 8 20.6% 12 6.1% 4 9.2% 8 10.6% 16
Bus, minibus or coach 2.1% 31 0.7% 0 0.0% 0 1.0% 1 3.0% 3 2.0% 1 0.7% 0 5.1% 5 4.1% 6Using park & ride facility 0.0% 1 0.0% 0 0.0% 0 0.0% 0 0.0% 0 0.0% 0 0.0% 0 0.7% 1 0.0% 0Motorcycle, scooter or
moped 0.0% 0 0.0% 0 0.0% 0 0.0% 0 0.0% 0 0.0% 0 0.0% 0 0.0% 0 0.0% 0
Walk 8.0% 121 5.9% 2 2.4% 4 0.8% 1 10.1% 9 4.6% 3 3.9% 3 28.6% 26 10.0% 15Taxi 0.5% 7 0.0% 0 0.0% 0 0.0% 0 0.0% 0 0.0% 0 0.0% 0 1.4% 1 1.0% 2Train 0.0% 0 0.0% 0 0.0% 0 0.0% 0 0.0% 0 0.0% 0 0.0% 0 0.0% 0 0.0% 0Bicycle 0.2% 3 0.0% 0 0.0% 0 0.0% 0 0.0% 0 0.0% 0 0.0% 0 0.7% 1 0.0% 0Mobility scooter / wheelchair 0.3% 5 0.7% 0 0.0% 0 0.0% 0 0.8% 1 0.0% 0 0.0% 0 3.5% 3 0.0% 0Other 0.0% 0 0.0% 0 0.0% 0 0.0% 0 0.0% 0 0.0% 0 0.0% 0 0.0% 0 0.0% 0(Don’t know) 0.3% 4 0.7% 0 0.0% 0 0.0% 0 0.0% 0 1.5% 1 0.7% 0 0.0% 0 0.0% 0(Varies) 0.8% 12 0.0% 0 0.0% 0 0.0% 0 5.6% 5 0.8% 0 0.0% 0 1.4% 1 0.8% 1Weighted base: 1503 30 146 78 88 58 70 91 154Sample: 1499 95 97 87 93 89 96 98 97 Q04 When you visit (STORE MENTIONED AT Q01) for your main food shopping, do you combine your shopping with other activities (for
example non-food shopping, leisure / entertainment, visiting restaurants, bars, banks, etc.)? [MR] Those who gave a destination at Q01 Yes - non-food shopping 12.4% 187 16.1% 5 11.5% 17 22.8% 18 28.3% 25 20.5% 12 10.9% 8 7.4% 7 9.4% 15Yes - other food shopping 12.5% 188 19.9% 6 11.5% 17 25.4% 20 13.9% 12 12.7% 7 7.1% 5 16.7% 15 8.8% 14Yes - bars / pubs 0.0% 1 0.0% 0 0.0% 0 0.0% 0 0.0% 0 0.0% 0 0.0% 0 0.0% 0 0.0% 0Yes - bingo 0.0% 0 0.0% 0 0.0% 0 0.0% 0 0.0% 0 0.0% 0 0.0% 0 0.0% 0 0.0% 0Yes - cafés 1.8% 28 2.2% 1 2.6% 4 3.8% 3 4.5% 4 1.8% 1 2.9% 2 0.0% 0 3.3% 5Yes - cinemas 0.1% 2 2.1% 1 0.0% 0 0.0% 0 1.0% 1 0.0% 0 0.0% 0 0.0% 0 0.0% 0Yes - get petrol 1.4% 21 0.0% 0 1.5% 2 0.0% 0 0.0% 0 0.0% 0 0.9% 1 0.0% 0 1.5% 2Yes - go to park 0.2% 2 0.0% 0 0.7% 1 0.0% 0 0.0% 0 0.0% 0 0.7% 0 0.0% 0 0.0% 0Yes - gyms / health and
fitness 0.6% 8 0.7% 0 0.0% 0 0.0% 0 0.8% 1 1.5% 1 2.0% 1 0.0% 0 1.0% 2
Yes - library 0.6% 9 0.0% 0 0.0% 0 1.0% 1 0.0% 0 0.0% 0 0.0% 0 0.0% 0 1.5% 2Yes - markets 0.0% 1 0.0% 0 0.0% 0 0.0% 0 0.8% 1 0.0% 0 0.0% 0 0.0% 0 0.0% 0Yes - meeting family 1.1% 16 0.0% 0 0.7% 1 4.0% 3 1.8% 2 0.8% 0 1.4% 1 0.0% 0 2.5% 4Yes - meeting friends 1.1% 17 0.7% 0 0.7% 1 1.8% 1 0.0% 0 2.5% 1 3.2% 2 0.0% 0 3.5% 5Yes - museums / art gallery 0.0% 0 0.0% 0 0.0% 0 0.0% 0 0.0% 0 0.0% 0 0.0% 0 0.0% 0 0.0% 0Yes - other service (e.g.
travel agent, estate agent etc.)
0.4% 5 1.5% 0 0.0% 0 0.8% 1 1.1% 1 0.0% 0 0.7% 0 0.0% 0 1.0% 2
Yes - personal service (e.g. hairdressers, beauty salon etc.)
1.1% 16 0.7% 0 0.7% 1 1.8% 1 2.0% 2 2.5% 1 0.7% 0 1.4% 1 0.8% 1
Yes - restaurants 0.3% 4 0.7% 0 0.0% 0 0.0% 0 1.0% 1 1.5% 1 0.0% 0 0.7% 1 0.0% 0Yes - swimming 0.5% 7 0.0% 0 0.9% 1 0.0% 0 0.0% 0 0.0% 0 0.0% 0 0.0% 0 0.0% 0Yes - theatre 0.0% 0 0.0% 0 0.0% 0 0.0% 0 0.0% 0 0.0% 0 0.0% 0 0.0% 0 0.0% 0Yes - visiting services such
as banks and other financial institutions
4.0% 59 2.5% 1 4.1% 6 5.1% 4 4.7% 4 11.5% 7 8.8% 6 0.0% 0 5.8% 9
Yes - work 8.3% 125 2.7% 1 8.6% 13 11.3% 9 9.2% 8 17.6% 10 9.9% 7 4.6% 4 13.9% 21Yes - for education (e.g.
student at college, university, or other third level education)
1.0% 15 0.0% 0 3.3% 5 0.0% 0 0.8% 1 0.8% 0 3.4% 2 0.9% 1 0.0% 0
Yes - other 0.0% 0 0.0% 0 0.0% 0 0.0% 0 0.0% 0 0.0% 0 0.0% 0 0.0% 0 0.0% 0Yes - other leisure activity 0.9% 13 3.1% 1 0.0% 0 1.5% 1 0.0% 0 1.1% 1 1.4% 1 0.0% 0 0.8% 1Yes - school run 0.2% 3 0.0% 0 0.0% 0 0.0% 0 1.0% 1 0.0% 0 0.0% 0 2.0% 2 0.0% 0Yes - walk the dog 0.3% 4 0.0% 0 0.7% 1 0.8% 1 0.0% 0 0.0% 0 1.6% 1 1.0% 1 0.0% 0Yes - window shopping /
browsing 0.0% 0 0.0% 0 0.0% 0 0.0% 0 0.0% 0 0.0% 0 0.0% 0 0.0% 0 0.0% 0
(No) 57.2% 860 42.7% 13 62.9% 92 30.7% 24 45.5% 40 35.3% 21 51.3% 36 71.1% 65 56.4% 87(Don’t know) 3.4% 50 5.1% 2 1.7% 2 0.8% 1 1.5% 1 5.5% 3 3.4% 2 0.0% 0 1.8% 3Weighted base: 1503 30 146 78 88 58 70 91 154Sample: 1499 95 97 87 93 89 96 98 97

by Zone (Weighted, Part 2) South Wales Retail Study Page 5
Weighted: for Carter Jonas August 2016
Total Zone 9 Zone 10 Zone 11 Zone 12 Zone 13 Zone 14 Zone 15 Zone 16
Column %ges. 020716 NEMS market research
Q05 When you combine your trip with other activities, where do you normally go? Those who link their trip at Q04
Aberyswyth Town Centre 18.5% 110 0.0% 0 0.0% 0 1.1% 1 3.7% 2 60.1% 21 63.3% 20 75.1% 20 72.8% 47Aberyswyth out of centre
(e.g. retail parks, standalone foodstores)
2.7% 16 0.0% 0 0.0% 0 0.0% 0 3.3% 2 2.6% 1 15.2% 5 21.7% 6 4.3% 3
Cardigan Town Centre 11.1% 66 37.5% 6 71.2% 37 32.6% 17 0.0% 0 11.6% 4 0.0% 0 0.0% 0 0.0% 0Cardigan out of centre (e.g.
Tesco Superstore, Aldi, etc.)
2.8% 16 32.0% 5 3.7% 2 11.0% 6 1.9% 1 1.3% 0 1.5% 0 0.0% 0 0.0% 0
Lampeter 5.4% 32 0.0% 0 0.0% 0 3.7% 2 48.3% 23 9.5% 3 12.9% 4 0.0% 0 0.0% 0Llandysul 0.6% 4 1.4% 0 0.0% 0 4.8% 3 1.9% 1 0.0% 0 0.0% 0 0.0% 0 0.0% 0Aberaeron 0.7% 4 0.0% 0 0.0% 0 0.0% 0 1.4% 1 10.4% 4 0.0% 0 0.0% 0 0.0% 0Tregaron 0.1% 0 0.0% 0 0.0% 0 0.0% 0 0.0% 0 0.0% 0 1.5% 0 0.0% 0 0.0% 0Haverfordwest Town Centre 17.5% 104 11.9% 2 0.0% 0 0.0% 0 0.0% 0 0.0% 0 0.0% 0 0.0% 0 0.0% 0Haverfordwest out of centre
(e.g. retail parks, standalone foodstores)
6.2% 37 7.1% 1 0.0% 0 0.0% 0 0.0% 0 0.0% 0 0.0% 0 0.0% 0 0.0% 0
Pembroke Dock Town Centre
6.1% 36 0.0% 0 0.0% 0 0.0% 0 0.0% 0 0.0% 0 0.0% 0 0.0% 0 0.0% 0
Pembroke Dock out of centre (e.g. Bierspool Retail Park, Tesco London Road, Wilko Pier Road, Lidl Pier Road, etc)
1.5% 9 0.0% 0 0.0% 0 0.0% 0 0.0% 0 0.0% 0 0.0% 0 0.0% 0 0.0% 0
Pembroke Town Centre 1.6% 9 0.0% 0 0.0% 0 0.0% 0 0.0% 0 0.0% 0 0.0% 0 0.0% 0 0.0% 0Pembroke out of centre 0.4% 3 0.0% 0 0.0% 0 0.0% 0 0.0% 0 0.0% 0 0.0% 0 0.0% 0 0.0% 0Milford Haven Town Centre 5.1% 30 0.0% 0 1.9% 1 0.0% 0 0.0% 0 0.0% 0 0.0% 0 0.0% 0 0.0% 0Milford Haven out of centre
(e.g. Havenshead Retail Park, Tesco Superstore, etc.)
0.8% 4 0.0% 0 0.0% 0 0.0% 0 0.0% 0 0.0% 0 0.0% 0 0.0% 0 0.0% 0
0.8% 5 1.4% 0 0.0% 0 0.0% 0 0.0% 0 0.0% 0 0.0% 0 0.0% 0 0.0% 00.3% 2 0.0% 0 0.0% 0 0.0% 0 0.0% 0 0.0% 0 0.0% 0 0.0% 0 0.0% 00.4% 2 0.0% 0 0.0% 0 0.0% 0 0.0% 0 0.0% 0 0.0% 0 0.0% 0 0.0% 00.4% 3 0.0% 0 0.0% 0 0.0% 0 0.0% 0 0.0% 0 0.0% 0 0.0% 0 0.0% 00.5% 3 2.8% 0 4.3% 2 0.0% 0 0.0% 0 0.0% 0 0.0% 0 0.0% 0 0.0% 00.5% 3 0.0% 0 0.0% 0 0.0% 0 0.0% 0 0.0% 0 0.0% 0 0.0% 0 0.0% 02.1% 13 0.0% 0 0.0% 0 0.0% 0 0.0% 0 0.0% 0 0.0% 0 0.0% 0 0.0% 00.1% 1 4.3% 1 0.0% 0 0.0% 0 0.0% 0 0.0% 0 0.0% 0 0.0% 0 0.0% 00.5% 3 0.0% 0 0.0% 0 5.6% 3 0.0% 0 0.0% 0 0.0% 0 0.0% 0 0.0% 06.3% 37 0.0% 0 9.8% 5 27.7% 15 23.3% 11 2.6% 1 0.0% 0 3.1% 1 0.0% 00.2% 1 0.0% 0 2.4% 1 0.0% 0 0.0% 0 0.0% 0 0.0% 0 0.0% 0 0.0% 00.1% 0 0.0% 0 0.0% 0 0.0% 0 0.0% 0 0.0% 0 1.5% 0 0.0% 0 0.0% 00.1% 1 0.0% 0 0.0% 0 0.0% 0 1.4% 1 0.0% 0 0.0% 0 0.0% 0 0.0% 00.3% 2 0.0% 0 0.0% 0 0.0% 0 0.0% 0 0.0% 0 0.0% 0 0.0% 0 2.4% 20.2% 1 0.0% 0 0.0% 0 0.0% 0 2.2% 1 0.0% 0 0.0% 0 0.0% 0 0.0% 00.5% 3 0.0% 0 0.0% 0 0.0% 0 0.0% 0 0.0% 0 0.0% 0 0.0% 0 4.3% 30.2% 1 0.0% 0 0.0% 0 0.0% 0 0.0% 0 0.0% 0 0.0% 0 0.0% 0 0.0% 0
0.5% 3 0.0% 0 4.3% 2 1.1% 1 0.0% 0 0.0% 0 0.0% 0 0.0% 0 0.0% 0
0.2% 1 0.0% 0 0.0% 0 0.0% 0 0.0% 0 0.0% 0 0.0% 0 0.0% 0 1.8% 10.1% 1 0.0% 0 0.0% 0 0.0% 0 0.0% 0 0.0% 0 2.0% 1 0.0% 0 0.0% 04.8% 28 1.4% 0 2.4% 1 12.5% 7 12.6% 6 1.9% 1 2.1% 1 0.0% 0 14.4% 9
593 16 52 53 47 34 32 26 64
Fishguard Town Centre Fishguard out of centre Narberth Neyland Crymych Kilgetty Tenby Newport St Davids Carmarthen Town Centre Cenarth Village Hereford Town Centre Knighton Town Centre Llangwnadl Village Llanybydder Town Centre Machynlleth Town Centre Merlin's Bridge Village
Centre Newcastle Emlyn Town
Centre Newtown Town Centre Pontrhydfendigaid Village (Don't know / varies) Weighted base: Sample: 628 45 38 55 52 49 48 23 41
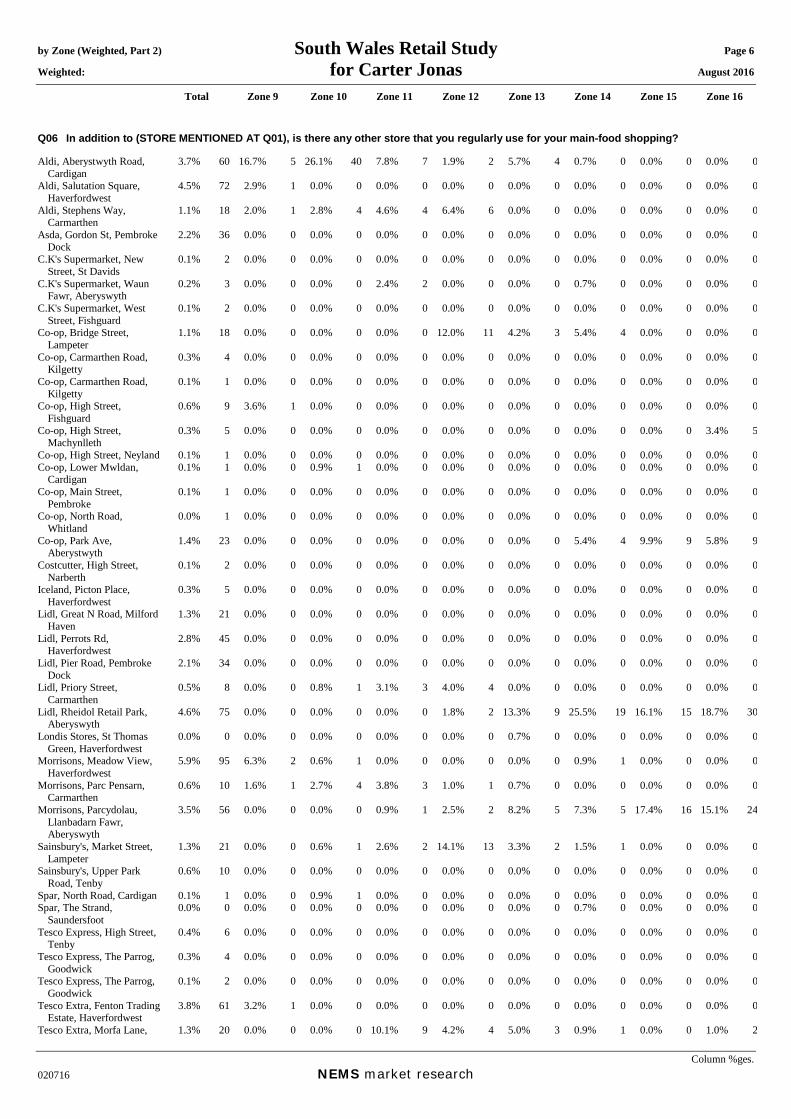
by Zone (Weighted, Part 2) South Wales Retail Study Page 6 Weighted: for Carter Jonas August 2016
Total Zone 9 Zone 10 Zone 11 Zone 12 Zone 13 Zone 14 Zone 15 Zone 16
Column %ges. 020716 NEMS market research
Q06 In addition to (STORE MENTIONED AT Q01), is there any other store that you regularly use for your main-food shopping? Aldi, Aberystwyth Road,
Cardigan 3.7% 60 16.7% 5 26.1% 40 7.8% 7 1.9% 2 5.7% 4 0.7% 0 0.0% 0 0.0% 0
Aldi, Salutation Square, Haverfordwest
4.5% 72 2.9% 1 0.0% 0 0.0% 0 0.0% 0 0.0% 0 0.0% 0 0.0% 0 0.0% 0
Aldi, Stephens Way, Carmarthen
1.1% 18 2.0% 1 2.8% 4 4.6% 4 6.4% 6 0.0% 0 0.0% 0 0.0% 0 0.0% 0
Asda, Gordon St, Pembroke Dock
2.2% 36 0.0% 0 0.0% 0 0.0% 0 0.0% 0 0.0% 0 0.0% 0 0.0% 0 0.0% 0
C.K's Supermarket, New Street, St Davids
0.1% 2 0.0% 0 0.0% 0 0.0% 0 0.0% 0 0.0% 0 0.0% 0 0.0% 0 0.0% 0
C.K's Supermarket, Waun Fawr, Aberyswyth
0.2% 3 0.0% 0 0.0% 0 2.4% 2 0.0% 0 0.0% 0 0.7% 0 0.0% 0 0.0% 0
C.K's Supermarket, West Street, Fishguard
0.1% 2 0.0% 0 0.0% 0 0.0% 0 0.0% 0 0.0% 0 0.0% 0 0.0% 0 0.0% 0
Co-op, Bridge Street, Lampeter
1.1% 18 0.0% 0 0.0% 0 0.0% 0 12.0% 11 4.2% 3 5.4% 4 0.0% 0 0.0% 0
Co-op, Carmarthen Road, Kilgetty
0.3% 4 0.0% 0 0.0% 0 0.0% 0 0.0% 0 0.0% 0 0.0% 0 0.0% 0 0.0% 0
Co-op, Carmarthen Road, Kilgetty
0.1% 1 0.0% 0 0.0% 0 0.0% 0 0.0% 0 0.0% 0 0.0% 0 0.0% 0 0.0% 0
Co-op, High Street, Fishguard
0.6% 9 3.6% 1 0.0% 0 0.0% 0 0.0% 0 0.0% 0 0.0% 0 0.0% 0 0.0% 0
Co-op, High Street, Machynlleth
0.3% 5 0.0% 0 0.0% 0 0.0% 0 0.0% 0 0.0% 0 0.0% 0 0.0% 0 3.4% 5
Co-op, High Street, Neyland 0.1% 1 0.0% 0 0.0% 0 0.0% 0 0.0% 0 0.0% 0 0.0% 0 0.0% 0 0.0% 0Co-op, Lower Mwldan,
Cardigan 0.1% 1 0.0% 0 0.9% 1 0.0% 0 0.0% 0 0.0% 0 0.0% 0 0.0% 0 0.0% 0
Co-op, Main Street, Pembroke
0.1% 1 0.0% 0 0.0% 0 0.0% 0 0.0% 0 0.0% 0 0.0% 0 0.0% 0 0.0% 0
Co-op, North Road, Whitland
0.0% 1 0.0% 0 0.0% 0 0.0% 0 0.0% 0 0.0% 0 0.0% 0 0.0% 0 0.0% 0
Co-op, Park Ave, Aberystwyth
1.4% 23 0.0% 0 0.0% 0 0.0% 0 0.0% 0 0.0% 0 5.4% 4 9.9% 9 5.8% 9
Costcutter, High Street, Narberth
0.1% 2 0.0% 0 0.0% 0 0.0% 0 0.0% 0 0.0% 0 0.0% 0 0.0% 0 0.0% 0
Iceland, Picton Place, Haverfordwest
0.3% 5 0.0% 0 0.0% 0 0.0% 0 0.0% 0 0.0% 0 0.0% 0 0.0% 0 0.0% 0
Lidl, Great N Road, Milford Haven
1.3% 21 0.0% 0 0.0% 0 0.0% 0 0.0% 0 0.0% 0 0.0% 0 0.0% 0 0.0% 0
Lidl, Perrots Rd, Haverfordwest
2.8% 45 0.0% 0 0.0% 0 0.0% 0 0.0% 0 0.0% 0 0.0% 0 0.0% 0 0.0% 0
Lidl, Pier Road, Pembroke Dock
2.1% 34 0.0% 0 0.0% 0 0.0% 0 0.0% 0 0.0% 0 0.0% 0 0.0% 0 0.0% 0
Lidl, Priory Street, Carmarthen
0.5% 8 0.0% 0 0.8% 1 3.1% 3 4.0% 4 0.0% 0 0.0% 0 0.0% 0 0.0% 0
Lidl, Rheidol Retail Park, Aberyswyth
4.6% 75 0.0% 0 0.0% 0 0.0% 0 1.8% 2 13.3% 9 25.5% 19 16.1% 15 18.7% 30
Londis Stores, St Thomas Green, Haverfordwest
0.0% 0 0.0% 0 0.0% 0 0.0% 0 0.0% 0 0.7% 0 0.0% 0 0.0% 0 0.0% 0
Morrisons, Meadow View, Haverfordwest
5.9% 95 6.3% 2 0.6% 1 0.0% 0 0.0% 0 0.0% 0 0.9% 1 0.0% 0 0.0% 0
Morrisons, Parc Pensarn, Carmarthen
0.6% 10 1.6% 1 2.7% 4 3.8% 3 1.0% 1 0.7% 0 0.0% 0 0.0% 0 0.0% 0
Morrisons, Parcydolau, Llanbadarn Fawr, Aberyswyth
3.5% 56 0.0% 0 0.0% 0 0.9% 1 2.5% 2 8.2% 5 7.3% 5 17.4% 16 15.1% 24
Sainsbury's, Market Street, Lampeter
1.3% 21 0.0% 0 0.6% 1 2.6% 2 14.1% 13 3.3% 2 1.5% 1 0.0% 0 0.0% 0
Sainsbury's, Upper Park Road, Tenby
0.6% 10 0.0% 0 0.0% 0 0.0% 0 0.0% 0 0.0% 0 0.0% 0 0.0% 0 0.0% 0
Spar, North Road, Cardigan 0.1% 1 0.0% 0 0.9% 1 0.0% 0 0.0% 0 0.0% 0 0.0% 0 0.0% 0 0.0% 0Spar, The Strand,
Saundersfoot 0.0% 0 0.0% 0 0.0% 0 0.0% 0 0.0% 0 0.0% 0 0.7% 0 0.0% 0 0.0% 0
Tesco Express, High Street, Tenby
0.4% 6 0.0% 0 0.0% 0 0.0% 0 0.0% 0 0.0% 0 0.0% 0 0.0% 0 0.0% 0
Tesco Express, The Parrog, Goodwick
0.3% 4 0.0% 0 0.0% 0 0.0% 0 0.0% 0 0.0% 0 0.0% 0 0.0% 0 0.0% 0
Tesco Express, The Parrog, Goodwick
0.1% 2 0.0% 0 0.0% 0 0.0% 0 0.0% 0 0.0% 0 0.0% 0 0.0% 0 0.0% 0
Tesco Extra, Fenton Trading Estate, Haverfordwest
3.8% 61 3.2% 1 0.0% 0 0.0% 0 0.0% 0 0.0% 0 0.0% 0 0.0% 0 0.0% 0
Tesco Extra, Morfa Lane, 1.3% 20 0.0% 0 0.0% 0 10.1% 9 4.2% 4 5.0% 3 0.9% 1 0.0% 0 1.0% 2
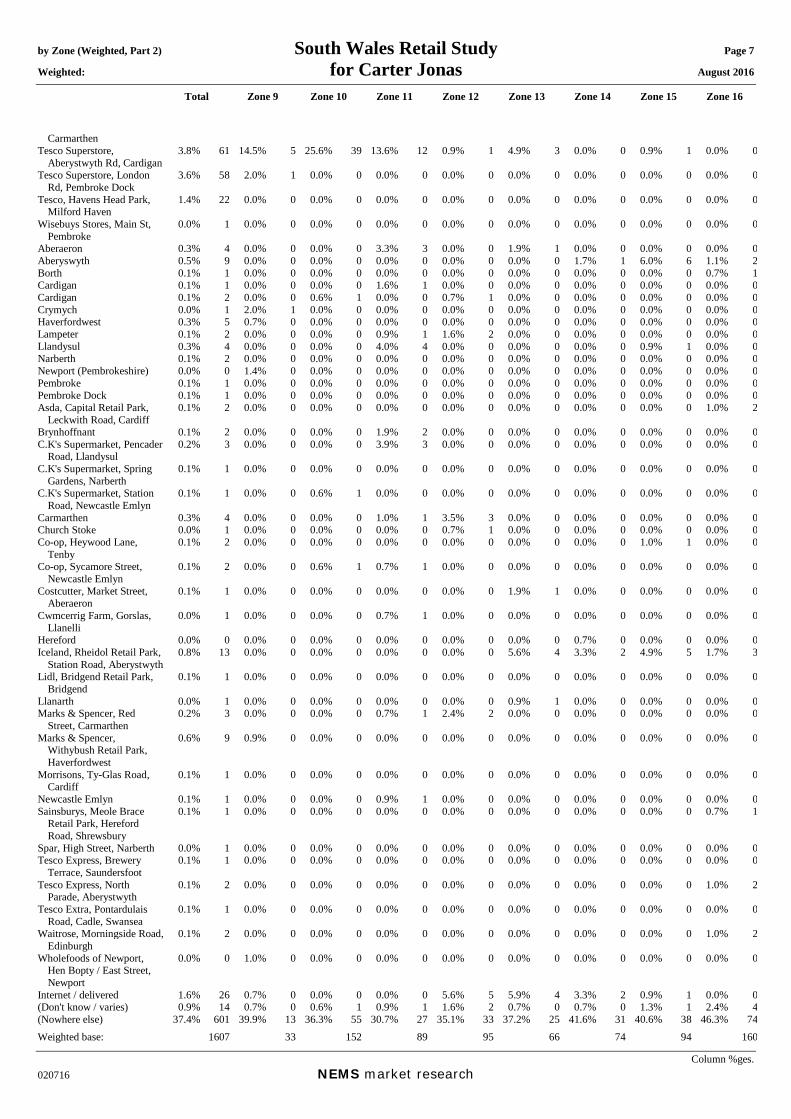
by Zone (Weighted, Part 2) South Wales Retail Study Page 7
Weighted: for Carter Jonas August 2016
Total Zone 9 Zone 10 Zone 11 Zone 12 Zone 13 Zone 14 Zone 15 Zone 16
Column %ges. 020716 NEMS market research
Carmarthen Tesco Superstore,
Aberystwyth Rd, Cardigan 3.8% 61 14.5% 5 25.6% 39 13.6% 12 0.9% 1 4.9% 3 0.0% 0 0.9% 1 0.0% 0
Tesco Superstore, London Rd, Pembroke Dock
3.6% 58 2.0% 1 0.0% 0 0.0% 0 0.0% 0 0.0% 0 0.0% 0 0.0% 0 0.0% 0
Tesco, Havens Head Park, Milford Haven
1.4% 22 0.0% 0 0.0% 0 0.0% 0 0.0% 0 0.0% 0 0.0% 0 0.0% 0 0.0% 0
Wisebuys Stores, Main St, Pembroke
0.0% 1 0.0% 0 0.0% 0 0.0% 0 0.0% 0 0.0% 0 0.0% 0 0.0% 0 0.0% 0
Aberaeron 0.3% 4 0.0% 0 0.0% 0 3.3% 3 0.0% 0 1.9% 1 0.0% 0 0.0% 0 0.0% 0Aberyswyth 0.5% 9 0.0% 0 0.0% 0 0.0% 0 0.0% 0 0.0% 0 1.7% 1 6.0% 6 1.1% 2Borth 0.1% 1 0.0% 0 0.0% 0 0.0% 0 0.0% 0 0.0% 0 0.0% 0 0.0% 0 0.7% 1Cardigan 0.1% 1 0.0% 0 0.0% 0 1.6% 1 0.0% 0 0.0% 0 0.0% 0 0.0% 0 0.0% 0Cardigan 0.1% 2 0.0% 0 0.6% 1 0.0% 0 0.7% 1 0.0% 0 0.0% 0 0.0% 0 0.0% 0Crymych 0.0% 1 2.0% 1 0.0% 0 0.0% 0 0.0% 0 0.0% 0 0.0% 0 0.0% 0 0.0% 0
0.3% 5 0.7% 0 0.0% 0 0.0% 0 0.0% 0 0.0% 0 0.0% 0 0.0% 0 0.0% 00.1% 2 0.0% 0 0.0% 0 0.9% 1 1.6% 2 0.0% 0 0.0% 0 0.0% 0 0.0% 00.3% 4 0.0% 0 0.0% 0 4.0% 4 0.0% 0 0.0% 0 0.0% 0 0.9% 1 0.0% 00.1% 2 0.0% 0 0.0% 0 0.0% 0 0.0% 0 0.0% 0 0.0% 0 0.0% 0 0.0% 00.0% 0 1.4% 0 0.0% 0 0.0% 0 0.0% 0 0.0% 0 0.0% 0 0.0% 0 0.0% 00.1% 1 0.0% 0 0.0% 0 0.0% 0 0.0% 0 0.0% 0 0.0% 0 0.0% 0 0.0% 00.1% 1 0.0% 0 0.0% 0 0.0% 0 0.0% 0 0.0% 0 0.0% 0 0.0% 0 0.0% 00.1% 2 0.0% 0 0.0% 0 0.0% 0 0.0% 0 0.0% 0 0.0% 0 0.0% 0 1.0% 2
Haverfordwest Lampeter Llandysul Narberth Newport (Pembrokeshire) Pembroke Pembroke Dock Asda, Capital Retail Park,
Leckwith Road, Cardiff Brynhoffnant 0.1% 2 0.0% 0 0.0% 0 1.9% 2 0.0% 0 0.0% 0 0.0% 0 0.0% 0 0.0% 0C.K's Supermarket, Pencader
Road, Llandysul0.2% 3 0.0% 0 0.0% 0 3.9% 3 0.0% 0 0.0% 0 0.0% 0 0.0% 0 0.0% 0
C.K's Supermarket, Spring Gardens, Narberth
0.1% 1 0.0% 0 0.0% 0 0.0% 0 0.0% 0 0.0% 0 0.0% 0 0.0% 0 0.0% 0
C.K's Supermarket, Station Road, Newcastle Emlyn
0.1% 1 0.0% 0 0.6% 1 0.0% 0 0.0% 0 0.0% 0 0.0% 0 0.0% 0 0.0% 0
Carmarthen 0.3% 4 0.0% 0 0.0% 0 1.0% 1 3.5% 3 0.0% 0 0.0% 0 0.0% 0 0.0% 0Church Stoke 0.0% 1 0.0% 0 0.0% 0 0.0% 0 0.7% 1 0.0% 0 0.0% 0 0.0% 0 0.0% 0Co-op, Heywood Lane,
Tenby 0.1% 2 0.0% 0 0.0% 0 0.0% 0 0.0% 0 0.0% 0 0.0% 0 1.0% 1 0.0% 0
Co-op, Sycamore Street, Newcastle Emlyn
0.1% 2 0.0% 0 0.6% 1 0.7% 1 0.0% 0 0.0% 0 0.0% 0 0.0% 0 0.0% 0
Costcutter, Market Street, Aberaeron
0.1% 1 0.0% 0 0.0% 0 0.0% 0 0.0% 0 1.9% 1 0.0% 0 0.0% 0 0.0% 0
Cwmcerrig Farm, Gorslas, Llanelli
0.0% 1 0.0% 0 0.0% 0 0.7% 1 0.0% 0 0.0% 0 0.0% 0 0.0% 0 0.0% 0
Hereford 0.0% 0 0.0% 0 0.0% 0 0.0% 0 0.0% 0 0.0% 0 0.7% 0 0.0% 0 0.0% 0Iceland, Rheidol Retail Park,
Station Road, Aberystwyth 0.8% 13 0.0% 0 0.0% 0 0.0% 0 0.0% 0 5.6% 4 3.3% 2 4.9% 5 1.7% 3
Lidl, Bridgend Retail Park, Bridgend
0.1% 1 0.0% 0 0.0% 0 0.0% 0 0.0% 0 0.0% 0 0.0% 0 0.0% 0 0.0% 0
Llanarth 0.0% 1 0.0% 0 0.0% 0 0.0% 0 0.0% 0 0.9% 1 0.0% 0 0.0% 0 0.0% 0Marks & Spencer, Red
Street, Carmarthen 0.2% 3 0.0% 0 0.0% 0 0.7% 1 2.4% 2 0.0% 0 0.0% 0 0.0% 0 0.0% 0
Marks & Spencer, Withybush Retail Park, Haverfordwest
0.6% 9 0.9% 0 0.0% 0 0.0% 0 0.0% 0 0.0% 0 0.0% 0 0.0% 0 0.0% 0
Morrisons, Ty-Glas Road, Cardiff
0.1% 1 0.0% 0 0.0% 0 0.0% 0 0.0% 0 0.0% 0 0.0% 0 0.0% 0 0.0% 0
Newcastle Emlyn 0.1% 1 0.0% 0 0.0% 0 0.9% 1 0.0% 0 0.0% 0 0.0% 0 0.0% 0 0.0% 0Sainsburys, Meole Brace
Retail Park, Hereford Road, Shrewsbury
0.1% 1 0.0% 0 0.0% 0 0.0% 0 0.0% 0 0.0% 0 0.0% 0 0.0% 0 0.7% 1
Spar, High Street, Narberth 0.0% 1 0.0% 0 0.0% 0 0.0% 0 0.0% 0 0.0% 0 0.0% 0 0.0% 0 0.0% 0Tesco Express, Brewery
Terrace, Saundersfoot 0.1% 1 0.0% 0 0.0% 0 0.0% 0 0.0% 0 0.0% 0 0.0% 0 0.0% 0 0.0% 0
Tesco Express, North Parade, Aberystwyth
0.1% 2 0.0% 0 0.0% 0 0.0% 0 0.0% 0 0.0% 0 0.0% 0 0.0% 0 1.0% 2
Tesco Extra, Pontardulais Road, Cadle, Swansea
0.1% 1 0.0% 0 0.0% 0 0.0% 0 0.0% 0 0.0% 0 0.0% 0 0.0% 0 0.0% 0
Waitrose, Morningside Road, Edinburgh
0.1% 2 0.0% 0 0.0% 0 0.0% 0 0.0% 0 0.0% 0 0.0% 0 0.0% 0 1.0% 2
Wholefoods of Newport, Hen Bopty / East Street, Newport
0.0% 0 1.0% 0 0.0% 0 0.0% 0 0.0% 0 0.0% 0 0.0% 0 0.0% 0 0.0% 0
Internet / delivered 1.6% 26 0.7% 0 0.0% 0 0.0% 0 5.6% 5 5.9% 4 3.3% 2 0.9% 1 0.0% 0(Don't know / varies) 0.9% 14 0.7% 0 0.6% 1 0.9% 1 1.6% 2 0.7% 0 0.7% 0 1.3% 1 2.4% 4(Nowhere else) 37.4% 601 39.9% 13 36.3% 55 30.7% 27 35.1% 33 37.2% 25 41.6% 31 40.6% 38 46.3% 74Weighted base: 1607 33 152 89 95 66 74 94 160
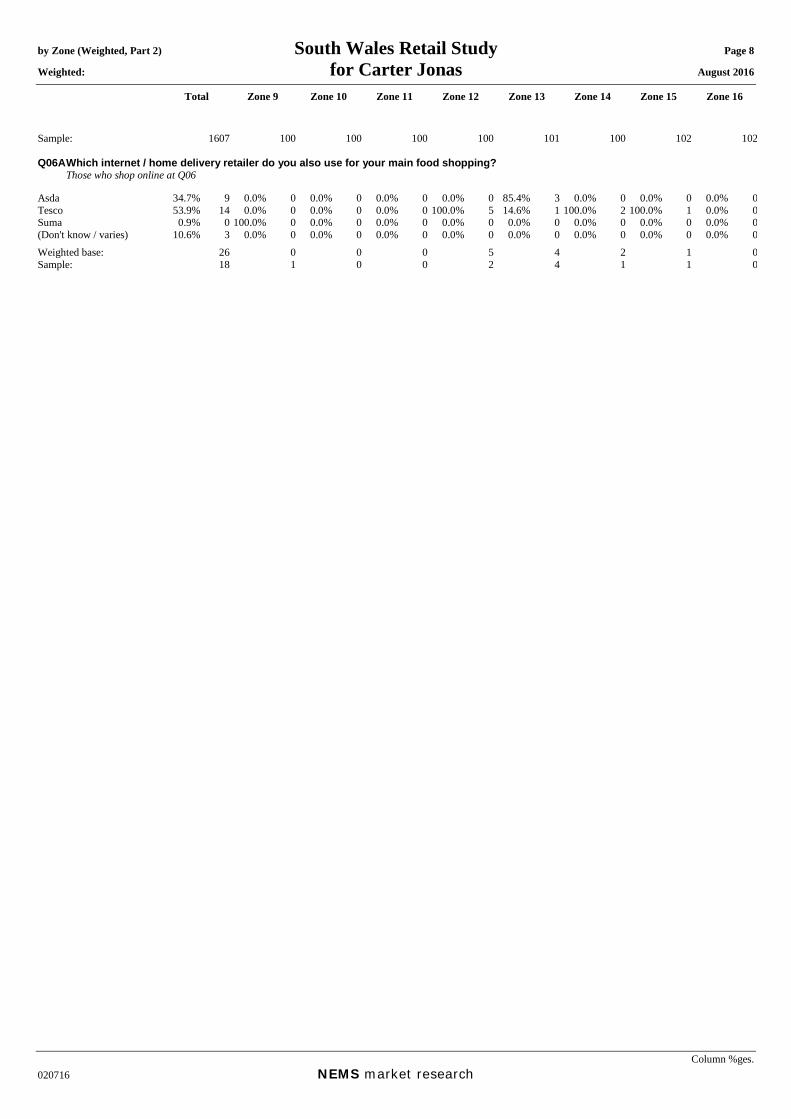
by Zone (Weighted, Part 2) South Wales Retail Study Page 8 Weighted: for Carter Jonas August 2016
Total Zone 9 Zone 10 Zone 11 Zone 12 Zone 13 Zone 14 Zone 15 Zone 16
Column %ges. 020716 NEMS market research
Sample: 1607 100 100 100 100 101 100 102 102 Q06A Which internet / home delivery retailer do you also use for your main food shopping? Those who shop online at Q06 Asda 34.7% 9 0.0% 0 0.0% 0 0.0% 0 0.0% 0 85.4% 3 0.0% 0 0.0% 0 0.0% 0Tesco 53.9% 14 0.0% 0 0.0% 0 0.0% 0 100.0% 5 14.6% 1 100.0% 2 100.0% 1 0.0% 0Suma 0.9% 0 100.0% 0 0.0% 0 0.0% 0 0.0% 0 0.0% 0 0.0% 0 0.0% 0 0.0% 0(Don't know / varies) 10.6% 3 0.0% 0 0.0% 0 0.0% 0 0.0% 0 0.0% 0 0.0% 0 0.0% 0 0.0% 0Weighted base: 26 0 0 0 5 4 2 1 0Sample: 18 1 0 0 2 4 1 1 0

by Zone (Weighted, Part 2) South Wales Retail Study Page 9 Weighted: for Carter Jonas August 2016
Total Zone 9 Zone 10 Zone 11 Zone 12 Zone 13 Zone 14 Zone 15 Zone 16
Column %ges. 020716 NEMS market research
Q07 In addition to your main food shopping, where do you normally do most of your household's small scale top-up food shopping (i.e. the store you visit regularly (2+ times a week to buy bread, milk, etc., on a day-to-day basis)?
Aldi, Aberystwyth Road,
Cardigan 1.0% 16 3.4% 1 9.3% 14 0.9% 1 0.0% 0 0.0% 0 0.0% 0 0.0% 0 0.0% 0
Aldi, Salutation Square, Haverfordwest
1.1% 18 0.0% 0 0.0% 0 0.0% 0 0.0% 0 0.0% 0 0.0% 0 0.0% 0 0.0% 0
Aldi, Stephens Way, Carmarthen
0.0% 1 0.0% 0 0.0% 0 0.9% 1 0.0% 0 0.0% 0 0.0% 0 0.0% 0 0.0% 0
Asda, Gordon St, Pembroke Dock
2.4% 38 0.0% 0 0.0% 0 0.0% 0 0.0% 0 0.0% 0 0.0% 0 0.0% 0 0.0% 0
C.K's Supermarket, New Street, St Davids
0.6% 9 0.0% 0 0.0% 0 0.0% 0 0.0% 0 0.0% 0 0.0% 0 0.0% 0 0.0% 0
C.K's Supermarket, Waun Fawr, Aberyswyth
1.0% 16 0.0% 0 0.0% 0 0.0% 0 0.0% 0 0.9% 1 1.5% 1 0.0% 0 7.4% 12
C.K's Supermarket, West Street, Fishguard
0.2% 4 2.0% 1 0.0% 0 0.0% 0 0.0% 0 0.0% 0 0.0% 0 0.0% 0 0.0% 0
Co-op, Bridge Street, Lampeter
1.1% 17 0.0% 0 0.0% 0 0.0% 0 14.0% 13 3.3% 2 2.4% 2 0.0% 0 0.0% 0
Co-op, Carmarthen Road, Kilgetty
0.7% 11 0.0% 0 0.0% 0 0.0% 0 0.0% 0 0.0% 0 0.0% 0 0.0% 0 0.0% 0
Co-op, Carmarthen Road, Kilgetty
0.7% 11 0.0% 0 0.0% 0 0.0% 0 0.0% 0 0.0% 0 0.0% 0 0.0% 0 0.0% 0
Co-op, High Street, Fishguard
1.3% 20 3.9% 1 0.0% 0 0.0% 0 0.0% 0 0.0% 0 0.0% 0 0.0% 0 0.0% 0
Co-op, High Street, Machynlleth
0.8% 13 0.0% 0 0.0% 0 0.0% 0 0.0% 0 0.0% 0 0.0% 0 0.9% 1 7.8% 12
Co-op, High Street, Neyland 1.1% 18 0.0% 0 0.0% 0 0.0% 0 0.0% 0 0.0% 0 0.0% 0 0.0% 0 0.0% 0Co-op, Main Street,
Pembroke 0.5% 8 0.0% 0 0.0% 0 0.0% 0 0.0% 0 0.0% 0 0.0% 0 0.0% 0 1.0% 2
Co-op, North Road, Whitland
0.0% 1 0.0% 0 0.0% 0 0.0% 0 0.0% 0 0.0% 0 0.0% 0 0.0% 0 0.0% 0
Co-op, Park Ave, Aberystwyth
1.8% 29 0.0% 0 0.0% 0 0.0% 0 0.0% 0 0.0% 0 11.5% 8 12.6% 12 5.1% 8
Costcutter, High Street, Narberth
0.2% 3 0.0% 0 0.0% 0 0.0% 0 0.9% 1 1.9% 1 0.0% 0 0.0% 0 0.0% 0
Iceland, Picton Place, Haverfordwest
0.1% 1 0.0% 0 0.0% 0 0.0% 0 0.0% 0 0.0% 0 0.0% 0 0.7% 1 0.0% 0
Lidl, Great N Road, Milford Haven
1.2% 19 0.0% 0 0.0% 0 0.0% 0 0.0% 0 0.0% 0 0.0% 0 0.0% 0 0.0% 0
Lidl, Perrots Rd, Haverfordwest
1.0% 15 0.0% 0 0.0% 0 0.0% 0 0.0% 0 0.0% 0 0.0% 0 0.0% 0 0.0% 0
Lidl, Pier Road, Pembroke Dock
0.9% 14 0.0% 0 0.0% 0 0.0% 0 0.0% 0 0.0% 0 0.0% 0 0.0% 0 0.0% 0
Lidl, Priory Street, Carmarthen
0.1% 2 0.0% 0 0.8% 1 0.7% 1 0.0% 0 0.0% 0 0.0% 0 0.0% 0 0.0% 0
Lidl, Rheidol Retail Park, Aberyswyth
2.0% 32 0.0% 0 0.0% 0 0.0% 0 0.0% 0 7.3% 5 0.9% 1 18.0% 17 6.1% 10
Londis Stores, St Thomas Green, Haverfordwest
0.0% 1 0.0% 0 0.0% 0 0.0% 0 0.0% 0 0.0% 0 0.0% 0 0.0% 0 0.0% 0
Morrisons, Meadow View, Haverfordwest
2.1% 34 1.6% 1 0.0% 0 0.0% 0 0.0% 0 0.0% 0 0.0% 0 0.0% 0 0.0% 0
Morrisons, Parcydolau, Llanbadarn Fawr, Aberyswyth
1.7% 28 0.0% 0 0.0% 0 0.0% 0 0.0% 0 1.3% 1 7.9% 6 12.7% 12 5.6% 9
Sainsbury's, Market Street, Lampeter
1.4% 22 0.0% 0 0.0% 0 0.7% 1 21.2% 20 0.0% 0 0.9% 1 0.0% 0 0.0% 0
Sainsbury's, Upper Park Road, Tenby
1.0% 16 0.0% 0 0.0% 0 0.0% 0 0.0% 0 0.0% 0 0.0% 0 0.0% 0 0.0% 0
Spar, Long Mains, Pembroke 0.4% 7 0.0% 0 0.0% 0 0.0% 0 0.0% 0 0.0% 0 0.0% 0 0.0% 0 0.0% 0Spar, North Road, Cardigan 0.1% 1 0.0% 0 0.6% 1 0.0% 0 0.0% 0 0.0% 0 0.0% 0 0.0% 0 0.0% 0Spar, The Strand,
Saundersfoot 0.6% 10 0.0% 0 1.8% 3 1.8% 2 0.0% 0 0.0% 0 0.0% 0 3.4% 3 0.0% 0
Tesco Express, High Street, Tenby
0.3% 4 0.0% 0 0.0% 0 0.0% 0 0.0% 0 0.0% 0 0.0% 0 0.0% 0 0.0% 0
Tesco Express, The Parrog, Goodwick
0.2% 3 0.0% 0 0.0% 0 0.0% 0 0.0% 0 0.0% 0 0.0% 0 0.0% 0 0.0% 0
Tesco Express, The Parrog, Goodwick
0.3% 5 0.0% 0 0.0% 0 0.0% 0 0.0% 0 0.0% 0 0.0% 0 0.0% 0 0.0% 0
Tesco Extra, Fenton Trading Estate, Haverfordwest
2.9% 47 0.9% 0 0.0% 0 0.0% 0 0.0% 0 0.0% 0 0.0% 0 0.0% 0 0.0% 0
Tesco Extra, Morfa Lane, Carmarthen
0.3% 4 0.0% 0 0.0% 0 4.0% 4 0.0% 0 0.0% 0 0.0% 0 0.0% 0 0.0% 0
Tesco Superstore, 1.4% 23 6.1% 2 11.7% 18 0.0% 0 0.0% 0 0.0% 0 0.0% 0 3.4% 3 0.0% 0
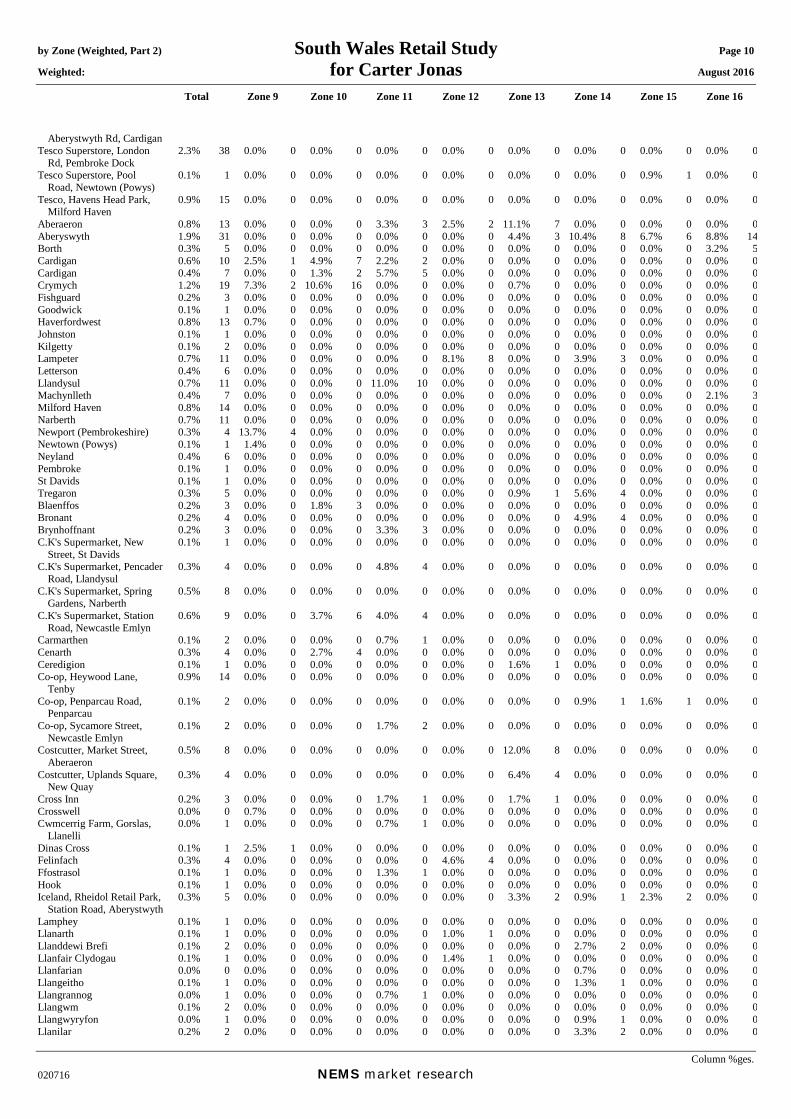
by Zone (Weighted, Part 2) South Wales Retail Study Page 10
Weighted: for Carter Jonas August 2016
Total Zone 9 Zone 10 Zone 11 Zone 12 Zone 13 Zone 14 Zone 15 Zone 16
Column %ges. 020716 NEMS market research
Aberystwyth Rd, Cardigan Tesco Superstore, London
Rd, Pembroke Dock 2.3% 38 0.0% 0 0.0% 0 0.0% 0 0.0% 0 0.0% 0 0.0% 0 0.0% 0 0.0% 0
Tesco Superstore, Pool Road, Newtown (Powys)
0.1% 1 0.0% 0 0.0% 0 0.0% 0 0.0% 0 0.0% 0 0.0% 0 0.9% 1 0.0% 0
Tesco, Havens Head Park, Milford Haven
0.9% 15 0.0% 0 0.0% 0 0.0% 0 0.0% 0 0.0% 0 0.0% 0 0.0% 0 0.0% 0
Aberaeron 0.8% 13 0.0% 0 0.0% 0 3.3% 3 2.5% 2 11.1% 7 0.0% 0 0.0% 0 0.0% 0Aberyswyth 1.9% 31 0.0% 0 0.0% 0 0.0% 0 0.0% 0 4.4% 3 10.4% 8 6.7% 6 8.8% 14Borth 0.3% 5 0.0% 0 0.0% 0 0.0% 0 0.0% 0 0.0% 0 0.0% 0 0.0% 0 3.2% 5Cardigan 0.6% 10 2.5% 1 4.9% 7 2.2% 2 0.0% 0 0.0% 0 0.0% 0 0.0% 0 0.0% 0Cardigan 0.4% 7 0.0% 0 1.3% 2 5.7% 5 0.0% 0 0.0% 0 0.0% 0 0.0% 0 0.0% 0Crymych 1.2% 19 7.3% 2 10.6% 16 0.0% 0 0.0% 0 0.7% 0 0.0% 0 0.0% 0 0.0% 0Fishguard 0.2% 3 0.0% 0 0.0% 0 0.0% 0 0.0% 0 0.0% 0 0.0% 0 0.0% 0 0.0% 0Goodwick 0.1% 1 0.0% 0 0.0% 0 0.0% 0 0.0% 0 0.0% 0 0.0% 0 0.0% 0 0.0% 0Haverfordwest 0.8% 13 0.7% 0 0.0% 0 0.0% 0 0.0% 0 0.0% 0 0.0% 0 0.0% 0 0.0% 0Johnston 0.1% 1 0.0% 0 0.0% 0 0.0% 0 0.0% 0 0.0% 0 0.0% 0 0.0% 0 0.0% 0Kilgetty 0.1% 2 0.0% 0 0.0% 0 0.0% 0 0.0% 0 0.0% 0 0.0% 0 0.0% 0 0.0% 0Lampeter 0.7% 11 0.0% 0 0.0% 0 0.0% 0 8.1% 8 0.0% 0 3.9% 3 0.0% 0 0.0% 0Letterson 0.4% 6 0.0% 0 0.0% 0 0.0% 0 0.0% 0 0.0% 0 0.0% 0 0.0% 0 0.0% 0Llandysul 0.7% 11 0.0% 0 0.0% 0 11.0% 10 0.0% 0 0.0% 0 0.0% 0 0.0% 0 0.0% 0
0.4% 7 0.0% 0 0.0% 0 0.0% 0 0.0% 0 0.0% 0 0.0% 0 0.0% 0 2.1% 30.8% 14 0.0% 0 0.0% 0 0.0% 0 0.0% 0 0.0% 0 0.0% 0 0.0% 0 0.0% 00.7% 11 0.0% 0 0.0% 0 0.0% 0 0.0% 0 0.0% 0 0.0% 0 0.0% 0 0.0% 00.3% 4 13.7% 4 0.0% 0 0.0% 0 0.0% 0 0.0% 0 0.0% 0 0.0% 0 0.0% 00.1% 1 1.4% 0 0.0% 0 0.0% 0 0.0% 0 0.0% 0 0.0% 0 0.0% 0 0.0% 00.4% 6 0.0% 0 0.0% 0 0.0% 0 0.0% 0 0.0% 0 0.0% 0 0.0% 0 0.0% 00.1% 1 0.0% 0 0.0% 0 0.0% 0 0.0% 0 0.0% 0 0.0% 0 0.0% 0 0.0% 00.1% 1 0.0% 0 0.0% 0 0.0% 0 0.0% 0 0.0% 0 0.0% 0 0.0% 0 0.0% 00.3% 5 0.0% 0 0.0% 0 0.0% 0 0.0% 0 0.9% 1 5.6% 4 0.0% 0 0.0% 00.2% 3 0.0% 0 1.8% 3 0.0% 0 0.0% 0 0.0% 0 0.0% 0 0.0% 0 0.0% 00.2% 4 0.0% 0 0.0% 0 0.0% 0 0.0% 0 0.0% 0 4.9% 4 0.0% 0 0.0% 0
Machynlleth Milford Haven Narberth Newport (Pembrokeshire) Newtown (Powys) Neyland Pembroke St Davids Tregaron Blaenffos Bronant Brynhoffnant 0.2% 3 0.0% 0 0.0% 0 3.3% 3 0.0% 0 0.0% 0 0.0% 0 0.0% 0 0.0% 0C.K's Supermarket, New
Street, St Davids 0.1% 1 0.0% 0 0.0% 0 0.0% 0 0.0% 0 0.0% 0 0.0% 0 0.0% 0 0.0% 0
C.K's Supermarket, Pencader Road, Llandysul
0.3% 4 0.0% 0 0.0% 0 4.8% 4 0.0% 0 0.0% 0 0.0% 0 0.0% 0 0.0% 0
C.K's Supermarket, Spring Gardens, Narberth
0.5% 8 0.0% 0 0.0% 0 0.0% 0 0.0% 0 0.0% 0 0.0% 0 0.0% 0 0.0% 0
C.K's Supermarket, Station Road, Newcastle Emlyn
0.6% 9 0.0% 0 3.7% 6 4.0% 4 0.0% 0 0.0% 0 0.0% 0 0.0% 0 0.0% 0
Carmarthen 0.1% 2 0.0% 0 0.0% 0 0.7% 1 0.0% 0 0.0% 0 0.0% 0 0.0% 0 0.0% 0Cenarth 0.3% 4 0.0% 0 2.7% 4 0.0% 0 0.0% 0 0.0% 0 0.0% 0 0.0% 0 0.0% 0Ceredigion 0.1% 1 0.0% 0 0.0% 0 0.0% 0 0.0% 0 1.6% 1 0.0% 0 0.0% 0 0.0% 0Co-op, Heywood Lane,
Tenby 0.9% 14 0.0% 0 0.0% 0 0.0% 0 0.0% 0 0.0% 0 0.0% 0 0.0% 0 0.0% 0
Co-op, Penparcau Road, Penparcau
0.1% 2 0.0% 0 0.0% 0 0.0% 0 0.0% 0 0.0% 0 0.9% 1 1.6% 1 0.0% 0
Co-op, Sycamore Street, Newcastle Emlyn
0.1% 2 0.0% 0 0.0% 0 1.7% 2 0.0% 0 0.0% 0 0.0% 0 0.0% 0 0.0% 0
Costcutter, Market Street, Aberaeron
0.5% 8 0.0% 0 0.0% 0 0.0% 0 0.0% 0 12.0% 8 0.0% 0 0.0% 0 0.0% 0
Costcutter, Uplands Square, New Quay
0.3% 4 0.0% 0 0.0% 0 0.0% 0 0.0% 0 6.4% 4 0.0% 0 0.0% 0 0.0% 0
Cross Inn 0.2% 3 0.0% 0 0.0% 0 1.7% 1 0.0% 0 1.7% 1 0.0% 0 0.0% 0 0.0% 0Crosswell 0.0% 0 0.7% 0 0.0% 0 0.0% 0 0.0% 0 0.0% 0 0.0% 0 0.0% 0 0.0% 0Cwmcerrig Farm, Gorslas,
Llanelli 0.0% 1 0.0% 0 0.0% 0 0.7% 1 0.0% 0 0.0% 0 0.0% 0 0.0% 0 0.0% 0
Dinas Cross 0.1% 1 2.5% 1 0.0% 0 0.0% 0 0.0% 0 0.0% 0 0.0% 0 0.0% 0 0.0% 0Felinfach 0.3% 4 0.0% 0 0.0% 0 0.0% 0 4.6% 4 0.0% 0 0.0% 0 0.0% 0 0.0% 0Ffostrasol 0.1% 1 0.0% 0 0.0% 0 1.3% 1 0.0% 0 0.0% 0 0.0% 0 0.0% 0 0.0% 0Hook 0.1% 1 0.0% 0 0.0% 0 0.0% 0 0.0% 0 0.0% 0 0.0% 0 0.0% 0 0.0% 0Iceland, Rheidol Retail Park,
Station Road, Aberystwyth 0.3% 5 0.0% 0 0.0% 0 0.0% 0 0.0% 0 3.3% 2 0.9% 1 2.3% 2 0.0% 0
Lamphey 0.1% 1 0.0% 0 0.0% 0 0.0% 0 0.0% 0 0.0% 0 0.0% 0 0.0% 0 0.0% 0Llanarth 0.1% 1 0.0% 0 0.0% 0 0.0% 0 1.0% 1 0.0% 0 0.0% 0 0.0% 0 0.0% 0Llanddewi Brefi 0.1% 2 0.0% 0 0.0% 0 0.0% 0 0.0% 0 0.0% 0 2.7% 2 0.0% 0 0.0% 0Llanfair Clydogau 0.1% 1 0.0% 0 0.0% 0 0.0% 0 1.4% 1 0.0% 0 0.0% 0 0.0% 0 0.0% 0Llanfarian 0.0% 0 0.0% 0 0.0% 0 0.0% 0 0.0% 0 0.0% 0 0.7% 0 0.0% 0 0.0% 0Llangeitho 0.1% 1 0.0% 0 0.0% 0 0.0% 0 0.0% 0 0.0% 0 1.3% 1 0.0% 0 0.0% 0Llangrannog 0.0% 1 0.0% 0 0.0% 0 0.7% 1 0.0% 0 0.0% 0 0.0% 0 0.0% 0 0.0% 0Llangwm 0.1% 2 0.0% 0 0.0% 0 0.0% 0 0.0% 0 0.0% 0 0.0% 0 0.0% 0 0.0% 0Llangwyryfon 0.0% 1 0.0% 0 0.0% 0 0.0% 0 0.0% 0 0.0% 0 0.9% 1 0.0% 0 0.0% 0Llanilar 0.2% 2 0.0% 0 0.0% 0 0.0% 0 0.0% 0 0.0% 0 3.3% 2 0.0% 0 0.0% 0
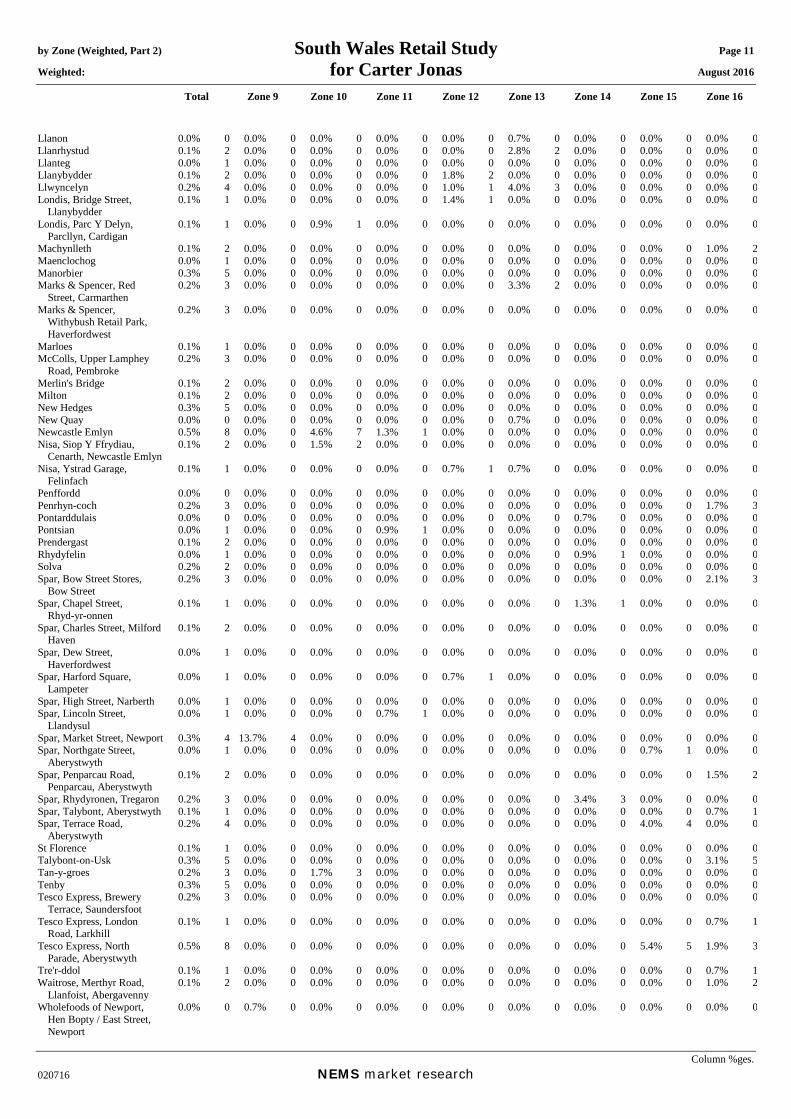
by Zone (Weighted, Part 2) South Wales Retail Study Page 11 Weighted: for Carter Jonas August 2016
Total Zone 9 Zone 10 Zone 11 Zone 12 Zone 13 Zone 14 Zone 15 Zone 16
Column %ges. 020716 NEMS market research
Llanon 0.0% 0 0.0% 0 0.0% 0 0.0% 0 0.0% 0 0.7% 0 0.0% 0 0.0% 0 0.0% 0Llanrhystud 0.1% 2 0.0% 0 0.0% 0 0.0% 0 0.0% 0 2.8% 2 0.0% 0 0.0% 0 0.0% 0Llanteg 0.0% 1 0.0% 0 0.0% 0 0.0% 0 0.0% 0 0.0% 0 0.0% 0 0.0% 0 0.0% 0Llanybydder 0.1% 2 0.0% 0 0.0% 0 0.0% 0 1.8% 2 0.0% 0 0.0% 0 0.0% 0 0.0% 0Llwyncelyn 0.2% 4 0.0% 0 0.0% 0 0.0% 0 1.0% 1 4.0% 3 0.0% 0 0.0% 0 0.0% 0Londis, Bridge Street,
Llanybydder 0.1% 1 0.0% 0 0.0% 0 0.0% 0 1.4% 1 0.0% 0 0.0% 0 0.0% 0 0.0% 0
Londis, Parc Y Delyn, Parcllyn, Cardigan
0.1% 1 0.0% 0 0.9% 1 0.0% 0 0.0% 0 0.0% 0 0.0% 0 0.0% 0 0.0% 0
Machynlleth 0.1% 2 0.0% 0 0.0% 0 0.0% 0 0.0% 0 0.0% 0 0.0% 0 0.0% 0 1.0% 2Maenclochog 0.0% 1 0.0% 0 0.0% 0 0.0% 0 0.0% 0 0.0% 0 0.0% 0 0.0% 0 0.0% 0Manorbier 0.3% 5 0.0% 0 0.0% 0 0.0% 0 0.0% 0 0.0% 0 0.0% 0 0.0% 0 0.0% 0Marks & Spencer, Red
Street, Carmarthen 0.2% 3 0.0% 0 0.0% 0 0.0% 0 0.0% 0 3.3% 2 0.0% 0 0.0% 0 0.0% 0
Marks & Spencer, Withybush Retail Park, Haverfordwest
0.2% 3 0.0% 0 0.0% 0 0.0% 0 0.0% 0 0.0% 0 0.0% 0 0.0% 0 0.0% 0
Marloes 0.1% 1 0.0% 0 0.0% 0 0.0% 0 0.0% 0 0.0% 0 0.0% 0 0.0% 0 0.0% 0McColls, Upper Lamphey
Road, Pembroke 0.2% 3 0.0% 0 0.0% 0 0.0% 0 0.0% 0 0.0% 0 0.0% 0 0.0% 0 0.0% 0
Merlin's Bridge 0.1% 2 0.0% 0 0.0% 0 0.0% 0 0.0% 0 0.0% 0 0.0% 0 0.0% 0 0.0% 0Milton 0.1% 2 0.0% 0 0.0% 0 0.0% 0 0.0% 0 0.0% 0 0.0% 0 0.0% 0 0.0% 0New Hedges 0.3% 5 0.0% 0 0.0% 0 0.0% 0 0.0% 0 0.0% 0 0.0% 0 0.0% 0 0.0% 0New Quay 0.0% 0 0.0% 0 0.0% 0 0.0% 0 0.0% 0 0.7% 0 0.0% 0 0.0% 0 0.0% 0Newcastle Emlyn 0.5% 8 0.0% 0 4.6% 7 1.3% 1 0.0% 0 0.0% 0 0.0% 0 0.0% 0 0.0% 0Nisa, Siop Y Ffrydiau,
Cenarth, Newcastle Emlyn 0.1% 2 0.0% 0 1.5% 2 0.0% 0 0.0% 0 0.0% 0 0.0% 0 0.0% 0 0.0% 0
Nisa, Ystrad Garage, Felinfach
0.1% 1 0.0% 0 0.0% 0 0.0% 0 0.7% 1 0.7% 0 0.0% 0 0.0% 0 0.0% 0
Penffordd 0.0% 0 0.0% 0 0.0% 0 0.0% 0 0.0% 0 0.0% 0 0.0% 0 0.0% 0 0.0% 0Penrhyn-coch 0.2% 3 0.0% 0 0.0% 0 0.0% 0 0.0% 0 0.0% 0 0.0% 0 0.0% 0 1.7% 3Pontarddulais 0.0% 0 0.0% 0 0.0% 0 0.0% 0 0.0% 0 0.0% 0 0.7% 0 0.0% 0 0.0% 0Pontsian 0.0% 1 0.0% 0 0.0% 0 0.9% 1 0.0% 0 0.0% 0 0.0% 0 0.0% 0 0.0% 0Prendergast 0.1% 2 0.0% 0 0.0% 0 0.0% 0 0.0% 0 0.0% 0 0.0% 0 0.0% 0 0.0% 0Rhydyfelin 0.0% 1 0.0% 0 0.0% 0 0.0% 0 0.0% 0 0.0% 0 0.9% 1 0.0% 0 0.0% 0Solva 0.2% 2 0.0% 0 0.0% 0 0.0% 0 0.0% 0 0.0% 0 0.0% 0 0.0% 0 0.0% 0Spar, Bow Street Stores,
Bow Street 0.2% 3 0.0% 0 0.0% 0 0.0% 0 0.0% 0 0.0% 0 0.0% 0 0.0% 0 2.1% 3
Spar, Chapel Street, Rhyd-yr-onnen
0.1% 1 0.0% 0 0.0% 0 0.0% 0 0.0% 0 0.0% 0 1.3% 1 0.0% 0 0.0% 0
Spar, Charles Street, Milford Haven
0.1% 2 0.0% 0 0.0% 0 0.0% 0 0.0% 0 0.0% 0 0.0% 0 0.0% 0 0.0% 0
Spar, Dew Street, Haverfordwest
0.0% 1 0.0% 0 0.0% 0 0.0% 0 0.0% 0 0.0% 0 0.0% 0 0.0% 0 0.0% 0
Spar, Harford Square, Lampeter
0.0% 1 0.0% 0 0.0% 0 0.0% 0 0.7% 1 0.0% 0 0.0% 0 0.0% 0 0.0% 0
Spar, High Street, Narberth 0.0% 1 0.0% 0 0.0% 0 0.0% 0 0.0% 0 0.0% 0 0.0% 0 0.0% 0 0.0% 0Spar, Lincoln Street,
Llandysul 0.0% 1 0.0% 0 0.0% 0 0.7% 1 0.0% 0 0.0% 0 0.0% 0 0.0% 0 0.0% 0
Spar, Market Street, Newport 0.3% 4 13.7% 4 0.0% 0 0.0% 0 0.0% 0 0.0% 0 0.0% 0 0.0% 0 0.0% 0Spar, Northgate Street,
Aberystwyth 0.0% 1 0.0% 0 0.0% 0 0.0% 0 0.0% 0 0.0% 0 0.0% 0 0.7% 1 0.0% 0
Spar, Penparcau Road, Penparcau, Aberystwyth
0.1% 2 0.0% 0 0.0% 0 0.0% 0 0.0% 0 0.0% 0 0.0% 0 0.0% 0 1.5% 2
Spar, Rhydyronen, Tregaron 0.2% 3 0.0% 0 0.0% 0 0.0% 0 0.0% 0 0.0% 0 3.4% 3 0.0% 0 0.0% 0Spar, Talybont, Aberystwyth 0.1% 1 0.0% 0 0.0% 0 0.0% 0 0.0% 0 0.0% 0 0.0% 0 0.0% 0 0.7% 1Spar, Terrace Road,
Aberystwyth 0.2% 4 0.0% 0 0.0% 0 0.0% 0 0.0% 0 0.0% 0 0.0% 0 4.0% 4 0.0% 0
St Florence 0.1% 1 0.0% 0 0.0% 0 0.0% 0 0.0% 0 0.0% 0 0.0% 0 0.0% 0 0.0% 0Talybont-on-Usk 0.3% 5 0.0% 0 0.0% 0 0.0% 0 0.0% 0 0.0% 0 0.0% 0 0.0% 0 3.1% 5Tan-y-groes 0.2% 3 0.0% 0 1.7% 3 0.0% 0 0.0% 0 0.0% 0 0.0% 0 0.0% 0 0.0% 0Tenby 0.3% 5 0.0% 0 0.0% 0 0.0% 0 0.0% 0 0.0% 0 0.0% 0 0.0% 0 0.0% 0Tesco Express, Brewery
Terrace, Saundersfoot 0.2% 3 0.0% 0 0.0% 0 0.0% 0 0.0% 0 0.0% 0 0.0% 0 0.0% 0 0.0% 0
Tesco Express, London Road, Larkhill
0.1% 1 0.0% 0 0.0% 0 0.0% 0 0.0% 0 0.0% 0 0.0% 0 0.0% 0 0.7% 1
Tesco Express, North Parade, Aberystwyth
0.5% 8 0.0% 0 0.0% 0 0.0% 0 0.0% 0 0.0% 0 0.0% 0 5.4% 5 1.9% 3
Tre'r-ddol 0.1% 1 0.0% 0 0.0% 0 0.0% 0 0.0% 0 0.0% 0 0.0% 0 0.0% 0 0.7% 1Waitrose, Merthyr Road,
Llanfoist, Abergavenny 0.1% 2 0.0% 0 0.0% 0 0.0% 0 0.0% 0 0.0% 0 0.0% 0 0.0% 0 1.0% 2
Wholefoods of Newport, Hen Bopty / East Street, Newport
0.0% 0 0.7% 0 0.0% 0 0.0% 0 0.0% 0 0.0% 0 0.0% 0 0.0% 0 0.0% 0

by Zone (Weighted, Part 2) South Wales Retail Study Page 12 Weighted: for Carter Jonas August 2016
Total Zone 9 Zone 10 Zone 11 Zone 12 Zone 13 Zone 14 Zone 15 Zone 16
Column %ges. 020716 NEMS market research
Internet / delivered 0.3% 5 0.0% 0 0.0% 0 0.0% 0 1.6% 2 0.0% 0 0.0% 0 0.9% 1 0.0% 0(Don't know / varies) 2.3% 37 1.7% 1 0.9% 1 2.5% 2 5.3% 5 3.5% 2 2.3% 2 0.7% 1 1.7% 3(Don't do this) 37.4% 602 37.3% 12 41.2% 62 44.6% 40 33.7% 32 27.5% 18 31.0% 23 25.2% 24 36.7% 59Weighted base: 1607 33 152 89 95 66 74 94 160Sample: 1607 100 100 100 100 101 100 102 102 Q07A Which retailer do you purchase your top-up food internet / home delivery shopping from? Those who shop online at Q07 Asda 14.8% 1 0.0% 0 0.0% 0 0.0% 0 43.5% 1 0.0% 0 0.0% 0 0.0% 0 0.0% 0Tesco 36.8% 2 0.0% 0 0.0% 0 0.0% 0 0.0% 0 0.0% 0 0.0% 0 100.0% 1 0.0% 0Amazon 19.2% 1 0.0% 0 0.0% 0 0.0% 0 56.5% 1 0.0% 0 0.0% 0 0.0% 0 0.0% 0(Don't know / varies) 29.2% 1 0.0% 0 0.0% 0 0.0% 0 0.0% 0 0.0% 0 0.0% 0 0.0% 0 0.0% 0Weighted base: 5 0 0 0 2 0 0 1 0Sample: 6 0 0 0 2 0 0 1 0 Mean score [%]: Q08 Of all the money you spend on your main and top-up food shopping, what share goes to your main food shopping? Those who do top-up shopping at Q07 0 - 10% 1.8% 18 1.1% 0 0.0% 0 3.1% 2 1.5% 1 10.9% 5 0.0% 0 0.0% 0 3.3% 311 - 20% 0.9% 9 0.0% 0 0.0% 0 1.6% 1 1.4% 1 5.4% 3 0.0% 0 0.0% 0 0.0% 021 - 30% 1.9% 19 2.6% 1 2.6% 2 2.9% 1 0.0% 0 6.7% 3 0.0% 0 0.0% 0 1.6% 231 - 40% 2.1% 21 2.6% 1 1.1% 1 1.2% 1 1.4% 1 2.1% 1 2.2% 1 5.7% 4 4.9% 541 - 50% 9.6% 97 10.0% 2 14.4% 13 12.7% 6 19.2% 12 9.1% 4 5.4% 3 15.6% 11 4.6% 551 - 60% 8.4% 85 6.7% 1 3.9% 3 13.9% 7 12.2% 8 2.1% 1 5.6% 3 4.4% 3 8.9% 961 - 70% 11.0% 111 10.7% 2 17.8% 16 22.4% 11 10.7% 7 9.0% 4 10.6% 5 4.2% 3 11.3% 1171 - 80% 28.3% 285 28.3% 6 17.3% 15 17.7% 9 17.6% 11 26.4% 13 37.6% 19 32.3% 23 33.5% 3481 - 90% 16.1% 162 23.0% 5 4.7% 4 14.6% 7 9.9% 6 16.1% 8 17.0% 9 16.8% 12 23.1% 2391 - 100% 4.9% 49 1.5% 0 7.3% 7 5.9% 3 9.6% 6 2.1% 1 4.8% 2 0.9% 1 3.8% 4(Don't know / varies) 14.7% 147 12.4% 3 31.0% 28 4.0% 2 14.1% 9 9.0% 4 16.9% 9 19.1% 13 4.9% 5(Refused) 0.3% 3 1.1% 0 0.0% 0 0.0% 0 2.5% 2 0.9% 0 0.0% 0 0.9% 1 0.0% 0Mean: 71.05 71.77 69.03 67.30 67.90 59.99 76.46 70.76 72.13Weighted base: 1005 21 89 49 63 48 51 70 101Sample: 990 63 57 56 64 68 64 69 63

by Zone (Weighted, Part 2) South Wales Retail Study Page 13 Weighted: for Carter Jonas August 2016
Total Zone 9 Zone 10 Zone 11 Zone 12 Zone 13 Zone 14 Zone 15 Zone 16
Column %ges. 020716 NEMS market research
Q09 In addition to (STORE MENTIONED AT Q07), is there any other store that you regularly use for your household's small scale top-up food shopping?
Those who do top-up shopping at Q07 Aldi, Aberystwyth Road,
Cardigan 0.4% 4 2.8% 1 4.2% 4 0.0% 0 0.0% 0 0.0% 0 0.0% 0 0.0% 0 0.0% 0
Aldi, Salutation Square, Haverfordwest
1.4% 14 0.0% 0 0.0% 0 0.0% 0 0.0% 0 0.0% 0 0.0% 0 0.0% 0 0.0% 0
Asda, Gordon St, Pembroke Dock
1.5% 15 0.0% 0 0.0% 0 0.0% 0 0.0% 0 0.0% 0 0.0% 0 0.0% 0 0.0% 0
C.K's Supermarket, New Street, St Davids
0.5% 5 0.0% 0 0.0% 0 6.0% 3 0.0% 0 0.0% 0 0.0% 0 0.0% 0 0.0% 0
C.K's Supermarket, Waun Fawr, Aberyswyth
0.4% 4 0.0% 0 0.0% 0 6.0% 3 0.0% 0 0.0% 0 0.0% 0 0.9% 1 0.0% 0
C.K's Supermarket, West Street, Fishguard
0.3% 3 1.1% 0 0.0% 0 0.0% 0 0.0% 0 0.0% 0 0.0% 0 0.0% 0 0.0% 0
Co-op, Bridge Street, Lampeter
1.3% 13 0.0% 0 0.0% 0 3.5% 2 18.0% 11 0.0% 0 0.0% 0 0.0% 0 0.0% 0
Co-op, Carmarthen Road, Kilgetty
0.1% 1 0.0% 0 0.0% 0 0.0% 0 0.0% 0 0.0% 0 0.0% 0 0.0% 0 0.0% 0
Co-op, Carmarthen Road, Kilgetty
0.1% 1 0.0% 0 0.0% 0 0.0% 0 0.0% 0 0.0% 0 0.0% 0 0.0% 0 0.0% 0
Co-op, High Street, Fishguard
0.8% 8 11.2% 2 0.0% 0 0.0% 0 0.0% 0 0.0% 0 0.0% 0 0.0% 0 0.0% 0
Co-op, High Street, Machynlleth
0.2% 2 0.0% 0 0.0% 0 0.0% 0 0.0% 0 0.0% 0 0.0% 0 0.0% 0 1.6% 2
Co-op, High Street, Neyland 0.1% 1 0.0% 0 0.0% 0 0.0% 0 0.0% 0 0.0% 0 0.0% 0 0.0% 0 0.0% 0Co-op, Lower Mwldan,
Cardigan 0.0% 0 1.4% 0 0.0% 0 0.0% 0 0.0% 0 0.0% 0 0.0% 0 0.0% 0 0.0% 0
Co-op, Main Street, Pembroke
0.1% 1 0.0% 0 0.0% 0 0.0% 0 0.0% 0 0.0% 0 0.0% 0 0.0% 0 0.0% 0
Co-op, North Road, Whitland
0.1% 1 0.0% 0 0.0% 0 0.0% 0 0.0% 0 0.0% 0 0.0% 0 0.0% 0 0.0% 0
Co-op, Park Ave, Aberystwyth
1.1% 11 0.0% 0 0.0% 0 0.0% 0 0.0% 0 0.0% 0 3.7% 2 4.5% 3 5.8% 6
Costcutter, High Street, Narberth
0.2% 2 0.0% 0 0.0% 0 0.0% 0 0.0% 0 0.0% 0 0.0% 0 0.0% 0 0.0% 0
Iceland, Picton Place, Haverfordwest
0.3% 3 0.0% 0 0.0% 0 0.0% 0 0.0% 0 0.0% 0 0.0% 0 0.0% 0 1.7% 2
Lidl, Great N Road, Milford Haven
0.7% 7 0.0% 0 0.0% 0 0.0% 0 0.0% 0 0.0% 0 0.0% 0 0.0% 0 0.0% 0
Lidl, Perrots Rd, Haverfordwest
1.4% 14 0.0% 0 0.0% 0 0.0% 0 0.0% 0 0.0% 0 0.0% 0 0.0% 0 0.0% 0
Lidl, Pier Road, Pembroke Dock
1.2% 12 0.0% 0 0.0% 0 0.0% 0 0.0% 0 0.0% 0 0.0% 0 0.0% 0 0.0% 0
Lidl, Priory Street, Carmarthen
0.1% 1 0.0% 0 0.0% 0 0.0% 0 0.0% 0 0.0% 0 0.0% 0 0.0% 0 0.0% 0
Lidl, Rheidol Retail Park, Aberyswyth
0.8% 8 0.0% 0 0.0% 0 0.0% 0 0.0% 0 0.9% 0 9.6% 5 2.1% 1 1.6% 2
Londis Stores, St Thomas Green, Haverfordwest
0.1% 1 0.0% 0 0.0% 0 0.0% 0 0.0% 0 0.0% 0 0.0% 0 0.0% 0 0.0% 0
Londis Stores, Trafalgar Rd, Tenby
0.3% 3 0.0% 0 0.0% 0 0.0% 0 0.0% 0 0.0% 0 0.0% 0 0.0% 0 0.0% 0
Morrisons, Meadow View, Haverfordwest
1.5% 15 1.1% 0 0.0% 0 0.0% 0 0.0% 0 0.0% 0 0.0% 0 0.0% 0 0.0% 0
Morrisons, Parcydolau, Llanbadarn Fawr, Aberyswyth
0.6% 6 0.0% 0 0.0% 0 0.0% 0 1.1% 1 2.2% 1 2.2% 1 1.2% 1 2.7% 3
Sainsbury's, Market Street, Lampeter
0.7% 7 0.0% 0 0.0% 0 1.6% 1 9.1% 6 1.2% 1 0.0% 0 0.0% 0 0.0% 0
Sainsbury's, Upper Park Road, Tenby
1.0% 10 0.0% 0 0.0% 0 0.0% 0 0.0% 0 0.0% 0 0.0% 0 0.0% 0 0.0% 0
Spar, Long Mains, Pembroke 0.4% 4 0.0% 0 0.0% 0 0.0% 0 0.0% 0 0.0% 0 0.0% 0 0.0% 0 0.0% 0Spar, North Road, Cardigan 0.1% 1 0.0% 0 0.0% 0 0.0% 0 0.0% 0 0.0% 0 0.0% 0 0.0% 0 0.0% 0Spar, The Strand,
Saundersfoot 0.3% 3 0.0% 0 0.0% 0 0.0% 0 0.0% 0 0.0% 0 0.0% 0 0.0% 0 0.0% 0
Tesco Express, High Street, Tenby
0.2% 2 0.0% 0 0.0% 0 0.0% 0 0.0% 0 0.0% 0 0.0% 0 0.0% 0 0.0% 0
Tesco Express, The Parrog, Goodwick
0.1% 1 0.0% 0 0.0% 0 0.0% 0 0.0% 0 0.0% 0 0.0% 0 0.0% 0 0.0% 0
Tesco Express, The Parrog, Goodwick
0.4% 4 0.0% 0 0.0% 0 0.0% 0 0.0% 0 0.0% 0 0.0% 0 0.0% 0 0.0% 0
Tesco Extra, Fenton Trading Estate, Haverfordwest
0.9% 9 0.0% 0 0.0% 0 0.0% 0 0.0% 0 0.0% 0 0.0% 0 0.0% 0 0.0% 0

by Zone (Weighted, Part 2) South Wales Retail Study Page 14
Weighted: for Carter Jonas August 2016
Total Zone 9 Zone 10 Zone 11 Zone 12 Zone 13 Zone 14 Zone 15 Zone 16
Column %ges. 020716 NEMS market research
0.7% 7 0.0% 0 5.8% 5 2.9% 1 0.0% 0 0.0% 0 0.0% 0 0.0% 0 0.0% 0
1.4% 14 0.0% 0 0.0% 0 0.0% 0 0.0% 0 0.0% 0 0.0% 0 0.0% 0 0.0% 0
0.8% 8 0.0% 0 0.0% 0 0.0% 0 0.0% 0 0.0% 0 0.0% 0 0.0% 0 0.0% 0
0.1% 1 0.0% 0 0.0% 0 0.0% 0 0.0% 0 0.0% 0 0.0% 0 0.0% 0 0.0% 0
0.3% 3 0.0% 0 0.0% 0 0.0% 0 0.0% 0 5.4% 3 0.0% 0 0.0% 0 0.0% 02.0% 20 0.0% 0 0.0% 0 0.0% 0 0.0% 0 0.0% 0 6.2% 3 14.4% 10 6.2% 60.3% 3 0.0% 0 2.5% 2 1.2% 1 0.0% 0 0.0% 0 0.0% 0 0.0% 0 0.0% 00.1% 1 3.1% 1 0.0% 0 0.0% 0 0.0% 0 0.0% 0 0.0% 0 0.0% 0 0.0% 00.3% 3 0.0% 0 0.0% 0 0.0% 0 0.0% 0 0.0% 0 0.0% 0 0.0% 0 0.0% 00.1% 1 0.0% 0 0.0% 0 0.0% 0 0.0% 0 0.0% 0 0.0% 0 0.0% 0 0.0% 00.8% 8 0.0% 0 0.0% 0 0.0% 0 0.0% 0 0.0% 0 0.0% 0 0.0% 0 0.0% 00.2% 2 0.0% 0 0.0% 0 0.0% 0 0.0% 0 0.0% 0 0.0% 0 0.0% 0 0.0% 00.2% 2 0.0% 0 0.0% 0 0.0% 0 0.0% 0 0.0% 0 0.0% 0 0.0% 0 0.0% 00.5% 5 0.0% 0 0.0% 0 0.0% 0 7.7% 5 0.0% 0 0.0% 0 0.0% 0 0.0% 00.1% 1 0.0% 0 0.0% 0 1.6% 1 0.0% 0 0.0% 0 0.0% 0 0.0% 0 0.0% 00.5% 5 0.0% 0 0.0% 0 0.0% 0 0.0% 0 0.0% 0 0.0% 0 0.0% 0 3.9% 40.7% 7 0.0% 0 0.0% 0 0.0% 0 0.0% 0 0.0% 0 0.0% 0 0.0% 0 0.0% 00.6% 6 0.0% 0 1.1% 1 0.0% 0 0.0% 0 0.0% 0 0.0% 0 0.0% 0 0.0% 00.5% 5 3.6% 1 3.1% 3 0.0% 0 0.0% 0 0.0% 0 0.0% 0 0.0% 0 0.0% 00.0% 0 1.1% 0 0.0% 0 0.0% 0 0.0% 0 0.0% 0 0.0% 0 0.0% 0 0.0% 00.3% 3 0.0% 0 0.0% 0 0.0% 0 0.0% 0 0.0% 0 0.0% 0 0.0% 0 0.0% 00.1% 1 0.0% 0 0.0% 0 0.0% 0 0.0% 0 0.0% 0 0.0% 0 0.0% 0 0.0% 00.1% 1 0.0% 0 0.0% 0 0.0% 0 0.0% 0 0.0% 0 0.0% 0 0.0% 0 0.0% 00.4% 4 0.0% 0 0.0% 0 0.0% 0 0.0% 0 0.0% 0 0.0% 0 0.0% 0 0.0% 00.2% 2 0.0% 0 0.0% 0 0.0% 0 0.0% 0 0.0% 0 3.1% 2 0.0% 0 0.0% 0
Tesco Superstore, Aberystwyth Rd, Cardigan
Tesco Superstore, London Rd, Pembroke Dock
Tesco, Havens Head Park, Milford Haven
Wisebuys Stores, Main St, Pembroke
Aberaeron Aberyswyth Cardigan Crymych Fishguard Goodwick Haverfordwest Johnston Kilgetty Lampeter Llandysul Machynlleth Milford Haven Narberth Newport (Pembrokeshire) Newtown (Powys) Neyland Pembroke Pembroke Dock St Davids Tregaron Bayview Stores, Maes Ewan,
Solva, Haverfordwest 0.1% 1 0.0% 0 0.0% 0 0.0% 0 0.0% 0 0.0% 0 0.0% 0 0.0% 0 0.0% 0
C.K's Supermarket,Gelliswick Road, Hakin
0.1% 1 0.0% 0 0.0% 0 0.0% 0 0.0% 0 0.0% 0 0.0% 0 0.0% 0 0.0% 0
C.K's Supermarket, Spring Gardens, Narberth
0.1% 1 0.0% 0 0.0% 0 0.0% 0 0.0% 0 0.0% 0 0.0% 0 0.0% 0 0.0% 0
C.K's Supermarket, Station Road, Newcastle Emlyn
0.3% 3 0.0% 0 3.1% 3 0.0% 0 0.0% 0 1.2% 1 0.0% 0 0.0% 0 0.0% 0
Capel Bangor 0.2% 2 0.0% 0 0.0% 0 0.0% 0 0.0% 0 0.0% 0 0.0% 0 0.0% 0 1.5% 2Carmarthen 0.1% 1 0.0% 0 0.0% 0 0.0% 0 0.0% 0 0.0% 0 0.0% 0 0.0% 0 0.0% 0Ceredigion 0.1% 1 0.0% 0 0.0% 0 0.0% 0 0.0% 0 1.4% 1 0.0% 0 0.0% 0 0.0% 0Co-op, Penparcau Road,
Penparcau 0.2% 2 0.0% 0 0.0% 0 0.0% 0 0.0% 0 0.0% 0 0.0% 0 0.0% 0 1.5% 2
Costcutter, Market Street, Aberaeron
0.4% 4 0.0% 0 0.0% 0 0.0% 0 0.0% 0 9.2% 4 0.0% 0 0.0% 0 0.0% 0
Costcutter, Uplands Square, New Quay
0.1% 1 0.0% 0 0.0% 0 1.6% 1 0.0% 0 0.9% 0 0.0% 0 0.0% 0 0.0% 0
Cross Inn 0.1% 1 0.0% 0 0.0% 0 0.0% 0 0.0% 0 2.6% 1 0.0% 0 0.0% 0 0.0% 0Crundale 0.0% 0 0.0% 0 0.0% 0 0.0% 0 0.0% 0 0.0% 0 0.0% 0 0.0% 0 0.0% 0Hook 0.1% 1 0.0% 0 0.0% 0 0.0% 0 0.0% 0 0.0% 0 0.0% 0 0.0% 0 0.0% 0Iceland, Rheidol Retail Park,
Station Road, Aberystwyth 0.5% 5 0.0% 0 0.0% 0 0.0% 0 0.0% 0 0.9% 0 0.0% 0 6.6% 5 0.0% 0
Llanarth 0.1% 1 0.0% 0 0.0% 0 0.0% 0 1.1% 1 0.9% 0 0.0% 0 0.0% 0 0.0% 0Llangwm 0.0% 0 0.0% 0 0.0% 0 0.0% 0 0.0% 0 0.0% 0 0.0% 0 0.0% 0 0.0% 0Llanrhystud 0.1% 1 0.0% 0 0.0% 0 0.0% 0 0.0% 0 1.3% 1 0.0% 0 0.0% 0 0.0% 0Llwyncelyn 0.0% 0 0.0% 0 0.0% 0 0.0% 0 0.0% 0 0.9% 0 0.0% 0 0.0% 0 0.0% 0Marks & Spencer, Red
Street, Carmarthen 0.1% 1 0.0% 0 0.0% 0 1.2% 1 0.0% 0 1.4% 1 0.0% 0 0.0% 0 0.0% 0
Marks & Spencer, Withybush Retail Park, Haverfordwest
0.5% 5 0.0% 0 0.0% 0 0.0% 0 0.0% 0 0.0% 0 0.0% 0 0.0% 0 0.0% 0
Merlin's Bridge 0.0% 0 0.0% 0 0.0% 0 0.0% 0 0.0% 0 0.0% 0 0.0% 0 0.0% 0 0.0% 0New Quay 0.1% 1 0.0% 0 0.0% 0 0.0% 0 0.0% 0 1.2% 1 0.0% 0 0.0% 0 0.0% 0Newcastle Emlyn 0.2% 2 0.0% 0 1.1% 1 1.6% 1 0.0% 0 0.0% 0 0.0% 0 0.0% 0 0.0% 0Penally 0.1% 1 0.0% 0 0.0% 0 0.0% 0 0.0% 0 0.0% 0 0.0% 0 0.0% 0 0.0% 0Solva 0.1% 1 0.0% 0 0.0% 0 0.0% 0 0.0% 0 0.0% 0 0.0% 0 0.0% 0 0.0% 0Spar, Chapel Street,
Rhyd-yr-onnen 0.2% 2 0.0% 0 0.0% 0 0.0% 0 0.0% 0 0.0% 0 4.7% 2 0.0% 0 0.0% 0
Spar, Charles Street, Milford Haven
0.1% 1 0.0% 0 0.0% 0 0.0% 0 0.0% 0 0.0% 0 0.0% 0 0.0% 0 0.0% 0
Spar, High Street, Narberth 0.1% 1 0.0% 0 0.0% 0 0.0% 0 0.0% 0 0.0% 0 0.0% 0 0.0% 0 0.0% 0Spar, Market Street, Newport 0.1% 1 3.6% 1 0.0% 0 0.0% 0 0.0% 0 0.0% 0 0.0% 0 0.0% 0 0.0% 0Spar, Terrace Road,
Aberystwyth 0.9% 9 0.0% 0 0.0% 0 0.0% 0 0.0% 0 0.0% 0 0.0% 0 7.1% 5 4.2% 4
Tenby 0.1% 1 0.0% 0 0.0% 0 0.0% 0 0.0% 0 0.0% 0 0.0% 0 0.0% 0 0.0% 0
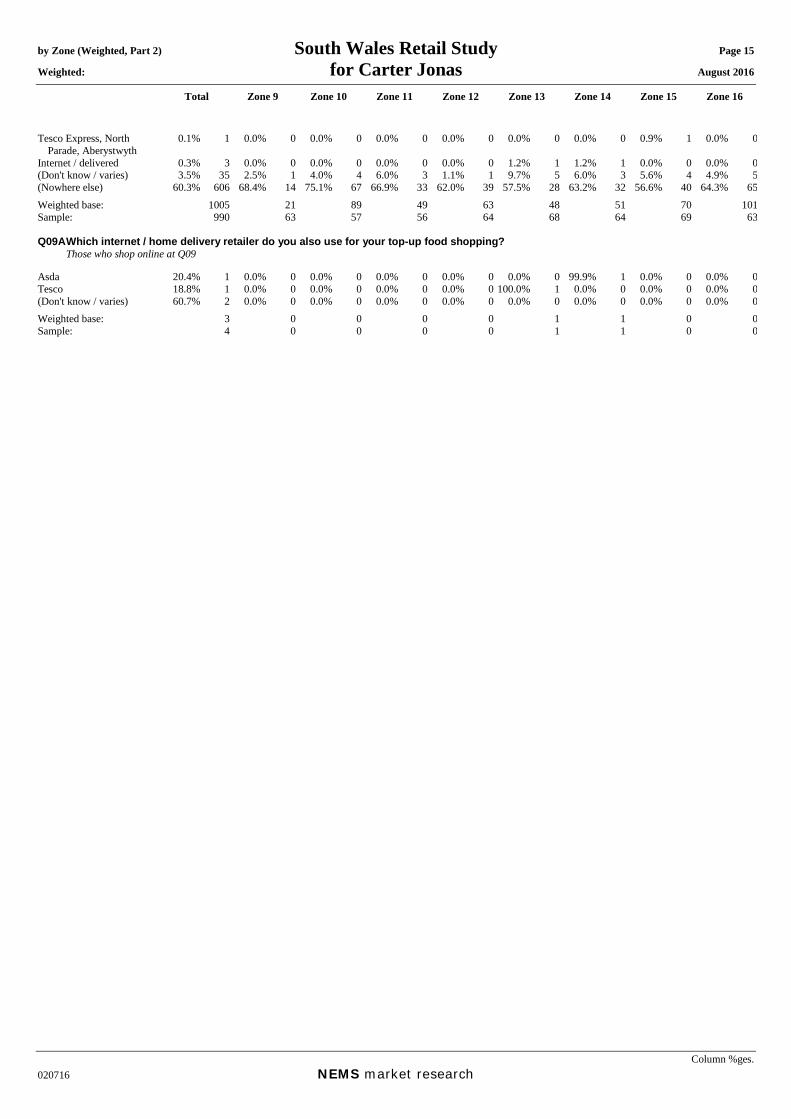
by Zone (Weighted, Part 2) South Wales Retail Study Page 15 Weighted: for Carter Jonas August 2016
Total Zone 9 Zone 10 Zone 11 Zone 12 Zone 13 Zone 14 Zone 15 Zone 16
Column %ges. 020716 NEMS market research
Tesco Express, North Parade, Aberystwyth
0.1% 1 0.0% 0 0.0% 0 0.0% 0 0.0% 0 0.0% 0 0.0% 0 0.9% 1 0.0% 0
Internet / delivered 0.3% 3 0.0% 0 0.0% 0 0.0% 0 0.0% 0 1.2% 1 1.2% 1 0.0% 0 0.0% 0(Don't know / varies) 3.5% 35 2.5% 1 4.0% 4 6.0% 3 1.1% 1 9.7% 5 6.0% 3 5.6% 4 4.9% 5(Nowhere else) 60.3% 606 68.4% 14 75.1% 67 66.9% 33 62.0% 39 57.5% 28 63.2% 32 56.6% 40 64.3% 65Weighted base: 1005 21 89 49 63 48 51 70 101Sample: 990 63 57 56 64 68 64 69 63 Q09A Which internet / home delivery retailer do you also use for your top-up food shopping? Those who shop online at Q09 Asda 20.4% 1 0.0% 0 0.0% 0 0.0% 0 0.0% 0 0.0% 0 99.9% 1 0.0% 0 0.0% 0Tesco 18.8% 1 0.0% 0 0.0% 0 0.0% 0 0.0% 0 100.0% 1 0.0% 0 0.0% 0 0.0% 0(Don't know / varies) 60.7% 2 0.0% 0 0.0% 0 0.0% 0 0.0% 0 0.0% 0 0.0% 0 0.0% 0 0.0% 0Weighted base: 3 0 0 0 0 1 1 0 0Sample: 4 0 0 0 0 1 1 0 0
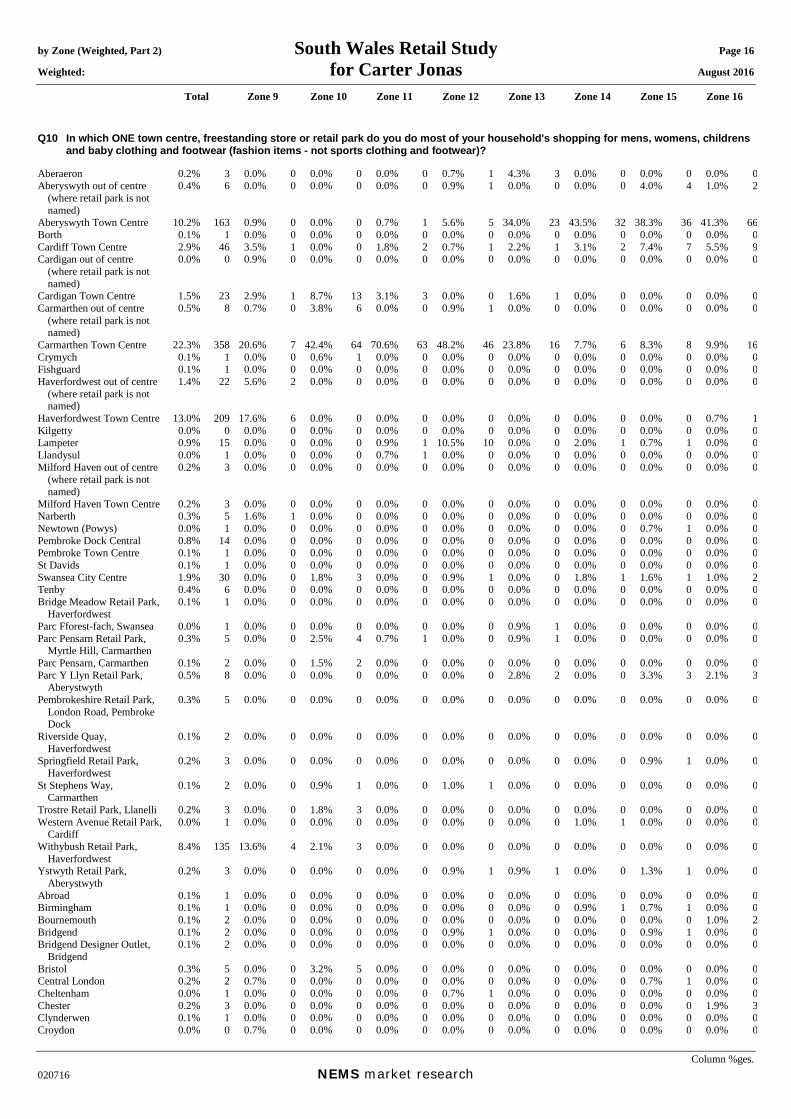
by Zone (Weighted, Part 2) South Wales Retail Study Page 16 Weighted: for Carter Jonas August 2016
Total Zone 9 Zone 10 Zone 11 Zone 12 Zone 13 Zone 14 Zone 15 Zone 16
Column %ges. 020716 NEMS market research
Q10 In which ONE town centre, freestanding store or retail park do you do most of your household's shopping for mens, womens, childrens and baby clothing and footwear (fashion items - not sports clothing and footwear)?
Aberaeron 0.2% 3 0.0% 0 0.0% 0 0.0% 0 0.7% 1 4.3% 3 0.0% 0 0.0% 0 0.0% 0Aberyswyth out of centre
(where retail park is not named)
0.4% 6 0.0% 0 0.0% 0 0.0% 0 0.9% 1 0.0% 0 0.0% 0 4.0% 4 1.0% 2
Aberyswyth Town Centre 10.2% 163 0.9% 0 0.0% 0 0.7% 1 5.6% 5 34.0% 23 43.5% 32 38.3% 36 41.3% 66Borth 0.1% 1 0.0% 0 0.0% 0 0.0% 0 0.0% 0 0.0% 0 0.0% 0 0.0% 0 0.0% 0Cardiff Town Centre 2.9% 46 3.5% 1 0.0% 0 1.8% 2 0.7% 1 2.2% 1 3.1% 2 7.4% 7 5.5% 9Cardigan out of centre
(where retail park is not named)
0.0% 0 0.9% 0 0.0% 0 0.0% 0 0.0% 0 0.0% 0 0.0% 0 0.0% 0 0.0% 0
Cardigan Town Centre 1.5% 23 2.9% 1 8.7% 13 3.1% 3 0.0% 0 1.6% 1 0.0% 0 0.0% 0 0.0% 0Carmarthen out of centre
(where retail park is not named)
0.5% 8 0.7% 0 3.8% 6 0.0% 0 0.9% 1 0.0% 0 0.0% 0 0.0% 0 0.0% 0
Carmarthen Town Centre 22.3% 358 20.6% 7 42.4% 64 70.6% 63 48.2% 46 23.8% 16 7.7% 6 8.3% 8 9.9% 16Crymych 0.1% 1 0.0% 0 0.6% 1 0.0% 0 0.0% 0 0.0% 0 0.0% 0 0.0% 0 0.0% 0Fishguard 0.1% 1 0.0% 0 0.0% 0 0.0% 0 0.0% 0 0.0% 0 0.0% 0 0.0% 0 0.0% 0Haverfordwest out of centre
(where retail park is not named)
1.4% 22 5.6% 2 0.0% 0 0.0% 0 0.0% 0 0.0% 0 0.0% 0 0.0% 0 0.0% 0
Haverfordwest Town Centre 13.0% 209 17.6% 6 0.0% 0 0.0% 0 0.0% 0 0.0% 0 0.0% 0 0.0% 0 0.7% 1Kilgetty 0.0% 0 0.0% 0 0.0% 0 0.0% 0 0.0% 0 0.0% 0 0.0% 0 0.0% 0 0.0% 0Lampeter 0.9% 15 0.0% 0 0.0% 0 0.9% 1 10.5% 10 0.0% 0 2.0% 1 0.7% 1 0.0% 0Llandysul 0.0% 1 0.0% 0 0.0% 0 0.7% 1 0.0% 0 0.0% 0 0.0% 0 0.0% 0 0.0% 0Milford Haven out of centre
(where retail park is not named)
0.2% 3 0.0% 0 0.0% 0 0.0% 0 0.0% 0 0.0% 0 0.0% 0 0.0% 0 0.0% 0
Milford Haven Town Centre 0.2% 3 0.0% 0 0.0% 0 0.0% 0 0.0% 0 0.0% 0 0.0% 0 0.0% 0 0.0% 0Narberth 0.3% 5 1.6% 1 0.0% 0 0.0% 0 0.0% 0 0.0% 0 0.0% 0 0.0% 0 0.0% 0Newtown (Powys) 0.0% 1 0.0% 0 0.0% 0 0.0% 0 0.0% 0 0.0% 0 0.0% 0 0.7% 1 0.0% 0Pembroke Dock Central 0.8% 14 0.0% 0 0.0% 0 0.0% 0 0.0% 0 0.0% 0 0.0% 0 0.0% 0 0.0% 0Pembroke Town Centre 0.1% 1 0.0% 0 0.0% 0 0.0% 0 0.0% 0 0.0% 0 0.0% 0 0.0% 0 0.0% 0St Davids 0.1% 1 0.0% 0 0.0% 0 0.0% 0 0.0% 0 0.0% 0 0.0% 0 0.0% 0 0.0% 0Swansea City Centre 1.9% 30 0.0% 0 1.8% 3 0.0% 0 0.9% 1 0.0% 0 1.8% 1 1.6% 1 1.0% 2Tenby 0.4% 6 0.0% 0 0.0% 0 0.0% 0 0.0% 0 0.0% 0 0.0% 0 0.0% 0 0.0% 0Bridge Meadow Retail Park,
Haverfordwest 0.1% 1 0.0% 0 0.0% 0 0.0% 0 0.0% 0 0.0% 0 0.0% 0 0.0% 0 0.0% 0
Parc Fforest-fach, Swansea 0.0% 1 0.0% 0 0.0% 0 0.0% 0 0.0% 0 0.9% 1 0.0% 0 0.0% 0 0.0% 0Parc Pensarn Retail Park,
Myrtle Hill, Carmarthen 0.3% 5 0.0% 0 2.5% 4 0.7% 1 0.0% 0 0.9% 1 0.0% 0 0.0% 0 0.0% 0
Parc Pensarn, Carmarthen 0.1% 2 0.0% 0 1.5% 2 0.0% 0 0.0% 0 0.0% 0 0.0% 0 0.0% 0 0.0% 0Parc Y Llyn Retail Park,
Aberystwyth 0.5% 8 0.0% 0 0.0% 0 0.0% 0 0.0% 0 2.8% 2 0.0% 0 3.3% 3 2.1% 3
Pembrokeshire Retail Park, London Road, Pembroke Dock
0.3% 5 0.0% 0 0.0% 0 0.0% 0 0.0% 0 0.0% 0 0.0% 0 0.0% 0 0.0% 0
Riverside Quay, Haverfordwest
0.1% 2 0.0% 0 0.0% 0 0.0% 0 0.0% 0 0.0% 0 0.0% 0 0.0% 0 0.0% 0
Springfield Retail Park, Haverfordwest
0.2% 3 0.0% 0 0.0% 0 0.0% 0 0.0% 0 0.0% 0 0.0% 0 0.9% 1 0.0% 0
St Stephens Way, Carmarthen
0.1% 2 0.0% 0 0.9% 1 0.0% 0 1.0% 1 0.0% 0 0.0% 0 0.0% 0 0.0% 0
Trostre Retail Park, Llanelli 0.2% 3 0.0% 0 1.8% 3 0.0% 0 0.0% 0 0.0% 0 0.0% 0 0.0% 0 0.0% 0Western Avenue Retail Park,
Cardiff 0.0% 1 0.0% 0 0.0% 0 0.0% 0 0.0% 0 0.0% 0 1.0% 1 0.0% 0 0.0% 0
Withybush Retail Park, Haverfordwest
8.4% 135 13.6% 4 2.1% 3 0.0% 0 0.0% 0 0.0% 0 0.0% 0 0.0% 0 0.0% 0
Ystwyth Retail Park, Aberystwyth
0.2% 3 0.0% 0 0.0% 0 0.0% 0 0.9% 1 0.9% 1 0.0% 0 1.3% 1 0.0% 0
Abroad 0.1% 1 0.0% 0 0.0% 0 0.0% 0 0.0% 0 0.0% 0 0.0% 0 0.0% 0 0.0% 0Birmingham 0.1% 1 0.0% 0 0.0% 0 0.0% 0 0.0% 0 0.0% 0 0.9% 1 0.7% 1 0.0% 0Bournemouth 0.1% 2 0.0% 0 0.0% 0 0.0% 0 0.0% 0 0.0% 0 0.0% 0 0.0% 0 1.0% 2Bridgend 0.1% 2 0.0% 0 0.0% 0 0.0% 0 0.9% 1 0.0% 0 0.0% 0 0.9% 1 0.0% 0Bridgend Designer Outlet,
Bridgend 0.1% 2 0.0% 0 0.0% 0 0.0% 0 0.0% 0 0.0% 0 0.0% 0 0.0% 0 0.0% 0
Bristol 0.3% 5 0.0% 0 3.2% 5 0.0% 0 0.0% 0 0.0% 0 0.0% 0 0.0% 0 0.0% 0Central London 0.2% 2 0.7% 0 0.0% 0 0.0% 0 0.0% 0 0.0% 0 0.0% 0 0.7% 1 0.0% 0Cheltenham 0.0% 1 0.0% 0 0.0% 0 0.0% 0 0.7% 1 0.0% 0 0.0% 0 0.0% 0 0.0% 0Chester 0.2% 3 0.0% 0 0.0% 0 0.0% 0 0.0% 0 0.0% 0 0.0% 0 0.0% 0 1.9% 3Clynderwen 0.1% 1 0.0% 0 0.0% 0 0.0% 0 0.0% 0 0.0% 0 0.0% 0 0.0% 0 0.0% 0Croydon 0.0% 0 0.7% 0 0.0% 0 0.0% 0 0.0% 0 0.0% 0 0.0% 0 0.0% 0 0.0% 0

by Zone (Weighted, Part 2) South Wales Retail Study Page 17 Weighted: for Carter Jonas August 2016
Total Zone 9 Zone 10 Zone 11 Zone 12 Zone 13 Zone 14 Zone 15 Zone 16
Column %ges. 020716 NEMS market research
Edinburgh 0.1% 1 0.0% 0 0.0% 0 0.0% 0 0.0% 0 0.0% 0 0.0% 0 1.0% 1 0.0% 0Leicester 0.1% 1 0.0% 0 0.0% 0 0.0% 0 0.0% 0 0.0% 0 0.0% 0 0.0% 0 0.0% 0Lincoln 0.0% 1 0.0% 0 0.0% 0 0.0% 0 0.0% 0 0.0% 0 0.0% 0 0.7% 1 0.0% 0Llandudno 0.0% 1 0.0% 0 0.0% 0 0.0% 0 0.0% 0 0.0% 0 0.0% 0 0.7% 1 0.0% 0Newcastle Emlyn 0.2% 4 0.0% 0 1.5% 2 1.6% 1 0.0% 0 0.0% 0 0.0% 0 0.0% 0 0.0% 0Rheidol Retail Park,
Aberystwyth 0.1% 1 0.0% 0 0.0% 0 0.0% 0 0.0% 0 0.0% 0 0.0% 0 0.9% 1 0.0% 0
Sainsbury's, The Derwen, Bridgend
0.1% 1 0.0% 0 0.0% 0 0.0% 0 0.0% 0 0.0% 0 0.0% 0 0.0% 0 0.0% 0
Sheffield 0.1% 1 0.0% 0 0.0% 0 0.0% 0 0.0% 0 0.0% 0 0.0% 0 0.0% 0 0.0% 0Shrewsbury 0.7% 12 0.0% 0 0.0% 0 0.0% 0 0.9% 1 0.0% 0 0.9% 1 1.0% 1 5.7% 9Tesco Extra, Fenton Trading
Estate, Haverfordwest 0.2% 3 0.0% 0 0.0% 0 0.0% 0 0.0% 0 0.0% 0 0.0% 0 0.0% 0 0.0% 0
York 0.0% 0 0.7% 0 0.0% 0 0.0% 0 0.0% 0 0.0% 0 0.0% 0 0.0% 0 0.0% 0Internet / catalogue 22.3% 359 15.9% 5 21.7% 33 12.8% 11 22.7% 22 24.8% 16 31.6% 23 14.9% 14 20.5% 33(Don’t know) 1.0% 16 0.7% 0 1.3% 2 0.0% 0 0.7% 1 1.7% 1 1.5% 1 1.8% 2 1.0% 2(Varies) 1.7% 27 4.8% 2 3.1% 5 1.3% 1 2.3% 2 0.0% 0 0.7% 0 1.3% 1 2.4% 4(Don't do this type of
shopping) 4.1% 66 8.6% 3 3.1% 5 5.9% 5 1.4% 1 2.2% 1 5.4% 4 9.0% 8 5.9% 9
Weighted base: 1607 33 152 89 95 66 74 94 160Sample: 1607 100 100 100 100 101 100 102 102

by Zone (Weighted, Part 2) South Wales Retail Study Page 18 Weighted: for Carter Jonas August 2016
Total Zone 9 Zone 10 Zone 11 Zone 12 Zone 13 Zone 14 Zone 15 Zone 16
Column %ges. 020716 NEMS market research
Q10A Which internet / home delivery retailer do you use for your household's shopping for mens, womens, childrens and baby clothing and footwear (fashion items - not sports clothing and footwear)?
Those who shop online at Q10 Amazon 6.2% 22 11.5% 1 4.4% 1 7.1% 1 7.2% 2 7.0% 1 13.0% 3 0.0% 0 9.8% 3ASOS 0.3% 1 0.0% 0 0.0% 0 0.0% 0 0.0% 0 0.0% 0 0.0% 0 0.0% 0 0.0% 0Debenhams 1.5% 5 4.3% 0 4.0% 1 0.0% 0 0.0% 0 6.4% 1 0.0% 0 6.2% 1 0.0% 0Ebay 2.6% 9 0.0% 0 0.0% 0 7.1% 1 10.3% 2 3.5% 1 2.7% 1 0.0% 0 0.0% 0Ebuyer 0.2% 1 0.0% 0 0.0% 0 0.0% 0 0.0% 0 3.5% 1 0.0% 0 0.0% 0 0.0% 0John Lewis 2.3% 8 0.0% 0 0.0% 0 0.0% 0 0.0% 0 0.0% 0 2.1% 0 28.5% 4 4.9% 2Littlewoods 0.6% 2 0.0% 0 0.0% 0 0.0% 0 0.0% 0 0.0% 0 0.0% 0 0.0% 0 0.0% 0Marks & Spencer 3.6% 13 0.0% 0 0.0% 0 0.0% 0 0.0% 0 0.0% 0 0.0% 0 0.0% 0 0.0% 0Next 12.9% 46 21.5% 1 7.8% 3 26.1% 3 19.6% 4 26.9% 4 22.3% 5 0.0% 0 15.2% 5Tesco 0.2% 1 4.3% 0 0.0% 0 0.0% 0 0.0% 0 0.0% 0 0.0% 0 0.0% 0 0.0% 0Adini 0.2% 1 0.0% 0 0.0% 0 0.0% 0 0.0% 0 0.0% 0 0.0% 0 0.0% 0 0.0% 0Ambrose Wilson 0.4% 1 0.0% 0 0.0% 0 0.0% 0 0.0% 0 0.0% 0 0.0% 0 0.0% 0 0.0% 0Boden 0.2% 1 0.0% 0 0.0% 0 0.0% 0 0.0% 0 0.0% 0 0.0% 0 0.0% 0 0.0% 0Bon Marche 0.4% 1 0.0% 0 0.0% 0 0.0% 0 0.0% 0 0.0% 0 0.0% 0 6.2% 1 0.0% 0Ce Ce 0.1% 0 0.0% 0 0.0% 0 0.0% 0 0.0% 0 0.0% 0 0.0% 0 0.0% 0 0.0% 0Chums 0.2% 1 0.0% 0 0.0% 0 0.0% 0 4.0% 1 0.0% 0 0.0% 0 0.0% 0 0.0% 0Clarks 0.8% 3 0.0% 0 3.8% 1 0.0% 0 4.0% 1 0.0% 0 2.7% 1 0.0% 0 0.0% 0Cotton Traders 0.5% 2 4.3% 0 0.0% 0 0.0% 0 0.0% 0 5.4% 1 0.0% 0 5.9% 1 0.0% 0Cotwolds Camping 0.2% 1 0.0% 0 0.0% 0 0.0% 0 0.0% 0 0.0% 0 2.7% 1 0.0% 0 0.0% 0Damart 0.9% 3 4.3% 0 2.9% 1 0.0% 0 0.0% 0 5.4% 1 0.0% 0 4.5% 1 0.0% 0Daxon 0.3% 1 0.0% 0 0.0% 0 0.0% 0 3.1% 1 0.0% 0 2.1% 0 0.0% 0 0.0% 0Dorothy Perkins 0.8% 3 0.0% 0 8.4% 3 0.0% 0 0.0% 0 0.0% 0 0.0% 0 0.0% 0 0.0% 0Dr. Martens 0.2% 1 0.0% 0 0.0% 0 0.0% 0 0.0% 0 0.0% 0 0.0% 0 0.0% 0 0.0% 0Fifty Plus 0.3% 1 0.0% 0 0.0% 0 0.0% 0 0.0% 0 0.0% 0 0.0% 0 0.0% 0 3.6% 1Grattan 0.6% 2 0.0% 0 0.0% 0 0.0% 0 0.0% 0 0.0% 0 2.7% 1 0.0% 0 0.0% 0H&M 1.6% 6 0.0% 0 0.0% 0 0.0% 0 0.0% 0 0.0% 0 6.0% 1 0.0% 0 0.0% 0Hotter Shoes 1.2% 4 4.3% 0 0.0% 0 5.2% 1 0.0% 0 0.0% 0 4.1% 1 4.5% 1 3.6% 1JD Williams 1.2% 4 4.3% 0 0.0% 0 5.2% 1 0.0% 0 0.0% 0 0.0% 0 4.5% 1 7.2% 2Julipa 0.3% 1 0.0% 0 2.9% 1 0.0% 0 0.0% 0 0.0% 0 0.0% 0 0.0% 0 0.0% 0Kays 0.2% 1 0.0% 0 0.0% 0 0.0% 0 3.1% 1 0.0% 0 0.0% 0 0.0% 0 0.0% 0L. K. Bennet 0.1% 0 0.0% 0 0.0% 0 0.0% 0 0.0% 0 0.0% 0 0.0% 0 0.0% 0 0.0% 0Lands' End 0.9% 3 5.6% 0 2.9% 1 0.0% 0 0.0% 0 2.7% 0 0.0% 0 0.0% 0 0.0% 0Littlewoods 0.3% 1 0.0% 0 0.0% 0 0.0% 0 0.0% 0 0.0% 0 0.0% 0 0.0% 0 0.0% 0Long Tall Sally 0.1% 0 0.0% 0 0.0% 0 0.0% 0 0.0% 0 0.0% 0 0.0% 0 0.0% 0 0.0% 0MandM Direct 0.1% 0 5.9% 0 0.0% 0 0.0% 0 0.0% 0 0.0% 0 0.0% 0 0.0% 0 0.0% 0Marisota 0.3% 1 0.0% 0 0.0% 0 0.0% 0 0.0% 0 0.0% 0 0.0% 0 0.0% 0 0.0% 0Matalan 0.6% 2 0.0% 0 0.0% 0 0.0% 0 0.0% 0 0.0% 0 0.0% 0 0.0% 0 0.0% 0New Look 1.4% 5 0.0% 0 0.0% 0 0.0% 0 0.0% 0 0.0% 0 0.0% 0 0.0% 0 0.0% 0Orvis UK 0.1% 0 0.0% 0 0.0% 0 0.0% 0 0.0% 0 0.0% 0 0.0% 0 0.0% 0 0.0% 0Oxendales 0.1% 0 0.0% 0 0.0% 0 0.0% 0 0.0% 0 2.7% 0 0.0% 0 0.0% 0 0.0% 0Poetry Fashion 0.2% 1 0.0% 0 0.0% 0 0.0% 0 0.0% 0 0.0% 0 0.0% 0 0.0% 0 0.0% 0Premier Man 0.6% 2 0.0% 0 4.0% 1 0.0% 0 0.0% 0 0.0% 0 0.0% 0 0.0% 0 0.0% 0QVC 0.4% 1 0.0% 0 0.0% 0 0.0% 0 0.0% 0 0.0% 0 0.0% 0 0.0% 0 3.6% 1River Island 1.2% 4 0.0% 0 0.0% 0 0.0% 0 4.2% 1 0.0% 0 0.0% 0 0.0% 0 0.0% 0Simply Be 0.2% 1 0.0% 0 0.0% 0 0.0% 0 0.0% 0 0.0% 0 0.0% 0 6.2% 1 0.0% 0Superdry 0.7% 2 0.0% 0 0.0% 0 0.0% 0 0.0% 0 0.0% 0 10.3% 2 0.0% 0 0.0% 0TK Maxx 0.3% 1 0.0% 0 0.0% 0 0.0% 0 0.0% 0 0.0% 0 0.0% 0 0.0% 0 0.0% 0WALL London 0.1% 0 4.3% 0 0.0% 0 0.0% 0 0.0% 0 0.0% 0 0.0% 0 0.0% 0 0.0% 0White Stuff 0.1% 0 0.0% 0 0.0% 0 0.0% 0 0.0% 0 0.0% 0 0.0% 0 0.0% 0 0.0% 0Wider Fit shoes 0.3% 1 0.0% 0 0.0% 0 0.0% 0 0.0% 0 0.0% 0 0.0% 0 0.0% 0 0.0% 0(Don't know / varies) 51.0% 183 25.4% 1 58.8% 19 49.2% 6 44.5% 10 36.5% 6 29.4% 7 33.5% 5 52.3% 17Weighted base: 359 5 33 11 22 16 23 14 33Sample: 316 17 21 13 23 24 26 14 20

by Zone (Weighted, Part 2) South Wales Retail Study Page 19 Weighted: for Carter Jonas August 2016
Total Zone 9 Zone 10 Zone 11 Zone 12 Zone 13 Zone 14 Zone 15 Zone 16
Column %ges. 020716 NEMS market research
Q11 How do you normally travel to (STORE OR CENTRE MENTIONED AT Q10)? Those who gave a location at Q10 Car / van (as driver) 76.6% 872 86.5% 20 96.6% 104 89.5% 63 70.8% 49 72.6% 34 83.8% 37 31.3% 22 60.7% 68Car / van (as passenger) 8.9% 102 8.6% 2 1.4% 1 8.6% 6 11.4% 8 16.7% 8 12.2% 5 11.0% 8 19.7% 22Bus, minibus or coach 5.0% 56 2.0% 0 0.9% 1 1.9% 1 11.0% 8 5.5% 3 1.1% 0 9.1% 6 8.5% 10Using park & ride facility 0.1% 1 0.0% 0 0.0% 0 0.0% 0 0.0% 0 0.9% 0 0.0% 0 0.0% 0 0.0% 0Motorcycle, scooter or
moped 0.1% 1 0.0% 0 0.0% 0 0.0% 0 0.0% 0 0.0% 0 0.0% 0 0.0% 0 0.0% 0
Walk 5.1% 59 0.0% 0 1.2% 1 0.0% 0 1.3% 1 2.3% 1 0.0% 0 38.6% 27 2.7% 3Taxi 0.2% 2 1.0% 0 0.0% 0 0.0% 0 0.0% 0 0.9% 0 0.0% 0 0.0% 0 0.0% 0Train 2.7% 31 2.0% 0 0.0% 0 0.0% 0 1.3% 1 0.0% 0 1.5% 1 3.1% 2 8.4% 9Bicycle 0.3% 3 0.0% 0 0.0% 0 0.0% 0 0.0% 0 0.0% 0 0.0% 0 0.9% 1 0.0% 0Mobility scooter / wheelchair 0.0% 0 0.0% 0 0.0% 0 0.0% 0 0.0% 0 0.0% 0 0.0% 0 0.0% 0 0.0% 0Other 0.0% 0 0.0% 0 0.0% 0 0.0% 0 0.0% 0 0.0% 0 0.0% 0 0.0% 0 0.0% 0Aeroplane 0.1% 1 0.0% 0 0.0% 0 0.0% 0 0.0% 0 0.0% 0 0.0% 0 0.0% 0 0.0% 0(Don’t know) 0.1% 1 0.0% 0 0.0% 0 0.0% 0 0.0% 0 0.0% 0 0.0% 0 0.0% 0 0.0% 0(Varies) 0.8% 9 0.0% 0 0.0% 0 0.0% 0 4.2% 3 0.9% 0 1.5% 1 6.0% 4 0.0% 0Weighted base: 1139 23 107 71 70 47 45 69 113Sample: 1152 67 70 78 71 72 63 75 71 Q12 What do you like about this store / town centre? (STORE OR CENTRE MENTIONED AT Q10) [MR] Those who gave a location at Q10 Attractive environment / nice
place 6.6% 75 5.5% 1 5.1% 5 5.7% 4 11.0% 8 8.5% 4 8.3% 4 13.1% 9 5.9% 7
Close to friends or relatives 0.8% 10 0.0% 0 0.0% 0 0.0% 0 0.0% 0 0.9% 0 1.4% 1 0.9% 1 2.4% 3Close to home 22.3% 254 28.5% 7 16.7% 18 22.6% 16 16.4% 11 21.7% 10 28.0% 13 36.6% 25 18.7% 21Close to work 1.0% 11 0.0% 0 0.0% 0 0.0% 0 0.0% 0 4.7% 2 0.0% 0 0.0% 0 1.4% 2Compact 8.8% 100 5.1% 1 9.1% 10 9.4% 7 8.6% 6 7.1% 3 5.7% 3 13.4% 9 9.8% 11Easy to get to by bike 0.0% 0 0.0% 0 0.0% 0 0.0% 0 0.0% 0 0.0% 0 0.0% 0 0.0% 0 0.0% 0Easy to get to by bus 0.2% 2 0.0% 0 0.0% 0 0.0% 0 0.0% 0 0.0% 0 0.0% 0 0.9% 1 0.0% 0Easy to get to by car 1.8% 21 0.0% 0 2.1% 2 2.1% 1 1.3% 1 0.0% 0 0.0% 0 0.0% 0 1.0% 1Easy to park 3.8% 43 3.6% 1 2.5% 3 6.9% 5 1.3% 1 2.2% 1 0.0% 0 0.0% 0 1.4% 2Free parking 0.7% 8 1.0% 0 2.6% 3 0.0% 0 0.0% 0 0.0% 0 1.1% 0 0.0% 0 0.0% 0Size of store 0.4% 5 0.0% 0 0.9% 1 0.0% 0 0.0% 0 0.9% 0 0.0% 0 1.3% 1 0.0% 0Range of goods 14.0% 160 21.9% 5 18.9% 20 13.1% 9 26.1% 18 5.0% 2 6.6% 3 5.4% 4 8.5% 10Value for money 2.0% 23 0.0% 0 4.5% 5 0.8% 1 2.6% 2 5.6% 3 0.0% 0 0.9% 1 0.0% 0Good facilities 1.0% 11 2.2% 1 0.0% 0 0.0% 0 0.0% 0 0.9% 0 0.0% 0 0.0% 0 0.0% 0Good food stores 0.7% 8 0.0% 0 0.9% 1 0.0% 0 0.0% 0 0.0% 0 1.4% 1 0.0% 0 2.5% 3Good pubs, cafés or
restaurants 1.0% 12 0.0% 0 0.0% 0 1.1% 1 0.0% 0 0.9% 0 1.5% 1 3.1% 2 2.1% 2
Good range of non-food shops
32.7% 372 26.6% 6 35.3% 38 46.8% 33 39.5% 27 37.5% 18 28.8% 13 27.7% 19 25.0% 28
Makes a change from other places
0.4% 4 2.0% 0 0.0% 0 0.8% 1 2.2% 2 0.0% 0 1.1% 0 0.0% 0 1.0% 1
Quiet 1.1% 12 3.5% 1 0.9% 1 0.0% 0 0.0% 0 1.9% 1 2.5% 1 4.6% 3 3.0% 3Safe and secure 0.1% 1 0.0% 0 0.0% 0 0.0% 0 0.0% 0 0.0% 0 0.0% 0 1.2% 1 0.0% 0The market (food / farmers
market, other markets) 0.1% 1 0.0% 0 0.0% 0 0.0% 0 0.0% 0 2.2% 1 0.0% 0 0.0% 0 0.0% 0
Traditional 0.5% 6 1.0% 0 0.0% 0 0.0% 0 1.5% 1 1.9% 1 0.0% 0 1.3% 1 1.0% 1Traffic free shopping centre 0.4% 5 1.3% 0 1.2% 1 0.0% 0 0.0% 0 0.0% 0 0.0% 0 0.0% 0 0.0% 0Other 0.0% 0 0.0% 0 0.0% 0 0.0% 0 0.0% 0 0.0% 0 0.0% 0 0.0% 0 0.0% 0Good / friendly staff / service
/ people 0.9% 11 0.0% 0 1.2% 1 0.8% 1 1.0% 1 0.0% 0 2.2% 1 0.9% 1 3.5% 4
Good opening hours 0.1% 1 0.0% 0 0.0% 0 0.0% 0 0.0% 0 0.0% 0 0.0% 0 0.0% 0 0.0% 0Good quality 0.9% 10 0.0% 0 0.0% 0 0.0% 0 0.0% 0 0.0% 0 0.0% 0 0.0% 0 0.0% 0Good range of independent
shops 1.5% 17 1.0% 0 0.0% 0 3.5% 2 6.5% 4 0.0% 0 4.3% 2 2.2% 2 4.9% 5
Good range of services 0.2% 2 2.8% 1 0.0% 0 0.0% 0 1.3% 1 0.0% 0 0.0% 0 0.0% 0 0.0% 0Habit / familiarity 1.1% 13 1.0% 0 1.2% 1 0.0% 0 0.0% 0 9.3% 4 4.6% 2 0.9% 1 1.0% 1Presence of a Marks &
Spencer store 1.0% 12 0.0% 0 0.9% 1 0.0% 0 1.0% 1 1.9% 1 0.0% 0 0.0% 0 0.0% 0
(Nothing / very little) 14.0% 160 8.5% 2 21.6% 23 17.2% 12 3.2% 2 8.1% 4 16.4% 7 14.2% 10 25.3% 28(Don't know) 2.5% 29 3.7% 1 3.3% 4 4.9% 4 1.3% 1 1.3% 1 1.1% 0 1.2% 1 3.5% 4Weighted base: 1139 23 107 71 70 47 45 69 113Sample: 1152 67 70 78 71 72 63 75 71
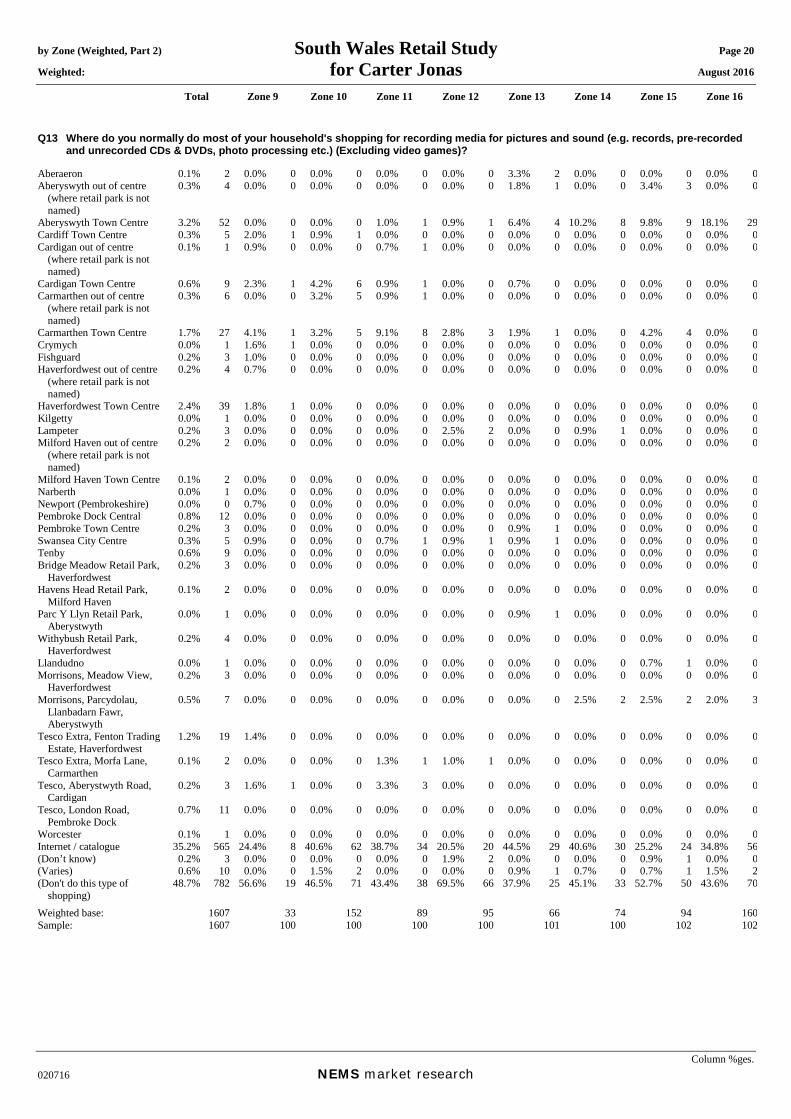
by Zone (Weighted, Part 2) South Wales Retail Study Page 20 Weighted: for Carter Jonas August 2016
Total Zone 9 Zone 10 Zone 11 Zone 12 Zone 13 Zone 14 Zone 15 Zone 16
Column %ges. 020716 NEMS market research
Q13 Where do you normally do most of your household's shopping for recording media for pictures and sound (e.g. records, pre-recorded and unrecorded CDs & DVDs, photo processing etc.) (Excluding video games)?
Aberaeron 0.1% 2 0.0% 0 0.0% 0 0.0% 0 0.0% 0 3.3% 2 0.0% 0 0.0% 0 0.0% 0Aberyswyth out of centre
(where retail park is not named)
0.3% 4 0.0% 0 0.0% 0 0.0% 0 0.0% 0 1.8% 1 0.0% 0 3.4% 3 0.0% 0
Aberyswyth Town Centre 3.2% 52 0.0% 0 0.0% 0 1.0% 1 0.9% 1 6.4% 4 10.2% 8 9.8% 9 18.1% 29Cardiff Town Centre 0.3% 5 2.0% 1 0.9% 1 0.0% 0 0.0% 0 0.0% 0 0.0% 0 0.0% 0 0.0% 0Cardigan out of centre
(where retail park is not named)
0.1% 1 0.9% 0 0.0% 0 0.7% 1 0.0% 0 0.0% 0 0.0% 0 0.0% 0 0.0% 0
Cardigan Town Centre 0.6% 9 2.3% 1 4.2% 6 0.9% 1 0.0% 0 0.7% 0 0.0% 0 0.0% 0 0.0% 0Carmarthen out of centre
(where retail park is not named)
0.3% 6 0.0% 0 3.2% 5 0.9% 1 0.0% 0 0.0% 0 0.0% 0 0.0% 0 0.0% 0
Carmarthen Town Centre 1.7% 27 4.1% 1 3.2% 5 9.1% 8 2.8% 3 1.9% 1 0.0% 0 4.2% 4 0.0% 0Crymych 0.0% 1 1.6% 1 0.0% 0 0.0% 0 0.0% 0 0.0% 0 0.0% 0 0.0% 0 0.0% 0Fishguard 0.2% 3 1.0% 0 0.0% 0 0.0% 0 0.0% 0 0.0% 0 0.0% 0 0.0% 0 0.0% 0Haverfordwest out of centre
(where retail park is not named)
0.2% 4 0.7% 0 0.0% 0 0.0% 0 0.0% 0 0.0% 0 0.0% 0 0.0% 0 0.0% 0
Haverfordwest Town Centre 2.4% 39 1.8% 1 0.0% 0 0.0% 0 0.0% 0 0.0% 0 0.0% 0 0.0% 0 0.0% 0Kilgetty 0.0% 1 0.0% 0 0.0% 0 0.0% 0 0.0% 0 0.0% 0 0.0% 0 0.0% 0 0.0% 0Lampeter 0.2% 3 0.0% 0 0.0% 0 0.0% 0 2.5% 2 0.0% 0 0.9% 1 0.0% 0 0.0% 0Milford Haven out of centre
(where retail park is not named)
0.2% 2 0.0% 0 0.0% 0 0.0% 0 0.0% 0 0.0% 0 0.0% 0 0.0% 0 0.0% 0
Milford Haven Town Centre 0.1% 2 0.0% 0 0.0% 0 0.0% 0 0.0% 0 0.0% 0 0.0% 0 0.0% 0 0.0% 0Narberth 0.0% 1 0.0% 0 0.0% 0 0.0% 0 0.0% 0 0.0% 0 0.0% 0 0.0% 0 0.0% 0Newport (Pembrokeshire) 0.0% 0 0.7% 0 0.0% 0 0.0% 0 0.0% 0 0.0% 0 0.0% 0 0.0% 0 0.0% 0Pembroke Dock Central 0.8% 12 0.0% 0 0.0% 0 0.0% 0 0.0% 0 0.0% 0 0.0% 0 0.0% 0 0.0% 0Pembroke Town Centre 0.2% 3 0.0% 0 0.0% 0 0.0% 0 0.0% 0 0.9% 1 0.0% 0 0.0% 0 0.0% 0Swansea City Centre 0.3% 5 0.9% 0 0.0% 0 0.7% 1 0.9% 1 0.9% 1 0.0% 0 0.0% 0 0.0% 0Tenby 0.6% 9 0.0% 0 0.0% 0 0.0% 0 0.0% 0 0.0% 0 0.0% 0 0.0% 0 0.0% 0Bridge Meadow Retail Park,
Haverfordwest 0.2% 3 0.0% 0 0.0% 0 0.0% 0 0.0% 0 0.0% 0 0.0% 0 0.0% 0 0.0% 0
Havens Head Retail Park, Milford Haven
0.1% 2 0.0% 0 0.0% 0 0.0% 0 0.0% 0 0.0% 0 0.0% 0 0.0% 0 0.0% 0
Parc Y Llyn Retail Park, Aberystwyth
0.0% 1 0.0% 0 0.0% 0 0.0% 0 0.0% 0 0.9% 1 0.0% 0 0.0% 0 0.0% 0
Withybush Retail Park, Haverfordwest
0.2% 4 0.0% 0 0.0% 0 0.0% 0 0.0% 0 0.0% 0 0.0% 0 0.0% 0 0.0% 0
Llandudno 0.0% 1 0.0% 0 0.0% 0 0.0% 0 0.0% 0 0.0% 0 0.0% 0 0.7% 1 0.0% 0Morrisons, Meadow View,
Haverfordwest 0.2% 3 0.0% 0 0.0% 0 0.0% 0 0.0% 0 0.0% 0 0.0% 0 0.0% 0 0.0% 0
Morrisons, Parcydolau, Llanbadarn Fawr, Aberystwyth
0.5% 7 0.0% 0 0.0% 0 0.0% 0 0.0% 0 0.0% 0 2.5% 2 2.5% 2 2.0% 3
Tesco Extra, Fenton Trading Estate, Haverfordwest
1.2% 19 1.4% 0 0.0% 0 0.0% 0 0.0% 0 0.0% 0 0.0% 0 0.0% 0 0.0% 0
Tesco Extra, Morfa Lane, Carmarthen
0.1% 2 0.0% 0 0.0% 0 1.3% 1 1.0% 1 0.0% 0 0.0% 0 0.0% 0 0.0% 0
Tesco, Aberystwyth Road, Cardigan
0.2% 3 1.6% 1 0.0% 0 3.3% 3 0.0% 0 0.0% 0 0.0% 0 0.0% 0 0.0% 0
Tesco, London Road, Pembroke Dock
0.7% 11 0.0% 0 0.0% 0 0.0% 0 0.0% 0 0.0% 0 0.0% 0 0.0% 0 0.0% 0
Worcester 0.1% 1 0.0% 0 0.0% 0 0.0% 0 0.0% 0 0.0% 0 0.0% 0 0.0% 0 0.0% 0Internet / catalogue 35.2% 565 24.4% 8 40.6% 62 38.7% 34 20.5% 20 44.5% 29 40.6% 30 25.2% 24 34.8% 56(Don’t know) 0.2% 3 0.0% 0 0.0% 0 0.0% 0 1.9% 2 0.0% 0 0.0% 0 0.9% 1 0.0% 0(Varies) 0.6% 10 0.0% 0 1.5% 2 0.0% 0 0.0% 0 0.9% 1 0.7% 0 0.7% 1 1.5% 2(Don't do this type of
shopping) 48.7% 782 56.6% 19 46.5% 71 43.4% 38 69.5% 66 37.9% 25 45.1% 33 52.7% 50 43.6% 70
Weighted base: 1607 33 152 89 95 66 74 94 160Sample: 1607 100 100 100 100 101 100 102 102
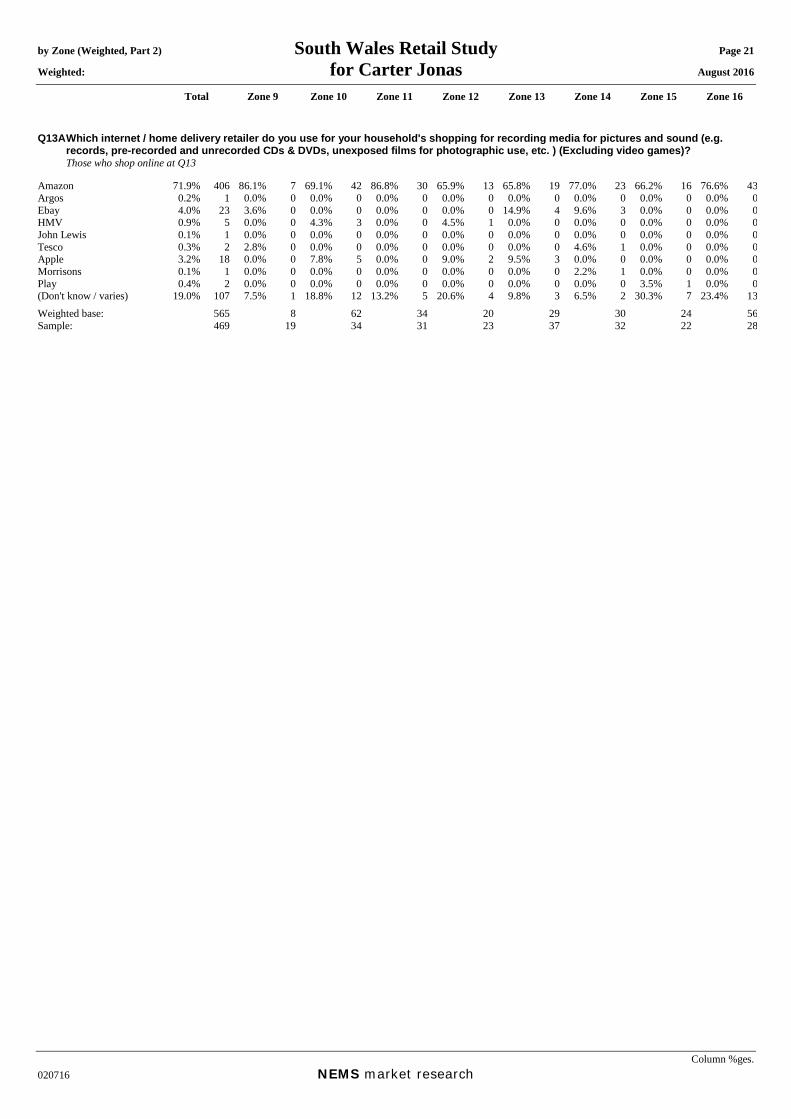
by Zone (Weighted, Part 2) South Wales Retail Study Page 21 Weighted: for Carter Jonas August 2016
Total Zone 9 Zone 10 Zone 11 Zone 12 Zone 13 Zone 14 Zone 15 Zone 16
Column %ges. 020716 NEMS market research
Q13A Which internet / home delivery retailer do you use for your household's shopping for recording media for pictures and sound (e.g. records, pre-recorded and unrecorded CDs & DVDs, unexposed films for photographic use, etc. ) (Excluding video games)?
Those who shop online at Q13 Amazon 71.9% 406 86.1% 7 69.1% 42 86.8% 30 65.9% 13 65.8% 19 77.0% 23 66.2% 16 76.6% 43Argos 0.2% 1 0.0% 0 0.0% 0 0.0% 0 0.0% 0 0.0% 0 0.0% 0 0.0% 0 0.0% 0Ebay 4.0% 23 3.6% 0 0.0% 0 0.0% 0 0.0% 0 14.9% 4 9.6% 3 0.0% 0 0.0% 0HMV 0.9% 5 0.0% 0 4.3% 3 0.0% 0 4.5% 1 0.0% 0 0.0% 0 0.0% 0 0.0% 0John Lewis 0.1% 1 0.0% 0 0.0% 0 0.0% 0 0.0% 0 0.0% 0 0.0% 0 0.0% 0 0.0% 0Tesco 0.3% 2 2.8% 0 0.0% 0 0.0% 0 0.0% 0 0.0% 0 4.6% 1 0.0% 0 0.0% 0Apple 3.2% 18 0.0% 0 7.8% 5 0.0% 0 9.0% 2 9.5% 3 0.0% 0 0.0% 0 0.0% 0Morrisons 0.1% 1 0.0% 0 0.0% 0 0.0% 0 0.0% 0 0.0% 0 2.2% 1 0.0% 0 0.0% 0Play 0.4% 2 0.0% 0 0.0% 0 0.0% 0 0.0% 0 0.0% 0 0.0% 0 3.5% 1 0.0% 0(Don't know / varies) 19.0% 107 7.5% 1 18.8% 12 13.2% 5 20.6% 4 9.8% 3 6.5% 2 30.3% 7 23.4% 13Weighted base: 565 8 62 34 20 29 30 24 56Sample: 469 19 34 31 23 37 32 22 28
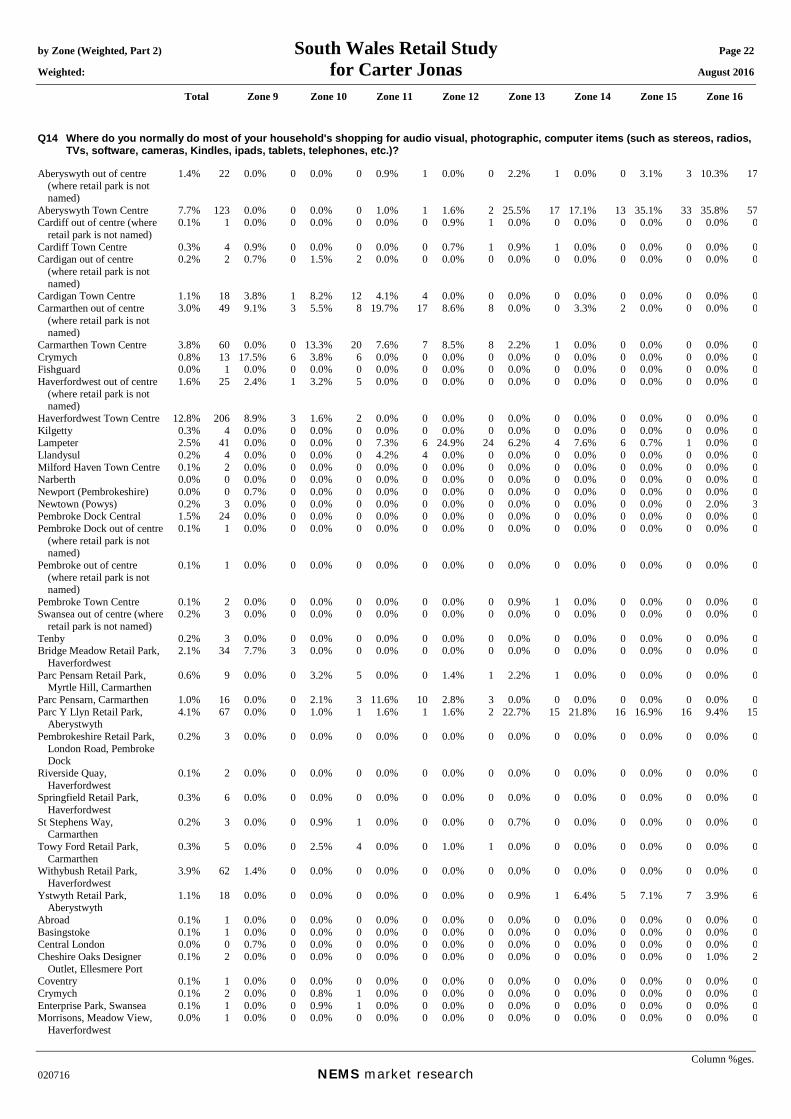
by Zone (Weighted, Part 2) South Wales Retail Study Page 22 Weighted: for Carter Jonas August 2016
Total Zone 9 Zone 10 Zone 11 Zone 12 Zone 13 Zone 14 Zone 15 Zone 16
Column %ges. 020716 NEMS market research
Q14 Where do you normally do most of your household's shopping for audio visual, photographic, computer items (such as stereos, radios, TVs, software, cameras, Kindles, ipads, tablets, telephones, etc.)?
Aberyswyth out of centre
(where retail park is not named)
1.4% 22 0.0% 0 0.0% 0 0.9% 1 0.0% 0 2.2% 1 0.0% 0 3.1% 3 10.3% 17
Aberyswyth Town Centre 7.7% 123 0.0% 0 0.0% 0 1.0% 1 1.6% 2 25.5% 17 17.1% 13 35.1% 33 35.8% 57Cardiff out of centre (where
retail park is not named) 0.1% 1 0.0% 0 0.0% 0 0.0% 0 0.9% 1 0.0% 0 0.0% 0 0.0% 0 0.0% 0
Cardiff Town Centre 0.3% 4 0.9% 0 0.0% 0 0.0% 0 0.7% 1 0.9% 1 0.0% 0 0.0% 0 0.0% 0Cardigan out of centre
(where retail park is not named)
0.2% 2 0.7% 0 1.5% 2 0.0% 0 0.0% 0 0.0% 0 0.0% 0 0.0% 0 0.0% 0
Cardigan Town Centre 1.1% 18 3.8% 1 8.2% 12 4.1% 4 0.0% 0 0.0% 0 0.0% 0 0.0% 0 0.0% 0Carmarthen out of centre
(where retail park is not named)
3.0% 49 9.1% 3 5.5% 8 19.7% 17 8.6% 8 0.0% 0 3.3% 2 0.0% 0 0.0% 0
Carmarthen Town Centre 3.8% 60 0.0% 0 13.3% 20 7.6% 7 8.5% 8 2.2% 1 0.0% 0 0.0% 0 0.0% 0Crymych 0.8% 13 17.5% 6 3.8% 6 0.0% 0 0.0% 0 0.0% 0 0.0% 0 0.0% 0 0.0% 0Fishguard 0.0% 1 0.0% 0 0.0% 0 0.0% 0 0.0% 0 0.0% 0 0.0% 0 0.0% 0 0.0% 0Haverfordwest out of centre
(where retail park is not named)
1.6% 25 2.4% 1 3.2% 5 0.0% 0 0.0% 0 0.0% 0 0.0% 0 0.0% 0 0.0% 0
Haverfordwest Town Centre 12.8% 206 8.9% 3 1.6% 2 0.0% 0 0.0% 0 0.0% 0 0.0% 0 0.0% 0 0.0% 0Kilgetty 0.3% 4 0.0% 0 0.0% 0 0.0% 0 0.0% 0 0.0% 0 0.0% 0 0.0% 0 0.0% 0Lampeter 2.5% 41 0.0% 0 0.0% 0 7.3% 6 24.9% 24 6.2% 4 7.6% 6 0.7% 1 0.0% 0Llandysul 0.2% 4 0.0% 0 0.0% 0 4.2% 4 0.0% 0 0.0% 0 0.0% 0 0.0% 0 0.0% 0Milford Haven Town Centre 0.1% 2 0.0% 0 0.0% 0 0.0% 0 0.0% 0 0.0% 0 0.0% 0 0.0% 0 0.0% 0Narberth 0.0% 0 0.0% 0 0.0% 0 0.0% 0 0.0% 0 0.0% 0 0.0% 0 0.0% 0 0.0% 0Newport (Pembrokeshire) 0.0% 0 0.7% 0 0.0% 0 0.0% 0 0.0% 0 0.0% 0 0.0% 0 0.0% 0 0.0% 0Newtown (Powys) 0.2% 3 0.0% 0 0.0% 0 0.0% 0 0.0% 0 0.0% 0 0.0% 0 0.0% 0 2.0% 3Pembroke Dock Central 1.5% 24 0.0% 0 0.0% 0 0.0% 0 0.0% 0 0.0% 0 0.0% 0 0.0% 0 0.0% 0Pembroke Dock out of centre
(where retail park is not named)
0.1% 1 0.0% 0 0.0% 0 0.0% 0 0.0% 0 0.0% 0 0.0% 0 0.0% 0 0.0% 0
Pembroke out of centre (where retail park is not named)
0.1% 1 0.0% 0 0.0% 0 0.0% 0 0.0% 0 0.0% 0 0.0% 0 0.0% 0 0.0% 0
Pembroke Town Centre 0.1% 2 0.0% 0 0.0% 0 0.0% 0 0.0% 0 0.9% 1 0.0% 0 0.0% 0 0.0% 0Swansea out of centre (where
retail park is not named) 0.2% 3 0.0% 0 0.0% 0 0.0% 0 0.0% 0 0.0% 0 0.0% 0 0.0% 0 0.0% 0
Tenby 0.2% 3 0.0% 0 0.0% 0 0.0% 0 0.0% 0 0.0% 0 0.0% 0 0.0% 0 0.0% 0Bridge Meadow Retail Park,
Haverfordwest 2.1% 34 7.7% 3 0.0% 0 0.0% 0 0.0% 0 0.0% 0 0.0% 0 0.0% 0 0.0% 0
Parc Pensarn Retail Park, Myrtle Hill, Carmarthen
0.6% 9 0.0% 0 3.2% 5 0.0% 0 1.4% 1 2.2% 1 0.0% 0 0.0% 0 0.0% 0
Parc Pensarn, Carmarthen 1.0% 16 0.0% 0 2.1% 3 11.6% 10 2.8% 3 0.0% 0 0.0% 0 0.0% 0 0.0% 0Parc Y Llyn Retail Park,
Aberystwyth 4.1% 67 0.0% 0 1.0% 1 1.6% 1 1.6% 2 22.7% 15 21.8% 16 16.9% 16 9.4% 15
Pembrokeshire Retail Park, London Road, Pembroke Dock
0.2% 3 0.0% 0 0.0% 0 0.0% 0 0.0% 0 0.0% 0 0.0% 0 0.0% 0 0.0% 0
Riverside Quay, Haverfordwest
0.1% 2 0.0% 0 0.0% 0 0.0% 0 0.0% 0 0.0% 0 0.0% 0 0.0% 0 0.0% 0
Springfield Retail Park, Haverfordwest
0.3% 6 0.0% 0 0.0% 0 0.0% 0 0.0% 0 0.0% 0 0.0% 0 0.0% 0 0.0% 0
St Stephens Way, Carmarthen
0.2% 3 0.0% 0 0.9% 1 0.0% 0 0.0% 0 0.7% 0 0.0% 0 0.0% 0 0.0% 0
Towy Ford Retail Park, Carmarthen
0.3% 5 0.0% 0 2.5% 4 0.0% 0 1.0% 1 0.0% 0 0.0% 0 0.0% 0 0.0% 0
Withybush Retail Park, Haverfordwest
3.9% 62 1.4% 0 0.0% 0 0.0% 0 0.0% 0 0.0% 0 0.0% 0 0.0% 0 0.0% 0
Ystwyth Retail Park, Aberystwyth
1.1% 18 0.0% 0 0.0% 0 0.0% 0 0.0% 0 0.9% 1 6.4% 5 7.1% 7 3.9% 6
Abroad 0.1% 1 0.0% 0 0.0% 0 0.0% 0 0.0% 0 0.0% 0 0.0% 0 0.0% 0 0.0% 0Basingstoke 0.1% 1 0.0% 0 0.0% 0 0.0% 0 0.0% 0 0.0% 0 0.0% 0 0.0% 0 0.0% 0Central London 0.0% 0 0.7% 0 0.0% 0 0.0% 0 0.0% 0 0.0% 0 0.0% 0 0.0% 0 0.0% 0Cheshire Oaks Designer
Outlet, Ellesmere Port 0.1% 2 0.0% 0 0.0% 0 0.0% 0 0.0% 0 0.0% 0 0.0% 0 0.0% 0 1.0% 2
Coventry 0.1% 1 0.0% 0 0.0% 0 0.0% 0 0.0% 0 0.0% 0 0.0% 0 0.0% 0 0.0% 0Crymych 0.1% 2 0.0% 0 0.8% 1 0.0% 0 0.0% 0 0.0% 0 0.0% 0 0.0% 0 0.0% 0Enterprise Park, Swansea 0.1% 1 0.0% 0 0.9% 1 0.0% 0 0.0% 0 0.0% 0 0.0% 0 0.0% 0 0.0% 0Morrisons, Meadow View,
Haverfordwest 0.0% 1 0.0% 0 0.0% 0 0.0% 0 0.0% 0 0.0% 0 0.0% 0 0.0% 0 0.0% 0

by Zone (Weighted, Part 2) South Wales Retail Study Page 23 Weighted: for Carter Jonas August 2016
Total Zone 9 Zone 10 Zone 11 Zone 12 Zone 13 Zone 14 Zone 15 Zone 16
Column %ges. 020716 NEMS market research
Morrisons, Parcydolau, Llanbadarn Fawr, Aberystwyth
0.0% 1 0.0% 0 0.0% 0 0.0% 0 0.0% 0 0.0% 0 0.0% 0 0.7% 1 0.0% 0
Newcastle Emlyn 0.7% 12 0.7% 0 3.6% 5 6.8% 6 0.0% 0 0.0% 0 0.0% 0 0.0% 0 0.0% 0Rheidol Retail Park,
Aberystwyth 0.0% 1 0.0% 0 0.0% 0 0.0% 0 0.0% 0 1.0% 1 0.0% 0 0.0% 0 0.0% 0
St Clears 0.1% 1 0.0% 0 0.0% 0 0.0% 0 0.0% 0 0.0% 0 0.0% 0 0.0% 0 0.0% 0Tesco Extra, Fenton Trading
Estate, Haverfordwest 0.7% 11 1.4% 0 0.0% 0 0.0% 0 0.0% 0 0.0% 0 0.0% 0 0.0% 0 0.0% 0
Tesco Extra, Morfa Lane, Carmarthen
0.0% 1 0.0% 0 0.0% 0 0.7% 1 0.0% 0 0.0% 0 0.0% 0 0.0% 0 0.0% 0
Tesco, Aberystwyth Road, Cardigan
0.0% 1 0.0% 0 0.0% 0 0.9% 1 0.0% 0 0.0% 0 0.0% 0 0.0% 0 0.0% 0
Tesco, London Road, Pembroke Dock
0.3% 5 0.0% 0 0.0% 0 0.0% 0 0.0% 0 0.0% 0 0.0% 0 0.0% 0 0.0% 0
Internet / catalogue 27.3% 439 14.1% 5 33.6% 51 19.2% 17 30.0% 29 27.2% 18 24.2% 18 7.7% 7 27.0% 43(Don’t know) 2.2% 35 3.4% 1 1.5% 2 2.5% 2 1.9% 2 0.9% 1 3.4% 3 1.9% 2 1.7% 3(Varies) 1.3% 21 2.0% 1 0.6% 1 0.0% 0 5.8% 6 0.9% 1 2.5% 2 2.2% 2 1.0% 2(Don't do this type of
shopping) 14.5% 234 24.8% 8 12.5% 19 12.0% 11 10.2% 10 5.7% 4 13.6% 10 24.6% 23 7.9% 13
Weighted base: 1607 33 152 89 95 66 74 94 160Sample: 1607 100 100 100 100 101 100 102 102 Q14A Which internet / home delivery retailer do you use for your household's shopping for audio visual, photographic, computer items (such
as stereos, radios, TVs, software, cameras, Kindles, iPads, telephones, etc.)? Those who shop online at Q14 Amazon 34.8% 153 41.9% 2 49.2% 25 25.4% 4 20.2% 6 21.1% 4 27.9% 5 44.3% 3 27.2% 12AO.com 4.5% 20 0.0% 0 1.9% 1 12.8% 2 2.4% 1 15.4% 3 0.0% 0 0.0% 0 0.0% 0Argos 4.0% 18 0.0% 0 4.4% 2 0.0% 0 0.0% 0 2.5% 0 6.2% 1 0.0% 0 10.6% 5B&Q 0.3% 1 0.0% 0 0.0% 0 0.0% 0 0.0% 0 0.0% 0 0.0% 0 0.0% 0 0.0% 0Currys 6.8% 30 0.0% 0 1.9% 1 8.0% 1 10.3% 3 25.3% 5 14.2% 3 0.0% 0 3.7% 2Ebay 3.3% 14 6.3% 0 4.4% 2 0.0% 0 9.3% 3 0.0% 0 13.5% 2 0.0% 0 0.0% 0Ebuyer 1.3% 6 0.0% 0 2.6% 1 0.0% 0 0.0% 0 7.1% 1 7.8% 1 0.0% 0 0.0% 0John Lewis 1.5% 7 0.0% 0 0.0% 0 0.0% 0 5.4% 2 0.0% 0 3.5% 1 22.9% 2 3.7% 2Littlewoods 0.8% 3 0.0% 0 0.0% 0 0.0% 0 0.0% 0 0.0% 0 3.5% 1 0.0% 0 0.0% 0PC World 0.9% 4 0.0% 0 0.0% 0 4.7% 1 3.2% 1 0.0% 0 0.0% 0 0.0% 0 0.0% 0Tesco 0.2% 1 0.0% 0 0.0% 0 0.0% 0 0.0% 0 0.0% 0 0.0% 0 0.0% 0 0.0% 0Apple 0.6% 3 0.0% 0 0.0% 0 0.0% 0 0.0% 0 0.0% 0 0.0% 0 0.0% 0 3.7% 2BT 0.4% 2 0.0% 0 0.0% 0 0.0% 0 0.0% 0 0.0% 0 0.0% 0 0.0% 0 3.7% 2Co-op 0.3% 2 0.0% 0 0.0% 0 0.0% 0 0.0% 0 0.0% 0 0.0% 0 0.0% 0 3.5% 2Dell 0.3% 1 0.0% 0 0.0% 0 0.0% 0 0.0% 0 0.0% 0 0.0% 0 0.0% 0 0.0% 0EE 0.1% 1 0.0% 0 0.0% 0 0.0% 0 0.0% 0 0.0% 0 0.0% 0 0.0% 0 0.0% 0Ocado 0.1% 0 0.0% 0 0.0% 0 0.0% 0 0.0% 0 2.5% 0 0.0% 0 0.0% 0 0.0% 0QVC 0.1% 0 0.0% 0 0.0% 0 0.0% 0 0.0% 0 0.0% 0 0.0% 0 0.0% 0 0.0% 0Sony 0.7% 3 0.0% 0 0.0% 0 0.0% 0 0.0% 0 0.0% 0 0.0% 0 0.0% 0 0.0% 0(Don't know / varies) 39.1% 172 51.7% 2 35.7% 18 49.1% 8 49.2% 14 26.2% 5 23.3% 4 32.8% 2 43.8% 19Weighted base: 439 5 51 17 29 18 18 7 43Sample: 358 14 27 19 26 20 21 9 26
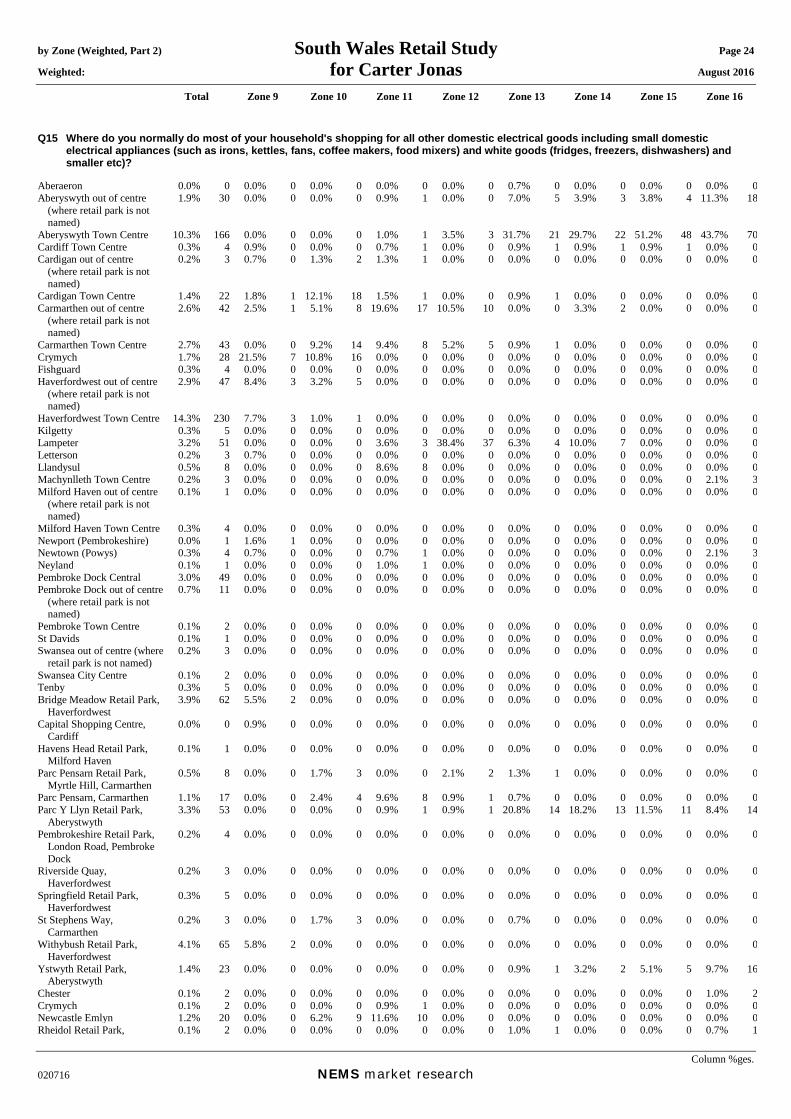
by Zone (Weighted, Part 2) South Wales Retail Study Page 24 Weighted: for Carter Jonas August 2016
Total Zone 9 Zone 10 Zone 11 Zone 12 Zone 13 Zone 14 Zone 15 Zone 16
Column %ges. 020716 NEMS market research
Q15 Where do you normally do most of your household's shopping for all other domestic electrical goods including small domestic electrical appliances (such as irons, kettles, fans, coffee makers, food mixers) and white goods (fridges, freezers, dishwashers) and smaller etc)?
Aberaeron 0.0% 0 0.0% 0 0.0% 0 0.0% 0 0.0% 0 0.7% 0 0.0% 0 0.0% 0 0.0% 0Aberyswyth out of centre
(where retail park is not named)
1.9% 30 0.0% 0 0.0% 0 0.9% 1 0.0% 0 7.0% 5 3.9% 3 3.8% 4 11.3% 18
Aberyswyth Town Centre 10.3% 166 0.0% 0 0.0% 0 1.0% 1 3.5% 3 31.7% 21 29.7% 22 51.2% 48 43.7% 70Cardiff Town Centre 0.3% 4 0.9% 0 0.0% 0 0.7% 1 0.0% 0 0.9% 1 0.9% 1 0.9% 1 0.0% 0Cardigan out of centre
(where retail park is not named)
0.2% 3 0.7% 0 1.3% 2 1.3% 1 0.0% 0 0.0% 0 0.0% 0 0.0% 0 0.0% 0
Cardigan Town Centre 1.4% 22 1.8% 1 12.1% 18 1.5% 1 0.0% 0 0.9% 1 0.0% 0 0.0% 0 0.0% 0Carmarthen out of centre
(where retail park is not named)
2.6% 42 2.5% 1 5.1% 8 19.6% 17 10.5% 10 0.0% 0 3.3% 2 0.0% 0 0.0% 0
Carmarthen Town Centre 2.7% 43 0.0% 0 9.2% 14 9.4% 8 5.2% 5 0.9% 1 0.0% 0 0.0% 0 0.0% 0Crymych 1.7% 28 21.5% 7 10.8% 16 0.0% 0 0.0% 0 0.0% 0 0.0% 0 0.0% 0 0.0% 0Fishguard 0.3% 4 0.0% 0 0.0% 0 0.0% 0 0.0% 0 0.0% 0 0.0% 0 0.0% 0 0.0% 0Haverfordwest out of centre
(where retail park is not named)
2.9% 47 8.4% 3 3.2% 5 0.0% 0 0.0% 0 0.0% 0 0.0% 0 0.0% 0 0.0% 0
Haverfordwest Town Centre 14.3% 230 7.7% 3 1.0% 1 0.0% 0 0.0% 0 0.0% 0 0.0% 0 0.0% 0 0.0% 0Kilgetty 0.3% 5 0.0% 0 0.0% 0 0.0% 0 0.0% 0 0.0% 0 0.0% 0 0.0% 0 0.0% 0Lampeter 3.2% 51 0.0% 0 0.0% 0 3.6% 3 38.4% 37 6.3% 4 10.0% 7 0.0% 0 0.0% 0Letterson 0.2% 3 0.7% 0 0.0% 0 0.0% 0 0.0% 0 0.0% 0 0.0% 0 0.0% 0 0.0% 0Llandysul 0.5% 8 0.0% 0 0.0% 0 8.6% 8 0.0% 0 0.0% 0 0.0% 0 0.0% 0 0.0% 0Machynlleth Town Centre 0.2% 3 0.0% 0 0.0% 0 0.0% 0 0.0% 0 0.0% 0 0.0% 0 0.0% 0 2.1% 3Milford Haven out of centre
(where retail park is not named)
0.1% 1 0.0% 0 0.0% 0 0.0% 0 0.0% 0 0.0% 0 0.0% 0 0.0% 0 0.0% 0
Milford Haven Town Centre 0.3% 4 0.0% 0 0.0% 0 0.0% 0 0.0% 0 0.0% 0 0.0% 0 0.0% 0 0.0% 0Newport (Pembrokeshire) 0.0% 1 1.6% 1 0.0% 0 0.0% 0 0.0% 0 0.0% 0 0.0% 0 0.0% 0 0.0% 0Newtown (Powys) 0.3% 4 0.7% 0 0.0% 0 0.7% 1 0.0% 0 0.0% 0 0.0% 0 0.0% 0 2.1% 3Neyland 0.1% 1 0.0% 0 0.0% 0 1.0% 1 0.0% 0 0.0% 0 0.0% 0 0.0% 0 0.0% 0Pembroke Dock Central 3.0% 49 0.0% 0 0.0% 0 0.0% 0 0.0% 0 0.0% 0 0.0% 0 0.0% 0 0.0% 0Pembroke Dock out of centre
(where retail park is not named)
0.7% 11 0.0% 0 0.0% 0 0.0% 0 0.0% 0 0.0% 0 0.0% 0 0.0% 0 0.0% 0
Pembroke Town Centre 0.1% 2 0.0% 0 0.0% 0 0.0% 0 0.0% 0 0.0% 0 0.0% 0 0.0% 0 0.0% 0St Davids 0.1% 1 0.0% 0 0.0% 0 0.0% 0 0.0% 0 0.0% 0 0.0% 0 0.0% 0 0.0% 0Swansea out of centre (where
retail park is not named) 0.2% 3 0.0% 0 0.0% 0 0.0% 0 0.0% 0 0.0% 0 0.0% 0 0.0% 0 0.0% 0
Swansea City Centre 0.1% 2 0.0% 0 0.0% 0 0.0% 0 0.0% 0 0.0% 0 0.0% 0 0.0% 0 0.0% 0Tenby 0.3% 5 0.0% 0 0.0% 0 0.0% 0 0.0% 0 0.0% 0 0.0% 0 0.0% 0 0.0% 0Bridge Meadow Retail Park,
Haverfordwest 3.9% 62 5.5% 2 0.0% 0 0.0% 0 0.0% 0 0.0% 0 0.0% 0 0.0% 0 0.0% 0
Capital Shopping Centre, Cardiff
0.0% 0 0.9% 0 0.0% 0 0.0% 0 0.0% 0 0.0% 0 0.0% 0 0.0% 0 0.0% 0
Havens Head Retail Park, Milford Haven
0.1% 1 0.0% 0 0.0% 0 0.0% 0 0.0% 0 0.0% 0 0.0% 0 0.0% 0 0.0% 0
Parc Pensarn Retail Park, Myrtle Hill, Carmarthen
0.5% 8 0.0% 0 1.7% 3 0.0% 0 2.1% 2 1.3% 1 0.0% 0 0.0% 0 0.0% 0
Parc Pensarn, Carmarthen 1.1% 17 0.0% 0 2.4% 4 9.6% 8 0.9% 1 0.7% 0 0.0% 0 0.0% 0 0.0% 0Parc Y Llyn Retail Park,
Aberystwyth 3.3% 53 0.0% 0 0.0% 0 0.9% 1 0.9% 1 20.8% 14 18.2% 13 11.5% 11 8.4% 14
Pembrokeshire Retail Park, London Road, Pembroke Dock
0.2% 4 0.0% 0 0.0% 0 0.0% 0 0.0% 0 0.0% 0 0.0% 0 0.0% 0 0.0% 0
Riverside Quay, Haverfordwest
0.2% 3 0.0% 0 0.0% 0 0.0% 0 0.0% 0 0.0% 0 0.0% 0 0.0% 0 0.0% 0
Springfield Retail Park, Haverfordwest
0.3% 5 0.0% 0 0.0% 0 0.0% 0 0.0% 0 0.0% 0 0.0% 0 0.0% 0 0.0% 0
St Stephens Way, Carmarthen
0.2% 3 0.0% 0 1.7% 3 0.0% 0 0.0% 0 0.7% 0 0.0% 0 0.0% 0 0.0% 0
Withybush Retail Park, Haverfordwest
4.1% 65 5.8% 2 0.0% 0 0.0% 0 0.0% 0 0.0% 0 0.0% 0 0.0% 0 0.0% 0
Ystwyth Retail Park, Aberystwyth
1.4% 23 0.0% 0 0.0% 0 0.0% 0 0.0% 0 0.9% 1 3.2% 2 5.1% 5 9.7% 16
Chester 0.1% 2 0.0% 0 0.0% 0 0.0% 0 0.0% 0 0.0% 0 0.0% 0 0.0% 0 1.0% 2Crymych 0.1% 2 0.0% 0 0.0% 0 0.9% 1 0.0% 0 0.0% 0 0.0% 0 0.0% 0 0.0% 0Newcastle Emlyn 1.2% 20 0.0% 0 6.2% 9 11.6% 10 0.0% 0 0.0% 0 0.0% 0 0.0% 0 0.0% 0Rheidol Retail Park, 0.1% 2 0.0% 0 0.0% 0 0.0% 0 0.0% 0 1.0% 1 0.0% 0 0.0% 0 0.7% 1
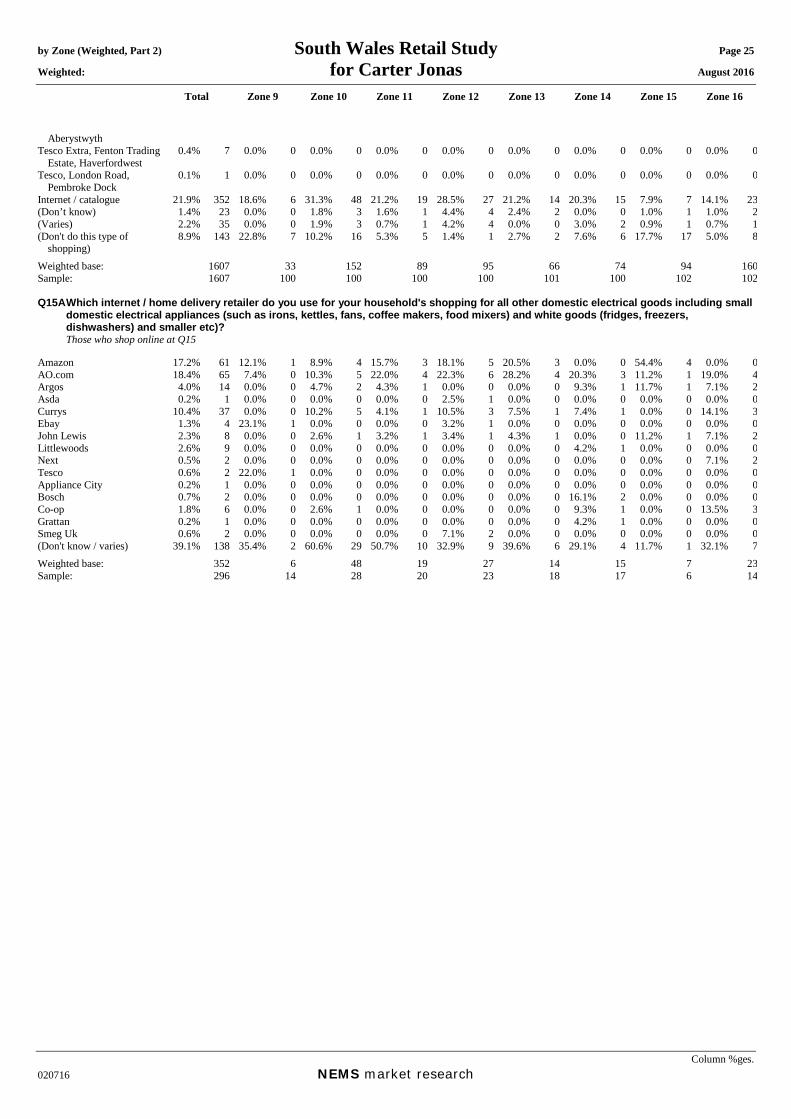
by Zone (Weighted, Part 2) South Wales Retail Study Page 25 Weighted: for Carter Jonas August 2016
Total Zone 9 Zone 10 Zone 11 Zone 12 Zone 13 Zone 14 Zone 15 Zone 16
Column %ges. 020716 NEMS market research
Aberystwyth Tesco Extra, Fenton Trading
Estate, Haverfordwest 0.4% 7 0.0% 0 0.0% 0 0.0% 0 0.0% 0 0.0% 0 0.0% 0 0.0% 0 0.0% 0
Tesco, London Road, Pembroke Dock
0.1% 1 0.0% 0 0.0% 0 0.0% 0 0.0% 0 0.0% 0 0.0% 0 0.0% 0 0.0% 0
Internet / catalogue 21.9% 352 18.6% 6 31.3% 48 21.2% 19 28.5% 27 21.2% 14 20.3% 15 7.9% 7 14.1% 23(Don’t know) 1.4% 23 0.0% 0 1.8% 3 1.6% 1 4.4% 4 2.4% 2 0.0% 0 1.0% 1 1.0% 2(Varies) 2.2% 35 0.0% 0 1.9% 3 0.7% 1 4.2% 4 0.0% 0 3.0% 2 0.9% 1 0.7% 1(Don't do this type of
shopping) 8.9% 143 22.8% 7 10.2% 16 5.3% 5 1.4% 1 2.7% 2 7.6% 6 17.7% 17 5.0% 8
Weighted base: 1607 33 152 89 95 66 74 94 160Sample: 1607 100 100 100 100 101 100 102 102 Q15A Which internet / home delivery retailer do you use for your household's shopping for all other domestic electrical goods including small
domestic electrical appliances (such as irons, kettles, fans, coffee makers, food mixers) and white goods (fridges, freezers, dishwashers) and smaller etc)?
Those who shop online at Q15 Amazon 17.2% 61 12.1% 1 8.9% 4 15.7% 3 18.1% 5 20.5% 3 0.0% 0 54.4% 4 0.0% 0AO.com 18.4% 65 7.4% 0 10.3% 5 22.0% 4 22.3% 6 28.2% 4 20.3% 3 11.2% 1 19.0% 4Argos 4.0% 14 0.0% 0 4.7% 2 4.3% 1 0.0% 0 0.0% 0 9.3% 1 11.7% 1 7.1% 2Asda 0.2% 1 0.0% 0 0.0% 0 0.0% 0 2.5% 1 0.0% 0 0.0% 0 0.0% 0 0.0% 0Currys 10.4% 37 0.0% 0 10.2% 5 4.1% 1 10.5% 3 7.5% 1 7.4% 1 0.0% 0 14.1% 3Ebay 1.3% 4 23.1% 1 0.0% 0 0.0% 0 3.2% 1 0.0% 0 0.0% 0 0.0% 0 0.0% 0John Lewis 2.3% 8 0.0% 0 2.6% 1 3.2% 1 3.4% 1 4.3% 1 0.0% 0 11.2% 1 7.1% 2Littlewoods 2.6% 9 0.0% 0 0.0% 0 0.0% 0 0.0% 0 0.0% 0 4.2% 1 0.0% 0 0.0% 0Next 0.5% 2 0.0% 0 0.0% 0 0.0% 0 0.0% 0 0.0% 0 0.0% 0 0.0% 0 7.1% 2Tesco 0.6% 2 22.0% 1 0.0% 0 0.0% 0 0.0% 0 0.0% 0 0.0% 0 0.0% 0 0.0% 0Appliance City 0.2% 1 0.0% 0 0.0% 0 0.0% 0 0.0% 0 0.0% 0 0.0% 0 0.0% 0 0.0% 0Bosch 0.7% 2 0.0% 0 0.0% 0 0.0% 0 0.0% 0 0.0% 0 16.1% 2 0.0% 0 0.0% 0Co-op 1.8% 6 0.0% 0 2.6% 1 0.0% 0 0.0% 0 0.0% 0 9.3% 1 0.0% 0 13.5% 3Grattan 0.2% 1 0.0% 0 0.0% 0 0.0% 0 0.0% 0 0.0% 0 4.2% 1 0.0% 0 0.0% 0Smeg Uk 0.6% 2 0.0% 0 0.0% 0 0.0% 0 7.1% 2 0.0% 0 0.0% 0 0.0% 0 0.0% 0(Don't know / varies) 39.1% 138 35.4% 2 60.6% 29 50.7% 10 32.9% 9 39.6% 6 29.1% 4 11.7% 1 32.1% 7Weighted base: 352 6 48 19 27 14 15 7 23Sample: 296 14 28 20 23 18 17 6 14

by Zone (Weighted, Part 2) South Wales Retail Study Page 26 Weighted: for Carter Jonas August 2016
Total Zone 9 Zone 10 Zone 11 Zone 12 Zone 13 Zone 14 Zone 15 Zone 16
Column %ges. 020716 NEMS market research
Q16 Where do you normally do most of your household's shopping for books (incl. dictionaries, encyclopaedias, text books, guidebooks and musical scores) and stationary (incl. writing pads, envelopes pens, diaries, etc.) and drawing materials?
Aberaeron 0.4% 7 0.0% 0 0.0% 0 1.0% 1 1.6% 2 6.6% 4 0.0% 0 0.0% 0 0.0% 0Aberyswyth out of centre
(where retail park is not named)
0.0% 1 0.0% 0 0.0% 0 0.0% 0 0.0% 0 0.9% 1 0.0% 0 0.0% 0 0.0% 0
Aberyswyth Town Centre 11.7% 187 0.9% 0 0.0% 0 0.0% 0 1.4% 1 29.3% 19 40.0% 29 55.3% 52 52.8% 85Cardiff Town Centre 0.3% 5 0.0% 0 0.6% 1 0.0% 0 0.0% 0 0.9% 1 0.0% 0 0.0% 0 0.0% 0Cardigan Town Centre 4.1% 66 22.3% 7 34.0% 52 7.1% 6 0.7% 1 0.0% 0 0.0% 0 0.0% 0 0.0% 0Carmarthen out of centre
(where retail park is not named)
0.2% 2 0.0% 0 0.6% 1 0.0% 0 0.9% 1 0.0% 0 0.0% 0 0.0% 0 0.0% 0
Carmarthen Town Centre 3.7% 60 3.2% 1 4.4% 7 25.1% 22 10.6% 10 1.6% 1 0.0% 0 0.0% 0 1.0% 2Crymych 0.4% 6 6.9% 2 2.7% 4 0.0% 0 0.0% 0 0.0% 0 0.0% 0 0.0% 0 0.0% 0Fishguard 0.7% 12 5.8% 2 0.0% 0 0.0% 0 0.0% 0 0.0% 0 0.0% 0 0.0% 0 0.0% 0Goodwick 0.0% 1 0.0% 0 0.0% 0 0.0% 0 0.0% 0 0.0% 0 0.0% 0 0.0% 0 0.0% 0Haverfordwest out of centre
(where retail park is not named)
0.6% 10 0.0% 0 0.0% 0 0.0% 0 0.0% 0 0.0% 0 0.0% 0 0.0% 0 0.0% 0
Haverfordwest Town Centre 11.3% 181 2.9% 1 0.0% 0 0.0% 0 0.0% 0 0.0% 0 0.0% 0 0.9% 1 0.0% 0Johnston 0.2% 3 0.0% 0 0.0% 0 0.0% 0 0.0% 0 0.0% 0 0.0% 0 0.0% 0 0.0% 0Kilgetty 0.2% 3 0.0% 0 0.0% 0 0.0% 0 0.0% 0 0.0% 0 0.0% 0 0.0% 0 0.0% 0Lampeter 1.4% 22 0.0% 0 0.0% 0 2.5% 2 18.5% 18 0.0% 0 3.3% 2 0.0% 0 0.0% 0Letterson 0.1% 1 0.0% 0 0.0% 0 0.0% 0 0.0% 0 0.0% 0 0.0% 0 0.0% 0 0.0% 0Llandysul 0.7% 11 0.0% 0 0.0% 0 12.3% 11 0.0% 0 0.0% 0 0.0% 0 0.0% 0 0.0% 0Llanelli Town Centre 0.1% 2 0.0% 0 0.0% 0 0.0% 0 2.0% 2 0.0% 0 0.0% 0 0.0% 0 0.0% 0Machynlleth Town Centre 0.3% 4 0.0% 0 0.0% 0 0.0% 0 0.0% 0 0.0% 0 0.0% 0 0.0% 0 2.6% 4Milford Haven out of centre
(where retail park is not named)
0.1% 2 0.0% 0 0.0% 0 0.0% 0 0.0% 0 0.0% 0 0.0% 0 0.0% 0 0.0% 0
Milford Haven Town Centre 1.0% 15 0.0% 0 0.0% 0 0.0% 0 0.0% 0 0.0% 0 0.0% 0 0.0% 0 0.0% 0Narberth 0.3% 4 0.0% 0 0.0% 0 0.0% 0 0.0% 0 0.0% 0 0.0% 0 0.0% 0 0.0% 0Newport (Pembrokeshire) 0.2% 4 11.3% 4 0.0% 0 0.0% 0 0.0% 0 0.0% 0 0.0% 0 0.0% 0 0.0% 0Pembroke Dock Central 2.2% 35 0.0% 0 0.0% 0 0.0% 0 0.0% 0 0.0% 0 0.0% 0 0.0% 0 0.0% 0Pembroke Dock out of centre
(where retail park is not named)
0.3% 5 0.0% 0 0.0% 0 0.0% 0 0.0% 0 0.0% 0 0.0% 0 0.0% 0 0.0% 0
Pembroke Town Centre 0.5% 8 0.0% 0 0.6% 1 0.0% 0 0.0% 0 0.0% 0 0.0% 0 0.0% 0 0.0% 0St Davids 0.2% 3 0.0% 0 0.0% 0 0.0% 0 0.0% 0 0.0% 0 0.0% 0 0.0% 0 0.0% 0Swansea City Centre 0.1% 2 0.0% 0 0.6% 1 0.0% 0 0.0% 0 0.0% 0 0.0% 0 0.0% 0 0.0% 0Tenby 2.5% 40 0.0% 0 0.0% 0 0.0% 0 0.0% 0 0.0% 0 0.0% 0 0.0% 0 0.0% 0Tregaron 0.0% 0 0.0% 0 0.0% 0 0.0% 0 0.0% 0 0.0% 0 0.7% 0 0.0% 0 0.0% 0Bridge Meadow Retail Park,
Haverfordwest 0.2% 3 0.0% 0 0.0% 0 0.0% 0 0.0% 0 0.0% 0 0.0% 0 0.0% 0 0.0% 0
Havens Head Retail Park, Milford Haven
0.3% 5 0.0% 0 0.0% 0 0.0% 0 0.0% 0 0.0% 0 0.0% 0 0.0% 0 0.0% 0
Parc Pensarn Retail Park, Myrtle Hill, Carmarthen
0.1% 1 0.0% 0 1.0% 1 0.0% 0 0.0% 0 0.0% 0 0.0% 0 0.0% 0 0.0% 0
Parc Y Llyn Retail Park, Aberystwyth
0.1% 2 0.0% 0 0.0% 0 0.0% 0 0.0% 0 0.7% 0 0.0% 0 0.0% 0 1.0% 2
Riverside Quay, Haverfordwest
0.1% 1 0.0% 0 0.0% 0 0.0% 0 0.0% 0 0.0% 0 0.0% 0 0.0% 0 0.0% 0
Withybush Retail Park, Haverfordwest
0.1% 2 0.0% 0 0.0% 0 0.0% 0 0.0% 0 0.0% 0 0.0% 0 0.0% 0 0.0% 0
Ystwyth Retail Park, Aberystwyth
0.1% 2 0.0% 0 0.0% 0 0.0% 0 0.0% 0 0.0% 0 0.7% 0 0.0% 0 0.7% 1
Chelmsford 0.1% 1 0.0% 0 0.0% 0 0.0% 0 0.0% 0 0.0% 0 0.0% 0 0.9% 1 0.0% 0Clynderwen 0.0% 0 0.0% 0 0.0% 0 0.0% 0 0.0% 0 0.0% 0 0.0% 0 0.0% 0 0.0% 0Hakin 0.1% 1 0.0% 0 0.0% 0 0.0% 0 0.0% 0 0.0% 0 0.0% 0 0.0% 0 0.0% 0Hungerford 0.0% 1 0.0% 0 0.0% 0 0.0% 0 0.0% 0 0.9% 1 0.0% 0 0.0% 0 0.0% 0Llandudno 0.0% 1 0.0% 0 0.0% 0 0.0% 0 0.0% 0 0.0% 0 0.0% 0 0.7% 1 0.0% 0Llangwyryfon 0.0% 1 0.0% 0 0.0% 0 0.0% 0 0.0% 0 0.0% 0 0.9% 1 0.0% 0 0.0% 0Morrisons, Meadow View,
Haverfordwest 0.1% 2 0.7% 0 0.0% 0 0.0% 0 0.0% 0 0.0% 0 0.0% 0 0.0% 0 0.0% 0
Morrisons, Parcydolau, Llanbadarn Fawr, Aberystwyth
0.2% 4 0.0% 0 0.0% 0 0.0% 0 0.0% 0 0.0% 0 2.5% 2 1.9% 2 0.0% 0
Newcastle Emlyn 0.7% 11 0.0% 0 4.8% 7 4.0% 4 0.0% 0 0.0% 0 0.0% 0 0.0% 0 0.0% 0Parc Y Dolau 0.0% 0 0.0% 0 0.0% 0 0.0% 0 0.0% 0 0.0% 0 0.7% 0 0.0% 0 0.0% 0Pontsian 0.0% 1 0.0% 0 0.0% 0 0.7% 1 0.0% 0 0.0% 0 0.0% 0 0.0% 0 0.0% 0Sainsbury's, The Derwen,
Bridgend 0.1% 2 0.0% 0 0.0% 0 0.0% 0 0.0% 0 0.7% 0 0.0% 0 0.0% 0 0.0% 0
Tesco Extra, Fenton Trading 1.3% 21 2.1% 1 0.0% 0 0.0% 0 0.0% 0 0.0% 0 0.0% 0 0.0% 0 0.0% 0
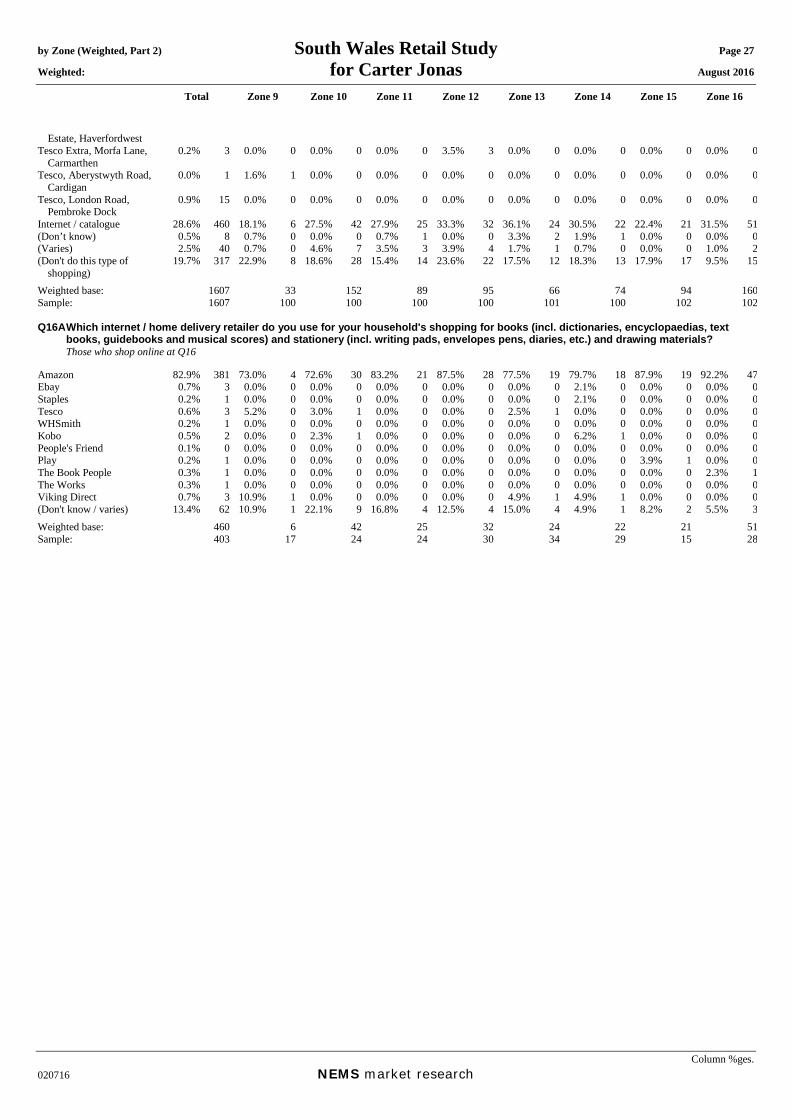
by Zone (Weighted, Part 2) South Wales Retail Study Page 27 Weighted: for Carter Jonas August 2016
Total Zone 9 Zone 10 Zone 11 Zone 12 Zone 13 Zone 14 Zone 15 Zone 16
Column %ges. 020716 NEMS market research
Estate, Haverfordwest Tesco Extra, Morfa Lane,
Carmarthen 0.2% 3 0.0% 0 0.0% 0 0.0% 0 3.5% 3 0.0% 0 0.0% 0 0.0% 0 0.0% 0
Tesco, Aberystwyth Road, Cardigan
0.0% 1 1.6% 1 0.0% 0 0.0% 0 0.0% 0 0.0% 0 0.0% 0 0.0% 0 0.0% 0
Tesco, London Road, Pembroke Dock
0.9% 15 0.0% 0 0.0% 0 0.0% 0 0.0% 0 0.0% 0 0.0% 0 0.0% 0 0.0% 0
Internet / catalogue 28.6% 460 18.1% 6 27.5% 42 27.9% 25 33.3% 32 36.1% 24 30.5% 22 22.4% 21 31.5% 51(Don’t know) 0.5% 8 0.7% 0 0.0% 0 0.7% 1 0.0% 0 3.3% 2 1.9% 1 0.0% 0 0.0% 0(Varies) 2.5% 40 0.7% 0 4.6% 7 3.5% 3 3.9% 4 1.7% 1 0.7% 0 0.0% 0 1.0% 2(Don't do this type of
shopping) 19.7% 317 22.9% 8 18.6% 28 15.4% 14 23.6% 22 17.5% 12 18.3% 13 17.9% 17 9.5% 15
Weighted base: 1607 33 152 89 95 66 74 94 160Sample: 1607 100 100 100 100 101 100 102 102 Q16A Which internet / home delivery retailer do you use for your household's shopping for books (incl. dictionaries, encyclopaedias, text
books, guidebooks and musical scores) and stationery (incl. writing pads, envelopes pens, diaries, etc.) and drawing materials? Those who shop online at Q16 Amazon 82.9% 381 73.0% 4 72.6% 30 83.2% 21 87.5% 28 77.5% 19 79.7% 18 87.9% 19 92.2% 47Ebay 0.7% 3 0.0% 0 0.0% 0 0.0% 0 0.0% 0 0.0% 0 2.1% 0 0.0% 0 0.0% 0Staples 0.2% 1 0.0% 0 0.0% 0 0.0% 0 0.0% 0 0.0% 0 2.1% 0 0.0% 0 0.0% 0Tesco 0.6% 3 5.2% 0 3.0% 1 0.0% 0 0.0% 0 2.5% 1 0.0% 0 0.0% 0 0.0% 0WHSmith 0.2% 1 0.0% 0 0.0% 0 0.0% 0 0.0% 0 0.0% 0 0.0% 0 0.0% 0 0.0% 0Kobo 0.5% 2 0.0% 0 2.3% 1 0.0% 0 0.0% 0 0.0% 0 6.2% 1 0.0% 0 0.0% 0People's Friend 0.1% 0 0.0% 0 0.0% 0 0.0% 0 0.0% 0 0.0% 0 0.0% 0 0.0% 0 0.0% 0Play 0.2% 1 0.0% 0 0.0% 0 0.0% 0 0.0% 0 0.0% 0 0.0% 0 3.9% 1 0.0% 0The Book People 0.3% 1 0.0% 0 0.0% 0 0.0% 0 0.0% 0 0.0% 0 0.0% 0 0.0% 0 2.3% 1The Works 0.3% 1 0.0% 0 0.0% 0 0.0% 0 0.0% 0 0.0% 0 0.0% 0 0.0% 0 0.0% 0Viking Direct 0.7% 3 10.9% 1 0.0% 0 0.0% 0 0.0% 0 4.9% 1 4.9% 1 0.0% 0 0.0% 0(Don't know / varies) 13.4% 62 10.9% 1 22.1% 9 16.8% 4 12.5% 4 15.0% 4 4.9% 1 8.2% 2 5.5% 3Weighted base: 460 6 42 25 32 24 22 21 51Sample: 403 17 24 24 30 34 29 15 28
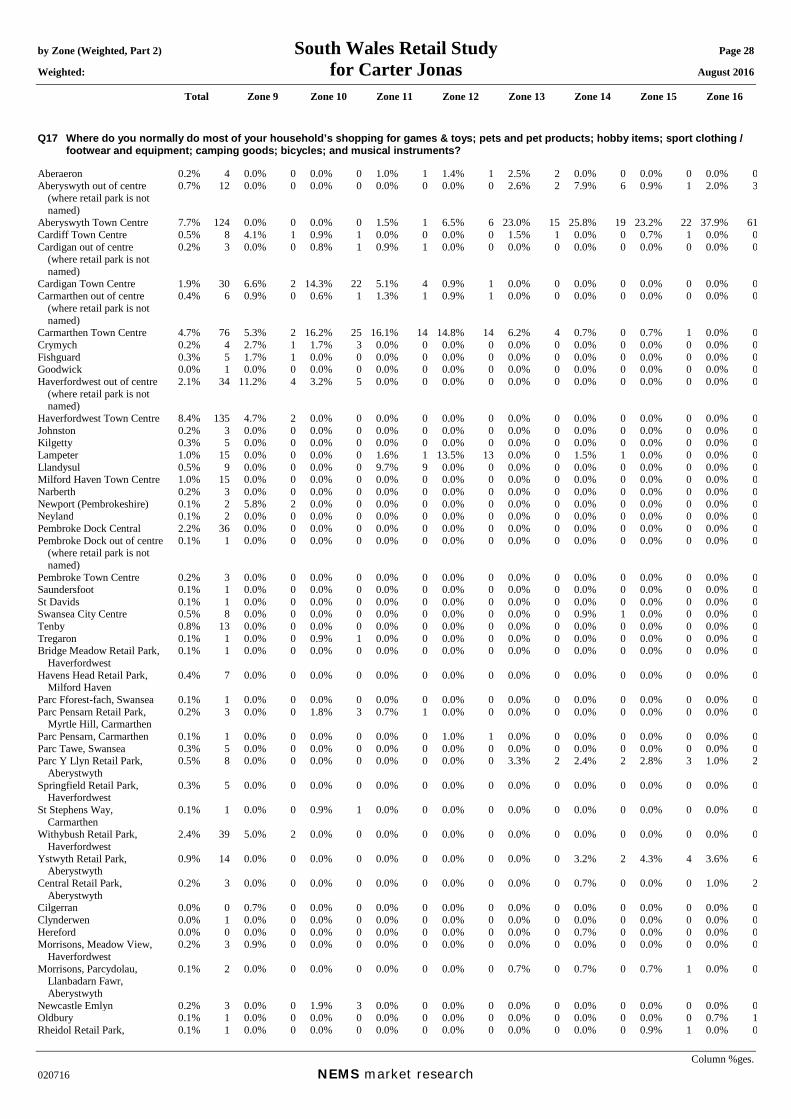
by Zone (Weighted, Part 2) South Wales Retail Study Page 28 Weighted: for Carter Jonas August 2016
Total Zone 9 Zone 10 Zone 11 Zone 12 Zone 13 Zone 14 Zone 15 Zone 16
Column %ges. 020716 NEMS market research
Q17 Where do you normally do most of your household’s shopping for games & toys; pets and pet products; hobby items; sport clothing / footwear and equipment; camping goods; bicycles; and musical instruments?
Aberaeron 0.2% 4 0.0% 0 0.0% 0 1.0% 1 1.4% 1 2.5% 2 0.0% 0 0.0% 0 0.0% 0Aberyswyth out of centre
(where retail park is not named)
0.7% 12 0.0% 0 0.0% 0 0.0% 0 0.0% 0 2.6% 2 7.9% 6 0.9% 1 2.0% 3
Aberyswyth Town Centre 7.7% 124 0.0% 0 0.0% 0 1.5% 1 6.5% 6 23.0% 15 25.8% 19 23.2% 22 37.9% 61Cardiff Town Centre 0.5% 8 4.1% 1 0.9% 1 0.0% 0 0.0% 0 1.5% 1 0.0% 0 0.7% 1 0.0% 0Cardigan out of centre
(where retail park is not named)
0.2% 3 0.0% 0 0.8% 1 0.9% 1 0.0% 0 0.0% 0 0.0% 0 0.0% 0 0.0% 0
Cardigan Town Centre 1.9% 30 6.6% 2 14.3% 22 5.1% 4 0.9% 1 0.0% 0 0.0% 0 0.0% 0 0.0% 0Carmarthen out of centre
(where retail park is not named)
0.4% 6 0.9% 0 0.6% 1 1.3% 1 0.9% 1 0.0% 0 0.0% 0 0.0% 0 0.0% 0
Carmarthen Town Centre 4.7% 76 5.3% 2 16.2% 25 16.1% 14 14.8% 14 6.2% 4 0.7% 0 0.7% 1 0.0% 0Crymych 0.2% 4 2.7% 1 1.7% 3 0.0% 0 0.0% 0 0.0% 0 0.0% 0 0.0% 0 0.0% 0Fishguard 0.3% 5 1.7% 1 0.0% 0 0.0% 0 0.0% 0 0.0% 0 0.0% 0 0.0% 0 0.0% 0Goodwick 0.0% 1 0.0% 0 0.0% 0 0.0% 0 0.0% 0 0.0% 0 0.0% 0 0.0% 0 0.0% 0Haverfordwest out of centre
(where retail park is not named)
2.1% 34 11.2% 4 3.2% 5 0.0% 0 0.0% 0 0.0% 0 0.0% 0 0.0% 0 0.0% 0
Haverfordwest Town Centre 8.4% 135 4.7% 2 0.0% 0 0.0% 0 0.0% 0 0.0% 0 0.0% 0 0.0% 0 0.0% 0Johnston 0.2% 3 0.0% 0 0.0% 0 0.0% 0 0.0% 0 0.0% 0 0.0% 0 0.0% 0 0.0% 0Kilgetty 0.3% 5 0.0% 0 0.0% 0 0.0% 0 0.0% 0 0.0% 0 0.0% 0 0.0% 0 0.0% 0Lampeter 1.0% 15 0.0% 0 0.0% 0 1.6% 1 13.5% 13 0.0% 0 1.5% 1 0.0% 0 0.0% 0Llandysul 0.5% 9 0.0% 0 0.0% 0 9.7% 9 0.0% 0 0.0% 0 0.0% 0 0.0% 0 0.0% 0Milford Haven Town Centre 1.0% 15 0.0% 0 0.0% 0 0.0% 0 0.0% 0 0.0% 0 0.0% 0 0.0% 0 0.0% 0Narberth 0.2% 3 0.0% 0 0.0% 0 0.0% 0 0.0% 0 0.0% 0 0.0% 0 0.0% 0 0.0% 0Newport (Pembrokeshire) 0.1% 2 5.8% 2 0.0% 0 0.0% 0 0.0% 0 0.0% 0 0.0% 0 0.0% 0 0.0% 0Neyland 0.1% 2 0.0% 0 0.0% 0 0.0% 0 0.0% 0 0.0% 0 0.0% 0 0.0% 0 0.0% 0Pembroke Dock Central 2.2% 36 0.0% 0 0.0% 0 0.0% 0 0.0% 0 0.0% 0 0.0% 0 0.0% 0 0.0% 0Pembroke Dock out of centre
(where retail park is not named)
0.1% 1 0.0% 0 0.0% 0 0.0% 0 0.0% 0 0.0% 0 0.0% 0 0.0% 0 0.0% 0
Pembroke Town Centre 0.2% 3 0.0% 0 0.0% 0 0.0% 0 0.0% 0 0.0% 0 0.0% 0 0.0% 0 0.0% 0Saundersfoot 0.1% 1 0.0% 0 0.0% 0 0.0% 0 0.0% 0 0.0% 0 0.0% 0 0.0% 0 0.0% 0St Davids 0.1% 1 0.0% 0 0.0% 0 0.0% 0 0.0% 0 0.0% 0 0.0% 0 0.0% 0 0.0% 0Swansea City Centre 0.5% 8 0.0% 0 0.0% 0 0.0% 0 0.0% 0 0.0% 0 0.9% 1 0.0% 0 0.0% 0Tenby 0.8% 13 0.0% 0 0.0% 0 0.0% 0 0.0% 0 0.0% 0 0.0% 0 0.0% 0 0.0% 0Tregaron 0.1% 1 0.0% 0 0.9% 1 0.0% 0 0.0% 0 0.0% 0 0.0% 0 0.0% 0 0.0% 0Bridge Meadow Retail Park,
Haverfordwest 0.1% 1 0.0% 0 0.0% 0 0.0% 0 0.0% 0 0.0% 0 0.0% 0 0.0% 0 0.0% 0
Havens Head Retail Park, Milford Haven
0.4% 7 0.0% 0 0.0% 0 0.0% 0 0.0% 0 0.0% 0 0.0% 0 0.0% 0 0.0% 0
Parc Fforest-fach, Swansea 0.1% 1 0.0% 0 0.0% 0 0.0% 0 0.0% 0 0.0% 0 0.0% 0 0.0% 0 0.0% 0Parc Pensarn Retail Park,
Myrtle Hill, Carmarthen 0.2% 3 0.0% 0 1.8% 3 0.7% 1 0.0% 0 0.0% 0 0.0% 0 0.0% 0 0.0% 0
Parc Pensarn, Carmarthen 0.1% 1 0.0% 0 0.0% 0 0.0% 0 1.0% 1 0.0% 0 0.0% 0 0.0% 0 0.0% 0Parc Tawe, Swansea 0.3% 5 0.0% 0 0.0% 0 0.0% 0 0.0% 0 0.0% 0 0.0% 0 0.0% 0 0.0% 0Parc Y Llyn Retail Park,
Aberystwyth 0.5% 8 0.0% 0 0.0% 0 0.0% 0 0.0% 0 3.3% 2 2.4% 2 2.8% 3 1.0% 2
Springfield Retail Park, Haverfordwest
0.3% 5 0.0% 0 0.0% 0 0.0% 0 0.0% 0 0.0% 0 0.0% 0 0.0% 0 0.0% 0
St Stephens Way, Carmarthen
0.1% 1 0.0% 0 0.9% 1 0.0% 0 0.0% 0 0.0% 0 0.0% 0 0.0% 0 0.0% 0
Withybush Retail Park, Haverfordwest
2.4% 39 5.0% 2 0.0% 0 0.0% 0 0.0% 0 0.0% 0 0.0% 0 0.0% 0 0.0% 0
Ystwyth Retail Park, Aberystwyth
0.9% 14 0.0% 0 0.0% 0 0.0% 0 0.0% 0 0.0% 0 3.2% 2 4.3% 4 3.6% 6
Central Retail Park, Aberystwyth
0.2% 3 0.0% 0 0.0% 0 0.0% 0 0.0% 0 0.0% 0 0.7% 0 0.0% 0 1.0% 2
Cilgerran 0.0% 0 0.7% 0 0.0% 0 0.0% 0 0.0% 0 0.0% 0 0.0% 0 0.0% 0 0.0% 0Clynderwen 0.0% 1 0.0% 0 0.0% 0 0.0% 0 0.0% 0 0.0% 0 0.0% 0 0.0% 0 0.0% 0Hereford 0.0% 0 0.0% 0 0.0% 0 0.0% 0 0.0% 0 0.0% 0 0.7% 0 0.0% 0 0.0% 0Morrisons, Meadow View,
Haverfordwest 0.2% 3 0.9% 0 0.0% 0 0.0% 0 0.0% 0 0.0% 0 0.0% 0 0.0% 0 0.0% 0
Morrisons, Parcydolau, Llanbadarn Fawr, Aberystwyth
0.1% 2 0.0% 0 0.0% 0 0.0% 0 0.0% 0 0.7% 0 0.7% 0 0.7% 1 0.0% 0
Newcastle Emlyn 0.2% 3 0.0% 0 1.9% 3 0.0% 0 0.0% 0 0.0% 0 0.0% 0 0.0% 0 0.0% 0Oldbury 0.1% 1 0.0% 0 0.0% 0 0.0% 0 0.0% 0 0.0% 0 0.0% 0 0.0% 0 0.7% 1Rheidol Retail Park, 0.1% 1 0.0% 0 0.0% 0 0.0% 0 0.0% 0 0.0% 0 0.0% 0 0.9% 1 0.0% 0

by Zone (Weighted, Part 2) South Wales Retail Study Page 29 Weighted: for Carter Jonas August 2016
Total Zone 9 Zone 10 Zone 11 Zone 12 Zone 13 Zone 14 Zone 15 Zone 16
Column %ges. 020716 NEMS market research
Aberystwyth Sainsbury's, The Derwen,
Bridgend 0.1% 1 0.0% 0 0.0% 0 0.0% 0 0.0% 0 0.0% 0 0.0% 0 0.0% 0 0.0% 0
Tesco Extra, Fenton Trading Estate, Haverfordwest
0.4% 7 0.7% 0 0.0% 0 0.0% 0 0.0% 0 0.0% 0 0.0% 0 0.0% 0 0.0% 0
Tesco, Aberystwyth Road, Cardigan
0.0% 1 2.3% 1 0.0% 0 0.0% 0 0.0% 0 0.0% 0 0.0% 0 0.0% 0 0.0% 0
Tesco, London Road, Pembroke Dock
0.8% 13 0.0% 0 0.0% 0 0.0% 0 0.0% 0 0.0% 0 0.0% 0 0.0% 0 0.0% 0
Internet / catalogue 21.0% 337 15.6% 5 28.5% 43 23.1% 20 15.7% 15 12.4% 8 25.7% 19 15.7% 15 19.1% 31(Don’t know) 0.9% 15 0.0% 0 1.5% 2 0.9% 1 2.6% 2 1.5% 1 0.7% 0 0.7% 1 0.0% 0(Varies) 2.8% 45 0.9% 0 2.1% 3 1.3% 1 4.4% 4 0.9% 1 0.0% 0 2.6% 2 2.5% 4(Don't do this type of
shopping) 32.8% 527 31.0% 10 24.8% 38 36.8% 33 38.4% 37 45.3% 30 29.4% 22 46.9% 44 32.3% 52
Weighted base: 1607 33 152 89 95 66 74 94 160Sample: 1607 100 100 100 100 101 100 102 102 Q17A Which internet / home delivery retailer do you use for your household’s shopping for games & toys; pets and pet products; hobby
items; sport clothing / footwear and equipment; camping goods; bicycles; and musical instruments? Those who shop online at Q17 Amazon 41.9% 141 49.3% 3 24.6% 11 50.9% 10 44.5% 7 40.8% 3 48.9% 9 48.4% 7 35.5% 11Argos 3.4% 11 0.0% 0 0.0% 0 0.0% 0 0.0% 0 0.0% 0 0.0% 0 0.0% 0 20.0% 6Boots 0.3% 1 0.0% 0 2.2% 1 0.0% 0 0.0% 0 0.0% 0 0.0% 0 0.0% 0 0.0% 0Ebay 4.8% 16 0.0% 0 5.3% 2 2.9% 1 6.1% 1 0.0% 0 6.6% 1 0.0% 0 0.0% 0Next 0.3% 1 0.0% 0 0.0% 0 0.0% 0 5.8% 1 0.0% 0 0.0% 0 0.0% 0 0.0% 0Tesco 1.2% 4 0.0% 0 0.0% 0 0.0% 0 6.8% 1 0.0% 0 0.0% 0 0.0% 0 0.0% 0Toys R Us 1.5% 5 0.0% 0 6.4% 3 0.0% 0 0.0% 0 0.0% 0 3.5% 1 0.0% 0 0.0% 0Big Orange Watersports 0.1% 0 0.0% 0 0.0% 0 0.0% 0 0.0% 0 5.4% 0 0.0% 0 0.0% 0 0.0% 0Cotwolds Camping 0.2% 1 0.0% 0 0.0% 0 0.0% 0 0.0% 0 0.0% 0 3.3% 1 0.0% 0 0.0% 0Create and Craft 0.1% 0 4.4% 0 0.0% 0 0.0% 0 0.0% 0 0.0% 0 0.0% 0 0.0% 0 0.0% 0Cricket Direct 0.4% 1 0.0% 0 0.0% 0 0.0% 0 0.0% 0 0.0% 0 0.0% 0 0.0% 0 0.0% 0Dog Food Dave 0.5% 2 0.0% 0 0.0% 0 8.4% 2 0.0% 0 0.0% 0 0.0% 0 0.0% 0 0.0% 0Game 0.4% 1 0.0% 0 3.0% 1 0.0% 0 0.0% 0 0.0% 0 0.0% 0 0.0% 0 0.0% 0Hobbyking 0.4% 1 0.0% 0 0.0% 0 0.0% 0 0.0% 0 0.0% 0 0.0% 0 0.0% 0 0.0% 0MandM Direct 0.4% 1 0.0% 0 0.0% 0 0.0% 0 0.0% 0 0.0% 0 7.3% 1 0.0% 0 0.0% 0Natures Menu 0.3% 1 4.4% 0 0.0% 0 0.0% 0 0.0% 0 0.0% 0 0.0% 0 0.0% 0 0.0% 0Pet at Home 0.2% 1 0.0% 0 0.0% 0 0.0% 0 0.0% 0 0.0% 0 0.0% 0 0.0% 0 0.0% 0Pet-Supermarket 0.3% 1 0.0% 0 0.0% 0 0.0% 0 0.0% 0 0.0% 0 0.0% 0 0.0% 0 0.0% 0Pullingers 0.1% 0 0.0% 0 0.0% 0 0.0% 0 0.0% 0 0.0% 0 0.0% 0 0.0% 0 0.0% 0Rollersnakes 1.0% 3 0.0% 0 0.0% 0 0.0% 0 0.0% 0 0.0% 0 0.0% 0 0.0% 0 11.1% 3Simply Scuba 0.4% 1 0.0% 0 0.0% 0 0.0% 0 0.0% 0 0.0% 0 0.0% 0 0.0% 0 0.0% 0Smyths 0.9% 3 0.0% 0 0.0% 0 14.5% 3 0.0% 0 0.0% 0 0.0% 0 0.0% 0 0.0% 0Special Need Toys 1.0% 3 0.0% 0 0.0% 0 0.0% 0 0.0% 0 0.0% 0 0.0% 0 0.0% 0 0.0% 0Sports Direct 3.3% 11 0.0% 0 0.0% 0 0.0% 0 4.5% 1 0.0% 0 0.0% 0 0.0% 0 5.2% 2Swindon Airsoft 0.4% 1 0.0% 0 0.0% 0 0.0% 0 0.0% 0 0.0% 0 0.0% 0 0.0% 0 3.9% 1The Toy Shop 0.7% 2 0.0% 0 0.0% 0 0.0% 0 0.0% 0 26.9% 2 0.0% 0 0.0% 0 0.0% 0Viovet 0.4% 1 0.0% 0 0.0% 0 0.0% 0 0.0% 0 0.0% 0 7.3% 1 0.0% 0 0.0% 0Wiggle 0.6% 2 0.0% 0 0.0% 0 0.0% 0 0.0% 0 7.0% 1 0.0% 0 0.0% 0 0.0% 0Zooplus 0.4% 1 5.7% 0 0.0% 0 0.0% 0 0.0% 0 0.0% 0 0.0% 0 0.0% 0 0.0% 0(Don't know / varies) 34.5% 116 36.3% 2 58.5% 25 23.4% 5 32.3% 5 19.8% 2 23.1% 4 51.6% 8 24.4% 7Weighted base: 337 5 43 20 15 8 19 15 31Sample: 252 13 22 15 14 11 19 10 17
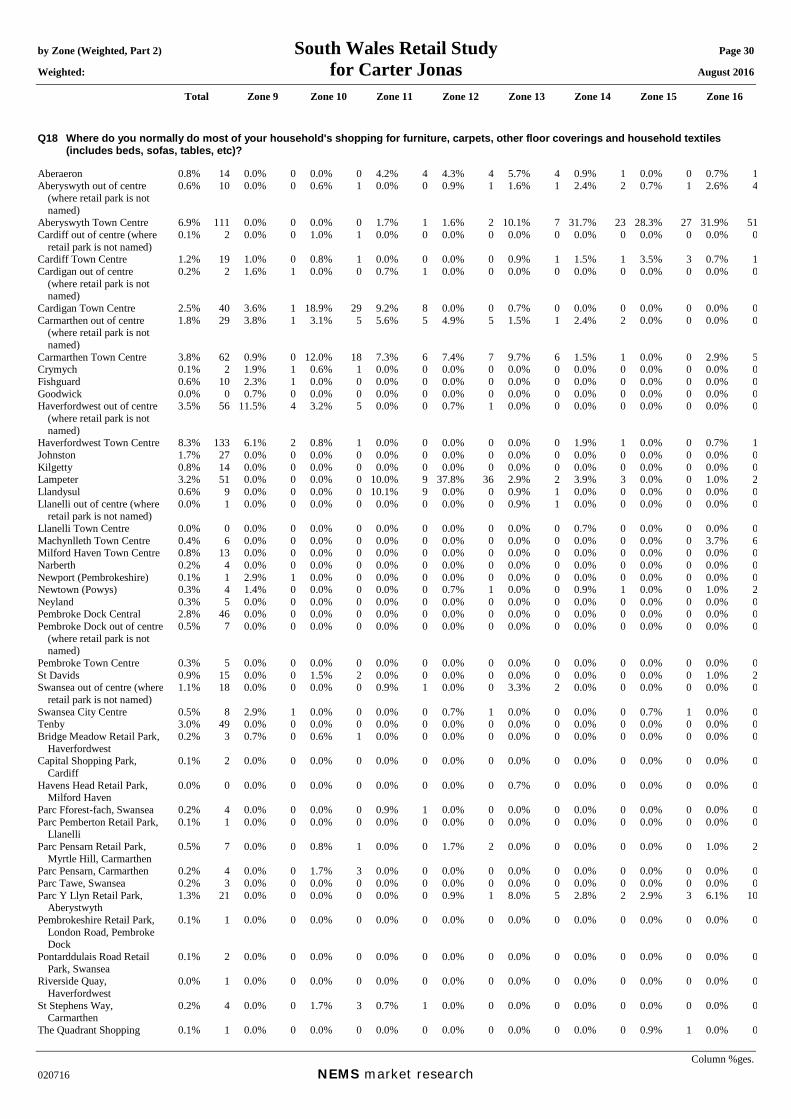
by Zone (Weighted, Part 2) South Wales Retail Study Page 30 Weighted: for Carter Jonas August 2016
Total Zone 9 Zone 10 Zone 11 Zone 12 Zone 13 Zone 14 Zone 15 Zone 16
Column %ges. 020716 NEMS market research
Q18 Where do you normally do most of your household's shopping for furniture, carpets, other floor coverings and household textiles (includes beds, sofas, tables, etc)?
Aberaeron 0.8% 14 0.0% 0 0.0% 0 4.2% 4 4.3% 4 5.7% 4 0.9% 1 0.0% 0 0.7% 1Aberyswyth out of centre
(where retail park is not named)
0.6% 10 0.0% 0 0.6% 1 0.0% 0 0.9% 1 1.6% 1 2.4% 2 0.7% 1 2.6% 4
Aberyswyth Town Centre 6.9% 111 0.0% 0 0.0% 0 1.7% 1 1.6% 2 10.1% 7 31.7% 23 28.3% 27 31.9% 51Cardiff out of centre (where
retail park is not named) 0.1% 2 0.0% 0 1.0% 1 0.0% 0 0.0% 0 0.0% 0 0.0% 0 0.0% 0 0.0% 0
Cardiff Town Centre 1.2% 19 1.0% 0 0.8% 1 0.0% 0 0.0% 0 0.9% 1 1.5% 1 3.5% 3 0.7% 1Cardigan out of centre
(where retail park is not named)
0.2% 2 1.6% 1 0.0% 0 0.7% 1 0.0% 0 0.0% 0 0.0% 0 0.0% 0 0.0% 0
Cardigan Town Centre 2.5% 40 3.6% 1 18.9% 29 9.2% 8 0.0% 0 0.7% 0 0.0% 0 0.0% 0 0.0% 0Carmarthen out of centre
(where retail park is not named)
1.8% 29 3.8% 1 3.1% 5 5.6% 5 4.9% 5 1.5% 1 2.4% 2 0.0% 0 0.0% 0
Carmarthen Town Centre 3.8% 62 0.9% 0 12.0% 18 7.3% 6 7.4% 7 9.7% 6 1.5% 1 0.0% 0 2.9% 5Crymych 0.1% 2 1.9% 1 0.6% 1 0.0% 0 0.0% 0 0.0% 0 0.0% 0 0.0% 0 0.0% 0Fishguard 0.6% 10 2.3% 1 0.0% 0 0.0% 0 0.0% 0 0.0% 0 0.0% 0 0.0% 0 0.0% 0Goodwick 0.0% 0 0.7% 0 0.0% 0 0.0% 0 0.0% 0 0.0% 0 0.0% 0 0.0% 0 0.0% 0Haverfordwest out of centre
(where retail park is not named)
3.5% 56 11.5% 4 3.2% 5 0.0% 0 0.7% 1 0.0% 0 0.0% 0 0.0% 0 0.0% 0
Haverfordwest Town Centre 8.3% 133 6.1% 2 0.8% 1 0.0% 0 0.0% 0 0.0% 0 1.9% 1 0.0% 0 0.7% 1Johnston 1.7% 27 0.0% 0 0.0% 0 0.0% 0 0.0% 0 0.0% 0 0.0% 0 0.0% 0 0.0% 0Kilgetty 0.8% 14 0.0% 0 0.0% 0 0.0% 0 0.0% 0 0.0% 0 0.0% 0 0.0% 0 0.0% 0Lampeter 3.2% 51 0.0% 0 0.0% 0 10.0% 9 37.8% 36 2.9% 2 3.9% 3 0.0% 0 1.0% 2Llandysul 0.6% 9 0.0% 0 0.0% 0 10.1% 9 0.0% 0 0.9% 1 0.0% 0 0.0% 0 0.0% 0Llanelli out of centre (where
retail park is not named) 0.0% 1 0.0% 0 0.0% 0 0.0% 0 0.0% 0 0.9% 1 0.0% 0 0.0% 0 0.0% 0
Llanelli Town Centre 0.0% 0 0.0% 0 0.0% 0 0.0% 0 0.0% 0 0.0% 0 0.7% 0 0.0% 0 0.0% 0Machynlleth Town Centre 0.4% 6 0.0% 0 0.0% 0 0.0% 0 0.0% 0 0.0% 0 0.0% 0 0.0% 0 3.7% 6Milford Haven Town Centre 0.8% 13 0.0% 0 0.0% 0 0.0% 0 0.0% 0 0.0% 0 0.0% 0 0.0% 0 0.0% 0Narberth 0.2% 4 0.0% 0 0.0% 0 0.0% 0 0.0% 0 0.0% 0 0.0% 0 0.0% 0 0.0% 0Newport (Pembrokeshire) 0.1% 1 2.9% 1 0.0% 0 0.0% 0 0.0% 0 0.0% 0 0.0% 0 0.0% 0 0.0% 0Newtown (Powys) 0.3% 4 1.4% 0 0.0% 0 0.0% 0 0.7% 1 0.0% 0 0.9% 1 0.0% 0 1.0% 2Neyland 0.3% 5 0.0% 0 0.0% 0 0.0% 0 0.0% 0 0.0% 0 0.0% 0 0.0% 0 0.0% 0Pembroke Dock Central 2.8% 46 0.0% 0 0.0% 0 0.0% 0 0.0% 0 0.0% 0 0.0% 0 0.0% 0 0.0% 0Pembroke Dock out of centre
(where retail park is not named)
0.5% 7 0.0% 0 0.0% 0 0.0% 0 0.0% 0 0.0% 0 0.0% 0 0.0% 0 0.0% 0
Pembroke Town Centre 0.3% 5 0.0% 0 0.0% 0 0.0% 0 0.0% 0 0.0% 0 0.0% 0 0.0% 0 0.0% 0St Davids 0.9% 15 0.0% 0 1.5% 2 0.0% 0 0.0% 0 0.0% 0 0.0% 0 0.0% 0 1.0% 2Swansea out of centre (where
retail park is not named) 1.1% 18 0.0% 0 0.0% 0 0.9% 1 0.0% 0 3.3% 2 0.0% 0 0.0% 0 0.0% 0
Swansea City Centre 0.5% 8 2.9% 1 0.0% 0 0.0% 0 0.7% 1 0.0% 0 0.0% 0 0.7% 1 0.0% 0Tenby 3.0% 49 0.0% 0 0.0% 0 0.0% 0 0.0% 0 0.0% 0 0.0% 0 0.0% 0 0.0% 0Bridge Meadow Retail Park,
Haverfordwest 0.2% 3 0.7% 0 0.6% 1 0.0% 0 0.0% 0 0.0% 0 0.0% 0 0.0% 0 0.0% 0
Capital Shopping Park, Cardiff
0.1% 2 0.0% 0 0.0% 0 0.0% 0 0.0% 0 0.0% 0 0.0% 0 0.0% 0 0.0% 0
Havens Head Retail Park, Milford Haven
0.0% 0 0.0% 0 0.0% 0 0.0% 0 0.0% 0 0.7% 0 0.0% 0 0.0% 0 0.0% 0
Parc Fforest-fach, Swansea 0.2% 4 0.0% 0 0.0% 0 0.9% 1 0.0% 0 0.0% 0 0.0% 0 0.0% 0 0.0% 0Parc Pemberton Retail Park,
Llanelli 0.1% 1 0.0% 0 0.0% 0 0.0% 0 0.0% 0 0.0% 0 0.0% 0 0.0% 0 0.0% 0
Parc Pensarn Retail Park, Myrtle Hill, Carmarthen
0.5% 7 0.0% 0 0.8% 1 0.0% 0 1.7% 2 0.0% 0 0.0% 0 0.0% 0 1.0% 2
Parc Pensarn, Carmarthen 0.2% 4 0.0% 0 1.7% 3 0.0% 0 0.0% 0 0.0% 0 0.0% 0 0.0% 0 0.0% 0Parc Tawe, Swansea 0.2% 3 0.0% 0 0.0% 0 0.0% 0 0.0% 0 0.0% 0 0.0% 0 0.0% 0 0.0% 0Parc Y Llyn Retail Park,
Aberystwyth 1.3% 21 0.0% 0 0.0% 0 0.0% 0 0.9% 1 8.0% 5 2.8% 2 2.9% 3 6.1% 10
Pembrokeshire Retail Park, London Road, Pembroke Dock
0.1% 1 0.0% 0 0.0% 0 0.0% 0 0.0% 0 0.0% 0 0.0% 0 0.0% 0 0.0% 0
Pontarddulais Road Retail Park, Swansea
0.1% 2 0.0% 0 0.0% 0 0.0% 0 0.0% 0 0.0% 0 0.0% 0 0.0% 0 0.0% 0
Riverside Quay, Haverfordwest
0.0% 1 0.0% 0 0.0% 0 0.0% 0 0.0% 0 0.0% 0 0.0% 0 0.0% 0 0.0% 0
St Stephens Way, Carmarthen
0.2% 4 0.0% 0 1.7% 3 0.7% 1 0.0% 0 0.0% 0 0.0% 0 0.0% 0 0.0% 0
The Quadrant Shopping 0.1% 1 0.0% 0 0.0% 0 0.0% 0 0.0% 0 0.0% 0 0.0% 0 0.9% 1 0.0% 0

by Zone (Weighted, Part 2) South Wales Retail Study Page 31 Weighted: for Carter Jonas August 2016
Total Zone 9 Zone 10 Zone 11 Zone 12 Zone 13 Zone 14 Zone 15 Zone 16
Column %ges. 020716 NEMS market research
Centre, Swansea Towy Ford Retail Park,
Carmarthen 0.1% 2 0.0% 0 0.9% 1 0.9% 1 0.0% 0 0.0% 0 0.0% 0 0.0% 0 0.0% 0
Trostre Retail Park, Llanelli 0.2% 3 0.0% 0 0.0% 0 0.0% 0 0.0% 0 0.9% 1 0.0% 0 0.0% 0 1.0% 2Withybush Retail Park,
Haverfordwest 2.9% 46 5.5% 2 2.1% 3 0.0% 0 0.0% 0 0.0% 0 0.0% 0 0.0% 0 0.0% 0
Ystwyth Retail Park, Aberystwyth
0.7% 12 0.0% 0 0.0% 0 0.0% 0 0.0% 0 4.0% 3 4.8% 4 4.4% 4 0.7% 1
Chester 0.1% 1 0.0% 0 0.0% 0 0.0% 0 0.0% 0 0.0% 0 0.0% 0 0.0% 0 0.7% 1Chester Retail Park, Chester 0.2% 3 0.0% 0 0.0% 0 0.0% 0 0.0% 0 0.0% 0 0.0% 0 0.0% 0 2.1% 3Cross Hands 0.9% 14 2.9% 1 0.6% 1 1.5% 1 1.6% 2 1.3% 1 0.0% 0 0.0% 0 0.0% 0Cross Hands Retail Park,
Cross Hands 0.2% 3 0.0% 0 0.0% 0 0.0% 0 0.0% 0 1.6% 1 0.0% 0 0.7% 1 0.0% 0
Dre-fach Felindre 0.1% 2 0.0% 0 0.0% 0 1.9% 2 0.0% 0 0.0% 0 0.0% 0 0.0% 0 0.0% 0Edinburgh 0.0% 1 0.0% 0 0.0% 0 0.0% 0 0.0% 0 0.0% 0 0.9% 1 0.0% 0 0.0% 0Felindre 0.1% 1 0.0% 0 0.6% 1 0.0% 0 0.0% 0 0.0% 0 0.0% 0 0.0% 0 0.0% 0Hafren Furnishers, Llangurig
Road, Llanidloes 0.2% 3 0.0% 0 0.0% 0 0.0% 0 0.0% 0 2.6% 2 0.0% 0 1.3% 1 0.0% 0
Havering 0.1% 2 0.0% 0 0.0% 0 0.0% 0 0.0% 0 0.0% 0 0.0% 0 0.0% 0 1.0% 2Hereford 0.0% 0 0.0% 0 0.0% 0 0.0% 0 0.0% 0 0.0% 0 0.7% 0 0.0% 0 0.0% 0Ikea, Ferry Road, Cardiff 0.3% 5 0.0% 0 0.0% 0 0.0% 0 1.6% 2 0.0% 0 0.0% 0 0.0% 0 0.7% 1Kidderminster 0.1% 1 0.0% 0 0.0% 0 0.0% 0 0.0% 0 0.0% 0 0.0% 0 0.0% 0 0.7% 1Llanidloes 0.4% 7 0.0% 0 0.0% 0 0.0% 0 0.0% 0 0.0% 0 0.7% 0 1.3% 1 3.2% 5Merry Hill, Brierley Hill 0.1% 1 0.0% 0 0.0% 0 0.0% 0 0.0% 0 0.0% 0 0.0% 0 0.0% 0 0.7% 1Newcastle Emlyn 0.2% 3 0.0% 0 0.8% 1 1.5% 1 0.0% 0 0.0% 0 0.0% 0 0.0% 0 0.0% 0Port Talbot 0.1% 1 0.0% 0 0.6% 1 0.0% 0 0.0% 0 0.0% 0 0.0% 0 0.0% 0 0.0% 0Sainsbury's, The Derwen,
Bridgend 0.1% 1 0.0% 0 0.0% 0 0.0% 0 0.0% 0 1.7% 1 0.0% 0 0.0% 0 0.0% 0
Stoke-on-Trent 0.0% 0 0.0% 0 0.0% 0 0.0% 0 0.0% 0 0.0% 0 0.0% 0 0.0% 0 0.0% 0Treharris 0.1% 1 0.0% 0 0.0% 0 0.0% 0 0.0% 0 0.0% 0 0.0% 0 0.0% 0 0.0% 0Internet / catalogue 10.6% 170 7.3% 2 12.9% 20 3.5% 3 4.6% 4 18.3% 12 10.7% 8 2.5% 2 12.4% 20(Don’t know) 4.2% 68 1.6% 1 2.4% 4 5.6% 5 6.1% 6 7.4% 5 10.4% 8 3.4% 3 5.8% 9(Varies) 5.3% 86 2.0% 1 8.1% 12 6.8% 6 4.2% 4 4.4% 3 1.7% 1 3.4% 3 2.6% 4(Don't do this type of
shopping) 21.4% 343 39.5% 13 23.4% 35 27.0% 24 20.1% 19 10.9% 7 19.5% 14 45.9% 43 15.0% 24
Weighted base: 1607 33 152 89 95 66 74 94 160Sample: 1607 100 100 100 100 101 100 102 102 Q18A Which internet / home delivery retailer do you use for your household's shopping for furniture, carpets, other floor coverings and
household textiles (includes beds, sofas, tables, etc)? Those who shop online at Q18 Amazon 7.5% 13 0.0% 0 0.0% 0 0.0% 0 0.0% 0 10.5% 1 0.0% 0 0.0% 0 0.0% 0Argos 2.7% 5 0.0% 0 0.0% 0 0.0% 0 0.0% 0 3.6% 0 0.0% 0 0.0% 0 0.0% 0Ebay 7.6% 13 0.0% 0 0.0% 0 0.0% 0 19.8% 1 3.6% 0 8.3% 1 0.0% 0 25.2% 5Ikea 0.7% 1 26.9% 1 0.0% 0 0.0% 0 0.0% 0 4.8% 1 0.0% 0 0.0% 0 0.0% 0John Lewis 3.0% 5 0.0% 0 0.0% 0 0.0% 0 0.0% 0 0.0% 0 12.2% 1 37.2% 1 8.1% 2Littlewoods 1.4% 2 0.0% 0 0.0% 0 0.0% 0 0.0% 0 0.0% 0 30.4% 2 0.0% 0 0.0% 0Next 9.8% 17 0.0% 0 14.2% 3 0.0% 0 20.7% 1 0.0% 0 17.6% 1 0.0% 0 23.1% 5Tesco 0.7% 1 0.0% 0 0.0% 0 0.0% 0 0.0% 0 0.0% 0 0.0% 0 0.0% 0 0.0% 0Bed World 0.8% 1 0.0% 0 6.7% 1 0.0% 0 0.0% 0 0.0% 0 0.0% 0 0.0% 0 0.0% 0Carpetright 0.4% 1 0.0% 0 0.0% 0 0.0% 0 0.0% 0 5.0% 1 0.0% 0 0.0% 0 0.0% 0DFS 0.8% 1 0.0% 0 0.0% 0 0.0% 0 0.0% 0 0.0% 0 17.6% 1 0.0% 0 0.0% 0Flooring Direct 1.3% 2 0.0% 0 0.0% 0 0.0% 0 0.0% 0 18.2% 2 0.0% 0 0.0% 0 0.0% 0Furnituredirectory 0.2% 0 0.0% 0 0.0% 0 0.0% 0 0.0% 0 0.0% 0 0.0% 0 0.0% 0 0.0% 0Grattan 0.4% 1 0.0% 0 0.0% 0 0.0% 0 0.0% 0 0.0% 0 7.9% 1 0.0% 0 0.0% 0Mattressman 0.4% 1 0.0% 0 0.0% 0 0.0% 0 0.0% 0 0.0% 0 0.0% 0 0.0% 0 0.0% 0QVC 0.6% 1 0.0% 0 0.0% 0 0.0% 0 0.0% 0 0.0% 0 0.0% 0 0.0% 0 0.0% 0Secret Sales 1.3% 2 0.0% 0 0.0% 0 0.0% 0 0.0% 0 18.2% 2 0.0% 0 0.0% 0 0.0% 0SofaSofa 0.8% 1 0.0% 0 6.7% 1 0.0% 0 0.0% 0 0.0% 0 0.0% 0 0.0% 0 0.0% 0Studio 1.0% 2 0.0% 0 0.0% 0 0.0% 0 0.0% 0 0.0% 0 0.0% 0 0.0% 0 0.0% 0Tonys Textiles 0.3% 1 0.0% 0 0.0% 0 0.0% 0 0.0% 0 4.8% 1 0.0% 0 0.0% 0 0.0% 0Very 3.6% 6 0.0% 0 24.6% 5 0.0% 0 0.0% 0 0.0% 0 0.0% 0 0.0% 0 0.0% 0Zara 0.9% 1 0.0% 0 7.4% 1 0.0% 0 0.0% 0 0.0% 0 0.0% 0 0.0% 0 0.0% 0(Don't know / varies) 53.9% 92 73.1% 2 40.4% 8 100.0% 3 59.5% 3 31.3% 4 6.1% 0 62.9% 1 43.6% 9Weighted base: 170 2 20 3 4 12 8 2 20Sample: 136 6 10 3 5 12 8 3 11

by Zone (Weighted, Part 2) South Wales Retail Study Page 32 Weighted: for Carter Jonas August 2016
Total Zone 9 Zone 10 Zone 11 Zone 12 Zone 13 Zone 14 Zone 15 Zone 16
Column %ges. 020716 NEMS market research
Q19 Where do you normally do most of your household's shopping for DIY goods, decorating supplies and garden products (such as drills, lawn mowers, hammers, hedge cutters, garden tools, plants, shrubs etc)?
Aberaeron 0.6% 9 0.0% 0 0.0% 0 4.0% 4 3.1% 3 4.3% 3 0.0% 0 0.0% 0 0.0% 0Aberyswyth out of centre
(where retail park is not named)
1.2% 19 0.0% 0 0.0% 0 0.0% 0 2.0% 2 8.0% 5 2.4% 2 1.6% 2 5.0% 8
Aberyswyth Town Centre 9.1% 146 0.0% 0 0.0% 0 1.7% 1 0.7% 1 11.8% 8 35.7% 26 46.8% 44 39.9% 64Cardigan out of centre
(where retail park is not named)
1.8% 29 3.2% 1 17.6% 27 1.7% 1 0.0% 0 0.0% 0 0.0% 0 0.0% 0 0.0% 0
Cardigan Town Centre 3.9% 63 7.9% 3 30.9% 47 6.9% 6 0.7% 1 4.2% 3 0.9% 1 0.0% 0 1.0% 2Carmarthen out of centre
(where retail park is not named)
3.0% 48 3.5% 1 2.7% 4 21.2% 19 8.6% 8 5.8% 4 0.7% 0 0.0% 0 0.0% 0
Carmarthen Town Centre 3.7% 59 2.9% 1 6.5% 10 13.0% 12 7.4% 7 4.3% 3 0.0% 0 0.7% 1 0.0% 0Crymych 0.4% 7 7.7% 3 3.0% 4 0.0% 0 0.0% 0 0.0% 0 0.0% 0 0.0% 0 0.0% 0Fishguard 0.5% 8 3.4% 1 0.0% 0 0.0% 0 0.0% 0 0.0% 0 0.0% 0 0.0% 0 0.0% 0Goodwick 0.1% 1 0.0% 0 0.0% 0 0.0% 0 0.0% 0 0.0% 0 0.0% 0 0.0% 0 0.0% 0Haverfordwest out of centre
(where retail park is not named)
4.5% 73 13.3% 4 0.0% 0 0.0% 0 0.0% 0 0.0% 0 0.0% 0 0.0% 0 2.1% 3
Haverfordwest Town Centre 9.4% 151 10.2% 3 0.0% 0 0.0% 0 0.0% 0 0.0% 0 0.0% 0 0.0% 0 0.0% 0Kilgetty 0.1% 2 0.0% 0 0.0% 0 0.0% 0 0.7% 1 0.0% 0 0.0% 0 0.0% 0 0.0% 0Lampeter 2.9% 46 0.0% 0 0.0% 0 1.6% 1 40.5% 39 2.2% 1 4.8% 4 0.0% 0 0.7% 1Llandysul 0.4% 6 0.0% 0 0.0% 0 7.3% 6 0.0% 0 0.0% 0 0.0% 0 0.0% 0 0.0% 0Llanelli Town Centre 0.0% 1 0.0% 0 0.0% 0 0.7% 1 0.0% 0 0.0% 0 0.0% 0 0.0% 0 0.0% 0Machynlleth Out of Centre 0.1% 1 0.0% 0 0.0% 0 0.0% 0 0.0% 0 0.0% 0 0.0% 0 0.0% 0 0.7% 1Machynlleth Town Centre 0.5% 8 0.0% 0 0.0% 0 0.0% 0 0.0% 0 0.0% 0 0.0% 0 0.0% 0 4.8% 8Milford Haven out of centre
(where retail park is not named)
0.4% 6 0.0% 0 0.0% 0 0.0% 0 0.0% 0 0.0% 0 0.0% 0 0.0% 0 0.0% 0
Milford Haven Town Centre 0.6% 10 0.0% 0 0.0% 0 0.0% 0 0.0% 0 0.0% 0 0.0% 0 0.0% 0 0.0% 0Narberth 0.3% 5 0.0% 0 0.0% 0 0.0% 0 0.0% 0 0.0% 0 0.0% 0 0.0% 0 0.0% 0Newport (Pembrokeshire) 0.1% 1 4.2% 1 0.0% 0 0.0% 0 0.0% 0 0.0% 0 0.0% 0 0.0% 0 0.0% 0Newtown (Powys) 0.1% 1 0.7% 0 0.0% 0 0.0% 0 0.0% 0 0.0% 0 0.0% 0 0.0% 0 0.0% 0Neyland 0.2% 4 0.0% 0 0.0% 0 0.0% 0 0.0% 0 0.0% 0 0.0% 0 0.0% 0 0.0% 0Pembroke Dock Central 2.8% 45 0.0% 0 0.0% 0 0.0% 0 0.0% 0 0.0% 0 0.0% 0 0.0% 0 0.0% 0Pembroke Dock out of centre
(where retail park is not named)
1.1% 18 0.0% 0 0.0% 0 0.0% 0 0.0% 0 0.0% 0 0.0% 0 0.0% 0 0.0% 0
Pembroke out of centre (where retail park is not named)
0.0% 0 0.0% 0 0.0% 0 0.0% 0 0.0% 0 0.0% 0 0.0% 0 0.0% 0 0.0% 0
Pembroke Town Centre 0.3% 4 0.0% 0 0.0% 0 0.0% 0 0.0% 0 0.0% 0 0.0% 0 0.0% 0 1.0% 2Saundersfoot 0.5% 9 0.0% 0 0.0% 0 0.0% 0 0.0% 0 0.0% 0 0.0% 0 0.0% 0 0.0% 0St Davids 0.3% 5 0.0% 0 0.0% 0 0.0% 0 0.0% 0 0.0% 0 0.0% 0 0.0% 0 0.0% 0Swansea out of centre (where
retail park is not named) 0.1% 2 0.0% 0 0.0% 0 0.0% 0 0.0% 0 0.0% 0 0.0% 0 0.0% 0 1.0% 2
Tenby 0.9% 15 0.0% 0 0.0% 0 0.0% 0 0.0% 0 0.0% 0 0.0% 0 0.0% 0 0.0% 0Tregaron 0.2% 3 0.0% 0 0.0% 0 0.0% 0 0.0% 0 0.0% 0 2.9% 2 0.0% 0 0.0% 0Bridge Meadow Retail Park,
Haverfordwest 0.7% 11 0.0% 0 0.0% 0 0.0% 0 0.0% 0 0.0% 0 0.0% 0 0.0% 0 0.0% 0
Havens Head Retail Park, Milford Haven
0.2% 3 0.0% 0 0.0% 0 0.0% 0 0.0% 0 0.0% 0 0.0% 0 0.0% 0 0.0% 0
Parc Pensarn Retail Park, Myrtle Hill, Carmarthen
1.5% 24 1.8% 1 3.3% 5 0.0% 0 3.0% 3 1.8% 1 0.0% 0 0.9% 1 1.9% 3
Parc Pensarn, Carmarthen 1.3% 20 0.0% 0 4.2% 6 6.1% 5 1.1% 1 0.0% 0 5.0% 4 0.0% 0 0.0% 0Parc Y Llyn Retail Park,
Aberystwyth 2.9% 46 0.9% 0 0.0% 0 0.7% 1 0.9% 1 16.3% 11 6.7% 5 4.8% 5 15.1% 24
Pembrokeshire Retail Park, London Road, Pembroke Dock
0.5% 8 0.0% 0 0.0% 0 0.0% 0 0.0% 0 0.0% 0 0.0% 0 0.0% 0 0.0% 0
Springfield Retail Park, Haverfordwest
1.0% 16 0.9% 0 0.0% 0 0.0% 0 0.0% 0 0.0% 0 0.0% 0 0.0% 0 0.0% 0
St Stephens Way, Carmarthen
0.3% 5 0.0% 0 0.9% 1 0.9% 1 0.0% 0 0.0% 0 0.0% 0 0.0% 0 0.0% 0
Towy Ford Retail Park, Carmarthen
0.5% 7 0.0% 0 0.0% 0 1.9% 2 0.0% 0 0.0% 0 0.0% 0 0.0% 0 0.0% 0
Withybush Retail Park, Haverfordwest
11.9% 191 7.7% 3 0.8% 1 0.0% 0 0.0% 0 0.0% 0 0.0% 0 0.0% 0 1.0% 2
Ystwyth Retail Park, Aberystwyth
0.5% 7 0.0% 0 0.0% 0 0.0% 0 0.0% 0 2.0% 1 5.7% 4 0.0% 0 0.0% 0
Aberporth 0.1% 1 0.0% 0 0.8% 1 0.0% 0 0.0% 0 0.0% 0 0.0% 0 0.0% 0 0.0% 0
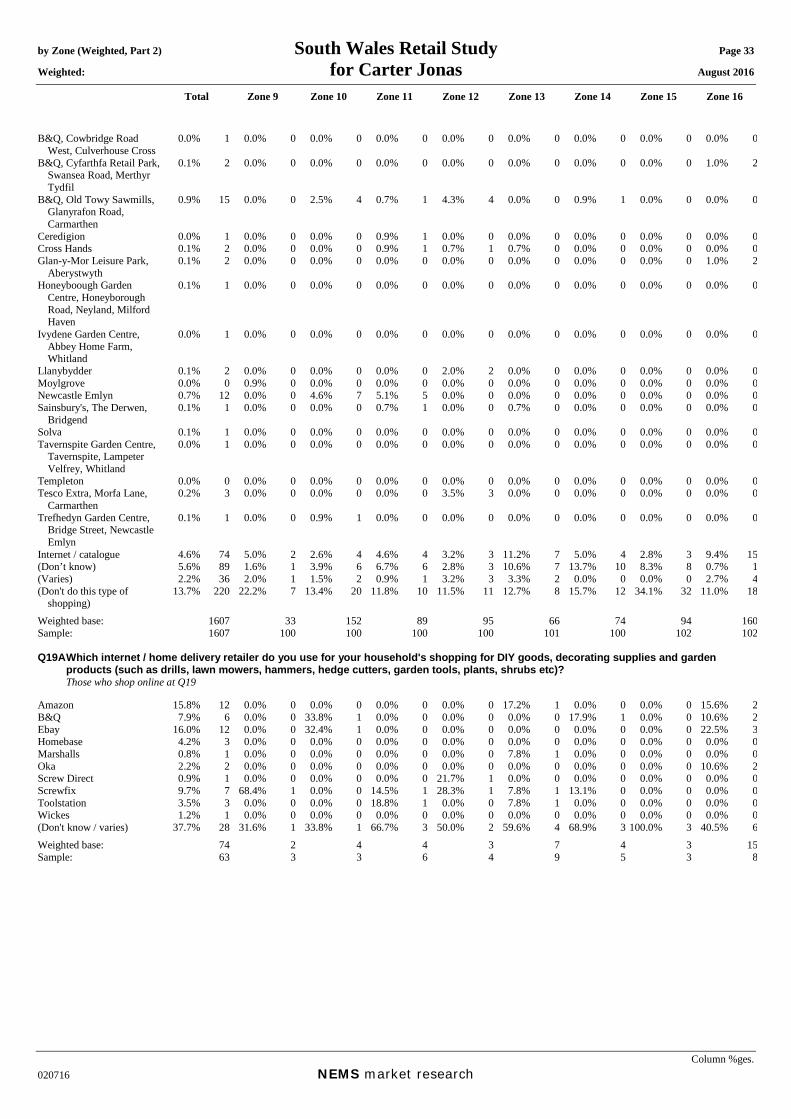
by Zone (Weighted, Part 2) South Wales Retail Study Page 33 Weighted: for Carter Jonas August 2016
Total Zone 9 Zone 10 Zone 11 Zone 12 Zone 13 Zone 14 Zone 15 Zone 16
Column %ges. 020716 NEMS market research
B&Q, Cowbridge Road West, Culverhouse Cross
0.0% 1 0.0% 0 0.0% 0 0.0% 0 0.0% 0 0.0% 0 0.0% 0 0.0% 0 0.0% 0
B&Q, Cyfarthfa Retail Park, Swansea Road, Merthyr Tydfil
0.1% 2 0.0% 0 0.0% 0 0.0% 0 0.0% 0 0.0% 0 0.0% 0 0.0% 0 1.0% 2
B&Q, Old Towy Sawmills, Glanyrafon Road, Carmarthen
0.9% 15 0.0% 0 2.5% 4 0.7% 1 4.3% 4 0.0% 0 0.9% 1 0.0% 0 0.0% 0
Ceredigion 0.0% 1 0.0% 0 0.0% 0 0.9% 1 0.0% 0 0.0% 0 0.0% 0 0.0% 0 0.0% 0Cross Hands 0.1% 2 0.0% 0 0.0% 0 0.9% 1 0.7% 1 0.7% 0 0.0% 0 0.0% 0 0.0% 0Glan-y-Mor Leisure Park,
Aberystwyth 0.1% 2 0.0% 0 0.0% 0 0.0% 0 0.0% 0 0.0% 0 0.0% 0 0.0% 0 1.0% 2
Honeyboough Garden Centre, Honeyborough Road, Neyland, Milford Haven
0.1% 1 0.0% 0 0.0% 0 0.0% 0 0.0% 0 0.0% 0 0.0% 0 0.0% 0 0.0% 0
Ivydene Garden Centre, Abbey Home Farm, Whitland
0.0% 1 0.0% 0 0.0% 0 0.0% 0 0.0% 0 0.0% 0 0.0% 0 0.0% 0 0.0% 0
Llanybydder 0.1% 2 0.0% 0 0.0% 0 0.0% 0 2.0% 2 0.0% 0 0.0% 0 0.0% 0 0.0% 0Moylgrove 0.0% 0 0.9% 0 0.0% 0 0.0% 0 0.0% 0 0.0% 0 0.0% 0 0.0% 0 0.0% 0Newcastle Emlyn 0.7% 12 0.0% 0 4.6% 7 5.1% 5 0.0% 0 0.0% 0 0.0% 0 0.0% 0 0.0% 0Sainsbury's, The Derwen,
Bridgend 0.1% 1 0.0% 0 0.0% 0 0.7% 1 0.0% 0 0.7% 0 0.0% 0 0.0% 0 0.0% 0
Solva 0.1% 1 0.0% 0 0.0% 0 0.0% 0 0.0% 0 0.0% 0 0.0% 0 0.0% 0 0.0% 0Tavernspite Garden Centre,
Tavernspite, Lampeter Velfrey, Whitland
0.0% 1 0.0% 0 0.0% 0 0.0% 0 0.0% 0 0.0% 0 0.0% 0 0.0% 0 0.0% 0
Templeton 0.0% 0 0.0% 0 0.0% 0 0.0% 0 0.0% 0 0.0% 0 0.0% 0 0.0% 0 0.0% 0Tesco Extra, Morfa Lane,
Carmarthen 0.2% 3 0.0% 0 0.0% 0 0.0% 0 3.5% 3 0.0% 0 0.0% 0 0.0% 0 0.0% 0
Trefhedyn Garden Centre, Bridge Street, Newcastle Emlyn
0.1% 1 0.0% 0 0.9% 1 0.0% 0 0.0% 0 0.0% 0 0.0% 0 0.0% 0 0.0% 0
Internet / catalogue 4.6% 74 5.0% 2 2.6% 4 4.6% 4 3.2% 3 11.2% 7 5.0% 4 2.8% 3 9.4% 15(Don’t know) 5.6% 89 1.6% 1 3.9% 6 6.7% 6 2.8% 3 10.6% 7 13.7% 10 8.3% 8 0.7% 1(Varies) 2.2% 36 2.0% 1 1.5% 2 0.9% 1 3.2% 3 3.3% 2 0.0% 0 0.0% 0 2.7% 4(Don't do this type of
shopping) 13.7% 220 22.2% 7 13.4% 20 11.8% 10 11.5% 11 12.7% 8 15.7% 12 34.1% 32 11.0% 18
Weighted base: 1607 33 152 89 95 66 74 94 160Sample: 1607 100 100 100 100 101 100 102 102 Q19A Which internet / home delivery retailer do you use for your household's shopping for DIY goods, decorating supplies and garden
products (such as drills, lawn mowers, hammers, hedge cutters, garden tools, plants, shrubs etc)? Those who shop online at Q19 Amazon 15.8% 12 0.0% 0 0.0% 0 0.0% 0 0.0% 0 17.2% 1 0.0% 0 0.0% 0 15.6% 2B&Q 7.9% 6 0.0% 0 33.8% 1 0.0% 0 0.0% 0 0.0% 0 17.9% 1 0.0% 0 10.6% 2Ebay 16.0% 12 0.0% 0 32.4% 1 0.0% 0 0.0% 0 0.0% 0 0.0% 0 0.0% 0 22.5% 3Homebase 4.2% 3 0.0% 0 0.0% 0 0.0% 0 0.0% 0 0.0% 0 0.0% 0 0.0% 0 0.0% 0Marshalls 0.8% 1 0.0% 0 0.0% 0 0.0% 0 0.0% 0 7.8% 1 0.0% 0 0.0% 0 0.0% 0Oka 2.2% 2 0.0% 0 0.0% 0 0.0% 0 0.0% 0 0.0% 0 0.0% 0 0.0% 0 10.6% 2Screw Direct 0.9% 1 0.0% 0 0.0% 0 0.0% 0 21.7% 1 0.0% 0 0.0% 0 0.0% 0 0.0% 0Screwfix 9.7% 7 68.4% 1 0.0% 0 14.5% 1 28.3% 1 7.8% 1 13.1% 0 0.0% 0 0.0% 0Toolstation 3.5% 3 0.0% 0 0.0% 0 18.8% 1 0.0% 0 7.8% 1 0.0% 0 0.0% 0 0.0% 0Wickes 1.2% 1 0.0% 0 0.0% 0 0.0% 0 0.0% 0 0.0% 0 0.0% 0 0.0% 0 0.0% 0(Don't know / varies) 37.7% 28 31.6% 1 33.8% 1 66.7% 3 50.0% 2 59.6% 4 68.9% 3 100.0% 3 40.5% 6Weighted base: 74 2 4 4 3 7 4 3 15Sample: 63 3 3 6 4 9 5 3 8
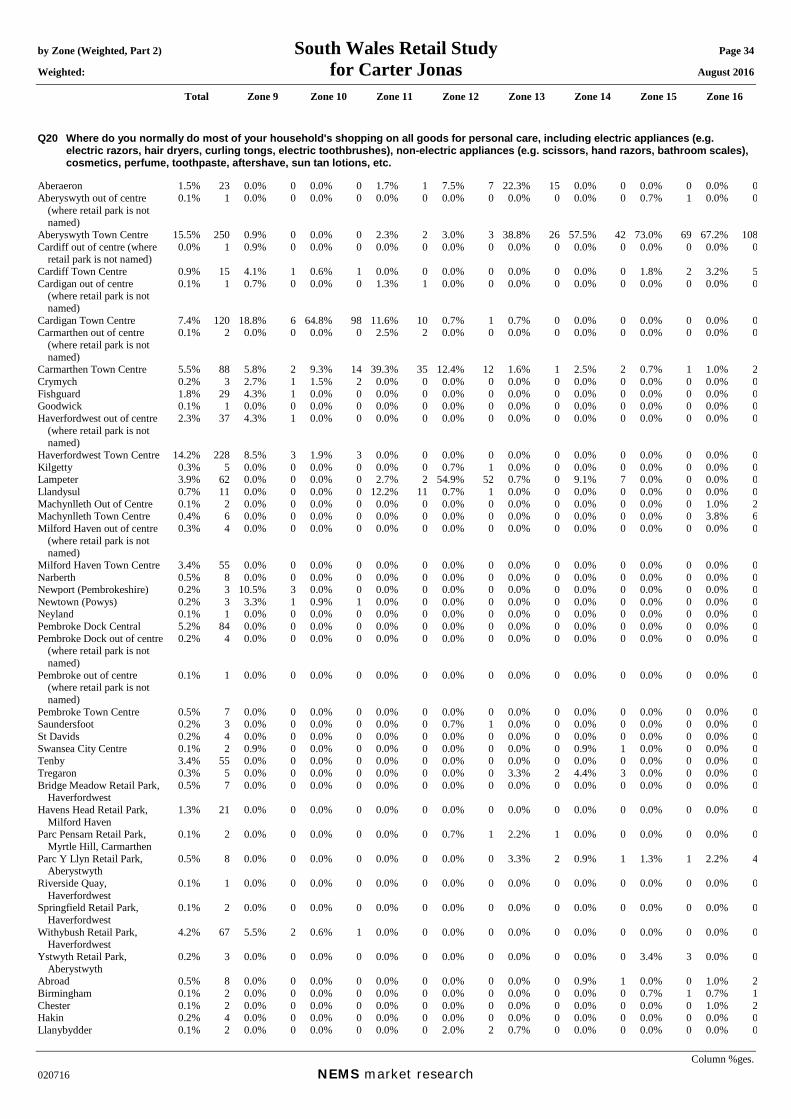
by Zone (Weighted, Part 2) South Wales Retail Study Page 34 Weighted: for Carter Jonas August 2016
Total Zone 9 Zone 10 Zone 11 Zone 12 Zone 13 Zone 14 Zone 15 Zone 16
Column %ges. 020716 NEMS market research
Q20 Where do you normally do most of your household's shopping on all goods for personal care, including electric appliances (e.g. electric razors, hair dryers, curling tongs, electric toothbrushes), non-electric appliances (e.g. scissors, hand razors, bathroom scales), cosmetics, perfume, toothpaste, aftershave, sun tan lotions, etc.
Aberaeron 1.5% 23 0.0% 0 0.0% 0 1.7% 1 7.5% 7 22.3% 15 0.0% 0 0.0% 0 0.0% 0Aberyswyth out of centre
(where retail park is not named)
0.1% 1 0.0% 0 0.0% 0 0.0% 0 0.0% 0 0.0% 0 0.0% 0 0.7% 1 0.0% 0
Aberyswyth Town Centre 15.5% 250 0.9% 0 0.0% 0 2.3% 2 3.0% 3 38.8% 26 57.5% 42 73.0% 69 67.2% 108Cardiff out of centre (where
retail park is not named) 0.0% 1 0.9% 0 0.0% 0 0.0% 0 0.0% 0 0.0% 0 0.0% 0 0.0% 0 0.0% 0
Cardiff Town Centre 0.9% 15 4.1% 1 0.6% 1 0.0% 0 0.0% 0 0.0% 0 0.0% 0 1.8% 2 3.2% 5Cardigan out of centre
(where retail park is not named)
0.1% 1 0.7% 0 0.0% 0 1.3% 1 0.0% 0 0.0% 0 0.0% 0 0.0% 0 0.0% 0
Cardigan Town Centre 7.4% 120 18.8% 6 64.8% 98 11.6% 10 0.7% 1 0.7% 0 0.0% 0 0.0% 0 0.0% 0Carmarthen out of centre
(where retail park is not named)
0.1% 2 0.0% 0 0.0% 0 2.5% 2 0.0% 0 0.0% 0 0.0% 0 0.0% 0 0.0% 0
Carmarthen Town Centre 5.5% 88 5.8% 2 9.3% 14 39.3% 35 12.4% 12 1.6% 1 2.5% 2 0.7% 1 1.0% 2Crymych 0.2% 3 2.7% 1 1.5% 2 0.0% 0 0.0% 0 0.0% 0 0.0% 0 0.0% 0 0.0% 0Fishguard 1.8% 29 4.3% 1 0.0% 0 0.0% 0 0.0% 0 0.0% 0 0.0% 0 0.0% 0 0.0% 0Goodwick 0.1% 1 0.0% 0 0.0% 0 0.0% 0 0.0% 0 0.0% 0 0.0% 0 0.0% 0 0.0% 0Haverfordwest out of centre
(where retail park is not named)
2.3% 37 4.3% 1 0.0% 0 0.0% 0 0.0% 0 0.0% 0 0.0% 0 0.0% 0 0.0% 0
Haverfordwest Town Centre 14.2% 228 8.5% 3 1.9% 3 0.0% 0 0.0% 0 0.0% 0 0.0% 0 0.0% 0 0.0% 0Kilgetty 0.3% 5 0.0% 0 0.0% 0 0.0% 0 0.7% 1 0.0% 0 0.0% 0 0.0% 0 0.0% 0Lampeter 3.9% 62 0.0% 0 0.0% 0 2.7% 2 54.9% 52 0.7% 0 9.1% 7 0.0% 0 0.0% 0Llandysul 0.7% 11 0.0% 0 0.0% 0 12.2% 11 0.7% 1 0.0% 0 0.0% 0 0.0% 0 0.0% 0Machynlleth Out of Centre 0.1% 2 0.0% 0 0.0% 0 0.0% 0 0.0% 0 0.0% 0 0.0% 0 0.0% 0 1.0% 2Machynlleth Town Centre 0.4% 6 0.0% 0 0.0% 0 0.0% 0 0.0% 0 0.0% 0 0.0% 0 0.0% 0 3.8% 6Milford Haven out of centre
(where retail park is not named)
0.3% 4 0.0% 0 0.0% 0 0.0% 0 0.0% 0 0.0% 0 0.0% 0 0.0% 0 0.0% 0
Milford Haven Town Centre 3.4% 55 0.0% 0 0.0% 0 0.0% 0 0.0% 0 0.0% 0 0.0% 0 0.0% 0 0.0% 0Narberth 0.5% 8 0.0% 0 0.0% 0 0.0% 0 0.0% 0 0.0% 0 0.0% 0 0.0% 0 0.0% 0Newport (Pembrokeshire) 0.2% 3 10.5% 3 0.0% 0 0.0% 0 0.0% 0 0.0% 0 0.0% 0 0.0% 0 0.0% 0Newtown (Powys) 0.2% 3 3.3% 1 0.9% 1 0.0% 0 0.0% 0 0.0% 0 0.0% 0 0.0% 0 0.0% 0Neyland 0.1% 1 0.0% 0 0.0% 0 0.0% 0 0.0% 0 0.0% 0 0.0% 0 0.0% 0 0.0% 0Pembroke Dock Central 5.2% 84 0.0% 0 0.0% 0 0.0% 0 0.0% 0 0.0% 0 0.0% 0 0.0% 0 0.0% 0Pembroke Dock out of centre
(where retail park is not named)
0.2% 4 0.0% 0 0.0% 0 0.0% 0 0.0% 0 0.0% 0 0.0% 0 0.0% 0 0.0% 0
Pembroke out of centre (where retail park is not named)
0.1% 1 0.0% 0 0.0% 0 0.0% 0 0.0% 0 0.0% 0 0.0% 0 0.0% 0 0.0% 0
Pembroke Town Centre 0.5% 7 0.0% 0 0.0% 0 0.0% 0 0.0% 0 0.0% 0 0.0% 0 0.0% 0 0.0% 0Saundersfoot 0.2% 3 0.0% 0 0.0% 0 0.0% 0 0.7% 1 0.0% 0 0.0% 0 0.0% 0 0.0% 0St Davids 0.2% 4 0.0% 0 0.0% 0 0.0% 0 0.0% 0 0.0% 0 0.0% 0 0.0% 0 0.0% 0Swansea City Centre 0.1% 2 0.9% 0 0.0% 0 0.0% 0 0.0% 0 0.0% 0 0.9% 1 0.0% 0 0.0% 0Tenby 3.4% 55 0.0% 0 0.0% 0 0.0% 0 0.0% 0 0.0% 0 0.0% 0 0.0% 0 0.0% 0Tregaron 0.3% 5 0.0% 0 0.0% 0 0.0% 0 0.0% 0 3.3% 2 4.4% 3 0.0% 0 0.0% 0Bridge Meadow Retail Park,
Haverfordwest 0.5% 7 0.0% 0 0.0% 0 0.0% 0 0.0% 0 0.0% 0 0.0% 0 0.0% 0 0.0% 0
Havens Head Retail Park, Milford Haven
1.3% 21 0.0% 0 0.0% 0 0.0% 0 0.0% 0 0.0% 0 0.0% 0 0.0% 0 0.0% 0
Parc Pensarn Retail Park, Myrtle Hill, Carmarthen
0.1% 2 0.0% 0 0.0% 0 0.0% 0 0.7% 1 2.2% 1 0.0% 0 0.0% 0 0.0% 0
Parc Y Llyn Retail Park, Aberystwyth
0.5% 8 0.0% 0 0.0% 0 0.0% 0 0.0% 0 3.3% 2 0.9% 1 1.3% 1 2.2% 4
Riverside Quay, Haverfordwest
0.1% 1 0.0% 0 0.0% 0 0.0% 0 0.0% 0 0.0% 0 0.0% 0 0.0% 0 0.0% 0
Springfield Retail Park, Haverfordwest
0.1% 2 0.0% 0 0.0% 0 0.0% 0 0.0% 0 0.0% 0 0.0% 0 0.0% 0 0.0% 0
Withybush Retail Park, Haverfordwest
4.2% 67 5.5% 2 0.6% 1 0.0% 0 0.0% 0 0.0% 0 0.0% 0 0.0% 0 0.0% 0
Ystwyth Retail Park, Aberystwyth
0.2% 3 0.0% 0 0.0% 0 0.0% 0 0.0% 0 0.0% 0 0.0% 0 3.4% 3 0.0% 0
Abroad 0.5% 8 0.0% 0 0.0% 0 0.0% 0 0.0% 0 0.0% 0 0.9% 1 0.0% 0 1.0% 2Birmingham 0.1% 2 0.0% 0 0.0% 0 0.0% 0 0.0% 0 0.0% 0 0.0% 0 0.7% 1 0.7% 1Chester 0.1% 2 0.0% 0 0.0% 0 0.0% 0 0.0% 0 0.0% 0 0.0% 0 0.0% 0 1.0% 2Hakin 0.2% 4 0.0% 0 0.0% 0 0.0% 0 0.0% 0 0.0% 0 0.0% 0 0.0% 0 0.0% 0Llanybydder 0.1% 2 0.0% 0 0.0% 0 0.0% 0 2.0% 2 0.7% 0 0.0% 0 0.0% 0 0.0% 0
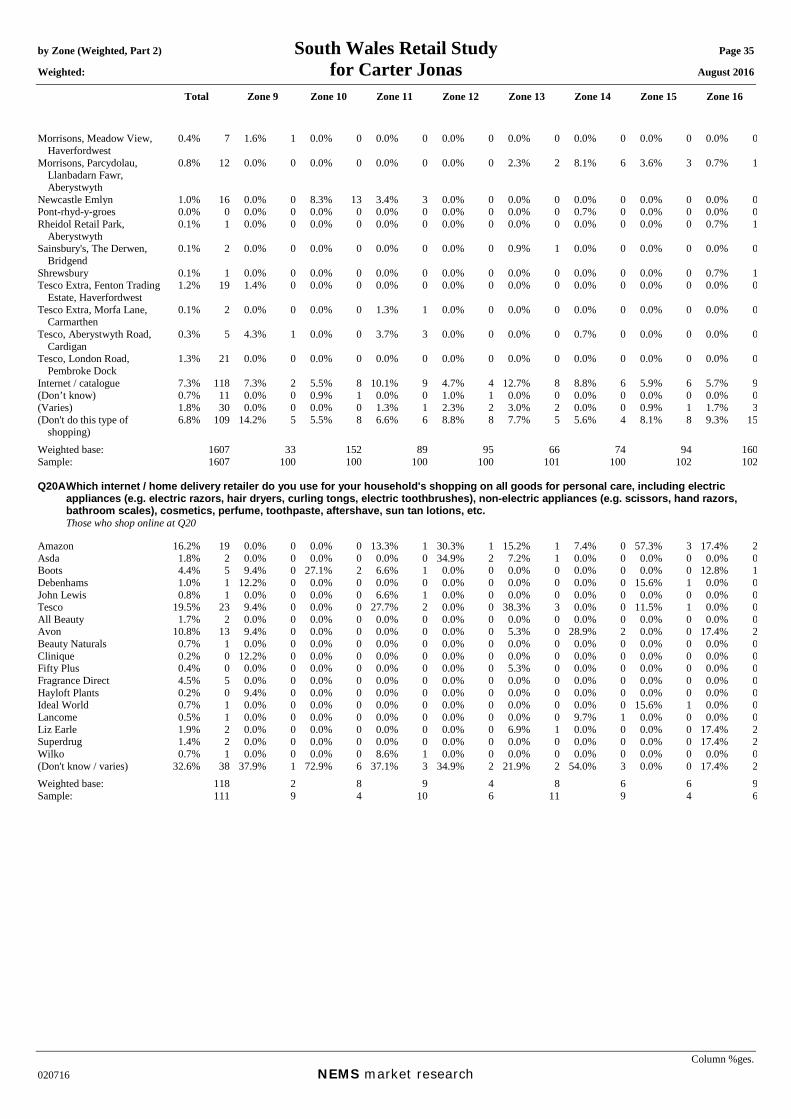
by Zone (Weighted, Part 2) South Wales Retail Study Page 35 Weighted: for Carter Jonas August 2016
Total Zone 9 Zone 10 Zone 11 Zone 12 Zone 13 Zone 14 Zone 15 Zone 16
Column %ges. 020716 NEMS market research
Morrisons, Meadow View, Haverfordwest
0.4% 7 1.6% 1 0.0% 0 0.0% 0 0.0% 0 0.0% 0 0.0% 0 0.0% 0 0.0% 0
Morrisons, Parcydolau, Llanbadarn Fawr, Aberystwyth
0.8% 12 0.0% 0 0.0% 0 0.0% 0 0.0% 0 2.3% 2 8.1% 6 3.6% 3 0.7% 1
Newcastle Emlyn 1.0% 16 0.0% 0 8.3% 13 3.4% 3 0.0% 0 0.0% 0 0.0% 0 0.0% 0 0.0% 0Pont-rhyd-y-groes 0.0% 0 0.0% 0 0.0% 0 0.0% 0 0.0% 0 0.0% 0 0.7% 0 0.0% 0 0.0% 0Rheidol Retail Park,
Aberystwyth 0.1% 1 0.0% 0 0.0% 0 0.0% 0 0.0% 0 0.0% 0 0.0% 0 0.0% 0 0.7% 1
Sainsbury's, The Derwen, Bridgend
0.1% 2 0.0% 0 0.0% 0 0.0% 0 0.0% 0 0.9% 1 0.0% 0 0.0% 0 0.0% 0
Shrewsbury 0.1% 1 0.0% 0 0.0% 0 0.0% 0 0.0% 0 0.0% 0 0.0% 0 0.0% 0 0.7% 1Tesco Extra, Fenton Trading
Estate, Haverfordwest 1.2% 19 1.4% 0 0.0% 0 0.0% 0 0.0% 0 0.0% 0 0.0% 0 0.0% 0 0.0% 0
Tesco Extra, Morfa Lane, Carmarthen
0.1% 2 0.0% 0 0.0% 0 1.3% 1 0.0% 0 0.0% 0 0.0% 0 0.0% 0 0.0% 0
Tesco, Aberystwyth Road, Cardigan
0.3% 5 4.3% 1 0.0% 0 3.7% 3 0.0% 0 0.0% 0 0.7% 0 0.0% 0 0.0% 0
Tesco, London Road, Pembroke Dock
1.3% 21 0.0% 0 0.0% 0 0.0% 0 0.0% 0 0.0% 0 0.0% 0 0.0% 0 0.0% 0
Internet / catalogue 7.3% 118 7.3% 2 5.5% 8 10.1% 9 4.7% 4 12.7% 8 8.8% 6 5.9% 6 5.7% 9(Don’t know) 0.7% 11 0.0% 0 0.9% 1 0.0% 0 1.0% 1 0.0% 0 0.0% 0 0.0% 0 0.0% 0(Varies) 1.8% 30 0.0% 0 0.0% 0 1.3% 1 2.3% 2 3.0% 2 0.0% 0 0.9% 1 1.7% 3(Don't do this type of
shopping) 6.8% 109 14.2% 5 5.5% 8 6.6% 6 8.8% 8 7.7% 5 5.6% 4 8.1% 8 9.3% 15
Weighted base: 1607 33 152 89 95 66 74 94 160Sample: 1607 100 100 100 100 101 100 102 102 Q20A Which internet / home delivery retailer do you use for your household's shopping on all goods for personal care, including electric
appliances (e.g. electric razors, hair dryers, curling tongs, electric toothbrushes), non-electric appliances (e.g. scissors, hand razors, bathroom scales), cosmetics, perfume, toothpaste, aftershave, sun tan lotions, etc.
Those who shop online at Q20 Amazon 16.2% 19 0.0% 0 0.0% 0 13.3% 1 30.3% 1 15.2% 1 7.4% 0 57.3% 3 17.4% 2Asda 1.8% 2 0.0% 0 0.0% 0 0.0% 0 34.9% 2 7.2% 1 0.0% 0 0.0% 0 0.0% 0Boots 4.4% 5 9.4% 0 27.1% 2 6.6% 1 0.0% 0 0.0% 0 0.0% 0 0.0% 0 12.8% 1Debenhams 1.0% 1 12.2% 0 0.0% 0 0.0% 0 0.0% 0 0.0% 0 0.0% 0 15.6% 1 0.0% 0John Lewis 0.8% 1 0.0% 0 0.0% 0 6.6% 1 0.0% 0 0.0% 0 0.0% 0 0.0% 0 0.0% 0Tesco 19.5% 23 9.4% 0 0.0% 0 27.7% 2 0.0% 0 38.3% 3 0.0% 0 11.5% 1 0.0% 0All Beauty 1.7% 2 0.0% 0 0.0% 0 0.0% 0 0.0% 0 0.0% 0 0.0% 0 0.0% 0 0.0% 0Avon 10.8% 13 9.4% 0 0.0% 0 0.0% 0 0.0% 0 5.3% 0 28.9% 2 0.0% 0 17.4% 2Beauty Naturals 0.7% 1 0.0% 0 0.0% 0 0.0% 0 0.0% 0 0.0% 0 0.0% 0 0.0% 0 0.0% 0Clinique 0.2% 0 12.2% 0 0.0% 0 0.0% 0 0.0% 0 0.0% 0 0.0% 0 0.0% 0 0.0% 0Fifty Plus 0.4% 0 0.0% 0 0.0% 0 0.0% 0 0.0% 0 5.3% 0 0.0% 0 0.0% 0 0.0% 0Fragrance Direct 4.5% 5 0.0% 0 0.0% 0 0.0% 0 0.0% 0 0.0% 0 0.0% 0 0.0% 0 0.0% 0Hayloft Plants 0.2% 0 9.4% 0 0.0% 0 0.0% 0 0.0% 0 0.0% 0 0.0% 0 0.0% 0 0.0% 0Ideal World 0.7% 1 0.0% 0 0.0% 0 0.0% 0 0.0% 0 0.0% 0 0.0% 0 15.6% 1 0.0% 0Lancome 0.5% 1 0.0% 0 0.0% 0 0.0% 0 0.0% 0 0.0% 0 9.7% 1 0.0% 0 0.0% 0Liz Earle 1.9% 2 0.0% 0 0.0% 0 0.0% 0 0.0% 0 6.9% 1 0.0% 0 0.0% 0 17.4% 2Superdrug 1.4% 2 0.0% 0 0.0% 0 0.0% 0 0.0% 0 0.0% 0 0.0% 0 0.0% 0 17.4% 2Wilko 0.7% 1 0.0% 0 0.0% 0 8.6% 1 0.0% 0 0.0% 0 0.0% 0 0.0% 0 0.0% 0(Don't know / varies) 32.6% 38 37.9% 1 72.9% 6 37.1% 3 34.9% 2 21.9% 2 54.0% 3 0.0% 0 17.4% 2Weighted base: 118 2 8 9 4 8 6 6 9Sample: 111 9 4 10 6 11 9 4 6
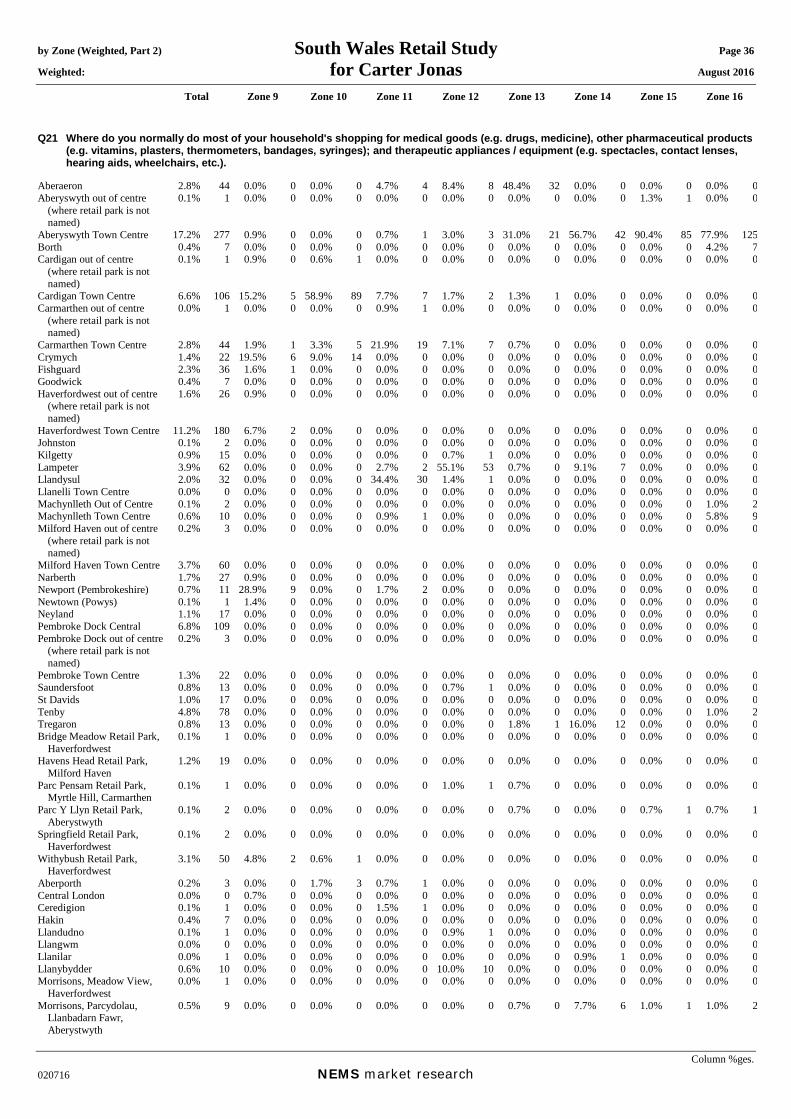
by Zone (Weighted, Part 2) South Wales Retail Study Page 36 Weighted: for Carter Jonas August 2016
Total Zone 9 Zone 10 Zone 11 Zone 12 Zone 13 Zone 14 Zone 15 Zone 16
Column %ges. 020716 NEMS market research
Q21 Where do you normally do most of your household's shopping for medical goods (e.g. drugs, medicine), other pharmaceutical products (e.g. vitamins, plasters, thermometers, bandages, syringes); and therapeutic appliances / equipment (e.g. spectacles, contact lenses, hearing aids, wheelchairs, etc.).
Aberaeron 2.8% 44 0.0% 0 0.0% 0 4.7% 4 8.4% 8 48.4% 32 0.0% 0 0.0% 0 0.0% 0Aberyswyth out of centre
(where retail park is not named)
0.1% 1 0.0% 0 0.0% 0 0.0% 0 0.0% 0 0.0% 0 0.0% 0 1.3% 1 0.0% 0
Aberyswyth Town Centre 17.2% 277 0.9% 0 0.0% 0 0.7% 1 3.0% 3 31.0% 21 56.7% 42 90.4% 85 77.9% 125Borth 0.4% 7 0.0% 0 0.0% 0 0.0% 0 0.0% 0 0.0% 0 0.0% 0 0.0% 0 4.2% 7Cardigan out of centre
(where retail park is not named)
0.1% 1 0.9% 0 0.6% 1 0.0% 0 0.0% 0 0.0% 0 0.0% 0 0.0% 0 0.0% 0
Cardigan Town Centre 6.6% 106 15.2% 5 58.9% 89 7.7% 7 1.7% 2 1.3% 1 0.0% 0 0.0% 0 0.0% 0Carmarthen out of centre
(where retail park is not named)
0.0% 1 0.0% 0 0.0% 0 0.9% 1 0.0% 0 0.0% 0 0.0% 0 0.0% 0 0.0% 0
Carmarthen Town Centre 2.8% 44 1.9% 1 3.3% 5 21.9% 19 7.1% 7 0.7% 0 0.0% 0 0.0% 0 0.0% 0Crymych 1.4% 22 19.5% 6 9.0% 14 0.0% 0 0.0% 0 0.0% 0 0.0% 0 0.0% 0 0.0% 0Fishguard 2.3% 36 1.6% 1 0.0% 0 0.0% 0 0.0% 0 0.0% 0 0.0% 0 0.0% 0 0.0% 0Goodwick 0.4% 7 0.0% 0 0.0% 0 0.0% 0 0.0% 0 0.0% 0 0.0% 0 0.0% 0 0.0% 0Haverfordwest out of centre
(where retail park is not named)
1.6% 26 0.9% 0 0.0% 0 0.0% 0 0.0% 0 0.0% 0 0.0% 0 0.0% 0 0.0% 0
Haverfordwest Town Centre 11.2% 180 6.7% 2 0.0% 0 0.0% 0 0.0% 0 0.0% 0 0.0% 0 0.0% 0 0.0% 0Johnston 0.1% 2 0.0% 0 0.0% 0 0.0% 0 0.0% 0 0.0% 0 0.0% 0 0.0% 0 0.0% 0Kilgetty 0.9% 15 0.0% 0 0.0% 0 0.0% 0 0.7% 1 0.0% 0 0.0% 0 0.0% 0 0.0% 0Lampeter 3.9% 62 0.0% 0 0.0% 0 2.7% 2 55.1% 53 0.7% 0 9.1% 7 0.0% 0 0.0% 0Llandysul 2.0% 32 0.0% 0 0.0% 0 34.4% 30 1.4% 1 0.0% 0 0.0% 0 0.0% 0 0.0% 0Llanelli Town Centre 0.0% 0 0.0% 0 0.0% 0 0.0% 0 0.0% 0 0.0% 0 0.0% 0 0.0% 0 0.0% 0Machynlleth Out of Centre 0.1% 2 0.0% 0 0.0% 0 0.0% 0 0.0% 0 0.0% 0 0.0% 0 0.0% 0 1.0% 2Machynlleth Town Centre 0.6% 10 0.0% 0 0.0% 0 0.9% 1 0.0% 0 0.0% 0 0.0% 0 0.0% 0 5.8% 9Milford Haven out of centre
(where retail park is not named)
0.2% 3 0.0% 0 0.0% 0 0.0% 0 0.0% 0 0.0% 0 0.0% 0 0.0% 0 0.0% 0
Milford Haven Town Centre 3.7% 60 0.0% 0 0.0% 0 0.0% 0 0.0% 0 0.0% 0 0.0% 0 0.0% 0 0.0% 0Narberth 1.7% 27 0.9% 0 0.0% 0 0.0% 0 0.0% 0 0.0% 0 0.0% 0 0.0% 0 0.0% 0Newport (Pembrokeshire) 0.7% 11 28.9% 9 0.0% 0 1.7% 2 0.0% 0 0.0% 0 0.0% 0 0.0% 0 0.0% 0Newtown (Powys) 0.1% 1 1.4% 0 0.0% 0 0.0% 0 0.0% 0 0.0% 0 0.0% 0 0.0% 0 0.0% 0Neyland 1.1% 17 0.0% 0 0.0% 0 0.0% 0 0.0% 0 0.0% 0 0.0% 0 0.0% 0 0.0% 0Pembroke Dock Central 6.8% 109 0.0% 0 0.0% 0 0.0% 0 0.0% 0 0.0% 0 0.0% 0 0.0% 0 0.0% 0Pembroke Dock out of centre
(where retail park is not named)
0.2% 3 0.0% 0 0.0% 0 0.0% 0 0.0% 0 0.0% 0 0.0% 0 0.0% 0 0.0% 0
Pembroke Town Centre 1.3% 22 0.0% 0 0.0% 0 0.0% 0 0.0% 0 0.0% 0 0.0% 0 0.0% 0 0.0% 0Saundersfoot 0.8% 13 0.0% 0 0.0% 0 0.0% 0 0.7% 1 0.0% 0 0.0% 0 0.0% 0 0.0% 0St Davids 1.0% 17 0.0% 0 0.0% 0 0.0% 0 0.0% 0 0.0% 0 0.0% 0 0.0% 0 0.0% 0Tenby 4.8% 78 0.0% 0 0.0% 0 0.0% 0 0.0% 0 0.0% 0 0.0% 0 0.0% 0 1.0% 2Tregaron 0.8% 13 0.0% 0 0.0% 0 0.0% 0 0.0% 0 1.8% 1 16.0% 12 0.0% 0 0.0% 0Bridge Meadow Retail Park,
Haverfordwest 0.1% 1 0.0% 0 0.0% 0 0.0% 0 0.0% 0 0.0% 0 0.0% 0 0.0% 0 0.0% 0
Havens Head Retail Park, Milford Haven
1.2% 19 0.0% 0 0.0% 0 0.0% 0 0.0% 0 0.0% 0 0.0% 0 0.0% 0 0.0% 0
Parc Pensarn Retail Park, Myrtle Hill, Carmarthen
0.1% 1 0.0% 0 0.0% 0 0.0% 0 1.0% 1 0.7% 0 0.0% 0 0.0% 0 0.0% 0
Parc Y Llyn Retail Park, Aberystwyth
0.1% 2 0.0% 0 0.0% 0 0.0% 0 0.0% 0 0.7% 0 0.0% 0 0.7% 1 0.7% 1
Springfield Retail Park, Haverfordwest
0.1% 2 0.0% 0 0.0% 0 0.0% 0 0.0% 0 0.0% 0 0.0% 0 0.0% 0 0.0% 0
Withybush Retail Park, Haverfordwest
3.1% 50 4.8% 2 0.6% 1 0.0% 0 0.0% 0 0.0% 0 0.0% 0 0.0% 0 0.0% 0
Aberporth 0.2% 3 0.0% 0 1.7% 3 0.7% 1 0.0% 0 0.0% 0 0.0% 0 0.0% 0 0.0% 0Central London 0.0% 0 0.7% 0 0.0% 0 0.0% 0 0.0% 0 0.0% 0 0.0% 0 0.0% 0 0.0% 0Ceredigion 0.1% 1 0.0% 0 0.0% 0 1.5% 1 0.0% 0 0.0% 0 0.0% 0 0.0% 0 0.0% 0Hakin 0.4% 7 0.0% 0 0.0% 0 0.0% 0 0.0% 0 0.0% 0 0.0% 0 0.0% 0 0.0% 0Llandudno 0.1% 1 0.0% 0 0.0% 0 0.0% 0 0.9% 1 0.0% 0 0.0% 0 0.0% 0 0.0% 0Llangwm 0.0% 0 0.0% 0 0.0% 0 0.0% 0 0.0% 0 0.0% 0 0.0% 0 0.0% 0 0.0% 0Llanilar 0.0% 1 0.0% 0 0.0% 0 0.0% 0 0.0% 0 0.0% 0 0.9% 1 0.0% 0 0.0% 0Llanybydder 0.6% 10 0.0% 0 0.0% 0 0.0% 0 10.0% 10 0.0% 0 0.0% 0 0.0% 0 0.0% 0Morrisons, Meadow View,
Haverfordwest 0.0% 1 0.0% 0 0.0% 0 0.0% 0 0.0% 0 0.0% 0 0.0% 0 0.0% 0 0.0% 0
Morrisons, Parcydolau, Llanbadarn Fawr, Aberystwyth
0.5% 9 0.0% 0 0.0% 0 0.0% 0 0.0% 0 0.7% 0 7.7% 6 1.0% 1 1.0% 2
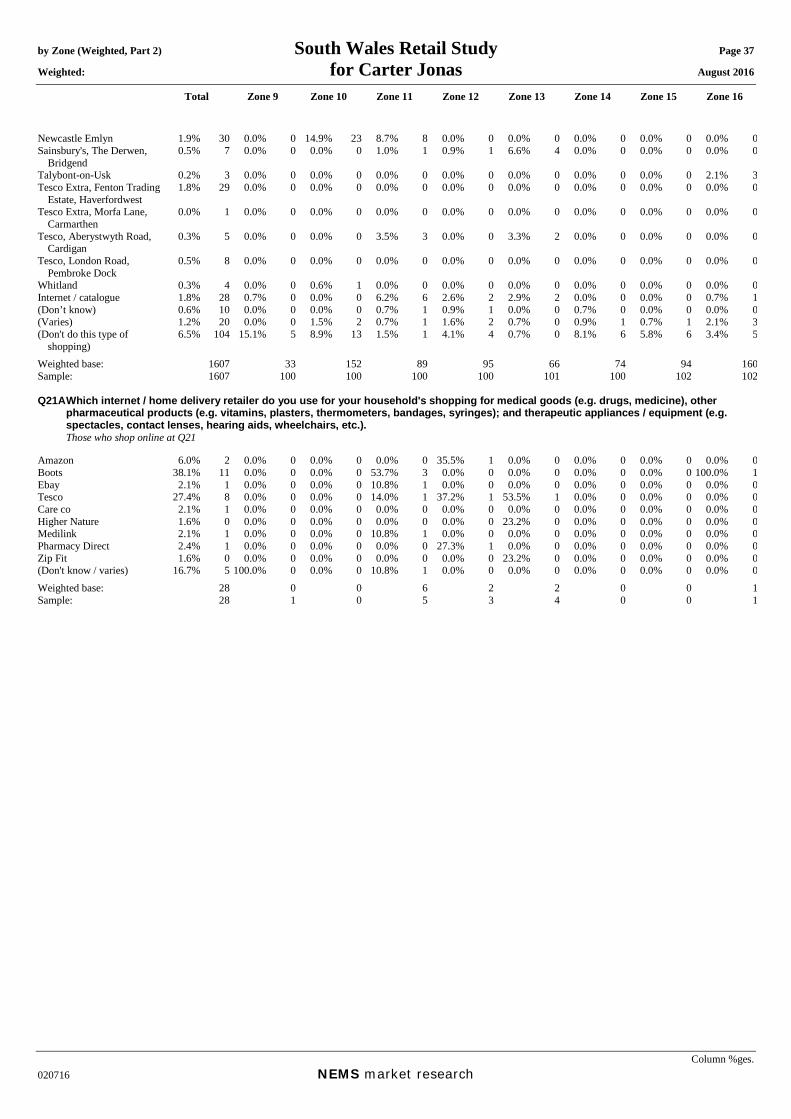
by Zone (Weighted, Part 2) South Wales Retail Study Page 37 Weighted: for Carter Jonas August 2016
Total Zone 9 Zone 10 Zone 11 Zone 12 Zone 13 Zone 14 Zone 15 Zone 16
Column %ges. 020716 NEMS market research
Newcastle Emlyn 1.9% 30 0.0% 0 14.9% 23 8.7% 8 0.0% 0 0.0% 0 0.0% 0 0.0% 0 0.0% 0Sainsbury's, The Derwen,
Bridgend 0.5% 7 0.0% 0 0.0% 0 1.0% 1 0.9% 1 6.6% 4 0.0% 0 0.0% 0 0.0% 0
Talybont-on-Usk 0.2% 3 0.0% 0 0.0% 0 0.0% 0 0.0% 0 0.0% 0 0.0% 0 0.0% 0 2.1% 3Tesco Extra, Fenton Trading
Estate, Haverfordwest 1.8% 29 0.0% 0 0.0% 0 0.0% 0 0.0% 0 0.0% 0 0.0% 0 0.0% 0 0.0% 0
Tesco Extra, Morfa Lane, Carmarthen
0.0% 1 0.0% 0 0.0% 0 0.0% 0 0.0% 0 0.0% 0 0.0% 0 0.0% 0 0.0% 0
Tesco, Aberystwyth Road, Cardigan
0.3% 5 0.0% 0 0.0% 0 3.5% 3 0.0% 0 3.3% 2 0.0% 0 0.0% 0 0.0% 0
Tesco, London Road, Pembroke Dock
0.5% 8 0.0% 0 0.0% 0 0.0% 0 0.0% 0 0.0% 0 0.0% 0 0.0% 0 0.0% 0
Whitland 0.3% 4 0.0% 0 0.6% 1 0.0% 0 0.0% 0 0.0% 0 0.0% 0 0.0% 0 0.0% 0Internet / catalogue 1.8% 28 0.7% 0 0.0% 0 6.2% 6 2.6% 2 2.9% 2 0.0% 0 0.0% 0 0.7% 1(Don’t know) 0.6% 10 0.0% 0 0.0% 0 0.7% 1 0.9% 1 0.0% 0 0.7% 0 0.0% 0 0.0% 0(Varies) 1.2% 20 0.0% 0 1.5% 2 0.7% 1 1.6% 2 0.7% 0 0.9% 1 0.7% 1 2.1% 3(Don't do this type of
shopping) 6.5% 104 15.1% 5 8.9% 13 1.5% 1 4.1% 4 0.7% 0 8.1% 6 5.8% 6 3.4% 5
Weighted base: 1607 33 152 89 95 66 74 94 160Sample: 1607 100 100 100 100 101 100 102 102 Q21A Which internet / home delivery retailer do you use for your household's shopping for medical goods (e.g. drugs, medicine), other
pharmaceutical products (e.g. vitamins, plasters, thermometers, bandages, syringes); and therapeutic appliances / equipment (e.g. spectacles, contact lenses, hearing aids, wheelchairs, etc.).
Those who shop online at Q21 Amazon 6.0% 2 0.0% 0 0.0% 0 0.0% 0 35.5% 1 0.0% 0 0.0% 0 0.0% 0 0.0% 0Boots 38.1% 11 0.0% 0 0.0% 0 53.7% 3 0.0% 0 0.0% 0 0.0% 0 0.0% 0 100.0% 1Ebay 2.1% 1 0.0% 0 0.0% 0 10.8% 1 0.0% 0 0.0% 0 0.0% 0 0.0% 0 0.0% 0Tesco 27.4% 8 0.0% 0 0.0% 0 14.0% 1 37.2% 1 53.5% 1 0.0% 0 0.0% 0 0.0% 0Care co 2.1% 1 0.0% 0 0.0% 0 0.0% 0 0.0% 0 0.0% 0 0.0% 0 0.0% 0 0.0% 0Higher Nature 1.6% 0 0.0% 0 0.0% 0 0.0% 0 0.0% 0 23.2% 0 0.0% 0 0.0% 0 0.0% 0Medilink 2.1% 1 0.0% 0 0.0% 0 10.8% 1 0.0% 0 0.0% 0 0.0% 0 0.0% 0 0.0% 0Pharmacy Direct 2.4% 1 0.0% 0 0.0% 0 0.0% 0 27.3% 1 0.0% 0 0.0% 0 0.0% 0 0.0% 0Zip Fit 1.6% 0 0.0% 0 0.0% 0 0.0% 0 0.0% 0 23.2% 0 0.0% 0 0.0% 0 0.0% 0(Don't know / varies) 16.7% 5 100.0% 0 0.0% 0 10.8% 1 0.0% 0 0.0% 0 0.0% 0 0.0% 0 0.0% 0Weighted base: 28 0 0 6 2 2 0 0 1Sample: 28 1 0 5 3 4 0 0 1
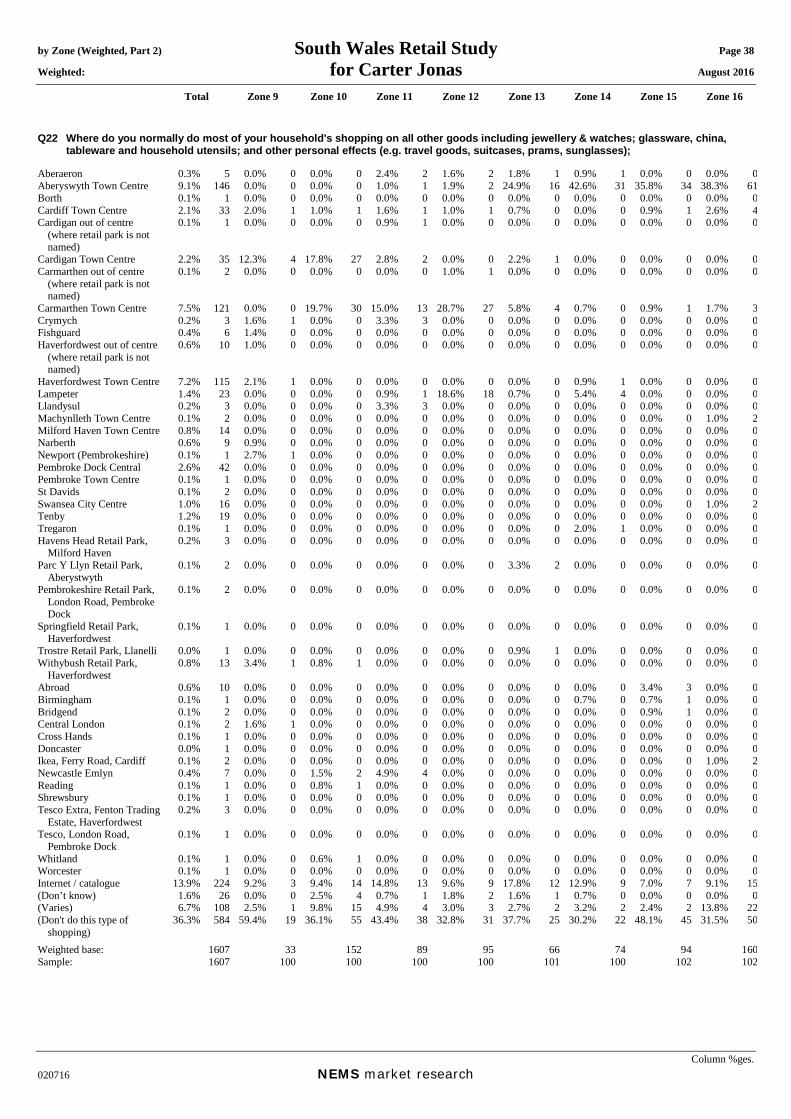
by Zone (Weighted, Part 2) South Wales Retail Study Page 38 Weighted: for Carter Jonas August 2016
Total Zone 9 Zone 10 Zone 11 Zone 12 Zone 13 Zone 14 Zone 15 Zone 16
Column %ges. 020716 NEMS market research
Q22 Where do you normally do most of your household's shopping on all other goods including jewellery & watches; glassware, china, tableware and household utensils; and other personal effects (e.g. travel goods, suitcases, prams, sunglasses);
Aberaeron 0.3% 5 0.0% 0 0.0% 0 2.4% 2 1.6% 2 1.8% 1 0.9% 1 0.0% 0 0.0% 0Aberyswyth Town Centre 9.1% 146 0.0% 0 0.0% 0 1.0% 1 1.9% 2 24.9% 16 42.6% 31 35.8% 34 38.3% 61Borth 0.1% 1 0.0% 0 0.0% 0 0.0% 0 0.0% 0 0.0% 0 0.0% 0 0.0% 0 0.0% 0Cardiff Town Centre 2.1% 33 2.0% 1 1.0% 1 1.6% 1 1.0% 1 0.7% 0 0.0% 0 0.9% 1 2.6% 4Cardigan out of centre
(where retail park is not named)
0.1% 1 0.0% 0 0.0% 0 0.9% 1 0.0% 0 0.0% 0 0.0% 0 0.0% 0 0.0% 0
Cardigan Town Centre 2.2% 35 12.3% 4 17.8% 27 2.8% 2 0.0% 0 2.2% 1 0.0% 0 0.0% 0 0.0% 0Carmarthen out of centre
(where retail park is not named)
0.1% 2 0.0% 0 0.0% 0 0.0% 0 1.0% 1 0.0% 0 0.0% 0 0.0% 0 0.0% 0
Carmarthen Town Centre 7.5% 121 0.0% 0 19.7% 30 15.0% 13 28.7% 27 5.8% 4 0.7% 0 0.9% 1 1.7% 3Crymych 0.2% 3 1.6% 1 0.0% 0 3.3% 3 0.0% 0 0.0% 0 0.0% 0 0.0% 0 0.0% 0Fishguard 0.4% 6 1.4% 0 0.0% 0 0.0% 0 0.0% 0 0.0% 0 0.0% 0 0.0% 0 0.0% 0Haverfordwest out of centre
(where retail park is not named)
0.6% 10 1.0% 0 0.0% 0 0.0% 0 0.0% 0 0.0% 0 0.0% 0 0.0% 0 0.0% 0
Haverfordwest Town Centre 7.2% 115 2.1% 1 0.0% 0 0.0% 0 0.0% 0 0.0% 0 0.9% 1 0.0% 0 0.0% 0Lampeter 1.4% 23 0.0% 0 0.0% 0 0.9% 1 18.6% 18 0.7% 0 5.4% 4 0.0% 0 0.0% 0Llandysul 0.2% 3 0.0% 0 0.0% 0 3.3% 3 0.0% 0 0.0% 0 0.0% 0 0.0% 0 0.0% 0Machynlleth Town Centre 0.1% 2 0.0% 0 0.0% 0 0.0% 0 0.0% 0 0.0% 0 0.0% 0 0.0% 0 1.0% 2Milford Haven Town Centre 0.8% 14 0.0% 0 0.0% 0 0.0% 0 0.0% 0 0.0% 0 0.0% 0 0.0% 0 0.0% 0Narberth 0.6% 9 0.9% 0 0.0% 0 0.0% 0 0.0% 0 0.0% 0 0.0% 0 0.0% 0 0.0% 0Newport (Pembrokeshire) 0.1% 1 2.7% 1 0.0% 0 0.0% 0 0.0% 0 0.0% 0 0.0% 0 0.0% 0 0.0% 0Pembroke Dock Central 2.6% 42 0.0% 0 0.0% 0 0.0% 0 0.0% 0 0.0% 0 0.0% 0 0.0% 0 0.0% 0Pembroke Town Centre 0.1% 1 0.0% 0 0.0% 0 0.0% 0 0.0% 0 0.0% 0 0.0% 0 0.0% 0 0.0% 0St Davids 0.1% 2 0.0% 0 0.0% 0 0.0% 0 0.0% 0 0.0% 0 0.0% 0 0.0% 0 0.0% 0Swansea City Centre 1.0% 16 0.0% 0 0.0% 0 0.0% 0 0.0% 0 0.0% 0 0.0% 0 0.0% 0 1.0% 2Tenby 1.2% 19 0.0% 0 0.0% 0 0.0% 0 0.0% 0 0.0% 0 0.0% 0 0.0% 0 0.0% 0Tregaron 0.1% 1 0.0% 0 0.0% 0 0.0% 0 0.0% 0 0.0% 0 2.0% 1 0.0% 0 0.0% 0Havens Head Retail Park,
Milford Haven 0.2% 3 0.0% 0 0.0% 0 0.0% 0 0.0% 0 0.0% 0 0.0% 0 0.0% 0 0.0% 0
Parc Y Llyn Retail Park, Aberystwyth
0.1% 2 0.0% 0 0.0% 0 0.0% 0 0.0% 0 3.3% 2 0.0% 0 0.0% 0 0.0% 0
Pembrokeshire Retail Park, London Road, Pembroke Dock
0.1% 2 0.0% 0 0.0% 0 0.0% 0 0.0% 0 0.0% 0 0.0% 0 0.0% 0 0.0% 0
Springfield Retail Park, Haverfordwest
0.1% 1 0.0% 0 0.0% 0 0.0% 0 0.0% 0 0.0% 0 0.0% 0 0.0% 0 0.0% 0
Trostre Retail Park, Llanelli 0.0% 1 0.0% 0 0.0% 0 0.0% 0 0.0% 0 0.9% 1 0.0% 0 0.0% 0 0.0% 0Withybush Retail Park,
Haverfordwest 0.8% 13 3.4% 1 0.8% 1 0.0% 0 0.0% 0 0.0% 0 0.0% 0 0.0% 0 0.0% 0
Abroad 0.6% 10 0.0% 0 0.0% 0 0.0% 0 0.0% 0 0.0% 0 0.0% 0 3.4% 3 0.0% 0Birmingham 0.1% 1 0.0% 0 0.0% 0 0.0% 0 0.0% 0 0.0% 0 0.7% 0 0.7% 1 0.0% 0Bridgend 0.1% 2 0.0% 0 0.0% 0 0.0% 0 0.0% 0 0.0% 0 0.0% 0 0.9% 1 0.0% 0Central London 0.1% 2 1.6% 1 0.0% 0 0.0% 0 0.0% 0 0.0% 0 0.0% 0 0.0% 0 0.0% 0Cross Hands 0.1% 1 0.0% 0 0.0% 0 0.0% 0 0.0% 0 0.0% 0 0.0% 0 0.0% 0 0.0% 0Doncaster 0.0% 1 0.0% 0 0.0% 0 0.0% 0 0.0% 0 0.0% 0 0.0% 0 0.0% 0 0.0% 0Ikea, Ferry Road, Cardiff 0.1% 2 0.0% 0 0.0% 0 0.0% 0 0.0% 0 0.0% 0 0.0% 0 0.0% 0 1.0% 2Newcastle Emlyn 0.4% 7 0.0% 0 1.5% 2 4.9% 4 0.0% 0 0.0% 0 0.0% 0 0.0% 0 0.0% 0Reading 0.1% 1 0.0% 0 0.8% 1 0.0% 0 0.0% 0 0.0% 0 0.0% 0 0.0% 0 0.0% 0Shrewsbury 0.1% 1 0.0% 0 0.0% 0 0.0% 0 0.0% 0 0.0% 0 0.0% 0 0.0% 0 0.0% 0Tesco Extra, Fenton Trading
Estate, Haverfordwest 0.2% 3 0.0% 0 0.0% 0 0.0% 0 0.0% 0 0.0% 0 0.0% 0 0.0% 0 0.0% 0
Tesco, London Road, Pembroke Dock
0.1% 1 0.0% 0 0.0% 0 0.0% 0 0.0% 0 0.0% 0 0.0% 0 0.0% 0 0.0% 0
Whitland 0.1% 1 0.0% 0 0.6% 1 0.0% 0 0.0% 0 0.0% 0 0.0% 0 0.0% 0 0.0% 0Worcester 0.1% 1 0.0% 0 0.0% 0 0.0% 0 0.0% 0 0.0% 0 0.0% 0 0.0% 0 0.0% 0Internet / catalogue 13.9% 224 9.2% 3 9.4% 14 14.8% 13 9.6% 9 17.8% 12 12.9% 9 7.0% 7 9.1% 15(Don’t know) 1.6% 26 0.0% 0 2.5% 4 0.7% 1 1.8% 2 1.6% 1 0.7% 0 0.0% 0 0.0% 0(Varies) 6.7% 108 2.5% 1 9.8% 15 4.9% 4 3.0% 3 2.7% 2 3.2% 2 2.4% 2 13.8% 22(Don't do this type of
shopping) 36.3% 584 59.4% 19 36.1% 55 43.4% 38 32.8% 31 37.7% 25 30.2% 22 48.1% 45 31.5% 50
Weighted base: 1607 33 152 89 95 66 74 94 160Sample: 1607 100 100 100 100 101 100 102 102
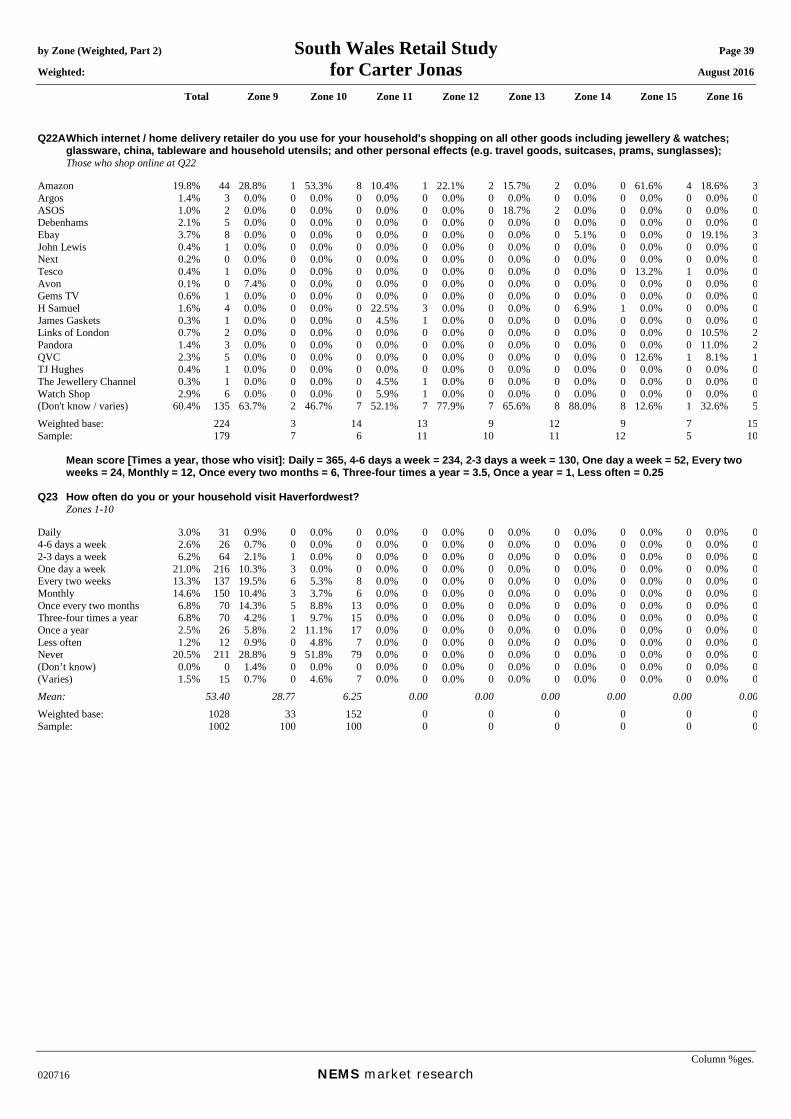
by Zone (Weighted, Part 2) South Wales Retail Study Page 39 Weighted: for Carter Jonas August 2016
Total Zone 9 Zone 10 Zone 11 Zone 12 Zone 13 Zone 14 Zone 15 Zone 16
Column %ges. 020716 NEMS market research
Q22A Which internet / home delivery retailer do you use for your household's shopping on all other goods including jewellery & watches; glassware, china, tableware and household utensils; and other personal effects (e.g. travel goods, suitcases, prams, sunglasses);
Those who shop online at Q22 Amazon 19.8% 44 28.8% 1 53.3% 8 10.4% 1 22.1% 2 15.7% 2 0.0% 0 61.6% 4 18.6% 3Argos 1.4% 3 0.0% 0 0.0% 0 0.0% 0 0.0% 0 0.0% 0 0.0% 0 0.0% 0 0.0% 0ASOS 1.0% 2 0.0% 0 0.0% 0 0.0% 0 0.0% 0 18.7% 2 0.0% 0 0.0% 0 0.0% 0Debenhams 2.1% 5 0.0% 0 0.0% 0 0.0% 0 0.0% 0 0.0% 0 0.0% 0 0.0% 0 0.0% 0Ebay 3.7% 8 0.0% 0 0.0% 0 0.0% 0 0.0% 0 0.0% 0 5.1% 0 0.0% 0 19.1% 3John Lewis 0.4% 1 0.0% 0 0.0% 0 0.0% 0 0.0% 0 0.0% 0 0.0% 0 0.0% 0 0.0% 0Next 0.2% 0 0.0% 0 0.0% 0 0.0% 0 0.0% 0 0.0% 0 0.0% 0 0.0% 0 0.0% 0Tesco 0.4% 1 0.0% 0 0.0% 0 0.0% 0 0.0% 0 0.0% 0 0.0% 0 13.2% 1 0.0% 0Avon 0.1% 0 7.4% 0 0.0% 0 0.0% 0 0.0% 0 0.0% 0 0.0% 0 0.0% 0 0.0% 0Gems TV 0.6% 1 0.0% 0 0.0% 0 0.0% 0 0.0% 0 0.0% 0 0.0% 0 0.0% 0 0.0% 0H Samuel 1.6% 4 0.0% 0 0.0% 0 22.5% 3 0.0% 0 0.0% 0 6.9% 1 0.0% 0 0.0% 0James Gaskets 0.3% 1 0.0% 0 0.0% 0 4.5% 1 0.0% 0 0.0% 0 0.0% 0 0.0% 0 0.0% 0Links of London 0.7% 2 0.0% 0 0.0% 0 0.0% 0 0.0% 0 0.0% 0 0.0% 0 0.0% 0 10.5% 2Pandora 1.4% 3 0.0% 0 0.0% 0 0.0% 0 0.0% 0 0.0% 0 0.0% 0 0.0% 0 11.0% 2QVC 2.3% 5 0.0% 0 0.0% 0 0.0% 0 0.0% 0 0.0% 0 0.0% 0 12.6% 1 8.1% 1TJ Hughes 0.4% 1 0.0% 0 0.0% 0 0.0% 0 0.0% 0 0.0% 0 0.0% 0 0.0% 0 0.0% 0The Jewellery Channel 0.3% 1 0.0% 0 0.0% 0 4.5% 1 0.0% 0 0.0% 0 0.0% 0 0.0% 0 0.0% 0Watch Shop 2.9% 6 0.0% 0 0.0% 0 5.9% 1 0.0% 0 0.0% 0 0.0% 0 0.0% 0 0.0% 0(Don't know / varies) 60.4% 135 63.7% 2 46.7% 7 52.1% 7 77.9% 7 65.6% 8 88.0% 8 12.6% 1 32.6% 5Weighted base: 224 3 14 13 9 12 9 7 15Sample: 179 7 6 11 10 11 12 5 10 Mean score [Times a year, those who visit]: Daily = 365, 4-6 days a week = 234, 2-3 days a week = 130, One day a week = 52, Every two
weeks = 24, Monthly = 12, Once every two months = 6, Three-four times a year = 3.5, Once a year = 1, Less often = 0.25 Q23 How often do you or your household visit Haverfordwest? Zones 1-10 Daily 3.0% 31 0.9% 0 0.0% 0 0.0% 0 0.0% 0 0.0% 0 0.0% 0 0.0% 0 0.0% 04-6 days a week 2.6% 26 0.7% 0 0.0% 0 0.0% 0 0.0% 0 0.0% 0 0.0% 0 0.0% 0 0.0% 02-3 days a week 6.2% 64 2.1% 1 0.0% 0 0.0% 0 0.0% 0 0.0% 0 0.0% 0 0.0% 0 0.0% 0One day a week 21.0% 216 10.3% 3 0.0% 0 0.0% 0 0.0% 0 0.0% 0 0.0% 0 0.0% 0 0.0% 0Every two weeks 13.3% 137 19.5% 6 5.3% 8 0.0% 0 0.0% 0 0.0% 0 0.0% 0 0.0% 0 0.0% 0Monthly 14.6% 150 10.4% 3 3.7% 6 0.0% 0 0.0% 0 0.0% 0 0.0% 0 0.0% 0 0.0% 0Once every two months 6.8% 70 14.3% 5 8.8% 13 0.0% 0 0.0% 0 0.0% 0 0.0% 0 0.0% 0 0.0% 0Three-four times a year 6.8% 70 4.2% 1 9.7% 15 0.0% 0 0.0% 0 0.0% 0 0.0% 0 0.0% 0 0.0% 0Once a year 2.5% 26 5.8% 2 11.1% 17 0.0% 0 0.0% 0 0.0% 0 0.0% 0 0.0% 0 0.0% 0Less often 1.2% 12 0.9% 0 4.8% 7 0.0% 0 0.0% 0 0.0% 0 0.0% 0 0.0% 0 0.0% 0Never 20.5% 211 28.8% 9 51.8% 79 0.0% 0 0.0% 0 0.0% 0 0.0% 0 0.0% 0 0.0% 0(Don’t know) 0.0% 0 1.4% 0 0.0% 0 0.0% 0 0.0% 0 0.0% 0 0.0% 0 0.0% 0 0.0% 0(Varies) 1.5% 15 0.7% 0 4.6% 7 0.0% 0 0.0% 0 0.0% 0 0.0% 0 0.0% 0 0.0% 0Mean: 53.40 28.77 6.25 0.00 0.00 0.00 0.00 0.00 0.00Weighted base: 1028 33 152 0 0 0 0 0 0Sample: 1002 100 100 0 0 0 0 0 0

by Zone (Weighted, Part 2) South Wales Retail Study Page 40 Weighted: for Carter Jonas August 2016
Total Zone 9 Zone 10 Zone 11 Zone 12 Zone 13 Zone 14 Zone 15 Zone 16
Column %ges. 020716 NEMS market research
Q24A In order of importance, what are your two main reasons for visiting Haverfordwest Town Centre? Main reason: Zones 1-10 and those who visit Haverfordwest town centre at Q23 Food shopping 31.4% 256 33.3% 8 19.7% 14 0.0% 0 0.0% 0 0.0% 0 0.0% 0 0.0% 0 0.0% 0Non-food shopping 38.9% 318 44.6% 10 30.7% 22 0.0% 0 0.0% 0 0.0% 0 0.0% 0 0.0% 0 0.0% 0To visit bars / pubs 0.7% 6 0.0% 0 0.0% 0 0.0% 0 0.0% 0 0.0% 0 0.0% 0 0.0% 0 0.0% 0To visit cafés / restaurants 2.0% 17 0.0% 0 1.3% 1 0.0% 0 0.0% 0 0.0% 0 0.0% 0 0.0% 0 0.0% 0To visit personal service
providers (e.g. hairdressers, beauty salon etc.)
0.5% 4 0.0% 0 0.0% 0 0.0% 0 0.0% 0 0.0% 0 0.0% 0 0.0% 0 0.0% 0
To visit financial services such as banks and other financial institutions
5.3% 43 0.0% 0 0.0% 0 0.0% 0 0.0% 0 0.0% 0 0.0% 0 0.0% 0 0.0% 0
To visit other service providers (e.g. travel agent, estate agent etc.)
0.3% 3 0.0% 0 1.7% 1 0.0% 0 0.0% 0 0.0% 0 0.0% 0 0.0% 0 0.0% 0
To visit public services (e.g. medical or dentist appointment, library, job centre, community centre, etc)
6.5% 53 5.0% 1 27.0% 20 0.0% 0 0.0% 0 0.0% 0 0.0% 0 0.0% 0 0.0% 0
To get petrol 0.0% 0 1.3% 0 0.0% 0 0.0% 0 0.0% 0 0.0% 0 0.0% 0 0.0% 0 0.0% 0To visit the cinema 0.1% 1 0.0% 0 0.0% 0 0.0% 0 0.0% 0 0.0% 0 0.0% 0 0.0% 0 0.0% 0To visit a park 0.0% 0 0.0% 0 0.0% 0 0.0% 0 0.0% 0 0.0% 0 0.0% 0 0.0% 0 0.0% 0To visit the swimming pool 0.0% 0 0.0% 0 0.0% 0 0.0% 0 0.0% 0 0.0% 0 0.0% 0 0.0% 0 0.0% 0To visit other gyms / health
and fitness facilities 0.0% 0 0.0% 0 0.0% 0 0.0% 0 0.0% 0 0.0% 0 0.0% 0 0.0% 0 0.0% 0
To visit the library 0.0% 0 0.0% 0 0.0% 0 0.0% 0 0.0% 0 0.0% 0 0.0% 0 0.0% 0 0.0% 0To visit museums / art
gallery 0.0% 0 0.0% 0 0.0% 0 0.0% 0 0.0% 0 0.0% 0 0.0% 0 0.0% 0 0.0% 0
To visit the theatre or musical venues
0.0% 0 0.0% 0 0.0% 0 0.0% 0 0.0% 0 0.0% 0 0.0% 0 0.0% 0 0.0% 0
To visit night time venues e.g. nightclub
0.0% 0 0.0% 0 0.0% 0 0.0% 0 0.0% 0 0.0% 0 0.0% 0 0.0% 0 0.0% 0
For other leisure activities 1.0% 8 3.7% 1 0.0% 0 0.0% 0 0.0% 0 0.0% 0 0.0% 0 0.0% 0 0.0% 0To shop at the market(s) 0.6% 5 1.9% 0 0.0% 0 0.0% 0 0.0% 0 0.0% 0 0.0% 0 0.0% 0 0.0% 0To meet family 1.1% 9 1.9% 0 1.7% 1 0.0% 0 0.0% 0 0.0% 0 0.0% 0 0.0% 0 0.0% 0To meet friends 1.1% 9 0.0% 0 1.7% 1 0.0% 0 0.0% 0 0.0% 0 0.0% 0 0.0% 0 0.0% 0To visit the theatre 0.0% 0 0.0% 0 0.0% 0 0.0% 0 0.0% 0 0.0% 0 0.0% 0 0.0% 0 0.0% 0For work (i.e. place of work) 5.0% 41 3.5% 1 1.7% 1 0.0% 0 0.0% 0 0.0% 0 0.0% 0 0.0% 0 0.0% 0For business (e.g. attend a
business appointment) 0.1% 0 1.9% 0 0.0% 0 0.0% 0 0.0% 0 0.0% 0 0.0% 0 0.0% 0 0.0% 0
For education as a student (e.g. student at college, university, or other third level education)
0.3% 2 0.0% 0 0.0% 0 0.0% 0 0.0% 0 0.0% 0 0.0% 0 0.0% 0 0.0% 0
To access public transport for onward travel (e.g. train station, bus station)
0.0% 0 0.0% 0 0.0% 0 0.0% 0 0.0% 0 0.0% 0 0.0% 0 0.0% 0 0.0% 0
Other 0.0% 0 0.0% 0 0.0% 0 0.0% 0 0.0% 0 0.0% 0 0.0% 0 0.0% 0 0.0% 0As part of a day out / for a
day out / something different
1.5% 12 1.0% 0 13.0% 10 0.0% 0 0.0% 0 0.0% 0 0.0% 0 0.0% 0 0.0% 0
Browsing / window shopping 1.2% 10 0.0% 0 0.0% 0 0.0% 0 0.0% 0 0.0% 0 0.0% 0 0.0% 0 0.0% 0(Don't know / varies) 1.5% 13 0.0% 0 1.3% 1 0.0% 0 0.0% 0 0.0% 0 0.0% 0 0.0% 0 0.0% 0(Nothing / nothing further) 0.9% 7 1.9% 0 0.0% 0 0.0% 0 0.0% 0 0.0% 0 0.0% 0 0.0% 0 0.0% 0Weighted base: 817 23 73 0 0 0 0 0 0Sample: 822 71 47 0 0 0 0 0 0

by Zone (Weighted, Part 2) South Wales Retail Study Page 41 Weighted: for Carter Jonas August 2016
Total Zone 9 Zone 10 Zone 11 Zone 12 Zone 13 Zone 14 Zone 15 Zone 16
Column %ges. 020716 NEMS market research
Q24B In order of importance, what are your two main reasons for visiting Haverfordwest Town Centre? Secondary reason: Those who gave a reason at Q24A Food shopping 12.8% 102 5.9% 1 1.7% 1 0.0% 0 0.0% 0 0.0% 0 0.0% 0 0.0% 0 0.0% 0Non-food shopping 24.4% 195 19.6% 4 13.9% 10 0.0% 0 0.0% 0 0.0% 0 0.0% 0 0.0% 0 0.0% 0To visit bars / pubs 0.7% 6 4.9% 1 0.0% 0 0.0% 0 0.0% 0 0.0% 0 0.0% 0 0.0% 0 0.0% 0To visit cafés / restaurants 6.2% 49 10.9% 2 9.1% 7 0.0% 0 0.0% 0 0.0% 0 0.0% 0 0.0% 0 0.0% 0To visit personal service
providers (e.g. hairdressers, beauty salon etc.)
0.6% 5 0.0% 0 0.0% 0 0.0% 0 0.0% 0 0.0% 0 0.0% 0 0.0% 0 0.0% 0
To visit financial services such as banks and other financial institutions
2.4% 19 2.9% 1 0.0% 0 0.0% 0 0.0% 0 0.0% 0 0.0% 0 0.0% 0 0.0% 0
To visit other service providers (e.g. travel agent, estate agent etc.)
0.6% 5 0.0% 0 0.0% 0 0.0% 0 0.0% 0 0.0% 0 0.0% 0 0.0% 0 0.0% 0
To visit public services (e.g. medical or dentist appointment, library, job centre, community centre, etc)
3.3% 26 3.9% 1 3.1% 2 0.0% 0 0.0% 0 0.0% 0 0.0% 0 0.0% 0 0.0% 0
To get petrol 0.0% 0 0.0% 0 0.0% 0 0.0% 0 0.0% 0 0.0% 0 0.0% 0 0.0% 0 0.0% 0To visit the cinema 0.0% 0 0.0% 0 0.0% 0 0.0% 0 0.0% 0 0.0% 0 0.0% 0 0.0% 0 0.0% 0To visit a park 0.0% 0 0.0% 0 0.0% 0 0.0% 0 0.0% 0 0.0% 0 0.0% 0 0.0% 0 0.0% 0To visit the swimming pool 0.0% 0 0.0% 0 0.0% 0 0.0% 0 0.0% 0 0.0% 0 0.0% 0 0.0% 0 0.0% 0To visit other gyms / health
and fitness facilities 0.5% 4 0.0% 0 0.0% 0 0.0% 0 0.0% 0 0.0% 0 0.0% 0 0.0% 0 0.0% 0
To visit the library 0.0% 0 0.0% 0 0.0% 0 0.0% 0 0.0% 0 0.0% 0 0.0% 0 0.0% 0 0.0% 0To visit museums / art
gallery 0.0% 0 0.0% 0 0.0% 0 0.0% 0 0.0% 0 0.0% 0 0.0% 0 0.0% 0 0.0% 0
To visit the theatre or musical venues
0.0% 0 0.0% 0 0.0% 0 0.0% 0 0.0% 0 0.0% 0 0.0% 0 0.0% 0 0.0% 0
To visit night time venues e.g. nightclub
0.0% 0 0.0% 0 0.0% 0 0.0% 0 0.0% 0 0.0% 0 0.0% 0 0.0% 0 0.0% 0
For other leisure activities 1.6% 13 3.7% 1 1.3% 1 0.0% 0 0.0% 0 0.0% 0 0.0% 0 0.0% 0 0.0% 0To shop at the market(s) 0.4% 3 0.0% 0 1.7% 1 0.0% 0 0.0% 0 0.0% 0 0.0% 0 0.0% 0 0.0% 0To meet family 0.5% 4 0.0% 0 0.0% 0 0.0% 0 0.0% 0 0.0% 0 0.0% 0 0.0% 0 0.0% 0To meet friends 0.8% 7 0.0% 0 0.0% 0 0.0% 0 0.0% 0 0.0% 0 0.0% 0 0.0% 0 0.0% 0To visit the theatre 0.0% 0 0.0% 0 0.0% 0 0.0% 0 0.0% 0 0.0% 0 0.0% 0 0.0% 0 0.0% 0For work (i.e. place of work) 1.6% 12 0.0% 0 1.8% 1 0.0% 0 0.0% 0 0.0% 0 0.0% 0 0.0% 0 0.0% 0For business (e.g. attend a
business appointment) 0.0% 0 0.0% 0 0.0% 0 0.0% 0 0.0% 0 0.0% 0 0.0% 0 0.0% 0 0.0% 0
For education as a student (e.g. student at college, university, or other third level education)
0.3% 2 0.0% 0 0.0% 0 0.0% 0 0.0% 0 0.0% 0 0.0% 0 0.0% 0 0.0% 0
To access public transport for onward travel (e.g. train station, bus station)
0.1% 1 0.0% 0 0.0% 0 0.0% 0 0.0% 0 0.0% 0 0.0% 0 0.0% 0 0.0% 0
Other 0.0% 0 0.0% 0 0.0% 0 0.0% 0 0.0% 0 0.0% 0 0.0% 0 0.0% 0 0.0% 0As part of a day out / for a
day out / something different
0.4% 3 0.0% 0 1.3% 1 0.0% 0 0.0% 0 0.0% 0 0.0% 0 0.0% 0 0.0% 0
Browsing / window shopping 0.8% 7 0.0% 0 1.8% 1 0.0% 0 0.0% 0 0.0% 0 0.0% 0 0.0% 0 0.0% 0(Don't know / varies) 0.6% 4 6.8% 2 1.7% 1 0.0% 0 0.0% 0 0.0% 0 0.0% 0 0.0% 0 0.0% 0(Nothing / nothing further) 41.4% 330 41.4% 9 62.4% 45 0.0% 0 0.0% 0 0.0% 0 0.0% 0 0.0% 0 0.0% 0Weighted base: 798 23 72 0 0 0 0 0 0Sample: 803 69 46 0 0 0 0 0 0

by Zone (Weighted, Part 2) South Wales Retail Study Page 42 Weighted: for Carter Jonas August 2016
Total Zone 9 Zone 10 Zone 11 Zone 12 Zone 13 Zone 14 Zone 15 Zone 16
Column %ges. 020716 NEMS market research
Q24X In order of importance, what are your two main reasons for visiting Haverfordwest Town Centre? Any mention: [MR] Zones 1-10 and those who visit Haverfordwest town centre at Q23 Food shopping 43.8% 358 39.1% 9 21.4% 16 0.0% 0 0.0% 0 0.0% 0 0.0% 0 0.0% 0 0.0% 0Non-food shopping 62.8% 513 63.9% 15 44.4% 32 0.0% 0 0.0% 0 0.0% 0 0.0% 0 0.0% 0 0.0% 0To visit bars / pubs 1.4% 12 4.8% 1 0.0% 0 0.0% 0 0.0% 0 0.0% 0 0.0% 0 0.0% 0 0.0% 0To visit cafés / restaurants 8.1% 66 10.6% 2 10.3% 7 0.0% 0 0.0% 0 0.0% 0 0.0% 0 0.0% 0 0.0% 0To visit personal service
providers (e.g. hairdressers, beauty salon etc.)
1.1% 9 0.0% 0 0.0% 0 0.0% 0 0.0% 0 0.0% 0 0.0% 0 0.0% 0 0.0% 0
To visit financial services such as banks and other financial institutions
7.6% 62 2.9% 1 0.0% 0 0.0% 0 0.0% 0 0.0% 0 0.0% 0 0.0% 0 0.0% 0
To visit other service providers (e.g. travel agent, estate agent etc.)
0.9% 8 0.0% 0 1.7% 1 0.0% 0 0.0% 0 0.0% 0 0.0% 0 0.0% 0 0.0% 0
To visit public services (e.g. medical or dentist appointment, library, job centre, community centre, etc)
9.7% 80 8.8% 2 30.0% 22 0.0% 0 0.0% 0 0.0% 0 0.0% 0 0.0% 0 0.0% 0
To get petrol 0.0% 0 1.3% 0 0.0% 0 0.0% 0 0.0% 0 0.0% 0 0.0% 0 0.0% 0 0.0% 0To visit the cinema 0.1% 1 0.0% 0 0.0% 0 0.0% 0 0.0% 0 0.0% 0 0.0% 0 0.0% 0 0.0% 0To visit a park 0.0% 0 0.0% 0 0.0% 0 0.0% 0 0.0% 0 0.0% 0 0.0% 0 0.0% 0 0.0% 0To visit the swimming pool 0.0% 0 0.0% 0 0.0% 0 0.0% 0 0.0% 0 0.0% 0 0.0% 0 0.0% 0 0.0% 0To visit other gyms / health
and fitness facilities 0.5% 4 0.0% 0 0.0% 0 0.0% 0 0.0% 0 0.0% 0 0.0% 0 0.0% 0 0.0% 0
To visit the library 0.0% 0 0.0% 0 0.0% 0 0.0% 0 0.0% 0 0.0% 0 0.0% 0 0.0% 0 0.0% 0To visit museums / art
gallery 0.0% 0 0.0% 0 0.0% 0 0.0% 0 0.0% 0 0.0% 0 0.0% 0 0.0% 0 0.0% 0
To visit the theatre or musical venues
0.0% 0 0.0% 0 0.0% 0 0.0% 0 0.0% 0 0.0% 0 0.0% 0 0.0% 0 0.0% 0
To visit night time venues e.g. nightclub
0.0% 0 0.0% 0 0.0% 0 0.0% 0 0.0% 0 0.0% 0 0.0% 0 0.0% 0 0.0% 0
For other leisure activities 2.5% 21 7.3% 2 1.3% 1 0.0% 0 0.0% 0 0.0% 0 0.0% 0 0.0% 0 0.0% 0To shop at the market(s) 0.9% 8 1.9% 0 1.7% 1 0.0% 0 0.0% 0 0.0% 0 0.0% 0 0.0% 0 0.0% 0To meet family 1.6% 13 1.9% 0 1.7% 1 0.0% 0 0.0% 0 0.0% 0 0.0% 0 0.0% 0 0.0% 0To meet friends 1.9% 15 0.0% 0 1.7% 1 0.0% 0 0.0% 0 0.0% 0 0.0% 0 0.0% 0 0.0% 0To visit the theatre 0.0% 0 0.0% 0 0.0% 0 0.0% 0 0.0% 0 0.0% 0 0.0% 0 0.0% 0 0.0% 0For work (i.e. place of work) 6.6% 54 3.5% 1 3.5% 3 0.0% 0 0.0% 0 0.0% 0 0.0% 0 0.0% 0 0.0% 0For business (e.g. attend a
business appointment) 0.1% 0 1.9% 0 0.0% 0 0.0% 0 0.0% 0 0.0% 0 0.0% 0 0.0% 0 0.0% 0
For education as a student (e.g. student at college, university, or other third level education)
0.6% 5 0.0% 0 0.0% 0 0.0% 0 0.0% 0 0.0% 0 0.0% 0 0.0% 0 0.0% 0
To access public transport for onward travel (e.g. train station, bus station)
0.1% 1 0.0% 0 0.0% 0 0.0% 0 0.0% 0 0.0% 0 0.0% 0 0.0% 0 0.0% 0
Other 0.0% 0 0.0% 0 0.0% 0 0.0% 0 0.0% 0 0.0% 0 0.0% 0 0.0% 0 0.0% 0As part of a day out / for a
day out / something different
1.8% 15 1.0% 0 14.4% 10 0.0% 0 0.0% 0 0.0% 0 0.0% 0 0.0% 0 0.0% 0
Browsing / window shopping 2.0% 16 0.0% 0 1.8% 1 0.0% 0 0.0% 0 0.0% 0 0.0% 0 0.0% 0 0.0% 0Weighted base: 817 23 73 0 0 0 0 0 0Sample: 822 71 47 0 0 0 0 0 0
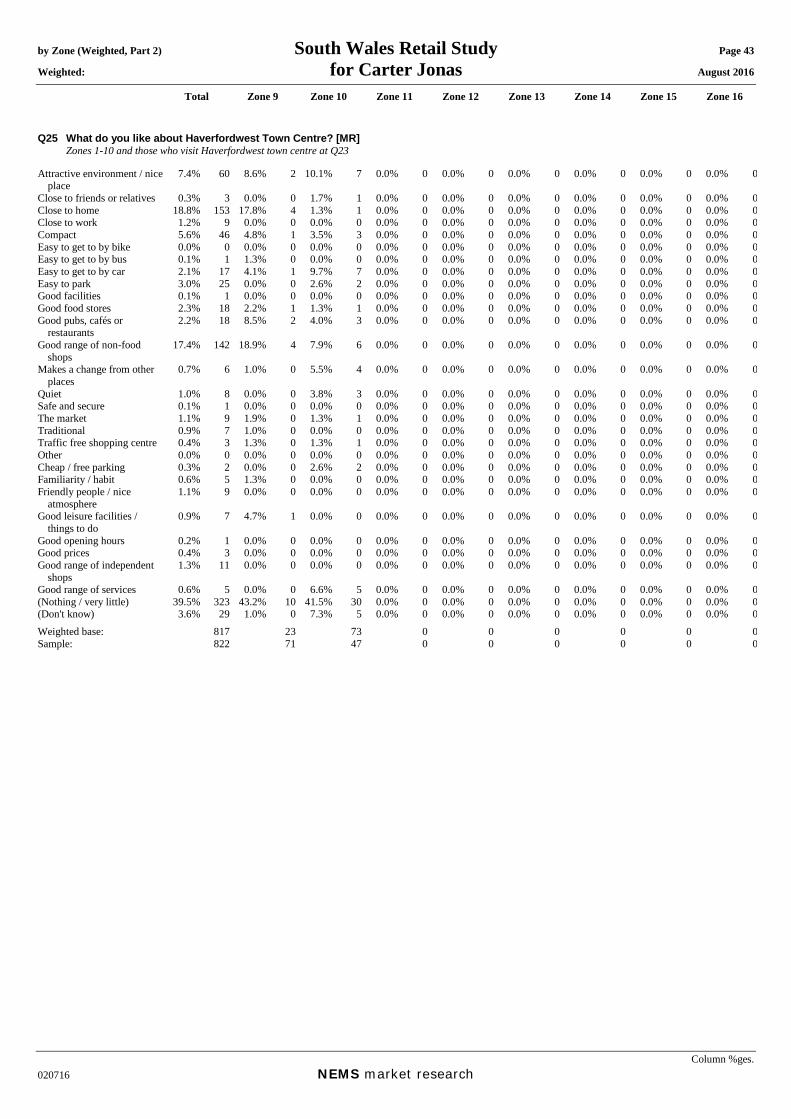
by Zone (Weighted, Part 2) South Wales Retail Study Page 43 Weighted: for Carter Jonas August 2016
Total Zone 9 Zone 10 Zone 11 Zone 12 Zone 13 Zone 14 Zone 15 Zone 16
Column %ges. 020716 NEMS market research
Q25 What do you like about Haverfordwest Town Centre? [MR] Zones 1-10 and those who visit Haverfordwest town centre at Q23 Attractive environment / nice
place 7.4% 60 8.6% 2 10.1% 7 0.0% 0 0.0% 0 0.0% 0 0.0% 0 0.0% 0 0.0% 0
Close to friends or relatives 0.3% 3 0.0% 0 1.7% 1 0.0% 0 0.0% 0 0.0% 0 0.0% 0 0.0% 0 0.0% 0Close to home 18.8% 153 17.8% 4 1.3% 1 0.0% 0 0.0% 0 0.0% 0 0.0% 0 0.0% 0 0.0% 0Close to work 1.2% 9 0.0% 0 0.0% 0 0.0% 0 0.0% 0 0.0% 0 0.0% 0 0.0% 0 0.0% 0Compact 5.6% 46 4.8% 1 3.5% 3 0.0% 0 0.0% 0 0.0% 0 0.0% 0 0.0% 0 0.0% 0Easy to get to by bike 0.0% 0 0.0% 0 0.0% 0 0.0% 0 0.0% 0 0.0% 0 0.0% 0 0.0% 0 0.0% 0Easy to get to by bus 0.1% 1 1.3% 0 0.0% 0 0.0% 0 0.0% 0 0.0% 0 0.0% 0 0.0% 0 0.0% 0Easy to get to by car 2.1% 17 4.1% 1 9.7% 7 0.0% 0 0.0% 0 0.0% 0 0.0% 0 0.0% 0 0.0% 0Easy to park 3.0% 25 0.0% 0 2.6% 2 0.0% 0 0.0% 0 0.0% 0 0.0% 0 0.0% 0 0.0% 0Good facilities 0.1% 1 0.0% 0 0.0% 0 0.0% 0 0.0% 0 0.0% 0 0.0% 0 0.0% 0 0.0% 0Good food stores 2.3% 18 2.2% 1 1.3% 1 0.0% 0 0.0% 0 0.0% 0 0.0% 0 0.0% 0 0.0% 0Good pubs, cafés or
restaurants 2.2% 18 8.5% 2 4.0% 3 0.0% 0 0.0% 0 0.0% 0 0.0% 0 0.0% 0 0.0% 0
Good range of non-food shops
17.4% 142 18.9% 4 7.9% 6 0.0% 0 0.0% 0 0.0% 0 0.0% 0 0.0% 0 0.0% 0
Makes a change from other places
0.7% 6 1.0% 0 5.5% 4 0.0% 0 0.0% 0 0.0% 0 0.0% 0 0.0% 0 0.0% 0
Quiet 1.0% 8 0.0% 0 3.8% 3 0.0% 0 0.0% 0 0.0% 0 0.0% 0 0.0% 0 0.0% 0Safe and secure 0.1% 1 0.0% 0 0.0% 0 0.0% 0 0.0% 0 0.0% 0 0.0% 0 0.0% 0 0.0% 0The market 1.1% 9 1.9% 0 1.3% 1 0.0% 0 0.0% 0 0.0% 0 0.0% 0 0.0% 0 0.0% 0Traditional 0.9% 7 1.0% 0 0.0% 0 0.0% 0 0.0% 0 0.0% 0 0.0% 0 0.0% 0 0.0% 0Traffic free shopping centre 0.4% 3 1.3% 0 1.3% 1 0.0% 0 0.0% 0 0.0% 0 0.0% 0 0.0% 0 0.0% 0Other 0.0% 0 0.0% 0 0.0% 0 0.0% 0 0.0% 0 0.0% 0 0.0% 0 0.0% 0 0.0% 0Cheap / free parking 0.3% 2 0.0% 0 2.6% 2 0.0% 0 0.0% 0 0.0% 0 0.0% 0 0.0% 0 0.0% 0Familiarity / habit 0.6% 5 1.3% 0 0.0% 0 0.0% 0 0.0% 0 0.0% 0 0.0% 0 0.0% 0 0.0% 0Friendly people / nice
atmosphere 1.1% 9 0.0% 0 0.0% 0 0.0% 0 0.0% 0 0.0% 0 0.0% 0 0.0% 0 0.0% 0
Good leisure facilities / things to do
0.9% 7 4.7% 1 0.0% 0 0.0% 0 0.0% 0 0.0% 0 0.0% 0 0.0% 0 0.0% 0
Good opening hours 0.2% 1 0.0% 0 0.0% 0 0.0% 0 0.0% 0 0.0% 0 0.0% 0 0.0% 0 0.0% 0Good prices 0.4% 3 0.0% 0 0.0% 0 0.0% 0 0.0% 0 0.0% 0 0.0% 0 0.0% 0 0.0% 0Good range of independent
shops 1.3% 11 0.0% 0 0.0% 0 0.0% 0 0.0% 0 0.0% 0 0.0% 0 0.0% 0 0.0% 0
Good range of services 0.6% 5 0.0% 0 6.6% 5 0.0% 0 0.0% 0 0.0% 0 0.0% 0 0.0% 0 0.0% 0(Nothing / very little) 39.5% 323 43.2% 10 41.5% 30 0.0% 0 0.0% 0 0.0% 0 0.0% 0 0.0% 0 0.0% 0(Don't know) 3.6% 29 1.0% 0 7.3% 5 0.0% 0 0.0% 0 0.0% 0 0.0% 0 0.0% 0 0.0% 0Weighted base: 817 23 73 0 0 0 0 0 0Sample: 822 71 47 0 0 0 0 0 0

by Zone (Weighted, Part 2) South Wales Retail Study Page 44 Weighted: for Carter Jonas August 2016
Total Zone 9 Zone 10 Zone 11 Zone 12 Zone 13 Zone 14 Zone 15 Zone 16
Column %ges. 020716 NEMS market research
Q26 What could be improved about Haverfordwest that would make you visit more often? [MR] Zones 1-10 Better access by road 1.3% 13 1.4% 0 0.9% 1 0.0% 0 0.0% 0 0.0% 0 0.0% 0 0.0% 0 0.0% 0Better public transport 1.1% 12 0.0% 0 0.9% 1 0.0% 0 0.0% 0 0.0% 0 0.0% 0 0.0% 0 0.0% 0Better signposting 0.0% 0 0.0% 0 0.0% 0 0.0% 0 0.0% 0 0.0% 0 0.0% 0 0.0% 0 0.0% 0Cleaner streets 1.7% 18 3.4% 1 0.6% 1 0.0% 0 0.0% 0 0.0% 0 0.0% 0 0.0% 0 0.0% 0Facilities which would assist
you if shopping with children
0.0% 0 0.0% 0 0.0% 0 0.0% 0 0.0% 0 0.0% 0 0.0% 0 0.0% 0 0.0% 0
Free / cheaper car parking 3.1% 31 6.0% 2 0.0% 0 0.0% 0 0.0% 0 0.0% 0 0.0% 0 0.0% 0 0.0% 0Jewellery / food markets /
other events 0.2% 2 0.0% 0 0.0% 0 0.0% 0 0.0% 0 0.0% 0 0.0% 0 0.0% 0 0.0% 0
More / better comparison retailers (i.e. non-food shops)
19.7% 203 20.1% 7 9.3% 14 0.0% 0 0.0% 0 0.0% 0 0.0% 0 0.0% 0 0.0% 0
More / better entertainment 1.8% 18 2.5% 1 0.0% 0 0.0% 0 0.0% 0 0.0% 0 0.0% 0 0.0% 0 0.0% 0More / better places for
eating out (e.g. cafés and restaurants)
1.9% 19 0.0% 0 0.0% 0 0.0% 0 0.0% 0 0.0% 0 0.0% 0 0.0% 0 0.0% 0
More / better food shops 4.0% 41 2.0% 1 5.3% 8 0.0% 0 0.0% 0 0.0% 0 0.0% 0 0.0% 0 0.0% 0More / better parking 8.5% 87 8.8% 3 6.0% 9 0.0% 0 0.0% 0 0.0% 0 0.0% 0 0.0% 0 0.0% 0More / better pedestrianised
streets 0.3% 3 0.0% 0 0.0% 0 0.0% 0 0.0% 0 0.0% 0 0.0% 0 0.0% 0 0.0% 0
More / better public conveniences
0.1% 1 0.0% 0 0.0% 0 0.0% 0 0.0% 0 0.0% 0 0.0% 0 0.0% 0 0.0% 0
More / better seats / flower displays
0.7% 7 1.6% 1 0.0% 0 0.0% 0 0.0% 0 0.0% 0 0.0% 0 0.0% 0 0.0% 0
More / better services 0.2% 2 0.0% 0 0.0% 0 0.0% 0 0.0% 0 0.0% 0 0.0% 0 0.0% 0 0.0% 0More advertising 0.1% 2 0.0% 0 0.0% 0 0.0% 0 0.0% 0 0.0% 0 0.0% 0 0.0% 0 0.0% 0More national multiple shops
/ High Street shops 20.7% 212 16.6% 5 8.2% 12 0.0% 0 0.0% 0 0.0% 0 0.0% 0 0.0% 0 0.0% 0
Protection from the weather (i.e. covered shopping malls)
0.4% 4 0.0% 0 0.0% 0 0.0% 0 0.0% 0 0.0% 0 0.0% 0 0.0% 0 0.0% 0
Shops / services open on Sundays / better opening hours
0.0% 0 0.0% 0 0.0% 0 0.0% 0 0.0% 0 0.0% 0 0.0% 0 0.0% 0 0.0% 0
Fewer vacant shops 8.3% 86 15.9% 5 2.1% 3 0.0% 0 0.0% 0 0.0% 0 0.0% 0 0.0% 0 0.0% 0Better maintained buildings 2.3% 24 1.4% 0 0.0% 0 0.0% 0 0.0% 0 0.0% 0 0.0% 0 0.0% 0 0.0% 0Better disabled access 0.2% 2 0.0% 0 0.8% 1 0.0% 0 0.0% 0 0.0% 0 0.0% 0 0.0% 0 0.0% 0Better prices 0.5% 5 0.0% 0 0.0% 0 0.0% 0 0.0% 0 0.0% 0 0.0% 0 0.0% 0 0.0% 0Better quality shops 0.5% 5 0.0% 0 0.0% 0 0.0% 0 0.0% 0 0.0% 0 0.0% 0 0.0% 0 0.0% 0Fewer charity shops 4.1% 42 5.5% 2 3.8% 6 0.0% 0 0.0% 0 0.0% 0 0.0% 0 0.0% 0 0.0% 0Improve the environment /
refurbish 4.8% 50 4.3% 1 4.3% 7 0.0% 0 0.0% 0 0.0% 0 0.0% 0 0.0% 0 0.0% 0
Less congestion / too busy 0.3% 4 0.0% 0 0.0% 0 0.0% 0 0.0% 0 0.0% 0 0.0% 0 0.0% 0 0.0% 0More independent shops 3.7% 38 0.0% 0 1.8% 3 0.0% 0 0.0% 0 0.0% 0 0.0% 0 0.0% 0 0.0% 0Other 0.0% 0 0.0% 0 0.0% 0 0.0% 0 0.0% 0 0.0% 0 0.0% 0 0.0% 0 0.0% 0(Nothing) 30.1% 310 41.2% 13 45.2% 69 0.0% 0 0.0% 0 0.0% 0 0.0% 0 0.0% 0 0.0% 0(Don’t know) 10.1% 104 7.9% 3 19.5% 30 0.0% 0 0.0% 0 0.0% 0 0.0% 0 0.0% 0 0.0% 0Weighted base: 1028 33 152 0 0 0 0 0 0Sample: 1002 100 100 0 0 0 0 0 0
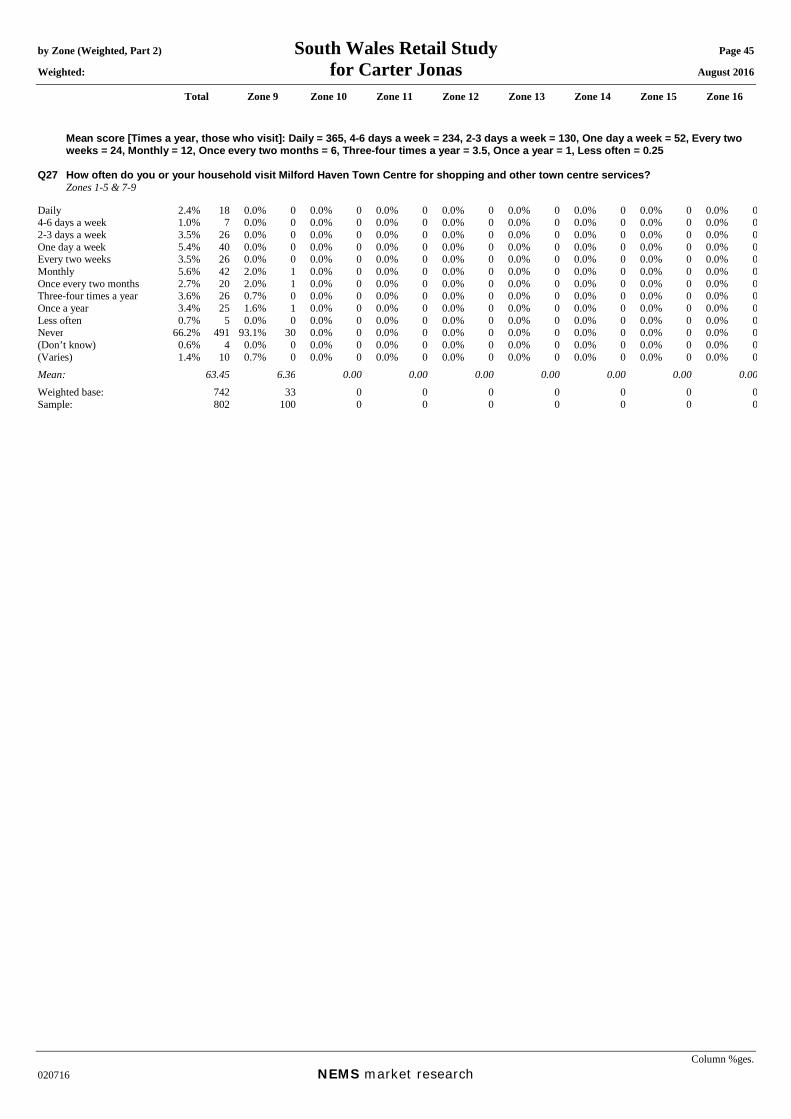
by Zone (Weighted, Part 2) South Wales Retail Study Page 45 Weighted: for Carter Jonas August 2016
Total Zone 9 Zone 10 Zone 11 Zone 12 Zone 13 Zone 14 Zone 15 Zone 16
Column %ges. 020716 NEMS market research
Mean score [Times a year, those who visit]: Daily = 365, 4-6 days a week = 234, 2-3 days a week = 130, One day a week = 52, Every two weeks = 24, Monthly = 12, Once every two months = 6, Three-four times a year = 3.5, Once a year = 1, Less often = 0.25
Q27 How often do you or your household visit Milford Haven Town Centre for shopping and other town centre services? Zones 1-5 & 7-9 Daily 2.4% 18 0.0% 0 0.0% 0 0.0% 0 0.0% 0 0.0% 0 0.0% 0 0.0% 0 0.0% 04-6 days a week 1.0% 7 0.0% 0 0.0% 0 0.0% 0 0.0% 0 0.0% 0 0.0% 0 0.0% 0 0.0% 02-3 days a week 3.5% 26 0.0% 0 0.0% 0 0.0% 0 0.0% 0 0.0% 0 0.0% 0 0.0% 0 0.0% 0One day a week 5.4% 40 0.0% 0 0.0% 0 0.0% 0 0.0% 0 0.0% 0 0.0% 0 0.0% 0 0.0% 0Every two weeks 3.5% 26 0.0% 0 0.0% 0 0.0% 0 0.0% 0 0.0% 0 0.0% 0 0.0% 0 0.0% 0Monthly 5.6% 42 2.0% 1 0.0% 0 0.0% 0 0.0% 0 0.0% 0 0.0% 0 0.0% 0 0.0% 0Once every two months 2.7% 20 2.0% 1 0.0% 0 0.0% 0 0.0% 0 0.0% 0 0.0% 0 0.0% 0 0.0% 0Three-four times a year 3.6% 26 0.7% 0 0.0% 0 0.0% 0 0.0% 0 0.0% 0 0.0% 0 0.0% 0 0.0% 0Once a year 3.4% 25 1.6% 1 0.0% 0 0.0% 0 0.0% 0 0.0% 0 0.0% 0 0.0% 0 0.0% 0Less often 0.7% 5 0.0% 0 0.0% 0 0.0% 0 0.0% 0 0.0% 0 0.0% 0 0.0% 0 0.0% 0Never 66.2% 491 93.1% 30 0.0% 0 0.0% 0 0.0% 0 0.0% 0 0.0% 0 0.0% 0 0.0% 0(Don’t know) 0.6% 4 0.0% 0 0.0% 0 0.0% 0 0.0% 0 0.0% 0 0.0% 0 0.0% 0 0.0% 0(Varies) 1.4% 10 0.7% 0 0.0% 0 0.0% 0 0.0% 0 0.0% 0 0.0% 0 0.0% 0 0.0% 0Mean: 63.45 6.36 0.00 0.00 0.00 0.00 0.00 0.00 0.00Weighted base: 742 33 0 0 0 0 0 0 0Sample: 802 100 0 0 0 0 0 0 0

by Zone (Weighted, Part 2) South Wales Retail Study Page 46 Weighted: for Carter Jonas August 2016
Total Zone 9 Zone 10 Zone 11 Zone 12 Zone 13 Zone 14 Zone 15 Zone 16
Column %ges. 020716 NEMS market research
Q28A In order of importance, what are your two main reasons for visiting Milford Haven Town Centre? Main reason: Zones 1-5 & 7-9 and those who visit Milford Haven town centre at Q27 Food shopping 20.4% 51 0.0% 0 0.0% 0 0.0% 0 0.0% 0 0.0% 0 0.0% 0 0.0% 0 0.0% 0Non-food shopping 31.7% 79 41.6% 1 0.0% 0 0.0% 0 0.0% 0 0.0% 0 0.0% 0 0.0% 0 0.0% 0To visit bars / pubs 0.0% 0 0.0% 0 0.0% 0 0.0% 0 0.0% 0 0.0% 0 0.0% 0 0.0% 0 0.0% 0To visit cafés / restaurants 8.4% 21 0.0% 0 0.0% 0 0.0% 0 0.0% 0 0.0% 0 0.0% 0 0.0% 0 0.0% 0To visit personal service
providers (e.g. hairdressers, beauty salon etc.)
2.4% 6 0.0% 0 0.0% 0 0.0% 0 0.0% 0 0.0% 0 0.0% 0 0.0% 0 0.0% 0
To visit financial services such as banks and other financial institutions
5.1% 13 0.0% 0 0.0% 0 0.0% 0 0.0% 0 0.0% 0 0.0% 0 0.0% 0 0.0% 0
To visit other service providers (e.g. travel agent, estate agent etc.)
1.3% 3 0.0% 0 0.0% 0 0.0% 0 0.0% 0 0.0% 0 0.0% 0 0.0% 0 0.0% 0
To visit public services (e.g. medical or dentist appointment, library, job centre, community centre, etc)
5.0% 13 38.6% 1 0.0% 0 0.0% 0 0.0% 0 0.0% 0 0.0% 0 0.0% 0 0.0% 0
To get petrol 0.0% 0 0.0% 0 0.0% 0 0.0% 0 0.0% 0 0.0% 0 0.0% 0 0.0% 0 0.0% 0To visit the cinema 1.9% 5 0.0% 0 0.0% 0 0.0% 0 0.0% 0 0.0% 0 0.0% 0 0.0% 0 0.0% 0To visit a park 0.0% 0 0.0% 0 0.0% 0 0.0% 0 0.0% 0 0.0% 0 0.0% 0 0.0% 0 0.0% 0To visit the swimming pool 0.0% 0 0.0% 0 0.0% 0 0.0% 0 0.0% 0 0.0% 0 0.0% 0 0.0% 0 0.0% 0To visit other gyms / health
and fitness facilities 0.5% 1 0.0% 0 0.0% 0 0.0% 0 0.0% 0 0.0% 0 0.0% 0 0.0% 0 0.0% 0
To visit the library 0.0% 0 0.0% 0 0.0% 0 0.0% 0 0.0% 0 0.0% 0 0.0% 0 0.0% 0 0.0% 0To visit museums / art
gallery 0.0% 0 0.0% 0 0.0% 0 0.0% 0 0.0% 0 0.0% 0 0.0% 0 0.0% 0 0.0% 0
To visit the theatre or musical venues
2.5% 6 0.0% 0 0.0% 0 0.0% 0 0.0% 0 0.0% 0 0.0% 0 0.0% 0 0.0% 0
To visit night time venues e.g. nightclub
0.0% 0 0.0% 0 0.0% 0 0.0% 0 0.0% 0 0.0% 0 0.0% 0 0.0% 0 0.0% 0
For other leisure activities 1.9% 5 0.0% 0 0.0% 0 0.0% 0 0.0% 0 0.0% 0 0.0% 0 0.0% 0 0.0% 0To shop at the market(s) 0.0% 0 0.0% 0 0.0% 0 0.0% 0 0.0% 0 0.0% 0 0.0% 0 0.0% 0 0.0% 0To meet family 3.1% 8 0.0% 0 0.0% 0 0.0% 0 0.0% 0 0.0% 0 0.0% 0 0.0% 0 0.0% 0To meet friends 5.0% 12 0.0% 0 0.0% 0 0.0% 0 0.0% 0 0.0% 0 0.0% 0 0.0% 0 0.0% 0To visit the theatre 0.3% 1 9.9% 0 0.0% 0 0.0% 0 0.0% 0 0.0% 0 0.0% 0 0.0% 0 0.0% 0For work (i.e. place of work) 4.6% 12 0.0% 0 0.0% 0 0.0% 0 0.0% 0 0.0% 0 0.0% 0 0.0% 0 0.0% 0For business (e.g. attend a
business appointment) 0.0% 0 0.0% 0 0.0% 0 0.0% 0 0.0% 0 0.0% 0 0.0% 0 0.0% 0 0.0% 0
For education as a student (e.g. student at college, university, or other third level education)
0.0% 0 0.0% 0 0.0% 0 0.0% 0 0.0% 0 0.0% 0 0.0% 0 0.0% 0 0.0% 0
To access public transport for onward travel (e.g. train station, bus station)
0.0% 0 0.0% 0 0.0% 0 0.0% 0 0.0% 0 0.0% 0 0.0% 0 0.0% 0 0.0% 0
Other 0.0% 0 0.0% 0 0.0% 0 0.0% 0 0.0% 0 0.0% 0 0.0% 0 0.0% 0 0.0% 0As part of a day out / for a
day out / something different
1.6% 4 0.0% 0 0.0% 0 0.0% 0 0.0% 0 0.0% 0 0.0% 0 0.0% 0 0.0% 0
Browsing / window shopping 1.9% 5 0.0% 0 0.0% 0 0.0% 0 0.0% 0 0.0% 0 0.0% 0 0.0% 0 0.0% 0(Don't know / varies) 0.7% 2 0.0% 0 0.0% 0 0.0% 0 0.0% 0 0.0% 0 0.0% 0 0.0% 0 0.0% 0(Nothing / nothing further) 1.6% 4 9.9% 0 0.0% 0 0.0% 0 0.0% 0 0.0% 0 0.0% 0 0.0% 0 0.0% 0Weighted base: 251 2 0 0 0 0 0 0 0Sample: 234 6 0 0 0 0 0 0 0
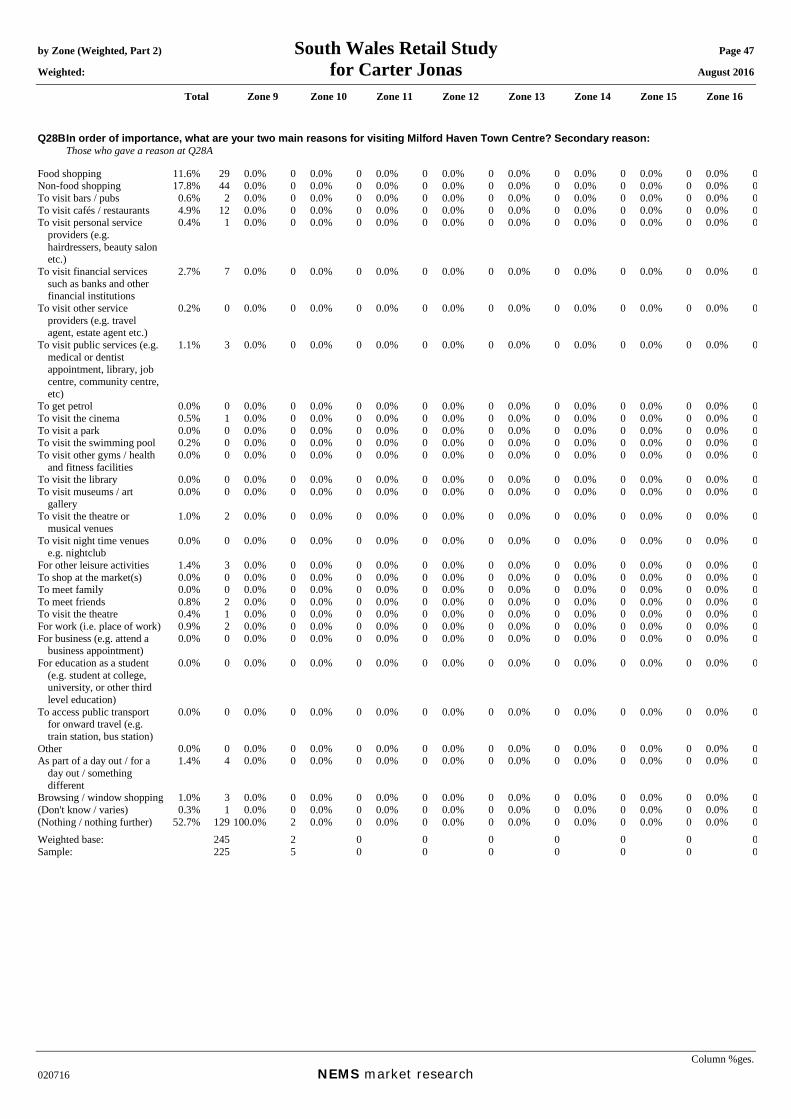
by Zone (Weighted, Part 2) South Wales Retail Study Page 47 Weighted: for Carter Jonas August 2016
Total Zone 9 Zone 10 Zone 11 Zone 12 Zone 13 Zone 14 Zone 15 Zone 16
Column %ges. 020716 NEMS market research
Q28B In order of importance, what are your two main reasons for visiting Milford Haven Town Centre? Secondary reason: Those who gave a reason at Q28A Food shopping 11.6% 29 0.0% 0 0.0% 0 0.0% 0 0.0% 0 0.0% 0 0.0% 0 0.0% 0 0.0% 0Non-food shopping 17.8% 44 0.0% 0 0.0% 0 0.0% 0 0.0% 0 0.0% 0 0.0% 0 0.0% 0 0.0% 0To visit bars / pubs 0.6% 2 0.0% 0 0.0% 0 0.0% 0 0.0% 0 0.0% 0 0.0% 0 0.0% 0 0.0% 0To visit cafés / restaurants 4.9% 12 0.0% 0 0.0% 0 0.0% 0 0.0% 0 0.0% 0 0.0% 0 0.0% 0 0.0% 0To visit personal service
providers (e.g. hairdressers, beauty salon etc.)
0.4% 1 0.0% 0 0.0% 0 0.0% 0 0.0% 0 0.0% 0 0.0% 0 0.0% 0 0.0% 0
To visit financial services such as banks and other financial institutions
2.7% 7 0.0% 0 0.0% 0 0.0% 0 0.0% 0 0.0% 0 0.0% 0 0.0% 0 0.0% 0
To visit other service providers (e.g. travel agent, estate agent etc.)
0.2% 0 0.0% 0 0.0% 0 0.0% 0 0.0% 0 0.0% 0 0.0% 0 0.0% 0 0.0% 0
To visit public services (e.g. medical or dentist appointment, library, job centre, community centre, etc)
1.1% 3 0.0% 0 0.0% 0 0.0% 0 0.0% 0 0.0% 0 0.0% 0 0.0% 0 0.0% 0
To get petrol 0.0% 0 0.0% 0 0.0% 0 0.0% 0 0.0% 0 0.0% 0 0.0% 0 0.0% 0 0.0% 0To visit the cinema 0.5% 1 0.0% 0 0.0% 0 0.0% 0 0.0% 0 0.0% 0 0.0% 0 0.0% 0 0.0% 0To visit a park 0.0% 0 0.0% 0 0.0% 0 0.0% 0 0.0% 0 0.0% 0 0.0% 0 0.0% 0 0.0% 0To visit the swimming pool 0.2% 0 0.0% 0 0.0% 0 0.0% 0 0.0% 0 0.0% 0 0.0% 0 0.0% 0 0.0% 0To visit other gyms / health
and fitness facilities 0.0% 0 0.0% 0 0.0% 0 0.0% 0 0.0% 0 0.0% 0 0.0% 0 0.0% 0 0.0% 0
To visit the library 0.0% 0 0.0% 0 0.0% 0 0.0% 0 0.0% 0 0.0% 0 0.0% 0 0.0% 0 0.0% 0To visit museums / art
gallery 0.0% 0 0.0% 0 0.0% 0 0.0% 0 0.0% 0 0.0% 0 0.0% 0 0.0% 0 0.0% 0
To visit the theatre or musical venues
1.0% 2 0.0% 0 0.0% 0 0.0% 0 0.0% 0 0.0% 0 0.0% 0 0.0% 0 0.0% 0
To visit night time venues e.g. nightclub
0.0% 0 0.0% 0 0.0% 0 0.0% 0 0.0% 0 0.0% 0 0.0% 0 0.0% 0 0.0% 0
For other leisure activities 1.4% 3 0.0% 0 0.0% 0 0.0% 0 0.0% 0 0.0% 0 0.0% 0 0.0% 0 0.0% 0To shop at the market(s) 0.0% 0 0.0% 0 0.0% 0 0.0% 0 0.0% 0 0.0% 0 0.0% 0 0.0% 0 0.0% 0To meet family 0.0% 0 0.0% 0 0.0% 0 0.0% 0 0.0% 0 0.0% 0 0.0% 0 0.0% 0 0.0% 0To meet friends 0.8% 2 0.0% 0 0.0% 0 0.0% 0 0.0% 0 0.0% 0 0.0% 0 0.0% 0 0.0% 0To visit the theatre 0.4% 1 0.0% 0 0.0% 0 0.0% 0 0.0% 0 0.0% 0 0.0% 0 0.0% 0 0.0% 0For work (i.e. place of work) 0.9% 2 0.0% 0 0.0% 0 0.0% 0 0.0% 0 0.0% 0 0.0% 0 0.0% 0 0.0% 0For business (e.g. attend a
business appointment) 0.0% 0 0.0% 0 0.0% 0 0.0% 0 0.0% 0 0.0% 0 0.0% 0 0.0% 0 0.0% 0
For education as a student (e.g. student at college, university, or other third level education)
0.0% 0 0.0% 0 0.0% 0 0.0% 0 0.0% 0 0.0% 0 0.0% 0 0.0% 0 0.0% 0
To access public transport for onward travel (e.g. train station, bus station)
0.0% 0 0.0% 0 0.0% 0 0.0% 0 0.0% 0 0.0% 0 0.0% 0 0.0% 0 0.0% 0
Other 0.0% 0 0.0% 0 0.0% 0 0.0% 0 0.0% 0 0.0% 0 0.0% 0 0.0% 0 0.0% 0As part of a day out / for a
day out / something different
1.4% 4 0.0% 0 0.0% 0 0.0% 0 0.0% 0 0.0% 0 0.0% 0 0.0% 0 0.0% 0
Browsing / window shopping 1.0% 3 0.0% 0 0.0% 0 0.0% 0 0.0% 0 0.0% 0 0.0% 0 0.0% 0 0.0% 0(Don't know / varies) 0.3% 1 0.0% 0 0.0% 0 0.0% 0 0.0% 0 0.0% 0 0.0% 0 0.0% 0 0.0% 0(Nothing / nothing further) 52.7% 129 100.0% 2 0.0% 0 0.0% 0 0.0% 0 0.0% 0 0.0% 0 0.0% 0 0.0% 0Weighted base: 245 2 0 0 0 0 0 0 0Sample: 225 5 0 0 0 0 0 0 0

by Zone (Weighted, Part 2) South Wales Retail Study Page 48 Weighted: for Carter Jonas August 2016
Total Zone 9 Zone 10 Zone 11 Zone 12 Zone 13 Zone 14 Zone 15 Zone 16
Column %ges. 020716 NEMS market research
Q28X In order of importance, what are your two main reasons for visiting Milford Haven Town Centre? Any mention: [MR] Zones 1-5 & 7-9 and those who visit Milford Haven town centre at Q27 Food shopping 31.8% 80 0.0% 0 0.0% 0 0.0% 0 0.0% 0 0.0% 0 0.0% 0 0.0% 0 0.0% 0Non-food shopping 49.1% 123 41.6% 1 0.0% 0 0.0% 0 0.0% 0 0.0% 0 0.0% 0 0.0% 0 0.0% 0To visit bars / pubs 0.6% 2 0.0% 0 0.0% 0 0.0% 0 0.0% 0 0.0% 0 0.0% 0 0.0% 0 0.0% 0To visit cafés / restaurants 13.2% 33 0.0% 0 0.0% 0 0.0% 0 0.0% 0 0.0% 0 0.0% 0 0.0% 0 0.0% 0To visit personal service
providers (e.g. hairdressers, beauty salon etc.)
2.8% 7 0.0% 0 0.0% 0 0.0% 0 0.0% 0 0.0% 0 0.0% 0 0.0% 0 0.0% 0
To visit financial services such as banks and other financial institutions
7.8% 20 0.0% 0 0.0% 0 0.0% 0 0.0% 0 0.0% 0 0.0% 0 0.0% 0 0.0% 0
To visit other service providers (e.g. travel agent, estate agent etc.)
1.5% 4 0.0% 0 0.0% 0 0.0% 0 0.0% 0 0.0% 0 0.0% 0 0.0% 0 0.0% 0
To visit public services (e.g. medical or dentist appointment, library, job centre, community centre, etc)
6.1% 15 38.6% 1 0.0% 0 0.0% 0 0.0% 0 0.0% 0 0.0% 0 0.0% 0 0.0% 0
To get petrol 0.0% 0 0.0% 0 0.0% 0 0.0% 0 0.0% 0 0.0% 0 0.0% 0 0.0% 0 0.0% 0To visit the cinema 2.4% 6 0.0% 0 0.0% 0 0.0% 0 0.0% 0 0.0% 0 0.0% 0 0.0% 0 0.0% 0To visit a park 0.0% 0 0.0% 0 0.0% 0 0.0% 0 0.0% 0 0.0% 0 0.0% 0 0.0% 0 0.0% 0To visit the swimming pool 0.2% 0 0.0% 0 0.0% 0 0.0% 0 0.0% 0 0.0% 0 0.0% 0 0.0% 0 0.0% 0To visit other gyms / health
and fitness facilities 0.5% 1 0.0% 0 0.0% 0 0.0% 0 0.0% 0 0.0% 0 0.0% 0 0.0% 0 0.0% 0
To visit the library 0.0% 0 0.0% 0 0.0% 0 0.0% 0 0.0% 0 0.0% 0 0.0% 0 0.0% 0 0.0% 0To visit museums / art
gallery 0.0% 0 0.0% 0 0.0% 0 0.0% 0 0.0% 0 0.0% 0 0.0% 0 0.0% 0 0.0% 0
To visit the theatre or musical venues
3.4% 9 0.0% 0 0.0% 0 0.0% 0 0.0% 0 0.0% 0 0.0% 0 0.0% 0 0.0% 0
To visit night time venues e.g. nightclub
0.0% 0 0.0% 0 0.0% 0 0.0% 0 0.0% 0 0.0% 0 0.0% 0 0.0% 0 0.0% 0
For other leisure activities 3.3% 8 0.0% 0 0.0% 0 0.0% 0 0.0% 0 0.0% 0 0.0% 0 0.0% 0 0.0% 0To shop at the market(s) 0.0% 0 0.0% 0 0.0% 0 0.0% 0 0.0% 0 0.0% 0 0.0% 0 0.0% 0 0.0% 0To meet family 3.1% 8 0.0% 0 0.0% 0 0.0% 0 0.0% 0 0.0% 0 0.0% 0 0.0% 0 0.0% 0To meet friends 5.7% 14 0.0% 0 0.0% 0 0.0% 0 0.0% 0 0.0% 0 0.0% 0 0.0% 0 0.0% 0To visit the theatre 0.7% 2 9.9% 0 0.0% 0 0.0% 0 0.0% 0 0.0% 0 0.0% 0 0.0% 0 0.0% 0For work (i.e. place of work) 5.5% 14 0.0% 0 0.0% 0 0.0% 0 0.0% 0 0.0% 0 0.0% 0 0.0% 0 0.0% 0For business (e.g. attend a
business appointment) 0.0% 0 0.0% 0 0.0% 0 0.0% 0 0.0% 0 0.0% 0 0.0% 0 0.0% 0 0.0% 0
For education as a student (e.g. student at college, university, or other third level education)
0.0% 0 0.0% 0 0.0% 0 0.0% 0 0.0% 0 0.0% 0 0.0% 0 0.0% 0 0.0% 0
To access public transport for onward travel (e.g. train station, bus station)
0.0% 0 0.0% 0 0.0% 0 0.0% 0 0.0% 0 0.0% 0 0.0% 0 0.0% 0 0.0% 0
Other 0.0% 0 0.0% 0 0.0% 0 0.0% 0 0.0% 0 0.0% 0 0.0% 0 0.0% 0 0.0% 0As part of a day out / for a
day out / something different
3.0% 8 0.0% 0 0.0% 0 0.0% 0 0.0% 0 0.0% 0 0.0% 0 0.0% 0 0.0% 0
Browsing / window shopping 2.9% 7 0.0% 0 0.0% 0 0.0% 0 0.0% 0 0.0% 0 0.0% 0 0.0% 0 0.0% 0Weighted base: 251 2 0 0 0 0 0 0 0Sample: 234 6 0 0 0 0 0 0 0
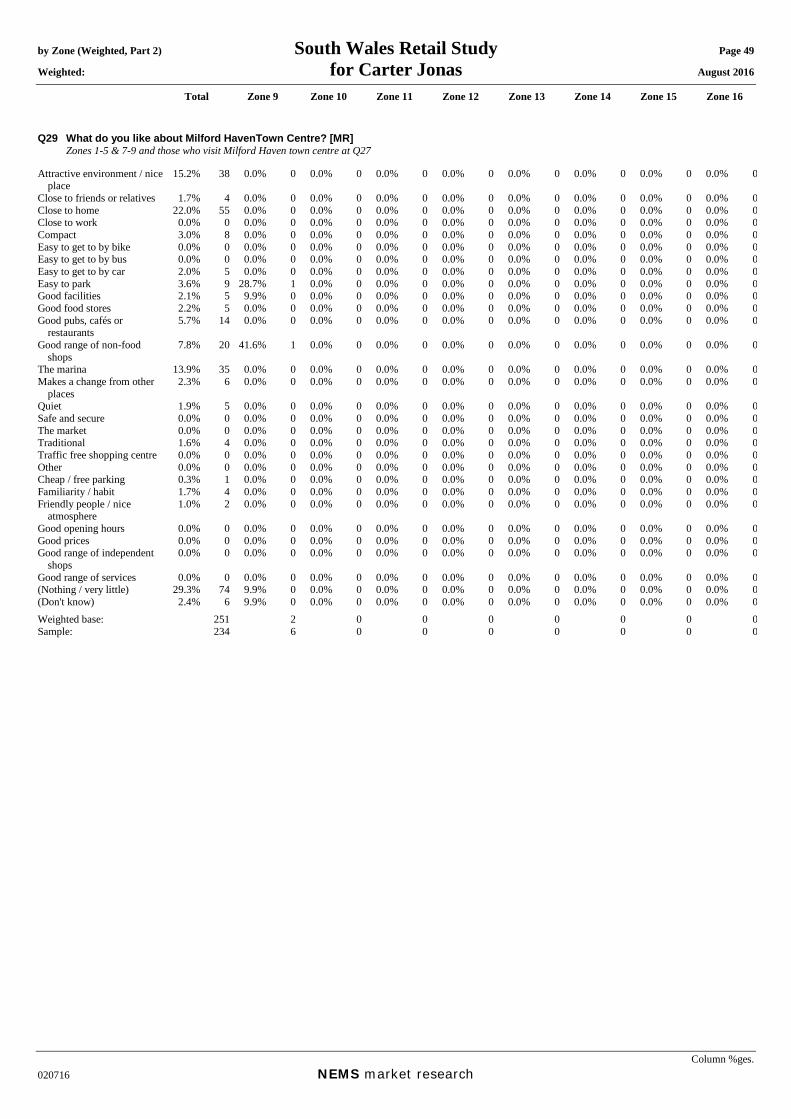
by Zone (Weighted, Part 2) South Wales Retail Study Page 49 Weighted: for Carter Jonas August 2016
Total Zone 9 Zone 10 Zone 11 Zone 12 Zone 13 Zone 14 Zone 15 Zone 16
Column %ges. 020716 NEMS market research
Q29 What do you like about Milford HavenTown Centre? [MR] Zones 1-5 & 7-9 and those who visit Milford Haven town centre at Q27 Attractive environment / nice
place 15.2% 38 0.0% 0 0.0% 0 0.0% 0 0.0% 0 0.0% 0 0.0% 0 0.0% 0 0.0% 0
Close to friends or relatives 1.7% 4 0.0% 0 0.0% 0 0.0% 0 0.0% 0 0.0% 0 0.0% 0 0.0% 0 0.0% 0Close to home 22.0% 55 0.0% 0 0.0% 0 0.0% 0 0.0% 0 0.0% 0 0.0% 0 0.0% 0 0.0% 0Close to work 0.0% 0 0.0% 0 0.0% 0 0.0% 0 0.0% 0 0.0% 0 0.0% 0 0.0% 0 0.0% 0Compact 3.0% 8 0.0% 0 0.0% 0 0.0% 0 0.0% 0 0.0% 0 0.0% 0 0.0% 0 0.0% 0Easy to get to by bike 0.0% 0 0.0% 0 0.0% 0 0.0% 0 0.0% 0 0.0% 0 0.0% 0 0.0% 0 0.0% 0Easy to get to by bus 0.0% 0 0.0% 0 0.0% 0 0.0% 0 0.0% 0 0.0% 0 0.0% 0 0.0% 0 0.0% 0Easy to get to by car 2.0% 5 0.0% 0 0.0% 0 0.0% 0 0.0% 0 0.0% 0 0.0% 0 0.0% 0 0.0% 0Easy to park 3.6% 9 28.7% 1 0.0% 0 0.0% 0 0.0% 0 0.0% 0 0.0% 0 0.0% 0 0.0% 0Good facilities 2.1% 5 9.9% 0 0.0% 0 0.0% 0 0.0% 0 0.0% 0 0.0% 0 0.0% 0 0.0% 0Good food stores 2.2% 5 0.0% 0 0.0% 0 0.0% 0 0.0% 0 0.0% 0 0.0% 0 0.0% 0 0.0% 0Good pubs, cafés or
restaurants 5.7% 14 0.0% 0 0.0% 0 0.0% 0 0.0% 0 0.0% 0 0.0% 0 0.0% 0 0.0% 0
Good range of non-food shops
7.8% 20 41.6% 1 0.0% 0 0.0% 0 0.0% 0 0.0% 0 0.0% 0 0.0% 0 0.0% 0
The marina 13.9% 35 0.0% 0 0.0% 0 0.0% 0 0.0% 0 0.0% 0 0.0% 0 0.0% 0 0.0% 0Makes a change from other
places 2.3% 6 0.0% 0 0.0% 0 0.0% 0 0.0% 0 0.0% 0 0.0% 0 0.0% 0 0.0% 0
Quiet 1.9% 5 0.0% 0 0.0% 0 0.0% 0 0.0% 0 0.0% 0 0.0% 0 0.0% 0 0.0% 0Safe and secure 0.0% 0 0.0% 0 0.0% 0 0.0% 0 0.0% 0 0.0% 0 0.0% 0 0.0% 0 0.0% 0The market 0.0% 0 0.0% 0 0.0% 0 0.0% 0 0.0% 0 0.0% 0 0.0% 0 0.0% 0 0.0% 0Traditional 1.6% 4 0.0% 0 0.0% 0 0.0% 0 0.0% 0 0.0% 0 0.0% 0 0.0% 0 0.0% 0Traffic free shopping centre 0.0% 0 0.0% 0 0.0% 0 0.0% 0 0.0% 0 0.0% 0 0.0% 0 0.0% 0 0.0% 0Other 0.0% 0 0.0% 0 0.0% 0 0.0% 0 0.0% 0 0.0% 0 0.0% 0 0.0% 0 0.0% 0Cheap / free parking 0.3% 1 0.0% 0 0.0% 0 0.0% 0 0.0% 0 0.0% 0 0.0% 0 0.0% 0 0.0% 0Familiarity / habit 1.7% 4 0.0% 0 0.0% 0 0.0% 0 0.0% 0 0.0% 0 0.0% 0 0.0% 0 0.0% 0Friendly people / nice
atmosphere 1.0% 2 0.0% 0 0.0% 0 0.0% 0 0.0% 0 0.0% 0 0.0% 0 0.0% 0 0.0% 0
Good opening hours 0.0% 0 0.0% 0 0.0% 0 0.0% 0 0.0% 0 0.0% 0 0.0% 0 0.0% 0 0.0% 0Good prices 0.0% 0 0.0% 0 0.0% 0 0.0% 0 0.0% 0 0.0% 0 0.0% 0 0.0% 0 0.0% 0Good range of independent
shops 0.0% 0 0.0% 0 0.0% 0 0.0% 0 0.0% 0 0.0% 0 0.0% 0 0.0% 0 0.0% 0
Good range of services 0.0% 0 0.0% 0 0.0% 0 0.0% 0 0.0% 0 0.0% 0 0.0% 0 0.0% 0 0.0% 0(Nothing / very little) 29.3% 74 9.9% 0 0.0% 0 0.0% 0 0.0% 0 0.0% 0 0.0% 0 0.0% 0 0.0% 0(Don't know) 2.4% 6 9.9% 0 0.0% 0 0.0% 0 0.0% 0 0.0% 0 0.0% 0 0.0% 0 0.0% 0Weighted base: 251 2 0 0 0 0 0 0 0Sample: 234 6 0 0 0 0 0 0 0
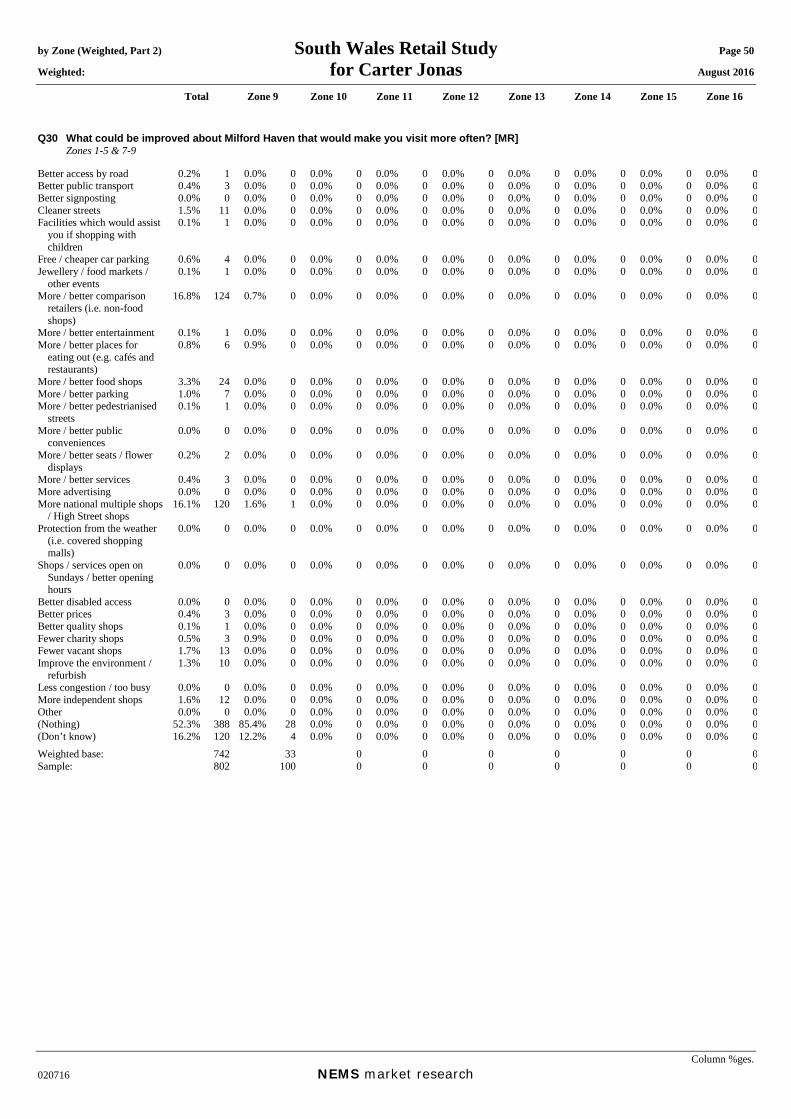
by Zone (Weighted, Part 2) South Wales Retail Study Page 50 Weighted: for Carter Jonas August 2016
Total Zone 9 Zone 10 Zone 11 Zone 12 Zone 13 Zone 14 Zone 15 Zone 16
Column %ges. 020716 NEMS market research
Q30 What could be improved about Milford Haven that would make you visit more often? [MR] Zones 1-5 & 7-9 Better access by road 0.2% 1 0.0% 0 0.0% 0 0.0% 0 0.0% 0 0.0% 0 0.0% 0 0.0% 0 0.0% 0Better public transport 0.4% 3 0.0% 0 0.0% 0 0.0% 0 0.0% 0 0.0% 0 0.0% 0 0.0% 0 0.0% 0Better signposting 0.0% 0 0.0% 0 0.0% 0 0.0% 0 0.0% 0 0.0% 0 0.0% 0 0.0% 0 0.0% 0Cleaner streets 1.5% 11 0.0% 0 0.0% 0 0.0% 0 0.0% 0 0.0% 0 0.0% 0 0.0% 0 0.0% 0Facilities which would assist
you if shopping with children
0.1% 1 0.0% 0 0.0% 0 0.0% 0 0.0% 0 0.0% 0 0.0% 0 0.0% 0 0.0% 0
Free / cheaper car parking 0.6% 4 0.0% 0 0.0% 0 0.0% 0 0.0% 0 0.0% 0 0.0% 0 0.0% 0 0.0% 0Jewellery / food markets /
other events 0.1% 1 0.0% 0 0.0% 0 0.0% 0 0.0% 0 0.0% 0 0.0% 0 0.0% 0 0.0% 0
More / better comparison retailers (i.e. non-food shops)
16.8% 124 0.7% 0 0.0% 0 0.0% 0 0.0% 0 0.0% 0 0.0% 0 0.0% 0 0.0% 0
More / better entertainment 0.1% 1 0.0% 0 0.0% 0 0.0% 0 0.0% 0 0.0% 0 0.0% 0 0.0% 0 0.0% 0More / better places for
eating out (e.g. cafés and restaurants)
0.8% 6 0.9% 0 0.0% 0 0.0% 0 0.0% 0 0.0% 0 0.0% 0 0.0% 0 0.0% 0
More / better food shops 3.3% 24 0.0% 0 0.0% 0 0.0% 0 0.0% 0 0.0% 0 0.0% 0 0.0% 0 0.0% 0More / better parking 1.0% 7 0.0% 0 0.0% 0 0.0% 0 0.0% 0 0.0% 0 0.0% 0 0.0% 0 0.0% 0More / better pedestrianised
streets 0.1% 1 0.0% 0 0.0% 0 0.0% 0 0.0% 0 0.0% 0 0.0% 0 0.0% 0 0.0% 0
More / better public conveniences
0.0% 0 0.0% 0 0.0% 0 0.0% 0 0.0% 0 0.0% 0 0.0% 0 0.0% 0 0.0% 0
More / better seats / flower displays
0.2% 2 0.0% 0 0.0% 0 0.0% 0 0.0% 0 0.0% 0 0.0% 0 0.0% 0 0.0% 0
More / better services 0.4% 3 0.0% 0 0.0% 0 0.0% 0 0.0% 0 0.0% 0 0.0% 0 0.0% 0 0.0% 0More advertising 0.0% 0 0.0% 0 0.0% 0 0.0% 0 0.0% 0 0.0% 0 0.0% 0 0.0% 0 0.0% 0More national multiple shops
/ High Street shops 16.1% 120 1.6% 1 0.0% 0 0.0% 0 0.0% 0 0.0% 0 0.0% 0 0.0% 0 0.0% 0
Protection from the weather (i.e. covered shopping malls)
0.0% 0 0.0% 0 0.0% 0 0.0% 0 0.0% 0 0.0% 0 0.0% 0 0.0% 0 0.0% 0
Shops / services open on Sundays / better opening hours
0.0% 0 0.0% 0 0.0% 0 0.0% 0 0.0% 0 0.0% 0 0.0% 0 0.0% 0 0.0% 0
Better disabled access 0.0% 0 0.0% 0 0.0% 0 0.0% 0 0.0% 0 0.0% 0 0.0% 0 0.0% 0 0.0% 0Better prices 0.4% 3 0.0% 0 0.0% 0 0.0% 0 0.0% 0 0.0% 0 0.0% 0 0.0% 0 0.0% 0Better quality shops 0.1% 1 0.0% 0 0.0% 0 0.0% 0 0.0% 0 0.0% 0 0.0% 0 0.0% 0 0.0% 0Fewer charity shops 0.5% 3 0.9% 0 0.0% 0 0.0% 0 0.0% 0 0.0% 0 0.0% 0 0.0% 0 0.0% 0Fewer vacant shops 1.7% 13 0.0% 0 0.0% 0 0.0% 0 0.0% 0 0.0% 0 0.0% 0 0.0% 0 0.0% 0Improve the environment /
refurbish 1.3% 10 0.0% 0 0.0% 0 0.0% 0 0.0% 0 0.0% 0 0.0% 0 0.0% 0 0.0% 0
Less congestion / too busy 0.0% 0 0.0% 0 0.0% 0 0.0% 0 0.0% 0 0.0% 0 0.0% 0 0.0% 0 0.0% 0More independent shops 1.6% 12 0.0% 0 0.0% 0 0.0% 0 0.0% 0 0.0% 0 0.0% 0 0.0% 0 0.0% 0Other 0.0% 0 0.0% 0 0.0% 0 0.0% 0 0.0% 0 0.0% 0 0.0% 0 0.0% 0 0.0% 0(Nothing) 52.3% 388 85.4% 28 0.0% 0 0.0% 0 0.0% 0 0.0% 0 0.0% 0 0.0% 0 0.0% 0(Don’t know) 16.2% 120 12.2% 4 0.0% 0 0.0% 0 0.0% 0 0.0% 0 0.0% 0 0.0% 0 0.0% 0Weighted base: 742 33 0 0 0 0 0 0 0Sample: 802 100 0 0 0 0 0 0 0

by Zone (Weighted, Part 2) South Wales Retail Study Page 51 Weighted: for Carter Jonas August 2016
Total Zone 9 Zone 10 Zone 11 Zone 12 Zone 13 Zone 14 Zone 15 Zone 16
Column %ges. 020716 NEMS market research
Mean score [Times a year, those who visit]: Daily = 365, 4-6 days a week = 234, 2-3 days a week = 130, One day a week = 52, Every two weeks = 24, Monthly = 12, Once every two months = 6, Three-four times a year = 3.5, Once a year = 1, Less often = 0.25
Q31 How often do you or your household visit Pembroke Town Centre for shopping and other town centre services? Zones 1-6 Daily 1.3% 9 0.0% 0 0.0% 0 0.0% 0 0.0% 0 0.0% 0 0.0% 0 0.0% 0 0.0% 04-6 days a week 0.9% 6 0.0% 0 0.0% 0 0.0% 0 0.0% 0 0.0% 0 0.0% 0 0.0% 0 0.0% 02-3 days a week 3.1% 21 0.0% 0 0.0% 0 0.0% 0 0.0% 0 0.0% 0 0.0% 0 0.0% 0 0.0% 0One day a week 6.5% 44 0.0% 0 0.0% 0 0.0% 0 0.0% 0 0.0% 0 0.0% 0 0.0% 0 0.0% 0Every two weeks 1.3% 9 0.0% 0 0.0% 0 0.0% 0 0.0% 0 0.0% 0 0.0% 0 0.0% 0 0.0% 0Monthly 7.1% 48 0.0% 0 0.0% 0 0.0% 0 0.0% 0 0.0% 0 0.0% 0 0.0% 0 0.0% 0Once every two months 2.4% 16 0.0% 0 0.0% 0 0.0% 0 0.0% 0 0.0% 0 0.0% 0 0.0% 0 0.0% 0Three-four times a year 4.4% 30 0.0% 0 0.0% 0 0.0% 0 0.0% 0 0.0% 0 0.0% 0 0.0% 0 0.0% 0Once a year 2.7% 18 0.0% 0 0.0% 0 0.0% 0 0.0% 0 0.0% 0 0.0% 0 0.0% 0 0.0% 0Daily 1.3% 9 0.0% 0 0.0% 0 0.0% 0 0.0% 0 0.0% 0 0.0% 0 0.0% 0 0.0% 0Less often 0.7% 5 0.0% 0 0.0% 0 0.0% 0 0.0% 0 0.0% 0 0.0% 0 0.0% 0 0.0% 0Never 68.6% 462 0.0% 0 0.0% 0 0.0% 0 0.0% 0 0.0% 0 0.0% 0 0.0% 0 0.0% 0(Don’t know) 0.1% 1 0.0% 0 0.0% 0 0.0% 0 0.0% 0 0.0% 0 0.0% 0 0.0% 0 0.0% 0(Varies) 0.9% 6 0.0% 0 0.0% 0 0.0% 0 0.0% 0 0.0% 0 0.0% 0 0.0% 0 0.0% 0Mean: 49.46 0.00 0.00 0.00 0.00 0.00 0.00 0.00 0.00Weighted base: 674 0 0 0 0 0 0 0 0Sample: 602 0 0 0 0 0 0 0 0

by Zone (Weighted, Part 2) South Wales Retail Study Page 52 Weighted: for Carter Jonas August 2016
Total Zone 9 Zone 10 Zone 11 Zone 12 Zone 13 Zone 14 Zone 15 Zone 16
Column %ges. 020716 NEMS market research
Q32A In order of importance, what are your two main reasons for visiting Pembroke Town Centre? Main reason: Zones 1-6 and those who visit Pembroke town centre at Q31 Food shopping 21.7% 46 0.0% 0 0.0% 0 0.0% 0 0.0% 0 0.0% 0 0.0% 0 0.0% 0 0.0% 0Non-food shopping 38.5% 81 0.0% 0 0.0% 0 0.0% 0 0.0% 0 0.0% 0 0.0% 0 0.0% 0 0.0% 0To visit bars / pubs 0.1% 0 0.0% 0 0.0% 0 0.0% 0 0.0% 0 0.0% 0 0.0% 0 0.0% 0 0.0% 0To visit cafés / restaurants 4.5% 9 0.0% 0 0.0% 0 0.0% 0 0.0% 0 0.0% 0 0.0% 0 0.0% 0 0.0% 0To visit personal service
providers (e.g. hairdressers, beauty salon etc.)
2.4% 5 0.0% 0 0.0% 0 0.0% 0 0.0% 0 0.0% 0 0.0% 0 0.0% 0 0.0% 0
To visit financial services such as banks and other financial institutions
12.6% 27 0.0% 0 0.0% 0 0.0% 0 0.0% 0 0.0% 0 0.0% 0 0.0% 0 0.0% 0
To visit other service providers (e.g. travel agent, estate agent etc.)
0.0% 0 0.0% 0 0.0% 0 0.0% 0 0.0% 0 0.0% 0 0.0% 0 0.0% 0 0.0% 0
To visit public services (e.g. medical or dentist appointment, library, job centre, community centre, etc)
1.0% 2 0.0% 0 0.0% 0 0.0% 0 0.0% 0 0.0% 0 0.0% 0 0.0% 0 0.0% 0
To get petrol 0.0% 0 0.0% 0 0.0% 0 0.0% 0 0.0% 0 0.0% 0 0.0% 0 0.0% 0 0.0% 0To visit the cinema 0.0% 0 0.0% 0 0.0% 0 0.0% 0 0.0% 0 0.0% 0 0.0% 0 0.0% 0 0.0% 0To visit a park 0.0% 0 0.0% 0 0.0% 0 0.0% 0 0.0% 0 0.0% 0 0.0% 0 0.0% 0 0.0% 0To visit the swimming pool 0.0% 0 0.0% 0 0.0% 0 0.0% 0 0.0% 0 0.0% 0 0.0% 0 0.0% 0 0.0% 0To visit other gyms / health
and fitness facilities 0.0% 0 0.0% 0 0.0% 0 0.0% 0 0.0% 0 0.0% 0 0.0% 0 0.0% 0 0.0% 0
To visit the library 0.0% 0 0.0% 0 0.0% 0 0.0% 0 0.0% 0 0.0% 0 0.0% 0 0.0% 0 0.0% 0To visit museums / art
gallery 0.2% 0 0.0% 0 0.0% 0 0.0% 0 0.0% 0 0.0% 0 0.0% 0 0.0% 0 0.0% 0
To visit the theatre or musical venues
0.0% 0 0.0% 0 0.0% 0 0.0% 0 0.0% 0 0.0% 0 0.0% 0 0.0% 0 0.0% 0
To visit night time venues e.g. nightclub
0.0% 0 0.0% 0 0.0% 0 0.0% 0 0.0% 0 0.0% 0 0.0% 0 0.0% 0 0.0% 0
For other leisure activities 1.2% 3 0.0% 0 0.0% 0 0.0% 0 0.0% 0 0.0% 0 0.0% 0 0.0% 0 0.0% 0To shop at the market(s) 1.5% 3 0.0% 0 0.0% 0 0.0% 0 0.0% 0 0.0% 0 0.0% 0 0.0% 0 0.0% 0To meet family 1.3% 3 0.0% 0 0.0% 0 0.0% 0 0.0% 0 0.0% 0 0.0% 0 0.0% 0 0.0% 0To meet friends 3.7% 8 0.0% 0 0.0% 0 0.0% 0 0.0% 0 0.0% 0 0.0% 0 0.0% 0 0.0% 0To visit the theatre 0.4% 1 0.0% 0 0.0% 0 0.0% 0 0.0% 0 0.0% 0 0.0% 0 0.0% 0 0.0% 0For work (i.e. place of work) 2.5% 5 0.0% 0 0.0% 0 0.0% 0 0.0% 0 0.0% 0 0.0% 0 0.0% 0 0.0% 0For business (e.g. attend a
business appointment) 0.0% 0 0.0% 0 0.0% 0 0.0% 0 0.0% 0 0.0% 0 0.0% 0 0.0% 0 0.0% 0
For education as a student (e.g. student at college, university, or other third level education)
0.0% 0 0.0% 0 0.0% 0 0.0% 0 0.0% 0 0.0% 0 0.0% 0 0.0% 0 0.0% 0
To access public transport for onward travel (e.g. train station, bus station)
0.0% 0 0.0% 0 0.0% 0 0.0% 0 0.0% 0 0.0% 0 0.0% 0 0.0% 0 0.0% 0
Other 0.0% 0 0.0% 0 0.0% 0 0.0% 0 0.0% 0 0.0% 0 0.0% 0 0.0% 0 0.0% 0As part of a day out / for a
day out / something different
1.7% 4 0.0% 0 0.0% 0 0.0% 0 0.0% 0 0.0% 0 0.0% 0 0.0% 0 0.0% 0
Browsing / window shopping 4.6% 10 0.0% 0 0.0% 0 0.0% 0 0.0% 0 0.0% 0 0.0% 0 0.0% 0 0.0% 0(Don't know / varies) 0.3% 1 0.0% 0 0.0% 0 0.0% 0 0.0% 0 0.0% 0 0.0% 0 0.0% 0 0.0% 0(Nothing / nothing further) 1.6% 3 0.0% 0 0.0% 0 0.0% 0 0.0% 0 0.0% 0 0.0% 0 0.0% 0 0.0% 0Weighted base: 211 0 0 0 0 0 0 0 0Sample: 166 0 0 0 0 0 0 0 0

by Zone (Weighted, Part 2) South Wales Retail Study Page 53 Weighted: for Carter Jonas August 2016
Total Zone 9 Zone 10 Zone 11 Zone 12 Zone 13 Zone 14 Zone 15 Zone 16
Column %ges. 020716 NEMS market research
Q32B In order of importance, what are your two main reasons for visiting Pembroke Town Centre? Secondary reason: Those who gave a reason at Q32A Food shopping 10.9% 23 0.0% 0 0.0% 0 0.0% 0 0.0% 0 0.0% 0 0.0% 0 0.0% 0 0.0% 0Non-food shopping 13.8% 29 0.0% 0 0.0% 0 0.0% 0 0.0% 0 0.0% 0 0.0% 0 0.0% 0 0.0% 0To visit bars / pubs 1.3% 3 0.0% 0 0.0% 0 0.0% 0 0.0% 0 0.0% 0 0.0% 0 0.0% 0 0.0% 0To visit cafés / restaurants 9.3% 19 0.0% 0 0.0% 0 0.0% 0 0.0% 0 0.0% 0 0.0% 0 0.0% 0 0.0% 0To visit personal service
providers (e.g. hairdressers, beauty salon etc.)
1.3% 3 0.0% 0 0.0% 0 0.0% 0 0.0% 0 0.0% 0 0.0% 0 0.0% 0 0.0% 0
To visit financial services such as banks and other financial institutions
4.2% 9 0.0% 0 0.0% 0 0.0% 0 0.0% 0 0.0% 0 0.0% 0 0.0% 0 0.0% 0
To visit other service providers (e.g. travel agent, estate agent etc.)
0.0% 0 0.0% 0 0.0% 0 0.0% 0 0.0% 0 0.0% 0 0.0% 0 0.0% 0 0.0% 0
To visit public services (e.g. medical or dentist appointment, library, job centre, community centre, etc)
1.5% 3 0.0% 0 0.0% 0 0.0% 0 0.0% 0 0.0% 0 0.0% 0 0.0% 0 0.0% 0
To get petrol 0.0% 0 0.0% 0 0.0% 0 0.0% 0 0.0% 0 0.0% 0 0.0% 0 0.0% 0 0.0% 0To visit the cinema 0.0% 0 0.0% 0 0.0% 0 0.0% 0 0.0% 0 0.0% 0 0.0% 0 0.0% 0 0.0% 0To visit a park 0.0% 0 0.0% 0 0.0% 0 0.0% 0 0.0% 0 0.0% 0 0.0% 0 0.0% 0 0.0% 0To visit the swimming pool 0.0% 0 0.0% 0 0.0% 0 0.0% 0 0.0% 0 0.0% 0 0.0% 0 0.0% 0 0.0% 0To visit other gyms / health
and fitness facilities 0.0% 0 0.0% 0 0.0% 0 0.0% 0 0.0% 0 0.0% 0 0.0% 0 0.0% 0 0.0% 0
To visit the library 0.0% 0 0.0% 0 0.0% 0 0.0% 0 0.0% 0 0.0% 0 0.0% 0 0.0% 0 0.0% 0To visit museums / art
gallery 0.0% 0 0.0% 0 0.0% 0 0.0% 0 0.0% 0 0.0% 0 0.0% 0 0.0% 0 0.0% 0
To visit the theatre or musical venues
0.0% 0 0.0% 0 0.0% 0 0.0% 0 0.0% 0 0.0% 0 0.0% 0 0.0% 0 0.0% 0
To visit night time venues e.g. nightclub
0.0% 0 0.0% 0 0.0% 0 0.0% 0 0.0% 0 0.0% 0 0.0% 0 0.0% 0 0.0% 0
For other leisure activities 0.5% 1 0.0% 0 0.0% 0 0.0% 0 0.0% 0 0.0% 0 0.0% 0 0.0% 0 0.0% 0To shop at the market(s) 0.0% 0 0.0% 0 0.0% 0 0.0% 0 0.0% 0 0.0% 0 0.0% 0 0.0% 0 0.0% 0To meet family 1.2% 2 0.0% 0 0.0% 0 0.0% 0 0.0% 0 0.0% 0 0.0% 0 0.0% 0 0.0% 0To meet friends 0.0% 0 0.0% 0 0.0% 0 0.0% 0 0.0% 0 0.0% 0 0.0% 0 0.0% 0 0.0% 0To visit the theatre 0.0% 0 0.0% 0 0.0% 0 0.0% 0 0.0% 0 0.0% 0 0.0% 0 0.0% 0 0.0% 0For work (i.e. place of work) 0.3% 1 0.0% 0 0.0% 0 0.0% 0 0.0% 0 0.0% 0 0.0% 0 0.0% 0 0.0% 0For business (e.g. attend a
business appointment) 0.0% 0 0.0% 0 0.0% 0 0.0% 0 0.0% 0 0.0% 0 0.0% 0 0.0% 0 0.0% 0
For education as a student (e.g. student at college, university, or other third level education)
0.0% 0 0.0% 0 0.0% 0 0.0% 0 0.0% 0 0.0% 0 0.0% 0 0.0% 0 0.0% 0
To access public transport for onward travel (e.g. train station, bus station)
0.0% 0 0.0% 0 0.0% 0 0.0% 0 0.0% 0 0.0% 0 0.0% 0 0.0% 0 0.0% 0
Other 0.0% 0 0.0% 0 0.0% 0 0.0% 0 0.0% 0 0.0% 0 0.0% 0 0.0% 0 0.0% 0As part of a day out / for a
day out / something different
0.2% 0 0.0% 0 0.0% 0 0.0% 0 0.0% 0 0.0% 0 0.0% 0 0.0% 0 0.0% 0
Browsing / window shopping 1.8% 4 0.0% 0 0.0% 0 0.0% 0 0.0% 0 0.0% 0 0.0% 0 0.0% 0 0.0% 0(Don't know / varies) 2.3% 5 0.0% 0 0.0% 0 0.0% 0 0.0% 0 0.0% 0 0.0% 0 0.0% 0 0.0% 0(Nothing / nothing further) 51.2% 106 0.0% 0 0.0% 0 0.0% 0 0.0% 0 0.0% 0 0.0% 0 0.0% 0 0.0% 0Weighted base: 207 0 0 0 0 0 0 0 0Sample: 162 0 0 0 0 0 0 0 0

by Zone (Weighted, Part 2) South Wales Retail Study Page 54 Weighted: for Carter Jonas August 2016
Total Zone 9 Zone 10 Zone 11 Zone 12 Zone 13 Zone 14 Zone 15 Zone 16
Column %ges. 020716 NEMS market research
Q32X In order of importance, what are your two main reasons for visiting Pembroke Town Centre? Any mention: [MR] Zones 1-6 and those who visit Pembroke town centre at Q31 Food shopping 32.4% 69 0.0% 0 0.0% 0 0.0% 0 0.0% 0 0.0% 0 0.0% 0 0.0% 0 0.0% 0Non-food shopping 52.1% 110 0.0% 0 0.0% 0 0.0% 0 0.0% 0 0.0% 0 0.0% 0 0.0% 0 0.0% 0To visit bars / pubs 1.4% 3 0.0% 0 0.0% 0 0.0% 0 0.0% 0 0.0% 0 0.0% 0 0.0% 0 0.0% 0To visit cafés / restaurants 13.6% 29 0.0% 0 0.0% 0 0.0% 0 0.0% 0 0.0% 0 0.0% 0 0.0% 0 0.0% 0To visit personal service
providers (e.g. hairdressers, beauty salon etc.)
3.7% 8 0.0% 0 0.0% 0 0.0% 0 0.0% 0 0.0% 0 0.0% 0 0.0% 0 0.0% 0
To visit financial services such as banks and other financial institutions
16.8% 35 0.0% 0 0.0% 0 0.0% 0 0.0% 0 0.0% 0 0.0% 0 0.0% 0 0.0% 0
To visit other service providers (e.g. travel agent, estate agent etc.)
0.0% 0 0.0% 0 0.0% 0 0.0% 0 0.0% 0 0.0% 0 0.0% 0 0.0% 0 0.0% 0
To visit public services (e.g. medical or dentist appointment, library, job centre, community centre, etc)
2.5% 5 0.0% 0 0.0% 0 0.0% 0 0.0% 0 0.0% 0 0.0% 0 0.0% 0 0.0% 0
To get petrol 0.0% 0 0.0% 0 0.0% 0 0.0% 0 0.0% 0 0.0% 0 0.0% 0 0.0% 0 0.0% 0To visit the cinema 0.0% 0 0.0% 0 0.0% 0 0.0% 0 0.0% 0 0.0% 0 0.0% 0 0.0% 0 0.0% 0To visit a park 0.0% 0 0.0% 0 0.0% 0 0.0% 0 0.0% 0 0.0% 0 0.0% 0 0.0% 0 0.0% 0To visit the swimming pool 0.0% 0 0.0% 0 0.0% 0 0.0% 0 0.0% 0 0.0% 0 0.0% 0 0.0% 0 0.0% 0To visit other gyms / health
and fitness facilities 0.0% 0 0.0% 0 0.0% 0 0.0% 0 0.0% 0 0.0% 0 0.0% 0 0.0% 0 0.0% 0
To visit the library 0.0% 0 0.0% 0 0.0% 0 0.0% 0 0.0% 0 0.0% 0 0.0% 0 0.0% 0 0.0% 0To visit museums / art
gallery 0.2% 0 0.0% 0 0.0% 0 0.0% 0 0.0% 0 0.0% 0 0.0% 0 0.0% 0 0.0% 0
To visit the theatre or musical venues
0.0% 0 0.0% 0 0.0% 0 0.0% 0 0.0% 0 0.0% 0 0.0% 0 0.0% 0 0.0% 0
To visit night time venues e.g. nightclub
0.0% 0 0.0% 0 0.0% 0 0.0% 0 0.0% 0 0.0% 0 0.0% 0 0.0% 0 0.0% 0
For other leisure activities 1.7% 4 0.0% 0 0.0% 0 0.0% 0 0.0% 0 0.0% 0 0.0% 0 0.0% 0 0.0% 0To shop at the market(s) 1.5% 3 0.0% 0 0.0% 0 0.0% 0 0.0% 0 0.0% 0 0.0% 0 0.0% 0 0.0% 0To meet family 2.5% 5 0.0% 0 0.0% 0 0.0% 0 0.0% 0 0.0% 0 0.0% 0 0.0% 0 0.0% 0To meet friends 3.7% 8 0.0% 0 0.0% 0 0.0% 0 0.0% 0 0.0% 0 0.0% 0 0.0% 0 0.0% 0To visit the theatre 0.4% 1 0.0% 0 0.0% 0 0.0% 0 0.0% 0 0.0% 0 0.0% 0 0.0% 0 0.0% 0For work (i.e. place of work) 2.8% 6 0.0% 0 0.0% 0 0.0% 0 0.0% 0 0.0% 0 0.0% 0 0.0% 0 0.0% 0For business (e.g. attend a
business appointment) 0.0% 0 0.0% 0 0.0% 0 0.0% 0 0.0% 0 0.0% 0 0.0% 0 0.0% 0 0.0% 0
For education as a student (e.g. student at college, university, or other third level education)
0.0% 0 0.0% 0 0.0% 0 0.0% 0 0.0% 0 0.0% 0 0.0% 0 0.0% 0 0.0% 0
To access public transport for onward travel (e.g. train station, bus station)
0.0% 0 0.0% 0 0.0% 0 0.0% 0 0.0% 0 0.0% 0 0.0% 0 0.0% 0 0.0% 0
Other 0.0% 0 0.0% 0 0.0% 0 0.0% 0 0.0% 0 0.0% 0 0.0% 0 0.0% 0 0.0% 0As part of a day out / for a
day out / something different
1.9% 4 0.0% 0 0.0% 0 0.0% 0 0.0% 0 0.0% 0 0.0% 0 0.0% 0 0.0% 0
Browsing / window shopping 6.4% 14 0.0% 0 0.0% 0 0.0% 0 0.0% 0 0.0% 0 0.0% 0 0.0% 0 0.0% 0Weighted base: 211 0 0 0 0 0 0 0 0Sample: 166 0 0 0 0 0 0 0 0
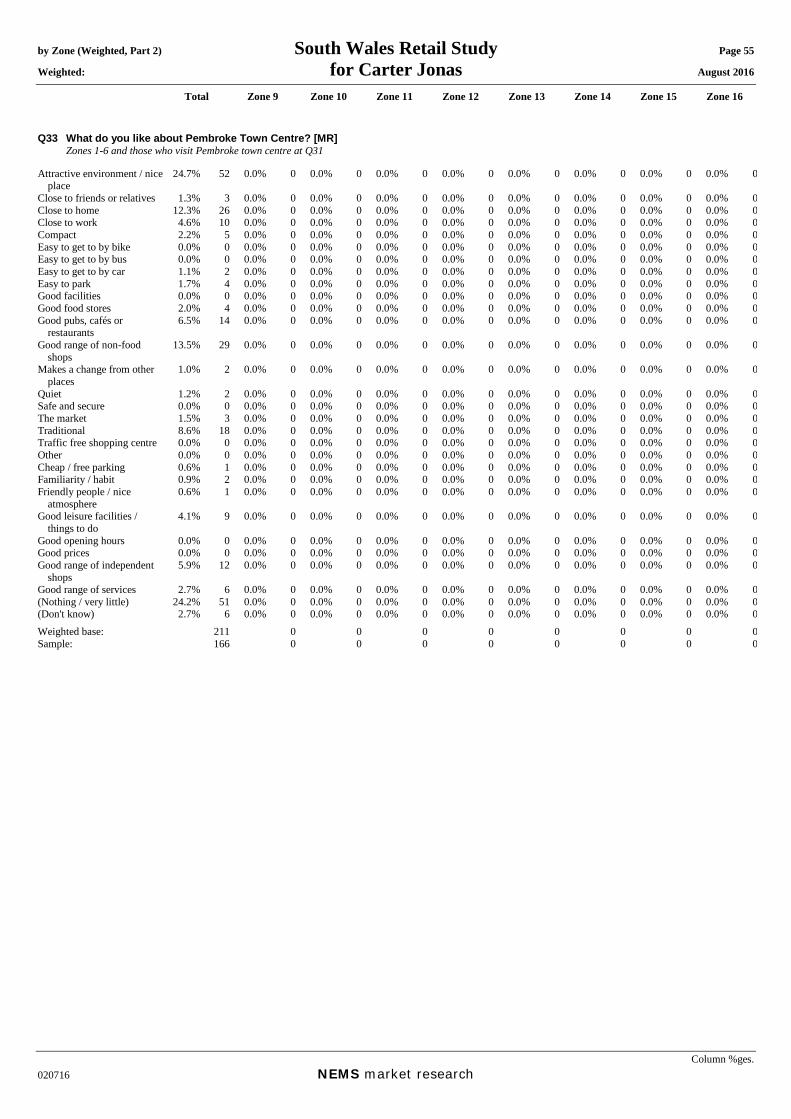
by Zone (Weighted, Part 2) South Wales Retail Study Page 55 Weighted: for Carter Jonas August 2016
Total Zone 9 Zone 10 Zone 11 Zone 12 Zone 13 Zone 14 Zone 15 Zone 16
Column %ges. 020716 NEMS market research
Q33 What do you like about Pembroke Town Centre? [MR] Zones 1-6 and those who visit Pembroke town centre at Q31 Attractive environment / nice
place 24.7% 52 0.0% 0 0.0% 0 0.0% 0 0.0% 0 0.0% 0 0.0% 0 0.0% 0 0.0% 0
Close to friends or relatives 1.3% 3 0.0% 0 0.0% 0 0.0% 0 0.0% 0 0.0% 0 0.0% 0 0.0% 0 0.0% 0Close to home 12.3% 26 0.0% 0 0.0% 0 0.0% 0 0.0% 0 0.0% 0 0.0% 0 0.0% 0 0.0% 0Close to work 4.6% 10 0.0% 0 0.0% 0 0.0% 0 0.0% 0 0.0% 0 0.0% 0 0.0% 0 0.0% 0Compact 2.2% 5 0.0% 0 0.0% 0 0.0% 0 0.0% 0 0.0% 0 0.0% 0 0.0% 0 0.0% 0Easy to get to by bike 0.0% 0 0.0% 0 0.0% 0 0.0% 0 0.0% 0 0.0% 0 0.0% 0 0.0% 0 0.0% 0Easy to get to by bus 0.0% 0 0.0% 0 0.0% 0 0.0% 0 0.0% 0 0.0% 0 0.0% 0 0.0% 0 0.0% 0Easy to get to by car 1.1% 2 0.0% 0 0.0% 0 0.0% 0 0.0% 0 0.0% 0 0.0% 0 0.0% 0 0.0% 0Easy to park 1.7% 4 0.0% 0 0.0% 0 0.0% 0 0.0% 0 0.0% 0 0.0% 0 0.0% 0 0.0% 0Good facilities 0.0% 0 0.0% 0 0.0% 0 0.0% 0 0.0% 0 0.0% 0 0.0% 0 0.0% 0 0.0% 0Good food stores 2.0% 4 0.0% 0 0.0% 0 0.0% 0 0.0% 0 0.0% 0 0.0% 0 0.0% 0 0.0% 0Good pubs, cafés or
restaurants 6.5% 14 0.0% 0 0.0% 0 0.0% 0 0.0% 0 0.0% 0 0.0% 0 0.0% 0 0.0% 0
Good range of non-food shops
13.5% 29 0.0% 0 0.0% 0 0.0% 0 0.0% 0 0.0% 0 0.0% 0 0.0% 0 0.0% 0
Makes a change from other places
1.0% 2 0.0% 0 0.0% 0 0.0% 0 0.0% 0 0.0% 0 0.0% 0 0.0% 0 0.0% 0
Quiet 1.2% 2 0.0% 0 0.0% 0 0.0% 0 0.0% 0 0.0% 0 0.0% 0 0.0% 0 0.0% 0Safe and secure 0.0% 0 0.0% 0 0.0% 0 0.0% 0 0.0% 0 0.0% 0 0.0% 0 0.0% 0 0.0% 0The market 1.5% 3 0.0% 0 0.0% 0 0.0% 0 0.0% 0 0.0% 0 0.0% 0 0.0% 0 0.0% 0Traditional 8.6% 18 0.0% 0 0.0% 0 0.0% 0 0.0% 0 0.0% 0 0.0% 0 0.0% 0 0.0% 0Traffic free shopping centre 0.0% 0 0.0% 0 0.0% 0 0.0% 0 0.0% 0 0.0% 0 0.0% 0 0.0% 0 0.0% 0Other 0.0% 0 0.0% 0 0.0% 0 0.0% 0 0.0% 0 0.0% 0 0.0% 0 0.0% 0 0.0% 0Cheap / free parking 0.6% 1 0.0% 0 0.0% 0 0.0% 0 0.0% 0 0.0% 0 0.0% 0 0.0% 0 0.0% 0Familiarity / habit 0.9% 2 0.0% 0 0.0% 0 0.0% 0 0.0% 0 0.0% 0 0.0% 0 0.0% 0 0.0% 0Friendly people / nice
atmosphere 0.6% 1 0.0% 0 0.0% 0 0.0% 0 0.0% 0 0.0% 0 0.0% 0 0.0% 0 0.0% 0
Good leisure facilities / things to do
4.1% 9 0.0% 0 0.0% 0 0.0% 0 0.0% 0 0.0% 0 0.0% 0 0.0% 0 0.0% 0
Good opening hours 0.0% 0 0.0% 0 0.0% 0 0.0% 0 0.0% 0 0.0% 0 0.0% 0 0.0% 0 0.0% 0Good prices 0.0% 0 0.0% 0 0.0% 0 0.0% 0 0.0% 0 0.0% 0 0.0% 0 0.0% 0 0.0% 0Good range of independent
shops 5.9% 12 0.0% 0 0.0% 0 0.0% 0 0.0% 0 0.0% 0 0.0% 0 0.0% 0 0.0% 0
Good range of services 2.7% 6 0.0% 0 0.0% 0 0.0% 0 0.0% 0 0.0% 0 0.0% 0 0.0% 0 0.0% 0(Nothing / very little) 24.2% 51 0.0% 0 0.0% 0 0.0% 0 0.0% 0 0.0% 0 0.0% 0 0.0% 0 0.0% 0(Don't know) 2.7% 6 0.0% 0 0.0% 0 0.0% 0 0.0% 0 0.0% 0 0.0% 0 0.0% 0 0.0% 0Weighted base: 211 0 0 0 0 0 0 0 0Sample: 166 0 0 0 0 0 0 0 0

by Zone (Weighted, Part 2) South Wales Retail Study Page 56 Weighted: for Carter Jonas August 2016
Total Zone 9 Zone 10 Zone 11 Zone 12 Zone 13 Zone 14 Zone 15 Zone 16
Column %ges. 020716 NEMS market research
Q34 What could be improved about Pembroke Town Centre that would make you visit more often? [MR] Zones 1-6 Better access by road 0.7% 5 0.0% 0 0.0% 0 0.0% 0 0.0% 0 0.0% 0 0.0% 0 0.0% 0 0.0% 0Better public transport 0.0% 0 0.0% 0 0.0% 0 0.0% 0 0.0% 0 0.0% 0 0.0% 0 0.0% 0 0.0% 0Better signposting 0.0% 0 0.0% 0 0.0% 0 0.0% 0 0.0% 0 0.0% 0 0.0% 0 0.0% 0 0.0% 0Cleaner streets 0.4% 2 0.0% 0 0.0% 0 0.0% 0 0.0% 0 0.0% 0 0.0% 0 0.0% 0 0.0% 0Facilities which would assist
you if shopping with children
0.1% 1 0.0% 0 0.0% 0 0.0% 0 0.0% 0 0.0% 0 0.0% 0 0.0% 0 0.0% 0
Free / cheaper car parking 1.8% 12 0.0% 0 0.0% 0 0.0% 0 0.0% 0 0.0% 0 0.0% 0 0.0% 0 0.0% 0Jewellery / food markets /
other events 0.1% 0 0.0% 0 0.0% 0 0.0% 0 0.0% 0 0.0% 0 0.0% 0 0.0% 0 0.0% 0
More / better comparison retailers (i.e. non-food shops)
10.9% 73 0.0% 0 0.0% 0 0.0% 0 0.0% 0 0.0% 0 0.0% 0 0.0% 0 0.0% 0
More / better entertainment 0.2% 1 0.0% 0 0.0% 0 0.0% 0 0.0% 0 0.0% 0 0.0% 0 0.0% 0 0.0% 0More / better places for
eating out (e.g. cafés and restaurants)
0.2% 2 0.0% 0 0.0% 0 0.0% 0 0.0% 0 0.0% 0 0.0% 0 0.0% 0 0.0% 0
More / better food shops 1.8% 12 0.0% 0 0.0% 0 0.0% 0 0.0% 0 0.0% 0 0.0% 0 0.0% 0 0.0% 0More / better parking 5.1% 35 0.0% 0 0.0% 0 0.0% 0 0.0% 0 0.0% 0 0.0% 0 0.0% 0 0.0% 0More / better pedestrianised
streets 0.9% 6 0.0% 0 0.0% 0 0.0% 0 0.0% 0 0.0% 0 0.0% 0 0.0% 0 0.0% 0
More / better public conveniences
0.0% 0 0.0% 0 0.0% 0 0.0% 0 0.0% 0 0.0% 0 0.0% 0 0.0% 0 0.0% 0
More / better seats / flower displays
0.1% 1 0.0% 0 0.0% 0 0.0% 0 0.0% 0 0.0% 0 0.0% 0 0.0% 0 0.0% 0
More / better services 0.0% 0 0.0% 0 0.0% 0 0.0% 0 0.0% 0 0.0% 0 0.0% 0 0.0% 0 0.0% 0More advertising 0.2% 2 0.0% 0 0.0% 0 0.0% 0 0.0% 0 0.0% 0 0.0% 0 0.0% 0 0.0% 0More national multiple shops
/ High Street shops 9.4% 63 0.0% 0 0.0% 0 0.0% 0 0.0% 0 0.0% 0 0.0% 0 0.0% 0 0.0% 0
Protection from the weather (i.e. covered shopping malls)
0.0% 0 0.0% 0 0.0% 0 0.0% 0 0.0% 0 0.0% 0 0.0% 0 0.0% 0 0.0% 0
Shops / services open on Sundays / better opening hours
0.2% 1 0.0% 0 0.0% 0 0.0% 0 0.0% 0 0.0% 0 0.0% 0 0.0% 0 0.0% 0
Fewer vacant shops 1.8% 12 0.0% 0 0.0% 0 0.0% 0 0.0% 0 0.0% 0 0.0% 0 0.0% 0 0.0% 0Better maintained buildings 0.6% 4 0.0% 0 0.0% 0 0.0% 0 0.0% 0 0.0% 0 0.0% 0 0.0% 0 0.0% 0Better disabled access 0.0% 0 0.0% 0 0.0% 0 0.0% 0 0.0% 0 0.0% 0 0.0% 0 0.0% 0 0.0% 0Better prices 0.0% 0 0.0% 0 0.0% 0 0.0% 0 0.0% 0 0.0% 0 0.0% 0 0.0% 0 0.0% 0Better quality shops 0.5% 3 0.0% 0 0.0% 0 0.0% 0 0.0% 0 0.0% 0 0.0% 0 0.0% 0 0.0% 0Fewer charity shops 0.1% 1 0.0% 0 0.0% 0 0.0% 0 0.0% 0 0.0% 0 0.0% 0 0.0% 0 0.0% 0Improve the environment /
refurbish 1.0% 6 0.0% 0 0.0% 0 0.0% 0 0.0% 0 0.0% 0 0.0% 0 0.0% 0 0.0% 0
Less congestion / too busy 0.0% 0 0.0% 0 0.0% 0 0.0% 0 0.0% 0 0.0% 0 0.0% 0 0.0% 0 0.0% 0More independent shops 1.1% 7 0.0% 0 0.0% 0 0.0% 0 0.0% 0 0.0% 0 0.0% 0 0.0% 0 0.0% 0(Nothing) 52.1% 351 0.0% 0 0.0% 0 0.0% 0 0.0% 0 0.0% 0 0.0% 0 0.0% 0 0.0% 0Other 0.0% 0 0.0% 0 0.0% 0 0.0% 0 0.0% 0 0.0% 0 0.0% 0 0.0% 0 0.0% 0(Don’t know) 18.8% 127 0.0% 0 0.0% 0 0.0% 0 0.0% 0 0.0% 0 0.0% 0 0.0% 0 0.0% 0Weighted base: 674 0 0 0 0 0 0 0 0Sample: 602 0 0 0 0 0 0 0 0
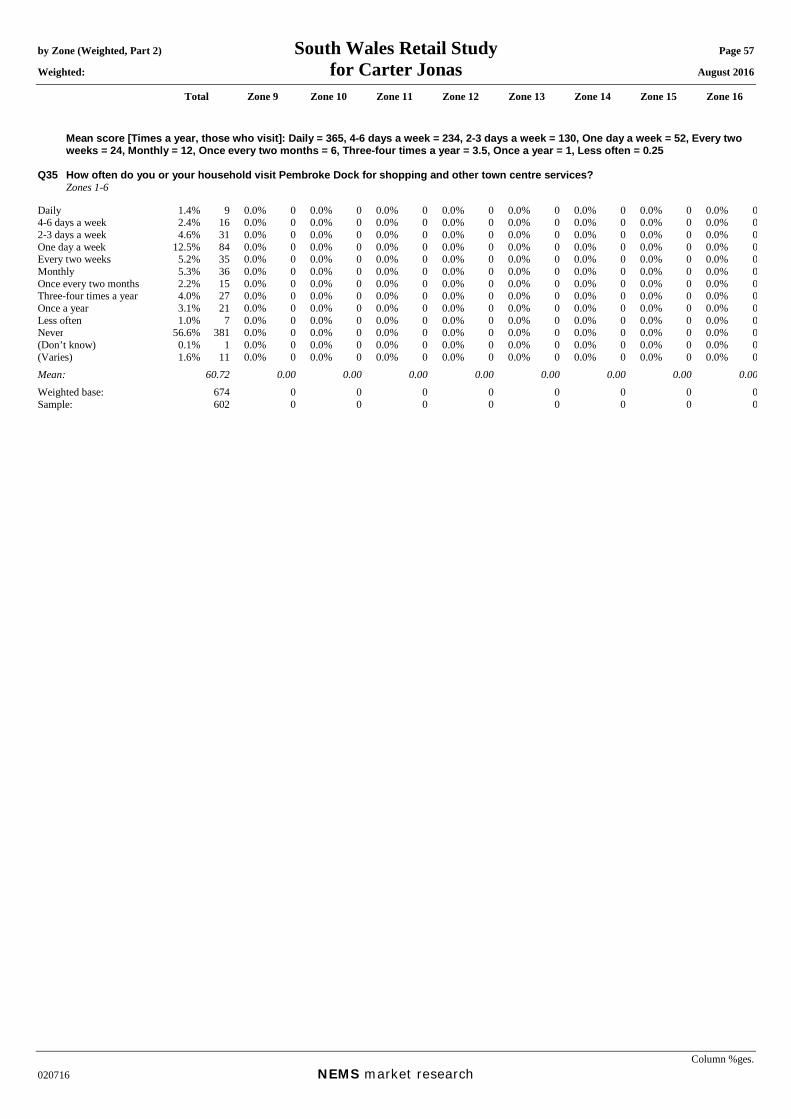
by Zone (Weighted, Part 2) South Wales Retail Study Page 57 Weighted: for Carter Jonas August 2016
Total Zone 9 Zone 10 Zone 11 Zone 12 Zone 13 Zone 14 Zone 15 Zone 16
Column %ges. 020716 NEMS market research
Mean score [Times a year, those who visit]: Daily = 365, 4-6 days a week = 234, 2-3 days a week = 130, One day a week = 52, Every two weeks = 24, Monthly = 12, Once every two months = 6, Three-four times a year = 3.5, Once a year = 1, Less often = 0.25
Q35 How often do you or your household visit Pembroke Dock for shopping and other town centre services? Zones 1-6 Daily 1.4% 9 0.0% 0 0.0% 0 0.0% 0 0.0% 0 0.0% 0 0.0% 0 0.0% 0 0.0% 04-6 days a week 2.4% 16 0.0% 0 0.0% 0 0.0% 0 0.0% 0 0.0% 0 0.0% 0 0.0% 0 0.0% 02-3 days a week 4.6% 31 0.0% 0 0.0% 0 0.0% 0 0.0% 0 0.0% 0 0.0% 0 0.0% 0 0.0% 0One day a week 12.5% 84 0.0% 0 0.0% 0 0.0% 0 0.0% 0 0.0% 0 0.0% 0 0.0% 0 0.0% 0Every two weeks 5.2% 35 0.0% 0 0.0% 0 0.0% 0 0.0% 0 0.0% 0 0.0% 0 0.0% 0 0.0% 0Monthly 5.3% 36 0.0% 0 0.0% 0 0.0% 0 0.0% 0 0.0% 0 0.0% 0 0.0% 0 0.0% 0Once every two months 2.2% 15 0.0% 0 0.0% 0 0.0% 0 0.0% 0 0.0% 0 0.0% 0 0.0% 0 0.0% 0Three-four times a year 4.0% 27 0.0% 0 0.0% 0 0.0% 0 0.0% 0 0.0% 0 0.0% 0 0.0% 0 0.0% 0Once a year 3.1% 21 0.0% 0 0.0% 0 0.0% 0 0.0% 0 0.0% 0 0.0% 0 0.0% 0 0.0% 0Less often 1.0% 7 0.0% 0 0.0% 0 0.0% 0 0.0% 0 0.0% 0 0.0% 0 0.0% 0 0.0% 0Never 56.6% 381 0.0% 0 0.0% 0 0.0% 0 0.0% 0 0.0% 0 0.0% 0 0.0% 0 0.0% 0(Don’t know) 0.1% 1 0.0% 0 0.0% 0 0.0% 0 0.0% 0 0.0% 0 0.0% 0 0.0% 0 0.0% 0(Varies) 1.6% 11 0.0% 0 0.0% 0 0.0% 0 0.0% 0 0.0% 0 0.0% 0 0.0% 0 0.0% 0Mean: 60.72 0.00 0.00 0.00 0.00 0.00 0.00 0.00 0.00Weighted base: 674 0 0 0 0 0 0 0 0Sample: 602 0 0 0 0 0 0 0 0

by Zone (Weighted, Part 2) South Wales Retail Study Page 58 Weighted: for Carter Jonas August 2016
Total Zone 9 Zone 10 Zone 11 Zone 12 Zone 13 Zone 14 Zone 15 Zone 16
Column %ges. 020716 NEMS market research
Q36A In order of importance, what are your two main reasons for visiting Pembroke Dock? Main reason: Zones 1-6 and those who visit Pembroke Dock at Q35 Food shopping 62.3% 182 0.0% 0 0.0% 0 0.0% 0 0.0% 0 0.0% 0 0.0% 0 0.0% 0 0.0% 0Non-food shopping 24.7% 72 0.0% 0 0.0% 0 0.0% 0 0.0% 0 0.0% 0 0.0% 0 0.0% 0 0.0% 0To visit bars / pubs 0.1% 0 0.0% 0 0.0% 0 0.0% 0 0.0% 0 0.0% 0 0.0% 0 0.0% 0 0.0% 0To visit cafés / restaurants 0.7% 2 0.0% 0 0.0% 0 0.0% 0 0.0% 0 0.0% 0 0.0% 0 0.0% 0 0.0% 0To visit personal service
providers (e.g. hairdressers, beauty salon etc.)
0.0% 0 0.0% 0 0.0% 0 0.0% 0 0.0% 0 0.0% 0 0.0% 0 0.0% 0 0.0% 0
To visit financial services such as banks and other financial institutions
2.4% 7 0.0% 0 0.0% 0 0.0% 0 0.0% 0 0.0% 0 0.0% 0 0.0% 0 0.0% 0
To visit other service providers (e.g. travel agent, estate agent etc.)
0.4% 1 0.0% 0 0.0% 0 0.0% 0 0.0% 0 0.0% 0 0.0% 0 0.0% 0 0.0% 0
To visit public services (e.g. medical or dentist appointment, library, job centre, community centre, etc)
2.7% 8 0.0% 0 0.0% 0 0.0% 0 0.0% 0 0.0% 0 0.0% 0 0.0% 0 0.0% 0
To get petrol 0.3% 1 0.0% 0 0.0% 0 0.0% 0 0.0% 0 0.0% 0 0.0% 0 0.0% 0 0.0% 0To visit the cinema 0.0% 0 0.0% 0 0.0% 0 0.0% 0 0.0% 0 0.0% 0 0.0% 0 0.0% 0 0.0% 0To visit a park 0.0% 0 0.0% 0 0.0% 0 0.0% 0 0.0% 0 0.0% 0 0.0% 0 0.0% 0 0.0% 0To visit the swimming pool 0.0% 0 0.0% 0 0.0% 0 0.0% 0 0.0% 0 0.0% 0 0.0% 0 0.0% 0 0.0% 0To visit other gyms / health
and fitness facilities 0.0% 0 0.0% 0 0.0% 0 0.0% 0 0.0% 0 0.0% 0 0.0% 0 0.0% 0 0.0% 0
To visit the library 0.0% 0 0.0% 0 0.0% 0 0.0% 0 0.0% 0 0.0% 0 0.0% 0 0.0% 0 0.0% 0To visit museums / art
gallery 0.0% 0 0.0% 0 0.0% 0 0.0% 0 0.0% 0 0.0% 0 0.0% 0 0.0% 0 0.0% 0
To visit the theatre or musical venues
0.3% 1 0.0% 0 0.0% 0 0.0% 0 0.0% 0 0.0% 0 0.0% 0 0.0% 0 0.0% 0
To visit night time venues e.g. nightclub
0.0% 0 0.0% 0 0.0% 0 0.0% 0 0.0% 0 0.0% 0 0.0% 0 0.0% 0 0.0% 0
For other leisure activities 0.6% 2 0.0% 0 0.0% 0 0.0% 0 0.0% 0 0.0% 0 0.0% 0 0.0% 0 0.0% 0To shop at the market(s) 0.3% 1 0.0% 0 0.0% 0 0.0% 0 0.0% 0 0.0% 0 0.0% 0 0.0% 0 0.0% 0To meet family 0.4% 1 0.0% 0 0.0% 0 0.0% 0 0.0% 0 0.0% 0 0.0% 0 0.0% 0 0.0% 0To meet friends 0.7% 2 0.0% 0 0.0% 0 0.0% 0 0.0% 0 0.0% 0 0.0% 0 0.0% 0 0.0% 0To visit the theatre 0.0% 0 0.0% 0 0.0% 0 0.0% 0 0.0% 0 0.0% 0 0.0% 0 0.0% 0 0.0% 0For work (i.e. place of work) 1.6% 5 0.0% 0 0.0% 0 0.0% 0 0.0% 0 0.0% 0 0.0% 0 0.0% 0 0.0% 0For business (e.g. attend a
business appointment) 0.0% 0 0.0% 0 0.0% 0 0.0% 0 0.0% 0 0.0% 0 0.0% 0 0.0% 0 0.0% 0
For education as a student (e.g. student at college, university, or other third level education)
0.0% 0 0.0% 0 0.0% 0 0.0% 0 0.0% 0 0.0% 0 0.0% 0 0.0% 0 0.0% 0
To access public transport for onward travel (e.g. train station, bus station)
0.4% 1 0.0% 0 0.0% 0 0.0% 0 0.0% 0 0.0% 0 0.0% 0 0.0% 0 0.0% 0
Other 0.0% 0 0.0% 0 0.0% 0 0.0% 0 0.0% 0 0.0% 0 0.0% 0 0.0% 0 0.0% 0As part of a day out / for a
day out / something different
0.0% 0 0.0% 0 0.0% 0 0.0% 0 0.0% 0 0.0% 0 0.0% 0 0.0% 0 0.0% 0
Browsing / window shopping 1.4% 4 0.0% 0 0.0% 0 0.0% 0 0.0% 0 0.0% 0 0.0% 0 0.0% 0 0.0% 0(Don't know / varies) 0.0% 0 0.0% 0 0.0% 0 0.0% 0 0.0% 0 0.0% 0 0.0% 0 0.0% 0 0.0% 0(Nothing / nothing further) 0.7% 2 0.0% 0 0.0% 0 0.0% 0 0.0% 0 0.0% 0 0.0% 0 0.0% 0 0.0% 0Weighted base: 292 0 0 0 0 0 0 0 0Sample: 217 0 0 0 0 0 0 0 0

by Zone (Weighted, Part 2) South Wales Retail Study Page 59 Weighted: for Carter Jonas August 2016
Total Zone 9 Zone 10 Zone 11 Zone 12 Zone 13 Zone 14 Zone 15 Zone 16
Column %ges. 020716 NEMS market research
Q36B In order of importance, what are your two main reasons for visiting Pembroke Dock? Secondary reason: Those who gave a reason at Q36A Food shopping 3.8% 11 0.0% 0 0.0% 0 0.0% 0 0.0% 0 0.0% 0 0.0% 0 0.0% 0 0.0% 0Non-food shopping 21.2% 61 0.0% 0 0.0% 0 0.0% 0 0.0% 0 0.0% 0 0.0% 0 0.0% 0 0.0% 0To visit bars / pubs 0.1% 0 0.0% 0 0.0% 0 0.0% 0 0.0% 0 0.0% 0 0.0% 0 0.0% 0 0.0% 0To visit cafés / restaurants 3.3% 9 0.0% 0 0.0% 0 0.0% 0 0.0% 0 0.0% 0 0.0% 0 0.0% 0 0.0% 0To visit personal service
providers (e.g. hairdressers, beauty salon etc.)
0.0% 0 0.0% 0 0.0% 0 0.0% 0 0.0% 0 0.0% 0 0.0% 0 0.0% 0 0.0% 0
To visit financial services such as banks and other financial institutions
2.2% 6 0.0% 0 0.0% 0 0.0% 0 0.0% 0 0.0% 0 0.0% 0 0.0% 0 0.0% 0
To visit other service providers (e.g. travel agent, estate agent etc.)
0.4% 1 0.0% 0 0.0% 0 0.0% 0 0.0% 0 0.0% 0 0.0% 0 0.0% 0 0.0% 0
To visit public services (e.g. medical or dentist appointment, library, job centre, community centre, etc)
2.8% 8 0.0% 0 0.0% 0 0.0% 0 0.0% 0 0.0% 0 0.0% 0 0.0% 0 0.0% 0
To get petrol 0.4% 1 0.0% 0 0.0% 0 0.0% 0 0.0% 0 0.0% 0 0.0% 0 0.0% 0 0.0% 0To visit the cinema 0.0% 0 0.0% 0 0.0% 0 0.0% 0 0.0% 0 0.0% 0 0.0% 0 0.0% 0 0.0% 0To visit a park 0.0% 0 0.0% 0 0.0% 0 0.0% 0 0.0% 0 0.0% 0 0.0% 0 0.0% 0 0.0% 0To visit the swimming pool 0.0% 0 0.0% 0 0.0% 0 0.0% 0 0.0% 0 0.0% 0 0.0% 0 0.0% 0 0.0% 0To visit other gyms / health
and fitness facilities 0.0% 0 0.0% 0 0.0% 0 0.0% 0 0.0% 0 0.0% 0 0.0% 0 0.0% 0 0.0% 0
To visit the library 0.3% 1 0.0% 0 0.0% 0 0.0% 0 0.0% 0 0.0% 0 0.0% 0 0.0% 0 0.0% 0To visit museums / art
gallery 0.0% 0 0.0% 0 0.0% 0 0.0% 0 0.0% 0 0.0% 0 0.0% 0 0.0% 0 0.0% 0
To visit the theatre or musical venues
0.0% 0 0.0% 0 0.0% 0 0.0% 0 0.0% 0 0.0% 0 0.0% 0 0.0% 0 0.0% 0
To visit night time venues e.g. nightclub
0.0% 0 0.0% 0 0.0% 0 0.0% 0 0.0% 0 0.0% 0 0.0% 0 0.0% 0 0.0% 0
For other leisure activities 1.0% 3 0.0% 0 0.0% 0 0.0% 0 0.0% 0 0.0% 0 0.0% 0 0.0% 0 0.0% 0To shop at the market(s) 0.0% 0 0.0% 0 0.0% 0 0.0% 0 0.0% 0 0.0% 0 0.0% 0 0.0% 0 0.0% 0To meet family 1.3% 4 0.0% 0 0.0% 0 0.0% 0 0.0% 0 0.0% 0 0.0% 0 0.0% 0 0.0% 0To meet friends 1.7% 5 0.0% 0 0.0% 0 0.0% 0 0.0% 0 0.0% 0 0.0% 0 0.0% 0 0.0% 0To visit the theatre 0.0% 0 0.0% 0 0.0% 0 0.0% 0 0.0% 0 0.0% 0 0.0% 0 0.0% 0 0.0% 0For work (i.e. place of work) 0.9% 2 0.0% 0 0.0% 0 0.0% 0 0.0% 0 0.0% 0 0.0% 0 0.0% 0 0.0% 0For business (e.g. attend a
business appointment) 0.0% 0 0.0% 0 0.0% 0 0.0% 0 0.0% 0 0.0% 0 0.0% 0 0.0% 0 0.0% 0
For education as a student (e.g. student at college, university, or other third level education)
0.0% 0 0.0% 0 0.0% 0 0.0% 0 0.0% 0 0.0% 0 0.0% 0 0.0% 0 0.0% 0
To access public transport for onward travel (e.g. train station, bus station)
0.0% 0 0.0% 0 0.0% 0 0.0% 0 0.0% 0 0.0% 0 0.0% 0 0.0% 0 0.0% 0
Other 0.0% 0 0.0% 0 0.0% 0 0.0% 0 0.0% 0 0.0% 0 0.0% 0 0.0% 0 0.0% 0As part of a day out / for a
day out / something different
0.0% 0 0.0% 0 0.0% 0 0.0% 0 0.0% 0 0.0% 0 0.0% 0 0.0% 0 0.0% 0
Browsing / window shopping 0.0% 0 0.0% 0 0.0% 0 0.0% 0 0.0% 0 0.0% 0 0.0% 0 0.0% 0 0.0% 0(Don't know / varies) 0.9% 3 0.0% 0 0.0% 0 0.0% 0 0.0% 0 0.0% 0 0.0% 0 0.0% 0 0.0% 0(Nothing / nothing further) 59.7% 173 0.0% 0 0.0% 0 0.0% 0 0.0% 0 0.0% 0 0.0% 0 0.0% 0 0.0% 0Weighted base: 291 0 0 0 0 0 0 0 0Sample: 214 0 0 0 0 0 0 0 0

by Zone (Weighted, Part 2) South Wales Retail Study Page 60 Weighted: for Carter Jonas August 2016
Total Zone 9 Zone 10 Zone 11 Zone 12 Zone 13 Zone 14 Zone 15 Zone 16
Column %ges. 020716 NEMS market research
Q36X In order of importance, what are your two main reasons for visiting Pembroke Dock? Any mention: [MR] Zones 1-6 and those who visit Pembroke Dock at Q35 Food shopping 66.1% 193 0.0% 0 0.0% 0 0.0% 0 0.0% 0 0.0% 0 0.0% 0 0.0% 0 0.0% 0Non-food shopping 45.7% 134 0.0% 0 0.0% 0 0.0% 0 0.0% 0 0.0% 0 0.0% 0 0.0% 0 0.0% 0To visit bars / pubs 0.2% 1 0.0% 0 0.0% 0 0.0% 0 0.0% 0 0.0% 0 0.0% 0 0.0% 0 0.0% 0To visit cafés / restaurants 4.0% 12 0.0% 0 0.0% 0 0.0% 0 0.0% 0 0.0% 0 0.0% 0 0.0% 0 0.0% 0To visit personal service
providers (e.g. hairdressers, beauty salon etc.)
0.0% 0 0.0% 0 0.0% 0 0.0% 0 0.0% 0 0.0% 0 0.0% 0 0.0% 0 0.0% 0
To visit financial services such as banks and other financial institutions
4.6% 13 0.0% 0 0.0% 0 0.0% 0 0.0% 0 0.0% 0 0.0% 0 0.0% 0 0.0% 0
To visit other service providers (e.g. travel agent, estate agent etc.)
0.9% 3 0.0% 0 0.0% 0 0.0% 0 0.0% 0 0.0% 0 0.0% 0 0.0% 0 0.0% 0
To visit public services (e.g. medical or dentist appointment, library, job centre, community centre, etc)
5.5% 16 0.0% 0 0.0% 0 0.0% 0 0.0% 0 0.0% 0 0.0% 0 0.0% 0 0.0% 0
To get petrol 0.7% 2 0.0% 0 0.0% 0 0.0% 0 0.0% 0 0.0% 0 0.0% 0 0.0% 0 0.0% 0To visit the cinema 0.0% 0 0.0% 0 0.0% 0 0.0% 0 0.0% 0 0.0% 0 0.0% 0 0.0% 0 0.0% 0To visit a park 0.0% 0 0.0% 0 0.0% 0 0.0% 0 0.0% 0 0.0% 0 0.0% 0 0.0% 0 0.0% 0To visit the swimming pool 0.0% 0 0.0% 0 0.0% 0 0.0% 0 0.0% 0 0.0% 0 0.0% 0 0.0% 0 0.0% 0To visit other gyms / health
and fitness facilities 0.0% 0 0.0% 0 0.0% 0 0.0% 0 0.0% 0 0.0% 0 0.0% 0 0.0% 0 0.0% 0
To visit the library 0.3% 1 0.0% 0 0.0% 0 0.0% 0 0.0% 0 0.0% 0 0.0% 0 0.0% 0 0.0% 0To visit museums / art
gallery 0.0% 0 0.0% 0 0.0% 0 0.0% 0 0.0% 0 0.0% 0 0.0% 0 0.0% 0 0.0% 0
To visit the theatre or musical venues
0.3% 1 0.0% 0 0.0% 0 0.0% 0 0.0% 0 0.0% 0 0.0% 0 0.0% 0 0.0% 0
To visit night time venues e.g. nightclub
0.0% 0 0.0% 0 0.0% 0 0.0% 0 0.0% 0 0.0% 0 0.0% 0 0.0% 0 0.0% 0
For other leisure activities 1.5% 4 0.0% 0 0.0% 0 0.0% 0 0.0% 0 0.0% 0 0.0% 0 0.0% 0 0.0% 0To shop at the market(s) 0.3% 1 0.0% 0 0.0% 0 0.0% 0 0.0% 0 0.0% 0 0.0% 0 0.0% 0 0.0% 0To meet family 1.8% 5 0.0% 0 0.0% 0 0.0% 0 0.0% 0 0.0% 0 0.0% 0 0.0% 0 0.0% 0To meet friends 2.4% 7 0.0% 0 0.0% 0 0.0% 0 0.0% 0 0.0% 0 0.0% 0 0.0% 0 0.0% 0To visit the theatre 0.0% 0 0.0% 0 0.0% 0 0.0% 0 0.0% 0 0.0% 0 0.0% 0 0.0% 0 0.0% 0For work (i.e. place of work) 2.4% 7 0.0% 0 0.0% 0 0.0% 0 0.0% 0 0.0% 0 0.0% 0 0.0% 0 0.0% 0For business (e.g. attend a
business appointment) 0.0% 0 0.0% 0 0.0% 0 0.0% 0 0.0% 0 0.0% 0 0.0% 0 0.0% 0 0.0% 0
For education as a student (e.g. student at college, university, or other third level education)
0.0% 0 0.0% 0 0.0% 0 0.0% 0 0.0% 0 0.0% 0 0.0% 0 0.0% 0 0.0% 0
To access public transport for onward travel (e.g. train station, bus station)
0.4% 1 0.0% 0 0.0% 0 0.0% 0 0.0% 0 0.0% 0 0.0% 0 0.0% 0 0.0% 0
Other 0.0% 0 0.0% 0 0.0% 0 0.0% 0 0.0% 0 0.0% 0 0.0% 0 0.0% 0 0.0% 0As part of a day out / for a
day out / something different
0.0% 0 0.0% 0 0.0% 0 0.0% 0 0.0% 0 0.0% 0 0.0% 0 0.0% 0 0.0% 0
Browsing / window shopping 1.4% 4 0.0% 0 0.0% 0 0.0% 0 0.0% 0 0.0% 0 0.0% 0 0.0% 0 0.0% 0Weighted base: 292 0 0 0 0 0 0 0 0Sample: 217 0 0 0 0 0 0 0 0
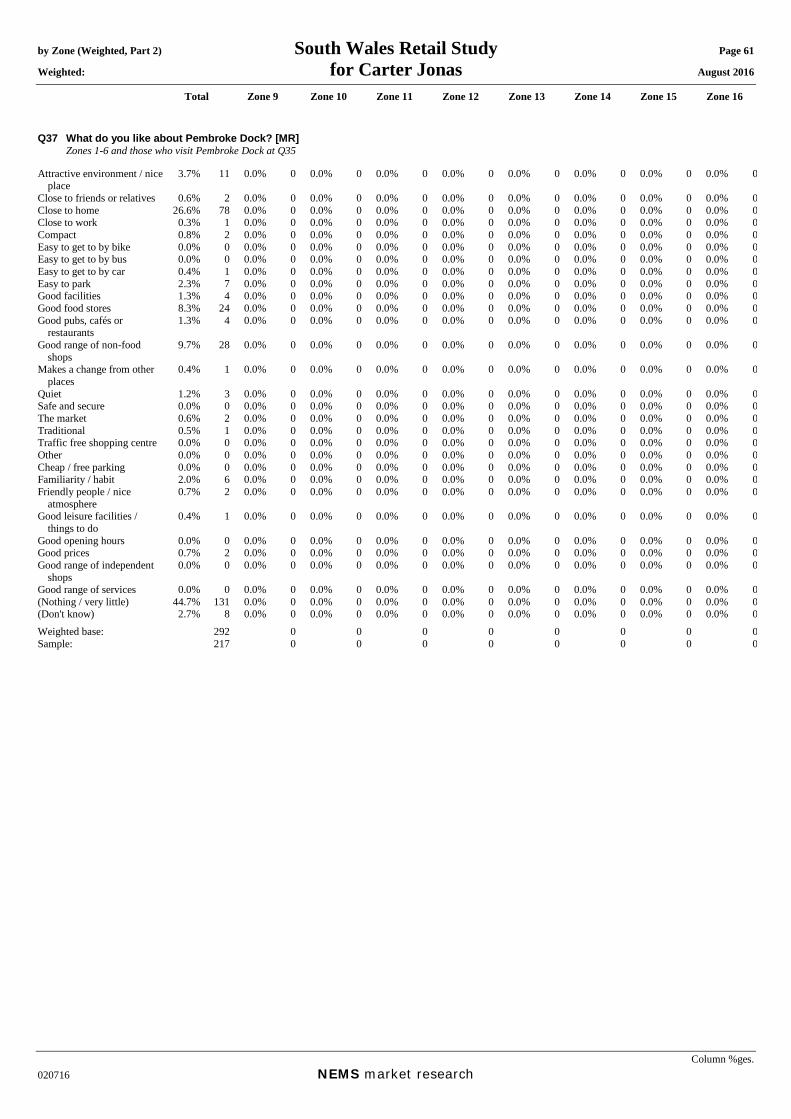
by Zone (Weighted, Part 2) South Wales Retail Study Page 61 Weighted: for Carter Jonas August 2016
Total Zone 9 Zone 10 Zone 11 Zone 12 Zone 13 Zone 14 Zone 15 Zone 16
Column %ges. 020716 NEMS market research
Q37 What do you like about Pembroke Dock? [MR] Zones 1-6 and those who visit Pembroke Dock at Q35 Attractive environment / nice
place 3.7% 11 0.0% 0 0.0% 0 0.0% 0 0.0% 0 0.0% 0 0.0% 0 0.0% 0 0.0% 0
Close to friends or relatives 0.6% 2 0.0% 0 0.0% 0 0.0% 0 0.0% 0 0.0% 0 0.0% 0 0.0% 0 0.0% 0Close to home 26.6% 78 0.0% 0 0.0% 0 0.0% 0 0.0% 0 0.0% 0 0.0% 0 0.0% 0 0.0% 0Close to work 0.3% 1 0.0% 0 0.0% 0 0.0% 0 0.0% 0 0.0% 0 0.0% 0 0.0% 0 0.0% 0Compact 0.8% 2 0.0% 0 0.0% 0 0.0% 0 0.0% 0 0.0% 0 0.0% 0 0.0% 0 0.0% 0Easy to get to by bike 0.0% 0 0.0% 0 0.0% 0 0.0% 0 0.0% 0 0.0% 0 0.0% 0 0.0% 0 0.0% 0Easy to get to by bus 0.0% 0 0.0% 0 0.0% 0 0.0% 0 0.0% 0 0.0% 0 0.0% 0 0.0% 0 0.0% 0Easy to get to by car 0.4% 1 0.0% 0 0.0% 0 0.0% 0 0.0% 0 0.0% 0 0.0% 0 0.0% 0 0.0% 0Easy to park 2.3% 7 0.0% 0 0.0% 0 0.0% 0 0.0% 0 0.0% 0 0.0% 0 0.0% 0 0.0% 0Good facilities 1.3% 4 0.0% 0 0.0% 0 0.0% 0 0.0% 0 0.0% 0 0.0% 0 0.0% 0 0.0% 0Good food stores 8.3% 24 0.0% 0 0.0% 0 0.0% 0 0.0% 0 0.0% 0 0.0% 0 0.0% 0 0.0% 0Good pubs, cafés or
restaurants 1.3% 4 0.0% 0 0.0% 0 0.0% 0 0.0% 0 0.0% 0 0.0% 0 0.0% 0 0.0% 0
Good range of non-food shops
9.7% 28 0.0% 0 0.0% 0 0.0% 0 0.0% 0 0.0% 0 0.0% 0 0.0% 0 0.0% 0
Makes a change from other places
0.4% 1 0.0% 0 0.0% 0 0.0% 0 0.0% 0 0.0% 0 0.0% 0 0.0% 0 0.0% 0
Quiet 1.2% 3 0.0% 0 0.0% 0 0.0% 0 0.0% 0 0.0% 0 0.0% 0 0.0% 0 0.0% 0Safe and secure 0.0% 0 0.0% 0 0.0% 0 0.0% 0 0.0% 0 0.0% 0 0.0% 0 0.0% 0 0.0% 0The market 0.6% 2 0.0% 0 0.0% 0 0.0% 0 0.0% 0 0.0% 0 0.0% 0 0.0% 0 0.0% 0Traditional 0.5% 1 0.0% 0 0.0% 0 0.0% 0 0.0% 0 0.0% 0 0.0% 0 0.0% 0 0.0% 0Traffic free shopping centre 0.0% 0 0.0% 0 0.0% 0 0.0% 0 0.0% 0 0.0% 0 0.0% 0 0.0% 0 0.0% 0Other 0.0% 0 0.0% 0 0.0% 0 0.0% 0 0.0% 0 0.0% 0 0.0% 0 0.0% 0 0.0% 0Cheap / free parking 0.0% 0 0.0% 0 0.0% 0 0.0% 0 0.0% 0 0.0% 0 0.0% 0 0.0% 0 0.0% 0Familiarity / habit 2.0% 6 0.0% 0 0.0% 0 0.0% 0 0.0% 0 0.0% 0 0.0% 0 0.0% 0 0.0% 0Friendly people / nice
atmosphere 0.7% 2 0.0% 0 0.0% 0 0.0% 0 0.0% 0 0.0% 0 0.0% 0 0.0% 0 0.0% 0
Good leisure facilities / things to do
0.4% 1 0.0% 0 0.0% 0 0.0% 0 0.0% 0 0.0% 0 0.0% 0 0.0% 0 0.0% 0
Good opening hours 0.0% 0 0.0% 0 0.0% 0 0.0% 0 0.0% 0 0.0% 0 0.0% 0 0.0% 0 0.0% 0Good prices 0.7% 2 0.0% 0 0.0% 0 0.0% 0 0.0% 0 0.0% 0 0.0% 0 0.0% 0 0.0% 0Good range of independent
shops 0.0% 0 0.0% 0 0.0% 0 0.0% 0 0.0% 0 0.0% 0 0.0% 0 0.0% 0 0.0% 0
Good range of services 0.0% 0 0.0% 0 0.0% 0 0.0% 0 0.0% 0 0.0% 0 0.0% 0 0.0% 0 0.0% 0(Nothing / very little) 44.7% 131 0.0% 0 0.0% 0 0.0% 0 0.0% 0 0.0% 0 0.0% 0 0.0% 0 0.0% 0(Don't know) 2.7% 8 0.0% 0 0.0% 0 0.0% 0 0.0% 0 0.0% 0 0.0% 0 0.0% 0 0.0% 0Weighted base: 292 0 0 0 0 0 0 0 0Sample: 217 0 0 0 0 0 0 0 0
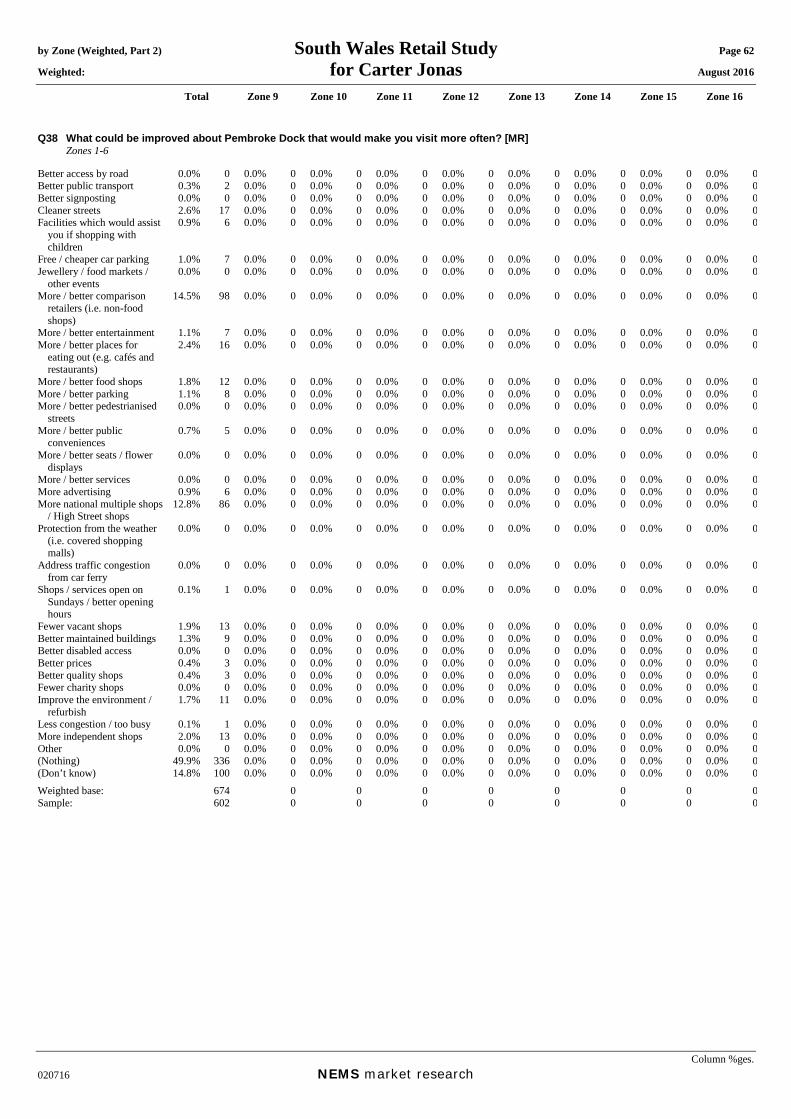
by Zone (Weighted, Part 2) South Wales Retail Study Page 62 Weighted: for Carter Jonas August 2016
Total Zone 9 Zone 10 Zone 11 Zone 12 Zone 13 Zone 14 Zone 15 Zone 16
Column %ges. 020716 NEMS market research
Q38 What could be improved about Pembroke Dock that would make you visit more often? [MR] Zones 1-6 Better access by road 0.0% 0 0.0% 0 0.0% 0 0.0% 0 0.0% 0 0.0% 0 0.0% 0 0.0% 0 0.0% 0Better public transport 0.3% 2 0.0% 0 0.0% 0 0.0% 0 0.0% 0 0.0% 0 0.0% 0 0.0% 0 0.0% 0Better signposting 0.0% 0 0.0% 0 0.0% 0 0.0% 0 0.0% 0 0.0% 0 0.0% 0 0.0% 0 0.0% 0Cleaner streets 2.6% 17 0.0% 0 0.0% 0 0.0% 0 0.0% 0 0.0% 0 0.0% 0 0.0% 0 0.0% 0Facilities which would assist
you if shopping with children
0.9% 6 0.0% 0 0.0% 0 0.0% 0 0.0% 0 0.0% 0 0.0% 0 0.0% 0 0.0% 0
Free / cheaper car parking 1.0% 7 0.0% 0 0.0% 0 0.0% 0 0.0% 0 0.0% 0 0.0% 0 0.0% 0 0.0% 0Jewellery / food markets /
other events 0.0% 0 0.0% 0 0.0% 0 0.0% 0 0.0% 0 0.0% 0 0.0% 0 0.0% 0 0.0% 0
More / better comparison retailers (i.e. non-food shops)
14.5% 98 0.0% 0 0.0% 0 0.0% 0 0.0% 0 0.0% 0 0.0% 0 0.0% 0 0.0% 0
More / better entertainment 1.1% 7 0.0% 0 0.0% 0 0.0% 0 0.0% 0 0.0% 0 0.0% 0 0.0% 0 0.0% 0More / better places for
eating out (e.g. cafés and restaurants)
2.4% 16 0.0% 0 0.0% 0 0.0% 0 0.0% 0 0.0% 0 0.0% 0 0.0% 0 0.0% 0
More / better food shops 1.8% 12 0.0% 0 0.0% 0 0.0% 0 0.0% 0 0.0% 0 0.0% 0 0.0% 0 0.0% 0More / better parking 1.1% 8 0.0% 0 0.0% 0 0.0% 0 0.0% 0 0.0% 0 0.0% 0 0.0% 0 0.0% 0More / better pedestrianised
streets 0.0% 0 0.0% 0 0.0% 0 0.0% 0 0.0% 0 0.0% 0 0.0% 0 0.0% 0 0.0% 0
More / better public conveniences
0.7% 5 0.0% 0 0.0% 0 0.0% 0 0.0% 0 0.0% 0 0.0% 0 0.0% 0 0.0% 0
More / better seats / flower displays
0.0% 0 0.0% 0 0.0% 0 0.0% 0 0.0% 0 0.0% 0 0.0% 0 0.0% 0 0.0% 0
More / better services 0.0% 0 0.0% 0 0.0% 0 0.0% 0 0.0% 0 0.0% 0 0.0% 0 0.0% 0 0.0% 0More advertising 0.9% 6 0.0% 0 0.0% 0 0.0% 0 0.0% 0 0.0% 0 0.0% 0 0.0% 0 0.0% 0More national multiple shops
/ High Street shops 12.8% 86 0.0% 0 0.0% 0 0.0% 0 0.0% 0 0.0% 0 0.0% 0 0.0% 0 0.0% 0
Protection from the weather (i.e. covered shopping malls)
0.0% 0 0.0% 0 0.0% 0 0.0% 0 0.0% 0 0.0% 0 0.0% 0 0.0% 0 0.0% 0
Address traffic congestion from car ferry
0.0% 0 0.0% 0 0.0% 0 0.0% 0 0.0% 0 0.0% 0 0.0% 0 0.0% 0 0.0% 0
Shops / services open on Sundays / better opening hours
0.1% 1 0.0% 0 0.0% 0 0.0% 0 0.0% 0 0.0% 0 0.0% 0 0.0% 0 0.0% 0
Fewer vacant shops 1.9% 13 0.0% 0 0.0% 0 0.0% 0 0.0% 0 0.0% 0 0.0% 0 0.0% 0 0.0% 0Better maintained buildings 1.3% 9 0.0% 0 0.0% 0 0.0% 0 0.0% 0 0.0% 0 0.0% 0 0.0% 0 0.0% 0Better disabled access 0.0% 0 0.0% 0 0.0% 0 0.0% 0 0.0% 0 0.0% 0 0.0% 0 0.0% 0 0.0% 0Better prices 0.4% 3 0.0% 0 0.0% 0 0.0% 0 0.0% 0 0.0% 0 0.0% 0 0.0% 0 0.0% 0Better quality shops 0.4% 3 0.0% 0 0.0% 0 0.0% 0 0.0% 0 0.0% 0 0.0% 0 0.0% 0 0.0% 0Fewer charity shops 0.0% 0 0.0% 0 0.0% 0 0.0% 0 0.0% 0 0.0% 0 0.0% 0 0.0% 0 0.0% 0Improve the environment /
refurbish 1.7% 11 0.0% 0 0.0% 0 0.0% 0 0.0% 0 0.0% 0 0.0% 0 0.0% 0 0.0% 0
Less congestion / too busy 0.1% 1 0.0% 0 0.0% 0 0.0% 0 0.0% 0 0.0% 0 0.0% 0 0.0% 0 0.0% 0More independent shops 2.0% 13 0.0% 0 0.0% 0 0.0% 0 0.0% 0 0.0% 0 0.0% 0 0.0% 0 0.0% 0Other 0.0% 0 0.0% 0 0.0% 0 0.0% 0 0.0% 0 0.0% 0 0.0% 0 0.0% 0 0.0% 0(Nothing) 49.9% 336 0.0% 0 0.0% 0 0.0% 0 0.0% 0 0.0% 0 0.0% 0 0.0% 0 0.0% 0(Don’t know) 14.8% 100 0.0% 0 0.0% 0 0.0% 0 0.0% 0 0.0% 0 0.0% 0 0.0% 0 0.0% 0Weighted base: 674 0 0 0 0 0 0 0 0Sample: 602 0 0 0 0 0 0 0 0

by Zone (Weighted, Part 2) South Wales Retail Study Page 63 Weighted: for Carter Jonas August 2016
Total Zone 9 Zone 10 Zone 11 Zone 12 Zone 13 Zone 14 Zone 15 Zone 16
Column %ges. 020716 NEMS market research
Mean score [Times a year, those who visit]: Daily = 365, 4-6 days a week = 234, 2-3 days a week = 130, One day a week = 52, Every two weeks = 24, Monthly = 12, Once every two months = 6, Three-four times a year = 3.5, Once a year = 1, Less often = 0.25
Q39 How often do you or your household visit Fishguard Town Centre for shopping and other town centre services? Zones 3 & 7-10 Daily 6.4% 28 0.9% 0 0.0% 0 0.0% 0 0.0% 0 0.0% 0 0.0% 0 0.0% 0 0.0% 04-6 days a week 1.3% 6 0.0% 0 0.0% 0 0.0% 0 0.0% 0 0.0% 0 0.0% 0 0.0% 0 0.0% 02-3 days a week 4.0% 18 2.9% 1 0.0% 0 0.0% 0 0.0% 0 0.0% 0 0.0% 0 0.0% 0 0.0% 0One day a week 4.9% 22 22.9% 7 0.0% 0 0.0% 0 0.0% 0 0.0% 0 0.0% 0 0.0% 0 0.0% 0Every two weeks 2.3% 10 5.6% 2 0.9% 1 0.0% 0 0.0% 0 0.0% 0 0.0% 0 0.0% 0 0.0% 0Monthly 4.2% 19 5.9% 2 6.0% 9 0.0% 0 0.0% 0 0.0% 0 0.0% 0 0.0% 0 0.0% 0Once every two months 2.0% 9 6.5% 2 0.0% 0 0.0% 0 0.0% 0 0.0% 0 0.0% 0 0.0% 0 0.0% 0Three-four times a year 3.0% 13 5.7% 2 1.3% 2 0.0% 0 0.0% 0 0.0% 0 0.0% 0 0.0% 0 0.0% 0Once a year 1.5% 7 2.3% 1 2.3% 4 0.0% 0 0.0% 0 0.0% 0 0.0% 0 0.0% 0 0.0% 0Less often 1.0% 4 0.9% 0 0.0% 0 0.0% 0 0.0% 0 0.0% 0 0.0% 0 0.0% 0 0.0% 0Never 67.9% 300 45.7% 15 89.6% 136 0.0% 0 0.0% 0 0.0% 0 0.0% 0 0.0% 0 0.0% 0(Don’t know) 0.2% 1 0.0% 0 0.0% 0 0.0% 0 0.0% 0 0.0% 0 0.0% 0 0.0% 0 0.0% 0(Varies) 1.3% 6 0.7% 0 0.0% 0 0.0% 0 0.0% 0 0.0% 0 0.0% 0 0.0% 0 0.0% 0Mean: 115.49 40.62 9.50 0.00 0.00 0.00 0.00 0.00 0.00Weighted base: 441 33 152 0 0 0 0 0 0Sample: 501 100 100 0 0 0 0 0 0

by Zone (Weighted, Part 2) South Wales Retail Study Page 64 Weighted: for Carter Jonas August 2016
Total Zone 9 Zone 10 Zone 11 Zone 12 Zone 13 Zone 14 Zone 15 Zone 16
Column %ges. 020716 NEMS market research
Q40A In order of importance, what are your two main reasons for visiting Fishguard Town Centre? Main reason: Zones 3 & 7-10 and those who visit Fishguard town centre at Q39 Food shopping 31.1% 44 34.5% 6 17.6% 3 0.0% 0 0.0% 0 0.0% 0 0.0% 0 0.0% 0 0.0% 0Non-food shopping 21.9% 31 19.2% 3 45.7% 7 0.0% 0 0.0% 0 0.0% 0 0.0% 0 0.0% 0 0.0% 0To visit bars / pubs 0.0% 0 0.0% 0 0.0% 0 0.0% 0 0.0% 0 0.0% 0 0.0% 0 0.0% 0 0.0% 0To visit cafés / restaurants 5.1% 7 3.6% 1 6.1% 1 0.0% 0 0.0% 0 0.0% 0 0.0% 0 0.0% 0 0.0% 0To visit personal service
providers (e.g. hairdressers, beauty salon etc.)
3.1% 4 8.8% 2 0.0% 0 0.0% 0 0.0% 0 0.0% 0 0.0% 0 0.0% 0 0.0% 0
To visit financial services such as banks and other financial institutions
2.9% 4 1.9% 0 0.0% 0 0.0% 0 0.0% 0 0.0% 0 0.0% 0 0.0% 0 0.0% 0
To visit other service providers (e.g. travel agent, estate agent etc.)
1.2% 2 0.0% 0 0.0% 0 0.0% 0 0.0% 0 0.0% 0 0.0% 0 0.0% 0 0.0% 0
To visit public services (e.g. medical or dentist appointment, library, job centre, community centre, etc)
7.9% 11 7.4% 1 14.4% 2 0.0% 0 0.0% 0 0.0% 0 0.0% 0 0.0% 0 0.0% 0
To get petrol 0.0% 0 0.0% 0 0.0% 0 0.0% 0 0.0% 0 0.0% 0 0.0% 0 0.0% 0 0.0% 0To visit the cinema 0.0% 0 0.0% 0 0.0% 0 0.0% 0 0.0% 0 0.0% 0 0.0% 0 0.0% 0 0.0% 0To visit a park 0.0% 0 0.0% 0 0.0% 0 0.0% 0 0.0% 0 0.0% 0 0.0% 0 0.0% 0 0.0% 0To visit the swimming pool 0.0% 0 0.0% 0 0.0% 0 0.0% 0 0.0% 0 0.0% 0 0.0% 0 0.0% 0 0.0% 0To visit other gyms / health
and fitness facilities 1.8% 3 0.0% 0 0.0% 0 0.0% 0 0.0% 0 0.0% 0 0.0% 0 0.0% 0 0.0% 0
To visit the library 0.0% 0 0.0% 0 0.0% 0 0.0% 0 0.0% 0 0.0% 0 0.0% 0 0.0% 0 0.0% 0To visit museums / art
gallery 0.4% 1 0.0% 0 0.0% 0 0.0% 0 0.0% 0 0.0% 0 0.0% 0 0.0% 0 0.0% 0
To visit the theatre or musical venues
0.0% 0 0.0% 0 0.0% 0 0.0% 0 0.0% 0 0.0% 0 0.0% 0 0.0% 0 0.0% 0
To visit night time venues e.g. nightclub
0.0% 0 0.0% 0 0.0% 0 0.0% 0 0.0% 0 0.0% 0 0.0% 0 0.0% 0 0.0% 0
For other leisure activities 5.9% 8 7.1% 1 7.9% 1 0.0% 0 0.0% 0 0.0% 0 0.0% 0 0.0% 0 0.0% 0To shop at the market(s) 0.4% 1 2.9% 1 0.0% 0 0.0% 0 0.0% 0 0.0% 0 0.0% 0 0.0% 0 0.0% 0To meet family 4.9% 7 2.5% 0 8.3% 1 0.0% 0 0.0% 0 0.0% 0 0.0% 0 0.0% 0 0.0% 0To meet friends 1.4% 2 6.2% 1 0.0% 0 0.0% 0 0.0% 0 0.0% 0 0.0% 0 0.0% 0 0.0% 0To visit the theatre 0.0% 0 0.0% 0 0.0% 0 0.0% 0 0.0% 0 0.0% 0 0.0% 0 0.0% 0 0.0% 0For work (i.e. place of work) 4.7% 7 1.6% 0 0.0% 0 0.0% 0 0.0% 0 0.0% 0 0.0% 0 0.0% 0 0.0% 0For business (e.g. attend a
business appointment) 0.0% 0 0.0% 0 0.0% 0 0.0% 0 0.0% 0 0.0% 0 0.0% 0 0.0% 0 0.0% 0
For education as a student (e.g. student at college, university, or other third level education)
1.8% 3 0.0% 0 0.0% 0 0.0% 0 0.0% 0 0.0% 0 0.0% 0 0.0% 0 0.0% 0
To access public transport for onward travel (e.g. train station, bus station)
0.0% 0 0.0% 0 0.0% 0 0.0% 0 0.0% 0 0.0% 0 0.0% 0 0.0% 0 0.0% 0
Other 0.0% 0 0.0% 0 0.0% 0 0.0% 0 0.0% 0 0.0% 0 0.0% 0 0.0% 0 0.0% 0As part of a day out / for a
day out / something different
1.5% 2 1.6% 0 0.0% 0 0.0% 0 0.0% 0 0.0% 0 0.0% 0 0.0% 0 0.0% 0
Browsing / window shopping 1.0% 1 0.0% 0 0.0% 0 0.0% 0 0.0% 0 0.0% 0 0.0% 0 0.0% 0 0.0% 0(Don't know / varies) 1.3% 2 0.0% 0 0.0% 0 0.0% 0 0.0% 0 0.0% 0 0.0% 0 0.0% 0 0.0% 0(Nothing / nothing further) 1.8% 3 2.5% 0 0.0% 0 0.0% 0 0.0% 0 0.0% 0 0.0% 0 0.0% 0 0.0% 0Weighted base: 141 18 16 0 0 0 0 0 0Sample: 185 56 9 0 0 0 0 0 0

by Zone (Weighted, Part 2) South Wales Retail Study Page 65 Weighted: for Carter Jonas August 2016
Total Zone 9 Zone 10 Zone 11 Zone 12 Zone 13 Zone 14 Zone 15 Zone 16
Column %ges. 020716 NEMS market research
Q40B In order of importance, what are your two main reasons for visiting Fishguard Town Centre? Secondary reason: Those who gave a reason at Q40A Food shopping 12.0% 17 9.9% 2 0.0% 0 0.0% 0 0.0% 0 0.0% 0 0.0% 0 0.0% 0 0.0% 0Non-food shopping 14.6% 20 10.4% 2 0.0% 0 0.0% 0 0.0% 0 0.0% 0 0.0% 0 0.0% 0 0.0% 0To visit bars / pubs 0.0% 0 0.0% 0 0.0% 0 0.0% 0 0.0% 0 0.0% 0 0.0% 0 0.0% 0 0.0% 0To visit cafés / restaurants 5.7% 8 5.2% 1 0.0% 0 0.0% 0 0.0% 0 0.0% 0 0.0% 0 0.0% 0 0.0% 0To visit personal service
providers (e.g. hairdressers, beauty salon etc.)
2.9% 4 1.3% 0 0.0% 0 0.0% 0 0.0% 0 0.0% 0 0.0% 0 0.0% 0 0.0% 0
To visit financial services such as banks and other financial institutions
2.6% 4 4.3% 1 0.0% 0 0.0% 0 0.0% 0 0.0% 0 0.0% 0 0.0% 0 0.0% 0
To visit other service providers (e.g. travel agent, estate agent etc.)
0.4% 1 0.0% 0 0.0% 0 0.0% 0 0.0% 0 0.0% 0 0.0% 0 0.0% 0 0.0% 0
To visit public services (e.g. medical or dentist appointment, library, job centre, community centre, etc)
3.5% 5 10.7% 2 0.0% 0 0.0% 0 0.0% 0 0.0% 0 0.0% 0 0.0% 0 0.0% 0
To get petrol 0.0% 0 0.0% 0 0.0% 0 0.0% 0 0.0% 0 0.0% 0 0.0% 0 0.0% 0 0.0% 0To visit the cinema 0.0% 0 0.0% 0 0.0% 0 0.0% 0 0.0% 0 0.0% 0 0.0% 0 0.0% 0 0.0% 0To visit a park 1.0% 1 0.0% 0 8.3% 1 0.0% 0 0.0% 0 0.0% 0 0.0% 0 0.0% 0 0.0% 0To visit the swimming pool 0.2% 0 1.3% 0 0.0% 0 0.0% 0 0.0% 0 0.0% 0 0.0% 0 0.0% 0 0.0% 0To visit other gyms / health
and fitness facilities 0.6% 1 0.0% 0 0.0% 0 0.0% 0 0.0% 0 0.0% 0 0.0% 0 0.0% 0 0.0% 0
To visit the library 0.9% 1 0.0% 0 0.0% 0 0.0% 0 0.0% 0 0.0% 0 0.0% 0 0.0% 0 0.0% 0To visit museums / art
gallery 0.0% 0 0.0% 0 0.0% 0 0.0% 0 0.0% 0 0.0% 0 0.0% 0 0.0% 0 0.0% 0
To visit the theatre or musical venues
0.6% 1 0.0% 0 0.0% 0 0.0% 0 0.0% 0 0.0% 0 0.0% 0 0.0% 0 0.0% 0
To visit night time venues e.g. nightclub
0.0% 0 0.0% 0 0.0% 0 0.0% 0 0.0% 0 0.0% 0 0.0% 0 0.0% 0 0.0% 0
For other leisure activities 3.7% 5 1.7% 0 0.0% 0 0.0% 0 0.0% 0 0.0% 0 0.0% 0 0.0% 0 0.0% 0To shop at the market(s) 1.5% 2 5.2% 1 0.0% 0 0.0% 0 0.0% 0 0.0% 0 0.0% 0 0.0% 0 0.0% 0To meet family 1.8% 3 0.0% 0 0.0% 0 0.0% 0 0.0% 0 0.0% 0 0.0% 0 0.0% 0 0.0% 0To meet friends 1.0% 1 0.0% 0 0.0% 0 0.0% 0 0.0% 0 0.0% 0 0.0% 0 0.0% 0 0.0% 0To visit the theatre 0.4% 1 0.0% 0 0.0% 0 0.0% 0 0.0% 0 0.0% 0 0.0% 0 0.0% 0 0.0% 0For work (i.e. place of work) 4.4% 6 1.7% 0 17.6% 3 0.0% 0 0.0% 0 0.0% 0 0.0% 0 0.0% 0 0.0% 0For business (e.g. attend a
business appointment) 0.0% 0 0.0% 0 0.0% 0 0.0% 0 0.0% 0 0.0% 0 0.0% 0 0.0% 0 0.0% 0
For education as a student (e.g. student at college, university, or other third level education)
0.0% 0 0.0% 0 0.0% 0 0.0% 0 0.0% 0 0.0% 0 0.0% 0 0.0% 0 0.0% 0
To access public transport for onward travel (e.g. train station, bus station)
0.0% 0 0.0% 0 0.0% 0 0.0% 0 0.0% 0 0.0% 0 0.0% 0 0.0% 0 0.0% 0
Other 0.0% 0 0.0% 0 0.0% 0 0.0% 0 0.0% 0 0.0% 0 0.0% 0 0.0% 0 0.0% 0As part of a day out / for a
day out / something different
0.0% 0 0.0% 0 0.0% 0 0.0% 0 0.0% 0 0.0% 0 0.0% 0 0.0% 0 0.0% 0
Browsing / window shopping 0.0% 0 0.0% 0 0.0% 0 0.0% 0 0.0% 0 0.0% 0 0.0% 0 0.0% 0 0.0% 0(Don't know / varies) 1.1% 2 0.0% 0 0.0% 0 0.0% 0 0.0% 0 0.0% 0 0.0% 0 0.0% 0 0.0% 0(Nothing / nothing further) 41.0% 56 48.3% 8 74.1% 12 0.0% 0 0.0% 0 0.0% 0 0.0% 0 0.0% 0 0.0% 0Weighted base: 137 17 16 0 0 0 0 0 0Sample: 177 54 9 0 0 0 0 0 0

by Zone (Weighted, Part 2) South Wales Retail Study Page 66 Weighted: for Carter Jonas August 2016
Total Zone 9 Zone 10 Zone 11 Zone 12 Zone 13 Zone 14 Zone 15 Zone 16
Column %ges. 020716 NEMS market research
Q40X In order of importance, what are your two main reasons for visiting Fishguard Town Centre? Any mention: [MR] Zones 3 & 7-10 and those who visit Fishguard town centre at Q39 Food shopping 42.7% 60 44.2% 8 17.6% 3 0.0% 0 0.0% 0 0.0% 0 0.0% 0 0.0% 0 0.0% 0Non-food shopping 36.0% 51 29.4% 5 45.7% 7 0.0% 0 0.0% 0 0.0% 0 0.0% 0 0.0% 0 0.0% 0To visit bars / pubs 0.0% 0 0.0% 0 0.0% 0 0.0% 0 0.0% 0 0.0% 0 0.0% 0 0.0% 0 0.0% 0To visit cafés / restaurants 10.7% 15 8.7% 2 6.1% 1 0.0% 0 0.0% 0 0.0% 0 0.0% 0 0.0% 0 0.0% 0To visit personal service
providers (e.g. hairdressers, beauty salon etc.)
5.9% 8 10.1% 2 0.0% 0 0.0% 0 0.0% 0 0.0% 0 0.0% 0 0.0% 0 0.0% 0
To visit financial services such as banks and other financial institutions
5.5% 8 6.1% 1 0.0% 0 0.0% 0 0.0% 0 0.0% 0 0.0% 0 0.0% 0 0.0% 0
To visit other service providers (e.g. travel agent, estate agent etc.)
1.6% 2 0.0% 0 0.0% 0 0.0% 0 0.0% 0 0.0% 0 0.0% 0 0.0% 0 0.0% 0
To visit public services (e.g. medical or dentist appointment, library, job centre, community centre, etc)
11.3% 16 17.9% 3 14.4% 2 0.0% 0 0.0% 0 0.0% 0 0.0% 0 0.0% 0 0.0% 0
To get petrol 0.0% 0 0.0% 0 0.0% 0 0.0% 0 0.0% 0 0.0% 0 0.0% 0 0.0% 0 0.0% 0To visit the cinema 0.0% 0 0.0% 0 0.0% 0 0.0% 0 0.0% 0 0.0% 0 0.0% 0 0.0% 0 0.0% 0To visit a park 0.9% 1 0.0% 0 8.3% 1 0.0% 0 0.0% 0 0.0% 0 0.0% 0 0.0% 0 0.0% 0To visit the swimming pool 0.2% 0 1.3% 0 0.0% 0 0.0% 0 0.0% 0 0.0% 0 0.0% 0 0.0% 0 0.0% 0To visit other gyms / health
and fitness facilities 2.3% 3 0.0% 0 0.0% 0 0.0% 0 0.0% 0 0.0% 0 0.0% 0 0.0% 0 0.0% 0
To visit the library 0.8% 1 0.0% 0 0.0% 0 0.0% 0 0.0% 0 0.0% 0 0.0% 0 0.0% 0 0.0% 0To visit museums / art
gallery 0.4% 1 0.0% 0 0.0% 0 0.0% 0 0.0% 0 0.0% 0 0.0% 0 0.0% 0 0.0% 0
To visit the theatre or musical venues
0.6% 1 0.0% 0 0.0% 0 0.0% 0 0.0% 0 0.0% 0 0.0% 0 0.0% 0 0.0% 0
To visit night time venues e.g. nightclub
0.0% 0 0.0% 0 0.0% 0 0.0% 0 0.0% 0 0.0% 0 0.0% 0 0.0% 0 0.0% 0
For other leisure activities 9.5% 13 8.8% 2 7.9% 1 0.0% 0 0.0% 0 0.0% 0 0.0% 0 0.0% 0 0.0% 0To shop at the market(s) 1.9% 3 7.9% 1 0.0% 0 0.0% 0 0.0% 0 0.0% 0 0.0% 0 0.0% 0 0.0% 0To meet family 6.7% 9 2.5% 0 8.3% 1 0.0% 0 0.0% 0 0.0% 0 0.0% 0 0.0% 0 0.0% 0To meet friends 2.4% 3 6.2% 1 0.0% 0 0.0% 0 0.0% 0 0.0% 0 0.0% 0 0.0% 0 0.0% 0To visit the theatre 0.4% 1 0.0% 0 0.0% 0 0.0% 0 0.0% 0 0.0% 0 0.0% 0 0.0% 0 0.0% 0For work (i.e. place of work) 9.0% 13 3.3% 1 17.6% 3 0.0% 0 0.0% 0 0.0% 0 0.0% 0 0.0% 0 0.0% 0For business (e.g. attend a
business appointment) 0.0% 0 0.0% 0 0.0% 0 0.0% 0 0.0% 0 0.0% 0 0.0% 0 0.0% 0 0.0% 0
For education as a student (e.g. student at college, university, or other third level education)
1.8% 3 0.0% 0 0.0% 0 0.0% 0 0.0% 0 0.0% 0 0.0% 0 0.0% 0 0.0% 0
To access public transport for onward travel (e.g. train station, bus station)
0.0% 0 0.0% 0 0.0% 0 0.0% 0 0.0% 0 0.0% 0 0.0% 0 0.0% 0 0.0% 0
Other 0.0% 0 0.0% 0 0.0% 0 0.0% 0 0.0% 0 0.0% 0 0.0% 0 0.0% 0 0.0% 0As part of a day out / for a
day out / something different
1.5% 2 1.6% 0 0.0% 0 0.0% 0 0.0% 0 0.0% 0 0.0% 0 0.0% 0 0.0% 0
Browsing / window shopping 1.0% 1 0.0% 0 0.0% 0 0.0% 0 0.0% 0 0.0% 0 0.0% 0 0.0% 0 0.0% 0Weighted base: 141 18 16 0 0 0 0 0 0Sample: 185 56 9 0 0 0 0 0 0

by Zone (Weighted, Part 2) South Wales Retail Study Page 67 Weighted: for Carter Jonas August 2016
Total Zone 9 Zone 10 Zone 11 Zone 12 Zone 13 Zone 14 Zone 15 Zone 16
Column %ges. 020716 NEMS market research
Q41 What do you like about Fishguard Town Centre? [MR] Zones 3 & 7-10 and those who visit Fishguard town centre at Q39 Attractive environment / nice
place 22.8% 32 19.4% 3 46.0% 7 0.0% 0 0.0% 0 0.0% 0 0.0% 0 0.0% 0 0.0% 0
Close to friends or relatives 0.9% 1 0.0% 0 0.0% 0 0.0% 0 0.0% 0 0.0% 0 0.0% 0 0.0% 0 0.0% 0Close to home 22.3% 32 18.9% 3 9.2% 1 0.0% 0 0.0% 0 0.0% 0 0.0% 0 0.0% 0 0.0% 0Close to work 0.6% 1 0.0% 0 0.0% 0 0.0% 0 0.0% 0 0.0% 0 0.0% 0 0.0% 0 0.0% 0Compact 5.8% 8 9.8% 2 0.0% 0 0.0% 0 0.0% 0 0.0% 0 0.0% 0 0.0% 0 0.0% 0Easy to get to by bike 0.0% 0 0.0% 0 0.0% 0 0.0% 0 0.0% 0 0.0% 0 0.0% 0 0.0% 0 0.0% 0Easy to get to by bus 0.2% 0 1.3% 0 0.0% 0 0.0% 0 0.0% 0 0.0% 0 0.0% 0 0.0% 0 0.0% 0Easy to get to by car 1.2% 2 0.0% 0 0.0% 0 0.0% 0 0.0% 0 0.0% 0 0.0% 0 0.0% 0 0.0% 0Easy to park 0.2% 0 1.7% 0 0.0% 0 0.0% 0 0.0% 0 0.0% 0 0.0% 0 0.0% 0 0.0% 0Good facilities 1.1% 1 3.6% 1 0.0% 0 0.0% 0 0.0% 0 0.0% 0 0.0% 0 0.0% 0 0.0% 0Good food stores 0.8% 1 2.9% 1 0.0% 0 0.0% 0 0.0% 0 0.0% 0 0.0% 0 0.0% 0 0.0% 0Good pubs, cafés or
restaurants 6.7% 9 5.3% 1 30.4% 5 0.0% 0 0.0% 0 0.0% 0 0.0% 0 0.0% 0 0.0% 0
Good range of non-food shops
4.1% 6 6.8% 1 6.1% 1 0.0% 0 0.0% 0 0.0% 0 0.0% 0 0.0% 0 0.0% 0
Makes a change from other places
1.2% 2 1.6% 0 0.0% 0 0.0% 0 0.0% 0 0.0% 0 0.0% 0 0.0% 0 0.0% 0
Quiet 6.2% 9 6.7% 1 0.0% 0 0.0% 0 0.0% 0 0.0% 0 0.0% 0 0.0% 0 0.0% 0Safe and secure 1.2% 2 0.0% 0 0.0% 0 0.0% 0 0.0% 0 0.0% 0 0.0% 0 0.0% 0 0.0% 0The market 0.6% 1 5.0% 1 0.0% 0 0.0% 0 0.0% 0 0.0% 0 0.0% 0 0.0% 0 0.0% 0Traditional 3.1% 4 7.1% 1 16.2% 3 0.0% 0 0.0% 0 0.0% 0 0.0% 0 0.0% 0 0.0% 0Traffic free shopping centre 0.0% 0 0.0% 0 0.0% 0 0.0% 0 0.0% 0 0.0% 0 0.0% 0 0.0% 0 0.0% 0Other 0.0% 0 0.0% 0 0.0% 0 0.0% 0 0.0% 0 0.0% 0 0.0% 0 0.0% 0 0.0% 0Cheap / free parking 0.0% 0 0.0% 0 0.0% 0 0.0% 0 0.0% 0 0.0% 0 0.0% 0 0.0% 0 0.0% 0Familiarity / habit 3.7% 5 4.2% 1 0.0% 0 0.0% 0 0.0% 0 0.0% 0 0.0% 0 0.0% 0 0.0% 0Friendly people / nice
atmosphere 2.0% 3 4.9% 1 0.0% 0 0.0% 0 0.0% 0 0.0% 0 0.0% 0 0.0% 0 0.0% 0
Good leisure facilities / things to do
1.2% 2 1.6% 0 0.0% 0 0.0% 0 0.0% 0 0.0% 0 0.0% 0 0.0% 0 0.0% 0
Good opening hours 0.0% 0 0.0% 0 0.0% 0 0.0% 0 0.0% 0 0.0% 0 0.0% 0 0.0% 0 0.0% 0Good prices 0.0% 0 0.0% 0 0.0% 0 0.0% 0 0.0% 0 0.0% 0 0.0% 0 0.0% 0 0.0% 0Good range of independent
shops 3.6% 5 1.3% 0 0.0% 0 0.0% 0 0.0% 0 0.0% 0 0.0% 0 0.0% 0 0.0% 0
Good range of services 0.0% 0 0.0% 0 0.0% 0 0.0% 0 0.0% 0 0.0% 0 0.0% 0 0.0% 0 0.0% 0(Nothing / very little) 26.6% 38 28.2% 5 8.3% 1 0.0% 0 0.0% 0 0.0% 0 0.0% 0 0.0% 0 0.0% 0(Don't know) 1.8% 3 3.8% 1 0.0% 0 0.0% 0 0.0% 0 0.0% 0 0.0% 0 0.0% 0 0.0% 0Weighted base: 141 18 16 0 0 0 0 0 0Sample: 185 56 9 0 0 0 0 0 0
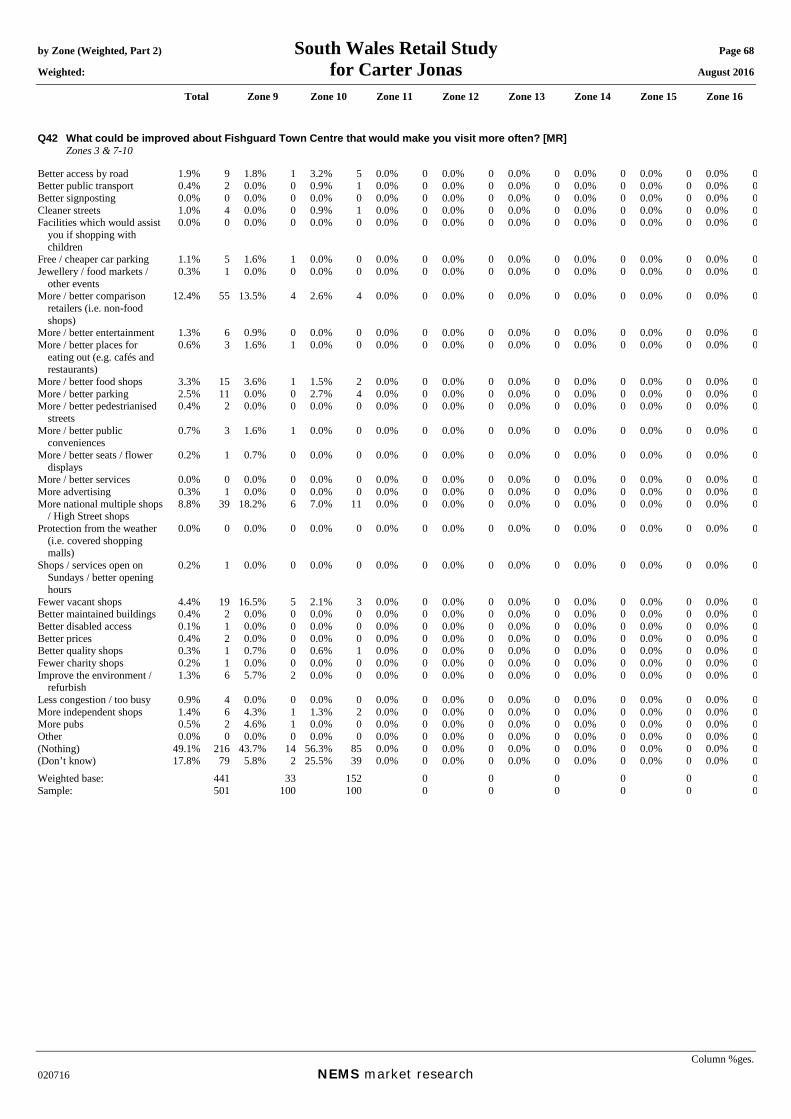
by Zone (Weighted, Part 2) South Wales Retail Study Page 68 Weighted: for Carter Jonas August 2016
Total Zone 9 Zone 10 Zone 11 Zone 12 Zone 13 Zone 14 Zone 15 Zone 16
Column %ges. 020716 NEMS market research
Q42 What could be improved about Fishguard Town Centre that would make you visit more often? [MR] Zones 3 & 7-10 Better access by road 1.9% 9 1.8% 1 3.2% 5 0.0% 0 0.0% 0 0.0% 0 0.0% 0 0.0% 0 0.0% 0Better public transport 0.4% 2 0.0% 0 0.9% 1 0.0% 0 0.0% 0 0.0% 0 0.0% 0 0.0% 0 0.0% 0Better signposting 0.0% 0 0.0% 0 0.0% 0 0.0% 0 0.0% 0 0.0% 0 0.0% 0 0.0% 0 0.0% 0Cleaner streets 1.0% 4 0.0% 0 0.9% 1 0.0% 0 0.0% 0 0.0% 0 0.0% 0 0.0% 0 0.0% 0Facilities which would assist
you if shopping with children
0.0% 0 0.0% 0 0.0% 0 0.0% 0 0.0% 0 0.0% 0 0.0% 0 0.0% 0 0.0% 0
Free / cheaper car parking 1.1% 5 1.6% 1 0.0% 0 0.0% 0 0.0% 0 0.0% 0 0.0% 0 0.0% 0 0.0% 0Jewellery / food markets /
other events 0.3% 1 0.0% 0 0.0% 0 0.0% 0 0.0% 0 0.0% 0 0.0% 0 0.0% 0 0.0% 0
More / better comparison retailers (i.e. non-food shops)
12.4% 55 13.5% 4 2.6% 4 0.0% 0 0.0% 0 0.0% 0 0.0% 0 0.0% 0 0.0% 0
More / better entertainment 1.3% 6 0.9% 0 0.0% 0 0.0% 0 0.0% 0 0.0% 0 0.0% 0 0.0% 0 0.0% 0More / better places for
eating out (e.g. cafés and restaurants)
0.6% 3 1.6% 1 0.0% 0 0.0% 0 0.0% 0 0.0% 0 0.0% 0 0.0% 0 0.0% 0
More / better food shops 3.3% 15 3.6% 1 1.5% 2 0.0% 0 0.0% 0 0.0% 0 0.0% 0 0.0% 0 0.0% 0More / better parking 2.5% 11 0.0% 0 2.7% 4 0.0% 0 0.0% 0 0.0% 0 0.0% 0 0.0% 0 0.0% 0More / better pedestrianised
streets 0.4% 2 0.0% 0 0.0% 0 0.0% 0 0.0% 0 0.0% 0 0.0% 0 0.0% 0 0.0% 0
More / better public conveniences
0.7% 3 1.6% 1 0.0% 0 0.0% 0 0.0% 0 0.0% 0 0.0% 0 0.0% 0 0.0% 0
More / better seats / flower displays
0.2% 1 0.7% 0 0.0% 0 0.0% 0 0.0% 0 0.0% 0 0.0% 0 0.0% 0 0.0% 0
More / better services 0.0% 0 0.0% 0 0.0% 0 0.0% 0 0.0% 0 0.0% 0 0.0% 0 0.0% 0 0.0% 0More advertising 0.3% 1 0.0% 0 0.0% 0 0.0% 0 0.0% 0 0.0% 0 0.0% 0 0.0% 0 0.0% 0More national multiple shops
/ High Street shops 8.8% 39 18.2% 6 7.0% 11 0.0% 0 0.0% 0 0.0% 0 0.0% 0 0.0% 0 0.0% 0
Protection from the weather (i.e. covered shopping malls)
0.0% 0 0.0% 0 0.0% 0 0.0% 0 0.0% 0 0.0% 0 0.0% 0 0.0% 0 0.0% 0
Shops / services open on Sundays / better opening hours
0.2% 1 0.0% 0 0.0% 0 0.0% 0 0.0% 0 0.0% 0 0.0% 0 0.0% 0 0.0% 0
Fewer vacant shops 4.4% 19 16.5% 5 2.1% 3 0.0% 0 0.0% 0 0.0% 0 0.0% 0 0.0% 0 0.0% 0Better maintained buildings 0.4% 2 0.0% 0 0.0% 0 0.0% 0 0.0% 0 0.0% 0 0.0% 0 0.0% 0 0.0% 0Better disabled access 0.1% 1 0.0% 0 0.0% 0 0.0% 0 0.0% 0 0.0% 0 0.0% 0 0.0% 0 0.0% 0Better prices 0.4% 2 0.0% 0 0.0% 0 0.0% 0 0.0% 0 0.0% 0 0.0% 0 0.0% 0 0.0% 0Better quality shops 0.3% 1 0.7% 0 0.6% 1 0.0% 0 0.0% 0 0.0% 0 0.0% 0 0.0% 0 0.0% 0Fewer charity shops 0.2% 1 0.0% 0 0.0% 0 0.0% 0 0.0% 0 0.0% 0 0.0% 0 0.0% 0 0.0% 0Improve the environment /
refurbish 1.3% 6 5.7% 2 0.0% 0 0.0% 0 0.0% 0 0.0% 0 0.0% 0 0.0% 0 0.0% 0
Less congestion / too busy 0.9% 4 0.0% 0 0.0% 0 0.0% 0 0.0% 0 0.0% 0 0.0% 0 0.0% 0 0.0% 0More independent shops 1.4% 6 4.3% 1 1.3% 2 0.0% 0 0.0% 0 0.0% 0 0.0% 0 0.0% 0 0.0% 0More pubs 0.5% 2 4.6% 1 0.0% 0 0.0% 0 0.0% 0 0.0% 0 0.0% 0 0.0% 0 0.0% 0Other 0.0% 0 0.0% 0 0.0% 0 0.0% 0 0.0% 0 0.0% 0 0.0% 0 0.0% 0 0.0% 0(Nothing) 49.1% 216 43.7% 14 56.3% 85 0.0% 0 0.0% 0 0.0% 0 0.0% 0 0.0% 0 0.0% 0(Don’t know) 17.8% 79 5.8% 2 25.5% 39 0.0% 0 0.0% 0 0.0% 0 0.0% 0 0.0% 0 0.0% 0Weighted base: 441 33 152 0 0 0 0 0 0Sample: 501 100 100 0 0 0 0 0 0

by Zone (Weighted, Part 2) South Wales Retail Study Page 69 Weighted: for Carter Jonas August 2016
Total Zone 9 Zone 10 Zone 11 Zone 12 Zone 13 Zone 14 Zone 15 Zone 16
Column %ges. 020716 NEMS market research
Mean score [Times a year, those who visit]: Daily = 365, 4-6 days a week = 234, 2-3 days a week = 130, One day a week = 52, Every two weeks = 24, Monthly = 12, Once every two months = 6, Three-four times a year = 3.5, Once a year = 1, Less often = 0.25
Q43 How often do you or your household visit Narberth for shopping and other town centre services? Zones 1, 2, 5-7 & 9 Daily 1.9% 11 0.0% 0 0.0% 0 0.0% 0 0.0% 0 0.0% 0 0.0% 0 0.0% 0 0.0% 04-6 days a week 1.3% 7 0.0% 0 0.0% 0 0.0% 0 0.0% 0 0.0% 0 0.0% 0 0.0% 0 0.0% 02-3 days a week 3.3% 18 0.0% 0 0.0% 0 0.0% 0 0.0% 0 0.0% 0 0.0% 0 0.0% 0 0.0% 0One day a week 3.1% 17 0.9% 0 0.0% 0 0.0% 0 0.0% 0 0.0% 0 0.0% 0 0.0% 0 0.0% 0Every two weeks 5.2% 29 0.0% 0 0.0% 0 0.0% 0 0.0% 0 0.0% 0 0.0% 0 0.0% 0 0.0% 0Monthly 10.2% 56 8.6% 3 0.0% 0 0.0% 0 0.0% 0 0.0% 0 0.0% 0 0.0% 0 0.0% 0Once every two months 7.9% 43 7.5% 2 0.0% 0 0.0% 0 0.0% 0 0.0% 0 0.0% 0 0.0% 0 0.0% 0Three-four times a year 12.1% 66 15.4% 5 0.0% 0 0.0% 0 0.0% 0 0.0% 0 0.0% 0 0.0% 0 0.0% 0Once a year 6.0% 33 10.7% 3 0.0% 0 0.0% 0 0.0% 0 0.0% 0 0.0% 0 0.0% 0 0.0% 0Less often 1.4% 8 2.3% 1 0.0% 0 0.0% 0 0.0% 0 0.0% 0 0.0% 0 0.0% 0 0.0% 0Never 45.1% 246 51.7% 17 0.0% 0 0.0% 0 0.0% 0 0.0% 0 0.0% 0 0.0% 0 0.0% 0(Don’t know) 0.3% 2 1.0% 0 0.0% 0 0.0% 0 0.0% 0 0.0% 0 0.0% 0 0.0% 0 0.0% 0(Varies) 1.9% 10 2.1% 1 0.0% 0 0.0% 0 0.0% 0 0.0% 0 0.0% 0 0.0% 0 0.0% 0Mean: 37.16 5.73 0.00 0.00 0.00 0.00 0.00 0.00 0.00Weighted base: 545 33 0 0 0 0 0 0 0Sample: 601 100 0 0 0 0 0 0 0

by Zone (Weighted, Part 2) South Wales Retail Study Page 70 Weighted: for Carter Jonas August 2016
Total Zone 9 Zone 10 Zone 11 Zone 12 Zone 13 Zone 14 Zone 15 Zone 16
Column %ges. 020716 NEMS market research
Q44A In order of importance, what are your two main reasons for visiting Narberth Town Centre? Main reason: Zones 1, 2, 5-7 & 9 and those who visit Narberth town centre at Q43 Food shopping 16.8% 50 3.7% 1 0.0% 0 0.0% 0 0.0% 0 0.0% 0 0.0% 0 0.0% 0 0.0% 0Non-food shopping 49.8% 149 59.3% 9 0.0% 0 0.0% 0 0.0% 0 0.0% 0 0.0% 0 0.0% 0 0.0% 0To visit bars / pubs 0.4% 1 7.1% 1 0.0% 0 0.0% 0 0.0% 0 0.0% 0 0.0% 0 0.0% 0 0.0% 0To visit cafés / restaurants 6.8% 20 6.2% 1 0.0% 0 0.0% 0 0.0% 0 0.0% 0 0.0% 0 0.0% 0 0.0% 0To visit personal service
providers (e.g. hairdressers, beauty salon etc.)
0.6% 2 0.0% 0 0.0% 0 0.0% 0 0.0% 0 0.0% 0 0.0% 0 0.0% 0 0.0% 0
To visit financial services such as banks and other financial institutions
1.8% 5 4.1% 1 0.0% 0 0.0% 0 0.0% 0 0.0% 0 0.0% 0 0.0% 0 0.0% 0
To visit other service providers (e.g. travel agent, estate agent etc.)
0.3% 1 1.4% 0 0.0% 0 0.0% 0 0.0% 0 0.0% 0 0.0% 0 0.0% 0 0.0% 0
To visit public services (e.g. medical or dentist appointment, library, job centre, community centre, etc)
4.8% 14 0.0% 0 0.0% 0 0.0% 0 0.0% 0 0.0% 0 0.0% 0 0.0% 0 0.0% 0
To get petrol 0.0% 0 0.0% 0 0.0% 0 0.0% 0 0.0% 0 0.0% 0 0.0% 0 0.0% 0 0.0% 0To visit the cinema 0.0% 0 0.0% 0 0.0% 0 0.0% 0 0.0% 0 0.0% 0 0.0% 0 0.0% 0 0.0% 0To visit a park 0.0% 0 0.0% 0 0.0% 0 0.0% 0 0.0% 0 0.0% 0 0.0% 0 0.0% 0 0.0% 0To visit the swimming pool 0.4% 1 0.0% 0 0.0% 0 0.0% 0 0.0% 0 0.0% 0 0.0% 0 0.0% 0 0.0% 0To visit other gyms / health
and fitness facilities 0.0% 0 0.0% 0 0.0% 0 0.0% 0 0.0% 0 0.0% 0 0.0% 0 0.0% 0 0.0% 0
To visit the library 0.2% 0 0.0% 0 0.0% 0 0.0% 0 0.0% 0 0.0% 0 0.0% 0 0.0% 0 0.0% 0To visit museums / art
gallery 0.2% 1 0.0% 0 0.0% 0 0.0% 0 0.0% 0 0.0% 0 0.0% 0 0.0% 0 0.0% 0
To visit the theatre or musical venues
0.4% 1 0.0% 0 0.0% 0 0.0% 0 0.0% 0 0.0% 0 0.0% 0 0.0% 0 0.0% 0
To visit night time venues e.g. nightclub
0.0% 0 0.0% 0 0.0% 0 0.0% 0 0.0% 0 0.0% 0 0.0% 0 0.0% 0 0.0% 0
For other leisure activities 0.6% 2 4.7% 1 0.0% 0 0.0% 0 0.0% 0 0.0% 0 0.0% 0 0.0% 0 0.0% 0To shop at the market(s) 0.2% 1 0.0% 0 0.0% 0 0.0% 0 0.0% 0 0.0% 0 0.0% 0 0.0% 0 0.0% 0To meet family 2.1% 6 1.4% 0 0.0% 0 0.0% 0 0.0% 0 0.0% 0 0.0% 0 0.0% 0 0.0% 0To meet friends 2.3% 7 1.9% 0 0.0% 0 0.0% 0 0.0% 0 0.0% 0 0.0% 0 0.0% 0 0.0% 0To visit the theatre 0.0% 0 0.0% 0 0.0% 0 0.0% 0 0.0% 0 0.0% 0 0.0% 0 0.0% 0 0.0% 0For work (i.e. place of work) 4.2% 13 0.0% 0 0.0% 0 0.0% 0 0.0% 0 0.0% 0 0.0% 0 0.0% 0 0.0% 0For business (e.g. attend a
business appointment) 0.3% 1 0.0% 0 0.0% 0 0.0% 0 0.0% 0 0.0% 0 0.0% 0 0.0% 0 0.0% 0
For education as a student (e.g. student at college, university, or other third level education)
0.0% 0 0.0% 0 0.0% 0 0.0% 0 0.0% 0 0.0% 0 0.0% 0 0.0% 0 0.0% 0
To access public transport for onward travel (e.g. train station, bus station)
0.0% 0 0.0% 0 0.0% 0 0.0% 0 0.0% 0 0.0% 0 0.0% 0 0.0% 0 0.0% 0
Other 0.0% 0 0.0% 0 0.0% 0 0.0% 0 0.0% 0 0.0% 0 0.0% 0 0.0% 0 0.0% 0As part of a day out / for a
day out / something different
0.9% 3 4.8% 1 0.0% 0 0.0% 0 0.0% 0 0.0% 0 0.0% 0 0.0% 0 0.0% 0
Browsing / window shopping 5.0% 15 1.9% 0 0.0% 0 0.0% 0 0.0% 0 0.0% 0 0.0% 0 0.0% 0 0.0% 0(Don't know / varies) 0.4% 1 2.1% 0 0.0% 0 0.0% 0 0.0% 0 0.0% 0 0.0% 0 0.0% 0 0.0% 0(Nothing / nothing further) 1.6% 5 1.4% 0 0.0% 0 0.0% 0 0.0% 0 0.0% 0 0.0% 0 0.0% 0 0.0% 0Weighted base: 299 16 0 0 0 0 0 0 0Sample: 375 51 0 0 0 0 0 0 0

by Zone (Weighted, Part 2) South Wales Retail Study Page 71 Weighted: for Carter Jonas August 2016
Total Zone 9 Zone 10 Zone 11 Zone 12 Zone 13 Zone 14 Zone 15 Zone 16
Column %ges. 020716 NEMS market research
Q44B In order of importance, what are your two main reasons for visiting Narberth Town Centre? Secondary reason: Those who gave a reason at Q44A Food shopping 9.2% 27 19.2% 3 0.0% 0 0.0% 0 0.0% 0 0.0% 0 0.0% 0 0.0% 0 0.0% 0Non-food shopping 16.6% 49 8.3% 1 0.0% 0 0.0% 0 0.0% 0 0.0% 0 0.0% 0 0.0% 0 0.0% 0To visit bars / pubs 2.0% 6 0.0% 0 0.0% 0 0.0% 0 0.0% 0 0.0% 0 0.0% 0 0.0% 0 0.0% 0To visit cafés / restaurants 16.3% 48 23.3% 4 0.0% 0 0.0% 0 0.0% 0 0.0% 0 0.0% 0 0.0% 0 0.0% 0To visit personal service
providers (e.g. hairdressers, beauty salon etc.)
0.3% 1 0.0% 0 0.0% 0 0.0% 0 0.0% 0 0.0% 0 0.0% 0 0.0% 0 0.0% 0
To visit financial services such as banks and other financial institutions
1.1% 3 0.0% 0 0.0% 0 0.0% 0 0.0% 0 0.0% 0 0.0% 0 0.0% 0 0.0% 0
To visit other service providers (e.g. travel agent, estate agent etc.)
0.7% 2 0.0% 0 0.0% 0 0.0% 0 0.0% 0 0.0% 0 0.0% 0 0.0% 0 0.0% 0
To visit public services (e.g. medical or dentist appointment, library, job centre, community centre, etc)
1.6% 5 0.0% 0 0.0% 0 0.0% 0 0.0% 0 0.0% 0 0.0% 0 0.0% 0 0.0% 0
To get petrol 0.0% 0 0.0% 0 0.0% 0 0.0% 0 0.0% 0 0.0% 0 0.0% 0 0.0% 0 0.0% 0To visit the cinema 0.0% 0 0.0% 0 0.0% 0 0.0% 0 0.0% 0 0.0% 0 0.0% 0 0.0% 0 0.0% 0To visit a park 0.0% 0 0.0% 0 0.0% 0 0.0% 0 0.0% 0 0.0% 0 0.0% 0 0.0% 0 0.0% 0To visit the swimming pool 0.0% 0 0.0% 0 0.0% 0 0.0% 0 0.0% 0 0.0% 0 0.0% 0 0.0% 0 0.0% 0To visit other gyms / health
and fitness facilities 0.0% 0 0.0% 0 0.0% 0 0.0% 0 0.0% 0 0.0% 0 0.0% 0 0.0% 0 0.0% 0
To visit the library 0.0% 0 0.0% 0 0.0% 0 0.0% 0 0.0% 0 0.0% 0 0.0% 0 0.0% 0 0.0% 0To visit museums / art
gallery 0.5% 2 0.0% 0 0.0% 0 0.0% 0 0.0% 0 0.0% 0 0.0% 0 0.0% 0 0.0% 0
To visit the theatre or musical venues
0.0% 0 0.0% 0 0.0% 0 0.0% 0 0.0% 0 0.0% 0 0.0% 0 0.0% 0 0.0% 0
To visit night time venues e.g. nightclub
0.5% 1 0.0% 0 0.0% 0 0.0% 0 0.0% 0 0.0% 0 0.0% 0 0.0% 0 0.0% 0
For other leisure activities 1.9% 5 1.5% 0 0.0% 0 0.0% 0 0.0% 0 0.0% 0 0.0% 0 0.0% 0 0.0% 0To shop at the market(s) 0.3% 1 1.9% 0 0.0% 0 0.0% 0 0.0% 0 0.0% 0 0.0% 0 0.0% 0 0.0% 0To meet family 1.3% 4 0.0% 0 0.0% 0 0.0% 0 0.0% 0 0.0% 0 0.0% 0 0.0% 0 0.0% 0To meet friends 2.4% 7 1.5% 0 0.0% 0 0.0% 0 0.0% 0 0.0% 0 0.0% 0 0.0% 0 0.0% 0To visit the theatre 0.0% 0 0.0% 0 0.0% 0 0.0% 0 0.0% 0 0.0% 0 0.0% 0 0.0% 0 0.0% 0For work (i.e. place of work) 0.7% 2 0.0% 0 0.0% 0 0.0% 0 0.0% 0 0.0% 0 0.0% 0 0.0% 0 0.0% 0For business (e.g. attend a
business appointment) 0.2% 0 0.0% 0 0.0% 0 0.0% 0 0.0% 0 0.0% 0 0.0% 0 0.0% 0 0.0% 0
For education as a student (e.g. student at college, university, or other third level education)
0.0% 0 0.0% 0 0.0% 0 0.0% 0 0.0% 0 0.0% 0 0.0% 0 0.0% 0 0.0% 0
To access public transport for onward travel (e.g. train station, bus station)
0.0% 0 0.0% 0 0.0% 0 0.0% 0 0.0% 0 0.0% 0 0.0% 0 0.0% 0 0.0% 0
Other 0.0% 0 0.0% 0 0.0% 0 0.0% 0 0.0% 0 0.0% 0 0.0% 0 0.0% 0 0.0% 0As part of a day out / for a
day out / something different
1.4% 4 1.9% 0 0.0% 0 0.0% 0 0.0% 0 0.0% 0 0.0% 0 0.0% 0 0.0% 0
Browsing / window shopping 0.8% 2 0.0% 0 0.0% 0 0.0% 0 0.0% 0 0.0% 0 0.0% 0 0.0% 0 0.0% 0(Don't know / varies) 1.4% 4 0.0% 0 0.0% 0 0.0% 0 0.0% 0 0.0% 0 0.0% 0 0.0% 0 0.0% 0(Nothing / nothing further) 41.0% 120 42.5% 6 0.0% 0 0.0% 0 0.0% 0 0.0% 0 0.0% 0 0.0% 0 0.0% 0Weighted base: 293 15 0 0 0 0 0 0 0Sample: 365 49 0 0 0 0 0 0 0

by Zone (Weighted, Part 2) South Wales Retail Study Page 72 Weighted: for Carter Jonas August 2016
Total Zone 9 Zone 10 Zone 11 Zone 12 Zone 13 Zone 14 Zone 15 Zone 16
Column %ges. 020716 NEMS market research
Q44X In order of importance, what are your two main reasons for visiting Narberth Town Centre? Any mention: [MR] Zones 1, 2, 5-7 & 9 and those who visit Narberth town centre at Q43 Food shopping 25.8% 77 22.2% 4 0.0% 0 0.0% 0 0.0% 0 0.0% 0 0.0% 0 0.0% 0 0.0% 0Non-food shopping 66.0% 197 67.3% 11 0.0% 0 0.0% 0 0.0% 0 0.0% 0 0.0% 0 0.0% 0 0.0% 0To visit bars / pubs 2.4% 7 7.1% 1 0.0% 0 0.0% 0 0.0% 0 0.0% 0 0.0% 0 0.0% 0 0.0% 0To visit cafés / restaurants 22.8% 68 28.6% 5 0.0% 0 0.0% 0 0.0% 0 0.0% 0 0.0% 0 0.0% 0 0.0% 0To visit personal service
providers (e.g. hairdressers, beauty salon etc.)
0.9% 3 0.0% 0 0.0% 0 0.0% 0 0.0% 0 0.0% 0 0.0% 0 0.0% 0 0.0% 0
To visit financial services such as banks and other financial institutions
2.9% 9 4.1% 1 0.0% 0 0.0% 0 0.0% 0 0.0% 0 0.0% 0 0.0% 0 0.0% 0
To visit other service providers (e.g. travel agent, estate agent etc.)
0.9% 3 1.4% 0 0.0% 0 0.0% 0 0.0% 0 0.0% 0 0.0% 0 0.0% 0 0.0% 0
To visit public services (e.g. medical or dentist appointment, library, job centre, community centre, etc)
6.3% 19 0.0% 0 0.0% 0 0.0% 0 0.0% 0 0.0% 0 0.0% 0 0.0% 0 0.0% 0
To get petrol 0.0% 0 0.0% 0 0.0% 0 0.0% 0 0.0% 0 0.0% 0 0.0% 0 0.0% 0 0.0% 0To visit the cinema 0.0% 0 0.0% 0 0.0% 0 0.0% 0 0.0% 0 0.0% 0 0.0% 0 0.0% 0 0.0% 0To visit a park 0.0% 0 0.0% 0 0.0% 0 0.0% 0 0.0% 0 0.0% 0 0.0% 0 0.0% 0 0.0% 0To visit the swimming pool 0.4% 1 0.0% 0 0.0% 0 0.0% 0 0.0% 0 0.0% 0 0.0% 0 0.0% 0 0.0% 0To visit other gyms / health
and fitness facilities 0.0% 0 0.0% 0 0.0% 0 0.0% 0 0.0% 0 0.0% 0 0.0% 0 0.0% 0 0.0% 0
To visit the library 0.2% 0 0.0% 0 0.0% 0 0.0% 0 0.0% 0 0.0% 0 0.0% 0 0.0% 0 0.0% 0To visit museums / art
gallery 0.7% 2 0.0% 0 0.0% 0 0.0% 0 0.0% 0 0.0% 0 0.0% 0 0.0% 0 0.0% 0
To visit the theatre or musical venues
0.4% 1 0.0% 0 0.0% 0 0.0% 0 0.0% 0 0.0% 0 0.0% 0 0.0% 0 0.0% 0
To visit night time venues e.g. nightclub
0.4% 1 0.0% 0 0.0% 0 0.0% 0 0.0% 0 0.0% 0 0.0% 0 0.0% 0 0.0% 0
For other leisure activities 2.4% 7 6.1% 1 0.0% 0 0.0% 0 0.0% 0 0.0% 0 0.0% 0 0.0% 0 0.0% 0To shop at the market(s) 0.5% 1 1.8% 0 0.0% 0 0.0% 0 0.0% 0 0.0% 0 0.0% 0 0.0% 0 0.0% 0To meet family 3.4% 10 1.4% 0 0.0% 0 0.0% 0 0.0% 0 0.0% 0 0.0% 0 0.0% 0 0.0% 0To meet friends 4.6% 14 3.3% 1 0.0% 0 0.0% 0 0.0% 0 0.0% 0 0.0% 0 0.0% 0 0.0% 0To visit the theatre 0.0% 0 0.0% 0 0.0% 0 0.0% 0 0.0% 0 0.0% 0 0.0% 0 0.0% 0 0.0% 0For work (i.e. place of work) 4.9% 15 0.0% 0 0.0% 0 0.0% 0 0.0% 0 0.0% 0 0.0% 0 0.0% 0 0.0% 0For business (e.g. attend a
business appointment) 0.5% 1 0.0% 0 0.0% 0 0.0% 0 0.0% 0 0.0% 0 0.0% 0 0.0% 0 0.0% 0
For education as a student (e.g. student at college, university, or other third level education)
0.0% 0 0.0% 0 0.0% 0 0.0% 0 0.0% 0 0.0% 0 0.0% 0 0.0% 0 0.0% 0
To access public transport for onward travel (e.g. train station, bus station)
0.0% 0 0.0% 0 0.0% 0 0.0% 0 0.0% 0 0.0% 0 0.0% 0 0.0% 0 0.0% 0
Other 0.0% 0 0.0% 0 0.0% 0 0.0% 0 0.0% 0 0.0% 0 0.0% 0 0.0% 0 0.0% 0As part of a day out / for a
day out / something different
2.2% 7 6.6% 1 0.0% 0 0.0% 0 0.0% 0 0.0% 0 0.0% 0 0.0% 0 0.0% 0
Browsing / window shopping 5.8% 17 1.9% 0 0.0% 0 0.0% 0 0.0% 0 0.0% 0 0.0% 0 0.0% 0 0.0% 0Weighted base: 299 16 0 0 0 0 0 0 0Sample: 375 51 0 0 0 0 0 0 0

by Zone (Weighted, Part 2) South Wales Retail Study Page 73 Weighted: for Carter Jonas August 2016
Total Zone 9 Zone 10 Zone 11 Zone 12 Zone 13 Zone 14 Zone 15 Zone 16
Column %ges. 020716 NEMS market research
Q45 What do you like about Narberth Town Centre? [MR] Zones 1, 2, 5-7 & 9 and those who visit Narberth town centre at Q43 Attractive environment / nice
place 38.9% 116 42.6% 7 0.0% 0 0.0% 0 0.0% 0 0.0% 0 0.0% 0 0.0% 0 0.0% 0
Close to friends or relatives 0.3% 1 0.0% 0 0.0% 0 0.0% 0 0.0% 0 0.0% 0 0.0% 0 0.0% 0 0.0% 0Close to home 5.3% 16 0.0% 0 0.0% 0 0.0% 0 0.0% 0 0.0% 0 0.0% 0 0.0% 0 0.0% 0Close to work 0.4% 1 0.0% 0 0.0% 0 0.0% 0 0.0% 0 0.0% 0 0.0% 0 0.0% 0 0.0% 0Compact 7.5% 22 4.7% 1 0.0% 0 0.0% 0 0.0% 0 0.0% 0 0.0% 0 0.0% 0 0.0% 0Easy to get to by bike 0.0% 0 0.0% 0 0.0% 0 0.0% 0 0.0% 0 0.0% 0 0.0% 0 0.0% 0 0.0% 0Easy to get to by bus 0.0% 0 0.0% 0 0.0% 0 0.0% 0 0.0% 0 0.0% 0 0.0% 0 0.0% 0 0.0% 0Easy to get to by car 0.6% 2 1.4% 0 0.0% 0 0.0% 0 0.0% 0 0.0% 0 0.0% 0 0.0% 0 0.0% 0Easy to park 2.9% 9 2.8% 0 0.0% 0 0.0% 0 0.0% 0 0.0% 0 0.0% 0 0.0% 0 0.0% 0Good facilities 1.0% 3 0.0% 0 0.0% 0 0.0% 0 0.0% 0 0.0% 0 0.0% 0 0.0% 0 0.0% 0Good food stores 5.0% 15 5.1% 1 0.0% 0 0.0% 0 0.0% 0 0.0% 0 0.0% 0 0.0% 0 0.0% 0Good pubs, cafés or
restaurants 6.8% 20 7.3% 1 0.0% 0 0.0% 0 0.0% 0 0.0% 0 0.0% 0 0.0% 0 0.0% 0
Good range of non-food shops
33.3% 99 26.6% 4 0.0% 0 0.0% 0 0.0% 0 0.0% 0 0.0% 0 0.0% 0 0.0% 0
Makes a change from other places
4.9% 15 5.7% 1 0.0% 0 0.0% 0 0.0% 0 0.0% 0 0.0% 0 0.0% 0 0.0% 0
Quiet 1.2% 4 4.8% 1 0.0% 0 0.0% 0 0.0% 0 0.0% 0 0.0% 0 0.0% 0 0.0% 0Safe and secure 0.4% 1 0.0% 0 0.0% 0 0.0% 0 0.0% 0 0.0% 0 0.0% 0 0.0% 0 0.0% 0The market 1.6% 5 0.0% 0 0.0% 0 0.0% 0 0.0% 0 0.0% 0 0.0% 0 0.0% 0 0.0% 0Traditional 9.1% 27 5.7% 1 0.0% 0 0.0% 0 0.0% 0 0.0% 0 0.0% 0 0.0% 0 0.0% 0Traffic free shopping centre 0.1% 0 0.0% 0 0.0% 0 0.0% 0 0.0% 0 0.0% 0 0.0% 0 0.0% 0 0.0% 0Other 0.0% 0 0.0% 0 0.0% 0 0.0% 0 0.0% 0 0.0% 0 0.0% 0 0.0% 0 0.0% 0Cheap / free parking 0.0% 0 0.0% 0 0.0% 0 0.0% 0 0.0% 0 0.0% 0 0.0% 0 0.0% 0 0.0% 0Familiarity / habit 0.0% 0 0.0% 0 0.0% 0 0.0% 0 0.0% 0 0.0% 0 0.0% 0 0.0% 0 0.0% 0Friendly people / nice
atmosphere 5.3% 16 1.4% 0 0.0% 0 0.0% 0 0.0% 0 0.0% 0 0.0% 0 0.0% 0 0.0% 0
Good leisure facilities / things to do
0.4% 1 0.0% 0 0.0% 0 0.0% 0 0.0% 0 0.0% 0 0.0% 0 0.0% 0 0.0% 0
Good opening hours 0.0% 0 0.0% 0 0.0% 0 0.0% 0 0.0% 0 0.0% 0 0.0% 0 0.0% 0 0.0% 0Good prices 0.0% 0 0.0% 0 0.0% 0 0.0% 0 0.0% 0 0.0% 0 0.0% 0 0.0% 0 0.0% 0Good range of independent
shops 25.0% 75 25.7% 4 0.0% 0 0.0% 0 0.0% 0 0.0% 0 0.0% 0 0.0% 0 0.0% 0
Good range of services 0.3% 1 0.0% 0 0.0% 0 0.0% 0 0.0% 0 0.0% 0 0.0% 0 0.0% 0 0.0% 0(Nothing / very little) 6.1% 18 14.9% 2 0.0% 0 0.0% 0 0.0% 0 0.0% 0 0.0% 0 0.0% 0 0.0% 0(Don't know) 1.2% 3 5.4% 1 0.0% 0 0.0% 0 0.0% 0 0.0% 0 0.0% 0 0.0% 0 0.0% 0Weighted base: 299 16 0 0 0 0 0 0 0Sample: 375 51 0 0 0 0 0 0 0
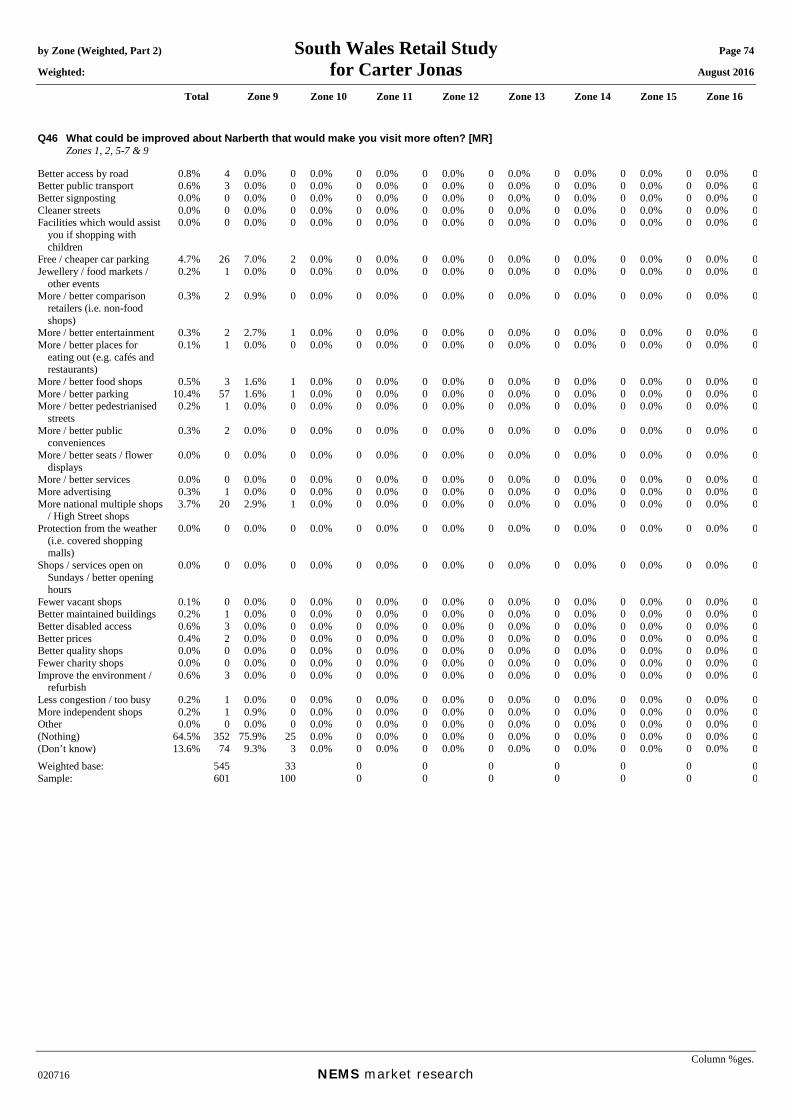
by Zone (Weighted, Part 2) South Wales Retail Study Page 74 Weighted: for Carter Jonas August 2016
Total Zone 9 Zone 10 Zone 11 Zone 12 Zone 13 Zone 14 Zone 15 Zone 16
Column %ges. 020716 NEMS market research
Q46 What could be improved about Narberth that would make you visit more often? [MR] Zones 1, 2, 5-7 & 9 Better access by road 0.8% 4 0.0% 0 0.0% 0 0.0% 0 0.0% 0 0.0% 0 0.0% 0 0.0% 0 0.0% 0Better public transport 0.6% 3 0.0% 0 0.0% 0 0.0% 0 0.0% 0 0.0% 0 0.0% 0 0.0% 0 0.0% 0Better signposting 0.0% 0 0.0% 0 0.0% 0 0.0% 0 0.0% 0 0.0% 0 0.0% 0 0.0% 0 0.0% 0Cleaner streets 0.0% 0 0.0% 0 0.0% 0 0.0% 0 0.0% 0 0.0% 0 0.0% 0 0.0% 0 0.0% 0Facilities which would assist
you if shopping with children
0.0% 0 0.0% 0 0.0% 0 0.0% 0 0.0% 0 0.0% 0 0.0% 0 0.0% 0 0.0% 0
Free / cheaper car parking 4.7% 26 7.0% 2 0.0% 0 0.0% 0 0.0% 0 0.0% 0 0.0% 0 0.0% 0 0.0% 0Jewellery / food markets /
other events 0.2% 1 0.0% 0 0.0% 0 0.0% 0 0.0% 0 0.0% 0 0.0% 0 0.0% 0 0.0% 0
More / better comparison retailers (i.e. non-food shops)
0.3% 2 0.9% 0 0.0% 0 0.0% 0 0.0% 0 0.0% 0 0.0% 0 0.0% 0 0.0% 0
More / better entertainment 0.3% 2 2.7% 1 0.0% 0 0.0% 0 0.0% 0 0.0% 0 0.0% 0 0.0% 0 0.0% 0More / better places for
eating out (e.g. cafés and restaurants)
0.1% 1 0.0% 0 0.0% 0 0.0% 0 0.0% 0 0.0% 0 0.0% 0 0.0% 0 0.0% 0
More / better food shops 0.5% 3 1.6% 1 0.0% 0 0.0% 0 0.0% 0 0.0% 0 0.0% 0 0.0% 0 0.0% 0More / better parking 10.4% 57 1.6% 1 0.0% 0 0.0% 0 0.0% 0 0.0% 0 0.0% 0 0.0% 0 0.0% 0More / better pedestrianised
streets 0.2% 1 0.0% 0 0.0% 0 0.0% 0 0.0% 0 0.0% 0 0.0% 0 0.0% 0 0.0% 0
More / better public conveniences
0.3% 2 0.0% 0 0.0% 0 0.0% 0 0.0% 0 0.0% 0 0.0% 0 0.0% 0 0.0% 0
More / better seats / flower displays
0.0% 0 0.0% 0 0.0% 0 0.0% 0 0.0% 0 0.0% 0 0.0% 0 0.0% 0 0.0% 0
More / better services 0.0% 0 0.0% 0 0.0% 0 0.0% 0 0.0% 0 0.0% 0 0.0% 0 0.0% 0 0.0% 0More advertising 0.3% 1 0.0% 0 0.0% 0 0.0% 0 0.0% 0 0.0% 0 0.0% 0 0.0% 0 0.0% 0More national multiple shops
/ High Street shops 3.7% 20 2.9% 1 0.0% 0 0.0% 0 0.0% 0 0.0% 0 0.0% 0 0.0% 0 0.0% 0
Protection from the weather (i.e. covered shopping malls)
0.0% 0 0.0% 0 0.0% 0 0.0% 0 0.0% 0 0.0% 0 0.0% 0 0.0% 0 0.0% 0
Shops / services open on Sundays / better opening hours
0.0% 0 0.0% 0 0.0% 0 0.0% 0 0.0% 0 0.0% 0 0.0% 0 0.0% 0 0.0% 0
Fewer vacant shops 0.1% 0 0.0% 0 0.0% 0 0.0% 0 0.0% 0 0.0% 0 0.0% 0 0.0% 0 0.0% 0Better maintained buildings 0.2% 1 0.0% 0 0.0% 0 0.0% 0 0.0% 0 0.0% 0 0.0% 0 0.0% 0 0.0% 0Better disabled access 0.6% 3 0.0% 0 0.0% 0 0.0% 0 0.0% 0 0.0% 0 0.0% 0 0.0% 0 0.0% 0Better prices 0.4% 2 0.0% 0 0.0% 0 0.0% 0 0.0% 0 0.0% 0 0.0% 0 0.0% 0 0.0% 0Better quality shops 0.0% 0 0.0% 0 0.0% 0 0.0% 0 0.0% 0 0.0% 0 0.0% 0 0.0% 0 0.0% 0Fewer charity shops 0.0% 0 0.0% 0 0.0% 0 0.0% 0 0.0% 0 0.0% 0 0.0% 0 0.0% 0 0.0% 0Improve the environment /
refurbish 0.6% 3 0.0% 0 0.0% 0 0.0% 0 0.0% 0 0.0% 0 0.0% 0 0.0% 0 0.0% 0
Less congestion / too busy 0.2% 1 0.0% 0 0.0% 0 0.0% 0 0.0% 0 0.0% 0 0.0% 0 0.0% 0 0.0% 0More independent shops 0.2% 1 0.9% 0 0.0% 0 0.0% 0 0.0% 0 0.0% 0 0.0% 0 0.0% 0 0.0% 0Other 0.0% 0 0.0% 0 0.0% 0 0.0% 0 0.0% 0 0.0% 0 0.0% 0 0.0% 0 0.0% 0(Nothing) 64.5% 352 75.9% 25 0.0% 0 0.0% 0 0.0% 0 0.0% 0 0.0% 0 0.0% 0 0.0% 0(Don’t know) 13.6% 74 9.3% 3 0.0% 0 0.0% 0 0.0% 0 0.0% 0 0.0% 0 0.0% 0 0.0% 0Weighted base: 545 33 0 0 0 0 0 0 0Sample: 601 100 0 0 0 0 0 0 0
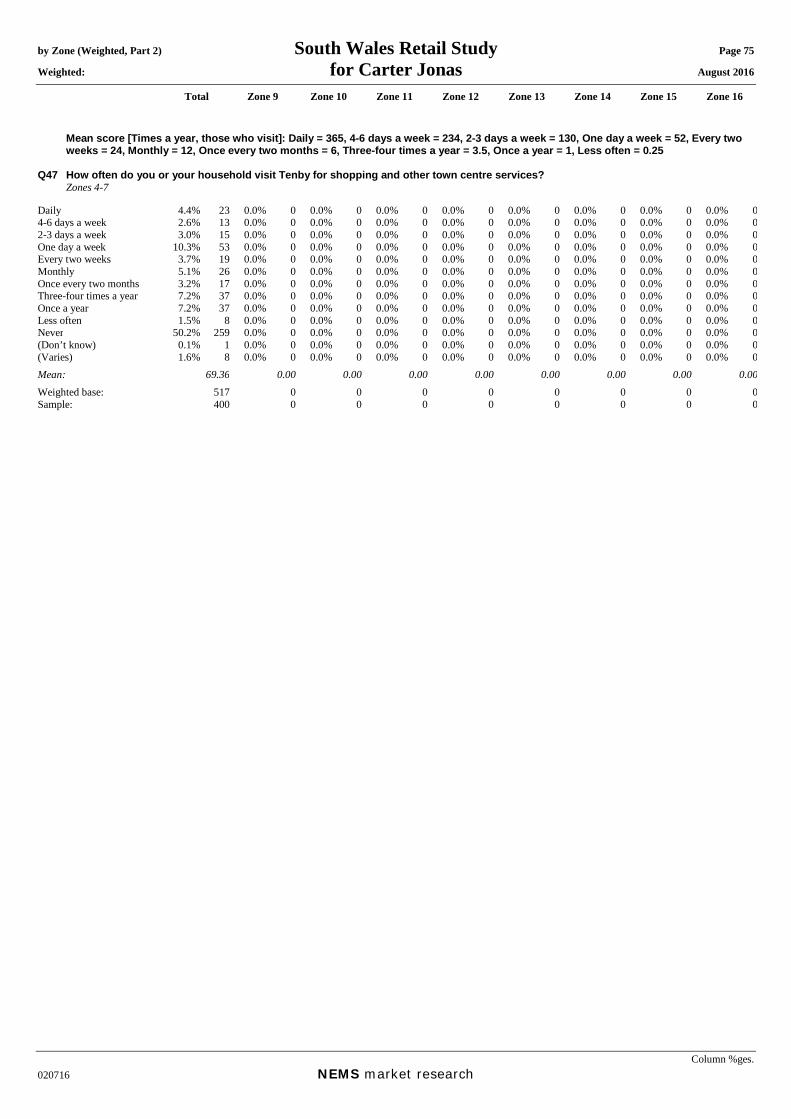
by Zone (Weighted, Part 2) South Wales Retail Study Page 75 Weighted: for Carter Jonas August 2016
Total Zone 9 Zone 10 Zone 11 Zone 12 Zone 13 Zone 14 Zone 15 Zone 16
Column %ges. 020716 NEMS market research
Mean score [Times a year, those who visit]: Daily = 365, 4-6 days a week = 234, 2-3 days a week = 130, One day a week = 52, Every two weeks = 24, Monthly = 12, Once every two months = 6, Three-four times a year = 3.5, Once a year = 1, Less often = 0.25
Q47 How often do you or your household visit Tenby for shopping and other town centre services? Zones 4-7 Daily 4.4% 23 0.0% 0 0.0% 0 0.0% 0 0.0% 0 0.0% 0 0.0% 0 0.0% 0 0.0% 04-6 days a week 2.6% 13 0.0% 0 0.0% 0 0.0% 0 0.0% 0 0.0% 0 0.0% 0 0.0% 0 0.0% 02-3 days a week 3.0% 15 0.0% 0 0.0% 0 0.0% 0 0.0% 0 0.0% 0 0.0% 0 0.0% 0 0.0% 0One day a week 10.3% 53 0.0% 0 0.0% 0 0.0% 0 0.0% 0 0.0% 0 0.0% 0 0.0% 0 0.0% 0Every two weeks 3.7% 19 0.0% 0 0.0% 0 0.0% 0 0.0% 0 0.0% 0 0.0% 0 0.0% 0 0.0% 0Monthly 5.1% 26 0.0% 0 0.0% 0 0.0% 0 0.0% 0 0.0% 0 0.0% 0 0.0% 0 0.0% 0Once every two months 3.2% 17 0.0% 0 0.0% 0 0.0% 0 0.0% 0 0.0% 0 0.0% 0 0.0% 0 0.0% 0Three-four times a year 7.2% 37 0.0% 0 0.0% 0 0.0% 0 0.0% 0 0.0% 0 0.0% 0 0.0% 0 0.0% 0Once a year 7.2% 37 0.0% 0 0.0% 0 0.0% 0 0.0% 0 0.0% 0 0.0% 0 0.0% 0 0.0% 0Less often 1.5% 8 0.0% 0 0.0% 0 0.0% 0 0.0% 0 0.0% 0 0.0% 0 0.0% 0 0.0% 0Never 50.2% 259 0.0% 0 0.0% 0 0.0% 0 0.0% 0 0.0% 0 0.0% 0 0.0% 0 0.0% 0(Don’t know) 0.1% 1 0.0% 0 0.0% 0 0.0% 0 0.0% 0 0.0% 0 0.0% 0 0.0% 0 0.0% 0(Varies) 1.6% 8 0.0% 0 0.0% 0 0.0% 0 0.0% 0 0.0% 0 0.0% 0 0.0% 0 0.0% 0Mean: 69.36 0.00 0.00 0.00 0.00 0.00 0.00 0.00 0.00Weighted base: 517 0 0 0 0 0 0 0 0Sample: 400 0 0 0 0 0 0 0 0

by Zone (Weighted, Part 2) South Wales Retail Study Page 76 Weighted: for Carter Jonas August 2016
Total Zone 9 Zone 10 Zone 11 Zone 12 Zone 13 Zone 14 Zone 15 Zone 16
Column %ges. 020716 NEMS market research
Q48A In order of importance, what are your two main reasons for visiting Tenby Town Centre? Main reason: Zones 4-7 and those who visit Tenby town centre at Q47 Food shopping 12.3% 32 0.0% 0 0.0% 0 0.0% 0 0.0% 0 0.0% 0 0.0% 0 0.0% 0 0.0% 0Non-food shopping 28.7% 74 0.0% 0 0.0% 0 0.0% 0 0.0% 0 0.0% 0 0.0% 0 0.0% 0 0.0% 0To visit bars / pubs 1.2% 3 0.0% 0 0.0% 0 0.0% 0 0.0% 0 0.0% 0 0.0% 0 0.0% 0 0.0% 0To visit cafés / restaurants 7.3% 19 0.0% 0 0.0% 0 0.0% 0 0.0% 0 0.0% 0 0.0% 0 0.0% 0 0.0% 0To visit personal service
providers (e.g. hairdressers, beauty salon etc.)
0.8% 2 0.0% 0 0.0% 0 0.0% 0 0.0% 0 0.0% 0 0.0% 0 0.0% 0 0.0% 0
To visit financial services such as banks and other financial institutions
3.1% 8 0.0% 0 0.0% 0 0.0% 0 0.0% 0 0.0% 0 0.0% 0 0.0% 0 0.0% 0
To visit other service providers (e.g. travel agent, estate agent etc.)
1.2% 3 0.0% 0 0.0% 0 0.0% 0 0.0% 0 0.0% 0 0.0% 0 0.0% 0 0.0% 0
To visit public services (e.g. medical or dentist appointment, library, job centre, community centre, etc)
0.5% 1 0.0% 0 0.0% 0 0.0% 0 0.0% 0 0.0% 0 0.0% 0 0.0% 0 0.0% 0
To get petrol 0.0% 0 0.0% 0 0.0% 0 0.0% 0 0.0% 0 0.0% 0 0.0% 0 0.0% 0 0.0% 0To visit the cinema 0.0% 0 0.0% 0 0.0% 0 0.0% 0 0.0% 0 0.0% 0 0.0% 0 0.0% 0 0.0% 0To visit a park 0.0% 0 0.0% 0 0.0% 0 0.0% 0 0.0% 0 0.0% 0 0.0% 0 0.0% 0 0.0% 0To visit the swimming pool 0.0% 0 0.0% 0 0.0% 0 0.0% 0 0.0% 0 0.0% 0 0.0% 0 0.0% 0 0.0% 0To visit other gyms / health
and fitness facilities 0.0% 0 0.0% 0 0.0% 0 0.0% 0 0.0% 0 0.0% 0 0.0% 0 0.0% 0 0.0% 0
To visit the library 0.0% 0 0.0% 0 0.0% 0 0.0% 0 0.0% 0 0.0% 0 0.0% 0 0.0% 0 0.0% 0To visit museums / art
gallery 0.0% 0 0.0% 0 0.0% 0 0.0% 0 0.0% 0 0.0% 0 0.0% 0 0.0% 0 0.0% 0
To visit the theatre or musical venues
0.0% 0 0.0% 0 0.0% 0 0.0% 0 0.0% 0 0.0% 0 0.0% 0 0.0% 0 0.0% 0
To visit night time venues e.g. nightclub
0.0% 0 0.0% 0 0.0% 0 0.0% 0 0.0% 0 0.0% 0 0.0% 0 0.0% 0 0.0% 0
For other leisure activities 15.9% 41 0.0% 0 0.0% 0 0.0% 0 0.0% 0 0.0% 0 0.0% 0 0.0% 0 0.0% 0To shop at the market(s) 0.0% 0 0.0% 0 0.0% 0 0.0% 0 0.0% 0 0.0% 0 0.0% 0 0.0% 0 0.0% 0To meet family 0.7% 2 0.0% 0 0.0% 0 0.0% 0 0.0% 0 0.0% 0 0.0% 0 0.0% 0 0.0% 0To meet friends 1.1% 3 0.0% 0 0.0% 0 0.0% 0 0.0% 0 0.0% 0 0.0% 0 0.0% 0 0.0% 0To visit the theatre 0.0% 0 0.0% 0 0.0% 0 0.0% 0 0.0% 0 0.0% 0 0.0% 0 0.0% 0 0.0% 0For work (i.e. place of work) 2.9% 8 0.0% 0 0.0% 0 0.0% 0 0.0% 0 0.0% 0 0.0% 0 0.0% 0 0.0% 0For business (e.g. attend a
business appointment) 0.0% 0 0.0% 0 0.0% 0 0.0% 0 0.0% 0 0.0% 0 0.0% 0 0.0% 0 0.0% 0
For education as a student (e.g. student at college, university, or other third level education)
0.0% 0 0.0% 0 0.0% 0 0.0% 0 0.0% 0 0.0% 0 0.0% 0 0.0% 0 0.0% 0
To access public transport for onward travel (e.g. train station, bus station)
0.0% 0 0.0% 0 0.0% 0 0.0% 0 0.0% 0 0.0% 0 0.0% 0 0.0% 0 0.0% 0
Other 0.0% 0 0.0% 0 0.0% 0 0.0% 0 0.0% 0 0.0% 0 0.0% 0 0.0% 0 0.0% 0As part of a day out / for a
day out / something different
16.0% 41 0.0% 0 0.0% 0 0.0% 0 0.0% 0 0.0% 0 0.0% 0 0.0% 0 0.0% 0
Browsing / window shopping 4.4% 11 0.0% 0 0.0% 0 0.0% 0 0.0% 0 0.0% 0 0.0% 0 0.0% 0 0.0% 0(Don't know / varies) 2.0% 5 0.0% 0 0.0% 0 0.0% 0 0.0% 0 0.0% 0 0.0% 0 0.0% 0 0.0% 0(Nothing / nothing further) 1.7% 4 0.0% 0 0.0% 0 0.0% 0 0.0% 0 0.0% 0 0.0% 0 0.0% 0 0.0% 0Weighted base: 258 0 0 0 0 0 0 0 0Sample: 196 0 0 0 0 0 0 0 0

by Zone (Weighted, Part 2) South Wales Retail Study Page 77 Weighted: for Carter Jonas August 2016
Total Zone 9 Zone 10 Zone 11 Zone 12 Zone 13 Zone 14 Zone 15 Zone 16
Column %ges. 020716 NEMS market research
Q48B In order of importance, what are your two main reasons for visiting Tenby Town Centre? Secondary reason: Those who gave a reason at Q48A Food shopping 6.0% 15 0.0% 0 0.0% 0 0.0% 0 0.0% 0 0.0% 0 0.0% 0 0.0% 0 0.0% 0Non-food shopping 11.8% 29 0.0% 0 0.0% 0 0.0% 0 0.0% 0 0.0% 0 0.0% 0 0.0% 0 0.0% 0To visit bars / pubs 1.1% 3 0.0% 0 0.0% 0 0.0% 0 0.0% 0 0.0% 0 0.0% 0 0.0% 0 0.0% 0To visit cafés / restaurants 14.3% 35 0.0% 0 0.0% 0 0.0% 0 0.0% 0 0.0% 0 0.0% 0 0.0% 0 0.0% 0To visit personal service
providers (e.g. hairdressers, beauty salon etc.)
0.0% 0 0.0% 0 0.0% 0 0.0% 0 0.0% 0 0.0% 0 0.0% 0 0.0% 0 0.0% 0
To visit financial services such as banks and other financial institutions
3.1% 8 0.0% 0 0.0% 0 0.0% 0 0.0% 0 0.0% 0 0.0% 0 0.0% 0 0.0% 0
To visit other service providers (e.g. travel agent, estate agent etc.)
0.0% 0 0.0% 0 0.0% 0 0.0% 0 0.0% 0 0.0% 0 0.0% 0 0.0% 0 0.0% 0
To visit public services (e.g. medical or dentist appointment, library, job centre, community centre, etc)
0.0% 0 0.0% 0 0.0% 0 0.0% 0 0.0% 0 0.0% 0 0.0% 0 0.0% 0 0.0% 0
To get petrol 0.0% 0 0.0% 0 0.0% 0 0.0% 0 0.0% 0 0.0% 0 0.0% 0 0.0% 0 0.0% 0To visit the cinema 0.0% 0 0.0% 0 0.0% 0 0.0% 0 0.0% 0 0.0% 0 0.0% 0 0.0% 0 0.0% 0To visit a park 0.0% 0 0.0% 0 0.0% 0 0.0% 0 0.0% 0 0.0% 0 0.0% 0 0.0% 0 0.0% 0To visit the swimming pool 0.5% 1 0.0% 0 0.0% 0 0.0% 0 0.0% 0 0.0% 0 0.0% 0 0.0% 0 0.0% 0To visit other gyms / health
and fitness facilities 0.0% 0 0.0% 0 0.0% 0 0.0% 0 0.0% 0 0.0% 0 0.0% 0 0.0% 0 0.0% 0
To visit the library 0.0% 0 0.0% 0 0.0% 0 0.0% 0 0.0% 0 0.0% 0 0.0% 0 0.0% 0 0.0% 0To visit museums / art
gallery 0.0% 0 0.0% 0 0.0% 0 0.0% 0 0.0% 0 0.0% 0 0.0% 0 0.0% 0 0.0% 0
To visit the theatre or musical venues
0.0% 0 0.0% 0 0.0% 0 0.0% 0 0.0% 0 0.0% 0 0.0% 0 0.0% 0 0.0% 0
To visit night time venues e.g. nightclub
0.0% 0 0.0% 0 0.0% 0 0.0% 0 0.0% 0 0.0% 0 0.0% 0 0.0% 0 0.0% 0
For other leisure activities 4.2% 10 0.0% 0 0.0% 0 0.0% 0 0.0% 0 0.0% 0 0.0% 0 0.0% 0 0.0% 0To shop at the market(s) 0.0% 0 0.0% 0 0.0% 0 0.0% 0 0.0% 0 0.0% 0 0.0% 0 0.0% 0 0.0% 0To meet family 2.7% 7 0.0% 0 0.0% 0 0.0% 0 0.0% 0 0.0% 0 0.0% 0 0.0% 0 0.0% 0To meet friends 3.3% 8 0.0% 0 0.0% 0 0.0% 0 0.0% 0 0.0% 0 0.0% 0 0.0% 0 0.0% 0To visit the theatre 0.0% 0 0.0% 0 0.0% 0 0.0% 0 0.0% 0 0.0% 0 0.0% 0 0.0% 0 0.0% 0For work (i.e. place of work) 1.2% 3 0.0% 0 0.0% 0 0.0% 0 0.0% 0 0.0% 0 0.0% 0 0.0% 0 0.0% 0For business (e.g. attend a
business appointment) 1.8% 5 0.0% 0 0.0% 0 0.0% 0 0.0% 0 0.0% 0 0.0% 0 0.0% 0 0.0% 0
For education as a student (e.g. student at college, university, or other third level education)
0.0% 0 0.0% 0 0.0% 0 0.0% 0 0.0% 0 0.0% 0 0.0% 0 0.0% 0 0.0% 0
To access public transport for onward travel (e.g. train station, bus station)
0.0% 0 0.0% 0 0.0% 0 0.0% 0 0.0% 0 0.0% 0 0.0% 0 0.0% 0 0.0% 0
Other 0.0% 0 0.0% 0 0.0% 0 0.0% 0 0.0% 0 0.0% 0 0.0% 0 0.0% 0 0.0% 0As part of a day out / for a
day out / something different
3.1% 8 0.0% 0 0.0% 0 0.0% 0 0.0% 0 0.0% 0 0.0% 0 0.0% 0 0.0% 0
Browsing / window shopping 2.8% 7 0.0% 0 0.0% 0 0.0% 0 0.0% 0 0.0% 0 0.0% 0 0.0% 0 0.0% 0(Don't know / varies) 1.1% 3 0.0% 0 0.0% 0 0.0% 0 0.0% 0 0.0% 0 0.0% 0 0.0% 0 0.0% 0(Nothing / nothing further) 43.1% 107 0.0% 0 0.0% 0 0.0% 0 0.0% 0 0.0% 0 0.0% 0 0.0% 0 0.0% 0Weighted base: 248 0 0 0 0 0 0 0 0Sample: 188 0 0 0 0 0 0 0 0

by Zone (Weighted, Part 2) South Wales Retail Study Page 78 Weighted: for Carter Jonas August 2016
Total Zone 9 Zone 10 Zone 11 Zone 12 Zone 13 Zone 14 Zone 15 Zone 16
Column %ges. 020716 NEMS market research
Q48X In order of importance, what are your two main reasons for visiting Tenby Town Centre? Any mention: [MR] Zones 4-7 and those who visit Tenby town centre at Q47 Food shopping 18.1% 47 0.0% 0 0.0% 0 0.0% 0 0.0% 0 0.0% 0 0.0% 0 0.0% 0 0.0% 0Non-food shopping 40.0% 103 0.0% 0 0.0% 0 0.0% 0 0.0% 0 0.0% 0 0.0% 0 0.0% 0 0.0% 0To visit bars / pubs 2.3% 6 0.0% 0 0.0% 0 0.0% 0 0.0% 0 0.0% 0 0.0% 0 0.0% 0 0.0% 0To visit cafés / restaurants 21.0% 54 0.0% 0 0.0% 0 0.0% 0 0.0% 0 0.0% 0 0.0% 0 0.0% 0 0.0% 0To visit personal service
providers (e.g. hairdressers, beauty salon etc.)
0.8% 2 0.0% 0 0.0% 0 0.0% 0 0.0% 0 0.0% 0 0.0% 0 0.0% 0 0.0% 0
To visit financial services such as banks and other financial institutions
6.1% 16 0.0% 0 0.0% 0 0.0% 0 0.0% 0 0.0% 0 0.0% 0 0.0% 0 0.0% 0
To visit other service providers (e.g. travel agent, estate agent etc.)
1.2% 3 0.0% 0 0.0% 0 0.0% 0 0.0% 0 0.0% 0 0.0% 0 0.0% 0 0.0% 0
To visit public services (e.g. medical or dentist appointment, library, job centre, community centre, etc)
0.5% 1 0.0% 0 0.0% 0 0.0% 0 0.0% 0 0.0% 0 0.0% 0 0.0% 0 0.0% 0
To get petrol 0.0% 0 0.0% 0 0.0% 0 0.0% 0 0.0% 0 0.0% 0 0.0% 0 0.0% 0 0.0% 0To visit the cinema 0.0% 0 0.0% 0 0.0% 0 0.0% 0 0.0% 0 0.0% 0 0.0% 0 0.0% 0 0.0% 0To visit a park 0.0% 0 0.0% 0 0.0% 0 0.0% 0 0.0% 0 0.0% 0 0.0% 0 0.0% 0 0.0% 0To visit the swimming pool 0.5% 1 0.0% 0 0.0% 0 0.0% 0 0.0% 0 0.0% 0 0.0% 0 0.0% 0 0.0% 0To visit other gyms / health
and fitness facilities 0.0% 0 0.0% 0 0.0% 0 0.0% 0 0.0% 0 0.0% 0 0.0% 0 0.0% 0 0.0% 0
To visit the library 0.0% 0 0.0% 0 0.0% 0 0.0% 0 0.0% 0 0.0% 0 0.0% 0 0.0% 0 0.0% 0To visit museums / art
gallery 0.0% 0 0.0% 0 0.0% 0 0.0% 0 0.0% 0 0.0% 0 0.0% 0 0.0% 0 0.0% 0
To visit the theatre or musical venues
0.0% 0 0.0% 0 0.0% 0 0.0% 0 0.0% 0 0.0% 0 0.0% 0 0.0% 0 0.0% 0
To visit night time venues e.g. nightclub
0.0% 0 0.0% 0 0.0% 0 0.0% 0 0.0% 0 0.0% 0 0.0% 0 0.0% 0 0.0% 0
For other leisure activities 20.0% 51 0.0% 0 0.0% 0 0.0% 0 0.0% 0 0.0% 0 0.0% 0 0.0% 0 0.0% 0To shop at the market(s) 0.0% 0 0.0% 0 0.0% 0 0.0% 0 0.0% 0 0.0% 0 0.0% 0 0.0% 0 0.0% 0To meet family 3.3% 9 0.0% 0 0.0% 0 0.0% 0 0.0% 0 0.0% 0 0.0% 0 0.0% 0 0.0% 0To meet friends 4.3% 11 0.0% 0 0.0% 0 0.0% 0 0.0% 0 0.0% 0 0.0% 0 0.0% 0 0.0% 0To visit the theatre 0.0% 0 0.0% 0 0.0% 0 0.0% 0 0.0% 0 0.0% 0 0.0% 0 0.0% 0 0.0% 0For work (i.e. place of work) 4.0% 10 0.0% 0 0.0% 0 0.0% 0 0.0% 0 0.0% 0 0.0% 0 0.0% 0 0.0% 0For business (e.g. attend a
business appointment) 1.8% 5 0.0% 0 0.0% 0 0.0% 0 0.0% 0 0.0% 0 0.0% 0 0.0% 0 0.0% 0
For education as a student (e.g. student at college, university, or other third level education)
0.0% 0 0.0% 0 0.0% 0 0.0% 0 0.0% 0 0.0% 0 0.0% 0 0.0% 0 0.0% 0
To access public transport for onward travel (e.g. train station, bus station)
0.0% 0 0.0% 0 0.0% 0 0.0% 0 0.0% 0 0.0% 0 0.0% 0 0.0% 0 0.0% 0
Other 0.0% 0 0.0% 0 0.0% 0 0.0% 0 0.0% 0 0.0% 0 0.0% 0 0.0% 0 0.0% 0As part of a day out / for a
day out / something different
19.0% 49 0.0% 0 0.0% 0 0.0% 0 0.0% 0 0.0% 0 0.0% 0 0.0% 0 0.0% 0
Browsing / window shopping 7.1% 18 0.0% 0 0.0% 0 0.0% 0 0.0% 0 0.0% 0 0.0% 0 0.0% 0 0.0% 0Weighted base: 258 0 0 0 0 0 0 0 0Sample: 196 0 0 0 0 0 0 0 0
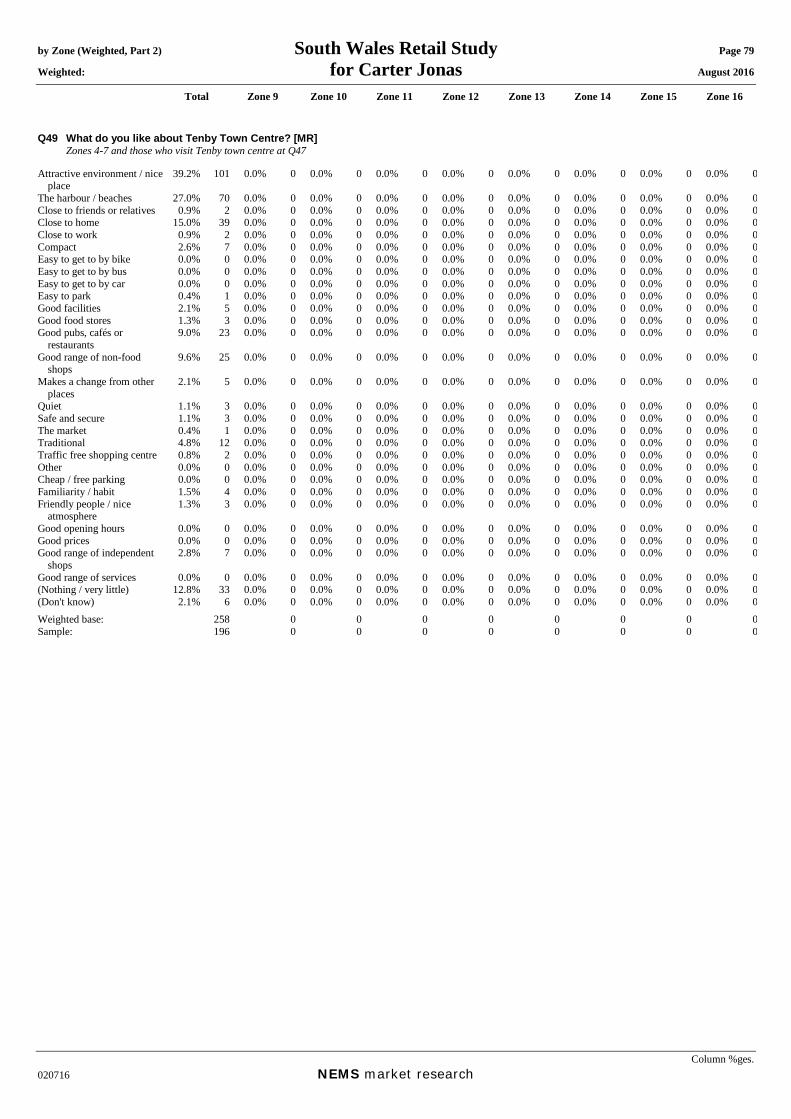
by Zone (Weighted, Part 2) South Wales Retail Study Page 79 Weighted: for Carter Jonas August 2016
Total Zone 9 Zone 10 Zone 11 Zone 12 Zone 13 Zone 14 Zone 15 Zone 16
Column %ges. 020716 NEMS market research
Q49 What do you like about Tenby Town Centre? [MR] Zones 4-7 and those who visit Tenby town centre at Q47 Attractive environment / nice
place 39.2% 101 0.0% 0 0.0% 0 0.0% 0 0.0% 0 0.0% 0 0.0% 0 0.0% 0 0.0% 0
The harbour / beaches 27.0% 70 0.0% 0 0.0% 0 0.0% 0 0.0% 0 0.0% 0 0.0% 0 0.0% 0 0.0% 0Close to friends or relatives 0.9% 2 0.0% 0 0.0% 0 0.0% 0 0.0% 0 0.0% 0 0.0% 0 0.0% 0 0.0% 0Close to home 15.0% 39 0.0% 0 0.0% 0 0.0% 0 0.0% 0 0.0% 0 0.0% 0 0.0% 0 0.0% 0Close to work 0.9% 2 0.0% 0 0.0% 0 0.0% 0 0.0% 0 0.0% 0 0.0% 0 0.0% 0 0.0% 0Compact 2.6% 7 0.0% 0 0.0% 0 0.0% 0 0.0% 0 0.0% 0 0.0% 0 0.0% 0 0.0% 0Easy to get to by bike 0.0% 0 0.0% 0 0.0% 0 0.0% 0 0.0% 0 0.0% 0 0.0% 0 0.0% 0 0.0% 0Easy to get to by bus 0.0% 0 0.0% 0 0.0% 0 0.0% 0 0.0% 0 0.0% 0 0.0% 0 0.0% 0 0.0% 0Easy to get to by car 0.0% 0 0.0% 0 0.0% 0 0.0% 0 0.0% 0 0.0% 0 0.0% 0 0.0% 0 0.0% 0Easy to park 0.4% 1 0.0% 0 0.0% 0 0.0% 0 0.0% 0 0.0% 0 0.0% 0 0.0% 0 0.0% 0Good facilities 2.1% 5 0.0% 0 0.0% 0 0.0% 0 0.0% 0 0.0% 0 0.0% 0 0.0% 0 0.0% 0Good food stores 1.3% 3 0.0% 0 0.0% 0 0.0% 0 0.0% 0 0.0% 0 0.0% 0 0.0% 0 0.0% 0Good pubs, cafés or
restaurants 9.0% 23 0.0% 0 0.0% 0 0.0% 0 0.0% 0 0.0% 0 0.0% 0 0.0% 0 0.0% 0
Good range of non-food shops
9.6% 25 0.0% 0 0.0% 0 0.0% 0 0.0% 0 0.0% 0 0.0% 0 0.0% 0 0.0% 0
Makes a change from other places
2.1% 5 0.0% 0 0.0% 0 0.0% 0 0.0% 0 0.0% 0 0.0% 0 0.0% 0 0.0% 0
Quiet 1.1% 3 0.0% 0 0.0% 0 0.0% 0 0.0% 0 0.0% 0 0.0% 0 0.0% 0 0.0% 0Safe and secure 1.1% 3 0.0% 0 0.0% 0 0.0% 0 0.0% 0 0.0% 0 0.0% 0 0.0% 0 0.0% 0The market 0.4% 1 0.0% 0 0.0% 0 0.0% 0 0.0% 0 0.0% 0 0.0% 0 0.0% 0 0.0% 0Traditional 4.8% 12 0.0% 0 0.0% 0 0.0% 0 0.0% 0 0.0% 0 0.0% 0 0.0% 0 0.0% 0Traffic free shopping centre 0.8% 2 0.0% 0 0.0% 0 0.0% 0 0.0% 0 0.0% 0 0.0% 0 0.0% 0 0.0% 0Other 0.0% 0 0.0% 0 0.0% 0 0.0% 0 0.0% 0 0.0% 0 0.0% 0 0.0% 0 0.0% 0Cheap / free parking 0.0% 0 0.0% 0 0.0% 0 0.0% 0 0.0% 0 0.0% 0 0.0% 0 0.0% 0 0.0% 0Familiarity / habit 1.5% 4 0.0% 0 0.0% 0 0.0% 0 0.0% 0 0.0% 0 0.0% 0 0.0% 0 0.0% 0Friendly people / nice
atmosphere 1.3% 3 0.0% 0 0.0% 0 0.0% 0 0.0% 0 0.0% 0 0.0% 0 0.0% 0 0.0% 0
Good opening hours 0.0% 0 0.0% 0 0.0% 0 0.0% 0 0.0% 0 0.0% 0 0.0% 0 0.0% 0 0.0% 0Good prices 0.0% 0 0.0% 0 0.0% 0 0.0% 0 0.0% 0 0.0% 0 0.0% 0 0.0% 0 0.0% 0Good range of independent
shops 2.8% 7 0.0% 0 0.0% 0 0.0% 0 0.0% 0 0.0% 0 0.0% 0 0.0% 0 0.0% 0
Good range of services 0.0% 0 0.0% 0 0.0% 0 0.0% 0 0.0% 0 0.0% 0 0.0% 0 0.0% 0 0.0% 0(Nothing / very little) 12.8% 33 0.0% 0 0.0% 0 0.0% 0 0.0% 0 0.0% 0 0.0% 0 0.0% 0 0.0% 0(Don't know) 2.1% 6 0.0% 0 0.0% 0 0.0% 0 0.0% 0 0.0% 0 0.0% 0 0.0% 0 0.0% 0Weighted base: 258 0 0 0 0 0 0 0 0Sample: 196 0 0 0 0 0 0 0 0
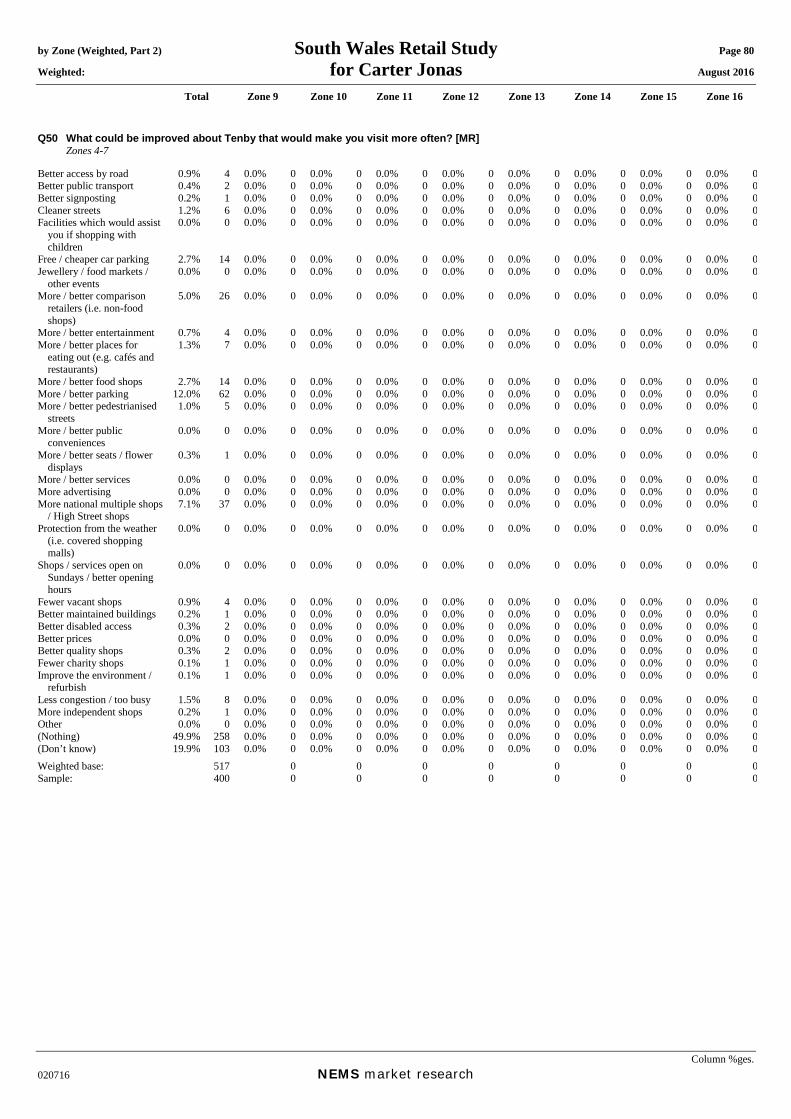
by Zone (Weighted, Part 2) South Wales Retail Study Page 80 Weighted: for Carter Jonas August 2016
Total Zone 9 Zone 10 Zone 11 Zone 12 Zone 13 Zone 14 Zone 15 Zone 16
Column %ges. 020716 NEMS market research
Q50 What could be improved about Tenby that would make you visit more often? [MR] Zones 4-7 Better access by road 0.9% 4 0.0% 0 0.0% 0 0.0% 0 0.0% 0 0.0% 0 0.0% 0 0.0% 0 0.0% 0Better public transport 0.4% 2 0.0% 0 0.0% 0 0.0% 0 0.0% 0 0.0% 0 0.0% 0 0.0% 0 0.0% 0Better signposting 0.2% 1 0.0% 0 0.0% 0 0.0% 0 0.0% 0 0.0% 0 0.0% 0 0.0% 0 0.0% 0Cleaner streets 1.2% 6 0.0% 0 0.0% 0 0.0% 0 0.0% 0 0.0% 0 0.0% 0 0.0% 0 0.0% 0Facilities which would assist
you if shopping with children
0.0% 0 0.0% 0 0.0% 0 0.0% 0 0.0% 0 0.0% 0 0.0% 0 0.0% 0 0.0% 0
Free / cheaper car parking 2.7% 14 0.0% 0 0.0% 0 0.0% 0 0.0% 0 0.0% 0 0.0% 0 0.0% 0 0.0% 0Jewellery / food markets /
other events 0.0% 0 0.0% 0 0.0% 0 0.0% 0 0.0% 0 0.0% 0 0.0% 0 0.0% 0 0.0% 0
More / better comparison retailers (i.e. non-food shops)
5.0% 26 0.0% 0 0.0% 0 0.0% 0 0.0% 0 0.0% 0 0.0% 0 0.0% 0 0.0% 0
More / better entertainment 0.7% 4 0.0% 0 0.0% 0 0.0% 0 0.0% 0 0.0% 0 0.0% 0 0.0% 0 0.0% 0More / better places for
eating out (e.g. cafés and restaurants)
1.3% 7 0.0% 0 0.0% 0 0.0% 0 0.0% 0 0.0% 0 0.0% 0 0.0% 0 0.0% 0
More / better food shops 2.7% 14 0.0% 0 0.0% 0 0.0% 0 0.0% 0 0.0% 0 0.0% 0 0.0% 0 0.0% 0More / better parking 12.0% 62 0.0% 0 0.0% 0 0.0% 0 0.0% 0 0.0% 0 0.0% 0 0.0% 0 0.0% 0More / better pedestrianised
streets 1.0% 5 0.0% 0 0.0% 0 0.0% 0 0.0% 0 0.0% 0 0.0% 0 0.0% 0 0.0% 0
More / better public conveniences
0.0% 0 0.0% 0 0.0% 0 0.0% 0 0.0% 0 0.0% 0 0.0% 0 0.0% 0 0.0% 0
More / better seats / flower displays
0.3% 1 0.0% 0 0.0% 0 0.0% 0 0.0% 0 0.0% 0 0.0% 0 0.0% 0 0.0% 0
More / better services 0.0% 0 0.0% 0 0.0% 0 0.0% 0 0.0% 0 0.0% 0 0.0% 0 0.0% 0 0.0% 0More advertising 0.0% 0 0.0% 0 0.0% 0 0.0% 0 0.0% 0 0.0% 0 0.0% 0 0.0% 0 0.0% 0More national multiple shops
/ High Street shops 7.1% 37 0.0% 0 0.0% 0 0.0% 0 0.0% 0 0.0% 0 0.0% 0 0.0% 0 0.0% 0
Protection from the weather (i.e. covered shopping malls)
0.0% 0 0.0% 0 0.0% 0 0.0% 0 0.0% 0 0.0% 0 0.0% 0 0.0% 0 0.0% 0
Shops / services open on Sundays / better opening hours
0.0% 0 0.0% 0 0.0% 0 0.0% 0 0.0% 0 0.0% 0 0.0% 0 0.0% 0 0.0% 0
Fewer vacant shops 0.9% 4 0.0% 0 0.0% 0 0.0% 0 0.0% 0 0.0% 0 0.0% 0 0.0% 0 0.0% 0Better maintained buildings 0.2% 1 0.0% 0 0.0% 0 0.0% 0 0.0% 0 0.0% 0 0.0% 0 0.0% 0 0.0% 0Better disabled access 0.3% 2 0.0% 0 0.0% 0 0.0% 0 0.0% 0 0.0% 0 0.0% 0 0.0% 0 0.0% 0Better prices 0.0% 0 0.0% 0 0.0% 0 0.0% 0 0.0% 0 0.0% 0 0.0% 0 0.0% 0 0.0% 0Better quality shops 0.3% 2 0.0% 0 0.0% 0 0.0% 0 0.0% 0 0.0% 0 0.0% 0 0.0% 0 0.0% 0Fewer charity shops 0.1% 1 0.0% 0 0.0% 0 0.0% 0 0.0% 0 0.0% 0 0.0% 0 0.0% 0 0.0% 0Improve the environment /
refurbish 0.1% 1 0.0% 0 0.0% 0 0.0% 0 0.0% 0 0.0% 0 0.0% 0 0.0% 0 0.0% 0
Less congestion / too busy 1.5% 8 0.0% 0 0.0% 0 0.0% 0 0.0% 0 0.0% 0 0.0% 0 0.0% 0 0.0% 0More independent shops 0.2% 1 0.0% 0 0.0% 0 0.0% 0 0.0% 0 0.0% 0 0.0% 0 0.0% 0 0.0% 0Other 0.0% 0 0.0% 0 0.0% 0 0.0% 0 0.0% 0 0.0% 0 0.0% 0 0.0% 0 0.0% 0(Nothing) 49.9% 258 0.0% 0 0.0% 0 0.0% 0 0.0% 0 0.0% 0 0.0% 0 0.0% 0 0.0% 0(Don’t know) 19.9% 103 0.0% 0 0.0% 0 0.0% 0 0.0% 0 0.0% 0 0.0% 0 0.0% 0 0.0% 0Weighted base: 517 0 0 0 0 0 0 0 0Sample: 400 0 0 0 0 0 0 0 0

by Zone (Weighted, Part 2) South Wales Retail Study Page 81 Weighted: for Carter Jonas August 2016
Total Zone 9 Zone 10 Zone 11 Zone 12 Zone 13 Zone 14 Zone 15 Zone 16
Column %ges. 020716 NEMS market research
Mean score [Times a year, those who visit]: Daily = 365, 4-6 days a week = 234, 2-3 days a week = 130, One day a week = 52, Every two weeks = 24, Monthly = 12, Once every two months = 6, Three-four times a year = 3.5, Once a year = 1, Less often = 0.25
Q51 How often do you or your household visit Newport for shopping and other town centre services? Zones 8-10 Daily 2.5% 7 19.0% 6 0.0% 0 0.0% 0 0.0% 0 0.0% 0 0.0% 0 0.0% 0 0.0% 04-6 days a week 1.0% 3 8.3% 3 0.0% 0 0.0% 0 0.0% 0 0.0% 0 0.0% 0 0.0% 0 0.0% 02-3 days a week 3.1% 9 9.4% 3 3.2% 5 0.0% 0 0.0% 0 0.0% 0 0.0% 0 0.0% 0 0.0% 0One day a week 2.3% 6 8.1% 3 1.8% 3 0.0% 0 0.0% 0 0.0% 0 0.0% 0 0.0% 0 0.0% 0Every two weeks 1.9% 5 7.6% 3 0.0% 0 0.0% 0 0.0% 0 0.0% 0 0.0% 0 0.0% 0 0.0% 0Monthly 3.9% 11 8.0% 3 4.0% 6 0.0% 0 0.0% 0 0.0% 0 0.0% 0 0.0% 0 0.0% 0Once every two months 3.4% 10 5.2% 2 2.7% 4 0.0% 0 0.0% 0 0.0% 0 0.0% 0 0.0% 0 0.0% 0Three-four times a year 6.7% 19 1.4% 0 7.6% 11 0.0% 0 0.0% 0 0.0% 0 0.0% 0 0.0% 0 0.0% 0Once a year 3.6% 10 0.0% 0 6.2% 9 0.0% 0 0.0% 0 0.0% 0 0.0% 0 0.0% 0 0.0% 0Less often 0.0% 0 0.0% 0 0.0% 0 0.0% 0 0.0% 0 0.0% 0 0.0% 0 0.0% 0 0.0% 0Never 68.9% 192 31.4% 10 72.3% 110 0.0% 0 0.0% 0 0.0% 0 0.0% 0 0.0% 0 0.0% 0(Don’t know) 1.2% 3 1.0% 0 0.0% 0 0.0% 0 0.0% 0 0.0% 0 0.0% 0 0.0% 0 0.0% 0(Varies) 1.6% 4 0.7% 0 2.2% 3 0.0% 0 0.0% 0 0.0% 0 0.0% 0 0.0% 0 0.0% 0Mean: 63.78 161.68 23.73 0.00 0.00 0.00 0.00 0.00 0.00Weighted base: 279 33 152 0 0 0 0 0 0Sample: 300 100 100 0 0 0 0 0 0

by Zone (Weighted, Part 2) South Wales Retail Study Page 82 Weighted: for Carter Jonas August 2016
Total Zone 9 Zone 10 Zone 11 Zone 12 Zone 13 Zone 14 Zone 15 Zone 16
Column %ges. 020716 NEMS market research
Q52A In order of importance, what are your two main reasons for visiting Newport Town Centre? Main reason: Zones 8-10 and those who visit Tenby town centre at Q51 Food shopping 17.5% 15 36.2% 8 11.2% 5 0.0% 0 0.0% 0 0.0% 0 0.0% 0 0.0% 0 0.0% 0Non-food shopping 20.5% 18 25.0% 6 16.7% 7 0.0% 0 0.0% 0 0.0% 0 0.0% 0 0.0% 0 0.0% 0To visit bars / pubs 0.7% 1 0.0% 0 0.0% 0 0.0% 0 0.0% 0 0.0% 0 0.0% 0 0.0% 0 0.0% 0To visit cafés / restaurants 22.8% 20 6.7% 2 24.4% 10 0.0% 0 0.0% 0 0.0% 0 0.0% 0 0.0% 0 0.0% 0To visit personal service
providers (e.g. hairdressers, beauty salon etc.)
1.0% 1 3.9% 1 0.0% 0 0.0% 0 0.0% 0 0.0% 0 0.0% 0 0.0% 0 0.0% 0
To visit financial services such as banks and other financial institutions
0.9% 1 3.3% 1 0.0% 0 0.0% 0 0.0% 0 0.0% 0 0.0% 0 0.0% 0 0.0% 0
To visit other service providers (e.g. travel agent, estate agent etc.)
0.0% 0 0.0% 0 0.0% 0 0.0% 0 0.0% 0 0.0% 0 0.0% 0 0.0% 0 0.0% 0
To visit public services (e.g. medical or dentist appointment, library, job centre, community centre, etc)
8.3% 7 13.6% 3 9.9% 4 0.0% 0 0.0% 0 0.0% 0 0.0% 0 0.0% 0 0.0% 0
To get petrol 0.0% 0 0.0% 0 0.0% 0 0.0% 0 0.0% 0 0.0% 0 0.0% 0 0.0% 0 0.0% 0To visit the cinema 0.0% 0 0.0% 0 0.0% 0 0.0% 0 0.0% 0 0.0% 0 0.0% 0 0.0% 0 0.0% 0To visit a park 0.0% 0 0.0% 0 0.0% 0 0.0% 0 0.0% 0 0.0% 0 0.0% 0 0.0% 0 0.0% 0To visit the swimming pool 0.0% 0 0.0% 0 0.0% 0 0.0% 0 0.0% 0 0.0% 0 0.0% 0 0.0% 0 0.0% 0To visit other gyms / health
and fitness facilities 0.0% 0 0.0% 0 0.0% 0 0.0% 0 0.0% 0 0.0% 0 0.0% 0 0.0% 0 0.0% 0
To visit the library 0.0% 0 0.0% 0 0.0% 0 0.0% 0 0.0% 0 0.0% 0 0.0% 0 0.0% 0 0.0% 0To visit museums / art
gallery 0.0% 0 0.0% 0 0.0% 0 0.0% 0 0.0% 0 0.0% 0 0.0% 0 0.0% 0 0.0% 0
To visit the theatre or musical venues
2.0% 2 0.0% 0 0.0% 0 0.0% 0 0.0% 0 0.0% 0 0.0% 0 0.0% 0 0.0% 0
To visit night time venues e.g. nightclub
0.0% 0 0.0% 0 0.0% 0 0.0% 0 0.0% 0 0.0% 0 0.0% 0 0.0% 0 0.0% 0
For other leisure activities 5.5% 5 0.0% 0 10.0% 4 0.0% 0 0.0% 0 0.0% 0 0.0% 0 0.0% 0 0.0% 0To shop at the market(s) 0.0% 0 0.0% 0 0.0% 0 0.0% 0 0.0% 0 0.0% 0 0.0% 0 0.0% 0 0.0% 0To meet family 0.8% 1 3.0% 1 0.0% 0 0.0% 0 0.0% 0 0.0% 0 0.0% 0 0.0% 0 0.0% 0To meet friends 1.8% 2 4.2% 1 0.0% 0 0.0% 0 0.0% 0 0.0% 0 0.0% 0 0.0% 0 0.0% 0To visit the theatre 0.0% 0 0.0% 0 0.0% 0 0.0% 0 0.0% 0 0.0% 0 0.0% 0 0.0% 0 0.0% 0For work (i.e. place of work) 7.8% 7 1.4% 0 11.5% 5 0.0% 0 0.0% 0 0.0% 0 0.0% 0 0.0% 0 0.0% 0For business (e.g. attend a
business appointment) 0.0% 0 0.0% 0 0.0% 0 0.0% 0 0.0% 0 0.0% 0 0.0% 0 0.0% 0 0.0% 0
For education as a student (e.g. student at college, university, or other third level education)
0.0% 0 0.0% 0 0.0% 0 0.0% 0 0.0% 0 0.0% 0 0.0% 0 0.0% 0 0.0% 0
To access public transport for onward travel (e.g. train station, bus station)
0.0% 0 0.0% 0 0.0% 0 0.0% 0 0.0% 0 0.0% 0 0.0% 0 0.0% 0 0.0% 0
Other 0.0% 0 0.0% 0 0.0% 0 0.0% 0 0.0% 0 0.0% 0 0.0% 0 0.0% 0 0.0% 0As part of a day out / for a
day out / something different
6.6% 6 1.3% 0 12.9% 5 0.0% 0 0.0% 0 0.0% 0 0.0% 0 0.0% 0 0.0% 0
Browsing / window shopping 1.9% 2 0.0% 0 0.0% 0 0.0% 0 0.0% 0 0.0% 0 0.0% 0 0.0% 0 0.0% 0(Don't know / varies) 0.4% 0 1.5% 0 0.0% 0 0.0% 0 0.0% 0 0.0% 0 0.0% 0 0.0% 0 0.0% 0(Nothing / nothing further) 1.7% 1 0.0% 0 3.5% 1 0.0% 0 0.0% 0 0.0% 0 0.0% 0 0.0% 0 0.0% 0Weighted base: 87 22 42 0 0 0 0 0 0Sample: 122 72 27 0 0 0 0 0 0

by Zone (Weighted, Part 2) South Wales Retail Study Page 83 Weighted: for Carter Jonas August 2016
Total Zone 9 Zone 10 Zone 11 Zone 12 Zone 13 Zone 14 Zone 15 Zone 16
Column %ges. 020716 NEMS market research
Q52B In order of importance, what are your two main reasons for visiting Newport Town Centre? Secondary reason: Those who gave a reason at Q52A Food shopping 9.0% 8 12.7% 3 11.9% 5 0.0% 0 0.0% 0 0.0% 0 0.0% 0 0.0% 0 0.0% 0Non-food shopping 8.6% 7 12.6% 3 6.9% 3 0.0% 0 0.0% 0 0.0% 0 0.0% 0 0.0% 0 0.0% 0To visit bars / pubs 0.6% 1 2.4% 1 0.0% 0 0.0% 0 0.0% 0 0.0% 0 0.0% 0 0.0% 0 0.0% 0To visit cafés / restaurants 13.1% 11 1.0% 0 23.0% 9 0.0% 0 0.0% 0 0.0% 0 0.0% 0 0.0% 0 0.0% 0To visit personal service
providers (e.g. hairdressers, beauty salon etc.)
5.7% 5 8.5% 2 0.0% 0 0.0% 0 0.0% 0 0.0% 0 0.0% 0 0.0% 0 0.0% 0
To visit financial services such as banks and other financial institutions
1.2% 1 4.6% 1 0.0% 0 0.0% 0 0.0% 0 0.0% 0 0.0% 0 0.0% 0 0.0% 0
To visit other service providers (e.g. travel agent, estate agent etc.)
0.3% 0 1.0% 0 0.0% 0 0.0% 0 0.0% 0 0.0% 0 0.0% 0 0.0% 0 0.0% 0
To visit public services (e.g. medical or dentist appointment, library, job centre, community centre, etc)
4.1% 3 15.8% 3 0.0% 0 0.0% 0 0.0% 0 0.0% 0 0.0% 0 0.0% 0 0.0% 0
To get petrol 0.0% 0 0.0% 0 0.0% 0 0.0% 0 0.0% 0 0.0% 0 0.0% 0 0.0% 0 0.0% 0To visit the cinema 0.0% 0 0.0% 0 0.0% 0 0.0% 0 0.0% 0 0.0% 0 0.0% 0 0.0% 0 0.0% 0To visit a park 0.0% 0 0.0% 0 0.0% 0 0.0% 0 0.0% 0 0.0% 0 0.0% 0 0.0% 0 0.0% 0To visit the swimming pool 0.0% 0 0.0% 0 0.0% 0 0.0% 0 0.0% 0 0.0% 0 0.0% 0 0.0% 0 0.0% 0To visit other gyms / health
and fitness facilities 0.0% 0 0.0% 0 0.0% 0 0.0% 0 0.0% 0 0.0% 0 0.0% 0 0.0% 0 0.0% 0
To visit the library 0.0% 0 0.0% 0 0.0% 0 0.0% 0 0.0% 0 0.0% 0 0.0% 0 0.0% 0 0.0% 0To visit museums / art
gallery 0.0% 0 0.0% 0 0.0% 0 0.0% 0 0.0% 0 0.0% 0 0.0% 0 0.0% 0 0.0% 0
To visit the theatre or musical venues
0.0% 0 0.0% 0 0.0% 0 0.0% 0 0.0% 0 0.0% 0 0.0% 0 0.0% 0 0.0% 0
To visit night time venues e.g. nightclub
0.0% 0 0.0% 0 0.0% 0 0.0% 0 0.0% 0 0.0% 0 0.0% 0 0.0% 0 0.0% 0
For other leisure activities 3.2% 3 2.6% 1 3.2% 1 0.0% 0 0.0% 0 0.0% 0 0.0% 0 0.0% 0 0.0% 0To shop at the market(s) 0.5% 0 2.0% 0 0.0% 0 0.0% 0 0.0% 0 0.0% 0 0.0% 0 0.0% 0 0.0% 0To meet family 1.6% 1 0.0% 0 0.0% 0 0.0% 0 0.0% 0 0.0% 0 0.0% 0 0.0% 0 0.0% 0To meet friends 2.2% 2 1.0% 0 0.0% 0 0.0% 0 0.0% 0 0.0% 0 0.0% 0 0.0% 0 0.0% 0To visit the theatre 0.0% 0 0.0% 0 0.0% 0 0.0% 0 0.0% 0 0.0% 0 0.0% 0 0.0% 0 0.0% 0For work (i.e. place of work) 0.3% 0 1.0% 0 0.0% 0 0.0% 0 0.0% 0 0.0% 0 0.0% 0 0.0% 0 0.0% 0For business (e.g. attend a
business appointment) 0.0% 0 0.0% 0 0.0% 0 0.0% 0 0.0% 0 0.0% 0 0.0% 0 0.0% 0 0.0% 0
For education as a student (e.g. student at college, university, or other third level education)
0.0% 0 0.0% 0 0.0% 0 0.0% 0 0.0% 0 0.0% 0 0.0% 0 0.0% 0 0.0% 0
To access public transport for onward travel (e.g. train station, bus station)
0.0% 0 0.0% 0 0.0% 0 0.0% 0 0.0% 0 0.0% 0 0.0% 0 0.0% 0 0.0% 0
Other 0.0% 0 0.0% 0 0.0% 0 0.0% 0 0.0% 0 0.0% 0 0.0% 0 0.0% 0 0.0% 0As part of a day out / for a
day out / something different
3.1% 3 3.9% 1 2.4% 1 0.0% 0 0.0% 0 0.0% 0 0.0% 0 0.0% 0 0.0% 0
Browsing / window shopping 3.5% 3 1.0% 0 6.9% 3 0.0% 0 0.0% 0 0.0% 0 0.0% 0 0.0% 0 0.0% 0(Don't know / varies) 0.8% 1 2.9% 1 0.0% 0 0.0% 0 0.0% 0 0.0% 0 0.0% 0 0.0% 0 0.0% 0(Nothing / nothing further) 42.3% 36 26.9% 6 45.8% 19 0.0% 0 0.0% 0 0.0% 0 0.0% 0 0.0% 0 0.0% 0Weighted base: 85 22 41 0 0 0 0 0 0Sample: 120 71 26 0 0 0 0 0 0

by Zone (Weighted, Part 2) South Wales Retail Study Page 84 Weighted: for Carter Jonas August 2016
Total Zone 9 Zone 10 Zone 11 Zone 12 Zone 13 Zone 14 Zone 15 Zone 16
Column %ges. 020716 NEMS market research
Q52X In order of importance, what are your two main reasons for visiting Newport Town Centre? Any mention: [MR] Zones 8-10 and those who visit Tenby town centre at Q51 Food shopping 26.3% 23 48.7% 11 22.7% 10 0.0% 0 0.0% 0 0.0% 0 0.0% 0 0.0% 0 0.0% 0Non-food shopping 28.9% 25 37.5% 8 23.4% 10 0.0% 0 0.0% 0 0.0% 0 0.0% 0 0.0% 0 0.0% 0To visit bars / pubs 1.3% 1 2.4% 1 0.0% 0 0.0% 0 0.0% 0 0.0% 0 0.0% 0 0.0% 0 0.0% 0To visit cafés / restaurants 35.6% 31 7.7% 2 46.5% 20 0.0% 0 0.0% 0 0.0% 0 0.0% 0 0.0% 0 0.0% 0To visit personal service
providers (e.g. hairdressers, beauty salon etc.)
6.6% 6 12.2% 3 0.0% 0 0.0% 0 0.0% 0 0.0% 0 0.0% 0 0.0% 0 0.0% 0
To visit financial services such as banks and other financial institutions
2.0% 2 7.8% 2 0.0% 0 0.0% 0 0.0% 0 0.0% 0 0.0% 0 0.0% 0 0.0% 0
To visit other service providers (e.g. travel agent, estate agent etc.)
0.3% 0 1.0% 0 0.0% 0 0.0% 0 0.0% 0 0.0% 0 0.0% 0 0.0% 0 0.0% 0
To visit public services (e.g. medical or dentist appointment, library, job centre, community centre, etc)
12.3% 11 29.1% 7 9.9% 4 0.0% 0 0.0% 0 0.0% 0 0.0% 0 0.0% 0 0.0% 0
To get petrol 0.0% 0 0.0% 0 0.0% 0 0.0% 0 0.0% 0 0.0% 0 0.0% 0 0.0% 0 0.0% 0To visit the cinema 0.0% 0 0.0% 0 0.0% 0 0.0% 0 0.0% 0 0.0% 0 0.0% 0 0.0% 0 0.0% 0To visit a park 0.0% 0 0.0% 0 0.0% 0 0.0% 0 0.0% 0 0.0% 0 0.0% 0 0.0% 0 0.0% 0To visit the swimming pool 0.0% 0 0.0% 0 0.0% 0 0.0% 0 0.0% 0 0.0% 0 0.0% 0 0.0% 0 0.0% 0To visit other gyms / health
and fitness facilities 0.0% 0 0.0% 0 0.0% 0 0.0% 0 0.0% 0 0.0% 0 0.0% 0 0.0% 0 0.0% 0
To visit the library 0.0% 0 0.0% 0 0.0% 0 0.0% 0 0.0% 0 0.0% 0 0.0% 0 0.0% 0 0.0% 0To visit museums / art
gallery 0.0% 0 0.0% 0 0.0% 0 0.0% 0 0.0% 0 0.0% 0 0.0% 0 0.0% 0 0.0% 0
To visit the theatre or musical venues
2.0% 2 0.0% 0 0.0% 0 0.0% 0 0.0% 0 0.0% 0 0.0% 0 0.0% 0 0.0% 0
To visit night time venues e.g. nightclub
0.0% 0 0.0% 0 0.0% 0 0.0% 0 0.0% 0 0.0% 0 0.0% 0 0.0% 0 0.0% 0
For other leisure activities 8.7% 7 2.6% 1 13.1% 6 0.0% 0 0.0% 0 0.0% 0 0.0% 0 0.0% 0 0.0% 0To shop at the market(s) 0.5% 0 2.0% 0 0.0% 0 0.0% 0 0.0% 0 0.0% 0 0.0% 0 0.0% 0 0.0% 0To meet family 2.4% 2 3.0% 1 0.0% 0 0.0% 0 0.0% 0 0.0% 0 0.0% 0 0.0% 0 0.0% 0To meet friends 3.9% 3 5.2% 1 0.0% 0 0.0% 0 0.0% 0 0.0% 0 0.0% 0 0.0% 0 0.0% 0To visit the theatre 0.0% 0 0.0% 0 0.0% 0 0.0% 0 0.0% 0 0.0% 0 0.0% 0 0.0% 0 0.0% 0For work (i.e. place of work) 8.0% 7 2.4% 1 11.5% 5 0.0% 0 0.0% 0 0.0% 0 0.0% 0 0.0% 0 0.0% 0For business (e.g. attend a
business appointment) 0.0% 0 0.0% 0 0.0% 0 0.0% 0 0.0% 0 0.0% 0 0.0% 0 0.0% 0 0.0% 0
For education as a student (e.g. student at college, university, or other third level education)
0.0% 0 0.0% 0 0.0% 0 0.0% 0 0.0% 0 0.0% 0 0.0% 0 0.0% 0 0.0% 0
To access public transport for onward travel (e.g. train station, bus station)
0.0% 0 0.0% 0 0.0% 0 0.0% 0 0.0% 0 0.0% 0 0.0% 0 0.0% 0 0.0% 0
Other 0.0% 0 0.0% 0 0.0% 0 0.0% 0 0.0% 0 0.0% 0 0.0% 0 0.0% 0 0.0% 0As part of a day out / for a
day out / something different
9.6% 8 5.2% 1 15.2% 6 0.0% 0 0.0% 0 0.0% 0 0.0% 0 0.0% 0 0.0% 0
Browsing / window shopping 5.4% 5 1.0% 0 6.6% 3 0.0% 0 0.0% 0 0.0% 0 0.0% 0 0.0% 0 0.0% 0Weighted base: 87 22 42 0 0 0 0 0 0Sample: 122 72 27 0 0 0 0 0 0

by Zone (Weighted, Part 2) South Wales Retail Study Page 85 Weighted: for Carter Jonas August 2016
Total Zone 9 Zone 10 Zone 11 Zone 12 Zone 13 Zone 14 Zone 15 Zone 16
Column %ges. 020716 NEMS market research
Q53 What do you like about Newport Town Centre? [MR] Zones 8-10 and those who visit Tenby town centre at Q51 Attractive environment / nice
place 41.4% 36 43.7% 10 30.7% 13 0.0% 0 0.0% 0 0.0% 0 0.0% 0 0.0% 0 0.0% 0
Close to friends or relatives 0.7% 1 2.9% 1 0.0% 0 0.0% 0 0.0% 0 0.0% 0 0.0% 0 0.0% 0 0.0% 0Close to home 6.5% 6 25.1% 6 0.0% 0 0.0% 0 0.0% 0 0.0% 0 0.0% 0 0.0% 0 0.0% 0Close to work 0.0% 0 0.0% 0 0.0% 0 0.0% 0 0.0% 0 0.0% 0 0.0% 0 0.0% 0 0.0% 0Compact 7.3% 6 3.4% 1 11.5% 5 0.0% 0 0.0% 0 0.0% 0 0.0% 0 0.0% 0 0.0% 0Easy to get to by bike 0.0% 0 0.0% 0 0.0% 0 0.0% 0 0.0% 0 0.0% 0 0.0% 0 0.0% 0 0.0% 0Easy to get to by bus 0.3% 0 1.0% 0 0.0% 0 0.0% 0 0.0% 0 0.0% 0 0.0% 0 0.0% 0 0.0% 0Easy to get to by car 0.0% 0 0.0% 0 0.0% 0 0.0% 0 0.0% 0 0.0% 0 0.0% 0 0.0% 0 0.0% 0Easy to park 0.0% 0 0.0% 0 0.0% 0 0.0% 0 0.0% 0 0.0% 0 0.0% 0 0.0% 0 0.0% 0Good facilities 1.1% 1 0.0% 0 2.3% 1 0.0% 0 0.0% 0 0.0% 0 0.0% 0 0.0% 0 0.0% 0Good food stores 1.9% 2 7.2% 2 0.0% 0 0.0% 0 0.0% 0 0.0% 0 0.0% 0 0.0% 0 0.0% 0Good pubs, cafés or
restaurants 12.6% 11 13.2% 3 11.7% 5 0.0% 0 0.0% 0 0.0% 0 0.0% 0 0.0% 0 0.0% 0
Good range of non-food shops
5.1% 4 14.1% 3 3.0% 1 0.0% 0 0.0% 0 0.0% 0 0.0% 0 0.0% 0 0.0% 0
Makes a change from other places
0.3% 0 1.0% 0 0.0% 0 0.0% 0 0.0% 0 0.0% 0 0.0% 0 0.0% 0 0.0% 0
Quiet 0.9% 1 3.3% 1 0.0% 0 0.0% 0 0.0% 0 0.0% 0 0.0% 0 0.0% 0 0.0% 0Safe and secure 0.0% 0 0.0% 0 0.0% 0 0.0% 0 0.0% 0 0.0% 0 0.0% 0 0.0% 0 0.0% 0The market 0.6% 1 2.3% 1 0.0% 0 0.0% 0 0.0% 0 0.0% 0 0.0% 0 0.0% 0 0.0% 0Traditional 13.6% 12 3.3% 1 25.0% 10 0.0% 0 0.0% 0 0.0% 0 0.0% 0 0.0% 0 0.0% 0Traffic free shopping centre 0.0% 0 0.0% 0 0.0% 0 0.0% 0 0.0% 0 0.0% 0 0.0% 0 0.0% 0 0.0% 0Other 0.0% 0 0.0% 0 0.0% 0 0.0% 0 0.0% 0 0.0% 0 0.0% 0 0.0% 0 0.0% 0Cheap / free parking 0.0% 0 0.0% 0 0.0% 0 0.0% 0 0.0% 0 0.0% 0 0.0% 0 0.0% 0 0.0% 0Familiarity / habit 2.8% 2 10.8% 2 0.0% 0 0.0% 0 0.0% 0 0.0% 0 0.0% 0 0.0% 0 0.0% 0Friendly people / nice
atmosphere 8.0% 7 12.7% 3 4.6% 2 0.0% 0 0.0% 0 0.0% 0 0.0% 0 0.0% 0 0.0% 0
Good leisure facilities / things to do
7.0% 6 2.0% 0 6.3% 3 0.0% 0 0.0% 0 0.0% 0 0.0% 0 0.0% 0 0.0% 0
Good opening hours 0.0% 0 0.0% 0 0.0% 0 0.0% 0 0.0% 0 0.0% 0 0.0% 0 0.0% 0 0.0% 0Good prices 0.0% 0 0.0% 0 0.0% 0 0.0% 0 0.0% 0 0.0% 0 0.0% 0 0.0% 0 0.0% 0Good range of independent
shops 4.7% 4 5.9% 1 6.6% 3 0.0% 0 0.0% 0 0.0% 0 0.0% 0 0.0% 0 0.0% 0
Good range of services 0.6% 1 2.3% 1 0.0% 0 0.0% 0 0.0% 0 0.0% 0 0.0% 0 0.0% 0 0.0% 0(Nothing / very little) 9.0% 8 10.6% 2 11.0% 5 0.0% 0 0.0% 0 0.0% 0 0.0% 0 0.0% 0 0.0% 0(Don't know) 6.0% 5 2.5% 1 8.9% 4 0.0% 0 0.0% 0 0.0% 0 0.0% 0 0.0% 0 0.0% 0Weighted base: 87 22 42 0 0 0 0 0 0Sample: 122 72 27 0 0 0 0 0 0
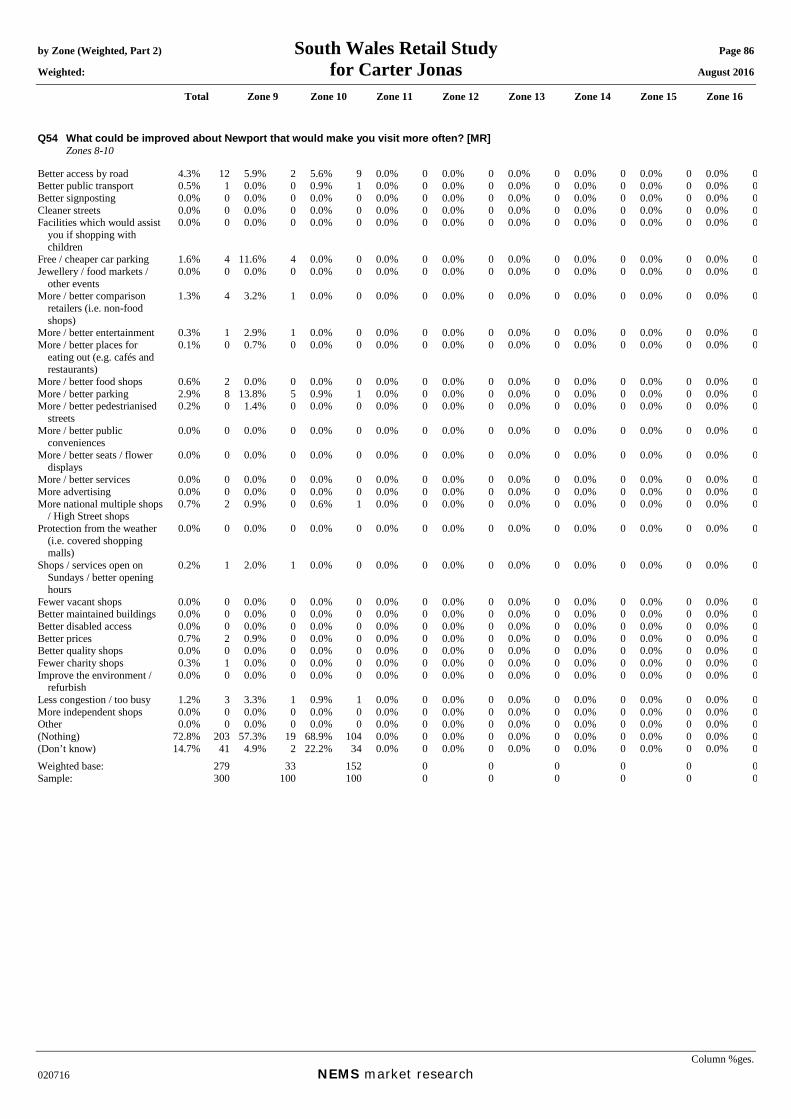
by Zone (Weighted, Part 2) South Wales Retail Study Page 86 Weighted: for Carter Jonas August 2016
Total Zone 9 Zone 10 Zone 11 Zone 12 Zone 13 Zone 14 Zone 15 Zone 16
Column %ges. 020716 NEMS market research
Q54 What could be improved about Newport that would make you visit more often? [MR] Zones 8-10 Better access by road 4.3% 12 5.9% 2 5.6% 9 0.0% 0 0.0% 0 0.0% 0 0.0% 0 0.0% 0 0.0% 0Better public transport 0.5% 1 0.0% 0 0.9% 1 0.0% 0 0.0% 0 0.0% 0 0.0% 0 0.0% 0 0.0% 0Better signposting 0.0% 0 0.0% 0 0.0% 0 0.0% 0 0.0% 0 0.0% 0 0.0% 0 0.0% 0 0.0% 0Cleaner streets 0.0% 0 0.0% 0 0.0% 0 0.0% 0 0.0% 0 0.0% 0 0.0% 0 0.0% 0 0.0% 0Facilities which would assist
you if shopping with children
0.0% 0 0.0% 0 0.0% 0 0.0% 0 0.0% 0 0.0% 0 0.0% 0 0.0% 0 0.0% 0
Free / cheaper car parking 1.6% 4 11.6% 4 0.0% 0 0.0% 0 0.0% 0 0.0% 0 0.0% 0 0.0% 0 0.0% 0Jewellery / food markets /
other events 0.0% 0 0.0% 0 0.0% 0 0.0% 0 0.0% 0 0.0% 0 0.0% 0 0.0% 0 0.0% 0
More / better comparison retailers (i.e. non-food shops)
1.3% 4 3.2% 1 0.0% 0 0.0% 0 0.0% 0 0.0% 0 0.0% 0 0.0% 0 0.0% 0
More / better entertainment 0.3% 1 2.9% 1 0.0% 0 0.0% 0 0.0% 0 0.0% 0 0.0% 0 0.0% 0 0.0% 0More / better places for
eating out (e.g. cafés and restaurants)
0.1% 0 0.7% 0 0.0% 0 0.0% 0 0.0% 0 0.0% 0 0.0% 0 0.0% 0 0.0% 0
More / better food shops 0.6% 2 0.0% 0 0.0% 0 0.0% 0 0.0% 0 0.0% 0 0.0% 0 0.0% 0 0.0% 0More / better parking 2.9% 8 13.8% 5 0.9% 1 0.0% 0 0.0% 0 0.0% 0 0.0% 0 0.0% 0 0.0% 0More / better pedestrianised
streets 0.2% 0 1.4% 0 0.0% 0 0.0% 0 0.0% 0 0.0% 0 0.0% 0 0.0% 0 0.0% 0
More / better public conveniences
0.0% 0 0.0% 0 0.0% 0 0.0% 0 0.0% 0 0.0% 0 0.0% 0 0.0% 0 0.0% 0
More / better seats / flower displays
0.0% 0 0.0% 0 0.0% 0 0.0% 0 0.0% 0 0.0% 0 0.0% 0 0.0% 0 0.0% 0
More / better services 0.0% 0 0.0% 0 0.0% 0 0.0% 0 0.0% 0 0.0% 0 0.0% 0 0.0% 0 0.0% 0More advertising 0.0% 0 0.0% 0 0.0% 0 0.0% 0 0.0% 0 0.0% 0 0.0% 0 0.0% 0 0.0% 0More national multiple shops
/ High Street shops 0.7% 2 0.9% 0 0.6% 1 0.0% 0 0.0% 0 0.0% 0 0.0% 0 0.0% 0 0.0% 0
Protection from the weather (i.e. covered shopping malls)
0.0% 0 0.0% 0 0.0% 0 0.0% 0 0.0% 0 0.0% 0 0.0% 0 0.0% 0 0.0% 0
Shops / services open on Sundays / better opening hours
0.2% 1 2.0% 1 0.0% 0 0.0% 0 0.0% 0 0.0% 0 0.0% 0 0.0% 0 0.0% 0
Fewer vacant shops 0.0% 0 0.0% 0 0.0% 0 0.0% 0 0.0% 0 0.0% 0 0.0% 0 0.0% 0 0.0% 0Better maintained buildings 0.0% 0 0.0% 0 0.0% 0 0.0% 0 0.0% 0 0.0% 0 0.0% 0 0.0% 0 0.0% 0Better disabled access 0.0% 0 0.0% 0 0.0% 0 0.0% 0 0.0% 0 0.0% 0 0.0% 0 0.0% 0 0.0% 0Better prices 0.7% 2 0.9% 0 0.0% 0 0.0% 0 0.0% 0 0.0% 0 0.0% 0 0.0% 0 0.0% 0Better quality shops 0.0% 0 0.0% 0 0.0% 0 0.0% 0 0.0% 0 0.0% 0 0.0% 0 0.0% 0 0.0% 0Fewer charity shops 0.3% 1 0.0% 0 0.0% 0 0.0% 0 0.0% 0 0.0% 0 0.0% 0 0.0% 0 0.0% 0Improve the environment /
refurbish 0.0% 0 0.0% 0 0.0% 0 0.0% 0 0.0% 0 0.0% 0 0.0% 0 0.0% 0 0.0% 0
Less congestion / too busy 1.2% 3 3.3% 1 0.9% 1 0.0% 0 0.0% 0 0.0% 0 0.0% 0 0.0% 0 0.0% 0More independent shops 0.0% 0 0.0% 0 0.0% 0 0.0% 0 0.0% 0 0.0% 0 0.0% 0 0.0% 0 0.0% 0Other 0.0% 0 0.0% 0 0.0% 0 0.0% 0 0.0% 0 0.0% 0 0.0% 0 0.0% 0 0.0% 0(Nothing) 72.8% 203 57.3% 19 68.9% 104 0.0% 0 0.0% 0 0.0% 0 0.0% 0 0.0% 0 0.0% 0(Don’t know) 14.7% 41 4.9% 2 22.2% 34 0.0% 0 0.0% 0 0.0% 0 0.0% 0 0.0% 0 0.0% 0Weighted base: 279 33 152 0 0 0 0 0 0Sample: 300 100 100 0 0 0 0 0 0

by Zone (Weighted, Part 2) South Wales Retail Study Page 87 Weighted: for Carter Jonas August 2016
Total Zone 9 Zone 10 Zone 11 Zone 12 Zone 13 Zone 14 Zone 15 Zone 16
Column %ges. 020716 NEMS market research
Mean score [Times a year, those who visit]: Daily = 365, 4-6 days a week = 234, 2-3 days a week = 130, One day a week = 52, Every two weeks = 24, Monthly = 12, Once every two months = 6, Three-four times a year = 3.5, Once a year = 1, Less often = 0.25
Q55 How often do you or your household visit Saundersfoot for shopping and other town centre services? Zones 5-7 Daily 3.3% 12 0.0% 0 0.0% 0 0.0% 0 0.0% 0 0.0% 0 0.0% 0 0.0% 0 0.0% 04-6 days a week 0.4% 2 0.0% 0 0.0% 0 0.0% 0 0.0% 0 0.0% 0 0.0% 0 0.0% 0 0.0% 02-3 days a week 1.1% 4 0.0% 0 0.0% 0 0.0% 0 0.0% 0 0.0% 0 0.0% 0 0.0% 0 0.0% 0One day a week 2.6% 10 0.0% 0 0.0% 0 0.0% 0 0.0% 0 0.0% 0 0.0% 0 0.0% 0 0.0% 0Every two weeks 3.2% 12 0.0% 0 0.0% 0 0.0% 0 0.0% 0 0.0% 0 0.0% 0 0.0% 0 0.0% 0Monthly 2.9% 11 0.0% 0 0.0% 0 0.0% 0 0.0% 0 0.0% 0 0.0% 0 0.0% 0 0.0% 0Once every two months 2.8% 10 0.0% 0 0.0% 0 0.0% 0 0.0% 0 0.0% 0 0.0% 0 0.0% 0 0.0% 0Three-four times a year 7.8% 29 0.0% 0 0.0% 0 0.0% 0 0.0% 0 0.0% 0 0.0% 0 0.0% 0 0.0% 0Once a year 3.5% 13 0.0% 0 0.0% 0 0.0% 0 0.0% 0 0.0% 0 0.0% 0 0.0% 0 0.0% 0Less often 0.8% 3 0.0% 0 0.0% 0 0.0% 0 0.0% 0 0.0% 0 0.0% 0 0.0% 0 0.0% 0Never 69.7% 255 0.0% 0 0.0% 0 0.0% 0 0.0% 0 0.0% 0 0.0% 0 0.0% 0 0.0% 0(Don’t know) 0.5% 2 0.0% 0 0.0% 0 0.0% 0 0.0% 0 0.0% 0 0.0% 0 0.0% 0 0.0% 0(Varies) 1.5% 6 0.0% 0 0.0% 0 0.0% 0 0.0% 0 0.0% 0 0.0% 0 0.0% 0 0.0% 0Mean: 60.73 0.00 0.00 0.00 0.00 0.00 0.00 0.00 0.00Weighted base: 365 0 0 0 0 0 0 0 0Sample: 300 0 0 0 0 0 0 0 0

by Zone (Weighted, Part 2) South Wales Retail Study Page 88 Weighted: for Carter Jonas August 2016
Total Zone 9 Zone 10 Zone 11 Zone 12 Zone 13 Zone 14 Zone 15 Zone 16
Column %ges. 020716 NEMS market research
Q56A In order of importance, what are your two main reasons for visiting Saundersfoot Town Centre? Main reason: Zones 5-7 and those who visit Saunderfoot town centre at Q55 Food shopping 12.7% 14 0.0% 0 0.0% 0 0.0% 0 0.0% 0 0.0% 0 0.0% 0 0.0% 0 0.0% 0Non-food shopping 15.2% 17 0.0% 0 0.0% 0 0.0% 0 0.0% 0 0.0% 0 0.0% 0 0.0% 0 0.0% 0To visit bars / pubs 0.0% 0 0.0% 0 0.0% 0 0.0% 0 0.0% 0 0.0% 0 0.0% 0 0.0% 0 0.0% 0To visit cafés / restaurants 14.1% 16 0.0% 0 0.0% 0 0.0% 0 0.0% 0 0.0% 0 0.0% 0 0.0% 0 0.0% 0To visit personal service
providers (e.g. hairdressers, beauty salon etc.)
2.0% 2 0.0% 0 0.0% 0 0.0% 0 0.0% 0 0.0% 0 0.0% 0 0.0% 0 0.0% 0
To visit financial services such as banks and other financial institutions
0.0% 0 0.0% 0 0.0% 0 0.0% 0 0.0% 0 0.0% 0 0.0% 0 0.0% 0 0.0% 0
To visit other service providers (e.g. travel agent, estate agent etc.)
0.0% 0 0.0% 0 0.0% 0 0.0% 0 0.0% 0 0.0% 0 0.0% 0 0.0% 0 0.0% 0
To visit public services (e.g. medical or dentist appointment, library, job centre, community centre, etc)
2.3% 3 0.0% 0 0.0% 0 0.0% 0 0.0% 0 0.0% 0 0.0% 0 0.0% 0 0.0% 0
To get petrol 0.0% 0 0.0% 0 0.0% 0 0.0% 0 0.0% 0 0.0% 0 0.0% 0 0.0% 0 0.0% 0To visit the cinema 0.0% 0 0.0% 0 0.0% 0 0.0% 0 0.0% 0 0.0% 0 0.0% 0 0.0% 0 0.0% 0To visit a park 0.0% 0 0.0% 0 0.0% 0 0.0% 0 0.0% 0 0.0% 0 0.0% 0 0.0% 0 0.0% 0To visit the swimming pool 0.0% 0 0.0% 0 0.0% 0 0.0% 0 0.0% 0 0.0% 0 0.0% 0 0.0% 0 0.0% 0To visit other gyms / health
and fitness facilities 0.0% 0 0.0% 0 0.0% 0 0.0% 0 0.0% 0 0.0% 0 0.0% 0 0.0% 0 0.0% 0
To visit the library 0.0% 0 0.0% 0 0.0% 0 0.0% 0 0.0% 0 0.0% 0 0.0% 0 0.0% 0 0.0% 0To visit museums / art
gallery 0.0% 0 0.0% 0 0.0% 0 0.0% 0 0.0% 0 0.0% 0 0.0% 0 0.0% 0 0.0% 0
To visit the theatre or musical venues
0.0% 0 0.0% 0 0.0% 0 0.0% 0 0.0% 0 0.0% 0 0.0% 0 0.0% 0 0.0% 0
To visit night time venues e.g. nightclub
0.0% 0 0.0% 0 0.0% 0 0.0% 0 0.0% 0 0.0% 0 0.0% 0 0.0% 0 0.0% 0
For other leisure activities 16.3% 18 0.0% 0 0.0% 0 0.0% 0 0.0% 0 0.0% 0 0.0% 0 0.0% 0 0.0% 0To shop at the market(s) 0.0% 0 0.0% 0 0.0% 0 0.0% 0 0.0% 0 0.0% 0 0.0% 0 0.0% 0 0.0% 0To meet family 3.7% 4 0.0% 0 0.0% 0 0.0% 0 0.0% 0 0.0% 0 0.0% 0 0.0% 0 0.0% 0To meet friends 1.9% 2 0.0% 0 0.0% 0 0.0% 0 0.0% 0 0.0% 0 0.0% 0 0.0% 0 0.0% 0To visit the theatre 0.0% 0 0.0% 0 0.0% 0 0.0% 0 0.0% 0 0.0% 0 0.0% 0 0.0% 0 0.0% 0For work (i.e. place of work) 6.3% 7 0.0% 0 0.0% 0 0.0% 0 0.0% 0 0.0% 0 0.0% 0 0.0% 0 0.0% 0For business (e.g. attend a
business appointment) 0.0% 0 0.0% 0 0.0% 0 0.0% 0 0.0% 0 0.0% 0 0.0% 0 0.0% 0 0.0% 0
For education as a student (e.g. student at college, university, or other third level education)
0.0% 0 0.0% 0 0.0% 0 0.0% 0 0.0% 0 0.0% 0 0.0% 0 0.0% 0 0.0% 0
To access public transport for onward travel (e.g. train station, bus station)
0.0% 0 0.0% 0 0.0% 0 0.0% 0 0.0% 0 0.0% 0 0.0% 0 0.0% 0 0.0% 0
Other 0.0% 0 0.0% 0 0.0% 0 0.0% 0 0.0% 0 0.0% 0 0.0% 0 0.0% 0 0.0% 0As part of a day out / for a
day out / something different
15.8% 18 0.0% 0 0.0% 0 0.0% 0 0.0% 0 0.0% 0 0.0% 0 0.0% 0 0.0% 0
Browsing / window shopping 8.0% 9 0.0% 0 0.0% 0 0.0% 0 0.0% 0 0.0% 0 0.0% 0 0.0% 0 0.0% 0(Don't know / varies) 0.6% 1 0.0% 0 0.0% 0 0.0% 0 0.0% 0 0.0% 0 0.0% 0 0.0% 0 0.0% 0(Nothing / nothing further) 1.2% 1 0.0% 0 0.0% 0 0.0% 0 0.0% 0 0.0% 0 0.0% 0 0.0% 0 0.0% 0Weighted base: 111 0 0 0 0 0 0 0 0Sample: 101 0 0 0 0 0 0 0 0

by Zone (Weighted, Part 2) South Wales Retail Study Page 89 Weighted: for Carter Jonas August 2016
Total Zone 9 Zone 10 Zone 11 Zone 12 Zone 13 Zone 14 Zone 15 Zone 16
Column %ges. 020716 NEMS market research
Q56B In order of importance, what are your two main reasons for visiting Saundersfoot Town Centre? Secondary reason: Those who gave a reason at Q56A Food shopping 1.8% 2 0.0% 0 0.0% 0 0.0% 0 0.0% 0 0.0% 0 0.0% 0 0.0% 0 0.0% 0Non-food shopping 11.7% 13 0.0% 0 0.0% 0 0.0% 0 0.0% 0 0.0% 0 0.0% 0 0.0% 0 0.0% 0To visit bars / pubs 2.5% 3 0.0% 0 0.0% 0 0.0% 0 0.0% 0 0.0% 0 0.0% 0 0.0% 0 0.0% 0To visit cafés / restaurants 13.7% 15 0.0% 0 0.0% 0 0.0% 0 0.0% 0 0.0% 0 0.0% 0 0.0% 0 0.0% 0To visit personal service
providers (e.g. hairdressers, beauty salon etc.)
1.4% 2 0.0% 0 0.0% 0 0.0% 0 0.0% 0 0.0% 0 0.0% 0 0.0% 0 0.0% 0
To visit financial services such as banks and other financial institutions
0.0% 0 0.0% 0 0.0% 0 0.0% 0 0.0% 0 0.0% 0 0.0% 0 0.0% 0 0.0% 0
To visit other service providers (e.g. travel agent, estate agent etc.)
0.0% 0 0.0% 0 0.0% 0 0.0% 0 0.0% 0 0.0% 0 0.0% 0 0.0% 0 0.0% 0
To visit public services (e.g. medical or dentist appointment, library, job centre, community centre, etc)
2.1% 2 0.0% 0 0.0% 0 0.0% 0 0.0% 0 0.0% 0 0.0% 0 0.0% 0 0.0% 0
To get petrol 0.0% 0 0.0% 0 0.0% 0 0.0% 0 0.0% 0 0.0% 0 0.0% 0 0.0% 0 0.0% 0To visit the cinema 0.0% 0 0.0% 0 0.0% 0 0.0% 0 0.0% 0 0.0% 0 0.0% 0 0.0% 0 0.0% 0To visit a park 0.0% 0 0.0% 0 0.0% 0 0.0% 0 0.0% 0 0.0% 0 0.0% 0 0.0% 0 0.0% 0To visit the swimming pool 0.0% 0 0.0% 0 0.0% 0 0.0% 0 0.0% 0 0.0% 0 0.0% 0 0.0% 0 0.0% 0To visit other gyms / health
and fitness facilities 0.0% 0 0.0% 0 0.0% 0 0.0% 0 0.0% 0 0.0% 0 0.0% 0 0.0% 0 0.0% 0
To visit the library 0.0% 0 0.0% 0 0.0% 0 0.0% 0 0.0% 0 0.0% 0 0.0% 0 0.0% 0 0.0% 0To visit museums / art
gallery 0.0% 0 0.0% 0 0.0% 0 0.0% 0 0.0% 0 0.0% 0 0.0% 0 0.0% 0 0.0% 0
To visit the theatre or musical venues
0.0% 0 0.0% 0 0.0% 0 0.0% 0 0.0% 0 0.0% 0 0.0% 0 0.0% 0 0.0% 0
To visit night time venues e.g. nightclub
0.0% 0 0.0% 0 0.0% 0 0.0% 0 0.0% 0 0.0% 0 0.0% 0 0.0% 0 0.0% 0
For other leisure activities 7.2% 8 0.0% 0 0.0% 0 0.0% 0 0.0% 0 0.0% 0 0.0% 0 0.0% 0 0.0% 0To shop at the market(s) 0.0% 0 0.0% 0 0.0% 0 0.0% 0 0.0% 0 0.0% 0 0.0% 0 0.0% 0 0.0% 0To meet family 0.8% 1 0.0% 0 0.0% 0 0.0% 0 0.0% 0 0.0% 0 0.0% 0 0.0% 0 0.0% 0To meet friends 0.0% 0 0.0% 0 0.0% 0 0.0% 0 0.0% 0 0.0% 0 0.0% 0 0.0% 0 0.0% 0To visit the theatre 0.0% 0 0.0% 0 0.0% 0 0.0% 0 0.0% 0 0.0% 0 0.0% 0 0.0% 0 0.0% 0For work (i.e. place of work) 1.1% 1 0.0% 0 0.0% 0 0.0% 0 0.0% 0 0.0% 0 0.0% 0 0.0% 0 0.0% 0For business (e.g. attend a
business appointment) 0.0% 0 0.0% 0 0.0% 0 0.0% 0 0.0% 0 0.0% 0 0.0% 0 0.0% 0 0.0% 0
For education as a student (e.g. student at college, university, or other third level education)
0.0% 0 0.0% 0 0.0% 0 0.0% 0 0.0% 0 0.0% 0 0.0% 0 0.0% 0 0.0% 0
To access public transport for onward travel (e.g. train station, bus station)
0.0% 0 0.0% 0 0.0% 0 0.0% 0 0.0% 0 0.0% 0 0.0% 0 0.0% 0 0.0% 0
Other 0.0% 0 0.0% 0 0.0% 0 0.0% 0 0.0% 0 0.0% 0 0.0% 0 0.0% 0 0.0% 0As part of a day out / for a
day out / something different
6.3% 7 0.0% 0 0.0% 0 0.0% 0 0.0% 0 0.0% 0 0.0% 0 0.0% 0 0.0% 0
Browsing / window shopping 0.8% 1 0.0% 0 0.0% 0 0.0% 0 0.0% 0 0.0% 0 0.0% 0 0.0% 0 0.0% 0(Don't know / varies) 2.9% 3 0.0% 0 0.0% 0 0.0% 0 0.0% 0 0.0% 0 0.0% 0 0.0% 0 0.0% 0(Nothing / nothing further) 47.6% 52 0.0% 0 0.0% 0 0.0% 0 0.0% 0 0.0% 0 0.0% 0 0.0% 0 0.0% 0Weighted base: 109 0 0 0 0 0 0 0 0Sample: 99 0 0 0 0 0 0 0 0
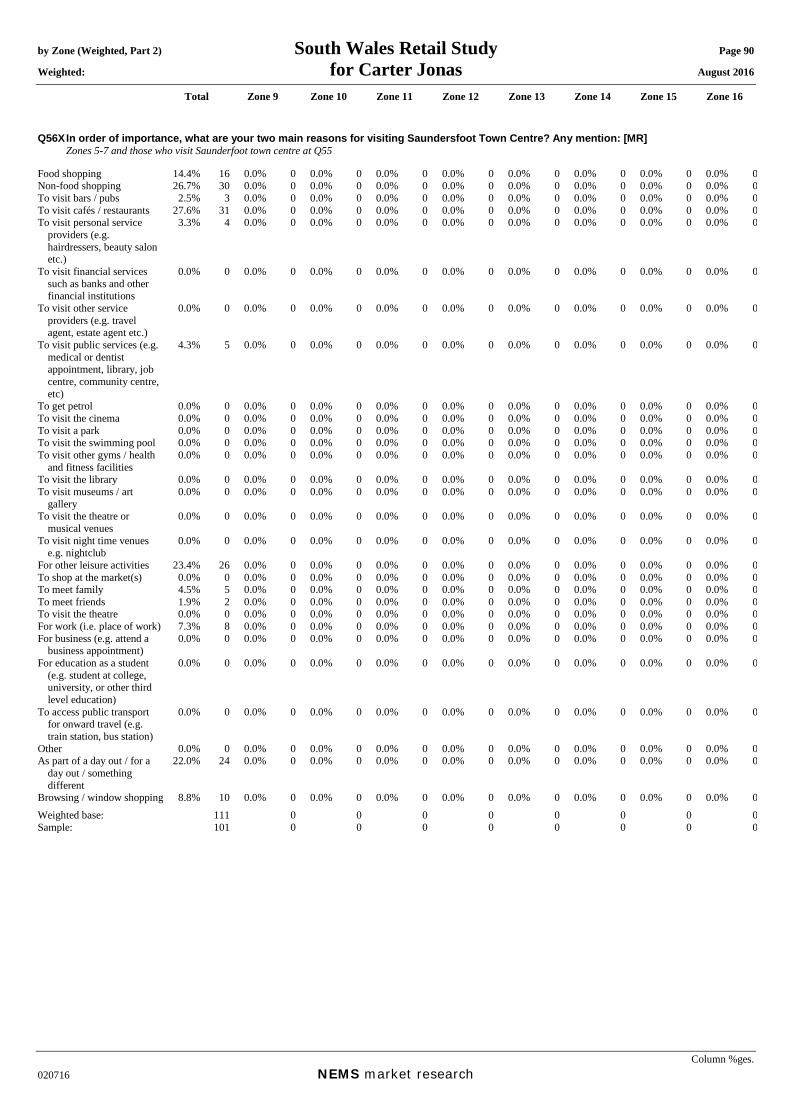
by Zone (Weighted, Part 2) South Wales Retail Study Page 90 Weighted: for Carter Jonas August 2016
Total Zone 9 Zone 10 Zone 11 Zone 12 Zone 13 Zone 14 Zone 15 Zone 16
Column %ges. 020716 NEMS market research
Q56X In order of importance, what are your two main reasons for visiting Saundersfoot Town Centre? Any mention: [MR] Zones 5-7 and those who visit Saunderfoot town centre at Q55 Food shopping 14.4% 16 0.0% 0 0.0% 0 0.0% 0 0.0% 0 0.0% 0 0.0% 0 0.0% 0 0.0% 0Non-food shopping 26.7% 30 0.0% 0 0.0% 0 0.0% 0 0.0% 0 0.0% 0 0.0% 0 0.0% 0 0.0% 0To visit bars / pubs 2.5% 3 0.0% 0 0.0% 0 0.0% 0 0.0% 0 0.0% 0 0.0% 0 0.0% 0 0.0% 0To visit cafés / restaurants 27.6% 31 0.0% 0 0.0% 0 0.0% 0 0.0% 0 0.0% 0 0.0% 0 0.0% 0 0.0% 0To visit personal service
providers (e.g. hairdressers, beauty salon etc.)
3.3% 4 0.0% 0 0.0% 0 0.0% 0 0.0% 0 0.0% 0 0.0% 0 0.0% 0 0.0% 0
To visit financial services such as banks and other financial institutions
0.0% 0 0.0% 0 0.0% 0 0.0% 0 0.0% 0 0.0% 0 0.0% 0 0.0% 0 0.0% 0
To visit other service providers (e.g. travel agent, estate agent etc.)
0.0% 0 0.0% 0 0.0% 0 0.0% 0 0.0% 0 0.0% 0 0.0% 0 0.0% 0 0.0% 0
To visit public services (e.g. medical or dentist appointment, library, job centre, community centre, etc)
4.3% 5 0.0% 0 0.0% 0 0.0% 0 0.0% 0 0.0% 0 0.0% 0 0.0% 0 0.0% 0
To get petrol 0.0% 0 0.0% 0 0.0% 0 0.0% 0 0.0% 0 0.0% 0 0.0% 0 0.0% 0 0.0% 0To visit the cinema 0.0% 0 0.0% 0 0.0% 0 0.0% 0 0.0% 0 0.0% 0 0.0% 0 0.0% 0 0.0% 0To visit a park 0.0% 0 0.0% 0 0.0% 0 0.0% 0 0.0% 0 0.0% 0 0.0% 0 0.0% 0 0.0% 0To visit the swimming pool 0.0% 0 0.0% 0 0.0% 0 0.0% 0 0.0% 0 0.0% 0 0.0% 0 0.0% 0 0.0% 0To visit other gyms / health
and fitness facilities 0.0% 0 0.0% 0 0.0% 0 0.0% 0 0.0% 0 0.0% 0 0.0% 0 0.0% 0 0.0% 0
To visit the library 0.0% 0 0.0% 0 0.0% 0 0.0% 0 0.0% 0 0.0% 0 0.0% 0 0.0% 0 0.0% 0To visit museums / art
gallery 0.0% 0 0.0% 0 0.0% 0 0.0% 0 0.0% 0 0.0% 0 0.0% 0 0.0% 0 0.0% 0
To visit the theatre or musical venues
0.0% 0 0.0% 0 0.0% 0 0.0% 0 0.0% 0 0.0% 0 0.0% 0 0.0% 0 0.0% 0
To visit night time venues e.g. nightclub
0.0% 0 0.0% 0 0.0% 0 0.0% 0 0.0% 0 0.0% 0 0.0% 0 0.0% 0 0.0% 0
For other leisure activities 23.4% 26 0.0% 0 0.0% 0 0.0% 0 0.0% 0 0.0% 0 0.0% 0 0.0% 0 0.0% 0To shop at the market(s) 0.0% 0 0.0% 0 0.0% 0 0.0% 0 0.0% 0 0.0% 0 0.0% 0 0.0% 0 0.0% 0To meet family 4.5% 5 0.0% 0 0.0% 0 0.0% 0 0.0% 0 0.0% 0 0.0% 0 0.0% 0 0.0% 0To meet friends 1.9% 2 0.0% 0 0.0% 0 0.0% 0 0.0% 0 0.0% 0 0.0% 0 0.0% 0 0.0% 0To visit the theatre 0.0% 0 0.0% 0 0.0% 0 0.0% 0 0.0% 0 0.0% 0 0.0% 0 0.0% 0 0.0% 0For work (i.e. place of work) 7.3% 8 0.0% 0 0.0% 0 0.0% 0 0.0% 0 0.0% 0 0.0% 0 0.0% 0 0.0% 0For business (e.g. attend a
business appointment) 0.0% 0 0.0% 0 0.0% 0 0.0% 0 0.0% 0 0.0% 0 0.0% 0 0.0% 0 0.0% 0
For education as a student (e.g. student at college, university, or other third level education)
0.0% 0 0.0% 0 0.0% 0 0.0% 0 0.0% 0 0.0% 0 0.0% 0 0.0% 0 0.0% 0
To access public transport for onward travel (e.g. train station, bus station)
0.0% 0 0.0% 0 0.0% 0 0.0% 0 0.0% 0 0.0% 0 0.0% 0 0.0% 0 0.0% 0
Other 0.0% 0 0.0% 0 0.0% 0 0.0% 0 0.0% 0 0.0% 0 0.0% 0 0.0% 0 0.0% 0As part of a day out / for a
day out / something different
22.0% 24 0.0% 0 0.0% 0 0.0% 0 0.0% 0 0.0% 0 0.0% 0 0.0% 0 0.0% 0
Browsing / window shopping 8.8% 10 0.0% 0 0.0% 0 0.0% 0 0.0% 0 0.0% 0 0.0% 0 0.0% 0 0.0% 0Weighted base: 111 0 0 0 0 0 0 0 0Sample: 101 0 0 0 0 0 0 0 0
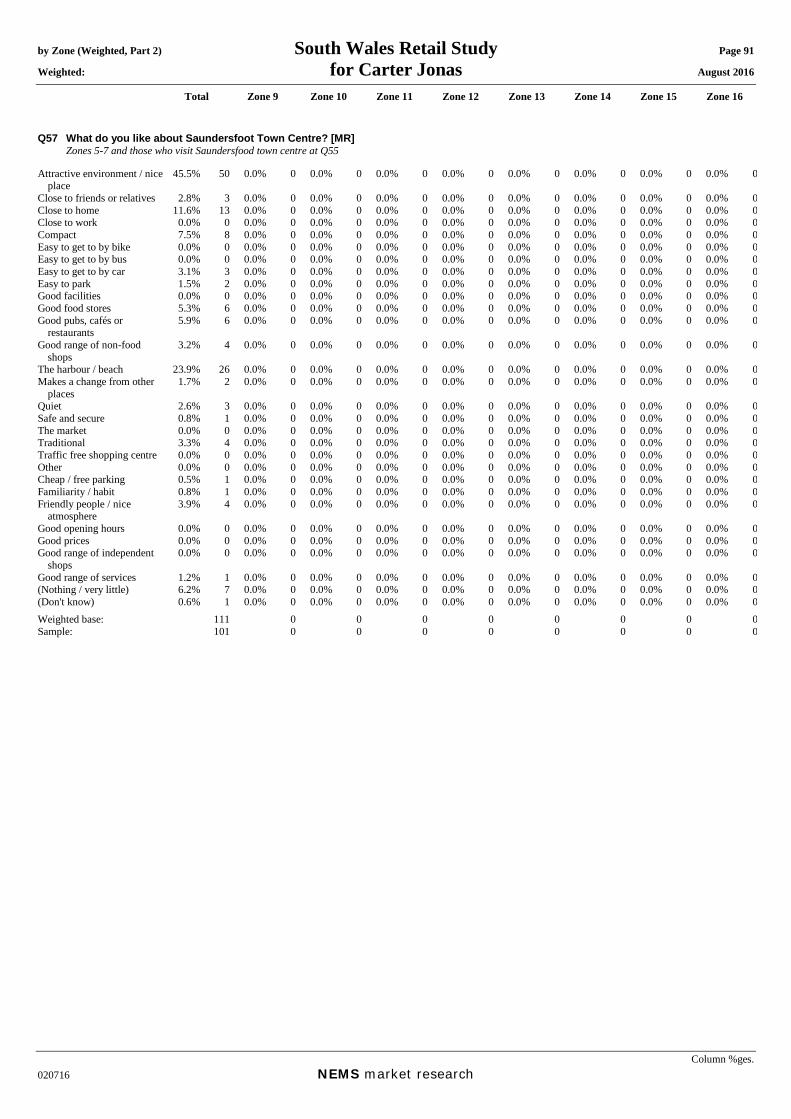
by Zone (Weighted, Part 2) South Wales Retail Study Page 91 Weighted: for Carter Jonas August 2016
Total Zone 9 Zone 10 Zone 11 Zone 12 Zone 13 Zone 14 Zone 15 Zone 16
Column %ges. 020716 NEMS market research
Q57 What do you like about Saundersfoot Town Centre? [MR] Zones 5-7 and those who visit Saundersfood town centre at Q55 Attractive environment / nice
place 45.5% 50 0.0% 0 0.0% 0 0.0% 0 0.0% 0 0.0% 0 0.0% 0 0.0% 0 0.0% 0
Close to friends or relatives 2.8% 3 0.0% 0 0.0% 0 0.0% 0 0.0% 0 0.0% 0 0.0% 0 0.0% 0 0.0% 0Close to home 11.6% 13 0.0% 0 0.0% 0 0.0% 0 0.0% 0 0.0% 0 0.0% 0 0.0% 0 0.0% 0Close to work 0.0% 0 0.0% 0 0.0% 0 0.0% 0 0.0% 0 0.0% 0 0.0% 0 0.0% 0 0.0% 0Compact 7.5% 8 0.0% 0 0.0% 0 0.0% 0 0.0% 0 0.0% 0 0.0% 0 0.0% 0 0.0% 0Easy to get to by bike 0.0% 0 0.0% 0 0.0% 0 0.0% 0 0.0% 0 0.0% 0 0.0% 0 0.0% 0 0.0% 0Easy to get to by bus 0.0% 0 0.0% 0 0.0% 0 0.0% 0 0.0% 0 0.0% 0 0.0% 0 0.0% 0 0.0% 0Easy to get to by car 3.1% 3 0.0% 0 0.0% 0 0.0% 0 0.0% 0 0.0% 0 0.0% 0 0.0% 0 0.0% 0Easy to park 1.5% 2 0.0% 0 0.0% 0 0.0% 0 0.0% 0 0.0% 0 0.0% 0 0.0% 0 0.0% 0Good facilities 0.0% 0 0.0% 0 0.0% 0 0.0% 0 0.0% 0 0.0% 0 0.0% 0 0.0% 0 0.0% 0Good food stores 5.3% 6 0.0% 0 0.0% 0 0.0% 0 0.0% 0 0.0% 0 0.0% 0 0.0% 0 0.0% 0Good pubs, cafés or
restaurants 5.9% 6 0.0% 0 0.0% 0 0.0% 0 0.0% 0 0.0% 0 0.0% 0 0.0% 0 0.0% 0
Good range of non-food shops
3.2% 4 0.0% 0 0.0% 0 0.0% 0 0.0% 0 0.0% 0 0.0% 0 0.0% 0 0.0% 0
The harbour / beach 23.9% 26 0.0% 0 0.0% 0 0.0% 0 0.0% 0 0.0% 0 0.0% 0 0.0% 0 0.0% 0Makes a change from other
places 1.7% 2 0.0% 0 0.0% 0 0.0% 0 0.0% 0 0.0% 0 0.0% 0 0.0% 0 0.0% 0
Quiet 2.6% 3 0.0% 0 0.0% 0 0.0% 0 0.0% 0 0.0% 0 0.0% 0 0.0% 0 0.0% 0Safe and secure 0.8% 1 0.0% 0 0.0% 0 0.0% 0 0.0% 0 0.0% 0 0.0% 0 0.0% 0 0.0% 0The market 0.0% 0 0.0% 0 0.0% 0 0.0% 0 0.0% 0 0.0% 0 0.0% 0 0.0% 0 0.0% 0Traditional 3.3% 4 0.0% 0 0.0% 0 0.0% 0 0.0% 0 0.0% 0 0.0% 0 0.0% 0 0.0% 0Traffic free shopping centre 0.0% 0 0.0% 0 0.0% 0 0.0% 0 0.0% 0 0.0% 0 0.0% 0 0.0% 0 0.0% 0Other 0.0% 0 0.0% 0 0.0% 0 0.0% 0 0.0% 0 0.0% 0 0.0% 0 0.0% 0 0.0% 0Cheap / free parking 0.5% 1 0.0% 0 0.0% 0 0.0% 0 0.0% 0 0.0% 0 0.0% 0 0.0% 0 0.0% 0Familiarity / habit 0.8% 1 0.0% 0 0.0% 0 0.0% 0 0.0% 0 0.0% 0 0.0% 0 0.0% 0 0.0% 0Friendly people / nice
atmosphere 3.9% 4 0.0% 0 0.0% 0 0.0% 0 0.0% 0 0.0% 0 0.0% 0 0.0% 0 0.0% 0
Good opening hours 0.0% 0 0.0% 0 0.0% 0 0.0% 0 0.0% 0 0.0% 0 0.0% 0 0.0% 0 0.0% 0Good prices 0.0% 0 0.0% 0 0.0% 0 0.0% 0 0.0% 0 0.0% 0 0.0% 0 0.0% 0 0.0% 0Good range of independent
shops 0.0% 0 0.0% 0 0.0% 0 0.0% 0 0.0% 0 0.0% 0 0.0% 0 0.0% 0 0.0% 0
Good range of services 1.2% 1 0.0% 0 0.0% 0 0.0% 0 0.0% 0 0.0% 0 0.0% 0 0.0% 0 0.0% 0(Nothing / very little) 6.2% 7 0.0% 0 0.0% 0 0.0% 0 0.0% 0 0.0% 0 0.0% 0 0.0% 0 0.0% 0(Don't know) 0.6% 1 0.0% 0 0.0% 0 0.0% 0 0.0% 0 0.0% 0 0.0% 0 0.0% 0 0.0% 0Weighted base: 111 0 0 0 0 0 0 0 0Sample: 101 0 0 0 0 0 0 0 0

by Zone (Weighted, Part 2) South Wales Retail Study Page 92 Weighted: for Carter Jonas August 2016
Total Zone 9 Zone 10 Zone 11 Zone 12 Zone 13 Zone 14 Zone 15 Zone 16
Column %ges. 020716 NEMS market research
Q58 What could be improved about Saundersfoot that would make you visit more often? [MR] Zones 5-7 Better access by road 1.0% 4 0.0% 0 0.0% 0 0.0% 0 0.0% 0 0.0% 0 0.0% 0 0.0% 0 0.0% 0Better public transport 0.1% 0 0.0% 0 0.0% 0 0.0% 0 0.0% 0 0.0% 0 0.0% 0 0.0% 0 0.0% 0Better signposting 0.0% 0 0.0% 0 0.0% 0 0.0% 0 0.0% 0 0.0% 0 0.0% 0 0.0% 0 0.0% 0Cleaner streets 0.2% 1 0.0% 0 0.0% 0 0.0% 0 0.0% 0 0.0% 0 0.0% 0 0.0% 0 0.0% 0Facilities which would assist
you if shopping with children
0.0% 0 0.0% 0 0.0% 0 0.0% 0 0.0% 0 0.0% 0 0.0% 0 0.0% 0 0.0% 0
Free / cheaper car parking 4.0% 15 0.0% 0 0.0% 0 0.0% 0 0.0% 0 0.0% 0 0.0% 0 0.0% 0 0.0% 0Jewellery / food markets /
other events 0.0% 0 0.0% 0 0.0% 0 0.0% 0 0.0% 0 0.0% 0 0.0% 0 0.0% 0 0.0% 0
More / better comparison retailers (i.e. non-food shops)
1.2% 4 0.0% 0 0.0% 0 0.0% 0 0.0% 0 0.0% 0 0.0% 0 0.0% 0 0.0% 0
More / better entertainment 0.0% 0 0.0% 0 0.0% 0 0.0% 0 0.0% 0 0.0% 0 0.0% 0 0.0% 0 0.0% 0More / better places for
eating out (e.g. cafés and restaurants)
0.0% 0 0.0% 0 0.0% 0 0.0% 0 0.0% 0 0.0% 0 0.0% 0 0.0% 0 0.0% 0
More / better food shops 0.3% 1 0.0% 0 0.0% 0 0.0% 0 0.0% 0 0.0% 0 0.0% 0 0.0% 0 0.0% 0More / better parking 6.2% 23 0.0% 0 0.0% 0 0.0% 0 0.0% 0 0.0% 0 0.0% 0 0.0% 0 0.0% 0More / better pedestrianised
streets 0.0% 0 0.0% 0 0.0% 0 0.0% 0 0.0% 0 0.0% 0 0.0% 0 0.0% 0 0.0% 0
More / better public conveniences
0.0% 0 0.0% 0 0.0% 0 0.0% 0 0.0% 0 0.0% 0 0.0% 0 0.0% 0 0.0% 0
More / better seats / flower displays
0.2% 1 0.0% 0 0.0% 0 0.0% 0 0.0% 0 0.0% 0 0.0% 0 0.0% 0 0.0% 0
More / better services 0.0% 0 0.0% 0 0.0% 0 0.0% 0 0.0% 0 0.0% 0 0.0% 0 0.0% 0 0.0% 0More advertising 0.0% 0 0.0% 0 0.0% 0 0.0% 0 0.0% 0 0.0% 0 0.0% 0 0.0% 0 0.0% 0More national multiple shops
/ High Street shops 2.6% 9 0.0% 0 0.0% 0 0.0% 0 0.0% 0 0.0% 0 0.0% 0 0.0% 0 0.0% 0
Protection from the weather (i.e. covered shopping malls)
0.0% 0 0.0% 0 0.0% 0 0.0% 0 0.0% 0 0.0% 0 0.0% 0 0.0% 0 0.0% 0
Shops / services open on Sundays / better opening hours
0.0% 0 0.0% 0 0.0% 0 0.0% 0 0.0% 0 0.0% 0 0.0% 0 0.0% 0 0.0% 0
Fewer vacant shops 0.0% 0 0.0% 0 0.0% 0 0.0% 0 0.0% 0 0.0% 0 0.0% 0 0.0% 0 0.0% 0Better maintained buildings 0.0% 0 0.0% 0 0.0% 0 0.0% 0 0.0% 0 0.0% 0 0.0% 0 0.0% 0 0.0% 0Better disabled access 0.0% 0 0.0% 0 0.0% 0 0.0% 0 0.0% 0 0.0% 0 0.0% 0 0.0% 0 0.0% 0Better prices 0.0% 0 0.0% 0 0.0% 0 0.0% 0 0.0% 0 0.0% 0 0.0% 0 0.0% 0 0.0% 0Better quality shops 0.2% 1 0.0% 0 0.0% 0 0.0% 0 0.0% 0 0.0% 0 0.0% 0 0.0% 0 0.0% 0Fewer charity shops 0.0% 0 0.0% 0 0.0% 0 0.0% 0 0.0% 0 0.0% 0 0.0% 0 0.0% 0 0.0% 0Improve the environment /
refurbish 0.4% 2 0.0% 0 0.0% 0 0.0% 0 0.0% 0 0.0% 0 0.0% 0 0.0% 0 0.0% 0
Less congestion / too busy 0.2% 1 0.0% 0 0.0% 0 0.0% 0 0.0% 0 0.0% 0 0.0% 0 0.0% 0 0.0% 0More independent shops 0.3% 1 0.0% 0 0.0% 0 0.0% 0 0.0% 0 0.0% 0 0.0% 0 0.0% 0 0.0% 0Other 0.0% 0 0.0% 0 0.0% 0 0.0% 0 0.0% 0 0.0% 0 0.0% 0 0.0% 0 0.0% 0(Nothing) 62.0% 227 0.0% 0 0.0% 0 0.0% 0 0.0% 0 0.0% 0 0.0% 0 0.0% 0 0.0% 0(Don’t know) 23.8% 87 0.0% 0 0.0% 0 0.0% 0 0.0% 0 0.0% 0 0.0% 0 0.0% 0 0.0% 0Weighted base: 365 0 0 0 0 0 0 0 0Sample: 300 0 0 0 0 0 0 0 0

by Zone (Weighted, Part 2) South Wales Retail Study Page 93 Weighted: for Carter Jonas August 2016
Total Zone 9 Zone 10 Zone 11 Zone 12 Zone 13 Zone 14 Zone 15 Zone 16
Column %ges. 020716 NEMS market research
Mean score [Times a year, those who visit]: Daily = 365, 4-6 days a week = 234, 2-3 days a week = 130, One day a week = 52, Every two weeks = 24, Monthly = 12, Once every two months = 6, Three-four times a year = 3.5, Once a year = 1, Less often = 0.25
Q59 How often do you or your household visit Aberystwyth shopping and other town centre services? Zones 10-16 Daily 5.4% 39 0.0% 0 0.0% 0 0.0% 0 0.0% 0 1.9% 1 6.7% 5 19.1% 18 9.4% 154-6 days a week 3.7% 27 0.0% 0 0.0% 0 0.0% 0 3.5% 3 0.9% 1 5.1% 4 16.3% 15 2.7% 42-3 days a week 12.2% 89 0.0% 0 0.0% 0 0.0% 0 1.6% 2 7.2% 5 24.8% 18 29.2% 28 23.0% 37One day a week 18.1% 132 0.0% 0 4.2% 6 1.0% 1 2.5% 2 22.3% 15 34.2% 25 22.4% 21 38.5% 62Every two weeks 7.8% 57 0.0% 0 0.9% 1 2.3% 2 8.5% 8 23.8% 16 13.6% 10 2.2% 2 10.9% 18Monthly 9.5% 69 0.0% 0 7.2% 11 9.9% 9 14.4% 14 14.6% 10 9.3% 7 5.4% 5 9.0% 14Once every two months 5.3% 38 0.0% 0 6.1% 9 6.3% 6 12.4% 12 9.6% 6 0.7% 0 0.0% 0 3.1% 5Three-four times a year 6.1% 45 0.0% 0 10.0% 15 9.9% 9 13.8% 13 8.1% 5 2.2% 2 0.7% 1 0.0% 0Once a year 5.7% 41 0.0% 0 18.4% 28 5.5% 5 8.9% 9 0.0% 0 0.0% 0 0.0% 0 0.0% 0Less often 1.4% 10 0.0% 0 3.2% 5 1.3% 1 3.7% 3 0.0% 0 0.7% 0 0.0% 0 0.0% 0Never 23.0% 168 0.0% 0 48.4% 73 62.2% 55 25.8% 25 9.2% 6 2.9% 2 4.0% 4 1.7% 3(Don’t know) 0.3% 2 0.0% 0 0.0% 0 0.7% 1 0.9% 1 0.7% 0 0.0% 0 0.0% 0 0.0% 0(Varies) 1.6% 12 0.0% 0 1.7% 3 0.9% 1 4.0% 4 1.7% 1 0.0% 0 0.7% 1 1.7% 3Mean: 76.20 0.00 8.32 8.38 24.13 43.47 93.45 166.43 97.72Weighted base: 730 0 152 89 95 66 74 94 160Sample: 705 0 100 100 100 101 100 102 102

by Zone (Weighted, Part 2) South Wales Retail Study Page 94 Weighted: for Carter Jonas August 2016
Total Zone 9 Zone 10 Zone 11 Zone 12 Zone 13 Zone 14 Zone 15 Zone 16
Column %ges. 020716 NEMS market research
Q60A In order of importance, what are your two main reasons for visiting Aberystwth Town Centre? Main reason: Zones 10-16 and those who visit Aberystwth town centre at Q59 Food shopping 36.8% 207 0.0% 0 3.1% 2 12.5% 4 26.3% 19 43.8% 26 40.5% 29 53.2% 48 49.7% 78Non-food shopping 21.7% 122 0.0% 0 18.8% 15 23.3% 8 20.3% 14 24.4% 15 20.5% 15 28.4% 26 18.9% 30To visit bars / pubs 0.1% 1 0.0% 0 0.0% 0 0.0% 0 1.0% 1 0.0% 0 0.0% 0 0.0% 0 0.0% 0To visit cafés / restaurants 3.4% 19 0.0% 0 5.8% 4 1.8% 1 1.2% 1 1.7% 1 6.1% 4 4.1% 4 2.5% 4To visit personal service
providers (e.g. hairdressers, beauty salon etc.)
0.5% 3 0.0% 0 0.0% 0 0.0% 0 1.0% 1 0.0% 0 0.7% 0 0.7% 1 0.7% 1
To visit financial services such as banks and other financial institutions
4.9% 27 0.0% 0 0.0% 0 1.8% 1 1.0% 1 4.2% 3 3.9% 3 6.9% 6 9.4% 15
To visit other service providers (e.g. travel agent, estate agent etc.)
0.3% 2 0.0% 0 0.0% 0 1.8% 1 1.3% 1 0.0% 0 0.0% 0 0.0% 0 0.0% 0
To visit public services (e.g. medical or dentist appointment, library, job centre, community centre, etc)
7.8% 44 0.0% 0 20.0% 16 17.3% 6 17.6% 12 9.9% 6 3.1% 2 0.7% 1 0.7% 1
To get petrol 0.1% 0 0.0% 0 0.0% 0 0.0% 0 0.0% 0 0.0% 0 0.7% 0 0.0% 0 0.0% 0To visit the cinema 0.3% 2 0.0% 0 0.0% 0 0.0% 0 1.0% 1 2.1% 1 0.0% 0 0.0% 0 0.0% 0To visit a park 0.0% 0 0.0% 0 0.0% 0 0.0% 0 0.0% 0 0.0% 0 0.0% 0 0.0% 0 0.0% 0To visit the swimming pool 0.0% 0 0.0% 0 0.0% 0 0.0% 0 0.0% 0 0.0% 0 0.0% 0 0.0% 0 0.0% 0To visit other gyms / health
and fitness facilities 0.1% 0 0.0% 0 0.0% 0 0.0% 0 0.0% 0 0.7% 0 0.0% 0 0.0% 0 0.0% 0
To visit the library 0.5% 3 0.0% 0 0.0% 0 0.0% 0 0.0% 0 0.0% 0 0.7% 0 0.0% 0 1.5% 2To visit museums / art
gallery 0.0% 0 0.0% 0 0.0% 0 0.0% 0 0.0% 0 0.0% 0 0.0% 0 0.0% 0 0.0% 0
To visit the theatre or musical venues
0.0% 0 0.0% 0 0.0% 0 0.0% 0 0.0% 0 0.0% 0 0.0% 0 0.0% 0 0.0% 0
To visit night time venues e.g. nightclub
0.0% 0 0.0% 0 0.0% 0 0.0% 0 0.0% 0 0.0% 0 0.0% 0 0.0% 0 0.0% 0
For other leisure activities 2.2% 12 0.0% 0 1.6% 1 4.6% 2 4.6% 3 0.7% 0 7.0% 5 0.9% 1 0.0% 0To shop at the market(s) 0.2% 1 0.0% 0 0.0% 0 0.0% 0 1.3% 1 0.0% 0 0.0% 0 0.0% 0 0.0% 0To meet family 1.7% 10 0.0% 0 5.1% 4 4.1% 1 2.9% 2 1.0% 1 0.0% 0 0.0% 0 1.0% 2To meet friends 2.2% 12 0.0% 0 5.2% 4 6.9% 2 1.0% 1 0.0% 0 1.6% 1 0.0% 0 2.5% 4To visit the theatre 0.1% 1 0.0% 0 0.0% 0 2.4% 1 0.0% 0 0.0% 0 0.0% 0 0.0% 0 0.0% 0For work (i.e. place of work) 9.7% 55 0.0% 0 15.9% 12 16.0% 5 7.3% 5 6.0% 4 14.6% 10 3.4% 3 9.3% 15For business (e.g. attend a
business appointment) 0.0% 0 0.0% 0 0.0% 0 0.0% 0 0.0% 0 0.0% 0 0.0% 0 0.0% 0 0.0% 0
For education as a student (e.g. student at college, university, or other third level education)
0.9% 5 0.0% 0 6.1% 5 0.0% 0 0.0% 0 0.0% 0 0.0% 0 0.0% 0 0.0% 0
To access public transport for onward travel (e.g. train station, bus station)
2.0% 11 0.0% 0 10.5% 8 0.0% 0 3.4% 2 0.7% 0 0.0% 0 0.0% 0 0.0% 0
Other 0.0% 0 0.0% 0 0.0% 0 0.0% 0 0.0% 0 0.0% 0 0.0% 0 0.0% 0 0.0% 0As part of a day out / for a
day out / something different
1.8% 10 0.0% 0 1.7% 1 3.5% 1 6.0% 4 0.0% 0 0.0% 0 1.0% 1 1.5% 2
Browsing / window shopping 0.5% 3 0.0% 0 1.6% 1 0.0% 0 0.0% 0 0.0% 0 0.7% 0 0.0% 0 0.7% 1(Don't know / varies) 1.6% 9 0.0% 0 4.5% 4 4.1% 1 3.1% 2 0.0% 0 0.0% 0 0.7% 1 0.7% 1(Nothing / nothing further) 0.7% 4 0.0% 0 0.0% 0 0.0% 0 0.0% 0 4.7% 3 0.0% 0 0.0% 0 0.7% 1Weighted base: 562 0 78 33 71 60 72 91 158Sample: 552 0 51 40 78 89 96 98 100

by Zone (Weighted, Part 2) South Wales Retail Study Page 95 Weighted: for Carter Jonas August 2016
Total Zone 9 Zone 10 Zone 11 Zone 12 Zone 13 Zone 14 Zone 15 Zone 16
Column %ges. 020716 NEMS market research
Q60B In order of importance, what are your two main reasons for visiting Aberystwth Town Centre? Secondary reason: Those who gave a reason at Q60A Food shopping 8.8% 48 0.0% 0 0.0% 0 6.9% 2 12.6% 9 5.1% 3 12.8% 9 5.4% 5 13.3% 21Non-food shopping 26.4% 145 0.0% 0 17.6% 13 21.3% 7 18.6% 13 25.9% 15 24.4% 17 31.9% 29 33.0% 51To visit bars / pubs 0.1% 1 0.0% 0 0.0% 0 0.0% 0 0.0% 0 0.0% 0 0.0% 0 0.7% 1 0.0% 0To visit cafés / restaurants 11.4% 63 0.0% 0 4.3% 3 20.1% 6 4.6% 3 8.6% 5 12.7% 9 13.3% 12 15.3% 24To visit personal service
providers (e.g. hairdressers, beauty salon etc.)
0.5% 3 0.0% 0 0.0% 0 0.0% 0 0.0% 0 2.2% 1 0.9% 1 0.7% 1 0.0% 0
To visit financial services such as banks and other financial institutions
3.4% 19 0.0% 0 0.0% 0 0.0% 0 1.0% 1 9.8% 6 5.0% 4 2.4% 2 4.3% 7
To visit other service providers (e.g. travel agent, estate agent etc.)
0.4% 2 0.0% 0 0.0% 0 0.0% 0 0.0% 0 0.0% 0 0.0% 0 0.9% 1 1.0% 2
To visit public services (e.g. medical or dentist appointment, library, job centre, community centre, etc)
2.6% 14 0.0% 0 1.3% 1 0.0% 0 2.5% 2 4.6% 3 2.4% 2 2.3% 2 3.2% 5
To get petrol 0.0% 0 0.0% 0 0.0% 0 0.0% 0 0.0% 0 0.0% 0 0.0% 0 0.0% 0 0.0% 0To visit the cinema 0.5% 3 0.0% 0 0.0% 0 0.0% 0 0.0% 0 0.0% 0 1.9% 1 0.0% 0 0.8% 1To visit a park 0.5% 3 0.0% 0 0.0% 0 0.0% 0 0.0% 0 0.0% 0 0.0% 0 3.0% 3 0.0% 0To visit the swimming pool 0.1% 1 0.0% 0 0.0% 0 0.0% 0 0.0% 0 0.0% 0 0.9% 1 0.0% 0 0.0% 0To visit other gyms / health
and fitness facilities 0.2% 1 0.0% 0 0.0% 0 0.0% 0 0.0% 0 0.0% 0 1.6% 1 0.0% 0 0.0% 0
To visit the library 0.0% 0 0.0% 0 0.0% 0 0.0% 0 0.0% 0 0.0% 0 0.0% 0 0.0% 0 0.0% 0To visit museums / art
gallery 1.0% 6 0.0% 0 3.7% 3 4.3% 1 1.0% 1 0.8% 0 0.7% 0 0.0% 0 0.0% 0
To visit the theatre or musical venues
0.0% 0 0.0% 0 0.0% 0 0.0% 0 0.0% 0 0.0% 0 0.0% 0 0.0% 0 0.0% 0
To visit night time venues e.g. nightclub
0.0% 0 0.0% 0 0.0% 0 0.0% 0 0.0% 0 0.0% 0 0.0% 0 0.0% 0 0.0% 0
For other leisure activities 1.7% 9 0.0% 0 1.8% 1 1.8% 1 5.4% 4 0.8% 0 3.2% 2 0.0% 0 0.8% 1To shop at the market(s) 0.0% 0 0.0% 0 0.0% 0 0.0% 0 0.0% 0 0.0% 0 0.0% 0 0.0% 0 0.0% 0To meet family 0.7% 4 0.0% 0 0.0% 0 2.4% 1 1.3% 1 1.9% 1 0.0% 0 1.1% 1 0.0% 0To meet friends 3.8% 21 0.0% 0 0.0% 0 2.8% 1 3.2% 2 5.2% 3 3.3% 2 3.5% 3 5.8% 9To visit the theatre 0.0% 0 0.0% 0 0.0% 0 0.0% 0 0.0% 0 0.0% 0 0.0% 0 0.0% 0 0.0% 0For work (i.e. place of work) 1.4% 8 0.0% 0 0.0% 0 0.0% 0 0.0% 0 0.0% 0 5.8% 4 0.7% 1 2.0% 3For business (e.g. attend a
business appointment) 0.0% 0 0.0% 0 0.0% 0 0.0% 0 0.0% 0 0.0% 0 0.0% 0 0.0% 0 0.0% 0
For education as a student (e.g. student at college, university, or other third level education)
0.0% 0 0.0% 0 0.0% 0 0.0% 0 0.0% 0 0.0% 0 0.0% 0 0.0% 0 0.0% 0
To access public transport for onward travel (e.g. train station, bus station)
0.3% 2 0.0% 0 1.3% 1 0.0% 0 1.3% 1 0.0% 0 0.0% 0 0.0% 0 0.0% 0
Other 0.0% 0 0.0% 0 0.0% 0 0.0% 0 0.0% 0 0.0% 0 0.0% 0 0.0% 0 0.0% 0As part of a day out / for a
day out / something different
0.3% 2 0.0% 0 0.0% 0 0.0% 0 1.3% 1 0.0% 0 0.0% 0 0.7% 1 0.0% 0
Browsing / window shopping 2.5% 14 0.0% 0 1.8% 1 2.4% 1 1.0% 1 0.0% 0 0.0% 0 4.2% 4 4.6% 7(Don't know / varies) 0.4% 2 0.0% 0 1.3% 1 0.0% 0 0.0% 0 1.2% 1 0.9% 1 0.0% 0 0.0% 0(Nothing / nothing further) 33.0% 181 0.0% 0 67.0% 50 38.1% 12 46.3% 32 33.9% 19 23.5% 17 29.1% 26 15.9% 25Weighted base: 550 0 75 32 69 57 72 90 155Sample: 539 0 48 38 75 87 96 97 98

by Zone (Weighted, Part 2) South Wales Retail Study Page 96 Weighted: for Carter Jonas August 2016
Total Zone 9 Zone 10 Zone 11 Zone 12 Zone 13 Zone 14 Zone 15 Zone 16
Column %ges. 020716 NEMS market research
Q60X In order of importance, what are your two main reasons for visiting Aberystwth Town Centre? Any mention: [MR] Zones 10-16 and those who visit Aberystwth town centre at Q59 Food shopping 45.5% 256 0.0% 0 3.1% 2 19.1% 6 38.5% 27 48.7% 29 53.3% 38 58.6% 53 62.9% 99Non-food shopping 47.4% 267 0.0% 0 35.6% 28 43.7% 15 38.4% 27 49.1% 30 44.9% 32 60.1% 54 51.4% 81To visit bars / pubs 0.2% 1 0.0% 0 0.0% 0 0.0% 0 1.0% 1 0.0% 0 0.0% 0 0.7% 1 0.0% 0To visit cafés / restaurants 14.5% 82 0.0% 0 9.9% 8 21.1% 7 5.7% 4 9.9% 6 18.8% 13 17.2% 16 17.6% 28To visit personal service
providers (e.g. hairdressers, beauty salon etc.)
1.0% 6 0.0% 0 0.0% 0 0.0% 0 1.0% 1 2.1% 1 1.6% 1 1.4% 1 0.7% 1
To visit financial services such as banks and other financial institutions
8.2% 46 0.0% 0 0.0% 0 1.8% 1 1.9% 1 13.5% 8 8.8% 6 9.2% 8 13.5% 21
To visit other service providers (e.g. travel agent, estate agent etc.)
0.7% 4 0.0% 0 0.0% 0 1.8% 1 1.3% 1 0.0% 0 0.0% 0 0.9% 1 1.0% 2
To visit public services (e.g. medical or dentist appointment, library, job centre, community centre, etc)
10.3% 58 0.0% 0 21.2% 17 17.3% 6 20.0% 14 14.3% 9 5.6% 4 3.0% 3 3.9% 6
To get petrol 0.1% 0 0.0% 0 0.0% 0 0.0% 0 0.0% 0 0.0% 0 0.7% 0 0.0% 0 0.0% 0To visit the cinema 0.8% 5 0.0% 0 0.0% 0 0.0% 0 1.0% 1 2.1% 1 1.9% 1 0.0% 0 0.7% 1To visit a park 0.5% 3 0.0% 0 0.0% 0 0.0% 0 0.0% 0 0.0% 0 0.0% 0 3.0% 3 0.0% 0To visit the swimming pool 0.1% 1 0.0% 0 0.0% 0 0.0% 0 0.0% 0 0.0% 0 0.9% 1 0.0% 0 0.0% 0To visit other gyms / health
and fitness facilities 0.3% 2 0.0% 0 0.0% 0 0.0% 0 0.0% 0 0.7% 0 1.6% 1 0.0% 0 0.0% 0
To visit the library 0.5% 3 0.0% 0 0.0% 0 0.0% 0 0.0% 0 0.0% 0 0.7% 0 0.0% 0 1.5% 2To visit museums / art
gallery 1.0% 6 0.0% 0 3.6% 3 4.1% 1 1.0% 1 0.7% 0 0.7% 0 0.0% 0 0.0% 0
To visit the theatre or musical venues
0.0% 0 0.0% 0 0.0% 0 0.0% 0 0.0% 0 0.0% 0 0.0% 0 0.0% 0 0.0% 0
To visit night time venues e.g. nightclub
0.0% 0 0.0% 0 0.0% 0 0.0% 0 0.0% 0 0.0% 0 0.0% 0 0.0% 0 0.0% 0
For other leisure activities 3.9% 22 0.0% 0 3.3% 3 6.4% 2 9.8% 7 1.5% 1 10.2% 7 0.9% 1 0.7% 1To shop at the market(s) 0.2% 1 0.0% 0 0.0% 0 0.0% 0 1.3% 1 0.0% 0 0.0% 0 0.0% 0 0.0% 0To meet family 2.4% 13 0.0% 0 5.1% 4 6.4% 2 4.1% 3 2.8% 2 0.0% 0 1.1% 1 1.0% 2To meet friends 5.8% 33 0.0% 0 5.2% 4 9.5% 3 4.1% 3 4.9% 3 4.9% 4 3.5% 3 8.2% 13To visit the theatre 0.1% 1 0.0% 0 0.0% 0 2.4% 1 0.0% 0 0.0% 0 0.0% 0 0.0% 0 0.0% 0For work (i.e. place of work) 11.2% 63 0.0% 0 15.9% 12 16.0% 5 7.3% 5 6.0% 4 20.5% 15 4.1% 4 11.3% 18For business (e.g. attend a
business appointment) 0.0% 0 0.0% 0 0.0% 0 0.0% 0 0.0% 0 0.0% 0 0.0% 0 0.0% 0 0.0% 0
For education as a student (e.g. student at college, university, or other third level education)
0.9% 5 0.0% 0 6.1% 5 0.0% 0 0.0% 0 0.0% 0 0.0% 0 0.0% 0 0.0% 0
To access public transport for onward travel (e.g. train station, bus station)
2.3% 13 0.0% 0 11.8% 9 0.0% 0 4.7% 3 0.7% 0 0.0% 0 0.0% 0 0.0% 0
Other 0.0% 0 0.0% 0 0.0% 0 0.0% 0 0.0% 0 0.0% 0 0.0% 0 0.0% 0 0.0% 0As part of a day out / for a
day out / something different
2.0% 11 0.0% 0 1.7% 1 3.5% 1 7.2% 5 0.0% 0 0.0% 0 1.7% 2 1.5% 2
Browsing / window shopping 3.0% 17 0.0% 0 3.3% 3 2.3% 1 1.0% 1 0.0% 0 0.7% 0 4.2% 4 5.3% 8Weighted base: 562 0 78 33 71 60 72 91 158Sample: 552 0 51 40 78 89 96 98 100
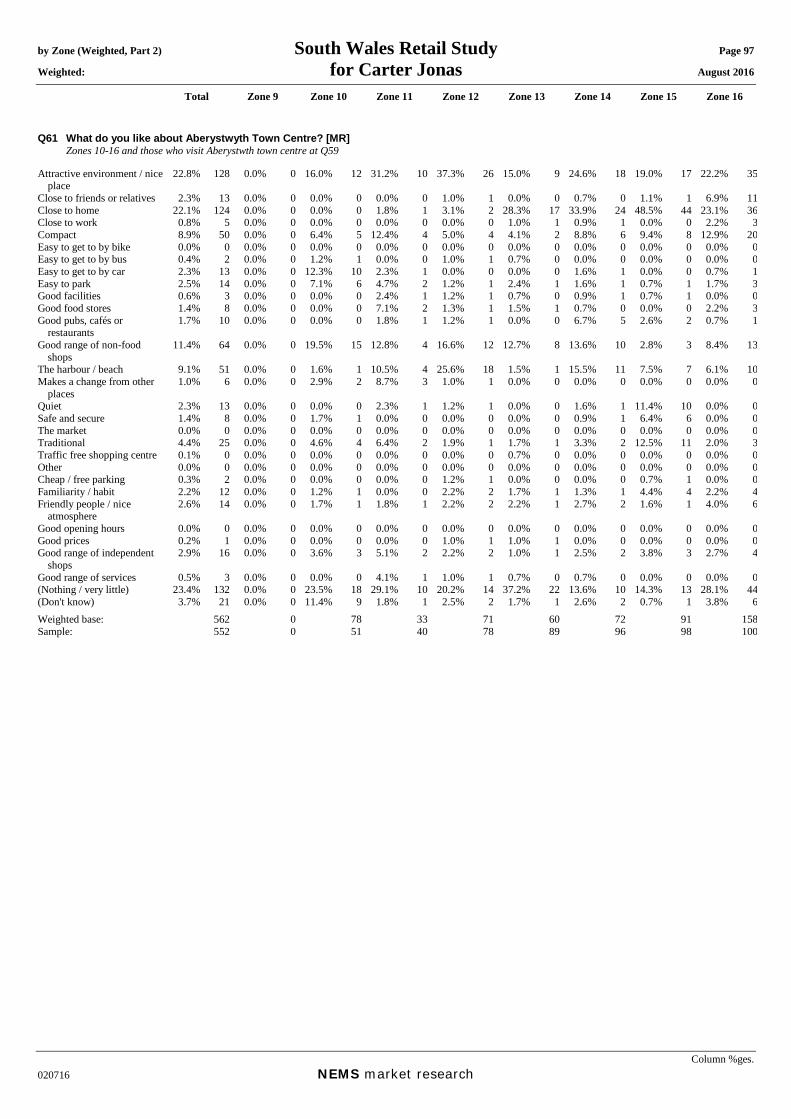
by Zone (Weighted, Part 2) South Wales Retail Study Page 97 Weighted: for Carter Jonas August 2016
Total Zone 9 Zone 10 Zone 11 Zone 12 Zone 13 Zone 14 Zone 15 Zone 16
Column %ges. 020716 NEMS market research
Q61 What do you like about Aberystwyth Town Centre? [MR] Zones 10-16 and those who visit Aberystwth town centre at Q59 Attractive environment / nice
place 22.8% 128 0.0% 0 16.0% 12 31.2% 10 37.3% 26 15.0% 9 24.6% 18 19.0% 17 22.2% 35
Close to friends or relatives 2.3% 13 0.0% 0 0.0% 0 0.0% 0 1.0% 1 0.0% 0 0.7% 0 1.1% 1 6.9% 11Close to home 22.1% 124 0.0% 0 0.0% 0 1.8% 1 3.1% 2 28.3% 17 33.9% 24 48.5% 44 23.1% 36Close to work 0.8% 5 0.0% 0 0.0% 0 0.0% 0 0.0% 0 1.0% 1 0.9% 1 0.0% 0 2.2% 3Compact 8.9% 50 0.0% 0 6.4% 5 12.4% 4 5.0% 4 4.1% 2 8.8% 6 9.4% 8 12.9% 20Easy to get to by bike 0.0% 0 0.0% 0 0.0% 0 0.0% 0 0.0% 0 0.0% 0 0.0% 0 0.0% 0 0.0% 0Easy to get to by bus 0.4% 2 0.0% 0 1.2% 1 0.0% 0 1.0% 1 0.7% 0 0.0% 0 0.0% 0 0.0% 0Easy to get to by car 2.3% 13 0.0% 0 12.3% 10 2.3% 1 0.0% 0 0.0% 0 1.6% 1 0.0% 0 0.7% 1Easy to park 2.5% 14 0.0% 0 7.1% 6 4.7% 2 1.2% 1 2.4% 1 1.6% 1 0.7% 1 1.7% 3Good facilities 0.6% 3 0.0% 0 0.0% 0 2.4% 1 1.2% 1 0.7% 0 0.9% 1 0.7% 1 0.0% 0Good food stores 1.4% 8 0.0% 0 0.0% 0 7.1% 2 1.3% 1 1.5% 1 0.7% 0 0.0% 0 2.2% 3Good pubs, cafés or
restaurants 1.7% 10 0.0% 0 0.0% 0 1.8% 1 1.2% 1 0.0% 0 6.7% 5 2.6% 2 0.7% 1
Good range of non-food shops
11.4% 64 0.0% 0 19.5% 15 12.8% 4 16.6% 12 12.7% 8 13.6% 10 2.8% 3 8.4% 13
The harbour / beach 9.1% 51 0.0% 0 1.6% 1 10.5% 4 25.6% 18 1.5% 1 15.5% 11 7.5% 7 6.1% 10Makes a change from other
places 1.0% 6 0.0% 0 2.9% 2 8.7% 3 1.0% 1 0.0% 0 0.0% 0 0.0% 0 0.0% 0
Quiet 2.3% 13 0.0% 0 0.0% 0 2.3% 1 1.2% 1 0.0% 0 1.6% 1 11.4% 10 0.0% 0Safe and secure 1.4% 8 0.0% 0 1.7% 1 0.0% 0 0.0% 0 0.0% 0 0.9% 1 6.4% 6 0.0% 0The market 0.0% 0 0.0% 0 0.0% 0 0.0% 0 0.0% 0 0.0% 0 0.0% 0 0.0% 0 0.0% 0Traditional 4.4% 25 0.0% 0 4.6% 4 6.4% 2 1.9% 1 1.7% 1 3.3% 2 12.5% 11 2.0% 3Traffic free shopping centre 0.1% 0 0.0% 0 0.0% 0 0.0% 0 0.0% 0 0.7% 0 0.0% 0 0.0% 0 0.0% 0Other 0.0% 0 0.0% 0 0.0% 0 0.0% 0 0.0% 0 0.0% 0 0.0% 0 0.0% 0 0.0% 0Cheap / free parking 0.3% 2 0.0% 0 0.0% 0 0.0% 0 1.2% 1 0.0% 0 0.0% 0 0.7% 1 0.0% 0Familiarity / habit 2.2% 12 0.0% 0 1.2% 1 0.0% 0 2.2% 2 1.7% 1 1.3% 1 4.4% 4 2.2% 4Friendly people / nice
atmosphere 2.6% 14 0.0% 0 1.7% 1 1.8% 1 2.2% 2 2.2% 1 2.7% 2 1.6% 1 4.0% 6
Good opening hours 0.0% 0 0.0% 0 0.0% 0 0.0% 0 0.0% 0 0.0% 0 0.0% 0 0.0% 0 0.0% 0Good prices 0.2% 1 0.0% 0 0.0% 0 0.0% 0 1.0% 1 1.0% 1 0.0% 0 0.0% 0 0.0% 0Good range of independent
shops 2.9% 16 0.0% 0 3.6% 3 5.1% 2 2.2% 2 1.0% 1 2.5% 2 3.8% 3 2.7% 4
Good range of services 0.5% 3 0.0% 0 0.0% 0 4.1% 1 1.0% 1 0.7% 0 0.7% 0 0.0% 0 0.0% 0(Nothing / very little) 23.4% 132 0.0% 0 23.5% 18 29.1% 10 20.2% 14 37.2% 22 13.6% 10 14.3% 13 28.1% 44(Don't know) 3.7% 21 0.0% 0 11.4% 9 1.8% 1 2.5% 2 1.7% 1 2.6% 2 0.7% 1 3.8% 6Weighted base: 562 0 78 33 71 60 72 91 158Sample: 552 0 51 40 78 89 96 98 100
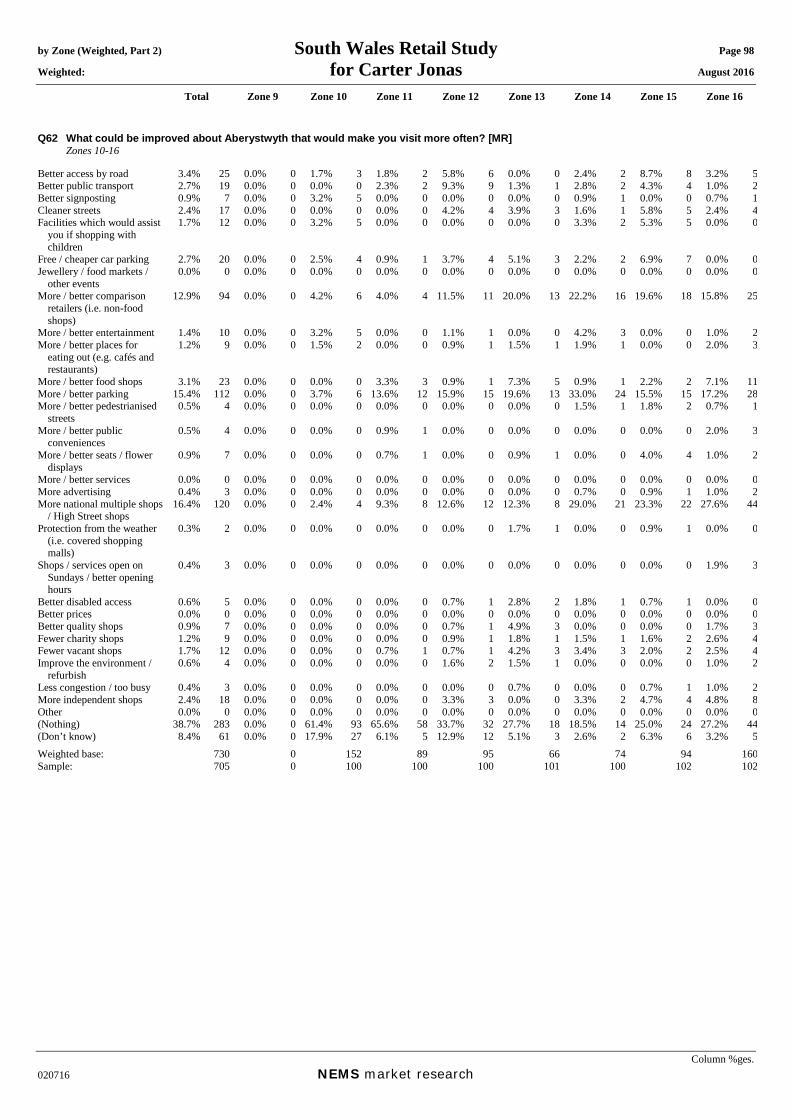
by Zone (Weighted, Part 2) South Wales Retail Study Page 98 Weighted: for Carter Jonas August 2016
Total Zone 9 Zone 10 Zone 11 Zone 12 Zone 13 Zone 14 Zone 15 Zone 16
Column %ges. 020716 NEMS market research
Q62 What could be improved about Aberystwyth that would make you visit more often? [MR] Zones 10-16 Better access by road 3.4% 25 0.0% 0 1.7% 3 1.8% 2 5.8% 6 0.0% 0 2.4% 2 8.7% 8 3.2% 5Better public transport 2.7% 19 0.0% 0 0.0% 0 2.3% 2 9.3% 9 1.3% 1 2.8% 2 4.3% 4 1.0% 2Better signposting 0.9% 7 0.0% 0 3.2% 5 0.0% 0 0.0% 0 0.0% 0 0.9% 1 0.0% 0 0.7% 1Cleaner streets 2.4% 17 0.0% 0 0.0% 0 0.0% 0 4.2% 4 3.9% 3 1.6% 1 5.8% 5 2.4% 4Facilities which would assist
you if shopping with children
1.7% 12 0.0% 0 3.2% 5 0.0% 0 0.0% 0 0.0% 0 3.3% 2 5.3% 5 0.0% 0
Free / cheaper car parking 2.7% 20 0.0% 0 2.5% 4 0.9% 1 3.7% 4 5.1% 3 2.2% 2 6.9% 7 0.0% 0Jewellery / food markets /
other events 0.0% 0 0.0% 0 0.0% 0 0.0% 0 0.0% 0 0.0% 0 0.0% 0 0.0% 0 0.0% 0
More / better comparison retailers (i.e. non-food shops)
12.9% 94 0.0% 0 4.2% 6 4.0% 4 11.5% 11 20.0% 13 22.2% 16 19.6% 18 15.8% 25
More / better entertainment 1.4% 10 0.0% 0 3.2% 5 0.0% 0 1.1% 1 0.0% 0 4.2% 3 0.0% 0 1.0% 2More / better places for
eating out (e.g. cafés and restaurants)
1.2% 9 0.0% 0 1.5% 2 0.0% 0 0.9% 1 1.5% 1 1.9% 1 0.0% 0 2.0% 3
More / better food shops 3.1% 23 0.0% 0 0.0% 0 3.3% 3 0.9% 1 7.3% 5 0.9% 1 2.2% 2 7.1% 11More / better parking 15.4% 112 0.0% 0 3.7% 6 13.6% 12 15.9% 15 19.6% 13 33.0% 24 15.5% 15 17.2% 28More / better pedestrianised
streets 0.5% 4 0.0% 0 0.0% 0 0.0% 0 0.0% 0 0.0% 0 1.5% 1 1.8% 2 0.7% 1
More / better public conveniences
0.5% 4 0.0% 0 0.0% 0 0.9% 1 0.0% 0 0.0% 0 0.0% 0 0.0% 0 2.0% 3
More / better seats / flower displays
0.9% 7 0.0% 0 0.0% 0 0.7% 1 0.0% 0 0.9% 1 0.0% 0 4.0% 4 1.0% 2
More / better services 0.0% 0 0.0% 0 0.0% 0 0.0% 0 0.0% 0 0.0% 0 0.0% 0 0.0% 0 0.0% 0More advertising 0.4% 3 0.0% 0 0.0% 0 0.0% 0 0.0% 0 0.0% 0 0.7% 0 0.9% 1 1.0% 2More national multiple shops
/ High Street shops 16.4% 120 0.0% 0 2.4% 4 9.3% 8 12.6% 12 12.3% 8 29.0% 21 23.3% 22 27.6% 44
Protection from the weather (i.e. covered shopping malls)
0.3% 2 0.0% 0 0.0% 0 0.0% 0 0.0% 0 1.7% 1 0.0% 0 0.9% 1 0.0% 0
Shops / services open on Sundays / better opening hours
0.4% 3 0.0% 0 0.0% 0 0.0% 0 0.0% 0 0.0% 0 0.0% 0 0.0% 0 1.9% 3
Better disabled access 0.6% 5 0.0% 0 0.0% 0 0.0% 0 0.7% 1 2.8% 2 1.8% 1 0.7% 1 0.0% 0Better prices 0.0% 0 0.0% 0 0.0% 0 0.0% 0 0.0% 0 0.0% 0 0.0% 0 0.0% 0 0.0% 0Better quality shops 0.9% 7 0.0% 0 0.0% 0 0.0% 0 0.7% 1 4.9% 3 0.0% 0 0.0% 0 1.7% 3Fewer charity shops 1.2% 9 0.0% 0 0.0% 0 0.0% 0 0.9% 1 1.8% 1 1.5% 1 1.6% 2 2.6% 4Fewer vacant shops 1.7% 12 0.0% 0 0.0% 0 0.7% 1 0.7% 1 4.2% 3 3.4% 3 2.0% 2 2.5% 4Improve the environment /
refurbish 0.6% 4 0.0% 0 0.0% 0 0.0% 0 1.6% 2 1.5% 1 0.0% 0 0.0% 0 1.0% 2
Less congestion / too busy 0.4% 3 0.0% 0 0.0% 0 0.0% 0 0.0% 0 0.7% 0 0.0% 0 0.7% 1 1.0% 2More independent shops 2.4% 18 0.0% 0 0.0% 0 0.0% 0 3.3% 3 0.0% 0 3.3% 2 4.7% 4 4.8% 8Other 0.0% 0 0.0% 0 0.0% 0 0.0% 0 0.0% 0 0.0% 0 0.0% 0 0.0% 0 0.0% 0(Nothing) 38.7% 283 0.0% 0 61.4% 93 65.6% 58 33.7% 32 27.7% 18 18.5% 14 25.0% 24 27.2% 44(Don’t know) 8.4% 61 0.0% 0 17.9% 27 6.1% 5 12.9% 12 5.1% 3 2.6% 2 6.3% 6 3.2% 5Weighted base: 730 0 152 89 95 66 74 94 160Sample: 705 0 100 100 100 101 100 102 102
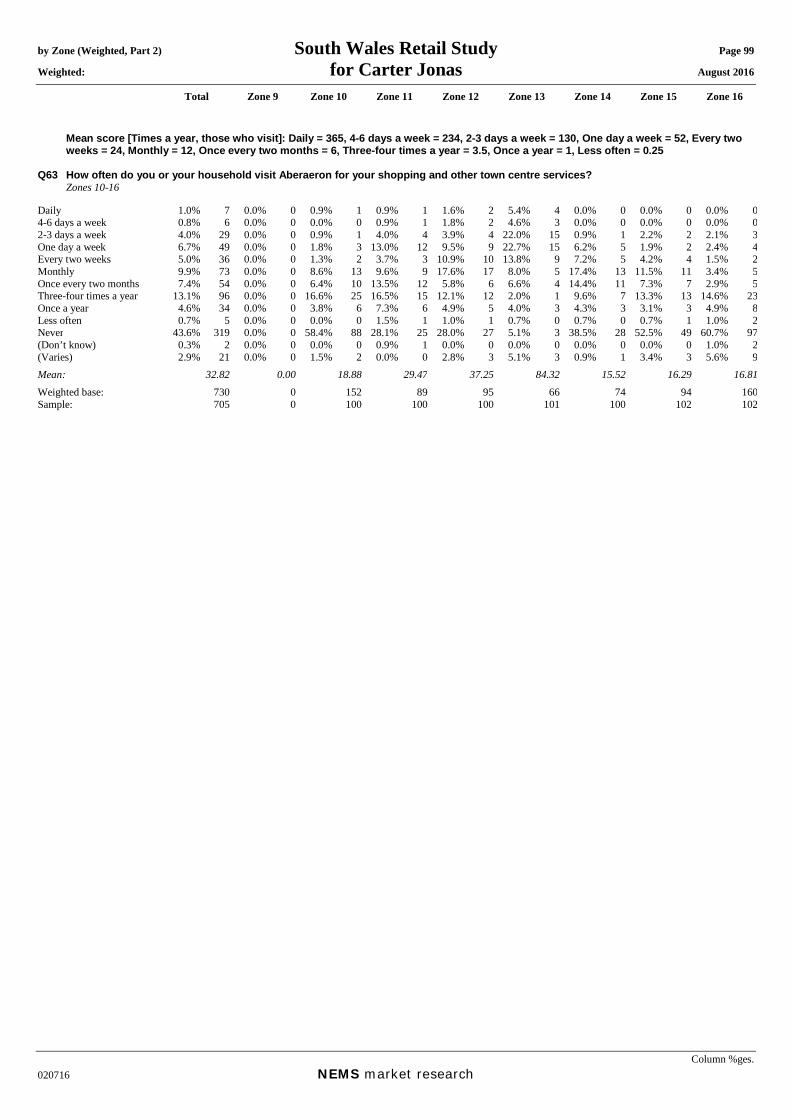
by Zone (Weighted, Part 2) South Wales Retail Study Page 99 Weighted: for Carter Jonas August 2016
Total Zone 9 Zone 10 Zone 11 Zone 12 Zone 13 Zone 14 Zone 15 Zone 16
Column %ges. 020716 NEMS market research
Mean score [Times a year, those who visit]: Daily = 365, 4-6 days a week = 234, 2-3 days a week = 130, One day a week = 52, Every two weeks = 24, Monthly = 12, Once every two months = 6, Three-four times a year = 3.5, Once a year = 1, Less often = 0.25
Q63 How often do you or your household visit Aberaeron for your shopping and other town centre services? Zones 10-16 Daily 1.0% 7 0.0% 0 0.9% 1 0.9% 1 1.6% 2 5.4% 4 0.0% 0 0.0% 0 0.0% 04-6 days a week 0.8% 6 0.0% 0 0.0% 0 0.9% 1 1.8% 2 4.6% 3 0.0% 0 0.0% 0 0.0% 02-3 days a week 4.0% 29 0.0% 0 0.9% 1 4.0% 4 3.9% 4 22.0% 15 0.9% 1 2.2% 2 2.1% 3One day a week 6.7% 49 0.0% 0 1.8% 3 13.0% 12 9.5% 9 22.7% 15 6.2% 5 1.9% 2 2.4% 4Every two weeks 5.0% 36 0.0% 0 1.3% 2 3.7% 3 10.9% 10 13.8% 9 7.2% 5 4.2% 4 1.5% 2Monthly 9.9% 73 0.0% 0 8.6% 13 9.6% 9 17.6% 17 8.0% 5 17.4% 13 11.5% 11 3.4% 5Once every two months 7.4% 54 0.0% 0 6.4% 10 13.5% 12 5.8% 6 6.6% 4 14.4% 11 7.3% 7 2.9% 5Three-four times a year 13.1% 96 0.0% 0 16.6% 25 16.5% 15 12.1% 12 2.0% 1 9.6% 7 13.3% 13 14.6% 23Once a year 4.6% 34 0.0% 0 3.8% 6 7.3% 6 4.9% 5 4.0% 3 4.3% 3 3.1% 3 4.9% 8Less often 0.7% 5 0.0% 0 0.0% 0 1.5% 1 1.0% 1 0.7% 0 0.7% 0 0.7% 1 1.0% 2Never 43.6% 319 0.0% 0 58.4% 88 28.1% 25 28.0% 27 5.1% 3 38.5% 28 52.5% 49 60.7% 97(Don’t know) 0.3% 2 0.0% 0 0.0% 0 0.9% 1 0.0% 0 0.0% 0 0.0% 0 0.0% 0 1.0% 2(Varies) 2.9% 21 0.0% 0 1.5% 2 0.0% 0 2.8% 3 5.1% 3 0.9% 1 3.4% 3 5.6% 9Mean: 32.82 0.00 18.88 29.47 37.25 84.32 15.52 16.29 16.81Weighted base: 730 0 152 89 95 66 74 94 160Sample: 705 0 100 100 100 101 100 102 102

by Zone (Weighted, Part 2) South Wales Retail Study Page 100 Weighted: for Carter Jonas August 2016
Total Zone 9 Zone 10 Zone 11 Zone 12 Zone 13 Zone 14 Zone 15 Zone 16
Column %ges. 020716 NEMS market research
Q64A In order of importance, what are your two main reasons for visiting Aberaeron Town Centre? Main reason: Zones 10-16 and those who visit Aberaeron town centre at Q63 Food shopping 12.1% 50 0.0% 0 3.6% 2 16.5% 11 9.0% 6 36.8% 23 2.5% 1 0.0% 0 10.4% 7Non-food shopping 19.2% 79 0.0% 0 14.5% 9 21.9% 14 16.3% 11 22.3% 14 6.8% 3 20.8% 9 29.0% 18To visit bars / pubs 1.4% 6 0.0% 0 5.1% 3 2.1% 1 1.0% 1 0.0% 0 1.1% 0 0.0% 0 0.0% 0To visit cafés / restaurants 23.3% 96 0.0% 0 27.2% 17 14.3% 9 25.3% 17 7.5% 5 32.0% 15 43.3% 19 21.7% 14To visit personal service
providers (e.g. hairdressers, beauty salon etc.)
0.3% 1 0.0% 0 0.0% 0 0.9% 1 0.0% 0 0.7% 0 0.0% 0 0.0% 0 0.0% 0
To visit financial services such as banks and other financial institutions
2.2% 9 0.0% 0 0.0% 0 6.0% 4 3.7% 3 2.9% 2 1.6% 1 0.0% 0 0.0% 0
To visit other service providers (e.g. travel agent, estate agent etc.)
0.9% 4 0.0% 0 1.5% 1 0.0% 0 0.0% 0 3.5% 2 1.1% 0 0.0% 0 0.0% 0
To visit public services (e.g. medical or dentist appointment, library, job centre, community centre, etc)
3.4% 14 0.0% 0 0.0% 0 0.9% 1 7.1% 5 12.5% 8 1.4% 1 0.0% 0 0.0% 0
To get petrol 0.0% 0 0.0% 0 0.0% 0 0.0% 0 0.0% 0 0.0% 0 0.0% 0 0.0% 0 0.0% 0To visit the cinema 0.2% 1 0.0% 0 0.0% 0 1.2% 1 0.0% 0 0.0% 0 0.0% 0 0.0% 0 0.0% 0To visit a park 0.1% 1 0.0% 0 0.0% 0 0.9% 1 0.0% 0 0.0% 0 0.0% 0 0.0% 0 0.0% 0To visit the swimming pool 0.0% 0 0.0% 0 0.0% 0 0.0% 0 0.0% 0 0.0% 0 0.0% 0 0.0% 0 0.0% 0To visit other gyms / health
and fitness facilities 1.8% 7 0.0% 0 7.6% 5 0.9% 1 1.0% 1 0.0% 0 2.8% 1 0.0% 0 0.0% 0
To visit the library 0.3% 1 0.0% 0 0.0% 0 0.0% 0 1.0% 1 0.7% 0 0.0% 0 0.0% 0 0.0% 0To visit museums / art
gallery 0.2% 1 0.0% 0 0.0% 0 0.0% 0 0.0% 0 0.0% 0 0.0% 0 1.4% 1 0.0% 0
To visit the theatre or musical venues
0.0% 0 0.0% 0 0.0% 0 0.0% 0 0.0% 0 0.0% 0 0.0% 0 0.0% 0 0.0% 0
To visit night time venues e.g. nightclub
0.0% 0 0.0% 0 0.0% 0 0.0% 0 0.0% 0 0.0% 0 0.0% 0 0.0% 0 0.0% 0
For other leisure activities 10.0% 41 0.0% 0 11.2% 7 6.6% 4 19.5% 13 1.9% 1 17.5% 8 6.0% 3 7.5% 5To shop at the market(s) 0.0% 0 0.0% 0 0.0% 0 0.0% 0 0.0% 0 0.0% 0 0.0% 0 0.0% 0 0.0% 0To meet family 3.7% 15 0.0% 0 3.6% 2 1.9% 1 1.3% 1 1.0% 1 2.1% 1 5.0% 2 11.2% 7To meet friends 4.0% 16 0.0% 0 1.5% 1 4.6% 3 3.5% 2 1.8% 1 5.6% 3 9.0% 4 3.7% 2To visit the theatre 0.0% 0 0.0% 0 0.0% 0 0.0% 0 0.0% 0 0.0% 0 0.0% 0 0.0% 0 0.0% 0For work (i.e. place of work) 3.2% 13 0.0% 0 8.6% 5 3.5% 2 1.0% 1 3.6% 2 4.2% 2 1.8% 1 0.0% 0For business (e.g. attend a
business appointment) 0.8% 3 0.0% 0 4.4% 3 0.0% 0 0.0% 0 0.0% 0 1.1% 0 0.0% 0 0.0% 0
For education as a student (e.g. student at college, university, or other third level education)
0.2% 1 0.0% 0 0.0% 0 1.2% 1 0.0% 0 0.0% 0 0.0% 0 0.0% 0 0.0% 0
To access public transport for onward travel (e.g. train station, bus station)
0.0% 0 0.0% 0 0.0% 0 0.0% 0 0.0% 0 0.0% 0 0.0% 0 0.0% 0 0.0% 0
Other 0.0% 0 0.0% 0 0.0% 0 0.0% 0 0.0% 0 0.0% 0 0.0% 0 0.0% 0 0.0% 0As part of a day out / for a
day out / something different
6.7% 28 0.0% 0 7.6% 5 7.5% 5 8.4% 6 0.7% 0 14.5% 7 8.5% 4 2.5% 2
Browsing / window shopping 3.1% 13 0.0% 0 2.0% 1 4.9% 3 1.0% 1 2.0% 1 4.6% 2 1.4% 1 6.2% 4(Don't know / varies) 1.4% 6 0.0% 0 0.0% 0 2.8% 2 0.0% 0 0.0% 0 0.0% 0 1.4% 1 5.4% 3(Nothing / nothing further) 1.5% 6 0.0% 0 1.5% 1 1.2% 1 1.0% 1 2.0% 1 1.1% 0 1.4% 1 2.4% 2Weighted base: 412 0 63 64 69 63 45 45 63Sample: 440 0 44 71 76 94 64 50 41
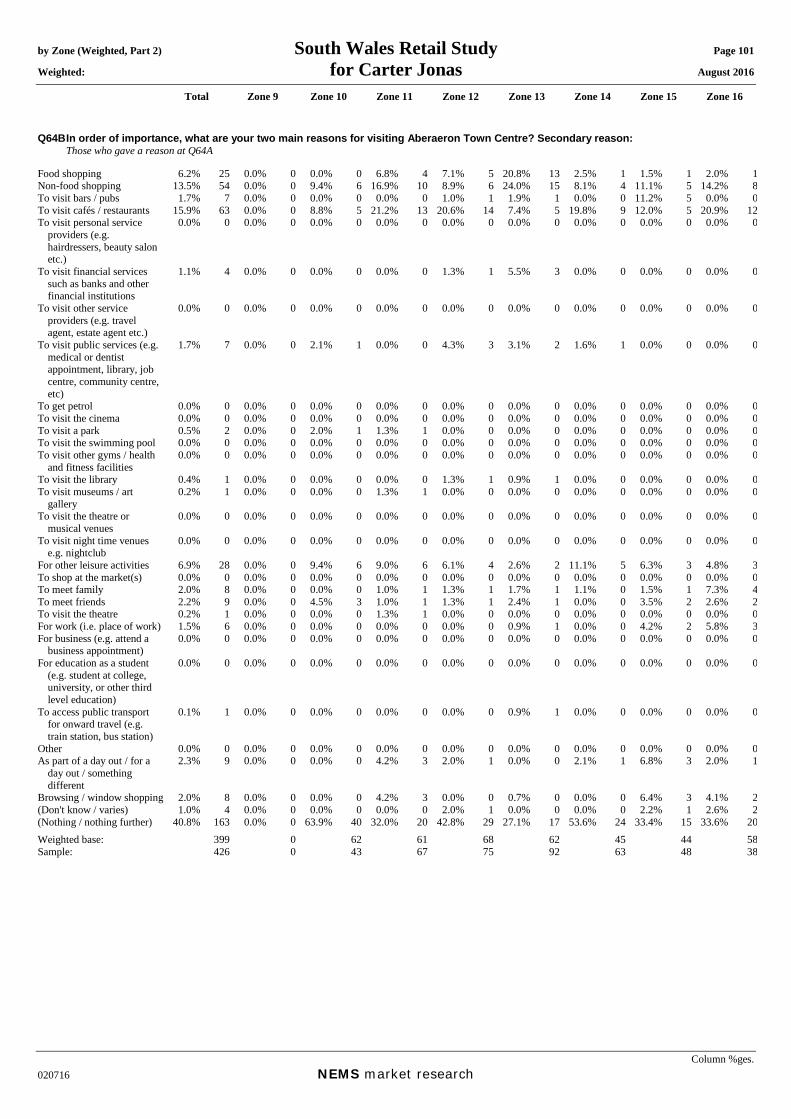
by Zone (Weighted, Part 2) South Wales Retail Study Page 101 Weighted: for Carter Jonas August 2016
Total Zone 9 Zone 10 Zone 11 Zone 12 Zone 13 Zone 14 Zone 15 Zone 16
Column %ges. 020716 NEMS market research
Q64B In order of importance, what are your two main reasons for visiting Aberaeron Town Centre? Secondary reason: Those who gave a reason at Q64A Food shopping 6.2% 25 0.0% 0 0.0% 0 6.8% 4 7.1% 5 20.8% 13 2.5% 1 1.5% 1 2.0% 1Non-food shopping 13.5% 54 0.0% 0 9.4% 6 16.9% 10 8.9% 6 24.0% 15 8.1% 4 11.1% 5 14.2% 8To visit bars / pubs 1.7% 7 0.0% 0 0.0% 0 0.0% 0 1.0% 1 1.9% 1 0.0% 0 11.2% 5 0.0% 0To visit cafés / restaurants 15.9% 63 0.0% 0 8.8% 5 21.2% 13 20.6% 14 7.4% 5 19.8% 9 12.0% 5 20.9% 12To visit personal service
providers (e.g. hairdressers, beauty salon etc.)
0.0% 0 0.0% 0 0.0% 0 0.0% 0 0.0% 0 0.0% 0 0.0% 0 0.0% 0 0.0% 0
To visit financial services such as banks and other financial institutions
1.1% 4 0.0% 0 0.0% 0 0.0% 0 1.3% 1 5.5% 3 0.0% 0 0.0% 0 0.0% 0
To visit other service providers (e.g. travel agent, estate agent etc.)
0.0% 0 0.0% 0 0.0% 0 0.0% 0 0.0% 0 0.0% 0 0.0% 0 0.0% 0 0.0% 0
To visit public services (e.g. medical or dentist appointment, library, job centre, community centre, etc)
1.7% 7 0.0% 0 2.1% 1 0.0% 0 4.3% 3 3.1% 2 1.6% 1 0.0% 0 0.0% 0
To get petrol 0.0% 0 0.0% 0 0.0% 0 0.0% 0 0.0% 0 0.0% 0 0.0% 0 0.0% 0 0.0% 0To visit the cinema 0.0% 0 0.0% 0 0.0% 0 0.0% 0 0.0% 0 0.0% 0 0.0% 0 0.0% 0 0.0% 0To visit a park 0.5% 2 0.0% 0 2.0% 1 1.3% 1 0.0% 0 0.0% 0 0.0% 0 0.0% 0 0.0% 0To visit the swimming pool 0.0% 0 0.0% 0 0.0% 0 0.0% 0 0.0% 0 0.0% 0 0.0% 0 0.0% 0 0.0% 0To visit other gyms / health
and fitness facilities 0.0% 0 0.0% 0 0.0% 0 0.0% 0 0.0% 0 0.0% 0 0.0% 0 0.0% 0 0.0% 0
To visit the library 0.4% 1 0.0% 0 0.0% 0 0.0% 0 1.3% 1 0.9% 1 0.0% 0 0.0% 0 0.0% 0To visit museums / art
gallery 0.2% 1 0.0% 0 0.0% 0 1.3% 1 0.0% 0 0.0% 0 0.0% 0 0.0% 0 0.0% 0
To visit the theatre or musical venues
0.0% 0 0.0% 0 0.0% 0 0.0% 0 0.0% 0 0.0% 0 0.0% 0 0.0% 0 0.0% 0
To visit night time venues e.g. nightclub
0.0% 0 0.0% 0 0.0% 0 0.0% 0 0.0% 0 0.0% 0 0.0% 0 0.0% 0 0.0% 0
For other leisure activities 6.9% 28 0.0% 0 9.4% 6 9.0% 6 6.1% 4 2.6% 2 11.1% 5 6.3% 3 4.8% 3To shop at the market(s) 0.0% 0 0.0% 0 0.0% 0 0.0% 0 0.0% 0 0.0% 0 0.0% 0 0.0% 0 0.0% 0To meet family 2.0% 8 0.0% 0 0.0% 0 1.0% 1 1.3% 1 1.7% 1 1.1% 0 1.5% 1 7.3% 4To meet friends 2.2% 9 0.0% 0 4.5% 3 1.0% 1 1.3% 1 2.4% 1 0.0% 0 3.5% 2 2.6% 2To visit the theatre 0.2% 1 0.0% 0 0.0% 0 1.3% 1 0.0% 0 0.0% 0 0.0% 0 0.0% 0 0.0% 0For work (i.e. place of work) 1.5% 6 0.0% 0 0.0% 0 0.0% 0 0.0% 0 0.9% 1 0.0% 0 4.2% 2 5.8% 3For business (e.g. attend a
business appointment) 0.0% 0 0.0% 0 0.0% 0 0.0% 0 0.0% 0 0.0% 0 0.0% 0 0.0% 0 0.0% 0
For education as a student (e.g. student at college, university, or other third level education)
0.0% 0 0.0% 0 0.0% 0 0.0% 0 0.0% 0 0.0% 0 0.0% 0 0.0% 0 0.0% 0
To access public transport for onward travel (e.g. train station, bus station)
0.1% 1 0.0% 0 0.0% 0 0.0% 0 0.0% 0 0.9% 1 0.0% 0 0.0% 0 0.0% 0
Other 0.0% 0 0.0% 0 0.0% 0 0.0% 0 0.0% 0 0.0% 0 0.0% 0 0.0% 0 0.0% 0As part of a day out / for a
day out / something different
2.3% 9 0.0% 0 0.0% 0 4.2% 3 2.0% 1 0.0% 0 2.1% 1 6.8% 3 2.0% 1
Browsing / window shopping 2.0% 8 0.0% 0 0.0% 0 4.2% 3 0.0% 0 0.7% 0 0.0% 0 6.4% 3 4.1% 2(Don't know / varies) 1.0% 4 0.0% 0 0.0% 0 0.0% 0 2.0% 1 0.0% 0 0.0% 0 2.2% 1 2.6% 2(Nothing / nothing further) 40.8% 163 0.0% 0 63.9% 40 32.0% 20 42.8% 29 27.1% 17 53.6% 24 33.4% 15 33.6% 20Weighted base: 399 0 62 61 68 62 45 44 58Sample: 426 0 43 67 75 92 63 48 38

by Zone (Weighted, Part 2) South Wales Retail Study Page 102 Weighted: for Carter Jonas August 2016
Total Zone 9 Zone 10 Zone 11 Zone 12 Zone 13 Zone 14 Zone 15 Zone 16
Column %ges. 020716 NEMS market research
Q64X In order of importance, what are your two main reasons for visiting Aberaeron Town Centre? Any mention: [MR] Zones 10-16 and those who visit Aberaeron town centre at Q63 Food shopping 18.1% 75 0.0% 0 3.6% 2 23.0% 15 16.1% 11 57.2% 36 5.0% 2 1.4% 1 12.2% 8Non-food shopping 32.3% 133 0.0% 0 23.7% 15 38.1% 24 25.1% 17 45.9% 29 14.8% 7 31.6% 14 42.1% 27To visit bars / pubs 3.0% 12 0.0% 0 5.1% 3 2.1% 1 2.0% 1 1.8% 1 1.1% 0 10.9% 5 0.0% 0To visit cafés / restaurants 38.7% 159 0.0% 0 35.9% 23 34.7% 22 45.7% 31 14.7% 9 51.6% 23 55.0% 25 41.0% 26To visit personal service
providers (e.g. hairdressers, beauty salon etc.)
0.3% 1 0.0% 0 0.0% 0 0.9% 1 0.0% 0 0.7% 0 0.0% 0 0.0% 0 0.0% 0
To visit financial services such as banks and other financial institutions
3.2% 13 0.0% 0 0.0% 0 6.0% 4 4.9% 3 8.3% 5 1.6% 1 0.0% 0 0.0% 0
To visit other service providers (e.g. travel agent, estate agent etc.)
0.9% 4 0.0% 0 1.5% 1 0.0% 0 0.0% 0 3.5% 2 1.1% 0 0.0% 0 0.0% 0
To visit public services (e.g. medical or dentist appointment, library, job centre, community centre, etc)
5.1% 21 0.0% 0 2.1% 1 0.9% 1 11.4% 8 15.5% 10 3.0% 1 0.0% 0 0.0% 0
To get petrol 0.0% 0 0.0% 0 0.0% 0 0.0% 0 0.0% 0 0.0% 0 0.0% 0 0.0% 0 0.0% 0To visit the cinema 0.2% 1 0.0% 0 0.0% 0 1.2% 1 0.0% 0 0.0% 0 0.0% 0 0.0% 0 0.0% 0To visit a park 0.6% 3 0.0% 0 2.0% 1 2.2% 1 0.0% 0 0.0% 0 0.0% 0 0.0% 0 0.0% 0To visit the swimming pool 0.0% 0 0.0% 0 0.0% 0 0.0% 0 0.0% 0 0.0% 0 0.0% 0 0.0% 0 0.0% 0To visit other gyms / health
and fitness facilities 1.8% 7 0.0% 0 7.6% 5 0.9% 1 1.0% 1 0.0% 0 2.8% 1 0.0% 0 0.0% 0
To visit the library 0.6% 3 0.0% 0 0.0% 0 0.0% 0 2.3% 2 1.6% 1 0.0% 0 0.0% 0 0.0% 0To visit museums / art
gallery 0.3% 1 0.0% 0 0.0% 0 1.2% 1 0.0% 0 0.0% 0 0.0% 0 1.4% 1 0.0% 0
To visit the theatre or musical venues
0.0% 0 0.0% 0 0.0% 0 0.0% 0 0.0% 0 0.0% 0 0.0% 0 0.0% 0 0.0% 0
To visit night time venues e.g. nightclub
0.0% 0 0.0% 0 0.0% 0 0.0% 0 0.0% 0 0.0% 0 0.0% 0 0.0% 0 0.0% 0
For other leisure activities 16.7% 69 0.0% 0 20.4% 13 15.2% 10 25.5% 18 4.5% 3 28.5% 13 12.1% 5 11.9% 7To shop at the market(s) 0.0% 0 0.0% 0 0.0% 0 0.0% 0 0.0% 0 0.0% 0 0.0% 0 0.0% 0 0.0% 0To meet family 5.6% 23 0.0% 0 3.6% 2 2.8% 2 2.6% 2 2.6% 2 3.2% 1 6.4% 3 17.9% 11To meet friends 6.1% 25 0.0% 0 5.9% 4 5.6% 4 4.8% 3 4.2% 3 5.6% 3 12.3% 6 6.2% 4To visit the theatre 0.2% 1 0.0% 0 0.0% 0 1.2% 1 0.0% 0 0.0% 0 0.0% 0 0.0% 0 0.0% 0For work (i.e. place of work) 4.6% 19 0.0% 0 8.6% 5 3.5% 2 1.0% 1 4.6% 3 4.2% 2 5.9% 3 5.4% 3For business (e.g. attend a
business appointment) 0.8% 3 0.0% 0 4.4% 3 0.0% 0 0.0% 0 0.0% 0 1.1% 0 0.0% 0 0.0% 0
For education as a student (e.g. student at college, university, or other third level education)
0.2% 1 0.0% 0 0.0% 0 1.2% 1 0.0% 0 0.0% 0 0.0% 0 0.0% 0 0.0% 0
To access public transport for onward travel (e.g. train station, bus station)
0.1% 1 0.0% 0 0.0% 0 0.0% 0 0.0% 0 0.9% 1 0.0% 0 0.0% 0 0.0% 0
Other 0.0% 0 0.0% 0 0.0% 0 0.0% 0 0.0% 0 0.0% 0 0.0% 0 0.0% 0 0.0% 0As part of a day out / for a
day out / something different
8.9% 37 0.0% 0 7.6% 5 11.5% 7 10.3% 7 0.7% 0 16.7% 8 15.1% 7 4.4% 3
Browsing / window shopping 5.1% 21 0.0% 0 2.0% 1 8.9% 6 1.0% 1 2.7% 2 4.6% 2 7.6% 3 9.9% 6Weighted base: 412 0 63 64 69 63 45 45 63Sample: 440 0 44 71 76 94 64 50 41
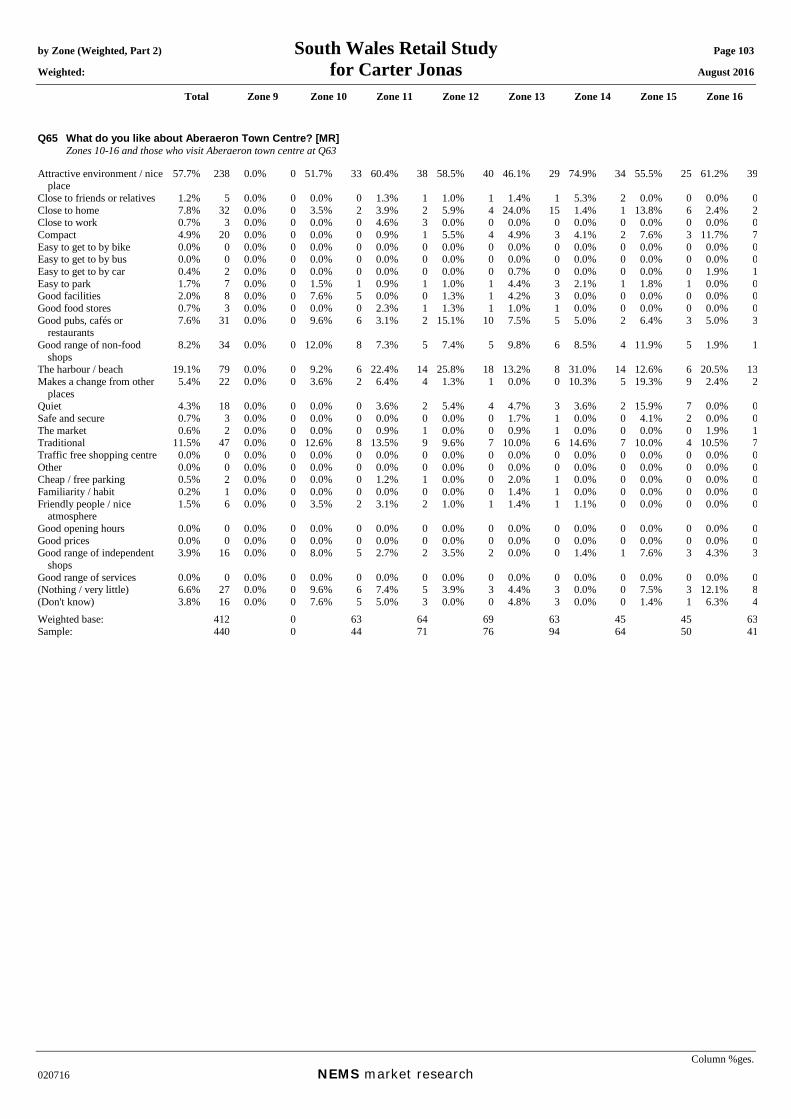
by Zone (Weighted, Part 2) South Wales Retail Study Page 103 Weighted: for Carter Jonas August 2016
Total Zone 9 Zone 10 Zone 11 Zone 12 Zone 13 Zone 14 Zone 15 Zone 16
Column %ges. 020716 NEMS market research
Q65 What do you like about Aberaeron Town Centre? [MR] Zones 10-16 and those who visit Aberaeron town centre at Q63 Attractive environment / nice
place 57.7% 238 0.0% 0 51.7% 33 60.4% 38 58.5% 40 46.1% 29 74.9% 34 55.5% 25 61.2% 39
Close to friends or relatives 1.2% 5 0.0% 0 0.0% 0 1.3% 1 1.0% 1 1.4% 1 5.3% 2 0.0% 0 0.0% 0Close to home 7.8% 32 0.0% 0 3.5% 2 3.9% 2 5.9% 4 24.0% 15 1.4% 1 13.8% 6 2.4% 2Close to work 0.7% 3 0.0% 0 0.0% 0 4.6% 3 0.0% 0 0.0% 0 0.0% 0 0.0% 0 0.0% 0Compact 4.9% 20 0.0% 0 0.0% 0 0.9% 1 5.5% 4 4.9% 3 4.1% 2 7.6% 3 11.7% 7Easy to get to by bike 0.0% 0 0.0% 0 0.0% 0 0.0% 0 0.0% 0 0.0% 0 0.0% 0 0.0% 0 0.0% 0Easy to get to by bus 0.0% 0 0.0% 0 0.0% 0 0.0% 0 0.0% 0 0.0% 0 0.0% 0 0.0% 0 0.0% 0Easy to get to by car 0.4% 2 0.0% 0 0.0% 0 0.0% 0 0.0% 0 0.7% 0 0.0% 0 0.0% 0 1.9% 1Easy to park 1.7% 7 0.0% 0 1.5% 1 0.9% 1 1.0% 1 4.4% 3 2.1% 1 1.8% 1 0.0% 0Good facilities 2.0% 8 0.0% 0 7.6% 5 0.0% 0 1.3% 1 4.2% 3 0.0% 0 0.0% 0 0.0% 0Good food stores 0.7% 3 0.0% 0 0.0% 0 2.3% 1 1.3% 1 1.0% 1 0.0% 0 0.0% 0 0.0% 0Good pubs, cafés or
restaurants 7.6% 31 0.0% 0 9.6% 6 3.1% 2 15.1% 10 7.5% 5 5.0% 2 6.4% 3 5.0% 3
Good range of non-food shops
8.2% 34 0.0% 0 12.0% 8 7.3% 5 7.4% 5 9.8% 6 8.5% 4 11.9% 5 1.9% 1
The harbour / beach 19.1% 79 0.0% 0 9.2% 6 22.4% 14 25.8% 18 13.2% 8 31.0% 14 12.6% 6 20.5% 13Makes a change from other
places 5.4% 22 0.0% 0 3.6% 2 6.4% 4 1.3% 1 0.0% 0 10.3% 5 19.3% 9 2.4% 2
Quiet 4.3% 18 0.0% 0 0.0% 0 3.6% 2 5.4% 4 4.7% 3 3.6% 2 15.9% 7 0.0% 0Safe and secure 0.7% 3 0.0% 0 0.0% 0 0.0% 0 0.0% 0 1.7% 1 0.0% 0 4.1% 2 0.0% 0The market 0.6% 2 0.0% 0 0.0% 0 0.9% 1 0.0% 0 0.9% 1 0.0% 0 0.0% 0 1.9% 1Traditional 11.5% 47 0.0% 0 12.6% 8 13.5% 9 9.6% 7 10.0% 6 14.6% 7 10.0% 4 10.5% 7Traffic free shopping centre 0.0% 0 0.0% 0 0.0% 0 0.0% 0 0.0% 0 0.0% 0 0.0% 0 0.0% 0 0.0% 0Other 0.0% 0 0.0% 0 0.0% 0 0.0% 0 0.0% 0 0.0% 0 0.0% 0 0.0% 0 0.0% 0Cheap / free parking 0.5% 2 0.0% 0 0.0% 0 1.2% 1 0.0% 0 2.0% 1 0.0% 0 0.0% 0 0.0% 0Familiarity / habit 0.2% 1 0.0% 0 0.0% 0 0.0% 0 0.0% 0 1.4% 1 0.0% 0 0.0% 0 0.0% 0Friendly people / nice
atmosphere 1.5% 6 0.0% 0 3.5% 2 3.1% 2 1.0% 1 1.4% 1 1.1% 0 0.0% 0 0.0% 0
Good opening hours 0.0% 0 0.0% 0 0.0% 0 0.0% 0 0.0% 0 0.0% 0 0.0% 0 0.0% 0 0.0% 0Good prices 0.0% 0 0.0% 0 0.0% 0 0.0% 0 0.0% 0 0.0% 0 0.0% 0 0.0% 0 0.0% 0Good range of independent
shops 3.9% 16 0.0% 0 8.0% 5 2.7% 2 3.5% 2 0.0% 0 1.4% 1 7.6% 3 4.3% 3
Good range of services 0.0% 0 0.0% 0 0.0% 0 0.0% 0 0.0% 0 0.0% 0 0.0% 0 0.0% 0 0.0% 0(Nothing / very little) 6.6% 27 0.0% 0 9.6% 6 7.4% 5 3.9% 3 4.4% 3 0.0% 0 7.5% 3 12.1% 8(Don't know) 3.8% 16 0.0% 0 7.6% 5 5.0% 3 0.0% 0 4.8% 3 0.0% 0 1.4% 1 6.3% 4Weighted base: 412 0 63 64 69 63 45 45 63Sample: 440 0 44 71 76 94 64 50 41
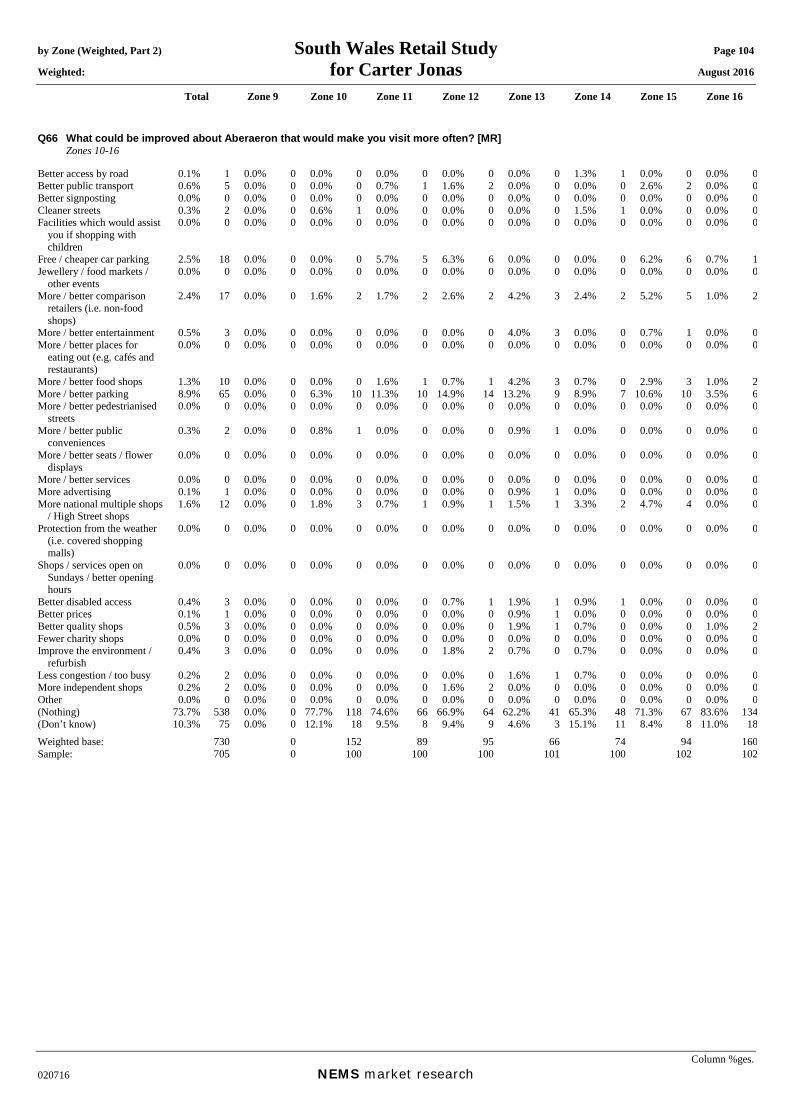
by Zone (Weighted, Part 2) South Wales Retail Study Page 104 Weighted: for Carter Jonas August 2016
Total Zone 9 Zone 10 Zone 11 Zone 12 Zone 13 Zone 14 Zone 15 Zone 16
Column %ges. 020716 NEMS market research
Q66 What could be improved about Aberaeron that would make you visit more often? [MR] Zones 10-16 Better access by road 0.1% 1 0.0% 0 0.0% 0 0.0% 0 0.0% 0 0.0% 0 1.3% 1 0.0% 0 0.0% 0Better public transport 0.6% 5 0.0% 0 0.0% 0 0.7% 1 1.6% 2 0.0% 0 0.0% 0 2.6% 2 0.0% 0Better signposting 0.0% 0 0.0% 0 0.0% 0 0.0% 0 0.0% 0 0.0% 0 0.0% 0 0.0% 0 0.0% 0Cleaner streets 0.3% 2 0.0% 0 0.6% 1 0.0% 0 0.0% 0 0.0% 0 1.5% 1 0.0% 0 0.0% 0Facilities which would assist
you if shopping with children
0.0% 0 0.0% 0 0.0% 0 0.0% 0 0.0% 0 0.0% 0 0.0% 0 0.0% 0 0.0% 0
Free / cheaper car parking 2.5% 18 0.0% 0 0.0% 0 5.7% 5 6.3% 6 0.0% 0 0.0% 0 6.2% 6 0.7% 1Jewellery / food markets /
other events 0.0% 0 0.0% 0 0.0% 0 0.0% 0 0.0% 0 0.0% 0 0.0% 0 0.0% 0 0.0% 0
More / better comparison retailers (i.e. non-food shops)
2.4% 17 0.0% 0 1.6% 2 1.7% 2 2.6% 2 4.2% 3 2.4% 2 5.2% 5 1.0% 2
More / better entertainment 0.5% 3 0.0% 0 0.0% 0 0.0% 0 0.0% 0 4.0% 3 0.0% 0 0.7% 1 0.0% 0More / better places for
eating out (e.g. cafés and restaurants)
0.0% 0 0.0% 0 0.0% 0 0.0% 0 0.0% 0 0.0% 0 0.0% 0 0.0% 0 0.0% 0
More / better food shops 1.3% 10 0.0% 0 0.0% 0 1.6% 1 0.7% 1 4.2% 3 0.7% 0 2.9% 3 1.0% 2More / better parking 8.9% 65 0.0% 0 6.3% 10 11.3% 10 14.9% 14 13.2% 9 8.9% 7 10.6% 10 3.5% 6More / better pedestrianised
streets 0.0% 0 0.0% 0 0.0% 0 0.0% 0 0.0% 0 0.0% 0 0.0% 0 0.0% 0 0.0% 0
More / better public conveniences
0.3% 2 0.0% 0 0.8% 1 0.0% 0 0.0% 0 0.9% 1 0.0% 0 0.0% 0 0.0% 0
More / better seats / flower displays
0.0% 0 0.0% 0 0.0% 0 0.0% 0 0.0% 0 0.0% 0 0.0% 0 0.0% 0 0.0% 0
More / better services 0.0% 0 0.0% 0 0.0% 0 0.0% 0 0.0% 0 0.0% 0 0.0% 0 0.0% 0 0.0% 0More advertising 0.1% 1 0.0% 0 0.0% 0 0.0% 0 0.0% 0 0.9% 1 0.0% 0 0.0% 0 0.0% 0More national multiple shops
/ High Street shops 1.6% 12 0.0% 0 1.8% 3 0.7% 1 0.9% 1 1.5% 1 3.3% 2 4.7% 4 0.0% 0
Protection from the weather (i.e. covered shopping malls)
0.0% 0 0.0% 0 0.0% 0 0.0% 0 0.0% 0 0.0% 0 0.0% 0 0.0% 0 0.0% 0
Shops / services open on Sundays / better opening hours
0.0% 0 0.0% 0 0.0% 0 0.0% 0 0.0% 0 0.0% 0 0.0% 0 0.0% 0 0.0% 0
Better disabled access 0.4% 3 0.0% 0 0.0% 0 0.0% 0 0.7% 1 1.9% 1 0.9% 1 0.0% 0 0.0% 0Better prices 0.1% 1 0.0% 0 0.0% 0 0.0% 0 0.0% 0 0.9% 1 0.0% 0 0.0% 0 0.0% 0Better quality shops 0.5% 3 0.0% 0 0.0% 0 0.0% 0 0.0% 0 1.9% 1 0.7% 0 0.0% 0 1.0% 2Fewer charity shops 0.0% 0 0.0% 0 0.0% 0 0.0% 0 0.0% 0 0.0% 0 0.0% 0 0.0% 0 0.0% 0Improve the environment /
refurbish 0.4% 3 0.0% 0 0.0% 0 0.0% 0 1.8% 2 0.7% 0 0.7% 0 0.0% 0 0.0% 0
Less congestion / too busy 0.2% 2 0.0% 0 0.0% 0 0.0% 0 0.0% 0 1.6% 1 0.7% 0 0.0% 0 0.0% 0More independent shops 0.2% 2 0.0% 0 0.0% 0 0.0% 0 1.6% 2 0.0% 0 0.0% 0 0.0% 0 0.0% 0Other 0.0% 0 0.0% 0 0.0% 0 0.0% 0 0.0% 0 0.0% 0 0.0% 0 0.0% 0 0.0% 0(Nothing) 73.7% 538 0.0% 0 77.7% 118 74.6% 66 66.9% 64 62.2% 41 65.3% 48 71.3% 67 83.6% 134(Don’t know) 10.3% 75 0.0% 0 12.1% 18 9.5% 8 9.4% 9 4.6% 3 15.1% 11 8.4% 8 11.0% 18Weighted base: 730 0 152 89 95 66 74 94 160Sample: 705 0 100 100 100 101 100 102 102

by Zone (Weighted, Part 2) South Wales Retail Study Page 105 Weighted: for Carter Jonas August 2016
Total Zone 9 Zone 10 Zone 11 Zone 12 Zone 13 Zone 14 Zone 15 Zone 16
Column %ges. 020716 NEMS market research
Mean score [Times a year, those who visit]: Daily = 365, 4-6 days a week = 234, 2-3 days a week = 130, One day a week = 52, Every two weeks = 24, Monthly = 12, Once every two months = 6, Three-four times a year = 3.5, Once a year = 1, Less often = 0.25
Q67 How often do you or your household visit Cardigan for shopping and other town centre services? Zones 8-16 Daily 2.1% 18 3.4% 1 10.6% 16 0.9% 1 0.0% 0 0.0% 0 0.0% 0 0.0% 0 0.0% 04-6 days a week 1.8% 15 1.6% 1 8.2% 12 1.6% 1 0.0% 0 0.0% 0 0.0% 0 0.9% 1 0.0% 02-3 days a week 5.0% 43 10.0% 3 23.6% 36 2.5% 2 0.9% 1 0.0% 0 0.0% 0 0.0% 0 0.0% 0One day a week 9.6% 82 28.4% 9 33.6% 51 17.3% 15 0.0% 0 5.7% 4 1.7% 1 0.7% 1 0.0% 0Every two weeks 5.1% 44 25.2% 8 7.2% 11 17.4% 15 0.0% 0 8.8% 6 0.0% 0 0.0% 0 1.0% 2Monthly 5.6% 48 11.0% 4 2.1% 3 9.5% 8 9.0% 9 9.5% 6 2.7% 2 2.2% 2 3.9% 6Once every two months 4.0% 34 2.7% 1 2.3% 3 10.3% 9 4.7% 4 7.6% 5 3.7% 3 0.9% 1 1.0% 2Three-four times a year 5.5% 47 2.7% 1 2.5% 4 5.6% 5 4.9% 5 12.2% 8 8.1% 6 4.6% 4 4.7% 8Once a year 4.0% 35 0.9% 0 0.9% 1 6.6% 6 6.9% 7 3.1% 2 1.5% 1 2.9% 3 2.6% 4Less often 1.7% 14 0.7% 0 0.0% 0 1.5% 1 7.0% 7 1.5% 1 2.7% 2 0.7% 1 0.7% 1Never 54.5% 467 11.0% 4 6.6% 10 24.7% 22 65.8% 63 49.6% 33 79.4% 59 87.1% 82 86.1% 138(Don’t know) 0.2% 2 1.0% 0 1.0% 1 0.0% 0 0.0% 0 0.0% 0 0.0% 0 0.0% 0 0.0% 0(Varies) 0.9% 8 1.4% 0 1.5% 2 2.2% 2 0.9% 1 1.9% 1 0.0% 0 0.0% 0 0.0% 0Mean: 57.86 59.49 118.99 34.72 8.45 14.76 8.58 23.34 6.81Weighted base: 857 33 152 89 95 66 74 94 160Sample: 905 100 100 100 100 101 100 102 102

by Zone (Weighted, Part 2) South Wales Retail Study Page 106 Weighted: for Carter Jonas August 2016
Total Zone 9 Zone 10 Zone 11 Zone 12 Zone 13 Zone 14 Zone 15 Zone 16
Column %ges. 020716 NEMS market research
Q68A In order of importance, what are your two main reasons for visiting Cardigan Town Centre? Main reason: Zones 8-16 and those who visit Cardigan town centre at Q67 Food shopping 36.3% 142 45.3% 13 52.5% 74 37.7% 25 16.8% 5 47.3% 16 0.0% 0 20.9% 3 0.0% 0Non-food shopping 21.5% 84 37.1% 11 10.3% 15 28.4% 19 16.2% 5 20.6% 7 42.2% 6 17.3% 2 22.0% 5To visit bars / pubs 0.5% 2 0.0% 0 0.0% 0 1.2% 1 0.0% 0 0.0% 0 0.0% 0 0.0% 0 5.3% 1To visit cafés / restaurants 2.6% 10 3.0% 1 1.6% 2 0.0% 0 2.1% 1 1.7% 1 17.8% 3 5.2% 1 6.9% 2To visit personal service
providers (e.g. hairdressers, beauty salon etc.)
0.5% 2 1.5% 0 0.7% 1 0.0% 0 0.0% 0 1.7% 1 0.0% 0 0.0% 0 0.0% 0
To visit financial services such as banks and other financial institutions
4.2% 16 3.8% 1 6.6% 9 3.5% 2 2.8% 1 7.9% 3 0.0% 0 0.0% 0 0.0% 0
To visit other service providers (e.g. travel agent, estate agent etc.)
0.0% 0 0.0% 0 0.0% 0 0.0% 0 0.0% 0 0.0% 0 0.0% 0 0.0% 0 0.0% 0
To visit public services (e.g. medical or dentist appointment, library, job centre, community centre, etc)
2.8% 11 0.8% 0 2.8% 4 4.7% 3 0.0% 0 2.7% 1 0.0% 0 0.0% 0 12.5% 3
To get petrol 0.0% 0 0.0% 0 0.0% 0 0.0% 0 0.0% 0 0.0% 0 0.0% 0 0.0% 0 0.0% 0To visit the cinema 2.9% 11 0.0% 0 0.0% 0 9.0% 6 2.1% 1 1.8% 1 0.0% 0 0.0% 0 0.0% 0To visit a park 0.0% 0 0.0% 0 0.0% 0 0.0% 0 0.0% 0 0.0% 0 0.0% 0 0.0% 0 0.0% 0To visit the swimming pool 0.0% 0 0.0% 0 0.0% 0 0.0% 0 0.0% 0 0.0% 0 0.0% 0 0.0% 0 0.0% 0To visit other gyms / health
and fitness facilities 1.1% 4 0.0% 0 0.0% 0 0.0% 0 10.3% 3 0.0% 0 0.0% 0 6.8% 1 0.0% 0
To visit the library 0.2% 1 0.0% 0 0.7% 1 0.0% 0 0.0% 0 0.0% 0 0.0% 0 0.0% 0 0.0% 0To visit museums / art
gallery 0.8% 3 1.5% 0 0.0% 0 0.9% 1 0.0% 0 1.3% 0 0.0% 0 5.2% 1 5.3% 1
To visit the theatre or musical venues
0.2% 1 0.0% 0 0.0% 0 0.0% 0 2.7% 1 0.0% 0 0.0% 0 0.0% 0 0.0% 0
To visit night time venues e.g. nightclub
0.0% 0 0.0% 0 0.0% 0 0.0% 0 0.0% 0 0.0% 0 0.0% 0 0.0% 0 0.0% 0
For other leisure activities 2.0% 8 0.0% 0 0.7% 1 2.0% 1 9.0% 3 5.5% 2 0.0% 0 0.0% 0 0.0% 0To shop at the market(s) 0.2% 1 1.0% 0 0.0% 0 0.0% 0 0.0% 0 0.0% 0 4.1% 1 0.0% 0 0.0% 0To meet family 2.7% 11 0.0% 0 0.9% 1 2.7% 2 2.1% 1 0.0% 0 12.4% 2 5.2% 1 6.9% 2To meet friends 2.4% 9 0.8% 0 3.4% 5 0.0% 0 2.7% 1 1.8% 1 3.2% 0 14.7% 2 0.0% 0To visit the theatre 0.2% 1 0.0% 0 0.0% 0 1.2% 1 0.0% 0 0.0% 0 0.0% 0 0.0% 0 0.0% 0For work (i.e. place of work) 7.4% 29 0.0% 0 13.0% 18 2.4% 2 2.7% 1 0.0% 0 8.5% 1 0.0% 0 30.5% 7For business (e.g. attend a
business appointment) 0.8% 3 0.8% 0 0.0% 0 1.2% 1 2.7% 1 0.0% 0 0.0% 0 0.0% 0 5.3% 1
For education as a student (e.g. student at college, university, or other third level education)
1.6% 6 0.8% 0 3.4% 5 0.0% 0 0.0% 0 0.0% 0 8.7% 1 0.0% 0 0.0% 0
To access public transport for onward travel (e.g. train station, bus station)
0.0% 0 0.0% 0 0.0% 0 0.0% 0 0.0% 0 0.0% 0 0.0% 0 0.0% 0 0.0% 0
Other 0.0% 0 0.0% 0 0.0% 0 0.0% 0 0.0% 0 0.0% 0 0.0% 0 0.0% 0 0.0% 0As part of a day out / for a
day out / something different
1.1% 4 0.8% 0 0.0% 0 0.0% 0 2.1% 1 1.8% 1 3.2% 0 10.5% 1 5.3% 1
Browsing / window shopping 2.5% 10 0.0% 0 0.9% 1 0.9% 1 2.8% 1 0.0% 0 0.0% 0 0.0% 0 0.0% 0(Don't know / varies) 3.7% 15 2.2% 1 2.6% 4 1.8% 1 17.7% 6 2.0% 1 0.0% 0 7.1% 1 0.0% 0(Nothing / nothing further) 1.5% 6 0.8% 0 0.0% 0 2.6% 2 5.4% 2 3.8% 1 0.0% 0 7.1% 1 0.0% 0Weighted base: 390 29 142 67 33 33 15 12 22Sample: 423 85 92 73 33 47 20 17 13

by Zone (Weighted, Part 2) South Wales Retail Study Page 107 Weighted: for Carter Jonas August 2016
Total Zone 9 Zone 10 Zone 11 Zone 12 Zone 13 Zone 14 Zone 15 Zone 16
Column %ges. 020716 NEMS market research
Q68B In order of importance, what are your two main reasons for visiting Cardigan Town Centre? Secondary reason: Those who gave a reason at Q68A Food shopping 12.4% 46 11.7% 3 17.8% 25 10.8% 7 3.7% 1 6.9% 2 20.2% 3 6.1% 1 12.2% 3Non-food shopping 20.3% 75 15.4% 4 31.9% 44 19.6% 12 5.4% 1 9.8% 3 10.5% 2 12.2% 1 15.3% 3To visit bars / pubs 0.0% 0 0.0% 0 0.0% 0 0.0% 0 0.0% 0 0.0% 0 0.0% 0 0.0% 0 0.0% 0To visit cafés / restaurants 7.6% 28 5.0% 1 4.3% 6 9.3% 6 2.7% 1 15.5% 5 0.0% 0 12.2% 1 15.3% 3To visit personal service
providers (e.g. hairdressers, beauty salon etc.)
0.5% 2 4.7% 1 0.0% 0 0.9% 1 0.0% 0 0.0% 0 0.0% 0 0.0% 0 0.0% 0
To visit financial services such as banks and other financial institutions
5.5% 20 4.3% 1 11.3% 16 4.5% 3 0.0% 0 1.4% 0 0.0% 0 0.0% 0 0.0% 0
To visit other service providers (e.g. travel agent, estate agent etc.)
0.9% 3 0.0% 0 2.0% 3 0.9% 1 0.0% 0 0.0% 0 0.0% 0 0.0% 0 0.0% 0
To visit public services (e.g. medical or dentist appointment, library, job centre, community centre, etc)
4.2% 16 3.7% 1 6.9% 10 6.4% 4 3.5% 1 0.0% 0 0.0% 0 0.0% 0 0.0% 0
To get petrol 0.0% 0 0.0% 0 0.0% 0 0.0% 0 0.0% 0 0.0% 0 0.0% 0 0.0% 0 0.0% 0To visit the cinema 1.3% 5 5.8% 2 0.7% 1 0.0% 0 2.7% 1 0.0% 0 0.0% 0 7.9% 1 0.0% 0To visit a park 0.0% 0 0.0% 0 0.0% 0 0.0% 0 0.0% 0 0.0% 0 0.0% 0 0.0% 0 0.0% 0To visit the swimming pool 0.5% 2 1.1% 0 0.0% 0 1.3% 1 0.0% 0 1.9% 1 0.0% 0 0.0% 0 0.0% 0To visit other gyms / health
and fitness facilities 0.0% 0 0.0% 0 0.0% 0 0.0% 0 0.0% 0 0.0% 0 0.0% 0 0.0% 0 0.0% 0
To visit the library 0.5% 2 0.0% 0 0.0% 0 2.7% 2 0.0% 0 0.0% 0 0.0% 0 0.0% 0 0.0% 0To visit museums / art
gallery 0.6% 2 0.0% 0 0.0% 0 1.2% 1 0.0% 0 0.0% 0 3.2% 0 0.0% 0 0.0% 0
To visit the theatre or musical venues
0.8% 3 0.8% 0 0.0% 0 2.1% 1 5.4% 1 0.0% 0 0.0% 0 0.0% 0 0.0% 0
To visit night time venues e.g. nightclub
0.0% 0 0.0% 0 0.0% 0 0.0% 0 0.0% 0 0.0% 0 0.0% 0 0.0% 0 0.0% 0
For other leisure activities 1.3% 5 1.8% 1 0.7% 1 1.2% 1 0.0% 0 1.4% 0 4.1% 1 6.1% 1 0.0% 0To shop at the market(s) 0.5% 2 1.6% 0 0.0% 0 1.2% 1 0.0% 0 0.0% 0 0.0% 0 0.0% 0 0.0% 0To meet family 1.6% 6 3.3% 1 1.7% 2 0.0% 0 3.5% 1 0.0% 0 0.0% 0 0.0% 0 8.0% 2To meet friends 0.8% 3 0.8% 0 0.0% 0 1.2% 1 3.5% 1 1.4% 0 4.3% 1 0.0% 0 0.0% 0To visit the theatre 0.0% 0 0.0% 0 0.0% 0 0.0% 0 0.0% 0 0.0% 0 0.0% 0 0.0% 0 0.0% 0For work (i.e. place of work) 1.1% 4 3.9% 1 2.0% 3 0.0% 0 0.0% 0 0.0% 0 0.0% 0 0.0% 0 0.0% 0For business (e.g. attend a
business appointment) 0.0% 0 0.0% 0 0.0% 0 0.0% 0 0.0% 0 0.0% 0 0.0% 0 0.0% 0 0.0% 0
For education as a student (e.g. student at college, university, or other third level education)
0.3% 1 3.9% 1 0.0% 0 0.0% 0 0.0% 0 0.0% 0 0.0% 0 0.0% 0 0.0% 0
To access public transport for onward travel (e.g. train station, bus station)
0.0% 0 0.0% 0 0.0% 0 0.0% 0 0.0% 0 0.0% 0 0.0% 0 0.0% 0 0.0% 0
Other 0.0% 0 0.0% 0 0.0% 0 0.0% 0 0.0% 0 0.0% 0 0.0% 0 0.0% 0 0.0% 0As part of a day out / for a
day out / something different
1.1% 4 0.8% 0 0.0% 0 0.0% 0 0.0% 0 0.0% 0 0.0% 0 9.2% 1 5.3% 1
Browsing / window shopping 2.4% 9 0.8% 0 1.6% 2 5.8% 4 0.0% 0 1.8% 1 0.0% 0 6.1% 1 7.2% 2(Don't know / varies) 0.7% 3 0.0% 0 0.0% 0 0.9% 1 0.0% 0 0.0% 0 0.0% 0 6.1% 1 6.9% 2(Nothing / nothing further) 35.2% 130 30.4% 9 19.0% 26 29.9% 19 69.8% 18 59.9% 19 57.6% 9 34.1% 4 30.0% 7Weighted base: 369 28 138 64 25 32 15 10 22Sample: 403 82 89 70 27 45 20 15 13

by Zone (Weighted, Part 2) South Wales Retail Study Page 108 Weighted: for Carter Jonas August 2016
Total Zone 9 Zone 10 Zone 11 Zone 12 Zone 13 Zone 14 Zone 15 Zone 16
Column %ges. 020716 NEMS market research
Q68X In order of importance, what are your two main reasons for visiting Cardigan Town Centre? Any mention: [MR] Zones 8-16 and those who visit Cardigan town centre at Q67 Food shopping 48.1% 187 56.7% 17 69.9% 99 48.0% 32 19.7% 6 53.8% 18 20.2% 3 26.1% 3 12.2% 3Non-food shopping 40.7% 159 52.0% 15 41.4% 59 47.1% 31 20.3% 7 29.8% 10 52.7% 8 27.7% 3 37.3% 8To visit bars / pubs 0.5% 2 0.0% 0 0.0% 0 1.2% 1 0.0% 0 0.0% 0 0.0% 0 0.0% 0 5.3% 1To visit cafés / restaurants 9.8% 38 7.9% 2 5.8% 8 8.9% 6 4.1% 1 16.3% 5 17.8% 3 15.7% 2 22.1% 5To visit personal service
providers (e.g. hairdressers, beauty salon etc.)
1.0% 4 6.1% 2 0.7% 1 0.9% 1 0.0% 0 1.7% 1 0.0% 0 0.0% 0 0.0% 0
To visit financial services such as banks and other financial institutions
9.4% 37 8.0% 2 17.6% 25 7.8% 5 2.8% 1 9.3% 3 0.0% 0 0.0% 0 0.0% 0
To visit other service providers (e.g. travel agent, estate agent etc.)
0.9% 3 0.0% 0 2.0% 3 0.9% 1 0.0% 0 0.0% 0 0.0% 0 0.0% 0 0.0% 0
To visit public services (e.g. medical or dentist appointment, library, job centre, community centre, etc)
6.8% 26 4.4% 1 9.5% 13 10.7% 7 2.7% 1 2.7% 1 0.0% 0 0.0% 0 12.5% 3
To get petrol 0.0% 0 0.0% 0 0.0% 0 0.0% 0 0.0% 0 0.0% 0 0.0% 0 0.0% 0 0.0% 0To visit the cinema 4.2% 16 5.6% 2 0.7% 1 9.0% 6 4.1% 1 1.8% 1 0.0% 0 6.8% 1 0.0% 0To visit a park 0.0% 0 0.0% 0 0.0% 0 0.0% 0 0.0% 0 0.0% 0 0.0% 0 0.0% 0 0.0% 0To visit the swimming pool 0.4% 2 1.0% 0 0.0% 0 1.2% 1 0.0% 0 1.8% 1 0.0% 0 0.0% 0 0.0% 0To visit other gyms / health
and fitness facilities 1.1% 4 0.0% 0 0.0% 0 0.0% 0 10.3% 3 0.0% 0 0.0% 0 6.8% 1 0.0% 0
To visit the library 0.7% 3 0.0% 0 0.7% 1 2.6% 2 0.0% 0 0.0% 0 0.0% 0 0.0% 0 0.0% 0To visit museums / art
gallery 1.4% 5 1.5% 0 0.0% 0 2.0% 1 0.0% 0 1.3% 0 3.2% 0 5.2% 1 5.3% 1
To visit the theatre or musical venues
1.0% 4 0.8% 0 0.0% 0 2.0% 1 6.8% 2 0.0% 0 0.0% 0 0.0% 0 0.0% 0
To visit night time venues e.g. nightclub
0.0% 0 0.0% 0 0.0% 0 0.0% 0 0.0% 0 0.0% 0 0.0% 0 0.0% 0 0.0% 0
For other leisure activities 3.2% 13 1.8% 1 1.4% 2 3.2% 2 9.0% 3 6.9% 2 4.1% 1 5.2% 1 0.0% 0To shop at the market(s) 0.7% 3 2.5% 1 0.0% 0 1.2% 1 0.0% 0 0.0% 0 4.1% 1 0.0% 0 0.0% 0To meet family 4.2% 16 3.2% 1 2.5% 4 2.7% 2 4.7% 2 0.0% 0 12.4% 2 5.2% 1 14.8% 3To meet friends 3.2% 12 1.5% 0 3.4% 5 1.2% 1 5.4% 2 3.1% 1 7.5% 1 14.7% 2 0.0% 0To visit the theatre 0.2% 1 0.0% 0 0.0% 0 1.2% 1 0.0% 0 0.0% 0 0.0% 0 0.0% 0 0.0% 0For work (i.e. place of work) 8.4% 33 3.8% 1 14.9% 21 2.4% 2 2.7% 1 0.0% 0 8.5% 1 0.0% 0 30.5% 7For business (e.g. attend a
business appointment) 0.8% 3 0.8% 0 0.0% 0 1.2% 1 2.7% 1 0.0% 0 0.0% 0 0.0% 0 5.3% 1
For education as a student (e.g. student at college, university, or other third level education)
1.9% 7 4.6% 1 3.4% 5 0.0% 0 0.0% 0 0.0% 0 8.7% 1 0.0% 0 0.0% 0
To access public transport for onward travel (e.g. train station, bus station)
0.0% 0 0.0% 0 0.0% 0 0.0% 0 0.0% 0 0.0% 0 0.0% 0 0.0% 0 0.0% 0
Other 0.0% 0 0.0% 0 0.0% 0 0.0% 0 0.0% 0 0.0% 0 0.0% 0 0.0% 0 0.0% 0As part of a day out / for a
day out / something different
2.2% 8 1.5% 0 0.0% 0 0.0% 0 2.1% 1 1.8% 1 3.2% 0 18.3% 2 10.6% 2
Browsing / window shopping 4.8% 19 0.8% 0 2.5% 3 6.5% 4 2.8% 1 1.7% 1 0.0% 0 5.2% 1 7.2% 2Weighted base: 390 29 142 67 33 33 15 12 22Sample: 423 85 92 73 33 47 20 17 13

by Zone (Weighted, Part 2) South Wales Retail Study Page 109 Weighted: for Carter Jonas August 2016
Total Zone 9 Zone 10 Zone 11 Zone 12 Zone 13 Zone 14 Zone 15 Zone 16
Column %ges. 020716 NEMS market research
Q69 What do you like about Cardigan Town Centre? [MR] Zones 8-16 and those who visit Cardigan town centre at Q67 Attractive environment / nice
place 21.3% 83 28.3% 8 13.0% 18 22.7% 15 28.0% 9 26.0% 9 30.4% 5 27.3% 3 19.4% 4
Close to friends or relatives 0.3% 1 2.2% 1 0.0% 0 0.0% 0 0.0% 0 0.0% 0 0.0% 0 0.0% 0 0.0% 0Close to home 17.9% 70 11.4% 3 38.3% 54 10.7% 7 0.0% 0 11.0% 4 0.0% 0 0.0% 0 5.3% 1Close to work 0.0% 0 0.0% 0 0.0% 0 0.0% 0 0.0% 0 0.0% 0 0.0% 0 0.0% 0 0.0% 0Compact 5.5% 22 2.2% 1 5.4% 8 9.3% 6 0.0% 0 4.4% 1 4.1% 1 6.8% 1 5.3% 1Easy to get to by bike 0.0% 0 0.0% 0 0.0% 0 0.0% 0 0.0% 0 0.0% 0 0.0% 0 0.0% 0 0.0% 0Easy to get to by bus 0.2% 1 0.8% 0 0.0% 0 0.0% 0 2.1% 1 0.0% 0 0.0% 0 0.0% 0 0.0% 0Easy to get to by car 1.4% 5 2.2% 1 0.7% 1 4.4% 3 2.7% 1 0.0% 0 0.0% 0 0.0% 0 0.0% 0Easy to park 3.8% 15 5.5% 2 2.6% 4 3.5% 2 2.1% 1 0.0% 0 15.9% 2 0.0% 0 15.3% 3Good facilities 3.3% 13 6.1% 2 3.4% 5 4.7% 3 0.0% 0 9.3% 3 0.0% 0 0.0% 0 0.0% 0Good food stores 2.2% 9 10.4% 3 0.9% 1 2.1% 1 0.0% 0 2.7% 1 0.0% 0 5.2% 1 0.0% 0Good pubs, cafés or
restaurants 1.9% 7 2.3% 1 0.9% 1 2.1% 1 2.1% 1 2.7% 1 3.2% 0 0.0% 0 5.3% 1
Good range of non-food shops
16.1% 63 22.2% 6 11.8% 17 17.5% 12 13.4% 4 15.8% 5 19.0% 3 6.8% 1 15.3% 3
The harbour / beach 1.3% 5 0.8% 0 0.7% 1 0.0% 0 8.0% 3 0.0% 0 4.1% 1 5.2% 1 0.0% 0Makes a change from other
places 2.6% 10 1.5% 0 0.0% 0 6.7% 4 0.0% 0 1.3% 0 0.0% 0 0.0% 0 0.0% 0
Quiet 2.1% 8 1.8% 1 2.6% 4 0.0% 0 2.7% 1 1.7% 1 0.0% 0 13.9% 2 0.0% 0Safe and secure 0.0% 0 0.0% 0 0.0% 0 0.0% 0 0.0% 0 0.0% 0 0.0% 0 0.0% 0 0.0% 0The market 0.9% 4 3.8% 1 0.9% 1 0.0% 0 0.0% 0 3.7% 1 0.0% 0 0.0% 0 0.0% 0Traditional 5.1% 20 8.9% 3 3.9% 6 3.2% 2 8.9% 3 4.9% 2 7.3% 1 5.2% 1 15.3% 3Traffic free shopping centre 0.0% 0 0.0% 0 0.0% 0 0.0% 0 0.0% 0 0.0% 0 0.0% 0 0.0% 0 0.0% 0Other 0.0% 0 0.0% 0 0.0% 0 0.0% 0 0.0% 0 0.0% 0 0.0% 0 0.0% 0 0.0% 0Cheap / free parking 0.0% 0 0.0% 0 0.0% 0 0.0% 0 0.0% 0 0.0% 0 0.0% 0 0.0% 0 0.0% 0Familiarity / habit 1.1% 4 3.2% 1 0.9% 1 0.0% 0 2.1% 1 0.0% 0 4.3% 1 5.2% 1 0.0% 0Friendly people / nice
atmosphere 3.5% 14 1.0% 0 7.0% 10 0.0% 0 2.1% 1 1.3% 0 0.0% 0 0.0% 0 5.3% 1
Good opening hours 0.0% 0 0.0% 0 0.0% 0 0.0% 0 0.0% 0 0.0% 0 0.0% 0 0.0% 0 0.0% 0Good prices 0.2% 1 2.2% 1 0.0% 0 0.0% 0 0.0% 0 0.0% 0 0.0% 0 0.0% 0 0.0% 0Good range of independent
shops 2.5% 10 1.8% 1 1.6% 2 4.4% 3 0.0% 0 3.0% 1 13.5% 2 0.0% 0 0.0% 0
Good range of services 0.0% 0 0.0% 0 0.0% 0 0.0% 0 0.0% 0 0.0% 0 0.0% 0 0.0% 0 0.0% 0(Nothing / very little) 23.7% 92 18.2% 5 18.9% 27 24.0% 16 30.9% 10 32.1% 11 11.8% 2 32.9% 4 54.8% 12(Don't know) 8.8% 34 8.3% 2 7.6% 11 9.1% 6 17.7% 6 12.0% 4 17.7% 3 5.2% 1 0.0% 0Weighted base: 390 29 142 67 33 33 15 12 22Sample: 423 85 92 73 33 47 20 17 13
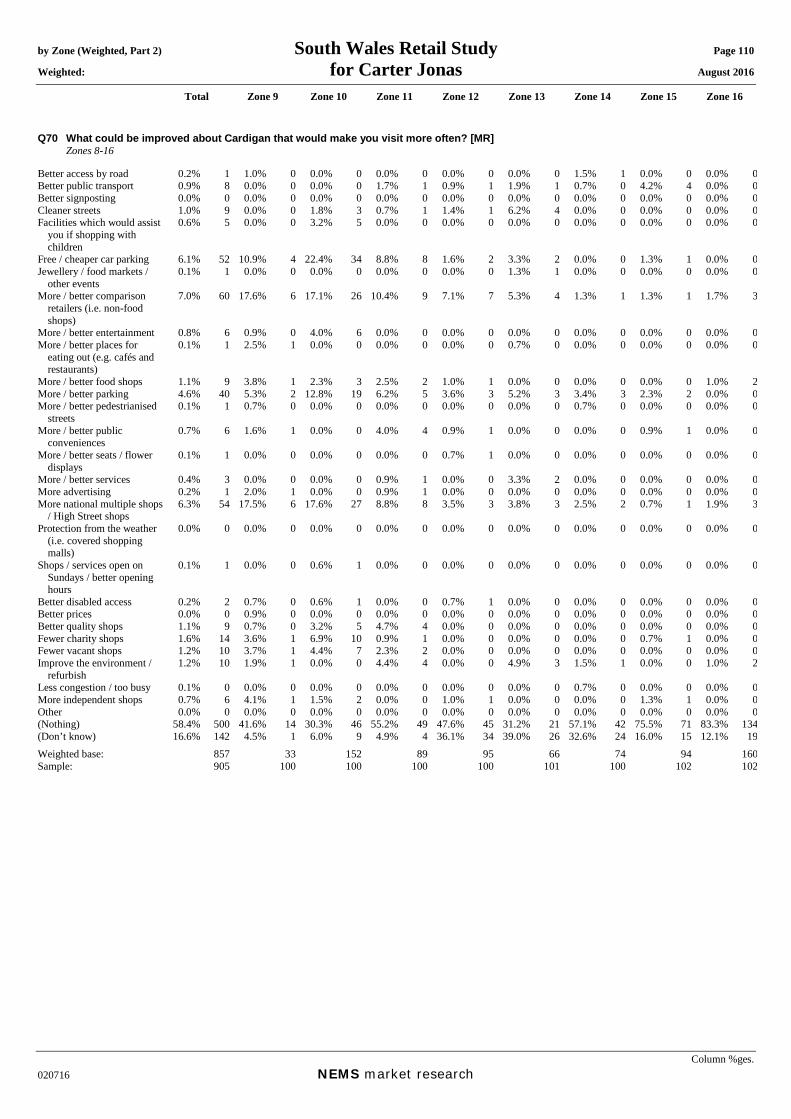
by Zone (Weighted, Part 2) South Wales Retail Study Page 110 Weighted: for Carter Jonas August 2016
Total Zone 9 Zone 10 Zone 11 Zone 12 Zone 13 Zone 14 Zone 15 Zone 16
Column %ges. 020716 NEMS market research
Q70 What could be improved about Cardigan that would make you visit more often? [MR] Zones 8-16 Better access by road 0.2% 1 1.0% 0 0.0% 0 0.0% 0 0.0% 0 0.0% 0 1.5% 1 0.0% 0 0.0% 0Better public transport 0.9% 8 0.0% 0 0.0% 0 1.7% 1 0.9% 1 1.9% 1 0.7% 0 4.2% 4 0.0% 0Better signposting 0.0% 0 0.0% 0 0.0% 0 0.0% 0 0.0% 0 0.0% 0 0.0% 0 0.0% 0 0.0% 0Cleaner streets 1.0% 9 0.0% 0 1.8% 3 0.7% 1 1.4% 1 6.2% 4 0.0% 0 0.0% 0 0.0% 0Facilities which would assist
you if shopping with children
0.6% 5 0.0% 0 3.2% 5 0.0% 0 0.0% 0 0.0% 0 0.0% 0 0.0% 0 0.0% 0
Free / cheaper car parking 6.1% 52 10.9% 4 22.4% 34 8.8% 8 1.6% 2 3.3% 2 0.0% 0 1.3% 1 0.0% 0Jewellery / food markets /
other events 0.1% 1 0.0% 0 0.0% 0 0.0% 0 0.0% 0 1.3% 1 0.0% 0 0.0% 0 0.0% 0
More / better comparison retailers (i.e. non-food shops)
7.0% 60 17.6% 6 17.1% 26 10.4% 9 7.1% 7 5.3% 4 1.3% 1 1.3% 1 1.7% 3
More / better entertainment 0.8% 6 0.9% 0 4.0% 6 0.0% 0 0.0% 0 0.0% 0 0.0% 0 0.0% 0 0.0% 0More / better places for
eating out (e.g. cafés and restaurants)
0.1% 1 2.5% 1 0.0% 0 0.0% 0 0.0% 0 0.7% 0 0.0% 0 0.0% 0 0.0% 0
More / better food shops 1.1% 9 3.8% 1 2.3% 3 2.5% 2 1.0% 1 0.0% 0 0.0% 0 0.0% 0 1.0% 2More / better parking 4.6% 40 5.3% 2 12.8% 19 6.2% 5 3.6% 3 5.2% 3 3.4% 3 2.3% 2 0.0% 0More / better pedestrianised
streets 0.1% 1 0.7% 0 0.0% 0 0.0% 0 0.0% 0 0.0% 0 0.7% 0 0.0% 0 0.0% 0
More / better public conveniences
0.7% 6 1.6% 1 0.0% 0 4.0% 4 0.9% 1 0.0% 0 0.0% 0 0.9% 1 0.0% 0
More / better seats / flower displays
0.1% 1 0.0% 0 0.0% 0 0.0% 0 0.7% 1 0.0% 0 0.0% 0 0.0% 0 0.0% 0
More / better services 0.4% 3 0.0% 0 0.0% 0 0.9% 1 0.0% 0 3.3% 2 0.0% 0 0.0% 0 0.0% 0More advertising 0.2% 1 2.0% 1 0.0% 0 0.9% 1 0.0% 0 0.0% 0 0.0% 0 0.0% 0 0.0% 0More national multiple shops
/ High Street shops 6.3% 54 17.5% 6 17.6% 27 8.8% 8 3.5% 3 3.8% 3 2.5% 2 0.7% 1 1.9% 3
Protection from the weather (i.e. covered shopping malls)
0.0% 0 0.0% 0 0.0% 0 0.0% 0 0.0% 0 0.0% 0 0.0% 0 0.0% 0 0.0% 0
Shops / services open on Sundays / better opening hours
0.1% 1 0.0% 0 0.6% 1 0.0% 0 0.0% 0 0.0% 0 0.0% 0 0.0% 0 0.0% 0
Better disabled access 0.2% 2 0.7% 0 0.6% 1 0.0% 0 0.7% 1 0.0% 0 0.0% 0 0.0% 0 0.0% 0Better prices 0.0% 0 0.9% 0 0.0% 0 0.0% 0 0.0% 0 0.0% 0 0.0% 0 0.0% 0 0.0% 0Better quality shops 1.1% 9 0.7% 0 3.2% 5 4.7% 4 0.0% 0 0.0% 0 0.0% 0 0.0% 0 0.0% 0Fewer charity shops 1.6% 14 3.6% 1 6.9% 10 0.9% 1 0.0% 0 0.0% 0 0.0% 0 0.7% 1 0.0% 0Fewer vacant shops 1.2% 10 3.7% 1 4.4% 7 2.3% 2 0.0% 0 0.0% 0 0.0% 0 0.0% 0 0.0% 0Improve the environment /
refurbish 1.2% 10 1.9% 1 0.0% 0 4.4% 4 0.0% 0 4.9% 3 1.5% 1 0.0% 0 1.0% 2
Less congestion / too busy 0.1% 0 0.0% 0 0.0% 0 0.0% 0 0.0% 0 0.0% 0 0.7% 0 0.0% 0 0.0% 0More independent shops 0.7% 6 4.1% 1 1.5% 2 0.0% 0 1.0% 1 0.0% 0 0.0% 0 1.3% 1 0.0% 0Other 0.0% 0 0.0% 0 0.0% 0 0.0% 0 0.0% 0 0.0% 0 0.0% 0 0.0% 0 0.0% 0(Nothing) 58.4% 500 41.6% 14 30.3% 46 55.2% 49 47.6% 45 31.2% 21 57.1% 42 75.5% 71 83.3% 134(Don’t know) 16.6% 142 4.5% 1 6.0% 9 4.9% 4 36.1% 34 39.0% 26 32.6% 24 16.0% 15 12.1% 19Weighted base: 857 33 152 89 95 66 74 94 160Sample: 905 100 100 100 100 101 100 102 102

by Zone (Weighted, Part 2) South Wales Retail Study Page 111 Weighted: for Carter Jonas August 2016
Total Zone 9 Zone 10 Zone 11 Zone 12 Zone 13 Zone 14 Zone 15 Zone 16
Column %ges. 020716 NEMS market research
Mean score [Times a year, those who visit]: Daily = 365, 4-6 days a week = 234, 2-3 days a week = 130, One day a week = 52, Every two weeks = 24, Monthly = 12, Once every two months = 6, Three-four times a year = 3.5, Once a year = 1, Less often = 0.25
Q71 How often do you or your household visit Lampeter for shopping and other town centre services? Zones 11-16 Daily 2.6% 15 0.0% 0 0.0% 0 0.0% 0 14.8% 14 0.0% 0 0.9% 1 0.0% 0 0.0% 04-6 days a week 1.3% 8 0.0% 0 0.0% 0 0.0% 0 7.2% 7 0.0% 0 0.9% 1 0.0% 0 0.0% 02-3 days a week 4.9% 29 0.0% 0 0.0% 0 0.9% 1 25.5% 24 0.0% 0 4.8% 4 0.0% 0 0.0% 0One day a week 8.8% 51 0.0% 0 0.0% 0 3.1% 3 30.9% 30 4.9% 3 12.8% 9 0.0% 0 3.7% 6Every two weeks 4.6% 26 0.0% 0 0.0% 0 12.4% 11 9.4% 9 4.7% 3 4.5% 3 0.0% 0 0.0% 0Monthly 3.5% 20 0.0% 0 0.0% 0 6.0% 5 0.7% 1 6.2% 4 5.7% 4 2.5% 2 2.1% 3Once every two months 4.3% 25 0.0% 0 0.0% 0 4.8% 4 2.8% 3 8.9% 6 8.7% 6 3.5% 3 1.5% 2Three-four times a year 6.4% 37 0.0% 0 0.0% 0 11.3% 10 0.0% 0 10.6% 7 4.8% 4 7.3% 7 5.9% 9Once a year 2.7% 16 0.0% 0 0.0% 0 1.7% 2 1.4% 1 2.2% 1 3.5% 3 6.5% 6 1.7% 3Less often 1.6% 9 0.0% 0 0.0% 0 1.3% 1 0.0% 0 2.2% 1 0.0% 0 3.4% 3 2.0% 3Never 58.0% 335 0.0% 0 0.0% 0 58.4% 52 2.8% 3 59.4% 39 51.7% 38 76.2% 72 82.2% 132(Don’t know) 0.0% 0 0.0% 0 0.0% 0 0.0% 0 0.0% 0 0.0% 0 0.0% 0 0.0% 0 0.0% 0(Varies) 1.4% 8 0.0% 0 0.0% 0 0.0% 0 4.4% 4 0.9% 1 1.9% 1 0.7% 1 1.0% 2Mean: 62.49 0.00 0.00 17.21 132.17 13.47 44.13 3.62 14.67Weighted base: 579 0 0 89 95 66 74 94 160Sample: 605 0 0 100 100 101 100 102 102

by Zone (Weighted, Part 2) South Wales Retail Study Page 112 Weighted: for Carter Jonas August 2016
Total Zone 9 Zone 10 Zone 11 Zone 12 Zone 13 Zone 14 Zone 15 Zone 16
Column %ges. 020716 NEMS market research
Q72A In order of importance, what are your two main reasons for visiting Lampeter Town Centre? Main reason: Zones 11-16 and those who visit Lampeter town centre at Q71 Food shopping 40.5% 99 0.0% 0 0.0% 0 25.2% 9 63.3% 59 40.4% 11 24.7% 9 31.0% 7 13.6% 4Non-food shopping 19.6% 48 0.0% 0 0.0% 0 15.6% 6 14.8% 14 32.9% 9 28.9% 10 15.0% 3 19.5% 6To visit bars / pubs 1.3% 3 0.0% 0 0.0% 0 0.0% 0 0.0% 0 0.0% 0 0.0% 0 14.1% 3 0.0% 0To visit cafés / restaurants 4.3% 11 0.0% 0 0.0% 0 10.1% 4 0.9% 1 1.6% 0 3.2% 1 12.3% 3 5.6% 2To visit personal service
providers (e.g. hairdressers, beauty salon etc.)
0.7% 2 0.0% 0 0.0% 0 1.6% 1 0.0% 0 3.9% 1 0.0% 0 0.0% 0 0.0% 0
To visit financial services such as banks and other financial institutions
2.5% 6 0.0% 0 0.0% 0 1.6% 1 1.7% 2 5.4% 1 6.7% 2 0.0% 0 0.0% 0
To visit other service providers (e.g. travel agent, estate agent etc.)
1.2% 3 0.0% 0 0.0% 0 2.1% 1 1.1% 1 3.8% 1 0.0% 0 0.0% 0 0.0% 0
To visit public services (e.g. medical or dentist appointment, library, job centre, community centre, etc)
5.5% 13 0.0% 0 0.0% 0 21.2% 8 3.0% 3 8.7% 2 1.4% 0 0.0% 0 0.0% 0
To get petrol 0.0% 0 0.0% 0 0.0% 0 0.0% 0 0.0% 0 0.0% 0 0.0% 0 0.0% 0 0.0% 0To visit the cinema 0.0% 0 0.0% 0 0.0% 0 0.0% 0 0.0% 0 0.0% 0 0.0% 0 0.0% 0 0.0% 0To visit a park 0.2% 0 0.0% 0 0.0% 0 0.0% 0 0.0% 0 0.0% 0 1.4% 0 0.0% 0 0.0% 0To visit the swimming pool 0.0% 0 0.0% 0 0.0% 0 0.0% 0 0.0% 0 0.0% 0 0.0% 0 0.0% 0 0.0% 0To visit other gyms / health
and fitness facilities 0.0% 0 0.0% 0 0.0% 0 0.0% 0 0.0% 0 0.0% 0 0.0% 0 0.0% 0 0.0% 0
To visit the library 0.0% 0 0.0% 0 0.0% 0 0.0% 0 0.0% 0 0.0% 0 0.0% 0 0.0% 0 0.0% 0To visit museums / art
gallery 0.0% 0 0.0% 0 0.0% 0 0.0% 0 0.0% 0 0.0% 0 0.0% 0 0.0% 0 0.0% 0
To visit the theatre or musical venues
0.0% 0 0.0% 0 0.0% 0 0.0% 0 0.0% 0 0.0% 0 0.0% 0 0.0% 0 0.0% 0
To visit night time venues e.g. nightclub
0.0% 0 0.0% 0 0.0% 0 0.0% 0 0.0% 0 0.0% 0 0.0% 0 0.0% 0 0.0% 0
For other leisure activities 2.4% 6 0.0% 0 0.0% 0 3.7% 1 1.5% 1 1.6% 0 3.4% 1 7.1% 2 0.0% 0To shop at the market(s) 0.4% 1 0.0% 0 0.0% 0 0.0% 0 0.0% 0 0.0% 0 0.0% 0 3.9% 1 0.0% 0To meet family 3.9% 10 0.0% 0 0.0% 0 3.2% 1 1.7% 2 0.0% 0 4.5% 2 11.0% 2 9.5% 3To meet friends 4.1% 10 0.0% 0 0.0% 0 8.0% 3 0.7% 1 0.0% 0 12.6% 4 2.8% 1 4.1% 1To visit the theatre 0.0% 0 0.0% 0 0.0% 0 0.0% 0 0.0% 0 0.0% 0 0.0% 0 0.0% 0 0.0% 0For work (i.e. place of work) 7.2% 18 0.0% 0 0.0% 0 2.2% 1 6.1% 6 0.0% 0 5.4% 2 0.0% 0 32.4% 9For business (e.g. attend a
business appointment) 0.6% 1 0.0% 0 0.0% 0 0.0% 0 0.0% 0 0.0% 0 4.1% 1 0.0% 0 0.0% 0
For education as a student (e.g. student at college, university, or other third level education)
1.4% 3 0.0% 0 0.0% 0 0.0% 0 3.6% 3 0.0% 0 0.0% 0 0.0% 0 0.0% 0
To access public transport for onward travel (e.g. train station, bus station)
0.0% 0 0.0% 0 0.0% 0 0.0% 0 0.0% 0 0.0% 0 0.0% 0 0.0% 0 0.0% 0
Other 0.0% 0 0.0% 0 0.0% 0 0.0% 0 0.0% 0 0.0% 0 0.0% 0 0.0% 0 0.0% 0As part of a day out / for a
day out / something different
0.3% 1 0.0% 0 0.0% 0 0.0% 0 0.0% 0 0.0% 0 0.0% 0 2.8% 1 0.0% 0
Browsing / window shopping 1.4% 3 0.0% 0 0.0% 0 1.6% 1 0.0% 0 0.0% 0 0.0% 0 0.0% 0 9.7% 3(Don't know / varies) 1.5% 4 0.0% 0 0.0% 0 1.6% 1 1.7% 2 0.0% 0 0.0% 0 0.0% 0 5.6% 2(Nothing / nothing further) 1.1% 3 0.0% 0 0.0% 0 2.2% 1 0.0% 0 1.6% 0 3.9% 1 0.0% 0 0.0% 0Weighted base: 243 0 0 37 93 27 36 22 29Sample: 271 0 0 38 97 45 52 23 16

by Zone (Weighted, Part 2) South Wales Retail Study Page 113 Weighted: for Carter Jonas August 2016
Total Zone 9 Zone 10 Zone 11 Zone 12 Zone 13 Zone 14 Zone 15 Zone 16
Column %ges. 020716 NEMS market research
Q72B In order of importance, what are your two main reasons for visiting Lampeter Town Centre? Secondary reason: Those who gave a reason at Q72A Food shopping 10.3% 24 0.0% 0 0.0% 0 8.9% 3 9.4% 9 21.7% 6 20.4% 7 0.0% 0 0.0% 0Non-food shopping 26.4% 63 0.0% 0 0.0% 0 18.8% 7 45.8% 42 18.7% 5 9.5% 3 19.7% 4 5.7% 2To visit bars / pubs 0.0% 0 0.0% 0 0.0% 0 0.0% 0 0.0% 0 0.0% 0 0.0% 0 0.0% 0 0.0% 0To visit cafés / restaurants 5.0% 12 0.0% 0 0.0% 0 11.4% 4 2.2% 2 1.7% 0 6.1% 2 9.3% 2 4.4% 1To visit personal service
providers (e.g. hairdressers, beauty salon etc.)
2.0% 5 0.0% 0 0.0% 0 4.8% 2 3.4% 3 0.0% 0 0.0% 0 0.0% 0 0.0% 0
To visit financial services such as banks and other financial institutions
7.3% 17 0.0% 0 0.0% 0 10.1% 4 6.7% 6 10.6% 3 13.9% 5 0.0% 0 0.0% 0
To visit other service providers (e.g. travel agent, estate agent etc.)
0.7% 2 0.0% 0 0.0% 0 0.0% 0 1.7% 2 0.0% 0 0.0% 0 0.0% 0 0.0% 0
To visit public services (e.g. medical or dentist appointment, library, job centre, community centre, etc)
3.1% 7 0.0% 0 0.0% 0 1.7% 1 5.8% 5 3.3% 1 1.9% 1 0.0% 0 0.0% 0
To get petrol 0.0% 0 0.0% 0 0.0% 0 0.0% 0 0.0% 0 0.0% 0 0.0% 0 0.0% 0 0.0% 0To visit the cinema 0.0% 0 0.0% 0 0.0% 0 0.0% 0 0.0% 0 0.0% 0 0.0% 0 0.0% 0 0.0% 0To visit a park 0.0% 0 0.0% 0 0.0% 0 0.0% 0 0.0% 0 0.0% 0 0.0% 0 0.0% 0 0.0% 0To visit the swimming pool 0.0% 0 0.0% 0 0.0% 0 0.0% 0 0.0% 0 0.0% 0 0.0% 0 0.0% 0 0.0% 0To visit other gyms / health
and fitness facilities 0.0% 0 0.0% 0 0.0% 0 0.0% 0 0.0% 0 0.0% 0 0.0% 0 0.0% 0 0.0% 0
To visit the library 0.3% 1 0.0% 0 0.0% 0 0.0% 0 0.7% 1 0.0% 0 0.0% 0 0.0% 0 0.0% 0To visit museums / art
gallery 0.0% 0 0.0% 0 0.0% 0 0.0% 0 0.0% 0 0.0% 0 0.0% 0 0.0% 0 0.0% 0
To visit the theatre or musical venues
0.0% 0 0.0% 0 0.0% 0 0.0% 0 0.0% 0 0.0% 0 0.0% 0 0.0% 0 0.0% 0
To visit night time venues e.g. nightclub
0.0% 0 0.0% 0 0.0% 0 0.0% 0 0.0% 0 0.0% 0 0.0% 0 0.0% 0 0.0% 0
For other leisure activities 1.0% 2 0.0% 0 0.0% 0 0.0% 0 1.0% 1 1.7% 0 2.8% 1 0.0% 0 0.0% 0To shop at the market(s) 0.0% 0 0.0% 0 0.0% 0 0.0% 0 0.0% 0 0.0% 0 0.0% 0 0.0% 0 0.0% 0To meet family 1.0% 2 0.0% 0 0.0% 0 2.2% 1 0.0% 0 0.0% 0 0.0% 0 0.0% 0 5.7% 2To meet friends 4.5% 11 0.0% 0 0.0% 0 1.7% 1 1.7% 2 5.5% 1 1.8% 1 2.8% 1 21.8% 6To visit the theatre 0.0% 0 0.0% 0 0.0% 0 0.0% 0 0.0% 0 0.0% 0 0.0% 0 0.0% 0 0.0% 0For work (i.e. place of work) 1.2% 3 0.0% 0 0.0% 0 2.2% 1 1.8% 2 0.0% 0 1.4% 0 0.0% 0 0.0% 0For business (e.g. attend a
business appointment) 0.0% 0 0.0% 0 0.0% 0 0.0% 0 0.0% 0 0.0% 0 0.0% 0 0.0% 0 0.0% 0
For education as a student (e.g. student at college, university, or other third level education)
1.1% 3 0.0% 0 0.0% 0 2.2% 1 2.0% 2 0.0% 0 0.0% 0 0.0% 0 0.0% 0
To access public transport for onward travel (e.g. train station, bus station)
0.0% 0 0.0% 0 0.0% 0 0.0% 0 0.0% 0 0.0% 0 0.0% 0 0.0% 0 0.0% 0
Other 0.0% 0 0.0% 0 0.0% 0 0.0% 0 0.0% 0 0.0% 0 0.0% 0 0.0% 0 0.0% 0As part of a day out / for a
day out / something different
1.0% 2 0.0% 0 0.0% 0 0.0% 0 0.7% 1 0.0% 0 0.0% 0 7.1% 2 0.0% 0
Browsing / window shopping 1.8% 4 0.0% 0 0.0% 0 0.0% 0 0.0% 0 0.0% 0 0.0% 0 14.1% 3 4.4% 1(Don't know / varies) 0.4% 1 0.0% 0 0.0% 0 0.0% 0 1.0% 1 0.0% 0 0.0% 0 0.0% 0 0.0% 0(Nothing / nothing further) 32.9% 78 0.0% 0 0.0% 0 36.2% 13 16.1% 15 36.8% 10 42.2% 14 46.9% 11 58.2% 16Weighted base: 237 0 0 35 91 26 34 22 27Sample: 264 0 0 36 95 44 51 23 15

by Zone (Weighted, Part 2) South Wales Retail Study Page 114 Weighted: for Carter Jonas August 2016
Total Zone 9 Zone 10 Zone 11 Zone 12 Zone 13 Zone 14 Zone 15 Zone 16
Column %ges. 020716 NEMS market research
Q72X In order of importance, what are your two main reasons for visiting Lampeter Town Centre? Any mention: [MR] Zones 11-16 and those who visit Lampeter town centre at Q71 Food shopping 50.5% 123 0.0% 0 0.0% 0 33.7% 12 72.5% 67 61.7% 17 44.3% 16 31.0% 7 13.6% 4Non-food shopping 45.3% 110 0.0% 0 0.0% 0 33.8% 12 59.8% 55 51.3% 14 38.0% 14 34.7% 8 24.8% 7To visit bars / pubs 1.3% 3 0.0% 0 0.0% 0 0.0% 0 0.0% 0 0.0% 0 0.0% 0 14.1% 3 0.0% 0To visit cafés / restaurants 9.2% 22 0.0% 0 0.0% 0 21.0% 8 3.1% 3 3.3% 1 9.0% 3 21.7% 5 9.7% 3To visit personal service
providers (e.g. hairdressers, beauty salon etc.)
2.7% 6 0.0% 0 0.0% 0 6.2% 2 3.4% 3 3.9% 1 0.0% 0 0.0% 0 0.0% 0
To visit financial services such as banks and other financial institutions
9.6% 23 0.0% 0 0.0% 0 11.3% 4 8.3% 8 15.9% 4 20.1% 7 0.0% 0 0.0% 0
To visit other service providers (e.g. travel agent, estate agent etc.)
1.8% 4 0.0% 0 0.0% 0 2.1% 1 2.8% 3 3.8% 1 0.0% 0 0.0% 0 0.0% 0
To visit public services (e.g. medical or dentist appointment, library, job centre, community centre, etc)
8.5% 21 0.0% 0 0.0% 0 22.8% 8 8.6% 8 12.0% 3 3.2% 1 0.0% 0 0.0% 0
To get petrol 0.0% 0 0.0% 0 0.0% 0 0.0% 0 0.0% 0 0.0% 0 0.0% 0 0.0% 0 0.0% 0To visit the cinema 0.0% 0 0.0% 0 0.0% 0 0.0% 0 0.0% 0 0.0% 0 0.0% 0 0.0% 0 0.0% 0To visit a park 0.2% 0 0.0% 0 0.0% 0 0.0% 0 0.0% 0 0.0% 0 1.4% 0 0.0% 0 0.0% 0To visit the swimming pool 0.0% 0 0.0% 0 0.0% 0 0.0% 0 0.0% 0 0.0% 0 0.0% 0 0.0% 0 0.0% 0To visit other gyms / health
and fitness facilities 0.0% 0 0.0% 0 0.0% 0 0.0% 0 0.0% 0 0.0% 0 0.0% 0 0.0% 0 0.0% 0
To visit the library 0.3% 1 0.0% 0 0.0% 0 0.0% 0 0.7% 1 0.0% 0 0.0% 0 0.0% 0 0.0% 0To visit museums / art
gallery 0.0% 0 0.0% 0 0.0% 0 0.0% 0 0.0% 0 0.0% 0 0.0% 0 0.0% 0 0.0% 0
To visit the theatre or musical venues
0.0% 0 0.0% 0 0.0% 0 0.0% 0 0.0% 0 0.0% 0 0.0% 0 0.0% 0 0.0% 0
To visit night time venues e.g. nightclub
0.0% 0 0.0% 0 0.0% 0 0.0% 0 0.0% 0 0.0% 0 0.0% 0 0.0% 0 0.0% 0
For other leisure activities 3.4% 8 0.0% 0 0.0% 0 3.7% 1 2.4% 2 3.3% 1 6.1% 2 7.1% 2 0.0% 0To shop at the market(s) 0.4% 1 0.0% 0 0.0% 0 0.0% 0 0.0% 0 0.0% 0 0.0% 0 3.9% 1 0.0% 0To meet family 4.9% 12 0.0% 0 0.0% 0 5.3% 2 1.7% 2 0.0% 0 4.5% 2 11.0% 2 14.8% 4To meet friends 8.5% 21 0.0% 0 0.0% 0 9.6% 4 2.4% 2 5.4% 1 14.3% 5 5.7% 1 24.7% 7To visit the theatre 0.0% 0 0.0% 0 0.0% 0 0.0% 0 0.0% 0 0.0% 0 0.0% 0 0.0% 0 0.0% 0For work (i.e. place of work) 8.4% 21 0.0% 0 0.0% 0 4.3% 2 7.9% 7 0.0% 0 6.7% 2 0.0% 0 32.4% 9For business (e.g. attend a
business appointment) 0.6% 1 0.0% 0 0.0% 0 0.0% 0 0.0% 0 0.0% 0 4.1% 1 0.0% 0 0.0% 0
For education as a student (e.g. student at college, university, or other third level education)
2.4% 6 0.0% 0 0.0% 0 2.1% 1 5.6% 5 0.0% 0 0.0% 0 0.0% 0 0.0% 0
To access public transport for onward travel (e.g. train station, bus station)
0.0% 0 0.0% 0 0.0% 0 0.0% 0 0.0% 0 0.0% 0 0.0% 0 0.0% 0 0.0% 0
Other 0.0% 0 0.0% 0 0.0% 0 0.0% 0 0.0% 0 0.0% 0 0.0% 0 0.0% 0 0.0% 0As part of a day out / for a
day out / something different
1.2% 3 0.0% 0 0.0% 0 0.0% 0 0.7% 1 0.0% 0 0.0% 0 9.9% 2 0.0% 0
Browsing / window shopping 3.2% 8 0.0% 0 0.0% 0 1.6% 1 0.0% 0 0.0% 0 0.0% 0 14.1% 3 13.8% 4Weighted base: 243 0 0 37 93 27 36 22 29Sample: 271 0 0 38 97 45 52 23 16

by Zone (Weighted, Part 2) South Wales Retail Study Page 115 Weighted: for Carter Jonas August 2016
Total Zone 9 Zone 10 Zone 11 Zone 12 Zone 13 Zone 14 Zone 15 Zone 16
Column %ges. 020716 NEMS market research
Q73 What do you like about Lampeter Town Centre? [MR] Zones 11-16 and those who visit Lampeter town centre at Q71 Attractive environment / nice
place 20.4% 50 0.0% 0 0.0% 0 26.5% 10 19.1% 18 12.0% 3 26.7% 10 15.0% 3 21.6% 6
Close to friends or relatives 5.5% 13 0.0% 0 0.0% 0 0.0% 0 5.4% 5 0.0% 0 6.7% 2 0.0% 0 20.5% 6Close to home 19.6% 48 0.0% 0 0.0% 0 3.7% 1 44.8% 42 9.1% 2 6.8% 2 0.0% 0 0.0% 0Close to work 0.0% 0 0.0% 0 0.0% 0 0.0% 0 0.0% 0 0.0% 0 0.0% 0 0.0% 0 0.0% 0Compact 6.5% 16 0.0% 0 0.0% 0 6.7% 2 3.9% 4 3.3% 1 13.4% 5 18.4% 4 0.0% 0Easy to get to by bike 0.0% 0 0.0% 0 0.0% 0 0.0% 0 0.0% 0 0.0% 0 0.0% 0 0.0% 0 0.0% 0Easy to get to by bus 0.0% 0 0.0% 0 0.0% 0 0.0% 0 0.0% 0 0.0% 0 0.0% 0 0.0% 0 0.0% 0Easy to get to by car 0.4% 1 0.0% 0 0.0% 0 1.6% 1 0.0% 0 1.6% 0 0.0% 0 0.0% 0 0.0% 0Easy to park 2.4% 6 0.0% 0 0.0% 0 3.2% 1 0.0% 0 9.8% 3 3.2% 1 3.7% 1 0.0% 0Good facilities 0.3% 1 0.0% 0 0.0% 0 0.0% 0 0.0% 0 0.0% 0 1.8% 1 0.0% 0 0.0% 0Good food stores 3.0% 7 0.0% 0 0.0% 0 7.5% 3 0.7% 1 2.1% 1 2.7% 1 0.0% 0 8.2% 2Good pubs, cafés or
restaurants 2.1% 5 0.0% 0 0.0% 0 0.0% 0 1.9% 2 5.4% 1 1.8% 1 5.7% 1 0.0% 0
Good range of non-food shops
10.8% 26 0.0% 0 0.0% 0 22.8% 8 5.7% 5 12.1% 3 14.8% 5 5.7% 1 9.7% 3
Makes a change from other places
3.2% 8 0.0% 0 0.0% 0 16.0% 6 0.0% 0 0.0% 0 0.0% 0 8.5% 2 0.0% 0
Quiet 5.1% 13 0.0% 0 0.0% 0 6.8% 3 5.3% 5 6.0% 2 1.4% 0 13.2% 3 0.0% 0Safe and secure 0.4% 1 0.0% 0 0.0% 0 0.0% 0 0.9% 1 0.0% 0 0.0% 0 0.0% 0 0.0% 0The market 0.3% 1 0.0% 0 0.0% 0 2.1% 1 0.0% 0 0.0% 0 0.0% 0 0.0% 0 0.0% 0Traditional 5.7% 14 0.0% 0 0.0% 0 5.8% 2 4.3% 4 3.8% 1 9.7% 3 7.1% 2 5.6% 2Traffic free shopping centre 0.2% 0 0.0% 0 0.0% 0 0.0% 0 0.0% 0 1.6% 0 0.0% 0 0.0% 0 0.0% 0Other 0.0% 0 0.0% 0 0.0% 0 0.0% 0 0.0% 0 0.0% 0 0.0% 0 0.0% 0 0.0% 0Cheap / free parking 0.0% 0 0.0% 0 0.0% 0 0.0% 0 0.0% 0 0.0% 0 0.0% 0 0.0% 0 0.0% 0Familiarity / habit 2.3% 6 0.0% 0 0.0% 0 0.0% 0 3.9% 4 1.6% 0 0.0% 0 0.0% 0 5.4% 2Friendly people / nice
atmosphere 2.7% 7 0.0% 0 0.0% 0 0.0% 0 4.8% 4 1.6% 0 1.4% 0 0.0% 0 4.1% 1
Good leisure facilities / things to do
1.3% 3 0.0% 0 0.0% 0 0.0% 0 2.8% 3 1.6% 0 0.0% 0 0.0% 0 0.0% 0
Good opening hours 0.0% 0 0.0% 0 0.0% 0 0.0% 0 0.0% 0 0.0% 0 0.0% 0 0.0% 0 0.0% 0Good prices 0.0% 0 0.0% 0 0.0% 0 0.0% 0 0.0% 0 0.0% 0 0.0% 0 0.0% 0 0.0% 0Good range of independent
shops 3.1% 7 0.0% 0 0.0% 0 0.0% 0 3.9% 4 2.1% 1 9.2% 3 0.0% 0 0.0% 0
Good range of services 0.2% 0 0.0% 0 0.0% 0 0.0% 0 0.0% 0 0.0% 0 1.4% 0 0.0% 0 0.0% 0(Nothing / very little) 22.3% 54 0.0% 0 0.0% 0 23.4% 9 14.0% 13 35.6% 10 20.2% 7 39.3% 9 24.8% 7(Don't know) 2.3% 6 0.0% 0 0.0% 0 1.6% 1 3.1% 3 1.6% 0 2.7% 1 2.8% 1 0.0% 0Weighted base: 243 0 0 37 93 27 36 22 29Sample: 271 0 0 38 97 45 52 23 16

by Zone (Weighted, Part 2) South Wales Retail Study Page 116 Weighted: for Carter Jonas August 2016
Total Zone 9 Zone 10 Zone 11 Zone 12 Zone 13 Zone 14 Zone 15 Zone 16
Column %ges. 020716 NEMS market research
Q74 What could be improved about Lampeter that would make you visit more often? [MR] Zones 11-16 Better access by road 0.4% 2 0.0% 0 0.0% 0 0.0% 0 1.4% 1 0.0% 0 1.0% 1 0.0% 0 0.0% 0Better public transport 1.6% 9 0.0% 0 0.0% 0 0.0% 0 4.9% 5 0.0% 0 0.0% 0 3.4% 3 1.0% 2Better signposting 0.0% 0 0.0% 0 0.0% 0 0.0% 0 0.0% 0 0.0% 0 0.0% 0 0.0% 0 0.0% 0Cleaner streets 2.0% 11 0.0% 0 0.0% 0 0.0% 0 0.9% 1 5.8% 4 0.7% 0 3.4% 3 2.0% 3Facilities which would assist
you if shopping with children
0.0% 0 0.0% 0 0.0% 0 0.0% 0 0.0% 0 0.0% 0 0.0% 0 0.0% 0 0.0% 0
Free / cheaper car parking 1.8% 11 0.0% 0 0.0% 0 2.5% 2 7.4% 7 0.0% 0 1.8% 1 0.0% 0 0.0% 0Jewellery / food markets /
other events 0.1% 1 0.0% 0 0.0% 0 0.0% 0 0.0% 0 0.0% 0 0.9% 1 0.0% 0 0.0% 0
More / better comparison retailers (i.e. non-food shops)
8.5% 49 0.0% 0 0.0% 0 7.1% 6 19.5% 19 20.1% 13 7.4% 5 2.8% 3 1.7% 3
More / better entertainment 0.5% 3 0.0% 0 0.0% 0 0.0% 0 0.9% 1 3.3% 2 0.0% 0 0.0% 0 0.0% 0More / better places for
eating out (e.g. cafés and restaurants)
0.6% 3 0.0% 0 0.0% 0 0.0% 0 1.9% 2 2.2% 1 0.0% 0 0.0% 0 0.0% 0
More / better food shops 1.8% 11 0.0% 0 0.0% 0 2.4% 2 6.1% 6 1.7% 1 0.0% 0 0.0% 0 1.0% 2More / better parking 3.0% 17 0.0% 0 0.0% 0 2.5% 2 5.4% 5 6.2% 4 5.5% 4 0.7% 1 0.7% 1More / better pedestrianised
streets 1.2% 7 0.0% 0 0.0% 0 0.7% 1 4.4% 4 0.7% 0 0.0% 0 1.9% 2 0.0% 0
More / better public conveniences
0.1% 1 0.0% 0 0.0% 0 0.0% 0 0.0% 0 0.0% 0 0.9% 1 0.0% 0 0.0% 0
More / better seats / flower displays
0.1% 1 0.0% 0 0.0% 0 0.0% 0 0.0% 0 0.0% 0 0.9% 1 0.0% 0 0.0% 0
More / better services 0.0% 0 0.0% 0 0.0% 0 0.0% 0 0.0% 0 0.0% 0 0.0% 0 0.0% 0 0.0% 0More advertising 0.3% 2 0.0% 0 0.0% 0 0.9% 1 0.0% 0 0.0% 0 0.0% 0 0.0% 0 0.7% 1More national multiple shops
/ High Street shops 7.6% 44 0.0% 0 0.0% 0 6.9% 6 20.8% 20 4.0% 3 8.0% 6 2.6% 2 4.3% 7
Protection from the weather (i.e. covered shopping malls)
0.2% 1 0.0% 0 0.0% 0 0.0% 0 0.9% 1 0.0% 0 0.0% 0 0.0% 0 0.0% 0
Shops / services open on Sundays / better opening hours
0.0% 0 0.0% 0 0.0% 0 0.0% 0 0.0% 0 0.0% 0 0.0% 0 0.0% 0 0.0% 0
Better disabled access 0.3% 2 0.0% 0 0.0% 0 0.0% 0 0.0% 0 1.9% 1 0.9% 1 0.0% 0 0.0% 0Better prices 0.3% 1 0.0% 0 0.0% 0 0.7% 1 0.9% 1 0.0% 0 0.0% 0 0.0% 0 0.0% 0Better quality shops 0.7% 4 0.0% 0 0.0% 0 0.0% 0 1.6% 2 0.0% 0 0.0% 0 0.0% 0 1.7% 3Fewer charity shops 0.4% 2 0.0% 0 0.0% 0 0.0% 0 0.7% 1 0.0% 0 0.0% 0 0.0% 0 1.0% 2Fewer vacant shops 3.0% 18 0.0% 0 0.0% 0 2.4% 2 13.3% 13 2.4% 2 1.5% 1 0.0% 0 0.0% 0Improve the environment /
refurbish 1.2% 7 0.0% 0 0.0% 0 0.9% 1 0.7% 1 5.8% 4 2.2% 2 0.0% 0 0.0% 0
Less congestion / too busy 0.6% 3 0.0% 0 0.0% 0 2.8% 2 0.0% 0 0.7% 0 0.7% 0 0.0% 0 0.0% 0More independent shops 0.8% 5 0.0% 0 0.0% 0 0.0% 0 3.2% 3 0.0% 0 0.7% 0 0.0% 0 0.7% 1Other 0.0% 0 0.0% 0 0.0% 0 0.0% 0 0.0% 0 0.0% 0 0.0% 0 0.0% 0 0.0% 0(Nothing) 59.9% 347 0.0% 0 0.0% 0 70.5% 63 35.8% 34 26.6% 18 47.9% 35 73.5% 69 79.7% 128(Don’t know) 14.2% 82 0.0% 0 0.0% 0 10.4% 9 2.3% 2 31.7% 21 28.2% 21 15.6% 15 8.9% 14Weighted base: 579 0 0 89 95 66 74 94 160Sample: 605 0 0 100 100 101 100 102 102

by Zone (Weighted, Part 2) South Wales Retail Study Page 117 Weighted: for Carter Jonas August 2016
Total Zone 9 Zone 10 Zone 11 Zone 12 Zone 13 Zone 14 Zone 15 Zone 16
Column %ges. 020716 NEMS market research
Mean score [Times a year, those who visit]: Daily = 365, 4-6 days a week = 234, 2-3 days a week = 130, One day a week = 52, Every two weeks = 24, Monthly = 12, Once every two months = 6, Three-four times a year = 3.5, Once a year = 1, Less often = 0.25
Q75 How often do you or your household visit Tregaron for shopping and other town centre services? Zones 11-16 Daily 0.5% 3 0.0% 0 0.0% 0 0.0% 0 0.0% 0 0.0% 0 3.7% 3 0.0% 0 0.0% 04-6 days a week 0.9% 5 0.0% 0 0.0% 0 0.0% 0 0.0% 0 0.0% 0 6.8% 5 0.0% 0 0.0% 02-3 days a week 0.7% 4 0.0% 0 0.0% 0 0.0% 0 0.0% 0 0.9% 1 4.4% 3 0.0% 0 0.0% 0One day a week 1.7% 10 0.0% 0 0.0% 0 0.0% 0 1.6% 2 0.0% 0 8.8% 6 1.9% 2 0.0% 0Every two weeks 0.7% 4 0.0% 0 0.0% 0 0.0% 0 0.0% 0 1.8% 1 4.1% 3 0.0% 0 0.0% 0Monthly 1.3% 7 0.0% 0 0.0% 0 0.0% 0 2.3% 2 1.5% 1 4.4% 3 0.9% 1 0.0% 0Once every two months 1.9% 11 0.0% 0 0.0% 0 1.8% 2 0.7% 1 0.0% 0 8.9% 7 0.7% 1 1.0% 2Three-four times a year 4.2% 24 0.0% 0 0.0% 0 4.0% 4 4.8% 5 3.7% 2 5.6% 4 4.1% 4 3.6% 6Once a year 2.3% 14 0.0% 0 0.0% 0 0.9% 1 5.1% 5 0.9% 1 3.7% 3 3.6% 3 0.7% 1Less often 1.4% 8 0.0% 0 0.0% 0 0.7% 1 2.5% 2 3.3% 2 0.7% 0 0.0% 0 1.5% 2Never 84.1% 486 0.0% 0 0.0% 0 92.7% 82 80.9% 77 87.8% 58 48.2% 36 88.9% 84 93.3% 150(Don’t know) 0.2% 1 0.0% 0 0.0% 0 0.0% 0 1.1% 1 0.0% 0 0.0% 0 0.0% 0 0.0% 0(Varies) 0.3% 2 0.0% 0 0.0% 0 0.0% 0 0.9% 1 0.0% 0 0.9% 1 0.0% 0 0.0% 0Mean: 39.32 0.00 0.00 3.52 8.16 16.02 82.21 11.99 2.89Weighted base: 579 0 0 89 95 66 74 94 160Sample: 605 0 0 100 100 101 100 102 102

by Zone (Weighted, Part 2) South Wales Retail Study Page 118 Weighted: for Carter Jonas August 2016
Total Zone 9 Zone 10 Zone 11 Zone 12 Zone 13 Zone 14 Zone 15 Zone 16
Column %ges. 020716 NEMS market research
Q76A In order of importance, what are your two main reasons for visiting Tregaron Town Centre? Main reason: Zones 11-16 and those who visit Tregaron town centre at Q75 Food shopping 11.4% 10 0.0% 0 0.0% 0 0.0% 0 12.2% 2 7.5% 1 20.1% 8 0.0% 0 0.0% 0Non-food shopping 18.7% 17 0.0% 0 0.0% 0 45.5% 3 12.2% 2 13.0% 1 21.0% 8 6.1% 1 21.8% 2To visit bars / pubs 3.8% 3 0.0% 0 0.0% 0 9.1% 1 10.7% 2 5.5% 0 1.3% 0 0.0% 0 0.0% 0To visit cafés / restaurants 12.9% 12 0.0% 0 0.0% 0 0.0% 0 9.6% 2 32.8% 3 5.5% 2 40.4% 4 10.9% 1To visit personal service
providers (e.g. hairdressers, beauty salon etc.)
0.7% 1 0.0% 0 0.0% 0 0.0% 0 0.0% 0 0.0% 0 1.7% 1 0.0% 0 0.0% 0
To visit financial services such as banks and other financial institutions
3.3% 3 0.0% 0 0.0% 0 0.0% 0 3.7% 1 0.0% 0 6.2% 2 0.0% 0 0.0% 0
To visit other service providers (e.g. travel agent, estate agent etc.)
0.8% 1 0.0% 0 0.0% 0 11.9% 1 0.0% 0 0.0% 0 0.0% 0 0.0% 0 0.0% 0
To visit public services (e.g. medical or dentist appointment, library, job centre, community centre, etc)
4.4% 4 0.0% 0 0.0% 0 0.0% 0 0.0% 0 13.0% 1 8.0% 3 0.0% 0 0.0% 0
To get petrol 1.2% 1 0.0% 0 0.0% 0 0.0% 0 0.0% 0 0.0% 0 2.9% 1 0.0% 0 0.0% 0To visit the cinema 0.0% 0 0.0% 0 0.0% 0 0.0% 0 0.0% 0 0.0% 0 0.0% 0 0.0% 0 0.0% 0To visit a park 0.0% 0 0.0% 0 0.0% 0 0.0% 0 0.0% 0 0.0% 0 0.0% 0 0.0% 0 0.0% 0To visit the swimming pool 0.0% 0 0.0% 0 0.0% 0 0.0% 0 0.0% 0 0.0% 0 0.0% 0 0.0% 0 0.0% 0To visit other gyms / health
and fitness facilities 1.1% 1 0.0% 0 0.0% 0 0.0% 0 0.0% 0 7.1% 1 1.3% 0 0.0% 0 0.0% 0
To visit the library 0.0% 0 0.0% 0 0.0% 0 0.0% 0 0.0% 0 0.0% 0 0.0% 0 0.0% 0 0.0% 0To visit museums / art
gallery 2.7% 2 0.0% 0 0.0% 0 0.0% 0 3.7% 1 0.0% 0 0.0% 0 6.1% 1 10.9% 1
To visit the theatre or musical venues
0.0% 0 0.0% 0 0.0% 0 0.0% 0 0.0% 0 0.0% 0 0.0% 0 0.0% 0 0.0% 0
To visit night time venues e.g. nightclub
0.0% 0 0.0% 0 0.0% 0 0.0% 0 0.0% 0 0.0% 0 0.0% 0 0.0% 0 0.0% 0
For other leisure activities 8.8% 8 0.0% 0 0.0% 0 9.1% 1 8.5% 2 0.0% 0 3.0% 1 13.9% 1 31.4% 3To shop at the market(s) 1.0% 1 0.0% 0 0.0% 0 0.0% 0 4.8% 1 0.0% 0 0.0% 0 0.0% 0 0.0% 0To meet family 11.2% 10 0.0% 0 0.0% 0 0.0% 0 0.0% 0 8.2% 1 8.9% 3 33.6% 4 25.1% 3To meet friends 1.2% 1 0.0% 0 0.0% 0 0.0% 0 3.7% 1 5.5% 0 0.0% 0 0.0% 0 0.0% 0To visit the theatre 0.0% 0 0.0% 0 0.0% 0 0.0% 0 0.0% 0 0.0% 0 0.0% 0 0.0% 0 0.0% 0For work (i.e. place of work) 6.6% 6 0.0% 0 0.0% 0 12.4% 1 0.0% 0 7.5% 1 12.3% 5 0.0% 0 0.0% 0For business (e.g. attend a
business appointment) 0.8% 1 0.0% 0 0.0% 0 11.9% 1 0.0% 0 0.0% 0 0.0% 0 0.0% 0 0.0% 0
For education as a student (e.g. student at college, university, or other third level education)
2.6% 2 0.0% 0 0.0% 0 0.0% 0 0.0% 0 0.0% 0 6.3% 2 0.0% 0 0.0% 0
To access public transport for onward travel (e.g. train station, bus station)
1.1% 1 0.0% 0 0.0% 0 0.0% 0 5.6% 1 0.0% 0 0.0% 0 0.0% 0 0.0% 0
Other 0.0% 0 0.0% 0 0.0% 0 0.0% 0 0.0% 0 0.0% 0 0.0% 0 0.0% 0 0.0% 0As part of a day out / for a
day out / something different
1.4% 1 0.0% 0 0.0% 0 0.0% 0 3.7% 1 0.0% 0 1.7% 1 0.0% 0 0.0% 0
Browsing / window shopping 0.0% 0 0.0% 0 0.0% 0 0.0% 0 0.0% 0 0.0% 0 0.0% 0 0.0% 0 0.0% 0(Don't know / varies) 1.5% 1 0.0% 0 0.0% 0 0.0% 0 7.4% 1 0.0% 0 0.0% 0 0.0% 0 0.0% 0(Nothing / nothing further) 2.8% 3 0.0% 0 0.0% 0 0.0% 0 14.1% 3 0.0% 0 0.0% 0 0.0% 0 0.0% 0Weighted base: 92 0 0 6 18 8 38 11 11Sample: 114 0 0 6 22 12 54 13 7

by Zone (Weighted, Part 2) South Wales Retail Study Page 119 Weighted: for Carter Jonas August 2016
Total Zone 9 Zone 10 Zone 11 Zone 12 Zone 13 Zone 14 Zone 15 Zone 16
Column %ges. 020716 NEMS market research
Q76B In order of importance, what are your two main reasons for visiting Tregaron Town Centre? Secondary reason: Those who gave a reason at Q76A Food shopping 5.8% 5 0.0% 0 0.0% 0 0.0% 0 4.7% 1 0.0% 0 11.7% 4 0.0% 0 0.0% 0Non-food shopping 6.1% 5 0.0% 0 0.0% 0 0.0% 0 0.0% 0 0.0% 0 10.2% 4 13.9% 1 0.0% 0To visit bars / pubs 2.7% 2 0.0% 0 0.0% 0 0.0% 0 4.7% 1 0.0% 0 0.0% 0 16.1% 2 0.0% 0To visit cafés / restaurants 7.7% 7 0.0% 0 0.0% 0 0.0% 0 4.7% 1 20.9% 2 3.8% 1 17.5% 2 10.9% 1To visit personal service
providers (e.g. hairdressers, beauty salon etc.)
0.0% 0 0.0% 0 0.0% 0 0.0% 0 0.0% 0 0.0% 0 0.0% 0 0.0% 0 0.0% 0
To visit financial services such as banks and other financial institutions
1.9% 2 0.0% 0 0.0% 0 0.0% 0 0.0% 0 7.5% 1 2.9% 1 0.0% 0 0.0% 0
To visit other service providers (e.g. travel agent, estate agent etc.)
0.0% 0 0.0% 0 0.0% 0 0.0% 0 0.0% 0 0.0% 0 0.0% 0 0.0% 0 0.0% 0
To visit public services (e.g. medical or dentist appointment, library, job centre, community centre, etc)
1.3% 1 0.0% 0 0.0% 0 0.0% 0 0.0% 0 0.0% 0 2.9% 1 0.0% 0 0.0% 0
To get petrol 0.0% 0 0.0% 0 0.0% 0 0.0% 0 0.0% 0 0.0% 0 0.0% 0 0.0% 0 0.0% 0To visit the cinema 0.9% 1 0.0% 0 0.0% 0 11.9% 1 0.0% 0 0.0% 0 0.0% 0 0.0% 0 0.0% 0To visit a park 0.0% 0 0.0% 0 0.0% 0 0.0% 0 0.0% 0 0.0% 0 0.0% 0 0.0% 0 0.0% 0To visit the swimming pool 0.0% 0 0.0% 0 0.0% 0 0.0% 0 0.0% 0 0.0% 0 0.0% 0 0.0% 0 0.0% 0To visit other gyms / health
and fitness facilities 0.0% 0 0.0% 0 0.0% 0 0.0% 0 0.0% 0 0.0% 0 0.0% 0 0.0% 0 0.0% 0
To visit the library 0.0% 0 0.0% 0 0.0% 0 0.0% 0 0.0% 0 0.0% 0 0.0% 0 0.0% 0 0.0% 0To visit museums / art
gallery 0.5% 0 0.0% 0 0.0% 0 0.0% 0 0.0% 0 0.0% 0 1.3% 0 0.0% 0 0.0% 0
To visit the theatre or musical venues
0.0% 0 0.0% 0 0.0% 0 0.0% 0 0.0% 0 0.0% 0 0.0% 0 0.0% 0 0.0% 0
To visit night time venues e.g. nightclub
0.5% 0 0.0% 0 0.0% 0 0.0% 0 0.0% 0 0.0% 0 1.3% 0 0.0% 0 0.0% 0
For other leisure activities 4.5% 4 0.0% 0 0.0% 0 0.0% 0 0.0% 0 5.5% 0 6.2% 2 0.0% 0 10.9% 1To shop at the market(s) 0.0% 0 0.0% 0 0.0% 0 0.0% 0 0.0% 0 0.0% 0 0.0% 0 0.0% 0 0.0% 0To meet family 0.7% 1 0.0% 0 0.0% 0 0.0% 0 0.0% 0 7.5% 1 0.0% 0 0.0% 0 0.0% 0To meet friends 4.0% 4 0.0% 0 0.0% 0 9.1% 1 4.7% 1 0.0% 0 5.9% 2 0.0% 0 0.0% 0To visit the theatre 0.0% 0 0.0% 0 0.0% 0 0.0% 0 0.0% 0 0.0% 0 0.0% 0 0.0% 0 0.0% 0For work (i.e. place of work) 0.0% 0 0.0% 0 0.0% 0 0.0% 0 0.0% 0 0.0% 0 0.0% 0 0.0% 0 0.0% 0For business (e.g. attend a
business appointment) 1.1% 1 0.0% 0 0.0% 0 0.0% 0 0.0% 0 0.0% 0 2.5% 1 0.0% 0 0.0% 0
For education as a student (e.g. student at college, university, or other third level education)
1.6% 1 0.0% 0 0.0% 0 0.0% 0 0.0% 0 0.0% 0 3.6% 1 0.0% 0 0.0% 0
To access public transport for onward travel (e.g. train station, bus station)
0.0% 0 0.0% 0 0.0% 0 0.0% 0 0.0% 0 0.0% 0 0.0% 0 0.0% 0 0.0% 0
Other 0.0% 0 0.0% 0 0.0% 0 0.0% 0 0.0% 0 0.0% 0 0.0% 0 0.0% 0 0.0% 0As part of a day out / for a
day out / something different
0.0% 0 0.0% 0 0.0% 0 0.0% 0 0.0% 0 0.0% 0 0.0% 0 0.0% 0 0.0% 0
Browsing / window shopping 0.0% 0 0.0% 0 0.0% 0 0.0% 0 0.0% 0 0.0% 0 0.0% 0 0.0% 0 0.0% 0(Don't know / varies) 0.8% 1 0.0% 0 0.0% 0 0.0% 0 4.7% 1 0.0% 0 0.0% 0 0.0% 0 0.0% 0(Nothing / nothing further) 60.0% 53 0.0% 0 0.0% 0 79.0% 5 76.4% 11 58.7% 5 47.7% 18 52.5% 6 78.2% 8Weighted base: 88 0 0 6 14 8 38 11 11Sample: 109 0 0 6 17 12 54 13 7

by Zone (Weighted, Part 2) South Wales Retail Study Page 120 Weighted: for Carter Jonas August 2016
Total Zone 9 Zone 10 Zone 11 Zone 12 Zone 13 Zone 14 Zone 15 Zone 16
Column %ges. 020716 NEMS market research
Q76X In order of importance, what are your two main reasons for visiting Tregaron Town Centre? Any mention: [MR] Zones 11-16 and those who visit Tregaron town centre at Q75 Food shopping 16.9% 16 0.0% 0 0.0% 0 0.0% 0 15.9% 3 7.5% 1 31.8% 12 0.0% 0 0.0% 0Non-food shopping 24.5% 23 0.0% 0 0.0% 0 45.5% 3 12.2% 2 13.0% 1 31.2% 12 20.0% 2 21.8% 2To visit bars / pubs 6.3% 6 0.0% 0 0.0% 0 9.1% 1 14.4% 3 5.5% 0 1.3% 0 16.1% 2 0.0% 0To visit cafés / restaurants 20.3% 19 0.0% 0 0.0% 0 0.0% 0 13.3% 2 53.7% 4 9.3% 4 57.8% 6 21.8% 2To visit personal service
providers (e.g. hairdressers, beauty salon etc.)
0.7% 1 0.0% 0 0.0% 0 0.0% 0 0.0% 0 0.0% 0 1.7% 1 0.0% 0 0.0% 0
To visit financial services such as banks and other financial institutions
5.1% 5 0.0% 0 0.0% 0 0.0% 0 3.7% 1 7.5% 1 9.1% 3 0.0% 0 0.0% 0
To visit other service providers (e.g. travel agent, estate agent etc.)
0.8% 1 0.0% 0 0.0% 0 11.9% 1 0.0% 0 0.0% 0 0.0% 0 0.0% 0 0.0% 0
To visit public services (e.g. medical or dentist appointment, library, job centre, community centre, etc)
5.6% 5 0.0% 0 0.0% 0 0.0% 0 0.0% 0 13.0% 1 10.9% 4 0.0% 0 0.0% 0
To get petrol 1.2% 1 0.0% 0 0.0% 0 0.0% 0 0.0% 0 0.0% 0 2.9% 1 0.0% 0 0.0% 0To visit the cinema 0.8% 1 0.0% 0 0.0% 0 11.9% 1 0.0% 0 0.0% 0 0.0% 0 0.0% 0 0.0% 0To visit a park 0.0% 0 0.0% 0 0.0% 0 0.0% 0 0.0% 0 0.0% 0 0.0% 0 0.0% 0 0.0% 0To visit the swimming pool 0.0% 0 0.0% 0 0.0% 0 0.0% 0 0.0% 0 0.0% 0 0.0% 0 0.0% 0 0.0% 0To visit other gyms / health
and fitness facilities 1.1% 1 0.0% 0 0.0% 0 0.0% 0 0.0% 0 7.1% 1 1.3% 0 0.0% 0 0.0% 0
To visit the library 0.0% 0 0.0% 0 0.0% 0 0.0% 0 0.0% 0 0.0% 0 0.0% 0 0.0% 0 0.0% 0To visit museums / art
gallery 3.2% 3 0.0% 0 0.0% 0 0.0% 0 3.7% 1 0.0% 0 1.3% 0 6.1% 1 10.9% 1
To visit the theatre or musical venues
0.0% 0 0.0% 0 0.0% 0 0.0% 0 0.0% 0 0.0% 0 0.0% 0 0.0% 0 0.0% 0
To visit night time venues e.g. nightclub
0.5% 0 0.0% 0 0.0% 0 0.0% 0 0.0% 0 0.0% 0 1.3% 0 0.0% 0 0.0% 0
For other leisure activities 13.1% 12 0.0% 0 0.0% 0 9.1% 1 8.5% 2 5.5% 0 9.2% 3 13.9% 1 42.3% 5To shop at the market(s) 1.0% 1 0.0% 0 0.0% 0 0.0% 0 4.8% 1 0.0% 0 0.0% 0 0.0% 0 0.0% 0To meet family 11.8% 11 0.0% 0 0.0% 0 0.0% 0 0.0% 0 15.7% 1 8.9% 3 33.6% 4 25.1% 3To meet friends 5.0% 5 0.0% 0 0.0% 0 9.1% 1 7.4% 1 5.5% 0 5.9% 2 0.0% 0 0.0% 0To visit the theatre 0.0% 0 0.0% 0 0.0% 0 0.0% 0 0.0% 0 0.0% 0 0.0% 0 0.0% 0 0.0% 0For work (i.e. place of work) 6.6% 6 0.0% 0 0.0% 0 12.4% 1 0.0% 0 7.5% 1 12.3% 5 0.0% 0 0.0% 0For business (e.g. attend a
business appointment) 1.9% 2 0.0% 0 0.0% 0 11.9% 1 0.0% 0 0.0% 0 2.5% 1 0.0% 0 0.0% 0
For education as a student (e.g. student at college, university, or other third level education)
4.1% 4 0.0% 0 0.0% 0 0.0% 0 0.0% 0 0.0% 0 9.9% 4 0.0% 0 0.0% 0
To access public transport for onward travel (e.g. train station, bus station)
1.1% 1 0.0% 0 0.0% 0 0.0% 0 5.6% 1 0.0% 0 0.0% 0 0.0% 0 0.0% 0
Other 0.0% 0 0.0% 0 0.0% 0 0.0% 0 0.0% 0 0.0% 0 0.0% 0 0.0% 0 0.0% 0As part of a day out / for a
day out / something different
1.4% 1 0.0% 0 0.0% 0 0.0% 0 3.7% 1 0.0% 0 1.7% 1 0.0% 0 0.0% 0
Browsing / window shopping 0.0% 0 0.0% 0 0.0% 0 0.0% 0 0.0% 0 0.0% 0 0.0% 0 0.0% 0 0.0% 0Weighted base: 92 0 0 6 18 8 38 11 11Sample: 114 0 0 6 22 12 54 13 7
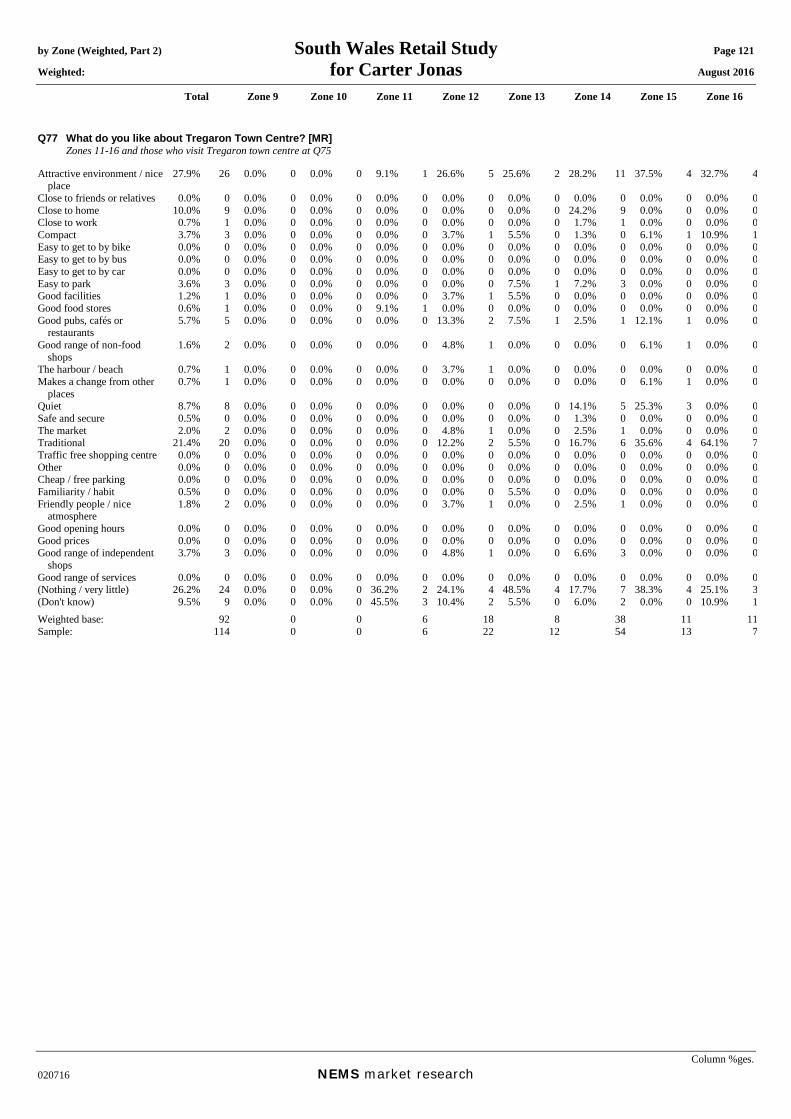
by Zone (Weighted, Part 2) South Wales Retail Study Page 121 Weighted: for Carter Jonas August 2016
Total Zone 9 Zone 10 Zone 11 Zone 12 Zone 13 Zone 14 Zone 15 Zone 16
Column %ges. 020716 NEMS market research
Q77 What do you like about Tregaron Town Centre? [MR] Zones 11-16 and those who visit Tregaron town centre at Q75 Attractive environment / nice
place 27.9% 26 0.0% 0 0.0% 0 9.1% 1 26.6% 5 25.6% 2 28.2% 11 37.5% 4 32.7% 4
Close to friends or relatives 0.0% 0 0.0% 0 0.0% 0 0.0% 0 0.0% 0 0.0% 0 0.0% 0 0.0% 0 0.0% 0Close to home 10.0% 9 0.0% 0 0.0% 0 0.0% 0 0.0% 0 0.0% 0 24.2% 9 0.0% 0 0.0% 0Close to work 0.7% 1 0.0% 0 0.0% 0 0.0% 0 0.0% 0 0.0% 0 1.7% 1 0.0% 0 0.0% 0Compact 3.7% 3 0.0% 0 0.0% 0 0.0% 0 3.7% 1 5.5% 0 1.3% 0 6.1% 1 10.9% 1Easy to get to by bike 0.0% 0 0.0% 0 0.0% 0 0.0% 0 0.0% 0 0.0% 0 0.0% 0 0.0% 0 0.0% 0Easy to get to by bus 0.0% 0 0.0% 0 0.0% 0 0.0% 0 0.0% 0 0.0% 0 0.0% 0 0.0% 0 0.0% 0Easy to get to by car 0.0% 0 0.0% 0 0.0% 0 0.0% 0 0.0% 0 0.0% 0 0.0% 0 0.0% 0 0.0% 0Easy to park 3.6% 3 0.0% 0 0.0% 0 0.0% 0 0.0% 0 7.5% 1 7.2% 3 0.0% 0 0.0% 0Good facilities 1.2% 1 0.0% 0 0.0% 0 0.0% 0 3.7% 1 5.5% 0 0.0% 0 0.0% 0 0.0% 0Good food stores 0.6% 1 0.0% 0 0.0% 0 9.1% 1 0.0% 0 0.0% 0 0.0% 0 0.0% 0 0.0% 0Good pubs, cafés or
restaurants 5.7% 5 0.0% 0 0.0% 0 0.0% 0 13.3% 2 7.5% 1 2.5% 1 12.1% 1 0.0% 0
Good range of non-food shops
1.6% 2 0.0% 0 0.0% 0 0.0% 0 4.8% 1 0.0% 0 0.0% 0 6.1% 1 0.0% 0
The harbour / beach 0.7% 1 0.0% 0 0.0% 0 0.0% 0 3.7% 1 0.0% 0 0.0% 0 0.0% 0 0.0% 0Makes a change from other
places 0.7% 1 0.0% 0 0.0% 0 0.0% 0 0.0% 0 0.0% 0 0.0% 0 6.1% 1 0.0% 0
Quiet 8.7% 8 0.0% 0 0.0% 0 0.0% 0 0.0% 0 0.0% 0 14.1% 5 25.3% 3 0.0% 0Safe and secure 0.5% 0 0.0% 0 0.0% 0 0.0% 0 0.0% 0 0.0% 0 1.3% 0 0.0% 0 0.0% 0The market 2.0% 2 0.0% 0 0.0% 0 0.0% 0 4.8% 1 0.0% 0 2.5% 1 0.0% 0 0.0% 0Traditional 21.4% 20 0.0% 0 0.0% 0 0.0% 0 12.2% 2 5.5% 0 16.7% 6 35.6% 4 64.1% 7Traffic free shopping centre 0.0% 0 0.0% 0 0.0% 0 0.0% 0 0.0% 0 0.0% 0 0.0% 0 0.0% 0 0.0% 0Other 0.0% 0 0.0% 0 0.0% 0 0.0% 0 0.0% 0 0.0% 0 0.0% 0 0.0% 0 0.0% 0Cheap / free parking 0.0% 0 0.0% 0 0.0% 0 0.0% 0 0.0% 0 0.0% 0 0.0% 0 0.0% 0 0.0% 0Familiarity / habit 0.5% 0 0.0% 0 0.0% 0 0.0% 0 0.0% 0 5.5% 0 0.0% 0 0.0% 0 0.0% 0Friendly people / nice
atmosphere 1.8% 2 0.0% 0 0.0% 0 0.0% 0 3.7% 1 0.0% 0 2.5% 1 0.0% 0 0.0% 0
Good opening hours 0.0% 0 0.0% 0 0.0% 0 0.0% 0 0.0% 0 0.0% 0 0.0% 0 0.0% 0 0.0% 0Good prices 0.0% 0 0.0% 0 0.0% 0 0.0% 0 0.0% 0 0.0% 0 0.0% 0 0.0% 0 0.0% 0Good range of independent
shops 3.7% 3 0.0% 0 0.0% 0 0.0% 0 4.8% 1 0.0% 0 6.6% 3 0.0% 0 0.0% 0
Good range of services 0.0% 0 0.0% 0 0.0% 0 0.0% 0 0.0% 0 0.0% 0 0.0% 0 0.0% 0 0.0% 0(Nothing / very little) 26.2% 24 0.0% 0 0.0% 0 36.2% 2 24.1% 4 48.5% 4 17.7% 7 38.3% 4 25.1% 3(Don't know) 9.5% 9 0.0% 0 0.0% 0 45.5% 3 10.4% 2 5.5% 0 6.0% 2 0.0% 0 10.9% 1Weighted base: 92 0 0 6 18 8 38 11 11Sample: 114 0 0 6 22 12 54 13 7

by Zone (Weighted, Part 2) South Wales Retail Study Page 122 Weighted: for Carter Jonas August 2016
Total Zone 9 Zone 10 Zone 11 Zone 12 Zone 13 Zone 14 Zone 15 Zone 16
Column %ges. 020716 NEMS market research
Q78 What could be improved about Tregaron that would make you visit more often? [MR] Zones 11-16 Better access by road 0.4% 2 0.0% 0 0.0% 0 0.9% 1 0.7% 1 0.0% 0 0.0% 0 0.9% 1 0.0% 0Better public transport 0.6% 4 0.0% 0 0.0% 0 0.0% 0 0.0% 0 1.9% 1 0.0% 0 0.9% 1 1.0% 2Better signposting 0.0% 0 0.0% 0 0.0% 0 0.0% 0 0.0% 0 0.0% 0 0.0% 0 0.0% 0 0.0% 0Cleaner streets 0.4% 2 0.0% 0 0.0% 0 0.0% 0 0.0% 0 1.6% 1 0.7% 0 0.9% 1 0.0% 0Facilities which would assist
you if shopping with children
0.3% 2 0.0% 0 0.0% 0 0.0% 0 0.0% 0 0.0% 0 0.0% 0 1.9% 2 0.0% 0
Free / cheaper car parking 0.7% 4 0.0% 0 0.0% 0 0.9% 1 0.0% 0 0.0% 0 0.0% 0 3.4% 3 0.0% 0Jewellery / food markets /
other events 0.0% 0 0.0% 0 0.0% 0 0.0% 0 0.0% 0 0.0% 0 0.0% 0 0.0% 0 0.0% 0
More / better comparison retailers (i.e. non-food shops)
2.1% 12 0.0% 0 0.0% 0 0.7% 1 3.0% 3 0.7% 0 7.6% 6 2.8% 3 0.0% 0
More / better entertainment 0.2% 1 0.0% 0 0.0% 0 0.0% 0 0.7% 1 0.9% 1 0.0% 0 0.0% 0 0.0% 0More / better places for
eating out (e.g. cafés and restaurants)
0.3% 2 0.0% 0 0.0% 0 0.7% 1 0.7% 1 0.0% 0 0.7% 0 0.0% 0 0.0% 0
More / better food shops 0.1% 1 0.0% 0 0.0% 0 0.0% 0 0.0% 0 0.0% 0 0.9% 1 0.0% 0 0.0% 0More / better parking 1.1% 6 0.0% 0 0.0% 0 0.0% 0 0.0% 0 1.8% 1 5.8% 4 0.7% 1 0.0% 0More / better pedestrianised
streets 0.0% 0 0.0% 0 0.0% 0 0.0% 0 0.0% 0 0.0% 0 0.0% 0 0.0% 0 0.0% 0
More / better public conveniences
0.0% 0 0.0% 0 0.0% 0 0.0% 0 0.0% 0 0.0% 0 0.0% 0 0.0% 0 0.0% 0
More / better seats / flower displays
0.2% 1 0.0% 0 0.0% 0 0.0% 0 0.0% 0 0.0% 0 1.3% 1 0.0% 0 0.0% 0
More / better services 0.1% 1 0.0% 0 0.0% 0 0.0% 0 0.0% 0 0.0% 0 0.9% 1 0.0% 0 0.0% 0More advertising 0.1% 1 0.0% 0 0.0% 0 0.0% 0 0.0% 0 0.0% 0 0.9% 1 0.0% 0 0.0% 0More national multiple shops
/ High Street shops 2.9% 17 0.0% 0 0.0% 0 0.7% 1 0.9% 1 0.9% 1 9.7% 7 4.8% 5 1.9% 3
Protection from the weather (i.e. covered shopping malls)
0.0% 0 0.0% 0 0.0% 0 0.0% 0 0.0% 0 0.0% 0 0.0% 0 0.0% 0 0.0% 0
Shops / services open on Sundays / better opening hours
0.0% 0 0.0% 0 0.0% 0 0.0% 0 0.0% 0 0.0% 0 0.0% 0 0.0% 0 0.0% 0
Fewer vacant shops 0.5% 3 0.0% 0 0.0% 0 0.0% 0 0.9% 1 0.0% 0 2.2% 2 0.7% 1 0.0% 0Better maintained buildings 0.2% 1 0.0% 0 0.0% 0 0.0% 0 0.0% 0 0.0% 0 0.0% 0 0.9% 1 0.0% 0Better disabled access 0.0% 0 0.0% 0 0.0% 0 0.0% 0 0.0% 0 0.0% 0 0.0% 0 0.0% 0 0.0% 0Better prices 0.0% 0 0.0% 0 0.0% 0 0.0% 0 0.0% 0 0.0% 0 0.0% 0 0.0% 0 0.0% 0Better quality shops 0.0% 0 0.0% 0 0.0% 0 0.0% 0 0.0% 0 0.0% 0 0.0% 0 0.0% 0 0.0% 0Fewer charity shops 0.0% 0 0.0% 0 0.0% 0 0.0% 0 0.0% 0 0.0% 0 0.0% 0 0.0% 0 0.0% 0Improve the environment /
refurbish 0.8% 5 0.0% 0 0.0% 0 0.0% 0 0.0% 0 3.3% 2 3.3% 2 0.0% 0 0.0% 0
Less congestion / too busy 0.2% 1 0.0% 0 0.0% 0 0.0% 0 0.0% 0 0.0% 0 1.9% 1 0.0% 0 0.0% 0More independent shops 0.4% 2 0.0% 0 0.0% 0 0.0% 0 0.0% 0 0.0% 0 1.5% 1 0.0% 0 0.7% 1Other 0.0% 0 0.0% 0 0.0% 0 0.0% 0 0.0% 0 0.0% 0 0.0% 0 0.0% 0 0.0% 0(Nothing) 66.3% 384 0.0% 0 0.0% 0 86.8% 77 54.3% 52 40.4% 27 37.0% 27 74.9% 71 81.1% 130(Don’t know) 24.5% 142 0.0% 0 0.0% 0 10.7% 10 38.7% 37 49.5% 33 33.3% 25 14.4% 14 15.3% 25Weighted base: 579 0 0 89 95 66 74 94 160Sample: 605 0 0 100 100 101 100 102 102

by Zone (Weighted, Part 2) South Wales Retail Study Page 123 Weighted: for Carter Jonas August 2016
Total Zone 9 Zone 10 Zone 11 Zone 12 Zone 13 Zone 14 Zone 15 Zone 16
Column %ges. 020716 NEMS market research
Mean score [Times a year, those who visit]: Daily = 365, 4-6 days a week = 234, 2-3 days a week = 130, One day a week = 52, Every two weeks = 24, Monthly = 12, Once every two months = 6, Three-four times a year = 3.5, Once a year = 1, Less often = 0.25
X75 How often do you or your household visit St Davids for shopping and other town centre services? Zones 3, 4 & 8 Daily 2.1% 7 0.0% 0 0.0% 0 0.0% 0 0.0% 0 0.0% 0 0.0% 0 0.0% 0 0.0% 04-6 days a week 1.1% 4 0.0% 0 0.0% 0 0.0% 0 0.0% 0 0.0% 0 0.0% 0 0.0% 0 0.0% 02-3 days a week 2.0% 7 0.0% 0 0.0% 0 0.0% 0 0.0% 0 0.0% 0 0.0% 0 0.0% 0 0.0% 0One day a week 3.0% 10 0.0% 0 0.0% 0 0.0% 0 0.0% 0 0.0% 0 0.0% 0 0.0% 0 0.0% 0Every two weeks 2.2% 7 0.0% 0 0.0% 0 0.0% 0 0.0% 0 0.0% 0 0.0% 0 0.0% 0 0.0% 0Monthly 3.7% 12 0.0% 0 0.0% 0 0.0% 0 0.0% 0 0.0% 0 0.0% 0 0.0% 0 0.0% 0Once every two months 4.7% 16 0.0% 0 0.0% 0 0.0% 0 0.0% 0 0.0% 0 0.0% 0 0.0% 0 0.0% 0Three-four times a year 6.3% 21 0.0% 0 0.0% 0 0.0% 0 0.0% 0 0.0% 0 0.0% 0 0.0% 0 0.0% 0Once a year 7.5% 25 0.0% 0 0.0% 0 0.0% 0 0.0% 0 0.0% 0 0.0% 0 0.0% 0 0.0% 0Less often 2.3% 8 0.0% 0 0.0% 0 0.0% 0 0.0% 0 0.0% 0 0.0% 0 0.0% 0 0.0% 0Never 64.7% 215 0.0% 0 0.0% 0 0.0% 0 0.0% 0 0.0% 0 0.0% 0 0.0% 0 0.0% 0(Don’t know) 0.0% 0 0.0% 0 0.0% 0 0.0% 0 0.0% 0 0.0% 0 0.0% 0 0.0% 0 0.0% 0(Varies) 0.2% 1 0.0% 0 0.0% 0 0.0% 0 0.0% 0 0.0% 0 0.0% 0 0.0% 0 0.0% 0Mean: 45.35 0.00 0.00 0.00 0.00 0.00 0.00 0.00 0.00Weighted base: 332 0 0 0 0 0 0 0 0Sample: 301 0 0 0 0 0 0 0 0

by Zone (Weighted, Part 2) South Wales Retail Study Page 124 Weighted: for Carter Jonas August 2016
Total Zone 9 Zone 10 Zone 11 Zone 12 Zone 13 Zone 14 Zone 15 Zone 16
Column %ges. 020716 NEMS market research
X76A In order of importance, what are your two main reasons for visiting St Davids Town Centre? Main reason: Zones 3, 4 & 8 and those who visit St Davids town centre at X75 Food shopping 7.8% 9 0.0% 0 0.0% 0 0.0% 0 0.0% 0 0.0% 0 0.0% 0 0.0% 0 0.0% 0Non-food shopping 24.7% 29 0.0% 0 0.0% 0 0.0% 0 0.0% 0 0.0% 0 0.0% 0 0.0% 0 0.0% 0To visit bars / pubs 0.0% 0 0.0% 0 0.0% 0 0.0% 0 0.0% 0 0.0% 0 0.0% 0 0.0% 0 0.0% 0To visit cafés / restaurants 2.7% 3 0.0% 0 0.0% 0 0.0% 0 0.0% 0 0.0% 0 0.0% 0 0.0% 0 0.0% 0To visit personal service
providers (e.g. hairdressers, beauty salon etc.)
0.5% 1 0.0% 0 0.0% 0 0.0% 0 0.0% 0 0.0% 0 0.0% 0 0.0% 0 0.0% 0
To visit financial services such as banks and other financial institutions
0.7% 1 0.0% 0 0.0% 0 0.0% 0 0.0% 0 0.0% 0 0.0% 0 0.0% 0 0.0% 0
To visit other service providers (e.g. travel agent, estate agent etc.)
0.0% 0 0.0% 0 0.0% 0 0.0% 0 0.0% 0 0.0% 0 0.0% 0 0.0% 0 0.0% 0
To visit public services (e.g. medical or dentist appointment, library, job centre, community centre, etc)
3.4% 4 0.0% 0 0.0% 0 0.0% 0 0.0% 0 0.0% 0 0.0% 0 0.0% 0 0.0% 0
To get petrol 0.0% 0 0.0% 0 0.0% 0 0.0% 0 0.0% 0 0.0% 0 0.0% 0 0.0% 0 0.0% 0To visit the cinema 0.0% 0 0.0% 0 0.0% 0 0.0% 0 0.0% 0 0.0% 0 0.0% 0 0.0% 0 0.0% 0To visit a park 0.0% 0 0.0% 0 0.0% 0 0.0% 0 0.0% 0 0.0% 0 0.0% 0 0.0% 0 0.0% 0To visit the swimming pool 0.0% 0 0.0% 0 0.0% 0 0.0% 0 0.0% 0 0.0% 0 0.0% 0 0.0% 0 0.0% 0To visit other gyms / health
and fitness facilities 0.0% 0 0.0% 0 0.0% 0 0.0% 0 0.0% 0 0.0% 0 0.0% 0 0.0% 0 0.0% 0
To visit the library 0.0% 0 0.0% 0 0.0% 0 0.0% 0 0.0% 0 0.0% 0 0.0% 0 0.0% 0 0.0% 0To visit museums / art
gallery 0.5% 1 0.0% 0 0.0% 0 0.0% 0 0.0% 0 0.0% 0 0.0% 0 0.0% 0 0.0% 0
To visit the theatre or musical venues
0.0% 0 0.0% 0 0.0% 0 0.0% 0 0.0% 0 0.0% 0 0.0% 0 0.0% 0 0.0% 0
To visit night time venues e.g. nightclub
0.0% 0 0.0% 0 0.0% 0 0.0% 0 0.0% 0 0.0% 0 0.0% 0 0.0% 0 0.0% 0
For other leisure activities 19.7% 23 0.0% 0 0.0% 0 0.0% 0 0.0% 0 0.0% 0 0.0% 0 0.0% 0 0.0% 0To shop at the market(s) 0.7% 1 0.0% 0 0.0% 0 0.0% 0 0.0% 0 0.0% 0 0.0% 0 0.0% 0 0.0% 0To meet family 3.5% 4 0.0% 0 0.0% 0 0.0% 0 0.0% 0 0.0% 0 0.0% 0 0.0% 0 0.0% 0To meet friends 7.2% 8 0.0% 0 0.0% 0 0.0% 0 0.0% 0 0.0% 0 0.0% 0 0.0% 0 0.0% 0To visit the theatre 0.0% 0 0.0% 0 0.0% 0 0.0% 0 0.0% 0 0.0% 0 0.0% 0 0.0% 0 0.0% 0For work (i.e. place of work) 4.8% 6 0.0% 0 0.0% 0 0.0% 0 0.0% 0 0.0% 0 0.0% 0 0.0% 0 0.0% 0For business (e.g. attend a
business appointment) 0.0% 0 0.0% 0 0.0% 0 0.0% 0 0.0% 0 0.0% 0 0.0% 0 0.0% 0 0.0% 0
For education as a student (e.g. student at college, university, or other third level education)
2.5% 3 0.0% 0 0.0% 0 0.0% 0 0.0% 0 0.0% 0 0.0% 0 0.0% 0 0.0% 0
To access public transport for onward travel (e.g. train station, bus station)
0.7% 1 0.0% 0 0.0% 0 0.0% 0 0.0% 0 0.0% 0 0.0% 0 0.0% 0 0.0% 0
Other 0.0% 0 0.0% 0 0.0% 0 0.0% 0 0.0% 0 0.0% 0 0.0% 0 0.0% 0 0.0% 0As part of a day out / for a
day out / something different
13.4% 16 0.0% 0 0.0% 0 0.0% 0 0.0% 0 0.0% 0 0.0% 0 0.0% 0 0.0% 0
Browsing / window shopping 2.5% 3 0.0% 0 0.0% 0 0.0% 0 0.0% 0 0.0% 0 0.0% 0 0.0% 0 0.0% 0(Don't know / varies) 2.1% 2 0.0% 0 0.0% 0 0.0% 0 0.0% 0 0.0% 0 0.0% 0 0.0% 0 0.0% 0(Nothing / nothing further) 2.7% 3 0.0% 0 0.0% 0 0.0% 0 0.0% 0 0.0% 0 0.0% 0 0.0% 0 0.0% 0Weighted base: 117 0 0 0 0 0 0 0 0Sample: 123 0 0 0 0 0 0 0 0

by Zone (Weighted, Part 2) South Wales Retail Study Page 125 Weighted: for Carter Jonas August 2016
Total Zone 9 Zone 10 Zone 11 Zone 12 Zone 13 Zone 14 Zone 15 Zone 16
Column %ges. 020716 NEMS market research
X76B In order of importance, what are your two main reasons for visiting St Davids Town Centre? Secondary reason: Those who gave a reason at X76A Food shopping 4.5% 5 0.0% 0 0.0% 0 0.0% 0 0.0% 0 0.0% 0 0.0% 0 0.0% 0 0.0% 0Non-food shopping 12.8% 14 0.0% 0 0.0% 0 0.0% 0 0.0% 0 0.0% 0 0.0% 0 0.0% 0 0.0% 0To visit bars / pubs 1.7% 2 0.0% 0 0.0% 0 0.0% 0 0.0% 0 0.0% 0 0.0% 0 0.0% 0 0.0% 0To visit cafés / restaurants 16.4% 18 0.0% 0 0.0% 0 0.0% 0 0.0% 0 0.0% 0 0.0% 0 0.0% 0 0.0% 0To visit personal service
providers (e.g. hairdressers, beauty salon etc.)
0.6% 1 0.0% 0 0.0% 0 0.0% 0 0.0% 0 0.0% 0 0.0% 0 0.0% 0 0.0% 0
To visit financial services such as banks and other financial institutions
1.8% 2 0.0% 0 0.0% 0 0.0% 0 0.0% 0 0.0% 0 0.0% 0 0.0% 0 0.0% 0
To visit other service providers (e.g. travel agent, estate agent etc.)
0.0% 0 0.0% 0 0.0% 0 0.0% 0 0.0% 0 0.0% 0 0.0% 0 0.0% 0 0.0% 0
To visit public services (e.g. medical or dentist appointment, library, job centre, community centre, etc)
2.3% 3 0.0% 0 0.0% 0 0.0% 0 0.0% 0 0.0% 0 0.0% 0 0.0% 0 0.0% 0
To get petrol 0.0% 0 0.0% 0 0.0% 0 0.0% 0 0.0% 0 0.0% 0 0.0% 0 0.0% 0 0.0% 0To visit the cinema 0.7% 1 0.0% 0 0.0% 0 0.0% 0 0.0% 0 0.0% 0 0.0% 0 0.0% 0 0.0% 0To visit a park 0.0% 0 0.0% 0 0.0% 0 0.0% 0 0.0% 0 0.0% 0 0.0% 0 0.0% 0 0.0% 0To visit the swimming pool 0.0% 0 0.0% 0 0.0% 0 0.0% 0 0.0% 0 0.0% 0 0.0% 0 0.0% 0 0.0% 0To visit other gyms / health
and fitness facilities 0.7% 1 0.0% 0 0.0% 0 0.0% 0 0.0% 0 0.0% 0 0.0% 0 0.0% 0 0.0% 0
To visit the library 0.0% 0 0.0% 0 0.0% 0 0.0% 0 0.0% 0 0.0% 0 0.0% 0 0.0% 0 0.0% 0To visit museums / art
gallery 2.1% 2 0.0% 0 0.0% 0 0.0% 0 0.0% 0 0.0% 0 0.0% 0 0.0% 0 0.0% 0
To visit the theatre or musical venues
0.8% 1 0.0% 0 0.0% 0 0.0% 0 0.0% 0 0.0% 0 0.0% 0 0.0% 0 0.0% 0
To visit night time venues e.g. nightclub
0.7% 1 0.0% 0 0.0% 0 0.0% 0 0.0% 0 0.0% 0 0.0% 0 0.0% 0 0.0% 0
For other leisure activities 1.9% 2 0.0% 0 0.0% 0 0.0% 0 0.0% 0 0.0% 0 0.0% 0 0.0% 0 0.0% 0To shop at the market(s) 0.0% 0 0.0% 0 0.0% 0 0.0% 0 0.0% 0 0.0% 0 0.0% 0 0.0% 0 0.0% 0To meet family 3.8% 4 0.0% 0 0.0% 0 0.0% 0 0.0% 0 0.0% 0 0.0% 0 0.0% 0 0.0% 0To meet friends 2.5% 3 0.0% 0 0.0% 0 0.0% 0 0.0% 0 0.0% 0 0.0% 0 0.0% 0 0.0% 0To visit the theatre 0.0% 0 0.0% 0 0.0% 0 0.0% 0 0.0% 0 0.0% 0 0.0% 0 0.0% 0 0.0% 0For work (i.e. place of work) 0.0% 0 0.0% 0 0.0% 0 0.0% 0 0.0% 0 0.0% 0 0.0% 0 0.0% 0 0.0% 0For business (e.g. attend a
business appointment) 0.0% 0 0.0% 0 0.0% 0 0.0% 0 0.0% 0 0.0% 0 0.0% 0 0.0% 0 0.0% 0
For education as a student (e.g. student at college, university, or other third level education)
0.8% 1 0.0% 0 0.0% 0 0.0% 0 0.0% 0 0.0% 0 0.0% 0 0.0% 0 0.0% 0
To access public transport for onward travel (e.g. train station, bus station)
0.6% 1 0.0% 0 0.0% 0 0.0% 0 0.0% 0 0.0% 0 0.0% 0 0.0% 0 0.0% 0
Other 0.0% 0 0.0% 0 0.0% 0 0.0% 0 0.0% 0 0.0% 0 0.0% 0 0.0% 0 0.0% 0As part of a day out / for a
day out / something different
3.3% 4 0.0% 0 0.0% 0 0.0% 0 0.0% 0 0.0% 0 0.0% 0 0.0% 0 0.0% 0
Browsing / window shopping 2.2% 2 0.0% 0 0.0% 0 0.0% 0 0.0% 0 0.0% 0 0.0% 0 0.0% 0 0.0% 0(Don't know / varies) 1.3% 1 0.0% 0 0.0% 0 0.0% 0 0.0% 0 0.0% 0 0.0% 0 0.0% 0 0.0% 0(Nothing / nothing further) 38.6% 43 0.0% 0 0.0% 0 0.0% 0 0.0% 0 0.0% 0 0.0% 0 0.0% 0 0.0% 0Weighted base: 111 0 0 0 0 0 0 0 0Sample: 116 0 0 0 0 0 0 0 0

by Zone (Weighted, Part 2) South Wales Retail Study Page 126 Weighted: for Carter Jonas August 2016
Total Zone 9 Zone 10 Zone 11 Zone 12 Zone 13 Zone 14 Zone 15 Zone 16
Column %ges. 020716 NEMS market research
X76X In order of importance, what are your two main reasons for visiting St Davids Town Centre? Any mention: [MR] Zones 3, 4 & 8 and those who visit St Davids town centre at X75 Food shopping 12.1% 14 0.0% 0 0.0% 0 0.0% 0 0.0% 0 0.0% 0 0.0% 0 0.0% 0 0.0% 0Non-food shopping 36.8% 43 0.0% 0 0.0% 0 0.0% 0 0.0% 0 0.0% 0 0.0% 0 0.0% 0 0.0% 0To visit bars / pubs 1.6% 2 0.0% 0 0.0% 0 0.0% 0 0.0% 0 0.0% 0 0.0% 0 0.0% 0 0.0% 0To visit cafés / restaurants 18.2% 21 0.0% 0 0.0% 0 0.0% 0 0.0% 0 0.0% 0 0.0% 0 0.0% 0 0.0% 0To visit personal service
providers (e.g. hairdressers, beauty salon etc.)
1.0% 1 0.0% 0 0.0% 0 0.0% 0 0.0% 0 0.0% 0 0.0% 0 0.0% 0 0.0% 0
To visit financial services such as banks and other financial institutions
2.5% 3 0.0% 0 0.0% 0 0.0% 0 0.0% 0 0.0% 0 0.0% 0 0.0% 0 0.0% 0
To visit other service providers (e.g. travel agent, estate agent etc.)
0.0% 0 0.0% 0 0.0% 0 0.0% 0 0.0% 0 0.0% 0 0.0% 0 0.0% 0 0.0% 0
To visit public services (e.g. medical or dentist appointment, library, job centre, community centre, etc)
5.5% 6 0.0% 0 0.0% 0 0.0% 0 0.0% 0 0.0% 0 0.0% 0 0.0% 0 0.0% 0
To get petrol 0.0% 0 0.0% 0 0.0% 0 0.0% 0 0.0% 0 0.0% 0 0.0% 0 0.0% 0 0.0% 0To visit the cinema 0.7% 1 0.0% 0 0.0% 0 0.0% 0 0.0% 0 0.0% 0 0.0% 0 0.0% 0 0.0% 0To visit a park 0.0% 0 0.0% 0 0.0% 0 0.0% 0 0.0% 0 0.0% 0 0.0% 0 0.0% 0 0.0% 0To visit the swimming pool 0.0% 0 0.0% 0 0.0% 0 0.0% 0 0.0% 0 0.0% 0 0.0% 0 0.0% 0 0.0% 0To visit other gyms / health
and fitness facilities 0.7% 1 0.0% 0 0.0% 0 0.0% 0 0.0% 0 0.0% 0 0.0% 0 0.0% 0 0.0% 0
To visit the library 0.0% 0 0.0% 0 0.0% 0 0.0% 0 0.0% 0 0.0% 0 0.0% 0 0.0% 0 0.0% 0To visit museums / art
gallery 2.6% 3 0.0% 0 0.0% 0 0.0% 0 0.0% 0 0.0% 0 0.0% 0 0.0% 0 0.0% 0
To visit the theatre or musical venues
0.8% 1 0.0% 0 0.0% 0 0.0% 0 0.0% 0 0.0% 0 0.0% 0 0.0% 0 0.0% 0
To visit night time venues e.g. nightclub
0.7% 1 0.0% 0 0.0% 0 0.0% 0 0.0% 0 0.0% 0 0.0% 0 0.0% 0 0.0% 0
For other leisure activities 21.5% 25 0.0% 0 0.0% 0 0.0% 0 0.0% 0 0.0% 0 0.0% 0 0.0% 0 0.0% 0To shop at the market(s) 0.7% 1 0.0% 0 0.0% 0 0.0% 0 0.0% 0 0.0% 0 0.0% 0 0.0% 0 0.0% 0To meet family 7.1% 8 0.0% 0 0.0% 0 0.0% 0 0.0% 0 0.0% 0 0.0% 0 0.0% 0 0.0% 0To meet friends 9.5% 11 0.0% 0 0.0% 0 0.0% 0 0.0% 0 0.0% 0 0.0% 0 0.0% 0 0.0% 0To visit the theatre 0.0% 0 0.0% 0 0.0% 0 0.0% 0 0.0% 0 0.0% 0 0.0% 0 0.0% 0 0.0% 0For work (i.e. place of work) 4.8% 6 0.0% 0 0.0% 0 0.0% 0 0.0% 0 0.0% 0 0.0% 0 0.0% 0 0.0% 0For business (e.g. attend a
business appointment) 0.0% 0 0.0% 0 0.0% 0 0.0% 0 0.0% 0 0.0% 0 0.0% 0 0.0% 0 0.0% 0
For education as a student (e.g. student at college, university, or other third level education)
3.2% 4 0.0% 0 0.0% 0 0.0% 0 0.0% 0 0.0% 0 0.0% 0 0.0% 0 0.0% 0
To access public transport for onward travel (e.g. train station, bus station)
1.2% 1 0.0% 0 0.0% 0 0.0% 0 0.0% 0 0.0% 0 0.0% 0 0.0% 0 0.0% 0
Other 0.0% 0 0.0% 0 0.0% 0 0.0% 0 0.0% 0 0.0% 0 0.0% 0 0.0% 0 0.0% 0As part of a day out / for a
day out / something different
16.6% 19 0.0% 0 0.0% 0 0.0% 0 0.0% 0 0.0% 0 0.0% 0 0.0% 0 0.0% 0
Browsing / window shopping 4.7% 5 0.0% 0 0.0% 0 0.0% 0 0.0% 0 0.0% 0 0.0% 0 0.0% 0 0.0% 0Weighted base: 117 0 0 0 0 0 0 0 0Sample: 123 0 0 0 0 0 0 0 0

by Zone (Weighted, Part 2) South Wales Retail Study Page 127 Weighted: for Carter Jonas August 2016
Total Zone 9 Zone 10 Zone 11 Zone 12 Zone 13 Zone 14 Zone 15 Zone 16
Column %ges. 020716 NEMS market research
X77 What do you like about St Davids Town Centre? [MR] Zones 11-16 and those who visit St Davids town centre at X75 Attractive environment / nice
place 56.8% 67 0.0% 0 0.0% 0 0.0% 0 0.0% 0 0.0% 0 0.0% 0 0.0% 0 0.0% 0
Close to friends or relatives 2.6% 3 0.0% 0 0.0% 0 0.0% 0 0.0% 0 0.0% 0 0.0% 0 0.0% 0 0.0% 0Close to home 9.7% 11 0.0% 0 0.0% 0 0.0% 0 0.0% 0 0.0% 0 0.0% 0 0.0% 0 0.0% 0Close to work 0.0% 0 0.0% 0 0.0% 0 0.0% 0 0.0% 0 0.0% 0 0.0% 0 0.0% 0 0.0% 0Compact 6.9% 8 0.0% 0 0.0% 0 0.0% 0 0.0% 0 0.0% 0 0.0% 0 0.0% 0 0.0% 0Easy to get to by bike 0.0% 0 0.0% 0 0.0% 0 0.0% 0 0.0% 0 0.0% 0 0.0% 0 0.0% 0 0.0% 0Easy to get to by bus 0.5% 1 0.0% 0 0.0% 0 0.0% 0 0.0% 0 0.0% 0 0.0% 0 0.0% 0 0.0% 0Easy to get to by car 0.0% 0 0.0% 0 0.0% 0 0.0% 0 0.0% 0 0.0% 0 0.0% 0 0.0% 0 0.0% 0Easy to park 1.6% 2 0.0% 0 0.0% 0 0.0% 0 0.0% 0 0.0% 0 0.0% 0 0.0% 0 0.0% 0Good facilities 0.7% 1 0.0% 0 0.0% 0 0.0% 0 0.0% 0 0.0% 0 0.0% 0 0.0% 0 0.0% 0Good food stores 0.5% 1 0.0% 0 0.0% 0 0.0% 0 0.0% 0 0.0% 0 0.0% 0 0.0% 0 0.0% 0Good pubs, cafés or
restaurants 5.6% 7 0.0% 0 0.0% 0 0.0% 0 0.0% 0 0.0% 0 0.0% 0 0.0% 0 0.0% 0
Good range of non-food shops
6.4% 7 0.0% 0 0.0% 0 0.0% 0 0.0% 0 0.0% 0 0.0% 0 0.0% 0 0.0% 0
The harbour / beach 3.5% 4 0.0% 0 0.0% 0 0.0% 0 0.0% 0 0.0% 0 0.0% 0 0.0% 0 0.0% 0Makes a change from other
places 5.1% 6 0.0% 0 0.0% 0 0.0% 0 0.0% 0 0.0% 0 0.0% 0 0.0% 0 0.0% 0
Quiet 4.8% 6 0.0% 0 0.0% 0 0.0% 0 0.0% 0 0.0% 0 0.0% 0 0.0% 0 0.0% 0Safe and secure 0.0% 0 0.0% 0 0.0% 0 0.0% 0 0.0% 0 0.0% 0 0.0% 0 0.0% 0 0.0% 0The market 0.0% 0 0.0% 0 0.0% 0 0.0% 0 0.0% 0 0.0% 0 0.0% 0 0.0% 0 0.0% 0Traditional 16.0% 19 0.0% 0 0.0% 0 0.0% 0 0.0% 0 0.0% 0 0.0% 0 0.0% 0 0.0% 0Traffic free shopping centre 0.0% 0 0.0% 0 0.0% 0 0.0% 0 0.0% 0 0.0% 0 0.0% 0 0.0% 0 0.0% 0Other 0.0% 0 0.0% 0 0.0% 0 0.0% 0 0.0% 0 0.0% 0 0.0% 0 0.0% 0 0.0% 0Cheap / free parking 0.0% 0 0.0% 0 0.0% 0 0.0% 0 0.0% 0 0.0% 0 0.0% 0 0.0% 0 0.0% 0Familiarity / habit 0.7% 1 0.0% 0 0.0% 0 0.0% 0 0.0% 0 0.0% 0 0.0% 0 0.0% 0 0.0% 0Friendly people / nice
atmosphere 3.1% 4 0.0% 0 0.0% 0 0.0% 0 0.0% 0 0.0% 0 0.0% 0 0.0% 0 0.0% 0
Good opening hours 0.0% 0 0.0% 0 0.0% 0 0.0% 0 0.0% 0 0.0% 0 0.0% 0 0.0% 0 0.0% 0Good prices 0.0% 0 0.0% 0 0.0% 0 0.0% 0 0.0% 0 0.0% 0 0.0% 0 0.0% 0 0.0% 0Good range of independent
shops 4.1% 5 0.0% 0 0.0% 0 0.0% 0 0.0% 0 0.0% 0 0.0% 0 0.0% 0 0.0% 0
Good range of services 0.0% 0 0.0% 0 0.0% 0 0.0% 0 0.0% 0 0.0% 0 0.0% 0 0.0% 0 0.0% 0(Nothing / very little) 13.0% 15 0.0% 0 0.0% 0 0.0% 0 0.0% 0 0.0% 0 0.0% 0 0.0% 0 0.0% 0(Don't know) 1.5% 2 0.0% 0 0.0% 0 0.0% 0 0.0% 0 0.0% 0 0.0% 0 0.0% 0 0.0% 0Weighted base: 117 0 0 0 0 0 0 0 0Sample: 123 0 0 0 0 0 0 0 0

by Zone (Weighted, Part 2) South Wales Retail Study Page 128 Weighted: for Carter Jonas August 2016
Total Zone 9 Zone 10 Zone 11 Zone 12 Zone 13 Zone 14 Zone 15 Zone 16
Column %ges. 020716 NEMS market research
X78 What could be improved about St Davids that would make you visit more often? [MR] Zones 3, 4 & 8 Better access by road 0.8% 3 0.0% 0 0.0% 0 0.0% 0 0.0% 0 0.0% 0 0.0% 0 0.0% 0 0.0% 0Better public transport 0.0% 0 0.0% 0 0.0% 0 0.0% 0 0.0% 0 0.0% 0 0.0% 0 0.0% 0 0.0% 0Better signposting 0.2% 1 0.0% 0 0.0% 0 0.0% 0 0.0% 0 0.0% 0 0.0% 0 0.0% 0 0.0% 0Cleaner streets 0.0% 0 0.0% 0 0.0% 0 0.0% 0 0.0% 0 0.0% 0 0.0% 0 0.0% 0 0.0% 0Facilities which would assist
you if shopping with children
0.0% 0 0.0% 0 0.0% 0 0.0% 0 0.0% 0 0.0% 0 0.0% 0 0.0% 0 0.0% 0
Free / cheaper car parking 0.4% 1 0.0% 0 0.0% 0 0.0% 0 0.0% 0 0.0% 0 0.0% 0 0.0% 0 0.0% 0Jewellery / food markets /
other events 0.0% 0 0.0% 0 0.0% 0 0.0% 0 0.0% 0 0.0% 0 0.0% 0 0.0% 0 0.0% 0
More / better comparison retailers (i.e. non-food shops)
1.8% 6 0.0% 0 0.0% 0 0.0% 0 0.0% 0 0.0% 0 0.0% 0 0.0% 0 0.0% 0
More / better entertainment 0.2% 1 0.0% 0 0.0% 0 0.0% 0 0.0% 0 0.0% 0 0.0% 0 0.0% 0 0.0% 0More / better places for
eating out (e.g. cafés and restaurants)
0.2% 1 0.0% 0 0.0% 0 0.0% 0 0.0% 0 0.0% 0 0.0% 0 0.0% 0 0.0% 0
More / better food shops 0.5% 2 0.0% 0 0.0% 0 0.0% 0 0.0% 0 0.0% 0 0.0% 0 0.0% 0 0.0% 0More / better parking 7.0% 23 0.0% 0 0.0% 0 0.0% 0 0.0% 0 0.0% 0 0.0% 0 0.0% 0 0.0% 0More / better pedestrianised
streets 0.0% 0 0.0% 0 0.0% 0 0.0% 0 0.0% 0 0.0% 0 0.0% 0 0.0% 0 0.0% 0
More / better public conveniences
0.0% 0 0.0% 0 0.0% 0 0.0% 0 0.0% 0 0.0% 0 0.0% 0 0.0% 0 0.0% 0
More / better seats / flower displays
0.0% 0 0.0% 0 0.0% 0 0.0% 0 0.0% 0 0.0% 0 0.0% 0 0.0% 0 0.0% 0
More / better services 0.2% 1 0.0% 0 0.0% 0 0.0% 0 0.0% 0 0.0% 0 0.0% 0 0.0% 0 0.0% 0More advertising 0.0% 0 0.0% 0 0.0% 0 0.0% 0 0.0% 0 0.0% 0 0.0% 0 0.0% 0 0.0% 0More national multiple shops
/ High Street shops 0.2% 1 0.0% 0 0.0% 0 0.0% 0 0.0% 0 0.0% 0 0.0% 0 0.0% 0 0.0% 0
Protection from the weather (i.e. covered shopping malls)
0.0% 0 0.0% 0 0.0% 0 0.0% 0 0.0% 0 0.0% 0 0.0% 0 0.0% 0 0.0% 0
Shops / services open on Sundays / better opening hours
0.2% 1 0.0% 0 0.0% 0 0.0% 0 0.0% 0 0.0% 0 0.0% 0 0.0% 0 0.0% 0
Fewer vacant shops 0.0% 0 0.0% 0 0.0% 0 0.0% 0 0.0% 0 0.0% 0 0.0% 0 0.0% 0 0.0% 0Better maintained buildings 0.2% 1 0.0% 0 0.0% 0 0.0% 0 0.0% 0 0.0% 0 0.0% 0 0.0% 0 0.0% 0Better disabled access 0.0% 0 0.0% 0 0.0% 0 0.0% 0 0.0% 0 0.0% 0 0.0% 0 0.0% 0 0.0% 0Better prices 1.5% 5 0.0% 0 0.0% 0 0.0% 0 0.0% 0 0.0% 0 0.0% 0 0.0% 0 0.0% 0Better quality shops 0.0% 0 0.0% 0 0.0% 0 0.0% 0 0.0% 0 0.0% 0 0.0% 0 0.0% 0 0.0% 0Fewer charity shops 0.0% 0 0.0% 0 0.0% 0 0.0% 0 0.0% 0 0.0% 0 0.0% 0 0.0% 0 0.0% 0Improve the environment /
refurbish 0.4% 1 0.0% 0 0.0% 0 0.0% 0 0.0% 0 0.0% 0 0.0% 0 0.0% 0 0.0% 0
Less congestion / too busy 0.6% 2 0.0% 0 0.0% 0 0.0% 0 0.0% 0 0.0% 0 0.0% 0 0.0% 0 0.0% 0More independent shops 1.1% 4 0.0% 0 0.0% 0 0.0% 0 0.0% 0 0.0% 0 0.0% 0 0.0% 0 0.0% 0Other 0.0% 0 0.0% 0 0.0% 0 0.0% 0 0.0% 0 0.0% 0 0.0% 0 0.0% 0 0.0% 0(Nothing) 68.6% 228 0.0% 0 0.0% 0 0.0% 0 0.0% 0 0.0% 0 0.0% 0 0.0% 0 0.0% 0(Don’t know) 19.6% 65 0.0% 0 0.0% 0 0.0% 0 0.0% 0 0.0% 0 0.0% 0 0.0% 0 0.0% 0Weighted base: 332 0 0 0 0 0 0 0 0Sample: 301 0 0 0 0 0 0 0 0
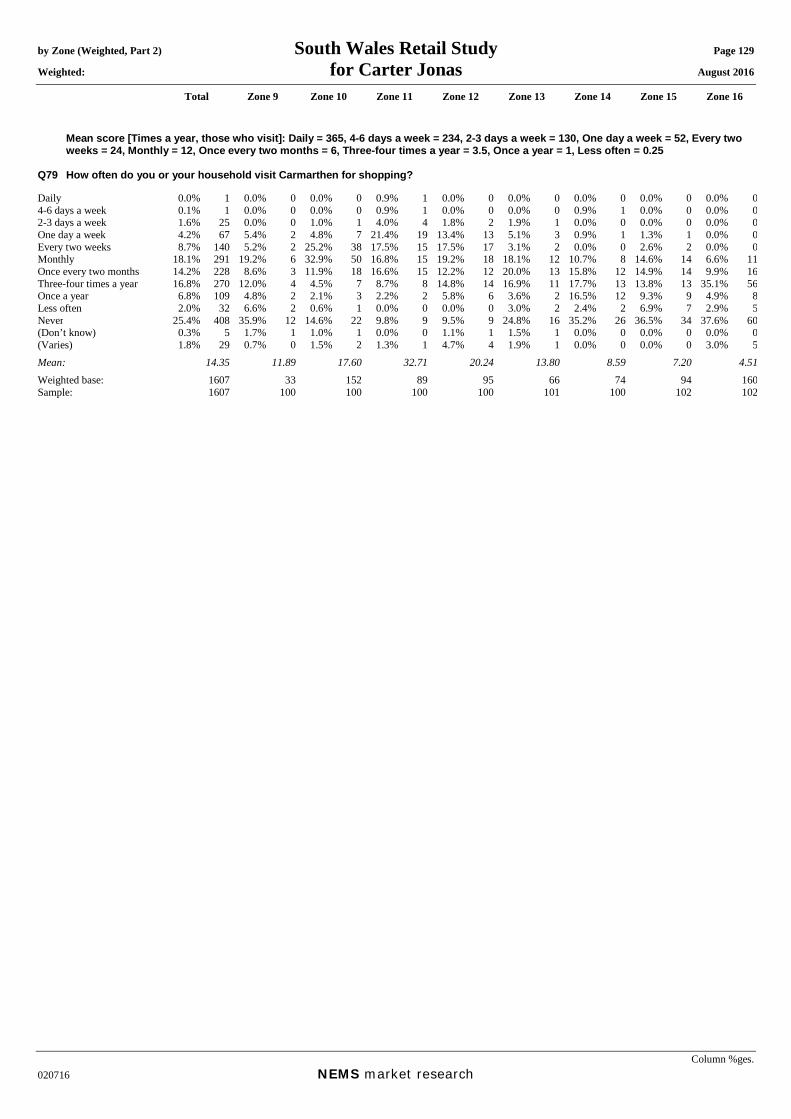
by Zone (Weighted, Part 2) South Wales Retail Study Page 129 Weighted: for Carter Jonas August 2016
Total Zone 9 Zone 10 Zone 11 Zone 12 Zone 13 Zone 14 Zone 15 Zone 16
Column %ges. 020716 NEMS market research
Mean score [Times a year, those who visit]: Daily = 365, 4-6 days a week = 234, 2-3 days a week = 130, One day a week = 52, Every two weeks = 24, Monthly = 12, Once every two months = 6, Three-four times a year = 3.5, Once a year = 1, Less often = 0.25
Q79 How often do you or your household visit Carmarthen for shopping? Daily 0.0% 1 0.0% 0 0.0% 0 0.9% 1 0.0% 0 0.0% 0 0.0% 0 0.0% 0 0.0% 04-6 days a week 0.1% 1 0.0% 0 0.0% 0 0.9% 1 0.0% 0 0.0% 0 0.9% 1 0.0% 0 0.0% 02-3 days a week 1.6% 25 0.0% 0 1.0% 1 4.0% 4 1.8% 2 1.9% 1 0.0% 0 0.0% 0 0.0% 0One day a week 4.2% 67 5.4% 2 4.8% 7 21.4% 19 13.4% 13 5.1% 3 0.9% 1 1.3% 1 0.0% 0Every two weeks 8.7% 140 5.2% 2 25.2% 38 17.5% 15 17.5% 17 3.1% 2 0.0% 0 2.6% 2 0.0% 0Monthly 18.1% 291 19.2% 6 32.9% 50 16.8% 15 19.2% 18 18.1% 12 10.7% 8 14.6% 14 6.6% 11Once every two months 14.2% 228 8.6% 3 11.9% 18 16.6% 15 12.2% 12 20.0% 13 15.8% 12 14.9% 14 9.9% 16Three-four times a year 16.8% 270 12.0% 4 4.5% 7 8.7% 8 14.8% 14 16.9% 11 17.7% 13 13.8% 13 35.1% 56Once a year 6.8% 109 4.8% 2 2.1% 3 2.2% 2 5.8% 6 3.6% 2 16.5% 12 9.3% 9 4.9% 8Less often 2.0% 32 6.6% 2 0.6% 1 0.0% 0 0.0% 0 3.0% 2 2.4% 2 6.9% 7 2.9% 5Never 25.4% 408 35.9% 12 14.6% 22 9.8% 9 9.5% 9 24.8% 16 35.2% 26 36.5% 34 37.6% 60(Don’t know) 0.3% 5 1.7% 1 1.0% 1 0.0% 0 1.1% 1 1.5% 1 0.0% 0 0.0% 0 0.0% 0(Varies) 1.8% 29 0.7% 0 1.5% 2 1.3% 1 4.7% 4 1.9% 1 0.0% 0 0.0% 0 3.0% 5Mean: 14.35 11.89 17.60 32.71 20.24 13.80 8.59 7.20 4.51Weighted base: 1607 33 152 89 95 66 74 94 160Sample: 1607 100 100 100 100 101 100 102 102

by Zone (Weighted, Part 2) South Wales Retail Study Page 130 Weighted: for Carter Jonas August 2016
Total Zone 9 Zone 10 Zone 11 Zone 12 Zone 13 Zone 14 Zone 15 Zone 16
Column %ges. 020716 NEMS market research
Q80A In order of importance, what are your two main reasons for visiting Carmarthen Town Centre instead of shopping facilities in Pembrokeshire or Ceredigion? Main reason:
Those who visit Carmarthen town centre at Q79 Food shopping 10.3% 124 6.2% 1 17.6% 23 36.4% 29 16.3% 14 14.0% 7 0.0% 0 11.3% 7 9.7% 10Non-food shopping 66.8% 800 63.4% 13 58.0% 75 43.6% 35 59.9% 52 62.6% 31 83.5% 40 73.3% 44 71.1% 71To visit bars / pubs 0.1% 1 0.0% 0 0.0% 0 0.0% 0 0.0% 0 1.2% 1 0.0% 0 0.0% 0 0.0% 0To visit cafés / restaurants 1.9% 23 1.1% 0 4.6% 6 2.7% 2 2.2% 2 0.9% 0 0.0% 0 1.1% 1 1.6% 2To visit personal service
providers (e.g. hairdressers, beauty salon etc.)
0.2% 3 0.0% 0 0.0% 0 0.7% 1 0.0% 0 1.2% 1 0.0% 0 1.4% 1 0.0% 0
To visit financial services such as banks and other financial institutions
0.5% 6 0.0% 0 0.7% 1 3.5% 3 1.0% 1 0.0% 0 0.0% 0 0.0% 0 0.0% 0
To visit other service providers (e.g. travel agent, estate agent etc.)
0.2% 2 0.0% 0 0.0% 0 0.0% 0 0.0% 0 0.0% 0 0.0% 0 0.0% 0 1.2% 1
To visit public services (e.g. medical or dentist appointment, library, job centre, community centre, etc)
3.7% 44 2.5% 1 8.8% 11 3.6% 3 6.5% 6 3.2% 2 7.1% 3 1.4% 1 1.6% 2
To get petrol 0.1% 1 0.0% 0 0.0% 0 0.0% 0 0.8% 1 0.0% 0 0.0% 0 0.0% 0 0.0% 0To visit the cinema 6.6% 79 1.5% 0 3.2% 4 1.0% 1 2.0% 2 0.0% 0 0.0% 0 3.1% 2 0.0% 0To visit a park 0.0% 0 0.0% 0 0.0% 0 0.0% 0 0.0% 0 0.0% 0 0.0% 0 0.0% 0 0.0% 0To visit the swimming pool 0.0% 0 0.0% 0 0.0% 0 0.0% 0 0.0% 0 0.0% 0 0.0% 0 0.0% 0 0.0% 0To visit other gyms / health
and fitness facilities 0.0% 0 0.0% 0 0.0% 0 0.0% 0 0.0% 0 0.0% 0 0.0% 0 0.0% 0 0.0% 0
To visit the library 0.0% 0 0.0% 0 0.0% 0 0.0% 0 0.0% 0 0.0% 0 0.0% 0 0.0% 0 0.0% 0To visit museums / art
gallery 0.1% 1 0.0% 0 0.0% 0 0.0% 0 1.0% 1 0.0% 0 0.0% 0 0.0% 0 0.0% 0
To visit the theatre or musical venues
0.0% 0 0.0% 0 0.0% 0 0.0% 0 0.0% 0 0.0% 0 0.0% 0 0.0% 0 0.0% 0
To visit night time venues e.g. nightclub
0.0% 0 0.0% 0 0.0% 0 0.0% 0 0.0% 0 0.0% 0 0.0% 0 0.0% 0 0.0% 0
For other leisure activities 1.7% 21 1.5% 0 1.0% 1 2.1% 2 1.1% 1 2.5% 1 0.0% 0 1.1% 1 0.0% 0To shop at the market(s) 0.3% 4 0.0% 0 0.0% 0 1.0% 1 0.8% 1 0.0% 0 0.0% 0 1.1% 1 1.2% 1To meet family 2.4% 29 16.0% 3 1.0% 1 0.7% 1 0.8% 1 6.5% 3 3.3% 2 3.8% 2 7.9% 8To meet friends 0.6% 7 0.0% 0 0.0% 0 0.0% 0 1.8% 2 0.0% 0 0.0% 0 1.1% 1 1.2% 1To visit the theatre 0.0% 0 0.0% 0 0.0% 0 0.0% 0 0.0% 0 0.0% 0 0.0% 0 0.0% 0 0.0% 0For work (i.e. place of work) 1.1% 14 0.0% 0 3.0% 4 2.7% 2 1.0% 1 2.6% 1 2.4% 1 0.0% 0 0.0% 0For business (e.g. attend a
business appointment) 0.0% 0 0.0% 0 0.0% 0 0.0% 0 0.0% 0 0.0% 0 0.0% 0 0.0% 0 0.0% 0
For education as a student (e.g. student at college, university, or other third level education)
0.4% 5 0.0% 0 0.0% 0 0.0% 0 0.0% 0 0.0% 0 0.0% 0 0.0% 0 0.0% 0
To access public transport for onward travel (e.g. train station, bus station)
0.5% 6 1.1% 0 0.0% 0 0.0% 0 2.0% 2 0.0% 0 1.0% 0 0.0% 0 1.6% 2
Other 0.0% 0 0.0% 0 0.0% 0 0.0% 0 0.0% 0 0.0% 0 0.0% 0 0.0% 0 0.0% 0As part of a day out / for a
day out / something different
0.3% 3 2.1% 0 0.0% 0 0.0% 0 0.0% 0 0.9% 0 0.0% 0 0.0% 0 0.0% 0
Browsing / window shopping 0.3% 3 1.1% 0 0.0% 0 0.0% 0 0.0% 0 0.0% 0 0.0% 0 0.0% 0 0.0% 0(Don't know / varies) 0.9% 11 2.7% 1 1.0% 1 0.0% 0 2.7% 2 4.4% 2 2.7% 1 0.0% 0 1.8% 2(Nothing / nothing further) 1.1% 13 1.1% 0 1.1% 1 2.0% 2 0.0% 0 0.0% 0 0.0% 0 1.4% 1 1.2% 1Weighted base: 1199 21 129 80 86 50 48 60 100Sample: 1138 55 83 91 90 71 59 70 59
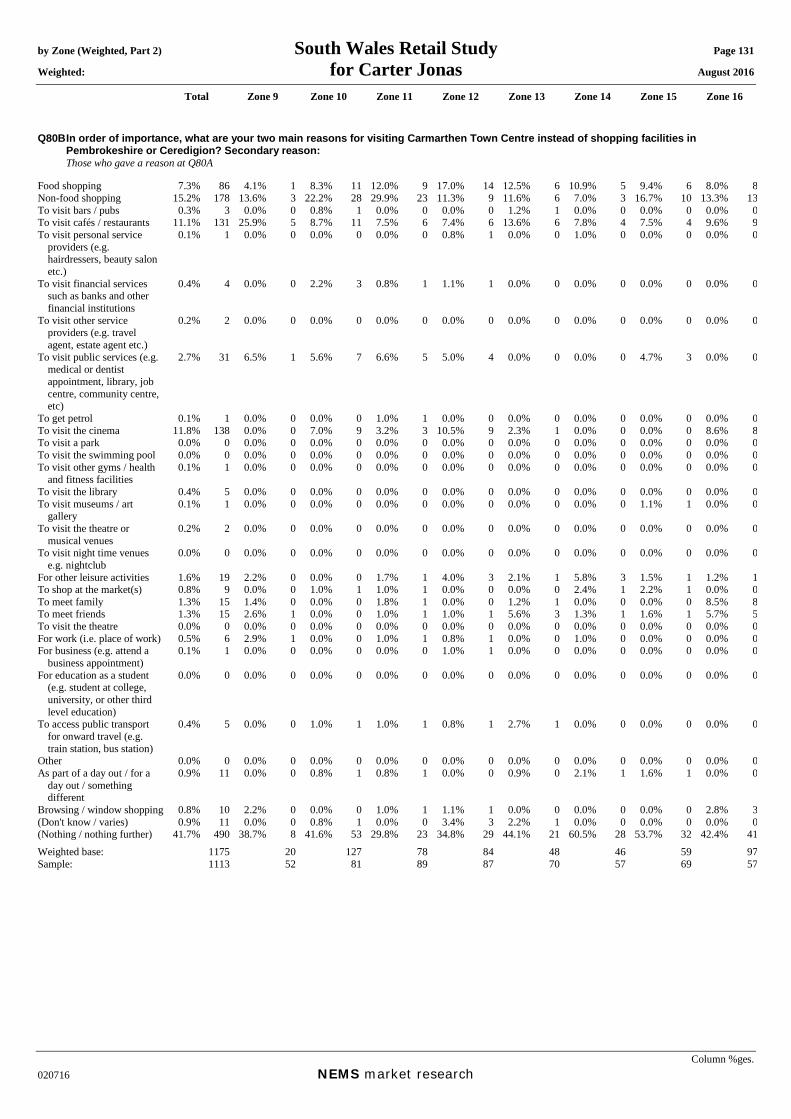
by Zone (Weighted, Part 2) South Wales Retail Study Page 131 Weighted: for Carter Jonas August 2016
Total Zone 9 Zone 10 Zone 11 Zone 12 Zone 13 Zone 14 Zone 15 Zone 16
Column %ges. 020716 NEMS market research
Q80B In order of importance, what are your two main reasons for visiting Carmarthen Town Centre instead of shopping facilities in Pembrokeshire or Ceredigion? Secondary reason:
Those who gave a reason at Q80A Food shopping 7.3% 86 4.1% 1 8.3% 11 12.0% 9 17.0% 14 12.5% 6 10.9% 5 9.4% 6 8.0% 8Non-food shopping 15.2% 178 13.6% 3 22.2% 28 29.9% 23 11.3% 9 11.6% 6 7.0% 3 16.7% 10 13.3% 13To visit bars / pubs 0.3% 3 0.0% 0 0.8% 1 0.0% 0 0.0% 0 1.2% 1 0.0% 0 0.0% 0 0.0% 0To visit cafés / restaurants 11.1% 131 25.9% 5 8.7% 11 7.5% 6 7.4% 6 13.6% 6 7.8% 4 7.5% 4 9.6% 9To visit personal service
providers (e.g. hairdressers, beauty salon etc.)
0.1% 1 0.0% 0 0.0% 0 0.0% 0 0.8% 1 0.0% 0 1.0% 0 0.0% 0 0.0% 0
To visit financial services such as banks and other financial institutions
0.4% 4 0.0% 0 2.2% 3 0.8% 1 1.1% 1 0.0% 0 0.0% 0 0.0% 0 0.0% 0
To visit other service providers (e.g. travel agent, estate agent etc.)
0.2% 2 0.0% 0 0.0% 0 0.0% 0 0.0% 0 0.0% 0 0.0% 0 0.0% 0 0.0% 0
To visit public services (e.g. medical or dentist appointment, library, job centre, community centre, etc)
2.7% 31 6.5% 1 5.6% 7 6.6% 5 5.0% 4 0.0% 0 0.0% 0 4.7% 3 0.0% 0
To get petrol 0.1% 1 0.0% 0 0.0% 0 1.0% 1 0.0% 0 0.0% 0 0.0% 0 0.0% 0 0.0% 0To visit the cinema 11.8% 138 0.0% 0 7.0% 9 3.2% 3 10.5% 9 2.3% 1 0.0% 0 0.0% 0 8.6% 8To visit a park 0.0% 0 0.0% 0 0.0% 0 0.0% 0 0.0% 0 0.0% 0 0.0% 0 0.0% 0 0.0% 0To visit the swimming pool 0.0% 0 0.0% 0 0.0% 0 0.0% 0 0.0% 0 0.0% 0 0.0% 0 0.0% 0 0.0% 0To visit other gyms / health
and fitness facilities 0.1% 1 0.0% 0 0.0% 0 0.0% 0 0.0% 0 0.0% 0 0.0% 0 0.0% 0 0.0% 0
To visit the library 0.4% 5 0.0% 0 0.0% 0 0.0% 0 0.0% 0 0.0% 0 0.0% 0 0.0% 0 0.0% 0To visit museums / art
gallery 0.1% 1 0.0% 0 0.0% 0 0.0% 0 0.0% 0 0.0% 0 0.0% 0 1.1% 1 0.0% 0
To visit the theatre or musical venues
0.2% 2 0.0% 0 0.0% 0 0.0% 0 0.0% 0 0.0% 0 0.0% 0 0.0% 0 0.0% 0
To visit night time venues e.g. nightclub
0.0% 0 0.0% 0 0.0% 0 0.0% 0 0.0% 0 0.0% 0 0.0% 0 0.0% 0 0.0% 0
For other leisure activities 1.6% 19 2.2% 0 0.0% 0 1.7% 1 4.0% 3 2.1% 1 5.8% 3 1.5% 1 1.2% 1To shop at the market(s) 0.8% 9 0.0% 0 1.0% 1 1.0% 1 0.0% 0 0.0% 0 2.4% 1 2.2% 1 0.0% 0To meet family 1.3% 15 1.4% 0 0.0% 0 1.8% 1 0.0% 0 1.2% 1 0.0% 0 0.0% 0 8.5% 8To meet friends 1.3% 15 2.6% 1 0.0% 0 1.0% 1 1.0% 1 5.6% 3 1.3% 1 1.6% 1 5.7% 5To visit the theatre 0.0% 0 0.0% 0 0.0% 0 0.0% 0 0.0% 0 0.0% 0 0.0% 0 0.0% 0 0.0% 0For work (i.e. place of work) 0.5% 6 2.9% 1 0.0% 0 1.0% 1 0.8% 1 0.0% 0 1.0% 0 0.0% 0 0.0% 0For business (e.g. attend a
business appointment) 0.1% 1 0.0% 0 0.0% 0 0.0% 0 1.0% 1 0.0% 0 0.0% 0 0.0% 0 0.0% 0
For education as a student (e.g. student at college, university, or other third level education)
0.0% 0 0.0% 0 0.0% 0 0.0% 0 0.0% 0 0.0% 0 0.0% 0 0.0% 0 0.0% 0
To access public transport for onward travel (e.g. train station, bus station)
0.4% 5 0.0% 0 1.0% 1 1.0% 1 0.8% 1 2.7% 1 0.0% 0 0.0% 0 0.0% 0
Other 0.0% 0 0.0% 0 0.0% 0 0.0% 0 0.0% 0 0.0% 0 0.0% 0 0.0% 0 0.0% 0As part of a day out / for a
day out / something different
0.9% 11 0.0% 0 0.8% 1 0.8% 1 0.0% 0 0.9% 0 2.1% 1 1.6% 1 0.0% 0
Browsing / window shopping 0.8% 10 2.2% 0 0.0% 0 1.0% 1 1.1% 1 0.0% 0 0.0% 0 0.0% 0 2.8% 3(Don't know / varies) 0.9% 11 0.0% 0 0.8% 1 0.0% 0 3.4% 3 2.2% 1 0.0% 0 0.0% 0 0.0% 0(Nothing / nothing further) 41.7% 490 38.7% 8 41.6% 53 29.8% 23 34.8% 29 44.1% 21 60.5% 28 53.7% 32 42.4% 41Weighted base: 1175 20 127 78 84 48 46 59 97Sample: 1113 52 81 89 87 70 57 69 57

by Zone (Weighted, Part 2) South Wales Retail Study Page 132 Weighted: for Carter Jonas August 2016
Total Zone 9 Zone 10 Zone 11 Zone 12 Zone 13 Zone 14 Zone 15 Zone 16
Column %ges. 020716 NEMS market research
Q80X In order of importance, what are your two main reasons for visiting Carmarthen Town Centre instead of shopping facilities in Pembrokeshire or Ceredigion? Any mention:
Those who visit Carmarthen town centre at Q79 Food shopping 17.5% 210 10.1% 2 25.8% 33 48.1% 38 32.9% 28 25.9% 13 10.6% 5 20.6% 12 17.5% 18Non-food shopping 81.6% 978 76.4% 16 79.7% 103 72.8% 58 70.8% 61 73.7% 37 90.3% 43 89.7% 54 84.0% 84To visit bars / pubs 0.4% 4 0.0% 0 0.7% 1 0.0% 0 0.0% 0 2.4% 1 0.0% 0 0.0% 0 0.0% 0To visit cafés / restaurants 12.8% 153 26.0% 5 13.2% 17 10.1% 8 9.4% 8 13.8% 7 7.6% 4 8.5% 5 10.9% 11To visit personal service
providers (e.g. hairdressers, beauty salon etc.)
0.3% 4 0.0% 0 0.0% 0 0.7% 1 0.8% 1 1.2% 1 1.0% 0 1.4% 1 0.0% 0
To visit financial services such as banks and other financial institutions
0.9% 10 0.0% 0 2.9% 4 4.2% 3 2.1% 2 0.0% 0 0.0% 0 0.0% 0 0.0% 0
To visit other service providers (e.g. travel agent, estate agent etc.)
0.4% 5 0.0% 0 0.0% 0 0.0% 0 0.0% 0 0.0% 0 0.0% 0 0.0% 0 1.2% 1
To visit public services (e.g. medical or dentist appointment, library, job centre, community centre, etc)
6.3% 76 8.8% 2 14.3% 18 10.1% 8 11.3% 10 3.2% 2 7.1% 3 6.0% 4 1.6% 2
To get petrol 0.1% 1 0.0% 0 0.0% 0 1.0% 1 0.8% 1 0.0% 0 0.0% 0 0.0% 0 0.0% 0To visit the cinema 18.1% 217 1.5% 0 10.0% 13 4.2% 3 12.3% 11 2.2% 1 0.0% 0 3.1% 2 8.3% 8To visit a park 0.0% 0 0.0% 0 0.0% 0 0.0% 0 0.0% 0 0.0% 0 0.0% 0 0.0% 0 0.0% 0To visit the swimming pool 0.0% 0 0.0% 0 0.0% 0 0.0% 0 0.0% 0 0.0% 0 0.0% 0 0.0% 0 0.0% 0To visit other gyms / health
and fitness facilities 0.1% 1 0.0% 0 0.0% 0 0.0% 0 0.0% 0 0.0% 0 0.0% 0 0.0% 0 0.0% 0
To visit the library 0.4% 5 0.0% 0 0.0% 0 0.0% 0 0.0% 0 0.0% 0 0.0% 0 0.0% 0 0.0% 0To visit museums / art
gallery 0.1% 2 0.0% 0 0.0% 0 0.0% 0 1.0% 1 0.0% 0 0.0% 0 1.1% 1 0.0% 0
To visit the theatre or musical venues
0.2% 2 0.0% 0 0.0% 0 0.0% 0 0.0% 0 0.0% 0 0.0% 0 0.0% 0 0.0% 0
To visit night time venues e.g. nightclub
0.0% 0 0.0% 0 0.0% 0 0.0% 0 0.0% 0 0.0% 0 0.0% 0 0.0% 0 0.0% 0
For other leisure activities 3.3% 39 3.6% 1 1.0% 1 3.8% 3 4.9% 4 4.5% 2 5.7% 3 2.5% 2 1.2% 1To shop at the market(s) 1.1% 13 0.0% 0 1.0% 1 1.9% 2 0.8% 1 0.0% 0 2.3% 1 3.2% 2 1.2% 1To meet family 3.7% 44 17.4% 4 1.0% 1 2.5% 2 0.8% 1 7.6% 4 3.3% 2 3.8% 2 16.1% 16To meet friends 1.9% 22 2.5% 1 0.0% 0 1.0% 1 2.9% 2 5.3% 3 1.3% 1 2.7% 2 6.7% 7To visit the theatre 0.0% 0 0.0% 0 0.0% 0 0.0% 0 0.0% 0 0.0% 0 0.0% 0 0.0% 0 0.0% 0For work (i.e. place of work) 1.6% 19 2.8% 1 3.0% 4 3.7% 3 1.8% 2 2.6% 1 3.4% 2 0.0% 0 0.0% 0For business (e.g. attend a
business appointment) 0.1% 1 0.0% 0 0.0% 0 0.0% 0 1.0% 1 0.0% 0 0.0% 0 0.0% 0 0.0% 0
For education as a student (e.g. student at college, university, or other third level education)
0.4% 5 0.0% 0 0.0% 0 0.0% 0 0.0% 0 0.0% 0 0.0% 0 0.0% 0 0.0% 0
To access public transport for onward travel (e.g. train station, bus station)
0.9% 11 1.1% 0 1.0% 1 1.0% 1 2.8% 2 2.6% 1 1.0% 0 0.0% 0 1.6% 2
Other 0.0% 0 0.0% 0 0.0% 0 0.0% 0 0.0% 0 0.0% 0 0.0% 0 0.0% 0 0.0% 0As part of a day out / for a
day out / something different
1.2% 14 2.1% 0 0.7% 1 0.7% 1 0.0% 0 1.8% 1 2.0% 1 1.6% 1 0.0% 0
Browsing / window shopping 1.1% 13 3.2% 1 0.0% 0 1.0% 1 1.1% 1 0.0% 0 0.0% 0 0.0% 0 2.7% 3Weighted base: 1199 21 129 80 86 50 48 60 100Sample: 1138 55 83 91 90 71 59 70 59

by Zone (Weighted, Part 2) South Wales Retail Study Page 133 Weighted: for Carter Jonas August 2016
Total Zone 9 Zone 10 Zone 11 Zone 12 Zone 13 Zone 14 Zone 15 Zone 16
Column %ges. 020716 NEMS market research
Mean score [Times a year, those who visit]: Daily = 365, 4-6 days a week = 234, 2-3 days a week = 130, One day a week = 52, Every two weeks = 24, Monthly = 12, Once every two months = 6, Three-four times a year = 3.5, Once a year = 1, Less often = 0.25
Q81 How often do you or your household visit Swansea City Centre for shopping? Daily 0.0% 0 0.0% 0 0.0% 0 0.0% 0 0.0% 0 0.0% 0 0.0% 0 0.0% 0 0.0% 04-6 days a week 0.0% 0 0.0% 0 0.0% 0 0.0% 0 0.0% 0 0.0% 0 0.0% 0 0.0% 0 0.0% 02-3 days a week 0.2% 3 0.0% 0 0.0% 0 0.0% 0 0.0% 0 0.0% 0 0.0% 0 0.7% 1 0.0% 0One day a week 0.4% 7 0.0% 0 0.0% 0 0.0% 0 0.0% 0 0.0% 0 0.0% 0 3.4% 3 0.0% 0Every two weeks 1.0% 16 0.0% 0 0.0% 0 0.9% 1 0.9% 1 0.0% 0 0.0% 0 0.0% 0 0.0% 0Monthly 2.3% 37 0.9% 0 3.7% 6 1.7% 2 3.5% 3 1.5% 1 0.9% 1 0.0% 0 1.0% 2Once every two months 3.1% 49 0.9% 0 0.9% 1 0.0% 0 3.0% 3 5.5% 4 0.9% 1 3.5% 3 3.1% 5Three-four times a year 9.4% 151 4.8% 2 4.1% 6 12.0% 11 14.7% 14 11.4% 8 10.7% 8 3.6% 3 4.1% 7Once a year 8.5% 136 5.3% 2 11.7% 18 17.5% 16 12.6% 12 5.0% 3 10.3% 8 9.4% 9 4.9% 8Less often 2.1% 33 3.5% 1 1.7% 3 0.7% 1 5.4% 5 4.7% 3 1.5% 1 3.2% 3 2.0% 3Never 72.8% 1169 81.7% 27 77.9% 118 67.2% 60 57.4% 55 71.2% 47 75.8% 56 75.6% 71 84.9% 136(Don’t know) 0.2% 3 1.0% 0 0.0% 0 0.0% 0 1.8% 2 0.0% 0 0.0% 0 0.0% 0 0.0% 0(Varies) 0.2% 3 1.7% 1 0.0% 0 0.0% 0 0.7% 1 0.7% 0 0.0% 0 0.7% 1 0.0% 0Mean: 5.74 2.57 3.44 3.10 3.68 3.48 2.64 12.93 3.35Weighted base: 1607 33 152 89 95 66 74 94 160Sample: 1607 100 100 100 100 101 100 102 102

by Zone (Weighted, Part 2) South Wales Retail Study Page 134 Weighted: for Carter Jonas August 2016
Total Zone 9 Zone 10 Zone 11 Zone 12 Zone 13 Zone 14 Zone 15 Zone 16
Column %ges. 020716 NEMS market research
Q82A In order of importance, what are your two main reasons for visiting Swansea City Centre instead of shopping facilities in Pembrokeshire or Ceredigion? Main reason:
Those who visit Swansea city centre at Q79 Food shopping 2.5% 11 0.0% 0 12.2% 4 0.0% 0 2.3% 1 0.0% 0 0.0% 0 0.0% 0 0.0% 0Non-food shopping 71.5% 313 85.0% 5 69.7% 23 58.2% 17 54.8% 22 61.0% 12 76.1% 14 79.1% 18 71.3% 17To visit bars / pubs 0.0% 0 0.0% 0 0.0% 0 0.0% 0 0.0% 0 0.0% 0 0.0% 0 0.0% 0 0.0% 0To visit cafés / restaurants 1.1% 5 0.0% 0 0.0% 0 0.0% 0 0.0% 0 0.0% 0 0.0% 0 3.8% 1 0.0% 0To visit personal service
providers (e.g. hairdressers, beauty salon etc.)
0.1% 0 0.0% 0 0.0% 0 0.0% 0 0.0% 0 0.0% 0 0.0% 0 0.0% 0 0.0% 0
To visit financial services such as banks and other financial institutions
0.3% 1 0.0% 0 0.0% 0 0.0% 0 0.0% 0 0.0% 0 0.0% 0 0.0% 0 0.0% 0
To visit other service providers (e.g. travel agent, estate agent etc.)
0.0% 0 0.0% 0 0.0% 0 0.0% 0 0.0% 0 0.0% 0 0.0% 0 0.0% 0 0.0% 0
To visit public services (e.g. medical or dentist appointment, library, job centre, community centre, etc)
4.0% 17 0.0% 0 0.0% 0 2.8% 1 16.9% 7 10.0% 2 7.8% 1 0.0% 0 12.7% 3
To get petrol 0.0% 0 0.0% 0 0.0% 0 0.0% 0 0.0% 0 0.0% 0 0.0% 0 0.0% 0 0.0% 0To visit the cinema 1.1% 5 0.0% 0 0.0% 0 0.0% 0 0.0% 0 0.0% 0 3.7% 1 0.0% 0 0.0% 0To visit a park 0.0% 0 0.0% 0 0.0% 0 0.0% 0 0.0% 0 0.0% 0 0.0% 0 0.0% 0 0.0% 0To visit the swimming pool 0.0% 0 0.0% 0 0.0% 0 0.0% 0 0.0% 0 0.0% 0 0.0% 0 0.0% 0 0.0% 0To visit other gyms / health
and fitness facilities 0.0% 0 0.0% 0 0.0% 0 0.0% 0 0.0% 0 0.0% 0 0.0% 0 0.0% 0 0.0% 0
To visit the library 0.0% 0 0.0% 0 0.0% 0 0.0% 0 0.0% 0 0.0% 0 0.0% 0 0.0% 0 0.0% 0To visit museums / art
gallery 0.0% 0 0.0% 0 0.0% 0 0.0% 0 0.0% 0 0.0% 0 0.0% 0 0.0% 0 0.0% 0
To visit the theatre or musical venues
1.5% 6 0.0% 0 0.0% 0 0.0% 0 2.2% 1 0.0% 0 0.0% 0 0.0% 0 4.9% 1
To visit night time venues e.g. nightclub
0.0% 0 0.0% 0 0.0% 0 0.0% 0 0.0% 0 0.0% 0 0.0% 0 0.0% 0 0.0% 0
For other leisure activities 3.7% 16 0.0% 0 0.0% 0 5.9% 2 4.4% 2 3.2% 1 0.0% 0 0.0% 0 0.0% 0To shop at the market(s) 0.5% 2 0.0% 0 0.0% 0 0.0% 0 2.3% 1 0.0% 0 2.7% 0 2.8% 1 0.0% 0To meet family 4.0% 17 0.0% 0 6.8% 2 5.3% 2 0.0% 0 4.6% 1 3.5% 1 14.3% 3 4.9% 1To meet friends 1.0% 4 0.0% 0 2.9% 1 0.0% 0 0.0% 0 0.0% 0 3.5% 1 0.0% 0 0.0% 0To visit the theatre 0.6% 2 0.0% 0 0.0% 0 5.4% 2 0.0% 0 0.0% 0 0.0% 0 0.0% 0 0.0% 0For work (i.e. place of work) 0.2% 1 0.0% 0 0.0% 0 0.0% 0 2.2% 1 0.0% 0 0.0% 0 0.0% 0 0.0% 0For business (e.g. attend a
business appointment) 0.2% 1 0.0% 0 0.0% 0 0.0% 0 1.7% 1 0.0% 0 0.0% 0 0.0% 0 0.0% 0
For education as a student (e.g. student at college, university, or other third level education)
0.0% 0 0.0% 0 0.0% 0 0.0% 0 0.0% 0 0.0% 0 0.0% 0 0.0% 0 0.0% 0
To access public transport for onward travel (e.g. train station, bus station)
1.3% 6 0.0% 0 0.0% 0 10.2% 3 3.8% 2 6.2% 1 0.0% 0 0.0% 0 0.0% 0
Other 0.0% 0 0.0% 0 0.0% 0 0.0% 0 0.0% 0 0.0% 0 0.0% 0 0.0% 0 0.0% 0As part of a day out / for a
day out / something different
3.1% 14 0.0% 0 8.3% 3 0.0% 0 0.0% 0 0.0% 0 2.7% 0 0.0% 0 6.3% 2
Browsing / window shopping 0.5% 2 0.0% 0 0.0% 0 0.0% 0 0.0% 0 0.0% 0 0.0% 0 0.0% 0 0.0% 0(Don't know / varies) 1.3% 6 5.6% 0 0.0% 0 2.0% 1 2.5% 1 15.0% 3 0.0% 0 0.0% 0 0.0% 0(Nothing / nothing further) 1.8% 8 9.4% 1 0.0% 0 10.2% 3 7.1% 3 0.0% 0 0.0% 0 0.0% 0 0.0% 0Weighted base: 438 6 33 29 41 19 18 23 24Sample: 374 16 19 28 35 24 22 19 15

by Zone (Weighted, Part 2) South Wales Retail Study Page 135 Weighted: for Carter Jonas August 2016
Total Zone 9 Zone 10 Zone 11 Zone 12 Zone 13 Zone 14 Zone 15 Zone 16
Column %ges. 020716 NEMS market research
Q82B In order of importance, what are your two main reasons for visiting Swansea City Centre instead of shopping facilities in Pembrokeshire or Ceredigion? Secondary reason: [MR]
Those who gave a reason at Q82A Food shopping 2.9% 12 5.7% 0 0.0% 0 0.0% 0 2.4% 1 0.0% 0 3.5% 1 17.4% 4 0.0% 0Non-food shopping 12.2% 52 0.0% 0 16.2% 5 9.2% 2 9.1% 3 15.5% 3 11.3% 2 14.5% 3 0.0% 0To visit bars / pubs 0.4% 2 22.0% 1 0.0% 0 3.0% 1 0.0% 0 0.0% 0 0.0% 0 0.0% 0 0.0% 0To visit cafés / restaurants 10.2% 43 16.1% 1 0.0% 0 3.0% 1 9.1% 3 2.7% 0 15.6% 3 3.6% 1 6.6% 2To visit personal service
providers (e.g. hairdressers, beauty salon etc.)
0.1% 1 0.0% 0 0.0% 0 0.0% 0 0.0% 0 3.6% 1 0.0% 0 0.0% 0 0.0% 0
To visit financial services such as banks and other financial institutions
0.0% 0 0.0% 0 0.0% 0 0.0% 0 0.0% 0 0.0% 0 0.0% 0 0.0% 0 0.0% 0
To visit other service providers (e.g. travel agent, estate agent etc.)
0.9% 4 0.0% 0 0.0% 0 0.0% 0 1.8% 1 13.6% 2 0.0% 0 0.0% 0 0.0% 0
To visit public services (e.g. medical or dentist appointment, library, job centre, community centre, etc)
0.9% 4 0.0% 0 2.9% 1 3.0% 1 0.0% 0 0.0% 0 2.7% 0 0.0% 0 0.0% 0
To get petrol 0.0% 0 0.0% 0 0.0% 0 0.0% 0 0.0% 0 0.0% 0 0.0% 0 0.0% 0 0.0% 0To visit the cinema 1.7% 7 6.0% 0 0.0% 0 0.0% 0 5.3% 2 0.0% 0 0.0% 0 0.0% 0 0.0% 0To visit a park 0.0% 0 0.0% 0 0.0% 0 0.0% 0 0.0% 0 0.0% 0 0.0% 0 0.0% 0 0.0% 0To visit the swimming pool 0.6% 3 0.0% 0 0.0% 0 0.0% 0 0.0% 0 7.9% 1 0.0% 0 2.8% 1 0.0% 0To visit other gyms / health
and fitness facilities 0.5% 2 0.0% 0 0.0% 0 0.0% 0 0.0% 0 0.0% 0 0.0% 0 0.0% 0 0.0% 0
To visit the library 0.0% 0 0.0% 0 0.0% 0 0.0% 0 0.0% 0 0.0% 0 0.0% 0 0.0% 0 0.0% 0To visit museums / art
gallery 0.3% 1 4.4% 0 0.0% 0 0.0% 0 0.0% 0 0.0% 0 0.0% 0 0.0% 0 4.9% 1
To visit the theatre or musical venues
1.5% 6 0.0% 0 3.9% 1 5.3% 1 0.0% 0 3.7% 1 0.0% 0 0.0% 0 0.0% 0
To visit night time venues e.g. nightclub
0.0% 0 0.0% 0 0.0% 0 0.0% 0 0.0% 0 0.0% 0 0.0% 0 0.0% 0 0.0% 0
For other leisure activities 6.1% 26 17.1% 1 3.8% 1 14.6% 4 3.7% 1 0.0% 0 19.2% 3 0.0% 0 6.6% 2To shop at the market(s) 0.0% 0 0.0% 0 0.0% 0 0.0% 0 0.0% 0 0.0% 0 0.0% 0 0.0% 0 0.0% 0To meet family 4.0% 17 4.4% 0 0.0% 0 0.0% 0 9.1% 3 0.0% 0 6.4% 1 0.0% 0 20.6% 5To meet friends 1.4% 6 0.0% 0 0.0% 0 0.0% 0 7.2% 3 0.0% 0 0.0% 0 0.0% 0 0.0% 0To visit the theatre 0.2% 1 0.0% 0 0.0% 0 0.0% 0 0.0% 0 0.0% 0 0.0% 0 0.0% 0 0.0% 0For work (i.e. place of work) 0.2% 1 0.0% 0 0.0% 0 0.0% 0 0.0% 0 0.0% 0 0.0% 0 0.0% 0 0.0% 0For business (e.g. attend a
business appointment) 0.0% 0 0.0% 0 0.0% 0 0.0% 0 0.0% 0 0.0% 0 0.0% 0 0.0% 0 0.0% 0
For education as a student (e.g. student at college, university, or other third level education)
0.0% 0 0.0% 0 0.0% 0 0.0% 0 0.0% 0 0.0% 0 0.0% 0 0.0% 0 0.0% 0
To access public transport for onward travel (e.g. train station, bus station)
0.0% 0 0.0% 0 0.0% 0 0.0% 0 0.0% 0 0.0% 0 0.0% 0 0.0% 0 0.0% 0
Other 0.0% 0 0.0% 0 0.0% 0 0.0% 0 0.0% 0 0.0% 0 0.0% 0 0.0% 0 0.0% 0As part of a day out / for a
day out / something different
1.4% 6 0.0% 0 3.9% 1 0.0% 0 9.1% 3 0.0% 0 7.2% 1 0.0% 0 0.0% 0
Browsing / window shopping 0.3% 1 0.0% 0 0.0% 0 0.0% 0 0.0% 0 0.0% 0 0.0% 0 0.0% 0 4.9% 1(Don't know / varies) 0.2% 1 0.0% 0 0.0% 0 0.0% 0 2.4% 1 0.0% 0 0.0% 0 0.0% 0 0.0% 0(Nothing / nothing further) 54.1% 230 24.2% 1 69.3% 23 61.8% 16 40.7% 15 53.1% 9 34.1% 6 61.7% 14 56.4% 14Weighted base: 424 5 33 26 37 16 18 23 24Sample: 359 13 19 26 30 22 22 19 15
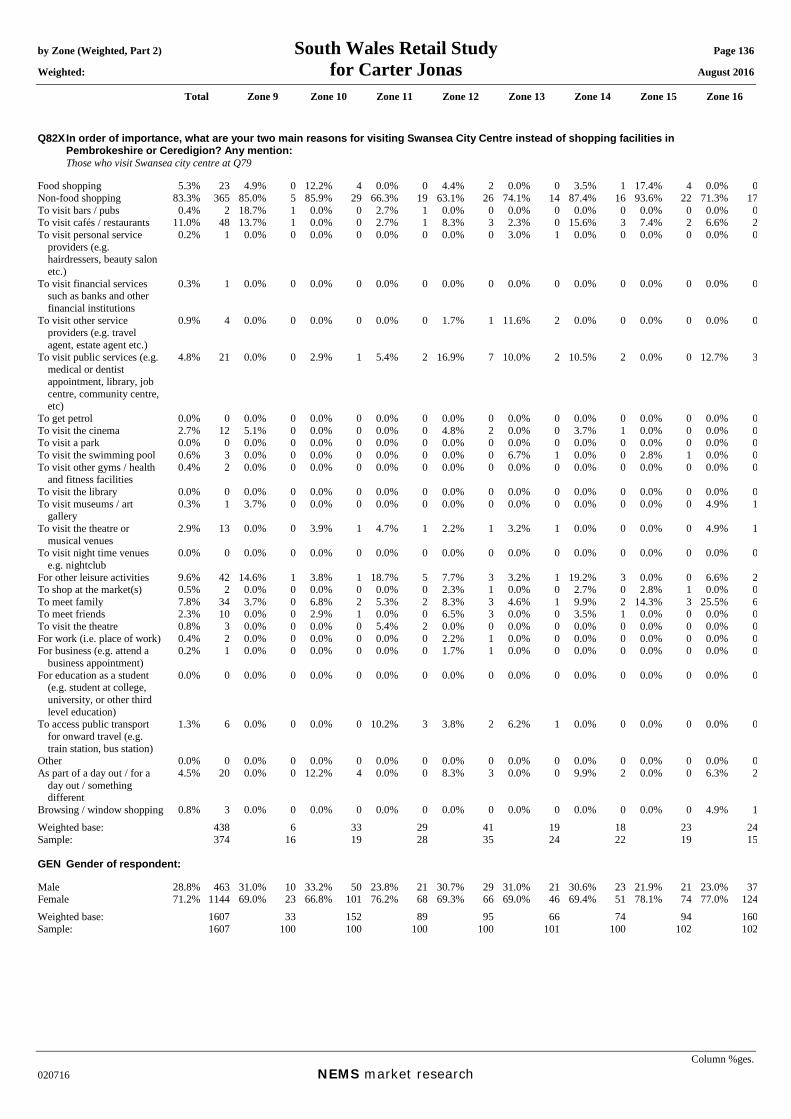
by Zone (Weighted, Part 2) South Wales Retail Study Page 136 Weighted: for Carter Jonas August 2016
Total Zone 9 Zone 10 Zone 11 Zone 12 Zone 13 Zone 14 Zone 15 Zone 16
Column %ges. 020716 NEMS market research
Q82X In order of importance, what are your two main reasons for visiting Swansea City Centre instead of shopping facilities in Pembrokeshire or Ceredigion? Any mention:
Those who visit Swansea city centre at Q79 Food shopping 5.3% 23 4.9% 0 12.2% 4 0.0% 0 4.4% 2 0.0% 0 3.5% 1 17.4% 4 0.0% 0Non-food shopping 83.3% 365 85.0% 5 85.9% 29 66.3% 19 63.1% 26 74.1% 14 87.4% 16 93.6% 22 71.3% 17To visit bars / pubs 0.4% 2 18.7% 1 0.0% 0 2.7% 1 0.0% 0 0.0% 0 0.0% 0 0.0% 0 0.0% 0To visit cafés / restaurants 11.0% 48 13.7% 1 0.0% 0 2.7% 1 8.3% 3 2.3% 0 15.6% 3 7.4% 2 6.6% 2To visit personal service
providers (e.g. hairdressers, beauty salon etc.)
0.2% 1 0.0% 0 0.0% 0 0.0% 0 0.0% 0 3.0% 1 0.0% 0 0.0% 0 0.0% 0
To visit financial services such as banks and other financial institutions
0.3% 1 0.0% 0 0.0% 0 0.0% 0 0.0% 0 0.0% 0 0.0% 0 0.0% 0 0.0% 0
To visit other service providers (e.g. travel agent, estate agent etc.)
0.9% 4 0.0% 0 0.0% 0 0.0% 0 1.7% 1 11.6% 2 0.0% 0 0.0% 0 0.0% 0
To visit public services (e.g. medical or dentist appointment, library, job centre, community centre, etc)
4.8% 21 0.0% 0 2.9% 1 5.4% 2 16.9% 7 10.0% 2 10.5% 2 0.0% 0 12.7% 3
To get petrol 0.0% 0 0.0% 0 0.0% 0 0.0% 0 0.0% 0 0.0% 0 0.0% 0 0.0% 0 0.0% 0To visit the cinema 2.7% 12 5.1% 0 0.0% 0 0.0% 0 4.8% 2 0.0% 0 3.7% 1 0.0% 0 0.0% 0To visit a park 0.0% 0 0.0% 0 0.0% 0 0.0% 0 0.0% 0 0.0% 0 0.0% 0 0.0% 0 0.0% 0To visit the swimming pool 0.6% 3 0.0% 0 0.0% 0 0.0% 0 0.0% 0 6.7% 1 0.0% 0 2.8% 1 0.0% 0To visit other gyms / health
and fitness facilities 0.4% 2 0.0% 0 0.0% 0 0.0% 0 0.0% 0 0.0% 0 0.0% 0 0.0% 0 0.0% 0
To visit the library 0.0% 0 0.0% 0 0.0% 0 0.0% 0 0.0% 0 0.0% 0 0.0% 0 0.0% 0 0.0% 0To visit museums / art
gallery 0.3% 1 3.7% 0 0.0% 0 0.0% 0 0.0% 0 0.0% 0 0.0% 0 0.0% 0 4.9% 1
To visit the theatre or musical venues
2.9% 13 0.0% 0 3.9% 1 4.7% 1 2.2% 1 3.2% 1 0.0% 0 0.0% 0 4.9% 1
To visit night time venues e.g. nightclub
0.0% 0 0.0% 0 0.0% 0 0.0% 0 0.0% 0 0.0% 0 0.0% 0 0.0% 0 0.0% 0
For other leisure activities 9.6% 42 14.6% 1 3.8% 1 18.7% 5 7.7% 3 3.2% 1 19.2% 3 0.0% 0 6.6% 2To shop at the market(s) 0.5% 2 0.0% 0 0.0% 0 0.0% 0 2.3% 1 0.0% 0 2.7% 0 2.8% 1 0.0% 0To meet family 7.8% 34 3.7% 0 6.8% 2 5.3% 2 8.3% 3 4.6% 1 9.9% 2 14.3% 3 25.5% 6To meet friends 2.3% 10 0.0% 0 2.9% 1 0.0% 0 6.5% 3 0.0% 0 3.5% 1 0.0% 0 0.0% 0To visit the theatre 0.8% 3 0.0% 0 0.0% 0 5.4% 2 0.0% 0 0.0% 0 0.0% 0 0.0% 0 0.0% 0For work (i.e. place of work) 0.4% 2 0.0% 0 0.0% 0 0.0% 0 2.2% 1 0.0% 0 0.0% 0 0.0% 0 0.0% 0For business (e.g. attend a
business appointment) 0.2% 1 0.0% 0 0.0% 0 0.0% 0 1.7% 1 0.0% 0 0.0% 0 0.0% 0 0.0% 0
For education as a student (e.g. student at college, university, or other third level education)
0.0% 0 0.0% 0 0.0% 0 0.0% 0 0.0% 0 0.0% 0 0.0% 0 0.0% 0 0.0% 0
To access public transport for onward travel (e.g. train station, bus station)
1.3% 6 0.0% 0 0.0% 0 10.2% 3 3.8% 2 6.2% 1 0.0% 0 0.0% 0 0.0% 0
Other 0.0% 0 0.0% 0 0.0% 0 0.0% 0 0.0% 0 0.0% 0 0.0% 0 0.0% 0 0.0% 0As part of a day out / for a
day out / something different
4.5% 20 0.0% 0 12.2% 4 0.0% 0 8.3% 3 0.0% 0 9.9% 2 0.0% 0 6.3% 2
Browsing / window shopping 0.8% 3 0.0% 0 0.0% 0 0.0% 0 0.0% 0 0.0% 0 0.0% 0 0.0% 0 4.9% 1Weighted base: 438 6 33 29 41 19 18 23 24Sample: 374 16 19 28 35 24 22 19 15 GEN Gender of respondent: Male 28.8% 463 31.0% 10 33.2% 50 23.8% 21 30.7% 29 31.0% 21 30.6% 23 21.9% 21 23.0% 37Female 71.2% 1144 69.0% 23 66.8% 101 76.2% 68 69.3% 66 69.0% 46 69.4% 51 78.1% 74 77.0% 124Weighted base: 1607 33 152 89 95 66 74 94 160Sample: 1607 100 100 100 100 101 100 102 102
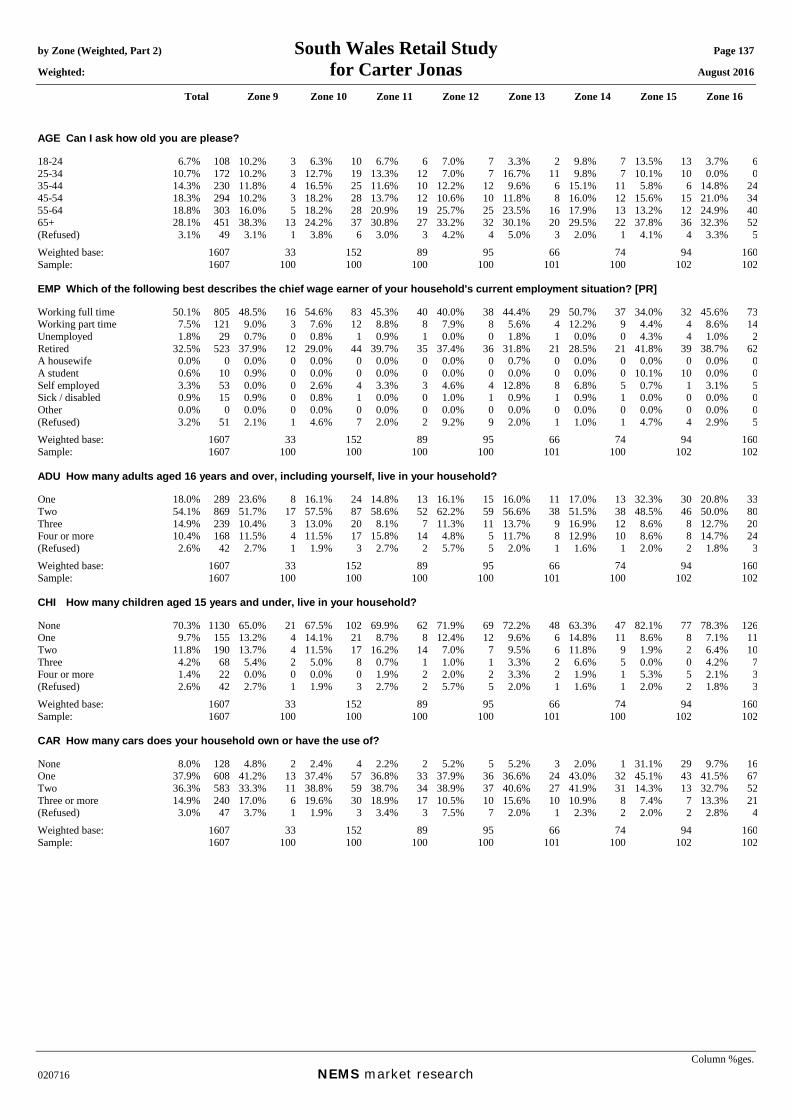
by Zone (Weighted, Part 2) South Wales Retail Study Page 137 Weighted: for Carter Jonas August 2016
Total Zone 9 Zone 10 Zone 11 Zone 12 Zone 13 Zone 14 Zone 15 Zone 16
Column %ges. 020716 NEMS market research
AGE Can I ask how old you are please? 18-24 6.7% 108 10.2% 3 6.3% 10 6.7% 6 7.0% 7 3.3% 2 9.8% 7 13.5% 13 3.7% 625-34 10.7% 172 10.2% 3 12.7% 19 13.3% 12 7.0% 7 16.7% 11 9.8% 7 10.1% 10 0.0% 035-44 14.3% 230 11.8% 4 16.5% 25 11.6% 10 12.2% 12 9.6% 6 15.1% 11 5.8% 6 14.8% 2445-54 18.3% 294 10.2% 3 18.2% 28 13.7% 12 10.6% 10 11.8% 8 16.0% 12 15.6% 15 21.0% 3455-64 18.8% 303 16.0% 5 18.2% 28 20.9% 19 25.7% 25 23.5% 16 17.9% 13 13.2% 12 24.9% 4065+ 28.1% 451 38.3% 13 24.2% 37 30.8% 27 33.2% 32 30.1% 20 29.5% 22 37.8% 36 32.3% 52(Refused) 3.1% 49 3.1% 1 3.8% 6 3.0% 3 4.2% 4 5.0% 3 2.0% 1 4.1% 4 3.3% 5Weighted base: 1607 33 152 89 95 66 74 94 160Sample: 1607 100 100 100 100 101 100 102 102 EMP Which of the following best describes the chief wage earner of your household's current employment situation? [PR] Working full time 50.1% 805 48.5% 16 54.6% 83 45.3% 40 40.0% 38 44.4% 29 50.7% 37 34.0% 32 45.6% 73Working part time 7.5% 121 9.0% 3 7.6% 12 8.8% 8 7.9% 8 5.6% 4 12.2% 9 4.4% 4 8.6% 14Unemployed 1.8% 29 0.7% 0 0.8% 1 0.9% 1 0.0% 0 1.8% 1 0.0% 0 4.3% 4 1.0% 2Retired 32.5% 523 37.9% 12 29.0% 44 39.7% 35 37.4% 36 31.8% 21 28.5% 21 41.8% 39 38.7% 62A housewife 0.0% 0 0.0% 0 0.0% 0 0.0% 0 0.0% 0 0.7% 0 0.0% 0 0.0% 0 0.0% 0A student 0.6% 10 0.9% 0 0.0% 0 0.0% 0 0.0% 0 0.0% 0 0.0% 0 10.1% 10 0.0% 0Self employed 3.3% 53 0.0% 0 2.6% 4 3.3% 3 4.6% 4 12.8% 8 6.8% 5 0.7% 1 3.1% 5Sick / disabled 0.9% 15 0.9% 0 0.8% 1 0.0% 0 1.0% 1 0.9% 1 0.9% 1 0.0% 0 0.0% 0Other 0.0% 0 0.0% 0 0.0% 0 0.0% 0 0.0% 0 0.0% 0 0.0% 0 0.0% 0 0.0% 0(Refused) 3.2% 51 2.1% 1 4.6% 7 2.0% 2 9.2% 9 2.0% 1 1.0% 1 4.7% 4 2.9% 5Weighted base: 1607 33 152 89 95 66 74 94 160Sample: 1607 100 100 100 100 101 100 102 102 ADU How many adults aged 16 years and over, including yourself, live in your household? One 18.0% 289 23.6% 8 16.1% 24 14.8% 13 16.1% 15 16.0% 11 17.0% 13 32.3% 30 20.8% 33Two 54.1% 869 51.7% 17 57.5% 87 58.6% 52 62.2% 59 56.6% 38 51.5% 38 48.5% 46 50.0% 80Three 14.9% 239 10.4% 3 13.0% 20 8.1% 7 11.3% 11 13.7% 9 16.9% 12 8.6% 8 12.7% 20Four or more 10.4% 168 11.5% 4 11.5% 17 15.8% 14 4.8% 5 11.7% 8 12.9% 10 8.6% 8 14.7% 24(Refused) 2.6% 42 2.7% 1 1.9% 3 2.7% 2 5.7% 5 2.0% 1 1.6% 1 2.0% 2 1.8% 3Weighted base: 1607 33 152 89 95 66 74 94 160Sample: 1607 100 100 100 100 101 100 102 102 CHI How many children aged 15 years and under, live in your household? None 70.3% 1130 65.0% 21 67.5% 102 69.9% 62 71.9% 69 72.2% 48 63.3% 47 82.1% 77 78.3% 126One 9.7% 155 13.2% 4 14.1% 21 8.7% 8 12.4% 12 9.6% 6 14.8% 11 8.6% 8 7.1% 11Two 11.8% 190 13.7% 4 11.5% 17 16.2% 14 7.0% 7 9.5% 6 11.8% 9 1.9% 2 6.4% 10Three 4.2% 68 5.4% 2 5.0% 8 0.7% 1 1.0% 1 3.3% 2 6.6% 5 0.0% 0 4.2% 7Four or more 1.4% 22 0.0% 0 0.0% 0 1.9% 2 2.0% 2 3.3% 2 1.9% 1 5.3% 5 2.1% 3(Refused) 2.6% 42 2.7% 1 1.9% 3 2.7% 2 5.7% 5 2.0% 1 1.6% 1 2.0% 2 1.8% 3Weighted base: 1607 33 152 89 95 66 74 94 160Sample: 1607 100 100 100 100 101 100 102 102 CAR How many cars does your household own or have the use of? None 8.0% 128 4.8% 2 2.4% 4 2.2% 2 5.2% 5 5.2% 3 2.0% 1 31.1% 29 9.7% 16One 37.9% 608 41.2% 13 37.4% 57 36.8% 33 37.9% 36 36.6% 24 43.0% 32 45.1% 43 41.5% 67Two 36.3% 583 33.3% 11 38.8% 59 38.7% 34 38.9% 37 40.6% 27 41.9% 31 14.3% 13 32.7% 52Three or more 14.9% 240 17.0% 6 19.6% 30 18.9% 17 10.5% 10 15.6% 10 10.9% 8 7.4% 7 13.3% 21(Refused) 3.0% 47 3.7% 1 1.9% 3 3.4% 3 7.5% 7 2.0% 1 2.3% 2 2.0% 2 2.8% 4Weighted base: 1607 33 152 89 95 66 74 94 160Sample: 1607 100 100 100 100 101 100 102 102

by Zone (Weighted, Part 2) South Wales Retail Study Page 138 Weighted: for Carter Jonas August 2016
Total Zone 9 Zone 10 Zone 11 Zone 12 Zone 13 Zone 14 Zone 15 Zone 16
Column %ges. 020716 NEMS market research
INC Approximately what is your total household income? £0 - £15,000 8.4% 135 9.3% 3 8.1% 12 10.6% 9 10.7% 10 17.4% 12 11.6% 9 8.0% 8 8.8% 14£15,001 - £20,000 4.6% 74 4.6% 1 5.5% 8 3.6% 3 4.7% 4 4.5% 3 3.4% 3 1.6% 2 6.0% 10£20,001 - £30,000 8.1% 129 10.0% 3 8.8% 13 3.1% 3 6.1% 6 3.1% 2 9.1% 7 5.1% 5 8.7% 14£30,001 - £40,000 5.4% 87 6.8% 2 7.5% 11 4.5% 4 5.4% 5 4.3% 3 9.3% 7 5.8% 5 0.0% 0£40,001 - £50,000 5.0% 80 4.5% 1 7.6% 12 3.6% 3 6.6% 6 1.6% 1 3.0% 2 4.5% 4 6.8% 11£50,001 - £60,000 3.2% 51 2.5% 1 4.0% 6 1.8% 2 0.9% 1 5.1% 3 4.7% 3 0.9% 1 4.1% 7£60,001 - £70,000 1.5% 24 0.0% 0 0.8% 1 1.8% 2 4.5% 4 0.0% 0 4.7% 3 1.8% 2 1.7% 3£70,001 - £80,000 0.9% 14 1.6% 1 0.9% 1 0.9% 1 0.0% 0 0.0% 0 0.7% 0 0.9% 1 0.0% 0£80,001 - £90,000 0.8% 13 0.0% 0 0.0% 0 0.0% 0 0.0% 0 0.9% 1 0.9% 1 0.9% 1 0.0% 0£90,001 - £100,000 0.4% 6 0.0% 0 0.0% 0 0.0% 0 0.0% 0 0.0% 0 0.0% 0 0.0% 0 0.0% 0£100,001 - £150,000 0.8% 13 0.0% 0 0.0% 0 0.9% 1 0.0% 0 0.0% 0 0.0% 0 0.0% 0 1.0% 2£150,001+ 0.1% 1 0.0% 0 0.0% 0 0.0% 0 0.0% 0 0.0% 0 0.0% 0 0.0% 0 0.0% 0(Don't know / refused) 61.0% 981 60.9% 20 56.9% 86 69.2% 61 61.1% 58 63.1% 42 52.7% 39 70.4% 66 62.9% 101Weighted base: 1607 33 152 89 95 66 74 94 160Sample: 1607 100 100 100 100 101 100 102 102 FUT Would you be willing to be recontacted for future quality control purposes? Yes 63.3% 1017 60.9% 20 62.4% 95 63.2% 56 62.2% 59 64.0% 42 57.4% 42 66.9% 63 65.6% 105No 36.7% 590 39.1% 13 37.6% 57 36.8% 33 37.8% 36 36.0% 24 42.6% 31 33.1% 31 34.4% 55Weighted base: 1607 33 152 89 95 66 74 94 160Sample: 1607 100 100 100 100 101 100 102 102 QUOTA Zone: Zone 1 6.5% 104 0.0% 0 0.0% 0 0.0% 0 0.0% 0 0.0% 0 0.0% 0 0.0% 0 0.0% 0Zone 2 2.6% 42 0.0% 0 0.0% 0 0.0% 0 0.0% 0 0.0% 0 0.0% 0 0.0% 0 0.0% 0Zone 3 5.4% 86 0.0% 0 0.0% 0 0.0% 0 0.0% 0 0.0% 0 0.0% 0 0.0% 0 0.0% 0Zone 4 9.4% 151 0.0% 0 0.0% 0 0.0% 0 0.0% 0 0.0% 0 0.0% 0 0.0% 0 0.0% 0Zone 5 9.6% 154 0.0% 0 0.0% 0 0.0% 0 0.0% 0 0.0% 0 0.0% 0 0.0% 0 0.0% 0Zone 6 8.4% 135 0.0% 0 0.0% 0 0.0% 0 0.0% 0 0.0% 0 0.0% 0 0.0% 0 0.0% 0Zone 7 4.7% 76 0.0% 0 0.0% 0 0.0% 0 0.0% 0 0.0% 0 0.0% 0 0.0% 0 0.0% 0Zone 8 5.9% 94 0.0% 0 0.0% 0 0.0% 0 0.0% 0 0.0% 0 0.0% 0 0.0% 0 0.0% 0Zone 9 2.0% 33 100.0% 33 0.0% 0 0.0% 0 0.0% 0 0.0% 0 0.0% 0 0.0% 0 0.0% 0Zone 10 9.4% 152 0.0% 0 100.0% 152 0.0% 0 0.0% 0 0.0% 0 0.0% 0 0.0% 0 0.0% 0Zone 11 5.5% 89 0.0% 0 0.0% 0 100.0% 89 0.0% 0 0.0% 0 0.0% 0 0.0% 0 0.0% 0Zone 12 5.9% 95 0.0% 0 0.0% 0 0.0% 0 100.0% 95 0.0% 0 0.0% 0 0.0% 0 0.0% 0Zone 13 4.1% 66 0.0% 0 0.0% 0 0.0% 0 0.0% 0 100.0% 66 0.0% 0 0.0% 0 0.0% 0Zone 14 4.6% 74 0.0% 0 0.0% 0 0.0% 0 0.0% 0 0.0% 0 100.0% 74 0.0% 0 0.0% 0Zone 15 5.9% 94 0.0% 0 0.0% 0 0.0% 0 0.0% 0 0.0% 0 0.0% 0 100.0% 94 0.0% 0Zone 16 10.0% 160 0.0% 0 0.0% 0 0.0% 0 0.0% 0 0.0% 0 0.0% 0 0.0% 0 100.0% 160Weighted base: 1607 33 152 89 95 66 74 94 160Sample: 1607 100 100 100 100 101 100 102 102
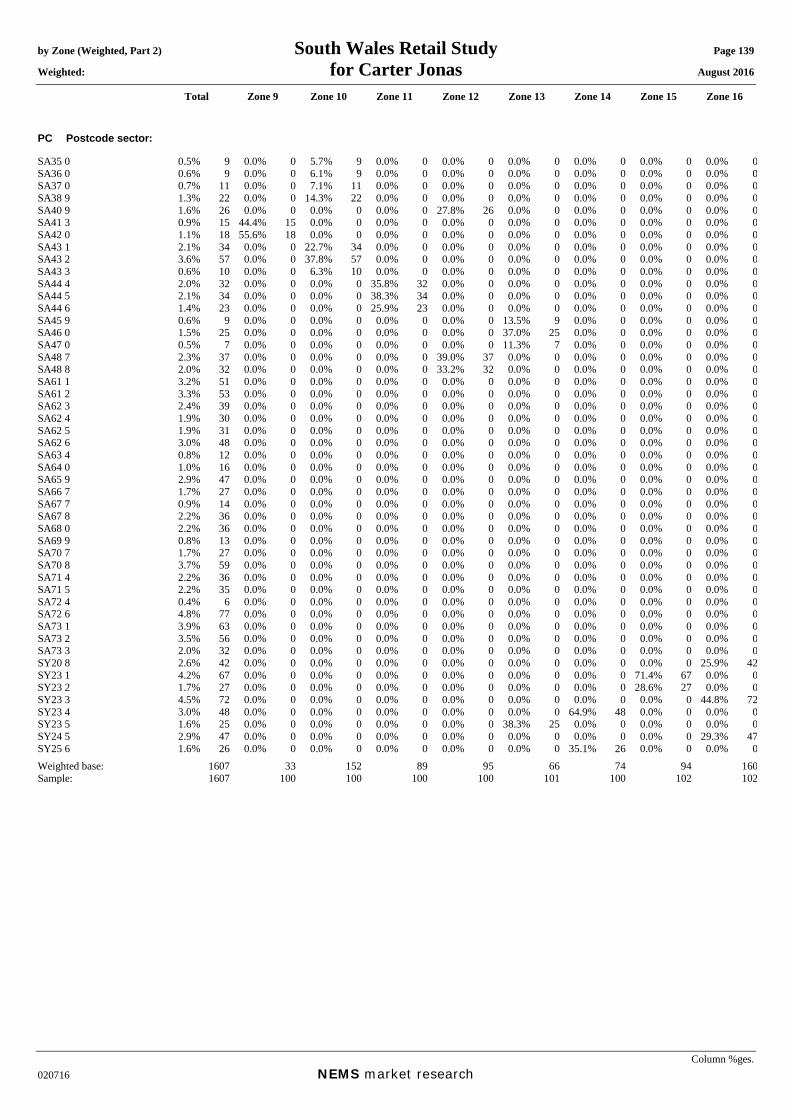
by Zone (Weighted, Part 2) South Wales Retail Study Page 139 Weighted: for Carter Jonas August 2016
Total Zone 9 Zone 10 Zone 11 Zone 12 Zone 13 Zone 14 Zone 15 Zone 16
Column %ges. 020716 NEMS market research
PC Postcode sector: SA35 0 0.5% 9 0.0% 0 5.7% 9 0.0% 0 0.0% 0 0.0% 0 0.0% 0 0.0% 0 0.0% 0SA36 0 0.6% 9 0.0% 0 6.1% 9 0.0% 0 0.0% 0 0.0% 0 0.0% 0 0.0% 0 0.0% 0SA37 0 0.7% 11 0.0% 0 7.1% 11 0.0% 0 0.0% 0 0.0% 0 0.0% 0 0.0% 0 0.0% 0SA38 9 1.3% 22 0.0% 0 14.3% 22 0.0% 0 0.0% 0 0.0% 0 0.0% 0 0.0% 0 0.0% 0SA40 9 1.6% 26 0.0% 0 0.0% 0 0.0% 0 27.8% 26 0.0% 0 0.0% 0 0.0% 0 0.0% 0SA41 3 0.9% 15 44.4% 15 0.0% 0 0.0% 0 0.0% 0 0.0% 0 0.0% 0 0.0% 0 0.0% 0SA42 0 1.1% 18 55.6% 18 0.0% 0 0.0% 0 0.0% 0 0.0% 0 0.0% 0 0.0% 0 0.0% 0SA43 1 2.1% 34 0.0% 0 22.7% 34 0.0% 0 0.0% 0 0.0% 0 0.0% 0 0.0% 0 0.0% 0SA43 2 3.6% 57 0.0% 0 37.8% 57 0.0% 0 0.0% 0 0.0% 0 0.0% 0 0.0% 0 0.0% 0SA43 3 0.6% 10 0.0% 0 6.3% 10 0.0% 0 0.0% 0 0.0% 0 0.0% 0 0.0% 0 0.0% 0SA44 4 2.0% 32 0.0% 0 0.0% 0 35.8% 32 0.0% 0 0.0% 0 0.0% 0 0.0% 0 0.0% 0SA44 5 2.1% 34 0.0% 0 0.0% 0 38.3% 34 0.0% 0 0.0% 0 0.0% 0 0.0% 0 0.0% 0SA44 6 1.4% 23 0.0% 0 0.0% 0 25.9% 23 0.0% 0 0.0% 0 0.0% 0 0.0% 0 0.0% 0SA45 9 0.6% 9 0.0% 0 0.0% 0 0.0% 0 0.0% 0 13.5% 9 0.0% 0 0.0% 0 0.0% 0SA46 0 1.5% 25 0.0% 0 0.0% 0 0.0% 0 0.0% 0 37.0% 25 0.0% 0 0.0% 0 0.0% 0SA47 0 0.5% 7 0.0% 0 0.0% 0 0.0% 0 0.0% 0 11.3% 7 0.0% 0 0.0% 0 0.0% 0SA48 7 2.3% 37 0.0% 0 0.0% 0 0.0% 0 39.0% 37 0.0% 0 0.0% 0 0.0% 0 0.0% 0SA48 8 2.0% 32 0.0% 0 0.0% 0 0.0% 0 33.2% 32 0.0% 0 0.0% 0 0.0% 0 0.0% 0SA61 1 3.2% 51 0.0% 0 0.0% 0 0.0% 0 0.0% 0 0.0% 0 0.0% 0 0.0% 0 0.0% 0SA61 2 3.3% 53 0.0% 0 0.0% 0 0.0% 0 0.0% 0 0.0% 0 0.0% 0 0.0% 0 0.0% 0SA62 3 2.4% 39 0.0% 0 0.0% 0 0.0% 0 0.0% 0 0.0% 0 0.0% 0 0.0% 0 0.0% 0SA62 4 1.9% 30 0.0% 0 0.0% 0 0.0% 0 0.0% 0 0.0% 0 0.0% 0 0.0% 0 0.0% 0SA62 5 1.9% 31 0.0% 0 0.0% 0 0.0% 0 0.0% 0 0.0% 0 0.0% 0 0.0% 0 0.0% 0SA62 6 3.0% 48 0.0% 0 0.0% 0 0.0% 0 0.0% 0 0.0% 0 0.0% 0 0.0% 0 0.0% 0SA63 4 0.8% 12 0.0% 0 0.0% 0 0.0% 0 0.0% 0 0.0% 0 0.0% 0 0.0% 0 0.0% 0SA64 0 1.0% 16 0.0% 0 0.0% 0 0.0% 0 0.0% 0 0.0% 0 0.0% 0 0.0% 0 0.0% 0SA65 9 2.9% 47 0.0% 0 0.0% 0 0.0% 0 0.0% 0 0.0% 0 0.0% 0 0.0% 0 0.0% 0SA66 7 1.7% 27 0.0% 0 0.0% 0 0.0% 0 0.0% 0 0.0% 0 0.0% 0 0.0% 0 0.0% 0SA67 7 0.9% 14 0.0% 0 0.0% 0 0.0% 0 0.0% 0 0.0% 0 0.0% 0 0.0% 0 0.0% 0SA67 8 2.2% 36 0.0% 0 0.0% 0 0.0% 0 0.0% 0 0.0% 0 0.0% 0 0.0% 0 0.0% 0SA68 0 2.2% 36 0.0% 0 0.0% 0 0.0% 0 0.0% 0 0.0% 0 0.0% 0 0.0% 0 0.0% 0SA69 9 0.8% 13 0.0% 0 0.0% 0 0.0% 0 0.0% 0 0.0% 0 0.0% 0 0.0% 0 0.0% 0SA70 7 1.7% 27 0.0% 0 0.0% 0 0.0% 0 0.0% 0 0.0% 0 0.0% 0 0.0% 0 0.0% 0SA70 8 3.7% 59 0.0% 0 0.0% 0 0.0% 0 0.0% 0 0.0% 0 0.0% 0 0.0% 0 0.0% 0SA71 4 2.2% 36 0.0% 0 0.0% 0 0.0% 0 0.0% 0 0.0% 0 0.0% 0 0.0% 0 0.0% 0SA71 5 2.2% 35 0.0% 0 0.0% 0 0.0% 0 0.0% 0 0.0% 0 0.0% 0 0.0% 0 0.0% 0SA72 4 0.4% 6 0.0% 0 0.0% 0 0.0% 0 0.0% 0 0.0% 0 0.0% 0 0.0% 0 0.0% 0SA72 6 4.8% 77 0.0% 0 0.0% 0 0.0% 0 0.0% 0 0.0% 0 0.0% 0 0.0% 0 0.0% 0SA73 1 3.9% 63 0.0% 0 0.0% 0 0.0% 0 0.0% 0 0.0% 0 0.0% 0 0.0% 0 0.0% 0SA73 2 3.5% 56 0.0% 0 0.0% 0 0.0% 0 0.0% 0 0.0% 0 0.0% 0 0.0% 0 0.0% 0SA73 3 2.0% 32 0.0% 0 0.0% 0 0.0% 0 0.0% 0 0.0% 0 0.0% 0 0.0% 0 0.0% 0SY20 8 2.6% 42 0.0% 0 0.0% 0 0.0% 0 0.0% 0 0.0% 0 0.0% 0 0.0% 0 25.9% 42SY23 1 4.2% 67 0.0% 0 0.0% 0 0.0% 0 0.0% 0 0.0% 0 0.0% 0 71.4% 67 0.0% 0SY23 2 1.7% 27 0.0% 0 0.0% 0 0.0% 0 0.0% 0 0.0% 0 0.0% 0 28.6% 27 0.0% 0SY23 3 4.5% 72 0.0% 0 0.0% 0 0.0% 0 0.0% 0 0.0% 0 0.0% 0 0.0% 0 44.8% 72SY23 4 3.0% 48 0.0% 0 0.0% 0 0.0% 0 0.0% 0 0.0% 0 64.9% 48 0.0% 0 0.0% 0SY23 5 1.6% 25 0.0% 0 0.0% 0 0.0% 0 0.0% 0 38.3% 25 0.0% 0 0.0% 0 0.0% 0SY24 5 2.9% 47 0.0% 0 0.0% 0 0.0% 0 0.0% 0 0.0% 0 0.0% 0 0.0% 0 29.3% 47SY25 6 1.6% 26 0.0% 0 0.0% 0 0.0% 0 0.0% 0 0.0% 0 35.1% 26 0.0% 0 0.0% 0Weighted base: 1607 33 152 89 95 66 74 94 160Sample: 1607 100 100 100 100 101 100 102 102
South West Wales Regional Retail Study
APPENDIX 15C: HOUSEHOLD TELEPHONE INTERVIEW SURVEY QUESTIONNAIRE
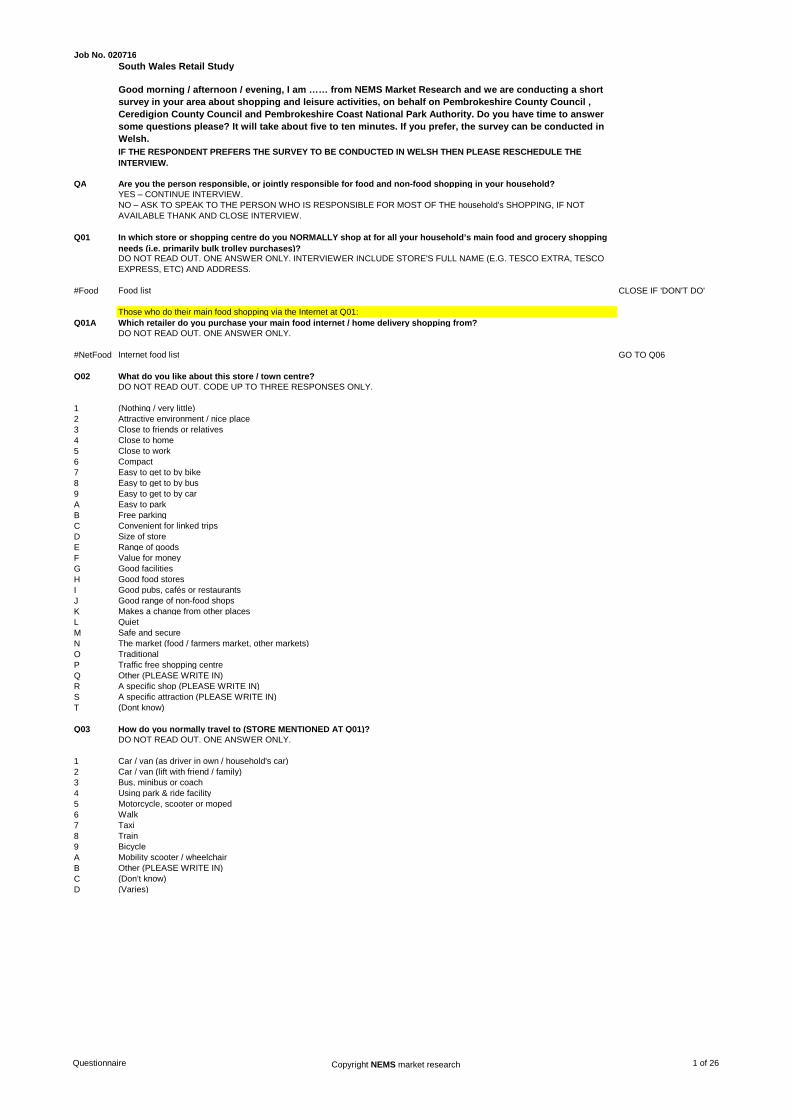
South Wales Retail Study
Good morning / afternoon / evening, I am …… from NEMS Market Research and we are conducting a short survey in your area about shopping and leisure activities, on behalf on Pembrokeshire County Council , Ceredigion County Council and Pembrokeshire Coast National Park Authority. Do you have time to answer some questions please? It will take about five to ten minutes. If you prefer, the survey can be conducted in Welsh.IF THE RESPONDENT PREFERS THE SURVEY TO BE CONDUCTED IN WELSH THEN PLEASE RESCHEDULE THE INTERVIEW.
QA Are you the person responsible, or jointly responsible for food and non-food shopping in your household?YES – CONTINUE INTERVIEW. NO – ASK TO SPEAK TO THE PERSON WHO IS RESPONSIBLE FOR MOST OF THE household's SHOPPING, IF NOT AVAILABLE THANK AND CLOSE INTERVIEW.
Q01 In which store or shopping centre do you NORMALLY shop at for all your household’s main food and grocery shopping needs (i.e. primarily bulk trolley purchases)? DO NOT READ OUT. ONE ANSWER ONLY. INTERVIEWER INCLUDE STORE'S FULL NAME (E.G. TESCO EXTRA, TESCO EXPRESS, ETC) AND ADDRESS.
#Food Food list CLOSE IF 'DON'T DO'
Those who do their main food shopping via the Internet at Q01:Q01A Which retailer do you purchase your main food internet / home delivery shopping from?
DO NOT READ OUT. ONE ANSWER ONLY.
#NetFood Internet food list GO TO Q06
Q02 What do you like about this store / town centre?DO NOT READ OUT. CODE UP TO THREE RESPONSES ONLY.
1 (Nothing / very little)2 Attractive environment / nice place3 Close to friends or relatives 4 Close to home 5 Close to work 6 Compact 7 Easy to get to by bike 8 Easy to get to by bus 9 Easy to get to by car A Easy to park B Free parkingC Convenient for linked tripsD Size of storeE Range of goodsF Value for moneyG Good facilitiesH Good food stores I Good pubs, cafés or restaurantsJ Good range of non-food shopsK Makes a change from other placesL Quiet M Safe and secure N The market (food / farmers market, other markets)O Traditional P Traffic free shopping centre Q Other (PLEASE WRITE IN)R A specific shop (PLEASE WRITE IN)S A specific attraction (PLEASE WRITE IN)T (Dont know)
Q03 How do you normally travel to (STORE MENTIONED AT Q01)?DO NOT READ OUT. ONE ANSWER ONLY.
1 Car / van (as driver in own / household's car)2 Car / van (lift with friend / family)3 Bus, minibus or coach 4 Using park & ride facility5 Motorcycle, scooter or moped6 Walk7 Taxi8 Train9 BicycleA Mobility scooter / wheelchairB Other (PLEASE WRITE IN)C (Don’t know)D (Varies)
Job No. 020716
Questionnaire Copyright NEMS market research 1 of 26
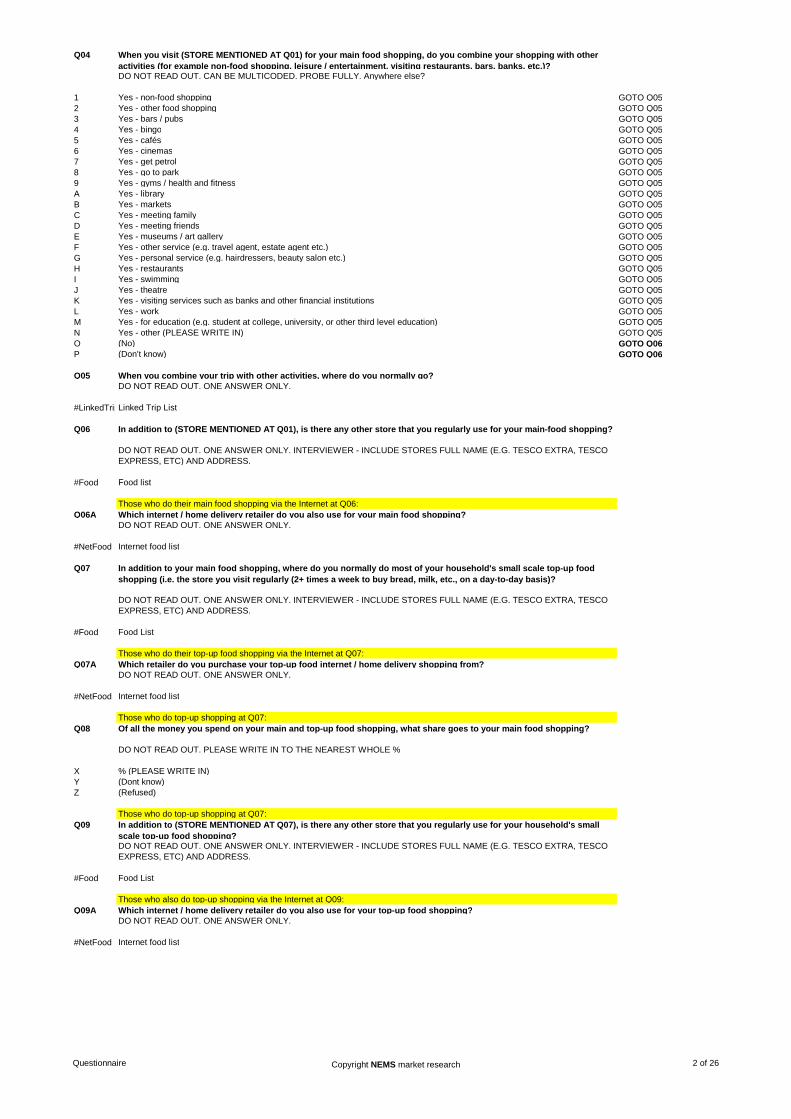
Q04 When you visit (STORE MENTIONED AT Q01) for your main food shopping, do you combine your shopping with other activities (for example non-food shopping, leisure / entertainment, visiting restaurants, bars, banks, etc.)?DO NOT READ OUT. CAN BE MULTICODED. PROBE FULLY. Anywhere else?
1 Yes - non-food shopping GOTO Q052 Yes - other food shopping GOTO Q053 Yes - bars / pubs GOTO Q054 Yes - bingo GOTO Q055 Yes - cafés GOTO Q056 Yes - cinemas GOTO Q057 Yes - get petrol GOTO Q058 Yes - go to park GOTO Q059 Yes - gyms / health and fitness GOTO Q05A Yes - library GOTO Q05B Yes - markets GOTO Q05C Yes - meeting family GOTO Q05D Yes - meeting friends GOTO Q05E Yes - museums / art gallery GOTO Q05F Yes - other service (e.g. travel agent, estate agent etc.) GOTO Q05G Yes - personal service (e.g. hairdressers, beauty salon etc.) GOTO Q05H Yes - restaurants GOTO Q05I Yes - swimming GOTO Q05J Yes - theatre GOTO Q05K Yes - visiting services such as banks and other financial institutions GOTO Q05L Yes - work GOTO Q05M Yes - for education (e.g. student at college, university, or other third level education) GOTO Q05N Yes - other (PLEASE WRITE IN) GOTO Q05O (No) GOTO Q06P (Don’t know) GOTO Q06
Q05 When you combine your trip with other activities, where do you normally go?DO NOT READ OUT. ONE ANSWER ONLY.
#LinkedTripLinked Trip List
Q06 In addition to (STORE MENTIONED AT Q01), is there any other store that you regularly use for your main-food shopping?
DO NOT READ OUT. ONE ANSWER ONLY. INTERVIEWER - INCLUDE STORES FULL NAME (E.G. TESCO EXTRA, TESCO EXPRESS, ETC) AND ADDRESS.
#Food Food list
Those who do their main food shopping via the Internet at Q06:Q06A Which internet / home delivery retailer do you also use for your main food shopping?
DO NOT READ OUT. ONE ANSWER ONLY.
#NetFood Internet food list
Q07 In addition to your main food shopping, where do you normally do most of your household's small scale top-up food shopping (i.e. the store you visit regularly (2+ times a week to buy bread, milk, etc., on a day-to-day basis)?
DO NOT READ OUT. ONE ANSWER ONLY. INTERVIEWER - INCLUDE STORES FULL NAME (E.G. TESCO EXTRA, TESCO EXPRESS, ETC) AND ADDRESS.
#Food Food List
Those who do their top-up food shopping via the Internet at Q07:Q07A Which retailer do you purchase your top-up food internet / home delivery shopping from?
DO NOT READ OUT. ONE ANSWER ONLY.
#NetFood Internet food list
Those who do top-up shopping at Q07:Q08 Of all the money you spend on your main and top-up food shopping, what share goes to your main food shopping?
DO NOT READ OUT. PLEASE WRITE IN TO THE NEAREST WHOLE %
X % (PLEASE WRITE IN)Y (Dont know)Z (Refused)
Those who do top-up shopping at Q07:Q09 In addition to (STORE MENTIONED AT Q07), is there any other store that you regularly use for your household's small
scale top-up food shopping?DO NOT READ OUT. ONE ANSWER ONLY. INTERVIEWER - INCLUDE STORES FULL NAME (E.G. TESCO EXTRA, TESCO EXPRESS, ETC) AND ADDRESS.
#Food Food List
Those who also do top-up shopping via the Internet at Q09:Q09A Which internet / home delivery retailer do you also use for your top-up food shopping?
DO NOT READ OUT. ONE ANSWER ONLY.
#NetFood Internet food list
Questionnaire Copyright NEMS market research 2 of 26
READ OUT: I would now like to ask you some questions about your non-food shopping habits / preferences.
Q10 In which ONE town centre, freestanding store or retail park do you do most of your household's shopping for mens, womens, childrens and baby clothing and footwear (fashion items - not sports clothing and footwear)?DO NOT READ OUT. ONE ANSWER ONLY.INTERVIEWER NOTE: PLEASE PROBE FULLY FOR ROAD NAME AND LOCATION IF LOCATED OUT OF CENTRE.
#NonFood Non-Food List
Those who do most of their clothing and footwear via the Internet at Q10:Q10A Which internet / home delivery retailer do you use for your household's shopping for mens, womens, childrens and baby
clothing and footwear (fashion items - not sports clothing and footwear)?DO NOT READ OUT. ONE ANSWER ONLY.
#NetNonFoodInternet Non-Food List GO TO Q13
Those who buy clothing and footwear (excluding via the Internet) at Q10:Q11
DO NOT READ OUT. ONE ANSWER ONLY
1 Car / van (as driver)2 Car / van (as passenger)3 Bus, minibus or coach 4 Using park & ride facility5 Motorcycle, scooter or moped6 Walk7 Taxi8 Train9 BicycleA Mobility scooter / wheelchairB Other (PLEASE WRITE IN)C (Don’t know)D (Varies)
Q12 What do you like about this store / town centre?DO NOT READ OUT. CODE UP TO THREE RESPONSES ONLY.
1 (Nothing / very little)2 Attractive environment / nice place3 Close to friends or relatives 4 Close to home 5 Close to work 6 Compact 7 Easy to get to by bike 8 Easy to get to by bus 9 Easy to get to by car A Easy to park B Free parkingC Size of storeD Range of goodsE Value for moneyF Good facilitiesG Good food stores H Good pubs, cafés or restaurantsI Good range of non-food shopsJ Makes a change from other placesK Quiet L Safe and secure M The market (food / farmers market, other markets)N Traditional O Traffic free shopping centre P Other (PLEASE WRITE IN)Q A specific shop (PLEASE WRITE IN)R A specific attraction (PLEASE WRITE IN)S (Dont know)
Q13 Where do you normally do most of your household's shopping for recording media for pictures and sound (e.g. records, pre-recorded and unrecorded CDs & DVDs, photo processing etc.) (Excluding video games)?DO NOT READ OUT. ONE ANSWER ONLY.INTERVIEWER NOTE: PLEASE PROBE FULLY FOR ROAD NAME AND LOCATION IF LOCATED OUT OF CENTRE.
#NonFood Non-Food List
Those who buy recording media products via the Internet at Q13:Q13A Which internet / home delivery retailer do you use for your household's shopping for recording media for pictures and
sound (e.g. records, pre-recorded and unrecorded CDs & DVDs, unexposed films for photographic use, etc. ) (Excluding video games)?DO NOT READ OUT. ONE ANSWER ONLY.
#NetNonFoodInternet Non-Food List
Q14 Where do you normally do most of your household's shopping for audio visual, photographic, computer items (such as stereos, radios, TVs, software, cameras, Kindles, ipads, tablets, telephones, etc.)?DO NOT READ OUT. ONE ANSWER ONLY.INTERVIEWER NOTE: PLEASE PROBE FULLY FOR ROAD NAME AND LOCATION IF LOCATED OUT OF CENTRE.
#NonFood Non-Food List
How do you normally travel to (STORE OR CENTRE MENTIONED AT Q10)?
Questionnaire Copyright NEMS market research 3 of 26
Those who buy audio / visual equipment via the Internet at Q14:Q14A Which internet / home delivery retailer do you use for your household's shopping for audio visual, photographic,
computer items (such as stereos, radios, TVs, software, cameras, Kindles, iPads, telephones, etc.)?
DO NOT READ OUT. ONE ANSWER ONLY.
#NetNonFoodInternet Non-Food List
Q15 Where do you normally do most of your household's shopping for all other domestic electrical goods including small domestic electrical appliances (such as irons, kettles, fans, coffee makers, food mixers) and white goods (fridges, freezers, dishwashers) and smaller etc)? DO NOT READ OUT. ONE ANSWER ONLY.INTERVIEWER NOTE: PLEASE PROBE FULLY FOR ROAD NAME AND LOCATION IF LOCATED OUT OF CENTRE.
#NonFood Non-Food List
Thoe who buy domestic electrical goods via the Internet at Q15:Q15A Which internet / home delivery retailer do you use for your household's shopping for all other domestic electrical goods
including small domestic electrical appliances (such as irons, kettles, fans, coffee makers, food mixers) and white goods (fridges, freezers, dishwashers) and smaller etc)? DO NOT READ OUT. ONE ANSWER ONLY.
#NetNonFoodInternet Non-Food List
Q16 Where do you normally do most of your household's shopping for books (incl. dictionaries, encyclopaedias, text books, guidebooks and musical scores) and stationary (incl. writing pads, envelopes pens, diaries, etc.) and drawing materials?
INTERVIEWER NOTE: PLEASE PROBE FULLY FOR ROAD NAME AND LOCATION IF LOCATED OUT OF CENTRE.
#NonFood Non-Food List
Those who buy books and stationery via the Internet at Q16:Q16A Which internet / home delivery retailer do you use for your household's shopping for books (incl. dictionaries,
encyclopaedias, text books, guidebooks and musical scores) and stationery (incl. writing pads, envelopes pens, diaries, etc.) and drawing materials?DO NOT READ OUT. ONE ANSWER ONLY.
#NetNonFoodInternet Non-Food List
Q17 Where do you normally do most of your household’s shopping for games & toys; pets and pet products; hobby items; sport clothing / footwear and equipment; camping goods; bicycles; and musical instruments?DO NOT READ OUT. ONE ANSWER ONLY.
#NonFood Non-Food List
Those who buy games, toys, pet products, sports equipment etc. via the Internet at Q17:Q17A Which internet / home delivery retailer do you use for your household’s shopping for games & toys; pets and pet
products; hobby items; sport clothing / footwear and equipment; camping goods; bicycles; and musical instruments?
DO NOT READ OUT. ONE ANSWER ONLY.
#NetNonFoodInternet Non-Food List
Q18 Where do you normally do most of your household's shopping for furniture, carpets, other floor coverings and household textiles (includes beds, sofas, tables, etc)?INTERVIEWER NOTE: PLEASE PROBE FULLY FOR ROAD NAME AND LOCATION IF LOCATED OUT OF CENTRE.
#NonFood Non-Food List
Those who buy furniture, carpets and other floor coverings via the Internet at Q18:Q18A Which internet / home delivery retailer do you use for your household's shopping for furniture, carpets, other floor
coverings and household textiles (includes beds, sofas, tables, etc)?DO NOT READ OUT. ONE ANSWER ONLY.
#NetNonFoodInternet Non-Food List
Q19 Where do you normally do most of your household's shopping for DIY goods, decorating supplies and garden products (such as drills, lawn mowers, hammers, hedge cutters, garden tools, plants, shrubs etc)? INTERVIEWER NOTE: PLEASE PROBE FULLY FOR ROAD NAME AND LOCATION IF LOCATED OUT OF CENTRE.
#NonFood Non-Food List
Those who buy DIY goods, decorating supplies and garden products via the Internet at Q19:Q19A Which internet / home delivery retailer do you use for your household's shopping for DIY goods, decorating supplies and
garden products (such as drills, lawn mowers, hammers, hedge cutters, garden tools, plants, shrubs etc)?
DO NOT READ OUT. ONE ANSWER ONLY.
#NetNonFoodInternet Non-Food List
Q20 Where do you normally do most of your household's shopping on all goods for personal care, including electric appliances (e.g. electric razors, hair dryers, curling tongs, electric toothbrushes), non-electric appliances (e.g. scissors, hand razors, bathroom scales), cosmetics, perfume, toothpaste, aftershave, sun tan lotions, etc. INTERVIEWER NOTE: PLEASE PROBE FULLY FOR ROAD NAME AND LOCATION IF LOCATED OUT OF CENTRE.
#NonFood Non-Food List
Questionnaire Copyright NEMS market research 4 of 26
Thoe who buy personal care goods via the Internet at Q20:Q20A Which internet / home delivery retailer do you use for your household's shopping on all goods for personal care,
including electric appliances (e.g. electric razors, hair dryers, curling tongs, electric toothbrushes), non-electric appliances (e.g. scissors, hand razors, bathroom scales), cosmetics, perfume, toothpaste, aftershave, sun tan lotions, etc. DO NOT READ OUT. ONE ANSWER ONLY.
#NetNonFoodInternet Non-Food List
Q21 Where do you normally do most of your household's shopping for medical goods (e.g. drugs, medicine), other pharmaceutical products (e.g. vitamins, plasters, thermometers, bandages, syringes); and therapeutic appliances / equipment (e.g. spectacles, contact lenses, hearing aids, wheelchairs, etc.).INTERVIEWER NOTE: PLEASE PROBE FULLY FOR ROAD NAME AND LOCATION IF LOCATED OUT OF CENTRE.
#NonFood Non-Food List
Those who buy medical goods via the Internet at Q21:Q21A Which internet / home delivery retailer do you use for your household's shopping for medical goods (e.g. drugs,
medicine), other pharmaceutical products (e.g. vitamins, plasters, thermometers, bandages, syringes); and therapeutic appliances / equipment (e.g. spectacles, contact lenses, hearing aids, wheelchairs, etc.).DO NOT READ OUT. ONE ANSWER ONLY.
#NetNonFoodInternet Non-Food List
Q22 Where do you normally do most of your household's shopping on all other goods including jewellery & watches; glassware, china, tableware and household utensils; and other personal effects (e.g. travel goods, suitcases, prams, sunglasses);INTERVIEWER NOTE: PLEASE PROBE FULLY FOR ROAD NAME AND LOCATION IF LOCATED OUT OF CENTRE.
#NonFood Non-Food List
Those who buy all other types of goods via the Internet at Q22:Q22A Which internet / home delivery retailer do you use for your household's shopping on all other goods including jewellery
& watches; glassware, china, tableware and household utensils; and other personal effects (e.g. travel goods, suitcases, prams, sunglasses);DO NOT READ OUT. ONE ANSWER ONLY.
#NetNonFoodInternet Non-Food List
Question to be asked to respondents living in Zones 1 to 10Q23 How often do you or your household visit Haverfordwest?
DO NOT READ OUT. ONE ANSWER ONLY.
1 Daily GO TO Q242 4-6 days a week GO TO Q243 2-3 days a week GO TO Q244 One day a week GO TO Q245 Every two weeks GO TO Q246 Monthly GO TO Q247 Once every two months GO TO Q248 Three-four times a year GO TO Q249 Once a year GO TO Q24A Less often GO TO Q24B Never GO TO Q26C (Don’t know) GO TO Q24D (Varies) GO TO Q24
Those who visit Haverfordwest Town Centre at Q23:Q24 In order of importance, what are your two main reasons for visiting Haverfordwest Town Centre?
DO NOT READ OUT. PLEASE RECORD TWO ANSWERS: 1) MAIN REASON 2) SECONDARY REASONMain|Secondary
1 Food shopping2 Non-food shopping3 To visit bars / pubs4 To visit cafes/ restaurants5 To visit personal service providers (e.g. hairdressers, beauty salon etc.)6 To visit financial services such as banks and other financial institutions7 To visit other service providers (e.g. travel agent, estate agent etc.)8 To visit public services (e.g. medical or dentist appointment, library, job centre, community centre, etc)9 To get petrolA To visit the cinemaB To visit a parkC To visit the swimming poolD To visit other gyms / health and fitness facilitiesE To visit the libraryF To visit museums / art galleryG To visit the theatre or musical venuesH To visit night time venues e.g. nightclubI For other leisure activitiesJ To shop at the market(s)K To meet familyL To meet friendsM To visit the theatreN For work (i.e. place of work)O For business (e.g. attend a business appointment)P For education as a student (e.g. student at college, university, or other third level education)Q To access public transport for onward travel (e.g. train station, bus station)R (Dont know)S (Varies)
Questionnaire Copyright NEMS market research 5 of 26
Those who visit Haverfordwest Town Centre at Q23:Q25 What do you like about Haverfordwest Town Centre?
DO NOT READ OUT. CODE UP TO THREE RESPONSES ONLY.
1 (Nothing / very little)2 Attractive environment / nice place3 Close to friends or relatives 4 Close to home 5 Close to work 6 Compact 7 Easy to get to by bike 8 Easy to get to by bus 9 Easy to get to by car A Easy to park B Good facilities C Good food stores D Good pubs, cafés or restaurantsE Good range of non-food shopsF Makes a change from other placesG Quiet H Safe and secure I The market J Traditional K Traffic free shopping centre L Other (PLEASE WRITE IN)M A specific shop (PLEASE WRITE IN)N A specific attraction (PLEASE WRITE IN)O (Dont know)
Q26 What could be improved about Haverfordwest that would make you visit more often?DO NOT READ OUT. CODE UP TO THREE RESPONSES ONLY
1 (Nothing)2 Better access by road 3 Better public transport 4 Better signposting 5 Cleaner streets 6 Facilities which would assist you if shopping with children7 Free car parking 8 Jewellery / food markets / other events9 More / better comparison retailers (i.e. non-food shops)A More / better entertainmentB More / better places for eating out (e.g. cafes and restaurants)C More / better food shops D More / better parking E More / better pedestrianised streetsF More / better public conveniencesG More / better seats / flower displaysH More / better services I More advertising J More national multiple shops / High Street shopsK Protection from the weather (ie. covered shopping malls)L Shops / services open on SundaysM Fewer vacant shopsN Better maintained buildingsO Other (PLEASE WRITE IN)P (Don’t know)
Question to be asked to respondents living in Zones 1 to 4 and 7 to 9Q27 How often do you or your household visit Milford Haven Town Centre for shopping and other town centre services?
DO NOT READ OUT. ONE ANSWER ONLY.
1 Daily GO TO Q282 4-6 days a week GO TO Q283 2-3 days a week GO TO Q284 One day a week GO TO Q285 Every two weeks GO TO Q286 Monthly GO TO Q287 Once every two months GO TO Q288 Three-four times a year GO TO Q289 Once a year GO TO Q28A Less often GO TO Q28B Never GO TO Q30C (Don’t know) GO TO Q28D (Varies) GO TO Q28
Questionnaire Copyright NEMS market research 6 of 26
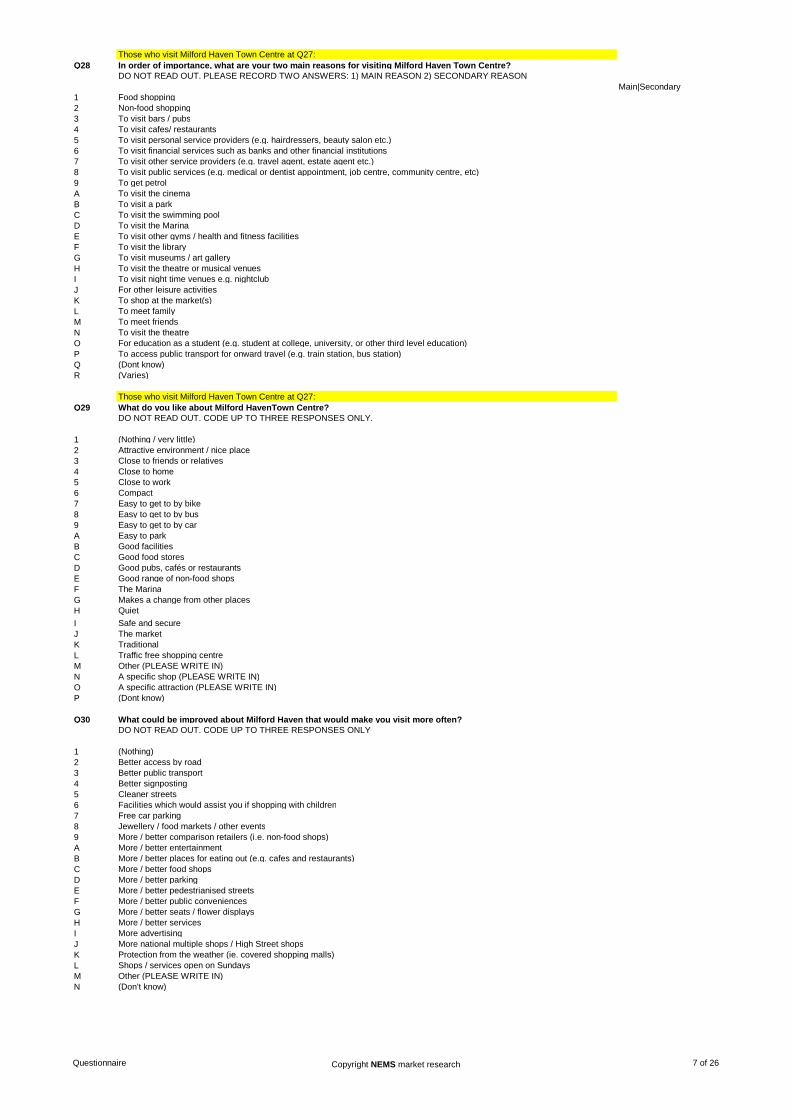
Those who visit Milford Haven Town Centre at Q27:Q28 In order of importance, what are your two main reasons for visiting Milford Haven Town Centre?
DO NOT READ OUT. PLEASE RECORD TWO ANSWERS: 1) MAIN REASON 2) SECONDARY REASONMain|Secondary
1 Food shopping2 Non-food shopping3 To visit bars / pubs4 To visit cafes/ restaurants5 To visit personal service providers (e.g. hairdressers, beauty salon etc.)6 To visit financial services such as banks and other financial institutions7 To visit other service providers (e.g. travel agent, estate agent etc.)8 To visit public services (e.g. medical or dentist appointment, job centre, community centre, etc)9 To get petrolA To visit the cinemaB To visit a parkC To visit the swimming poolD To visit the MarinaE To visit other gyms / health and fitness facilitiesF To visit the libraryG To visit museums / art galleryH To visit the theatre or musical venuesI To visit night time venues e.g. nightclubJ For other leisure activitiesK To shop at the market(s)L To meet familyM To meet friendsN To visit the theatreO For education as a student (e.g. student at college, university, or other third level education)P To access public transport for onward travel (e.g. train station, bus station)Q (Dont know)R (Varies)
Those who visit Milford Haven Town Centre at Q27:Q29 What do you like about Milford HavenTown Centre?
DO NOT READ OUT. CODE UP TO THREE RESPONSES ONLY.
1 (Nothing / very little)2 Attractive environment / nice place3 Close to friends or relatives 4 Close to home 5 Close to work 6 Compact 7 Easy to get to by bike 8 Easy to get to by bus 9 Easy to get to by car A Easy to park B Good facilities C Good food stores D Good pubs, cafés or restaurantsE Good range of non-food shopsF The MarinaG Makes a change from other placesH Quiet I Safe and secure J The market K Traditional L Traffic free shopping centre M Other (PLEASE WRITE IN)N A specific shop (PLEASE WRITE IN)O A specific attraction (PLEASE WRITE IN)P (Dont know)
Q30 What could be improved about Milford Haven that would make you visit more often?DO NOT READ OUT. CODE UP TO THREE RESPONSES ONLY
1 (Nothing)2 Better access by road 3 Better public transport 4 Better signposting 5 Cleaner streets 6 Facilities which would assist you if shopping with children7 Free car parking 8 Jewellery / food markets / other events9 More / better comparison retailers (i.e. non-food shops)A More / better entertainmentB More / better places for eating out (e.g. cafes and restaurants)C More / better food shops D More / better parking E More / better pedestrianised streetsF More / better public conveniencesG More / better seats / flower displaysH More / better services I More advertising J More national multiple shops / High Street shopsK Protection from the weather (ie. covered shopping malls)L Shops / services open on SundaysM Other (PLEASE WRITE IN)N (Don’t know)
Questionnaire Copyright NEMS market research 7 of 26
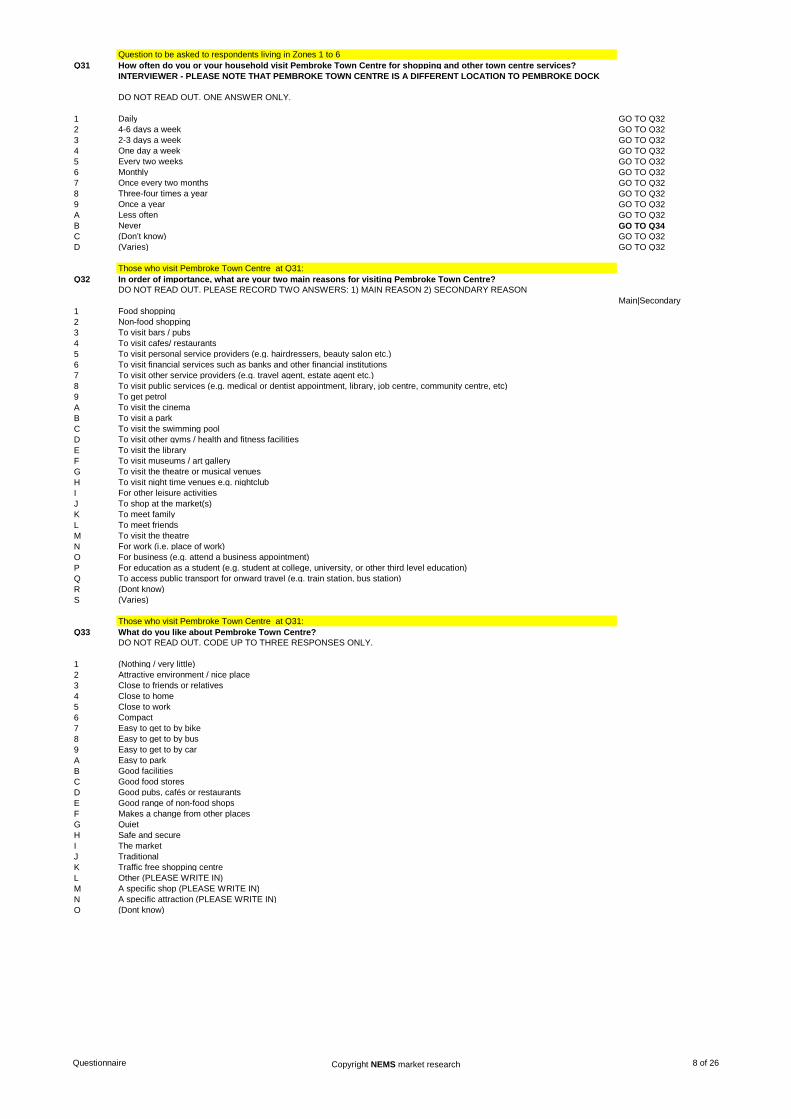
Question to be asked to respondents living in Zones 1 to 6Q31 How often do you or your household visit Pembroke Town Centre for shopping and other town centre services?
INTERVIEWER - PLEASE NOTE THAT PEMBROKE TOWN CENTRE IS A DIFFERENT LOCATION TO PEMBROKE DOCK
DO NOT READ OUT. ONE ANSWER ONLY.
1 Daily GO TO Q322 4-6 days a week GO TO Q323 2-3 days a week GO TO Q324 One day a week GO TO Q325 Every two weeks GO TO Q326 Monthly GO TO Q327 Once every two months GO TO Q328 Three-four times a year GO TO Q329 Once a year GO TO Q32A Less often GO TO Q32B Never GO TO Q34C (Don’t know) GO TO Q32D (Varies) GO TO Q32
Those who visit Pembroke Town Centre at Q31:Q32 In order of importance, what are your two main reasons for visiting Pembroke Town Centre?
DO NOT READ OUT. PLEASE RECORD TWO ANSWERS: 1) MAIN REASON 2) SECONDARY REASONMain|Secondary
1 Food shopping2 Non-food shopping3 To visit bars / pubs4 To visit cafes/ restaurants5 To visit personal service providers (e.g. hairdressers, beauty salon etc.)6 To visit financial services such as banks and other financial institutions7 To visit other service providers (e.g. travel agent, estate agent etc.)8 To visit public services (e.g. medical or dentist appointment, library, job centre, community centre, etc)9 To get petrolA To visit the cinemaB To visit a parkC To visit the swimming poolD To visit other gyms / health and fitness facilitiesE To visit the libraryF To visit museums / art galleryG To visit the theatre or musical venuesH To visit night time venues e.g. nightclubI For other leisure activitiesJ To shop at the market(s)K To meet familyL To meet friendsM To visit the theatreN For work (i.e. place of work)O For business (e.g. attend a business appointment)P For education as a student (e.g. student at college, university, or other third level education)Q To access public transport for onward travel (e.g. train station, bus station)R (Dont know)S (Varies)
Those who visit Pembroke Town Centre at Q31:Q33 What do you like about Pembroke Town Centre?
DO NOT READ OUT. CODE UP TO THREE RESPONSES ONLY.
1 (Nothing / very little)2 Attractive environment / nice place3 Close to friends or relatives 4 Close to home 5 Close to work 6 Compact 7 Easy to get to by bike 8 Easy to get to by bus 9 Easy to get to by car A Easy to park B Good facilities C Good food stores D Good pubs, cafés or restaurantsE Good range of non-food shopsF Makes a change from other placesG Quiet H Safe and secure I The market J Traditional K Traffic free shopping centre L Other (PLEASE WRITE IN)M A specific shop (PLEASE WRITE IN)N A specific attraction (PLEASE WRITE IN)O (Dont know)
Questionnaire Copyright NEMS market research 8 of 26
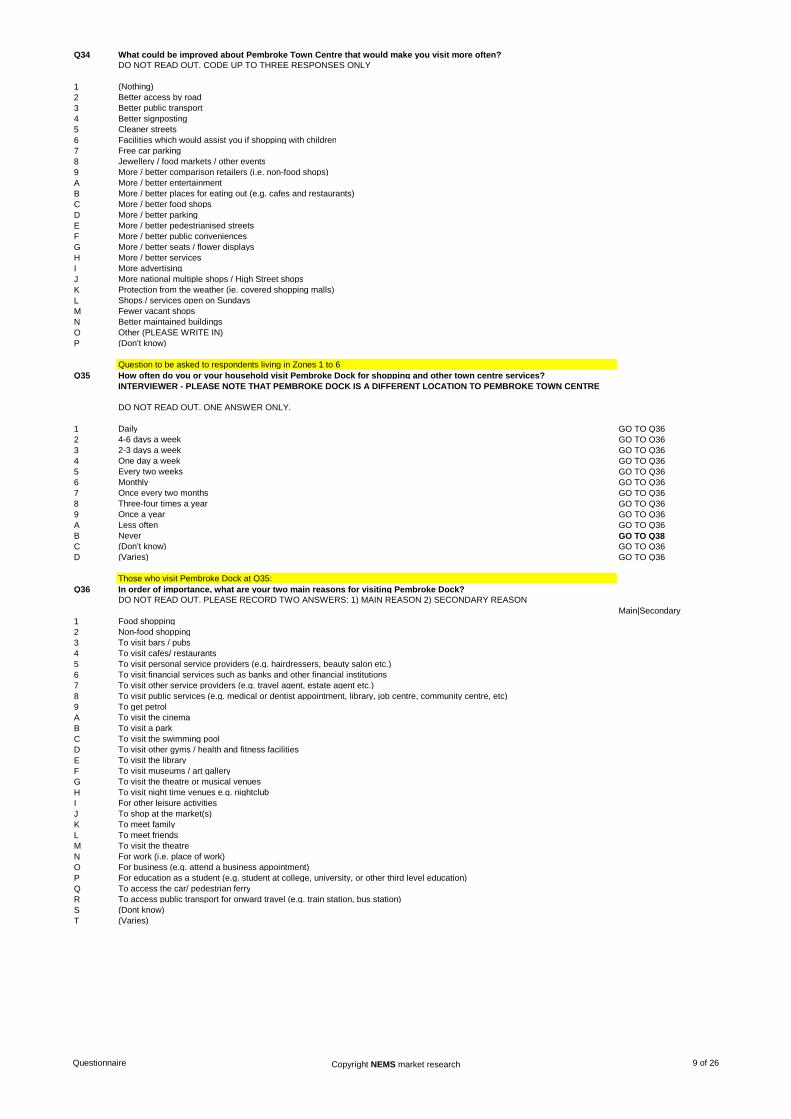
Q34 What could be improved about Pembroke Town Centre that would make you visit more often?DO NOT READ OUT. CODE UP TO THREE RESPONSES ONLY
1 (Nothing)2 Better access by road 3 Better public transport 4 Better signposting 5 Cleaner streets 6 Facilities which would assist you if shopping with children7 Free car parking 8 Jewellery / food markets / other events9 More / better comparison retailers (i.e. non-food shops)A More / better entertainmentB More / better places for eating out (e.g. cafes and restaurants)C More / better food shops D More / better parking E More / better pedestrianised streetsF More / better public conveniencesG More / better seats / flower displaysH More / better services I More advertising J More national multiple shops / High Street shopsK Protection from the weather (ie. covered shopping malls)L Shops / services open on SundaysM Fewer vacant shopsN Better maintained buildingsO Other (PLEASE WRITE IN)P (Don’t know)
Question to be asked to respondents living in Zones 1 to 6Q35 How often do you or your household visit Pembroke Dock for shopping and other town centre services?
INTERVIEWER - PLEASE NOTE THAT PEMBROKE DOCK IS A DIFFERENT LOCATION TO PEMBROKE TOWN CENTRE
DO NOT READ OUT. ONE ANSWER ONLY.
1 Daily GO TO Q362 4-6 days a week GO TO Q363 2-3 days a week GO TO Q364 One day a week GO TO Q365 Every two weeks GO TO Q366 Monthly GO TO Q367 Once every two months GO TO Q368 Three-four times a year GO TO Q369 Once a year GO TO Q36A Less often GO TO Q36B Never GO TO Q38C (Don’t know) GO TO Q36D (Varies) GO TO Q36
Those who visit Pembroke Dock at Q35:Q36 In order of importance, what are your two main reasons for visiting Pembroke Dock?
DO NOT READ OUT. PLEASE RECORD TWO ANSWERS: 1) MAIN REASON 2) SECONDARY REASONMain|Secondary
1 Food shopping2 Non-food shopping3 To visit bars / pubs4 To visit cafes/ restaurants5 To visit personal service providers (e.g. hairdressers, beauty salon etc.)6 To visit financial services such as banks and other financial institutions7 To visit other service providers (e.g. travel agent, estate agent etc.)8 To visit public services (e.g. medical or dentist appointment, library, job centre, community centre, etc)9 To get petrolA To visit the cinemaB To visit a parkC To visit the swimming poolD To visit other gyms / health and fitness facilitiesE To visit the libraryF To visit museums / art galleryG To visit the theatre or musical venuesH To visit night time venues e.g. nightclubI For other leisure activitiesJ To shop at the market(s)K To meet familyL To meet friendsM To visit the theatreN For work (i.e. place of work)O For business (e.g. attend a business appointment)P For education as a student (e.g. student at college, university, or other third level education)Q To access the car/ pedestrian ferryR To access public transport for onward travel (e.g. train station, bus station)S (Dont know)T (Varies)
Questionnaire Copyright NEMS market research 9 of 26
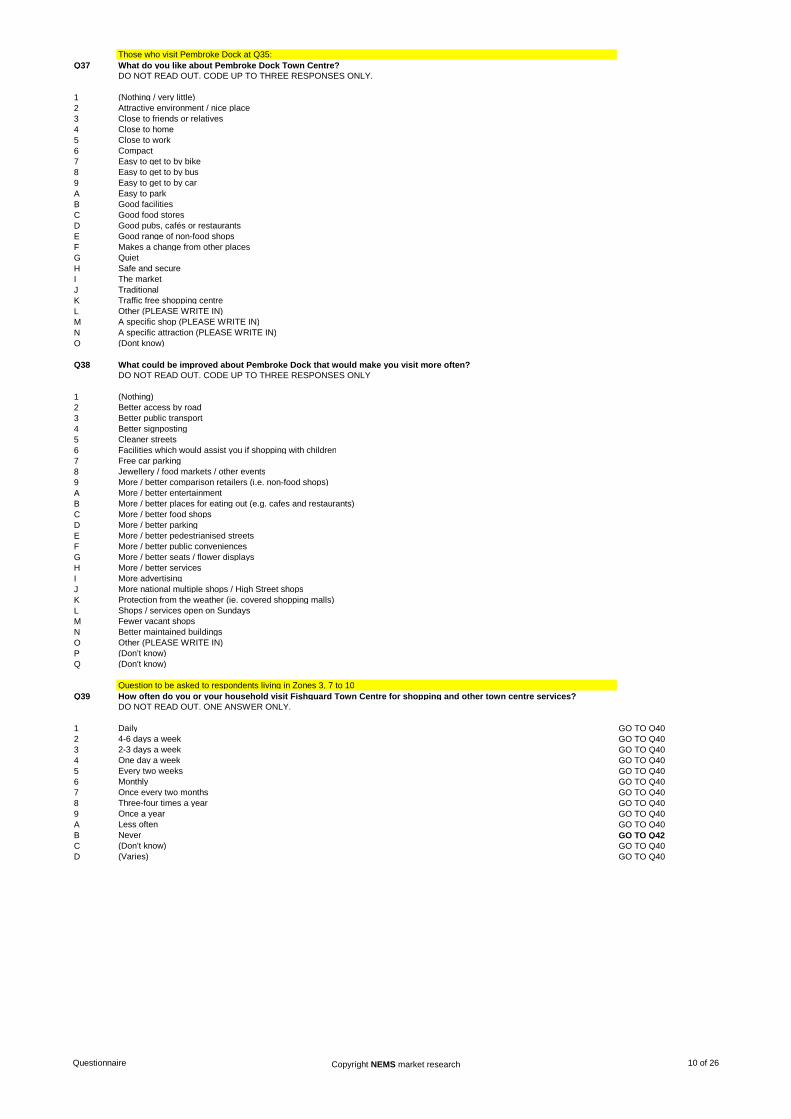
Those who visit Pembroke Dock at Q35:Q37 What do you like about Pembroke Dock Town Centre?
DO NOT READ OUT. CODE UP TO THREE RESPONSES ONLY.
1 (Nothing / very little)2 Attractive environment / nice place3 Close to friends or relatives 4 Close to home 5 Close to work 6 Compact 7 Easy to get to by bike 8 Easy to get to by bus 9 Easy to get to by car A Easy to park B Good facilities C Good food stores D Good pubs, cafés or restaurantsE Good range of non-food shopsF Makes a change from other placesG Quiet H Safe and secure I The market J Traditional K Traffic free shopping centre L Other (PLEASE WRITE IN)M A specific shop (PLEASE WRITE IN)N A specific attraction (PLEASE WRITE IN)O (Dont know)
Q38 What could be improved about Pembroke Dock that would make you visit more often?DO NOT READ OUT. CODE UP TO THREE RESPONSES ONLY
1 (Nothing)2 Better access by road 3 Better public transport 4 Better signposting 5 Cleaner streets 6 Facilities which would assist you if shopping with children7 Free car parking 8 Jewellery / food markets / other events9 More / better comparison retailers (i.e. non-food shops)A More / better entertainmentB More / better places for eating out (e.g. cafes and restaurants)C More / better food shops D More / better parking E More / better pedestrianised streetsF More / better public conveniencesG More / better seats / flower displaysH More / better services I More advertising J More national multiple shops / High Street shopsK Protection from the weather (ie. covered shopping malls)L Shops / services open on SundaysM Fewer vacant shopsN Better maintained buildingsO Other (PLEASE WRITE IN)P (Don’t know)Q (Don’t know)
Question to be asked to respondents living in Zones 3, 7 to 10Q39 How often do you or your household visit Fishguard Town Centre for shopping and other town centre services?
DO NOT READ OUT. ONE ANSWER ONLY.
1 Daily GO TO Q402 4-6 days a week GO TO Q403 2-3 days a week GO TO Q404 One day a week GO TO Q405 Every two weeks GO TO Q406 Monthly GO TO Q407 Once every two months GO TO Q408 Three-four times a year GO TO Q409 Once a year GO TO Q40A Less often GO TO Q40B Never GO TO Q42C (Don’t know) GO TO Q40D (Varies) GO TO Q40
Questionnaire Copyright NEMS market research 10 of 26
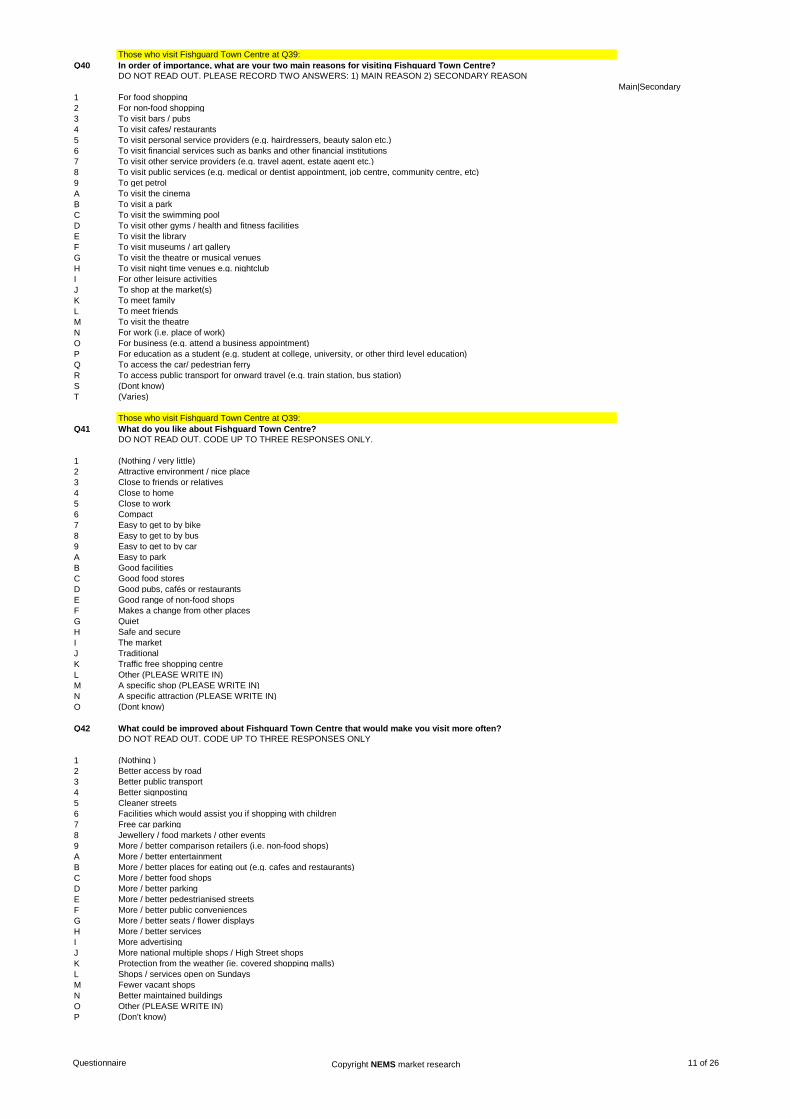
Those who visit Fishguard Town Centre at Q39:Q40 In order of importance, what are your two main reasons for visiting Fishguard Town Centre?
DO NOT READ OUT. PLEASE RECORD TWO ANSWERS: 1) MAIN REASON 2) SECONDARY REASONMain|Secondary
1 For food shopping2 For non-food shopping3 To visit bars / pubs4 To visit cafes/ restaurants5 To visit personal service providers (e.g. hairdressers, beauty salon etc.)6 To visit financial services such as banks and other financial institutions7 To visit other service providers (e.g. travel agent, estate agent etc.)8 To visit public services (e.g. medical or dentist appointment, job centre, community centre, etc)9 To get petrolA To visit the cinemaB To visit a parkC To visit the swimming poolD To visit other gyms / health and fitness facilitiesE To visit the libraryF To visit museums / art galleryG To visit the theatre or musical venuesH To visit night time venues e.g. nightclubI For other leisure activitiesJ To shop at the market(s)K To meet familyL To meet friendsM To visit the theatreN For work (i.e. place of work)O For business (e.g. attend a business appointment)P For education as a student (e.g. student at college, university, or other third level education)Q To access the car/ pedestrian ferryR To access public transport for onward travel (e.g. train station, bus station)S (Dont know)T (Varies)
Those who visit Fishguard Town Centre at Q39:Q41 What do you like about Fishguard Town Centre?
DO NOT READ OUT. CODE UP TO THREE RESPONSES ONLY.
1 (Nothing / very little)2 Attractive environment / nice place3 Close to friends or relatives 4 Close to home 5 Close to work 6 Compact 7 Easy to get to by bike 8 Easy to get to by bus 9 Easy to get to by car A Easy to park B Good facilities C Good food stores D Good pubs, cafés or restaurantsE Good range of non-food shopsF Makes a change from other placesG Quiet H Safe and secure I The market J Traditional K Traffic free shopping centre L Other (PLEASE WRITE IN)M A specific shop (PLEASE WRITE IN)N A specific attraction (PLEASE WRITE IN)O (Dont know)
Q42 What could be improved about Fishguard Town Centre that would make you visit more often?DO NOT READ OUT. CODE UP TO THREE RESPONSES ONLY
1 (Nothing )2 Better access by road 3 Better public transport 4 Better signposting 5 Cleaner streets 6 Facilities which would assist you if shopping with children7 Free car parking 8 Jewellery / food markets / other events9 More / better comparison retailers (i.e. non-food shops)A More / better entertainmentB More / better places for eating out (e.g. cafes and restaurants)C More / better food shops D More / better parking E More / better pedestrianised streetsF More / better public conveniencesG More / better seats / flower displaysH More / better services I More advertising J More national multiple shops / High Street shopsK Protection from the weather (ie. covered shopping malls)L Shops / services open on SundaysM Fewer vacant shopsN Better maintained buildingsO Other (PLEASE WRITE IN)P (Don’t know)
Questionnaire Copyright NEMS market research 11 of 26
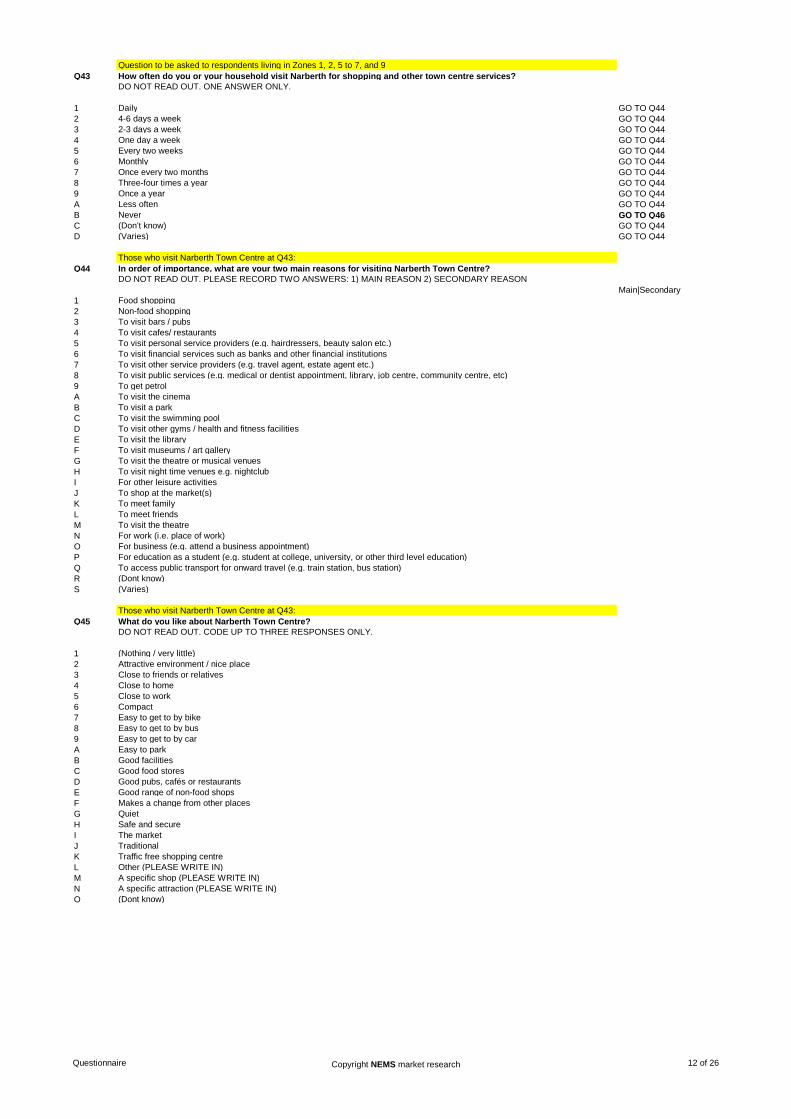
Question to be asked to respondents living in Zones 1, 2, 5 to 7, and 9Q43 How often do you or your household visit Narberth for shopping and other town centre services?
DO NOT READ OUT. ONE ANSWER ONLY.
1 Daily GO TO Q442 4-6 days a week GO TO Q443 2-3 days a week GO TO Q444 One day a week GO TO Q445 Every two weeks GO TO Q446 Monthly GO TO Q447 Once every two months GO TO Q448 Three-four times a year GO TO Q449 Once a year GO TO Q44A Less often GO TO Q44B Never GO TO Q46C (Don’t know) GO TO Q44D (Varies) GO TO Q44
Those who visit Narberth Town Centre at Q43:Q44 In order of importance, what are your two main reasons for visiting Narberth Town Centre?
DO NOT READ OUT. PLEASE RECORD TWO ANSWERS: 1) MAIN REASON 2) SECONDARY REASONMain|Secondary
1 Food shopping2 Non-food shopping3 To visit bars / pubs4 To visit cafes/ restaurants5 To visit personal service providers (e.g. hairdressers, beauty salon etc.)6 To visit financial services such as banks and other financial institutions7 To visit other service providers (e.g. travel agent, estate agent etc.)8 To visit public services (e.g. medical or dentist appointment, library, job centre, community centre, etc)9 To get petrolA To visit the cinemaB To visit a parkC To visit the swimming poolD To visit other gyms / health and fitness facilitiesE To visit the libraryF To visit museums / art galleryG To visit the theatre or musical venuesH To visit night time venues e.g. nightclubI For other leisure activitiesJ To shop at the market(s)K To meet familyL To meet friendsM To visit the theatreN For work (i.e. place of work)O For business (e.g. attend a business appointment)P For education as a student (e.g. student at college, university, or other third level education)Q To access public transport for onward travel (e.g. train station, bus station)R (Dont know)S (Varies)
Those who visit Narberth Town Centre at Q43:Q45 What do you like about Narberth Town Centre?
DO NOT READ OUT. CODE UP TO THREE RESPONSES ONLY.
1 (Nothing / very little)2 Attractive environment / nice place3 Close to friends or relatives 4 Close to home 5 Close to work 6 Compact 7 Easy to get to by bike 8 Easy to get to by bus 9 Easy to get to by car A Easy to park B Good facilities C Good food stores D Good pubs, cafés or restaurantsE Good range of non-food shopsF Makes a change from other placesG Quiet H Safe and secure I The market J Traditional K Traffic free shopping centre L Other (PLEASE WRITE IN)M A specific shop (PLEASE WRITE IN)N A specific attraction (PLEASE WRITE IN)O (Dont know)
Questionnaire Copyright NEMS market research 12 of 26
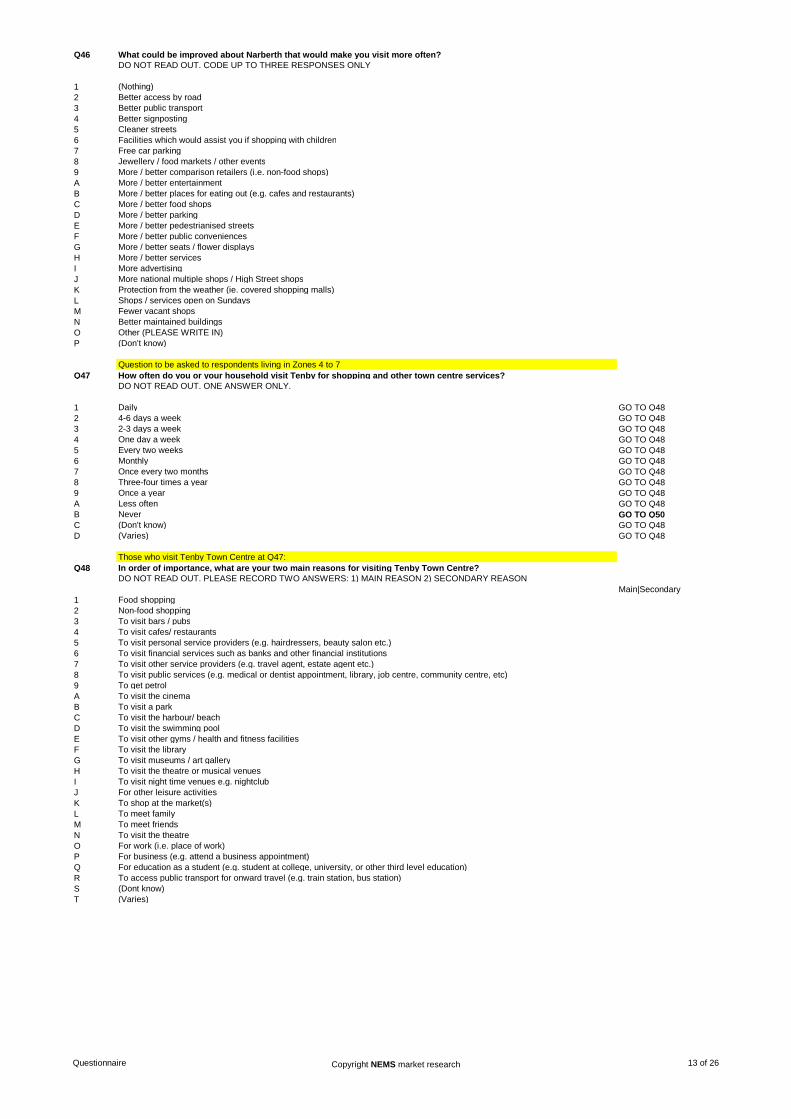
Q46 What could be improved about Narberth that would make you visit more often?DO NOT READ OUT. CODE UP TO THREE RESPONSES ONLY
1 (Nothing)2 Better access by road 3 Better public transport 4 Better signposting 5 Cleaner streets 6 Facilities which would assist you if shopping with children7 Free car parking 8 Jewellery / food markets / other events9 More / better comparison retailers (i.e. non-food shops)A More / better entertainmentB More / better places for eating out (e.g. cafes and restaurants)C More / better food shops D More / better parking E More / better pedestrianised streetsF More / better public conveniencesG More / better seats / flower displaysH More / better services I More advertising J More national multiple shops / High Street shopsK Protection from the weather (ie. covered shopping malls)L Shops / services open on SundaysM Fewer vacant shopsN Better maintained buildingsO Other (PLEASE WRITE IN)P (Don’t know)
Question to be asked to respondents living in Zones 4 to 7Q47 How often do you or your household visit Tenby for shopping and other town centre services?
DO NOT READ OUT. ONE ANSWER ONLY.
1 Daily GO TO Q482 4-6 days a week GO TO Q483 2-3 days a week GO TO Q484 One day a week GO TO Q485 Every two weeks GO TO Q486 Monthly GO TO Q487 Once every two months GO TO Q488 Three-four times a year GO TO Q489 Once a year GO TO Q48A Less often GO TO Q48B Never GO TO Q50C (Don’t know) GO TO Q48D (Varies) GO TO Q48
Those who visit Tenby Town Centre at Q47:Q48 In order of importance, what are your two main reasons for visiting Tenby Town Centre?
DO NOT READ OUT. PLEASE RECORD TWO ANSWERS: 1) MAIN REASON 2) SECONDARY REASONMain|Secondary
1 Food shopping2 Non-food shopping3 To visit bars / pubs4 To visit cafes/ restaurants5 To visit personal service providers (e.g. hairdressers, beauty salon etc.)6 To visit financial services such as banks and other financial institutions7 To visit other service providers (e.g. travel agent, estate agent etc.)8 To visit public services (e.g. medical or dentist appointment, library, job centre, community centre, etc)9 To get petrolA To visit the cinemaB To visit a parkC To visit the harbour/ beachD To visit the swimming poolE To visit other gyms / health and fitness facilitiesF To visit the libraryG To visit museums / art galleryH To visit the theatre or musical venuesI To visit night time venues e.g. nightclubJ For other leisure activitiesK To shop at the market(s)L To meet familyM To meet friendsN To visit the theatreO For work (i.e. place of work)P For business (e.g. attend a business appointment)Q For education as a student (e.g. student at college, university, or other third level education)R To access public transport for onward travel (e.g. train station, bus station)S (Dont know)T (Varies)
Questionnaire Copyright NEMS market research 13 of 26
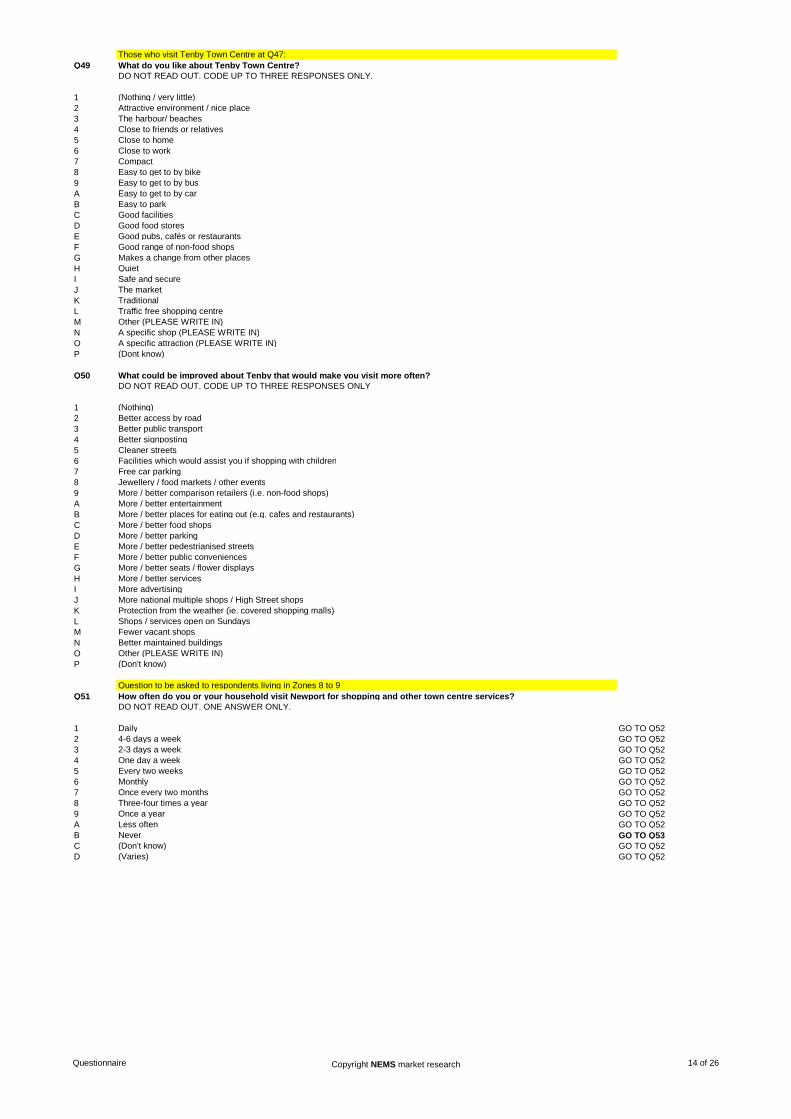
Those who visit Tenby Town Centre at Q47:Q49 What do you like about Tenby Town Centre?
DO NOT READ OUT. CODE UP TO THREE RESPONSES ONLY.
1 (Nothing / very little)2 Attractive environment / nice place3 The harbour/ beaches4 Close to friends or relatives 5 Close to home 6 Close to work 7 Compact 8 Easy to get to by bike 9 Easy to get to by bus A Easy to get to by car B Easy to park C Good facilities D Good food stores E Good pubs, cafés or restaurantsF Good range of non-food shopsG Makes a change from other placesH Quiet I Safe and secure J The market K Traditional L Traffic free shopping centre M Other (PLEASE WRITE IN)N A specific shop (PLEASE WRITE IN)O A specific attraction (PLEASE WRITE IN)P (Dont know)
Q50 What could be improved about Tenby that would make you visit more often?DO NOT READ OUT. CODE UP TO THREE RESPONSES ONLY
1 (Nothing)2 Better access by road 3 Better public transport 4 Better signposting 5 Cleaner streets 6 Facilities which would assist you if shopping with children7 Free car parking 8 Jewellery / food markets / other events9 More / better comparison retailers (i.e. non-food shops)A More / better entertainmentB More / better places for eating out (e.g. cafes and restaurants)C More / better food shops D More / better parking E More / better pedestrianised streetsF More / better public conveniencesG More / better seats / flower displaysH More / better services I More advertising J More national multiple shops / High Street shopsK Protection from the weather (ie. covered shopping malls)L Shops / services open on SundaysM Fewer vacant shopsN Better maintained buildingsO Other (PLEASE WRITE IN)P (Don’t know)
Question to be asked to respondents living in Zones 8 to 9Q51 How often do you or your household visit Newport for shopping and other town centre services?
DO NOT READ OUT. ONE ANSWER ONLY.
1 Daily GO TO Q522 4-6 days a week GO TO Q523 2-3 days a week GO TO Q524 One day a week GO TO Q525 Every two weeks GO TO Q526 Monthly GO TO Q527 Once every two months GO TO Q528 Three-four times a year GO TO Q529 Once a year GO TO Q52A Less often GO TO Q52B Never GO TO Q53C (Don’t know) GO TO Q52D (Varies) GO TO Q52
Questionnaire Copyright NEMS market research 14 of 26
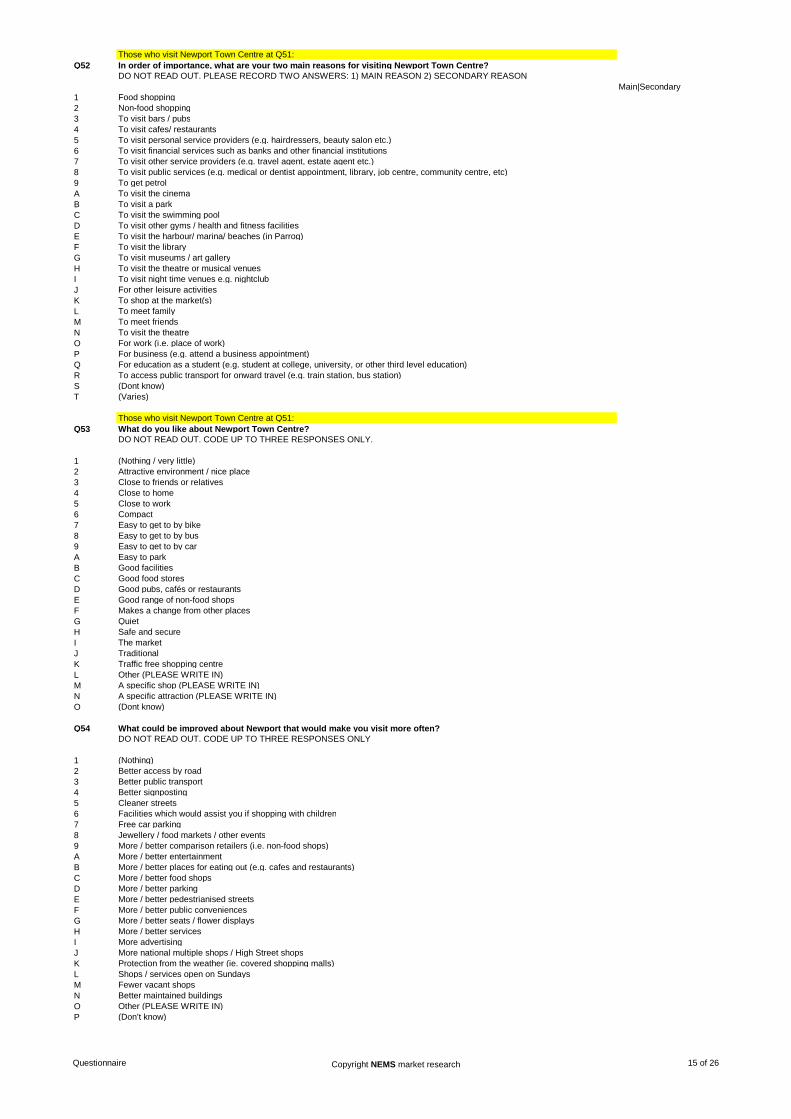
Those who visit Newport Town Centre at Q51:Q52 In order of importance, what are your two main reasons for visiting Newport Town Centre?
DO NOT READ OUT. PLEASE RECORD TWO ANSWERS: 1) MAIN REASON 2) SECONDARY REASONMain|Secondary
1 Food shopping2 Non-food shopping3 To visit bars / pubs4 To visit cafes/ restaurants5 To visit personal service providers (e.g. hairdressers, beauty salon etc.)6 To visit financial services such as banks and other financial institutions7 To visit other service providers (e.g. travel agent, estate agent etc.)8 To visit public services (e.g. medical or dentist appointment, library, job centre, community centre, etc)9 To get petrolA To visit the cinemaB To visit a parkC To visit the swimming poolD To visit other gyms / health and fitness facilitiesE To visit the harbour/ marina/ beaches (in Parrog)F To visit the libraryG To visit museums / art galleryH To visit the theatre or musical venuesI To visit night time venues e.g. nightclubJ For other leisure activitiesK To shop at the market(s)L To meet familyM To meet friendsN To visit the theatreO For work (i.e. place of work)P For business (e.g. attend a business appointment)Q For education as a student (e.g. student at college, university, or other third level education)R To access public transport for onward travel (e.g. train station, bus station)S (Dont know)T (Varies)
Those who visit Newport Town Centre at Q51:Q53 What do you like about Newport Town Centre?
DO NOT READ OUT. CODE UP TO THREE RESPONSES ONLY.
1 (Nothing / very little)2 Attractive environment / nice place3 Close to friends or relatives 4 Close to home 5 Close to work 6 Compact 7 Easy to get to by bike 8 Easy to get to by bus 9 Easy to get to by car A Easy to park B Good facilities C Good food stores D Good pubs, cafés or restaurantsE Good range of non-food shopsF Makes a change from other placesG Quiet H Safe and secure I The market J Traditional K Traffic free shopping centre L Other (PLEASE WRITE IN)M A specific shop (PLEASE WRITE IN)N A specific attraction (PLEASE WRITE IN)O (Dont know)
Q54 What could be improved about Newport that would make you visit more often?DO NOT READ OUT. CODE UP TO THREE RESPONSES ONLY
1 (Nothing)2 Better access by road 3 Better public transport 4 Better signposting 5 Cleaner streets 6 Facilities which would assist you if shopping with children7 Free car parking 8 Jewellery / food markets / other events9 More / better comparison retailers (i.e. non-food shops)A More / better entertainmentB More / better places for eating out (e.g. cafes and restaurants)C More / better food shops D More / better parking E More / better pedestrianised streetsF More / better public conveniencesG More / better seats / flower displaysH More / better services I More advertising J More national multiple shops / High Street shopsK Protection from the weather (ie. covered shopping malls)L Shops / services open on SundaysM Fewer vacant shopsN Better maintained buildingsO Other (PLEASE WRITE IN)P (Don’t know)
Questionnaire Copyright NEMS market research 15 of 26
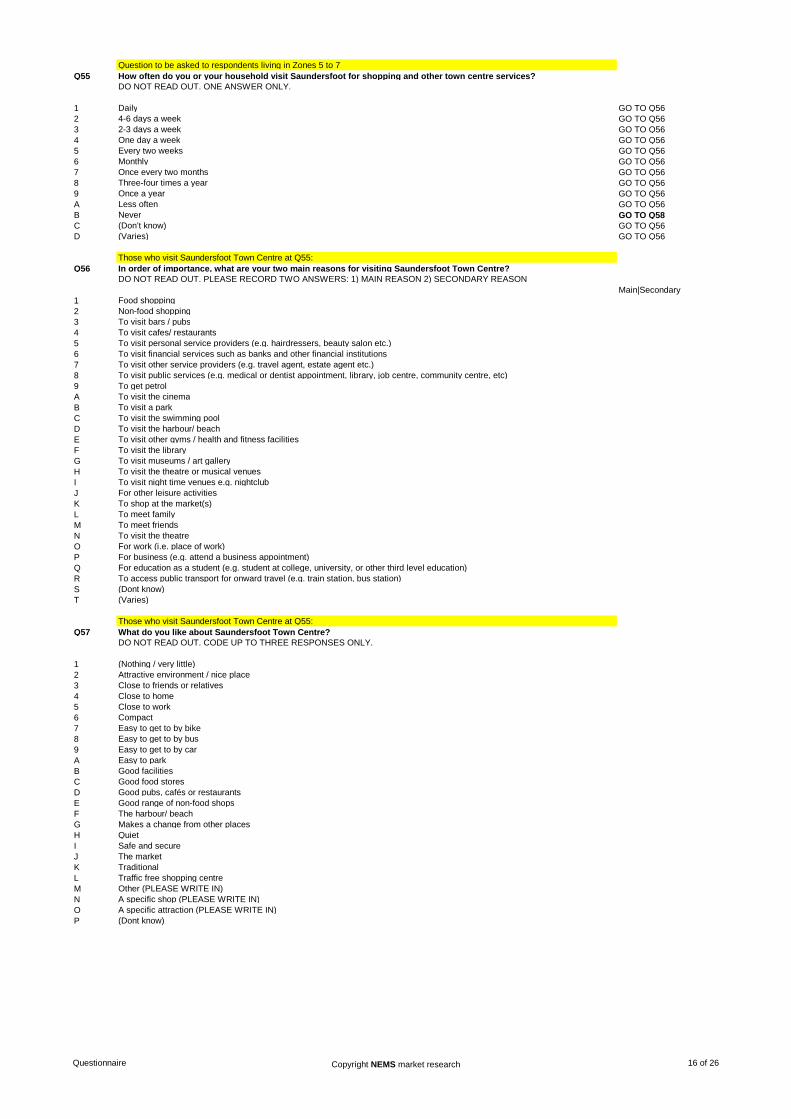
Question to be asked to respondents living in Zones 5 to 7Q55 How often do you or your household visit Saundersfoot for shopping and other town centre services?
DO NOT READ OUT. ONE ANSWER ONLY.
1 Daily GO TO Q562 4-6 days a week GO TO Q563 2-3 days a week GO TO Q564 One day a week GO TO Q565 Every two weeks GO TO Q566 Monthly GO TO Q567 Once every two months GO TO Q568 Three-four times a year GO TO Q569 Once a year GO TO Q56A Less often GO TO Q56B Never GO TO Q58C (Don’t know) GO TO Q56D (Varies) GO TO Q56
Those who visit Saundersfoot Town Centre at Q55:Q56 In order of importance, what are your two main reasons for visiting Saundersfoot Town Centre?
DO NOT READ OUT. PLEASE RECORD TWO ANSWERS: 1) MAIN REASON 2) SECONDARY REASONMain|Secondary
1 Food shopping2 Non-food shopping3 To visit bars / pubs4 To visit cafes/ restaurants5 To visit personal service providers (e.g. hairdressers, beauty salon etc.)6 To visit financial services such as banks and other financial institutions7 To visit other service providers (e.g. travel agent, estate agent etc.)8 To visit public services (e.g. medical or dentist appointment, library, job centre, community centre, etc)9 To get petrolA To visit the cinemaB To visit a parkC To visit the swimming poolD To visit the harbour/ beachE To visit other gyms / health and fitness facilitiesF To visit the libraryG To visit museums / art galleryH To visit the theatre or musical venuesI To visit night time venues e.g. nightclubJ For other leisure activitiesK To shop at the market(s)L To meet familyM To meet friendsN To visit the theatreO For work (i.e. place of work)P For business (e.g. attend a business appointment)Q For education as a student (e.g. student at college, university, or other third level education)R To access public transport for onward travel (e.g. train station, bus station)S (Dont know)T (Varies)
Those who visit Saundersfoot Town Centre at Q55:Q57 What do you like about Saundersfoot Town Centre?
DO NOT READ OUT. CODE UP TO THREE RESPONSES ONLY.
1 (Nothing / very little)2 Attractive environment / nice place3 Close to friends or relatives 4 Close to home 5 Close to work 6 Compact 7 Easy to get to by bike 8 Easy to get to by bus 9 Easy to get to by car A Easy to park B Good facilities C Good food stores D Good pubs, cafés or restaurantsE Good range of non-food shopsF The harbour/ beachG Makes a change from other placesH Quiet I Safe and secure J The market K Traditional L Traffic free shopping centre M Other (PLEASE WRITE IN)N A specific shop (PLEASE WRITE IN)O A specific attraction (PLEASE WRITE IN)P (Dont know)
Questionnaire Copyright NEMS market research 16 of 26
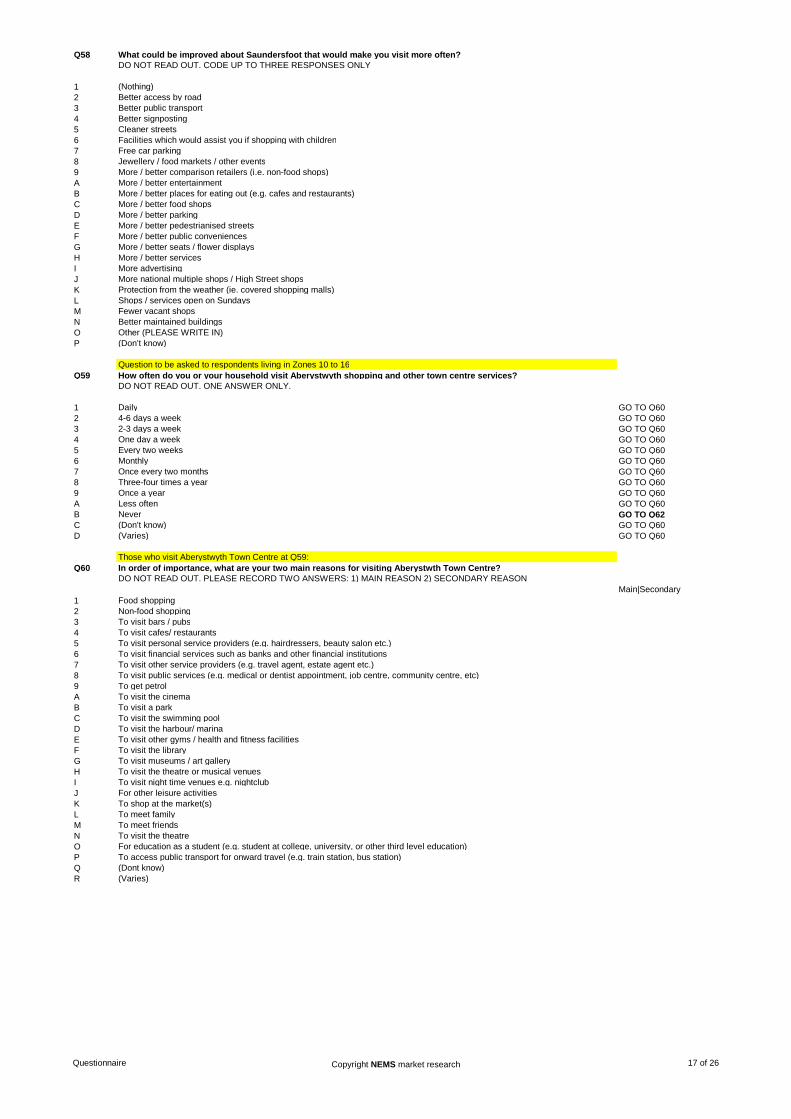
Q58 What could be improved about Saundersfoot that would make you visit more often?DO NOT READ OUT. CODE UP TO THREE RESPONSES ONLY
1 (Nothing)2 Better access by road 3 Better public transport 4 Better signposting 5 Cleaner streets 6 Facilities which would assist you if shopping with children7 Free car parking 8 Jewellery / food markets / other events9 More / better comparison retailers (i.e. non-food shops)A More / better entertainmentB More / better places for eating out (e.g. cafes and restaurants)C More / better food shops D More / better parking E More / better pedestrianised streetsF More / better public conveniencesG More / better seats / flower displaysH More / better services I More advertising J More national multiple shops / High Street shopsK Protection from the weather (ie. covered shopping malls)L Shops / services open on SundaysM Fewer vacant shopsN Better maintained buildingsO Other (PLEASE WRITE IN)P (Don’t know)
Question to be asked to respondents living in Zones 10 to 16Q59 How often do you or your household visit Aberystwyth shopping and other town centre services?
DO NOT READ OUT. ONE ANSWER ONLY.
1 Daily GO TO Q602 4-6 days a week GO TO Q603 2-3 days a week GO TO Q604 One day a week GO TO Q605 Every two weeks GO TO Q606 Monthly GO TO Q607 Once every two months GO TO Q608 Three-four times a year GO TO Q609 Once a year GO TO Q60A Less often GO TO Q60B Never GO TO Q62C (Don’t know) GO TO Q60D (Varies) GO TO Q60
Those who visit Aberystwyth Town Centre at Q59:Q60 In order of importance, what are your two main reasons for visiting Aberystwth Town Centre?
DO NOT READ OUT. PLEASE RECORD TWO ANSWERS: 1) MAIN REASON 2) SECONDARY REASONMain|Secondary
1 Food shopping2 Non-food shopping3 To visit bars / pubs4 To visit cafes/ restaurants5 To visit personal service providers (e.g. hairdressers, beauty salon etc.)6 To visit financial services such as banks and other financial institutions7 To visit other service providers (e.g. travel agent, estate agent etc.)8 To visit public services (e.g. medical or dentist appointment, job centre, community centre, etc)9 To get petrolA To visit the cinemaB To visit a parkC To visit the swimming poolD To visit the harbour/ marinaE To visit other gyms / health and fitness facilitiesF To visit the libraryG To visit museums / art galleryH To visit the theatre or musical venuesI To visit night time venues e.g. nightclubJ For other leisure activitiesK To shop at the market(s)L To meet familyM To meet friendsN To visit the theatreO For education as a student (e.g. student at college, university, or other third level education)P To access public transport for onward travel (e.g. train station, bus station)Q (Dont know)R (Varies)
Questionnaire Copyright NEMS market research 17 of 26
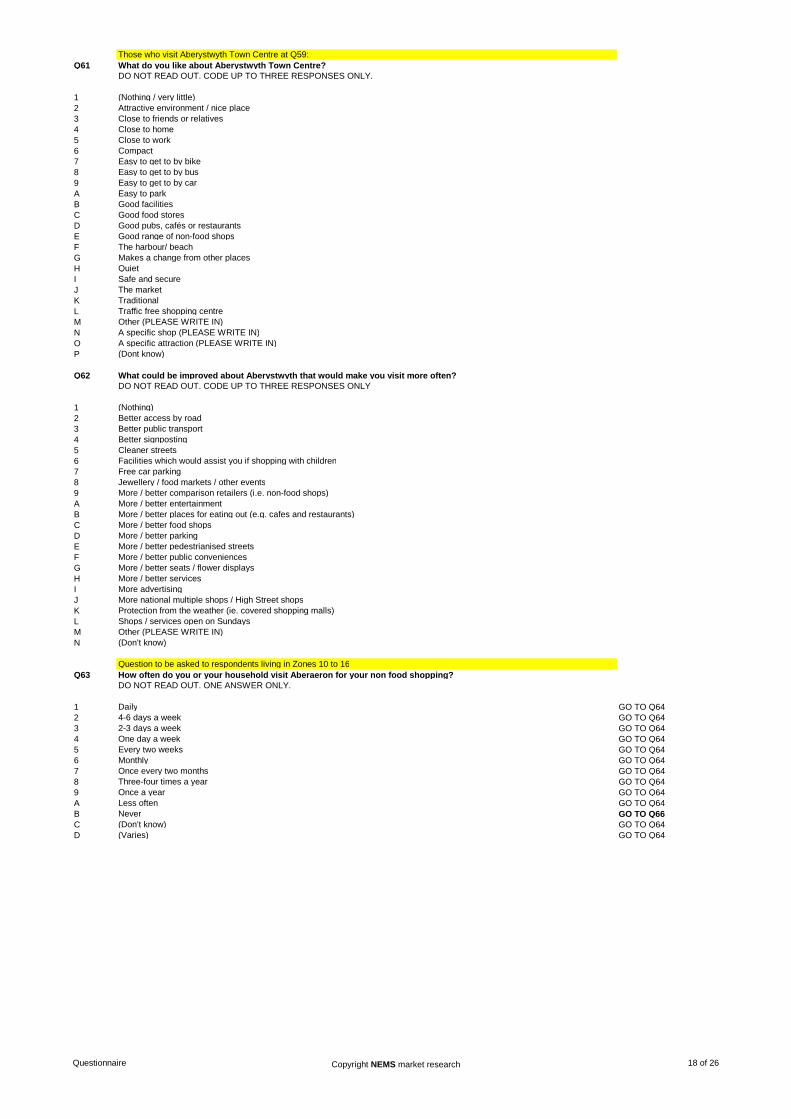
Those who visit Aberystwyth Town Centre at Q59:Q61 What do you like about Aberystwyth Town Centre?
DO NOT READ OUT. CODE UP TO THREE RESPONSES ONLY.
1 (Nothing / very little)2 Attractive environment / nice place3 Close to friends or relatives 4 Close to home 5 Close to work 6 Compact 7 Easy to get to by bike 8 Easy to get to by bus 9 Easy to get to by car A Easy to park B Good facilities C Good food stores D Good pubs, cafés or restaurantsE Good range of non-food shopsF The harbour/ beachG Makes a change from other placesH Quiet I Safe and secure J The market K Traditional L Traffic free shopping centre M Other (PLEASE WRITE IN)N A specific shop (PLEASE WRITE IN)O A specific attraction (PLEASE WRITE IN)P (Dont know)
Q62 What could be improved about Aberystwyth that would make you visit more often?DO NOT READ OUT. CODE UP TO THREE RESPONSES ONLY
1 (Nothing)2 Better access by road 3 Better public transport 4 Better signposting 5 Cleaner streets 6 Facilities which would assist you if shopping with children7 Free car parking 8 Jewellery / food markets / other events9 More / better comparison retailers (i.e. non-food shops)A More / better entertainmentB More / better places for eating out (e.g. cafes and restaurants)C More / better food shops D More / better parking E More / better pedestrianised streetsF More / better public conveniencesG More / better seats / flower displaysH More / better services I More advertising J More national multiple shops / High Street shopsK Protection from the weather (ie. covered shopping malls)L Shops / services open on SundaysM Other (PLEASE WRITE IN)N (Don’t know)
Question to be asked to respondents living in Zones 10 to 16Q63 How often do you or your household visit Aberaeron for your non food shopping?
DO NOT READ OUT. ONE ANSWER ONLY.
1 Daily GO TO Q642 4-6 days a week GO TO Q643 2-3 days a week GO TO Q644 One day a week GO TO Q645 Every two weeks GO TO Q646 Monthly GO TO Q647 Once every two months GO TO Q648 Three-four times a year GO TO Q649 Once a year GO TO Q64A Less often GO TO Q64B Never GO TO Q66C (Don’t know) GO TO Q64D (Varies) GO TO Q64
Questionnaire Copyright NEMS market research 18 of 26
Those who visit Aberaeron Town Centre at Q63:Q64 In order of importance, what are your two main reasons for visiting Aberaeron Town Centre?
DO NOT READ OUT. PLEASE RECORD TWO ANSWERS: 1) MAIN REASON 2) SECONDARY REASONMain|Secondary
1 Food shopping2 Non-food shopping3 To visit bars / pubs4 To visit cafes/ restaurants5 To visit personal service providers (e.g. hairdressers, beauty salon etc.)6 To visit financial services such as banks and other financial institutions7 To visit other service providers (e.g. travel agent, estate agent etc.)8 To visit public services (e.g. medical or dentist appointment, job centre, community centre, etc)9 To get petrolA To visit the cinemaB To visit a parkC To visit the swimming poolD To visit the harbour/ marinaE To visit other gyms / health and fitness facilitiesF To visit the libraryG To visit museums / art galleryH To visit the theatre or musical venuesI To visit night time venues e.g. nightclubJ For other leisure activitiesK To shop at the market(s)L To meet familyM To meet friendsN To visit the theatreO For education as a student (e.g. student at college, university, or other third level education)P To access public transport for onward travel (e.g. train station, bus station)Q (Dont know)R (Varies)
Those who visit Aberaeron Town Centre at Q63:Q65 What do you like about Aberaeron Town Centre?
DO NOT READ OUT. CODE UP TO THREE RESPONSES ONLY.
1 (Nothing / very little)2 Attractive environment / nice place3 Close to friends or relatives 4 Close to home 5 Close to work 6 Compact 7 Easy to get to by bike 8 Easy to get to by bus 9 Easy to get to by car A Easy to park B Good facilities C Good food stores D Good pubs, cafés or restaurantsE Good range of non-food shopsF The harbour/ beachG Makes a change from other placesH Quiet I Safe and secure J The market K Traditional L Traffic free shopping centre M Other (PLEASE WRITE IN)N A specific shop (PLEASE WRITE IN)O A specific attraction (PLEASE WRITE IN)P (Dont know)
Q66 What could be improved about Aberaeron that would make you visit more often?DO NOT READ OUT. CODE UP TO THREE RESPONSES ONLY
1 (Nothing)2 Better access by road 3 Better public transport 4 Better signposting 5 Cleaner streets 6 Facilities which would assist you if shopping with children7 Free car parking 8 Jewellery / food markets / other events9 More / better comparison retailers (i.e. non-food shops)A More / better entertainmentB More / better places for eating out (e.g. cafes and restaurants)C More / better food shops D More / better parking E More / better pedestrianised streetsF More / better public conveniencesG More / better seats / flower displaysH More / better services I More advertising J More national multiple shops / High Street shopsK Protection from the weather (ie. covered shopping malls)L Shops / services open on SundaysM Other (PLEASE WRITE IN)N (Don’t know)
Questionnaire Copyright NEMS market research 19 of 26
Question to be asked to respondents living in Zones 8 to 11Q67 How often do you or your household visit Cardigan for shopping and other town centre services?
DO NOT READ OUT. ONE ANSWER ONLY.
1 Daily GO TO Q682 4-6 days a week GO TO Q683 2-3 days a week GO TO Q684 One day a week GO TO Q685 Every two weeks GO TO Q686 Monthly GO TO Q687 Once every two months GO TO Q688 Three-four times a year GO TO Q689 Once a year GO TO Q68A Less often GO TO Q68B Never GO TO Q70C (Don’t know) GO TO Q68D (Varies) GO TO Q68
Those who visit Cardigan Town Centre at Q67:Q68 In order of importance, what are your two main reasons for visiting Cardigan Town Centre?
DO NOT READ OUT. PLEASE RECORD TWO ANSWERS: 1) MAIN REASON 2) SECONDARY REASONMain|Secondary
1 Food shopping2 Non-food shopping3 To visit bars / pubs4 To visit cafes/ restaurants5 To visit personal service providers (e.g. hairdressers, beauty salon etc.)6 To visit financial services such as banks and other financial institutions7 To visit other service providers (e.g. travel agent, estate agent etc.)8 To visit public services (e.g. medical or dentist appointment, job centre, community centre, etc)9 To get petrolA To visit the cinemaB To visit a parkC To visit the swimming poolD To visit the harbour/ marinaE To visit other gyms / health and fitness facilitiesF To visit the libraryG To visit museums / art galleryH To visit the theatre or musical venuesI To visit night time venues e.g. nightclubJ For other leisure activitiesK To shop at the market(s)L To meet familyM To meet friendsN To visit the theatreO For education as a student (e.g. student at college, university, or other third level education)P To access public transport for onward travel (e.g. train station, bus station)Q (Dont know)R (Varies)
Those who visit Cardigan Town Centre at Q67:Q69 What do you like about Cardigan Town Centre?
DO NOT READ OUT. CODE UP TO THREE RESPONSES ONLY.
1 (Nothing / very little)2 Attractive environment / nice place3 Close to friends or relatives 4 Close to home 5 Close to work 6 Compact 7 Easy to get to by bike 8 Easy to get to by bus 9 Easy to get to by car A Easy to park B Good facilities C Good food stores D Good pubs, cafés or restaurantsE Good range of non-food shopsF The harbour/ beachG Makes a change from other placesH Quiet I Safe and secure J The market K Traditional L Traffic free shopping centre M Other (PLEASE WRITE IN)N A specific shop (PLEASE WRITE IN)O A specific attraction (PLEASE WRITE IN)P (Dont know)
Questionnaire Copyright NEMS market research 20 of 26
Q70 What could be improved about Cardigan that would make you visit more often?DO NOT READ OUT. CODE UP TO THREE RESPONSES ONLY
1 (Nothing)2 Better access by road 3 Better public transport 4 Better signposting 5 Cleaner streets 6 Facilities which would assist you if shopping with children7 Free car parking 8 Jewellery / food markets / other events9 More / better comparison retailers (i.e. non-food shops)A More / better entertainmentB More / better places for eating out (e.g. cafes and restaurants)C More / better food shops D More / better parking E More / better pedestrianised streetsF More / better public conveniencesG More / better seats / flower displaysH More / better services I More advertising J More national multiple shops / High Street shopsK Protection from the weather (ie. covered shopping malls)L Shops / services open on SundaysM Other (PLEASE WRITE IN)N (Don’t know)
Question to be asked to respondents living in Zones 11 to 16Q71 How often do you or your household visit Lampeter for shopping and other town centre services?
DO NOT READ OUT. ONE ANSWER ONLY.
1 Daily GO TO Q722 4-6 days a week GO TO Q723 2-3 days a week GO TO Q724 One day a week GO TO Q725 Every two weeks GO TO Q726 Monthly GO TO Q727 Once every two months GO TO Q728 Three-four times a year GO TO Q729 Once a year GO TO Q72A Less often GO TO Q72B Never GO TO Q74C (Don’t know) GO TO Q72D (Varies) GO TO Q72
Those who visit Lampeter Town Centre at Q71:Q72 In order of importance, what are your two main reasons for visiting Lampeter Town Centre?
DO NOT READ OUT. PLEASE RECORD TWO ANSWERS: 1) MAIN REASON 2) SECONDARY REASONMain|Secondary
1 Food shopping2 Non-food shopping3 To visit bars / pubs4 To visit cafes/ restaurants5 To visit personal service providers (e.g. hairdressers, beauty salon etc.)6 To visit financial services such as banks and other financial institutions7 To visit other service providers (e.g. travel agent, estate agent etc.)8 To visit public services (e.g. medical or dentist appointment, job centre, community centre, etc)9 To get petrolA To visit the cinemaB To visit a parkC To visit the swimming poolD To visit other gyms / health and fitness facilitiesE To visit the libraryF To visit museums / art galleryG To visit the theatre or musical venuesH To visit night time venues e.g. nightclubI For other leisure activitiesJ To shop at the market(s)K To meet familyL To meet friendsM To visit the theatreN For education as a student (e.g. student at college, university, or other third level education)O To access public transport for onward travel (e.g. train station, bus station)P (Dont know)Q (Varies)
Questionnaire Copyright NEMS market research 21 of 26
Those who visit Lampeter Town Centre at Q71:Q73 What do you like about Lampeter Town Centre?
DO NOT READ OUT. CODE UP TO THREE RESPONSES ONLY.
1 (Nothing / very little)2 Attractive environment / nice place3 Close to friends or relatives 4 Close to home 5 Close to work 6 Compact 7 Easy to get to by bike 8 Easy to get to by bus 9 Easy to get to by car A Easy to park B Good facilities C Good food stores D Good pubs, cafés or restaurantsE Good range of non-food shopsF Makes a change from other placesG Quiet H Safe and secure I The market J Traditional K Traffic free shopping centre L Other (PLEASE WRITE IN)M A specific shop (PLEASE WRITE IN)N A specific attraction (PLEASE WRITE IN)O (Dont know)
Q74 What could be improved about Lampeter that would make you visit more often?DO NOT READ OUT. CODE UP TO THREE RESPONSES ONLY
1 (Nothing)2 Better access by road 3 Better public transport 4 Better signposting 5 Cleaner streets 6 Facilities which would assist you if shopping with children7 Free car parking 8 Jewellery / food markets / other events9 More / better comparison retailers (i.e. non-food shops)A More / better entertainmentB More / better places for eating out (e.g. cafes and restaurants)C More / better food shops D More / better parking E More / better pedestrianised streetsF More / better public conveniencesG More / better seats / flower displaysH More / better services I More advertising J More national multiple shops / High Street shopsK Protection from the weather (ie. covered shopping malls)L Shops / services open on SundaysM Other (PLEASE WRITE IN)N (Don’t know)
Question to be asked to respondents living in Zones 11 to 16Q75 How often do you or your household visit Tregaron for shopping and other town centre services?
DO NOT READ OUT. ONE ANSWER ONLY.
1 Daily GO TO Q762 4-6 days a week GO TO Q763 2-3 days a week GO TO Q764 One day a week GO TO Q765 Every two weeks GO TO Q766 Monthly GO TO Q767 Once every two months GO TO Q768 Three-four times a year GO TO Q769 Once a year GO TO Q76A Less often GO TO Q76B Never GO TO Q78C (Don’t know) GO TO Q76D (Varies) GO TO Q76
Questionnaire Copyright NEMS market research 22 of 26
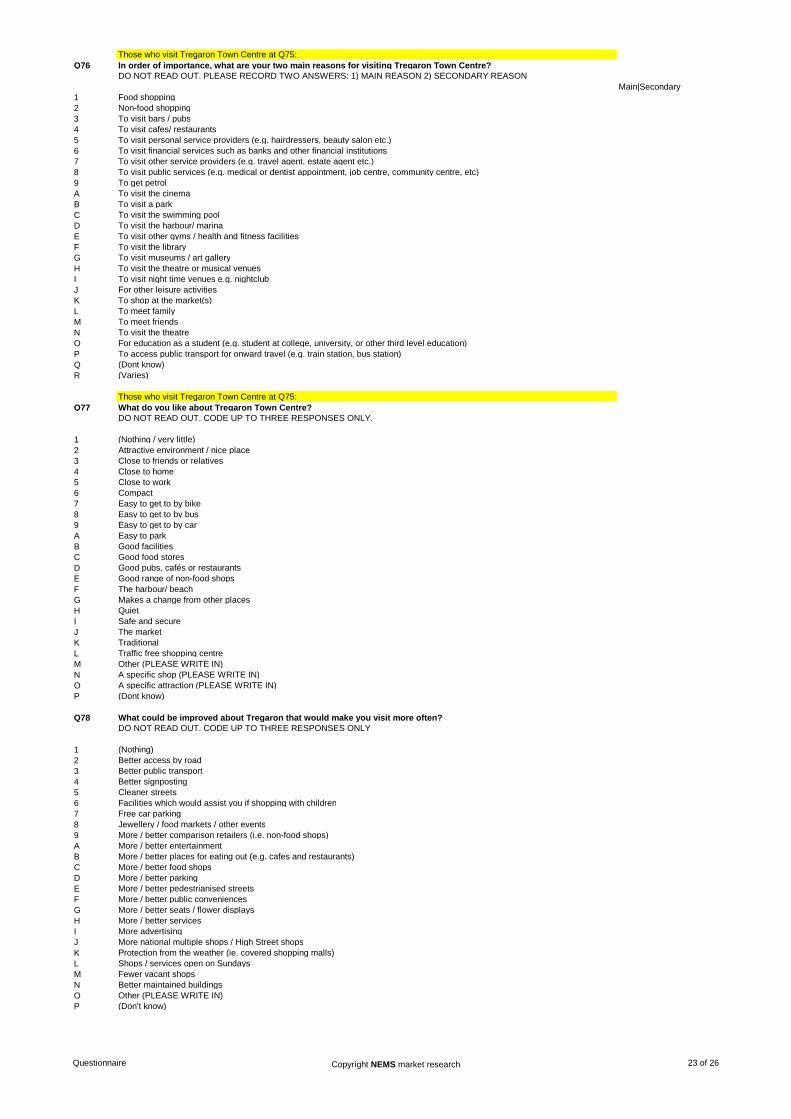
Those who visit Tregaron Town Centre at Q75:Q76 In order of importance, what are your two main reasons for visiting Tregaron Town Centre?
DO NOT READ OUT. PLEASE RECORD TWO ANSWERS: 1) MAIN REASON 2) SECONDARY REASONMain|Secondary
1 Food shopping2 Non-food shopping3 To visit bars / pubs4 To visit cafes/ restaurants5 To visit personal service providers (e.g. hairdressers, beauty salon etc.)6 To visit financial services such as banks and other financial institutions7 To visit other service providers (e.g. travel agent, estate agent etc.)8 To visit public services (e.g. medical or dentist appointment, job centre, community centre, etc)9 To get petrolA To visit the cinemaB To visit a parkC To visit the swimming poolD To visit the harbour/ marinaE To visit other gyms / health and fitness facilitiesF To visit the libraryG To visit museums / art galleryH To visit the theatre or musical venuesI To visit night time venues e.g. nightclubJ For other leisure activitiesK To shop at the market(s)L To meet familyM To meet friendsN To visit the theatreO For education as a student (e.g. student at college, university, or other third level education)P To access public transport for onward travel (e.g. train station, bus station)Q (Dont know)R (Varies)
Those who visit Tregaron Town Centre at Q75:Q77 What do you like about Tregaron Town Centre?
DO NOT READ OUT. CODE UP TO THREE RESPONSES ONLY.
1 (Nothing / very little)2 Attractive environment / nice place3 Close to friends or relatives 4 Close to home 5 Close to work 6 Compact 7 Easy to get to by bike 8 Easy to get to by bus 9 Easy to get to by car A Easy to park B Good facilities C Good food stores D Good pubs, cafés or restaurantsE Good range of non-food shopsF The harbour/ beachG Makes a change from other placesH Quiet I Safe and secure J The market K Traditional L Traffic free shopping centre M Other (PLEASE WRITE IN)N A specific shop (PLEASE WRITE IN)O A specific attraction (PLEASE WRITE IN)P (Dont know)
Q78 What could be improved about Tregaron that would make you visit more often?DO NOT READ OUT. CODE UP TO THREE RESPONSES ONLY
1 (Nothing)2 Better access by road 3 Better public transport 4 Better signposting 5 Cleaner streets 6 Facilities which would assist you if shopping with children7 Free car parking 8 Jewellery / food markets / other events9 More / better comparison retailers (i.e. non-food shops)A More / better entertainmentB More / better places for eating out (e.g. cafes and restaurants)C More / better food shops D More / better parking E More / better pedestrianised streetsF More / better public conveniencesG More / better seats / flower displaysH More / better services I More advertising J More national multiple shops / High Street shopsK Protection from the weather (ie. covered shopping malls)L Shops / services open on SundaysM Fewer vacant shopsN Better maintained buildingsO Other (PLEASE WRITE IN)P (Don’t know)
Questionnaire Copyright NEMS market research 23 of 26
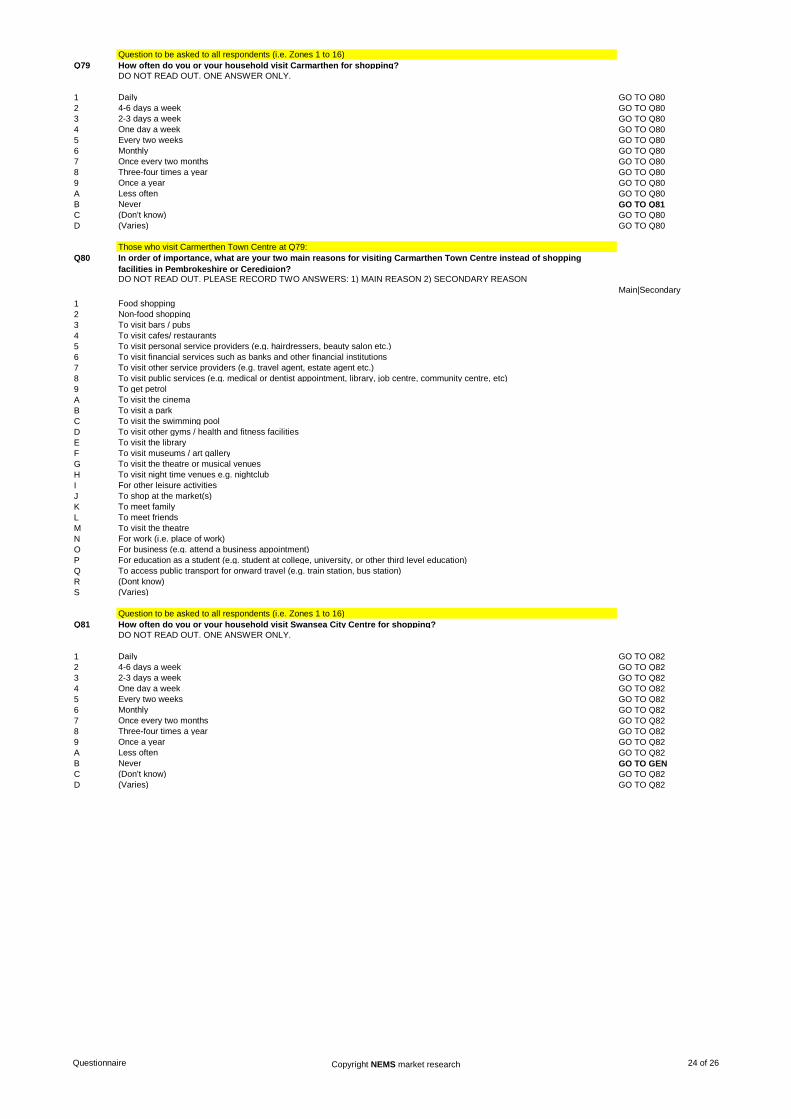
Question to be asked to all respondents (i.e. Zones 1 to 16)Q79 How often do you or your household visit Carmarthen for shopping?
DO NOT READ OUT. ONE ANSWER ONLY.
1 Daily GO TO Q802 4-6 days a week GO TO Q803 2-3 days a week GO TO Q804 One day a week GO TO Q805 Every two weeks GO TO Q806 Monthly GO TO Q807 Once every two months GO TO Q808 Three-four times a year GO TO Q809 Once a year GO TO Q80A Less often GO TO Q80B Never GO TO Q81C (Don’t know) GO TO Q80D (Varies) GO TO Q80
Those who visit Carmerthen Town Centre at Q79:Q80 In order of importance, what are your two main reasons for visiting Carmarthen Town Centre instead of shopping
facilities in Pembrokeshire or Ceredigion?DO NOT READ OUT. PLEASE RECORD TWO ANSWERS: 1) MAIN REASON 2) SECONDARY REASON
Main|Secondary1 Food shopping2 Non-food shopping3 To visit bars / pubs4 To visit cafes/ restaurants5 To visit personal service providers (e.g. hairdressers, beauty salon etc.)6 To visit financial services such as banks and other financial institutions7 To visit other service providers (e.g. travel agent, estate agent etc.)8 To visit public services (e.g. medical or dentist appointment, library, job centre, community centre, etc)9 To get petrolA To visit the cinemaB To visit a parkC To visit the swimming poolD To visit other gyms / health and fitness facilitiesE To visit the libraryF To visit museums / art galleryG To visit the theatre or musical venuesH To visit night time venues e.g. nightclubI For other leisure activitiesJ To shop at the market(s)K To meet familyL To meet friendsM To visit the theatreN For work (i.e. place of work)O For business (e.g. attend a business appointment)P For education as a student (e.g. student at college, university, or other third level education)Q To access public transport for onward travel (e.g. train station, bus station)R (Dont know)S (Varies)
Question to be asked to all respondents (i.e. Zones 1 to 16)Q81 How often do you or your household visit Swansea City Centre for shopping?
DO NOT READ OUT. ONE ANSWER ONLY.
1 Daily GO TO Q822 4-6 days a week GO TO Q823 2-3 days a week GO TO Q824 One day a week GO TO Q825 Every two weeks GO TO Q826 Monthly GO TO Q827 Once every two months GO TO Q828 Three-four times a year GO TO Q829 Once a year GO TO Q82A Less often GO TO Q82B Never GO TO GENC (Don’t know) GO TO Q82D (Varies) GO TO Q82
Questionnaire Copyright NEMS market research 24 of 26
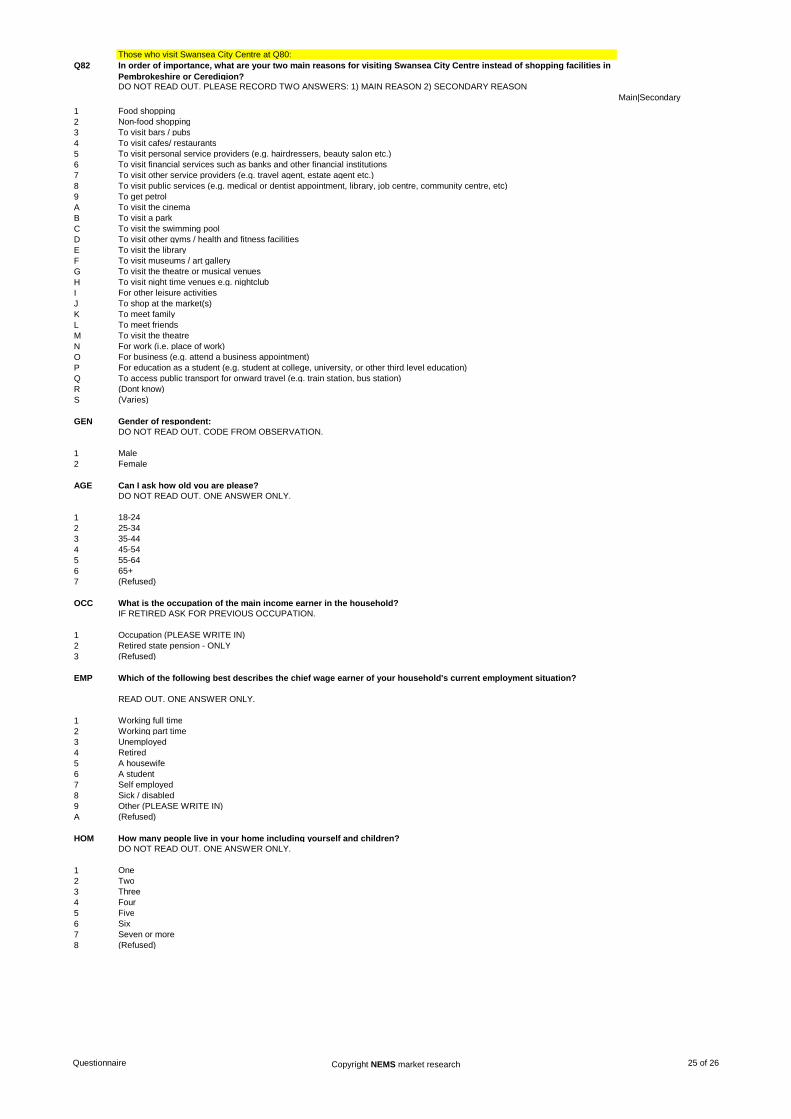
Those who visit Swansea City Centre at Q80:Q82 In order of importance, what are your two main reasons for visiting Swansea City Centre instead of shopping facilities in
Pembrokeshire or Ceredigion?DO NOT READ OUT. PLEASE RECORD TWO ANSWERS: 1) MAIN REASON 2) SECONDARY REASON
Main|Secondary1 Food shopping2 Non-food shopping3 To visit bars / pubs4 To visit cafes/ restaurants5 To visit personal service providers (e.g. hairdressers, beauty salon etc.)6 To visit financial services such as banks and other financial institutions7 To visit other service providers (e.g. travel agent, estate agent etc.)8 To visit public services (e.g. medical or dentist appointment, library, job centre, community centre, etc)9 To get petrolA To visit the cinemaB To visit a parkC To visit the swimming poolD To visit other gyms / health and fitness facilitiesE To visit the libraryF To visit museums / art galleryG To visit the theatre or musical venuesH To visit night time venues e.g. nightclubI For other leisure activitiesJ To shop at the market(s)K To meet familyL To meet friendsM To visit the theatreN For work (i.e. place of work)O For business (e.g. attend a business appointment)P For education as a student (e.g. student at college, university, or other third level education)Q To access public transport for onward travel (e.g. train station, bus station)R (Dont know)S (Varies)
GEN Gender of respondent:DO NOT READ OUT. CODE FROM OBSERVATION.
1 Male2 Female
AGE Can I ask how old you are please?DO NOT READ OUT. ONE ANSWER ONLY.
1 18-242 25-343 35-444 45-545 55-646 65+7 (Refused)
OCC What is the occupation of the main income earner in the household?IF RETIRED ASK FOR PREVIOUS OCCUPATION.
1 Occupation (PLEASE WRITE IN)2 Retired state pension - ONLY3 (Refused)
EMP Which of the following best describes the chief wage earner of your household's current employment situation?
READ OUT. ONE ANSWER ONLY.
1 Working full time2 Working part time3 Unemployed 4 Retired 5 A housewife 6 A student 7 Self employed 8 Sick / disabled9 Other (PLEASE WRITE IN)A (Refused)
HOM How many people live in your home including yourself and children?DO NOT READ OUT. ONE ANSWER ONLY.
1 One2 Two3 Three 4 Four5 Five6 Six 7 Seven or more 8 (Refused)
Questionnaire Copyright NEMS market research 25 of 26
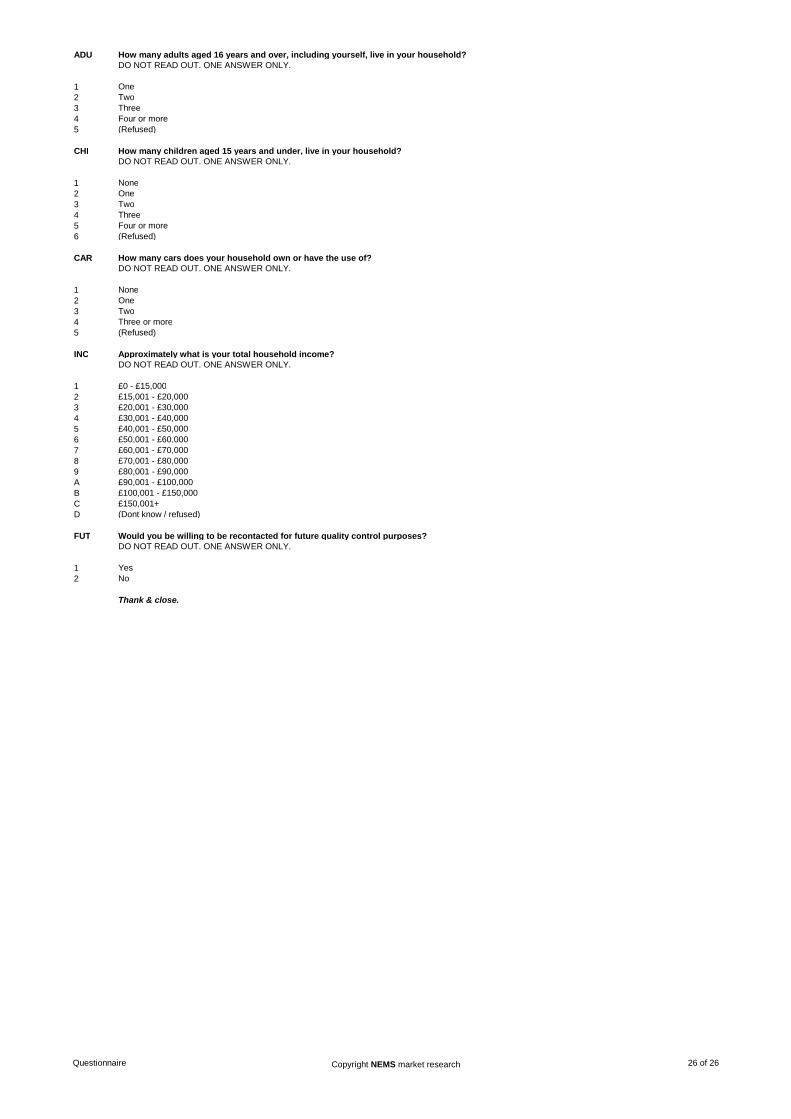
ADU How many adults aged 16 years and over, including yourself, live in your household?DO NOT READ OUT. ONE ANSWER ONLY.
1 One2 Two3 Three4 Four or more5 (Refused)
CHI How many children aged 15 years and under, live in your household?DO NOT READ OUT. ONE ANSWER ONLY.
1 None2 One3 Two4 Three5 Four or more6 (Refused)
CAR How many cars does your household own or have the use of?DO NOT READ OUT. ONE ANSWER ONLY.
1 None2 One3 Two4 Three or more5 (Refused)
INC Approximately what is your total household income?DO NOT READ OUT. ONE ANSWER ONLY.
1 £0 - £15,0002 £15,001 - £20,000 3 £20,001 - £30,000 4 £30,001 - £40,000 5 £40,001 - £50,000 6 £50,001 - £60,0007 £60,001 - £70,0008 £70,001 - £80,000 9 £80,001 - £90,000A £90,001 - £100,000B £100,001 - £150,000 C £150,001+D (Dont know / refused)
FUT Would you be willing to be recontacted for future quality control purposes?DO NOT READ OUT. ONE ANSWER ONLY.
1 Yes2 No
Thank & close.
Questionnaire Copyright NEMS market research 26 of 26
South West Wales Regional Retail Study
APPENDIX 16: WEST SOMERSET VISITOR SURVEY – EXTRACT OF FINDINGS