
Technical Memorandum - Sacramento Area Council of ...
16
Page | 1 Technical Memorandum Date: November 5, 2019 To: Erik Ruehr, VRPA Bruce Griesenbeck and Maricela Salazar, SACOG From: Jimmy Fong, Jinghua Xu, and Ronald T. Milam, Fehr & Peers Subject: Trip Length Adjustments for SB 743 VMT Analysis Introduction SB 743 implementation has created the need to modify travel demand models to ensure they capture the full trip length for those trips that start or end outside the model boundary. This need stems from the CEQA guidance listed below and the general desire to avoid arbitrary truncation of trip lengths based on model or political boundaries. • According to the Technical Advisory, the assessment should cover the full area in which driving patterns are expected to change, including induced growth impacts and cumulative impacts. OPR states that the VMT estimation should not be truncated at a modeling or jurisdictional boundary for convenience of analysis when travel behavior is substantially affected beyond that boundary. (p. 6 and 23 - Technical Advisory on Evaluating Transportation Impacts in CEQA, OPR, December 2018) • CEQA Guidelines section 15277: o “…. Any emissions or discharges that would have a significant effect on the environment in the State of California are subject to CEQA where a California public agency has authority over the emissions or discharges.” Since VMT is the key input for mobile emissions, tracking the full length of trips is essential for complying with this expectation. Since all travel demand models in California have boundaries, they truncate trip lengths to varying degrees. Truncation tends to be most severe at the edge of the model boundary and when the modeled area exhibits a high proportion of external travel (i.e., from a suburban area in one region to a job center in another region). To compensate for the influence of model boundaries, the following steps can be used to modify trip lengths through model gateways.
-
Upload
khangminh22 -
Category
Documents
-
view
3 -
download
0
Transcript of Technical Memorandum - Sacramento Area Council of ...

P a g e | 1
Technical Memorandum Date: November 5, 2019
To: Erik Ruehr, VRPA Bruce Griesenbeck and Maricela Salazar, SACOG
From: Jimmy Fong, Jinghua Xu, and Ronald T. Milam, Fehr & Peers
Subject: Trip Length Adjustments for SB 743 VMT Analysis
Introduction SB 743 implementation has created the need to modify travel demand models to ensure they capture the full trip length for those trips that start or end outside the model boundary. This need stems from the CEQA guidance listed below and the general desire to avoid arbitrary truncation of trip lengths based on model or political boundaries.
• According to the Technical Advisory, the assessment should cover the full area in which driving patterns are expected to change, including induced growth impacts and cumulative impacts. OPR states that the VMT estimation should not be truncated at a modeling or jurisdictional boundary for convenience of analysis when travel behavior is substantially affected beyond that boundary. (p. 6 and 23 - Technical Advisory on Evaluating Transportation Impacts in CEQA, OPR, December 2018)
• CEQA Guidelines section 15277:
o “…. Any emissions or discharges that would have a significant effect on the environment in the State of California are subject to CEQA where a California public agency has authority over the emissions or discharges.” Since VMT is the key input for mobile emissions, tracking the full length of trips is essential for complying with this expectation.
Since all travel demand models in California have boundaries, they truncate trip lengths to varying degrees. Truncation tends to be most severe at the edge of the model boundary and when the modeled area exhibits a high proportion of external travel (i.e., from a suburban area in one region to a job center in another region). To compensate for the influence of model boundaries, the following steps can be used to modify trip lengths through model gateways.

Trip Length Adjustments for SB 743 VMT Analysis November 5, 2019 Page 2 of 16
Trip Length Adjustment Process Adjusting the length of trips leaving a model boundary requires appending extra distance at the model gateway zone (or external centroid) connector as outlined below. This process results in new gateway distances that are weighted based on the amount and location of external travel origins and destinations. Other adjustment methods that are available include appending extra trip lengths to each individual origin-destination (OD) trip pair in the model or expanding the model’s zone structure to cover a larger area. Both of the methods are much more resource and time intensive and are not covered further in this memo. 1. Model IX and XI Trips at Gateways The first step of this process is to determine trip volume leaving or entering the model boundary. These are referred to in the remainder of this memo as internal-to-external (IX) and external-to-internal (XI) trips. This data can be generated either from OD trip matrices or by conducting a select zone analysis to track trips to the model gateways. The volume at the gateways for this purpose should not include external-to-external (XX) through trips. A table that identifies all gateways, IX volume, and XI volume should be prepared similar to the example below from the Mendocino Council of Governments (MCOG) model.
Table 1: Example Model Gateway and IX, XI Link Volumes Table
Gateway ID Gateway Link ID IX Volume XI Volume
7081 SR 1 - South 7081 1,190 1,190
7083 US 101 - South 7083 5,004 5,004
7082 US 101 - North 7082 567 567
7085 SR 20 - East 7085 3,529 3,529
7086 SR 175 - East 7086 551 551
2. Origin-Destination Data between Model and External Areas Determining the full length of trips leaving or entering a model boundary requires an OD dataset that includes flows between the model area and the area external to the model. How much of the external area to include is an important question. Per the CEQA guidance cited, the full length of trip between their start and end is desired. Whether this extends outside of California has not been legally tested so it is possible that capturing trip lengths even beyond state limits could be necessary. An appropriate OD dataset should be chosen based on the details of your project, context of the study area, level of CEQA risk, and available time and budget for analysis. An assessment of each of the OD data sources is presented the Table 2.

Trip Length Adjustments for SB 743 VMT Analysis November 5, 2019 Page 3 of 16
Table 2: Origin-Destination Data Assessment Origin-
Destination Data Sources
Description Advantages Disadvantages
Available travel demand model larger than local model
All regional models in California nest within the California State Travel Demand Model (CSTDM). All local models (i.e., city models) nest within the CSTDM and their respective regional models.
• CSTDM Includes TAZs for the entire state of California
• Regional models are often the source model for local model variants, so they have a high compatibility for making gateway adjustments.
• CSTDM and regional models include changes in travel patterns over time between base and future years.
• Larger models may have greater aggregation and only coarse correspondence between TAZs in the smaller model.
• Regional models may not fully capture full trip length.
• CSTDM has not been recently calibrated and validated.
• CSTDM truncates trip at state boundary.
California Household Travel Survey (CHTS)
Survey of California resident travel that documents full length of OD travel.
• Robust sample with data available for most cities and counties above 50,000 population. Data may be sufficient for smaller jurisdictions based on a review of the sample
• Includes all trip purposes.
• Insufficient detail below city level.
• 2012 data may not reflect recent changes in travel patterns.
• Does not include data about future travel.
Longitudinal Employer-Household Dynamics Data (LEHD)
Employer/Employee data showing locations of where employees live and work, visualized in an online portal with export to OD tables, produced by the U.S. Census Bureau.
• Data available at the census tract level (or custom TAZ structure).
• 2017 data is current. • Quick production of OD data.
• Employment data is only relevant for calculating trip lengths for home-based work trips, does not include other trip purposes.
• Does not include data about future travel.
Mobile device OD Data
Data from smartphone/GPS devices that can be used to estimate OD trip tables associated with specific gateways.
• Data available at small scales (i.e., 250-meter grid cell, census block group, or custom traffic analysis zone).
• Data scale allows isolation of specific land uses in many cases.
• 2019 data available from multiple vendors.
• Data includes all 365 days of the year and can be aggregated.
• Limited trip length truncation.
• Includes all trip purposes.
• Minimum purchase cost is about $5000, more expensive if greater detail/number of zones is desired.
• Does not include data about future travel.

Trip Length Adjustments for SB 743 VMT Analysis November 5, 2019 Page 4 of 16
3. Gateway Identification After identifying an appropriate OD data source, the next step requires determining the gateway(s) based on the model used in your project, which trips from the OD data source would travel through. An assessment of options for this process is presented in Table 3.
Table 3: Gateway Identification Methods and Assessment Data Source Gateway Identification Method
Available travel demand model larger than local model
• A highway skimming procedure to determine the gateway used for each OD pair for each assignment time period. This method is not able to track more than one gateway for an OD pair.
• A select zone and select link assignment procedure to determine the gateway(s) for an OD pair. This method requires more processing/computing time – dependent on the specific travel model and software.
Mobile Device OD Data • Data purchase includes identification of gateway locations and automatic filtering to create associated OD trip tables.
Streamlined selection with Google Maps (or online mapping program)
• Spreadsheet template that creates a link to Google Maps for each OD pair, manual identification of gateway(s) in the routing is required.
• An off-model, quick assessment tool, suitable for limited number of OD pairs.
• Not able to quantify the split across multiple routes/gateways (if applicable) for an OD pair.
• Time consuming; not suitable for large number of OD pairs due to manual process.
4. Weighted Average Trip Length Beyond Model Gateways The trip length adjustment process ultimately requires calculating the weighted average distance beyond each model gateway. A list of options for this process is identified in Table 4. Some of the processes calculate the distance beyond the model gateway directly; while other processes generate distance between each OD pair first, with a separate calculation for distance beyond the model gateway.

Trip Length Adjustments for SB 743 VMT Analysis November 5, 2019 Page 5 of 16
Table 4: Trip Length Beyond Model Boundary – Methods and Assessment Data Source Trip Length Method Description
Available travel demand model larger than local model
• Creates a new link variable equal to the link length for all the links external to the local model and 0 for all the links internal to the local model, and then uses a highway skimming procedure to skim this link variable to generate the total distance outside of the gateway for each OD pair for each assignment time period.
• Uses a select zone and select link assignment procedure to generate the volume distribution for each selected gateway, and calculates the weighted average distance based on the select link volume associated with each gateway.
CHTS
• Estimates total OD distances between origin-destination for each trip record. • Calculates the distance from the trip-end within the model boundary to the
gateway for each record, based on the distance skim from the model, and subtracts it from the total CHTS OD distance to generate external trip length for each trip record.
• Aggregates the external trip distance across all the trip records to generate average external trip distance for each gateway.
Mobile Device OD Data
• Distance between origins-destinations through each gateway are provided in the dataset.
• Calculates the distance from the trip-end within the model boundary to the gateway based on the distance skim from the model and subtracts it from the total mobile device OD distance to generate external trip length for each gateway.
Streamlined selection with Google Maps (or online mapping program)
• Links to Google Maps and generates a path for each OD pair. • Calculates the distance between the manually identified gateway(s) and the
trip end location external to the model boundary, based on the shortest travel time path between the OD pair.
Process Summary An analyst can mix and match the procedures based on the most appropriate method for each step. For example, if CHTS is the most appropriate OD dataset to generate external trip length estimates, the user can generate the OD trip matrices based on CHTS while following the TAZ structure of the CSTDM, then identify local model gateways in the CSTDM highway network, and calculate the average trip length beyond each gateway, using the distance skims of the CSTDM, weighted by trips from the CHTS OD trip matrices.

Trip Length Adjustments for SB 743 VMT Analysis November 5, 2019 Page 6 of 16
Trip Length Adjustment User Guide and Resources This section provides a user-guide and links to resources for the data sources and processes previously described in this memorandum. California Statewide Travel Demand Model (CSTDM) Caltrans maintains and updates the California Statewide Travel Demand Model, and provides resources regarding the model on their website:
• https://dot.ca.gov/programs/transportation-planning/multi-modal-system-planning/statewide-modeling
Information regarding the previous version of the CSTDM is no longer available on Caltrans’ website. Caltrans is currently in the process of updating the statewide travel demand model. Requests regarding statewide modeling should be directed to Caltrans. An example of the CSTDM used for OD data, gateway selection, and trip length beyond local model gateways is described below:
• Create correspondence between Study Area TAZs within local/regional model to the Statewide Model TAZs, similar to the example from the Mendocino Council of Governments (MCOG) Model, as shown in Table 5.
Table 5: Example TAZ Correspondence Table
MCOG TAZ CSTDM TAZ
1 256
3 259
5 259
6 259
7 259
8 260
9 260
10 260

Trip Length Adjustments for SB 743 VMT Analysis November 5, 2019 Page 7 of 16
• Add “Gate” attribute to CSTDM roadway network links and set “Gate” equal to gateway id only for those links identified as the locations corresponding to the local/regional model gateways.

Trip Length Adjustments for SB 743 VMT Analysis November 5, 2019 Page 8 of 16
• Add “Gate_Dist” attribute to CSTDM roadway network links and set “Gate_Dist” equal to the link distance for those links outside the local/regional model boundary. All the CSTDM roadway links inside the local/regional model boundary will have a “Gate_Dist” attribute of 0.
Trip Length Adjustments for SB 743 VMT Analysis November 5, 2019 Page 9 of 16
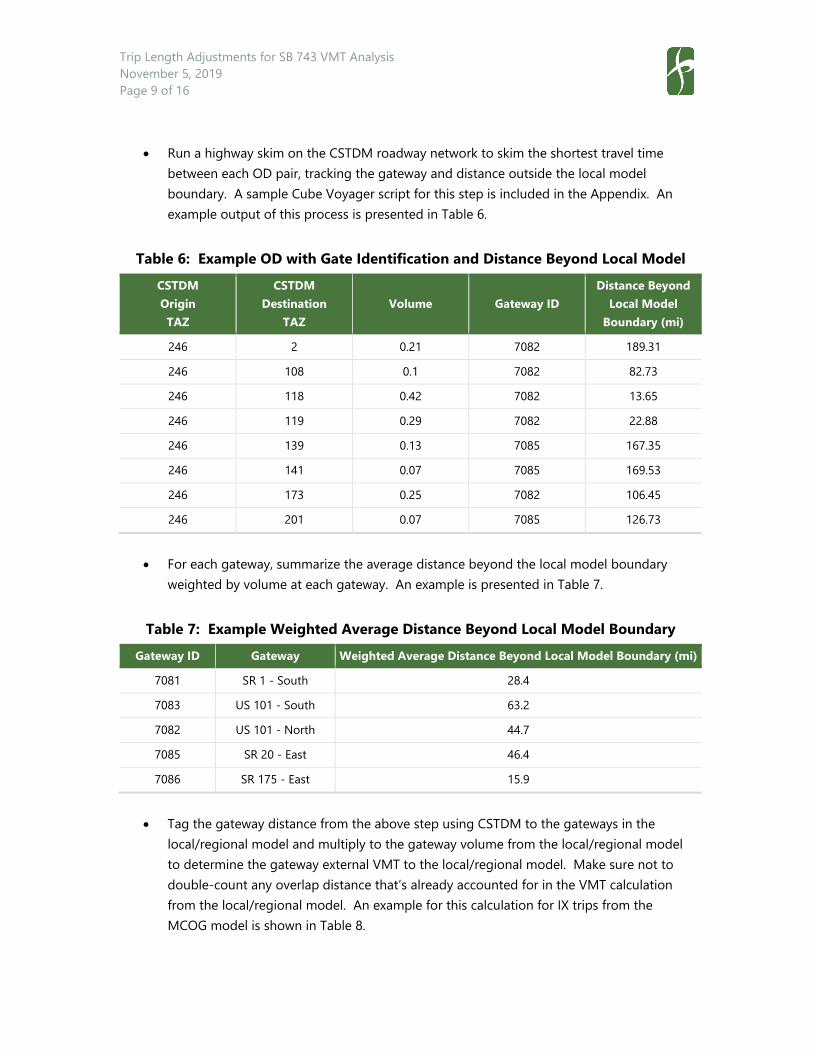
• Run a highway skim on the CSTDM roadway network to skim the shortest travel time between each OD pair, tracking the gateway and distance outside the local model boundary. A sample Cube Voyager script for this step is included in the Appendix. An example output of this process is presented in Table 6.
Table 6: Example OD with Gate Identification and Distance Beyond Local Model
CSTDM Origin TAZ
CSTDM Destination
TAZ Volume Gateway ID
Distance Beyond Local Model
Boundary (mi)
246 2 0.21 7082 189.31
246 108 0.1 7082 82.73
246 118 0.42 7082 13.65
246 119 0.29 7082 22.88
246 139 0.13 7085 167.35
246 141 0.07 7085 169.53
246 173 0.25 7082 106.45
246 201 0.07 7085 126.73
• For each gateway, summarize the average distance beyond the local model boundary
weighted by volume at each gateway. An example is presented in Table 7.
Table 7: Example Weighted Average Distance Beyond Local Model Boundary
Gateway ID Gateway Weighted Average Distance Beyond Local Model Boundary (mi)
7081 SR 1 - South 28.4
7083 US 101 - South 63.2
7082 US 101 - North 44.7
7085 SR 20 - East 46.4
7086 SR 175 - East 15.9
• Tag the gateway distance from the above step using CSTDM to the gateways in the
local/regional model and multiply to the gateway volume from the local/regional model to determine the gateway external VMT to the local/regional model. Make sure not to double-count any overlap distance that’s already accounted for in the VMT calculation from the local/regional model. An example for this calculation for IX trips from the MCOG model is shown in Table 8.

Trip Length Adjustments for SB 743 VMT Analysis November 5, 2019 Page 10 of 16
Table 8: Example Adjustment Gateway and IX, XI Link Volumes Table
Gateway Weighted Average Distance
Beyond Local Model Boundary (From CSTDM)
MCOG IX Volume MCOG IX VMT Beyond Local Model Boundary
SR 1 - South 28.4 1,190 33,796
US 101 - South 63.2 5,004 316,253
US 101 - North 44.7 567 25,345
SR 20 - East 46.4 3,529 163,746
SR 175 - East 15.9 551 8,761
California Household Travel Survey (CHTS) CHTS data was collected by Caltrans and is shared on the following website.
• https://www.nrel.gov/transportation/secure-transportation-data/tsdc-california-travel-survey.html
An example of CHTS data filtered for IX trips for Mendocino County is shown below. This example requires processing of the survey data and specific formatting such that it contains trip origin, destination, distance, and volume information.

Trip Length Adjustments for SB 743 VMT Analysis November 5, 2019 Page 11 of 16
Longitudinal Employer-Household Dynamics Data (LEHD) LEHD data can be accessed using the following online resource.
• https://onthemap.ces.census.gov/ OD data using this resource can be identified by searching a study area (City, County, or can upload a shapefile with specific geography) and looking at the “Destination” Analysis Type.
• For IX trips, use the “Home” setting for Home/Work Area • For XI trips, use the “Work” setting for Home/Work Area

Trip Length Adjustments for SB 743 VMT Analysis November 5, 2019 Page 12 of 16
Mobile Device OD Data Streetlight is one vendor that can provide data for OD, gateway identification, and trip lengths. A middle filter analysis is needed to determine which particular gateway a trip passes through. An example showing IX trips from Chico to areas beyond the Butte Council of Governments (BCAG) Model boundary is presented below.

Trip Length Adjustments for SB 743 VMT Analysis November 5, 2019 Page 13 of 16
Google Maps (for Gateway Identification and Trip Length Beyond Local Model Gateways) Google Maps (or similar online mapping tool) can be used as a quick tool for gateway identification and for determining trip lengths beyond a local model boundary. An example of trips from Chico leaving the BCAG model boundary to Redding is shown below. Trips for this OD pair pass through the gateway on SR 99 (based on the shortest travel time).
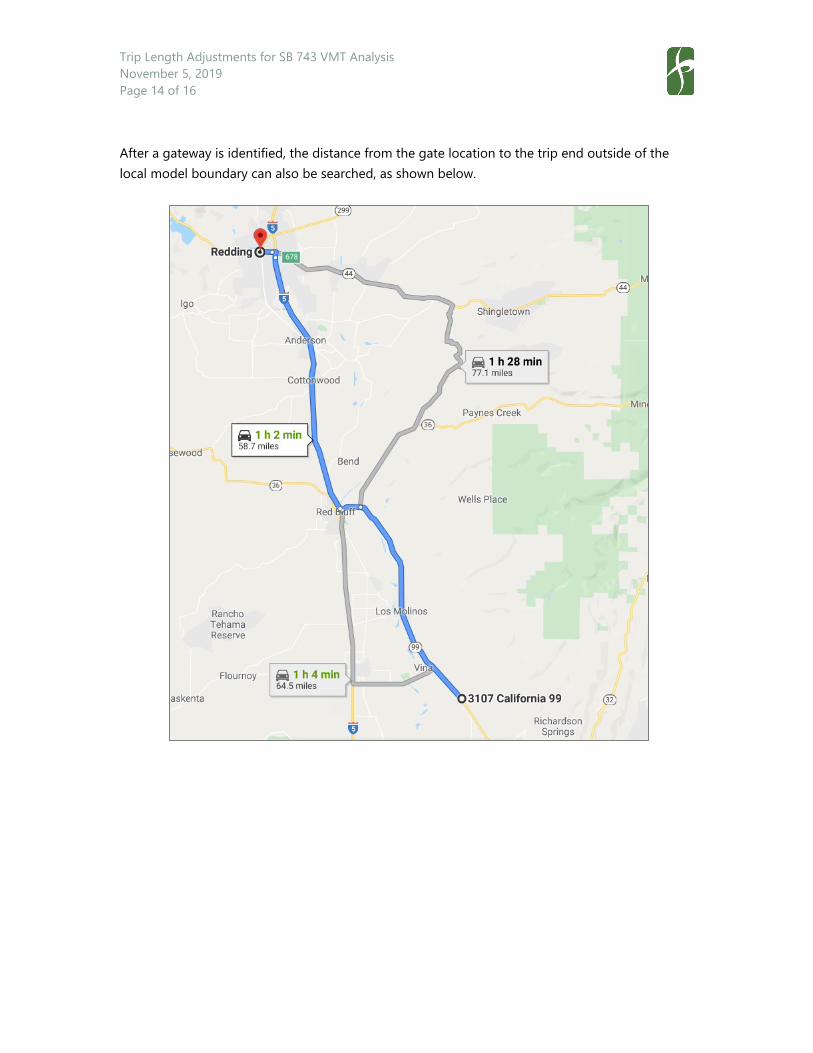
Trip Length Adjustments for SB 743 VMT Analysis November 5, 2019 Page 14 of 16
After a gateway is identified, the distance from the gate location to the trip end outside of the local model boundary can also be searched, as shown below.

Trip Length Adjustments for SB 743 VMT Analysis November 5, 2019 Page 15 of 16
Appendix (Cube Voyager Sample Script) ;TAZs from local model within the CSTDM Project1='246-261' ;================================================== ; PM peak period highway skim RUN PGM=highway NETI=..\LoadedNetworks\HwyNetwork_Loaded_PM_?.net ; input network MATO=Skim_PM_?.mat, MO=1-4, NAME=TIME,GATE,GATE_DIST,FULL_DIST ; output skim matrix PHASE=ILOOP PATH=LI.TIME_2,MW[1]=PATHTRACE(LI.TIME_2), MW[2]=PATHTRACE(LI.GATE), MW[3]=PATHTRACE(LI.GATE_DIST), MW[4]=PATHTRACE(LI.DISTANCE) endphase ENDRUN ;================================================== ; Summarize OD Volumes and Skim Matrices RUN PGM=MATRIX MATI[1]=..\TripTables\OD_?.mat MATI[2]=Skim_PM_?.mat MATO=OD_Gate_VMT_?.mat, MO=1-6, name=VOL_DAY,GATE,GATE_DIST,GATE_VMT_DAY,FULL_DIST,FULL_VMT MW[1]=mi.1.1 + mi.1.2 + mi.1.3 + mi.1.4 + mi.1.5 + mi.1.6 + mi.1.7 + mi.1.8 + mi.1.9 + mi.1.10 + mi.1.11 + mi.1.12 + mi.1.13 + mi.1.14 + mi.1.15 + mi.1.16 + mi.1.17 + mi.1.18 + mi.1.19 + mi.1.20 + mi.1.21 + mi.1.22 + mi.1.23 + mi.1.24 + mi.1.25 + mi.1.26 + mi.1.27 + mi.1.28 + mi.1.29 + mi.1.30 + mi.1.31 + mi.1.32 + mi.1.33 + mi.1.34 + mi.1.35 + mi.1.36 + mi.1.37 + mi.1.38 + mi.1.39 + mi.1.14 + mi.1.41 + mi.1.42 + mi.1.43 + mi.1.44 + mi.1.45 + mi.1.46 + mi.1.47 + mi.1.48 + mi.1.49 + mi.1.50 + mi.1.51 + mi.1.52 + mi.1.53 + mi.1.54 + mi.1.55 + mi.1.56 + mi.1.57 + mi.1.58 + mi.1.59 + mi.1.60 MW[2]=mi.2.2 MW[3]=mi.2.3 MW[4]=MW[1]*MW[3] MW[5]=mi.2.4 MW[6]=MW[1]*MW[5] ENDRUN ;========================= ; Export to CSV run pgm=matrix filei mati[1] = OD_Gate_VMT_?.mat fileo mato[1]= OD_Gate_VMT_?_IX.csv, MO=1-6, FORMAT=csv, PATTERN=IJM:V, DEC=d, DELIMITER=',' fileo mato[2]= OD_Gate_VMT_?_XI.csv, MO=7-12, FORMAT=csv, PATTERN=IJM:V, DEC=d, DELIMITER=',' IF (I=@Project1@) MW[1]=MI.1.1 EXCLUDE=@Project1@ MW[2]=MI.1.2 EXCLUDE=@Project1@ MW[3]=MI.1.3 EXCLUDE=@Project1@ MW[4]=MI.1.4 EXCLUDE=@Project1@ MW[5]=MI.1.5 EXCLUDE=@Project1@ MW[6]=MI.1.6 EXCLUDE=@Project1@ ELSE MW[1]=0 MW[2]=0 MW[3]=0 MW[4]=0 MW[5]=0 MW[6]=0 ENDIF JLOOP IF (I=@Project1@ & J=@Project1@) MW[7]=0 MW[8]=0

Trip Length Adjustments for SB 743 VMT Analysis November 5, 2019 Page 16 of 16
MW[9]=0 MW[10]=0 MW[11]=0 MW[12]=0 ELSEIF (J=@Project1@) MW[7]=MI.1.1 MW[8]=MI.1.2 MW[9]=MI.1.3 MW[10]=MI.1.4 MW[11]=MI.1.5 MW[12]=MI.1.6 ELSE MW[7]=0 MW[8]=0 MW[9]=0 MW[10]=0 MW[11]=0 MW[12]=0 ENDIF ENDJLOOP ENDRUN