Appe A endix 4E for Austal Limite the year end ed ded 30 ...
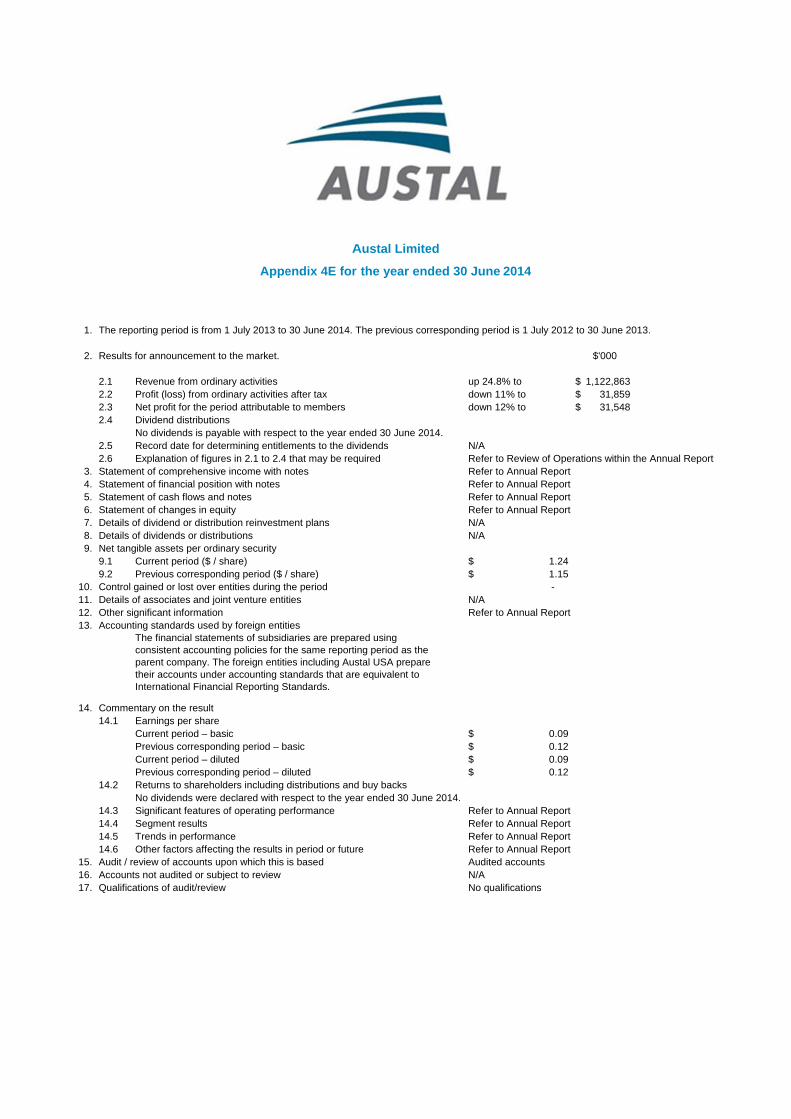
104
1. The report 2. Results fo 2.1 Re 2.2 Pr 2.3 Ne 2.4 D No 2.5 Re 2.6 Ex 3. Statement 4. Statement 5. Statement 6. Statement 7. Details of 8. Details of 9. Net tangib 9.1 Cu 9.2 Pr 10. Control ga 11. Details of 12. Other sign 13. Accounting Th co pa th In 14. Commenta 14.1 Ea Cu Pr Cu Pr 14.2 Re No 14.3 Si 14.4 Se 14.5 Tr 14.6 O 15. Audit / rev 16. Accounts 17. Qualificatio ting period is from r announcement evenue from ord rofit (loss) from o et profit for the p ividend distributio o dividends is pa ecord date for de xplanation of figu t of comprehensi t of financial pos t of cash flows an t of changes in e dividend or distri dividends or dist ble assets per ord urrent period ($ / revious correspo ained or lost over associates and j nificant informatio g standards used he financial state onsistent accoun arent company. T eir accounts und ternational Finan ary on the result arnings per share urrent period – b revious correspo urrent period – d revious correspo eturns to shareh o dividends were ignificant feature egment results rends in perform ther factors affec view of accounts not audited or su ons of audit/revie Appe m 1 July 2013 to t to the market. inary activities ordinary activities period attributable ons ayable with respe etermining entitle ures in 2.1 to 2.4 ive income with n ition with notes nd notes equity ibution reinvestm tributions dinary security / share) onding period ($ / r entities during t oint venture enti on d by foreign entit ements of subsid ting policies for t The foreign entiti der accounting st ncial Reporting S e basic onding period – b diluted onding period – d olders including e declared with re es of operating pe ance cting the results i upon which this ubject to review ew A endix 4E for 30 June 2014. T s after tax e to members ect to the year en ements to the div that may be req notes ment plans / share) he period ties ties iaries are prepar the same reportin ies including Aus tandards that are Standards. basic diluted distributions and espect to the yea erformance in period or futur is based Austal Limite the year end The previous cor nded 30 June 20 vidends quired red using ng period as the stal USA prepare e equivalent to d buy backs ar ended 30 June re ed ded 30 June rresponding perio up 24.8 down 1 down 1 14. N/A Refer to Refer to Refer to Refer to Refer to N/A N/A $ $ N/A Refer to e $ $ $ $ e 2014. Refer to Refer to Refer to Refer to Audited N/A No qua 2014 od is 1 July 2012 8% to 1% to 2% to o Review of Ope o Annual Report o Annual Report o Annual Report o Annual Report 1.24 1.15 - o Annual Report 0.09 0.12 0.09 0.12 o Annual Report o Annual Report o Annual Report o Annual Report d accounts lifications 2 to 30 June 2013 $'000 1,122,863 $ 31,859 $ 31,548 $ rations within the 3. e Annual Report
-
Upload
khangminh22 -
Category
Documents
-
view
4 -
download
0
Transcript of Appe A endix 4E for Austal Limite the year end ed ded 30 ...
1. The report
2. Results fo
2.1 Re2.2 Pr2.3 Ne2.4 D
No2.5 Re2.6 Ex
3. Statement4. Statement5. Statement6. Statement7. Details of 8. Details of 9. Net tangib
9.1 Cu9.2 Pr
10. Control ga11. Details of 12. Other sign13. Accounting
ThcopathIn
14. Commenta14.1 Ea
CuPrCuPr
14.2 ReNo
14.3 Si14.4 Se14.5 Tr14.6 O
15. Audit / rev16. Accounts 17. Qualificatio
ting period is from
r announcement
evenue from ordrofit (loss) from oet profit for the pividend distributioo dividends is paecord date for dexplanation of figut of comprehensit of financial post of cash flows ant of changes in edividend or distridividends or dist
ble assets per ordurrent period ($ /revious correspo
ained or lost overassociates and j
nificant informatiog standards usedhe financial stateonsistent accounarent company. Teir accounts undternational Finan
ary on the resultarnings per shareurrent period – brevious correspourrent period – drevious correspoeturns to shareho dividends wereignificant featureegment resultsrends in performther factors affec
view of accounts not audited or suons of audit/revie
Appe
m 1 July 2013 to
t to the market.
inary activitiesordinary activitiesperiod attributableonsayable with respeetermining entitleures in 2.1 to 2.4ive income with nition with notesnd notes
equityibution reinvestmtributionsdinary security/ share)
onding period ($ /r entities during toint venture enti
ond by foreign entitements of subsidting policies for t
The foreign entitider accounting stncial Reporting S
ebasiconding period – bdilutedonding period – dolders including
e declared with rees of operating pe
ancecting the results iupon which this
ubject to reviewew
A
endix 4E for
30 June 2014. T
s after taxe to members
ect to the year enements to the div that may be reqnotes
ment plans
/ share)he periodties
tiesiaries are preparthe same reportinies including Austandards that are
Standards.
basic
diluteddistributions andespect to the yeaerformance
in period or futuris based
Austal Limite
the year end
The previous cor
nded 30 June 20videndsquired
red using ng period as the stal USA preparee equivalent to
d buy backsar ended 30 June
re
ed
ded 30 June
rresponding perio
up 24.8down 1down 1
14.N/ARefer toRefer toRefer toRefer toRefer toN/AN/A
$ $
N/ARefer to
e
$ $ $ $
e 2014.Refer toRefer toRefer toRefer toAuditedN/ANo qua
2014
od is 1 July 2012
8% to1% to2% to
o Review of Opeo Annual Reporto Annual Reporto Annual Reporto Annual Report
1.24 1.15 -
o Annual Report
0.09 0.12 0.09 0.12
o Annual Reporto Annual Reporto Annual Reporto Annual Reportd accounts
lifications
2 to 30 June 2013
$'000
1,122,863$ 31,859$ 31,548$
rations within the
3.
e Annual Report

AU
USTAL L
IMITED 2014 ANNUUAL REPPORT
HIEF EXECUTIVE OFFICER’S REPORT
1 | AUSTAL LIMITED ANNUAL REPORT 2014
Contents
Contents ..................................................................................................................................................................... 1
Index to the notes to the financial statements ............................................................................................................ 2
Chairman’s report ...................................................................................................................................................... 3
Chief Executive Officer’s report ................................................................................................................................. 5
Review of operations ................................................................................................................................................. 7
Directors’ report ......................................................................................................................................................... 9
Message from the Nomination and Remuneration Committee ................................................................................ 15
Remuneration report (audited) ................................................................................................................................. 16
Auditor independence and non-audit services ......................................................................................................... 28
Consolidated statement of profit or loss and other comprehensive income for the year ended 30 June 2014 ....... 29
Consolidated statement of financial position as at 30 June 2014 ............................................................................ 30
Consolidated statement of changes in equity for the year ended 30 June 2014 ..................................................... 31
Consolidated statement of cash flows for the year ended 30 June 2014 ................................................................ 32
Notes to the financial statements ............................................................................................................................. 33
Directors’ declaration ............................................................................................................................................... 90
Corporate governance statement ............................................................................................................................ 91
Independent audit report to the members of Austal Limited .................................................................................... 98
Shareholder information ......................................................................................................................................... 100
Corporate directory ................................................................................................................................................ 101
HIEF EXECU
2 | AUSTAL
Index to
Basis of prep
Note 1. Note 2.
Current year
Note 3. Note 4. Note 5. Note 6. Note 7. Note 8. Note 9.
Capital struc
Note 10. Note 11. Note 12. Note 13.
Working cap
Note 14. Note 15. Note 16. Note 17.
Infrastructur
Note 18. Note 19.
Other liabiliti
Note 20.
Financial ris
Note 21. Note 22. Note 23.
Unrecognise
Note 24. Note 25.
The Group,
Note 26. Note 27. Note 28. Note 29. Note 30. Note 31.
UTIVE OFFICE
L LIMITED ANN
the notes
paration .......
Corporate InBasis of pre
r performance
Operating seRevenue ....Other incomEarnings peReconciliatioDividends paIncome and
cture .............
Cash and caInterest beaContributed Government
pital ..............
Trade and oConstructionInventories aTrade and o
re & other ass
Property, plaIntangible as
ies ...............
Provisions ..
k manageme
Fair value mFinancial risDerivative fin
ed items .......
CommitmenEvents after
management
Parent intereRelated partKey manageShare basedParent entityBusiness co
ER’S REPOR
UAL REPORT 2
s to the f
.....................
nformation .....paration ........
e ...................
egments ............................
me and expensr share .........on of net profitaid and propoother taxes ..
.....................
ash equivalentring loans andequity and rest grants relatin
.....................
other receivabln contracts in and work in pr
other payables
sets ...............
ant and equipmssets .............
.....................
.....................
ent .................
measurements k managemennancial instrum
.....................
nts and contingr the balance d
t and related
ests in subsidity disclosure .ement personnd payments ...y ...................
ombinations ...
RT
2014
financial s
.....................
......................
......................
.....................
......................
......................ses .......................................t after tax to nsed .....................................
.....................
ts ...................d borrowings ..serves ...........ng to assets ...
.....................
les .................progress .......rogress ..........s .....................
.....................
ment ....................................
.....................
......................
.....................
.....................nt ...................ments and hed
.....................
gencies ..........date ...............
parties .........
iaries ...................................nel compensa..................................................................
statemen
....................
......................
......................
....................
......................
......................
......................
......................net cash flows ............................................
....................
......................
......................
......................
......................
....................
......................
......................
......................
......................
....................
......................
......................
....................
......................
....................
......................
......................dging ............
....................
......................
......................
....................
......................
......................ation .................................................................................
nts
.....................
.....................
.....................
.....................
.....................
.....................
.....................
.....................from operatio..........................................
.....................
.....................
.....................
.....................
.....................
.....................
.....................
.....................
.....................
.....................
.....................
.....................
.....................
.....................
.....................
.....................
.....................
.....................
.....................
.....................
.....................
.....................
.....................
.....................
.....................
.....................
.....................
.....................
.....................
.....................
......................
......................
.....................
......................
......................
......................
......................ns .............................................................
.....................
......................
......................
......................
......................
.....................
......................
......................
......................
......................
.....................
......................
......................
.....................
......................
.....................
......................
......................
......................
.....................
......................
......................
.....................
......................
......................
......................
......................
......................
......................
....................
......................
......................
....................
......................
......................
......................
......................
......................
......................
......................
....................
......................
......................
......................
......................
....................
......................
......................
......................
......................
....................
......................
......................
....................
......................
....................
......................
......................
......................
....................
......................
......................
....................
......................
......................
......................
......................
......................
......................
................ 33
................. 33
................. 33
................ 39
................. 39
................. 43
................. 45
................. 47
................. 48
................. 48
................. 49
................ 53
................. 53
................. 54
................. 56
................. 57
................ 58
................. 58
................. 60
................. 60
................. 61
................ 62
................. 62
................. 65
................ 68
................. 68
................ 70
................. 70
................. 74
................. 79
................ 82
................. 82
................. 82
................ 83
................. 83
................. 83
................. 83
................. 84
................. 88
................. 89
3
3 3
9
9 3 5 7 8 8 9
3
3 4 6 7
8
8 0 0
2
2 5
8
8
0
0 4 9
2
2 2
3
3 3 3 4 8 9
HIEF EXECUTIVE OFFICER’S REPORT
3 | AUSTAL LIMITED ANNUAL REPORT 2014
Chairman’s report It is my pleasure to present the 2014 Annual Report to you on behalf of the Board of Austal Limited.
The past 12 months represented a year of solid operational improvement and strengthening of the balance sheet by generation of cash and repaying of debt. In that time our Group:
Exceeded revenue guidance of $1 billion.
Concluded the sale of surplus assets in Henderson and used proceeds to repay debt.
Maintained a strong focus on cash generation also used to repay debt.
Made operational improvements at our US shipyard, which translated into improved shipbuilding margins and profit growth.
Confirmed funding for two more Littoral Combat Ships under our existing contract with the US Navy.
Secured new shipbuilding contracts with the Royal Navy of Oman and the Abu Dhabi National Oil Company.
Matured delivery of the US Navy and Australian Customs contracts such that the outlook is one of lower risk and more predictable earnings.
Successfully delivered an 80 m high speed ferry from the Philippines Shipyard Operation and grew local capability.
Profitability grew Support activities following the restructure and consolidation in FY2013.
The Chief Executive Officer, Andrew Bellamy, will provide more detail in his report on the operational achievements for the year, and the strategic direction and outlook for Austal.
Financial results
Austal reported a net profit after tax of $31.859 million in FY2014, compared to $35.742 million in FY2013. FY2014 earnings before interest, tax, depreciation and amortisation were $79.338 million for the year compared to $62.575 million in FY2013. The improvement in earnings was driven by stronger shipbuilding margins in our US and Australian shipyards as existing programs matured.
Revenue for the year grew by 24.8 per cent from $899.491 million in FY2013 to $1,122.863 million.
US operations was the largest contributor to revenue, delivering $933.615 million (FY2013: $747.739 million) and $61.682 million in earnings before interest and tax (EBIT) (FY2013: $50.100 million) as Austal continued to perform work on its major Littoral Combat Ships (LCS) and Joint High Speed Vessels (JHSV) contracts for the US Navy.
Australian operations delivered an improved result as the Cape Class program matured with $241.912 million in revenue (FY2013: $144.058) and $16.684 million EBIT (FY2013: $0.041 million).
Philippines Operation reported a $2.703 million EBIT (FY2013: $5.020 million).
Group net debt was reduced to $68.579 million (FY2013: $137.074 million) with proceeds from the sale of surplus assets and cash generated from operations being used to repay long term debt.
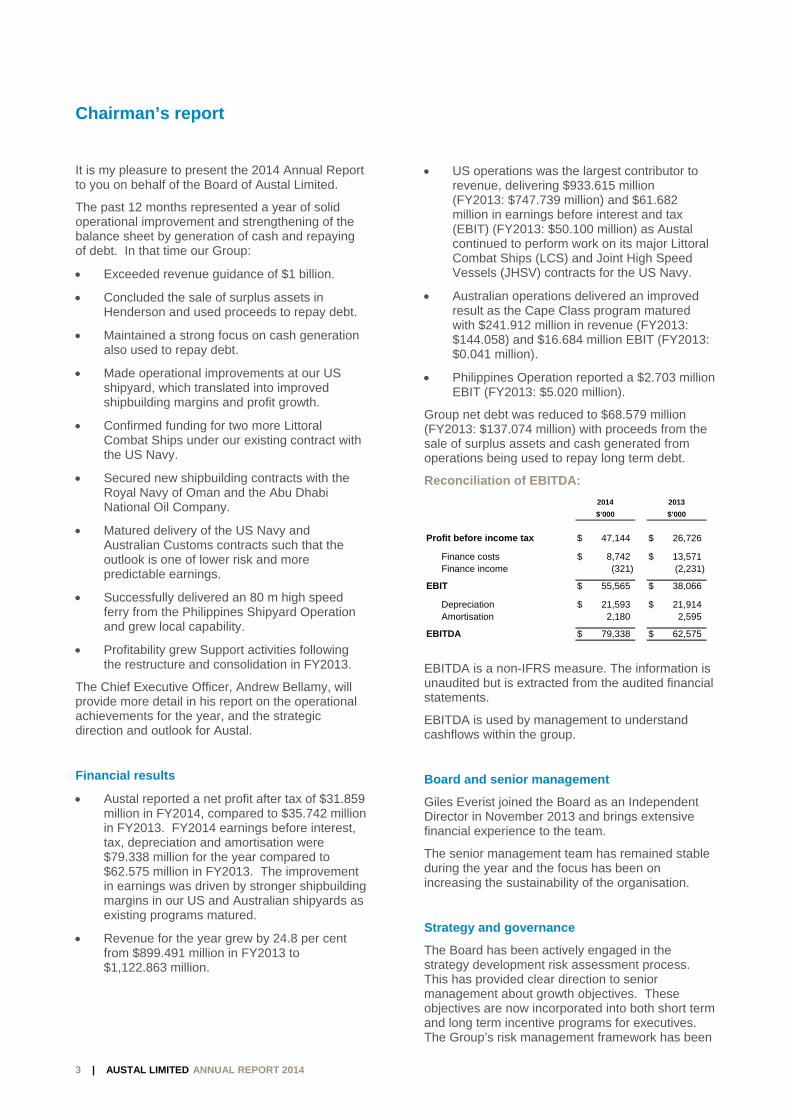
Reconciliation of EBITDA:
EBITDA is a non-IFRS measure. The information is unaudited but is extracted from the audited financial statements.
EBITDA is used by management to understand cashflows within the group.
Board and senior management
Giles Everist joined the Board as an Independent Director in November 2013 and brings extensive financial experience to the team.
The senior management team has remained stable during the year and the focus has been on increasing the sustainability of the organisation.
Strategy and governance
The Board has been actively engaged in the strategy development risk assessment process. This has provided clear direction to senior management about growth objectives. These objectives are now incorporated into both short term and long term incentive programs for executives. The Group’s risk management framework has been
2014 2013
$’000 $’000
Profit before income tax 47,144$ 26,726$
Finance costs 8,742$ 13,571$ Finance income (321) (2,231)
EBIT 55,565$ 38,066$
Depreciation 21,593$ 21,914$ Amortisation 2,180 2,595
EBITDA 79,338$ 62,575$
HIEF EXECUTIVE OFFICER’S REPORT
4 | AUSTAL LIMITED ANNUAL REPORT 2014
refreshed during the year at both a strategic and corporate level. Both the Audit and Risk committee and Remuneration committee have been involved in that process to ensure that the necessary controls and governance are in place.
Austal has the opportunity to leverage its intellectual property in new markets and new opportunities to expand the engineering services business.
Outlook
The significant steps we took to transform Austal in the year have placed the Group in a stronger position to deliver on our significant order book and progress the operational improvements we have made. The US Navy funded an additional US$680 million of work in the 12 months, taking the Group order book to $2.8 billion as at 30 June 2014. This secures revenue through CY2018. With a record amount of work in hand, our focus is to deliver prudent cash management and continue to drive operational improvements across our businesses, with a near-term view to return dividends to shareholders.
I would like to acknowledge our employees for their loyalty and hard work during the year. The achievements we made would not have been possible without their professionalism and dedication, and to shareholders, thank you for your ongoing support of Austal during the year. I am pleased that we have delivered on the operational and financial performance to drive shareholder value, and your Board will focus on continuing to achieve this objective.
John Rothwell AO Chairman
5 | AUSTAL LIMITED ANNUAL REPORT 2014
Chief Executive Officer’s report Austal was able to sustain and build upon the prior year’s significant operational improvements. This translated into improved operating profit before tax for the Group.
Financial summary
*Excludes other income
Operational improvements
Management’s focus was to implement further operational improvements to sustain and enhance the turn-around in operating profit which began in the prior year. Improving margins at our state of the art shipyard in the US, where Austal is contracted to construct Littoral Combat Ships (LCS) and Joint High Speed Vessels (JHSV) for the US Navy was the primary driver in improved profitability for the Group. Both programs are maturing well with the number of design changes reducing and the workforce stabilising. Austal delivered JHSV 3 to the US Navy and JHSV 4 was launched. LCS 4 was delivered and LCS 6 was launched. Construction of LCS 6, 8,10 and 12 progressed well. The award of two service and support contracts for the US Navy is an indicator of the future potential for service work.
Operational improvements at our Australian shipyard delivered a profitable result after a difficult few years, as production of the Cape Class Patrol Boats (CCPB) matured. The $330 million contract progressed well with two vessels delivered and a further six CCPB in production. The design of two High Speed Support Vessels (HSSV) for the Royal Navy of Oman is underway following the contract award in March.
The Philippines shipyard delivered an 80m high speed ferry to Tahiti and a further three wind farm support vessels to the UK. A positive financial result is pleasing as we continue to invest in the development of capability in the yard.
This year saw the establishment of a production design team as well as small component manufacture for Australian operations. The two ferries contracted to the Abu Dhabi National Oil Company (ADNOC) in April are being constructed in the Philippines shipyard.
Consolidation of the Henderson Service base into the Henderson shipyard yielded an improved financial performance in the year. All three business units are now generating income from both shipbuilding contracts and from Service and Systems activities.
Strategy
We made significant progress in implementing the strategic plan, which included further reducing gearing through a reduction in net debt to strengthen the balance sheet. This was achieved from the proceeds of the sale of the surplus Henderson Service Base and from cash generated by operations.
The order book grew to $2.8 billion following appropriation of funds in line with US Navy contracts. This secures work through 2018 with two additional LCS funded in the year. The new contract for two HSSV for the Royal Navy of Oman is strategically significant because it is the first example of the JHSV concept being adopted in a new and important region. The ADNOC ferry contract underlines our competitiveness with the establishment of the Philippines shipyard.
Our strategy is clear for the year ahead. Austal will strive to improve margins in the US through operational efficiency. Australian Operations will expand to deliver the Cape Class Patrol Boat and HSSV contracts and continue to target opportunities for domestic and export defence contracts. Technology transfer to the Philippines Operation will continue, and capacity will be expanded in line with market potential. The Philippines shipyard will increase the supply of small components within the Group to increase the competitiveness of the Group as a whole.
All three business units will pursue service and systems opportunities from their well-established shipbuilding operations.
A prudent cash management focus will ensure that costs and inflows are aligned. This will enhance Austal’s ability to deliver on the record amount of work in progress and strategic objectives.
2014 2013
Year ended 30 June $’000 $’000
Revenue* 1,122,863$ 899,491$
EBIT 55,565$ 38,066$ Net Interest (Expense) / Income (8,421) (11,340)
Operating Profit Before Tax 47,144$ 26,726$
Tax (Expense)/Benefit (15,285)$ 9,016$
Operating Profit After Tax 31,859$ 35,742$
% EBIT/Revenue 4.9% 4.2%Basic Earnings Per Share ($ per share) 0.09$ 0.12$ Net Assets 433,232$ 407,187$ Return on Invested Capital (%) 7.8% 5.5%
6 | AUSTAL
People
Our Values oand Teamwotangible andthroughout t
I’d like to thastakeholdersand loyalty.
We have condeveloped gpresented opgrow and weimportant exand experienand more su
Outlook
Austal is betbook as a restrengtheninFY2014.
We will sustaand shipbuilmajor contraJHSV. We eFY2015 as pdemonstrateperformancesequestrationew US Navcontracts.
The translatiare directly iexchange ratranslation wthe AUD. A internationalbusiness.
We will contAustralian opremaining Care well prepthe two HSSopportunitiesboth domest
We will invesPhilippines Ocommercial established Philippines. successful sPhilippines a
Our Service developed inand Australiagrew in FY2expected thaof our busine
L LIMITED ANN
of Excellenceork have bee
d sustainable he year.
ank all of our s for their har
ntinued to invgreater depth pportunities fe have augmexternal recruitnce. The orgustainable as
tter positionedesult of improvng the Group’
ain the operading margins
acts for the USexpect furtheper the contraed strong onge, low-cost LCon. Austal is wvy constructio
ion of profits mpacted by t
ate. We couldwith markets f
weaker AUDl competitiven
inue to improperations as
Cape Class Papared for the
SV for Oman. s exist to contic and export
st in developiOperations wcontracts. Foa production We will conti
supply of smaacross the Gr
and Systemsn preparationan defence v014 and will cat these prodess in the me
UAL REPORT 2
e, Customer, n the basis fobusiness suc
employees ard work, comm
vest in our peof talent. This
for many empented this witts to increaseganisation is s
a result.
d to deliver oved margins s balance she
ational improvs, delivering oS Navy, the Lr LCS to be fuact. The US Ngoing support CS despite well positione
on and vessel
from our US the USD / AUd see a benefforecasting w
D also improveness of our A
ove productiviproduction ofatrol Boats mstart of constA good numstruct similart defence ma
ing capabilitiehilst we pursuor the first timdesign team nue to build u
all componentroup.
s products ha for deploymeessels. This continue to doucts become
edium term.
2014
Integrity or many ccesses
nd other mitment
eople and s has
ployees to th some our skills
stronger
n the order and eet in
vements n our two
LCS and unded in Navy has to the high
ed to win l support
operations UD fit in profit eakening of es the ustralian
ty in our f the atures. We truction for ber of vessels for
arkets.
es in the ue new
me we have in the
upon the ts from the
ave been ent to US activity o so. It is a core part
Future succimproving oproduction managemesales, markspend to enwork. Theswell positioto generate
Andrew BeExecutive D
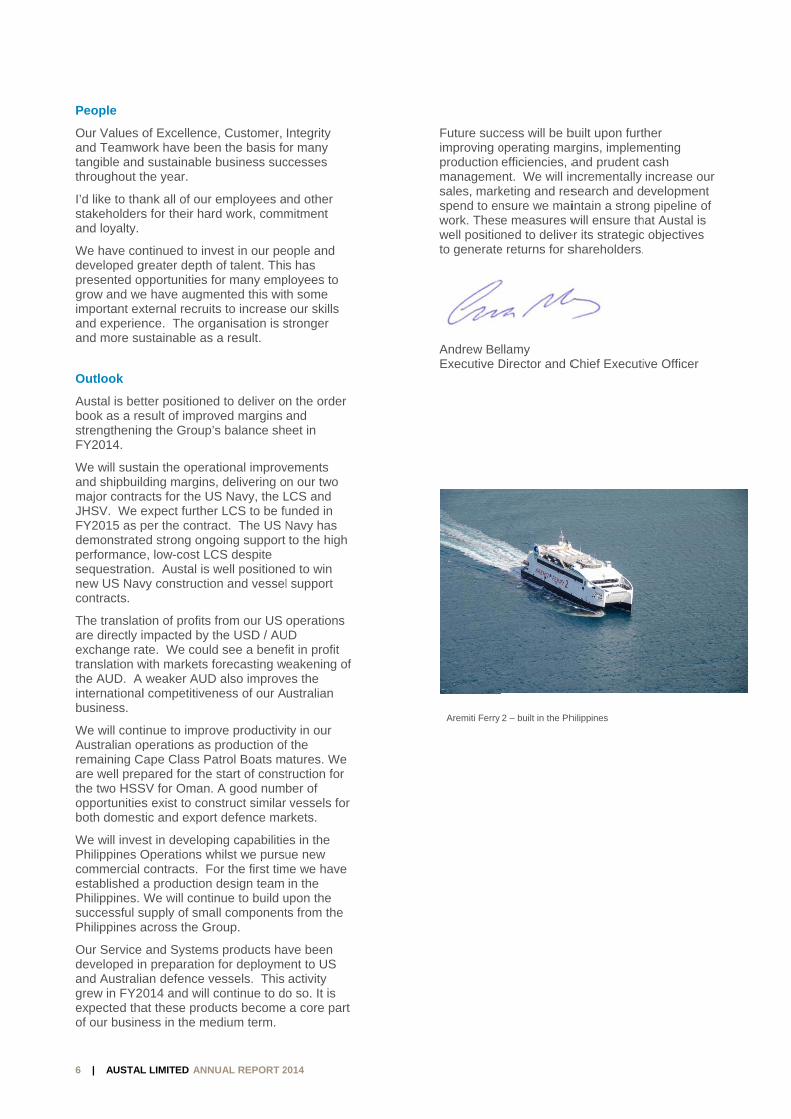
Aremiti Ferry
cess will be boperating marefficiencies, a
ent. We will inketing and resnsure we maie measures wned to delive
e returns for s
llamy Director and C
2 – built in the Ph
built upon furtrgins, implemand prudent cncrementally search and dintain a stronwill ensure th
er its strategicshareholders.
Chief Executi
hilippines
ther menting cash increase ourevelopment g pipeline of
hat Austal is c objectives
ive Officer
7 | AUSTAL LIMITED ANNUAL REPORT 2014
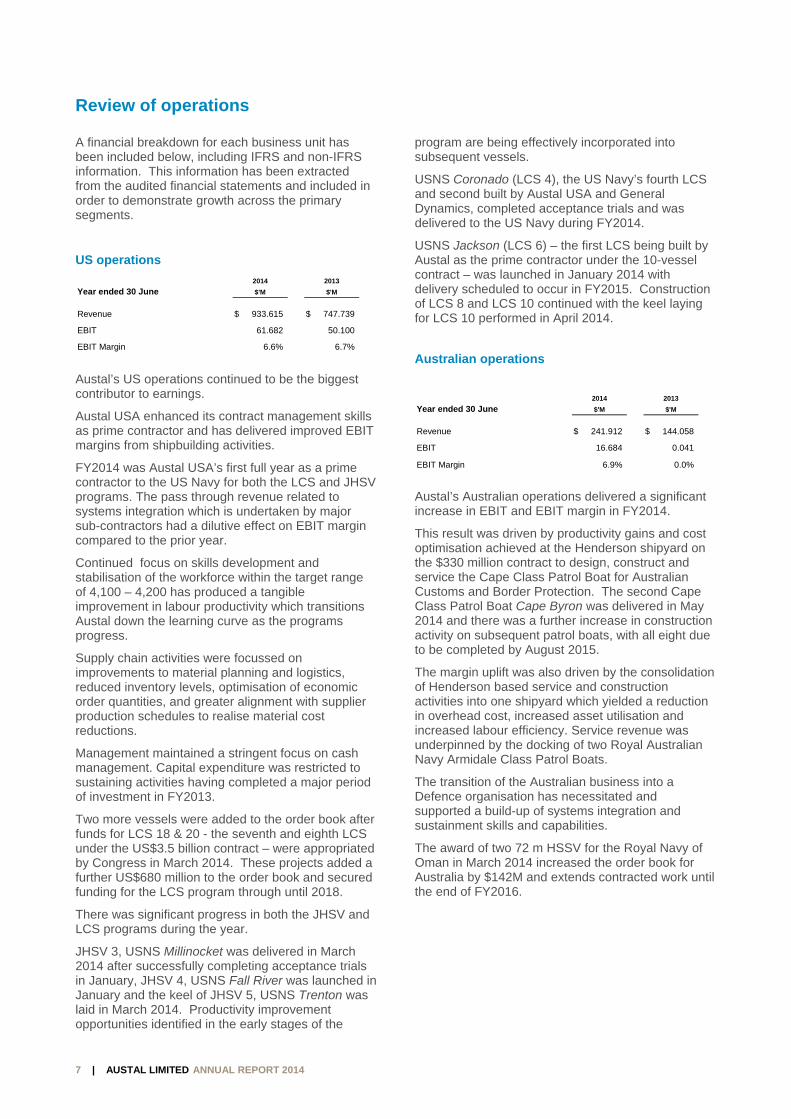
Review of operations A financial breakdown for each business unit has been included below, including IFRS and non-IFRS information. This information has been extracted from the audited financial statements and included in order to demonstrate growth across the primary segments.
US operations
Austal’s US operations continued to be the biggest contributor to earnings.
Austal USA enhanced its contract management skills as prime contractor and has delivered improved EBIT margins from shipbuilding activities.
FY2014 was Austal USA’s first full year as a prime contractor to the US Navy for both the LCS and JHSV programs. The pass through revenue related to systems integration which is undertaken by major sub-contractors had a dilutive effect on EBIT margin compared to the prior year.
Continued focus on skills development and stabilisation of the workforce within the target range of 4,100 – 4,200 has produced a tangible improvement in labour productivity which transitions Austal down the learning curve as the programs progress.
Supply chain activities were focussed on improvements to material planning and logistics, reduced inventory levels, optimisation of economic order quantities, and greater alignment with supplier production schedules to realise material cost reductions.
Management maintained a stringent focus on cash management. Capital expenditure was restricted to sustaining activities having completed a major period of investment in FY2013.
Two more vessels were added to the order book after funds for LCS 18 & 20 - the seventh and eighth LCS under the US$3.5 billion contract – were appropriated by Congress in March 2014. These projects added a further US$680 million to the order book and secured funding for the LCS program through until 2018.
There was significant progress in both the JHSV and LCS programs during the year.
JHSV 3, USNS Millinocket was delivered in March 2014 after successfully completing acceptance trials in January, JHSV 4, USNS Fall River was launched in January and the keel of JHSV 5, USNS Trenton was laid in March 2014. Productivity improvement opportunities identified in the early stages of the
program are being effectively incorporated into subsequent vessels.
USNS Coronado (LCS 4), the US Navy’s fourth LCS and second built by Austal USA and General Dynamics, completed acceptance trials and was delivered to the US Navy during FY2014.
USNS Jackson (LCS 6) – the first LCS being built by Austal as the prime contractor under the 10-vessel contract – was launched in January 2014 with delivery scheduled to occur in FY2015. Construction of LCS 8 and LCS 10 continued with the keel laying for LCS 10 performed in April 2014.
Australian operations
Austal’s Australian operations delivered a significant increase in EBIT and EBIT margin in FY2014.
This result was driven by productivity gains and cost optimisation achieved at the Henderson shipyard on the $330 million contract to design, construct and service the Cape Class Patrol Boat for Australian Customs and Border Protection. The second Cape Class Patrol Boat Cape Byron was delivered in May 2014 and there was a further increase in construction activity on subsequent patrol boats, with all eight due to be completed by August 2015.
The margin uplift was also driven by the consolidation of Henderson based service and construction activities into one shipyard which yielded a reduction in overhead cost, increased asset utilisation and increased labour efficiency. Service revenue was underpinned by the docking of two Royal Australian Navy Armidale Class Patrol Boats.
The transition of the Australian business into a Defence organisation has necessitated and supported a build-up of systems integration and sustainment skills and capabilities.
The award of two 72 m HSSV for the Royal Navy of Oman in March 2014 increased the order book for Australia by $142M and extends contracted work until the end of FY2016.
2014 2013
Year ended 30 June $'M $'M
Revenue 933.615$ 747.739$
EBIT 61.682 50.100
EBIT Margin 6.6% 6.7%
2014 2013
Year ended 30 June $'M $'M
Revenue 241.912$ 144.058$
EBIT 16.684 0.041
EBIT Margin 6.9% 0.0%
8 | AUSTAL LIMITED ANNUAL REPORT 2014
Philippines operations
The Philippines Operations successfully completed the construction of an 80 metre commercial vehicle / passenger ferry which was delivered to Tahiti in the second quarter of FY2014 and also completed the construction of three wind farm vessels for operation in Europe.
The year on year fall in revenue and EBIT was caused by the reduction in activities following the completion of the 80 metre ferry. Throughput is expected to pick up again in FY2015 after the award of two 48 m crew transfer vessels for delivery to ADNOC.
The award of the two vessels added US$27.8M to the Philippines Order book and provides contracted work through FY2015.
The Philippines Operations entered the Service market in FY2014 by supporting the docking of Austal vessels in Europe and Asia.
The Philippines Operations are playing a pivotal role in cost optimisation of manufacturing activities within the Group by supplying sub-assemblies and components to Australia.
The capital investment program to establish the footprint for infrastructure required to construct larger vessels (80 – 130 m in length) was completed on schedule.
The Group continues to focus on capability development with the objective of the Philippines becoming self-sustaining. The two key areas of focus are on production / project management and the establishment of a Philippines based design team.
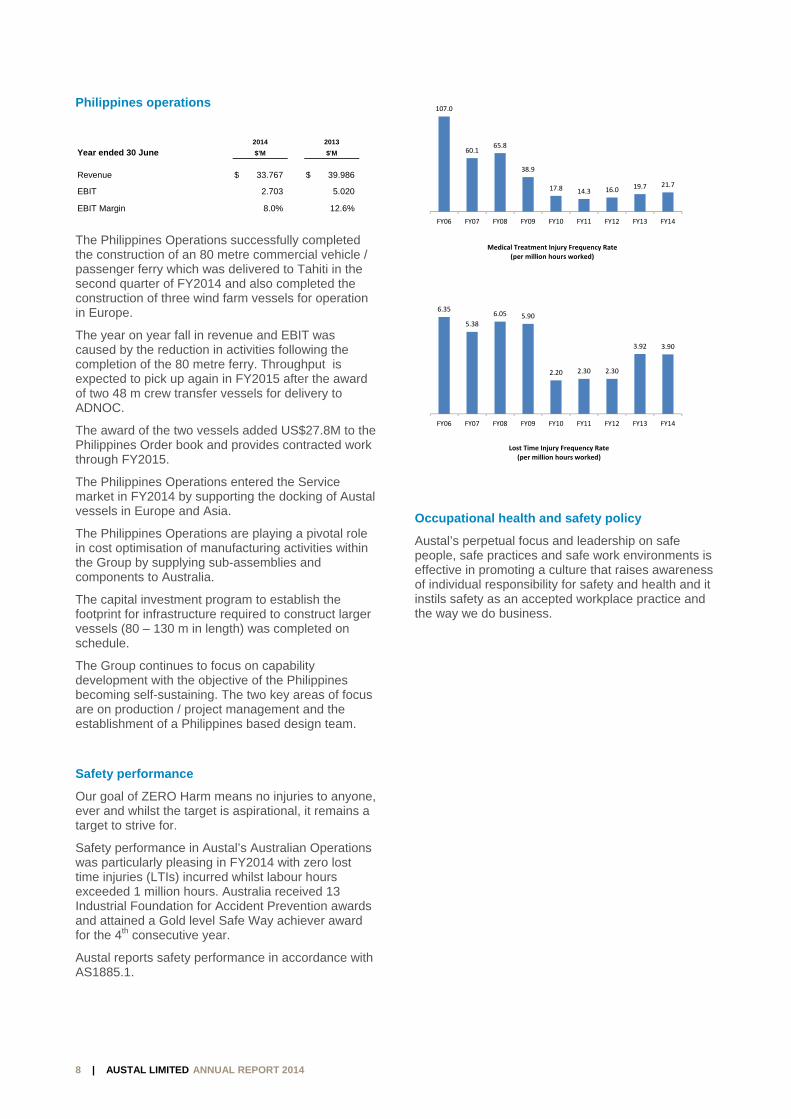
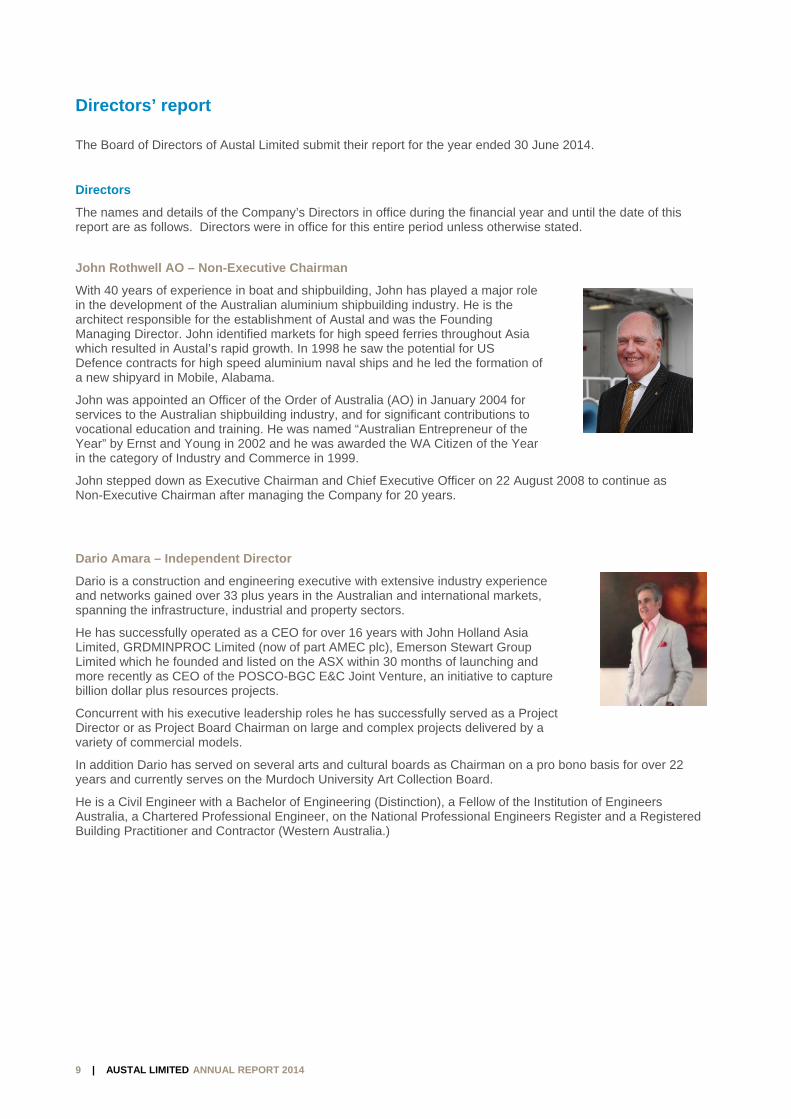
Safety performance
Our goal of ZERO Harm means no injuries to anyone, ever and whilst the target is aspirational, it remains a target to strive for.
Safety performance in Austal’s Australian Operations was particularly pleasing in FY2014 with zero lost time injuries (LTIs) incurred whilst labour hours exceeded 1 million hours. Australia received 13 Industrial Foundation for Accident Prevention awards and attained a Gold level Safe Way achiever award for the 4th consecutive year.
Austal reports safety performance in accordance with AS1885.1.
Occupational health and safety policy
Austal’s perpetual focus and leadership on safe people, safe practices and safe work environments is effective in promoting a culture that raises awareness of individual responsibility for safety and health and it instils safety as an accepted workplace practice and the way we do business.
2014 2013
Year ended 30 June $'M $'M
Revenue 33.767$ 39.986$
EBIT 2.703 5.020
EBIT Margin 8.0% 12.6%
107.0
60.1 65.8
38.9
17.8 14.3 16.0 19.7 21.7
FY06 FY07 FY08 FY09 FY10 FY11 FY12 FY13 FY14
Medical Treatment Injury Frequency Rate(per million hours worked)
6.35
5.38
6.05 5.90
2.20 2.30 2.30
3.92 3.90
FY06 FY07 FY08 FY09 FY10 FY11 FY12 FY13 FY14
Lost Time Injury Frequency Rate(per million hours worked)
9 | AUSTAL LIMITED ANNUAL REPORT 2014
Directors’ report
The Board of Directors of Austal Limited submit their report for the year ended 30 June 2014.
Directors
The names and details of the Company’s Directors in office during the financial year and until the date of this report are as follows. Directors were in office for this entire period unless otherwise stated.
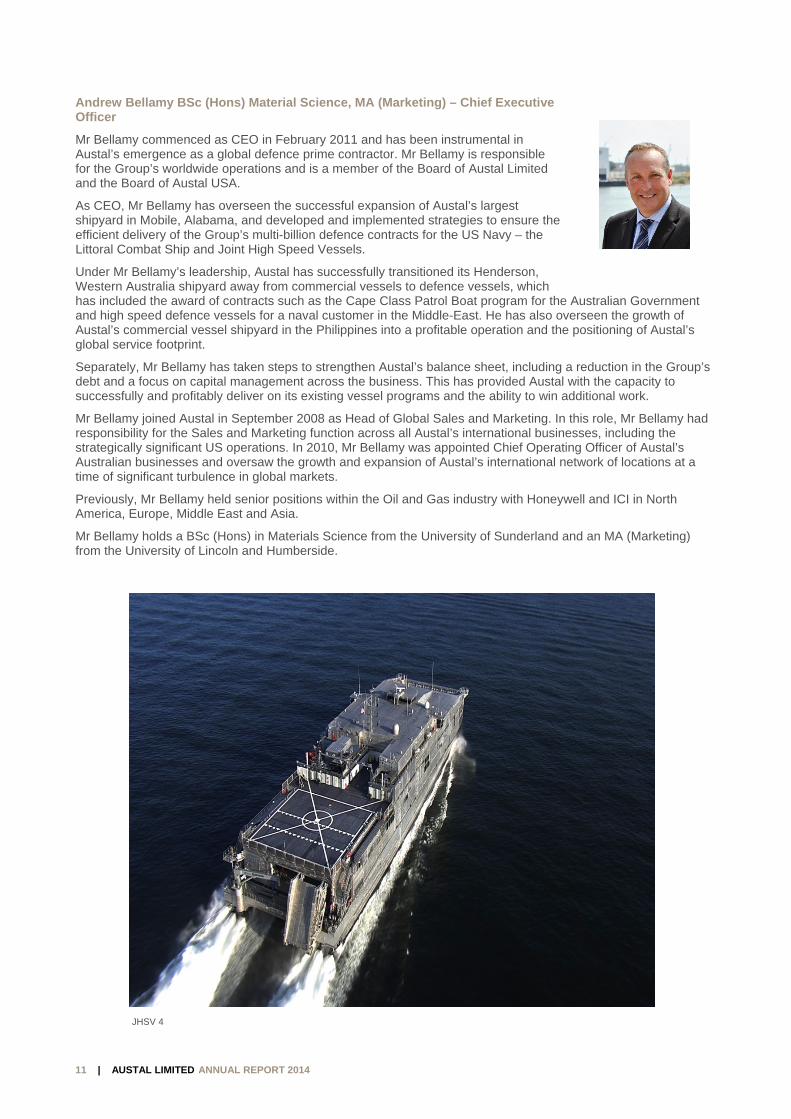
John Rothwell AO – Non-Executive Chairman
With 40 years of experience in boat and shipbuilding, John has played a major role in the development of the Australian aluminium shipbuilding industry. He is the architect responsible for the establishment of Austal and was the Founding Managing Director. John identified markets for high speed ferries throughout Asia which resulted in Austal’s rapid growth. In 1998 he saw the potential for US Defence contracts for high speed aluminium naval ships and he led the formation of a new shipyard in Mobile, Alabama.
John was appointed an Officer of the Order of Australia (AO) in January 2004 for services to the Australian shipbuilding industry, and for significant contributions to vocational education and training. He was named “Australian Entrepreneur of the Year” by Ernst and Young in 2002 and he was awarded the WA Citizen of the Year in the category of Industry and Commerce in 1999.
John stepped down as Executive Chairman and Chief Executive Officer on 22 August 2008 to continue as Non-Executive Chairman after managing the Company for 20 years.
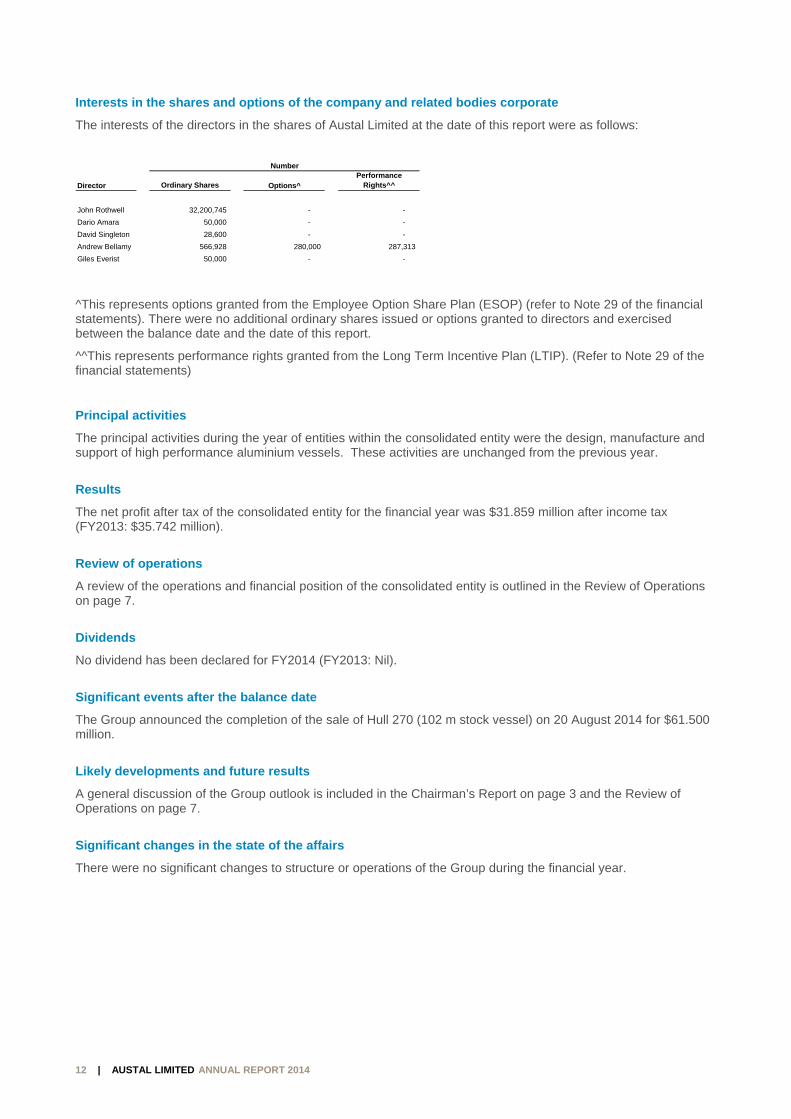
Dario Amara – Independent Director
Dario is a construction and engineering executive with extensive industry experience and networks gained over 33 plus years in the Australian and international markets, spanning the infrastructure, industrial and property sectors.
He has successfully operated as a CEO for over 16 years with John Holland Asia Limited, GRDMINPROC Limited (now of part AMEC plc), Emerson Stewart Group Limited which he founded and listed on the ASX within 30 months of launching and more recently as CEO of the POSCO-BGC E&C Joint Venture, an initiative to capture billion dollar plus resources projects.
Concurrent with his executive leadership roles he has successfully served as a Project Director or as Project Board Chairman on large and complex projects delivered by a variety of commercial models.
In addition Dario has served on several arts and cultural boards as Chairman on a pro bono basis for over 22 years and currently serves on the Murdoch University Art Collection Board.
He is a Civil Engineer with a Bachelor of Engineering (Distinction), a Fellow of the Institution of Engineers Australia, a Chartered Professional Engineer, on the National Professional Engineers Register and a Registered Building Practitioner and Contractor (Western Australia.)

10 | AUSTAL LIMITED ANNUAL REPORT 2014
David Singleton – Independent Director
David brings a wealth of highly relevant business expertise and experience to Austal in both the defence and manufacturing and product support sectors.
David has held numerous senior roles with BAE Systems (formerly British Aerospace), which is one of the world’s largest defence companies. He served as Group Head of Strategy and Mergers & Acquisitions in London from 1997 to 1998 and again in 2003. In the intervening years, David was BAE’s Managing Director of Asset Management before spending three years in Rome as the Chief Executive Officer of Alenia Marconi Systems (AMS).
AMS was a European leader of naval warfare and air defence systems, C4I, ground and naval radars, naval command and control training systems and long term naval support.
David started his career with the UK Ministry of Defence and worked in research, development and manufacturing as well as senior management roles in Royal Ordnance which by then was part of BAE. He has also served as a member of the National Defence Industries Council in the UK, and as a board member and Vice President (Defence) of Intellect, a leading trade association for the UK technology industry.
David is the CEO and Managing Director of Perth-based mineral exploration company Poseidon Nickel Limited. Prior to this role, he served as CEO and Managing Director of Clough Limited between 2003 and 2007. David is also a Non-Executive Director of Quickstep Holdings.
David was appointed to the Board of Directors of Austal Limited on 21 December 2011.
Giles Everist – Independent Director
Giles has a breadth of experience with project and service based businesses gained over more than 25 years, working internationally in Australia, UK and Africa, largely in the resources, engineering and construction industries.
Giles was appointed as Non-Executive Director in November 2013. Giles is a qualified chartered accountant and was formerly the Chief Financial Officer and Company Secretary of Monadelphous Group Limited between 2003 and 2009. He has held senior financial executive roles with Rio Tinto in the United Kingdom and Australia, as well as major US design engineering Group Fluor Corp during his career.
Giles is currently a Non-Executive Director of Decmil Group Limited, LogiCamms Ltd and Macmahon Holdings Limited.
11 | AUSTAL LIMITED ANNUAL REPORT 2014
Andrew Bellamy BSc (Hons) Material Science, MA (Marketing) – Chief Executive Officer
Mr Bellamy commenced as CEO in February 2011 and has been instrumental in Austal’s emergence as a global defence prime contractor. Mr Bellamy is responsible for the Group’s worldwide operations and is a member of the Board of Austal Limited and the Board of Austal USA.
As CEO, Mr Bellamy has overseen the successful expansion of Austal’s largest shipyard in Mobile, Alabama, and developed and implemented strategies to ensure the efficient delivery of the Group’s multi-billion defence contracts for the US Navy – the Littoral Combat Ship and Joint High Speed Vessels.
Under Mr Bellamy’s leadership, Austal has successfully transitioned its Henderson, Western Australia shipyard away from commercial vessels to defence vessels, which has included the award of contracts such as the Cape Class Patrol Boat program for the Australian Government and high speed defence vessels for a naval customer in the Middle-East. He has also overseen the growth of Austal’s commercial vessel shipyard in the Philippines into a profitable operation and the positioning of Austal’s global service footprint.
Separately, Mr Bellamy has taken steps to strengthen Austal’s balance sheet, including a reduction in the Group’s debt and a focus on capital management across the business. This has provided Austal with the capacity to successfully and profitably deliver on its existing vessel programs and the ability to win additional work.
Mr Bellamy joined Austal in September 2008 as Head of Global Sales and Marketing. In this role, Mr Bellamy had responsibility for the Sales and Marketing function across all Austal’s international businesses, including the strategically significant US operations. In 2010, Mr Bellamy was appointed Chief Operating Officer of Austal’s Australian businesses and oversaw the growth and expansion of Austal’s international network of locations at a time of significant turbulence in global markets.
Previously, Mr Bellamy held senior positions within the Oil and Gas industry with Honeywell and ICI in North America, Europe, Middle East and Asia.
Mr Bellamy holds a BSc (Hons) in Materials Science from the University of Sunderland and an MA (Marketing) from the University of Lincoln and Humberside.
JHSV 4
12 | AUSTAL LIMITED ANNUAL REPORT 2014
Interests in the shares and options of the company and related bodies corporate
The interests of the directors in the shares of Austal Limited at the date of this report were as follows:
^This represents options granted from the Employee Option Share Plan (ESOP) (refer to Note 29 of the financial statements). There were no additional ordinary shares issued or options granted to directors and exercised between the balance date and the date of this report.
^^This represents performance rights granted from the Long Term Incentive Plan (LTIP). (Refer to Note 29 of the financial statements)
Principal activities
The principal activities during the year of entities within the consolidated entity were the design, manufacture and support of high performance aluminium vessels. These activities are unchanged from the previous year.
Results
The net profit after tax of the consolidated entity for the financial year was $31.859 million after income tax (FY2013: $35.742 million).
Review of operations
A review of the operations and financial position of the consolidated entity is outlined in the Review of Operations on page 7.
Dividends
No dividend has been declared for FY2014 (FY2013: Nil).
Significant events after the balance date
The Group announced the completion of the sale of Hull 270 (102 m stock vessel) on 20 August 2014 for $61.500 million.
Likely developments and future results
A general discussion of the Group outlook is included in the Chairman’s Report on page 3 and the Review of Operations on page 7.
Significant changes in the state of the affairs
There were no significant changes to structure or operations of the Group during the financial year.
Number
Director Ordinary Shares Options^Performance
Rights^^
John Rothwell 32,200,745 - -
Dario Amara 50,000 - -
David Singleton 28,600 - -
Andrew Bellamy 566,928 280,000 287,313
Giles Everist 50,000 - -

13 | AUSTAL LIMITED ANNUAL REPORT 2014
Environmental regulation and performance
The Group has a policy of at least complying with, but in most cases exceeding, environmental performance requirements. No environmental breaches have been notified by any Government Agency during the year ended 30 June 2014.
Share options and performance rights
There were 9,392,329 un-issued ordinary shares under options and 1,049,022 un-vested performance rights at the date of this report. Refer to Note 29 for further details of the options outstanding. There were no options exercised or performance rights that had vested during the year.
Indemnification and insurance of directors and officers
An indemnity agreement has been entered into between the parent entity and each of the Directors named in this report. Under the agreement, the company has agreed to indemnify those Directors against any claim to the extent allowed by the law, for any expenses or costs which may arise as a result of work performed in their respective capacities.
The parent entity has paid premiums during the financial year in respect of a contract insuring the Directors and officers of the Group in respect of liability resulting from these indemnities. The terms of the insurance arrangements and premiums payable are subject to a confidentiality clause.
Indemnification of auditors
To the extent permitted by law, the parent entity has agreed to indemnify its auditors, Ernst & Young, as part of the terms of its audit engagement agreement against claims by third parties arising from the audit (for an unspecified amount). No payment has been made to indemnify Ernst & Young during or since the financial year.
Directors’ meetings
The number of meetings of directors (including meetings of committees of Directors) held during the year and the number of meetings attended by each Director was as follows:
Meeting
Nomination &
Austal Limted Audit & Risk Remuneration
Board Committee Committee
Number of meetings held 8 4 2
Number of meetings attended:
John Rothwell 8 - 2
Dario Amara 8 4 -
David Singleton 6 3 2
Giles Everist * 3 2 2
Andrew Bellamy ** 8 4 2
* Giles Everist joined the board in November 2013 and both subcommittees in January 2014. Three Board meetings, two Audit & Risk Committee
meetings and two Nomination & Remuneration Committee meetings were held after that date.
** Andrew Bellamy attended all Audit & Risk and Nomination & Remuneration committee meetings as a guest of each committee.
14 | AUSTAL LIMITED ANNUAL REPORT 2014
Committee membership
The Company has an Audit and Risk Committee and a Nomination and Remuneration Committee of the Board of Directors.
Members acting on the committees of the Board during the year were:
Audit and Risk Nomination and Remuneration
Dario Amara^ David Singleton^ Giles Everist Giles Everist David Singleton John Rothwell
^ Designates the Chairman of the committee.
Rounding
The amounts contained in this report and in the financial report have been rounded to the nearest $1,000 (where rounding is applicable) under the option available to the Company under ASIC Class Order 98/0100. The Company is an entity to which the Class Order applies.
15 | AUSTA
Message
Dear Shareh
The achievepeople throuthis success
Fundamentaentire businean importantand provide
We seek to tgroups, our As a global Gthe major jurhowever it isof our busine
We recognisshareholder
It is with pleaconcise. I lofuture.
Yours sincer
David SingleChairman, N
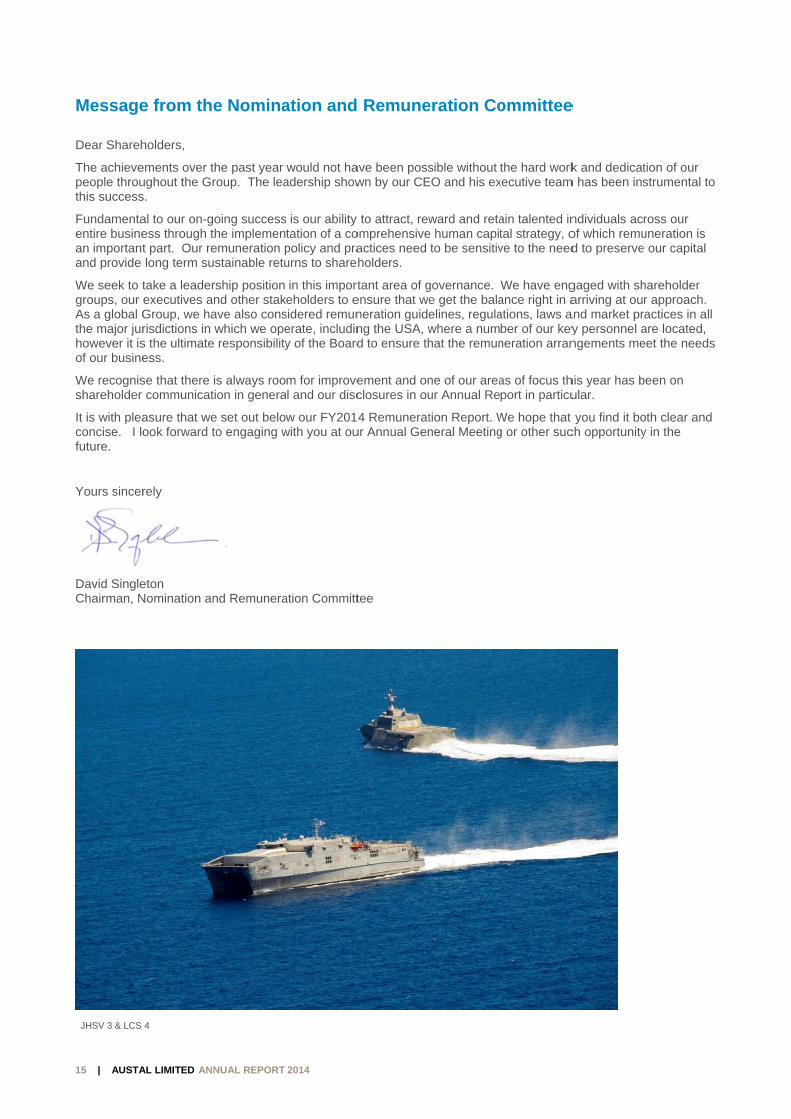
JHSV 3 & LCS
AL LIMITED ANN
e from the
holders,
ements over tughout the Grs.
al to our on-goess through tt part. Our relong term su
take a leaderexecutives anGroup, we harisdictions in s the ultimate ess.
se that there icommunicat
asure that weook forward t
rely
eton Nomination an
4
NUAL REPORT
e Nomina
he past year roup. The lea
oing successhe implemen
emuneration pstainable retu
rship position nd other stakave also conswhich we ope responsibility
is always rooion in genera
e set out beloto engaging w
nd Remunera
2014
ation and
would not haadership show
is our ability tation of a copolicy and praurns to share
in this importeholders to e
sidered remunerate, includiny of the Board
m for improveal and our disc
w our FY201with you at ou
ation Committ
Remune
ave been posswn by our CE
to attract, rewomprehensiveactices need holders.
tant area of gensure that weneration guideng the USA, wd to ensure th
ement and onclosures in ou
4 Remuneratur Annual Gen
tee
eration Co
sible without EO and his ex
ward and retae human capitto be sensitiv
governance. e get the balaelines, regulawhere a numhat the remun
ne of our areaur Annual Re
tion Report. Wneral Meeting
ommittee
the hard workxecutive team
ain talented intal strategy, ove to the need
We have engance right in aations, laws aber of our keyneration arran
as of focus thport in particu
We hope that g or other suc
e
k and dedicatm has been ins
ndividuals acof which remud to preserve
gaged with sharriving at ou
and market pry personnel angements me
his year has bular.
you find it boch opportunity
tion of our strumental to
ross our uneration is e our capital
hareholder r approach.
ractices in all are located, eet the needs
been on
oth clear and y in the
16 | AUSTAL LIMITED ANNUAL REPORT 2014
Remuneration report (audited) This Remuneration Report for the year ended 30 June 2014 outlines the remuneration arrangements of the Company and the Group in accordance with the requirements of the Corporations Act 2001 (the Act) and its regulations. This information has been audited as required by section 308(3C) of the Act. The remuneration report is presented under the following sections:
1. Key Management Personnel (KMP) 2. Relationship between remuneration and Austal Limited’s performance 3. Remuneration governance 4. Executive remuneration 5. Remuneration Structure 6. Board composition 7. Non-executive Director remuneration 8. Remuneration of key management personnel 9. Details of contractual provisions for KMP 10. Options granted or vested during the period 11. Performance rights granted or vested during the period 12. Shares granted or vested during the period 13. Equity instruments held by KMP 14. Loans to KMP 15. Other transactions with KMP 1. Key Management Personnel (KMP) This report covers all KMP as defined in Accounting Standards, including all Directors, as well as those Executives who have specific responsibility for planning, directing, and controlling material activities of the Group.
KMP for the year ended 30 June 2014 were as follows:
Executives Non-executive Directors
Executive directors
Mr Andrew Bellamy Chief Executive Officer
Executives with no Director duties
Mr Graham Backhouse President Australia Mr Greg Jason Group Chief Financial Officer Mr Brian Leathers Chief Financial Officer USA Mr Craig Perciavalle President USA Mr Joselito Turano President Philippines
Mr John Rothwell Non-Executive Chairman Mr Dario Amara Independent Director Mr Giles Everist (1) Independent Director Mr David Singleton Independent Director (1) Mr Giles Everist joined the Board of Directors in November 2013.
2. Relationship between remuneration and Austal Limited’s performance Our long-term remuneration framework is linked to a number of internal and external performance measures which when achieved provide direct benefits to the shareholders through increased returns.
Two key performance measures we use are:
Total Shareholder Return (TSR) (the capital growth in the value of our share plus dividend paid). We use absolute return as opposed to a relative return due to the lack of a comparable peer group; and
Return on Capital Invested (ROIC) (Net operating profit after tax exclusive of abnormal items / Net Assets (excluding Cash, Debt, Derivatives and Tax Accounts). Actual ROIC results are compared against internal targets).
The current Austal Long Term Incentive Plan was established in CY2013. (Refer to Note 29)
17 | AUSTAL LIMITED ANNUAL REPORT 2014
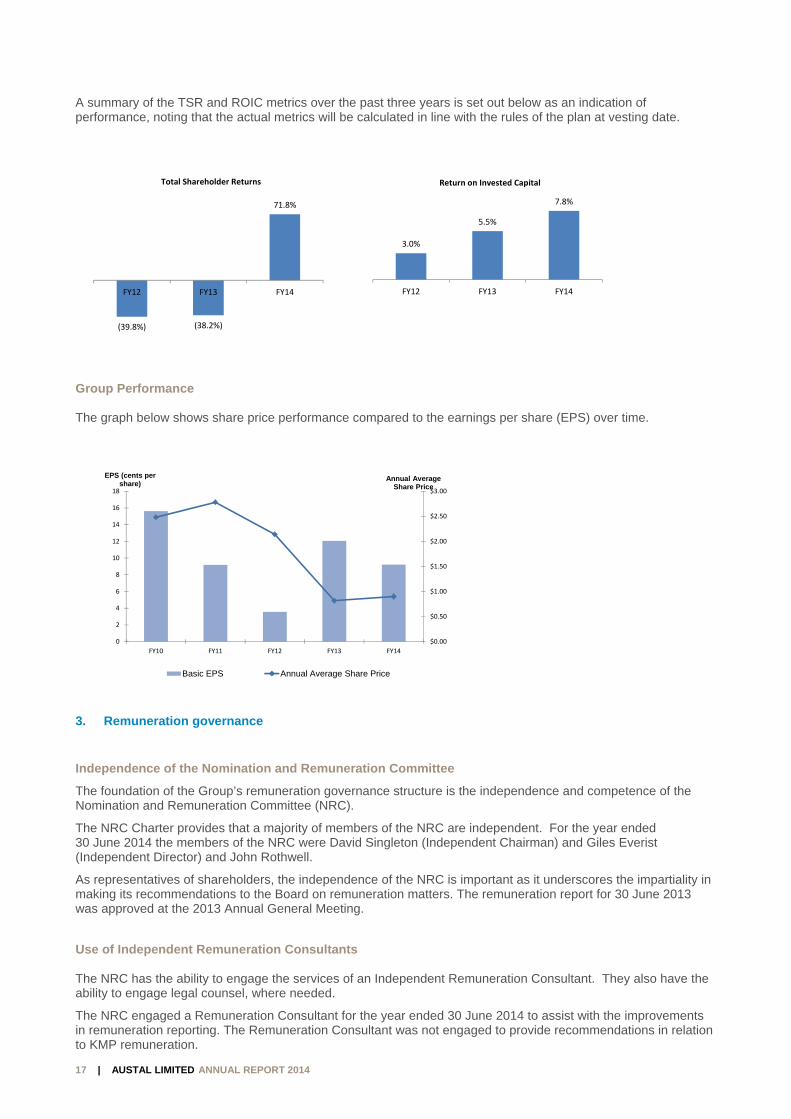
A summary of the TSR and ROIC metrics over the past three years is set out below as an indication of performance, noting that the actual metrics will be calculated in line with the rules of the plan at vesting date.
Group Performance The graph below shows share price performance compared to the earnings per share (EPS) over time.
3. Remuneration governance Independence of the Nomination and Remuneration Committee
The foundation of the Group’s remuneration governance structure is the independence and competence of the Nomination and Remuneration Committee (NRC).
The NRC Charter provides that a majority of members of the NRC are independent. For the year ended 30 June 2014 the members of the NRC were David Singleton (Independent Chairman) and Giles Everist (Independent Director) and John Rothwell.
As representatives of shareholders, the independence of the NRC is important as it underscores the impartiality in making its recommendations to the Board on remuneration matters. The remuneration report for 30 June 2013 was approved at the 2013 Annual General Meeting.
Use of Independent Remuneration Consultants The NRC has the ability to engage the services of an Independent Remuneration Consultant. They also have the ability to engage legal counsel, where needed.
The NRC engaged a Remuneration Consultant for the year ended 30 June 2014 to assist with the improvements in remuneration reporting. The Remuneration Consultant was not engaged to provide recommendations in relation to KMP remuneration.
(39.8%) (38.2%)
71.8%
FY12 FY13 FY14
Total Shareholder Returns
3.0%
5.5%
7.8%
FY12 FY13 FY14
Return on Invested Capital
$0.00
$0.50
$1.00
$1.50
$2.00
$2.50
$3.00
0
2
4
6
8
10
12
14
16
18
FY10 FY11 FY12 FY13 FY14
Annual Average Share Price
EPS (cents per share)
Basic EPS Annual Average Share Price
18 | AUSTAL LIMITED ANNUAL REPORT 2014
Share Trading Policy All equity based remuneration awards granted pursuant to the Group’s policy are subject to the Group’s Share Trading Policy, details of which can be found on our website.
In particular, there is a prohibition on employees entering into contracts to hedge their exposure to the share price movement of the Group.
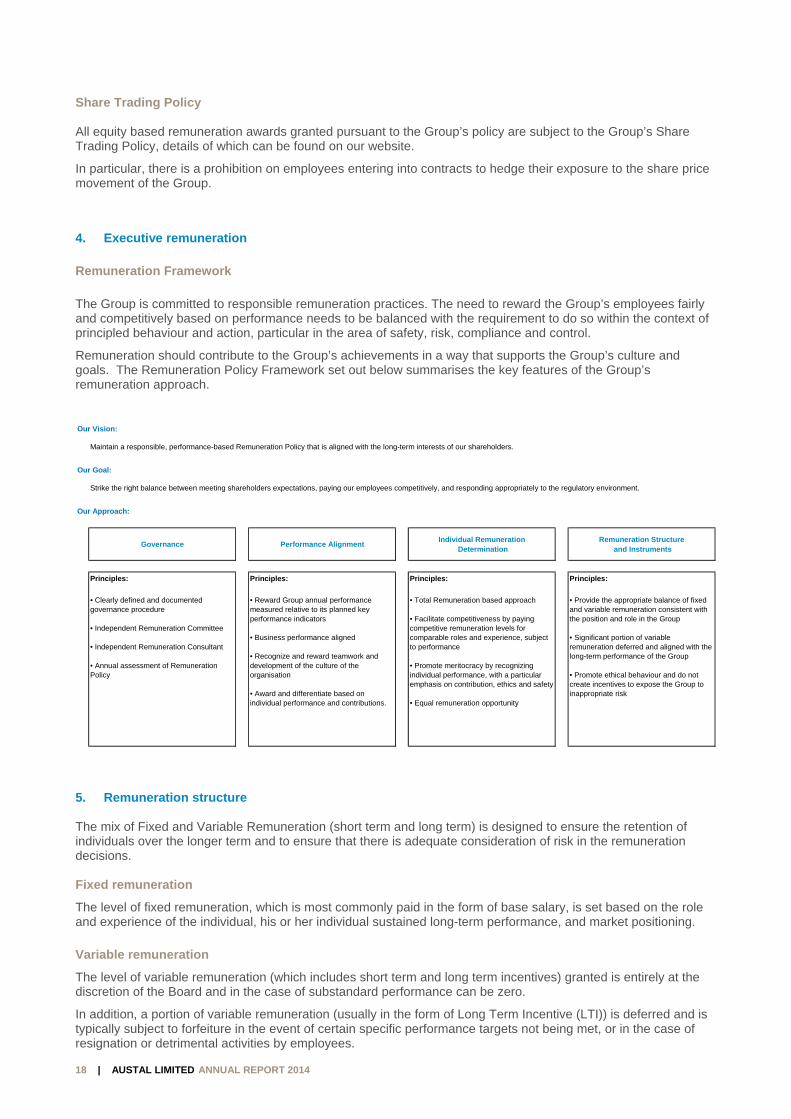
4. Executive remuneration Remuneration Framework The Group is committed to responsible remuneration practices. The need to reward the Group’s employees fairly and competitively based on performance needs to be balanced with the requirement to do so within the context of principled behaviour and action, particular in the area of safety, risk, compliance and control.
Remuneration should contribute to the Group’s achievements in a way that supports the Group’s culture and goals. The Remuneration Policy Framework set out below summarises the key features of the Group’s remuneration approach.
5. Remuneration structure The mix of Fixed and Variable Remuneration (short term and long term) is designed to ensure the retention of individuals over the longer term and to ensure that there is adequate consideration of risk in the remuneration decisions. Fixed remuneration
The level of fixed remuneration, which is most commonly paid in the form of base salary, is set based on the role and experience of the individual, his or her individual sustained long-term performance, and market positioning. Variable remuneration
The level of variable remuneration (which includes short term and long term incentives) granted is entirely at the discretion of the Board and in the case of substandard performance can be zero.
In addition, a portion of variable remuneration (usually in the form of Long Term Incentive (LTI)) is deferred and is typically subject to forfeiture in the event of certain specific performance targets not being met, or in the case of resignation or detrimental activities by employees.
Our Vision:
Maintain a responsible, performance-based Remuneration Policy that is aligned with the long-term interests of our shareholders.
Our Goal:
Strike the right balance between meeting shareholders expectations, paying our employees competitively, and responding appropriately to the regulatory environment.
Our Approach:
Governance Performance AlignmentIndividual Remuneration
DeterminationRemuneration Structure
and Instruments
Principles: Principles: Principles: Principles:
• Clearly defined and documented governance procedure
• Independent Remuneration Committee
• Independent Remuneration Consultant
• Annual assessment of Remuneration Policy
• Reward Group annual performance measured relative to its planned key performance indicators
• Business performance aligned
• Recognize and reward teamwork and development of the culture of the organisation
• Award and differentiate based on individual performance and contributions.
• Total Remuneration based approach
• Facilitate competitiveness by paying competitive remuneration levels for comparable roles and experience, subject to performance
• Promote meritocracy by recognizing individual performance, with a particular emphasis on contribution, ethics and safety
• Equal remuneration opportunity
• Provide the appropriate balance of fixed and variable remuneration consistent with the position and role in the Group
• Significant portion of variable remuneration deferred and aligned with the long-term performance of the Group
• Promote ethical behaviour and do not create incentives to expose the Group to inappropriate risk
19 | AUSTAL LIMITED ANNUAL REPORT 2014
Remuneration peer group
From time to time the Group will undertake a detailed review of its remuneration structures and amounts and as part of that review will benchmark against comparable companies. The criteria for selecting the peer Group include: market capitalization, industry segment and location of operations.
Remuneration structure
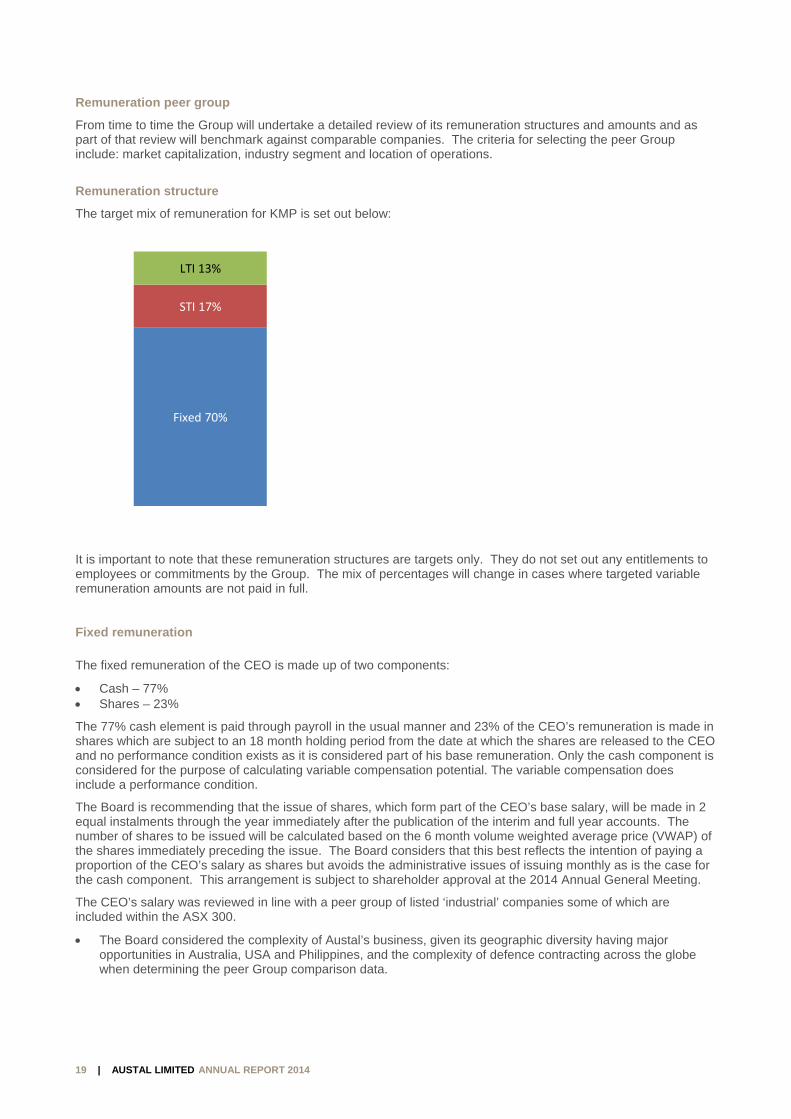
The target mix of remuneration for KMP is set out below:
It is important to note that these remuneration structures are targets only. They do not set out any entitlements to employees or commitments by the Group. The mix of percentages will change in cases where targeted variable remuneration amounts are not paid in full.
Fixed remuneration The fixed remuneration of the CEO is made up of two components:
Cash – 77% Shares – 23%
The 77% cash element is paid through payroll in the usual manner and 23% of the CEO’s remuneration is made in shares which are subject to an 18 month holding period from the date at which the shares are released to the CEO and no performance condition exists as it is considered part of his base remuneration. Only the cash component is considered for the purpose of calculating variable compensation potential. The variable compensation does include a performance condition.
The Board is recommending that the issue of shares, which form part of the CEO’s base salary, will be made in 2 equal instalments through the year immediately after the publication of the interim and full year accounts. The number of shares to be issued will be calculated based on the 6 month volume weighted average price (VWAP) of the shares immediately preceding the issue. The Board considers that this best reflects the intention of paying a proportion of the CEO’s salary as shares but avoids the administrative issues of issuing monthly as is the case for the cash component. This arrangement is subject to shareholder approval at the 2014 Annual General Meeting.
The CEO’s salary was reviewed in line with a peer group of listed ‘industrial’ companies some of which are included within the ASX 300.
The Board considered the complexity of Austal’s business, given its geographic diversity having major opportunities in Australia, USA and Philippines, and the complexity of defence contracting across the globe when determining the peer Group comparison data.
Fixed 70%
STI 17%
LTI 13%

20 | AUSTAL LIMITED ANNUAL REPORT 2014
The peer group was selectively compiled from companies within or just below the ASX 300. The peer Group excludes ASX 100 companies which are deemed to be considerably larger in scale for comparison purposes. The focus was on companies that are manufacturing industrial goods, and / or industrial businesses with a contract delivery model for their products/services or selling into international markets (like Austal).
Exclusions have primarily extended to resources, oil & gas, financial services, property, investment funds, consumer goods, technology, healthcare or energy/infrastructure companies for comparison purposes.
Some Perth companies that sit outside the definitions above were included where the market capitalisation was close to that of Austal at the time of compilation for local market comparison purposes.
Perth listed companies of comparable scale are heavily weighted toward mining services or construction based business which has historically attracted a salary premium.
The data was extracted from FY2013 and is therefore dated 12 months. There has been a significant slowdown for many of these businesses over the past 12 months and it is expected that the bonus components awarded to executives will reflect this.
The average and median remuneration data from the peer group is summarised below. The Board is satisfied that the CEO’s remuneration is market competitive having completed the review.
Peer group data:
Fixed remuneration for KMPs being cash and shares for the CEO and cash for other KMPs is targeted at the 50th percentile of peer group base salaries for comparable positions. In cases where an individual has critical proprietary knowledge or specific and relevant industry experience, base salary may exceed the 50th percentile of peer group, this is particularly the case with regard to high performers.
Variable remuneration - Short Term Incentive program (STI) All KMPs are eligible to participate in the Group’s Short Term Incentive program.
STI is designed to support the Group’s overall strategy by:
focusing participants on achieving financial year performance goals which contribute to sustainable shareholder value;
providing a significant incentive based on individual performance measured against challenging targets to motivate key employees; and
providing clear correlation between key performance measures that influence business outcomes and the employee’s ability to influence those measures.
The Group uses a range of qualitative and quantitative performance measures to set goals and assess the performance of individuals. These performance measures are specific to each individual’s area of responsibility and include both financial and non-financial measures, such as ethics, health and safety.
The Board reviews and approves performance targets and objectives annually for the CEO and executive management team. Performance targets relate to key business objectives that must be delivered during the current financial year.
Each performance objective may contain multiple targets and initiatives to provide specific milestones for measurement.
The performance objective/s as a part of the STI program are designed to focus employees on adding shareholder value and may be a mixture of financial and non-financial objectives. The objectives will be relative to the most desirable outcomes identified by the CEO.
Financial objectives are to account for a minimum of 50% of the STI objectives and will relate to Board approved budget targets.
Salary including Short Term Long Term TotalMetric Superannuation Incentive Incentive Remuneration
Average 1,004,480$ 352,520$ 329,560$ 1,686,560$
Median 933,000$ 210,000$ 273,000$ 1,416,000$
21 | AUSTAL LIMITED ANNUAL REPORT 2014
When non‐financial performance objectives are used, they will relate to strategic performance such as safety, customer satisfaction, operational improvement, business growth and employee relations. When used, the weighting allocated to each of the non‐financial objectives will likely be dependent upon the employee’s job size and role focus.
Performance relative to financial and individual targets set during the annual budget process provides the basis for determining payments made for at‐risk remuneration.
STI awards for KMP are generally between 20% and 50% of total fixed cash remuneration and are paid in cash as soon as possible after the performance criteria has been measured and validated and after the Board has approved the recommended amounts.
The FY2014 STI for the CEO was solely focussed on EBIT and the Board has elected to adopt a balanced scorecard approach for assessing the CEO’s performance with respect to the STI plan for FY2015.
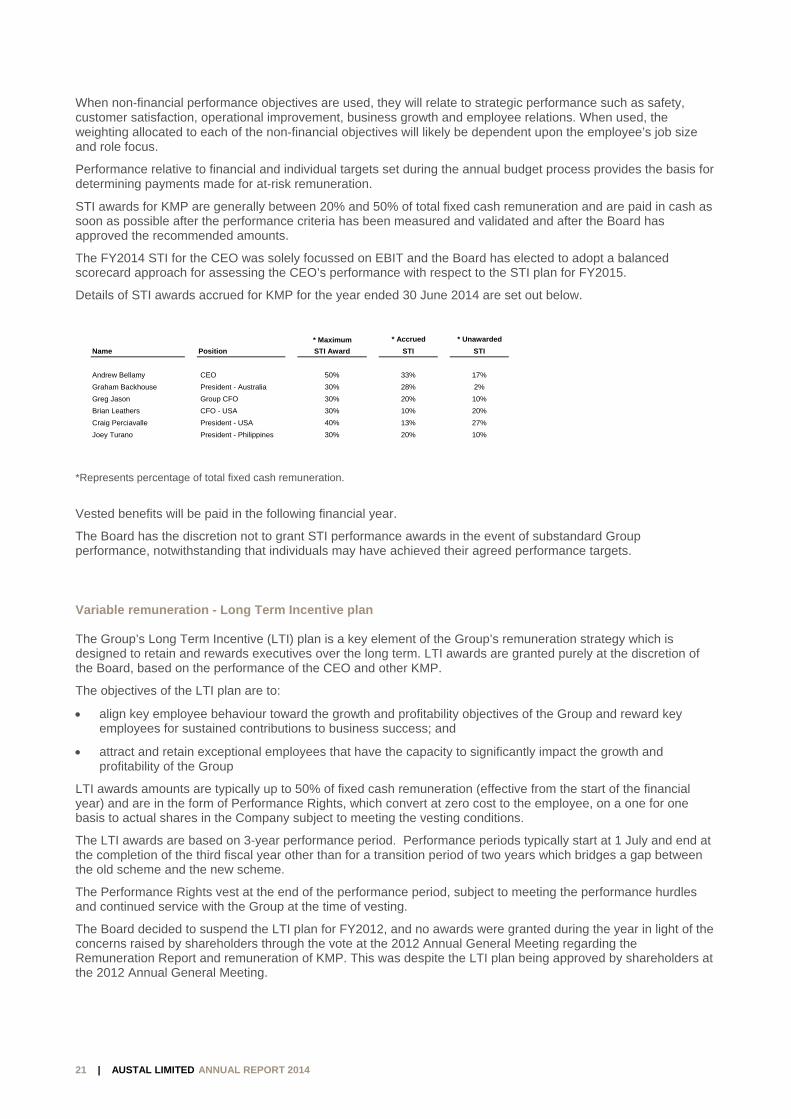
Details of STI awards accrued for KMP for the year ended 30 June 2014 are set out below.
*Represents percentage of total fixed cash remuneration.
Vested benefits will be paid in the following financial year.
The Board has the discretion not to grant STI performance awards in the event of substandard Group performance, notwithstanding that individuals may have achieved their agreed performance targets.
Variable remuneration - Long Term Incentive plan The Group’s Long Term Incentive (LTI) plan is a key element of the Group’s remuneration strategy which is designed to retain and rewards executives over the long term. LTI awards are granted purely at the discretion of the Board, based on the performance of the CEO and other KMP.
The objectives of the LTI plan are to:
align key employee behaviour toward the growth and profitability objectives of the Group and reward key employees for sustained contributions to business success; and
attract and retain exceptional employees that have the capacity to significantly impact the growth and profitability of the Group
LTI awards amounts are typically up to 50% of fixed cash remuneration (effective from the start of the financial year) and are in the form of Performance Rights, which convert at zero cost to the employee, on a one for one basis to actual shares in the Company subject to meeting the vesting conditions.
The LTI awards are based on 3-year performance period. Performance periods typically start at 1 July and end at the completion of the third fiscal year other than for a transition period of two years which bridges a gap between the old scheme and the new scheme.
The Performance Rights vest at the end of the performance period, subject to meeting the performance hurdles and continued service with the Group at the time of vesting.
The Board decided to suspend the LTI plan for FY2012, and no awards were granted during the year in light of the concerns raised by shareholders through the vote at the 2012 Annual General Meeting regarding the Remuneration Report and remuneration of KMP. This was despite the LTI plan being approved by shareholders at the 2012 Annual General Meeting.
* Maximum * Accrued * Unawarded
Name Position STI Award STI STI
Andrew Bellamy CEO 50% 33% 17%
Graham Backhouse President - Australia 30% 28% 2%
Greg Jason Group CFO 30% 20% 10%
Brian Leathers CFO - USA 30% 10% 20%
Craig Perciavalle President - USA 40% 13% 27%
Joey Turano President - Philippines 30% 20% 10%
22 | AUSTAL LIMITED ANNUAL REPORT 2014
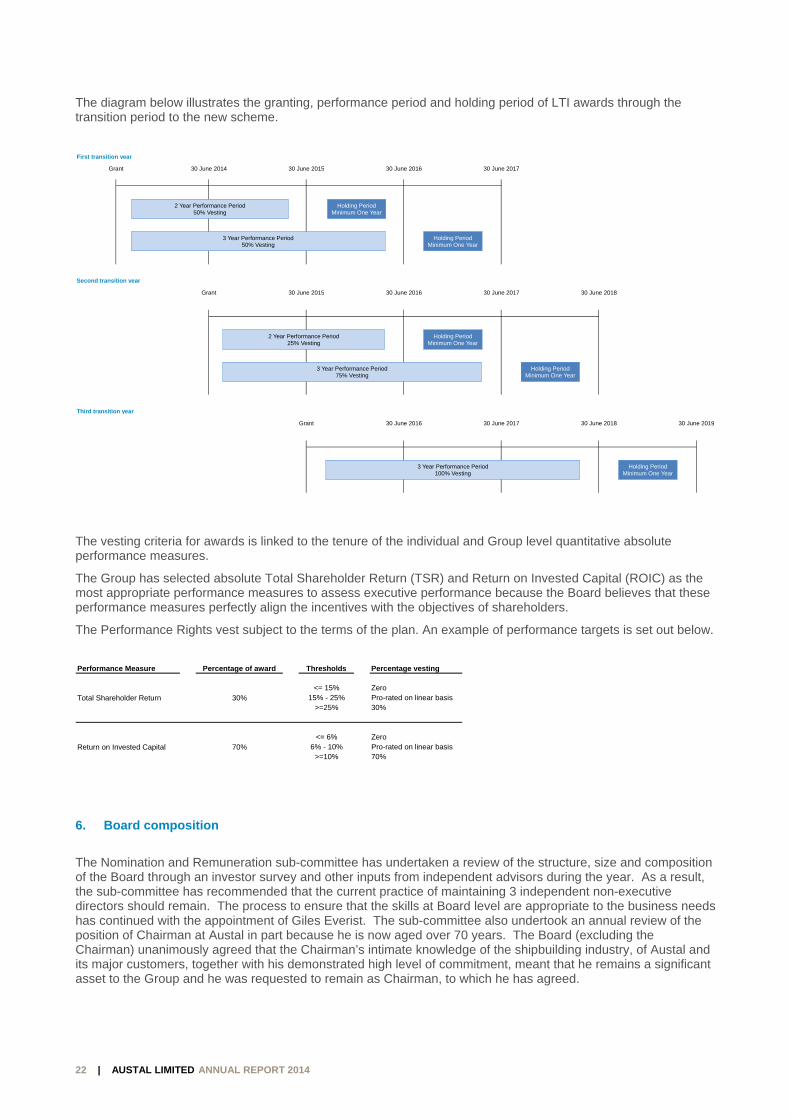
The diagram below illustrates the granting, performance period and holding period of LTI awards through the transition period to the new scheme.
The vesting criteria for awards is linked to the tenure of the individual and Group level quantitative absolute performance measures.
The Group has selected absolute Total Shareholder Return (TSR) and Return on Invested Capital (ROIC) as the most appropriate performance measures to assess executive performance because the Board believes that these performance measures perfectly align the incentives with the objectives of shareholders.
The Performance Rights vest subject to the terms of the plan. An example of performance targets is set out below.
6. Board composition
The Nomination and Remuneration sub-committee has undertaken a review of the structure, size and composition of the Board through an investor survey and other inputs from independent advisors during the year. As a result, the sub-committee has recommended that the current practice of maintaining 3 independent non-executive directors should remain. The process to ensure that the skills at Board level are appropriate to the business needs has continued with the appointment of Giles Everist. The sub-committee also undertook an annual review of the position of Chairman at Austal in part because he is now aged over 70 years. The Board (excluding the Chairman) unanimously agreed that the Chairman’s intimate knowledge of the shipbuilding industry, of Austal and its major customers, together with his demonstrated high level of commitment, meant that he remains a significant asset to the Group and he was requested to remain as Chairman, to which he has agreed.
First transition year
Grant 30 June 2014 30 June 2015 30 June 2016 30 June 2017
Second transition year
Grant 30 June 2015 30 June 2016 30 June 2017 30 June 2018
Third transition year
Grant 30 June 2016 30 June 2017 30 June 2018 30 June 2019
3 Year Performance Period 50% Vesting
Holding Period Minimum One Year
2 Year Performance Period 50% Vesting
Holding PeriodMinimum One Year
3 Year Performance Period 75% Vesting
2 Year Performance Period 25% Vesting
Holding PeriodMinimum One Year
Holding PeriodMinimum One Year
3 Year Performance Period 100% Vesting
Holding PeriodMinimum One Year
Performance Measure Percentage of award Thresholds Percentage vesting
<= 15% ZeroTotal Shareholder Return 30% 15% - 25% Pro-rated on linear basis
>=25% 30%
<= 6% ZeroReturn on Invested Capital 70% 6% - 10% Pro-rated on linear basis
>=10% 70%
23 | AUSTAL LIMITED ANNUAL REPORT 2014
7. Non-Executive Director remuneration The remuneration of Non-Executive Directors is determined by other executive members of the Board in accordance with the Group’s Nomination and Remuneration Committee Charter, which also provides that no Director or Manager shall be involved in any decisions as to his or her own remuneration.
Non-Executive Directors receive only fixed remuneration, typically in the form of cash, non-cash benefits and superannuation contributions. Fees may also be paid in the form of equity in the Group.
The remuneration pool limit for Non-Executive Directors is set at $3 million.
The Directors agreed that the Chairman would reduce his time commitment to the Group from 1 January 2014 with a corresponding pro rata reduction to his remuneration.
The Group proposes a review of Non-Executive Director remuneration for the year ending 30 June 2015.
24 | AUSTAL LIMITED ANNUAL REPORT 2014
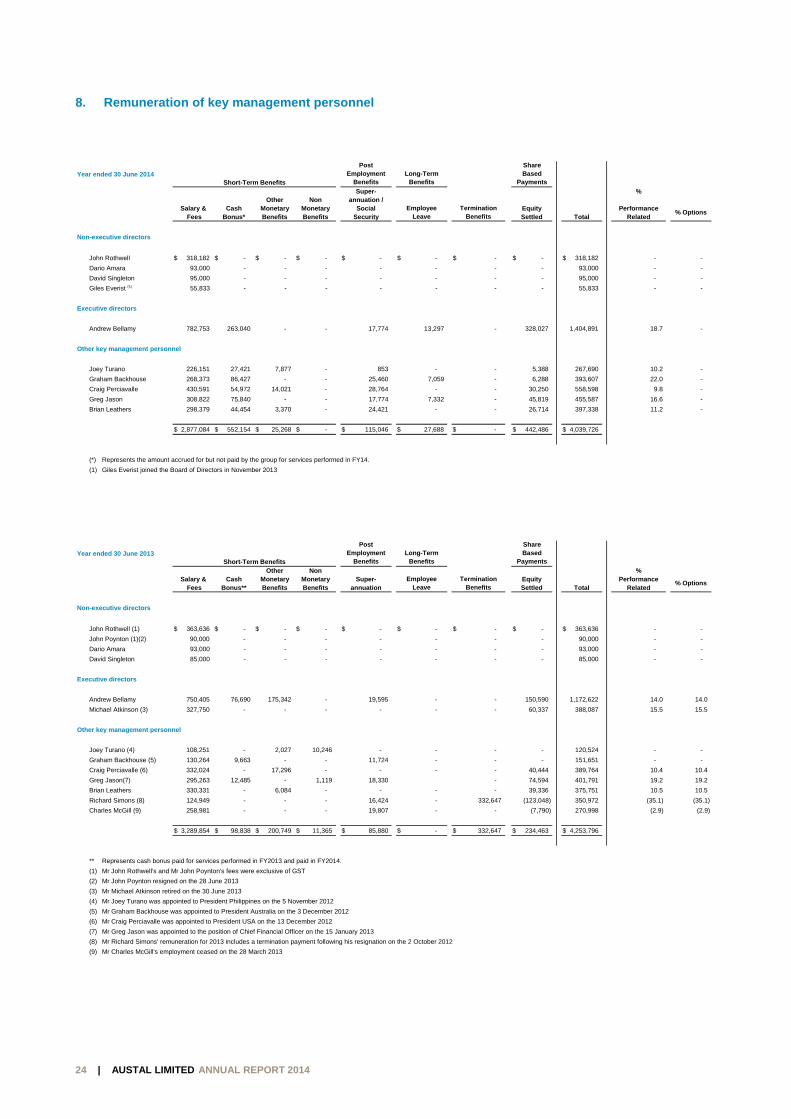
8. Remuneration of key management personnel
Year ended 30 June 2014Short-Term Benefits
Post Employment
BenefitsLong-Term
Benefits
Share Based
Payments
Super- %Other Non annuation /
Salary & Cash Monetary Monetary Social Equity Performance Fees Bonus* Benefits Benefits Security Settled Total Related
Non-executive directors
John Rothwell $ 318,182 $ - $ - $ - $ - $ - $ - $ - $ 318,182 - -
Dario Amara 93,000 - - - - - - - 93,000 - -
David Singleton 95,000 - - - - - - - 95,000 - -
Giles Everist (1) 55,833 - - - - - - - 55,833 - -
Executive directors
Andrew Bellamy 782,753 263,040 - - 17,774 13,297 - 328,027 1,404,891 18.7 -
Other key management personnel
Joey Turano 226,151 27,421 7,877 - 853 - - 5,388 267,690 10.2 -
Graham Backhouse 268,373 86,427 - - 25,460 7,059 - 6,288 393,607 22.0 -
Craig Perciavalle 430,591 54,972 14,021 - 28,764 - - 30,250 558,598 9.8 -
Greg Jason 308,822 75,840 - - 17,774 7,332 - 45,819 455,587 16.6 -
Brian Leathers 298,379 44,454 3,370 - 24,421 - - 26,714 397,338 11.2 -
$ 2,877,084 $ 552,154 $ 25,268 $ - $ 115,046 $ 27,688 $ - $ 442,486 $ 4,039,726
(*) Represents the amount accrued for but not paid by the group for services performed in FY14.
(1) Giles Everist joined the Board of Directors in November 2013
Employee Leave
% OptionsTermination
Benefits
Year ended 30 June 2013Short-Term Benefits
Post Employment
BenefitsLong-Term
Benefits
Share Based
Payments
Other Non %Salary & Cash Monetary Monetary Super- Equity Performance
Fees Bonus** Benefits Benefits annuation Settled Total Related
Non-executive directors
John Rothwell (1) $ 363,636 $ - $ - $ - $ - $ - $ - $ - $ 363,636 - -
John Poynton (1)(2) 90,000 - - - - - - - 90,000 - -
Dario Amara 93,000 - - - - - - - 93,000 - -
David Singleton 85,000 - - - - - - - 85,000 - -
Executive directors
Andrew Bellamy 750,405 76,690 175,342 - 19,595 - - 150,590 1,172,622 14.0 14.0
Michael Atkinson (3) 327,750 - - - - - - 60,337 388,087 15.5 15.5
Other key management personnel
Joey Turano (4) 108,251 - 2,027 10,246 - - - - 120,524 - -
Graham Backhouse (5) 130,264 9,663 - - 11,724 - - - 151,651 - -
Craig Perciavalle (6) 332,024 - 17,296 - - - - 40,444 389,764 10.4 10.4
Greg Jason(7) 295,263 12,485 - 1,119 18,330 - 74,594 401,791 19.2 19.2
Brian Leathers 330,331 - 6,084 - - - - 39,336 375,751 10.5 10.5
Richard Simons (8) 124,949 - - - 16,424 - 332,647 (123,048) 350,972 (35.1) (35.1)
Charles McGill (9) 258,981 - - - 19,807 - - (7,790) 270,998 (2.9) (2.9)
$ 3,289,854 $ 98,838 $ 200,749 $ 11,365 $ 85,880 $ - $ 332,647 $ 234,463 $ 4,253,796
** Represents cash bonus paid for services performed in FY2013 and paid in FY2014.
(1) Mr John Rothwell's and Mr John Poynton's fees were exclusive of GST
(2) Mr John Poynton resigned on the 28 June 2013
(3) Mr Michael Atkinson retired on the 30 June 2013
(4) Mr Joey Turano was appointed to President Philippines on the 5 November 2012
(5) Mr Graham Backhouse was appointed to President Australia on the 3 December 2012
(6) Mr Craig Perciavalle was appointed to President USA on the 13 December 2012
(7) Mr Greg Jason was appointed to the position of Chief Financial Officer on the 15 January 2013
(8) Mr Richard Simons' remuneration for 2013 includes a termination payment following his resignation on the 2 October 2012
(9) Mr Charles McGill's employment ceased on the 28 March 2013
Employee Leave
% OptionsTermination
Benefits
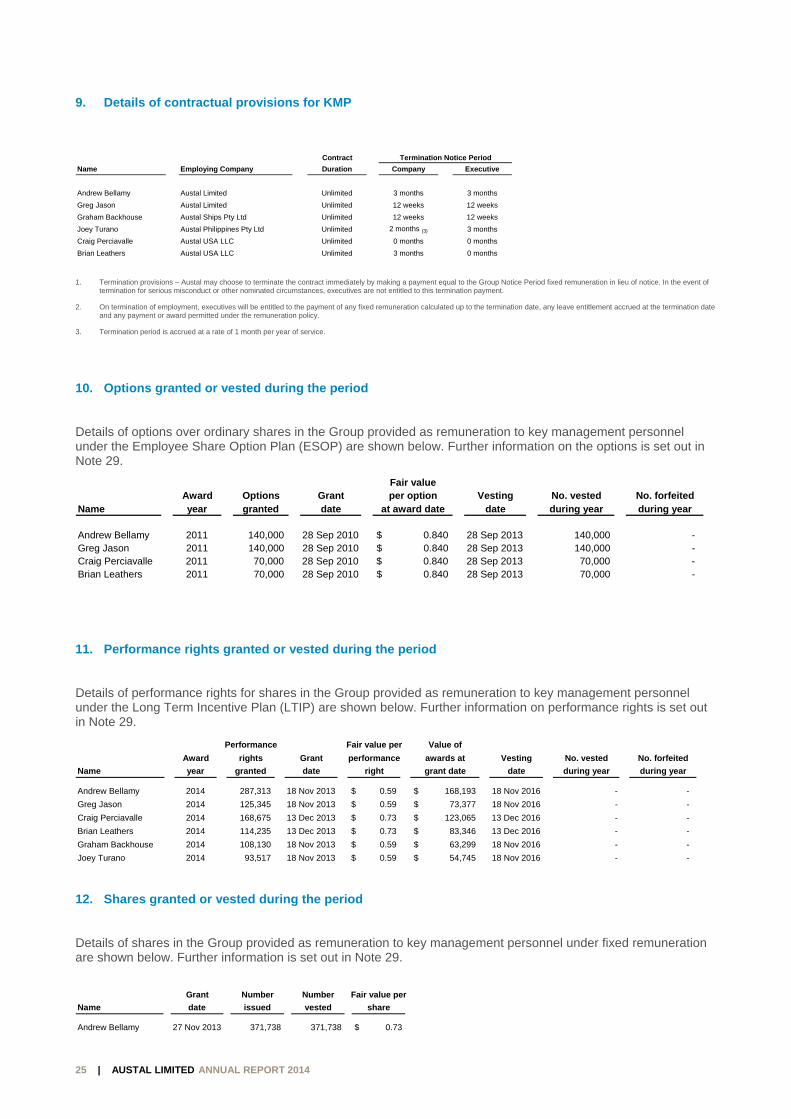
25 | AUSTAL LIMITED ANNUAL REPORT 2014
9. Details of contractual provisions for KMP
1. Termination provisions – Austal may choose to terminate the contract immediately by making a payment equal to the Group Notice Period fixed remuneration in lieu of notice. In the event of
termination for serious misconduct or other nominated circumstances, executives are not entitled to this termination payment.
2. On termination of employment, executives will be entitled to the payment of any fixed remuneration calculated up to the termination date, any leave entitlement accrued at the termination date and any payment or award permitted under the remuneration policy.
3. Termination period is accrued at a rate of 1 month per year of service.
10. Options granted or vested during the period Details of options over ordinary shares in the Group provided as remuneration to key management personnel under the Employee Share Option Plan (ESOP) are shown below. Further information on the options is set out in Note 29.
11. Performance rights granted or vested during the period Details of performance rights for shares in the Group provided as remuneration to key management personnel under the Long Term Incentive Plan (LTIP) are shown below. Further information on performance rights is set out in Note 29.
12. Shares granted or vested during the period Details of shares in the Group provided as remuneration to key management personnel under fixed remuneration are shown below. Further information is set out in Note 29.
Contract Termination Notice Period
Name Employing Company Duration Company Executive
Andrew Bellamy Austal Limited Unlimited 3 months 3 months
Greg Jason Austal Limited Unlimited 12 weeks 12 weeks
Graham Backhouse Austal Ships Pty Ltd Unlimited 12 weeks 12 weeks
Joey Turano Austal Philippines Pty Ltd Unlimited 2 months (3) 3 months
Craig Perciavalle Austal USA LLC Unlimited 0 months 0 months
Brian Leathers Austal USA LLC Unlimited 3 months 0 months
Fair valueAward Options Grant per option Vesting No. vested No. forfeited
Name year granted date at award date date during year during year
Andrew Bellamy 2011 140,000 28 Sep 2010 $ 0.840 28 Sep 2013 140,000 - Greg Jason 2011 140,000 28 Sep 2010 $ 0.840 28 Sep 2013 140,000 - Craig Perciavalle 2011 70,000 28 Sep 2010 $ 0.840 28 Sep 2013 70,000 - Brian Leathers 2011 70,000 28 Sep 2010 $ 0.840 28 Sep 2013 70,000 -
Performance Fair value per Value of
Award rights Grant performance awards at Vesting No. vested No. forfeited
Name year granted date right grant date date during year during year
Andrew Bellamy 2014 287,313 18 Nov 2013 $ 0.59 $ 168,193 18 Nov 2016 - -
Greg Jason 2014 125,345 18 Nov 2013 $ 0.59 $ 73,377 18 Nov 2016 - -
Craig Perciavalle 2014 168,675 13 Dec 2013 $ 0.73 $ 123,065 13 Dec 2016 - -
Brian Leathers 2014 114,235 13 Dec 2013 $ 0.73 $ 83,346 13 Dec 2016 - -
Graham Backhouse 2014 108,130 18 Nov 2013 $ 0.59 $ 63,299 18 Nov 2016 - -
Joey Turano 2014 93,517 18 Nov 2013 $ 0.59 $ 54,745 18 Nov 2016 - -
Grant Number Number Fair value per
Name date issued vested share
Andrew Bellamy 27 Nov 2013 371,738 371,738 $ 0.73
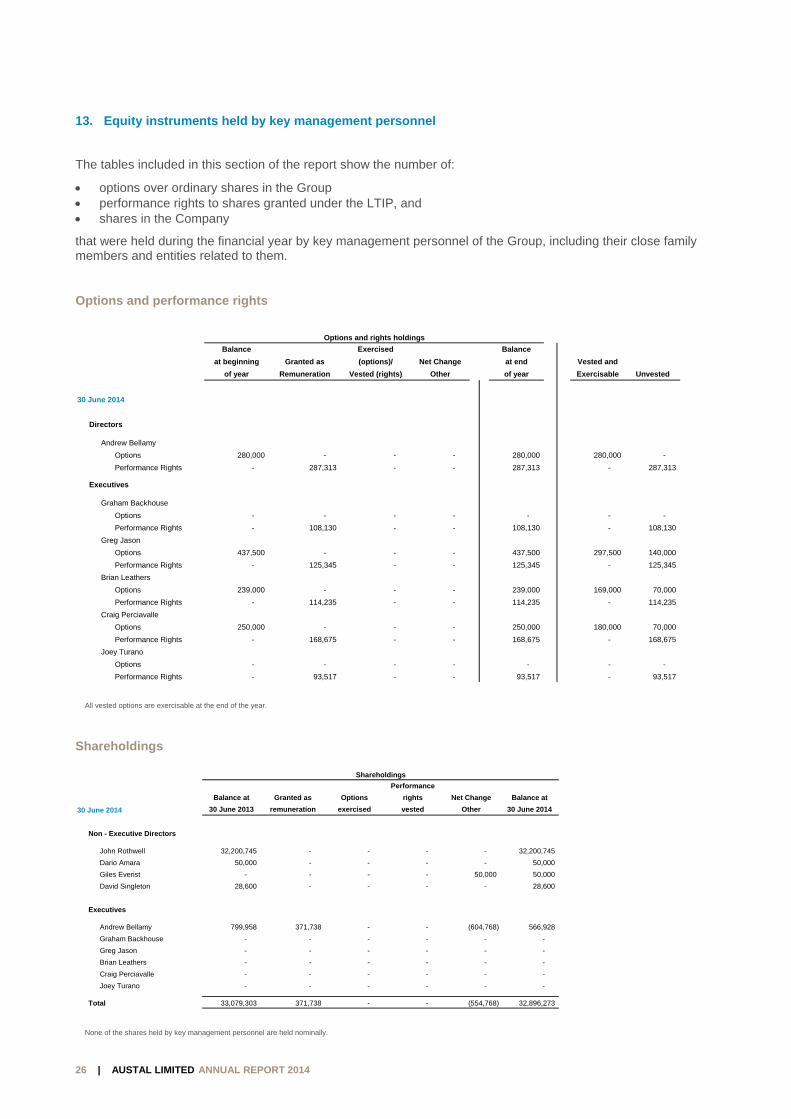
26 | AUSTAL LIMITED ANNUAL REPORT 2014
13. Equity instruments held by key management personnel The tables included in this section of the report show the number of:
options over ordinary shares in the Group performance rights to shares granted under the LTIP, and shares in the Company
that were held during the financial year by key management personnel of the Group, including their close family members and entities related to them.
Options and performance rights
All vested options are exercisable at the end of the year.
Shareholdings
None of the shares held by key management personnel are held nominally.
Options and rights holdings
Balance Exercised Balance
at beginning Granted as (options)/ Net Change at end Vested and
of year Remuneration Vested (rights) Other of year Exercisable Unvested
30 June 2014
Directors
Andrew Bellamy
Options 280,000 - - - 280,000 280,000 -
Performance Rights - 287,313 - - 287,313 - 287,313
Executives
Graham Backhouse
Options - - - - - - -
Performance Rights - 108,130 - - 108,130 - 108,130
Greg Jason
Options 437,500 - - - 437,500 297,500 140,000
Performance Rights - 125,345 - - 125,345 - 125,345
Brian Leathers
Options 239,000 - - - 239,000 169,000 70,000
Performance Rights - 114,235 - - 114,235 - 114,235
Craig Perciavalle
Options 250,000 - - - 250,000 180,000 70,000
Performance Rights - 168,675 - - 168,675 - 168,675
Joey Turano
Options - - - - - - -
Performance Rights - 93,517 - - 93,517 - 93,517
Shareholdings
Performance
Balance at Granted as Options rights Net Change Balance at
30 June 2014 30 June 2013 remuneration exercised vested Other 30 June 2014
Non - Executive Directors
John Rothwell 32,200,745 - - - - 32,200,745
Dario Amara 50,000 - - - - 50,000
Giles Everist - - - - 50,000 50,000
David Singleton 28,600 - - - - 28,600
Executives
Andrew Bellamy 799,958 371,738 - - (604,768) 566,928
Graham Backhouse - - - - - -
Greg Jason - - - - - -
Brian Leathers - - - - - -
Craig Perciavalle - - - - - -
Joey Turano - - - - - -
Total 33,079,303 371,738 - - (554,768) 32,896,273
27 | AUSTAL LIMITED ANNUAL REPORT 2014
14. Loans to key management personnel
There were no loans to Directors or other key management personnel at any time during year ended 30 June 2014.
15. Other transactions with key management personnel
There were no transactions involving key management personnel other than compensation and transactions concerning shares, performance rights and options as discussed in other sections of the remuneration report.
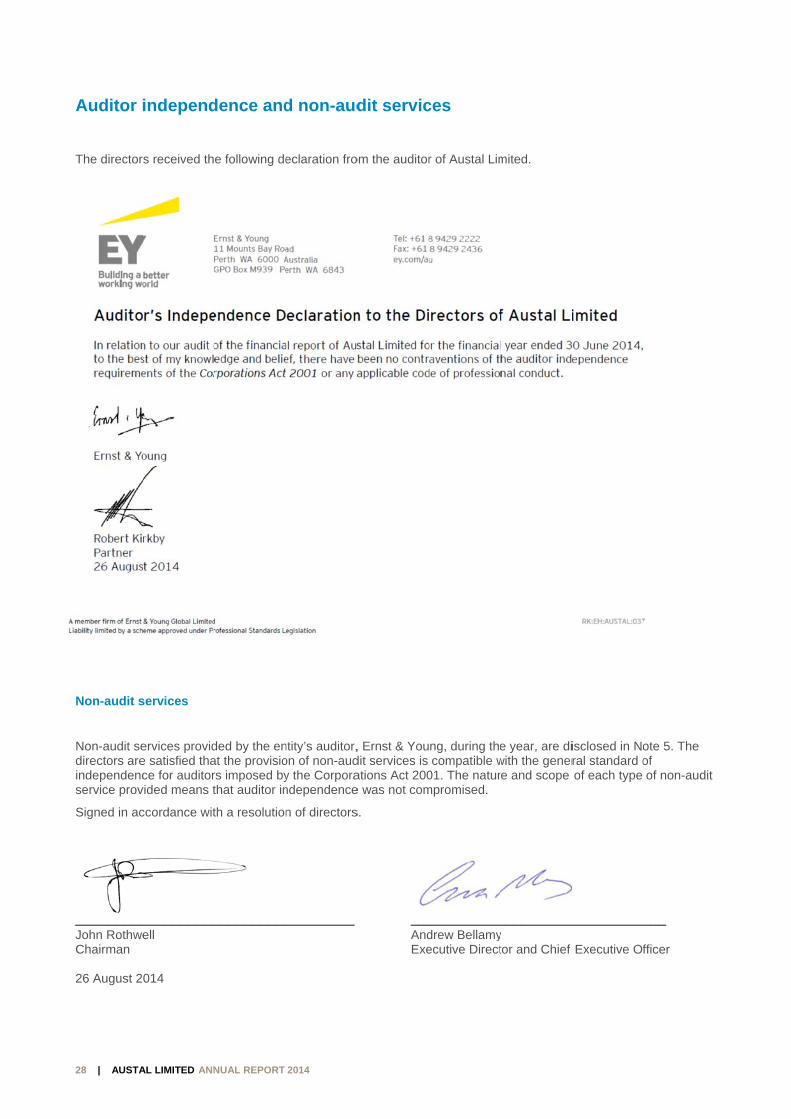
28 | AUSTA
Auditor i The director
Non-audit s
Non-audit sedirectors areindependencservice prov
Signed in ac
_________John RothweChairman 26 August 2
AL LIMITED ANN
independ
rs received th
services
ervices provide satisfied thace for auditor
vided means t
ccordance wit
__________ell
014
NUAL REPORT
dence and
e following de
ded by the enat the provisiors imposed bythat auditor in
th a resolution
__________
2014
d non-aud
eclaration fro
ntity’s auditor,on of non-audy the Corporandependence
n of directors
_________
dit servic
om the auditor
, Ernst & Youdit services is ations Act 200e was not com
s.
___ And Exe
ces
r of Austal Lim
ng, during thecompatible w
01. The naturmpromised.
__________drew Bellamyecutive Direct
mited.
e year, are diwith the generre and scope
__________y tor and Chief
isclosed in Noral standard oof each type
__________
Executive Of
ote 5. The of of non-audit
___
fficer
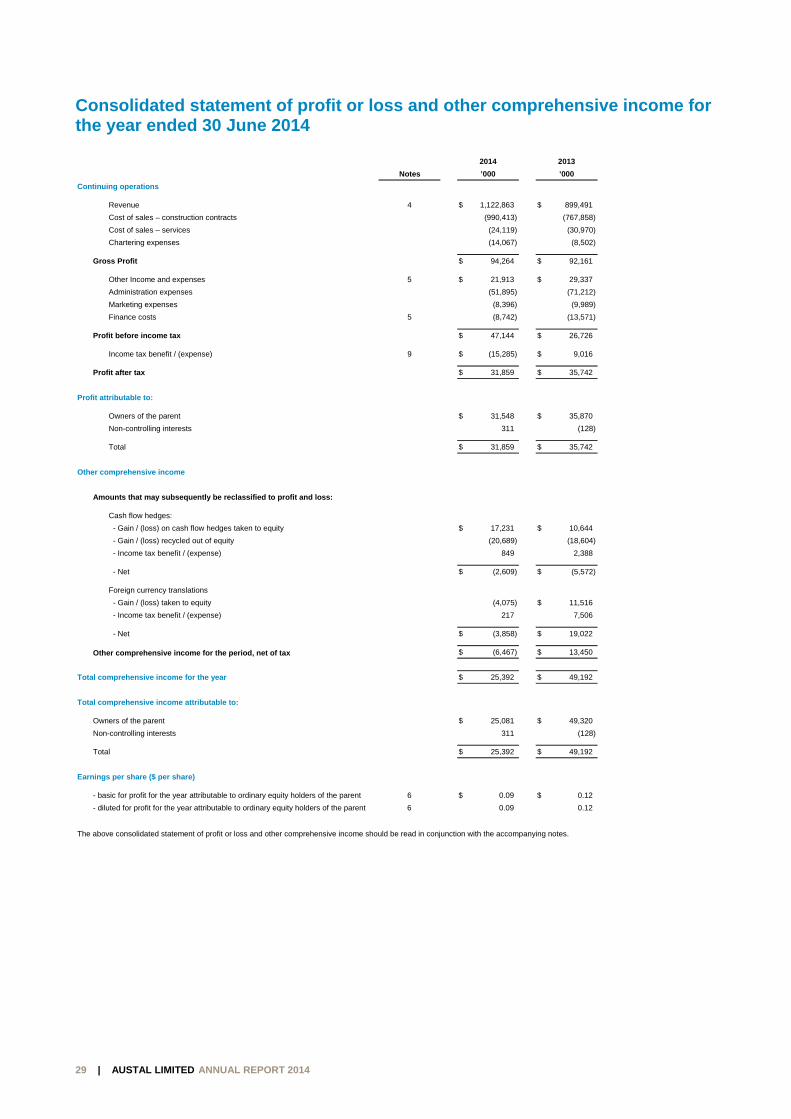
29 | AUSTAL LIMITED ANNUAL REPORT 2014
Consolidated statement of profit or loss and other comprehensive income for the year ended 30 June 2014
2014 2013
Notes ’000 ’000
Continuing operations
Revenue 4 $ 1,122,863 $ 899,491
Cost of sales – construction contracts (990,413) (767,858)
Cost of sales – services (24,119) (30,970)
Chartering expenses (14,067) (8,502)
Gross Profit $ 94,264 $ 92,161
Other Income and expenses 5 $ 21,913 $ 29,337
Administration expenses (51,895) (71,212)
Marketing expenses (8,396) (9,989)
Finance costs 5 (8,742) (13,571)
Profit before income tax $ 47,144 $ 26,726
Income tax benefit / (expense) 9 $ (15,285) $ 9,016
Profit after tax $ 31,859 $ 35,742
Profit attributable to:
Owners of the parent $ 31,548 $ 35,870
Non-controlling interests 311 (128)
Total $ 31,859 $ 35,742
Other comprehensive income
Amounts that may subsequently be reclassified to profit and loss:
Cash flow hedges:
- Gain / (loss) on cash flow hedges taken to equity $ 17,231 $ 10,644
- Gain / (loss) recycled out of equity (20,689) (18,604)
- Income tax benefit / (expense) 849 2,388
- Net $ (2,609) $ (5,572)
Foreign currency translations
- Gain / (loss) taken to equity (4,075) $ 11,516
- Income tax benefit / (expense) 217 7,506
- Net $ (3,858) $ 19,022
Other comprehensive income for the period, net of tax $ (6,467) $ 13,450
Total comprehensive income for the year $ 25,392 $ 49,192
Total comprehensive income attributable to:
Owners of the parent $ 25,081 $ 49,320
Non-controlling interests 311 (128)
Total $ 25,392 $ 49,192
Earnings per share ($ per share)
- basic for profit for the year attributable to ordinary equity holders of the parent 6 $ 0.09 $ 0.12
- diluted for profit for the year attributable to ordinary equity holders of the parent 6 0.09 0.12
The above consolidated statement of profit or loss and other comprehensive income should be read in conjunction with the accompanying notes.

30 | AUSTAL LIMITED ANNUAL REPORT 2014
Consolidated statement of financial position as at 30 June 2014
2014 2013
Notes ’000 ’000
Assets
Current Assets
Cash and cash equivalents 10 $ 77,345 $ 38,030
Restricted cash 10 9,532 69,673
Trade and other receivables 14 95,753 102,743
Inventories 16 328,142 277,888
Prepayments 4,054 7,653
Derivatives 23 2,701 7,749
Total $ 517,527 $ 503,736
Non - Current Assets
Other financial assets $ - $ 4,141
Trade and other receivables 14 1,020 -
Prepayments 1,968 -
Derivatives 23 5,787 1,651
Property, plant and equipment 18 366,500 399,917
Intangible assets and goodwill 19 9,473 12,526
Deferred tax assets 9 9,022 22,647
Total $ 393,770 $ 440,882
Total Assets $ 911,297 $ 944,618
Liabilities
Current Liabilities
Trade and other payables 17 $ (183,570) $ (133,813)
Derivatives 23 (1,972) (12,193)
Interest-bearing loans and borrowings 11 (13,192) (243,614)
Provisions 20 (33,704) (25,128)
Government grants 13 (3,550) (4,221)
Income tax payable 9 (10,980) (24,537)
Progress payments received in advance 15 (29,062) (21,790)
Total $ (276,030) $ (465,296)
Non - Current Liabilities
Derivatives 23 $ (2,229) $ (4,885)
Interest-bearing loans and borrowings 11 (142,264) (1,163)
Provisions 20 (1,023) (2,217)
Government grants 13 (49,892) (52,794)
Deferred tax liabilities 9 (6,627) (11,076)
Total $ (202,035) $ (72,135)
Total Liabilities $ (478,065) $ (537,431)
Net Assets $ 433,232 $ 407,187
Equity
Contributed equity 12 $ 111,598 $ 111,328
Reserves 12 27,292 37,309
Retained earnings 12 294,041 258,560
Equity attributable to owners of the parent $ 432,931 $ 407,197
Non - Controlling Interests $ 301 $ (10)
Total Equity $ 433,232 $ 407,187
The above consolidated statement of financial position should be read in conjunction with the accompanying notes.

REPORT TO THE MEMBERS OF AUSTAL LIMITED
31 | AUSTAL LIMITED ANNUAL REPORT 2014
Consolidated statement of changes in equity for the year ended 30 June 2014
*Reserved shares are in relation to the Austal Group Management Share Plan.
Employee Cash flow Common Asset Non
Issued * Reserved Retained Benefits Hedge Control Reval'n Controlling Total
Capital Shares Earnings FCTR Reserve Reserve Reserve Reserve Total Interest Equity
’000 ’000 ’000 ’000 ’000 ’000 ’000 ’000 ’000 ’000 ’000
Equity at 1 July 2012 41,373$ (9,612)$ 222,690$ (10,568)$ 4,948$ 16,649$ (15,925)$ 27,491$ 277,046$ - $ 277,046$
Comprehensive Income
Profit for the year - $ - $ 35,870$ - $ - $ - $ - $ - $ 35,870$ (128)$ 35,742$
Other Comprehensive Income - - - 19,023 - (5,572) - - 13,451 - 13,451
Total - $ - $ 35,870$ 19,023$ - $ (5,572)$ - $ - $ 49,321$ (128)$ 49,193$
Other equity transactions
Shares issued 77,891$ - $ - $ - $ - $ - $ - $ - $ 77,891$ - $ 77,891$
Transaction costs (1,823) - - - - - - - (1,823) - (1,823)
Cost of share-based payments - - - - 1,263 - - - 1,263 - 1,263
Acquisition of Subsidiary 3,499 - - - - - - - 3,499 118 3,617
Total 79,567$ - $ - $ - $ 1,263$ - $ - $ - $ 80,830$ 118$ 80,948$
Equity at 1 July 2013 120,940$ (9,612)$ 258,560$ 8,455$ 6,211$ 11,077$ (15,925)$ 27,491$ 407,197$ (10)$ 407,187$
Comprehensive Income
Profit for the year - $ - $ 31,548$ - $ - $ - $ - $ - $ 31,548$ 311$ 31,859$
Other Comprehensive Income - - - (3,858) - (2,609) - - (6,467) - (6,467)
Total - $ - $ 31,548$ (3,858)$ - $ (2,609)$ - $ - $ 25,081$ 311$ 25,392$
Transfers between reserves - $ - $ 3,933$ 3,008$ (1,508)$ 301$ - $ (5,734)$ - $ - $ - $
Other equity transactions
Shares issued 270$ - $ - $ - $ - $ - $ - $ - $ 270$ - $ 270$
Cost of share-based payments - - - - 383 - - - 383 - 383
Total 270$ - $ - $ - $ 383$ - $ - $ - $ 653$ - $ 653$
Equity at 30 June 2014 121,210$ (9,612)$ 294,041$ 7,605$ 5,086$ 8,769$ (15,925)$ 21,757$ 432,931$ 301$ 433,232$
The above consolidated statement of changes in equity should be read in conjunction with the accompanying notes.
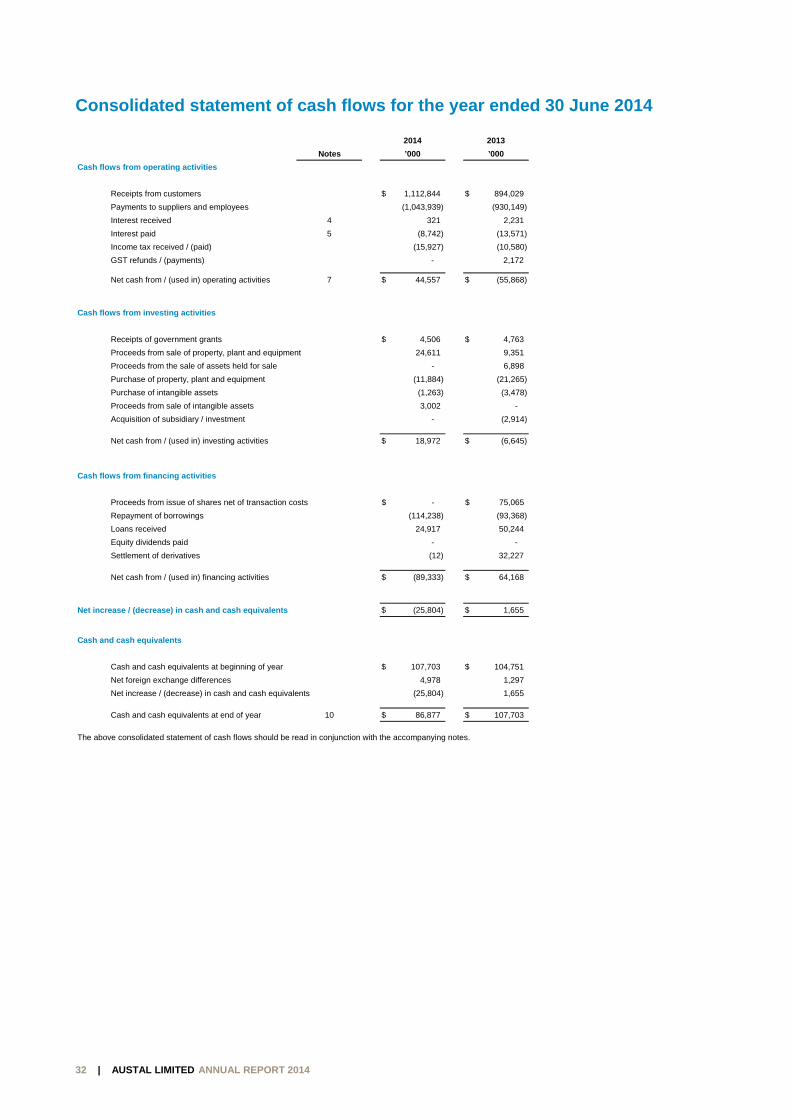
REPORT TO THE MEMBERS OF AUSTAL LIMITED
32 | AUSTAL LIMITED ANNUAL REPORT 2014
Consolidated statement of cash flows for the year ended 30 June 2014
2014 2013
Notes ’000 ’000
Cash flows from operating activities
Receipts from customers $ 1,112,844 $ 894,029
Payments to suppliers and employees (1,043,939) (930,149)
Interest received 4 321 2,231
Interest paid 5 (8,742) (13,571)
Income tax received / (paid) (15,927) (10,580)
GST refunds / (payments) - 2,172
Net cash from / (used in) operating activities 7 $ 44,557 $ (55,868)
Cash flows from investing activities
Receipts of government grants $ 4,506 $ 4,763
Proceeds from sale of property, plant and equipment 24,611 9,351
Proceeds from the sale of assets held for sale - 6,898
Purchase of property, plant and equipment (11,884) (21,265)
Purchase of intangible assets (1,263) (3,478)
Proceeds from sale of intangible assets 3,002 -
Acquisition of subsidiary / investment - (2,914)
Net cash from / (used in) investing activities $ 18,972 $ (6,645)
Cash flows from financing activities
Proceeds from issue of shares net of transaction costs $ - $ 75,065
Repayment of borrowings (114,238) (93,368)
Loans received 24,917 50,244
Equity dividends paid - -
Settlement of derivatives (12) 32,227
Net cash from / (used in) financing activities $ (89,333) $ 64,168
Net increase / (decrease) in cash and cash equivalents $ (25,804) $ 1,655
Cash and cash equivalents
Cash and cash equivalents at beginning of year $ 107,703 $ 104,751
Net foreign exchange differences 4,978 1,297
Net increase / (decrease) in cash and cash equivalents (25,804) 1,655
Cash and cash equivalents at end of year 10 $ 86,877 $ 107,703
The above consolidated statement of cash flows should be read in conjunction with the accompanying notes.
33 | AUSTA
Notes to Basis of
Note 1.
The financiaauthorised fo
Austal Limitetraded on th
The principaperformance
Note 2.
i. Introd
The firequir
The fiinstru
The fidollar98/01
The fiLimite
ii. Repo
The nsumm
Curre
This sreturnvia div
Capit
This sborrow
Work
This spayab
Infras
This s
Other
This s
AL LIMITED ANN
o the finan
f preparat
Corporate
al report of theor issue in ac
ed is a limitede Australian s
al activities of e aluminium v
Basis of pr
duction
inancial reporrements of th
inancial reporuments and la
inancial reporrs ($’000) unle00. The Gro
inancial repored is a for pro
orting structu
notes to the cmarised as fol
ent year perf
section focusn to shareholdvidends.
tal structure
section focuswings, contrib
king capital
section focusbles, construc
structure & o
section focus
r liabilities
section focus
REPOR
NUAL REPORT
ncial stat
tion
Information
e Austal Limitccordance wit
d liability comstock exchan
the Group duvessels. Thes
reparation
rt is a generae Corporation
rt has also beand and build
rt is presenteess otherwise
oup is an entit
rt presents thofit entity.
ure
onsolidated fllows:
formance
es on the resders via earn
es on the lonbuted equity a
es on shorterction contract
other assets
es on propert
es on provisio
RT TO THE M
2014
ements
ted Group of th a resolution
pany incorpoge.
uring the yease activities a
al-purpose finans Act 2001 a
een prepared ings that have
d in Australiae stated undety to which th
he figures of th
financial state
sults and perfoings per shar
g term fundinand reserves
r term workingts in progress
ty, plant & eq
ons such as e
MEMBERS O
Companies (n of the direc
orated and do
r were the dere unchanged
ancial report,and Australia
on a historice been meas
an dollars ander the option ae class order
he consolidat
ements have
formance of thre and cash g
ng of the Grous and governm
g capital concs, inventories
quipment as w
employee be
OF AUSTAL L
the Group) fotors on 26 Au
omiciled in Au
esign, manufad from the pre
which has bn Accounting
cal cost basis,sured at fair v
d all values aravailable to thr applies.
ted entity only
been divided
he Group, incgeneration, an
up including cment grants.
cepts such asincluding wo
well as intang
nefits, warran
LIMITED
or the year enugust 2014.
stralia whose
acture and suevious year.
een prepared Standards.
, except for dealue.
re rounded tohe Group und
y, unless othe
into 8 main s
cluding profitand the return
cash, interest
s trade and ork in progress
ible assets of
nty costs etc.
nded 30 June
e shares are p
upport of high
d in accordan
erivative fina
o the nearest der ASIC Clas
erwise stated
sections whic
ability and theof cash to sh
t bearing loan
other receivabs.
f the Group.
e 2014 was
publicly
ce with the
ncial
thousand ss Order
d. Austal
ch is
e resultant areholders
ns and
bles and
REPORT TO THE MEMBERS OF AUSTAL LIMITED
34 | AUSTAL LIMITED ANNUAL REPORT 2014
Financial risk management
This section focuses on the Groups’ approach to financial risk management, fair value measurements and foreign exchange hedging and the associated derivative financial instruments.
Unrecognised items
This section focuses on commitments and contingencies that are not recognised in the financial statements and events occurring after the balance date.
The Group, management and related parties
This section focuses on the corporate structure of the Group, parent entity data, key management personnel compensation and related party transactions.
iii. Basis of consolidation
The consolidated financial statements comprise the financial statements of Austal Limited and its subsidiaries as at and for the year ended 30 June each year (the Group).
Subsidiaries are all those entities over which the Group has power over the investee, exposure or rights to variable returns from its involvement with its investee and the ability to use its power over the investee to affect its returns. The existence and effect of potential voting rights that are currently exercisable or convertible are considered when assessing whether a Group controls another entity.
Financial statements of foreign controlled entities presented in accordance with overseas accounting principles are, for consolidation purposes, adjusted to comply with Group policy and generally accepted accounting principles in Australia. In preparing the consolidated financial statements, all intercompany balances, transactions, unrealised gains and losses resulting from intra-Group transactions and dividends have been eliminated in full.
Subsidiaries are fully consolidated from the date on which control is obtained by the Group and cease to be consolidated from the date on which control is transferred out of the Group.
Investments in subsidiaries held by Austal Limited are accounted for at cost in the separate financial statements of the parent entity less any impairment charges. Dividends received from subsidiaries are recorded as a component of other revenues in the statement of comprehensive income of the parent entity, and do not impact the recorded cost of the investment. Upon receipt of dividend payments from subsidiaries, the parent will assess whether any indicators of impairment of the carrying value of the investment in the subsidiary exist. Where such indicators exist, to the extent that the carrying value of the investment exceeds its recoverable amount, an impairment loss is recognised.
iv. Foreign currency transactions and translation
Both the functional and presentation currency of Austal Limited and its Australian subsidiaries is Australian dollars (A$). Each entity in the Group determines its own functional currency and items included in the financial statements of each entity are measured using that functional currency.
Transactions in foreign currencies are initially recorded in the functional currency by applying the exchange rates ruling at the date of the transaction. Monetary assets and liabilities denominated in foreign currencies are retranslated at the rate of exchange ruling at the balance date. All exchange differences arising from the above procedures are taken to the statement of comprehensive income.
The functional currency of the USA and the Philippines Operations is United States dollars (US$).
As at the reporting date, the assets and liabilities of the overseas subsidiaries are translated into the presentation currency of Austal Limited at the rate of exchange ruling at the balance date and the statement of comprehensive income is translated at the average exchange rates for the period. The exchange differences arising on the translation are taken directly to a separate component of equity. The deferred cumulative amount recognised in equity relating to that particular foreign operation is recognised in the statement of comprehensive income on disposal of a foreign entity.
v. Statement of compliance
The financial report complies with Australian Accounting Standards and International Financial Reporting Standards (IFRS), as issued by the International Accounting Standards Board.
REPORT TO THE MEMBERS OF AUSTAL LIMITED
35 | AUSTAL LIMITED ANNUAL REPORT 2014
vi. New and amended standards adopted by the Group
The accounting policies adopted are consistent with those of the previous financial year except for changes in accounting policies due to implementation of new and amended standards adopted by the Group as discussed below.
The adoption of these standards has impacted the Group’s accounting policies and required disclosures in the notes to the financial statements but did not have any effect on the financial position or performance of the Group.
The Group has applied all new and amended accounting standards and interpretations effective from 1 July 2013:
AASB 10 Consolidated Financial Statements, AASB 11 Joint Arrangements, AASB 12 Disclosure of Interests in Other Entities, AASB 128 Investments in Associates and Joint Ventures, AASB 127 Separate Financial Statements and AASB 2011-7 Amendments to Australian Accounting Standards arising from the Consolidation and Joint Arrangements Standards
AASB 2013-3 Amendments to Australian Accounting Standards – Transition Guidance and other amendments which provides an exemption from the requirement to disclose the impact of the change in accounting policy on the current period
AASB 13 Fair Value Measurement and AASB 2011-8 Amendments to Australian Accounting Standards arising from AASB 13
AASB 119 Employee Benefits (revised 2011) and AASB 2011-10 Amendments to Australian Accounting Standards arising from AASB 119 (September 2011)
AASB 2012-5 Amendments to Australian Accounting Standards arising from Annual Improvements 2009-2011 Cycle, and
AASB 2012-2 Amendments to Australian Accounting Standards – Disclosures – Offsetting Financial Assets and Financial Liabilities
vii. Pronouncements issued and not effective
A number of Australian Accounting Standards and Interpretations have been issued or amended but are not yet effective. A full assessment of the impact of all the new or amended Accounting Standards and interpretations issued but not effective has not yet been completed.
The pronouncements relevant to the Group which have not been adopted by the Group are as follows:
AASB 2012-3: Amendments to Australian Accounting Standards – Offsetting Financial Assets and Financial Liabilities:
AASB 2012-3 adds application guidance to AASB 132 Financial Instruments: Presentation to address inconsistencies identified in applying some of the offsetting criteria of AASB 132, including clarifying the meaning of “currently has a legally enforceable right of set-off” and that some gross settlement systems may be considered equivalent to net settlement. The effective date for the Group will be from 1 July 2014.
Interpretation 21: Accounting for Levies
This Interpretation confirms that a liability to pay a levy is only recognised when the activity that triggers the payment occurs. Applying the going concern assumption does not create a constructive obligation. The effective date for the Group will be from 1 July 2014.
AASB 9: Financial Instruments:
On 24 July 2014 The IASB issued the final version of IFRS 9 which replaces IAS 39 and includes a logical model for classification and measurement, a single, forward-looking ‘expected loss’ impairment model and a substantially-reformed approach to hedge accounting.
IFRS 9 is effective for annual periods beginning on or after 1 January 2018, however, the Standard is available for early application. The own credit changes can be early applied in isolation without otherwise changing the accounting for financial instruments.
REPORT TO THE MEMBERS OF AUSTAL LIMITED
36 | AUSTAL LIMITED ANNUAL REPORT 2014
The final version of IFRS 9 introduces a new expected-loss impairment model that will require more timely recognition of expected credit losses. Specifically, the new Standard requires entities to account for expected credit losses from when financial instruments are first recognised and to recognise full lifetime expected losses on a more timely basis.
The AASB is yet to issue the final version of AASB 9. A revised version of AASB 9 (AASB 2013-9) was issued in December 2013 which included the new hedge accounting requirements, including changes to hedge effectiveness testing, treatment of hedging costs, risk components that can be hedged and disclosures.
AASB 9 includes requirements for a simplified approach for classification and measurement of financial assets compared with the requirements of AASB 139.
The main changes are described below.
a. Financial assets that are debt instruments will be classified based on (1) the objective of the entity's business model for managing the financial assets; (2) the characteristics of the contractual cash flows.
b. Allows an irrevocable election on initial recognition to present gains and losses on investments in equity instruments that are not held for trading in other comprehensive income. Dividends in respect of these investments that are a return on investment can be recognised in profit or loss and there is no impairment or recycling on disposal of the instrument.
c. Financial assets can be designated and measured at fair value through profit or loss at initial recognition if doing so eliminates or significantly reduces a measurement or recognition inconsistency that would arise from measuring assets or liabilities, or recognising the gains and losses on them, on different bases.
d. Where the fair value option is used for financial liabilities the change in fair value is to be accounted for as follows:
The change attributable to changes in credit risk are presented in other comprehensive income (OCI)
The remaining change is presented in profit or loss
AASB 9 also removes the volatility in profit or loss that was caused by changes in the credit risk of liabilities elected to be measured at fair value. This change in accounting means that gains caused by the deterioration of an entity’s own credit risk on such liabilities are no longer recognised in profit or loss.
AASB 2013-3: Amendments to AASB 136 – Recoverable Amount Disclosures for Non-Financial Assets
AASB 2013-3 amends the disclosure requirements in AASB 136 Impairment of Assets. The amendments include the requirement to disclose additional information about the fair value measurement when the recoverable amount of impaired assets is based on fair value less costs of disposal. The effective date for the Group will be from 1 July 2014.
AASB 2013-4: Amendments to Australian Accounting Standards – Novation of Derivatives and Continuation of Hedge Accounting (AASB 139)
AASB 2013-4 amends AASB 139 to permit the continuation of hedge accounting in specified circumstances where a derivative, which has been designated as a hedging instrument, is novated from one counterparty to a central counterparty as a consequence of laws or regulations. The effective date for the Group will be from 1 July 2014.
AASB 2014-1 Part A - Annual Improvements 2010–2012 Cycle: Amendments to Australian Accounting Standards - Part A - Annual Improvements to IFRSs 2010–2012 Cycle
Annual Improvements to IFRSs 2010–2012 Cycle addresses the following items:
AASB 2 - Clarifies the definition of 'vesting conditions' and 'market condition' and introduces the definition of 'performance condition' and 'service condition'.
REPORT TO THE MEMBERS OF AUSTAL LIMITED
37 | AUSTAL LIMITED ANNUAL REPORT 2014
AASB 3 - Clarifies the classification requirements for contingent consideration in a business combination by removing all references to AASB 137.
AASB 8 - Requires entities to disclose factors used to identify the entity's reportable segments when operating segments have been aggregated. An entity is also required to provide a reconciliation of total reportable segments' asset to the entity's total assets.
AASB 116 & AASB 138 - Clarifies that the determination of accumulated depreciation does not depend on the selection of the valuation technique and that it is calculated as the difference between the gross and net carrying amounts.
AASB 124 - Defines a management entity providing KMP services as a related party of the reporting entity. The amendments added an exemption from the detailed disclosure requirements in paragraph 17 of AASB 124 for KMP services provided by a management entity. Payments made to a management entity in respect of KMP services should be separately disclosed.
The effective date for the Group will be from 1 July 2014.
AASB 2014-1 Part A - Annual Improvements 2011–2013 Cycle: Amendments to Australian Accounting Standards - Part A - Annual Improvements to IFRSs 2011–2013 Cycle
Annual Improvements to IFRSs 2011–2013 Cycle addresses the following items:
AASB13 - Clarifies that the portfolio exception in paragraph 52 of AASB 13 applies to all contracts within the scope of AASB 139 or AASB 9, regardless of whether they meet the definitions of financial assets or financial liabilities as defined in AASB 132.
AASB40 - Clarifies that judgment is needed to determine whether an acquisition of investment property is solely the acquisition of an investment property or whether it is the acquisition of a group of assets or a business combination in the scope of AASB 3 that includes an investment property. That judgment is based on guidance in AASB 3.
The effective date for the Group will be from 1 July 2014.
AASB 1031: Materiality
The revised AASB 1031 is an interim standard that cross-references to other Standards and the Framework (issued December 2013) that contain guidance on materiality. AASB 1031 will be withdrawn when references to AASB 1031 in all Standards and Interpretations have been removed.
AASB 2014-1 Part C issued in June 2014 makes amendments to eight Australian Accounting Standards to delete their references to AASB 1031. The amendments are effective from 1 July 2014.
AASB 2013-9: Amendments to Australian Accounting Standards – Conceptual Framework, Materiality and Financial Instruments
The Standard contains three main parts and makes amendments to a number Standards and Interpretations.
Part A of AASB 2013-9 makes consequential amendments arising from the issuance of AASB CF 2013-1. Part A of the amendments was effective for the Group from 1 July 2013 and did not have any effect on the financial position or performance of the Group.
Part B makes amendments to particular Australian Accounting Standards to delete references to AASB 1031 and also makes minor editorial amendments to various other standards. The effective date for the Group of Part B of the amendments will be from 1 July 2014.
Part C makes amendments to a number of Australian Accounting Standards, including incorporating Chapter 6 Hedge Accounting into AASB 9 Financial Instruments. The effective date for the Group of Part C of the amendments will be from 1 July 2015.
REPORT TO THE MEMBERS OF AUSTAL LIMITED
38 | AUSTAL LIMITED ANNUAL REPORT 2014
Amendments to IAS 16 and IAS 38: Clarification of Acceptable Methods of Depreciation and Amortisation (Amendments to IAS 16 and IAS 38)
IAS 16 and IAS 38 both establish the principle for the basis of depreciation and amortisation as being the expected pattern of consumption of the future economic benefits of an asset.
The IASB has clarified that the use of revenue-based methods to calculate the depreciation of an asset is not appropriate because revenue generated by an activity that includes the use of an asset generally reflects factors other than the consumption of the economic benefits embodied in the asset.
The IASB also clarified that revenue is generally presumed to be an inappropriate basis for measuring the consumption of the economic benefits embodied in an intangible asset. This presumption, however, can be rebutted in certain limited circumstances.
The effective date for the Group will be from 1 July 2016.
IFRS 15
In May 2014, the IASB issued IFRS 15 Revenue from Contracts with Customers, which replaces IAS 11 Construction Contracts, IAS 18 Revenue and related Interpretations (IFRIC 13 Customer Loyalty Programmes, IFRIC 15 Agreements for the Construction of Real Estate, IFRIC 18 Transfers of Assets from Customers and SIC-31 Revenue—Barter Transactions Involving Advertising Services)
The core principle of IFRS 15 is that an entity recognises revenue to depict the transfer of promised goods or services to customers in an amount that reflects the consideration to which the entity expects to be entitled in exchange for those goods or services. An entity recognises revenue in accordance with that core principle by applying the following steps:
(a) Step 1: Identify the contract(s) with a customer
(b) Step 2: Identify the performance obligations in the contract
(c) Step 3: Determine the transaction price
(d) Step 4: Allocate the transaction price to the performance obligations in the contract
(e) Step 5: Recognise revenue when (or as) the entity satisfies a performance obligation
The effective date for the Group will be from 1 July 2017. Early application of this standard is permitted.

39 | AUSTA
Current y
Note 3.
Year ended 30 June
Revenues
External custo
Inter-segment
Finance incom
Total
Segment result
EBIT
Finance incom
Finance expe
Total
Depreciation a
Balance sheet
Segment asse
Segment liabi
Year ended 30 June
Revenues
External custo
Inter-segment
Finance incom
Total
Segment result
EBIT
Finance incom
Finance expe
Total
Depreciation a
Balance sheet
Segment asse
Segment liabi
Inter-segment rev
AL LIMITED ANN
year perf
Operating s
e 2014
omers
t
me
me
nses
and amortisation
ets
lities
e 2013
omers
t
me
me
nses
and amortisation
ets
lities
venues, investments, re
REPOR
NUAL REPORT
formance
segments
Australia U
’000 ’0
153,886$ $
88,026
-
241,912$ $
16,684$ $
-
-
16,684$ $
(1,606)$ $
192,119$ $
(174,198) (
Australia U
’000 ’0
105,294$ $
38,764
-
144,058$ $
41$ $
-
-
41$ $
(1,030)$ $
146,387$ $
(91,355) (
eceivables and payabl
RT TO THE M
2014
e
USA Philippine
000 ’000
933,615 32,75$
- 1,00
- -
933,615 33,76$
61,682 2,70$
- -
- -
61,682 2,70$
(17,937) (97$
662,948 22,26$
456,424) (15,26
USA Philippine
000 ’000
747,739 33,05$
- 6,92
- -
747,739 39,98$
50,100 5,02$
- -
- -
50,100 5,02$
(18,708) (70$
604,650 41,62$
517,244) (36,96
es are eliminated on c
MEMBERS O
El
s Unallocated Ad
’000
58 2,609$ $
09 -
4,682
67 7,291$ $
03 (27,211)$ $
4,682
(13,271)
03 (35,800)$ $
72) (3,258)$ $
61 577,205$ $
63) (142,867)
El
s Unallocated Ad
’000
57 11,160$ $
29 2,333
2,231
86 15,724$ $
20 (25,894)$ $
2,231
(13,571)
20 (37,234)$ $
08) (4,063)$ $
21 421,830$ $
60) (72,492)
onsolidation.
OF AUSTAL L
imination /
djustments T
’000
(326) 1$
(89,035)
(4,361)
(93,722) 1$
1,707 $
(4,361)
4,529
1,875 $
- $
(543,236) $
310,687
imination /
djustments T
’000
10 $
(48,026)
-
(48,016) $
8,799 $
-
-
8,799 $
- $
(269,870) $
180,620
LIMITED
Total
’000
,122,542
-
321
,122,863
55,565
321
(8,742)
47,144
(23,773)
911,297
(478,065)
Total
’000
897,260
-
2,231
899,491
38,066
2,231
(13,571)
26,726
(24,509)
944,618
(537,431)
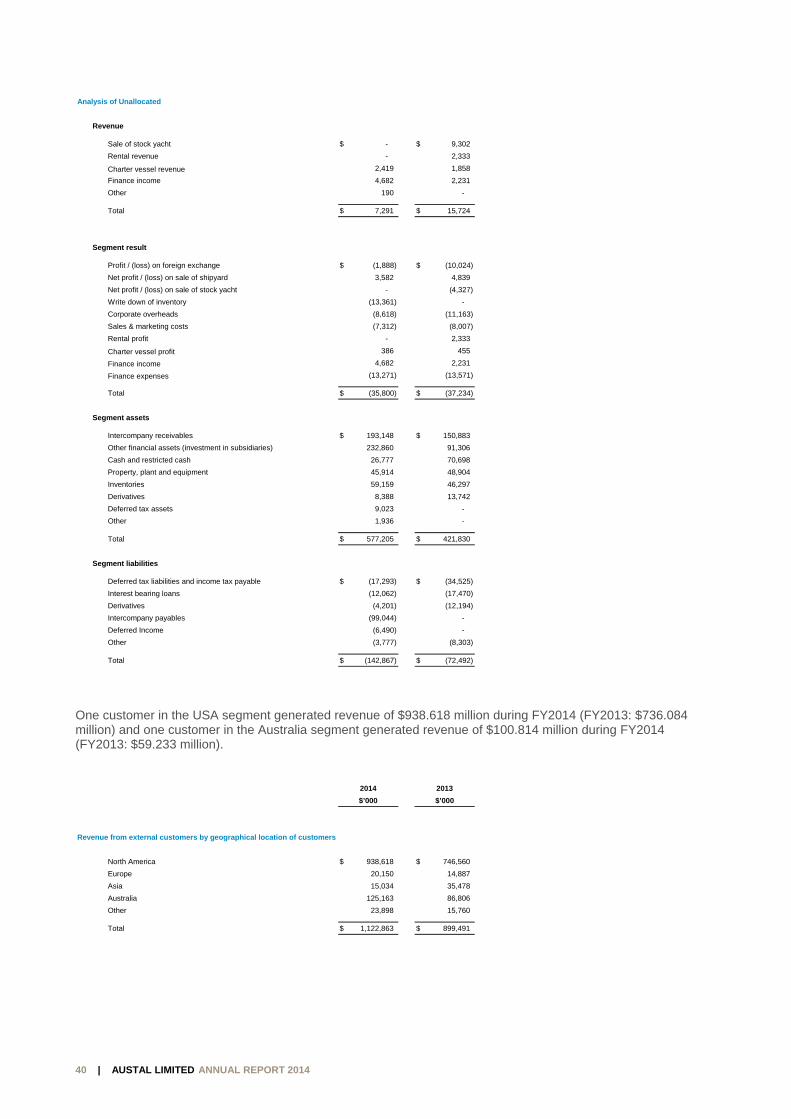
REPORT TO THE MEMBERS OF AUSTAL LIMITED
40 | AUSTAL LIMITED ANNUAL REPORT 2014
One customer in the USA segment generated revenue of $938.618 million during FY2014 (FY2013: $736.084 million) and one customer in the Australia segment generated revenue of $100.814 million during FY2014 (FY2013: $59.233 million).
Analysis of Unallocated
Revenue
Sale of stock yacht $ - $ 9,302
Rental revenue - 2,333
Charter vessel revenue 2,419 1,858
Finance income 4,682 2,231
Other 190 -
Total $ 7,291 $ 15,724
Segment result
Profit / (loss) on foreign exchange $ (1,888) $ (10,024)
Net profit / (loss) on sale of shipyard 3,582 4,839
Net profit / (loss) on sale of stock yacht - (4,327)
Write down of inventory (13,361) -
Corporate overheads (8,618) (11,163)
Sales & marketing costs (7,312) (8,007)
Rental profit - 2,333
Charter vessel profit 386 455
Finance income 4,682 2,231
Finance expenses (13,271) (13,571)
Total $ (35,800) $ (37,234)
Segment assets
Intercompany receivables $ 193,148 $ 150,883
Other financial assets (investment in subsidiaries) 232,860 91,306
Cash and restricted cash 26,777 70,698
Property, plant and equipment 45,914 48,904
Inventories 59,159 46,297
Derivatives 8,388 13,742
Deferred tax assets 9,023 -
Other 1,936 -
Total $ 577,205 $ 421,830
Segment liabilities
Deferred tax liabilities and income tax payable $ (17,293) $ (34,525)
Interest bearing loans (12,062) (17,470)
Derivatives (4,201) (12,194)
Intercompany payables (99,044) -
Deferred Income (6,490) -
Other (3,777) (8,303)
Total $ (142,867) $ (72,492)
2014 2013
$’000 $’000
Revenue from external customers by geographical location of customers
North America $ 938,618 $ 746,560
Europe 20,150 14,887
Asia 15,034 35,478
Australia 125,163 86,806
Other 23,898 15,760
Total $ 1,122,863 $ 899,491
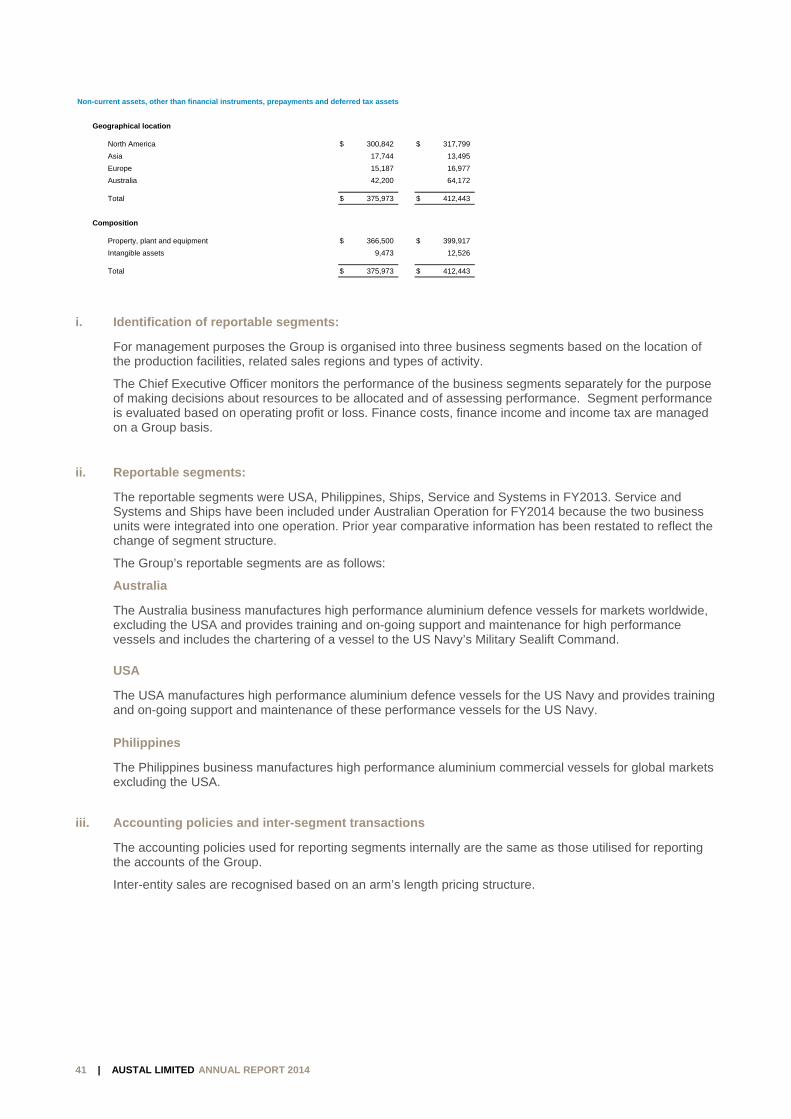
REPORT TO THE MEMBERS OF AUSTAL LIMITED
41 | AUSTAL LIMITED ANNUAL REPORT 2014
i. Identification of reportable segments:
For management purposes the Group is organised into three business segments based on the location of the production facilities, related sales regions and types of activity.
The Chief Executive Officer monitors the performance of the business segments separately for the purpose of making decisions about resources to be allocated and of assessing performance. Segment performance is evaluated based on operating profit or loss. Finance costs, finance income and income tax are managed on a Group basis.
ii. Reportable segments:
The reportable segments were USA, Philippines, Ships, Service and Systems in FY2013. Service and Systems and Ships have been included under Australian Operation for FY2014 because the two business units were integrated into one operation. Prior year comparative information has been restated to reflect the change of segment structure.
The Group’s reportable segments are as follows:
Australia
The Australia business manufactures high performance aluminium defence vessels for markets worldwide, excluding the USA and provides training and on-going support and maintenance for high performance vessels and includes the chartering of a vessel to the US Navy’s Military Sealift Command. USA
The USA manufactures high performance aluminium defence vessels for the US Navy and provides training and on-going support and maintenance of these performance vessels for the US Navy.
Philippines
The Philippines business manufactures high performance aluminium commercial vessels for global markets excluding the USA.
iii. Accounting policies and inter-segment transactions
The accounting policies used for reporting segments internally are the same as those utilised for reporting the accounts of the Group.
Inter-entity sales are recognised based on an arm’s length pricing structure.
Non-current assets, other than financial instruments, prepayments and deferred tax assets
Geographical location
North America $ 300,842 $ 317,799
Asia 17,744 13,495
Europe 15,187 16,977
Australia 42,200 64,172
Total $ 375,973 $ 412,443
Composition
Property, plant and equipment $ 366,500 $ 399,917
Intangible assets 9,473 12,526
Total $ 375,973 $ 412,443
REPORT TO THE MEMBERS OF AUSTAL LIMITED
42 | AUSTAL LIMITED ANNUAL REPORT 2014
iv. Unallocated
The following items and associated assets and liabilities are not allocated to operating segments as they are not considered part of the core operations of any segment:
Cost of Group services Corporate overheads Revenue from property leased to other Group segments Finance revenue and costs Taxation Assets held for sale Derivatives Commercial vessel charter contracts
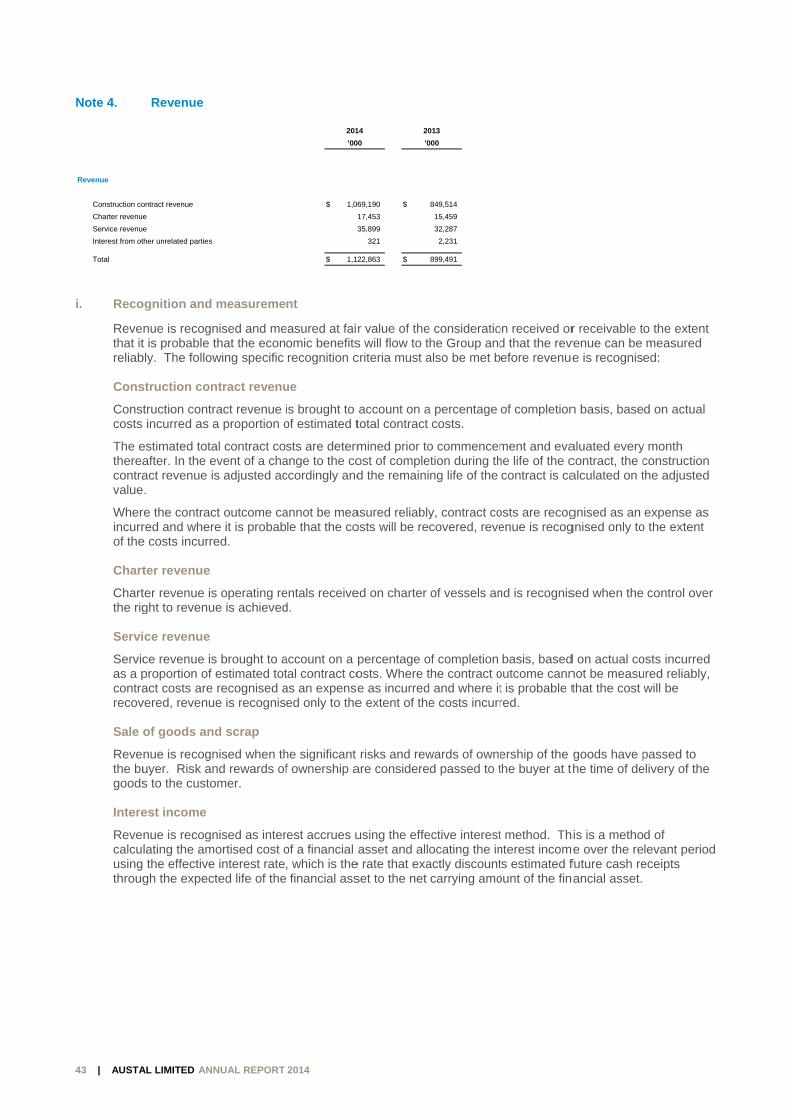
43 | AUSTA
Note 4.
i. Reco
Revethat itreliab Cons
Constcosts
The ethereacontravalue
Wherincurrof the Chart
Chartthe rig Servi
Servicas a pcontrarecov Sale
Revethe bugoods Intere
Revecalcuusingthroug
Revenue
Construction co
Charter revenue
Service revenu
Interest from ot
Total
AL LIMITED ANN
Revenue
ognition and
nue is recognt is probable t
bly. The follow
struction con
truction contrincurred as a
estimated totaafter. In the eact revenue is.
re the contracred and where costs incurre
ter revenue
ter revenue isght to revenu
ice revenue
ce revenue isproportion of act costs are
vered, revenu
of goods an
nue is recognuyer. Risk ans to the custo
est income
nue is recognlating the am the effectivegh the expec
ontract revenue
e
e
ther unrelated parties
REPOR
NUAL REPORT
measureme
nised and methat the econwing specific
ntract revenu
ract revenue a proportion o
al contract coevent of a chas adjusted ac
ct outcome cae it is probabed.
s operating ree is achieved
s brought to aestimated totrecognised ae is recognis
d scrap
nised when thnd rewards ofomer.
nised as interortised cost o
e interest rateted life of the
RT TO THE M
2014
nt
easured at fairomic benefitsrecognition c
ue
is brought to of estimated t
sts are determange to the coccordingly and
annot be meale that the co
entals received.
account on a ptal contract coas an expenseed only to the
he significant f ownership a
rest accrues uof a financial , which is the financial ass
201
’00
$ 1,0
$ 1,12
MEMBERS O
r value of thes will flow to tcriteria must a
account on atotal contract
mined prior toost of compled the remaini
asured reliablyosts will be re
ed on charter
percentage oosts. Where te as incurrede extent of the
risks and reware considere
using the effeasset and all
e rate that exaset to the net
14 20
0 ’0
69,190 $
17,453
35,899
321
22,863 $
OF AUSTAL L
e consideratiohe Group and
also be met b
a percentage costs.
o commencemetion during thng life of the
y, contract cocovered, reve
of vessels an
of completion the contract od and where ite costs incurr
wards of owned passed to t
ective interestocating the in
actly discountcarrying amo
013
000
849,514
15,459
32,287
2,231
899,491
LIMITED
on received ord that the revefore revenue
of completion
ment and evahe life of the ccontract is ca
osts are recogenue is recog
nd is recognis
basis, basedoutcome cannt is probable tred.
ership of the the buyer at t
t method. Thnterest incomts estimated fount of the fin
r receivable tvenue can be e is recognise
n basis, base
aluated everycontract, the calculated on t
gnised as an gnised only to
sed when the
d on actual conot be measuthat the cost
goods have pthe time of de
his is a methome over the re
future cash reancial asset.
o the extent measured ed:
d on actual
y month construction the adjusted
expense as o the extent
control over
osts incurred ured reliably, will be
passed to elivery of the
d of levant period
eceipts

REPORT TO THE MEMBERS OF AUSTAL LIMITED
44 | AUSTAL LIMITED ANNUAL REPORT 2014
ii. Significant accounting judgements and estimates
Construction contract revenue and expected construction profits at completion.
The assessment of construction contract revenue in accordance with the Group’s accounting policies requires certain estimates to be made of total contract revenues, total contract costs and the current stage of completion.
Contract revenue and contract costs are recognised as revenue and expenses respectively by reference to the stage of completion of the contract activity at the balance sheet date (“percentage-of-completion method”) when the outcome of a construction contact can be estimated reliably. Contract revenue is recognised to the extent of contract costs incurred that are likely to be recoverable when the outcome of a construction contract cannot be estimated reliably.
Management have made estimates in this area, which if ultimately inaccurate will impact the level of revenue recognised in the Consolidated Statement of Comprehensive Income of FY2014 and beyond.
The percentage of completion is calculated on actual costs over the sum of actual costs plus projected costs to complete the contract and profit is recognised from commencement of the project.
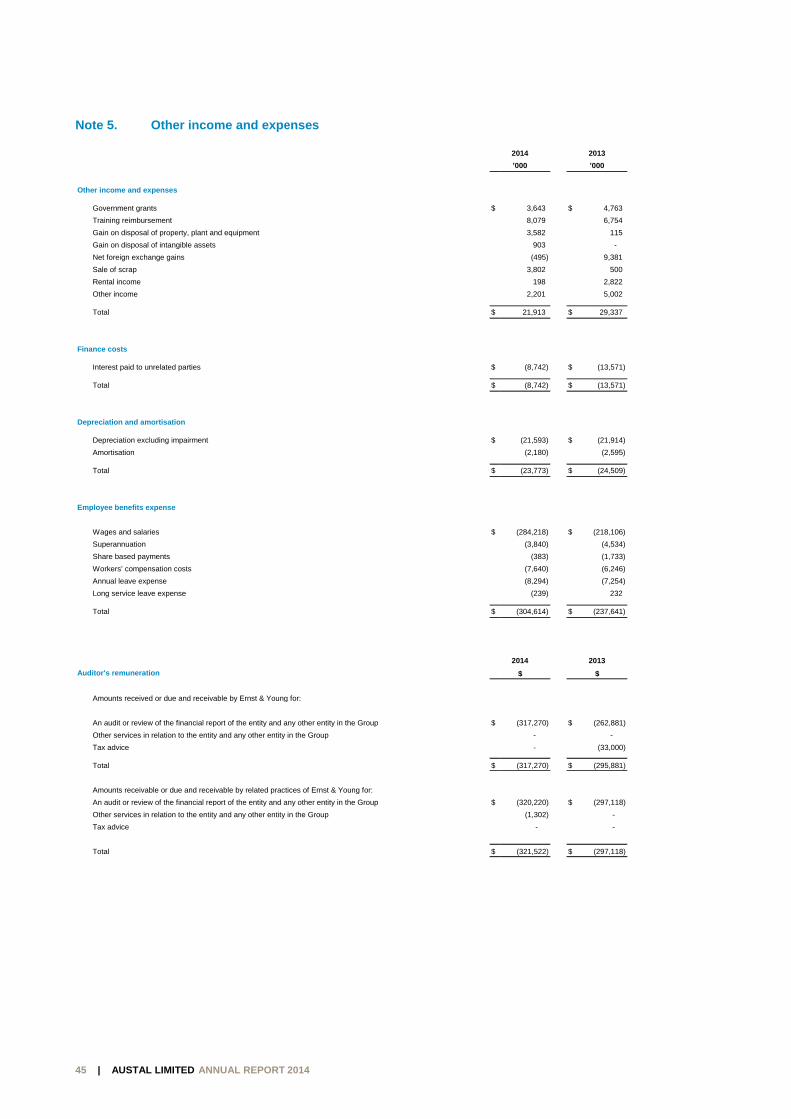
45 | AUSTA
Note 5.
Other income and
Government gra
Training reimbu
Gain on dispos
Gain on dispos
Net foreign exc
Sale of scrap
Rental income
Other income
Total
Finance costs
Interest paid to
Total
Depreciation and a
Depreciation ex
Amortisation
Total
Employee benefits
Wages and sal
Superannuation
Share based pa
Workers’ comp
Annual leave ex
Long service le
Total
Auditor's remunera
Amounts receiv
An audit or revi
Other services
Tax advice
Total
Amounts receiv
An audit or revi
Other services
Tax advice
Total
AL LIMITED ANN
Other inco
expenses
ants
ursement
al of property, plant an
al of intangible assets
change gains
unrelated parties
amortisation
xcluding impairment
expense
aries
n
ayments
ensation costs
xpense
eave expense
ation
ved or due and receiva
ew of the financial rep
in relation to the entity
vable or due and recei
ew of the financial rep
in relation to the entity
REPOR
NUAL REPORT
me and expe
nd equipment
s
able by Ernst & Young
port of the entity and a
y and any other entity
ivable by related pract
port of the entity and a
y and any other entity
RT TO THE M
2014
enses
g for:
any other entity in the
in the Group
tices of Ernst & Young
any other entity in the
in the Group
MEMBERS O
Group
g for:
Group
OF AUSTAL L
$
$
$
$
$
$
$
$
$
$
$
$
LIMITED
2014
’000
3,643 $
8,079
3,582
903
(495)
3,802
198
2,201
21,913 $
(8,742) $
(8,742) $
(21,593) $
(2,180)
(23,773) $
(284,218) $
(3,840)
(383)
(7,640)
(8,294)
(239)
(304,614) $
2014
$
(317,270) $
-
-
(317,270) $
(320,220) $
(1,302)
-
(321,522) $
2013
’000
4,763
6,754
115
-
9,381
500
2,822
5,002
29,337
(13,571)
(13,571)
(21,914)
(2,595)
(24,509)
(218,106)
(4,534)
(1,733)
(6,246)
(7,254)
232
(237,641)
2013
$
(262,881)
-
(33,000)
(295,881)
(297,118)
-
-
(297,118)
REPORT TO THE MEMBERS OF AUSTAL LIMITED
46 | AUSTAL LIMITED ANNUAL REPORT 2014
i. Recognition & measurement
The following recognition and measurement criteria must be met before the following specific items are recognised in profit or loss:
Government grants relating to expense items
Government grants are recognised when there is reasonable assurance that the grant will be received and all attaching conditions will be complied with.
A grant is recognised as income when it relates to an expense item. The grant income is recognised over the periods necessary to match the grant to the costs that it is intended to compensate.
Impairment of assets
No impairment charge was recognised by the Group during the period. Refer to Note 19 for details regarding Impairment testing of goodwill and intangible assets with indefinite useful lives.
Finance costs
Finance costs directly attributable to the acquisition, construction or production of a qualifying asset (i.e. an asset that necessarily takes a substantial period of time to get ready for its intended use or sale) are capitalised as part of the cost of that asset. All other finance costs are expensed in the period they occur.
Finance costs include interest payments, amortisation of capitalised loan origination costs and other costs that an entity incurs in connection with the borrowing of funds.
Depreciation and amortisation
Refer to accounting policies for depreciation disclosed in note 18, and to note 19 for accounting policies related to amortisation of intangible assets. Employee benefits
Refer to accounting policies for employee benefits in note 20.
Leases
The determination of whether an arrangement is or contains a lease is based on the substance of the arrangement and requires an assessment of whether the fulfilment of the arrangement is dependent on the use of a specific asset or assets and the arrangement conveys a right to use the asset.
Operating lease payments are recognised as an expense in the statement of comprehensive income on a straight-line basis over the lease term.
ii. Foreign exchange gains & losses included in profit and loss
Foreign exchange gains and losses included in profit and loss includes:
Mark to market adjustments on non-derivative financial assets such as foreign currency denominated loans.
Mark to market adjustments on foreign currency hedge instruments designated as fair value hedges. Foreign currency gains and losses on cash flow hedges that were deemed to be ineffective during the
accounting period.
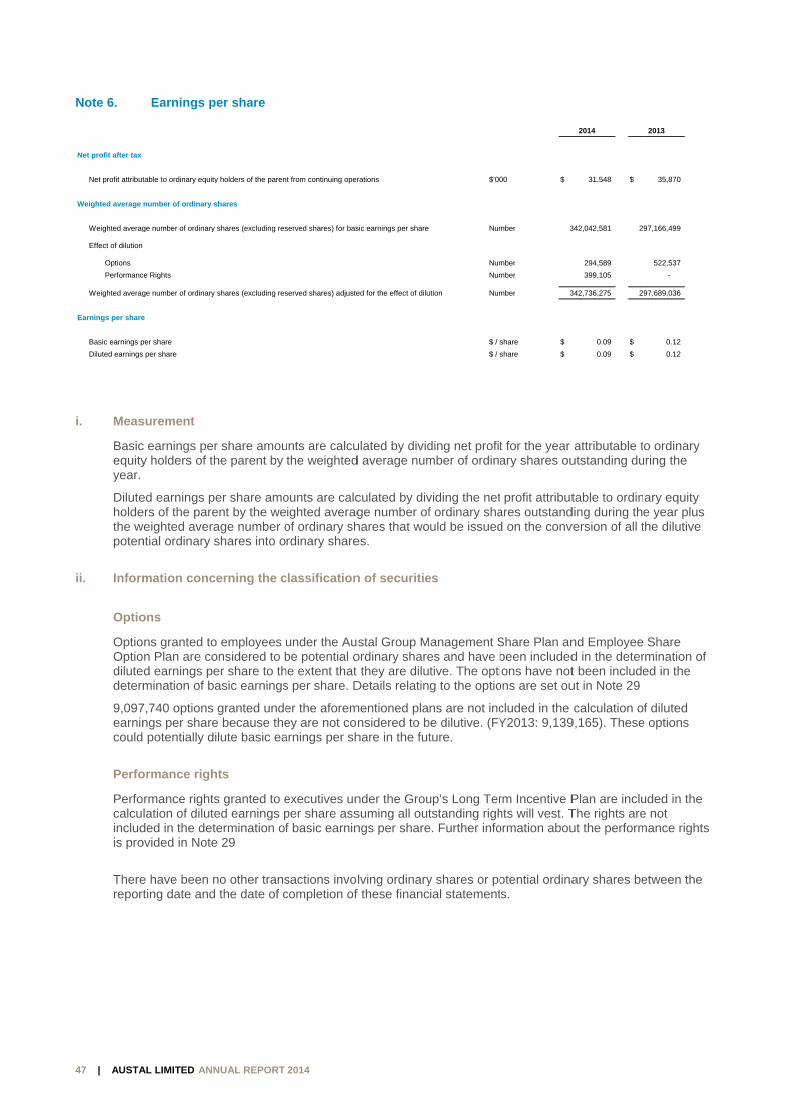
47 | AUSTA
Note 6.
i. Meas
Basicequityyear.
Diluteholdethe wpoten
ii. Inform
Optio
OptioOptiodilutedeterm
9,097earnincould
Perfo
Perfocalcuincludis pro
Therereport
Net profit after tax
Net profit attribut
Weighted average
Weighted averag
Effect of dilution
Options
Performanc
Weighted averag
Earnings per share
Basic earnings p
Diluted earnings
AL LIMITED ANN
Earnings p
surement
c earnings pery holders of th
ed earnings pers of the pareweighted averantial ordinary s
mation conc
ons
ns granted ton Plan are cod earnings pemination of b
7,740 options ngs per share potentially d
ormance righ
rmance rightslation of dilute
ded in the detovided in Note
e have been nting date and
table to ordinary equity
number of ordinary s
ge number of ordinary
ce Rights
ge number of ordinary
e
per share
per share
REPOR
NUAL REPORT
per share
r share amouhe parent by
per share amoent by the weage number oshares into o
cerning the c
o employees onsidered to ber share to thasic earnings
granted undee because theilute basic ea
hts
s granted to eed earnings ptermination ofe 29
no other transd the date of c
y holders of the paren
shares
y shares (excluding res
y shares (excluding res
RT TO THE M
2014
unts are calcuthe weighted
ounts are calcighted averagof ordinary shrdinary share
classification
under the Aube potential o
he extent that s per share. D
er the aforemey are not conarnings per sh
executives unper share assf basic earnin
sactions involcompletion of
nt from continuing oper
served shares) for bas
served shares) adjuste
MEMBERS O
ulated by dividd average num
culated by divge number ofhares that woes.
n of securitie
stal Group Mordinary share
they are diluDetails relatin
mentioned plansidered to bhare in the fut
nder the Grousuming all outngs per share
lving ordinaryf these financ
rations
sic earnings per share
ed for the effect of dilu
OF AUSTAL L
ding net profitmber of ordina
viding the netf ordinary shauld be issued
es
Management Ses and have btive. The optig to the optio
ns are not incbe dilutive. (FYture.
up’s Long Tertstanding righ
e. Further info
y shares or pocial statement
$’00
Num
Num
Num
ution Num
$ / s
$ / s
LIMITED
t for the year ary shares ou
profit attributares outstandd on the conv
Share Plan anbeen includedons have not
ons are set ou
cluded in the Y2013: 9,139
rm Incentive Phts will vest. Tormation abou
otential ordinas.
00 $
mber 3
mber
mber
mber 3
share $
share $
attributable tutstanding du
table to ordinding during thversion of all t
nd Employeed in the detert been includeut in Note 29
calculation o9,165). These
Plan are incluThe rights areut the perform
ary shares be
2014
31,548 $
342,042,581 2
294,589
399,105
342,736,275 2
0.09 $
0.09 $
o ordinary uring the
ary equity e year plus the dilutive
Share rmination of ed in the
f diluted e options
uded in the e not mance rights
etween the
2013
35,870
97,166,499
522,537
-
97,689,036
0.12
0.12
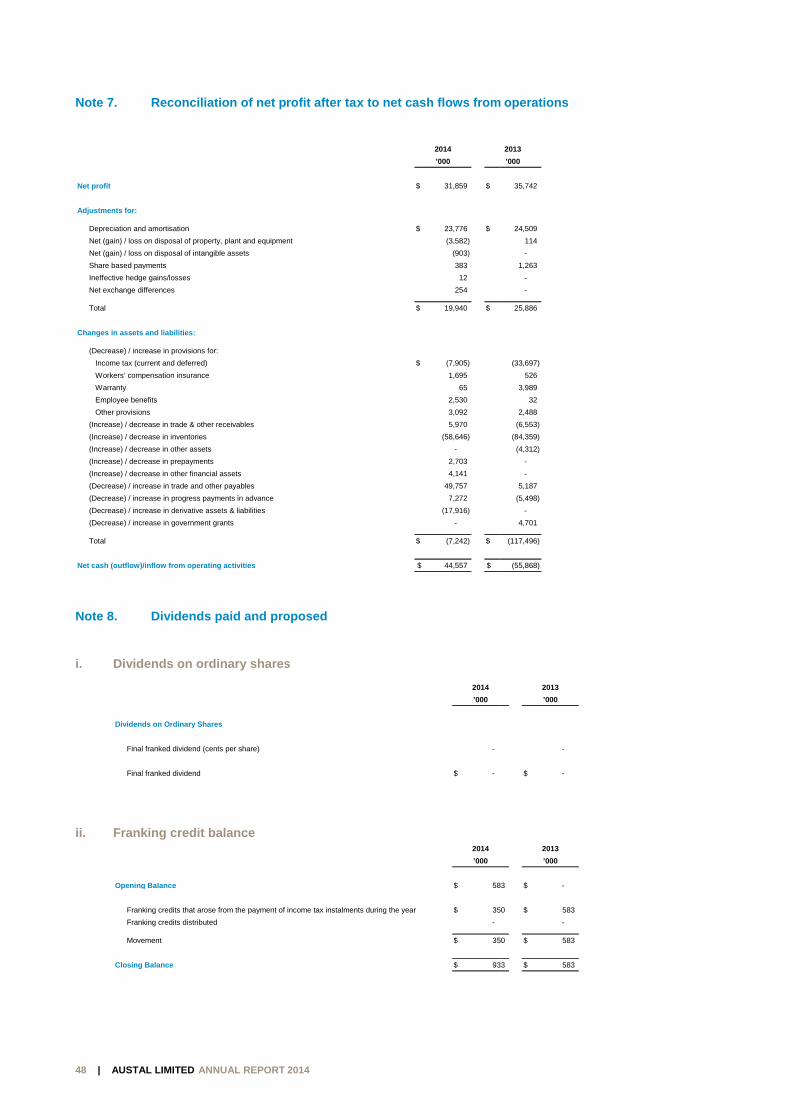
48 | AUSTA
Note 7.
Note 8.
i. Divid
ii. Frank
Net profit
Adjustments for:
Depreciation and
Net (gain) / loss
Net (gain) / loss
Share based pay
Ineffective hedge
Net exchange di
Total
Changes in assets
(Decrease) / incr
Income tax (cu
Workers’ comp
Warranty
Employee ben
Other provision
(Increase) / decr
(Increase) / decr
(Increase) / decr
(Increase) / decr
(Increase) / decr
(Decrease) / incr
(Decrease) / incr
(Decrease) / incr
(Decrease) / incr
Total
Net cash (outflow)/
Dividend
Final
Final
Opening
Frank
Frank
Move
Closing
AL LIMITED ANN
Reconciliat
Dividends
dends on ord
king credit b
d amortisation
on disposal of proper
on disposal of intangi
yments
e gains/losses
fferences
and liabilities:
rease in provisions for
urrent and deferred)
pensation insurance
efits
ns
rease in trade & other
rease in inventories
rease in other assets
rease in prepayments
rease in other financia
rease in trade and oth
rease in progress pay
rease in derivative ass
rease in government g
/inflow from operatin
ds on Ordinary Share
franked dividend (cen
franked dividend
g Balance
king credits that arose
king credits distributed
ement
Balance
REPOR
NUAL REPORT
tion of net p
paid and pro
dinary shares
balance
rty, plant and equipme
ble assets
r:
receivables
al assets
her payables
yments in advance
sets & liabilities
grants
ng activities
es
nts per share)
e from the payment of
d
RT TO THE M
2014
rofit after tax
oposed
s
ent
income tax instalmen
MEMBERS O
x to net cash
$
$
$
$
$
$
ts during the year
OF AUSTAL L
h flows from
2014
’000
31,859 $
23,776 $
(3,582)
(903)
383
12
254
19,940 $
(7,905)
1,695
65
2,530
3,092
5,970
(58,646)
-
2,703
4,141
49,757
7,272
(17,916)
-
(7,242) $
44,557 $
2014
’000
-
- $
2014
’000
58$
35$
-
35$
93$
LIMITED
operations
2013
’000
35,742
24,509
114
-
1,263
-
-
25,886
(33,697)
526
3,989
32
2,488
(6,553)
(84,359)
(4,312)
-
-
5,187
(5,498)
-
4,701
(117,496)
(55,868)
2013
’000
-
- $
2013
’000
83 - $
50 583$
-
50 583$
33 583$
3
3
3
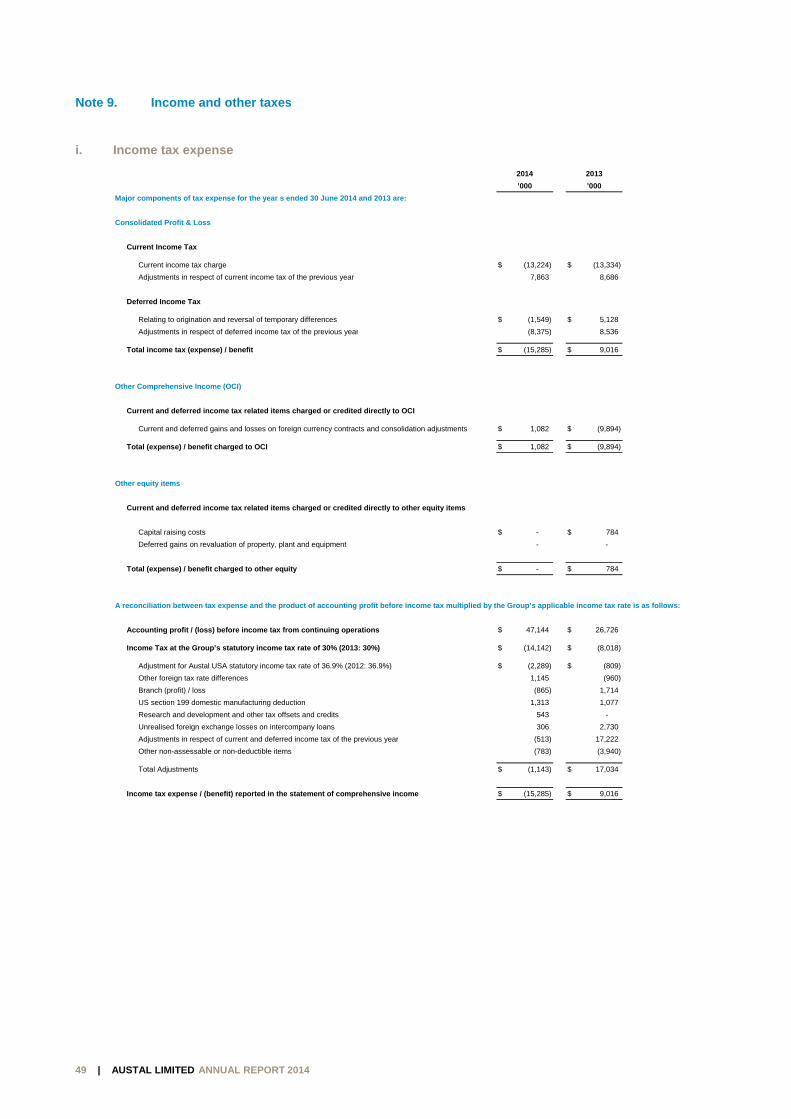
49 | AUSTA
Note 9.
i. Incom
Major co
Consolid
Curre
C
A
Defe
R
A
Total
Other Co
Curre
C
Total
Other eq
Curre
C
D
Total
A reconc
Acco
Incom
A
O
B
U
R
U
A
O
T
Incom
AL LIMITED ANN
Income and
me tax expen
omponents of tax exp
dated Profit & Loss
ent Income Tax
Current income tax cha
Adjustments in respect
rred Income Tax
Relating to origination a
Adjustments in respect
l income tax (expens
omprehensive Incom
ent and deferred inco
Current and deferred ga
l (expense) / benefit c
quity items
ent and deferred inco
Capital raising costs
Deferred gains on reva
l (expense) / benefit c
ciliation between tax
ounting profit / (loss)
me Tax at the Group
Adjustment for Austal U
Other foreign tax rate d
ranch (profit) / loss
US section 199 domest
Research and developm
Unrealised foreign exch
Adjustments in respect
Other non-assessable o
otal Adjustments
me tax expense / (be
REPOR
NUAL REPORT
d other taxes
nse
pense for the year s
arge
of current income tax
and reversal of tempor
of deferred income ta
se) / benefit
me (OCI)
ome tax related item
ains and losses on for
charged to OCI
ome tax related item
luation of property, pla
charged to other equ
x expense and the pr
before income tax fr
’s statutory income t
USA statutory income
differences
tic manufacturing dedu
ment and other tax off
hange losses on interc
of current and deferre
or non-deductible item
enefit) reported in the
RT TO THE M
2014
s
ended 30 June 2014
x of the previous year
rary differences
ax of the previous year
s charged or credite
reign currency contrac
s charged or credite
ant and equipment
uity
oduct of accounting
rom continuing oper
tax rate of 30% (2013
tax rate of 36.9% (201
uction
fsets and credits
company loans
ed income tax of the p
ms
e statement of compr
MEMBERS O
and 2013 are:
r
d directly to OCI
cts and consolidation a
d directly to other eq
profit before income
rations
3: 30%)
12: 36.9%)
previous year
rehensive income
OF AUSTAL L
$
$
$
adjustments $
$
quity items
$
$
e tax multiplied by th
$
$
$
$
$
LIMITED
2014
’000
(13,224)$ $
7,863
(1,549)$ $
(8,375)
(15,285)$ $
1,082$ $
1,082$ $
- $ $
-
- $ $
e Group’s applicable
47,144$ $
(14,142)$ $
(2,289)$ $
1,145
(865)
1,313
543
306
(513)
(783)
(1,143)$ $
(15,285)$ $
2013
’000
(13,334)
8,686
5,128
8,536
9,016
(9,894)
(9,894)
784
-
784
e income tax rate is a
26,726
(8,018)
(809)
(960)
1,714
1,077
-
2,730
17,222
(3,940)
17,034
9,016
as follows:
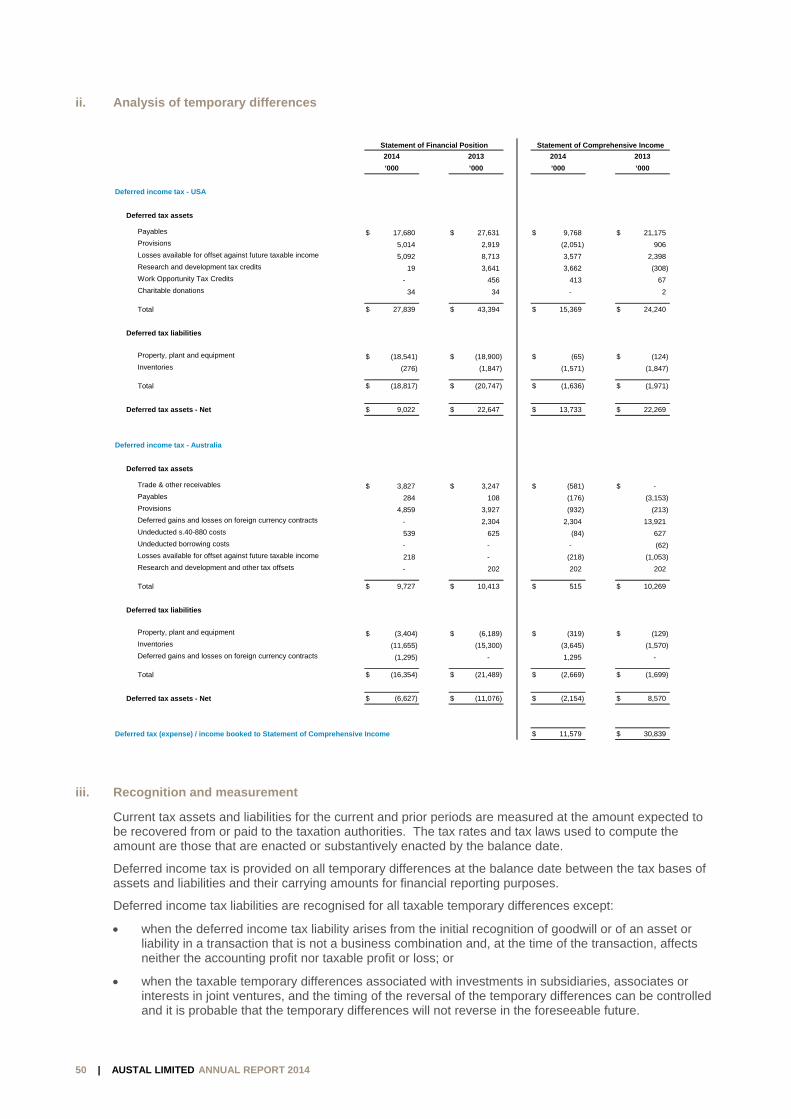
REPORT TO THE MEMBERS OF AUSTAL LIMITED
50 | AUSTAL LIMITED ANNUAL REPORT 2014
ii. Analysis of temporary differences
iii. Recognition and measurement
Current tax assets and liabilities for the current and prior periods are measured at the amount expected to be recovered from or paid to the taxation authorities. The tax rates and tax laws used to compute the amount are those that are enacted or substantively enacted by the balance date.
Deferred income tax is provided on all temporary differences at the balance date between the tax bases of assets and liabilities and their carrying amounts for financial reporting purposes.
Deferred income tax liabilities are recognised for all taxable temporary differences except:
when the deferred income tax liability arises from the initial recognition of goodwill or of an asset or liability in a transaction that is not a business combination and, at the time of the transaction, affects neither the accounting profit nor taxable profit or loss; or
when the taxable temporary differences associated with investments in subsidiaries, associates or interests in joint ventures, and the timing of the reversal of the temporary differences can be controlled and it is probable that the temporary differences will not reverse in the foreseeable future.
Statement of Financial Position Statement of Comprehensive Income
2014 2013 2014 2013
’000 ’000 ’000 ’000
Deferred income tax - USA
Deferred tax assets
Payables 17,680$ 27,631$ 9,768$ 21,175$
Provisions 5,014 2,919 (2,051) 906
Losses available for offset against future taxable income 5,092 8,713 3,577 2,398
Research and development tax credits 19 3,641 3,662 (308)
Work Opportunity Tax Credits - 456 413 67
Charitable donations 34 34 - 2
Total 27,839$ 43,394$ 15,369$ 24,240$
Deferred tax liabilities
Property, plant and equipment (18,541)$ (18,900)$ (65)$ (124)$
Inventories (276) (1,847) (1,571) (1,847)
Total (18,817)$ (20,747)$ (1,636)$ (1,971)$
Deferred tax assets - Net 9,022$ 22,647$ 13,733$ 22,269$
Deferred income tax - Australia
Deferred tax assets
Trade & other receivables 3,827$ 3,247$ (581)$ - $
Payables 284 108 (176) (3,153)
Provisions 4,859 3,927 (932) (213)
Deferred gains and losses on foreign currency contracts - 2,304 2,304 13,921
Undeducted s.40-880 costs 539 625 (84) 627
Undeducted borrowing costs - - - (62)
Losses available for offset against future taxable income 218 - (218) (1,053)
Research and development and other tax offsets - 202 202 202
Total 9,727$ 10,413$ 515$ 10,269$
Deferred tax liabilities
Property, plant and equipment (3,404)$ (6,189)$ (319)$ (129)$
Inventories (11,655) (15,300) (3,645) (1,570)
Deferred gains and losses on foreign currency contracts (1,295) - 1,295 -
Total (16,354)$ (21,489)$ (2,669)$ (1,699)$
Deferred tax assets - Net (6,627)$ (11,076)$ (2,154)$ 8,570$
Deferred tax (expense) / income booked to Statement of Comprehensive Income 11,579$ 30,839$

REPORT TO THE MEMBERS OF AUSTAL LIMITED
51 | AUSTAL LIMITED ANNUAL REPORT 2014
deferred income tax assets are recognised for all deductible temporary differences, carry-forward of unused tax assets and unused tax losses, to the extent that it is probable that taxable profit will be available against which the deductible temporary differences, and the carry-forward of unused tax assets and unused tax losses can be utilised except:
when the deferred income tax asset relating to the deductible temporary difference arises from the initial recognition of an asset or liability in a transaction that is not a business combination and, at the time of the transaction, affects neither the accounting profit nor taxable profit or loss; or
when the deductible temporary differences is associated with investments in subsidiaries, associates and interests in joint ventures in which case a deferred tax asset is only recognised to the extent that it is probable that the temporary differences will reverse in the foreseeable future and taxable profit will be available against which the temporary
The carrying amount of deferred income tax assets is reviewed at each balance date and reduced to the extent that it is no longer probable that sufficient taxable profit will be available to allow all or part of the deferred income tax asset to be utilised.
Unrecognised deferred income tax assets are reassessed at each balance date and are recognised to the extent that it has become probable that future taxable profit will allow the deferred tax asset to be recovered.
Deferred income tax assets and liabilities are measured at the tax rates that are expected to apply to the year when the asset is realised or the liability is settled, based on tax rates (and tax laws) that have been enacted or substantively enacted at the balance date.
Income taxes relating to items recognised directly in equity are recognised in equity and not in the statement of comprehensive income.
Deferred tax assets and deferred tax liabilities are offset only if a legally enforceable right exists to set off current tax assets against current tax liabilities and the deferred tax assets and liabilities relate to the same taxable entity and the same taxation authority.
iv. Tax consolidation
Austal Limited (‘the Company’) is the head entity in a tax-consolidated Group comprising the Company and its 100% owned Australian resident subsidiaries. The implementation date of the tax consolidated system for the tax-consolidated Group was 1 July 2002. Members of the Group have entered into a tax sharing arrangement in order to allocate income tax expense to the wholly owned subsidiaries on a pro-rata basis. The agreement provides for the allocation of income tax liabilities between the entities should the head entity default on its tax payment obligations. At the balance date, the possibility of default was remote.
v. Tax effect by members of the tax consolidated Group
The current and deferred tax amounts for the tax-consolidated Group are allocated among the entities in the Group using a stand-alone taxpayer approach whereby each entity in the tax-consolidated Group measures its current and deferred taxes as if it continued to be a separately taxable entity in its own right. Deferred tax assets and deferred tax liabilities are measured by reference to the carrying amounts of the assets and liabilities in each entity’s statement of financial position and their tax values applying under tax consolidation.
Any current tax liabilities (or assets) and deferred tax assets arising from unused tax losses assumed by the head entity from the subsidiaries in the tax consolidated Group are recognised in conjunction with any tax funding arrangement amounts (refer below).
The Group recognises deferred tax assets arising from unused tax losses of the tax-consolidated Group to the extent that it is probable that future taxable profits of the tax-consolidated Group will be available against which the asset can be utilised.
Any subsequent period adjustments to deferred tax assets arising from unused tax losses assumed from subsidiaries are recognised by the head entity only.
The members of the tax-consolidated Group have entered into a tax funding arrangement which sets out the funding obligations of members of the tax-consolidated Group in respect of tax amounts. The tax funding arrangements require payments to/from the head entity equal to the current tax liability (asset) assumed by the head entity and any tax-loss deferred tax asset assumed by the head entity.
No amounts have been recognised as tax consolidation contribution/distribution adjustments in preparing the accounts for the parent company for the current year.
REPORT TO THE MEMBERS OF AUSTAL LIMITED
52 | AUSTAL LIMITED ANNUAL REPORT 2014
vi. Significant accounting judgements and estimates
Deferred tax assets are recognised for deductible temporary differences as management considers that it is probable that future taxable profits will be available to utilise those temporary differences.
Uncertainties exist with respect to the interpretation of complex tax regulations, changes in tax laws, and the amount and timing of future taxable income. Given the wide range of international business relationships and the long-term nature and complexity of existing contractual agreements, differences arising between the actual results and the assumptions made, or future changes to such assumptions, could necessitate future adjustments to tax income and expense already recorded. The Group establishes provisions, based on reasonable estimates, for possible consequences of audits by the tax authorities of the respective counties in which it operates. The amount of such provisions is based on various factors, such as experience of previous tax audits and differing interpretations of tax regulations by the taxable entity and the responsible tax authority. Such differences in interpretation may arise for a wide variety of issues depending on the conditions prevailing in the respective domicile of the Group companies.
Deferred tax assets are recognised for unused tax losses to the extent that it is probable that taxable profit will be available against which the losses can be utilised. Significant management judgement is required to determine the amount of deferred tax assets that can be recognised, based upon the likely timing and the level of future taxable profits together with future tax planning strategies.
vii. Other taxes
Revenues, expenses and assets are recognised net of the amount of GST except:
when the GST incurred on a purchase of goods and services is not recoverable from the taxation authority, in which case the GST is recognised as part of the cost of acquisition of the asset or as part of the expense item as applicable; and
receivables and payables, which are stated with the amount of GST included.
The net amount of GST recoverable from, or payable to, the taxation authority is included as part of receivables or payables in the statement of financial position.
Cash flows are included in the statement of cash flows on a gross profit basis and the GST component of cash flows arising from investing and financing activities, which is recoverable from, or payable to, the taxation authority, are classified as operating cash flows.
Commitments and contingencies are disclosed net of the amount of GST recoverable from, or payable to, the taxation authority.

53 | AUSTA
Capital s
Note 10.
i. Reco
Cash short-
For thequiv
Current
Cash at bank an
Total
Restricted cash:
Unutilised Go Zo
Cash and term d
Total
Total Cash per Cas
(i) Unutilised Go Zo
(ii) Comparitive bala
AL LIMITED ANN
structure
Cash and c
ognition and
and short-te-term deposit
he purposes ovalents as def
nd in hand
one Bond funds (i)
deposits (ii)
sh Flow Statement
one Bonds may only b
ance represented part
REPOR
NUAL REPORT
cash equival
measureme
rm deposits its with an orig
of the Cash Ffined above, n
be spent on those capi
tial proceeds from the
RT TO THE M
2014
ents
nt
n the statemeginal maturity
Flow Statemenet of cash he
20
’0
$
$
$
$
$
ital works projects tha
FY2013 capital raisin
MEMBERS O
ent of financiay of three mon
nt, cash and eld as a guar
014 20
00 ’00
77,345 $
77,345 $
9,532 $
-
9,532 $
86,877 1$
at were specifically ide
g that were used in FY
OF AUSTAL L
al position conths or less.
cash equivalrantee.
13
00
38,030
38,030
11,617
58,056
69,673
07,703
entified in the documen
Y2014 to retire Go Zo
LIMITED
mprise cash a
ents consist o
ntation issued to inves
ne debt.
at bank and i
of cash and c
stors.
n hand and
cash
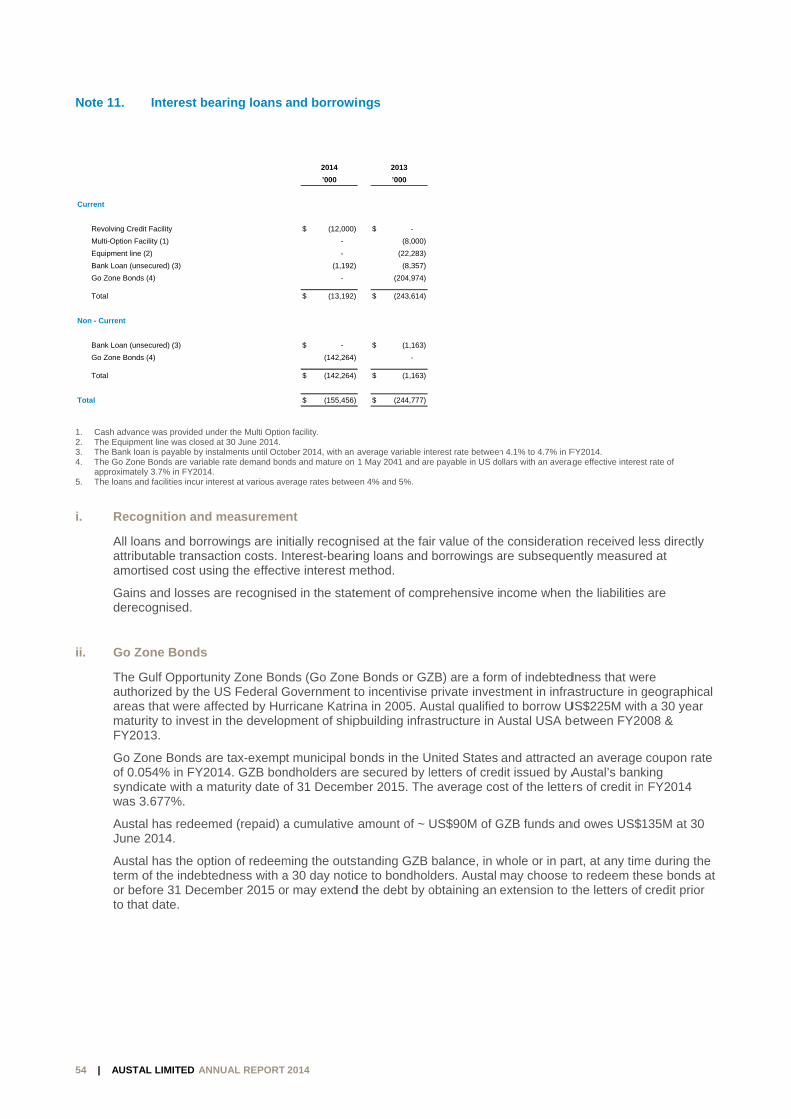
54 | AUSTA
Note 11.
1. Cash advanc2. The Equipme3. The Bank loa4. The Go Zone
approximatel5. The loans an
i. Reco
All loaattribuamort
Gainsderec
ii. Go Zo
The GauthoareasmaturFY20
Go Zoof 0.0syndiwas 3
AustaJune
Austaterm oor befto tha
Current
Revolving Cred
Multi-Option Fa
Equipment line
Bank Loan (uns
Go Zone Bonds
Total
Non - Current
Bank Loan (uns
Go Zone Bonds
Total
Total
AL LIMITED ANN
Interest be
ce was provided unent line was closed an is payable by inse Bonds are variablly 3.7% in FY2014.nd facilities incur int
ognition and
ans and borroutable transatised cost usi
s and losses acognised.
one Bonds
Gulf Opportunorized by the s that were affrity to invest i13.
one Bonds ar054% in FY20cate with a m
3.677%.
al has redeem2014.
al has the optof the indebtefore 31 Dece
at date.
it Facility
cility (1)
(2)
secured) (3)
s (4)
secured) (3)
s (4)
REPOR
NUAL REPORT
aring loans
der the Multi Optioat 30 June 2014.
stalments until Octoe rate demand bon terest at various ave
measureme
owings are inction costs. Inng the effecti
are recognise
nity Zone BonUS Federal Gffected by Hun the develop
re tax-exemp014. GZB bon
maturity date o
med (repaid) a
ion of redeemedness with amber 2015 o
RT TO THE M
2014
and borrowi
n facility.
ober 2014, with an ands and mature on
erage rates betwee
nt
itially recogninterest-bearinive interest m
ed in the state
nds (Go ZoneGovernment trricane Katrinpment of ship
t municipal bondholders areof 31 Decemb
a cumulative
ming the outsta 30 day noticr may extend
2014
’000
(12,000)$
-
-
(1,192)
-
(13,192)$
- $
(142,264)
(142,264)$
(155,456)$
MEMBERS O
ngs
average variable in1 May 2041 and ar
en 4% and 5%.
ised at the fang loans and
method.
ement of com
e Bonds or GZto incentivise na in 2005. Aupbuilding infra
onds in the Ue secured by lber 2015. The
amount of ~
tanding GZB ce to bondhold the debt by o
2013
’000
- $
(8,000)
(22,283)
(8,357)
(204,974)
(243,614)$
(1,163)$
-
(1,163)$
(244,777)$
OF AUSTAL L
nterest rate betweenre payable in US do
ir value of theborrowings a
mprehensive i
ZB) are a formprivate invesustal qualified
astructure in A
United States letters of crede average cos
US$90M of G
balance, in wlders. Austal obtaining an
LIMITED
n 4.1% to 4.7% in Follars with an averag
e consideratioare subseque
ncome when
m of indebtedtment in infra
d to borrow UAustal USA b
and attracteddit issued by Ast of the lette
GZB funds an
whole or in pamay choose textension to t
FY2014. age effective interes
on received leently measure
the liabilities
dness that weastructure in gUS$225M withbetween FY20
d an average Austal’s bankrs of credit in
nd owes US$1
art, at any timto redeem ththe letters of
st rate of
ess directly ed at
s are
ere geographical h a 30 year 008 &
coupon rate king FY2014
135M at 30
e during the ese bonds atcredit prior
t
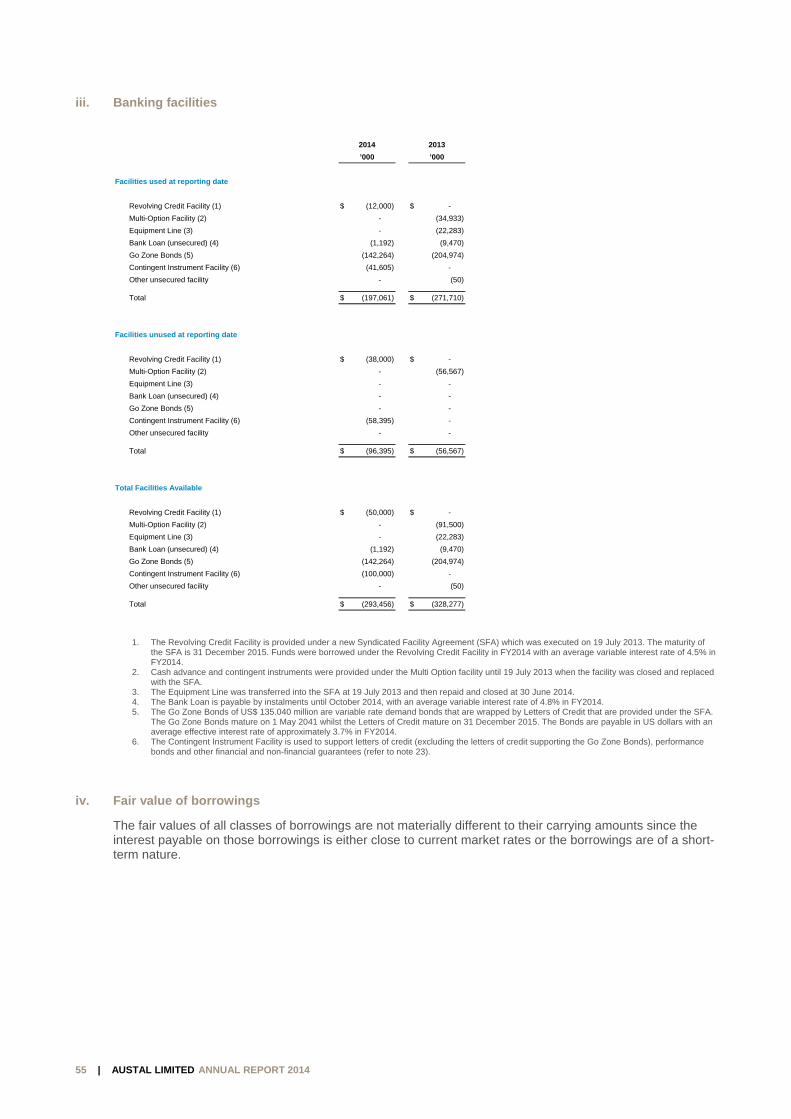
REPORT TO THE MEMBERS OF AUSTAL LIMITED
55 | AUSTAL LIMITED ANNUAL REPORT 2014
iii. Banking facilities
1. The Revolving Credit Facility is provided under a new Syndicated Facility Agreement (SFA) which was executed on 19 July 2013. The maturity of
the SFA is 31 December 2015. Funds were borrowed under the Revolving Credit Facility in FY2014 with an average variable interest rate of 4.5% in FY2014.
2. Cash advance and contingent instruments were provided under the Multi Option facility until 19 July 2013 when the facility was closed and replaced with the SFA.
3. The Equipment Line was transferred into the SFA at 19 July 2013 and then repaid and closed at 30 June 2014. 4. The Bank Loan is payable by instalments until October 2014, with an average variable interest rate of 4.8% in FY2014. 5. The Go Zone Bonds of US$ 135.040 million are variable rate demand bonds that are wrapped by Letters of Credit that are provided under the SFA.
The Go Zone Bonds mature on 1 May 2041 whilst the Letters of Credit mature on 31 December 2015. The Bonds are payable in US dollars with an average effective interest rate of approximately 3.7% in FY2014.
6. The Contingent Instrument Facility is used to support letters of credit (excluding the letters of credit supporting the Go Zone Bonds), performance bonds and other financial and non-financial guarantees (refer to note 23).
iv. Fair value of borrowings
The fair values of all classes of borrowings are not materially different to their carrying amounts since the interest payable on those borrowings is either close to current market rates or the borrowings are of a short-term nature.
2014 2013
’000 ’000
Facilities used at reporting date
Revolving Credit Facility (1) (12,000)$ - $
Multi-Option Facility (2) - (34,933)
Equipment Line (3) - (22,283)
Bank Loan (unsecured) (4) (1,192) (9,470)
Go Zone Bonds (5) (142,264) (204,974)
Contingent Instrument Facility (6) (41,605) -
Other unsecured facility - (50)
Total (197,061)$ (271,710)$
Facilities unused at reporting date
Revolving Credit Facility (1) (38,000)$ - $
Multi-Option Facility (2) - (56,567)
Equipment Line (3) - -
Bank Loan (unsecured) (4) - -
Go Zone Bonds (5) - -
Contingent Instrument Facility (6) (58,395) -
Other unsecured facility - -
Total (96,395)$ (56,567)$
Total Facilities Available
Revolving Credit Facility (1) (50,000)$ - $
Multi-Option Facility (2) - (91,500)
Equipment Line (3) - (22,283)
Bank Loan (unsecured) (4) (1,192) (9,470)
Go Zone Bonds (5) (142,264) (204,974)
Contingent Instrument Facility (6) (100,000) -
Other unsecured facility - (50)
Total (293,456)$ (328,277)$
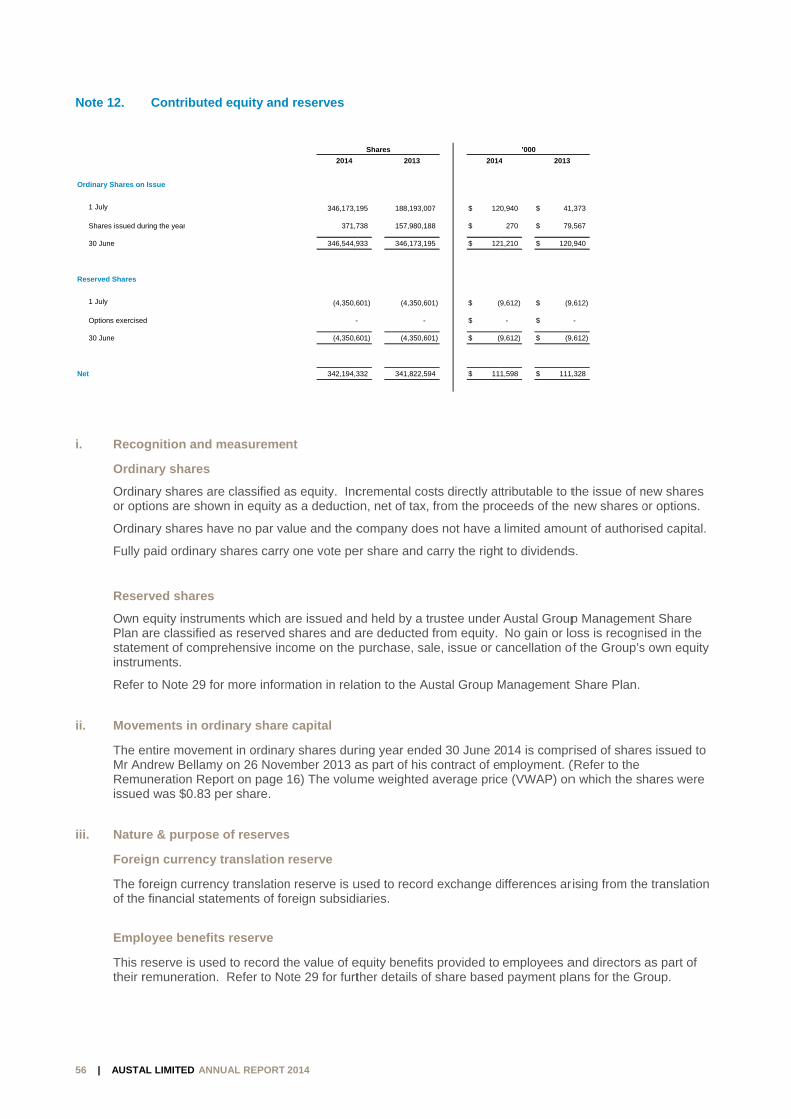
56 | AUSTA
Note 12.
i. Reco
Ordin
Ordinor opt
Ordin
Fully
Rese
Own ePlan astateminstru
Refer
ii. Move
The eMr AnRemuissued
iii. Natur
Forei
The foof the
Empl
This rtheir r
Ordinary Shares on
1 July
Shares issued du
30 June
Reserved Shares
1 July
Options exercise
30 June
Net
AL LIMITED ANN
Contribute
ognition and
nary shares
nary shares artions are show
nary shares ha
paid ordinary
rved shares
equity instrumare classifiedment of comp
uments.
r to Note 29 fo
ements in ord
entire movemndrew Bellamuneration Repd was $0.83
re & purpose
ign currency
oreign currene financial sta
loyee benefit
reserve is useremuneration
n Issue
uring the year
d
REPOR
NUAL REPORT
d equity and
measureme
re classified awn in equity a
ave no par va
y shares carry
ments which ad as reserved prehensive inc
or more inform
dinary share
ent in ordinarmy on 26 Noveport on page per share.
e of reserves
y translation
ncy translationatements of fo
ts reserve
ed to record tn. Refer to No
RT TO THE M
2014
d reserves
nt
as equity. Incas a deductio
alue and the c
y one vote pe
are issued anshares and a
come on the
mation in rela
e capital
ry shares durember 2013 a16) The volum
s
reserve
n reserve is uoreign subsidi
the value of eote 29 for furt
2014
346,173,1
371,7
346,544,9
(4,350,6
-
(4,350,6
342,194,3
MEMBERS O
cremental coson, net of tax,
company doe
er share and c
nd held by a tare deducted purchase, sa
ation to the Au
ring year endeas part of his me weighted
used to recordiaries.
equity benefitsther details of
Shares
2013
195 188,193,00
738 157,980,18
933 346,173,19
601) (4,350,60
- -
601) (4,350,60
332 341,822,59
OF AUSTAL L
sts directly at from the pro
es not have a
carry the right
trustee under from equity.
ale, issue or c
ustal Group M
ed 30 June 2contract of eaverage pric
d exchange d
s provided to f share based
2014
07 120$
88 $
95 12$
01) (9$
$
01) (9$
94 11$
LIMITED
ttributable to tceeds of the
limited amou
t to dividends
Austal Group No gain or lo
cancellation o
Management
014 is comprmployment. (
ce (VWAP) on
differences ar
employees ad payment pla
’000
4 2013
0,940 41$
270 79$
1,210 120$
9,612) (9$
- $
9,612) (9$
1,598 111$
the issue of nnew shares o
unt of authori
s.
p Managemeoss is recogn
of the Group’s
Share Plan.
rised of share(Refer to the n which the sh
rising from the
and directors ans for the G
,373
,567
,940
,612)
-
,612)
,328
new shares or options.
sed capital.
ent Share ised in the
s own equity
es issued to
hares were
e translation
as part of roup.
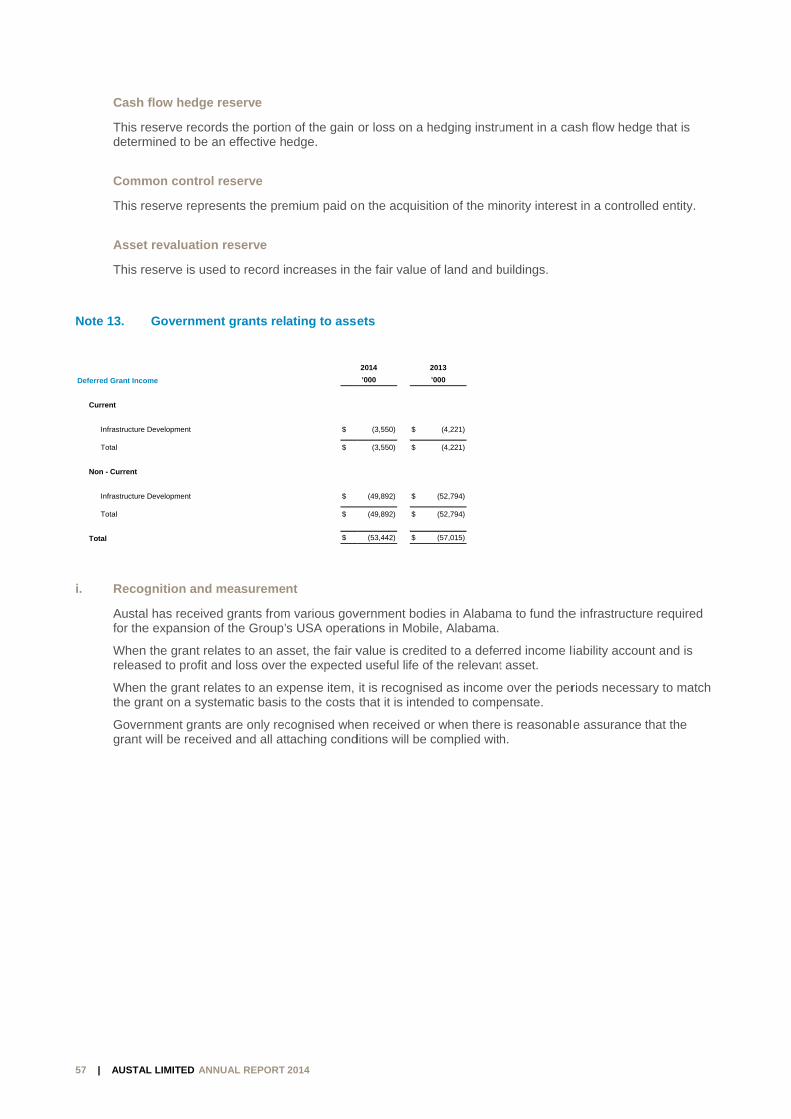
57 | AUSTA
Cash
This rdeterm
Comm
This r
Asse
This r
Note 13.
i. Reco
Austafor the
Whenreleas
Whenthe gr
Govegrant
Deferred Grant Inc
Current
Infrastructure
Total
Non - Current
Infrastructure
Total
Total
AL LIMITED ANN
h flow hedge
reserve recormined to be a
mon control
reserve repre
t revaluation
reserve is use
Governmen
ognition and
al has receivee expansion o
n the grant resed to profit a
n the grant rerant on a syst
rnment grantwill be receiv
ome
e Development
e Development
REPOR
NUAL REPORT
reserve
rds the portionan effective h
reserve
esents the pre
n reserve
ed to record i
nt grants rel
measureme
ed grants fromof the Group’
lates to an asand loss over
lates to an extematic basis
ts are only recved and all at
RT TO THE M
2014
n of the gain edge.
emium paid o
ncreases in t
ating to asse
nt
m various govs USA opera
sset, the fair vthe expected
xpense item, s to the costs
cognised whettaching cond
$
$
$
$
$
MEMBERS O
or loss on a h
n the acquisit
the fair value
ets
vernment bodations in Mobi
value is credid useful life o
it is recognisthat it is inten
en received oditions will be
2014
’000
(3,550) $
(3,550) $
(49,892) $
(49,892) $
(53,442) $
OF AUSTAL L
hedging instru
tion of the mi
of land and b
dies in Alabamle, Alabama.
ted to a deferf the relevant
ed as incomended to comp
or when therecomplied with
2013
’000
(4,221)
(4,221)
(52,794)
(52,794)
(57,015)
LIMITED
ument in a ca
nority interes
buildings.
ma to fund the
rred income lt asset.
e over the perpensate.
is reasonablh.
ash flow hedg
st in a controll
e infrastructur
liability accou
riods necessa
e assurance
ge that is
led entity.
re required
unt and is
ary to match
that the
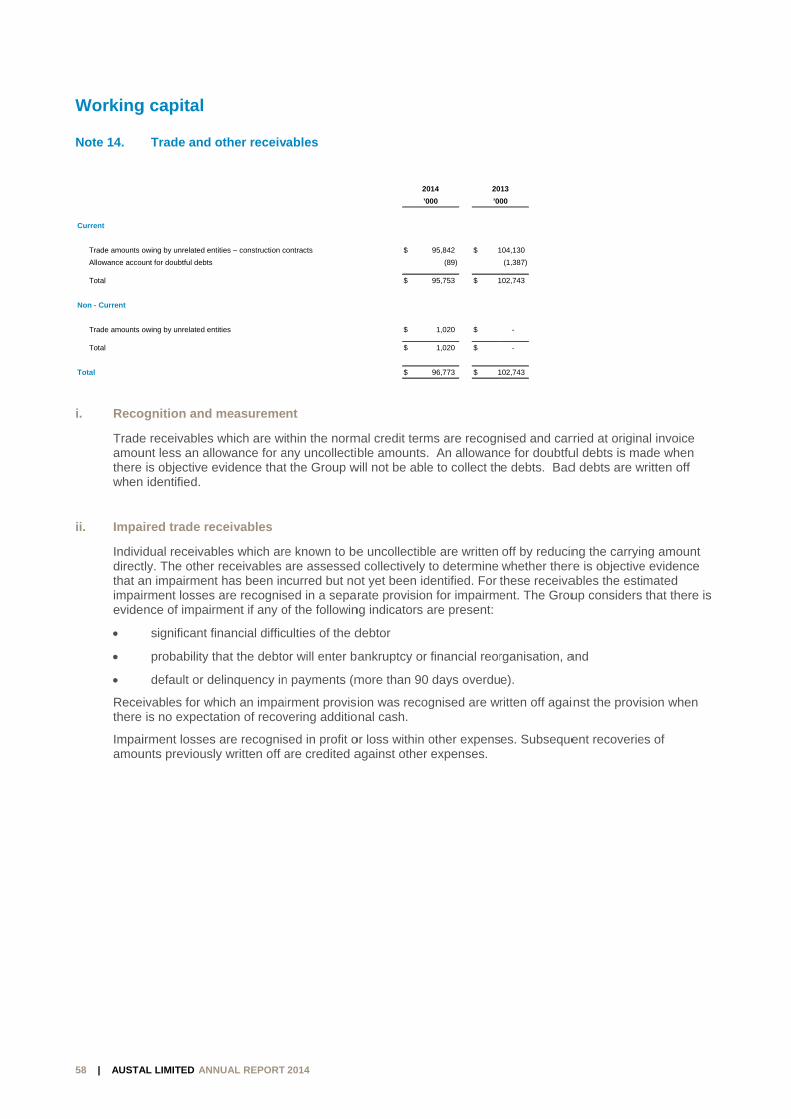
58 | AUSTA
Working
Note 14.
i. Reco
Tradeamouthere when
ii. Impa
Individdirectthat aimpaievide
Recethere
Impaiamou
Current
Trade amounts o
Allowance accou
Total
Non - Current
Trade amounts o
Total
Total
AL LIMITED ANN
g capital
Trade and
ognition and
e receivables unt less an all
is objective e identified.
ired trade re
dual receivabtly. The other an impairmenrment lossesnce of impair
significant f
probability t
default or d
ivables for whis no expecta
irment lossesunts previousl
owing by unrelated en
unt for doubtful debts
owing by unrelated en
REPOR
NUAL REPORT
other receiv
measureme
which are wiowance for a
evidence that
eceivables
bles which arereceivables a
t has been in are recognisrment if any o
inancial diffic
that the debto
elinquency in
hich an impaiation of recov
s are recognisly written off a
ntities – construction c
ntities
RT TO THE M
2014
ables
nt
thin the normany uncollectibt the Group w
e known to beare assessedcurred but no
sed in a separof the followin
ulties of the d
or will enter ba
n payments (m
irment provisivering additio
sed in profit oare credited a
ontracts
MEMBERS O
mal credit termble amounts.
will not be able
e uncollectibld collectively tot yet been idrate provision
ng indicators a
debtor
ankruptcy or
more than 90
ion was recognal cash.
or loss within oagainst other
20
’0
$
$
$
$
$
OF AUSTAL L
ms are recogn An allowance to collect th
e are written to determine
dentified. For tn for impairmeare present:
financial reor
days overdu
gnised are wr
other expensexpenses.
014 20
000 ’00
95,842 1$
(89)
95,753 1$
1,020 $
1,020 $
96,773 1$
LIMITED
nised and carce for doubtfue debts. Bad
off by reducinwhether therthese receivaent. The Grou
rganisation, a
e).
ritten off agai
es. Subseque
13
00
04,130
(1,387)
02,743
-
-
02,743
rried at originaul debts is mad debts are w
ng the carryinre is objectiveables the estiup considers
and
inst the provis
ent recoverie
al invoice ade when
written off
ng amount e evidence mated that there is
sion when
es of
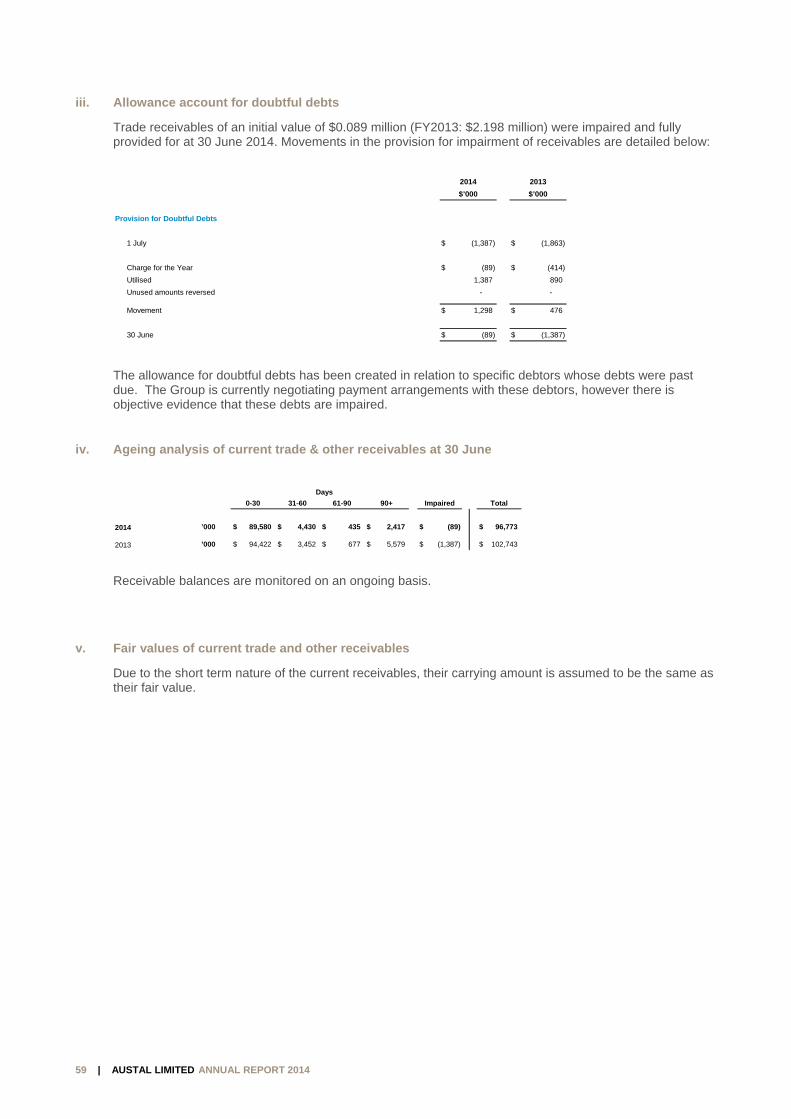
REPORT TO THE MEMBERS OF AUSTAL LIMITED
59 | AUSTAL LIMITED ANNUAL REPORT 2014
iii. Allowance account for doubtful debts
Trade receivables of an initial value of $0.089 million (FY2013: $2.198 million) were impaired and fully provided for at 30 June 2014. Movements in the provision for impairment of receivables are detailed below:
The allowance for doubtful debts has been created in relation to specific debtors whose debts were past due. The Group is currently negotiating payment arrangements with these debtors, however there is objective evidence that these debts are impaired.
iv. Ageing analysis of current trade & other receivables at 30 June
Receivable balances are monitored on an ongoing basis.
v. Fair values of current trade and other receivables
Due to the short term nature of the current receivables, their carrying amount is assumed to be the same as their fair value.
2014 2013
$’000 $’000
Provision for Doubtful Debts
1 July (1,387)$ (1,863)$
Charge for the Year (89)$ (414)$
Utilised 1,387 890
Unused amounts reversed - -
Movement 1,298$ 476$
30 June (89)$ (1,387)$
Days
0-30 31-60 61-90 90+ Impaired Total
2014 ’000 89,580$ 4,430$ 435$ 2,417$ (89)$ 96,773$
2013 ’000 94,422$ 3,452$ 677$ 5,579$ (1,387)$ 102,743$

60 | AUSTA
Note 15.
i. Reco
Constany ppercedate a
ii. Signi
Refer
Note 16.
i. Reco
Stockprodu
Work in Progress
Construction rev
less Progress pa
Total due from c
Progress Payment
Construction rev
less Progress pa
Total due to cust
Total due from / (to
Inventories
Work in progress
Other stock
Total
AL LIMITED ANN
Constructi
ognition and
truction work provision for aentage of comas a proportio
ificant accou
r to Note 4 for
Inventories
ognition and
k and finisheduction overhe
venue recognised to d
ayments received & re
customers
ts Received in Advan
venue recognised to d
ayments received & re
tomers
o) customers
s
REPOR
NUAL REPORT
on contracts
measureme
in progress ianticipated futmpletion basison of estimate
unting judge
r details of es
s and work in
measureme
d goods are vads. Cost of s
ate
eceivable
nce
ate
eceivable
RT TO THE M
2014
s in progress
nt
s valued at cture losses ans. Percentageed total contra
ments and e
stimates made
n progress
nt
alued at the lstock is deter
20
’0
3,6$
(3,2
3$
2$
(2
$
2$
Notes
15
MEMBERS O
s
contract cost ind progress b
e of completioact costs.
estimates
e regarding c
lower of cost rmined on the
014 20
00 ’00
603,494 2,5$
275,969) (2,2
327,525 2$
204,322 $
233,384) (
(29,062) ($
298,463 2$
2014
’000
327,525$
617
328,142$
OF AUSTAL L
ncurred to dabillings. Conson is determin
construction c
and net realise weighted av
13
00
503,102
225,910)
277,192
49,848
(71,638)
(21,790)
255,402
2013
’000
5 277,192$
7 696
2 277,888$
LIMITED
ate, plus profistruction profitned by referen
contracts.
sable value, wverage cost b
2
6
8
it recognised ts are recognnce to actual
where costs ibasis.
to date, less nised on the
costs to
nclude
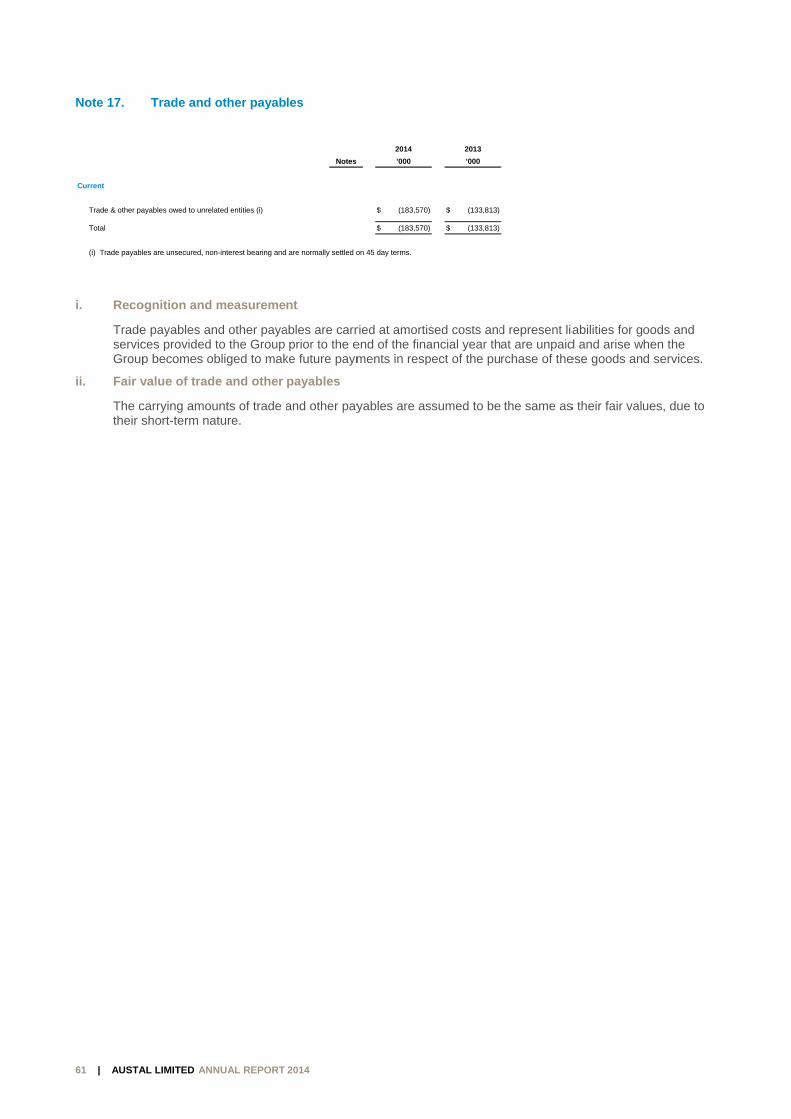
61 | AUSTA
Note 17.
i. Reco
TradeservicGroup
ii. Fair v
The ctheir s
Current
Trade & other pa
Total
(i) Trade payabl
AL LIMITED ANN
Trade and
ognition and
e payables ances provided p becomes ob
value of trad
carrying amoushort-term na
ayables owed to unrela
es are unsecured, non
REPOR
NUAL REPORT
other payab
measureme
nd other payato the Group bliged to mak
e and other
unts of trade aature.
ated entities (i)
n-interest bearing and
RT TO THE M
2014
les
nt
ables are carrprior to the e
ke future paym
payables
and other pay
Notes
are normally settled o
MEMBERS O
ried at amortisend of the finaments in resp
yables are as
2014
’000
(183,570)$
(183,570)$
on 45 day terms.
OF AUSTAL L
sed costs andancial year thpect of the pu
ssumed to be
2013
’000
) (133,813)$
) (133,813)$
LIMITED
d represent liaat are unpaidrchase of the
the same as
abilities for god and arise wese goods an
s their fair valu
oods and hen the d services.
ues, due to
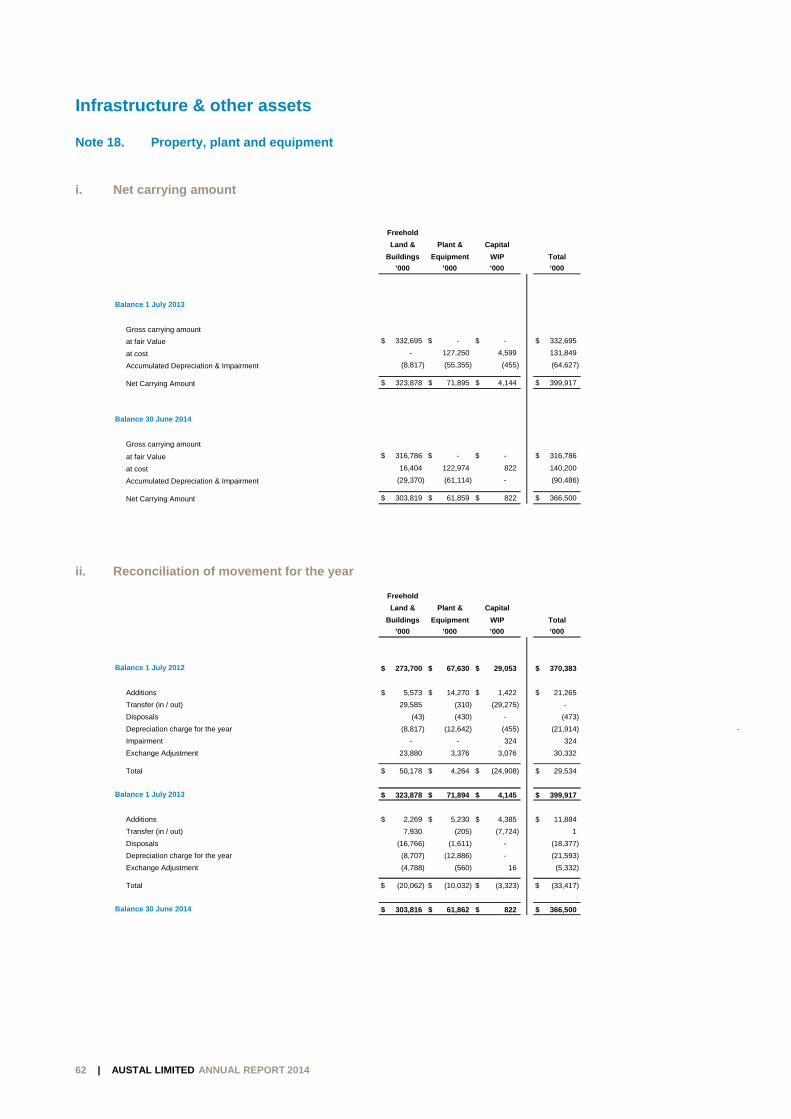
62 | AUSTA
Infrastru
Note 18.
i. Net c
ii. Reco
Balance
Gross
at fair
at cos
Accu
Net C
Balance
Gross
at fair
at cos
Accu
Net C
Balance
Addit
Trans
Dispo
Depre
Impai
Excha
Total
Balance
Addit
Trans
Dispo
Depre
Excha
Total
Balance
AL LIMITED ANN
ucture & o
Property, p
carrying amo
onciliation of
e 1 July 2013
s carrying amount
r Value
st
mulated Depreciation
Carrying Amount
e 30 June 2014
s carrying amount
r Value
st
mulated Depreciation
Carrying Amount
e 1 July 2012
ions
sfer (in / out)
osals
eciation charge for the
irment
ange Adjustment
e 1 July 2013
ions
sfer (in / out)
osals
eciation charge for the
ange Adjustment
e 30 June 2014
REPOR
NUAL REPORT
other ass
plant and equ
ount
f movement f
& Impairment
& Impairment
e year
e year
RT TO THE M
2014
ets
uipment
for the year
MEMBERS O
Freehold
Land &
Buildings
’000
332,695$ $
-
(8,817)
323,878$ $
316,786$ $
16,404
(29,370)
303,819$ $
Freehold
Land &
Buildings
’000
273,700$ $
5,573$ $
29,585
(43)
(8,817)
-
23,880
50,178$ $
323,878$ $
2,269$ $
7,930
(16,766)
(8,707)
(4,788)
(20,062)$ $
303,816$ $
OF AUSTAL L
Plant & Capi
Equipment WIP
’000 ’000
- $ $
127,250 4
(55,355)
71,895$ 4$
- $ $
122,974
(61,114)
61,859$ $
Plant & Capi
Equipment WIP
’000 ’000
67,630$ 29$
14,270$ 1$
(310) (29
(430)
(12,642)
-
3,376 3
4,264$ (24$
71,894$ 4$
5,230$ 4$
(205) (7
(1,611)
(12,886)
(560)
(10,032)$ (3$
61,862$ $
LIMITED
tal
P Total
0 ’000
- 332,69$
4,599 131,84
(455) (64,62
4,144 399,91$
- 316,78$
822 140,20
- (90,48
822 366,50$
tal
P Total
0 ’000
9,053 370,38$
1,422 21,26$
9,275) -
- (47
(455) (21,91
324 32
3,076 30,33
4,908) 29,53$
4,145 399,91$
4,385 11,88$
7,724)
- (18,37
- (21,59
16 (5,33
3,323) (33,41$
822 366,50$
95
49
27)
7
86
00
86)
00
83
65
73)
4)
24
32
34
7
84
1
77)
93)
32)
7)
00
-
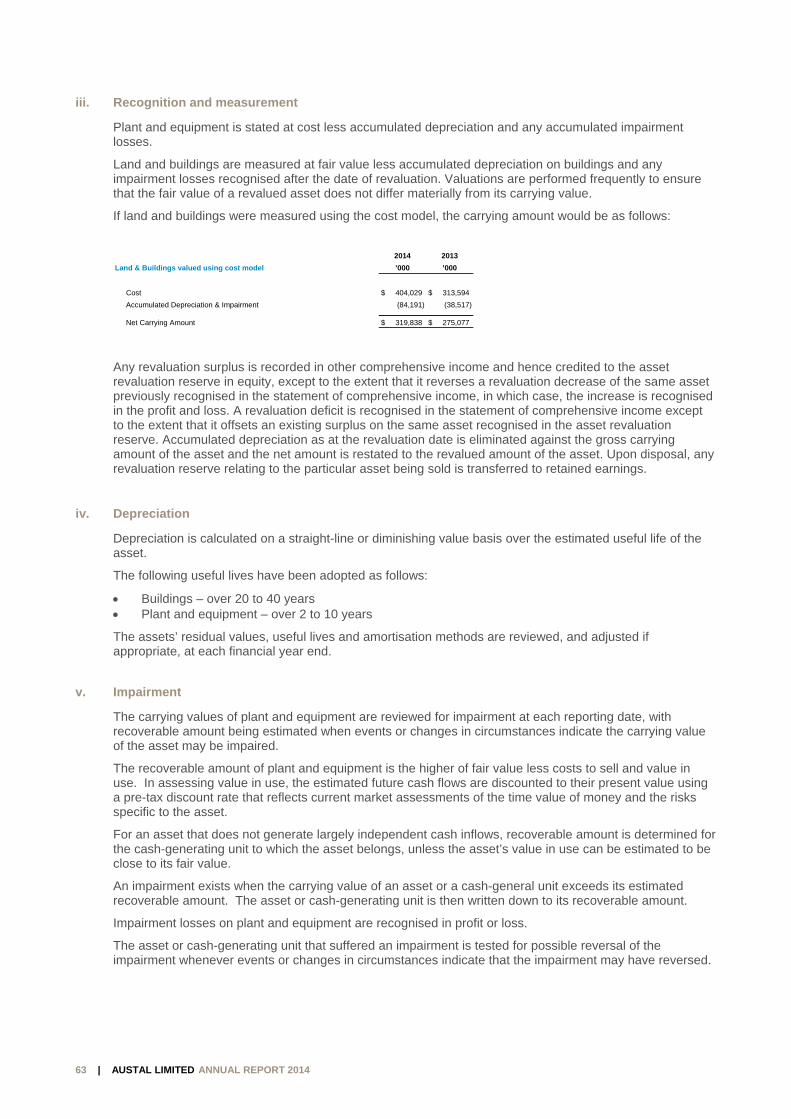
REPORT TO THE MEMBERS OF AUSTAL LIMITED
63 | AUSTAL LIMITED ANNUAL REPORT 2014
iii. Recognition and measurement
Plant and equipment is stated at cost less accumulated depreciation and any accumulated impairment losses.
Land and buildings are measured at fair value less accumulated depreciation on buildings and any impairment losses recognised after the date of revaluation. Valuations are performed frequently to ensure that the fair value of a revalued asset does not differ materially from its carrying value.
If land and buildings were measured using the cost model, the carrying amount would be as follows:
Any revaluation surplus is recorded in other comprehensive income and hence credited to the asset revaluation reserve in equity, except to the extent that it reverses a revaluation decrease of the same asset previously recognised in the statement of comprehensive income, in which case, the increase is recognised in the profit and loss. A revaluation deficit is recognised in the statement of comprehensive income except to the extent that it offsets an existing surplus on the same asset recognised in the asset revaluation reserve. Accumulated depreciation as at the revaluation date is eliminated against the gross carrying amount of the asset and the net amount is restated to the revalued amount of the asset. Upon disposal, any revaluation reserve relating to the particular asset being sold is transferred to retained earnings.
iv. Depreciation
Depreciation is calculated on a straight-line or diminishing value basis over the estimated useful life of the asset.
The following useful lives have been adopted as follows:
Buildings – over 20 to 40 years Plant and equipment – over 2 to 10 years
The assets’ residual values, useful lives and amortisation methods are reviewed, and adjusted if appropriate, at each financial year end.
v. Impairment
The carrying values of plant and equipment are reviewed for impairment at each reporting date, with recoverable amount being estimated when events or changes in circumstances indicate the carrying value of the asset may be impaired.
The recoverable amount of plant and equipment is the higher of fair value less costs to sell and value in use. In assessing value in use, the estimated future cash flows are discounted to their present value using a pre-tax discount rate that reflects current market assessments of the time value of money and the risks specific to the asset.
For an asset that does not generate largely independent cash inflows, recoverable amount is determined for the cash-generating unit to which the asset belongs, unless the asset’s value in use can be estimated to be close to its fair value.
An impairment exists when the carrying value of an asset or a cash-general unit exceeds its estimated recoverable amount. The asset or cash-generating unit is then written down to its recoverable amount.
Impairment losses on plant and equipment are recognised in profit or loss.
The asset or cash-generating unit that suffered an impairment is tested for possible reversal of the impairment whenever events or changes in circumstances indicate that the impairment may have reversed.
2014 2013
Land & Buildings valued using cost model ’000 ’000
Cost 404,029$ 313,594$
Accumulated Depreciation & Impairment (84,191) (38,517)
Net Carrying Amount 319,838$ 275,077$
REPORT TO THE MEMBERS OF AUSTAL LIMITED
64 | AUSTAL LIMITED ANNUAL REPORT 2014
vi. De-recognition and disposal
An item of property, plant and equipment is derecognised upon disposal or when no further future economic benefits are expected from its use.
Any gain or loss arising on de-recognition of the asset (calculated as the difference between the net disposal proceeds and the carrying amount of the asset) is included in the profit and loss in the year the asset is derecognised.
vii. Key judgements and accounting estimates
Estimation of useful lives of assets
The estimation of the useful lives of assets has been based on historical experience. In addition, the condition of the assets is assessed at least once per year and considered against the remaining useful life. Adjustments to useful life are made when considered necessary.
Revaluation of land and buildings
Information about the valuation of land and buildings is provided in Note 21.iii.
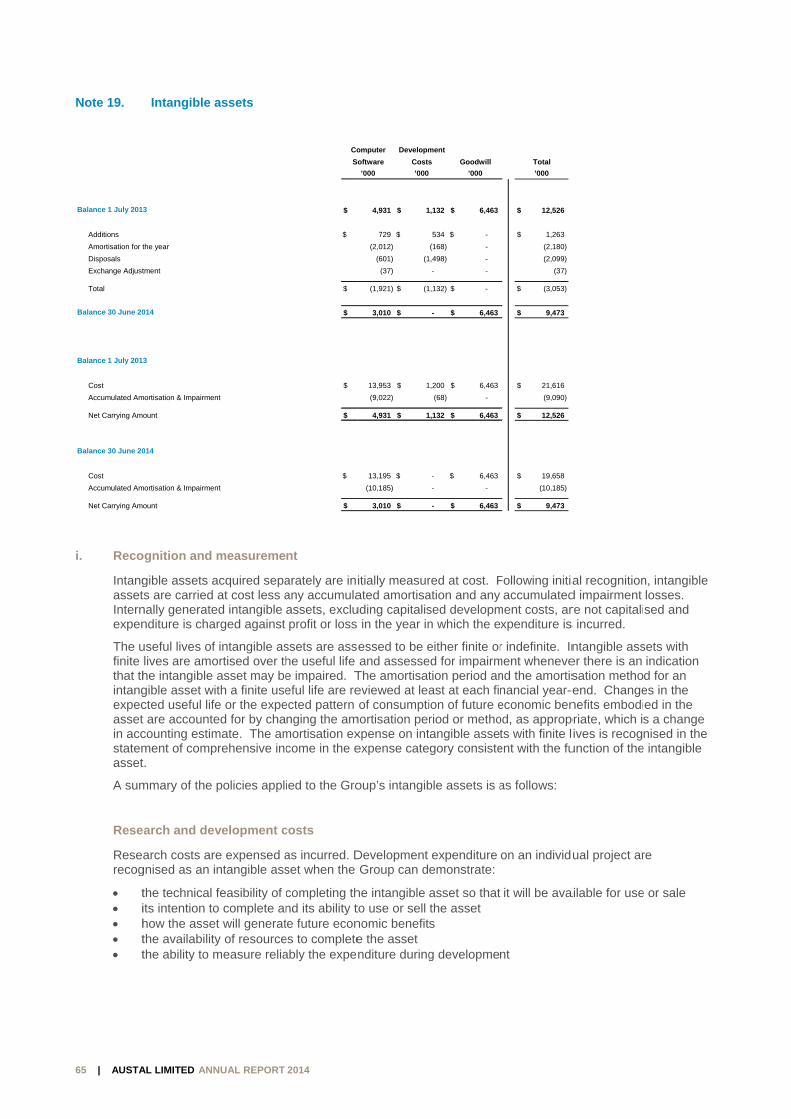
65 | AUSTA
Note 19.
i. Reco
IntangassetInternexpen
The ufinite that thintangexpecassetin accstatemasset
A sum
Rese
Researecog
t i h t t
Balance 1 July 201
Additions
Amortisation for t
Disposals
Exchange Adjust
Total
Balance 30 June 20
Balance 1 July 201
Cost
Accumulated Am
Net Carrying Am
Balance 30 June 20
Cost
Accumulated Am
Net Carrying Am
AL LIMITED ANN
Intangible
ognition and
gible assets ats are carried nally generatenditure is cha
useful lives oflives are amohe intangible gible asset wicted useful lift are accountecounting estimment of compt.
mmary of the
arch and de
arch costs argnised as an i
the technical its intention tohow the assethe availabilitthe ability to m
3
the year
tment
014
3
mortisation & Impairme
ount
014
mortisation & Impairme
ount
REPOR
NUAL REPORT
assets
measureme
acquired sepaat cost less a
ed intangible arged against
f intangible asortised over thasset may beith a finite usefe or the expeed for by chamate. The amprehensive inc
policies appl
velopment c
re expensed aintangible ass
feasibility of co complete an
et will generaty of resourcemeasure relia
nt
nt
RT TO THE M
2014
nt
arately are iniany accumulaassets, excluprofit or loss
ssets are asshe useful life e impaired. Teful life are re
ected pattern nging the am
mortisation excome in the e
ied to the Gro
costs
as incurred. Dset when the
completing thnd its ability tte future econes to completeably the expe
Co
S
$
$
$
$
$
$
$
$
MEMBERS O
itially measurated amortisauding capitalis in the year in
essed to be eand assesse
The amortisateviewed at leaof consumpti
mortisation perxpense on intexpense cate
oup’s intangib
Development Group can d
he intangible to use or sell nomic benefite the asset nditure during
omputer Developm
oftware Costs
’000 ’000
4,931 1$
729 $
(2,012)
(601) (1
(37)
(1,921) (1$
3,010 $
13,953 1$
(9,022)
4,931 1$
13,195 $
(10,185)
3,010 $
OF AUSTAL L
red at cost. Fation and any sed developmn which the e
either finite ored for impairmtion period anast at each finion of future eriod or methotangible assetgory consiste
ble assets is a
expenditure emonstrate:
asset so that the asset s
g developme
ment
s Goodwill
’000
,132 6,463$
534 - $
(168) -
,498) -
- -
,132) - $
- 6,463$
,200 6,463$
(68) -
,132 6,463$
- 6,463$
- -
- 6,463$
LIMITED
Following initiaaccumulated
ment costs, arxpenditure is
r indefinite. Inment whenevend the amortisnancial year-eeconomic benod, as appropts with finite l
ent with the fu
as follows:
on an individ
it will be ava
nt
Total
’000
12,526$
1,263$
(2,180)
(2,099)
(37)
(3,053)$
9,473$
21,616$
(9,090)
12,526$
19,658$
(10,185)
9,473$
al recognitiond impairment re not capitalis incurred.
ntangible asser there is an sation methoend. Changenefits embodipriate, which isives is recog
unction of the
ual project ar
ailable for use
n, intangible losses. sed and
sets with indication d for an es in the ed in the s a change nised in the
e intangible
re
e or sale
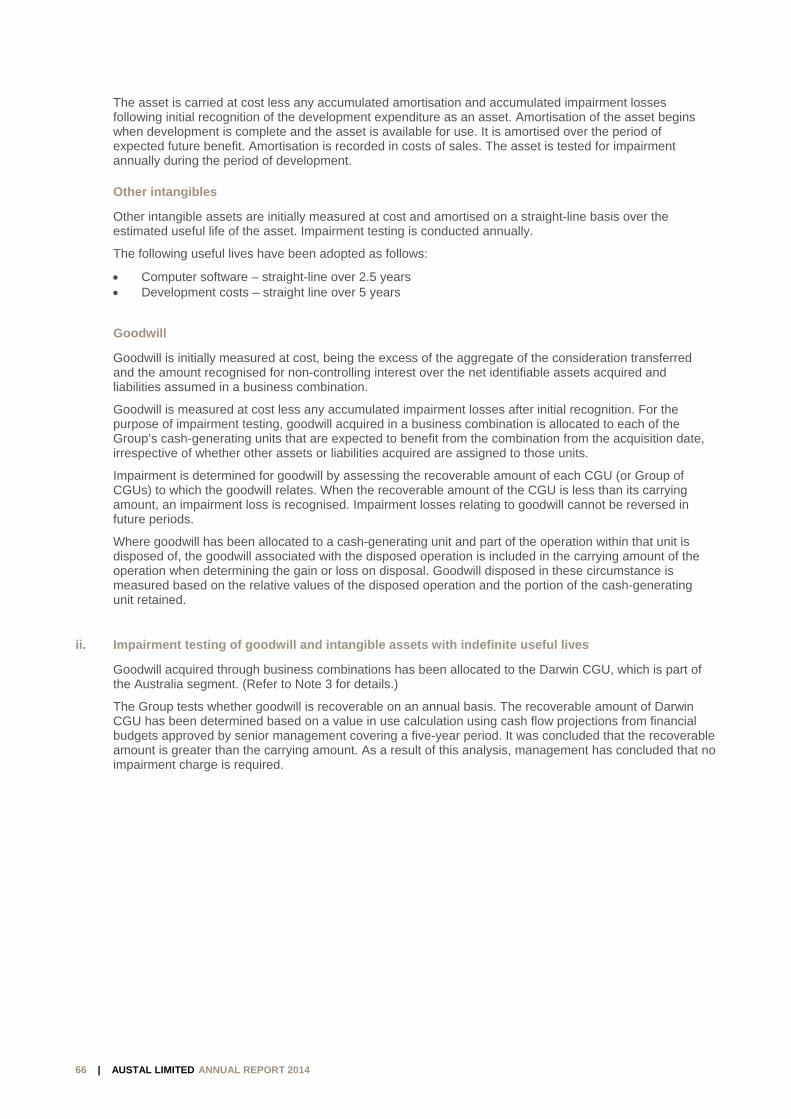
REPORT TO THE MEMBERS OF AUSTAL LIMITED
66 | AUSTAL LIMITED ANNUAL REPORT 2014
The asset is carried at cost less any accumulated amortisation and accumulated impairment losses following initial recognition of the development expenditure as an asset. Amortisation of the asset begins when development is complete and the asset is available for use. It is amortised over the period of expected future benefit. Amortisation is recorded in costs of sales. The asset is tested for impairment annually during the period of development. Other intangibles
Other intangible assets are initially measured at cost and amortised on a straight-line basis over the estimated useful life of the asset. Impairment testing is conducted annually.
The following useful lives have been adopted as follows:
Computer software – straight-line over 2.5 years Development costs – straight line over 5 years
Goodwill
Goodwill is initially measured at cost, being the excess of the aggregate of the consideration transferred and the amount recognised for non-controlling interest over the net identifiable assets acquired and liabilities assumed in a business combination.
Goodwill is measured at cost less any accumulated impairment losses after initial recognition. For the purpose of impairment testing, goodwill acquired in a business combination is allocated to each of the Group’s cash-generating units that are expected to benefit from the combination from the acquisition date, irrespective of whether other assets or liabilities acquired are assigned to those units.
Impairment is determined for goodwill by assessing the recoverable amount of each CGU (or Group of CGUs) to which the goodwill relates. When the recoverable amount of the CGU is less than its carrying amount, an impairment loss is recognised. Impairment losses relating to goodwill cannot be reversed in future periods.
Where goodwill has been allocated to a cash-generating unit and part of the operation within that unit is disposed of, the goodwill associated with the disposed operation is included in the carrying amount of the operation when determining the gain or loss on disposal. Goodwill disposed in these circumstance is measured based on the relative values of the disposed operation and the portion of the cash-generating unit retained.
ii. Impairment testing of goodwill and intangible assets with indefinite useful lives
Goodwill acquired through business combinations has been allocated to the Darwin CGU, which is part of the Australia segment. (Refer to Note 3 for details.)
The Group tests whether goodwill is recoverable on an annual basis. The recoverable amount of Darwin CGU has been determined based on a value in use calculation using cash flow projections from financial budgets approved by senior management covering a five-year period. It was concluded that the recoverable amount is greater than the carrying amount. As a result of this analysis, management has concluded that no impairment charge is required.
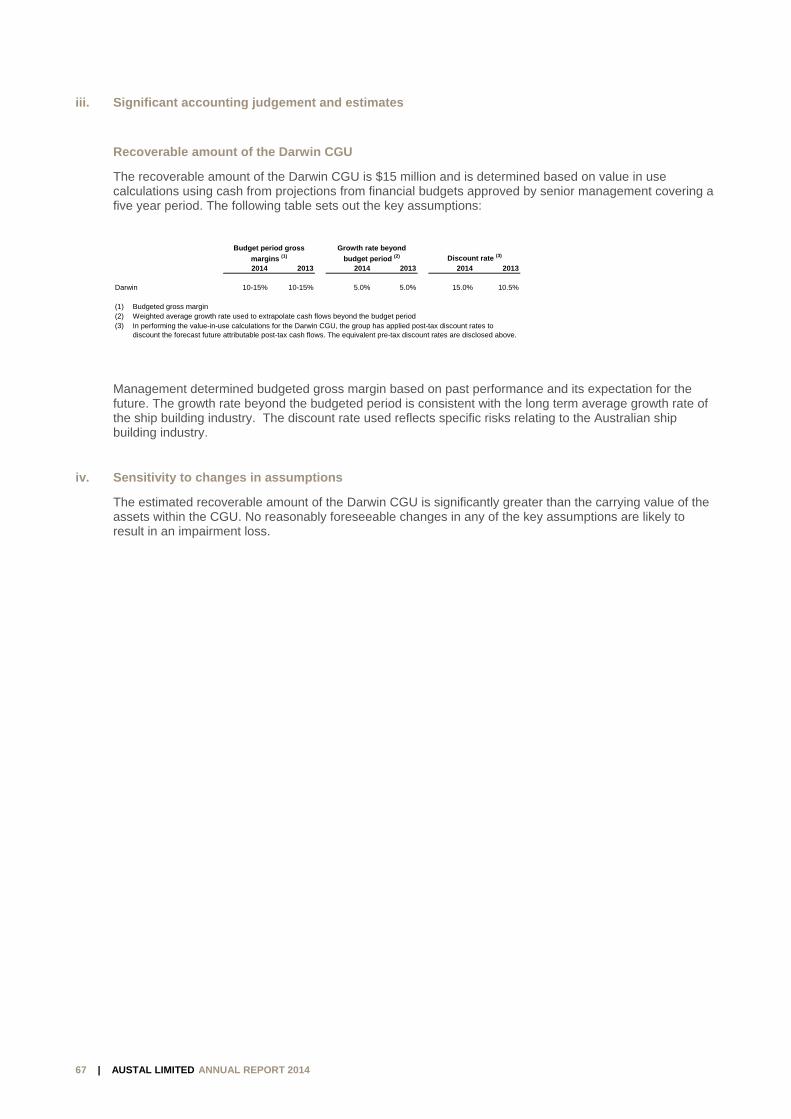
REPORT TO THE MEMBERS OF AUSTAL LIMITED
67 | AUSTAL LIMITED ANNUAL REPORT 2014
iii. Significant accounting judgement and estimates
Recoverable amount of the Darwin CGU
The recoverable amount of the Darwin CGU is $15 million and is determined based on value in use calculations using cash from projections from financial budgets approved by senior management covering a five year period. The following table sets out the key assumptions:
Management determined budgeted gross margin based on past performance and its expectation for the future. The growth rate beyond the budgeted period is consistent with the long term average growth rate of the ship building industry. The discount rate used reflects specific risks relating to the Australian ship building industry.
iv. Sensitivity to changes in assumptions
The estimated recoverable amount of the Darwin CGU is significantly greater than the carrying value of the assets within the CGU. No reasonably foreseeable changes in any of the key assumptions are likely to result in an impairment loss.
Discount rate (3)
2014 2013 2014 2013 2014 2013
Darwin 10-15% 10-15% 5.0% 5.0% 15.0% 10.5%
(1) Budgeted gross margin(2) Weighted average growth rate used to extrapolate cash flows beyond the budget period(3)
Growth rate beyond
budget period (2)
Budget period gross
margins (1)
In performing the value-in-use calculations for the Darwin CGU, the group has applied post-tax discount rates to discount the forecast future attributable post-tax cash flows. The equivalent pre-tax discount rates are disclosed above.
68 | AUSTA
Other lia
Note 20.
i. Reco
Provispast ethe ob
Proviseffect
The inis use
ii. Inform
Wage
Liabilbe seservicliabilit
Long
The lipresethe reobligaemplopaymterms
Provisons at 1 J
Arising during
Utilised
Unused amou
Effects of fore
Movement
Provisions at 30
2013
Current
Non-Current
Total
2014
Current
Non-Current
Total
AL LIMITED ANN
abilities
Provisions
ognition and
sions are recevent, it is probligation and
sions are disct of the time v
ncrease in theed.
mation abou
es, salaries,
ities for wageettled within 1ces up to the ties are settle
g service leav
iability for lonent value of exeporting date.ations. This reoyees attainin
ments are discs to maturity a
uly 2013
the year
unts reversed
eign exchange
June 2014
REPOR
NUAL REPORT
s
measureme
ognised wheobable that aa reliable est
counted usingvalue of mone
e provision d
ut individual
vested sick
es and salarie2 months of treporting dat
ed.
ve
g service leaxpected futur. Assumptionequires estimng the servicecounted usingand currencie
Employee
Benefits
’000
(11,193)$
(14,912)$
12,648
(102)
(164)
(2,530)$
(13,723)$
Employee
Benefits
’000
(10,088)$ $
(1,105)
(11,193)$ $
(12,700)$ $
(1,023)
(13,723)$ $
RT TO THE M
2014
nt
n the Group hn outflow of rtimate can be
g a current prey is material
ue to the pas
provisions a
leave, work
es, including nthe reporting te. They are
ve is recognisre payments tns are formula
mation of future period requg market yieldes that match,
Workers'
Compensation W
’000
(6,449)$ $
(5,400)$ $
3,648
-
57
(1,695)$ $
(8,144)$ $
Workers'
Compensation W
’000
(6,449) $
-
(6,449)$ $
(8,144) $
-
(8,144)$ $
MEMBERS O
has a presentresources eme made of the
re-tax rate tha.
ssage of time
and significa
safe bonus
non-monetarydate are recomeasured at
sed in the proto be made inated when dere wage and sired to qualify
ds at the repo, as closely a
Warranty Other
’000 ’000
(6,510) (3,1$
(5,314) (6,2$
5,249 2,8
- 2
-
(65) (3,0$
(6,575) (6,2$
Warranty Other
’000 ’000
(6,510) (2,08$
- (1,11
(6,510) (3,19$
(6,575) (6,28$
- -
(6,575) (6,28$
OF AUSTAL L
t obligation (lmbodying econe amount of th
at reflects the
is recognised
ant accountin
and other sh
y benefits andognised in oththe amounts
ovision for emn respect of setermining thesalary levels ay for long serv
orting date on s possible, th
Total
’000
93) (27,345)$
204) (31,830)$
827 24,372
269 167
16 (91)
092) (7,382)$
285) (34,727)$
Total
’000
1) (25,128)$
2) (2,217)
3) (27,345)$
5) (33,704)$
(1,023)
5) (34,727)$
LIMITED
egal or constnomic benefithe obligation.
e risks specific
d as a finance
ng estimates
hort term ben
d accumulatinher payables
expected to
mployee beneervices provid
e Group’s lonand the probavice leave benational gove
he estimated f
)
)
)
)
)
tructive) as a ts will be requ
c to the liabili
e cost when d
s
nefits
ng sick leave in respect of be paid when
efits and meaded by emplog service leaability of curre
enefits. Expecvernment bonfuture cash o
result of a uired to settle
ity if the
discounting
expected to employees’
n the
sured as the oyees up to ve ent cted future ds with
outflows.
e
REPORT TO THE MEMBERS OF AUSTAL LIMITED
69 | AUSTAL LIMITED ANNUAL REPORT 2014
Dividends
A provision for dividends is not recognised as a liability unless the dividends are declared, determined or publicly recommended on or before the reporting date. No provision for dividends has been recognised as at 30 June 2014. (FY2013: nil).
Warranties
Provision for warranty is made upon delivery of the vessels based on the estimated future costs of warranty repairs on vessels.
Workers’ compensation insurance
A provision for workers’ compensation insurance is recognised for the expected costs of current claims and claims incurred but not reported at the balance date.
Other
Other includes a provision for refitting a military vessel to return it to a passenger ferry specification. This is consistent with the comparative period.
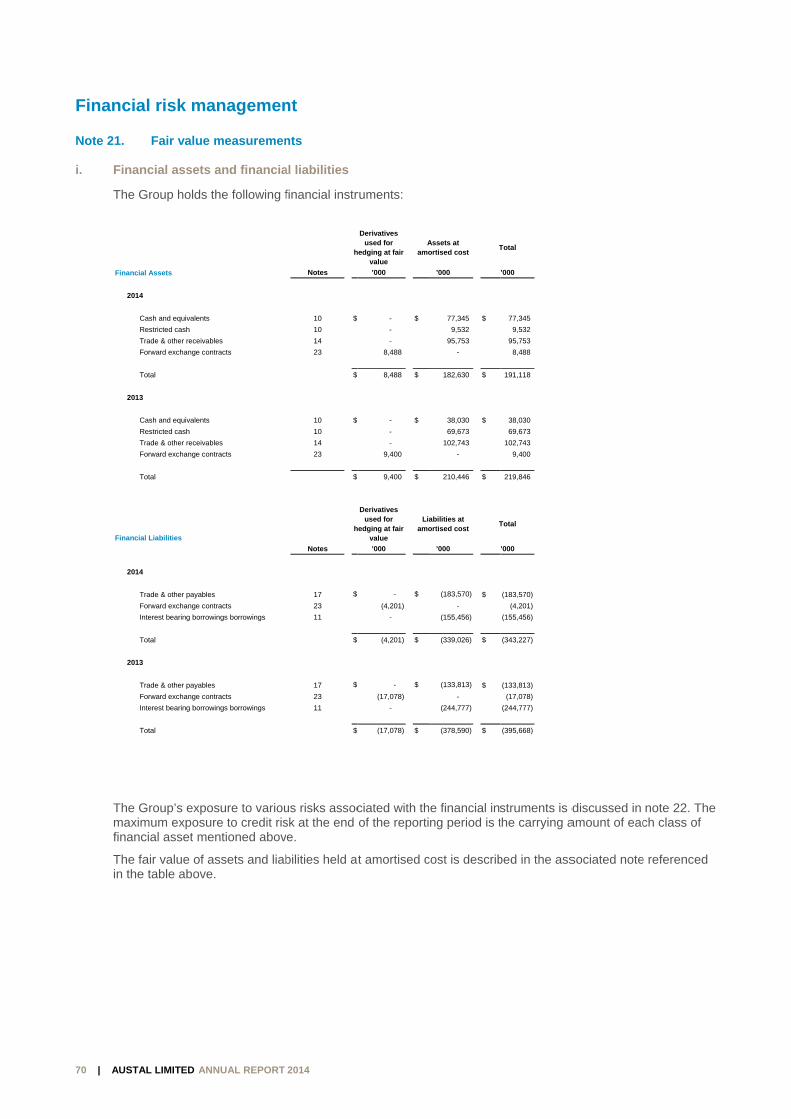
70 | AUSTA
Financia
Note 21.
i. Finan
The G
The Gmaximfinanc
The fain the
Financia
2014
C
R
T
F
T
2013
C
R
T
F
T
Financia
2014
T
F
In
T
2013
T
F
In
T
AL LIMITED ANN
al risk ma
Fair value m
ncial assets
Group holds t
Group’s exposmum exposurcial asset me
air value of ae table above.
al Assets
Cash and equivalents
Restricted cash
Trade & other receivabl
Forward exchange cont
Total
Cash and equivalents
Restricted cash
Trade & other receivabl
Forward exchange cont
Total
al Liabilities
Trade & other payables
Forward exchange cont
nterest bearing borrow
Total
Trade & other payables
Forward exchange cont
nterest bearing borrow
Total
REPOR
NUAL REPORT
anagemen
measuremen
and financia
he following f
sure to varioure to credit risntioned abov
ssets and liab.
les
tracts
les
tracts
s
tracts
ings borrowings
s
tracts
ings borrowings
RT TO THE M
2014
nt
nts
al liabilities
financial instr
us risks assocsk at the end ve.
bilities held a
h
Notes
10 $
10
14
23
$
10 $
10
14
23
$
h
Notes
17 $
23
11
$
17 $
23
11
$
MEMBERS O
ruments:
ciated with thof the reporti
t amortised c
Derivatives used for
hedging at fair value
Aamo
’000
- $
-
-
8,488
8,488 $
- $
-
-
9,400
9,400 $
Derivatives used for
hedging at fair value
Liaamo
’000
- $
(4,201)
-
(4,201) $
- $
(17,078)
-
(17,078) $
OF AUSTAL L
he financial insng period is t
cost is describ
Assets at ortised cost
T
’000
77,345 $
9,532
95,753
-
182,630 $
38,030 $
69,673
102,743
-
210,446 $
abilities at ortised cost
T
’000
(183,570) $
-
(155,456)
(339,026) $
(133,813) $
-
(244,777)
(378,590) $
LIMITED
struments is dthe carrying a
bed in the ass
Total
’000
77,345
9,532
95,753
8,488
191,118
38,030
69,673
102,743
9,400
219,846
Total
’000
(183,570)
(4,201)
(155,456)
(343,227)
(133,813)
(17,078)
(244,777)
(395,668)
discussed in amount of eac
sociated note
note 22. Thech class of
e referenced
e
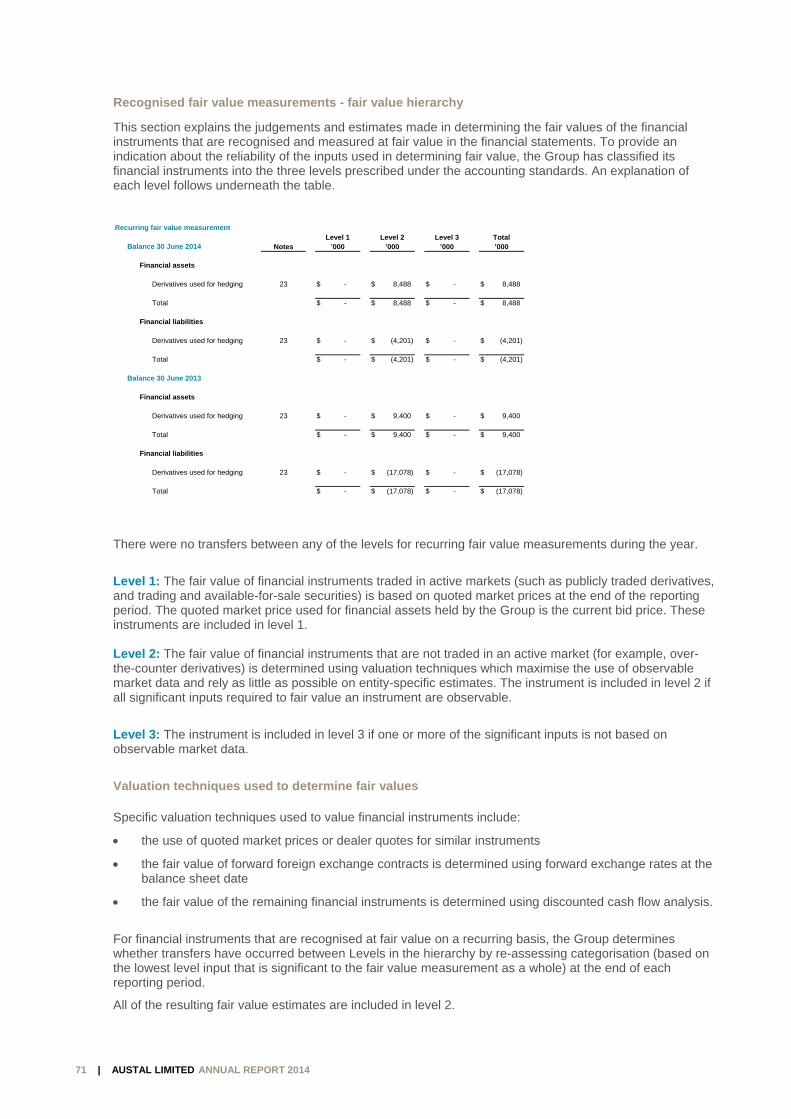
REPORT TO THE MEMBERS OF AUSTAL LIMITED
71 | AUSTAL LIMITED ANNUAL REPORT 2014
Recognised fair value measurements - fair value hierarchy
This section explains the judgements and estimates made in determining the fair values of the financial instruments that are recognised and measured at fair value in the financial statements. To provide an indication about the reliability of the inputs used in determining fair value, the Group has classified its financial instruments into the three levels prescribed under the accounting standards. An explanation of each level follows underneath the table.
There were no transfers between any of the levels for recurring fair value measurements during the year.
Level 1: The fair value of financial instruments traded in active markets (such as publicly traded derivatives, and trading and available-for-sale securities) is based on quoted market prices at the end of the reporting period. The quoted market price used for financial assets held by the Group is the current bid price. These instruments are included in level 1. Level 2: The fair value of financial instruments that are not traded in an active market (for example, over-the-counter derivatives) is determined using valuation techniques which maximise the use of observable market data and rely as little as possible on entity-specific estimates. The instrument is included in level 2 if all significant inputs required to fair value an instrument are observable.
Level 3: The instrument is included in level 3 if one or more of the significant inputs is not based on observable market data.
Valuation techniques used to determine fair values Specific valuation techniques used to value financial instruments include:
the use of quoted market prices or dealer quotes for similar instruments
the fair value of forward foreign exchange contracts is determined using forward exchange rates at the balance sheet date
the fair value of the remaining financial instruments is determined using discounted cash flow analysis.
For financial instruments that are recognised at fair value on a recurring basis, the Group determines whether transfers have occurred between Levels in the hierarchy by re-assessing categorisation (based on the lowest level input that is significant to the fair value measurement as a whole) at the end of each reporting period.
All of the resulting fair value estimates are included in level 2.
Recurring fair value measurementLevel 1 Level 2 Level 3 Total
Balance 30 June 2014 Notes ’000 ’000 ’000 ’000
Financial assets
Derivatives used for hedging 23 - $ 8,488$ - $ 8,488$
Total - $ 8,488$ - $ 8,488$
Financial liabilities
Derivatives used for hedging 23 - $ (4,201)$ - $ (4,201)$
Total - $ (4,201)$ - $ (4,201)$
Balance 30 June 2013
Financial assets
Derivatives used for hedging 23 - $ 9,400$ - $ 9,400$
Total - $ 9,400$ - $ 9,400$
Financial liabilities
Derivatives used for hedging 23 - $ (17,078)$ - $ (17,078)$
Total - $ (17,078)$ - $ (17,078)$
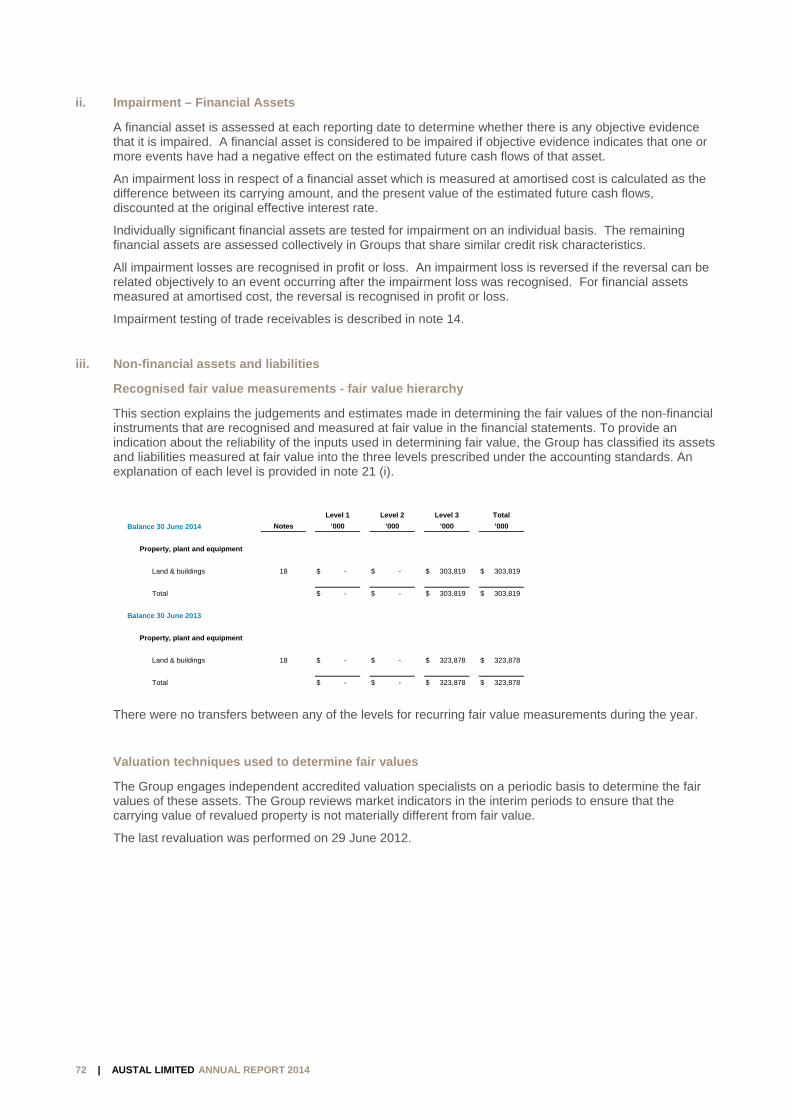
REPORT TO THE MEMBERS OF AUSTAL LIMITED
72 | AUSTAL LIMITED ANNUAL REPORT 2014
ii. Impairment – Financial Assets
A financial asset is assessed at each reporting date to determine whether there is any objective evidence that it is impaired. A financial asset is considered to be impaired if objective evidence indicates that one or more events have had a negative effect on the estimated future cash flows of that asset.
An impairment loss in respect of a financial asset which is measured at amortised cost is calculated as the difference between its carrying amount, and the present value of the estimated future cash flows, discounted at the original effective interest rate.
Individually significant financial assets are tested for impairment on an individual basis. The remaining financial assets are assessed collectively in Groups that share similar credit risk characteristics.
All impairment losses are recognised in profit or loss. An impairment loss is reversed if the reversal can be related objectively to an event occurring after the impairment loss was recognised. For financial assets measured at amortised cost, the reversal is recognised in profit or loss.
Impairment testing of trade receivables is described in note 14.
iii. Non-financial assets and liabilities
Recognised fair value measurements - fair value hierarchy
This section explains the judgements and estimates made in determining the fair values of the non-financial instruments that are recognised and measured at fair value in the financial statements. To provide an indication about the reliability of the inputs used in determining fair value, the Group has classified its assets and liabilities measured at fair value into the three levels prescribed under the accounting standards. An explanation of each level is provided in note 21 (i).
There were no transfers between any of the levels for recurring fair value measurements during the year.
Valuation techniques used to determine fair values
The Group engages independent accredited valuation specialists on a periodic basis to determine the fair values of these assets. The Group reviews market indicators in the interim periods to ensure that the carrying value of revalued property is not materially different from fair value.
The last revaluation was performed on 29 June 2012.
Level 1 Level 2 Level 3 Total
Balance 30 June 2014 Notes ’000 ’000 ’000 ’000
Property, plant and equipment
Land & buildings 18 - $ - $ 303,819$ 303,819$
Total - $ - $ 303,819$ 303,819$
Balance 30 June 2013
Property, plant and equipment
Land & buildings 18 - $ - $ 323,878$ 323,878$
Total - $ - $ 323,878$ 323,878$

REPORT TO THE MEMBERS OF AUSTAL LIMITED
73 | AUSTAL LIMITED ANNUAL REPORT 2014
Valuation inputs and relationships to fair value
The following table summarises the quantitative information about the significant unobservable inputs used in recurring level 3 fair value measurements.
iv. Impairment – non-financial assets
Significant accounting judgements
The Group assesses impairment of all assets at each reporting date by evaluating conditions specific to the Group and to the particular asset that may lead to impairment. These include product and manufacturing performance, technology, economic and political environments and future product expectations. If an impairment trigger exists, the recoverable amount of the asset is determined. The recoverable amount of the asset is the higher of fair value less costs to sell and value in use. In assessing value in use, the estimated future cash flows are discounted to their present value using a pre-tax discount rate that reflects current market assessments of the time value of money and the risks specific to the asset.
For an asset that does not generate largely independent cash inflows, the recoverable amount is determined for the cash-generating unit to which the asset belongs, unless the asset’s value in use can be estimated to be close to its fair value.
Impairment exists when the carrying value of an asset or a cash-general unit exceeds its estimated recoverable amount. The asset or cash-generating unit is then written down to its recoverable amount.
Impairment testing of property, plant and equipment, goodwill and other intangible assets is described in Note 18 and Note 19 respectively.
Description
Fair value at 30 June 2014
'000 Unobservable inputs
Range of inputs (probability-weighted
average)Relationship of unobservable
inputs to fair value
Selection of land with similar approximate utility
US$1.69 - US$ 2.04
(US$1.70) per ft2
Buildings - Mobile
US$ 304,242 Consumed economic benefit/ obsolescence of asset
2.22% Greater consumption of economic benefit or increased obsolescence lowers fair value.
Cost per square foot
floor area (ft2)
US$100 - $211 ($185) per
ft2Higher cost per ft2 increases fair value.
Selection of land with similar approximate utility
$200-220 ($210) per m2
Buildings - Henderson
A$ 22,900 Consumed economic benefit/ obsolescence of asset
2.50% Greater consumption of economic benefit or increased obsolescence lowers fair value.
Cost per square meter
floor area (m2)
$500 - $1,750 ($998) per m2
Higher cost per m2 increases fair value.
Higher value of similar land increases estimated fair value
US$ 11,000 Land - Mobile
Land - Henderson
A$ 8,800 Higher value of similar land increases estimated fair value
74 | AUSTA
Note 22.
This note exfinancial percontext.
Objectives
Ultimate resCommittee urisks identifieprojections.
Details of theof measuremasset, financ
Market risk
i. Capit
The Gconfidthe Gdeterm
The Gand dnot lim
Therepolicie
Neithethan n
Risk
Market risk - interest rate
Market risk - foreign currency
Credit risk
Liquidity
AL LIMITED ANN
Financial r
xplains the Grrformance. Cu
and policy
ponsibility forunder the auted below, inc
e significant ament and the cial liabilities a
tal managem
Group’s policydence to sust
Group defines mines the lev
Group monitodetailed budgemit the Group
e were no chaes and proce
er the Group normal bankin
Exposure a
Long-term b
yFuture commRecognisedliabilities nocurrency
Cash, short receivables instruments
Borrowings,derivative fin
REPOR
NUAL REPORT
isk managem
roup’s exposuurrent year pr
r identificationhority of the B
cluding hedgin
accounting pobasis on whicand equity ins
ment
y is to maintatain future devas total shar
vel of dividend
ors statement eting process
p’s growth opp
anges in the Gedures are est
nor any of itsng requireme
arising from
borrowings at vari
mercial transactiod financial assets t denominated in
term deposits, traand derivative fin
, trade payables anancial instrumen
RT TO THE M
2014
ment
ure to financiarofit and loss
n and control Board. The Bng cover of fo
olicies and mch income anstrument are
in a strong anvelopment of eholders’ equds to shareho
of financial pses. The grosportunities an
Group’s approtablished with
s subsidiariesents.
Mea
able rates Sen
ons,and functional
CasSen
ade nancial
AgeCred
and nts
Rollfore
MEMBERS O
al risks and hinformation h
of financial rBoard reviewsoreign currenc
ethods adoptnd expenses disclosed in
nd flexible caf the businessuity attributabolders.
position strengss gearing rand is in line w
oach to capith regular mon
s are subject t
asurement
sitivity analysis
h flow forecast,sitivity analysis
ing analysis,dit ratings
ing cash flow casts
OF AUSTAL L
how these riskhas been incl
isks rests wits and agreescy, credit allo
ted, includingare recognisethe relevant n
apital base to s. The Groupble to membe
gth and flexibtio is monitor
with peers and
al managemenitoring and re
to externally
Management
Interest rate sw
Forward foreignexchange contrForward currenoptions
Monitoring credallowances
Availability of committed credand borrowing facilities
LIMITED
ks could affecuded where r
h the Audit & policies for mwances, and
the criteria foed, in respectnotes to the f
provide invesp monitors thers of Austal L
bility using cased and maint
d industry nor
ent during theeporting.
imposed cap
waps
n racts,
ncy
dit
dit lines
ct the Group’srelevant to ad
& Risk Managemanaging eac future cash f
for recognitiont of each clasfinancial state
stor, creditor e return on caLimited. The
sh flow forecatained at a levrms.
e year. Risk m
ital requireme
s future dd further
ement ch of the flow forecast
n, the basis ss of financialements.
and market apital, which Board
ast analysis vel that does
management
ents, other
t

REPORT TO THE MEMBERS OF AUSTAL LIMITED
75 | AUSTAL LIMITED ANNUAL REPORT 2014
ii. Interest rate risk exposure
The Group’s exposure to market interest rates relates primarily to the Group’s long-term debt obligations and investment in cash funds.
The Group constantly analyses its interest rate exposure. Consideration is given to potential renewals of existing positions and alternative financing.
At the end of the reporting period, the Group had the following variable rate borrowings and interest rate swap contracts outstanding:
Profit or loss is sensitive to higher/lower interest income from cash and cash equivalents and interest expenses on borrowings as a result of changes in interest rates. There would be no impact on other components of equity as a result of changes in interest rates. The below sensitivity analysis shows the impact on post tax profit had a 1 percentage point movement in interest rates occurred. 1 percentage point was deemed to be a reasonable level of volatility based on FY2014 observations.
2014 2013
Financial Assets ’000 ’000
Cash and cash equivalents
Australian variable rate interest 35,324$ 18,320$
US variable rate interest 51,553 89,383
Total 86,877$ 107,703$
Financial Liabilities
Interest bearing loans and borrowings
Australian variable rate interest (13,192)$ (17,520)$
US variable rate interest (142,264) (227,257)
Total (155,456)$ (244,777)$
Net Exposure (68,579)$ (137,074)$
2014 2013
’000 ’000
Post tax gain / (loss)
+1% (100 basis points) (686)$ (1,371)$
-1% (100 basis points) 686 1,371
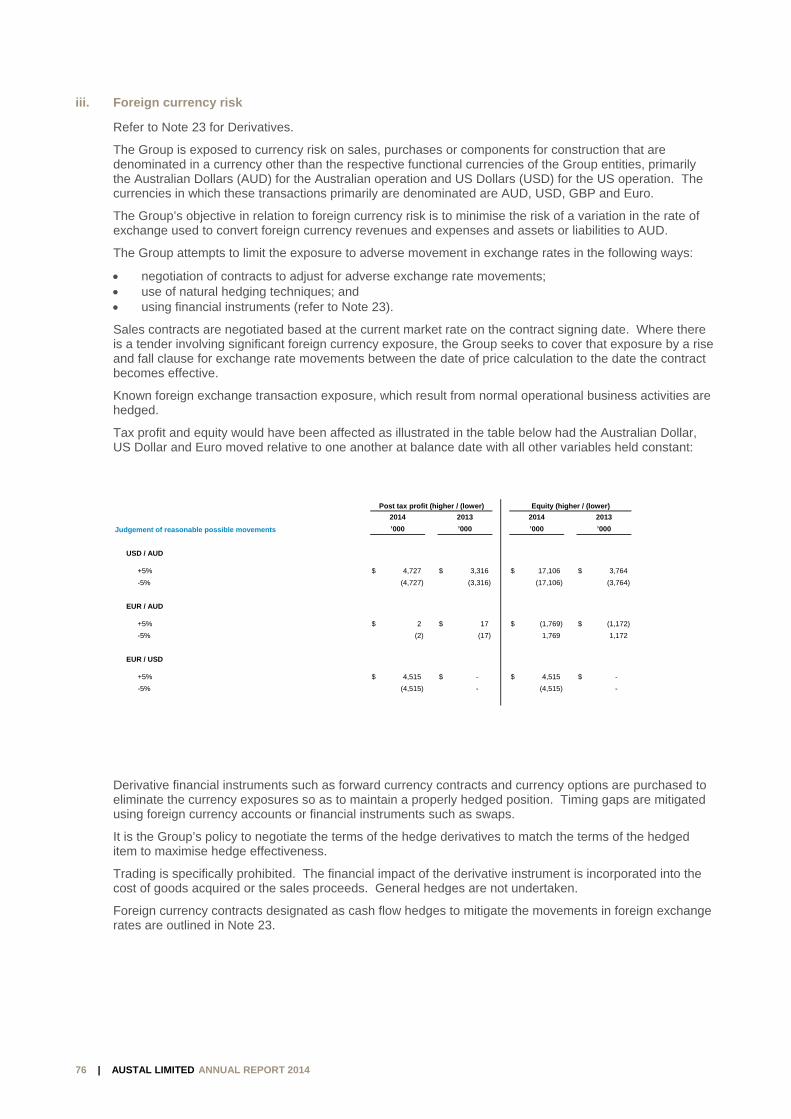
REPORT TO THE MEMBERS OF AUSTAL LIMITED
76 | AUSTAL LIMITED ANNUAL REPORT 2014
iii. Foreign currency risk
Refer to Note 23 for Derivatives.
The Group is exposed to currency risk on sales, purchases or components for construction that are denominated in a currency other than the respective functional currencies of the Group entities, primarily the Australian Dollars (AUD) for the Australian operation and US Dollars (USD) for the US operation. The currencies in which these transactions primarily are denominated are AUD, USD, GBP and Euro.
The Group’s objective in relation to foreign currency risk is to minimise the risk of a variation in the rate of exchange used to convert foreign currency revenues and expenses and assets or liabilities to AUD.
The Group attempts to limit the exposure to adverse movement in exchange rates in the following ways:
negotiation of contracts to adjust for adverse exchange rate movements; use of natural hedging techniques; and using financial instruments (refer to Note 23).
Sales contracts are negotiated based at the current market rate on the contract signing date. Where there is a tender involving significant foreign currency exposure, the Group seeks to cover that exposure by a rise and fall clause for exchange rate movements between the date of price calculation to the date the contract becomes effective.
Known foreign exchange transaction exposure, which result from normal operational business activities are hedged.
Tax profit and equity would have been affected as illustrated in the table below had the Australian Dollar, US Dollar and Euro moved relative to one another at balance date with all other variables held constant:
Derivative financial instruments such as forward currency contracts and currency options are purchased to eliminate the currency exposures so as to maintain a properly hedged position. Timing gaps are mitigated using foreign currency accounts or financial instruments such as swaps.
It is the Group’s policy to negotiate the terms of the hedge derivatives to match the terms of the hedged item to maximise hedge effectiveness.
Trading is specifically prohibited. The financial impact of the derivative instrument is incorporated into the cost of goods acquired or the sales proceeds. General hedges are not undertaken.
Foreign currency contracts designated as cash flow hedges to mitigate the movements in foreign exchange rates are outlined in Note 23.
Post tax profit (higher / (lower) Equity (higher / (lower)
2014 2013 2014 2013
Judgement of reasonable possible movements ’000 ’000 ’000 ’000
USD / AUD
+5% 4,727$ 3,316$ 17,106$ 3,764$
-5% (4,727) (3,316) (17,106) (3,764)
EUR / AUD
+5% 2$ 17$ (1,769)$ (1,172)$
-5% (2) (17) 1,769 1,172
EUR / USD
+5% 4,515$ - $ 4,515$ - $
-5% (4,515) - (4,515) -
REPORT TO THE MEMBERS OF AUSTAL LIMITED
77 | AUSTAL LIMITED ANNUAL REPORT 2014
iv. Credit risk
The Group trades only with recognised, creditworthy third parties. It is the Group’s policy that all customers who wish to trade on credit terms are subject to credit verification procedures, which are conducted internally. The Group, while exposed to credit related losses in the event of non-performance by counterparties to financial instruments, does not expect counterparties to fail to meet their obligations given their credit ratings.
The Group minimises concentrations of credit risk and the risk of default of counterparties in relation to cash and cash equivalents and financial instruments by spreading them amongst a number of financial institutions.
It is the Group’s policy to minimise the risk that the principle amount will not be recovered and the risk that funds will not be available when required whilst at the same time obtaining the maximum return relative to the risk. To manage this, it is the Group’s policy to restrict its investment of surplus cash funds to financial institutions with a Standard and Poor credit rating of at least A-2, and for a period not exceeding 180 days. The Group undertakes investments in 11am / 24 hour call deposits, term deposits or negotiable certificates of deposit in order to achieve this objective.
In addition, vessel sales contracts are structured to ensure that the Group will be paid on delivery of the vessel through the following measures:
obtaining progress payments from the client to cover the cost of the construction; or
obtaining a letter of credit from a credible bank to cover payment of the contract; or
obtaining a minimum payment of 20% of the contract price and a letter from the bank or financial institution providing finance to the customer that funding has been arranged for the balance of the purchase price.
With respect to credit risk arising from the other financial assets of the Group, which comprise cash and cash equivalents and certain derivative instruments, the Group’s exposure to credit risk arises from default of the counter party, with a maximum exposure equal to the carrying amount of these instruments. The maximum exposure to credit risk at the reporting date is disclosed in Note 10 and Note 23.
Cash and term deposits are predominantly held with two tier one Australian financial institutions, which are considered to be low concentrations of credit risk.
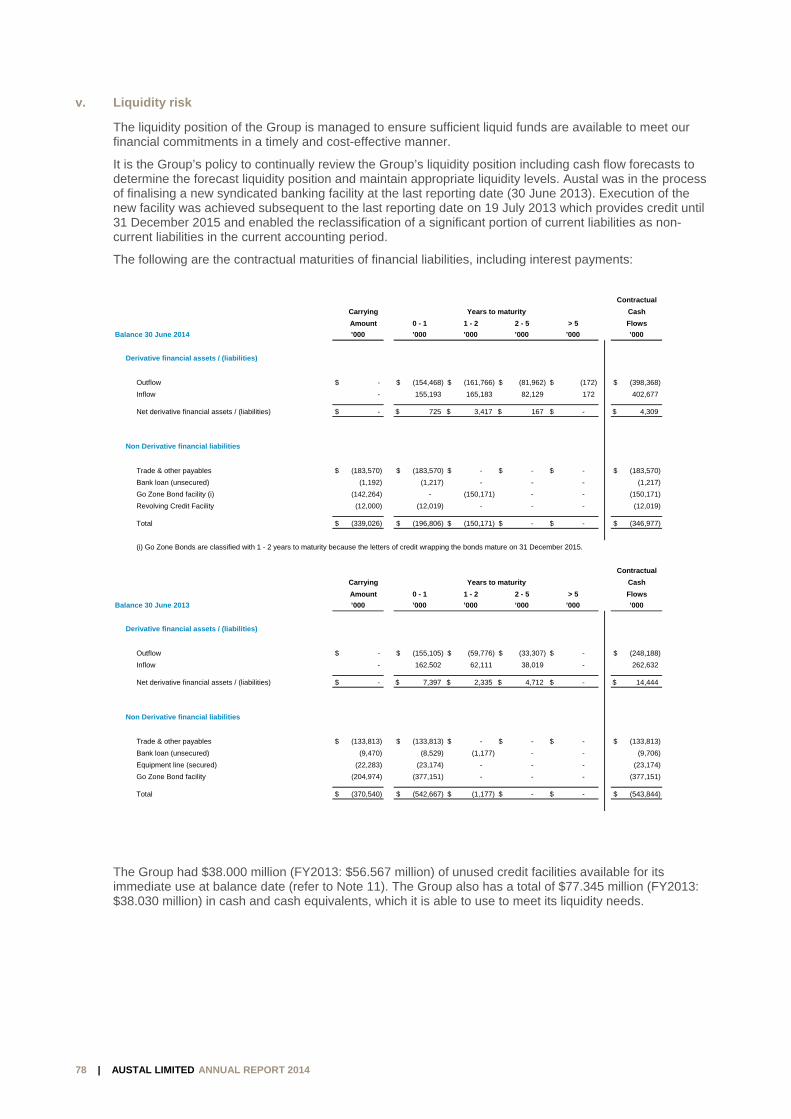
REPORT TO THE MEMBERS OF AUSTAL LIMITED
78 | AUSTAL LIMITED ANNUAL REPORT 2014
v. Liquidity risk
The liquidity position of the Group is managed to ensure sufficient liquid funds are available to meet our financial commitments in a timely and cost-effective manner.
It is the Group’s policy to continually review the Group’s liquidity position including cash flow forecasts to determine the forecast liquidity position and maintain appropriate liquidity levels. Austal was in the process of finalising a new syndicated banking facility at the last reporting date (30 June 2013). Execution of the new facility was achieved subsequent to the last reporting date on 19 July 2013 which provides credit until 31 December 2015 and enabled the reclassification of a significant portion of current liabilities as non-current liabilities in the current accounting period.
The following are the contractual maturities of financial liabilities, including interest payments:
The Group had $38.000 million (FY2013: $56.567 million) of unused credit facilities available for its immediate use at balance date (refer to Note 11). The Group also has a total of $77.345 million (FY2013: $38.030 million) in cash and cash equivalents, which it is able to use to meet its liquidity needs.
Contractual
Carrying Years to maturity Cash
Amount 0 - 1 1 - 2 2 - 5 > 5 Flows
Balance 30 June 2014 ’000 ’000 ’000 ’000 ’000 ’000
Derivative financial assets / (liabilities)
Outflow - $ (154,468)$ (161,766)$ (81,962)$ (172)$ (398,368)$
Inflow - 155,193 165,183 82,129 172 402,677
Net derivative financial assets / (liabilities) - $ 725$ 3,417$ 167$ - $ 4,309$
Non Derivative financial liabilities
Trade & other payables (183,570)$ (183,570)$ - $ - $ - $ (183,570)$
Bank loan (unsecured) (1,192) (1,217) - - - (1,217)
Go Zone Bond facility (i) (142,264) - (150,171) - - (150,171)
Revolving Credit Facility (12,000) (12,019) - - - (12,019)
Total (339,026)$ (196,806)$ (150,171)$ - $ - $ (346,977)$
(i) Go Zone Bonds are classified with 1 - 2 years to maturity because the letters of credit wrapping the bonds mature on 31 December 2015.
Contractual
Carrying Years to maturity Cash
Amount 0 - 1 1 - 2 2 - 5 > 5 Flows
Balance 30 June 2013 ’000 ’000 ’000 ’000 ’000 ’000
Derivative financial assets / (liabilities)
Outflow - $ (155,105)$ (59,776)$ (33,307)$ - $ (248,188)$
Inflow - 162,502 62,111 38,019 - 262,632
Net derivative financial assets / (liabilities) - $ 7,397$ 2,335$ 4,712$ - $ 14,444$
Non Derivative financial liabilities
Trade & other payables (133,813)$ (133,813)$ - $ - $ - $ (133,813)$
Bank loan (unsecured) (9,470) (8,529) (1,177) - - (9,706)
Equipment line (secured) (22,283) (23,174) - - - (23,174)
Go Zone Bond facility (204,974) (377,151) - - - (377,151)
Total (370,540)$ (542,667)$ (1,177)$ - $ - $ (543,844)$
79 | AUSTA
Note 23.
The Group iseach other a
The Group uto hedge its receipts andreceived and
i. Reco
Such enterevalue
Any gcash
The facontra
The Gcalcudirect
ii. Hedg
For th
fl
cpc
At therelatiostrate
The dnatureoffsetrisk.
Such and athe fin
iii. Fair v
Fair vliabilitsuch loss. attribuboth a
The Gor exedesigintereas sofor ch
AL LIMITED ANN
Derivative
s exposed to arising from re
uses derivativrisks associa
d payments and made.
ognition and
derivative fined into and a is positive an
gains or losseflow hedges,
air value of foacts with simi
Group’s derivalated using vatly or indirectl
ge designatio
he purposes o
fair value hedliability or an
cash flow hedparticular riskcommitments
e inception of onship to whiegy for undert
documentatioe of the risk btting the expo
hedges are eare assessed nancial report
value hedge
value hedges ty or an unrecan asset, liabFor fair value
utable to the are taken to t
Group discontercised, the hnation. Any a
est method is on as an adju
hanges in its f
REPOR
NUAL REPORT
financial ins
the risk of adeceipts from e
ve financial inated with forend they are ti
measureme
nancial instrumare subsequennd as liabilitie
es arising fromare taken to
orward currenilar maturity p
atives are cataluation techy based on m
on
of hedge acco
dges when theunrecognised
dges when thk associated ws.
f a hedge relach the Grouptaking the hed
n includes idebeing hedgedosure to chan
expected to bon an ongointing periods f
accounting
are hedges ocognised firmbility or firm coe hedges, therisk being hethe statement
tinues fair vahedge no longadjustment toused is amor
ustment existfair value attr
RT TO THE M
2014
struments an
dverse movemexport sales a
struments suign currency med to matur
nt
ments are stantly remeasures when the fa
m changes in the statemen
ncy contractsprofiles. Cred
tegorised in leniques where
market observ
ounting, hedg
ey hedge thed firm commit
ey hedge expwith a recogn
ationship, the p wishes to apdge.
entification ofd and how theges in the he
be highly effecng basis to defor which they
of the Group’sm commitment
ommitment the carrying amdged, the dert of comprehe
lue hedge acger meets theo the carryingrtised to the sts and shall bibutable to th
MEMBERS O
nd hedging
ments in the Aand the purch
uch as forwardfluctuations. re when the r
ated at fair vared at fair val
fair value is ne
the fair valuent of compreh
is calculatedit risk has be
evel 2 of the e the inputs thvable data.
ges are class
e exposure to tment other th
posure to varnised asset or
Group formapply hedge ac
f the hedging e entity will asedged item’s f
ctive in achieetermine that y were design
s exposure tot other than fohat is attributa
mount of the hrivative is remensive incom
ccounting if the criteria for hg amount of astatement of cegin no later e risk being h
OF AUSTAL L
Australian Dohase of comp
d exchange cThese contra
receipts and p
alue on the dalue. Derivativegative.
e of derivativehensive incom
by referenceen included in
valuation hiehat have a sig
ified as:
changes in than foreign c
riability in casr liability or fo
ally designateccounting and
instrument, tssess the hedfair value or c
ving offsettinthey actually
nated.
o changes in oreign exchanable to a partedged item is
measured to fe.
e hedging inshedge accoun hedged financomprehensivthan when th
hedged.
LIMITED
ollar, US Dollaponents for co
contracts andacts are matcpayments are
ate on which aves are carrie
es, except forme.
e to current fon foreign curr
rarchy, as thegnificant effec
he fair value ourrency risk;
h flows that isreign exchan
s and documd the risk man
the hedged itedging instrumecash flows att
g changes in y have been h
the fair valuenge rate risk,icular risk ands adjusted forfair value and
strument expinting or the Gncial instrumeve income. Ahe hedged ite
ar and Euro ronstruction.
d forward currched to highlye scheduled t
a derivative ced as assets w
r those that q
orward excharency contrac
eir fair value hct on the valu
of a recognisor
s attributablenge risks on fi
ments the hednagement ob
em or transacent’s effectivetributable to th
fair value or highly effectiv
e of a recognis or an identifid could affecr gains and lo
d gains and lo
ires or is soldGroup revokesent for which Amortisation mem ceases to
relative to
rency options y probable o be
contract is when the fair
ualify as
nge rates for cts.
has been ation are
sed asset or
either to a rm
ge bjective and
ction, the eness in he hedged
cash flows ve throughout
sed asset or ied portion oft profit or
osses osses from
d, terminated s the the effective
may begin be adjusted
t
f
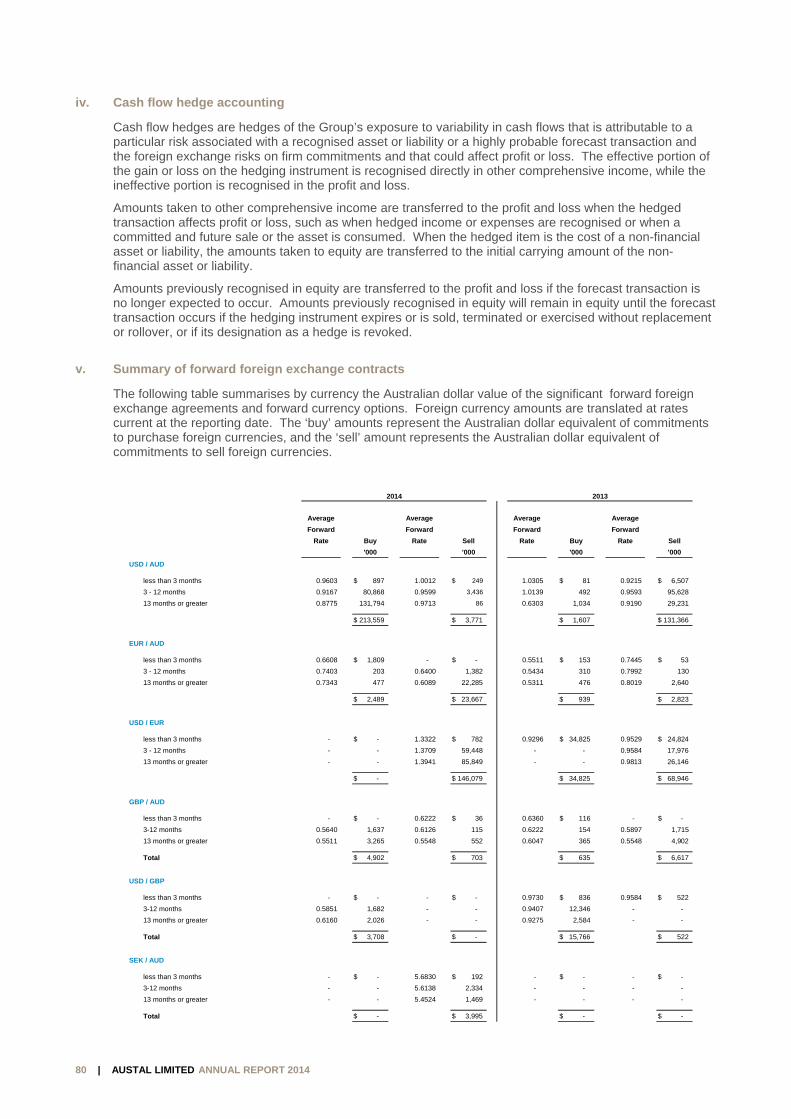
REPORT TO THE MEMBERS OF AUSTAL LIMITED
80 | AUSTAL LIMITED ANNUAL REPORT 2014
iv. Cash flow hedge accounting
Cash flow hedges are hedges of the Group’s exposure to variability in cash flows that is attributable to a particular risk associated with a recognised asset or liability or a highly probable forecast transaction and the foreign exchange risks on firm commitments and that could affect profit or loss. The effective portion of the gain or loss on the hedging instrument is recognised directly in other comprehensive income, while the ineffective portion is recognised in the profit and loss.
Amounts taken to other comprehensive income are transferred to the profit and loss when the hedged transaction affects profit or loss, such as when hedged income or expenses are recognised or when a committed and future sale or the asset is consumed. When the hedged item is the cost of a non-financial asset or liability, the amounts taken to equity are transferred to the initial carrying amount of the non-financial asset or liability.
Amounts previously recognised in equity are transferred to the profit and loss if the forecast transaction is no longer expected to occur. Amounts previously recognised in equity will remain in equity until the forecast transaction occurs if the hedging instrument expires or is sold, terminated or exercised without replacement or rollover, or if its designation as a hedge is revoked.
v. Summary of forward foreign exchange contracts
The following table summarises by currency the Australian dollar value of the significant forward foreign exchange agreements and forward currency options. Foreign currency amounts are translated at rates current at the reporting date. The ‘buy’ amounts represent the Australian dollar equivalent of commitments to purchase foreign currencies, and the ‘sell’ amount represents the Australian dollar equivalent of commitments to sell foreign currencies.
2014 2013
Average Average Average Average
Forward Forward Forward Forward
Rate Buy Rate Sell Rate Buy Rate Sell
'000 '000 '000 '000
USD / AUD
less than 3 months 0.9603 $ 897 1.0012 $ 249 1.0305 $ 81 0.9215 $ 6,507
3 - 12 months 0.9167 80,868 0.9599 3,436 1.0139 492 0.9593 95,628
13 months or greater 0.8775 131,794 0.9713 86 0.6303 1,034 0.9190 29,231
$ 213,559 $ 3,771 $ 1,607 $ 131,366
EUR / AUD
less than 3 months 0.6608 $ 1,809 - $ - 0.5511 $ 153 0.7445 $ 53
3 - 12 months 0.7403 203 0.6400 1,382 0.5434 310 0.7992 130
13 months or greater 0.7343 477 0.6089 22,285 0.5311 476 0.8019 2,640
$ 2,489 $ 23,667 $ 939 $ 2,823
USD / EUR
less than 3 months - $ - 1.3322 $ 782 0.9296 $ 34,825 0.9529 $ 24,824
3 - 12 months - - 1.3709 59,448 - - 0.9584 17,976
13 months or greater - - 1.3941 85,849 - - 0.9813 26,146
$ - $ 146,079 $ 34,825 $ 68,946
GBP / AUD
less than 3 months - $ - 0.6222 $ 36 0.6360 $ 116 - $ -
3-12 months 0.5640 1,637 0.6126 115 0.6222 154 0.5897 1,715
13 months or greater 0.5511 3,265 0.5548 552 0.6047 365 0.5548 4,902
Total $ 4,902 $ 703 $ 635 $ 6,617
USD / GBP
less than 3 months - $ - - $ - 0.9730 $ 836 0.9584 $ 522
3-12 months 0.5851 1,682 - - 0.9407 12,346 - -
13 months or greater 0.6160 2,026 - - 0.9275 2,584 - -
Total $ 3,708 $ - $ 15,766 $ 522
SEK / AUD
less than 3 months - $ - 5.6830 $ 192 - $ - - $ -
3-12 months - - 5.6138 2,334 - - - -
13 months or greater - - 5.4524 1,469 - - - -
Total $ - $ 3,995 $ - $ -
REPORT TO THE MEMBERS OF AUSTAL LIMITED
81 | AUSTAL LIMITED ANNUAL REPORT 2014
vi. Offsetting financial instruments
The Group presents its assets and liabilities on a gross basis. Derivative financial instruments entered into by the Group are subject to enforceable master netting arrangements such as International Swaps and Derivatives Associations (ISDA) master netting agreement. In certain circumstances, for example, when a credit event such as a default occurs, all outstanding transactions under an ISDA agreement are terminated. The termination value is assessed and only a single net amount is payable in settlement of all transactions.
The amounts set out in the table above represent the derivative financial assets and liabilities of the group that are subject to the above arrangements and are presented on a gross basis.
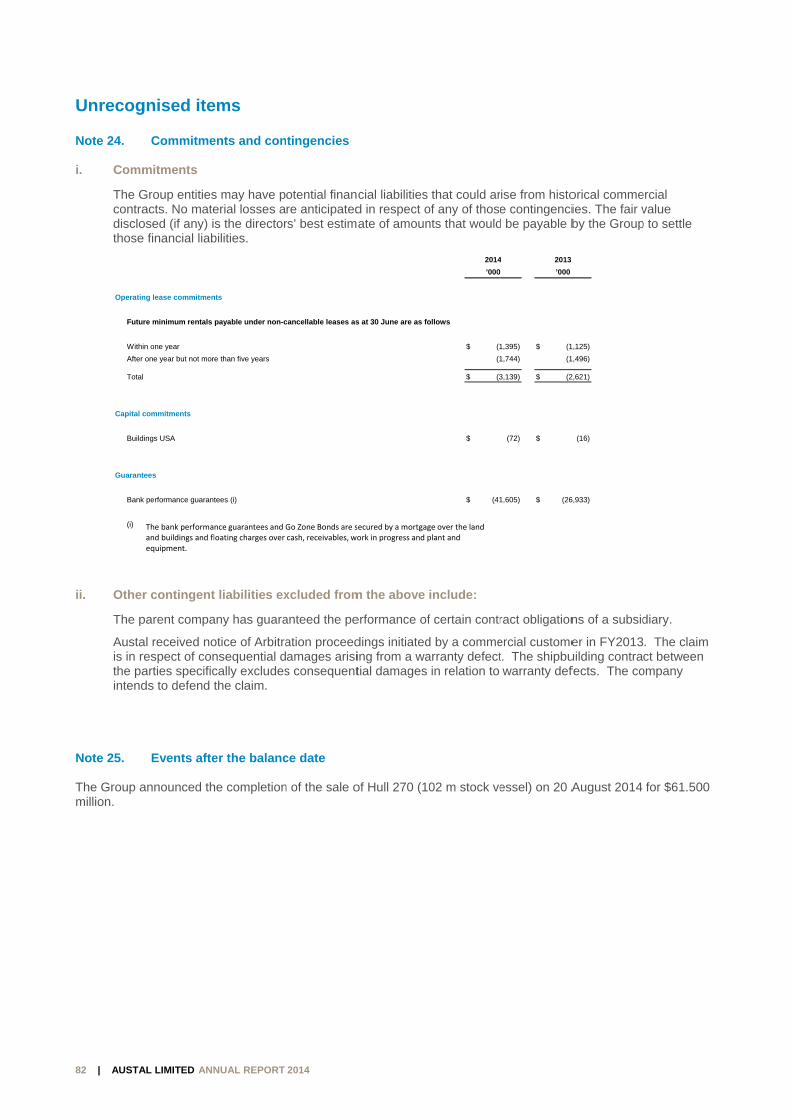
82 | AUSTA
Unrecog
Note 24.
i. Comm
The Gcontradisclothose
ii. Other
The p
Austais in rthe paintend
Note 25.
The Group amillion.
Operatin
Futu
Withi
After
Total
Capital c
Build
Guarant
Bank
(i)
AL LIMITED ANN
gnised ite
Commitme
mitments
Group entitiesacts. No mateosed (if any) ie financial liab
r contingent
parent compa
al received norespect of conarties specificds to defend t
Events afte
announced th
ng lease commitmen
re minimum rentals
in one year
one year but not more
commitments
dings USA
tees
k performance guarant
The bank performaand buildings and flequipment.
REPOR
NUAL REPORT
ems
ents and con
s may have perial losses as the director
bilities.
t liabilities ex
any has guara
otice of Arbitransequential dcally excludesthe claim.
er the balanc
he completion
nts
payable under non-c
e than five years
tees (i)
nce guarantees and Goating charges over
RT TO THE M
2014
tingencies
otential finanre anticipatedrs’ best estim
xcluded from
anteed the pe
ation proceedamages arisis consequent
ce date
n of the sale o
cancellable leases as
Go Zone Bonds are scash, receivables, wo
MEMBERS O
cial liabilities d in respect oate of amoun
m the above
erformance of
dings initiateding from a watial damages
of Hull 270 (10
s at 30 June are as fo
ecured by a mortgagork in progress and p
OF AUSTAL L
that could arof any of thosents that would
include:
f certain contr
d by a commearranty defectin relation to
02 m stock ve
2014
’000
ollows
(1$
(1
(3$
$
(41$
ge over the land plant and
LIMITED
ise from histoe contingenci
d be payable b
ract obligation
ercial customet. The shipbuwarranty def
essel) on 20 A
4 2013
’000
1,395) (1$
1,744) (1
3,139) (2$
(72) $
1,605) (26$
orical commeies. The fair vby the Group
ns of a subsid
er in FY2013uilding contrafects. The co
August 2014
,125)
,496)
2,621)
(16)
6,933)
ercial value
p to settle
diary.
. The claim ct between
ompany
for $61.500
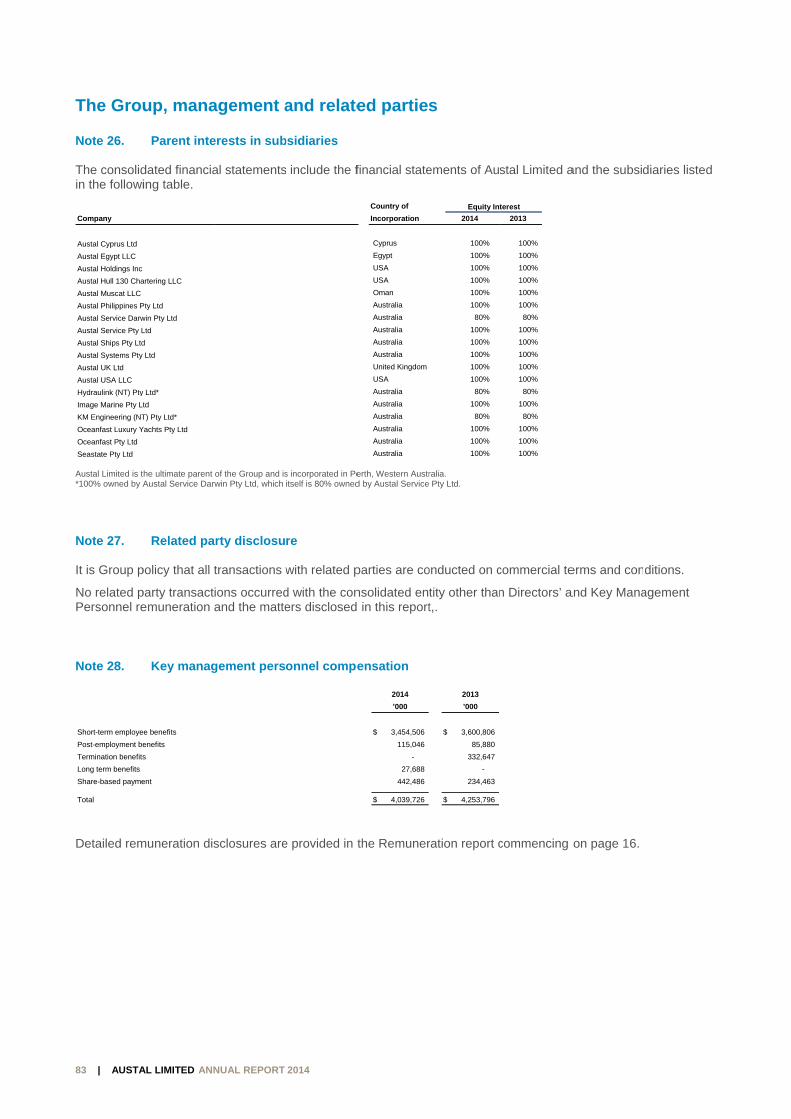
83 | AUSTA
The Grou
Note 26.
The consolidin the followi
Austal Limited is t*100% owned by A
Note 27.
It is Group p
No related pPersonnel re
Note 28.
Detailed rem
Company
Austal Cyprus Ltd
Austal Egypt LLC
Austal Holdings Inc
Austal Hull 130 Cha
Austal Muscat LLC
Austal Philippines P
Austal Service Darw
Austal Service Pty L
Austal Ships Pty Ltd
Austal Systems Pty
Austal UK Ltd
Austal USA LLC
Hydraulink (NT) Pty
Image Marine Pty Lt
KM Engineering (NT
Oceanfast Luxury Y
Oceanfast Pty Ltd
Seastate Pty Ltd
Short-term employe
Post-employment be
Termination benefits
Long term benefits
Share-based payme
Total
AL LIMITED ANN
up, mana
Parent inte
dated financiaing table.
the ultimate parent Austal Service Darw
Related pa
policy that all t
party transactemuneration a
Key manag
muneration dis
artering LLC
Pty Ltd
win Pty Ltd
Ltd
d
Ltd
y Ltd*
td
T) Pty Ltd*
Yachts Pty Ltd
ee benefits
enefits
s
ent
REPOR
NUAL REPORT
agement a
erests in sub
al statements
of the Group and iswin Pty Ltd, which
rty disclosu
transactions w
ions occurredand the matte
gement pers
sclosures are
RT TO THE M
2014
and relate
bsidiaries
s include the f
s incorporated in Peitself is 80% owned
re
with related p
d with the coners disclosed
onnel compe
e provided in t
MEMBERS O
ed parties
financial state
erth, Western Austrd by Austal Service
parties are co
nsolidated en in this report
ensation
the Remuner
Country of
Incorporation
Cyprus
Egypt
USA
USA
Oman
Australia
Australia
Australia
Australia
Australia
United Kingdom
USA
Australia
Australia
Australia
Australia
Australia
Australia
2014
’000
3,454,506$
115,046
-
27,688
442,486
4,039,726$
OF AUSTAL L
s
ements of Aus
ralia. Pty Ltd.
onducted on c
tity other thant,.
ration report c
Equity Int
2014
100%
100%
100%
100%
100%
100%
80%
100%
100%
100%
100%
100%
80%
100%
80%
100%
100%
100%
2013
’000
3,600,806$
85,880
332,647
-
234,463
4,253,796$
LIMITED
stal Limited a
commercial te
n Directors’ a
commencing
terest
2013
100%
100%
100%
100%
100%
100%
80%
100%
100%
100%
100%
100%
80%
100%
80%
100%
100%
100%
and the subsid
erms and con
and Key Mana
on page 16.
diaries listed
ditions.
agement
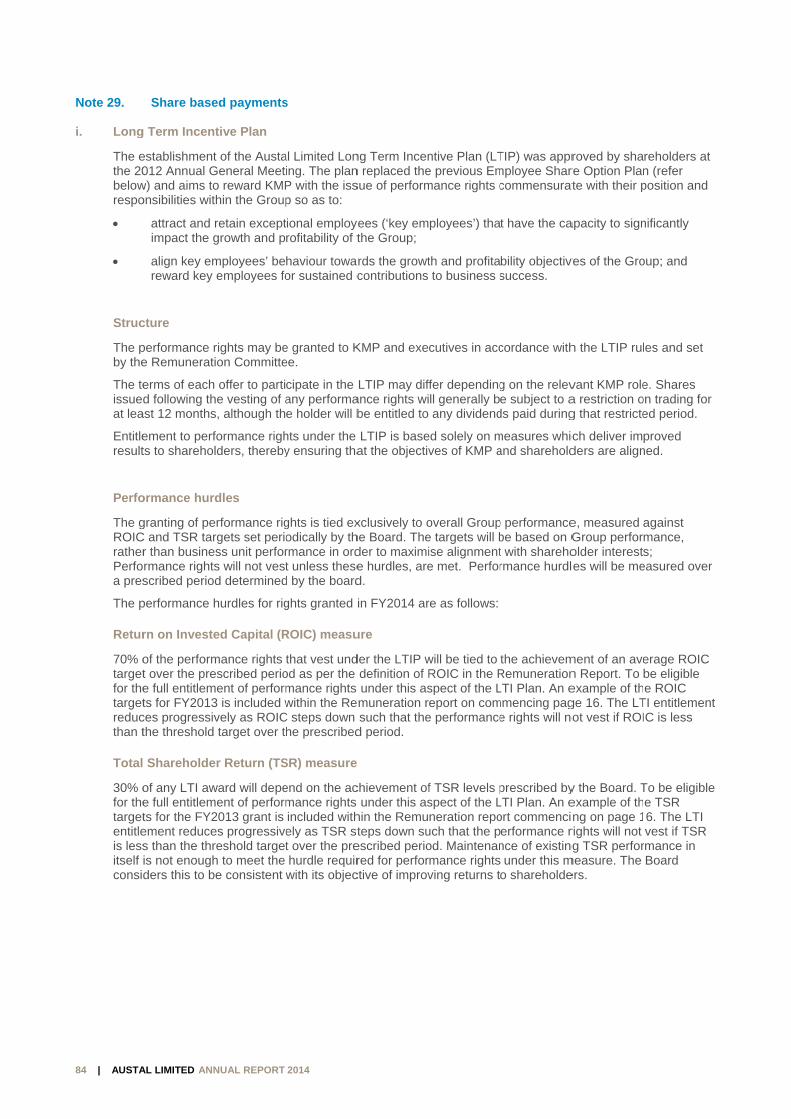
84 | AUSTA
Note 29.
i. Long
The ethe 20belowrespo
Struc
The pby the
The teissuedat lea
Entitleresult
Perfo
The gROICratherPerfoa pres
The p Retur
70% otargetfor thetargetreducthan t Total
30% ofor thetargetentitleis lessitself consid
AL LIMITED ANN
Share base
g Term Incen
establishment012 Annual G
w) and aims toonsibilities wit
attract and impact the g
align key emreward key
cture
performance re Remunerat
erms of eachd following th
ast 12 months
ement to perfts to sharehol
ormance hur
granting of peC and TSR tarr than businermance rightsscribed perio
performance h
rn on Investe
of the performt over the pree full entitlemts for FY2013
ces progressivthe threshold
Shareholde
of any LTI awe full entitlemts for the FY2ement reduces than the thris not enoughders this to b
REPOR
NUAL REPORT
ed payments
tive Plan
t of the AustaGeneral Meeto reward KMPthin the Group
retain exceptgrowth and p
mployees’ beemployees fo
rights may beion Committe
offer to partihe vesting of as, although th
formance righlders, thereby
rdles
erformance rigrgets set perio
ess unit perfors will not vestd determined
hurdles for rig
ed Capital (R
mance rights escribed perio
ment of perform3 is included wvely as ROICtarget over t
er Return (TS
ward will depement of perform2013 grant is es progressivereshold targeth to meet the
be consistent
RT TO THE M
2014
s
al Limited Loning. The planP with the issp so as to:
ional employerofitability of t
haviour towaor sustained c
e granted to Kee.
cipate in the any performae holder will b
hts under the y ensuring tha
ghts is tied exodically by thrmance in ordt unless these
d by the board
ghts granted i
ROIC) measu
that vest undod as per the mance rights within the Re
C steps down he prescribed
SR) measure
end on the acmance rights included withely as TSR stt over the prehurdle requirwith its objec
MEMBERS O
ng Term Incenn replaced thesue of perform
ees (‘key emthe Group;
rds the growtcontributions
KMP and exe
LTIP may diffance rights wibe entitled to
LTIP is baseat the objectiv
xclusively to ohe Board. Theder to maximie hurdles, ared.
in FY2014 ar
ure
der the LTIP wdefinition of Runder this asmuneration rsuch that the
d period.
chievement ofunder this as
hin the Remuteps down su
escribed periored for perfor
ctive of improv
OF AUSTAL L
ntive Plan (LTe previous Emmance rights c
ployees’) tha
th and profitato business s
cutives in acc
ffer dependingll generally bany dividend
ed solely on mves of KMP a
overall Groupe targets will bise alignmente met. Perfor
re as follows:
will be tied to ROIC in the Rspect of the Leport on com
e performance
f TSR levels pspect of the Lneration repo
uch that the pod. Maintenanmance rightsving returns t
LIMITED
TIP) was apprmployee Sharcommensurat
t have the ca
bility objectivsuccess.
cordance with
g on the releve subject to a
ds paid during
measures whicand sharehold
p performancebe based on Gt with sharehormance hurdl
the achievemRemunerationLTI Plan. An e
mmencing page rights will no
prescribed byLTI Plan. An eort commencierformance rnce of existingunder this m
o shareholde
roved by share Option Plante with their p
apacity to sign
ves of the Gro
h the LTIP rul
vant KMP rolea restriction og that restricte
ch deliver imders are align
e, measured Group perforolder interestes will be me
ment of an aven Report. To example of thge 16. The LTot vest if ROI
y the Board. Texample of thng on page 1
rights will not g TSR perfor
measure. The ers.
reholders at n (refer position and
nificantly
oup; and
les and set
e. Shares on trading for ed period.
proved ned.
against mance, s;
easured over
erage ROIC be eligible e ROIC
TI entitlementIC is less
To be eligiblee TSR 6. The LTI vest if TSR
rmance in Board
t
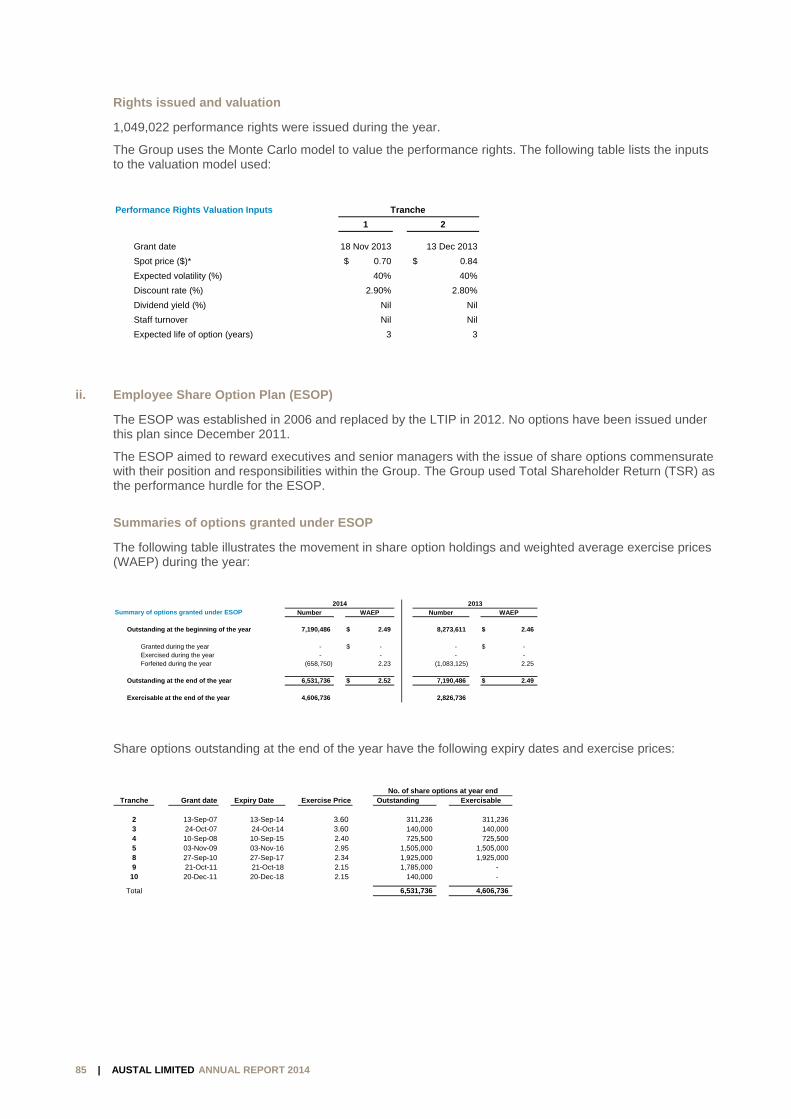
REPORT TO THE MEMBERS OF AUSTAL LIMITED
85 | AUSTAL LIMITED ANNUAL REPORT 2014
Rights issued and valuation
1,049,022 performance rights were issued during the year.
The Group uses the Monte Carlo model to value the performance rights. The following table lists the inputs to the valuation model used:
ii. Employee Share Option Plan (ESOP)
The ESOP was established in 2006 and replaced by the LTIP in 2012. No options have been issued under this plan since December 2011.
The ESOP aimed to reward executives and senior managers with the issue of share options commensurate with their position and responsibilities within the Group. The Group used Total Shareholder Return (TSR) as the performance hurdle for the ESOP.
Summaries of options granted under ESOP
The following table illustrates the movement in share option holdings and weighted average exercise prices (WAEP) during the year:
Share options outstanding at the end of the year have the following expiry dates and exercise prices:
Performance Rights Valuation Inputs Tranche
1 2
Grant date 18 Nov 2013 13 Dec 2013
Spot price ($)* $ 0.70 $ 0.84
Expected volatility (%) 40% 40%
Discount rate (%) 2.90% 2.80%
Dividend yield (%) Nil Nil
Staff turnover Nil Nil
Expected life of option (years) 3 3
2014 2013Summary of options granted under ESOP Number WAEP Number WAEP
Outstanding at the beginning of the year 7,190,486 2.49$ 8,273,611 2.46$
Granted during the year - - $ - - $ Exercised during the year - - - - Forfeited during the year (658,750) 2.23 (1,083,125) 2.25
Outstanding at the end of the year 6,531,736 2.52$ 7,190,486 2.49$
Exercisable at the end of the year 4,606,736 2,826,736
No. of share options at year endTranche Grant date Expiry Date Outstanding Exercisable
2 13-Sep-07 13-Sep-14 3.60 311,236 311,236 3 24-Oct-07 24-Oct-14 3.60 140,000 140,000 4 10-Sep-08 10-Sep-15 2.40 725,500 725,500 5 03-Nov-09 03-Nov-16 2.95 1,505,000 1,505,000 8 27-Sep-10 27-Sep-17 2.34 1,925,000 1,925,000 9 21-Oct-11 21-Oct-18 2.15 1,785,000 -
10 20-Dec-11 20-Dec-18 2.15 140,000 -
Total 6,531,736 4,606,736
Exercise Price
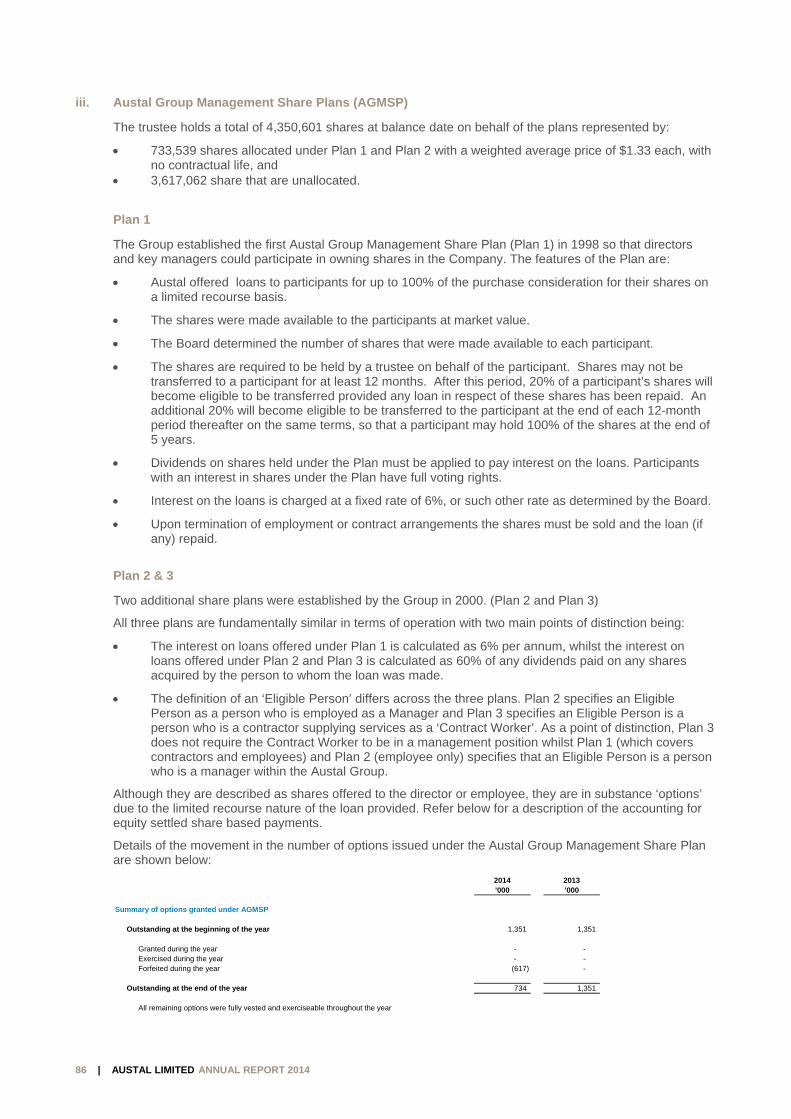
REPORT TO THE MEMBERS OF AUSTAL LIMITED
86 | AUSTAL LIMITED ANNUAL REPORT 2014
iii. Austal Group Management Share Plans (AGMSP)
The trustee holds a total of 4,350,601 shares at balance date on behalf of the plans represented by:
733,539 shares allocated under Plan 1 and Plan 2 with a weighted average price of $1.33 each, with no contractual life, and
3,617,062 share that are unallocated.
Plan 1
The Group established the first Austal Group Management Share Plan (Plan 1) in 1998 so that directors and key managers could participate in owning shares in the Company. The features of the Plan are:
Austal offered loans to participants for up to 100% of the purchase consideration for their shares on a limited recourse basis.
The shares were made available to the participants at market value.
The Board determined the number of shares that were made available to each participant.
The shares are required to be held by a trustee on behalf of the participant. Shares may not be transferred to a participant for at least 12 months. After this period, 20% of a participant’s shares will become eligible to be transferred provided any loan in respect of these shares has been repaid. An additional 20% will become eligible to be transferred to the participant at the end of each 12-month period thereafter on the same terms, so that a participant may hold 100% of the shares at the end of 5 years.
Dividends on shares held under the Plan must be applied to pay interest on the loans. Participants with an interest in shares under the Plan have full voting rights.
Interest on the loans is charged at a fixed rate of 6%, or such other rate as determined by the Board.
Upon termination of employment or contract arrangements the shares must be sold and the loan (if any) repaid.
Plan 2 & 3
Two additional share plans were established by the Group in 2000. (Plan 2 and Plan 3)
All three plans are fundamentally similar in terms of operation with two main points of distinction being:
The interest on loans offered under Plan 1 is calculated as 6% per annum, whilst the interest on loans offered under Plan 2 and Plan 3 is calculated as 60% of any dividends paid on any shares acquired by the person to whom the loan was made.
The definition of an ‘Eligible Person’ differs across the three plans. Plan 2 specifies an Eligible Person as a person who is employed as a Manager and Plan 3 specifies an Eligible Person is a person who is a contractor supplying services as a ‘Contract Worker’. As a point of distinction, Plan 3 does not require the Contract Worker to be in a management position whilst Plan 1 (which covers contractors and employees) and Plan 2 (employee only) specifies that an Eligible Person is a person who is a manager within the Austal Group.
Although they are described as shares offered to the director or employee, they are in substance ‘options’ due to the limited recourse nature of the loan provided. Refer below for a description of the accounting for equity settled share based payments.
Details of the movement in the number of options issued under the Austal Group Management Share Plan are shown below:
2014 2013’000 ’000
Summary of options granted under AGMSP
Outstanding at the beginning of the year 1,351 1,351
Granted during the year - - Exercised during the year - - Forfeited during the year (617) -
Outstanding at the end of the year 734 1,351
All remaining options were fully vested and exerciseable throughout the year

REPORT TO THE MEMBERS OF AUSTAL LIMITED
87 | AUSTAL LIMITED ANNUAL REPORT 2014
iv. CEO fixed remuneration share issue
23% of the CEO’s fixed remuneration is provided in shares which are subject to an 18 month holding period from the date at which the shares are released to the CEO and no performance condition exists as it is considered part of his base remuneration. 371,738 shares were issued during the year. The fair value of the shares was determined using the closing price on the grant date.
The Board is recommending that the issue of shares, which form part of the CEO’s base salary, will be made in 2 equal instalments through the year immediately after the publication of the interim and full year accounts. The number of shares to be issued will be calculated based on the 6 month volume weighted average price (VWAP) of the shares immediately preceding the issue. The Board considers that this best reflects the intention of paying a proportion of the CEO’s salary as shares but avoids the administrative issues of issuing monthly as is the case for the cash component. This arrangement is subject to shareholder approval at the 2014 Annual General Meeting.
v. Recognition and measurement - equity settled transactions
The Group provides benefits to employees (including executive directors and key management personnel) of the Group in the form of share-based payments, whereby employees render services in exchange for shares or rights over shares (equity-settled transactions).
There are currently two plans in place to provide these benefits, which extend to senior management and directors:
The Austal Group Management Share Plan (AGMSP); and The Long Term Incentive Plan (LTI Plan).
The cost of these equity-settled transactions with employees is measured by reference to the fair value at the date at which they are granted. The fair value is determined by an external valuer using a Monte Carlo model.
In valuing equity-settled transactions, no account is taken of any performance conditions, other than conditions linked to the price of the shares of Austal Limited (market conditions) if applicable. Where non-market performance conditions must be satisfied, the number of entitlements included in expense recognition is adjusted to an estimate of the ultimate number of entitlements expected to vest.
The cost of equity-settled transactions is recognised, together with a corresponding increase in equity, over the period in which the performance conditions are fulfilled, ending on the date on which the relevant employees become fully entitled to the award (the vesting period).
The cumulative expense recognised for equity-settled transactions at each reporting date until vesting date reflects (i) the extent to which the vesting period has expired and (ii) the number of awards that, in the opinion of the directors of the Group, will ultimately vest. This opinion is formed based on the best available information at balance date. No adjustment is made for the likelihood of market performance conditions being met as the effect of these conditions is included in the determination of fair value at grant date. The statement of comprehensive income charge or credit for a period represents the movement in cumulative expense recognised as at the beginning and end of that period.
No expense is recognised for awards that do not ultimately vest, except for awards where vesting is conditional upon a market condition.
If the terms of an equity-settled award are modified, as a minimum an expense is recognised as if the terms had not been modified. In addition, an expense is recognised for any modification that increases the total fair value of the share-based payment arrangement, or is otherwise beneficial to the employee, as measured at the date of modification.
If an equity-settled award is cancelled, it is treated as if it had vested on the date of cancellation, and any expense not yet recognised for the award is recognised immediately. However, if a new award is substituted for the cancelled award and designated as a replacement award on the date that it is granted, the cancelled and new award are treated as if they were a modification of the original award, as described in the previous paragraph.
Shares in the Group held by the AGMSP are classified and disclosed as reserved shares and deducted from equity.

88 | AUSTA
vi. Reco
The e
Note 30.
Information r
Share B
Expe
Balance sheet
Assets
Current
Non - Curren
Total
Liabilities
Current
Non - Curren
Total
Net Assets
Equity
Contributed E
Employee be
Asset revalua
Cash flow he
Retained ear
Total
Income
Profit / (Loss
Total Compre
AL LIMITED ANN
ognised shar
expense reco
Parent enti
relating to Au
Based Payments Expe
ense arising from equit
nt
nt
Equity
enefiit reserve
ation reserve
edge reserve
rnings
) after tax
ehensive Income
REPOR
NUAL REPORT
re-based pay
gnised for sh
ity
ustal Limited,
ense
ty-settled share-based
RT TO THE M
2014
yment expen
are based pa
the Parent en
d payment transaction
$
$
$
$
$
$
$
$
MEMBERS O
nses
ayments durin
ntity, is detail
2014
’000
ns (383)$
2014
’000
239,735 $
176,776
416,511 $
(28,135) $
(19,980)
(48,115) $
368,396 $
111,598 $
6,750
8,247
8,675
233,126
368,396 $
39,563 $
39,563
OF AUSTAL L
ng the year is
ed below:
2013
’000
(1,263)$
2013
’000
290,917
112,054
402,971
(46,052)
(27,741)
(73,793)
329,178
111,328
3,887
14,162
11,340
188,461
329,178
840
840
LIMITED
shown in thee table below:

89 | AUSTA
Note 31.
No business
The Group asubsidiary Aconsidered t
Accounting fbelow.
i. Acco
Businbusinacquiformeintere
For efair va
Acqui
Whenapprothe Ginclud
If the held eloss.
Any cacquibe anchangbe rem
Goodcontrogain iconsid
Acqui
AL LIMITED ANN
Business c
s combination
acquired an 8Austal Serviceto be materia
for business c
ounting for b
ness combinaess combinasition date fa
er owners of test in the acqu
ach businessalue or at the
isition-related
n the Group aopriate classif
Group’s operades the separ
business comequity interes
contingent consition date. S
n asset or liabge to other comeasured un
dwill is recognolling interests recognisedderation trans
isitions prior t
REPOR
NUAL REPORT
combination
ns have taken
80% interest ie Darwin Pty Ll for the Grou
combinations
usiness com
ations are acction shall be
air values of ththe acquiree auiree.
s combinationproportionate
d costs are ex
acquires a busfication and dting or accouration of embe
mbination is ast in the acqui
nsideration toSubsequent cbility will be reomprehensiventil it is finally
nised if the agt is in excess in profit and sferred. Refe
to July 2009 w
RT TO THE M
2014
s
n place within
n KM EngineLtd in the comup.
s in previous p
mbinations
counted for usmeasured at he assets tranand the equit
n, the acquiree share of the
xpensed as in
siness, it assdesignation innting policiesedded deriva
achieved in stiree is remea
o be transferrhanges to the
ecognised in ae income. If thsettled within
ggregate of thof the net ideloss if the fair to Note 19 f
were account
MEMBERS O
the Group in
ering (NT) Ptmparative yea
periods has b
sing the acqufair value, wh
nsferred by thty issued by th
r measures the acquiree's i
ncurred, and i
esses the finn accordance s and other peatives in host
tages, the acsured to fair v
red by the acqe fair value ofaccordance whe contingentn equity.
he consideratientifiable asseir value of thefor additional
ted for using
OF AUSTAL L
n the year end
ty Ltd and Hyar ended 30 J
been done in
uisition methohich shall be he acquirer, thhe acquirer, a
he non-controdentifiable ne
included in ad
ancial assetswith the cont
ertinent condcontracts by t
quisition datevalue at the a
quirer will be f the contingewith AASB 13t consideratio
ion transferreets acquired e net assets a
information o
the purchase
LIMITED
ded 30 June 2
draulink (NT)June 2013. Th
accordance w
d. The considcalculated ashe liabilities inand the amou
olling interestet assets.
dministrative
and liabilitiestractual termsitions as at ththe acquiree.
e fair value of acquisition da
recognised aent considerat9 either in pro
on is classified
ed and the amand liabilities
acquired is in on goodwill re
e method of a
2014.
) Pty Ltd throhe transactio
with the acco
deration transs the sum of tncurred by thunt of any non
t in the acquir
expenses.
s assumed fos, economic che acquisition.
f the acquirer'ate through pr
at fair value attion which is
rofit and loss d as equity, it
mount recogns assumed. A
excess of theecognised by
accounting.
ugh its n was not
unting policy
sferred in a he
he acquirer ton-controlling
ree either at
or conditions, n date. This
's previously rofit and
t the deemed to or as a t should not
ised for non-lternatively ae aggregate the Group.
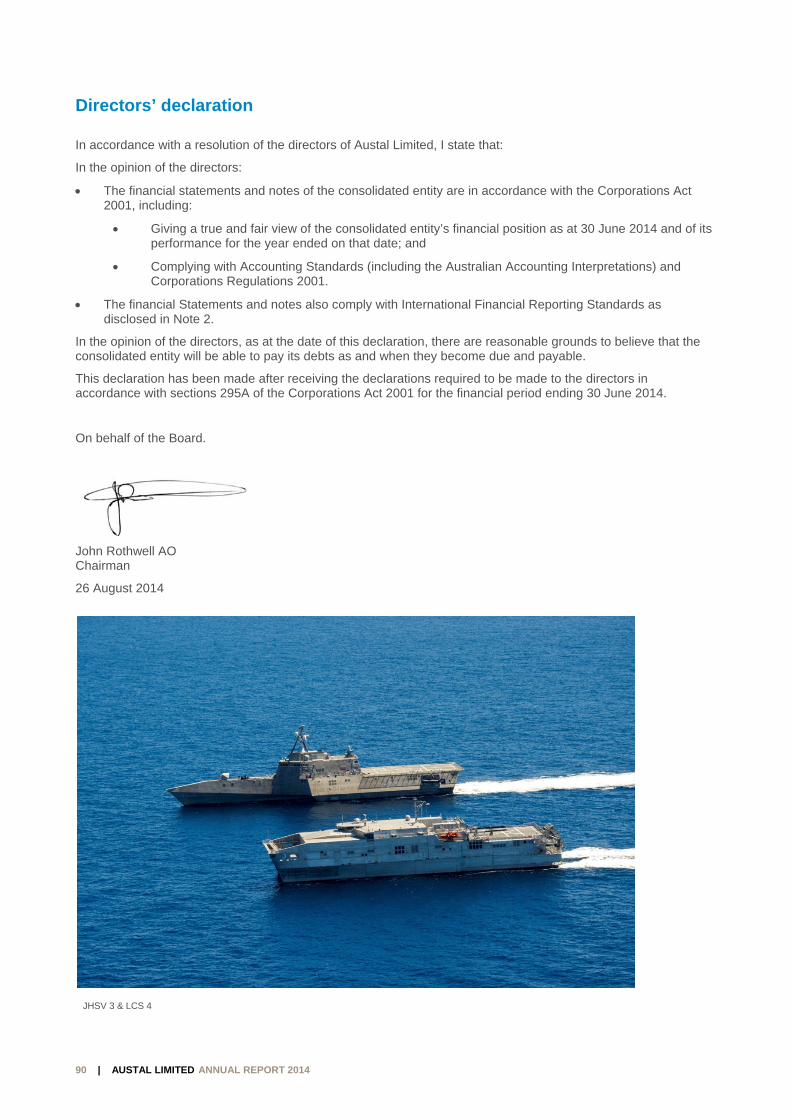
REPORT TO THE MEMBERS OF AUSTAL LIMITED
90 | AUSTAL LIMITED ANNUAL REPORT 2014
Directors’ declaration
In accordance with a resolution of the directors of Austal Limited, I state that:
In the opinion of the directors:
The financial statements and notes of the consolidated entity are in accordance with the Corporations Act 2001, including:
Giving a true and fair view of the consolidated entity’s financial position as at 30 June 2014 and of its performance for the year ended on that date; and
Complying with Accounting Standards (including the Australian Accounting Interpretations) and Corporations Regulations 2001.
The financial Statements and notes also comply with International Financial Reporting Standards as disclosed in Note 2.
In the opinion of the directors, as at the date of this declaration, there are reasonable grounds to believe that the consolidated entity will be able to pay its debts as and when they become due and payable.
This declaration has been made after receiving the declarations required to be made to the directors in accordance with sections 295A of the Corporations Act 2001 for the financial period ending 30 June 2014.
On behalf of the Board.
John Rothwell AO Chairman
26 August 2014
JHSV 3 & LCS 4
REPORT TO THE MEMBERS OF AUSTAL LIMITED
91 | AUSTAL LIMITED ANNUAL REPORT 2014
Corporate governance statement
Austal Limited, its Board of directors and senior management are committed to the best practices of corporate governance, ethical standards and risk management and the Group’s approach to corporate governance is summarised in this section of the report. This Corporate Governance Statement should be read in conjunction with the Directors’ Report on page 9.
The Board of Austal Limited is responsible for guiding and monitoring of the consolidated entity on behalf of shareholders. The Board’s Audit and Risk subcommittee is tasked with the oversight and management of the Group’s corporate governance policies and procedures.
The Austal Limited Corporate Governance Statement is now structured to specifically align with the ASX Corporate Governance Council’s (the Council) Principles and Recommendations, which are as follows:
Principle 1. Lay solid foundations for management and oversight
Principle 2. Structure the board to add value
Principle 3. Promote ethical and responsible decision making
Principle 4. Safeguard integrity in financial reporting
Principle 5. Make timely and balanced disclosure
Principle 6. Respect the rights of shareholders
Principle 7. Recognise and manage risk
Principle 8. Remunerate fairly and responsibly
Principle 1 – Lay solid foundations for management and oversight
The Board gives direction and exercises judgment in setting the Group’s objectives and overseeing their implementation. Responsibility for the operation and administration of the Group is delegated by the Board to the CEO and the executive management team. The Board ensures that this team is appropriately qualified and experienced to discharge their responsibilities and has in place procedures to assess the performance of the CEO and the executive management team.
The Board’s functions include:
adopting a Strategic Plan for the Group, including general and specific goals and reviewing actual results against that plan, which is aimed at meeting stakeholders’ objectives and managing business risk;
establishing and maintaining policies directed to ensuring that the Group complies with the law and conforms to the highest standards of financial and ethical behaviour;
reviewing the Group’s reporting systems and internal controls (both operational and financial) together with appropriate monitoring of compliance activities to determine these systems and controls are adequate and appropriate;
ensuring that significant risks are identified, assessed, appropriately managed and monitored;
the appointment, performance assessment and, if necessary, removal of members of the executive management team;
determining and implementing appropriate delegations of authority from the Board to the management to enable their respective functions to be effectively carried out;
agreeing key performance indicators (both financial and non-financial) with management and monitoring progress against these indicators; and
reporting to shareholders.
The performance of key executives is reviewed regularly against both measurable and qualitative indicators. Each year the Nomination and Remuneration Committee assesses the performance of key executives. The performance criteria against which they are assessed are aligned with the financial and non-financial objectives of the Group.

REPORT TO THE MEMBERS OF AUSTAL LIMITED
92 | AUSTAL LIMITED ANNUAL REPORT 2014
Principle 2: Structure the Board to add value
To ensure that the Board is well equipped to discharge its responsibilities it has established guidelines for the nomination and selection of directors and for the operation of the Board. Any proposed new director is nominated by the Nomination and Remuneration Committee and approved by the Board prior to being appointed. The appointment is until the next General Meeting of shareholders at which time the shareholders are required to approve the appointment.
In accordance with the Council’s Recommendation 2.1, a majority of the Board are independent directors. The Board is made up of a Non-Executive Chair, one Executive director and three independent Non-Executive directors. As a result the Board considers those independent directors have a material impact on Board matters and the Group’s direction, and are therefore able to ensure that management acts in the best interests of the Group. The directors believe that the Board is well balanced, with a mix of expertise that ensures value for shareholders.
Each year the Nomination and Remuneration Committee conducts a performance assessment for each Board member against both measurable and qualitative indicators. The performance criteria against which directors are assessed are aligned with the financial and non-financial objectives of the Group. Directors whose performance is consistently unsatisfactory may be asked to retire.
The performance of the directors was assessed during the year in accordance with the above process and the Board is satisfied with the performance of the Company’s directors.
Independence
The Council guidelines provide that directors are considered to be independent when they are independent of management and free from any business or other relationship that could materially interfere with – or could reasonably be perceived to materially interfere with – the exercise of their unfettered and independent judgement.
In the context of director independence, the Board considers ‘materiality’ from both the Group’s and the individual director’s perspective. The determination of materiality is based on the Council’s guidelines which include:
whether a director is a substantial shareholder of the Company, or affiliated with a substantial shareholder of the Company;
whether the director is employed or has previously been employed by the Company, the nature of that employment and the period (if any) between ceasing employment and commencing as a director;
whether the director has been a member or principal of an organisation that has provided services or consulted to the Group within the last 3 years;
whether the director is, or is affiliated with a material supplier to or customer of the Group; and
whether the director has a material contractual relationship with the Group other than as a director.
The above matters, along with any other qualitative factors which point to the actual ability of the Director to have an influence in shaping the direction of the Group, are considered when determining each director’s independence.
Based on the above criteria, the Board considers the following directors are independent:
Name Position
Dario Amara Non-Executive Director David Singleton Non-Executive Director Giles Everist Non-Executive Director
Austal’s Non-executive Chairman is not classified as independent (as the term is used in the Council’s recommendations), however he is a founding director of the Company and possesses extensive Australian shipbuilding experience, from which Austal’s shareholders continue to benefit. Mr Rothwell has made a significant contribution to the development of the shipbuilding industry in Australia and continues to draw on his broad experience to add value to the Group.
The Chairman’s position is reviewed regularly by the Nomination and Remuneration Committee. Following the most recent review and in light of the above unique skills and experience he brings to the Group, it remains the Board’s opinion that Mr Rothwell is the best candidate to Chair the Company.
Directors are required to disclose any actual or potential conflicts or material personal interests on their appointment to the Board. These disclosures are required to be kept up to date. Directors with material personal interests in matters that are before the Board are excluded from consideration of the matter and from related voting processes.
All directors are entitled to seek independent professional advice at the Group’s expense if required.

REPORT TO THE MEMBERS OF AUSTAL LIMITED
93 | AUSTAL LIMITED ANNUAL REPORT 2014
Outside directorships
The number of outside directorships held by directors is considered as part of his or her appointment and retention. Unless exceptional circumstances apply, the Group follows the Council’s guidelines for acceptance of outside directorships by Executive and Non-Executive Directors.
None of the Company’s current directors have outside directorship commitments that exceed the Council’s guidelines.
Nomination and Remuneration Committee
The Nomination and Remuneration Committee has 3 members, comprised of two independent directors and the Non-executive Chairman. The Nomination and Remuneration Committee is chaired by David Singleton, an independent director. The Committee reviews and makes recommendations to the Board in relation to candidates for vacant Board positions, remuneration of directors and key executives, Board evaluation processes and succession planning.
The Nomination and Remuneration Committee’s functions are described in its charter, which is reviewed and updated regularly and published on the Group’s website.
Principle 3: Promote ethical and responsible decision-making
Ethical standards and performance
The Board acknowledges the need for continued maintenance of the highest standards of corporate governance practice and ethical conduct by all directors and employees of the Austal Group. The Group has adopted a Director Code of Conduct under which directors are expected to:
act honestly and in good faith; exercise due care and diligence in fulfilling the functions of their office; use their powers to act in the best interests of the Group as a whole; avoid conflicts and make full disclosure of any possible conflict of interest; comply with the law; be independent in judgement and ensure all reasonable steps are taken to be satisfied as to the soundness of
Board decisions; encourage the reporting and investigating of unlawful and unethical behaviour; and comply with the share trading rules and other Group policies.
The Group also has an Employee Code of Conduct that applies to all employees across the Austal Group. The Employee Code of Conduct contains requirements that are similar to those contained in the Director Code of Conduct, adjusted to reflect the different roles and expectations arising out of various positions of employment within the Group.
Share trading policy
Directors and key management personnel are required to comply with the Group’s share trading policy, which may from time to time be adjusted by the Board and applies in addition to legislative requirements and the ASX Listing Rules.
The Group’s share trading policy is published on its website and includes:
a restriction on trading in securities of Austal Limited shares to the period of four months following the release of half yearly and preliminary final reports. Directors and executive managers are also restricted from trading in Austal Limited shares for 24 hours following any announcement by the Company to the ASX;
any director or executive manager intending to buy or sell shares in the Company or any company in which the Company has an interest is required to notify the Chairman or the Company Secretary of his/her intentions before proceeding with the transaction; and
directors, managers and staff are not permitted to deal in the Company's securities if they are in possession of material information which is not available to the share market, but if it were, may impact the value at which the securities are traded.
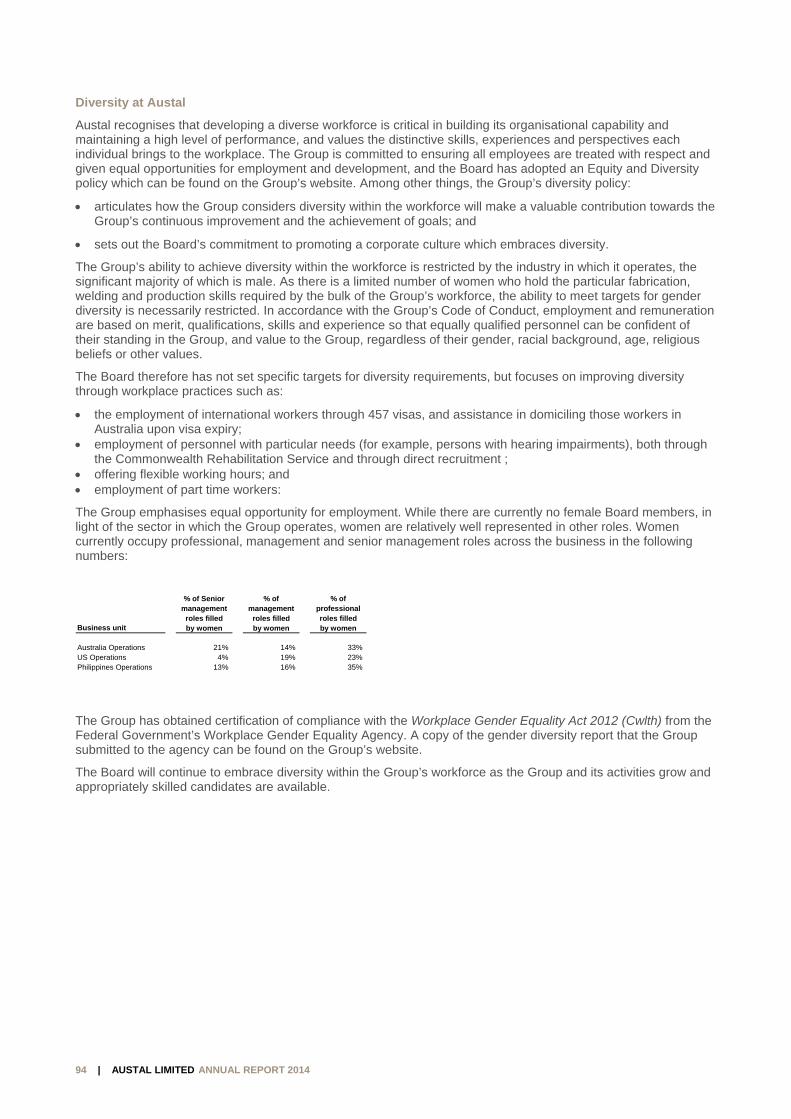
REPORT TO THE MEMBERS OF AUSTAL LIMITED
94 | AUSTAL LIMITED ANNUAL REPORT 2014
Diversity at Austal
Austal recognises that developing a diverse workforce is critical in building its organisational capability and maintaining a high level of performance, and values the distinctive skills, experiences and perspectives each individual brings to the workplace. The Group is committed to ensuring all employees are treated with respect and given equal opportunities for employment and development, and the Board has adopted an Equity and Diversity policy which can be found on the Group’s website. Among other things, the Group’s diversity policy:
articulates how the Group considers diversity within the workforce will make a valuable contribution towards the Group’s continuous improvement and the achievement of goals; and
sets out the Board’s commitment to promoting a corporate culture which embraces diversity.
The Group’s ability to achieve diversity within the workforce is restricted by the industry in which it operates, the significant majority of which is male. As there is a limited number of women who hold the particular fabrication, welding and production skills required by the bulk of the Group’s workforce, the ability to meet targets for gender diversity is necessarily restricted. In accordance with the Group’s Code of Conduct, employment and remuneration are based on merit, qualifications, skills and experience so that equally qualified personnel can be confident of their standing in the Group, and value to the Group, regardless of their gender, racial background, age, religious beliefs or other values.
The Board therefore has not set specific targets for diversity requirements, but focuses on improving diversity through workplace practices such as:
the employment of international workers through 457 visas, and assistance in domiciling those workers in Australia upon visa expiry;
employment of personnel with particular needs (for example, persons with hearing impairments), both through the Commonwealth Rehabilitation Service and through direct recruitment ;
offering flexible working hours; and employment of part time workers:
The Group emphasises equal opportunity for employment. While there are currently no female Board members, in light of the sector in which the Group operates, women are relatively well represented in other roles. Women currently occupy professional, management and senior management roles across the business in the following numbers:
The Group has obtained certification of compliance with the Workplace Gender Equality Act 2012 (Cwlth) from the Federal Government’s Workplace Gender Equality Agency. A copy of the gender diversity report that the Group submitted to the agency can be found on the Group’s website.
The Board will continue to embrace diversity within the Group’s workforce as the Group and its activities grow and appropriately skilled candidates are available.
% of Senior % of % ofmanagement management professional
roles filled roles filled roles filledBusiness unit by women by women by women
Australia Operations 21% 14% 33%US Operations 4% 19% 23%Philippines Operations 13% 16% 35%
REPORT TO THE MEMBERS OF AUSTAL LIMITED
95 | AUSTAL LIMITED ANNUAL REPORT 2014
Principle 4: Safeguard integrity in financial reporting
Audit and Risk Management Committee
The Company’s Audit & Risk Management Committee has 3 members, all of whom are independent Non-executive directors. The Audit & Risk Management Committee is chaired by Dario Amara. The Committee also obtains advice on corporate governance and related financial matters from an independent academic consultant who attends Committee meetings as required.
The Audit & Risk Management Committee’s functions are described in its charter, which is reviewed and updated regularly and published on the Group’s website. They include:
reviewing the Group’s financial reporting processes to ensure the integrity, accuracy and timeliness of the Group’s financial accounts;
reviewing the internal controls, policies and procedures the Group uses to identify and manage business risks; the policies and procedures for ensuring compliance with relevant regulatory and legal requirements, and good
corporate governance practice; ensuring compliance with statutory reporting responsibilities; assessing the effectiveness of the management of business risk and reliability of management reporting; and reporting any significant deficiencies in the above to the Board.
In addition to the above, the Audit & Risk Management Committee (in accordance with its Charter) annually reviews the performance of the external auditor on behalf of the Board, focussing particularly on:
the scope and rigour of the audit; the quality of the service provided, considered form the shareholders’ point of view; and the independence of the auditor.
If the Board considers a change in auditor is necessary, it will make a recommendation to shareholders to do so. Such recommendation would be the subject of shareholder approval in a General Meeting.
Principle 5: Make timely and balanced disclosure
Continuous disclosure
Austal Limited has established written policies and procedures on information disclosure. The focus of these procedures is on compliance with ASX disclosure commitments and improving access to information for all investors. The objective is to ensure information announced by the Company is timely, factual, clear and contains all information relevant to shareholders and potential investors.
The Chief Executive Officer, with oversight from the Audit & Risk Committee, has responsibility for:
making sure that the Group complies with continuous disclosure requirements; overseeing and co-ordinating disclosure of information to the stock exchange, analysts, brokers, shareholders,
the media and the public; and educating directors and staff on the Group’s disclosure policies and procedures and raising awareness of the
principles underlying continuous disclosure.
The Company releases all price sensitive information through the ASX, whether as part of regulatory reporting such as financial results, directors interests and changes in shareholdings, or other operational information that is relevant to shareholders or anyone considering investment in the Company.
REPORT TO THE MEMBERS OF AUSTAL LIMITED
96 | AUSTAL LIMITED ANNUAL REPORT 2014
Principle 6: Respect the rights of shareholders
Shareholder communication policy
The Board is ultimately responsible for ensuring that the shareholders are informed of all major developments affecting the Group’s state of affairs.
Information is communicated to shareholders through:
the Annual Report; the interim financial report; disclosures made to the ASX; notices and explanatory memoranda of the Annual General Meeting (AGM); and the AGM. The Company posts all ASX announcements on its website immediately after they are published by ASX and maintains that information on the website for 4 years. Announcements include the full content of all presentations made to analysts and industry conferences, which are lodged with ASX and published prior to the presentation being given.
It is Company policy for the auditor’s lead engagement partner to be present at the AGM in the event of questions about the conduct of the audit, the preparation and content of the auditors’ report, accounting policies adopted by the Group or auditor independence. The Company’s legal adviser is also present at the AGM.
Principle 7: Recognise and manage risk
Risk management and internal compliance and control
The Board determines the Group’s ‘risk profile’ and reviews internal processes and procedures to satisfy itself that management has developed and implemented a thorough system of risk management and internal control. The Board delegates responsibility for undertaking and assessing risk management and internal control effectiveness to management, however it retains ultimate responsibility for this function and therefore requires management to regularly assess internal compliance, risk management and control procedures and report back to the Board on the efficiency and effectiveness of those procedures. The Group’s process of risk management and internal compliance and control includes:
continuously identifying and measuring risks that might impact upon the achievement of the Group’s goals and objectives, and monitoring the environment for emerging factors and trends that affect these risks;
formulating risk management strategies to manage identified risks, and designing and implementing appropriate risk management policies and internal controls; and
monitoring the performance, and continuously improving the effectiveness of risk management systems and internal compliance and controls.
The risk management programme addresses risks under the following categories:
business risks inherent to the shipbuilding industry; operating risks associated with sales, design and production; financial risks; and specific vessel risks.
The Board oversees regular assessment of the effectiveness of risk management and internal compliance and control. In the past year, a focus on financial risk has led to the revision and updating of several risk management policies regarding treasury management, financial accounting, financial risk management and taxation and the employment of additional resources to ensure these issues are continually addressed and policies improved.
The Board is satisfied with the executive’s approach to and management of the risks faced by the business, based on the measures adopted for addressing those risks.
The Board receives monthly updates from management about the financial status of the Group and its controlled entities. The Board is comfortable that the declarations made by the CEO and CFO in accordance with s295A are based on a sound process. To ensure the appropriate level of confidence in this process, executives across the business are required to make similar declarations to the CEO before the declaration is made to the Board.
REPORT TO THE MEMBERS OF AUSTAL LIMITED
97 | AUSTAL LIMITED ANNUAL REPORT 2014
Principle 8: Remunerate fairly and responsibly
It is the Group’s objective to provide maximum stakeholder benefit from the retention of a high quality Board and executive team by remunerating directors and key executives fairly and appropriately with reference to relevant employment market conditions. The Group has implemented and will maintain a responsible, performance-based remuneration policy that is aligned with the long-term interests of its shareholders as set out in more detail in the Remuneration Report found at page 16. The key objectives of the remuneration policy are to:
strike the right balance between meeting shareholders’ expectations, paying our employees competitively, and responding appropriately to the regulatory environment;
motivate executives to pursue the long term success of the Group; and
clearly demonstrate the relationship between executives’ performance and remuneration, and the alignment of those 2 factors.
The Group’s approach to remuneration, including the structuring of executive remuneration and the role of incentives, is set out in detail in the Remuneration Report. Only executives and employees are eligible to participate in the Group’s incentive schemes (whether those schemes are based on STI, LTI or employee share plans). Non-executive directors are paid a fixed fee which does not include equity-based remuneration, in order to maximise the benefit of their independence and eliminate the potential for conflicts of interest to arise.
98 | AUSTA
Independ
AL LIMITED ANN
dent aud
REPOR
NUAL REPORT
it report t
RT TO THE M
2014
to the me
MEMBERS O
embers of
OF AUSTAL L
f Austal L
LIMITED
Limited

99 | AUSTAAL LIMITED ANN
REPOR
NUAL REPORT
RT TO THE M
2014
MEMBERS OOF AUSTAL LLIMITED
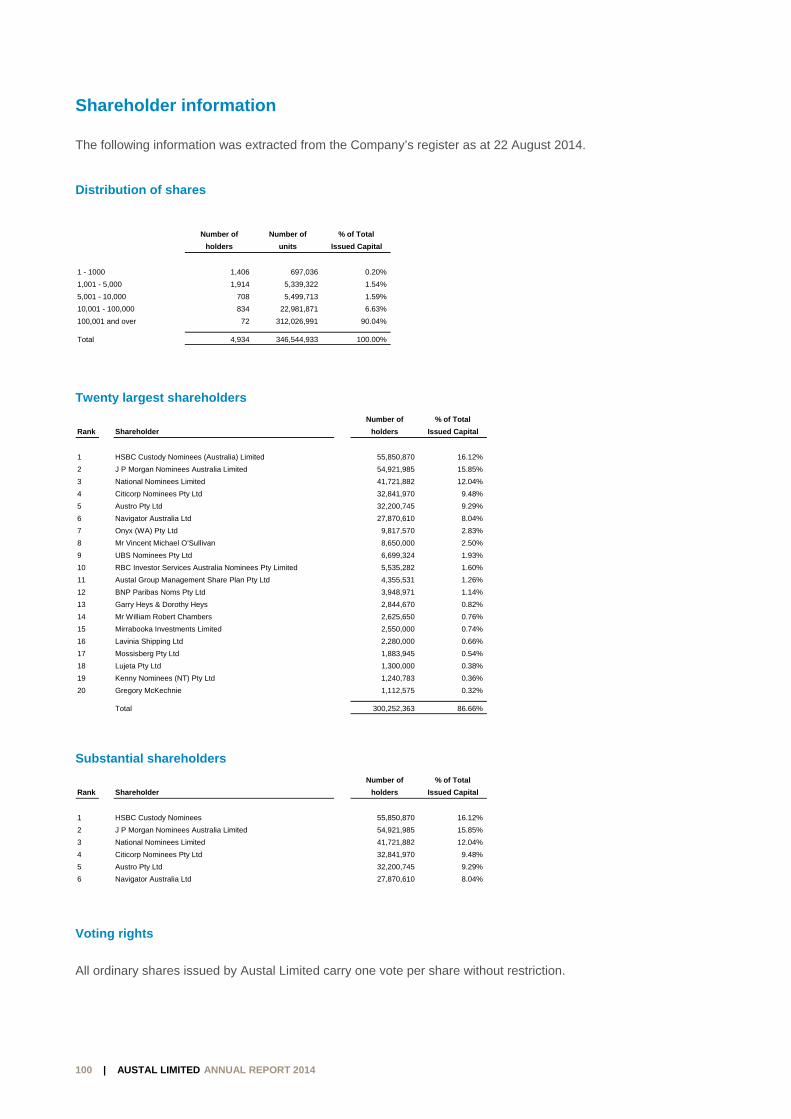
SHAREHOLDER INFORMATION
100 | AUSTAL LIMITED ANNUAL REPORT 2014
Shareholder information
The following information was extracted from the Company’s register as at 22 August 2014.
Distribution of shares
Twenty largest shareholders
Substantial shareholders
Voting rights
All ordinary shares issued by Austal Limited carry one vote per share without restriction.
Number of Number of % of Total
holders units Issued Capital
1 - 1000 1,406 697,036 0.20%
1,001 - 5,000 1,914 5,339,322 1.54%
5,001 - 10,000 708 5,499,713 1.59%
10,001 - 100,000 834 22,981,871 6.63%
100,001 and over 72 312,026,991 90.04%
Total 4,934 346,544,933 100.00%
Number of % of Total
Rank Shareholder holders Issued Capital
1 HSBC Custody Nominees (Australia) Limited 55,850,870 16.12%
2 J P Morgan Nominees Australia Limited 54,921,985 15.85%
3 National Nominees Limited 41,721,882 12.04%
4 Citicorp Nominees Pty Ltd 32,841,970 9.48%
5 Austro Pty Ltd 32,200,745 9.29%
6 Navigator Australia Ltd 27,870,610 8.04%
7 Onyx (WA) Pty Ltd 9,817,570 2.83%
8 Mr Vincent Michael O’Sullivan 8,650,000 2.50%
9 UBS Nominees Pty Ltd 6,699,324 1.93%
10 RBC Investor Services Australia Nominees Pty Limited 5,535,282 1.60%
11 Austal Group Management Share Plan Pty Ltd 4,355,531 1.26%
12 BNP Paribas Noms Pty Ltd 3,948,971 1.14%
13 Garry Heys & Dorothy Heys 2,844,670 0.82%
14 Mr William Robert Chambers 2,625,650 0.76%
15 Mirrabooka Investments Limited 2,550,000 0.74%
16 Lavinia Shipping Ltd 2,280,000 0.66%
17 Mossisberg Pty Ltd 1,883,945 0.54%
18 Lujeta Pty Ltd 1,300,000 0.38%
19 Kenny Nominees (NT) Pty Ltd 1,240,783 0.36%
20 Gregory McKechnie 1,112,575 0.32%
Total 300,252,363 86.66%
Number of % of Total
Rank Shareholder holders Issued Capital
1 HSBC Custody Nominees 55,850,870 16.12%
2 J P Morgan Nominees Australia Limited 54,921,985 15.85%
3 National Nominees Limited 41,721,882 12.04%
4 Citicorp Nominees Pty Ltd 32,841,970 9.48%
5 Austro Pty Ltd 32,200,745 9.29%
6 Navigator Australia Ltd 27,870,610 8.04%

CORPORATE DIRECTORY
101 | AUSTAL LIMITED ANNUAL REPORT 2014
Corporate directory
Directors
Executive Directors
Andrew Bellamy Non-Executive Directors
John Rothwell Dario Amara David Singleton Giles Everist Auditors
Ernst & Young
The Ernst & Young Building 11 Mounts Bay Road Perth 6000 Western Australia Company Secretary
Adrian Strang
Registered office
100 Clarence Beach Road Henderson 6166 Western Australia Telephone: +61 8 9410 1111 Facsimile: +61 8 9410 2564 Share registry
Advanced Share Registry Services
110 Stirling Highway Nedlands 6009 Western Australia Telephone: +61 8 9389 8033 Facsimile: +61 8 9389 7871
Cape Byron
Launch of Cape Sorell
Cape Byron