Apparent digestibility of selected feed ingredients in diets formulated for the sub-adult mud crab,...
9
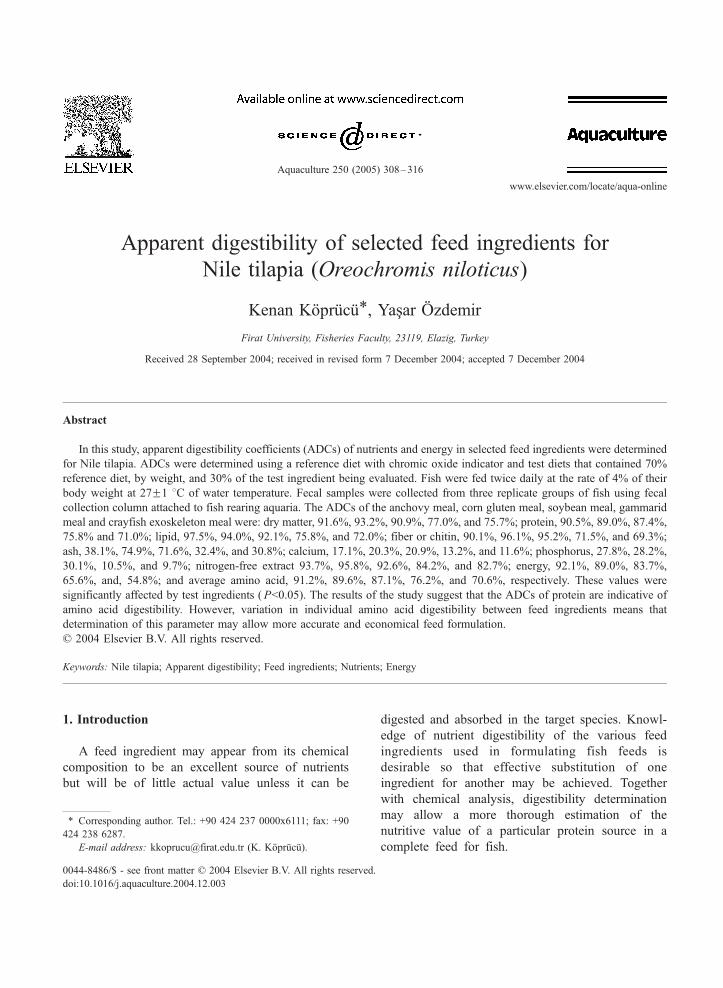
Apparent digestibility of selected feed ingredients for Nile tilapia (Oreochromis niloticus ) Kenan Ko ¨pru ¨cu ¨ * , YaYar O ¨ zdemir Firat University, Fisheries Faculty, 23119, Elazig, Turkey Received 28 September 2004; received in revised form 7 December 2004; accepted 7 December 2004 Abstract In this study, apparent digestibility coefficients (ADCs) of nutrients and energy in selected feed ingredients were determined for Nile tilapia. ADCs were determined using a reference diet with chromic oxide indicator and test diets that contained 70% reference diet, by weight, and 30% of the test ingredient being evaluated. Fish were fed twice daily at the rate of 4% of their body weight at 27F1 8C of water temperature. Fecal samples were collected from three replicate groups of fish using fecal collection column attached to fish rearing aquaria. The ADCs of the anchovy meal, corn gluten meal, soybean meal, gammarid meal and crayfish exoskeleton meal were: dry matter, 91.6%, 93.2%, 90.9%, 77.0%, and 75.7%; protein, 90.5%, 89.0%, 87.4%, 75.8% and 71.0%; lipid, 97.5%, 94.0%, 92.1%, 75.8%, and 72.0%; fiber or chitin, 90.1%, 96.1%, 95.2%, 71.5%, and 69.3%; ash, 38.1%, 74.9%, 71.6%, 32.4%, and 30.8%; calcium, 17.1%, 20.3%, 20.9%, 13.2%, and 11.6%; phosphorus, 27.8%, 28.2%, 30.1%, 10.5%, and 9.7%; nitrogen-free extract 93.7%, 95.8%, 92.6%, 84.2%, and 82.7%; energy, 92.1%, 89.0%, 83.7%, 65.6%, and, 54.8%; and average amino acid, 91.2%, 89.6%, 87.1%, 76.2%, and 70.6%, respectively. These values were significantly affected by test ingredients ( Pb0.05). The results of the study suggest that the ADCs of protein are indicative of amino acid digestibility. However, variation in individual amino acid digestibility between feed ingredients means that determination of this parameter may allow more accurate and economical feed formulation. D 2004 Elsevier B.V. All rights reserved. Keywords: Nile tilapia; Apparent digestibility; Feed ingredients; Nutrients; Energy 1. Introduction A feed ingredient may appear from its chemical composition to be an excellent source of nutrients but will be of little actual value unless it can be digested and absorbed in the target species. Knowl- edge of nutrient digestibility of the various feed ingredients used in formulating fish feeds is desirable so that effective substitution of one ingredient for another may be achieved. Together with chemical analysis, digestibility determination may allow a more thorough estimation of the nutritive value of a particular protein source in a complete feed for fish. 0044-8486/$ - see front matter D 2004 Elsevier B.V. All rights reserved. doi:10.1016/j.aquaculture.2004.12.003 * Corresponding author. Tel.: +90 424 237 0000x6111; fax: +90 424 238 6287. E-mail address: [email protected] (K. Ko ¨pru ¨cu ¨). Aquaculture 250 (2005) 308 – 316 www.elsevier.com/locate/aqua-online
-
Upload
independent -
Category
Documents
-
view
0 -
download
0
Transcript of Apparent digestibility of selected feed ingredients in diets formulated for the sub-adult mud crab,...
www.elsevier.com/locate/aqua-online
Aquaculture 250 (
Apparent digestibility of selected feed ingredients for
Nile tilapia (Oreochromis niloticus)
Kenan Koprucu*, YaYar Ozdemir
Firat University, Fisheries Faculty, 23119, Elazig, Turkey
Received 28 September 2004; received in revised form 7 December 2004; accepted 7 December 2004
Abstract
In this study, apparent digestibility coefficients (ADCs) of nutrients and energy in selected feed ingredients were determined
for Nile tilapia. ADCs were determined using a reference diet with chromic oxide indicator and test diets that contained 70%
reference diet, by weight, and 30% of the test ingredient being evaluated. Fish were fed twice daily at the rate of 4% of their
body weight at 27F1 8C of water temperature. Fecal samples were collected from three replicate groups of fish using fecal
collection column attached to fish rearing aquaria. The ADCs of the anchovy meal, corn gluten meal, soybean meal, gammarid
meal and crayfish exoskeleton meal were: dry matter, 91.6%, 93.2%, 90.9%, 77.0%, and 75.7%; protein, 90.5%, 89.0%, 87.4%,
75.8% and 71.0%; lipid, 97.5%, 94.0%, 92.1%, 75.8%, and 72.0%; fiber or chitin, 90.1%, 96.1%, 95.2%, 71.5%, and 69.3%;
ash, 38.1%, 74.9%, 71.6%, 32.4%, and 30.8%; calcium, 17.1%, 20.3%, 20.9%, 13.2%, and 11.6%; phosphorus, 27.8%, 28.2%,
30.1%, 10.5%, and 9.7%; nitrogen-free extract 93.7%, 95.8%, 92.6%, 84.2%, and 82.7%; energy, 92.1%, 89.0%, 83.7%,
65.6%, and, 54.8%; and average amino acid, 91.2%, 89.6%, 87.1%, 76.2%, and 70.6%, respectively. These values were
significantly affected by test ingredients (Pb0.05). The results of the study suggest that the ADCs of protein are indicative of
amino acid digestibility. However, variation in individual amino acid digestibility between feed ingredients means that
determination of this parameter may allow more accurate and economical feed formulation.
D 2004 Elsevier B.V. All rights reserved.
Keywords: Nile tilapia; Apparent digestibility; Feed ingredients; Nutrients; Energy
1. Introduction
A feed ingredient may appear from its chemical
composition to be an excellent source of nutrients
but will be of little actual value unless it can be
0044-8486/$ - see front matter D 2004 Elsevier B.V. All rights reserved.
doi:10.1016/j.aquaculture.2004.12.003
* Corresponding author. Tel.: +90 424 237 0000x6111; fax: +90
424 238 6287.
E-mail address: [email protected] (K. Koprucu).
digested and absorbed in the target species. Knowl-
edge of nutrient digestibility of the various feed
ingredients used in formulating fish feeds is
desirable so that effective substitution of one
ingredient for another may be achieved. Together
with chemical analysis, digestibility determination
may allow a more thorough estimation of the
nutritive value of a particular protein source in a
complete feed for fish.
2005) 308–316

Table 1
Composition of the reference and test diets (%)
Ingredients Reference diet Test diets
Anchovy meal 15
Soybean meal (solvent extracted) 43
Wheat flour 38.7
Sunflower oil 1.9
Antioxidanta 0.1
Vitamin premixb 0.25
Mineral premixc 0.05
Chromic oxide (Cr2O3) 1
Reference diet 70
Test ingredient 30
K. Koprucu, Y. Ozdemir / Aquaculture 250 (2005) 308–316 309
The tilapia feeds efficiently on natural fauna and
flora and can utilize supplementary feed materials to
achieve rapid growth and weight gain. The intensi-
fication of tilapia culture requires the development of
suitable feeds both for complete and supplementary
feeding in tanks and ponds. The nutritive value of
mixed rations depends on the nutrient composition of
the individual feed components and the ability of the
animal to digest and absorb the nutrients (Moreau,
1996; Watanabe et al., 1996; Degani et al., 1997;
Falaye and Jauncey, 1999; Riche et al., 2001). For
tilapia feeds typical protein sources examined have
included poultry by-product (Gaber, 1996), cacao
husks (Pouomogne et al., 1997), legume seed meal
(Fagbenro, 1998), defatted soybean meal, full-fat
toasted soybean, lupin seed meal and faba bean meal
(Fontainhas-Fernandes et al., 1999), sunflower cakes,
fish (anchovy) meal and wheat bran (Maina et al.,
2002), cottonseed meal, sunflower meal (El-Saidy
and Gaber, 2003), fish and poultry meals, corn
gluten, rapeseed meal, sorghum, barley (Sklan et al.,
2004). Anchovy meal, corn gluten meal, soybean
meal, gammarid meal and crayfish exoskeleton meal
were selected as dietary protein sources on the basis
of their availability and use in tilapia feeds in
Turkey. Gammarid (Mathias et al., 1982; Ozdemir
et al., 1997; Koprucu et al., 1998) and crayfish
exoskeleton (Ozdemir et al., 1999) have high protein
levels and favourable essential amino acid profiles,
but ash and chitin contents of these feed ingredients
are very high. The ability of fish to digest and absorb
gammarid and crayfish (crustacean) exoskeleton
meals as feed is not well understood (Forster,
1999; Shiau and Yu, 1999). The total production of
crustacea in the world and Turkey was about
935,000 and 220 tonnes in 1995, respectively
(FAO, 1995).
The objective of this study was to determine the
apparent digestibility of nutrients and energy in
selected feed ingredients for Nile tilapia.
Total 100 100
a Antioxidant (mg/g): butylated hydroxytoluene, 12.5.b Vitamin premix contains (IU or mg/g of premix): retinol, 1600
IU; calciferol, 800 IU; tocopherol, 20; menadione, 4; thiamine, 4
riboflavin, 6; niacin, 12; pantothenic acid, 20; pyridoxine, 4
cobalamin, 0.008; folic acid, 2; biotin, 0.4; choline chloride, 200
ascorbic acid, 80.c Mineral premix contains (mg/g of premix): manganese 50, iron
88, zinc 200, copper 6, iodine 10, selenium 0.6.
2. Materials and methods
2.1. Fish and experimental condition
This study was conducted at the fish reproduction
unit of the Fisheries Faculty of Firat University,
Elazig, Turkey. Each treatment had three replicates, 15
Nile tilapia per replicate, with mean initial fish
weights of 15F0.1 g. Each treatment combination
was randomly assigned to three glass aquaria (25 l).
Water temperature in the aquaria was maintained at
27F1 8C and the fish were subjected to a 12 h
photoperiod using fluorescent lights. The water was
constantly replaced in the aquaria by continuous flow
at a rate of 250 ml min�1 to provide oxygen and
remove excess nitrogenous wastes.
2.2. Diet preparation
The reference diet (Table 1) was formulated to
satisfy the nutrient requirements of Nile tilapia
(Lovell, 1989). Chromic oxide (Cr2O3) was used as
an inert marker at a concentration of 1% in
reference diet. Test ingredients were obtained from
a local supplier (Elazig Feed Manufacture, Elazig,
Turkey). Chromic oxide was donated by Merck
Products. Vitamin and mineral premixes were
obtained from Roche Products.
Test ingredients for apparent digestibility were
anchovy meal (mechanical extracted), corn gluten
meal (dehydrated), soybean meal (solvent extracted
with hexane), gammarid (Gammarus kischineffensis)
;
;
;
K. Koprucu, Y. Ozdemir / Aquaculture 250 (2005) 308–316310
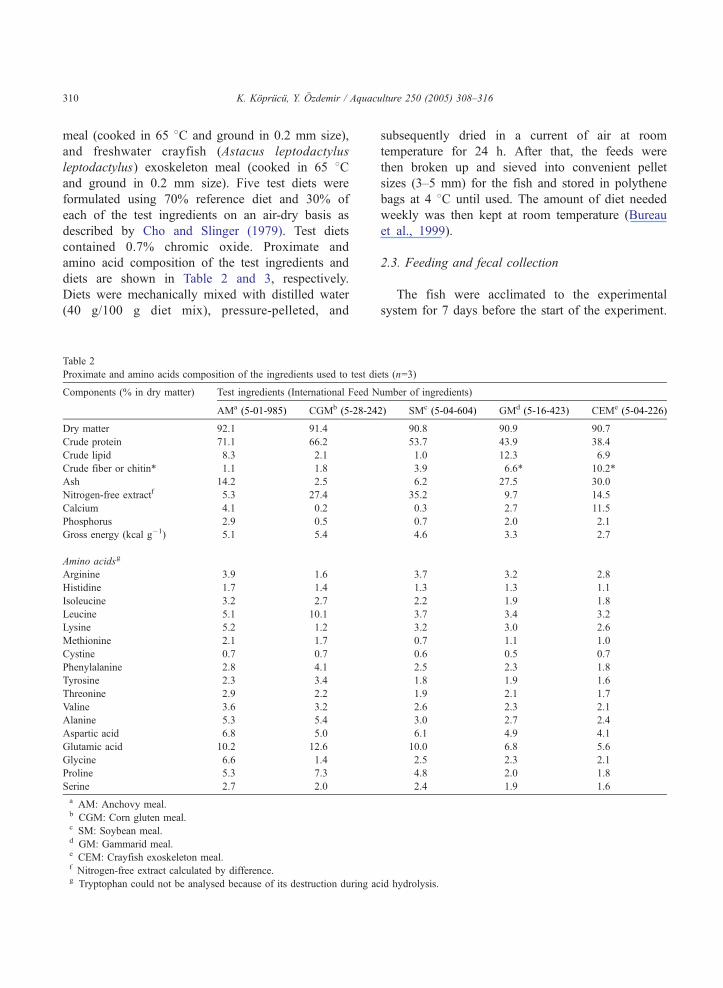
meal (cooked in 65 8C and ground in 0.2 mm size),
and freshwater crayfish (Astacus leptodactylus
leptodactylus) exoskeleton meal (cooked in 65 8Cand ground in 0.2 mm size). Five test diets were
formulated using 70% reference diet and 30% of
each of the test ingredients on an air-dry basis as
described by Cho and Slinger (1979). Test diets
contained 0.7% chromic oxide. Proximate and
amino acid composition of the test ingredients and
diets are shown in Table 2 and 3, respectively.
Diets were mechanically mixed with distilled water
(40 g/100 g diet mix), pressure-pelleted, and
Table 2
Proximate and amino acids composition of the ingredients used to test di
Components (% in dry matter) Test ingredients (International Feed N
AMa (5-01-985) CGMb (5-28-24
Dry matter 92.1 91.4
Crude protein 71.1 66.2
Crude lipid 8.3 2.1
Crude fiber or chitin* 1.1 1.8
Ash 14.2 2.5
Nitrogen-free extractf 5.3 27.4
Calcium 4.1 0.2
Phosphorus 2.9 0.5
Gross energy (kcal g�1) 5.1 5.4
Amino acidsg
Arginine 3.9 1.6
Histidine 1.7 1.4
Isoleucine 3.2 2.7
Leucine 5.1 10.1
Lysine 5.2 1.2
Methionine 2.1 1.7
Cystine 0.7 0.7
Phenylalanine 2.8 4.1
Tyrosine 2.3 3.4
Threonine 2.9 2.2
Valine 3.6 3.2
Alanine 5.3 5.4
Aspartic acid 6.8 5.0
Glutamic acid 10.2 12.6
Glycine 6.6 1.4
Proline 5.3 7.3
Serine 2.7 2.0
a AM: Anchovy meal.b CGM: Corn gluten meal.c SM: Soybean meal.d GM: Gammarid meal.e CEM: Crayfish exoskeleton meal.f Nitrogen-free extract calculated by difference.g Tryptophan could not be analysed because of its destruction during ac
subsequently dried in a current of air at room
temperature for 24 h. After that, the feeds were
then broken up and sieved into convenient pellet
sizes (3–5 mm) for the fish and stored in polythene
bags at 4 8C until used. The amount of diet needed
weekly was then kept at room temperature (Bureau
et al., 1999).
2.3. Feeding and fecal collection
The fish were acclimated to the experimental
system for 7 days before the start of the experiment.
ets (n=3)
umber of ingredients)
2) SMc (5-04-604) GMd (5-16-423) CEMe (5-04-226)
90.8 90.9 90.7
53.7 43.9 38.4
1.0 12.3 6.9
3.9 6.6* 10.2*
6.2 27.5 30.0
35.2 9.7 14.5
0.3 2.7 11.5
0.7 2.0 2.1
4.6 3.3 2.7
3.7 3.2 2.8
1.3 1.3 1.1
2.2 1.9 1.8
3.7 3.4 3.2
3.2 3.0 2.6
0.7 1.1 1.0
0.6 0.5 0.7
2.5 2.3 1.8
1.8 1.9 1.6
1.9 2.1 1.7
2.6 2.3 2.1
3.0 2.7 2.4
6.1 4.9 4.1
10.0 6.8 5.6
2.5 2.3 2.1
4.8 2.0 1.8
2.4 1.9 1.6
id hydrolysis.

Table 3
Proximate and amino acids composition of the reference and test diets (n=3)
Components (% in dry matter) Reference diet Test diets (70% reference diet+30% test ingredient)
AMa CGMb SMc GMd CEMe
Dry matter 95.0 95.1 94.8 94.9 95.0 94.7
Crude protein 40.0 49.3 47.9 44.1 41.2 39.5
Crude lipid 3.9 5.2 3.4 3.0 6.4 4.8
Crude fiber or chitin* 2.7 2.2 2.4 3.1 3.9 * 5.0 *
Ash 5.6 8.2 4.7 5.8 12.2 12.9
Nitrogen-free extractf 47.8 35.1 41.6 44.0 36.3 37.8
Calcium 0.8 1.8 0.6 0.6 1.3 4.0
Phosphorus 0.9 1.5 0.8 0.9 1.2 1.3
Gross energy (kcal g�1) 4.7 4.8 4.9 4.7 4.3 4.1
Amino acidsg
Arginine 2.6 3.0 2.3 2.9 2.8 2.7
Histidine 1.0 1.2 1.1 1.1 1.0 1.0
Isoleucine 1.7 2.2 2.0 1.9 1.8 1.7
Leucine 2.8 3.5 4.4 3.1 3.0 2.9
Lysine 2.6 3.4 2.2 2.8 2.7 2.6
Methionine 0.7 1.2 1.0 0.7 0.6 0.5
Cystine 0.5 0.6 0.6 0.5 0.5 0.6
Phenylalanine 1.7 2.0 2.4 1.9 1.9 1.7
Tyrosine 1.3 1.6 1.9 1.5 1.6 1.5
Threonine 1.5 2.7 2.3 1.6 2.0 1.6
Valine 2.0 2.5 2.4 2.2 2.1 2.0
Alanine 2.2 3.1 3.2 2.5 2.4 2.3
Aspartic acid 5.0 5.3 5.0 5.2 4.9 4.8
Glutamic acid 6.8 7.8 8.5 7.7 6.7 6.4
Glycine 2.5 3.1 2.2 2.5 2.4 2.4
Proline 2.9 3.6 4.2 3.5 2.6 2.6
Serine 1.7 2.0 1.8 1.9 1.8 1.7
a AM: Anchovy meal.b CGM: Corn gluten meal.c SM: Soybean meal.d GM: Gammarid meal.e CEM: Crayfish exoskeleton meal.f Nitrogen-free extract calculated by difference.g Tryptophan could not be analysed because of its destruction during acid hydrolysis.
K. Koprucu, Y. Ozdemir / Aquaculture 250 (2005) 308–316 311
Fecal collection started 4 days after changing to the
experimental diets to allow evacuation of all previ-
ously ingested material. Fecal samples were collected
using fecal collection column described by Cho et al.
(1982). The velocity of the water flow was adjusted to
minimize collection of the feces in the drainpipe and
maximize recovery of the feces in the collection
column.
During the trial, fish were fed twice daily (09:00
and 17:00 h) at the rate of 4% of their body weight.
About 30 min after the every feeding, the drainpipe
and the collection column were brushed out to remove
feed residues and feces from the system. Fecal
samples were collected by collection column for each
replicate twice daily, morning and evening for 30
days. The settled feces and surrounding water were
gently withdrawn from the base of the collection
column into a centrifuge bottle.
For all treatment groups, twice daily feces
collections were centrifuged at 5000 �g for 15
min and the supernatant discarded. The feces were
then freeze-dried, ground using a 1 mm screen, and
stored at �35 8C until required for analysis (Windell
et al., 1978; Vandenberg and De la Noue, 2001).
K. Koprucu, Y. Ozdemir / Aquaculture 250 (2005) 308–316312
Fecal samples from each aquaria were pooled at the
end of the experiment.
2.4. Analytical methods
Diets and fecal samples were analysed in
triplicate for proximate composition (AOAC,
1995) and chromic oxide (Furukawa and Tsuka-
hara, 1966). These samples were analysed for dry
matter at 65 8C for 24 h in a vacuum oven. Crude
protein (%N�6.25) was determined by the Kjeldahl
method using an Auto Kjeldahl System, lipid by
ether extraction and fiber by drying and ashing
after the extraction with 0.5 M H2SO4 and 0.5 M
NaOH. Ash content was determined after inciner-
ation at 550 8C for 12 h in a muffle furnace.
Calcium and phosphorus were analysed using an
atomic emission spectrometry. Nitrogen-free extract
was calculated by difference. Energy contents were
analysed using an Automatic Adiabatic Bomb
Calorimeter.
Amino acid content of fecal samples from each
aquaria, test ingredients and feeds were also deter-
mined. Amino acid analyses were performed using an
LC 3000 model amino acid analyser according to the
manufacturer’s recommendations for protein hydro-
lysates (Sarwar and Botting, 1993). Tryptophan could
not be analysed because of its destruction during acid
hydrolysis.
The apparent digestibility coefficients (ADCs) of
dry matter, protein, lipid, fiber, chitin, ash, calcium,
phosphorus, nitrogen-free extract, amino acids and
energy for the test ingredients and diets were calculated
as follows (Cho and Slinger, 1979):
ADC ¼ 100� 1� F=Dð Þ � Di=Fið Þ½ �
ADCI ¼ ADCT � 0:7� ADCRÞð �=0:3½
where:D=% nutrient or energy of diet; F=% nutrient or
energy of feces; Di=% marker (Cr2O3) in diet; Fi=%
marker (Cr2O3) in feces, ADCT=% apparent digesti-
bility coefficient of nutrient or energy in test diet;
ADCR=apparent digestibility coefficient of nutrient or
energy in the reference diet; I=test ingredient under
investigation.
2.5. Statistical analyses
Data were subjected to one-way ANOVA. When
appropriate, the Duncan’s New Multiple Range test
was applied to evaluate difference between means.
3. Results
Apparent digestibility coefficients (ADCs) of dry
matter, protein, lipid, fiber, chitin, ash, calcium,
phosphorus, nitrogen-free extract, energy, and amino
acids in the selected test ingredients for Nile tilapia are
shown in Table 4. The ADC values of nutrients and
energy were significantly affected by test ingredients
(Pb0.05).
ADCs of dry matter and nitrogen-free extract in
anchovy meal, corn gluten meal and soybean meal
were significantly higher (Pb0.05) than gammarid
meal and crayfish exoskeleton meal. There were no
significant differences in ADCs of dry matter and
nitrogen-free extract between gammarid meal and
crayfish exoskeleton meal.
ADCs of protein and average amino acid were found
as 90.5% and 91.2% for anchovy meal, 89.0% and
89.6% for corn gluten meal, 87.4% and 87.1% for
soybean meal, 75.8% and 76.2% for gammarid meal,
71.0% and 70.6% for crayfish exoskeleton meal. ADCs
of average amino acid for the test ingredients followed
similar trend to ADCs of protein. ADCs of protein and
average amino acid in anchovy meal, corn gluten meal
and soybean meal were significantly higher (Pb0.05)
than gammarid meal and crayfish exoskeleton meal.
Differences in ADCs of protein and average amino acid
between gammaridmeal and crayfish exoskeletonmeal
were found significant (Pb0.05).
The anchovy meal had higher ADCs of lipid
(Pb0.05) than that of soybean meal, gammarid meal
and crayfish exoskeleton meal but no differences
between the corn gluten meal with anchovy meal and
soybean meal. ADCs of phosphorus were significantly
different among test ingredients (Pb0.05, except for
anchovy meal and corn gluten meal). Differences in
ADCs of fiber or chitin, ash and calcium between
anchovy meal and others test ingredients were found
significant (Pb0.05) but no differences between the
corn gluten meal and soybean meal or gammarid meal
and crayfish exoskeleton meal.

Table 4
Apparent digestibility of nutrients and energy in the test ingredients for Nile tilapia
Components (%)a Reference diet Test ingredients
AMb CGMc SMd GMe CEMf SEMg
Dry matter 89.0 91.6b 93.2b 90.9b 77.0c 75.7c 0.38
Protein 87.1 90.5b 89.0b 87.4b 75.8c 71.0d 0.39
Lipid 90.6 97.5b 94.0b,c 92.1c 75.8d 72.0e 0.52
Fiber or Chitin* 88.0 90.1b 96.1c 95.2c 71.5d * 69.3d * 0.58
Ash 63.5 38.1b 74.9c 71.6c 32.4d 30.8d 0.98
Nitrogen-free extract 88.7 93.7b 95.8b 92.6b 84.2d 82.7d 0.27
Calcium 18.4 17.1b 20.3c 20.9c 13.2d 11.6d 0.19
Phosphorus 25.7 27.8b 28.2b 30.1c 10.5d 9.7e 0.46
Energy 81.8 92.1b 89.0c 83.7d 65.6e 54.8f 0.72
Amino acids
Arginine 89.3 92.1b 88.9b 88.7b 77.0c 71.5d 0.39
Histidine 90.1 92.4b 90.0b 88.9b 79.2c 72.3d 0.38
Isoleucine 82.7 90.7b 89.5b 86.1c 70.5d 65.2e 0.52
Leucine 86.6 90.8b 87.7b,c 86.5c 77.0d 69.5e 0.41
Lysine 88.1 90.5b 88.0b,c 83.4c 76.7d 70.1e 0.40
Methionine 86.6 94.0b 94.1b 84.0c 70.3d 67.0d 0.57
Cystine 86.2 89.6b 86.7b,c 86.0c 72.7d 68.9e 0.43
Phenylalanine 88.5 90.0b 90.3b 87.2b 79.2c 70.0d 0.39
Tyrosine 89.0 90.5b 86.0c 85.7c 80.3d 72.7e 0.33
Threonine 86.1 90.1b 88.5b 86.9b 77.0c 68.1d 0.42
Valine 86.0 90.3b 88.6b 83.5c 76.1d 69.7e 0.40
Alanine 84.9 93.2b 94.0b 86.0c 74.1d 68.3e 0.51
Aspartic acid 85.8 91.4b 89.4b 88.0b 78.6c 72.9d 0.37
Glutamic acid 90.7 92.8b 90.2b 92.1b 78.4c 71.3d 0.43
Glycine 87.1 90.4b 91.9b 89.0b 79.0c 77.0c 0.31
Proline 91.0 91.2b 90.1b 90.5b 77.0c 74.6c 0.37
Serine 86.8 91.6b 89.9b,c 88.0c 72.7d 70.4d 0.45
Average AAADh 87.7 91.2b 89.6b 87.1b 76.2c 70.6d 0.41
a Standard error of the treatment mean (SEM) calculated from the residual mean square in the analyses of variance.b AM: Anchovy meal (5-01-985).c CGM: Corn gluten meal (5-28-242).d SM: Soybean meal (5-04-604).e GM: Gammarid meal (5-16-423).f CEM: Crayfish exoskeleton meal (5-04-226).g Coefficients (mean of three replicate groups) in each row with a different letter are significantly different ( Pb0.05).h Average AAAD: Average apparent amino acid digestibility.
K. Koprucu, Y. Ozdemir / Aquaculture 250 (2005) 308–316 313
ADCs of energy were significantly (Pb0.05) differ-
ent among ingredients tested. Anchovy meal had the
highest (92.1%) ADCs of energy whereas crayfish
exoskeleton meal had the lowest (54.8%) ADCs of
energy (Table 4).
4. Discussion and conclusion
Generally, the protein quality of dietary ingredients
is the leading factor affecting fish performance, and
protein digestibility is the first measure of its
availability by fish. Protein quality of dietary protein
sources depends on the amino acid composition and
their digestibility. Deficiency of an essential amino
acid leads to poor utilization of the dietary protein and
consequently reduces growth and decreases feed
efficiency (Halver and Hardy, 2002).
Although the data presented in this study suggest
a reasonable agreement between ADCs of protein
and average amino acid, ADCs of individual amino
acids within a feed ingredient are variable. Since
K. Koprucu, Y. Ozdemir / Aquaculture 250 (2005) 308–316314
ADCs of especially essential amino acids, nutrients
and energy for selected protein sources used in this
study have not been reported for Nile tilapia, use of
the ADCs obtained from this study should allow
for more accurate and economical tilapia feed
formulation.
The present study showed that ADCs of dry matter,
protein, lipid, fiber, chitin, ash, calcium, phosphorus,
nitrogen-free extract, average amino acid, and energy
in the test ingredients for Nile tilapia were affected by
test ingredients (Pb0.05). The differences in ADCs of
nutrients and energy may be explained by differences
in chemical composition, origin and processing of
these feed ingredients (Table 2). ADCs of protein and
average amino acid were highest in feed ingredients
with high protein and low ash contents. Especially,
ADCs of dry matter, protein, average amino acid,
lipid, and energy in crayfish exoskeleton meal and
gammarid meal were significantly lower than those of
other test ingredients, and this trend may be due to
high content of ash (30.0% and 27.5%, respectively)
and chitin (10.2% and 6.6%, respectively) in these
ingredients. Shiau and Yu (1999) revealed lower lipid
and dry matter digestibilities of tilapia fed diets
containing high chitin (10%). Studies with rainbow
trout also indicated that chitin was not digested when
feed at 10% and 30% of the diet (Lindsay et al.,
1984).
The ADCs for protein in protein-rich feed ingre-
dients are usually in the range of 75–95%. The ADCs
of protein (71–90.5%) in test ingredients for Nile
tilapia in our study (fecal samples collected using
fecal collection column) are generally in agreement
with the reported ADCs of protein in various feed
ingredients for Nile tilapia. For example, alfalfa (66%)
and fish (menhaden, 85%) meals (feces collected by
frequent removal from water) (Pompa, 1982); corn
(83–84%), soybean (91–94.4%) and fish (sardine,
86%) meals (fecal samples collected by dissection)
(Hanley, 1987); defatted soybean meal (94.4%), full-
fat soybean (90%) and micronized wheat (88.6%)
(feces collected by the Guelph system) (Fontainhas-
Fernandes et al., 1999); anchovy meal (90%), sun-
flower cakes (86–89%) and wheat bran (75%) (Maina
et al., 2002). Part of the variability in ADCs of protein
may explain by differences in chemical composition,
origin and processing of these various feed ingre-
dients, and methods of feces collection. Bureau et al.
(1999) reported that the difference in the ADCs
obtained when using fecal samples collected by
stripping vs. with the Guelph system and the need
to report the method used to collect fecal material
when comparing estimates of apparent digestibility
among studies.
Fat when administered either alone or in a mixed
diet routinely gives digestibility values range from
85% to 95% for fish (Cho and Slinger, 1979; Aksnes
and Opstvedt, 1998). Sklan et al. (2004) reported that
for tilapia the ADCs of lipid (72–90%) and energy
(39–89%) for fish and poultry meals, corn gluten,
soybean meal, rapeseed meal, sunflower seed meal,
wheat, corn, sorghum, barley and wheat bran. The
ADCs of lipid (72–97.5%) and energy (54.8–92.1%)
in test ingredients for Nile tilapia in our study are
generally in agreement with that reported by Sklan et
al. (2004).
The apparent phosphorus digestibility coefficients
of anchovy meal (27.8%), corn gluten meal (28.2%)
and soybean meal (30.1%) for Nile tilapia in our study
are higher than the reported ADCs of phosphorus in
brown fishmeal (24%) for common carp (Ogino et al.,
1979), corn (25%) and soybean meal (29%) for
channel catfish (Wilson et al., 1982). Tilapia and
salmonids utilize phosphorus present in fish meal
more efficiently than do carp and channel catfish
(NRC, 1993). The differences in the bioavailability of
phosphorus to salmonids and tilapia or carp is
probably due to the limited secretion of gastric juices
by these warmwater species (Ogino et al., 1979).
In conclusion, data presented here suggest a
reasonable agreement between ADCs of protein and
average amino acid and, in general, the protein
digestibility coefficients were indicative of amino
acid digestibility. The results of the study suggest that
protein digestibility coefficients are indicative of
average amino acid digestibility. However, because
of variation within individual amino acid availabilities
between feed ingredients, the use of specific amino
acid digestibility coefficients may allow more accu-
rate and economical feed formulation.
Acknowledgements
This research was funded by the support from
the Firat University, Unit of Scientific Research
K. Koprucu, Y. Ozdemir / Aquaculture 250 (2005) 308–316 315
Projects, under agreement No: FUBAP-680. The
authors gratefully acknowledge the Cukurova Uni-
versity, Fisheries Faculty (Adana, Turkey) for
provision of fish samples.
References
Aksnes, A., Opstvedt, J., 1998. Content of digestible energy in fish
feed ingredients determined by the ingredient-substitution
method. Aquaculture 161, 45–53.
AOAC (Association of Official Analytical Chemists), 1995. Official
methods of analysis, 16th ed. AOAC, Arlington, VA.
Bureau, D.P., Harris, A.M., Cho, C.Y., 1999. Apparent
digestibility of rendered animal protein ingredients for
rainbow trout (Oncorhynchus mykiss). Aquaculture 180,
345–358.
Cho, C.Y., Slinger, S.J., 1979. Apparent digestibility measurement
in feedstuffs for rainbow trout. In: Halver, J., Tiews, K. (Eds.),
Proc. World Symp. on Finfish Nutrition and Fishfeed Technol-
ogy vol. 2. Heenemann, Berlin, pp. 239–247.
Cho, C.Y., Slinger, S.J., Baley, H.S., 1982. Bioenergetics of
salmonid fishes: energy intake, expenditure and productivity.
Comparative Biochemistry and Physiology 73B, 25–41.
Degani, G., Viola, S., Yehuda, Y., 1997. Apparent digestibility of
protein and carbohydrate in feed ingredientes for adult tilapia
(Oreochromis aureus � O. niloticus). The Israeli Journal
Aquaculture 49, 115–123.
El-Saidy, D.M.S.D., Gaber, M.M.A., 2003. Replacement of fish
meal with a mixture of different plant protein sources in juvenile
Nile tilapia Oreochromis niloticus (L.) diets. Aquaculture
Research 34, 1119–1127.
Fagbenro, O.A., 1998. Apparent digestibility of various legume
seed meals in Nile tilapia diets. Aquaculture International 6,
83–87.
Falaye, A.E., Jauncey, K., 1999. Acceptability and digestibility by
tilapia Oreochromis niloticus of feeds containing cocoa husk.
Aquaculture Nutrition 5, 157–161.
FAO, 1995. Fishery information, data and statistics. Aquaculture
Production 1983–1993, FAO Fish. Circ. 815 (rev. 7). 186 p.
Fontainhas-Fernandes, A., Gomes, E., Reis-Henriques, M.A.,
Coimbra, J., 1999. Replacement of fish meal by plant proteins
in the diet of Nile tilapia: digestibility and growth performance.
Aquaculture International 7, 57–67.
Forster, I., 1999. A note on the method of calculating digestibility
coefficients of nutrients provided by single ingredients to feeds
of aquatic animals. Aquaculture Nutrition 5, 143–145.
Furukawa, A., Tsukahara, H., 1966. On the acid digestion of
chromic oxide as an index substance in the study of digestibility
of fish feed. Bulletin of the Japanese Society of Scientific
Fisheries 32, 502–506.
Gaber, M.M.A., 1996. Partial and complete replacement of fish
meal by poultry by-product and feather meal in diets of Nile
tilapia, Oreochromis niloticus. Annals of Agricultural Science
32, 203–214.
Halver, J.E., Hardy, R.W., 2002. Fish nutrition, Third edition.
Academic Press, New York. 824 pp.
Hanley, F., 1987. The digestibility of foodstuffs and the effects of
feeding selectivity on digestibility determinations in tilapia,
Oreochromis niloticus (L.). Aquaculture 66, 163–179.
Koprucu, K., Harlioglu, M.M., Konar, V., 1998. Use of Gammarus
kischineffensis (Schellenberg 1937) as a protein, amino acid and
pigment source in rainbow trout (Oncorhynchus mykiss
Walbaum, 1792) rations. Journal of Fisheries and Aquatic
Sciences 15 (3–4), 199–210.
Lindsay, G.J.H., Walton, M.J., Adron, J.W., Fletcher, T.C., Cho,
C.Y., Cowey, C.B., 1984. The growth of rainbow trout (Salmo
gairdneri) given diets containing chitin and its relationship to
chitinolytic enzymes and chitin digestibility. Aquaculture 37,
315–334.
Lovell, T., 1989. Nutrition and feeding of fish. An. AVI Book. Van
Nostrand Reinhold, New York. 260 pp.
Maina, J.G., Beames, R.M., Higgs, D., Mbugua, P.N., Iwama, G.,
Kisia, S.M., 2002. Digestibility and feeding value of some feed
ingredients fed to tilapia, Oreochromis niloticus (L.). Aqua-
culture Research 33, 853–862.
Mathias, J.A., Martin, J., Yurkowski, M., Lark, J.G.I., Papst, M.,
Tabachek, J.L., 1982. Harvest and nutritional quality of
Gammarus lacustris for trout culture. Transactions of the
American Fisheries Society 111, 83–89.
Moreau, Y., 1996. Measurement of the apparent digestibility
coefficients for Oreochromis niloticus of agro-industrial by-
products available in Cote d’Ivoire. In: Pullin, R.S.V., Lazard, J.,
Legendre, M., Amon Kottias, J.B., Pauly, D. (Eds.), The Third
International Symposium on Tilapia in Aquaculture ICLARM
Conference Proceedings No. 14, ICLARM, Manila, Philippines,
pp. 204–210.
NRC (National Research Council), 1993. Nutrient requirement of
fish. National Academy Press, Washington, DC. 114 p.
Ogino, C., Takeuchi, T., Takeda, H., Watanabe, T., 1979. Avail-
ability of dietary phosphorus in carp and rainbow trout. Bulletin
of the Japanese Society of Scientific Fisheries 45, 1527–1532.
Ozdemir, Y., Koprucu, K., Harlioglu, M.M., Gur, F., 1997. An
investigation on the seasonal nutritional quality of Gammarus
kischineffensis (Amphipoda Schellenberg, 1937). Mediterranean
Fisheries Congress, 9–11 April, Izmir, Turkey, pp. 563–569.
Ozdemir, Y., Koprucu, K., Xeker, E., Cakmak, M.N., 1999.
An investigation on the nutrient quality of freshwater
crayfish, Astacus leptodactylus ssp. (in Turkish), X.
National symposium on aquatic products, 22–24 September,
Adana, Turkey, pp. 385–393.
Pompa, T.J., 1982. Digestibility of selected feedstuffs and naturally
occurring algae by tilapia, PhD dissertation, Auburn University,
Auburn, Alabama.
Pouomogne, V., Takam, G., Pouemegne, J., 1997. A preliminary
evaluation of cacao husks in practical diets for juvenile Nile
tilapia (Oreochromis niloticus). Aquaculture 156, 211–219.
Riche, M., Trottier, N.L., Ku, P.K., Garling, D.L., 2001. Apparent
digestibility of crude protein and apparent availability of
individual amino acids in tilapia (Oreochromis niloticus) fed
phytase pretreated soybean meal diets. Fish Physiology and
Biochemistry 25, 181–194.
K. Koprucu, Y. Ozdemir / Aquaculture 250 (2005) 308–316316
Sarwar, G., Botting, H.G., 1993. Evaluation of liquid chromato-
graphic analysis of important amino acids in food and
physiological samples. Journal of Chromatography 615, 1–22.
Shiau, S.Y., Yu, Y.P., 1999. Dietary supplementation of chitin and
chitosan depresses growth in tilapia, Oreochromis niloticus x O.
aureus. Aquaculture 179, 439–446.
Sklan, D., Prag, T., Lupatsch, I., 2004. Apparent digestibility
coefficients of feed ingredients and their prediction in diets for
tilapia, Oreochromis niloticus x Oreochromis aureus (Teleostei,
Cichlidae). Aquaculture Research 35, 358–364.
Vandenberg, G.W., De la Noue, J., 2001. Apparent digestibility
comparison in rainbow trout (Oncorhynchus mykiss) assessed
using three methods of feces collection and three digestibility
markers. Aquaculture Nutrition 7, 237–245.
Watanabe, T., Takeuchi, T., Satoh, S., Kiron, V., 1996.
Digestible crude protein contents in various feedstuffs
determined with four freshwater fish species. Fisheries
Science 62, 278–282.
Wilson, R.P., Robinson, E.H., Gatlin III, D.M., Poe, W.E., 1982.
Dietary phosphorus requirement of channel catfish. Journal of
Nutrition 112, 1197–1202.
Windell, J.T., Foltz, J.W., Sarokon, J.A., 1978. Methods of fecal
collection and nutrient leaching in digestibility studies. Pro-
gressive Fish-Culturist 40 (2), 51–55.