Assessing the Jarman-Bell Principle: Scaling of intake, digestibility, retention time and gut fill...
12
Assessing the Jarman–Bell Principle: Scaling of intake, digestibility, retention time and gut fill with body mass in mammalian herbivores Dennis W.H. Müller a, b , Daryl Codron a, c , Carlo Meloro d , Adam Munn e , Angela Schwarm f , Jürgen Hummel g, h , Marcus Clauss a, ⁎ a Clinic for Zoo Animals, Exotic Pets and Wildlife, Vetsuisse Faculty, University of Zurich, Winterthurerstr. 260, 8057 Zurich, Switzerland b National Park ‘Bavarian Forest’, Freyungerstr. 2, 94481 Grafenau, Germany c Florisbad Quaternary Research, National Museum, Bloemfontein, 9300, South Africa d Center for Anatomical and Human Science, Hull York Medical School, University of Hull, Cottingham Road, Hull HU6 3RX, UK e Institute for Conservation Biology and Environmental Management, School of Biological Sciences, The University of Wollongong, New South Wales 2522, Australia f Research Unit Nutritional Physiology ‘Oskar Kellner’, Leibniz Institute for Farm Animal Biology (FBN), Wilhelm-Stahl-Allee 2, 18196 Dummerstorf, Germany g Institute of Animal Science, University of Bonn, Endenicher Allee 15, 53115 Bonn, Germany h Ruminant Nutrition, Department of Animal Sciences, University of Göttingen, Kellnerweg 6, 37077 Göttingen, Germany abstract article info Article history: Received 11 September 2012 Received in revised form 26 September 2012 Accepted 28 September 2012 Available online 6 October 2012 Keywords: Jarman–Bell Principle Herbivory Body size Diet quality Digestion Allometry Feeding ecology Digestive physiology Differences in allometric scaling of physiological characters have the appeal to explain species diversification and niche differentiation along a body mass (BM) gradient — because they lead to different combinations of physio- logical properties, and thus may facilitate different adaptive strategies. An important argument in physiological ecology is built on the allometries of gut fill (assumed to scale to BM 1.0 ) and energy requirements/intake (assumed to scale to BM 0.75 ) in mammalian herbivores. From the difference in exponents, it has been postulated that the mean retention time (MRT) of digesta should scale to BM 1.0–0.75 =BM 0.25 . This has been used to argue that larger animals have an advantage in digestive efficiency and hence can tolerate lower-quality diets. However, empirical data does not support the BM 0.25 scaling of MRT, and the deduction of MRT scaling implies, according to physical principles, no scaling of digestibility; basing assumptions on digestive efficiency on the thus-derived MRT scaling amounts to circular reasoning. An alternative explanation considers a higher scaling exponent for food intake than for metabolism, allowing larger animals to eat more of a lower quality food without having to increase digestive efficiency; to date, this concept has only been explored in ruminants. Here, using data for 77 species in which intake, digestibility and MRT were measured (allowing the calculation of the dry matter gut contents (DMC)), we show that the unexpected shallow scaling of MRT is common in herbivores and may result from deviations of other scaling exponents from expectations. Notably, DMC have a lower scaling exponent than 1.0, and the 95% confidence intervals of the scaling exponents for intake and DMC generally overlap. Differences in the scaling of wet gut contents and dry matter gut contents confirm a previous finding that the dry matter concentration of gut contents decreases with body mass, possibly compensating for the less favorable volume– surface ratio in the guts of larger organisms. These findings suggest that traditional explanations for herbivore niche differentiation along a BM gradient should not be based on allometries of digestive physiology. In contrast, they support the recent interpretation that larger species can tolerate lower-quality diets because their intake has a higher allometric scaling than their basal metabolism, allowing them to eat relatively more of a lower quality food without having to increase digestive efficiency. © 2012 Elsevier Inc. All rights reserved. 1. Introduction 1.1. The Jarman–Bell Principle The scaling relationships of digestive features with body mass (BM) in herbivores are a fundamental part of our interpretation of herbivore feeding ecology, interspecific niche differentiation and intraspecific niche segregation due to sexual dimorphism. Geist (1974) explained how two PhD studies, which resulted in two publi- cations (Bell, 1971; Jarman, 1974), crystallized an understanding of the ways in which BM affects the ecology of ungulates of the African savannahs. These studies have become the springboard for most analyses of mammal herbivore ecological interactions that include a range of BM (du Toit, 2005). The so-called ‘Jarman–Bell Principle’ (JBP) (Geist, 1974) has been applied to other animal groups such as primates (Gaulin, 1979), fruit bats (Fleming, 1991) or baleen whales (Tershy, 1992), and predicts that BM constrains nutritional ecology Comparative Biochemistry and Physiology, Part A 164 (2013) 129–140 ⁎ Corresponding author. Tel.: +41 44 635 83 76. E-mail addresses: [email protected] (D.W.H. Müller), [email protected] (D. Codron), [email protected] (C. Meloro), [email protected] (A. Munn), [email protected] (A. Schwarm), [email protected] (J. Hummel), [email protected] (M. Clauss). 1095-6433/$ – see front matter © 2012 Elsevier Inc. All rights reserved. http://dx.doi.org/10.1016/j.cbpa.2012.09.018 Contents lists available at SciVerse ScienceDirect Comparative Biochemistry and Physiology, Part A journal homepage: www.elsevier.com/locate/cbpa
Transcript of Assessing the Jarman-Bell Principle: Scaling of intake, digestibility, retention time and gut fill...

Comparative Biochemistry and Physiology, Part A 164 (2013) 129–140
Contents lists available at SciVerse ScienceDirect
Comparative Biochemistry and Physiology, Part A
j ourna l homepage: www.e lsev ie r .com/ locate /cbpa
Assessing the Jarman–Bell Principle: Scaling of intake, digestibility, retention timeand gut fill with body mass in mammalian herbivores
Dennis W.H. Müller a,b, Daryl Codron a,c, Carlo Meloro d, Adam Munn e, Angela Schwarm f,Jürgen Hummel g,h, Marcus Clauss a,⁎a Clinic for Zoo Animals, Exotic Pets and Wildlife, Vetsuisse Faculty, University of Zurich, Winterthurerstr. 260, 8057 Zurich, Switzerlandb National Park ‘Bavarian Forest’, Freyungerstr. 2, 94481 Grafenau, Germanyc Florisbad Quaternary Research, National Museum, Bloemfontein, 9300, South Africad Center for Anatomical and Human Science, Hull York Medical School, University of Hull, Cottingham Road, Hull HU6 3RX, UKe Institute for Conservation Biology and Environmental Management, School of Biological Sciences, The University of Wollongong, New South Wales 2522, Australiaf Research Unit Nutritional Physiology ‘Oskar Kellner’, Leibniz Institute for Farm Animal Biology (FBN), Wilhelm-Stahl-Allee 2, 18196 Dummerstorf, Germanyg Institute of Animal Science, University of Bonn, Endenicher Allee 15, 53115 Bonn, Germanyh Ruminant Nutrition, Department of Animal Sciences, University of Göttingen, Kellnerweg 6, 37077 Göttingen, Germany
⁎ Corresponding author. Tel.: +41 44 635 83 76.E-mail addresses: [email protected]
[email protected] (D. Codron), carlo.meloro@[email protected] (A. Munn), schwarm@[email protected] (J. Hummel), [email protected]
1095-6433/$ – see front matter © 2012 Elsevier Inc. Allhttp://dx.doi.org/10.1016/j.cbpa.2012.09.018
a b s t r a c t
a r t i c l e i n f oArticle history:Received 11 September 2012Received in revised form 26 September 2012Accepted 28 September 2012Available online 6 October 2012
Keywords:Jarman–Bell PrincipleHerbivoryBody sizeDiet qualityDigestionAllometryFeeding ecologyDigestive physiology
Differences in allometric scaling of physiological characters have the appeal to explain species diversification andniche differentiation along a body mass (BM) gradient— because they lead to different combinations of physio-logical properties, and thus may facilitate different adaptive strategies. An important argument in physiologicalecology is built on the allometries of gut fill (assumed to scale to BM1.0) and energy requirements/intake(assumed to scale to BM0.75) inmammalian herbivores. From the difference in exponents, it has been postulatedthat the mean retention time (MRT) of digesta should scale to BM1.0–0.75=BM0.25. This has been used to arguethat larger animals have an advantage in digestive efficiency and hence can tolerate lower-quality diets. However,empirical data does not support the BM0.25 scaling of MRT, and the deduction of MRT scaling implies, according tophysical principles, no scaling of digestibility; basing assumptions on digestive efficiency on the thus-derivedMRTscaling amounts to circular reasoning. An alternative explanation considers a higher scaling exponent for foodintake than for metabolism, allowing larger animals to eat more of a lower quality food without having toincrease digestive efficiency; to date, this concept has only been explored in ruminants. Here, using data for 77species in which intake, digestibility and MRT were measured (allowing the calculation of the dry matter gutcontents (DMC)), we show that the unexpected shallow scaling of MRT is common in herbivores andmay resultfrom deviations of other scaling exponents from expectations. Notably, DMC have a lower scaling exponent than1.0, and the 95% confidence intervals of the scaling exponents for intake and DMC generally overlap. Differencesin the scaling of wet gut contents and drymatter gut contents confirm a previous finding that the drymatterconcentration of gut contents decreases with body mass, possibly compensating for the less favorable volume–surface ratio in the guts of larger organisms. These findings suggest that traditional explanations for herbivoreniche differentiation along a BM gradient should not be based on allometries of digestive physiology. In contrast,they support the recent interpretation that larger species can tolerate lower-quality diets because their intake has ahigher allometric scaling than their basal metabolism, allowing them to eat relatively more of a lower quality foodwithout having to increase digestive efficiency.
© 2012 Elsevier Inc. All rights reserved.
1. Introduction
1.1. The Jarman–Bell Principle
The scaling relationships of digestive features with body mass(BM) in herbivores are a fundamental part of our interpretation of
(D.W.H. Müller),yms.ac.uk (C. Meloro),rstorf.de (A. Schwarm),h.ch (M. Clauss).
rights reserved.
herbivore feeding ecology, interspecific niche differentiation andintraspecific niche segregation due to sexual dimorphism. Geist(1974) explained how two PhD studies, which resulted in two publi-cations (Bell, 1971; Jarman, 1974), crystallized an understanding ofthe ways in which BM affects the ecology of ungulates of the Africansavannahs. These studies have become the springboard for mostanalyses of mammal herbivore ecological interactions that includea range of BM (du Toit, 2005). The so-called ‘Jarman–Bell Principle’(JBP) (Geist, 1974) has been applied to other animal groups such asprimates (Gaulin, 1979), fruit bats (Fleming, 1991) or baleen whales(Tershy, 1992), and predicts that BM constrains nutritional ecology

130 D.W.H. Müller et al. / Comparative Biochemistry and Physiology, Part A 164 (2013) 129–140
— in terms of the diet quality that larger animals can or must tolerate,as well as their digestive efficiency. That larger animals commonlyingest diets of lower quality has been demonstrated repeatedly(e.g. Owen-Smith, 1988; Codron et al., 2007), and that they oftenmust tolerate poor-quality foods is usually not an issue of debate.This is considered a consequence of large animals' higher absolutefood requirements that prevent them from foraging selectively interms of time constraints, and also a consequence of larger, more‘clumsy’ feeding apparatus that again prevents them from foragingselectively in terms of picking out individual food items or plantparts (Owen-Smith, 1988; Shipley, 2007).
A fact often used to explain the increased dietary tolerance (mea-sured as the range in fiber and/or protein content of the diet the ani-mal can tolerate) of larger species is the decreased mass-specificmetabolic demands — because the daily requirements for energy(Nagy et al., 1999), nitrogen (Robbins, 1993) and even minerals(Rucker and Storms, 2002) scale to metabolic body mass (BM0.75).This scaling effectmeans that small-bodied species requiremore energyand nutrients per day and per unit of BM than do large-bodied forms(Geist, 1974). However, without information about the scaling ofenergy/nutrient intake, knowledge about the scaling of requirementsallows no further insight. Concepts about niche diversification along aBM gradient must make an assumption about the difference in scalingbetween requirement and intake. Given that larger animals ingestlower-quality diets, a similar scaling of intake and requirementswould make it necessary that digestive efficiency has a positive scaling,i.e. it should increase with BM. This could be achieved either byselecting a more digestible diet (which violates the assumption ofdecreasing diet quality), or by measures of digestive physiologythat increase digestive efficiency, such as prolonged digesta retention.In contrast, if we postulate that there is no scaling of digestive efficiencywith BM, then intake would have to scale to BM at a higher exponentthan requirements, in order to compensate for the lower diet qualityin larger animals. Historically, the JBP has more often been linkedto variation in digestive efficiency than to variation in intake levels.
When developing this approach of the JBP, food intake was, withoutempirical testing, assumed to scale to bodymass in a similar way as an-imal metabolism (explicitly in Demment, 1983; implicitly in Demmentand Van Soest, 1985; note that Van Soest, 1994 does notmake an explicitassumption about intake scaling but rests his argument on the scaling ofgut fill only). In large datasets, food intake (measured as dry matterintake, DMI, or as gross energy intake) was actually often found toscale to BM0.75 across a wide range of mammalian species (reviewedin Clauss et al., 2007a; Meyer et al., 2010), and thus resembles thescaling of metabolism and requirements. Therefore, the approachthat focuses on scaling effects on digestive physiology appears as thelogical next step. Including gut fill in these considerations has extendedthe JBP to specifically comprise not only metabolic scaling, but alsodigestive physiology. Gut fill (measured as wet matter content, WMC)or dry matter content (DMC) has been suggested to be a constant frac-tion of BM in herbivores (Parra, 1978; Demment and Van Soest, 1985;Illius and Gordon, 1992; Justice and Smith, 1992; Clauss et al., 2007a).If gut fill actually scales to BM1.00, and food intake scales to BM0.75,these different scaling effects result in a larger gut fill per unit food in-take with increasing BM. This should in theory lead to an increase inthe time digesta is retained in the gastrointestinal tract (measured asmean retention time, MRT) with increasing BM (Demment and VanSoest, 1985; Illius and Gordon, 1992; Robbins, 1993; McNab, 2002).Explicitly, it is thought that MRT should scale to BM(1.00–0.75)=BM0.25.Because MRT is positively linked to the digestive efficiency of a herbivore(Foose, 1982; Udén and Van Soest, 1982; Clauss et al., 2007b), this con-cept has been invoked to postulate that larger herbivores can use foodof a lower quality due to a hypothetical capacity for more efficient digestion(Demment and Van Soest, 1985; Illius and Gordon, 1992; Gordon andIllius, 1996). In this way, the JBP delivers an elegant explanation (higherdigestive efficiency in larger animals) for a common observation (lower
diet quality in larger animals), and represents what may be the mostprominent set of allometric considerations in large animal ecology,including theoretical approaches to understanding intraspecific size di-morphism (Short, 1963; Prins and Geelen, 1971; Sinclair, 1977; Hanleyand Hanley, 1980; Hanley, 1982; Barboza and Bowyer, 2000; du Toit,2005; Shannon et al., 2006; Woolley et al., 2011).
Empirical evidence for the physiological predictions of the JBP,however, is scarce. While the findings that wet gut contents scale toBM1.00 and food intake scales to BM0.75 are mostly undisputed, digestaretention has repeatedly been shown, in various datasets, not to scaleto BM0.25 (Clauss et al., 2007a, 2009; Franz et al., 2011a; Müller et al.,2011; Steuer et al., 2011), with the exception of mammalian caecumfermenters (Clauss et al., 2007a, but see the results of phylogeneticallyinformed statistics in this study down below). Additionally, there islittle indication for an increase in digestive efficiency with BM (Justiceand Smith, 1992; Wenninger and Shipley, 2000; Pérez-Barbería et al.,2004; Clauss et al., 2009; Steuer et al., in press). These findings repre-sent a serious conceptual problem for herbivore digestive physiology,because the link between gut fill, food intake and digesta retention ismathematically sound.
1.2. Linking digesta retention to gut capacity, food intake and digestibility
Holleman andWhite (1989) provided the underlying equation to thisproblem, based on the ‘Stewart–Hamilton Principle’ or the ‘OccupancyPrinciple’ (Steele, 1971; Shipley and Clark, 1972), where
indDMC kg½ � ¼ fecal output kg=h½ � �MRTparticleGIT h½ � ð1Þ
with indDMC being the indigestible (or undigested) DM content ofthe whole gastrointestinal tract (GIT), and MRTparticleGIT the meanretention time of an indigestible particle marker in the whole GIT.Because fecal output is a function of food intake (measured as drymatter intake DMI) and apparent digestibility of dry matter (aDDM) or, in other terms, DMI and the apparent indigestibility of DM(aID DM), we get
fecal output kg=h½ � ¼ DMI kg=h½ � � aID DMð Þ ð2Þ
and thus gut fill, food intake and retention time are closely linked as
indDMC kg½ � ¼ DMI kg=h½ � � aID DM �MRTparticleGIT h½ �: ð3Þ
Solving this equation for MRT yields
MRTparticleGIT h½ � ¼ indDMC kg½ �= DMI kg=h½ � � aID DMð Þ: ð4Þ
Assuming scaling laws for indDMC, DMI and aID DM with bodymass with the exponents a, b and c, respectively, it follows that
MRTparticleGIT e BMa= BMb � BMc� �
or MRTparticleGIT e BMa− bþcð Þ: ð5Þ
Under the assumption that indDMC scales as does wet mattercontents, i.e. to BM1.00, and DMI scales to BM0.75, we can thus assumethat MRTparticleGIT should scale to BM0.25 if digestive efficiency does notchange with BM. Note that an increase in digestibility with increasingBM (i.e., a decrease in indigestibility, or a negative exponent c) wouldlead to a higher scaling exponent for MRTparticleGIT, and a decrease indigestibility with increasing BMwould lead to a lower scaling exponentfor MRTparticleGIT. This is because a lower digestibility would result inmore material in the GIT that is pushed along due to the continuousfood intake, and hence make any particular portion of the indigestibledigesta be excreted relatively sooner (Hummel and Clauss, 2011).
The calculation of gut fill can be expanded to include not only in-digestible gut fill, but also total gut fill (dry matter contents (DMC))(Holleman and White, 1989). For that, the digestible portion of DMC

131D.W.H. Müller et al. / Comparative Biochemistry and Physiology, Part A 164 (2013) 129–140
(dDMC) has to be added to indDMC. To do so, one has to make an as-sumption regarding the course of digestion. If one assumes digestionto be exponential over MRT (with most of digestion occurring at thebeginning of MRT and slowly ‘fading out’), then the estimateddDMC in the total GIT will be less than if one assumes digestion tobe linear across MRT. Holleman and White (1989) and Munn et al.(2012) showed that assuming a linear course of digestion acrossMRT yields better results when validated against empirical measuresin slaughtered animals, albeit using small sample sizes. Because as-suming a linear course of digestion across MRT means that dDMC isassumed to be present in the GIT during half of MRT, it follows that
dDMC kg½ � ¼ DMI kg=h½ � � aD DM � MRTparticleGIT h½ �=2� �
: ð6Þ
Combining Eqs. (3) and (6) to calculate total DMC yields,
DMC kg½ � ¼ DMI kg=h½ � �MRTparticleGIT h½ � � aID DMþ 0:5 aD DMð Þ:ð7Þ
Solving the equation for MRTparticleGIT [h] yields
MRTparticleGIT h½ � ¼ DMC kg½ �=DMI kg=h½ � � 1= aID DMþ 0:5 aD DMð Þð Þ:ð8Þ
Assuming scaling laws for DMC, DMI and aD DM with body masswith the exponents d, b and c, respectively, it follows that
MRTparticleGIT e BMd=BMb � 1= BM−c þ 0:5 BMc� �� �
or
MRTparticleGIT e BMd−bþc:
ð9Þ
Assuming that DMC scales similar as wet matter contents, i.e.to BM1.00, and DMI scales to BM0.75, we can thus again assume thatMRTparticleGIT should scale to BM0.25 if digestive efficiency does notchange with BM. Note that again, an increase in digestibility withBM (i.e., a positive c) would lead to a higher scaling exponent forMRTparticleGIT, and a decrease in digestibility with BM would lead toa lower scaling exponent for MRTparticleGIT. One important conclusionfrom these derivations is that if one uses the scaling of intake and gutfill to make any conclusions about digesta retention, one must not usethe result to make inferences about digestive efficiency — because anassumption about the scaling of digestibility is made already (explic-itly or implicitly) to derive the scaling of digesta retention. Deriving ascaling for digesta retention in this way and then using it to explain apattern of digestive efficiency with body mass amounts to circularreasoning.
1.3. Re-assessing data from herbivore feeding trials
Given these considerations, a discrepancy in the scaling of gut con-tents, food intake, and digesta retention, as indicated by empirical data,warrants a re-assessment of both empirical datasets and, potentially, arevision of our understanding of herbivore digestive allometry. An intu-itive reason for this discrepancy might be that whereas it is commonpractice to measure both food intake and digesta retention in thesame experiment, gut fill is usually not measured simultaneously, asmost experiments do not include the dissection of the experimentalanimals. The discrepancy of the scaling exponents therefore mightsimply result from the fact that different datasets have been usedto generate these allometries (Clauss et al., 2007a); nevertheless,the discrepancy requires further explanation. If in addition tomeasuresof food intake and digesta retention, the apparent digestibility of drymatter is alsomeasured in the same feeding trial, the derivation of indi-gestible and complete gut fill (as DMC) as indicated in the equationsabove is possible. Although this has been done repeatedly in individualstudies to compare selected species, or make intraspecific or inter-clade
comparisons (Baker and Hobbs, 1987; Gross et al., 1996; Behrend et al.,2004; Munn and Dawson, 2006; Munn and Barboza, 2008; Schwarm etal., 2009a; Clauss et al., 2010b; Franz et al., 2011b; Sawada et al., 2011;Fritz et al., 2012; Munn et al., 2012), a large-scale comparison of mam-malianherbivore gutfill has not beenperformed so far. Therefore, it wasthe aim of this study to explore the scaling of food intake, digesta reten-tion, apparent digestibility and the calculated gutfill inmammalianher-bivores, using available literature data. Because these variables are usedto calculate gut fill according to the principles outlined above, weexpected that their scaling relationships also follow these principles.
The following hypotheses guided our investigation:
(i) Across the whole mammal body size range, food intakemeasuredas dry matter intake (DMI) has a scaling exponent close to BM0.75
(reviewed in Clauss et al., 2007a).(ii) Apparent digestibility generally does not scale with body mass
(i.e. to BM0.00) (Justice and Smith, 1992; Wenninger and Shipley,2000; Pérez-Barbería et al., 2004; Clauss et al., 2009; Steuer et al.,in press), and therefore the scaling exponents of gut fill (BMa),food intake (BMb) and digesta retention (BMd) are associatedaccording to d=a−b. It should be noted, however, that any con-clusions concerning the apparent digestibility must be consideredin the context of the food sources that were used across experi-ments. When collating data for a large variety of species from theliterature, aswedohere, it is highly likely that data on smaller spe-cies, which are often kept on artificial feeds for experimentalpurposes, is combined with data on larger species, which aremore often kept on roughage-only diets that are generally lessdigestible. Thus, a putative negative allometry of digestibility (adecrease with bodymass) would be an indication of this unevendistribution of diet quality. How close this potential decrease indiet qualitywith body size in the dataset actuallymight resemblethe general decrease of diet quality with body size that is sup-posed to occur in thewild is difficult to judge. Therefore, if scalingis detected between bodymass and digestibility, then the scalingexponents of gut fill (BMa), food intake (BMb), digestibility(BMc) and digesta retention (BMd) are associated according tod=a−b+c.
(iii) The low empirical overall scaling exponent for digesta retention(Clauss et al., 2007a, 2009; Müller et al., 2011; Steuer et al.,2011) results from the fact that gut fill, measured as dry mattercontents (DMC), does not scale to BM1.00 but to a lower expo-nent.
(iv) In parallel to observations on the scaling of mammalian basalmetabolic rate (BMR) that does not follow a single exponentacross the whole BM range (Clarke et al., 2010; Isaac andCarbone, 2010; Kolokotrones et al., 2010; Müller et al., 2012),we expect that DMI also does not follow one single exponentacross the whole BM range. In fact, variation in the scaling ofDMI across the BM range could be responsible for the observa-tion that digesta retention scales differently in different diges-tion types, which are distributed unevenly across the BM range(Clauss et al., 2007a). In accord with Packard (2012), we donot follow the argument that a curvature (or ‘quadratic scaling’)in double-logarithmic space represents a true mechanistic pat-tern (Kolokotrones et al., 2010), but assume that it is the effectof combined simple scaling patterns in the overall dataset andcan be used as a test for such scaling combinations (Müller etal., 2012). A test for such a curvature effect is then followed byanalysis of scaling patterns within subsets of the data. In particu-lar, following the dichotomy in metabolism scaling between an-imals with one and with more than one offspring per litter(Müller et al., 2012), we expect that food intake has a lower scal-ing exponent in herbivores that represent the majority of thelower BM range (especially caecum fermenters), and a higherscaling exponent in herbivores that represent the majority of

132 D.W.H. Müller et al. / Comparative Biochemistry and Physiology, Part A 164 (2013) 129–140
the higher BM range (i.e. non-coprophageous hindgut fer-menters, nonruminant foregut fermenters and ruminants),resulting in a typical curvature shape in double-logarithmicspace, or when plotting body mass-residuals of DMI againstbody mass. An important question when assessing the indi-vidual scaling relationships of intake in different groups willbe whether the scaling exponent is similar to that of metabo-lism, or whether it is actually higher (Hackmann and Spain,2010).
(v) Differences in the scaling of wet matter gut contents (WMC) anddry matter gut contents (DMC) with BM reflect the finding ofJustice and Smith (1992) that larger animals have a higherdigestamoisture content; when using theWMC and DMC allom-etries to calculate the allometry of the dry matter concentrationof the GIT contents, the result should be close to that of Justiceand Smith (1992) where DM concentration in the contents ofthe fermentation chamber scales to 22 BM−0.08.
(vi) Species with a relatively higher food intake have a relativelyshorter retention time (Clauss et al., 2007a; Müller et al.,2011). Based on Eq. (6), this could in theory lead to relativelylower calculated dry matter gut contents. On the other hand,higher food intake itself should lead to higher calculated gutcontents based on the same equation (Eq. (6)). We aim tocharacterize these interdependencies in our analysis. A longerrelative retention time should be related to a higher relativedigestibility (Udén et al., 1982; Clauss et al., 2007b).
Because one of the largest existing datasets on the digestivephysiology of large herbivores (Foose, 1982) is basically incompatiblewith other published data (Clauss et al., 2007a, 2010b), we performedthe same analyses for both the Foose (1982) dataset and an indepen-dent collation of literature data. With the limitation that the Foose(1982) dataset comprises only comparatively large species, this allowsa corroboration of results from one dataset with the other.
2. Methods
The datasets used in this study are
a) Foose (1982), comprising 26 species of large (>100 kg) herbivoresfrom the Artiodactyla, Perissodactyla and Proboscidea, which re-ceived two standardized diets (grass and lucerne hay); in thisdataset, the unit of reference is organic matter rather than drymatter; and
b) the data collation of Clauss et al. (2007a) that was supplementedwith additional sources, and pruned according to the followingselection criteria. Only sources were used which gave bodymass (BM), dry matter intake (DMI), particle mean retentiontime in the whole gastrointestinal tract (MRTparticleGIT,) andthe apparent digestibility of dry matter (aD DM) from the sameexperiment (in some cases, this information had to be collectedfrom several publications reporting on the same experiment).From these data, drymatter content (DMC) of the GIT was calculatedas outlined in the Introduction. For the sake of a large data collection,we did not select publications according to the passagemarkers used.Therefore, any particle marker was accepted; however, only studiesin which small particles (generallyb2 mm; as opposed to wholeforages) were labeled were included. Similarly, we did not selectpublications according to the type of food offered; therefore, thedata collection comprises animals fed on a complete, pelleted diet, an-imals on mixtures of roughages and concentrates, as well as animalson roughage-only diets. Ideally, a data collection with a standardizeddiet (such as in Foose, 1982; Steuer et al., 2011, in press) or with dietsrepresenting the natural diets of the species would be preferable, butare not available at a larger scale and over a wide body mass range.With regard to some domestic species (rabbits, horse, goats, sheep,cattle), no attempt was made to collate all published data. For
lagomorphs and rodents, only data from trials in which coprophagywas not prevented by the study design were used. For each species,one average value for BM, DMI, MRTparticleGIT, aD DM and DMCwascalculated using all available data from the cited publications. Thedata for the resulting 77 mammalian species and its sources aresummarized in the Appendix.
c) To compare the relationship ofwetmatter contents (WMC)of theGITwith the dry matter contents, the data collection onWMC collated inClauss et al. (2007a; n=72 species) was used.
Species were allocated, according to Stevens and Hume (1995), toone of the following categories: caecum fermenters, colon fermenters,non-ruminant foregut fermenters, and ruminants (Appendix). Addition-ally, species were allocated to litter size classes (one or more than oneoffspring per litter) (Müller et al., 2012) and body size classes (b10 kg,>10 kg). In order to account for ancestry-biased correlations in thedatasets (i.e., significant associations in interspecific datasets mightbe due to the fact that phylogenetically related species exhibit similareco-physiological traits; Harvey and Pagel, 1991), the data were con-trolled for phylogenetic influences using the “Phylogenetic GeneralizedLeast-Squares”method (PGLS; Martins and Hansen, 1997; Rohlf, 2001).This procedure estimates a covariancematrix of the species due to theirancestral roots and includes these interrelationships as error term in ageneralized least squares algorithm to determine the model parame-ters. The phylogenetic trees for the two datasets were derived by prun-ing the mammal supertree from Bininda-Emonds et al. (2007, 2008) ofthose species not represented in the datasets.
Allometric regressions were performed as linear regressions onlog-transformed data, with digestive parameters (DMI, MRTparticleGIT,aD DM, DMC) as the respective dependent variables, and withlog-transformed BM as the independent variable. Tests for a ‘curvature’in double-logarithmic space were made using quadratic regressions.Statistical analyses were performedwithout (ordinary least squares re-gressions: OLS) and with accounting for phylogeny (PGLS), in PASW18.0 (SPSS Inc., Chicago, IL) and in R 2.15.0 (Team, 2011) with the apeand caper packages. The significance level was set to α=0.05.
3. Results
3.1. Foose (1982) dataset
Variables scaled as: food intake (as organic matter intake, OMI)with BM0.76, apparent digestibility (of organic matter) with BM0.02,organic matter gut contents (OMC) with BM0.82, and digesta reten-tion with BM0.07, which matches the predicted relationships of0.07~[0.82−0.76+0.02] (Table 1). Notably, the 95% confidence in-terval for the scaling of OMC did not include 1.00 (Table 1). Resultswere similar in PGLS. Similar patterns were evident within the hindgutfermenters and the ruminants only (Table 1). Both digesta retentionand gut fill had a scaling exponent lower than expected.
Within the body mass residuals, intake was negatively correlatedwith digesta retention in the whole dataset in OLS but not in PGLS(Table 2), indicating that certain taxonomic groups (notably the ru-minants) did not follow this pattern (Fig. 1a). Intake was positivelycorrelated with gut fill in both OLS and PGLS (Table 2, Fig. 1b).There was a positive correlation between digesta retention and digest-ibility in OLS but not in PGLS (Table 2), because these two residualsshowed a clear dichotomy between ruminants and colon fermenters(Fig. 1c). Digesta retention was not correlated with gut fill in OLS butit was in PGLS (Table 2), indicating that the relationship only existedwithin more closely related groups (Fig. 1d).
3.2. Our dataset
Variables scaled as: food intake (as dry matter intake, DMI) withBM0.76 (Fig. 2a), apparent digestibility (of dry matter, aD DM) with

Table 1Scaling relationships of parameters of digestive physiology with body mass (BM) in theFoose (1982) dataset using OLS and PGLS statistics according to y=a BMb.
y Stats a 95%CI b 95%CI r2 p
All species (n=26)OMI OLS 0.064 0.027–0.153 0.759 0.621–0.897 0.843 b0.001aDOM 53.6 40.6–70.6 0.015 −0.029–0.059 0.020 0.494OMC 0.074 0.038–0.147 0.819 0.710–0.927 0.910 b0.001MRT 38.2 22.2–65.6 0.065 −0.020–0.151 0.094 0.128OMI PGLS 0.052 0.024–0.114 0.792 0.690–0.895 0.905 b0.001aDOM 45.7 34.7–60.2 0.033 −0.004–0.069 0.115 0.062OMC 0.063 0.025–0.161 0.842 0.719–0.964 0.883 b0.001MRT 37.3 21.6–64.5 0.062 −0.010–0.134 0.107 0.075
Hindgut fermenter (n=11)OMI OLS 0.097 0.034–0.281 0.726 0.564–0.888 0.920 b0.001aDOM 46.5 36.1–59.7 0.024 −0.015–0.062 0.180 0.194OMC 0.085 0.037–0.196 0.809 0.681–0.937 0.958 b0.001MRT 27.1 16.9–43.6 0.092 0.019–0.164 0.477 0.019OMI PGLS 0.083 0.029–0.242 0.748 0.597–0.899 0.913 b0.001aDOM 37.1 26.9–51.3 0.054 0.008–0.099 0.375 0.029OMC 0.074 0.026–0.208 0.824 0.679–0.970 0.932 b0.001MRT 25.2 14.9–42.8 0.098 0.023–0.172 0.425 0.017
Ruminant (n=13)OMI OLS 0.104 0.029–0.372 0.664 0.452–0.875 0.813 b0.001aDOM 52.1 33.8–80.2 0.031 −0.040–0.103 0.079 0.353OMC 0.126 0.028–0.581 0.728 0.476–0.980 0.786 b0.001MRT 39.3 17.1–89.7 0.079 −0.058–0.216 0.128 0.231OMI PGLS 0.099 0.034–0.283 0.665 0.504–0.825 0.857 b0.001aDOM 67.2 43.8–103.0 −0.010 −0.075–0.055 0.008 0.911OMC 0.165 0.037–0.737 0.687 0.460–0.915 0.761 b0.001MRT 61.0 23.7–156.9 0.016 −0.128–0.160 0.004 0.954
Organicmatter intake (OMI in kg d−1); apparent digestibility of organicmatter (aDOM in%);organic matter gut contents (OMC in kg); particle mean retention time (MRT in h).
133D.W.H. Müller et al. / Comparative Biochemistry and Physiology, Part A 164 (2013) 129–140
BM−0.03 (Fig. 2c), dry matter gut contents (DMC) with BM0.93 (Fig. 2e),and digesta retention with BM0.16 (Fig. 2g) (all in OLS), which matchesthe predicted relationships of 0.16~[0.93−0.76+(−0.03)]. Notably,the 95% confidence interval for the scaling of DMC did not include 1.00(Table 3). Results for PGLS were similar; notably, the scaling exponentfor MRT was lower than in OLS at BM0.12.
When testing for a curvature effect in the overall dataset in OLS,such a curvature (visible when plotting body mass residuals againstbody mass) was evident for dry matter intake (Fig. 2b) and for digestaretention (Fig. 2h), but not for digestibility (Fig. 2d) or gut contents(Fig. 2f). The full term describing the curvature was significant, with95% confidence intervals that did not include zero for the quadraticterm, for intake and digesta retention only (Table 4); the exponentof the quadratic term had a similar magnitude but a different signfor these two measurements (intake: 0.053, retention: −0.057). InPGLS, these quadratic terms were not significant (Table 4), indicatingthat the effect of the curvature was caused by the phylogenetic struc-ture of the dataset.
Table 2Correlations between body mass residuals of parameters of digestive physiology in alspecies of the Foose (1982) dataset analyzed by OLS and PGLS statistics (differenceindicated by gray shading).
Stats Residual aDOM Residual OMC Residual MRT
Residual OMI OLS R=−0.137, p=0.505 R=0.841, p<0.001 PGLS R=−0.300, p=0.114 R=0.828, p<0.001 R=0.033, p=0.975
R=−0.557, p=0.002
Residual aDOM OSL R=0.654, p<0.001 R=0.173, p=0.398R=0.297, p=0.120PSLG R=0.293, p=0.126
Residual OMC OSL R=−0.055, p=0.790 PSLG R=0.575, p<0.001
Organic matter intake (OMI in kg d−1); apparent digestibility of organic matte(aDOM in %); organic matter gut contents (OMC in kg); particle mean retention time(MRT in h).
ls
r
Splitting the overall dataset led to different scaling exponents for thevarious subsets (Table 5). The scaling of food intake had a lower expo-nent among species that produce more than one offspring per litter orthat are below a 10 kg threshold (95%CI 0.57–0.70 in OLS and 0.64–0.81 in PGLS), as opposed to species with one offspring per litter orabove the 10 kg threshold (95%CI 0.82–0.96 in OLS and 0.74–0.95 inPGLS). The scaling of dry gut contents was similar among thesegroups (0.91–0.94 in OLS and 0.84–0.96 in PGLS; never including1.00 in the 95%CI in OLS but for the larger animals in PGLS). In OLS,there was a difference in the scaling of digesta retention betweenthese groups, with a significant scaling exponent in animals withmore than one offspring per litter or below the 10 kg threshold, in con-trast to no significant scaling (95% confidence interval for the exponentincluded zero) in animals above the 10 kg threshold (Table 5). In PGLS,the exponent of theMRT scaling in the animals with more than one off-spring per litter/below the 10 kg threshold was distinctively lower thanin OLS, with 95%CI approaching or including zero (Table 5) and thusmaking the scaling in this group similar to the scaling in the group of an-imalswith one offspring per litter/more than 10 kg. Notably, the 95%CI ofthe scaling exponent of intake and dry gut contents overlapped in ani-mals with a single offspring/animals>10 kg in OLS, and for all herbi-vores in PGLS.
Splitting the species into the four digestion types resulted in similarpatterns, with a lower scaling exponent for intake, and a higher one fordigesta retention, in the (small) caecum fermenters as compared to theother groups in OLS (Table 6). In PGLS, these differences were not evi-dent; in particular, the scaling exponent for MRT in caecum fermenterswasmuch lower in PGLS at 0.14 than in OLS at 0.27, suggesting that thehigh scalingpreviously reported in caecum fermenters of 0.25 (Clauss etal., 2007a) was due to an uneven distribution of phylogenetically dis-tant species within this data subset (Table 6). A scaling exponent of1.00 for gut fill was only included in the confidence interval for rumi-nants in OLS, and for colon fermenters and ruminants in PGLS. The95% CI of the scaling exponent overlapped for intake and gut fill in allbut the caecum fermenters in OLS, and in all four groups in PGLS(Table 6).
Within the body mass residuals of the whole dataset (Table 7), in-take was negatively correlated with digesta retention (Fig. 3a) andpositively with gut fill (Fig. 3b) in both OLS and PGLS. Although di-gestibility was negatively related to intake and positively related todigesta retention (Fig. 3c) in OLS, these relationships were not signifi-cant in PGLS (Table 7), i.e. they do not occur withinmore closely relatedtaxa. By contrast, digestibility was negatively related to gut fill in PGLS,indicating that among more closely related species, those with a highergut fill had lower digestibilities. Gut fill was positively related to digestaretention in both OLS and PGLS (Table 7, Fig. 3d).
3.3. Wet gut contents
When testing for a scaling curvature in the dataset on wet gut con-tents, the quadratic term was not significant (OLS p=0.706; PGLSp=0.463). Wet gut contents scaled to 0.108 (0.095–0.123)BM1.062(1.029–1.094) (R2=0.984, pb0.001) in OLS and 0.109 (0.036–0.332) BM1.086(1.004–1.167) (R2=0.907, pb0.001) in PGLS. Thus, whencomparing the scaling of wet gut contents and of dry matter gut con-tents, the difference between the two increases with body mass(Fig. 4); from the comparison of the two scaling exponents (OLS 0.93and 1.06; PGLS 0.92 and 1.09), the drymatter concentration of gut con-tents should theoretically scale to BM−0.13 or BM−0.17.
4. Discussion
The aim of this study was to test whether empirical data allowevoking differences in the allometric scaling between physiologicalcharacteristics, to explain species diversification and niche differenti-ation along a body size gradient in herbivores. Two effects have

Fig. 1. Relationships between body mass residuals of different parameters of digestive physiology (organic matter intake (OMI in kg d−1); particle mean retention time (MRT in h);organic matter gut contents (OMC in kg), apparent organic matter digestibility (aDOM in %)) in large mammalian herbivores of different digestion types (colon fermenters,nonruminant foregut fermenters, ruminants) in the dataset of Foose (1982). a) OMI and MRT; b) OMI and OMC; c) MRT and aDOM; d) MRT and OMC. For statistics, see Table 2.
134 D.W.H. Müller et al. / Comparative Biochemistry and Physiology, Part A 164 (2013) 129–140
previously been associated with body size-driven diversification inmammalian herbivores, namely a higher scaling of food intake ascompared to the scaling of metabolism (Hackmann and Spain,2010), and a distinct difference in the scaling of food intake and gutfill, leading to a positive scaling of digesta retention time (Demmentand Van Soest, 1985). If we assume that the results of controlled feedingstudies are indeed representative of the digestive physiology of theanimals investigated, then the results indicate that from these twoeffects, the former represents themore promising approach, in particularfor larger herbivores.
We suggest several reasons for the fact that the concept of an in-creasing difference between intake and gut fill, and hence increasingdigesta retention timewith body size, does not apply to herbivores to theextent previously suggested. Indeed, the concept has been questioned re-peatedly based on the empirical finding that the expected scaling ofdigesta retention with body mass cannot be demonstrated (see In-troduction). Similarly, the results of our study demonstrate that anyscaling of digesta retention, though principally existent, is below thequarter-power scaling often associated with biological times (Illiusand Gordon, 1992; Brown et al., 2012). Because of themathematical re-lationships between intake, digestibility, retention and gut fill, thistranslates into the following deviations from the original concept: gutfill does not scale linearly with body mass, but to a slightly lower expo-nent (the 95%CI often did not include 1.0); on the other hand, intakescales to an exponent higher than 0.75 in large herbivores. Therefore,the difference between the two scaling exponents is lower than as-sumed when interpreting the Jarman–Bell Principle in terms of diges-tive physiology, with confidence intervals overlapping in manydatasets. Additionally, there is a slight negative scaling of digestibil-ity with body mass across these experiments, which also reducesthe scaling exponent of retention time (see Introduction). The ulti-mate reason why digesta retention shows a low scaling with bodymass in herbivores might stem from the fact that from a certain
body size upwards, a further increase in retention time will not, on av-erage, convey additional advantages, principally because the additionalgain from exposing digesta to the digestive process for a longer time islower than the gain from additional food intake (Hummel et al., 2006).
Several arguments can be put forward to support the validity of ourfindings. The below-linear scaling of gut contentswas present in both ofthe datasets investigated (Tables 1 and 3). The assumption that gut con-tents (as a proxy for gut capacity) scale linearly with body mass wasoriginally derived from datasets that related wet gut content mass tobody mass (Parra, 1978; Demment and Van Soest, 1985; Justice andSmith, 1992; Clauss et al., 2007a; Illius and Gordon, 1992 is the onlypublication that uses dry matter gut contents and also arrives at linearscaling, but the dataset comprised only 16 species). If one assumesthat this finding translates directly into a similar scaling for that unit ofgut fill related to food intake (i.e. dry matter), then onemakes the silentassumption that the proportion of moisture in gut contents is similaracross all body sizes (as done by Demment, 1983). However, Justiceand Smith (1992) reported that the DM concentration of the con-tents of the fermentation chamber scales to BM−0.08 — in otherwords, the contents of this part of the gut become more watery inlarger animals. Their finding is corroborated by our comparison ofthe scaling of total wet and dry matter gut contents, which yields asimilar negative scaling at BM−0.13 to BM−0.17. Similarly, Müller etal. (2011) found, in a comparative analysis of mean retention timesof particle and solute (fluid) markers, that the difference betweenthese two digesta phases tends to increase with body mass — notnecessarily because particles are retained longer in larger animals,but also because fluids are passed through their digestive system ata higher rate. One non-exclusive ultimate reason for this might bethe fact that in the larger guts of larger animals, diffusion distancesfrom within the digesta to the sites of absorption in the gut wallare increased (Clauss and Hummel, 2005), a problem that could besolved by a more fluid digesta (Lentle et al., 2006). Thus, we suggest
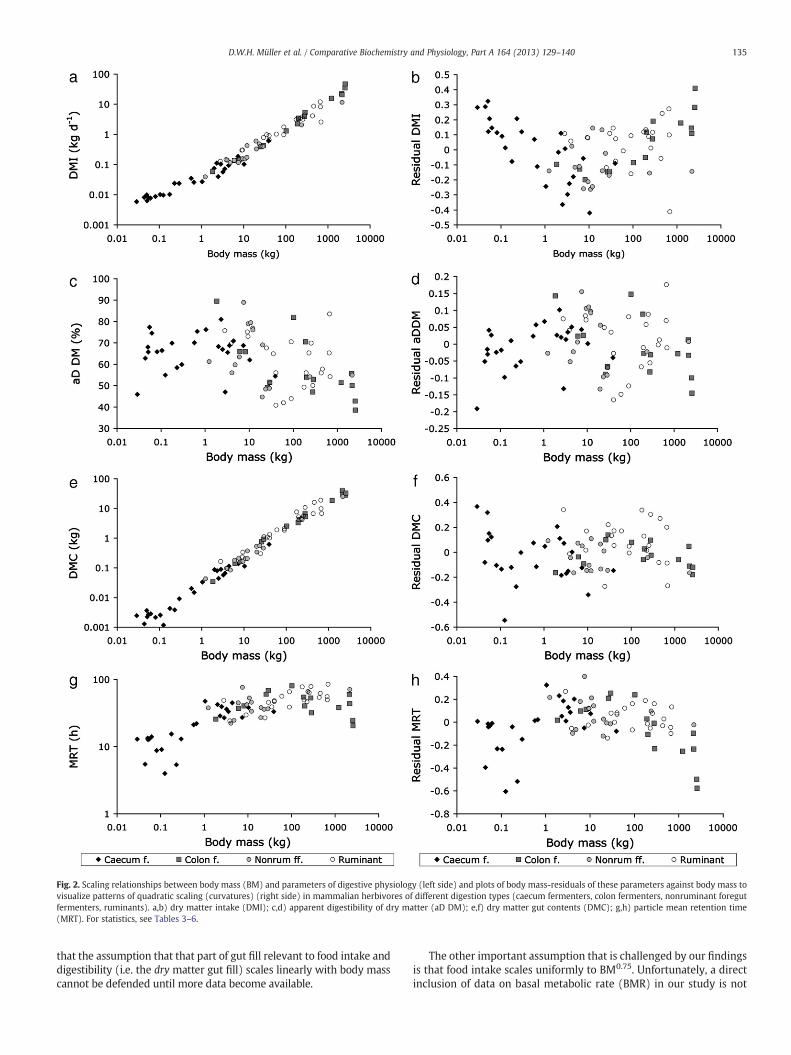
Fig. 2. Scaling relationships between body mass (BM) and parameters of digestive physiology (left side) and plots of body mass-residuals of these parameters against body mass tovisualize patterns of quadratic scaling (curvatures) (right side) in mammalian herbivores of different digestion types (caecum fermenters, colon fermenters, nonruminant foregutfermenters, ruminants). a,b) dry matter intake (DMI); c,d) apparent digestibility of dry matter (aD DM); e,f) dry matter gut contents (DMC); g,h) particle mean retention time(MRT). For statistics, see Tables 3–6.
135D.W.H. Müller et al. / Comparative Biochemistry and Physiology, Part A 164 (2013) 129–140
that the assumption that that part of gut fill relevant to food intake anddigestibility (i.e. the dry matter gut fill) scales linearly with body masscannot be defended until more data become available.
The other important assumption that is challenged by our findingsis that food intake scales uniformly to BM0.75. Unfortunately, a directinclusion of data on basal metabolic rate (BMR) in our study is not

Table 3Scaling relationships of parameters of digestive physiology with body mass (BM) in thedataset of this study (n=77) using OLS and PGLS statistics according to y=a BMb.
y stats a 95%CI b 95%CI r2 p
DMI OLS 0.046 0.041–0.052 0.763 0.732–0.794 0.970 b0.001aDDM 65.5 61.9–69.2 −0.025 −0.039 to −0.011 0.147 0.001DMC 0.029 0.025–0.032 0.931 0.902–0.960 0.982 b0.001MRT 22.3 19.5–25.5 0.158 0.124–0.191 0.540 b0.001DMI PGLS 0.039 0.017–0.089 0.773 0.720–0.825 0.916 b0.001aDDM 67.8 42.3–108.6 −0.052 −0.082 to −0.021 0.130 b0.001DMC 0.028 0.010–0.075 0.915 0.851–0.979 0.913 b0.001MRT 26.1 11.639–58.4 0.120 0.068–0.172 0.214 b0.001
Dry matter intake (DMI in kg d−1); apparent digestibility of dry matter (aDDM in %);dry matter gut contents (DMC in kg); particle mean retention time (MRT in h).
Table 5Scaling relationships of parameters of digestive physiology with body mass (BM) in thedataset of this study in subsets according to litter size or a 10 kg body mass thresholdusing OLS and PGLS statistics according to y=a BMb.
y Stats a 95%CI b 95%CI r2 p
Litter size>1 (n=24)DMI OLS 0.050 0.046–0.055 0.663 0.626–0.701 0.984 b0.001aDDM 62.2 57.4–67.3 −0.023 −0.054–0.008 0.095 0.142DMC 0.027 0.022–0.034 0.905 0.825–0.986 0.961 b0.001MRT 19.3 16.0–23.2 0.233 0.160–0.307 0.662 b0.001DMI PGLS 0.047 0.032–0.067 0.724 0.647–0.802 0.938 b0.001aDDM 64.3 50.7–81.6 −0.015 −0.066–0.035 0.015 0.712DMC 0.028 0.014–0.058 0.884 0.733–1.036 0.856 b0.001MRT 21.8 12.6–37.9 0.153 0.036–0.270 0.230 0.006
Litter size=1 (n=53)DMI OLS 0.029 0.024–0.036 0.864 0.818–0.910 0.966 b0.001aDDM 72.6 65.9–80.0 −0.046 −0.067; −0.024 0.260 b0.001DMC 0.028 0.023–0.035 0.935 0.891–0.978 0.973 b0.001MRT 36.5 30.3–44.1 0.051 0.009–0.093 0.105 0.018DMI PGLS 0.030 0.013–0.074 0.814 0.747–0.881 0.917 b0.001aDDM 67.0 45.0–99.8 −0.040 −0.071; −0.010 0.117 0.002DMC 0.026 0.010–0.070 0.916 0.841–0.990 0.919 b0.001MRT 31.5 14.1–70.2 0.084 0.023–0.145 0.125 0.002
b10 kg (n=36)DMI OLS 0.045 0.040–0.050 0.622 0.568–0.677 0.941 b0.001aDDM 67.5 64.3–70.8 0.020 −0.005–0.045 0.070 0.119DMC 0.028 0.024–0.032 0.909 0.834–0.984 0.947 b0.001MRT 22.8 19.8–26.2 0.297 0.223–0.371 0.661 b0.001DMI PGLS 0.038 0.021–0.069 0.723 0.640–0.806 0.896 b0.001aDDM 67.3 49.7–91.2 0.007 −0.036–0.050 0.003 0.896DMC 0.029 0.011–0.074 0.840 0.707–0.973 0.819 b0.001MRT 27.4 11.4–65.9 0.119 −0.005–0.243 0.095 0.040
> 10 kg (n=41)DMI OLS 0.026 0.018–0.037 0.885 0.815–0.955 0.944 b0.001aDDM 64.9 53.6–78.5 −0.029 −0.066–0.009 0.058 0.129DMC 0.030 0.021–0.043 0.924 0.854–0.993 0.948 b0.001MRT 41.7 29.9–58.2 0.026 −0.038–0.091 0.017 0.414DMI PGLS 0.029 0.010–0.081 0.844 0.743–0.945 0.873 b0.001aDDM 54.8 34.6–86.7 −0.003 −0.049–0.042 0.001 0.979DMC 0.023 0.007–0.070 0.959 0.848–1.070 0.880 b0.001MRT 26.3 12.1–57.5 0.114 0.037–0.190 0.176 0.001
Dry matter intake (DMI in kg d−1); apparent digestibility of dry matter (aDDM in %);dry matter gut contents (DMC in kg); particle mean retention time (MRT in h).
136 D.W.H. Müller et al. / Comparative Biochemistry and Physiology, Part A 164 (2013) 129–140
feasible; although BMR has been measured in a large variety of mam-malian species (McNab, 2008), the large animals that form a majorityof our dataset are not included in the available BMR data pool. There-fore, we need to refer to comparisons of our findings to those fromBMR studies, inherently with a distinct difference in the species sets in-vestigated. In the debate on the scaling of basal metabolic rate, it hasbeen found repeatedly that across the whole mammalian body massrange, a single allometric exponent does not represent the data veryprecisely, but that either a curvature in log–log space, or a combinationof different scaling relationships of subgroups, provide a better fit(Hayssen and Lacy, 1985; Clarke et al., 2010; Isaac and Carbone, 2010;Kolokotrones et al., 2010; Müller et al., 2012). The magnitude of anoverall mammalian scaling exponent will therefore depend either onthe body mass range included in the analysis (Lovegrove, 2000; Doddset al., 2001; Glazier, 2005; White and Seymour, 2005), the taxonomiccomposition of the sample (Hayssen and Lacy, 1985; Sieg et al., 2009;White et al., 2009; Capellini et al., 2010), or on the inclusion of animalsaccording to certain biological characteristics (McNab, 2008; Müller etal., 2012). Although our species sample of mammalian herbivores islower than the datasets used to investigate the scaling of metabolism, asimilar ‘curvature effect’ is evident in the intake and retention data(Fig. 2a–b and g–h). Our findings thus provide further support to theseprevious studies that scaling exponents are not necessarily a universalcharacteristic for the whole mammalian clade, but may differ eitherbetween different groups, or vary across the bodymass range. In par-ticular, the results indicate that the group of mammals that can beclassified as either small, giving birth to multiple young at a time, orbeing caecum fermenters has a generally lower scaling of food intakethan animals classified as larger, giving birth to a single offspring, orbeing colon fermenters, nonruminant foregut fermenters or ruminants.Which of these classifications is biologically relevant for the differencein scaling, or whether they are all proxies for a yet undefined functionalsubdivision of mammals, remains to be investigated. Because a similar‘curvature effect’ is evident in the scaling of metabolic rate, where notonly herbivores but also other feeding types were included in thedataset (Kolokotrones et al., 2010; Müller et al., 2012), we suggestthat digestive strategy is unlikely to be the relevant proxy. Regardless,
Table 4Evidence for quadratic scaling in parameters of digestive physiology with body mass (BM) ina+b1(logBM)+b2((logBM)2) or y=a BM(b1+b2(logBM)). Equations with both b1 and b2 si
y Stats a 95%CI b1 95%CI
DMI OLS 0.042 0.038–0.047 0.659 0.616–0.702aDDM 66.7 63.1–70.5 −0.004 −0.027–0.01DMC 0.028 0.025–0.032 0.930 0.881–0.979MRT 24.7 22.0–27.7 0.270 0.223–0.316DMI PGLS 0.039 0.018–0.088 0.706 0.617–0.795aDDM 67.7 42.1–108.9 −0.056 −0.108 to −DMC 0.028 0.010–0.074 0.851 0.743–0.959MRT 26.1 11.6–58.7 0.121 0.032–0.211
Dry matter intake (DMI in kg d−1); apparent digestibility of dry matter (aDDM in %); dry m
our study suggests that the use of one single exponent to describe rela-tive metabolic rates or relative food intakes may be convenient, butshould not be the basis for biological models.
Within one notable subset of large herbivores, the ruminants, theassumption that food intake scales to BM0.75 has previously been refutedbased either on conceptual approaches or collections of empirical data:Mertens (1994) and Südekum (2002) explain that for low-qualityforages, relating food intake in domestic ruminants to body massmay be more appropriate than using metabolic body mass as the
the dataset of this study (n=77) (OLS). Linear regression models according to log y=gnificant indicated in bold.
b2 95%CI R2 (adj.) p
0.053 0.035–0.070 0.980 (0.979) b0.0018 −0.010 −0.019 to −0.001 0.202 (0.181) b0.001
0.001 −0.019–0.021 0.982 (0.981) b0.001−0.057 −0.076 to −0.038 0.692 (0.983) b0.001
0.026 −0.002–0.054 0.920 (0.918) b0.0010.003 0.001 −0.015–0.018 0.130 (0.106) 0.002
0.025 −0.009–0.060 0.915 (0.913) b0.001−0.001 −0.029–0.028 0.214 (0.193) b0.001
atter gut contents (DMC in kg); particle mean retention time (MRT in h).

Table 6Scaling relationships of parameters of digestive physiology with body mass (BM) in thedataset of this study in subsets according to digestion types using OLS and PGLS statisticsaccording to y=a BMb.
y Stats a 95%CI b 95%CI r2 p
Caecum fermenter (n=25)DMI OLS 0.041 0.036–0.048 0.589 0.524–0.654 0.938 b0.001aDDM 65.3 61.4–69.5 0.001 −0.029–0.031 0.000 0.950DMC 0.025 0.021–0.031 0.860 0.767–0.954 0.940 b0.001MRT 21.7 17.8–26.5 0.271 0.177–0.365 0.606 b0.001DMI PGLS 0.033 0.017–0.066 0.688 0.594–0.782 0.900 b0.001aDDM 67.2 50.7–89.2 −0.003 −0.042–0.036 0.001 0.977DMC 0.025 0.009–0.070 0.830 0.689–0.972 0.852 b0.001MRT 27.4 11.5–65.1 0.140 0.021–0.258 0.187 0.013
Colon fermenter (n=15)DMI OLS 0.024 0.018–0.033 0.911 0.856–0.967 0.990 b0.001aDDM 78.7 61.9–100.0 −0.066 −0.109; −0.023 0.459 0.006DMC 0.029 0.021–0.040 0.919 0.861–0.977 0.989 b0.001MRT 47.1 27.2–81.5 −0.021 −0.120–0.077 0.017 0.647DMI PGLS 0.031 0.016–0.058 0.852 0.757–0.947 0.960 b0.001aDDM 75.7 49.3–116.1 −0.070 −0.134; −0.006 0.259 0.032DMC 0.027 0.015–0.049 0.948 0.858–1.037 0.971 b0.001MRT 34.4 14.3–82.6 0.061 −0.071–0.192 0.060 0.461
Nonruminant foregut fermenter (n=15)DMI OLS 0.036 0.026–0.051 0.755 0.655–0.855 0.953 b0.001aDDM 69.8 56.0–87.3 −0.038 −0.105–0.030 0.102 0.246DMC 0.030 0.023–0.038 0.881 0.806–0.957 0.980 b0.001MRT 30.3 21.4–43.0 0.109 0.003–0.215 0.274 0.045DMI PGLS 0.031 0.009–0.113 0.812 0.659–0.965 0.893 b0.001aDDM 75.1 46.7–120.9 −0.064 −0.120; −0.008 0.276 0.025DMC 0.033 0.009–0.114 0.844 0.697–0.992 0.907 b0.001MRT 40.2 11.1–145.1 0.006 −0.145–0.158 0.001 0.993
Ruminant (n=22)DMI OLS 0.054 0.035–0.083 0.752 0.659–0.845 0.934 b0.001aDDM 66.7 51.6–86.3 −0.025 −0.080–0.030 0.044 0.347DMC 0.041 0.024–0.067 0.897 0.788–1.005 0.937 b0.001MRT 27.6 20.2–37.7 0.133 0.066–0.200 0.464 b0.001DMI PGLS 0.036 0.014–0.093 0.765 0.660–0.870 0.910 b0.001aDDM 85.3 42.8–169.9 −0.072 −0.149–0.005 0.144 0.055DMC 0.024 0.007–0.078 0.973 0.841–1.104 0.913 b0.001MRT 26.3 13.2–52.5 0.177 0.100–0.254 0.502 b0.001
Dry matter intake (DMI in kg d−1); apparent digestibility of dry matter (aDDM in %);dry matter gut contents (DMC in kg); particle mean retention time (MRT in h).
137D.W.H. Müller et al. / Comparative Biochemistry and Physiology, Part A 164 (2013) 129–140
basis. Hackmann and Spain (2010) collated data on the voluntaryfood intake (VFI) in domestic and wild ruminant species in a datasetmore comprehensive than ours (that was limited to studies that alsomeasured digestibility and retention), and concluded that VFI scaledto BM0.9, which was similar to that described in previous studies ondomestic ruminants (Graham, 1972; Minson, 1990; Reid et al.,1990). The authors concluded that the intermediate scaling betweenmetabolism (0.75) and gut fill (1.0) indicated that both metabolic andphysical constraints determine food intake; they also conclude that the
Table 7Correlations between body mass residuals of parameters of digestive physiology in thedataset of this study (n=77) analyzed byOLS and PGLS statistics (differences indicated bygray shading).
Stats Residual aD DM Residual DMC Residual MRT
PGLS R=−0.254, p=0.026 R=0.444, p<0.001 R=-0.583, p<0.001 R=0.087, p=0.567 R=0.589, p<0.001 R=-0.270, p=0.004
Residual DMI OLS
Residual aD DM OLS R=-0.082, p=0.471 R=0.345, p=0.002 PGLS R=-0.200, p=0.050 R=-0.084, p=0.592 OLSResidual CMD R=0.450, p<0.001
R=0.593, p<0.001PGLS
Dry matter intake (DMI in kg d−1); apparent digestibility of dry matter (aDDM in %);dry matter gut contents (DMC in kg); particle mean retention time (MRT in h).
putative difference between the scaling of metabolism (0.75) and thescaling of intake (0.9) allows larger animals to ingest lower-qualityfood and still meet their energetic requirements. Note that this interpre-tation of scaling differences does not draw on an alleged scaling of diges-tion efficiency and retention times.
The assumption that intakemight scale to a higher exponent thanbasal metabolic rate is supported when comparing the intake scalingexponent of large herbivores/herbivores with one offspring of thisstudy (0.81–0.89, Table 5) with that of the BMR in mammals withone offspring (0.76; Müller et al., 2012). In contrast, for the smallherbivores/herbivores with more than one offspring, such a differ-ence is not evident at 0.62–0.72 for the intake scaling exponent inthis study and 0.69 for that of BMR (Müller et al., 2012). To explainbody size effects in this group, factors such as variation in feeding selec-tivity and caecotroph use via coprophagy must be further investigated(Justice and Smith, 1992; Franz et al., 2011b). In particular, it remainsunknown whether the proportion of intake achieved via coprophagyvaries systematically with body mass. Preliminary results indicate thatthis proportion increases with increasing dietary fiber content(Takahashi and Sakaguchi, 1998). If we assume that compared to smallerspecies, larger caecum fermenters are adapted to lower-quality diets(i.e. diets higher in fiber), and should therefore be generally adaptedto a higher proportion of intake via coprophagy, this might help explainthe lower scaling of intake via food (asmeasured in the digestion exper-iments collated in this study) in this group. Further studies that assessthe contribution of coprophagy over a wide range of body sizes are re-quired to explore this possibility.
Apart from the logical issue with drawing conclusions on the scalingof digestibility from the scaling of digesta retention explained in theIntroduction, our data collection yields some further insights concerningcorrelates and effects of digesta retention. As reported previously ininter- and intraspecific analyses (Clauss et al., 2007a, 2007b; Müller etal., 2011; Steuer et al., 2011), species with a higher relative food intakehave comparatively shorter retention times (Fig. 3a). Langer and Snipes(1991) suggested that interspecifically, animals achieve longer digestaretention by higher gut capacities, a concept supported by our findings(Fig. 3b). Additionally, capacity for a higher gut fill will allow a higherfood intake (Fig. 3d).
Although increasing retention times may be associated withhigher general digestive efficiencies in intraspecific studies (Clausset al., 2007b), this effect is most evident in interspecific comparisonsin relation to the digestibility of the fiber component of the food(Udén and Van Soest, 1982; Clauss et al., 2009). When comparingthe overall diet digestibility, as in this study, where we collateddata on the dry matter or organic matter digestibility but not thefiber digestibility, no significant effect of digesta retention on digest-ibility is evident when accounting for the phylogenetic structure ofthe data (Tables 3 and 7). In other words, although larger clades differsystematically in retention and digestibility, such as the colon fermen-ters and ruminants in Fig. 1c, the effect is not evident among moreclosely related species — in the case of the Foose (1982) dataset eventhough consistent diets were used. One potential reason is that digestaretention is not the only determinant of digestibility, but acts togetherwith digesta particle size reduction, either compensating for poorchewing efficiency (as for example in hippopotamuses) or reinforcinga high chewing efficiency (as in the ruminants) (Clauss et al., 2009).Another potential reason is that overall dry matter digestibility doesnot necessarily reflect fiber digestibility. A small-scale data collectionin Clauss and Hummel (2005) suggested that fiber digestibility mayvary more across a large herbivore body mass range than does overalldiet digestibility, which remained rather constant (as in this study).The authors summarized concepts that interpret these data as indicationfor a better utilization of non-fibrous food components in smaller ani-mals, including the segregation of bacterial protein during caecotrophformation by the colonic separation mechanism (Björnhag, 1987; Franzet al., 2011b). Understanding how bacterial nitrogen utilization and
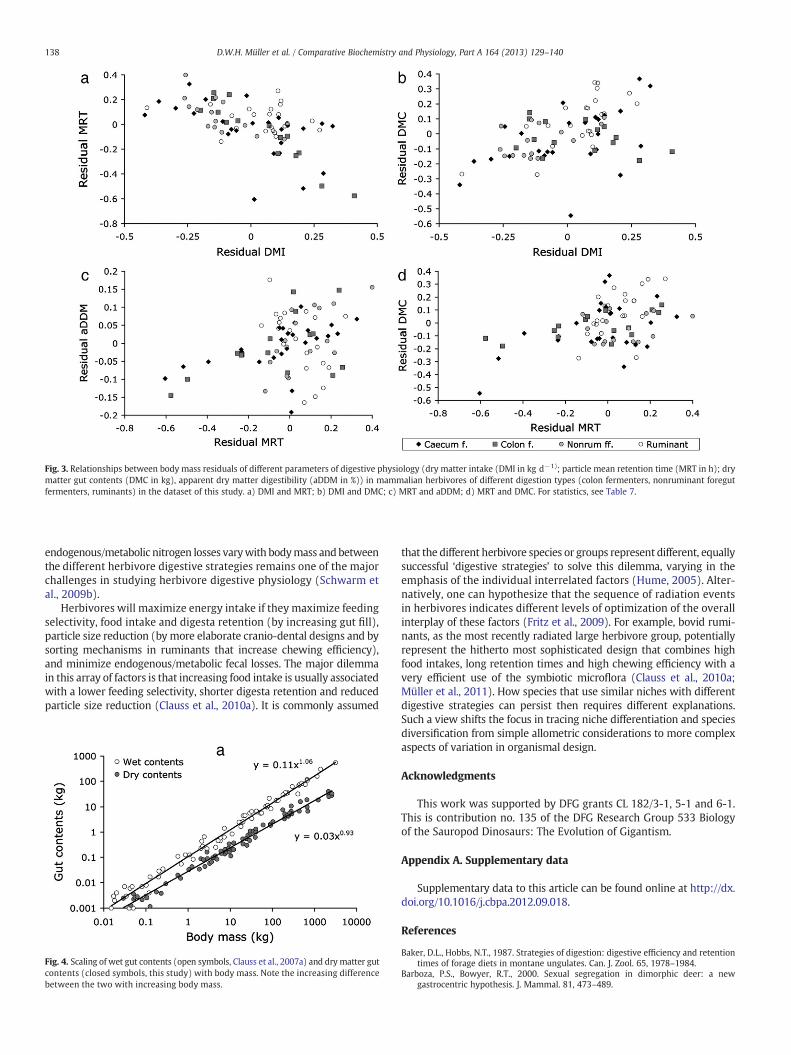
Fig. 3. Relationships between body mass residuals of different parameters of digestive physiology (dry matter intake (DMI in kg d−1); particle mean retention time (MRT in h); drymatter gut contents (DMC in kg), apparent dry matter digestibility (aDDM in %)) in mammalian herbivores of different digestion types (colon fermenters, nonruminant foregutfermenters, ruminants) in the dataset of this study. a) DMI and MRT; b) DMI and DMC; c) MRT and aDDM; d) MRT and DMC. For statistics, see Table 7.
138 D.W.H. Müller et al. / Comparative Biochemistry and Physiology, Part A 164 (2013) 129–140
endogenous/metabolic nitrogen losses varywith bodymass andbetweenthe different herbivore digestive strategies remains one of the majorchallenges in studying herbivore digestive physiology (Schwarm etal., 2009b).
Herbivores will maximize energy intake if they maximize feedingselectivity, food intake and digesta retention (by increasing gut fill),particle size reduction (by more elaborate cranio-dental designs and bysorting mechanisms in ruminants that increase chewing efficiency),and minimize endogenous/metabolic fecal losses. The major dilemmain this array of factors is that increasing food intake is usually associatedwith a lower feeding selectivity, shorter digesta retention and reducedparticle size reduction (Clauss et al., 2010a). It is commonly assumed
Fig. 4. Scaling of wet gut contents (open symbols, Clauss et al., 2007a) and dry matter gutcontents (closed symbols, this study) with body mass. Note the increasing differencebetween the two with increasing body mass.
that the different herbivore species or groups represent different, equallysuccessful ‘digestive strategies’ to solve this dilemma, varying in theemphasis of the individual interrelated factors (Hume, 2005). Alter-natively, one can hypothesize that the sequence of radiation eventsin herbivores indicates different levels of optimization of the overallinterplay of these factors (Fritz et al., 2009). For example, bovid rumi-nants, as the most recently radiated large herbivore group, potentiallyrepresent the hitherto most sophisticated design that combines highfood intakes, long retention times and high chewing efficiency with avery efficient use of the symbiotic microflora (Clauss et al., 2010a;Müller et al., 2011). How species that use similar niches with differentdigestive strategies can persist then requires different explanations.Such a view shifts the focus in tracing niche differentiation and speciesdiversification from simple allometric considerations to more complexaspects of variation in organismal design.
Acknowledgments
This work was supported by DFG grants CL 182/3-1, 5-1 and 6-1.This is contribution no. 135 of the DFG Research Group 533 Biologyof the Sauropod Dinosaurs: The Evolution of Gigantism.
Appendix A. Supplementary data
Supplementary data to this article can be found online at http://dx.doi.org/10.1016/j.cbpa.2012.09.018.
References
Baker, D.L., Hobbs, N.T., 1987. Strategies of digestion: digestive efficiency and retentiontimes of forage diets in montane ungulates. Can. J. Zool. 65, 1978–1984.
Barboza, P.S., Bowyer, R.T., 2000. Sexual segregation in dimorphic deer: a newgastrocentric hypothesis. J. Mammal. 81, 473–489.

139D.W.H. Müller et al. / Comparative Biochemistry and Physiology, Part A 164 (2013) 129–140
Behrend, A., Lechner-Doll, M., Streich, W.J., Clauss, M., 2004. Seasonal faecal excretion,gut fill, liquid and particle marker retention in mouflon (Ovis ammon musimon),and a comparison with roe deer (Capreolus capreolus). Acta Theriol. 49, 503–515.
Bell, R.H.V., 1971. A grazing ecosystem in the Serengeti. Sci. Am. 225, 86–93.Bininda-Emonds, O.R.P., Cardillo, M., Jones, K.E., MacPhee, R.D.E., Beck, R.M.D., Grenyer,
R., Price, S.A., Vos, R.A., Gittleman, J.L., Purvis, A., 2007. The delayed rise of present-daymammals. Nature 446, 507–512.
Bininda-Emonds, O.R.P., Cardillo, M., Jones, K.E., MacPhee, R.D.E., Beck, R.M.D., Grenyer,R., Price, S.A., Vos, R.A., Gittleman, J.L., Purvis, A., 2008. Corrigendum: the delayedrise of present-day mammals. Nature 456, 274.
Björnhag, G., 1987. Comparative aspects of digestion in the hindgut of mammals. Thecolonic separation mechanism. Dtsch. Tierärztl. Wochenschr 94, 33–36.
Brown, J.H., Sibly, R.M., Kodric-Brown, A., 2012. Introduction:metabolism as the basis for atheoretical unification of ecology. In: Sibly, R.M., Brown, J.H., Kodric-Brown, A. (Eds.),Metabolic Ecology. A Scaling Approach. Wiley-Blackwell, Chichester, UK, pp. 1–6.
Capellini, I., Venditi, C., Barton, R.A., 2010. Phylogeny and metabolic scaling in mammals.Ecology 91, 2783–2793.
Clarke, A., Rothery, P., Isaac, N.J.B., 2010. Scaling of basal metabolic rate with body massand temperature in mammals. J. Anim. Ecol. 79, 610–619.
Clauss, M., Hummel, J., 2005. The digestive performance of mammalian herbivores:why big may not be that much better. Mammal Rev. 35, 174–187.
Clauss,M., Schwarm, A., Ortmann, S., Streich,W.J., Hummel, J., 2007a. A case of non-scalinginmammalian physiology? Body size, digestive capacity, food intake, and ingesta pas-sage in mammalian herbivores. Comp. Biochem. Physiol. A 148, 249–265.
Clauss, M., Streich, W.J., Schwarm, A., Ortmann, S., Hummel, J., 2007b. The relationshipof food intake and ingesta passage predicts feeding ecology in two differentmegaherbivore groups. Oikos 116, 209–216.
Clauss, M., Nunn, C., Fritz, J., Hummel, J., 2009. Evidence for a tradeoff between retentiontime and chewing efficiency in large mammalian herbivores. Comp. Biochem. Physiol.A 154, 376–382.
Clauss, M., Hume, I.D., Hummel, J., 2010a. Evolutionary adaptations of ruminants andtheir potential relevance for modern production systems. Animal 4, 979–992.
Clauss, M., Lang-Deuerling, S., Müller, D.W.H., Kienzle, E., Steuer, P., Hummel, J., 2010b.Retention of fluid and particles in captive tapirs (Tapirus spp.). Comp. Biochem.Physiol. A 157, 95–101.
Codron, D., Lee-Thorp, J.A., Sponheimer, M., Codron, J., de Ruiter, D., Brink, J.S., 2007.Significance of diet type and diet quality for ecological diversity of African ungulates.J. Anim. Ecol. 76, 526–537.
Demment, M.W., 1983. Feeding ecology and the evolution of body size of baboons.Afr. J. Ecol. 21, 219–233.
Demment, M.W., Van Soest, P.J., 1985. A nutritional explanation for body size patternsof ruminant and nonruminant herbivores. Am. Nat. 125, 641–672.
Dodds, P.S., Rothman, D.H., Weitz, J.S., 2001. Re-examination of the “3/4-law” ofmetabolism.J. Theor. Biol. 209, 9–27.
du Toit, J.T., 2005. Sex differences in the foraging ecology of large mammalian herbivores.In: Ruckstuhl, K.E., Neuhaus, P. (Eds.), Sexual Segregation in Vertebrates: Ecology ofthe Two Sexes. Cambridge University Press, New York, pp. 35–52.
Fleming, T.H., 1991. The relationship between body size, diet, and habitat use in frugivorousbats, Genus Carollia (Phyllostomidae). J. Mammal. 72, 493–501.
Foose, T.J., 1982. Trophic Strategies of Ruminant Versus Nonruminant Ungulates. Universityof Chicago, Chicago.
Franz, R., Hummel, J., Müller, D.W.H., Bauert, M., Hatt, J.-M., Clauss, M., 2011a. Herbivorousreptiles and bodymass: effects on food intake, digesta retention, digestibility and gutcapacity, and a comparison with mammals. Comp. Biochem. Physiol. A 158, 94–101.
Franz, R., Kreuzer, M., Hummel, J., Hatt, J.-M., Clauss, M., 2011b. Intake, selection, digestaretention, digestion and gut fill of two coprophageous species, rabbits (Oryctolaguscuniculus) and guinea pigs (Cavia porcellus), on a hay-only diet. J. Anim. Physiol.Anim. Nutr. 95, 564–570.
Fritz, J., Hummel, J., Kienzle, E., Arnold, C., Nunn, C., Clauss, M., 2009. Comparativechewing efficiency in mammalian herbivores. Oikos 118, 1623–1632.
Fritz, J., Hammer, S., Hebel, C., Arif, A., Michalke, B., Dittmann, M.T., Müller, D.W.H.,Clauss, M., 2012. Retention of solutes and different-sized particles in the digestivetract of the ostrich (Struthio camelus massaicus), and a comparison with mammalsand reptiles. Comp. Biochem. Physiol. A 163, 56–65.
Gaulin, S.J.C., 1979. A Jarman–Bell model of primate feeding niches. Hum. Ecol. 7, 1–20.Geist, V., 1974. On the relationship of social evolution and ecology in ungulates. Am.
Zool. 14, 205–220.Glazier, D.S., 2005. Beyond the ‘3/4-power law’: variation in the intra- and interspecific
scaling of metabolic rate in animals. Biol. Rev. 80, 1–52.Gordon, I.J., Illius, A.W., 1996. The nutritional ecology of African ruminants: a reinter-
pretation. J. Anim. Ecol. 65, 18–28.Graham, N.M., 1972. Units of metabolic body size for comparisons amongst adult sheep
and cattle. Proc. Aust. Soc. Anim. Prod. 9, 352–355.Gross, J.E., Alkon, P.U., Demment, M.W., 1996. Nutritional ecology of dimorphic
herbivores: digestion and passage rates in Nubian ibex. Oecologia 107, 170–178.Hackmann, T.J., Spain, J.N., 2010. Ruminant ecology and evolution: perspectives useful
to ruminant livestock research and production. J. Dairy Sci. 93, 1320–1334.Hanley, T.A., 1982. The nutritional basis for food selection by ungulates. J. Range
Manage. 35, 146–151.Hanley, T.A., Hanley, K.A., 1980. Food resource partitioning by sympatric ungulates on
Great Basin rangeland. J. Range Manage. 35, 152–158.Harvey, P.H., Pagel, M.D., 1991. The Comparative Method in Evolutionary Biology.
Oxford University Press, Oxford.Hayssen, V., Lacy, R.C., 1985. Basal metabolic rates in mammals: taxonomic differ-
ences in the allometry of BMR and body mass. Comp. Biochem. Physiol. A 81,741–754.
Holleman, D.F., White, R.G., 1989. Determination of digesta fill and passage rate from nonabsorbed particulate phase markers using the single dosing method. Can. J. Zool. 67,488–494.
Hume, I.D., 2005. Concepts of digestive efficiency. In: Starck, J.M., Wang, T. (Eds.), Phys-iological and Ecological Adaptations to Feeding in Vertebrates. Science Publishers,Enfield NH, pp. 43–58.
Hummel, J., Clauss, M., 2011. Feeding and digestive physiology. In: Klein, N., Remes, K.,Gee, C.T., Sander, M. (Eds.), Understanding the Life of Giants. The Biology of theSauropod Dinosaurs. Indiana University Press, Bloomington, pp. 11–33.
Hummel, J., Südekum, K.-H., Streich, W.J., Clauss, M., 2006. Forage fermentationpatterns and their implications for herbivore ingesta retention times. Funct. Ecol.20, 989–1002.
Illius, A.W., Gordon, I.J., 1992. Modelling the nutritional ecology of ungulate herbivores:evolution of body size and competitive interactions. Oecologia 89, 428–434.
Isaac, N.J.B., Carbone, C., 2010. Why are metabolic scaling exponents so controversial?Quantifying variance and testing hypotheses. Ecol. Lett. 13, 728–735.
Jarman, P.J., 1974. The social organization of antelope in relation to their ecology.Behaviour 48, 215–266.
Justice, K.E., Smith, F.A., 1992. A model of dietary fiber utilization by small mammalianherbivores, with empirical results for Neotoma. Am. Nat. 139, 398–416.
Kolokotrones, T., Savage, V.M., Deeds, E.J., Fontana, W., 2010. Curvature in metabolicscaling. Nature 464, 753–756.
Langer, P., Snipes, R.L., 1991. Adaptations of gut structure to function in herbivores. In:Tsuda, T., Sasaki, Y., Kawashima, R. (Eds.), Physiological Aspects of Digestion andMetabolism in Ruminants. Academic Press, San Diego, pp. 349–384.
Lentle, R., Hemar, Y., Hall, C., 2006. Viscoelastic behaviour aids extrusion from andreabsorption of the liquid phase into the digesta plug: creep rheometry of hindgutdigesta in the common brushtail possum Trichosurus vulpecula. J. Comp. Physiol. B.176, 469–475.
Lovegrove, B.G., 2000. The zoogeography of mammalian basal metabolic rate. Am. Nat.156, 201–219.
Martins, E.P., Hansen, T.F., 1997. Phylogenies and the comparative method: a generalapproach to incorporating phylogenetic information into analysis of interspecificdata. Am. Nat. 149, 646–667.
McNab, B.K., 2002. The Physiological Ecology of Vertebrates. A View from Energetics.Cornell University Press, Ithaca & London.
McNab, B.K., 2008. An analysis of the factors that influence the level and scaling ofmammalian BMR. Comp. Biochem. Physiol. A 151, 5–28.
Mertens, D.R., 1994. Regulation of forage intake. In: Fahey, G.C., Collins, M., Mertens,D.R., Moser, L.E. (Eds.), Forage Quality, Evaluation, and Utilization. AmericanSociety of Agronomy, Madison, WI, pp. 450–493.
Meyer, K., Hummel, J., Clauss, M., 2010. The relationship between forage cell wall contentand voluntary food intake in mammalian herbivores. Mammal Rev. 40, 221–245.
Minson, D.J., 1990. Forage in Ruminant Nutrition. Academic Press, London.Müller, D.W.H., Caton, J., Codron, D., Schwarm, A., Lentle, R., Streich, W.J., Hummel, J.,
Clauss, M., 2011. Phylogenetic constraints on digesta separation: variation influid throughput in the digestive tract in mammalian herbivores. Comp. Biochem.Physiol. A 160, 207–220.
Müller, D.W.H., Codron, D., Werner, J., Fritz, J., Hummel, J., Griebeler, E.M., Clauss, M.,2012. Dichotomy of eutherian reproduction and metabolism. Oikos 121, 102–115.
Munn, A.J., Barboza, P.S., 2008. Could a big gut be too costly for muskoxen (Ovibosmoschatus) in their first winter? Zoology 111, 350–362.
Munn, A.J., Dawson, T.J., 2006. Forage fibre digestion, rates of feed passage and gut fill injuvenile and adult red kangaroos (Macropus rufus): why body size matters. J. Exp.Biol. 209, 1535–1547.
Munn, A.J., Tomlinson, S., Savage, T., Clauss, M., 2012. Retention of different-sizedparticles and derived gut fill estimate in tammar wallabies (Macropus eugenii):physiological and methodological considerations. Comp. Biochem. Physiol. A 161,243–249.
Nagy, K.A., Girard, I.A., Brown, T.K., 1999. Energetics of free-ranging mammals, reptiles,and birds. Ann. Rev. Nutr. 19, 247–277.
Owen-Smith, N., 1988. Megaherbivores — The Influence of Very Large Body Size onEcology. Cambridge University Press, Cambridge.
Packard, G.C., in press. Is non-loglinear allometry a statistical artifact? Biol. J. Linn. Soc.http://dx.doi.org/10.1111/j.1095–8312.2012.01995.x.
Parra, R., 1978. Comparison of foregut and hindgut fermentation in herbivores. In:Montgomery, G.G. (Ed.), The Ecology of Arboreal Folivores. Smithsonian InstitutionPress, Washington DC, pp. 205–229.
Pérez-Barbería, F.J., Elston, D.A., Gordon, I.J., Illius, A.W., 2004. The evolution of phylo-genetic differences in the efficiency of digestion in ruminants. Proc. Roy. Soc. B271, 1081–1090.
Prins, R.A., Geelen, M.J.H., 1971. Rumen characteristics of red deer, fallow deer and roedeer. J. Wildl. Manag. 35, 673–680.
Reid, R.L., Jung, G.A., Cox-Ganser, J.M., Rybeck, B.F., Townsend, E.C., 1990. Comparativeutilization of warm- and cool-season forages by cattle, sheep and goats. J. Anim.Sci. 68, 2986–2994.
Robbins, C.T., 1993. Wildlife Feeding and Nutrition. Academic Press, San Diego.Rohlf, F., 2001. Comparative methods for the analysis of continuous variables: geometric
interpretations. Evolution 55, 2143–2160.Rucker, R., Storms, D., 2002. Interspecies comparisons of micronutrient requirements:
metabolic vs. absolute body size. J. Nutr. 132, 2999–3000.Sawada, A., Sakaguchi, E., Hanya, G., 2011. Digesta passage time, digestibility, and total
gut fill in captive Japanese macaques (Macaca fuscata): effects food type and foodintake level. Int. J. Primatol. 32, 390–405.
Schwarm, A., Ortmann, S., Wolf, C., Streich, W.J., Clauss, M., 2009a. More efficient masti-cation allows increasing intake without compromising digestibility or necessitating

140 D.W.H. Müller et al. / Comparative Biochemistry and Physiology, Part A 164 (2013) 129–140
a larger gut: comparative feeding trials in banteng (Bos javanicus) and pygmy hippo-potamus (Hexaprotodon liberiensis). Comp. Biochem. Physiol. A 152, 504–512.
Schwarm, A., Schweigert, M., Ortmann, S., Hummel, J., Janssens, G., Streich, W.J., Clauss,M., 2009b. No easy solution for the fractionation of faecal nitrogen in captive wildherbivores: results of a pilot study. J. Anim. Physiol. Anim. Nutr. 93, 596–605.
Shannon, G., Page, B., Duffy, K., Slotow, R., 2006. The role of foraging behaviour in thesexual segregation of the African elephant. Oecologia 150, 344–354.
Shipley, L.A., 2007. The influence of bite size on foraging at larger spatial and temporalscales by mammalian herbivores. Oikos 116, 1964–1974.
Shipley, R.A., Clark, R.E., 1972. Tracer Methods for In Vivo Kinetics. Academic Press,New York.
Short, H.L., 1963. Rumen fermentation and energy relationships in the white-taileddeer. J. Wildl. Manag. 28, 445–458.
Sieg, A.E., O'Connor, M.P., McNair, J.N., Grant, B.W., Agosta, S.J., Dunham, A.E., 2009. Mam-malian metabolic allometry: do intraspecific variation, phylogeny, and regressionmodels matter? Am. Nat. 174, 720–733.
Sinclair, A.R.E., 1977. The African Buffalo: A Study of Resource Limitation ofPopulations. University of Chicago Press, Chicago.
Steele, R., 1971. Tracer Probes in Steady State Systems. Charles C. Thomas Publisher,Springfield IL.
Steuer, P., Südekum, K.-H., Müller, D.W.H., Franz, R., Kaandorp, J., Clauss, M., Hummel,J., 2011. Is there an influence of body mass on digesta mean retention time inherbivores? A comparative study on ungulates. Comp. Biochem. Physiol. A 160,355–364.
Steuer, P., Südekum, K.-H.,Müller, D.W.H., Kaandorp, J., Clauss, M., Hummel, J., in press.Fibre digestibility in large herbivores as related to digestion type and body mass —an in vitro approach. Comparative Biochemistry and Physiology A. http://dx.doi.org/10.1016/j.cbpa.2012.10.026.
Stevens, C.E., Hume, I.D., 1995. Comparative Physiology of the Vertebrate DigestiveSystem. Cambridge University Press, New York.
Südekum, K.-H., 2002. Technical basis of international feed evaluation systems fordairy cows and future prospects for the German recommendations (energy,protein and amino acids). Übersichten Tierernährung 30, 135–162.
Takahashi, T., Sakaguchi, E., 1998. Behaviors and nutritional importance of coprophagyin captive adult and young nutrias (Myocastor coypus). J. Comp. Physiol. B. 168,281–288.
Team, R.D.C., 2011. R: A Language and Environment for Statistical Computing. R Foun-dation for Statistical Computing, Vienna, Austria3-900051-07-0. URL http://www.R-project.org/.
Tershy, B.R., 1992. Body size, diet, habitat use, and social behavior of balaenopterawhales in the Gulf of California. J. Mammal. 73, 477–486.
Udén, P., Van Soest, P.J., 1982. Comparative digestion of timothy fiber by ruminants,equines and rabbits. Br. J. Nutr. 47, 267–272.
Udén, P., Rounsaville, T.R., Wiggans, G.R., Van Soest, P.J., 1982. The measurement ofliquid and solid digesta retention in ruminants, equines and rabbits given timothy(Phleum pratense) hay. Br. J. Nutr. 48, 329–339.
Van Soest, P.J., 1994. Nutritional Ecology of the Ruminant, 2nd ed. Cornell UniversityPress, Ithaca.
Wenninger, P.S., Shipley, L.A., 2000. Harvesting, rumination, digestion, and passage offruit and leaf diets by a small ruminant, the blue duiker. Oecologia 123, 466–474.
White, C.R., Seymour, R.S., 2005. Allometric scaling of mammalian metabolism. J. Exp. Biol.208, 1611–1619.
White, C.R., Blackburn, T.M., Seymour, R.S., 2009. Phylogenetically informed analysis ofthe allometry of mammalian basal metabolic rate supports neither geometric norquarter-power scaling. Evolution 63, 2658–2667.
Woolley, L.-A., Page, B., Slotow, R., 2011. Foraging strategy within African elephantfamily units: why body size matters. Biotropica 43, 489–495.