
ap macro economics mr. lipman
77
AP MACRO ECONOMICS MR. LIPMAN MEASURING ECONOMIC PERFORMANCE KRUGMAN MODULES 10-15
-
Upload
khangminh22 -
Category
Documents
-
view
0 -
download
0
Transcript of ap macro economics mr. lipman

AP MACRO ECONOMICS
MR. LIPMAN
MEASURING ECONOMIC PERFORMANCE
KRUGMAN MODULES 10-15

1. Promote Economic Growth
2. Limit Unemployment
3. Keep Prices Stable (Limit Inflation)
In this unit we will analyze how each
of these are measured.
For all countries there are three major economic goals:
2

Keys to the Unit
• 1. Circular Flow Diagrams
– (Module 10)
• 2. Gross Domestic Production (GDP)
• Module 10 & 11
• 3. Unemployment
– (Module 12 & 13)
• 4. Inflation
– (Module 14 & 15)
5. Money & Inflation & the Phillips curve
(Modules 33 & 34)

• Economists collect statistics on production,
income, investment, and savings.
The most important measure of growth is GDP.
Gross Domestic Product (GDP) = dollar value of all final goods and services produced in a country in one year.
•Dollar value- GDP is measured in dollars.• Final Goods-GDP does not include the value of
intermediate goods. Intermediate goods are goods used in the production of final goods and services.
•One Year-GDP measures annual economic performance. 4

Does GDP accurately measure
standard of living?
Standard of living (or quality of life) can be
measured, in part, by how well the economy is
doing…but it does not measure a nation’s
happiness just output

Keys to the Circular Flow Chart
• Chart has 4 sectors:
– Households
– Firms
– Government
– Rest of the world
All are connected by 3 types of markets
Factor; Market for Goods & Services; Financial
Markets

Circular Flow Diagram: Inflow of money into each market or sector must
equal the outflow of money coming from that market or sector

Calculating GDP
Three Ways of calculating GDP:
1. Expenditure Approach (aka Aggregate Spending)
THIS IS THE ONE WE WILL FOLLOW
2. Income Approach (aka Sum of total factor income)
3. Total Value Approach of all final goods and services
All ways generate the same amount since every dollar spent is a dollar of income.
8

1. Expenditures Approach-Add up all the spending on final goods and services produced in a given year.
GDP = C + I + G + Xn (exports-imports)
C IS CONSUMER SPENDING
I IS INVESTMENT SPENDING
G IS GOVERNMENT PURCHASES OF GOODS AND SERVICES
X IS EXPORTS - IMPORTS
9

Four components of GDP:1. Consumer Spending (C)
Ex: $5 Spent on Pizza
2. Investments (I) -Businesses putting money back into their own business.
3. Government SpendingEx: Bombs or tanks, NOT social security
4. Net Exports -Exports (X) – Imports (M)Ex: Value of 2 Ford Focuses minus 3 Hondas
Remember: GDP = C + I + G + Xn (exports–imports)
Expenditures Approach

2. Nonproduction Transactions•Financial Transactions (nothing produced)
•Ex: Stocks, bonds, Real estate•Used Goods
•Ex: Old cars, used clothes
What is NOT included in GDP
1. Intermediate Goods• No Multiple Counting, Only Final Goods
• EX: Price of finished car, not the radio, tire, etc.
3. Non-Market (Illegal) Activities •Ex: Illegal drugs, unpaid work
11

America’s Trade Balance
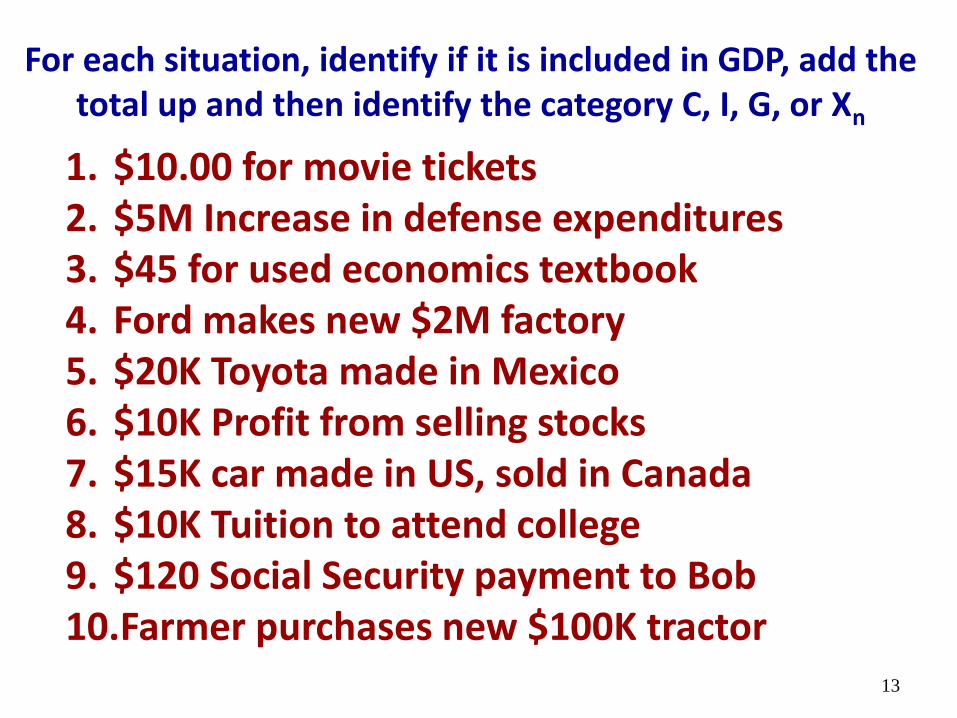
For each situation, identify if it is included in GDP, add the total up and then identify the category C, I, G, or Xn
1. $10.00 for movie tickets2. $5M Increase in defense expenditures3. $45 for used economics textbook4. Ford makes new $2M factory5. $20K Toyota made in Mexico6. $10K Profit from selling stocks7. $15K car made in US, sold in Canada8. $10K Tuition to attend college9. $120 Social Security payment to Bob10.Farmer purchases new $100K tractor
13

1. $10.00 for movie tickets2. $5M Increase in defense expendituresX $45 for used economics textbook4. Ford makes new $2M factoryX $20K Toyota made in MexicoX $10K Profit from selling stocks7. $15K car made in US, sold in Canada8. $10K Tuition to attend collegeX $120 Social Security payment to Bob10.Farmer purchases new $100K tractor
GDP=$7,125,010
14

Real vs. Nominal GDP (Module 11)
Nominal GDP is GDP measured in current prices. It does not account for inflation from year to year.
Real GDP adjusts for inflation and is the BEST MEASURE OF ECONOMIC
GROWTH
Per Capita GDP measures a country’s GDP by the size of its population.
Divide the GDP for a year by the number of people in the nation to obtain the best measurement of a nations
growth and productivity.

How can you measure growth from year to year?
Chain-Linking: Use a base year and a later year
% Change in GDP
=Year 2 – Year 1
Year 1X 100

Real vs. Nominal GDP Example2008
10 cars at $15,000 each = $150,00010 trucks at $20,000 each = $200,000Nominal GDP = $350,000
200910 cars at $16,000 each = $160,00010 trucks at $21,000 each= $210,000Nominal GDP = $370,000
The GDP for year 2008 shows the dollar value of all final goods produced.
The nominal GDP in year 2009 is higher which suggests that the economy is improving. But how much is the REAL GDP? How do you get it?
Use 2008 Prices.
The Real GDP for 2009 is the same as 2008 after we adjust for inflation.
-------------------------------------------
Year 2-Year1 x 100
Year 1
200910 cars at $15,000 each = $150,00010 trucks at $20,000 each= $200,000REAL GDP = $350,000

World Ranking of GDP 2016

Top 10 Nations GDP Per Capita
19

What is the most popular movie of all time?
What is the problem with this method?
Nominal Box Office Receipts
20

Real Box Office Receipts (adjusted for inflation)

Real GDP “deflates” nominal GDP by adjusting for inflation in terms of a base year prices.
22

Three Types of Unemployment (Module 12 & 13)1. Frictional
2. Structural3. Cyclical

#1. Frictional Unemployment
•Temporarily unemployed or between jobs.
•Qualified workers with transferable skills but
they aren’t working.
Examples:
• High school or college graduates looking
for jobs.
• Individuals that were fired and are looking
for a better job. You’reFired!

Seasonal Unemployment
•A specific type of frictional unemployment which is due to time of year and the nature of the job.
•These jobs will come back
Examples:
•Professional Santa Claus Impersonators
•Construction workers in Michigan
25

#2. Structural Unemployment
•Changes in the structure of the labor force
makes the worker’s skills obsolete and the jobs
will not be coming back.
•Workers must learn new skills to get a job.
•The permanent loss of these jobs is called
“creative destruction.”
Examples:
•VCR repairmen
•Carriage makers

Technological Unemployment
•Type of structural unemployment where
automation and machinery replace workers
causing unemployment
Examples:
•Auto assemblers fired as robots take over
production
• Producers of Capital Goods (tractors) fire assembly workers
27

#3 Cyclical Unemployment
•Unemployment that results from economic downturns (recessions).
•As demand for goods and services falls, demand for labor falls and workers are fired.
Examples:
•Steel workers laid off during recessions.
•Restaurant owners fire waiters after months of poor sales due to recession.
This sucks!
28
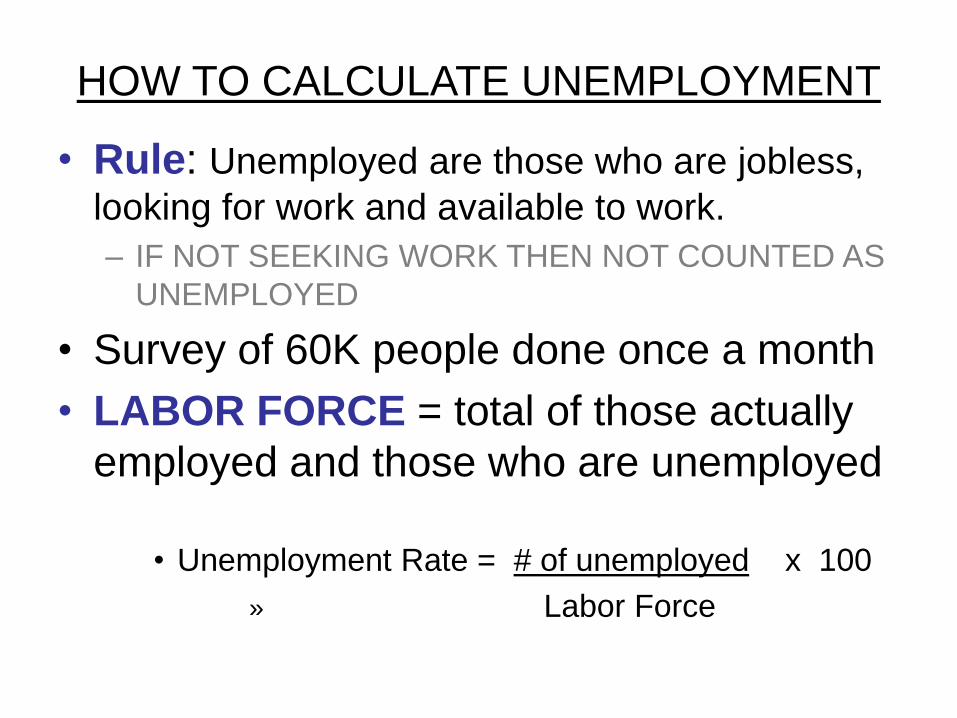
HOW TO CALCULATE UNEMPLOYMENT
• Rule: Unemployed are those who are jobless,
looking for work and available to work.
– IF NOT SEEKING WORK THEN NOT COUNTED AS
UNEMPLOYED
• Survey of 60K people done once a month
• LABOR FORCE = total of those actually
employed and those who are unemployed
• Unemployment Rate = # of unemployed x 100
» Labor Force

Two of the three types of unemployment are unavoidable:
•Frictional unemployment (TEMPORARY)
•Structural unemployment (OBSOLETE)
•Together they make up the natural rate unemployment (NRU).
America is at full employment if we have NRU. This is the normal amount of unemployment that we SHOULD have.
The Natural Rate of Unemployment (NRU)

Full employment means NO Cyclical unemployment!
Economists generally agree that unemployment
rate of around 4 to 6 % is full employment.
4-6% Unemployment = NRU
Okun’s Law: When unemployment rises 1 percent above the natural rate, GDP falls by
about 2 percent

Rule: There is a negative relationship between unemployment and
growth. Unemployment rises in a recession and usually falls during
a period of economic expansion.

The natural rate in France and Germany is around 8–10%. Higher than America. Why?
• Some economists attribute difference to more generous unemployment benefits in European countries– U.S. unemployment benefits usually last for 6
months– Unemployment benefits in some European
countries are indefinite– Generous benefits reduce incentives to search
for a job

Firing workers can be costly but in America the amount received
for unemployment is always less than the actual wages that would
have been received

What’s wrong with the unemployment rate?Can hide actual unemployment rate:
Discouraged job seekers-•Some people are no longer looking for a job because they have given up.
Part-Time Workers-•Someone who wants more shifts but can’t get them is still considered employed.
Race/Age Inequalities-•Hispanics – 10% for Sept. 2016
• But teenage rate is 25%•African American- 14% for Sept. 2016
• But teenage rate is 41%Illegal Labor-
•Many people work under the table.35

The Changing Makeup of the U.S. Labor Force 1948–2009

Inflation: Module 14 & 15
WHAT IS INFLATION AND HOW IS IT
CAUSED?

Inflation is a general rising level of prices
It reduces the “purchasing power” of money
Examples: •It takes $2 to buy today what
$1 bought in 1982
•It takes $6 to buy today what $1 bought in 1961
•When inflation occurs, each dollar of income will buy fewer goods than before.

Three Causes of Inflation1. Printing too much Money2.Demand-Pull Inflation3. Cost-Push Inflation

1. The Government Prints TOO MUCH Money (The Quantity Theory)
• Governments that keep printing money to pay debts end up with hyperinflation.
• There are more “rich” people but the same amount of products.
• Result: Banks refuse to lend and GDP falls
Examples:• Bolivia, Peru, Brazil• Germany after WWI

This is known as Hyper Inflation
----------------------------Zimbabwe, 2008
Annual Inflation Rate-79,600,000,000%
Time for Prices to Double-24.7 hours

What would happen if the government printed
money to pay off the national debt all at once?

2. DEMAND-PULL INFLATION
“Too many dollars chasing too few goods”
DEMAND PULLS UP PRICES!!!• Demand increases but supply stays the
same. The result is a shortage driving prices up.•An overheated economy with
excessive spending but same amount of goods.

3. COST-PUSH INFLATION
Higher production costs increase pricesA negative supply shock increases the costs of production and forces producers to increase their prices.
Examples: •Hurricane Katrina destroyed oil refineries and
caused gas prices to go up. Companies that use gas then increased their prices.

Cost-Push Inflation

Measuring Inflation
• Inflation Rate Percentage =‘s
Price Yr 2 - Price Yr 1 x 100
Price Yr 1
The process of bringing the inflation rate down
is known as Disinflation and it is difficult to do
because you must temporarily slow growth or
even depress the economy.

Price Level versus the Inflation Rate, 1969–2009….Notice how by 2009 costs of items are much higher
than the actual inflation rate thus reducing the purchasing power of the consumer.

Key Inflation Terms
• Shoe-leather costs
– Increased transaction costs of shopping around
• Menu Costs
– $ it costs to change prices
• Unit of Accounts Costs
– inflation makes $ less reliable as a unit of measurement

A Perpetual Process:1.Workers demand raises2.Owners increase prices to pay for raises3. High prices cause workers to demand higher raises 4. Owners increase prices to pay for higher raises5. High prices cause workers to demand higher raises 6. Owners increase prices to pay for higher raises
Giving raises to workers is not always a good thing: The Wage-Price Spiral
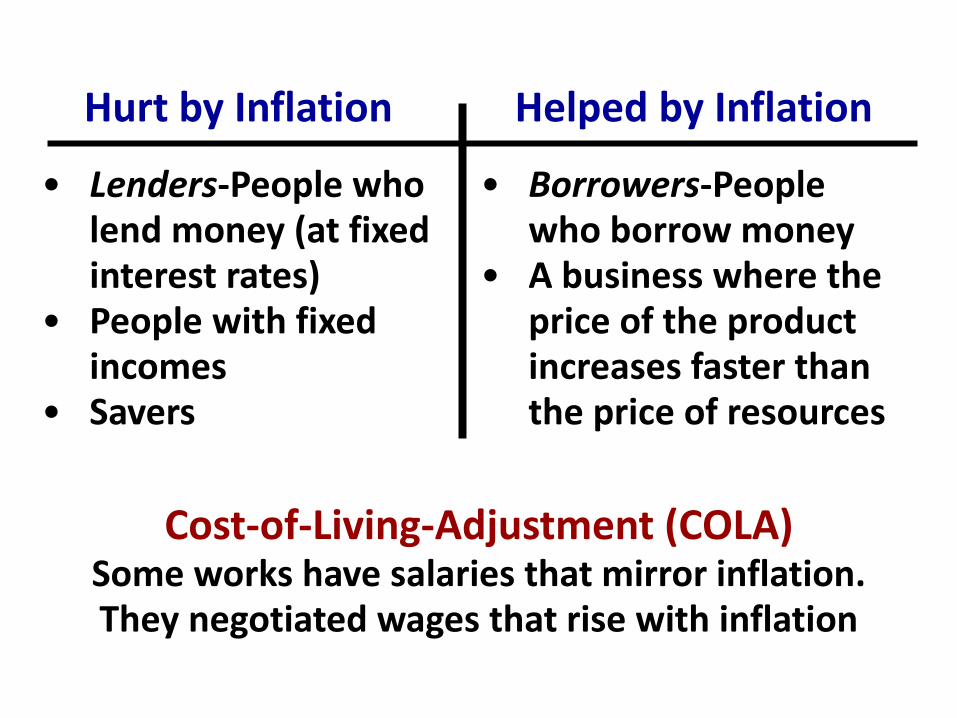
• Borrowers-People who borrow money
• A business where the price of the product increases faster than the price of resources
• Lenders-People who lend money (at fixed interest rates)
• People with fixed incomes
• Savers
Hurt by Inflation Helped by Inflation
Cost-of-Living-Adjustment (COLA)Some works have salaries that mirror inflation. They negotiated wages that rise with inflation

Identify which people are helped and which are
hurt by unanticipated inflation?
1. A man who lent out $500 to his friend in 1960
and is still waiting to be paid back.
2. A tenant who is charged $850 rent each year.
3. An elderly couple living off fixed retirement
payments of $2000 a month.
4. A man that borrowed $1,000 in 1995 and paid it
back in 2006.
5. A women who saved a paycheck from 1950 by
putting it under her mattress.

Interest Rates

What are interest rates? Why do lenders charge them?
Real Interest Rates-The percentage increase in purchasing power that a
borrower pays to the lender. (adjusted for inflation)Real = nominal interest rate - expected inflation
Nominal Interest Rates-the percentage increase in money that the borrower pays
back to the lender not adjusting for inflation.

Nominal vs. Real Interest RatesExample #1:You lend out $100 with 20% interest. Inflation is 15%.A year later you get paid back $120.
What is the nominal and what is the real interest rate?Nominal interest rate is 20%. Real interest rate was 5%
Example #2:You lend out $100 with 10% interest. Prices are expected
to increase 20%. In a year you get paid back $110. What is the nominal and what is the real interest rate?
Nominal interest rate is 10%. Real rate was –10%
In reality, you get paid back an amount with less purchasing power.

Notice the “Stagflation Era” of the early 1980s.

How is Inflation measured? (Module 15)
The government tracks the prices of the same goods and services each year.
• This “market basket” is made up of about 300 commonly purchased goods
• The Inflation Rate-% change in prices in 1 year• Then compare changes in prices to a given base year
(usually 1982)• Prices of subsequent years are then expressed as a
percentage of the base year• Examples:
•2005 inflation rate was 3.4% but only 1.5% in 2013•U.S. prices have increase 98.3% since 1982 (base year).

=Price of market
basket in base year
x 100CPIPrice of market basket
The most commonly used method to determine inflation for consumers is the Consumer Price Index
Here is how it works:• The base year is given an index of 100• To compare, each year is given an index # as well
1997 Market Basket: Movie is $6 & Pizza is $14Total = $20 (Index of Base Year = 100)
2009 Market Basket: Movie is $8 & Pizza is $17Total = $25 (Index of 125)
•This means inflation increased 25% between ’97 & ‘09•Items that cost $100 in ’97 cost $125 in ‘09


The Market Basket of Goods used to compute the Consumer Price Index in 2008.

Problems with using CPI as a Measurement1. Substitution Bias- As prices increase for the fixed
market basket, consumers buy less of these products and more substitutes that may not be part of the market basket. (Result: CPI may be higher than what consumers are really paying)
2. New Products- The CPI market basket may not include the newest consumer products. (Result: CPI measures prices but not the increase in choices)
3. Product Quality- The CPI ignores both improvements and decline in product quality. (Result: CPI may suggest that prices stay the same though economic well being has improved significantly)

=Real GDP
x 100GDPDeflator
Nominal GDP
CPI vs. GDP DeflatorThe GDP deflator measures the price of all goods
produced, whereas the CPI measures prices of only the goods and services bought by consumers.
An increase in the price of goods bought by firms or the government will show up in the GDP deflator but not in the CPI.
The GDP deflator includes only those goods and services produced domestically.

Sample Calculations1. In an economy, Real GDP (base year = 1996) is $100
billion and the Nominal GDP is $150 billion. Calculate the GDP deflator.
2. In an economy, Real GDP (base year = 1996) is $125 billion and the Nominal GDP is $150 billion. Calculate the GDP deflator.
3. In an economy, Real GDP for year 2002 (base year = 1996) is $200 billion and the GDP deflator 2002 (base year = 1996) is 120. Calculate the Nominal GDP for 2002.
4. In an economy, Nominal GDP for year 2005 (base year = 1996) is $60 billion and the GDP deflator 2005 (base year = 1996) is 120. Calculate the Real GDP for 2005.

Sample Calculations1. In an economy, Real GDP (base year = 1996) is $100
billion and the Nominal GDP is $150 billion. Calculate the GDP deflator. (150)
2. In an economy, Real GDP (base year = 1996) is $125 billion and the Nominal GDP is $150 billion. Calculate the GDP deflator. (120)
3. In an economy, Real GDP for year 2002 (base year = 1996) is $200 billion and the GDP deflator 2002 (base year = 1996) is 120. Calculate the Nominal GDP for 2002. ( 240)
4. In an economy, Nominal GDP for year 2005 (base year = 1996) is $60 billion and the GDP deflator 2005 (base year = 1996) is
120. Calculate the Real GDP for 2005. (50)

There are 3 different ways to measure inflation & they tend to be
close in calculations to each other. The most common
measurement used is CPI

• Lower unemployment tends to lead to
higher periods of inflation
• Higher inflation tends to lead to lower
unemployment.
THESE RULES ARE USUALLY
REPRESENTED BY A GRAPH KNOWN AS
THE PHILLIPS CURVE

The Short-Run Phillips Curve

The short run and long run effects of expansionary policies
LONG RUN PHILLIPS CURVE

So What Do You Actually Understand?
• Modules 10-15 Review Questions


Formulas to Remember for Unit 3
• GDP = C + I + G + Xn (exports – imports)
• Nominal GDP = P (price) x Q (quantity)
• Real GDP = Py1 x Qy2
• Change % GDP = Y2-Y1 x 100
Y1
• Unemployment = # unemployed x 100
labor force
• Inflation Rate % = Py2 – Py1 x 100
Py1
• CPI = Price market basket x 100
Price basket base yr
• GDP Deflator = Nominal GDP x 100
Real GDP

51. GDP is:A) the monetary value of all goods and services (final,
intermediate, and non-market) produced in a given year.B) total resource income less taxes, saving, and
spending on exports.C) the economic value of all economic resources used
in the production of a year's output.D) the market value of all final goods and services
produced within a nation in a specific year.
52. GDP can be calculated by summing: A) consumption, investment, government purchases, exports, and imports. B) consumption, investment, government purchases, and imports. C) investment, government purchases, consumption, and net exports. D) consumption, investment, wages, and rents.

53. Net exports are negative when: A) a nation's imports exceed its exports. B) the economy's stock of capital goods is declining. C) depreciation exceeds domestic investment. D) a nation's exports exceed its imports. E) the government increases trade barriers
54. Historically, real GDP has increased less rapidly than nominal GDP because:
A) price indices have not reflected improvements in product quality. B) the general prices have increased. C) technological progress has resulted in more efficient production. D) the general prices have declined.E) nominal GDP is adjusted for inflation

55. Which of the following best measures a nation’s standard of living:
A) unemployment rate.B) nominal GDP.C) total consumption and government spendingD) real GDP per capita.E) inflation rate
56. The phase of the business cycle in which real GDP declines for at least 2 quarters is called:
A) the peak. B) a recovery. C) a recession. D) the trough. E) a depression

57. Assuming the total population is 100 million, the civilian labor force is 50 million, and 47 million workers are employed, the unemployment rate:
A) is 3 percent. B) is 6 percent. C) is 7 percent. D) is 9 percent. E) cannot be determined because we do not know
how many workers are retired. 58. Which of the following is correct?
A) The unemployment rates of men and women workers are roughly the same. B) Unemployment rates for black and white workers are approximately the same. C) Teenagers experience approximately the same unemployment rates as do adults. D) Laborers are less vulnerable to unemployment than are professional workers.
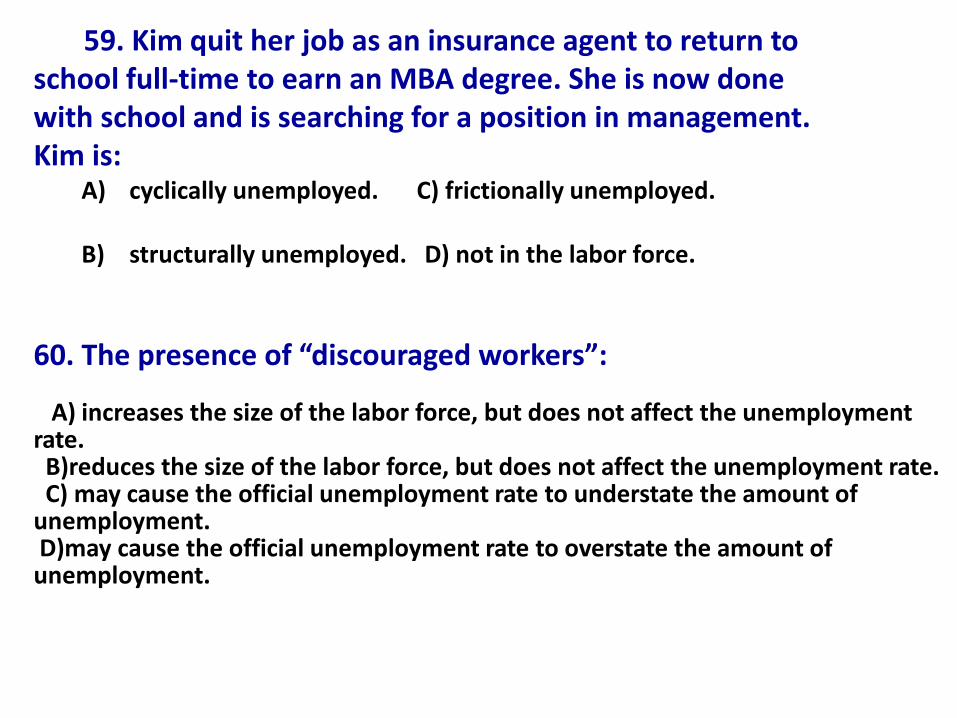
60. The presence of “discouraged workers”:
A) increases the size of the labor force, but does not affect the unemployment rate. B)reduces the size of the labor force, but does not affect the unemployment rate. C) may cause the official unemployment rate to understate the amount of
unemployment. D)may cause the official unemployment rate to overstate the amount of unemployment.
59. Kim quit her job as an insurance agent to return to school full-time to earn an MBA degree. She is now done with school and is searching for a position in management. Kim is:
A) cyclically unemployed. C) frictionally unemployed.
B) structurally unemployed. D) not in the labor force.

Answers51.D52.C53.A54.B55.D56.C57.B58.A59.C60.C