AP Biology Complete Student Notes Units 1-8 - Lee County ...
318
AP Biology Complete Student Notes 1 Return to Table of Contents AP Biology Complete Student Notes Units 1-8
-
Upload
khangminh22 -
Category
Documents
-
view
0 -
download
0
Transcript of AP Biology Complete Student Notes Units 1-8 - Lee County ...

AP Biology Complete Student Notes
1 Return to Table of Contents
AP Biology
Complete
Student Notes
Units 1-8

Page 2 of 318
2 Return to Table of Contents
Table of Contents
Unit 1—Chemistry of Life/Introduction to Statistics—Pages 3-50
Unit 2—Cell Structure and Function--Pages 51-73
Unit 3—Cellular Energetics—Pages 74-119
Unit 4—Cell Communication and the Cell Cycle—Pages 120-149
Unit 5—Heredity--Pages 150-187
Unit 6—Gene Expression and Regulation—Pages 188-244
Unit 7—Natural Selection—Pages 245-271
Unit 8—Ecology—Pages 272-318

Page 3 of 318
3 Return to Table of Contents
AP Biology
Unit 1
Student Notes

Page 4 of 318
4 Return to Table of Contents
Unit 1 Student Notes
Table of Contents
A. Scientific Method/Experimental Design—Pages 5-7 B. Graphing—Pages 8--9 C. Free Response Writing Tips—Pages 8-12 D. Data Analysis/Statistics—Pages 13--28 E. Graphs With Error Bars—Pages 15--19 F. Hypothesis Testing—Pages 19--28 G. Chi Square Analysis—Pages 19--22 H. t-tests—Pages 23--28 I. Box and Whisker Plots—Pages 28-31 J. Chemistry Basics—Pages 32--33 K. Biochemistry of Water—Pages 33-35 L. Biochemistry of Carbon—Pages 36--37 M. Carbohydrates—Pages 37--38 N. Lipids—Pages 38--40 O. Proteins—Pages 40--45 P. Nitrogen Cycle—Pages 45--46 Q. Nucleic Acids—Pages 46--49 R. Phosphorus Cycle—Pages 49--50
Page 5 of 318
5 Return to Table of Contents
Key Ideas/Enduring Understandings for Unit 1
1. Living Systems are organized in a hierarchy of structural levels that interact. 2. The highly complex organization of living systems requires constant input of energy and the
exchange of macromolecules. 3. Heritable information provides for the continuity of life.
Unit 1 Student Notes
Content Outline: The Scientific Method
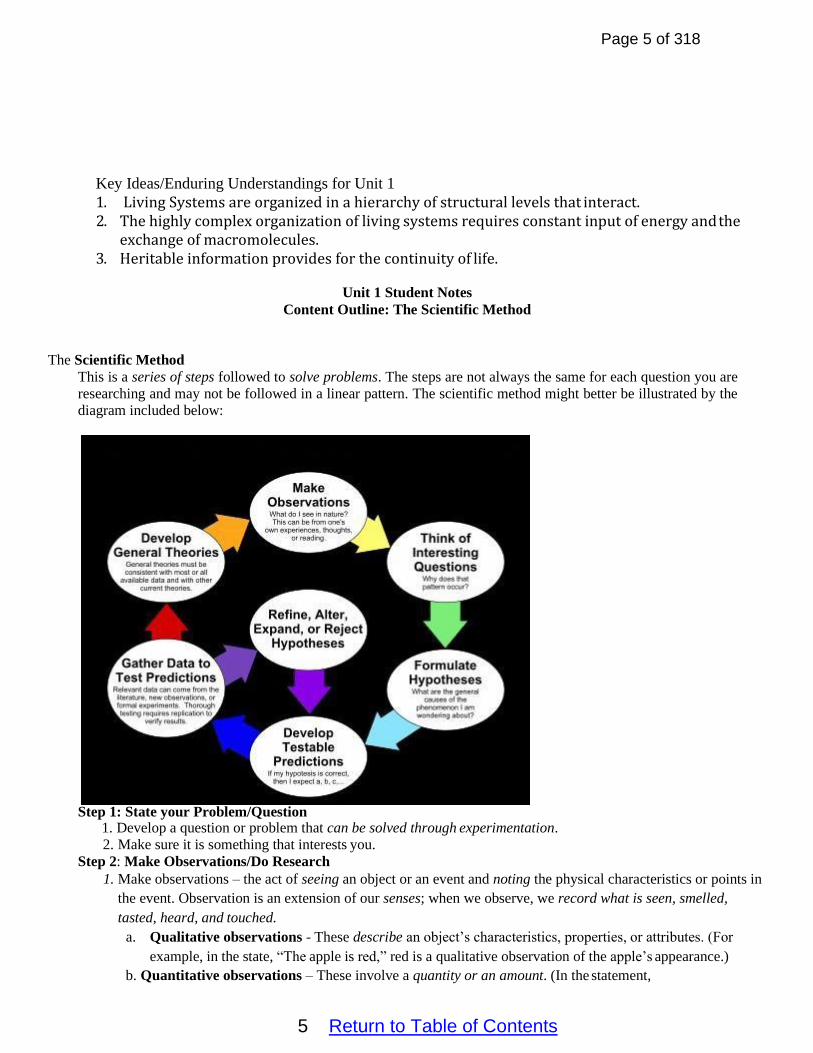
The Scientific Method
This is a series of steps followed to solve problems. The steps are not always the same for each question you are
researching and may not be followed in a linear pattern. The scientific method might better be illustrated by the
diagram included below:
Step 1: State your Problem/Question 1. Develop a question or problem that can be solved through experimentation.
2. Make sure it is something that interests you.
Step 2: Make Observations/Do Research
1. Make observations – the act of seeing an object or an event and noting the physical characteristics or points in
the event. Observation is an extension of our senses; when we observe, we record what is seen, smelled,
tasted, heard, and touched.
a. Qualitative observations - These describe an object’s characteristics, properties, or attributes. (For
example, in the state, “The apple is red,” red is a qualitative observation of the apple’s appearance.)
b. Quantitative observations – These involve a quantity or an amount. (In the statement,

Page 6 of 318
6 Return to Table of Contents
“The apple weighs 125 grams,” 125 grams is a quantitative observation of the apple’s appearance.)
Quantitative data refers to numerical or measured data.
c. Inferences – conclusions based on observations. Inferences go beyond what we
can directly sense. (Example: You make an inference when you use clues from a story to figure out
something the author doesn’t tell you.)
d. Predictions- using observations, inferences, and/or trends in data to predict what will happen in the
future.
(Example: If, on a sunny day, you observe a massive line of dark clouds quickly advancing, what
prediction can you make?)
2. Do research – In this step, we are talking about doing literature research, not lab-based research. Scientists
should read about the research that has already been done on the topic by searching the Internet and scientific
journals. Good quality research helps in developing an excellent hypothesis.
Step 3: Formulate a Hypothesis
1. A hypothesis is a prediction or possible answer to the problem or question.
2. It is a relationship between the Independent variable and Dependent variables.
a. Independent Variable (manipulated variable) – the factor that is intentionally varied/tested by the
experimenter.
b. Dependent Variable (responding variable) – the factor that may change as a result of changes made in
the independent variable (the outcome).
c. Example: Let’s say that a scientist wanted to know if the use of miracle-gro affected the height of tomato
plants. The independent variable in the experiment would be the amount of miracle-gro applied to the
plants. The dependent variable would be the height of the plants.
d. The hypothesis needs to be written as an “If…then” statement.
The “If” part of the statement should describe what is done to the independent variable.
The “then” part of your statement is the prediction of what will happen to the dependent variable.
Example: If miracle-gro is applied to tomato plants, then they will grow taller.
Step 4: Experiment
A. The scientist must develop and follow a procedure that anyone can follow. 1. Use precise directions. 2. Include a detailed materials list.
3. The outcome must be quantifiable (measurable).
4. The experiment must have a control group.
a. The control group may be a “no treatment” or an “experimenter selected” group to use as a standard of comparison for the independent variable.
b. The control group may be a “no treatment” or an “experimenter selected” group to use as a standard of comparison for the independent variable. A negative control group is a control group that is not exposed to the experimental treatment or to any other treatment that is expected to have an effect.
For example, imagine that you wanted to know if some lettuce carried bacteria. You set up an experiment in which you wipe lettuce leaves with a swab, wipe the swab on a bacterial growth plate, incubate the plate, and see what grows on the plate. As a negative control, you might just wipe a sterile swab on the growth plate. You would not expect to see any bacterial growth on this plate, and if you do, it is an indication that your swabs, plates, or incubator are contaminated with bacteria that could interfere with the results of the experiment.

Page 7 of 318
7 Return to Table of Contents
A positive control group is a control group that is not exposed to the experimental treatment but that is exposed to some other treatment that is known to produce the expected effect. As a positive control, you might swab an existing colony of bacteria and wipe it on the growth plate. In this case, you would expect to see bacterial growth on the plate, and if you do not, it is an indication that something in your experimental set-up is preventing the growth of bacteria. Perhaps the growth plates contain an antibiotic or the incubator is set to too high a temperature.
Example: In the miracle-gro experiment described above, the negative control group would
consist of plants that are not exposed to any miracle-gro.
c. The control group is exposed to all of the same factors as the experimental group(s) except for
the independent variable being tested.
Experimental group – group or groups that have the independent variable
applied/manipulated.
Example: In the miracle-gro experiment, the experimental group would consist of a
group of plants that are treated with miracle-gro. We might treat different subgroups
with different amounts of miracle-gro to test the effect of concentration.
Constants – all the factors that the experimenter attempts to keep the same/control in all of the
groups in the experiment.
Example: In the miracle-gro experiment, we would want to ensure that all of the plants are of
the same species, growing in the same type of soil, exposed to the same amount of light, given
the same amount of water, and grown at the same temperature.
Step 5: Collect Data
A. You must write down results (measurements, observations, temperatures, times, etc.) as you perform your experiment.
1. Qualitative Data - observations (using senses) written in note form. 2. Quantitative Data- numerical measurements and calculations.
a. SI Units must be included on all measurements. 2. Must be kept orderly in a table or chart.
3. Modify the procedure if needed.
Step 6: Analyze Data A. Confirm the results by retesting, if possible.
B. Trials – the number of times you repeat the experiment. 1. The more trials you can do, the more reliable the results.
C. Convert results to a graph that is appropriate for the experiment.
D. Use both descriptive and inferential statistics to help make a conclusion.
Step 7: Conclusion A. The written results of the experiment.
B. Include a statement if the hypothesis was supported or refuted.
C. Make recommendations for further study and possible improvements to the procedure.
Step 8: Communicate Results
A. Be prepared to present the project to an audience. Scientists share information through media, journal articles, and lectures.

Page 8 of 318
8 Return to Table of Contents
Graphing
Graphs and charts communicate information visually. They can show patterns, help scientists identifycorrelations,
and get the point of the experiment across quickly.
The independent variable is plotted on the x-axis
The dependent variable is plotted on the y-axis.
The mnemonic DRY MIX, for “dependent, responding, y-axis” and “manipulated, independent, x-axis,” can help
you remember this pattern.
Label both axes (independent variable on the X-axis and dependent variable on the Y-axis)
Include units on both axes. Enclose the unit in parentheses.
Provide a descriptive title. Use the pattern, “The Effect of the independent variable on the dependent variable”.
For example if you were graphing the miracle-gro concentration against plant height. The title of the graph might
be “The Effect of Miracle-Gro Concentration on Plant Height”.
If the instruction is to plot rather than graph the data points, no line needs to be drawn.
If a line is drawn, do not extend the line beyond the last point plotted (unless asked to make a prediction) or connect
the line from the origin (unless there is a time zero reading.)
If multiple lines are drawn on the same graph, label each line clearly.
Use a line of best fit when appropriate.
Which Graph Type To Use?
A) Line Graph: are used for looking at the relationship between two continuous types of data. Typically, both the
independent and dependent variables are numerical.
B) Bar Graphs: are used for making comparisons between discrete cases or to look for trends, such as overspace
or time. The independent variable is usually a category and the dependent variable is usually an average,
percentage, or frequency.
C) Scatter Plot: Scatter plots are used for examining relationships between two types of data. These are very
similar to line graphs, just without the line.
Line graphs provide an excellent way to map independent and dependent variables that are both quantitative. When
both variables are quantitative, the line segment that connects two points on the graph expresses a slope, which can
be interpreted visually relative to the slope of other lines or expressed as a precise mathematical formula. Scatter
plots are similar to line graphs in that they start with mapping quantitative data points. The difference is that with a
scatter plot, the decision is made that the individual points should not be connected directly together with a line but,
instead express a trend. This trend can be seen directly through the distribution of points or with the addition of a
regression line or line of best fit.
Determining the rate from a graph.
The AP Biology exam often asks students to find the rate of a process or reaction between two points on a graph.
In order to find the rate, calculate the slope of the best fit line that connects the two points. Use m=y2-y1/x2- x1

Page 9 of 318
9 Return to Table of Contents
Be sure to include a unit with your answer. The unit for the slope/rate should be the y axis unit divided by the x
axis unit.
Example:
You are asked to calculate the yeast population growth rate between t=5 hours and t=10 hours.
First, determine your coordinates at those times. The coordinates should be (5, 3.5) and (10, 25).
Next, calculate the slope: m=(25-3.5)/(10-5)=4.3 yeast cells/hour
Free Response Writing Tips
• Free Response Section—10 minute outlining/planning period followed by an 80 minute writing period.
• Students can begin to write their actual answers during the outlining/planning period.
• This section includes two long free response questions (worth 8-10 points each) and 4 short free response questions worth 4 points each.
• The two long free response questions each typically require answers that are 2-3 solid paragraphs long.
• Free Response Question 1 will always deal with “Interpreting and Evaluating Experimental Results”. This question will require students to: A) Describe and explain biological concepts, processes, and/or

Page 10 of 318
10 Return to Table of Contents
models, B) Identify experimental design procedures, C) Analyze data, D) Make and justify predictions.
• Free Response Question 2 will always deal with “Interpreting and Evaluating Experimental Results With Graphing”. Students will be given a scenario and a table of experimental data and will be asked to: A) Describe and explain biological concepts, processes, or models, B)Construct a graph, plot, or chart and use confidence intervals or error bars, C) Analyze data, D) Make and justify predictions.
• Free Response Question 3 will deal with “Scientific Investigation”. The question will provide students with a description of a lab investigation scenario and ask them to: A) Describe biological concepts or processes, B)Identify experimental procedures, C)Predict results, D) Justify predictions.
• Free Response Question 4 will deal with “Conceptual Analysis”. The question will provide students with a scenario of a biological phenomenon with a disruption. The question will ask students to: A)Describe biological concepts or processes, B)Explain biological concepts or processes, C)Predict the causes or effects of a change in a biological system, D)Justify predictions.
• Free Response Question 5 will require students to “Analyze Models or Visual Representations”. The question will assess students’ abilities to: A) Describe characteristics of a biological concept, process, or model represented visually, B)Explain relationships between different characteristics of a biological concept or process represented visually, C)Represent relationships within a biological model, D)Explain how a biological concept or process represented visually relates to a larger biological principle, concept, process, or theory.
• Free Response Question 6 deals with “Data Analysis”. The question will present students with data in a graph, table, or visual representation . The question will ask students to: A)Describe the data, B)Use data to evaluate a hypothesis or prediction, C)Explain how experimental results related to biological principles, concepts, processes, or theories.
• Each of the 4 short free response questions can usually be answered in a single solidparagraph.
• Student responses must be written in complete sentences and should be written in black ink. Students should answer each section of a free response section separately (1A, 1B, 1C, etc…). Section Responses should be clearly labeled.
• Introduction and conclusion paragraphs should not be included. Students should not restate the question in their answers.
• The two sections of the exam (MCQ and FRQ) are waited equally to determine the final AP exam score.
You must write all answers in complete sentences! There is room on the test for you to create an outline to guide your answer, but outlines are not graded. That being said, perfect essay writing is not expected. There are no deductions for grammar or spelling mishaps (provided the spelling is close enough to determine the word you are trying to write). Diagrams are helpful. However, if you draw a diagram, be sure to refer to it in your essay. You will not earn points for diagrams that stand by themselves. You must explain all diagrams and drawings.
Points are not deducted from your essay score if you give an incorrect statement. You just do not receive points for incorrect statements. However, you must be careful not to contradict yourself. If you state something correctly but then later state the opposite, you will not earn the point. Use graphs or diagrams when it will enhance your essay response. However, unless the prompt specifically asks for drawings/graphs, every thought you hope to convey must also be put in writing. Label all graphs correctly. Include a graph title. Include a key/legend which clearly identifies lines and data points. Label axes (including units).

Page 11 of 318
11 Return to Table of Contents
Tips for AP Lab Free Response Questions: Design an Experiment Free Response Questions
The AP Biology exam will often ask you to design an experiment to address a certain topic/question. When asked
to design an experiment, always include the following elements in your answer:
Form a concise hypothesis which is testable. State It Clearly! Use the if…then format. For example: If tomato
plants are exposed to increased amounts of Miracle-Gro, then they will grow taller.
Describe the control group that you will use for comparison with the experiment.
Identify the independent variable.
Identify the dependent variable.
Identify at least 3-4 variables that you will use as constants.
Describe the basic procedure that you will use. Describe the measurements that you will take, the # or subjects
that you will use, and how the subjects were assigned to either the control or experimental groups. This should
usually be random.
Stress the importance of a large sample sizes.
Mention that you will conduct multiple trials.
Describe the statistical tests that you will use to interpret the data (Chi Square, rate determination…).
Graph: Choose an appropriate graph. Use the guidelines included above.
Make a prediction about the expected outcome and a rationale for your prediction.
DOS and DON’TS on Exam Day
DO THIS on Exam Day:
DO use the ten minute reading time advantageously. Carefully read all of the free response questions and map out/outline your answers. These maps will NOT be graded, but you can use them to write your responses.
o Read the prompt thoroughly, then read the prompt again, then read the prompt, then read the prompt again, then read the prompt, then…
o Jot down the big ideas. Make sure you clearly understand what you are being asked todo. o Use this time to create a mindmap or bullet points of the main terms you want to elaborateon. o Outline your answer to organize your thoughts. o Remain focused and on task. o Answer the prompt and only the prompt. o Feel free to write on the exam/question booklet.
DO underline the important terms in the question such as “OR” and “CHOOSE 2”and the power verbs such as “DESCRIBE,” “IDENTIFY,” “LABEL,” “CONSTRUCT,” “DESIGN,” or “EXPLAIN.” The verbs usually indicate where points can be earned.

Page 12 of 318
12 Return to Table of Contents
DO use the 80 minutes to write thorough responses to all eight questions. Use all of your time. Don’t give up. DO stay focused on what the prompt is requiring you to do. Pay particular attention to words like:
o Discuss: give reasoning pro and con; analyze carefully o Analyze: summarize in detail with a selected focus o Explain: clarify and interpret; give reasons for differences, analyze causes o Compare/contrast: emphasize similarities and differences o Relate: show how ideas or concepts are connected to each other
DO use the outline, mindmap or bullet points that you developed during the 10 minute reading time. DO write as legibly as possible, using black ink. The papers are shuffled quite a bit when they are scored,and answers written in pencil may be smeared. If the person scoring your essays cannot read what you have written, then you will not earn any points. Do use a pencil to create all graphs. When the graph is complete and correct, outline over the response in pen. DO answer in the format of the question so that you do not slow the reader down.
o Use the format of the free response to write your answer so that the reader has an easy time finding your responses to each section of each essay.
o Organize the free response answers using the format of the question—write „1a‟ then respond to 1a; write „1b‟ then respond to 1b, etc…
o It is best not to skip around when responding to sub-questions in onequestion. DO apply the language of science, show depth, elaboration, and give examples.
o Pull, tie, link and loop together your ideas—show how ideas connect. o Use a scientific term and then explain what it means. o Write for clarity, accuracy, thoroughness, and breadth (not just factual regurgitation).
DO use graphs or diagrams when it will enhance your essay response. However, unless the prompt specifically asks for drawings/graphs, every thought you hope to convey must also be put in writing. DO clearly mark your answer sheet with the free response question you are answering. Write freely on the response sheet—use several sheets as needed. Usually, the longer the answer to the question the more points you will earn! Write! Write! Write! DO answer ALL subunits of a question thoroughly—to ensure you will gain maximum points for your response. DO label all graphs correctly.
o Include a graph title. o Include a key identifying lines and data points. o Label axes (including units).
DO use the time at the end to re-read responses—underlining key concepts, checking for clarity, accuracy and thoroughness.
DON’T DO THIS on Exam Day:
DON’T leave any free response questions blank. o Even if the question seems odd or you draw a temporary blank, find the “main idea” being addressed
and elaborate on it. o Remember that all students in the nation will be in the same boat with a difficult or unclearquestion.
DON’T obsess over correct grammar. There are no deductions for grammatical imperfections. DON’T write introductory or closing paragraphs. No points are earned for thesis statements or topic sentences. DON’T ramble. Get to the point. Do not waste time describing your feelings about how glad you are that the AP College Board asked you about photosynthesis. If anything, this will annoy the reader. DON’T write only in outline format. Your answers must be written in complete sentences. DON’T over-answer the sub-questions of a free response question.
o Remember that for any given question requiring sub-question responses, each response is allotted a maximum number of points. Writing more than is necessary will not earn you more points.
Page 13 of 318
13 Return to Table of Contents
Unit 1 Student Notes Content: Data Analysis/Statistics
Adapted from the AP Biology Quantitative Skills Guide, Using Biointeractive Resources to Teach Mathematics in Statistics in Biology As you start making observations and collecting data for a lab investigation, you will probably notice patterns. These patterns may or may not be real, or valid. Quantitative data analysis is one of the first steps toward determining whether an observed pattern has validity. Data analysis also helps distinguish among multiple working hypotheses. Every AP Biology laboratory activity will require data collection and analysis. This analysis will help you to discover meaningful patterns relevant to your investigation.
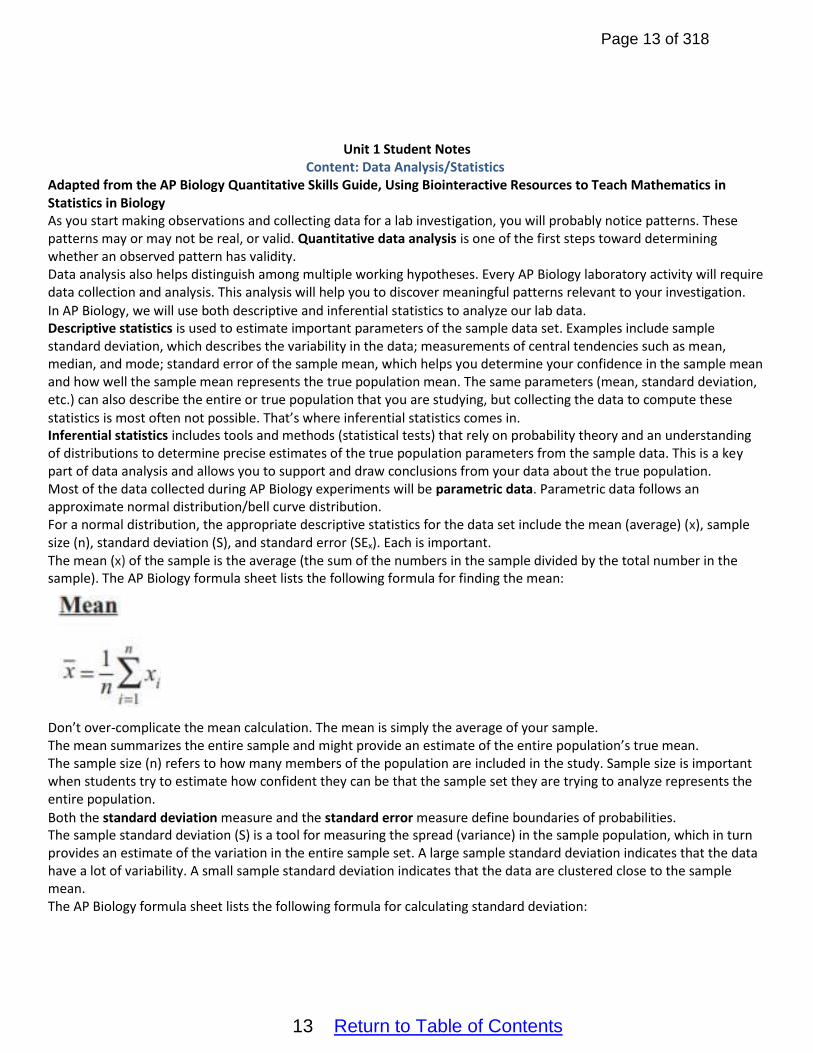
In AP Biology, we will use both descriptive and inferential statistics to analyze our lab data. Descriptive statistics is used to estimate important parameters of the sample data set. Examples include sample standard deviation, which describes the variability in the data; measurements of central tendencies such as mean, median, and mode; standard error of the sample mean, which helps you determine your confidence in the sample mean and how well the sample mean represents the true population mean. The same parameters (mean, standard deviation, etc.) can also describe the entire or true population that you are studying, but collecting the data to compute these statistics is most often not possible. That’s where inferential statistics comes in. Inferential statistics includes tools and methods (statistical tests) that rely on probability theory and an understanding of distributions to determine precise estimates of the true population parameters from the sample data. This is a key part of data analysis and allows you to support and draw conclusions from your data about the true population. Most of the data collected during AP Biology experiments will be parametric data. Parametric data follows an approximate normal distribution/bell curve distribution. For a normal distribution, the appropriate descriptive statistics for the data set include the mean (average) (x), sample size (n), standard deviation (S), and standard error (SEx). Each is important. The mean (x) of the sample is the average (the sum of the numbers in the sample divided by the total number in the sample). The AP Biology formula sheet lists the following formula for finding the mean:
Don’t over-complicate the mean calculation. The mean is simply the average of your sample. The mean summarizes the entire sample and might provide an estimate of the entire population’s true mean. The sample size (n) refers to how many members of the population are included in the study. Sample size is important when students try to estimate how confident they can be that the sample set they are trying to analyze represents the entire population.
Both the standard deviation measure and the standard error measure define boundaries of probabilities. The sample standard deviation (S) is a tool for measuring the spread (variance) in the sample population, which in turn provides an estimate of the variation in the entire sample set. A large sample standard deviation indicates that the data have a lot of variability. A small sample standard deviation indicates that the data are clustered close to the sample mean. The AP Biology formula sheet lists the following formula for calculating standard deviation:

Page 14 of 318
14 Return to Table of Contents
Most likely, you will not be asked to calculate the standard deviation on an AP exam, but you will be expected to be able to interpret its meaning and be able to use it to analyze your data and construct appropriate graphs. In a normal distribution, a little more than two-thirds of the data points will fall between +1 standard deviation and −1 standard deviation from the sample mean. More than 95% of the data falls between ±2 standard deviations from the sample mean.
Sample standard error (SEx) is a statistic that allows students to make an inference about how well the sample mean matches up to the true population mean. The standard error of the mean utilizes the standard deviation of the sample and the sample size to estimate how closely the sample data approximates the data that would be collected if the entire population were measured. If one were to take a large number of samples (at least 30) from a population, the means for each sample would form an approximately normal distribution—a distribution of sample means. Normally, you would not do hundreds of individual investigations on a population. This distribution of sample means, then, is a theoretical construct that helps us define our boundaries of confidence in our sample. This distribution also has parameters, such as a standard deviation. Standard error is the equivalent of the standard deviation of the sampling distribution of the means and is calculated from the following formula:
You will probably not be asked to calculate the standard error of the mean on an AP Biology exam, but you will be expected to use the standard error to analyze your data and construct appropriate graphs. An interval within ±1 SEx of the sample mean describes the range of values about which an investigator can have approximately 67% confidence that the range includes the true population mean. Even better, a sample interval within

Page 15 of 318
15 Return to Table of Contents
±2 SEx of the sample mean defines a range of values with approximately a 95% certainty that the true population mean falls within the interval. This interval is often referred at as a 95% confidence interval. You will be asked to graph 95% confidence intervals on a regular basis in this course. The 95% confidence interval technique is an inference; it is a statistic that allows investigators to gauge just how good their estimate of the true population mean actually is. With this understanding, the investigator can establish ahead of time a reasonable sample size for this population and the degree of confidence needed. Note: The larger the sample size, the smaller the standard error and the more confident the researcher can be about the reliability of the data.
Creating and Interpreting Graphs with Error Bars The Standard Error of the Mean and the 95% Confidence Interval are used to construct error bars for graphs showing the mean values of data sets. In AP Biology, the error bars usually show the range 2 standard errors above and 2 below the mean value. To create a graph with error bars, graph the means of each data set using a bar chart. Starting at the mean of the first bar, move directly up 2 times the SEx. At that point, draw a horizontal line centered over the bar. Go back to the mean, and move directly down 2 times the SEx. Again, draw a horizontal line that is in line with the line you drew above the bar. Connect the two horizonal lines with a vertical line through their centers. Repeat the process for the other bars included in the chart. The vertical space between the two horizontal lines represents a 95% confidence interval. This means that you can be 95% sure that the mean for the entire population falls within this interval. As a researcher, you may want to use your collected data to compare samples/groups and to determine if the groups
are “significantly different”. A "significant difference" means that the results that are seen in the data are most likely not due to chance or sampling error. In any experiment or observation that involves sampling from a population, there is always the possibility that an observed effect could have occurred due to sampling error alone. But if a result is "significant," the investigator may conclude that the observed effect actually reflects the characteristics of the population rather than just sampling error or chance.
The standard error bars on a graph can be used to get a sense for whether or not a difference in two groups/samples is significant. Look for overlap between the error bars:
When errors bars overlap quite a bit, it's likely that the difference between the two groups is not statistically significant and the differences are probably due to chance or sampling error. You must actually perform a statistical test to draw a valid conclusion, but in AP Biology you can simply say that if the error bars overlap that the two groups/samples are not statistically different. On the other hand, if there is no overlap between the error bars, the differences between the two groups is likely to be statistically significant.
Example: Descriptive Statistics and Error Bars The data included below is from research done by Peter and Rosemary Grant on Daphne Major in the Galápagos Islands. The data shows the change in beak depth of a population of finches following a drought year (1977). Think of the band numbers like names for the individual birds.

Page 16 of 318
16 Return to Table of Contents
Use the data to fill in the chart included below:
Died in Drought Survived Drought
Band Beak Depth (mm)
Band Beak Depth (mm)
283 11.2 1019 11.21 278 10.6 1919 11.2
294 10.5 2244 11.01
609 10.5 8191 10.86
674 10.5 1659 10.78
422 10.3 1861 10.7 428 10.2 1599 10.7
561 10.2 2249 10.68
605 10.2 1426 10.61
461 9.8 2206 10.5 Died in Drought Survived Drought
mean
S
SEM
95% CL

Page 17 of 318
17 Return to Table of Contents
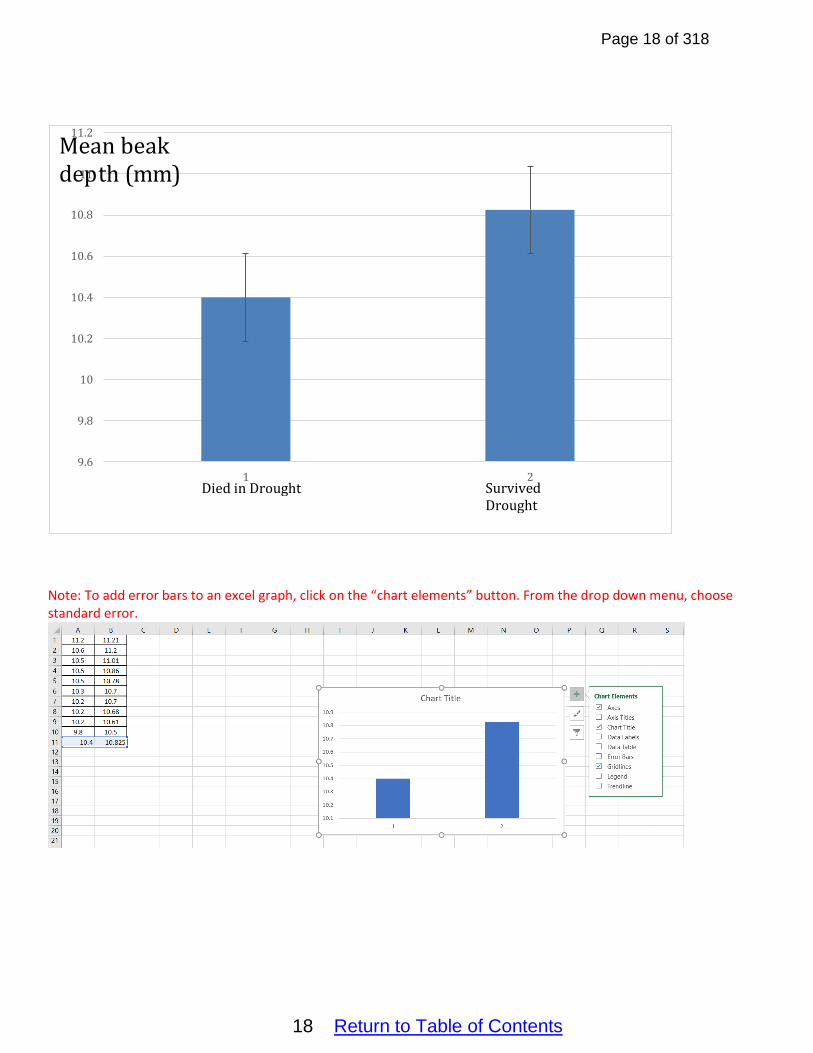
Graph the data as a bar chart of the means showing error bars that create a 95% Confidence Interval.
Was the mean beak depth before the drought different from the mean beak depth after the drought?
Answer to Example:
Died in Drought Survived Drought
mean 10.4 10.825
S 0.365148 0.242773
SEM 0.11547 0.076772
95% CL 10.169--10.631 10.671--10.979
The mean beak depth after the drought was different in a statistically significant amount from the beak depth before the drought. This can be determined by looking at the error bars for the two conditions. Since the error bars don’t overlap, the differences are likely to be statistically significant.
Page 18 of 318
18 Return to Table of Contents
Note: To add error bars to an excel graph, click on the “chart elements” button. From the drop down menu, choose standard error.
Mean beak de1p1 th (mm)
10.8
11.2
10.6
10.4
10.2
10
9.8
9.6
Died in Drought 1
Survived Drought
2

Page 19 of 318
19 Return to Table of Contents
Hypothesis Testing
A hypothesis is a statement explaining that a causal relationship exists between an underlying factor (variable) and an observable phenomenon. Often, after making an observation, you might propose some sort of tentative explanation for the phenomenon; this could be called your working hypothesis. Because absolute proof is not possible, statistical hypothesis testing focuses on trying to reject a null hypothesis. A null hypothesis (H0) is a statement explaining that the underlying factor or variable is independent of the observed phenomenon—there is no causal relationship. Stated another way, a null hypothesis (H0) is usually a statement asserting that there is no difference or no association between variables. The null hypothesis is a tool that makes it possible to use certain statistical tests to figure out if another hypothesis of interest is likely to be accurate or not. For example, if you were testing the idea that sugar makes kids hyperactive, your null hypothesis might be that there is no difference in the amount of time that kids previously given a sugary drink and kids previously given a sugar-substitute drink are able to sit still. After making your observations, you would then perform a statistical test to determine whether or not there is a significant difference between the two groups of kids in terms of time spent sitting still. The alternative hypothesis (HA) to the null hypothesis might be that there is a difference between the two groups of kids in terms of time spent sitting still. Usually (but not always), an investigator is trying to find an alternative to the null hypothesis—evidence that supports the alternative hypothesis by rejecting the null (based on statistical tests). If the null hypothesis (that there is no difference between the two groups of kids in terms of time spend sitting still) can be rejected, then that is support for this alternative hypothesis. It is important to realize that hypothesis testing does not allow proof, or even acceptance, of the alternative to the null hypothesis. Typically, the decision comes down to whether there is enough evidence to reject the null hypothesis. If evidence to reject the null hypothesis is sufficient, what can be said is that the investigator rejects the null hypothesis—not that the investigation has proven the alternative hypothesis. This is a crucial concept for students to understand. In data analysis, investigators determine the size and confidence they have in various population parameters that were measured, counted, or calculated during the course of the investigation. Hypothesis testing asks the question, Is there something to these measurements? or Is the effect real?
Types of Statistical Tests There are a wide range of statistical tests which can be used for hypothesis testing. For AP Biology, we will focus on only two of these methods: chi square analysis and the t-test.
Chi Square Analysis The Chi-square test is a statistical method that makes a comparison between the data collected in an experiment and the data an investigator expected to find. The Chi square test is a way to evaluate the variability that is always present in the real world to get an idea if the difference between the real and expected results is due to random chance or if some other factor is involved.

Page 20 of 318
20 Return to Table of Contents
Chi square analysis can be used when you are comparing two or more categories of data. In AP Biology, the categories will usually be the observed and expected data. The actual data under these categories will typically be in the form of either counts or percentages. Chi square analysis should not be used to compare averages. For example, chi square analysis can be used to test how well the results of genetic crosses fit predicted outcomes based on Mendel’s laws of inheritance or to see how well measured gene frequencies in a population match up to Hardy-Weinberg predictions. When the Chi-square test is applied in these kinds of analyses, the goal is to determine whether or not the variation in the results from the expected values is due to chance. In these analyses, students are trying to confirm a theoretical expectation about their data, and they hope to quantify the contribution due to chance events. Here researchers hope to fail to reject the null hypothesis, i.e., that there is no evidence of a significant difference between the expected and observed results. This approach might also be used in the M& M lab in which students compare the percentages of M&Ms of each color in a bag to the theoretical percentages produced at the factory. In other investigations, however, students may ask a question that requires a different application of the Chi-square test. For example, in a pill bug environmental choice experiment, students may wish to know if pill bugs actually choose one environment over another, or whether they just randomly move about. With this type of investigation, students are trying to discover and verify that an actual pattern exists as opposed to the random variation that often characterizes natural systems. Here students hope to reject the null hypothesis, indicating that their observed results are significantly different from the ones they expected. The Chi Square statistic can be calculated using the table formula included on the next page. My advice for calculating chi square is to setup a table like the one included at the bottom of the next page.

Page 21 of 318
21 Return to Table of Contents
Let’s walk you through the process of calculating chi square by working through an example problem. • A student wanted to know if pillbugs have a preference for wet or dry environments. The student setup a choice
chamber with a wet and a dry side. He placed 10 pillbugs on each side of the chamber and after 2 hours found
14 pillbugs on the wet side and 6 on the dry side.
• The student’s null hypothesis was that pillbugs had no preference for either wet or dry
• His phenotypes or groups for this test are “wet” and “dry”
• His expected values on each side are “10”.
• His observed values are “14” on the wet side and “6” on the dry side.
• Fill in the columns in the chart by performing the mathematical calculations shown at the top of each row. See
the chart below as an example.
• The chi square statistic is calculated by find the sum of the last column in the table. Remember that chi square is
equal to:
•
• In this case, chi square is equal to 3.2.

Page 22 of 318
22 Return to Table of Contents
• There are two different ways to interpret the meaning of the chi square statistic. One way is to compare it to a
critical value. Use the chi square table, included above to find this critical value. First, determine your degrees
of freedom. The degrees of freedom are equal to your number of phenotypes/categories minus one. In this
case, our degrees of freedom are equal to 1.
• We are always going to use the 0.05 significance level in Biology. The significance level, also denoted as alpha or
α, is the probability of rejecting the null hypothesis when it is true. For example, a significance level of 0.05
indicates a 5% risk of concluding that a difference exists when there is no actual difference. This is essentially an
error range.
• Use the 0.05 significance level and the 1 degree of freedom to find a critical value of “3.84” in the chi square
table.
• Compare the critical value “3.84” to the chi square statistic (3.2) that we calculated. If the chi square statistic is
greater than the critical value, we will reject the null hypothesis. In this experiment, the chi square statistic is
less than the critical value. This means that we must fail to reject the null hypothesis. This essentially means
that the differences between our observed and expected values are small and likely due to chance.
• The other way to interpret the chi square statistic is to use the p-value approach. Move along row 1 (1 degree
of freedom) in the chi square distribution table included below until you can find the Chi-square value of 3.2. It is
somewhere between the 0.10 column and the 0.05 column. This means that the p-value for this data isbetween
0.10 and 0.05. Remember, the probability of whether the results of an investigation differ from the null results
by chance alone is called the p-value. A p-value of 0.05 means that there is a 5% chance that the difference
between the observed and the expected data is a random difference and a 95% chance that the difference is
real and repeatable—in other words, a significant difference. Therefore, if an investigator’s p-value is greater
than 0.05, he or she would fail to reject the null hypothesis—that the difference between the observed results
and the expected results is due to random chance and is not significant. Our data fall into this category. This
means that our data doesn’t indicate that pillbugs prefer a wet environment over a dry environment. On the
other hand, if the p-value had been less than 0.05, we would have rejected the null hypothesis. This would
have indicated that the differences between our observed and expected data were significant and likely due to
something other than chance. This same p-value approach is used with the t-test and ANOVA testing.
• See the chi square Powerpoint and chi square video for more practice with chi square analysis.

Page 23 of 318
23 Return to Table of Contents
t-Test A t-test is commonly used to determine whether the mean of a population significantly differs from the mean of another population. This is useful if you need to compare the means of control and experimental groups. In most cases in AP Biology, you are going to assume that the data is parametric (follows a normal distribution) and that the two samples are independent of each other. An excellent place to use the t-test in AP Biology would be in comparing the mean number of trichomes in the different fast plant generations (from the Artificial Selection Lab). We will use the t-test to analyze some simulated artificial selection lab data. Our null hypothesis for this test is that, “The mean number of trichomes in the generation 2 sample is the same as the mean of the generation 1 sample.”
Trichome numbers Generation 1 Trichome Number Generation 2
20 18
8 56
24 37
12 22
4 65
31 33
16 82
16.42857 44.71429 mean
9.378293 23.64822 Standard deviation (S)
87.9524 559.2383 Variance (S2)
Note: The sample size (n) for both samples is equal to 7.
Calculation steps: 1. Calculate the mean of each sample population and subtract one from the other. Take the absolute value of this difference.

Page 24 of 318
24 Return to Table of Contents
2. Calculate the standard error, SE. To compute it, calculate the variance (standard deviation squared) (S2) of each sample, and divide it by the number of measured values in that sample (n, the sample size). Add these two values and then take the square root.
3. Divide the difference between the means by the standard error to get a value for the t-statistic. This calculationyields “2.9417” for our data. 4. Compare the calculated value to the appropriate critical t-value in the table included below. Table 8 shows the critical values for different degrees of freedom at a significance value of 0.05. The degrees of freedom are calculated by adding the number of data points in the two groups combined, minus 2. In our situation that would be (7 + 7 -2). We should use 12 degrees of freedom for our trichome data. Note that you do not have to have the same number of data points in each group. If the calculated t-value is greater than the appropriate critical t-value, this indicates that you should reject the null hypothesis and that you have enough evidence to support the hypothesis that the means of the two samples are significantly different at the probability value listed (in this case, 0.05). If the calculated t is smaller than the critical value, then you cannot reject the null hypothesis that there is no significant difference.
In our example the t-test statistic of “2.9417” is greater than the critical value of “2.18”. This means that we should reject the null hypothesis. There is evidence that the mean number of trichomes in the generation 2 sample is different than the mean number of trichomes in the generation 1 sample.

Page 25 of 318
25 Return to Table of Contents
Just as there is with chi square analysis, there is another way to interpret the t-test data using p-values. Move along row 12 (12 degrees of freedom) in the t distribution table included below until you can find the t value of .2.9417. It is somewhere between the 0.02 column and the 0.01 column. This means that the p-value for this data is between 0.02 and 0.01. Remember, the probability of whether the results of an investigation differ from the null results by chance alone is called the p-value. A p-value of 0.05 means that there is a 5% chance that the difference between the observed and the expected data is a random difference and a 95% chance that the difference is real and repeatable—in other words, a significant difference. Therefore, if an investigator’s p-value is greater than 0.05, he or she would fail to reject the null hypothesis—that the difference between the observed results and the expected results is due to random chance and is not significant. In our case, the p-value is less than 0.05. This means that we should reject the null hypothesis and that the differences between the means of the two generations is statistically different. There is less than a 5% chance that the differences between the means is due to chance.
Visit the following links for more information about the t-test. AP Biology Statistics Teacher Guide AP Quantitative Skills Guide Bozeman Science t-test video Performing a t-test in Google Sheets
The t-test calculations are very laborious. In most cases, you won’t do them by hand. Below are directions for calculating a t-test with Excel, a TI calculator, and Google Sheets.
Performing a t-test with Excel

Page 26 of 318
26 Return to Table of Contents
Excel calculates a T-test in a slightly different way. Rather than giving you the t value and comparing it to a table of critical values, Excel simply tells you the probability that the means are different simply due to chance, the “P value.” Follow these steps to calculate a P value using a t-test with Excel:
1. Create two columns, side by side, for the data of interest. Each sample’s data should be in separate columns 2. Click on another blank cell where you wish the P value to appear. 3. Then click “fx” on the Excel Formulas toolbar. 4. In the box, search for the "T test" function and choose “T.TEST" from the list. Hit OK. You will need to set the t-
test parameters:
• For “Array1” highlight the data from one sample; for “Array2”, highlight the data in the second sample. • Enter “2” in the box for “Tails.” • Lastly, you will have to select the “Type” of t-test. For our purposes, we will mostly use type “2.” Although, if
you are measuring the same sample at two points in time (for example before and after treatment) then you would have a type "1."
5. After answering these questions click “OK” and the P value will appear. The P value will fall between zero and one.

Page 27 of 318
27 Return to Table of Contents
What does my P value mean? Excel gives the chance that the differences between the two samples are due to random chance alone. If Excel calculates a P value of 0.22, it means that there is a 22% likelihood that the difference in the means of your two data sets is due to random chance. If the calculated p-value is .05 or less the differences between the two groups is significant and you should reject the null hypothesis. If the P value is greater than 0.05, we can accept the null hypothesis and conclude that there is no significant difference between the two groups.
A. Performing a T-test with the TI-83/84
1. Hit the STAT button on the calculator 2. Select option 4 to clear any past lists of data. 3. Select option 1 to EDIT your lists. 4. Enter your data for each group as List 1 and List 2
5. Hit STAT button and use the arrow key to move over to the TESTS option 6. Scroll down to option 4, the 2-sample T test and hit ENTER 7. Scroll to the bottom of the screen and hit ENTER over the CALCULATE option 8. Your results are given. Compare the calculate t-statistic to the critical value from the table 8. If the t statistic is
greater than the critical value reject the null hypothesis. If the t statistic is less that the critical value, fail to reject the null hypothesis.

Page 28 of 318
28 Return to Table of Contents
Performing a t-test with Google Sheets
1. Enter the data from your two samples in two separate columns. 2. Insert the formula: =TTEST(A1:A4, B1:B4, 2, 2). Replace A1:A4 with your data from the first sample and
B1:B4 with your data from the second sample. 3. As with Excel, this calculation will give you the p-value, not the t-test statistic. If the p-value is less than
0.05, reject the null hypothesis. If the p-value is greater than 0.05, accept the null hypothesis.
Box and Whisker Plots A box and whisker or box plot is a way of summarizing a set of data measured on an interval scale. It is often
used in explanatory data analysis. This type of graph is used to show the shape of the distribution, its central
value, and its variability.
Creating a Box and Whisker Plot
1. Order/Rank the raw data in numerical order from least to greatest.
2. Find the median of the data. The median is the middle number in the data set. If the data set contains an even
number of data points, the median is the average of the two middle numbers in the data set.
3. Divide the data into two equal halves at the median (the middle value). If the median is a data point, donot
include it into either group.
4. Find the median of the lower half. This value (the median of the lower half of the data) is known as the first or
lower quartile (Q1). This is equivalent to the 25th percentile. 5. Find the median of the upper half of the data set. This value is known as the third or upper quartile (Q3). It is equivalent to the 75th percentile. 6. On an appropriately scaled number line, draw short vertical lines at the values for the lower and upper quartile.
7. Complete the “box” with horizontal lines joining the vertical lines. This represents the middle 50% of the data.
8. Mark the median as a vertical line inside the box.
9. Draw the “whiskers” as horizontal line segments that extend from the middle of the sides of the box tothe
minimum and maximum values of the data set.
Special Issues Related to Box and Whisker Plots
Parallel box plots are a useful way of comparing groups of data. For example, compare the data from different lab
groups or different trials of an experiment. Or compare the data collected from an experiment conducted at
different times when a variable is changed, such as time of the day.
Interquartile range (IQR):
The interquartile range is the difference between the upper and lower quartile. (Q3 – Q1) This gives the spread of
the middle 50% of the data and is a good way to evaluate the variability of a data set. A rule of thumb is that 0.75
times the IQR is a good approximation of the standard deviation of the data set.

Page 29 of 318
29 Return to Table of Contents
Inner quartiles:
Comparisons of the locations of the inner quartiles (in addition to comparisons of the medians) are the most
valuable statistical comparisons for you to make. If the inner quartiles (the “boxes”) overlap by a full quartile
or more, this indicates that there is not a significant statistical difference in the data sets. If the inner quartiles (the
“boxes”) don’t overlap by at least a full quartile, it is likely that there is a significant statistical difference in the
data sets.
The location of the median line relative to the first and third quartiles indicates the amount
of skewness or asymmetry in the data.
If the distribution is symmetric, the median will be exactly in the middle.
If the median is closer to Q3 than to Q1, the distribution is negatively skewed (or "skewed to the left" meaning the
left tail of the distribution is longer). This indicates that data points on the right side of the median have less
variability than those on the left side of the median.
If the median is closer to Q1 than to Q3, the distribution is positively skewed. This indicates that the data points
on the right side of the median has more variability than those on the left side of the median.
Outlier:An outlier is an extreme value that is not typical of the data. These are values lying more than 1.5 times
the interquartile range away from the nearer quartile. Outliers should be represented by open circles (or asterisks)
and the whiskers should be drawn to the next closer value within the acceptable range.
Caution: It is important that students understand that a smaller side of the “box” or a shorter “whisker” doesnot
mean that there are fewer values represented, but rather that the values are grouped closer together, in other
words, the smaller side or whisker has a smaller spread than the larger side or whisker.
Sample 1
A researcher counted the number of trichomes (hair-like structures) on 15 Wisconsin Fast Plants. The number of
trichomes is listed below:
25, 15, 26, 10, 20, 18, 20, 21, 25, 17, 22, 15, 21, 20, 12
Page 30 of 318
30 Return to Table of Contents
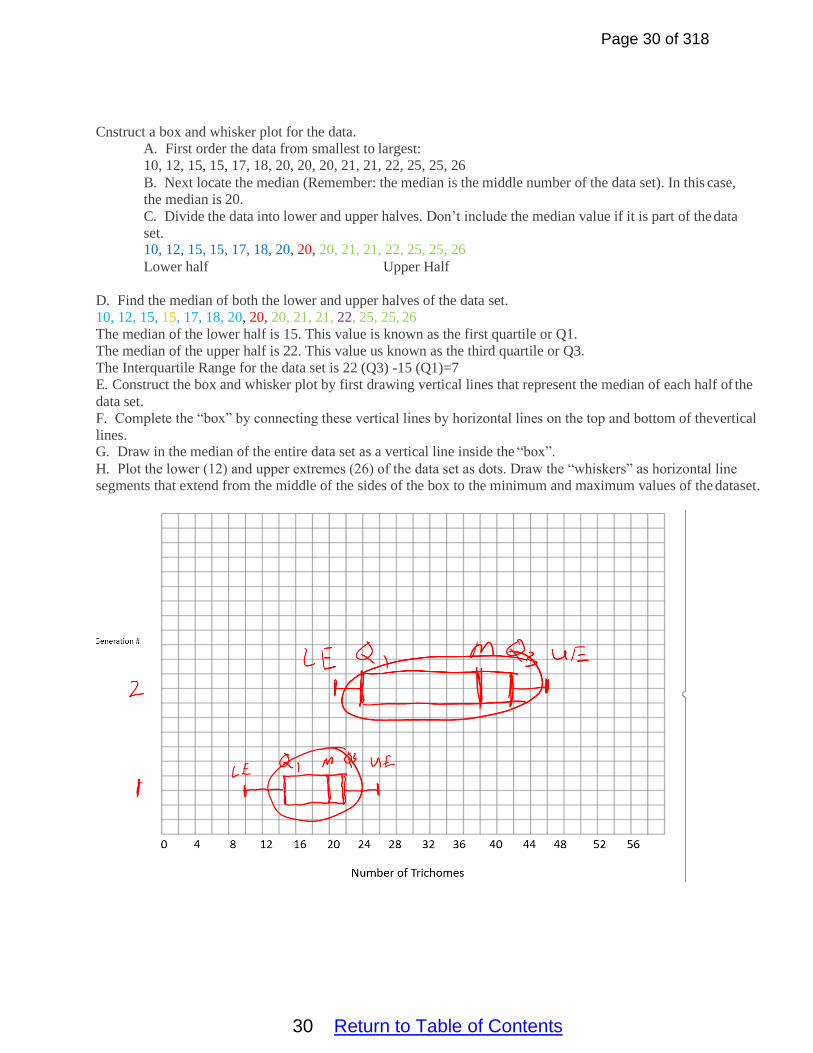
Cnstruct a box and whisker plot for the data.
A. First order the data from smallest to largest:
10, 12, 15, 15, 17, 18, 20, 20, 20, 21, 21, 22, 25, 25, 26
B. Next locate the median (Remember: the median is the middle number of the data set). In this case,
the median is 20.
C. Divide the data into lower and upper halves. Don’t include the median value if it is part of the data
set. 10, 12, 15, 15, 17, 18, 20, 20, 20, 21, 21, 22, 25, 25, 26
Lower half Upper Half
D. Find the median of both the lower and upper halves of the data set.
10, 12, 15, 15, 17, 18, 20, 20, 20, 21, 21, 22, 25, 25, 26
The median of the lower half is 15. This value is known as the first quartile or Q1.
The median of the upper half is 22. This value us known as the third quartile or Q3.
The Interquartile Range for the data set is 22 (Q3) -15 (Q1)=7
E. Construct the box and whisker plot by first drawing vertical lines that represent the median of each half of the
data set.
F. Complete the “box” by connecting these vertical lines by horizontal lines on the top and bottom of thevertical
lines. G. Draw in the median of the entire data set as a vertical line inside the “box”.
H. Plot the lower (12) and upper extremes (26) of the data set as dots. Draw the “whiskers” as horizontal line
segments that extend from the middle of the sides of the box to the minimum and maximum values of the dataset.

Page 31 of 318
31 Return to Table of Contents
Sample 2
The researcher then artificially selected the 5 plants with the most trichomes (from the Sample 1 group) and
allowed only those plants to reproduce with each other.
After a period of growth and development, the researcher counted the number of trichomes on the Generation 2
offspring and found the following number of trichomes on the 15 Generation 2 offspring. 35, 38, 24, 42, 21, 39, 41, 38, 22, 42, 40, 22, 42, 46, 38
Construct a box and whisker plot that depicts the generation 1 and generation 2 data on the same graph.
A. First order the generation 2 data from smallest to largest:
21, 22, 22, 24, 35, 38, 38, 38, 39, 40, 41, 42, 42, 42, 46
B. Next locate the median (Remember: the median is the middle number of the data set). In this case,
the median is 38.
C. Divide the data into lower and upper halves. Don’t include the median value if it is part of the data
set. 21, 22, 22, 24, 35, 38, 38, 38, 39, 40, 41, 42, 42, 42, 46
Lower half Upper half
D. Find the median of both the lower and upper halves of the data set.
21, 22, 22, 24, 35, 38, 38, 38, 39, 40, 41, 42, 42, 42, 46
The median of the lower half is 24. This value is known as the first quartile or Q1.
The median of the upper half is 42. This value us known as the third quartile or Q3.
The Interquartile Range for the data set is 42 (Q3) -24 (Q1)=18
E. Construct the box and whisker plot for the generation 2 data (on the same axis as the plot you already
constructed for the generation 1 data) by first drawing vertical lines that represent the median of each half ofthe
data set.
F. Complete the “box” by connecting these vertical lines by horizontal lines on the top and bottom of thevertical
lines. G. Draw in the median of the entire data set as a vertical line inside the “box”.
H. Plot the lower (12) and upper extremes (26) of the data set as dots. Draw the “whiskers” as horizontal line
segments that extend from the middle of the sides of the box to the minimum and maximum values of the data set.
I. Are the 2 data sets significantly different? Justify your answer.

Page 32 of 318
32 Return to Table of Contents
Atom
AP Biology
Biochemistry – Chemistry Basics
The smallest unit of an element that maintains the chemical properties of the element.
Subatomic Particles
Proton – Subatomic particles that carry a positive charge. They are located in the nucleus of an atom.
The number of protons never changes in an element. The number of protons determines the
identity of the element and defines the atomic number of the element.
Neutron - These particles carry NO charge (are neutral). They are also located in the nucleus of
an atom and are similar in size to the proton.The number of neutrons can change. (Atoms of the
same element with different numbers of neutrons are called Isotopes.)
Electrons - These subatomic particles carry a negative charge. They are located in the “Electron cloud”. The
electrons are attracted to the positive protons in the nucleus, but can move within the electron cloud. The
number of electrons associated with an atom can change. (Atoms with different numbers of electrons than the
normal amount for that element are called Ions.)
Molecule
Two or more atoms that are covalently bonded together.
E levels or e- shells – Where the electrons are located within an atom or molecule.
Adding energy to the electrons makes them move farther out, away from the nucleus; losing energy causes
them to move inward, toward the nucleus. Valence Shell- Where the outer most electrons are located on an atom.
Valence e- - Refers to the outer most electrons. (These are the most important for chemical bonds and the
chemical properties of an element or molecule.) Most elements need 8 valence electrons (an octet) in order
to be chemically stable. Atoms react with other elements in order to obtain a total of 8 valence electrons and
to become chemically stable.
Chemical Bonds (These occur between atoms.)
Covalent Bonds
A type of intramolecular bond.
Results from the sharing of valence electrons between atoms.
Atoms held together by covalent bonds are called molecules.
Polar molecules carry a slight electrical charge at opposite poles (poles refers to the “ends” of the
molecule) and non-polar molecules do not have an electrical charge.
Electronegativity
Refers to an atom’s desire to acquire electrons.
Hydrogen is the least electronegative atom.
Oxygen and Nitrogen are the most biologically important molecules with a high
electronegativity.
Molecules which contain oxygen and nitrogen are likely to be polar.
Ionic Bonds
Ionic bonds form between metal and non-metal atoms.
They form when the metal atoms loses electrons and the non-metal atom gains electrons.

Page 33 of 318
33 Return to Table of Contents
Both atoms do this in order to have 8 valence electrons.
Compounds held together by ionic bonds are called salts.
Ionic Bonds are very strong when the compound is dry.
Ionic bonds are easily broken in water. This is why many salts dissolve easily in water to form
ions.
Cations – Ions which possess a positive charge because they have more protons than
electrons. The metal atoms in a salt typically become cations.
Anions –Ions which possess a negative charge because they have more electrons than
protons. The non-metal atoms in a salt typically become anions.
Hydrogen Bonds
Hydrogen Bonds are fairly weak (compared to covalent and ionic bonds) intermolecular attractions
that occur between polar molecules. They are often depicted as dots in chemical diagrams.
Hydrogen bonding is very important in water due to its polar nature.
Van der Waals Interactions or London Dispersion Forces
These are temporary intermolecular attractions. (Usually a fraction of a second.)
These interactions are “created” when electrons clump on one side of an atom making that side
temporarily “negative” and the other side “positive”. This allows other charged particles to attach
momentarily. The electrons eventually unclump and the van der waals interactions disappear.
AP Biology
Biochemistry of Water
Water supports life on Earth.
Water makes up over 70% of the bodies of most organisms.
Biogeochemical Cycles--These refer to the cycling of matter.
Water cycle – Water vapor is generated by the sun causing the evaporation of water from oceans, lakes,
rivers, trees, etc…. This water vapor rises and condenses to form rain or snow (referred to as precipitation)
and is returned to the land or ocean. Eventually, the water that lands back on the land, makes its way to plants
or rivers and streams that lead back to the oceans. Plants take in the water and use it for photosynthesis but
also can lose it in the form of transpiration to the air.

Page 34 of 318
34 Return to Table of Contents
Water is a Polar Molecule.
Because of the high electronegativity of oxygen and the low electronegativity of hydrogen, the oxygen end of
the water molecule has a slight negative charge, while the hydrogen end has a slight positive charge. The
water molecule’s shape is said to be “bent”. This shape means that one side of the molecule “the hydrogen
side” is positive, while the other side “the oxygen side” is negative. The polar water molecules form
hydrogen bonds with each other. These bonds affect many of the biologically important properties ofwater.

Page 35 of 318
35 Return to Table of Contents
Important Properties of Water for Biology
Water has a high specific heat.
Specific heat refers to the amount of heat needed to change the temperature of 1 gram of a substance by 1
degree. Water’s specific heat is very high due to the hydrogen bonds that hold the water molecules
together.
Due to its high specific heat, water is excellent for helping to maintain a constant internal body
temperature. Large bodies of water have fairly constant temperatures. Water also helps to moderate the
air temperatures of land masses located near large bodies of water.
Water is an excellent solvent.
Water is often referred to as the “Universal Solvent”. This means that it is great at dissolving other materials
(solutes).
Due to its polarity, water is best at dissolving salts and polar molecules.
This is important in Biology, because it allows vital nutrients and gases to be dissolved and transported
through the body and through the ground.
Water has a high heat of vaporization.
Heat of vaporization refers to the amount of heat needed to convert a liquid to a gas. Due to the many
hydrogen bonds which hold water molecules together, the heat of vaporization is very high for water. When
the water does eventually evaporate it carries heat away with it.
This is important in Biology, because it allows processes like sweating and transpiration to cool off organisms
through the process of evaporative cooling.
Water is cohesive and adhesive.
Due to its polarity, water molecules stick to each other (cohesion) and to other polar molecules
(adhesion). This property allows transpiration, the movement of water through the xylem of plants, to
move water from the ground, through the plant, and eventually out into the air.
Water expands as it freezes.
Like most other compounds, the volume of water contracts as it cools down, but unlike most other materials,
the volume of water begins to expand after it cools to temperatures below 4 degrees Celsius. This causes ice
to be less dense than liquid water. This means that ice floats on liquid water.
This happens because the HYDROGEN bonds force the chains of water molecules further apart as the
molecules cool down and slow down. This increased volume causes a decrease in density. This property is
important to life, because as bodies of water freeze, the ice floats and insulates the liquid water underneath.
This allows aquatic life to survive long, cold winters.

Page 36 of 318
36 Return to Table of Contents
Organic Chemistry
AP Biology
Biochemistry: Carbon Properties
Branch of science dealing with the element carbon and its many properties.
Most of the compounds found in living things, other than water, are organic.
About 30% of an organism’s dry weight (Biomass) is composed of Carbon found in the body’s organic
molecules. Carbon helps to make the 4 major groups of organic macromolecules: Carbohydrates, Lipids, Proteins, and
Nucleic Acids. The original source for Carbon in all life forms is Carbon Dioxide. (CO2 - Photosynthesis)
Miller/Urey Experiment (Took place in 1953.)
Miller/Urey took inorganic substances that were thought to have been present in Earth’s early atmosphere
(H2O vapor, H2, NH3, CH4) and created organic amino acids and oils. (CO2 and CH4 are not considered
organic compounds, even though they contain Carbon.) Miller wanted to show that organic molecules, which
are necessary for life, could be created by non-living things.
Important Properties of Carbon for Biology
Carbon has 4 valence electrons
Since carbon has 4 valence electrons, it can form four covalent bonds. This allows carbon to bond with a
variety of molecules and form molecules with an almost infinite variety of shapes and functions.
Page 37 of 318
37 Return to Table of Contents
Carbon atoms are small
Because carbon is a small atom, its valence electrons are near the nucleus. This means that when carbon
forms covalent bonds, the bonds are strong. This makes carbon an excellent building material for life.
Carbon is abundant on Earth
Carbon isn’t the most abundant element on Earth, but there is a lot of carbon found on the planet. This
makes it a good choice for the building block of life.
Organic Macromolecules
Polymers
These are large molecules that are formed by combining/bonding individual units called
monomers.
The monomers are linked together by covalent bonds. Remember that covalent bonds are strong.
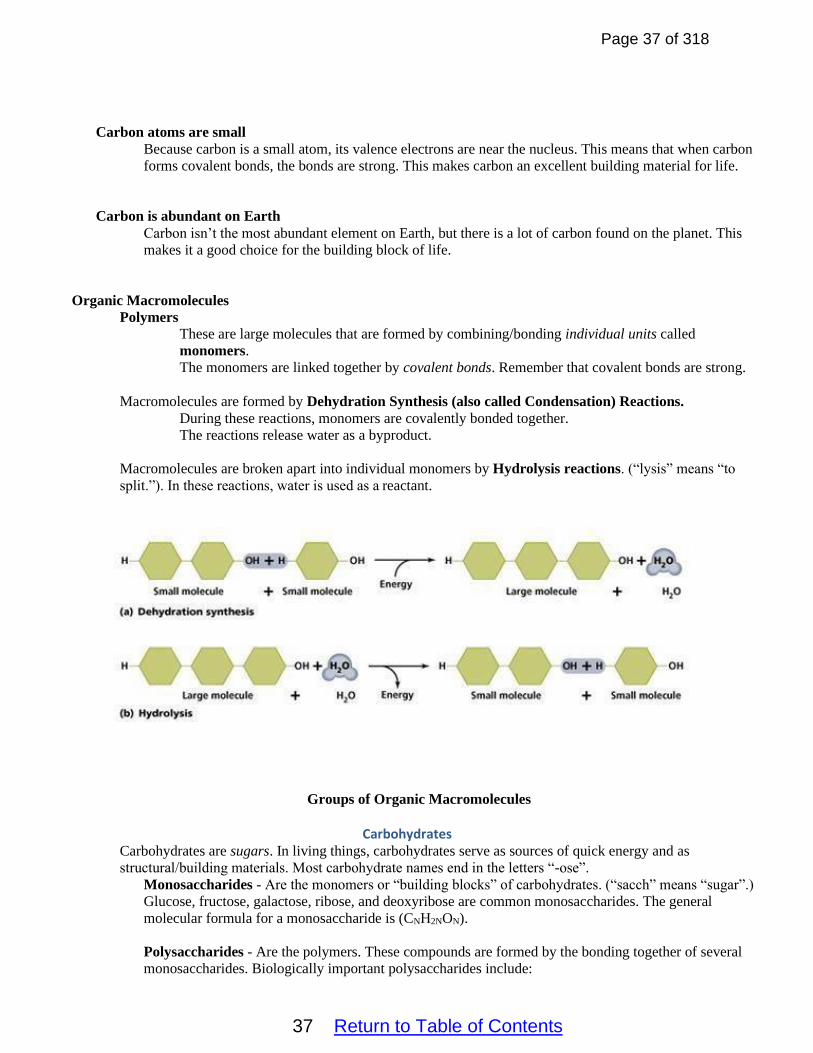
Macromolecules are formed by Dehydration Synthesis (also called Condensation) Reactions.
During these reactions, monomers are covalently bonded together.
The reactions release water as a byproduct.
Macromolecules are broken apart into individual monomers by Hydrolysis reactions. (“lysis” means “to
split.”). In these reactions, water is used as a reactant.
Groups of Organic Macromolecules
Carbohydrates Carbohydrates are sugars. In living things, carbohydrates serve as sources of quick energy and as
structural/building materials. Most carbohydrate names end in the letters “-ose”.
Monosaccharides - Are the monomers or “building blocks” of carbohydrates. (“sacch” means “sugar”.)
Glucose, fructose, galactose, ribose, and deoxyribose are common monosaccharides. The general
molecular formula for a monosaccharide is (CNH2NON).
Polysaccharides - Are the polymers. These compounds are formed by the bonding together of several
monosaccharides. Biologically important polysaccharides include:

Page 38 of 318
38 Return to Table of Contents
Starch – Used as an energy storage molecule in plants.
Glycogen – Used as an energy storage molecule in Animals.
Cellulose – Used as a structural component of plant cell walls.
Cellulose is the most abundant organic compound on Earth. Due to the hydrogen bonds that
occur in cellulose, it is very hard for most organisms to digest. Chitin – Used as a component of the exoskeleton of some animals and also fungal cell walls.
Although starch, cellulose, and glycogen are all polymers of glucose, the molecules have different
shapes. Some of these complex carbohydrates consist of straight chains of monomers, while others
consist of branched chains. Because of the orientation of the glucose monomers, many hydrogen
bonds form in cellulose and cause the molecule to be very strong and hard to digest, while starch is
relatively easy to digest.
Lipids These macromolecules are fats, oils, waxes, and steroids.
Most lipids are hydrophobic molecules. They contain little oxygen and are mostly nonpolar in nature.
Two Main parts of a lipid: Fatty Acid—long chain of carbon and hydrogen atoms.
3 Carbon Glycerol molecule (alcohol) to hold the whole molecule together.
Lipids use a covalent bond called an Ester Linkage to hold the fatty acids and glycerol together.
Major Types of lipids:
Triglycerols or Triglycerides (These are your basic fat or oil.)
The degree of saturation (lack of carbon—carbon double bonds) helps to determine the
structure and function of many lipids.
Saturated fats--These fatty acids are saturated with Hydrogen atoms. The molecule has no
open bonds to put any more Hydrogen on. There are no carbon—carbon double or triple
bonds in these chains. Saturated fats are solids at room temp and they usually are associated
with animals. Saturated fats contribute to coronary artery disease.
Unsaturated fats--These fatty acid chains contain some carbon-carbon double or triple
bonds that “could be broken” to add more Hydrogen to the fatty acid. Saturated fats tend to
be liquids at room temperature and they usually are associated with plants (vegetable oil,
sunflower oil, or peanut oil). Unsaturated fats are typically viewed as a healthy part of the
diet.
Page 39 of 318
39 Return to Table of Contents
Polyunsaturated fats--These fats have many double or triple bonds in their fatty acid chains.
Hydrogenated or Trans fats. These are oils turned solid fats by adding Hydrogen and by
breaking the double or triple bonds in the fatty acids. This was done in the past to change the
texture, stability, and shelf life of fats. Trans fats were common in processed foods. They
have been shown to increase LDL cholesterol levels and to contribute to coronary artery
disease.
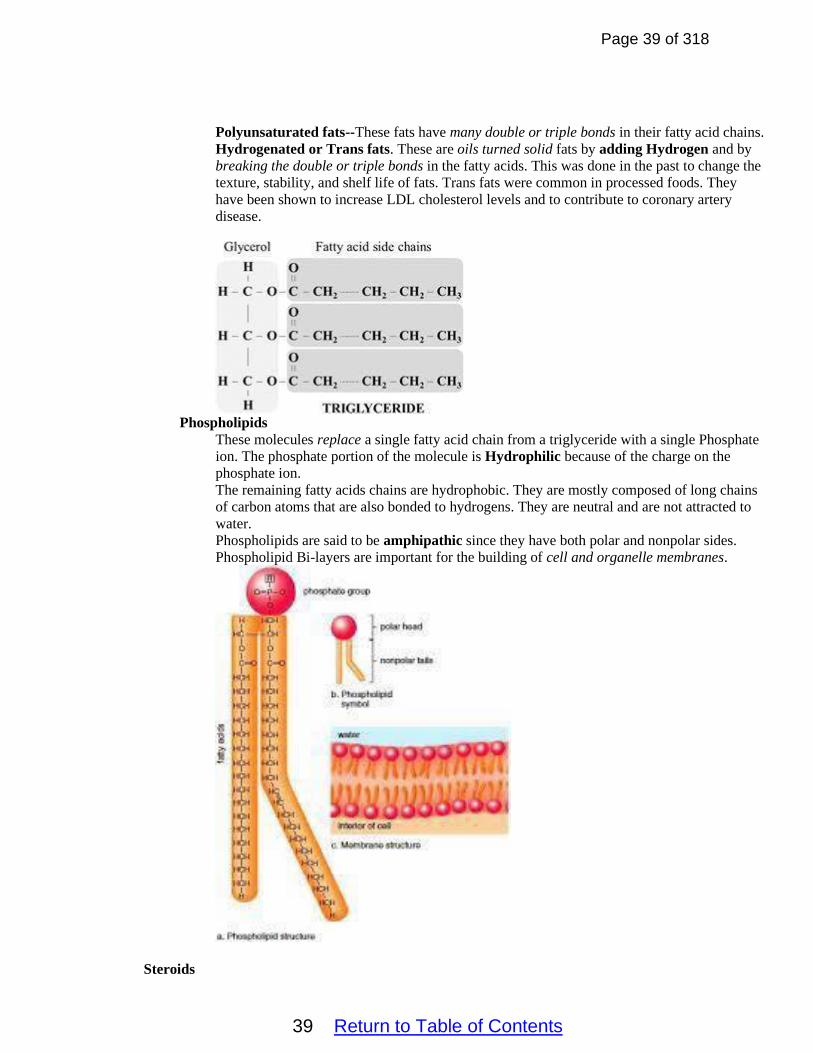
Phospholipids
These molecules replace a single fatty acid chain from a triglyceride with a single Phosphate
ion. The phosphate portion of the molecule is Hydrophilic because of the charge on the
phosphate ion.
The remaining fatty acids chains are hydrophobic. They are mostly composed of long chains
of carbon atoms that are also bonded to hydrogens. They are neutral and are not attracted to
water.
Phospholipids are said to be amphipathic since they have both polar and nonpolar sides.
Phospholipid Bi-layers are important for the building of cell and organelle membranes.
Steroids

Page 40 of 318
40 Return to Table of Contents
A steroid is a lipid composed of 4 carbon rings. Common steroids found in the body include
testosterone, estrogen, progesterone, and cholesterol.
What makes them different from each other are the attached functional groups. These
functional groups help determine the function of the steroid. Most of the steroids are built
from cholesterol. Steroids function in the body as cell signals/hormones. Due to their
lipid/nonpolar nature they can penetrate the cell membrane and bind to intracellular receptors.
They often act to regulate the expression of certain genes.
Cholesterol is an important component of the cell membrane. It helps with cell membrane
flexibility.
Common Steroids
Proteins
Proteins make up greater than 50% of an organism’s dry weight or biomass.
The names of most proteins end in “lin” while the names of most enzymes (which are composed of proteins)
usually end in “ase”.
Proteins are large macromolecules which are composed of monomers “building blocks” called Amino Acids.
There are 20 different Amino Acids used by living things to make proteins. Proteins and enzymes usually have
hundreds to thousands of Amino acids in their structure.
Amino Acids have 4 different parts to them:
Amine end (NH2) – This end can act as a base by accepting a Hydrogen ion.
Carboxyl end (COOH) – This part acts as an acid because it can release a hydrogen ion.
Alpha (α) Carbon – This is the central carbon atom to which all of the other functional groups are attached.
R group - This part is the only part that is different in the 20 different amino acids. The R group gives different
amino acids their distinctive properties.

Page 41 of 318
41 Return to Table of Contents
Structure of an Amino Acid
Individual Amino Acids (monomers) are bonded together by a covalent bond called a peptide bond. The peptide
bond is a covalent bond and is strong and hard to break.
In order to create a peptide bond, the amino end of one amino acid is positioned to combine with the Carboxyl
end of the second amino acid. The amino acids are joined during dehydration synthesis reactions (also known as
“condensation reactions”).
Two amino acids bonded together are referred to as a dipeptide. When more than two are bonded, the structure is
referred to as a polypeptide chain.

Page 42 of 318
42 Return to Table of Contents
Because of the structure of the amino acids, a polypeptide chain has directionality, meaning that it has two ends
that are chemically distinct from one another. At one end, the polypeptide has a free amino group, and this end is
called the amino terminus (or N-terminus). The other end, which has a free carboxyl group, is known as
the carboxyl terminus (or C-terminus). The N-terminus is on the left and the C-terminus is on the right for the
very short polypeptide shown above.
New amino acids are always added to the carboxyl terminus of a growing polypeptide chain.
A protein is typically made from several polypeptide chains that are wrapped together into a large 3-D unit.
The function of a protein is largely determined by its shape/structure.
The information included below discusses the four levels of protein structure.
Levels of Protein Structure
Primary Structure (Represented by the symbol - 1’. )
This refers to the sequence of bonded Amino Acids (which amino acids are present and what order are they in). The primary structure of each protein is coded for by DNA.
A mutation in the DNA can change the primary structure of a protein. This change can vastly change the
overall shape of the protein and cause it to lose its function.
Secondary Structure (2’ )
This refers to the shape of specific sections of each polypeptide chain.
HYDROGEN bonding between polar amino acids allows for overlapping and coiling to occur in the “folding” of
the protein into its 3-D shape. All proteins must be “folded” in order to work. The polarity/nonpolarity of
the “R” groups of the protein’s amino acids determine how the protein will fold.
For proteins that are built by ribosomes located on the rough ER, this folding takes place within the Rough
Endoplasmic Reticulum. These proteins are usually exported from the cell through the process of
exocytosis (secretion).
Other proteins are constructed by ribosomes which float freely in the cytosol. These proteins typically
remain within the cell in which they were made. The folding of these proteins usually takes place within a
chaperonin. Chaperonins are protective structures that allows proteins to fold without water present.

Page 43 of 318
43 Return to Table of Contents
Two common types of secondary structure are the alpha helix and the beta pleated sheet.
Tertiary Structure (3’ ) (“Tert” means “third”)
This refers to the overall shape of each individual polypeptide chain.
Di-sulfide bridges help stabilize the protein’s folded structure. These bonds form when cysteines (a type of
amino acid) are near each other in a polypeptide. These cysteines form a disulfide bond or bridge which is
much stronger than a hydrogen bond.
The tertiary structure is also partially determined by ionic interactions between certain “R” groups and by
hydrophobic interactions between certain R groups and water.

Page 44 of 318
44 Return to Table of Contents
Quaternary Structure (4’ )
This is when two or more polypeptides are woven together to form the overall structure of a protein.
Example: Hemoglobin -has four polypeptides woven together to make it.

Page 45 of 318
45 Return to Table of Contents
4
2
3
Denaturation
The “unraveling” or “unfolding” of a protein or enzyme causing it not to function.
Denaturation can be caused by pH changes, salt concentration changes, and increases in temperature.
Denaturation usually disrupts the secondary and tertiary levels of protein structure by affecting either
the hydrogen bonds or disulfide bonds which stabilize the structure.
Nitrogen Cycle
Although there is plenty of nitrogen found in the air, the amount of usable nitrogen available for life on Earth
is limited. Since the nitrogen atoms in nitrogen gas are held together by triple covalent bonds, atmospheric
nitrogen is difficult for life forms to break apart and use. The nitrogen cycle is the process via which nitrogen
moves from the atmosphere into living things and ultimately back to the atmosphere. Cycles like the nitrogen
cycle, the carbon cycle, the water cycle, and the phosphorus cycle are collectively known as the biogeochemical
cycles. These processes continuously cycle elements throughout the Earth.
Nitrogen is an essential element for the construction of proteins and amino acids. Nitrogen is also an important component of nucleic acids such as DNA, RNA, and ATP. Some nitrogen is removed from the air by rainwater. Remember, water is the universal solvent, so the gas is dissolved in the rain. The Nitrogen in the water can be
consumed by Nitrogen Fixing bacteria, in the soil, that convert it into Ammonium ions (NH +). This process is referred to as Nitrogen Fixation. The Ammonium ions can then be absorbed by plants to help make proteins and
DNA or RNA. Some Ammonium in the soil is also consumed by Nitrifying Bacteria, and converted to Nitrite (NO - ) first and then ultimately into Nitrate (NO -). This process is called Nitrification. The Nitrates are also
absorbed by the plants, just as was the Ammonium ions. Other bacteria, called denitrifying bacteria, in the soil can

Page 46 of 318
46 Return to Table of Contents
also absorb the nitrates and convert them back into Oxygen gas (O2) and Nitrogen gas (N2). These molecules
are both returned to the air to be used again. This process is called Denitrification. As plants are eaten by
animals, the Nitrogen travels through the food chain. When all life forms die, the bodies decompose and
create Ammonia (NH3), which is why they stink. The Ammonia is converted by bacteria into Ammonium to be used again by plants and bacteria. This conversion is called
Ammonification. Some Nitrogen is also released by animals in their urine. It too undergoes
Ammonification.
Nucleic Acids
Nucleic Acids function to store genetic information and/or to store and transfer energy. Common nucleic
acids found living organisms include: DNA, RNA, ATP, cAMP, NADH, and NADPH.
The monomers of nucleic acids are called nucleotides. A nucleotide consists of a 5 carbon (pentose) sugar
bonded to a phosphate group and a nitrogenous base.

Page 47 of 318
47 Return to Table of Contents
DNA and mRNA are both polymers. DNA and RNA are the primary sources of genes and hereditary
information.
1. DNA has Deoxyribose as its 5 Carbon sugar. DNA is double stranded. In eukaryotic cells, DNA is
always stored inside a nuclear membrane or envelope. DNA’s function is to code for proteins.
The sequence of the nitrogenous bases in the DNA determines the order of the amino acids in each
of the body’s proteins. Watson and Crick were eventually able to determine that the DNA molecule is composed of two strands of
nucleotides that are then twisted into a double helix. The individual strands are built when the phosphate groups
of the nucleotides form covalent bonds with the deoxyribose molecules of adjacent nucleotides. The actual bonds
form when one deoxyribose attaches to another by connecting its 5' carbon to the 3' carbon of the next sugar in the
next nucleotide using a phosphate group. The alternating sugars and phosphates form the “backbone” of the DNA
molecule.
The two strands are connected together by hydrogen bonding between complementary nitrogenous bases. An A on
one strand bonds with a T on the other strand. A G on one strand binds with a C on the other strand. Each A-T base
pair is held together by 2 hydrogen bonds, while each G-C pair is held together by 3 hydrogen bonds. This
means that it is easier to separate DNA strands with lots of A-T base pairs than it is to separate strands with
lots of G-C base pairs. It is important to remember that hydrogen bonds are weak when compared to covalent or
ionic bonds. This is important, because the two DNA strands have to be separated during both the processes of
replication and transcription.
Like a protein, a DNA molecule has directionality. The DNA molecule is composed of two strands of
nucleotides held together by hydrogen bonds. Each strand has two slightly different ends. One end, known as the 5’
end, terminates with an unbound 5’ carbon on the last nucleotide in the chain. The other end, known as the 3’ end,
terminates with an unbound 3’ carbon on the last deoxyribose molecule at its end. When the two strands are
connected together, they are oriented in opposite directions. Because they run parallel to each other, but have
opposite directional orientations, the two strands are said to be antiparallel.

Page 48 of 318
48 Return to Table of Contents
2. RNA has Ribose as its 5 Carbon sugar. RNA is single stranded. There are several types of RNA.
Messenger RNA (mRNA) is made from the DNA template during the process of transcription.
mRNA’s job is to transmit the protein building directions from the DNA in the nucleus to the
ribosomes in the cytoplasm. Transfer RNA’s (tRNA) job is to deliver and place the appropriate
amino acids into the proteins that are built by the ribosomes. Ribosomal RNA (rRNA) is one ofthe
main building components of the cell’s ribosomes.
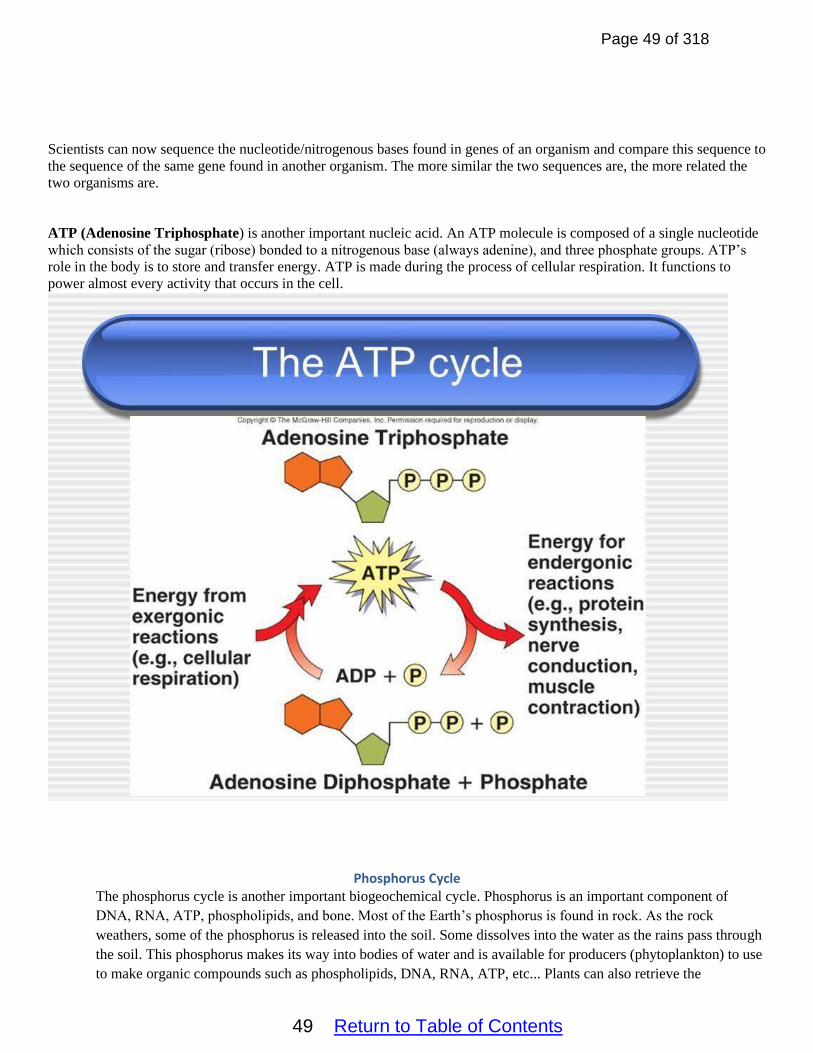
Page 49 of 318
49 Return to Table of Contents
Scientists can now sequence the nucleotide/nitrogenous bases found in genes of an organism and compare this sequence to
the sequence of the same gene found in another organism. The more similar the two sequences are, the more related the
two organisms are.
ATP (Adenosine Triphosphate) is another important nucleic acid. An ATP molecule is composed of a single nucleotide
which consists of the sugar (ribose) bonded to a nitrogenous base (always adenine), and three phosphate groups. ATP’s
role in the body is to store and transfer energy. ATP is made during the process of cellular respiration. It functions to
power almost every activity that occurs in the cell.
Phosphorus Cycle The phosphorus cycle is another important biogeochemical cycle. Phosphorus is an important component of
DNA, RNA, ATP, phospholipids, and bone. Most of the Earth’s phosphorus is found in rock. As the rock
weathers, some of the phosphorus is released into the soil. Some dissolves into the water as the rains pass through
the soil. This phosphorus makes its way into bodies of water and is available for producers (phytoplankton) to use
to make organic compounds such as phospholipids, DNA, RNA, ATP, etc... Plants can also retrieve the

Page 50 of 318
50 Return to Table of Contents
phosphorus directly from the soil and use it to make organic compounds. When organisms die, decomposers
break down the bodies and return the phosphorus to the soil so that it can be reused.

Page 51 of 318
51 Return to Table of Contents
AP Biology
Unit 2
Student Notes

Page 52 of 318
52 Return to Table of Contents
Unit 2 Student Notes
Table of Contents
A. Basic Cell Structure—Pages 53-57 B. Endosymbiotic Hypothesis—Pages 53-54 C. Membrane Structure—Pages 58-60
D. Eukaryotic Cell Components—Pages 61-65 E. Endomembrane System—Page 62 F. Cellular Transport—Pages 66-73 G. Diffusion—Page 67 H. Osmosis—Pages 67-69
I. Water Potential—Pages 68-69 J. Facilitated Diffusion—Page 69 K. Active Transport—Pages 69-73
L. Cotransport—Pages 70-71 M. Bulk Transport—Pages 71-73

Page 53 of 318
53 Return to Table of Contents
Key Ideas/Enduring Understandings for this unit:
1. Living systems are organized in a hierarchy of structural levels that interact.
2. The highly complex organization of living systems requires constant input of energy and the exchange of
macromolecules.
3. Cell have membranes that allow them to establish and maintain internal environments that are different from
their external environments.
4. Evolution is characterized by a change in the genetic makeup of a population over time and is supported by
multiple lines of evidence.
AP Biology
Basic Cell Structure
Cells
Cells are considered to be the basic units of life.
The cell is an example of Emergent Properties. The organelles alone can do nothing, but if all of them are put
together inside a cell membrane, “life” can emerge.
Cytology is the study of cells; Cytologist – a person who works with cells.
Cell Types
Prokaryotic cells
These organisms (eubacteria and archae) evolved before the evolution of the nuclear membrane and
nucleus. These cells also lack membrane bound organelles. They do have ribosomes. They are
extremely small when compared to eukaryotic cells.
It is believed that the first prokaryotic cells came into existence about 3. 5 Billion Years Ago (BYA).
The oldest prokaryotic fossils are found on stromatalites (bacterial mounds) in Shark Bay, Australia.
Eukaryotic cells (“Eu” means “true”)
These cells evolved after the evolution of the nucleus. All organisms on Earth, other than eubacteria
and archae are composed of eukaryotic cells. Eukaryotic cells have a membrane bound nucleus and
membrane bound organelles. Endosymbiotic Hypothesis
The Endosymbiotic Hypothesis, proposed by Lynn Margulis in the 1960s, hypothesized that some
prokaryotes begin to live together in symbiotic relationships with the smaller prokaryotes living inside
larger ones. This gave the symbionts a survival advantage over other prokaryotes and eventually they
evolved into Eukaryotic cells. Smaller organisms gained protection.
Larger organisms gained energy production or faster motility.
Over time DNA segments were “swapped” to create a more permanent existence. This
“swapping” is referred to as genetic annealing.
The smaller prokaryotes eventually became the membrane-bound organelles within the
larger prokaryotes. Evidence for this hypothesis is found in mitochondria and chloroplasts.
Mitochondria and chloroplasts have their own single circular chromosome like
Bacteria.
Mitochondria and chloroplasts have ribosomes that are similar to those found in
Bacteria.
Mitochondria and chloroplasts are able to independently reproduce within the
larger eukaryotic cells. They use a process similar to binary fission.
Mitochondria and chloroplasts have a double phospholipid bilayer cell membrane.
This might be evidence of the phagocytosis of the original symbionts.

Page 54 of 318
54 Return to Table of Contents
The Surface Area- to- Volume Ratio is of GREAT Importance for all cells.
As cells grow, the surface area to volume ratio for the cell decreases while the demand for internal resources
increases. Think of the surface area as the cell membrane and the volume as the internal contents of the cell. As
the cell gets larger, it gets harder for cells to transport in and out the required materials. This is one of the main
reasons that cells must always be very small. Smaller cells have a higher surface area to volume ratio and are
better able to transport materials through the cell membrane.
Adaptions for increasing the surface area without increasing the volume
Surface area to volume ratio can also be used to explain the shape of many cells / cellular surfaces. For
example the folds inside the mitochondria or the flat pan-cake like structures inside chloroplasts
provide a greater surface area on which specific reactions can occur. The folds in the lining of our
stomachs or the tiny cellular, finger-like projections that protrude from the wall of the small intestine
(villi and microvilli) all act to increase the surface area without increasing the overall size or volume of
the organ.
In addition to being important for the transport of nutrients/wastes, the surface area to volume
ratio also is very important in determining the rate of heat exchange between an organism and its
environment.

Page 55 of 318
55 Return to Table of Contents
Basic Prokaryotic Cell (Bacteria and Archae) Structure
All prokaryotes are unicellular. Prokaryotic cells possess a single circular chromosome (not enclosed in a nuclear
membrane), ribosomes (for making proteins), and cytoplasm. The cells do not possess membrane-bound
organelles like mitochondria or chloroplasts. They may, however, have specific internal regions with specialized
structures and functions.
Three basic shapes of prokaryotes exist:

Page 56 of 318
56 Return to Table of Contents
Cocci (Means “round”)
Bacilli (Means “rod”)
Helical (Means “spiral”)
Most prokaryotes have a cell wall. (This is NOT the same as a plant’s cell wall.)
This structure is primarily for protection of the underlying cell membrane. It also helps prevent the prokaryotes from bursting in an aquatic environment.
In eubacteria, the cell wall is mainly composed a protein and complex carbohydrate-based substance
known as peptidoglycan.
Scientists/doctors perform Gram stains to identify bacteria as either Gram positive or Gram negative.
Different antibiotics work against each group.
Gram positive bacteria stain blue. These bacteria possess a THICK peptidoglycan layer.
Gram negative bacteria stain red. These bacteria possess a THIN peptidoglycan layer
BETWEEN phospholipid layers.
Some bacteria produce a Capsule that covers the cell wall. The capsule is a sticky substance for adherence to
surfaces. The capsule can protect the bacteria from a host cell’s immune response.
Although we think of bacteria as germs that make us sick, most bacteria are beneficial. Bacteria are important in
the process of decomposition/mineral recycling. Other bacteria fix nitrogen, do photosynthesis, and help us
manufacture certain foods and chemicals.
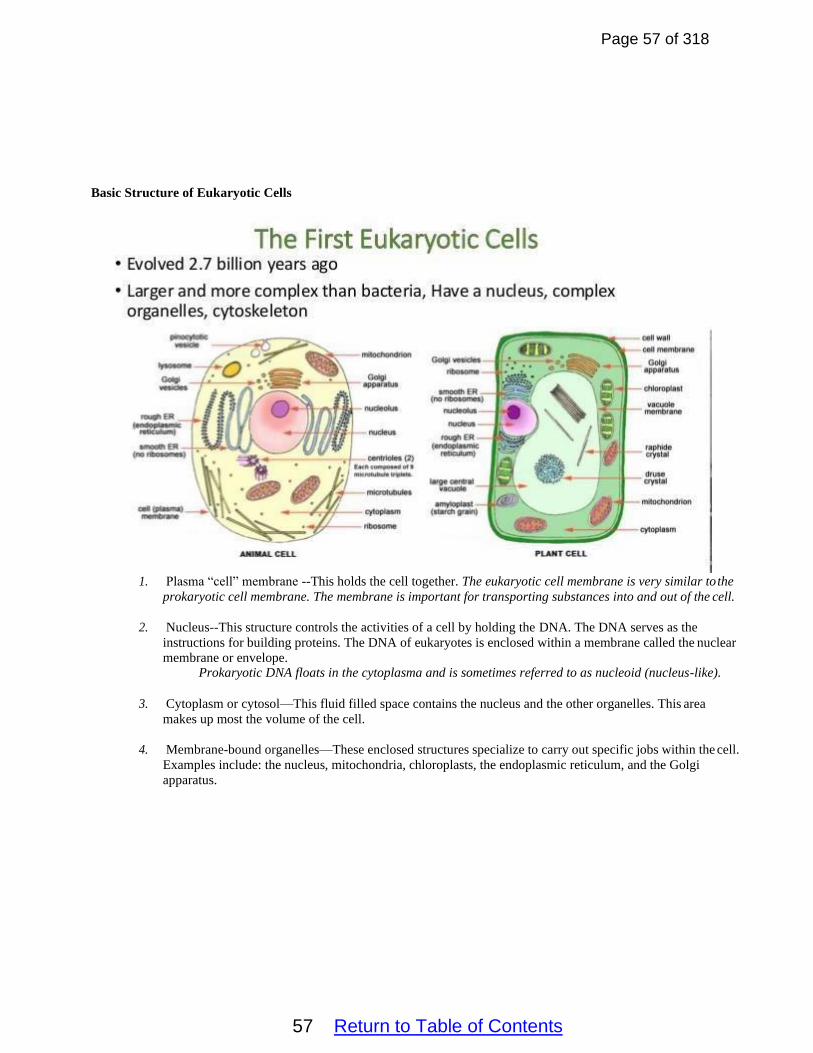
Page 57 of 318
57 Return to Table of Contents
Basic Structure of Eukaryotic Cells
1. Plasma “cell” membrane --This holds the cell together. The eukaryotic cell membrane is very similar to the
prokaryotic cell membrane. The membrane is important for transporting substances into and out of the cell.
2. Nucleus--This structure controls the activities of a cell by holding the DNA. The DNA serves as the
instructions for building proteins. The DNA of eukaryotes is enclosed within a membrane called the nuclear
membrane or envelope. Prokaryotic DNA floats in the cytoplasma and is sometimes referred to as nucleoid (nucleus-like).
3. Cytoplasm or cytosol—This fluid filled space contains the nucleus and the other organelles. This area
makes up most the volume of the cell.
4. Membrane-bound organelles—These enclosed structures specialize to carry out specific jobs within the cell.
Examples include: the nucleus, mitochondria, chloroplasts, the endoplasmic reticulum, and the Golgi
apparatus.

Page 58 of 318
58 Return to Table of Contents
AP Biology
Membrane Structure and Transport of Molecules
The Cell/Plasma Membrane
Cell membranes allow cells to establish and maintain internal environments that are different from their external
environments. Selectively Permeable
The cell membrane (plasma membrane) is referred to as selectively permeable or semipermeable. This means
that the cell allows or actively transports certain materials into or out of the cell while not allowing other
materials to enter or exit the cell. Typically, small and nonpolar substances (like N2, O2, and CO2) can enter the
cell easily, while large and/or polar/charged substances either cannot enter or have to be brought into the cell via
some type of protein channel. Some small but polar substances (like water) can pass through the phospholipid
portion of the membrane in small amounts.
Membrane Structure
A phospholipid bilayer makes up the majority of the cell membrane and also the organelle membranes.
Phospholipids are amphipathic molecules. They have both hydrophilic and hydrophobic
components/sides. These molecules form a bilayer because the hydrophilic portions of the molecule
(the phosphate groups) orient themselves toward the water that is located both inside and outside the
cell, while the hydrophobic portions of the molecule (the fatty acid tails) orient themselves away from
the water and toward each other in the center of the membrane.
Structure of a Phospholipid
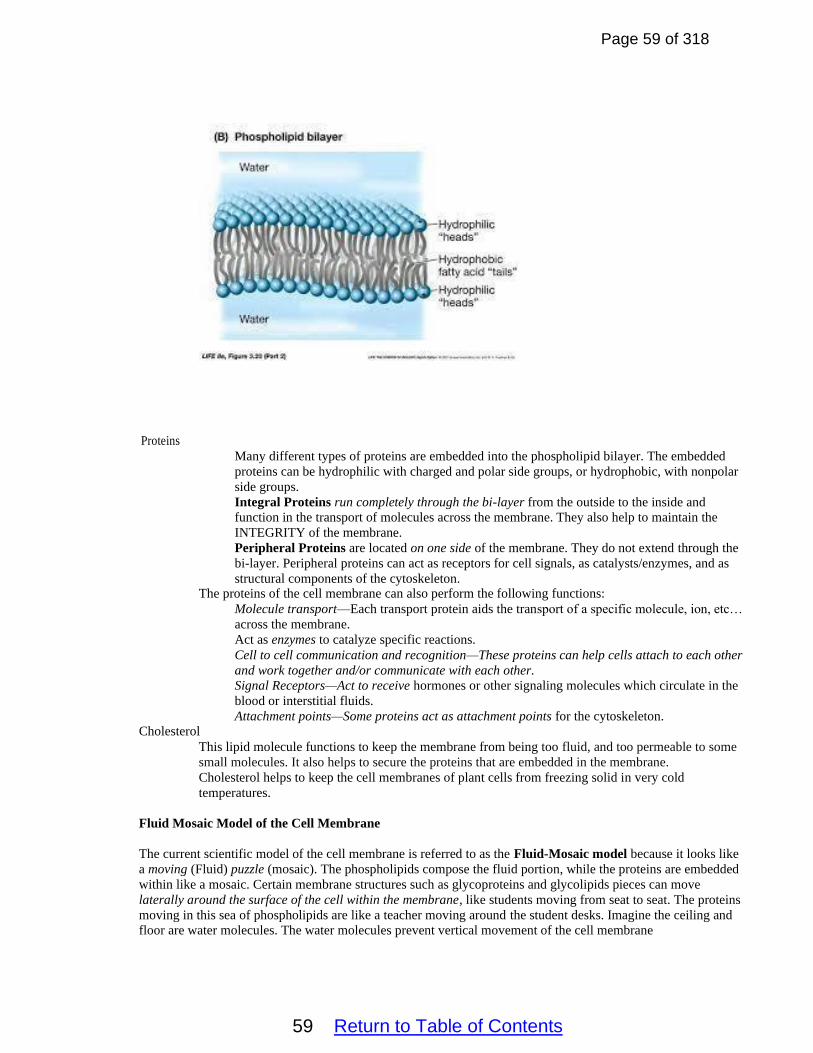
Page 59 of 318
59 Return to Table of Contents
Proteins Many different types of proteins are embedded into the phospholipid bilayer. The embedded
proteins can be hydrophilic with charged and polar side groups, or hydrophobic, with nonpolar
side groups.
Integral Proteins run completely through the bi-layer from the outside to the inside and
function in the transport of molecules across the membrane. They also help to maintain the
INTEGRITY of the membrane.
Peripheral Proteins are located on one side of the membrane. They do not extend through the
bi-layer. Peripheral proteins can act as receptors for cell signals, as catalysts/enzymes, and as
structural components of the cytoskeleton. The proteins of the cell membrane can also perform the following functions:
Molecule transport—Each transport protein aids the transport of a specific molecule, ion, etc…
across the membrane.
Act as enzymes to catalyze specific reactions.
Cell to cell communication and recognition—These proteins can help cells attach to each other
and work together and/or communicate with each other.
Signal Receptors—Act to receive hormones or other signaling molecules which circulate in the
blood or interstitial fluids.
Attachment points—Some proteins act as attachment points for the cytoskeleton. Cholesterol
This lipid molecule functions to keep the membrane from being too fluid, and too permeable to some
small molecules. It also helps to secure the proteins that are embedded in the membrane.
Cholesterol helps to keep the cell membranes of plant cells from freezing solid in very cold
temperatures.
Fluid Mosaic Model of the Cell Membrane
The current scientific model of the cell membrane is referred to as the Fluid-Mosaic model because it looks like
a moving (Fluid) puzzle (mosaic). The phospholipids compose the fluid portion, while the proteins are embedded
within like a mosaic. Certain membrane structures such as glycoproteins and glycolipids pieces can move
laterally around the surface of the cell within the membrane, like students moving from seat to seat. The proteins
moving in this sea of phospholipids are like a teacher moving around the student desks. Imagine the ceiling and
floor are water molecules. The water molecules prevent vertical movement of the cell membrane

Page 60 of 318
60 Return to Table of Contents
components.

Page 61 of 318
61 Return to Table of Contents
AP Biology
Eukaryotic Cell Components
There are four main parts to Eukaryotic Cells:
Plasma “cell” membrane—This structure holds the cell together and helps to regulate which substances can
enter/exit the cell.
Nucleus--This controls the activities of a cell because it contains the DNA which acts as the instruction for
building the cell’s proteins and determining its traits.
Cytoplasm or cytosol—This fluid-filled space contains the organelles and makes up most of the volume of the
cell.
Organelles—These structures specialize to carry specific functions within the cell. By specializing, they divide
up the labor and make the cell more efficient. It is important to note that the number and distribution of
organelles differs from cell type to cell type.
Nucleus
This acts as a control center for all activities performed by the cell.
It is the source of the cell’s genetic information or DNA. Nuclear Envelope
It is composed mainly of a double phospholipid bi- layer.
It encloses the DNA.
It also contains pores (tunnels) composed from proteins which allow certain specific materials to
enter/exit the nucleus. The messenger RNA must exit the nucleus and go to the ribosomes where it
acts as the directions for making proteins. DNA
Nucleolus
Ribosomes
Chromatin phase—During most of the cell’s life cycle, the DNA is loose and spread-out throughout
the nucleus. During the chromatin phase, the DNA looks like a bowl of plain spaghetti noodles. During the phase, the DNA can be transcribed and used to make proteins.
Chromosome phase—During this phase, the DNA coils around proteins called histones (in
eukaryotes and archae). The coiling helps to organize the DNA so that it can be corrected distributed
during the processes of nuclear and cell division
This structure appears as a dark spot within the nucleus.
The nucleolus functions to make the ribosomal RNA (rRNA) and proteins which make up the cell’s
ribosomes.
These are CELL PARTICLES made of ribosomal RNA(rRNA) and proteins. Ribsomes are not usually
considered to be organelles because they are not enclosed within a membrane. All cell types, both prokaryotic
and eukaryotic, have ribosomes. The presence of ribosomes in all cells reflects the common ancestry of all
living things. Ribosomes are the sites of Protein Synthesis. The cell’s normal proteins and enzymes are ALL
made here.

Page 62 of 318
62 Return to Table of Contents
Two types of ribosomes exist based on location:
Free Ribosomes– These float “freely” in the cytoplasm of a cell. (They are found in ALL
TYPES of cells.) These ribosomes make proteins that will stay and function inside the cell that
made them.
Bound Ribosomes – These ribosomes are attached to the rough endoplasmic reticulum (RER).
(These are ONLY found in Eukaryotes ONLY because only they have the RER.) Bound
ribosomes make proteins that will leave the cell to be used elsewhere. Many of these proteins
acts as cellular communication signals or as antibodies to fight infections.
Compartmentalization
Membranes and membrane-bound organelles in eukaryotic cells compartmentalize/partition/divide the cell into
distinct locations where specific intracellular metabolic processes and enzymatic reactions can occur. This allows
for the specialization of certain cell parts and the division of labor between these specialized structures. These
internal membranes and the resulting compartmentalization/partitioning, also minimize competing interactions
and increase the surface area needed for some reactions to occur.
Endomembrane system
The endomembrane system (endo = “within”) is a group of membranes and organelles in eukaryotic
cells that work together to modify, package, and transport lipids and proteins. Once the bound
ribosomes make their proteins, the proteins enter the Rough ER and are eventually packaged into
phospholipid-based secretory vesicles. These vesicles transport the proteins to the Golgi apparatus
where they will be modified. After modification, the proteins are once again packaged into a lipid-
based vesicle and shipped to the cell membrane. The proteins are excreted from the cell while the
phospholipids that made up the vesicle become part of the cell membrane. The general pathway is (RER Secretory vesicle Golgi secretory vesicle Membrane for release. In some cases, the pkcagade
proteins/enzymes become part of lysosome instead of being transported out of the cell.
Endoplasmic Reticulum (ER)
It is composed of a network of small tubes called cisternae. (“cisternae” means “tubes”)
The ER is ALWAYS found just outside and around the nucleus.
Two types of ER can exist inside EUKARYOTIC cells:
Smooth Endoplasmic Reticulum (SER)
This structure helps with the synthesis of lipids, phospholipids, and steroids.

Page 63 of 318
63 Return to Table of Contents
It also helps with carbohydrate breakdown.
The smooth ER can also aid in the detoxification of the blood. (Liver cells are loaded with
SER.)
It also helps the storage of Ca++, needed for muscle contraction. (Muscle cells have lots of
SER.)
Rough Endoplasmic Reticulum (RER)
This structure helps with protein synthesis, modification, and transport.
Ribosomes are bound to the outside of the organelle and deposit the newly constructed proteins
into the Rough ER. Inside the structure, the proteins are folded into the specific 3-D structure
needed to function.
The Rough ER also functions to compartmentalize the cell so that specialization and division of
labor can take place.
Golgi Apparatus
The Golgi Apparatus or Golgi Body, a membrane-bound structure which consists of a series of flattened
membrane sacs, modifies proteins by attaching sugars to them. (called Glycoproteins). This process is known as
glycosylation. The addition of sugars to the proteins helps to determine the function of the protein and the
location of the protein’s final destination. The Golgi make act as a warehouse for storage of proteins, but
eventually packages the proteins and ships them out in vesicles. The Golgi apparatus is usually located near the cell membrane.
Lysosomes - These membrane-enclosed organelles contain powerful hydrolytic enzymes and acids.
The lysosomes help to carry out the process of intracellular digestion. This process helps to breakdown materials
within a cell.
Once broken down, the components of some of these materials may be recycled for other purposes.
The lysosomes also play a role in the destruction of old cells that are undergoing apoptosis (programmed cell
death).
Vacuoles and Vesicles – These membrane bound sac-like organelles act as phospholipid-based storage containers
for the storage and release of macromolecules needed by the cell. Vacuoles can also serve to store wastes or
toxins. Various types such as Food, Contractile, Central exist in different types of cells. ed
Mitochondria - Nicknamed the “Power House”.

Page 64 of 318
64 Return to Table of Contents
The mitochondria perform the process of aerobic cellular respiration. During this process the energy from food is
transferred to the bonds of ADP and P to create ATP. ATP then serves as the source of energy for most of the
cell’s processes.
This organelle has its own DNA, its own bacteria-like ribosomes, its own enzymes and it can even reproduce
independently via binary fission. Each mitochondrion has a double phospholipid membrane. The outer
phospholipid bilayer is smooth, while , the inner membranes of the mitochondria are convoluted/folded into
structures known as cristae. The folds increase the surface area and serve as the sites for the electron transport
chain. The two membranes help to provide compartments within the cell where specific metabolic reactions can
take place.
Evolutionary Significance—Mitochondria are believed to have descended from aerobic bacteria that entered into
a symbiotic relationship with a larger prokaryote cells that could provide protection in return for the ATP
produced by the mitochondria. Together they would have an evolutionary advantage over other bacteria. The
advantage allowed them to survive and reproduce and eventually led to the evolution of Eukaryotic cells.
Chloroplasts
These organelles are the sites of Photosynthesis in plants and algae.
Chloroplasts are a type of Plastid or pigment container.
Like mitochondria, chloroplasts have their own DNA, ribosomes, and enzymes! They can also reproduce
independently via binary fission too!
The interior of a chloroplast is composed of stacks of sack-like structures known as thylakoids. The stacks of
thylakoids are known as grana. This stack-like arrangement increases the surface area needed to carry out the
light-dependent stages of photosynthesis. The pigments and electron transport proteins required for the light
dependent stage of photosynthesis are embedded within the membranes of the thylakoids.
The stroma is mostly watery space in between the thylakoids and outer membrane. The stroma serves as the site
of the Calvin Cycle (the metabolic pathway in which sugar is made).
Evolutionary Significance—Chloroplasts are thought to have evolved from blue-green bacteria (cyanobacteria)
that entered into a symbiotic relationship with other bacteria for protection in return for sugar production.

Page 65 of 318
65 Return to Table of Contents
Endosymbiont Hypothesis tries to scientifically explain the symbiotic relationships that led to the evolution of
membrane-bound organelles and eukaryotic cells from once free-living prokaryotic cells.
This hypothesis was proposed by Lynn Margulis in the 1960’s.
It basically hypothesized that Prokaryotes came to live together in symbiotic relationships with smaller
prokaryotes living inside larger prokaryotes in order to gain a survival advantage over other prokaryotes. In
return, the larger prokaryotic hosts gained extra sources or energy or better motility. These symbiotic
partnerships eventually evolved into Eukaryotic cells over many generations that spanned hundreds of thousands
of years.
Cytoskeleton
These structures help to support and protect the cell.
The cytoskeleton also helps to keep inner organelles organized. The spindle fibers that help to move the
chromosomes during mitosis and meiosis are composed of elements of the cytoskeleton.
The cytoskeleton also helps to make up structures such as flagella and cilia which aid in cell motility or cell
organelle movement. (Much like your skeleton helps you move.)
The cytoskeleton is composed of various sized protein fibers known as either microtubules, microfilaments, or
intermediate filaments. (Your skeleton has different sized structures too. Largest – bones, middle – Ligament and
tendons, smallest- muscle fibers.)

Page 66 of 318
66 Return to Table of Contents
Cell Walls
In general, cell walls provide a structural boundary, as well as a permeability barrier for some substances to
the cell’s internal environment.
Cell Wall of Plant Cells--It is composed primarily of the complex carbohydrate cellulose. It functions to provide
support and protection to the plant. It may also protect the cells from bursting if they are exposed to hypotonic
conditions.
Cell Walls of Fungus--Composed of the complex carbohydrate called Chitin. The functions of the fungal cell
wall are similar to those of the plant cell wall.
Bacterial cell walls are also mostly composed of complex carbohydrates.
Extra Cellular Matrix (ECM)
The extracellular matrix consists of molecules that are secreted by a cell into the space out the cell’s
membrane. The extracellular matrix can form cell walls, bone, cartilage, etc… The ECM can
function to provide support, to segregate different tissues from one another, and to regulate
intercellular communication.
A CELL IS THE MORE THAN THE SUM OF ITS PARTS! Only when all the parts come together and work together
can “LIFE” happen.
AP Biology
Cellular Transport Mechanisms
Material Transport
The highly complex organization of living systems requires a constant input of energy and the exchange of
macromolecules between the cell and its environment/surroundings. Growth and homeostasis are maintained by the
constant movement of molecules across membranes.
CO2 and O2 (both gases) can diffuse across the wet phospholipid bi-layer because they are neutrally charged and small
particles.
Ions, polar molecules, and large molecules move through the membrane with the help of either channel or carrier
proteins.
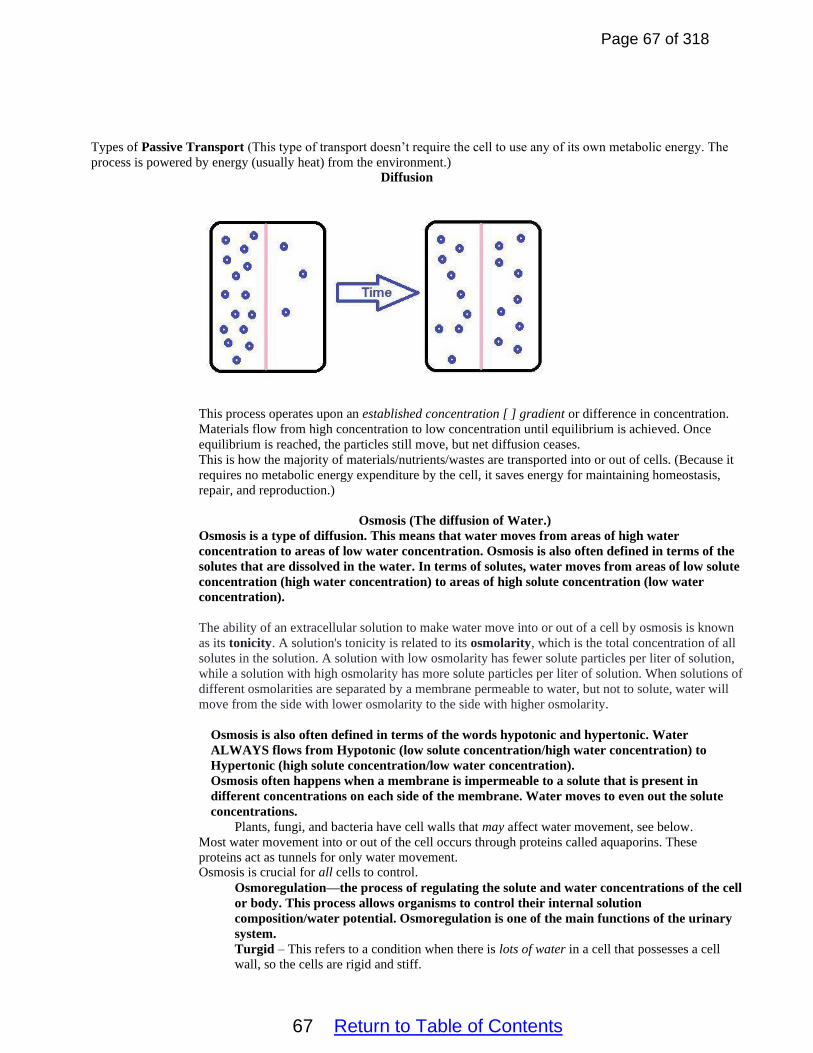
Page 67 of 318
67 Return to Table of Contents
Types of Passive Transport (This type of transport doesn’t require the cell to use any of its own metabolic energy. The
process is powered by energy (usually heat) from the environment.) Diffusion
This process operates upon an established concentration [ ] gradient or difference in concentration.
Materials flow from high concentration to low concentration until equilibrium is achieved. Once
equilibrium is reached, the particles still move, but net diffusion ceases.
This is how the majority of materials/nutrients/wastes are transported into or out of cells. (Because it
requires no metabolic energy expenditure by the cell, it saves energy for maintaining homeostasis,
repair, and reproduction.)
Osmosis (The diffusion of Water.)
Osmosis is a type of diffusion. This means that water moves from areas of high water
concentration to areas of low water concentration. Osmosis is also often defined in terms of the
solutes that are dissolved in the water. In terms of solutes, water moves from areas of low solute
concentration (high water concentration) to areas of high solute concentration (low water
concentration).
The ability of an extracellular solution to make water move into or out of a cell by osmosis is known
as its tonicity. A solution's tonicity is related to its osmolarity, which is the total concentration of all
solutes in the solution. A solution with low osmolarity has fewer solute particles per liter of solution,
while a solution with high osmolarity has more solute particles per liter of solution. When solutions of
different osmolarities are separated by a membrane permeable to water, but not to solute, water will
move from the side with lower osmolarity to the side with higher osmolarity.
Osmosis is also often defined in terms of the words hypotonic and hypertonic. Water
ALWAYS flows from Hypotonic (low solute concentration/high water concentration) to
Hypertonic (high solute concentration/low water concentration).
Osmosis often happens when a membrane is impermeable to a solute that is present in
different concentrations on each side of the membrane. Water moves to even out the solute
concentrations.
Plants, fungi, and bacteria have cell walls that may affect water movement, see below.
Most water movement into or out of the cell occurs through proteins called aquaporins. These
proteins act as tunnels for only water movement. Osmosis is crucial for all cells to control.
Osmoregulation—the process of regulating the solute and water concentrations of the cell
or body. This process allows organisms to control their internal solution
composition/water potential. Osmoregulation is one of the main functions of the urinary
system.
Turgid – This refers to a condition when there is lots of water in a cell that possesses a cell
wall, so the cells are rigid and stiff.

Page 68 of 318
68 Return to Table of Contents
Flaccid – This refers to a condition when there is not very much water in a cell that possesses a
cell wall, so the cells are limp and wilted.
Plasmolysis – This is when the cell membrane shrivels away from the cell wall. This happens
when a cell is placed into a hypertonic environment. Water leaves the cell and it shrivels up.
This is why salty environments kill plants.
Assume that the membrane is impermeable to the solute in each of the two diagrams
included below.
Water Potential
(Represented by the Greek letter psi – Ψ…after Poseidon’s Trident.)
Water Potential is a measure of the relative tendency of water to move from one area to
another. Water potential takes into account both the effects of solute concentration and
pressure. Such calculations are important when trying to determine the effects of
osmosis on cells that possess a cell wall. Water always flows from High Ψ to Low Ψ. The total water potential of pure water in an open
container is 0. Pressure Potential (Represented by ΨP.)

Page 69 of 318
69 Return to Table of Contents
Pushing is positive pressure being exerted on the cell. (+ΨP)
Pulling away from is negative pressure (-ΨP) being exerted on a cell. (Important when
you consider a plant is having water pulled out of it by transpiration at the stomata and
pushed into the xylem vascular cylinder in the root. Solute Potential (Represented by the symbol ΨS.)
ΨS = -iCRT
i is the ionization constant. The ionization constant is essentially the number of ions that are formed when a substance dissolves. The ionization for sugars is always 1. Sugars don’t ionize when they dissolve. The ionization constant for NaCl is 2 because
it ionizes into 1Na+ and 1Cl- ion when it dissolves. The ionization constant for CaCl2
is 3 because the salt dissolves into 1 Ca+2 and 2Cl- ions.
Don’t forget to include the leading negative sign from the formula. C is the molar concentration or molarity measured in moles of solute/Liter of solution.
R is the pressure constant. (R= 0.0831liter-bars/mole-K)
T is the temperature in Kelvin. (273+ ⁰C=K) You must use the Kelvin temperature in
these calculations. Total Water Potential (Represented by ΨT)
ΨT= ΨS +ΨP
Water Potential is important during the process of transpiration. The water potential is highest in the soil
and lowest in the air. Water thus moves from the soil into the roots, from the roots to the stem, and the
stem to the leaves, and from the leaves out the stomata into the air.
Facilitated Diffusion
Facilitated diffusion (a type of passive transport) transports materials from high concentration to low
concentration. This type of transport requires the help of channel or transport proteins because the
materials that are being transported are either polar/ionic/large.
Aquaporins- Channel proteins which help move water (because it is a polar molecule) across a
membrane via facilitated diffusion. This is how most water moves into a cell.
Gated-ion channels which move sodium and potassium ions in and out of neurons are also examples of
channel proteins which aid in the process of facilitated diffusion.
Active Transport
(This process requires the use of metabolic ENERGY by the cell. This energy is often provided by ATP Hydrolysis.)
This process moves materials against the concentration gradient. (Like pushing a car up a hill…it will require
energy.) Materials are being moved from areas of low concentration to areas of high concentration.

Page 70 of 318
70 Return to Table of Contents
The Na+/K+ Pump of the nervous system, is an example. This sodium/potassium pump has an
ATPase enzyme associated with it. This enzyme catalyzes the hydrolysis of ATP which provides the
energy needed for the active transport of the ions and the establishment and maintenance of
concentration gradients. The movement of ions can cause the membranes of certain cells (like
neurons) to become polarized (be positive on one side of the membrane and negative on the other
side).
Energy from ATP by Phosphorylation (Attaching a phosphate ion to a structure to make it
work.) activates the protein to grab and move molecules.
Electrogenic Pump (A.K.A. Proton [H+] Pump)
This is the most important active transport protein for all life forms. Proton pumps are important in
processes involved in the electron transport chain of photosynthesis and cellular respiration.
Hydrogen ions, H+, move out of the cell to create a gradient. (Outside is + and inside is -.) Diffusion
can now occur based on charges into and out of cell. The gradient serves as a source of energy for
producing ATP.
Co-transport
Co-transport is a process in which two substances are simultaneously transported across a
membrane by one protein, or protein complex which does not have ATPase activity.
Co-transport is a type of active transport. Usually one of the substances moves with the
concentration gradient (from high to low concentration). The movement of this substance provides
the energy to transport the other substances against the concentration gradient (from low to high
concentration). When both substances are transported in the same direction the transport protein is known as a
symport .
When the substances are transported in opposite directions the transport protein is known as an
antiport.
An example of co-transport is the absorption of glucose by epithelial cells in the gut. In the gut,
glucose is co-transported with sodium ions. The concentration of Sodium ions is higher outside the
gut cells than it is inside them. The sodium/potassium pump establishes and helps to maintain the
sodium concentration gradient. This is called primary active transport. Sodium then moves into the

Page 71 of 318
71 Return to Table of Contents
cells (through a transport protein (symport)) down its concentration gradient. The concentration of
glucose is higher inside the cells that it is outside the cells. The energy from the movement of the
sodium ions powers the secondary active transport of glucose into the cells by the same transport
protein or symport.
Large Molecule Transport or Bulk Transport
The movement of molecules that are TOO big for proteins to transport. All forms of bulk transport require the cell to
expend metabolic energy and thus can be classified as forms of active transport.

Page 72 of 318
72 Return to Table of Contents
Exocytosis – This is the process of moving large materials out of a cell. Exocytosis is often referred to as
secretion. An example of this process would be Pancreatic cells releasing the hormone Insulin into the blood
stream to help regulate blood glucose levels. Typically, this involves vesicles from Golgi Apparatus fusing with
the cell membrane and secreting the proteins through the cell membrane and into the interstitial fluids around the
cell.
Endocytosis – This is the process of moving large materials into a cell. (“Endo” means “in”)
Phagocytosis – This process is transports large, solid particles into the cell. It usually involves the
surrounding of the particles with the cell membrane, the engulfing of the particles, and the surrounding
of the particles with a vesicle. A white blood cell taking in a bacterial cell is a good example of
phagocytosis. Phagocytosis is often followed by the process of intracellular digestion.
Pinocytosis – Pinocytosis is a mode of endocytosis in which small particles suspended in extracellular
fluid are brought into the cell through an invagination of the cell membrane, resulting in a suspension
of the particles within a small vesicle inside the cell. These pinocytotic vesicles subsequently fuse with
lysosomes to hydrolyze (break down) the particles.
Receptor-Mediated Endocytosis
Receptor mediated endocytosis is an endocytotic mechanism in which specific molecules are
transported into the cell. The specificity results from a receptor-ligand interaction. In this case, the
ligand is the substance that is being transported into the cell. The ligand binds to a receptor (on the
cell membrane) that is specific to that particular ligand. This triggers an endocytotic process and the
ligand is ingested. The transport of cholesterol into cells is a good example. LDL cholesterol
normally binds to receptors on the cell membrane and is then transported into cells. Individuals with
the genetic condition familial hypercholesterolemia don’t have receptors for LDL cholesterol. The
LDL can’t be transported into the cells, stays in the bloodstream, and causing clogging of thearteries.

Page 73 of 318
73 Return to Table of Contents

Page 74 of 318
74 Return to Table of Contents
AP Biology
Unit 3
Student Notes

Page 75 of 318
75 Return to Table of Contents
Unit 3 Student Notes
Table of Contents
A. Bioenergetics—Pages 76-77
B. Metabolism and Metabolic Pathways—Pages 77-79 C. Thermodynamics—Pages 79-80
D. ATP—Pages 80--82 E. Coupling—Page 82 F. Phosphorylation—Pages 82-83 G. Enzymes—Pages 84-88 H. Factors That Affect Enzyme Activity—Pages 85-88
I. Inhibitors—Pages 86-88 J. Feedback Inhibition—Pages 87--88 K. Introduction to Cellular Respiration—Page 88 L. Redox Reactions—Pages 89-90 M. Aerobic Cellular Respiration—Pages 89-102 N. Glycolysis—Pages 91-94 O. The Mitochondria—Pages 94-95
P. Pyruvate Conversion—Pages 96-97 Q. Krebs Cycle—Pages 97-98 R. Electron Transport Chain—Pages 99-100 S. Utilizing Proteins and Lipids as Energy Sources—Pages 101-102 T. Anaerobic Cellular Respiration—Pages 102-104 U. Photosynthesis—Pages 105-117 V. Overview of Photosynthesis—Page105 W. Chloroplast Structure—Page 106 X. Light Energy—Pages 106-108 Y. Absorption and Reflection of Light—Pages 108-109 Z. Absorption Spectrum—Page 110 AA.Light Dependent Reactions of Photosynthesis—Pages 110-112 BB. Calvin Cycle—Pages 113-114 CC. Fitness/Photorespiration & Adaptations for Hot/Dry Con.—Pages 114-116 DD. Thermoregulation—pages 117-119
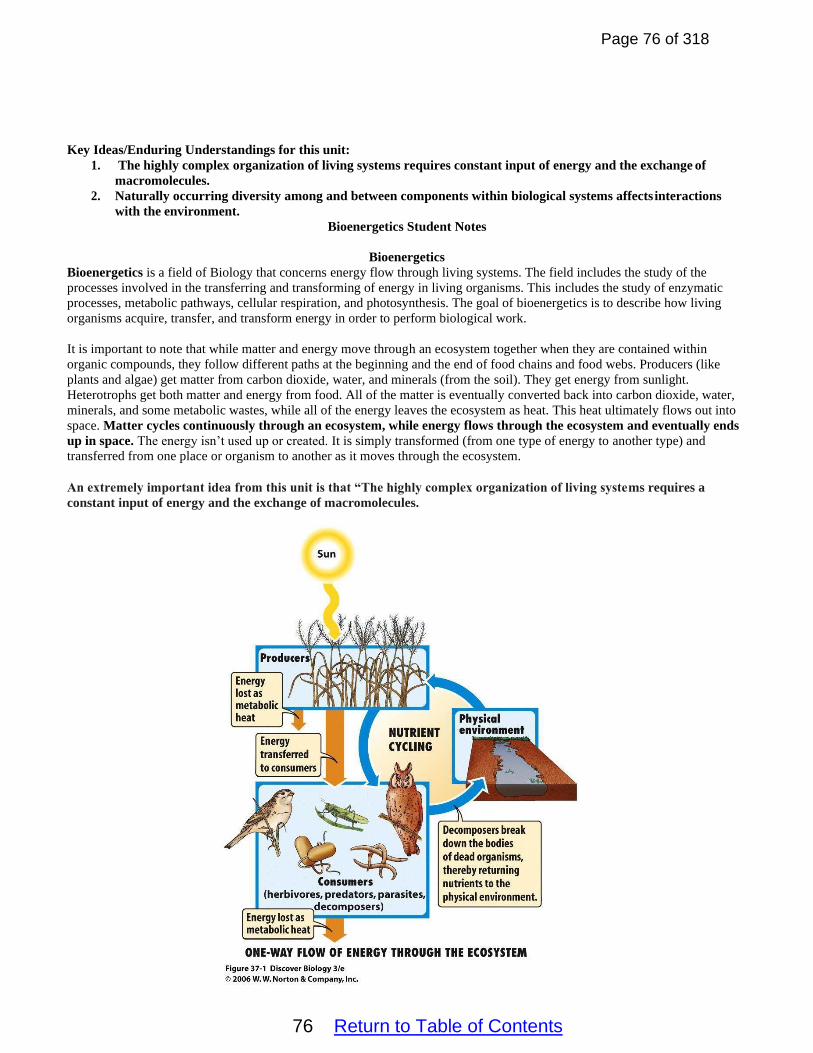
Page 76 of 318
76 Return to Table of Contents
Key Ideas/Enduring Understandings for this unit:
1. The highly complex organization of living systems requires constant input of energy and the exchange of
macromolecules.
2. Naturally occurring diversity among and between components within biological systems affects interactions
with the environment.
Bioenergetics Student Notes
Bioenergetics
Bioenergetics is a field of Biology that concerns energy flow through living systems. The field includes the study of the
processes involved in the transferring and transforming of energy in living organisms. This includes the study of enzymatic
processes, metabolic pathways, cellular respiration, and photosynthesis. The goal of bioenergetics is to describe how living
organisms acquire, transfer, and transform energy in order to perform biological work.
It is important to note that while matter and energy move through an ecosystem together when they are contained within
organic compounds, they follow different paths at the beginning and the end of food chains and food webs. Producers (like
plants and algae) get matter from carbon dioxide, water, and minerals (from the soil). They get energy from sunlight.
Heterotrophs get both matter and energy from food. All of the matter is eventually converted back into carbon dioxide, water,
minerals, and some metabolic wastes, while all of the energy leaves the ecosystem as heat. This heat ultimately flows out into
space. Matter cycles continuously through an ecosystem, while energy flows through the ecosystem and eventually ends
up in space. The energy isn’t used up or created. It is simply transformed (from one type of energy to another type) and
transferred from one place or organism to another as it moves through the ecosystem.
An extremely important idea from this unit is that “The highly complex organization of living systems requires a
constant input of energy and the exchange of macromolecules.

Page 77 of 318
77 Return to Table of Contents
Enzymes and Energy Student Notes
Metabolism
Enzymes, Metabolism, and Energy Screencast Metabolism--The sum of all the chemical reactions occurring in an organism. All of life’s processes occur due to
chemical reactions.
Metabolism can be subdivided into two separate phases.
Catabolism – This refers to chemical reactions which break down molecules.
In many cases, catabolic reactions release the “potential” energy found in the chemical bonds
between monomers.
These reactions are often exergonic reactions because they release heat energy to the
environment
Anabolism –These reactions combine monomers to build polymers.
Anabolic reactions usually require an input of “Kinetic” energy to create bonds between the
monomers.
Usually, anabolic reactions are endergonic reactions because they absorb energy from the
environment.

Page 78 of 318
78 Return to Table of Contents
•

Page 79 of 318
79 Return to Table of Contents
Energy (represented by “E”)—The ability to do work or make things move.
There are three main types of Energy that affect living organisms.
Kinetic Energy (represented as “KE”) - This is the energy of movement. (Usually refers to the
movement of electrons or protons in Biology.)
Potential Energy (represented as “PE”) – This is energy in its stored form. (In Biology, this usually
refers to the energy stored in the bonds of chemicals.)
Thermal Energy—Thermal energy is a form of kinetic energy. The movement of thermal energy is
called heat. Thermal energy/heat is often released to the environment during chemical reactions.
For living organisms, the chemical energy of life is found in chemical bonds.
The processes of Cellular Respiration and Digestion are catabolic processes which release energy from
biological macromolecules for use by cells.
The process of photosynthesis, an anabolic process, allows plants to store solar energy in the form of
chemical energy (sugar). The process involves the bonding together of carbon atoms (from carbon
dioxide) to create biological macromolecules like sugars.
Metabolic Pathways
Metabolic pathways—Everything that happens in a cell happens because of chemical reactions. Most of these processes are
complicated and require lots of chemical reaction steps to take place. Metabolic pathways are enzyme-regulated sets of
biochemical reactions that lead to either biosynthesis (anabolic pathways) or breakdown (catabolic pathways).
Examples of metabolic pathways include glycolysis, the Krebs cycle, and the Calvin Cycle. Photosynthesis, Cellular
Respiration, and Digestion might also be thought of as metabolic pathways. Each step of a metabolic pathway consists of a
separate chemical reaction. Metabolic pathways consist of a sequential set of chemical reactions in which the products of one
reaction are typically the reactants (substrates) for the next reaction. Each step is catalyzed by a different, specific enzyme.
Many of the major metabolic pathways such as glycolysis and Krebs cycle are conserved across most living things. This
indicates that the organisms inherited the metabolic pathways from a common ancestor.
Sample Metabolic Pathway
Thermodynamics
The study of Heat Energy(Thermo) and its properties (dynamics).
First Law of Thermodynamics (Also called the Law of the Conservation of Energy)
Energy cannot be created nor destroyed but can be transformed from one type of energy to another type of energy and can be transferred from one location to another location.
Second Law of Thermodynamics
Every energy transfer increases the entropy of the universe.

Page 80 of 318
80 Return to Table of Contents
Entropy- a thermodynamic quantity representing the unavailability of a system's thermal energy for conversion
into mechanical work; often interpreted as the degree of disorder or randomness in the system. Essentially,
the Second Law of Thermodynamics says that during every energy transfer, some of the system’s energy is
converted to heat. This heat is then unavailable to do useful work. Life requires a highly ordered system and
does not violate the Second Law of Thermodynamics. This means that the amount of energy input into an
organism or biological system must exceed the amount of energy lost to maintain order and power cellular
processes. The loss of order or energy flow results in the death of the organism.
ATP
A cell can be thought of as a small, busy city. Carrier proteins move substances into and out of the cell, motor proteins carry
cargo along microtubule tracks, and metabolic enzymes busily break down and build up macromolecules.
Even processes that are not energetically favorable (spontaneous or exergonic) will occur if there is energy available to power
them. However, if the energy runs out, the reactions will grind to a halt, and the cell will begin to die.
Energetically unfavorable reactions are “paid for” by coupled, energetically favorable reactions that release energy. Often, the
"payment" reaction involves one particular small molecule: adenosine triphosphate, or ATP.
Adenosine triphosphate, or ATP, is a small, relatively simple molecule. It can be thought of as the main energy currency of
cells, much as money is the main economic currency of human societies. The energy released by the hydrolysis (breakdown)
of ATP is used to power many energy-requiring cellular reactions.
Structurally, an ATP molecule is composed of a single nucleotide that bears a chain of three phosphates. At the center of the
molecule lies a five-carbon sugar, ribose, which is attached to the nitrogenous base adenine and to the chain of three
phosphates.
ATP is made unstable by the three adjacent negative charges in its phosphate tail, which "want" very badly to get further away
from each other. The bonds between the phosphate groups are called phosphoanhydride bonds and are often referred to as
“high-energy” bonds.
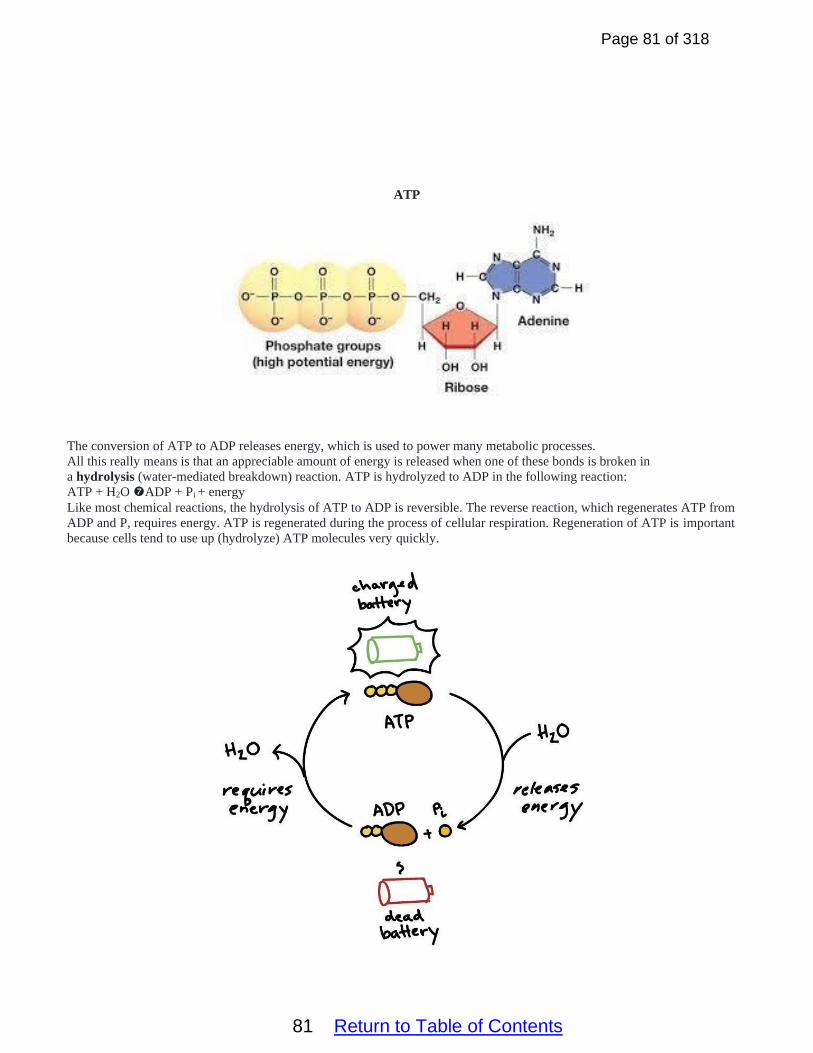
Page 81 of 318
81 Return to Table of Contents
ATP
The conversion of ATP to ADP releases energy, which is used to power many metabolic processes.
All this really means is that an appreciable amount of energy is released when one of these bonds is broken in
a hydrolysis (water-mediated breakdown) reaction. ATP is hydrolyzed to ADP in the following reaction:
ATP + H2O ADP + Pi + energy Like most chemical reactions, the hydrolysis of ATP to ADP is reversible. The reverse reaction, which regenerates ATP from
ADP and P, requires energy. ATP is regenerated during the process of cellular respiration. Regeneration of ATP is important
because cells tend to use up (hydrolyze) ATP molecules very quickly.

Page 82 of 318
82 Return to Table of Contents
You can think of ATP and ADP as being sort of like the charged and uncharged forms of a rechargeable battery (as shown
above). ATP, the charged battery, has energy that can be used to power cellular reactions. Once the energy has transferred to
another molecule, the uncharged battery (ADP) must be recharged before it can again be used as a power source. The ATP
regeneration reaction is just the reverse of the hydrolysis reaction.
∆G for the hydrolysis of one mole of ATP in a living cell is around -14 kcal/mol or −57 kJ/mol. Because of this value, the
reaction is extremely spontaneous. This means that ATP is very reactive and is difficult for the body to store or transport. This
is why plants use ATP to make glucose. Glucose and other sugars are much more storable and transportable energy molecules.
Coupling
The energy from ATP is often used to power endergonic reactions via a process known as reaction coupling. During coupling
an energetically favorable/spontaneous reaction (like ATP hydrolysis) is directly linked with an energetically unfavorable
(endergonic) reaction. This essentially means that a reaction that releases energy (like the hydrolysis of ATP) is often coupled
with reactions that require an input of energy.
Phosphorylation
When reaction coupling involves ATP, the shared intermediate is often a phosphorylated molecule (a molecule to which one
of the phosphate groups of ATP has been attached). As an example of how this works, let’s look at the formation of sucrose, or
table sugar, from glucose and fructose.
The formation of sucrose requires an input of energy: its ΔG is about +27 kJ/mol. ATP hydrolysis has a ΔG around -30 kJ/mol,
so it can release enough energy to “power” the synthesis of a sucrose molecule
How is the energy released in ATP hydrolysis channeled into the production of a sucrose molecule? As it turns out, there are
actually two reactions that take place, not just one big reaction, and the product of the first reaction acts as a reactant for the
second.
In the first reaction, a phosphate group is transferred from ATP to glucose, forming a phosphorylated glucose intermediate
(glucose-P). This is an energetically favorable (energy-releasing) reaction because ATP is so unstable, i.e., really "wants" to
lose its phosphate group.
In the second reaction, the glucose-P intermediate reacts with fructose to form sucrose. Because glucose-P is relatively unstable
(thanks to its attached phosphate group), this reaction also releases energy and is spontaneous.

Page 83 of 318
83 Return to Table of Contents
This example shows how reaction coupling involving ATP can work through phosphorylation, breaking a reaction down into
two energetically favored steps connected by a phosphorylated (phosphate-bearing) intermediate. This strategy is used in many
metabolic pathways in the cell, providing a way for the energy released by converting ATP to ADP to drive other reactions
forward.
Protein phosphorylation is the major molecular mechanism through which protein function is regulated in response to
extracellular stimuli both inside and outside the nervous system. Virtually all types of extracellular signals, including
neurotransmitters, hormones, light, neurotrophic factors and cytokines, produce most of their diverse physiological effects by
regulating phosphorylation of specific phosphoproteins in their target cells.
It is the job of a group of enzymes known as protein kinases to carry out the many phosphorylations that happen in a cell.

Page 84 of 318
84 Return to Table of Contents
.
Enzymes
After completing this unit, students should be able to describe the properties of enzymes.
Enzymes are proteins which catalyze chemical reactions. Enzymes increase the rate of biological reactions.
They do this by lowering the activation energy required for a reaction to occur.
The substance(s) acted upon by an enzyme is the substrate.
The substrate binds to an area of the enzyme known as the active site. The shape of the substrate and enzyme must be
complimentary. The charges of the substrate and active site must also be compatible. This ensures that each enzyme is
very specific and only catalyzes one particular reaction.
Once the substrate binds to the enzyme, the enzyme undergoes a slight change in shape (induced fit). This change in
shape helps to catalyze the reaction.

Page 85 of 318
85 Return to Table of Contents
Some enzymes catalyze anabolic reactions, while others catalyze catabolic reactions.
Enzymes catalyze reactions, but aren’t themselves changed by or used up during the reactions in which they take part.
Each enzyme works best at a specific (optimal) temperature and pH. If the temperature and/or pH is moved away from
the optimal conditions, the enzyme will begin to denature (change shape and lose function). This is largely because the
changes in pH and increases in temperature disrupt the hydrogen bonds which help to provide and support the
shape/structure of the enzyme. In most cases, denaturation is permanent although in some cases it can be reversible.
It is important to remember that pH is a measure of the hydrogen ion concentration in a solution. It can be calculated
using: pH=-log[H+] Higher hydrogen ion concentrations [H+] lead to lower pH values. Lower hydrogen ion
concentrations lead to higher pH values. Solutions with pH values below 7 are acidic, while those above 7 are basic.
Most human enzymes have an optimal temperature of 37 degrees Celsius and an optimal pH around 7.
Factors that can affect enzyme activity
Concentration of Enzymes and Substrates: The rate of reaction increases with increasing substrate concentration up to a
point, beyond which any further increase in substrate concentration produces no significant change in reaction rate. This occurs
because after a certain concentration of the substrate, all the active sites on the enzymes are full and no further reactions can
occur. The rate of reaction also increases with increased enzyme concentration, up to the point at which all of the substrate is
either used up or bound to an enzyme. The relative concentrations of substrates and products can also determine how
efficiently an enzymatic process proceeds. When the concentration of products is high compared to the concentration of
substrates, the reaction will proceed slowly. When the concentration of the substrates is high compared to the concentrations of
the products, the reaction will proceed quickly.
Temperature: With an increase in temperature, enzyme activity increases because of the increase in kinetic energy of the
molecules. More kinetic energy means more movement of enzymes and substrates. This means that the enzymes and
substrates will bind to each other more often and more reactions will take place. There is an optimum level at which the
enzymes work best. This temperature is often the normal body temperature. When the temperature increases beyond a certain
limit, enzymes, which are actually made up of proteins, begin to denature and the rate of the reaction slows down.
pH: Enzymes are very sensitive to changes in pH and work in very small windows of permissible pH levels. Below or above
the optimum pH level, there is a risk of the enzymes denaturing and the reaction rate slowing down.
Salinity: Enzymes are also very sensitive to salinity (salt levels). If salinity levels vary on either the high or low side of
normal, enzymes may denature and reaction rates may slow.

Page 86 of 318
86 Return to Table of Contents
Inhibitors
Inhibitors: Certain substances can attach to and inhibit/prevent the action of a particular enzyme.
Types of Inhibitors:
Competitive Inhibitors- These molecules compete for the active site. They have a shape similar to that of the
substrate. These molecules slow down the reaction rate because they prevent normal substrate binding. Some
competitive inhibitors bind permanently to the enzyme and permanently deactivate it, while others bind reversibly.
Non-competitive Inhibitors –These molecules attach somewhere other than the active site causing the shape of the active site
to change so the substrate can’t fit into it. In many cases, non-competitive inhibitors bind to allosteric or feedback sites.
These molecules cause the reaction to stop completely. (These molecules may affect the enzyme permanently or maybe
temporarily in the case of an Allosteric connection.)
If an inhibitor is competitive, it will decrease the reaction rate when there's not much substrate, but can be "out-competed" by
lots of substrate. That is, the enzyme can still reach its maximum reaction rate given enough substrate. In that case, almost all
of the active sites of almost all the enzyme molecules will be occupied by the substrate rather than the inhibitor.
If an inhibitor is noncompetitive, the enzyme-catalyzed reaction will never reach its normal maximum rate even with a lot of
substrate. This is because the enzyme molecules with the noncompetitive inhibitor bound are "poisoned" and can't do their job,
regardless of how much substrate is available.
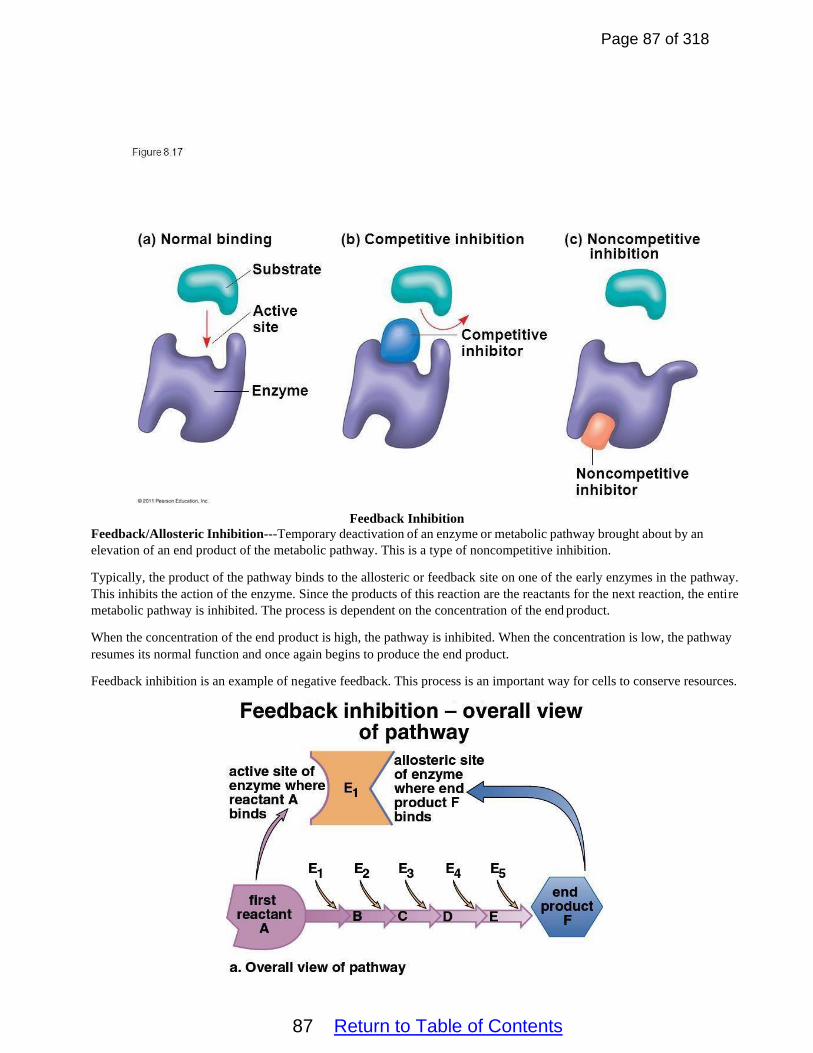
Page 87 of 318
87 Return to Table of Contents
Feedback Inhibition
Feedback/Allosteric Inhibition---Temporary deactivation of an enzyme or metabolic pathway brought about by an
elevation of an end product of the metabolic pathway. This is a type of noncompetitive inhibition.
Typically, the product of the pathway binds to the allosteric or feedback site on one of the early enzymes in the pathway.
This inhibits the action of the enzyme. Since the products of this reaction are the reactants for the next reaction, the entire
metabolic pathway is inhibited. The process is dependent on the concentration of the end product.
When the concentration of the end product is high, the pathway is inhibited. When the concentration is low, the pathway
resumes its normal function and once again begins to produce the end product.
Feedback inhibition is an example of negative feedback. This process is an important way for cells to conserve resources.

Page 88 of 318
88 Return to Table of Contents
Allosteric Activators
Co-enzymes and Co-factors These are molecules or ions that help enhance an enzyme’s ability to work.
Cofactors are inorganic metal minerals (such as Mg, Fe, and Zn) that attach to and activate specific enzymes.
Coenzymes are organic molecules (what are called “vitamins”) that attach to and activate specific enzymes.
Vitamin and mineral deficiencies are dangerous because without them the body’s enzymes don’t
function properly.
Cellular Respiration Student Notes
Introduction to Cellular Respiration
Cellular Respiration
Cellular Respiration Screencast
Cellular Respiration is the process of releasing the energy contained in organic molecules (mainly Glucose) to do
work. (This is an example of catabolism.)
The process uses the energy from the organic, biological macromolecules to make ATP. ATP then serves
as the energy source for most of the body’s endergonic reactions.
Cellular Respiration also releases heat (unusable energy) and free electrons. The free electrons serve as a
source of energy for producing ATP.
The process of cellular respiration is a series of coordinated enzyme-catalyzed reactions that capture
energy from biological macromolecules. When O2 is present in the cell, aerobic respiration takes place. The first stage of this process, glycolysis, occurs in the
cytoplasm/cytosol. The other two stages, Krebs Cycle and the Electron Transport Chain, take place within the mitochondria. Exceptions to these statements will be discussed below.
Aerobic Cellular Respiration Chemical Equation
602 + C6H12O6 6CO2 + 6H2O + Free Energy +Heat Energy ∆G = -686 kcal per mole of Glucose A negative ∆ G means Free E is available to do work. During
cellular respiration the free energy is used to make ATP.
Without O2 present in the cell, anaerobic respiration takes place. This process also involves glycolysis as its first step.
This step is again carried out in the cytoplasm/cytosol. The second step of the process is called fermentation. It too occurs in
the cytoplasm. Some books/questions refer to all of anaerobic respiration as fermentation. Be sure to pay attention to the
context of the question when answering questions about anaerobic respiration.
The process of cellular respiration is highly conserved across all life forms on Earth. Almost all organisms, both
prokaryotic and eukaryotic, carry out glycolysis in almost exactly the same way, using the same enzymes. The enzymes and
chemical reactions of Krebs Cycle and the Electron Transport are also highly conserved. The process of
fermentation/anaerobic cellular respiration is also highly conserved throughout most living things. This high level of
conservation indicates that all living things are related and that somewhere back in evolutionary history they shared a common
ancestor which did cellular respiration. The genes for the enzymes that carry out the process have been passed on to almost all
life forms from that common ancestor.

Page 89 of 318
89 Return to Table of Contents
Redox Reactions
During cellular respiration, glucose (or other organic molecules) is oxidized.
Oxidation—The process in which electrons and energy are removed from a molecule/atom.
Whenever one molecule/atom is oxidized, another molecule/atom must be reduced.
The process is called oxidation, because oxygen is very good at removing electrons from other atoms/molecules. Note: Not all
oxidation reactions actually involve oxygen.
Reduction—The process in which electrons and energy are added to a molecule/atom.
During aerobic cellular respiration, the electrons and energy that are removed from the glucose are initially used to reduce
electron carriers/coenzymes (NAD+ or FAD). Ultimately, the electrons provide the energy to produce ATP. The electrons end
up combining with oxygen gas and hydrogen ions to form water. Reduction is called reduction because the addition of
electrons to a molecule/atom decreases its charge.
Other terms to be aware of:
Oxidizing Agent—The atom/molecule that takes electrons away from another atom/molecule. The oxidizing agent is actually
reduced during redox reactions.
Reducing Agent—The atom/molecule that donates electrons to another atom/molecule. The reducing agent is actually
oxidized during redox reactions.
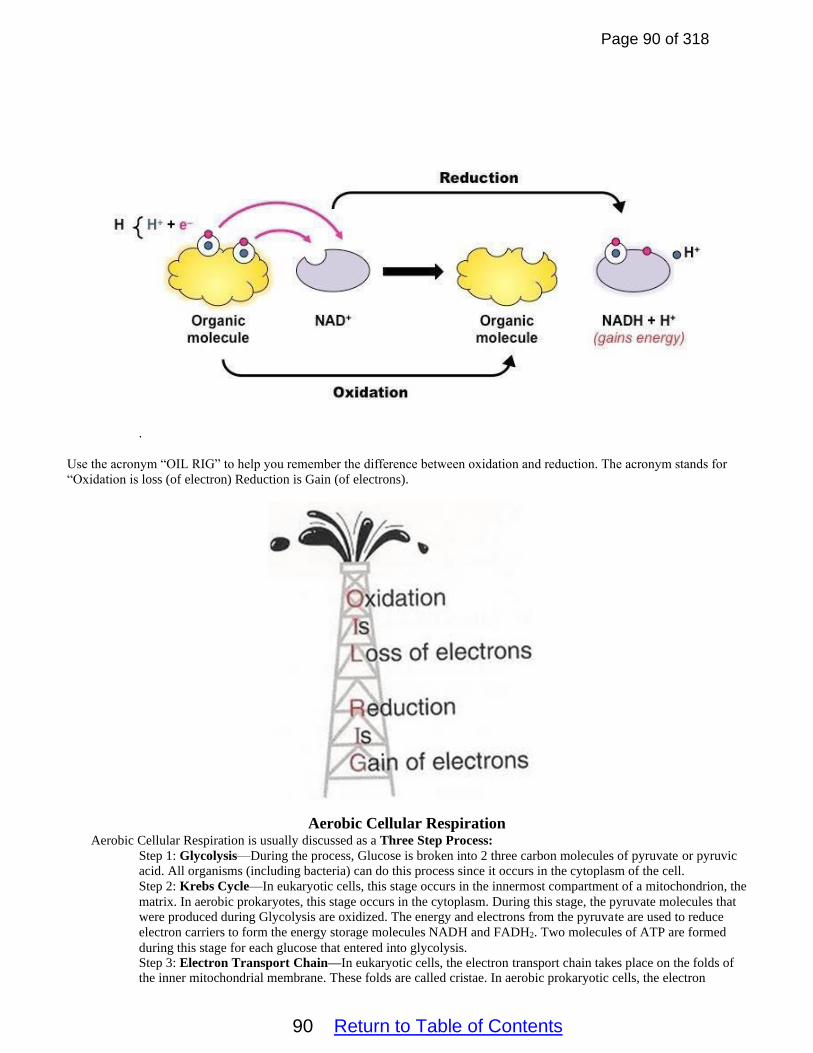
Page 90 of 318
90 Return to Table of Contents
.
Use the acronym “OIL RIG” to help you remember the difference between oxidation and reduction. The acronym stands for
“Oxidation is loss (of electron) Reduction is Gain (of electrons).
Aerobic Cellular Respiration Aerobic Cellular Respiration is usually discussed as a Three Step Process:
Step 1: Glycolysis—During the process, Glucose is broken into 2 three carbon molecules of pyruvate or pyruvic
acid. All organisms (including bacteria) can do this process since it occurs in the cytoplasm of the cell.
Step 2: Krebs Cycle—In eukaryotic cells, this stage occurs in the innermost compartment of a mitochondrion, the
matrix. In aerobic prokaryotes, this stage occurs in the cytoplasm. During this stage, the pyruvate molecules that
were produced during Glycolysis are oxidized. The energy and electrons from the pyruvate are used to reduce
electron carriers to form the energy storage molecules NADH and FADH2. Two molecules of ATP are formed
during this stage for each glucose that entered into glycolysis. Step 3: Electron Transport Chain—In eukaryotic cells, the electron transport chain takes place on the folds of the inner mitochondrial membrane. These folds are called cristae. In aerobic prokaryotic cells, the electron

Page 91 of 318
91 Return to Table of Contents
transport chain takes place on the folded inner surface of the cell membrane. During the ETC, the electron carriers
(NADH and FADH2) that were formed during glycolysis and the Krebs Cycle are oxidized. The energy from
these electrons is used to create large amounts of ATP. The electrons ultimately reduce oxygen gas and form
water. Oxygen gas is a required reactant for this process. The ETC and the process of chemiosmosis, which
accompanies it, are sometimes referred to as oxidative phosphorylation because the electron carriers are
oxidized and their energy is used to bring about the phosphorylation of ADP to form ATP.
The whole process of aerobic cellular respiration yields a Maximum of 38 ATP molecules per glucose.
Glycolysis Glycolysis is a highly conserved biochemical pathway that releases energy from glucose to form ATP from ADP and inorganic
phosphate, NADH from NAD+, and pyruvate from the original glucose. During Glycolysis, Glucose (C6 H12 O6 ) is broken apart into 2 three carbon molecules of G3P. Each molecule of G3P is then
oxidized to form a molecule of Pyruvate (a 3 carbon molecule with less energy than G3P).
There are two phases of Glycolysis:
1. Energy Investment Phase—During this stage 2 ATP molecules are required to act as activation energy for each glucose
molecule that enters the process. The ATPs are used to phosphorylate the glucose. The phosphorylation makes the glucose
unstable. This ultimately leads to the breaking of the glucose into 2 G3P molecules.
The enzyme phosphofructokinase carries out the second phosphorylation step. This enzyme has an allosteric/feedback site.
ATP can bind to this allosteric site. If the cell has produced lots of ATP and the concentration of ATP is high within the cell,
ATP is likely to bind to the allosteric site on phosphofructokinase. This changes the shape of the enzyme and deactivates it.
Once this enzyme is deactivated, glycolysis cannot happen The deactivation is temporary. When ATP levels within the cell
drop, the ATP molecule releases from the feedback/allosteric site and phosphofructokinase returns to its active form. The
process described above is an example of feedback inhibition. The process helps the cell regulate when and how much
cellular respiration it carries out. Since ATP is highly unstable, it doesn’t make sense for the cell to make more of the molecule
than it can use within a short period of time.

Page 92 of 318
92 Return to Table of Contents
2. Energy Payoff or Energy Harvesting Phase—During this stage, each of the two G3P molecules formed during the energy
investment phase is oxidized. The energy and electrons from the 2 G3P molecules are used to create 2 molecules of NADH
and 4 ATP molecules per glucose (that initially entered glycolysis).
During Glycolysis, the ATPs are formed by a process known as substrate-level phosphorylation. In this process, phosphate
groups and energy are transferred from 1,3 bisphosphoglycerate and phosphoenolpyruvate directly to ADP to make ATP.
Phosphofructokinase acts
here.

Page 93 of 318
93 Return to Table of Contents
The NADH formed during this phase is formed by the oxidation of G3P and the transfer of electrons and energy to NAD+.
The electrons (2e-) in the equation shown above were removed from G3P.

Page 94 of 318
94 Return to Table of Contents
At the conclusion of glycolysis, the following products have been formed from 1 glucose molecule:
A. 2 molecules of pyruvate (3 carbon molecules/essentially half of a glucose)
B. 2 molecules of NADH (electron carriers/energy storage molecules)
C. 2 net molecules of ATP—4 molecules of ATP are formed, but 2 are used during the energy investment
stage.
Some important points to remember about Glycolysis: A. This process occurs with or without O2 present in the cell.
B. ALL organisms carry out glycolysis essentially the same way due to common ancestry. It
always takes place in the cytoplasm.
C. When glycolysis is complete, most of the energy that was originally in the glucose molecule is
now in the 2 molecules of pyruvate.
The Mitochondria In eukaryotic cells, the Krebs Cycle and the Electron Transport Chain phases of aerobic cellular respiration take place within
the mitochondria.
This organelle has its own DNA, its own bacteria-like ribosomes, its own enzymes and it can even reproduce independently via
binary fission. The inner membrane of a mitochondrion is folded into structures known as cristae. The folds increase the
surface area and serve as the sites for the electron transport chain.
Evolutionary Significance—Mitochondria are believed to have descended from aerobic bacteria that entered into a symbiotic
relationship with larger prokaryotic cells that could provide protection in return for the ATP produced by the mitochondria.
G3P

Page 95 of 318
95 Return to Table of Contents
Together they would have an evolutionary advantage over other bacteria. The advantage allowed them to survive and
reproduce and eventually led to the evolution of Eukaryotic cells/organelles. This idea is known as the endosymbiotic
hypothesis.
The innermost compartment of a mitochondrion is called the matrix. This is the location for the Krebs Cycle in eukaryotic
cells. It is important to remember that aerobic prokaryotes carry out the Krebs Cycle in the cytoplasm. If the endosymbiotic
hypothesis is correct, the cytoplasm of an aerobic bacteria corresponds to the matrix of a mitochondrion (which originated from
an engulfed aerobic bacterium).
In eukaryotic cells, the electron transport chain takes places on the folds of the inner mitochondrial membrane (cristae). These
folds correspond to the folded surface of the cell membrane in aerobic bacteria. These cell membrane folds serve as the
location of the electron transport chain in aerobic bacteria.

Page 96 of 318
96 Return to Table of Contents
Pyruvate Conversion If Oxygen is present within a eukaryotic cell or an aerobic bacterial cell, the cell can perform the other two parts of
Aerobic Cellular Respiration – Krebs Cycle and Electron Transport Chain. Note: The Krebs Cycle is also sometimes referred to as the citric acid cycle.
Before Krebs Cycle can start, the pyruvate (a 3 carbon molecule created during glycolysis) is transported from the cytosol
to the mitochondrion where it is oxidized more. It is first converted to a 2 carbon molecule known as an acetyl group.
This conversion process occurs in the mitochondria and is referred to as the Preparatory Step, the Transition Step, or
the Pyruvate Conversion.
During this process, each pyruvate is oxidized. Two electrons from each pyruvate are transferred to NAD+ molecules to
form two molecules of NADH. Each pyruvate releases one of its carbons as a carbon dioxide molecule. The resulting 2
carbon acetyl groups each attach to a molecule known as coenzyme A to form two molecules of Acetyl Coenyzme A.
These molecules serve as the starting point for the Krebs Cycle.

Page 97 of 318
97 Return to Table of Contents
Krebs Cycle
Krebs Cycle occurs in the matrix of the mitochondria (in eukaryotic cells) and in the cytoplasm of aerobic
prokaryotic cells. During Krebs cycle, the 2 Acetyl CoA molecules (the remains of the original glucose molecule
from glycolysis) are oxidized. Their electrons and energy are transferred to the electron carriers/coenzymes NAD+ or
FAD to make either NADH or FADH2 . Two molecules of ATP (per glucose) are also produced via the process of
substrate level phosphorylation. During the substrate level phosphorylation process, phosphate groups are transferred
directly form succinyl-CoA to ADP to form ATP. By the end of Krebs Cycle, all of the carbon atoms from the
original sugar are released as carbon dioxide gas.
It is important to note that you don’t need to memorize all of the complicated steps in the Krebs Cycle (see the
diagram included below). The important details to remember are that:
A. Acetyl Coenzyme A is oxidized. The energy that was originally contained in the Acetyl CoEnzyme A is
contained mostly in the electron carriers/coenzymes (NADH or FADH2) at the end of the process. B. By the end of the process, the carbon atoms that originally composed the glucose are all released as
carbon dioxide gas. The CO2 is released from organic intermediates that are oxidized during the Krebs Cycle.
C. The two ATP molecules (per glucose) created from ADP and inorganic phosphate during Krebs Cycle
are created via the process of substrate level phosphorylation.

Page 98 of 318
98 Return to Table of Contents

Page 99 of 318
99 Return to Table of Contents
Electron Transport Chain The Electron Transport Chain occurs on the folds (cristae) of the inner mitochondrial membrane (in eukaryotic cells) and on
the folds of the cell membrane (in aerobic prokaryotic cells). The folds increase the available surface area (like the
villi/microvilli in the small intestine) and allow for the production of more ATP.
The electron transport chain transfers the energy from electrons (contained in the electron carriers like NADH and FADH2) in a
series of coupled reactions that establish an electrochemical (H+) gradient across the membranes of the mitochondria (in eukaryotes) or the cell membrane (in prokaryotes).
During the Electron Transport Chain, the electron carriers formed during glycolysis and Krebs Cycle are oxidized. The energy
from these molecules is used to generate large amounts of ATP.
The actual electron transport chain is composed of a group of proteins known as the cytochromes. These proteins are highly
conserved in all organisms.
The process starts when NADH is oxidized by the first cytochrome in the chain (this protein is known as FMN). The 2
electrons lost from NADH pass through three proteins (proton pumps) as they move down the ETC. The electrons move from
the least electronegative location (the first cytochrome/electron acceptor) toward the most electronegative location (the last
cytochrome/electron acceptor). As the electrons move through the proton pumps, the energy from the electrons powers the
pumping of a hydrogen ion or proton from the matrix into the intermembrane space (the space between the inner and out
mitochondrial membrane). A single proton is pumped as a pair of electrons travels through each of the three proton pumps. A
proton/hydrogen ion gradient is created across the inner membrane. The pumping of the protons creates an area of high
proton/H+ concentration in the intermembrane space and an area of low proton/H+ concentration in the matrix. The
gradient is a way to store potential energy. The bigger the gradient, the more potential energy is stored. In prokaryotes, the
protons are pumped from the cytoplasm through the cell membrane and into the fluids around the cell.
An enzyme, ATP synthase, embedded in the inner membrane, has a channel that will allow protons/H+ ions to move through
it. Since this is the only way back into the matrix (in eukaryotes) or prokaryotic cell (because the nonpolar nature of the inner
membrane won’t allow protons to cross it), the protons/H+ ions move quickly through the ATP Synthase channel. The enzyme
is able to use the kinetic energy of the moving protons/hydrogen ions to add a phosphate group to ADP to make ATP. The
energy from a single proton provides the energy to create a single ATP molecule. The process of using energy from a
proton/H+ ion gradient to phosphorylate ADP with an inorganic phosphate group is known as chemiosmosis. This
process is responsible for the creation of most of the ATP created during both aerobic cellular respiration and
photosynthesis.
Since the pair of electrons from each NADH molecule power the pumping of three protons into the intermembrane space, each
NADH ultimately provides the energy to create three molecules of ATP.
FADH2 is also oxidized during the ETC. It is oxidized at a protein (known as Q) that is located further down the electron
transport chain than the protein involved in the oxidation of NADH. The pair of electrons from FADH2 only passes through 2
proton pumps. This means that each FADH2 molecule provides the energy to make 2 molecules of ATP.
Once the electrons reach the final cytochrome, they must be removed. If not, the last cytochrome will become negatively
charged and will repel addition electrons. This would shut down the entire process of aerobic respiration.
The role of oxygen in aerobic respiration is to remove the electrons from the final cytochrome. Because of its role,
oxygen is often referred to as the final/terminal electron acceptor. Oxygen is capable of this task because of its high
electronegativity. Since it is more electronegative than the final cytochrome, the electrons move from the final cytochrome to
oxygen. The now negatively charged oxygen, combines with hydrogen ions to form water.
The electron transport chain can produce a maximum of 34 ATP molecules per glucose that initially entered glycolysis. The
process also creates water and regenerates the electron acceptors NAD+ and FAD.

Page 100 of 318
100 Return to Table of Contents
The electron transport chain and chemiosmosis are collectively referred to as oxidative phosphorylation. This term is very
descriptive of the processes since the electron carriers (NADH and FADH2) are oxidized and their energy is used to
phosphorylate ADP to make ATP.
Oxidative phosphorylation is an example of ENERGY COUPLING. During the process, the active transport of the hydrogen
ions/protons into the intermembrane space and the subsequent movement of the protons/H+ ions through ATP synthase provide
the energy to phosphorylate ADP to make ATP.
In cellular respiration, the decoupling of oxidative phosphorylation from electron transport generates heat. This heat can be
used by endothermic organisms to regulate body temperature.

Page 101 of 318
101 Return to Table of Contents
Summary of the Products of Aerobic Cellular Respiration from 1 Glucose Molecule
Utilizing Proteins and Lipids as Energy Sources
Although we normally think of sugars/carbohydrates as the source of energy for our bodies, proteins and lipids can also be
used to fuel the body.
In order to use proteins for energy, the body must first break the proteins down into individual amino acids. The amino acids
then undergo a process known as deamination. During this process, the amino group is removed from the amino acid. The
remaining 2 carbon skeleton is very similar to an acetyl group. The 2 carbon group is attached to coenzyme A and enters the
Krebs Cycle. From this point forward, the process works essentially the same as it did with glucose as the initial energy
molecule. The removed amino group is converted to ammonia which has to be disposed of by the liver and kidneys.
In order to use lipids for energy, the fatty acid chains undergo a process known as beta oxidation in which they are essentially
broken up into 2 carbon skeletons. These 2 carbon skeletons are attached to coenzyme A and enter the Krebs Cycle. From this
point forward, the process works essentially the same as it did with glucose as the initial energy molecule.

Page 102 of 318
102 Return to Table of Contents
Anaerobic Cellular Respiration If NO OXYGEN is present within the cell, the cell carries out anaerobic cellular respiration.
Some cells solely use anaerobic cellular respiration to make ATP. This typically only works in very small and relatively
inactive organisms because the process of anaerobic cellular respiration is highly inefficient and does not yield very much ATP
(only 2 ATPs per glucose).
Larger and more active organisms use anaerobic cellular respiration to supplement ATP production in times of low oxygen
concentration. This type of situation might arise when the organism is running at full speed or exerting the muscles with full
force (lifting extremely heavy weights).
The process of anaerobic respiration occurs in two phases: glycolysis and fermentation.
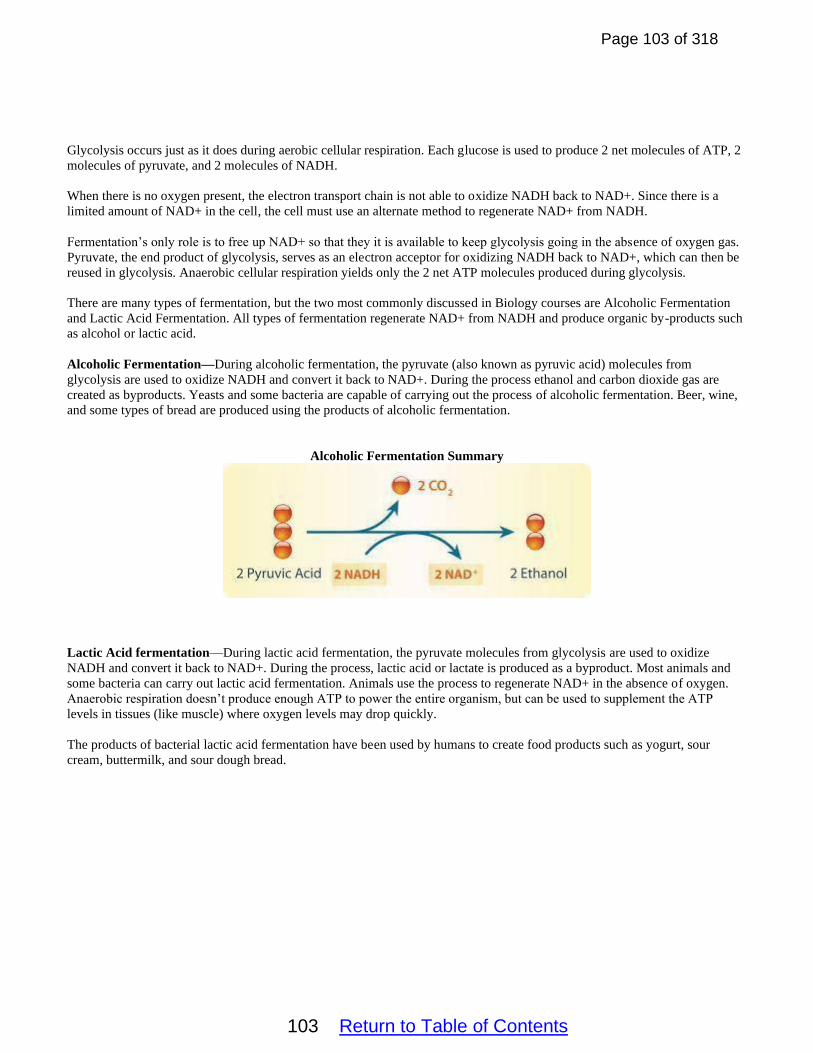
Page 103 of 318
103 Return to Table of Contents
Glycolysis occurs just as it does during aerobic cellular respiration. Each glucose is used to produce 2 net molecules of ATP, 2
molecules of pyruvate, and 2 molecules of NADH.
When there is no oxygen present, the electron transport chain is not able to oxidize NADH back to NAD+. Since there is a
limited amount of NAD+ in the cell, the cell must use an alternate method to regenerate NAD+ from NADH.
Fermentation’s only role is to free up NAD+ so that they it is available to keep glycolysis going in the absence of oxygen gas.
Pyruvate, the end product of glycolysis, serves as an electron acceptor for oxidizing NADH back to NAD+, which can then be
reused in glycolysis. Anaerobic cellular respiration yields only the 2 net ATP molecules produced during glycolysis.
There are many types of fermentation, but the two most commonly discussed in Biology courses are Alcoholic Fermentation
and Lactic Acid Fermentation. All types of fermentation regenerate NAD+ from NADH and produce organic by-products such
as alcohol or lactic acid.
Alcoholic Fermentation—During alcoholic fermentation, the pyruvate (also known as pyruvic acid) molecules from
glycolysis are used to oxidize NADH and convert it back to NAD+. During the process ethanol and carbon dioxide gas are
created as byproducts. Yeasts and some bacteria are capable of carrying out the process of alcoholic fermentation. Beer, wine,
and some types of bread are produced using the products of alcoholic fermentation.
Alcoholic Fermentation Summary
Lactic Acid fermentation—During lactic acid fermentation, the pyruvate molecules from glycolysis are used to oxidize
NADH and convert it back to NAD+. During the process, lactic acid or lactate is produced as a byproduct. Most animals and
some bacteria can carry out lactic acid fermentation. Animals use the process to regenerate NAD+ in the absence of oxygen.
Anaerobic respiration doesn’t produce enough ATP to power the entire organism, but can be used to supplement the ATP
levels in tissues (like muscle) where oxygen levels may drop quickly.
The products of bacterial lactic acid fermentation have been used by humans to create food products such as yogurt, sour
cream, buttermilk, and sour dough bread.

Page 104 of 318
104 Return to Table of Contents
Comparison between Aerobic and Anaerobic Cellular Respiration

Page 105 of 318
105 Return to Table of Contents
Photosynthesis Screencast
Photosynthesis Student Notes
Overview of Photosynthesis
During photosynthesis, energy is captured from the sun/light and converted to chemical energy stored in the bonds of glucose.
Plants, algae, some protists, and some bacteria (cyanobacteria) are capable of carrying out photosynthesis.
Scientists think that photosynthesis first evolved in some prokaryotes and that the photosynthesis carried out by these
organisms was responsible for the production of an oxygenated atmosphere on Earth. These original prokaryotic
photosynthetic pathways served as the foundation for the evolution of eukaryotic photosynthesis.
The reactants for photosynthesis include carbon dioxide (taken in from the air via the stomata), water (taken in from the ground
through the roots), and light energy (absorbed by the pigment proteins in the leaves). The overall products of photosynthesis include glucose (stored energy) and oxygen gas.
The balanced overall equation for photosynthesis may be written in either of the two ways illustrated below.
Most textbooks teach that photosynthesis occurs in a two-phase process.
Phase 1—Light Dependent Reactions—The light dependent reactions occur on the thylakoid membranes of the chloroplasts
of leaf cells (in eukaryotes). In prokaryotic photosynthesizes, the light dependent reactions occur on folds of the cell
membrane. The light dependent reactions involve a series of coordinated enzyme-catalyzed reaction pathways that capture
energy from light. During the light dependent reactions, light energy is absorbed and used to reduce the electron acceptor
NADP+ to make NADPH (a form of stored energy). NADP+ is the final/terminal electron acceptor. The light energy is also
used to power the creation of a proton/H+ gradient which is used, during chemiosmosis, to create ATP (another form of stored
energy). Oxygen gas is also released as a by-product of the light dependent reactions. The energy from ATP and NADPH
power the production of organic molecules (like glucose) during the Calvin Cycle.
Phase 2—Calvin Cycle/Calvin-Benson Cycle/Light Independent Reactions—The Calvin Cycle occurs in the stroma of the
chloroplasts in eukaryotic cells and in the cytoplasm of photosynthetic prokaryotes. During this phase, the energy from the
NADPH and ATP (formed during the light dependent reactions) is used to reduce and phosphorylate carbon dioxide gas to
create G3P and ultimately glucose. Glucose is an energy storage molecule that can be readily stored and/or transported to other
parts of the plant like the roots and stems.
Important Terms to Know
Autotrophs – Organisms that can “produce” their own food. Most autotrophs produce food through the process of
photosynthesis. There are a few organisms (mostly bacteria and archae that live around thermal vents in the oceans) that carry
out a process known as chemosynthesis. Chemosynthesis is the biological conversion of one or more carbon-containing
molecules (usually carbon dioxide or methane) and nutrients into organic matter using the oxidation of inorganic compounds
(e.g., hydrogen gas, hydrogen sulfide, or methane) as the original source of energy.
Heterotrophs – Organisms that “consume” other organisms in order to obtain energy and nutrients.

Page 106 of 318
106 Return to Table of Contents
Chlorophyll – A green light-absorbing pigment found in the chloroplasts of plants, algae, and some protists. Chlorophyll is
also embedded in the cell membranes of cyanobacteria. Chlorophyll appears green because it reflects green light and absorbs
red and blue light.
Chloroplast Structure
Chloroplasts are the sites of Photosynthesis in plants and algae.
Chloroplasts are a type of Plastid or pigment container.
Like mitochondria, chloroplasts have their own DNA, ribosomes, and enzymes! They can also reproduce independently of the
cell in which they reside (via binary fission).
The interior of a chloroplast is composed of stacks of sack-like structures known as thylakoids. The pigment molecules
needed for photosynthesis are embedded in the membranes of the thylakoids. Stacks of thylakoids are known as grana. This
stack-like arrangement increases the surface area needed to carry out the light-dependent stages of photosynthesis.
The stroma is the mostly watery space in between the thylakoids and the outer membrane. The stroma serves as the site of the
Calvin Cycle (the metabolic pathway in which sugar is made).
Evolutionary Significance—Chloroplasts are thought to have evolved from blue-green bacteria (cyanobacteria) that entered
into a symbiotic relationship with other bacteria for protection in return for sugar production. This is the endosymbiotic
hypothesis.
The Chloroplast
Light Energy Sunlight is a form of high quality electromagnetic energy that can be used by some organisms to do work.
Sunlight travels in waves with different wavelengths and frequencies. Waves with different wavelengths and frequencies have
different colors and different amounts of energy per photon.
A photon is the smallest discrete amount or quantum of electromagnetic radiation. It is the basic unit of all light. Think of a
photon as the smallest packet of light energy that is possible. Photons are always in motion and, in a vacuum, travel at a
constant speed of 3 x 10⁸ m/s (the speed of light).

Page 107 of 318
107 Return to Table of Contents
The following equation illustrates the relationship between the speed of light (c), the wavelength (λ), and the frequency (f).
As the equation implies, wavelength and frequency are inversely proportional. Waves with a long wavelength have a lower
frequency. Waves with a short wavelength have a higher frequency.
The frequency of light is directly related to the amount of energy contained per photon. A higher frequency means that each
photon has a higher energy content.
The diagram included below, the electromagnetic spectrum, illustrates the relationship between frequency and wavelength for
each form of electromagnetic radiation. It also indicates that of the visible forms of light, the purples and blues have the
shortest wavelength, the highest frequency, and the most energy per photon, while the reds and oranges have the longest
wavelength, the lowest frequency, and the least energy per photon.

Page 108 of 318
108 Return to Table of Contents
Absorption and Reflection of Light Different types of pigment proteins appear as different colors because they absorb and reflect different wavelengths/colors of
light. The absorbed light is used to provide the energy to make glucose. The reflected light is not used by the plant.
Plants contain three major groups of pigments:
A. Chlorophyll A – This is the main pigment found in all plants and algae. It is a protein which consists of a ring of
carbon, nitrogen, and hydrogen atoms, connected to a central atom of magnesium. This is very similar in structure to
the heme group found in hemoglobin, except that in heme the central atom is iron, whereas in chlorophyll it is
magnesium. Chlorophyll A is best at absorbing blue and red wavelengths of light. Chlorophyll A reflects most green
and yellow wavelengths. This is why it appears green.
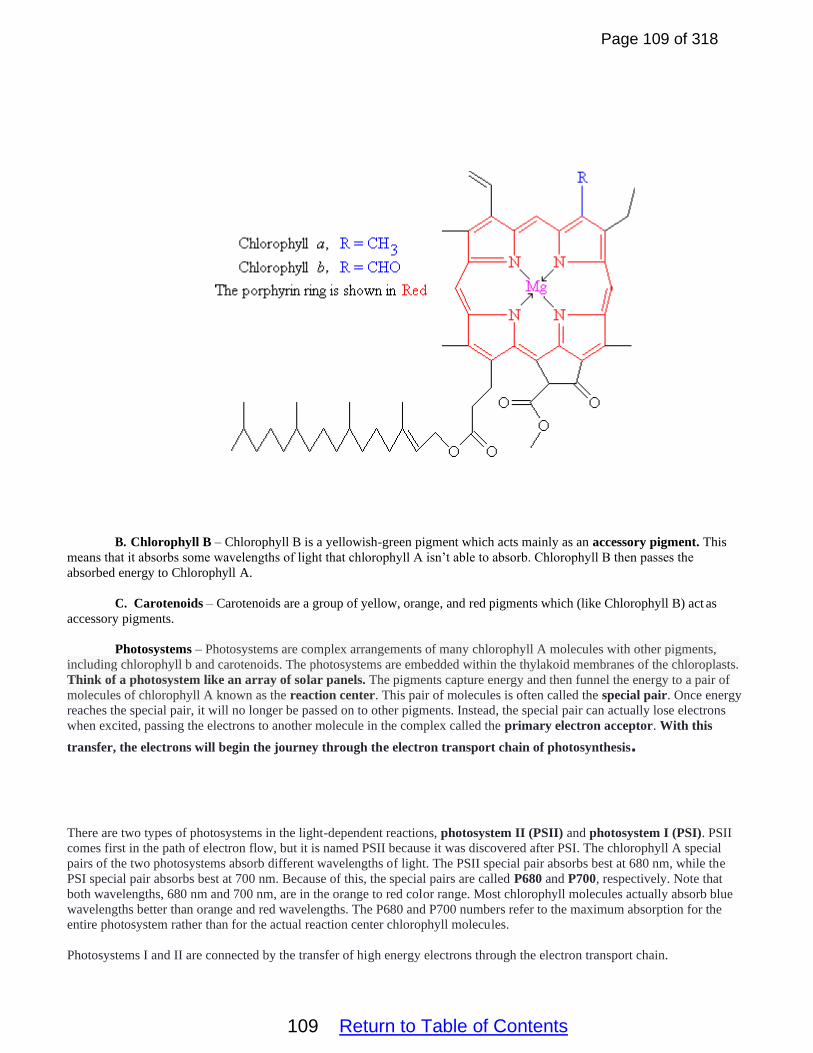
Page 109 of 318
109 Return to Table of Contents
B. Chlorophyll B – Chlorophyll B is a yellowish-green pigment which acts mainly as an accessory pigment. This
means that it absorbs some wavelengths of light that chlorophyll A isn’t able to absorb. Chlorophyll B then passes the
absorbed energy to Chlorophyll A.
C. Carotenoids – Carotenoids are a group of yellow, orange, and red pigments which (like Chlorophyll B) act as
accessory pigments.
Photosystems – Photosystems are complex arrangements of many chlorophyll A molecules with other pigments,
including chlorophyll b and carotenoids. The photosystems are embedded within the thylakoid membranes of the chloroplasts.
Think of a photosystem like an array of solar panels. The pigments capture energy and then funnel the energy to a pair of
molecules of chlorophyll A known as the reaction center. This pair of molecules is often called the special pair. Once energy
reaches the special pair, it will no longer be passed on to other pigments. Instead, the special pair can actually lose electrons
when excited, passing the electrons to another molecule in the complex called the primary electron acceptor. With this
transfer, the electrons will begin the journey through the electron transport chain of photosynthesis.
There are two types of photosystems in the light-dependent reactions, photosystem II (PSII) and photosystem I (PSI). PSII
comes first in the path of electron flow, but it is named PSII because it was discovered after PSI. The chlorophyll A special
pairs of the two photosystems absorb different wavelengths of light. The PSII special pair absorbs best at 680 nm, while the
PSI special pair absorbs best at 700 nm. Because of this, the special pairs are called P680 and P700, respectively. Note that
both wavelengths, 680 nm and 700 nm, are in the orange to red color range. Most chlorophyll molecules actually absorb blue
wavelengths better than orange and red wavelengths. The P680 and P700 numbers refer to the maximum absorption for the
entire photosystem rather than for the actual reaction center chlorophyll molecules.
Photosystems I and II are connected by the transfer of high energy electrons through the electron transport chain.

Page 110 of 318
110 Return to Table of Contents
Absorption Spectrum The set of wavelengths absorbed by a pigment is its absorption spectrum. In the diagram below, you can see the
absorption spectra of three key pigments in photosynthesis: chlorophyll a, chlorophyll b, and β-carotene. The set of
wavelengths that a pigment doesn't absorb are reflected, and the reflected light is what we see as color. For instance, plants
appear green to us because they contain many chlorophyll a and b molecules, which reflect green light.
Light Dependent Reactions of Photosynthesis This process occurs on the thylakoid membranes of the chloroplasts located in leaf cells. During the process, light energy is
absorbed and used to produce the energy storage molecules ATP and NADPH. Oxygen gas is generated as a by-product of the
process.
The light dependent reactions occur in two different ways in most photosynthesizers, non-cyclic photophosphorylation and
cyclic photophosphorylation. These processes occur simultaneously across the thousands of photosystems on each thylakoid
membrane.
Non-cyclic photophosphorylation (also known as non-cyclic electron flow) – During this process, both photosystems absorb
light energy. The absorbed light energy is funneled to the reaction center of each photosystem. This absorbed energy boosts
electrons in photosystems I and II to higher energy levels. Eventually, so much energy is absorbed that it causes the reaction
centers to be oxidized. A pair of electrons is released from the reaction center of each photosystem. The electrons from
Photosystem II travel through a cytochrome complex (ETC) and are eventually used to reduce Photosystem I’s reaction center.
As the electrons move across the ETC, their energy is used to power the active transport of hydrogen ions/protons from the
stroma into the thylakoid. This process begins the build-up of a hydrogen ion/proton/electrochemical gradient much like the
one that occurs during the ETC stage of cellular respiration. During this process (in photosynthesis) an area of high H+
concentration is established inside the thylakoid and an area of low H+ concentration is established in the surrounding stroma.
This process/gradient stores potential energy within the thylakoid. This energy will eventually be used to manufacture ATP.

Page 111 of 318
111 Return to Table of Contents
The electrons that leave Photosystem I also travel through an ETC. These electrons are ultimately used to reduce NADP+ to
form NADPH. NADP+ is an electron carrier, much like the NAD+ that functions during cellular respiration. Think of
NADP+ as a “dead battery” and NADPH as a “charged battery”. The electrons and energy from Photosystem I “charge” this
molecular battery. The energy stored in NADPH will be used to make glucose during the Calvin Cycle.
The hydrogen ions within the thylakoid eventually rush out (into the stroma) via a channel within the ATP synthase enzyme.
The enzyme is able to harness the kinetic energy of the moving hydrogen ions/protons to phosphorylate ADP to make ATP.
This process of using energy from a proton/H+ ion gradient to phosphorylate ADP is known as chemiosmosis. The energy
from the ATP will be used during the Calvin Cycle to make glucose.
One other product is formed during non-cyclic photophosphorylation. That product is oxygen gas.
After Photosystem II is oxidized, it acquires a positive charge. The Photosystem then splits water molecules, through a process
called photolysis, in order to acquire electrons to replace those lost during the oxidation. The remains of the split water
molecules are hydrogen ions, which contribute to the H+ gradient in the thylakoid, and oxygen gas. This process is the source
of all of Earth’s oxygen gas. All of Earth’s oxygen gas was originally part of water molecules. Plants release some of the
oxygen gas into the atmosphere. It is important to note that plants do use some oxygen gas to perform aerobic cellular
respiration.
To summarize, non-cyclic photophosphorylation produces three main products NADPH and ATP, energy storage molecules
which will be used during the Calvin Cycle to produce glucose, and oxygen gas. The name non-cycle photophosphorylation is
very descriptive of the process. During the process, electrons move across the thylakoid membrane in a linear/noncyclic

Page 112 of 318
112 Return to Table of Contents
pattern. Essentially, the electrons move from water to Photosystem II to the ETC to Photosystem I to the ETC to
NADP+ to make NADPH. The phosphorylation portion of the name refers to the part of the process in which energy from the
movement of hydrogen ions is used to add a phosphate group to ADP to make ATP.
Cyclic photophosphorylation or cyclic electron flow – This process occurs simultaneously with noncyclic
photophosphorylation. Cyclic photophosphorylation involves only Photosystem I. During this process, photosystem I’s
pigment proteins absorb light energy and funnel it to the reaction center. The absorbed energy eventually causes the reaction
center to be oxidized. The ejected pair of electrons move through a different ETC network than the one used during the
noncyclic version of the process. As the electrons move through this ETC, their energy is used to power the active transport of
hydrogen ions/protons from the stroma into the thylakoid. This again builds up a hydrogen ion gradient. The hydrogen ions
eventually move through the channel within the ATP synthase and exit the thylakoid. The kinetic energy of the moving ions is
used to phosphorylate ADP to make ATP.
The only product of cyclic photophosphorylation is ATP. No oxygen gas or NADPH are produced. The name of the
process is again very descriptive of what occurs during the process. The cyclic portion of the name refers to the fact that the
ejected electrons from Photosystem I move through a circular arrangement of cytochromes and ultimately end up reducing the
reaction center that they were ejected from. The phosphorylation portion of the name refers to the part of the process in which
energy from the movement of hydrogen ions is used to add a phosphate group to ADP to make ATP.

Page 113 of 318
113 Return to Table of Contents
Calvin Cycle/Light Independent Reactions of Photosynthesis
The light dependent reactions of photosynthesis use the energy from the sun to create the energy storage molecules NADPH
and ATP. These molecules are very chemically reactive and can’t be efficiently stored or transported. Since almost all
photosynthesis occurs in the leaf, the plant needs to be able to store and transport energy to the stem and roots. In order to do
this, the plant must transfer the energy from NADPH and ATP to carbon dioxide in order to form a more stable and
transportable energy storage molecule, glucose. This is the purpose of the Calvin Cycle.
The Calvin Cycle occurs in the stroma of the chloroplast (in eukaryotic cells) and in the cytoplasm of photosynthetic
prokaryotes. The Calvin Cycle occurs in three main phases:
Phase 1—Carbon Fixation—During this phase, a carbon dioxide molecule is attached to a 5-carbon chain known as ribulose
bisphosphate by an enzyme known as Rubisco or RuBP Carboxylase. This forms an unstable 6 carbon compound that quickly
breaks into two 3 carbon chains that are referred to as phosphoglycerate or PGA molecules. Think of a PGA molecule as ½ of
a glucose molecule, but without the stored energy.
Phase 2—Reduction—During this phase, the PGA molecules formed during Phase 1 are energized using the energy storage
molecules which were manufactured during the light dependent stage of photosynthesis. First, phosphate groups/energy from
ATP molecules are transferred to the PGA molecules. Next. the PGA molecules are reduced using electrons and energy from
NADPH. The product of this process is a highly energized 3 carbon compound known as Gyceraldehyde-3-Phosphate or G3P.
Two G3P molecules can be combined to form glucose. G3P can also be used to synthesize starch, cellulose, and other organic
molecules needed by the plant.
Note: The Calvin Cycle diagram included below depicts the Calvin Cycle as it occurs for every 3 carbon dioxide molecules
that are fixed. The fixation of 3 carbon dioxide molecules results in the creation of 6 molecules of G3P. Only one of the six
G3Ps are used to create glucose or other organic molecules. The other 5 are used to carry out Phase 3 of the Calvin Cycle.
Phase 3—Regeneration of the Carbon Dioxide Acceptor/Ribulose Bisphosphate—During this phase, the remaining 5 G3P
molecules are phosphorylated again (using ATP from the light dependent reactions) to regenerate ribulose bisphosphate. This
ensures that the cell doesn’t run out of ribulose bisphosphate so that the Calvin Cycle can continue.

Page 114 of 318
114 Return to Table of Contents
To summarize, during the Calvin Cycle the energy from the energy storage molecules (manufactured during the light
dependent stage of photosynthesis) is added to carbon dioxide to form G3P and ultimately glucose and other organic
molecules. This is necessary because ATP and NADPH are chemically reactive and difficult to store and transport. On the
other hand, glucose and other sugars are stable and highly transportable and storable.
Fitness Although many of the biochemical metabolic pathways of life are conserved through almost all life forms, small amounts of
variation at the molecular level can provide organisms with the ability to respond to a variety of different environmental
stimuli. This variation in the number and types of molecules within cells provides organisms a greater ability to survive and/or
reproduce in different environments. For example: plants found in different environments have slightly different collections of
photosynthetic pigments that all them to exploit the wavelengths of light that are available in their specific environments. Deep
water plants must use different pigments than land plants because the water only allows certain wavelengths of light to
penetrate (mostly blues and greens). That is why many aquatic plants often appear red or orange. They are absorbing blue and
green wavelengths. The description of C3, C4, and CAM plants included below provides another illustrative example of the
importance of variation to fitness and evolution.
Photorespiration and Adaptations for Dealing with Hot and Dry Conditions The carbon-fixing enzyme, Rubisco or RuBP Carboxylase, has an evolutionary flaw. It is capable of attaching both carbon
dioxide and oxygen gas to ribulose bisphosphate. The attachment of carbon dioxide ultimately leads to the creation of G3P and
glucose, while the attachment of oxygen yields no glucose and actually requires the cell to use energy to rid itself of the

Page 115 of 318
115 Return to Table of Contents
products of oxygen fixation. The process of fixing oxygen instead of carbon dioxide and the resulting dramatic decrease in
photosynthetic efficiency is known as photorespiration.
When the environment is not too hot and there is plenty of water available in the soil, photorespiration isn’t a huge problem .
When the environment is very hot and dry, plants are forced to close their stomata to conserve water. When the stomates are
closed, the concentration of oxygen gas in the leaf rapidly increases, while the concentration of carbon dioxide rapidly
decreases. Under these conditions, much more oxygen is fixed than carbon dioxide. This dramatically decreases the
photosynthetic efficiency of the plant and if the conditions persist for long periods of time, the plant may die or be forced to
enter a dormant state.
C3 Plants—Most plants are classified as C3 plants. They perform the Calvin Cycle as described above. These plants are the
most efficient of all plants as long as the environment is not too hot or dry, but have an issue with photorespiration in hot and
dry climates. If C3 plants close their stomates to conserve water, they begin to carry out a large amount of photorespiration
very quickly.
C4 plants—C4 plants, like corn and cotton, have adaptations that allow them to avoid photorespiration in hot and dry climates.
In the mesophyll of the leaf, C4 plants have a carbon-fixing enzyme known as PEP Carboxylase. This enzyme has no
attraction for oxygen gas. Once PEP fixes the carbon dioxide, the fixed carbon is transported into a small, enclosed chamber
known as the bundle sheath. Once there, the carbon dioxide is released and fixed again by Rubisco. In C4 plants, the initial
carbon fixation step and the Calvin Cycle are said to be spatially separated because they occur in different locations. Since the
bundle sheath is small, and there is a constant supply of carbon dioxide, carbon dioxide concentrations are high and Rubisco
works without fixing oxygen. These adaptations allow C4 plants to close their stomates for extended periods of time and
continue to do photosynthesis without photorespiration. When CO2 levels drop below a critical level the stomates can be
opened for a short period in order to replenish the needed CO2. This allows the plants to continue to make sugar while also
conserving water. It is important to note that C4 plants perform the Calvin Cycle in exactly the same way as C3 plants; C4
plants just have an extra carbon-fixation step that occurs before the Calvin Cycle.
CAM Plants—CAM plants, like the cactus, are highly adapted to life in hot and dry environments. Like the C4 plants, these
plants possess PEP carboxylase. An additional adaptation of CAM Plants is that they only open their stomata at night when the
environment is cool. During the night, PEP carboxylase fixes carbon and stores it as malate. Once the sun comes up, the
stomata close (so that the plants don’t lose water through transpiration). During the day, the malate breaks down and releases a
constant supply of Carbon Dioxide so that Rubisco and the Calvin Cycle can function without a high degree of

Page 116 of 318
116 Return to Table of Contents
photorespiration. In CAM plants, carbon fixation and the Calvin Cycle are said to be temporally separated because they occur
at different times. CAM plants are the plant group that is best adapted to hot and dry conditions.

Page 117 of 318
117 Return to Table of Contents
Thermoregulation
Thermoregulation Screencast
Ectotherms—Organisms whose body temperatures vary greatly with the external environment. These
organisms are often also referred to as “cold-blooded” or “thermoconformers”.
As the external temperature drops, the body temperature of these organisms drops. This causes a decrease
in metabolic activity.
As the external temperature rises, the body temperature of these organisms increases. This causes an
increase in metabolic activity.
Examples of ectotherms include: most fish, reptiles, amphibians, and insects.
An advantage of being an ectotherm is that organisms don’t use energy (ATP) to produce heat and regulate
the body temperature. This means that ectotherms don’t need to eat as much as endotherms.
A disadvantage of being an ectotherm is that ectotherms can’t normally live in places where it gets too hot
or too cold. If they do live in these environments, their activity is limited to only certain parts of the day or
seasons of the year.
Endotherms-- Organisms who maintain their body at a metabolically favorable, nearly constant
temperature, largely by the use of heat set free by internal bodily functions. These organisms don’t rely
purely on ambient heat for thermoregulation. The internally generated heat is mainly an incidental product
of the animal's routine metabolism, but under conditions of excessive cold or low activity an endotherm
might apply special mechanisms adapted specifically to heat production. These organisms are also known
as “warm-blooded” and also as “thermoregulators”.
Changes in the external temperature have little effect on the internal temperature of an endotherm.
If the external temperature drops, an endotherm will either generate or trap excess body heat so that it
maintains a constant internal temperature. Possible mechanisms include: shivering, increasing the rate of
metabolism/cellular respiration, vasoconstriction of blood vessels located near the skin.
If the external temperature rises, an endotherm will release excess body heat to the environment. Possible
mechanisms include: sweating (evaporative cooling), panting, vasodilation of blood vessels located near
the skin, and/or decreasing the metabolic rate.
Endotherms typically use negative feedback loops, like the one included below, to regulate their internal
temperature.

Page 118 of 318
118 Return to Table of Contents
Examples of endotherms include birds, mammals, and a few species of fish.
An advantage of being an endotherm is that the internal temperature of the organisms is independent of the
external, environmental temperature. This allows endotherms to live in almost all habitats on Earth.
A disadvantage of being an endotherm is that in order to maintain a constant internal temperature, an
organism must use a lot energy. This requires endotherms to eat on a regular basis.
Metabolic Rates—Comparison
• In general, endotherms have higher metabolic rates than ectotherms.
• As the external temperature drops, the metabolic rate of an ectotherm will also drop. The metabolic rate of
an endotherm will either be unaffected or it might rise slightly.
• As the internal temperature increases, the metabolic rate of an ectotherm will rise quickly. The metabolic
rate of an endotherm will be largely unaffected, but may drop slightly.
• The metabolic rates of endotherms per kilogram tends to decrease dramatically with increased body mass.
• This is largely due to the fact that as body size increases, the surface area to volume ratio decreases. This
means that larger endotherms are more efficient at keeping in heat and therefore don’t lose as much heat to
the environment. Small endotherms have a high surface area to volume ratio, lose lots of heat to the
environment, and must use high metabolic rates to replace this lost heat (so that they can maintain a
constant internal temperature).

Page 119 of 318
119 Return to Table of Contents
Page 120 of 318
120 Return to Table of Contents
AP Biology
Unit 4
Student Notes

Page 121 of 318
121 Return to Table of Contents
Unit 4 Student Notes
Table of Contents
A. Cell Communication/Signal Transduction —Pages 122-125 B. Direct Communication Between Cells—Pages 122-124
C. Local Communication Between Cells—Pages 125-127 D. Long Distance Communication Between Cells—Pages 127-129 E. Signal Transduction Pathways—Steps of Cell Signaling—Pages 129-132 F. Types of Receptors—Pages 133-135 G. Feedback Loops—Pages 136-139 H. Introduction to the Cell Cycle—Pages 140-142 I. Stages of the Cell Cycle/Cell Cycle Regulation—Pages 142-149 J. The Cell Cycle and Cancer—Page 149
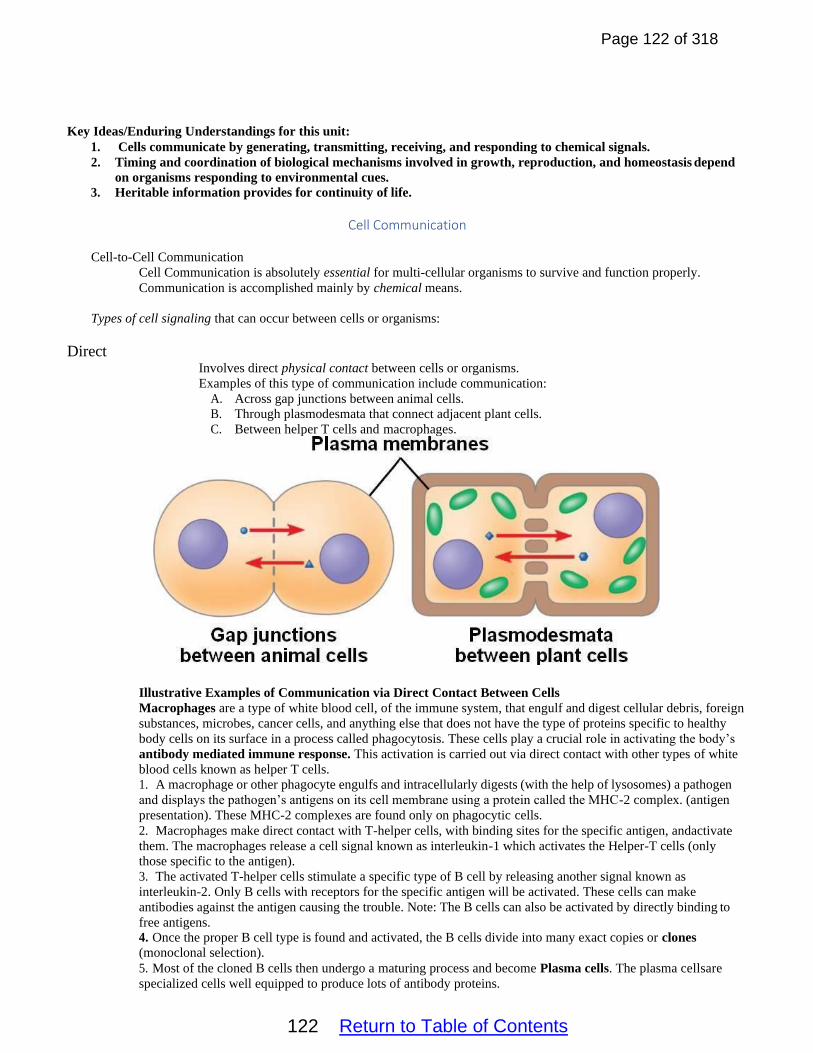
Page 122 of 318
122 Return to Table of Contents
Key Ideas/Enduring Understandings for this unit:
1. Cells communicate by generating, transmitting, receiving, and responding to chemical signals.
2. Timing and coordination of biological mechanisms involved in growth, reproduction, and homeostasis depend
on organisms responding to environmental cues.
3. Heritable information provides for continuity of life.
Cell Communication
Cell-to-Cell Communication
Cell Communication is absolutely essential for multi-cellular organisms to survive and function properly.
Communication is accomplished mainly by chemical means.
Types of cell signaling that can occur between cells or organisms:
Direct Involves direct physical contact between cells or organisms.
Examples of this type of communication include communication:
A. Across gap junctions between animal cells.
B. Through plasmodesmata that connect adjacent plant cells.
C. Between helper T cells and macrophages.
Illustrative Examples of Communication via Direct Contact Between Cells
Macrophages are a type of white blood cell, of the immune system, that engulf and digest cellular debris, foreign
substances, microbes, cancer cells, and anything else that does not have the type of proteins specific to healthy
body cells on its surface in a process called phagocytosis. These cells play a crucial role in activating the body’s
antibody mediated immune response. This activation is carried out via direct contact with other types of white
blood cells known as helper T cells.
1. A macrophage or other phagocyte engulfs and intracellularly digests (with the help of lysosomes) a pathogen
and displays the pathogen’s antigens on its cell membrane using a protein called the MHC-2 complex. (antigen
presentation). These MHC-2 complexes are found only on phagocytic cells.
2. Macrophages make direct contact with T-helper cells, with binding sites for the specific antigen, andactivate
them. The macrophages release a cell signal known as interleukin-1 which activates the Helper-T cells (only
those specific to the antigen).
3. The activated T-helper cells stimulate a specific type of B cell by releasing another signal known as
interleukin-2. Only B cells with receptors for the specific antigen will be activated. These cells can make
antibodies against the antigen causing the trouble. Note: The B cells can also be activated by directly binding to
free antigens. 4. Once the proper B cell type is found and activated, the B cells divide into many exact copies or clones
(monoclonal selection).
5. Most of the cloned B cells then undergo a maturing process and become Plasma cells. The plasma cellsare
specialized cells well equipped to produce lots of antibody proteins.

Page 123 of 318
123 Return to Table of Contents
6. The plasma cells produce lots and lots of antibodies. Each antibody is a protein formed in a very specificshape
to bind to the specific antigen involved in this infection. These antibodies are secreted in large amounts into the
bloodstream where they attach to a specific antigen and mark it for destruction.
7. Once the infection has been dealt with, most of the plasma cells undergo programmed cell death (apoptosis).
Some hang around for quite a while producing more antibodies but eventually they fade away.
8. Some of the activated B cells don’t become plasma cells but instead remain behind as memory cells so that if
the antigen is encountered again, the whole process will be faster and stronger. These activated cells may remain
in the body for years, possibly for life.
The macrophages also help to activate the body’s cell mediated immune response by directly communicating
with Helper T cells.
1. A macrophage or other phagocyte engulfs and intracellularly digests (with the help of lysosomes) a pathogen
and displays the pathogen’s antigens on its cell membrane. (antigen presentation).
2. Macrophages interact with T-helper cells, with binding sites for the specific antigen, and activate them. The
macrophages release a cell signal known as interleukin-1 which activates the Helper-T cells.
3. The Helper-T cells release interleukin-2 which stimulates Cytotoxic T-Cells specific to the antigen.
4. The Cytotoxic T-cells, once stimulated by a T-helper cell, will go through clonal selection. Most of the cloned
cells will become active Cytotoxic T-cells and will search out and destroy any cells in the body that are
displaying the specific antigen involved in this infection. Somatic (body) cells display antigens from intracellular
infections on a protein call the MHC-1 complex. This alerts the Cytotoxic T-Cell to the infection. The MHC-1
complex can interact with a receptor (CD-8) on a Cytotoxic-T cell.
5. Once attached to the infected cell, the Cytotoxic-T cell releases proteins called perforins which kill the
infected cell.
6. Once the infected cells are destroyed, most of the activated T cells, both helper and cytotoxic, will undergo
programmed cell death (apoptosis).
7. A number of activated T-cells remain as Memory cells. These cells will respond to the same antigen in a much
faster manner than occurred during the original infection.

Page 124 of 318
124 Return to Table of Contents
Local Often, cells that are near one another communicate through the release of chemical messengers (ligands that can
diffuse through the space between the cells). This type of signaling, in which cells communicate over relatively
short distances, is known as local or paracrine signaling.
Paracrine signaling allows cells to locally coordinate activities with their neighbors. Although they're used in
many different tissues and contexts, paracrine signals are especially important during development, when they
allow one group of cells to tell a neighboring group of cells what cellular identity to take on.
Local signaling may also refer to the communication that occurs at the synapse between two neurons. At the
synapse, the axon of the presynaptic neuron releases neurotransmitters which diffuse across the synapse and bind
to receptors on the post-synaptic neuron.
Illustrative Examples of Communication via the Release of Local Regulators
Neurons--The neuron is the basic working unit of the nervous system. Neurons are specialized cells designed to
transmit information to other nerve cells, muscle cells, or gland cells. Neuron (Nerve cell) structure:
Cell Body or Soma - This portion of the neuron contains the DNA and organelles of the cell. This structure
helps to produce the proteins and other substances needed throughout the rest of the cell.
Dendrites - These structures receive incoming signals from other neurons. Most neurons have several dendrites
that branch out from the soma like tree branches. The dendrites have ligand-gated ion channel receptors that
interact with neurotransmitters released by other neurons.
Axon – The axon transmits the signal to the next neuron or muscle cell. It typically does this by releasing
neurotransmitters which bond to receptors on the next cell in the chain.

Page 125 of 318
125 Return to Table of Contents
Synaptic Terminal – This term refers to the end of the axon found at a synapse.
Synapse - This is the gap between neurons or between a neuron and an effector cell.
Neurotransmitter – Neurotransmitters are chemical signals that are produced by the neuron that are used to
transmit the signal across the synapse and to the next neuron. Example neurotransmitters include:
Acetylcholine, Dopamine, Serotonin, Nitric Oxide, Epinephrine, and Norepinephrine. Neurotransmitters are released from the axon terminal of the Presynaptic neuron.
Neurotransmitters are received by the receptors on the dendrites of the Postsynaptic neuron. Once enough
neurotransmitters bind to the receptors, an action potential/nerve impulse is initiated in the post synaptic neuron.
Neuron Structure
The Synapse

Page 126 of 318
126 Return to Table of Contents
Morphogens
Morphogens are secreted signaling molecules that diffuse from local sources to form concentration gradients,
which specify multiple cell fates during embryonic development. One of the most famous morphogens is the
Sonic Hedgehog protein. Sonic hedgehog is one of three proteins in the mammalian signaling pathway family
called hedgehog, the others being desert hedgehog (DHH) and Indian hedgehog (IHH). SHH is the best
studied ligand of the hedgehog signaling pathway. It plays a key role in regulating vertebrate organogenesis, such
as in the growth of digits on limbs and organization of the brain. Sonic hedgehog is the best established example
of a morphogen as defined by Lewis Wolpert's French flag model—a molecule that diffuses to form
a concentration gradient and has different effects on the cells of the developing embryo depending on its
concentration. SHH remains important in the adult. It controls cell division of adult stem cells and has been
implicated in the development of some cancers.
Quorum Sensing in Bacteria
Unicellular prokaryotes, like bacteria, also possess mechanisms for cell to cell communication. One of the most
important examples of a local signaling mechanism in bacteria is quorum sensing. Quorum sensing (QS) is a
bacterial cell–cell communication process that involves the production, release, detection, and response to
extracellular signaling molecules called autoinducers (AIs). AIs accumulate in the environment as the bacterial
population density increases, and bacteria monitor this information to track changes in their cell numbers and
collectively alter gene expression. QS controls genes that direct activities that are only beneficial when performed
by groups of bacteria acting in synchrony. These genes are only activated when the bacterial density in the local
area is high enough for their actions to be beneficial. Processes controlled by QS include bioluminescence,
sporulation, competence, antibiotic production, biofilm formation, and virulence factor secretion.

Page 127 of 318
127 Return to Table of Contents
Long Distance Long distance signaling may occur between cells (in the same organism) that are located far apart or
between two different organisms that are separated by large distances.
Hormones – Hormones are chemical messengers that are released directly into the bloodstream from an
endocrine gland located in one part of the body. The hormones travel through the blood to specific cells (target
cells) that have the appropriate receptor for the hormone. The binding of the hormone to the receptor transmits
the message to the target cell. Hormones are typically composed of either proteins or steroids (lipids).
Pheromones - Pheromones are chemicals capable of acting like hormones outside the body of the
secreting individual, to impact the behavior of the receiving individuals. There
are alarm pheromones, food trail pheromones, sex pheromones, and many others that affect behavior or
physiology. Pheromones are used from basic unicellular prokaryotes to
complex multicellular eukaryotes. Pheromones are usually made from steroids (lipids).
Illustrative Examples of Cellular Communication That Occurs Over Long Distances
Blood Glucose Maintenance
When blood glucose levels rise above the set point range, the pancreas releases the hormone insulin.
Insulin travels throughout the body via the bloodstream. It binds to receptors on numerous types of body cells
like those in the liver and muscles. Once insulin attaches to the receptors, the signal transduction pathway that it
initiates ultimately causes the target cells to absorb glucose from the blood and store it within the cell. This
lowers the blood glucose level.
When blood glucose levels drop below the set point range, the pancreas releases the hormone glucagon.
Glucagon travels throughout the body via the bloodstream. It binds to receptors on numerous types of body cells
like those in the liver and muscles. Once glucagon attaches to the receptors, the signal transduction pathway that
it initiates ultimately causes the target cells to breakdown glucose storage molecules like glycogen and to release
the freed glucose into the bloodstream. This ultimately raises the blood glucose level.
The levels of insulin and glucagon in the bloodstream are regulated by a negative feedback loop.

Page 128 of 318
128 Return to Table of Contents
Steroid Hormones
Other hormones like testosterone and estrogen are steroid (lipid-based) hormones which are capable of passing
through the cell membrane. Once inside the cell, these hormones bind to intracellular receptors.
The hormone/receptor complex enters the nucleus and acts as a transcription factor. This transcription factor causes
the activation of a specific gene or set of genes.
The responses caused by steroid hormones are typically slower than those caused by protein hormones, but the
responses caused by steroid hormones are typically longer in duration.

Page 129 of 318
129 Return to Table of Contents
Signal Transduction Pathway Signal Transduction pathways link signal reception with cellular responses. The pathways usually involve a
group of molecules in a cell that work together to control one or more cell functions, such as cell division or cell
death. After the first molecule in a pathway receives a signal, it activates another molecule. This process is repeated
until the last molecule is activated and the cell function is carried out.
Ligand – Ligand is another name for a signaling molecule.
The ligand binds to the receptor protein on the cell membrane (if the ligand is made of protein) or inside the cell
(if the ligand is a steroid/lipid).
The attachment of the ligand to the receptor causes a conformational shape change in the receptor protein that
sets in motion the signal transduction pathway.
Different ligands can initiate different responses. The same ligand can initiate different responses in different
types of cells because these cells contain different signal transduction pathways.

Page 130 of 318
130 Return to Table of Contents
Three parts to the pathway:
Reception – Reception begins when the signaling molecule binds to the ligand binding domain of
a membrane receptor protein.
The receptors are very specific to a particular signaling molecule. The signal molecule must fit into
the receptor like a substrate fits into the active site of an enzyme. Different cells possess different
receptors and are capable of interacting with different signaling molecules. Most receptors extend
outside the cell membrane (extracellular receptors) because most signaling molecules are composed
of proteins This means that they are too large and charged to enter the cell. After the signal
molecule attaches to the receptor, the intracellular domain of the receptor protein (the part of the
receptor protein that extends through the membrane and into the cytoplasm) undergoes a
conformation change (change in shape). This process helps to move the signal from outside to
inside the cell and initiates the transduction of the signal.
It is important to note that mutations in the genes that code for any of the domains (sections)
of the receptor proteins or in any component/protein of the signaling pathway may affect the
other downstream components of the pathway by altering the subsequent transduction of the
signal.
Chemicals which interfere any component of the signaling pathway may activate or inhibit the
pathway.
Note that steroid/lipid-based hormones bind to receptors located inside the cell (intracellular
receptors).
Transduction -- Since signaling systems need to be responsive to small concentrations of chemical
signals and act quickly, cells often use a multi-step pathway that transmits the signal quickly, while
amplifying the signal to numerous molecules at each step. Steps in the signal transduction pathway
often involve the addition or removal of phosphate groups which results in the activation of
proteins. Enzymes that transfer phosphate groups and energy from ATP to a protein are
called protein kinases. Many of the relay molecules in a signal transduction pathway are protein

Page 131 of 318
131 Return to Table of Contents
kinases and often act on other protein kinases in the pathway. Often this creates a phosphorylation
cascade, where one enzyme phosphorylates another, which then phosphorylates another protein,
causing a chain reaction. Also important to the phosphorylation cascade are a group of proteins
known as protein phosphatases. Protein phosphatases are enzymes that can rapidly remove
phosphate groups from proteins (dephosphorylation) and thus inactivate protein kinases. Protein
phosphatases are the “off switch” in the signal transduction pathway.
A benefit of transduction is that a small number of ligands (signals) can help to activate a large
number of molecules at the end of the pathway. We can say that transduction often amplifies a
chemical signal along the signal transduction pathway.

Page 132 of 318
132 Return to Table of Contents
Response – The response is the action the signal was meant to initiate and/or regulate. A signal transduction
pathway regulates one or more cellular activities. Potential responses to cell signals include:
The opening of an ion channel—Example: The opening of ligand gated ion channels on neurons in
response to the binding of neurotransmitters.
The breakdown of a substance in a cell—The breakdown of glycogen in the liver stimulated by thebinding
of epinephrine to receptors on the liver cells.
The synthesis of enzymes or proteins (gene expression)—Rising levels of ethylene gas cause the
production and activation of enzymes that cause the ripening of fruits.
The turning on/off of certain genes (gene regulation)—The expression of the SRY gene triggers the
development of the male sexual development pathway.
Hox genes are a group of related genes that specify regions of the body plan of an embryo along the head-tail
axis of animals. Hox genes actually code for transcription factors which cause the expression of genes that
encode and specify the characteristics of 'position', ensuring that the correct structures form in the correct
places of the body. For example, Hox genes in insects specify which appendages form on a segment (e.g.
legs, antennae, and wings in fruit flies), and Hox genes in vertebrates specify the types and shape of vertebrae
that will form. In segmented animals, Hox proteins thus confer segmental or positional identity, but do not
form the actual segments themselves.
An analogy for the Hox genes can be made to the role of a play director that calls which scene the actors
should carry out next. If the play director calls the scenes in the wrong order, the overall play will be
presented in the wrong order. Similarly, mutations in the Hox genes can result in body parts and limbs in the
wrong place along the body. Like a play director, the Hox genes do not act in the play or participate in limb
formation themselves.
Cell Growth/Reproduction—Cytokines are cell signals that regulate gene expression and stimulate cell
replication and division.

Page 133 of 318
133 Return to Table of Contents
AP Biology
Cell Communication Part 2
Types of Signal Receptors
G- Protein Linked Receptor
G-Protein-Linked Receptors-- These extracellular receptors are the largest and most diverse group of
receptors found in eukaryotes. G-protein-linked receptors may bind ligands which range from odor
molecules to pheromones to hormones to neurotransmitters.
Once a ligand binds to the G-protein-linked receptor, a GTP molecule is attached to the alpha subunit of the
receptor. The alpha subunit then breaks free (the conformational change) and activates a protein/enzyme
which creates multiple secondary messengers like cAMP. The job of a secondary messenger is to transmit
the signal from just inside the cell membrane throughout the rest of the cytoplasm.
Secondary messengers stimulate the proteins of the signal transduction pathway and the creation of multiple
secondary messengers in response to one ligand. This starts the amplification (spreading of the signal
throughout the cell) of the signal.
A limitation of individual G-protein-linked receptors is that they can only activate one signal transduction
pathway and thus bring about one, specific response.
Receptor Tyrosine Kinases

Page 134 of 318
134 Return to Table of Contents
Receptor Tyrosine Kinase (RTK)-- These cell surface (extracellular) receptors bind and respond to growth factors
and other locally released proteins that are present at low concentrations. RTKs play important roles in
the regulation of cell growth, differentiation, and survival. Insulin receptors are an example of this category of
extracellular receptors. When signaling molecules bind to RTKs, they cause neighboring RTKs to associate with
each other, forming cross-linked dimers. Cross-linking activates the tyrosine kinase activity in these RTKs
through phosphorylation. Each RTK in the dimer phosphorylates multiple tyrosines on the other RTK. This
process is called cross-phosphorylation.
This allows receptor tyrosine kinases to activate multiple signal transduction pathways at a time and stimulate
multiple cellular responses.
RTKs are often involved with growth/emergency repair processes.
Ligand Gated Ion Channels
Certain cells, commonly called excitable cells, are unique because of their ability to generate electrical signals.
Although several types of excitable cells exist — including neurons, muscle cells, and touch receptor cells — all
of them use ligand-gated ion channel receptors to convert chemical or mechanical messages into electrical
signals.
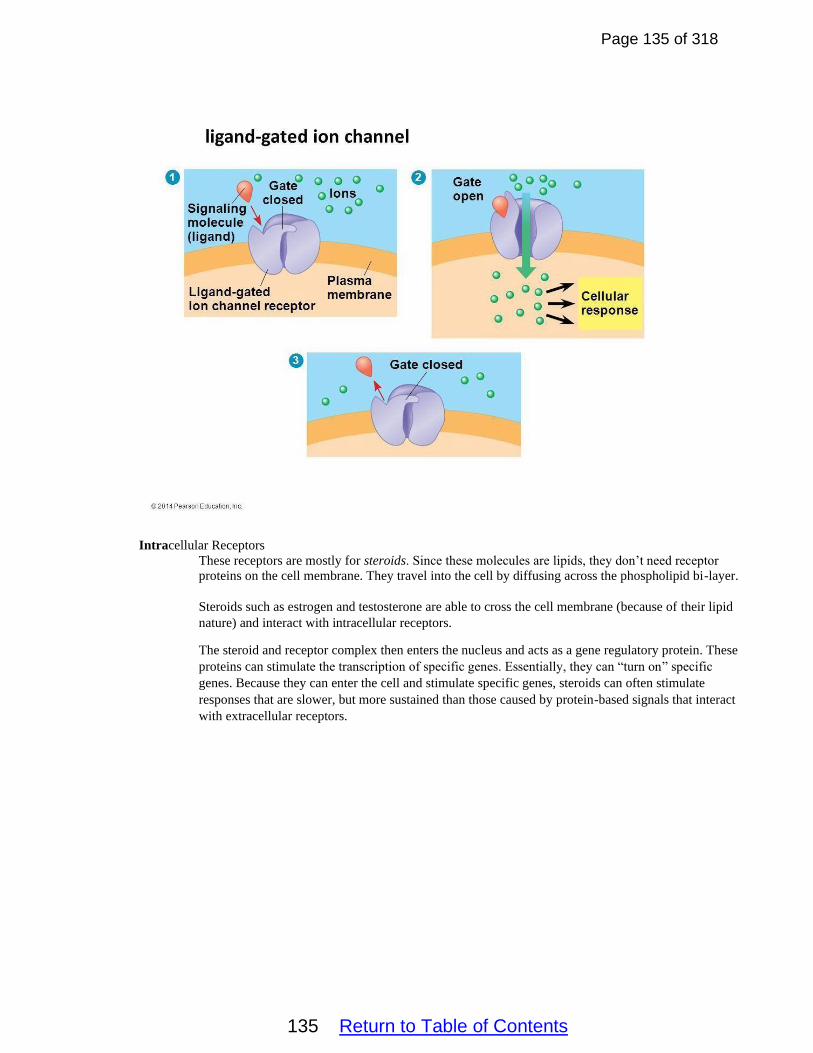
Page 135 of 318
135 Return to Table of Contents
Intracellular Receptors
These receptors are mostly for steroids. Since these molecules are lipids, they don’t need receptor
proteins on the cell membrane. They travel into the cell by diffusing across the phospholipid bi-layer.
Steroids such as estrogen and testosterone are able to cross the cell membrane (because of their lipid
nature) and interact with intracellular receptors.
The steroid and receptor complex then enters the nucleus and acts as a gene regulatory protein. These
proteins can stimulate the transcription of specific genes. Essentially, they can “turn on” specific
genes. Because they can enter the cell and stimulate specific genes, steroids can often stimulate
responses that are slower, but more sustained than those caused by protein-based signals that interact
with extracellular receptors.

Page 136 of 318
136 Return to Table of Contents
Feedback Loops
Homeostasis--a property of an organism or system that helps it maintain its parameters (temperature, blood glucose levels,
blood calcium levels, heart rate, blood pressure, etc..) within a normal (fairly constant) range of values. One of the main
functions of the endocrine system is to help maintain homeostasis.
Feedback loops are mechanisms used by organisms to maintain their internal environments and respond to internal and
external environmental changes.
Negative Feedback Loop—A negative feedback loop occurs in biology when the product of a reaction leads to a decrease in
that reaction. In this way, a negative feedback loop brings a system closer to a target set point of stability or homeostasis.
Negative feedback loops are responsible for the stabilization of a system, and ensure the maintenance of a steady, stable
internal state. The response of the regulating mechanism is opposite to the output of the event. Another way of thinking
about negative feedback loops is that if a system is perturbed/disturbed, negative feedback mechanisms return the system to
its target set point. These mechanisms operate on both the molecular and cellular levels. Examples in the human body
include: Thermoregulation; Maintenance of blood glucose levels; Maintenance of blood calcium levels.
Components of a Negative Feedback Loop
Stimulus—a change in a variable away from the set point range.
Receptor—senses a change in a variable.
Control Center—compares the changes to the set point range. Sends out either nervous or endocrine signals to
effectors which will reverse the change back toward the set point. In many human feedback loops, the control
center is the hypothalamus.
Effector—makes adjustments to the variable.
Response—change in the variable caused by the effector.

Page 137 of 318
137 Return to Table of Contents
Idealized Negative Feedback Loop
Negative Feedback Loop for Blood Glucose Maintenance
Insulin is normally secreted by the beta cells (a type of islet cell) of the pancreas. The stimulus for insulin secretion is a HIGH
blood glucose...it's as simple as that! Although there is always a low level of insulin secreted by the pancreas, the amount
secreted into the blood increases as the blood glucose rises. Similarly, as blood glucose falls, the amount of insulin secreted by
the pancreatic islets goes down.
As can be seen in the picture below, insulin has an effect on a number of cells, including muscle, red blood cells, and fat
cells. In response to insulin, these cells absorb glucose out of the blood, having the net effect of lowering the high blood
glucose levels into the normal range.
Glucagon is secreted by the alpha cells of the pancreatic islets in much the same manner as insulin...except in the opposite
direction. If blood glucose is high, then no glucagon is secreted.
When blood glucose goes LOW, however, (such as between meals, and during exercise) more and more glucagon is secreted.
Like insulin, glucagon has an effect on many cells of the body, but most notably the liver.
The effect of glucagon is to make the liver release the glucose it has stored in its cells into the bloodstream, with the net effect
of increasing blood glucose. Glucagon also induces the liver (and some other cells such as muscle) to make glucose out of
building blocks obtained from other nutrients found in the body (eg, protein).

Page 138 of 318
138 Return to Table of Contents
Positive Feedback Loops
Positive Feedback Loop--A positive feedback loop occurs in nature when the product of a reaction leads
to an increase in that reaction. If we look at a system in homeostasis, a positive feedback loop moves a
system further away from the target of equilibrium. It does this by amplifying the effects of a product or
event and occurs when something needs to happen quickly. Breast milk production and release—The act
of suckling by an infant causes the pituitary gland to release prolactin, which leads to milk production;
more suckling leads to more prolactin release, which in turn leads to more lactation. This is a positive
feedback system as the product (milk) produces more suckling and more hormone. When the child is no
longer breast feeding, the prolactin drops off and milk production goes down.
A baby pushing against the cervix causes the cervix to stretch. The stretching causes nerve impulses to
travel to the brain. This stimulates the release of the hormone oxytocin by the pituitary gland. The
oxytocin binds to receptors on the cells of the uterine wall and stimulates it to contract. This causes the
cervix to stretch even more, which causes the release of more oxytocin, which causes more frequent and
stronger uterine contractions.
A ripening apple releases the hormone known as ethylene gas. This hormone stimulates neighboring
apples to ripen. This causes the release of more ethylene gas which causes even more apples to ripen.

Page 139 of 318
139 Return to Table of Contents
Positive Feedback Loop for Childbirth
Positive Feedback Loop for Fruit Ripening

Page 140 of 318
140 Return to Table of Contents
AP Biology
Introduction to the Cell Cycle
ALL cells undergo three basic processes associated with reproduction/division.
• Replication of the DNA within the parent cell. This occurs in what is referred to as the “Sphase”.
(Synthesis phase). Each cell must have a complete copy of the DNA. The DNA in each cell is
identical.
• Replication of any items that are in the cytoplasm, such as ribosomes and organelles (only ineukaryotic
cells).
• Division of the cytoplasm and cell membrane. This is referred to as cytokinesis.
Binary Fission (Prokaryotic Fission) in Prokaryotes
This is the process of Reproduction/Replication in prokaryotes (bacteria). Binary Fission is a type of asexual
reproduction. The process does not create any genetic diversity.
DNA replication (S phase) starts at a single “origin of replication” and works around the entire single, circular
chromosome. This results in two identical circular chromosomes in the nucleoid region.
This is followed by the production of a cleavage furrow in the cell membrane (cytokinesis) to produce 2 new
cells, that are referred to as clones.
The cleavage furrow is produced using actin and myosin (protein) microfilaments of the cytoskeleton.
The two resulting cells are called clones because they possess 100% identical DNA strands.
Biologists think that binary fission evolved into Mitosis as the DNA content of cells increased dramatically.
Binary Fission

Page 141 of 318
141 Return to Table of Contents
Vocabulary Related to Eukaryotic Cell Division
Cell Cycle—The life cycle of the cell. This includes times in which the cell grows and carries out its designated function(s)
and times in which it replicates its DNA and divides. The cell cycle is a highly regulated series of events for the growth
and development of cells. The cell cycle is a highly regulated series of events for the growth and development of cells.
Parent or Mother cell—The original cell that begins to divide.
Daughter cells—The two identical cells that result from the division of the mother cell. These cells are genetically identical
clones.
Genome – The entire genetic material (DNA) for an organism or cell.
In humans, the genome length is about 2 m or 7 ft. per cell.
Chromatin – This term refers to DNA in its loose, non-chromosome, formation. In this state DNA can be replicated and
transcribed.
Chromosomes – This term refers to DNA in its tightly coiled state. Chromosomes are only present in a cell just before
and during the process of cell division.
Somatic cells (“soma” means body) - These are normal body cells.
These are the cells that make up the majority of an organism.
Their chromosomal content is 2n or diploid. This means that these cells have two copies of each type of
chromosome. (They get half “n”from the “mother”; half “n” from the “father”.)
For humans cells, the diploid number is 46 chromosomes = 2n. (n= 23 in the egg; n=23 in the sperm.)
Germ cells- These are the only cells in the human body that are capable of doing meiosis. Meiosis forms four haploid
gametes (sperm or egg cells) from each diploid germ cell.
Meiosis is the process of making haploid sperm or eggs.
Histones
These are the proteins that help DNA coil up “condense” to form chromosomes during cell division.
When DNA is wrapped around these histones, the whole combined structure is referred to as a nucleosome.
The histones also play an important role in gene regulation.
Sister Chromatids--A portion of the whole “duplicated” chromosome.
This term refers to half of a duplicated or bivalent chromosome. Duplicated or bivalent chromosomes look like
an “X”.
The two halves are held together at the centromere , which is a group of proteins in a constricted portion of the
chromosome.

Page 142 of 318
142 Return to Table of Contents
The “homologous chromosomes” pictured above are bivalent or duplicated. Homologous means that the
two chromosomes are of the same type and control the same traits.
Mitosis vs. Meiosis
Mitosis – This process refers to ordinary cell division. Almost all cells in the body carry out mitosis. After
mitosis and cytokinesis, one mother cell forms two identical daughter cells. Mitosis is a form of cloning. Its
functions include repair of tissue damage, replacement of old/worn out cells, growth, and asexual reproduction (in
some organisms). .
Meiosis – Meiosis is the process of forming haploid gametes from diploid germ cells. One germ cell forms
four haploid gametes after meiosis. The four gametes are genetically different from each other. Meiosis is an
important source of genetic variation.
AP Biology
Stages of the Cell Cycle/Cell Cycle Regulation
Phases of the Eukaryotic Cell Cycle:
Interphase
Cells spend up to 90% of their existence in Interphase. Interphase is not part of mitosis. It is the time
during the cell division in which the cell carries out ordinary, everyday growth, activity, and/or repair of
the cell.
Interphase consists of three parts:
G1 (Primary or “first” growth)
During this stage ordinary, everyday growth, activity, and/or repair of the cell takes place.
Organelles begin replicating.
The first checkpoint of the cell cycle occurs at the end of G1.
A checkpoint is one of several points in the eukaryotic cell cycle at which the
progression of a cell to the next stage in the cycle can be halted until conditions are
favorable.
The cell will only pass the G1 checkpoint if it is an appropriate size and has adequate
energy reserves. At this point, the cell also checks for DNA damage. A cell that does not meet all the requirements will not progress to the S phase. The cell can halt the cycle and
attempt to remedy the problematic condition, or the cell can advance into G0 (inactive)
phase and await further signals when conditions improve. .
S (synthesis)
During S phase, DNA replicates or is synthesized.
In humans, the 46 single chromatid chromosomes are replicated to form 46 bivalent
chromosomes.

Page 143 of 318
143 Return to Table of Contents
G2 (Secondary or “second” growth)
During G2, the organelles enlarge and are replicated.
The newly synthesized DNA is checked for errors.
The second checkpoint occurs at the end of G2. The G2 checkpoint bars entry into the
mitotic phase if certain conditions are not met. As with the G1 checkpoint, cell size and
protein reserves are assessed. However, the most important role of the G2 checkpoint is to
ensure that all of the chromosomes have been accurately replicated without mistakes or
damage. If the checkpoint mechanisms detect problems with the DNA, the cell cycle is halted and the cell attempts to either complete DNA replication or repair the damaged
DNA.
Mitosis- Mitosis ensures the transfer of a complete genome from a parent cell to two genetically identical daughter
cells. Mitosis is technically not “cell division”. Mitosis is a form of nuclear division. It is followed by the process of
cytokinesis which divides the cell or cytoplasm. Mitosis plays an important role in the processes of growth, tissue repair, and asexual reproduction.
Mitosis occurs in the sequential stages of—Prophase, Metaphase, Anaphase, and Telophase. Note that some textbook
authors choose to divide prophase into two phases (prophase and prometaphase).
Prophase
During prophase, the nuclear envelope is broken down and the centrosomes construct the
spindle apparatus.
The chromatin condenses to form “X” shaped bivalent chromosomes. (Two chromatids.)
Centrioles move toward the poles. Note that plant cells don’t have centrioles.
The spindle fibers begin to attach to each chromosome at a point on the chromosome called
the kinetochore (a part of the centromere).

Page 144 of 318
144 Return to Table of Contents
Metaphase (“meta” means “middle”)
The chromosomes are pulled toward the middle of the cell and line up on the metaphase
plate. (Middle of cell.)
The third checkpoint occurs at the end of metaphase. The M checkpoint occurs near the
end of the metaphase stage of mitosis. The M checkpoint is also known as the spindle
checkpoint because it determines whether all the sister chromatids are correctly attached to
the spindle microtubules. Because the separation of the sister chromatids during anaphase
is an irreversible step, the cycle will not proceed until the kinetochores of each pair ofsister
chromatids are firmly anchored to at least two spindle fibers arising from opposite poles of
the cell. As the chromosomes’ kinetochores connect with the spindle apparatus, enzymes
are “turned on”. The enzymes are called Anaphase Promoting Complexes. (APC). When
concentration levels of APC reach the checkpoint level, Anaphase begins. The process
described above is sometimes referred to as the kinetochore signal.
Anaphase (“ana” means “separate”)
Each of the bivalent chromosomes are pulled apart and the two chromatids from each
bivalent chromosome (now referred to as a chromosomes) are pulled towards opposite
poles (ends) of the cell.
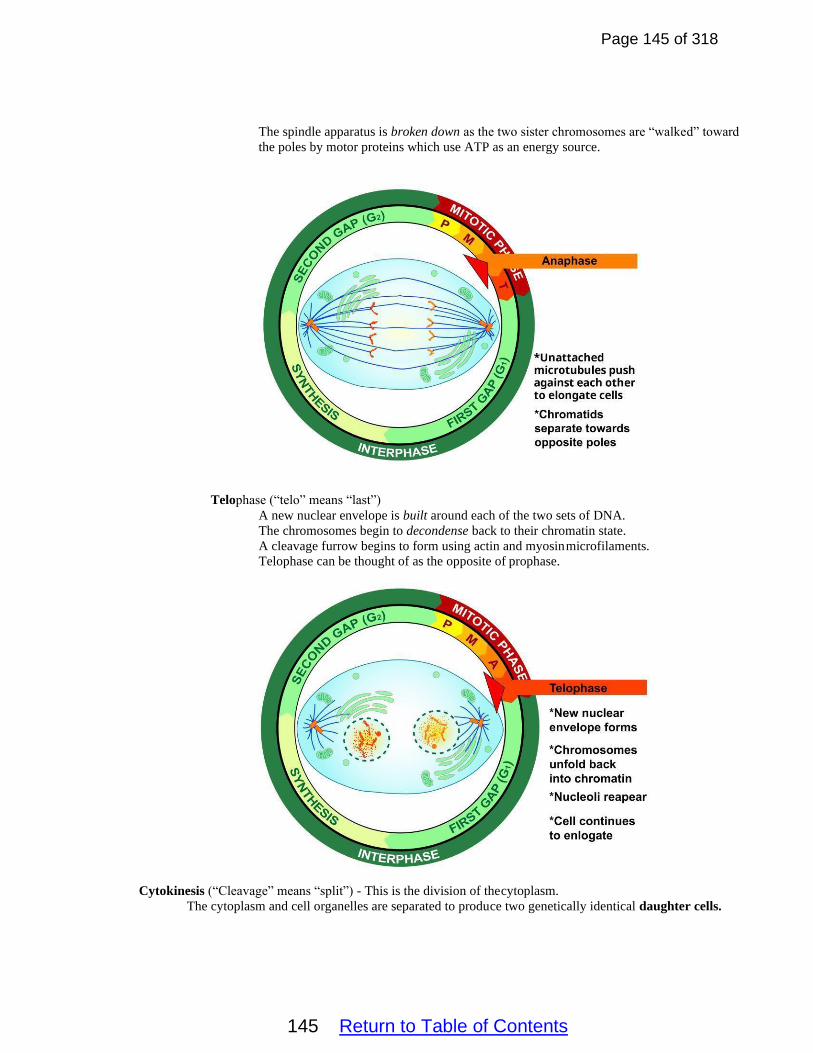
Page 145 of 318
145 Return to Table of Contents
The spindle apparatus is broken down as the two sister chromosomes are “walked” toward
the poles by motor proteins which use ATP as an energy source.
Telophase (“telo” means “last”)
A new nuclear envelope is built around each of the two sets of DNA.
The chromosomes begin to decondense back to their chromatin state.
A cleavage furrow begins to form using actin and myosin microfilaments.
Telophase can be thought of as the opposite of prophase.
Cytokinesis (“Cleavage” means “split”) - This is the division of the cytoplasm.
The cytoplasm and cell organelles are separated to produce two genetically identical daughter cells.

Page 146 of 318
146 Return to Table of Contents
G0 (Zero growth phase)
The G0 phase is a period in the cell cycle in which cells exist in a quiescent/non-dividing state. G0 phase
is viewed as either an extended G1 phase, where the cell is neither dividing nor preparing to divide, or a
distinct quiescent stage that occurs outside of the cell cycle. G0 is sometimes referred to as a "post-
mitotic" state, since cells in G0 are in a non-dividing phase outside of the cell cycle. Some types of cells,
such as nerve and heart muscle cells, become post-mitotic when they reach maturity (i.e., when they are
terminally differentiated) but continue to perform their main functions for the rest of the organism's life.
These cells will never re-enter the normal cell cycle. Multinucleated muscle cells that do not undergo
cytokinesis are also often considered to be in the G0 stage. On occasion, a distinction in terms is made
between a G0 cell and a 'post-mitotic' cell (e.g., heart muscle cells and neurons), which will never enter
the G1 phase, whereas other G0 cells may. There are cases in which cells in the G0 phase reenter the
normal cell cycle in response to certain environmental cues.
Spindle Apparatus
The spindle apparatus is composed of a network of protein filaments (mostly microtubules).
The construction begins at the centrosome (where the centrioles are) and works toward the chromosomes.
The spindle fibers attach to the kinetochore on the centromere of the replicated chromosomes.
Motor Proteins “walk” the chromosomes/sister chromatids toward the opposite poles (ends) using ATP as a
source of energy.
Non-kinetochore spindles are used to “push” the poles farther apart (to elongate the cell) and to help produce the
cleavage furrow.

Page 147 of 318
147 Return to Table of Contents
Cell Plate
Centrioles (in animal cells) act as anchorage points for the spindle fibers.
Plant cells DO NOT have centrioles because the cell wall is used as an anchor point for the spindle fibers.
When plant cells divide, a NEW cell wall “Plate” develops, using small segments of cellulose. There is not a
need for a cleavage furrow.

Page 148 of 318
148 Return to Table of Contents
Regulation “control” of the Cell Cycle.
Regulation is crucial for normal growth and development.
Regulation varies from cell type to cell type.
The most important form of regulation involves protein-based cell signals called Cyclins.
Checkpoints are also important. See the discussion included above for information pertaining to the three
cell cycle checkpoints.
Cyclin Production
The cyclin concentration in a cell increases from S phase until Anaphase.
Cyclins combine with an inactive enzyme known as Cyclin dependent Kinase (CdK) to form an active enzyme
known as Maturation Promoting Factor (MPF). MPF causes the cell to enter mitosis because it phosphorylates the
nuclear lamina and causes the nuclear membrane to begin the process of disintegration.
Cyclins are degraded after Mitosis leaving only CdK behind. Without cyclin, CDK is inactive.
This process essentially resets the “life clock” for the cell.

Page 149 of 318
149 Return to Table of Contents
The Cell Cycle and Cancer
Cancer (ABNORMAL cell growth/reproduction)
Cancer “creates”abnormally high Cyclin production within cells.
No checkpoints exist within cancerous cells, so there is no density-dependent inhibition.
Cancer cells are considered “immortal” as long as they have oxygen and nutrients.
Angiogenesis occurs – Angiogenesis is the “creation of new blood vessels” to “feed” the tumor.
Cancer cells have active telomerase enzymes present. A telomere is a region of
repetitive sequences at each end of eukaryotic chromosomes in most eukaryotes. Telomeres protect
the end of the chromosome from DNA damage or from fusion with neighboring chromosomes.
Telomeres get shorter with every cell division/DNA replication. There is evidence that the length of
the telomeres may regulate the life expectancy of a cell. When the telomeres get to a certain length,
the cell is programmed to undergo apoptosis (cell death). Telomerase is an enzyme that lengthens the
telomeres. The enzyme is active in fetuses, but is mostly inactivated after birth. Since cancer cells
have active telomerase enzymes, their telomeres don’t shorten. This means that they never have to go
through apoptosis and are essentially immortal.
Normal cells divide between 1 and 100 times each. This varies from cell type to cell type.
If no telomeres are present, the cell will not be able to continue dividing.
Cancer starts with Transformation of the DNA in a cell. (Transformation of telomerase to the “on”
setting.)
Things that can causes this to occur: weak genetic history, trauma, a viral insert of DNA/RNA and/or
repeated carcinogen exposure.

Page 150 of 318
150 Return to Table of Contents
AP Biology
Unit 5
Student Notes

Page 151 of 318
151 Return to Table of Contents
Unit 5 Student Notes
Table of Contents
A. Chromosomes, Meiosis, and Sexual Reproduction—Pages 152-156
B. Important Terms Related to Chromosomes and Meiosis—Pages 152-154
C. Types of Reproduction—Page 155
D. Types of Life Cycles—Pages 156-157
E. Meiosis—Pages 157-163
F. Gametogenesis—Pages 163--165
G. Nondisjunction—Pages 165-169
H. Chromosomal Rearrangements—Page 170
I. Crossover Frequency/Chromosome Mapping—Page 171
J. Mitosis and Meiosis Compared and Contrasted—Page 172
K. Mendelian Inheritance —Pages 172-176
L. Important Terms Related to Mendelian Inheritance—Pages 172-174
M. Monohybrid Cross—Pages 174-176
N. Dihybrid Cross—Pages 176-177
O. Trihybrid or Larger Cross—Pages 177-178
P. Linked Genes and Dihybrid Crosses—Pages 178-179
Q. Non-Mendelian Inheritance Patterns—Pages 179-181
R. Pedigree Charts/Modes of Inheritance—Pages 182-186
S. Modes of Inheritance--Autosomal Dominant—Page 183
T. Modes of Inheritance--Autosomal Recessive—Page 183
U. Modes of Inheritance--X-linked Dominant—Page 184
V. Modes of Inheritance--X-linked Recessive—Pages 184-185
W. Modes of Inheritance--Y-linked—Page 185
X. Modes of Inheritance--Mitochondrial--Page 186
Y. Environmental Effects on Phenotype—Page 187

Page 152 of 318
152 Return to Table of Contents
Important Ideas/Enduring Understandings for this unit.
• Heritable information provides for the continuity of life.
• Organisms are linked by line of descent from common ancestry.
• Naturally occurring diversity among and between components within biological systems affects interactions with the
environment.
Chromosomes, Meiosis, and Sexual Reproduction
Important Terms
Heredity
Heredity refers to the transmission of traits from one generation to the next by INHERITING DNA from a single
parent (asexual reproduction) or from two parents (sexual reproduction). The genetic information transmitted via
the DNA provides for the continuity of life across generations. Major features of the genetic code and many of
the core metabolic pathways regulated by genes are conserved across all living things. All life forms possess
DNA, RNA, and ribosomes and carry out the processes of DNA replication, transcription, and translation (protein
synthesis) in very similar ways. This high level of conservation supports the concept of common ancestry for all
organisms.
Chromosome
Chromosomes are the packaged and organized structures of DNA found in cells. Chromosomes consist of
chains of linked genes and associated proteins. The chromosomal basis of inheritance can be used to explain
the pattern of transmission of genes from parent(s) to offspring.
A eukaryotic chromosome consists of a single molecule of DNA wrapped around proteins called histones.
The histones function to package and organize the DNA. They also play an important role in gene
regulation.
Eukaryotic chromosomes are only visible (with a microscope) just before and during cell division. During
other parts of the cell cell cycle, the DNA is present in an a less condensed form known as chromatin. In
this form, the DNA can be transcribed and replicated.
Each chromosome contains several genes and the other DNA sequences involved in the regulation of the
genes. Genes that are located on the same chromosome are said to be linked.
Eukaryotic chromosomes are said to have a linear shape.
After replication, eukaryotic chromosomes often have an “X-shaped” appearance. These structures are
more correctly referred to as bivalent chromosomes. They consist of two copies of the original
chromosome attached at a central point known as the centromere. While connected the two copies are
referred to as chromatids.
Chromosomes that are not involved in gender determination are called autosomes. Human cells contain 44
autosomes.
Chromosomes that are involved in the process of gender determination are called sex chromosomes. Human
females have two X sex chromosomes, while human males have one X and one Y sex chromosome.

Page 153 of 318
153 Return to Table of Contents
BIVALENT

Page 154 of 318
154 Return to Table of Contents
A prokaryotic chromosome is circular and resides in a cell region called the nucleoid. Prokaryotes typically have
only one chromosome per cell. The types of proteins found in prokaryotic chromosomes, known as the nucleoid-
associated proteins, differ from the histone proteins that appear in eukaryotic chromosomes and cause the prokaryotic
chromosomes to form looped structures. In addition to the single, circular chromosome, many prokaryotes also
contain plasmids. A plasmid is a small, circular, double-stranded DNA molecule that is distinct from a cell's
chromosomal DNA. Plasmids naturally exist in bacterial cells, and they also occur in some eukaryotes. Often, the
genes carried in plasmids provide bacteria with genetic advantages, such as antibiotic resistance. Plasmids can be
exchanged between bacterial cells during the process of conjugation. During conjugation the bacterial cells attach to
each other and exchange plasmids. This is an important process for increasing genetic variation within the population.
Gene
A gene is a segment of DNA which codes for a single polypeptide or protein. Each chromosome consists of a
chain of several genes and the accompanying regulatory sequences and associated proteins.
Genome
A genome is an organism's complete set of DNA, including all of its genes. Each genome contains all of the
information needed to build and maintain that organism. In humans, a copy of the entire genome—more than 3 billion
DNA base pairs—is contained in all cells that have a nucleus.
Haploid
Haploid refers to cells that have only one copy of each type of chromosome. Haploid cells are sometimes referred to
as N or 1N cells. In human cells, the haploid number is 23. The only haploid cells found in the human body are the
gametes or sex cells.
Diploid
Diploid cells have two copies of each type of chromosome. Diploid cells are sometimes referred to as 2N cells. In
human cells, the diploid number is 46. All of the human body’s somatic cells are diploid.
Locus
The location of a gene on a chromosome.

Page 155 of 318
155 Return to Table of Contents
Types of Reproduction
Asexual Reproduction
Asexual reproduction involves only ONE parent. During the process, the parent produces clones which are
genetically identical to itself. The benefits of asexual reproduction are that the process can occur rapidly,
the process requires less energy than sexual reproduction, and that only one organism is required to carry
out the process. Examples of asexual reproduction include binary fission in bacteria, budding in yeasts and
hydras, and vegetative propagation in some plants.
The major disadvantage of asexual reproduction is that it produces identical organisms. Since there is no
variation, the ability of the population to adapt/evolve is severely limited. Asexual reproduction works
well in stable environments (to which the organism is well adapted), but does not work well in changing
environments to which populations need to be able to adapt.
Sexual Reproduction
Sexual reproduction involves the combining of DNA from two parents to create an offspring. During
fertilization, two haploid games fuse together to form a zygote. Fertilization restores the diploid
number of chromosomes and maintains in from generation to generation. The major benefit of the
sexual reproduction is that it creates genetic diversity/variation within the population by combining the
DNA from two different individuals to form a new organism with new allele combinations. This
variation allows the population to adapt/evolve with a changing environment. The major
disadvantages of sexual reproduction are that two parents of opposite sexes are required (this may be
nearly impossible for endangered species to be able to do), the process takes much longer than asexual
reproduction, and the process requires more energy than asexual reproduction. Most animals and
plants reproduce sexually. Some protists and fungi also utilize sexual reproduction.

Page 156 of 318
156 Return to Table of Contents
Types of Life Cycle
Most living things follow one of three possible types of life cycles, based on the amount of DNA within their
cells.
Haploid Majority
Organisms with a haploid life cycle spend the majority of their lives as haploid cells. When two of the
haploid cells fuse, they form a diploid zygote. The zygote quickly undergoes meiosis to produce more haploid cells that repeat the life cycle.
This haploid majority life cycle occurs mostly in Fungi and Protists.
The fusion of the haploid cells and the accompanying meiosis event, functions to create genetic
diversity/variation within the population.
Diploid Majority
Organisms with a diploid life cycle spend the majority of their lives as multicellular organisms
composed of diploid cells. In these organisms, diploid germ cells undergo meiosis to create haploid
gametes/sex cells. During fertilization, a haploid egg fuses with a haploid sperm to create a diploid
zygote. The zygote undergoes repeated rounds of mitosis to create a multicellular organism composed
of diploid cells. Most animals exhibit a diploid majority life cycle.
Alternation of Generations
Organisms which exhibit an alternation of generations alternate between a haploid sexual phase (the
gametophyte) and a diploid asexual phase (the sporophyte) of the life cycle.
The gametophyte generation begins with a spore produced by meiosis. The spore is haploid, and
all of the cells derived from it (by mitosis) are also haploid. In due course, this multicellular
structure produces gametes — by mitosis — and the fusion of two of these gametes then produces
the diploid sporophyte generation.
The sporophyte generation starts as a diploid zygote. Eventually, certain cells within the organism
undergo meiosis, forming spores. Each spore is capable of developing into a new haploid
gametophyte. Most plants exhibit an alternation of generations.

Page 157 of 318
157 Return to Table of Contents
In bryophytes, such as mosses and liverworts, the gametophyte is the dominant life phase, whereas
in angiosperms and gymnosperms the sporophyte is dominant. The haploid phase is also dominant
among fungi.
Meiosis
Meiosis is a specialized type of nuclear division (in sexually reproducing diploid organisms) that reduces the
chromosome number by half, creating four haploid cells, each genetically distinct from the parent cell that gave rise to
them. The haploid cells, after undergoing a period of maturation, become gametes.
The two main roles of meiosis are to create haploid gametes and to increase genetic diversity/variation within the
gametes.
In multicellular animals, meiosis occurs only in the sex organs/gonads. The only cells capable of doing meiosis are
specialized, diploid germ cells found in the gonads.
Before meiosis begins, the DNA is replicated during the S phase of interphase.
Meiosis involves two rounds of a sequential series of steps. These rounds are referred to as Meiosis I and Meiosis II.
Prophase I
Stages of Meiosis
Meiosis I
Meiosis begins with Prophase I. During Prophase I, the cell’s chromatin coils and condenses to form bivalent
chromosomes. The nucleolus disappears. The centrosomes form the spindle fibers and the nuclear envelope disintegrates.
Chromosomes of the same type/number (homologous chromosomes) pair up and join together during the process of
synapsis to form tetrads (groups of 4 homologous chromatids). The members of each pair contain the same genes in the
same order on the chromosome, but may contain different alleles or versions of the genes. After synapsis, the homologous
chromosomes undergo the process of crossing over in which they physically exchange segments. This is an example of

Page 158 of 318
158 Return to Table of Contents
genetic recombination. The process is an important source of genetic variation/diversity in the gametes that result at the
end of meiosis.
Metaphase I
During Metaphase I, the two members of each homologous pair of bivalent chromosomes align on each side of
the metaphase plate (middle of the cell). Each chromosome also attaches to the spindle fibers at a point on the
centromere known as the kinetochore. During the process of lining up, the paternal and maternal members of each
homologous pair randomly line up across from each other on either side of the metaphase plate. The pattern in which each
pair arranges itself is completely independent of the other homologous pairs. This process of random alignment, known as
independent assortment, can create up to 223 (8,388,608) possible alignments in human germ cells. Since the two rows
of chromosomes will eventually end up in different gametes, the process of independent assortment gives each human the
ability to create over 8 million genetically distinct types of gametes. Independent assortment increases genetic variation
by allowing daughter cells to each randomly receive a different proportion of paternal and maternal chromosomes.

Page 159 of 318
159 Return to Table of Contents
In the diagram above, red chromosomes represent maternal chromosomes and blue ones represent paternal chromosomes.
During independent assortment, both red, maternal chromosomes could face the top pole and both blue chromosomes
could face the bottom pole or both blue chromosomes could face the top pole and both red could face the bottom or one
red on the left and one blue on the right could face the top or one blue on the left and one red on the right could face the
top. It turns out the total possible combinations of alignments due to independent assortment can be found by raising 2 to
the number of homologous pairs contained within the cell. Number of combinations=2number of homologous pairs
For example, a cell with 6 homologous pairs of chromosomes could independently assort into 26 or 64 different
arrangements.
Anaphase I
During Anaphase I, one member of each homologous pair of chromosomes is pulled toward each pole of the cell by the
microtubules of the spindle apparatus. This process is called Segregation. The individual chromatids of each bivalent
chromosome are not separated as they are during the anaphase stage of mitosis. Anaphase I separates the members of the
homologous pairs from each other. This process of separation ensures that each gamete receives a haploid (1N) set of
chromosomes comprised of a mixture of chromosomes from both parents.
Telophase I
During Telophase I, the homologous chromosome pairs reach the poles of the cell, the spindle fibers disappear, nuclear
envelopes form around each set of chromosomes, and cytokinesis follows to produce two cells. The two new cells are
haploid and have half the number of chromosomes as the original germ cell. It is important to note that we count
chromosomes by counting the number of centromeres present. Even though the chromosomes at the end of telophase I are
bivalent, each bivalent chromosome has one centromere and only counts as a single chromosome.

Page 160 of 318
160 Return to Table of Contents
Meiosis I is often referred to as reductive division, because it halves the number of chromosomes found in the two cells
which result from the process.
To summarize, Meiosis I begins with 1 diploid germ cell and ends with 2 haploid cells which both possess bivalent
chromosomes.
Interkinesis
Interkinesis is a short interphase-like period that occurs between Meiosis 1 and Meiosis 2. No DNA replication occurs
during interkinesis, however it does occur during the interphase I stage that occurs before meiosis begins. During
interkinesis, the single spindle of the first meiotic division disassembles and the microtubules reassemble into two new
spindles for the second meiotic division.
Meiosis 2
Prophase II
The nuclear envelopes and the nucleoli of each of the cells produced during Meiosis 1 disintegrate during prophase II.
The chromosomes condense and the centrosomes replicate and move towards opposite poles. Spindle fibers grow outward
from the centrosomes. Prophase II is almost identical to the Prophase stage of mitosis. No synapsis or crossing over occur
during this stage.
Metaphase II
The chromosomes in both cells become arranged on the metaphase plate, much as the chromosomes do in mitosis, and
are attached to the now fully formed spindle.

Page 161 of 318
161 Return to Table of Contents
Anaphase II
During Anaphase II, the centromeres of each chromosome (in both cells) separate and the sister chromatids—now called
individual chromosomes—move toward the opposite poles of the cells. Anaphase II is the process in which sister
chromatids are separated from each other.
Telophase II
During Telophase II, a nuclear envelope forms around each set of chromosomes and cytokinesis occurs, producing four
genetically different daughter cells, each with a haploid set of chromosomes.
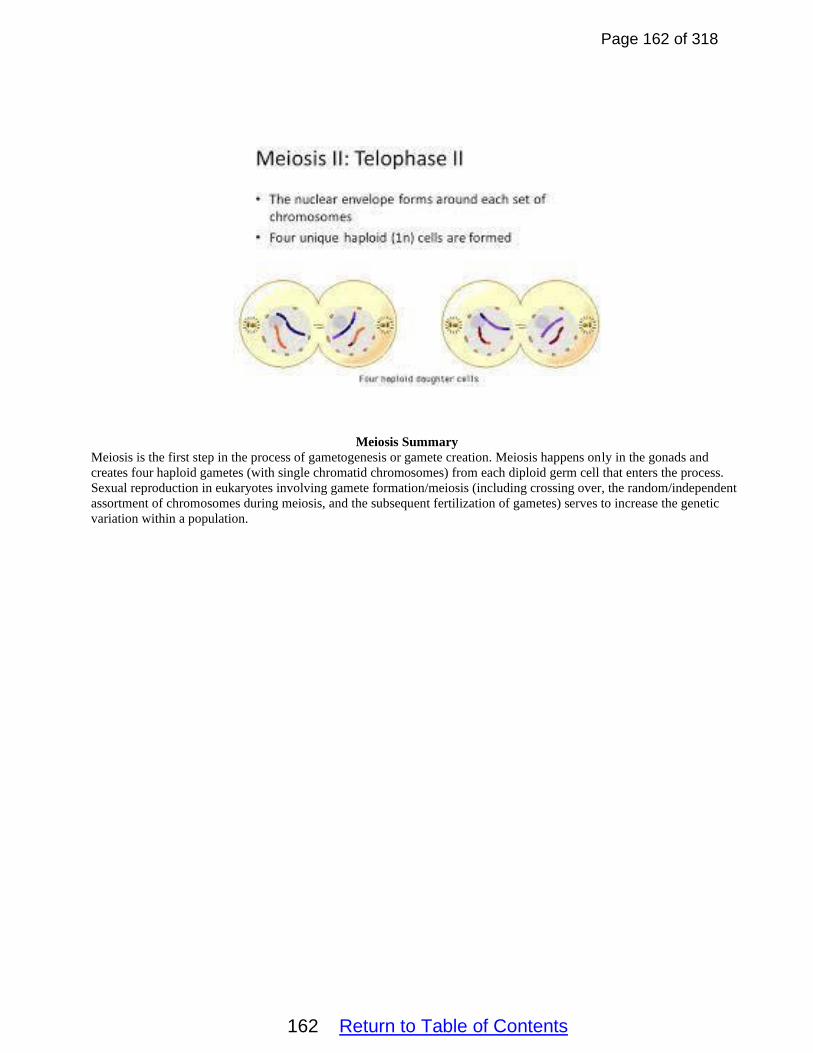
Page 162 of 318
162 Return to Table of Contents
Meiosis Summary
Meiosis is the first step in the process of gametogenesis or gamete creation. Meiosis happens only in the gonads and
creates four haploid gametes (with single chromatid chromosomes) from each diploid germ cell that enters the process.
Sexual reproduction in eukaryotes involving gamete formation/meiosis (including crossing over, the random/independent
assortment of chromosomes during meiosis, and the subsequent fertilization of gametes) serves to increase the genetic
variation within a population.

Page 163 of 318
163 Return to Table of Contents
Gametogenesis
Gametogenesis is the process which creates gametes or sex cells. The process starts with meiosis. Meiosis is then
followed by a period of maturation.
The process of sperm creation is known as spermatogenesis. Spermatogenesis begins when a diploid germ cell, known
as a primary spermatocyte, undergoes the process of meiosis to create 4 haploid spermatids. The spermatids mature in the
epididymis to become functional sperm. Men can continue to carry out the process of spermatogenesis from puberty until
death.
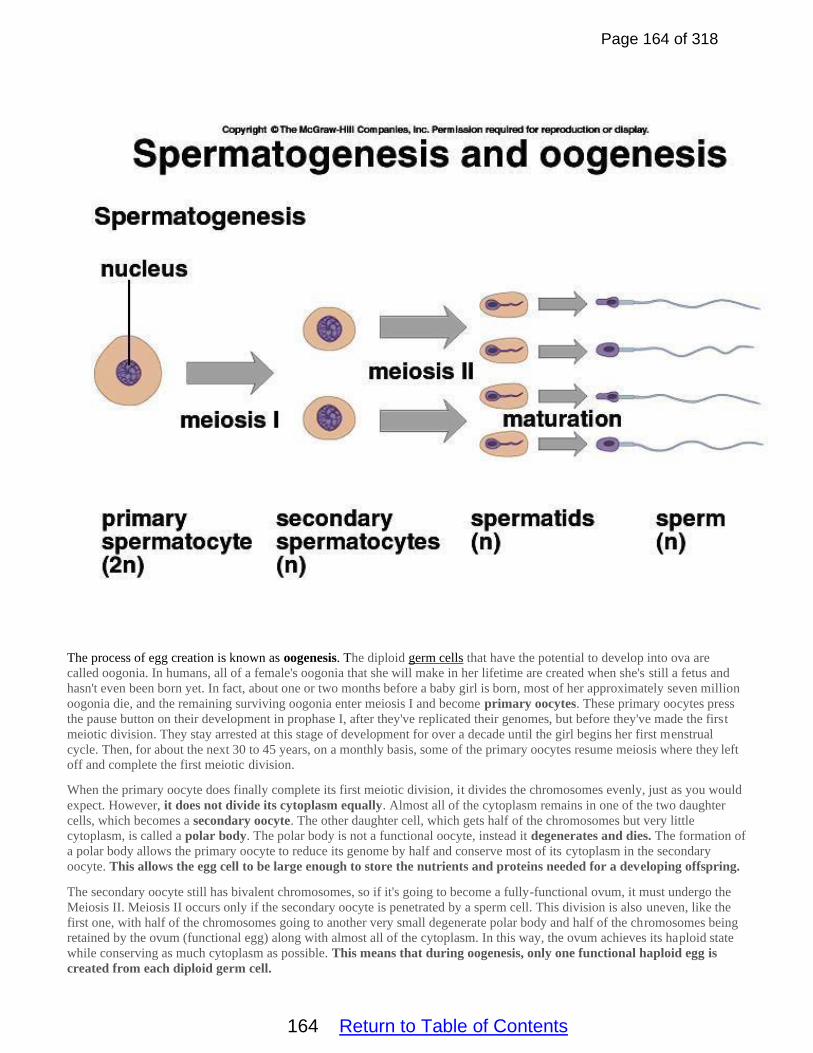
Page 164 of 318
164 Return to Table of Contents
The process of egg creation is known as oogenesis. The diploid germ cells that have the potential to develop into ova are
called oogonia. In humans, all of a female's oogonia that she will make in her lifetime are created when she's still a fetus and
hasn't even been born yet. In fact, about one or two months before a baby girl is born, most of her approximately seven million
oogonia die, and the remaining surviving oogonia enter meiosis I and become primary oocytes. These primary oocytes press
the pause button on their development in prophase I, after they've replicated their genomes, but before they've made the first
meiotic division. They stay arrested at this stage of development for over a decade until the girl begins her first menstrual
cycle. Then, for about the next 30 to 45 years, on a monthly basis, some of the primary oocytes resume meiosis where they left
off and complete the first meiotic division.
When the primary oocyte does finally complete its first meiotic division, it divides the chromosomes evenly, just as you would
expect. However, it does not divide its cytoplasm equally. Almost all of the cytoplasm remains in one of the two daughter
cells, which becomes a secondary oocyte. The other daughter cell, which gets half of the chromosomes but very little
cytoplasm, is called a polar body. The polar body is not a functional oocyte, instead it degenerates and dies. The formation of
a polar body allows the primary oocyte to reduce its genome by half and conserve most of its cytoplasm in the secondary
oocyte. This allows the egg cell to be large enough to store the nutrients and proteins needed for a developing offspring.
The secondary oocyte still has bivalent chromosomes, so if it's going to become a fully-functional ovum, it must undergo the
Meiosis II. Meiosis II occurs only if the secondary oocyte is penetrated by a sperm cell. This division is also uneven, like the
first one, with half of the chromosomes going to another very small degenerate polar body and half of the chromosomes being
retained by the ovum (functional egg) along with almost all of the cytoplasm. In this way, the ovum achieves its haploid state
while conserving as much cytoplasm as possible. This means that during oogenesis, only one functional haploid egg is
created from each diploid germ cell.

Page 165 of 318
165 Return to Table of Contents
Nondisjunction
Nondisjunction is the failure of homologous chromosomes or sister chromatids to separate properly during cell division. There
are three forms of nondisjunction: failure of a pair of homologous chromosomes to separate in meiosis I, failure of sister
chromatids to separate during meiosis II, and failure of sister chromatids to separate during mitosis. Nondisjunction results in
daughter cells with abnormal chromosome numbers, a condition called aneuploidy. When nondisjunction occurs during
meiosis, it can result in gametes with the wrong number of chromosomes. If fertilized, the most common result is miscarriage.
Most human embryos cannot survive with an abnormal chromosome number.
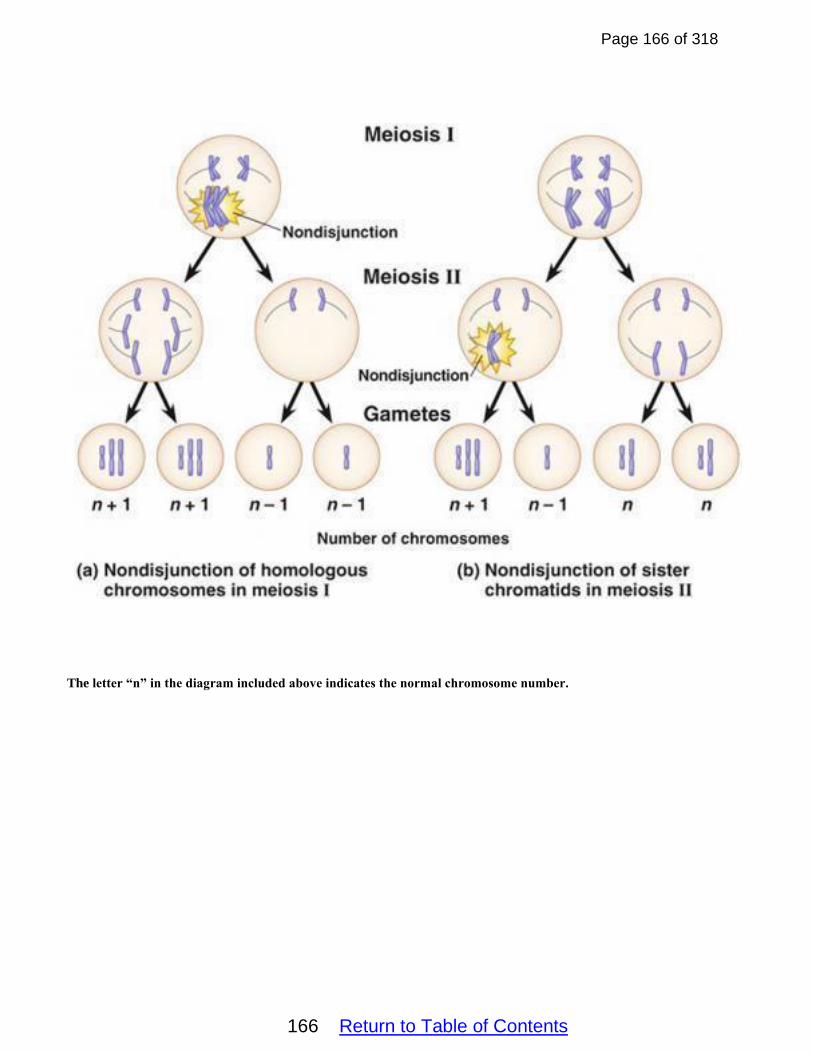
Page 166 of 318
166 Return to Table of Contents
The letter “n” in the diagram included above indicates the normal chromosome number.

Page 167 of 318
167 Return to Table of Contents
There are some conditions in which the aneuploid zygote survives. The table below describes some of the conditions which
result.
Many of these conditions can be diagnosed either before or right after birth by the analysis of a karyotype. A karyotype is
simply a picture of a person’s chromosomes. In order to get this picture, the chromosomes are isolated, stained, and examined
under the microscope. Most often, this is done using the chromosomes in the white blood cells. A picture of the chromosomes
is taken through the microscope. Then, the picture of the chromosomes is cut up and the chromosomes are arranged by size
into homologous pairs. The chromosomes are lined up from largest to smallest. The autosomes are displayed are displayed
as pairs 1-22 and the sex chromosomes are shown as pair 23.

Page 168 of 318
168 Return to Table of Contents
Karyotype of a Normal Female
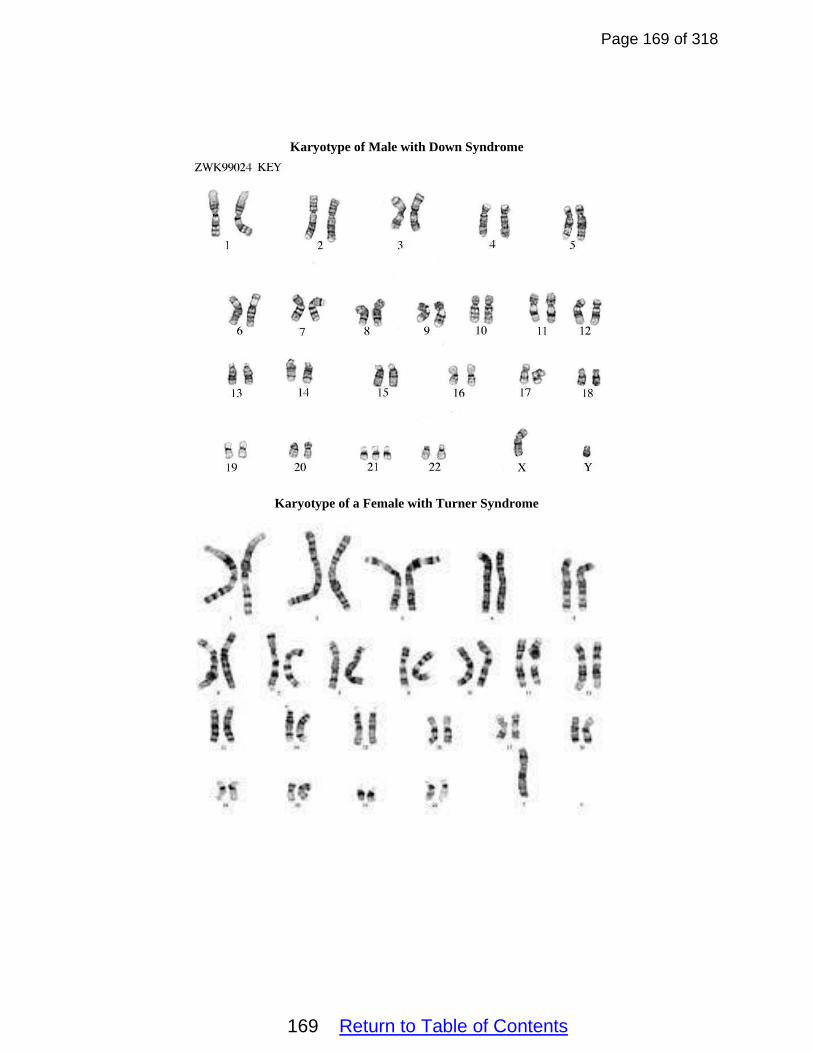
Page 169 of 318
169 Return to Table of Contents
Karyotype of Male with Down Syndrome
Karyotype of a Female with Turner Syndrome

Page 170 of 318
170 Return to Table of Contents
Chromosomal Rearrangements
In some cases, large chunks of chromosomes (but not entire chromosomes) are affected. Such changes are
called chromosomal rearrangements or chromosomal mutations. The rearranged chromosomes are called aberrant
chromosomes. The rearrangements often happen when crossing over doesn’t work correctly. There are four main
types of chromosomal rearrangements.
Duplication—A chromosome ends up with two or more copies of a gene segment.
Deletion—A chromosome ends up with no copies of a particular gene segment.
Inversion—A chromosomal region is flipped around so that it points in the opposite, wrong direction.
Translocation-- A piece of one chromosome is attached to another non-homologous chromosome.
Chromosomal rearrangements are responsible for several human disorders. These include:
Deletions—Cri Du Chat—Part of chromosome 5 is deleted. This leads to symptoms which include a high-pitched
cat-like cry, mental retardation, delayed development, distinctive facial features, small head size (microcephaly),
widely-spaced eyes (hypertelorism), low birth weight and weak muscle tone (hypotonia) in infancy. Duplications—Fragile X syndrome—part of the X chromosome is duplicated. This leads to mental retardation.
Inversions—may not cause any problems—can lead to infertility
Translocations—Philadelphia chromosome—A segment of chromosome 9 is translocated to chromosome 22. This
leads to a severe form of leukemia.
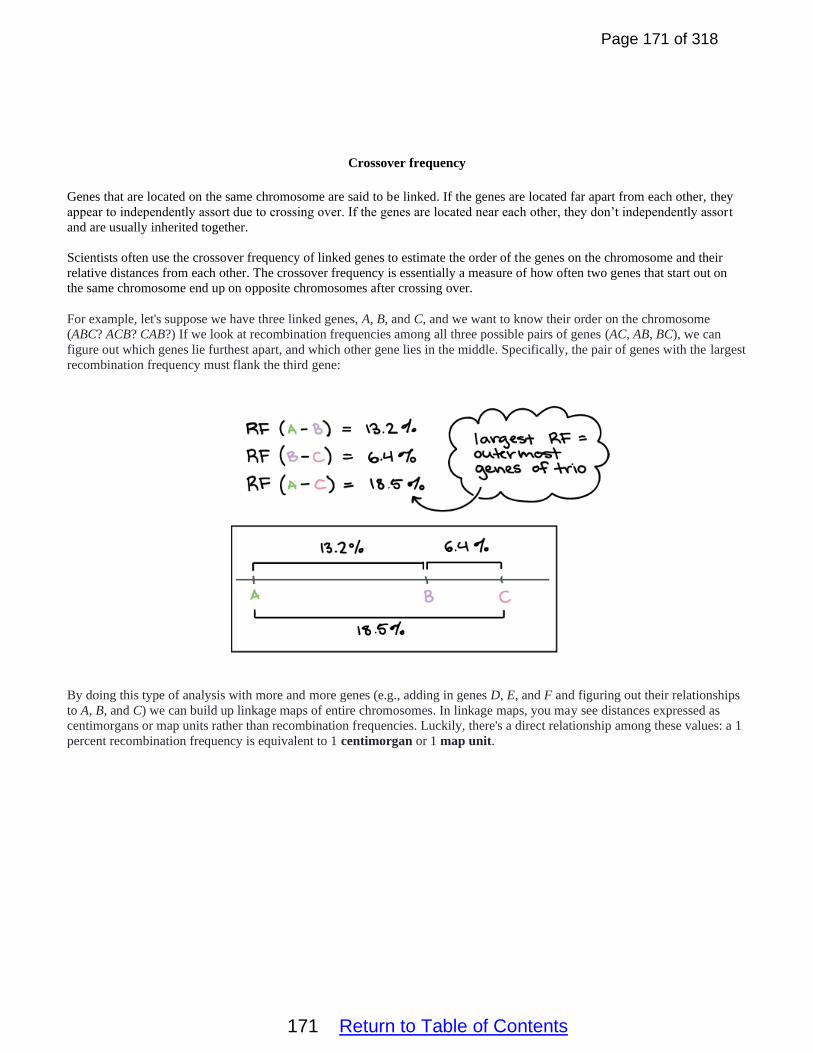
Page 171 of 318
171 Return to Table of Contents
Crossover frequency
Genes that are located on the same chromosome are said to be linked. If the genes are located far apart from each other, they
appear to independently assort due to crossing over. If the genes are located near each other, they don’t independently assor t
and are usually inherited together.
Scientists often use the crossover frequency of linked genes to estimate the order of the genes on the chromosome and their
relative distances from each other. The crossover frequency is essentially a measure of how often two genes that start out on
the same chromosome end up on opposite chromosomes after crossing over.
For example, let's suppose we have three linked genes, A, B, and C, and we want to know their order on the chromosome
(ABC? ACB? CAB?) If we look at recombination frequencies among all three possible pairs of genes (AC, AB, BC), we can
figure out which genes lie furthest apart, and which other gene lies in the middle. Specifically, the pair of genes with the largest
recombination frequency must flank the third gene:
By doing this type of analysis with more and more genes (e.g., adding in genes D, E, and F and figuring out their relationships
to A, B, and C) we can build up linkage maps of entire chromosomes. In linkage maps, you may see distances expressed as
centimorgans or map units rather than recombination frequencies. Luckily, there's a direct relationship among these values: a 1
percent recombination frequency is equivalent to 1 centimorgan or 1 map unit.

Page 172 of 318
172 Return to Table of Contents
Mitosis and Meiosis Compared and Contrasted
Mitosis and meiosis are both forms of nuclear division. They are similar in the way the chromosomes segregate but differ in
the number of cells produced and the genetic contents of the resulting cells. The table below summarizes the key similarities
and differences of the two processes.
Mendelian Inheritance Gregor Mendel—Mendel is considered to be the “Father of Genetics” because of his groundbreaking work with
inheritance in pea plants. Mendel conducted his experiments at an Austrian monastery in the late 1800s. He discovered
the basic laws of inheritance. He was able to do this before science had an understanding of DNA, chromosomes, or
meiosis. One of the characteristics of Mendel’s work that made it so successful was that he quantitatively analyzed the
results of his pea plant breeding experiments. Most biologists, before Mendel, didn’t think that biological processes could
be mathematically analyzed. Mendel’s main conclusions included: 1. Each trait is controlled by a single pair of alleles. Mendel called them factors.
2. Some alleles are dominant and can mask the appearance of recessive alleles (Law of Dominance)
3. The alleles from a pair separate (during meiosis) and only one member of each pair is transmitted to an offspring from
each parent (Law of Segregation). Realize that Mendel did not know about meiosis, but essentially predicted its
existence.
4. The maternal and paternal alleles/factors from each pair assort independently from the alleles in the other pairs. All
possible combinations of alleles/factors occur in the gametes. We know today that independent assortment occurs
during Metaphase I of Meiosis. (Law of Independent Assortment).
We know today that Mendel’s Laws of Segregation and Independent Assortment apply only to genes that are
located on different chromosomes. Mendel was unaware of the existence of chromosomes and linked genes.
Important Terms
Trait—a genetically determined characteristic. Mendel hypothesized that each trait is determined by two alleles (one
inherited from each parent). Although this is often true, there are many exceptions to this rule. We will explore some of
those exceptions in the Non-Mendelian Inheritance section of the notes (included below).
Alleles--This term refers to different versions of a gene. For example, a gene might control the color of one’s eyes.
Different versions (alleles) of that gene might cause the individual to have brown, blue, or green eyes. Dominant alleles
are represented with capital letters, while recessive alleles are represented with lower case letters.

Page 173 of 318
173 Return to Table of Contents
Homozygous—An organism is said to be homozygous or pure bred for a trait if the two alleles it possesses for the trait
are identical. (TT or tt for example).
Heterozygous-- An organism is said to be heterozygous or a hybrid for a trait if the two alleles it possesses for the trait
are different. (Tt for example).
Phenotype--This term refers to the physical traits or appearance of an organism. (Blue eyes or Type A blood, would be
examples.)
Genotype--This term refers to an organism’s genetic (DNA) make-up for a trait. (Such as TT, Tt or tt.) A genotype of TT
might cause a pea plant to have the “tall” phenotype.
If the genotype of an organism is unknown, we can perform a TESTCROSS to determine it. To perform this test,
you must cross the individual with the unknown genotype with a homozygous recessive individual. The
phenotypes of the resulting offspring can then be used to deduce the genotype of the parent.

Page 174 of 318
174 Return to Table of Contents
.
Punnett Square--This is a chart which shows the possible genotypic outcomes for a mating cross based on the parents’
genotypes.
Monohybrid Cross Monohybrid Cross—This is a cross in which only one trait is analyzed. To complete the cross, you must first
determine the possible gamete combinations of the parents. Remember that gametes are haploid. They should
only contain one allele for each trait. For example: If we crossed two purple flowered plants, with the genotype
Bb, the possible gametes for each plant are “B” or “b”. The gametes for one parent are written along the top of
the Punnett square, one haploid gamete per column. The gametes of the other parent are written along the left
hand side of the Punnett square, one haploid gamete per row. The boxes inside the square are then filled in using
the column and row headers as shown below.

Page 175 of 318
175 Return to Table of Contents
The cross illustrated above predicts a phenotypic ratio of 3 purple: 1 white and a genotypic ratio of 1 BB: 2Bb:1
bb
The rules of probability can be applied to analyze the passage of single-gene traits from parent to offspring.
The two rules commonly used in an AP Biology class are listed below:
If A and B are mutually exclusive (separate, unconnected events) then:
P(A or B)=P(A) + P (B)
The rule listed above is used to calculate the probability (P) of either event A or event B happening. The
probability that either event will occur is simply the sum of each of the individual events.
Product Rule
P (A and B)=P(A) X P(B)
The product rule is used to calculate the probability (P) that multiple independent events will each occur. The
probability that both event A and event B will occur is the product of the individual probabilities.
If you were asked to determine the probability that the cross above would produce a plant with white flowers,
your answer would be ¼ or 25% (from the Punnett square). If you were asked to determine the probability that
the cross would produce a plant with purple flowers, your answer would be ¾ or 75%.
If you were asked to determine the probability that the above cross would produce either a homozygous purple
(PP) or a homozygous white (pp) plant, you would: First use the Punnett Square to determine that the probability
of getting a homozygous purple plant is ¼ and the probability of getting a homozygous white plant is also ¼.
Then use:
P(A or B)= ¼ + ¼= ½
Suppose you were asked to determine the probability that the cross produced two purple-flowered plants in a
row?
To calculate this probability, you would need to use the product rule. The product rule states that in order to
determine the probability of two independent events occurring together, you must multiply the individual
probabilities of each event. In this example, we should multiple ¾ X ¾ to get a probability of 9/16 or 56.25%.

Page 176 of 318
176 Return to Table of Contents
Dihybrid Cross Dihybrid Cross–A dihybrid cross is a cross in which the inheritance of two traits is analyzed at the same
time. For example: Suppose that in pea plants “R” is the allele for round seeds, “r” is the allele for wrinkled
seeds, “Y” is the allele for yellow seeds, and “y” is the allele for green seeds. The Punnett Square below
illustrates the cross between two plants that are heterozygous (RrYy X RrYy) for both traits, a true dihybrid
cross. To construct the cross, you must first determine the possible gametes that each parent can create. Each
gamete should contain only one allele from each gene. In this case, each allele contains only one R (either
upper or lowercase) and one Y (either upper or lowercase). All possible combinations of the parental alleles are
possible. This means that each of the two parents can create the following gamete combinations: RY; Ry; rY;
and ry.
To determine the possible number of unique gamete combinations, analyze each gene pair. For the R pair, each
parent has a single R and a single r, 2 different alleles. For the Y pair, each parent also has a single Y and a
single y, 2 different alleles. To calculate the number of possible unique gametes, multiply the number of unique
alleles in each gene pair together. In this case that would mean 2 (from the R pair) X 2 (from the Y pair) =4
unique gametes per parent.
Let’s say that one of the original parents had the following genotype: rrYy To calculate the number of possible
alleles from this parent, multiple 1 (from the unique alleles in the r pair) X 2 (from the unique alleles in the Y
pair) to get 2 possible unique gamete combinations. In this case those would be rY and ry.
Once the possible gamete combinations are determined, the gametes for one parent are written along the top of
the Punnett square, one haploid gamete per column. The gametes of the other parent are written along the left-
hand side of the Punnett square, one haploid gamete per row. The boxes inside the square are then filled in using
the column and row headers as shown below.

Page 177 of 318
177 Return to Table of Contents
In a true dihybrid cross (one in which both parents are heterozygous for both traits), the phenotypic ratio
will always be 9:3:3:1 as shown in the Punnett square above.
Trihybrid or Larger Cross
It is possible to construct Punnett Squares for trihybrid crosses (crosses in which the inheritance of three traits are
analyzed at the same time). These squares can be really large (up to 64 squares). You will typically not be asked
to draw a trihybrid Punnett Square on the AP exam. You might, however, be asked to answer questions like the
following:
How many different possible gametes can an individual with the following genotype produce Aa Bb Dd Ee?
To answer this question, use the same approach as that described above. Multiple the number of unique alleles
from each pair together. In this case. 2 unique alleles from the A pair X 2 unique alleles from the B pair X 2
unique alleles from the D pair X 2 unique alleles from the E pair to yield 16 total unique allele
combinations/gamete types.
If the genotype of the parent had instead been AA Bb cc, the calculation would have been:
1 unique allele from the A pair X 2 unique alleles from the B pair X 1 unique allele from the c pair to yield only
two possible gamete combinations. In this case, those combinations would be ABc and Abc.
What is the probability that the cross between the following genotypes:
Aa BB Dd Ee X Aa Bb Dd ee will produce an offspring with the genotype Aa BB dd Ee?
To answer this question, you could draw a huge Punnett Square, but the easiest and fastest approach is to use
the product rule. First, analyze each gene pair separately. Think of doing four separate Punnett squares.

Page 178 of 318
178 Return to Table of Contents
What is the probability that AA (from parent 1) and Aa (from parent 2) will yield (Aa) in the offspring? The
answer is ½.
What is the probability that BB (from parent 1) and Bb (from parent 2) will yield BB in the offspring? Again,
the answer is ½.
What is the probability that Dd (from parent 1) and Dd (from parent 2) will yield dd in the offspring? This
time, the answer is ¼.
What is the probability that Ee (from parent 1) and ee (from parent 2) will yield Ee in the offspring? This
time the answer is ½.
To determine the overall probability that the cross between parents Aa BB Dd Ee X Aa Bb Dd ee will
produce an offspring with the genotype Aa BB dd Ee, multiply the probabilities from each gene pair (in bold
above). In this case, the calculation is ½ (from the A pair) X ½ (from the B pair) X ¼ (from the C pair) X ½
(from the D pair) to yield an overall probability of 1/32.
Linked Genes and Dihybrid Crosses Linked genes occur on the same chromosome, and therefore, tend to be inherited together (i.e., do not segregate
independently). When two heterozygotes are mated in a normal dihybrid cross with independent assortment of alleles, the
expected ratio in the offspring is 9:3:3:1. However, as shown in the figure below, in cases of dihybrid crosses involving
linkage, the ratio of the offspring produced is 3:1 and only the parental types, with no recombinants, are expected.

Page 179 of 318
179 Return to Table of Contents
The table below includes the actual observed results of the dihybrid cross involving the two heterozygotes described above.
Even though offspring with long wings/white eyes and offspring with short wings/red eyes weren’t expected, some were
produced. This often occurs in crosses involving linked genes because of the genetic recombination that occurs during
crossing over.
Non-Mendelian Inheritance Although Mendel discovered some of the most basic laws of inheritance, scientists have discovered many exceptions to
the so-called laws of Mendelian inheritance. The processes/conditions described below are all examples on non-
mendelian inheritance patterns. In these situations, the patterns of inheritance do not follow the ratios predicted by
Mendel’s laws. Quantitative analysis of the results of such crosses reveals that the observed phenotypic ratios
statistically differ from the ratios predicted by Mendel’s laws.
Incomplete Dominance is a form of intermediate inheritance in which one allele for a specific trait is not completely
expressed over its paired allele. This results in a third phenotype in which the expressed physical trait is a combination or
blending of the phenotypes of both alleles. In some plants, there are alleles for red flowers (R) and for white flowers (r).
Heterozygous plants (Rr) end up with pink flowers (a blend between red and white).
Codominance—This is a condition in which both alleles in a pair are expressed at the same time. They are both equally present in the phenotype (not blended). An example of codominance is human blood type. There are alleles for Type A
blood (IA), Type B (IB), and type O (i) blood. The alleles for type A and B code for different cell surface proteins that occur on the surface of the red blood cells (RBCs). Individuals with two O alleles (ii) lack these proteins. Individuals
with either IAIA or IAi possess the type A proteins on their RBCs. Individuals with either IBIB or IBi possess the type B
proteins on their RBCs. Individuals with the IAIB genotype possess both the A and B proteins on the surface of their RBCs.
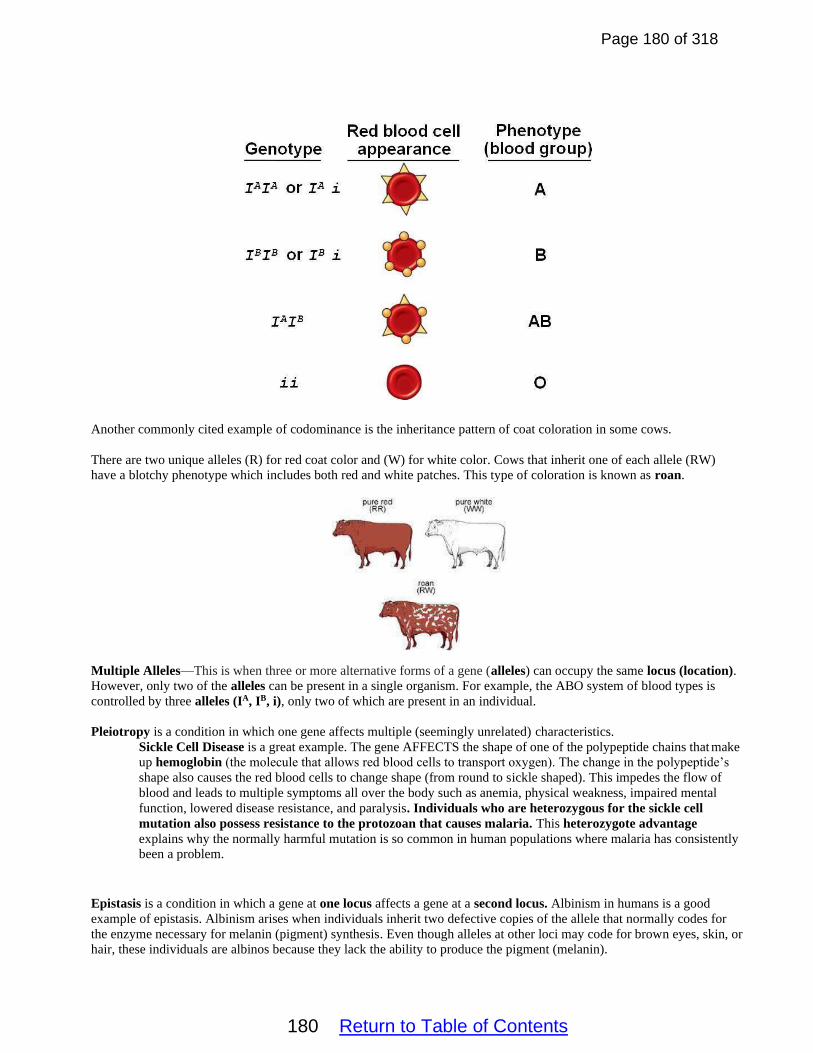
Page 180 of 318
180 Return to Table of Contents
Another commonly cited example of codominance is the inheritance pattern of coat coloration in some cows.
There are two unique alleles (R) for red coat color and (W) for white color. Cows that inherit one of each allele (RW)
have a blotchy phenotype which includes both red and white patches. This type of coloration is known as roan.
Multiple Alleles—This is when three or more alternative forms of a gene (alleles) can occupy the same locus (location).
However, only two of the alleles can be present in a single organism. For example, the ABO system of blood types is
controlled by three alleles (IA, IB, i), only two of which are present in an individual.
Pleiotropy is a condition in which one gene affects multiple (seemingly unrelated) characteristics.
Sickle Cell Disease is a great example. The gene AFFECTS the shape of one of the polypeptide chains that make
up hemoglobin (the molecule that allows red blood cells to transport oxygen). The change in the polypeptide’s
shape also causes the red blood cells to change shape (from round to sickle shaped). This impedes the flow of
blood and leads to multiple symptoms all over the body such as anemia, physical weakness, impaired mental
function, lowered disease resistance, and paralysis. Individuals who are heterozygous for the sickle cell
mutation also possess resistance to the protozoan that causes malaria. This heterozygote advantage
explains why the normally harmful mutation is so common in human populations where malaria has consistently
been a problem.
Epistasis is a condition in which a gene at one locus affects a gene at a second locus. Albinism in humans is a good
example of epistasis. Albinism arises when individuals inherit two defective copies of the allele that normally codes for
the enzyme necessary for melanin (pigment) synthesis. Even though alleles at other loci may code for brown eyes, skin, or
hair, these individuals are albinos because they lack the ability to produce the pigment (melanin).
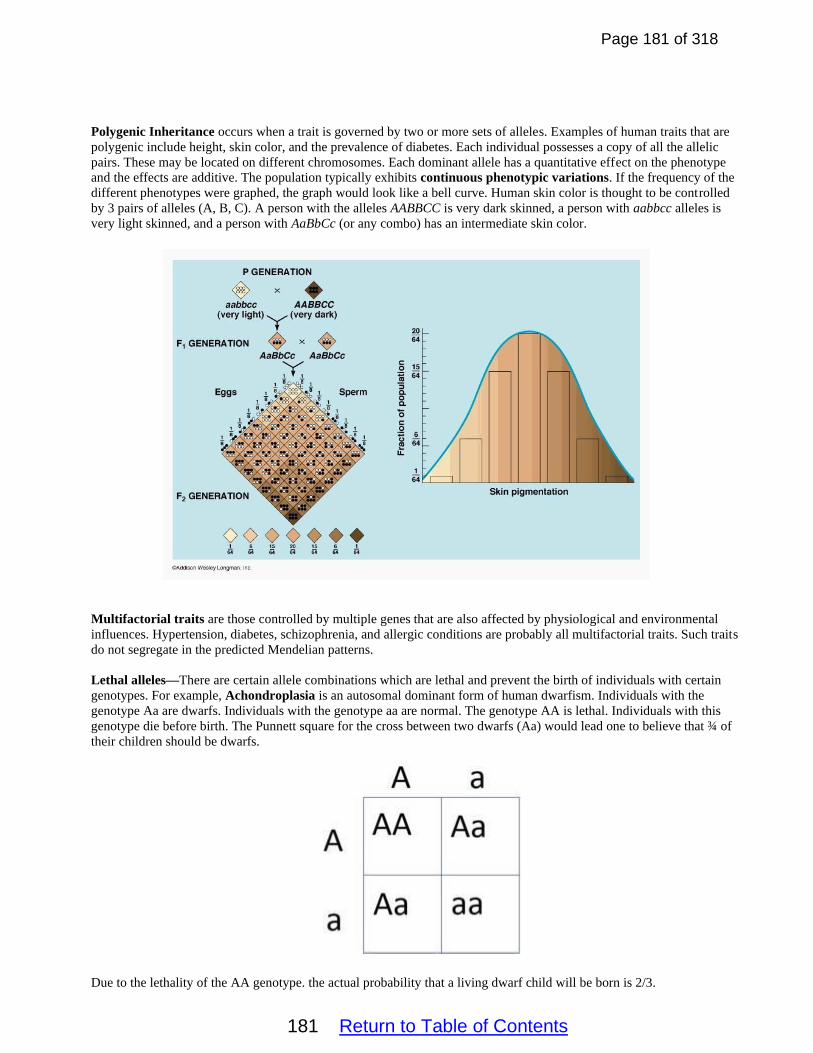
Page 181 of 318
181 Return to Table of Contents
Polygenic Inheritance occurs when a trait is governed by two or more sets of alleles. Examples of human traits that are
polygenic include height, skin color, and the prevalence of diabetes. Each individual possesses a copy of all the allelic
pairs. These may be located on different chromosomes. Each dominant allele has a quantitative effect on the phenotype
and the effects are additive. The population typically exhibits continuous phenotypic variations. If the frequency of the
different phenotypes were graphed, the graph would look like a bell curve. Human skin color is thought to be controlled
by 3 pairs of alleles (A, B, C). A person with the alleles AABBCC is very dark skinned, a person with aabbcc alleles is
very light skinned, and a person with AaBbCc (or any combo) has an intermediate skin color.
Multifactorial traits are those controlled by multiple genes that are also affected by physiological and environmental
influences. Hypertension, diabetes, schizophrenia, and allergic conditions are probably all multifactorial traits. Such traits
do not segregate in the predicted Mendelian patterns.
Lethal alleles—There are certain allele combinations which are lethal and prevent the birth of individuals with certain
genotypes. For example, Achondroplasia is an autosomal dominant form of human dwarfism. Individuals with the
genotype Aa are dwarfs. Individuals with the genotype aa are normal. The genotype AA is lethal. Individuals with this
genotype die before birth. The Punnett square for the cross between two dwarfs (Aa) would lead one to believe that ¾ of
their children should be dwarfs.
Due to the lethality of the AA genotype. the actual probability that a living dwarf child will be born is 2/3.

Page 182 of 318
182 Return to Table of Contents
Pedigree Charts/Modes of Inheritance
Important Terms Pedigree Chart--A diagram showing the lineage or genealogy of an individual and all the direct ancestors, usually to analyze or follow the inheritance of trait. The pattern of the inheritance of monohybrid, dihybrid, sex-linked, and
genetically-linked genes traits can often be predicted from data, including pedigrees, which indicate the genotypes and/or phenotypes of parent and offspring. Mode of Inheritance--The manner in which a genetic trait or disorder is passed from one generation to the next.
Autosomal dominant, autosomal recessive, X-linked dominant, X-linked recessive, Y-linked, and
mitochondrial inheritance are examples.
Autosome—A non-sex chromosome. Humans have 44 autosomes per diploid, somatic cell.
X and Y chromosomes—The two types of sex chromosomes in mammals, flies, and most other animals. These
chromosomes determine the sex of an individual. Females usually have 2 X chromosomes per somatic cell, while
males usually have only 1 X chromosome per cell. In certain species, the chromosomal basis of sex determination is
not based on X and Y chromosomes. Birds, butterflies, and snakes take everything we know about sex at the
chromosomal level and stand it on its head. Instead of X and Y chromosomes, they have Z and W
chromosomes.What's the difference? Everything. The XY and ZW chromosomes share no genes at all. What's more,
the ZW chromosomes flip the sex determination system. A male chicken - or peacock, or giant river prawn, or
komodo dragon - has ZZ chromosomes. A female has ZW chromosomes. For both XY and ZW systems, there are all
kinds of variations on what happens if one gene is missing or doubled. In mammals, an XO (an X chromosome and a
missing sex chromosome) usually results in a female. When it comes to fruit flies or crickets, a single X chromosome
results in a male. So sometimes the presence of a Y is required to produce a male, and sometimes it isn't. There
haven't been any ZO birds found, indicating they need at least two chromosomes to develop, but ZO, ZZW and
ZZWW all produce female butterflies. Snakes added to the confusion recently, when a female python produced
offspring despite not having been near any males. This parthenogenesis produced all-female offspring with WW
chromosomes — a combination not previously thought possible.
Carrier—An Individual who possesses only one copy of a recessive allele. This individual doesn’t express the trait,
but can pass the allele on to his/her offspring.
Gene Linkage—Genes are linked if they are found together on the same chromosome.
The diagram included below illustrates the symbols commonly used in pedigree charts.

Page 183 of 318
183 Return to Table of Contents
Modes of Inheritance—Autosomal Dominant
The genes for autosomal dominant traits are located on one of the 44 autosomes in a human cell. The genes are
dominant, which indicates that individuals with only one copy of the gene are affected. Characteristics of autosomal
dominant traits include: • Males and females are equally likely to have the trait.
• Traits do not skip generations because there are no carriers for the traits.
• The trait is present whenever a single copy of the corresponding allele is present.
• There is male-to-male transmission. This means that fathers can pass to trait to their sons.
Some examples of human genetic conditions that are transmitted via the autosomal dominant mode of inheritance
include: Huntington’s Disease, Achondroplasia, Polycystic Kidney Disease, and Familial Hypercholesterolemia.
The pedigree chart included below depicts the transmission of an autosomal dominant trait.
Modes of Inheritance—Autosomal Recessive
The genes for autosomal recessive traits are located on one of the 44 autosomes in a human cell. The genes are
recessive, which indicates that individuals must possess two copies of the recessive allele in order to exhibit the trait.
Characteristics of autosomal recessive traits include: • Males and females are equally likely to have the trait.
• Traits often skip generations (due to the possibility of carriers).
• Only homozygous recessive individuals have the trait.
• Traits may appear in siblings without appearing in their parents.
• If a parent has the trait, those offspring who do not have it are heterozygous carriers of the trait.
• Some examples of human genetic conditions that are transmitted via the autosomal recessive mode of inheritance
include: Tay Sachs Disease, PKU, and Cystic Fibrosis.
The pedigree chart included below depicts the transmission of an autosomal recessive trait.
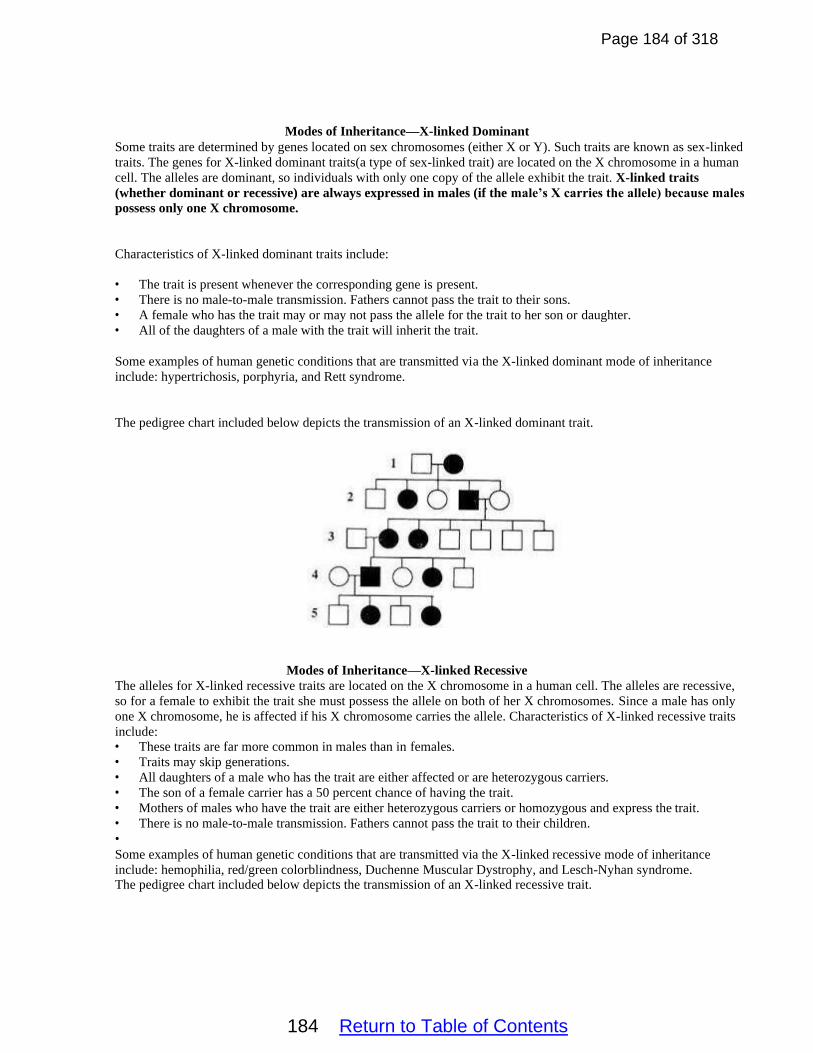
Page 184 of 318
184 Return to Table of Contents
Modes of Inheritance—X-linked Dominant
Some traits are determined by genes located on sex chromosomes (either X or Y). Such traits are known as sex-linked
traits. The genes for X-linked dominant traits(a type of sex-linked trait) are located on the X chromosome in a human
cell. The alleles are dominant, so individuals with only one copy of the allele exhibit the trait. X-linked traits
(whether dominant or recessive) are always expressed in males (if the male’s X carries the allele) because males
possess only one X chromosome.
Characteristics of X-linked dominant traits include:
• The trait is present whenever the corresponding gene is present.
• There is no male-to-male transmission. Fathers cannot pass the trait to their sons.
• A female who has the trait may or may not pass the allele for the trait to her son or daughter.
• All of the daughters of a male with the trait will inherit the trait.
Some examples of human genetic conditions that are transmitted via the X-linked dominant mode of inheritance
include: hypertrichosis, porphyria, and Rett syndrome.
The pedigree chart included below depicts the transmission of an X-linked dominant trait.
Modes of Inheritance—X-linked Recessive
The alleles for X-linked recessive traits are located on the X chromosome in a human cell. The alleles are recessive,
so for a female to exhibit the trait she must possess the allele on both of her X chromosomes. Since a male has only
one X chromosome, he is affected if his X chromosome carries the allele. Characteristics of X-linked recessive traits
include: • These traits are far more common in males than in females.
• Traits may skip generations.
• All daughters of a male who has the trait are either affected or are heterozygous carriers.
• The son of a female carrier has a 50 percent chance of having the trait.
• Mothers of males who have the trait are either heterozygous carriers or homozygous and express the trait.
• There is no male-to-male transmission. Fathers cannot pass the trait to their children.
• Some examples of human genetic conditions that are transmitted via the X-linked recessive mode of inheritance
include: hemophilia, red/green colorblindness, Duchenne Muscular Dystrophy, and Lesch-Nyhan syndrome. The pedigree chart included below depicts the transmission of an X-linked recessive trait.

Page 185 of 318
185 Return to Table of Contents
Modes of Inheritance—Y-linked
The alleles for Y-linked traits are located on the Y chromosome in a human cell. Since males possess only one Y
chromosome, the traits aren’t usually referred to as dominant or recessive. A man who possesses a Y-linked allele
will exhibit the trait it controls. Since females don’t possess a Y chromosome, they are not affected by Y-linked traits.
Characteristics of Y-linked traits include:
• Only males are affected.
• All sons of an affected male will also be affected.
• Females can’t possess or pass on the trait.
Some forms of Retinitis pigmentosum (a form of progressive blindness) are transmitted via the Y-linked mode of
inheritance The pedigree chart included below depicts the transmission of an Y-linked trait.

Page 186 of 318
186 Return to Table of Contents
Modes of Inheritance—Mitochondrial
Some traits result from non-nuclear inheritance. The alleles for mitochondrial traits are located on the small circular
chromosome found in the mitochondria. Since children (in animals) of both sexes inherit their organelles (including
the mitochondria) from the egg of the mother, mitochondrial traits are always transmitted from mother to child. Since
the mitochondria only have one chromosome each, there are no dominant or recessive mitochondrial traits.
Individuals who possess a single copy of a mitochondrial allele express the trait. Characteristics of mitochondrial
traits include: • All of the children of an affected female will express the trait. These traits are always maternally inherited.
• Males can express the trait but are unable to pass it on to their offspring.
The human mitochondrial chromosome is a very small piece of DNA and codes for only 13 proteins which are part of
the electron transport chain. Disorders related to mutations in the mitochondrial chromosome usually affect one’s
ability to make ATP.
In plants, both mitochondria and chloroplasts are transmitted in the ovule and not in the pollen. Since both organelles
contain their own single, circular chromosome, traits determined by the genes on the mitochondrial and chloroplast
chromosomes are always maternally inherited. Because chloroplasts and mitochondria are randomly assorted to
gametes and daughter cells, traits determined by chloroplast and mitochondrial DNA do not follow simple Mendelian
rules.
The pedigree chart included below depicts the transmission of a mitochondrial trait.
Page 187 of 318
187 Return to Table of Contents
Environmental Effects on Phenotypes
Environmental factors influence gene expression and can lead to phenotypic plasticity. Phenotypic plasticity occurs when
individuals with the same genotype exhibit different phenotypes in different environments. Natural environmental influences
include the phenomenon of color change in the Arctic fox (and other arctic animals) from red-brown in the summer months to
pure white during the winter season for better camouflage. The genes that produce the red-brown summer pigment are blocked
by cold temperatures, causing the hair to grow with no color (therefore, white). Another colorful example is the interaction
between the color of the hydrangea flower, which is blue in acidic soils and pink in alkaline soils. A recent study also linked
improved diet in infants and adolescents to a taller average height in the United States and Europe with the opposite effect in
famine-stricken populations. Some reptiles such as crocodilians and some turtles are known to display temperature-dependent
sex determination (TSD), where the ambient temperature of the developing eggs determines the individual's sex. For example,
in the American alligator's eggs, incubation at 33 ºC produces mostly males, while incubation at 30 ºC produces mostly
females. The genetic complement of an individual is inherited; however, the environmental effect on these genes may alter
their application and expression.

Page 188 of 318
188 Return to Table of Contents
AP Biology
Unit 6
Student Notes

Page 189 of 318
189 Return to Table of Contents
Unit 6 Student Notes
Table of Contents
A. History of DNA Research —Pages 190-197 B. Proteins or DNA: Which is the Genetic Molecule—Page 190-193 C. DNA Structure—Pages 195-198 D. DNA Replication—Pages 198-202 E. Telomeres—Pages 202-204 F. The Central Dogma of Genetics—Page 204 G. Transcription—Pages 205-208 H. RNA Processing—Pages 208-210 I. Alternative Splicing—Page 209 J. Types of RNA—Page 210 K. Differences Between DNA and RNA—Pages 211-212
L. Translation—Pages 213-218
M. Genetic Code Table—Page 213
N. Genetic Code Wheel—Page 212
O. tRNA—Page 214
P. Ribosomes—Page 215
Q. Three Stages of Translation—Pages 215-218
R. Wobble Effect—Pages 218-219
S. Post-Translation Modification or Protein Folding—Pages 219-220
T. Mutations and Genetic Disorders—Pages 220-222
U. Mutations and Natural Selection—Pages 222-223
V. Other Mechanisms that Can Change the Genotype and/or Phenotype of a Cell /Organism—
Pages 223-224
W. Gene Regulation—Pages 225-226
X. Operons—Pages 225-228
Y. Gene Regulation in Eukaryotic Cells—Pages 228-231
Z. Epigenetics—Page 230
AA. Embryonic Development—Pages 231-233
BB. Hox Genes—Pages 233-234
CC. DNA Biotechnology—Pages 234-244
DD. Possible Applications of Biotechnology and Recombinant DNA—Page 234-235
EE. DNA Cloning—Pages 235-237
FF. Polymerase Chain Reaction (PCR)—Pages 237-240
GG. Gel Electrophoresis—Pages 240-242
HH. DNA Sequencing/Human Genome Project—Page 243
II. Gene Editing/CRISPR/CAS9—Pages 243-244

Page 190 of 318
190 Return to Table of Contents
Key Ideas/Enduring Understandings for Unit 6
Heritable information provides for the continuity of life.
Differences in the expression of genes account for some of the phenotypic differences between organisms.
The processing of genetic information is imperfect and is a source of genetic variation.
Introduction
Scientists now know that DNA, and in some cases RNA, is the primary source of genetic/heritable information in all life forms.
This genetic information is both stored and transmitted from one generation to the next through either DNA or RNA molecules.
The DNA of a prokaryotic cell is typically packaged in a single, circular chromosome, while in a eukaryotic cell, the DNA is
typically contained in multiple linear chromosomes. Prokaryotes (and some eukaryotes) can also contain plasmids, which are
small extra-chromosomal, double-stranded, circular DNA molecules. The “History of DNA Research” note section (included
below) will describe how scientists were able to determine that DNA and RNA serve as the sources of heritable information
storage and transfer.
History of DNA Research
Gregor Mendel (in 1866)
Mendel, an Australian monk, worked with pea plants to discover the basic laws of inheritance.
Friedrich Miescher (in 1869)
Miescher, while trying to isolate proteins from white blood cells, discovered a chemical which he
called nuclein. Today, that chemical is known as DNA.
Proteins or DNA: Which is the Genetic Molecule?
For several years after Miescher’s discovery, the importance of DNA was not understood. Most scientists believed that
proteins served as the genetic molecules of cells. That made sense because scientists already understood that proteins
were built from several kinds of amino acids (20). This, they thought, could explain the genetic diversity of life. DNA, on
the other hand, was built from only 4 nitrogenous bases. Scientists didn’t think that DNA could code for the diversity of
traits found across life. Experiments in the early 1900s eventually proved that DNA, not protein, was the genetic
molecule.
Frederick Griffith (in 1928)
Griffith was a British Army doctor who was studying Pneumonia in the hopes of finding a cure.
He is given credit for the transformation experiment, even though this was not his original intent. In the experiment,
he took pathogenic (disease causing) bacteria and non-pathogenic bacteria and injected them into mice. The
pathogenic bacteria killed the mice. The non-pathogenic did not. He then took some pathogenic bacteria and killed
them by exposing them to heat. He took the dead bacteria and injected them into more mice. The mice did not die. He
then took some of the dead pathogenic bacteria and mixed them with living non-pathogenic bacteria. He then injected
the mixture into mice. The mice died. His reasoning was some “instructional agent” was exchanged between the dead
pathogenic bacteria and the living non-pathogenic bacteria allowing them to “learn” a new trick. The non-pathogenic
bacteria were transformed from non-pathogenic into pathogenic bacteria. Griffith was never able to determine
which molecule acted as the “instructional agent” that allowed the transformation to take place.
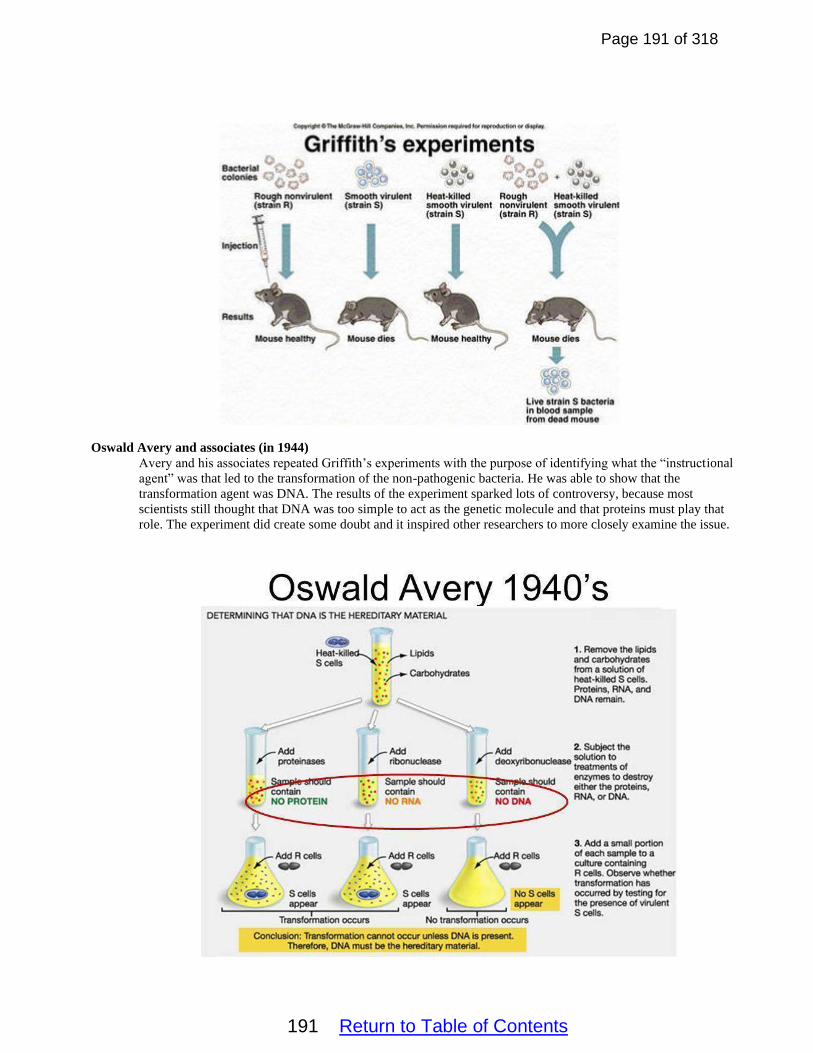
Page 191 of 318
191 Return to Table of Contents
Oswald Avery and associates (in 1944)
Avery and his associates repeated Griffith’s experiments with the purpose of identifying what the “instructional
agent” was that led to the transformation of the non-pathogenic bacteria. He was able to show that the
transformation agent was DNA. The results of the experiment sparked lots of controversy, because most
scientists still thought that DNA was too simple to act as the genetic molecule and that proteins must play that
role. The experiment did create some doubt and it inspired other researchers to more closely examine the issue.

Page 192 of 318
192 Return to Table of Contents
Alfred Hershey and Martha Chase (in 1952)
Hershey and Chase worked with the T2 Bacteriophage (a virus that infects bacteria) and E. Coli bacteria.
They wanted to definitively identify if protein or DNA served as the genetic material. Bacteriophages were
perfect for the task because they consist of only DNA and proteins.
The researchers used radioactive Sulfur 35 to label the virus’s outer protein coat or capsid. Proteins, because
of the amino acid Cysteine, contain sulfur. DNA does not. Hershey and Chase were able to use the
radioactivity to follow where the proteins went during the experiment.
In a second experiment, they then used radioactive Phosphorus 32 to label the DNA inside the virus. DNA
contains phosphorus, while proteins do not.
The radioactively labeled viruses were exposed to bacteria. The viruses infected the bacteria. In the
radioactive Sulfur experiment, the radioactive sulfur did NOT enter the bacteria. When the viruses
reproduced inside the bacteria, the new viruses that came out of the dead bacteria were NOT radioactive.
In the radioactive Phosphorus experiment, the radioactive phosphorus did enter the bacteria. When the
viruses reproduced inside the bacteria, the new viruses that came out of the dead bacteria WERE radioactive.
The experiment showed that viruses attack bacteria by injecting their DNA, not their proteins, into the
bacterial cells. This proved to most scientists that DNA was the “transformation agent” and that DNA
carries the information “blueprint” from one generation to the next.
Bacteriophage
Hershey and Chase Experiment

Page 193 of 318
193 Return to Table of Contents
Transduction is the process by which a virus transfers genetic material from one bacterium to another. Viruses called
bacteriophages are able to infect bacterial cells and use them as hosts to make more viruses. After multiplying, these
viruses assemble and occasionally remove a portion of the host cell's bacterial DNA. Later, when one of these
bacteriophages infects a new host cell, this piece of bacterial DNA may be incorporated into the genome of the new host.
Transduction is a type of horizontal gene transfer. Horizontal or lateral gene transfer is the movement of genetic material
between unicellular and/or multicellular organisms other than by the ("vertical") transmission of DNA from parent to
offspring. Transfer of genes through conjugation and transformation are also types of horizontal gene transfer.
Erwin Chargaff (in 1947)
Chargaff developed what became known as Chargaff’s Rules. Chargaff was able to show that A, T, C, and G are not
found in equal quantities in a cell. He also showed that the amounts of each of the bases vary between individuals of
different species, but not between individuals of the same species. Finally, he also proved that for all organisms, the
amount of Adenine (A) is equal to the amount of Thymine (T) and that the amount of Cytosine (C) is equal to the amount
of Guanine (G). Chargaff didn’t understand the significance of his findings, but the findings turned out to be critical for
the work of Watson and Crick.

Page 194 of 318
194 Return to Table of Contents
Rosalind Franklin (in the 1950’s)
Franklin performed X-ray Crystallography on DNA. X-ray crystallography is a technique used for determining
the atomic and molecular structure of a crystal, in which the crystalline structure causes a beam of incident X-
rays to diffract into many specific directions. Franklin’s best image, known as photo 51, was eventually obtained
by Watson and Crick and convinced them that the DNA molecule is a double helix.
Photo 51
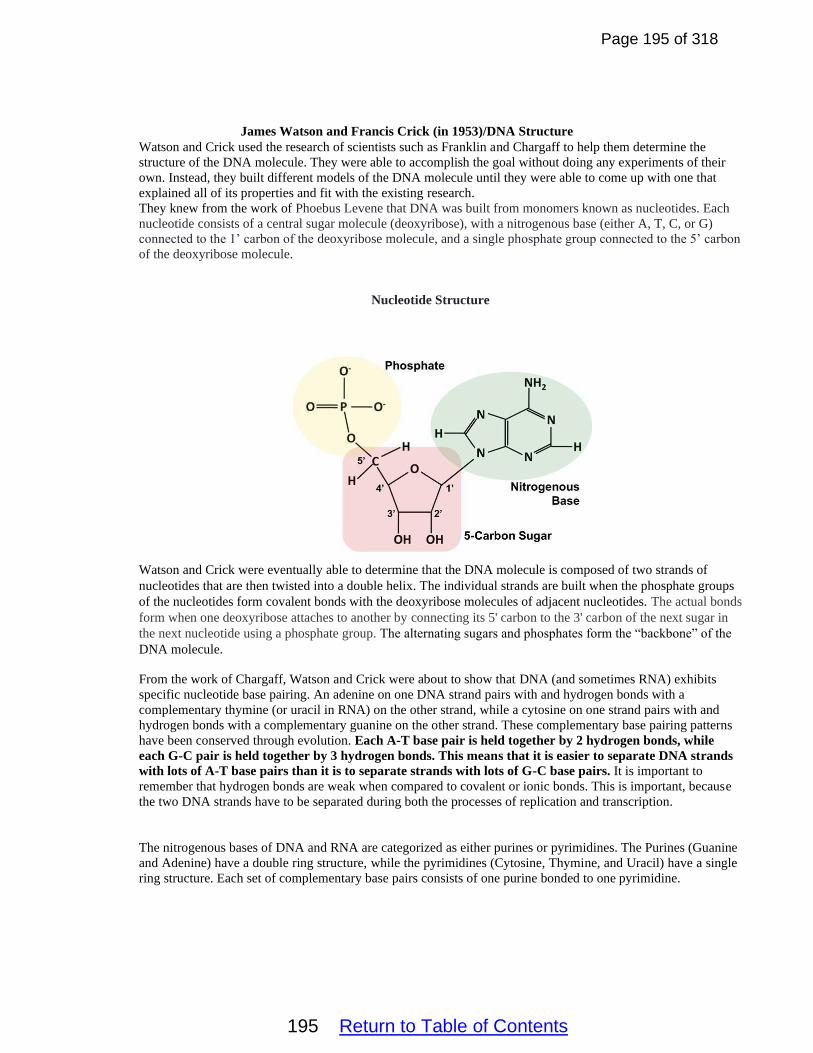
Page 195 of 318
195 Return to Table of Contents
James Watson and Francis Crick (in 1953)/DNA Structure
Watson and Crick used the research of scientists such as Franklin and Chargaff to help them determine the
structure of the DNA molecule. They were able to accomplish the goal without doing any experiments of their
own. Instead, they built different models of the DNA molecule until they were able to come up with one that
explained all of its properties and fit with the existing research.
They knew from the work of Phoebus Levene that DNA was built from monomers known as nucleotides. Each
nucleotide consists of a central sugar molecule (deoxyribose), with a nitrogenous base (either A, T, C, or G)
connected to the 1’ carbon of the deoxyribose molecule, and a single phosphate group connected to the 5’ carbon
of the deoxyribose molecule.
Nucleotide Structure
Watson and Crick were eventually able to determine that the DNA molecule is composed of two strands of
nucleotides that are then twisted into a double helix. The individual strands are built when the phosphate groups
of the nucleotides form covalent bonds with the deoxyribose molecules of adjacent nucleotides. The actual bonds
form when one deoxyribose attaches to another by connecting its 5' carbon to the 3' carbon of the next sugar in
the next nucleotide using a phosphate group. The alternating sugars and phosphates form the “backbone” of the
DNA molecule.
From the work of Chargaff, Watson and Crick were about to show that DNA (and sometimes RNA) exhibits
specific nucleotide base pairing. An adenine on one DNA strand pairs with and hydrogen bonds with a
complementary thymine (or uracil in RNA) on the other strand, while a cytosine on one strand pairs with and
hydrogen bonds with a complementary guanine on the other strand. These complementary base pairing patterns
have been conserved through evolution. Each A-T base pair is held together by 2 hydrogen bonds, while
each G-C pair is held together by 3 hydrogen bonds. This means that it is easier to separate DNA strands
with lots of A-T base pairs than it is to separate strands with lots of G-C base pairs. It is important to
remember that hydrogen bonds are weak when compared to covalent or ionic bonds. This is important, because
the two DNA strands have to be separated during both the processes of replication and transcription.
The nitrogenous bases of DNA and RNA are categorized as either purines or pyrimidines. The Purines (Guanine
and Adenine) have a double ring structure, while the pyrimidines (Cytosine, Thymine, and Uracil) have a single
ring structure. Each set of complementary base pairs consists of one purine bonded to one pyrimidine.
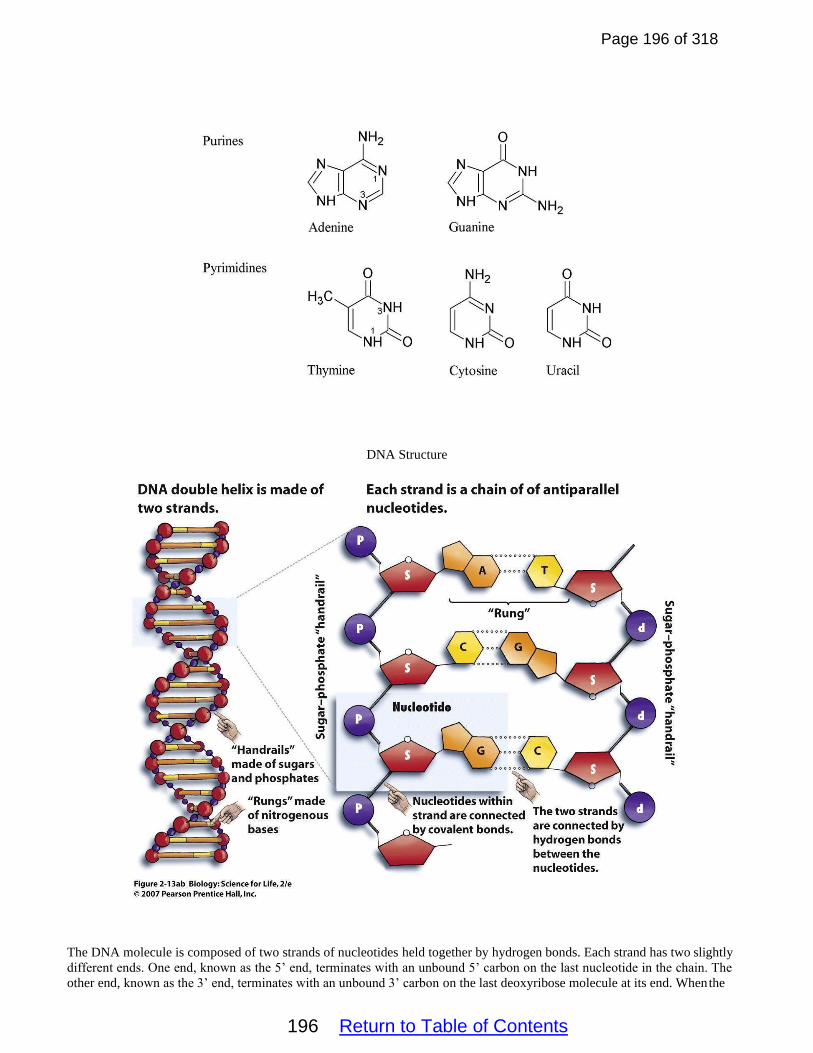
Page 196 of 318
196 Return to Table of Contents
DNA Structure
The DNA molecule is composed of two strands of nucleotides held together by hydrogen bonds. Each strand has two slightly
different ends. One end, known as the 5’ end, terminates with an unbound 5’ carbon on the last nucleotide in the chain. The
other end, known as the 3’ end, terminates with an unbound 3’ carbon on the last deoxyribose molecule at its end. When the

Page 197 of 318
197 Return to Table of Contents
two strands are connected together, they are oriented in opposite directions. Because they run parallel to each other, but have
opposite directional orientations, the two strands are said to be antiparallel.
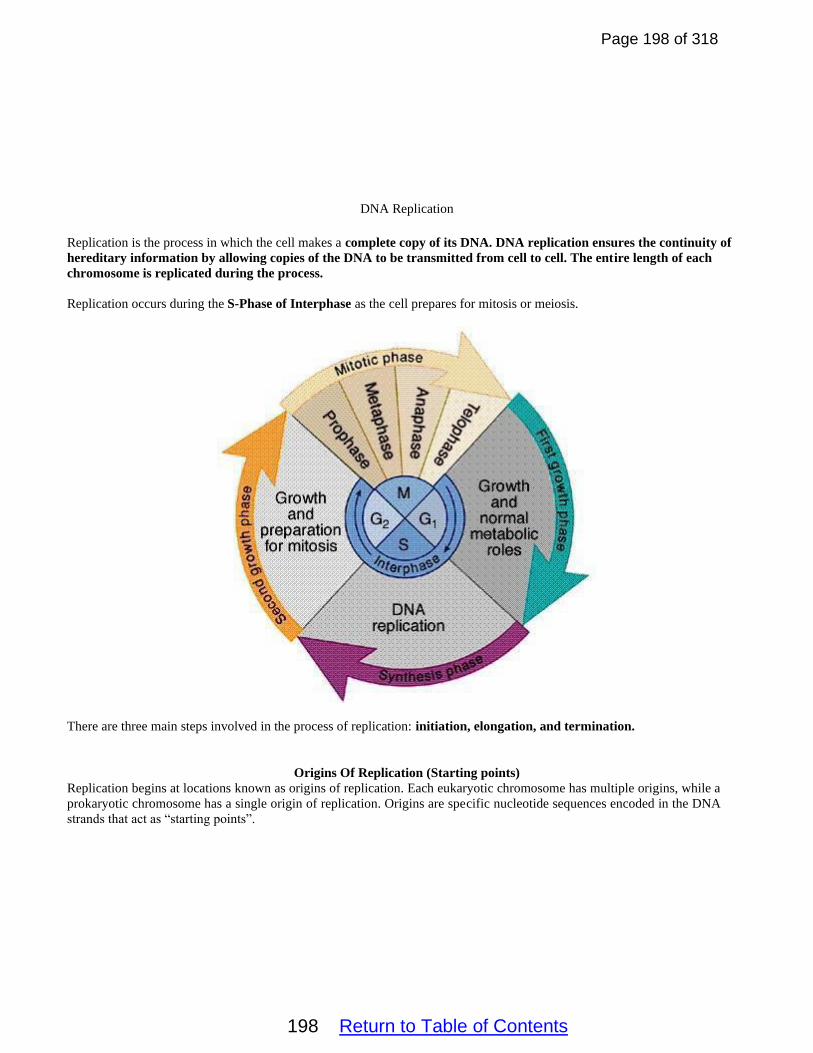
Page 198 of 318
198 Return to Table of Contents
DNA Replication
Replication is the process in which the cell makes a complete copy of its DNA. DNA replication ensures the continuity of
hereditary information by allowing copies of the DNA to be transmitted from cell to cell. The entire length of each
chromosome is replicated during the process.
Replication occurs during the S-Phase of Interphase as the cell prepares for mitosis or meiosis.
There are three main steps involved in the process of replication: initiation, elongation, and termination.
Origins Of Replication (Starting points)
Replication begins at locations known as origins of replication. Each eukaryotic chromosome has multiple origins, while a
prokaryotic chromosome has a single origin of replication. Origins are specific nucleotide sequences encoded in the DNA
strands that act as “starting points”.

Page 199 of 318
199 Return to Table of Contents
Origins of Replication in Prokaryotes
Origins of Replication in Eukaryotes
Initiation
Replication begins when the enzyme helicase begins to unwind or unzip the two strands of the DNA at each origin of
replication. This creates Replication Bubbles or Replication Forks. Both strands of DNA act as templates for the building

Page 200 of 318
200 Return to Table of Contents
of new DNA strands. Single-stranded binding proteins attach to the unzipped DNA strands to help keep the strands
separated and to stabilize them.
Many replication bubbles/forks can form on each DNA strand. (This speeds up the process of replication.)
A group of enzymes known as topoisomerases work to untangle/relax supercoiling of the DNA double helix ahead of the
replication fork.
Next, an enzyme known as Primase synthesizes short RNA sequences called primers. These primers serve as starting points
for DNA synthesis. Since primase produces RNA molecules, the enzyme is a type of RNA polymerase. Primase functions by
synthesizing short RNA sequences that are complementary to a single-stranded piece of DNA, which serves as its template. It
is critical that primers are synthesized by primase before DNA replication can occur because the enzymes that synthesize DNA,
which are called DNA polymerases, can only attach new DNA nucleotides to an existing strand of nucleotides. Therefore,
primase serves to prime and lay a foundation for DNA synthesis. After replication, the RNA primers are removed and replaced
with DNA.
Elongation
Elongation of the new DNA strands requires the enzyme DNA Polymerase. This enzyme performs the addition
of new nucleotides to the new DNA strands and also acts as a proofreader to help prevent errors/mutations in
construction from occurring. The enzyme works at a rate of about 500 nucleotides added per second.
The DNA Nucleotides are brought to the enzyme from the cytoplasm of a cell. They are created from either
broken down DNA strands found in the cells or from particles of food during the process of digestion.
DNA Polymerase can only synthesize/build new DNA strands in the 5’ 3’ direction. The original/parental
DNA strand that runs in the 3’ to 5’ direction is used as a template for building the leading strand of DNA. This
strand is built quickly and in one continuous piece.
The original/parental DNA strand which runs in the 5’ to 3’ direction acts as a template for the lagging strand of
DNA. This strand will run in the 3’ to 5’ direction, but must be built in the 5’ to 3’ direction. This strand must
be built discontinuously.
This side of the FORK has to wait for a LONG SEGMENT of DNA to become unwound and exposed before
replication on the strand can start with the addition of a primer. Once the primer is in place, DNA Polymerase III
will work backwards (in the 5’ to 3’ direction). Eventually a short fragment of DNA known as an Okazaki
fragment is synthesized. By this time, a new segment of the double-stranded parental DNA is unzipped. RNA

Page 201 of 318
201 Return to Table of Contents
primase synthesizes a new primer and DNA Polymerase III synthesizes a new Okazaki fragment in the 5’ to 3’
direction.
When the DNA Polymerase III, on the newly created Okazaki fragment, reaches the RNA primer of the previous
Okazaki fragment, the DNA Polymerase III will remove the old RNA primer and replace it with new DNA nucleotides. The Okazaki fragments are joined/”stitched”/covalently bonded together using the enzyme Ligase.
DNA replication is said to be a semiconservative process. Since each of the two original DNA strands act as a
template for the building of new complementary strands, the result is the formation of two identical copies of the
original double stranded molecule, each of which consists of one of the original strands and one newly
synthesized strand.
Correction of Errors (Proofreading)
During DNA replication, most DNA polymerases can “check their work” with each base that they add. This
process is called proofreading. If the polymerase detects that a wrong (incorrectly paired) nucleotide has been
added, it will remove and replace the nucleotide right away, before continuing with DNA synthesis. This function is performed by DNA Polymerase III as the new DNA strand is being made.
Many errors are corrected by proofreading, but a few slip through. Mismatch repair happens right after new
DNA has been made, and its job is to remove and replace mis-paired bases (ones that were not fixed during
proofreading). Mismatch repair happens when a protein complex (group of proteins) recognizes and binds to the
mispaired base. A second complex cuts the DNA near the mismatch, and more enzymes chop out the incorrect
nucleotide and the surrounding patch of DNA. A DNA polymerase then replaces the missing section with correct
nucleotides, and an enzyme called DNA ligase seals the gap

Page 202 of 318
202 Return to Table of Contents
Telomeres
Telomeres (TTAGGG nucleotide sequence)
A telomere is a region of repetitive DNA at the end of a chromosome, which protects the genes located at the end of
the chromosome from deterioration. Telomeres typically consist of repeated units made of the sequence TTAGGG.
The telomeres are non-coding sequences.
Russian theorist Alexei Olovnikov was the first to recognize (1971) that since DNA replication only occurs in the 5’
to 3’ direction, the very tip of a linear chromosome can’t be copied. This results in a slow, gradual shortening of the
chromosome. If coding sequences were located near the end of the chromosome, organisms would lose genetic
information with each replication.
Why can’t the end of the chromosome be replicated? When DNA is being copied, one of the two new strands of
DNA at a replication fork is made continuously and is called the leading strand. The other strand is produced in
many small pieces called Okazaki fragments, each of which begins with its own RNA primer, and is known as
the lagging strand. In most cases, the primers of the Okazaki fragments are replaced with DNA (by DNA
Polymerase) and the fragments are connected (by Ligase) to form an unbroken strand. When the replication fork
reaches the end of the chromosome, however, there is a short stretch of DNA that does not get covered by an Okazaki
fragment—essentially, there's no way to get the fragment started because the primer would have to fall beyond the
chromosome’s end. Also, the primer of the last Okazaki fragment that does get made can't be replaced with DNA like
other primers.
Leonard Hayflick formulated the idea of limited somatic cell division. He suggested that DNA sequences at the tips
of a chromosome are lost in every replicative phase until they reach a critical level, at which point cell division stops.

Page 203 of 318
203 Return to Table of Contents
The telomere shortening mechanism normally limits cells to a fixed number of divisions, and animal studies suggest
that this is responsible for aging on the cellular level and sets a limit on lifespans. Once a cell’s telomeres reach a

Page 204 of 318
204 Return to Table of Contents
certain level of shortness, the cells typically undergo apoptosis or programmed cell death. This prevents them from
replicating with missing genetic sequences.
Telomerase
Telomerase is an enzyme which lengthens telomeres during fetal development. After the fetus is fully developed,
this enzyme shuts off and degrades over time. The gene that is responsible for producing the enzyme is heavily
methylated and permanently deactivated before birth.
The telomerase enzyme can become active again in some mutated cells and can lead to cancer. This condition leads to
abnormally fast growth and reproduction in cells. These cells essentially become immortal and can continue to
reproduce an unlimited number of times.
Central Dogma of Genetics
The central dogma of molecular biology describes the flow of genetic information in cells from a sequence of
nucleotides in DNA to a sequence of bases in an messenger RNA (mRNA) molecule to a sequence of amino acids in a
protein. It states that DNA (in the nucleus) is transcribed to create mRNA molecules. The mRNA molecules travel
out of the nucleus and to the ribosomes where the sequence of the mRNA is translated and used to produce proteins.
These proteins then determine the traits of the organism. The central dogma also includes the process of replication.
Replication of DNA occurs during the S phase of Interphase and creates an identical copy of the entire genome so that
when cell division occurs, both cells get an entire, complete, identical copy of the DNA. All living things carry out
replication, transcription, and translation in similar ways. The central dogma is another example of a conserved trait
and is further evidence of the common ancestry of all life forms on Earth.
There are a couple of exceptions to the Central Dogma. Retroviruses, like HIV, the influenza viruses, and
the hepatitis B virus, don’t have any DNA. Their only genetic material is RNA. The viruses transcribe
RNA into DNA through the use of a special enzyme called reverse transcriptase; RNA → DNA → RNA →
protein. The DNA generated by reverse transcriptase integrates into the host cell’s genome and becomes
transcribed and translated for the assembly of new viruses/viral progeny. Also, some virus species are so
primitive that they use only RNA → proteins, having not developed DNA. With the discovery of prions
(like those that cause Mad Cow Disease, Kuru, and CWD), a new exception to the central dogma has been
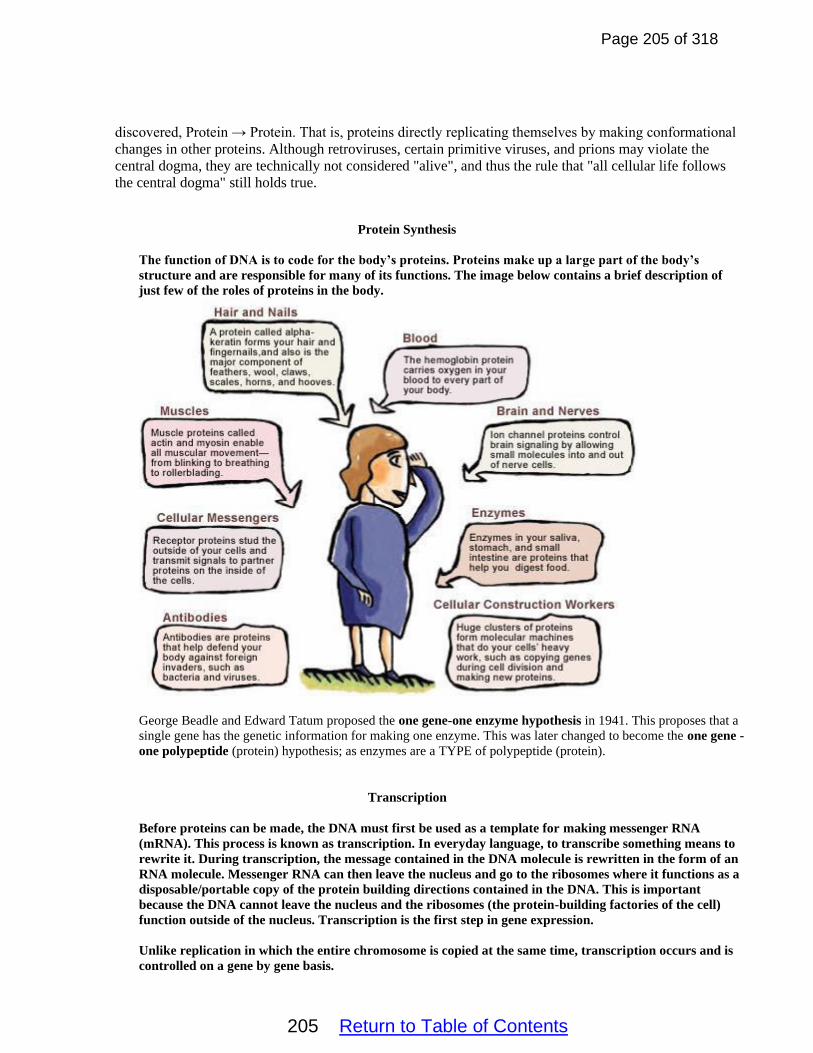
Page 205 of 318
205 Return to Table of Contents
discovered, Protein → Protein. That is, proteins directly replicating themselves by making conformational
changes in other proteins. Although retroviruses, certain primitive viruses, and prions may violate the
central dogma, they are technically not considered "alive", and thus the rule that "all cellular life follows
the central dogma" still holds true.
Protein Synthesis
The function of DNA is to code for the body’s proteins. Proteins make up a large part of the body’s
structure and are responsible for many of its functions. The image below contains a brief description of
just few of the roles of proteins in the body.
George Beadle and Edward Tatum proposed the one gene-one enzyme hypothesis in 1941. This proposes that a
single gene has the genetic information for making one enzyme. This was later changed to become the one gene -
one polypeptide (protein) hypothesis; as enzymes are a TYPE of polypeptide (protein).
Transcription
Before proteins can be made, the DNA must first be used as a template for making messenger RNA
(mRNA). This process is known as transcription. In everyday language, to transcribe something means to
rewrite it. During transcription, the message contained in the DNA molecule is rewritten in the form of an
RNA molecule. Messenger RNA can then leave the nucleus and go to the ribosomes where it functions as a
disposable/portable copy of the protein building directions contained in the DNA. This is important
because the DNA cannot leave the nucleus and the ribosomes (the protein-building factories of the cell)
function outside of the nucleus. Transcription is the first step in gene expression.
Unlike replication in which the entire chromosome is copied at the same time, transcription occurs and is
controlled on a gene by gene basis.

Page 206 of 318
206 Return to Table of Contents
The process of transcription occurs in the nucleus of the cell and includes three major phases: Initiation, Chain
Elongation, and Termination.
Initiation—During initiation a group of proteins known as a transcription factors attach to the promoter region
found near the gene. Each gene or set of co-transcribed genes has its own promoter sequence. This sequence
essentially serves as a signal that indicates the beginning of a gene. You may hear references to a specific part of
the promoter called the TATA box. Many promoter sequences have repeated sequences of the nitrogenous bases
Thymine and Adenine, thus the name TATA box is used for this region.
Next, an enzyme known as RNA Polymerase attaches to the promoter. RNA Polymerase is the main enzyme of
transcription. It is actually assembles the new RNA molecules. RNA Polymerase first separates or unzips the
two strands of DNA. This only occurs in the area of the gene being transcribed. The rest of the DNA stays
connected in its double stranded conformation.
Initiation
Elongation
Elongation—During the process of elongation, only one strand of the DNA acts as a template for RNA
polymerase to direct the inclusion of bases in the newly formed RNA molecule. The single DNA strand used by
RNA Polymerase is referred to as the template strand, the noncoding strand, the minus strand, or the antisense
strand. For simplification, these notes will refer to the strand as the template strand. Selection of which DNA
strand serves as the template strand depends on the gene being transcribed. RNA Polymerase “reads” the DNA
template strand one base or nucleotide at a time and builds an RNA molecule out of complimentary nucleotides.
The new RNA molecule must always be built in the 5’ to 3’ direction which means the DNA template
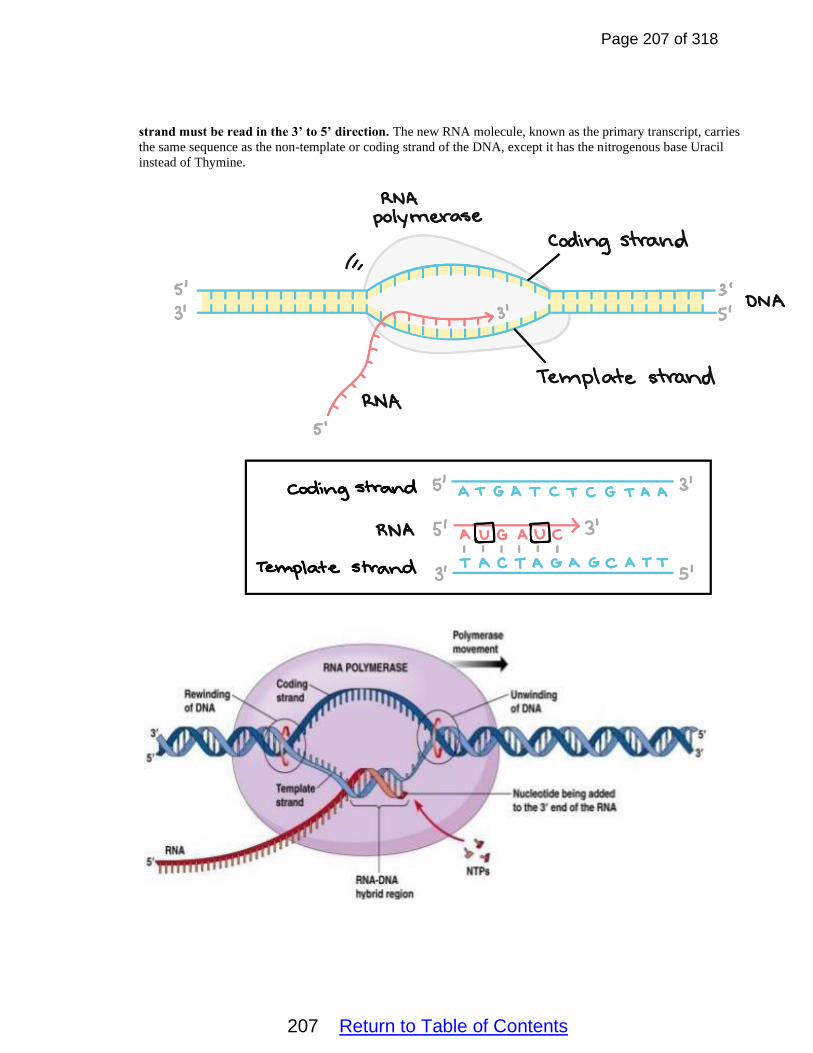
Page 207 of 318
207 Return to Table of Contents
strand must be read in the 3’ to 5’ direction. The new RNA molecule, known as the primary transcript, carries
the same sequence as the non-template or coding strand of the DNA, except it has the nitrogenous base Uracil
instead of Thymine.

Page 208 of 318
208 Return to Table of Contents
Termination
The RNA Polymerase will eventually reach the end of the gene. At that point a stop or terminator sequence in the
DNA signals the RNA Polymerase to stop transcription and to release the RNA molecule. At this point the RNA
polymerase will unattach from the DNA and any remaining portions of the DNA strands that are “unzipped” will
reattach to each other. Many RNA polymerase enzymes may transcribe a gene at the same time. This allows the cell
to produce many copies of the same mRNA molecule in a short period of time.
Termination
RNA Processing or RNA Modification
In prokaryotic cells, the RNA molecules produced during transcription can immediately act as messenger RNAs.
Translation begins while transcription is still ongoing.
In eukaryotic cells, the newly formed RNA molecule is known as pre-mRNA molecule or the primary mRNA
transcript. These molecules must be processed through a series of enzyme regulated modifications before
they can be used to direct translation.
This RNA modification process involves several steps:
1. Front end or 5’ modification—During this process, a protective GTP cap is added to the 5’
end of the RNA molecule. This cap helps the mRNA molecule attach to the rRNA of the
ribosomes.
2. Back end or 3’ modification—During this process 50-250 adenine nucleotides are added to
the 3’ end of the RNA molecule. This adenine sequence is known as a Poly A Tail. The Poly
A tail helps to prevent the enzymatic breakdown of the RNA molecule and aids in the processes
of exporting the RNA molecule out of the nucleus and transporting it to the ribosomes.
3. Splicing or Middle Modification—The RNA sequence, at this point, consists of exons
(protein-coding regions) and introns (non-coding regions). For the RNA to be functional, the
intron sequences must be removed or excised and the exon sequences must be retained and
spliced (attached) together. This process (in multicellular eukaryotes) is carried out by
spliceosomes. These structures contain snRNAs that attach to the intron sequences via
complementary base pairing. The spliceosome then uses ribozymes (enzymes made of RNA)
to cut and remove the intron sequences and splice together the exon sequences. Once all three
steps of RNA processing are complete, the RNA is referred to as a mature mRNA. This
molecule is now ready to direct the process of translation.

Page 209 of 318
209 Return to Table of Contents
Alternative Splicing
For years, scientists thought that the process of splicing and the presence of introns were evolutionary relics and
essentially caused organisms to waste time and energy during the process of gene expression. They have now
determined that both are important. It is now understood that the presence of introns allows a cell to “choose”
which exons will be included in a particular mature mRNA. Even though the pre-mRNA will always include all
of the exons, during processing a cell may remove particular exons along with the introns. This process is known
as alternative processing or alternative splicing. It allows a cell to generate multiple versions of mRNA and
ultimately multiple proteins from a single gene and greatly increases the protein diversity within a cell.
Human cells contain approximately 20,000 protein-coding genes, but some scientists estimate that humans can
produce over 100,000 different proteins. Alternative splicing is largely responsible for this phenomenon. The
process allows a few genes to code for many different proteins with many different functions. For example, the
body contains only a few genes that code for antibody proteins, but the body can produce over 1,000,000,000,000
distinct types of antibodies. Alternative splicing and the combining of different proteins together largely account
for this extreme antibody diversity.
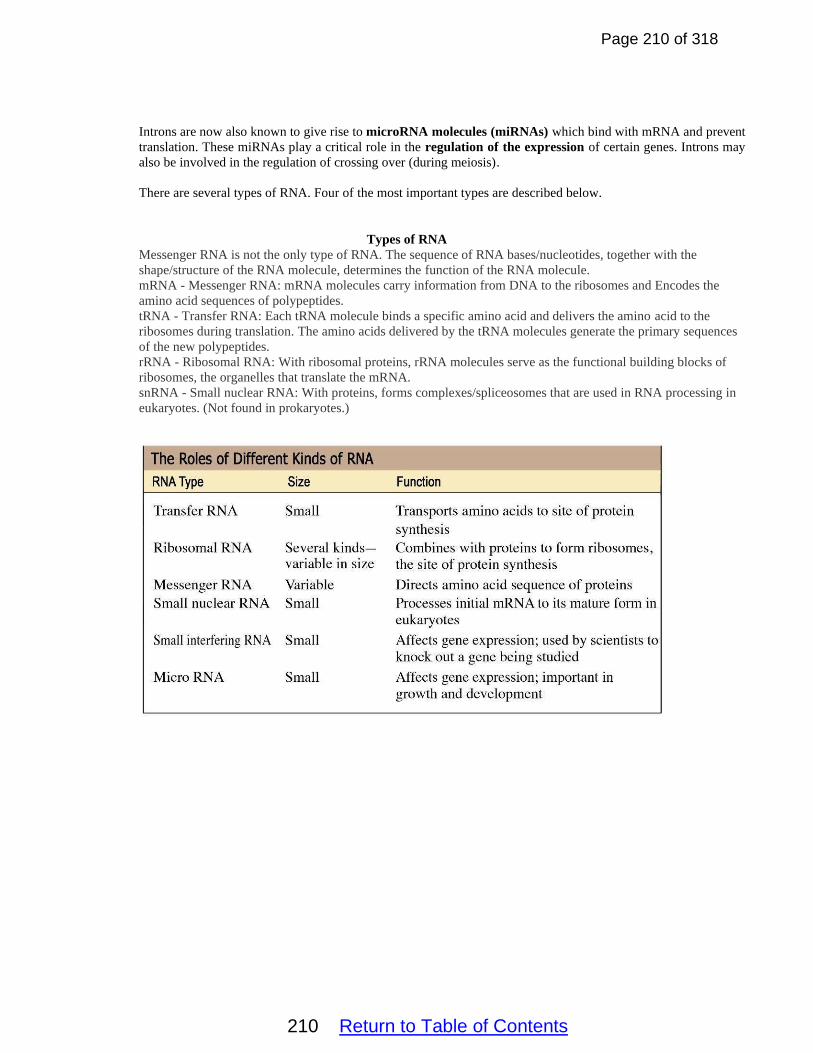
Page 210 of 318
210 Return to Table of Contents
Introns are now also known to give rise to microRNA molecules (miRNAs) which bind with mRNA and prevent
translation. These miRNAs play a critical role in the regulation of the expression of certain genes. Introns may
also be involved in the regulation of crossing over (during meiosis).
There are several types of RNA. Four of the most important types are described below.
Types of RNA
Messenger RNA is not the only type of RNA. The sequence of RNA bases/nucleotides, together with the
shape/structure of the RNA molecule, determines the function of the RNA molecule.
mRNA - Messenger RNA: mRNA molecules carry information from DNA to the ribosomes and Encodes the
amino acid sequences of polypeptides.
tRNA - Transfer RNA: Each tRNA molecule binds a specific amino acid and delivers the amino acid to the
ribosomes during translation. The amino acids delivered by the tRNA molecules generate the primary sequences
of the new polypeptides.
rRNA - Ribosomal RNA: With ribosomal proteins, rRNA molecules serve as the functional building blocks of
ribosomes, the organelles that translate the mRNA.
snRNA - Small nuclear RNA: With proteins, forms complexes/spliceosomes that are used in RNA processing in
eukaryotes. (Not found in prokaryotes.)

Page 211 of 318
211 Return to Table of Contents
Differences Between DNA and RNA

Page 212 of 318
212 Return to Table of Contents
Translation
Translation—During translation, a cell’s ribosomes “read” the information encoded in a mRNA molecule and
use the information to generate/build a polypeptide. A polypeptide is a chain of amino acids. Usually, several
polypeptides are combined to form a protein. Ribosomes are present in the cytoplasm of both prokaryotic
and eukaryotic cells and on the Rough Endoplasmic Reticulum of eukaryotic cells.
Translation is an active process which requires the cell to use its own energy/ATP. The process consists of
many coordinated, sequential steps which include initiation, elongation, and termination.
Each set of three mRNA nucleotides (referred to as a codon or triplet) codes for a specific amino acid. The 4
different types of nucleotides (A, U, C, and G containing) can be combined into 64 different codons. Sixty-one of
these codons code for amino acids. One of these codons (AUG) codes for the amino acid methionine, but also
acts as the “start codon” to signal the beginning of protein synthesis. The other 3 codons (UAA, UAG, and
UGA) act as stop codons. These codons don’t code for amino acids, but instead “tell” the cell that the
polypeptide is complete and that translation should stop.
Scientists have “decoded” the genetic code and illustrate this code in either a table or wheel format. You should
be able to use either the table or the wheel (included below) to determine the amino acids coded for by a group of
codons.

Page 213 of 318
213 Return to Table of Contents
Genetic Code Table
Genetic Code Wheel

Page 214 of 318
214 Return to Table of Contents
Be sure that you can see why:
1. UAC codes for Tyrosine
2. GAG codes for Glutamic Acid
3. UGU codes for Cysteine
4. AAA codes for Lysine
The genetic code is universal for all living organisms and for viruses (non-living). This indicates common
ancestry among all forms of life (and viruses).
Scientists think that the very first organisms used an RNA based genome. Some organisms eventually began to
use a DNA-based genome. DNA is more stable than RNA and less likely to mutate. This why most surviving
organisms and most viruses are now DNA based.
tRNA
In addition to mRNA molecules, tRNA molecules and ribosomes play key roles during the process of translation.
Transfer RNA molecules are shaped in a cross-like arrangement. The tRNA molecule’s job is to bind to and transport
a specific amino acid to the ribosome so that it can be incorporated into the forming protein. On one side of the tRNA
molecule is a set of three unpaired nucleotides called an anticodon. The anticodon of a given tRNA can bind to one or
a few specific mRNA codons. The tRNA molecule also carries an amino acid: specifically, the one encoded by the
codons that the tRNA binds with. The tRNA molecule is recruited to the ribosome during translation and delivers its
amino acid so that the ribosome can generate/build the primary polypeptide sequence.

Page 215 of 318
215 Return to Table of Contents
Ribosomes
Translation takes place inside structures called ribosomes, which are made of rRNA and protein. Ribosomesorganize
translation and catalyze the reaction that joins amino acids to make a polypeptide chain. Many ribosomes are
embedded into the membrane of the Rough ER of eukaryotic cells. These ribosomes synthesize proteins that are
either exported out of the cell or embedded into the cell membrane. Other ribosomes are found freely floating in the
cytoplasm of both prokaryotic and eukaryotic cells. These ribosomes produce proteins that function within the cell.
Ribosomes are composed of two major parts: the large and small subunits. The two subunits come together around
an mRNA molecule and form a fully functioning, complete ribosome. Once translation is complete, the two subunits
of the ribosome disassemble.
Each ribosome has three slots for tRNA molecules. These slots are known as the E, P, and A sites. The function of
each slot will be discussed below.
Three Stages of Translation
Like replication and transcription, translation is said to occur in three major stages: initiation, elongation, and
termination. The discussion below describes the process of translation as it occurs in eukaryotic cells.
Initiation
Initiation begins when the initiator tRNA carrying methionine attaches to the rRNA of the small ribosomal subunit.
Together, they bind to the 5' end of the mRNA by recognizing the 5' cap . Then, they "walk" along the mRNA in the
5’ to 3' direction, stopping when they reach the start codon on the mRNA (usually AUG).
The initiator tRNA binds to the start codon of the mRNA. The large ribosomal subunit then attaches. The initiator
tRNA sits in the P site on the ribosome. Together, the complete ribosome, the tRNA, and the mRNA are known as the
initiation complex.

Page 216 of 318
216 Return to Table of Contents

Page 217 of 318
217 Return to Table of Contents
Elongation
During elongation, the sequence of nucleotides on the mRNA molecule is read in triplets/codons. Each codon
encodes a specific amino acid (which can be deduced using the genetic code chart or wheel). The correct amino acids
are delivered to the correct place as specified by the codons on the mRNA molecule. Amino acids are added to the
growing polypeptide chain and increase the chain’s length. Remember, that the original initiator tRNA molecule
begins the process of elongation in the P site of the ribosome. Another codon sits (unpaired) in the A site of the
ribosome. A tRNA molecule with an anticodon that is complementary to the exposed codon enters the A site. The
codon and anticodon, with the addition of energy from GTP, bind together. The ribosome now catalyzes a peptide
bond to form between the amino acid carried by the tRNA in the P site and the amino acid carried by the tRNA in the
A site.
Next, the mRNA is pulled forward through the ribosome by one codon. The original tRNA moves into the E site of
the ribosome. This tRNA (which is no longer carrying an amino acid) exits the ribosome and will eventually pick up
another amino acid (the same type as before) and be reused to make another protein. The second tRNA, which now
has the joined amino acids attached to it, sits in the P site. A third tRNA now moves into the A site. The anticodon
on this tRNA binds to the unpaired, complementary codon on the mRNA. The ribosome catalyzes the formation of a
peptide bond between the second amino acid in the polypeptide chain and the amino acid transported by the tRNA.
This cycle repeats itself over an over until the polypeptide chain is complete.

Page 218 of 318
218 Return to Table of Contents
Termination
Termination is the process in which translation is stopped. It happens when a stop codon (UAA, UAG, or UGA) on the
mRNA enters the A site of the ribosome. The stop codon is recognized by proteins known as release factors. These proteins
fit into the P site and cause the ribosome to add a water molecule to the last amino acid of the polypeptide chain. This
separates/releases the newly synthesized polypeptide chain/protein from the tRNA and the newly made polypeptide is released
from the tRNA and the ribosome. The small and large subunits of the ribosome separate and the tRNA is freed from the
complex. All of the components will likely be reused to assemble another polypeptide.
Wobble Effect
The wobble effect is an effect caused by the redundancy found in the genetic code. Each amino acid is coded for by a 3
nucleotide codon sequence on the mRNA.
Though there are only 20 amino acids (used in living things), 61of the 64 possible codons found on the mRNA code for amino
acids (the other 3 codons act as stop codons). Thus, most of the amino acids can be coded for by more than one codon. For any
amino acid, the first 2 nucleotides in the codon are always identical. It's the 3rd nucleotide that can change. This is where
the wobble effect comes in.
If the cell had to pair tRNA molecules that exactly complemented the sequences found on the mRNA, it would require the cell
to have 61 different tRNA molecules. Through experiments, scientists have found that most organisms have far fewer unique
tRNA molecules than that, though they can successfully translate proteins. This discrepancy was a bit of a paradox, and one
that intrigued Francis Crick (of Watson and Crick DNA fame).
The answer to this paradox is that the 3rd nucleotide of the codon doesn't require the same level of binding specificity as the
first 2. The 3rd position "wobbles" between several nucleotide possibilities. The wobble allows for a cell to successfully
synthesize proteins without needing to have all 61 codons represented in the cell's tRNA. Some tRNA anticodons have the
nitrogenous base inosine (I) in the third position. This base is able to successfully bind with A, C, and U nitrogenous bases
found in the mRNA.
The wobble effect provides some protection against deleterious mutations, because a DNA mutation at the 3rd position of any
codon has a good chance of not changing the amino acid inserted during translation. That's good for us because it turns a
potentially disease-causing mutation into a silent one that causes no noticeable effect.
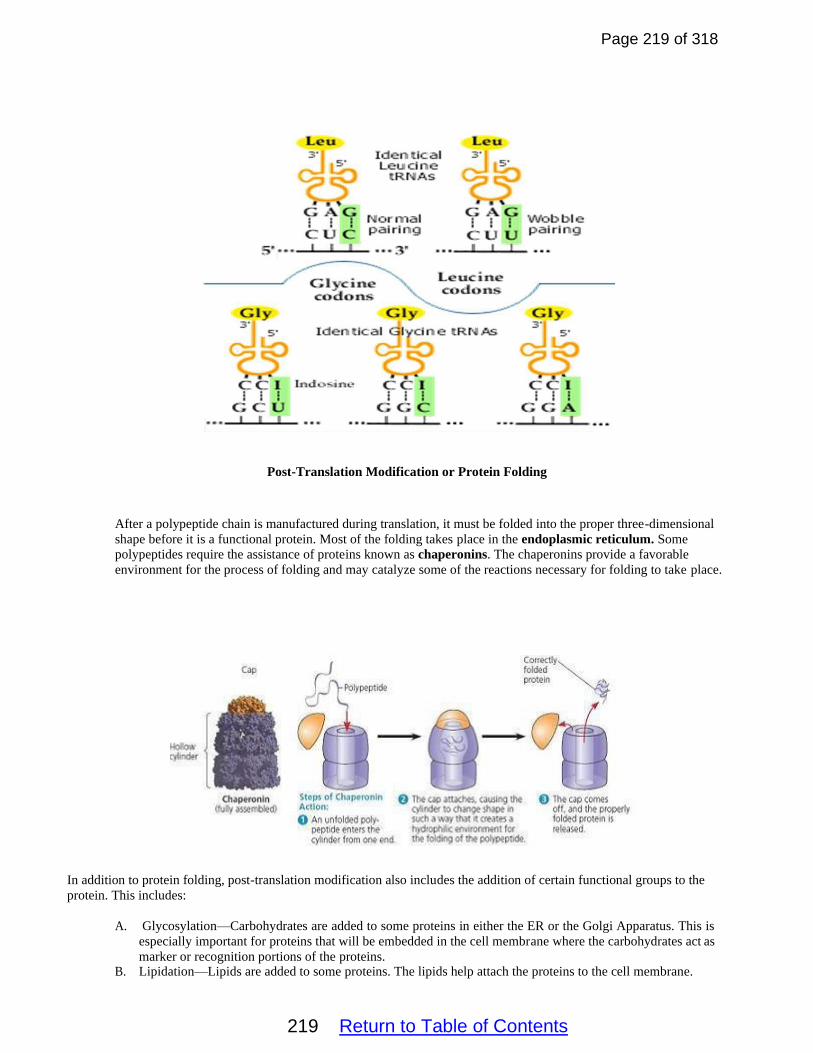
Page 219 of 318
219 Return to Table of Contents
Post-Translation Modification or Protein Folding
After a polypeptide chain is manufactured during translation, it must be folded into the proper three-dimensional
shape before it is a functional protein. Most of the folding takes place in the endoplasmic reticulum. Some
polypeptides require the assistance of proteins known as chaperonins. The chaperonins provide a favorable
environment for the process of folding and may catalyze some of the reactions necessary for folding to take place.
In addition to protein folding, post-translation modification also includes the addition of certain functional groups to the
protein. This includes:
A. Glycosylation—Carbohydrates are added to some proteins in either the ER or the Golgi Apparatus. This is
especially important for proteins that will be embedded in the cell membrane where the carbohydrates act as
marker or recognition portions of the proteins. B. Lipidation—Lipids are added to some proteins. The lipids help attach the proteins to the cell membrane.

Page 220 of 318
220 Return to Table of Contents
C. Phosphorylation—Phosphorylation is the addition of a phosphate group (usually from ATP or GTP) to a protein.
Phosphorylation is especially important for protein function, as this modification activates (or deactivates) almost
half of all enzymes, thereby regulating their function.
D. Ubiquitination—In ubiquitination, the small regulatory protein, ubiquitin, is added to a protein. Ubiquitin often
marks the protein for degradation in the cell’s proteasomes.
Mutations and Genetic Disorders
Mutations are changes in the nucleotide sequence of DNA or mRNA that code for a protein. Mutations are the primary source
of genetic variation. Mutations can occur spontaneously due to errors during DNA replication or DNA repair mechanisms.
Mutations can also be caused by external factors called mutagens. Mutagens are physical or chemical factors which change
the nucleotide sequence of DNA. Examples of mutagens include: Ultraviolet radiation, gamma rays, X-rays, cigarette smoke,
certain viruses, insecticides, pesticides, and other reactive chemicals.
Point Mutations—Point mutations (also known as substitutions) are mutations in which a single nucleotide is changed to
another, incorrect nucleotide. This changes a single codon. There are three major types of point/substitution mutations.
A. Silent Point Mutations—In silent point mutations, no change in the amino acid sequence occurs. This is
because the new, mutated codon still codes for the same amino acid as the original codon. These mutations cause
no negative effects.
B. Missense Point Mutations—Missense point mutations cause the amino acid coded for by the original DNA
sequence to be replaced by a different amino acid. The results of this type of mutation can be dramatic, especially
if the chemical properties of the original and new amino acid are very different. Sickle Cell Anemia is caused by
a point mutation in the gene for hemoglobin. In the mutation, an adenine nucleotide is replaced with a thymine
nucleotide. This causes the amino acid glutamic acid to be replaced with valine. Since the chemical properties of
these two amino acids are very different, the resulting mutated hemoglobin has a very different shape than normal
hemoglobin. The misshapen hemoglobin causes the shape of the body’s red blood cells to also change. This
causes the symptoms of sickle cell anemia which include: trouble breathing, poor circulation, pain in the abdomen
and joints, dizziness and lightheadedness, fast heart rate, fatigue, irritability, pale skin color, chronic infections, stroke-
like symptoms, delayed growth in infants, and delayed puberty in teens.
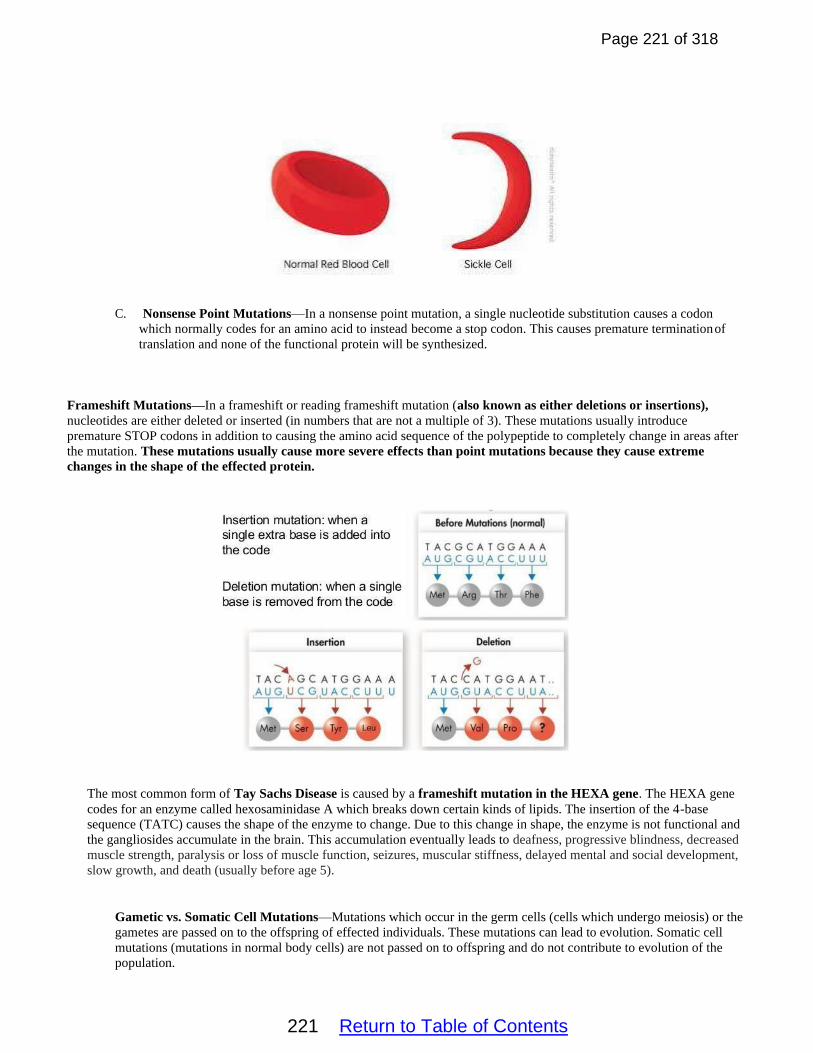
Page 221 of 318
221 Return to Table of Contents
C. Nonsense Point Mutations—In a nonsense point mutation, a single nucleotide substitution causes a codon
which normally codes for an amino acid to instead become a stop codon. This causes premature termination of
translation and none of the functional protein will be synthesized.
Frameshift Mutations—In a frameshift or reading frameshift mutation (also known as either deletions or insertions),
nucleotides are either deleted or inserted (in numbers that are not a multiple of 3). These mutations usually introduce
premature STOP codons in addition to causing the amino acid sequence of the polypeptide to completely change in areas after
the mutation. These mutations usually cause more severe effects than point mutations because they cause extreme
changes in the shape of the effected protein.
The most common form of Tay Sachs Disease is caused by a frameshift mutation in the HEXA gene. The HEXA gene
codes for an enzyme called hexosaminidase A which breaks down certain kinds of lipids. The insertion of the 4-base
sequence (TATC) causes the shape of the enzyme to change. Due to this change in shape, the enzyme is not functional and
the gangliosides accumulate in the brain. This accumulation eventually leads to deafness, progressive blindness, decreased
muscle strength, paralysis or loss of muscle function, seizures, muscular stiffness, delayed mental and social development,
slow growth, and death (usually before age 5).
Gametic vs. Somatic Cell Mutations—Mutations which occur in the germ cells (cells which undergo meiosis) or the
gametes are passed on to the offspring of effected individuals. These mutations can lead to evolution. Somatic cell
mutations (mutations in normal body cells) are not passed on to offspring and do not contribute to evolution of the
population.

Page 222 of 318
222 Return to Table of Contents
Mutations and Natural Selection
The normal functioning of the genes and the proteins/gene products collectively determine/comprise the normal
function of the cell/organism. Mutations/disruptions in the genes lead to changes in the genotype of a cell/organism
which can result in changes in phenotype. These mutations/alterations lead to changes in the type or amount of
protein produced by the gene. These changes can lead to positive, negative, or neutral changes based on the effect or
the lack of effect they have on the cell’s/organism’s phenotype. The changes in phenotype (caused by the mutational
changes in genotype) are subject to natural selection. Genetic changes that enhance survival and reproduction are
selected for by environmental conditions.
An excellent example of the situation described above is the evolution of rock pocket mice. Rock pocket mice are
generally light-colored and live on light-colored rocks. However, populations of dark (melanic) mice are found on
dark lava, and this concealing coloration provides protection from bird and mammal predators. The dark coloration
results from mutations in the melanocortin-1-receptor gene, Mc1r. Individuals with these mutations/the dark
phenotype are selected for in populations of rock pocket mice that live on the dark lava and the population quickly
becomes dominated by individuals who possess the dark colored phenotype. The frequency of the mutated gene in the
mice populations found on light-colored rocks remains low because the dark phenotype causes the mice to be more
visible to predators (in that particular environment) and is thus selected against. This example shows that whether a
mutation is detrimental, beneficial, or neutral depends on the environmental context in which it is found.
Another example of the interaction of mutations, the environment, and natural selection is provided by the
mutations that result in antibiotic resistance in bacteria. Resistant bacteria survive antibiotic treatment and
can increase in numbers by natural selection. When bacteria multiply, one cell divides into two cells. Before a
bacterium can divide, it needs to make two identical copies of the DNA in its chromosome; one for each cell. Every
time the bacterium goes through this process there is a chance that mutations will occur. These mutations are random
and can be located anywhere in the DNA. While many mutations are harmful to the bacterium, others can provide an
advantage given the right circumstances. Here, Darwin’s theory of natural selection comes in to play. If a mutation
gives the bacterium an advantage in a particular environment, bacteria with this phenotype will grow better/out
reproduce their neighbors-- (that phenotype is selected for). Mutations are one way for bacteria to become resistant to
antibiotics. Some spontaneous mutations (or genes that have been acquired from other bacteria through horizontal
gene transfer) may make the bacterium resistant to an antibiotic. If we were to treat the bacterial population with that

Page 223 of 318
223 Return to Table of Contents
specific antibiotic, only the resistant bacteria will be able to multiply; the antibiotic selects for the resistant phenotype.
These bacteria now increase in number and the end result is a population of mainly resistant bacteria.
Like antibiotic resistance, mutations and natural selection have led to the development of pesticide resistance in
insects. Pesticides are mostly novel synthetic compounds, and yet target insect species are often able to evolve
resistance soon after a new compound is introduced. This happens due to either new mutations or existing genetic
variation within the insect population which are acted on by natural selection. Individuals with genes that allow them
to tolerate the pesticide are selected for and these individuals out survive and out reproduce individuals that lack the
gene(s). This quickly leads to a population that is comprised mostly of pesticide resistant individuals. Pesticide
resistance is an excellent example of rapid evolution under strong selective pressures (the application of the
pesticide).
Other Mechanisms that Can Change the Genotype and/or Phenotype of a Cell/Organism
In addition to mutations, changes/variations in genotype and/or phenotype can be brought about or transmitted by the
following mechanisms:
A. Errors in mitosis or meiosis can change the chromosome number in the resulting cells. These
changes can lead to new phenotypes. Such events in plants can lead to triploid plants which have
increased vigor (grow better/stronger) than their diploid peers. In humans, errors in meiosis can lead to
individuals who possess three sex chromosomes instead of the normal two. This condition is referred to
as triploidy and usually results in sterility and other negative effects. Other errors in meiosis can lead to
human disorders such as Down Syndrome or Turner Syndrome which are accompanied by
developmental limitations.
B. Some prokaryotes (and even eukaryotes in some cases) are able to obtain genetic information
(DNA/RNA) from individuals by mechanisms other than by the ("vertical") transmission of DNA from
parent to offspring (reproduction). These mechanisms of genetic information transfer are referred to as
horizontal gene transfers. Horizontal gene transfers can occur via transformation (in which prokaryotes
uptake naked DNA from the environment), transduction (viral transmission of genetic information
between two bacteria), conjugation (prokaryote to prokaryote direct transfer of DNA), and transposition
(the movement of DNA segments within and between DNA molecules). Related viruses can also
combine/recombine genetic information if they infect the same host cell. All of these processes increase
genetic variation and are thus evolutionarily conserved and shared by various organisms.

Page 224 of 318
224 Return to Table of Contents

Page 225 of 318
225 Return to Table of Contents
Gene Regulation
Every cell in a multicellular organism contains the same DNA.
Even though this is true, organisms contain cells that look and function very differently from each other.
This is possible because of selective gene expression. This essentially means that only certain genes are expressed (used to
make proteins) in certain cells. The same genes may be inactive in different cell types within the same organism. Another way
of saying this is that the phenotype of a cell or organism is determined by the combination of genes that are expressed and the
levels at which they are expressed. Observable cell differentiation results from the expression of genes for tissue-specific
proteins. Gene regulation results in differential gene expression and influences both the products/proteins a cell produces and
the cell’s function.
Scientists have worked for years to determine how the processes of selective gene expression and gene regulation are carried
out in organisms.
We will first take a look out how genes are regulated in prokaryotes since these cells represent the simplest possible case.
Operons
Both prokaryotes and eukaryotes have groups of genes that are coordinately regulated (regulated as a group).
Prokaryotic genes tend to be physically organized into related groups. These structural genes and the other DNA sequences
that help to regulate their expression are known as operons.
An operon might be thought of a functional unit of transcription and gene regulation. For a gene to be expressed (on) it
must be transcribed and translated. In operons, groups of related genes are transcribed into a single mRNA molecule. Operons typically consist of the following parts:
Promoter—Promotors are DNA sequences upstream of the transcription start site where RNA polymerase and transcription
factors bind to initiate transcription.
Operator—This sequence serves as the site of repressor binding. Structural genes—The DNA sequences/genes that code for the actual proteins/enzymes of the operon.
Regulatory Genes—These sequences code for repressor proteins.
Repressor Proteins—In certain situations, these proteins bind to the operator and prevent the transcription and expression of
the structural genes.

Page 226 of 318
226 Return to Table of Contents
Operons are often classified as either inducible or repressible.
Inducible Operons
The structural genes in inducible operons are usually not expressed (the genes are normally “off”). This means that repressor
proteins are normally bound to the operator of the operon. These proteins block transcription of the structural genes and
prevent the expression of the genes. Under certain environmental or internal conditions, an inducer binds to the repressor
protein and causes it to change shape and unbind from the operator. Once the repressor protein is released from the operator,
RNA polymerase transcribes the genes and they are expressed.
A commonly cited example of an inducible operon is the lac operon. The structural genes in this operon code for a group of
enzymes (collectively referred to as lactase) that break down the carbohydrate lactose.

Page 227 of 318
227 Return to Table of Contents
If bacterial cells don’t have access to lactose, it makes no sense for them to manufacture lactase, so in the absence of lactose the
structural genes of the lac operon are not expressed.
If, however, the bacterial cells have access to lactose, the lactose acts as an inducer. It binds to the repressor proteins and
causes them to change shape and unbind from the operator of the lac operon. Once this happens, the genes are transcribed
and translated. The cell now possesses lactase and can metabolize the lactose and use it as a food source. Once all of the
lactose is used up, the repressor proteins once again bind to the operator and the expression of the structural genes ceases.
Operons function much like negative feedback loops and allow prokaryotes to express genes only when they need to be
expressed. This helps to save energy and resources for the cells.
Repressible Operons
The structural genes in repressible operons are usually expressed (the genes are normally “on”). This means that repressor
proteins are normally not bound to the operator of the operon. Under certain environmental or internal conditions, a
corepressor binds to the repressor protein and changes its shape so that it can bind to the operator and then block the
transcription and expression of the structural genes.
A commonly cited example of a repressible operon is the trp operon. The structural genes in this operon code for a group of
enzymes that make the amino acid tryptophan. This amino acid is essential for bacteria and they don’t normally get
enough of it from their diet, thus the need from the enzymes that manufacture it.

Page 228 of 318
228 Return to Table of Contents
If bacteria are exposed to large amounts of tryptophan in their environment, it doesn’t make sense for them to use energy and
resources to manufacture something that is freely available. In this case, the tryptophan acts as an corepressor and binds to the
inactive repressor and changes its shape so that it can bind to the operator. Once there, the structural genes are no longer
expressed and the cell stops making the enzymes to produce tryptophan. Once the environmental tryptophan is used up, the
repressor protein unbinds from the operator and the cell once again expresses the structural genes and produces the enzymes
needed to manufacture tryptophan. Like inducible operons, repressible operons function like negative feedback loops and
help bacterial cells to conserve energy and resources.
Gene Regulation in Eukaryotic Cells
The expression of eukaryotic genes is controlled on several different levels. These include:
A. Chromatin Structure—In Unit 5 you learned that eukaryotic DNA is associated with proteins known as histones.
The histones help to organize, compact, and regulate the expression of DNA. DNA is often organized into
nucleosomes (a small portion of DNA wrapped around a group of histones). The degree to which the DNA is
compacted and coiled affects the accessibility of the DNA to RNA polymerase and thus affects if the DNA can be
transcribed and expressed. Active/expressed genes are typically loosely compacted and coiled and are referred to as
euchromatin. Inactive genes are tightly compacted/coiled and are referred to as heterochromatin. Genes can be
inactivated when methyl groups (-CH3) are attached to the cytosines of a gene. The addition of these methyl tags
causes the DNA to tightly wind around the histones and become inactive and not expressed. Methylation is typically
permanent. Methylation deactivates specific genes in different cells types and plays an important role in cell
differentiation.

Page 229 of 318
229 Return to Table of Contents
An example of the results of methylation is the Barr body in mammalian females. Each cell in a female mammal has
two “X” chromosomes, but only one active “X” chromosome. The second “X” chromosome is highly methylated and
is compacted into a tiny structure known as a Barr Body. The genes of this “X” are completely inactive and do not
produce proteins.
Another tag that affects chromatin structure is the acetyl group (--COCH3). Acetyl groups are often attached to the
histone proteins. This causes the DNA that is wrapped around the histone to uncoil and thus the genes are transcribed
and expressed. Acetylation (the process of adding acetyl groups) plays an important role in allowing cells to
respond to changes in their internal and/or external environments. Acetylation is a reversible process.

Page 230 of 318
230 Return to Table of Contents
Epigenetics
Acetylation and Methylation are often linked to a phenomenon known as epigenetics. Epigenetic changes can affect
gene expression through reversible modifications of DNA or histones. The term epigenetics refers to changes in
the expression of genes that do not depend on the nucleotide sequence itself. Epigenetics is responsible for the
changes that occur through the years in identical twins. Even though the twins have identical nucleotides sequences,
the patterns of methylation and acetylation in their genomes become more and more different over time due to the
twins’ different lifestyles and environments.
Methylation and acetylation patterns can also sometimes be inherited from parents. Although in most cases,
epigenetic tags are removed from the DNA during either meiosis or events right after fertilization, there are some
situations in which the methylation and acetylation patterns are transmitted from parent to child. Although scientists
don’t yet know how important this epigenetic form of inheritance is, it is possible that the diet, lifestyle habits (like
smoking, drug use, lack of exercise), and exposure to environmental toxins of an individual’s parents may cause
epigenetic changes in the DNA of both the parent and child. These changes may then be passed on to future
generations without changing the actual nucleotide sequence of the DNA.
B. Transcriptional Control— The enzyme RNA polymerase, which makes a new RNA molecule from a DNA
template, must attach to the DNA of the gene. It attaches at a spot called the promoter. In humans and
other eukaryotes, there is an extra step. RNA polymerase can attach to the promoter only with the help of proteins
called basal (general) transcription factors. These transcription factors help regulate transcription (and therefore
gene expression) by assisting the binding of RNA Polymerase to the promoter. There are also specialized
transcription factors that control the expression of specific, individual genes. For instance, a transcription factor
might activate only a set of genes needed in certain neurons. Regulatory sequences of the DNA near the genes
interact with transcription activators which enhance transcription or with negative regulatory molecules which inhibit
gene expression by binding to the DNA and blocking transcription. In eukaryotes, groups of genes may be
influenced by the same transcription factors so that the expression of the genes can be coordinated.
C. Posttranscriptional Control—Once the pre-mRNA or primary transcript is made during transcription, it next has to
be processed. One of the most important parts of RNA processing is the removal of the intron sequences and the

Page 231 of 318
231 Return to Table of Contents
splicing together of the exon sequences. RNA can be alternatively processed and thus one gene can actually be
expressed as multiple proteins.
D. Translational Control—Small segments of RNA, known as microRNAs, can bind to and disable the translation of
mRNA molecules and affect the processes of development and host/pathogen interactions.
E. Posttranslational Control—The expression of a gene can also be controlled by how the protein is folded after
translation. Additionally, the lifespan of a protein in a cell, is usually regulated by enzymes known as proteases.
These enzymes, usually housed in the lysosomes or proteasomes, break down proteins usually after they have been
tagged by a signaling protein such as ubiquitin.
Embryonic Development
Embryonic development begins when a haploid egg and a haploid sperm fuse to form the organism’s first diploid cell, the
zygote. This cell goes through a 12 to 24 hour period of rapid cell division (mitosis) known as cleavage. During this stage,
cell division occurs so rapidly that the cells have little time to grow. When the developing organism reaches the 32 cell stage,
known as the morula, it is the same size as the original zygote. The morula consists of a solid ball of cells that is still
surrounded by the zona pellucida which surrounded and protected the egg.

Page 232 of 318
232 Return to Table of Contents
At this point in development all of the cells are totipotent stem cells. These cells have the potential to become any type of cell
in the embryo or in the extraembryonic tissues (cells that will become the placenta) because essentially none of the genes have
been deactivated by methylation.
By day 4 of embryonic development, the cells continue to divide, but they also begin to differentiate. During this stage,
known as blastulation, two layers develop: an outer shell known as the trophoblast (which will eventually form the placenta)
and an inner cell mass that will form the embryo. The inner cell mass is pushed off to one side of the structure, while the rest
of the inside of the sphere forms a fluid-filled cavity called the blastocoel. At this point in development, the entire ball of cells
is known as the blastocyst (in mammals) or as the blastula (in non-mammal animals). During the blastula stage, the cells of
the inner cell mass are pluripotent stem cells. This means that they have begun the process of differentiation and that some of
their genes have been deactivated through methylation. Pluripotent cells are capable of becoming any type of cell in the
embryo, but they now lack the ability to become extraembryonic cells.
During Week 3 of embryonic development the cells of the inner cell mass go through the process of gastrulation. During
gastrulation, the cells organize themselves into three distinct layers known as the germ layers. The cells in the outer layer (the
ectoderm) will eventually go on to form the epidermis, the hair, the nails, the brain, the spinal cord, and the peripheral nervous
system. The cells of the middle germ layer (the mesoderm) will go on to form the muscles, the bones, the connective tissues,
the notochord, the kidneys, the gonads, and the circulatory system. The cells of the innermost germ layer (the endoderm) go
on to form the epithelial lining of the digestive tract, the stomach, the colon, the liver, the pancreas, the bladder, and the lungs.
Once the cells are organized into the three germ layers, the entire ball of cells is known as the gastrula. Also during
gastrulation, an invagination forms an opening (known as the blastopore) in the gastrula. In protostomes (like worms,
mollusks, and arthropods) this opening eventually becomes the mouth. In deuterostomes (like echinoderms and chordates) this
opening becomes the anus.

Page 233 of 318
233 Return to Table of Contents
After gastrulation, the cells undergo neurulation. During this process, the notochord forms and causes the ectoderm to bend
itself into a tube known as the neural tube. The neural tube will give rise to the brain and spinal cord. The cells of the
mesoderm begin to give rise to the kidneys, gonads, adrenal glands, blood vessels, and muscles of the organs. At the same
time, the cells of the endoderm roll themselves into a tube known as the digestive tract. The organs of the gastrointestinal tract
start off as outpouchings of the digestive tract. The endoderm also give rise to the lungs.
Hox Genes
Hox genes are a group of related genes that control the body plan of an embryo along the head-tail axis. After the embryonic
segments have formed, the Hox proteins determine the type of appendages (e.g. legs, antennae, and wings in fruit flies) or the
different types of vertebrae (in humans) that will form on a segment. Hox proteins thus confer segmental identity, but do not
form the actual segments themselves.
An analogy for the Hox genes can be made to the role of a play director that calls which scene the actors should carry out next.
If the play director calls the scenes in the wrong order, the overall play will be presented in the wrong order. Similarly,
mutations in the Hox genes can result in body parts and limbs in the wrong place along the body. Like a play director, the Hox
genes do not act in the play or participate in limb formation themselves.
The protein product of each Hox gene is a transcription factor. Each Hox gene contains a well-conserved DNA sequence
known as the homeobox, of which the term "Hox" is a contraction. In many animals, the organization of the Hox genes in
the chromosome is the same as the order of their expression along the anterior-posterior axis of the developing animal

Page 234 of 318
234 Return to Table of Contents
DNA Biotechnology
Genetic Engineering
Genetic engineering, sometimes called genetic modification, is the process of altering the DNA in an organism’s
genome. This may mean changing one base pair (A-T or C-G), deleting a whole region of DNA, or introducing an
additional copy of a gene. It may also mean extracting DNA from another organism’s genome and combining it with the
DNA of that individual. Genetic engineering is used by scientists to enhance or modify the characteristics of an individual
organism. Genetic engineering can be applied to any organism, from a bacterium to a sheep. For example, genetic
engineering can be used to produce plants that have a higher nutritional value or that can tolerate exposure to herbicides.
Organisms which contain such genetic modifications are referred to as transgenic organisms.
Biotechnology involves the use of living systems, organisms, or parts of organisms to manipulate natural processes
in order to develop products, systems, or environments to benefit people. These may be products, such as foods,
pharmaceuticals, or compost; systems, such as waste management or water purification; or environments, such as
hydroponics. Biotechnology also includes genetic or biomedical engineering.
Recombinant DNA technology is the process of joining together DNA molecules from two different species. The
recombinant DNA is then inserted into a host organism to produce new gene products that are of value to science,
medicine, agriculture, and industry.
Possible Applications of Biotechnology and Recombinant DNA
Gene Therapy-- Gene therapy is an experimental technique that uses genes to treat or prevent disease. In the
future, this technique may allow doctors to treat a disorder by inserting a gene into a patient's cells instead of
using drugs or surgery.
Pharmaceuticals—Biotechnology is currently used to create medical products such as human insulin, human
growth hormone, and vaccines.
.
Criminal Forensics—Biotechnology is used create DNA fingerprints and identify criminal suspects.

Page 235 of 318
235 Return to Table of Contents
Paternity/Maternity testing—Biotechnology is used to accurately determine the parentage of children.
Agriculture—Biotechnology has been used to create Genetically Modified Foods and Genetically Modified
Organisms (GMOs). Some crop plants have been modified to be herbicide resistant. Others have been modified
to create larger and hardier fruits. Still others have been modified to be cold weather tolerant and disease
resistant.
DNA Cloning
DNA/gene cloning is the process of propagating specific DNA fragments or making multiple, identical copies of a
particular piece of DNA. In a typical DNA cloning procedure, the gene or other DNA fragment of interest (perhaps a gene
for a medically important human protein) is first inserted into a circular piece of bacterial DNA called a plasmid. The
insertion is done using enzymes that “cut and paste” DNA, and produces a molecule of recombinant DNA, or DNA
assembled out of fragments from different organisms/sources. In some cases, we need lots of DNA copies to conduct
experiments or to build new plasmids. In other cases, the piece of DNA encodes a useful protein, and the bacteria are used
as “factories” to make the protein. For instance, the human insulin gene is expressed in E. coli bacteria to make insulin for
use by diabetics.
Next, the recombinant plasmid is introduced into and used to transform bacteria. Bacteria carrying the plasmid are
selected and grown. As they reproduce, they replicate the plasmid and pass it on to their offspring, making copies of the
DNA it contains and potentially produce lots of the protein coded for by the inserted gene.
Steps in the DNA Cloning Process
Cut open a bacterial plasmid with restriction enzymes. Restriction enzymes are enzymes that were isolated from
bacteria. They are used by the bacteria to defend themselves against bacteriophages. They cut DNA after specific
nucleotide sequences known as restriction sites. Restriction enzymes have strange names like EcoRI and HinDIII.
They are often named after the bacteria they were discovered in. Many restriction enzymes cut the two strands of the
DNA molecule at different points and thus leave behind unpaired base sequences known as “sticky ends”. If the gene
of interest (the one the scientist wants to insert into the plasmid) is cut with the same restriction enzyme, the sticky
ends match and bond together. Once bonded, the enzyme ligase is used to permanently bond the strands. At this
point, a recombinant DNA plasmid has been created.

Page 236 of 318
236 Return to Table of Contents
Next, the plasmid is inserted into the bacteria. The bacteria are said to be transgenic because they contain DNA from
another species. A gene that codes for resistance to a particular antibiotic is often also inserted into the plasmid. The
insertion of the plasmid into the bacteria is facilitated via a process of chemical treatment and heat shock. Since most of
the bacteria are not transformed due to the inefficiency of the process, the bacteria are cultured in a medium containing an
antibiotic (the one that the plasmid codes resistance to). This process eliminates the untransformed bacteria and allows
only the transformed ones (the ones that took in the recombinant plasmid) to be artificially selected for. The bacteria are
then cultured in large vats. Every time one of the bacteria reproduce, they reproduce the plasmid. The bacteria essentially
become factories that are used to create the protein coded for by the inserted gene. The proteins are then harvested and
purified.

Page 237 of 318
237 Return to Table of Contents
.
Polymerase Chain Reaction (PCR)
Polymerase chain reaction (PCR) is a laboratory technique used to quickly produce many copies (millions or
billions!) of a particular region of DNA. The process of copying is often referred to as amplification of the DNA. The
DNA region can be anything the experimenter is interested in. For example, it might be a gene whose function a
researcher wants to understand, or a genetic marker used by forensic scientists to match crime scene DNA with the
DNA of a suspect or victim.
Typically, the goal of PCR is to make enough copies of the target DNA region so that it can be analyzed or used in
some other way. For instance, DNA amplified by PCR may be sent for sequencing, visualized by gel electrophoresis,
or cloned into a plasmid for further experiments.
PCR is used in many areas of biology and medicine, including molecular biology research, medical diagnostics, and
even some branches of ecology. Amplified DNA fragments can be used to identify organisms or to perform
phylogenetic analyses.

Page 238 of 318
238 Return to Table of Contents
Like DNA replication in an organism, PCR requires a DNA polymerase enzyme that makes new strands of DNA,
using existing strands as templates. The DNA polymerase typically used in PCR is called Taq polymerase, after the
heat-tolerant bacterium from which it was isolated (Thermus aquaticus).
T. aquaticus lives in hot springs and hydrothermal vents. Its DNA polymerase is very heat-stable and is most active
around 70°C (a temperature at which a human or E. coli DNA polymerase would be nonfunctional). This heat-
stability makes Taq polymerase ideal for PCR. As we'll see, high temperature is used repeatedly in PCR to denature
(separate its strands) the template DNA.
Like other DNA polymerases, Taq polymerase can only make DNA if it's given a primer, a short sequence of
nucleotides that provides a starting point for DNA synthesis. In a PCR reaction, the experimenter determines the
region of DNA that will be copied, or amplified, by the primers she or he chooses.
PCR primers are short pieces of single-stranded DNA, usually around 20 nucleotides in length. Two primers are used
in each PCR reaction, and they are designed so that they flank the target region (region that should be copied). That is,
they are given sequences that will make them bind to opposite strands of the template DNA, just at the edges of the
region to be copied. The primers bind to the template by complementary base pairing.
When the primers are bound to the template, they can be extended by the polymerase, and the region that lies between
them will get copied.

Page 239 of 318
239 Return to Table of Contents
Steps of the PCR Process
1. Denaturation (96°C): Heat the reaction strongly to separate, or denature, the DNA strands. This provides single-stranded
DNA templates for the next step.
2. Annealing (55 - 65°C): Cool the reaction so the primers can bind to their complementary sequences on the single-stranded
template DNA.
3. Extension (72°C): Raise the reaction temperature so that Taq polymerase can extend the primers and synthesize thenew
strands of DNA.
4. This cycle is then repeated 25 - 35 times in a typical PCR reaction, which generally takes 2 – 4 hours, depending on the
length of the DNA region being copied. If the reaction is efficient, billions of the copies of the target region can be made.
The process is able to make so many copies of the original DNA because the new DNA that’s made in each round can
serve as a template in the next round of DNA synthesis. There are many copies of the primers and many molecules
of Taq polymerase floating around in the reaction, so the number of DNA molecules can roughly double in each round
of cycling. This pattern of exponential growth is shown in the image below.

Page 240 of 318
240 Return to Table of Contents
.
Gel Electrophoresis
Gel electrophoresis is a technique used to separate DNA fragments, RNA fragments, or proteins based on their size
and charge. Electrophoresis involves running a current through a gel containing the molecules of interest. Based on
their size and charge, the molecules will travel through the gel in different directions or at different speeds, allowing
them to be separated from one another.
All DNA molecules have the same amount of charge per mass. Because of this, gel electrophoresis of DNA fragments
separates them based on size only. Using electrophoresis, we can see how many different DNA fragments are
present in a sample and how large they are relative to one another. We can also determine the absolute size of a piece
of DNA by examining it next to a standard "yardstick" or ladder made up of DNA fragments of known sizes.
As the name suggests, gel electrophoresis involves a gel: a slab of Jello-like material known as agarose. The gel
contains tiny pores through which the DNA fragments can move.
At one end, the gel has pocket-like indentations called wells, which are where the DNA samples are initially loaded
into the gel.

Page 241 of 318
241 Return to Table of Contents
Before the DNA samples are added, the gel must be placed in a gel box. One end of the box contains a positive
electrode, while the other end is attached to a negative electrode. The main body of the box, where the gel is placed, is
filled with a salt-containing buffer solution that can conduct current. The buffer fills the gel box to a level where it just
barely covers the gel. The end of the gel with the wells is positioned towards the negative electrode. The end without
wells (towards which the DNA fragments will migrate) is positioned towards the positive electrode.
Once the gel is in the box, each of the DNA samples (for instance, each PCR reaction or each restriction-digested
plasmid) is carefully transferred into one of the wells using a micropipette.

Page 242 of 318
242 Return to Table of Contents
One well is reserved for a DNA ladder, a standard reference that contains DNA fragments of known lengths.
Next, the power to the gel box is turned on, and current begins to flow through the gel. The DNA molecules have a
negative charge because of the phosphate groups in their sugar-phosphate backbone, so they start moving through the
matrix of the gel towards the positive pole. Due to the size of the pores in the gel, large fragments move through the
gel more slowly than do smaller fragments. When the power is turned on and current is passing through the gel, the
gel is said to be running.
A well-defined “line” of DNA on a gel is called a band. Each band contains a large number of DNA fragments of the
same size that have all traveled as a group to the same position. A single DNA fragment (or even a small group of
DNA fragments) would not be visible by itself on a gel.
By comparing the bands in a sample to the DNA ladder, we can determine their approximate sizes. For instance, the
two fragments in lane A are of sizes 1000 and 500 base pairs.

Page 243 of 318
243 Return to Table of Contents
DNA Sequencing/Human Genome Project
DNA sequencing is a process which determines the order of the nucleotides (A, T, G, and C) in a DNA molecule. DNA
sequencing is now being used to quickly identify microbes, personalize genome-based cancer treatments, and study the
evolutionary changes that have occurred over time.
The Human Genome Project was an international research effort to determine the nucleotide sequence of the entire human
genome and to identify the genes that it contains. The Project was coordinated by the National Institutes of Health and the U.S.
Department of Energy. The Human Genome Project formally began in 1990 and was completed in 2003, 2 years ahead of its
original schedule. The Human Genome Project’s goal was to provide researchers with powerful tools to understand the genetic
factors in human disease, paving the way for new strategies for their diagnosis, treatment and prevention. The Human Genome
Project has already fueled the discovery of more than 1,800 disease genes.
As a result of the Human Genome Project, today’s researchers can find a gene suspected of causing an inherited disease in a
matter of days, rather than the years it took before the genome sequence was in hand. There are now more than 2,000 genetic
tests for human conditions. These tests enable patients to learn their genetic risks for disease and also help healthcare
professionals to diagnose disease. At least 350 biotechnology-based products resulting from the Human Genome Project are
currently in clinical trials.
All data generated by the Human Genome Project were made freely and rapidly available on the Internet, serving to accelerate
the pace of medical discovery around the globe. The data can now be accessed at:
https://www.ncbi.nlm.nih.gov/projects/genome/guide/human/
Gene Editing/CRISPR/CAS9
The term CRISPR/Cas9 stands for Clustered Regularly Interspaced Short Palindromic Repeats/CRISPR associated protein 9.
CRISPR/Cas9 is a system found in bacteria involved in immune defense. Bacteria use CRISPR/Cas9 to cut up the DNA of
invading bacterial viruses that might otherwise kill them.
Today, scientists have adapted this molecular machinery for an entirely different purpose – to change the nucleotide sequences
of an organism’s DNA code.
We might want to correct a disease-causing error that was inherited or crept into our DNA when it replicated. Or, in some
cases, we may want to enhance the genetic code of crops, livestock or perhaps even people. CRISPR/Cas9 is already allowing
scientists to make these types of genetic edits.

Page 244 of 318
244 Return to Table of Contents

Page 245 of 318
245 Return to Table of Contents
AP Biology
Unit 7
Student Notes

Page 246 of 318
246 Return to Table of Contents
Unit 7 Student Notes
Table of Contents
A. History of the Theory of Evolution—Pages 247-252
B. Evolution Via Natural Selection—Pages 250-252 C. Patterns of Selection—Pages 252-253 D. Population Genetics—Pages 253-255 E. Hardy Weinberg Equilibrium—Pages 254-255
F. Hardy Weinberg Equations—Pages 254-255 G. Genetic Drift—Page 255-256 H. Patterns of Evolution—Page 256 I. Speciation—Pages 256-257
J. Types of Speciation—Pages 256-258 K. Adaptive Radiation—Pages 258-259 L. Reproductive Isolating Mechanisms—Page 259 M. Evidence for Evolution—Pages 260--261 N. Types of Evolution—Page 262 O. Phylogenetic Relationships/Shared Ancestry—Pages 262-268
P. Methods Used to Depict Phylogenetic Relationships—Pages 262-268 Q. Constructing a Cladogram Based on Morphology—Pages 265-267 R. Using Molecular Evidence to Create Cladograms—Pages 267-268 S. Origins of Life on Earth—Pages 268-269 T. Extinction—Pages 269-270 U. Variations in Populations—Pages 270-271

Page 247 of 318
247 Return to Table of Contents
Unit 7
Evolution
Student Notes
Important Ideas/Enduring Understandings for this unit.
A. Evolution is characterized by a change in the genetic makeup of a population over time and is
supported by multiple lines of evidence.
B. Organisms are linked by lines of descent from common ancestry.
C. Life continues to evolve within a changing environment.
D. Naturally occurring diversity among and between components within biological systems affects
interactions with the environment.
History of The Theory of Evolution Carolus Linnaeus (1707 – 1778)
He is considered the Father of Taxonomy. (Taxonomy is the Science of species classification.) There
were originally only two Kingdoms in his system: Plantae & Animalia.
His system uses Binomial Nomenclature. This means that he assigned a two-part name to each
organism. Rules of Binomial Nomenclature:
The Genus name is written first and has a capitalized first letter.
The Species name is written second and is not capitalized.
The whole name is written in Latin and italicized or underlined.
The current levels (called “taxa”) of classification include:
Domain (This is the MOST inclusive; yet LEAST specific taxon.)
Domains are composed of similar, evolutionarily-related Kingdoms.
Kingdoms
Kingdoms are composed from similar, evolutionarily-related Phyla or Divisions (if it is plants).

Page 248 of 318
248 Return to Table of Contents
A Phylum or Division (used with plants) is composed of similar, evolutionarily-related Classes.
Classes are composed of similar, evolutionarily-related Orders.
Orders are composed of similar, evolutionarily-related Families.
Families are composed of similar, evolutionarily-related Genus.
A Genus is composed of similar, evolutionarily-related Species. The plural of genus is genera.
Species (This is the LEAST inclusive; yet MOST specific taxon)
A breed is a sub category of a species.
An easy way to remember the order of the taxa in the system is the following acronym: Dominating King
Phillip Came Over For Green Salad.
Although Linnaeus originally based his taxonomic system on morphology (body shape/structure), the
modern classification system is based on evolutionary relationships. Organisms in the same taxa are
classified there because they share common ancestors.

Page 249 of 318
249 Return to Table of Contents
Classification of Modern Humans
Charles Lyell (1797 – 1875)
He became Darwin’s best friend over several years of reviewing and supporting Darwin’s research.
He was a Geologist who wrote Principles of Geology. (Darwin took this book on the Beagle voyage.)
The book was an important influence on Darwin’s thought process and his eventual theories.
In the book, Lyell proposed the Theory of Uniformitarianism. (“The key to the past is the
present”.) The theory tries to explain that the same geologic processes that are occurring
today, also occurred in the past. These processes helped to create, over millions of years,
the geologic formations we see today. For example, erosion, over millions of years and
STILL today, led to the formation of the Grand Canyon. For this theory to work, Earth
must be hundreds of millions of years old. (This also supports Darwin’s theory… it
provides enough time to pass so that we get the millions of different species to evolve.)

Page 250 of 318
250 Return to Table of Contents
Jean Baptiste Lamarck (1744 – 1829)
Lamarck proposed a theory of evolution via the inheritance of acquired traits. He proposed this
theory in 1809, the year Charles Darwin was born.
The evolution of the giraffe is often used as an
example. Main tenets
1. Living organisms or their component parts tend to increase in size.
2. Production of a new organ occurs when there is a new need.
3. Continued use of an organ makes it more developed, while disuse ofan organ
results in degeneration.
4. Acquired characters (or modifications) developed by individualsduring their own
lifetime are inheritable and accumulate over a period of time resulting in a new
species.
Problems with the theory: Was proposed before genetics was understood.
Acquired traits cannot be inherited.
Evolution via Natural Selection
Proposed by Charles Darwin and Alfred Wallace in 1859. This is the current, accepted theory of
evolution.
Compatible with an understanding of genetics.
According to Darwin, natural selection is the mechanism of evolution.
Natural Selection is the process in which the organisms best adapted to their environment tend to survive and
transmit their genetic characters in increasing numbers to succeeding generations while those less adapted tend to be
eliminated.
Natural selection is one of the major mechanisms of evolution.
Evolution is about reproduction. Those organisms that are better adapted to an environment out reproduce those
that are poorly adapted to the environment.
Factors that must be in place for evolution to occur:
1. Genetic Variability—Variation may come from sexual reproduction (random fertilization, crossing over, and
independent assortment), mutations, immigration.
2. More offspring are produced than can survive (due to limited resources, predation, etc…)
3. Some organisms must have phenotypes that are better adapted than others. These phenotypic variations
significantly increase the fitness of the organism in their current environment. These adaptations must have a
genetic basis. Natural selection acts on phenotypic variations within a population.
4. There must be differential reproduction rates due to the adaptive characteristics ofsome
members.
Essentially, Darwin’s theory says that competition for limited resources results in
differential survival. Individuals with more favorable phenotypes (for that specific

Page 251 of 318
251 Return to Table of Contents
environment) are more likely to survive and produce offspring, thus passing traits to
subsequent generations more often than their counterparts with less favorable phenotypes.
The biotic and abiotic factors in an environment can be more or less stable/fluctuating and can
affect the rate and direction of evolution. Different genetic variations can be selected for in each
generation. Essentially, this means that environments can change and thus apply different
selective pressures to populations at different times.
Evolution is often referred to as “survival of the fittest”.
In a biological context, fitness means: the ability to survive to reproductive age, find a mate, and produce
offspring. Basically, the more offspring an organism produces during its lifetime, the greater its biological
fitness. Biological fitness has nothing to do with size or strength. Fitness is measured by reproductive
success.
Fecundity is the actual reproductive rate of an organism or population.
Modern definition of Evolution—A change in the allele frequency/genetic makeup of a population
over time. The theory of evolution is supported by multiple lines of evidence.
Microevolution—a change in the allele frequency within a population thathappens over a short period of time.
Microevolution leads to changes within the group, but does not lead to speciation.
Macroevolution—major evolutionary change over time which leads to speciation.
Natural Selection--the process whereby organisms better adapted to their environment tend to survive and
produce more offspring. The theory of its action was first fully expounded by Charles Darwin and is now

Page 252 of 318
252 Return to Table of Contents
believed to be the main process that brings about evolution. Natural selection is sometimes referred to as
Darwin’s mechanism of evolution.
Artificial Selection (selective breeding)--is a form of selection in which humans actively choose which
traits should be passed onto offspring. Through this process, humans affect variation in other, non-human
species. Humans used selective breeding long before Darwin's Postulates and the discovery of genetics.
Farmers chose cattle with beneficial traits such as larger size, and made them breed; and although they may
have known nothing about genes, they knew that the beneficial traits could be heritable. The farmers
selected for certain traits in their cattle and noticed that the offspring were becoming more and more
productive with each generation. Artificial selection is essentially a human caused type of evolution.
There have been situations in which artificial selection has backfired or caused negative outcomes. Some
of these include:
A. Insecticide use selects for insects that are resistant/tolerant of the insecticide. The use of insecticides has led
to the creation of “super bugs”.
B. The use of antiviral drugs has selected for versions of the HIV virus that are resistant to the drugs. This has
caused resistant strains of HIV to become more common.
C. MRSA and other antibiotic resistant bacteria are selected for during antibiotic treatment of diseases. Some
bacterial diseases like tuberculosis and MRSA are now very hard to treat
Patterns of Selection Stabilizing Selection-- Stabilizing selection occurs when individuals at the extremes of the range of a characteristic
are consistently selected against. This kind of selection is very common. If the environment is stable, most of the
individuals show characteristics that are consistent with the demands of the environment. For example, for many
kinds of animals, there is a range of color possibilities. Suppose a population of mice has mostly brown individuals
and a few white or black ones. If the white or black individuals are more conspicuous and are consistently more
likely to be discovered and killed by predators, the elimination of the extreme forms will result in a continued high
frequency of the brown form. Many kinds of marine animals, such as horseshoe crabs and sharks, have remained
unchanged for thousands of years. The marine environment is relatively constant and probably favors stabilizing
selection.
Directional Selection-- Directional selection occurs when individuals at one extreme of the range of a characteristic
are consistently selected for. This kind of selection often occurs when there is a consistent change in the
environment in which the organism exists. For example, when a particular insecticide is introduced to control a
certain species of pest insect, there is consistent selection for individuals that have alleles for resistance to the
insecticide. Because of this, there is a shift in the original allele frequency, from one in which the alleles for
resistance to the insecticide were rare to one in which most of the population has the alleles for resistance. Similarly,
changes in climate, such as long periods of drought, can consistently select for individuals that have characteristics
that allow them to survive in the drier environment, and a change in allele frequency can result.
Disruptive or Diversifying Selection-- Disruptive selection occurs when both extremes of a range for a
characteristic are selected for and the intermediate condition is selected against. This kind of selection is likely to
happen when there are sharp differences in the nature of the environment where the organisms live. For example,
there are many kinds of insects that feed on the leaves of trees. Many of these insects have colors that match the
leaves they feed on. Suppose the species of insect ranges in color from light green to dark green, and medium green
is the most common. If a particular species of insect had some individuals that fed on plants with dark green leaves,
whereas other individuals fed on plants with light green leaves, medium green insects could be selected against and
the two extremes selected for, depending on the kind of plant they were feeding on.
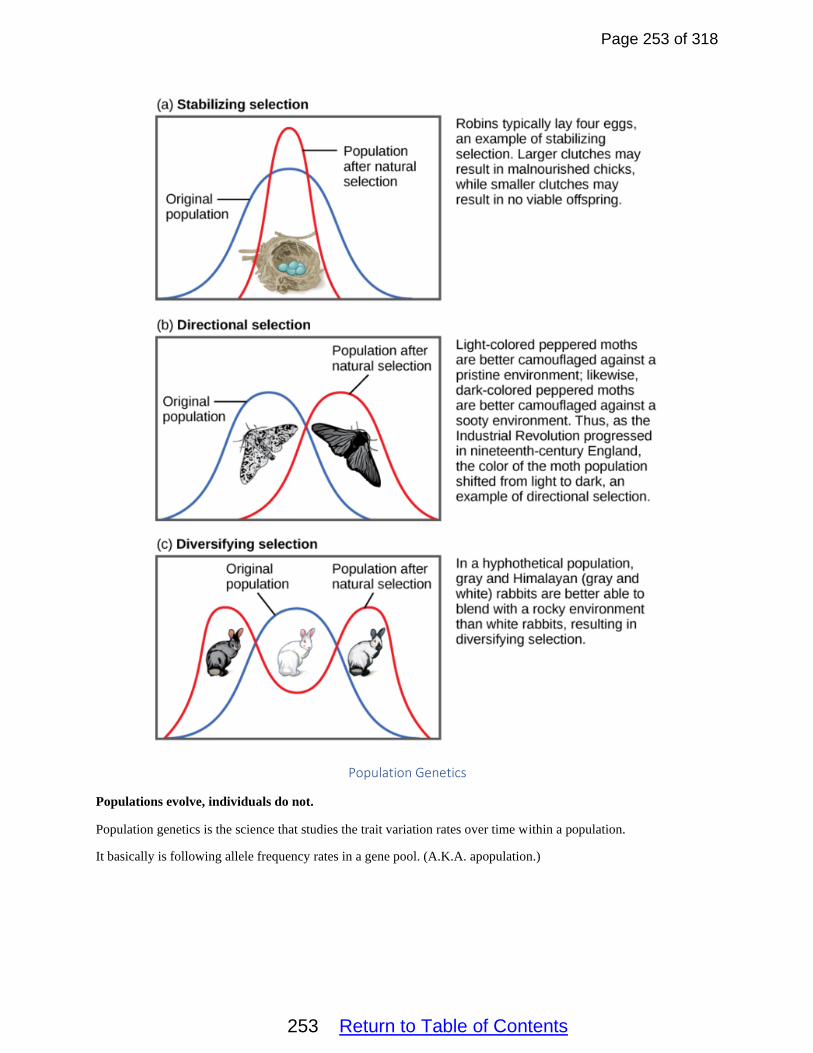
Page 253 of 318
253 Return to Table of Contents
Population Genetics
Populations evolve, individuals do not.
Population genetics is the science that studies the trait variation rates over time within a population.
It basically is following allele frequency rates in a gene pool. (A.K.A. apopulation.)

Page 254 of 318
254 Return to Table of Contents
A population is defined by four criteria:
A. SAME species of organism.
B. Located in the SAME location.
C. At the SAME time.
D. And showing signs of reproduction. (Offspring are present within the group.)
Hardy-Weinberg Equilibrium
Hardy Weinberg /Genetic Equilibrium—a theoretical condition in which a population's
genotype and allele frequencies will remain unchanged over successive generations. Essentially,
evolution is not occurring. The Hardy-Weinberg model can be used to describe and predict
allele frequencies in a nonevolving population.
In order for Hardy-Weinberg equilibrium to be achieved, the five requirements listed below must apply to the
population.
Requirements for Hardy-Weinberg Equilibrium
1. No mutations. Germ cell mutations bring about evolution. Somatic cell mutations are not
passed on to offspring.
2. No immigration or emigration. (No gene flow)
3. There must be a very large population in order to avoid genetic drift.
Genetic Drift—unpredicted changes in allele frequencies due to chance. Usually occurs in small,
isolated populations.
4. There must be no natural selection.
5. There must be no sexual selection. Mating must be random.
So if the above conditions are met, no evolution occurs. This also means that if any of the conditions are not met,
evolution can/will occur. We can think of mutation, immigration/emigration/gene flow, genetic drift, natural
selection, and sexual selection/non-random mating as mechanisms of evolution.
Mutations occur randomly. Mutations result in the formation of new alleles/increased genetic variation within the
population. This provides new phenotypes on which natural selection acts. If a random mutation gives an
individual a phenotype which is advantageous in a particular environment, it will be selected for and willcontribute
to the evolution of the population.
The movement of alleles between populations caused by migration/gene flow can also drive evolution.
Hardy Weinberg Equations The Hardy-Weinberg equation is a mathematical equation that can be used to calculate the genetic variation of a
population at equilibrium. In 1908, G. H. Hardy and Wilhelm Weinberg independently described a basic principle of
population genetics, which is now named the Hardy-Weinberg equation. The equation is an expression of the
principle known as Hardy-Weinberg equilibrium, which states that the amount of genetic variation in a population
will remain constant from one generation to the next in the absence of disturbing factors.
To explore the Hardy-Weinberg equation, we can examine a simple genetic locus (location) at which there are two
alleles, A and a. The Hardy-Weinberg equation is expressed as: p2 + 2pq + q2 = 1 (genotype frequency equation)
where p is the frequency of the "A" dominant allele and q is the frequency of the "a" recessive allele in the population. In the equation, p2 represents the frequency of the homozygous dominant genotype AA, q2 represents the
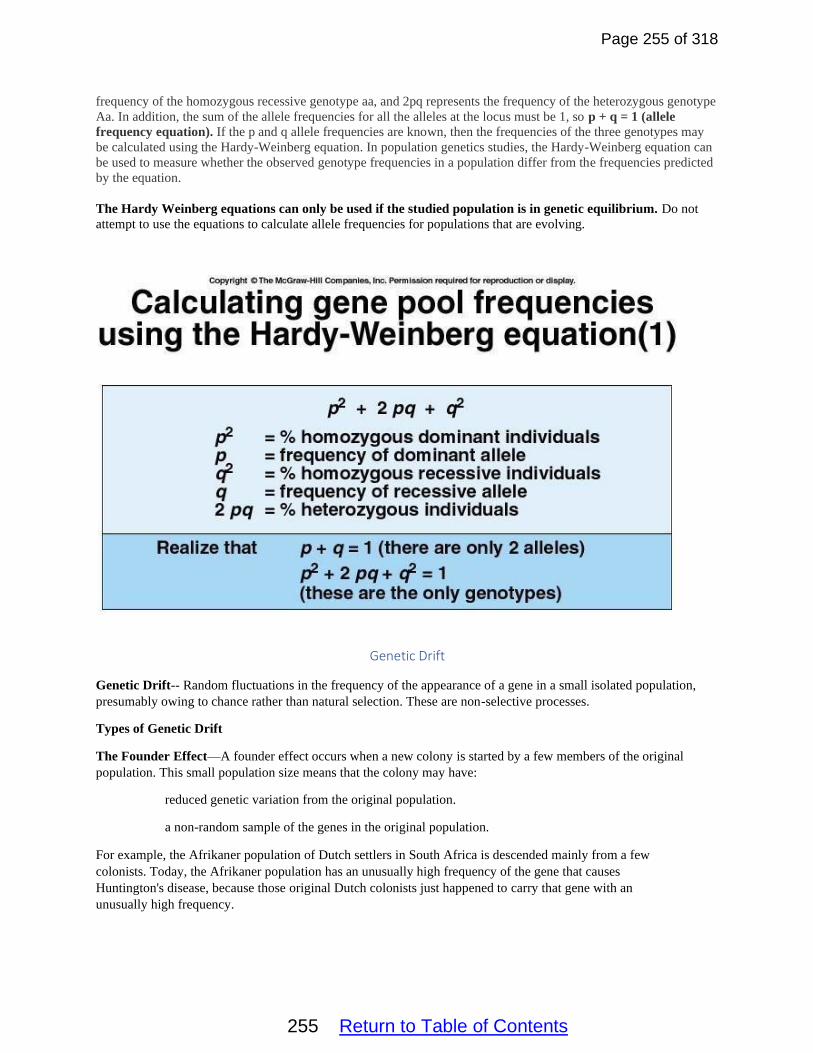
Page 255 of 318
255 Return to Table of Contents
frequency of the homozygous recessive genotype aa, and 2pq represents the frequency of the heterozygous genotype
Aa. In addition, the sum of the allele frequencies for all the alleles at the locus must be 1, so p + q = 1 (allele
frequency equation). If the p and q allele frequencies are known, then the frequencies of the three genotypes may
be calculated using the Hardy-Weinberg equation. In population genetics studies, the Hardy-Weinberg equation can
be used to measure whether the observed genotype frequencies in a population differ from the frequencies predicted
by the equation.
The Hardy Weinberg equations can only be used if the studied population is in genetic equilibrium. Do not
attempt to use the equations to calculate allele frequencies for populations that are evolving.
Genetic Drift
Genetic Drift-- Random fluctuations in the frequency of the appearance of a gene in a small isolated population,
presumably owing to chance rather than natural selection. These are non-selective processes.
Types of Genetic Drift
The Founder Effect—A founder effect occurs when a new colony is started by a few members of the original
population. This small population size means that the colony may have:
reduced genetic variation from the original population.
a non-random sample of the genes in the original population.
For example, the Afrikaner population of Dutch settlers in South Africa is descended mainly from a few
colonists. Today, the Afrikaner population has an unusually high frequency of the gene that causes
Huntington's disease, because those original Dutch colonists just happened to carry that gene with an
unusually high frequency.

Page 256 of 318
256 Return to Table of Contents
Bottleneck Effect—genetic drift resulting from the reduction of a population dueto a natural disaster/human
activity. The new population is not representative of the original population. Northern elephant seals have
reduced genetic variation probably because of a population bottleneck humans inflicted on them in the 1890s.
Hunting reduced their population size to as few as 20 individuals at theend of the 19th century. Their
population has since rebounded to over 30,000 — but their genes still carry the marks of this bottleneck: they
have much less genetic variation than a population of southern elephant seals that was not so intensely
hunted.
Genetic drift can result in a decrease in genetic variation within a given population. This decrease in
variation can increase the differences between populations of the same species.
Small populations with less genetic variability are more susceptible to random environmental impacts and
less able to adapt to them than are larger populations with more genetic variability.
Patterns of Evolution
Coevolution—Coevolution occurs when closely interacting species exert selective pressures on each other, so that
they evolve together in a kind of conversation of adaptations. Examples of coevolution predator/prey relationships,
the relationships between plants and their pollinators, and the relationships between parasites and their hosts.
Hummingbirds are a good example of pollinators that have coevolved with plants for mutual benefit. The
hummingbirds serve as pollinators and the flowers supply the birds with nutrient-rich nectar. The flowering plants
attract the hummingbirds with certain colors, the shape of the flower accommodates the bird’s bill, and such flowers
tend to bloom when hummingbirds are breeding. Coevolution of such flowering plants with various hummingbird
species is evident by the distinct shape and length of the flower’s corolla tubes, which have adapted to the shape and
length of the hummingbird bill that pollinates that plant.
Divergent Evolution—Divergent evolution occurs when adaptation to new habitats results in phenotypic
diversification. It is essentially a process in which a trait held by a common ancestor evolves into different
variations over time. A good example of divergent evolution is the evolution of vertebrate limbs. Whale flippers,
frog forelimbs, bird wings, and human arms all evolved from the front flippers of a fish-like ancestor as populations
of the organisms adapted to new environments. Because these limbs share a common evolutionary origin, they are
examples of homologous structures. An important consequence of divergent evolution is speciation, the divergence
evolution of one species into two or more descendent species. Speciation rates can be especially rapid during times
of adaptive radiation as new habitats/niches become available.
Convergent Evolution—Convergent evolution is the process in which species that are not closely related
independently evolve similar traits. This process occurs when similar selective pressures result in similar
phenotypic adaptations in different populations or species. For example, sharks and dolphins (which aren’t closely
related) have similar body shapes, body colors, and fins placements because those traits are important for success in
the environments/niches that the organisms both inhabit.
Speciation
Biological Species Concept—A species consists of genetically similar organisms that can interbreed and
produce viable, fertile offspring.
For speciation to occur, two populations must become reproductively isolated from each other.
– Over time, random mutations accumulate and are selected for or against.
– Given enough time, this process can cause the separated populationsto diverge into different
species.
Types of Speciation
Allopatric Speciation—Two populations are separated by a geographical barrier. This reproductively
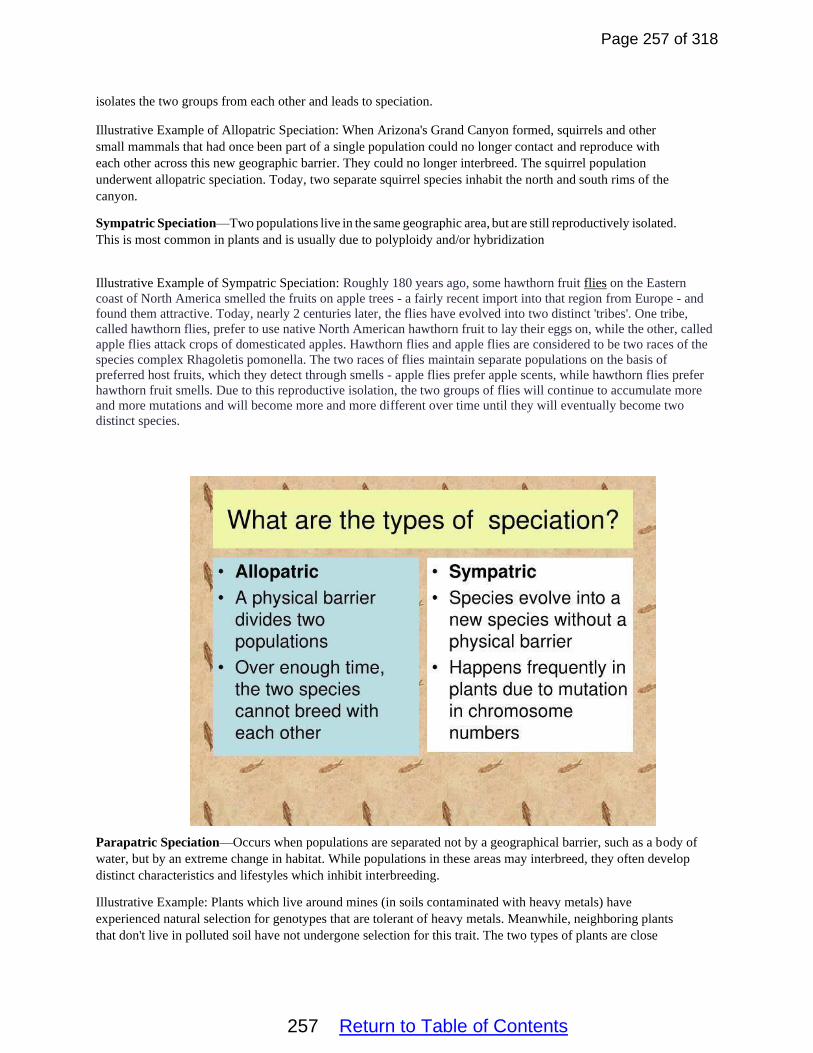
Page 257 of 318
257 Return to Table of Contents
isolates the two groups from each other and leads to speciation.
Illustrative Example of Allopatric Speciation: When Arizona's Grand Canyon formed, squirrels and other
small mammals that had once been part of a single population could no longer contact and reproduce with
each other across this new geographic barrier. They could no longer interbreed. The squirrel population
underwent allopatric speciation. Today, two separate squirrel species inhabit the north and south rims of the
canyon.
Sympatric Speciation—Two populations live in the same geographic area, but are still reproductively isolated.
This is most common in plants and is usually due to polyploidy and/or hybridization
Illustrative Example of Sympatric Speciation: Roughly 180 years ago, some hawthorn fruit flies on the Eastern
coast of North America smelled the fruits on apple trees - a fairly recent import into that region from Europe - and
found them attractive. Today, nearly 2 centuries later, the flies have evolved into two distinct 'tribes'. One tribe,
called hawthorn flies, prefer to use native North American hawthorn fruit to lay their eggs on, while the other, called
apple flies attack crops of domesticated apples. Hawthorn flies and apple flies are considered to be two races of the
species complex Rhagoletis pomonella. The two races of flies maintain separate populations on the basis of
preferred host fruits, which they detect through smells - apple flies prefer apple scents, while hawthorn flies prefer
hawthorn fruit smells. Due to this reproductive isolation, the two groups of flies will continue to accumulate more
and more mutations and will become more and more different over time until they will eventually become two
distinct species.
Parapatric Speciation—Occurs when populations are separated not by a geographical barrier, such as a body of
water, but by an extreme change in habitat. While populations in these areas may interbreed, they often develop
distinct characteristics and lifestyles which inhibit interbreeding.
Illustrative Example: Plants which live around mines (in soils contaminated with heavy metals) have
experienced natural selection for genotypes that are tolerant of heavy metals. Meanwhile, neighboring plants
that don't live in polluted soil have not undergone selection for this trait. The two types of plants are close

Page 258 of 318
258 Return to Table of Contents
enough that tolerant and non-tolerant individuals could potentially fertilize each other — so they seem to meet
the first requirement of parapatric speciation, that of a continuous population. However, the two types of plants
have evolved different flowering times. This change could be the first step in cutting off gene flow entirely
between the two groups. The groups are temporally isolated.
Adaptive Radiation
Adaptive radiation is a process in which organisms diversify rapidly from an ancestral species into a
multitude of new forms, particularly when a change in the environment makes new resources available, creates
new challenges, or opens new environmental niches. Starting with a recent single ancestor, this process results
in the speciation and phenotypic adaptation of an array of species exhibiting different morphological and
physiological traits.
Adaptive radiation may occur due to a combination of allopatric, parapatric, and/or sympatric speciation
events.
Adaptive Radiation Examples

Page 259 of 318
259 Return to Table of Contents
Reproductive Isolating Mechanisms
Reproductive isolating mechanisms are a collection of evolutionary mechanisms such as behaviors and
physiological processes which are critical for speciation. They function to maintain reproductive isolation and
prevent members of different species from producing offspring or ensure that any hybrid offspring are sterile. These
barriers maintain the integrity of a species by preventing gene flow between related species.
They are generally categorized as either pre-zygotic or post-zygotic.
Pre-zygotic Isolating Mechanisms
Pre-zygotic isolating mechanisms prevent related species from forming zygotes with each other.
A. Habitat isolation - The organisms live in two different environments.
B. Behavioral Isolation – The “Mating Dances”/Mating behaviors are not recognized by the other.
C. Temporal (time) Isolation – They have different times of year they can reproduce.
D. Mechanical Isolation – The reproductive parts just don’t fit together correctly.
E. Gametic Isolation – The sperm and egg do not recognize each other.
Post-zygotic Isolating Mechanisms
Post-zygotic isolating mechanisms--mechanisms which act after fertilization to prevent successful inter-
population/species production of viable offspring.
A. Reduced Hybrid Viability – The hybrid organism can’t survive for long during development.
B. Reduced Hybrid Fertility – The hybrid organism survives, it just can’t reproduce.
2

Page 260 of 318
260 Return to Table of Contents
Evidence for Evolution
The theory of evolution is supported by multiple lines of scientific evidence from many disciplines
(geographical, geological, physical, biochemical, and mathematical). Molecular, morphological (anatomical),
and genetic evidence from extant (living) and extinct organisms adds to our understanding of evolution and
supports the relatedness of all organisms in all domains.
Phylogeny or Phylogenetics—The evolutionary history of a species.
Morphological Homologous features/homologies—structures in different species that are similar because
of common ancestry (arm of a human, wing of bat, flipper of a whale). These structures have the SAME
STRUCTURE because the DNA “blueprint” is the same. Shared DNA/RNA/Protein Structure is the ultimate
homology. The similarity of DNA sequences is the most compelling evidence that scientists have to prove
the evolutionary relationships between organisms. There is a great deal of structural/morphological evidence
which indicates the common ancestry of all eukaryotic organisms. This evidence includes: A) all
eukaryotes possess membrane-bound organelles, B) All eukaryotes have linear chromosomes, C) All
eukaryotes have genes that contain introns (non-coding sections).
Analogous features—Similarity in two species due to convergent evolutionrather than to descent from a
common ancestor (wing of bird and wing of a mosquito). Does not imply common ancestry. Indicates
different solutions to the same evolutionary problem.
Vestigial organ—A morphological structure that is a historical/evolutionary remnant of a structure that was
important in evolutionary ancestors (appendix in humans, pelvis in a whale). Since snakes have a vestigial
pelvis, scientists think they evolved from a lizard ancestor.
Fossil Record—The fish/amphibian/reptile/bird/mammal fossil pattern found in rock strata over the entire
Earth is evidence that the different types of vertebrates evolved in that order. The fossil record also supports
the idea that populations continue to evolve because it shows continuous changes in the fossil record over
millions of years. Fossils can be dated by a variety of methods which include: a) using the age of the rocks
where the fossil is found, b) using the rate of decay of atomic isotopes like carbon-14, c) using geographical
data.
Comparative Embryology--the study of the similarities and differences among various organisms
during the embryologic period of development. Organisms with more similar embryonic development
patterns are more related than those with different patterns.
Comparative Biochemistry and Molecular Biology—Comparing the DNA,RNA, amino acid
sequences of proteins, and metabolic pathways of related organisms. Organisms who share these
characteristics must have inherited them from a common ancestor. Many fundamental
molecular/biochemical and cellular processes are conserved across organisms. For example, almost
all organisms use the same enzymes and metabolic pathways to carry out glycolysis, the Krebs Cycle,
and the electron transport chain. Most organisms also use the same or similar enzymes to carry out
the processes of DNA replication and protein synthesis.
Artificial Selection—evolution brought about by selective breeding (examples: dog breeds, crop plants). Man-
made evolution—Works much faster than natural evolution. The argument is that if humans can make
evolution happen, so can nature.
Direct Observation of Microevolution—Populations of organisms continue to evolve. Development of
antibiotic and pesticide/herbicide resistance have been witnessed within the last 75 years. These types of
evolution continue to happen at a very high rate. Scientists have also been able to observe the evolution
of the pathogens that continue to cause emergent diseases.

Page 261 of 318
261 Return to Table of Contents
Biogeography--The geographic distribution of organisms on Earth follows patterns that are best
explained by evolution, in combination with the movement of tectonic plates over geological time. For
example, broad groupings of organisms that had already evolved before the breakup of the
supercontinent Pangaea (about 200 million years ago) tend to be distributed worldwide. In contrast,
broad groupings that evolved after the breakup tend to appear uniquely in smaller regions of Earth. For
instance, there are unique groups of plants and animals on northern and southern continents that can be
traced to the split of Pangaea into two supercontinents (Laurasia in the north, Gondwana in the south).
The evolution of unique species on islands is another example of how evolution and geography intersect.
For instance, most of the mammal species in Australia are marsupials (carry young in a pouch), while
most mammal species elsewhere in the world are placental (nourish young through a placenta).
Australia’s marsupial species are very diverse and fill a wide range of ecological roles. Because
Australia was isolated by water for millions of years, these species were able to evolve without
competition from (or exchange with) mammal species elsewhere in the world.

Page 262 of 318
262 Return to Table of Contents
Types of Evolution
Gradualism--Gradualism is when evolution occurs slowly/gradually over thousands or millions of years. Over
a short period of time it is hard to notice. Small variations that fit an organism slightly better to its environment
are selected for: a few more individuals with more of the helpful trait survive, and a few more with less of the
helpful trait die. Very gradually, over a long time, the population changes. Change is slow,constant, and
consistent.
Punctuated Equilibrium--In punctuated equilibrium, change comes in spurts. There is a period of very little
change (stasis), and then one or a few huge changes occur, often through mutations in the genes of a few
individuals. Punctuated equilibrium can also occur due to sudden/cataclysmic changes in the environment that
result in more rapid changes in the organisms through harsher selection. Essentially, punctuated equilibrium is
when evolution occurs rapidly after long periods of stasis/stability. These rapid periods of evolution typically
occur after mass extinctions have provided newly available niches that can then be exploited by different
species.
Phylogenetic Relationships/Shared Ancestry
• Phylogeny--The history of the evolution of a species or group, especially in reference to lines of descent
and relationships among broad groups of organisms.
• Ways to establish phylogenetic relationships between organisms:
• Compare DNA/RNA sequences of specific genes. The more similar the sequences, the

Page 263 of 318
263 Return to Table of Contents
more recently the organisms shared a common ancestor.
• Compare the amino acid sequences of specific proteins. The more similar the sequences, the
more similar the DNA/genes, the more recently the organisms shared a common ancestor.
• Compare morphology/shared derived traits. The more traits the organisms share, themore
recently they shared a common ancestor. Traits that are either gained or lost during
evolution can be used during the construction of phylogenetic trees/cladograms.
• Molecular data (like the comparison of DNA/RNA/amino acid sequences) provide
more accurate and reliable evidence than morphological traits for the construction
of phylogenetic trees/cladograms.
• Phylogenetic trees and cladograms represent hypotheses and are constantly being
revised, based on evidence (especially newly available DNA sequence comparisons).
Methods Used to Depict Phylogenetic Relationships
• Phylogenetic Tree--A branching treelike diagram used to illustrate evolutionary (phylogenetic)
relationships among organisms. Each node, or point of divergence, has two branching lines of descendance,
indicating evolutionary divergence from a common ancestor. A phylogenetic tree is drawn like a branching
tree diagram in which branch length is proportional to the evolutionary distance/time (as estimated from
the fossil record or a molecular clock) between organisms. This is not true in a cladogram. Cladograms do
not indicate time. Branch lengths are typically all the same length in a cladogram.
• Cladogram--A branching treelike diagram used to illustrate evolutionary (phylogenetic) relationships
among organisms. Each node, or point of divergence, has two branching lines of descendance, indicating
evolutionary divergence/speciation from a common ancestor. A cladogram is a type of phylogenetictree.
Important Terms to
Know
• Clade--a group of biological taxa (such as species) that includes all descendants of one common
ancestor.
• Root--The initial ancestor common to all organisms within the cladogram. This is the point which
begins the cladogram.
• Morphology--a branch of biology dealing with the study of the form and structure of organisms and
their specific structural features.
• Shared Ancestral Trait--a trait shared by a group of organisms as a result of descent from a common
ancestor.
• Derived Trait/Derived Character--a trait that is present in an organism/group/lineage, but
was absent in the last common ancestor of the group/lineage being considered. Derived traits
that are shared by different lineages/groups indicate common ancestry and can be used in the
process of cladogram construction.
• Outgroup—An outgroup is a group of organisms that serves as a reference group when
determining the evolutionary relationships of the ingroup, the set of organisms under study.
The out-group represents the lineage/group that is least closely related to the remainder ofthe
organisms in the phylogenetic tree or cladogram. The evolutionary conclusion from these

Page 264 of 318
264 Return to Table of Contents
relationships is that the outgroup species has a common ancestor with the ingroup that is older
than the common ancestor of the ingroup.
• Ingroup—The group of related species that are being studied/illustrated by the
cladogram/phylogenetic tree.
• Node-- Each node corresponds to a hypothetical common ancestor that speciated to give rise to
two (or more) daughter taxa. Cladograms can be rotated around each node without changing
the meaning/relationships depicted by the cladogram.
• Clade/Monophyletic Group-- A common ancestor and all of its descendants (i.e. a node and
all of its connected branches)

Page 265 of 318
265 Return to Table of Contents
Constructing a Cladogram Based on Morphology
• Begin by constructing a character table like the one included on the proceeding slide. In the table use
a “1” to indicate that an organism possesses a trait and a “0” to indicate that an organism does not
possess the trait.
• The trait possessed by all of the organisms is the ancestral trait.

Page 266 of 318
266 Return to Table of Contents
Character Table
Constructing a Cladogram Based on Morphology
• Step 1: Draw a single right slanted line from the bottom left corner of your paper toward the top right-
hand corner of the page. At the top of the line, list the most complex group of organisms. This organism
should possess more of the shared derived traits than any of the other organisms. This line will be the
main evolutionary pathway or line.
• Step 2: Determine the first outgroup. This is the most primitive (oldest) group of organisms. It will share
only one of the traits (the ancestral trait) with the other taxa (clades) and therefore will be your first
outgroup. Just up from the root ofyour cladogram (bottom left corner) draw a left slanted line off of the
main line. At the top of the line write the name of the taxon of your first outgroup.
• Step 3: Just below and to the left of the outgroup line, draw a short horizontal line across the main line. At
the end of this small line, write the name of the ancestral trait, the trait shared by all of the organisms in the
cladogram.
• Step 4: Just above the outgroup line, draw a left slanted line that will show the next most primitive
group or second outgroup. List the group name at the endof the line. This group should possess only
the ancestral trait and one additional shared derived trait. These and all the other organisms that
evolved later are referred to as the ingroup .

Page 267 of 318
267 Return to Table of Contents
• Step 4: Between the first outgroup line and the line drawn in Step 4, draw a small horizontal line across
the main line. At the right end of the small line, write the name of the shared derived trait that separates
the first outgroup from the first taxa in the ingroup.
• Step 6: Looking at the character table, decide the next group of organisms to become the next outgroup each
time. Draw another left leaning line for them and list their name at the end of the line. Be sure to use
horizontal lines across the main line to indicate the traits which separate the outgroups. Only traits shared by
all of the organisms above and to the right of the indicated line should be included on the main line.
• Step 7: Repeat until all groups of organisms have been listed or branched off ofthe main evolutionary line.
• Step 8: If you have two groups of organisms in the same outgroup, draw one left leaning line for the group.
Have a second right leaning line branching off of this left leaning line. On this second right leaning line,
draw a small horizontal line and list the separating trait here. (Just as you did on the main line.)
Using Molecular Evidence to Create Cladograms
• All organisms use DNA and RNA as genetic material and the genetic code by which proteins are
synthesized is (almost) universal.
• This shared molecular heritage means that nitrogenous base and amino acid sequences canbe
compared to ascertain levels of relatedness.
• Over the course of millions of years, mutations will accumulate within any given segment of DNA.
• The number of differences between comparable base sequences demonstrates the degree ofevolutionary
divergence.
• A greater number of differences between comparable base sequences suggests more time has passed
since two species diverged,
• Hence, the more similar the base sequences of two species are, the more closely related the two species
are expected to be.
• When comparing molecular sequences, scientists may use non-coding DNA, gene sequences or amino
acid sequences.
• Non-coding DNA provides the best means of comparison as mutations will occur more readily in these
sequences.
• Gene sequences mutate at a slower rate, as changes to base sequences may potentiallyaffect
protein structure and function.
• Amino acid sequences may also be used for comparison, but will have the slowest rate of change due to
codon degeneracy.
• Amino acid sequences are typically used to compare distantly related species (i.e. different taxa), while
DNA or RNA base sequences are often used to compare closely related organisms (e.g. different
haplogroups – such as various human ethnic groups)
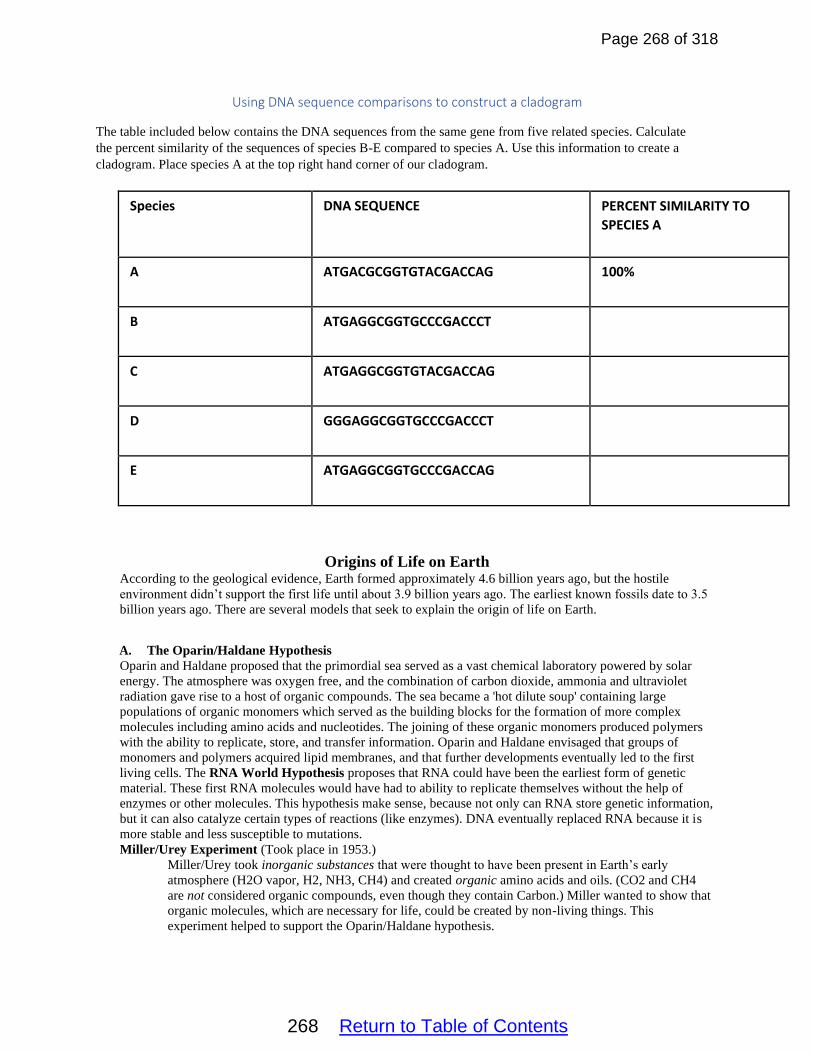
Page 268 of 318
268 Return to Table of Contents
Using DNA sequence comparisons to construct a cladogram
The table included below contains the DNA sequences from the same gene from five related species. Calculate
the percent similarity of the sequences of species B-E compared to species A. Use this information to create a
cladogram. Place species A at the top right hand corner of our cladogram.
Species DNA SEQUENCE PERCENT SIMILARITY TO
SPECIES A
A ATGACGCGGTGTACGACCAG 100%
B ATGAGGCGGTGCCCGACCCT
C ATGAGGCGGTGTACGACCAG
D GGGAGGCGGTGCCCGACCCT
E ATGAGGCGGTGCCCGACCAG
Origins of Life on Earth According to the geological evidence, Earth formed approximately 4.6 billion years ago, but the hostile
environment didn’t support the first life until about 3.9 billion years ago. The earliest known fossils date to 3.5
billion years ago. There are several models that seek to explain the origin of life on Earth.
A. The Oparin/Haldane Hypothesis
Oparin and Haldane proposed that the primordial sea served as a vast chemical laboratory powered by solar
energy. The atmosphere was oxygen free, and the combination of carbon dioxide, ammonia and ultraviolet
radiation gave rise to a host of organic compounds. The sea became a 'hot dilute soup' containing large
populations of organic monomers which served as the building blocks for the formation of more complex
molecules including amino acids and nucleotides. The joining of these organic monomers produced polymers
with the ability to replicate, store, and transfer information. Oparin and Haldane envisaged that groups of
monomers and polymers acquired lipid membranes, and that further developments eventually led to the first
living cells. The RNA World Hypothesis proposes that RNA could have been the earliest form of genetic
material. These first RNA molecules would have had to ability to replicate themselves without the help of
enzymes or other molecules. This hypothesis make sense, because not only can RNA store genetic information,
but it can also catalyze certain types of reactions (like enzymes). DNA eventually replaced RNA because it is
more stable and less susceptible to mutations.
Miller/Urey Experiment (Took place in 1953.)
Miller/Urey took inorganic substances that were thought to have been present in Earth’s early
atmosphere (H2O vapor, H2, NH3, CH4) and created organic amino acids and oils. (CO2 and CH4
are not considered organic compounds, even though they contain Carbon.) Miller wanted to show that
organic molecules, which are necessary for life, could be created by non-living things. This
experiment helped to support the Oparin/Haldane hypothesis.

Page 269 of 318
269 Return to Table of Contents
B. Other scientists believe that the first organic molecules were brought to Earth on meteorites or by other celestial events and that the arrival of these organic molecules led to the evolution of life on Earth. The remains of several meteorites have been shown to contain diverse organic molecules, thus supporting this hypothesis.
Extinction
Extinctions have occurred throughout Earth’s history. There is geological evidence which shows that there have
been at least 5 mass extinctions (events in which at least half of all species die in a relatively short period of time) in
Earth’s history. During the Ordovician-silurian extinction, many small marine organisms died out approximately
440 million years ago. During the Devonian extinction, many tropical marine species went extinct approximately
365 million years ago. The largest extinction in Earth’s history was the Permian-triassic extinction. During this
event (which occurred about 250 million years ago), 95% of marine species and 70% of terrestrial species went
extinct. The Triassic-jurassic extinction (210 million years ago) brought about the extinction of many land
vertebrates and allowed dinosaurs to flourish. Maybe the most famous mass extinction is the cretaceous-tertiary
extinction which occurred about 65.5 million years ago. This is the extinction event in which the dinosaurs were
killed. Some scientists think that a sixth mass extinction, caused by humans, is currently in progress.

Page 270 of 318
270 Return to Table of Contents
Extinction rates can be extremely rapid during times of ecological stress. These stresses and thus extinctions can be
caused by:
A. Sudden, massive volcanic activity. The volcanoes emit huge amounts of carbon dioxide which can
result in global warming. The dust and aerosols from the eruptions can also inhibit photosynthesis and
bring about the collapse of food chains.
B. Rapidly changing climate.
C. Asteroid/Comet impacts.
D. Anoxic events in which the middle and lower layers of the oceans become deficient in oxygen.
E. Changing positions of the oceans and continents/Changing of sea levels.
F. Human impacts can change ecosystems and cause extinctions.
The amount of biodiversity in an ecosystem is determined by the rates of speciation and extinction. High speciation
rates and low extinction rates increased levels of biodiversity, while low speciation rates and high extinction rates
lead to decreased levels of biodiversity.
Extinctions can provide newly available niches that can be exploited by different species. All of Earth’s mass
extinction events have been followed by periods of rapid evolution/speciation. Events such as this are the basis for
the idea of punctuated equilibrium.
Variations in Populations A population’s ability to withstand environmental pressures and response to changes in the environment is
influenced by the population’s genetic diversity. Populations/species with little genetic diversity are at risk of
decline/extinction while those with high levels of genetic diversity are more able to adapt/evolve. Genetically
diverse populations are more resilient to environmental perturbations/disturbances because they are more likely to
contain individuals who can withstand the perturbation/disturbance.
Illustrative Example 1: In the 1800s, the Irish solved the problem of feeding a growing population of people by
planting a specific potato variety, the “lumper”. Since potatoes can propagate asexually, all of the lumpers were
clones and were genetically identical to each other. The lumpers were all genetically susceptible to a rot caused by
the fungus Phyotphthora infestans. The rot quickly turns the potatoes into inedible slime. When the rot eventually
struck Ireland in the 1840s, the potato crop was decimated and one in eight Irish people starved. The disaster would
likely not have been nearly as bad if the Irish had planted several varieties of genetically variable potatoes. Some of
the potato plants would likely have possessed genes that allowed them to survive the rot and produce edible
potatoes. The more resistant varieties would then have been planted after the first outbreak of the rot and
subsequent outbreaks would have been prevented or limited.
Illustrative Example 2: With the development of antibiotics in the 1940s, scientists thought that the human race had
conquered bacterial disease. However, they quickly learned that bacterial populations can quickly evolve to become
resistant to antibiotics. What they learned is that genetic variability within a population acts as the raw material for
evolution. This genetic variability often arises from random mutations. In genetically diverse bacterial populations,
these mutations may:
1. Permit evolution of protein enzymes which destroy antibiotics. An example is the bacterial enzyme beta-
lactamase which destroys beta-lactam antibiotics such as penicillin and ampicillin. Most Staphylococcus
aureus carry genes for production of beta-lactamases and therefore are not killed in the presence of
penicillin.
2. Permit evolution of protein enzymes which chemically modify antibiotics or targets, inhibiting action of
antibiotics
3. Change the target of the antibiotic so the antibiotic can no longer bind to and inhibit function of the protein
4. Permit evolution of bacterial “pumps” which specifically pump out antibiotics if they enter the bacterium

Page 271 of 318
271 Return to Table of Contents
When antibiotics are used, individual bacterial cells which randomly possess resistance-conferring mutations are
artificially selected for, while those without the mutations are killed off. Since bacteria reproduce so quickly and
have such short life spans, antibiotic resistance can evolve within very small time increments.
Illustrative Example 3: About 12,000 years ago, an extinction event wiped out almost the entire cheetah population.
A handful of cheetahs managed to survive and were eventually able to restore the world’s population. The
population bottleneck/extinction event caused an extreme reduction in the cheetah species’ genetic diversity. The
resulting genetic homogeneity of today’s cheetahs has led to poor sperm quality, susceptibility to the same infectious
diseases, kinked tails, and tooth/jaw disease throughout the population.

Page 272 of 318
272 Return to Table of Contents
AP Biology
Unit 8
Student Notes

Page 273 of 318
273 Return to Table of Contents
Unit 8 Student Notes
Table of Contents
A. Ecology Basics —Pages 274-275 B. Population Ecology—Page 276-288
C. Measuring Population Size—Pages 276-277 D. Patterns of Dispersion—Pages 277-278 E. Survivorship Curves—Page 280 F. Age-Sex Structures—Pages 281-282
G. Life History Strategies—Pages 282-283 H. Population Dynamics—Pages 283-289 I. Community Ecology—Pages 288-293 J. Interspecific/Interpopulation Interactions—Pages 288-293
K. Communication Between Organisms—Pages 293-294
L. Community Structure—Pages 293-296
M. Simpson’s Diversity Index—Pages 294-295
N. Ecological Succession—Pages 297-298
O. Ecosystem Ecology—Pages 298-311
P. Responses to the Environment—Pages 300-301
Q. Energy and Matter in Ecosystems—Pages 301-311
R. Energy Flow and Primary Productivity—Pages 307
S. Thermoregulation—Pages 307-310
T. Biogeochemical Cycles--Pages 310-315
U. Carbon Cycle—Pages 310-311
V. Nitrogen Cycle—Pages 312-313
W. Phosphorus Cycle—Pages 313-314
X. Water Cycle—Page 315
Y. Movement of Water Through a Plant—Pages 316-317
Z. Biological Magnification—Pages 317-318
AA. Ecology and Evolution—Page 318

Page 274 of 318
274 Return to Table of Contents
Important Ideas/Enduring Understandings for This Unit Timing and coordination of biological mechanisms involved in growth, reproduction, and homeostasis
depend on organisms responding to environmental cues.
Transmission of information results in changes within and between biological systems.
The highly complex organization of living systems requires constant input of energy and the exchange of
macromolecules.
Living systems are organized in a hierarchy of structural levels that interact.
Communities and ecosystems change on the basis of interactions among populations and disruptions to
the environment.
Naturally occurring diversity among and between components within biological systems affects
interactions with the environment.
Evolution is characterized by change in the genetic make-up of a population over time and is supported
by multiple lines of evidence.
Competition and cooperation are important aspects of biological systems.
Ecology Basics Ecology – Is the study of the interactions that occur between organisms and their environment.
Ecologists also study how the distribution and abundance of organisms across the planet is affected by both abiotic
and biotic factors.
Abiotic factors –environmental factors that are not living. Abiotic factors include: temperature, light,
water, nutrients, soil, and wind.
Biotic factors – environmental factors that are living or are related to living things. Biotic factors include:
bacteria, protists, fungi, plants, animals, competition, and symbiosis.
Ecologists study the field of Ecology at five different levels: the organism level, the population level, the
community level, the ecosystem level, and the biosphere level.
At the organism level, ecologists study the adaptations that allow individual living things to live in
specific environments.
At the population level, ecologists study the size, density, and structure of groups of the same
species that live in the same place at the same time.

Page 275 of 318
275 Return to Table of Contents
At the community level, ecologists study the interactions between different populations that
live in the same area.
At the ecosystem level, ecologists study the flow of energy and the recycling of
nutrients in an area and how communities interact with the environment.
At the biosphere level, ecologists study the interactions between ecosystems and how these
interactions affect the entire Earth.

Page 276 of 318
276 Return to Table of Contents
The five levels of ecology (discussed above) were introduced from small to large. The levels build progressively—
populations are made up of individual organisms; communities are made up of populations; ecosystems are made up
of a community plus its environment; and so forth.
Each level of organization has emergent properties, new properties that are not present in the level's component
parts but emerge from the parts' interactions and relationships.
Population Ecology A population includes all of the organisms of the same species that live in the same area at the same time and show
signs of reproduction with each other.
Demography is the statistical study of populations and how they change over time.
Population Ecologists focus on the population size (N) (the number of individuals in a population) and population
density (the number of individuals per unit of area or volume). These measures are both important for describing
the status of a population and for making predictions about future changes that may occur.
Measuring Population Size It typically isn’t possible or cost effective to count each member of a population. Scientists usually estimate the size
of the population by taking samples from the population and using the samples to make inferences about the size of
the actual population. The two most important sampling methods used in Ecology are the quadrat method and the
mark-recapture method.
Quadrat Method
The quadrat method works best for immobile or slow-moving organisms. As part of the quadrant method, multiple
small plots/quadrats of a habitat are staked off. All of the individuals within each quadrant are counted and the
counts are used to estimate the population size or density for the entire habitat.
Mark-Recapture Method
The Mark-Recapture Method works best for mobile organisms. The process involves capturing a sample of the
organisms and marking them with tags, paint, bands, etc… The marked organisms are then released back into the
original environment. At a later time, a new sample is collected from the same environment. The new sample
should include some of the marked individuals from the initial sample and some individuals that were never
marked/captured. The ratio of the marked to unmarked individuals in the sample can be used to estimate the
population size.

Page 277 of 318
277 Return to Table of Contents
Patterns of Dispersion Ecologists are also often interested in species dispersion patterns or distribution patterns. These patterns refer to
how the individuals in a population are distributed in space at a given time.
Types of Dispersion/Distribution Patterns
A. Clumped/Aggregated/Clustered – In this pattern, individuals are clustered together in groups. This pattern is
common in plants that drop their seeds on the ground and in animals that live in schools or herds.
B. Uniform (evenly) – In this pattern, individuals are spaced evenly throughout a habitat. This pattern is common in
animals that stake out and defend their territories.
C. Random – In this pattern, individuals are distributed with no regular or predictable pattern. This pattern is
common in plants that have wind dispersed seeds.

Page 278 of 318
278 Return to Table of Contents
Life Tables
Life Tables summarize the birth and death rates for organisms at different stages of their lives. The data from these
tables can be used to predict how a population is likely to grow or shrink in the future. The life table included below
illustrates the life pattern of the Dall mountain sheep.

Page 279 of 318
279 Return to Table of Contents
Note: The age-specific mortality rate for each age interval was calculated by dividing the number of organisms who
died in the interval by the number surviving at the beginning of the age interval.

Page 280 of 318
280 Return to Table of Contents
Survivorship Curves A survivorship curve is a graph showing the number or proportion of individuals surviving to each age for a given
species or group (e.g. males or females). Survivorship curves are constructed for a given cohort (a group of
individuals of roughly the same age) based on the data from a life table.
There are three common types of survivorship curves:
Type I individuals survive well early in life and generally live many years. At an advanced age, the death rate
increases dramatically. Examples include large mammals.
Type II individuals have a death rate that is relatively constant at any age. Examples include lizards, hydra, and
some small mammals.
Type III individuals initially have a rather low chance of survival. Those that do survive may live to an advanced
age. Examples include many insects and fish.

Page 281 of 318
281 Return to Table of Contents
Age-Sex Structures
The most important demographic characteristic of a population is its age-sex structure. Age-sex pyramids (also
known as population pyramids) graphically display this information to improve understanding and ease of
comparison.
How to Read an Age-Sex Pyramid Graph
An age-sex pyramid breaks down a population into male and female genders and age ranges. Usually, you'll find the
left side of the pyramid graphing the male population and the right side of the pyramid displaying the female
population.
Along the horizontal axis (x-axis) of a population pyramid, the graph displays either the number of individuals of
that age or a percentage of the population at that age. The center of the pyramid starts at zero population and extends
out to the left for male and right for female in increasing size or proportion of the population.
Along the vertical axis (y-axis), age-sex pyramids display five-year age increments, from birth at the bottom to old
age at the top.
Example Age-Sex Pyramid
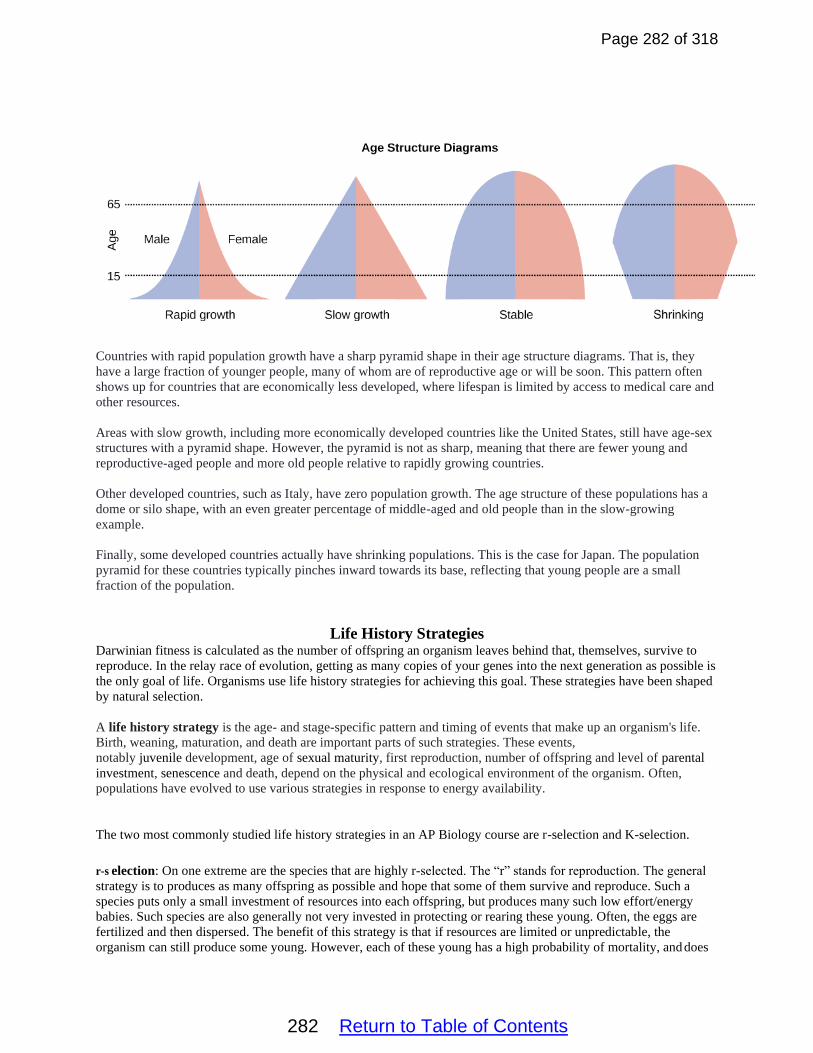
Page 282 of 318
282 Return to Table of Contents
Countries with rapid population growth have a sharp pyramid shape in their age structure diagrams. That is, they
have a large fraction of younger people, many of whom are of reproductive age or will be soon. This pattern often
shows up for countries that are economically less developed, where lifespan is limited by access to medical care and
other resources.
Areas with slow growth, including more economically developed countries like the United States, still have age-sex
structures with a pyramid shape. However, the pyramid is not as sharp, meaning that there are fewer young and
reproductive-aged people and more old people relative to rapidly growing countries.
Other developed countries, such as Italy, have zero population growth. The age structure of these populations has a
dome or silo shape, with an even greater percentage of middle-aged and old people than in the slow-growing
example.
Finally, some developed countries actually have shrinking populations. This is the case for Japan. The population
pyramid for these countries typically pinches inward towards its base, reflecting that young people are a small
fraction of the population.
Life History Strategies Darwinian fitness is calculated as the number of offspring an organism leaves behind that, themselves, survive to
reproduce. In the relay race of evolution, getting as many copies of your genes into the next generation as possible is
the only goal of life. Organisms use life history strategies for achieving this goal. These strategies have been shaped
by natural selection.
A life history strategy is the age- and stage-specific pattern and timing of events that make up an organism's life.
Birth, weaning, maturation, and death are important parts of such strategies. These events,
notably juvenile development, age of sexual maturity, first reproduction, number of offspring and level of parental
investment, senescence and death, depend on the physical and ecological environment of the organism. Often,
populations have evolved to use various strategies in response to energy availability.
The two most commonly studied life history strategies in an AP Biology course are r-selection and K-selection.
r-s election: On one extreme are the species that are highly r-selected. The “r” stands for reproduction. The general
strategy is to produces as many offspring as possible and hope that some of them survive and reproduce. Such a
species puts only a small investment of resources into each offspring, but produces many such low effort/energy
babies. Such species are also generally not very invested in protecting or rearing these young. Often, the eggs are
fertilized and then dispersed. The benefit of this strategy is that if resources are limited or unpredictable, the
organism can still produce some young. However, each of these young has a high probability of mortality, and does

Page 283 of 318
283 Return to Table of Contents
not benefit from the protection or nurturing of a caring parent or parents. r-selected babies grow rapidly, and tend to
be found in less competitive, low quality or unstable environments. Although not always the case, r-selection is
more common among smaller animals with shorter lifespans and, frequently, non-overlapping generations, such as
fish or insects. The young tend to be precocial (rapidly maturing) and develop early independence. r-selected
species tend to follow a Type III survivorship curve and often exhibit exponential growth, followed by massive
declines in population size.
K-selection: On the other extreme are species that are highly K-selected. K refers to the carrying capacity, and
means that the babies are entering a competitive world, in a population at or near its carrying capacity. K-selected
reproductive strategies tend towards heavy investment in each offspring and are more common in long-lived
organisms. These organisms tend to have a long period of maturation to adulthood, heavy parental care and
nurturing, an extended period of time devoted to teaching the young, and fierce protection of the babies by the
parents. K-selected species produce offspring that each have a higher probability of survival to maturity. Although
not always the case, K-selection is more common in larger animals, like whales or elephants, with longer lifespans
and overlapping generations. The young tend to be altricial (immature, requiring extensive care). K-selection
usually occurs in populations found in stable environments. K-selected organisms typically follow a Type I
survivorship curve and exhibit logistic growth.
It should be noted that r- and K-selection are the extremes at both ends of a continuum and that most species fall
somewhere in between.
Population Dynamics In theory, any species could reproduce so much that it could dominate the entire Earth. In practice, this doesn’t
happen because the availability of required resources such as water, food, shelter, nutrients, etc… is limited.
Population Dynamics is the study of how populations change in size and composition over time.
Population ecologists use a variety of mathematical models and equations to describe the changes that occur within a
population and to predict possible future changes.

Page 284 of 318
284 Return to Table of Contents
In order to understand the different models that are used to represent population dynamics, we will start by looking
at the general equation for the population growth rate (change in number of individuals in a population over time):
rN=(dN)/(dT)
In this equation, dN/dT is the growth rate of the population at a given instant. N is the population size. T is time
and r is the per capita rate of increase –that is, how quickly the population grows per individual already in the
population. If we assume no movement of individuals into or out of the population, r is just a function of birth and
death rates.
To calculate the per capita birth rate, divide the number of births during the period by the initial population size at
the beginning of the period.
To calculate the per capita death rate, divide the number of deaths during the period by the initial population size at
the beginning of the period.
To calculate the per capita growth rate (rmax), subtract the per capita death rate from the per capita growth rate.
The population growth equation above is very general, and we can make more specific forms of it to describe two
different kinds of growth models: exponential and logistic.
When the per capita rate of increase (r) takes the same positive value regardless of the population size, then we
get exponential growth.
When the per capita rate of increase (r) decreases as the population increases towards a maximum limit or carrying
capacity, then we get logistic growth.
Exponential Growth
Exponential growth can be thought of as a pattern in which reproduction without any restraints occurs within a
population. During exponential growth, the population growth rate (not the per capita growth rate) increases as the
population size increases. This pattern can lead to immense population growth in a very short amount of time.
When population size is plotted against time (during exponential growth) a J-shaped curve results.
While any positive, constant r can lead to exponential growth, you will often see the per capita growth rate during
exponential growth represented with an rmax.

Page 285 of 318
285 Return to Table of Contents
rmax is the maximum per capita rate of increase for a particular species under ideal conditions, and it varies from
species to species. For instance, bacteria can reproduce much faster than humans, and would have a much higher maximum per capita rate of increase. The maximum population growth rate (exponential growth rate) for a species,
sometimes called its biotic potential, is expressed in the following equation:
(dN)/(dT)=rmaxN
Logistic Growth
Exponential growth is not sustainable for the long term since it depends on the availability of an infinite amount of
resources. As limits to growth due to density-dependent and density-independent factors are imposed, a logistic
growth model generally ensues. Although exponential growth may occur for a short period of time, eventually as the
number of individuals continues to increase, the growth rate slows. This causes the graph of population size versus
time to level off and to appear as an S-shaped curve. Typically, the plateau occurs when the population size reaches
the carrying capacity (K). The carrying capacity is the maximum number of organisms that the resources of a
particular environment can sustain.

Page 286 of 318
286 Return to Table of Contents
Logistic growth can be mathematically modeled using the equation below. It is important to note that during
logistic growth, the per capita growth rate depends on population size. As population size increases, the per
capita growth rate decreases.
Logistic Growth Equation

Page 287 of 318
287 Return to Table of Contents
Carrying Capacity
The carrying capacity of an environment can be limited by the availability of many types of resources. These
include water, sunlight, nutrients, space, and shelter. When any of these factors is scarce, the result is competition
between members of the same species/population. This intraspecific competition intensifies as the population size
increases and can thus help to set the carrying capacity. The accumulation of waste products (from the large number
of individuals) can also reduce the carrying capacity.
If a population exceeds the carrying capacity, the population might die back to the original carrying capacity, die
back to a new but lower carrying capacity, or completely die out.
Regulation of Population Size
No population can continue to increase in size forever. Environmental limiting factors are typically categorized as
either density-dependent or density-independent factors.
Density-Dependent Limiting Factors
Density-dependent limiting factors affect the per capita growth rate (r) differently depending on the population
density. As population size and population density increase, resources are limited and intraspecific competition
occurs. Thus, density-dependent factors cause the per capita growth rate to decrease with population size increases.
This usually leads to a logistic pattern of growth. This is yet another biological example of negative feedback. In
this case, the feedback loop regulates the population size.
Most density-dependent limiting factors are biotic (related to living organisms) as opposed to the physical features
of the habitat. Examples include:
A. Predation—Areas of high prey population density attract predators. Since there are many prey, the
predator population has enough resources to increase its population size. This in turn causes a decrease in
the prey population which in turn causes a decrease in the predator population. A famous example of this
type of predator-prey interaction involves the Canada lynx—the predator—and snowshoe hare—the prey—
whose populations have been shown to co-vary in cycles, with a drop in hare numbers predicting a drop in
lynx numbers.

Page 288 of 318
288 Return to Table of Contents
Adaptions that allow predators to be more successful: built for speed, sharp teeth and claws,
camouflage to avoid being seen by prey, eyes located near the front of the head to allow for depth
perception.
Adaptions that allow prey to avoid predation:
o live in groups (herds or shoals)
o built for speed
o defenses such as poison or stings
o camouflage (cryptic coloration) to avoid being seen by predators
o eyes located on the side of the head to allow for a wide field of view (monocular vision). o Aposematic Coloration (Warning Coloration)—This is the situation in which bright or
contrasting color patterns, such as the bright colors of poison dart frogs, serve ascommon aposematic/warning signals to potential predators.
o Mimicry-- Mimicry is an evolved resemblance between an organism and a dangerous/unpleasant organism. This relationship confers protection from predators to the organism. In Batesian
mimicry, an edible animal is protected by its resemblance to a noxious/dangerous one that is avoided by predators. An example of Batesian mimicry is the relationship between the non- poisonous king snake and the poisonous coral snake. In Mullerian mimicry, several unpalatable species share warning colors or patterns to evade predation. Both models and mimics are toxic. Several species from several different orders may comprise a mimicry complex. The advantage is that the predators need only encounter one form to shun the entire complex. An example of Mullerian mimicry is the yellow coloration and black strips common on many types of bees/wasps/yellow jackets.
B. Disease—Diseases spread more easily when the population density is high.
C. Waste Build-up—Harmful waste products accumulate quickly and reduce population growth
when population density is high.
D. Intraspecific Competition—Members of the same population must compete for food, water,
shelter, mates, and other resources when the population density increases.
Density-Independent Limiting Factors
Density-independent limiting factors affect the per capita growth rate (r) regardless of the population density.
Natural disasters (like fires or floods), severe weather, and pollution are common examples of density-independent
limiting factors. Unlike density-dependent factors, density-independent factors alone can’t maintain constant
population sizes. Often density-independent factors lead to large, erratic shifts in the size of the population.

Page 289 of 318
289 Return to Table of Contents
Community Ecology
A community consists of all of the different populations that share a habitat and interact with each other.
Community ecologists study the interspecific (between different species) interactions that drive the patterns of
diversity and distribution in nature and drive population dynamics (how and why populations change in sizeand
structure over time). Communities change over time depending on the interactions that occur between different
species/populations. These interactions among populations can determine how the organisms access energy and
matter within the community. The interactions can be characterized by positive and negative effects and can be
modeled. Examples of interspecific interactions include:
Interspecific/Interpopulation Interactions A. Competition (-,-)—Competition is sometimes referred to as a (-,-) relationship because it has a
negative impact on both species. Different species compete with each other when they have
overlapping niches. This means that they have similar ecological roles and utilize similar
natural resources. The Competitive Exclusion Principle states that two species with exactly the
same niche can’t stably coexist in the same habitat because they continually compete for the same
resources. In some cases, competing species evolve to modify their niches and limit competition.
This is called resource partitioning or niche partitioning and may involve one of the species
evolving to use a different resource, occupy a different area in the habitat, or feed during a
different part of the day. The anole lizards found on the island of Puerto Rico are a good example
of resource/niche partitioning. In this group, natural selection has led to the evolution of different
species that make use of different resources. The figure below shows resource/niche partitioning
among 11 species of anole lizards. Each species lives in its own preferred habitat, which is
defined by type and height of vegetation (trees, shrubs, cactus, etc.), sunlight, and moisture,
among other factors.
B. Predation (Predator/prey interactions (+,-)—Predation occurs when a member of one species
(the predator) eats the body of another species (the prey). It can be referred to as a (+,-)
relationship because one of the members of the relationship (the predator) benefits, white the
other member (the prey) is harmed by the relationship. Although we tend to think of predation as
one animal eating another animal, herbivory (when an animal feeds on a plant) is also a type of
predation. The interactions between predators and prey often lead to coevolution in which the

Page 290 of 318
290 Return to Table of Contents
prey develop protections against predation and the predators develop to become more efficient at
predation.
Trophic ecology is the general study of the structure of feeding relationships/energy flow among
organisms in an ecosystem. These feeding or trophic relationships are often represented as food
webs or food chains. One very important phenomenon of trophic ecology is known as a trophic
cascade, which describes the indirect control that a top predator exerts on species at lower,
nonadjacent trophic levels. In a trophic cascade, ecological processes and consequences initiated
by a change at the top of the food chain work their way down to lower trophic levels and
eventually rebalance the ecological relationships of numerous species. For example, predators can
reduce the population density of their direct prey or can hinder the behavior of their prey to such
an extent that they improve the survival of other species that their prey suppressed. Trophic
cascades can also have the opposite effect: The removal of the top predator from a food chain can
raise the population of its prey, leading in turn to reductions of species at the next lower trophic
level.
A notable example of a top-down trophic cascade was observed in Yellowstone National Park. In
the 1920s, the local extinction of the park's population of gray wolves (Canis lupus) through
hunting caused an increase in the population of elk (Cervus elaphus), thereby leading to an
overwhelming drop in the abundance of numerous plants (especially aspens, willows, and grasses)
eaten by the elk. In fact, the elk reduced these plants to negligible levels. In 1995, the
reintroduction of the wolves into the park started a dramatic reversal of this trend, slashing the
number of elk and increasing the levels of the aforementioned plants. Moreover, the reintroduction
of the wolves not only reduced the numbers of elk through predation, but also changed the elks'
behavior. The elk began to congregate in areas away from the wolves and moved more quickly
through territory frequented by the wolves. Because the elk did not graze as heavily on the plants
in wolf territories, plant species there thrived.
C. Symbiosis—Symbiosis is a term that describes interspecific interactions in which two different
species live together in a long-term association. There are several important types of symbiotic
relationships in nature. They include:
1. Mutualism (+, +)—Both species involved in the relationship benefit during mutualism.
For example, mycorrhizae are fungi that form a mutualistic relationship with the roots of
many plants. The fungi increase the surface area of the roots and help to provide
additional water and nutrients to the plants, while the plants provide the fungi with
sugars and other organic molecules. The relationship between plants and
pollinators is another important example of mutualism.
2. Commensalism (+,0)—During a commensalistic relationship, one of the species benefits
while the other species is not affected in either a positive or negative manner by the
relationship. The relationship between bacteria and human skin is an example of a
commensalism. The bacteria live on the skin and feed on the dead skin, while
the human isn’t affected at all by the relationship.
3. Parasitism (+,-)—In a parasitic relationship, one of the participating species benefits,
while the other is harmed by the relationship. The relationship between a human and
tapeworm is an example of a parasitic relationship. The tapeworm lives inside the
body and uses many of the resources consumed by the person, while the person loses
resources and can potentially die if the tapeworm infection spreads to the brain.
D. Cooperation/Coordination--Cooperation evolves where two or more individuals have some form of
specialization that can be brought to bear on, for example, a matter and/or energy acquisition or
movement problem. Both individuals have capabilities that together improve the acquisition such that
there is more than would have been available to each individually. This cooperation increases the
fitness of individuals and the survival of the population. Because natural selection favors innate and

Page 291 of 318
291 Return to Table of Contents
learned behaviors that increase survival and reproductive fitness, cooperation is often selected for.
Examples of cooperative behaviors in biological world include:
1. Various forms of gut bacteria live and operate in the rumen of cattle and other ruminants. The
bacteria break down cellulose and through fermentation make nutrients available to the ruminant
as well as themselves. Without these bacteria, the ruminant would not be able to digest the
grasses anywhere near as efficiently. The bacteria receive a regular food source and a home for
their contributions. This is another example of a mutualistic relationship.
Another good example is the relation between many kinds of corals and the endosymbiotic
dinoflagellates known as zooxanthella. The coral receive nutrition from the dinoflagellates and
the dinoflagellates are provided with a protected home by the coral.
2. Herd Behaviors--Buffalo and other such animals group together (herd). This makes it more
difficult for predators to attack a single buffalo (a confusion tactic). Animals often form defensive
circles, all facing outwards so that that their rears are not exposed and their young (in the center)
are protected.
3. Pack Hunting--Animals often hunt in packs so that they can kill larger animals. They then share
the kill (alpha male will eat first but always leaves some for even the least dominant). Hunting
together also allows the group to circle larger animals and attack from behind or to separate
younger, older, or weaker individuals from a herd. This reduces the chance of injury and enables
the pack to kill larger animals that no single individual normally could on their own.
4. Division of Labor/Specialization--Social insects such as ants have complex social structures /
colonies with only one reproducing female (Queen) who coordinates the whole group with
pheromones (chemical signals). All the other female ants are infertile and join the other ants as
workers. Working co-operatively allows ants to have specialized roles, such as maintaining the
nest, gathering food, etc.
5. Modification of the Environment--Groups can modify their environment to the advantage of the
whole species. For instance, ants, termites, and bees produce nests / hives that are quite amazing
works. This modification to their environment would not be possible without coordinated
cooperative behavior.
6. Kin Selection--Natural selection in favor of behavior by individuals that may decrease their
chance of survival but increases that of their kin (who share a proportion of their genes).
Examples of kin selection include:
A. Alarm calls are an example of altruistic behavior motivated by kin selection. In
certain groups of closely related animals, such as squirrels and apes, members of the
extended family will call out an alarm signal when a predator is within striking
range. This puts the organisms in danger, but helps to protect its kin.
B. The Florida scrub jay is one of several bird species in which some members of the
social group act as helpers during the breeding season. Instead of pairing up with
their own mates, the helpers forgo reproduction and assist other breeding pairs with
gathering food and protecting the nest from predators.
C. Large colonies of certain ants, bees, and wasps are other popular examples of kin
selection at work. In many of these colonies, the queen is the only female that
reproduces. Throngs of sterile female workers handle nearly every other task in the
colony, from scouting and collecting food, to building the nest or hive, and raising
the young. Since successive generations of these insects are born from the same
mother, they are, in fact, sisters. This may explain the single-minded drive to feed
and protect the young at the cost of their own reproduction.

Page 292 of 318
292 Return to Table of Contents
Communication Between Organisms
Individual organisms can act on information and communicate it to other individuals through a variety of
mechanisms. The communications allow the organisms to exchange information with one another in response to
internal changes and/or external cues, which can ultimately change behavior. Organisms have a variety of signaling
behaviors that produce changes in the behavior of other organisms and can result in differential reproductive
success. Animals, in particular, use visual, audible, tactile (touch), electrical, and chemical signals to communicate
dominance, find food, establish territory, and ensure reproductive success. Examples several types of
communication mechanisms include:
A. Territorial Marking in Mammals--Scent marking, also known as territorial marking or spraying when
this involves urination, is a behavior used by animals to identify their territory to other organisms. Most commonly, this is accomplished by depositing strong-smelling substances contained in
the urine, feces, or from specialized scent glands located on various areas of the body. Often, the scent
contains pheromones or carrier proteins such as the major urinary proteins to stabilize the odors and
maintain them for longer. Scent marking is often performed by scent rubbing in many mammals. In
many mammal species, scent marking is more frequent during the breeding season.

Page 293 of 318
293 Return to Table of Contents
B. Coloration in Flowers--Researchers believe flowers evolved their colors over time to better attract
specific birds, bees, or other pollinators. To lure hummingbirds, for example, certain flowers produce
red and orange colors (which hummingbirds prefer), while certain plant species produce brightcolored
petals or ultraviolet patterns to attract bees. After a while, animals and insects begin to connect the
flower's color to rewarding food sources and are more likely to seek out those specific types of flowers
for pollen and nectar in the future as a result. The plant and the pollinate coevolve and form a
symbiotic relationship (mutualism) which is beneficial to both partners. While other flower features,
such as texture and fragrances, are also used to attract pollinators, a plant's color is vital to its survival
from one generation to the next. C. Bird Songs—Birds use both songs and call notes to communicate with each other. The males sing to
announce their presence and to let females know that they are available for mating. They also sing to
defend the territory in which they mate, nest, or feed. Females do not sing as frequently as the males.
While a song is a multi-noted phrase that is repeated over and over, a call note consists of a single note.
Birds use call notes to alert other birds of danger, and some species may have different call notes for
different threats (for example, they may have one note to sound the alarm for an airborne predator like
a hawk or owl and another note for a land predator like a cat). Birds also use call notes to locate their
mate or offspring or to communicate with other birds in their flock while they are flying. In smaller
birds, call notes often sound like a chip or peep, and in larger birds the call notes may sound like a
screech, caw, or click.
D. Coloration in Animals—Some prey animals have evolved to grab a predator's attention with
conspicuous signals like bright coloration. This strategy only works when the prey animals teem with
defensive toxins or bristle with other hidden weaponry. Animals that warn predators of their dangerous
nature are called aposematic. Lionfish advertise their venomous spines with waving flags and banners.
Bright or contrasting color patterns, such as the yellow and black stripes of a wasp or the bright colors
of poison dart frogs, serve as common aposematic signals. While aposematic coloration usually signals
danger, any kind of warning signal could be considered aposematism (like the rattle of a rattlesnake).
E. Courtship and Mating Behaviors in Animals—Many animals have courtship behaviors/rituals thatare
used to attract mates. These behaviors may be rather simple, involving a small number of chemical,
visual, or auditory stimuli; or they may consist of a highly complex series of acts by two or more
individuals, using several modes of communication.
Many creatures resort to courtship feeding to attract a mate. Females of some insect species, such as
the gypsy moth, use odorous substances called pheromones to attract males from a distance. Male
painted turtles court by touch, and the courtship songs of frogs are heard on spring nights across much
of the world. Complex courtship patterns are found in certain bird species. Boobies perform ritualized
dances with components, including whistling and an elaborate gesture known to ornithologists as sky-
pointing. The more elaborate forms of courtship frequently help strengthen a pair bond that may last
through the raising of the young or even longer. Another important function of courtship is its use as
an isolating mechanism, a method of keeping different species from interbreeding.
Community Structure
The structure of a community is measured and described in terms of species composition/species richness and
species diversity. Species richness is the number of different species found in a particular community. Species
diversity is a measure of both species richness and the relative abundance of each species. Habitats with many
different species and a high number of individuals of each species have a high species diversity. Typically, more
diverse communities are more stable and better able to recover after a disturbance.
Communities with the highest levels of species richness tend to be found near the equator in biomes like the tropical
rainforest which contain abundant resources. The diagram included below depicts the species richness of mammals
across North and South America.

Page 294 of 318
294 Return to Table of Contents
Simpson’s Diversity Index
Simpson's Diversity Index is a measure of diversity which takes into account the number of species present, as well
as the relative abundance of each species. As species richness and evenness increase, so diversity increases. The
formula included below is used to calculate the Simpson’s Diversity Index. This formula is also included on the AP
Biology formula sheet:

Page 295 of 318
295 Return to Table of Contents
.
The value of the Diversity Index (D) ranges between 0 and 1. With this index, 1 represents infinite diversity and 0,
no diversity. Example Calculation
The calculation below is an example of the calculation of Simpson’s Diversity Index for a single quadrat of ground
vegetation from the Muntanyans sand dunes of Spain. It is important to note that the sampling of only one quadrat
would not give you a reliable estimate of the diversity of the dune flora. Several samples would have to be taken and
the data pooled to give a better estimate of overall diversity.
Species Number of each
species present (n)
Sea holly 2
Sand couch 8
Sea bindweed 1
Sporobolus pungens 1
Echinophora spinosa 3
Total Number of Organisms (N) 15
Calculation: Diversity Index=1-((2/15)2 + (8/15)2 + (1/15)2 + (1/15)2 + (3/15)2)=0.649
Factors That Shape Community Structure
Many interacting factors (both biotic and abiotic) help to shape the structure of a community. They include:
A. The climate patterns of the habitat.
B. The geography of the habitat.
C. The heterogeneity of the environment.
D. The frequency of disturbances in the habitat.
E. Interactions between organisms.
Foundation and Keystone Species
Foundation species play important roles in creating and defining a community. In many cases, the foundation
species modify the environment so that it can support the other organisms that form the community. Kelp, a type of
brown algae, are an important foundation species because they form kelp forests off the coast of California. This
forest then becomes the home of many other types of organisms. Another example of a foundation species is coral.
Coral reefs help to form one of the most diverse habitats on Earth.

Page 296 of 318
296 Return to Table of Contents
A keystone species is a species that has a disproportionately large effect on community structure relative to its
biomass or abundance. When keystone species are removed from the ecosystem, the ecosystem often collapses.
Keystone species are different from foundation species in that they are more likely to belong to higher trophic levels
and they act in more diverse ways than foundation species.
The intertidal sea star Pisaster ochraceus, which is found in the northwestern United States, is perhaps the most
famous example of a keystone species. In a classic experiment of community ecology, the sea stars were
experimentally removed from the intertidal zone where they lived. As a result, populations of their prey (mussels)
increased, altering the species composition of the community and sharply reducing species diversity. When the sea
stars were present, about 2525 species of barnacles and algae were found in the lower part of the intertidal zone, but
when they were missing, the mussel population expanded dramatically and almost entirely replaced these other
species.
This type of sharp reduction in diversity or collapse of community structure commonly occurs when a keystone
species is removed. In this case, the loss of diversity happened because the mussels crowded out other species,
which could normally persist because the sea stars kept the mussels in check. Sharks are another important marine keystone species.
Invasive Species
An invasive species is one that has been introduced to an area outside of its native range. Whether intentional or
not, the introduction of an invasive species can allow the species to exploit a new niche free of natural predators or
competitors or to outcompete other, native organisms for resources. These invasive species not only out compete
the native species, but also out reproduce them and can cause the population size of the native species to drop
dramatically. Kudzu is one of the most famous invasive plant species, while Asian carp (introduced to the US to rid
waterways of algae) now form up to 95% of the biomass in some US waterways. Other famous examples of
invasive species include pythons in the Everglades, the snakehead fish in Florida, and the rabbit in Australia.

Page 297 of 318
297 Return to Table of Contents
Ecological Succession Succession is a series of progressive changes in the composition of a community over time. In many cases,
succession involves a progression from less stable communities with low species diversity to more stable
communities with a higher species diversity. Scientists often identify two main types of succession:
Primary Succession—Primary succession occurs when new land is formed (maybe by the
hardening of lava) or when bare rock is exposed by erosion. Once the barren land is formed or
exposed, weathering and other natural forces break down the rock and begin the process of soil
formation. Certain plants and lichens (which don’t need much soil) colonize the rocky area.
These organisms are known as pioneer species. They help to continue the breakdown of the
rock and their decaying bodies contribute organic matter to the forming soil. This part of
the process occurs very slowly because it takes a long time to create soil. Once soil
formation progresses to a certain point, larger plants begin to colonize the area. At each stage,
new species move into the habitat, usually due to the changes made to the environment by the
preceding species. The newly arriving species often replace their predecessors. At some point,
the community may reach a relatively stable state (climax community). It is important to note
that even though succession may slow, it never truly ceases to occur.
Secondary Succession—In secondary succession, a previously occupied habitat is re-colonized
following a disturbance that kills much or all of the community. Such disturbances might include
fires or floods.
A classic example of secondary succession occurs in oak and hickory forests cleared by wildfire. Wildfires
burn most vegetation and kill animals unable to flee the area. Their nutrients, however, are returned to the
ground in the form of ash. Since a disturbed area already has nutrient-rich soil, it can be recolonized much
more quickly than the bare rock of primary succession.
Before a fire, the vegetation of an oak and hickory forest would have been dominated by tall trees. Their
height would have helped them acquire solar energy, while also shading the ground and other low-lying
species. After the fire, however, these trees do not spring right back up. Instead, the first plants to grow
back are usually annual plants—plants that live a single year—followed within a few years by quickly
growing and spreading grasses. The early colonizers can be classified as pioneer species, as they are in
primary succession. Over many years, due at least in part to changes in the environment caused by the
growth of grasses and other species, shrubs will emerge, followed by small pine, oak, and hickory trees.
Eventually, barring further disturbances, the oak and hickory trees will become dominant and form a dense
canopy, returning the community to its original state—its pre-fire composition. This process of succession
takes about 150 years.

Page 298 of 318
298 Return to Table of Contents
Ecosystem Ecology An ecosystem consists of a community of organisms together with their physical environment. Ecosystems can
vary in size and diversity. Ecosystems with high species diversity tend to be more stable and resilient. Ecosystems
can be both marine, freshwater, or terrestrial. Geological (volcanic eruptions, earthquakes, meteorite impacts,
Continental drift) and meteorological (precipitation, temperature, humidity, El Nino) events affect habit change and
ecosystem distributions across the Earth. The distribution of local and global ecosystems changes over time.
Human impacts can accelerate these changes at both local and global levels. Global climate change, logging,
urbanization, the introduction of non-native species, and mono-cropping are examples of ways in which humans can
cause/accelerate habitat change. Humans have also intentionally or unintentionally introduced new diseases into
certain habitats. In many cases, these new diseases have devastated native species. Examples of this include the
introduction of Dutch elm disease from Europe and its effect on the elm trees of North America, the spread of Potato
blight from North America and its devastation of the potato crop in Ireland, and the introduction of smallpox to
North America from Europe and its effect on the Native American human population.
Terrestrial ecosystems are grouped into biomes (distinct biological communities that have formed in response to a
shared physical climate) based largely on climate. The table included below describes some of Earth’s major
biomes.

Page 299 of 318
299 Return to Table of Contents

Page 300 of 318
300 Return to Table of Contents
Responses to the Environment
The timing and coordination of the biological mechanisms involved in growth, reproduction, and homeostasis
depend on organisms responding to environmental cures/changes. These responses can be either behavioral or
physiological in nature.
Examples of responses to the environment
Plant respond to light in a number of ways. They use special molecules called photoreceptors, which are made up of
a protein linked to a light-absorbing pigment called a chromophore, to sense light. When the chromophore absorbs
light, it causes a change in the shape of the protein, altering its activity and starting a signaling pathway. The
signaling pathway results in a response to the light cue, such as a change in gene expression, growth, or hormone
production.
One plant response to light is photoperiodism. Photoperiodism is the regulation of physiology or development in
response to day length. Photoperiodism allows some plant species to flower only at certain times of the year (certain
day lengths). Tuber formation in potatoes and bud dormancy in preparation for winter (in trees growing in cold
areas) are other examples of photoperiodisms in plants.
Another type of plant response to light is the phototropism. Phototropisms involve growth toward—or away from
a light source. A positive phototropism is growth towards a light source; a negative phototropism is growth away
from light.
Shoots, or above-ground parts of plants, generally display positive phototropism—they bend toward the light. This
response helps the green parts of the plant get closer to a source of light energy, which can then be used for
photosynthesis. Roots, on the other hand, exhibit negative phototropism and grow away from light.
Plants also respond to herbivores. Many plants grow in places or at heights that are hard for the herbivores to reach.
Other plants grow or flower at times in which herbivores are relatively inactive. Still other plants exhibit crypsis or
types of camouflage. The Mimosa pudica folds and droops its leaves when touched and looks like a dead or wilted
plant. Other plant responses to herbivores include the growth of structural defenses such as spines, trichomes (hair-
like appendages), thick leaves/stems, and sand or needle-like particles inside the plant tissues. Other plants produce
chemical defenses or poisons which can kill herbivores. Finally, some plants use indirect defenses in which they
encourage predators of common herbivores to protect them. For example, the acacia provides food rewards and
shelter for ants which in return protect the plant.
Animals also respond to the changes in the environment in a number of ways. Some of these responses involve the
movement of the animals. For some lower animals, movement is undirected and random, such as a Paramecium
blundering about its environment. Such undirected orientation is called kinesis. An additional example of kinesis is
when pillbugs move faster in response to temperatures that are higher or lower than their preferred range. The
movement is random, but the higher speed increases the chances that the pillbugs will find their preferred
environment.
Taxis involves more complex behavior than kinesis and is generally what we think of when we think of movement.
An example of positive chemotaxis is the movement of an ant or fruit fly toward sugar. An example of negative
chemotaxis is the movement of mosquitoes away from deet. An example of a positive phototaxis is the movement
of an insect toward a light source.
Many animals have activity patterns that occur in cycles of about twenty-four hours. These patterns are called a
circadian rhythms. Nocturnality is a behavior in which animals are active during the night and sleep during the
day. The animals have adapted to be nocturnal to avoid predators, to more easily ambush prey, to avoid competition
with diurnal organisms, and to avoid high temperatures. Diurnality is a behavior in which animals are active during

Page 301 of 318
301 Return to Table of Contents
the day and rest/sleep at night. Most animals are diurnal. Diurnality allows organisms to hunt during the day (when
most organisms see best), to avoid nocturnal predators, to avoid competition with nocturnal organisms, and to avoid
cold temperatures. Scientists generally concur that the evolution of species on Earth has proceeded in the direction
to take full advantage of all possible niches. This is why some organisms have evolved to be better suited for
nighttime and others have become more specialized for daytime. In a sense, organisms work in "shifts" so as to use
the environment at all times. This allows a greater number of organisms to occupy the same area without excessive
competition for space and food at any one time.
Energy and Matter in Ecosystems Ecologists are interested in tracing the movement of energy and matter through ecosystems because changes in
energy and nutrient availability can result in changes in population size or disruptions in an ecosystem. One of the
most important ideas related to this topic is that matter is recycled while energy flows through and eventually
out of an ecosystem.
The following describes an example of the process of matter recycling through an ecosystem. A land plant takes in
carbon dioxide from the atmosphere and other nutrients, such as nitrogen and phosphorous, from the soil to build the
biomolecules that make up its cells. When an animal eats the plant, it uses the plant’s molecules for energy and as
building materials for its own cells, often rearranging atoms and molecules into new forms.
When plants and animals carry out cellular respiration, carbon dioxide is released into the atmosphere. Similarly,
when they excrete wastes or die, their chemical compounds are used for energy and building materials by bacteria
and fungi. These decomposers release simple molecules back into the soil and atmosphere, where they can be taken
up anew in the next round of the cycle.

Page 302 of 318
302 Return to Table of Contents
Unlike the flow of matter, the flow of energy through an ecosystem is unidirectional (one-way). Autotrophscapture
energy from physical or chemical sources in the environment. Energy usually enters ecosystems as sunlight and is
captured in chemical form by photosynthesizers like plants and algae. Chemosynthetic autotrophs capture energy
from small inorganic molecules (often in environments that lack energy). After the autotrophs capture the energy, it
is then passed through the ecosystem, changing forms as organisms metabolize, produce wastes, eat one another,
and eventually, die and decompose. Any change or disruption to the initial energy source or the producer level of
the food chain can affect the number and size of all of the other trophic levels. Heterotrophs capture the energy
present in carbon compounds produced by other organisms. They may metabolize carbohydrates, lipids, and/or
proteins as sources of energy by hydrolysis.
Each time energy changes forms, some of it is converted to heat. Heat still counts as energy—and thus no energy
has been destroyed—but it generally can't be used as an energy source by living organisms. Ultimately, all of the
energy that entered the ecosystem as sunlight is dissipated as heat and radiated back into space. Because energy
flows in a unidirectional manner, every ecosystem must have a constant supply of energy. The sun usually acts as
this initial, constant energy source.
It is important to note that a net gain in energy results in energy storage and the growth (weight gain) of the
organism, while a net loss of energy results in the loss of mass and possibly the death of the organism (if the loss is
prolonged).
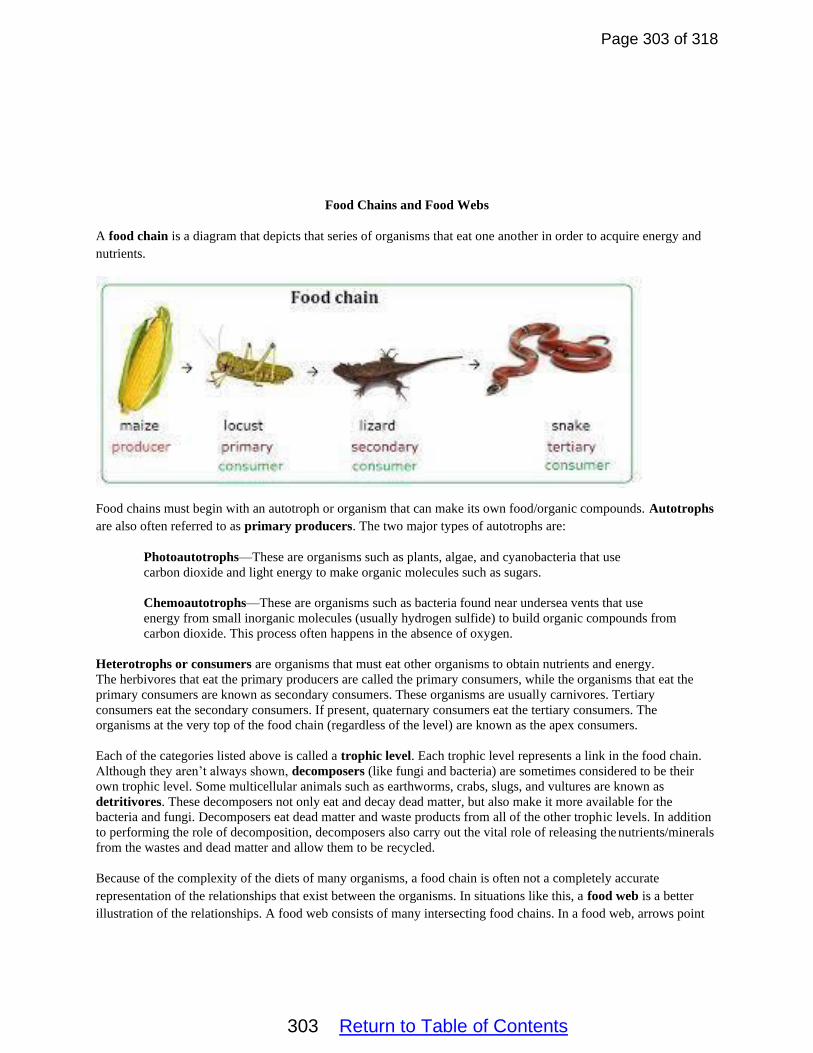
Page 303 of 318
303 Return to Table of Contents
Food Chains and Food Webs
A food chain is a diagram that depicts that series of organisms that eat one another in order to acquire energy and
nutrients.
Food chains must begin with an autotroph or organism that can make its own food/organic compounds. Autotrophs
are also often referred to as primary producers. The two major types of autotrophs are:
Photoautotrophs—These are organisms such as plants, algae, and cyanobacteria that use
carbon dioxide and light energy to make organic molecules such as sugars.
Chemoautotrophs—These are organisms such as bacteria found near undersea vents that use
energy from small inorganic molecules (usually hydrogen sulfide) to build organic compounds from
carbon dioxide. This process often happens in the absence of oxygen.
Heterotrophs or consumers are organisms that must eat other organisms to obtain nutrients and energy.
The herbivores that eat the primary producers are called the primary consumers, while the organisms that eat the
primary consumers are known as secondary consumers. These organisms are usually carnivores. Tertiary
consumers eat the secondary consumers. If present, quaternary consumers eat the tertiary consumers. The
organisms at the very top of the food chain (regardless of the level) are known as the apex consumers.
Each of the categories listed above is called a trophic level. Each trophic level represents a link in the food chain.
Although they aren’t always shown, decomposers (like fungi and bacteria) are sometimes considered to be their
own trophic level. Some multicellular animals such as earthworms, crabs, slugs, and vultures are known as
detritivores. These decomposers not only eat and decay dead matter, but also make it more available for the
bacteria and fungi. Decomposers eat dead matter and waste products from all of the other trophic levels. In addition
to performing the role of decomposition, decomposers also carry out the vital role of releasing the nutrients/minerals
from the wastes and dead matter and allow them to be recycled.
Because of the complexity of the diets of many organisms, a food chain is often not a completely accurate
representation of the relationships that exist between the organisms. In situations like this, a food web is a better
illustration of the relationships. A food web consists of many intersecting food chains. In a food web, arrows point

Page 304 of 318
304 Return to Table of Contents
from an organism that is eaten to the organism that eats it. Some organisms eat more than one other organism.
These prey items may be from completely different trophic levels.
Sample Food Web
In this food web, the leopard seal feeds on fish (a secondary consumer), seagulls (a tertiary consumer) and penguins
(a tertiary consumer).
Energy Transfer Through Food Chains/Webs
Energy is transferred between trophic levels when one organism eats the energy-rich organic molecules contained in
another organism’s body. The energy transfers between levels are highly inefficient and this inefficiency limits not
only the length of food chains but also the number of organisms found at each trophic level.
When energy is transferred to a new trophic level, some of it is stored as biomass as part of the consumer’s body.
This energy is then available to the next trophic level since only energy stored as biomass can be consumed. As a
rule, only about 10% of the energy that’s stored as biomass in one trophic level ends up stored as biomass in the next
trophic level. This rule of thumb is known as the Rule of 10 or the 10% Rule of Energy Transfer. This
essentially means that 90% of the energy that is consumed is not available for use by the consumer. Because of this
extremely inefficient transfer of energy between trophic levels, the length of food chains is generally limited to three
to six trophic levels. The number of organisms found at the upper trophic levels is also extremely limited due to the
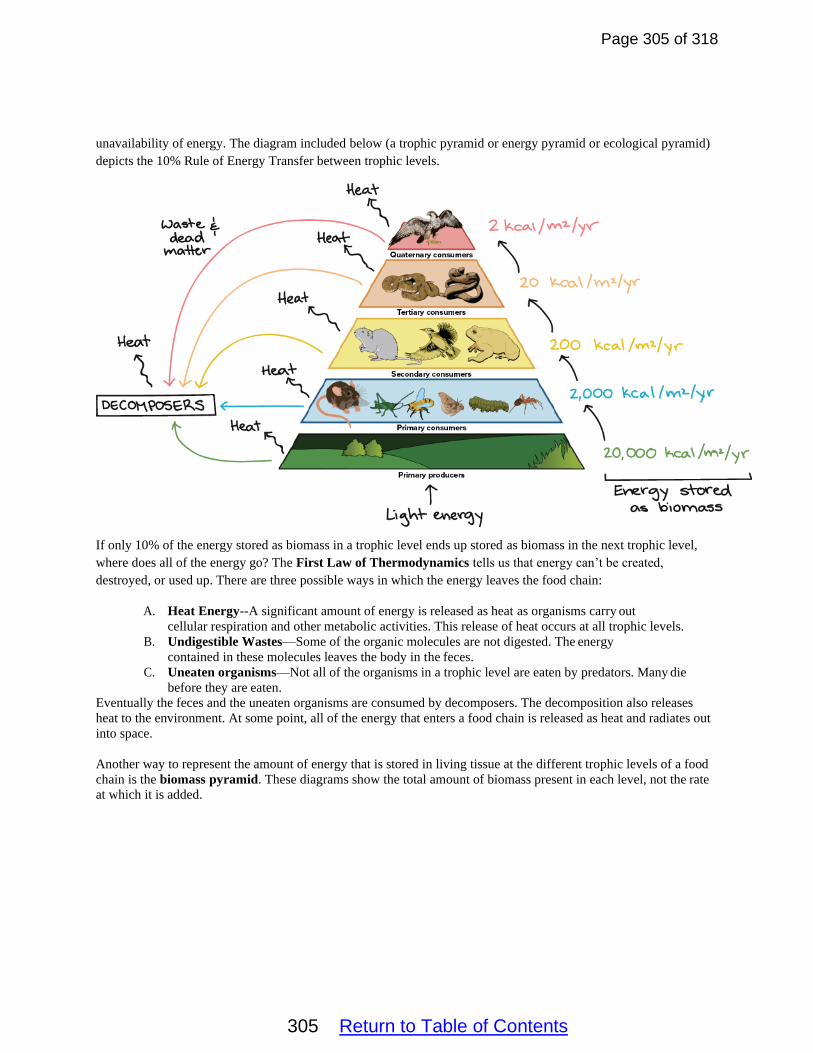
Page 305 of 318
305 Return to Table of Contents
unavailability of energy. The diagram included below (a trophic pyramid or energy pyramid or ecological pyramid)
depicts the 10% Rule of Energy Transfer between trophic levels.
If only 10% of the energy stored as biomass in a trophic level ends up stored as biomass in the next trophic level,
where does all of the energy go? The First Law of Thermodynamics tells us that energy can’t be created,
destroyed, or used up. There are three possible ways in which the energy leaves the food chain:
A. Heat Energy--A significant amount of energy is released as heat as organisms carry out
cellular respiration and other metabolic activities. This release of heat occurs at all trophic levels.
B. Undigestible Wastes—Some of the organic molecules are not digested. The energy
contained in these molecules leaves the body in the feces.
C. Uneaten organisms—Not all of the organisms in a trophic level are eaten by predators. Many die
before they are eaten.
Eventually the feces and the uneaten organisms are consumed by decomposers. The decomposition also releases
heat to the environment. At some point, all of the energy that enters a food chain is released as heat and radiates out
into space.
Another way to represent the amount of energy that is stored in living tissue at the different trophic levels of a food
chain is the biomass pyramid. These diagrams show the total amount of biomass present in each level, not the rate
at which it is added.

Page 306 of 318
306 Return to Table of Contents
Pyramid of Biomass
Yet another way to depict these relationships is the Pyramid of Numbers. Numbers pyramids show how many
individual organisms there are in each trophic level. They can be upright, inverted, or kind of lumpy, depending on
the ecosystem. Pyramid of Numbers

Page 307 of 318
307 Return to Table of Contents
Energy Flow and Primary Productivity
Plants, algae, and autotrophic bacteria are the producers which act as an energy gateway for the Earth. These
organisms are the only organisms that are capable of harnessing the energy of sunlight or certain inorganic
molecules to create organic molecules (like sugar). Essentially, these organisms are the entry points for energy into
the food chain. The energy stored in the organic molecules either directly or indirectly provides the needed energy
for all consumers in all trophic levels.
Productivity is the rate at which energy is stored in the bodies of organisms in the form of biomass (the amount of
matter stored in organisms).
Gross Primary Productivity (GPP) is the rate at which solar energy is captured and stored in sugar molecules
during photosynthesis. Autotrophs like plants use this energy to carry out metabolism and to grow. Think of GPP
as a way of measuring the entire amount of sugars that are made in an ecosystem by photosynthesis.
Net Primary Productivity (NPP) is equal to the gross primary productivity minus the rate at which energy is lost
due to cellular respiration and other metabolic activities. Think of NPP as a measure of the amount of sugars that
remain after producers have used photosynthesis to produce the sugars and cellular respiration to break down some
of their sugars for their own metabolic needs.
One common way to measure the rate of productivity in a body of water is to measure changes in the levels of
dissolved oxygen (DO) in the water. If photosynthesis happens faster than cellular respiration dissolved oxygen
levels will increase. If cellular respiration happens faster then photosynthesis, DO levels will drop.
It is also important to note that factors other than photosynthesis and cellular respiration can affect dissolved oxygen
(DO) levels. For example, high temperatures cause DO levels to decrease and low temperatures cause DO levels to
increase. The movement of water also affects DO levels. Increased movement increases DO levels and decreased
movement decreases DO levels. Increased salinity levels can also cause drops in DO levels.
Thermoregulation
Thermoregulation Screencast
Organisms use different strategies to regulate body temperature and metabolism. Endotherms use thermal energy
generated by metabolism to maintain homeostatic body temperatures. Ectotherms lack efficient internal
mechanisms for maintaining body temperature. They may regulate their temperature behaviorally by moving into
the sun or shade or by aggregating (grouping) with other individuals.
Ectotherms—Organisms whose body temperatures vary greatly with the external environment. These organisms
are often also referred to as “cold-blooded” or “thermoconformers”.
As the external temperature drops, the body temperature of these organisms drops. This causes a decrease in
metabolic activity.
As the external temperature rises, the body temperature of these organisms increases. This causes an increase in
metabolic activity.
Examples of ectotherms include: most fish, reptiles, amphibians, and insects.
An advantage of being an ectotherm is that organisms don’t use energy (ATP) to produce heat and regulate the body
temperature. This means that ectotherms don’t need to eat as much as endotherms.

Page 308 of 318
308 Return to Table of Contents
A disadvantage of being an ectotherm is that ectotherms can’t normally live in places where it gets too hot or too
cold. If they do live in these environments, their activity is limited to only certain parts of the day or seasons of the
year.
Endotherms-- Organisms who maintain their body at a metabolically favorable, nearly constant temperature,
largely by the use of heat set free by internal bodily functions. These organisms don’t rely purely on ambient heat
for thermoregulation. The internally generated heat is mainly an incidental product of the animal's
routine metabolism, but under conditions of excessive cold or low activity an endotherm might apply special
mechanisms adapted specifically to heat production. These organisms are also known as “warm-blooded” and
also as “thermoregulators”.
Changes in the external temperature have little effect on the internal temperature of an endotherm.
If the external temperature drops, an endotherm will either generate or trap excess body heat so that it maintains a
constant internal temperature. Possible mechanisms include: shivering, increasing the rate of metabolism/cellular
respiration, vasoconstriction of blood vessels located near the skin.
If the external temperature rises, an endotherm will release excess body heat to the environment. Possible
mechanisms include: sweating (evaporative cooling), panting, vasodilation of blood vessels located near the skin,
and/or decreasing the metabolic rate.
Endotherms typically use negative feedback loops, like the one included below, to regulate their internal
temperature.

Page 309 of 318
309 Return to Table of Contents
Examples of endotherms include birds, mammals, and a few species of fish.
An advantage of being an endotherm is that the internal temperature of the organisms is independent of the external,
environmental temperature. This allows endotherms to live in almost all habitats on Earth.
A disadvantage of being an endotherm is that in order to maintain a constant internal temperature, an organism must
use a lot energy. This requires endotherms to eat on a regular basis.
Metabolic Rates—Comparison
• In general, endotherms have higher metabolic rates than ectotherms.
• As the external temperature drops, the metabolic rate of an ectotherm will also drop. The metabolic rate of an
endotherm will either be unaffected or it might rise slightly.
• As the internal temperature increases, the metabolic rate of an ectotherm will rise quickly. The metabolic rate
of an endotherm will be largely unaffected, but may drop slightly.
• The metabolic rates of endotherms per kilogram tends to decrease dramatically with increased body mass
(Smaller organisms have higher metabolic rates).
• This is largely due to the fact that as body size increases, the surface area to volume ratio decreases. This
means that larger endotherms are more efficient at keeping in heat and therefore don’t lose as much heat to the
environment. Small endotherms have a high surface area to volume ratio, lose lots of heat to the environment,
and must use high metabolic rates to replace this lost heat (so that they can maintain a constant internal
temperature).

Page 310 of 318
310 Return to Table of Contents
Biogeochemical Cycles
Energy flows through an ecosystem and is eventually dissipated as heat, but the chemical elements that make up
living things are recycled over and over. The ways in which elements and compounds (like water) move and are
recycled between living things and the environment are called biogeochemical cycles.
The biogeochemical cycles of carbon, nitrogen, phosphorus, and water are important to life.
The Carbon Cycle
Biology plays an important role in the movement of carbon between land, ocean, and atmosphere through the
processes of photosynthesis and respiration. Virtually all multicellular life on Earth depends on the production
of sugars from sunlight and carbon dioxide (photosynthesis) and the metabolic breakdown (respiration) of those
sugars to produce the energy needed for movement, growth, and reproduction. Plants, algae, and photosynthetic
bacteria take in carbon dioxide (CO2) from the atmosphere during photosynthesis, and release CO2 back into the
atmosphere during respiration through the following chemical reactions: Respiration: C6H12O6 (organic matter) + 6O2 → 6CO2 + 6 H2O + energy
Page 311 of 318
311 Return to Table of Contents
Photosynthesis: energy (sunlight) + 6CO2 + H2O → C6H12O6 + 6O2
Through photosynthesis, green plants use solar energy and atmospheric carbon dioxide to produce carbohydrates
(sugars). Plants and animals use these carbohydrates (and other products derived from them) through
a process called cellular respiration, the reverse of photosynthesis. Respiration releases the energy contained
in sugars for use in metabolism and released carbon dioxide from the carbohydrates back to the atmosphere.
On land, the major exchange of carbon with the atmosphere results from photosynthesis and respiration. During
daytime in the growing season, leaves absorb sunlight and take up carbon dioxide from the atmosphere. At the same time plants, animals, and soil microbes consume the carbon in organic matter and return carbon dioxide to the
atmosphere (via cell respiration). Photosynthesis stops at night when the sun cannot provide the driving energy for
the reaction, but cell respiration continues 24 hours per day. This kind of imbalance between these two processes is reflected in seasonal changes in the atmospheric CO2 concentrations. During winter in the northern hemisphere,
photosynthesis severely slows when many plants lose their leaves, but respiration continues. This condition leads to
an increase in atmospheric CO2 concentrations during the northern hemisphere winter. With the onset of spring,
however, photosynthesis resumes and atmospheric CO2 concentrations are reduced.
In the oceans, phytoplankton (microscopic marine plants/algae that form the base of the marine food chain) use
carbon from carbon dioxide to make shells of calcium carbonate (CaCO3). The shells settle to the bottom of the
ocean when the phytoplankton die and are buried in the sediments. The shells can become compressed over time as
they are buried and are often eventually transformed into limestone. Additionally, under certain geological
conditions, organic matter can be buried and over time form deposits of the carbon-containing fuels coal and oil. It is
the non-calcium containing organic matter that is transformed into fossil fuel. Both limestone formation and fossil
fuel formation are biologically controlled processes and represent long-term sinks for atmospheric CO2. Since the onset of the industrial revolution about 150 years ago, human activities such as the burning of fossil fuels
and deforestation have accelerated, and both have contributed to a long-term rise in atmospheric CO2. Burning oil
and coal releases carbon into the atmosphere far more rapidly than it is being removed, and this imbalance causes atmospheric carbon dioxide concentrations to increase. In addition, by clearing forests, we reduce the ability
of photosynthesis to remove CO2 from the atmosphere, also resulting in a net increase. Because of these human
activities, atmospheric carbon dioxide concentrations are higher today than they have been over the last half-million
years or longer.
Because CO2 increases the atmosphere's ability to hold heat, it has been called a "greenhouse gas." Scientists believe
that the increase in CO2 is already causing important changes in the global climate. Many attribute the observed 0.6 degree C increase in global average temperature over the past century mainly to increases in atmospheric CO2. Without substantive changes in global patterns of fossil fuel consumption and deforestation, warming trends are
likely to continue. The best scientific estimate is that global mean temperature will increase between 1.4 and 5.8
degrees C over the next century as a result of increases in atmospheric CO2 and other greenhouse gases. This kind of increase in global temperature would cause a significant rise in average sea-level (0.09-0.88 meters), exposing low-
lying coastal cities or cities located by tidal rivers, such as New Orleans, Portland, Washington, and Philadelphia, to
increasingly frequent and severe floods. Glacial retreat and species range shifts are also likely to result from global
warming, and it remains to be seen whether relatively immobile species such as trees can shift their ranges fast
enough to keep pace with warming.

Page 312 of 318
312 Return to Table of Contents
Nitrogen Cycle
Nitrogen is a very abundant element on Earth, but most of Earth’s nitrogen is found in the form of N2 gas. Over
70% of the Earth’s atmosphere is composed of nitrogen gas. Because the 2 nitrogen atoms in N2 are held together
by triple covalent bonds, most plants and animals can’t metabolize nitrogen gas or directly use the nitrogen atoms from the gas. Four major processes help to cycle nitrogen atoms through the environment. Those steps are:
nitrogen fixation, decomposition/ammonification, nitrification, and denitrification. Nitrogen Fixation
Nitrogen fixation is a term for several processes that convert atmospheric N2 into forms of nitrogen containing
molecules that can be metabolized by plants and animals. One of these processes is atmospheric nitrogen fixation
in which lightning breaks nitrogen gas molecules and enables their N atoms to combine with oxygen in the air to
form nitrogen oxides. These dissolve in rain, forming nitrates, that are carried to the earth.
A second process is biological nitrogen fixation. During this process, bacteria or archae that are found free-living in the soil or water or in mutualistic symbiotic relationships with plant roots (especially those in the legume family)
convert N2 into ammonia (NH3). Most of this ammonia is quickly absorbed by plants and used by the plants in the
creation of proteins and other organic, nitrogen-containing molecules.
A third process is industrial nitrogen fixation. Under high pressure and temperature, chemists are able to synthesize
ammonia from atmospheric nitrogen. This ammonia is used either directly as a fertilizer or used to synthesize
ammonium nitrate.

Page 313 of 318
313 Return to Table of Contents
Decomposition/Decay/Ammonification
The nitrogen containing proteins and nucleic acids made by plants, algae, and cyanobacteria pass through food webs
just as sugars do. At each trophic level, the metabolism of these molecules produces nitrogen containing molecules
that return to the environment in bodily excretions or in the dead bodies of organisms. Microorganisms break down
these molecules and convert them to ammonia.
Nitrification
The ammonia produced from decay products can be taken up directly by plant roots. However, most of the
ammonia is converted by bacteria or archae into nitrites and ultimately nitrates via a process known as nitrification.
Denitrification
Denitrification reduces nitrites and nitrates in the soil and converts them back to nitrogen gas which is released back
into the atmospheres. This process is carried out by bacteria and plays the critical role of replenishing the
atmosphere with nitrogen gas.
Humans have impacted the nitrogen cycle by the creation and use of fertilizers and the release of sewage and other
nitrogen containing wastes into bodies of water. The levels of nitrogen in the water is usually low and thus nitrogen
often acts as a limiting factor for plant and algae growth. Eutrophication occurs when a body of water receives an
excessive nutrient load, particularly phosphorus and nitrogen. This often results in an overgrowth of algae. As the
algae die and decompose, dissolved oxygen is depleted from the water (due to the decomposition of the dead algae),
and this lack of oxygen in the water causes the death of aquatic animals, like fish.
Phosphorus Cycle

Page 314 of 318
314 Return to Table of Contents
Phosphorus is an essential nutrient for animals and plants. It plays a critical role in cell development and is a key
component of biomolecules such as ATP, DNA, and phospholipids. Insufficient phosphorus in the soil can result in
a decreased crop yield.
Although phosphorus is found on Earth in numerous compound forms, such as the phosphate ion, the quantities of
phosphorus in soil are generally small, and this often limits plant growth. This is why people often apply
phosphate fertilizers on farmland. Animals absorb phosphates by eating plants or plant-eating animals.
Most of Earth’s phosphorus is stored in rocks as inorganic phosphate. Over time, rain and weathering cause rocks to
release the phosphate ions which are then distributed in the soil and groundwater. Plants take up the inorganic
phosphate from the soil and incorporate it into organic biomolecules. Animals get their needed phosphorus from
eating plants or other animals. Once a plant or animal dies and decays, the organic phosphate is returned to the soil.
In the soil, bacteria break down the organic matter and convert the phosphate back into inorganic phosphate in a
process known as mineralization. Some of this phosphate can end up in sediments and eventually return to the rocks
from which it came.
Like the nitrogen cycle, humans have also impacted the phosphorus cycle. Since phosphorus also acts a limiting
factor for aquatic algae and plant growth, the release of fertilizers and phosphate containing detergents into bodies of
water, can lead to eutrophication and the death of much of the plant and animal life in the bodies of water.

Page 315 of 318
315 Return to Table of Contents
Water Cycle
The water cycle is also known as the hydrologic cycle. In the hydrologic cycle, water from oceans, lakes, swamps,
rivers, and other bodies of water evaporates and forms water vapor. Water vapor then rises and condenses into
millions of tiny droplets that form clouds. Clouds lose their water as rain or snow (precipitation). Precipitation is
either absorbed into the ground or runs off into rivers. Water that was absorbed into the ground is taken up by
plants. Plants lose water vapor through the process of transpiration back into the atmosphere. Water that runs off
into rivers flows into ponds, lakes, or oceans where it evaporates back into the atmosphere and the cycle repeats.
Humans have impacted the water cycle in many ways. The extraction of groundwater for
home/commercial/agricultural use has lowered the water table. Increases in urbanization have led to an increase in
runoff and an increase in the contamination of the water supply. The combustion of fossil fuels has led to an
increase in the amount of water vapor present in the air and potentially contributed to global warming. The creation
of large water reservoirs has caused the drying up of many small streams, a potential decrease in sea levels, and the
blockage of the migration of many species of fish.

Page 316 of 318
316 Return to Table of Contents
Movement of Water Through a Plant
Water is absorbed by the roots of a plants. This absorption is aided by the large surface area created by root hairs.
Since the cells of the roots have a higher solute concentration than the surrounding groundwater, the water potential
in the root is lower than the water potential of the ground water. The water then enters the xylem of the plant.
Cohesion of water molecules to each other and adhesion of water molecules to the xylem cells help to draw water up
the xylem and the stem of the plants. The water continues to move upward until it reaches a stomate (a pore on the
underside of a leaf). As a droplet of water evaporates from the stomate, it exerts a transpiration pull on the hydrogen-
bonded water molecules behind it and thus helps to continue the upward movement of the water. It is important to
note that within the plant, the water potential is highest at the roots and decreases as the water moves upward toward
the stomates. Osmosis moves water passively from areas of higher water potential to areas of lower water potential.
Transpiration is an example of this type of passive transport. The plant doesn’t have to use its own ATP to transport
water.
The amount of water that plants transpire varies greatly geographically and over time. There are a number of factors
that determine transpiration rates:

Page 317 of 318
317 Return to Table of Contents
• Temperature: Transpiration rates go up as the temperature goes up, especially during the growing season,
when the air is warmer due to stronger sunlight and warmer air masses. Higher temperatures cause the
guard cells which control the openings (stoma) where water is released to the atmosphere to open, whereas
colder temperatures cause the openings to close. Higher temperatures also increase evaporation rates which
in turn increase transpiration rates.
• Relative humidity: As the relative humidity of the air surrounding the plant rises, the transpiration rate
falls. It is easier for water to evaporate into dryer air than into more saturated air.
• Wind and air movement: Increased movement of the air around a plant will result in a higher
transpiration rate. This is somewhat related to the relative humidity of the air, in that as water transpires
from a leaf, the water saturates the air surrounding the leaf. If there is no wind, the air around the leaf may
not move very much, raising the humidity of the air around the leaf. Wind will move the air around, with
the result that the more saturated air close to the leaf is replaced by drier air.
• Soil-moisture availability: When moisture is lacking, plants can begin to senesce (prematurely age), which can result in leaf loss and less transpiration.
• Type of plant: Different types of plants transpire water at different rates. Some plants which grow in arid
regions, like cacti and other succulents, conserve precious water by transpiring less water than otherplants.
Biological Magnification
One result of the contamination of the water supply is biological magnification (also known as bioaccumulation).
Biological magnification occurs when the concentration of poisonous substances in the bodies of living thing
increases as you move up the food chain. An example of biological magnification and its dangers is mercury
contamination. In most cases, the concentration of mercury in contaminated water is very low. Some of this

Page 318 of 318
318 Return to Table of Contents
mercury is absorbed by plankton. Since the mercury is fat-soluble, most of the absorbed mercury remains in the
plankton, this causes the plankton to have a higher mercury concentration than the water they live in. This pattern is
repeated as small fish feed on the plankton and store all of the mercury from all of the plankton that they eat. In the
upper trophic levels, the mercury levels get so high that the organisms experience serious negative effects from the
mercury exposure.
Biological magnification caused a crisis with bald eagle populations, where DDT was used to control mosquitoes
and other pests. The eagles would accumulate toxic levels of DDT in their bodies which would cause their eggs to
become fragile and break before they were ready to hatch. This almost caused the extinction of the bald eagle
because the eagles were unable to reproduce at a sustainable rate.
Ecology and Evolution
Natural selection acts on phenotypic variations within populations. As environments change, selective pressures act
on the populations. Phenotypes that are advantageous in a particular environment are selected for. Individuals who
possess these phenotypes survive longer and/or reproduce more than those that lack the phenotypes. It is important
to note that the variation of alleles/phenotypes within a population is largely due to mutation. Mutations are random
and are not directed by specific environmental pressures. Individuals who randomly possess advantageous
mutations/phenotypes are selected for. It is also important to note that a phenotype that is advantageous in one
environment, may be detrimental in another environment.
For example, the coat color of snow shoe hares is determined by a single gene pair. Alleles for both white and
brown winter coats exist. The brown allele is currently very rare in the gene pool, because individuals with white
winter coats are selected for in the snowy environments in which snow shoe hares are found. If climate change
reduces the snow fall in the habitats of the snow shoe hares, individuals with brown winter coats will begin to be
selected for and the frequency of the brown allele will increase, while the frequency of the white allele willdecrease.