AOM2007 Submission # 12852 - Alexandria (UniSG)
41
Business Models for Distributed Energy Technologies – Evidence from German Cleantech Firms Manuscript by Jasper Boehnke and Rolf Wüstenhagen presented at the Academy of Management 2007 Annual Meeting, Philadelphia PA, August 2007 please do not cite without prior contact to the authors ([email protected])
-
Upload
khangminh22 -
Category
Documents
-
view
1 -
download
0
Transcript of AOM2007 Submission # 12852 - Alexandria (UniSG)

Business Models for Distributed Energy Technologies –
Evidence from German Cleantech Firms
Manuscript by Jasper Boehnke and Rolf Wüstenhagen presented at the Academy of Management 2007 Annual Meeting, Philadelphia PA, August 2007 please do not cite without prior contact to the authors ([email protected])

12852
1
Business Models for Distributed Energy Technologies –
Evidence from German Cleantech Firms
ABSTRACT
Global demand for heating and electricity relies heavily on fossil fuels, which contribute
significantly to global warming and climate change. There is an urgent need to accelerate the
diffusion of clean energy technologies such as solar thermal collectors and micro CHP
(combined heat and power generation). One important bottleneck is the identification of
adequate business models. Building on a thorough review of business model literature, we
identify important aspects of successful business models for distributed energy. The second part
of the paper reports on empirical evidence from a survey of 64 German distributed energy firms.
Keywords:
Business Model, Renewable Energy, Sustainable Innovation

12852
2
Business Models for Distributed Renewable Energy Technologies –
Evidence from German Cleantech Firms
In large parts of Europe and North America, winter 2006/07 is characterized by "unusually"
high temperatures. A wide public increasingly starts to realize that we are facing the
consequences of climate change. One of the key areas for action against the climate change
challenge is energy. Two-thirds of all Greenhouse Gas (GHG) emissions worldwide and more
than 80 % of all GHG emissions in industrialized countries are directly related to the use of
energy (Stern 2006, UNFCCC 2006). Electric power generation is the single most important
contributor to climate change, accounting for 24 % of all GHG emissions, followed by transport
(14 %), industry (14 %) and buildings (8 %). While there has been some progress with regard to
energy efficiency in manufacturing, GHG emissions related to power generation and heat remain
on high levels. Therefore, there is an urgent need for more sustainable ways of providing heat
and power to buildings.
One possible vision of a sustainable energy future has been coined the "energy internet" by
the Economist, and is based on increasing use of distributed and renewable forms of energy.
These systems, also referred to as micropower or clean energy, include technologies such as
solar cells, solar thermal collectors, heat pumps (for using geothermal energy), wood pellet
stoves, and micro combined heat and power generation (micro CHP) based on either renewable
fuels or natural gas and using conversion technologies such as internal combustion engines,
stirling engines or fuel cells. Significant progress has been made in technological research and
development, as well as design of energy policies to support clean energy. Venture capitalists are
also starting to discover this as a promising growth area, and with that investment inflow comes

12852
3
the search for adequate business models. Very similar to the early days of e-commerce more than
10 years ago, the public excitement about the new technological opportunities has created a lot of
entrepreneurial experimentation, but truly sustainable business models have yet to emerge for
distributed energy ventures. Our research is addressing this void by first clarifying the
terminology around business models, and then identifying some of the key open questions with
regard to successful business models for distributed energy. The second part of the paper reports
on empirical evidence from a survey of 64 executives of German distributed energy firms.
THE BUSINESS MODEL CONCEPT
The Business Model as a New Unit of Analyis
The business model concept has emerged as an important addition to the predominant
dichotomy of the market-based view (Porter, 1979, 1980; Brandenburger and Nalebuff 1996) and
the resource-based view (Wernerfelt 1984, Prahalad and Hamel, 1990, Teece, Pisano and Shuen,
1997) in management research. These views evolved against a particular background of
traditional economic structures and processes. Today, however, the underlying assumptions of
these traditions are no longer valid. The breakthrough of information technology in general and
e-commerce in particular has radically altered the way business is conducted. The resulting
revolutionary innovations in structures and processes tend to escape the traditional analytic
frameworks, making it difficult to explain how firms create value and compete in the market
(Bettis, 1998; Zott and Amit, 2004). Moreover, industry as well as company boundaries become
increasingly blurred (Osterwalder, Pigneur and Tucci, 2005), which calls for a new analytic
framework that takes into account the changes brought about by e-commerce. A framework that
answers this call is the business model concept (Hedman and Kalling, 2003; Stähler, 2001).

12852
4
Over the last years, the business model concept as a tool for analysing commercial structures
and processes has become increasingly popular in management theory and practice (Magretta,
2002; Osterwalder et al 2005; Shafer, Smith and Linder, 2005). In general, a business model can
be defined as a description of a planned or an existing business and its specific characteristics
with respect to value creation on the one hand and market-orientation on the other hand (Hedman
and Kalling, 2003; Osterwalder et al, 2005; Stähler, 2001). The business model concept
combines elements of the two traditional perspectives sketched in the previous section and thus
takes an integrated point of view (Kalling, 2002; Morris, Schindehutte and Allen, 2005).
Initially, research on business models was to be found almost exclusively in the field of
e-commerce (Mahadevan, 2000; Morris et al, 2005). The first attempts of definition and
application accordingly appeared in publications related to information technology (eg Afuah
and Tucci, 2001; Alt and Zimmermann, 2001; Mahadevan, 2000; Tapscott, Ticoll and Lowy,
2000; Timmers, 1998). More recently, the business model has made its entry into management-
related publications as well (eg Chesbrough and Rosenbloom, 2002; Rentmeister and Klein,
2003; Shafer et al 2005). E-commerce activities seem no longer to be a prerequisite for applying
business model analysis to explain value creation (Magretta 2002, Sillin 2004). Nonetheless, the
level of attention in academic research does in no way match the emphasis that the business
model has experienced in practice (Morris et al 2005). Although a considerable number of
publications have tried to explain the business model concept, no generally accepted definition
has evolved so far (Osterwalder et al 2005, Porter 2001, Shafer et al 2005). Most practitioners
are not able to explain the concept either (Linder and Cantrell 2000). Yet, researchers seem to
agree upon the fact that a business model somehow describes how a business creates value. They
also agree that it is an important new unit of analysis, highly relevant to both management theory

12852
5
and practice (Belz and Bieger, 2004; Chesbrough and Rosenbloom, 2002; Morris et al, 2005;
Rentmeister and Klein, 2003). Business model analysis can help to understand and communicate
the key success factors of value creation. Furthermore, it can be used to measure, compare or
even change the business logic (Morris et al, 2005; Osterwalder et al, 2005; Shafer et al, 2005).
Defining Business Model Components
While there is no clear consensus about what a business model is, this section explores some
of the definitions suggested as well as their main similarities and differences.1 Timmers (1998)
was among the first to put forward a prominent formal definition of a business model, viewing it
as a description of the architecture of value generation (across firm boundaries), of the potential
value generated for partners and final consumers, of the sources of revenue and of the marketing
strategy.2 Another early definition was given by Hamel (2000) who proposes four business
model components: core strategy (including the product or service), strategic resources (ie
competences, assets and processes and their configuration), customer interface (by which
benefits are delivered) and value network. According to Mahadevan (2000), a business model
consists of a value stream for partners and final consumers, a revenue stream and a logistical
stream. Other original definitions are, eg, offered by Amit and Zott (2001), Chesbrough and
Rosenbloom (2002), Linder and Cantrell (2000), Mitchell and Bruckner Coles (2003) and Wallin
(2000). Besides the large number of original business model definitions, the literature also shows
many secondary definitions that are based on syntheses of earlier work. Although most
1 A number of publications provide summaries and comparisons of different business model definitions (eg Belz and Bieger, 2004; Hayes and Finnegan, 2005; Morris et al, 2005; Osterwalder et al, 2005; Shafer et al, 2005; Stähler, 2001). Most of these publications also propose own definitions as a synthesis.
2 Actually, this definition refers to what Timmers (1998) calls a marketing model, an extended version of a business model. His original definition does not include a description of the business’s marketing strategy and therefore is – also in Timmers’ opinion – insufficient to explain how a business captures the value it creates.

12852
6
definitions to some extent differ from each other at first glance, there seems to be a common
underlying intention, namely to depict a business’s core logic for value creation (Chesbrough and
Rosenbloom, 2002; Osterwalder et al, 2005; Shafer et al, 2005; Wallin, 2000). Also, the
definitions illustrated above show some overlap with respect to several business model elements.
Consolidating the commonalities of the different definitions, the following paragraphs explore
market components as well as configuration components of a business model.
The market components of a business model define how a firm delivers value. Four market
components can be distinguished: value proposition, strategy, customers and revenue model. The
value proposition illustrates the benefits a business generates for its customers and final
consumers (Mahadevan, 2000; Stähler, 2002).3 It also includes the products and services that
mediate those benefits (Chesbrough and Rosenbloom, 2002; Osterwalder et al, 2005). The
strategy component encompasses the competitive strategy of a business, which is closely related
to the value proposition, as well as transformational strategies that are directed towards changing
the market environment (Bieger et al, 2002; Morris et al, 2005). Customers constitute an
important part of a firm’s business model. It is crucial to be aware of actual and potential target
groups in order to formulate a coherent value proposition (Hedman and Kalling, 2003; Stähler,
2002). The revenue model describes how the value delivered to the market is translated into sales
revenues and, ultimately, profits. It therefore secures the economic bottom line of the business
(Alt and Zimmerman, 2001; Timmers, 1998).
The configuration components of a business model describe how a firm creates the value it
derives its revenues from. Configuration components are a firm’s value partners, value creation
3 For conceptual reasons, the potential benefits for partners are not included as a part of the market component ‘value proposition’ as opposed to Mahadevan (2000) and Stähler (2002). Instead, they are incorporated in the configuration component ‘value partners’.

12852
7
architecture and strategic resources. Value partners are external actors that – either directly or
indirectly – are involved in the value generation of a particular business. In turn, they also benefit
from the business’s activities. Suppliers and distributors are typical examples for direct value
partners whereas complementors, for instance, can rather be characterised as indirect value
partners (Bieger et al, 2002; Osterwalder et al, 2005). The value creation architecture indicates
which steps of the value chain are performed by the firm and whether it specialises on certain
value steps or integrates larger parts of the value chain. This culminates in the formulation of
core processes and the description of interfaces between value steps (Alt and Zimmermann,
2001; Hedman and Kalling, 2003). The value creation architecture is highly dependent on
strategic resources and vice versa. Strategic resources are unique sources of value that cannot
easily be copied by others. They consist of a business’s core competences and strategic assets
like production capacity or intellectual property (Hamel, 2000; Hedman and Kalling, 2003).
Figure 1 illustrates the market and configuration components of a business model as
described above.
------------------------------------------Insert Figure 1 about here
-------------------------------------------
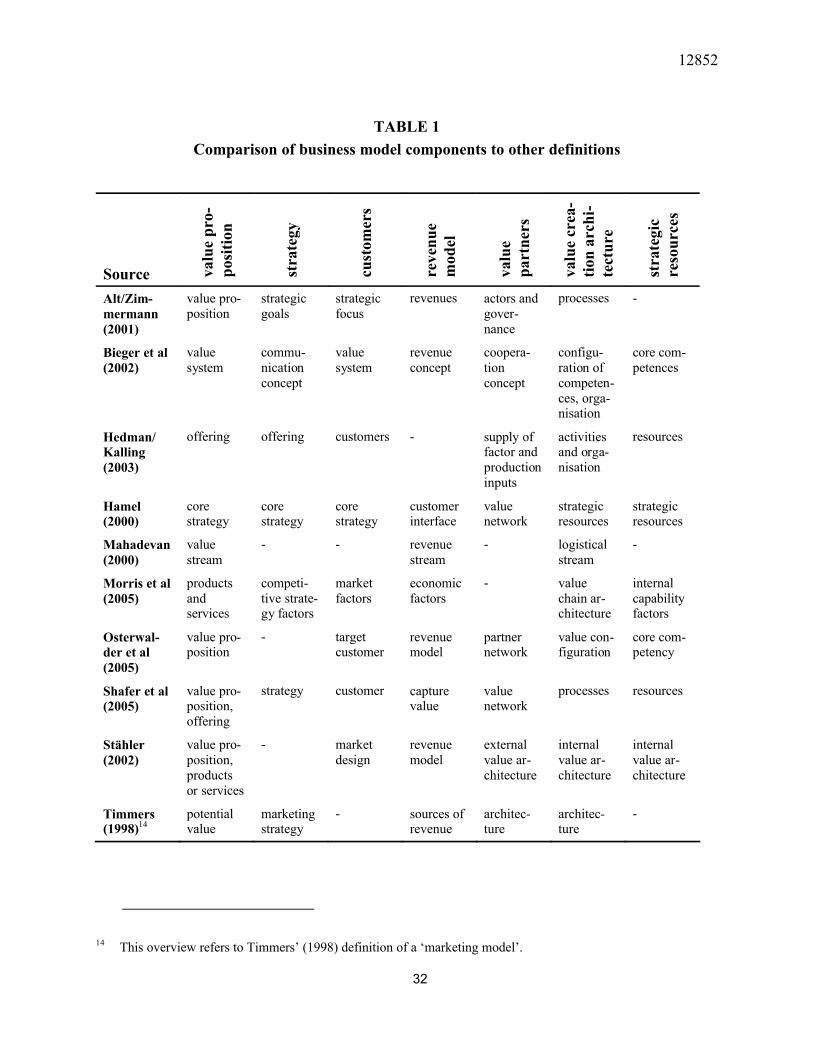
Table 1 below shows which elements of the business model definitions discussed earlier in
this section are covered (at least partially) or extended by the components proposed in previous
literature.
------------------------------------------Insert Table 1 about here
-------------------------------------------

12852
8
When applying business model analysis, it is important not only to look at the components
separately but also at the fit between them (Belz and Bieger, 2004; Hedman and Kalling, 2003;
Morris et al, 2005). Strategy, customers and revenue model, for instance, must be consistent with
the value proposition if the firm’s activities are to be successful. Likewise, value partners and
value creation architecture have to fit the firm’s strategic resources. Furthermore, there is also a
strong interplay between market and configuration components that has to be reflected in the
design of a business model.
Discussion of the business model concept
The business model concept is a valuable addition to the pool of analytic tools in
management science (Belz and Bieger, 2004; Morris et al, 2005). It combines elements of the
market-based and resource-based perspectives of analysis and views the business as an
intermediary between market factors on the one hand and resource factors on the other (Hedman
and Kalling, 2003; Morris et al, 2005). Although the business model framework extends beyond
firm boundaries, it neither considers all market factors nor covers every aspect of a firm.4
Instead, its scope includes (and is restricted to) all internal and external factors relevant and
necessary for explaining a particular value stream from the viewpoint of a particular firm (Belz
and Bieger 2004; Chesbrough and Rosenbloom, 2002; Hedman and Kalling, 2003; Zott and
Amit, 2004). The following paragraphs explore possible applications of the business model
concept as well as its advantages and limitations.
The business model framework as presented in the previous section is very useful for various
applications in management research and practice. Most importantly, it is a valuable tool for
4 The latter is especially true for large diversified companies.
12852
9
analysis, communication, decision-making and planning. The analysis of a particular business’s
operations with the help of the model permits, in the first place, to identify the composition of
market and configuration components underlying value creation (Morris et al, 2005). In other
words, it provides a snapshot of strategic choices made in the past and thus enables researchers
and practitioners to understand the business logic (Osterwalder et al, 2005; Shafer et al, 2005).
Applying business model analysis can help to define indicators for measuring and monitoring
purposes (Osterwalder et al, 2005). Besides being suitable for investigating an individual
business, the concept can also be used as a means of comparison (ibid). For instance, managers
can compare their own business model to those of competitors. Researchers can use comparative
analysis to determine critical success factors for different industries or to define and categorise
generic business model configurations (Linder and Cantrell, 2000; Morris et al, 2005; Timmers,
1998). Communication is another important function of the business model concept. The concept
offers a clear structure for capturing the essence of value creation. Explaining and visualising a
business’s core logic is key to sharing it with other stakeholders such as employees, customers,
value partners and, especially, investors (Möller and Rolf, 2003; Shafer et al, 2005; Stähler,
2001). In some cases, a clearly communicated description of a business model can also be used
to patent one or more of its aspects (Hedman and Kalling, 2003; Osterwalder et al, 2005).
Facilitating decision-making for managers and employees alike is a third vital application of the
business model framework. It enables to make decisions in accordance with the market and
configuration components and hence provides a basis for cohesive management and operations
(Linder and Cantrell, 2000; Osterwalder and Pigneur, 2004). When extending decision-making to
the long run, business model analysis can also assist in planning the future. The holistic approach
makes it possible to detect and evaluate effects of fundamental strategic choices in advance and

12852
10
thus provides the foundations for scenario analyses as well as subsequent strategy formulation
(Morris et al, 2005; Rentmeister and Klein, 2003). Business models can also be used to improve
the design of core processes or to assess the viability of additional strategic assets (Hedman and
Kalling, 2003; Osterwalder and Pigneur, 2004). Last but not least, the business model concept
can be a starting point for building a new business from scratch (Osterwalder et al, 2005).
The business model has some inherent advantages that make it highly suitable for the
applications described above. A very important conceptual strength of the business model is its
appropriate scope. It extends the view beyond company boundaries and enables to capture
configurations based on value networks. Furthermore, interdependences between components
can be detected and analysed. At the same time, the framework avoids complexity by
concentrating only on aspects that constitute central parts of the business logic (Hedman and
Kalling, 2003; Rentmeister and Klein, 2003). This simplicity makes it easy to grasp the ‘big
picture’ and, moreover, to compare the business models of different firms (Osterwalder and
Pigneur, 2004). Yet, the structure of the framework also permits to investigate the market and
configuration components of a particular business in great detail (Stähler, 2001). Another benefit
of using the concept to analyse existing businesses is its completeness in the sense that it makes
explicit all relevant strategic choices. This includes not only the choices made by intention but
also those made subconsciously (Morris et al, 2005; Shafer et al, 2005). When applied in
practice, a special quality of the business model is that it fosters consistency. It encourages
managers to coherently align strategic choices with the business logic. Likewise, it provides
guidance for managers and employees in everyday decision-making and thus strengthens the
business’s focus (Hayes and Finnegan, 2005; Linder and Cantrell, 2000). Furthermore, the
business model concept also facilitates customisation, ie the process of developing a unique

12852
11
constellation of decision parameters which distinguishes a business from its competitors and,
hence, is a potential source of competitive advantage (Mitchell and Bruckner Coles, 2003). This
is possible due to the fact that the concept enables to identify and exploit opportunities as
starting-points for innovation (Morris et al, 2005; Rentmeister and Klein, 2003; Zott and Amit,
2003).
As appealing as the business model framework is, it nevertheless suffers from a number of
limitations that have to be kept in mind when using it to analyse and manage businesses. The
boundaries of the framework result mainly from its conceptual limitations on the one hand and
potential flaws in its application on the other. Conceptual limitations are constraining factors
that researchers and managers must be aware of in order not be misguided in their analytic
efforts. First of all, the business model itself must not be mistaken as a strategy or as a
replacement of strategy (Magretta, 2002; Porter, 2001; Stähler, 2001). Although it contains
strategic elements, it is rather a reflection of strategic choices than it is an elaborated strategic
plan (Chesbrough and Rosenbloom, 2002; Morris et al, 2005; Osterwalder et al, 2005). However,
as indicated before, it can be a very useful tool for strategic planning due to its ability to depict
the effects of different strategic decisions (Shafer et al, 2005). Another boundary of the concept
is its restriction in scope. Since it concentrates on explaining a particular value stream, it does not
include a full description of the environmental setting5 which may be necessary for
understanding entirely why this model is successful or not. Although it does not impair the
concept’s value for the analysis and communication of a particular model or for the comparison
of models set in the same context, this limitation must be considered when comparing business
5 The environmental setting can be described in terms of policies, technological development, consumer behaviour, competition etc.
12852
12
models in different markets (Chesbrough and Rosenbloom, 2002). Therefore, for the purposes of
comparing or planning a model, business model analysis has to be complemented by an
investigation of the environmental setting (Porter, 2001; Zott and Amit, 2004). Besides
environmental aspects, there are also company-internal factors that escape the scope of the
concept, namely financing and ownership issues as well as the way the model is embedded in the
context of the firm as a whole. These aspects may, however, well be important decision variables
with respect to business model design in some cases (Bieger et al, 2002; Linder and Cantrell,
2000). One more important conceptual limitation of the framework is its static nature. It shows a
snapshot of a business in a certain state and does not incorporate dynamics per se (Linder and
Cantrell, 2000; Osterwalder et al, 2005).6 This problem can be coped with by looking at a
sequence of models that represent different points in time, eg the present and the future.7 Thus,
changes in the real-life business model can be mapped or simulated, which even makes it
possible to trace the evolution of a firm’s core logic in a business model lifecycle (Betz, 2002;
Linder and Cantrell, 2000; Morris et al, 2005).
In addition to conceptual limitations, potential flaws in the application of the business
model concept constitute a second category of boundaries. The most frequent flaw is probably a
confusion of the terminology. Many researchers and managers use the term business model when
actually referring to only a small part of it, such as eg a new value proposition (Linder and
6 Note that this does not imply that a business model is the picture of an inflexible business. – Hedman and Kalling (2003) include a longitudinal process component in their version of the business model concept to cover dynamic aspects. However, this component is not a part of the framework proposed in this paper since it does not contribute to understanding the business logic as it is. Therefore, its inclusion would reduce sharpness as well as increase complexity. As will be shown, dynamics can be included otherwise.
7 Betz (2002) uses the term ‘strategic business model’ to refer to a model that describes the future of a business. Linder and Cantrell (2000) identify ‘change models’ that show according to which parameters a business model is changed over time.

12852
13
Cantrell, 2000; Rentmeister and Klein, 2003).8 This may lead to serious problems since
important aspects of the business’s core logic for value generation are simply left out of the
analysis (Belz and Bieger, 2004; Shafer et al, 2005). How risky this can be has been
demonstrated impressively by the downfall of the so-called new economy, where a lot of money
had been spent on businesses with innovative ideas without regard to the flaws in their business
models (Porter, 2001; Shafer et al, 2005). Problems in the application of the business model for
planning purposes can also occur when relying on wrong assumptions about the future.9 If future
developments are predicted incorrectly, strategic choices may turn out to be hazardous to the
firm. Therefore, it is vitally important to constantly check the validity of the underlying
assumptions to ensure consistency in strategic planning (Shafer et al, 2005). Another potential
source of trouble is rooted in failure to adapt the business model to new conditions. A business
model can never be considered to be optimal (Hedman and Kalling, 2003; Magretta, 2002). It is
constantly subject to external influences and can become obsolete soon, especially in a dynamic
environment (Osterwalder et al, 2005; Sillin, 2004). In order to respond to changing conditions,
the business model has to be conceived as the outcome of an iterative and heuristic planning
process (Hedman and Kalling, 2003; Morris et al, 2005). The fact that the business model
concept does not fully cover the context of a business may lead to a complete neglect of
contextual factors by researchers or managers. If business model analysis is performed without a
complementing look at the context, results are likely to be incomplete. This can be especially
problematic for managers who try to improve their business model by copying features from
another business (Linder and Cantrell, 2000; Morris et al, 2005). Diversified firms may also have
8 Sometimes, the term business model is also used to denote the modelling of business processes (Osterwalder et al, 2005).
9 This is, of course, a problem of most tools for strategic planning.

12852
14
a hard time achieving consistency across different business models if they omit to consider the
company level in the design of a business model (Bieger et al, 2002).
All in all, it can be said that the business model does not replace the traditional analytic
approaches but, instead, complements them as a new, valuable unit of analysis in its own right
(Morris et al, 2005).
BUSINESS MODELS FOR DISTRIBUTED ENERGY SYSTEMS IN GERMANY
This chapter provides empirical insights into existing business practice and possible success
factors in the emerging German market for distributed energy systems, particularly for solar
thermal energy and micro CHP.
Data and Methodology
For both market sectors, a questionnaire-based survey was conducted. A list of companies
active in the German markets for solar thermal and micro CHP was compiled through internet
research. Subsequently, a total of 403 questionnaires were sent out by e-mail to CEOs or Heads
of Division of 311 solar thermal businesses and 92 micro CHP businesses. These companies
comprise manufacturers, wholesalers, retailers, planners and installers. The survey-based
approach enables to cover a broad range of companies and represents a well-structured high-
level approach to business model analysis, thus ensuring good comparability of the results.
Altogether, 60 solar thermal companies (19 %) responded to the survey. Of these, 23 (7 %)
explicitly refused to fill in the questionnaire. A total number of 37 completed questionnaires
were returned, indicating a return rate of 12 %, which is a reasonable value for an internet-based
survey (Porter and Whitcomb, 2003). The sample for the analysis consists of 22 German, 13
Swiss and 2 Austrian businesses. For micro CHP, 40 companies (43 %) responded, 13 (14 %)

12852
15
were unwilling to participate in the survey and 27 companies returned completed questionnaires,
which represents a return rate of 29 %, a good value for such a survey considering current market
dynamics. For micro CHP, the final sample consists of 25 German and 2 Swiss businesses. 25 %
of the solar thermal businesses and 35 % of the micro CHP businesses are diversified firms with
residential micropower being only one small part of their activities. On the opposite side, 19 %
and 35 % concentrate exclusively on the solar thermal and micro CHP markets, respectively. The
solar thermal companies carry out various activities: 54 % of them are manufacturers, 46 % are
system planners, 40 % perform service and maintenance activities, 37 % are wholesalers, 34 %
are installers and 23 % pursue further activities.10 In the micro CHP sample, 73 % perform
service and maintenance activities, 46 % are manufacturers, 38 % are installers, 27 % are
wholesalers and 23 % are system planners. Fuel supply and utility services are each delivered by
12 % of the sample, while 8 % offer building management services and 12 % still pursue further
activities. On average, the solar thermal businesses generated an annual turnover of
approximately EUR 3 million in 2005 and employed 26 persons by the end of the same year,
while the micro CHP businesses achieved a turnover of approximately EUR 2.7 million in 2005
and employed 15 persons.11 The average growth rates of the solar thermal sample for the past
five years lie between 28 % in the year 2005 and 10 % in the year 2002. For 2006, the average
estimated growth rate is 27 % while, thereafter, an average annual growth rate of 22 % is
expected until 2010. As indicated in Table 2, a comparison with latest data published by the
sustainability research department of Bank Sarasin (2006) shows that our sample is reasonably
representative of the German solar thermal industry. As for micro CHP, the firms in our samle
10 Some firms pursue more than one activity, therefore the total adds up to more than 100 %.11 Only 25 solar thermal businesses and 20 micro CHP businesses provided turnover figures. Numbers of
employees were revealed by 30 and 20 firms, respectively.

12852
16
achieved average growth rates between 25 % in the year 2002 and 12 % in the year 2004. For
2006, the average estimated growth rate is 27 % while, thereafter, an average annual growth rate
of 29 % is expected until 2010. Table shows the average historic and expected growth rates for
the years 2001 to 2010 as well as the number of companies that disclosed growth figures for the
respective years.
------------------------------------------Insert Table 2 about here
-------------------------------------------
The following sections present the results of the survey regarding the market and
configuration components of a business model and thus provide insights on the existing business
practice in the micropower market.
Value Proposition
The value proposition of a business is of the utmost importance. It is the key to revenue
generation as it gives consumers a reason to opt for solar thermal systems and become
micropower users. As a consequence, it is vital for businesses to design their offering in
accordance with consumer preferences. The survey investigates how managers perceive the
preferences of three different consumer groups, ie eco-active, eco-balanced and eco-passive
consumers (Villiger, Wüstenhagen and Meyer, 2000). Eco-active consumers actively seek
environmentally beneficial products, eco-balanced consumers view environmental aspects and
cost-related aspects as equally important, and eco-passive consumers do not consider
environmental aspects to be particularly relevant. For each of these groups, survey participants
were asked to estimate the importance of different aspects of a solar thermal system or micro
CHP system, respectively on a five-point scale ranging from ‘highly important’ (1) to

12852
17
‘unimportant’ (5). Considering solar thermal systems, an aspect that seems to be very important
to all three groups alike is that the systems facilitate independent heat supply (with average
values of 1.7 to 2.1). Furthermore, advising and planning services (2.3 to 2.6) as well as
installation and maintenance services (2.4) are perceived to be equally important for all three
segments of solar thermal consumers. This holds also for another aspect, the positive image
associated with owning a solar thermal system (2.3 to 2.7). Not surprisingly, suppliers perceive
eco-active consumers as placing the highest emphasis on the avoidance of harmful emissions
(1.2) as well as on the utilisation of renewable energy (1.2) whereas, for eco-passive consumers,
these aspects are perceived to be fairly unimportant (4.0 and 3.9, respectively). In turn, capital
and upfront costs of solar thermal systems are of the highest relevance to the eco-passive group
(1.4) while they only play a moderate role for eco-active individuals (3.2). Interestingly, eco-
active consumers are the only ones who are considered to view operating costs (3.0) as being
more important than upfront costs.12 All in all, eco-active consumers seem to perceive all criteria
of a solar thermal system as more important than the other two groups – with the exception of
costs and visual aspects. The preference profiles of the three different consumer groups as
perceived by survey participants from the solar thermal industry are illustrated in Figure 2 below.
------------------------------------------Insert Figure 2 about here
-------------------------------------------
In the micro CHP sample, the importance of the various aspects for final consumers is
perceived slightly different. For all three groups alike, advising and planning services seem to be
12 This is consistent with the results of a survey among German fuel cell pioneers, who can basically be categorised as eco-active consumers. Fischer (2006) finds that, for pioneers, low operating costs are significantly more important than low capital costs.

12852
18
of great importance (with average values of 1.6 to 1.8). The same also holds for installation and
maintenance services (1.6 to 2.0). Another aspect that is perceived to be rather central to all types
of consumers is that micro cogeneration facilitates an independent energy supply (2.1 to 2.3). For
eco-active and eco-balanced consumers, the positive image associated with owning and
operating a micro CHP system appears to matter equally strong (2.0) while being slightly less
important for eco-passive consumers (2.5). Not surprisingly, suppliers perceive eco-active
consumers as placing the highest emphasis on the avoidance of harmful emissions (1.2) as well
as on the utilisation of renewable energy (1.4) whereas, for eco-passive consumers, these aspects
seem to be a great deal less important (3.4 and 3.6, respectively). In turn, capital and upfront
costs as well as operating costs are highly relevant to the eco-passive group (both 1.7) while they
only play a moderate role for eco-active individuals (3.1 and 2.8, respectively). The latter ones
are the only group of consumers considered to attribute a noteworthy value to eco labels (2.5)
and local or regional value generation (2.7). Visual aspects (3.1 for all), in general, do not seem
to be a factor capable of tipping the scale in one direction or another. All in all, besides an
increased independence of residential energy supply, advice and planning as well as installation
and maintenance services are perceived to be fundamental for all types of consumers. This
indicates that residential energy supply systems are complicated and need thorough explanation.
Furthermore, eco-active consumers are viewed as regarding criteria concerned with
environmental benefits and local value generation as more important than the other two groups
while placing less emphasis on costs. The preference profiles of the three different consumer
groups as perceived by survey participants from the micro CHP industry are illustrated in Figure
3 below.
------------------------------------------Insert Figure 3 about here
-------------------------------------------

12852
19
For solar thermal systems, an average estimation for the payback period that eco-active
consumers are willing to accept is 9.7 years. Eco-balanced and eco-passive consumers are
thought to accept 8.4 years and 6.6 years, respectively. For micro CHP, the average estimated
payback period for eco-active consumers is 13.5 years. Eco-balanced and eco-passive consumers
are thought to accept 9.6 years and 7.0 years, respectively. 65 % think that eco-balanced
consumers as well accept at least ten years, and 23 % also expect eco-passive consumers to do
so. Obviously, the payback times accepted in the micro CHP market are longer than those in the
solar thermal market. In designing their value propositions, businesses must diligently take into
account the preferences of their target group. Otherwise, their products and services may not
appeal to consumers, which could ultimately result in failure to capture the created value. In
addition to a strong service orientation, businesses should find a way to offer products with
environmental benefits and competitive upfront and operating costs. In this way, they stand a
good chance of being able to recruit customers from all three consumer groups.
In order to investigate the relative importance of product quality and costs in the value
proposition, survey participants were asked to indicate the roles these two aspects play in the
communication activities of their businesses (with reference to the same five-point scale as
above). Regarding the solar thermal sample, both aspects are quite important in general, quality
reaches an average importance of 1.8 in communication and clearly dominates cost-related
aspects (2.6). The same is true for the micro CHP sample with values of 1.4 for quality and 2.4
for costs. 71 % of the solar thermal firms and 89 % of the micro CHP firms rated quality as
highly important (1) or important (2) in their communication activities whereas, for costs, just
34 % and 50 %, respectively, did so. Only one of the solar thermal companies puts more
12852
20
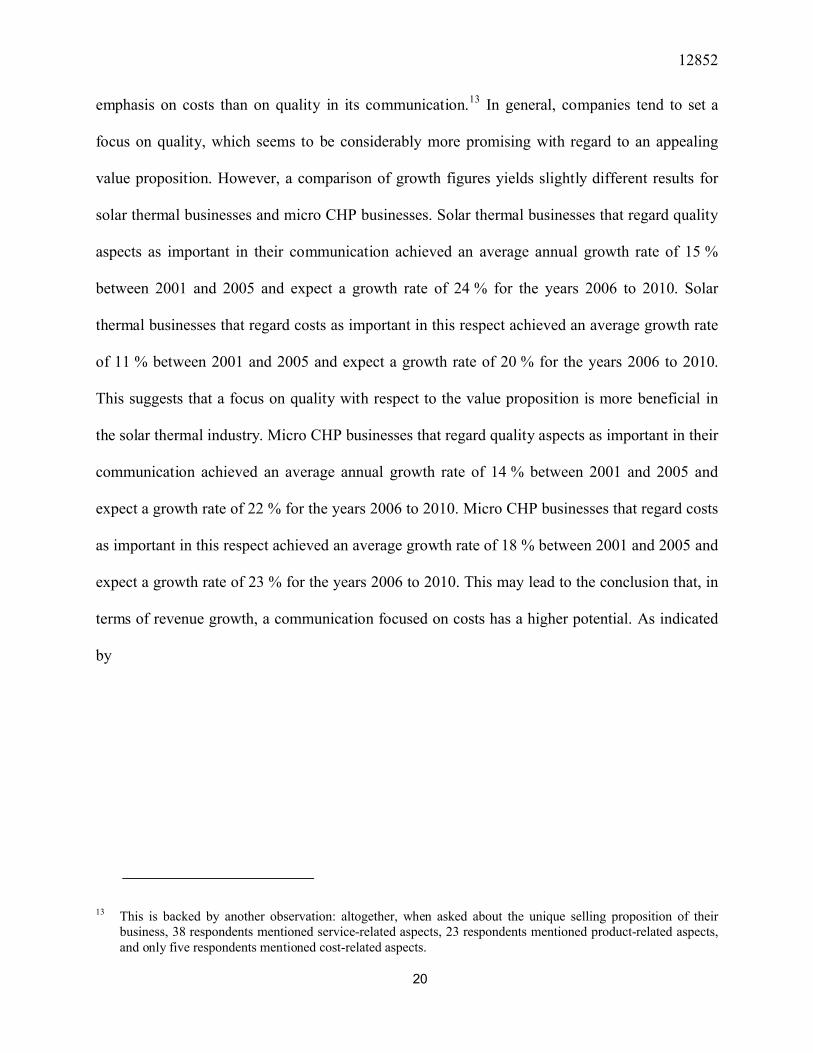
emphasis on costs than on quality in its communication.13 In general, companies tend to set a
focus on quality, which seems to be considerably more promising with regard to an appealing
value proposition. However, a comparison of growth figures yields slightly different results for
solar thermal businesses and micro CHP businesses. Solar thermal businesses that regard quality
aspects as important in their communication achieved an average annual growth rate of 15 %
between 2001 and 2005 and expect a growth rate of 24 % for the years 2006 to 2010. Solar
thermal businesses that regard costs as important in this respect achieved an average growth rate
of 11 % between 2001 and 2005 and expect a growth rate of 20 % for the years 2006 to 2010.
This suggests that a focus on quality with respect to the value proposition is more beneficial in
the solar thermal industry. Micro CHP businesses that regard quality aspects as important in their
communication achieved an average annual growth rate of 14 % between 2001 and 2005 and
expect a growth rate of 22 % for the years 2006 to 2010. Micro CHP businesses that regard costs
as important in this respect achieved an average growth rate of 18 % between 2001 and 2005 and
expect a growth rate of 23 % for the years 2006 to 2010. This may lead to the conclusion that, in
terms of revenue growth, a communication focused on costs has a higher potential. As indicated
by
13 This is backed by another observation: altogether, when asked about the unique selling proposition of their business, 38 respondents mentioned service-related aspects, 23 respondents mentioned product-related aspects, and only five respondents mentioned cost-related aspects.

12852
21
Table , there seems to be a trade-off between quality and costs for solar thermal businesses.
Businesses that concentrate on quality exclusively outperform those who concentrate on costs as
well as those who treat quality and costs as equally important. Yet, concerning the performance
of micro CHP businesses, the figures reveal another interesting insight. In the cogeneration
sample, the fastest growing companies by far are those reporting that they regard neither quality
nor costs as important in their communication. That said, it must be noted that only three
businesses fall into this category, all of which are fairly new to the market and, therefore, still
have rather low revenues and grow much faster than others. What is more, they might only fall
into this category because, at this early stage, their value proposition is not fully elaborated yet.
All other micro CHP businesses emphasise product or service quality when addressing their
customers. The majority, who also regard costs as being important, outperform those businesses
that neglect the importance of costs. Between 2001 and 2005 they achieved a 9 % higher average
growth rate. For the years 2006 to 2010, their expected performance will still be better by 3 % on
average.
------------------------------------------Insert Table 3 about here
-------------------------------------------
Customers
The targeted customers constitute another business model component that must be taken into
consideration in order to formulate a coherent value proposition. In the questionnaire, companies
were asked to define their target customers on the basis of the three groups of eco-active, eco-
balanced and eco-passive consumers. 32 % (31 %) of solar thermal (micro CHP) firms indicated
eco-balanced consumers ("beyond the eco-niche") as their primary target group, while 68 %

12852
22
(69 %) address the eco-passive mass market. None of the firms indicated eco-active customers as
their primary target segment.
In terms of geographical focus, there is an interesting difference between the solar thermal
and micro CHP companies in our sample. Only 18 % of the solar thermal, but 56 % of the micro
CHP companies generated their entire 2005 revenues in Germany, pointing to a strong domestic
exposure of micro CHP firms. Internationalisation appears to be an issue on their agenda though,
as these figures are expected to decrease to 15 % and 36 %, respectively, by 2010. The weighted
average geographical distribution of revenues in the sample for the years 2005 and 2010 is
shown in Table 4. The majority of 2005 revenues was generated in Germany (51 % for solar
thermal and 94 % for micro CHP). Austria and Switzerland are further target markets. In the
years to come, the share of the German market can be expected to decrease in both industries, as
other European markets become more attractive.
------------------------------------------Insert Table 4 about here
-------------------------------------------
Revenue Model
The revenue model is one of the crucial components of a business model as it describes how
the value created translates into sales and, ultimately, profits. It therefore secures the economic
bottom line of a business. As can be seen from Figure 4 below, 89 % of the solar thermal sample
and 85 % of the micro CHP sample at least part of their turnover simply by selling hardware.
Other common ways to generate revenues in the micro CHP market are installation and
maintenance as well as planning services. The former are performed by 43 % of the solar thermal

12852
23
businesses and 69 % of the micro CHP businesses, while the latter are performed by 54 % and
46 %, respectively. 23 % of the micro CHP firms, but just 6 % of solar thermal firms offer
financing solutions, thereby trying to reduce initial costs for their customers – a major barrier to
a wider diffusion of micropower. Other innovative sources of income like contracting or leasing
services are less popular, especially with the solar thermal sample. In the micro CHP sample,
12 % of the businesses offer fuel supply services. As this overview shows, the traditional ways of
revenue generation in the heating market, i.e. particularly hardware sales, installation and
maintenance as well as planning services, dominate among the surveyed solar thermal and micro
CHP businesses. Yet, in the micro CHP market, more innovative ideas seem to be emerging as is
suggested by the share of companies that use financing schemes to generate revenues.
------------------------------------------Insert Figure 4 about here
-------------------------------------------
Value Partners
Almost always, value partners from outside the company are integrated in a business’s
process of value creation. In addition to suppliers and distributors, which are mainly determined
by the value creation architecture (and vice versa), complementors can also play a significant
role. In the case of micro CHP, additional value for the final consumer can, eg, be created by
teaming up with banks or other financial institutions in order to provide financing services that
reduce initial costs for the final consumer. In the survey, companies were asked about existing or
planned cooperations. 14 % of the solar thermal businesses and 65 % of the micro CHP
businesses already cooperate with financial institutions. Additionally, 26 % of the solar thermal
businesses and 19 % of the micro CHP businesses plan to do so in the future. This is an

12852
24
unmistakable sign that, especially with respect to micro CHP, partnerships with the aim of jointly
offering innovative financial services along with the actual systems are a key factor for
successful commercial activities in the micropower market.
Value Creation Architecture
A central pillar of each business model is the value creation architecture. It describes which
steps of the value chain are performed by a firm and whether it specialises on certain parts of the
value chain or integrates vertically. In the sample, 33 % of the solar thermal companies and 35 %
of the micro CHP companies are specialised on one or a few parts of the value chain. 19% of the
solar thermal businesses and 4 % of the micro CHP businesses follow a contrary path and are
more vertically integrated. Vertical integration appears to be more common in solar thermal than
in micro CHP, possibly due to the lower complexity and capital intensity of the product.
Comparing average revenue growth rates between 2001 and 2005 shows that specialised solar
thermal energy firms were also slightly less successful than integrated ones (16 % and 18 %
respectively), whereas specialised businesses were significantly more successful in the micro
CHP sample (23 % vs. 12 %). The difference between the two sectors extends into the future,
where solar thermal firms expect annual growth rates (2006-2010) of 18 % for specialized and
22 % for integrated firms respectively, as opposed to 31 % vs. 28 % for micro CHP.
In designing the value creation architecture, micropower businesses have to decide on how
to deliver their product or service to the final consumer. Table 5 below shows the actual and
expected shares of different delivery configurations in the two samples. The current solar thermal
market appears to be dominated by two variations of the traditional boiler delivery chain with a
combined share of two thirds of the market. 33 % of solar thermal firms' revenues are generated
in a configuration where manufacturers sell their products to wholesalers who supply installers

12852
25
who set up the systems at consumer sites. Another 33 % come from a shorter version of this
configuration that excludes wholesalers, which means that manufacturers of solar thermal
systems directly supply installers. As for micro CHP, the first observation is that there is more
variety, pointing to more experimentation in this early market. The configuration with the largest
share (39 %) is the abbreviated boiler delivery chain without wholesalers. However, the five
other options have fairly similar market shares of between 9 and 15 %, respectively. A striking
difference between the two sectors is that the delivery through energy suppliers, which accounts
for 14 % of the micro CHP revenues, is almost negligible in the solar thermal market. One
explanation is of course that solar thermal collectors do not generate electricity and are therefore
seen as outside their core business by many electric utilities. Nevertheless, there seems to be
some unused potential for electric or gas utilities in entering the solar thermal market as a
possible platform for creating long-term customer relations.
------------------------------------------Insert Table 5 about here
-------------------------------------------
Strategic Resources
Strategic resources (such as core competences) are unique sources of value that cannot easily
be copied by others. Therefore, survey participants were asked to name their key strengths. 69 %
(56 %) of the solar thermal (micro CHP) businesses highlighted their friendly and competent
service, whereas 34 % (44 %) mentioned well-designed products as their unique feature.
Longstanding experience and knowledge of the market was highlighted by 11 % of the solar
thermal companies and 44 % of the micro CHP companies. Costs for the final consumer,
however, do not appear to play as important a role: only 6 % of the solar thermal sample and

12852
26
12 % of the micro CHP sample explicitly listed core competences that contribute to a reduction
of costs. This again portrays both sectors as emerging industries that are for now mainly
engineering and high-quality driven and serving customers with relatively low price sensitivities,
leaving room for later entry of larger and more low cost-focused suppliers.
Success Factors, Experience So Far And Future Potential
This picture is mirrored by Figure 5, which shows what survey participants consider to be
key success factors for business models in their industries. 71 % (59 %) of the solar thermal
(micro CHP) businesses view good product quality and performance as highly important
prerequisite for success. Aspects related to service quality were mentioned by 38 % and 59 %,
respectively. Other important factors are a fair price as well as know-how and reliability.
Interestingly, none of the solar thermal businesses and only 4.5 % of the micro CHP businesses
referred to low manufacturing costs as a success factor.
------------------------------------------Insert Figure 5 about here
-------------------------------------------
Summary and Discussion
The investigation of the German solar thermal and micro CHP markets yields some
interesting results with respect to business models for distributed energy. Surveyed firms
indicated that cost is a key aspect for final consumers. Initial cost is perceived to be a major
concern, particularly for mainstream customers, while operating costs is less important on
average, but still relatively important for eco-active consumers and in the case of micro CHP. An
attractive value proposition seems to be the idea of increasing the independence of residential
energy supply. Regarding the communication towards final consumers, most firms currently

12852
27
focus on quality rather than cost in the case of solar thermal, while cost is more of an issue for
micro CHP. A general conclusion than can be drawn from the survey with respect to the value
proposition is that, in addition to a strong service orientation, businesses should find a way to
offer products with competitive upfront and operating costs as well as environmental benefits.
The revenue models of micropower businesses are still dominated by income streams traditional
to the heating market. Yet, more innovative revenue models emerge – particularly in the market
for residential micro CHP. Consequently, value partnerships with financing institutions are
considered an important success factor for micropower businesses. With respect to the value
creation architecture, specialized micro CHP tend to be more successful than vertically
integrated ones, while the opposite is true for solar thermal. Regarding the delivery
configuration, businesses in the solar thermal sample prefer the traditional boiler value chain,
which includes manufacturer, (wholesaler,) installer and final consumer. The shorter version of
this, without wholesalers, is also common for micro CHP, but firms in this sector seem to be
experimenting with a wide variety of delivery configurations, including distribution partnerships
with energy suppliers which are almost absent in the solar thermal market. When asked about
key success factors in the market for residential micropower, both solar thermal and micro CHP
businesses mainly think about product and service quality, while manufacturing costs are rarely
considered. All in all, the sample businesses attribute a high potential for success to the markets
for solar thermal and mirco CHP, as evidenced by the strong past and expected future growth
rates. However, the market potential seems to be far from being fully captured. This also opens
up opportunities for new business model configurations that break with traditional ways in the
micropower market.
12852
28
LIMITATIONS AND FURTHER RESEARCH
This paper has contributed to the conceptual clarification of business models and provided an
empirical application of this concept to the emerging market for distributed energy technologies.
As any research, it is subject to some technical and practical limitations. Technical limitations
mainly result from the high level approach of the questionnaire-based analysis. Differences
between business models can often only be detected by taking a close look at crucial details
(Linder/Cantrell 2000). Those, however, cannot be fully captured by a standardised
questionnaire. Another technical shortcoming is that growth and revenues may not be sufficient
measures to quantify success. Finally, we mainly worked with self-reported measures of success,
and this should be complemented by other measures, as we started to do in table 2. Practical
limitations of the research are mostly related to the sample investigated. First of all, the analysis
is restricted to the German market. The conclusions drawn might not be transferable to markets
with significantly different characteristics. Furthermore, the survey suffers from a survivorship
bias. Looking at failed business models may be an important complement and can probably be
best captured by taking a longitudinal approach. Finally, the market for residential micropower is
still young in absolute terms, which makes it difficult to evaluate long-term success. In the end,
this may also lead to neglect of the true potential of innovative business model configurations.
As indicated at the beginning of this paper, there is an urgent need for successful market
introduction of more sustainable energy technologies, therefore there is clearly room for more
research in this important area. Also, we are convinced that the discussion about business
models, which until now had a strong bias towards e-businesses, will be enriched by adding
business models for the emerging "energy internet" to the debate.

12852
29
REFERENCES
Afuah, A. & Tucci, C.L. 2001. Internet business models. New York: McGraw-Hill.
Alt, R. & Zimmermann, H.-D. 2001. Preface: Introduction to special section – Business models. EM – Electronic Markets, 11: 3-9.
Amit, R. & Zott, C. 2001. Value creation in e-business. Strategic Management Journal, 22: 493-520.
Belz, C. & Bieger (Eds.), T. 2004. Customer Value: Kundenvorteile schaffen Unternehmensvorteile. St. Gallen: Thexis.
Bettis, R. A. 1998. Commentary on ‘Redefining industry structure for the information age’ by J. L. Sampler. Strategic Management Journal, 19: 357-361.
Betz, F. 2002. Strategic business models. Engineering Management Journal, 14: 21-27.
Bieger, T., Rüegg-Stürm, J. & Vonrohr, T. 2002. Strukturen und Ansätze einer Gestaltung von Beziehungskonfigurationen – das Konzept Geschäftsmodell. In Bieger, T., Bickoff, N.,Caspar, R., zu Knyphausen-Aufsess, D. & Reding, J. (Eds.), Zukünftige Geschäftsmodelle: Konzept und Anwendung in der Netzökonomie: 35-61. Berlin: Springer.
Brandenburger, A. M. & Nalebuff, B. J. 1996. Co-opetition. New York: HarperCollins.
Chesbrough, C. & Rosenbloom, R. S. 2002. The role of the business model in capturing value from innovation: evidence from Xerox Corporation’s technology spin-off companies, Industrial and Corporate Change, 11: 529-555.
Hamel, G. 2000. Leading the revolution. Boston: Havard Business School Press.
Hayes, J. & Finnegan, P. 2005. Assessing the potential of e-business models: towards a framework for assisting decision-makers. European Journal of Operational Research, 160: 365-379.
Hedman, J. & Kalling, T. 2003. The business model concept: theoretical underpinnings and empirical illustrations. European Journal of Information Systems, 12: 49-59.
Kalling, T. 2002. The business model and the resource management model: A tool for strategic management and analysis. Working Paper, Lund University School of Economics and Management, Lund.
Linder, J. C. & Cantrell, S. 2000. Changing business models: Surveying the landscape. Working Paper, Accenture Institute for Strategic Change.
Magretta, J. 2002. Why business models matter. Harvard Business Review, 80: 86-92.

12852
30
Mahadevan, B. 2000. Business models for internet-based e-commerce. California Management Review, 42: 55-69.
Mitchell, D. & Brucker Coles, C. 2003. The ultimate competitive advantage of continuing business model innovation. Journal of Business Strategy, 24: 15-21.
Möller, A. & Rolf, A. 2003. Nachhaltige Geschäftsmodelle. Working Paper, University of Hamburg School of Computer Science, Hamburg.
Morris, M., Schindehutte, M. & Allen, J. 2005. The entrepreneur’s business model: Toward a unified perspective. Journal of Business Research, 58: 726-735.
Osterwalder, A. & Pigneur, Y. 2004. Investigating the use of the business model concept through interviews. URL http://www.hec.unil.ch/yp/Pub/04-ICEB.pdf. Accessed on 21 March 2006.
Osterwalder, A., Pigneur, Y. & Tucci, C. L. 2005. Clarifying business models: Origins, present and future of the concept. Communications of the Association for Information Systems, 16: 1-37.
Porter, M. E. 1979. How competitive forces shape strategy, Havard Business Review, 57: 137-145.
Porter, M. E. 1980. Competitive strategy: Techniques for analyzing industries and competitors. New York: The Free Press.
Porter, M. E. 2001. Strategy and the internet. Harvard Business Review, 79: 63-78.
Porter, M.E, & Whitcomb, S.R. 2003. The impact of lottery incentives on student survey response rates, Research in Higher Education, 44: 389-407.
Prahalad, C. K. & Hamel, G. 1990. The core competence of the corporation. Harvard Business Review, 68: 79-91.
Rentmeister, J. & Klein, S. 2003. Geschäftsmodelle – ein Modebegriff auf der Waagschale. Zeitschrift für Betriebswirtschaft, Ergänzungsheft 1/2003: 17-30.
Sarasin 2006. Solar energy 2006 – light and shade in a booming industry. Investment Research Report. Basel: Bank Sarasin, Sustainability Research.
Shafer, S. M., Smith, H. J. & Linder, J. C. 2005. The power of business models. Business Horizons, 48: 199-207.
Sillin, J. O. 2004. The electric power industry business model for the 21st century. The Electricity Journal, April: 42-51.
Stähler, P. 2001. Geschäftsmodelle in der digitalen Ökonomie: Merkmale, Strategien undAuswirkungen. Cologne: Josef Eul.
12852
31
Stähler, P. 2002. Business Models as a Unit of Analysis for Strategizing. Paper presented at the International Workshop on Business Models, Lausanne.
Tapscott, D., Ticoll, D. & Lowy, A. 2000. Digital Capital – Harnessing the Power of Business Webs. Boston: Harvard Business School Press.
Teece, D. J., Pisano, G. & Shuen, A. 1997. Dynamic capabilities and strategic management. Strategic Management Journal, 18: 509-533.
Timmers, P. 1998. Business models for electronic markets. EM – Electronic Markets, 8: 3-8.
Villiger, A., Wüstenhagen, R., Meyer A. 2000. Jenseits der Öko-Nische [Beyond the Eco-Niche]. Basel: Birkhäuser.
Wallin, J. 2000. Further development of conceptual and theoretical foundations for the competence perspective. Paper presented at the Fifth Annual International Conference on Competence-Based Management, Helsinki.
Wernerfelt, B. 1984. A Resource-based view of the firm. Strategic Management Journal, 5: 171-180.
Zott, C. & Amit, R. 2004. Business strategy and business model: Extending the strategy-structure-performance paradigm. Working Paper, INSEAD-Wharton Alliance Center for Global Research & Development, Fontainebleau.
12852
32
TABLE 1Comparison of business model components to other definitions
Source valu
e pr
o-po
sitio
n
stra
tegy
cust
omer
s
reve
nue
mod
el
valu
e pa
rtne
rs
valu
e cr
ea-
tion
arch
i-te
ctur
e
stra
tegi
c re
sour
ces
Alt/Zim-mermann (2001)
value pro-position
strategic goals
strategic focus
revenues actors and gover-nance
processes -
Bieger et al (2002)
value system
commu-nication concept
value system
revenue concept
coopera-tion concept
configu-ration of competen-ces, orga-nisation
core com-petences
Hedman/ Kalling (2003)
offering offering customers - supply of factor and production inputs
activities and orga-nisation
resources
Hamel (2000)
core strategy
core strategy
core strategy
customer interface
value network
strategic resources
strategic resources
Mahadevan (2000)
value stream
- - revenue stream
- logistical stream
-
Morris et al (2005)
products and services
competi-tive strate-gy factors
market factors
economic factors
- value chain ar-chitecture
internal capability factors
Osterwal-der et al (2005)
value pro-position
- target customer
revenue model
partner network
value con-figuration
core com-petency
Shafer et al (2005)
value pro-position, offering
strategy customer capture value
value network
processes resources
Stähler (2002)
value pro-position, products or services
- market design
revenue model
external value ar-chitecture
internal value ar-chitecture
internal value ar-chitecture
Timmers (1998)14
potential value
marketing strategy
- sources of revenue
architec-ture
architec-ture
-
14 This overview refers to Timmers’ (1998) definition of a ‘marketing model’.

12852
33
TABLE 2
Average growth rates for micropower businesses
2001 2002 2003 2004 2005 2006e 2007 to 2010eCAGR15 solar thermal sample 12.6 % 10.2 % 18.0 % 16.0 % 28.1 % 26.5 % 21.8 %
n 18 21 27 27 28 29 27For Comparison: CAGR of overall German solar thermal market (source: Sarasin 2006)
N/A N/A N/A N/A 27.6 % 34.0 %19.2 % (2007e)
CAGR micro CHP sample 14.8 % 24.8 % 17.5 % 11.7 % 12.0 % 36.0 % 29.0 %
n 11 12 13 15 17 22 21
15 CAGR: Compound Annual Growth Rate

12852
34
TABLE 3
Communication priorities and average historic and future growth rates
Communication priorities costs important (1-2) costs less important (3-5)solar thermalbusinesses
2001-2005: 10.7 %2006-2010e: 20.0 %
(n = 9)(n = 9)
2001-2005: 20.1 %2006-2010e: 27.5 %
(n = 9)(n = 11)quality
important(1-2) micro CHP
businesses2001-2005: 18.1 %2006-2010e: 22.6 %
(n = 9)(n = 13)
2001-2005: 8.7 %2006-2010e: 20.0 %
(n = 7)(n = 7)
solar thermalbusinesses
2001-2005: n/a2006-2010e: n/a
(n = 0)(n = 0)
2001-2005: 15.7 %2006-2010e: 17.8 %
(n = 8)(n = 8)quality less
important(3-5) micro CHP
businesses2001-2005: n/a2006-2010e: n/a
(n = 0)(n = 0)
2001-2005: [32.5 %]2006-2010e: [76.7 %]
(n = 2)(n = 3)

12852
35
TABLE 4:
Geographical distribution of revenues in the sample (weighted average)
Solar thermal sample Micro CHP sampleShare of
revenues in2005
(n = 34)2010e
(n = 34)2005
(n = 25)2010e
(n = 25)
Germany 50.8 % 42.0 % 94.4 % 81.4 %Austria 13.4 % 6.4 % 2.2 % 4.5 %Switzerland 11.5 % 12.3 % 1.0 % 2.3 %Rest of Europe 22.1 % 36.4 % 2.4 % 11.8 %Rest of World 2.2 % 2.9 % 0.0 % 0.0 %

12852
36
TABLE 5
Revenue share of different delivery configurations
Solar heating sample
Micro CHP sample
Delivery configuration 2005 2010e 2005 2010e
manufacturer intermediary installer final consumer 13.5 % 13.5 % 15.3 % 16.5 %
manufacturer wholesaler installer final consumer 32.8 % 31.1 % 8.9 % 13.1 %
manufacturer installer final consumer 32.6 % 29.4 % 38.7 % 34.4 %
manufacturer energy supplier final consumer 0.6 % 1.4 % 14.0 % 13.5 %
manufacturer intermediary final consumer 9.2 % 11.3 % 11.5 % 11.4 %
manufacturer final consumer 7.2 % 8.9 % 11.6 % 11.1 %
other configurations 4.1 % 4.4 % 0.0 % 0.0 %

12852
37
FIGURE 1
Business model components
Market components
value proposition strategy
customers revenue model
Configuration components
value partners value creationarchitecture
strategic resoures
Bus
ines
s m
odel

12852
38
FIGURE 2
Importance of micropower attributes for different customer segments as perceived by solar thermal businesses
capital and set-up costs
operating costs
advising and planning services
installation and maintenance services
avoidance of harmful emissions,climate protection
utilisation of renewable energyeco label
local/regional value generation
visual aspects
positive image
independent heat supply
eco-passive consumers eco-rational consumers eco-active consumer
5
1
n = 34
FIGURE 3
Importance of micropower attributes for different customer segments as perceived bymicro CHP businesses
capital and set-up costs
operating costs
advising and planning services
installation and maintenance services
avoidance of harmful emissions,climate protection
utilisation of renewable energyeco label
local/regional value generation
visual aspects
positive image
independent energy supply
eco-passive consumers eco-rational consumers eco-active consumer
5
1
n = 25

12852
39
FIGURE 4
Revenue models of micropower businesses
89%
43%
54%
6% 9%0% 0%
11%
85%
69%
46%
23%15% 12%
8%15%
0%
20%
40%
60%
80%
100%
syst
em s
ales
inst
alla
tion
and
mai
nten
ance
plan
ning
serv
ices
finan
cing
serv
ices
cont
ract
ing
serv
ices
fuel
sup
ply
leas
ing
serv
ices
othe
r
solar heating businesses (n = 35)
micro CHP businesses (n = 25)

12852
40
FIGURE 5
Success factors for micro CHP businesses as cited by respondents
70,6%
38,2%
50,0%
38,2%
32,4%
17,6%
14,7%
14,7%
11,8%
2,9%
8,8%
5,9%
8,8%
2,9%
2,9%
59,1%
59,1%
45,5%
40,9%
22,7%
22,7%
22,7%
18,2%
13,6%
13,6%
9,1%
9,1%
4,5%
4,5%
product quality and performance
technical services and advice
fair price
know-how and reliability
reputation of business/image of technology
delivery value chain
marketing and distribution of information
product range/choosing the right systems
energy savings/environmental benefits
independent energy supply
experience
motivated and skilled staff
diversification beyond regional markets
low manufacturing costs
security of supply
availability of financing services
performance measurement
solar heating businesses (n = 34)micro CHP businesses (n = 22)