Submission Data File - Ecopetrol
43
Submission Data File Date: 05/01/2012 08:30 AM User: mchen Vintage Filings Project: v311358 Form Type: 6-K Client: v311358_ECOPETROL S.A. (PRN CLIENT)_6-K General Information Form Type* 6-K Contact Name Matthew Judge Contact Phone 866-683-5332 Filer File Number Filer CIK* 0001444406 Filer CCC* ********** Confirming Copy No Notify via Website only No Return Copy No SROS* NONE Period* 05-01-2012 (End General Information) Document Information File Count* 2 Document Name 1* v311358_6k.htm Document Type 1* 6-K Document Description 1 Form 6-K (End Document Information) Notifications Notify via Website only No E-mail 1 matthew@vfilings.com (End Notifications)
-
Upload
khangminh22 -
Category
Documents
-
view
0 -
download
0
Transcript of Submission Data File - Ecopetrol

Submission Data File
Date: 05/01/2012 08:30 AM User: mchen Vintage Filings Project: v311358 Form Type: 6-K
Client: v311358_ECOPETROL S.A. (PRN CLIENT)_6-K
General Information Form Type* 6-K
Contact Name Matthew Judge Contact Phone 866-683-5332
Filer File Number Filer CIK* 0001444406 Filer CCC* **********
Confirming Copy No Notify via Website only No Return Copy No SROS* NONE Period* 05-01-2012
(End General Information)
Document Information File Count* 2
Document Name 1* v311358_6k.htm Document Type 1* 6-K Document Description 1 Form 6-K
(End Document Information)
Notifications Notify via Website only No E-mail 1 [email protected]
(End Notifications)
SECURITIES AND EXCHANGE COMMISSION Washington, D.C. 20549
FORM 6-K REPORT OF FOREIGN PRIVATE ISSUER
PURSUANT TO RULE 13a-16 OR 15d-16 OF THE SECURITIES EXCHANGE ACT OF 1934
May 2012
Commission File Number: 333-153452
ECOPETROL S.A.
(Exact name of registrant as specified in its Charter)
Carrera 7 No. 37 – 69
BOGOTA – COLOMBIA (Address of registrant’s principal executive offices)
Indicate by check mark whether the registrant files or will file annual reports under cover Form 20-F or Form 40-F.
Indicate by check mark if the registrant is submitting the Form 6-K in paper as permitted by Regulation S-T Rule 101(b)(1):
Indicate by check mark if the registrant is submitting the Form 6-K in paper as permitted by Regulation S-T Rule 101(b)(7):
Indicate by check mark whether by furnishing the information contained in this Form, the registrant is also thereby furnishing the information to the Commissionpursuant to Rule 12g3-2(b) under the Securities Exchange Act of 1934.
If “Yes” is marked, indicate below the file number assigned to the registrant in connection with Rule 12g3-2(b): 82- N/A
Date: 05/01/2012 08:30 AM User: mchen Vintage Filings Project: v311358 Form Type: 6-K
Client: v311358_ECOPETROL S.A. (PRN CLIENT)_6-K File: v311358_6k.htm Type: 6-K Pg: 1 of 42
Form 20-F ⌧ Form 40-F
Yes No ⌧
Yes No ⌧
Yes No ⌧

Ecopetrol Announces Its Results for the First Quarter of 2012
BOGOTA, April 30, 2012/ — Ecopetrol S.A. (BVC: ECOPETROL; NYSE: EC; TSX:ECP) announced today its unaudited financial results, both consolidatedand unconsolidated, for the first quarter of 2012, prepared and filed in Colombian pesos (COL$) in accordance with the Public Accountancy Legal Framework(Régimen de Contabilidad Pública - RCP) of Colombia’s General Accounting Office. Some figures in this report are presented in U.S. dollars (USD) where indicated. Tables shown in the body of the report are rounded to one digit. Figurespresented in COP$ billion are equivalent to COP$ one thousand million.
Ecopetrol S.A. Financial Results Highlights
1 Thousands of barrels of oil equivalent per day. 2 Earnings before taxes, interest, depreciation and amortization
Date: 05/01/2012 08:30 AM User: mchen Vintage Filings Project: v311358 Form Type: 6-K
Client: v311358_ECOPETROL S.A. (PRN CLIENT)_6-K File: v311358_6k.htm Type: 6-K Pg: 2 of 42
• The consolidated average production was 743.4 MBOED1 in the first quarter of 2012, an increase of 8.3% compared to the consolidated averageproduction for the first quarter of 2011.
• Revenues, operating income, EBITDA2 and net income of Ecopetrol S.A. in the first quarter of 2012 grew by 24.1%, 28.9%, 24.2% and 27.6%,respectively, compared to the first quarter of 2011.
• Ecopetrol S.A.’s net income for the first quarter of 2012 was COL$4,343.1 billion, equivalent to COL$105.63 per share.
Unconsolidated(COP$ Billion) 1Q 2012 * 1Q 2011 * ∆ %Total sales 15,387.8 12,399.2 24.1%Operating profit 6,928.3 5,376.7 28.9%Net Income 4,343.1 3,404.6 27.6%Earnings per share (COP$) 105.63 84.12 EBITDA 8,061.8 6,489.3 24.2%EBITDA Margin 52% 52%
Consolidated(COP$ Billion) 1Q 2012 * 1Q 2011 * ∆ %Total sales 17,970.5 14,387.7 24.9%Operating profit 7,480.7 5,678.9 31.7%Net Income 4,273.9 3,110.3 37.4%EBITDA 8,721.7 6,870.4 26.9%EBITDA Margin 49% 48% * Not audited, for illustration purposes only
Dirección de Relacionamiento con el Inversionista Tel: 2345190, correo electrónico: [email protected] www.ecopetrol.com.co
1

In the opinion of Ecopetrol S.A.’s CEO, Javier Gutiérrez:
“In the first quarter of 2012 the company continued growing in all its business segments, fulfilling its strategic goals and reaching record levels in volumesproduced, transported and sold. Additionally, the favorable price environment, together with our competitive cost structure, allowed reaching record net incomeand EBITDA during the quarter. In production, we reached a record level of 743 thousand barrels per day, a growth of 8% when compared to the same quarter of 2011. Our hydrocarbon transportation segment continued growing in response to increases in production in Colombia. During the first quarter of the year, dailytransportation capacity grew 7.5%. Additionally, we launched the integrity program for the infrastructure of the country with the objective of verifying all of transportation systems in the country toimprove and fortify the network to avoid incidents such as the ones in Dosquebradas and Cucuta. Our refining team continued to advance the project to modernize the Barrancabermeja and Cartagena facilities in order to improve the quality of our productsand the returns of the refining and petrochemical business. Sales volume increased 5.6% in the previous twelve months as a result of the market diversification strategy for crude oil and products, in the midst of afavorable price scenario in the international market. Given the record production, higher sale volumes and better prices, financial results were very positive. Revenues were 24% higher than in the first quarter of2011 and net income amounted to COP$4.3 trillion. The company had a strong cash balance by the end of the first quarter of the year which amounted toCOP$17.4 billion. Regarding organizational consolidation, I highlight the continued improvement in the safety and security standards of our operations and the accident frequencyindex with time losses which is a clear evidence of this improvement. The index reduced to 0.99 accident per million of worked hours, from 1.56 a year ago. Finally, in March of 2012 we held our Annual Shareholder Meeting with more than 16.000 shareholders, which is a record attendance. Beside presenting themanagement report and making the required elections, we approved a historically high dividend of COP$300 per share which was paid in one installment to ourminority shareholders starting on April 25th. To sum up, results of the first quarter are satisfactory and an important step towards the fulfillment of our goals in 2012.”
Date: 05/01/2012 08:30 AM User: mchen Vintage Filings Project: v311358 Form Type: 6-K
Client: v311358_ECOPETROL S.A. (PRN CLIENT)_6-K File: v311358_6k.htm Type: 6-K Pg: 3 of 42
Dirección de Relacionamiento con el Inversionista Tel: 2345190, correo electrónico: [email protected] www.ecopetrol.com.co
2

Ecopetrol S.A. announces its results for the first quarter of 2012
Table of Contents
Date: 05/01/2012 08:30 AM User: mchen Vintage Filings Project: v311358 Form Type: 6-K
Client: v311358_ECOPETROL S.A. (PRN CLIENT)_6-K File: v311358_6k.htm Type: 6-K Pg: 4 of 42
I. Financial and operating results 4a. Availability of crude and products 4b. Ecopetrol S.A. sales volume 5c. Crudes and product´s prices 7d. Financial results 8e. Ecopetrol’s cash flow 9f. Ecopetrol S.A. segment results 10g. Ecopetrol S.A. balance sheet 11
II. Business aspects 12a. Investment plan 12b. Exploration 12c. Production 14d. Refining and petrochemicals 17e. Transportation 18f. Biofuels 19
III. Organizational Consolidation, Social Corporate Responsibility and Corporate Governance 19a. Organizational consolidation 19b. Corporate responsibility 20c. Corporate governance 21
IV. Consolidated financial results 22V. Presentation of results 24VI. Exhibits 26VII. Subsidiaries results 32
Dirección de Relacionamiento con el Inversionista Tel: 2345190, correo electrónico: [email protected] www.ecopetrol.com.co
3
I. Financial and operating results
The availability of Ecopetrol S.A.’s crude oil, products and volumes produced, purchased and imported is summarized in the following exhibit: Ecopetrol S.A. (unconsolidated) Gross oil and gas production
* Purchase volume includes royalties from Ecopetrol and other companies
The main source of hydrocarbons for Ecopetrol S.A. (unconsolidated) operations was net production of crude oil and gas, which increased by 9.3% whencompared to the first quarter of 2011.
Date: 05/01/2012 08:30 AM User: mchen Vintage Filings Project: v311358 Form Type: 6-K
Client: v311358_ECOPETROL S.A. (PRN CLIENT)_6-K File: v311358_6k.htm Type: 6-K Pg: 5 of 42
a. Availability of crude and products
(MBOED) 1Q 2012 1Q 2011 ∆ (%)Crude Oil 579.1 537.0 7.8%Natural Gas 108.4 97.1 11.6%Total 687.5 634.1 8.4% (-) Royalties (MBOED) 1Q 2012 1Q 2011 ∆ (%)Crude Oil 85.7 82.6 3.8%Natural Gas 21.1 20.4 3.4%Total 106.8 103.0 3.7% (=) Net oil and gas production (MBOED) 1Q 2012 1Q 2011 ∆ (%)Crudo 493.4 454.4 8.6%Gas natural 87.3 76.7 13.8%Total 580.7 531.1 9.3% Purchase volume (MBOED)* 1Q 2012 1Q 2011 ∆ (%)Crude Oil 196.6 171.9 14.4%Products 6.8 6.9 -1.4%Natural Gas 27.8 35.2 -21.0%Total 231.2 214.0 8.0% Imports volume (MBD) 1Q 2012 1Q 2011 ∆ (%)Products 96.6 70.3 37.4%
Dirección de Relacionamiento con el Inversionista Tel: 2345190, correo electrónico: [email protected] www.ecopetrol.com.co
4

During the first quarter of the year, the higher volume of imported products was caused mainly by: 1) higher demand for diesel due to the economic growth inColombia; 2) greater crude oil diluent requirements to transport heavy crude and; 3) gasoline imports to secure supply during the scheduled maintenance of someunits at the refineries. Additionally, more crude oil was purchased in order given the business opportunities from the increase of production in Colombia. Gas purchases fell mainly because of lower purchases royalties given that the Decree 2100 of 2011 now allows our partners to sell royalties directly.
The following is a summary of sales volumes: Ecopetrol S.A. (unconsolidated) Sales volume
International market (60% of the first quarter of 2012 sales, 69% including sales to Free Trade Zones/ Reficar S.A.): The increase in volume exported by Ecopetrol (unconsolidated) was primarily the result of:
Date: 05/01/2012 08:30 AM User: mchen Vintage Filings Project: v311358 Form Type: 6-K
Client: v311358_ECOPETROL S.A. (PRN CLIENT)_6-K File: v311358_6k.htm Type: 6-K Pg: 6 of 42
b. Ecopetrol S.A. sales volume
Local sales volume (MBOED) 1Q 2012 1Q 2011 ∆ (%)Crude Oil 8.2 2.1 290.5%Natural Gas 57.5 72.6 (20.8)%Gasoline 66.2 68.7 (3.6)%Medium Distillates 108.1 105.1 2.9%LPG and propane 16.3 17.0 (4.1)%Fuel oil 2.3 0.8 187.5%Industrial and Petrochemical 14.2 16.8 (15.5)% Total Local Sales 272.8 283.1 (3.6)% Export sales volume (MBOED) 1Q 2012 1Q 2011 ∆ (%)Crude Oil 441.5 385.8 14.4%Products 53.6 51.4 4.3%Natural Gas 29.1 21.0 38.6%Total Export Sales 524.2 458.2 14.4% Sales to free trade zone (MBOED) 1Q 2012 1Q 2011 ∆ (%)Crude Oil 68.6 78.2 (12.3)%Products 2.9 2.5 16.0%Natural Gas 2.0 2.5 (20.0)%Total sales to free trade zone 73.5 83.2 (11.7)% Total sales volume 870.5 824.5 5.6%
• Crude oil: Higher availability of volumes of Magdalena Blend.
Dirección de Relacionamiento con el Inversionista Tel: 2345190, correo electrónico: [email protected] www.ecopetrol.com.co
5

The following is a summary of the main destinations of crude and product exports (not including natural gas) during the first quarters of 2011 and 2012:
In the first quarter of 2012, volumes of crude oil sold to Europe, the Far East and the U.S. increased, offset by a reduction in exports to the Caribbean. Highervolumes of products were sold to the Caribbean and the Far East. Local market (40% of sales in the first quarter of 2012, 31% excluding sales to Free Trade Zone/Reficar S.A.): The reduction in local sales volume in the first quarter of 2012 was primarily explained by the net result of:
Date: 05/01/2012 08:30 AM User: mchen Vintage Filings Project: v311358 Form Type: 6-K
Client: v311358_ECOPETROL S.A. (PRN CLIENT)_6-K File: v311358_6k.htm Type: 6-K Pg: 7 of 42
• Natural gas: Higher sales to Venezuela. Additionally, Ecopetrol exported directly some additional gas which last year was sold to local partners, to belater exported by them.
• Products: Higher delivery of fuel oil production and gasoline from contracts signed with clients in Central America and the Caribbean.
Export destinations - CrudesDestination 1Q 12 1Q 11
U.S. Gulf Coast 48.2% 45.1%Far East 21.3% 19.2%Caribbean 0.7% 14.4%U.S. West Coast 12.2% 11.3%South America 6.0% 4.1%Europe 7.1% 2.9%Central America 0.2% 1.6%Canada 0.0% 1.4%U.S. Atlantic Coast 4.3% 0.0% 100.0% 100.0%
Export destinations - Products Destination 1Q 12 1Q 11
U.S. Gulf Coast 31.2% 36.3%Caribbean 41.2% 28.8%U.S. Atlantic Coast 10.4% 31.8%South America 0.0% 0.0%Central America 0.7% 3.1%Far East 16.2% 0.0%U.S. West Coast 0.3% 0.0% 100.0% 100.0%
1) Lower sales volume of the following products:
• Natural gas: due to a reduction in thermal generation in Colombia and higher volume exported directly. Also, starting January 2012, other companies were authorized to sign commercialization agreements to sell gas royalties (Decree 2100 of 2011). Therefore, Ecopetrol stoppedselling gas royalties from some fields owned by third parties.
• LPG and propane: lower demand due to its substitution by natural gas • Gasoline: decreased because the mix of ethanol in gasoline rose from 8% to 10% in Colombia’s central region. This new blend reduced
Ecopetrol’s volume sold of gasoline. • Industrial and petrochemicals: Reduction in aromatics and polyethylene availability due to the maintenance stoppages in the Barrancabermeja
refinery.
2) Higher sales volume of the following products:
• Crude oil: greater availability of heavy crude (Moriche, Jazmín and Rubiales) for marine fuel market (bunkers).
Dirección de Relacionamiento con el Inversionista Tel: 2345190, correo electrónico: [email protected] www.ecopetrol.com.co
6
* Free trade zone = Reficar S.A.
During the first quarter of 2012 there was a rise in the price of the export basket of crudes due to higher international prices and the strengthening of Castillablend’s price, in line with the performance of heavy crudes. Price of crude oils have benefited from lower supply due to maintenance and operating problems in Venezuelan and Canadian pipelines. Differentials of crude exports improved USD$9.0 per barrel versus Brent, and USD$13.4 per barrel versus WTI when compared to first quarter of 2011. Theimprovement comes after the geographic and index diversification trading strategy. Ecopetrol is no longer using WTI as a reference for trading, replacing it byother references such as Brent and Maya.
Date: 05/01/2012 08:30 AM User: mchen Vintage Filings Project: v311358 Form Type: 6-K
Client: v311358_ECOPETROL S.A. (PRN CLIENT)_6-K File: v311358_6k.htm Type: 6-K Pg: 8 of 42
• Medium distillates: increase of jet fuel and diesel due to a greater demand driven by the Colombia’s economic growth (mainly mining industry and air travel).
• Fuel oil: higher volumes produced.
c. Crudes and product´s prices
Prices 1Q 2012 1Q 2011 ∆ (%)WTI (average) (US$/Bl) 102.9 94.2 9.2%Brent (average) (US$/Bl) 118.3 105.2 12.5%Export crude oil basket (US$/Bl) 111.2 89.1 24.8%Crudes sold to free trade zone* (US$/Bl) 115.3 94.4 22.1%Export products basket (US$/Bl) 106.3 88.4 20.2%Products sold to free trade zone* (US$/Bl) 88.8 107.3 -17.2%Natural gas basket (US$/MMBTU) 5.8 4.2 38.1%Gas sold to free trade zone* (US$/MMBTU) 5.7 4.2 35.7%
Dirección de Relacionamiento con el Inversionista Tel: 2345190, correo electrónico: [email protected] www.ecopetrol.com.co
7

* Not audited, for illustration purposes only
Operating income for the first quarter of 2012 increased by 24% compared to the same period of 2011, due mainly to: 1) higher international benchmark pricesduring the first quarter of 2012, which generated increases of 24.8% in export crude prices and 20.2% in export products; 2) a growth of 10.5% in export volumes(including sales to Free Trade Zone); 3) a decline of 3.6% in local sales volume, mainly natural gas; and 4) the negative effect of a 4.2% revaluation of theColombian peso versus the U.S. dollar. Cost of sales in the first quarter of 2012 was increased 25.8% compared to the same quarter of 2011. The variation is largely attributable to a 26.4% net increasein variable costs, as the result of: 1) a larger volume of crude purchased from the National Hydrocarbons Agency - ANH (980 MBOED), coupled with theUS$22.4/Bl rise in average purchase price; 2) an increase in volumes and reference prices compared to first quarter 2011 of the following imports: diluentnaphtha for transporting heavy crude (1,186 MBOED), gasoline (802 MBOED), and low sulfur diesel (405 MBOED). A 23.3% increase in fixed costs as compared to the first quarter of last year is attributable mainly to greater operating activity, as well as 1) an increase in depreciations of COL$29.6 billion from new capitalizations; 2) COL$166.7 billion in expenditures on contracted services, namely association contracts wherethere was greater participation derived from the application of high price clauses and greater operating activity; and 3) COL$40.1 billion in maintenance works atrefining plants, transportation systems and other facilities.
Date: 05/01/2012 08:30 AM User: mchen Vintage Filings Project: v311358 Form Type: 6-K
Client: v311358_ECOPETROL S.A. (PRN CLIENT)_6-K File: v311358_6k.htm Type: 6-K Pg: 9 of 42
d. Financial results
Unconsolidated Income Statement (COP$ Billion) 1Q 2012 * 1Q 2011 ∆ (%)
Local Sales 4,539.3 4,089.5 11.0%Export Sales 9,132.2 6,657.3 37.2%Sales to free trade zone 1,347.6 1,302.5 3.5%Sales of services 368.7 349.9 5.4%
Total Sales 15,387.8 12,399.2 24.1%Variable Costs 6,091.0 4,817.5 26.4%Fixed Costs 1,576.1 1,277.9 23.3%Cost of Sales 7,667.1 6,095.4 25.8%
Gross profit 7,720.7 6,303.8 22.5%Operating Expenses 792.4 927.1 (14.5)%
Operating Profit 6,928.3 5,376.7 28.9%Non Operating Loss (514.1) (284.5) 80.7%
Income tax 2,071.1 1,687.6 22.7%Net Income 4,343.1 3,404.6 27.6% Earnings per share (COP$) 105.6 84.1 25.6%EBITDA 8,061.8 6,489.3 24.2%EBITDA Margin 52% 52%
Dirección de Relacionamiento con el Inversionista Tel: 2345190, correo electrónico: [email protected] www.ecopetrol.com.co
8

In the first quarter of 2012, operating expenditures saw a reduction of 14.5% compared to the first period of 2011. The variation was primarily the result of 1) areduction in exploration expenditures and projects given that figures from first quarter of 2011 include purchase rights to the Cano Sur block, and 2) increase inoperating expenses and marketing associated mainly with the increased cost of transporting crude for export through the pipelines. The operating margin for the first quarter of 2012 was 45.0%, compared to 43.4% for the first quarter of 2011.
The non-operating result for the first quarter amounted to a loss of COL$514 billion, compared to a loss of COL$284 in first quarter 2011. The main results ofthe variation stemmed from: 1) a loss from exchange rate of COL$264 billion; 2) provision expenses for COL$77 billion, mainly from a pension allowance forCOL$106 billion because of lower returns of the portfolios that fund the company´s pension liability; and 3) a COL$ 107 billion improvement in the results ofcompanies, coming from the equity method. The growth in the income tax provision is mainly the result of a 26% net increase in pre-tax earnings. Strong operating results produced largely by better prices, higher production and the effectiveness of certain cost initiatives drove Ecopetrol’s net income to increase by 27.6%, compared to the first quarter of 2011, to a total of COL$4,343 billion (COL$105.63 per share compared to COL$84.12 per share in the sameprior last year). Net margin was 28.2%, versus 27.5% in the first quarter of 2011. EBITDA was COL$8,062 billion, a gain of 24.2%, with EBITDA marginremaining flat at 52% compared to the 2011 first quarter.
*For purposes of recording, balances in U.S. dollars are converted monthly at the average exchange rate. The initial cash position for each quarter is calculated based on the average rate for the last month of the respective quarter.
As of March 31, 2012 Ecopetrol had COL$17,365 billion in cash and portfolio investments (52% denominated in U.S. dollars).
Date: 05/01/2012 08:30 AM User: mchen Vintage Filings Project: v311358 Form Type: 6-K
Client: v311358_ECOPETROL S.A. (PRN CLIENT)_6-K File: v311358_6k.htm Type: 6-K Pg: 10 of 42
e. Ecopetrol’s cash flow
Col$ Trillion * 1Q 2012 1Q 2011Initial Cash 9,238 5,479Cash generated from operations (+) 16,514 11,125Cash used in operations (-) (7,208) (5,933)Capex (-) (1,339) (1,557)Acquisitions (-) - (769)Dividend payments (-) - -Equity offering (+) 121 -New debt (+) - 179Other inflows (+/-) 604 -Fx differences (+) (566) (20)Final Cash 17,365 8,504
Dirección de Relacionamiento con el Inversionista Tel: 2345190, correo electrónico: [email protected] www.ecopetrol.com.co
9

Note: The report by segment is calculated based on transfer prices between business units, using as reference export parity prices. Due to changes inmethodology, 2011 crude pipeline and river transport expenses were reallocated to other segments. Exploration and Production: In the first quarter of 2012, net income for the segment was COL$4,370.5 billion, 35.1% above that of the same period a year ago. EBITDA margin was 76.5%because of the higher volumes sold and better sales prices due to the sales benchmark switch from WTI to other indexes. The segment results were affected by theattacks on the Cano Limon and Transandino oil Pipelines. Refining: In the first quarter of 2012 the segment had a net loss of COL$156 billion, COL$108 billion higher than that of the first quarter of last year, mainly as a result ofhigher raw material costs, whose price is set according to Ecopetrol´s crude export prices. In addition, the scheduled stoppage at the bottom product distillationcolumn lowered the valuable product index at the Barrancabermeja Refinery and therefore the margins. EBITDA margin was -0.8% compared to 6.9% for the first quarter of last year. Transportation: This segment had net income of COL$87.7 billion in the first quarter of 2012, down 20.5% compared to the first quarter of last year (COL$110 billion). Earningsrose as a result of the higher volumes of production countrywide. However, costs and expenses increased significantly primarily because of maintenanceexpenditures related to our transportation infrastructure. Non-operating expenses increased substantially due to recognition of the equity tax. EBITDA margin forthe first quarter of 2012 was 56.1% compared to 57.8% for the same period of 2011. Sales and Marketing: In the first quarter of 2012, the segment recorded net income of COL$41.2 billion, a COL$66.2 billion decline compared to the same period of 2011. This was theresult of the higher transportation cost of crude and solvent purchases for transporting heavy crude, plus lower trading margins for gas. The segment had asignificant non-operating impact due to a revaluation, taking into account that the main destinations of its products are foreign markets. EBITDA margin for thequarter was 3.0%, while in last year’s first quarter it was 7.0%.
Date: 05/01/2012 08:30 AM User: mchen Vintage Filings Project: v311358 Form Type: 6-K
Client: v311358_ECOPETROL S.A. (PRN CLIENT)_6-K File: v311358_6k.htm Type: 6-K Pg: 11 of 42
f. Ecopetrol S.A. segment results
Quarterly Results by SegmentCOP$ Billion E&P Refining & Petrochem. Transportation Sales and Marketing
1Q-12 1Q-11 1Q-12 1Q-11 1Q-12 1Q-11 1Q-12 1Q-11Domestic Sales 3,832.8 3,353.2 4,289.1 3,829.2 637.0 532.7 297.8 269.3International Sales 6,144.7 4,695.5 911.7 773.1 - - 3,423.4 2,491.2Total Sales 9,977.6 8,048.7 5,200.7 4,602.3 637.0 532.7 3,721.2 2,760.5Operating Revenues 6,712.3 4,751.8 (164.5) 201.2 271.7 231.2 108.8 192.6Operating Margin 67.3% 59.0% (3.2)% 4.4% 42.6% 43.4% 2.9% 7.0%Net Income 4,370.5 3,234.8 (156.3) (47.8) 87.7 110.3 41.2 107.4Net Margin 43.8% 40.2% (3.0)% (1.0)% 13.8% 20.7% 1.1% 3.9%EBITDA 7,636.1 5,671.9 (42.9) 315.5 357.6 307.7 111.2 194.2Ebitda Margin 76.5% 70.5% (0.8)% 6.9% 56.1% 57.8% 3.0% 7.0%
Dirección de Relacionamiento con el Inversionista Tel: 2345190, correo electrónico: [email protected] www.ecopetrol.com.co
10
The main variations in assets stemmed from: 1) an increase in cash and cash equivalents from higher treasury surpluses caused by higher hydrocarbon prices during the first quarter of 2012; 2) an increase in investments, mainly Term Deposits and short-term Treasury Securities to be used in payment of taxes, dividends and investments; 3) Reductions in accounts receivables, especially the US$831 million payment by the Cartagena Refinery for sale of crude; 4) an increase inprojects for COL$881 billion; 5) Capitalizations by Ecopetrol Oleo é Gas do Brasil Ltda for US$29.5 million, Ecopetrol Capital AG for US$130 million, andEcopetrol Global Energy for COP$94 million. As of the end of March 2012, liabilities represented 49.5% of assets. The main variations occurred in: 1) current liabilities from the recognition of the 2011dividend payment obligation in the amount of COL$12,335 billion, equivalent to COL$300 per share and, 2) an the increase in tax obligation provision (incometax) of COL$8,434 billion. Financial obligations accounted for 12.7% of total liabilities and the equivalent of 6.3% of total assets, including: 1) a 2009 credit facility with 11 national banksfor COL$ 1,998 billion; 2) a US$1,500 million bond issue in 2010; 3) internal public debt bonds for COL$1,000 billion; 4) Gibraltar Gas Plant contract (BOMT)with the firm Union Temporal Gas Gibraltar, whose balance as of March was COL$63.2 billion. Equity amounted to COL$47,066 billion as of March 2012, compared to COL$55,011 million at the end of 2011. The variation is due to the transfer to accounts payable of dividends paid on 2011 earnings, offset by COL$4,343 billion in first quarter 2012´s net income.
Date: 05/01/2012 08:30 AM User: mchen Vintage Filings Project: v311358 Form Type: 6-K
Client: v311358_ECOPETROL S.A. (PRN CLIENT)_6-K File: v311358_6k.htm Type: 6-K Pg: 12 of 42
g. Ecopetrol S.A. balance sheet
Unconsolidated Balance Sheet(COP$ Billion) March 31, 2012 December 31, 2011 ∆ (%)Current Assets 20,765.4 15,824.1 31.2%Long Term Assets 72,432.2 69,427.1 4.3%Total Assets 93,197.6 85,251.2 9.3%Current Liabilities 29,543.9 13,818.3 113.8%Long Term Liabilities 16,587.4 16,421.8 1.0% Total Liabilities 46,131.3 30,240.1 52.6%Equity 47,066.3 55,011.0 (14.4)%Total Liabilities and Shareholders´ Equity 93,197.6 85,251.1 9.3% Debit Memorandum accounts 121,666.8 122,266.3Credit Memorandum accounts 101,153.8 103,461.1
Dirección de Relacionamiento con el Inversionista Tel: 2345190, correo electrónico: [email protected] www.ecopetrol.com.co
11

II. Business aspects
The following is a summary of investments by Ecopetrol for the first quarter of 2012 and 2011:
Investments in the first quarter of 2012 totaled US$1,107.0 million, a reduction of 40% when compared to the same quarter of 2011, explained mainly by: 1) theauthorization given in the first quarter of 2011 for the purchase and development of the Caño Sur block and, 2) the approval of additional resources to pay theobligations from the acquisition of Equion Energía. Of the total invested in the quarter, 63% was allocated to production (US$697.0 million), 15% to subsidiaries (US$166.0 million), 11% to transportation(US$126.0 million), 6% to exploration (US$62.0 million), 4% to refining and petrochemicals (US$46.0 million) and the remaining 1% to the corporate segment(US$10.0 million).
Exploration in Colombia: During the first quarter of 2012, the Tisquirama Este-1 well was drilled in the Tisquirama Block in the province of Cesar, 100% owned and operated by Ecopetrol. As of the end of the quarter this well was in evaluation but later in April the presence of hydrocarbons was confirmed, with an initial production of 624MBOD and API of 23. In order to estimate full potential, further tests will take place in the coming months as well as drilling of two appraisal wells. Additionally, Ecopetrol (as operator) drilled two stratigraphic wells on block CPE-2 located in Vichada province, which were dry. Seven exploratory appraisalwells were drilled, six of them on the Quifa block (operated by Metapetroleum), and the remainder on the Cano Sur block (operated by Ecopetrol).
Date: 05/01/2012 08:30 AM User: mchen Vintage Filings Project: v311358 Form Type: 6-K
Client: v311358_ECOPETROL S.A. (PRN CLIENT)_6-K File: v311358_6k.htm Type: 6-K Pg: 13 of 42
a. Investment plan
Capex (US$ million) Business Segment 1Q 2012 1Q 2011 ∆ (%)
Exploration 62.0 289.0 -79%Production 697.0 629.0 11%Refining and Petrochemicals 46.0 75.0 -39%Transportation 126.0 118.0 7%Subsidiaries 166.0 322.0 -48%Acquisitions - 410.0 -100%Corporate 10.0 12.0 -17%Total 1,107.0 1.855,0* -40%* Investments in acquisitions and new exploration business were revised in order to show accrued amounts instead of committed amounts.
b. Exploration
Dirección de Relacionamiento con el Inversionista Tel: 2345190, correo electrónico: [email protected] www.ecopetrol.com.co
12

Additionally, drilling was completed on La Luna 1, Ecopetrol´s first stratigraphic well in the search for non-conventional hydrocarbons. Results of the well were under evaluation at the end of the first quarter of 2012. At the end of the quarter, Ecopetrol was drilling three stratigraphic wells, two on block CPE-2 and one on block CPO-9. Additionally, two appraisal wells werebeing drilled on Quifa block by the operator Metapetroleum. Regarding offshore activity, during the quarter, the exploration platform Offshore Mischief arrived to Cartagena, which is a specialized rig to drill during the next six months the exploratory wells Mapalé 1 and Mapalé 2, located in the Caribbean offshore. The objective is to determine if there are commercial hydrocarbonreserves on block RC5, assigned by the ANH to the partnership of Ecopetrol (30%), Equión Energía (30%), and Petrobras (40%).
Drilling in Colombia (A2/A3 and Stratigraphic) - 1Q 2012 Ecopetrol S.A.
* Includes one stratigraphic well of unconventional hydrocarbons Regarding the activities of our subsidiaries, Hocol drilled four A3/A2 and five stratigraphic wells during the first quarter of 2012. There was presence ofhydrocarbons in two A3/A2 wells, one is being evaluated (Mamey), and one was declared dry (Margay). Two of the five stratigraphic wells showed presence ofhydrocarbons and three were declared dry (ST1, ST3, ST5).
Drilling in Colombia (A2/A3 and Stratigraphic) - 1Q 2012
Hocol
Date: 05/01/2012 08:30 AM User: mchen Vintage Filings Project: v311358 Form Type: 6-K
Client: v311358_ECOPETROL S.A. (PRN CLIENT)_6-K File: v311358_6k.htm Type: 6-K Pg: 14 of 42
Type of well Number of wells Hydrocarbon
Presence In evaluation DryA3/A2 1 0 1 0
Stratigraphic* 3 0 1 2
Type of well Number of wells Hydrocarbon
Presence In evaluation DryA3/A2 4 2 1 1
Stratigraphic 5 2 0 3
Dirección de Relacionamiento con el Inversionista Tel: 2345190, correo electrónico: [email protected] www.ecopetrol.com.co
13

The following is a summary of successful wells:
International exploration: During the first quarter of the year, the Itauna 2 appraisal well was drilled in Brasil in the BMC-29-Block, where Ecopetrol has a 50% interest and Anadarko (the operator) has the remainder 50%. Results were under evaluation by the end of the quarter. In March, the Bureau of Ocean Energy Management (BOEM) of the U.S. Department of the Interior officially awarded to Ecopetrol America Inc blocks EB–284, 285, 328 and 329, located in deep wathers of the East Breaks sector of the U.S. Gulf Coast. Additionally, the awarding of the KC-623 block, at the Keathley Canyon sector was confirmed in February. With these announcements on the results of Lease Sale 218, Ecopetrol adds five new exploratory wells to its portfolioin the U.S. Gulf Coast,.
Corporate Group Production: The consolidated gross production was 743.4 MBOED3 in the first quarter of 2012, an increase of 8.3% compared to the production in the same quarter of 2011. In the first quarter of 2012, Ecopetrol S.A.’s gross production (including royalties) accounted for 92.5% of the Corporate Group´s total production, Hocol 3.9%,Equion 2.3%, Savia 1.0%, and Ecopetrol America the remaining 0.3%. 3 Includes 7.2 MBOED of white products
Date: 05/01/2012 08:30 AM User: mchen Vintage Filings Project: v311358 Form Type: 6-K
Client: v311358_ECOPETROL S.A. (PRN CLIENT)_6-K File: v311358_6k.htm Type: 6-K Pg: 15 of 42
Exploratory wellsQuarter Operator Basin Block Well
1 Hocol Llanos Guarrojo Pintado1 Hocol Llanos CPO 17 Dorcas
Stratigraphic wellsQuarter Operator Basin Block Well
1 Hocol Llanos CPO 16 ST3A1 Hocol Llanos CPO 16 ST6
c. Production
Dirección de Relacionamiento con el Inversionista Tel: 2345190, correo electrónico: [email protected] www.ecopetrol.com.co
14

Corporate Group´s Production
* Gas production for the first quarter of 2012 includes 7,2 mboed of white products ** Production for the first quarter of 2011 was revised in order to show production on field instead of sold volumes
Date: 05/01/2012 08:30 AM User: mchen Vintage Filings Project: v311358 Form Type: 6-K
Client: v311358_ECOPETROL S.A. (PRN CLIENT)_6-K File: v311358_6k.htm Type: 6-K Pg: 16 of 42
Ecopetrol S.A. gross oil and gas production (mboed) 1Q 2012 1Q 2011 ∆ (%)Crude Oil 579.1 537.0 7.8%Natural Gas* 108.4 97.1 11.6%Total 687.5 634.1 8.4% Hocol (mboed) 1Q 2012 1Q 2011 ∆ (%)Crude Oil 28.5 30.5 -6.6%Natural Gas 0.5 0.8 -37.5%Total 29.0 31.3 -7.3% Savia (mboed)** 1Q 2012 1Q 2011 ∆ (%)Crude Oil 6.6 6.2 6.5%Natural Gas 0.8 1.2 -33.3%Total 7.4 7.4 0.0% Equion (mboed) 1Q 2012 1Q 2011 ∆ (%)Crude Oil 10.6 6.5 63.1%Natural Gas 6.6 5.0 32.0%Total 17.2 11.5 49.6% Ecopetrol America-K2 (mboed) 1Q 2012 1Q 2011 ∆ (%)Crude Oil 2.1 1.8 16.7%Natural Gas 0.2 0.2 0.0%Total 2.3 2.0 15.0% Corporate Group 1Q 2012 1Q 2011 ∆ (%)Crude Oil 626.9 582.0 7.7%Natural Gas 116.5 104.3 11.7%Total Group's production 743.4 686.3 8.3%
Dirección de Relacionamiento con el Inversionista Tel: 2345190, correo electrónico: [email protected] www.ecopetrol.com.co
15
Production of Ecopetrol S.A.: Ecopetrol S.A.’s gross production equivalent of crude oil and gas grew 8.4% over last year’s first quarter, from 634.1 MBOED to 687.54 MBOED with 84.2% of crude oil.
*Does not include subsidiary companies In the first quarter of 2012, the company experienced security issues and attacks against the Caño Limon – Coveñas pipeline that impacted the growth of crude oil production. Production of heavy crude oil accounted for 51% of total crude production increasing 20.1% over the production of the first quarter of 2011. The fields withhighest production were: 1) Castilla and Chichimene which reached an average quarterly production of 109.6 MBOD and 42.7 MBOD respectively; 2) Inpartnership operations, the assets with the greatest participation were Rubiales and Quifa (in partnership with Metapetroleum), which contributed 121.4 MBOD ofgross production for Ecopetrol; and 3) Chuchupa and Ballena with 60 MBOED and Cusiana with 37 MBOED for Ecopetrol. Gas sales in the first quarter of 2012, not including white products, were 101.1 MBOED. According to the drilling plans for this year, 170 development wells were drilled in the first quarter of 2012. The reduction when compared to same quarter of2011 is part of this year’s plan and does not compromise meeting 2012 production targets. The following is a summary of development wells by region:
4 Includes 7.2 MBOED of white products
Date: 05/01/2012 08:30 AM User: mchen Vintage Filings Project: v311358 Form Type: 6-K
Client: v311358_ECOPETROL S.A. (PRN CLIENT)_6-K File: v311358_6k.htm Type: 6-K Pg: 17 of 42
Production per type of crude* 1Q 2012 1Q 2011 ∆ (%)Light crudes 61.3 60.0 2.2%Medium crudes 221.3 230.3 -3.9%Heavy crudes 296.5 246.7 20.2%Total 579.1 537.0 7.8%
Development wells 1Q 2012 1Q 2011
Region Direct In
partnership Total Direct In partnership Total ∆ (%)Magdalena 20 41 61 33 100 133 -54.1%Central 37 49 86 48 63 111 -22.5%Nororiental - 2 2 1 3 4 -50.0%Catatumbo Orinoquia 1 12 13 1 13 14 -7.1%South 1 5 6 1 8 9 -33.3%Minor fields - 2 2 - - - 0.0%Total 59 111 170 84 187 271 -37.3%
Dirección de Relacionamiento con el Inversionista Tel: 2345190, correo electrónico: [email protected] www.ecopetrol.com.co
16

Lifting costs of Ecopetrol S.A.: Lifting cost per barrel produced by Ecopetrol S.A. in the first quarter of 2012 was US$9.14 (based on the methodology approved by the SEC, which does notinclude royalties in the calculation of per barrel costs), an increase of US$1.73 per barrel as compared to the same period of 2011, as the net result of:
Barrancabermeja Refinery:
Throughput at the refinery fell 12.7% in the first quarter of 2012 compared to the same period of the preceding year. The utilization factor dropped from 82.7% to64.8% due to scheduled maintenance of the bottom product distillation column. With regard to the modernization project, contracts for all risk insurance were awarded for the assembly, construction and transporting of materials and heavyequipment. By the end of the quarter, 10% progress had been reached. The master plan for industrial services was 42% complete by the end of the quarter. Cost and refining margins of the Barrancabermeja refinery: Operating cash cost of the Refinery for the first quarter of 2012 was US$6.78 per barrel, an increase of US$1.88 per barrel compared to the same quarter of 2011as the net result of:
Date: 05/01/2012 08:30 AM User: mchen Vintage Filings Project: v311358 Form Type: 6-K
Client: v311358_ECOPETROL S.A. (PRN CLIENT)_6-K File: v311358_6k.htm Type: 6-K Pg: 18 of 42
• Higher costs of the associated operation related to high-price clauses, increase in water treatment volumes, logistical schemes designed to face specific situations derived from attacks against transportation infrastructure and efforts to reactivate wells (US$+2.01 per barrel).
• Revaluation of the Colombian peso versus the U.S. dollar (US$+0.37 per barrel).• Lower costs from higher production volumes (US$-0.65 per barrel).
d. Refining and petrochemicals
Refinery runs* Mbod 1Q 2012 1Q 2011 ∆ (%)Barrancabermeja 200.3 229.5 (12.7)% * Includes volumes used in the refinery, not total volumes received.
• Higher costs due to decreased throughput given the scheduled stoppages (US$+0.80 per barrel). • Higher costs due to: 1) maintenance during scheduled stoppages, 2) greater utilization of labor hours, and 3) higher service requirements generated by
plant stoppages (US$+0.81)• Higher cost due to the Colombian peso revaluation vs. the U.S. dollar (US$+0.27 per barrel).
Dirección de Relacionamiento con el Inversionista Tel: 2345190, correo electrónico: [email protected] www.ecopetrol.com.co
17

Gross refining margin for the first quarter of 2012 was US$5.92 per barrel, down 55.5% from the US$13.31 per barrel during the same period of last year. Thisreduction in margin comes from a cost increase of US$13.4 per barrel due to the higher crude export prices which are the benchmark of the refinery´s feedstock.Results were also affected by the lower percentage of valuable products from the scheduled maintenance at the bottom product distillation column. Reficar S.A. (Cartagena Refinery):
Crude oil throughput at the refinery fell 5.9% in the first quarter of 2012 compared to the same period of 2011, due to less availability of light crude after theattacks versus the Cano-Limo-Coveñas Pipeline and the Oleoducto Transandino. The utilization factor went from 82.67% to 50.8% due to scheduled maintenanceon the cracking unit. Gross refining margin for the first quarter was US$5.44/Bl, a reduction of 44% compared to the same quarter of last year, as the result of higher crude exportprices which are the benchmark of the feedstock. Additionally there was a lower production of gasoline due to the maintenance of the cracking unit. As of March 31, 2012, the expansion and modernization project at the refinery was 61.3%, complete in with COL$650 billion invested.
Transported volumes: In the first quarter of 2012, an average 1,224.3 MBOD was transported (316.6 MBOD in refined products and 907.7 MBOD of crude oil), an increase of 85.1MBOD (7.5%) compared to the daily average volume transported in the first quarter of 2011 (1,139.2 MBOD5). Higher transported volumes were led mainly by the increased transportation of crude and diluents in the Llanos region. The following are the highlights of the quarter: Crude oil:
Date: 05/01/2012 08:30 AM User: mchen Vintage Filings Project: v311358 Form Type: 6-K
Client: v311358_ECOPETROL S.A. (PRN CLIENT)_6-K File: v311358_6k.htm Type: 6-K Pg: 19 of 42
Refinery runs* Mbod 1Q 2012 1Q 2011 ∆ (%)Cartagena 73.6 78.2 (5.9)% * Includes volumes used in the refinery, not total volumes received.
e. Transportation
• Installation of two 85 MBOD pumping units to increase the capacity of the Monterrey – Altos del Porvenir system from 340 to 550 MBOD. These units should start operations during the second quarter of the year.
• The 20 MBOD pumping unit on the Galan – Ayacucho 14” system was put in place.• Start of operations of a new line that allows handling the Bachado crude in the Rubiales – Monterrey ODL system.• Beginning of the construction contract for the Apiay - Monterrey 30” oil pipeline.
5 Transported volumes reported in the first quarter of 2011 were reestimated because of 1) an adjustment in the information, and 2) the addition of the volumes transported through the El Viento –Cusiana pipeline
Dirección de Relacionamiento con el Inversionista Tel: 2345190, correo electrónico: [email protected] www.ecopetrol.com.co
18

Storage facilities:
Transportation costs: The barrel/kilometer transport cost for the first quarter of 2012 was COL$7.07/BKM, decreasing COL$0.18/BKM when compared to the same quarter of last year(COL$7.25 /BKM), due primarily to:
Oleoducto Bicentenario: During the first quarter of 2012 construction proceeded on phase I of the project (construction of the Araguaney – Banadía line) of which 52.09% had beencompleted. By the end of the quarter the total Capex amounted to US$779,747.
Ecodiesel Colombia S.A.: During the first quarter of 2012 a total of 30.3 thousand tons of biofuels were produced, compared to 22.5 thousand tons in the first quarter of 2011, mainlyexplained by a better operating efficiency and a 96% utilization factor. Sales of biofuels and its byproducts generated revenues of COL$79.9 in the quarter. Bioenergy S.A.: The Bioenergy project was completed in 33.8% by the end of the first quarter (32.1% an industrial component and 38.0% an agricultural component). The projectis expected to start operations by the first quarter of 2013. III. Organizational Consolidation, Social Corporate Responsibility and Corporate Governance
a Health, Safety and Environment (HSE): In the first quarter of 2012, the Lost Time Accident Frequency Index was 0.99 accidents per million man hours, an improvement over the 1.56 accidents permillion man hours in the same quarter of the previous year. During this quarter, 35 accidents were reported, a 28% decrease in comparison to the first quarter of2011.
Date: 05/01/2012 08:30 AM User: mchen Vintage Filings Project: v311358 Form Type: 6-K
Client: v311358_ECOPETROL S.A. (PRN CLIENT)_6-K File: v311358_6k.htm Type: 6-K Pg: 20 of 42
• The TK 142 storage tank was delivered in the Puerto Salgar plant with 56 MBD of reinstated capacity.
• Lower costs associated with greater transported volumes (COL$-1.41/BKM).• Higher costs as the result of: 1) an increase in processing raw materials for higher volumes of drag reducing agents required to handle higher transported
volume, 2) maintenance to ensure that the systems are operating properly and to address geotechnical maintenance issues associated with the harsh rainseason, 3) higher infrastructure aerial surveillance costs, and 4) higher depreciations given the start of operations of revamped systems and new pipelinesand multipurpose lines (COL$+1.23 BKM).
f. Biofuels
a. Organizational consolidation
Dirección de Relacionamiento con el Inversionista Tel: 2345190, correo electrónico: [email protected] www.ecopetrol.com.co
19
With respect to environmental management, the company signed technical cooperation agreements with the U.S. Environmental Protection Agency – EPA (in the framework of the Global Methane Initiative) and the Canadian government through PTAC (Petroleum Technology Alliance of Canada) for identification andevaluation of mitigation opportunities for greenhouse gases and increasing energy efficiency in the various areas where Ecopetrol operates. The donation thatEcopetrol will receive for the period March 2012-March 2013 is estimated at US$1.5 million. In the first quarter of 2012, there were 4 environmental accidents pursuant and 76 barrels were spilled. The results show a marked improvement over the firstquarter of last year in which there were 2,274 barrels spilled and 11 environmental accidents due to operating causes. On April 16, 2012, Ecopetrol was served with a class action suit against the company seeking monetary damages of approximately COL$85,936 billion related tothe Caño Limon – Coveñas crude oil pipeline spill. Based on a preliminary analysis, Ecopetrol believes that the amount of money damages claimed is reckless.The Attorney General´s Office filed a motion requesting the judge to require the claimant to justify the amount. However, Ecopetrol is still in the process ofevaluating the merits of this claim and whether the ultimate outcome is likely to have a material adverse effect on the financial position or results of operations. Science and technology: The Administrative Department of Science, Technology and Innovation of Colombia – Colciencias officially recognized Ecopetrol’s Colombian Petroleum Institute as a research center. In March 2012, the Mexican government, through its Mexican Industrial Property Institute, granted Ecopetrol for the first time patents for two additives (anti-rubber, anti-clogging and asphalt dispersants and its acquiring process, and anti-coking and asphaltine stabilizer and its acquiring process), helping improve visbreaking processes in refining and petrochemical areas. By means of the application of technological solutions between the ICP and the company’s operating areas, we generated US$118.52 million in economic benefits through initiatives such as: 1) use of additives at refineries, 2) optimization strategies in the rational use of energy, 3) reliability strategies, 4) energyintegration at Castilla field and 5) injection of chemicals at the Dina-Tello fields, among others.
Social investments: As a result of productive projects developed during the first quarter of 2012, 255 people were trained in production skills. 145 productive units and 10 companieswere consolidated. The objective is to have a coherent process of design and management, taking into account criteria such as sustainability, participation andcompetitiveness and eventually inclusion within the company’s value chain.
Date: 05/01/2012 08:30 AM User: mchen Vintage Filings Project: v311358 Form Type: 6-K
Client: v311358_ECOPETROL S.A. (PRN CLIENT)_6-K File: v311358_6k.htm Type: 6-K Pg: 21 of 42
b. Corporate responsibility
Dirección de Relacionamiento con el Inversionista Tel: 2345190, correo electrónico: [email protected] www.ecopetrol.com.co
20
Stakeholders: During the first quarter of 2012, the following milestones were reached in interactions with stakeholders:
General Shareholder Meeting: On March 22, the General Shareholder Meeting was held with the participation of more than 16,000 shareholders. The main approvals were: 1) administration reports, 2) the concept from external auditors, 3) appointment of KPMG as external auditor for fiscal year 2012 4) unconsolidated and consolidated financial statements through December 31, 2011; 5) project for income distribution, and 5) election of the Board of Directors for the period 2012-2013 as follows: Non-independent members:
Independent members:
Date: 05/01/2012 08:30 AM User: mchen Vintage Filings Project: v311358 Form Type: 6-K
Client: v311358_ECOPETROL S.A. (PRN CLIENT)_6-K File: v311358_6k.htm Type: 6-K Pg: 22 of 42
• Attention to the citizens: During the first quarter of the year, 4,756 petitions, complaints and claims were handled, all of which were answered,producing an opportunity indicator of 99.36%.
• Three monitoring reports of national stakeholders were issued as well as 14 of regional stakeholders.• Ecopetrol held four stakeholder roundtables with the participation of over 120 people.
c. Corporate governance
• Minister of Finance and Public Credit• Minister of Mines and Energy• Head of the National Planning Agency• Federico Rengifo Vélez
• Fabio Echeverri Correa• Joaquin Moreno Uribe• Luis Carlos Villegas• Amylkar Acosta Medina (represents hydrocarbon’s producing regions) • Roberto Steiner Sanpedro (represents minority shareholders)
Dirección de Relacionamiento con el Inversionista Tel: 2345190, correo electrónico: [email protected] www.ecopetrol.com.co
21

IV. Consolidated financial results6
* Not audited, for illustration purposes only
The highest individual contributions to total sales (before eliminations) came from the Cartagena Refinery COP$ 1,277.2 billion, Hocol with COP$ 1,087.3,Equión with COP$ 562.8 billion, Propilco S.A. COP$354.8 billion and Ocensa S.A. with COP$256.9 billion. The main contributions from subsidiaries to consolidated net income came from Equion with COP$219.4 billion, Hocol with COP$186.9 billion, Reficar with COL$116.8, ODL Finance with COL$25.4 billion and Comai with COP$8.9 billion. The highest net loss was recorded by Ecopetrol America Inc. in the amountof COP$ 23.2 billion
6 For purposes of consolidation of the first quarter 2012, in addition to Ecopetrol’s results, those of the following subsidiaries have been included: Ecopetrol Oleoe Gas Do Brasil, Ecopetrol América Inc, Ecopetrol del Perú S.A., Hocol, Bioenergy S.A., Andean Chemicals Limited, ECP Global Energy, Propilco S.A., Comai,ODL Finance S.A., Black Gold Re Ltd., Ecopetrol Transportation Company, Oleoducto de Colombia, Ocensa S.A., Reficar S.A. (as of Feb. 2012), OleoductoBicentenario, Ecopetrol Capital A.G., Ecopetrol Transportation Investments Ltd., Equión Energía Limited and Ecopetrol Global Capital SLU. The consolidated financial statements of first quarter 2011 include the following subsidiaries: Ecopetrol Oleo e Gas Do Brasil, Ecopetrol América Inc, Ecopetroldel Perú S.A., Hocol, Bioenergy S.A., Andean Chemicals Limited, ECP Global Energy, Propilco S.A., Comai, ODL Finance S.A., Black Gold Re Ltd., EcopetrolTransportation Company, Oleoducto de Colombia, Ocensa S.A., Reficar S.A. (as of Feb. 2011) , Oleoducto Bicentenario, Ecopetrol Capital A.G. and EcopetrolTransportation Investments Ltd., Equión Energía Limited (since January 24, 2011)
Date: 05/01/2012 08:30 AM User: mchen Vintage Filings Project: v311358 Form Type: 6-K
Client: v311358_ECOPETROL S.A. (PRN CLIENT)_6-K File: v311358_6k.htm Type: 6-K Pg: 23 of 42
Consolidated Income Statement (COP$ Billion) 1Q 2012 * 1Q 2011 * ∆ (%)
Local Sales 5,300.5 4,700.6 12.8%Export Sales 12,188.5 9,272.1 31.5%Sales of services 481.5 415.0 16.0%
Total Sales 17,970.5 14,387.7 24.9%
Variable Costs 7,750.6 6,115.0 26.7%Fixed Costs 1,979.7 1,669.1 18.6%
Cost of Sales 9,730.3 7,784.1 25.0%Gross profit 8,240.2 6,603.6 24.8%
Operating Expenses 759.5 924.7 (17.9)%Operating Profit 7,480.7 5,678.9 31.7%Non Operating Loss (847.9) (628.2) 35.0%
Income tax 2,245.2 1,824.2 23.1%Minority interest 113.7 116.2 (2.2)%
Net Income 4,273.9 3,110.3 37.4% EBITDA 8,721.7 6,870.4 26.9%EBITDA Margin 49% 48%
Dirección de Relacionamiento con el Inversionista Tel: 2345190, correo electrónico: [email protected] www.ecopetrol.com.co
22

Ecopetrol del Peru, Ecopetrol do Brasil, Ecopetrol America and Bioenergy have not reported earnings yet since they are either in the pre-operational stage or are carrying out exploratory activities that have not yielded production, with the exception of Ecopetrol America. In line with the foregoing, subsidiaries in the crudeand product transport business report earnings for the consolidated corporate group by lowering transport costs. Under the equity participation method, Offshore International Group (Savia Peru) contributed with COP$ 17.9 billion to the Group’s net income, Invercolsa with COP$ 1.5 billion, Transgas with COP$1.4 billion, and Serviport with COP$1.2 billion. Ebitda for the first quarter of 2012 was COP$8,721.7 billion, 27% higher than the Ebitda of the first quarter of 2011. Margin Ebitda was 49%, based mainly inoperating results.
Date: 05/01/2012 08:30 AM User: mchen Vintage Filings Project: v311358 Form Type: 6-K
Client: v311358_ECOPETROL S.A. (PRN CLIENT)_6-K File: v311358_6k.htm Type: 6-K Pg: 24 of 42
Equity Method: Net income by segment(COP$ Billion) 1Q 2011 Exploration and Production 290.10 Refining 119.10 Transportation 17.40 Corporate 17.30 Total 443.90
Consolidated Balance Sheet (COP$ Billion) March 31, 2012 December 31, 2011 ∆ (%)Current Assets 25,309.3 19,037.3 32.9%Long Term Assets 76,856.2 73,240.1 4.9%Total Assets 102,165.5 92,277.4 10.7%Current Liabilities 32,157.8 15,752.4 104.1%Long Term Liabilities 21,258.2 19,583.5 8.6%Total Liabilities 53,416.0 35,335.9 51.2%Equity 46,389.8 54,688.9 (15.2)%Minority interest 2,359.7 2,252.6 4.8%Total Liabilities and Shareholders´ Equity 102,165.5 92,277.4 10.7% Debit Memorandum accounts 127,798.3 130,221.9Credit Memorandum accounts 105,619.5 111,784.6
Dirección de Relacionamiento con el Inversionista Tel: 2345190, correo electrónico: [email protected] www.ecopetrol.com.co
23

V. Presentation of results On Wednesday, May 2, 2012, Ecopetrol’s management will host two webcasts to review results for the first quarter of 2012:
The webcast will be available on Ecopetrol’s website www.ecopetrol.com.co Please access the site 10 minutes beforehand in order to download the necessary software. A copy of the webcast will remain available for one year following the live event. About Ecopetrol S.A. Ecopetrol S.A. (BVC: ECOPETROL; NYSE: EC; TSX: ECP) is the largest company in Colombia as measured by revenue, profits, assets and net equity.Ecopetrol is the only Colombian vertically integrated crude oil and natural gas company with operations in Colombia, Brazil, Peru and the U.S. Gulf Coast. Itsaffiliates include the following companies: Propilco, Black Gold Re Ltd., Ecopetrol Oleo e Gas do Brasil Ltda., Ecopetrol America Inc., Ecopetrol del Perú S.A.,Hocol, Equión Energía Limited, Andean Chemicals Limited, COMAI, Bioenergy S.A., ODL Finance S.A., ECP Global Energy, Ecopetrol TransportationCompany, Ocensa S.A., Oleoducto de Colombia, Refinería de Cartagena, Ecopetrol Transportation Investment, Ecopetrol Capital AG and OleoductoBicentenario de Colombia S.A.S. Ecopetrol S.A. is one of the 50 largest oil companies in the world and one of the four main oil companies in Latin America. Thecompany is majority owned by the Republic of Colombia (88.5%), and its shares trade on the Bolsa de Valores de Colombia S.A. (BVC) under the symbolECOPETROL, the New York Stock Exchange (NYSE) under the symbol ECP and the Toronto Stock Exchange (TSX) under the symbol ECP. La companydivides its operations into four business segments as follow: 1) exploration and production, 2) transport, 3) refining and 4) supply and marketing. For more information on Ecopetrol, please visit www.ecopetrol.com.co Forward-looking statements This news release contains forward-looking statements related to the prospects of the business, estimates for operating and financial results, and growth forecasts of Ecopetrol. These are projections, and, as such, are solely based on the expectations of management concerning the future of the company and its continued access to capital to finance the company’s business plan. Such forward-looking statements depend, essentially, on changes in market conditions, government regulations, competitive pressures, performance of the Colombian economy and industry, among other factors; therefore, they are subject to change without prior notice.
Date: 05/01/2012 08:30 AM User: mchen Vintage Filings Project: v311358 Form Type: 6-K
Client: v311358_ECOPETROL S.A. (PRN CLIENT)_6-K File: v311358_6k.htm Type: 6-K Pg: 25 of 42
Spanish EnglishMay 2, 2012 May 2, 20121:30 p.m. Bogota 3:00 p.m. Bogota2:30 p.m. New York / Toronto 4:00 p.m. New York / Toronto
Dirección de Relacionamiento con el Inversionista Tel: 2345190, correo electrónico: [email protected] www.ecopetrol.com.co
24

Contact information:
Investor Relations Director Alejandro Giraldo Telephone: +571-234-5190 E-mail: [email protected] Media relations (Colombia) Jorge Mauricio Tellez Telephone: + 571-234-4329 E-mail: [email protected]
Date: 05/01/2012 08:30 AM User: mchen Vintage Filings Project: v311358 Form Type: 6-K
Client: v311358_ECOPETROL S.A. (PRN CLIENT)_6-K File: v311358_6k.htm Type: 6-K Pg: 26 of 42
Dirección de Relacionamiento con el Inversionista Tel: 2345190, correo electrónico: [email protected] www.ecopetrol.com.co
25
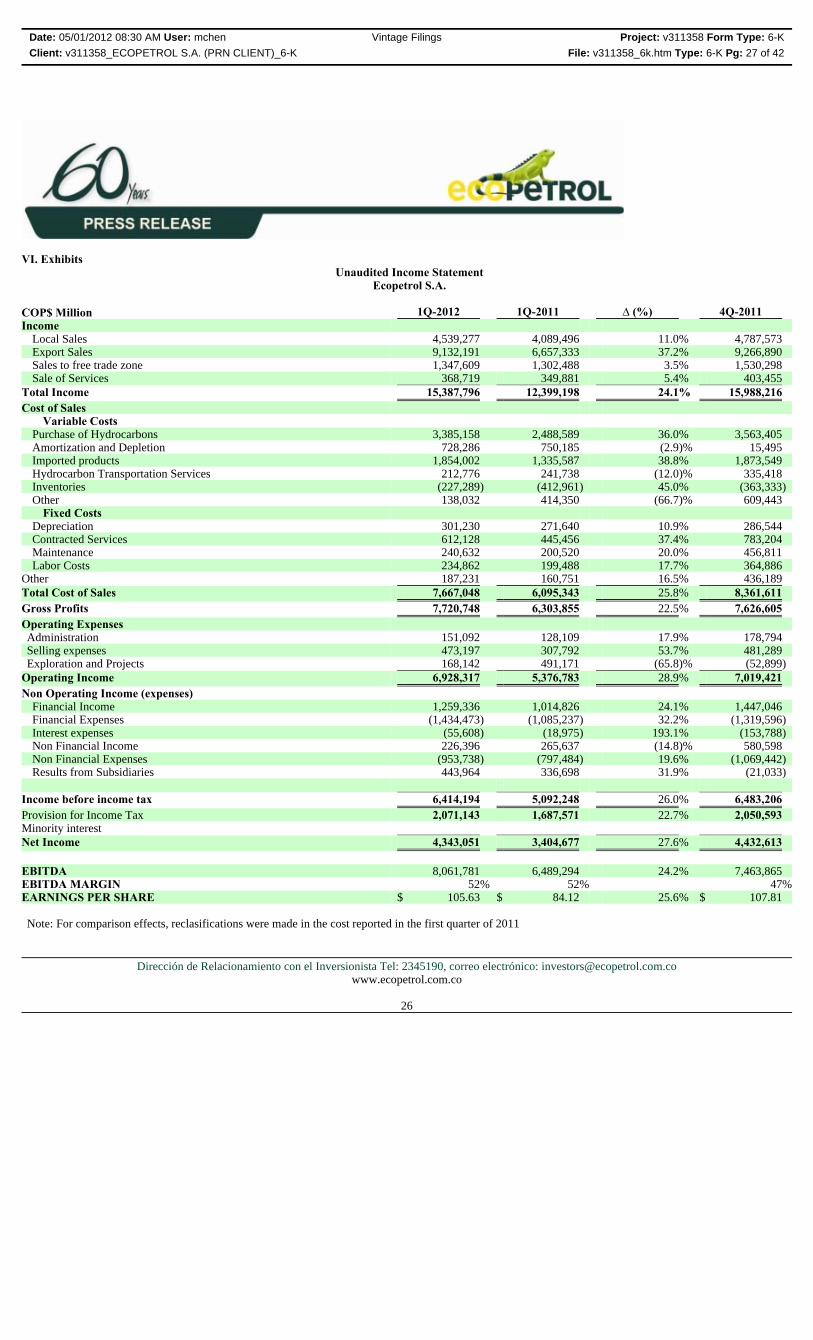
VI. Exhibits Unaudited Income Statement
Ecopetrol S.A.
Note: For comparison effects, reclasifications were made in the cost reported in the first quarter of 2011
Date: 05/01/2012 08:30 AM User: mchen Vintage Filings Project: v311358 Form Type: 6-K
Client: v311358_ECOPETROL S.A. (PRN CLIENT)_6-K File: v311358_6k.htm Type: 6-K Pg: 27 of 42
COP$ Million 1Q-2012 1Q-2011 ∆ (%) 4Q-2011Income
Local Sales 4,539,277 4,089,496 11.0% 4,787,573Export Sales 9,132,191 6,657,333 37.2% 9,266,890Sales to free trade zone 1,347,609 1,302,488 3.5% 1,530,298Sale of Services 368,719 349,881 5.4% 403,455
Total Income 15,387,796 12,399,198 24.1% 15,988,216Cost of Sales
Variable Costs Purchase of Hydrocarbons 3,385,158 2,488,589 36.0% 3,563,405Amortization and Depletion 728,286 750,185 (2.9)% 15,495Imported products 1,854,002 1,335,587 38.8% 1,873,549Hydrocarbon Transportation Services 212,776 241,738 (12.0)% 335,418Inventories (227,289) (412,961) 45.0% (363,333)Other 138,032 414,350 (66.7)% 609,443
Fixed Costs Depreciation 301,230 271,640 10.9% 286,544Contracted Services 612,128 445,456 37.4% 783,204Maintenance 240,632 200,520 20.0% 456,811Labor Costs 234,862 199,488 17.7% 364,886
Other 187,231 160,751 16.5% 436,189 Total Cost of Sales 7,667,048 6,095,343 25.8% 8,361,611Gross Profits 7,720,748 6,303,855 22.5% 7,626,605Operating Expenses Administration 151,092 128,109 17.9% 178,794Selling expenses 473,197 307,792 53.7% 481,289Exploration and Projects 168,142 491,171 (65.8)% (52,899)
Operating Income 6,928,317 5,376,783 28.9% 7,019,421Non Operating Income (expenses)
Financial Income 1,259,336 1,014,826 24.1% 1,447,046Financial Expenses (1,434,473) (1,085,237) 32.2% (1,319,596)Interest expenses (55,608) (18,975) 193.1% (153,788)Non Financial Income 226,396 265,637 (14.8)% 580,598Non Financial Expenses (953,738) (797,484) 19.6% (1,069,442)Results from Subsidiaries 443,964 336,698 31.9% (21,033)
Income before income tax 6,414,194 5,092,248 26.0% 6,483,206Provision for Income Tax 2,071,143 1,687,571 22.7% 2,050,593Minority interest Net Income 4,343,051 3,404,677 27.6% 4,432,613 EBITDA 8,061,781 6,489,294 24.2% 7,463,865EBITDA MARGIN 52% 52% 47%EARNINGS PER SHARE $ 105.63 $ 84.12 25.6% $ 107.81
Dirección de Relacionamiento con el Inversionista Tel: 2345190, correo electrónico: [email protected] www.ecopetrol.com.co
26
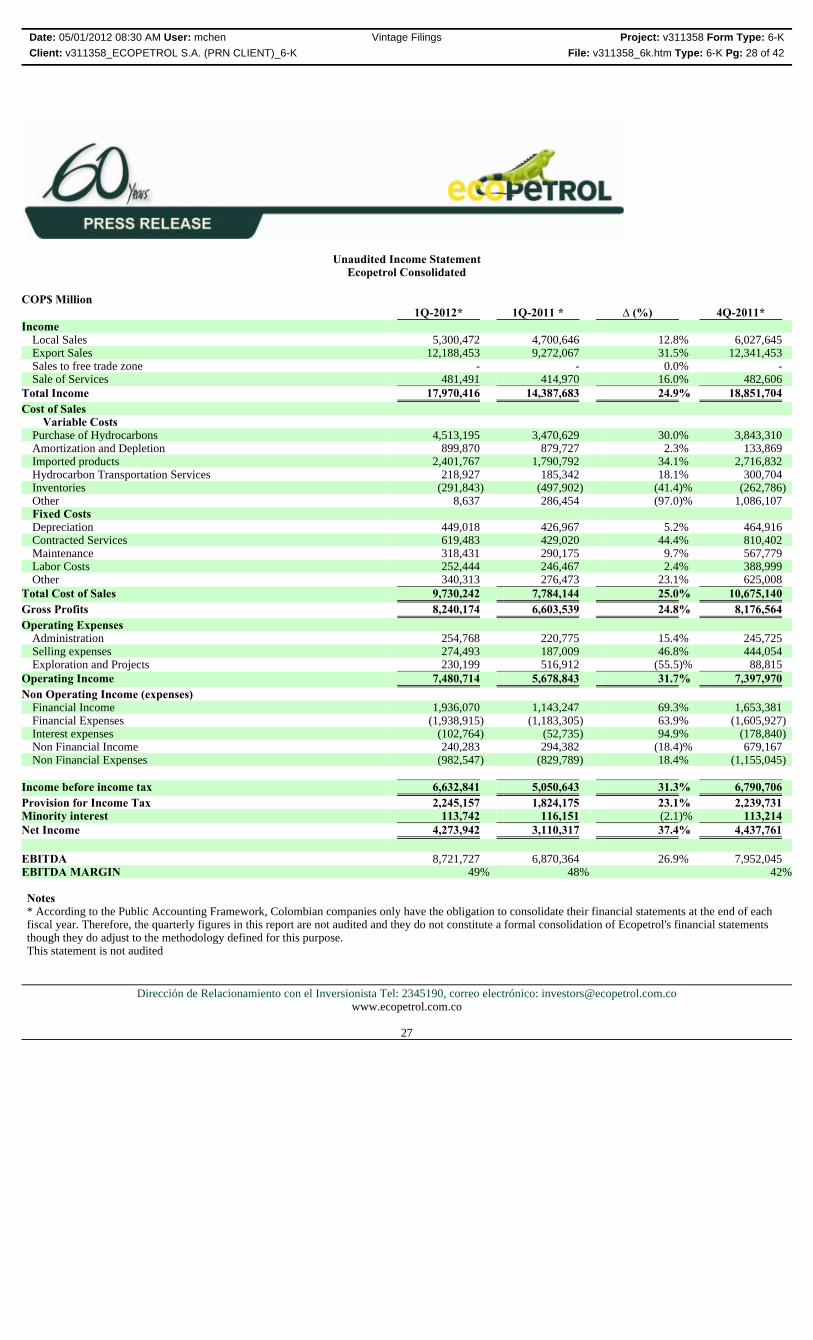
Unaudited Income Statement Ecopetrol Consolidated
Notes * According to the Public Accounting Framework, Colombian companies only have the obligation to consolidate their financial statements at the end of each fiscal year. Therefore, the quarterly figures in this report are not audited and they do not constitute a formal consolidation of Ecopetrol's financial statements though they do adjust to the methodology defined for this purpose. This statement is not audited
Date: 05/01/2012 08:30 AM User: mchen Vintage Filings Project: v311358 Form Type: 6-K
Client: v311358_ECOPETROL S.A. (PRN CLIENT)_6-K File: v311358_6k.htm Type: 6-K Pg: 28 of 42
COP$ Million 1Q-2012* 1Q-2011 * ∆ (%) 4Q-2011*Income
Local Sales 5,300,472 4,700,646 12.8% 6,027,645Export Sales 12,188,453 9,272,067 31.5% 12,341,453Sales to free trade zone - - 0.0% -Sale of Services 481,491 414,970 16.0% 482,606
Total Income 17,970,416 14,387,683 24.9% 18,851,704Cost of Sales
Variable Costs Purchase of Hydrocarbons 4,513,195 3,470,629 30.0% 3,843,310Amortization and Depletion 899,870 879,727 2.3% 133,869Imported products 2,401,767 1,790,792 34.1% 2,716,832Hydrocarbon Transportation Services 218,927 185,342 18.1% 300,704Inventories (291,843) (497,902) (41.4)% (262,786)Other 8,637 286,454 (97.0)% 1,086,107Fixed Costs Depreciation 449,018 426,967 5.2% 464,916Contracted Services 619,483 429,020 44.4% 810,402Maintenance 318,431 290,175 9.7% 567,779Labor Costs 252,444 246,467 2.4% 388,999Other 340,313 276,473 23.1% 625,008
Total Cost of Sales 9,730,242 7,784,144 25.0% 10,675,140Gross Profits 8,240,174 6,603,539 24.8% 8,176,564Operating Expenses
Administration 254,768 220,775 15.4% 245,725Selling expenses 274,493 187,009 46.8% 444,054Exploration and Projects 230,199 516,912 (55.5)% 88,815
Operating Income 7,480,714 5,678,843 31.7% 7,397,970Non Operating Income (expenses)
Financial Income 1,936,070 1,143,247 69.3% 1,653,381Financial Expenses (1,938,915) (1,183,305) 63.9% (1,605,927)Interest expenses (102,764) (52,735) 94.9% (178,840)Non Financial Income 240,283 294,382 (18.4)% 679,167Non Financial Expenses (982,547) (829,789) 18.4% (1,155,045)
Income before income tax 6,632,841 5,050,643 31.3% 6,790,706Provision for Income Tax 2,245,157 1,824,175 23.1% 2,239,731Minority interest 113,742 116,151 (2.1)% 113,214Net Income 4,273,942 3,110,317 37.4% 4,437,761 EBITDA 8,721,727 6,870,364 26.9% 7,952,045EBITDA MARGIN 49% 48% 42%
Dirección de Relacionamiento con el Inversionista Tel: 2345190, correo electrónico: [email protected] www.ecopetrol.com.co
27
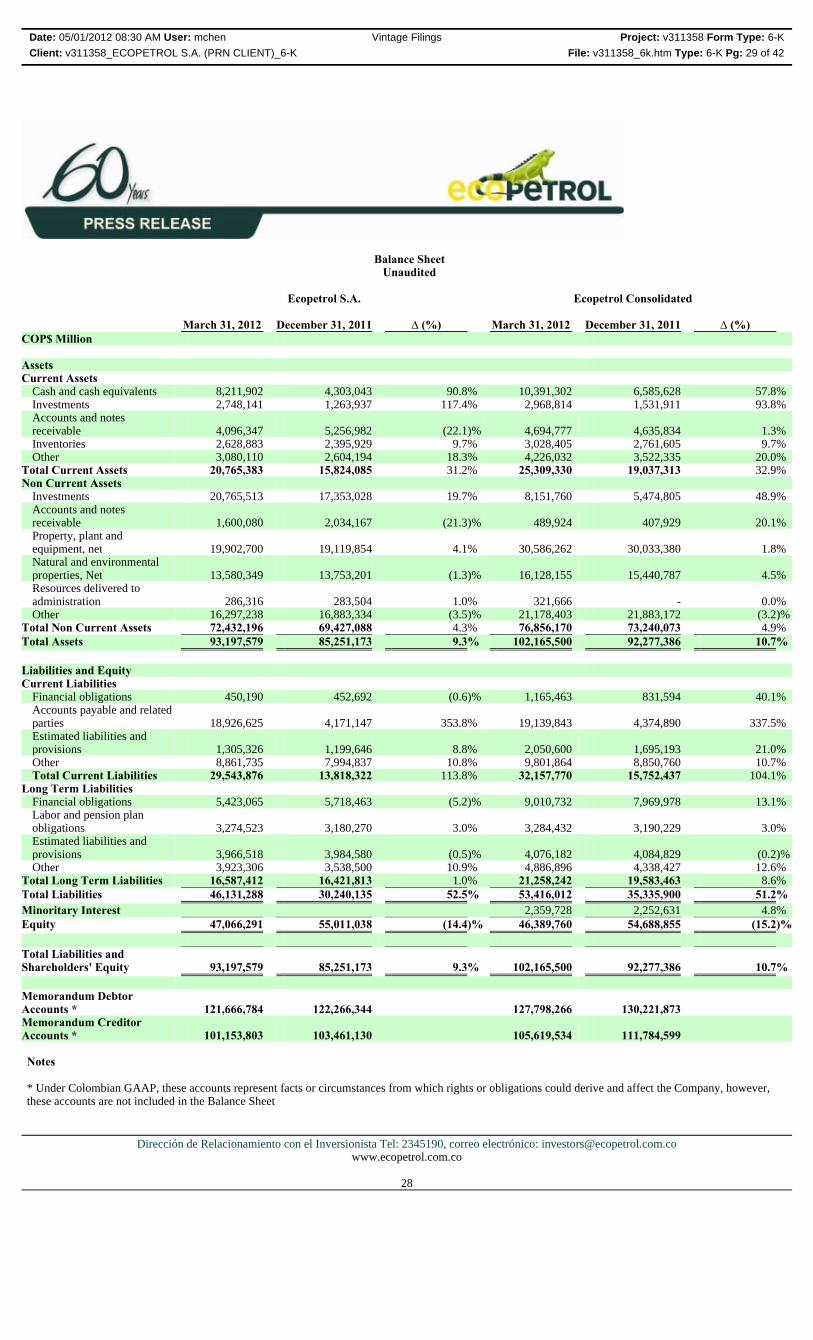
Balance Sheet Unaudited
Notes * Under Colombian GAAP, these accounts represent facts or circumstances from which rights or obligations could derive and affect the Company, however, these accounts are not included in the Balance Sheet
Date: 05/01/2012 08:30 AM User: mchen Vintage Filings Project: v311358 Form Type: 6-K
Client: v311358_ECOPETROL S.A. (PRN CLIENT)_6-K File: v311358_6k.htm Type: 6-K Pg: 29 of 42
Ecopetrol S.A. Ecopetrol Consolidated March 31, 2012 December 31, 2011 ∆ (%) March 31, 2012 December 31, 2011 ∆ (%)COP$ Million Assets Current Assets
Cash and cash equivalents 8,211,902 4,303,043 90.8% 10,391,302 6,585,628 57.8%Investments 2,748,141 1,263,937 117.4% 2,968,814 1,531,911 93.8%Accounts and notes receivable 4,096,347 5,256,982 (22.1)% 4,694,777 4,635,834 1.3%Inventories 2,628,883 2,395,929 9.7% 3,028,405 2,761,605 9.7%Other 3,080,110 2,604,194 18.3% 4,226,032 3,522,335 20.0%
Total Current Assets 20,765,383 15,824,085 31.2% 25,309,330 19,037,313 32.9%Non Current Assets
Investments 20,765,513 17,353,028 19.7% 8,151,760 5,474,805 48.9%Accounts and notes receivable 1,600,080 2,034,167 (21.3)% 489,924 407,929 20.1%Property, plant and equipment, net 19,902,700 19,119,854 4.1% 30,586,262 30,033,380 1.8%Natural and environmental properties, Net 13,580,349 13,753,201 (1.3)% 16,128,155 15,440,787 4.5%Resources delivered to administration 286,316 283,504 1.0% 321,666 - 0.0%Other 16,297,238 16,883,334 (3.5)% 21,178,403 21,883,172 (3.2)%
Total Non Current Assets 72,432,196 69,427,088 4.3% 76,856,170 73,240,073 4.9%Total Assets 93,197,579 85,251,173 9.3% 102,165,500 92,277,386 10.7% Liabilities and Equity Current Liabilities
Financial obligations 450,190 452,692 (0.6)% 1,165,463 831,594 40.1%Accounts payable and related parties 18,926,625 4,171,147 353.8% 19,139,843 4,374,890 337.5%Estimated liabilities and provisions 1,305,326 1,199,646 8.8% 2,050,600 1,695,193 21.0%Other 8,861,735 7,994,837 10.8% 9,801,864 8,850,760 10.7%Total Current Liabilities 29,543,876 13,818,322 113.8% 32,157,770 15,752,437 104.1%
Long Term Liabilities Financial obligations 5,423,065 5,718,463 (5.2)% 9,010,732 7,969,978 13.1%Labor and pension plan obligations 3,274,523 3,180,270 3.0% 3,284,432 3,190,229 3.0%Estimated liabilities and provisions 3,966,518 3,984,580 (0.5)% 4,076,182 4,084,829 (0.2)%Other 3,923,306 3,538,500 10.9% 4,886,896 4,338,427 12.6%
Total Long Term Liabilities 16,587,412 16,421,813 1.0% 21,258,242 19,583,463 8.6%Total Liabilities 46,131,288 30,240,135 52.5% 53,416,012 35,335,900 51.2%Minoritary Interest 2,359,728 2,252,631 4.8%Equity 47,066,291 55,011,038 (14.4)% 46,389,760 54,688,855 (15.2)% Total Liabilities and Shareholders' Equity 93,197,579 85,251,173 9.3% 102,165,500 92,277,386 10.7% Memorandum Debtor Accounts * 121,666,784 122,266,344 127,798,266 130,221,873Memorandum Creditor Accounts * 101,153,803 103,461,130 105,619,534 111,784,599
Dirección de Relacionamiento con el Inversionista Tel: 2345190, correo electrónico: [email protected] www.ecopetrol.com.co
28

Unaudited Cash Flow Statement Ecopetrol S.A.
NOTES: * Not audited, for illustration purposes only.
Date: 05/01/2012 08:30 AM User: mchen Vintage Filings Project: v311358 Form Type: 6-K
Client: v311358_ECOPETROL S.A. (PRN CLIENT)_6-K File: v311358_6k.htm Type: 6-K Pg: 30 of 42
COP$ million 1Q 2012 * 1Q 2011 * ∆ (%) 4Q 2011 *Cash flow provided by operating activities: Net income 4,343,051 3,404,677 27.6% 4,432,613Adjustments to reconcile net income to cash provided by operating activities: - - 0.0% -Depreciation, depletion and amortization 1,216,158 1,165,421 4.4% 927,255Net provisions 124,416 47,740 160.6% 211,883Disposal of property, plant and equipment 150 399 -62.4% (2,320)Loss for disposal of property, plant and equipment - - 0.0% 418Loss for disposal of natural and environmental resources 3,490 - 0.0% -Loss for disposal of other assets - 59 -100.0% 12Income (loss) from equity method on affiliated companies (443,964) (336,698) 31.9% 21,031Net changes in operating assets and liabilities: - - 0.0% -
Accounts and notes receivable 1,179,757 (1,301,946) 190.6% 1,607,939Inventories (232,729) (393,688) 40.9% (375,343)Deferred and other assets 484,146 (1,542,484) 131.4% 132,934Accounts payable and related parties 2,193,884 1,381,823 58.8% (2,280,447)Taxes payable 1,384,168 3,416,769 -59.5% 1,919,131Labor obligations (42,360) (14,526) 191.6% (117,336)Estimated liabilities and provisions (115,274) (93,448) 23.4% 50,384
Cash provided by operating activities 10,094,893 5,734,098 76.1% 6,528,154 Cash flows from investing activities: Payment for purchase of Companies, net of cash acquired - (813,145) 100.0% -Purchase of investment securities (6,871,316) (4,512,633) 52.3% (2,027,495)Redemption of investment securities 2,457,636 3,200,789 -23.2% 1,035,728Sale of property, plant and equipment - 711 -100.0% -Investment in natural and environmental resources (542,001) (413,297) -31.1% (1,386,313)Additions to property, plant and equipment (1,191,579) (1,152,401) 3.4% (1,739,619)Net cash used in investing activities (6,147,260) (3,689,976) 66.6% (4,117,699) Cash flows from financing activities: Financial obligations (71,316) (60,282) 18.3% (387,572)Received from associates - capitalization - (43) 100.0% 1,750,189Dividends 32,542 61,897 -47.4% (1,942,683)Net cash used in financing activities (38,774) 1,572 -2566.5% (580,066) Net increase (decrease) in cash and cash equivalents 3,908,859 2,045,694 91.1% 1,830,389Cash and cash equivalents at the beginnig of the year 4,303,043 1,592,083 170.3% 2,472,654 Cash and cash equivalents at the end of the year 8,211,902 3,637,777 125.7% 4,303,043
Dirección de Relacionamiento con el Inversionista Tel: 2345190, correo electrónico: [email protected] www.ecopetrol.com.co
29

Unaudited Cash Flow Statement Ecopetrol Consolidated
Notes * According to the Public Accounting Framework, Colombian companies only have the obligation to consolidate their financial statements t the end of each fiscal year, therefore the quarterly figures in this report are not audited and they do not constitute a formal consolidation of Ecopetrol’s financial statement, though they do adjust to the methodology defined for this purpose.
Date: 05/01/2012 08:30 AM User: mchen Vintage Filings Project: v311358 Form Type: 6-K
Client: v311358_ECOPETROL S.A. (PRN CLIENT)_6-K File: v311358_6k.htm Type: 6-K Pg: 31 of 42
COP$ million 1Q 2012 * 1Q 2011 * ∆ (%) 4Q 2011 * Cash flow provided by operating activities: Net income 4,273,943 3,110,317 37.4% 4,437,761Adjustments to reconcile net income to cash provided by operating activities: Minority interest 113,742 116,150 (2.1)% 113,214Depreciation, depletion and amortization 1,583,761 1,456,396 8.7% 1,270,254Net provisions 128,594 46,958 173.8% 193,519Disposal of property, plant and equipment - - 418Loss for disposal of property, plant and equipment 150 399 (62.4)% (2,320)Loss for disposal of natural and environmental resources 3,490 - -Loss for disposal of other assets - 59 12Income (loss) from equity method on affiliated companies (21,924) (43,524) 49.6% (53,055)Net changes in operating assets and liabilities:
Accounts and notes receivable (728,481) (1,226,084) (40.6)% 1,861,684Inventories (267,871) (485,373) 44.8% (209,456)Deferred and other assets 299,003 (433,747) 168.9% (1,674,074)Accounts payable and related parties 2,365,608 1,011,231 133.9% (2,394,614)Taxes payable 981,473 2,180,887 (55.0)% 2,827,276Labor obligations (67,771) (12,961) 422.9% (108,374)Estimated liabilities and provisions 601,262 447,590 34.3% 704,266
Cash provided by operating activities 9,264,979 6,168,298 50.2% 6,966,511 Cash flows from investing activities: Payment for purchase of Companies, net of cash acquired - (813,145) (100.0)% -Purchase of investment securities (6,871,316) (4,512,633) (52.3)% (2,027,495)Redemption of investment securities 2,474,274 3,619,698 (31.6)% 1,604,767Sale of property, plant and equipment - 711 (100.0)% -Investment in natural and environmental resources (1,541,153) (1,179,393) 30.7% (1,503,637)Additions to property, plant and equipment (1,148,214) (1,914,570) 40.0% (3,253,370)Net cash used in investing activities (7,086,409) (4,799,332) (47.7)% (5,179,735) Cash flows financing activities: Minority interest (6,645) 627,096 (101.1%) 919,085Financial obligations 1,601,207 (78,291) 2,145.2% (157,817)Received from associates - capitalization - (43) 100.0% 1,750,189Dividends 32,542 61,897 (47.4%) (1,981,183)Net cash used in financing activities 1,627,104 610,659 166.5% 530,274 Net increase (decrease) in cash and cash equivalents 3,805,674 1,979,625 92.2% 2,317,050Cash and cash equivalents at the beginnig of the year 6,585,628 3,726,778 76.7% 4,268,578 Cash and cash equivalents at the end of the year 10,391,302 5,706,403 82.1% 6,585,628
Dirección de Relacionamiento con el Inversionista Tel: 2345190, correo electrónico: [email protected] www.ecopetrol.com.co
30

Calculation and Reconciliation of EBITDA
Ecopetrol S.A.
Ecopetrol Consolidated
* Not audited, for illustration purposes only
Date: 05/01/2012 08:30 AM User: mchen Vintage Filings Project: v311358 Form Type: 6-K
Client: v311358_ECOPETROL S.A. (PRN CLIENT)_6-K File: v311358_6k.htm Type: 6-K Pg: 32 of 42
COP$ Millions 1Q 2012 * 1Q 2011 * ∆ (%) 4Q 2011*EBITDA CALCULATION Operating income 6,928,317 5,376,783 28.9% 7,019,420Plus: Depreciations, depletions and amortizations 1,133,464 1,112,511 1.9% 444,445UNCONSOLIDATED EBITDA 8,061,781 6,489,294 24.2% 7,463,865 RECONCILIATION NET INCOME TO EBITDA - - 0.0% -Net Income 4,343,051 3,404,677 27.6% 4,432,613Depreciations, depletions and amortizations 1,133,464 1,112,511 1.9% 444,445Financial income (1,259,336) (1,014,826) 24.1% (1,447,046)Financial expenses 1,490,081 1,104,212 34.9% 1,473,384Non financial income (226,396) (265,637) -14.8% (580,597)Non financial expenses 953,738 797,484 19.6% 1,069,442Results in subsidiaries (443,964) (336,698) 31.9% 21,031Provision for income tax 2,071,143 1,687,571 22.7% 2,050,593UNCONSOLIDATED EBITDA 8,061,781 6,489,294 24.2% 7,463,865
COP$ Millions 1Q 2012 * 1Q 2011 * ∆ (%) 4Q 2011*EBITDA CALCULATION Operating income 7,480,714 5,678,843 31.7% 7,397,969Plus: Depreciations, depletions and amortizations 1,475,601 1,404,141 5.1% 751,784Minority interest (234,587) (212,620) 10.3% (197,708)CONSOLIDATED EBITDA 8,721,728 6,870,364 26.9% 7,952,045 RECONCILIATION NET INCOME TO EBITDA - - 0.0% -Net income 4,273,943 3,110,317 37.4% 4,437,761Depreciations, depletions and amortizations 1,475,601 1,404,141 5.1% 751,784Financial income (1,912,702) (1,084,549) 76.4% (1,653,381)Financial expenses 2,040,233 1,220,866 67.1% 1,784,766Non financial income (263,651) (353,079) -25.3% (679,168)Non financial expenses 983,992 844,963 16.5% 1,155,046Minority interest on net income 113,742 116,150 -2.1% 113,214Provision for income taxes 2,245,157 1,824,175 23.1% 2,239,731Minority interest on Ebitda (234,587) (212,620) 10.3% (197,708)CONSOLIDATED EBITDA 8,721,728 6,870,364 26.9% 7,952,045
Dirección de Relacionamiento con el Inversionista Tel: 2345190, correo electrónico: [email protected] www.ecopetrol.com.co
31
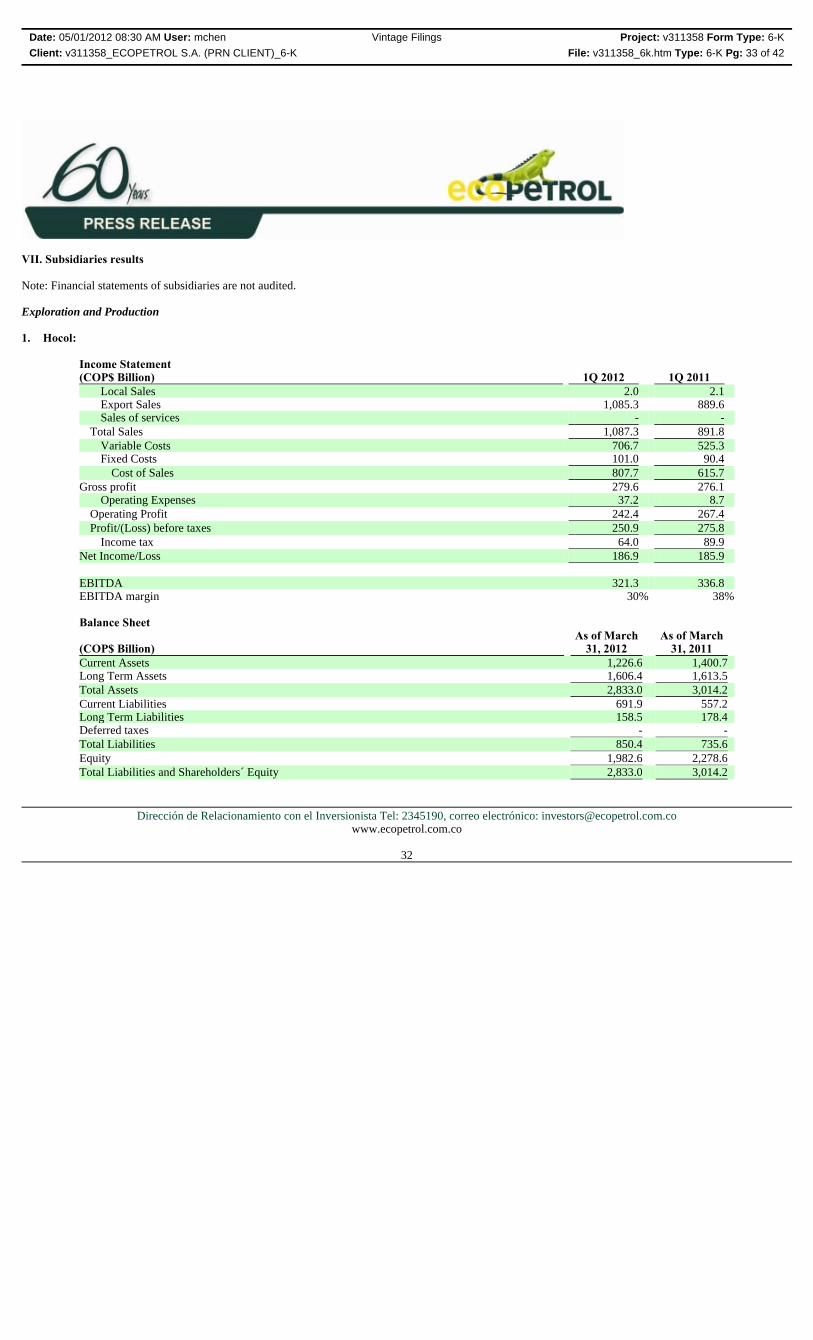
VII. Subsidiaries results Note: Financial statements of subsidiaries are not audited. Exploration and Production
Date: 05/01/2012 08:30 AM User: mchen Vintage Filings Project: v311358 Form Type: 6-K
Client: v311358_ECOPETROL S.A. (PRN CLIENT)_6-K File: v311358_6k.htm Type: 6-K Pg: 33 of 42
1. Hocol:
Income Statement (COP$ Billion) 1Q 2012 1Q 2011
Local Sales 2.0 2.1Export Sales 1,085.3 889.6Sales of services - -
Total Sales 1,087.3 891.8 Variable Costs 706.7 525.3Fixed Costs 101.0 90.4
Cost of Sales 807.7 615.7 Gross profit 279.6 276.1
Operating Expenses 37.2 8.7 Operating Profit 242.4 267.4 Profit/(Loss) before taxes 250.9 275.8
Income tax 64.0 89.9 Net Income/Loss 186.9 185.9 EBITDA 321.3 336.8EBITDA margin 30% 38%
Balance Sheet
(COP$ Billion)As of March
31, 2012 As of March
31, 2011Current Assets 1,226.6 1,400.7Long Term Assets 1,606.4 1,613.5 Total Assets 2,833.0 3,014.2 Current Liabilities 691.9 557.2Long Term Liabilities 158.5 178.4Deferred taxes - - Total Liabilities 850.4 735.6 Equity 1,982.6 2,278.6 Total Liabilities and Shareholders´ Equity 2,833.0 3,014.2
Dirección de Relacionamiento con el Inversionista Tel: 2345190, correo electrónico: [email protected] www.ecopetrol.com.co
32
Date: 05/01/2012 08:30 AM User: mchen Vintage Filings Project: v311358 Form Type: 6-K
Client: v311358_ECOPETROL S.A. (PRN CLIENT)_6-K File: v311358_6k.htm Type: 6-K Pg: 34 of 42
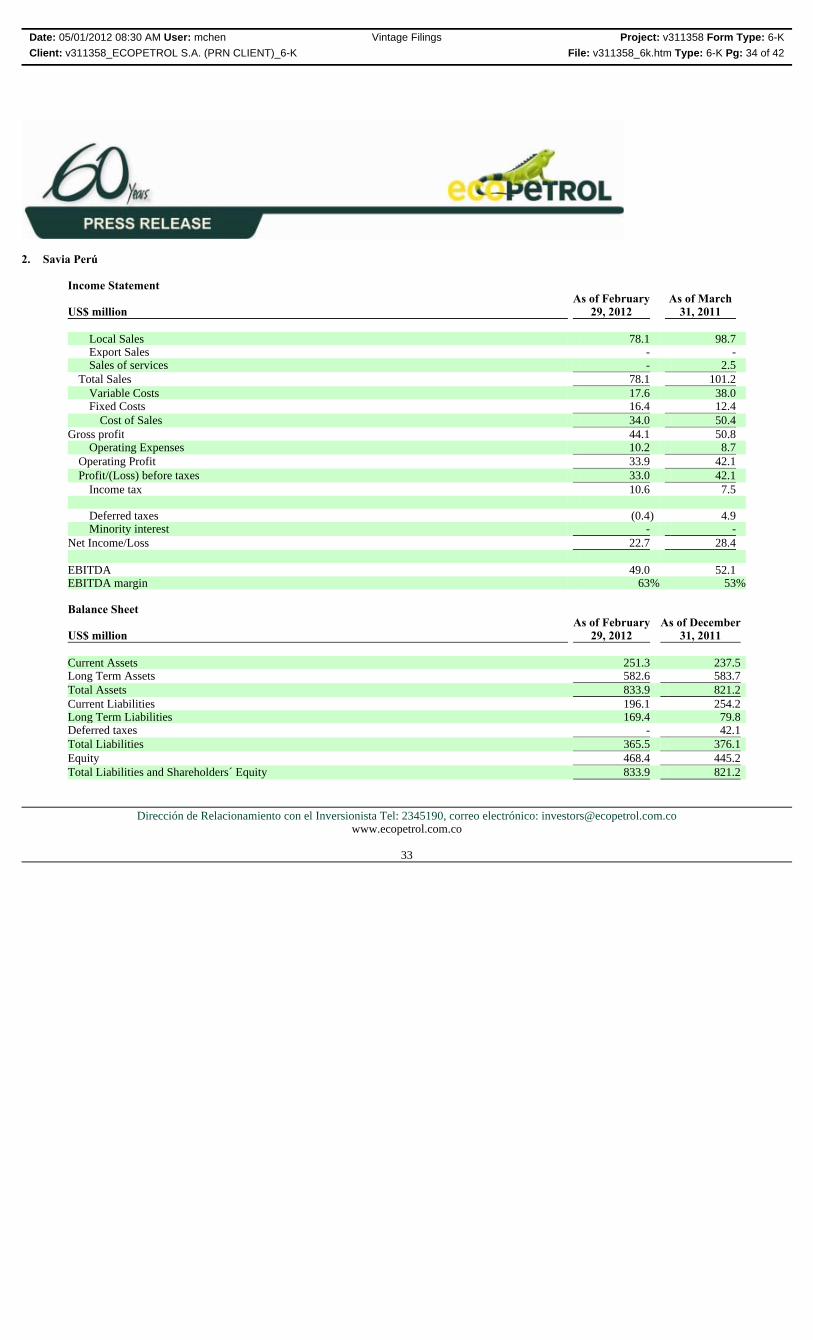
2. Savia Perú
Income Statement
US$ millionAs of February
29, 2012 As of March
31, 2011 Local Sales 78.1 98.7Export Sales - -Sales of services - 2.5
Total Sales 78.1 101.2 Variable Costs 17.6 38.0Fixed Costs 16.4 12.4
Cost of Sales 34.0 50.4 Gross profit 44.1 50.8
Operating Expenses 10.2 8.7 Operating Profit 33.9 42.1 Profit/(Loss) before taxes 33.0 42.1
Income tax 10.6 7.5 Deferred taxes (0.4) 4.9Minority interest - -
Net Income/Loss 22.7 28.4 EBITDA 49.0 52.1EBITDA margin 63% 53%
Balance Sheet
US$ millionAs of February
29, 2012 As of December
31, 2011 Current Assets 251.3 237.5Long Term Assets 582.6 583.7 Total Assets 833.9 821.2 Current Liabilities 196.1 254.2Long Term Liabilities 169.4 79.8Deferred taxes - 42.1 Total Liabilities 365.5 376.1 Equity 468.4 445.2 Total Liabilities and Shareholders´ Equity 833.9 821.2
Dirección de Relacionamiento con el Inversionista Tel: 2345190, correo electrónico: [email protected] www.ecopetrol.com.co
33

Date: 05/01/2012 08:30 AM User: mchen Vintage Filings Project: v311358 Form Type: 6-K
Client: v311358_ECOPETROL S.A. (PRN CLIENT)_6-K File: v311358_6k.htm Type: 6-K Pg: 35 of 42
3. Equión
Income Statement (COP$ Billion) 1Q 2012 1Q 2011Local Sales 55.3 24.5
Export Sales 507.5 415.9Sales of services - 0.8
Total Sales 562.8 441.2 Variable Costs 212.4 168.2Fixed Costs 31.5 24.3
Cost of Sales 243.9 192.5 Gross profit 318.9 248.7
Operating Expenses 12.6 5.7 Operating Profit 306.3 243.0 Profit/(Loss) before taxes 323.6 259.6
Income tax 104.2 48.0Net Income/Loss 219.4 211.6 EBITDA 187.0 138.5EBITDA margin 33% 31%
Balance Sheet
(COP$ Billion)As of March
31, 2012 As of March
31, 2011Current Assets 1,281.5 1,061.1Long Term Assets 2,170.6 2,112.1 Total Assets 3,452.1 3,173.2 Current Liabilities 859.5 800.1Long Term Liabilities 169.4 154.4 Total Liabilities 1,028.9 954.5 Equity 2,423.2 2,218.7 Total Liabilities and Shareholders´ Equity 3,452.1 3,173.2
Dirección de Relacionamiento con el Inversionista Tel: 2345190, correo electrónico: [email protected] www.ecopetrol.com.co
34

Refining and petrochemicals
Date: 05/01/2012 08:30 AM User: mchen Vintage Filings Project: v311358 Form Type: 6-K
Client: v311358_ECOPETROL S.A. (PRN CLIENT)_6-K File: v311358_6k.htm Type: 6-K Pg: 36 of 42
1. Propilco
Sales volume (tons) 1Q 2012 1Q 2011Polypropylene 101,092 95,515Polypropylene marketing for COMAI 2,796 2,613Polyethylene marketing 2,803 Total 106,691 98,127
Income Statement (COP$ Billion) 1Q 2012 1Q 2011
Local Sales 169.3 173.0Export Sales 185.5 200.5Sales of services - -
Total Sales 354.8 373.5 Variable Costs 293.8 302.9Fixed Costs 27.5 26.4
Cost of Sales 321.3 329.2 Gross profit 33.5 44.2
Operating Expenses 27.8 24.4 Operating Profit 5.7 19.9 Profit/(Loss) before taxes 5.5 15.0
Income tax 1.9 2.3Minority interest - -
Net Income/Loss 3.6 12.6 EBITDA 18.4 32.7EBITDA margin 5.2% 8.7%
Balance Sheet
COP$ BillionAs of March
31, 2012 As of March
31, 2011Current Assets 646.4 633.7Long Term Assets 506.7 540.9 Total Assets 1,153.1 1,174.6 Current Liabilities 383.5 362.6Long Term Liabilities 137.2 155.8 Total Liabilities 520.7 518.4 Equity 632.4 656.2 Total Liabilities and Shareholders´ Equity 1,153.1 1,174.6
Dirección de Relacionamiento con el Inversionista Tel: 2345190, correo electrónico: [email protected] www.ecopetrol.com.co
35
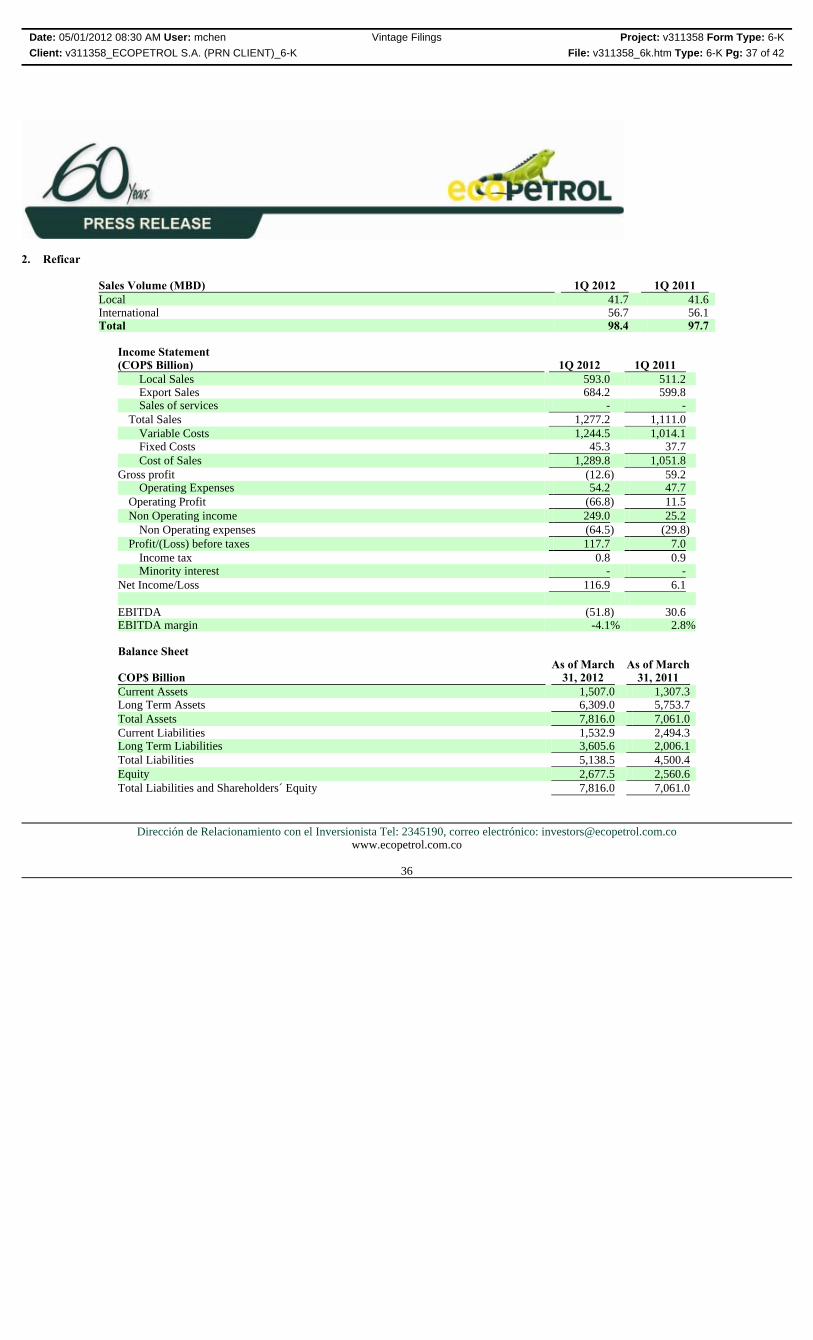
Date: 05/01/2012 08:30 AM User: mchen Vintage Filings Project: v311358 Form Type: 6-K
Client: v311358_ECOPETROL S.A. (PRN CLIENT)_6-K File: v311358_6k.htm Type: 6-K Pg: 37 of 42
2. Reficar
Sales Volume (MBD) 1Q 2012 1Q 2011Local 41.7 41.6International 56.7 56.1Total 98.4 97.7
Income Statement (COP$ Billion) 1Q 2012 1Q 2011
Local Sales 593.0 511.2Export Sales 684.2 599.8Sales of services - -
Total Sales 1,277.2 1,111.0 Variable Costs 1,244.5 1,014.1Fixed Costs 45.3 37.7 Cost of Sales 1,289.8 1,051.8
Gross profit (12.6) 59.2Operating Expenses 54.2 47.7
Operating Profit (66.8) 11.5 Non Operating income 249.0 25.2
Non Operating expenses (64.5) (29.8)Profit/(Loss) before taxes 117.7 7.0
Income tax 0.8 0.9Minority interest - -
Net Income/Loss 116.9 6.1 EBITDA (51.8) 30.6EBITDA margin -4.1% 2.8%
Balance Sheet COP$ Billion
As of March 31, 2012
As of March31, 2011
Current Assets 1,507.0 1,307.3Long Term Assets 6,309.0 5,753.7 Total Assets 7,816.0 7,061.0 Current Liabilities 1,532.9 2,494.3Long Term Liabilities 3,605.6 2,006.1 Total Liabilities 5,138.5 4,500.4 Equity 2,677.5 2,560.6 Total Liabilities and Shareholders´ Equity 7,816.0 7,061.0
Dirección de Relacionamiento con el Inversionista Tel: 2345190, correo electrónico: [email protected] www.ecopetrol.com.co
36

Transportation
Date: 05/01/2012 08:30 AM User: mchen Vintage Filings Project: v311358 Form Type: 6-K
Client: v311358_ECOPETROL S.A. (PRN CLIENT)_6-K File: v311358_6k.htm Type: 6-K Pg: 38 of 42
1. Ocensa
Transported volumes (thousand barrels per day) 1Q 2012 1Q 2011Cusiana-Porvenir 159.7 92.1Porvenir-Vasconia 596.2 516.3Vasconia-Coveñas 406.3 322.4Coveñas-Export Port 410.1 315.6
Income Statement (COP$ Billion) 1Q 2012 1Q 2011
Sales of services 256.9 234.0 Total Sales 256.9 234.0
Cost of Sales 159.7 155.8 Gross profit 97.2 78.2
Operating Expenses 22.7 21.1 Operating Profit 74.5 57.1 Profit/(Loss) before taxes (3.5) 28.6
Income tax 1.4 1.4Minority interest - -
Net Income/Loss (4.9) 27.2 EBITDA 147.50 96.60EBITDA margin 57% 41%
Dirección de Relacionamiento con el Inversionista Tel: 2345190, correo electrónico: [email protected] www.ecopetrol.com.co
37

Date: 05/01/2012 08:30 AM User: mchen Vintage Filings Project: v311358 Form Type: 6-K
Client: v311358_ECOPETROL S.A. (PRN CLIENT)_6-K File: v311358_6k.htm Type: 6-K Pg: 39 of 42
Balance Sheet
COP$ BillionAs of March
31, 2012 As of March
31, 2011Current Assets 734.2 784.7Long Term Assets 3,729.0 3,828.2 Total Assets 4,463.2 4,612.9 Current Liabilities 303.1 347.4Long Term Liabilities 820.3 920.8 Total Liabilities 1,123.4 1,268.2 Equity 3,339.8 3,344.7 Total Liabilities and Shareholders´ Equity 4,463.2 4,612.9
2. ODL
1Q 2012 1Q 2011Transported volumes (MBOD) 225.3 181.1
Income Statement (COP$ Billion) 1Q 2012 1Q 2011
Sales of services 124.9 69.9 Total Sales 124.9 69.9
Variable Costs 12.8 6.5Fixed Costs 56.0 29.3
Cost of Sales 68.8 35.7 Gross profit 56.1 34.1
Operating Expenses 4.7 3.0 Operating Profit 51.4 31.2 Profit/(Loss) before taxes 25.6 13.8
Income tax 0.2 -Minority interest - -
Net Income/Loss 25.4 13.8 EBITDA 55.7 33.2EBITDA margin 45% 48%
Dirección de Relacionamiento con el Inversionista Tel: 2345190, correo electrónico: [email protected] www.ecopetrol.com.co
38

Biofuels
Date: 05/01/2012 08:30 AM User: mchen Vintage Filings Project: v311358 Form Type: 6-K
Client: v311358_ECOPETROL S.A. (PRN CLIENT)_6-K File: v311358_6k.htm Type: 6-K Pg: 40 of 42
Balance Sheet
COP$ BillionAs of March
31, 2012 As of March
31, 2011Current Assets 353.80 361.30Long Term Assets 1,935.50 1,780.06 Total Assets 2,289.30 2,141.36 Current Liabilities 186.50 146.68Long Term Liabilities 1,399.70 1,316.93 Total Liabilities 1,586.20 1,463.61 Equity 703.10 677.76 Total Liabilities and Shareholders´ Equity 2,289.3 2,141.36
1. Ecodiesel
Sales volume (thousand barrels per day) 1Q 2012 1Q 2011Biodiesel 2.4 1.8Glycerin 0.2 0.0Total 2.6 1.8
Dirección de Relacionamiento con el Inversionista Tel: 2345190, correo electrónico: [email protected] www.ecopetrol.com.co
39

Date: 05/01/2012 08:30 AM User: mchen Vintage Filings Project: v311358 Form Type: 6-K
Client: v311358_ECOPETROL S.A. (PRN CLIENT)_6-K File: v311358_6k.htm Type: 6-K Pg: 41 of 42
Income Statement
(COP$ Billion)As of March 31
de 2012 As of March 31 de
2011Domestic sales 79.9 70.6Sales of services - -
Total Sales 79.9 70.6 Variable Costs 69.0 64.5Fixed Costs - -
Cost of Sales 69.0 64.5 Gross profit 10.9 6.1
Operating Expenses 8.8 4.0 Operating Profit 2.1 2.1 Profit/(Loss) before taxes 0.00 -
Income tax - -Minority interest - -
Net Income 0.00 0.00 EBITDA 10.5 2.1EBITDA margin 13% 3%
Balance Sheet
COP$ BillionAs of March 31
de 2012 As of December
31 de 2011Current Assets 64.1 47.9Long Term Assets 81.9 90.3 Total Assets 146.0 138.2 Current Liabilities 66.2 54.9Long Term Liabilities 58.5 61.9 Total Liabilities 124.7 116.8 Equity 21.4 21.4 Total Liabilities and Shareholders´ Equity 146.0 138.2
Dirección de Relacionamiento con el Inversionista Tel: 2345190, correo electrónico: [email protected] www.ecopetrol.com.co
40

SIGNATURE Pursuant to the requirements of the Securities Exchange Act of 1934, the Registrant has duly caused this report to be signed on its behalf by the undersigned, thereto duly authorized. Date: May 1, 2012
Date: 05/01/2012 08:30 AM User: mchen Vintage Filings Project: v311358 Form Type: 6-K
Client: v311358_ECOPETROL S.A. (PRN CLIENT)_6-K File: v311358_6k.htm Type: 6-K Pg: 42 of 42
Ecopetrol S.A. By: /s/ Adriana M. Echeverri Name: Adriana M. Echeverri Title: Chief Financial Officer


![[biodiv] Submission Acknowledgement - UNIB Scholar ...](https://static.fdokumen.com/doc/165x107/63240a99117b4414ec0c9818/biodiv-submission-acknowledgement-unib-scholar-.jpg)