Parent Component Data File User's Manual
712
NATIONAL CENTER FOR EDUCATION STATISTICS User's Manual June 1994 NATIONAL EDUCATION LONGITUDINAL STUDY OF 1988 SECOND FOLLOW-UP: PARENT COMPONENT DATA FILE USER'S MANUAL U.S. Department of Education Office of Educational Research and Improvement NCES 94-378
-
Upload
khangminh22 -
Category
Documents
-
view
1 -
download
0
Transcript of Parent Component Data File User's Manual

NATIONAL CENTER FOR EDUCATION STATISTICS
User's Manual June 1994
NATIONAL EDUCATION
LONGITUDINAL STUDY
OF 1988
SECOND FOLLOW-UP: PARENT COMPONENT DATA FILE USER'S MANUAL
U.S. Department of EducationOffice of Educational Research and Improvement NCES 94-378

NATIONAL CENTER FOR EDUCATION STATISTICS
User's Manual June 1994
NATIONAL EDUCATION
LONGITUDINAL STUDY
OF 1988
SECOND FOLLOW-UP: PARENT COMPONENT DATA FILE USER'S MANUAL
Steven J. IngelsLisa ThaljiPaul PulliamVirginia H. BartotMartin R. Frankel
National Opinion Research Center (NORC)at the University of Chicago
Jeffrey OwingsChiefLongitudinal and Household Studies Branch
Peggy QuinnProject OfficerNational Center for Education Statistics
U.S. Department of EducationOffice of Educational Research and Improvement NCES 94-378

U.S. Department of EducationRichard W. RileySecretary
Office of Educational Research and ImprovementSharon RobinsonAssistant Secretary
National Center for Education StatisticsEmerson J. ElliottCommissioner of Education Statistics
National Center for EducationStatistics
"The purpose of the Centershall be to collect, andanalyze, and disseminatestatistics and other datarelated to education in theUnited States and in othernations."--Section 406(b) ofthe General EducationProvisions Act, as amended (20U.S.C. 12213-1).
June 1994
Contact:Peggy Quinn(202) 219-1743

F2: Parent ComponentData File User's Manual
Foreword
This manual has been produced to familiarize data users withthe procedures followed for data collection and processing of thesecond follow-up parent component of the National EducationLongitudinal Study of 1988 (NELS:88). A corollary objective is toprovide the necessary documentation for use of the data file.
Use of the data set does not require the analyst to be asophisticated statistician or computer programmer. Most socialscientists and policy analysts should find the data set organizedand equipped in a manner that facilitates straightforwardproduction of statistical summaries and analyses. This manualprovides extensive documentation of the content of the data fileand how to use it. Chapter VII and Appendix E, in particular,contain essential information that allows the user to immediatelyproceed with minimal startup cost. A careful reading of ChapterVII and Appendix E will help users to avoid common mistakes thatresult in costly computer job failures or incorrect results.
The rest of the manual provides a wide range of information onthe design and conduct of the National Education Longitudinal Studyof 1988 (NELS:88). Chapter I begins with an overview and historyof NCES's National Education Longitudinal Studies program and thevarious studies that it comprises. Chapter II contains a generaldescription of the data collection instruments used in the NELS:88second follow-up.
The sample design and weighting procedures used in the secondfollow-up study are documented in Chapter III, as well as standarderrors and design effects and non-sampling measurement errors.
Data collection procedures, schedules, and results arepresented in Chapter IV. Chapter V describes data control andpreparation activities such as monitoring receipt ofquestionnaires, editing, and data retrieval. Chapter VI describesdata processing activities including machine editing, andconstruction of the cleaned data tape. Finally, Chapter VIIdescribes the organization and contents of the data file andprovides important suggestions for using it.
The appendices contain a list of other NCES publications; acomparison of the content areas of the student, dropout, and parentcomponents; crosswalks with items from other parent surveys;guidelines for Statistical Analysis System (SAS) users; the baseyear and second follow-up parent questionnaires; a list of itemsfor which data retrieval was conducted; a record layout for theparent data; a description of the parent composite variables; anda parent codebook. A glossary of terms used in NELS:88 constitutesthe final section of the manual.
In addition to the study described in this manual, a number ofsupplemental NELS:88 components and related education studies are
i

F2: Parent ComponentData File User's Manual
also described in Appendix A. These studies include: the HighSchool and Beyond (HS&B) base year files; merged HS&B first,second, third, and fourth follow-up files; related HS&B files; andassorted files related to the National Longitudinal Study of theHigh School Class of 1972 (NLS-72).
A Note on Data Use and Confidentiality
The NELS:88 second follow-up data files are released inaccordance with the provisions of the General Education ProvisionsAct (GEPA) [20-USC 122e 1] and the Carl D. Perkins VocationalEducation Act. The GEPA assures privacy by ensuring thatrespondents will never be individually identified.
The National Center for Education Statistics (NCES) isresponsible under the Privacy Act and Public Law 100-297 forprotecting the confidentiality of individually identifiablerespondents, and is releasing this data set to be used forstatistical purposes only. Record matching or deductive disclosureby any user is prohibited.
To ensure that the confidentiality provisions contained in PL100-297 and the Privacy Act have been fully implemented, procedurescommonly applied for disclosure avoidance in otherGovernment-sponsored surveys were used in preparing the data fileassociated with this manual. These include suppressing, abridging,and recoding identifiable variables. Every effort has been made toprovide the maximum research information that is consistent withreasonable confidentiality protection. Deleted, abridged, and/orrecoded variables appear with an explanatory footnote in thecodebook attached to each user's manual.
Acknowledgements
A study such as this is built first and foremost upon thestudents, dropouts, parents, school administrators, and teacherswho have so generously provided its basic data. We are gratefulfor their cooperation. We also thank the considerable numbers ofschool personnel who have assisted in the implementation ofNELS:88.
We are grateful to the members of NCES staff in theLongitudinal and Household Studies Branch who worked closely withus on this project. Jeffrey Owings, chief of the Longitudinal andHousehold Studies Branch; Peggy Quinn, project officer for thesecond follow-up; as well as other branch staff--Ralph Lee, Shi-Chang Wu, and Jerry West--contributed to various aspects of thisstudy. Bob Burton of the Statistical Standards and MethodologyDivision supplied statistical advice and review.
Three individuals in other agencies have worked particularlyhard and effectively to help realize and extend the potential ofNELS:88: Larry Suter of the National Science Foundation, Dick
ii

F2: Parent ComponentData File User's Manual
Berry (formerly of the National Science Foundation), and CarmenSimich-Dudgeon (formerly of the Office of Bilingual Education andMinority Languages Affairs (OBEMLA) of the U.S. Department ofEducation). We are grateful for their efforts.
In addition, we would like to express our appreciation of thecontribution of the members of what began in the base year as ourNational Advisory Panel, and became in 1989 the NELS:88 TechnicalReview Panel. The panelists--Jerald G. Bachman, Gordon Ensign,Lyle V. Jones, Nancy Karweit, Richard J. Murnane, Patricia Shell,Marshall S. Smith, and John Stiglmeier--provided wise counsel onmany a difficult issue of design, instrumentation andimplementation. Aaron Pallas, Joan Talbert, Leigh Burstein,Anthony Bryk, and Senta Raizen, as consultants to the secondfollow-up, also contributed importantly to the design and ultimatesuccess of the study.
Lisa Thalji, assisted by Paul Pulliam and Jim Stipe, wasproject manager for the second follow-up parent survey. Laura Reedand Virginia Bartot were the data processing managers, and MartinR. Frankel was the task leader for sampling and statistics. JohnBaldridge was task leader for data cleaning and performednonresponse analysis. Miriam K. Clarke provided counsel onmanagement issues in the main study, and Leslie A. Scottcontributed to the conceptualization and development of filespecifications and composite variables. Donald A. Rock and JudithM. Pollack of Educational Testing Service were the task leaders forcognitive test development. Steven J. Ingels was overall NELS:88Second Follow-Up project director.
The authors would like to thank individuals who contributed tothe production of this manual. Kenneth A. Rasinski performed theconfidentiality disclosure analysis. Programmers Gloria Rauens,Doug Barge, Shiow-Ling Tsai-Ma, and Michael Ma painstakinglyconstructed the composites, data file, and also generatedstatistics reported throughout the manual. Our appreciation isalso extended to Cynthia Mathews and Karen Sutherlin for theirpatience and thoroughness in the production of the manuscript.
Finally, we would like to thank the National Opinion ResearchCenter field and telephone center interviewers and supervisors whowith such energy and determination collected the NELS:88 data. Thefinal completion rates for the second follow-up testify to thededication and the success of their efforts.
iii

F2: Parent ComponentData File User's Manual
Table of Contents
Foreword . . . . . . . . . . . . . . . . . . . . . . . . . i
A Note on Data Use and Confidentiality . . . . . . . . ii
Acknowledgements . . . . . . . . . . . . . . . . . . . ii
I. Introduction . . . . . . . . . . . . . . . . . . . . . 1
1.1 The NELS:88 Second Follow-Up Parent Survey . . . . . 1
1.2 The Second Follow-Up Parent Sample . . . . . . . . . 1
1.3 The Second Follow-Up Parent Survey Respondents . . . 2
1.4 Structure of the Parent Data File . . . . . . . . . . 3
1.5 Organization of the Data User's Manuals . . . . . . . 3
1.6 Overview . . . . . . . . . . . . . . . . . . . . . . 4
1.6.1 NCES's National Education Longitudinal Studies Program 4
1.6.2 The National Longitudinal Study of the 1970s: NLS-72 5
1.6.3 High School and Beyond of the 1980s: HS&B . . . . . . 5
1.7 The National Education Longitudinal Study of 1986(NELS:88): Overview . . . . . . . . . . . . . . . . 6
1.7.1 NELS:88 Study Objectives . . . . . . . . . . . . . . 9
1.7.2 Base Year Study and Sample Design . . . . . . . . . 11
1.7.3 First Follow-Up Core Study and Sample Design . . . 15
1.7.4 Second Follow-Up Core Study and Sample Design . . . 16
1.7.5 Second Follow-Up Design Enhancements . . . . . . . 18
1.8 NELS:88 Sponsors . . . . . . . . . . . . . . . . . 19
1.8.1 Sample Supplements and Augmentations . . . . . . . 19
1.8.2 Instrument Supplements . . . . . . . . . . . . . . 19
1.9 NELS:88 Data and Documentation . . . . . . . . . . 20
1.9.1 Base Year Data Tapes and Documentation . . . . . . 21
iv

F2: Parent ComponentData File User's Manual
1.9.2 First Follow-Up Data Files and Documentation . . . 21
1.9.3 Second Follow-Up Tapes, Electronic Codebook on CD-ROM, and Documentation . . . . . . . 22
II. Data Collection Instruments . . . . . . . . . . . . 24
2.1 Parent Questionnaire . . . . . . . . . . . . . . . 25
2.1.1 Adapting the Parent Questionnaire for Telephone Administration . . . . . . . . . . . 26
2.1.2 Relationship between the Parent Instrument and Other Second Follow-Up Instruments . . . . . . . . 27
2.2 Student Questionnaire and Cognitive Tests . . . . . 27
2.3 Dropout Questionnaire . . . . . . . . . . . . . . 29
2.4 Adapting Student and Dropout Questionnairesfor Telephone Administration . . . . . . . . . . . 30
2.5 New Student Supplement . . . . . . . . . . . . . . 30
2.6 Early Graduate Supplement . . . . . . . . . . . . . 30
2.7 School Administrator Questionnaire . . . . . . . . 30
2.8 Teacher Questionnaire . . . . . . . . . . . . . . . 31
III. Sample Design and Implementation; Survey Error Assessment . . . . . . . . . . . . . . 33
3.1 NELS:88 Sample Design . . . . . . . . . . . . . . . 33
3.1.1 Base Year Sample Design . . . . . . . . . . . . . . 33
3.1.2 First Follow-Up Sample Design . . . . . . . . . . . 34
3.1.3 First Follow-Up Sample Enhancements and Modifications 35
3.1.4 Second Follow-Up Sample Design . . . . . . . . . . 36
3.1.5 Second Follow-Up Parent Sample . . . . . . . . . . 41
3.2 Calculation of Weights . . . . . . . . . . . . . . 43
3.2.1 Calculation of Base Year Sample Weights . . . . . . 46
3.2.2 Calculation of First Follow-Up Sample Weights . . . 48
v

F2: Parent ComponentData File User's Manual
3.2.3 Calculation of Second Follow-Up Weights . . . . . . 48
3.3 Standard Errors and Design Effects . . . . . . . . 54
3.3.1 Base Year Standard Errors and Design Effects . . . 55
3.3.2 First Follow-Up Standard Errors and Design Effects 55
3.3.3 Second Follow-Up Standard Errors and Design Effects 55 3.4 Additional Sources of Nonobservable Error . . . . . 59
3.4.1 Second Follow-Up Unit Nonresponse . . . . . . . . 60
3.4.2 Second Follow-Up Item Nonresponse . . . . . . . . . 60
IV. Data Collection . . . . . . . . . . . . . . . . . . 70
4.1 Second Follow-Up Pre-Data Collection Activities . . 70
4.2 Second Follow-Up Data Collection Activities . . . . 74
4.3 Parent Survey . . . . . . . . . . . . . . . . . . . 74
4.4 Relationship between NELS:88 Second Follow-Up Parent Survey and Other Parent Surveys . . . . . . . . . . . . . . . . . . 78
4.5 Second Follow-Up Student Survey and Cognitive Tests 81
4.6 Dropout Survey . . . . . . . . . . . . . . . . . . 82
4.7 School Effectiveness Study . . . . . . . . . . . . 84
4.8 Followback Study of Excluded Students . . . . . . . 85
4.9 School Administrator Survey . . . . . . . . . . . . 86
4.10 Teacher Survey . . . . . . . . . . . . . . . . . . 87
4.11 Academic Transcripts . . . . . . . . . . . . . . . 88
4.12 Second Follow-Up Data Collection Results . . . . . 89
V. Data Control and Preparation . . . . . . . . . . . 94
5.1 Monitoring and Receipt Control Procedures . . . . . 94
5.2 In-house Editing and Data Retrieval . . . . . . . . 94
5.3 Data Capture and Archival Storage . . . . . . . . . 94
vi

F2: Parent ComponentData File User's Manual
VI. Data Processing of the Parent Questionnaires . . . 95
6.1 Machine Editing . . . . . . . . . . . . . . . . . . 95
6.2 Data File Preparation . . . . . . . . . . . . . . . 96
6.3 CD-ROM Electronic Codebook . . . . . . . . . . . . 97
VII. Guide to the Data Files, Documentation,and CD-ROM Electronic Codebooks . . . . . . . . . 98
7.1 Basics for Analyses: Second Follow-UpQuestionnaire and Sample Indicators, and Parent Sample Statistical Weight . . . . . . . 100
7.2 Content and Organization of the Data Files . . . . 108
7.2.1 Identification Codes . . . . . . . . . . . . . . . 109
7.2.2 The Parent Public Use File Record Layout . . . . . 109
7.2.3 Composite Variables . . . . . . . . . . . . . . . . 110
7.2.4 Packaged Statistical Programs . . . . . . . . . . . 113
7.3 Guide to the NELS:88 Codebooks . . . . . . . . . . 113
7.3.1 Hardcopy Codebooks in NELS:88 Data User's Manuals . 114
7.3.2 The NELS:88 Electronic Codebook System (ECB) . . . 118
vii

F2: Parent ComponentData File User's Manual
Appendices
Appendix A: NELS:88-Related Data Files Available from theNational Center for Education Statistics
Appendix B: National Center for Education Statistics,Longitudinal and Household Studies Branch NELS:88Publications
Appendix C: NELS:88 Content Areas and Research Issues
Appendix D: Intracohort and Intercohort Parent QuestionnaireCrosswalks
Appendix E: Guidelines for Using SAS with NELS:88 SecondFollow-Up Parent Data
Appendix F: NELS:88 Base Year Parent Questionnaire
Appendix G: NELS:88 Second Follow-Up Parent Questionnaire
Appendix H: Critical Items from the Second Follow-Up ParentQuestionnaire
Appendix I: Record Layout for NELS:88 Second Follow-Up ParentTape
Appendix J: NELS:88 Second Follow-Up Parent CompositeVariables
Appendix K: NELS:88 Second Follow-Up Parent Codebook
Appendix L: Glossary of NELS:88 Terms
viii

F2: Parent ComponentData File User's Manual
I. Introduction
This manual provides guidance and documentation for users ofthe public release data for the parent component of the NationalEducation Longitudinal Study of 1988 (NELS:88). Information aboutthe purpose of the study, the data collection instruments, sampledesign, data collection, and data processing procedures ispresented in this manual.
1.1 The NELS:88 Second Follow-Up Parent Survey
In order to understand more fully the impact of schools andfamily life on student achievement and outcomes, data werecollected from a subsample of parents or guardians of NELS:88second follow-up sample members regarding the nature and extent ofparental support for educational activities. The parentquestionnaire was available in both English and Spanish versionsand was designed to collect information about factors thatinfluence the educational attainment and participation of NELS:88sample members and their transition from high school topostsecondary education and the work place. The parentquestionnaire explored family background and socioeconomiccharacteristics, and the character of the home educational supportsystem. These data provide a basis for understanding the effectson student educational outcomes of parental behaviors relating tostudent course selection, planning for postsecondary education, andparticipation in school activities and non-school extracurricularactivities.
The parent questionnaire collected data related to parentalbehaviors and circumstances about which the parent may be moreknowledgeable than the teenager, such as parental education andoccupation. The parent questionnaire also contained more sensitiveitems relating to income and family history and items relating toparents' educational expectations for their teenager. The parentdata is the definitive data source for examining the relationshipbetween student measures and family background and characteristics.For a more detailed exposition of the themes and subthemes of theparent questionnaire, refer to section 2.1.
1.2 The Second Follow-Up Parent Sample
The NELS:88 Second Follow-Up parent sample consists of 17,750parents or guardians of students and dropouts who participated inthe second follow-up student or dropout components. Unlike thebase year parent survey, parent data were collected in the secondfollow-up study from a subsample of parents of NELS:88 student anddropout participants. During data collection, a parent subsamplewas selected according to the priority of the subgroup of thesample in which the parent's teenager was included. 1,601 parentswere excluded through the subsampling process leaving the finalsample of 17,750 parents. Whereas 17,750 parents were included inthe final sample, only 17,610 parents are included on the public
1

F2: Parent ComponentData File User's Manual
use data file. The base year parent unweighted completion rate was92.1 percent and the second follow-up parent unweighted completionrate was 93.2 percent. Of the 17,610 parents included on thesecond follow-up public use data file, a base year parentquestionnaire was completed for 84.2 percent of the second follow-up respondents' teenagers, which means that 84.2 percent of the1988 to 1992 student panel have parent data available in both 1988and 1992.
A special parent weight, F2PAQWT, has been constructed for usewith the second follow-up parent data. F2PAQWT accounts forsubsampling and adjusts for parent nonresponse. Chapter IIIincludes a complete discussion of the second follow-up parentweight.
1.3 The Second Follow-Up Parent Survey Respondents
Because the parent questionnaire was designed to be completedby only one parental respondent, the cover letter to thequestionnaire and the questionnaire itself indicated that theparent or guardian who was most knowledgeable about the teenager'scurrent situation should complete the questionnaire. Guided bythis criterion, the parent respondent was self-selected.
It should be noted that insofar as the parent questionnairefocused on general home and family issues, it should have madelittle difference which parent or guardian completed thequestionnaire. Still the possibility exists that there may be,between the parents in two-parent homes, systematic gender or roledifferences in perceptions of family and school issues. Suchdifferences may have influenced responses to, in particular, themore subjective items in the parent survey. In particular, a giventeenager's parents may differ significantly in their responses toquestions measuring their aspirations for the teenager. In thebase year parent survey, the parent questionnaire was completed bythe mother approximately 77.7 percent of the time, by the father17.5 percent of the time, by other respondents such as astepparent, grandparent, or other relative or guardian 4.0 percentof the time, and the remaining 0.7 percent were not identified.(These figures do not sum to 100 percent due to rounding.)Similarly, the parent questionnaire data used to construct thesecond follow-up data file was completed 78.5 percent of the timeby the mother of the sampled teenager, 15.5 percent of the time bythe father, 4.6 percent of the time by other respondents such as astepparent, grandparent, or another adult relative or guardian, andthe remaining 1.4 percent were not identified.
Although the mother of the sampled student or dropoutcompleted the majority of the base year and second follow-up parentquestionnaires, it is difficult to ascertain whether the samerespondent reported on the teenager in the base year and secondfollow-up. In both the base year and second follow-up parentquestionnaires, respondents were asked to identify their
2

F2: Parent ComponentData File User's Manual
relationship to the sampled student or dropout. Because the familyof the teenager may have changed between 1988 and 1992, one cannotknow definitively whether the same parent or guardian completed theparent questionnaire in both rounds. For example, if the dataindicate that the grandmother of the teenager completed thequestionnaire in the base year and second follow-up, thequestionnaire does not elicit whether the same grandmothercompleted the questionnaire in 1992 as in 1988.
1.4 Structure of the Parent Data File
The student and dropout samples constitute the basic units ofanalysis in the NELS:88 second follow-up. All other data sets,including the parent, teacher, and school components, are intendedprimarily to supplement the student and dropout data. Even thoughdata for each respondent population can be analyzed separately,only the student and dropout data sets constitute representativestand-alone, national samples.
While in various respects the parent data set aftersubsampling resembles a representative or probability sample of theparents of eligible students and dropouts who were in eighth gradein 1988, several features of the NELS:88 second follow-up parentcomponent depart from the strict requirements of a probabilitysample. For example, a very small but unknown number of parentshad more than one sampled student or dropout and therefore had morethan one chance of being selected in the parent sample. Second,the parent sample was self-selected, and only one parent couldparticipate. Finally, only if the student or dropout completed aquestionnaire was a completed parent questionnaire included on thepublic or restricted use parent files.
The primary purpose of the parent data file is to providestudent and dropout-related contextual information that can belinked to individual records on the NELS:88 second follow-upstudent and dropout files. However, the parent data may be usedfor separate analyses using the parent questionnaire weight,F2PAQWT, included on the data file. Although analysis can berestricted, if the analyst chooses, to the parent sample only, itshould be noted that the parent data used with the parent weightdoes not provide a strict probability sample of parents. Instead,after selecting an appropriate student group (e.g., panel samplestudent or dropout, twelfth-grade cross-sectional sample student ordropout), the NELS:88 second follow-up parent data can provide anationwide cross-section of the "self-defined" most knowledgeableparent or guardian of that student group.
1.5 Organization of the Data User's Manuals
NELS:88 data sets have been produced in both public use andrestricted use form. The public use data files reflect alterationor suppression of some of the original data imposed to minimize therisk of statistical disclosure of the identity of responding
3

F2: Parent ComponentData File User's Manual
individuals and institutions. The restricted use files preservethe original data free of all confidentiality edits. Data fileswith high disclosure potential, specifically the transcript fileand the school effectiveness study file, are available inrestricted form only. This manual may be utilized with both thepublic use and restricted use data files. Variables that weremodified or suppressed on the public use files, but appear on therestricted use version of the data, are included in the codebook intheir modified public use form. A more detailed discussion ofmeasures used to preserve respondent confidentiality, and ofprocedures for gaining access to restricted use data, may be foundin section 1.9 of this manual. However, the parent restricted useand public use files differ only slightly. F2BIRTHY (the year ofthe teenager's birth), has been recoded on the public use file, andrace variables have been suppressed for the parents of a smallnumber of teenagers to protect confidentiality. The restricted useparent file contains an additional population, students who werefreshened in the first follow-up or second follow-up who droppedout prior to data collection, which was excluded from the publicuse file.
In addition to documentation for the restricted use transcriptand school effectiveness study data files, one manual has beenproduced to accompany each of the five public release files(student, dropout, parent, teacher, and school) for the NELS:88second follow-up. Each manual furnishes the user with informationand documentation about NELS:88 and the specific public releasedata file.
A set of four data file user's manuals was also produced andreleased to accompany each of the four public release data files ofthe base year and each of the four public release data files of thefirst follow-up survey. Information on these publications andother documentation for NELS:88 is discussed in sections 1.9.1 and1.9.2 of this manual.
1.6 Overview
1.6.1 NCES's National Education Longitudinal Studies Program
The U.S. Department of Education's National Center forEducation Statistics (NCES) is mandated to "collect and disseminatestatistics and other data related to education in the UnitedStates" and to "conduct and publish reports on specific analyses ofthe meaning and significance of such statistics" (EducationAmendments of 1974-Public Law 93-380, Title V, Section 501,amending Part A of the General Education Provisions Act).
Consistent with this mandate and in response to the need forpolicy-relevant, time-series data on nationally representativesamples of elementary and secondary school students, NCESinstituted the National Education Longitudinal Studies (NELS)program. The general aim of the NELS program is to study the
4

F2: Parent ComponentData File User's Manual
educational, vocational, and personal development of students atvarious grade levels, and the personal, familial, social,institutional, and cultural factors that may affect thatdevelopment. The NELS program currently consists of three majorstudies: the National Longitudinal Study of the High School Classof 1972 (NLS-72); High School and Beyond (HS&B); and the NationalEducation Longitudinal Study of 1988 (NELS:88). Taken together,these studies represent the educational experience of youth fromthree decades--the 1970s, 1980s, and 1990s. Figure 1-1 illustratesthe increasing number of issues that have become part of NCES'sNational Education Longitudinal Studies research agenda. A briefdescription of these studies follows.
1.6.2 The National Longitudinal Study of the 1970s: NLS-72
The first of the NELS projects, the National LongitudinalStudy of the High School Class of 1972 (NLS-72), began in thespring of 1972 with a survey of a national probability sample of19,001 seniors from 1,061 public, secular private, andchurch-affiliated high schools. The sample was designed to berepresentative of the approximately three million high schoolseniors enrolled in more than 17,000 schools in the spring of 1972.Each sample member was asked to complete a student questionnaireand a 69-minute test battery. School administrators were alsoasked to supply survey data on each student, as well as informationabout the schools' programs, resources, and grading systems. Fivefollow-ups, conducted in 1973, 1974, 1976, 1979, and 1986, havebeen completed.
In addition to background information, the NLS-72 base yearand follow-up surveys collected data on respondents' educationalactivities, such as schools attended, grades received, and degreeof satisfaction with their educational institutions. Participantswere also asked about work experiences, periods of unemployment,job satisfaction, military service, marital status, and children.Attitudinal information on self-concept, goals, participation inpolitical activities, and ratings of their high schools are othertopics for which respondents have supplied information.
1.6.3 High School and Beyond of the 1980s: HS&B
The next major longitudinal study sponsored by NCES was HighSchool and Beyond. HS&B was initiated in order to capture changesthat had occurred in education-related and more general socialconditions, in federal and state programs, and in the needs andcharacteristics of students since the time of the earlier survey.Thus, HS&B was designed to maintain the flow of education data topolicymakers at all levels who need to base their decisions on datathat are reliable, relevant, and current.
Base year data collection was conducted in the spring of 1980.Students were selected using a two-stage probability sample withschools as the first-stage units and students within schools as the
5

F2: Parent ComponentData File User's Manual
second-stage units. Unlike NLS-72, HS&B included cohorts of bothtenth and twelfth graders. Since the base year data collection in1980, four follow-ups of the HS&B cohorts have been completed: onein the spring of 1982; one in the spring of 1984; one in the springof 1986, and (for the sophomore cohort only) one in the spring of1992.
The four NELS program cohorts (NLS-72 seniors, the HS&Bsophomores and seniors, and NELS:88 eighth graders) are displayedin Figure 1-2 according to their initial and subsequent surveyyears and their modal age at the time of each survey. Asillustrated, NLS-72 seniors were first surveyed in 1972 at ageeighteen and have been resurveyed five times since, with the lastsurvey occurring in 1986 when these respondents were about thirty-two years of age. The HS&B cohorts have been surveyed at points intime that would permit as much comparison as possible with the timepoints selected for NLS-72. NELS:88 is designed to fit into thislarger analytical scheme. The NELS:88 first follow-up sophomoreclass of 1990 parallels the HS&B sophomore class of 1980;similarly, the second follow-up senior class of 1992 will parallelthe 1980 and 1982 HS&B, and 1972 NLS-72 senior classes.
1.7 The National Education Longitudinal Study of 1988 (NELS:88):Overview
The base year of the National Education Longitudinal Study of1988 (NELS:88) represented the first stage of a major longitudinaleffort designed to provide trend data about critical transitionsexperienced by students as they leave elementary school andprogress through high school and into postsecondary institutions orthe work force. This study of the 1988 eighth-grade cohortcollects data about educational processes and outcomes pertainingto student learning, predictors of dropping out, and the effects ofschools on students' access to programs and equal opportunity tolearn.
The first follow-up in 1990 provided the first opportunity forlongitudinal measurement of the 1988 baseline sample. It alsoprovided a comparison point to high school sophomores ten yearsbefore, as studied in HS&B. The study captured the population ofearly dropouts (those who leave school between the end of eighthgrade and the end of tenth grade), while monitoring the transitionof the student population into secondary schooling. Freshening the
6

F2: Parent ComponentData File User's Manual
Figure 1-1 Development of key research issues for the NCESNational Education Longitudinal Studies Program
Note: This figure is not available in the electronic version ofthe Data File User's manual. This figure can be found in theprinted version of the Second Follow-Up: Parent Component DataFile User's Manual.
7

F2: Parent ComponentData File User's Manual
Figure 1-2 Research design for the NCES National EducationLongitudinal Studies (NELS) program
Note: This figure is not available in the electronic version ofthe Data File User's manual. This figure can be found in theprinted version of the Second Follow-Up: Parent Component DataFile User's Manual.
8

F2: Parent ComponentData File User's Manual
NELS:88 sample to represent the tenth-grade class of 1990 makestrend comparisons with the HS&B sophomore cohort possible.1
The second follow-up took place in 1992, when most samplemembers entered the second term of their senior year. The secondfollow-up provides a culminating measurement of learning in thecourse of secondary school, and also collects information that willfacilitate investigation of students' transition into the laborforce and postsecondary education after high school. Fresheningthe NELS:88 sample to represent the twelfth-grade class of 1992makes trend comparisons with the senior cohorts that were studiedin NLS-72 and HS&B possible. The NELS:88 second follow-upresurveyed students who were identified as dropouts in 1990, andidentified and surveyed those additional students who left schoolafter the first follow-up.
The third follow-up is occurring in 1994, when most samplemembers will be in postsecondary education or in the labor market.The goals of the 1994 round are to provide data for trendcomparisons with NLS-72 and HS&B, and to continue cross-wavecomparisons with previous NELS:88 rounds. The third follow-up willpermit researchers to assess the effect of eighth-grade and highschool curricular experiences on postsecondary education choice.The third follow-up will provide the means by which access ofindividuals with different backgrounds to quality educationalinstitutions can be examined. The third follow-up will facilitatestudy of the influences of high school education experiences onpostsecondary education and employment opportunities and choices.Labor force participation, postsecondary persistence, curricularprogress, and family formation are further research topics whichwill be explored by the third follow-up. Additionally, the thirdfollow-up will provide a basis for assessing how many dropouts havereturned to school and by what route, and will measure the accessof dropouts to vocational training programs and to otherpostsecondary institutions. A fourth follow-up will take place in1997 or 1998.
1.7.1 NELS:88 Study Objectives
NELS:88's major features include the integration of student,dropout, parent, teacher, and school studies; the initialconcentration on an eighth-grade student cohort with follow-ups at
1 Note, however, that the HS&B 1980 sophomore cohort in1982 does not strictly constitute a representative sampleof the nation's 1982 seniors, but rather a representativesample of 1980 sophomores two years later. Because ofthe sample freshening that took place in NELS:88 (but notin HS&B), the subset of NELS:88 sample members who werehigh school seniors in the spring of 1992 are nationallyrepresentative of seniors and are comparable to the NLS-72 and HS&B 1980 probability samples of twelfth graders.
9

F2: Parent ComponentData File User's Manual
two year intervals; the inclusion of supplementary components tosupport analyses of geographically or demographically distinctsubgroups; and the design linkages to previous longitudinal studiesand other current studies.
Multiple research and policy objectives are addressed throughthe NELS:88 design. The study is intended to produce a generalpurpose data set for the development and examination of federaleducational policy. Part of its aim is to inform decision makers,education practitioners, and parents about the changes in theoperation of the educational system over time, and the effects ofvarious elements of the system on the lives of the individuals whopass through it. Specifically, NELS:88 focuses on a number ofinterrelated policy issues including: identification of schoolattributes associated with achievement; the transition of differenttypes of students from eighth grade to secondary school; thetransition of secondary students to postsecondary education or thework force; the influence of ability grouping and program type onfuture educational experiences and achievements; determinants ofdropping out of the educational system; and changes in educationalpractices over time. One of the defining features of NELS:88 isthe extensive attention it gives to the role of parents. Thesecond follow-up parent survey (the parent survey was alsoconducted in 1988) gathered data on the effect of parents'attitudes and behaviors on educational or career choices, financialpreparation for postsecondary education, the correlates of activeparental involvement in the school, and the parent's role in theeducational success of their children. Appendix C provides anoverview of some of the key policy issues of education research andthe second follow-up student, dropout, and parent items which arerelated to them.
The NELS:88 design enables researchers to conduct analyses onthree principal levels: cross-wave, cross-sectional at a singletime point, and cross-cohort by comparing NELS:88 findings to thoseof HS&B and NLS-72. The first of these levels provides NELS:88with its primary objective: to serve the purposes of longitudinalmeasurement. The sampling and data collection designs givepriority to maintaining and surveying a substantial number of baseyear sample members, as well as to sustaining overlapping butanalytically distinct cohorts of sophomores and seniors.2 Users ofNELS:88 data will be able to study the effect of a wide variety offactors on students' educational and professional attainment. Thelongitudinal data gathered from students, and augmented throughparent, teacher, school administrator, and school record (forexample, academic transcripts) accounts of students' progressionand development, will facilitate scrutiny of various facets of
2 Sample freshening in the first follow-up ensured theexistence of a nationally representative sophomore cohortas well. All 1990 tenth graders have been retained inthe 1992 sample.
10

F2: Parent ComponentData File User's Manual
students' lives--their problems and concerns, their relationshipswith parents, peers, and teachers, and the characteristics of theirschools--and permit examination of the impact of these factors onsocial, behavioral, and educational development.
The second analytic level within NELS:88 is cross-sectional.By beginning with a cross-section of 1988 eighth graders, followinga substantial subsample of these students at two-year intervals,and freshening the 1990 and 1992 samples to obtain representativenational cross-sections of tenth and twelfth graders, the studyalso provides a statistical profile of America's eighth graders,high school sophomores, and high school seniors. Figure 1-3 liststhe NELS:88 survey components, instruments, and modal grades forthe base year, first follow-up, and second follow-up. Figure 1-4illustrates the longitudinal design of NELS:88.
Finally, NELS:88 has been designed to provide researchers withdata for drawing comparisons with previous NCES longitudinalstudies. After the release of NELS:88 first follow-up data,researchers were able to conduct trend analyses with the 1980sophomore cohort of HS&B. With completion of the NELS:88 secondfollow-up, comparisons may be made among NELS:88, HS&B, and NLS-72senior cohorts. To facilitate cross-cohort comparisons, many ofthe content areas contained in the HS&B base year survey wererepeated in each wave of NELS:88, and data processing and fileconventions have been kept consistent, to the maximum extentfeasible, with HS&B and NLS-72. For users specifically interestedin conducting trend analyses of NLS-72, HS&B and NELS:88 data,further information on content and design similarities anddifferences between these three studies is presented in Appendix Dof the NELS:88 Second Follow-Up: Student Component Data FileUser's Manual.
1.7.2 Base Year Study and Sample Design
The base year study design comprised four components: surveysand tests of students, and surveys of parents, schooladministrators, and teachers. A student questionnaire gatheredinformation about basic background variables and a range of othertopics including school work, educational and occupationalaspirations, and social relationships. Students also completed aseries of curriculum-sensitive cognitive tests to measureeducational achievement and cognitive growth between eighth andtwelfth grades in four subject areas--reading, mathematics,science, and social studies (history/government). One parent ofeach student was asked to respond to a parent survey intended tomeasure parental aspirations for children, family willingness tocommit resources to children's education, the home educationalsupport system, and other family characteristics relevant toachievement. A school administrator questionnaire was completed byschool principals or headmasters. It gathered descriptiveinformation about the school's teaching staff, the school climate,characteristics of the student body, and school policies and
11

F2: Parent ComponentData File User's Manual
Figure 1-3: Base year through fourth follow-up -- NELS:88 components
BASE YEAR FIRST FOLLOW-UP
SECOND FOLLOW-UP
THIRDFOLLOW-UP
FOURTHFOLLOW-UP
Datacollection:
spring term1988
spring term1990
spring term1992
spring 1994 spring 1997or 1998
Gradesincluded:
Grade 8 modal grade =sophomore
modal grade =senior
H.S. + 2years
H.S. + 5 or 6years
Cohort: students: questionnaire,
tests
students,dropouts:
questionnairetests
students,dropouts:
questionnairetests, H.S.
transcripts
allindividuals:questionnaire
allindividuals:questionnaire
Parents: questionnaire none students,dropouts:
questionnaire
none none
Principals: questionnaire students:questionnaire
students:questionnaire
none none
12

F2: Parent ComponentData File User's Manual
BASE YEAR FIRST FOLLOW-UP
SECOND FOLLOW-UP
THIRDFOLLOW-UP
FOURTHFOLLOW-UP
Teachers:
two teachersper student(taken fromEnglish,socialstudies,
mathematics,or science)
students: two teachersper student(taken fromEnglish,socialstudies,
mathematics,or science)
students: one teacherper student(taken frommathematicsor science)
none none
13

F2: Parent ComponentData File User's Manual
Figure 1-4 Longitudinal sample design of NELS:88 (1988 - 1994)
Note: This figure is not available in the electronic version ofthe Data File User's Manual. This figure can be found in theprinted version of the Second Follow-Up: Parent Component DataFile User's Manual.
14

F2: Parent ComponentData File User's Manual
programs. Finally, selected teachers in two of the four subjectareas completed a teacher questionnaire designed to collect dataabout school and teacher characteristics, evaluations of theselected students, course content, and classroom teachingpractices.
In the NELS:88 base year, a two-stage stratified probabilitydesign was used to select a nationally representative sample ofeighth-grade schools and students. Schools constituted the primarysampling unit; the target sample size for schools was 1,032. Apool of 1,032 schools was selected through stratified sampling withprobability of selection proportional to eighth-grade size and withoversampling of private schools. A pool of 1,032 replacementschools was selected by the same method. Of the 1,032 initialselections, 30 proved to be ineligible. Of the 1,002 eligibleselections, 698 participated. An additional 359 schools (suppliedby alternative selections available from the replacement pool) alsoparticipated, for a total school sample of 1,057 cooperatingschools, of which 1,052 schools (815 public schools and 237 privateschools) contributed usable student data. For 1,035 of these 1,052schools, both student and school administrator data were received.In the NELS:88 base year design, students were the secondarysampling unit. The second stage--student sampling--produced arandom selection of 26,4323 students among participating sampledschools, resulting in participation by 24,599 spring term 1988eighth graders. On average, each of the participating schools wasrepresented by 23 student participants. Additional informationabout the base year sample design is provided in the NELS:88 BaseYear Sample Design Report.4
1.7.3 First Follow-Up Core Study and Sample Design
The first follow-up of NELS:88 comprised the same componentsas the base-year study, with the exception of the parent survey,which was not repeated in the 1990 round. In addition, three newcomponents--the dropout study, base year ineligible study, andschool effectiveness study--were initiated in the first follow-up,and a freshened sample was added to the student component. As inthe base year, students were asked to complete a questionnaire andcognitive test. The cognitive test was designed to measure tenth-grade achievement and cognitive growth between 1988 and 1990 in thesubject areas of mathematics, science, reading, and social studies(history/geography/civics). The student questionnaire collectedbasic background information, and asked students about such topics
3 The sample size of 26,435 cited in the NELS:88 Base YearStudent Component Data File User's Manual is atypographical error.
4 Spencer, B.D.; Frankel, M.R.; Ingels, S.J.; Rasinski,K.A.; Tourangeau, R.E. August 1990; NCES 90-463, ERIC ED325-502.
15

F2: Parent ComponentData File User's Manual
as their school and home environments, participation in classes andextra-curricular activities, current jobs, their goals andaspirations, and opinions about themselves. Following the baseyear design, a school administrator questionnaire was completed byschool principals, and two teachers of each student were asked tocomplete a teacher questionnaire. First-time participants inNELS:88 completed a new student supplement, containing basicdemographic items which were asked in the base year but notrepeated in the first follow-up. The first follow-up also surveyedand tested youths who had dropped out of school at some pointbetween the spring term of the 1987-88 school year and the springterm of the 1989-90 school year. The dropout questionnairecollected information on a wide range of subjects, includingreasons for leaving school, school experiences, absenteeism, familyformation, plans for the future, employment, attitudes and self-concept, and home environment.
The selection of students in the first follow-up wasimplemented in two stages. The first stage of sampling involvedthe selection of 21,474 students who were in the eighth-gradeNELS:88 sample in 1988.5 Because some sophomores were not in thecountry, or were not in the eighth grade in the spring term of1988, the representative subsample of the eighth-grade cohort wasaugmented through a process called freshening. The goal was toprovide a representative sample of students enrolled in the tenthgrade in the 1989-90 school year. Freshening added an additional1,229 tenth graders (of whom 1,043 were found to be eligible andstill retained after final subsampling) who were not contained inthe base year sampling frame.
Several components were added to the first follow-up toincrease its analytic power. One of these enhancements, the baseyear ineligible (BYI) study, was added to the first follow-up inorder to ascertain the 1990 school enrollment status and the 1990NELS:88 eligibility status of students who were excluded from thebase year survey due to a language barrier or physical or mentaldisability which precluded them from completing a questionnaire andcognitive test. Any eligible students were included in both thefirst and second follow-up.
In addition to the BYI study, the school effectiveness study,designed to sustain analyses of school effectiveness issues, wasconducted in conjunction with the first follow-up. The within-school student sample of 251 participating first follow-up highschools in the thirty largest metropolitan statistical areas wasaugmented to produce a probability sample of both schools andstudents within the framework of the primary longitudinal study.
5 This includes students who were base-year nonrespondentsas well as approximately 2,400 sample members sponsoredby the U.S. Department of Education's Office of BilingualEducation and Minority Languages Affairs (OBEMLA).
16

F2: Parent ComponentData File User's Manual
1.7.4 Second Follow-Up Core Study and Sample Design
The NELS:88 second follow-up repeats all components of thefirst follow-up study. In addition, the parent component isincluded once again in the second follow-up. Two new components--the transcript and course offerings components--were initiated inthe second follow-up. The course offerings component wasimplemented as a part of the school effectiveness study. Thetranscript component was undertaken for sample members as describedin section 1.7.5. Sample freshening was also implemented in thesecond follow-up to provide a representative sample of studentsenrolled in the twelfth grade during the spring term of the 1991-1992 school year.
Each student and dropout selected for the first follow-up wasincluded in the second follow-up. From within the schools attendedby the sample members, 1,500 twelfth-grade schools were selected assampled schools. Of the 1,500 sampled schools, the full complementof component activities occurred in 1,374 schools. For studentsattending schools other than those 1,374 schools, only the studentand parent questionnaires were administered. Retaining the entirefirst follow-up sample in the 1992 round provides a maximallyefficient sample for the NELS:88 second follow-up while satisfyingresearchers who are interested in maximizing the presence in thestudy of rare policy-relevant populations.
The student sample was then augmented through freshening atthe 1500 NELS:88 selected schools, the aim of which was to providea representative sample of students enrolled in the twelfth gradeduring the spring term of the 1991-92 school year. Fresheningadded 364 twelfth graders (of whom 243 were deemed eligible) whowere not contained in the base year sampling frame, either becausethey were not in the country, or were not in the eighth grade inthe spring term of 1988. Additional information about the secondfollow-up sample design is provided in Chapter III of this manualand in the forthcoming NELS:88 Second Follow-Up Sample DesignReport. Dropout data collection occurred between January andOctober 1992.
As in the previous waves, students were asked to complete aquestionnaire and cognitive test. The cognitive test was designedto measure twelfth-grade achievement and cognitive growth between1988 and 1992 in the subject areas of mathematics, science,reading, and social studies (history/citizenship/geography). Thestudent questionnaire asked students about such topics as academicachievement; student perceptions and feelings about theircurriculum and school; family structure and environment; socialrelations; and aspirations, attitudes, and values, especially asthey relate to high school and occupational or postsecondaryeducational plans. The student questionnaire also gathered dataabout the family decision-making structure during the criticaltransition from secondary school to postsecondary education or thework environment. The student questionnaire contained a supplement
17

F2: Parent ComponentData File User's Manual
for early graduates, the intent of which was to document thereasons for and circumstances of early graduation. If a studentwas a first-time participant in NELS:88, he or she also completeda new student supplement, containing basic demographic items whichwere asked in the base year but not repeated in the second follow-up.
A school administrator questionnaire, as in the first follow-up, was completed by school principals or headmasters. In adeparture from the base year and first follow-up teacher surveys,only one teacher, either a mathematics or science teacher, wasasked to complete a questionnaire for each sampled student enrolledin these subject areas in a NELS:88 sampled school.
The second follow-up, in addition to surveying students whowere enrolled in school, surveyed and tested youths who had droppedout of school at some point between the spring term of the 1987-88school year and the spring term of the 1991-92 school year. Thedropout and student questionnaires collected information on a widerange of subjects, including reasons for leaving school, schoolexperiences, absenteeism, plans for the future, employment,attitudes and self-concept, and home environment.
1.7.5 Second Follow-Up Design Enhancements
Two new components, the transcript and the course offeringscomponents, were added to the NELS:88 second follow-up. Thesecomponents provide archival data which describes the academicexperience of high school students and the curricula offered bytheir schools. The complete high school transcript record wascollected for 1) the contextual sample--students attending sampledschools in the spring of 1992; 2) all dropouts, dropouts inalternative programs, and early graduates, regardless of schoolaffiliation; and 3) triple ineligibles enrolled in the twelfthgrade in the spring of 1992, regardless of school affiliation.Triple ineligibles are sample members who were ineligible for thebase year, first follow-up, and second follow-up surveys due tomental or physical disability, or language barrier. NELS:88 course-taking data will provide not only a baseline against which futurestudent outcome measures can be compared, but will illuminatetrends when contrasted to the 1982 HS&B high school transcriptstudy, the 1987 National Assessment of Educational Progress (NAEP)transcript study, and the 1990 NAEP transcript study. The courseofferings component provides curriculum data from second follow-upschool effectiveness study schools through which school effects onstudent outcomes can be studied.
The school effectiveness study (SES) was added to the firstfollow-up to provide a probability sample of tenth-grade schools,with a sizable and representative within-school sample of students,through which longitudinal school-level analysis (comparable to1980-82 HS&B sophomore cohort analysis) could be conducted. In thefirst follow-up school effectiveness study, permission to conduct
18

F2: Parent ComponentData File User's Manual
the study was gained from 251 schools and 248 of those schools werefinal first follow-up SES participants. The second follow-upschool effectiveness study returned to 247 of the 251 cooperatingfirst follow-up SES schools (one school became ineligible),conducting freshening on both longitudinal and SES sample members,and selecting additional students from the pool including studentswho transferred into the school since the 1989 selection of SESstudents. The second follow-up school effectiveness study wasenhanced by the addition of archival data collected by the newcourse offerings component, and was further augmented by theadministration of free response science and mathematics cognitivetest items in SES schools.
1.8 NELS:88 Sponsors
The NELS:88 sponsor, the U.S. Department of Education'sNational Center for Education Statistics (NCES), provided federalagencies, states, and educational institutions with an opportunityto expand the scope of the base year, first follow-up, and secondfollow-up studies and enrich them through a variety of means.Enhancements sponsored by various groups included: samplesupplements for states to provide representative state samples,oversamples of specific student groups, supplemental questions forvarious data collection instruments, and supplementalquestionnaires.
1.8.1 Sample Supplements and Augmentations
Sample supplements and augmentations for the second follow-upwere sponsored by various sources. The National Science Foundation(NSF) sponsored the core study teacher component, while NCES fundedadministration of the teacher survey in the school effectivenessstudy. The U.S. Department of Education's Office of BilingualEducation and Minority Languages Affairs (OBEMLA) provided funds inthe base year for oversampling Hispanic and Asian-Pacific Islanderstudents, and for disproportionately retaining Hispanic, Asian-Pacific Islander, and American Indian students in the first follow-up. The school effectiveness study (SES) of the second follow-upwas begun in the first follow-up with funds from the MacArthurFoundation and from NCES. NCES also sponsored the follow-backstudy of excluded students (FSES), a continuation of the base yearineligible study of the first follow-up, which included 303 baseyear sample members who were ineligible to participate in the baseyear or first follow-up surveys. For each wave of NELS:88, allsurvey instruments and cognitive tests were administered to thecore study (which included the OBEMLA oversample) and augmentationsamples in an identical fashion; some by personal interviews, andothers by telephone.
1.8.2 Instrument Supplements
The NELS:88 second follow-up instruments were supplemented invarious ways by federal agencies. The National Science Foundation
19

F2: Parent ComponentData File User's Manual
(NSF) sponsored supplemental mathematics and science items on thestudent questionnaire and free response science and mathematicsitems on the school effectiveness study cognitive test. The U.S.Department of Education's Office of Bilingual Education andMinority Languages Affairs (OBEMLA), added questions about minoritylanguage use patterns and bilingual programs. Appendix A containsinformation on related NELS:88 enhancements and stateaugmentations, as well as data from other education studies whichare available through NCES.
1.9 NELS:88 Data and Documentation
NELS:88 base year, first follow-up, and second follow-up dataare available in both public use and restricted use versions onboth magnetic tape and on compact disc (CD-ROM). While this manualis specifically designed for use with the public release files, itis also appropriate for use with the restricted data.
Because multilevel microdata (that is, individual-level datafrom multiple, linkable sources) carries with it some risk ofstatistical disclosure of institutional or individual identities,the NELS:88 data have been extensively analyzed to determine whichitems of information, used alone, in conjunction with other keyvariables, or in conjunction with public external sources such asschool universe files, have significant disclosure potential.Variables that were found to pose significant disclosure risks weresuppressed or altered to remove or substantially reduce such risks.For example, in some cases, continuous variables have been recastas categorical variables, or fine-grained categorical variableshave been more grossly recategorized.
In a few instances, data elements have been suppressed orchanged. Because of this, a particular school or individualstudent might be characterized in terms of a certain variable onthe restricted use version of the NELS:88 data, but be coded tomissing on the public files, coded to an adjacent responsecategory, or included in a code which collapsed two or moreresponse categories. These suppressions and recodes have beenclearly labelled in the codebooks included in each data file user'smanual.
While the extremely high value that is placed onconfidentiality--not only by federal statute, but also by NCES andcontractor standards--justifies these alterations of the data, itis recognized that some of these protections against disclosure mayat times reduce the analysis potential of certain variables in thedata set. For example, when only ranges of percentages are givenfor a variable, threshold points that may be important for someanalyses may be obscured, or nonlinearities in relationshipshidden. No matter how thoughtfully continuous variables aretransformed into categorical form, different cut points for thecategories may be desirable, depending on one's particular analyticpurposes. While most suppressed data will have only a negligible
20

F2: Parent ComponentData File User's Manual
effect on most analyses, there are times when the suppressedinformation is critical. For this reason, NCES also makesrestricted use data files available to qualified researchers witha proven need for the data in its restricted use form. To obtainthe restricted use data, it is necessary for an organization toobtain a licensure agreement from NCES. The agreement must besigned by the principal investigator and by someone authorized tocommit the organization to the legal requirements. In addition,each professional or technical staff member with access to the datamust sign and have notarized an affidavit of nondisclosure. Referto section 7.3.2 for instructions for obtaining access to theNELS:88 restricted use data files.
1.9.1 Base Year Data Tapes and Documentation
Four public release tapes were produced for the NELS:88 baseyear study, one for each study component--the student, parent,teacher, and school. A data file user's manual was produced foreach of the public release data tapes.6 Additional forms ofdocumentation produced include the NELS:88 Base Year Sample DesignReport which assesses the sampling procedures for the base yearsurvey.7 The Psychometric Report for the NELS:88 Base Year TestBattery gives an in-depth description of the rationale,development, and statistical properties of the eighth-gradecognitive test battery.8 The NELS:88 Base Year Final TechnicalReport provides detailed documentation of the methodology of thesurvey.9 Finally, Quality of the Responses of Eighth-GradeStudents in NELS:88 documents the reliability and validity ofstudent responses.10 A number of additional NELS:88 analysisreports and special tabulations are available from NCES.Information on published and planned reports and tabulations islisted in Appendix B.
6 Ingels, S.J.; Abraham, S.Y.; Rasinski, K.A.; Karr, R.;Spencer, B.D.; Frankel, M.R. March 1990; NCES 90-464,90-466, 90-482 (ERIC ED 322-223), 90-484 (ERIC ED 322-222).
7 Spencer, B.D.; Frankel, M.R.; Ingels, S.J.; Rasinski,K.A.; Tourangeau, R. August 1990; NCES 90-463, ERIC ED325-502.
8 Rock, D.A., and Pollack, J.M. April 1991; NCES 91-468,ERIC ED 334-241.
9 Ingels, S.J.; Rasinski, K.A.; Frankel, M.R.; Spencer,B.D.; Buckley, P.; 1990; Chicago: NORC.
10 Kaufman, P.; Rasinski, K.A.; Lee, R.; West, J. September1991; NCES 91-487, ERIC ED 339-722.
21

F2: Parent ComponentData File User's Manual
1.9.2 First Follow-Up Data Files and Documentation
Four public release data files were produced for the NELS:88first follow-up, one for each study component--the student,dropout, school, and teacher surveys.11 As with the base year datafiles, a data user's manual was provided for use with each publicrelease first follow-up data file.12 The student data file user'smanual encompasses both the 1988 and 1990 waves of the study.
Further first follow-up documentation including an assessmentof sampling and the psychometric properties of the cognitive testsis provided in the NELS:88 First Follow-Up Final Technical Report.13
Special reports and tabulations based on first follow-up findingshave either been published or are in preparation at this time.These reports, and their estimated release dates, are listed inAppendix B.
An electronic codebook released in the spring of 1993 ishoused on CD-ROM, and includes public use student, school, andteacher data from the base year and first follow-up waves ofNELS:88. Also included in the first follow-up electronic codebookreleased on CD-ROM are public use data from the base year parentsurvey and dropout data from the first follow-up. The electroniccodebook is MS-DOS based and menu driven. This on-line codebooksystem allows PC or PC-compatible computer users to:
• search a list of relevant variables based on key words orvariable names;
• view frequencies for each variable;
• view question text;
• write SAS or SPSS control card files which can be used toconstruct a data system file; and,
• generate a codebook of selected variables.
Documentation includes an instruction guide to codebook operationand a technical appendix which outlines computer systemrequirements for codebook use.
11 The school effectiveness study data will be released asa combined first and second follow-up data set.
12 Ingels, S.J.; Scott, L.A.; Lindmark, J.T.; Frankel, M.R.;Myers, S.L. April 1992; NCES 92-030 (ERIC ED 347-780),92-083, 92-084, 92-085.
13 Ingels S.J., Scott L.A., Rock D., Pollack J., RasinskiK.; Washington D.C.: NCES, 1994.
22

F2: Parent ComponentData File User's Manual
1.9.3 Second Follow-Up Tapes, Electronic Codebook on CD-ROM,and Documentation
Five user's manuals have been produced for the NELS:88 secondfollow-up public release files, one to accompany each of thefollowing components: student, dropout, parent, teacher, andschool. Each manual furnishes the user with general informationand documentation both about NELS:88 and a specific public releasedata file. Although the five user's manuals are written for usewith the public release data files, they may also be utilized withthe restricted use files. Additional manuals will be produced foruse with the transcript and school effectiveness study restricteduse data files.
The second follow-up magnetic tapes and CD-ROM comprise allcomponents of the second follow-up survey, as well as updated baseyear and first follow-up files. Base year and first follow-upcognitive test scores have been rescaled for the second follow-uprelease of the base year, first follow-up, and second follow-upfiles. An electronic codebook (ECB) on the CD-ROM features windowswith both weighted as well as unweighted frequencies andpercentages. A user's guide is available for the ECB and CD-ROMproducts.
Other second follow-up restricted data files, such as the highschool transcript survey, the school effectiveness study (SES), andthe early graduate supplement, also appear on CD-ROM but not in theECB format. These files can be downloaded to floppy diskette orhard drive on a PC, and/or uploaded to mainframe or other machines.The files can be converted to systems files for use with standardstatistical software packages. Chapter VII of this manual containsadditional information on the magnetic tape and CD-ROM releases.
Additional forms of second follow-up documentation, includingan in-depth assessment of sampling and non-sampling error, thesampling design, the psychometric properties of the cognitivetests, and various analysis reports are planned. These reports,and their estimated release dates, are listed in Appendix B.
23

F2: Parent ComponentData File User's Manual
II. Data Collection Instruments
This chapter provides a brief description of the surveyinstruments and cognitive tests used in the NELS:88 second follow-up. The data collection instruments for the second follow-up weresimilar in content and form to those utilized in the prior waves.The instruments included a parent, student, dropout, schooladministrator, and teacher questionnaire, and a cognitive test forstudents and dropouts. The new student supplement, added in thefirst follow-up to elicit demographic information from newlyfreshened students, was again administered in the second follow-up.An early graduate supplement was added for students who graduatedfrom high school before their in-school data collection session inthe spring of 1992.
Instrument development was guided by the research objectivesof NELS:88. Questionnaires were designed to meet the longitudinalgoals of the study, and items were chosen based on their utility inpredicting or explaining future outcomes as measured in the secondfollow-up or later survey waves. All of the questionnairesemployed in the base year, first follow-up, and second follow-upsurveys were framed to provide continuity and consistency withearlier NCES education longitudinal studies, as well as to addressnew areas of policy concern and to reflect recent directions intheory. Where appropriate, NELS:88 drew test and questionnairecontent from NLS-72, HS&B, and other NCES studies, such as theNational Assessment of Educational Progress (NAEP) and the Schoolsand Staffing Study (SASS), to ensure a common standard ofmeasurement that would permit comparisons with other important datasources, and maximize the utility of NELS:88 data. For example,NELS:88 mathematics tests were designed so that NELS:88 and NAEPtest scores can be equated, and so that HS&B and NELS:88mathematics test results can be equated as well. Appendix D of theNELS:88 Second Follow-Up: Student Component Data File User's Manualcontains an outline of the items which overlap between the NELS:88base year, first follow-up, and second follow-up studentquestionnaires, the NLS-72 base year student questionnaire, and thebase year HS&B senior cohort student questionnaire. Appendix D ofthis manual contains a crosswalk between the questionnaire items inthe NELS:88 base year and second follow-up parent surveys and theHS&B parent surveys.
A field test of the NELS:88 second follow-up conducted in 1990and 1991 examined survey instruments and procedures and played akey role in instrument development. Although the teacher componentwas not included in the second follow-up field test, the secondfollow-up field test did include six other survey components: theschool administrator, student, the cognitive test battery, dropout,
24

F2: Parent ComponentData File User's Manual
and parent surveys, and the transcript component.14 Upon completionof field test data collection, the information gathered was used toinform planning for the main study. Analysis of field test datawas also used to improve the measurement properties of test andquestionnaire items, as well as to identify items which needed tobe modified or deleted for reasons of instrument length or itemformat. A detailed description of the second follow-up field testcan be found in the Field Test Report: National EducationLongitudinal Study of 1988 Second Follow-Up.15
The content areas of the base year, first follow-up, andsecond follow-up questionnaires are similar. Since longitudinaldata users may benefit from being able to take into account thedata that will be collected in 1994, a description of the NELS:88third follow-up questionnaire topic areas can be found in AppendixN of the NELS:88 Second Follow-Up: Student Component Data FileUser's Manual:
2.1 Parent Questionnaire
The parent questionnaire was designed to collect informationfrom parents about factors that influence educational attainmentand participation. The objective of the parent questionnaire wasto provide data that could be used primarily in the analysis ofstudent behaviors and outcomes, and only secondarily as a data setby itself. The questions focused on family background andsocioeconomic characteristics and on the character of the homeeducational support system. In addition, the parent instrumentcollected data related to parental behaviors and circumstances withwhich the student may not be familiar, such as parental educationand occupation, and contained more sensitive questions aboutincome, postsecondary educational costs and financial aiddecisions, and religious affiliation. English and Spanish languageversions of the questionnaire were made available to parents in thesecond follow-up as in the base year.
The questionnaire was arranged thematically into six differentsections. All parents were asked to complete the first fivesections. Respondents who were asked to complete the sixth sectionof the questionnaire were parents or guardians who were 1)nonrespondents in the base year parent survey or 2) the parent orguardian of a sample member new to NELS:88 in the first follow-up
14 In the original design of the NELS:88 second follow-up,the teacher survey was included as an optional componentof the study. Funding for the option was not received intime for its inclusion in the second follow-up fieldtest.
15 Dowd, K. et al.; v. 1; 1991; Chicago: NORC. ERIC ED 335-418.
25

F2: Parent ComponentData File User's Manual
or second follow-up. The content areas of these six sections areas follows:
• Information about the family's background. This sectionidentifies the relationship between the respondent andthe student or dropout sample member. Respondentsidentified the family size and composition and answeredquestions about their employment situation andoccupation, race, and language background and skills.
• Information about the teenager's school life. Thissection elicits parental knowledge of key characteristicsof the teenager's educational situation. The forms ofinteraction between the school and parent are included inthis portion of the questionnaire.
• The teenager's family life. The third section of thequestionnaire asks about the decision making processwithin the household and the kinds of interaction betweenthe respondent and teenager. Included are sensitivequestions about community life and drug and alcohol useby the teenager.
• The teenager's postsecondary plans. Parental aspirationsfor the teenager, preparations for postsecondaryeducation, and plans for the teenager's transition to theworkforce are covered.
• Financial information and educational costs. Familyincome and financial preparations for the teenager'spostsecondary education are asked in this section.
• Supplemental questions for parents new to NELS:88. Thefinal section of the questionnaire was only administeredto parents who did not participate in the base yearparent survey either because the parent or guardian wasa base year nonrespondent or because the student wasadded to the sample in the first or second follow-up.This section includes a number of questions asked in thebase year parent survey which were not repeated for theparents who participated in the earlier survey. Theitems include family characteristics, size, andcomposition in 1988, parent education, and parent age.
2.1.1 Adapting the Parent Questionnaire for TelephoneAdministration
Because the parent data were collected through self-administration and telephone administration, a number of steps weretaken in the second follow-up to minimize mode effects.Interviewers were trained to adapt the questions to make sense whenread over the telephone. Additionally, parents were asked to readalong in the questionnaire during the telephone interview if they
26

F2: Parent ComponentData File User's Manual
had a copy of the self-administered version of the questionnaireavailable.
2.1.2 Relationship between the Parent Instrument and OtherSecond Follow-Up Instruments
The data collected by the parent instrument is intended forprimary use as contextual data against which student and dropoutoutcomes and characteristics can be measured and is only intendedsecondarily for use without the student and dropout data. Likewisethe school administrator and teacher data are intended ascontextual data with which the central units of analysis, thestudents and dropouts, can be examined.
2.2 Student Questionnaire and Cognitive Tests
Sample members who attended school during the spring term ofthe 1991-92 school year were administered a student questionnaire,either at an in-school or off-campus survey session. Samplemembers administered a student questionnaire also included: thoseidentified as dropouts at some earlier time but who returned to andremained in school during the spring term of 1992; and students whohad left school but had already passed the General EducationalDevelopment test (GED) or had obtained some other equivalencycertification. The sixty-minute, self-administered questionnairecollected information on a wide range of topics, includingstudents' background, language use, home environment, perceptionsof self, occupational or postsecondary educational plans, jobs andhousehold chores, school experiences and activities, work, andsocial activities. Information collected by the second follow-upstudent questionnaire supplies a baseline for the study of theNELS:88 cohort's transition to postsecondary education or entryinto the labor market. The second follow-up student questionnairewas available in both English and Spanish.16
In addition to the student questionnaire, students completeda series of cognitive tests which were also administered at theirin-school or off-campus survey sessions. The combined testscovered four subject areas and included 116 items to be completedin 85 minutes. The cognitive tests are briefly described below:
16 Eight dropouts and 41 students completed the Spanish-language questionnaire in the NELS:88 second follow-up.Because of the small number of questionnaires completedin Spanish, a separate flag was not created for thesecases. The percentage of questionnaires completed inSpanish--around 0.2 percent--is similar to the percentageof HS&B seniors who opted to complete Spanish-languagequestionnaires in 1980/1982.
27

F2: Parent ComponentData File User's Manual
• Reading Comprehension (21 questions, 21 minutes)
This subtest contained five short reading passages or pairs ofpassages, with three to five questions about the content ofeach. Questions encompassed understanding the meaning ofwords in context, identifying figures of speech, interpretingthe author's perspective, and evaluating the passage as awhole.
• Mathematics (40 questions, 30 minutes)
Test items included word problems, graphs, equations,quantitative comparisons, and geometric figures. Somequestions could be answered by simple application of skills orknowledge, others required the student to demonstrate a moreadvanced level of comprehension and/or problem solving.
• Science (25 questions, 20 minutes)
The science test contained questions drawn from the fields oflife science, earth science, and physical science/chemistry.Emphasis was placed on understanding of underlying conceptsrather than retention of isolated facts.
• History/Citizenship/Geography (30 questions, 14 minutes)
American history questions addressed important issues andevents in political and economic history from colonial timesthrough the recent past. Citizenship items included questionson the workings of the federal government and the rights andobligations of citizens. The geography questions touched onpatterns of settlement and food production shared by othersocieties as well as our own.
NORC's subcontractor, the Educational Testing Service (ETS),developed the cognitive test battery for the second follow-up. Sixforms of the cognitive test battery were produced in the secondfollow-up, each comprising a different combination of mathematicsand reading difficulty levels. Each sample member's test form wasdetermined by his or her scores on the base year and/or firstfollow-up mathematics and reading tests; freshened students andfirst follow-up nonrespondents received the intermediate version ofthe second follow-up cognitive test battery. The purpose of themultilevel design of the second follow-up cognitive test batterywas to guard against ceiling and floor effects which may occur whentesting must span four years of schooling. This adaptive approachtailors the difficulty of the reading and mathematics tests to theability of the respondent, thereby leading, given limitations intesting time, to a more accurate measurement than a single leveldesign.
Psychometric properties of the cognitive tests are discussedin the forthcoming NELS:88 Second Follow-Up Final Psychometric
28

F2: Parent ComponentData File User's Manual
Report, the forthcoming NELS:88 First Follow-Up Final TechnicalReport, and the Psychometric Report for the NELS:88 Base Year TestBattery, all obtainable from NCES.17
2.3 Dropout Questionnaire
During the data collection period from January through October1992, a dropout questionnaire was administered to sample memberswho, based on data gathered through administration of a statusscreener, were not in an academic program leading to a high schooldiploma and had not received a GED by the spring of 1992. Thedropout questionnaire collected data about the last school attendedby the sample member and the school's climate, reasons for leavingschool, and actions school personnel, parents, and friends tookwhen the respondent stopped going to school. Respondents alsoreported on their likelihood of returning to and graduating fromhigh school, and described their current activities, employmenthistory, and future plans. The hour-long, self-administeredquestionnaire was normally completed with an interviewer present,at either a group or single survey session and was available inboth English and Spanish. However, in some cases the dropoutquestionnaire was administered as a telephone interview.
In addition to the dropout questionnaire, an 85-minutecognitive test battery was also administered to dropouts whenpossible. Because of the difficulty in collecting test data fromdropouts, and because data from many dropouts was collected intelephone interviews which preclude testing, the NELS:88 secondfollow-up achieved a comparatively low 41.7 percent weightedcognitive test completion rate for dropouts.
The dropout questionnaire was designed to facilitatecomparisons with the NELS:88 second follow-up studentquestionnaire, the first follow-up dropout questionnaire, and theHS&B 1982 dropout questionnaire. This item overlap with thestudent questionnaire permits users to contrast factors such asschool environment, family life, aspirations, and self-perceptionsof students with the responses of dropouts. The overlap of 1982and 1992 dropout items facilitates comparison of contemporarydropouts with those of a decade before. All sample members appearon the student data file regardless of their spring 1992 enrollmentstatus. Basic classification variables and test data appear forboth students and dropouts, though dropout questionnaire dataappear separately on the dropout component data file. Tofacilitate the use of school contextual data with dropout data, onthe restricted use CD-ROM delivery of the second follow-up data, alink is provided between a dropout and the first or second follow-up school the dropout last attended.
17 Rock, D.A., and Pollack, J.M. April 1991.
29

F2: Parent ComponentData File User's Manual
2.4 Adapting Student and Dropout Questionnaires for TelephoneAdministration
To adapt the second follow-up student and dropoutquestionnaires for telephone interviewing, two abbreviated versionsof the instruments were administered during the final weeks of datacollection. Adaptation of the student and dropout questionnairesfor telephone administration was guided by the need to preserveeach question's original meaning while wording each question sothat it made sense when read aloud. One abbreviated version of thestudent and dropout questionnaires excluded a small number ofquestions which did not lend themselves to being read aloud. Asecond abbreviated version of the questionnaires was administeredto sample members who explicitly refused to complete the full-length instrument and consisted mainly of locator information andkey items. The mode of administration for the abbreviatedinstruments was primarily a telephone interview; however, a smallpercentage of abbreviated questionnaires were completed by personalinterview.
2.5 New Student Supplement
First-time NELS:88 participants--due to freshening, previousineligibility, or non-participation--completed the new studentsupplement questionnaire, which was available in English andSpanish. New student supplement data were also obtained for anumber of first follow-up freshened students who had completed astudent questionnaire but had not completed a new studentsupplement in 1990. The self-administered supplement tookapproximately 15 minutes to complete, and contained questions thatgathered basic demographic information (such as birthdate, sex,family socioeconomic status, and race/ethnicity) about students andtheir families which was gathered by the base year questionnaire,but not repeated in the student questionnaire for later rounds.
2.6 Early Graduate Supplement
NELS:88 participants who graduated from high school or whoobtained equivalency certification such as the GED prior to datacollection in the spring term of 1992 completed the second follow-up early graduate supplement to the student questionnaire. Theintent of this supplement was to document the reasons for and thecircumstances of early graduation, the adjustments required tofinish early, and respondents' activities compared with those ofother school survey members. The items for the second follow-upearly graduate supplement were modeled on those used in the HS&Bsophomore cohort early graduate supplement administered in the HS&Bfirst follow-up in 1982.
2.7 School Administrator Questionnaire
The primary purpose of the school administrator questionnairewas to gather general descriptive information about the educational
30

F2: Parent ComponentData File User's Manual
setting and environment associated with the individual students whowere selected for participation in NELS:88. This schoolinformation describes the overall academic climate in terms ofspecific school practices and policies as well as enrollments andeducational offerings. The information obtained through the schooladministrator questionnaire provides supplemental data to thatprovided by the student questionnaire so that student outcomes canbe considered in terms of school measures.
In the second follow-up, a self-administered, forty-fiveminute school administrator questionnaire was completed by theschool principal, headmaster, or other knowledgeable schoolofficial designated by the school administrator of NELS:88 schools.The questionnaire was divided into five content areas as describedbelow:
• General school characteristics, such as grade span,school and twelfth-grade enrollment sizes, and schoolcontrol and demographic characteristics. In addition,questions were asked about college preparatory servicesand vocational programs offered to twelfth graders.
• General student characteristics of the twelfth-gradeclass, including average daily attendance rates, ethnicand racial composition, percentage of students withlimited English proficiency, and numbers of studentsreceiving special school services.
• Teaching staff characteristics encompassing such areas asthe number of full-time and part-time faculty,departmentalization of faculty, salary levels, andevaluation of teachers.
• School policies and programs including requirements forminimum competency and proficiency tests, and programsfor language minority students.
• School governance and climate such as administrationpractices, school reforms, types of parental involvement,student behavioral problems within school, and areas ofprincipal's control.
The questionnaire was designed so that the first four sectionscould be answered either by the school principal or by a designeewho was able to provide the requested information. Only theprincipal could answer the last section which asked for his or hersubjective opinions regarding the school environment.
2.8 Teacher Questionnaire
The NELS:88 teacher component was designed to provide teacherinformation that can be used to analyze the classroom and teacherinfluences on NELS:88 students, including their effects on
31

F2: Parent ComponentData File User's Manual
longitudinal student outcomes. The design of this component doesnot provide a stand-alone analysis sample of teachers, but insteadpermits specific teacher characteristics and practices to berelated directly to the learning context and educational outcomesof sampled students. The teacher questionnaire is the criticalinstrument for investigating the student's specific learningenvironment.
In the second follow-up, teachers were asked to respond to thequestionnaire items in relation to a specific list of sampledstudents enrolled in their classes. A thirty-minute questionnairewas collected for only one of the two cognitive test subjects,mathematics or science, if the student was enrolled in a class inone of the subjects.
The teacher questionnaire attempts to illuminate questions ofthe quality, equality, and diversity of educational opportunity byobtaining information in the following four content areas:
• Teacher's assessment of the student's school-relatedbehavior and academic performance, educational and careerplans and goals. Respondents completed this section withrespect to the sample members they instructed in aparticular subject matter.
• Information about the class the teacher taught to thesample member (e.g., track assignments, instructionalmethods, homework assignments, and curricular contents).
This section of the instrument includes classroom topiccoverage items ("Opportunity to Learn") that have beenarticulated with the cognitive tests subjects.
• Information about the school social climate andorganizational culture (e.g., teacher autonomy,participation in determining school policy, andrelationships with the principal).
• Information about the teacher's background and activities(e.g., academic training, subject areas of instruction,years of teaching experience, and participation inprofessional growth activities).
32

F2: Parent ComponentData File User's Manual
III. Sample Design and Implementation; Survey Error Assessment
This chapter describes the design and procedures used forselecting schools and students into the NELS:88 base year, firstfollow-up, and second follow-up samples and for selecting theparents in the second follow-up parent sample. It providesinformation on the calculation of sample weights and the relativeefficiency of the sample design. The chapter also providesinformation about procedures used to adjust sample weights fornonresponse and about the effect of unit and item nonresponse andother potential sources of bias on estimates.
3.1 NELS:88 Sample Design
The following section describes the sample design of NELS:88,from its base year inception through the first and second follow-ups. Beginning from a straight forward two-stage stratifiedsample, the complexities of the NELS:88 sample design have grownexponentially with each subsequent wave.
3.1.1 Base Year Sample Design
The NELS:88 base-year survey employed a two-stage, stratifiedsample design, with schools as the first-stage unit and studentswithin schools as the second-stage unit. Within each stratum,schools were selected with probabilities proportional to theirestimated eighth-grade enrollment to achieve virtual self-weighting. In addition, schools were oversampled in certainspecial strata so that policy-relevant subgroups would beadequately represented in the sample. Within each schoolapproximately 26 students were to be randomly selected (typically,24 regularly sampled students and two, on average, OBEMLA-supple-ment Hispanic and Asian/Pacific Islander oversampled students). Inschools with fewer than 24 eighth graders, all eligible studentswere selected. Because of the incidence of small schools in theNELS:88 sample, the average--within school sample size for the baseyear--was 25 students (or 23 participating students). From anational frame of about 39,000 schools with eighth grades, a targetsample size of 1,032 schools was set. Some 1,052 schools--815public and 237 private--participated and provided usable eighth-grade student data.
NORC's sampling frame was the school database compiled byQuality Education Data, Inc. (QED) of Denver, Colorado. The QEDlist contained information about whether a school was urban,suburban, or rural. NORC used this information for stratificationpurposes. The QED list did not at that time contain informationabout the racial/ethnic composition of individual public schoolsusable for the NELS:88 sampling frame. Racial/ethnic compositiondata were obtained from Westat, Inc. in its capacity as an NORCsubcontractor for the NELS:88 base year study. As part of theirwork on the National Assessment of Educational Progress (NAEP),Westat had obtained data from the Office of Civil Rights (OCR) and
33

F2: Parent ComponentData File User's Manual
from other sources (e.g., district personnel) that identified thoseschools with a minority enrollment of greater than 19 percent. Useof this data set facilitated the explicit stratification andallocation of schools with very large percentages of black orHispanic students. Stratification information on whether a schoolwas public, Catholic (private), or other private was obtained fromthe QED list and lists of private schools. Readers who desire moredetail on the base year sample design should consult the NELS:88Base Year Sample Design Report.
3.1.2 First Follow-Up Sample Design
There were three basic objectives for the NELS:88 firstfollow-up sample design. First, the sample was to includeapproximately 21,500 students who were in the eighth-grade samplein 1988 (including base year nonrespondents). This longitudinalcohort was to be distributed across 1,500 schools. Second, thesample was to constitute a valid probability sample of all studentscurrently enrolled in the tenth grade in the 1989-1990 school year.This entailed freshening the sample with students who were tenthgraders in 1990 but not in the eighth grade during the 1987-1988school year. Third, the first follow-up was to include a sample ofstudents who had been deemed ineligible for base year datacollection (because physical, mental, or linguistic barriersprevented them from participating) so that those able to take partcould be added to the first follow-up student sample, anddemographic and school enrollment information could be obtained forthem.
Longitudinal Cohort. The general sample design strategy forthis component of the sample involved subsampling students selectedfor the base year with non-zero probabilities related tocharacteristics of their 1990 schools. Base year students who haddropped out of school between 1988 and 1990 were subsampled withcertainty (their probabilities of selection were set equal to one).Base year students attending school in 1990 were subsampled withprobabilities related to the number of other base year studentsattending the same school. Base year students who were reported tobe attending a school with at least 10 other base year studentswere sampled with certainty. All other students were sampled withprobabilities greater than zero, but less than one.
Including nonrespondents, the NELS:88 base year samplecomprised 26,432 students. Of these, 96 were deemed out of scopefor the 1990 first follow-up (including students who had died ormoved out of the United States). Among the remaining 26,336students, 348 were found to have dropped out of school; all of
34

F2: Parent ComponentData File User's Manual
these students were selected into the first follow-up withcertainty (probability of selection equal to one).8
Distribution of Students in Schools. It was determined thatthe remaining pool of 25,988 students were distributed among 3,967schools.9 As had been anticipated, the distribution of thesestudents among schools was highly skewed. It was found thatapproximately 75 percent of the students (19,568 of 25,988) wereattending approximately 23 percent (908 of 3,967) of the schools;each of these schools included at least 11 base year students. Allof these 19,568 students were included in the first follow-up withcertainty. The remaining 6,420 students were distributed among3,059 schools with 10 or fewer members of the base year sample.Their sampling probabilities for the first follow-up depended onthe number of base year students the school contained. Theefficiency of this design relative to one with no subsampling atall was 66.5 percent.10 These schools--or, more precisely, clustersof base year students--were subsampled to achieve the final NELS:88first follow-up school sample, after the conclusion of the 1989spring term. There were 1,468 schools (1,506 student clusters)selected.
3.1.3 First Follow-Up Sample Enhancements and Modifications
Freshened Sophomore Sample. The second sampling objective wasto create a valid probability sample of students enrolled in tenthgrade in the 1989-1990 school year; this goal was achieved by aprocess called freshening. The freshening procedure was carriedout so that students who were not enrolled in the eighth grade inthe U.S. in 1988 had a chance of being selected for the sample.
8 The 348 dropouts comprise 250 dropouts whose status wasconfirmed by the student's home, 58 sample members whomthe school reported to have dropped out but fieldinterviewers could not locate, and 40 students who wereinstitutionalized. The latter group are not necessarilydropouts in the strict sense of the first follow-updropout definition because in some cases they werereceiving academic instruction. However, they weregrouped with the dropouts to ensure that they wouldremain in the first follow-up sample with certainty.
9 When the school a student was attending could not beidentified, a separate "school" of size one was created.This was the case for 221 students who could not belocated and ten students who were in home study. Hence,the number of actual schools was 3,736.
10 The measure of efficiency was computed as 1/(1+RV) *100%, where RV is the relative variance of the weightsrequired to compensate for the different rates ofsubsampling.
35

F2: Parent ComponentData File User's Manual
The freshening process could yield zero, one, or more than onenew sample member in a given school. A total of 1,229 new studentswere added to the tenth-grade sample--on average, just less thanone student per school. Some of these freshened students weredropped in the subsampling process described below either becausethey themselves were not included in the subsample or because thebase year student to whom they were linked was not included. Some1,043 students selected through the freshening procedure remainedin the final first follow-up sample.
Subsampling the Eighth-Grade Cohort and Freshened SophomoreSamples. After the initial selection of the longitudinal cohort,the combined longitudinal-freshened sample was further subsampled.The students dropped from the first follow-up as a result ofsubsampling were also excluded in the second follow-up. Twocategories of sample members were subsampled: 1) students who hadtransferred out of the school from which they had initially beenselected for the first follow-up sample; and 2) first follow-upnonrespondents who were classified as potential dropouts. NORCselected a 20 percent subsample of transfer students and a 50percent sample of "potential dropouts." Table 3.1.3-1 lists thefirst follow-up sample by race and means of entry into the sample.
Sample of Base Year Ineligibles. The NELS:88 base year sampleexcluded students for whom the NELS:88 survey instruments would beunsuitable (i.e., students with a mental disability and studentswho are not proficient in English) and students whose physical oremotional problems would have made participation in the surveyunduly difficult. A final sample of 653 of these students wereselected for a followback study of these students. The eligibilitystatus of these students was reassessed, their school enrollmentstatus and basic demographic characteristics were determined, andstudent questionnaire data were obtained from those deemed able tocomplete a questionnaire. Further detail on sample eligibility inthe base year is provided in the NELS:88 Base Year Sample DesignReport and in the NELS:88 First Follow-Up Final Technical Report.Chapter III of the NELS:88 Second Follow-Up: Student ComponentData File User's Manual includes additional detail about samplefreshening, student subsampling, and base year sample ineligiblestudents.
3.1.4 Second Follow-Up Sample Design
There were five basic objectives for the NELS:88 secondfollow-up sample design. First, the sample was to constitute avalid probability sample of all students enrolled in the twelfthgrade in the 1991-1992 school year. This entailed freshening thesample with students who were twelfth graders in 1992 but were notin the eighth grade in the U.S. in the 1987-88 school year, just asthe first follow-up sample had been freshened in 1989 to achieve a1990-91 representative sample of sophomores. Additionally, it wasnecessary to reassess the eligibility status of selected studentsfound in previous waves to be ineligible, and to include them in
36

F2: Parent ComponentData File User's Manual
the cohort if they were determined to be eligible for the secondfollow-up. Second, to continue the examination of the dropping outphenomenon, dropouts were to be retained with certainty. Third, itwas highly desirable for policy analysis purposes to retain themaximum number of Hispanics, Asians, and American Indians from thefirst follow-up sample. Fourth, to minimize nonresponse bias firstfollow-up nonrespondents were to be retained with certainty.Fifth, the sample was to be clustered in 1,500 schools from whichcontextual data--including schooladministrator, teacher, andtranscript data--would be collected. It was hoped that these goals
Table 3.1.3-1First follow-up sample by race breakdowna
First Freshened Dropped in FinalFollow-Up Sample final SampleInitial Subsamplingb
Selections
All 21,474 1,229 1,997 20,706c
Asian/Pacific Islanders 1,367 89 141 1,315Hispanics 2,828 246 323 2,751American Indians 278 28 32 274Blacks 2,265 235 280 2,220Whites 14,349 554 1,061 13,842Missing/Refused 387 77 160 304
a Figures in this table represent first follow-up constructedvariable frequencies. This variable--race identified at the timeof sampling--is not the same variable included on the data filesand reported in the codebooks. This variable was used because itwas the only race variable that was constructed for initial samplemembers dropped in final subsampling.
b 1,821 members of the eighth-grade longitudinal cohort and 169freshened tenth graders were dropped in Phase 3 subsampling. Inaddition, 7 members of the eighth-grade longitudinal cohort werediscarded because they were selected in error during the base year.
c This table is based on the original (1992-1993) release of thefirst follow-up student file. The second follow-up (1994) releaseof the first follow-up student data contains a slightly differentsample number than the original release. For additional detailsabout the sample numbers of the two releases, see the SecondFollow-Up: Student Component Data File User's Manual, section3.1.2, under the subheading "Subsampling the Eighth-Grade Cohortand Freshened Sophomore Samples."
37

F2: Parent ComponentData File User's Manual
could be achieved with minimal loss to both sample efficiency andeffective sample size.
Longitudinal Cohort. When second follow-up tracing of cohortmembers was completed, it was found that the first follow-up sample(that is, the sum of base year respondents and nonrespondentsretained after first follow-up subsampling and first follow-upfreshened students) was much more widely dispersed than had beenanticipated. After eliminating the locations of the "known"dropouts11 (N=1,564) from consideration (dropouts were sampled withcertainty), the remaining eligible sample of students (N=18,726)was dispersed among 3,224 schools/locations. Including dropouts,there were 4,788 locations. Once non-school locations associatedwith dropouts, early graduates, institutionalized sample members,home study students, and unlocatable sample members were subtractedfrom the total, there were 2,258 school sites.
It was clear that even if no attempt were made to satisfy thesecond goal--retention with near certainty of Hispanics, Asians,and American Indians from the first follow-up sample--that thefifth goal of achieving a cluster of students in 1,500 schoolscould not be met without significant losses in sample efficiency,effective sample size, or both. Table 3.1.4-1 shows thedistribution of students eligible for second follow-up sampling(excluding dropouts) by school size, as well as the number ofschools with at least one sample member who was either Hispanic,Asian, or American Indian. The data in the table indicated that toachieve disproportionate retention of minority students most of theschools containing these students would have to be selected,leaving few additional sample selections to distribute among theremaining school sites and contradicting the initial sampling plan
11 In the second follow-up, dropouts were defineddifferently for sampling purposes than for datacollection purposes. (See the NELS:88 Second Follow-Up:Dropout Component Data File User's Manual, section 4.3.1for further details regarding the definition of dropoutsfor data collection and assignment of questionnaire.)For sampling purposes, dropouts comprised all individualswho were classified in the first follow-up as ever havingdropped out--that is, dropouts (individuals who were notenrolled in school in the spring term of 1990) andstopouts (spring term 1990 students with a recorded 1988-1990 dropout episode), regardless of their schoolenrollment status as of the second follow-up spring term1991 tracing effort. In other words, dropouts who hadsince returned to school and stopouts who remained inschool were still counted as dropouts for samplingpurposes, along with institutionalized individuals andthe additional dropouts identified during second follow-up tracing.
38

F2: Parent ComponentData File User's Manual
to include with certainty any school with at least five NELS:88sample members enrolled at the school.
After consideration of several alternative allocations--takinginto account the negative effects of subsampling on sampleefficiency, the strong desire to retain as many Hispanics, Asians,and American Indians as possible, and the substantial investmentmade in two prior rounds in obtaining student, parent, teacher, andschool data for those students who would have been subsampled out--it was decided to include all first follow-up sample members in thesecond follow-up sample.
Initial Selection of the Second Follow-Up School Sample. Allfirst follow-up sample members remaining after subsampling wereincluded in the second follow-up (all sample members dropped fromthe first follow-up due to subsampling were also excluded from thesecond follow-up). Additionally, the school administrator,teacher, and transcript components were limited to a maximum of1,500 schools. For this reason it was still necessary to select asample of schools, although the students falling outside thatsample would not be excluded from the study. For students in the1,500 schools selected, the full range of data--student, schooladministrator, parent, teacher, and transcript data--werecollected; for the students in a school not among those selected,only student and parent data were collected.
A total of 2,258 schools were identified in the second follow-up tracing of the NELS:88 first follow-up sample; 1,500 of thesewere targeted for contextual data collection. In the spring of1991, interviewers traced students to schools, and all 1,030schools identified as having four or more first follow-up samplemembers enrolled were included in the school-level sample withcertainty (i.e., probability of 1.0). Prior to the fall of 1991the contextual school sample was finalized through the followingsampling process. A random sample of 45 of the 60(probability=0.75) schools containing three sample members wasselected. A random sample of 104 of the 160 (probability=0.65)schools containing two first follow-up sample members was selectedfor retention. Finally, a random sample of 321 of the 1,008(probability=0.31845) schools identified as containing one firstfollow-up sample member was selected for retention in the sample.In the fall of 1991 interviewers confirmed the enrollment ofstudents at schools previously identified as enrolling three orfewer NELS:88 students.
School Sample for Freshening Purposes. Like the first follow-up student and school samples, the movement of students amongschools resulted in a somewhat amorphous base from which to selectschools and collect data. Students could have transferred any timebetween the time they were traced to a specific school in thespring of 1991 to the fall of 1991, when they were freshened in thefall of 1991, and when student and school administrator data werecollected during the spring of 1992. It was possible for students
39

F2: Parent ComponentData File User's Manual
to transfer to either a school that had been identified as aNELS:88 second follow-up sampled school or to a non-NELS:88 school.
Table 3.1.4-1Clustering of first follow-up sample members eligible for second
follow-up(schools [N=2,258] and non-school locations)
School Total Total Schools Total SchoolsSize Schools With API,HIS,AI Without
1 1974 579 13952 160 70 903 60 25 354 53 35 185 38 14 246 26 17 97 27 17 108 33 20 139 21 10 1110 36 22 1411 43 31 1212 35 20 1513 47 37 1014 51 35 1615 57 41 1616 53 37 1617 82 48 3418 72 48 2419 77 58 1920 65 43 2221 55 43 1222 40 31 923 32 27 524 22 21 125 13 12 126 6 6 027 6 5 128 5 3 229 7 6 130 4 2 231 5 5 032 2 1 133 1 1 034 1 1 035 2 2 036 3 3 037 1 1 038 1 0 140 1 1 0
40

F2: Parent ComponentData File User's Manual
41 2 1 144 1 0 1
41

F2: Parent ComponentData File User's Manual
Table 3.1.4-1 (cont.)Clustering of first follow-up sample members eligible
for second follow-up(schools [N=2,258] and non-school locations)
School Total Total Schools Total SchoolsSize Schools With API,HIS,AI Without
45 1 1 050 1 1 053 1 1 060 1 1 0
Total 3224 1383 1841
Note: known school-leavers are not included in the numbers above.
Because students may have transferred between schools at anytime during the spring or fall of 1991, freshening did notnecessarily occur at each of the 1,500 sampled schools in thesecond follow-up. Freshening occurred only at those schoolsenrolling NELS:88 sample members as of the first day of the 1991-1992 school year.12
3.1.5 Second Follow-Up Parent Sample
Selection of Parents. The second follow-up parent sampleconsisted of a subsample of the parents of student and dropoutparticipants. While there is generally a one-to-one relationshipbetween parents and the student and dropout participants, severalfeatures of the NELS:88 second follow-up parent sample depart fromthe strict requirements of a probability sample. For example, avery small but unknown number of parents had more than one sampledstudent or dropout participant and therefore had more than onechance of being selected in the parent sample. Second, the parentsample was self-selected, and only one parent could participate.Finally, the survey used a broad definition of parent or guardianas the person who is responsible for the teenager and is mostknowledgeable about the teenager's current situation. Under thisdefinition, persons such as a grandparent, aunt, uncle, or other
12 Only those freshened sample members who remained inschool through the spring term became members of theHS&B-comparable NELS:88 sophomore cohort. However,autumn sophomores who had dropped out by spring weresurveyed in both first and second follow-up. While these"freshened dropouts" were included on the original firstfollow-up public release, in the current re-release thesecases appear only on the privileged use files.
42

F2: Parent ComponentData File User's Manual
adult relative completed a small percentage of parentquestionnaires.
The primary purpose of the parent data file is to providestudent-related contextual information that can be linked toindividual records on the NELS:88 student file. The parentquestionnaire weight, F2PAQWT, included on the parent data files,should be used for these analyses since it corrects for subsamplingof parents and adjusts for parent nonresponse. Analysts who wishto generate population estimates from the parent data should keepthe following important limitations regarding the generalizabilityof the parent data set in mind. The parent data used with theparent weight does not provide a nationally representative cross-section of all parents of dropouts or twelfth graders because ofthe reasons enumerated above. Using the parent data with theparent weight only provides analysts with a national cross-sectionof the self-defined "most knowledgeable" parent or guardian of,among other populations, dropouts from the eighth- or tenth-gradecohort and 1992 twelfth graders.
For a very small number of sampled student and dropoutparticipants, there was no adult parent or guardian who wasresponsible or knowledgeable about the teenager, and the parent ofthe sampled student or dropout was considered out of scope for thecollection of a parent questionnaire. The small number of casesexcluded from the parent survey for this reason fell into twogeneral situations: the teenager had been married and living awayfrom the teenager's biological family for several years; or theteenager's parent had been incarcerated for several years and theteenager was living independently. In both situations, there wasno parent or guardian who could report on the student or dropoutparticipant.
Selection of the Parent Subsample. During the data collectionperiod, a subsample of parents was selected to ensure thatcompletion rates for key subgroup populations were comparable withother subgroups. The probability of a parent's selection for thesubsample was determined by the priority of the subpopulation ofthe parent's teenager. Subsampling occurred when seventy percentof data collection was completed at which point all parents forwhom a questionnaire had not yet been collected received aselection probability. Four subpopulations (parents of dropouts;parents of students attending private schools; parents of studentswho were white, attended public school, and whose socioeconomicstatus was in the lowest quartile; and parents of black students)were retained with certainty; their selection probability was setto 1.0. An additional four subgroups (parents of Hispanic studentsattending public schools; parents of Asian students attendingpublic schools; parents of students of other races--primarilyAmerican Indians and Alaskan natives--who attended public schools;and parents of white students with a high socioeconomic status whoattended public schools) were assigned different selectionprobabilities greater than zero but less than one. A total of
43

F2: Parent ComponentData File User's Manual
1,601 parents from these four subgroups were not selected for thefinal sample of 17,750 parents.13 Figure 3-1 indicates the numberof second follow-up parent participants and nonparticipantsincluded on the parent public use magnetic tape for student anddropout populations from the base year throughout the secondfollow-up. Table 3.1.5-1 lists the subgroups of the studentpopulation and the rates at which their parents were subsampled tocreate the final parent sample.
3.2 Calculation of Weights
The general purpose of weighting survey data is to compensatefor unequal probabilities of selection and to adjust for theeffects of nonresponse. Weights are often calculated in two mainsteps. In the first step, unadjusted weights are calculated as theinverse of the probabilities of selection, taking into account allstages of the sample selection process. In the second step, theseinitial weights are adjusted to compensate for nonresponse; suchnonresponse adjustments are typically carried out separately withinmultiple weighting cells. This is the process that was applied toweighting NELS:88 data in all rounds.
Table 3.1.5-1Rates of subsampling for final second follow-up parent sample
Parents of Student/Dropout Cohort Subgroup Subsampling Fraction
1. Dropouts 1.02. Private school students 1.03. White students, public schools,
low socioeconomic status 1.04. Black students 1.05. Hispanic students, public schools 0.56. Asian students, public schools 0.87. Other students, public schools 0.58. White students, public schools,
high socioeconomic status 0.3
13 While the total parent sample includes 17,750 parents,the parent public use tape includes only 17,610 parentrecords because fall-defined cohort sample members andtheir parents are excluded from public use files.
44

F2: Parent ComponentData File User's Manual
Figure 3-1: NELS:88 8th grade spring defined cohort status distribution in first and second follow-ups
Parent Non- First Follow-Up Second Follow-Up Parent Participants/Base Year Status Status Participants Ineligiblesb
> Dropout N = 611 422 93 > Alt. Completera N = 222 177 30
Dropouts > Student N = 69 52 9 N = 1,029 > Out of Scope N = 9 0 0 > Status Unknown N = 118 0 0 > Dropout N = 1,041 768 104 > Alt. Completer N = 542 444 41 Students > Student N = 16,339 13,552 734 N = 18,270 > Out of Scope N = 82 0 0
Students > Status Unknown N = 266 0 0 N = 20,062 > Dropout N = 11 7 3
> Alt. Completer N = 6 3 2 Out of Scope > Student N = 11 9 0 N = 129 > Out of Scope N = 83 0 0 > Status Unknown N = 18 0 0
> Dropout N = 58 33 8 > Alt. Completera N = 20 16 3 Status Unknown > Student N = 466 254 53 N = 634
> Out of Scope N = 6 0 0 > Status Unknown N = 84 0 0
(F1 Freshened Students) N = 862 > 630 130(F2 Freshened Students) N = 264 > 28 5
45

F2: Parent ComponentData File User's Manual
(cont.) Figure 3-1: NELS:88 8th grade spring defined cohort status distribution in first and second follow-ups
_______________________________a Alt. Completer = Alternative Completer or Alternative Studentb The 17,610 parent records on the parent public use data file include 16,395
participants and 1,189 nonparticipants. This column also includes 26 parents whowere found to be out of scope for reasons described in section 3.1.5.
46

F2: Parent ComponentData File User's Manual
3.2.1 Calculation of Base Year Sample Weights
The base year weights were based on the inverse of theprobabilities of selection into the sample and on nonresponseadjustment factors computed within weighting cells. Two differentweights were calculated to adjust for the fact that not all samplemembers have data for all instruments. The weight BYQWT applies to24,599 student questionnaires (and is also used in conjunction withbase year parent data), while BYADMWT applies to the 1,035completed school administrator questionnaires. These weightsproject to the population of approximately 3,008,080 eligibleeighth graders in public, Catholic, and other private schools in1988.
The base year weighting procedures consisted of two basicstages:
Stage 1. Calculation of a preliminary base year weight basedon the inverse of the product of the probabilities of selection forthe base year sample.
Stage 2. Adjustment of this preliminary weight to compensatefor "unit" nonresponse, that is, for noncompletion of an entireschool questionnaire or student questionnaire. The unit varieddepending upon the weight being adjusted.
The nonresponse-adjusted school weight was derived as theproduct of the school's preliminary weight times a nonresponseadjustment factor intended to adjust for the fact that 17 sampledschools did not return a completed questionnaire. The preliminaryweight for students was based upon the inverse of the probabilitythat the student's school was selected into the sample multipliedby the inverse of the probability that the student was sampledwithin the school. The nonresponse-adjusted student weight wasderived as the product of the student's preliminary weight times anonresponse adjustment factor intended to adjust for the fact thatsome of the sampled students did not participate, that is, did notreturn a completed questionnaire. Statistical properties of thebase year weights are presented in Table 3.2.1-1.
Each school appearing on the NELS:88 base year school file,and each student appearing on the NELS:88 student file, has a valuefor the final weight variable. The weight represents theprobability of selection into the sample, in addition to a factorthat adjusts for nonresponse. Thus, the weight serves the purposeof allowing a particular case to represent other nonsampled caseswithin its sampling stratum, and to represent nonresponding casessimilar to it in various respects. Because separate final studentand school weights have been provided, the construction of eachwill be considered separately in the following discussion.
47

F2: Parent ComponentData File User's Manual
Table 3.2.1-1 NELS:88 base year statistical properties of sample case weights
School Student Weight BYADMWT BYQWT
Mean 37.46 122.29Variance 2,109.17 4,359.16Standard deviation 45.92 66.02Coefficient of variation (x100) 122.59 53.99Minimum 1.54 2.44Maximum 387.30 836.91Skewness 2.69 2.18Kurtosis 9.47 16.32Sum 38,774 3,007,779Number of cases 1,035 24,599
Base Year School Weights. The final school weight, BYADMWT,was derived using a multistage process. First, an initial weight--which represented the inverse of the school's selection probability--was attached to each school record in a filecontaining records for all eligible schools in the NELS:88 sample.A logistic regression procedure was used to estimate in terms of aprobability of nonresponding the degree to which each of theresponding schools resembled a nonresponding school. Thisestimated probability of nonresponse was the first adjustmentfactor applied to a school's weight.
Next, a polishing procedure--multi-dimensional raking--furtheradjusted the weights to sum to known population totals withinstrata. Estimating the nonresponse probability for each of theresponding schools was possible because key background informationon almost all of the nonresponding schools was available.
The final result of these procedures was a weight for each ofthe responding schools adjusted to compensate for nonresponse. Forthe purpose of adjusting the school weight, a nonresponding schoolwas defined as a school for which both school administratorquestionnaire data and student questionnaire data were unavailable.
Base Year Student Weights. The final student weight, BYQWT,was also derived using a multistage process. A design weight foreach eligible student on a participating school's sample rosterrepresented the student's probability of selection within theschool. A student-level nonresponse adjustment factor wascalculated by forming weighting cells based upon the combination ofcertain levels of variables representing school type, region,ethnicity, and gender. For each student, the product of apreliminary school weight and the student's design weight wasformed. This product was summed for participating and
48
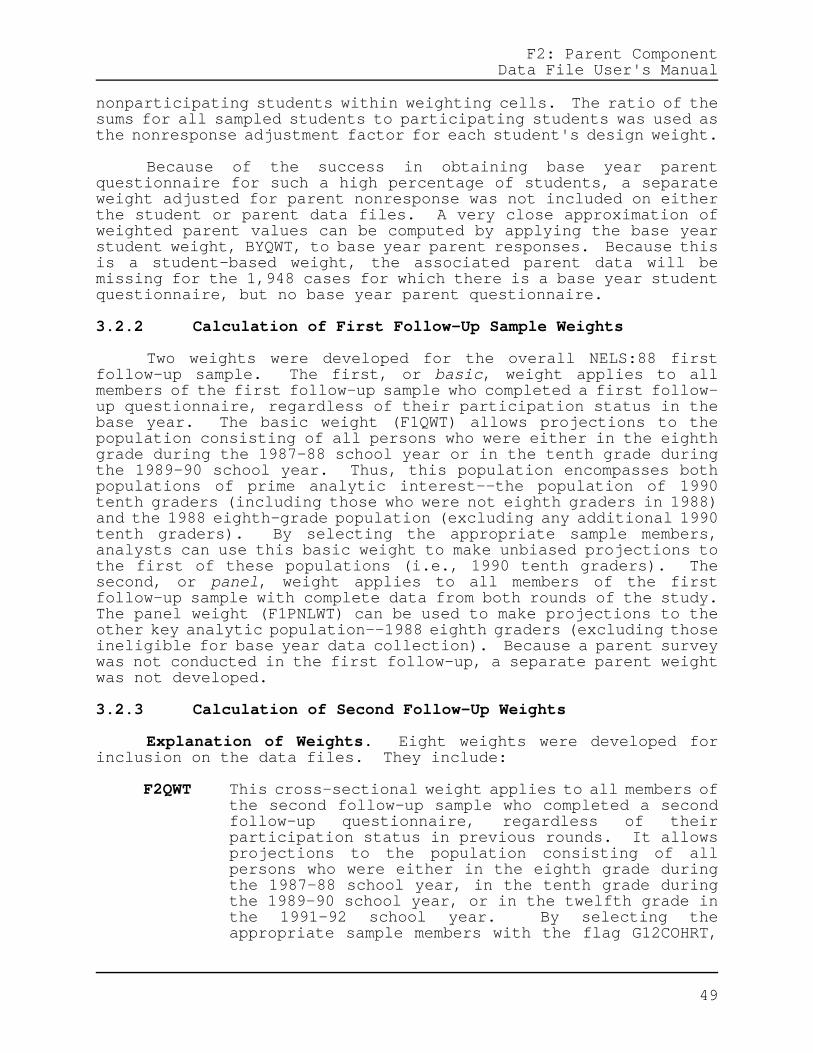
F2: Parent ComponentData File User's Manual
nonparticipating students within weighting cells. The ratio of thesums for all sampled students to participating students was used asthe nonresponse adjustment factor for each student's design weight.
Because of the success in obtaining base year parentquestionnaire for such a high percentage of students, a separateweight adjusted for parent nonresponse was not included on eitherthe student or parent data files. A very close approximation ofweighted parent values can be computed by applying the base yearstudent weight, BYQWT, to base year parent responses. Because thisis a student-based weight, the associated parent data will bemissing for the 1,948 cases for which there is a base year studentquestionnaire, but no base year parent questionnaire.
3.2.2 Calculation of First Follow-Up Sample Weights
Two weights were developed for the overall NELS:88 firstfollow-up sample. The first, or basic, weight applies to allmembers of the first follow-up sample who completed a first follow-up questionnaire, regardless of their participation status in thebase year. The basic weight (F1QWT) allows projections to thepopulation consisting of all persons who were either in the eighthgrade during the 1987-88 school year or in the tenth grade duringthe 1989-90 school year. Thus, this population encompasses bothpopulations of prime analytic interest--the population of 1990tenth graders (including those who were not eighth graders in 1988)and the 1988 eighth-grade population (excluding any additional 1990tenth graders). By selecting the appropriate sample members,analysts can use this basic weight to make unbiased projections tothe first of these populations (i.e., 1990 tenth graders). Thesecond, or panel, weight applies to all members of the firstfollow-up sample with complete data from both rounds of the study.The panel weight (F1PNLWT) can be used to make projections to theother key analytic population--1988 eighth graders (excluding thoseineligible for base year data collection). Because a parent surveywas not conducted in the first follow-up, a separate parent weightwas not developed.
3.2.3 Calculation of Second Follow-Up Weights
Explanation of Weights. Eight weights were developed forinclusion on the data files. They include:
F2QWT This cross-sectional weight applies to all members ofthe second follow-up sample who completed a secondfollow-up questionnaire, regardless of theirparticipation status in previous rounds. It allowsprojections to the population consisting of allpersons who were either in the eighth grade duringthe 1987-88 school year, in the tenth grade duringthe 1989-90 school year, or in the twelfth grade inthe 1991-92 school year. By selecting theappropriate sample members with the flag G12COHRT,
49

F2: Parent ComponentData File User's Manual
analysts can use F2QWT to make unbiased projectionsto such populations as 1992 twelfth graders.
F2CXTWT This cross-sectional weight applies to students whoattended the schools selected for inclusion in theschool administrator and teacher components and whocompleted a second follow-up questionnaire. Thepopulation was restricted to early graduates andstudents who were in the schools during spring datacollection. This weight allows analysts to generatenational statistics using the school administratorand teacher data despite the bias against smallcluster sizes in sample selection.
F2PNLWT This panel weight applies to sample members whocompleted a questionnaire in all three rounds ofNELS:88. This can be used to make projections to thepopulation of 1988 eighth graders.
F2F1PNWT This panel weight applies to all sample members whocompleted both a first follow-up and a secondfollow-up questionnaire, regardless of base yearstatus. This allows projections to the populationconsisting of persons who were in the eighth gradein 1988 or in the tenth grade in 1990. Byselecting appropriate sample members with the flagF2F1PNFL, analysts can use F2F1PNWT to makeprojections to such populations as 1990 tenthgraders.
F2TRSCWT This cross-sectional weight applies to all earlygraduates, dropouts, students in sampled schoolsduring spring data collection, and all samplemembers who were both ineligible for all threerounds of NELS:88 and were in the twelfth gradeduring the 1991-92 school year for whom we receiveda transcript.
F2TRP1WT This panel weight applies to sample members whowere participants in 1988, 1990, and 1992 (allthree rounds of NELS:88) and for whom transcriptdata are available. F2TRP1WT allows analysts toperform panel analyses using transcript data inconjunction with 1988, 1990, and 1992 test andquestionnaire data.
F2TRP2WT This panel weight applies to sample members whowere participants in 1990 and 1992 (the first andsecond follow-up) and for whom transcript data areavailable. F2TRP2WT allows analysts to performpanel analyses using transcript data in conjunctionwith 1990 and 1992 test and questionnaire data.
50

F2: Parent ComponentData File User's Manual
F2PAQWT This cross-sectional weight applies to all parentsincluded in the final parent sample for whom datawere collected during the second follow-up.
The Second Follow-Up Parent Weight: Cross-sectional and PanelAnalyses. The second follow-up parent weight, F2PAQWT, accountsfor the subsampling of the parent sample during data collection.It can be used in cross-sectional and panel analyses either inconjunction with student or dropout data or as a stand-alone dataset. When using F2PAQWT with only the second follow-up parentdata, it is important that the analyst be aware of the caveatsdiscussed in sections 1.4 and 3.1.5. F2PAQWT is not adjusted forbase year parent nonresponse, and it does not account for caseswhere the base year parent responded but cannot be included in apanel analysis because the second follow-up parent did not respond.Since F2PAQWT is not calibrated for panel analyses, researchersshould use caution if employing F2PAQWT in longitudinal analysesinvolving base year and second follow-up parent data. They shouldcarefully assess bias, relative to the subpopulations of interestand their specific analytic goals.
Process for Calculation of Second Follow-Up Weights. A basicfour-step process was defined for the calculation of all eightquestionnaire weights. The first step, developing a classificationscheme, was done at the beginning of the weighting process for allstudents in the sample. The values remained static and were usedthroughout the process for all weights. Steps 2 through 4 werefollowed for all weights, but the results of each were tailoredaccording to the characteristics of each weight's specificpopulation.
Step 1. Develop a classification scheme.
All sample members were divided into basic sample groupsdepending upon their status during data collection for each of thethree rounds of NELS:88. Freshened students were assigned thestatus of their linked student for those rounds where they had notbeen in the sample. Students for whom status was unknown had theirstatus imputed based upon the distribution of status across othersin their base year, first follow-up, or second follow-up categoriesand, where group size permitted, race and gender were alsoconsidered. The eight basic classification categories for a singleround are defined as:
1. Eligible, dropout as of survey date;
2. Eligible, in school, in expected grade;
3. Eligible, in school, not in expected grade;
4. Ineligible
a. in school, in expected grade
51

F2: Parent ComponentData File User's Manual
b. in school, not in expected grade c. not in school;
5. Out of scope (deceased or out of country);
6. Eligible, freshened, dropout as of survey date;
7. Eligible, freshened, in school; and,
8. Ineligible, freshened.
In this classification scheme, "dropout" (following the HighSchool and Beyond definition) generally refers to a student who hasleft a diploma-granting high school program. This included memberswho were not pursuing an education at all, home study students,members who were continuing their education in a non-traditionalsetting (e.g., preparing for the GED examination), andinstitutionalized sample members. There are two exceptions to thisgeneral rule. First, early graduates were included in the "inschool" category. Second, because sample members who attended non-traditional schools during the first follow-up were classified asstudents then, they were treated as such during the calculation oftheir first follow-up status.
"Ineligible" refers to members who were not given thequestionnaires due to a language barrier or a mental or physicalincapacity.
"Expected grade" means tenth grade in the first follow-up andtwelfth grade or early graduate in the second follow-up.
Step 2. Establish second follow-up design weight.
The design weight reflects the selection probabilities foreach case for a given population. Sample members may have multipledesign weights that vary depending upon the weight that is beingcalculated. For the weights unaffected by school sampling (F2QWT,F2PNLWT, F2F1PNWT) and for the dropouts, early graduates, andineligible twelfth graders in F2TRSCWT,14 the design weight used isequal to the first follow-up design weight. Second follow-upfreshened students take on the first follow-up design weight of thestudent they were linked to in the freshening process. When samplemembers are included due to their association with a sampledschool in F2TRSCWT and for all members in the F2CXTWT population,it is equal to the first follow-up design weight divided by theirschool's second follow-up selection probability. For studentsrepresented in the parent sample, the calculation of F2PAQWT uses
14 Included in the transcript data files are approximately90 students who were ineligible in all three rounds ofNELS:88 and were seniors in 1992.
52

F2: Parent ComponentData File User's Manual
the first follow-up design weight divided by the parent's secondfollow-up selection probability.
Step 3. Adjust for second follow-up nonresponse.
Nonresponse adjustment cells were based upon combinations ofthe classification values from step 1 as well as race (Hispanic,API, other, unknown), and gender for the members of that weight'spopulation. The second follow-up design weight for each respondingsample member was inflated by a factor equal to the inverse of theweighted response rate for their cell. This yielded theirnonresponse adjusted weight. This step was performed independentlyfor each weight calculated. For second follow-up freshenedstudents the nonresponse adjusted weight serves as their finalweight.
Step 4. Perform multidimensional raking.
Sample members who were not freshened in the second follow-uphad their second follow-up nonresponse adjusted weight furtheradjusted through a raking step. The total sum of the weights andpercentage distributions that were used in raking were developed asfollows:
a) Targets were developed that used the second follow-upexpanded sample weight. The second follow-up expanded weight is aweight that was calculated for every sample member in order toestimate national dropout rates.15 It was used in developing totalsum of weights targets to ensure consistency in dropout ratesderived when using questionnaire weights. These targets werecalculated separately for each of the eight questionnaire weightsand reflected the characteristics of each weight's inference
15 For sample members not freshened in the second follow-up,the process involved using a multidimensional rakingprocedure to adjust the second follow-up design weightwhere the marginal target categories were based on rosterrace (API, Hispanic, other, unknown) and gender, baseyear school type, base year school region, base yearschool urbanicity, and the status values from theclassification scheme described above in step 1. Targetmargins for the expanded weight were calculated using thefirst follow-up expanded sample weight (a similar weightdeveloped in the first follow-up for estimating the 1988-90 dropout rate) for students for whom one was calculatedand first follow-up design weights for the first follow-up sample members who did not receive a first follow-upexpanded weight (such as the freshened). Second follow-up freshened students have their second follow-up designweight as their expanded sample weight. This step wasperformed for the sample as a whole.
53

F2: Parent ComponentData File User's Manual
population. Two types of target numbers were developed. The sumof expanded weights for a given questionnaire weight's inferencepopulation was used as the target total population for thatquestionnaire weight. Weighted frequency distributions using theexpanded weights associated with a questionnaire weight's inferencepopulation were calculated for the following: dropout rates betweenbase year and first follow-up; dropout rates between first follow-up and second follow-up; and first follow-up status (from step 1)and second follow-up status (from step 1).
b) Additional percentage targets were developed for rakingusing first follow-up weights. Calculated independently for eachof the eight weights according to the characteristics of eachinference population, these targets used F1QWT for sample memberswho had been eligible for the first follow-up questionnaire or thefirst follow-up design weight for those who were not. Weightedfrequencies calculated using these weights were used as targetdistributions. These target categories included race (white,black, Hispanic, API, American Indian, unknown), gender, base yearschool region, base year school type, and base year schoolurbanicity.
Results of Weighting. To check the second follow-up parentweight, its statistical properties were analyzed. Table 3.2.3-1displays the mean, variance, standard deviation, coefficient ofvariation, minimum, maximum, skewness, and kurtosis for the weight.Tables showing results for the remaining weights can be found inthe student, school (contextual weight), and transcript (transcriptweights), data file user's manuals and the NELS:88 Second Follow-UpSample Design Report.
Table 3.2.3-1Statistical properties of the second follow-up parent weight
WEIGHT F2PAQWT
Mean 196.41Variance 61981.79Standard Deviation 248.96Coefficient of Variation (X 100) 126.76Minimum 2.39Maximum 7307.02Skewness 9.26Kurtosis 151.42Sum 3,247,182Number of Cases 16,395
54

F2: Parent ComponentData File User's Manual
3.3 Standard Errors and Design Effects
In this section we discuss the calculation of standard errorsas a measure of sampling variability in survey results; thestandard error is an estimate of the expected difference between astatistic from a particular sample and the corresponding populationvalue.
Survey Standard Errors. Because the NELS:88 sample designinvolved stratification, disproportionate sampling of certainstrata, and clustered (i.e. multi-stage) probability sampling, theresulting statistics are more variable than they would have beenhad they been based on data from a simple random sample of the samesize.
The calculation of exact standard errors for survey estimatescan be difficult and expensive. Popular statistical analysispackages such as SPSS (Statistical Program for the Social Sciences)or SAS (Statistical Analysis System) do not calculate standarderrors by taking into account complex sample designs. Severalprocedures are available for calculating precise estimates ofsampling errors for complex samples. Procedures such as TaylorSeries approximations, Balanced Repeated Replication (BRR), andJackknife Repeated Replication (JRR) produce similar results.16
Consequently, it is largely a matter of convenience which approachis taken. For NELS:88, NORC used the Taylor Series procedure tocalculate the standard errors.
Design Effects. The impact of departures from simple randomsampling on the precision of sample estimates is often measured bythe design effect (designated as DEFF). For any statisticalestimator such as a mean or a proportion, the design effect is theratio of the estimate of the variance of a statistic derived fromconsideration of the sample design to that obtained from theformula for simple random samples. The square root of the designeffect (also called the root design effect, and designated as DEFT)is also useful. The following formulas define the design effectsand root design effect:
1) DEFF = (DESIGN-SE)2
(SRS-SE)2
2) DEFT = DESIGN-SE SRS-SE
where DESIGN-SE designates the standard error of an estimatecalculated by taking into account the complex nature of the surveydesign, and SRS-SE designates the standard error of the same
16 Frankel, M.R., Inference from Survey Samples: AnEmpirical Investigation (Ann Arbor: Institute for SocialResearch, 1971).
55

F2: Parent ComponentData File User's Manual
estimate calculated as if the survey design was a simple randomsample.
3.3.1 Base Year Standard Errors and Design Effects
Selection of Base Year Items. Standard errors and designeffects were selected for 30 means and proportions based on theNELS:88 base year student, school, and parent data.17 The 30variables from the student questionnaire were selected to overlapas much as possible with those variables examined in High Schooland Beyond. The remaining variables from the student questionnaireand from the parent and school questionnaires were selectedrandomly from each topical section of each questionnaire. Standarderrors and design effects were calculated for each statistic bothfor the sample as a whole and for selected subgroups. For both thestudent and parent analyses, the subgroups were based on thestudent's sex, race and ethnicity, school type (public, Catholic,and other private), and socioeconomic status (lowest quartile,middle two quartiles, and highest quartile). For the schoolanalysis, the subgroups were based on two levels of school type(public and combined private) and eighth-grade enrollment (at orbelow the median and above the median).
3.3.2 First Follow-Up Standard Errors and Design Effects
Standard errors and design effects were also calculated for 30means and proportions based on the NELS:88 first follow-up studentand dropout data.18 The goal was to estimate standard errors/designeffects for all respondents including dropouts, on the one hand,and separately for dropouts, on the other. Because a specialcontextual weight was not constructed in the first follow-up,standard errors and design effects were not calculated separatelyfor the school component.
3.3.3 Second Follow-Up Standard Errors and Design Effects
Standard errors and design effects were also calculated for 30means and proportions based on the NELS:88 second follow-upstudent, dropout, parent, school, and teacher data. As in the
17 For a more detailed presentation of design effects forindividual items for the total sample and for varioussubsamples, see the NELS:88 Base Year Sample DesignReport. For tables of base year parent and schooladministrator questionnaire data standard errors anddesign effects, see the respective base year data fileuser's manuals, or the sample design report.
18 For a more detailed presentation of the first follow-updesign effects for individual items for the cohort sampleand for various subsamples, see the NELS:88 First Follow-Up: Student Component Data File User's Manual.
56

F2: Parent ComponentData File User's Manual
first follow-up analysis, the goal was to estimate standarderrors/design effects for all respondents including dropouts andseparately for dropouts.
Selection of Second Follow-Up Items. The same selectioncriteria were used for all components in selecting the items forstandard error and design effect analysis. The first criterion waswhether a question had been used in the NELS:88 base year analysesof standard errors and design effects. For the parent componentthis overlap resulted in the inclusion of 11 items. For theremaining 19 items, policy relevance was the second criterion forselecting items. This criterion was applied in order to ensurethat variables that are important to analysts, thus likely to havea higher frequency of use, were represented. These items consistedprimarily of critical items in the parent questionnaire.
Results. Standard errors and design effects were calculatedfor each of the parent questionnaire items for the parent sample asa whole and for selected subgroups. The subgroups were based onthe student respondent's sex, race/ethnicity, school type (public,Catholic, or other private), socioeconomic status (lowest quartile,middle two quartiles, and highest quartile), and urbanicity (urban,suburban, and rural). Student characteristics were used so thatdesign effects for subgroups could be compared with thosecalculated using items from the student questionnaire, and toemphasize that students are the units of analysis by design in theNELS surveys. NELS:88 second follow-up parent survey responses arebest thought of as providing contextual information for betterunderstanding the background and home education support system ofNELS:88 students and school leavers.
The standard errors and design effects were calculated usingthe second follow-up parent weight, F2PAQWT, with the 30 itemsselected from the parent survey. A description of F2PAQWT ispresented in section 3.2.3. Standard errors and design effects areshown in Table 3.3.3-1.
Despite the subsampling of parent nonrespondents, the overallmean design effect for the second follow-up parent survey (meanDEFF=3.68) is virtually identical to that for the second follow-upstudent component (mean DEFF=3.71). Subgroup design effects shownin Table 3.3.3-2 are very close to those for the student survey,with the exception of respondents from other private schools. Themean design effect is more than twice the size of that calculatedin the base year (other private schools parents: second follow-upmean DEFF=8.83, base year mean DEFF=4.11). This suggests that thecluster effect is higher than in the base year survey, perhapsrepresenting greater homogeneity of responding among parents inthis subgroup.
Compared to the NELS:88 base year parent survey, the meandesign effect from the second follow-up parent survey is higher
57

F2: Parent ComponentData File User's Manual
Table 3.3.3-1 NELS:88 second follow-up: Standard errors and design effects, (N=16,395)
Survey item Esti- Design SRS(or composite variable) mate S.E.a DEFF DEFT N S.E.b
Teen lives with R all of the time F2P2 87.80 0.511 3.983 1.996 16342 0.256Teen has parent who lives outside home F2P4 35.43 0.713 3.617 1.902 16277 0.375R's marital status single, never married F2P7 3.29 0.242 3.011 1.738 16357 0.139R's marital status is living like married F2P7 1.28 0.131 2.225 1.492 16357 0.088R is not working but is looking for work F2P11A 3.67 0.260 3.102 1.761 16231 0.148Spouse/partner is working full time F2P11B 62.94 0.691 3.207 1.791 15666 0.386Respondent is a full-time homemaker F2P13 5.35 0.256 1.975 1.405 15264 0.182Respondent's occupation is "operator" F2P13 5.40 0.259 2.004 1.416 15264 0.183Spouse/partner's occupation is "laborer" F2P16 10.45 0.503 3.433 1.853 12698 0.271Spouse/prtnr's occupation-"schl teacher" F2P16 3.02 0.273 3.233 1.798 12698 0.152R's race/ethnicity-Asian or Pac Islander F2P19 3.23 0.282 4.143 2.035 16293 0.139R's race/ethnicity-black, not Hispanic F2P19 13.66 0.856 10.122 3.181 16293 0.269Lang oth thn Englsh spoken in R's home F2P27 15.34 0.872 9.549 3.090 16308 0.282Is R's teen currently enrolled in school F2P30 85.41 0.604 4.777 2.186 16322 0.276Strongly agree-homework is worthwhile F2P42B 17.90 0.552 3.333 1.826 16075 0.302Strongly disagree-the school is safe F2P42I 6.06 0.320 2.899 1.703 16105 0.188Sch contacted R abt academc performanc F2P43A 53.19 0.669 2.912 1.706 16197 0.392Contacted sch about academc performanc F2P44A 56.00 0.662 2.899 1.703 16301 0.389Contacted schl about academic program F2P44B 46.43 0.685 3.036 1.742 16092 0.393Never discuss w/ teen things teen studies F2P49C 5.47 0.337 3.548 1.883 16152 0.179Family rule about maintaining grade avg F2P51A 61.48 0.670 2.971 1.724 15675 0.389R has lived in neighborhd less than 1 yr F2P58 3.29 0.288 4.261 2.064 16330 0.140R expects teen to finish college F2P61 37.29 0.629 2.764 1.663 16337 0.378R talked to teen abt applying for college F2P63 95.24 0.308 3.412 1.847 16300 0.167Proportion of parents who make less than median gross family income F2P74 51.10 0.911 5.210 2.282 15686 0.399Spent less than $500 on education this yr F2P77 60.69 0.734 3.537 1.881 15662 0.390R plannd to remortgag proprty/take loan F2P79I 12.96 0.426 2.344 1.531 14574 0.278R had teen put aside earnings F2P79J 46.71 0.697 2.854 1.689 14622 0.413Teen's grades not high enough to qualify F2P89B 27.62 0.876 2.921 1.709 7608 0.513Respondent has completed college F2P101A 15.18 1.418 3.278 1.811 2099 0.783
58

F2: Parent ComponentData File User's Manual
Table 3.3.3-1 (continued) NELS:88 second follow-up: Standard errors and design effects, (N=16,395)
Mean 3.685 1.880Minimum 1.975 1.405Maximum 10.122 3.181Standard deviation 1.791 0.388Median 3.220 1.794
_______________aStandard error calculated taking into account the sample design.bStandard error calculated under assumptions of simple random sampling.
59

F2: Parent ComponentData File User's Manual
Table 3.3.3-2Mean design effects (DEFFs) and root design effects (DEFTs)
for parent questionnaire data
Group Mean DEFF Mean DEFT
All Respondents 3.69 1.88
Male 3.16 1.74Female 3.22 1.77
White 3.05 1.73Black 2.77 1.63Hispanic 2.28 1.48Asian/Pacific Islander 2.57 1.57American Indian/Alaskan Native 2.25 1.45
Public schools 3.25 1.76Catholic schools 2.54 1.55Other private schools 8.83 2.72
Low SES 2.83 1.65Middle SES 2.87 1.67High SES 3.07 1.72
Urban 4.17 2.00Suburban 2.88 1.66Rural 3.54 1.72
Note: Each mean is based on 30 questionnaire items.
60

F2: Parent ComponentData File User's Manual
(mean DEFF=2.48 in the base year parent survey, and 3.68 in thesecond follow-up parent survey). Second follow-up parent surveysubgroup mean design effects fluctuate in their distance from thecorresponding base year parent survey mean design effects. Thedifferences are small but generally consistent with the overallfinding of slightly larger design effects for the second follow-updata. This result is also consistent with the finding that studentdesign effects are larger in the second follow-up survey, comparedto the base year survey. Both these results can be explained bythe 1990 student and 1992 parent subsampling and correspondinglarger weights occurring after the base year survey.
3.4 Additional Sources of Nonobservational Error
Analysis of survey error is important for understanding thepotential bias in making inferences from an obtained sample to apopulation. Sampling errors occur because the data are collectedfrom a sample rather than a census of the population. Samplingerror analyses for NELS:88 (documenting standard errors ofmeasurement and design effects for key variables) were presentedearlier in this chapter (see section 3.3). In this section, othersources of nonobservational error are discussed.
Nonobservational error results from measurements not beingtaken from a portion of the population.19 Several factors comprisenonobservational error, including nonresponse biases caused by unitand item nonresponse and undercoverage. Nonresponse is readilyquantified. While many data quality factors are difficult tomeasure in the non-experimental context of large-scale surveyadministration, NELS:88 offers the possibility of comparing reportsfrom multiple sources, thereby permitting some approximate butuseful validity parameters. Following is a discussion ofnonobservational error in the parent component in terms ofnonresponse. A detailed discussion of student undercoverageappears in the NELS:88 Second Follow-Up: Student Component DataFile User's Manual.
3.4.1 Second Follow-Up Unit Nonresponse
Unit nonresponse occurs when an individual respondent (such asa parent, student, or teacher) declines to participate, or when thecooperation of a school cannot be secured. In the base year, ananalysis of school-level nonresponse suggested that, to the extentthat schools can be characterized by size, control, organizationalstructure, student composition, and so on, the impact ofnonresponding schools on the quality of the student sample is small(for details, see the Base Year Sample Design Report, pp. 33-39).School nonresponse has not been assessed in the second follow-upfor two reasons. First, there was very little no school-level
19 Groves, R. M., Survey Errors and Survey Costs. New York:John Wiley and Sons, 1989, page 11.
61

F2: Parent ComponentData File User's Manual
nonresponse--institutional cooperation levels approached 99percent. Second, the second follow-up sample was student-driven,unlike the two-stage base year sample. Hence, even if a schoolrefused, the individual student was pursued outside of school.
The effect of student-level nonresponse within the respondingschools was not assessed in the base year, although males, blacks,and Hispanics tended to be nonparticipants more often than females,whites or Asians. The effects of individual nonparticipation inthe base year, first and second follow-ups will be systematicallyexamined, and reported in future NELS:88 documentation.
3.4.2 Second Follow-Up Item Nonresponse
Analysis of survey error is important for understandingpotential bias in making inferences from an obtained sample to apopulation. Sampling and nonsampling errors are the keyconstituents of total survey error. Sampling error is quantifiedthrough the standard errors and design effects for key variables.There are various sources and types of nonsampling measurementerror, including estimate error or bias associated with unit(individual) nonresponse and item nonresponse. This sectionreports specifically on nonsampling error as a function of itemnonresponse. In addition to its role as a potential source of bias,item nonresponse also has the effect of diminishing the number ofobservations that can be used in calculating statistics fromaffected data elements and thus increases sampling variances.Since item nonresponse is an important potential and uncorrectedsource of data bias, it is necessary to measure its impact so thatanalysts can properly take potential response biases into account.
Item nonresponse occurs when a respondent fails to completecertain items on the survey instrument. While bias associated withunit nonresponse has been controlled by making adjustments to caseweights, item nonresponse has generally not been compensated for inthe NELS:88 parent component data set. There are two exceptions tothis generalization.
The first exception is machine editing, through which,occasionally, certain nonresponse problems are rectified byimposing inter-item consistency, particularly by forcing logicalagreement between filter and dependent questions. Thus, forexample, the missing response to a filter question can often beinferred if the dependent question has been answered. Because theedited files were used in the nonresponse analysis reported below,this adjustment to item nonresponse is reflected in the results ofthe analysis.
The second exception is that some key student and parentclassification variables have been constructed in part fromadditional sources of information when student data are missing.Thus, data from school records (for example, student sex orrace/ethnicity as given on the sampling roster) or other respondent
62

F2: Parent ComponentData File User's Manual
sources (for example, the new student supplement) have been used toreplace missing student or parent data. Because compositevariables were not included in the nonresponse analysis, thisadjustment of missing data is not reflected in the statisticsreported below.
A further point to note is that there may be some hiddennonresponse in the NELS:88 questionnaires that is impossible toquantify. This is the case because for a few questions, a "markall that apply" format was used. While such a format results inslightly less burden on the respondent, it also makes it impossibleto distinguish between a negative response and nonresponse. Thisconflation of negative response and nonresponse creates thepotential for nonresponse biases that cannot be measured and thuscannot become the basis for precise warnings to users about thelimitations of data.
A final point to note is that, implicitly, unit nonresponse isa further source of missing item data--that is, nonparticipatingparents complete no questionnaire items. Weights accommodateparent level nonresponse by projecting questionnaire data to thefull student population, with appropriate adjustments for definedsubgroups. However, they cannot compensate for the bias thatarises if nonrespondents would have answered the questionnairedifferently than respondents. For this reason, "total response"should be thought of as the survey (unit) response rate times theitem response rate. (For example, given a weighted 1992 parentresponse rate of 90.6 percent, and an item response rate of 94.9percent, total response would be 85.9 percent.)
Two main objectives inform this item nonresponse analysis.One objective is to quantify mean questionnaire nonresponseoverall. A second objective is to describe nonresponse patterns interms of questionnaire item characteristics. In order to realizethe first objective, average nonresponse rates were calculated foreach item, and were classified by mode of questionnaireadministration. In order to fulfill the second objective,nonresponse was measured as a function of three characteristics: 1)position in the questionnaire; 2) topic; and 3) whether the itemwas contingent on a filter.
Population and Data File Definitions
Definition 1: "Item"
For purposes of this analysis, "item" refers to each dataelement or variable. For a question composed of multiple subparts,each subpart eliciting a distinct response is counted as an itemfor item nonresponse purposes. Thus, a single question that posesthree subquestions is treated as three variables.
Definition 2: "Response Rate"
63

F2: Parent ComponentData File User's Manual
NCES standards stipulate that item response rates (Ri) "are tobe calculated as the number of respondents for which an in-scoperesponse was obtained (i.e., the response conformed to acceptablecategories or ranges), divided by the number of completedinterviews for which the question (or questions if a compositevariable) was intended to be asked.":
weighted # of respondents with in-scope responsesRi = -----------------------------------------------------
weighted # of completed interviews for which question was intended to be asked
In-scope responses were considered to be valid answers(including a "don't know" response when this was a legitimateresponse option). Out-of-scope responses were multiple responsesto items requiring only a single response, refusals, and missingresponses.
Definition 3: "Analysis Populations"
Item nonresponse analysis population. All subsampled parentsof an eligible student or dropout who completed a parentquestionnaire, and whose teen completed a student or dropoutquestionnaire.
Definition 4: "Parent Questionnaire Data File"
The public use data elements with machine-edited, weighteddata were used as the basis for the analysis. Nonresponse rates ofcomposite and other constructed variables were not examined in thisanalysis.
Definition 5: "Nonresponse"
For the parent questionnaire several numerical reserved codeswere used to categorize nonresponse. The reserved codes anddefinitions appear below. The first three--reserved codes 6, 7 and8--define out-of-scope or illegitimate nonresponse, and were usedas the basis for this nonresponse analysis.
6 = Multiple Response. For an item that required oneresponse only, the respondent marked more than oneresponse, and the multiple response could not beresolved.
7 = Refused Critical Item. Respondent was unwilling toanswer the question at the time of the questionnaireadministration and upon nonresponse follow-up by surveyadministrators.
8 = Missing. The response datum is illegitimately missing.That is, a datum that should be present for thisrespondent is missing.
64

F2: Parent ComponentData File User's Manual
9 = Legitimate Skip. The response datum is legitimatelymissing. That is, owing either to responses to precedingfilter questions or to other respondent characteristicsdata for this item should not be present for thisrespondent. Responses under reserved code 9 were notincluded in the nonresponse analysis.
DK = "Don't Know." "Don't Know" is often used as anonresponse code. In the NELS:88 data set, "Don't Know"is embedded as a legitimate response category in some ofthe questionnaire items. For purposes of this analysis,"Don't Know" was not classified as a nonresponse.
Item-Level Nonresponse. Table 3.4-1 shows descriptivestatistics for parent questionnaire item nonresponse overall andfor items grouped into categories depending upon their position inthe questionnaire, the topic they addressed, and whether they werepart of a skip or filter pattern. The mean item nonresponse ratefor the NELS:88 second follow-up parent questionnaire is 5.1percent.
The second follow-up parent survey's mixed modes ofadministration contributed to the high rates of item responsefound. Some 9,639 questionnaires (58.8 percent) were self-administered. The relatively high degree of motivationdemonstrated by these parents helped to counteract the lengthinessand demanding skip patterns of the parent questionnaire. Lessmotivated parents were guided through 6,756 (41.2 percent)questionnaires by a telephone interviewer. Mean telephone-administered parent questionnaire item nonresponse was 3.2 percent,while mean self-administered questionnaire item nonresponse was 6.2percent.
Item-Level Nonresponse by Item Placement and Characteristic:Parent Questionnaire. Respondent burden associated with the lengthof the second follow-up parent questionnaire contributed to itemnonresponse. Mean item nonresponse in the final third of theparent questionnaire is 7.2 percent, compared with 5.3 percent inthe first third and 2.9 percent in the second third. Self-administered parent questionnaires display a similar pattern.Items in the final third of self-administered parent instrumentsdisplay a mean nonresponse rate of 8.6 percent, while items in thefirst and second thirds have nonresponse rates of 6.7 percent and3.2 percent respectively. Questionnaires administered by telephonebreak this pattern. Items in the first third of telephoneadministered questionnaires have the highest nonresponse rate (4.0percent), while items in the second and final thirds displaynonresponse rates of 1.9 percent and 3.6 percent respectively.
Item Nonresponse by Topic. At 5.7 percent, mean itemnonresponse in part two of the parent questionnaire, "YourTeenager's School Life," is slightly higher than rates found inother sections. Overall, however, item nonresponse rates in the
65

F2: Parent ComponentData File User's Manual
"School Life" section are quite low. The slightly elevatednonresponse rates in the "School Life" section may be a product ofincreased respondent burden associated with the long, dense listsof items contained in section two.
66

F2: Parent ComponentData File User's Manual
Table 3.4-1Percent nonresponse on the parent component data file
by various item characteristics
Standard NumberDomain Average Deviation Minimum Maximum of Items
Overall 5.14 5.83 0.00 46.14 388
Position
First Third 5.25 4.72 0.26 23.16 128Second Third 2.90 2.10 0.40 11.14 129Last Third 7.24 8.11 0.00 46.14 131
Topic (in order of appearance in the questionnaire) Family Backgrnd 2.86 3.04 0.26 23.16 78School Life 5.74 4.50 0.47 15.16 103Family Life 2.99 2.59 0.40 11.14 71Future Plans 2.74 2.01 0.45 10.20 48Financial Info 8.39 8.19 0.00 38.62 73New Parent Info 15.00 10.79 3.72 46.14 15
Filtered
No 2.34 1.91 0.00 14.20 198Yes 8.10 7.01 0.90 46.14 190
Three factors probably contribute to the 8.4 percent mean itemnonresponse rate found in the "Financial Information and EducationCosts" section of the parent questionnaire. First, part five isthe last section completed by all parents except those new toNELS:88 with the exception of locator information. Respondentfatigue decreased response to items in this section. Second, somerespondents may have chosen not to answer the financial items inpart five due to the sensitivity of those items. Third, a fewrespondents may have lacked the knowledge of their household'sfinances needed to answer items in part five.
"Part Six: Supplemental Questions for Parents New toNELS:88," is located at the end of the second follow-up parentinstrument. Parents new to NELS:88 had, on average, lower SES andlower educational attainment. These characteristics are oftenassociated with higher nonresponse and may have interacted with thelength of the questionnaire and the parent's perception of theburden of the questionnaire. (For example, completing a self-administered questionnaire is a more arduous task for poorreaders.) The effect of respondent fatigue on nonresponse in part
67

F2: Parent ComponentData File User's Manual
six can be seen when self-administered questionnaires (which onaverage impose more burden on respondents) are compared withtelephone administered questionnaires. Telephone administeredparent questionnaires display a mean part six item nonresponse rateof only 11.7 percent, compared with 17.1 percent in self-administered questionnaires.
In self-administered questionnaires routing to part sixdepends on the respondent's answer to question 94b. If therespondent failed to answer this key filter item, it is quitepossible that the respondent also failed to answer part six.Retrieval of parent data was conducted for only the critical itemslisted in Appendix H; however, data retrieval from parents whofailed to answer 94b would have decreased the nonresponse for thisitem.
Item Nonresponse by Dependence on a Filter Question. Secondfollow-up parent questionnaire nonresponse is over three timeshigher in items dependent on a filter question. This fact holdstrue whether the questionnaire was self-administered or telephoneadministered. In self-administered questionnaires items notdependent on a filter question had a mean nonresponse rate of only2.8 percent, compared with 9.8 in filtered items. Similarly,nonresponse in telephone administered items not dependent on afilter question was 1.5 percent, compared with 5.0 in itemsdependent on a filter question.
Dependent items carry with them missing data from thecorresponding filter item. Parent questionnaire filter items wouldprobably have benefitted from the High School & Beyond practice ofmaking nearly all filter items critical and thus subject toretrieval. The nonresponse rates reported here for items dependenton a filter question are inflated to the extent that the ratescontain "hidden skips." Hidden skips are those missing responsesthat would have been skips had the respondent answered theappropriate filter item. Unfortunately it is not possible toquantify hidden skips.
Parent Survey Item-Level Nonresponse by Critical Items. Thenonresponse rate for parent survey critical items is 2.4 percent,well below the rate found in the second follow-up studentquestionnaire (3.3 percent) or the second follow-up dropoutquestionnaire (4.2 percent). Of the parent instrument's 53critical items three items (questions 95, 101A, and 101B) arelocated in the last section, "Supplemental Questions for ParentsNew to NELS:88." Nonresponse rates for these three questions rangefrom 8.6 percent to 19.0 percent. When questions 95, 101A, and101B are excluded from analysis, the mean nonresponse rate forcritical items drops to 1.8 percent. The item nonresponse ratesfor each of the critical items in the parent questionnaire areshown in Table 3.4-2.
68

F2: Parent ComponentData File User's Manual
Summary and Conclusions. Second follow-up parentquestionnaire item nonresponse rates benefitted from telephoneadministration of 6,756 questionnaires. Telephone administrationof 41.2 percent of the questionnaires decreased, but did noteliminate, the effects of questionnaire length and filter items onitem nonresponse. Mean weighted parent questionnaire totalresponse, 85.9 percent, is well within the NCES standard. NCES'sstandard asserts that total weighted response (unit nonresponsemultiplied by item nonresponse) should be at least 70 percent.
69

F2: Parent ComponentData File User's Manual
Table 3.4-2Nonresponse for critical items in the parent questionnaire
Weighted UnweightedItem Percent PercentNumber Not Responding Not Responding
F2P2 0.31% 0.33% F2P4 0.69% 0.72% F2P7 0.26% 0.23% F2P13 0.90% 1.01% F2P16 2.36% 2.20% F2P19 0.80% 0.62% F2P1A 1.22% 0.29% F2P1B 2.14% 2.19% F2P27 0.70% 0.53% F2P30 0.47% 0.45% F2P61 0.46% 0.35% F2P74 4.09% 4.33% F2P95 8.63% 8.07% F2P11A 1.00% 1.00% F2P11B 5.03% 4.45% F2P44A 0.85% 0.57% F2P44C 1.02% 0.76% F2P79A 2.03% 1.98% F2P79B 2.42% 2.47% F2P79C 2.43% 2.50% F2P79D 2.33% 2.35% F2P79E 2.41% 2.41% F2P79F 2.37% 2.39% F2P79G 2.56% 2.54% F2P79H 2.32% 2.26% F2P79I 2.59% 2.56% F2P79J 2.28% 2.24% F2P101A 9.17% 8.94% F2P101B 18.99% 17.52% F2P18A1 1.67% 1.41% F2P18A2 1.67% 1.41% F2P18A3 1.67% 1.41% F2P18A4 1.67% 1.41% F2P18A5 1.67% 1.41% F2P18A6 1.67% 1.41%
Note: For a list of the actual questions, refer to Appendix H.
70

F2: Parent ComponentData File User's Manual
Table 3.4-2 (cont.)Nonresponse for critical items in the parent questionnaire
Weighted UnweightedItem Percent PercentNumber Not Responding Not Responding
F2P18B1 2.04% 1.81% F2P18B2 2.04% 1.81% F2P18B3 2.04% 1.81% F2P18B4 2.04% 1.81% F2P18B5 2.04% 1.81% F2P18B6 2.04% 1.81% F2P18C1 1.85% 1.68% F2P18C2 1.85% 1.68% F2P18C3 1.85% 1.68% F2P18C4 1.85% 1.68% F2P18C5 1.85% 1.68% F2P18C6 1.85% 1.68% F2P18D1 1.87% 1.54% F2P18D2 1.87% 1.54% F2P18D3 1.87% 1.54% F2P18D4 1.87% 1.54% F2P18D5 1.87% 1.54% F2P18D6 1.87% 1.54%
Note: For a list of the actual questions, refer to Appendix H.
71

F2: Parent ComponentData File User's Manual
IV. Data Collection
This chapter describes the data collection procedures for allcomponents of the NELS:88 second follow-up: parent, student anddropout, school administrator, teacher, and academic transcript andcourse offerings. The design of the second follow-up closelyresembled that of the first follow-up and was executed in threephases which spanned two years. Self-administration and telephoneadministration were the primary modes of data collection for thecomponents of the second follow-up. Although data collection didnot occur for the parent component until the third phase of thestudy in 1992, pre-data collection activities related to the parentcomponent were conducted in the first and second phases of thestudy in 1991. Phase three was conducted in 1992 and constitutedthe data collection effort. Figure 4-1 summarizes the activitiesconducted during the three phases of the second follow-up. 4.1 Second Follow-Up Pre-Data Collection Activities
Phase 1. Conducted from January through June of 1991, phase1 involved securing state, district, and school-level cooperationfor the study as well as tracing sample members. State cooperationwith NELS:88 was secured for all fifty states and the District ofColumbia. District and school-level cooperation were secured forfirst follow-up schools with four or more sample members still inattendance in the spring of 1991.
Tracing sample members served two purposes: defining theschools to be included in the second follow-up sampling process andlocating sample members for data collection. As in the firstfollow-up, the second follow-up study was designed such that onlystudents attending a school included in the second follow-up schoolsample would receive the full complement of contextual dataincluding school administrator and teacher reports. To maximizethe number of students to receive the full complement of contextualdata, interviewers attempted to trace all sample members to eithertheir first follow-up school of attendance or to a new school.Once students were traced to a school, the second follow-up schoolsample was drawn such that the greatest number of students would beincluded in the school sample and receive the full complement ofcontextual data.
The second purpose of tracing related to data collection.Interviewers attempted to trace students to their first follow-upor new school of attendance, and prior to the beginning of phase 2the sample of second follow-up schools was finalized. If aninterviewer was unable to confirm school enrollment for a cohortmember through the first follow-up school or a new school, theinterviewer traced the sample member to a home address to confirmthat the student was enrolled in a school or that the student hadleft school. Through tracing students to a first follow-up school,a new school, or a home address, and through the selection of theschools to be included in the second follow-up school sample,
72

F2: Parent ComponentData File User's Manual
interviewers were able to forecast whether a student's data wouldbe collected through a second follow-up school or if a samplemember would need to be contacted separately during datacollection. Confirmation of a sample member's enrollment statusdetermined which type of questionnaire--student or dropout--thesample member would be administered during the data collectionperiod.
Phase 2. From September to December 1991, phase 2 pre-datacollection activities occurred for all components of the study, andsome phase 1 activities continued. District and school-levelcooperation were verified again for any schools selected for thesecond follow-up sample for which cooperation was not gained inphase 1. Tracing continued for sample members who were not locatedduring phase 1, and enrollment was confirmed for students who weretraced to a school which was selected for the second follow-upschool sample. Students attending a school not included in thesecond follow-up school sample and sample members who had leftschool were also traced again to their school of attendance or toa home address. Table 4.1-1 summarizes the results of district andschool contacting and student tracing in phases 1 and 2.
Interviewers visited each of the second follow-up schools toconduct activities in preparation for data collection for allcomponents of the study. For student data collection, theyscheduled in-school data collection sessions and worked with schoolpersonnel to identify how parental permission for surveyingstudents would be gained for an individual school. Using schoolrosters, interviewers freshened the student sample to allow arandom sample of twelfth graders who were previously excluded fromthe study because, for example, they were not in the U.S. or in theeighth grade in 1988, and did not have a chance to be selected forthe base year sampling frame. Refer to Chapter III of the NELS:88Second Follow-Up: Student Component Data File User's Manual for acomplete discussion of freshening the student sample.
73

F2: Parent ComponentData File User's Manual
Figure 4-1: Second follow-up data collection phase diagram
Note: This figure is not available in the electronic version ofthe Data File User's manual. This figure can be found in theprinted version of the Second Follow-Up: Parent Component DataFile User's Manual.
74

F2: Parent ComponentData File User's Manual
Table 4.1-1 Summary of NELS:88 second follow-up district/diocese
and school contacting
Eligible Agreed to CooperationSamplea Participate Rate
District/DioceseContacting: Public 862 853 99.0% Catholic/ Other Private 52 52 100.0% Total 914 905 99.0%
School Contacting: Public 1155 1145 99.1% Catholic/ Other Private 232 228 98.3% Total 1387 1373 99.0%
a This column represents the portion of the phase 1 sampled schools(N=1,500) that had at least one core sample members still enrolledat the end of the school contacting phase (phase 2) of the study.These numbers reflect the schools at which cooperation with thestudy was gained rather than the NELS:88 schools whose studentswere included in the contextual sample.
Data were collected for the contextual components (the parent,teacher, school administrator, academic transcript, and courseofferings components). Interviewers collected parent address andtelephone information for the parent survey. To identify thesample for the teacher survey, the names of the mathematics andscience teachers of the student sample members were compiled.Course catalogs were collected, and interviewers collected samplesof student transcripts to inform data collection and datapreparation for the high school transcript component.
Final Tracing Results. After the tracing of sample memberswas completed, 97.3 percent (N=20,623) of the 21,188 second follow-up sample members had been located. Figure 4-2 illustrates theresults of the second follow-up locating efforts. Of the 21,188sample members, 83.3 percent were enrolled in high school, 8.2percent were verified dropouts, 0.5 percent were identified byschool officials as dropouts but were not confirmed as such, 4.1percent were sample members who had already completed analternative program, 1.3 percent were deemed ineligible toparticipate in the second follow-up study (e.g., deceased or movedout of the country), and 2.7 percent could not be located.
75

F2: Parent ComponentData File User's Manual
4.2 Second Follow-Up Data Collection Activities
Phase 3. Data collection for the second follow-up wasconducted from January through December 1992. Although the datacollection periods of the individual components of the study werestaggered, there was a high degree of overlap between the datacollection periods of the individual components, and most data wascollected from January through June of 1992, the spring term of the1991-1992 academic year. Figure 4-3 shows the field periods ofeach component of the study.
Most of the components of the survey utilized more than onemode of data collection, usually self-administration and telephoneadministration of the survey instruments. In some casesabbreviated versions of the instruments were implemented asdiscussed in Chapter II of this manual.
4.3 Parent Survey
In May 1992, parent questionnaires were mailed to all parentsand guardians of students and dropouts who had completed a studentor dropout questionnaire. The self-administered questionnairesinstructed the parent or guardian who was most knowledgeable aboutthe teenager's current living situation and educational plans tocomplete the questionnaire. Accordingly, the parent sample wasself-selected.
The timing of the second follow-up parent survey was differentfrom the timing of the base year parent survey due to differencesin the content of the questionnaires. Because the second follow-upparent questionnaire included questions on financial aid forpostsecondary education and this information is not available tomost families until late in the spring of teenagers' twelfth grade,the parent survey was not conducted at the same time as the studentand dropout surveys. However, parent respondents were asked torefer to the spring of 1992 when completing the questionnaire. Thebase year parent survey was conducted concurrently with the studentdata collection.
Two weeks after the questionnaires were mailed, a postcardreminder was mailed to all parents. For parents who had alreadycompleted the questionnaire, the postcard thanked them for theirparticipation. For parents who had not yet returned theirquestionnaire, the postcard asked them to complete and return thequestionnaire at their earliest convenience. Starting two weeksafter the postcard reminder was mailed to parents, telephoneinterviewers began prompting nonresponding parents over thetelephone for their completed questionnaire. Telephone interviewswere attempted with a subsample of parents who did not respond tothe postcard and telephone prompts. Figure 4-4 shows the mode ofadministration of the parent questionnaire for the 17,584 eligibleparent participants and nonparticipants on the parent public usedata file.
76

F2: Parent ComponentData File User's Manual
Figure 4-2: Second follow-up tracing results (N=21,188)
Note: This figure is not available in the electronic version ofthe Data File User's manual. This figure can be found in theprinted version of the Second Follow-Up: Parent Component DataFile User's Manual.
77

F2: Parent ComponentData File User's Manual
Figure 4-3 NELS:88 second follow-up data collection field periods by component
1992
JAN FEB MAR APR MAY JUNE JULY AUG SEPT OCT NOV DEC
Cohort ----- ----- ----- -----
School ----
Parenta -----
Teacher ----
Transcripts -----
= Main data collection period ------- = Low level of data collection
a The NELS:88 second follow-up parent questionnaire included questions about postsecondaryeducational costs and financial aid decisions. Because this information is not available tomany parents until the end of their teenager's senior year, parent data collection began inMay 1992, to ensure that parents could answer these questions fully.
78

F2: Parent ComponentData File User's Manual
Figure 4-4: NELS:88 second follow-up parent mode ofadministration for parent data on parent public usedata file (N=17,584)
Note: This figure is not available in the electronic version ofthe Data File User's manual. This figure can be found in theprinted version of the Second Follow-Up: Parent Component DateFile User's Manual.
79

F2: Parent ComponentData File User's Manual
To minimize mode effects between self-administration andtelephone administration of the instrument, interviewers weretrained to adapt the questions to make sense when read over thetelephone. Additionally, parents were asked to read along in thequestionnaire during the telephone interview if they had the copyof the questionnaire mailed to them.
Targeting Special Parent Populations. Special steps weretaken to ensure comparable completion rates for the parents ofOBEMLA (Hispanic and Asian/Pacific Islander) oversampled studentsand dropouts. In the initial mailing of questionnaires to parents,both English and Spanish questionnaires were mailed to parents ofHispanic students and dropouts so that an Hispanic parent couldcomplete the questionnaire in the language with which the parentwas more comfortable. Spanish-speaking interviewers were trainedto administer the questionnaire over the telephone in Spanish whennecessary. Much as in the base year parent survey when 575Spanish-language questionnaires (2.5 percent) were completed, 373Spanish-language parent questionnaires (2.1 percent) were completedduring the second follow-up.
While a native language questionnaire was not available toparents of Asian students and dropouts, parents who spoke the mostcommon Asian languages were prompted over the telephone for thereturn of the questionnaire by a native speaker. The languages inwhich these parents were prompted included Chinese, Japanese,Tagalog, Korean, and Vietnamese. In the respondent's nativelanguage, Asian telephone interviewers explained why the parent'sparticipation in the study was important and encouraged them toseek the assistance of another adult for completing the Englishversion of the questionnaire; however, no translation of thequestionnaire into these languages was conducted over thetelephone.
The Telephone Number Management System. For parent datacollected through telephone prompting and interviewing, thedelivery of cases to the telephone staff was controlled andmonitored by NORC's Telephone Number Management System (TNMS). TheTNMS contained information about each case necessary forinterviewers to contact and confirm that they were speaking to theparent or guardian of the sampled student. The TNMS storedinformation about respondents requiring interviewers with speciallanguage and interviewing skills and was also used to prioritizedata collection from certain subpopulations.
4.4 Relationship between NELS:88 Second Follow-Up Parent Surveyand Other Parent Surveys
Three basic contrasts may be drawn between the HS&Bsophomore and senior parent surveys, the NELS:88 base year parentsurvey, and the NELS:88 second follow-up parent survey. Thosecontrasts involve 1) the sampling strategy for the respective
80

F2: Parent ComponentData File User's Manual
parent surveys; 2) the time frame for data collection; and 3) thecontent of the questionnaires.
Sampling differences involve both different strategies forselection of the parent sample (such as no subsampling orsubsampling at different rates) and procedures for selection of thespecific parent respondent within the parent sample. The HS&B baseyear surveyed a subsample of parents. Specifically, parents wereselected from a sample of students who had completed the HS&Bcognitive tests, within a sample of 312 of the 1,015 HS&B schools.Some 3,367 sophomore cohort parents and 3,197 senior cohort parentsparticipated. In contrast, in the NELS:88 base year, there was nosubsampling; however, only the parents of student questionnairecompleters were included in the parent survey. Of 24,599 studentparticipants, the parents of 22,651 students completed the NELS:88base year parent questionnaire. In the NELS:88 second follow-up,the final parent sample consisted of 17,750 parents of whom 15,183were parents of students, 1,734 were parents of dropouts, and 833were parents of sample members in alternative (non-diplomagranting) programs.
In HS&B, the parent instrument was mailed to respondents.In most instances it was addressed to the mother of the samplemember. From the HS&B base year student identification pages,parent names and addresses were obtained. If the student reportedboth a male and a female parent, the questionnaire was sent to thefemale parent. If only one parent was mentioned, the questionnairewas sent to that parent. However, instructions did not prohibitthe other parent from completing the questionnaire. Acomparatively high proportion of HS&B parent questionnaires werecompleted by the father (36 percent for the senior cohort, 34percent for the sophomore), although mothers were the majority ofparent respondents (58 percent for seniors, 61 percent forsophomores) and a few questionnaires were completed by stepparents,grandparents, or guardians. In the NELS:88 base year, the studentcarried the questionnaire home to the parent, and instructionsrequired the parent who was most familiar with the educationalsituation of the eighth grader to complete the questionnaire. Inthe NELS:88 base year, mothers completed 77.7 percent of the parentquestionnaires, fathers completed 17.5 percent of thequestionnaires, 4.0 percent of the questionnaires were completed byother respondents such as a stepparent, grandparent, or otherrelative or guardian, and the remaining 0.7 percent were notidentified. (These figures do not sum to 100 percent due torounding.) In the NELS:88 second follow-up, questionnaires weremailed to parents with similar instructions for respondentselection, and the breakdown of parental respondents was like thebase year. The second follow-up parent questionnaires werecompleted 78.5 percent of the time by the mother, 15.5 percent ofthe time by the father, 4.6 percent of the time by otherrespondents such as a stepparent, grandparent, or another adultrelative or guardian, and the remaining 1.4 percent were notidentified. In both NELS:88 parent surveys, questionnaires were
81

F2: Parent ComponentData File User's Manual
addressed to "the parent or guardian" of the sampled child and thecover letter asked the parent who was most knowledgeable about thechild's current situation to complete the questionnaire.
The time frame for data collection was somewhat differentacross the various parent surveys. Data collection for the NELS:88base year parent survey took place primarily in the spring term of1988, although some nonresponse follow-up and critical itemretrieval continued into the summer. Given the stress in thequestionnaires on the eighth-grade situation of the child, the goalof the NELS:88 base year was to collect this information before theend of the eighth-grade school year whenever possible. Incontrast, the HS&B parent survey took place in the fall of 1980,several months after the end of the school year (data collectionwas conducted October to December, 1980; missing critical itemswere retrieved early in 1981). The heavy emphasis of the HS&Bquestionnaires on parents' preparation for financing postsecondaryeducation argued for a later data collection schedule to reflectthe postsecondary choices made by the senior cohort in the finalmonths of high school. In the NELS:88 second follow-up, parentdata collection took place primarily in the summer and fall of1992. In contrast to the NELS:88 base year, a later datacollection schedule was chosen for much the same reason as in HS&B;additional information about postsecondary choices and financingarrangements would be available at this later time.
Finally, there are important differences in the content ofthe parent questionnaires. The HS&B 1980 sophomore and seniorparent surveys had considerable item overlap and both were fairlylimited in their content. As noted above, they stressed thefamily's financial situation and financial planning forpostsecondary education. NELS:88 base year questionnaires, on theother hand, gave less stress to financial information and planningfor future educational costs, and more stress to familysocioeconomic and linguistic background, parental relationships toand views of the school, the family life of the student, andparental expectations and aspirations for the child. The NELS:88second follow-up questionnaire followed the model of HS&B inexpanding the coverage of issues pertaining to financingpostsecondary education, but also continued to explore themes ofthe NELS:88 base year parent questionnaire, including the nature ofthe home educational support system and of educational decisionmaking in the family.
Despite the limited overlap between the HS&B and NELS:88second follow-up parent studies, some key comparison items arecommon to both. In particular, items on parental educationalaspirations, such as how far in school the parent wants theirteenager to go as well as some items on family finances andpostsecondary planning, provide parent data comparison pointsbetween 1980 and 1992 seniors. Refer to Appendix D for a crosswalkbetween the items in the NELS:88 and HS&B parent surveys.
82

F2: Parent ComponentData File User's Manual
4.5 Second Follow-Up Student Survey and Cognitive Tests
In-school Survey Sessions. From January to June 1992, in-school survey sessions were held in all cooperating NELS:88 schoolsstill enrolling second follow-up sample members. Second follow-updata collection procedures were very similar to those used in thefirst follow-up. Student questionnaires and cognitive tests inmath, science, reading, and social studies were administered in-school, group data collection sessions of approximately 9 students.
Survey administration was usually conducted in a schoolclassroom or library and consisted of several steps. Studentsfirst completed the student questionnaire, and, if applicable, thenew student supplement or the early graduate supplement. Studentswho had transferred into or out of a school within the two weeksprior to the survey session were asked to report on their previousschool of attendance. Transfer students who had been at thesurveyed school for two weeks or longer were asked to report ontheir current school. After the students completed the studentquestionnaires, an 85 minute battery of cognitive tests wasadministered. The tests consisted of four timed sections devotedto mathematics, reading, science, and social studies(history/citizenship/geography). Once the test battery wascompleted, an attempt was made to retrieve missing (orinappropriately marked) questionnaire items before the student leftthe classroom. Interviewers reviewed the questionnaires to ensurethat all critical items were completed. An oval indicating "noretrieval" was marked whenever the missing data could not beretrieved due to respondent refusal or inability to clarify a vagueresponse.
At the end of the survey session, arrangements were made toconduct make-up sessions for students who were scheduled but unableto attend the initial survey session or whose schedules requiredthat they leave before completing both instruments. If fewer thanfive students were scheduled for a make-up session, school staffwere asked to handle the arrangements and oversee itsadministration; however, to ensure respondent confidentiality,school staff were prohibited from reviewing the studentquestionnaire for completeness. When five or more students werescheduled for a make-up session or when school staff wereunavailable to conduct a make-up session, interviewers arranged areturn visit to the school.
The second follow-up study attempted to collect a completequestionnaire and cognitive test from students and dropouts;however, for some student sample members only an abbreviatedversion of the student or dropout questionnaire was collected, orthe cognitive test was not collected at all.
Off-campus Survey Sessions. Off-campus survey sessions,typically attended by one to three students, were conductedprimarily from March to July 1992. Students who were not enrolled
83

F2: Parent ComponentData File User's Manual
in sampled schools, who had missed in-school data collectionsessions, or who were enrolled in schools that had refused toparticipate in the study were invited to off-campus sessions andadministered the student questionnaire and cognitive tests.Dropouts were also asked to attend these sessions and were surveyedalongside sample members who were currently enrolled in school. Aswith in-school survey sessions, off-campus survey sessions in thesecond follow-up were nearly identical to those in the firstfollow-up. If a sample member was unable to attend an off-campusgroup survey session, he or she was surveyed either over thetelephone or in-person. When the student questionnaire wasadministered over the telephone, cognitive test data were notcollected.
4.6 Dropout Survey
The NELS:88 second follow-up dropout survey sought tointerview all sample members who had left school prior tograduation, including both first follow-up dropouts who had notreturned to school and sample members who dropped out after thefirst follow-up. All sample members appear on the student datafile regardless of their spring 1992 enrollment status. Basicclassification variables and test data appear for both students anddropouts, though dropout questionnaire data appear separately onthe dropout component data file.
School Enrollment Classification and Data Collection. Inorder to determine which sample members should complete a dropoutquestionnaire, school enrollment status was classified for allsample members during the spring of 1992.
Four types of enrollment classifications were identified asillustrated by Figure 4-5. The first were high school students whowere enrolled in a school which offered programs ending in thegranting of a diploma. These students were administered thestudent questionnaire and the cognitive test battery. Earlygraduates were included in this classification, and were asked toreport retrospectively on the school from which they graduated andto complete supplemental questions about their reasons forgraduating early.
The second type were sample members who dropped out of highschool but later returned to a high school program to obtain a highschool diploma. These sample members were administered the studentquestionnaire and, when possible, the cognitive test battery.
The third type were sample members who dropped out of highschool but went on to seek an equivalent to a high school diplomasuch as the General Educational Development test (GED). If analternative completer had finished the requirements of his or heralternative program, a student questionnaire was collected from thestudent. If the alternative completer had not yet fulfilled therequirements for certification, the sample member was administered
84

F2: Parent ComponentData File User's Manual
Figure 4-5: Alternative educational paths through high school
Note: This figure is not available in the electronic version ofthe Data File User's manual. This figure can be found in theprinted version of the Second Follow-Up: Parent Component DataFile User's Manual.
85

F2: Parent ComponentData File User's Manual
a dropout questionnaire. In both cases, the cognitive test batterywas also administered when possible.
The fourth type were dropouts. These sample members hadleft their high school by the spring of 1992 and were not workingtoward an alternative certification. Dropouts were administered adropout questionnaire and, when possible, the cognitive testbattery.
Regardless of whether a dropout completed a student ordropout questionnaire, data collection efforts for the dropoutcomponent of the second follow-up were similar to those in thefirst follow-up survey. Interviewers attempted to survey mostdropouts in off-campus survey sessions with testing conditionssimilar to in-school sessions.
For analytical purposes, sample members classified asalternative completers can be included or compared with either highschool completers or dropouts. Additionally, alternativecompleters can be examined separately, depending on the needs ofthe analyst. For a complete description of the dropout component,see the NELS:88 Second Follow-Up: Dropout Component Data FileUser's Manual.
4.7 School Effectiveness Study
Because the NELS:88 second follow-up core study wasconducted at 97.8 percent of the schools at which the schooleffectiveness study was conducted, data were collected for studentsin these schools using the same data collection procedures assecond follow-up cohort students.
Self-administered student questionnaires and cognitive testswere administered to SES students through both in-school and off-campus survey sessions. Unlike student cohort sample members, mostSES students received an additional forty minute free-responsecognitive test after they completed the eighty-five minute testbattery. The subject area of the free-response test was randomlyselected for each school in either mathematics or science.
In the 247 participating SES schools, SES sample memberswere administered the student questionnaire and cognitive tests.If SES students missed in-school data collection sessions, theywere surveyed at off-campus survey sessions. Unlike the datacollection procedures for the student cohort sample members, SESstudents who were no longer attending the school with which theywere associated were not pursued or surveyed; however, enrollmentstatus was gathered for these students from the SES schools. Theparent, transcript, and course offerings components were alsoconducted for the SES sample members. A more detailed discussionof the school effectiveness study will be presented in forthcomingdocumentation, which will accompany the release of those data.
86

F2: Parent ComponentData File User's Manual
4.8 Followback Study of Excluded Students
In the first follow-up study, most classification changeswere made for a sample of students who had been excluded from thebase year study. Of the 618 base year ineligible sample members(BYIs), 580 were located and 312 were reclassified as eligibleduring the first follow-up. (Table 4.2.4-1 in the NELS:88 SecondFollow-Up Student Component Data File User's Manual containsadditional completion rate data for the BYI study.) In the secondfollow-up, the remaining ineligible students--BYIs who wereineligible in the first follow-up or more rarely, students who wereeligible in the base year but who became ineligible in the firstfollow-up through the occurrence of some sort of incapacitation--were pursued as a part of the Followback Study of ExcludedStudents.
The Followback Study of Excluded Students (FSES) of theNELS:88 second follow-up attempted to reassess the eligibilitystatus and ascertain the enrollment status of students who: 1) hadbeen excluded because of linguistic, mental, or physical obstaclesto participation when the baseline sample of eighthgraders was drawn in the 1987-88 school year, and were subsampledinto the Base Year Ineligible Study in the first follow-up; 2) wereeligible in the base year but became ineligible in the firstfollow-up; or, 3) were identified as ineligible when selectedthrough the freshening process in the first follow-up. If thestudents had since become eligible for NELS:88, the followbackstudy attempted to survey them.
The followback study continued the first follow-up base yearineligible study for several purposes. First, if the 5.3 percentof the potential base year sample declared ineligible differed inkey characteristics or outcomes from the sample of studentsincluded in NELS:88, this difference could bias baseline resultsand subsequent longitudinal measurements. By learning more aboutthese excluded students and their current school enrollment status,one might correct for potential undercoverage bias that couldaffect key national estimates, such as dropping out between eighthand twelfth grade.
Second, an individual's eligibility status could potentiallychange. A student excluded on language grounds in 1988 or 1990could have gained sufficient proficiency in English by 1992 tocomplete the student questionnaire. Like the complementaryactivity of sample freshening, the followback study of excludedstudents helped to generate a nationally representative sample oftwelfth-grade students.
Third, eligibility rules were modified in the first follow-up and retained in the second follow-up to allow for completion ofthe student questionnaire in Spanish in addition to English. Bygiving 1988 and/or 1990 excluded students who could complete aquestionnaire only in Spanish the opportunity to do so in 1992, the
87

F2: Parent ComponentData File User's Manual
revised eligibility rules of the first follow-up were successfullycarried back to the base year cohort.
Data Collection Procedures. Data collection for thefollowback study of base year excluded students took place duringthe main study data collection effort between April and October1992. Interviewers attempted to identify excluded students whowere eligible to be added to the longitudinal sample in the secondfollow-up. They obtained the following information about theexcluded student from the student's current school, school lastattended, or the student's home:
• Sex (if unknown): male or female;
• Race/ethnicity (if unknown): white, black, Hispanic,Asian/PI, American Indian, other;
• School enrollment status: student, dropout, or dropoutin alternative program; and,
• Eligibility: English/Spanish language proficiency, lackof mental or physical disability (i.e., ability tocomplete a questionnaire), reading ability level of atleast eighth grade.
After collecting the above information about the students,interviewers attempted to identify whether or not the student wascapable of meaningful participation in the survey under normalconditions. To make this assessment, interviewers were instructedto obtain reports from persons with first-hand knowledge of thestudents, such as a special education teacher, a bilingual teacher,a language arts teacher, or a guidance counselor. Interviewersoften spoke with several staff members to identify the staff memberwho was most qualified to assess whether or not the student couldparticipate. Unless there were severe mental or physicaldisabilities or lack of facility with written English or Spanishand the member was unable to complete the survey instruments undernormal circumstances, the student was considered eligible toparticipate in the study.
Eligibility information was gathered for 95.7 percent of theexcluded sample members. For excluded students who were identifiedas eligible, student or dropout questionnaires were administeredeither in-person or over the telephone. Cognitive tests wereadministered to a small percentage of these students. For studentswho remained ineligible, school enrollment status and other keycharacteristics were obtained.
4.9 School Administrator Survey
In February 1992, school administrator questionnaires weremailed to the principal or headmaster of selected NELS:88 schoolswith second follow-up sample members still in attendance.
88

F2: Parent ComponentData File User's Manual
Completed self-administered questionnaires and telephone interviewswere collected from February through June 1992. For any interviewsconducted after the end of the 1991-1992 academic year, schoolprincipals were asked to refer to the previous academic year.
As in the first follow-up the school principal or headmastercould delegate all but one of the sections to another knowledgeableschool official. The school principal was specifically required tocomplete the fifth section of the questionnaire on schoolgovernance and school climate.
Two weeks after the school administrator questionnaire wasmailed to principals and headmasters, a postcard was mailed to allprincipals asking them to return the questionnaire if they had notalready completed and returned it. Two weeks after the postcardreminder was mailed, interviewers began prompting nonrespondingprincipals over the telephone for the return of the questionnaire.About three weeks after each principal was prompted for the returnof the questionnaire over the telephone, interviewers began callingnonresponding school administrators to attempt to collect thequestionnaire over the telephone. An abbreviated version of theschool administrator questionnaire was administered tononresponding principals near the end of the data collectionperiod.
Because questionnaires from school principals were completedin two different modes of data collection, by self-administrationand telephone administration, a number of steps were taken tominimize any mode effects. Telephone interviewers were trained toadapt the questions in a way which made sense when asked over thetelephone. If a principal had a copy of the questionnaire, he orshe was encouraged to read along in the questionnaire as theinterviewer asked the questions over the telephone.
4.10 Teacher Survey
The teacher survey was designed to articulate with thestudent cognitive tests and included one mathematics or scienceteacher of students at NELS:88 sampled schools when the student wasenrolled in one of these classes. To minimize the amount of timebetween the collection of the student and teacher data, either thefall or spring term teacher was selected depending on when studentdata were collected at a school, and the questionnaires were mailedto the teachers in two waves.
The majority of sampled students at NELS:88 schools who wereenrolled in a mathematics or science class were instructed by thesame mathematics or science teacher during the entire 1991-1992academic year. For students who had different mathematics orscience teachers in the fall or spring term, the fall term teacherwas mailed a questionnaire in early February if the in-school datacollection session at a student's school was scheduled for a datebefore April 1, 1992. If the data collection session was scheduled
89

F2: Parent ComponentData File User's Manual
on or after April 1, then the spring term teacher was mailed aquestionnaire in early March 1992. Since most in-school datacollection occurred during January through March of 1992, moststudents' fall term teachers were selected for the teacher surveyand were mailed a questionnaire in early February. This design wasbased on the assumption that in the first three months of thespring term, the fall term teacher would be more familiar and ableto assess the student than the spring term teacher would be. On orafter April 1, it was assumed that the spring term teacher hadsufficient exposure to the student in order to make a fullassessment of the student and that three months after the beginningof the spring term, the fall term teacher might have difficultyrecalling the student's performance.
After identifying whether the fall or spring term teacherwould be selected for the teacher survey, the subject area of astudent's teacher report was determined. If the student wasenrolled in only one class out of the two subject areas,mathematics or science, then the one teacher was selected.However, if the student was enrolled in both subject areas, thenthe subject area of the teacher report was the same as the baseyear selected subject for the student. Some students who wereenrolled in both a mathematics and a science class were added tothe first or second follow-up through freshening. For thefreshened students who were enrolled in both mathematics andscience, the subject area of the student's teacher report was thebase year selected subject of the student's linked partner in thefreshening procedure.
Two weeks after the teacher questionnaires were mailed,nonresponding teachers were prompted for the return of thequestionnaire with a postcard reminder. Beginning two weeks afterthe postcard reminder was mailed to teachers, nonrespondingteachers were prompted for the return of the questionnaire over thetelephone. Interviewers attempted to interview over the telephoneany teachers who did not respond within two weeks after thepostcard and telephone prompts.
To minimize mode effects between self-administration andtelephone administration of the instrument, interviewers weretrained to adapt the questions to make sense when read over thetelephone. Additionally, teachers were asked to read along in thequestionnaire during the telephone interview if they had the copyof the questionnaire mailed to them.
4.11 Academic Transcripts
In August 1992, transcript survey materials were mailed tothe principals of the NELS:88 and non-NELS:88 schools attended ormost recently attended by sample members of the student cohort.Because of the variability in transcript format across schools,explicit instructions for transcript preparation were provided.School staff were asked to retrieve from alternate sources any data
90

F2: Parent ComponentData File User's Manual
elements that were not included on the school's transcripts.Transcript preparers were also asked to note any transfers ofstudents to new schools after data collection, to facilitate thepursuit of additional records from transfer schools.
Two weeks after survey materials were mailed, nonrespondingprincipals were prompted for the return of transcripts with apostcard reminder. Principals who did not return transcriptswithin three weeks of the postcard prompt were prompted over thetelephone. Telephone prompting of nonresponding principalscontinued from October 1992, to February 1993. Field visits toschools requesting assistance in the preparation of transcriptswere conducted in February and March 1993.
Abstraction of student-and course-level data fromtranscripts began in October 1992, and continued through March1993. Retrieval of missing critical items from school staffoccurred concurrently. Coding of transcript courses began inNovember 1992, and continued through April 1993. Courses werecoded using the course catalog for the school or district, inaccordance with the Classification System of Secondary Courses,updated for the 1990 NAEP High School Transcript Study. When aschool or district catalog was unavailable, courses were coded bytitle alone.
4.12 Second Follow-Up Data Collection Results
Tables 4.12-1 through 4.12-2 summarize the data collectionresults for the NELS:88 second follow-up study.
91

Table 4.12-1 NELS:88 second follow-up component survey completion rates by selectedcharacteristics
TotalParticipatedSelected
School typed
PublicCatholicOther private
Urbanicityd
UrbanSuburbanRural
Regiond
NortheastSouthMidwest West
EthnicityAsian/PIHispanicBlackWhiteAm. IndianRefused/Missingf
Student samplecompletion ratesWeightd Unwtd.
91.0 92.5 16,842 18,209b
94.7 95.3 98.4 98.0 94.8 95.5
95.0 95.8 94.4 95.2 95.5 95.5
94.3 94.7 95.4 95.8 96.1 95.8 92.9 95.4
91.7 92.7 86.6 89.8 88.1 90.5 93.5 94.2 90.3 86.5 28.5 33.2
Dropout/Alt.samplea
completion ratesWeightd Unwtd.
88.0 87.6 2,378 2,714
NA NANA NANA NA
NA NANA NANA NA
NA NANA NANA NANA NA
74.7 82.488.3 87.5 84.8 83.6 89.7 89.5 97.6 95.8 55.9 61.5
Parentquestionnaire(student anddropout)Completionrates Weightd Unwtd.
90.6 93.2 16,395 17,584c
NA NAe NA NANA NA
NA NAe
NA NANA NA
NA NAe
NA NANA NANA NA
87.8 88.083.6 88.886.0 88.293.0 95.678.9 89.182.8 74.7
Parentquestionnaire(student only)CompletionratesWeightd Unwtd
91.8 94.3 14,385 15,258
91.6 94.493.1 93.996.1 93.8
89.6 92.393.1 95.092.4 95.3
92.9 94.790.9 93.694.2 95.989.7 92.9
87.6 88.285.3 91.188.2 89.293.7 96.387.0 92.486.6 72.3
Parentquestionnaire(dropout only)CompletionratesWeightd Unwtd
83.4 86.4 2,010 2,326
NA NANA NANA NA
NA NANA NANA NA
NA NANA NANA NANA NA
91.6 83.977.5 80.877.0 83.788.1 89.764.4 81.874.7 78.1
92

F2: Parent ComponentData File User's Manual
Table 4.12-1 (cont.) NELS:88 second follow-up component survey completion rates by selected characteristics
a Alternative completers could have completed either a student or dropout questionnaire,depending on their status during data collection. 350 alternative sample members completed astudent questionnaire and 457 completed a dropout questionnaire.
b 565 unlocatable cases were assumed to be eligible students for the purposes of calculatingstudent completion rate, and are included in the total of 18,209.
c Although 17,584 eligible parents are included on the public use data file, records for 26ineligible parents are also included which makes the total number of records on the file17,610.
d Refers to the second follow-up school.e Not Applicable--Completion rates by school type, urbanicity, and region are calculated basedon the school a student attended in the second follow-up. Because dropouts are not linked toschools on the public use data files, it is not possible to calculate combined student anddropout completion rates for these subgroups.
f Refused/Missing refers only to the status of a sample member's ethnicity. It does not referto sample members who did not participate in the second follow-up.
93

Table 4.12-2 NELS:88 completion rates for panel members by selected characteristicsa
TotalParticipatedSelectedSchool typee
PublicCatholicOther privateUrbanicitye
UrbanSuburbanRuralRegione
NortheastSouthMidwest WestEthnicityAsian/PIHispanicBlackWhiteAm. IndianRefused/Missingf
Minority schoolse
Schools with morethan 19% minoritystudentsSchools with lessthan or equal to 19%minority students
Student/dropout questionnaire (BY,F1 and F2)completion ratesWeighted Unweighted
94.7 95.1 16,489d
17,337
94.3 94.797.9 97.097.4 97.0
93.5 95.195.5 95.394.8 94.9
94.8 95.194.1 94.595.7 96.094.6 95.1
93.3 95.093.1 94.492.4 92.695.5 95.794.1 91.381.1 75.0
92.2 93.5
95.0 95.3
Parentquestionnaireb
(F2 only)completion ratesWeighted Unweighted
92.0 94.6 14,278 15,097
91.5 94.4 95.1 95.8 95.5 94.9
89.8 92.6 92.8 95.4 92.8 95.2
93.4 95.4 90.8 93.5 94.5 96.0 89.3 93.6
90.0 90.3 85.7 90.6 87.7 89.4 93.9 96.4 82.2 90.7 100.0 100.0
84.8 89.0
92.8 95.1
Parentquestionnairec
(BY and/or F2)completion ratesWeighted Unweighted
98.7 99.1 14,964 15,097
98.6 99.299.2 98.999.3 98.8
98.1 98.699.1 99.298.6 99.5
98.7 98.898.8 99.299.4 99.697.4 98.6
99.0 98.996.7 98.197.4 98.399.3 99.593.5 96.0
100.0 100.0
97.9 98.0
98.8 99.2
94

F2: Parent ComponentData File User's Manual
Table 4.12-2 (cont.) NELS:88 completion rates for panel members by selected characteristics
a These panel completion rates are the proportion of base year-first follow-up completers for whoma second follow-up questionnaire was completed but exclude base year nonparticipants. Refer tosection 4.3.7 of the NELS:88 Second Follow-Up: Student Component Data File User's Manual forinformation on alternative approaches to calculating panel completion rates.
b Parent questionnaire completion rate for each sample member who completed a F2 student ordropout questionnaire.
c Parent questionnaire completion rate for each sample member who completed a BY and/or F2 studentor dropout questionnaire.
d This figure refers to base year, first follow-up, and second follow-up sample members.e Refers to 8th-grade schools. f Refused/Missing refers only to the status of a sample member's ethnicity. It does not refer tosample member nonparticipants.
95

F2: Parent ComponentData File User's Manual
V. Data Control and Preparation
This chapter describes the procedures used to control parentdata before transforming responses from second follow-upquestionnaires into a data file. Several procedures wereimplemented to prepare these documents for data capture, includingmonitoring the receipt of completed questionnaires, editingcompleted questionnaires, retrieving missing data, and preparingthe documents for archival storage. Data preparation activitiesspanned the entire length of the NELS:88 second follow-up parentsurvey, beginning with tracing and securing school cooperation,through monitoring and machine editing, and ending with thepreparation of public use data files.
5.1 Monitoring and Receipt Control Procedures
Questionnaire data were tracked and receipted for allrespondent populations. Once a parent questionnaire was returnedby a respondent, the completion status of the questionnaire forthat parent was entered into the microcomputer-based SurveyManagement System (SMS). The database identified the status ofeach parent questionnaire in the sample and stored the date thatthe data for each respondent was received.
5.2 In-house Editing and Data Retrieval
Editing was conducted to review completed questionnaires, toidentify problems requiring policy decisions, and to prepare thequestionnaires for data entry. After each questionnaire was loggedinto the SMS, it was edited for missing critical items. Criticalitems were questions judged as having important policy relevance.A complete listing of critical items appears in Appendix H.
Critical items were retrieved for questionnaires in whichresponses to one or more of the critical items were missing,illegible, or contained multiple codes when only one was required.Interviewers called respondents and attempted to elicit a responseto the missing critical item(s). If an error could not be resolvedin this way, then the appropriate code was assigned to the questionto indicate missing, multiple, or refused responses.
5.3 Data Capture and Archival Storage
Data entry for the parent questionnaires was performed throughan optical mark reading procedure by Questar Data Systems, Inc.All parent questionnaires were photographed onto microfilm. Afterthe questionnaires were scanned, the booklets were microfilmed andthen destroyed. The rolls of microfilmed questionnaires werereturned to NORC for archival storage.
94

F2: Parent ComponentData File User's Manual
VI. Data Processing of the Parent Questionnaires
In each round of the study, data processing activities beganwith sample selection and continued through receipt control,machine edit, and the preparation of public and restricted use datafiles and user documentation. Data processing activities variedlittle between the base year and second follow-up parent surveywaves. This chapter describes the post-processing that was carriedout to prepare the data for final release. The chapter concludeswith an introduction to the electronic codebooks (ECBs) that havealready been created or are planned for NELS:88 data.
6.1 Machine Editing
Conventions for editing, coding, error resolution, anddocumentation adhered as closely as possible to the procedures andstandards previously established for HS&B and NLS-72.
Detection of out-of-range codes was completed during scanningor data entry for all questions except those permitting an open-ended response. The scanning contractor converted the parent datato machine-readable form and supplied a raw data tape to NORC.After receipt of all scanned data, sequenced machine editing andvisual inspection of the output began. The tasks performedincluded: resolving inconsistencies between filter and dependentquestions, supplying the appropriate missing data codes forquestions left blank, detecting illegal codes and converting themto missing data codes and investigating inconsistencies orcontradictions in the data. Frequencies and crosstabulations foreach variable were inspected before and after these steps to verifythe accuracy and appropriateness of the automated machine editingprocesses.
Inconsistencies between filter and dependent questions wereresolved in the machine editing process. In most instances,dependent questions that conflicted with the skip instructions ofa filter question contained data that, although possibly valid,were superfluous. For instance, respondents sometimes indicated"no" to a filter question and then continued to answer "no" tosubsequent dependent items. When a filter question indicated thata subsequent question(s) should have been skipped, the dependentquestions were set to the value "legitimate skip," with oneexception. In the exception, if the dependent questions wereanswered in a manner that was inconsistent with the filter butconsistent across the dependent items, the filter was back edited(changed) to agree with the dependent responses. If a multipleresponse or no answer was given to a filter question, the questionwas assigned the suitable reserved code and all subsequentquestions that might have been skipped were processed as if therespondent should have answered them.
The frequency with which responses were recoded to alegitimate skip for each skip pattern was closely monitored.
95

F2: Parent ComponentData File User's Manual
Frequency distributions of responses before and after editing wereinspected. All filter questions and their respective dependentitems were displayed in crosstabulations to verify the correctnessof the recoding.
After improperly answered questions were converted to blanks,the parent data were passed through a second step in the editingprogram that supplied the appropriate reserved codes for blankquestions. Where a value was not provided by the respondent, areserved code fills the field. These codes are as follows:
6=MULTIPLE RESPONSE7=REFUSED 8=MISSING9=LEGITIMATE SKIP
When the legitimate response of a variable filled more thanone column of space, the right-hand column contained one of theabove codes and the remainder of the columns were filled with "9"s.
Items with unusually high nonresponse or multiple responseswere checked by verifying the data in the questionnaire onmicrofilm.
6.2 Data File Preparation
The conventions used to assign SAS and SPSS-X variable namesare as consistent as possible with HS&B and NLS-72. In those twosurveys, variable names were assigned according to the survey waveand the question number. A similar system was developed forNELS:88. For example, BYP49A is from the base year parent survey,question 49, part A. Likewise, F2P87C is from the second follow-upparent survey, question 87, part C.
Constructed variables including statistical weights, specialindicators or "flags," and variables that are composites of one ormore sources are added to the files in order to promote highcaliber analyses of the NELS:88 data. Some items add informationfrom study sources that would otherwise be unavailable to users;some items reference respondent properties to external standardsthat would be expensive for individual analysts to create; otheritems are recodes or combinations of internal questionnairesources. Some composites have appeared in earlier rounds andrepresent a convenience for the analyst, rather than wholly newinformation. Some of these constructed variables will be used bynearly all users, while others will be appropriate to those seekinginsights into distinctive populations, relationships or events.
Generally, the names of special flags, weights and otherconstructed variables that were created in the base year begin withBY; the first follow-up flags and weights begin with F1; and the
96

F2: Parent ComponentData File User's Manual
second follow-up names begin with F2.20 If the variable is aschool-level variable placed on the parent file, the compositevariable name begins with G8 (for grade 8 in base year), G10 (forgrade 10 in the first follow-up) or G12 (for grade 12 in the secondfollow-up). Over the course of the survey even basic demographicssuch as gender and ethnicity are re-examined and improved when andif new and/or more accurate information becomes available forparticular cases (thus there is an F1SEX on the first follow-upfiles, an F2SEX on the second follow-up files, etc.).
The only reserved code used for all of these speciallyconstructed variables is for missing data. For one-columnvariables that code is "8." Variables that are greater than onecolumn in length are filled with "9"s (i.e., 998) in all but theright-most column. This reserved code is used when the sources fordata are missing due to either item nonresponse, nonparticipationin all or part of the components of the study, or when data aremissing on one or more external source files. Appendix J explainsthe conditions under which specific composite variables wereassigned a missing code.
6.3 CD-ROM Electronic Codebook
An electronic codebook (ECB) permits PC users to interact withall of the features of a conventional hardcopy codebook and itsaccompanying documentation. In a very large, complex survey suchas NELS:88 with multiple highly elaborated codebook text files, theCompact Disc (CD) medium provides the necessary capacity to carrya tremendous amount of data in a very compact and convenient form.CD-ROM is a form that can be copied to and read by a microcomputer.The information on CD-ROM is "Read-Only." This feature protectsthe data on the disk from accidental alterations, such as a userunintentionally writing over the encoded information.
In addition to numerous hardcopy codebooks that accompanymagnetic tape releases on NELS:88, ECBs are also now available tousers. These permit users to search for variables based on keywords and names. The ECB displays question text and frequenciesfor each variable in order to assist users in deciding which dataelements may be useful in planned analyses. The ECB is also a toolfor selecting variables for subsequent analysis, writing SAS orSPSS-PC code for file construction of the designated variables, andeven generating a codebook of the chosen set of variables.
More detailed information on the features of the NELS:88 ECBsand the survey waves and components for which ECBs are availableappears in Chapter VII.
20 A few composite variables that were built in the base year do
not begin with the prefix "BY." These are: SEX, RACE, HISP,API, HEARIMP, HANDPAST, BIRTHMO, and BIRTHYR.
97

F2: Parent ComponentData File User's Manual
VII. Guide to the Data Files, Documentation, and CD-ROM ElectronicCodebooks
Fourteen NELS:88 study components are now available to userson magnetic tape or CD-ROM (Compact Disc Read-Only Memory) format.Magnetic tape and CD-ROM releases of the NELS:88 data contain filesthat are specific to one survey wave and one component, such as thesecond follow-up student component data. Table 7-1 displays theseNELS:88 products, by study component and by survey year.
The student and dropout data sets are the central units ofanalysis in NELS:88. Each of the student data files may beexamined as an independent entity or may be combined forobservation of the maturation of the original student cohort overtime. Table 7-1 suggests that the student and dropout data filesreleased in the second follow-up of NELS:88 may be combined withdata from second follow-up surveys of parents, teachers and schooladministrators. The most powerful analyses are possible whenstudents are viewed in the context of these fundamental influencesacross the four-year time frame that is now available. The NELS:88files are designed to be merged and used to examine how differentstudent and dropout outcomes relate to various structural patterns,as measured by parent, school, and teacher influences, and/or theways in which these change over time.
The contextual data files are dependent upon and subsidiary tothe student and dropout files in NELS:88. The contextual datafiles cannot stand alone. The only exception is the base yearschool file, which is representative of eighth-grade Americanschools and their principals in 1988. Even for the base year andsecond follow-up parent surveys--which closely resemble probabilitysamples of parents of the relevant student and dropout populations--there are some departures from the requirements of a stand-aloneprobability sample. In particular, some unknown number of baseyear and second follow-up parents had more than one sampled eighthgrader, hence more than one chance of selection into the sample.In addition, in both the base year and second follow-up, only oneparent was surveyed, and that parent was self-selected.
In the second follow-up parent component data file, the parentquestionnaire items and a number of additional pertinent constructshave been copied to the records of eligible parents (who were notsubsampled out of the parent survey) of eligible, participatingstudent and dropout sample members. Note that these parent recordsappear on the parent file even if the parent or guardian did notreturn a completed parent questionnaire. At the time of parentsubsampling, four types of parents or guardians were retained withcertainty (see section 3.1.5 for more information on these fourtypes). Several types of sample members are included in thestudent files; therefore, the user must take care to select the setthat is correct for the research question. Among the types of
98

F2: Parent ComponentData File User's Manual
sample members in the student data set are: 1) students who wereadded in the first or second follow-ups to freshen the sample;
99

F2: Parent ComponentData File User's Manual
Table 7-1NELS:88 components and survey waves for which both
magnetic tape and CD-ROM products are available
Number ofVariables onPublic Use
Available Versiona
Base Year
Student Yes 410Dropout Not Applicableb Not Applicableb
School Yes 211Teacher Yes 238Parent Yes 331Transcript Collected in Collected in
Second Follow-Upd Second Follow-UpdFirst Follow-Up
Student Yes 694Dropout Yes 561School Yes 832Teacher Yes 466Parent Not Collectedc Not Collectedc
Transcript Collected in Collected inSecond Follow-Upd Second Follow-Upd
Second Follow-Up
Student Yes 786Dropout Yes 577School Yes 385Teacher Yes 420Parent Yes 423Transcript Yes ---d
a The student ID number has not been included in the count ofthe number of variables on the public use data files. For thefirst follow-up school and second follow-up student fileswhich are split into two files, the questionnaire weight hasbeen counted only once.
b Since by definition dropouts could only be identified andstudied after the initial round of the survey, there is nobase year dropout component.
c The parent component was only conducted during the base yearand second follow-up.
d Transcripts collected during the second follow-up span theentire high school career and are available in restricted useform only. The restricted use transcript file includes 236student-level variables and 251 course-level variables.
100

F2: Parent ComponentData File User's Manual
2) sample members who have participated in one, two or all threewaves of the survey; and 3) Base Year Ineligible sample members whowere found to be eligible and subsequently included in the firstand second follow-up surveys of NELS:88.21 Eight analyticpopulations, both cross-sectional and longitudinal, are nowrepresented in the NELS:88 student sample. Different researchquestions apply to different student populations. In order tochoose the correct NELS:88 student sample and produce accurateresults, analysts must use the proper sample identification andquestionnaire availability indicators as well as the correctstatistical weight.
Section 7.1 provides an overview of the sample indicators andweights necessary for using the parent data. Section 7.2 includesa complete description of the content and organization of thesecond follow-up parent data files. Finally, section 7.3 offers anexplanation of the hardcopy codebook and an introduction to theNELS:88 electronic codebooks.
7.1 Basics for Analyses: Second Follow-Up Questionnaire andSample Indicators, and Parent Sample Statistical Weight
The method for naming variables follows a simple pattern."F2" refers to the second follow-up, "F1" refers to the firstfollow-up, and "BY" refers to the base year. An "F2" in the prefixmeans that the variable has been created in the second follow-upfor second follow-up sample members. This is an importantdistinction since some variables that measure the same concept havebeen created for data sets in more than one round of the survey.In addition, if new information becomes available--for example forstudents who have not heretofore participated in NELS:88--certainclassification variables are revised to reflect this newinformation. The more recent the creation of a composite, the morelikely that it contains the most accurate values. The recordlayout for the indicators and weight is included in Appendix I.Appendix K includes the second follow-up parent codebook whichcontains the frequencies for these items.
Questionnaire Indicator and Statistical Weight. One of thefirst steps to take in carrying out a plan for research involvesselection of the proper questionnaire availability indicators.Even tentative investigations that are not statistically weightedmust utilize the appropriate indicators for cases with thespecified items on the data file.
21 Note however that the sample of reclassified Base Year
Ineligibles (i.e., those found to be eligible in the firstfollow-up and second follow-up rounds) had not been releasedprior to the second follow-up.
101

F2: Parent ComponentData File User's Manual
F2PAQFLG Indicates whether or not a parent questionnaire isavailable for an eligible parent or guardian of aparticipating, eligible student.
0 = The parent is a member of the second follow-upsubsample and the parent did not complete a secondfollow-up parent questionnaire.
1 = The parent is a member of the second follow-upsubsample and the parent did complete a secondfollow-up questionnaire.
2 = Not applicable. The sample member is not member ofthe second follow-up parent subsample.
F2PAQFLG permits selection of eligible parent cases (F2PAQFLG < 2)and/or eligible cases with parent data present (F2PAQFLG = 1). Itis analogous to F2QFLG on the student files and similar indicatorsthat have been constructed for the contextual sample (schooladministrator and teacher components) and the high schooltranscript study.
Table 7.1-1 lists the student populations that are representedin the NELS:88 database and the different ways that NELS:88 parentdata may be used in analyses with them. Table 7.1-2 links three ofthese groups to the flags and other special variables, includingstatistical weights, that must be used in order to select andanalyze each of the student groups.
Parent Component Statistical Weight. The NELS:88 data filesare designed to be used as weighted data sets in all analyses. Dueto the complexity of the NELS:88 sample design, estimation andinference will most likely be inaccurate if the data are analyzedon an unweighted basis. Clustering, multistage selection, anddisproportionate sampling all contribute potential bias and variousdegrees of unreliability, which can only be avoided by using theweights provided to analyze specific subsets of the
102

F2: Parent ComponentData File User's Manual
Table 7.1-1 NELS:88 parent data to use with NELS:88 student analysis populations
Basic Analyses (Student-parent data combinations)
Student Populations Parent Data
1988 8th-grade cross-section ----------> 1988 parent data 1988 8th graders in 1992 ----------> 1992 parent data
Includes:• Students/early graduates• Dropouts from the 8th-grade cohort
1990 10th graders in 1992 ----------> 1992 parent dataIncludes:• Students/early graduates• Dropouts from the sophomore cohort
1992 12th graders (senior cohort) -----> 1992 parent data
Special Analyses (Undertake with caution)
Student Populations Parent Data Analysis Caveat
1988 8th graders in 1990 ----> 1988 parent data and/or No parent panel1992 parent data weight
1990 10th-grade cross-section ----> 1988 parent data No parent weight. Bias: no 1988 parent data for1990 freshened sophomores
1988 8th graders in 1992 ----> 1988 parent data and/or No parent panel weight1992 parent data
1990 10th graders in 1992 ----> 1992 parent data No parent panel weight
103

F2: Parent ComponentData File User's Manual
Table 7.1-2Sample combinations, sample numbers, indicators, and weights for analyses with parent data
Possible Data/Sample Combinations
1992 12th-GradeCross-Section with1992 Parent Data
Second Follow-UpDropouts andAlternativeCompleters with 1992Parent Data
1988 8th Graders in1992 with 1992Parent Data
Comment
Select from secondfollow-up student fileand second follow-upparent file.
Select from secondfollow-up student fileand second follow-upparent file.
Select from secondfollow-up student fileand second follow-upparent file.
Sample IDFlags
F2PAQFLG=1 andF2UNIV2D=01(from F2student file)
F2PAQFLG=1 andF2UNIV2D=03 (from F2student file)
F2PAQFLG=1 andF2UNIV2D=01 or02 or 03(from F2student file)
SampleNumber
N=14,039
N=2010
N=16,395
Weight
Use the secondfollow-upparent weight,F2PAQWT.
Use the secondfollow-upparent weight,F2PAQWT.
Use the secondfollow-upparent weightF2PAQWT.
104

F2: Parent ComponentData File User's Manual
sample.22 In order to accommodate analyses of the parent data,F2PAQWT has been constructed and added to the records on the secondfollow-up parent component magnetic tape and final CD-ROM releases.Refer to Chapter III for a full description of the NELS:88 secondfollow-up weights.
Panel Analyses with Parent Data. Weights have not beenconstructed for all possible analytic purposes, including panelanalyses with parent data. In instances where there is ananalyzable population of interest for which no specific weight hasbeen produced, some existing weights may provide reasonableapproximations. It was for this reason that no separate parentweight was produced in the NELS:88 base year: base year parentdata can be used with the base year student weight, BYQWT, withonly minimal bias.
However, because of parent subsampling in the secondfollow-up, a special weight, F2PAQWT, was created. F2PAQWT can beused to produce weighted estimates in analyses of 1992 NELS:88participants, including cohort dropouts and 1992 seniors. However,the second follow-up parent weight exists only in a cross-sectionalversion. This poses a difficulty if one wishes to conductlongitudinal analyses of, for example, parent-reported changes inthe home education support system between 1988 and 1992. Noavailable weight can be used to provide precise populationestimates for the longitudinal use of parent data. Use of the 1992parent weight in conjunction with data from prior rounds canprovide an approximation; however, since F2PAQWT was produced foranother purpose, population estimates produced from it will containbiases in a panel analysis.
22 Three student-level weights have been constructed for the
second follow-up and are available on the student files:
F2QWT is used for producing weighted twelfth-grade studentstatistics in cross-sectional analyses.
F2F1PNWT is used for producing weighted student panelstatistics when both the first follow-up and second follow-updata are employed in analyses.
F2PNLWT is used for producing weighted student panelstatistics when all three rounds, the base year, first follow-up, and second follow-up, are included in the analyses.
In addition to the parent weight, there is also a contextualweight (for the school administrator and teacher files) andthree transcript survey weights. A companion variable hasbeen constructed for each of these statistical weights inorder to select the appropriate cases.
105

F2: Parent ComponentData File User's Manual
Extreme caution must therefore be exercised if a researcherwishes to conduct a weighted analysis for which a specific weighthas not been provided. In particular, the analyst must weigh howmuch bias will be introduced by substitution of another weight. Twochecks that should be made are 1) examination of the sum of theweights to compare that sum to true population totals; and 2)analysis of nonresponse bias, that is of what groups aredisproportionately excluded by the weighting strategy. Thespecific purpose and required degree of precision of the analysismust be taken into account. If subgroup estimates are central tothe analytic plan, it is necessary to take into account bias at thesubgroup level. In instances where more than one possible weightis available, the decision as to which is best to use should beguided by a comparison of the bias inherent in each alternative.Whatever weighting strategy is used, if the amount of bias isnon-trivial, potential biases should be reported with the results.
Table 7.1-3 shows the sum of the second follow-up parentweight, F2PAQWT, when it is applied to the subset of second follow-up parents who completed both a base year and second follow-upparent questionnaire versus all parents who completed a secondfollow-up parent questionnaire. While the characteristics of mostconcern are in large measure a function of analytic goals, andwhile these characteristics might best be viewed in combinationrather than individually, Table 7.1-3 highlights race, SESquartile, and region for each group.
When F2PAQWT is used in a panel analysis with base year andsecond follow-up parent data, the sum of the weights is 85.3percent of the sum obtained when using only the second follow-upparent data. Analysts should examine the remaining 14.7 percent tosee if it is randomly distributed or whether the missing datadisproportionately affect certain groups and is therefore apotential source of bias. For example, while using F2PAQWT withthe parent panel represents only 85.3 percent of 2.6 millionparents, 89.2 percent of whites are represented but only 62.5percent of American Indians and Alaskan Natives, 74.0 percent ofAsians and Pacific Islanders, and 74.7 percent of Hispanics arerepresented. By SES quartile, 90.0 percent of the families in thehighest quartile are represented but only 82.2 percent of thefamilies in the lowest quartile are represented. By region, 91.7percent of students whose school is in the Midwest are represented,yet only 82.4 percent of students in the West are represented. Thecaveat that the analyst must assess for and be wary of bias isjustified in these instances.
Universe Variables. As in every longitudinal survey, thecomplexity of NELS:88 has increased with each successive surveywave. The changing numbers of cases delivered in each round may beone of several perplexing anomalies to users. The "universevariables" are designed to explain how the status of sample membershas changed from one round to another. These variables appear on
106

F2: Parent ComponentData File User's Manual
the student files but are explained here for researchers who mayseek a better understanding of the NELS:88 student sample, andtherefore, of the parent sample. Moreover, as is explainedelsewhere in this chapter, the student and parent files are easilymerged by means of the student ID number.
The first of the universe variables, F2UNIV1, is a set of overone hundred mutually-exclusive categories that was designed toencompass each sample member ever in the study. It describes howand when the student sample member entered the NELS:88 cohort andthe situation of the sample member in the base year, the firstfollow-up, and in the second follow-up. Abbreviations for the SASand SPSS-X value label cards provide this information in thecharacter lengths allowed by those programs (which are shorter thanthe labels displayed in the codebooks). These abbreviations are:
BY = Base YearF1 = First Follow-UpF2 = Second Follow-UpI = Ineligible for questionnaire administration
(mental/physical disability, language barrier)A = In-school, in-gradeB = In-school, out-of-gradeDO = DropoutE = Eligible for questionnaire administrationFR = FreshenedNA = Not Applicable (status description for rounds prior to
that in which one was freshened into sample)X = Out-of-scope (deceased, out-of-USA)? = Status unknown
For each valid category of this variable, the status of thesample member is indicated for the base year, first follow-up, andsecond follow-up. Examination of the categories of the variable inAppendix K reveals that the status of sample members did changeover time. For example, students ineligible for the base year weresubsequently re-surveyed and some were discovered to be capable ofcompleting the survey in the first and/or second follow-ups. Othersample members moved out of the country in a later round and weredefined as "out-of-scope" for that round. Some of these samplemembers had returned to the U.S.A. by the second follow-up and wereonce again in-scope for data collection. Similarly, students whowere freshened in the first or second follow-up did not participatein the base year.
Four additional universe variables are provided, each with amore limited descriptive mission than F2UNIV1. These variablesaccount separately for the information that is combined in thefirst universe variable. F2UNIV2A reports how sample membersinitially entered NELS:88. Categories are base year eligible, baseyear ineligible, or freshened in either the first or second follow-up. F2UNIV2B reports the base year status of all sample members:
107

F2: Parent ComponentData File User's Manual
freshened in either the first or second follow-ups (and thus not atthat time an active sample member), in school and in the
Table 7.1-3The sum of F2PAQWT for second follow-up panel parents
versus all second follow-up parents
Base Year-Second Follow-Up All SecondParent Panel Members Follow-Up Parents
Overall
Participants 2,236,725 2,622,028a
Race
Asian/PI 69,207 93,499Hispanic 196,771 263,563Black 273,047 336,271White 1,674,474 1,877,564American Indian/Alaskan Native 23,226 37,154Missing ---- 13,977
Socio-economicStatus
Low 472,899 574,707Medium 1,147,832 1,311,841High 615,994 684,690Missing ---- 50,792
Regionb
Northeast 381,474 443,275Midwest 545,858 595,093South 683,483 793,346West 352,245 427,230Not enrolled 271,751 357,062Missing 1,914 6,023
a The sum of F2PAQWT reported by race, SES, and region may notequal the overall sum of the weights due to rounding.
b Refers to the region of the student's school in the secondfollow-up. This information is not available for students whodid not attend a school in the second follow-up. These studentsare included on the line labeled "Not enrolled."
108
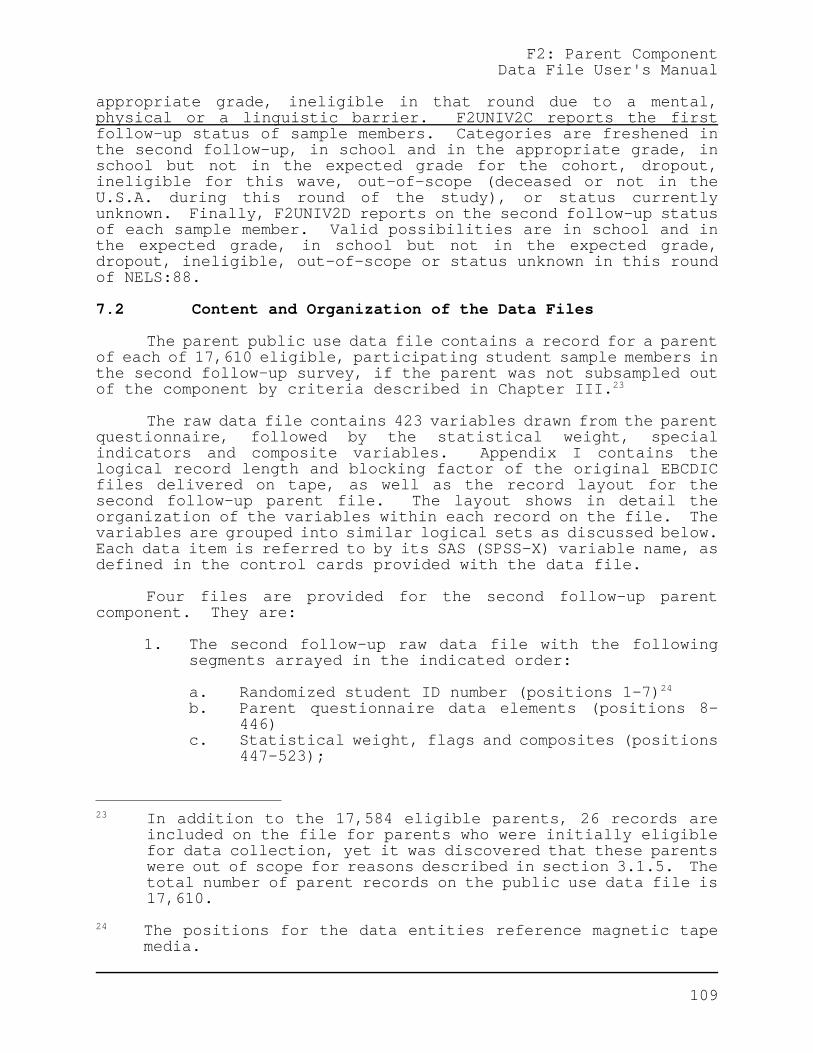
F2: Parent ComponentData File User's Manual
appropriate grade, ineligible in that round due to a mental,physical or a linguistic barrier. F2UNIV2C reports the firstfollow-up status of sample members. Categories are freshened inthe second follow-up, in school and in the appropriate grade, inschool but not in the expected grade for the cohort, dropout,ineligible for this wave, out-of-scope (deceased or not in theU.S.A. during this round of the study), or status currentlyunknown. Finally, F2UNIV2D reports on the second follow-up statusof each sample member. Valid possibilities are in school and inthe expected grade, in school but not in the expected grade,dropout, ineligible, out-of-scope or status unknown in this roundof NELS:88.
7.2 Content and Organization of the Data Files
The parent public use data file contains a record for a parentof each of 17,610 eligible, participating student sample members inthe second follow-up survey, if the parent was not subsampled outof the component by criteria described in Chapter III.23
The raw data file contains 423 variables drawn from the parentquestionnaire, followed by the statistical weight, specialindicators and composite variables. Appendix I contains thelogical record length and blocking factor of the original EBCDICfiles delivered on tape, as well as the record layout for thesecond follow-up parent file. The layout shows in detail theorganization of the variables within each record on the file. Thevariables are grouped into similar logical sets as discussed below.Each data item is referred to by its SAS (SPSS-X) variable name, asdefined in the control cards provided with the data file.
Four files are provided for the second follow-up parentcomponent. They are:
1. The second follow-up raw data file with the followingsegments arrayed in the indicated order:
a. Randomized student ID number (positions 1-7)24
b. Parent questionnaire data elements (positions 8-446)
c. Statistical weight, flags and composites (positions447-523);
23 In addition to the 17,584 eligible parents, 26 records are
included on the file for parents who were initially eligiblefor data collection, yet it was discovered that these parentswere out of scope for reasons described in section 3.1.5. Thetotal number of parent records on the public use data file is17,610.
24 The positions for the data entities reference magnetic tapemedia.
109

F2: Parent ComponentData File User's Manual
2. SPSS-X control cards for the parent component file;
3. SAS control cards for the parent component file; and,
4. SAS system file for the parent component data.
7.2.1 Identification Codes
The first variable on all of the raw data files, STU_ID, is aunique seven-digit student identification code. This numberremains with a student or dropout throughout NELS:88. To linkstudent records across two or more waves of the survey (1988, 1990,and 1992) or between survey components (student, dropout, parent,school, teacher, and transcript), analysts should use STU_ID.
The student ID code consists of a five-digit base year schoolID followed by a two-digit student code. Though both sets ofnumbers were randomly assigned to maintain confidentiality, the IDscontain embedded linking, stratum and PSU information.25 Studentsadded to the first or second follow-up through freshening werelinked to a core sample member. The base year school ID of thelinked student was used as the root of the added student's ID.Thus, in all cases, the student ID links students and dropouts toa base year school.
7.2.2 The Parent Public Use File Record Layout
The logical record length, block size and record layout forthe second follow-up parent component data file is in Appendix I.The record layout for the base year parent survey appears in VolumeI of the NELS:88 Base Year: Parent Component Data File User'sManual: The layout shows how variables are ordered within therecords for each parent respondent on the file. Items taken fromthe hardcopy questionnaire appear at the beginning of each parentdata record, in the same order as they appear in the second follow-up parent questionnaire contained in Appendix G.
The variables in the record layouts are identified by the SASand SPSS-X variable names that have been designated for each dataelement. No more than eight characters may comprise a SAS or SPSS-X variable name. The first two characters of the variable namesfrom the parent questionnaire indicate the survey wave in which thevariable was created. Thus, BY in the prefix of the variable name
25 Analysts who are employing variance estimation software should
note that the student ID reflects the NELS:88 sampling plan inthe following way: the left-most two digits of the IDrepresent the stratum identification number for the case; themiddle three digits are the primary sampling unit (PSU) forthe school; and the last two digits identify the studentuniquely within the stratum and PSU.
110

F2: Parent ComponentData File User's Manual
indicates a base year questionnaire item, while F2 in the prefix ofthe name refers to the second follow-up. The third character inthe variable name represents the NELS:88 component, with "P" forparent component, "S" for student, "D" for dropout, "C" for theschool component, and so on. BYP and F2P refer to the parentquestionnaires as the source document for, respectively, the baseyear or the second follow-up parent surveys. The naming scheme foritems that report parent responses is completed by the suffix ofthe variable name, which consists of the question number and part.For example, F2P50A is question 50, part A from the second follow-up parent questionnaire.
7.2.3 Composite Variables
Composites variables are constructed in order to enhancesubstantive analyses. Since research questions frequently requireindependent or control variables such as the urbanicity of theschool, the socioeconomic status of the family, or the gender ofthe individual, a large set of classification variables has beencarefully constructed and added to the records in most of thesecond follow-up component files. A description of thespecifications used to create these composite variables for theparent component is found in Appendix J.26 Perusal of thesesections may also suggest additional ways in which the data may beconfigured for analyses. This section introduces the compositesthat have been constructed for the parent component file of thesecond follow-up of NELS:88.
Most composite variables are constructed from two or moresources. These may be combinations of questionnaire items from thesame or different NELS:88 data files, in the base year, firstfollow-up, and second follow-up. Some composites are drawn from anexternal sampling resource that is unavailable to users, or utilizean external conceptual scheme in order to rank, order, or otherwiserecode survey data. A few composites are sufficiently central toanalyses that they are constructed in each round of the survey.Some values should change over time; for example, it is natural forfamily size to change over the four year data collection intervalof the base year and second follow-up parent surveys. Somevariables, such as school type, are quite stable over time for anindividual school but the type reported between survey rounds maynot be the same if the student sample member changes schools sincethe first report. Other constructs, such as student sample membergender, may be improved with new information as the surveycontinues. For example, the second follow-up report on basicdemographics is enhanced when a former non-participant completes anew student supplement and questionnaire. Because the sources forcomposite construction and quality control checks tend to multiply
26 Appendix J also lists the flags and the statistical weight for
the parent sample in the order in which they appear in thedata records.
111

F2: Parent ComponentData File User's Manual
as additional rounds of data are collected, the validity of certainclassification variables is strengthened over time. The mostrecent round in which such a variable appears contains the bestclassification information for sample members.
Composites of School-level Characteristics. The composites ofschool-level characteristics provide information on keycharacteristics of students' second follow-up school. "G12" in theprefix of the variable name indicates a characteristic of thetwelfth-grade school the student attended, even if the student wereactually attending a different grade in the school during the 1992data collection. School-level composites are also included on thestudent component data file for dropouts, and the identificationnumber of the last school attended by the dropout is included onthe restricted use dropout component data file.
G12CTRL1 classifies the student's second follow-up school bytype of control: public, Catholic or other private, with privateschools divided into other religious, no religious affiliation, oraffiliation unknown. G12CTRL1 is primarily reported from theschool administrator questionnaire and is checked against the QEDsampling file for consistency.
G12CTRL2 classifies the student's second follow-up school typeinto public, Catholic, private NAIS, and other private--not NAIS.The values for this variable were compiled from both QED and NAISmembership lists. This variable appears only on the restricted-useversion of the NELS:88 data files.
G12URBN3 is a three-category composite that reflects the typeof place in which the student's public school district, Catholicdiocese, or, for other private schools, county is located. Thecategories are urban, suburban and rural. The information wasobtained from QED, or when missing, looked up in the U.S. Bureau ofthe Census, Statistical Abstract of the United States: 1992 (112thedition), Washington DC, 1992, pages 896-904, and added to thefiles. This composite is analogous to the variable that was usedin HS&B and in NELS:88 sampling.
G12REGON indicates in which of the four U.S. Census regionsthe student's second follow-up school is located (Northeast,Midwest, South, West). It is created by collapsing the values ofthe state in the school address. G12STATE is only available onrestricted-use files.
Composites of Student-level Characteristics. A number ofvariables that have been reported by the student sample member (andsupplemented with other source materials as needed or available)are included on the parent data file.
F2SEX and F2RACE1 record the gender and race/ethnicity,respectively, of the student sample member. F2API and F2HISP
112

F2: Parent ComponentData File User's Manual
contain more specific Asian/Pacific Islander and Hispanicmembership categories of students. F2BIRTHM and F2BIRTHY give thebirth month and year of the student sample members. F2HSPROGrepeats the type of high school program reported by the student inthe second follow-up student questionnaire.
Two composites appear on the parent file that attempt tocapture the student sample member's perception of how chance,versus one's own actions, affects the way that life unfolds. Bothdraw on items that are in the second follow-up student and dropoutquestionnaires. The first "Locus of Control" construct is designedto be as comparable as possible with similar variables that werecreated for the NLS-72 and HS&B surveys. In order to achieve thiscomparability, F2LOCUS1 comprises fewer items than F2LOCUS2. Astandardized quartile (created by applying the student weight toscores) is represented in F2LOCU2Q.
Similarly, two constructs that attempt to capture the studentsample member's level of self-esteem appear on the parent files.The first, F2CNCPT1, is designed to be as comparable as possible toparallel items in NLS-72 and HS&B, while the second, F2CNCPT2, usesthe full set of second follow-up student questionnaire items thatare available for operationalizing the concept. The quartile,F2CNCP2Q, is a weighted reflection of the more elaborated selfconcept measure.
Finally, F2STAT gives the participation status of the studentin the second follow-up. F2F1DOST indicates the dropout status ofthe sample member given what was known at the time of the firstfollow-up. F2DOSTAT indicates the dropout status of the studentsample member by the end of the second follow-up data collection.
Parent and Family Composites. In addition to the F2PAQFLGthat indicates the presence of a second follow-up parentquestionnaire on the file, an analogous variable, F2BYPAFG,indicates whether a base year parent questionnaire is available.F2BYSPFG and F2SPANFG reveal whether or not the parentquestionnaire was completed in Spanish or English in the base yearor the second follow-up parent survey respectively.
Family size in the base year is reported in F2BYFMSZ, whichwas constructed from base year parent data or student data. Baseyear marital status, F2BYPMAR, was created from the base yearparent questionnaire (note that the categories were recoded tomatch the parallel second follow-up item). The composition of thestudent sample member's family in 1988 is contained in F2BYFCMP,for which responses were drawn from the base year studentquestionnaire. Family composition reported by the parentrespondent to the base year parent survey appears in F2F1FCMP,although the "F1" in the variable name reflects the fact that itwas created in the first follow-up.
113

F2: Parent ComponentData File User's Manual
Finally, a number of composites are constructed from thesecond follow-up parent survey data. The composition of thestudent sample member's family, F2FCMP, and the size of the familyin 1992, F2FAMSIZ, are built entirely from second follow-up parentquestionnaire items. On the other hand, the highest level ofeducation achieved by the parent respondent, F2PARED, begins withsecond follow-up parent survey information but brings in othersources of data when the parent item is not obtainable.
Three varieties of socioeconomic status have been constructedfor the second follow-up data files. The first of these, F2SES1,and its quartile employ the original scales used in NLS-72 and HS&Band utilize base year parent survey data as the first choice intheir complex formula. F2SES2 and its quartile, F2SES2Q, use thesame occupational scale but employ second follow-up parent datawhen available as the preferred source for the requiredinformation. The third socioeconomic composite and quartile,F2SES3, are constructed with an updated occupational prestige scaleand data from the second follow-up parent component.
7.2.4 Packaged Statistical Programs
The procedures recommended for analyses of NELS:88 data withSAS are outlined in Appendix E. SPSS-X can also be used and boththe magnetic data tape releases and the CD-ROM media include filesthat contain the appropriate control cards for each of thesestatistical packages. Analysts who wish to create an SPSS-X systemfile from a SAS system file (or vice-versa) can do so.
7.3 Guide to the NELS:88 Codebooks
The codebooks that have been provided for each wave of thesurvey fully describe and assist with interpretation of each of thevariables on each of the data files. The codebooks summarize allkey information for each data element, including:
• the variable name, question number and content; • the tape position and format on the file for each
variable;• valid and/or missing responses to each item; and,• for each response category, the unweighted frequency
counts, percents, and weighted percents are displayed.
Two related types of codebooks are provided for NELS:88--ahardcopy and an electronic codebook. Both forms of the codebookchronicle the details analysts need to interpret properly theresults of each item: the exact wording of the question that waspresented to the respondent, the distribution of all legitimateanswers among survey participants, the location and type of dataelement for each variable on the file, as well as names and labelsprovided for use with statistical software. For some items thisbasic presentation is supplemented with additional notes about
114

F2: Parent ComponentData File User's Manual
using the data. The first type of codebook is the hardcopycodebook included in the NELS:88 second follow-up data file usermanuals. Hardcopy codebook displays are described and illustratedin section 7.3.1.
The second type of codebook is the NELS:88 second follow-upelectronic codebook (ECB). The electronic print files that areproduced by the hardcopy codebook software are used as thefoundation (the input files) for the ECB software. ECBs provideseveral advantages. First, the NELS:88 ECBs reside on CD-ROM(Compact Disc Read-Only Memory) and, given the right equipment andsoftware, can be accessed by and copied to a user's personalcomputer. The NELS:88 data sets have also been released on CD-ROMs, a far more concentrated medium for archiving information thanmagnetic tapes. The PC mode is both more convenient and far lessexpensive than mainframe operations for most users. Second, ECBspermit users to scroll through the same variables and surveyresults found in all versions of the codebooks electronically. Inaddition, analysts interact with the ECB software to select onlythose data elements that will be needed for the user's specificanalyses. The result is a user-controlled subset of the variablesthat is fully equipped with the tools required for statisticalanalysis. The labor-intensive steps that were formerly required toaccomplish these preliminary steps to analysis, such as typing inexact variable names, have been rendered obsolete by the ECBsystem. Additional information on ECBs is given in section 7.3.2.
7.3.1 Hardcopy Codebooks in NELS:88 Data User's Manuals
Both the hardcopy and the ECB versions of the NELS:88codebooks contain the basic information available on each variablein the NELS:88 data sets. Therefore, even those readers who planto use ECBs should be familiar with the material in this section inorder to take full advantage of the ECB.
Figure 7-1 is an illustration of the information provided inthe codebooks for each data element. Each portion of this exampleis numbered and explained below.
115

F2: Parent ComponentData File User's Manual
Figure 7-1An entry in the parent public-use codebook
(1) Question 50A (2) Tape Pos. 234-234(3) Format: I1
(4) F2P50A (5) ATTENDED SCHOOL ACTIVITIES WITH TEEN
(6) Attending school activities (sports, plays) PER- WGTD
(7) RESPONSE (8) CODES (9) FREQ (10) CENT (11) PCT
NEVER. . . . . . . . 1 2744 15.6% 18.4%RARELY . . . . . . . 2 2274 12.9% 13.7%SOMETIMES . . . . . 3 4268 24.2% 24.6%FREQUENTLY. . . . . 4 5256 29.8% 29.6%DOES NOT APPLY (TEEN NOT INSCHOOL) . . . . . . 5 1665 9.5% 13.7%
(12) RESERVED CODES: NO PARENT QUEX . . 1215 6.9% (MISS) MULTIPLE RESPONSE . . . .6 5 0.0% (MISS) MISSING . . . . . . . . .8 183 1.0% (MISS)Totals: 17610 100.0% 100.0%
Explanations:
1. Question number: For variables taken directly from the parentquestionnaire, this is the same as the parent questionnaireitem number. Composite variables and other items such asflags and weights have variable names that reflect theircontent.
2. Tape position: This item gives the starting and ending tapeposition of each variable on the data tape.
3. Variable format: This item indicates the type of variable,its width, and the number of positions following the implicitdecimal point, if any.
4. SAS and SPSS-X variable name: Each variable on the data setis identified by a unique SAS and SPSS-X variable name. "F2P"in the variable name indicates a second follow-up parentquestionnaire variable. Data indicators (such as flags andstatus codes) and composite variables are given mnemonics that help identify them, for example, G12REGON for"Grade 12 Census region" and F2SES2 for the second of three"second follow-up socioeconomic status" variables that willappear on the final ECBs. For all variables the user shouldbe careful always to refer to the variable by its SAS (SPSS-X)
116

F2: Parent ComponentData File User's Manual
variable name in any computing procedures, rather than by itsquestion number.
Figure 7-1 (cont'd.)An entry in the parent public-use codebook
5. SAS (SPSS-X) variable label: A short variable label appearsafter the variable name. This label is the same as thevariable label in the SAS (SPSS-X) data definition cards onthe tape or CD-ROM.
6. Original question wording: This reproduces the exact questionwording as it appeared in the questionnaire.
7. Response categories: This item provides either the originalresponse categories in the case of questionnaire items or therecoded or constructed response categories for compositevariables and data indicators, such as flags. For display inthe codebooks, continuous variables have been recoded tocollapse all valid values into a single response category.This allows the codebook tables to show the frequency counts,unweighted percentages, and adjusted weighted percentages forcontinuous variables without printing each distinct value thatthe variable can take. These value labels are not the same asthose on the SAS (SPSS-X) data definition cards. Condensedvalue labels that do not cause truncation problems areprovided with the data definition cards.
8. Response codes: This item provides the actual numerical codesthat appear on the data tape in the tape position specified(except for continuous variables, where the actual values thatappear on the tape have been recoded to produce the frequencycounts and percentages). Certain codes, discussed below, arereserved to indicate missing data, legitimate skips and soforth.
9. Frequency counts: This item shows the unweighted frequencycounts for all records that were processed, including recordsthat have missing data codes, legitimate skips, and so forth.
10. Unweighted percentage frequencies: This column displays thefrequency counts of item 50A as percentages. All records thatwere processed are included.
11. Weighted percentage frequencies: This column displayspercentages based on response counts weighted up to therelevant population. Cases with reserve code values areexcluded from the computation.
117

F2: Parent ComponentData File User's Manual
Figure 7-1 (cont'd.)An entry in the parent public-use codebook
12. Reserve codes: In this data set certain codes, termed"reserve codes" have been chosen always to stand for certainsituations. These reserve codes and their interpretationsare:
6=multiple response more than one response where only oneresponse was called for
7=refusal respondent refused to answer an item or refusedto resolve a multiple response whereonly one was called for, either at thetime of the questionnaireadministration or at telephone follow-up
8=missing data data that should be present for thisrespondent is missing, but respondentdid not necessarily refuse to providedata
9=legitimate skip because of responses to precedingquestions, data for this item shouldnot be present for this respondent;that is, the value is legitimatelymissing.
These reserve codes are the same as those used in the NLS-72and HS&B surveys. The codes as listed above apply to variableswith single-column data fields. For variables with fields greaterthan one column, the left-most columns are filled with 9s (e.g.,96, 996, 9996).
Note that in the example shown in Figure 7-1, parents who didnot respond to the parent questionnaire are shown on a separateline from other missing cases.
Finally, additional comments and notes may be included anddisplayed below the standard information in the codebooks describedin Figure 7-1. These comments alert researchers to the potentialfor nonresponse bias, a relation to another similar variable orcomposite, a recoding of a continuous variable in order to improvethe codebook presentation, or to recodes or suppressions ofsensitive data for confidentiality purposes.
118

F2: Parent ComponentData File User's Manual
7.3.2 The NELS:88 Electronic Codebook System (ECB)
The electronic codebook combines the convenience, simplicityand cost efficiencies of personal computers (PCs) with CD-ROMtechnology. Thousands of NELS:88 variables, the extensivestatistical software programs and commands that transform the datain analyses, and electronic versions of data user manuals reside ona single CD-ROM. All are accessible with the MS-DOS operatingsystem and statistical and word processing software that the useris likely already accustomed to working with on his or her own PC;however, a user must already have access to PC-SAS or SPSS-PC.Virtually all steps that must be undertaken prior to actualanalysis on the data files may now be conducted within the ECB.
The ECB software is designed to acquaint the user with theavailable survey measures and responses by means of on-line, fullydocumented codebooks. Users may browse through the documentation,searching on both variables names, labels, and question text tofind items that are suitable for the research question at hand.The final version of the ECB includes weighted and unweightedfrequency distributions. Users can move quickly in the ECB betweenquestionnaire items, sample indicators, composite variables, orbetween components of the study and may select variables ofinterest, up to 255 variables per session. A window shows how manyvariables have been tagged at any one time. The process culls aset of variables, and only those variables, that are appropriate tothe user's own research issue. Since variable names and labels arealready in electronic form on the ECB, onerous tasks (such astyping in this information) that were formerly necessary areeliminated. The ECB permits users to write SAS-PC or SPSS-PCprogram code and/or command statements in order to construct systemfiles of the selected variables. Finally, a print file of acodebook containing the frequencies for only the tagged items isanother ECB option. The print file may subsequently be used togenerate individualized hardcopy codebooks of the selectedvariables, providing a convenient reference during subsequent dataanalyses.
In order to use the new ECB technology, the following arerequired:
• a NELS:88 Compact Disc;
• a CD-ROM reader, used to read or copy the NELS:88 CD-ROMto a personal computer;
• an IBM-compatible personal computer (PC), minimally a 286
system;
119

F2: Parent ComponentData File User's Manual
• up to 10 Mb space on the PC for the full ECB system;and,27
• a substantial amount of space for the data files.Although up to 165 Mb is required for all publicly-available base year, first follow-up and second follow-updata sets, it is not necessary to copy and/or analyze allof these files simultaneously.
The NELS:88 Compact Disc includes installation procedures,programs and files required by the codebook system, the raw datafiles and data user manuals (in WordPerfect format).
Different Versions of the ECBs. Table 7.3.2-1 lists threeversions of the NELS:88 ECBs that have been created for NELS:88.
The base year school sample is representative of all schoolsin the nation enrolling eighth graders in 1988. On the firstfollow-up ECB which includes base year files, informationreflecting these schools has been released at two levels ofanalysis: aggregated at the level of the school (one record foreach school), as well as distributed at the level of the studentswho attended those schools (one record for each such student). However, the second follow-up ECB only includes thebase year school data at the level of the student.
The 1994 release of the first follow-up data contains minoradjustments to the cases that are included on the files. Forexample, sample members found to have been sampled into the studyin error have been deleted, and base year ineligible students foundto be eligible in the first or second follow-up have been added.A few of the first follow-up variables have also been updated forthe second follow-up release of the first follow-up data. Suchadjustments are possible in longitudinal studies as new informationbecomes available or technical advancements become feasible.
Although Table 7.3.2-1 includes both the interim and finalversions of the second follow-up CD-ROM, this manual primarilydiscusses the contents of the final version of the second follow-upCD-ROM. The final second follow-up ECB encompasses thirteen of themajor component files through the second follow-up of NELS:88.(The fourteenth major component dataset, the transcript files,appears on the final restricted-use CD-ROM that is not in the ECBformat.) Cognitive test variables on all three waves of the surveyhave been refined and the first follow-up cases have been enhancedby the deletion of ineligibles and the addition of survey-eligible
27 Space requirements will vary by the ECB component that is
selected, the number of variables that may be chosen forgeneration of a hardcopy codebook, and by the statisticalpackage used by the researcher.
120
F2: Parent ComponentData File User's Manual
121

F2: Parent ComponentData File User's Manual
Table 7.3.2-1Three versions of the NELS:88 electronic codebooks
ECB Version Survey Waves and Components User Version
First Follow-Up ECB base year, public use onlyfirst follow-up(all components)
Second Follow-Up base year, public use onlyInterim ECB first follow-up,
and second follow-up,(student and dropout)
Second Follow-Up base year, public use andFinal ECB updated first follow-up, restricted use
and second follow-up (student, dropout, school,parent, and teacher)28
BYI sample members. Both the restricted use and public use CD-ROMsdisplay a weighted and an unweighted frequency window.
A number of restricted-use ASCII files are also available ona separate CD-ROM; these files are not in electronic codebookformat. These files include 1) the transcript component data file,data file user's manual, and files of SAS and SPSS control cardsfor transcript data, 2) all first follow-up and second follow-up School Effectiveness Study data files and controlcards, 3) the second follow-up early graduate student supplement,4) the cognitive test item file which is also on the restricted useCD-ROM that contains the ECB, 5) the expanded sample file, and 6)selected zip code-level community contextual variables drawn fromthe 1990 Census files for NELS:88 schools. Contents of this CD-ROMare more fully described in the NELS:88 Second Follow-Up FinalTechnical Report.
Magnetic tape versions of the public use data can be orderedfrom the U.S. Department of Education, Information TechnologyBranch at (202) 219-1522. The NELS:88 public use data on ECB/CD-ROM, which includes documentation for the ECB, can be ordered bycalling Peggy Quinn at (202) 219-1743. The ECB is a qualitativeadvance over older approaches to complex data sets. The ease
28 The second follow-up restricted use CD-ROM contains an
ASCII file of the student component cognitive test items;however, these items are not in the ECB format.
122

F2: Parent ComponentData File User's Manual
with which the pre-analysis phase is handled by the ECB is expectedto increase both the number and types of users drawn to the NELS:88database and, consequently, the variety of research topicsaddressed. Additional development of the ECB concept is expectedto add useful enhancements. Critiques and suggestions on the ECB,the hardcopy codebook and other elements of the NELS:88 data usermanuals are welcome. Please address your comments to:
Peggy QuinnU.S. Department of EducationOffice of Educational Research and ImprovementNational Center for Education Statistics555 New Jersey Avenue, N.W.Room 410HWashington D.C. 20208Fax (202) 219-1728
NELS:88 restricted use data on magnetic tapes and on CD-ROMare available at no charge on a restricted loan basis toindividuals and/or institutions that obtain an approved licenseagreement from NCES. To request a license agreement, theindividual and/or institution must provide the followinginformation:
• The title of the survey to which access is desired.
• A detailed discussion of the statistical research projectthat necessitates accessing the restricted NCES surveydata.
• The name and title of the most senior official having theauthority to bind the organization to the provisions ofthe license agreement.
• The name and title of the principal project officer whowill oversee the daily operations.
• The number, name, and title of professional and technicalstaff who will access the survey data base. Eachprofessional or technical staff member with access to thedata is required to sign and have notarized an affidavitof nondisclosure.
• The estimated loan period necessary for accessing theNCES survey data base.
• The desired computer product specifications, such asmedium (9-track tape, CD-ROM, PC diskette), codeconvention (ASCII, EBCDIC, SAS), etc.
123

F2: Parent ComponentData File User's Manual
To obtain further details and a license agreement form please writeto:
Alan W. MooreheadData Security OfficerStatistical Standards and Methodology DivisionU.S. Department of EducationOffice of Educational Research and ImprovementNational Center for Education Statistics555 New Jersey Avenue, N.W.Room 408Washington D.C. 20208ph. (202) 219-1920
124

F2: Parent ComponentData File User's Manual
Appendix A
NELS:88-Related Data Files Available from the National Center
for Education Statistics

F2: Parent ComponentData File User's Manual
Studies and Files Related to NELS:88
In addition to the core sample and survey described in themain text, several other supplemental components were undertakenand data files generated under the auspices of NELS:88. In thebase year survey, these included: several state augmentations; asupplement of hearing-impaired students, funded by GallaudetUniversity; a supplement of Reformed Christian schools that aremembers of the Christian Schools International Organization, fundedby the Barnabas Foundation; and the NELS:88 Enhancement Survey ofMiddle Grades Practices, funded by the Office of Research in theOffice of Educational Research and Improvement (OERI), through theJohns Hopkins University Center for Research on Effective Schoolingfor Disadvantaged Students (CDS). The first follow-up wave ofNELS:88 also included supplemental components: the stateaugmentations, continued from the base year; the SchoolEffectiveness Study, supported by funds from the John D. andCatherine T. MacArthur Foundation, and by NCES; and the Base YearIneligible study (BYI), also sponsored by NCES. The second follow-up wave of NELS:88 included continuations of the base year andfirst follow-up state augmentations; the school effectivenessstudy; the continuation of the first follow-up Base YearIneligibles study; and the continuation of the Christian schoolssupplement. These auxiliary data files greatly expand and enrichthe analytic uses of the study.
In the base year, the NCES-sponsored core sample of 1,052participating schools and 24,599 participating students wasincreased to 1,242 participating schools and 28,397 participatingstudents, respectively, as a result of the state augmentations andChristian schools supplements. The first follow-up School EffectsAugmentation added some 6,400 students to the initial base yearretained sample of 21,474 students. The second follow-up addedover 1,300 SES students to replace students lost due to attrition(such as transfers and dropouts).
Data for the state augmentations and other supplementsdiscussed below do not appear on the NCES public release files forNELS:88.
Christian Schools Supplement
A sample of Reformed Christian schools that are members of theChristian Schools International (CSI) Organization was drawn tosupplement the NELS:88 base year school sample. The sample wasselected from CSI schools with probability proportional to eighth-grade size. Two disproportionately large school units weredouble-sampled. Of the initially contacted 58 schools, 41 schoolsagreed to participate. (Due to the double-sampling of the twoschools, the number of sampling units was 43.) Students, parents,teachers, and school administrators were surveyed. Studentscompleted both the cognitive test battery and the questionnaire
A-1
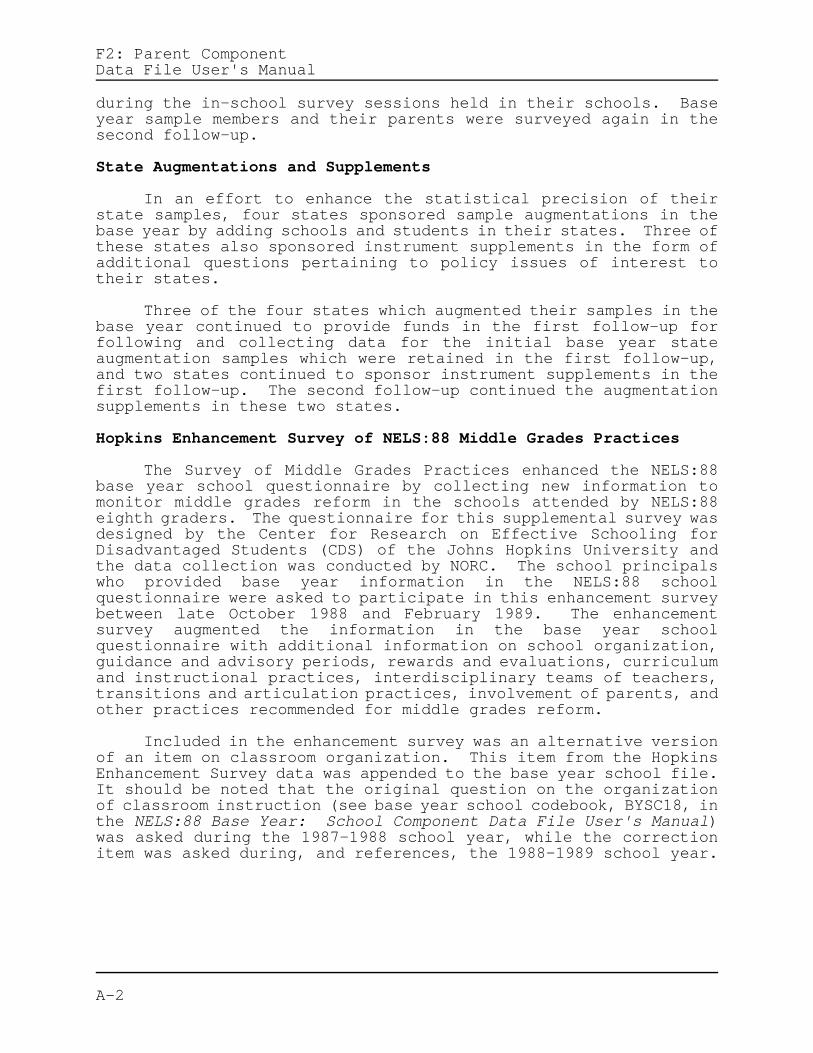
F2: Parent ComponentData File User's Manual
during the in-school survey sessions held in their schools. Baseyear sample members and their parents were surveyed again in thesecond follow-up.
State Augmentations and Supplements
In an effort to enhance the statistical precision of theirstate samples, four states sponsored sample augmentations in thebase year by adding schools and students in their states. Three ofthese states also sponsored instrument supplements in the form ofadditional questions pertaining to policy issues of interest totheir states.
Three of the four states which augmented their samples in thebase year continued to provide funds in the first follow-up forfollowing and collecting data for the initial base year stateaugmentation samples which were retained in the first follow-up,and two states continued to sponsor instrument supplements in thefirst follow-up. The second follow-up continued the augmentationsupplements in these two states.
Hopkins Enhancement Survey of NELS:88 Middle Grades Practices
The Survey of Middle Grades Practices enhanced the NELS:88base year school questionnaire by collecting new information tomonitor middle grades reform in the schools attended by NELS:88eighth graders. The questionnaire for this supplemental survey wasdesigned by the Center for Research on Effective Schooling forDisadvantaged Students (CDS) of the Johns Hopkins University andthe data collection was conducted by NORC. The school principalswho provided base year information in the NELS:88 schoolquestionnaire were asked to participate in this enhancement surveybetween late October 1988 and February 1989. The enhancementsurvey augmented the information in the base year schoolquestionnaire with additional information on school organization,guidance and advisory periods, rewards and evaluations, curriculumand instructional practices, interdisciplinary teams of teachers,transitions and articulation practices, involvement of parents, andother practices recommended for middle grades reform.
Included in the enhancement survey was an alternative versionof an item on classroom organization. This item from the HopkinsEnhancement Survey data was appended to the base year school file.It should be noted that the original question on the organizationof classroom instruction (see base year school codebook, BYSC18, inthe NELS:88 Base Year: School Component Data File User's Manual)was asked during the 1987-1988 school year, while the correctionitem was asked during, and references, the 1988-1989 school year.
A-2

F2: Parent ComponentData File User's Manual
Past Studies and Data Files Related to NELS:88 Available from NCES
Data from the earlier NCES longitudinal studies--NLS-72 andHS&B--may also be of interest to users of the NELS:88 data. Thesedata sets are of special interest for researchers interested incross-cohort comparisons between the sophomores of NELS:88 firstfollow-up (1990) and HS&B base year (1980), and, in the future,comparisons of the 1992 NELS:88 seniors and the HS&B sophomore andsenior cohorts in 1982 and 1980, and NLS-72 seniors in 1972.
In addition to the core surveys for HS&B and NLS-72, describedin Chapter I, records studies were undertaken, including thecollection of the high school transcripts29 of the sophomore cohortand the collection of postsecondary education transcript30 andfinancial aid data for the seniors. Data files for these studiesand other HS&B data, such as parent surveys, school surveys,teacher comments, etc., are described below. Users manuals orother forms of documentation are available from NCES for all thedata files. These auxiliary data files greatly expand the analyticcapabilities of the core data sets, and researchers are encouragedto become familiar with them.
HS&B Base Year Files
The Language File contains information on each student who,during the base year, reported some non-English language experienceeither during childhood or at the time of the survey. This filecontains 11,303 records (sophomores and seniors combined), with 42variables for each student.
The Parent File contains questionnaire responses from theparents of about 3,600 sophomores and 3,600 seniors who are on theStudent File. Each record on the Parent File contains a total of307 variables. Data on this file include parents' aspirations andplans for their children's postsecondary education. The NELS:88Second Follow-Up: Parent Component Data File User's Manualcontains a crosswalk between the items included in the HS&B parent
29 In addition to the HS&B and NELS:88 high school transcripts
available from the NELS program, two other NCES high schooltranscript data sets are also available, from records studiesof graduating seniors in NAEP schools: the 1987 and 1990 HighSchool Transcripts Studies.
30 In addition to the NLS-72 and HS&B postsecondary transcriptsfiles available within the NELS program, postsecondarytranscripts are also available for 1985-86 and 1989-90 collegegraduates, through the NCES 1987 and 1991 Recent CollegeGraduates Transcript Studies. Transcripts will also becollected for college graduates surveyed in 1994 as part ofthe NCES Baccalaureate and Beyond study.
A-3

F2: Parent ComponentData File User's Manual
surveys and the NELS:88 base year and second follow-up parentsurveys.
The Twin and Sibling File contains base year responses fromsampled twins and triplets; data on non-sampled twins and tripletsof sample members; and data from siblings in the sample. This file(2,718 records) includes all of the variables that are on the HS&Bstudent file, plus two additional variables (family ID andSETTYPE--type of twin or sibling).
The Sophomore Teacher File contains responses from 14,103teachers on 18,291 students from 616 schools. The Senior TeacherFile contains responses from 13,683 teachers on 17,056 studentsfrom 611 schools. At each grade level, teachers had theopportunity to answer questions about HS&B-sampled students who hadbeen in their classes. The typical student in the sample was ratedby an average of four different teachers. Preliminary analyses byNCES indicate that the files contain approximately 76,000 teacherobservations of sophomores and about 67,000 teacher observations ofseniors.
The Friends File contains identification numbers of studentsin the HS&B sample who were named as friends of other HS&B-sampledstudents. Each record contains the IDs of sampled students and IDsof up to three friends. Linkages among friends can be used toinvestigate the sociometry of friendship structures, includingreciprocity of choices among students in the sample, and to tracefriendship networks.
Merged HS&B Base Year, First, Second, Third, and Fourth Follow-UpFiles
The First Follow-Up Sophomore File contains responses from29,737 students and includes both base year and first follow-updata. This file includes information on school, family, workexperiences, educational and occupational aspirations, personalvalues, and test scores of sample participants. Students are alsoclassified in terms of high school status as of 1982 (that is,dropout, same school, transfer, or early graduate).
The First Follow-Up Senior File contains responses from 11,995individuals and includes both base year and first follow-up data.This file includes information from respondents concerning theirhigh school and postsecondary experiences and their workexperiences.
The Second Follow-Up Sophomore File has all base year, firstfollow-up, and second follow-up data for 14,825 members of thesophomore cohort. Data cover work experience, postsecondaryschooling, earnings, periods of unemployment, and so forth, for thesophomore cohort, who by this time had been out of high school fortwo years.
A-4

F2: Parent ComponentData File User's Manual
The Second Follow-Up Senior File encompasses all base year,first follow-up, and second follow-up data for the 11,995individuals who constitute this follow-up sample. Data cover workexperience, postsecondary schooling, earnings, periods ofunemployment, and so forth, for the senior cohort, who by this timehad been out of high school for four years.
The Third Follow-Up Sophomore File includes all base year,first follow-up, second follow-up, and third follow-up data for the14,825 members of the sophomore cohort. Data cover marriage andfamily formation, work experience, postsecondary schooling andinterest in graduate degree programs, earnings, periods ofunemployment, and alcohol consumption for this cohort, who by 1986had been out of high school for four years.
The Third Follow-Up Senior File includes all base year, firstfollow-up, second follow-up, and third follow-up data for the11,995 individuals who constitute this follow-up sample. Datacover marriage and family formation, work experience, postsecondaryschooling and interest in graduate degree programs, earnings,periods of unemployment, and alcohol consumption for the seniorcohort, who by 1986 had been out of high school for six years.
The Fourth Follow-Up Sophomore File includes all base year,first, second, third, and fourth follow-up data for the 14,825members of the sophomore cohort. Data cover marriage and familyformation, work experience, postsecondary schooling, earnings, andperiods of unemployment for this cohort, who by 1992 had been outof high school for ten years. HS&B fourth follow-up data arescheduled to be released in 1994.
Other HS&B Files
The High School Transcript File describes the coursetakingbehavior of 15,941 sophomores of 1980 throughout their four yearsof high school. Data include a six-digit course number for eachcourse taken, along with course credit, course grade, and yeartaken. Other items of information, such as grade point average,days absent, and standardized test scores, are also contained onthe file.
The Offerings File contains school information, courseofferings, data for 957 schools. Each course offered by a schoolis identified by a six-digit course number. Other information,such as credit offered by the school, is also contained on eachrecord.
The Updated School File contains base year data (966 completedquestionnaires) and first follow-up data (956 completedquestionnaires) from the 1,015 participating schools in the HS&Bsample. First follow-up data were requested only from thoseschools that were still in existence in the spring of 1982 and hadmembers of the 1980 sophomore cohort currently enrolled. Each high
A-5

F2: Parent ComponentData File User's Manual
school is represented by a single record that includes 230 dataelements from the base year school questionnaire, if available,along with other information from the sampling files (e.g., stratumcodes, case weights).
The Postsecondary Education Transcript File for the HS&Bseniors contains transcript data on dates of attendance, fields ofstudy, degrees earned, and the titles, grades, and credits of everycourse attempted at each school attended, coded into hierarchicalfiles with the student as the highest level of aggregation.Although no survey forms were used, detailed procedures weredeveloped for extracting and processing information from thepostsecondary school transcripts that were collected for allmembers of the 1980 senior cohort who reported attending any formof postsecondary schooling in the first or second follow-upsurveys. (Over 7,000 individuals reported over 11,000 instances ofschool attendance.)
The Postsecondary Education Transcript File for the HS&Bsophomores includes transcript data for over 6,000 members of the1980 sophomore cohort who reported in the follow-up survey thatthey had attended a postsecondary institution. The data filecreated for this study includes detailed information about programenrollments, periods of study, fields of study pursued, specificcourses taken, and credits earned. An updated transcript file isbeing prepared as part of the 1992 HS&B fourth follow-up.
The Senior Financial Aid File contains financial aid recordsfrom postsecondary institutions respondents reported attending andfederal records of the Guaranteed Student Loan Program and of thePell Grant program.
The Sophomore Financial Aid File includes data onpostsecondary financial aid experiences for 1980 sophomores whoattended a postsecondary institution. Financial aid data werecollected from federal records of the Guaranteed Student Loan andPell Grant programs, and GSL disbursement data from guaranteeagencies participating in the Guaranteed Student Loan program.
The HS&B HEGIS and PSVD File contains the postsecondary schoolcodes for schools HS&B respondents reported attending in the firstand second follow-ups. In addition, the file provides data oninstitutional characteristics, such as type of institution, highestdegree offered, enrollment, admissions requirements, tuition, andso forth. This file permits analysts to link HS&B questionnairedata with institutional data for postsecondary schools attended byrespondents.
A-6

F2: Parent ComponentData File User's Manual
NLS-72 Files
The NLS-72 Base Year Through Fourth Follow-Up (1979) Filecontains data from the base year through fourth follow-up for over23,000 respondents. Data include school experiences and testresults during the base year and subsequent activities related towork, postsecondary schooling, military service, family formation,and goals and aspirations.
The NLS-72 Fifth Follow-Up File consists of the results of thefifth follow-up survey, carried out in 1986, when sample memberswere about thirty-two years old. Data include work experiencegoing back to 1979, postsecondary schooling, extensive familyformation history, periods of unemployment, goals and aspirations,and selected attitudes. Records in this file can be linked throughstudent ID to those in the NLS-72 Base Year Through FourthFollow-Up (1979).
The NLS-72 Teacher Supplement File contains the responses ofthe portion of the fifth follow-up NLS-72 sample who had obtainedteacher certification and/or had teaching experience. Data includecertification history, subjects taught, years of experience,attitudes toward teaching as a career, and subsequent workexperiences of those who had left teaching. These data can belinked through the respondent ID to the NLS-72 Fifth Follow-Up Fileand to the NLS-72 Base Year Through Fourth Follow-Up File.
The Postsecondary Education Transcript Study of the NLS-72Sample contains transcript data on dates of attendance, fields ofstudy, degrees earned, and the titles, grades, and credits of everycourse attempted at each school attended, coded into hierarchicalfiles with the student as the highest level of aggregation.Although no survey forms were used, detailed procedures weredeveloped for extracting and processing information from thepostsecondary school transcripts that were collected in 1984 forall members of the NLS-72 cohort who reported attending any form ofpostsecondary schooling in any of the first through fourthfollow-up surveys. (Over 14,000 individuals reported over 24,000instances of school attendance.)
A-7

F2: Parent ComponentData File User's Manual
Appendix B
NELS:88-Related Data Files Available from the National Center for
Education Statistics

F2: Parent ComponentData File User's Manual
NCES NELS:88 Publications
ANALYSIS REPORTS.
Hafner, A., Ingels, S.J., Schneider, B., and Stevenson, D.L. AProfile of the American Eighth Grader, June 1990; NCES 90-458.
Hoachlander, E.G. A Profile of Schools Attended by Eighth Gradersin 1988, September 1991; NCES 91-129.
Bradby, D. Language Characteristics and Academic Achievement: ALook at Asian and Hispanic Eighth Graders in NELS:88, February1992; NCES 92-479.
Horn, L., and Hafner, A. A Profile of American Eighth-GradeMathematics and Science Instruction, June 1992; NCES 92-486.
Horn, L., and West, J. A Profile of Parents of Eighth Graders,July 1992; NCES 92-488.
Kaufman, P., and Bradby, D. Characteristics of At-Risk Students inNELS:88, August 1992; NCES 92-042.
McMillen, M. Eighth to Tenth Grade Dropouts, 1992; NCES 92-006.
Owings, J., and Peng, S. Transitions Experienced by 1988 EighthGraders, 1992. NCES 92-023.
Green, P. High School Seniors Look to the Future, 1972 and 1992,1993; NCES 93-473.
McMillen, M., Hausken, E., Kaufman, P., Ingels, S., Dowd, K.,Frankel, M. and Qian, J. Dropping Out of School: 1982 and1992, Issue Brief Series, 1993; NCES 93-901.
Rasinski, K.A., Ingels, S.J., Rock, D.A., Pollack, J. America'sHigh School Sophomores: A Ten Year Comparison, 1980 - 1990,1993; NCES 93-087.
Ingels, S.J., Plank, S.B., Schneider, B., and Scott, L.A. AProfile of the American High School Sophomore in 1990, NCES,forthcoming, 1994.
Myers, D., and Heiser, N. Students' School Transition Patternsbetween Eighth and Tenth Grades Based on NELS:88, forthcoming1994; NCES 94-137.
Rock, D.A., Owings, J.A., and Lee, R. Changes in Math ProficiencyBetween 8th and 10th Grades. Statistics in Brief series, 1994,NCES 93-455.
B-1

F2: Parent ComponentData File User's Manual
Scott, L.A., Rock, D.A., Pollack, J.M., and Ingels, S.J. Two YearsLater: Cognitive Gains and School Transitions of NELS:88Eighth Graders, NCES, forthcoming, 1994.
RELEASED E.D. TABULATIONS.
Rasinski, K.A., and West, J. NELS:88: Eighth Graders' Reports ofCourses Taken During the 1988 Academic Year by SelectedStudent Characteristics, July 1990; NCES 90-459.
Rock, D.A., Pollack, J.M., and Hafner, A. The Tested Achievementof the National Education Longitudinal Study of 1988 Eighth-Grade Class, April 1991; NCES 91-460.
USER'S MANUALS/TECHNICAL REPORTS/METHODOLOGY MONOGRAPHS.
Ingels, S.J., Abraham, S., Rasinski, K.A., Karr, R., Spencer, B.D.,and Frankel, M.R. NELS:88 Base Year Data File User's Manuals:
STUDENT COMPONENT: March 1990; NCES 90-464PARENT COMPONENT: March 1990; NCES 90-466SCHOOL COMPONENT: March 1990; NCES 90-482TEACHER COMPONENT: March 1990; NCES 90-484
Ingels, S.J., Rasinski, K.A., Frankel, M.R., Spencer, B.D., andBuckley, P. NELS:88 Base Year Final Technical Report, 1990;Chicago: NORC.
Spencer, B.D., Frankel, M.R., Ingels, S.J., Rasinski, K.A., andTourangeau, R. NELS:88 Base Year Sample Design Report, August1990; NCES 90-463.
Rock, D.A., and Pollack, J.M. Psychometric Report for the NELS:88Base Year Test Battery, April 1991; NCES 91-468.
Kaufman, P., Rasinski, K.A., Lee, R., and West, J. Quality ofResponses of Eighth-Grade Students to the NELS:88 Base YearQuestionnaire, September 1991; NCES 91-487.
Ingels, S.J., Scott, L.A., Lindmark, J.T., Frankel, M.R., andMyers, S.L. NELS:88 First Follow-Up Data File User's Manuals:
STUDENT COMPONENT: April 1992; NCES 92-030SCHOOL COMPONENT: May 1992; NCES 92-084DROPOUT COMPONENT: November 1992; NCES 92-083TEACHER COMPONENT: November 1992; NCES 92-085
Pieper, D., and Scott, L.A. User's Guide to the NELS:88 BaseYear/First Follow-Up Electronic Codebook, March 1993;Chicago: NORC.
B-2

F2: Parent ComponentData File User's Manual
Ingels, S.J., Scott, L.A., Rock, D.A., Pollack, J.M., Rasinski,K.A. NELS:88 First Follow-Up Final Technical Report,forthcoming 1994; Washington, D.C.: NCES.
Ingels, S.J., Dowd, K.L., Baldridge, J.D., Stipe, J.L., Bartot,V.H., Frankel, M.R. NELS:88 Second Follow-Up: StudentComponent Data File User's Manual, 1994; NCES 93-374.
Ingels, S.J., Dowd, K.L., Stipe, J.L., Baldridge, J.D., Bartot,V.H., Frankel, M.R. NELS:88 Second Follow-Up: DropoutComponent Data File User's Manual, 1994; NCES 93-375.
Ingels, S.J., Thalji, L., Pulliam, P., Bartot, V.H., Frankel, M.R.NELS:88 Second Follow-Up: Parent Component Data File User'sManual, 1994; NCES 94-378.
Ingels, S.J., Thalji, L., Pulliam, P., Bartot, V.H., Frankel, M.R.NELS:88 Second Follow-Up: Teacher Component Data File User'sManual, 1994; NCES 94-379.
Ingels, S.J., Thalji, L., Pulliam, P., Bartot, V.H., Frankel, M.R.NELS:88 Second Follow-Up: School Component Data File User'sManual, 1994; NCES 94-376.
Ingels, S.J., Dowd, K.L., Taylor, J.R., Bartot, V.H., Frankel, M.R.NELS:88 Second Follow-Up: Transcript Component Data FileUser's Manual, 1994; NCES 94-377.
Ingels, S.J., and Dowd, K.L. Conducting Trend Analyses: HS&B andNELS:88 Sophomore Cohort Dropouts, forthcoming 1994;Washington, D.C.: NCES.
Ingels, S.J., and Baldridge, J.B. Conducting Trend Analyses: NLS-72, HS&B, and NELS:88 Seniors, forthcoming 1994; Washington,D.C.: NCES.
Ingels, S.J., Taylor, J.R. Conducting Cross-Cohort ComparisonsUsing HS&B, NAEP, and NELS:88 Academic Transcript Data,forthcoming 1994; Washington, D.C.: NCES.
UPCOMING NELS:88 REPORTS AND TECHNICAL DOCUMENTATION.
NELS:88 Second Follow-Up Psychometric ReportNELS:88 Second Follow-Up Final Technical ReportNELS:88 Second Follow-Up Sample Design ReportA Profile of the American High School Senior in 1992America's High School Seniors: A Twenty Year Comparison,
1972-1992NELS:88 Second Follow-Up School Effectiveness Study Data File User's Manual
B-3

F2: Parent ComponentData File User's Manual
Appendix C
NELS:88 Content Areas and Research Issues

F2: Parent ComponentData File User's Manual
Content areas and corresponding questions in NELS:88 second follow-up
CONTENT CATEGORY: 1. EQUITY/ACCESS/CHOICE
Student Dropout Parent
Schoolprograms
7 School climateand teacherinteraction12B Access intocurrent high schoolprogram 13-14 Specialprograms, TalentSearch and UpwardBound15-18 Scienceteacher/class19-22 Mathteacher/class23B Vocationalteacher practice
23 Enrolled ineducationalinstitution sinceleft school25-30 Alternativeprograms31-32 Plans to gethigh school diplomaor GED
30-32 Is teenagercurrently inschool, for howlong33-34 Hasteenager changedschools35 Has teen everbeen suspended,expelled fromschool38 Why did teenstop attendingschool40 School'sreaction to teen'srepeated absences41 How satisfiedwith teen'seducation42 Thoughts aboutteen's schoolclimate, teachingand program
43-44 How oftendoes schoolcontact parents/do parents contactschool45 Parentalinvolvement inschool and teen'scourses47 Parentalinfluence inschool functioning
Transitionfromschool tocollege/work
50 Why notcontinue educationright away53-54 Who/whatservices at schoolhelped in jobsearch64-65 Careerexpectations91 Hourly pay rate
40 Jobexpectations44-47 Jobs heldsince high school48-50 Trainingprogramsparticipated in
68-69 Has teenexpressed interestin a particularcareer, what is it70 What is bestsource ofinformation forteen regardingthat career71-73 Teen's jobsheld
C-1

F2: Parent ComponentData File User's Manual
Student Dropout Parent
Applyingforcolleges
44 Plans fortaking collegeadmissions,placement tests45 Preparationsfor ACT/SAT57 Help fromschool in applyingfor colleges59-61 Choosing aschool62-63 Study fieldsdesired/most likelyto pursue
62 Parent hasencouraged teen totake action toprepare forcollege entranceexams64 Has teenapplied forcollege/vocational school 66 Factorsimportant toparents in teen'schoice of a school67 Number ofschools parent hasvisited with teen
Familyfinances
58 Steps taken tolearn aboutapplying forfinancial aid
6 How many peopleare financiallydependent onparent74-75 Totalfamily income,number of wageearners76-77 Currenteducationalexpenses, amount78 Teen plans tocontinue education79-82 Savings,plans to pay forteen's collegeeducation83-87 Knowledge,applying forfinancial aid forteen's education88 Teen appliedfor financial aid89 Why hasn'tteen applied forfinancial aid90-92 Amountsexpected to spend,borrow for teen'seducation
C-2
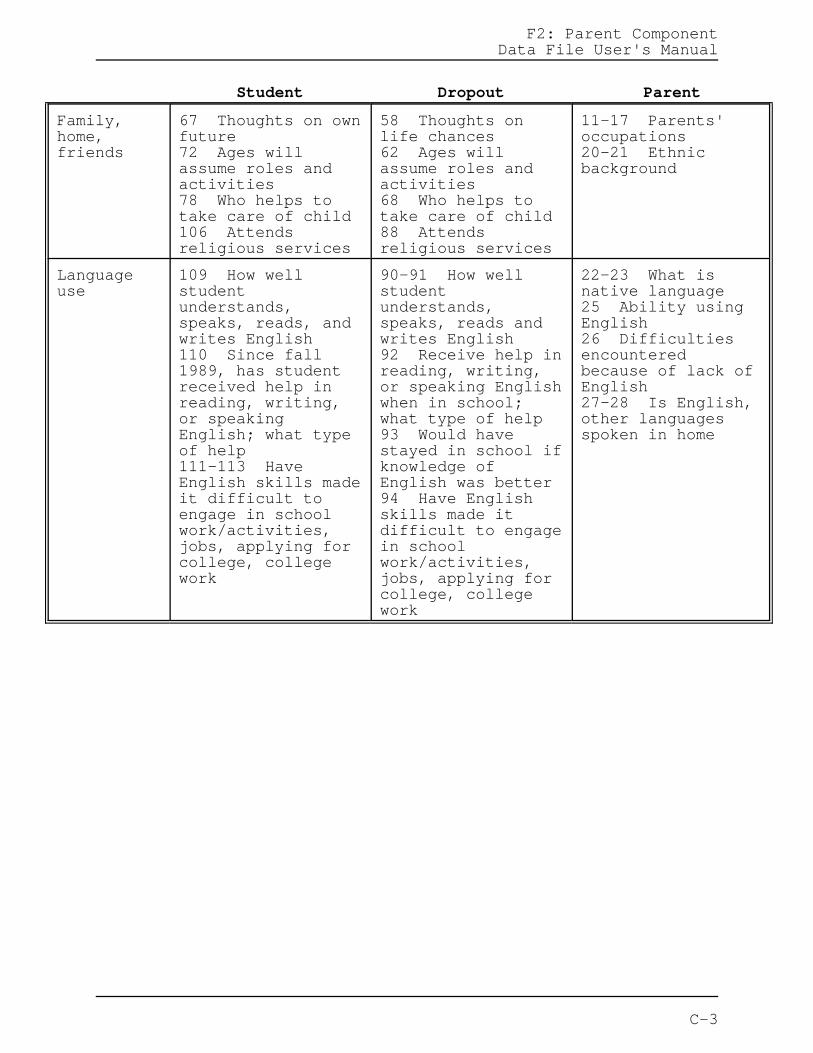
F2: Parent ComponentData File User's Manual
Student Dropout Parent
Family,home,friends
67 Thoughts on ownfuture72 Ages willassume roles andactivities78 Who helps totake care of child106 Attendsreligious services
58 Thoughts onlife chances62 Ages willassume roles andactivities68 Who helps totake care of child88 Attendsreligious services
11-17 Parents'occupations20-21 Ethnicbackground
Languageuse
109 How wellstudentunderstands,speaks, reads, andwrites English110 Since fall1989, has studentreceived help inreading, writing,or speakingEnglish; what typeof help111-113 HaveEnglish skills madeit difficult toengage in schoolwork/activities,jobs, applying forcollege, collegework
90-91 How wellstudentunderstands,speaks, reads andwrites English92 Receive help inreading, writing,or speaking Englishwhen in school;what type of help93 Would havestayed in school ifknowledge ofEnglish was better94 Have Englishskills made itdifficult to engagein schoolwork/activities,jobs, applying forcollege, collegework
22-23 What isnative language25 Ability usingEnglish26 Difficultiesencounteredbecause of lack ofEnglish27-28 Is English,other languagesspoken in home
C-3

F2: Parent ComponentData File User's Manual
CONTENT CATEGORY: 2. COGNITIVE GROWTH
Student Dropout Parent
C-4

F2: Parent ComponentData File User's Manual
Schoolprogram
6A Grade currentlyin7 School climateand teacherinteraction8 Safety in school9 Frequency ofcutting class andother disciplinaryproblems10 Reasons forabsences11 When/durationof last unexcusedabsence12 Description ofcurrent high schoolprogram15-18 Scienceteacher/class19-22 Mathteacher/class23B Vocationalteacher practice24 How often comesto class unprepared25 How much timespent on homeworkin various subjectseach week, in andout of school26 Who tutoredstudent (besidesparents)27-28 Have taken aminimum competencyor proficiencytest, results29 Have beenrecognized byschool or community31 Time spent onschool sponsoredextracurricularactivities per week32 Time spent onnon school relatedreading per week33 Frequency ofparticipation innon school relatedactivities
9-14 Event historyseries on droppingout of school18 Last school'sclimate 19 Frequency ofcutting class andother disciplinaryproblems in lastschool20 Description oflast high schoolprogram24 What hashappened in last 2years (i.e.counseling, drugrehab., alternativeschool, held backin school)29 Servicesreceived fromalternative program
29 Last gradeteenager completed30-32 Is teenagercurrently inschool, for howlong33-34 Hasteenager changedschools35 Has teen everbeen suspended,expelled fromschool
C-5

F2: Parent ComponentData File User's Manual
Applyingforcollege
42 Parental,friend, teacheraspirations forstudent's education43 Student'seducationalexpectations44-45 Plans fortaking collegeadmissions andplacement tests,preparations forthe SAT/ACT47 Have enoughskills now forcareer in fiveyears65 Educationneeded to get jobplanned to havewhen 30 years old
37 Parentalaspirations forrespondent'seducation38 Respondent'seducationalexpectations40B Have enoughskills now forcareer in fiveyears40C Educationneeded to get jobplanned to havewhen 30 years old
49 How oftendiscusses school,personal andvocational topicswith teenager
C-6

F2: Parent ComponentData File User's Manual
Peers,teen'sactivities
34-35 Time spentplaying computervideo games andwatching television40 Importance ofseveral lifegoals/ideals66 Self-esteem68 Importance ofpeer groupactivities
70-71 Student,friends belong to agang72 Ages willassume roles andactivities73 Marital status74 Importance ofwedlock for sexualrelationships80-85 Substanceabuse78 Who helps totake care of child93-95 Caring foryounger children
36 Importance ofseveral lifegoals/ideals57 Self-esteem58 Thoughts onlife chances
59 Activities ofrespondent'sfriends60 Importance ofpeer groupactivities61 Respondent,friends belong to agang63 Did spouseleave high schoolbefore graduating
64 Importance ofwedlock for sexualrelationships65 Wouldrespondent considerhaving a child ifnot married66-67 Doesrespondent havechildren,birthdates68 Who helps totake care of child69 Describerelationship withchild's otherparent70-75 Substanceabuse
48 Familydecision makingrules50 Family socialactivities57 Substanceabuse and teenager
Home 101 Run away fromhome102-103 How manytimes moved,changed schools
76 Who lives insame household withrespondent83 Run away fromhome85-86 How manytimes moved,changed schools
8-10 Who lives inhousehold, numberunder/ over 18years old58 How many yearslived at presentaddress
C-7

F2: Parent ComponentData File User's Manual
Family 96 Family relatedevents97 Do parents knowstudent's friends'parents98 Who makesdecisions in family99 How oftendiscusses school,college, jobs,problems withparents105-106 Attends/practicesreligion
77-79 Caring foryounger children80 Family relatedevents81 Who makesdecisions in family88-89 Attends/practicesreligion
6 How many peopleare financiallydependent onparent7 Marital status11-17 Parents'occupations18 Changes inmarital status
Languageuse
107-108 Is Englishnative language,usage of nativelanguage109 How wellstudentunderstands,speaks, reads, andwrites English110 Received helpin English, whattype, perceivedvalue of help111-113 HaveEnglish skills madeit difficult toengage in schoolwork/activities,jobs, applying forcollege, collegework
89-90 Is Englishnative language,usage of nativelanguage91 How wellstudentunderstands,speaks, reads, andwrites English92 Received helpin English, whattype, perceivedvalue of help93 Wouldrespondent havestayed in school ifhad betterknowledge ofEnglish
22-23 What isnative language24-25 Abilityusing English26 Difficultiesencounteredbecause of lack ofEnglish27-28 Is English,other languagesspoken in home
CONTENT CATEGORY: 3. TRACKING DYNAMICS
Student Dropout Parent
Schoolclimate
12 Description ofcurrent school program, accessinto program24 How often comesto class unprepared25 How much timespent on homeworkin various subjectseach week, in andout of school
19 Frequency ofcutting class andother disciplinaryproblems in lastschool20 Description oflast high schoolprogram
34 Reason teenchanged schools41 Satisfactionwith teen'seducation43-44 Interactionbetween school andparents46 Parent'sknowledge ofteen's education
C-8

F2: Parent ComponentData File User's Manual
Student Dropout Parent
Applyingforcolleges
41 What do peoplethink is mostimportant forstudent to do rightafter high school44 Plans fortaking collegeadmissions andplacement tests58 Steps taken tolearn aboutapplying forfinancial aid forcollege61 What type ofschool will mostlikely go on to
61 How far parentwants teen to go62 Parent'spreparation withteen forstandardized tests63 Discussionswith teen aboutcollege64 Has teenapplied forcollege/vocational school
Family,home
66 Self-esteem105/106 Practices/attendsreligious services
57 Self-esteem87-88Practices/attendsreligious services
6 How many peopleare financiallydependent onparent19-21 Ethnicbackground22-28 Parent/familylanguage use
Languageuse
107-108 Is Englishnative language,usage of nativelanguage110 Received helpin English,perceived value ofhelp
89-90 Is Englishnative language,usage of nativelanguage91 How wellstudentunderstands,speaks, reads, andwrites English92 Received helpin English,perceived value ofhelp93 Wouldrespondent havestayed in school ifhad betterknowledge ofEnglish
22-28 Parent/familylanguage use
C-9

F2: Parent ComponentData File User's Manual
CONTENT CATEGORY: 4. DROPPING OUT
Student Dropout Parent
Droppingout
9 Frequency ofcutting class andother disciplinaryproblems10 Reasons forabsences11 When/durationof last unexcusedabsence
6-8 When didrespondent lastattend school, whatgrade, didrespondent passthat grade9-16 Event historyseries on droppingout of school17 Was leavingschool a gooddecision, why19 Frequency ofcutting class andother disciplinaryproblems in lastschool21 School'sresponse torespondent droppingout22 Parents'response torespondent droppingout24 What hashappened in last 2years (i.e.counseling, drugrehab., alternativeschool, held backin school) 25-30 Alternativeprograms31 Plans to get ahigh school diplomaor GED
36-37 In last 2years has teenmissed 10+consecutive schooldays/ 21+consecutive schooldays for reasonsother than illness38 In referenceto teen's longestabsence fromschool, why didteen stopattending39-40 Whatactions didparents, schooltake for teen'sabsences
C-10

F2: Parent ComponentData File User's Manual
Student Dropout Parent
Schoolclimate
7 School climate8 Safety in school17 Studentengagement inscience class21 Studentengagement in mathclass24-25 Preparationfor class,completion ofhomework29 Have beenrecognized byschool or communityfor activities30 Participationin school sponsoredextracurricularactivities
18 Last school'sclimate
41-42 Feelingsabout aspects ofteen's school
Schoolprogram
13 Participationin special programs27-28 Have taken aminimum competencyor proficiencytest, results
20 Description oflast high schoolprogram
29 Last gradeteenager completed30-32 Is teenagercurrently inschool, for howlong33-34 Hasteenager changedschools35 Has teen everbeen suspended,expelled fromschool41 How satisfiedwith teen's highschool education43-44 How oftendoes schoolcontact parents/do parents contactschool45-46 Parentalinvolvement inschool and teen'scourses
C-11

F2: Parent ComponentData File User's Manual
Student Dropout Parent
Applyingforcolleges/ work
41 What do peoplethink is mostimportant forstudent to do rightafter high school42 Parental,friend, teacheraspirations forstudent's education43 Student'seducationalexpectations86-91 Jobs heldduring school year92 Spending ofearnings
31 Plans to get ahigh school diplomaor GED37 Parentalaspirations forrespondent'seducation38 Respondent'seducationalexpectations39 People talkedto respondent aboutcontinuingeducation40-43 Jobexpectations,recent job search44-46 Jobs heldsince high school47 Whererespondent spentearnings48-50 Participatedin trainingprograms
71-73 Teen's jobsheld
Familyfinances
74 Total familyincome76-77 Currenteducationalexpenses, amount
C-12

F2: Parent ComponentData File User's Manual
Student Dropout Parent
Peers,teen'sactivities
34-35 Time spentplaying computervideo games andwatching television40 Importance ofseveral lifegoals/ideals66 Self-esteem68 Importance ofpeer groupactivities
70-71 Student,friends belong to agang72 Ages willassume roles andactivities73 Marital status74 Importance ofwedlock for sexualrelationships80-85 Substanceabuse
78 Who helps totake care of child
36 Importance ofseveral lifegoals/ideals57 Self-esteem58 Thoughts onlife chances
59 Activities ofrespondent'sfriends60 Importance ofpeer groupactivities61 Respondent,friends belong to agang63 Did spouseleave high schoolbefore graduating
64 Importance ofwedlock for sexualrelationships65 Wouldrespondent considerhaving a child ifnot married66-67 Doesrespondent havechildren,birthdates68 Who helps totake care of child69 Describerelationship withchild's otherparent70-75 Substanceabuse
48 Familydecision makingrules49 Interactionbetween parentsabout teen50 Family socialactivities57 Substanceabuse and teenager
Home 101 Run away fromhome102-103 How manytimes moved,changed schools
76 Who lives insame household withrespondent83 Run away fromhome85-86 How manytimes moved,changed schools
2-5 Teen'scurrent livingsituation8-10 Who lives inhousehold, numberunder/ over 18years old58-60 How manyyears lived atpresent address,how respondentfeels aboutcommunity
C-13

F2: Parent ComponentData File User's Manual
Student Dropout Parent
Family 93-95 Caring foryounger children96 Family relatedevents97 Do parents knowstudent's friends'parents98 Who makesdecisions in family99 How oftendiscusses school,college, jobs,problems withparents105-106 Attends/practicesreligion
77-79 Caring foryounger children80 Family relatedevents81 Who makesdecisions in family88-89 Attends/practicesreligion
7 Marital status
11-17 Parents'occupations
Languageuse
110A Received helpin English, whattype, perceivedvalue of help111-113 HaveEnglish skills madeit difficult toengage in schoolwork/activities,jobs, applying forcollege, collegework
89-90 Is Englishnative language,usage of nativelanguage91 How wellstudentunderstands,speaks, reads, andwrites English92A Received helpin English94 Have Englishskills made itdifficult to engagein schoolwork/activities,jobs, applying forcollege, collegework
22-23 What isnative language25 Ability usingEnglish26 Difficultiesencounteredbecause of lack ofEnglish27-28 Is English,other languagesspoken in home
C-14

F2: Parent ComponentData File User's Manual
CONTENT CATEGORY: 5. TRANSITION PATTERNS
Student Dropout Parent
Schoolprograms
14 Participationin Upward Boundprogram
15 Name andlocation of lastschool attended
45-46 Parentalinvolvement inschool and teen'scourses
Transition fromschooltocollege/work
50 Why notcontinue withschool right away51-52 Have a joblined up for full-time work afterleaving high school53-54 Who/whatservices at schoolhelped in jobsearch55 Expected hourlywage in first jobafter high school
31-34 Plans to geta high schooldiploma or GED44-46 Details onjobs held sincehigh school48-50 Participatedin trainingprograms
68-69 Has teenexpressed interestin a particularcareer, what is it70 What is bestsource ofinformation forteen regardingthat career71-73 Teen's jobsheld78 Teen plans tocontinue education
Applyingforcollege
45 Preparationsfor the SAT/ACT49, 61 Plans to gostraight on toschool, type ofschool57 Help fromschool in applyingfor colleges59 Importance ofdifferent factorsin choosing aschool46 Work/studyplans for thissummer62-63 Study fieldsdesired/most likelyto pursue64 Jobexpectations rightafter high schooland when 30 yearsold
62 Parent hasencouraged teen totake action toprepare forcollege entranceexams64 Has teenapplied forcollege/vocational school65 How has parenthelped teen makedecisions aboutwhere to apply forcollege66 Factorsimportant toparents in teen'schoice of a school67 Number ofschools parent hasvisited with teen
C-15

F2: Parent ComponentData File User's Manual
Student Dropout Parent
Familyfinances
58 Steps taken tolearn aboutapplying forfinancial aid
74 Total familyincome76-77 Currenteducationalexpenses, amount79-82 Savings,plans to pay forteen's collegeeducation83-87 Knowledge,applying forfinancial aid forteen's education88 Teen appliedfor financial aid89 Why hasn'tteen applied forfinancial aid90-91 Amountsexpected to spend,borrow for teen'seducation
Family,home,friends
67 Thoughts onlife chances72 Ages willassume roles andactivities100 Perception ofrelationship withparents
58 Thoughts onlife chances80 Family relatedevents
49 How oftendiscusses school,personal andvocational topicswith teenager50 How oftenparticipated inactivities withteenager
CONTENT CATEGORY: 6. SCHOOL EFFECTIVENESS
Student Dropout Parent
Schoolclimate
7 School climate,teacher interaction8 Safety in school
18 Last school'sclimate
42 Thoughts aboutteen's schoolclimate, teachingand program44 How often haveparents contactedteen's school 47 Parentalinfluence inschool functioning
C-16

F2: Parent ComponentData File User's Manual
Student Dropout Parent
Droppingout
21 Plans to get ahigh school diplomaor GED24 What hashappened in last 2years (i.e.counseling, drugrehab., alternativeschool, held backin school)
38 Why did teenstop attendingschool40 School'sreaction to teen'srepeated absences
Schoolprograms
14 Upward Bound15-18 Scienceteacher/class19-22 Mathteacher/class23B Vocationalteacher practice26 Who tutoredstudent (besidesparents)27-28 Have taken aminimum competencyor proficiencytest, results
25-30 Alternativeprograms
41 How satisfiedwith teen'seducation
Transition fromschooltocollege/work
41 What do peoplethink is mostimportant forstudent to do rightafter high school43 Student'seducationalexpectations47 Have enoughskills now forcareer in fiveyears53-54 Who/whatservices at schoolhelped in jobsearch57 Help fromschool in applyingfor colleges
38 Respondent'seducationalexpectations
43-44 Interactionbetween school andparents45 Communicationbetween parentsabout teen'spostsecondarytransition56 Communicationwith parents ofteen's friends70 Sources ofinformation aboutpostsecondaryopportunities84 Who parentsdiscussedpostsecondarytransition with
Family,home,friends
68 Importance ofpeer groupactivities
59 Activities ofrespondent'sfriends60 Importance ofpeer groupactivities
60 Safety ofneighborhood
C-17

F2: Parent ComponentData File User's Manual
CONTENT CATEGORY: 7. PARENTAL INVOLVEMENT
Student Dropout Parent
School,education
12B Access intocurrent high schoolprogram14 Upward Bound26 Who tutoredstudent (besidesparents)
22 Parent'sresponse torespondent droppingout35 Time spent onvarious activities
30 Is teenagercurrently inschool35 Has teen everbeen suspended,expelled fromschool36-37 In last 2years has teenmissed 10+consecutive schooldays/ 21+consecutive schooldays for reasonsother than illness38 In referenceto teen's longestabsence fromschool, why didteen stopattending39 What actionsdid parents takefor teen'sabsences41 How satisfiedwith teen'seducation42 Thoughts aboutteen's schoolclimate, teachingand program43-44 How oftendoes schoolcontact parents/parents contactschool45-46 Parentalinvolvement inschool and teen'scourses47 Parentalinfluence inschool functioning
C-18

F2: Parent ComponentData File User's Manual
Student Dropout Parent
Applyingforcolleges
41 What do peoplethink is mostimportant forstudent to do rightafter high school42 Parental,friend, teacheraspirations forstudent's education
37 Parentalaspirations forrespondent40C Educationneeded to get jobplanned to havewhen 30 years old
61 Educationalaspirations forteenager 62 Parent hasencouraged teen totake action toprepare forcollege entranceexams64 Has teenapplied forcollege/vocational school65 How has parenthelped teen makedecisions aboutwhere to apply forcollege66 Factorsimportant toparents in teen'schoice of a school67 Number ofschools parent hasvisited with teen78 Teen plans tocontinue education
Transitions towork
44-47 Details ofjobs held sincehigh school
68-69 Has teenexpressed interestin a particularcareer, what is it70 What is bestsource ofinformation forteen regardingthat career
C-19

F2: Parent ComponentData File User's Manual
Student Dropout Parent
Familyfinances
6 How many peopleare financiallydependent onparent74-75 Totalfamily income,number of wageearners76-77 Currenteducationalexpenses, amount79-82 Savings,plans to pay forteen's collegeeducation83-87 Knowledge,applying forfinancial aid forteen's education88 Teen appliedfor financialeducation89 Why hasn'tteen applied forfinancial aid90-92 Amountsexpected to spend,borrow for teen'seducation
C-20

F2: Parent ComponentData File User's Manual
Student Dropout Parent
Familyrelations
67 Thoughts onlife chances96 Family relatedevents98 Who makesdecisions in family99 How oftendiscusses school,college, jobs,problems withparents100 Student'sperception ofrelationship withparents104 How old whenleft alone
58 Thoughts onlife chances68 Who helps totake care of child80 Family relatedevents81 Who makesdecisions in family82 Respondent'sperception ofrelationship withparents
48 Who makesdecisions inhousehold onvariousindependenceissues49 How oftendiscusses school,personal andvocational topicswith teenager50 How oftenparticipated inactivities withteenager51 Are therefamily rules aboutmaintaininggrades, doinghomework,attending school52 Importance ofdifferent valuesin a teenager57 Substanceabuse andteenager,teenager's friends
C-21

F2: Parent ComponentData File User's Manual
Student Dropout Parent
Home,communityrelations
29 Have beenrecognized byschool or community36 Feelings aboutyouth serviceprograms37-39 Haveparticipated involunteer/communityservice, why,through whatorganizations97 Do parents knowstudent's friends'parents
76 Who lives insame household withrespondent88 Attendedreligious services
2 How much oftime does teenagerlive withrespondent3 Whom does teenlive with when notwith respondent4-5 Does teenhave anotherparent livingoutside of home7 Marital status8-10 Who lives inhousehold, numberunder/ over 18years old11-17 Parents'occupations18 Changes inmarital status
25 Ability usingEnglish26 Difficultiesencounteredbecause of lack ofEnglish
53-54 Familiaritywith teen'sfriends55-56 How oftendoes parent talkto parents ofteen'sschoolmates,friends58-60 How manyyears lived atpresent address,how respondentfeels aboutcommunity
C-22

F2: Parent ComponentData File User's Manual
Appendix D
Intracohort and Intercohort Parent Questionnaire Crosswalks

F2: Parent ComponentData File User's Manual
Intracohort and Intercohort Parent Questionnaire Crosswalks
Parent QuestionsA=NELS:88 F2 ParentB=NELS:88 BY ParentC=HS&B Parents of SeniorsD=HS&B Parents of Sophomores
QUESTION NUMBER QUESTION WORDING
A B C D 1A 1A-1 1 1 R's relationship to teenager 1B 1A-2 - - R's spouse's relationship to teenager2 1B - - Time teenager lives with R 3 - - - Who teenager lives with most of the time4 78 - - Another parent who lives outside home 5 - - - Extent other parent decides on teen's
education6 2 58 5 Number of people financially dependent
on R7 7 49 43 Current marital status8A - - - Teenager's father lives with teen8B - - - Teenager's stepfather lives with teen8C - - - Other adult male lives with teen 8D - - - Teenager's mother lives with teen8E - - - Teenager's stepmother lives with teen 8F - - - Other adult female lives with teen8G - - - Teenager's husband/wife lives with
teen 8H - - - Teenager's boy/girlfriend lives with
teen9A - - - Number of brothers living with teen
(incl. step- and half-)9B - - - Numbers of sisters living with teen
(incl. step- and half-) 9C - - - Number of teen's children living with
teen 9D - - - Number of grandparents living with teen9E - - - Number of relatives under 18 living
with teen9F - - - Number of relatives over 18 living with
teen9G - - - Number non-relatives under 18 living
with teen9H - - - Number non-relatives over 18 living
with teen10A - - - Total number people under 18 living
with teen 10B - - - Total number people over 18 living with
teen11A 32,33 A46,46A 37,37A R's current employment situation
D-1

F2: Parent ComponentData File User's Manual
11B 35,36A 51,51A 45,45A R's spouse's current employment situation 12 33B 46B 37B Has R ever held regular job13 34B 47A 38A Description of most recent job or
occupation14 - - - Who R works for15 36B 52 45B Has R's spouse ever held regular job16 37B 53 46 Description of spouse's most recent job17 - - - Who spouse works for18A1 - - - R divorced in 198818A2 - - - R separated in 198818A3 - - - R was widowed in 198818A4 - - - R was married or remarried in 198818A5 - - - R began living in a marriage-like
relationship in 198818A6 - - - None of these events occurred in 198818B1 - - - R divorced in 198918B2 - - - R separated in 198918B3 - - - R was widowed in 198918B4 - - - R was married or remarried in 198918B5 - - - R began living in a marriage-like
relationship in 198918B6 - - - None of these events occurred in 198918C1 - - - R divorced in 199018C2 - - - R separated in 199018C3 - - - R was widowed in 199018C4 - - - R was married or remarried in 199018C5 - - - R began living in a marriage-like
relationship in 199018C6 - - - None of these events occurred in 199018D1 - - - R divorced in 199118D2 - - - R separated in 199118D3 - - - R was widowed in 199118D4 - - - R was married or remarried in 199118D5 - - - R began living in a marriage-like
relationship in 199118D6 - - - None of these events occurred in 199119 10 61 56 Ethnic, race and cultural distinctions20 10A - - Asian or Pacific Islander background21 10B 61 56 Hispanic background 22 - - - English is native language (first
learned)23 - - - Native language other than English24A - - - Time native language used with spouse24B - - - Time native language used with
child/children24C - - - Tine native language used with relatives24D - - - Time native language used with friends25A 26A - - How well R understands spoken English25B 26B - - How well R speaks English25C 26C - - How well R reads English25D 26D - - How well R writes English
D-2

F2: Parent ComponentData File User's Manual
26A - - - Problems reading books, news, etc. inEnglish
26B - - - Problems filling out forms in English26C - - - Problems understanding teen's teachers26D - - - Problems being understood by teen's
teachers26E - - - Problems helping with homework in
English27 22A - - Is language other than English spoken
in home28 22B - - Is English spoken at home29 - - - Last grade teen attended/current grade
level30 - - - Is teen currently enrolled in school31 39 - - Years teen been a present school32MO - - - Last month teen enrolled in school32YR - - - Last year teen enrolled in school33 - - - In past 4 years, times teen changed
schools34A - - - Teen changed schools because of
disciplinary problems34B - - - Teen changed schools because of
academic problems34C - - - Teen asked to changed schools34D - - - Family/teen moved to use a specialized
program34E - - - Family/teen moved for other reasons34F - - - School closed or merged with another34G - - - Wanted to change from public to
private34H - - - Wanted to change from private to public34I - - - Wanted to change to magnet school34J - - - Wanted to take advantage of special
courses34K - - - Teen came to the U.S. from another
country35A 50 - - Teen considered to have a behavior
problem35B - - - Has teen ever been suspended from school35C - - - Has teen ever been expelled from
school36 - - - Last 2 years, teen missed school for
10+ days37 - - - Last 2 years, teen missed school for
21+ days38A - - - Teen stopped attending school-
conflicting job38B - - - Teen stopped attending school-problems
w/teachers, students38C - - - Teen stopped attending school-became
pregnant or parent 38D - - - Teen stopped attending school-family,
friends dropped out
D-3

F2: Parent ComponentData File User's Manual
38E - - - Teen stopped attending school-suspendedor expelled
38F - - - Teen stopped attending school-failing/poor grades
38G - - - Teen stopped attending school-gotmarried
38H - - - Teen stopped attending school-drug/alcohol abuse
39A - - - R called school because teen stoppedattending
39B - - - R offered to send teen to specialprogram after absence
39C - - - R arranged outside counseling afterabsence
39D - - - R arranged special tutoring afterabsence
39E - - - R offered to help teen w/personalproblem after absence
39F - - - R encouraged teen to stay in school aftabsence
39G - - - R punished when teen stopped attendschool
39H - - - R decided not to get involved afterabsence
40A - - - School called home after longest absence40B - - - School visited home after longest
absence40C - - - School sent letter after longest absence40D - - - School offered to send teen to special
program40E - - - School encouraged teen to stay in
school after absence40F - - - School offered teen special tutoring
after absence40G - - - School offered to help teen make up
work missed40H - - - School offered to help with personal
problems40I - - - School made teen see a counselor after
absence40J - - - School threatened to suspend or expel
teen40K - - - School suspended or expelled teen after
absence41 75 2 2 R's satisfaction with teen's education
so far42A 74A - - School places high priority on learning42B 74B - - Homework is worthwhile42C - - - School assigns too much homework42D - - - School assigns too little homework42E 74F - - School sets realistic academic standards42F - - - School sets too low of academic
standards
D-4

F2: Parent ComponentData File User's Manual
42G 74G,74H - - School adequately prepares for furtherschool
42H - - - School adequately prepares for futurework
42I 74I - - School is a safe place42J - - - School rules for behavior are strict42K - - - Teaching at school is good42L - - - Teachers are interested in students42M 74J - - Parents have an adequate say in school
policy42N 74K - - Parents work together to support school
policy42O - - - School provides programs for students'
needs42P - - - Drinking on school grounds is a
problem42Q - - - Drug use on school grounds is a
problem42R - - - Sale/use of drugs to/from school is a
problem 42S - - - Theft on school grounds is a problem42T - - - Violence on school grounds is a problem42U - - - Lack of discipline in classes is a
problem 43A 57A - - School contacted R about teen's grades43B 57B - - School contacted R about teen's
academic program43C - - - School contacted R about teen's future
plans43D 57C - - School contacted R about teen's future
courses43E - - - School contacted R about teen's
attendance43F 57E - - School contacted R about teen's
behavior43G 57F,57H - - School contacted R about volunteering43H - - - School contacted R-specific homework
skills44A 58A - - R c o n t a c t e d s c h o o l - t e e n ' s
grades/performance44B 58B - - R contacted school-teen's academic
program 44C - - - R contacted school-teen's future plans44D - - - R contacted school-course selection
after high school44E - - - R contacted school-teen's attendance
record44F 58C - - R contacted school-teen's behavior in
school44G 58D,58F- - R contacted school-volunteering or fund
raising45A - - - R attended program on education
opportunities for teen
D-5

F2: Parent ComponentData File User's Manual
45B - - - R attended program on financial aidafter HS for teen
45C - - - R attended program on employment andcareers for teen
46A - - - R knows courses teen taking in past term46B - - - R knows how well teen is performing46C - - - R knows how many credits teen has gained46D - - - R knows how many credits teen needs to
graduate47A - - - Influence parents should have-where
school funds spent47B - - - Influence parents should have-
curriculum/courses offered47C - - - Influence parents should have-hiring
administrators47D - - - Influence parents should have-books and
instruct material47E - - - Influence parents should have-hiring
teachers47F - - - Influence parents should have-books put
in school libraries47G - - - Influence parents should have-
evaluation teachers/administrators47H - - - Influence parents should have-amount of
homework assigned47I - - - Influence parents should have-
discipline policies47J - - - Influence parents should have-academic
standards48A - - - Who decides-how late teen can stay out48B - - - Who decides-when teen can use care48C - - - Who decides-whether teen can have a job48D - - - Who decides-how teen spend his/her money48E - - - Who decides-whether teen drinks at home48F - - - Who decides-whether teen drinks when out48G - - - Who decides-when no privileges because
of alcohol/drug use 48H - - - Who decides-whether teen goes to
college/other48I - - - Who decided-which courses teen takes49A - - - Amt R and teen talk-about education
courses or programs 49B - - - Amt R and teen talk-about school
activities/events49C - - - Amt R and teen talk-about material
studied in class49D - - - Amt R and teen talk-about teen's grades49E - - - Amt R and teen talk-about admission
standardize test 49F 68 17D,17E 13B,13C Amt R and teen talk-about apply
college/other schools49G - 17D,17E 13B,13C Amt R and teen talk-about specific jobs
after HS
D-6

F2: Parent ComponentData File User's Manual
49H - - - Amt R and teen talk-aboutcommunity/national/world events
49I - - - Amt R and teen talk-about teen'sproblems
49J - - - Amt R and teen talk-about teen'sinterests/hobbies
50A - - - Time spent together-school activities50B - - - Time spent together-homework or schl
project50C - - - Time spent together-concerts, plays,
movies50D - - - Time spent together-sports event
outside school50E - - - Time spent together-religious services50F - - - Time spent together-family social
functions50G - - - Time spent together-day trips/vacations50H - - - Time spent together-hobby or playing
sports50I - - - Time spent together-going shopping50J - - - Time spent together-eating
out/restaurants50K - - - Time spent together-just talking50L - - - Time spent together-doing something
else fun51A 65A - - Family rules-maintain certain grade
point average51B 65B - - Family rules-doing homework51C - - - Family rules-attending school regularly52A - - - Importance of quality-try hard to
succeed 52B - - - Importance of quality-honesty52C - - - Importance of quality-good
sense/judgment52D - - - Importance of quality-self control52E - - - Importance of quality-gets along with
peers52F - - - Importance of quality-obeys parents52G - - - Importance of quality-responsible 52H - - - Importance of quality-considerate of
others52I - - - Importance of quality-interest in how &
why things happen52J - - - Importance of quality-good student52K - - - Importance of quality-stands up for
things he/she believes in52L - - - Importance of quality-resists peer
pressure53 62 - - R knows names of any of teen's friends54A1 62A1 - - 1st friend attends school with teen54B1 62B1 - - R knows parents of 1st friend54A2 62A2 - - 2nd friend attends school with teen54B2 62B2 - - R knows parents of 2nd friend
D-7

F2: Parent ComponentData File User's Manual
54A3 62A3 - - 3rd friend attends school with teen54B3 62B3 - - R knows parents of 3rd friend54A4 62A4 - - 4th friend attends schools with teen54B4 62B4 - - R knows parents of 4th friend54A5 62A5 - - 5th friend attends school with teen54B5 62B5 - - R knows parents of 5th friend55 - - - Number of parents R talks to-teens in
same school 56A - - - Amt R talks to other parents-things
going on at school56B - - - Amt R talks to other parents-teen's
education plans after HS56C - - - Amt R talks to other parents-teen's
career plans57A - - - R feels-drinking is a problem with
teen's friends57B - - - R feels-teen has drinking problem57C - - - R feels-drug use is a problem with
teen's friends57D - - - R feels-teen has drug problem57E - - - R feels-drinking by friends bad
influence on teen57F - - - R feels-drug use by friends bad
influence on teen57G - - - R feels-theft/violence problem with
teen's friends58 - - - Number of years R lived in neighborhood59 - - - R feels part of neighborhood or is it
just a place to live60 - - - How R rates neighborhood safety61 - 5 5 How far R wants teen to go in education62A - - - R encouraged teen to prepare for the SAT62B - - - R encouraged teen to prepare for the ACT62C - - - R encouraged teen to prepare for the
ASVAB62D - - - R encouraged teen to prepare for the GED63 - - - Past year amount R talked to teen about
education after HS 64 - - - Has teen applied for admiss to
educational program after HS65A - - - R's help-teen wants to decide
him/herself65B - - - R's talked to teen-particular schools65C - - - R's talked to teen-schl's general
qualities65D - - - R's gave teen info brochure about school65E - - - R offered to take teen to college
counselor66A - 37A - Important in deciding school-low
expenses66B - 37B - Important in deciding school-financial
aid
D-8

F2: Parent ComponentData File User's Manual
66C - 37C - Important in deciding school-curriculum/courses
66D - 37E - Important in deciding school-school'sathletics
66E - 37F - Important in deciding school-school'ssocial life
66F - 37G - Important in deciding school-live athome
66G - 37H - Important in deciding school-live awayfrom home
66H - 37I - Important in deciding school-religiousenvironment
66I - 37J - Important in deciding school-low crimeenvironment
66J - 37K - Important in deciding school-good jobplacement record
66K - - - Important in deciding school-goodgraduate placement
66L - 37D - Important in deciding school-academicreputation
66M - - - Important in deciding school-easyadmission standard
66N - - - Important in deciding school-degreeprogram for job
66O - - - Important in deciding school-racial/ethnic composition
66P - - - Important in deciding school-size ofschool
66Q - - - Important in deciding school-geographiclocation
66R - - - Important in deciding school-sameschool as spouse/partner
67 - - - Number of schools R visited with teen68 - - - Has teen expressed interest in job or
profession69 - - - Category/description of job teen
interested in70A - - - Best job information-R or spouse70B - - - Best job information-someone else in
family70C - - - Best job information-family friend70D - - - Best job information-teen's school70E - - - Best job information-school counselor70F - - - Best job information-teen's friends70G - - - Best job info-acquaintance who works in
field 70H - - - Best job information-books or magazines70I - - - Best job information-vocational or
community college70J - - - Best job information-local business or
association71 - - - Has teen ever worked for pay72MO - - - Month teen last worked for pay
D-9

F2: Parent ComponentData File User's Manual
72YR - - - Year teen last worked for pay73MO - - - Month teen started working for pay73YR - - - Year teen started working for pay74 80 70A,71A 65A,66A Family's total gross income before
taxes75 81 - - Number of wage earners contributing to
income 76A 82A,82B - - Current educational expenses-private
elementary or HS 76B 82D - - Current educational expenses-tutoring76C 82C - - Current educational expenses-college
tuition76D - - - Current educational expenses-other77 82A - - Total annual education expenditures78 83 28 27 Does teen plan to continue education79A 84AA 25A 21A Financial prep for teen's education-
savings account79B 84AB 25B 21B Financial prep for teen's education-
insurance policy79C 84AC 25C 21C Financial prep for teen's education-
U.S. Savings Bonds79D 84AD 25D 21D Financial prep for teen's education-
invest stock/real estate79E 84AE 25E 21E Financial prep for teen's education-
investment/mutual fund79F 84AF 25F 21F Financial prep for teen's education-
other job/work more 79G 84AG 25G 21G Financial prep for teen's education-
other savings79H - - - Financial prep for teen's education-
reduce other expense79I - - - Financial prep for teen's education-
remortgage property79J - - - Financial prep for teen's education-
teen savings80 - 27 23 Teen's grade when R began to save for
teen's education81 84B 26 22 How much money R set aside for teen's
education82 84D - - Does R expect this amount to cover
total costs83 - - - Has R read or talked about sources of
financial aid 84A - 28-1 - Financial aid-R talked with HS guidance
counselor84B - 28-2,-4 - Financial aid-R talked to
vocational/technical school rep 84C - 28-3 - Financial aid-R talked to loan officer
at bank84D - 28-10 - Financial aid-R talked to knowledgeable
person84E - 28-5 - Financial aid-R read US Dept of Ed info
on aid
D-10

F2: Parent ComponentData File User's Manual
84F - 28-6 - Financial aid-R read info fromvocational/tech school on aid
84G - 28-7 - Financial aid-R read about aidavailable through military
85A - - - Plan to pay for education-from loans85B - - - Plan to pay for education-
scholarships/grants85C - - - Plan to pay for education-work programs86A - - - Has R or teen applied-for loans86B - - - Has R or teen applied-for
scholarships/grants86C - - - Has R or teen applied-for work programs87A - 30D 25D How much R knows-state student loans 87B - 30B 25B How much R knows-federal loan programs87C - 30E 25E How much R knows-college/university
loans 87D - 30F 25F How much R knows-private loans by banks88 - 32 - Has teen ever applied for financial aid89A 85A,85B 33A,33B - Reason no aid-family/teen can pay for
education89B 85E,85F 33E,33F - Reason no aid-grades not high enough to
quality89C - - - Reason no aid-R nor teen wish to report
financial situation89D - - - Reason no aid-teen will attend school
part-time89E 85G 33H - Reason no aid-too much paper work
required89F 85H 33I - Reason no aid-R not able to get info on
aid89G - - - Reason no aid-money not available for
aid89H 86J 33K - Reason no aid-other relatives will pay
for education89I - - - Reason no aid-missed the application
deadline89J - - - Reason no aid-R doesn't know how to
apply90 - - - Amount of $ R expects to spend on
teen's education91 - - - Amt of debt R will go into for teen's
education92A 82BA - - Sources of $-R/spouse's current
earnings 92B 82BB - - Sources of $-R/spouse's savings/sale of
assets 92C 82BC 69 - Sources of $-second mortgage92D 82BD - - Sources of $-R/spouse's personal loan92E 82BE - - Sources of $-alimony or child support92F 82BF - - Sources of $-teen's earnings/savings92G 82BG - - Sources of $-trust fund92H 82BH - - Sources of $-contributions from
relatives
D-11

F2: Parent ComponentData File User's Manual
92I 82BI - - Sources of $-scholarships or grants92J 82BJ - - Sources of $-state and federal loans92K 82BK - - Sources of $-Social Security/Veteran's
benefit92L 82BL - - Sources of $-Other93 - - - Did anyone help R complete
questionnaire94A - - - Teen helped R complete questionnaire94B - - - R's spouse helped R complete
questionnaire94C - - - Another family member helped R complete
questionnaire94D - - - Friend helped R complete questionnaire94E - - - Another person helped R complete
questionnaire94AMO - - - Month questionnaire completed94AYR - - - Year questionnaire completed
Supplemental Questions for Parents New to NELS:88
95 1B - - Amount of time teen lived with R96 - - - Who teen lived with most of time, if
not R97 2 58 54 Number of people dependent on R98 7 49 43 R's marital status99 - - - Does R have a spouse/partner100A - 56 51 What is the sex of R100B - What is the sex of R's spouse/partner101A 30 38 29 Highest level of school R completed101B 31 50 44 Highest level of school R's spouse
completed102 3A - - Number of teen's brothers/sisters
(including half- and step-)103 4 - - Number of children in Q.102 older than
teen104 5B - - Number of children in Q.102 who
graduated HS105 6 - - Number of children in Q.102 who dropped
out HS106 8 57 52 Year R was born107 9 57A 52A Year R's spouse born
D-12

F2: Parent ComponentData File User's Manual
Appendix E
Guidelines for Using SAS with NELS:88
Second Follow-Up Parent Data

F2: Parent ComponentData File User's Manual
Guidelines for Using SAS with NELS:88 Second Follow-Up Parent Data
The files provided on the public release tape include SAScards and SAS system files for the NELS:88 second follow-up parentdata file. The SAS system file for the parent survey includes:
1) Questionnaire data2) Composites
Users who plan to analyze NELS:88 data on personal computerscan seek counsel in the Guide to the NELS:88 ECB/CD-ROM. Thesections that follow pertain primarily to mainframe applications.
The following are situations which may be encountered whenusing large data files with SAS and suggestions for handling them.
1. Use the '(KEEP=...)' and '(DROP=...)' options in the 'SET'statement and/or in the 'DATA' statement when creatingworking data files so that unwanted variables are notincluded in the files. The '(KEEP=...)' option does notreorder the variables in the new data set.
The files are large and the SAS cards associated with all ofthe variables within a file require a great deal of memory.Eliminating unwanted variables and the cards associated withthem will reduce the amount of memory necessary to run jobs.
2. Some of the label statements given in the SAS card files mayneed to be eliminated because of SAS system limitationspresent at many computer installations.
3. The large number of VALUE statements in the PROC FORMATsection requires that a special DD statement be placed justafter the // EXEC SAS statement to increase the capacity ofthe format library during a SAS run:
//LIBRARY DD SPACE=(TRK,(25,25,60))
Since this may not be possible at some computerinstallations, it may be necessary to delete some VALUEstatements.
4. When working with large files, it may be necessary tooverride the default work space with the following DDstatement:
//WORK DD UNIT=SYSCR,SPACE=(CYL,(40,40))
E-1

F2: Parent ComponentData File User's Manual
Place the //WORK DD statement just after the // EXEC SASstatement (or after the //LIBRARY DD statement, if that isincluded as well).
5. The formats given in the PROC FORMAT step here are notpermanently associated with each variable. Whenever theyare needed for a procedure, it is necessary to include themin this PROC FORMAT step before the procedure(s) that willuse them.
Suppose you were interested in investigating how the familysize reported by the parents of students in public andprivate Grade 12 schools may vary. In this example PROCFORMAT is used first to make a temporary library of formats(sets of value labels). Then PROC FREQ is used to accessthe second follow-up parent SAS system file and to create atwo-way crosstab. The FORMAT statement in PROC FREQ linkseach variable in the crosstab to the appropriate set ofvalue labels stored in the temporary format library.
// EXEC SAS
//LIBRARY DD SPACE=(TRK,(25,25,60))
//WORK DD UNIT=SYSCR,SPACE=(TRK,(1000,1000)) //IN1 DDDSN=ACT.PUBL.F2PA.SASLIB,DISP=SHR //SYSIN DD *
OPTIONS DQUOTE;
PROC FORMAT;
VALUE PC106V
01 = "PUBLIC"
02 = "CATHOLIC"
03 = "PRIV/OTH RELIG"
04 = "PRIV/NON-RELIG"
05 = "PRIV/TYPE UNKNWN"
06 = "STU NOT ENROLLED"
96 = "MULT RESPONSE"
E-2

F2: Parent ComponentData File User's Manual
97 = "REFUSAL"
98 = "MISSING" ;
VALUE PC103V
01 = "1"
02 = "2"
03 = "3"04 = "4"05 = "5"06 = "6"07 = "7"08 = "8"09 = "9"10 = "10+"98 = "MISSING"
;
PROC FREQ DATA=IN1.F2PARENT;
FORMAT
G12CTRL1 PC106V.
F2FAMSIZ PC103V.
;
TABLES G12CTRL1 * F2FAMSIZ;
TITLE "SCHOOL TYPE BY F2 FAMILY SIZE";
E-3
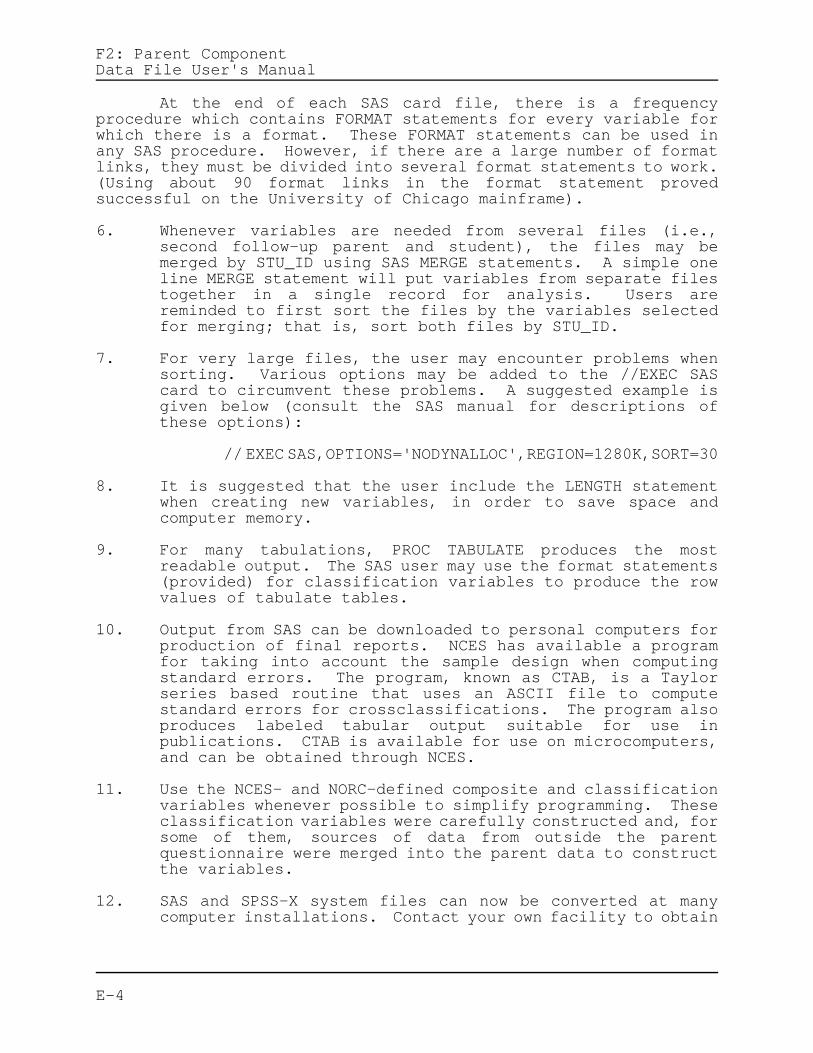
F2: Parent ComponentData File User's Manual
At the end of each SAS card file, there is a frequencyprocedure which contains FORMAT statements for every variable forwhich there is a format. These FORMAT statements can be used inany SAS procedure. However, if there are a large number of formatlinks, they must be divided into several format statements to work.(Using about 90 format links in the format statement provedsuccessful on the University of Chicago mainframe).
6. Whenever variables are needed from several files (i.e.,second follow-up parent and student), the files may bemerged by STU_ID using SAS MERGE statements. A simple oneline MERGE statement will put variables from separate filestogether in a single record for analysis. Users arereminded to first sort the files by the variables selectedfor merging; that is, sort both files by STU_ID.
7. For very large files, the user may encounter problems whensorting. Various options may be added to the //EXEC SAScard to circumvent these problems. A suggested example isgiven below (consult the SAS manual for descriptions ofthese options):
// EXEC SAS,OPTIONS='NODYNALLOC',REGION=1280K,SORT=30
8. It is suggested that the user include the LENGTH statementwhen creating new variables, in order to save space andcomputer memory.
9. For many tabulations, PROC TABULATE produces the mostreadable output. The SAS user may use the format statements(provided) for classification variables to produce the rowvalues of tabulate tables.
10. Output from SAS can be downloaded to personal computers forproduction of final reports. NCES has available a programfor taking into account the sample design when computingstandard errors. The program, known as CTAB, is a Taylorseries based routine that uses an ASCII file to computestandard errors for crossclassifications. The program alsoproduces labeled tabular output suitable for use inpublications. CTAB is available for use on microcomputers,and can be obtained through NCES.
11. Use the NCES- and NORC-defined composite and classificationvariables whenever possible to simplify programming. Theseclassification variables were carefully constructed and, forsome of them, sources of data from outside the parentquestionnaire were merged into the parent data to constructthe variables.
12. SAS and SPSS-X system files can now be converted at manycomputer installations. Contact your own facility to obtain
E-4

F2: Parent ComponentData File User's Manual
the information necessary to create an SPSS-X file from SASand vice versa.
13. There is a peculiarity with version 6.06 of SAS. The symbol"%" will not be printed if it appears as the first characterin the first variable label on a printed page.
E-5

F2: Parent ComponentData File User's Manual
Appendix F
NELS:88 Base Year Parent Questionnaire
Note: This appendix is not available in the electronic version ofthe Data File User's manual. This appendix can be found in theprinted version of the Second Follow-Up: Parent Component DataFile User's Manual.

F2: Parent ComponentData File User's Manual
Appendix G
NELS:88 Second Follow-Up Parent Questionnaire
Note: This appendix is not available in the electronic version ofthe Data File User's manual. This appendix can be found in theprinted version of the Second Follow-Up: Parent Component DataFile User's Manual.

F2: Parent ComponentData File User's Manual
Appendix H
Critical Items from the Second Follow-Up Parent Questionnaire

F2: Parent ComponentData File User's Manual
Critical Items on NELS:88 Second Follow-Up Parent Questionnaire
F2P1A Respondent's relationship to teenagerF2P1B Respondent's spouse's relationship to teenagerF2P2 How much time teenager lives with respondent F2P4 Teenager has another parent outside the homeF2P7 Current marital statusF2P11A Respondent's current employment situationF2P11B Respondent's spouse's current employment situationF2P13 Respondent's present jobF2P16 Spouse's present jobF2P18 Life changes in last four yearsF2P19 Ethnic backgroundF2P27 Languages other than English spoken in homeF2P30 Teenager is currently enrolled in schoolF2P44A Contacted teenager's school about gradesF2P44C Contacted teenager's school about plans after high schoolF2P61 Respondent wants teenager to go how far in schoolF2P74 Total gross family income 1991F2P79A Started a savings account to pay for teen's educationF2P79B Bought an insurance policy to pay for teen's educationF2P79C Bought U.S. Savings Bonds to pay for teen's educationF2P79D Made investments to pay for teen's educationF2P79E Set up college investment fund to pay for teen's
educationF2P79F Started working more to pay for teen's educationF2P79G Established other form of savings to pay for teen's
educationF2P79H Planned to reduce expenses to pay for teen's educationF2P79I Planned to remortgage house to pay for teen's educationF2P79J Had teenager put aside earnings to pay for educationF2P108 Name, addressF2P112 Name, address of a close relative
Supplemental Questions for Parents New to NELS:88
F2P95 Since Feb. 1, 1988, teenager lives with respondent howmuch
F2P101 Highest level of school respondent completedF2P101B Highest level of school respondent's spouse completed
H-1

F2: Parent ComponentData File User's Manual
Appendix I
Record Layout for NELS:88 Second Follow-Up Parent Tape

F2: Parent ComponentData File User's Manual
NELS:88 Second Follow-Up Public Use Parent Data FileRecord Layout (Magnetic Tape Version)
The original EBCDIC files delivered on magnetic tape have thefollowing structure (where LRECL = logical record layout andBLKSIZE = blocking factor):
raw data: LRECL = 524, BLKSIZE = 32488SAS and SPSS-X cards: LRECL = 80, BLKSIZE = 32720
VARIABLENAME POSITION
STU_ID 1-7F2P1A 8-9F2P1B 10-11 F2P2 12-12 F2P3 13-14 F2P4 15-15 F2P5 16-16 F2P6 17-18 F2P7 19-19 F2P8A 20-20 F2P8B 21-21 F2P8C 22-22 F2P8D 23-23 F2P8E 24-24 F2P8F 25-25 F2P8G 26-26 F2P8H 27-27 F2P9A 28-29 F2P9B 30-31 F2P9C 32-33 F2P9D 34-35 F2P9E 36-37 F2P9F 38-39 F2P9G 40-41 F2P9H 42-43 F2P10A 44-45 F2P10B 46-47 F2P11A 48-49 F2P11B 50-51 F2P12 52-52 F2P13 53-54 F2P14 55-56 F2P15 57-57 F2P16 58-59 F2P17 60-61 F2P18A1 62-62 F2P18A2 63-63 F2P18A3 64-64
I-1

F2: Parent ComponentData File User's Manual
F2P18A4 65-65 F2P18A5 66-66 F2P18A6 67-67 F2P18B1 68-68 F2P18B2 69-69 F2P18B3 70-70 F2P18B4 71-71 F2P18B5 72-72 F2P18B6 73-73 F2P18C1 74-74 F2P18C2 75-75 F2P18C3 76-76 F2P18C4 77-77 F2P18C5 78-78 F2P18C6 79-79 F2P18D1 80-80 F2P18D2 81-81 F2P18D3 82-82 F2P18D4 83-83 F2P18D5 84-84 F2P18D6 85-85 F2P19 86-86 F2P20 87-88 F2P21 89-90 F2P22 91-91 F2P23 92-93 F2P24A 94-94 F2P24B 95-95 F2P24C 96-96 F2P24D 97-97 F2P25A 98-98 F2P25B 99-99 F2P25C 100-100 F2P25D 101-101 F2P26A 102-102 F2P26B 103-103 F2P26C 104-104 F2P26D 105-105 F2P26E 106-106 F2P27 107-107 F2P28 108-108 F2P29 109-110 F2P30 111-111 F2P31 112-112 F2P32MO 113-114 F2P32YR 115-116 F2P33 117-117 F2P34A 118-118 F2P34B 119-119 F2P34C 120-120 F2P34D 121-121 F2P34E 122-122 F2P34F 123-123
I-2

F2: Parent ComponentData File User's Manual
F2P34G 124-124 F2P34H 125-125 F2P34I 126-126 F2P34J 127-127 F2P34K 128-128 F2P35A 129-129 F2P35B 130-130 F2P35C 131-131 F2P36 132-132 F2P37 133-133 F2P38A 134-134 F2P38B 135-135 F2P38C 136-136 F2P38D 137-137 F2P38E 138-138 F2P38F 139-139 F2P38G 140-140 F2P38H 141-141 F2P39A 142-142 F2P39B 143-143 F2P39C 144-144 F2P39D 145-145 F2P39E 146-146 F2P39F 147-147 F2P39G 148-148 F2P39H 149-149 F2P40A 150-150 F2P40B 151-151 F2P40C 152-152 F2P40D 153-153 F2P40E 154-154 F2P40F 155-155 F2P40G 156-156 F2P40H 157-157 F2P40I 158-158 F2P40J 159-159 F2P40K 160-160 F2P41 161-161 F2P42A 162-162 F2P42B 163-163 F2P42C 164-164 F2P42D 165-165 F2P42E 166-166 F2P42F 167-167 F2P42G 168-168 F2P42H 169-169 F2P42I 170-170 F2P42J 171-171 F2P42K 172-172 F2P42L 173-173 F2P42M 174-174 F2P42N 175-175 F2P42O 176-176
I-3

F2: Parent ComponentData File User's Manual
F2P42P 177-177 F2P42Q 178-178 F2P42R 179-179 F2P42S 180-180 F2P42T 181-181 F2P42U 182-182 F2P43A 183-183 F2P43B 184-184 F2P43C 185-185 F2P43D 186-186 F2P43E 187-187 F2P43F 188-188 F2P43G 189-189 F2P43H 190-190 F2P44A 191-191 F2P44B 192-192 F2P44C 193-193 F2P44D 194-194 F2P44E 195-195 F2P44F 196-196 F2P44G 197-197 F2P45A 198-198 F2P45B 199-199 F2P45C 200-200 F2P46A 201-201 F2P46B 202-202 F2P46C 203-203 F2P46D 204-204 F2P47A 205-205 F2P47B 206-206 F2P47C 207-207 F2P47D 208-208 F2P47E 209-209 F2P47F 210-210 F2P47G 211-211 F2P47H 212-212 F2P47I 213-213 F2P47J 214-214 F2P48A 215-215 F2P48B 216-216 F2P48C 217-217 F2P48D 218-218 F2P48E 219-219 F2P48F 220-220 F2P48G 221-221 F2P48H 222-222 F2P48I 223-223 F2P49A 224-224 F2P49B 225-225 F2P49C 226-226 F2P49D 227-227 F2P49E 228-228 F2P49F 229-229
I-4

F2: Parent ComponentData File User's Manual
F2P49G 230-230 F2P49H 231-231 F2P49I 232-232 F2P49J 233-233 F2P50A 234-234 F2P50B 235-235 F2P50C 236-236 F2P50D 237-237 F2P50E 238-238 F2P50F 239-239 F2P50G 240-240 F2P50H 241-241 F2P50I 242-242 F2P50J 243-243 F2P50K 244-244 F2P50L 245-245 F2P51A 246-246 F2P51B 247-247 F2P51C 248-248 F2P52A 249-249 F2P52B 250-250 F2P52C 251-251 F2P52D 252-252 F2P52E 253-253 F2P52F 254-254 F2P52G 255-255 F2P52H 256-256 F2P52I 257-257 F2P52J 258-258 F2P52K 259-259 F2P52L 260-260 F2P53 261-261 F2P54A1 262-262 F2P54B1 263-263 F2P54A2 264-264 F2P54B2 265-265 F2P54A3 266-266 F2P54B3 267-267 F2P54A4 268-268 F2P54B4 269-269 F2P54A5 270-270 F2P54B5 271-271 F2P55 272-273 F2P56A 274-274 F2P56B 275-275 F2P56C 276-276 F2P57A 277-277 F2P57B 278-278 F2P57C 279-279 F2P57D 280-280 F2P57E 281-281 F2P57F 282-282 F2P57G 283-283
I-5

F2: Parent ComponentData File User's Manual
F2P58 284-284 F2P59 285-285 F2P60 286-286 F2P61 287-288 F2P62A 289-289 F2P62B 290-290 F2P62C 291-291 F2P62D 292-292 F2P63 293-293 F2P64 294-294 F2P65A 295-295 F2P65B 296-296 F2P65C 297-297 F2P65D 298-298 F2P65E 299-299 F2P66A 300-300 F2P66B 301-301 F2P66C 302-302 F2P66D 303-303 F2P66E 304-304 F2P66F 305-305 F2P66G 306-306 F2P66H 307-307 F2P66I 308-308 F2P66J 309-309 F2P66K 310-310 F2P66L 311-311 F2P66M 312-312 F2P66N 313-313 F2P66O 314-314 F2P66P 315-315 F2P66Q 316-316 F2P66R 317-317 F2P67 318-319 F2P68 320-320 F2P69 321-322 F2P70A 323-323 F2P70B 324-324 F2P70C 325-325 F2P70D 326-326 F2P70E 327-327 F2P70F 328-328 F2P70G 329-329 F2P70H 330-330 F2P70I 331-331 F2P70J 332-332 F2P71 333-333 F2P72MO 334-335 F2P72YR 336-337 F2P73MO 338-339 F2P73YR 340-341 F2P74 342-343 F2P75 344-344
I-6

F2: Parent ComponentData File User's Manual
F2P76A 345-345 F2P76B 346-346 F2P76C 347-347 F2P76D 348-348 F2P77 349-350 F2P78 351-351 F2P79A 352-352 F2P79B 353-353 F2P79C 354-354 F2P79D 355-355 F2P79E 356-356 F2P79F 357-357 F2P79G 358-358 F2P79H 359-359 F2P79I 360-360 F2P79J 361-361 F2P80 362-362 F2P81 363-364 F2P82 365-365 F2P83 366-366 F2P84A 367-367 F2P84B 368-368 F2P84C 369-369 F2P84D 370-370 F2P84E 371-371 F2P84F 372-372 F2P84G 373-373 F2P85A 374-374 F2P85B 375-375 F2P85C 376-376 F2P86A 377-377 F2P86B 378-378 F2P86C 379-379 F2P87A 380-380 F2P87B 381-381 F2P87C 382-382 F2P87D 383-383 F2P88 384-384 F2P89A 385-385 F2P89B 386-386 F2P89C 387-387 F2P89D 388-388 F2P89E 389-389 F2P89F 390-390 F2P89G 391-391 F2P89H 392-392 F2P89I 393-393 F2P89J 394-394 F2P90 395-396 F2P91 397-398 F2P92A 399-399 F2P92B 400-400 F2P92C 401-401
I-7

F2: Parent ComponentData File User's Manual
F2P92D 402-402 F2P92E 403-403 F2P92F 404-404 F2P92G 405-405 F2P92H 406-406 F2P92I 407-407 F2P92J 408-408 F2P92K 409-409 F2P92L 410-410 F2P93 411-411 F2P94A 412-412 F2P94B 413-413 F2P94C 414-414 F2P94D 415-415 F2P94E 416-416 F2P94AMO 417-418 F2P94AYR 419-420 F2P94BB 421-421 F2P95 422-422 F2P96 423-424 F2P97 425-426 F2P98 427-427 F2P99 428-428 F2P100A 429-429 F2P100B 430-430 F2P101A 431-432 F2P101B 433-434 F2P102 435-436 F2P103 437-438 F2P104 439-440 F2P105 441-442 F2P106 443-444 F2P107 445-446 F2PAQWT 447-456 4*F2PAQFLG 457-457 F2SPANFG 458-458 F2BYPAFG 459-459 F2STAT 460-461 F2DOSTAT 462-463 F2F1DOST 464-465 F2SEX 466-466 F2RACE1 467-467 F2API 468-468 F2HISP 469-469 F2BIRTHM 470-471 F2BIRTHY 472-473 F2LOCUS1 474-477 2*F2LOCUS2 478-481 2*F2LOCU2Q 482-482 F2CNCPT1 483-486 2*F2CNCPT2 487-490 2*F2CNCP2Q 491-491 F2BYFMSZ 492-493
I-8

F2: Parent ComponentData File User's Manual
F2BYPMAR 494-494 F2BYSPFG 495-495 F2BYFCMP 496-497 F2F1FCMP 498-499 F2FCMP 500-501 F2FAMSIZ 502-503 F2PARED 504-505 F2SES2 506-510 3*F2SES2Q 511-511 F2SES3 512-516 3*F2SES3Q 517-517 G12CTRL1 518-519 G12URBN3 520-520 G12REGON 521-522 F2HSPROG 523-523
* Denotes a float variable. The number listedindicates the largest possible number of digitsthat may appear to the right of the decimal point.
I-9

F2: Parent ComponentData File User's Manual
Appendix J
NELS:88 Second Follow-Up Parent Composite Variables

F2: Parent ComponentData File User's Manual
Weights
Analysis of the second follow-up parent component requiresthat F2PAQWT, the statistical weight that has been designed forthis purpose, be used. There are 17,610 parent cases on the publicuse files (who were also not subsampled out of this component) andwho are the guardians of sample member teens who completed a secondfollow-up student or dropout questionnaire.31 Of these parents,16,395 completed a second follow-up parent questionnaire; it isthese parent cases that carry the parent statistical weight:
F2PAQWT The primary purpose of the parent data file is to providestudent- and dropout-related contextual information thatcan be linked to individual records on the NELS:88student and dropout files. F2PAQWT should be used forthese analyses since it corrects for subsampling ofparents and adjusts for second follow-up parentnonresponse. Using the parent data with F2PAQWT providesanalysts with a national cross-section of the self-defined "most knowledgeable" parent or guardian of, amongother populations, dropouts from the eighth- or tenth-grade cohort and 1992 twelfth graders. F2PAQWT can beused in cross-sectional and panel analyses either inconjunction with student or dropout data or as a stand-alone data set. However, when using F2PAQWT with onlythe second follow-up parent data, it is important thatthe analyst be aware of the caveats discussed in sections1.4 and 3.1.5 about the generalizability of the parentdata.
A detailed discussion of the NELS:88 second follow-up statisticalweights and the manner in which these are correctly applied appearsin Chapter III of this manual.
Flags
The following indicator, F2PAQFLG, discriminates betweenparent cases on the file with completed second follow-up parentquestionnaire data and those cases that did not complete the parentquestionnaire. It is essential for selection of cases that have aparent statistical weight (F2PAQFLG=1). Note that, as an aid inassociating these two variables in memory, the same stem ("F2PA-")has been assigned to the variable name for both this flag and forthe parent statistical weight (described above).
31 In addition to the 17,584 eligible parents, 26 records are
included on the file for parents who were initially eligiblefor data collection, yet it was discovered that these parentswere out of scope for reasons described in section 3.1.5. Thetotal number of parent records on the public use data file is17,610.
J-1

F2: Parent ComponentData File User's Manual
F2PAQFLG Indicates whether or not a second follow-up parentquestionnaire was completed by an eligible parent, whowas not subsampled out of the second follow-up, of a teensample member who completed a second follow-up student ordropout questionnaire.
0 = Did not complete a parent questionnaire1 = Completed a parent questionnaire
F2SPANFG Indicates whether the second follow-up parentquestionnaire was completed in English or in Spanish.
0 = Parent completed an English-languagequestionnaire
1 = Parent completed a Spanish-languagequestionnaire
2 = Not applicable--parent did not complete asecond follow-up parent questionnaire
F2BYPAFG Indicates whether or not a questionnaire was completed bya parent or guardian of the student sample member in thebase year parent component. Note that the parentrespondent to the base year survey is not necessarily thesame person as the parent respondent in the secondfollow-up.
0 = Base year parent questionnaire was notcompleted (although a base year studentquestionnaire was completed)
1 = Base year parent questionnaire wascompleted (and base year studentquestionnaire was also completed)
2 = Not applicable--student became a samplemember after the base year (due to"freshening" or base year ineligiblesbecoming eligible in a subsequent round)or a base year eligible student did notcomplete a base year studentquestionnaire (and therefore parent wasnot eligible to complete a base yearparent questionnaire)
F2STAT Indicates final status in the second follow-up for teensample members. The public use parent component containsdata only for the parents of those teen sample memberswho participated in the student/dropout components of thesecond follow-up (F2STAT=00).
00 = Sample member participated01 = Other reasons, nonrespondent02 = Sample member unlocatable03 = Sample member or parent refusal
J-2

F2: Parent ComponentData File User's Manual
04 = Sample member is ineligible for surveyowing to language barrier, or mental orphysical disability
05 = Sample member is out of USA in this round06 = Sample member is deceased
F2DOSTAT Indicates enrollment status, either dropout or student,as of the second follow-up only, for the teen samplemember. Also permits identification of dropoutsaccording to either the NELS:88 first follow-updefinition of a dropout (i.e., dropouts only: use values4 and 5) or the HS&B/NELS:88 second follow-up definitionof a dropout (i.e., dropouts plus alternative completers:use values 3, 4, and 5).
00 = Student (teen sample member was not aschool dropout or a stopout in the secondfollow-up)
01 = Enrollment status was not determined(includes out-of-country, deceased, andenrollment status unknown cases)
02 = Stopout (teen sample member dropped outof school at one time in second follow-up, but subsequently returned to school)
03 = Alternative completer(teen sample memberenrolled in or completed an alternativenon-diploma program [e.g., GED testpreparation classes, or passed GED testor received other alternativecertification])
04 = Dropout--school confirmed (teen samplemember was reported by the school to be adropout, but status was not alsoconfirmed by sample member or family)
05 = Dropout--twice confirmed (teen samplemember dropped out of school--confirmedby sample member or family)
F2F1DOST Indicates enrollment status, such as a dropout orstudent, as of the first follow-up only, for the teensample member. This variable is the first follow-upequivalent of F2DOSTAT (see above).
00 = Student (teen sample member was not aschool dropout or a stopout in the secondfollow-up)
01 = Enrollment status was not determined(includes out-of-country, deceased, andenrollment status unknown cases)
02 = Stopout (teen sample member dropped outof school at one time in first follow-up,but subsequently returned to school)
03 = Home study student
J-3

F2: Parent ComponentData File User's Manual
04 = Dropout--school confirmed (teen samplemember was reported by the school to be adropout, but status was not alsoconfirmed by sample member or family)
05 = Dropout--twice confirmed (teen samplemember dropped out of school--confirmedby sample member or family)
06 = Not applicable--teen sample member is asecond follow-up freshened student
Note that the categories for this composite have beenrevised to match the categories used for F2DOSTAT,enabling comparison between the two composites. Forinformation on the original categories used for the firstfollow-up composite F1DOSTAT, see Appendix I, page 2, ofthe First Follow-Up: Student Component Data File User'sManual:
F2SEX Most complete indicator of teen sample member's gender.For the base year ineligible sample, F1SEX was createdwith first follow-up new student supplement data (inF1N2) or from information on NORC's survey managementsystems. For all samples, F2SEX is based on the firstfollow-up (F1SEX) composite and is augmented by secondfollow-up new student supplement information (in F2N2)when appropriate or, if still missing, imputation fromteen's first name.
1 = Male2 = Female
F2RACE1 Indicates teen sample member's "best known" race. Forall samples, F2RACE1 is based on F1RACE and issupplemented when appropriate with second follow-up newstudent supplement data (in F2N17). If F2RACE1 was stillmissing, available information from NORC's surveymanagement systems was used to fill in missing values.
F1RACE was created for the base yearineligible sample using data from the firstfollow-up new student supplement (in F1N8A) orfrom information in NORC's survey managementsystems.
1 = Asian, Pacific Islander2 = Hispanic3 = Black, not Hispanic4 = White, not Hispanic5 = American Indian, Alaskan Native8 = Missing
J-4

F2: Parent ComponentData File User's Manual
F2API Further divides the "Asian, Pacific Islander"F2RACE1 category into sub-categories. F2API wasconstructed in the same manner as F2RACE1(described above). For the base year ineligiblesample and BY dropouts, F1API was created with datafrom the first follow-up new student supplement (inF1N8B) or from information in NORC's surveymanagement systems. For all samples, F2API isbased on F1API and is supplemented when appropriatewith second follow-up new student supplement data(in F2N18). If F2API was still missing, availableinformation from NORC's survey management systemswas used to fill in missing values.
F2API F2N18 F1API F2RACE1 LABEL
0 (any value) (any value) 2-5 Non-Asian1 01-05 1 1 East Asian2 07 3 1 South Asian3 06 4 1 Pacific Islander4 08, 96, 97, 98 2 or 5 1 Specific API unknown8 96, 97 or 98 8 8 Race missing
Employing the sum of the subgroups in F2API is appropriate forcomparisons to the NELS:88 base year and first follow-up.Since the race composite in HS&B defined Asians and PacificIslanders broadly, and since the questionnaires granted greatlatitude to respondent self-definition, F2API should also begenerally appropriate for use in trend comparisons to HS&B.
Because the terms "Asian" and "Asian/Pacific Islander" areused differently in various surveys and statistical recordssystems, analysts will need to combine and recombine thesecategories in various ways when making comparisons with datasources other than those mentioned above.
F2HISP Further divides the "Hispanic, regardless of race"F2RACE1 category into sub-categories. F2HISP wasconstructed in the same manner described for F2RACE1.However, because a composite comparable to F2HISP was notcreated in the first follow-up, F2HISP was constructedusing data from the base year composite HISP, and wassupplemented with data from the second follow-up NSS(item F2N19) and the first follow-up NSS (item F1N8C).If F2HISP was still missing, available information fromNORC's survey management systems was used to fill inmissing values.
J-5

F2: Parent ComponentData File User's Manual
F2HISP F2N19 F1N8C HISP F2RACE1 LABEL
0 (any value) (any value) (any value) 1,3-5 Non-Hispanic1 1 1 1 2 Mexican2 2 2 2 2 Cuban3 3 3 3 2 Puerto Rican4 4,6,7,8 4,6,7,8 4,6,7,8 2 Specific Hispanic8 6,7 or 8 6,7 or 8 8 8 Race missing
F2BIRTHM F2BIRTHM was taken from an updated version of F1BIRTHMwhich included birth data for base year ineligiblestudents and other teen sample members for whom F1BIRTHMwas previously missing. For first follow-upnonrespondents and students who were freshened in thesecond follow-up, F2N3MO from second follow-up newstudent supplement data were used. The range ofF2BIRTHM is 1 - 12 with 98 indicating missing.
F2BIRTHY F2BIRTHY was created by using an updated version ofF1BIRTHY which included data for base year ineligiblestudents and other teen sample members for whom birthdata were previously missing. For first follow-upnonrespondents and students who were freshened in thesecond follow-up, F2N3YR from the second follow-up newstudent supplement data were used. For the public useparent data file, all cases with years before 1972 wererecoded to '72,' and all cases with years after 1975were recoded to '75' to protect respondentconfidentiality.
F2LOCUS1 This composite of the locus of control items in thesecond follow-up student and dropout questionnaires isdesigned to be as comparable as possible to HS&B andNLS-72 data. All locus of control items are in studentquestion 66 (and dropout question 57). They are F2S66B(F2D57B), F2S66C (F2D57C), F2S66F (F2D57F), F2S66G(F2D57G), F2S66K (F2D57K), and F2S66M (F2D57M).
As in the base year and first follow-up, three of theseitems are comparable to HS&B and NLS-72 items. They areF2S66C (F2D57C), F2S66F (F2D57F), and F2S66G (F2D57G).
Each of the above three items were standardizedseparately to a mean of zero and a standard deviation of1, using F2QWT. All nonmissing components wereaveraged. That is, if none of the three items wasmissing, all three standardized values were added, thendivided by 3; if one item was missing, the other two(nonmissing) standardized values were added, thendivided by 2. Any teen sample member missing all threecomponents was assigned a missing value (8).
J-6

F2: Parent ComponentData File User's Manual
It is important to note that, while always comparable tothe items in the earlier studies, these items are notidentical. Some modifications in these items were madein order to make them more comprehensible to eighthgraders; other alterations were effected formethodological reasons (e.g., to remove a response setbias). The NELS:88 second follow-up items are listedbelow for comparison, with the HS&B and NLS-72 itemwording in parentheses:
F2S66C/F2D57C: "In my life, good luck is more importantthan hard work for success." ("Good luckis more important than hard work forsuccess.")
F2S66F/F2D57F: "Every time I try to get ahead, somethingor somebody stops me." [text identical]
F2S66G/F2D57G: "My plans hardly ever work out, soplanning only makes me unhappy."("Planning only makes a person unhappy,since plans hardly ever work outanyway.")
F2LOCUS2 This composite uses all of the second follow-up locus ofcontrol items in student question 66 (and dropoutquestion 57). These are F2S66B (F2D57B), F2S66C(F2D57C), F2S66F (F2D57F), F2S66G (F2D57G), F2S66K(F2D57K), and F2S66M (F2D57M). As with F2LOCUS1, each of the above six items wasstandardized separately to a mean of zero and a standarddeviation of 1, using F2QWT. All nonmissing componentsare averaged. Any teen sample member missing all sixcomponents was assigned a missing value (8). (SeeF2LOCUS1 above for detailed procedures.)
Note that item F2S66K (F2D57K) is a reverse scoringitem; therefore, the values were reversed before thecomposite was created.
F2LOCU2Q Quartile distribution of F2LOCUS2. It was constructedby recoding F2LOCUS2 into four categories based on theweighted (F2QWT) marginal distribution.
1 = Quartile 1 Low2 = Quartile 2 3 = Quartile 3 4 = Quartile 4 High8 = Missing
F2CNCPT1 This composite of self-concept items was designed to beas comparable as possible to HS&B and NLS-72 data. Allself-concept items are in student question 66 (and
J-7

F2: Parent ComponentData File User's Manual
dropout question 57). These are F2S66A (F2D57A), F2S66D(F2D57D), F2S66E (F2D57E), F2S66H (F2D57H), F2S66I(F2D57I), F2S66J (F2D57J), and F2S66L (F2D57L).
As in the base year and first follow-up, four of theseitems are comparable to HS&B and NLS-72 items. Theseare F2S66A (F2D57A), F2S66D (F2D57D), F2S66E (F2D57E),and F2S66H (F2D57H).
As with F2LOCUS1, each of the above four items werestandardized separately to a mean of zero and a standarddeviation of 1, using F2QWT. All nonmissing componentswere averaged. Any student missing all four componentswas assigned a missing value (8). (See F2LOCUS1 abovefor detailed procedures.)
All four items are reverse scoring items; therefore, thevalues were reversed before the composite was created.It is important to note that, while always comparable tothe items in the earlier studies, these items are notidentical. The NELS:88 second follow-up items arelisted below for comparison, with the HS&B and NLS-72item wording in parentheses:
F2S66A/F2D57A: "I feel good about myself." ("I take apositive attitude toward myself.")
F2S66D/F2D57D: "I feel I am a person of worth, the equalof other people." ("I feel I am a personof worth, on an equal plane withothers.")
F2S66E/F2D57E: "I am able to do things as well as mostother people." [text identical]
F2S66H/F2D57H: "On the whole, I am satisfied withmyself." [text identical]
F2CNCPT2 This composite employs all of the self-concept items instudent question 66 (and dropout question 57). They areF2S66A (F2D57A), F2S66D (F2D57D), F2S66E (F2D57E),F2S66H (F2D57H), F2S66I (F2D57I), F2S66J (F2D57J), andF2S66L (F2D57L).
As with F2LOCUS1, each of the above seven items wasstandardized separately to a mean of zero and a standarddeviation of 1, using F2QWT. All nonmissing componentswere averaged. Any student missing all seven componentswere assigned a missing value (8). (See F2LOCUS1 abovefor detailed procedures.)
Four of these items--F2S66A (F2D57A), F2S66D (F2D57D),F2S66E (F2D57E), and F2S66H (F2D57H)--are reverse
J-8

F2: Parent ComponentData File User's Manual
scoring items; therefore, the values were reversedbefore the composite was created.
F2CNCP2Q F2CNCP2Q is the quartile distribution of F2CNCPT2. Itwas constructed by recoding F2CNCPT2 into fourcategories based on the weighted (F2QWT) marginaldistribution.
1 = Quartile 1 Low2 = Quartile 2 3 = Quartile 3 4 = Quartile 4 High8 = Missing
F2BYFMSZ This composite reports the teen sample member'sestimated family size in 1988. F2BYFMSZ was computedusing both the parent and student base yearquestionnaires. If all of BYS8A-I were reserved codes,then F2BYFMSZ was coded as missing. Otherwise thenumber was 1 for the respondent plus an estimate for thenumber of siblings (detailed below) plus the number offamily members other than siblings as marked in itemsBYS8A-D and BYS8G-I. (This procedure counted only 1person each for BYS8G-I, even if more than one person ineach category lived in the household.) The firstreference used for the number of siblings is BYP3B. Ifthat was a reserved code, then BYS32 was used instead.If neither BYP3B nor BYS32 listed any siblings, then onesibling was counted for each item marked in BYS8E andBYS8F as a final source. All values for F2BYFMSZ whichwere greater than 9 were set to 10, creating the endvalue of 10 which means 10 or more.
02-09 = Base year family size as computed above
10 = Base year family size as computed aboveis ten or greater
98 = Missing or lives in an undefinedsituation
BLANK = Not applicable--no base year parentquestionnaire
F2BYPMAR This composite characterizes the parent's base yearmarital status. It was taken directly from BYP7. Note,however, that the categories for this composite havebeen revised to match the categories used in the secondfollow-up parent questionnaire, item F2P7. Forinformation on the original categories used for the baseyear composite BYPARMAR, see Appendix H, page 13, of the
J-9

F2: Parent ComponentData File User's Manual
First Follow-Up: Student Component Data File User'sManual: The revised values for F2BYPMAR are:
1 = Single, never married2 = Married3 = Divorced/Separated4 = Widowed5 = Not married but living in a marriage-like
relationshipBLANK = Not applicable--no base year parent
questionnaire
F2BYSPFG Indicates whether the base year parent questionnaire wascompleted in English or Spanish.
0 = Parent completed an English-languagequestionnaire
1 = Parent completed a Spanish-languagequestionnaire
2 = Not applicable--did not complete a baseyear parent questionnaire
F2BYFCMP Indicates the family or household composition in thebase year. It was constructed from student responses toBYS8A-I. Note, however, that the data for thiscomposite have been recoded from 1 digit in the baseyear to two digits in the second follow-up.
01 = Mother and father02 = Mother and male guardian03 = Father and female guardian04 = Mother only05 = Father only06 = Other relative or nonrelative98 = Missing, BYS8A-I were all missingBLANK = Not applicable--no base year parent
questionnaire
F2F1FCMP Indicates the family or household composition, and isbased entirely on base year parent questionnaire data.It is derived from question 1 in the base year parentquestionnaire (BYP1A1, BYP1A2) and indicates the adultcomposition of the teen sample member's household as ofthe base year.
Note, however, that the wording of the categories forthis composite has been revised to match the categoriesused for F2FCMP, enabling comparison between the twocomposites. The only exceptions to the wording revisionare for values 5 and 6. In F2FCMP, these two valuesallow for the possibility of same sex couples, indicatedby the value label "other female(s)" and "othermale(s)." In F2F1FCMP, the data for same sex couples
J-10

F2: Parent ComponentData File User's Manual
were coded as a value of 98 ("missing"). Forinformation on the original categories used for thefirst follow-up composite FAMCOMP, see Appendix I, page13, of the First Follow-Up: Student Component Data FileUser's Manual: The revised values for F2F1FCMP are:
01 = Mother & father are present in thehousehold
02 = Mother and step father/other malerelative/guardian are present in thehousehold.
03 = Father and step mother/other femalerelative/guardian are present in thehousehold.
04 = Other female and male families (such ass t e p m o t h e r / o t h e r f e m a l erelative/guardian and step father/othermale relative/guardian)
05 = Mother only, or other adult female ispresent in the household
06 = Father only, or other adult male ispresent in the household
98 = MissingBLANK = Not applicable--no base year parent
questionnaire
F2FCMP Indicates the family or household composition, and isbased entirely on the second follow-up parentquestionnaire items F2P8A-F. If no persons in F2P8A-Fwere indicated as living in the same household with theteen, then value 07 was used, "Independent teen, or witha friend or spouse." Additionally, 07 was used when thedata for F2P8A-F were all missing and the respondentindicated that the teen no longer lived with a parent orrelative (items F2P2 and F2P3).
01 = Mother and father are present in thehousehold
02 = Mother and step father/other malerelative/guardian are present in thehousehold
03 = Father and step mother/other femalerelative/guardian are present in thehousehold
04 = Other female and male families (such ass t e p m o t h e r / o t h e r f e m a l erelative/guardian and step father/othermale relative/guardian)
05 = Mother only, or other adult female(s) ispresent in the household
06 = Father only, or other adult male(s) ispresent in the household
J-11

F2: Parent ComponentData File User's Manual
07 = Independent teen, or living with a friendor spouse
98 = MissingBLANK = Not applicable--no second follow-up
parent questionnaire
Note that F2FCMP is constructed differently fromF2F1FCMP and F2BYFCMP; some inconsistencies arise fromthe different specifications. Therefore, caution shouldbe used when comparing the family composition betweenthe base year, first follow-up and second follow-up.
In the base year, F2BYFCMP was constructed using datafrom the base year student questionnaire, items BYS8A-I.These questions asked the student to mark all personswho lived in the same household with the student.
In the first follow-up, F2F1FCMP was constructed usingdata from the base year parent questionnaire, itemsBYP1A1 and BYP1A2. These questions asked the respondentto identify his/her relationship to the teen, and therelationship of the respondent'sspouse/partner (whenapplicable) to the teen.
In the second follow-up, the parent questionnaire itemsused to construct F2FCMP more closely approximate theitems used in F2BYFCMP, although with slightly differentcategories.
F2FAMSIZ This composite estimates the teen sample member's secondfollow-up family size. F2FAMSIZ was constructedentirely from the second follow-up parent questionnaire,items F2P10A-B.
If the data for F2P10A-B were missing or out of range,family size was imputed from items F2P9A-H. Because theteen is not included in F2P9A-H, one more person wasadded to the number derived from F2P9A-H to arrive atthe total family size. Also, items in F2P9A-H which hadan answer of "6 or more" were counted as 6 when arrivingat the total family size. When necessary, data inF2P9A-H were supplemented with data from F2P8A-H. Ifall data for F2P10A-B and F2P9A-H were missing, F2FAMSIZwas made 98 (missing).
01-09 = Family size is 1-9 people 10 = Family size is 10 or greater98 = Missing or lives in an undefined
situationBLANK = Not applicable--no second follow-up
parent questionnaire
J-12

F2: Parent ComponentData File User's Manual
F2PARED This composite characterizes the level of educationattained by the parent with the highest reportededucation level. It was constructed using secondfollow-up parent questionnaire data (F2P101A-B). Ifmissing, the sources given below were used to constructF2PARED, listed in order by priority from left to right:
F2 ParentValues: F2P101A &F2P101B
BY ParentQuex ValuesBYP30 &BYP31
F2 NSSValues:F2N8A &F2N8B
F1 NSSValues:F2N20A &F2N20B
BY StudentQuex ValuesBYS34A &BYS34B
FinalEducation Level
Value
01,02 01,02 01 01 01 01 = Did not finishH.S.
03,04 03,04 02 02 02 02 = H.S. grad orGED
06,0708,09
05,06,0708,09,10
03,04 03,04 03,04 03 = Greater thanH.S. and lessthan 4-yeardegree
11 11 05 05 05 04 = Collegegraduate
12 12 06 06 06 05 = M.A. orequivalent
13 13 07 07 07 06 = Ph.D., M.D.,other
-- -- 08 08 08 07 = Don't know
98 = Missing
Note: The values listed above are the recoded values, not the originalquestionnaire values.
F2SES2 This is the second of three socio-economic statusindicators of the teen that have been constructed forthe second follow-up data files. Like F2SES1, F2SES2utilizes the original occupational prestige scale usedfor NLS-72 and HS&B. This scale is known as the DuncanSEI and is included in Table J-1 below. F2SES2 isconstructed using second follow-up parent questionnairedata (F2SES1 uses base year parent data or, if missing,other early sources). F2SES2 has valid values only forcases where the second follow-up parent questionnairewas completed. If the second follow-up parentquestionnaire was not completed, then F2SES2 was set to"BLANK."
J-13

F2: Parent ComponentData File User's Manual
The following second follow-up parent data were used:father's education level, mother's education level,father's occupation, mother's occupation, and familyincome (data coming from F2P101A, F2P101B, F2P13, F2P16and F2P74). Since the education level questions(F2P101A & F2P101B) were only included in the "NewParent Supplement" portion (Part 6) of the secondfollow-up parent questionnaire, education level wassupplemented from the base year parent questionnaire,first and second follow-up new student supplement, orthe base year student questionnaire, whenever needed.The sources given below were used to construct theparent's education level for F2SES2, listed in order bypriority from left to right:
F2 ParentValues: F2P101A &F2P101B
BY ParentQuex ValuesBYP30 &BYP31
F2 NSSValues:F2N8A &F2N8B
F1 NSSValues:F2N20A &F2N20B
BY StudentQuex ValuesBYS34A &BYS34B
FinalEducation Level
Value
01,02 01,02 01 01 01 01 = Did not finishH.S.
03,04 03,04 02 02 02 02 = H.S. grad orGED
06,0708,09
05,06,0708,09,10
03,04 03,04 03,04 03 = Greater thanH.S. and lessthan 4-yeardegree
11 11 05 05 05 04 = Collegegraduate
12 12 06 06 06 05 = M.A. orequivalent
13 13 07 07 07 06 = Ph.D., M.D.,other
-- -- 08 08 08 98 = Missing
98 = MissingNote: The values listed above are the recoded values, not the original
questionnaire values.
Second follow-up parent data were used to constructF2SES2 if at least one variable is not missing (i.e., ifat least one of the following is available: F2P101A,F2P101B, F2P13, F2P16 and F2P74). If all second follow-up parent data components were missing, F2SES2 was setto missing (99.998). Each nonmissing component wasstandardized to a mean of 0 and a standard deviation of1. Nonmissing standardized components will be averagedyielding the F2SES2 composite. Occupational data wererecoded using the Duncan SEI scale as used in HS&B andindicated below.
J-14

F2: Parent ComponentData File User's Manual
Table J-1: Occupational prestige scales used in NELS:88 second follow-up
1989 GSSPrestige
Response code Label Duncan's SEI Scores
01 Clerical 56.58 38.1602 Craftsperson 27.41 38.5103 Farmer 28.00 35.5704 Homemaker/Housewife05 Laborer 7.33 29.4406 Manager/Administrator 67.73 53.5207 Military08 Operative 19.18 34.1009 Professional (accountant) 70.21 64.3810 Professional (MD, lawyer) 70.21 64.3811 Proprietor/Owner 49.70 50.6412 Protective service 38.00 48.4013 Sales 54.42 35.7714 School teacher 70.21 64.3815 Service 15.90 30.4616 Technical 61.40 51.2117 Never worked18 Other19 Missing
Note: although "Homemaker/Housewife" and "Military" were responseoptions in the second follow-up parent questionnaire, thesecategories are not included in the Duncan or GSS scales.
F2SES2Q F2SES2Q is the quartile distribution of F2SES2. It wasconstructed by recoding F2SES2 into quartiles based onthe weighted (F2PAQWT) marginal distribution. As withF2SES2, if the second follow-up parent questionnaire wasnot completed (F2PAQFLG=0 or 2), then F2SES2Q was set to"BLANK."
1 = Quartile 1 Low2 = Quartile 23 = Quartile 34 = Quartile 4 High8 = MissingBLANK = Not applicable--no second follow-up parent
questionnaire
F2SES3 This is the third of three socio-economic statusindicators of the teen that have been constructed for thesecond follow-up data files. F2SES3, like F2SES2, usessecond follow-up parent survey information to estimate
J-15

F2: Parent ComponentData File User's Manual
socioeconomic status. Unlike F2SES2, however, F2SES3utilizes a new prestige scale. Both F2SES1 (on thestudent component data file) and F2SES2 applied theDuncan SEI scores to respondent occupation as a measureof prestige. The Duncan scale had also been used byNLS-72 and HS&B surveys to estimate socioeconomic statusand applies the 1970 Census Occupation ClassificationSystem. F2SES3 applies prestige scores that weredeveloped at NORC in the 1989 General Social Survey(GSS). The GSS scale represents more recent occupationalrankings by a national sample of adults than the olderDuncan method. The GSS Prestige Scale uses the 1980Census Occupation Classification System.
There are some differences between the 1970 and 1980Census Occupational Coding Classification Systems. Forexample, the sales manager title has been moved from thesales category to the management category. However, theproportion of sales managers in the total population asof 1990 is less than 1.5 percent, probably not enough tomake a significant difference to prestige outcomes.32
Another change is that the averages that apply to theNELS:88 occupation categories (such as FARMER,PROFESSIONAL, etc., listed in block letters in theNELS:88 occupation items) were used for F2SES3. Theearlier versions of socioeconomic status took the averageprestige scores of only the occupations listed after themajor categories in the NELS:88 questionnaire.
Table J-1 contrasts the Duncan scores with the new GSSprestige scores for each occupational category used inNLS-72, HS&B, and NELS:88 questionnaires. The threeprofessional categories listed in the questionnaire item--school teacher, accountant, and M.D and lawyer--sharethe same prestige scores in both the Duncan and the GSSscales and do not make contributions to prestige that areindependent from each other. The crosswalk of prestigescores shows that the new method has both a tighter rangeof resulting prestige scores and more clustering of theoccupational categories by prestige scores. Thecorrelations between F2SES2 and F2SES3 are neverthelessquite high (.98) since occupational prestige is only oneof the dimensions of the socioeconomic status composite.
F2SES3Q F2SES3Q is the quartile distribution of F2SES3. It wasconstructed by recoding F2SES3 into quartiles based on
32 For a complete description of the occupation codes used by the
1970 Census and 1980 Census, please see Bureau of the Census,Technical Paper 59: The Relationship between the 1970 and1980 Industry and Occupation Classification Systems.Washington, D.C., 1989.
J-16

F2: Parent ComponentData File User's Manual
the weighted (F2PAQWT) marginal distribution. As withF2SES2, if the second follow-up parent questionnaire wasnot completed (F2PAQFLG=0 or 2), then F2SES3Q was set to"BLANK."
1 = Quartile 1 Low2 = Quartile 23 = Quartile 34 = Quartile 4 High8 = MissingBLANK = Not applicable--no second follow-up
parent questionnaire
G12CTRL1 Classifies the teen sample member's second follow-upschool type into public, Catholic or other private, asreported by the school.
01 = Public school02 = Catholic school03 = Private school, other religious
affiliation04 = Private school, no religious affiliation05 = Private school, type not ascertained06 = Not enrolled in any school or not
enrolled in a traditional diploma-granting school (dropouts and alternativecompleters)
98 = Missing (includes out-of-country,deceased, and enrollment status unknowncases)
G12URBN3 Trichotomizes the urbanicity of the area in which theteen sample member's second follow-up school is located.This metropolitan status is defined by QED for publicschool districts, for Catholic dioceses, or in some casesfor the county in which the school is located. QED basesthe classifications on the Federal Information ProcessingStandards as used by the U.S. Census.
1 = Urban--central city2 = Suburban--area surrounding a central city
within a county constituting the MSA3 = Rural--outside MSA4 = Not enrolled in any school or not
enrolled in a traditional diploma-granting school (dropouts and alternativecompleters)
8 = Missing (includes out-of-country,deceased, and enrollment status unknowncases)
J-17

F2: Parent ComponentData File User's Manual
G12REGON Indicates in which of the four U.S. Census regions theteen sample member's second follow-up school is located,created by collapsing the states into the followingcategories:
01 = Northeast--New England and MiddleAtlantic states
02 = Midwest--East North Central and WestNorth Central states
03 = South--South Atlantic, East South Centraland West South Central states
04 = West--Mountain and Pacific states05 = Not enrolled in any school or not
enrolled in a traditional diploma-granting school (dropouts and alternativecompleters)
98 = Missing (includes out-of-country,deceased, and enrollment status unknowncases)
F2HSPROG This composite categorizes the student-reported highschool program--either the type of high school programin which the student is enrolled or the last program inwhich the dropout was enrolled (as reported in the secondfollow-up). The source is the student questionnaire item12A (F2S12A) or the dropout questionnaire item 20(F2D20). The categories were recoded as follows:
F1HSPROG F2S12A or F2D20 Label
00 NA or 00 Never attended high school01 01 or 01 General high school program02 02 or 02 Academic/College prepprogram03 03-11 or 03-11 Vocational/Technicalprogram04 12 or 12 Other specialized highschool program05 13 or 13 Special education program06 15 or 15 A l t e r n a t i v e / D r o p o u tPrevention program07 14 or 14 Don't know08 98 or 98 MissingBLANK F2QFLG=0 Did not complete a
s t u d e n t / d r o p o u tquestionnaire
J-18
F2: Parent ComponentData File User's Manual
Appendix K
NELS:88 Second Follow-Up Parent Codebook
Note: For the user's convenience, some second follow-upquestionnaire variables were recoded to facilitate using NELS:88second follow-up data in cross-wave (NELS:88 base year parents) andcross-cohort (HS&B parents of sophomores and seniors) comparisons.These recodes generally involved the reordering of item values.Codebook item values and value labels reflect these recodes, asdoes the parent questionnaire that appears in Appendix G. Beforeprogram set-up, users are advised to read the codebook entriescarefully.

F2: Parent ComponentData File User's Manual
PARENT QUESTIONNAIRE NELS:88 SECOND FOLLOW-UP
-----------------Question STU_ID Tape Pos. 1-7----------------- Format: I7
STU_ID STUDENT ID
Student ID
K-1

F2: Parent ComponentData File User's Manual
I. YOUR FAMILY'S BACKGROUND
------------Question 1------------
What is your relationship and that of your spouse/partnerto the teenager named on the front cover?
K-2

F2: Parent ComponentData File User's Manual
-------------Question 1A Tape Pos. 8-9------------- Format: I2
F2P1A R'S RELATIONSHIP TO TEEN
You
PER- WGTD RESPONSE CODES FREQ CENT PCT ---------- -------- ----- ----- -----MOTHER........................ 01 12882 73.2% 79.5%FATHER........................ 02 2545 14.5% 14.8%STEPMOTHER.................... 03 175 1.0% 1.1%STEPFATHER.................... 04 93 0.5% 0.8%GRANDMOTHER................... 05 166 0.9% 1.7%GRANDFATHER................... 06 17 0.1% 0.1%OTHER FEMALE RELATIVE......... 07 82 0.5% 0.6%OTHER MALE RELATIVE........... 08 23 0.1% 0.2%OTHER ADULT FEMALE............ 09 167 0.9% 1.1%OTHER ADULT MALE.............. 10 39 0.2% 0.3% RESERVED CODES: NO PARENT QUEX............. 1215 6.9% (MISS) MULTIPLE RESPONSE.......... 96 53 0.3% (MISS) MISSING.................... 98 153 0.9% (MISS) ----- ----- ----- TOTALS: 17610 100.0% 100.0%
K-3

F2: Parent ComponentData File User's Manual
-------------Question 1B Tape Pos. 10-11------------- Format: I2
F2P1B SPOUSE/PARTNER'S RELATIONSHIP TO TEEN
Your Spouse/Partner
PER- WGTD RESPONSE CODES FREQ CENT PCT ---------- -------- ----- ----- -----MOTHER........................ 01 2072 11.8% 11.7%FATHER........................ 02 8591 48.8% 49.4%STEPMOTHER.................... 03 281 1.6% 2.0%STEPFATHER.................... 04 1493 8.5% 11.3%GRANDMOTHER................... 05 23 0.1% 0.1%GRANDFATHER................... 06 84 0.5% 0.7%OTHER FEMALE RELATIVE......... 07 15 0.1% 0.1%OTHER MALE RELATIVE........... 08 50 0.3% 0.5%OTHER ADULT FEMALE............ 09 73 0.4% 0.5%OTHER ADULT MALE.............. 10 191 1.1% 1.5%DOES NOT APPLY, NO OTHERPARENT/GUARDIAN............... 11 3163 18.0% 22.1% RESERVED CODES: NO PARENT QUEX............. 1215 6.9% (MISS) MULTIPLE RESPONSE.......... 96 13 0.1% (MISS) MISSING.................... 98 346 2.0% (MISS) ----- ----- ----- TOTALS: 17610 100.0% 100.0%
K-4

F2: Parent ComponentData File User's Manual
------------Question 2 Tape Pos. 12-12------------ Format: I1
F2P2 AMT OF TIME TEEN LIVES W/RESPONDENT
How much of the time does the teenager named on the frontcover live with you?
PER- WGTD RESPONSE CODES FREQ CENT PCT ---------- -------- ----- ----- -----ALL OF THE TIME............... 1 14644 83.2% 87.8%MOST OF THE TIME.............. 2 418 2.4% 2.7%HALF OF THE TIME.............. 3 267 1.5% 1.7%LESS THAN HALF OF THE TIME.... 4 1013 5.8% 7.8% RESERVED CODES: NO PARENT QUEX............. 1215 6.9% (MISS) MULTIPLE RESPONSE.......... 6 5 0.0% (MISS) MISSING.................... 8 48 0.3% (MISS) ----- ----- ----- TOTALS: 17610 100.0% 100.0%
K-5

F2: Parent ComponentData File User's Manual
------------Question 3 Tape Pos. 13-14------------ Format: I2
F2P3 WHO TEEN LIVES WITH WHEN NOT WITH R
With whom does the teenager named on the front cover livemost of the time when he/she does not live with you?
PER- WGTD RESPONSE CODES FREQ CENT PCT ---------- -------- ----- ----- -----BY HIMSELF/HERSELF............ 01 170 1.0% 11.1%WITH HIS OR HER OTHER PARENT.. 02 284 1.6% 16.1%WITH ANOTHER ADULT RELATIVE... 03 256 1.5% 17.2%HE/SHE LIVES AT BOARDINGSCHOOL........................ 04 78 0.4% 3.5%HE/SHE LIVES AT COLLEGE....... 05 92 0.5% 5.2%WITH A NON-RELATED ADULTGUARDIAN...................... 06 25 0.1% 1.8%WITH A FRIEND................. 07 299 1.7% 18.1%WITH HIS OR HER SPOUSE........ 08 277 1.6% 17.5%OTHER......................... 09 169 1.0% 9.5% RESERVED CODES: NO PARENT QUEX............. 1215 6.9% (MISS) MULTIPLE RESPONSE.......... 96 4 0.0% (MISS) MISSING.................... 98 97 0.6% (MISS) LEGITIMATE SKIP............ 99 14644 83.2% (MISS) ----- ----- ----- TOTALS: 17610 100.0% 100.0%
K-6

F2: Parent ComponentData File User's Manual
------------Question 4 Tape Pos. 15-15------------ Format: I1
F2P4 TEEN HAS PARENT WHO LIVES OUTSIDE HOME
Does your teenager have another parent (biological oradoptive) who lives outside of your home?
PER- WGTD RESPONSE CODES FREQ CENT PCT ---------- -------- ----- ----- -----YES........................... 1 4953 28.1% 35.4%NO............................ 2 11324 64.3% 64.6% RESERVED CODES: NO PARENT QUEX............. 1215 6.9% (MISS) MISSING.................... 8 118 0.7% (MISS) ----- ----- ----- TOTALS: 17610 100.0% 100.0%
K-7

F2: Parent ComponentData File User's Manual
------------Question 5 Tape Pos. 16-16------------ Format: I1
F2P5 OTH PARENT'S PART IN EDUCATION DECISIONS
To what extent does this other parent (biological oradoptive), living outside your home, participate indecisions about your teenager's education (for example,about where the teenager goes to school)?
PER- WGTD RESPONSE CODES FREQ CENT PCT ---------- -------- ----- ----- -----USUALLY PARTICIPATES.......... 1 675 3.8% 12.5%OFTEN PARTICIPATES............ 2 406 2.3% 8.0%SELDOM PARTICIPATES........... 3 815 4.6% 15.9%NEVER PARTICIPATES............ 4 2966 16.8% 63.7% RESERVED CODES: NO PARENT QUEX............. 1215 6.9% (MISS) MISSING.................... 8 209 1.2% (MISS) LEGITIMATE SKIP............ 9 11324 64.3% (MISS) ----- ----- ----- TOTALS: 17610 100.0% 100.0%
K-8

F2: Parent ComponentData File User's Manual
------------Question 6 Tape Pos. 17-18------------ Format: I2
F2P6 NUMBER OF PEOPLE DEPENDENT UPON R
Altogether, how many people are financially dependent uponyou (or you and your spouse/partner)? Count everyone whoreceives one-half or more of their financial support fromyou or your spouse/partner. Include individuals not livingwith you and your spouse/partner, but do not includeyourself or your spouse/partner.
Total number of dependents (not counting you or yourspouse/partner):
PER- WGTD RESPONSE CODES FREQ CENT PCT ---------- -------- ----- ----- -----NONE.......................... 01 573 3.3% 4.3%ONE........................... 02 3601 20.4% 22.2%TWO........................... 03 5739 32.6% 34.1%THREE......................... 04 3467 19.7% 21.1%FOUR.......................... 05 1691 9.6% 10.5%FIVE.......................... 06 721 4.1% 4.6%SIX........................... 07 262 1.5% 1.7%SEVEN......................... 08 113 0.6% 0.7%EIGHT OR MORE................. 09 96 0.5% 0.7% RESERVED CODES: NO PARENT QUEX............. 1215 6.9% (MISS) MULTIPLE RESPONSE.......... 96 1 0.0% (MISS) MISSING.................... 98 131 0.7% (MISS) ----- ----- ----- TOTALS: 17610 100.0% 100.0%
K-9

F2: Parent ComponentData File User's Manual
------------Question 7 Tape Pos. 19-19------------ Format: I1
F2P7 R'S CURRENT MARITAL STATUS
What is your current marital status?
PER- WGTD RESPONSE CODES FREQ CENT PCT ---------- -------- ----- ----- -----SINGLE, NEVER MARRIED......... 1 487 2.8% 3.3%MARRIED....................... 2 12614 71.6% 74.1%DIVORCED/SEPARATED............ 3 2495 14.2% 17.5%WIDOWED....................... 4 568 3.2% 3.8%NOT MARRIED BUT LIVING IN AMARRIAGE-LIKE RELATIONSHIP.... 5 193 1.1% 1.3% RESERVED CODES: NO PARENT QUEX............. 1215 6.9% (MISS) MULTIPLE RESPONSE.......... 6 1 0.0% (MISS) MISSING.................... 8 37 0.2% (MISS) ----- ----- ----- TOTALS: 17610 100.0% 100.0%
K-10

F2: Parent ComponentData File User's Manual
------------Question 8------------
Which of the following people live in the same householdwith the teen named on the front cover of this booklet? Remember to include yourself.
K-11

F2: Parent ComponentData File User's Manual
-------------Question 8A Tape Pos. 20-20------------- Format: I1
F2P8A LIVES W/ TEEN - TEEN'S FATHER
My teenager's father
PER- WGTD RESPONSE CODES FREQ CENT PCT ---------- -------- ----- ----- -----YES........................... 1 10914 62.0% 62.1%NO............................ 2 5306 30.1% 37.9% RESERVED CODES: NO PARENT QUEX............. 1215 6.9% (MISS) MULTIPLE RESPONSE.......... 6 1 0.0% (MISS) MISSING.................... 8 174 1.0% (MISS) ----- ----- ----- TOTALS: 17610 100.0% 100.0%
K-12

F2: Parent ComponentData File User's Manual
-------------Question 8B Tape Pos. 21-21------------- Format: I1
F2P8B LIVES W/ TEEN - TEEN'S STEPFATHER
My teenager's stepfather
PER- WGTD RESPONSE CODES FREQ CENT PCT ---------- -------- ----- ----- -----YES........................... 1 1590 9.0% 11.6%NO............................ 2 14628 83.1% 88.4% RESERVED CODES: NO PARENT QUEX............. 1215 6.9% (MISS) MULTIPLE RESPONSE.......... 6 2 0.0% (MISS) MISSING.................... 8 175 1.0% (MISS) ----- ----- ----- TOTALS: 17610 100.0% 100.0%
K-13

F2: Parent ComponentData File User's Manual
-------------Question 8C Tape Pos. 22-22------------- Format: I1
F2P8C LIVES W/ TEEN - OTHER ADULT MALE
Other adult male (such as my teenager's foster father,guardian)
PER- WGTD RESPONSE CODES FREQ CENT PCT ---------- -------- ----- ----- -----YES........................... 1 924 5.2% 6.1%NO............................ 2 15288 86.8% 93.9% RESERVED CODES: NO PARENT QUEX............. 1215 6.9% (MISS) MULTIPLE RESPONSE.......... 6 7 0.0% (MISS) MISSING.................... 8 176 1.0% (MISS) ----- ----- ----- TOTALS: 17610 100.0% 100.0%
K-14

F2: Parent ComponentData File User's Manual
-------------Question 8D Tape Pos. 23-23------------- Format: I1
F2P8D LIVES W/ TEEN - TEEN'S MOTHER
My teenager's mother
PER- WGTD RESPONSE CODES FREQ CENT PCT ---------- -------- ----- ----- -----YES........................... 1 14470 82.2% 87.2%NO............................ 2 1754 10.0% 12.8% RESERVED CODES: NO PARENT QUEX............. 1215 6.9% (MISS) MISSING.................... 8 171 1.0% (MISS) ----- ----- ----- TOTALS: 17610 100.0% 100.0%
K-15

F2: Parent ComponentData File User's Manual
-------------Question 8E Tape Pos. 24-24------------- Format: I1
F2P8E LIVES W/ TEEN - TEEN'S STEPMOTHER
My teenager's stepmother
PER- WGTD RESPONSE CODES FREQ CENT PCT ---------- -------- ----- ----- -----YES........................... 1 496 2.8% 3.3%NO............................ 2 15721 89.3% 96.7% RESERVED CODES: NO PARENT QUEX............. 1215 6.9% (MISS) MULTIPLE RESPONSE.......... 6 2 0.0% (MISS) MISSING.................... 8 176 1.0% (MISS) ----- ----- ----- TOTALS: 17610 100.0% 100.0%
K-16

F2: Parent ComponentData File User's Manual
-------------Question 8F Tape Pos. 25-25------------- Format: I1
F2P8F LIVES W/ TEEN - OTHER ADULT FEMALE
Other adult female (such as my teenager's foster mother,guardian)
PER- WGTD RESPONSE CODES FREQ CENT PCT ---------- -------- ----- ----- -----YES........................... 1 832 4.7% 6.0%NO............................ 2 15387 87.4% 94.0% RESERVED CODES: NO PARENT QUEX............. 1215 6.9% (MISS) MISSING.................... 8 176 1.0% (MISS) ----- ----- ----- TOTALS: 17610 100.0% 100.0%
K-17

F2: Parent ComponentData File User's Manual
-------------Question 8G Tape Pos. 26-26------------- Format: I1
F2P8G LIVES W/ TEEN - TEEN'S SPOUSE
My teenager's husband/wife
PER- WGTD RESPONSE CODES FREQ CENT PCT ---------- -------- ----- ----- -----YES........................... 1 322 1.8% 2.2%NO............................ 2 15899 90.3% 97.8% RESERVED CODES: NO PARENT QUEX............. 1215 6.9% (MISS) MULTIPLE RESPONSE.......... 6 2 0.0% (MISS) MISSING.................... 8 172 1.0% (MISS) ----- ----- ----- TOTALS: 17610 100.0% 100.0%
K-18

F2: Parent ComponentData File User's Manual
-------------Question 8H Tape Pos. 27-27------------- Format: I1
F2P8H LIVES W/ TEEN - TEEN'S BOY/GIRLFRIEND
My teenager's boyfriend/girlfriend
PER- WGTD RESPONSE CODES FREQ CENT PCT ---------- -------- ----- ----- -----YES........................... 1 265 1.5% 2.0%NO............................ 2 15949 90.6% 98.0% RESERVED CODES: NO PARENT QUEX............. 1215 6.9% (MISS) MULTIPLE RESPONSE.......... 6 2 0.0% (MISS) MISSING.................... 8 179 1.0% (MISS) ----- ----- ----- TOTALS: 17610 100.0% 100.0%
K-19

F2: Parent ComponentData File User's Manual
------------Question 9------------
How many of the following people live in the same householdwith the teenager named on the front cover of this booklet?Please include people listed in question 8, as applicable.
K-20

F2: Parent ComponentData File User's Manual
-------------Question 9A Tape Pos. 28-29------------- Format: I2
F2P9A # LIVE W/ TEEN - TEEN'S BROTHERS
My teenager's brother(s) (including adopted, step- orhalf-)
PER- WGTD RESPONSE CODES FREQ CENT PCT ---------- -------- ----- ----- -----NONE.......................... 00 8257 46.9% 52.6%ONE........................... 01 5603 31.8% 33.2%TWO........................... 02 1670 9.5% 10.3%THREE......................... 03 437 2.5% 2.7%FOUR.......................... 04 120 0.7% 0.8%FIVE.......................... 05 34 0.2% 0.3%SIX OR MORE................... 06 15 0.1% 0.1% RESERVED CODES: NO PARENT QUEX............. 1215 6.9% (MISS) MULTIPLE RESPONSE.......... 96 5 0.0% (MISS) MISSING.................... 98 254 1.4% (MISS) ----- ----- ----- TOTALS: 17610 100.0% 100.0%
K-21

F2: Parent ComponentData File User's Manual
-------------Question 9B Tape Pos. 30-31------------- Format: I2
F2P9B # LIVE W/ TEEN - TEEN'S SISTERS
My teenager's sister(s) (including adopted, step- or half-)
PER- WGTD RESPONSE CODES FREQ CENT PCT ---------- -------- ----- ----- -----NONE.......................... 00 8912 50.6% 54.9%ONE........................... 01 5317 30.2% 32.5%TWO........................... 02 1455 8.3% 9.3%THREE......................... 03 336 1.9% 2.4%FOUR.......................... 04 84 0.5% 0.7%FIVE.......................... 05 21 0.1% 0.2%SIX OR MORE................... 06 7 0.0% 0.1% RESERVED CODES: NO PARENT QUEX............. 1215 6.9% (MISS) MULTIPLE RESPONSE.......... 96 5 0.0% (MISS) MISSING.................... 98 258 1.5% (MISS) ----- ----- ----- TOTALS: 17610 100.0% 100.0%
K-22

F2: Parent ComponentData File User's Manual
-------------Question 9C Tape Pos. 32-33------------- Format: I2
F2P9C # LIVE W/ TEEN - TEEN'S CHILDREN
My teenager's child or children
PER- WGTD RESPONSE CODES FREQ CENT PCT ---------- -------- ----- ----- -----NONE.......................... 00 15456 87.8% 94.5%ONE........................... 01 550 3.1% 4.5%TWO........................... 02 102 0.6% 0.8%THREE......................... 03 20 0.1% 0.1%FOUR.......................... 04 1 0.0% 0.0%SIX OR MORE................... 06 1 0.0% 0.0% RESERVED CODES: NO PARENT QUEX............. 1215 6.9% (MISS) MULTIPLE RESPONSE.......... 96 2 0.0% (MISS) MISSING.................... 98 263 1.5% (MISS) ----- ----- ----- TOTALS: 17610 100.0% 100.0%
K-23
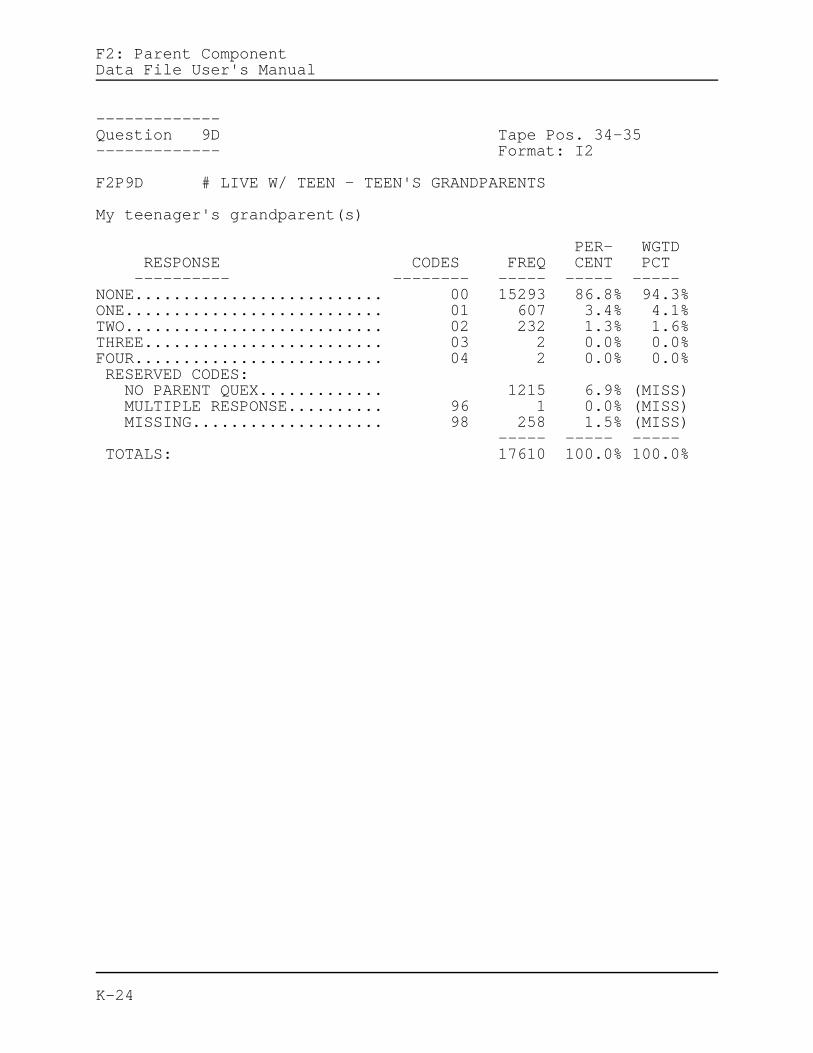
F2: Parent ComponentData File User's Manual
-------------Question 9D Tape Pos. 34-35------------- Format: I2
F2P9D # LIVE W/ TEEN - TEEN'S GRANDPARENTS
My teenager's grandparent(s)
PER- WGTD RESPONSE CODES FREQ CENT PCT ---------- -------- ----- ----- -----NONE.......................... 00 15293 86.8% 94.3%ONE........................... 01 607 3.4% 4.1%TWO........................... 02 232 1.3% 1.6%THREE......................... 03 2 0.0% 0.0%FOUR.......................... 04 2 0.0% 0.0% RESERVED CODES: NO PARENT QUEX............. 1215 6.9% (MISS) MULTIPLE RESPONSE.......... 96 1 0.0% (MISS) MISSING.................... 98 258 1.5% (MISS) ----- ----- ----- TOTALS: 17610 100.0% 100.0%
K-24

F2: Parent ComponentData File User's Manual
-------------Question 9E Tape Pos. 36-37------------- Format: I2
F2P9E # LIVE W/TEEN - OTH RELATIVES UNDER 18
Other relative(s) (under 18)
PER- WGTD RESPONSE CODES FREQ CENT PCT ---------- -------- ----- ----- -----NONE.......................... 00 15296 86.9% 93.5%ONE........................... 01 511 2.9% 4.1%TWO........................... 02 234 1.3% 1.8%THREE......................... 03 52 0.3% 0.4%FOUR.......................... 04 18 0.1% 0.1%FIVE.......................... 05 9 0.1% 0.1%SIX OR MORE................... 06 7 0.0% 0.0% RESERVED CODES: NO PARENT QUEX............. 1215 6.9% (MISS) MULTIPLE RESPONSE.......... 96 7 0.0% (MISS) MISSING.................... 98 261 1.5% (MISS) ----- ----- ----- TOTALS: 17610 100.0% 100.0%
K-25

F2: Parent ComponentData File User's Manual
-------------Question 9F Tape Pos. 38-39------------- Format: I2
F2P9F # LIVE W/ TEEN - OTH RELATIVES OVER 18
Other relative(s) (over 18)
PER- WGTD RESPONSE CODES FREQ CENT PCT ---------- -------- ----- ----- -----NONE.......................... 00 662 3.8% 4.7%ONE........................... 01 3244 18.4% 22.7%TWO........................... 02 11796 67.0% 69.8%THREE......................... 03 373 2.1% 2.4%FOUR.......................... 04 43 0.2% 0.2%FIVE.......................... 05 12 0.1% 0.1%SIX OR MORE................... 06 5 0.0% 0.0% RESERVED CODES: NO PARENT QUEX............. 1215 6.9% (MISS) MULTIPLE RESPONSE.......... 96 1 0.0% (MISS) MISSING.................... 98 259 1.5% (MISS) ----- ----- ----- TOTALS: 17610 100.0% 100.0%
K-26

F2: Parent ComponentData File User's Manual
-------------Question 9G Tape Pos. 40-41------------- Format: I2
F2P9G # LIVE W/ TEEN - NON-RELATIVES UNDER 18
Non-relative(s) (under 18)
PER- WGTD RESPONSE CODES FREQ CENT PCT ---------- -------- ----- ----- -----NONE.......................... 00 15866 90.1% 98.3%ONE........................... 01 184 1.0% 1.2%TWO........................... 02 61 0.3% 0.4%THREE......................... 03 12 0.1% 0.1%FOUR.......................... 04 7 0.0% 0.0%FIVE.......................... 05 1 0.0% 0.0%SIX OR MORE................... 06 4 0.0% 0.0% RESERVED CODES: NO PARENT QUEX............. 1215 6.9% (MISS) MULTIPLE RESPONSE.......... 96 1 0.0% (MISS) MISSING.................... 98 259 1.5% (MISS) ----- ----- ----- TOTALS: 17610 100.0% 100.0%
K-27

F2: Parent ComponentData File User's Manual
-------------Question 9H Tape Pos. 42-43------------- Format: I2
F2P9H # LIVE W/ TEEN - NON-RELATIVES OVER 18
Non-relative(s) (over 18)
PER- WGTD RESPONSE CODES FREQ CENT PCT ---------- -------- ----- ----- -----NONE.......................... 00 14323 81.3% 87.6%ONE........................... 01 1368 7.8% 9.2%TWO........................... 02 394 2.2% 2.9%THREE......................... 03 32 0.2% 0.2%FOUR.......................... 04 8 0.0% 0.1%FIVE.......................... 05 5 0.0% 0.0%SIX OR MORE................... 06 4 0.0% 0.0% RESERVED CODES: NO PARENT QUEX............. 1215 6.9% (MISS) MULTIPLE RESPONSE.......... 96 2 0.0% (MISS) MISSING.................... 98 259 1.5% (MISS) ----- ----- ----- TOTALS: 17610 100.0% 100.0%
K-28

F2: Parent ComponentData File User's Manual
-------------Question 10-------------
In all, how many people live in the household of theteenager (named on the cover) who are...
K-29

F2: Parent ComponentData File User's Manual
--------------Question 10A Tape Pos. 44-45-------------- Format: I2
F2P10A # LIVE W/ TEEN - TOTAL UNDER 18 YRS
Under the age of 18?
PER- WGTD RESPONSE CODES FREQ CENT PCT ---------- -------- ----- ----- -----0............................. 00 4928 28.0% 30.2%1............................. 01 5551 31.5% 34.3%2............................. 02 3212 18.2% 21.0%3............................. 03 1340 7.6% 8.5%4............................. 04 525 3.0% 3.6%5............................. 05 177 1.0% 1.2%6............................. 06 65 0.4% 0.4%7............................. 07 31 0.2% 0.3%8............................. 08 23 0.1% 0.3%9............................. 09 3 0.0% 0.0%10............................ 10 4 0.0% 0.0%11............................ 11 4 0.0% 0.0%12............................ 12 1 0.0% 0.0%13............................ 13 1 0.0% 0.0% RESERVED CODES: NO PARENT QUEX............. 1215 6.9% (MISS) MISSING.................... 98 530 3.0% (MISS) ----- ----- ----- TOTALS: 17610 100.0% 100.0%
K-30

F2: Parent ComponentData File User's Manual
--------------Question 10B Tape Pos. 46-47-------------- Format: I2
F2P10B # LIVE W/ TEEN - TOTAL 18 YRS AND OVER
18 years of age or older?
PER- WGTD RESPONSE CODES FREQ CENT PCT ---------- -------- ----- ----- -----0............................. 00 12 0.1% 0.1%1............................. 01 402 2.3% 2.8%2............................. 02 3017 17.1% 20.9%3............................. 03 9462 53.7% 57.3%4............................. 04 2291 13.0% 13.7%5............................. 05 614 3.5% 3.8%6............................. 06 159 0.9% 0.9%7............................. 07 39 0.2% 0.3%8............................. 08 13 0.1% 0.1%9............................. 09 8 0.0% 0.0%10............................ 10 2 0.0% 0.0%11............................ 11 1 0.0% 0.0% RESERVED CODES: NO PARENT QUEX............. 1215 6.9% (MISS) MISSING.................... 98 375 2.1% (MISS) ----- ----- ----- TOTALS: 17610 100.0% 100.0%
K-31

F2: Parent ComponentData File User's Manual
-------------Question 11-------------
Which best describes you and your spouse/partner's currentemployment situation right now?
K-32

F2: Parent ComponentData File User's Manual
--------------Question 11A Tape Pos. 48-49-------------- Format: I2
F2P11A R'S CURRENT EMPLOYMENT SITUATION
You
PER- WGTD RESPONSE CODES FREQ CENT PCT ---------- -------- ----- ----- -----WORKING PART-TIME............. 01 2545 14.5% 15.3%WORKING FULL-TIME............. 02 9620 54.6% 59.2%THIS PERSON HAS A JOB BUT ISNOT AT WORK RIGHT NOW BECAUSEOF TEMPORARY ILLNESS,VACATION, OR STRIKE........... 03 326 1.9% 2.1%RETIRED....................... 04 282 1.6% 2.0%IN SCHOOL FULL-TIME........... 05 150 0.9% 0.8%KEEPING HOUSE FULL-TIME....... 06 2242 12.7% 13.6%NOT WORKING, BUT LOOKING FORWORK.......................... 07 549 3.1% 3.7%NOT WORKING AND NOT LOOKINGFOR WORK...................... 08 227 1.3% 1.4%NONE OF ABOVE................. 09 290 1.6% 2.0% RESERVED CODES: NO PARENT QUEX............. 1215 6.9% (MISS) MULTIPLE RESPONSE.......... 96 52 0.3% (MISS) MISSING.................... 98 112 0.6% (MISS) ----- ----- ----- TOTALS: 17610 100.0% 100.0%
K-33

F2: Parent ComponentData File User's Manual
--------------Question 11B Tape Pos. 50-51-------------- Format: I2
F2P11B SPOUSE/PTNR'S CURRENT EMPLYMNT SITUATION
Your Spouse/Partner
PER- WGTD RESPONSE CODES FREQ CENT PCT ---------- -------- ----- ----- -----WORKING PART-TIME............. 01 857 4.9% 5.0%WORKING FULL-TIME............. 02 10184 57.8% 62.9%THIS PERSON HAS A JOB BUT ISNOT AT WORK RIGHT NOW BECAUSEOF TEMPORARY ILLNESS,VACATION, OR STRIKE........... 03 282 1.6% 2.0%RETIRED....................... 04 431 2.4% 2.9%IN SCHOOL FULL-TIME........... 05 45 0.3% 0.2%KEEPING HOUSE FULL-TIME....... 06 461 2.6% 2.8%NOT WORKING, BUT LOOKING FORWORK.......................... 07 320 1.8% 2.3%NOT WORKING AND NOT LOOKINGFOR WORK...................... 08 124 0.7% 0.7%NONE OF ABOVE................. 09 233 1.3% 1.5%DOES NOT APPLY................ 10 2729 15.5% 19.8% RESERVED CODES: NO PARENT QUEX............. 1215 6.9% (MISS) MULTIPLE RESPONSE.......... 96 53 0.3% (MISS) MISSING.................... 98 676 3.8% (MISS) ----- ----- ----- TOTALS: 17610 100.0% 100.0%
K-34

F2: Parent ComponentData File User's Manual
-------------Question 12 Tape Pos. 52-52------------- Format: I1
F2P12 HAVE YOU EVER HELD A REGULAR JOB
Have you ever held a regular job (includingself-employment)?
PER- WGTD RESPONSE CODES FREQ CENT PCT ---------- -------- ----- ----- -----YES........................... 1 15371 87.3% 94.1%NO............................ 2 975 5.5% 5.9% RESERVED CODES: NO PARENT QUEX............. 1215 6.9% (MISS) MISSING.................... 8 49 0.3% (MISS) ----- ----- ----- TOTALS: 17610 100.0% 100.0%
K-35

F2: Parent ComponentData File User's Manual
-------------Question 13 Tape Pos. 53-54------------- Format: I2
F2P13 DESCRIPTION OF CURRENT JOB
Which of the categories below comes closest to describingyour present or most recent job or occupation?
PER- WGTD RESPONSE CODES FREQ CENT PCT ---------- -------- ----- ----- -----OFFICE WORKER SUCH AS DATAENTRY CLERK, BANK TELLER,BOOKKEEPER, SECRETARY, WORDPROCESSOR, MAIL CARRIER,TICKET AGENT.................. 01 2669 15.2% 18.8%TRADESPERSON SUCH AS BAKER,AUTO MECHANIC, HOUSEPAINTER,PLUMBER, PHONE CABLEINSTALLER, CARPENTER.......... 02 415 2.4% 3.0%FARMER, FARM MANAGER.......... 03 124 0.7% 0.8%FULL-TIME HOMEMAKER........... 04 935 5.3% 5.4%LABORER SUCH AS CONSTRUCTIONWORKER, CAR WASHER, GARBAGECOLLECTOR, FARM WORKER........ 05 695 3.9% 4.7%MANAGER SUCH AS SALESMANAGER, SCHOOLADMINISTRATOR, RETAIL BUYER,RESTAURANT MANAGER,GOVERNMENT ADMINISTRATOR...... 06 1462 8.3% 9.6%MILITARY SUCH AS CAREEROFFICER OR ENLISTED PERSON INTHE ARMED FORCES.............. 07 70 0.4% 0.5%OPERATOR OF MACHINES ORTOOLS, SUCH AS MEAT CUTTER,ASSEMBLER, WELDER,TAXICAB/BUS/TRUCK DRIVER...... 08 843 4.8% 5.4%PROFESSIONAL SUCH ASACCOUNTANT, REGISTERED NURSE,ENGINEER, BANKER, LIBRARIAN,WRITER, SOCIAL WORKER, ACTOR,ATHLETE, ARTIST, POLITICIAN,BUT NOT INCLUDING SCHOOLTEACHER....................... 09 1716 9.7% 10.3%PROFESSIONAL SUCH ASMINISTER, DENTIST, DOCTOR,LAWYER, SCIENTIST, COLLEGETEACHER....................... 10 506 2.9% 2.3%OWNER OF A SMALL BUSINESS ORRESTAURANT, CONTRACTOR........ 11 756 4.3% 5.2%PROTECTIVE SERVICES SUCH AS
K-36

F2: Parent ComponentData File User's Manual
POLICE OFFICER, FIREFIGHTER,DETECTIVE, SHERIFF, SECURITYGUARD......................... 12 123 0.7% 1.1%SALES SUCH AS SALESREPRESENTATIVE, ADVERTISINGOR INSURANCE AGENT, REALESTATE BROKER................. 13 585 3.3% 3.9%SCHOOL TEACHER SUCH ASELEMENTARY, JUNIOR HIGH, ORHIGH SCHOOL, BUT NOT COLLEGE.. 14 1049 6.0% 6.4%SERVICE WORKER SUCH AS HAIRSTYLIST, PRACTICAL NURSE,CHILD CARE WORKER, WAITER,DOMESTIC, JANITOR............. 15 1549 8.8% 11.5%TECHNICAL SUCH AS COMPUTERPROGRAMMER, MEDICAL OR DENTALTECHNICIAN, DRAFTSPERSON...... 16 419 2.4% 2.6%OTHER......................... 17 1348 7.7% 8.7% RESERVED CODES: NO PARENT QUEX............. 1215 6.9% (MISS) MULTIPLE RESPONSE.......... 96 101 0.6% (MISS) MISSING.................... 98 55 0.3% (MISS) LEGITIMATE SKIP............ 99 975 5.5% (MISS) ----- ----- ----- TOTALS: 17610 100.0% 100.0%
K-37

F2: Parent ComponentData File User's Manual
-------------Question 14 Tape Pos. 55-56------------- Format: I2
F2P14 WHO DO YOU WORK FOR
In your present or most recent job are/were you:
PER- WGTD RESPONSE CODES FREQ CENT PCT ---------- -------- ----- ----- -----AN EMPLOYEE OF A COMPANY ORBUSINESS...................... 01 8190 46.5% 57.2%AN EMPLOYEE OF A NON-PROFITORGANIZATION OR INSTITUTION... 02 1849 10.5% 11.7%A GOVERNMENT EMPLOYEE(FEDERAL, STATE OR LOCAL)..... 03 2413 13.7% 16.6%SELF-EMPLOYED................. 04 1748 9.9% 11.7%WORKING FOR PAY IN YOURFAMILY'S BUSINESS OR FARM..... 05 180 1.0% 1.2%WORKING WITHOUT PAY IN YOURFAMILY'S BUSINESS OR FARM..... 06 142 0.8% 0.8%WORKING WITHOUT PAY IN AVOLUNTEER JOB................. 07 176 1.0% 0.9% RESERVED CODES: NO PARENT QUEX............. 1215 6.9% (MISS) MULTIPLE RESPONSE.......... 96 40 0.2% (MISS) MISSING.................... 98 682 3.9% (MISS) LEGITIMATE SKIP............ 99 975 5.5% (MISS) ----- ----- ----- TOTALS: 17610 100.0% 100.0%
K-38

F2: Parent ComponentData File User's Manual
-------------Question 15 Tape Pos. 57-57------------- Format: I1
F2P15 SPOUSE/PARTNER EVER HELD A REGULAR JOB
Has your spouse/partner ever held a regular job (includingself-employment)?
PER- WGTD RESPONSE CODES FREQ CENT PCT ---------- -------- ----- ----- -----YES........................... 1 12724 72.3% 76.6%NO............................ 2 480 2.7% 2.8%DOES NOT APPLY, NOSPOUSE/PARTNER................ 3 2931 16.6% 20.6% RESERVED CODES: NO PARENT QUEX............. 1215 6.9% (MISS) MULTIPLE RESPONSE.......... 6 3 0.0% (MISS) MISSING.................... 8 257 1.5% (MISS) ----- ----- ----- TOTALS: 17610 100.0% 100.0%
K-39

F2: Parent ComponentData File User's Manual
-------------Question 16 Tape Pos. 58-59------------- Format: I2
F2P16 DESCRPTN OF SPOUSE/PARTNER'S CURRENT JOB
Which of the categories below comes closest to describingyour spouse/partner's present or most recent job oroccupation?
PER- WGTD RESPONSE CODES FREQ CENT PCT ---------- -------- ----- ----- -----OFFICE WORKER SUCH AS DATAENTRY CLERK, BANK TELLER,BOOKKEEPER, SECRETARY, WORDPROCESSOR, MAIL CARRIER,TICKET AGENT.................. 01 644 3.7% 5.9%TRADESPERSON SUCH AS BAKER,AUTO MECHANIC, HOUSEPAINTER,PLUMBER, PHONE CABLEINSTALLER, CARPENTER.......... 02 1087 6.2% 9.4%FARMER, FARM MANAGER.......... 03 310 1.8% 2.5%FULL-TIME HOMEMAKER........... 04 118 0.7% 0.8%LABORER SUCH AS CONSTRUCTIONWORKER, CAR WASHER, GARBAGECOLLECTOR, FARM WORKER........ 05 1234 7.0% 10.5%MANAGER SUCH AS SALESMANAGER, SCHOOLADMINISTRATOR, RETAIL BUYER,RESTAURANT MANAGER,GOVERNMENT ADMINISTRATOR...... 06 1418 8.1% 12.1%MILITARY SUCH AS CAREEROFFICER OR ENLISTED PERSON INTHE ARMED FORCES.............. 07 119 0.7% 1.2%OPERATOR OF MACHINES ORTOOLS, SUCH AS MEAT CUTTER,ASSEMBLER, WELDER,TAXICAB/BUS/TRUCK DRIVER...... 08 1377 7.8% 11.5%PROFESSIONAL SUCH ASACCOUNTANT, REGISTERED NURSE,ENGINEER, BANKER, LIBRARIAN,WRITER, SOCIAL WORKER, ACTOR,ATHLETE, ARTIST, POLITICIAN,BUT NOT INCLUDING SCHOOLTEACHER....................... 09 1195 6.8% 8.4%PROFESSIONAL SUCH ASMINISTER, DENTIST, DOCTOR,LAWYER, SCIENTIST, COLLEGETEACHER....................... 10 786 4.5% 4.0%OWNER OF A SMALL BUSINESS ORRESTAURANT, CONTRACTOR........ 11 1089 6.2% 7.9%
K-40

F2: Parent ComponentData File User's Manual
PROTECTIVE SERVICES SUCH ASPOLICE OFFICER, FIREFIGHTER,DETECTIVE, SHERIFF, SECURITYGUARD......................... 12 284 1.6% 2.2%SALES SUCH AS SALESREPRESENTATIVE, ADVERTISINGOR INSURANCE AGENT, REALESTATE BROKER................. 13 577 3.3% 4.3%SCHOOL TEACHER SUCH ASELEMENTARY, JUNIOR HIGH, ORHIGH SCHOOL, BUT NOT COLLEGE.. 14 425 2.4% 3.0%SERVICE WORKER SUCH AS HAIRSTYLIST, PRACTICAL NURSE,CHILD CARE WORKER, WAITER,DOMESTIC, JANITOR............. 15 583 3.3% 5.1%TECHNICAL SUCH AS COMPUTERPROGRAMMER, MEDICAL OR DENTALTECHNICIAN, DRAFTSPERSON...... 16 450 2.6% 3.5%OTHER......................... 17 1002 5.7% 7.8% RESERVED CODES: NO PARENT QUEX............. 1215 6.9% (MISS) MULTIPLE RESPONSE.......... 96 51 0.3% (MISS) MISSING.................... 98 235 1.3% (MISS) LEGITIMATE SKIP............ 99 3411 19.4% (MISS) ----- ----- ----- TOTALS: 17610 100.0% 100.0%
K-41

F2: Parent ComponentData File User's Manual
-------------Question 17 Tape Pos. 60-61------------- Format: I2
F2P17 WHO DOES SPOUSE/PARTNER WORK FOR
In his or her present or most recent job is/was yourspouse/partner:
PER- WGTD RESPONSE CODES FREQ CENT PCT ---------- -------- ----- ----- -----AN EMPLOYEE OF A COMPANY ORBUSINESS...................... 01 7557 42.9% 63.6%AN EMPLOYEE OF A NON-PROFITORGANIZATION OR INSTITUTION... 02 689 3.9% 4.8%A GOVERNMENT EMPLOYEE(FEDERAL, STATE OR LOCAL)..... 03 1735 9.9% 14.5%SELF-EMPLOYED................. 04 2265 12.9% 15.6%WORKING FOR PAY IN HIS/HERFAMILY'S BUSINESS OR FARM..... 05 156 0.9% 1.1%WORKING WITHOUT PAY INHIS/HER FAMILY'S BUSINESS ORFARM.......................... 06 31 0.2% 0.2%WORKING WITHOUT PAY IN AVOLUNTEER JOB................. 07 23 0.1% 0.2% RESERVED CODES: NO PARENT QUEX............. 1215 6.9% (MISS) MULTIPLE RESPONSE.......... 96 30 0.2% (MISS) MISSING.................... 98 498 2.8% (MISS) LEGITIMATE SKIP............ 99 3411 19.4% (MISS) ----- ----- ----- TOTALS: 17610 100.0% 100.0%
K-42

F2: Parent ComponentData File User's Manual
-------------Question 18-------------
For each year since 1988, did any of the following changesoccur in your life?
K-43

F2: Parent ComponentData File User's Manual
---------------Question 18A1 Tape Pos. 62-62--------------- Format: I1
F2P18A1 R DIVORCED IN 1988
I divorced in 1988
PER- WGTD RESPONSE CODES FREQ CENT PCT ---------- -------- ----- ----- -----APPLIES....................... 1 240 1.4% 1.7%DOES NOT APPLY................ 2 15924 90.4% 98.3% RESERVED CODES: NO PARENT QUEX............. 1215 6.9% (MISS) MISSING.................... 8 231 1.3% (MISS) ----- ----- ----- TOTALS: 17610 100.0% 100.0%
K-44

F2: Parent ComponentData File User's Manual
---------------Question 18A2 Tape Pos. 63-63--------------- Format: I1
F2P18A2 R SEPARATED IN 1988
I separated in 1988
PER- WGTD RESPONSE CODES FREQ CENT PCT ---------- -------- ----- ----- -----APPLIES....................... 1 303 1.7% 2.1%DOES NOT APPLY................ 2 15861 90.1% 97.9% RESERVED CODES: NO PARENT QUEX............. 1215 6.9% (MISS) MISSING.................... 8 231 1.3% (MISS) ----- ----- ----- TOTALS: 17610 100.0% 100.0%
K-45

F2: Parent ComponentData File User's Manual
---------------Question 18A3 Tape Pos. 64-64--------------- Format: I1
F2P18A3 R WIDOWED IN 1988
I was widowed in 1988
PER- WGTD RESPONSE CODES FREQ CENT PCT ---------- -------- ----- ----- -----APPLIES....................... 1 73 0.4% 0.5%DOES NOT APPLY................ 2 16091 91.4% 99.5% RESERVED CODES: NO PARENT QUEX............. 1215 6.9% (MISS) MISSING.................... 8 231 1.3% (MISS) ----- ----- ----- TOTALS: 17610 100.0% 100.0%
K-46

F2: Parent ComponentData File User's Manual
---------------Question 18A4 Tape Pos. 65-65--------------- Format: I1
F2P18A4 R MARRIED OR REMARRIED IN 1988
I married or remarried in 1988
PER- WGTD RESPONSE CODES FREQ CENT PCT ---------- -------- ----- ----- -----APPLIES....................... 1 201 1.1% 1.5%DOES NOT APPLY................ 2 15963 90.6% 98.5% RESERVED CODES: NO PARENT QUEX............. 1215 6.9% (MISS) MISSING.................... 8 231 1.3% (MISS) ----- ----- ----- TOTALS: 17610 100.0% 100.0%
K-47

F2: Parent ComponentData File User's Manual
---------------Question 18A5 Tape Pos. 66-66--------------- Format: I1
F2P18A5 R BEGAN LIVING WITH SOMEONE IN 1988
I began living with someone in a marriage-like relationshipin 1988
PER- WGTD RESPONSE CODES FREQ CENT PCT ---------- -------- ----- ----- -----APPLIES....................... 1 150 0.9% 1.1%DOES NOT APPLY................ 2 16014 90.9% 98.9% RESERVED CODES: NO PARENT QUEX............. 1215 6.9% (MISS) MISSING.................... 8 231 1.3% (MISS) ----- ----- ----- TOTALS: 17610 100.0% 100.0%
K-48

F2: Parent ComponentData File User's Manual
---------------Question 18A6 Tape Pos. 67-67--------------- Format: I1
F2P18A6 NONE OF THESE EVENTS OCCURRED IN 1988
None of these events occurred during 1988
PER- WGTD RESPONSE CODES FREQ CENT PCT ---------- -------- ----- ----- -----APPLIES....................... 1 15292 86.8% 93.7%DOES NOT APPLY................ 2 872 5.0% 6.3% RESERVED CODES: NO PARENT QUEX............. 1215 6.9% (MISS) MISSING.................... 8 231 1.3% (MISS) ----- ----- ----- TOTALS: 17610 100.0% 100.0%
K-49

F2: Parent ComponentData File User's Manual
---------------Question 18B1 Tape Pos. 68-68--------------- Format: I1
F2P18B1 R DIVORCED IN 1989
I divorced in 1989
PER- WGTD RESPONSE CODES FREQ CENT PCT ---------- -------- ----- ----- -----APPLIES....................... 1 211 1.2% 1.6%DOES NOT APPLY................ 2 15887 90.2% 98.4% RESERVED CODES: NO PARENT QUEX............. 1215 6.9% (MISS) MISSING.................... 8 297 1.7% (MISS) ----- ----- ----- TOTALS: 17610 100.0% 100.0%
K-50

F2: Parent ComponentData File User's Manual
---------------Question 18B2 Tape Pos. 69-69--------------- Format: I1
F2P18B2 R SEPARATED IN 1989
I separated in 1989
PER- WGTD RESPONSE CODES FREQ CENT PCT ---------- -------- ----- ----- -----APPLIES....................... 1 214 1.2% 1.7%DOES NOT APPLY................ 2 15884 90.2% 98.3% RESERVED CODES: NO PARENT QUEX............. 1215 6.9% (MISS) MISSING.................... 8 297 1.7% (MISS) ----- ----- ----- TOTALS: 17610 100.0% 100.0%
K-51

F2: Parent ComponentData File User's Manual
---------------Question 18B3 Tape Pos. 70-70--------------- Format: I1
F2P18B3 R WIDOWED IN 1989
I was widowed in 1989
PER- WGTD RESPONSE CODES FREQ CENT PCT ---------- -------- ----- ----- -----APPLIES....................... 1 41 0.2% 0.2%DOES NOT APPLY................ 2 16057 91.2% 99.8% RESERVED CODES: NO PARENT QUEX............. 1215 6.9% (MISS) MISSING.................... 8 297 1.7% (MISS) ----- ----- ----- TOTALS: 17610 100.0% 100.0%
K-52

F2: Parent ComponentData File User's Manual
---------------Question 18B4 Tape Pos. 71-71--------------- Format: I1
F2P18B4 R MARRIED OR REMARRIED IN 1989
I married or remarried in 1989
PER- WGTD RESPONSE CODES FREQ CENT PCT ---------- -------- ----- ----- -----APPLIES....................... 1 128 0.7% 1.1%DOES NOT APPLY................ 2 15970 90.7% 98.9% RESERVED CODES: NO PARENT QUEX............. 1215 6.9% (MISS) MISSING.................... 8 297 1.7% (MISS) ----- ----- ----- TOTALS: 17610 100.0% 100.0%
K-53

F2: Parent ComponentData File User's Manual
---------------Question 18B5 Tape Pos. 72-72--------------- Format: I1
F2P18B5 R BEGAN LIVING WITH SOMEONE IN 1989
I began living with someone in a marriage like relationshipin 1989
PER- WGTD RESPONSE CODES FREQ CENT PCT ---------- -------- ----- ----- -----APPLIES....................... 1 97 0.6% 0.8%DOES NOT APPLY................ 2 16001 90.9% 99.2% RESERVED CODES: NO PARENT QUEX............. 1215 6.9% (MISS) MISSING.................... 8 297 1.7% (MISS) ----- ----- ----- TOTALS: 17610 100.0% 100.0%
K-54

F2: Parent ComponentData File User's Manual
---------------Question 18B6 Tape Pos. 73-73--------------- Format: I1
F2P18B6 NONE OF THESE EVENTS OCCURRED IN 1989
None of these events occurred during 1989
PER- WGTD RESPONSE CODES FREQ CENT PCT ---------- -------- ----- ----- -----APPLIES....................... 1 15353 87.2% 94.3%DOES NOT APPLY................ 2 745 4.2% 5.7% RESERVED CODES: NO PARENT QUEX............. 1215 6.9% (MISS) MISSING.................... 8 297 1.7% (MISS) ----- ----- ----- TOTALS: 17610 100.0% 100.0%
K-55

F2: Parent ComponentData File User's Manual
---------------Question 18C1 Tape Pos. 74-74--------------- Format: I1
F2P18C1 R DIVORCED IN 1990
I divorced in 1990
PER- WGTD RESPONSE CODES FREQ CENT PCT ---------- -------- ----- ----- -----APPLIES....................... 1 198 1.1% 1.7%DOES NOT APPLY................ 2 15921 90.4% 98.3% RESERVED CODES: NO PARENT QUEX............. 1215 6.9% (MISS) MISSING.................... 8 276 1.6% (MISS) ----- ----- ----- TOTALS: 17610 100.0% 100.0%
K-56

F2: Parent ComponentData File User's Manual
---------------Question 18C2 Tape Pos. 75-75--------------- Format: I1
F2P18C2 R SEPARATED IN 1990
I separated in 1990
PER- WGTD RESPONSE CODES FREQ CENT PCT ---------- -------- ----- ----- -----APPLIES....................... 1 221 1.3% 1.4%DOES NOT APPLY................ 2 15898 90.3% 98.6% RESERVED CODES: NO PARENT QUEX............. 1215 6.9% (MISS) MISSING.................... 8 276 1.6% (MISS) ----- ----- ----- TOTALS: 17610 100.0% 100.0%
K-57

F2: Parent ComponentData File User's Manual
---------------Question 18C3 Tape Pos. 76-76--------------- Format: I1
F2P18C3 R WIDOWED IN 1990
I was widowed in 1990
PER- WGTD RESPONSE CODES FREQ CENT PCT ---------- -------- ----- ----- -----APPLIES....................... 1 56 0.3% 0.4%DOES NOT APPLY................ 2 16063 91.2% 99.6% RESERVED CODES: NO PARENT QUEX............. 1215 6.9% (MISS) MISSING.................... 8 276 1.6% (MISS) ----- ----- ----- TOTALS: 17610 100.0% 100.0%
K-58

F2: Parent ComponentData File User's Manual
---------------Question 18C4 Tape Pos. 77-77--------------- Format: I1
F2P18C4 R MARRIED OR REMARRIED IN 1990
I married or remarried in 1990
PER- WGTD RESPONSE CODES FREQ CENT PCT ---------- -------- ----- ----- -----APPLIES....................... 1 159 0.9% 1.1%DOES NOT APPLY................ 2 15960 90.6% 98.9% RESERVED CODES: NO PARENT QUEX............. 1215 6.9% (MISS) MISSING.................... 8 276 1.6% (MISS) ----- ----- ----- TOTALS: 17610 100.0% 100.0%
K-59
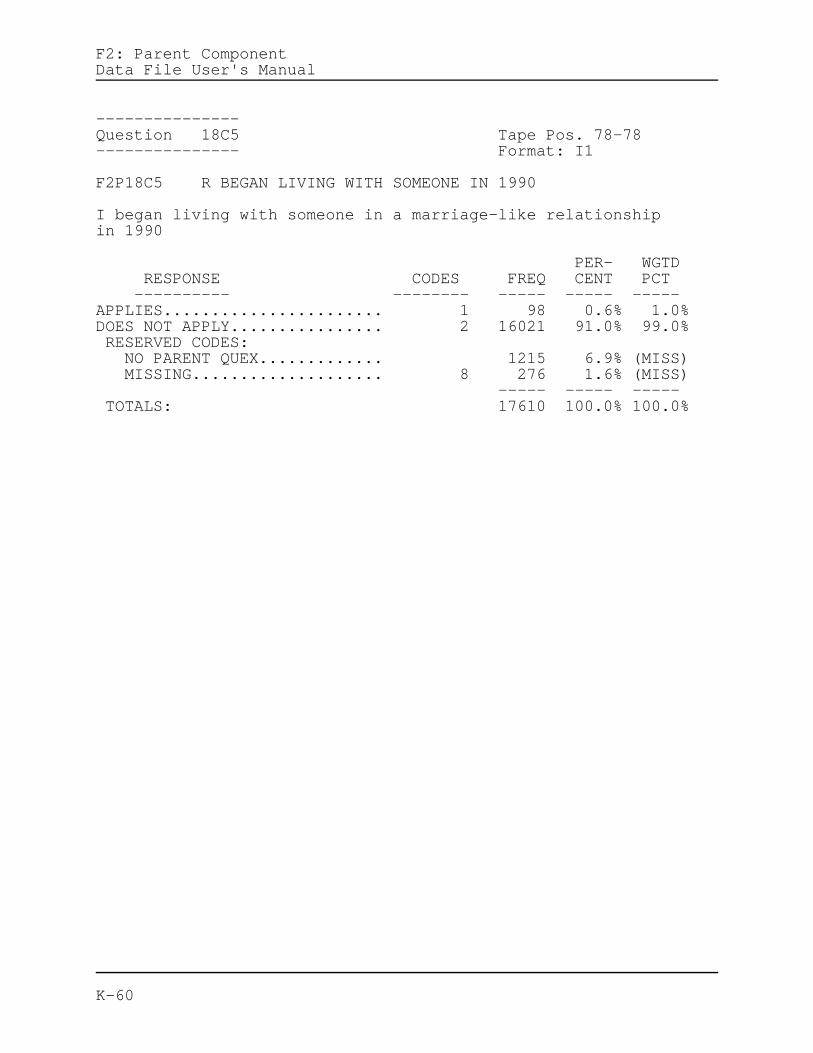
F2: Parent ComponentData File User's Manual
---------------Question 18C5 Tape Pos. 78-78--------------- Format: I1
F2P18C5 R BEGAN LIVING WITH SOMEONE IN 1990
I began living with someone in a marriage-like relationshipin 1990
PER- WGTD RESPONSE CODES FREQ CENT PCT ---------- -------- ----- ----- -----APPLIES....................... 1 98 0.6% 1.0%DOES NOT APPLY................ 2 16021 91.0% 99.0% RESERVED CODES: NO PARENT QUEX............. 1215 6.9% (MISS) MISSING.................... 8 276 1.6% (MISS) ----- ----- ----- TOTALS: 17610 100.0% 100.0%
K-60

F2: Parent ComponentData File User's Manual
---------------Question 18C6 Tape Pos. 79-79--------------- Format: I1
F2P18C6 NONE OF THESE EVENTS OCCURRED IN 1990
None of these events occurred during 1990
PER- WGTD RESPONSE CODES FREQ CENT PCT ---------- -------- ----- ----- -----APPLIES....................... 1 15348 87.2% 94.3%DOES NOT APPLY................ 2 771 4.4% 5.7% RESERVED CODES: NO PARENT QUEX............. 1215 6.9% (MISS) MISSING.................... 8 276 1.6% (MISS) ----- ----- ----- TOTALS: 17610 100.0% 100.0%
K-61

F2: Parent ComponentData File User's Manual
---------------Question 18D1 Tape Pos. 80-80--------------- Format: I1
F2P18D1 R DIVORCED IN 1991
I divorced in 1991
PER- WGTD RESPONSE CODES FREQ CENT PCT ---------- -------- ----- ----- -----APPLIES....................... 1 212 1.2% 1.7%DOES NOT APPLY................ 2 15931 90.5% 98.3% RESERVED CODES: NO PARENT QUEX............. 1215 6.9% (MISS) MISSING.................... 8 252 1.4% (MISS) ----- ----- ----- TOTALS: 17610 100.0% 100.0%
K-62

F2: Parent ComponentData File User's Manual
---------------Question 18D2 Tape Pos. 81-81--------------- Format: I1
F2P18D2 R SEPARATED IN 1991
I separated in 1991
PER- WGTD RESPONSE CODES FREQ CENT PCT ---------- -------- ----- ----- -----APPLIES....................... 1 189 1.1% 1.2%DOES NOT APPLY................ 2 15954 90.6% 98.8% RESERVED CODES: NO PARENT QUEX............. 1215 6.9% (MISS) MISSING.................... 8 252 1.4% (MISS) ----- ----- ----- TOTALS: 17610 100.0% 100.0%
K-63

F2: Parent ComponentData File User's Manual
---------------Question 18D3 Tape Pos. 82-82--------------- Format: I1
F2P18D3 R WIDOWED IN 1991
I was widowed in 1991
PER- WGTD RESPONSE CODES FREQ CENT PCT ---------- -------- ----- ----- -----APPLIES....................... 1 62 0.4% 0.3%DOES NOT APPLY................ 2 16081 91.3% 99.7% RESERVED CODES: NO PARENT QUEX............. 1215 6.9% (MISS) MISSING.................... 8 252 1.4% (MISS) ----- ----- ----- TOTALS: 17610 100.0% 100.0%
K-64

F2: Parent ComponentData File User's Manual
---------------Question 18D4 Tape Pos. 83-83--------------- Format: I1
F2P18D4 R MARRIED OR REMARRIED IN 1991
I married or remarried in 1991
PER- WGTD RESPONSE CODES FREQ CENT PCT ---------- -------- ----- ----- -----APPLIES....................... 1 156 0.9% 1.3%DOES NOT APPLY................ 2 15987 90.8% 98.7% RESERVED CODES: NO PARENT QUEX............. 1215 6.9% (MISS) MISSING.................... 8 252 1.4% (MISS) ----- ----- ----- TOTALS: 17610 100.0% 100.0%
K-65

F2: Parent ComponentData File User's Manual
---------------Question 18D5 Tape Pos. 84-84--------------- Format: I1
F2P18D5 R BEGAN LIVING WITH SOMEONE IN 1991
I began living with someone in a marriage-like relationshipin 1991
PER- WGTD RESPONSE CODES FREQ CENT PCT ---------- -------- ----- ----- -----APPLIES....................... 1 108 0.6% 1.0%DOES NOT APPLY................ 2 16035 91.1% 99.0% RESERVED CODES: NO PARENT QUEX............. 1215 6.9% (MISS) MISSING.................... 8 252 1.4% (MISS) ----- ----- ----- TOTALS: 17610 100.0% 100.0%
K-66
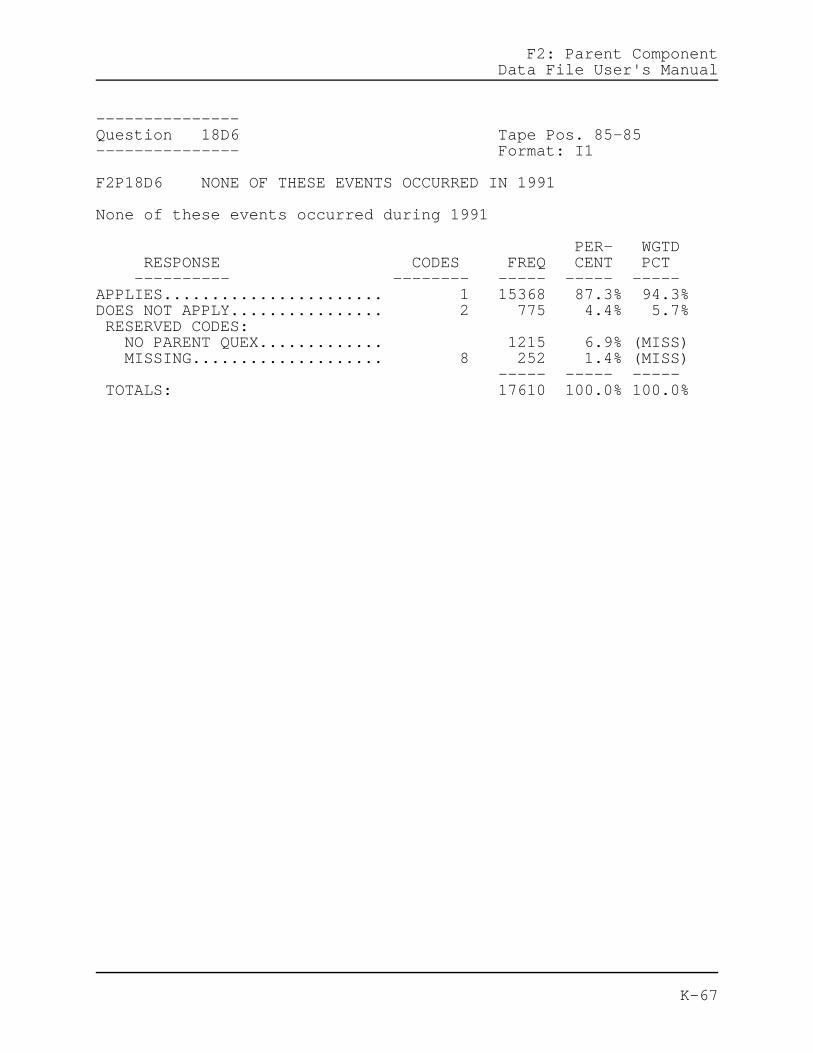
F2: Parent ComponentData File User's Manual
---------------Question 18D6 Tape Pos. 85-85--------------- Format: I1
F2P18D6 NONE OF THESE EVENTS OCCURRED IN 1991
None of these events occurred during 1991
PER- WGTD RESPONSE CODES FREQ CENT PCT ---------- -------- ----- ----- -----APPLIES....................... 1 15368 87.3% 94.3%DOES NOT APPLY................ 2 775 4.4% 5.7% RESERVED CODES: NO PARENT QUEX............. 1215 6.9% (MISS) MISSING.................... 8 252 1.4% (MISS) ----- ----- ----- TOTALS: 17610 100.0% 100.0%
K-67

F2: Parent ComponentData File User's Manual
-------------Question 19 Tape Pos. 86-86------------- Format: I1
F2P19 R'S RACE/ETHNICITY
Which best describes you?
PER- WGTD RESPONSE CODES FREQ CENT PCT ---------- -------- ----- ----- -----ASIAN OR PACIFIC ISLANDER..... 1 862 4.9% 3.2%HISPANIC, REGARDLESS OF RACE.. 2 1710 9.7% 10.2%BLACK, NOT OF HISPANIC ORIGIN. 3 1736 9.9% 13.7%WHITE, NOT OF HISPANIC ORIGIN. 4 11834 67.2% 71.9%AMERICAN INDIAN OR ALASKANNATIVE........................ 5 151 0.9% 1.0% RESERVED CODES: NO PARENT QUEX............. 1215 6.9% (MISS) MULTIPLE RESPONSE.......... 6 2 0.0% (MISS) MISSING.................... 8 100 0.6% (MISS) ----- ----- ----- TOTALS: 17610 100.0% 100.0%
NOTE: This variable was recoded by NCES in the public usecodebook in accordance with the confidentiality provisionsof PL 100-297.
K-68

F2: Parent ComponentData File User's Manual
-------------Question 20 Tape Pos. 87-88------------- Format: I2
F2P20 ASIAN ETHNIC BACKGROUND
Which of these best describes your background? (Asian orPacific Islander)
PER- WGTD RESPONSE CODES FREQ CENT PCT ---------- -------- ----- ----- -----CHINESE....................... 01 231 1.3% 22.0%FILIPINO...................... 02 153 0.9% 20.3%JAPANESE...................... 03 61 0.3% 6.9%KOREAN........................ 04 80 0.5% 9.2%SOUTHEAST ASIAN............... 05 166 0.9% 19.5%PACIFIC ISLANDER.............. 06 28 0.2% 4.2%SOUTH ASIAN................... 07 90 0.5% 9.3%OTHER ASIAN................... 08 39 0.2% 8.5% RESERVED CODES: NO PARENT QUEX............. 1215 6.9% (MISS) MULTIPLE RESPONSE.......... 96 2 0.0% (MISS) MISSING.................... 98 114 0.6% (MISS) LEGITIMATE SKIP............ 99 15431 87.6% (MISS) ----- ----- ----- TOTALS: 17610 100.0% 100.0%
NOTE: This variable was recoded by NCES in the public usecodebook in accordance with the confidentiality provisionsof PL 100-297.
NOTE: Nonresponse for this item exceeds the NCESstandard. Due to potential nonresponse bias, users shouldexercise caution when choosing this variable for analysis.
K-69

F2: Parent ComponentData File User's Manual
-------------Question 21 Tape Pos. 89-90------------- Format: I2
F2P21 HISPANIC ETHNIC BACKGROUND
Which of these best describes your background? (Hispanic)
PER- WGTD RESPONSE CODES FREQ CENT PCT ---------- -------- ----- ----- -----MEXICAN....................... 01 1166 6.6% 68.8%CUBAN......................... 02 62 0.4% 3.1%PUERTO RICAN.................. 03 151 0.9% 10.9%DOMINICAN..................... 04 22 0.1% 1.7%ECUADORIAN.................... 05 11 0.1% 1.4%SALVADORIAN................... 06 33 0.2% 2.3%COLOMBIAN..................... 07 25 0.1% 1.0%OTHER HISPANIC................ 08 181 1.0% 10.8% RESERVED CODES: NO PARENT QUEX............. 1215 6.9% (MISS) MULTIPLE RESPONSE.......... 96 2 0.0% (MISS) MISSING.................... 98 159 0.9% (MISS) LEGITIMATE SKIP............ 99 14583 82.8% (MISS) ----- ----- ----- TOTALS: 17610 100.0% 100.0%
NOTE: This variable was recoded by NCES in the public usecodebook in accordance with the confidentiality provisionsof PL 100-297.
K-70

F2: Parent ComponentData File User's Manual
-------------Question 22 Tape Pos. 91-91------------- Format: I1
F2P22 IS ENGLISH YOUR NATIVE LANGUAGE
Is English your native language (the first language youlearned to speak when you were a child)?
PER- WGTD RESPONSE CODES FREQ CENT PCT ---------- -------- ----- ----- -----YES........................... 1 13870 78.8% 86.9%NO............................ 2 2438 13.8% 13.1% RESERVED CODES: NO PARENT QUEX............. 1215 6.9% (MISS) MISSING.................... 8 87 0.5% (MISS) ----- ----- ----- TOTALS: 17610 100.0% 100.0%
K-71

F2: Parent ComponentData File User's Manual
-------------Question 23 Tape Pos. 92-93------------- Format: I2
F2P23 WHAT IS YOUR NATIVE LANGUAGE
What is your native language (the first language youlearned to speak when you were a child)?
PER- WGTD RESPONSE CODES FREQ CENT PCT ---------- -------- ----- ----- -----SPANISH....................... 02 1292 7.3% 60.4%A CHINESE LANGUAGE............ 03 216 1.2% 4.8%JAPANESE...................... 04 27 0.2% 0.9%KOREAN........................ 05 74 0.4% 2.0%A FILIPINO LANGUAGE........... 06 123 0.7% 3.6%ITALIAN....................... 07 39 0.2% 1.2%FRENCH........................ 08 62 0.4% 4.1%GERMAN........................ 09 61 0.3% 2.9%GREEK......................... 10 11 0.1% 0.6%POLISH........................ 11 33 0.2% 1.7%PORTUGUESE.................... 12 15 0.1% 0.5%VIETNAMESE.................... 13 92 0.5% 2.4%CAMBODIAN..................... 14 15 0.1% 0.3%OTHER......................... 15 381 2.2% 14.6% RESERVED CODES: NO PARENT QUEX............. 1215 6.9% (MISS) MULTIPLE RESPONSE.......... 96 2 0.0% (MISS) MISSING.................... 98 82 0.5% (MISS) LEGITIMATE SKIP............ 99 13870 78.8% (MISS) ----- ----- ----- TOTALS: 17610 100.0% 100.0%
K-72

F2: Parent ComponentData File User's Manual
-------------Question 24-------------
How often is the language you referred to in question 23used with...
K-73

F2: Parent ComponentData File User's Manual
--------------Question 24A Tape Pos. 94-94-------------- Format: I1
F2P24A HOW OFTN SPEAK NATIV LANG W/ SPOUSE/PTNR
Your spouse/partner?
PER- WGTD RESPONSE CODES FREQ CENT PCT ---------- -------- ----- ----- -----ALWAYS OR MOST OF THE TIME.... 0 1293 7.3% 54.7%ABOUT HALF OF THE TIME........ 1 262 1.5% 10.5%SOMETIMES..................... 2 241 1.4% 8.5%NEVER......................... 3 189 1.1% 8.8%DOES NOT APPLY................ 4 353 2.0% 17.5% RESERVED CODES: NO PARENT QUEX............. 1215 6.9% (MISS) MULTIPLE RESPONSE.......... 6 3 0.0% (MISS) MISSING.................... 8 184 1.0% (MISS) LEGITIMATE SKIP............ 9 13870 78.8% (MISS) ----- ----- ----- TOTALS: 17610 100.0% 100.0%
K-74

F2: Parent ComponentData File User's Manual
--------------Question 24B Tape Pos. 95-95-------------- Format: I1
F2P24B HOW OFTN SPEAK NATIVE LANG W/ CHILDREN
Your child/children?
PER- WGTD RESPONSE CODES FREQ CENT PCT ---------- -------- ----- ----- -----ALWAYS OR MOST OF THE TIME.... 0 981 5.6% 46.1%ABOUT HALF OF THE TIME........ 1 476 2.7% 17.6%SOMETIMES..................... 2 607 3.4% 21.2%NEVER......................... 3 303 1.7% 12.3%DOES NOT APPLY................ 4 56 0.3% 2.7% RESERVED CODES: NO PARENT QUEX............. 1215 6.9% (MISS) MULTIPLE RESPONSE.......... 6 1 0.0% (MISS) MISSING.................... 8 101 0.6% (MISS) LEGITIMATE SKIP............ 9 13870 78.8% (MISS) ----- ----- ----- TOTALS: 17610 100.0% 100.0%
K-75

F2: Parent ComponentData File User's Manual
--------------Question 24C Tape Pos. 96-96-------------- Format: I1
F2P24C HOW OFTN SPEAK NATIV LANG W/ OTH RELATIV
Other relatives?
PER- WGTD RESPONSE CODES FREQ CENT PCT ---------- -------- ----- ----- -----ALWAYS OR MOST OF THE TIME.... 0 1574 8.9% 66.3%ABOUT HALF OF THE TIME........ 1 342 1.9% 13.0%SOMETIMES..................... 2 327 1.9% 13.2%NEVER......................... 3 93 0.5% 4.0%DOES NOT APPLY................ 4 74 0.4% 3.5% RESERVED CODES: NO PARENT QUEX............. 1215 6.9% (MISS) MULTIPLE RESPONSE.......... 6 2 0.0% (MISS) MISSING.................... 8 113 0.6% (MISS) LEGITIMATE SKIP............ 9 13870 78.8% (MISS) ----- ----- ----- TOTALS: 17610 100.0% 100.0%
K-76

F2: Parent ComponentData File User's Manual
--------------Question 24D Tape Pos. 97-97-------------- Format: I1
F2P24D HOW OFTN SPEAK NATIVE LANG W/ FRIENDS
Your friends?
PER- WGTD RESPONSE CODES FREQ CENT PCT ---------- -------- ----- ----- -----ALWAYS OR MOST OF THE TIME.... 0 1110 6.3% 51.2%ABOUT HALF OF THE TIME........ 1 460 2.6% 15.7%SOMETIMES..................... 2 516 2.9% 18.8%NEVER......................... 3 258 1.5% 11.4%DOES NOT APPLY................ 4 61 0.3% 2.9% RESERVED CODES: NO PARENT QUEX............. 1215 6.9% (MISS) MULTIPLE RESPONSE.......... 6 3 0.0% (MISS) MISSING.................... 8 117 0.7% (MISS) LEGITIMATE SKIP............ 9 13870 78.8% (MISS) ----- ----- ----- TOTALS: 17610 100.0% 100.0%
K-77

F2: Parent ComponentData File User's Manual
-------------Question 25-------------
How well do you do the following?
K-78
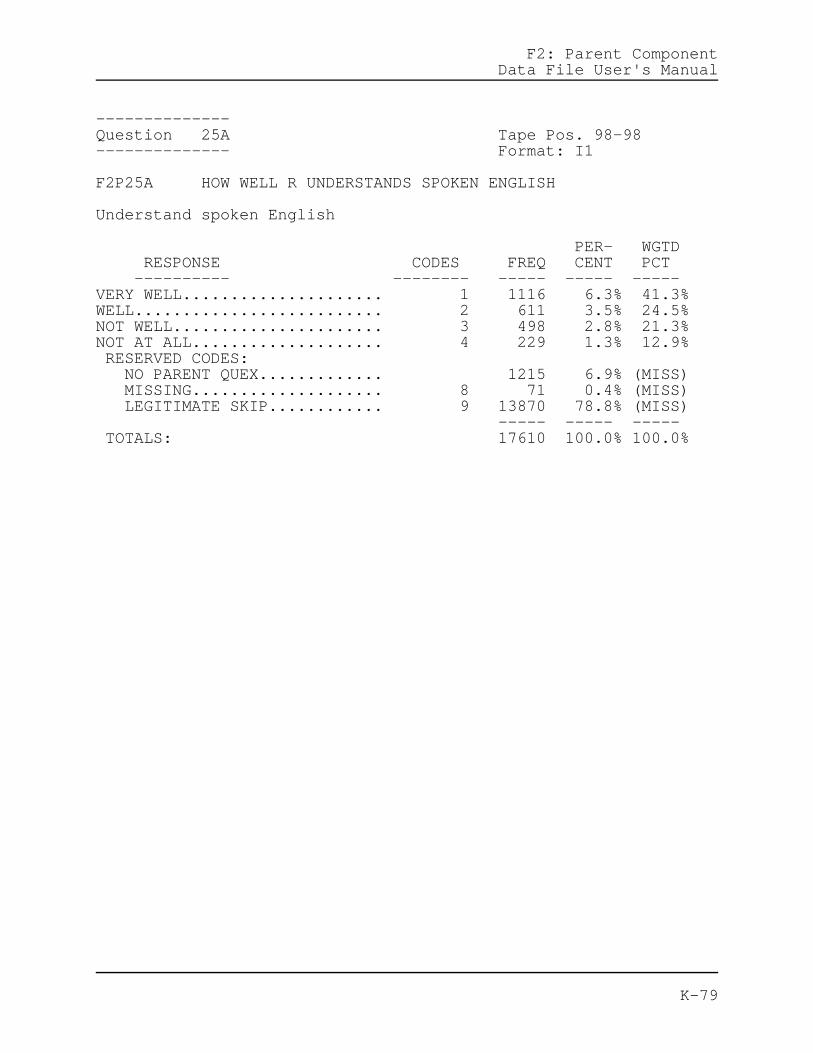
F2: Parent ComponentData File User's Manual
--------------Question 25A Tape Pos. 98-98-------------- Format: I1
F2P25A HOW WELL R UNDERSTANDS SPOKEN ENGLISH
Understand spoken English
PER- WGTD RESPONSE CODES FREQ CENT PCT ---------- -------- ----- ----- -----VERY WELL..................... 1 1116 6.3% 41.3%WELL.......................... 2 611 3.5% 24.5%NOT WELL...................... 3 498 2.8% 21.3%NOT AT ALL.................... 4 229 1.3% 12.9% RESERVED CODES: NO PARENT QUEX............. 1215 6.9% (MISS) MISSING.................... 8 71 0.4% (MISS) LEGITIMATE SKIP............ 9 13870 78.8% (MISS) ----- ----- ----- TOTALS: 17610 100.0% 100.0%
K-79

F2: Parent ComponentData File User's Manual
--------------Question 25B Tape Pos. 99-99-------------- Format: I1
F2P25B HOW WELL R SPEAKS ENGLISH
Speak English
PER- WGTD RESPONSE CODES FREQ CENT PCT ---------- -------- ----- ----- -----VERY WELL..................... 1 952 5.4% 35.9%WELL.......................... 2 648 3.7% 24.8%NOT WELL...................... 3 530 3.0% 22.8%NOT AT ALL.................... 4 316 1.8% 16.5% RESERVED CODES: NO PARENT QUEX............. 1215 6.9% (MISS) MISSING.................... 8 79 0.4% (MISS) LEGITIMATE SKIP............ 9 13870 78.8% (MISS) ----- ----- ----- TOTALS: 17610 100.0% 100.0%
K-80

F2: Parent ComponentData File User's Manual
--------------Question 25C Tape Pos. 100-100-------------- Format: I1
F2P25C HOW WELL R READS ENGLISH
Read English
PER- WGTD RESPONSE CODES FREQ CENT PCT ---------- -------- ----- ----- -----VERY WELL..................... 1 1023 5.8% 37.4%WELL.......................... 2 585 3.3% 23.6%NOT WELL...................... 3 442 2.5% 19.1%NOT AT ALL.................... 4 395 2.2% 19.9% RESERVED CODES: NO PARENT QUEX............. 1215 6.9% (MISS) MISSING.................... 8 80 0.5% (MISS) LEGITIMATE SKIP............ 9 13870 78.8% (MISS) ----- ----- ----- TOTALS: 17610 100.0% 100.0%
K-81

F2: Parent ComponentData File User's Manual
--------------Question 25D Tape Pos. 101-101-------------- Format: I1
F2P25D HOW WELL R WRITES ENGLISH
Write English
PER- WGTD RESPONSE CODES FREQ CENT PCT ---------- -------- ----- ----- -----VERY WELL..................... 1 913 5.2% 34.5%WELL.......................... 2 567 3.2% 21.5%NOT WELL...................... 3 501 2.8% 20.8%NOT AT ALL.................... 4 462 2.6% 23.2% RESERVED CODES: NO PARENT QUEX............. 1215 6.9% (MISS) MULTIPLE RESPONSE.......... 6 1 0.0% (MISS) MISSING.................... 8 81 0.5% (MISS) LEGITIMATE SKIP............ 9 13870 78.8% (MISS) ----- ----- ----- TOTALS: 17610 100.0% 100.0%
K-82

F2: Parent ComponentData File User's Manual
-------------Question 26-------------
Do you ever have problems with any of the following?
K-83

F2: Parent ComponentData File User's Manual
--------------Question 26A Tape Pos. 102-102-------------- Format: I1
F2P26A R HAS PROBLEMS READING ENGL BOOKS/MAGS
Reading books, newspapers, or magazines that are printed inEnglish
PER- WGTD RESPONSE CODES FREQ CENT PCT ---------- -------- ----- ----- -----YES........................... 1 759 4.3% 32.9%NO............................ 2 1550 8.8% 60.9%DON'T KNOW.................... 3 131 0.7% 6.2% RESERVED CODES: NO PARENT QUEX............. 1215 6.9% (MISS) MISSING.................... 8 85 0.5% (MISS) LEGITIMATE SKIP............ 9 13870 78.8% (MISS) ----- ----- ----- TOTALS: 17610 100.0% 100.0%
K-84

F2: Parent ComponentData File User's Manual
--------------Question 26B Tape Pos. 103-103-------------- Format: I1
F2P26B R HAS PROBLEMS FILLING OUT FORMS IN ENGL
Filling out forms (tax, insurance, financial aid) that areprinted in English
PER- WGTD RESPONSE CODES FREQ CENT PCT ---------- -------- ----- ----- -----YES........................... 1 849 4.8% 38.2%NO............................ 2 1452 8.2% 55.7%DON'T KNOW.................... 3 128 0.7% 6.2% RESERVED CODES: NO PARENT QUEX............. 1215 6.9% (MISS) MISSING.................... 8 96 0.5% (MISS) LEGITIMATE SKIP............ 9 13870 78.8% (MISS) ----- ----- ----- TOTALS: 17610 100.0% 100.0%
K-85

F2: Parent ComponentData File User's Manual
--------------Question 26C Tape Pos. 104-104-------------- Format: I1
F2P26C R HAS PRBLMS UNDERSTNDNG TEEN'S TEACHERS
Understanding your teenager's teachers
PER- WGTD RESPONSE CODES FREQ CENT PCT ---------- -------- ----- ----- -----YES........................... 1 670 3.8% 32.2%NO............................ 2 1673 9.5% 65.2%DON'T KNOW.................... 3 84 0.5% 2.7% RESERVED CODES: NO PARENT QUEX............. 1215 6.9% (MISS) MISSING.................... 8 98 0.6% (MISS) LEGITIMATE SKIP............ 9 13870 78.8% (MISS) ----- ----- ----- TOTALS: 17610 100.0% 100.0%
K-86

F2: Parent ComponentData File User's Manual
--------------Question 26D Tape Pos. 105-105-------------- Format: I1
F2P26D R HAS PRBLMS MKING SELF UNDRSTD BY TCHRS
Making yourself understood to your teenager's teachers
PER- WGTD RESPONSE CODES FREQ CENT PCT ---------- -------- ----- ----- -----YES........................... 1 725 4.1% 35.3%NO............................ 2 1597 9.1% 61.4%DON'T KNOW.................... 3 106 0.6% 3.2% RESERVED CODES: NO PARENT QUEX............. 1215 6.9% (MISS) MULTIPLE RESPONSE.......... 6 1 0.0% (MISS) MISSING.................... 8 96 0.5% (MISS) LEGITIMATE SKIP............ 9 13870 78.8% (MISS) ----- ----- ----- TOTALS: 17610 100.0% 100.0%
K-87
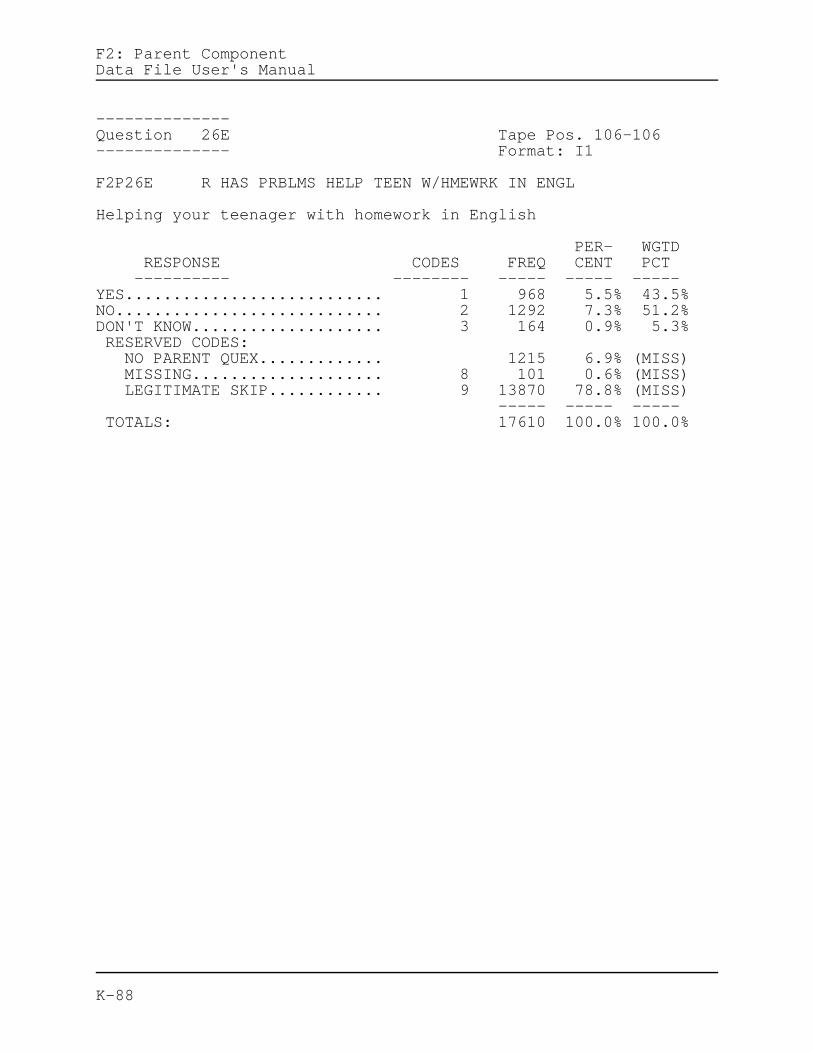
F2: Parent ComponentData File User's Manual
--------------Question 26E Tape Pos. 106-106-------------- Format: I1
F2P26E R HAS PRBLMS HELP TEEN W/HMEWRK IN ENGL
Helping your teenager with homework in English
PER- WGTD RESPONSE CODES FREQ CENT PCT ---------- -------- ----- ----- -----YES........................... 1 968 5.5% 43.5%NO............................ 2 1292 7.3% 51.2%DON'T KNOW.................... 3 164 0.9% 5.3% RESERVED CODES: NO PARENT QUEX............. 1215 6.9% (MISS) MISSING.................... 8 101 0.6% (MISS) LEGITIMATE SKIP............ 9 13870 78.8% (MISS) ----- ----- ----- TOTALS: 17610 100.0% 100.0%
K-88

F2: Parent ComponentData File User's Manual
-------------Question 27 Tape Pos. 107-107------------- Format: I1
F2P27 LANG OTHR THN ENGLISH SPOKEN IN R'S HOME
Is any language other than English regularly spoken in yourhome?
PER- WGTD RESPONSE CODES FREQ CENT PCT ---------- -------- ----- ----- -----YES........................... 1 2754 15.6% 15.3%NO............................ 2 13554 77.0% 84.7% RESERVED CODES: NO PARENT QUEX............. 1215 6.9% (MISS) MISSING.................... 8 87 0.5% (MISS) ----- ----- ----- TOTALS: 17610 100.0% 100.0%
K-89

F2: Parent ComponentData File User's Manual
-------------Question 28 Tape Pos. 108-108------------- Format: I1
F2P28 IS ENGLISH ALSO SPOKEN IN R'S HOME
Is English also spoken in your home?
PER- WGTD RESPONSE CODES FREQ CENT PCT ---------- -------- ----- ----- -----YES........................... 1 2476 14.1% 90.9%NO............................ 2 182 1.0% 9.1% RESERVED CODES: NO PARENT QUEX............. 1215 6.9% (MISS) MISSING.................... 8 183 1.0% (MISS) LEGITIMATE SKIP............ 9 13554 77.0% (MISS) ----- ----- ----- TOTALS: 17610 100.0% 100.0%
K-90

F2: Parent ComponentData File User's Manual
II. YOUR TEENAGER'S SCHOOL LIFE
-------------Question 29 Tape Pos. 109-110------------- Format: I2
F2P29 LAST/PRESENT GRADE TEEN ATTENDED
What is the last grade your teenager attended? If yourteenager is currently enrolled in school, please indicatethe grade in which he/she is enrolled.
PER- WGTD RESPONSE CODES FREQ CENT PCT ---------- -------- ----- ----- -----8TH GRADE..................... 00 66 0.4% 0.5%9TH GRADE..................... 01 295 1.7% 2.5%10TH GRADE.................... 02 561 3.2% 5.3%11TH GRADE.................... 03 926 5.3% 7.6%12TH GRADE.................... 04 14194 80.6% 82.3%COLLEGE OR TRADE/VOCATIONALSCHOOL........................ 05 164 0.9% 1.2%NO GRADE SYSTEM USED.......... 06 97 0.6% 0.6% RESERVED CODES: NO PARENT QUEX............. 1215 6.9% (MISS) MULTIPLE RESPONSE.......... 96 8 0.0% (MISS) MISSING.................... 98 84 0.5% (MISS) ----- ----- ----- TOTALS: 17610 100.0% 100.0%
K-91

F2: Parent ComponentData File User's Manual
-------------Question 30 Tape Pos. 111-111------------- Format: I1
F2P30 IS R'S TEEN CURRENTLY ENROLLED IN SCHOOL
Is your teenager currently enrolled in school?
PER- WGTD RESPONSE CODES FREQ CENT PCT ---------- -------- ----- ----- -----YES........................... 1 14535 82.5% 85.4%NO............................ 2 1787 10.1% 14.6% RESERVED CODES: NO PARENT QUEX............. 1215 6.9% (MISS) MULTIPLE RESPONSE.......... 6 1 0.0% (MISS) MISSING.................... 8 72 0.4% (MISS) ----- ----- ----- TOTALS: 17610 100.0% 100.0%
K-92

F2: Parent ComponentData File User's Manual
-------------Question 31 Tape Pos. 112-112------------- Format: I1
F2P31 # OF YEARS TEEN AT PRESENT SCHOOL
How many years has your teenager been at his/her presentschool?
PER- WGTD RESPONSE CODES FREQ CENT PCT ---------- -------- ----- ----- -----ONE YEAR OR LESS.............. 1 1506 8.6% 12.6%TWO YEARS..................... 2 633 3.6% 6.2%THREE YEARS................... 3 1615 9.2% 15.3%FOUR YEARS.................... 4 6703 38.1% 52.3%FIVE YEARS OR MORE............ 5 2538 14.4% 13.7% RESERVED CODES: NO PARENT QUEX............. 1215 6.9% (MISS) MISSING.................... 8 1613 9.2% (MISS) LEGITIMATE SKIP............ 9 1787 10.1% (MISS) ----- ----- ----- TOTALS: 17610 100.0% 100.0%
K-93

F2: Parent ComponentData File User's Manual
---------------Question 32MO Tape Pos. 113-114--------------- Format: I2
F2P32MO LAST MONTH R'S TEEN ENROLLED IN SCHOOL
When was the last month your teenager was enrolled inschool?
PER- WGTD RESPONSE CODES FREQ CENT PCT ---------- -------- ----- ----- -----JANUARY....................... 01 138 0.8% 8.9%FEBRUARY...................... 02 119 0.7% 7.5%MARCH......................... 03 130 0.7% 10.5%APRIL......................... 04 160 0.9% 8.9%MAY........................... 05 219 1.2% 14.2%JUNE.......................... 06 243 1.4% 15.1%JULY.......................... 07 18 0.1% 0.8%AUGUST........................ 08 46 0.3% 2.3%SEPTEMBER..................... 09 151 0.9% 9.7%OCTOBER....................... 10 133 0.8% 8.0%NOVEMBER...................... 11 112 0.6% 7.8%DECEMBER...................... 12 117 0.7% 6.3% RESERVED CODES: NO PARENT QUEX............. 1215 6.9% (MISS) MISSING.................... 98 274 1.6% (MISS) LEGITIMATE SKIP............ 99 14535 82.5% (MISS) ----- ----- ----- TOTALS: 17610 100.0% 100.0%
K-94

F2: Parent ComponentData File User's Manual
---------------Question 32YR Tape Pos. 115-116--------------- Format: I2
F2P32YR LAST YEAR R'S TEEN ENROLLED IN SCHOOL
When was the last year your teenager was enrolled inschool?
PER- WGTD RESPONSE CODES FREQ CENT PCT ---------- -------- ----- ----- -----1988.......................... 88 91 0.5% 4.8%1989.......................... 89 230 1.3% 14.5%1990.......................... 90 398 2.3% 26.8%1991.......................... 91 589 3.3% 35.8%1992.......................... 92 268 1.5% 18.2% RESERVED CODES: NO PARENT QUEX............. 1215 6.9% (MISS) MISSING.................... 98 284 1.6% (MISS) LEGITIMATE SKIP............ 99 14535 82.5% (MISS) ----- ----- ----- TOTALS: 17610 100.0% 100.0%
K-95
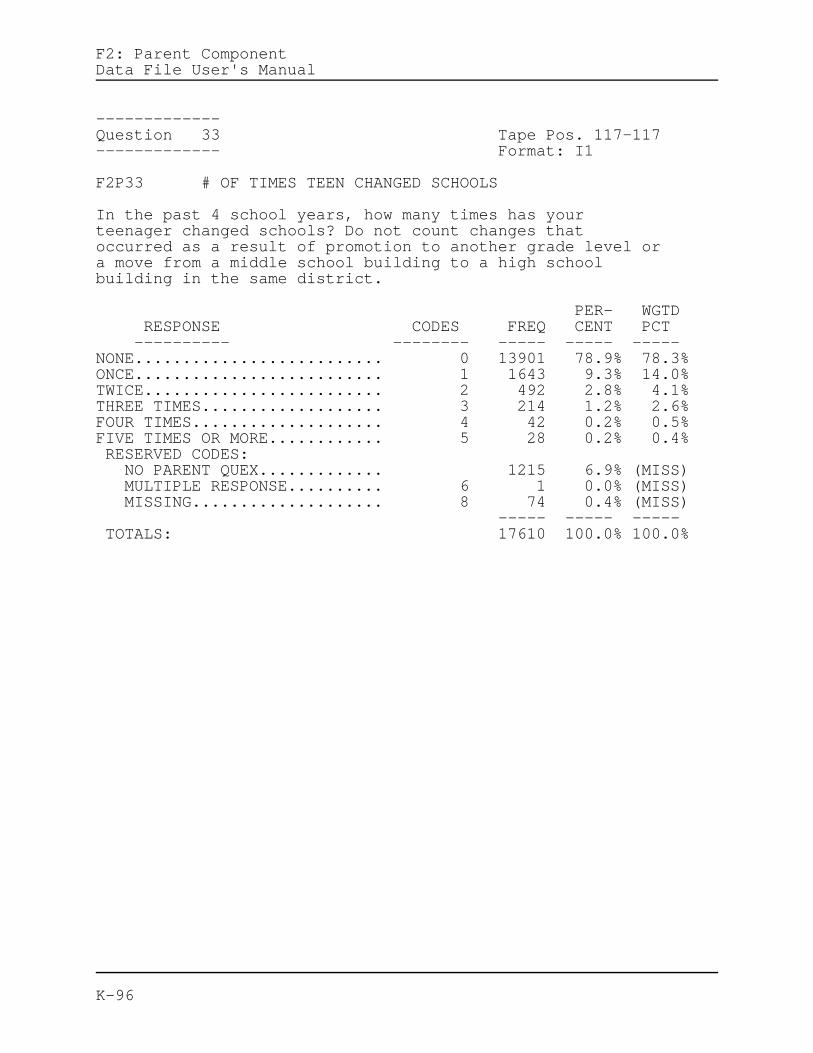
F2: Parent ComponentData File User's Manual
-------------Question 33 Tape Pos. 117-117------------- Format: I1
F2P33 # OF TIMES TEEN CHANGED SCHOOLS
In the past 4 school years, how many times has yourteenager changed schools? Do not count changes thatoccurred as a result of promotion to another grade level ora move from a middle school building to a high schoolbuilding in the same district.
PER- WGTD RESPONSE CODES FREQ CENT PCT ---------- -------- ----- ----- -----NONE.......................... 0 13901 78.9% 78.3%ONCE.......................... 1 1643 9.3% 14.0%TWICE......................... 2 492 2.8% 4.1%THREE TIMES................... 3 214 1.2% 2.6%FOUR TIMES.................... 4 42 0.2% 0.5%FIVE TIMES OR MORE............ 5 28 0.2% 0.4% RESERVED CODES: NO PARENT QUEX............. 1215 6.9% (MISS) MULTIPLE RESPONSE.......... 6 1 0.0% (MISS) MISSING.................... 8 74 0.4% (MISS) ----- ----- ----- TOTALS: 17610 100.0% 100.0%
K-96

F2: Parent ComponentData File User's Manual
-------------Question 34-------------
What was the reason for the most recent change of schools?
K-97

F2: Parent ComponentData File User's Manual
--------------Question 34A Tape Pos. 118-118-------------- Format: I1
F2P34A TEEN CHNGD SCHLS- DISCIPLINARY PROBLMS
School asked my teenager to leave because of disciplinaryproblems
PER- WGTD RESPONSE CODES FREQ CENT PCT ---------- -------- ----- ----- -----YES........................... 1 139 0.8% 6.2%NO............................ 2 2162 12.3% 93.8% RESERVED CODES: NO PARENT QUEX............. 1215 6.9% (MISS) MISSING.................... 8 193 1.1% (MISS) LEGITIMATE SKIP............ 9 13901 78.9% (MISS) ----- ----- ----- TOTALS: 17610 100.0% 100.0%
K-98

F2: Parent ComponentData File User's Manual
--------------Question 34B Tape Pos. 119-119-------------- Format: I1
F2P34B TEEN CHNGD SCHLS- ACADEMIC PROBLEMS
School asked my teenager to leave because of academicproblems
PER- WGTD RESPONSE CODES FREQ CENT PCT ---------- -------- ----- ----- -----YES........................... 1 102 0.6% 4.7%NO............................ 2 2198 12.5% 95.3% RESERVED CODES: NO PARENT QUEX............. 1215 6.9% (MISS) MISSING.................... 8 194 1.1% (MISS) LEGITIMATE SKIP............ 9 13901 78.9% (MISS) ----- ----- ----- TOTALS: 17610 100.0% 100.0%
K-99

F2: Parent ComponentData File User's Manual
--------------Question 34C Tape Pos. 120-120-------------- Format: I1
F2P34C TEEN CHNGD SCHLS- REQUESTED TRANSFER
My teenager asked to be transferred to another school
PER- WGTD RESPONSE CODES FREQ CENT PCT ---------- -------- ----- ----- -----YES........................... 1 811 4.6% 34.9%NO............................ 2 1490 8.5% 65.1% RESERVED CODES: NO PARENT QUEX............. 1215 6.9% (MISS) MISSING.................... 8 193 1.1% (MISS) LEGITIMATE SKIP............ 9 13901 78.9% (MISS) ----- ----- ----- TOTALS: 17610 100.0% 100.0%
K-100

F2: Parent ComponentData File User's Manual
--------------Question 34D Tape Pos. 121-121-------------- Format: I1
F2P34D TEEN CHNGD SCHLS- SPECIAL PROGRAMS
Family/teenager moved to take advantage of a specializedprogram in another school
PER- WGTD RESPONSE CODES FREQ CENT PCT ---------- -------- ----- ----- -----YES........................... 1 225 1.3% 10.4%NO............................ 2 2075 11.8% 89.6% RESERVED CODES: NO PARENT QUEX............. 1215 6.9% (MISS) MISSING.................... 8 194 1.1% (MISS) LEGITIMATE SKIP............ 9 13901 78.9% (MISS) ----- ----- ----- TOTALS: 17610 100.0% 100.0%
K-101

F2: Parent ComponentData File User's Manual
--------------Question 34E Tape Pos. 122-122-------------- Format: I1
F2P34E TEEN CHNGD SCHLS- TEEN/FAMILY MOVED
Family/teenager moved to a different location for otherreasons
PER- WGTD RESPONSE CODES FREQ CENT PCT ---------- -------- ----- ----- -----YES........................... 1 1088 6.2% 51.3%NO............................ 2 1211 6.9% 48.7% RESERVED CODES: NO PARENT QUEX............. 1215 6.9% (MISS) MISSING.................... 8 195 1.1% (MISS) LEGITIMATE SKIP............ 9 13901 78.9% (MISS) ----- ----- ----- TOTALS: 17610 100.0% 100.0%
K-102
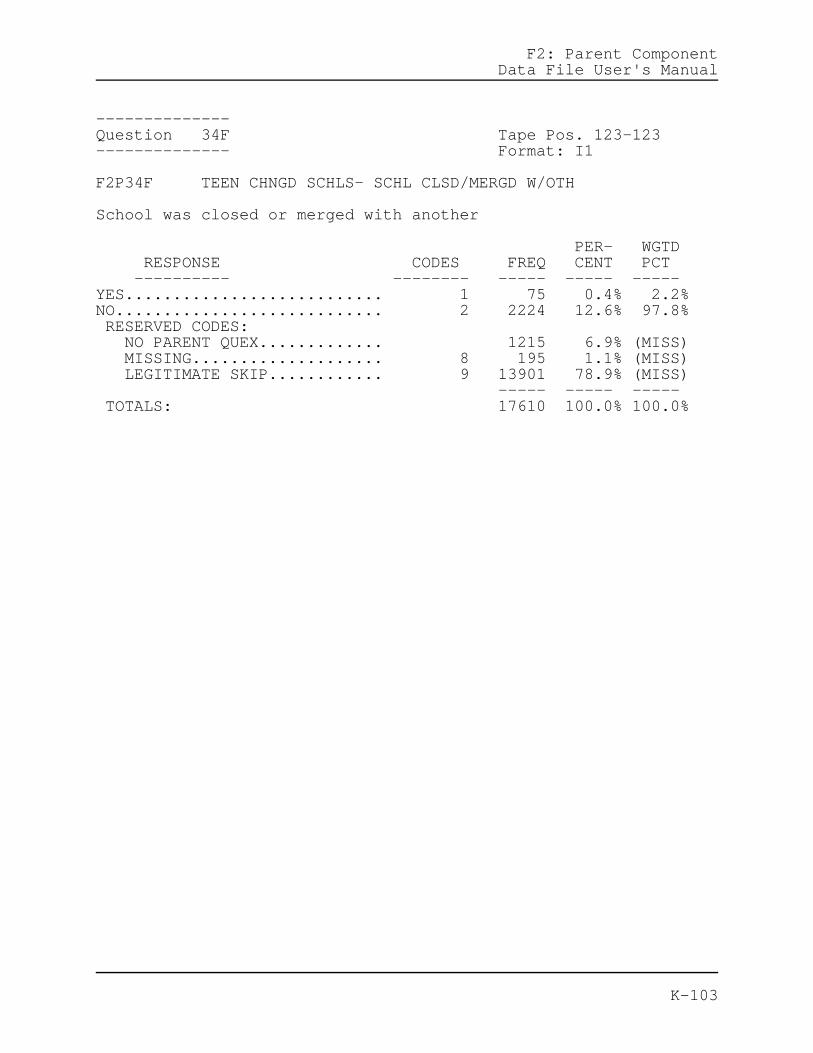
F2: Parent ComponentData File User's Manual
--------------Question 34F Tape Pos. 123-123-------------- Format: I1
F2P34F TEEN CHNGD SCHLS- SCHL CLSD/MERGD W/OTH
School was closed or merged with another
PER- WGTD RESPONSE CODES FREQ CENT PCT ---------- -------- ----- ----- -----YES........................... 1 75 0.4% 2.2%NO............................ 2 2224 12.6% 97.8% RESERVED CODES: NO PARENT QUEX............. 1215 6.9% (MISS) MISSING.................... 8 195 1.1% (MISS) LEGITIMATE SKIP............ 9 13901 78.9% (MISS) ----- ----- ----- TOTALS: 17610 100.0% 100.0%
K-103

F2: Parent ComponentData File User's Manual
--------------Question 34G Tape Pos. 124-124-------------- Format: I1
F2P34G TEEN CHNGD SCHLS- SWTCH FRM PUB TO PRIV
Wanted to switch from a public to a private school
PER- WGTD RESPONSE CODES FREQ CENT PCT ---------- -------- ----- ----- -----YES........................... 1 128 0.7% 6.0%NO............................ 2 2172 12.3% 94.0% RESERVED CODES: NO PARENT QUEX............. 1215 6.9% (MISS) MISSING.................... 8 194 1.1% (MISS) LEGITIMATE SKIP............ 9 13901 78.9% (MISS) ----- ----- ----- TOTALS: 17610 100.0% 100.0%
K-104

F2: Parent ComponentData File User's Manual
--------------Question 34H Tape Pos. 125-125-------------- Format: I1
F2P34H TEEN CHNGD SCHLS- SWTCH FRM PRIV TO PUB
Wanted to switch from a private to a public school
PER- WGTD RESPONSE CODES FREQ CENT PCT ---------- -------- ----- ----- -----YES........................... 1 154 0.9% 5.6%NO............................ 2 2145 12.2% 94.4% RESERVED CODES: NO PARENT QUEX............. 1215 6.9% (MISS) MISSING.................... 8 195 1.1% (MISS) LEGITIMATE SKIP............ 9 13901 78.9% (MISS) ----- ----- ----- TOTALS: 17610 100.0% 100.0%
K-105

F2: Parent ComponentData File User's Manual
--------------Question 34I Tape Pos. 126-126-------------- Format: I1
F2P34I TEEN CHNGD SCHLS- SWTCH TO MAGNET SCHOOL
Wanted to switch from a public or private school to amagnet school
PER- WGTD RESPONSE CODES FREQ CENT PCT ---------- -------- ----- ----- -----YES........................... 1 44 0.2% 1.7%NO............................ 2 2255 12.8% 98.3% RESERVED CODES: NO PARENT QUEX............. 1215 6.9% (MISS) MISSING.................... 8 195 1.1% (MISS) LEGITIMATE SKIP............ 9 13901 78.9% (MISS) ----- ----- ----- TOTALS: 17610 100.0% 100.0%
K-106

F2: Parent ComponentData File User's Manual
--------------Question 34J Tape Pos. 127-127-------------- Format: I1
F2P34J TEEN CHNGD SCHLS- SPECL CRSES AT NEW SCH
Wanted to take advantage of special courses offered at thenew school
PER- WGTD RESPONSE CODES FREQ CENT PCT ---------- -------- ----- ----- -----YES........................... 1 338 1.9% 14.7%NO............................ 2 1961 11.1% 85.3% RESERVED CODES: NO PARENT QUEX............. 1215 6.9% (MISS) MISSING.................... 8 195 1.1% (MISS) LEGITIMATE SKIP............ 9 13901 78.9% (MISS) ----- ----- ----- TOTALS: 17610 100.0% 100.0%
K-107

F2: Parent ComponentData File User's Manual
--------------Question 34K Tape Pos. 128-128-------------- Format: I1
F2P34K TEEN CHNGD SCHLS- CAME TO US FRM ABROAD
My teenager changed schools because he or she came to theU.S. from another country
PER- WGTD RESPONSE CODES FREQ CENT PCT ---------- -------- ----- ----- -----YES........................... 1 88 0.5% 2.6%NO............................ 2 2210 12.5% 97.4% RESERVED CODES: NO PARENT QUEX............. 1215 6.9% (MISS) MISSING.................... 8 196 1.1% (MISS) LEGITIMATE SKIP............ 9 13901 78.9% (MISS) ----- ----- ----- TOTALS: 17610 100.0% 100.0%
K-108

F2: Parent ComponentData File User's Manual
-------------Question 35-------------
Has your teenager ever. . .
K-109

F2: Parent ComponentData File User's Manual
--------------Question 35A Tape Pos. 129-129-------------- Format: I1
F2P35A TEEN EVER HAD BEHAVIOR PROBLEM AT SCHL
Been considered to have a behavior problem at school?
PER- WGTD RESPONSE CODES FREQ CENT PCT ---------- -------- ----- ----- -----YES........................... 1 1602 9.1% 12.1%NO............................ 2 14587 82.8% 87.9% RESERVED CODES: NO PARENT QUEX............. 1215 6.9% (MISS) MULTIPLE RESPONSE.......... 6 1 0.0% (MISS) MISSING.................... 8 205 1.2% (MISS) ----- ----- ----- TOTALS: 17610 100.0% 100.0%
K-110

F2: Parent ComponentData File User's Manual
--------------Question 35B Tape Pos. 130-130-------------- Format: I1
F2P35B TEEN EVER BEEN SUSPENDED FROM SCHOOL
Been suspended from school?
PER- WGTD RESPONSE CODES FREQ CENT PCT ---------- -------- ----- ----- -----YES........................... 1 2385 13.5% 18.3%NO............................ 2 13705 77.8% 81.7% RESERVED CODES: NO PARENT QUEX............. 1215 6.9% (MISS) MULTIPLE RESPONSE.......... 6 1 0.0% (MISS) MISSING.................... 8 304 1.7% (MISS) ----- ----- ----- TOTALS: 17610 100.0% 100.0%
K-111

F2: Parent ComponentData File User's Manual
--------------Question 35C Tape Pos. 131-131-------------- Format: I1
F2P35C TEEN EVER BEEN EXPELLED FROM SCHOOL
Been expelled from school?
PER- WGTD RESPONSE CODES FREQ CENT PCT ---------- -------- ----- ----- -----YES........................... 1 463 2.6% 4.1%NO............................ 2 15471 87.9% 95.9% RESERVED CODES: NO PARENT QUEX............. 1215 6.9% (MISS) MISSING.................... 8 461 2.6% (MISS) ----- ----- ----- TOTALS: 17610 100.0% 100.0%
K-112

F2: Parent ComponentData File User's Manual
-------------Question 36 Tape Pos. 132-132------------- Format: I1
F2P36 LAST 2 SCHL YRS, TEEN MISS 10+ SCHL DAYS
In the last 2 school years, did your teenager ever stopattending school for a period of 10 or more consecutiveschool days for a reason other than illness or vacation?
PER- WGTD RESPONSE CODES FREQ CENT PCT ---------- -------- ----- ----- -----YES........................... 1 1325 7.5% 10.8%NO............................ 2 14413 81.8% 84.7%MY TEEN HAS NOT ATTENDEDSCHOOL IN THE LAST TWO SCHOOLYEARS......................... 3 514 2.9% 4.5% RESERVED CODES: NO PARENT QUEX............. 1215 6.9% (MISS) MULTIPLE RESPONSE.......... 6 1 0.0% (MISS) MISSING.................... 8 142 0.8% (MISS) ----- ----- ----- TOTALS: 17610 100.0% 100.0%
K-113

F2: Parent ComponentData File User's Manual
-------------Question 37 Tape Pos. 133-133------------- Format: I1
F2P37 LAST 2 SCHL YRS, TEEN MISS 21+ SCHL DAYS
In the last 2 school years, did your teenager ever stopattending school for a period of 21 or more consecutiveschool days for a reason other than illness or vacation?
PER- WGTD RESPONSE CODES FREQ CENT PCT ---------- -------- ----- ----- -----YES........................... 1 925 5.3% 76.7%NO............................ 2 315 1.8% 23.1%MY TEEN HAS NOT ATTENDEDSCHOOL IN THE LAST TWO SCHOOLYEARS......................... 3 3 0.0% 0.2% RESERVED CODES: NO PARENT QUEX............. 1215 6.9% (MISS) MULTIPLE RESPONSE.......... 6 3 0.0% (MISS) MISSING.................... 8 222 1.3% (MISS) LEGITIMATE SKIP............ 9 14927 84.8% (MISS) ----- ----- ----- TOTALS: 17610 100.0% 100.0%
K-114

F2: Parent ComponentData File User's Manual
-------------Question 38-------------
Think back to the longest time over the last two years thatyour teenager was out of school for a reason other thanillness or vacation. Which of the following reasonsdescribes why your teenager stopped attending school?
K-115

F2: Parent ComponentData File User's Manual
--------------Question 38A Tape Pos. 134-134-------------- Format: I1
F2P38A TEEN STOPD ATTND SCHL- CONFLICTING JOB
My teenager had a job that conflicted with school
PER- WGTD RESPONSE CODES FREQ CENT PCT ---------- -------- ----- ----- -----YES........................... 1 130 0.7% 8.6%NO............................ 2 1534 8.7% 90.2%DON'T KNOW.................... 3 24 0.1% 1.2% RESERVED CODES: NO PARENT QUEX............. 1215 6.9% (MISS) MULTIPLE RESPONSE.......... 6 2 0.0% (MISS) MISSING.................... 8 292 1.7% (MISS) LEGITIMATE SKIP............ 9 14413 81.8% (MISS) ----- ----- ----- TOTALS: 17610 100.0% 100.0%
K-116

F2: Parent ComponentData File User's Manual
--------------Question 38B Tape Pos. 135-135-------------- Format: I1
F2P38B TEEN STOPD ATND SCHL- PROBLM W/TCHR, STU
My teenager couldn't get along with teachers or otherstudents
PER- WGTD RESPONSE CODES FREQ CENT PCT ---------- -------- ----- ----- -----YES........................... 1 442 2.5% 25.5%NO............................ 2 1171 6.6% 70.7%DON'T KNOW.................... 3 83 0.5% 3.8% RESERVED CODES: NO PARENT QUEX............. 1215 6.9% (MISS) MULTIPLE RESPONSE.......... 6 1 0.0% (MISS) MISSING.................... 8 285 1.6% (MISS) LEGITIMATE SKIP............ 9 14413 81.8% (MISS) ----- ----- ----- TOTALS: 17610 100.0% 100.0%
K-117

F2: Parent ComponentData File User's Manual
--------------Question 38C Tape Pos. 136-136-------------- Format: I1
F2P38C TEEN STOPD ATND SCHL- TEEN BECAME PARENT
My teenager was pregnant or became a parent
PER- WGTD RESPONSE CODES FREQ CENT PCT ---------- -------- ----- ----- -----YES........................... 1 318 1.8% 19.2%NO............................ 2 1353 7.7% 79.9%DON'T KNOW.................... 3 19 0.1% 1.0% RESERVED CODES: NO PARENT QUEX............. 1215 6.9% (MISS) MULTIPLE RESPONSE.......... 6 1 0.0% (MISS) MISSING.................... 8 291 1.7% (MISS) LEGITIMATE SKIP............ 9 14413 81.8% (MISS) ----- ----- ----- TOTALS: 17610 100.0% 100.0%
K-118

F2: Parent ComponentData File User's Manual
--------------Question 38D Tape Pos. 137-137-------------- Format: I1
F2P38D TEEN STOPD ATND SCHL- FRNDS/FAM DROP OUT
My teenager's friends or family member(s) had dropped outof school
PER- WGTD RESPONSE CODES FREQ CENT PCT ---------- -------- ----- ----- -----YES........................... 1 352 2.0% 20.3%NO............................ 2 1257 7.1% 75.5%DON'T KNOW.................... 3 77 0.4% 4.2% RESERVED CODES: NO PARENT QUEX............. 1215 6.9% (MISS) MULTIPLE RESPONSE.......... 6 1 0.0% (MISS) MISSING.................... 8 295 1.7% (MISS) LEGITIMATE SKIP............ 9 14413 81.8% (MISS) ----- ----- ----- TOTALS: 17610 100.0% 100.0%
K-119

F2: Parent ComponentData File User's Manual
--------------Question 38E Tape Pos. 138-138-------------- Format: I1
F2P38E TEEN STOPD ATND SCHL- SUSPENDED/EXPELLED
My teenager was suspended or expelled from school
PER- WGTD RESPONSE CODES FREQ CENT PCT ---------- -------- ----- ----- -----YES........................... 1 353 2.0% 20.9%NO............................ 2 1310 7.4% 77.3%DON'T KNOW.................... 3 22 0.1% 1.8% RESERVED CODES: NO PARENT QUEX............. 1215 6.9% (MISS) MISSING.................... 8 297 1.7% (MISS) LEGITIMATE SKIP............ 9 14413 81.8% (MISS) ----- ----- ----- TOTALS: 17610 100.0% 100.0%
K-120

F2: Parent ComponentData File User's Manual
--------------Question 38F Tape Pos. 139-139-------------- Format: I1
F2P38F TEEN STOPD ATND SCHL- GETTING POOR GRDES
My teenager was getting poor grades/failing school
PER- WGTD RESPONSE CODES FREQ CENT PCT ---------- -------- ----- ----- -----YES........................... 1 759 4.3% 44.4%NO............................ 2 911 5.2% 53.4%DON'T KNOW.................... 3 39 0.2% 2.3% RESERVED CODES: NO PARENT QUEX............. 1215 6.9% (MISS) MULTIPLE RESPONSE.......... 6 1 0.0% (MISS) MISSING.................... 8 272 1.5% (MISS) LEGITIMATE SKIP............ 9 14413 81.8% (MISS) ----- ----- ----- TOTALS: 17610 100.0% 100.0%
K-121

F2: Parent ComponentData File User's Manual
--------------Question 38G Tape Pos. 140-140-------------- Format: I1
F2P38G TEEN STOPD ATTND SCHL- GOT MARRIED
My teenager got married or planned to get married
PER- WGTD RESPONSE CODES FREQ CENT PCT ---------- -------- ----- ----- -----YES........................... 1 188 1.1% 11.6%NO............................ 2 1485 8.4% 87.5%DON'T KNOW.................... 3 15 0.1% 0.9% RESERVED CODES: NO PARENT QUEX............. 1215 6.9% (MISS) MISSING.................... 8 294 1.7% (MISS) LEGITIMATE SKIP............ 9 14413 81.8% (MISS) ----- ----- ----- TOTALS: 17610 100.0% 100.0%
K-122

F2: Parent ComponentData File User's Manual
--------------Question 38H Tape Pos. 141-141-------------- Format: I1
F2P38H TEEN STOPD ATND SCHL- DRUG/ALCOHOL PRBLM
My teenager had a drug or alcohol problem
PER- WGTD RESPONSE CODES FREQ CENT PCT ---------- -------- ----- ----- -----YES........................... 1 172 1.0% 9.5%NO............................ 2 1448 8.2% 86.5%DON'T KNOW.................... 3 68 0.4% 4.0% RESERVED CODES: NO PARENT QUEX............. 1215 6.9% (MISS) MISSING.................... 8 294 1.7% (MISS) LEGITIMATE SKIP............ 9 14413 81.8% (MISS) ----- ----- ----- TOTALS: 17610 100.0% 100.0%
K-123

F2: Parent ComponentData File User's Manual
-------------Question 39-------------
Which of the following did you or your spouse/partner doafter your teenager's longest absence from school for areason other than illness or vacation?
K-124

F2: Parent ComponentData File User's Manual
--------------Question 39A Tape Pos. 142-142-------------- Format: I1
F2P39A R CALLED SCHOOL AFT TEEN'S LONGST ABSC
Called the principal, a teacher, or a counselor at yourteenager's school
PER- WGTD RESPONSE CODES FREQ CENT PCT ---------- -------- ----- ----- -----YES........................... 1 1135 6.4% 66.8%NO............................ 2 624 3.5% 33.2% RESERVED CODES: NO PARENT QUEX............. 1215 6.9% (MISS) MISSING.................... 8 223 1.3% (MISS) LEGITIMATE SKIP............ 9 14413 81.8% (MISS) ----- ----- ----- TOTALS: 17610 100.0% 100.0%
K-125

F2: Parent ComponentData File User's Manual
--------------Question 39B Tape Pos. 143-143-------------- Format: I1
F2P39B R OFFRD TEEN NEW PROG/SCH AFT ABSENCE
Offered to send your teenager to a special program oranother school
PER- WGTD RESPONSE CODES FREQ CENT PCT ---------- -------- ----- ----- -----YES........................... 1 791 4.5% 48.1%NO............................ 2 968 5.5% 51.9% RESERVED CODES: NO PARENT QUEX............. 1215 6.9% (MISS) MISSING.................... 8 223 1.3% (MISS) LEGITIMATE SKIP............ 9 14413 81.8% (MISS) ----- ----- ----- TOTALS: 17610 100.0% 100.0%
K-126

F2: Parent ComponentData File User's Manual
--------------Question 39C Tape Pos. 144-144-------------- Format: I1
F2P39C R ARRANGED OUTSDE COUNSELING AFT ABSENCE
Arranged for outside counseling (with a privatepsychologist, social worker)
PER- WGTD RESPONSE CODES FREQ CENT PCT ---------- -------- ----- ----- -----YES........................... 1 533 3.0% 32.3%NO............................ 2 1225 7.0% 67.7% RESERVED CODES: NO PARENT QUEX............. 1215 6.9% (MISS) MISSING.................... 8 224 1.3% (MISS) LEGITIMATE SKIP............ 9 14413 81.8% (MISS) ----- ----- ----- TOTALS: 17610 100.0% 100.0%
K-127

F2: Parent ComponentData File User's Manual
--------------Question 39D Tape Pos. 145-145-------------- Format: I1
F2P39D R ARRANGED SPEC TUTORING AFT ABSENCE
Arranged for special tutoring
PER- WGTD RESPONSE CODES FREQ CENT PCT ---------- -------- ----- ----- -----YES........................... 1 265 1.5% 15.2%NO............................ 2 1493 8.5% 84.8% RESERVED CODES: NO PARENT QUEX............. 1215 6.9% (MISS) MISSING.................... 8 224 1.3% (MISS) LEGITIMATE SKIP............ 9 14413 81.8% (MISS) ----- ----- ----- TOTALS: 17610 100.0% 100.0%
K-128

F2: Parent ComponentData File User's Manual
--------------Question 39E Tape Pos. 146-146-------------- Format: I1
F2P39E R OFFRD TEEN HELP W/PERS PROB AFT ABSC
Offered to help your teenager with personal problems
PER- WGTD RESPONSE CODES FREQ CENT PCT ---------- -------- ----- ----- -----YES........................... 1 1333 7.6% 76.8%NO............................ 2 425 2.4% 23.2% RESERVED CODES: NO PARENT QUEX............. 1215 6.9% (MISS) MISSING.................... 8 224 1.3% (MISS) LEGITIMATE SKIP............ 9 14413 81.8% (MISS) ----- ----- ----- TOTALS: 17610 100.0% 100.0%
K-129

F2: Parent ComponentData File User's Manual
--------------Question 39F Tape Pos. 147-147-------------- Format: I1
F2P39F R ENCOURGD TEEN TO STAY IN SCHL AFT ABSC
Encouraged your teenager to stay in school
PER- WGTD RESPONSE CODES FREQ CENT PCT ---------- -------- ----- ----- -----YES........................... 1 1552 8.8% 88.7%NO............................ 2 207 1.2% 11.3% RESERVED CODES: NO PARENT QUEX............. 1215 6.9% (MISS) MISSING.................... 8 223 1.3% (MISS) LEGITIMATE SKIP............ 9 14413 81.8% (MISS) ----- ----- ----- TOTALS: 17610 100.0% 100.0%
K-130

F2: Parent ComponentData File User's Manual
--------------Question 39G Tape Pos. 148-148-------------- Format: I1
F2P39G R GOT ANGRY W/TEEN AFTER TEEN'S ABSENCE
Got angry at and/or punished your teenager
PER- WGTD RESPONSE CODES FREQ CENT PCT ---------- -------- ----- ----- -----YES........................... 1 702 4.0% 39.5%NO............................ 2 1055 6.0% 60.5% RESERVED CODES: NO PARENT QUEX............. 1215 6.9% (MISS) MISSING.................... 8 225 1.3% (MISS) LEGITIMATE SKIP............ 9 14413 81.8% (MISS) ----- ----- ----- TOTALS: 17610 100.0% 100.0%
K-131

F2: Parent ComponentData File User's Manual
--------------Question 39H Tape Pos. 149-149-------------- Format: I1
F2P39H R DECIDED NOT GET INVLVD AFT TEEN'S ABSC
Decided not to get involved
PER- WGTD RESPONSE CODES FREQ CENT PCT ---------- -------- ----- ----- -----YES........................... 1 230 1.3% 12.6%NO............................ 2 1528 8.7% 87.4% RESERVED CODES: NO PARENT QUEX............. 1215 6.9% (MISS) MISSING.................... 8 224 1.3% (MISS) LEGITIMATE SKIP............ 9 14413 81.8% (MISS) ----- ----- ----- TOTALS: 17610 100.0% 100.0%
K-132

F2: Parent ComponentData File User's Manual
-------------Question 40-------------
Which of the following did you teenager's school do duringor after his or her longest absence from school for areason other than illness or vacation?
K-133

F2: Parent ComponentData File User's Manual
--------------Question 40A Tape Pos. 150-150-------------- Format: I1
F2P40A SCHL CALLED R AFTER TEEN'S ABSC
Someone from school called your home
PER- WGTD RESPONSE CODES FREQ CENT PCT ---------- -------- ----- ----- -----YES........................... 1 958 5.4% 58.4%NO............................ 2 785 4.5% 41.6% RESERVED CODES: NO PARENT QUEX............. 1215 6.9% (MISS) MISSING.................... 8 239 1.4% (MISS) LEGITIMATE SKIP............ 9 14413 81.8% (MISS) ----- ----- ----- TOTALS: 17610 100.0% 100.0%
K-134

F2: Parent ComponentData File User's Manual
--------------Question 40B Tape Pos. 151-151-------------- Format: I1
F2P40B SCHL VISITED R AFTER TEEN'S ABSC
Someone from school visited your home
PER- WGTD RESPONSE CODES FREQ CENT PCT ---------- -------- ----- ----- -----YES........................... 1 170 1.0% 8.9%NO............................ 2 1573 8.9% 91.1% RESERVED CODES: NO PARENT QUEX............. 1215 6.9% (MISS) MISSING.................... 8 239 1.4% (MISS) LEGITIMATE SKIP............ 9 14413 81.8% (MISS) ----- ----- ----- TOTALS: 17610 100.0% 100.0%
K-135

F2: Parent ComponentData File User's Manual
--------------Question 40C Tape Pos. 152-152-------------- Format: I1
F2P40C SCHL SENT LETTER TO R AFT TEEN'S ABSENCE
The school sent a letter to you
PER- WGTD RESPONSE CODES FREQ CENT PCT ---------- -------- ----- ----- -----YES........................... 1 850 4.8% 50.7%NO............................ 2 888 5.0% 49.3% RESERVED CODES: NO PARENT QUEX............. 1215 6.9% (MISS) MISSING.................... 8 244 1.4% (MISS) LEGITIMATE SKIP............ 9 14413 81.8% (MISS) ----- ----- ----- TOTALS: 17610 100.0% 100.0%
K-136

F2: Parent ComponentData File User's Manual
--------------Question 40D Tape Pos. 153-153-------------- Format: I1
F2P40D SCHL OFRD SEND TEEN TO NEW SCHL AFT ABSC
The school offered to send your teenager to a specialprogram or another school
PER- WGTD RESPONSE CODES FREQ CENT PCT ---------- -------- ----- ----- -----YES........................... 1 352 2.0% 23.0%NO............................ 2 1387 7.9% 77.0% RESERVED CODES: NO PARENT QUEX............. 1215 6.9% (MISS) MISSING.................... 8 243 1.4% (MISS) LEGITIMATE SKIP............ 9 14413 81.8% (MISS) ----- ----- ----- TOTALS: 17610 100.0% 100.0%
K-137

F2: Parent ComponentData File User's Manual
--------------Question 40E Tape Pos. 154-154-------------- Format: I1
F2P40E SCHL ENCOURAGD TEEN STAY IN SCH AFT ABSC
The school encouraged your teenager to stay in school
PER- WGTD RESPONSE CODES FREQ CENT PCT ---------- -------- ----- ----- -----YES........................... 1 929 5.3% 53.3%NO............................ 2 804 4.6% 46.7% RESERVED CODES: NO PARENT QUEX............. 1215 6.9% (MISS) MISSING.................... 8 249 1.4% (MISS) LEGITIMATE SKIP............ 9 14413 81.8% (MISS) ----- ----- ----- TOTALS: 17610 100.0% 100.0%
K-138

F2: Parent ComponentData File User's Manual
--------------Question 40F Tape Pos. 155-155-------------- Format: I1
F2P40F SCHL OFFRD TEEN SPEC TUTORING AFT ABSC
The school offered your teenager special tutoring
PER- WGTD RESPONSE CODES FREQ CENT PCT ---------- -------- ----- ----- -----YES........................... 1 304 1.7% 19.2%NO............................ 2 1434 8.1% 80.8% RESERVED CODES: NO PARENT QUEX............. 1215 6.9% (MISS) MISSING.................... 8 244 1.4% (MISS) LEGITIMATE SKIP............ 9 14413 81.8% (MISS) ----- ----- ----- TOTALS: 17610 100.0% 100.0%
K-139

F2: Parent ComponentData File User's Manual
--------------Question 40G Tape Pos. 156-156-------------- Format: I1
F2P40G SCHL OFRD HELP TEEN W/MISSD WRK AFT ABSC
The school offered to help your teenager make up workhe/she missed
PER- WGTD RESPONSE CODES FREQ CENT PCT ---------- -------- ----- ----- -----YES........................... 1 611 3.5% 35.9%NO............................ 2 1122 6.4% 64.1% RESERVED CODES: NO PARENT QUEX............. 1215 6.9% (MISS) MISSING.................... 8 249 1.4% (MISS) LEGITIMATE SKIP............ 9 14413 81.8% (MISS) ----- ----- ----- TOTALS: 17610 100.0% 100.0%
K-140

F2: Parent ComponentData File User's Manual
--------------Question 40H Tape Pos. 157-157-------------- Format: I1
F2P40H SCHL OFRD HLP TEEN W/PERS PRBLM AFT ABSC
The school offered to help your teenager with personalproblems
PER- WGTD RESPONSE CODES FREQ CENT PCT ---------- -------- ----- ----- -----YES........................... 1 506 2.9% 29.8%NO............................ 2 1229 7.0% 70.2% RESERVED CODES: NO PARENT QUEX............. 1215 6.9% (MISS) MULTIPLE RESPONSE.......... 6 1 0.0% (MISS) MISSING.................... 8 246 1.4% (MISS) LEGITIMATE SKIP............ 9 14413 81.8% (MISS) ----- ----- ----- TOTALS: 17610 100.0% 100.0%
K-141

F2: Parent ComponentData File User's Manual
--------------Question 40I Tape Pos. 158-158-------------- Format: I1
F2P40I SCHL MADE TEEN SEE COUNSELOR AFT ABSENCE
The school made your teenager see a counselor
PER- WGTD RESPONSE CODES FREQ CENT PCT ---------- -------- ----- ----- -----YES........................... 1 545 3.1% 31.8%NO............................ 2 1190 6.8% 68.2% RESERVED CODES: NO PARENT QUEX............. 1215 6.9% (MISS) MISSING.................... 8 247 1.4% (MISS) LEGITIMATE SKIP............ 9 14413 81.8% (MISS) ----- ----- ----- TOTALS: 17610 100.0% 100.0%
K-142

F2: Parent ComponentData File User's Manual
--------------Question 40J Tape Pos. 159-159-------------- Format: I1
F2P40J SCHL THREATND SUSPND/EXPEL TEEN AFT ABSC
The school threatened to suspend or expel your teenager
PER- WGTD RESPONSE CODES FREQ CENT PCT ---------- -------- ----- ----- -----YES........................... 1 581 3.3% 33.6%NO............................ 2 1155 6.6% 66.4% RESERVED CODES: NO PARENT QUEX............. 1215 6.9% (MISS) MULTIPLE RESPONSE.......... 6 1 0.0% (MISS) MISSING.................... 8 245 1.4% (MISS) LEGITIMATE SKIP............ 9 14413 81.8% (MISS) ----- ----- ----- TOTALS: 17610 100.0% 100.0%
K-143

F2: Parent ComponentData File User's Manual
--------------Question 40K Tape Pos. 160-160-------------- Format: I1
F2P40K SCHL SUSPENDED/EXPELLED TEEN AFT ABSENCE
The school suspended or expelled your teenager
PER- WGTD RESPONSE CODES FREQ CENT PCT ---------- -------- ----- ----- -----YES........................... 1 459 2.6% 25.8%NO............................ 2 1280 7.3% 74.2% RESERVED CODES: NO PARENT QUEX............. 1215 6.9% (MISS) MISSING.................... 8 243 1.4% (MISS) LEGITIMATE SKIP............ 9 14413 81.8% (MISS) ----- ----- ----- TOTALS: 17610 100.0% 100.0%
K-144

F2: Parent ComponentData File User's Manual
-------------Question 41 Tape Pos. 161-161------------- Format: I1
F2P41 HOW SATISFIED IS R W/ TEEN'S HS EDUCATIN
How satisfied are you with the high school education yourteenager has received up to now?
PER- WGTD RESPONSE CODES FREQ CENT PCT ---------- -------- ----- ----- -----VERY UNSATISFIED.............. 1 2248 12.8% 14.0%SOMEWHAT UNSATISFIED.......... 2 1973 11.2% 13.0%SOMEWHAT SATISFIED............ 3 5643 32.0% 35.9%VERY SATISFIED................ 4 6420 36.5% 37.2% RESERVED CODES: NO PARENT QUEX............. 1215 6.9% (MISS) MULTIPLE RESPONSE.......... 6 1 0.0% (MISS) MISSING.................... 8 110 0.6% (MISS) ----- ----- ----- TOTALS: 17610 100.0% 100.0%
K-145

F2: Parent ComponentData File User's Manual
-------------Question 42-------------
Please indicate how much you agree or disagree with each ofthe following statements concerning the high school yourteenager attends. If he/she has left school, refer to theschool your teenager last attended.
K-146

F2: Parent ComponentData File User's Manual
--------------Question 42A Tape Pos. 162-162-------------- Format: I1
F2P42A SCHOOL PLACES HIGH PRIORITY ON LEARNING
The school places a high priority on learning
PER- WGTD RESPONSE CODES FREQ CENT PCT ---------- -------- ----- ----- -----STRONGLY AGREE................ 1 4932 28.0% 27.5%AGREE......................... 2 8958 50.9% 56.4%DISAGREE...................... 3 1841 10.5% 12.9%STRONGLY DISAGREE............. 4 414 2.4% 3.1% RESERVED CODES: NO PARENT QUEX............. 1215 6.9% (MISS) MULTIPLE RESPONSE.......... 6 1 0.0% (MISS) MISSING.................... 8 249 1.4% (MISS) ----- ----- ----- TOTALS: 17610 100.0% 100.0%
K-147

F2: Parent ComponentData File User's Manual
--------------Question 42B Tape Pos. 163-163-------------- Format: I1
F2P42B HOMEWORK ASSIGNED IS WORTHWHILE
The homework assigned is worthwhile
PER- WGTD RESPONSE CODES FREQ CENT PCT ---------- -------- ----- ----- -----STRONGLY AGREE................ 1 3310 18.8% 17.9%AGREE......................... 2 10385 59.0% 65.6%DISAGREE...................... 3 2021 11.5% 13.6%STRONGLY DISAGREE............. 4 359 2.0% 2.9% RESERVED CODES: NO PARENT QUEX............. 1215 6.9% (MISS) MULTIPLE RESPONSE.......... 6 6 0.0% (MISS) MISSING.................... 8 314 1.8% (MISS) ----- ----- ----- TOTALS: 17610 100.0% 100.0%
K-148

F2: Parent ComponentData File User's Manual
--------------Question 42C Tape Pos. 164-164-------------- Format: I1
F2P42C SCHOOL ASSIGNS TOO MUCH HOMEWORK
The school assigns too much homework
PER- WGTD RESPONSE CODES FREQ CENT PCT ---------- -------- ----- ----- -----STRONGLY AGREE................ 1 386 2.2% 2.2%AGREE......................... 2 1796 10.2% 10.6%DISAGREE...................... 3 11484 65.2% 72.7%STRONGLY DISAGREE............. 4 2363 13.4% 14.5% RESERVED CODES: NO PARENT QUEX............. 1215 6.9% (MISS) MULTIPLE RESPONSE.......... 6 3 0.0% (MISS) MISSING.................... 8 363 2.1% (MISS) ----- ----- ----- TOTALS: 17610 100.0% 100.0%
K-149

F2: Parent ComponentData File User's Manual
--------------Question 42D Tape Pos. 165-165-------------- Format: I1
F2P42D SCHOOL ASSIGNS TOO LITTLE HOMEWORK
The school assigns too little homework
PER- WGTD RESPONSE CODES FREQ CENT PCT ---------- -------- ----- ----- -----STRONGLY AGREE................ 1 967 5.5% 6.6%AGREE......................... 2 4404 25.0% 29.5%DISAGREE...................... 3 8908 50.6% 55.3%STRONGLY DISAGREE............. 4 1613 9.2% 8.6% RESERVED CODES: NO PARENT QUEX............. 1215 6.9% (MISS) MULTIPLE RESPONSE.......... 6 3 0.0% (MISS) MISSING.................... 8 500 2.8% (MISS) ----- ----- ----- TOTALS: 17610 100.0% 100.0%
K-150

F2: Parent ComponentData File User's Manual
--------------Question 42E Tape Pos. 166-166-------------- Format: I1
F2P42E STANDARDS SET BY THE SCHL ARE REALISTIC
The academic standards set by the school are realistic
PER- WGTD RESPONSE CODES FREQ CENT PCT ---------- -------- ----- ----- -----STRONGLY AGREE................ 1 3023 17.2% 16.3%AGREE......................... 2 10578 60.1% 67.8%DISAGREE...................... 3 2006 11.4% 13.0%STRONGLY DISAGREE............. 4 414 2.4% 2.9% RESERVED CODES: NO PARENT QUEX............. 1215 6.9% (MISS) MULTIPLE RESPONSE.......... 6 4 0.0% (MISS) MISSING.................... 8 370 2.1% (MISS) ----- ----- ----- TOTALS: 17610 100.0% 100.0%
K-151

F2: Parent ComponentData File User's Manual
--------------Question 42F Tape Pos. 167-167-------------- Format: I1
F2P42F STANDARDS SET BY THE SCHL ARE TOO LOW
The academic standards set by the school are too low
PER- WGTD RESPONSE CODES FREQ CENT PCT ---------- -------- ----- ----- -----STRONGLY AGREE................ 1 685 3.9% 4.7%AGREE......................... 2 2716 15.4% 18.9%DISAGREE...................... 3 9795 55.6% 62.1%STRONGLY DISAGREE............. 4 2767 15.7% 14.3% RESERVED CODES: NO PARENT QUEX............. 1215 6.9% (MISS) MULTIPLE RESPONSE.......... 6 5 0.0% (MISS) MISSING.................... 8 427 2.4% (MISS) ----- ----- ----- TOTALS: 17610 100.0% 100.0%
K-152

F2: Parent ComponentData File User's Manual
--------------Question 42G Tape Pos. 168-168-------------- Format: I1
F2P42G SCH PREPARING STU ADEQUATELY FOR COLLEGE
The school is preparing students adequately for furtherschooling after high school
PER- WGTD RESPONSE CODES FREQ CENT PCT ---------- -------- ----- ----- -----STRONGLY AGREE................ 1 3430 19.5% 17.3%AGREE......................... 2 8727 49.6% 55.6%DISAGREE...................... 3 2977 16.9% 20.3%STRONGLY DISAGREE............. 4 966 5.5% 6.8% RESERVED CODES: NO PARENT QUEX............. 1215 6.9% (MISS) MISSING.................... 8 295 1.7% (MISS) ----- ----- ----- TOTALS: 17610 100.0% 100.0%
K-153

F2: Parent ComponentData File User's Manual
--------------Question 42H Tape Pos. 169-169-------------- Format: I1
F2P42H SCH PREPARING STUS ADEQUATELY FOR WORK
The school is preparing students adequately for work
PER- WGTD RESPONSE CODES FREQ CENT PCT ---------- -------- ----- ----- -----STRONGLY AGREE................ 1 1535 8.7% 8.7%AGREE......................... 2 8771 49.8% 55.2%DISAGREE...................... 3 4650 26.4% 29.6%STRONGLY DISAGREE............. 4 945 5.4% 6.5% RESERVED CODES: NO PARENT QUEX............. 1215 6.9% (MISS) MISSING.................... 8 494 2.8% (MISS) ----- ----- ----- TOTALS: 17610 100.0% 100.0%
K-154
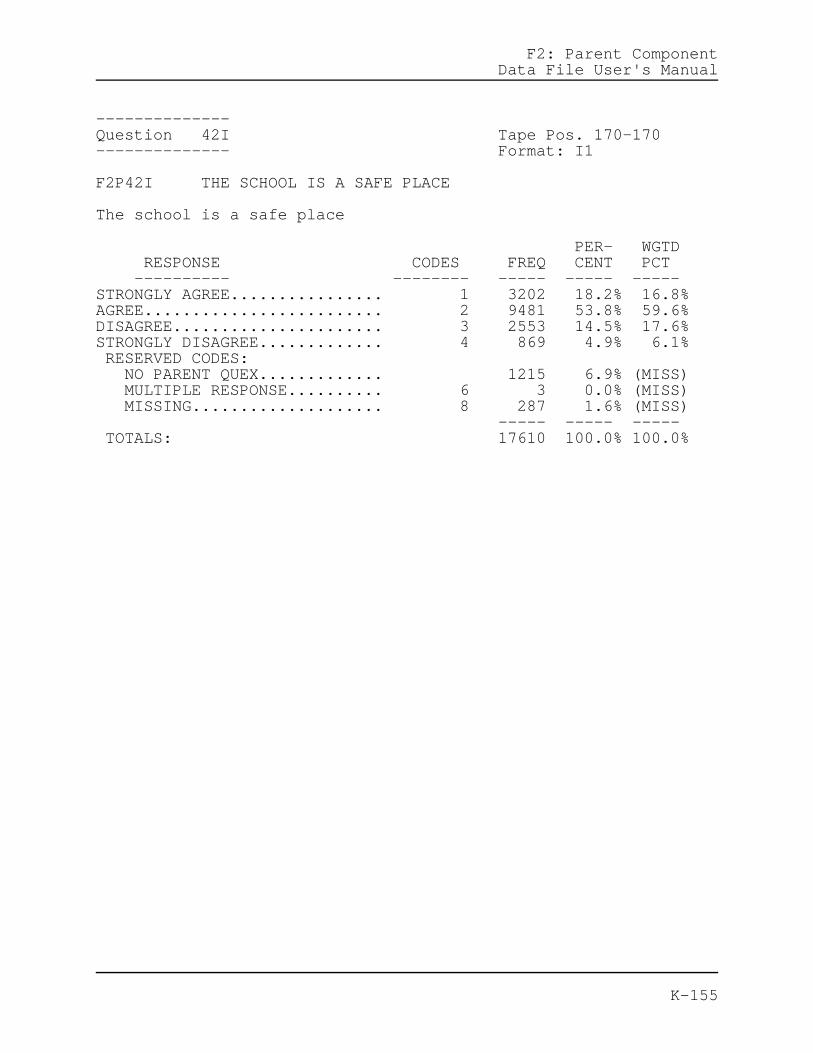
F2: Parent ComponentData File User's Manual
--------------Question 42I Tape Pos. 170-170-------------- Format: I1
F2P42I THE SCHOOL IS A SAFE PLACE
The school is a safe place
PER- WGTD RESPONSE CODES FREQ CENT PCT ---------- -------- ----- ----- -----STRONGLY AGREE................ 1 3202 18.2% 16.8%AGREE......................... 2 9481 53.8% 59.6%DISAGREE...................... 3 2553 14.5% 17.6%STRONGLY DISAGREE............. 4 869 4.9% 6.1% RESERVED CODES: NO PARENT QUEX............. 1215 6.9% (MISS) MULTIPLE RESPONSE.......... 6 3 0.0% (MISS) MISSING.................... 8 287 1.6% (MISS) ----- ----- ----- TOTALS: 17610 100.0% 100.0%
K-155

F2: Parent ComponentData File User's Manual
--------------Question 42J Tape Pos. 171-171-------------- Format: I1
F2P42J RULES FOR BEHAVIOR ARE STRICT
Rules for behavior are strict
PER- WGTD RESPONSE CODES FREQ CENT PCT ---------- -------- ----- ----- -----STRONGLY AGREE................ 1 2460 14.0% 13.5%AGREE......................... 2 8637 49.0% 54.2%DISAGREE...................... 3 4219 24.0% 27.3%STRONGLY DISAGREE............. 4 734 4.2% 5.1% RESERVED CODES: NO PARENT QUEX............. 1215 6.9% (MISS) MULTIPLE RESPONSE.......... 6 5 0.0% (MISS) MISSING.................... 8 340 1.9% (MISS) ----- ----- ----- TOTALS: 17610 100.0% 100.0%
K-156

F2: Parent ComponentData File User's Manual
--------------Question 42K Tape Pos. 172-172-------------- Format: I1
F2P42K THE TEACHING IS GOOD
The teaching is good
PER- WGTD RESPONSE CODES FREQ CENT PCT ---------- -------- ----- ----- -----STRONGLY AGREE................ 1 2522 14.3% 13.7%AGREE......................... 2 10554 59.9% 66.3%DISAGREE...................... 3 2461 14.0% 16.8%STRONGLY DISAGREE............. 4 492 2.8% 3.2% RESERVED CODES: NO PARENT QUEX............. 1215 6.9% (MISS) MULTIPLE RESPONSE.......... 6 4 0.0% (MISS) MISSING.................... 8 362 2.1% (MISS) ----- ----- ----- TOTALS: 17610 100.0% 100.0%
K-157

F2: Parent ComponentData File User's Manual
--------------Question 42L Tape Pos. 173-173-------------- Format: I1
F2P42L TEACHERS ARE INTERESTED IN STUDENTS
Teachers are interested in students
PER- WGTD RESPONSE CODES FREQ CENT PCT ---------- -------- ----- ----- -----STRONGLY AGREE................ 1 2786 15.8% 14.7%AGREE......................... 2 9576 54.4% 60.6%DISAGREE...................... 3 2929 16.6% 19.8%STRONGLY DISAGREE............. 4 685 3.9% 4.8% RESERVED CODES: NO PARENT QUEX............. 1215 6.9% (MISS) MULTIPLE RESPONSE.......... 6 8 0.0% (MISS) MISSING.................... 8 411 2.3% (MISS) ----- ----- ----- TOTALS: 17610 100.0% 100.0%
K-158

F2: Parent ComponentData File User's Manual
--------------Question 42M Tape Pos. 174-174-------------- Format: I1
F2P42M PARENTS HAVE ADEQUATE SAY IN SCHL POLICY
Parents have an adequate say in setting school policy
PER- WGTD RESPONSE CODES FREQ CENT PCT ---------- -------- ----- ----- -----STRONGLY AGREE................ 1 1110 6.3% 6.3%AGREE......................... 2 8112 46.1% 50.8%DISAGREE...................... 3 5488 31.2% 34.8%STRONGLY DISAGREE............. 4 1167 6.6% 8.0% RESERVED CODES: NO PARENT QUEX............. 1215 6.9% (MISS) MULTIPLE RESPONSE.......... 6 3 0.0% (MISS) MISSING.................... 8 515 2.9% (MISS) ----- ----- ----- TOTALS: 17610 100.0% 100.0%
K-159

F2: Parent ComponentData File User's Manual
--------------Question 42N Tape Pos. 175-175-------------- Format: I1
F2P42N PARENTS WK TOGETHR SUPPORTING SCH POLICY
Parents work together in supporting school policy
PER- WGTD RESPONSE CODES FREQ CENT PCT ---------- -------- ----- ----- -----STRONGLY AGREE................ 1 1515 8.6% 8.4%AGREE......................... 2 9204 52.3% 57.9%DISAGREE...................... 3 4416 25.1% 28.9%STRONGLY DISAGREE............. 4 679 3.9% 4.8% RESERVED CODES: NO PARENT QUEX............. 1215 6.9% (MISS) MULTIPLE RESPONSE.......... 6 1 0.0% (MISS) MISSING.................... 8 580 3.3% (MISS) ----- ----- ----- TOTALS: 17610 100.0% 100.0%
K-160

F2: Parent ComponentData File User's Manual
--------------Question 42O Tape Pos. 176-176-------------- Format: I1
F2P42O SCHL PROVDS PRGMS FOR STUS W/ DIFF NEEDS
The school provides a range of programs for students withdifferent needs
PER- WGTD RESPONSE CODES FREQ CENT PCT ---------- -------- ----- ----- -----STRONGLY AGREE................ 1 1966 11.2% 11.6%AGREE......................... 2 9999 56.8% 62.7%DISAGREE...................... 3 3270 18.6% 20.9%STRONGLY DISAGREE............. 4 705 4.0% 4.8% RESERVED CODES: NO PARENT QUEX............. 1215 6.9% (MISS) MULTIPLE RESPONSE.......... 6 2 0.0% (MISS) MISSING.................... 8 453 2.6% (MISS) ----- ----- ----- TOTALS: 17610 100.0% 100.0%
K-161

F2: Parent ComponentData File User's Manual
--------------Question 42P Tape Pos. 177-177-------------- Format: I1
F2P42P DRINKING ON SCHL GROUNDS IS A PROBLEM
Drinking on school grounds is a problem at my teenager'sschool
PER- WGTD RESPONSE CODES FREQ CENT PCT ---------- -------- ----- ----- -----STRONGLY AGREE................ 1 440 2.5% 3.0%AGREE......................... 2 1875 10.6% 12.2%DISAGREE...................... 3 9894 56.2% 63.2%STRONGLY DISAGREE............. 4 3659 20.8% 21.6% RESERVED CODES: NO PARENT QUEX............. 1215 6.9% (MISS) MULTIPLE RESPONSE.......... 6 2 0.0% (MISS) MISSING.................... 8 525 3.0% (MISS) ----- ----- ----- TOTALS: 17610 100.0% 100.0%
K-162

F2: Parent ComponentData File User's Manual
--------------Question 42Q Tape Pos. 178-178-------------- Format: I1
F2P42Q DRUG USE ON SCHL GROUNDS IS A PROBLEM
Drug use on school grounds is a problem at my teenager'sschool
PER- WGTD RESPONSE CODES FREQ CENT PCT ---------- -------- ----- ----- -----STRONGLY AGREE................ 1 789 4.5% 5.8%AGREE......................... 2 3606 20.5% 24.1%DISAGREE...................... 3 8562 48.6% 53.6%STRONGLY DISAGREE............. 4 2875 16.3% 16.5% RESERVED CODES: NO PARENT QUEX............. 1215 6.9% (MISS) MULTIPLE RESPONSE.......... 6 3 0.0% (MISS) MISSING.................... 8 560 3.2% (MISS) ----- ----- ----- TOTALS: 17610 100.0% 100.0%
K-163

F2: Parent ComponentData File User's Manual
--------------Question 42R Tape Pos. 179-179-------------- Format: I1
F2P42R SALE/USE OF DRUGS ON WAY TO SCHL IS PROB
The sale or use of drugs on the way to or from school is aproblem
PER- WGTD RESPONSE CODES FREQ CENT PCT ---------- -------- ----- ----- -----STRONGLY AGREE................ 1 760 4.3% 5.6%AGREE......................... 2 3417 19.4% 23.6%DISAGREE...................... 3 8718 49.5% 55.5%STRONGLY DISAGREE............. 4 2711 15.4% 15.3% RESERVED CODES: NO PARENT QUEX............. 1215 6.9% (MISS) MULTIPLE RESPONSE.......... 6 1 0.0% (MISS) MISSING.................... 8 788 4.5% (MISS) ----- ----- ----- TOTALS: 17610 100.0% 100.0%
K-164

F2: Parent ComponentData File User's Manual
--------------Question 42S Tape Pos. 180-180-------------- Format: I1
F2P42S THEFT ON SCHL GROUNDS IS A PROBLEM
Theft on school grounds is a problem at my teenager'sschool
PER- WGTD RESPONSE CODES FREQ CENT PCT ---------- -------- ----- ----- -----STRONGLY AGREE................ 1 993 5.6% 6.5%AGREE......................... 2 5089 28.9% 32.1%DISAGREE...................... 3 8259 46.9% 52.4%STRONGLY DISAGREE............. 4 1485 8.4% 8.9% RESERVED CODES: NO PARENT QUEX............. 1215 6.9% (MISS) MULTIPLE RESPONSE.......... 6 3 0.0% (MISS) MISSING.................... 8 566 3.2% (MISS) ----- ----- ----- TOTALS: 17610 100.0% 100.0%
K-165

F2: Parent ComponentData File User's Manual
--------------Question 42T Tape Pos. 181-181-------------- Format: I1
F2P42T VIOLENCE ON SCHL GROUNDS IS A PROBLEM
Violence on school grounds is a problem at my teenager'sschool
PER- WGTD RESPONSE CODES FREQ CENT PCT ---------- -------- ----- ----- -----STRONGLY AGREE................ 1 737 4.2% 5.0%AGREE......................... 2 2964 16.8% 20.5%DISAGREE...................... 3 9509 54.0% 60.0%STRONGLY DISAGREE............. 4 2755 15.6% 14.5% RESERVED CODES: NO PARENT QUEX............. 1215 6.9% (MISS) MULTIPLE RESPONSE.......... 6 2 0.0% (MISS) MISSING.................... 8 428 2.4% (MISS) ----- ----- ----- TOTALS: 17610 100.0% 100.0%
K-166

F2: Parent ComponentData File User's Manual
--------------Question 42U Tape Pos. 182-182-------------- Format: I1
F2P42U LACK OF DISCIPLINE IN CLASS IS A PROBLEM
The lack of discipline in classrooms is a problem
PER- WGTD RESPONSE CODES FREQ CENT PCT ---------- -------- ----- ----- -----STRONGLY AGREE................ 1 836 4.7% 5.9%AGREE......................... 2 3326 18.9% 22.1%DISAGREE...................... 3 9380 53.3% 59.4%STRONGLY DISAGREE............. 4 2350 13.3% 12.5% RESERVED CODES: NO PARENT QUEX............. 1215 6.9% (MISS) MULTIPLE RESPONSE.......... 6 4 0.0% (MISS) MISSING.................... 8 499 2.8% (MISS) ----- ----- ----- TOTALS: 17610 100.0% 100.0%
K-167

F2: Parent ComponentData File User's Manual
-------------Question 43-------------
Since your teenager's school opened last fall (or duringthe last year that your teenager was in school), how manytimes have you or your spouse/partner been contacted by theschool about each of the following?
K-168

F2: Parent ComponentData File User's Manual
--------------Question 43A Tape Pos. 183-183-------------- Format: I1
F2P43A SCH CONTACTED R ABOUT ACADEMC PERFORMANC
Your teenager's grades or academic performance (notincluding report cards)
PER- WGTD RESPONSE CODES FREQ CENT PCT ---------- -------- ----- ----- -----NEVER......................... 1 7759 44.1% 46.8%ONCE OR TWICE................. 2 4892 27.8% 31.0%3 OR 4 TIMES.................. 3 2163 12.3% 13.5%MORE THAN 4 TIMES............. 4 1383 7.9% 8.7% RESERVED CODES: NO PARENT QUEX............. 1215 6.9% (MISS) MISSING.................... 8 198 1.1% (MISS) ----- ----- ----- TOTALS: 17610 100.0% 100.0%
K-169

F2: Parent ComponentData File User's Manual
--------------Question 43B Tape Pos. 184-184-------------- Format: I1
F2P43B SCH CONTACTED R ABOUT ACADEMIC PROGRAM
Your teenager's academic program for this year
PER- WGTD RESPONSE CODES FREQ CENT PCT ---------- -------- ----- ----- -----NEVER......................... 1 9164 52.0% 57.3%ONCE OR TWICE................. 2 5247 29.8% 31.8%3 OR 4 TIMES.................. 3 1099 6.2% 6.9%MORE THAN 4 TIMES............. 4 611 3.5% 3.9% RESERVED CODES: NO PARENT QUEX............. 1215 6.9% (MISS) MULTIPLE RESPONSE.......... 6 1 0.0% (MISS) MISSING.................... 8 273 1.6% (MISS) ----- ----- ----- TOTALS: 17610 100.0% 100.0%
K-170

F2: Parent ComponentData File User's Manual
--------------Question 43C Tape Pos. 185-185-------------- Format: I1
F2P43C SCH CONTACTD R ABT TEEN'S PLANS AFTER HS
Your teenager's plans after leaving high school
PER- WGTD RESPONSE CODES FREQ CENT PCT ---------- -------- ----- ----- -----NEVER......................... 1 10176 57.8% 66.3%ONCE OR TWICE................. 2 3898 22.1% 23.2%3 OR 4 TIMES.................. 3 1167 6.6% 6.0%MORE THAN 4 TIMES............. 4 877 5.0% 4.5% RESERVED CODES: NO PARENT QUEX............. 1215 6.9% (MISS) MISSING.................... 8 277 1.6% (MISS) ----- ----- ----- TOTALS: 17610 100.0% 100.0%
K-171

F2: Parent ComponentData File User's Manual
--------------Question 43D Tape Pos. 186-186-------------- Format: I1
F2P43D SCH CONTACTD R ABT COLL PREP COURSE SEL
Your teenager's course selection for entry into college,vocational, or technical school after leaving high school
PER- WGTD RESPONSE CODES FREQ CENT PCT ---------- -------- ----- ----- -----NEVER......................... 1 10940 62.1% 70.0%ONCE OR TWICE................. 2 3763 21.4% 22.2%3 OR 4 TIMES.................. 3 885 5.0% 4.9%MORE THAN 4 TIMES............. 4 554 3.1% 2.9% RESERVED CODES: NO PARENT QUEX............. 1215 6.9% (MISS) MULTIPLE RESPONSE.......... 6 2 0.0% (MISS) MISSING.................... 8 251 1.4% (MISS) ----- ----- ----- TOTALS: 17610 100.0% 100.0%
K-172

F2: Parent ComponentData File User's Manual
--------------Question 43E Tape Pos. 187-187-------------- Format: I1
F2P43E SCH CONTACTED R ABOUT TEEN'S ATTENDANCE
You teenager's attendance record at school
PER- WGTD RESPONSE CODES FREQ CENT PCT ---------- -------- ----- ----- -----NEVER......................... 1 9975 56.6% 59.6%ONCE OR TWICE................. 2 3548 20.1% 22.6%3 OR 4 TIMES.................. 3 1310 7.4% 9.1%MORE THAN 4 TIMES............. 4 1296 7.4% 8.8% RESERVED CODES: NO PARENT QUEX............. 1215 6.9% (MISS) MISSING.................... 8 266 1.5% (MISS) ----- ----- ----- TOTALS: 17610 100.0% 100.0%
K-173

F2: Parent ComponentData File User's Manual
--------------Question 43F Tape Pos. 188-188-------------- Format: I1
F2P43F SCH CONTACTED R ABOUT TEEN'S BEHAVIOR
Your teenager's behavior in school
PER- WGTD RESPONSE CODES FREQ CENT PCT ---------- -------- ----- ----- -----NEVER......................... 1 12611 71.6% 76.1%ONCE OR TWICE................. 2 2321 13.2% 16.2%3 OR 4 TIMES.................. 3 593 3.4% 4.1%MORE THAN 4 TIMES............. 4 500 2.8% 3.7% RESERVED CODES: NO PARENT QUEX............. 1215 6.9% (MISS) MISSING.................... 8 370 2.1% (MISS) ----- ----- ----- TOTALS: 17610 100.0% 100.0%
K-174

F2: Parent ComponentData File User's Manual
--------------Question 43G Tape Pos. 189-189-------------- Format: I1
F2P43G SCH CONTACTED R ABT VOLUNTR WORK AT SCHL
You and/or your spouse/partner participating in school fundraising activities or doing volunteer work
PER- WGTD RESPONSE CODES FREQ CENT PCT ---------- -------- ----- ----- -----NEVER......................... 1 7616 43.2% 51.2%ONCE OR TWICE................. 2 4600 26.1% 26.6%3 OR 4 TIMES.................. 3 1979 11.2% 11.3%MORE THAN 4 TIMES............. 4 1984 11.3% 10.9% RESERVED CODES: NO PARENT QUEX............. 1215 6.9% (MISS) MISSING.................... 8 216 1.2% (MISS) ----- ----- ----- TOTALS: 17610 100.0% 100.0%
K-175

F2: Parent ComponentData File User's Manual
--------------Question 43H Tape Pos. 190-190-------------- Format: I1
F2P43H SCH CONTCT R ABT HOW TO HELP TEEN W/WORK
Information on how to help your teen at home with specificskills or homework
PER- WGTD RESPONSE CODES FREQ CENT PCT ---------- -------- ----- ----- -----NEVER......................... 1 12567 71.4% 77.6%ONCE OR TWICE................. 2 2603 14.8% 16.1%3 OR 4 TIMES.................. 3 595 3.4% 3.7%MORE THAN 4 TIMES............. 4 383 2.2% 2.5% RESERVED CODES: NO PARENT QUEX............. 1215 6.9% (MISS) MISSING.................... 8 247 1.4% (MISS) ----- ----- ----- TOTALS: 17610 100.0% 100.0%
K-176
F2: Parent ComponentData File User's Manual
-------------Question 44-------------
Since your teenager's school opened last fall (or duringthe last year that your teenager was in school), how manytimes have you or your spouse/partner contacted the schoolabout each of the following?
K-177

F2: Parent ComponentData File User's Manual
--------------Question 44A Tape Pos. 191-191-------------- Format: I1
F2P44A CONTACTED SCHL ABOUT ACADEMIC PERFORMANC
Your teenager's grades or academic performance
PER- WGTD RESPONSE CODES FREQ CENT PCT ---------- -------- ----- ----- -----NEVER......................... 1 7627 43.3% 44.0%ONCE OR TWICE................. 2 5112 29.0% 32.1%3 OR 4 TIMES.................. 3 2109 12.0% 14.2%MORE THAN 4 TIMES............. 4 1453 8.3% 9.8% RESERVED CODES: NO PARENT QUEX............. 1215 6.9% (MISS) MULTIPLE RESPONSE.......... 6 1 0.0% (MISS) MISSING.................... 8 93 0.5% (MISS) ----- ----- ----- TOTALS: 17610 100.0% 100.0%
K-178
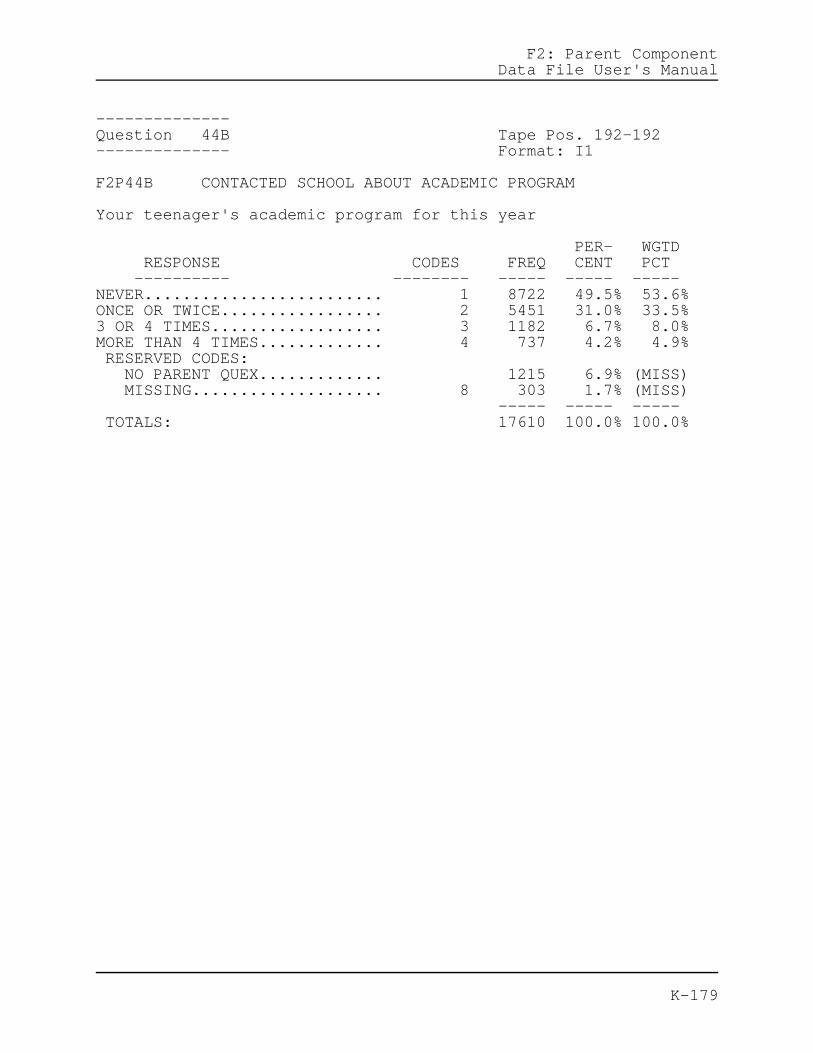
F2: Parent ComponentData File User's Manual
--------------Question 44B Tape Pos. 192-192-------------- Format: I1
F2P44B CONTACTED SCHOOL ABOUT ACADEMIC PROGRAM
Your teenager's academic program for this year
PER- WGTD RESPONSE CODES FREQ CENT PCT ---------- -------- ----- ----- -----NEVER......................... 1 8722 49.5% 53.6%ONCE OR TWICE................. 2 5451 31.0% 33.5%3 OR 4 TIMES.................. 3 1182 6.7% 8.0%MORE THAN 4 TIMES............. 4 737 4.2% 4.9% RESERVED CODES: NO PARENT QUEX............. 1215 6.9% (MISS) MISSING.................... 8 303 1.7% (MISS) ----- ----- ----- TOTALS: 17610 100.0% 100.0%
K-179

F2: Parent ComponentData File User's Manual
--------------Question 44C Tape Pos. 193-193-------------- Format: I1
F2P44C CONTACTED SCHL ABOUT TEEN'S PLANS AFT HS
Your teenager's plans after leaving high school
PER- WGTD RESPONSE CODES FREQ CENT PCT ---------- -------- ----- ----- -----NEVER......................... 1 8923 50.7% 56.4%ONCE OR TWICE................. 2 4800 27.3% 29.2%3 OR 4 TIMES.................. 3 1529 8.7% 8.7%MORE THAN 4 TIMES............. 4 1018 5.8% 5.6% RESERVED CODES: NO PARENT QUEX............. 1215 6.9% (MISS) MISSING.................... 8 125 0.7% (MISS) ----- ----- ----- TOTALS: 17610 100.0% 100.0%
K-180

F2: Parent ComponentData File User's Manual
--------------Question 44D Tape Pos. 194-194-------------- Format: I1
F2P44D CONTACTD SCHL ABOUT COLL PREP COURSE SEL
Your teenager's course selection for entry into college,vocational, or technical school after leaving high school
PER- WGTD RESPONSE CODES FREQ CENT PCT ---------- -------- ----- ----- -----NEVER......................... 1 9961 56.6% 62.6%ONCE OR TWICE................. 2 4439 25.2% 27.3%3 OR 4 TIMES.................. 3 1002 5.7% 6.1%MORE THAN 4 TIMES............. 4 660 3.7% 4.0% RESERVED CODES: NO PARENT QUEX............. 1215 6.9% (MISS) MULTIPLE RESPONSE.......... 6 2 0.0% (MISS) MISSING.................... 8 331 1.9% (MISS) ----- ----- ----- TOTALS: 17610 100.0% 100.0%
K-181

F2: Parent ComponentData File User's Manual
--------------Question 44E Tape Pos. 195-195-------------- Format: I1
F2P44E CONTACTED SCHL ABOUT TEEN'S ATTENDANCE
Your teenager's attendance record at school
PER- WGTD RESPONSE CODES FREQ CENT PCT ---------- -------- ----- ----- -----NEVER......................... 1 10947 62.2% 65.3%ONCE OR TWICE................. 2 2976 16.9% 19.0%3 OR 4 TIMES.................. 3 1021 5.8% 7.5%MORE THAN 4 TIMES............. 4 1107 6.3% 8.2% RESERVED CODES: NO PARENT QUEX............. 1215 6.9% (MISS) MISSING.................... 8 344 2.0% (MISS) ----- ----- ----- TOTALS: 17610 100.0% 100.0%
K-182

F2: Parent ComponentData File User's Manual
--------------Question 44F Tape Pos. 196-196-------------- Format: I1
F2P44F CONTACTED SCHOOL ABOUT TEEN'S BEHAVIOR
Your teenager's behavior in school
PER- WGTD RESPONSE CODES FREQ CENT PCT ---------- -------- ----- ----- -----NEVER......................... 1 12749 72.4% 76.5%ONCE OR TWICE................. 2 2069 11.7% 14.5%3 OR 4 TIMES.................. 3 587 3.3% 4.5%MORE THAN 4 TIMES............. 4 570 3.2% 4.4% RESERVED CODES: NO PARENT QUEX............. 1215 6.9% (MISS) MULTIPLE RESPONSE.......... 6 1 0.0% (MISS) MISSING.................... 8 419 2.4% (MISS) ----- ----- ----- TOTALS: 17610 100.0% 100.0%
K-183

F2: Parent ComponentData File User's Manual
--------------Question 44G Tape Pos. 197-197-------------- Format: I1
F2P44G CONTACTD SCHL ABOUT DOING VOLUNTEER WORK
You and/or your spouse/partner helping with school fundraising or doing volunteer work
PER- WGTD RESPONSE CODES FREQ CENT PCT ---------- -------- ----- ----- -----NEVER......................... 1 9830 55.8% 64.1%ONCE OR TWICE................. 2 3657 20.8% 20.9%3 OR 4 TIMES.................. 3 1152 6.5% 6.7%MORE THAN 4 TIMES............. 4 1429 8.1% 8.3% RESERVED CODES: NO PARENT QUEX............. 1215 6.9% (MISS) MISSING.................... 8 327 1.9% (MISS) ----- ----- ----- TOTALS: 17610 100.0% 100.0%
K-184

F2: Parent ComponentData File User's Manual
-------------Question 45-------------
Since this past fall, or during the last year your teenagerattended school, did you or your spouse/partner attend anyof the following types of programs dealing withopportunities for your teenager?
K-185

F2: Parent ComponentData File User's Manual
--------------Question 45A Tape Pos. 198-198-------------- Format: I1
F2P45A ATTENDED PROG ABT EDUCATIONL OPPS AFT HS
A program on educational opportunities after completinghigh school
PER- WGTD RESPONSE CODES FREQ CENT PCT ---------- -------- ----- ----- -----YES........................... 1 5209 29.6% 29.3%NO............................ 2 6511 37.0% 40.9%DIDN'T KNOW ABOUT THESEPROGRAMS...................... 3 4439 25.2% 29.8% RESERVED CODES: NO PARENT QUEX............. 1215 6.9% (MISS) MULTIPLE RESPONSE.......... 6 13 0.1% (MISS) MISSING.................... 8 223 1.3% (MISS) ----- ----- ----- TOTALS: 17610 100.0% 100.0%
K-186

F2: Parent ComponentData File User's Manual
--------------Question 45B Tape Pos. 199-199-------------- Format: I1
F2P45B ATTENDED PROG ABT COLLEGE FINANCIAL AID
A program on financial aid for colleges, universities, orvocational technical schools
PER- WGTD RESPONSE CODES FREQ CENT PCT ---------- -------- ----- ----- -----YES........................... 1 5275 30.0% 30.7%NO............................ 2 7635 43.4% 47.0%DIDN'T KNOW ABOUT THESEPROGRAMS...................... 3 3243 18.4% 22.2% RESERVED CODES: NO PARENT QUEX............. 1215 6.9% (MISS) MULTIPLE RESPONSE.......... 6 8 0.0% (MISS) MISSING.................... 8 234 1.3% (MISS) ----- ----- ----- TOTALS: 17610 100.0% 100.0%
K-187

F2: Parent ComponentData File User's Manual
--------------Question 45C Tape Pos. 200-200-------------- Format: I1
F2P45C ATTENDED PROGRAM ABOUT EMPLOYMENT OPPORT
A program on employment and career opportunities
PER- WGTD RESPONSE CODES FREQ CENT PCT ---------- -------- ----- ----- -----YES........................... 1 2226 12.6% 14.6%NO............................ 2 9751 55.4% 58.7%DIDN'T KNOW ABOUT THESEPROGRAMS...................... 3 4112 23.4% 26.7% RESERVED CODES: NO PARENT QUEX............. 1215 6.9% (MISS) MULTIPLE RESPONSE.......... 6 12 0.1% (MISS) MISSING.................... 8 294 1.7% (MISS) ----- ----- ----- TOTALS: 17610 100.0% 100.0%
K-188

F2: Parent ComponentData File User's Manual
-------------Question 46-------------
Do you know...
K-189

F2: Parent ComponentData File User's Manual
--------------Question 46A Tape Pos. 201-201-------------- Format: I1
F2P46A R KNOWS WHICH COURSES TEEN IS TAKING
Which courses your teenager has been taking this past term?
PER- WGTD RESPONSE CODES FREQ CENT PCT ---------- -------- ----- ----- -----YES........................... 1 13512 76.7% 82.6%NO............................ 2 901 5.1% 6.0%DOES NOT APPLY (TEEN NOT INSCHOOL)....................... 3 1311 7.4% 11.4% RESERVED CODES: NO PARENT QUEX............. 1215 6.9% (MISS) MULTIPLE RESPONSE.......... 6 6 0.0% (MISS) MISSING.................... 8 665 3.8% (MISS) ----- ----- ----- TOTALS: 17610 100.0% 100.0%
K-190

F2: Parent ComponentData File User's Manual
--------------Question 46B Tape Pos. 202-202-------------- Format: I1
F2P46B R KNOWS HOW WELL TEEN IS DOING IN SCHOOL
How well your teenager is performing in school?
PER- WGTD RESPONSE CODES FREQ CENT PCT ---------- -------- ----- ----- -----YES........................... 1 13959 79.3% 85.7%NO............................ 2 416 2.4% 2.9%DOES NOT APPLY (TEEN NOT INSCHOOL)....................... 3 1312 7.5% 11.5% RESERVED CODES: NO PARENT QUEX............. 1215 6.9% (MISS) MULTIPLE RESPONSE.......... 6 1 0.0% (MISS) MISSING.................... 8 707 4.0% (MISS) ----- ----- ----- TOTALS: 17610 100.0% 100.0%
K-191

F2: Parent ComponentData File User's Manual
--------------Question 46C Tape Pos. 203-203-------------- Format: I1
F2P46C R KNOWS # OF CREDITS TEEN HAS TWRD GRAD
How many credits your teenager has gained towardsgraduation?
PER- WGTD RESPONSE CODES FREQ CENT PCT ---------- -------- ----- ----- -----YES........................... 1 12592 71.5% 78.2%NO............................ 2 1713 9.7% 10.5%DOES NOT APPLY (TEEN NOT INSCHOOL)....................... 3 1291 7.3% 11.3% RESERVED CODES: NO PARENT QUEX............. 1215 6.9% (MISS) MULTIPLE RESPONSE.......... 6 2 0.0% (MISS) MISSING.................... 8 797 4.5% (MISS) ----- ----- ----- TOTALS: 17610 100.0% 100.0%
K-192
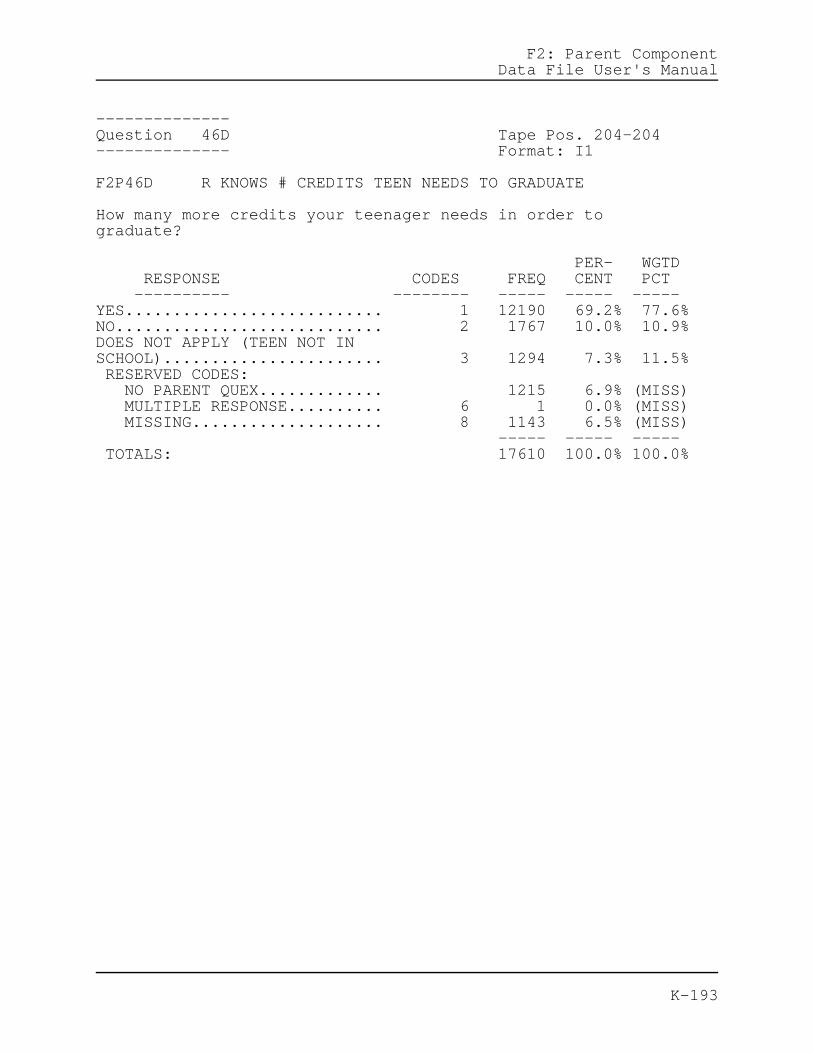
F2: Parent ComponentData File User's Manual
--------------Question 46D Tape Pos. 204-204-------------- Format: I1
F2P46D R KNOWS # CREDITS TEEN NEEDS TO GRADUATE
How many more credits your teenager needs in order tograduate?
PER- WGTD RESPONSE CODES FREQ CENT PCT ---------- -------- ----- ----- -----YES........................... 1 12190 69.2% 77.6%NO............................ 2 1767 10.0% 10.9%DOES NOT APPLY (TEEN NOT INSCHOOL)....................... 3 1294 7.3% 11.5% RESERVED CODES: NO PARENT QUEX............. 1215 6.9% (MISS) MULTIPLE RESPONSE.......... 6 1 0.0% (MISS) MISSING.................... 8 1143 6.5% (MISS) ----- ----- ----- TOTALS: 17610 100.0% 100.0%
K-193

F2: Parent ComponentData File User's Manual
-------------Question 47-------------
Do you feel that parents of students in your teenager'sschool should have more influence, less influence, or dothey have about the right amount of influence regarding thefollowing?
K-194

F2: Parent ComponentData File User's Manual
--------------Question 47A Tape Pos. 205-205-------------- Format: I1
F2P47A PARENTL INFLUENCE- SPENDING OF SCHL FUND
Deciding how school funds will be spent
PER- WGTD RESPONSE CODES FREQ CENT PCT ---------- -------- ----- ----- -----LESS INFLUENCE................ 1 887 5.0% 5.3%RIGHT AMOUNT OF INFLUENCE..... 2 5559 31.6% 31.2%MORE INFLUENCE................ 3 6907 39.2% 46.0%DON'T KNOW.................... 4 2660 15.1% 17.5% RESERVED CODES: NO PARENT QUEX............. 1215 6.9% (MISS) MULTIPLE RESPONSE.......... 6 3 0.0% (MISS) MISSING.................... 8 379 2.2% (MISS) ----- ----- ----- TOTALS: 17610 100.0% 100.0%
K-195

F2: Parent ComponentData File User's Manual
--------------Question 47B Tape Pos. 206-206-------------- Format: I1
F2P47B PARENTAL INFLUENCE- CURRICULUM
Curriculum (that is, the courses offered)
PER- WGTD RESPONSE CODES FREQ CENT PCT ---------- -------- ----- ----- -----LESS INFLUENCE................ 1 850 4.8% 4.9%RIGHT AMOUNT OF INFLUENCE..... 2 6439 36.6% 37.8%MORE INFLUENCE................ 3 6764 38.4% 44.7%DON'T KNOW.................... 4 1921 10.9% 12.6% RESERVED CODES: NO PARENT QUEX............. 1215 6.9% (MISS) MULTIPLE RESPONSE.......... 6 4 0.0% (MISS) MISSING.................... 8 417 2.4% (MISS) ----- ----- ----- TOTALS: 17610 100.0% 100.0%
K-196

F2: Parent ComponentData File User's Manual
--------------Question 47C Tape Pos. 207-207-------------- Format: I1
F2P47C PARENTAL INFL- SELECT/HIRE ADMINISTRATRS
Selection and hiring of administrators
PER- WGTD RESPONSE CODES FREQ CENT PCT ---------- -------- ----- ----- -----LESS INFLUENCE................ 1 1351 7.7% 7.9%RIGHT AMOUNT OF INFLUENCE..... 2 5444 30.9% 31.4%MORE INFLUENCE................ 3 6513 37.0% 43.9%DON'T KNOW.................... 4 2639 15.0% 16.8% RESERVED CODES: NO PARENT QUEX............. 1215 6.9% (MISS) MULTIPLE RESPONSE.......... 6 13 0.1% (MISS) MISSING.................... 8 435 2.5% (MISS) ----- ----- ----- TOTALS: 17610 100.0% 100.0%
K-197

F2: Parent ComponentData File User's Manual
--------------Question 47D Tape Pos. 208-208-------------- Format: I1
F2P47D PARENTAL INFLUENC- ABOUT BOOKS/MATERIALS
Books and instructional materials
PER- WGTD RESPONSE CODES FREQ CENT PCT ---------- -------- ----- ----- -----LESS INFLUENCE................ 1 1241 7.0% 7.5%RIGHT AMOUNT OF INFLUENCE..... 2 7402 42.0% 43.8%MORE INFLUENCE................ 3 4911 27.9% 33.4%DON'T KNOW.................... 4 2380 13.5% 15.3% RESERVED CODES: NO PARENT QUEX............. 1215 6.9% (MISS) MULTIPLE RESPONSE.......... 6 6 0.0% (MISS) MISSING.................... 8 455 2.6% (MISS) ----- ----- ----- TOTALS: 17610 100.0% 100.0%
K-198

F2: Parent ComponentData File User's Manual
--------------Question 47E Tape Pos. 209-209-------------- Format: I1
F2P47E PARENTAL INFLUENCE- SELECT/HIRE TEACHERS
Selection and hiring of teachers
PER- WGTD RESPONSE CODES FREQ CENT PCT ---------- -------- ----- ----- -----LESS INFLUENCE................ 1 1588 9.0% 9.6%RIGHT AMOUNT OF INFLUENCE..... 2 6163 35.0% 36.1%MORE INFLUENCE................ 3 5612 31.9% 37.7%DON'T KNOW.................... 4 2570 14.6% 16.6% RESERVED CODES: NO PARENT QUEX............. 1215 6.9% (MISS) MULTIPLE RESPONSE.......... 6 5 0.0% (MISS) MISSING.................... 8 457 2.6% (MISS) ----- ----- ----- TOTALS: 17610 100.0% 100.0%
K-199

F2: Parent ComponentData File User's Manual
--------------Question 47F Tape Pos. 210-210-------------- Format: I1
F2P47F PARENTAL INFLUENCE- BOOKS IN LIBRARIES
Books placed in the school libraries
PER- WGTD RESPONSE CODES FREQ CENT PCT ---------- -------- ----- ----- -----LESS INFLUENCE................ 1 1352 7.7% 8.5%RIGHT AMOUNT OF INFLUENCE..... 2 7905 44.9% 47.0%MORE INFLUENCE................ 3 4152 23.6% 28.2%DON'T KNOW.................... 4 2526 14.3% 16.2% RESERVED CODES: NO PARENT QUEX............. 1215 6.9% (MISS) MULTIPLE RESPONSE.......... 6 7 0.0% (MISS) MISSING.................... 8 453 2.6% (MISS) ----- ----- ----- TOTALS: 17610 100.0% 100.0%
K-200

F2: Parent ComponentData File User's Manual
--------------Question 47G Tape Pos. 211-211-------------- Format: I1
F2P47G PARENTAL INFLUENCE- EVALUATNG TCHRS/ADM
Evaluation of teachers and administrators
PER- WGTD RESPONSE CODES FREQ CENT PCT ---------- -------- ----- ----- -----LESS INFLUENCE................ 1 1243 7.1% 7.2%RIGHT AMOUNT OF INFLUENCE..... 2 5068 28.8% 30.3%MORE INFLUENCE................ 3 7363 41.8% 48.0%DON'T KNOW.................... 4 2260 12.8% 14.5% RESERVED CODES: NO PARENT QUEX............. 1215 6.9% (MISS) MULTIPLE RESPONSE.......... 6 6 0.0% (MISS) MISSING.................... 8 455 2.6% (MISS) ----- ----- ----- TOTALS: 17610 100.0% 100.0%
K-201

F2: Parent ComponentData File User's Manual
--------------Question 47H Tape Pos. 212-212-------------- Format: I1
F2P47H PARENTAL INFLUENCE- AMOUNT OF HOMEWORK
Amount of homework assigned
PER- WGTD RESPONSE CODES FREQ CENT PCT ---------- -------- ----- ----- -----LESS INFLUENCE................ 1 1404 8.0% 8.9%RIGHT AMOUNT OF INFLUENCE..... 2 7843 44.5% 46.8%MORE INFLUENCE................ 3 4867 27.6% 32.6%DON'T KNOW.................... 4 1819 10.3% 11.7% RESERVED CODES: NO PARENT QUEX............. 1215 6.9% (MISS) MULTIPLE RESPONSE.......... 6 11 0.1% (MISS) MISSING.................... 8 451 2.6% (MISS) ----- ----- ----- TOTALS: 17610 100.0% 100.0%
K-202

F2: Parent ComponentData File User's Manual
--------------Question 47I Tape Pos. 213-213-------------- Format: I1
F2P47I PARENTAL INFLUENCE- DISCIPLINE POLICIES
Discipline policies
PER- WGTD RESPONSE CODES FREQ CENT PCT ---------- -------- ----- ----- -----LESS INFLUENCE................ 1 1065 6.0% 6.7%RIGHT AMOUNT OF INFLUENCE..... 2 7087 40.2% 41.3%MORE INFLUENCE................ 3 6352 36.1% 42.5%DON'T KNOW.................... 4 1459 8.3% 9.4% RESERVED CODES: NO PARENT QUEX............. 1215 6.9% (MISS) MULTIPLE RESPONSE.......... 6 1 0.0% (MISS) MISSING.................... 8 431 2.4% (MISS) ----- ----- ----- TOTALS: 17610 100.0% 100.0%
K-203

F2: Parent ComponentData File User's Manual
--------------Question 47J Tape Pos. 214-214-------------- Format: I1
F2P47J PARENTAL INFLUENCE- ACADEMIC STANDARDS
Academic standards
PER- WGTD RESPONSE CODES FREQ CENT PCT ---------- -------- ----- ----- -----LESS INFLUENCE................ 1 856 4.9% 5.3%RIGHT AMOUNT OF INFLUENCE..... 2 7485 42.5% 43.3%MORE INFLUENCE................ 3 5959 33.8% 40.4%DON'T KNOW.................... 4 1659 9.4% 11.0% RESERVED CODES: NO PARENT QUEX............. 1215 6.9% (MISS) MULTIPLE RESPONSE.......... 6 2 0.0% (MISS) MISSING.................... 8 434 2.5% (MISS) ----- ----- ----- TOTALS: 17610 100.0% 100.0%
K-204

F2: Parent ComponentData File User's Manual
III. YOUR TEENAGER'S FAMILY LIFE
-------------Question 48-------------
In your family, who makes most of the decisions about eachof the following topics? (If you do not have aspouse/partner, please answer for yourself.)
K-205

F2: Parent ComponentData File User's Manual
--------------Question 48A Tape Pos. 215-215-------------- Format: I1
F2P48A WHO DECIDES HOW LATE TEEN CAN STAY OUT
How late my teenager can stay out
PER- WGTD RESPONSE CODES FREQ CENT PCT ---------- -------- ----- ----- -----MY SPOUSE/PARTNER AND IDECIDE TOGETHER............... 1 6478 36.8% 42.1%MY SPOUSE/PARTNER AND IDECIDE AFTER DISCUSSING ITWITH MY TEEN.................. 2 3169 18.0% 18.7%WE DECIDE TOGETHER WITH MYTEEN AFTER DISCUSSING IT...... 3 4523 25.7% 26.8%MY TEEN DECIDES AFTERDISCUSSING IT WITH ME AND MYSPOUSE/PARTNER................ 4 949 5.4% 5.8%MY TEEN DECIDES BY HIM/HERSELF 5 1045 5.9% 6.7% RESERVED CODES: NO PARENT QUEX............. 1215 6.9% (MISS) MULTIPLE RESPONSE.......... 6 4 0.0% (MISS) MISSING.................... 8 227 1.3% (MISS) ----- ----- ----- TOTALS: 17610 100.0% 100.0%
K-206

F2: Parent ComponentData File User's Manual
--------------Question 48B Tape Pos. 216-216-------------- Format: I1
F2P48B WHO DECIDES WHEN TEEN CAN USE CAR
When my teenager can use the car
PER- WGTD RESPONSE CODES FREQ CENT PCT ---------- -------- ----- ----- -----MY SPOUSE/PARTNER AND IDECIDE TOGETHER............... 1 5994 34.0% 42.0%MY SPOUSE/PARTNER AND IDECIDE AFTER DISCUSSING ITWITH MY TEEN.................. 2 2498 14.2% 14.7%WE DECIDE TOGETHER WITH MYTEEN AFTER DISCUSSING IT...... 3 3564 20.2% 21.2%MY TEEN DECIDES AFTERDISCUSSING IT WITH ME AND MYSPOUSE/PARTNER................ 4 883 5.0% 5.1%MY TEEN DECIDES BY HIM/HERSELF 5 2799 15.9% 17.0% RESERVED CODES: NO PARENT QUEX............. 1215 6.9% (MISS) MULTIPLE RESPONSE.......... 6 4 0.0% (MISS) MISSING.................... 8 653 3.7% (MISS) ----- ----- ----- TOTALS: 17610 100.0% 100.0%
K-207

F2: Parent ComponentData File User's Manual
--------------Question 48C Tape Pos. 217-217-------------- Format: I1
F2P48C WHO DECIDES WHETHER TEEN CAN HAVE A JOB
Whether my teenager can have a job
PER- WGTD RESPONSE CODES FREQ CENT PCT ---------- -------- ----- ----- -----MY SPOUSE/PARTNER AND IDECIDE TOGETHER............... 1 2488 14.1% 16.4%MY SPOUSE/PARTNER AND IDECIDE AFTER DISCUSSING ITWITH MY TEEN.................. 2 2070 11.8% 12.3%WE DECIDE TOGETHER WITH MYTEEN AFTER DISCUSSING IT...... 3 4780 27.1% 29.1%MY TEEN DECIDES AFTERDISCUSSING IT WITH ME AND MYSPOUSE/PARTNER................ 4 2671 15.2% 15.6%MY TEEN DECIDES BY HIM/HERSELF 5 4056 23.0% 26.6% RESERVED CODES: NO PARENT QUEX............. 1215 6.9% (MISS) MULTIPLE RESPONSE.......... 6 15 0.1% (MISS) MISSING.................... 8 315 1.8% (MISS) ----- ----- ----- TOTALS: 17610 100.0% 100.0%
K-208

F2: Parent ComponentData File User's Manual
--------------Question 48D Tape Pos. 218-218-------------- Format: I1
F2P48D WHO DECIDES HOW TEEN SPENDS OWN MONEY
How my teenager spends his/her money
PER- WGTD RESPONSE CODES FREQ CENT PCT ---------- -------- ----- ----- -----MY SPOUSE/PARTNER AND IDECIDE TOGETHER............... 1 828 4.7% 5.4%MY SPOUSE/PARTNER AND IDECIDE AFTER DISCUSSING ITWITH MY TEEN.................. 2 751 4.3% 4.3%WE DECIDE TOGETHR WITH MYTEEN AFTER DISCUSSING IT...... 3 2196 12.5% 14.2%MY TEEN DECIDES AFTERDISCUSSING IT WITH ME AND MYSPOUSE/PARTNER................ 4 3560 20.2% 21.3%MY TEEN DECIDES BY HIM/HERSELF 5 8703 49.4% 54.9% RESERVED CODES: NO PARENT QUEX............. 1215 6.9% (MISS) MULTIPLE RESPONSE.......... 6 15 0.1% (MISS) MISSING.................... 8 342 1.9% (MISS) ----- ----- ----- TOTALS: 17610 100.0% 100.0%
K-209

F2: Parent ComponentData File User's Manual
--------------Question 48E Tape Pos. 219-219-------------- Format: I1
F2P48E WHO DECIDES IF TEEN DRINKS ALCHL AT HOME
Whether my teenager can drink alcohol in front of me or myspouse/partner
PER- WGTD RESPONSE CODES FREQ CENT PCT ---------- -------- ----- ----- -----MY SPOUSE/PARTNER AND IDECIDE TOGETHER............... 1 8827 50.1% 57.9%MY SPOUSE/PARTNER AND IDECIDE AFTER DISCUSSING ITWITH MY TEEN.................. 2 1731 9.8% 10.8%WE DECIDE TOGETHER WITH MYTEEN AFTER DISCUSSING IT...... 3 3202 18.2% 19.0%MY TEEN DECIDES AFTERDISCUSSING IT WITH ME AND MYSPOUSE/PARTNER................ 4 772 4.4% 4.8%MY TEEN DECIDES BY HIM/HERSELF 5 1178 6.7% 7.5% RESERVED CODES: NO PARENT QUEX............. 1215 6.9% (MISS) MULTIPLE RESPONSE.......... 6 8 0.0% (MISS) MISSING.................... 8 677 3.8% (MISS) ----- ----- ----- TOTALS: 17610 100.0% 100.0%
K-210

F2: Parent ComponentData File User's Manual
--------------Question 48F Tape Pos. 220-220-------------- Format: I1
F2P48F WHO DECIDES IF TEEN CAN DRINK ALCOHOL
Whether my teenager can drink alcohol when he/she is atparties/social gatherings without me or my spouse/partner
PER- WGTD RESPONSE CODES FREQ CENT PCT ---------- -------- ----- ----- -----MY SPOUSE/PARTNER AND IDECIDE TOGETHER............... 1 5432 30.8% 35.1%MY SPOUSE/PARTNER AND IDECIDE AFTER DISCUSSING ITWITH MY TEEN.................. 2 1703 9.7% 9.9%WE DECIDE TOGETHER WITH MYTEEN AFTER DISCUSSING IT...... 3 2885 16.4% 17.6%MY TEEN DECIDES AFTERDISCUSSING IT WITH ME AND MYSPOUSE/PARTNER................ 4 1506 8.6% 8.9%MY TEEN DECIDES BY HIM/HERSELF 5 4225 24.0% 28.5% RESERVED CODES: NO PARENT QUEX............. 1215 6.9% (MISS) MULTIPLE RESPONSE.......... 6 10 0.1% (MISS) MISSING.................... 8 634 3.6% (MISS) ----- ----- ----- TOTALS: 17610 100.0% 100.0%
K-211

F2: Parent ComponentData File User's Manual
--------------Question 48G Tape Pos. 221-221-------------- Format: I1
F2P48G WHO DECIDES IF PRIVILEGES ARE TAKEN AWAY
If privileges should be taken away because my teenager hasused alcohol or drugs
PER- WGTD RESPONSE CODES FREQ CENT PCT ---------- -------- ----- ----- -----MY SPOUSE/PARTNER AND IDECIDE TOGETHER............... 1 9971 56.6% 65.8%MY SPOUSE/PARTNER AND IDECIDE AFTER DISCUSSING ITWITH MY TEEN.................. 2 2263 12.9% 13.8%WE DECIDE TOGETHER WITH MYTEEN AFTER DISCUSSING IT...... 3 2467 14.0% 15.4%MY TEEN DECIDES AFTERDISCUSSING IT WITH ME AND MYSPOUSE/PARTNER................ 4 277 1.6% 1.8%MY TEEN DECIDES BY HIM/HERSELF 5 460 2.6% 3.2% RESERVED CODES: NO PARENT QUEX............. 1215 6.9% (MISS) MULTIPLE RESPONSE.......... 6 5 0.0% (MISS) MISSING.................... 8 952 5.4% (MISS) ----- ----- ----- TOTALS: 17610 100.0% 100.0%
K-212

F2: Parent ComponentData File User's Manual
--------------Question 48H Tape Pos. 222-222-------------- Format: I1
F2P48H WHO DECIDES WHETHER TEEN SHLD GO TO COLL
Whether my teenager should go to college or avocational/technical school
PER- WGTD RESPONSE CODES FREQ CENT PCT ---------- -------- ----- ----- -----MY SPOUSE/PARTNER AND IDECIDE TOGETHER............... 1 1077 6.1% 6.9%MY SPOUSE/PARTNER AND IDECIDE AFTER DISCUSSING ITWITH MY TEEN.................. 2 1268 7.2% 7.5%WE DECIDE TOGETHER WITH MYTEEN AFTER DISCUSSING IT...... 3 5543 31.5% 33.3%MY TEEN DECIDES AFTERDISCUSSING IT WITH ME AND MYSPOUSE/PARTNER................ 4 3898 22.1% 23.9%MY TEEN DECIDES BY HIM/HERSELF 5 4297 24.4% 28.4% RESERVED CODES: NO PARENT QUEX............. 1215 6.9% (MISS) MULTIPLE RESPONSE.......... 6 14 0.1% (MISS) MISSING.................... 8 298 1.7% (MISS) ----- ----- ----- TOTALS: 17610 100.0% 100.0%
K-213

F2: Parent ComponentData File User's Manual
--------------Question 48I Tape Pos. 223-223-------------- Format: I1
F2P48I WHO DECIDES WHICH COURSES TEEN TAKES
The courses my teenager takes
PER- WGTD RESPONSE CODES FREQ CENT PCT ---------- -------- ----- ----- -----MY SPOUSE/PARTNER AND IDECIDE TOGETHER............... 1 334 1.9% 2.2%MY SPOUSE/PARTNER AND IDECIDE AFTER DISCUSSING ITWITH MY TEEN.................. 2 659 3.7% 3.9%WE DECIDE TOGETHER WITH MYTEEN AFTER DISCUSSING IT...... 3 3032 17.2% 18.5%MY TEEN DECIDES AFTERDISCUSSING IT WITH ME AND MYSPOUSE/PARTNER................ 4 4819 27.4% 27.6%MY TEEN DECIDES BY HIM/HERSELF 5 7247 41.2% 47.8% RESERVED CODES: NO PARENT QUEX............. 1215 6.9% (MISS) MULTIPLE RESPONSE.......... 6 8 0.0% (MISS) MISSING.................... 8 296 1.7% (MISS) ----- ----- ----- TOTALS: 17610 100.0% 100.0%
K-214

F2: Parent ComponentData File User's Manual
-------------Question 49-------------
How frequently during the past two years have you and/oryour spouse/partner talked about the following with yourteenager?
K-215

F2: Parent ComponentData File User's Manual
--------------Question 49A Tape Pos. 224-224-------------- Format: I1
F2P49A DISCUSS WITH TEEN SELECTING COURSES
Selecting courses or programs at school
PER- WGTD RESPONSE CODES FREQ CENT PCT ---------- -------- ----- ----- -----NEVER......................... 1 983 5.6% 6.8%SOMETIMES..................... 2 6329 35.9% 37.5%OFTEN......................... 3 8870 50.4% 55.7% RESERVED CODES: NO PARENT QUEX............. 1215 6.9% (MISS) MISSING.................... 8 213 1.2% (MISS) ----- ----- ----- TOTALS: 17610 100.0% 100.0%
K-216

F2: Parent ComponentData File User's Manual
--------------Question 49B Tape Pos. 225-225-------------- Format: I1
F2P49B DISCUSS WITH TEEN SCHOOL ACTIVITIES
School activities or events of particular interest to yourteenager
PER- WGTD RESPONSE CODES FREQ CENT PCT ---------- -------- ----- ----- -----NEVER......................... 1 1008 5.7% 7.3%SOMETIMES..................... 2 5785 32.9% 35.6%OFTEN......................... 3 9375 53.2% 57.1% RESERVED CODES: NO PARENT QUEX............. 1215 6.9% (MISS) MULTIPLE RESPONSE.......... 6 5 0.0% (MISS) MISSING.................... 8 222 1.3% (MISS) ----- ----- ----- TOTALS: 17610 100.0% 100.0%
K-217

F2: Parent ComponentData File User's Manual
--------------Question 49C Tape Pos. 226-226-------------- Format: I1
F2P49C DISCUSS W/ TEEN THINGS TEEN HAS STUDIED
Things your teenager has studied in class
PER- WGTD RESPONSE CODES FREQ CENT PCT ---------- -------- ----- ----- -----NEVER......................... 1 781 4.4% 5.5%SOMETIMES..................... 2 7009 39.8% 43.1%OFTEN......................... 3 8362 47.5% 51.4% RESERVED CODES: NO PARENT QUEX............. 1215 6.9% (MISS) MULTIPLE RESPONSE.......... 6 5 0.0% (MISS) MISSING.................... 8 238 1.4% (MISS) ----- ----- ----- TOTALS: 17610 100.0% 100.0%
K-218

F2: Parent ComponentData File User's Manual
--------------Question 49D Tape Pos. 227-227-------------- Format: I1
F2P49D DISCUSS WITH TEEN TEEN'S GRADES
Your teen's grades
PER- WGTD RESPONSE CODES FREQ CENT PCT ---------- -------- ----- ----- -----NEVER......................... 1 444 2.5% 3.5%SOMETIMES..................... 2 3698 21.0% 22.1%OFTEN......................... 3 11981 68.0% 74.4% RESERVED CODES: NO PARENT QUEX............. 1215 6.9% (MISS) MULTIPLE RESPONSE.......... 6 1 0.0% (MISS) MISSING.................... 8 271 1.5% (MISS) ----- ----- ----- TOTALS: 17610 100.0% 100.0%
K-219

F2: Parent ComponentData File User's Manual
--------------Question 49E Tape Pos. 228-228-------------- Format: I1
F2P49E DISCUSS WITH TEEN PLANS TO TAKE SAT/ACT
Plans and preparation for the American College Testing test(ACT), Scholastic Aptitude Test (SAT), or Armed ServicesVocational Aptitude Battery (ASVAB)
PER- WGTD RESPONSE CODES FREQ CENT PCT ---------- -------- ----- ----- -----NEVER......................... 1 2014 11.4% 15.0%SOMETIMES..................... 2 6424 36.5% 38.7%OFTEN......................... 3 7707 43.8% 46.2% RESERVED CODES: NO PARENT QUEX............. 1215 6.9% (MISS) MULTIPLE RESPONSE.......... 6 4 0.0% (MISS) MISSING.................... 8 246 1.4% (MISS) ----- ----- ----- TOTALS: 17610 100.0% 100.0%
K-220

F2: Parent ComponentData File User's Manual
--------------Question 49F Tape Pos. 229-229-------------- Format: I1
F2P49F DISCUSS WITH TEEN APPLYING TO COLLEGES
Applying to colleges or other schools after high school
PER- WGTD RESPONSE CODES FREQ CENT PCT ---------- -------- ----- ----- -----NEVER......................... 1 1182 6.7% 9.4%SOMETIMES..................... 2 4558 25.9% 29.4%OFTEN......................... 3 10408 59.1% 61.2% RESERVED CODES: NO PARENT QUEX............. 1215 6.9% (MISS) MULTIPLE RESPONSE.......... 6 2 0.0% (MISS) MISSING.................... 8 245 1.4% (MISS) ----- ----- ----- TOTALS: 17610 100.0% 100.0%
K-221

F2: Parent ComponentData File User's Manual
--------------Question 49G Tape Pos. 230-230-------------- Format: I1
F2P49G DISCUSS W/ TEEN JOBS TEEN MIGHT APPLY
Specific jobs your teen might apply for after high school
PER- WGTD RESPONSE CODES FREQ CENT PCT ---------- -------- ----- ----- -----NEVER......................... 1 1708 9.7% 10.2%SOMETIMES..................... 2 6779 38.5% 40.4%OFTEN......................... 3 7619 43.3% 49.5% RESERVED CODES: NO PARENT QUEX............. 1215 6.9% (MISS) MULTIPLE RESPONSE.......... 6 7 0.0% (MISS) MISSING.................... 8 282 1.6% (MISS) ----- ----- ----- TOTALS: 17610 100.0% 100.0%
K-222

F2: Parent ComponentData File User's Manual
--------------Question 49H Tape Pos. 231-231-------------- Format: I1
F2P49H DISCUSS W/TEEN COMMUNTY/NATL/WRLD EVENTS
Community, national, and world events
PER- WGTD RESPONSE CODES FREQ CENT PCT ---------- -------- ----- ----- -----NEVER......................... 1 1559 8.9% 10.7%SOMETIMES..................... 2 7735 43.9% 47.7%OFTEN......................... 3 6836 38.8% 41.6% RESERVED CODES: NO PARENT QUEX............. 1215 6.9% (MISS) MULTIPLE RESPONSE.......... 6 9 0.1% (MISS) MISSING.................... 8 256 1.5% (MISS) ----- ----- ----- TOTALS: 17610 100.0% 100.0%
K-223

F2: Parent ComponentData File User's Manual
--------------Question 49I Tape Pos. 232-232-------------- Format: I1
F2P49I DISCUSS WITH TEEN THINGS TROUBLING TEEN
Things that are troubling your teenager
PER- WGTD RESPONSE CODES FREQ CENT PCT ---------- -------- ----- ----- -----NEVER......................... 1 543 3.1% 3.6%SOMETIMES..................... 2 5583 31.7% 32.1%OFTEN......................... 3 10051 57.1% 64.3% RESERVED CODES: NO PARENT QUEX............. 1215 6.9% (MISS) MULTIPLE RESPONSE.......... 6 3 0.0% (MISS) MISSING.................... 8 215 1.2% (MISS) ----- ----- ----- TOTALS: 17610 100.0% 100.0%
K-224

F2: Parent ComponentData File User's Manual
--------------Question 49J Tape Pos. 233-233-------------- Format: I1
F2P49J DISCUSS W/TEEN TEEN'S INTERESTS/HOBBIES
Your teenager's special interests or hobbies
PER- WGTD RESPONSE CODES FREQ CENT PCT ---------- -------- ----- ----- -----NEVER......................... 1 493 2.8% 3.6%SOMETIMES..................... 2 4958 28.2% 29.7%OFTEN......................... 3 10723 60.9% 66.7% RESERVED CODES: NO PARENT QUEX............. 1215 6.9% (MISS) MULTIPLE RESPONSE.......... 6 1 0.0% (MISS) MISSING.................... 8 220 1.2% (MISS) ----- ----- ----- TOTALS: 17610 100.0% 100.0%
K-225

F2: Parent ComponentData File User's Manual
-------------Question 50-------------
Looking back over the past year, how frequently did you andyour teenager participate in the following activitiestogether?
K-226

F2: Parent ComponentData File User's Manual
--------------Question 50A Tape Pos. 234-234-------------- Format: I1
F2P50A ATTENDED SCHOOL ACTIVITIES WITH TEEN
Attending school activities (sports, plays)
PER- WGTD RESPONSE CODES FREQ CENT PCT ---------- -------- ----- ----- -----NEVER......................... 1 2744 15.6% 18.4%RARELY........................ 2 2274 12.9% 13.7%SOMETIMES..................... 3 4268 24.2% 24.6%FREQUENTLY.................... 4 5256 29.8% 29.6%DOES NOT APPLY (TEEN NOT INSCHOOL)....................... 5 1665 9.5% 13.7% RESERVED CODES: NO PARENT QUEX............. 1215 6.9% (MISS) MULTIPLE RESPONSE.......... 6 5 0.0% (MISS) MISSING.................... 8 183 1.0% (MISS) ----- ----- ----- TOTALS: 17610 100.0% 100.0%
K-227

F2: Parent ComponentData File User's Manual
--------------Question 50B Tape Pos. 235-235-------------- Format: I1
F2P50B WORKED ON HOMEWORK/PROJECTS WITH TEEN
Working on homework or school projects
PER- WGTD RESPONSE CODES FREQ CENT PCT ---------- -------- ----- ----- -----NEVER......................... 1 1981 11.2% 11.8%RARELY........................ 2 3368 19.1% 19.2%SOMETIMES..................... 3 6302 35.8% 38.1%FREQUENTLY.................... 4 2908 16.5% 17.4%DOES NOT APPLY (TEEN NOT INSCHOOL)....................... 5 1633 9.3% 13.5% RESERVED CODES: NO PARENT QUEX............. 1215 6.9% (MISS) MULTIPLE RESPONSE.......... 6 8 0.0% (MISS) MISSING.................... 8 195 1.1% (MISS) ----- ----- ----- TOTALS: 17610 100.0% 100.0%
K-228

F2: Parent ComponentData File User's Manual
--------------Question 50C Tape Pos. 236-236-------------- Format: I1
F2P50C ATTENDED CONCERTS, PLAYS, MOVIES W/ TEEN
Attending concerts, plays, or movies outside of school
PER- WGTD RESPONSE CODES FREQ CENT PCT ---------- -------- ----- ----- -----NEVER......................... 1 3329 18.9% 22.2%RARELY........................ 2 3587 20.4% 20.9%SOMETIMES..................... 3 6262 35.6% 39.4%FREQUENTLY.................... 4 2883 16.4% 17.5% RESERVED CODES: NO PARENT QUEX............. 1215 6.9% (MISS) MULTIPLE RESPONSE.......... 6 2 0.0% (MISS) MISSING.................... 8 332 1.9% (MISS) ----- ----- ----- TOTALS: 17610 100.0% 100.0%
K-229

F2: Parent ComponentData File User's Manual
--------------Question 50D Tape Pos. 237-237-------------- Format: I1
F2P50D ATTENDED SPORTS EVENTS OUTSIDE SCHL W/TN
Attending sporting events outside of school
PER- WGTD RESPONSE CODES FREQ CENT PCT ---------- -------- ----- ----- -----NEVER......................... 1 4768 27.1% 32.5%RARELY........................ 2 3672 20.9% 20.8%SOMETIMES..................... 3 4763 27.0% 29.2%FREQUENTLY.................... 4 2809 16.0% 17.5% RESERVED CODES: NO PARENT QUEX............. 1215 6.9% (MISS) MULTIPLE RESPONSE.......... 6 2 0.0% (MISS) MISSING.................... 8 381 2.2% (MISS) ----- ----- ----- TOTALS: 17610 100.0% 100.0%
K-230

F2: Parent ComponentData File User's Manual
--------------Question 50E Tape Pos. 238-238-------------- Format: I1
F2P50E ATTENDED RELIGIOUS SERVICES WITH TEEN
Attending religious services
PER- WGTD RESPONSE CODES FREQ CENT PCT ---------- -------- ----- ----- -----NEVER......................... 1 3050 17.3% 20.0%RARELY........................ 2 2559 14.5% 15.1%SOMETIMES..................... 3 3909 22.2% 24.5%FREQUENTLY.................... 4 6437 36.6% 40.4% RESERVED CODES: NO PARENT QUEX............. 1215 6.9% (MISS) MULTIPLE RESPONSE.......... 6 2 0.0% (MISS) MISSING.................... 8 438 2.5% (MISS) ----- ----- ----- TOTALS: 17610 100.0% 100.0%
K-231

F2: Parent ComponentData File User's Manual
--------------Question 50F Tape Pos. 239-239-------------- Format: I1
F2P50F ATTENDED FAMILY SOCIAL FUNCTIONS W/ TEEN
Attending family social functions (party, wedding)
PER- WGTD RESPONSE CODES FREQ CENT PCT ---------- -------- ----- ----- -----NEVER......................... 1 748 4.2% 5.2%RARELY........................ 2 1691 9.6% 10.2%SOMETIMES..................... 3 6438 36.6% 39.8%FREQUENTLY.................... 4 7175 40.7% 44.8% RESERVED CODES: NO PARENT QUEX............. 1215 6.9% (MISS) MULTIPLE RESPONSE.......... 6 3 0.0% (MISS) MISSING.................... 8 340 1.9% (MISS) ----- ----- ----- TOTALS: 17610 100.0% 100.0%
K-232

F2: Parent ComponentData File User's Manual
--------------Question 50G Tape Pos. 240-240-------------- Format: I1
F2P50G TOOK DAY TRIPS/VACATIONS WITH TEEN
Taking day trips or vacations
PER- WGTD RESPONSE CODES FREQ CENT PCT ---------- -------- ----- ----- -----NEVER......................... 1 1373 7.8% 9.8%RARELY........................ 2 2491 14.1% 15.5%SOMETIMES..................... 3 7429 42.2% 45.3%FREQUENTLY.................... 4 4743 26.9% 29.5% RESERVED CODES: NO PARENT QUEX............. 1215 6.9% (MISS) MULTIPLE RESPONSE.......... 6 5 0.0% (MISS) MISSING.................... 8 354 2.0% (MISS) ----- ----- ----- TOTALS: 17610 100.0% 100.0%
K-233

F2: Parent ComponentData File User's Manual
--------------Question 50H Tape Pos. 241-241-------------- Format: I1
F2P50H WORKED ON HOBBY/PLAYED SPORTS WITH TEEN
Working on a hobby or playing sports
PER- WGTD RESPONSE CODES FREQ CENT PCT ---------- -------- ----- ----- -----NEVER......................... 1 2861 16.2% 19.2%RARELY........................ 2 3804 21.6% 22.0%SOMETIMES..................... 3 5955 33.8% 37.2%FREQUENTLY.................... 4 3381 19.2% 21.6% RESERVED CODES: NO PARENT QUEX............. 1215 6.9% (MISS) MULTIPLE RESPONSE.......... 6 6 0.0% (MISS) MISSING.................... 8 388 2.2% (MISS) ----- ----- ----- TOTALS: 17610 100.0% 100.0%
K-234

F2: Parent ComponentData File User's Manual
--------------Question 50I Tape Pos. 242-242-------------- Format: I1
F2P50I WENT SHOPPING WITH TEEN
Going shopping
PER- WGTD RESPONSE CODES FREQ CENT PCT ---------- -------- ----- ----- -----NEVER......................... 1 686 3.9% 4.7%RARELY........................ 2 2073 11.8% 12.4%SOMETIMES..................... 3 6680 37.9% 40.5%FREQUENTLY.................... 4 6587 37.4% 42.3% RESERVED CODES: NO PARENT QUEX............. 1215 6.9% (MISS) MULTIPLE RESPONSE.......... 6 3 0.0% (MISS) MISSING.................... 8 366 2.1% (MISS) ----- ----- ----- TOTALS: 17610 100.0% 100.0%
K-235

F2: Parent ComponentData File User's Manual
--------------Question 50J Tape Pos. 243-243-------------- Format: I1
F2P50J WENT TO RESTAURANTS/ATE OUT WITH TEEN
Going to restaurants/eating out
PER- WGTD RESPONSE CODES FREQ CENT PCT ---------- -------- ----- ----- -----NEVER......................... 1 468 2.7% 3.3%RARELY........................ 2 1572 8.9% 9.8%SOMETIMES..................... 3 7030 39.9% 43.3%FREQUENTLY.................... 4 6997 39.7% 43.6% RESERVED CODES: NO PARENT QUEX............. 1215 6.9% (MISS) MULTIPLE RESPONSE.......... 6 8 0.0% (MISS) MISSING.................... 8 320 1.8% (MISS) ----- ----- ----- TOTALS: 17610 100.0% 100.0%
K-236

F2: Parent ComponentData File User's Manual
--------------Question 50K Tape Pos. 244-244-------------- Format: I1
F2P50K SPENT TIME TALKING WITH TEEN
Spending time just talking together
PER- WGTD RESPONSE CODES FREQ CENT PCT ---------- -------- ----- ----- -----NEVER......................... 1 181 1.0% 1.1%RARELY........................ 2 708 4.0% 4.3%SOMETIMES..................... 3 4681 26.6% 27.7%FREQUENTLY.................... 4 10506 59.7% 66.9% RESERVED CODES: NO PARENT QUEX............. 1215 6.9% (MISS) MULTIPLE RESPONSE.......... 6 1 0.0% (MISS) MISSING.................... 8 318 1.8% (MISS) ----- ----- ----- TOTALS: 17610 100.0% 100.0%
K-237

F2: Parent ComponentData File User's Manual
--------------Question 50L Tape Pos. 245-245-------------- Format: I1
F2P50L DID SOMETHING ELSE FUN WITH TEEN
Doing something else fun together
PER- WGTD RESPONSE CODES FREQ CENT PCT ---------- -------- ----- ----- -----NEVER......................... 1 432 2.5% 2.9%RARELY........................ 2 1697 9.6% 9.9%SOMETIMES..................... 3 7241 41.1% 43.8%FREQUENTLY.................... 4 6665 37.8% 43.4% RESERVED CODES: NO PARENT QUEX............. 1215 6.9% (MISS) MISSING.................... 8 360 2.0% (MISS) ----- ----- ----- TOTALS: 17610 100.0% 100.0%
K-238

F2: Parent ComponentData File User's Manual
-------------Question 51-------------
Are there family rules that are enforced for your teenagerabout any of the following activities?
K-239

F2: Parent ComponentData File User's Manual
--------------Question 51A Tape Pos. 246-246-------------- Format: I1
F2P51A FAMILY RULE ABOUT MAINTAINING GRADE AVG
Maintaining a certain grade average
PER- WGTD RESPONSE CODES FREQ CENT PCT ---------- -------- ----- ----- -----YES........................... 1 9795 55.6% 61.5%NO............................ 2 4466 25.4% 26.3%DOES NOT APPLY (TEEN NOT INSCHOOL)....................... 3 1414 8.0% 12.2% RESERVED CODES: NO PARENT QUEX............. 1215 6.9% (MISS) MULTIPLE RESPONSE.......... 6 4 0.0% (MISS) MISSING.................... 8 716 4.1% (MISS) ----- ----- ----- TOTALS: 17610 100.0% 100.0%
K-240

F2: Parent ComponentData File User's Manual
--------------Question 51B Tape Pos. 247-247-------------- Format: I1
F2P51B FAMILY RULE ABOUT DOING HOMEWORK
Doing homework
PER- WGTD RESPONSE CODES FREQ CENT PCT ---------- -------- ----- ----- -----YES........................... 1 11185 63.5% 70.2%NO............................ 2 3082 17.5% 17.6%DOES NOT APPLY (TEEN NOT INSCHOOL)....................... 3 1413 8.0% 12.2% RESERVED CODES: NO PARENT QUEX............. 1215 6.9% (MISS) MULTIPLE RESPONSE.......... 6 2 0.0% (MISS) MISSING.................... 8 713 4.0% (MISS) ----- ----- ----- TOTALS: 17610 100.0% 100.0%
K-241

F2: Parent ComponentData File User's Manual
--------------Question 51C Tape Pos. 248-248-------------- Format: I1
F2P51C FAMILY RULE ABT ATTENDING SCHL REGULARLY
Attending school regularly
PER- WGTD RESPONSE CODES FREQ CENT PCT ---------- -------- ----- ----- -----YES........................... 1 12879 73.1% 80.3%NO............................ 2 1398 7.9% 7.5%DOES NOT APPLY (TEEN NOT INSCHOOL)....................... 3 1411 8.0% 12.1% RESERVED CODES: NO PARENT QUEX............. 1215 6.9% (MISS) MULTIPLE RESPONSE.......... 6 3 0.0% (MISS) MISSING.................... 8 704 4.0% (MISS) ----- ----- ----- TOTALS: 17610 100.0% 100.0%
K-242

F2: Parent ComponentData File User's Manual
-------------Question 52-------------
Please read each of the qualities listed below and rate howimportant it is that a teenager have each of thesequalities. Please rate the qualities on a scale of 1 to 5,where 1 = not very important, and 5 = very important.
How important is it that a teenager...
K-243

F2: Parent ComponentData File User's Manual
--------------Question 52A Tape Pos. 249-249-------------- Format: I1
F2P52A IMPRTNT THT A TEEN TRIES HARD TO SUCCEED
Tries hard to succeed?
PER- WGTD RESPONSE CODES FREQ CENT PCT ---------- -------- ----- ----- -----NOT VERY IMPORTANT............ 1 61 0.3% 0.5% 2 91 0.5% 0.5% 3 981 5.6% 5.9% 4 3626 20.6% 21.2%EXTREMELY IMPORTANT........... 5 11489 65.2% 71.8% RESERVED CODES: NO PARENT QUEX............. 1215 6.9% (MISS) MULTIPLE RESPONSE.......... 6 3 0.0% (MISS) MISSING.................... 8 144 0.8% (MISS) ----- ----- ----- TOTALS: 17610 100.0% 100.0%
K-244

F2: Parent ComponentData File User's Manual
--------------Question 52B Tape Pos. 250-250-------------- Format: I1
F2P52B IMPORTANT THAT A TEEN IS HONEST
Is honest?
PER- WGTD RESPONSE CODES FREQ CENT PCT ---------- -------- ----- ----- -----NOT VERY IMPORTANT............ 1 69 0.4% 0.5% 2 62 0.4% 0.4% 3 251 1.4% 1.7% 4 1104 6.3% 6.5%EXTREMELY IMPORTANT........... 5 14738 83.7% 90.9% RESERVED CODES: NO PARENT QUEX............. 1215 6.9% (MISS) MULTIPLE RESPONSE.......... 6 1 0.0% (MISS) MISSING.................... 8 170 1.0% (MISS) ----- ----- ----- TOTALS: 17610 100.0% 100.0%
K-245
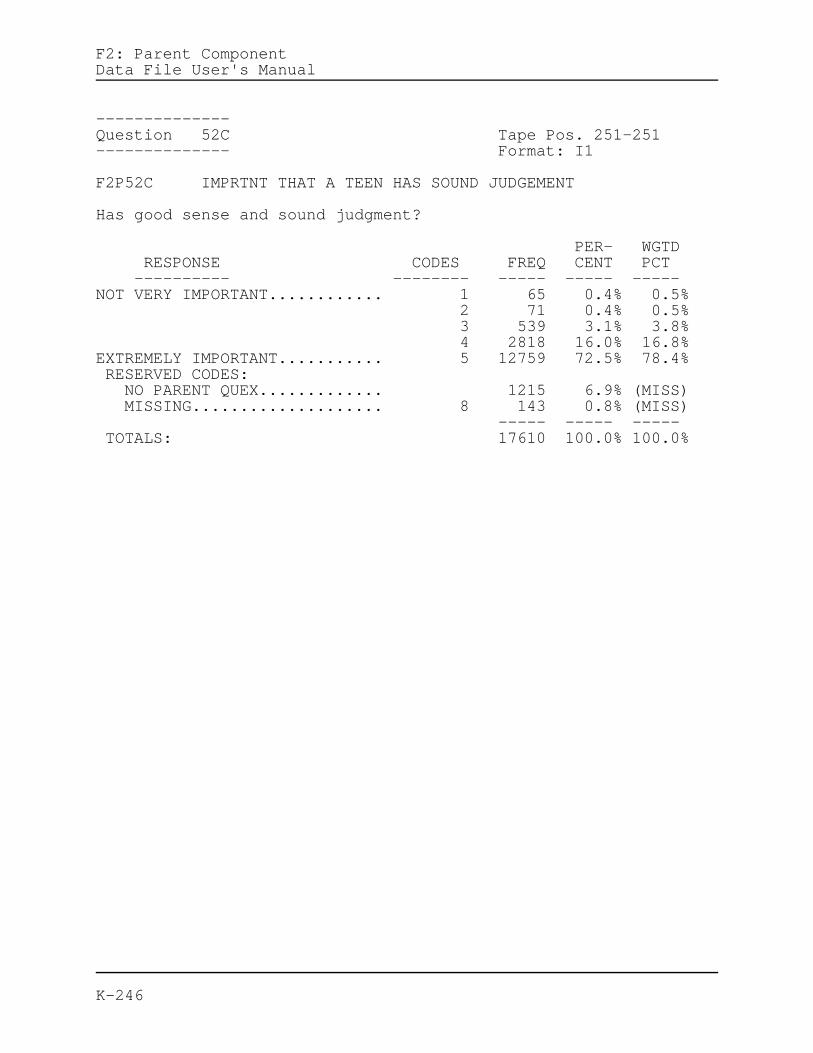
F2: Parent ComponentData File User's Manual
--------------Question 52C Tape Pos. 251-251-------------- Format: I1
F2P52C IMPRTNT THAT A TEEN HAS SOUND JUDGEMENT
Has good sense and sound judgment?
PER- WGTD RESPONSE CODES FREQ CENT PCT ---------- -------- ----- ----- -----NOT VERY IMPORTANT............ 1 65 0.4% 0.5% 2 71 0.4% 0.5% 3 539 3.1% 3.8% 4 2818 16.0% 16.8%EXTREMELY IMPORTANT........... 5 12759 72.5% 78.4% RESERVED CODES: NO PARENT QUEX............. 1215 6.9% (MISS) MISSING.................... 8 143 0.8% (MISS) ----- ----- ----- TOTALS: 17610 100.0% 100.0%
K-246

F2: Parent ComponentData File User's Manual
--------------Question 52D Tape Pos. 252-252-------------- Format: I1
F2P52D IMPORTANT THAT A TEEN HAS SELF-CONTROL
Has self-control?
PER- WGTD RESPONSE CODES FREQ CENT PCT ---------- -------- ----- ----- -----NOT VERY IMPORTANT............ 1 79 0.4% 0.7% 2 79 0.4% 0.5% 3 650 3.7% 4.2% 4 3441 19.5% 20.0%EXTREMELY IMPORTANT........... 5 11968 68.0% 74.7% RESERVED CODES: NO PARENT QUEX............. 1215 6.9% (MISS) MULTIPLE RESPONSE.......... 6 2 0.0% (MISS) MISSING.................... 8 176 1.0% (MISS) ----- ----- ----- TOTALS: 17610 100.0% 100.0%
K-247

F2: Parent ComponentData File User's Manual
--------------Question 52E Tape Pos. 253-253-------------- Format: I1
F2P52E IMPRTNT THAT A TEEN GETS ALONG W/ PEERS
Gets along well with his/her peers?
PER- WGTD RESPONSE CODES FREQ CENT PCT ---------- -------- ----- ----- -----NOT VERY IMPORTANT............ 1 84 0.5% 0.6% 2 133 0.8% 0.7% 3 1705 9.7% 10.3% 4 5548 31.5% 33.0%EXTREMELY IMPORTANT........... 5 8775 49.8% 55.4% RESERVED CODES: NO PARENT QUEX............. 1215 6.9% (MISS) MULTIPLE RESPONSE.......... 6 1 0.0% (MISS) MISSING.................... 8 149 0.8% (MISS) ----- ----- ----- TOTALS: 17610 100.0% 100.0%
K-248

F2: Parent ComponentData File User's Manual
--------------Question 52F Tape Pos. 254-254-------------- Format: I1
F2P52F IMPORTANT THAT A TEEN OBEYS PARENTS
Obeys his/her parents?
PER- WGTD RESPONSE CODES FREQ CENT PCT ---------- -------- ----- ----- -----NOT VERY IMPORTANT............ 1 82 0.5% 0.5% 2 115 0.7% 0.7% 3 937 5.3% 5.3% 4 3948 22.4% 23.1%EXTREMELY IMPORTANT........... 5 11165 63.4% 70.4% RESERVED CODES: NO PARENT QUEX............. 1215 6.9% (MISS) MULTIPLE RESPONSE.......... 6 1 0.0% (MISS) MISSING.................... 8 147 0.8% (MISS) ----- ----- ----- TOTALS: 17610 100.0% 100.0%
K-249

F2: Parent ComponentData File User's Manual
--------------Question 52G Tape Pos. 255-255-------------- Format: I1
F2P52G IMPORTANT THAT A TEEN IS RESPONSIBLE
Is responsible?
PER- WGTD RESPONSE CODES FREQ CENT PCT ---------- -------- ----- ----- -----NOT VERY IMPORTANT............ 1 81 0.5% 0.7% 2 55 0.3% 0.4% 3 403 2.3% 2.7% 4 2523 14.3% 14.9%EXTREMELY IMPORTANT........... 5 13162 74.7% 81.3% RESERVED CODES: NO PARENT QUEX............. 1215 6.9% (MISS) MULTIPLE RESPONSE.......... 6 2 0.0% (MISS) MISSING.................... 8 169 1.0% (MISS) ----- ----- ----- TOTALS: 17610 100.0% 100.0%
K-250

F2: Parent ComponentData File User's Manual
--------------Question 52H Tape Pos. 256-256-------------- Format: I1
F2P52H IMPORTANT THAT A TEEN IS CONSIDERATE
Is considerate of others?
PER- WGTD RESPONSE CODES FREQ CENT PCT ---------- -------- ----- ----- -----NOT VERY IMPORTANT............ 1 68 0.4% 0.6% 2 64 0.4% 0.4% 3 530 3.0% 3.3% 4 3054 17.3% 18.3%EXTREMELY IMPORTANT........... 5 12505 71.0% 77.5% RESERVED CODES: NO PARENT QUEX............. 1215 6.9% (MISS) MISSING.................... 8 174 1.0% (MISS) ----- ----- ----- TOTALS: 17610 100.0% 100.0%
K-251

F2: Parent ComponentData File User's Manual
--------------Question 52I Tape Pos. 257-257-------------- Format: I1
F2P52I IMPRTNT THT A TEEN INTERESTED IN HOW/WHY
Is interested in how and why things happen?
PER- WGTD RESPONSE CODES FREQ CENT PCT ---------- -------- ----- ----- -----NOT VERY IMPORTANT............ 1 107 0.6% 0.9% 2 162 0.9% 0.9% 3 1896 10.8% 11.4% 4 5795 32.9% 34.7%EXTREMELY IMPORTANT........... 5 8275 47.0% 52.1% RESERVED CODES: NO PARENT QUEX............. 1215 6.9% (MISS) MULTIPLE RESPONSE.......... 6 2 0.0% (MISS) MISSING.................... 8 158 0.9% (MISS) ----- ----- ----- TOTALS: 17610 100.0% 100.0%
K-252

F2: Parent ComponentData File User's Manual
--------------Question 52J Tape Pos. 258-258-------------- Format: I1
F2P52J IMPORTANT THAT A TEEN IS A GOOD STUDENT
Is a good student?
PER- WGTD RESPONSE CODES FREQ CENT PCT ---------- -------- ----- ----- -----NOT VERY IMPORTANT............ 1 105 0.6% 0.9% 2 137 0.8% 0.9% 3 1798 10.2% 11.3% 4 5267 29.9% 30.4%EXTREMELY IMPORTANT........... 5 8875 50.4% 56.5% RESERVED CODES: NO PARENT QUEX............. 1215 6.9% (MISS) MULTIPLE RESPONSE.......... 6 3 0.0% (MISS) MISSING.................... 8 210 1.2% (MISS) ----- ----- ----- TOTALS: 17610 100.0% 100.0%
K-253

F2: Parent ComponentData File User's Manual
--------------Question 52K Tape Pos. 259-259-------------- Format: I1
F2P52K IMPRTNT THAT A TEEN STNDS UP FOR BELIEFS
Stands up for what he or she believes?
PER- WGTD RESPONSE CODES FREQ CENT PCT ---------- -------- ----- ----- -----NOT VERY IMPORTANT............ 1 57 0.3% 0.3% 2 50 0.3% 0.3% 3 529 3.0% 3.0% 4 3239 18.4% 19.4%EXTREMELY IMPORTANT........... 5 12369 70.2% 77.0% RESERVED CODES: NO PARENT QUEX............. 1215 6.9% (MISS) MISSING.................... 8 151 0.9% (MISS) ----- ----- ----- TOTALS: 17610 100.0% 100.0%
K-254

F2: Parent ComponentData File User's Manual
--------------Question 52L Tape Pos. 260-260-------------- Format: I1
F2P52L IMPRTNT THAT A TEEN RESISTS PEER PRESSUR
Is able to resist pressure from peers?
PER- WGTD RESPONSE CODES FREQ CENT PCT ---------- -------- ----- ----- -----NOT VERY IMPORTANT............ 1 91 0.5% 0.6% 2 105 0.6% 0.7% 3 641 3.6% 4.3% 4 2583 14.7% 15.4%EXTREMELY IMPORTANT........... 5 12803 72.7% 79.1% RESERVED CODES: NO PARENT QUEX............. 1215 6.9% (MISS) MISSING.................... 8 172 1.0% (MISS) ----- ----- ----- TOTALS: 17610 100.0% 100.0%
K-255

F2: Parent ComponentData File User's Manual
-------------Question 53 Tape Pos. 261-261------------- Format: I1
F2P53 R KNOWS 1ST NAME OF TEEN'S FRIENDS
Do you know the first name (or nickname) of any of yourteenager's close friends?
PER- WGTD RESPONSE CODES FREQ CENT PCT ---------- -------- ----- ----- -----YES........................... 1 15455 87.8% 94.6%NO............................ 2 827 4.7% 5.4% RESERVED CODES: NO PARENT QUEX............. 1215 6.9% (MISS) MULTIPLE RESPONSE.......... 6 1 0.0% (MISS) MISSING.................... 8 112 0.6% (MISS) ----- ----- ----- TOTALS: 17610 100.0% 100.0%
K-256

F2: Parent ComponentData File User's Manual
-------------Question 54-------------
Please list the first names (or nicknames) of yourteenager's close friends and indicate: (A) whether thefriend attends school with your teenager, and (B) whetheryou know the parent/s of that teenager.
K-257

F2: Parent ComponentData File User's Manual
---------------Question 54A1 Tape Pos. 262-262--------------- Format: I1
F2P54A1 1ST FRIEND ATTENDS SAME SCHOOL
First friend attends same school
PER- WGTD RESPONSE CODES FREQ CENT PCT ---------- -------- ----- ----- -----YES........................... 1 11267 64.0% 74.7%NO............................ 2 2172 12.3% 15.9%NOT APPLICABLE (TEEN NOT INSCHOOL)....................... 3 984 5.6% 9.4% RESERVED CODES: NO PARENT QUEX............. 1215 6.9% (MISS) MULTIPLE RESPONSE.......... 6 25 0.1% (MISS) MISSING.................... 8 1120 6.4% (MISS) LEGITIMATE SKIP............ 9 827 4.7% (MISS) ----- ----- ----- TOTALS: 17610 100.0% 100.0%
K-258

F2: Parent ComponentData File User's Manual
---------------Question 54B1 Tape Pos. 263-263--------------- Format: I1
F2P54B1 R KNOWS PARENT(S) OF TEEN'S 1ST FRIEND
I know parent(s) of the first friend
PER- WGTD RESPONSE CODES FREQ CENT PCT ---------- -------- ----- ----- -----YES........................... 1 12347 70.1% 82.6%NO............................ 2 2452 13.9% 17.4% RESERVED CODES: NO PARENT QUEX............. 1215 6.9% (MISS) MULTIPLE RESPONSE.......... 6 1 0.0% (MISS) MISSING.................... 8 768 4.4% (MISS) LEGITIMATE SKIP............ 9 827 4.7% (MISS) ----- ----- ----- TOTALS: 17610 100.0% 100.0%
K-259

F2: Parent ComponentData File User's Manual
---------------Question 54A2 Tape Pos. 264-264--------------- Format: I1
F2P54A2 2ND FRIEND ATTENDS SAME SCHOOL
Second friend attends same school
PER- WGTD RESPONSE CODES FREQ CENT PCT ---------- -------- ----- ----- -----YES........................... 1 10611 60.3% 73.1%NO............................ 2 2302 13.1% 18.1%NOT APPLICABLE (TEEN NOT INSCHOOL)....................... 3 890 5.1% 8.8% RESERVED CODES: NO PARENT QUEX............. 1215 6.9% (MISS) MULTIPLE RESPONSE.......... 6 13 0.1% (MISS) MISSING.................... 8 1077 6.1% (MISS) LEGITIMATE SKIP............ 9 1502 8.5% (MISS) ----- ----- ----- TOTALS: 17610 100.0% 100.0%
K-260

F2: Parent ComponentData File User's Manual
---------------Question 54B2 Tape Pos. 265-265--------------- Format: I1
F2P54B2 R KNOWS PARENT(S) OF TEEN'S 2ND FRIEND
I know parent(s) of the second friend
PER- WGTD RESPONSE CODES FREQ CENT PCT ---------- -------- ----- ----- -----YES........................... 1 10789 61.3% 75.5%NO............................ 2 3320 18.9% 24.5% RESERVED CODES: NO PARENT QUEX............. 1215 6.9% (MISS) MISSING.................... 8 784 4.5% (MISS) LEGITIMATE SKIP............ 9 1502 8.5% (MISS) ----- ----- ----- TOTALS: 17610 100.0% 100.0%
K-261

F2: Parent ComponentData File User's Manual
---------------Question 54A3 Tape Pos. 266-266--------------- Format: I1
F2P54A3 3RD FRIEND ATTENDS SAME SCHOOL
Third friend attends same school
PER- WGTD RESPONSE CODES FREQ CENT PCT ---------- -------- ----- ----- -----YES........................... 1 9108 51.7% 72.0%NO............................ 2 2331 13.2% 20.1%NOT APPLICABLE (TEEN NOT INSCHOOL)....................... 3 725 4.1% 7.9% RESERVED CODES: NO PARENT QUEX............. 1215 6.9% (MISS) MULTIPLE RESPONSE.......... 6 13 0.1% (MISS) MISSING.................... 8 1054 6.0% (MISS) LEGITIMATE SKIP............ 9 3164 18.0% (MISS) ----- ----- ----- TOTALS: 17610 100.0% 100.0%
K-262

F2: Parent ComponentData File User's Manual
---------------Question 54B3 Tape Pos. 267-267--------------- Format: I1
F2P54B3 R KNOWS PARENT(S) OF TEEN'S 3RD FRIEND
I know parent(s) of the third friend
PER- WGTD RESPONSE CODES FREQ CENT PCT ---------- -------- ----- ----- -----YES........................... 1 9010 51.2% 71.5%NO............................ 2 3444 19.6% 28.5% RESERVED CODES: NO PARENT QUEX............. 1215 6.9% (MISS) MULTIPLE RESPONSE.......... 6 1 0.0% (MISS) MISSING.................... 8 776 4.4% (MISS) LEGITIMATE SKIP............ 9 3164 18.0% (MISS) ----- ----- ----- TOTALS: 17610 100.0% 100.0%
K-263

F2: Parent ComponentData File User's Manual
---------------Question 54A4 Tape Pos. 268-268--------------- Format: I1
F2P54A4 4TH FRIEND ATTENDS SAME SCHOOL
Fourth friend attends same school
PER- WGTD RESPONSE CODES FREQ CENT PCT ---------- -------- ----- ----- -----YES........................... 1 7192 40.8% 69.8%NO............................ 2 2161 12.3% 22.7%NOT APPLICABLE (TEEN NOT INSCHOOL)....................... 3 546 3.1% 7.5% RESERVED CODES: NO PARENT QUEX............. 1215 6.9% (MISS) MULTIPLE RESPONSE.......... 6 8 0.0% (MISS) MISSING.................... 8 900 5.1% (MISS) LEGITIMATE SKIP............ 9 5588 31.7% (MISS) ----- ----- ----- TOTALS: 17610 100.0% 100.0%
K-264

F2: Parent ComponentData File User's Manual
---------------Question 54B4 Tape Pos. 269-269--------------- Format: I1
F2P54B4 R KNOWS PARENT(S) OF TEEN'S 4TH FRIEND
I know parent(s) of the fourth friend
PER- WGTD RESPONSE CODES FREQ CENT PCT ---------- -------- ----- ----- -----YES........................... 1 7051 40.0% 68.9%NO............................ 2 2999 17.0% 31.1% RESERVED CODES: NO PARENT QUEX............. 1215 6.9% (MISS) MULTIPLE RESPONSE.......... 6 1 0.0% (MISS) MISSING.................... 8 756 4.3% (MISS) LEGITIMATE SKIP............ 9 5588 31.7% (MISS) ----- ----- ----- TOTALS: 17610 100.0% 100.0%
K-265

F2: Parent ComponentData File User's Manual
---------------Question 54A5 Tape Pos. 270-270--------------- Format: I1
F2P54A5 5TH FRIEND ATTENDS SAME SCHOOL
Fifth friend attends same school
PER- WGTD RESPONSE CODES FREQ CENT PCT ---------- -------- ----- ----- -----YES........................... 1 5574 31.7% 67.8%NO............................ 2 1841 10.5% 24.2%NOT APPLICABLE (TEEN NOT INSCHOOL)....................... 3 460 2.6% 8.0% RESERVED CODES: NO PARENT QUEX............. 1215 6.9% (MISS) MULTIPLE RESPONSE.......... 6 8 0.0% (MISS) MISSING.................... 8 864 4.9% (MISS) LEGITIMATE SKIP............ 9 7648 43.4% (MISS) ----- ----- ----- TOTALS: 17610 100.0% 100.0%
K-266

F2: Parent ComponentData File User's Manual
---------------Question 54B5 Tape Pos. 271-271--------------- Format: I1
F2P54B5 R KNOWS PARENT(S) OF TEEN'S 5TH FRIEND
I know parent(s) of the fifth friend
PER- WGTD RESPONSE CODES FREQ CENT PCT ---------- -------- ----- ----- -----YES........................... 1 5541 31.5% 66.8%NO............................ 2 2459 14.0% 33.2% RESERVED CODES: NO PARENT QUEX............. 1215 6.9% (MISS) MULTIPLE RESPONSE.......... 6 1 0.0% (MISS) MISSING.................... 8 746 4.2% (MISS) LEGITIMATE SKIP............ 9 7648 43.4% (MISS) ----- ----- ----- TOTALS: 17610 100.0% 100.0%
K-267

F2: Parent ComponentData File User's Manual
-------------Question 55 Tape Pos. 272-273------------- Format: I2
F2P55 # PARENTS R TALKS TO W/TEENS AT SAME SCH
How many parents do you talk to from time to time who haveteenagers who attend the same school as your teenager? (Ifyou know both the father and mother in one family, pleaseconsider them together as one parent.)
PER- WGTD RESPONSE CODES FREQ CENT PCT ---------- -------- ----- ----- -----NONE.......................... 01 1128 6.4% 9.0%ONE OR TWO.................... 02 3184 18.1% 21.4%THREE TO FIVE................. 03 4149 23.6% 27.0%SIX TO 10..................... 04 2872 16.3% 17.6%ELEVEN TO 20.................. 05 1414 8.0% 8.7%MORE THAN 20.................. 06 1510 8.6% 8.7%NOT APPLICABLE (TEEN NOT INSCHOOL)....................... 07 830 4.7% 7.6% RESERVED CODES: NO PARENT QUEX............. 1215 6.9% (MISS) MULTIPLE RESPONSE.......... 96 12 0.1% (MISS) MISSING.................... 98 469 2.7% (MISS) LEGITIMATE SKIP............ 99 827 4.7% (MISS) ----- ----- ----- TOTALS: 17610 100.0% 100.0%
K-268

F2: Parent ComponentData File User's Manual
-------------Question 56-------------
How often do you talk to the parents of your teenager'sfriends about each of the following topics?
K-269

F2: Parent ComponentData File User's Manual
--------------Question 56A Tape Pos. 274-274-------------- Format: I1
F2P56A DISCUSS THINGS AT TEEN'S SCH W/OTH PARNT
Things that are going on at your teenager's school
PER- WGTD RESPONSE CODES FREQ CENT PCT ---------- -------- ----- ----- -----SELDOM OR NEVER............... 1 5357 30.4% 35.1%ONCE OR TWICE A MONTH......... 2 5888 33.4% 35.2%ONCE OR TWICE A WEEK.......... 3 2427 13.8% 14.5%ALMOST EVERY DAY.............. 4 549 3.1% 3.4%DOES NOT APPLY (TEEN NOT INSCHOOL)....................... 5 1342 7.6% 11.8% RESERVED CODES: NO PARENT QUEX............. 1215 6.9% (MISS) MULTIPLE RESPONSE.......... 6 2 0.0% (MISS) MISSING.................... 8 830 4.7% (MISS) ----- ----- ----- TOTALS: 17610 100.0% 100.0%
K-270

F2: Parent ComponentData File User's Manual
--------------Question 56B Tape Pos. 275-275-------------- Format: I1
F2P56B DISCUSS TEEN'S EDUC PLANS W/OTH PARENTS
Your teenager's educational plans for after high school
PER- WGTD RESPONSE CODES FREQ CENT PCT ---------- -------- ----- ----- -----SELDOM OR NEVER............... 1 6102 34.7% 40.1%ONCE OR TWICE A MONTH......... 2 5886 33.4% 34.9%ONCE OR TWICE A WEEK.......... 3 1839 10.4% 10.7%ALMOST EVERY DAY.............. 4 412 2.3% 2.5%DOES NOT APPLY (TEEN NOT INSCHOOL)....................... 5 1334 7.6% 11.8% RESERVED CODES: NO PARENT QUEX............. 1215 6.9% (MISS) MULTIPLE RESPONSE.......... 6 3 0.0% (MISS) MISSING.................... 8 819 4.7% (MISS) ----- ----- ----- TOTALS: 17610 100.0% 100.0%
K-271

F2: Parent ComponentData File User's Manual
--------------Question 56C Tape Pos. 276-276-------------- Format: I1
F2P56C DISCUSS TEEN'S CAREER PLANS W/OTH PARNT
You teenager's career plans
PER- WGTD RESPONSE CODES FREQ CENT PCT ---------- -------- ----- ----- -----SELDOM OR NEVER............... 1 7989 45.4% 52.7%ONCE OR TWICE A MONTH......... 2 5806 33.0% 34.8%ONCE OR TWICE A WEEK.......... 3 1593 9.0% 9.6%ALMOST EVERY DAY.............. 4 448 2.5% 2.9% RESERVED CODES: NO PARENT QUEX............. 1215 6.9% (MISS) MULTIPLE RESPONSE.......... 6 1 0.0% (MISS) MISSING.................... 8 558 3.2% (MISS) ----- ----- ----- TOTALS: 17610 100.0% 100.0%
K-272

F2: Parent ComponentData File User's Manual
-------------Question 57-------------
Please respond to the following statements about yourteenager and your teenager's friends.
K-273

F2: Parent ComponentData File User's Manual
--------------Question 57A Tape Pos. 277-277-------------- Format: I1
F2P57A DRINKING IS PROBLEM AMONG TEEN'S FRIENDS
Drinking is a problem among my teenager's friends
PER- WGTD RESPONSE CODES FREQ CENT PCT ---------- -------- ----- ----- -----STRONGLY AGREE................ 1 764 4.3% 5.1%AGREE......................... 2 2068 11.7% 12.9%DISAGREE...................... 3 5862 33.3% 36.3%STRONGLY DISAGREE............. 4 6438 36.6% 38.3%DON'T KNOW.................... 5 1110 6.3% 7.4% RESERVED CODES: NO PARENT QUEX............. 1215 6.9% (MISS) MISSING.................... 8 153 0.9% (MISS) ----- ----- ----- TOTALS: 17610 100.0% 100.0%
K-274

F2: Parent ComponentData File User's Manual
--------------Question 57B Tape Pos. 278-278-------------- Format: I1
F2P57B R'S TEEN HAS A DRINKING PROBLEM
My teenager has a drinking problem
PER- WGTD RESPONSE CODES FREQ CENT PCT ---------- -------- ----- ----- -----STRONGLY AGREE................ 1 301 1.7% 2.1%AGREE......................... 2 346 2.0% 2.6%DISAGREE...................... 3 4190 23.8% 27.9%STRONGLY DISAGREE............. 4 11098 63.0% 65.5%DON'T KNOW.................... 5 310 1.8% 1.9% RESERVED CODES: NO PARENT QUEX............. 1215 6.9% (MISS) MISSING.................... 8 150 0.9% (MISS) ----- ----- ----- TOTALS: 17610 100.0% 100.0%
K-275

F2: Parent ComponentData File User's Manual
--------------Question 57C Tape Pos. 279-279-------------- Format: I1
F2P57C DRUG USE IS PROBLEM AMONG TEEN'S FRIENDS
Drug use is a problem among my teenager's friends
PER- WGTD RESPONSE CODES FREQ CENT PCT ---------- -------- ----- ----- -----STRONGLY AGREE................ 1 379 2.2% 2.4%AGREE......................... 2 764 4.3% 5.2%DISAGREE...................... 3 4936 28.0% 32.0%STRONGLY DISAGREE............. 4 9147 51.9% 54.0%DON'T KNOW.................... 5 1005 5.7% 6.4% RESERVED CODES: NO PARENT QUEX............. 1215 6.9% (MISS) MULTIPLE RESPONSE.......... 6 1 0.0% (MISS) MISSING.................... 8 163 0.9% (MISS) ----- ----- ----- TOTALS: 17610 100.0% 100.0%
K-276

F2: Parent ComponentData File User's Manual
--------------Question 57D Tape Pos. 280-280-------------- Format: I1
F2P57D R'S TEEN HAS A DRUG PROBLEM
My teenager has a drug problem
PER- WGTD RESPONSE CODES FREQ CENT PCT ---------- -------- ----- ----- -----STRONGLY AGREE................ 1 265 1.5% 1.7%AGREE......................... 2 161 0.9% 1.2%DISAGREE...................... 3 3524 20.0% 24.7%STRONGLY DISAGREE............. 4 11945 67.8% 70.2%DON'T KNOW.................... 5 320 1.8% 2.1% RESERVED CODES: NO PARENT QUEX............. 1215 6.9% (MISS) MULTIPLE RESPONSE.......... 6 1 0.0% (MISS) MISSING.................... 8 179 1.0% (MISS) ----- ----- ----- TOTALS: 17610 100.0% 100.0%
K-277

F2: Parent ComponentData File User's Manual
--------------Question 57E Tape Pos. 281-281-------------- Format: I1
F2P57E DRINKING AMONG TEENS FRIENDS IS BAD INFL
Drinking among my teenager's friends has been a badinfluence on my teenager
PER- WGTD RESPONSE CODES FREQ CENT PCT ---------- -------- ----- ----- -----STRONGLY AGREE................ 1 577 3.3% 4.1%AGREE......................... 2 1421 8.1% 9.7%DISAGREE...................... 3 4805 27.3% 30.9%STRONGLY DISAGREE............. 4 8891 50.5% 52.5%DON'T KNOW.................... 5 508 2.9% 2.8% RESERVED CODES: NO PARENT QUEX............. 1215 6.9% (MISS) MULTIPLE RESPONSE.......... 6 1 0.0% (MISS) MISSING.................... 8 192 1.1% (MISS) ----- ----- ----- TOTALS: 17610 100.0% 100.0%
K-278

F2: Parent ComponentData File User's Manual
--------------Question 57F Tape Pos. 282-282-------------- Format: I1
F2P57F DRUG USE AMONG TEENS FRIENDS IS BAD INFL
Drug use among my teenager's friends has been a badinfluence on my teenager
PER- WGTD RESPONSE CODES FREQ CENT PCT ---------- -------- ----- ----- -----STRONGLY AGREE................ 1 409 2.3% 2.7%AGREE......................... 2 641 3.6% 4.3%DISAGREE...................... 3 4563 25.9% 30.5%STRONGLY DISAGREE............. 4 9981 56.7% 58.8%DON'T KNOW.................... 5 606 3.4% 3.7% RESERVED CODES: NO PARENT QUEX............. 1215 6.9% (MISS) MULTIPLE RESPONSE.......... 6 1 0.0% (MISS) MISSING.................... 8 194 1.1% (MISS) ----- ----- ----- TOTALS: 17610 100.0% 100.0%
K-279

F2: Parent ComponentData File User's Manual
--------------Question 57G Tape Pos. 283-283-------------- Format: I1
F2P57G THEFT, VIOLENCE PRBLMS AMONG TEENS FRNDS
Theft and violence are a problem among my teenager'sfriends
PER- WGTD RESPONSE CODES FREQ CENT PCT ---------- -------- ----- ----- -----STRONGLY AGREE................ 1 351 2.0% 2.2%AGREE......................... 2 676 3.8% 4.9%DISAGREE...................... 3 4469 25.4% 30.0%STRONGLY DISAGREE............. 4 10079 57.2% 59.0%DON'T KNOW.................... 5 640 3.6% 4.0% RESERVED CODES: NO PARENT QUEX............. 1215 6.9% (MISS) MULTIPLE RESPONSE.......... 6 1 0.0% (MISS) MISSING.................... 8 179 1.0% (MISS) ----- ----- ----- TOTALS: 17610 100.0% 100.0%
K-280

F2: Parent ComponentData File User's Manual
-------------Question 58 Tape Pos. 284-284------------- Format: I1
F2P58 HOW MANY YEARS HAS R LIVED IN NEIGHBORHD
How many years have you lived in your neighborhood?
PER- WGTD RESPONSE CODES FREQ CENT PCT ---------- -------- ----- ----- -----LESS THAN ONE YEAR............ 1 447 2.5% 3.3%ONE TO THREE YEARS............ 2 1337 7.6% 10.2%THREE TO FIVE YEARS........... 3 1500 8.5% 11.2%FIVE TO TEN YEARS............. 4 3316 18.8% 19.8%MORE THAN TEN YEARS........... 5 9730 55.3% 55.5% RESERVED CODES: NO PARENT QUEX............. 1215 6.9% (MISS) MISSING.................... 8 65 0.4% (MISS) ----- ----- ----- TOTALS: 17610 100.0% 100.0%
K-281

F2: Parent ComponentData File User's Manual
-------------Question 59 Tape Pos. 285-285------------- Format: I1
F2P59 HOW INVOLVED R FEELS IN NEIGHBORHOOD
Do you feel as though you are a part of your neighborhoodor community, or do you think of it more as just a place tolive?
PER- WGTD RESPONSE CODES FREQ CENT PCT ---------- -------- ----- ----- -----JUST A PLACE TO LIVE.......... 1 3727 21.2% 24.0%FEEL A PART OF THENEIGHBORHOOD/COMMUNITY........ 2 12497 71.0% 76.0% RESERVED CODES: NO PARENT QUEX............. 1215 6.9% (MISS) MULTIPLE RESPONSE.......... 6 1 0.0% (MISS) MISSING.................... 8 170 1.0% (MISS) ----- ----- ----- TOTALS: 17610 100.0% 100.0%
K-282

F2: Parent ComponentData File User's Manual
-------------Question 60 Tape Pos. 286-286------------- Format: I1
F2P60 HOW SAFE IS NEIGHBORHOOD
How would you rate your neighborhood in terms of safety foryourself and your family?
PER- WGTD RESPONSE CODES FREQ CENT PCT ---------- -------- ----- ----- -----VERY SAFE..................... 1 9888 56.1% 58.7%SOMEWHAT SAFE................. 2 5342 30.3% 34.0%SOMEWHAT UNSAFE............... 3 796 4.5% 5.6%VERY UNSAFE................... 4 223 1.3% 1.6% RESERVED CODES: NO PARENT QUEX............. 1215 6.9% (MISS) MISSING.................... 8 146 0.8% (MISS) ----- ----- ----- TOTALS: 17610 100.0% 100.0%
K-283

F2: Parent ComponentData File User's Manual
IV. YOUR TEENAGER'S FUTURE PLANS
-------------Question 61 Tape Pos. 287-288------------- Format: I2
F2P61 HOW FAR IN SCHOOL R EXPECTS TEEN TO GO
How far in school do you want your teenager to go?
PER- WGTD RESPONSE CODES FREQ CENT PCT ---------- -------- ----- ----- -----LESS THAN HIGH SCHOOLGRADUATION.................... 01 36 0.2% 0.3%HIGH SCHOOL GRADUATION ONLY... 02 733 4.2% 5.0%LESS THAN TWO YEARSVOCATIONAL, TRADE OR BUSINESS. 03 368 2.1% 2.4%TWO YEARS OR MORE VOCATIONAL,TRADE OR BUSINESS............. 04 1406 8.0% 10.2%LESS THAN TWO YEARS OF COLLEGE 06 108 0.6% 0.6%TWO OR MORE YEARS OF COLLEGE.. 07 1111 6.3% 7.1%FINISH COLLEGE................ 08 5936 33.7% 37.3%MASTERS DEGREE OR EQUIVALENT.. 09 3559 20.2% 20.2%Ph.D. OR M.D., OR OTHERPROFESSIONAL DEGREE........... 10 3080 17.5% 16.9% RESERVED CODES: NO PARENT QUEX............. 1215 6.9% (MISS) MISSING.................... 98 58 0.3% (MISS) ----- ----- ----- TOTALS: 17610 100.0% 100.0%
NOTE: The data values have been recoded in order tomaintain comparability with previous NCES studies. In therecode, value 5 was not used.
K-284

F2: Parent ComponentData File User's Manual
-------------Question 62-------------
Have you ever encouraged your teenager to get a book, amanual, or a computer program, or to take a course thatwould help him/her to prepare for any of the followingtests?
K-285

F2: Parent ComponentData File User's Manual
--------------Question 62A Tape Pos. 289-289-------------- Format: I1
F2P62A R ENCOURAGED TEEN TO PREPARE FOR SAT
Scholastic Aptitude Test (SAT)
PER- WGTD RESPONSE CODES FREQ CENT PCT ---------- -------- ----- ----- -----YES, I HAVE ENCOURAGED MYTEENAGER TO PREPARE FOR THISTEST.......................... 1 11474 65.2% 70.3%NO, MY TEENAGER NEEDS TO TAKETHIS BUT HE/SHE DOES NOT NEEDTO PREPARE FOR THIS TEST...... 2 1075 6.1% 6.5%NO, I HAVE ANOTHER REASON FORNOT ENCOURAGING MY TEENAGERTO PREPARE FOR THIS TEST...... 3 1375 7.8% 9.9%NO, BECAUSE I DON'T THINK MYTEENAGER NEEDS TO TAKE THISTEST.......................... 4 1060 6.0% 6.8%NO, BECAUSE I HAVE NEVERHEARD OF THIS TEST............ 5 913 5.2% 6.5% RESERVED CODES: NO PARENT QUEX............. 1215 6.9% (MISS) MULTIPLE RESPONSE.......... 6 2 0.0% (MISS) MISSING.................... 8 496 2.8% (MISS) ----- ----- ----- TOTALS: 17610 100.0% 100.0%
K-286

F2: Parent ComponentData File User's Manual
--------------Question 62B Tape Pos. 290-290-------------- Format: I1
F2P62B R ENCOURAGED TEEN TO PREPARE FOR ACT
American College Test (ACT)
PER- WGTD RESPONSE CODES FREQ CENT PCT ---------- -------- ----- ----- -----YES, I HAVE ENCOURAGED MYTEENAGER TO PREPARE FOR THISTEST.......................... 1 8875 50.4% 55.8%NO, MY TEENAGER NEEDS TO TAKETHIS BUT HE/SHE DOES NOT NEEDTO PREPARE FOR THIS TEST...... 2 1070 6.1% 6.2%NO, I HAVE ANOTHER REASON FORNOT ENCOURAGING MY TEENAGERTO PREPARE FOR THIS TEST...... 3 1456 8.3% 10.6%NO, BECAUSE I DON'T THINK MYTEENAGER NEEDS TO TAKE THISTEST.......................... 4 2163 12.3% 12.3%NO, BECAUSE I HAVE NEVERHEARD OF THIS TEST............ 5 2142 12.2% 15.1% RESERVED CODES: NO PARENT QUEX............. 1215 6.9% (MISS) MULTIPLE RESPONSE.......... 6 2 0.0% (MISS) MISSING.................... 8 687 3.9% (MISS) ----- ----- ----- TOTALS: 17610 100.0% 100.0%
K-287

F2: Parent ComponentData File User's Manual
--------------Question 62C Tape Pos. 291-291-------------- Format: I1
F2P62C R ENCOURAGED TEEN TO PREPARE FOR ASVAB
Armed Services Vocational Aptitude Battery (ASVAB)
PER- WGTD RESPONSE CODES FREQ CENT PCT ---------- -------- ----- ----- -----YES, I HAVE ENCOURAGED MYTEENAGER TO PREPARE FOR THISTEST.......................... 1 2482 14.1% 18.7%NO, MY TEENAGER NEEDS TO TAKETHIS BUT HE/SHE DOES NOT NEEDTO PREPARE FOR THIS TEST...... 2 849 4.8% 5.1%NO, I HAVE ANOTHER REASON FORNOT ENCOURAGING MY TEENAGERTO PREPARE FOR THIS TEST...... 3 1620 9.2% 12.0%NO, BECAUSE I DON'T THINK MYTEENAGER NEEDS TO TAKE THISTEST.......................... 4 5846 33.2% 34.4%NO, BECAUSE I HAVE NEVERHEARD OF THIS TEST............ 5 4674 26.5% 29.9% RESERVED CODES: NO PARENT QUEX............. 1215 6.9% (MISS) MULTIPLE RESPONSE.......... 6 14 0.1% (MISS) MISSING.................... 8 910 5.2% (MISS) ----- ----- ----- TOTALS: 17610 100.0% 100.0%
K-288

F2: Parent ComponentData File User's Manual
--------------Question 62D Tape Pos. 292-292-------------- Format: I1
F2P62D R ENCOURAGED TEEN TO PREPARE FOR GED
General Education Development Test (GED)
PER- WGTD RESPONSE CODES FREQ CENT PCT ---------- -------- ----- ----- -----YES, I HAVE ENCOURAGED MYTEENAGER TO PREPARE FOR THISTEST.......................... 1 2778 15.8% 22.2%NO, MY TEENAGER NEEDS TO TAKETHIS BUT HE/SHE DOES NOT NEEDTO PREPARE FOR THIS TEST...... 2 620 3.5% 3.9%NO, I HAVE ANOTHER REASON FORNOT ENCOURAGING MY TEENAGERTO PREPARE FOR THIS TEST...... 3 832 4.7% 5.7%NO, BECAUSE I DON'T THINK MYTEENAGER NEEDS TO TAKE THISTEST.......................... 4 9884 56.1% 60.6%NO, BECAUSE I HAVE NEVERHEARD OF THIS TEST............ 5 1340 7.6% 7.7% RESERVED CODES: NO PARENT QUEX............. 1215 6.9% (MISS) MULTIPLE RESPONSE.......... 6 7 0.0% (MISS) MISSING.................... 8 934 5.3% (MISS) ----- ----- ----- TOTALS: 17610 100.0% 100.0%
K-289

F2: Parent ComponentData File User's Manual
-------------Question 63 Tape Pos. 293-293------------- Format: I1
F2P63 R TALKED TO TEEN ABOUT APPLYING FOR COLL
In the past year, how often have you talked to yourteenager about applying to a vocational/technical school,college, or university for education after high school?
PER- WGTD RESPONSE CODES FREQ CENT PCT ---------- -------- ----- ----- -----NEVER......................... 1 681 3.9% 4.8%RARELY........................ 2 533 3.0% 3.7%SOMETIMES..................... 3 2871 16.3% 18.2%OFTEN......................... 4 12215 69.4% 73.4% RESERVED CODES: NO PARENT QUEX............. 1215 6.9% (MISS) MULTIPLE RESPONSE.......... 6 1 0.0% (MISS) MISSING.................... 8 94 0.5% (MISS) ----- ----- ----- TOTALS: 17610 100.0% 100.0%
K-290

F2: Parent ComponentData File User's Manual
-------------Question 64 Tape Pos. 294-294------------- Format: I1
F2P64 HAS TEEN APPLIED TO COLLEGE/VOTECH SCHL
Has your teenager applied for admission to anyvocational/technical school, college, or university fornext year?
PER- WGTD RESPONSE CODES FREQ CENT PCT ---------- -------- ----- ----- -----YES........................... 1 11170 63.4% 62.8%NO............................ 2 5136 29.2% 37.2% RESERVED CODES: NO PARENT QUEX............. 1215 6.9% (MISS) MULTIPLE RESPONSE.......... 6 1 0.0% (MISS) MISSING.................... 8 88 0.5% (MISS) ----- ----- ----- TOTALS: 17610 100.0% 100.0%
K-291

F2: Parent ComponentData File User's Manual
-------------Question 65-------------
In which of the following ways have you and/or yourspouse/partner helped your teenager make decisions aboutwhere to apply for further education after high school?
K-292

F2: Parent ComponentData File User's Manual
--------------Question 65A Tape Pos. 295-295-------------- Format: I1
F2P65A TEEN WANTS TO DECIDE ABT COLL BY SELF
Offered assistance, but our teenager wants to do thishimself/herself
PER- WGTD RESPONSE CODES FREQ CENT PCT ---------- -------- ----- ----- -----YES........................... 1 7415 42.1% 67.3%NO............................ 2 3679 20.9% 32.7% RESERVED CODES: NO PARENT QUEX............. 1215 6.9% (MISS) MISSING.................... 8 165 0.9% (MISS) LEGITIMATE SKIP............ 9 5136 29.2% (MISS) ----- ----- ----- TOTALS: 17610 100.0% 100.0%
K-293

F2: Parent ComponentData File User's Manual
--------------Question 65B Tape Pos. 296-296-------------- Format: I1
F2P65B R TALKED TO TEEN ABOUT PARTICULAR SCHLS
Talked to our teenager about particular schools
PER- WGTD RESPONSE CODES FREQ CENT PCT ---------- -------- ----- ----- -----YES........................... 1 9932 56.4% 88.8%NO............................ 2 1160 6.6% 11.2% RESERVED CODES: NO PARENT QUEX............. 1215 6.9% (MISS) MISSING.................... 8 167 0.9% (MISS) LEGITIMATE SKIP............ 9 5136 29.2% (MISS) ----- ----- ----- TOTALS: 17610 100.0% 100.0%
K-294

F2: Parent ComponentData File User's Manual
--------------Question 65C Tape Pos. 297-297-------------- Format: I1
F2P65C R TALKED TO TEEN IN GENERAL ABOUT SCHLS
Talked to our teenager about general qualities that we feela school should have
PER- WGTD RESPONSE CODES FREQ CENT PCT ---------- -------- ----- ----- -----YES........................... 1 8904 50.6% 79.3%NO............................ 2 2187 12.4% 20.7% RESERVED CODES: NO PARENT QUEX............. 1215 6.9% (MISS) MISSING.................... 8 168 1.0% (MISS) LEGITIMATE SKIP............ 9 5136 29.2% (MISS) ----- ----- ----- TOTALS: 17610 100.0% 100.0%
K-295

F2: Parent ComponentData File User's Manual
--------------Question 65D Tape Pos. 298-298-------------- Format: I1
F2P65D R GAVE TEEN INFORMATION FROM SCHOOL
Gave our teenager information (brochure, booklet) that wereceived from school
PER- WGTD RESPONSE CODES FREQ CENT PCT ---------- -------- ----- ----- -----YES........................... 1 7776 44.2% 70.6%NO............................ 2 3314 18.8% 29.4% RESERVED CODES: NO PARENT QUEX............. 1215 6.9% (MISS) MULTIPLE RESPONSE.......... 6 1 0.0% (MISS) MISSING.................... 8 168 1.0% (MISS) LEGITIMATE SKIP............ 9 5136 29.2% (MISS) ----- ----- ----- TOTALS: 17610 100.0% 100.0%
K-296

F2: Parent ComponentData File User's Manual
--------------Question 65E Tape Pos. 299-299-------------- Format: I1
F2P65E R OFFERED TO TAKE TEEN TO PRVT COUNSELOR
Offered to take our teenager to a private college counselor
PER- WGTD RESPONSE CODES FREQ CENT PCT ---------- -------- ----- ----- -----YES........................... 1 3189 18.1% 28.7%NO............................ 2 7901 44.9% 71.3% RESERVED CODES: NO PARENT QUEX............. 1215 6.9% (MISS) MISSING.................... 8 169 1.0% (MISS) LEGITIMATE SKIP............ 9 5136 29.2% (MISS) ----- ----- ----- TOTALS: 17610 100.0% 100.0%
K-297

F2: Parent ComponentData File User's Manual
-------------Question 66-------------
How important is or was each of the following in yourteenager's choice of a school to attend after high school?
K-298

F2: Parent ComponentData File User's Manual
--------------Question 66A Tape Pos. 300-300-------------- Format: I1
F2P66A TEEN'S COLLEGE- IMPORTANCE OF LOW COST
Low expenses (tuition, books, room and board)
PER- WGTD RESPONSE CODES FREQ CENT PCT ---------- -------- ----- ----- -----NOT IMPORTANT................. 1 2088 11.9% 15.8%SOMEWHAT IMPORTANT............ 2 4940 28.1% 44.6%VERY IMPORTANT................ 3 3991 22.7% 39.6% RESERVED CODES: NO PARENT QUEX............. 1215 6.9% (MISS) MISSING.................... 8 240 1.4% (MISS) LEGITIMATE SKIP............ 9 5136 29.2% (MISS) ----- ----- ----- TOTALS: 17610 100.0% 100.0%
K-299

F2: Parent ComponentData File User's Manual
--------------Question 66B Tape Pos. 301-301-------------- Format: I1
F2P66B TEEN'S COLLEGE- IMPORTANCE FINANCIAL AID
Availability of financial aid, such as a school loan,scholarship, or grant
PER- WGTD RESPONSE CODES FREQ CENT PCT ---------- -------- ----- ----- -----NOT IMPORTANT................. 1 2450 13.9% 18.9%SOMEWHAT IMPORTANT............ 2 2871 16.3% 25.8%VERY IMPORTANT................ 3 5712 32.4% 55.3% RESERVED CODES: NO PARENT QUEX............. 1215 6.9% (MISS) MISSING.................... 8 226 1.3% (MISS) LEGITIMATE SKIP............ 9 5136 29.2% (MISS) ----- ----- ----- TOTALS: 17610 100.0% 100.0%
K-300

F2: Parent ComponentData File User's Manual
--------------Question 66C Tape Pos. 302-302-------------- Format: I1
F2P66C TEEN'S COLLEGE- IMPORTANCE OF CURRICULUM
Availability of specific courses or curriculum
PER- WGTD RESPONSE CODES FREQ CENT PCT ---------- -------- ----- ----- -----NOT IMPORTANT................. 1 419 2.4% 3.7%SOMEWHAT IMPORTANT............ 2 2942 16.7% 24.8%VERY IMPORTANT................ 3 7658 43.5% 71.4% RESERVED CODES: NO PARENT QUEX............. 1215 6.9% (MISS) MULTIPLE RESPONSE.......... 6 1 0.0% (MISS) MISSING.................... 8 239 1.4% (MISS) LEGITIMATE SKIP............ 9 5136 29.2% (MISS) ----- ----- ----- TOTALS: 17610 100.0% 100.0%
K-301

F2: Parent ComponentData File User's Manual
--------------Question 66D Tape Pos. 303-303-------------- Format: I1
F2P66D TEEN'S COLLEGE- IMPORTANCE OF SPORT PROG
Strong reputation of the school's athletic programs
PER- WGTD RESPONSE CODES FREQ CENT PCT ---------- -------- ----- ----- -----NOT IMPORTANT................. 1 7546 42.9% 68.1%SOMEWHAT IMPORTANT............ 2 2083 11.8% 18.6%VERY IMPORTANT................ 3 1400 8.0% 13.2% RESERVED CODES: NO PARENT QUEX............. 1215 6.9% (MISS) MISSING.................... 8 230 1.3% (MISS) LEGITIMATE SKIP............ 9 5136 29.2% (MISS) ----- ----- ----- TOTALS: 17610 100.0% 100.0%
K-302

F2: Parent ComponentData File User's Manual
--------------Question 66E Tape Pos. 304-304-------------- Format: I1
F2P66E TEEN'S COLLEGE- IMPRTNCE OF SOCIAL LIFE
Active social life at the school
PER- WGTD RESPONSE CODES FREQ CENT PCT ---------- -------- ----- ----- -----NOT IMPORTANT................. 1 5098 28.9% 47.1%SOMEWHAT IMPORTANT............ 2 4615 26.2% 40.4%VERY IMPORTANT................ 3 1311 7.4% 12.6% RESERVED CODES: NO PARENT QUEX............. 1215 6.9% (MISS) MISSING.................... 8 235 1.3% (MISS) LEGITIMATE SKIP............ 9 5136 29.2% (MISS) ----- ----- ----- TOTALS: 17610 100.0% 100.0%
K-303

F2: Parent ComponentData File User's Manual
--------------Question 66F Tape Pos. 305-305-------------- Format: I1
F2P66F TEEN'S COLLEGE- IMPRTNCE OF LIVE AT HOME
Ability to attend school while living at home
PER- WGTD RESPONSE CODES FREQ CENT PCT ---------- -------- ----- ----- -----NOT IMPORTANT................. 1 5579 31.7% 45.5%SOMEWHAT IMPORTANT............ 2 2277 12.9% 22.6%VERY IMPORTANT................ 3 3178 18.0% 31.9% RESERVED CODES: NO PARENT QUEX............. 1215 6.9% (MISS) MULTIPLE RESPONSE.......... 6 2 0.0% (MISS) MISSING.................... 8 223 1.3% (MISS) LEGITIMATE SKIP............ 9 5136 29.2% (MISS) ----- ----- ----- TOTALS: 17610 100.0% 100.0%
K-304

F2: Parent ComponentData File User's Manual
--------------Question 66G Tape Pos. 306-306-------------- Format: I1
F2P66G TEEN'S COLLEGE- IMPORTANC LIVE AWAY HOME
Chance to live away from home
PER- WGTD RESPONSE CODES FREQ CENT PCT ---------- -------- ----- ----- -----NOT IMPORTANT................. 1 4147 23.5% 38.5%SOMEWHAT IMPORTANT............ 2 4254 24.2% 39.5%VERY IMPORTANT................ 3 2606 14.8% 22.0% RESERVED CODES: NO PARENT QUEX............. 1215 6.9% (MISS) MULTIPLE RESPONSE.......... 6 1 0.0% (MISS) MISSING.................... 8 251 1.4% (MISS) LEGITIMATE SKIP............ 9 5136 29.2% (MISS) ----- ----- ----- TOTALS: 17610 100.0% 100.0%
K-305

F2: Parent ComponentData File User's Manual
--------------Question 66H Tape Pos. 307-307-------------- Format: I1
F2P66H TEEN'S COLLEGE- IMPRTNCE RELIGIOUS ENVIR
A religious environment
PER- WGTD RESPONSE CODES FREQ CENT PCT ---------- -------- ----- ----- -----NOT IMPORTANT................. 1 5243 29.8% 44.1%SOMEWHAT IMPORTANT............ 2 3488 19.8% 32.8%VERY IMPORTANT................ 3 2304 13.1% 23.0% RESERVED CODES: NO PARENT QUEX............. 1215 6.9% (MISS) MULTIPLE RESPONSE.......... 6 2 0.0% (MISS) MISSING.................... 8 222 1.3% (MISS) LEGITIMATE SKIP............ 9 5136 29.2% (MISS) ----- ----- ----- TOTALS: 17610 100.0% 100.0%
K-306

F2: Parent ComponentData File User's Manual
--------------Question 66I Tape Pos. 308-308-------------- Format: I1
F2P66I TEEN'S COLLEGE- IMPORTANCE OF LOW CRIME
A low-crime environment
PER- WGTD RESPONSE CODES FREQ CENT PCT ---------- -------- ----- ----- -----NOT IMPORTANT................. 1 772 4.4% 6.5%SOMEWHAT IMPORTANT............ 2 3127 17.8% 27.5%VERY IMPORTANT................ 3 7128 40.5% 66.0% RESERVED CODES: NO PARENT QUEX............. 1215 6.9% (MISS) MISSING.................... 8 232 1.3% (MISS) LEGITIMATE SKIP............ 9 5136 29.2% (MISS) ----- ----- ----- TOTALS: 17610 100.0% 100.0%
K-307

F2: Parent ComponentData File User's Manual
--------------Question 66J Tape Pos. 309-309-------------- Format: I1
F2P66J TEEN'S COLLEGE- IMPORTANCE JOB PLACEMENT
A good record for placing graduates in jobs
PER- WGTD RESPONSE CODES FREQ CENT PCT ---------- -------- ----- ----- -----NOT IMPORTANT................. 1 788 4.5% 6.9%SOMEWHAT IMPORTANT............ 2 3301 18.7% 28.6%VERY IMPORTANT................ 3 6930 39.4% 64.5% RESERVED CODES: NO PARENT QUEX............. 1215 6.9% (MISS) MISSING.................... 8 240 1.4% (MISS) LEGITIMATE SKIP............ 9 5136 29.2% (MISS) ----- ----- ----- TOTALS: 17610 100.0% 100.0%
K-308

F2: Parent ComponentData File User's Manual
--------------Question 66K Tape Pos. 310-310-------------- Format: I1
F2P66K TEEN'S COLLEGE- IMP OF GRAD SCH PLACEMNT
A good record for placing graduates in graduate school
PER- WGTD RESPONSE CODES FREQ CENT PCT ---------- -------- ----- ----- -----NOT IMPORTANT................. 1 1747 9.9% 16.7%SOMEWHAT IMPORTANT............ 2 3686 20.9% 32.6%VERY IMPORTANT................ 3 5552 31.5% 50.6% RESERVED CODES: NO PARENT QUEX............. 1215 6.9% (MISS) MISSING.................... 8 274 1.6% (MISS) LEGITIMATE SKIP............ 9 5136 29.2% (MISS) ----- ----- ----- TOTALS: 17610 100.0% 100.0%
K-309

F2: Parent ComponentData File User's Manual
--------------Question 66L Tape Pos. 311-311-------------- Format: I1
F2P66L TEEN'S COLLEGE- IMPORTNC OF ACADEMIC REP
Strong reputation of the school's academic programs
PER- WGTD RESPONSE CODES FREQ CENT PCT ---------- -------- ----- ----- -----NOT IMPORTANT................. 1 333 1.9% 2.9%SOMEWHAT IMPORTANT............ 2 2397 13.6% 22.9%VERY IMPORTANT................ 3 8296 47.1% 74.2% RESERVED CODES: NO PARENT QUEX............. 1215 6.9% (MISS) MISSING.................... 8 233 1.3% (MISS) LEGITIMATE SKIP............ 9 5136 29.2% (MISS) ----- ----- ----- TOTALS: 17610 100.0% 100.0%
K-310

F2: Parent ComponentData File User's Manual
--------------Question 66M Tape Pos. 312-312-------------- Format: I1
F2P66M TEEN'S COLLEGE- EASY ADMISSION STANDARDS
Easy admissions standards
PER- WGTD RESPONSE CODES FREQ CENT PCT ---------- -------- ----- ----- -----NOT IMPORTANT................. 1 5210 29.6% 43.6%SOMEWHAT IMPORTANT............ 2 3606 20.5% 34.3%VERY IMPORTANT................ 3 2128 12.1% 22.0% RESERVED CODES: NO PARENT QUEX............. 1215 6.9% (MISS) MISSING.................... 8 315 1.8% (MISS) LEGITIMATE SKIP............ 9 5136 29.2% (MISS) ----- ----- ----- TOTALS: 17610 100.0% 100.0%
K-311

F2: Parent ComponentData File User's Manual
--------------Question 66N Tape Pos. 313-313-------------- Format: I1
F2P66N TEEN'S COLLEGE- DESIRED PROGRAM AVAILBLE
Availability of a degree program that will allow my teen toget a job in his/her chosen field
PER- WGTD RESPONSE CODES FREQ CENT PCT ---------- -------- ----- ----- -----NOT IMPORTANT................. 1 441 2.5% 3.5%SOMEWHAT IMPORTANT............ 2 2146 12.2% 17.8%VERY IMPORTANT................ 3 8438 47.9% 78.7% RESERVED CODES: NO PARENT QUEX............. 1215 6.9% (MISS) MISSING.................... 8 234 1.3% (MISS) LEGITIMATE SKIP............ 9 5136 29.2% (MISS) ----- ----- ----- TOTALS: 17610 100.0% 100.0%
K-312

F2: Parent ComponentData File User's Manual
--------------Question 66O Tape Pos. 314-314-------------- Format: I1
F2P66O TEEN'S COLLEGE- IMP OF RACIAL/ETHNC COMP
Racial/ethnic composition of the school
PER- WGTD RESPONSE CODES FREQ CENT PCT ---------- -------- ----- ----- -----NOT IMPORTANT................. 1 5958 33.8% 54.0%SOMEWHAT IMPORTANT............ 2 3341 19.0% 29.4%VERY IMPORTANT................ 3 1663 9.4% 16.6% RESERVED CODES: NO PARENT QUEX............. 1215 6.9% (MISS) MULTIPLE RESPONSE.......... 6 1 0.0% (MISS) MISSING.................... 8 296 1.7% (MISS) LEGITIMATE SKIP............ 9 5136 29.2% (MISS) ----- ----- ----- TOTALS: 17610 100.0% 100.0%
K-313

F2: Parent ComponentData File User's Manual
--------------Question 66P Tape Pos. 315-315-------------- Format: I1
F2P66P TEEN'S COLLEGE- IMP OF SIZE OF SCHOOL
Size of the school
PER- WGTD RESPONSE CODES FREQ CENT PCT ---------- -------- ----- ----- -----NOT IMPORTANT................. 1 4207 23.9% 40.3%SOMEWHAT IMPORTANT............ 2 4856 27.6% 43.1%VERY IMPORTANT................ 3 1936 11.0% 16.6% RESERVED CODES: NO PARENT QUEX............. 1215 6.9% (MISS) MISSING.................... 8 260 1.5% (MISS) LEGITIMATE SKIP............ 9 5136 29.2% (MISS) ----- ----- ----- TOTALS: 17610 100.0% 100.0%
K-314
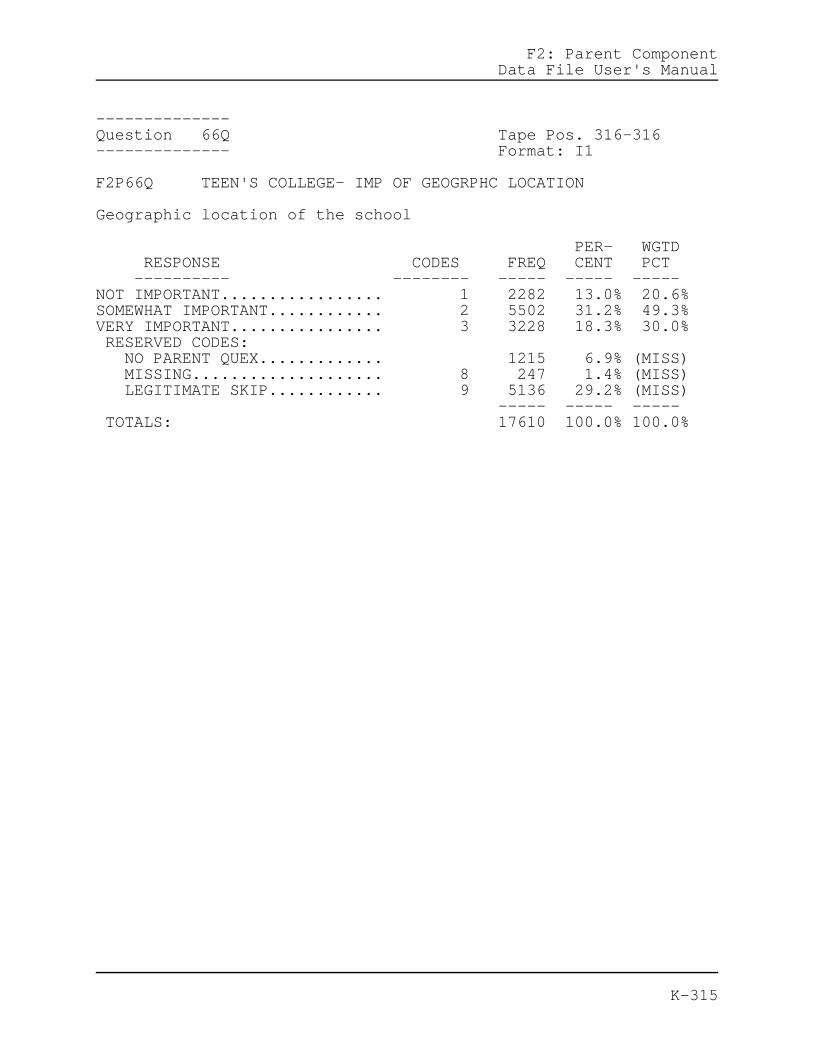
F2: Parent ComponentData File User's Manual
--------------Question 66Q Tape Pos. 316-316-------------- Format: I1
F2P66Q TEEN'S COLLEGE- IMP OF GEOGRPHC LOCATION
Geographic location of the school
PER- WGTD RESPONSE CODES FREQ CENT PCT ---------- -------- ----- ----- -----NOT IMPORTANT................. 1 2282 13.0% 20.6%SOMEWHAT IMPORTANT............ 2 5502 31.2% 49.3%VERY IMPORTANT................ 3 3228 18.3% 30.0% RESERVED CODES: NO PARENT QUEX............. 1215 6.9% (MISS) MISSING.................... 8 247 1.4% (MISS) LEGITIMATE SKIP............ 9 5136 29.2% (MISS) ----- ----- ----- TOTALS: 17610 100.0% 100.0%
K-315

F2: Parent ComponentData File User's Manual
--------------Question 66R Tape Pos. 317-317-------------- Format: I1
F2P66R TEEN'S COLLEGE- IMP OF ATTEND R'S SCHL
Ability to attend the same school my spouse/partner or Iattended
PER- WGTD RESPONSE CODES FREQ CENT PCT ---------- -------- ----- ----- -----NOT IMPORTANT................. 1 10009 56.8% 90.8%SOMEWHAT IMPORTANT............ 2 688 3.9% 6.4%VERY IMPORTANT................ 3 296 1.7% 2.8% RESERVED CODES: NO PARENT QUEX............. 1215 6.9% (MISS) MULTIPLE RESPONSE.......... 6 2 0.0% (MISS) MISSING.................... 8 264 1.5% (MISS) LEGITIMATE SKIP............ 9 5136 29.2% (MISS) ----- ----- ----- TOTALS: 17610 100.0% 100.0%
K-316

F2: Parent ComponentData File User's Manual
-------------Question 67 Tape Pos. 318-319------------- Format: I2
F2P67 VISITED HOW MANY SCHOOLS WITH TEEN
When you and/or your teenager were deciding which schoolhe/she would attend after high school, how many differentschools did you visit with him/her?
PER- WGTD RESPONSE CODES FREQ CENT PCT ---------- -------- ----- ----- -----NONE.......................... 01 3281 18.6% 30.5%ONE........................... 02 2257 12.8% 21.2%TWO........................... 03 2269 12.9% 21.5%THREE OR FOUR................. 04 2153 12.2% 19.2%FIVE TO SEVEN................. 05 785 4.5% 5.6%EIGHT TO TEN.................. 06 245 1.4% 1.2%ELEVEN OR MORE................ 07 125 0.7% 0.8% RESERVED CODES: NO PARENT QUEX............. 1215 6.9% (MISS) MULTIPLE RESPONSE.......... 96 1 0.0% (MISS) MISSING.................... 98 143 0.8% (MISS) LEGITIMATE SKIP............ 99 5136 29.2% (MISS) ----- ----- ----- TOTALS: 17610 100.0% 100.0%
K-317

F2: Parent ComponentData File User's Manual
-------------Question 68 Tape Pos. 320-320------------- Format: I1
F2P68 A PARTICULAR CAREER INTERESTS YOUR TEEN
Has your teenager expressed an interest in a particular jobor profession?
PER- WGTD RESPONSE CODES FREQ CENT PCT ---------- -------- ----- ----- -----YES........................... 1 13268 75.3% 80.6%NO............................ 2 3021 17.2% 19.4% RESERVED CODES: NO PARENT QUEX............. 1215 6.9% (MISS) MISSING.................... 8 106 0.6% (MISS) ----- ----- ----- TOTALS: 17610 100.0% 100.0%
K-318

F2: Parent ComponentData File User's Manual
-------------Question 69 Tape Pos. 321-322------------- Format: I2
F2P69 JOB OR OCCUPATION THAT INTERESTS TEEN
Which of the categories below comes closest to describingthe job or occupation your teenager is interested in?
PER- WGTD RESPONSE CODES FREQ CENT PCT ---------- -------- ----- ----- -----OFFICE WORKER SUCH AS DATAENTRY CLERK, BANK TELLER,BOOKKEEPER, SECRETARY, WORDPROCESSOR, MAIL CARRIER,TICKET AGENT.................. 01 418 2.4% 3.2%TRADESPERSON SUCH AS BAKER,AUTO MECHANIC, HOUSEPAINTER,PLUMBER, PHONE CABLEINSTALLER, CARPENTER.......... 02 585 3.3% 5.1%FARMER, FARM MANAGER.......... 03 70 0.4% 0.8%FULL-TIME HOMEMAKER........... 04 26 0.1% 0.2%LABORER SUCH AS CONSTRUCTIONWORKER, CAR WASHER, GARBAGECOLLECTOR, FARM WORKER........ 05 122 0.7% 1.1%MANAGER SUCH AS SALESMANAGER, SCHOOLADMINISTRATOR, RETAIL BUYER,RESTAURANT MANAGER,GOVERNMENT ADMINISTRATOR...... 06 419 2.4% 3.1%MILITARY SUCH AS CAREEROFFICER OR ENLISTED PERSON INTHE ARMED FORCES.............. 07 477 2.7% 3.9%OPERATOR OF MACHINES ORTOOLS, SUCH AS MEAT CUTTER,ASSEMBLER, WELDER,TAXICAB/BUS/TRUCK DRIVER...... 08 142 0.8% 1.1%PROFESSIONAL SUCH ASACCOUNTANT, REGISTERED NURSE,ENGINEER, BANKER, LIBRARIAN,WRITER, SOCIAL WORKER, ACTOR,ATHLETE, ARTIST, POLITICIAN,BUT NOT INCLUDING SCHOOLTEACHER....................... 09 4023 22.8% 30.1%PROFESSIONAL SUCH ASMINISTER, DENTIST, DOCTOR,LAWYER, SCIENTIST, COLLEGETEACHER....................... 10 2512 14.3% 16.9%OWNER OF A SMALL BUSINESS ORRESTAURANT, CONTRACTOR........ 11 222 1.3% 1.9%PROTECTIVE SERVICES SUCH AS
K-319

F2: Parent ComponentData File User's Manual
POLICE OFFICER, FIREFIGHTER,DETECTIVE, SHERIFF, SECURITYGUARD......................... 12 491 2.8% 4.1%SALES SUCH AS SALESREPRESENTATIVE, ADVERTISINGOR INSURANCE AGENT, REALESTATE BROKER................. 13 108 0.6% 0.9%SCHOOL TEACHER SUCH ASELEMENTARY, JUNIOR HIGH, ORHIGH SCHOOL, BUT NOT COLLEGE.. 14 957 5.4% 6.8%SERVICE WORKER SUCH AS HAIRSTYLIST, PRACTICAL NURSE,CHILD CARE WORKER, WAITER,DOMESTIC, JANITOR............. 15 471 2.7% 4.2%TECHNICAL SUCH AS COMPUTERPROGRAMMER, MEDICAL OR DENTALTECHNICIAN, DRAFTSPERSON...... 16 886 5.0% 7.8%OTHER......................... 17 1099 6.2% 8.8% RESERVED CODES: NO PARENT QUEX............. 1215 6.9% (MISS) MULTIPLE RESPONSE.......... 96 222 1.3% (MISS) MISSING.................... 98 124 0.7% (MISS) LEGITIMATE SKIP............ 99 3021 17.2% (MISS) ----- ----- ----- TOTALS: 17610 100.0% 100.0%
K-320

F2: Parent ComponentData File User's Manual
-------------Question 70-------------
Listed below are sources of information that might help aperson get an entry-level full time job or find out whereto go for training or education in a particular field. Mark what you think are your teenager's best sources ofinformation for the particular job or profession that youdescribed in question 69.
K-321

F2: Parent ComponentData File User's Manual
--------------Question 70A Tape Pos. 323-323-------------- Format: I1
F2P70A R, SPOUSE/PTNR IS BEST SOURC OF JOB INFO
You or your spouse/partner
PER- WGTD RESPONSE CODES FREQ CENT PCT ---------- -------- ----- ----- -----YES........................... 1 6775 38.5% 50.9%NO............................ 2 6319 35.9% 49.1% RESERVED CODES: NO PARENT QUEX............. 1215 6.9% (MISS) MISSING.................... 8 280 1.6% (MISS) LEGITIMATE SKIP............ 9 3021 17.2% (MISS) ----- ----- ----- TOTALS: 17610 100.0% 100.0%
K-322

F2: Parent ComponentData File User's Manual
--------------Question 70B Tape Pos. 324-324-------------- Format: I1
F2P70B OTH RELATIVE IS BEST SOURCE OF JOB INFO
Someone else in the family (for example, an older brotheror sister, aunt, uncle or cousin)
PER- WGTD RESPONSE CODES FREQ CENT PCT ---------- -------- ----- ----- -----YES........................... 1 5579 31.7% 43.6%NO............................ 2 7512 42.7% 56.4% RESERVED CODES: NO PARENT QUEX............. 1215 6.9% (MISS) MULTIPLE RESPONSE.......... 6 1 0.0% (MISS) MISSING.................... 8 282 1.6% (MISS) LEGITIMATE SKIP............ 9 3021 17.2% (MISS) ----- ----- ----- TOTALS: 17610 100.0% 100.0%
K-323

F2: Parent ComponentData File User's Manual
--------------Question 70C Tape Pos. 325-325-------------- Format: I1
F2P70C FAMILY FRIEND IS BEST SOURCE OF JOB INFO
A close family friend
PER- WGTD RESPONSE CODES FREQ CENT PCT ---------- -------- ----- ----- -----YES........................... 1 5599 31.8% 43.6%NO............................ 2 7491 42.5% 56.4% RESERVED CODES: NO PARENT QUEX............. 1215 6.9% (MISS) MISSING.................... 8 284 1.6% (MISS) LEGITIMATE SKIP............ 9 3021 17.2% (MISS) ----- ----- ----- TOTALS: 17610 100.0% 100.0%
K-324

F2: Parent ComponentData File User's Manual
--------------Question 70D Tape Pos. 326-326-------------- Format: I1
F2P70D TEEN'S SCHL IS BEST SOURCE OF JOB INFO
Your teenager's school
PER- WGTD RESPONSE CODES FREQ CENT PCT ---------- -------- ----- ----- -----YES........................... 1 8099 46.0% 62.1%NO............................ 2 4984 28.3% 37.9% RESERVED CODES: NO PARENT QUEX............. 1215 6.9% (MISS) MULTIPLE RESPONSE.......... 6 2 0.0% (MISS) MISSING.................... 8 289 1.6% (MISS) LEGITIMATE SKIP............ 9 3021 17.2% (MISS) ----- ----- ----- TOTALS: 17610 100.0% 100.0%
K-325

F2: Parent ComponentData File User's Manual
--------------Question 70E Tape Pos. 327-327-------------- Format: I1
F2P70E SCHL COUNSELOR IS BEST SRCE OF JOB INFO
A school counselor
PER- WGTD RESPONSE CODES FREQ CENT PCT ---------- -------- ----- ----- -----YES........................... 1 8893 50.5% 67.9%NO............................ 2 4193 23.8% 32.1% RESERVED CODES: NO PARENT QUEX............. 1215 6.9% (MISS) MULTIPLE RESPONSE.......... 6 2 0.0% (MISS) MISSING.................... 8 286 1.6% (MISS) LEGITIMATE SKIP............ 9 3021 17.2% (MISS) ----- ----- ----- TOTALS: 17610 100.0% 100.0%
K-326

F2: Parent ComponentData File User's Manual
--------------Question 70F Tape Pos. 328-328-------------- Format: I1
F2P70F TEEN'S FRIEND IS BEST SOURCE OF JOB INFO
One of your teenager's friends
PER- WGTD RESPONSE CODES FREQ CENT PCT ---------- -------- ----- ----- -----YES........................... 1 3348 19.0% 27.0%NO............................ 2 9735 55.3% 73.0% RESERVED CODES: NO PARENT QUEX............. 1215 6.9% (MISS) MULTIPLE RESPONSE.......... 6 2 0.0% (MISS) MISSING.................... 8 289 1.6% (MISS) LEGITIMATE SKIP............ 9 3021 17.2% (MISS) ----- ----- ----- TOTALS: 17610 100.0% 100.0%
K-327

F2: Parent ComponentData File User's Manual
--------------Question 70G Tape Pos. 329-329-------------- Format: I1
F2P70G PERSON IN THT FIELD IS BST SRCE JOB INFO
A non-related acquaintance who holds a job in the field
PER- WGTD RESPONSE CODES FREQ CENT PCT ---------- -------- ----- ----- -----YES........................... 1 9191 52.2% 70.5%NO............................ 2 3894 22.1% 29.5% RESERVED CODES: NO PARENT QUEX............. 1215 6.9% (MISS) MULTIPLE RESPONSE.......... 6 2 0.0% (MISS) MISSING.................... 8 287 1.6% (MISS) LEGITIMATE SKIP............ 9 3021 17.2% (MISS) ----- ----- ----- TOTALS: 17610 100.0% 100.0%
K-328

F2: Parent ComponentData File User's Manual
--------------Question 70H Tape Pos. 330-330-------------- Format: I1
F2P70H BOOK/MAGAZINE IS BEST SOURCE OF JOB INFO
Books or magazines
PER- WGTD RESPONSE CODES FREQ CENT PCT ---------- -------- ----- ----- -----YES........................... 1 7919 45.0% 61.3%NO............................ 2 5166 29.3% 38.7% RESERVED CODES: NO PARENT QUEX............. 1215 6.9% (MISS) MISSING.................... 8 289 1.6% (MISS) LEGITIMATE SKIP............ 9 3021 17.2% (MISS) ----- ----- ----- TOTALS: 17610 100.0% 100.0%
K-329

F2: Parent ComponentData File User's Manual
--------------Question 70I Tape Pos. 331-331-------------- Format: I1
F2P70I VOC SCHL/COLLEGE IS BEST SOURCE JOB INFO
A vocational school or community college
PER- WGTD RESPONSE CODES FREQ CENT PCT ---------- -------- ----- ----- -----YES........................... 1 7169 40.7% 58.8%NO............................ 2 5926 33.7% 41.2% RESERVED CODES: NO PARENT QUEX............. 1215 6.9% (MISS) MULTIPLE RESPONSE.......... 6 1 0.0% (MISS) MISSING.................... 8 278 1.6% (MISS) LEGITIMATE SKIP............ 9 3021 17.2% (MISS) ----- ----- ----- TOTALS: 17610 100.0% 100.0%
K-330

F2: Parent ComponentData File User's Manual
--------------Question 70J Tape Pos. 332-332-------------- Format: I1
F2P70J LOCAL BUSINESS IS BEST SRCE OF JOB INFO
A local business or business association
PER- WGTD RESPONSE CODES FREQ CENT PCT ---------- -------- ----- ----- -----YES........................... 1 5648 32.1% 45.3%NO............................ 2 7436 42.2% 54.7% RESERVED CODES: NO PARENT QUEX............. 1215 6.9% (MISS) MULTIPLE RESPONSE.......... 6 1 0.0% (MISS) MISSING.................... 8 289 1.6% (MISS) LEGITIMATE SKIP............ 9 3021 17.2% (MISS) ----- ----- ----- TOTALS: 17610 100.0% 100.0%
K-331

F2: Parent ComponentData File User's Manual
-------------Question 71 Tape Pos. 333-333------------- Format: I1
F2P71 HAS YOUR TEEN EVER WORKED FOR PAY
Has your teen ever worked for pay?
PER- WGTD RESPONSE CODES FREQ CENT PCT ---------- -------- ----- ----- -----YES........................... 1 14502 82.4% 89.6%NO............................ 2 1748 9.9% 10.4% RESERVED CODES: NO PARENT QUEX............. 1215 6.9% (MISS) MISSING.................... 8 145 0.8% (MISS) ----- ----- ----- TOTALS: 17610 100.0% 100.0%
K-332

F2: Parent ComponentData File User's Manual
-------------Question 72-------------
When did your teenager last work for pay, not counting workaround the house? (If your teenager is currently working,please enter the current month and year.)
K-333

F2: Parent ComponentData File User's Manual
---------------Question 72MO Tape Pos. 334-335--------------- Format: I2
F2P72MO WHAT MONTH DID TEEN LAST WORK FOR PAY
Month
PER- WGTD RESPONSE CODES FREQ CENT PCT ---------- -------- ----- ----- -----JANUARY....................... 01 246 1.4% 2.2%FEBRUARY...................... 02 179 1.0% 1.4%MARCH......................... 03 258 1.5% 2.2%APRIL......................... 04 358 2.0% 2.6%MAY........................... 05 3328 18.9% 21.9%JUNE.......................... 06 1337 7.6% 9.3%JULY.......................... 07 1483 8.4% 9.5%AUGUST........................ 08 2947 16.7% 19.4%SEPTEMBER..................... 09 1168 6.6% 8.6%OCTOBER....................... 10 1197 6.8% 10.8%NOVEMBER...................... 11 744 4.2% 7.1%DECEMBER...................... 12 528 3.0% 4.9% RESERVED CODES: NO PARENT QUEX............. 1215 6.9% (MISS) MISSING.................... 98 874 5.0% (MISS) LEGITIMATE SKIP............ 99 1748 9.9% (MISS) ----- ----- ----- TOTALS: 17610 100.0% 100.0%
K-334

F2: Parent ComponentData File User's Manual
---------------Question 72YR Tape Pos. 336-337--------------- Format: I2
F2P72YR WHAT YEAR DID TEEN LAST WORK FOR PAY
Year
PER- WGTD RESPONSE CODES FREQ CENT PCT ---------- -------- ----- ----- -----1985.......................... 85 3 0.0% 0.0%1986.......................... 86 4 0.0% 0.0%1987.......................... 87 10 0.1% 0.1%1988.......................... 88 37 0.2% 0.3%1989.......................... 89 117 0.7% 1.0%1990.......................... 90 422 2.4% 2.8%1991.......................... 91 1976 11.2% 12.7%1992.......................... 92 11148 63.3% 82.2%1993.......................... 93 56 0.3% 0.8% RESERVED CODES: NO PARENT QUEX............. 1215 6.9% (MISS) MISSING.................... 98 874 5.0% (MISS) LEGITIMATE SKIP............ 99 1748 9.9% (MISS) ----- ----- ----- TOTALS: 17610 100.0% 100.0%
K-335

F2: Parent ComponentData File User's Manual
-------------Question 73-------------
When did your teenager start working at the job in whichhe/she last worked for pay?
K-336

F2: Parent ComponentData File User's Manual
---------------Question 73MO Tape Pos. 338-339--------------- Format: I2
F2P73MO WHAT MONTH TEEN START WORKING AT LST JOB
Month
PER- WGTD RESPONSE CODES FREQ CENT PCT ---------- -------- ----- ----- -----JANUARY....................... 01 680 3.9% 5.4%FEBRUARY...................... 02 485 2.8% 3.9%MARCH......................... 03 727 4.1% 6.0%APRIL......................... 04 934 5.3% 7.2%MAY........................... 05 1602 9.1% 11.1%JUNE.......................... 06 3561 20.2% 25.4%JULY.......................... 07 1252 7.1% 10.0%AUGUST........................ 08 1031 5.9% 7.9%SEPTEMBER..................... 09 1244 7.1% 9.8%OCTOBER....................... 10 745 4.2% 6.2%NOVEMBER...................... 11 529 3.0% 4.4%DECEMBER...................... 12 361 2.0% 2.5% RESERVED CODES: NO PARENT QUEX............. 1215 6.9% (MISS) MISSING.................... 98 1496 8.5% (MISS) LEGITIMATE SKIP............ 99 1748 9.9% (MISS) ----- ----- ----- TOTALS: 17610 100.0% 100.0%
K-337

F2: Parent ComponentData File User's Manual
---------------Question 73YR Tape Pos. 340-341--------------- Format: I2
F2P73YR WHAT YEAR TEEN STARTD WORKING AT LST JOB
Year
PER- WGTD RESPONSE CODES FREQ CENT PCT ---------- -------- ----- ----- -----1985.......................... 85 24 0.1% 0.2%1986.......................... 86 70 0.4% 0.4%1987.......................... 87 120 0.7% 1.0%1988.......................... 88 387 2.2% 2.8%1989.......................... 89 851 4.8% 6.3%1990.......................... 90 2287 13.0% 16.5%1991.......................... 91 4298 24.4% 31.4%1992.......................... 92 5110 29.0% 41.4%1993.......................... 93 4 0.0% 0.1% RESERVED CODES: NO PARENT QUEX............. 1215 6.9% (MISS) MISSING.................... 98 1496 8.5% (MISS) LEGITIMATE SKIP............ 99 1748 9.9% (MISS) ----- ----- ----- TOTALS: 17610 100.0% 100.0%
K-338

F2: Parent ComponentData File User's Manual
V. FINANCIAL INFORMATION AND EDUCATIONAL COSTS
-------------Question 74 Tape Pos. 342-343------------- Format: I2
F2P74 TOTAL FAMILY INCOME FRM ALL SOURCES 1991
What was your total gross family income from all sourcesbefore taxes in 1991? (If you are not sure of the amount,please estimate.)
PER- WGTD RESPONSE CODES FREQ CENT PCT ---------- -------- ----- ----- -----NONE.......................... 01 73 0.4% 0.4%LESS THAN $1,000.............. 02 91 0.5% 0.6%$1,000-$2,999................. 03 156 0.9% 1.2%$3,000-$4,999................. 04 230 1.3% 1.7%$5,000-$7,499................. 05 477 2.7% 3.3%$7,500-$9,999................. 06 614 3.5% 4.6%$10,000-$14,999............... 07 1069 6.1% 7.5%$15,000-$19,999............... 08 1122 6.4% 8.3%$20,000-$24,999............... 09 1374 7.8% 8.9%$25,000-$34,999............... 10 2223 12.6% 14.5%$35,000-$49,999............... 11 2965 16.8% 19.2%$50,000-$74,999............... 12 2906 16.5% 18.2%$75,000-$99,999............... 13 1052 6.0% 5.9%$100,000-199,999.............. 14 943 5.4% 4.3%$200,000 OR MORE.............. 15 391 2.2% 1.3% RESERVED CODES: NO PARENT QUEX............. 1215 6.9% (MISS) MULTIPLE RESPONSE.......... 96 2 0.0% (MISS) MISSING.................... 98 707 4.0% (MISS) ----- ----- ----- TOTALS: 17610 100.0% 100.0%
K-339

F2: Parent ComponentData File User's Manual
-------------Question 75 Tape Pos. 344-344------------- Format: I1
F2P75 # OF EARNERS CONTRIBUTD TO FAMILY INCOME
How many wage-earners in your household contributed to thefamily income reported in the question above?
PER- WGTD RESPONSE CODES FREQ CENT PCT ---------- -------- ----- ----- -----ONE........................... 1 6099 34.6% 39.9%TWO........................... 2 9185 52.2% 56.4%MORE THAN TWO................. 3 600 3.4% 3.7% RESERVED CODES: NO PARENT QUEX............. 1215 6.9% (MISS) MULTIPLE RESPONSE.......... 6 1 0.0% (MISS) MISSING.................... 8 510 2.9% (MISS) ----- ----- ----- TOTALS: 17610 100.0% 100.0%
K-340

F2: Parent ComponentData File User's Manual
-------------Question 76-------------
Do you currently have any of the following educationalexpenses for any of your children?
K-341

F2: Parent ComponentData File User's Manual
--------------Question 76A Tape Pos. 345-345-------------- Format: I1
F2P76A ANY EDCTNL EXPENSES FOR PRIVATE SCHOOL
Private elementary or high school tuition and associatedexpenses
PER- WGTD RESPONSE CODES FREQ CENT PCT ---------- -------- ----- ----- -----YES........................... 1 3408 19.4% 17.7%NO............................ 2 12203 69.3% 82.3% RESERVED CODES: NO PARENT QUEX............. 1215 6.9% (MISS) MULTIPLE RESPONSE.......... 6 2 0.0% (MISS) MISSING.................... 8 782 4.4% (MISS) ----- ----- ----- TOTALS: 17610 100.0% 100.0%
K-342

F2: Parent ComponentData File User's Manual
--------------Question 76B Tape Pos. 346-346-------------- Format: I1
F2P76B ANY EDUCATIONAL EXPENSES FOR TUTORING
Tutoring
PER- WGTD RESPONSE CODES FREQ CENT PCT ---------- -------- ----- ----- -----YES........................... 1 884 5.0% 5.0%NO............................ 2 14328 81.4% 95.0% RESERVED CODES: NO PARENT QUEX............. 1215 6.9% (MISS) MISSING.................... 8 1183 6.7% (MISS) ----- ----- ----- TOTALS: 17610 100.0% 100.0%
K-343

F2: Parent ComponentData File User's Manual
--------------Question 76C Tape Pos. 347-347-------------- Format: I1
F2P76C ANY EDCTNL EXPENSES FOR COLLEGE TUITION
College tuition and associated expenses (including loans)
PER- WGTD RESPONSE CODES FREQ CENT PCT ---------- -------- ----- ----- -----YES........................... 1 4872 27.7% 27.0%NO............................ 2 10917 62.0% 73.0% RESERVED CODES: NO PARENT QUEX............. 1215 6.9% (MISS) MULTIPLE RESPONSE.......... 6 1 0.0% (MISS) MISSING.................... 8 605 3.4% (MISS) ----- ----- ----- TOTALS: 17610 100.0% 100.0%
K-344

F2: Parent ComponentData File User's Manual
--------------Question 76D Tape Pos. 348-348-------------- Format: I1
F2P76D ANY OTHER EDUCATIONAL EXPENSES
Other
PER- WGTD RESPONSE CODES FREQ CENT PCT ---------- -------- ----- ----- -----YES........................... 1 1790 10.2% 12.6%NO............................ 2 12586 71.5% 87.4% RESERVED CODES: NO PARENT QUEX............. 1215 6.9% (MISS) MISSING.................... 8 2019 11.5% (MISS) ----- ----- ----- TOTALS: 17610 100.0% 100.0%
K-345

F2: Parent ComponentData File User's Manual
-------------Question 77 Tape Pos. 349-350------------- Format: I2
F2P77 EDUCATIONAL EXPENSES FOR 1991-92 SCH YR
What is the total amount you have spent or will spendduring the 1991-1992 school year for all of the educationalexpenses you marked in question 76?
PER- WGTD RESPONSE CODES FREQ CENT PCT ---------- -------- ----- ----- -----NONE.......................... 01 6539 37.1% 46.0%LESS THAN $500................ 02 2148 12.2% 14.7%$500-$999..................... 03 1424 8.1% 9.0%$1,000-$4,999................. 04 2694 15.3% 17.0%$5,000-$9,999................. 05 1292 7.3% 7.1%$10,000-$14,999............... 06 664 3.8% 3.2%$15,000-$19,999............... 07 326 1.9% 1.2%$20,000 OR MORE............... 08 575 3.3% 1.8% RESERVED CODES: NO PARENT QUEX............. 1215 6.9% (MISS) MULTIPLE RESPONSE.......... 96 4 0.0% (MISS) MISSING.................... 98 729 4.1% (MISS) ----- ----- ----- TOTALS: 17610 100.0% 100.0%
K-346

F2: Parent ComponentData File User's Manual
-------------Question 78 Tape Pos. 351-351------------- Format: I1
F2P78 DOES TEEN PLAN TO CONTINUE EDUCATION
Does your teenager plan to continue his or her education?
PER- WGTD RESPONSE CODES FREQ CENT PCT ---------- -------- ----- ----- -----YES........................... 1 13794 78.3% 81.8%NO............................ 2 1438 8.2% 10.5%HASN'T DECIDED YET............ 3 1077 6.1% 7.7% RESERVED CODES: NO PARENT QUEX............. 1215 6.9% (MISS) MULTIPLE RESPONSE.......... 6 4 0.0% (MISS) MISSING.................... 8 82 0.5% (MISS) ----- ----- ----- TOTALS: 17610 100.0% 100.0%
K-347

F2: Parent ComponentData File User's Manual
-------------Question 79-------------
Which of the following have you or your spouse/partner doneto financially prepare for your teenager's education afterhigh school?
K-348

F2: Parent ComponentData File User's Manual
--------------Question 79A Tape Pos. 352-352-------------- Format: I1
F2P79A R STARTED A SAVINGS ACCOUNT
Started a savings account
PER- WGTD RESPONSE CODES FREQ CENT PCT ---------- -------- ----- ----- -----YES........................... 1 6715 38.1% 44.0%NO............................ 2 7946 45.1% 56.0% RESERVED CODES: NO PARENT QUEX............. 1215 6.9% (MISS) MULTIPLE RESPONSE.......... 6 4 0.0% (MISS) MISSING.................... 8 292 1.7% (MISS) LEGITIMATE SKIP............ 9 1438 8.2% (MISS) ----- ----- ----- TOTALS: 17610 100.0% 100.0%
K-349

F2: Parent ComponentData File User's Manual
--------------Question 79B Tape Pos. 353-353-------------- Format: I1
F2P79B R BOUGHT AN INSURANCE POLICY
Bought an insurance policy
PER- WGTD RESPONSE CODES FREQ CENT PCT ---------- -------- ----- ----- -----YES........................... 1 3209 18.2% 22.0%NO............................ 2 11378 64.6% 78.0% RESERVED CODES: NO PARENT QUEX............. 1215 6.9% (MISS) MULTIPLE RESPONSE.......... 6 6 0.0% (MISS) MISSING.................... 8 364 2.1% (MISS) LEGITIMATE SKIP............ 9 1438 8.2% (MISS) ----- ----- ----- TOTALS: 17610 100.0% 100.0%
K-350

F2: Parent ComponentData File User's Manual
--------------Question 79C Tape Pos. 354-354-------------- Format: I1
F2P79C R BOUGHT U.S. SAVINGS BONDS
Bought U.S. Savings Bonds
PER- WGTD RESPONSE CODES FREQ CENT PCT ---------- -------- ----- ----- -----YES........................... 1 2559 14.5% 18.6%NO............................ 2 12024 68.3% 81.4% RESERVED CODES: NO PARENT QUEX............. 1215 6.9% (MISS) MULTIPLE RESPONSE.......... 6 2 0.0% (MISS) MISSING.................... 8 372 2.1% (MISS) LEGITIMATE SKIP............ 9 1438 8.2% (MISS) ----- ----- ----- TOTALS: 17610 100.0% 100.0%
K-351

F2: Parent ComponentData File User's Manual
--------------Question 79D Tape Pos. 355-355-------------- Format: I1
F2P79D R MADE INVESTMENTS IN STOCKS/REAL ESTATE
Made investments in stocks or real estate
PER- WGTD RESPONSE CODES FREQ CENT PCT ---------- -------- ----- ----- -----YES........................... 1 3379 19.2% 20.4%NO............................ 2 11227 63.8% 79.6% RESERVED CODES: NO PARENT QUEX............. 1215 6.9% (MISS) MISSING.................... 8 351 2.0% (MISS) LEGITIMATE SKIP............ 9 1438 8.2% (MISS) ----- ----- ----- TOTALS: 17610 100.0% 100.0%
K-352

F2: Parent ComponentData File User's Manual
--------------Question 79E Tape Pos. 356-356-------------- Format: I1
F2P79E R SET UP A TRUST FUND
Set up a college investment fund (such as a mutual fund)
PER- WGTD RESPONSE CODES FREQ CENT PCT ---------- -------- ----- ----- -----YES........................... 1 1578 9.0% 9.3%NO............................ 2 13018 73.9% 90.7% RESERVED CODES: NO PARENT QUEX............. 1215 6.9% (MISS) MULTIPLE RESPONSE.......... 6 1 0.0% (MISS) MISSING.................... 8 360 2.0% (MISS) LEGITIMATE SKIP............ 9 1438 8.2% (MISS) ----- ----- ----- TOTALS: 17610 100.0% 100.0%
K-353

F2: Parent ComponentData File User's Manual
--------------Question 79F Tape Pos. 357-357-------------- Format: I1
F2P79F R STARTED WORKING ANOTHER JOB/MORE HOURS
Started working another job and/or more hours
PER- WGTD RESPONSE CODES FREQ CENT PCT ---------- -------- ----- ----- -----YES........................... 1 3634 20.6% 25.4%NO............................ 2 10966 62.3% 74.6% RESERVED CODES: NO PARENT QUEX............. 1215 6.9% (MISS) MULTIPLE RESPONSE.......... 6 1 0.0% (MISS) MISSING.................... 8 356 2.0% (MISS) LEGITIMATE SKIP............ 9 1438 8.2% (MISS) ----- ----- ----- TOTALS: 17610 100.0% 100.0%
K-354

F2: Parent ComponentData File User's Manual
--------------Question 79G Tape Pos. 358-358-------------- Format: I1
F2P79G R ESTABLISHED ANOTHER FORM OF SAVINGS
Established another form of savings
PER- WGTD RESPONSE CODES FREQ CENT PCT ---------- -------- ----- ----- -----YES........................... 1 3023 17.2% 19.9%NO............................ 2 11554 65.6% 80.1% RESERVED CODES: NO PARENT QUEX............. 1215 6.9% (MISS) MULTIPLE RESPONSE.......... 6 1 0.0% (MISS) MISSING.................... 8 379 2.2% (MISS) LEGITIMATE SKIP............ 9 1438 8.2% (MISS) ----- ----- ----- TOTALS: 17610 100.0% 100.0%
K-355

F2: Parent ComponentData File User's Manual
--------------Question 79H Tape Pos. 359-359-------------- Format: I1
F2P79H R PLANNED TO REDUCE EXPENSES IN SOME WAY
Planned to reduce other expenses in some way (e.g. pay offcar, put off vacations or other expenses)
PER- WGTD RESPONSE CODES FREQ CENT PCT ---------- -------- ----- ----- -----YES........................... 1 7824 44.4% 52.1%NO............................ 2 6795 38.6% 47.9% RESERVED CODES: NO PARENT QUEX............. 1215 6.9% (MISS) MULTIPLE RESPONSE.......... 6 1 0.0% (MISS) MISSING.................... 8 337 1.9% (MISS) LEGITIMATE SKIP............ 9 1438 8.2% (MISS) ----- ----- ----- TOTALS: 17610 100.0% 100.0%
K-356

F2: Parent ComponentData File User's Manual
--------------Question 79I Tape Pos. 360-360-------------- Format: I1
F2P79I R PLANNED TO REMORTGAG PROPRTY/TAKE LOAN
Planned to remortgage your property or take an equity loan
PER- WGTD RESPONSE CODES FREQ CENT PCT ---------- -------- ----- ----- -----YES........................... 1 2093 11.9% 13.0%NO............................ 2 12481 70.9% 87.0% RESERVED CODES: NO PARENT QUEX............. 1215 6.9% (MISS) MISSING.................... 8 383 2.2% (MISS) LEGITIMATE SKIP............ 9 1438 8.2% (MISS) ----- ----- ----- TOTALS: 17610 100.0% 100.0%
K-357

F2: Parent ComponentData File User's Manual
--------------Question 79J Tape Pos. 361-361-------------- Format: I1
F2P79J R HAD TEEN PUT ASIDE EARNINGS
Had teenager put aside earnings
PER- WGTD RESPONSE CODES FREQ CENT PCT ---------- -------- ----- ----- -----YES........................... 1 6897 39.2% 46.7%NO............................ 2 7725 43.9% 53.3% RESERVED CODES: NO PARENT QUEX............. 1215 6.9% (MISS) MULTIPLE RESPONSE.......... 6 7 0.0% (MISS) MISSING.................... 8 328 1.9% (MISS) LEGITIMATE SKIP............ 9 1438 8.2% (MISS) ----- ----- ----- TOTALS: 17610 100.0% 100.0%
K-358

F2: Parent ComponentData File User's Manual
-------------Question 80 Tape Pos. 362-362------------- Format: I1
F2P80 GRADE TEEN IN WHEN R STARTED SAVING
What grade was your teenager in when you began to preparefinancially for his/her education after high school?
PER- WGTD RESPONSE CODES FREQ CENT PCT ---------- -------- ----- ----- -----BEFORE 1ST GRADE.............. 1 1769 10.0% 10.7%BETWEEN THE 1ST AND 6TH GRADES 2 1911 10.9% 12.2%IN THE 7TH, 8TH OR 9TH GRADES. 3 2412 13.7% 17.7%IN THE 10TH, 11TH, OR 12THGRADES........................ 4 3823 21.7% 26.0%HAVE NOT BEGUN TO PREPARE..... 5 4457 25.3% 33.4% RESERVED CODES: NO PARENT QUEX............. 1215 6.9% (MISS) MULTIPLE RESPONSE.......... 6 5 0.0% (MISS) MISSING.................... 8 580 3.3% (MISS) LEGITIMATE SKIP............ 9 1438 8.2% (MISS) ----- ----- ----- TOTALS: 17610 100.0% 100.0%
K-359

F2: Parent ComponentData File User's Manual
-------------Question 81 Tape Pos. 363-364------------- Format: I2
F2P81 MONEY R SET ASIDE FOR TEEN'S FUTURE ED
About how much money have you set aside for your teenager'sfuture educational needs?
PER- WGTD RESPONSE CODES FREQ CENT PCT ---------- -------- ----- ----- -----NONE.......................... 01 920 5.2% 9.6%LESS THAN $1,000.............. 02 1477 8.4% 16.7%$1,000-$5,000................. 03 3141 17.8% 35.2%$5,001-$10,000................ 04 1461 8.3% 15.2%$10,001-$15,000............... 05 790 4.5% 8.9%$15,001-$30,000............... 06 845 4.8% 8.1%MORE THAN $30,000............. 07 921 5.2% 6.2% RESERVED CODES: NO PARENT QUEX............. 1215 6.9% (MISS) MULTIPLE RESPONSE.......... 96 1 0.0% (MISS) MISSING.................... 98 944 5.4% (MISS) LEGITIMATE SKIP............ 99 5895 33.5% (MISS) ----- ----- ----- TOTALS: 17610 100.0% 100.0%
K-360

F2: Parent ComponentData File User's Manual
-------------Question 82 Tape Pos. 365-365------------- Format: I1
F2P82 EXPECT AMOUNT TO COVER COST OF EDUCATION
Do you expect this amount to cover the total cost of his orher education?
PER- WGTD RESPONSE CODES FREQ CENT PCT ---------- -------- ----- ----- -----YES........................... 1 986 5.6% 9.2%NO............................ 2 8176 46.4% 84.7%DON'T KNOW.................... 3 636 3.6% 6.1% RESERVED CODES: NO PARENT QUEX............. 1215 6.9% (MISS) MISSING.................... 8 702 4.0% (MISS) LEGITIMATE SKIP............ 9 5895 33.5% (MISS) ----- ----- ----- TOTALS: 17610 100.0% 100.0%
K-361

F2: Parent ComponentData File User's Manual
-------------Question 83 Tape Pos. 366-366------------- Format: I1
F2P83 DISCUSSED/READ ABT EDUCATNL FIN AID
Have you talked to anyone or read anything about sources offinancial aid for education after high school for yourteenager?
PER- WGTD RESPONSE CODES FREQ CENT PCT ---------- -------- ----- ----- -----YES........................... 1 10174 57.8% 68.0%NO............................ 2 4403 25.0% 32.0% RESERVED CODES: NO PARENT QUEX............. 1215 6.9% (MISS) MULTIPLE RESPONSE.......... 6 1 0.0% (MISS) MISSING.................... 8 379 2.2% (MISS) LEGITIMATE SKIP............ 9 1438 8.2% (MISS) ----- ----- ----- TOTALS: 17610 100.0% 100.0%
K-362

F2: Parent ComponentData File User's Manual
-------------Question 84-------------
Have you or your spouse/partner done any of the followingto learn about applying for financial aid for furthereducation for your teenager?
K-363

F2: Parent ComponentData File User's Manual
--------------Question 84A Tape Pos. 367-367-------------- Format: I1
F2P84A TALKED W/HS GUIDANCE COUNSLR ABT FIN AID
Talked with a high school guidance counselor
PER- WGTD RESPONSE CODES FREQ CENT PCT ---------- -------- ----- ----- -----YES........................... 1 5198 29.5% 51.1%NO............................ 2 4806 27.3% 48.9% RESERVED CODES: NO PARENT QUEX............. 1215 6.9% (MISS) MULTIPLE RESPONSE.......... 6 1 0.0% (MISS) MISSING.................... 8 549 3.1% (MISS) LEGITIMATE SKIP............ 9 5841 33.2% (MISS) ----- ----- ----- TOTALS: 17610 100.0% 100.0%
K-364

F2: Parent ComponentData File User's Manual
--------------Question 84B Tape Pos. 368-368-------------- Format: I1
F2P84B TALKED W/COLL REP ABOUT FINANCIAL AID
Talked with a representative from a vocational/technicalschool or college
PER- WGTD RESPONSE CODES FREQ CENT PCT ---------- -------- ----- ----- -----YES........................... 1 5416 30.8% 55.6%NO............................ 2 4531 25.7% 44.4% RESERVED CODES: NO PARENT QUEX............. 1215 6.9% (MISS) MULTIPLE RESPONSE.......... 6 1 0.0% (MISS) MISSING.................... 8 606 3.4% (MISS) LEGITIMATE SKIP............ 9 5841 33.2% (MISS) ----- ----- ----- TOTALS: 17610 100.0% 100.0%
K-365

F2: Parent ComponentData File User's Manual
--------------Question 84C Tape Pos. 369-369-------------- Format: I1
F2P84C TALKED W/LOAN OFFICER ABT FINANCIAL AID
Talked with a loan officer at a bank
PER- WGTD RESPONSE CODES FREQ CENT PCT ---------- -------- ----- ----- -----YES........................... 1 2227 12.6% 21.7%NO............................ 2 7651 43.4% 78.3% RESERVED CODES: NO PARENT QUEX............. 1215 6.9% (MISS) MISSING.................... 8 676 3.8% (MISS) LEGITIMATE SKIP............ 9 5841 33.2% (MISS) ----- ----- ----- TOTALS: 17610 100.0% 100.0%
K-366

F2: Parent ComponentData File User's Manual
--------------Question 84D Tape Pos. 370-370-------------- Format: I1
F2P84D TALKED W/OTH PERSON ABT FINANCIAL AID
Talked to another knowledgeable person
PER- WGTD RESPONSE CODES FREQ CENT PCT ---------- -------- ----- ----- -----YES........................... 1 6265 35.6% 64.3%NO............................ 2 3644 20.7% 35.7% RESERVED CODES: NO PARENT QUEX............. 1215 6.9% (MISS) MISSING.................... 8 645 3.7% (MISS) LEGITIMATE SKIP............ 9 5841 33.2% (MISS) ----- ----- ----- TOTALS: 17610 100.0% 100.0%
K-367

F2: Parent ComponentData File User's Manual
--------------Question 84E Tape Pos. 371-371-------------- Format: I1
F2P84E READ U.S. DEPT OF EDUC INFO ON FINAN AID
Read U.S. Dept. of Education information on financial aid
PER- WGTD RESPONSE CODES FREQ CENT PCT ---------- -------- ----- ----- -----YES........................... 1 5616 31.9% 57.1%NO............................ 2 4336 24.6% 42.9% RESERVED CODES: NO PARENT QUEX............. 1215 6.9% (MISS) MULTIPLE RESPONSE.......... 6 1 0.0% (MISS) MISSING.................... 8 601 3.4% (MISS) LEGITIMATE SKIP............ 9 5841 33.2% (MISS) ----- ----- ----- TOTALS: 17610 100.0% 100.0%
K-368

F2: Parent ComponentData File User's Manual
--------------Question 84F Tape Pos. 372-372-------------- Format: I1
F2P84F READ COLLEGE INFO ON FINANCIAL AID
Read information from a vocational/technical school orcollege on financial aid
PER- WGTD RESPONSE CODES FREQ CENT PCT ---------- -------- ----- ----- -----YES........................... 1 7654 43.5% 76.3%NO............................ 2 2345 13.3% 23.7% RESERVED CODES: NO PARENT QUEX............. 1215 6.9% (MISS) MISSING.................... 8 555 3.2% (MISS) LEGITIMATE SKIP............ 9 5841 33.2% (MISS) ----- ----- ----- TOTALS: 17610 100.0% 100.0%
K-369

F2: Parent ComponentData File User's Manual
--------------Question 84G Tape Pos. 373-373-------------- Format: I1
F2P84G READ ABT FINANCIAL AID THROUGH MILITARY
Read about financial aid available through military service
PER- WGTD RESPONSE CODES FREQ CENT PCT ---------- -------- ----- ----- -----YES........................... 1 2866 16.3% 30.6%NO............................ 2 7051 40.0% 69.4% RESERVED CODES: NO PARENT QUEX............. 1215 6.9% (MISS) MISSING.................... 8 637 3.6% (MISS) LEGITIMATE SKIP............ 9 5841 33.2% (MISS) ----- ----- ----- TOTALS: 17610 100.0% 100.0%
K-370

F2: Parent ComponentData File User's Manual
-------------Question 85-------------
Do you plan to use funds from any of the following programsto help pay for your teenager's study beyond high school?
K-371

F2: Parent ComponentData File User's Manual
--------------Question 85A Tape Pos. 374-374-------------- Format: I1
F2P85A PLAN TO USE LOANS TO PAY FOR TEEN'S STDY
Loans
PER- WGTD RESPONSE CODES FREQ CENT PCT ---------- -------- ----- ----- -----YES........................... 1 6417 36.4% 44.7%NO............................ 2 5995 34.0% 41.3%DON'T KNOW ENOUGH ABOUTPROGRAM TO ANSWER QUESTION.... 3 1900 10.8% 14.0% RESERVED CODES: NO PARENT QUEX............. 1215 6.9% (MISS) MISSING.................... 8 645 3.7% (MISS) LEGITIMATE SKIP............ 9 1438 8.2% (MISS) ----- ----- ----- TOTALS: 17610 100.0% 100.0%
K-372

F2: Parent ComponentData File User's Manual
--------------Question 85B Tape Pos. 375-375-------------- Format: I1
F2P85B WILL USE SCHLSHPS, GRANTS FOR TEENS STDY
Scholarships, fellowships, and grants
PER- WGTD RESPONSE CODES FREQ CENT PCT ---------- -------- ----- ----- -----YES........................... 1 8512 48.3% 59.9%NO............................ 2 4122 23.4% 28.0%DON'T KNOW ENOUGH ABOUTPROGRAM TO ANSWER QUESTION.... 3 1715 9.7% 12.1% RESERVED CODES: NO PARENT QUEX............. 1215 6.9% (MISS) MULTIPLE RESPONSE.......... 6 6 0.0% (MISS) MISSING.................... 8 602 3.4% (MISS) LEGITIMATE SKIP............ 9 1438 8.2% (MISS) ----- ----- ----- TOTALS: 17610 100.0% 100.0%
K-373

F2: Parent ComponentData File User's Manual
--------------Question 85C Tape Pos. 376-376-------------- Format: I1
F2P85C PLAN TO USE WORK PROGRAMS FOR TEENS STDY
Work programs
PER- WGTD RESPONSE CODES FREQ CENT PCT ---------- -------- ----- ----- -----YES........................... 1 6639 37.7% 47.1%NO............................ 2 5033 28.6% 33.9%DON'T KNOW ENOUGH ABOUTPROGRAM TO ANSWER QUESTION.... 3 2603 14.8% 19.0% RESERVED CODES: NO PARENT QUEX............. 1215 6.9% (MISS) MULTIPLE RESPONSE.......... 6 2 0.0% (MISS) MISSING.................... 8 680 3.9% (MISS) LEGITIMATE SKIP............ 9 1438 8.2% (MISS) ----- ----- ----- TOTALS: 17610 100.0% 100.0%
K-374

F2: Parent ComponentData File User's Manual
-------------Question 86-------------
Have you or your teenager applied for funds from any of thefollowing programs to help pay for your teenager's studybeyond high school?
K-375

F2: Parent ComponentData File User's Manual
--------------Question 86A Tape Pos. 377-377-------------- Format: I1
F2P86A R OR TEEN HAS APPLIED FOR LOANS
Loans
PER- WGTD RESPONSE CODES FREQ CENT PCT ---------- -------- ----- ----- -----YES, APPLIED AND WAS APPROVED. 1 1877 10.7% 12.8%YES, APPLIED BUT DON'T KNOWIF APPROVED................... 2 1187 6.7% 7.5%YES, APPLIED BUT WAS TURNEDDOWN.......................... 3 327 1.9% 2.3%NO, HAVE NOT APPLIED.......... 4 10947 62.2% 77.3% RESERVED CODES: NO PARENT QUEX............. 1215 6.9% (MISS) MULTIPLE RESPONSE.......... 6 3 0.0% (MISS) MISSING.................... 8 616 3.5% (MISS) LEGITIMATE SKIP............ 9 1438 8.2% (MISS) ----- ----- ----- TOTALS: 17610 100.0% 100.0%
K-376

F2: Parent ComponentData File User's Manual
--------------Question 86B Tape Pos. 378-378-------------- Format: I1
F2P86B R OR TEEN HAS APPLD FOR SCHLRSHPS/GRANTS
Scholarships, fellowships, and grants
PER- WGTD RESPONSE CODES FREQ CENT PCT ---------- -------- ----- ----- -----YES, APPLIED AND WAS APPROVED. 1 3847 21.8% 26.2%YES, APPLIED BUT DON'T KNOWIF APPROVED................... 2 1947 11.1% 12.5%YES, APPLIED BUT WAS TURNEDDOWN.......................... 3 1109 6.3% 6.9%NO, HAVE NOT APPLIED.......... 4 7552 42.9% 54.4% RESERVED CODES: NO PARENT QUEX............. 1215 6.9% (MISS) MULTIPLE RESPONSE.......... 6 4 0.0% (MISS) MISSING.................... 8 498 2.8% (MISS) LEGITIMATE SKIP............ 9 1438 8.2% (MISS) ----- ----- ----- TOTALS: 17610 100.0% 100.0%
K-377

F2: Parent ComponentData File User's Manual
--------------Question 86C Tape Pos. 379-379-------------- Format: I1
F2P86C R OR TEEN HAS APPLIED FOR WORK PROGRAMS
Work programs
PER- WGTD RESPONSE CODES FREQ CENT PCT ---------- -------- ----- ----- -----YES, APPLIED AND WAS APPROVED. 1 1449 8.2% 9.8%YES, APPLIED BUT DON'T KNOWIF APPROVED................... 2 1208 6.9% 8.4%YES, APPLIED BUT WAS TURNEDDOWN.......................... 3 308 1.7% 1.9%NO, HAVE NOT APPLIED.......... 4 11304 64.2% 79.9% RESERVED CODES: NO PARENT QUEX............. 1215 6.9% (MISS) MULTIPLE RESPONSE.......... 6 4 0.0% (MISS) MISSING.................... 8 684 3.9% (MISS) LEGITIMATE SKIP............ 9 1438 8.2% (MISS) ----- ----- ----- TOTALS: 17610 100.0% 100.0%
K-378

F2: Parent ComponentData File User's Manual
-------------Question 87-------------
The following is a list of programs that provide loans forstudy beyond high school. For each program, indicate howmuch you know about it.
K-379

F2: Parent ComponentData File User's Manual
--------------Question 87A Tape Pos. 380-380-------------- Format: I1
F2P87A R KNOWS ABOUT STATE STUDENT LOAN PRGM
State student loan program
PER- WGTD RESPONSE CODES FREQ CENT PCT ---------- -------- ----- ----- -----I AM UNFAMILIAR WITH THISPROGRAM....................... 1 7276 41.3% 51.0%I AM FAMILIAR WITH THISPROGRAM....................... 2 5664 32.2% 39.7%MY TEENAGER HAS APPLIED FORTHIS PROGRAM.................. 3 1423 8.1% 9.3% RESERVED CODES: NO PARENT QUEX............. 1215 6.9% (MISS) MULTIPLE RESPONSE.......... 6 18 0.1% (MISS) MISSING.................... 8 576 3.3% (MISS) LEGITIMATE SKIP............ 9 1438 8.2% (MISS) ----- ----- ----- TOTALS: 17610 100.0% 100.0%
K-380

F2: Parent ComponentData File User's Manual
--------------Question 87B Tape Pos. 381-381-------------- Format: I1
F2P87B R KNOWS ABOUT FEDERAL LOAN PROGRAM
Federal loan program such as Perkins or Stafford LoanProgram
PER- WGTD RESPONSE CODES FREQ CENT PCT ---------- -------- ----- ----- -----I AM UNFAMILIAR WITH THISPROGRAM....................... 1 7099 40.3% 50.6%I AM FAMILIAR WITH THISPROGRAM....................... 2 5137 29.2% 35.3%MY TEENAGER HAS APPLIED FORTHIS PROGRAM.................. 3 2134 12.1% 14.2% RESERVED CODES: NO PARENT QUEX............. 1215 6.9% (MISS) MULTIPLE RESPONSE.......... 6 28 0.2% (MISS) MISSING.................... 8 559 3.2% (MISS) LEGITIMATE SKIP............ 9 1438 8.2% (MISS) ----- ----- ----- TOTALS: 17610 100.0% 100.0%
K-381

F2: Parent ComponentData File User's Manual
--------------Question 87C Tape Pos. 382-382-------------- Format: I1
F2P87C R KNOWS ABT COLLEGE STUDENT LOAN PRGM
College or university student loan program
PER- WGTD RESPONSE CODES FREQ CENT PCT ---------- -------- ----- ----- -----I AM UNFAMILIAR WITH THISPROGRAM....................... 1 6433 36.5% 46.3%I AM FAMILIAR WITH THISPROGRAM....................... 2 6443 36.6% 43.9%MY TEENAGER HAS APPLIED FORTHIS PROGRAM.................. 3 1464 8.3% 9.7% RESERVED CODES: NO PARENT QUEX............. 1215 6.9% (MISS) MULTIPLE RESPONSE.......... 6 12 0.1% (MISS) MISSING.................... 8 605 3.4% (MISS) LEGITIMATE SKIP............ 9 1438 8.2% (MISS) ----- ----- ----- TOTALS: 17610 100.0% 100.0%
K-382

F2: Parent ComponentData File User's Manual
--------------Question 87D Tape Pos. 383-383-------------- Format: I1
F2P87D R KNOWS ABOUT PRIVATE EDUCATION LOANS
Education loan privately arranged through a bank
PER- WGTD RESPONSE CODES FREQ CENT PCT ---------- -------- ----- ----- -----I AM UNFAMILIAR WITH THISPROGRAM....................... 1 6814 38.7% 49.2%I AM FAMILIAR WITH THISPROGRAM....................... 2 6898 39.2% 47.2%MY TEENAGER HAS APPLIED FORTHIS PROGRAM.................. 3 595 3.4% 3.5% RESERVED CODES: NO PARENT QUEX............. 1215 6.9% (MISS) MULTIPLE RESPONSE.......... 6 9 0.1% (MISS) MISSING.................... 8 641 3.6% (MISS) LEGITIMATE SKIP............ 9 1438 8.2% (MISS) ----- ----- ----- TOTALS: 17610 100.0% 100.0%
K-383

F2: Parent ComponentData File User's Manual
-------------Question 88 Tape Pos. 384-384------------- Format: I1
F2P88 TEEN HAS APPLIED FOR FINANCIAL AID
Has your teenager ever applied for financial aid?
PER- WGTD RESPONSE CODES FREQ CENT PCT ---------- -------- ----- ----- -----YES........................... 1 6319 35.9% 42.3%NO............................ 2 8199 46.6% 57.7% RESERVED CODES: NO PARENT QUEX............. 1215 6.9% (MISS) MULTIPLE RESPONSE.......... 6 1 0.0% (MISS) MISSING.................... 8 438 2.5% (MISS) LEGITIMATE SKIP............ 9 1438 8.2% (MISS) ----- ----- ----- TOTALS: 17610 100.0% 100.0%
K-384

F2: Parent ComponentData File User's Manual
-------------Question 89-------------
For which of the following reasons has your teenager notapplied for financial aid?
K-385

F2: Parent ComponentData File User's Manual
--------------Question 89A Tape Pos. 385-385-------------- Format: I1
F2P89A CAN PAY FOR TEEN ED WITHOUT ASSISTANCE
Our family and our teenager can pay for his/her education
PER- WGTD RESPONSE CODES FREQ CENT PCT ---------- -------- ----- ----- -----YES........................... 1 3494 19.8% 38.7%NO............................ 2 4309 24.5% 61.3% RESERVED CODES: NO PARENT QUEX............. 1215 6.9% (MISS) MULTIPLE RESPONSE.......... 6 2 0.0% (MISS) MISSING.................... 8 833 4.7% (MISS) LEGITIMATE SKIP............ 9 7757 44.0% (MISS) ----- ----- ----- TOTALS: 17610 100.0% 100.0%
K-386

F2: Parent ComponentData File User's Manual
--------------Question 89B Tape Pos. 386-386-------------- Format: I1
F2P89B TEEN GRADES NOT HIGH ENOUGH TO QUALIFY
Our teenager's grades and/or test scores are not highenough to qualify for a loan or scholarship
PER- WGTD RESPONSE CODES FREQ CENT PCT ---------- -------- ----- ----- -----YES........................... 1 2007 11.4% 27.6%NO............................ 2 5601 31.8% 72.4% RESERVED CODES: NO PARENT QUEX............. 1215 6.9% (MISS) MISSING.................... 8 1030 5.8% (MISS) LEGITIMATE SKIP............ 9 7757 44.0% (MISS) ----- ----- ----- TOTALS: 17610 100.0% 100.0%
K-387

F2: Parent ComponentData File User's Manual
--------------Question 89C Tape Pos. 387-387-------------- Format: I1
F2P89C WE DON'T WANT TO REPORT FINANCIAL SITUTN
Neither we nor our teenager wish to report our financialsituation
PER- WGTD RESPONSE CODES FREQ CENT PCT ---------- -------- ----- ----- -----YES........................... 1 973 5.5% 12.9%NO............................ 2 6622 37.6% 87.1% RESERVED CODES: NO PARENT QUEX............. 1215 6.9% (MISS) MULTIPLE RESPONSE.......... 6 1 0.0% (MISS) MISSING.................... 8 1042 5.9% (MISS) LEGITIMATE SKIP............ 9 7757 44.0% (MISS) ----- ----- ----- TOTALS: 17610 100.0% 100.0%
K-388

F2: Parent ComponentData File User's Manual
--------------Question 89D Tape Pos. 388-388-------------- Format: I1
F2P89D TEEN PART-TIME STUDENT- NOT ELIGIBLE
Our teenager is not eligible because he/she will onlyattend school part-time
PER- WGTD RESPONSE CODES FREQ CENT PCT ---------- -------- ----- ----- -----YES........................... 1 733 4.2% 10.9%NO............................ 2 6809 38.7% 89.1% RESERVED CODES: NO PARENT QUEX............. 1215 6.9% (MISS) MULTIPLE RESPONSE.......... 6 1 0.0% (MISS) MISSING.................... 8 1095 6.2% (MISS) LEGITIMATE SKIP............ 9 7757 44.0% (MISS) ----- ----- ----- TOTALS: 17610 100.0% 100.0%
K-389

F2: Parent ComponentData File User's Manual
--------------Question 89E Tape Pos. 389-389-------------- Format: I1
F2P89E TOO MUCH WORK TO APPLY FOR FINANCIAL AID
Too much paper work is required in order to apply forfinancial aid
PER- WGTD RESPONSE CODES FREQ CENT PCT ---------- -------- ----- ----- -----YES........................... 1 885 5.0% 10.6%NO............................ 2 6642 37.7% 89.4% RESERVED CODES: NO PARENT QUEX............. 1215 6.9% (MISS) MULTIPLE RESPONSE.......... 6 1 0.0% (MISS) MISSING.................... 8 1110 6.3% (MISS) LEGITIMATE SKIP............ 9 7757 44.0% (MISS) ----- ----- ----- TOTALS: 17610 100.0% 100.0%
K-390

F2: Parent ComponentData File User's Manual
--------------Question 89F Tape Pos. 390-390-------------- Format: I1
F2P89F NOT MUCH INFORMATION ON FINANCIAL AID
I was not able to get much information on how and where toapply for financial aid
PER- WGTD RESPONSE CODES FREQ CENT PCT ---------- -------- ----- ----- -----YES........................... 1 1412 8.0% 19.3%NO............................ 2 6137 34.8% 80.7% RESERVED CODES: NO PARENT QUEX............. 1215 6.9% (MISS) MULTIPLE RESPONSE.......... 6 1 0.0% (MISS) MISSING.................... 8 1088 6.2% (MISS) LEGITIMATE SKIP............ 9 7757 44.0% (MISS) ----- ----- ----- TOTALS: 17610 100.0% 100.0%
K-391

F2: Parent ComponentData File User's Manual
--------------Question 89G Tape Pos. 391-391-------------- Format: I1
F2P89G NO MONEY AVAILABLE FOR AID
No money is available for aid
PER- WGTD RESPONSE CODES FREQ CENT PCT ---------- -------- ----- ----- -----YES........................... 1 768 4.4% 10.5%NO............................ 2 6632 37.7% 89.5% RESERVED CODES: NO PARENT QUEX............. 1215 6.9% (MISS) MISSING.................... 8 1238 7.0% (MISS) LEGITIMATE SKIP............ 9 7757 44.0% (MISS) ----- ----- ----- TOTALS: 17610 100.0% 100.0%
K-392

F2: Parent ComponentData File User's Manual
--------------Question 89H Tape Pos. 392-392-------------- Format: I1
F2P89H RELTVS WILL HELP PAY TEEN COLL EXPENSES
Other relatives will help to pay my teenager's collegeexpenses
PER- WGTD RESPONSE CODES FREQ CENT PCT ---------- -------- ----- ----- -----YES........................... 1 613 3.5% 8.3%NO............................ 2 6988 39.7% 91.7% RESERVED CODES: NO PARENT QUEX............. 1215 6.9% (MISS) MULTIPLE RESPONSE.......... 6 2 0.0% (MISS) MISSING.................... 8 1035 5.9% (MISS) LEGITIMATE SKIP............ 9 7757 44.0% (MISS) ----- ----- ----- TOTALS: 17610 100.0% 100.0%
K-393

F2: Parent ComponentData File User's Manual
--------------Question 89I Tape Pos. 393-393-------------- Format: I1
F2P89I MISSED THE DEADLINE FOR APPLICATION
We missed the deadline for application
PER- WGTD RESPONSE CODES FREQ CENT PCT ---------- -------- ----- ----- -----YES........................... 1 776 4.4% 9.9%NO............................ 2 6756 38.4% 90.1% RESERVED CODES: NO PARENT QUEX............. 1215 6.9% (MISS) MISSING.................... 8 1106 6.3% (MISS) LEGITIMATE SKIP............ 9 7757 44.0% (MISS) ----- ----- ----- TOTALS: 17610 100.0% 100.0%
K-394

F2: Parent ComponentData File User's Manual
--------------Question 89J Tape Pos. 394-394-------------- Format: I1
F2P89J DON'T KNOW HOW TO APPLY
I don't know how to apply
PER- WGTD RESPONSE CODES FREQ CENT PCT ---------- -------- ----- ----- -----YES........................... 1 1504 8.5% 20.1%NO............................ 2 6095 34.6% 79.9% RESERVED CODES: NO PARENT QUEX............. 1215 6.9% (MISS) MULTIPLE RESPONSE.......... 6 5 0.0% (MISS) MISSING.................... 8 1034 5.9% (MISS) LEGITIMATE SKIP............ 9 7757 44.0% (MISS) ----- ----- ----- TOTALS: 17610 100.0% 100.0%
K-395

F2: Parent ComponentData File User's Manual
-------------Question 90 Tape Pos. 395-396------------- Format: I2
F2P90 AMNT EXPECT TO SPEND TEENS EDUC NEXT YR
How much money do you expect to spend on your teenager'seducational expenses next year?
PER- WGTD RESPONSE CODES FREQ CENT PCT ---------- -------- ----- ----- -----MY TEENAGER WANTS TO PAY FORHIS/HER EDUCATION WITHOUT OURHELP.......................... 01 1412 8.0% 10.8%NONE.......................... 02 2297 13.0% 19.2%LESS THAN $2,500.............. 03 3311 18.8% 25.2%$2,500-$4,999................. 04 2609 14.8% 18.8%$5,000-$9,999................. 05 2189 12.4% 14.6%$10,000-$14,999............... 06 983 5.6% 6.2%$15,000-$19,999............... 07 472 2.7% 2.4%OVER $20,000.................. 08 721 4.1% 2.8% RESERVED CODES: NO PARENT QUEX............. 1215 6.9% (MISS) MULTIPLE RESPONSE.......... 96 23 0.1% (MISS) MISSING.................... 98 940 5.3% (MISS) LEGITIMATE SKIP............ 99 1438 8.2% (MISS) ----- ----- ----- TOTALS: 17610 100.0% 100.0%
K-396

F2: Parent ComponentData File User's Manual
-------------Question 91 Tape Pos. 397-398------------- Format: I2
F2P91 AMOUNT OF DEBT OK FOR TEENS EDUC NEXT YR
How much debt are you willing to go into in order tofinance your teenager's education next year?
PER- WGTD RESPONSE CODES FREQ CENT PCT ---------- -------- ----- ----- -----NONE.......................... 00 3506 19.9% 32.7%LESS THAN $2,500.............. 01 2376 13.5% 24.3%$2,500-$4,999................. 02 2072 11.8% 21.4%$5,000-$9,999................. 03 1242 7.1% 12.1%$10,000-$14,999............... 04 438 2.5% 4.4%$15,999-$19,999............... 05 170 1.0% 2.0%OVER $20,000.................. 06 422 2.4% 3.2% RESERVED CODES: NO PARENT QUEX............. 1215 6.9% (MISS) MULTIPLE RESPONSE.......... 96 1 0.0% (MISS) MISSING.................... 98 1021 5.8% (MISS) LEGITIMATE SKIP............ 99 5147 29.2% (MISS) ----- ----- ----- TOTALS: 17610 100.0% 100.0%
K-397

F2: Parent ComponentData File User's Manual
-------------Question 92-------------
Which of the following sources of money will you use tocover your teenager's future educational expenses?
K-398

F2: Parent ComponentData File User's Manual
--------------Question 92A Tape Pos. 399-399-------------- Format: I1
F2P92A WILL USE CURRENT EARNGS FOR TEENS ED
Your (or your spouse's/partner's) current earnings
PER- WGTD RESPONSE CODES FREQ CENT PCT ---------- -------- ----- ----- -----YES........................... 1 10616 60.3% 72.9%NO............................ 2 3386 19.2% 27.1% RESERVED CODES: NO PARENT QUEX............. 1215 6.9% (MISS) MULTIPLE RESPONSE.......... 6 1 0.0% (MISS) MISSING.................... 8 954 5.4% (MISS) LEGITIMATE SKIP............ 9 1438 8.2% (MISS) ----- ----- ----- TOTALS: 17610 100.0% 100.0%
K-399

F2: Parent ComponentData File User's Manual
--------------Question 92B Tape Pos. 400-400-------------- Format: I1
F2P92B WILL USE SAVNGS/ASSETS FOR TEENS ED
Your (or your spouse's/partner's) savings or sale of assets
PER- WGTD RESPONSE CODES FREQ CENT PCT ---------- -------- ----- ----- -----YES........................... 1 7361 41.8% 51.2%NO............................ 2 6478 36.8% 48.8% RESERVED CODES: NO PARENT QUEX............. 1215 6.9% (MISS) MULTIPLE RESPONSE.......... 6 2 0.0% (MISS) MISSING.................... 8 1116 6.3% (MISS) LEGITIMATE SKIP............ 9 1438 8.2% (MISS) ----- ----- ----- TOTALS: 17610 100.0% 100.0%
K-400

F2: Parent ComponentData File User's Manual
--------------Question 92C Tape Pos. 401-401-------------- Format: I1
F2P92C WILL USE 2ND MORTGAGE FOR TEENS ED
Second mortgage
PER- WGTD RESPONSE CODES FREQ CENT PCT ---------- -------- ----- ----- -----YES........................... 1 1888 10.7% 13.5%NO............................ 2 11724 66.6% 86.5% RESERVED CODES: NO PARENT QUEX............. 1215 6.9% (MISS) MULTIPLE RESPONSE.......... 6 1 0.0% (MISS) MISSING.................... 8 1344 7.6% (MISS) LEGITIMATE SKIP............ 9 1438 8.2% (MISS) ----- ----- ----- TOTALS: 17610 100.0% 100.0%
K-401

F2: Parent ComponentData File User's Manual
--------------Question 92D Tape Pos. 402-402-------------- Format: I1
F2P92D WILL USE BORROWING FOR TEENS ED
Your (or your spouse's/partner's) borrowing (personal loan,etc.)
PER- WGTD RESPONSE CODES FREQ CENT PCT ---------- -------- ----- ----- -----YES........................... 1 4910 27.9% 36.8%NO............................ 2 8774 49.8% 63.2% RESERVED CODES: NO PARENT QUEX............. 1215 6.9% (MISS) MISSING.................... 8 1273 7.2% (MISS) LEGITIMATE SKIP............ 9 1438 8.2% (MISS) ----- ----- ----- TOTALS: 17610 100.0% 100.0%
K-402

F2: Parent ComponentData File User's Manual
--------------Question 92E Tape Pos. 403-403-------------- Format: I1
F2P92E WILL USE ALIMNY/CHLD SUP FOR TEENS ED
Alimony or child support
PER- WGTD RESPONSE CODES FREQ CENT PCT ---------- -------- ----- ----- -----YES........................... 1 796 4.5% 5.8%NO............................ 2 12853 73.0% 94.2% RESERVED CODES: NO PARENT QUEX............. 1215 6.9% (MISS) MISSING.................... 8 1308 7.4% (MISS) LEGITIMATE SKIP............ 9 1438 8.2% (MISS) ----- ----- ----- TOTALS: 17610 100.0% 100.0%
K-403

F2: Parent ComponentData File User's Manual
--------------Question 92F Tape Pos. 404-404-------------- Format: I1
F2P92F USE CHILD'S EARNGS/SAVNGS FOR TEENS ED
Your children's earnings or savings
PER- WGTD RESPONSE CODES FREQ CENT PCT ---------- -------- ----- ----- -----YES........................... 1 7177 40.8% 51.2%NO............................ 2 6597 37.5% 48.8% RESERVED CODES: NO PARENT QUEX............. 1215 6.9% (MISS) MULTIPLE RESPONSE.......... 6 2 0.0% (MISS) MISSING.................... 8 1181 6.7% (MISS) LEGITIMATE SKIP............ 9 1438 8.2% (MISS) ----- ----- ----- TOTALS: 17610 100.0% 100.0%
K-404

F2: Parent ComponentData File User's Manual
--------------Question 92G Tape Pos. 405-405-------------- Format: I1
F2P92G WILL USE TRUST FUND FOR TEENS ED
A trust fund
PER- WGTD RESPONSE CODES FREQ CENT PCT ---------- -------- ----- ----- -----YES........................... 1 1112 6.3% 7.3%NO............................ 2 12545 71.2% 92.7% RESERVED CODES: NO PARENT QUEX............. 1215 6.9% (MISS) MISSING.................... 8 1300 7.4% (MISS) LEGITIMATE SKIP............ 9 1438 8.2% (MISS) ----- ----- ----- TOTALS: 17610 100.0% 100.0%
K-405

F2: Parent ComponentData File User's Manual
--------------Question 92H Tape Pos. 406-406-------------- Format: I1
F2P92H USE RELATIVES' CONTRBUTIONS FOR TEENS ED
Contributions from relatives
PER- WGTD RESPONSE CODES FREQ CENT PCT ---------- -------- ----- ----- -----YES........................... 1 2879 16.3% 22.2%NO............................ 2 10809 61.4% 77.8% RESERVED CODES: NO PARENT QUEX............. 1215 6.9% (MISS) MULTIPLE RESPONSE.......... 6 2 0.0% (MISS) MISSING.................... 8 1267 7.2% (MISS) LEGITIMATE SKIP............ 9 1438 8.2% (MISS) ----- ----- ----- TOTALS: 17610 100.0% 100.0%
K-406

F2: Parent ComponentData File User's Manual
--------------Question 92I Tape Pos. 407-407-------------- Format: I1
F2P92I WILL USE SCHOLARSHPS/GRANTS FOR TEENS ED
Scholarships or grants
PER- WGTD RESPONSE CODES FREQ CENT PCT ---------- -------- ----- ----- -----YES........................... 1 8838 50.2% 64.9%NO............................ 2 4988 28.3% 35.1% RESERVED CODES: NO PARENT QUEX............. 1215 6.9% (MISS) MULTIPLE RESPONSE.......... 6 4 0.0% (MISS) MISSING.................... 8 1127 6.4% (MISS) LEGITIMATE SKIP............ 9 1438 8.2% (MISS) ----- ----- ----- TOTALS: 17610 100.0% 100.0%
K-407

F2: Parent ComponentData File User's Manual
--------------Question 92J Tape Pos. 408-408-------------- Format: I1
F2P92J USE STATE OR FEDERAL LOANS FOR TEENS ED
State or federal loans
PER- WGTD RESPONSE CODES FREQ CENT PCT ---------- -------- ----- ----- -----YES........................... 1 6521 37.0% 49.9%NO............................ 2 7155 40.6% 50.1% RESERVED CODES: NO PARENT QUEX............. 1215 6.9% (MISS) MULTIPLE RESPONSE.......... 6 7 0.0% (MISS) MISSING.................... 8 1274 7.2% (MISS) LEGITIMATE SKIP............ 9 1438 8.2% (MISS) ----- ----- ----- TOTALS: 17610 100.0% 100.0%
K-408

F2: Parent ComponentData File User's Manual
--------------Question 92K Tape Pos. 409-409-------------- Format: I1
F2P92K USE SOC SEC/VET ADMN BENFTS FOR TEENS ED
Social Security or Veterans Administration benefits
PER- WGTD RESPONSE CODES FREQ CENT PCT ---------- -------- ----- ----- -----YES........................... 1 1075 6.1% 8.9%NO............................ 2 12591 71.5% 91.1% RESERVED CODES: NO PARENT QUEX............. 1215 6.9% (MISS) MISSING.................... 8 1291 7.3% (MISS) LEGITIMATE SKIP............ 9 1438 8.2% (MISS) ----- ----- ----- TOTALS: 17610 100.0% 100.0%
K-409

F2: Parent ComponentData File User's Manual
--------------Question 92L Tape Pos. 410-410-------------- Format: I1
F2P92L OTHER SOURCE TO PAY FOR TEEN'S ED
Other
PER- WGTD RESPONSE CODES FREQ CENT PCT ---------- -------- ----- ----- -----YES........................... 1 2017 11.5% 15.3%NO............................ 2 10987 62.4% 84.7% RESERVED CODES: NO PARENT QUEX............. 1215 6.9% (MISS) MISSING.................... 8 1953 11.1% (MISS) LEGITIMATE SKIP............ 9 1438 8.2% (MISS) ----- ----- ----- TOTALS: 17610 100.0% 100.0%
K-410

F2: Parent ComponentData File User's Manual
-------------Question 93 Tape Pos. 411-411------------- Format: I1
F2P93 DID R RECEIVE HELP IN COMPLETING Q'NAIRE
While completing this questionnaire, did anyone help you bytranslating, clarifying meanings of questions, or providinginformation?
PER- WGTD RESPONSE CODES FREQ CENT PCT ---------- -------- ----- ----- -----YES........................... 1 976 5.5% 5.4%NO............................ 2 15182 86.2% 94.6% RESERVED CODES: NO PARENT QUEX............. 1215 6.9% (MISS) MULTIPLE RESPONSE.......... 6 1 0.0% (MISS) MISSING.................... 8 236 1.3% (MISS) ----- ----- ----- TOTALS: 17610 100.0% 100.0%
K-411

F2: Parent ComponentData File User's Manual
-------------Question 94-------------
Who assisted you?
K-412

F2: Parent ComponentData File User's Manual
--------------Question 94A Tape Pos. 412-412-------------- Format: I1
F2P94A TEEN NAMED ON COVER HELPED R W/ Q'NAIRE
My teenager named on the front cover
PER- WGTD RESPONSE CODES FREQ CENT PCT ---------- -------- ----- ----- -----YES........................... 1 540 3.1% 62.7%NO............................ 2 331 1.9% 37.3% RESERVED CODES: NO PARENT QUEX............. 1215 6.9% (MISS) MISSING.................... 8 342 1.9% (MISS) LEGITIMATE SKIP............ 9 15182 86.2% (MISS) ----- ----- ----- TOTALS: 17610 100.0% 100.0%
NOTE: Nonresponse for this item exceeds the NCES standard.Due to potential nonresponse bias, users should exercisecaution when choosing this variable for analysis.
K-413

F2: Parent ComponentData File User's Manual
--------------Question 94B Tape Pos. 413-413-------------- Format: I1
F2P94B SPOUSE/PARTNER HELPED R WITH Q'NAIRE
My spouse/partner
PER- WGTD RESPONSE CODES FREQ CENT PCT ---------- -------- ----- ----- -----YES........................... 1 422 2.4% 49.6%NO............................ 2 412 2.3% 50.4% RESERVED CODES: NO PARENT QUEX............. 1215 6.9% (MISS) MISSING.................... 8 379 2.2% (MISS) LEGITIMATE SKIP............ 9 15182 86.2% (MISS) ----- ----- ----- TOTALS: 17610 100.0% 100.0%
NOTE: Nonresponse for this item exceeds the NCES standard.Due to potential nonresponse bias, users should exercisecaution when choosing this variable for analysis.
K-414

F2: Parent ComponentData File User's Manual
--------------Question 94C Tape Pos. 414-414-------------- Format: I1
F2P94C OTHER FAMILY MEMBER HELPED R W/ Q'NAIRE
Another family member
PER- WGTD RESPONSE CODES FREQ CENT PCT ---------- -------- ----- ----- -----YES........................... 1 158 0.9% 19.2%NO............................ 2 645 3.7% 80.8% RESERVED CODES: NO PARENT QUEX............. 1215 6.9% (MISS) MULTIPLE RESPONSE.......... 6 2 0.0% (MISS) MISSING.................... 8 408 2.3% (MISS) LEGITIMATE SKIP............ 9 15182 86.2% (MISS) ----- ----- ----- TOTALS: 17610 100.0% 100.0%
NOTE: Nonresponse for this item exceeds the NCES standard.Due to potential nonresponse bias, users should exercisecaution when choosing this variable for analysis.
K-415

F2: Parent ComponentData File User's Manual
--------------Question 94D Tape Pos. 415-415-------------- Format: I1
F2P94D A FRIEND HELPED R WITH QUESTIONNAIRE
One of my friends
PER- WGTD RESPONSE CODES FREQ CENT PCT ---------- -------- ----- ----- -----YES........................... 1 34 0.2% 3.9%NO............................ 2 751 4.3% 96.1% RESERVED CODES: NO PARENT QUEX............. 1215 6.9% (MISS) MISSING.................... 8 428 2.4% (MISS) LEGITIMATE SKIP............ 9 15182 86.2% (MISS) ----- ----- ----- TOTALS: 17610 100.0% 100.0%
NOTE: Nonresponse for this item exceeds the NCES standard.Due to potential nonresponse bias, users should exercisecaution when choosing this variable for analysis.
K-416

F2: Parent ComponentData File User's Manual
--------------Question 94E Tape Pos. 416-416-------------- Format: I1
F2P94E OTHER PERSON IN COMMUNITY HELPED R
Another person in the community
PER- WGTD RESPONSE CODES FREQ CENT PCT ---------- -------- ----- ----- -----YES........................... 1 17 0.1% 1.8%NO............................ 2 760 4.3% 98.2% RESERVED CODES: NO PARENT QUEX............. 1215 6.9% (MISS) MISSING.................... 8 436 2.5% (MISS) LEGITIMATE SKIP............ 9 15182 86.2% (MISS) ----- ----- ----- TOTALS: 17610 100.0% 100.0%
NOTE: Nonresponse for this item exceeds the NCES standard.Due to potential nonresponse bias, users should exercisecaution when choosing this variable for analysis.
K-417

F2: Parent ComponentData File User's Manual
---------------Question 94AA---------------
Date Completed:
K-418

F2: Parent ComponentData File User's Manual
----------------Question 94AAM Tape Pos. 417-418---------------- Format: I2
F2P94AAM MONTH QUESTIONNAIRE COMPLETED
Month
PER- WGTD RESPONSE CODES FREQ CENT PCT ---------- -------- ----- ----- -----JANUARY....................... 01 129 0.7% 1.3%FEBRUARY...................... 02 25 0.1% 0.2%MAY........................... 05 4652 26.4% 27.8%JUNE.......................... 06 1102 6.3% 6.6%JULY.......................... 07 1309 7.4% 8.1%AUGUST........................ 08 1963 11.1% 12.0%SEPTEMBER..................... 09 1466 8.3% 9.5%OCTOBER....................... 10 2128 12.1% 17.1%NOVEMBER...................... 11 1170 6.6% 11.4%DECEMBER...................... 12 585 3.3% 6.0% RESERVED CODES: NO PARENT QUEX............. 1215 6.9% (MISS) MISSING.................... 98 1866 10.6% (MISS) ----- ----- ----- TOTALS: 17610 100.0% 100.0%
K-419

F2: Parent ComponentData File User's Manual
----------------Question 94AAY Tape Pos. 419-420---------------- Format: I2
F2P94AAY YEAR QUESTIONNAIRE COMPLETED
Year
PER- WGTD RESPONSE CODES FREQ CENT PCT ---------- -------- ----- ----- -----1992.......................... 92 14375 81.6% 98.5%1993.......................... 93 154 0.9% 1.5% RESERVED CODES: NO PARENT QUEX............. 1215 6.9% (MISS) MISSING.................... 98 1866 10.6% (MISS) ----- ----- ----- TOTALS: 17610 100.0% 100.0%
K-420

F2: Parent ComponentData File User's Manual
---------------Question 94BB Tape Pos. 421-421--------------- Format: I1
F2P94BB SHOULD PARENT COMPLETE PART 6 OF Q'NAIRE
Please refer to the label on the front cover of thisquestionnaire. Does "PART 6" appear on the label?
PER- WGTD RESPONSE CODES FREQ CENT PCT ---------- -------- ----- ----- -----YES........................... 1 2293 13.0% 15.4%NO............................ 2 14102 80.1% 84.6% RESERVED CODES: NO PARENT QUEX............. 1215 6.9% (MISS) ----- ----- ----- TOTALS: 17610 100.0% 100.0%
K-421

F2: Parent ComponentData File User's Manual
VI. SUPPLEMENTAL QUESTIONS FOR PARENTS NEW TO NELS:88
-------------Question 95 Tape Pos. 422-422------------- Format: I1
F2P95 AMT OF TIME TEEN LIVED W/R AS OF '88
As of February 1, 1988, how much of the time did theteenager named on the front cover live with you?
PER- WGTD RESPONSE CODES FREQ CENT PCT ---------- -------- ----- ----- -----ALL OF THE TIME............... 1 1877 10.7% 88.3%MOST OF THE TIME.............. 2 68 0.4% 3.7%HALF OF THE TIME.............. 3 36 0.2% 2.0%LESS THAN HALF OF THE TIME.... 4 127 0.7% 6.1% RESERVED CODES: NO PARENT QUEX............. 1215 6.9% (MISS) MISSING.................... 8 185 1.1% (MISS) LEGITIMATE SKIP............ 9 14102 80.1% (MISS) ----- ----- ----- TOTALS: 17610 100.0% 100.0%
K-422

F2: Parent ComponentData File User's Manual
-------------Question 96 Tape Pos. 423-424------------- Format: I2
F2P96 WHO TEEN LIVED W/WHEN NOT W/R AS OF '88
As of February 1, 1988, with whom did the teenager named onthe front cover live most of the time when he/she did notlive with you?
PER- WGTD RESPONSE CODES FREQ CENT PCT ---------- -------- ----- ----- -----BY HIMSELF/HERSELF............ 01 3 0.0% 1.0%WITH HIS OR HER OTHER PARENT.. 02 108 0.6% 51.1%WITH ANOTHER ADULT RELATIVE... 03 43 0.2% 20.9%HE/SHE LIVES AT BOARDINGSCHOOL........................ 04 18 0.1% 7.3%WITH A NON-RELATED ADULTGUARDIAN...................... 06 3 0.0% 2.7%WITH A FRIEND................. 07 15 0.1% 6.0%WITH HIS OR HER SPOUSE........ 08 8 0.0% 3.1%OTHER......................... 09 22 0.1% 7.8% RESERVED CODES: NO PARENT QUEX............. 1215 6.9% (MISS) MULTIPLE RESPONSE.......... 96 1 0.0% (MISS) MISSING.................... 98 195 1.1% (MISS) LEGITIMATE SKIP............ 99 15979 90.7% (MISS) ----- ----- ----- TOTALS: 17610 100.0% 100.0%
NOTE: Nonresponse for this item exceeds the NCES standard.Due to potential nonresponse bias, users should exercisecaution when choosing this variable for analysis.
K-423

F2: Parent ComponentData File User's Manual
-------------Question 97 Tape Pos. 425-426------------- Format: I2
F2P97 # OF PEOPLE DEPENDENT ON R AS OF '88
Altogether, how many people were financially dependent uponyou (or you and your spouse/partner) as of February 1,1988? Count everyone who received one-half or more oftheir financial support from you or your spouse/partner.Include individuals who did not live with you and yourspouse/partner, but do not include yourself or yourspouse/partner.
Total number of dependents (not counting you or yourspouse/partner):
PER- WGTD RESPONSE CODES FREQ CENT PCT ---------- -------- ----- ----- -----NONE.......................... 01 55 0.3% 2.2%ONE........................... 02 351 2.0% 16.9%TWO........................... 03 686 3.9% 32.3%THREE......................... 04 513 2.9% 23.7%FOUR.......................... 05 228 1.3% 11.6%FIVE.......................... 06 134 0.8% 7.2%SIX........................... 07 55 0.3% 2.6%SEVEN......................... 08 29 0.2% 2.1%EIGHT OR MORE................. 09 24 0.1% 1.4% RESERVED CODES: NO PARENT QUEX............. 1215 6.9% (MISS) MULTIPLE RESPONSE.......... 96 3 0.0% (MISS) MISSING.................... 98 215 1.2% (MISS) LEGITIMATE SKIP............ 99 14102 80.1% (MISS) ----- ----- ----- TOTALS: 17610 100.0% 100.0%
K-424

F2: Parent ComponentData File User's Manual
-------------Question 98 Tape Pos. 427-427------------- Format: I1
F2P98 R'S MARITAL STATUS AS OF '88
What was your marital status as of February 1, 1988?
PER- WGTD RESPONSE CODES FREQ CENT PCT ---------- -------- ----- ----- -----NEVER MARRIED................. 1 83 0.5% 3.8%MARRIED....................... 2 1577 9.0% 74.1%DIVORCED...................... 3 284 1.6% 15.8%WIDOWED....................... 4 71 0.4% 4.2%NOT MARRIED, BUT LIVING IN AMARRIAGE-LIKE RELATIONSHIP.... 5 43 0.2% 2.2% RESERVED CODES: NO PARENT QUEX............. 1215 6.9% (MISS) MISSING.................... 8 235 1.3% (MISS) LEGITIMATE SKIP............ 9 14102 80.1% (MISS) ----- ----- ----- TOTALS: 17610 100.0% 100.0%
K-425

F2: Parent ComponentData File User's Manual
-------------Question 99 Tape Pos. 428-428------------- Format: I1
F2P99 R HAS A SPOUSE OR PARTNER
Do you have a spouse/partner?
PER- WGTD RESPONSE CODES FREQ CENT PCT ---------- -------- ----- ----- -----YES........................... 1 1428 8.1% 73.4%NO............................ 2 444 2.5% 26.6% RESERVED CODES: NO PARENT QUEX............. 1215 6.9% (MISS) MISSING.................... 8 421 2.4% (MISS) LEGITIMATE SKIP............ 9 14102 80.1% (MISS) ----- ----- ----- TOTALS: 17610 100.0% 100.0%
K-426

F2: Parent ComponentData File User's Manual
--------------Question 100--------------
What is the sex of each person?
K-427

F2: Parent ComponentData File User's Manual
---------------Question 100A Tape Pos. 429-429--------------- Format: I1
F2P100A SEX OF RESPONDENT
You
PER- WGTD RESPONSE CODES FREQ CENT PCT ---------- -------- ----- ----- -----MALE.......................... 1 367 2.1% 18.1%FEMALE........................ 2 1553 8.8% 81.9% RESERVED CODES: NO PARENT QUEX............. 1215 6.9% (MISS) MULTIPLE RESPONSE.......... 6 2 0.0% (MISS) MISSING.................... 8 371 2.1% (MISS) LEGITIMATE SKIP............ 9 14102 80.1% (MISS) ----- ----- ----- TOTALS: 17610 100.0% 100.0%
K-428

F2: Parent ComponentData File User's Manual
---------------Question 100B Tape Pos. 430-430--------------- Format: I1
F2P100B SEX OF RESPONDENT'S SPOUSE OR PARTNER
Your spouse/partner (if applicable)
PER- WGTD RESPONSE CODES FREQ CENT PCT ---------- -------- ----- ----- -----MALE.......................... 1 1120 6.4% 78.8%FEMALE........................ 2 313 1.8% 21.2% RESERVED CODES: NO PARENT QUEX............. 1215 6.9% (MISS) MISSING.................... 8 416 2.4% (MISS) LEGITIMATE SKIP............ 9 14546 82.6% (MISS) ----- ----- ----- TOTALS: 17610 100.0% 100.0%
NOTE: Nonresponse for this item exceeds the NCES standard.Due to potential nonresponse bias, users should exercisecaution when choosing this variable for analysis.
K-429

F2: Parent ComponentData File User's Manual
--------------Question 101--------------
What is the highest level of school that each person hascompleted? (Please mark only the highest level you and yourspouse/partner have attained.)
K-430

F2: Parent ComponentData File User's Manual
---------------Question 101A Tape Pos. 431-432--------------- Format: I2
F2P101A HIGHEST LEVEL OF SCHOOL R HAS COMPLETED
You
PER- WGTD RESPONSE CODES FREQ CENT PCT ---------- -------- ----- ----- -----EIGHTH GRADE OR LESS.......... 01 198 1.1% 8.8%BEYOND EIGHTH GRADE, BUT NOTHIGH SCHOOL GRADUATION........ 02 272 1.5% 15.3%GED........................... 03 64 0.4% 3.3%HIGH SCHOOL GRADUATION........ 04 538 3.1% 28.5%LESS THAN TWO YEARSVOCATIONAL, TRADE OR BUSINESSSCHOOL........................ 06 125 0.7% 6.8%TWO YEARS OR MORE VOCATIONAL,TRADE OR BUSINESS SCHOOL...... 07 71 0.4% 4.0%LESS THAN TWO YEARS OF COLLEGE 08 162 0.9% 8.1%TWO OR MORE YEARS OF COLLEGE(INCLUDING 2-YEAR DEGREE)..... 09 218 1.2% 10.1%FINISH COLLEGE (4- OR 5-YEARDEGREE)....................... 11 243 1.4% 8.3%MASTERS DEGREE OR EQUIVALENT.. 12 146 0.8% 5.6%Ph.D. OR M.D., OR OTHERPROFESSIONAL DEGREE........... 13 51 0.3% 1.4% RESERVED CODES: NO PARENT QUEX............. 1215 6.9% (MISS) MULTIPLE RESPONSE.......... 96 2 0.0% (MISS) MISSING.................... 98 203 1.2% (MISS) LEGITIMATE SKIP............ 99 14102 80.1% (MISS) ----- ----- ----- TOTALS: 17610 100.0% 100.0%
NOTE: The data values have been recoded in order tomaintain comparability with previous NCES studies. In therecodes, values 5 and 10 were not used.
K-431

F2: Parent ComponentData File User's Manual
---------------Question 101B Tape Pos. 433-434--------------- Format: I2
F2P101B HIGHST LEVEL OF SCHOOL SPOUSE/PTNR COMPL
Your spouse/partner (if applicable)
PER- WGTD RESPONSE CODES FREQ CENT PCT ---------- -------- ----- ----- -----EIGHTH GRADE OR LESS.......... 01 169 1.0% 10.6%BEYOND EIGHTH GRADE, BUT NOTHIGH SCHOOL GRADUATION........ 02 168 1.0% 12.5%GED........................... 03 37 0.2% 3.1%HIGH SCHOOL GRADUATION........ 04 396 2.2% 30.4%LESS THAN TWO YEARSVOCATIONAL, TRADE OR BUSINESSSCHOOL........................ 06 66 0.4% 4.6%TWO YEARS OF MORE VOCATIONAL,TRADE OR BUSINESS SCHOOL...... 07 57 0.3% 3.2%LESS THAN TWO YEARS OF COLLEGE 08 117 0.7% 8.0%TWO OR MORE YEARS OF COLLEGE(INCLUDING 2-YEAR DEGREE)..... 09 130 0.7% 9.3%FINISH COLLEGE (4- OR 5-YEARDEGREE)....................... 11 201 1.1% 10.0%MASTERS DEGREE OR EQUIVALENT.. 12 105 0.6% 5.5%Ph.D. OR M.D., OR OTHERPROFESSIONAL DEGREE........... 13 79 0.4% 2.8% RESERVED CODES: NO PARENT QUEX............. 1215 6.9% (MISS) MISSING.................... 98 324 1.8% (MISS) LEGITIMATE SKIP............ 99 14546 82.6% (MISS) ----- ----- ----- TOTALS: 17610 100.0% 100.0%
NOTE: The data values have been recoded in order tomaintain comparability with previous NCES studies. In therecodes, values 5 and 10 were not used.
K-432

F2: Parent ComponentData File User's Manual
--------------Question 102 Tape Pos. 435-436-------------- Format: I2
F2P102 NUMBER OF TEEN'S SIBLINGS
We would like to know how many brothers and sisters yourteenager has. Please consider all siblings, including half-and step- and adoptive brothers and sisters, regardless ofwhere they live.
PER- WGTD RESPONSE CODES FREQ CENT PCT ---------- -------- ----- ----- -----NONE.......................... 00 200 1.1% 9.0%ONE........................... 01 648 3.7% 27.2%TWO........................... 02 543 3.1% 23.9%THREE......................... 03 328 1.9% 15.6%FOUR.......................... 04 212 1.2% 9.3%FIVE.......................... 05 123 0.7% 5.8%SIX OR MORE................... 06 192 1.1% 9.1% RESERVED CODES: NO PARENT QUEX............. 1215 6.9% (MISS) MISSING.................... 98 47 0.3% (MISS) LEGITIMATE SKIP............ 99 14102 80.1% (MISS) ----- ----- ----- TOTALS: 17610 100.0% 100.0%
K-433

F2: Parent ComponentData File User's Manual
--------------Question 103 Tape Pos. 437-438-------------- Format: I2
F2P103 NUMBER OF CHILDREN OLDER THAN R'S TEEN
How many of the children referred to in Question 102 areolder than your teenager?
PER- WGTD RESPONSE CODES FREQ CENT PCT ---------- -------- ----- ----- -----NONE.......................... 00 657 3.7% 34.1%ONE........................... 01 602 3.4% 30.1%TWO........................... 02 299 1.7% 16.0%THREE......................... 03 172 1.0% 8.6%FOUR.......................... 04 100 0.6% 5.2%FIVE.......................... 05 47 0.3% 2.3%SIX OR MORE................... 06 65 0.4% 3.7% RESERVED CODES: NO PARENT QUEX............. 1215 6.9% (MISS) MISSING.................... 98 151 0.9% (MISS) LEGITIMATE SKIP............ 99 14302 81.2% (MISS) ----- ----- ----- TOTALS: 17610 100.0% 100.0%
K-434

F2: Parent ComponentData File User's Manual
--------------Question 104 Tape Pos. 439-440-------------- Format: I2
F2P104 NUMBER OF CHILDREN GRADUATED FROM H.S.
How many of the children referred to in Question 102 havegraduated from high school?
PER- WGTD RESPONSE CODES FREQ CENT PCT ---------- -------- ----- ----- -----NONE.......................... 00 776 4.4% 42.0%ONE........................... 01 606 3.4% 30.6%TWO........................... 02 275 1.6% 14.3%THREE......................... 03 139 0.8% 6.8%FOUR.......................... 04 59 0.3% 2.7%FIVE.......................... 05 33 0.2% 2.2%SIX OR MORE................... 06 30 0.2% 1.3% RESERVED CODES: NO PARENT QUEX............. 1215 6.9% (MISS) MISSING.................... 98 175 1.0% (MISS) LEGITIMATE SKIP............ 99 14302 81.2% (MISS) ----- ----- ----- TOTALS: 17610 100.0% 100.0%
K-435

F2: Parent ComponentData File User's Manual
--------------Question 105 Tape Pos. 441-442-------------- Format: I2
F2P105 NUMBER OF CHILDREN WHO DROPPED OUT OF HS
How many of the children referred to in Question 102dropped out of school before graduating from high school?
PER- WGTD RESPONSE CODES FREQ CENT PCT ---------- -------- ----- ----- -----NONE.......................... 00 1532 8.7% 74.7%ONE........................... 01 233 1.3% 16.1%TWO........................... 02 84 0.5% 4.7%THREE......................... 03 39 0.2% 2.1%FOUR.......................... 04 22 0.1% 1.3%FIVE.......................... 05 9 0.1% 0.7%SIX OR MORE................... 06 7 0.0% 0.3% RESERVED CODES: NO PARENT QUEX............. 1215 6.9% (MISS) MISSING.................... 98 167 0.9% (MISS) LEGITIMATE SKIP............ 99 14302 81.2% (MISS) ----- ----- ----- TOTALS: 17610 100.0% 100.0%
K-436

F2: Parent ComponentData File User's Manual
--------------Question 106 Tape Pos. 443-444-------------- Format: I2
F2P106 R'S YEAR OF BIRTH
In what year were you born?
PER- WGTD RESPONSE CODES FREQ CENT PCT ---------- -------- ----- ----- -----1929 OR EARLIER............... 01 38 0.2% 1.5%1930-1939..................... 02 213 1.2% 8.7%1940-1944..................... 03 372 2.1% 15.8%1945-1949..................... 04 665 3.8% 30.7%1950-1954..................... 05 567 3.2% 30.3%1955-1959..................... 06 175 1.0% 11.0%1960 OR LATER................. 07 47 0.3% 2.1% RESERVED CODES: NO PARENT QUEX............. 1215 6.9% (MISS) MISSING.................... 98 216 1.2% (MISS) LEGITIMATE SKIP............ 99 14102 80.1% (MISS) ----- ----- ----- TOTALS: 17610 100.0% 100.0%
K-437

F2: Parent ComponentData File User's Manual
--------------Question 107 Tape Pos. 445-446-------------- Format: I2
F2P107 SPOUSE/PARTNER'S YEAR OF BIRTH
In what year was your spouse/partner born?
PER- WGTD RESPONSE CODES FREQ CENT PCT ---------- -------- ----- ----- -----1929 OR EARLIER............... 01 51 0.3% 2.3%1930-1939..................... 02 237 1.3% 11.0%1940-1944..................... 03 327 1.9% 15.8%1945-1949..................... 04 530 3.0% 27.3%1950-1954..................... 05 300 1.7% 19.0%1955-1959..................... 06 83 0.5% 5.5%1960 OR LATER................. 07 33 0.2% 2.6%DOES NOT APPLY (NOSPOUSE/PARTNER)............... 08 280 1.6% 16.6% RESERVED CODES: NO PARENT QUEX............. 1215 6.9% (MISS) MULTIPLE RESPONSE.......... 96 1 0.0% (MISS) MISSING.................... 98 451 2.6% (MISS) LEGITIMATE SKIP............ 99 14102 80.1% (MISS) ----- ----- ----- TOTALS: 17610 100.0% 100.0%
K-438

F2: Parent ComponentData File User's Manual
------------------Question F2PAQWT Tape Pos. 447-456------------------ Format: R10.4
F2PAQWT PARENT WEIGHT
The primary purpose of the parent data file is to providestudent- and dropout-related contextual information. Usingthe parent data with F2PAQWT only provides analysts with anational cross-section of the self-defined "mostknowledgeable" parent or guardian of, among otherpopulations, dropouts from the eighth or tenth grade cohortand 1992 twelfth graders. F2PAQWT can be used incross-sectional and panel analyses either in conjunctionwith student or dropout data or as a stand-alone data set. However, when using F2PAQWT with only the second follow-upparent data, it is important that the analyst be aware ofthe caveats discussed in this manual in sections 1.4 and3.1.5 about the generalizability of the parent data.
Note that eligible, in-sample, participating parents ofeligible student/dropouts who completed a F2student/dropout questionnaire carry a parent weight.
PER- WGTD RESPONSE CODES FREQ CENT PCT ---------- -------- ----- ----- -----2.3906 TO 7307.0223........... 00 16395 93.1% 100.0% RESERVED CODES: MISSING.................... 00 1215 6.9% (MISS) ----- ----- ----- TOTALS: 17610 100.0% 100.0%
K-439

F2: Parent ComponentData File User's Manual
-------------------Question F2PAQFLG Tape Pos. 457-457------------------- Format: I1
F2PAQFLG F2 PARENT QUESTIONNAIRE FLAG
Indicates whether or not a second follow-up parentquestionnaire was completed by an eligible parent, who wasnot subsampled out of the second follow-up, of a teensample member who completed a second follow-up student ordropout questionnaire.
PER- WGTD RESPONSE CODES FREQ CENT PCT ---------- -------- ----- ----- -----DID NOT COMPLETE QUESTIONNAIRE 0 1215 6.9% 0.0%COMPLETED PARENT QUESTIONNAIRE 1 16395 93.1% 100.0% ----- ----- ----- TOTALS: 17610 100.0% 100.0%
K-440

F2: Parent ComponentData File User's Manual
-------------------Question F2SPANFG Tape Pos. 458-458------------------- Format: I1
F2SPANFG F2 SPANISH PARENT QUESTIONNAIRE FLAG
Indicates whether the second follow-up parent questionnairewas completed in English or in Spanish.
PER- WGTD RESPONSE CODES FREQ CENT PCT ---------- -------- ----- ----- -----PARENT COMPLETEDENGLISH-LANGUAGEQUESTIONNAIRE................. 0 16024 91.0% 97.3%PARENT COMPLETEDSPANISH-LANGUAGEQUESTIONNAIRE................. 1 371 2.1% 2.7%N/A - DID NOT COMPLETE F2PARENT QUESTIONNAIRE.......... 2 1215 6.9% 0.0% ----- ----- ----- TOTALS: 17610 100.0% 100.0%
K-441

F2: Parent ComponentData File User's Manual
-------------------Question F2BYPAFG Tape Pos. 459-459------------------- Format: I1
F2BYPAFG BASE YEAR PARENT QUEX COMPLETED
Indicates whether or not a base year parent questionnairewas completed by a parent of an eligible, participatingstudent sample member. Parents of students who joined thesample after the base year (due to freshening, BYI status)or who did not participate in the BY student survey are notconsidered part of the BY parent sample. Note that theparent respondent to the base year survey is notnecessarily the same person as the parent respondent in thesecond follow-up.
PER- WGTD RESPONSE CODES FREQ CENT PCT ---------- -------- ----- ----- -----DID NOT COMPLETE A BASE YEARPARENT QUESTIONNAIRE.......... 0 911 5.2% 4.1%COMPLETED A BASE YEAR PARENTQUESTIONNAIRE................. 1 14819 84.2% 84.2%N/A - STUDENT/PARENT NOT INBY............................ 2 1880 10.7% 11.7% ----- ----- ----- TOTALS: 17610 100.0% 100.0%
K-442

F2: Parent ComponentData File User's Manual
-----------------Question F2STAT Tape Pos. 460-461----------------- Format: I2
F2STAT F2 TEEN SAMPLE MEMBER STATUS
Indicates final status in the second follow-up for teensample members. The public use parent component containsdata only for the parents of those teen sample members whoparticipated in the student/dropout components of thesecond follow-up (F2STAT = 00).
PER- WGTD RESPONSE CODES FREQ CENT PCT ---------- -------- ----- ----- -----PARTICIPATED.................. 00 17610 100.0% 100.0% ----- ----- ----- TOTALS: 17610 100.0% 100.0%
K-443

F2: Parent ComponentData File User's Manual
-------------------Question F2DOSTAT Tape Pos. 462-463------------------- Format: I2
F2DOSTAT F2 DROPOUT STATUS
Indicates enrollment status, either dropout or student, asof the second follow-up only, for the teen sample member. Also permits identification of dropouts according to eitherthe NELS:88 first follow-up definition of a dropout (i.e.,dropouts only: use values 4 and 5) and the HS&B/NELS:88second follow-up definition of a dropout (i.e., dropoutsplus alternative completers: use values 3, 4, and 5).
PER- WGTD RESPONSE CODES FREQ CENT PCT ---------- -------- ----- ----- -----DID NOT DROP OUT.............. 00 15177 86.2% 83.0%DROPOUT, BUT RETURNED......... 02 100 0.6% 0.5%ALTERNATIVE STUDENT........... 03 784 4.5% 5.8%DROPOUT, DID NOT RETURN....... 05 1549 8.8% 10.7% ----- ----- ----- TOTALS: 17610 100.0% 100.0%
K-444

F2: Parent ComponentData File User's Manual
-------------------Question F2F1DOST Tape Pos. 464-465------------------- Format: I2
F2F1DOST F1 DROPOUT STATUS
Indicates enrollment status, such as a dropout or student,as of the first follow-up only, for the teen sample member.This variable is the first follow-up equivalent ofF2DOSTAT.
PER- WGTD RESPONSE CODES FREQ CENT PCT ---------- -------- ----- ----- -----DID NOT DROP OUT.............. 00 16081 91.3% 90.2%STATUS NOT DETERMINED......... 01 427 2.4% 2.1%DROPOUT, BUT RETURNED......... 02 120 0.7% 0.7%HOME STUDY STUDENT............ 03 7 0.0% 0.0%SCHOOL REPORTED DROPOUT....... 04 20 0.1% 0.1%DROPOUT, DID NOT RETURN....... 05 756 4.3% 5.9%N/A - F2 FRESHENED............ 06 199 1.1% 0.9% ----- ----- ----- TOTALS: 17610 100.0% 100.0%
K-445

F2: Parent ComponentData File User's Manual
----------------Question F2SEX Tape Pos. 466-466---------------- Format: I1
F2SEX TEEN'S SEX COMPOSITE
The most complete indicator of teen sample member's gender,this variable is based on the first follow-up (F1SEX)composite and augmented by second follow-up New StudentSupplement information or, if still missing, imputationfrom teen's first name.
PER- WGTD RESPONSE CODES FREQ CENT PCT ---------- -------- ----- ----- -----MALE.......................... 1 8828 50.1% 50.8%FEMALE........................ 2 8782 49.9% 49.2% ----- ----- ----- TOTALS: 17610 100.0% 100.0%
K-446

F2: Parent ComponentData File User's Manual
------------------Question F2RACE1 Tape Pos. 467-467------------------ Format: I1
F2RACE1 TEEN'S RACE COMPOSITE
Indicates teen's "best known" race, based on F1RACEcomposite and supplemented when appropriate with secondfollow-up New Student Supplement data.
PER- WGTD RESPONSE CODES FREQ CENT PCT ---------- -------- ----- ----- -----ASIAN, PACIFIC ISLANDER....... 1 1170 6.6% 3.8%HISPANIC, REGARDLESS OF RACE.. 2 2121 12.0% 11.4%BLACK, NOT HISPANIC........... 3 1992 11.3% 13.6%WHITE, NOT HISPANIC........... 4 12018 68.2% 69.9%AMERICAN INDIAN, ALASKAN...... 5 197 1.1% 1.3% RESERVED CODES: MISSING.................... 8 112 0.6% (MISS) ----- ----- ----- TOTALS: 17610 100.0% 100.0%
NOTE: This variable was recoded by NCES in the public usecodebook in accordance with the confidentiality provisionsof PL 100-297.
K-447

F2: Parent ComponentData File User's Manual
----------------Question F2API Tape Pos. 468-468---------------- Format: I1
F2API F2 TEEN ASIAN/PACIFIC ISLE SUBGROUPS
Further divides the teen sample member's "Asian, PacificIslander" F2RACE1 category into sub-categories. F2API wasconstructed in the same manner as F2RACE1.
PER- WGTD RESPONSE CODES FREQ CENT PCT ---------- -------- ----- ----- -----NON-ASIAN..................... 0 16328 92.7% 96.2%EAST ASIAN.................... 1 846 4.8% 2.5%SOUTH ASIAN................... 2 98 0.6% 0.3%PACIFIC ISLANDER.............. 3 60 0.3% 0.2%SPECIFIC API UNKNOWN.......... 4 166 0.9% 0.8% RESERVED CODES: RACE MISSING............... 8 112 0.6% (MISS) ----- ----- ----- TOTALS: 17610 100.0% 100.0%
NOTE: This variable was recoded by NCES in the public usecodebook in accordance with the confidentiality provisionsof PL 100-297.
K-448

F2: Parent ComponentData File User's Manual
-----------------Question F2HISP Tape Pos. 469-469----------------- Format: I1
F2HISP F2 TEEN HISPANIC SUBGROUPS
Further divides the teen sample member's "Hispanic,regardless of race" F2RACE1 category into sub-categories. F2HISP was constructed in the same manner described forF2RACE1. However, because a composite comparable to F2HISPwas not created in the first follow-up, F2HISP wasconstructed using data from the base year composite HISP,and was supplemented with data from the first or secondfollow-up NSS. If F2HISP was still missing, availableinformation from NORC's survey management systems was usedto fill in missing values.
PER- WGTD RESPONSE CODES FREQ CENT PCT ---------- -------- ----- ----- -----NON-HISPANIC.................. 0 15377 87.3% 88.6%MEXICAN....................... 1 1327 7.5% 6.8%CUBAN......................... 2 83 0.5% 0.4%PUERTO RICAN.................. 3 196 1.1% 1.2%SPECIFIC HISPANIC UNKNOWN..... 4 515 2.9% 3.0% RESERVED CODES: RACE MISSING............... 8 112 0.6% (MISS) ----- ----- ----- TOTALS: 17610 100.0% 100.0%
NOTE: This variable was recoded by NCES in the public usecodebook in accordance with the confidentiality provisionsof PL 100-297.
K-449

F2: Parent ComponentData File User's Manual
-------------------Question F2BIRTHM Tape Pos. 470-471------------------- Format: I2
F2BIRTHM TEEN'S BIRTH MONTH
This variable was taken from an updated version of F1BIRTHMwhich included birth data for base year ineligible studentsand other teen sample members for whom F1BIRTHMO waspreviously missing. For first follow-up nonrespondents andstudents who were freshened in the second follow-up, thesecond follow-up New Student Supplement data were used.
PER- WGTD RESPONSE CODES FREQ CENT PCT ---------- -------- ----- ----- -----JANUARY....................... 01 1274 7.2% 7.2%FEBRUARY...................... 02 1227 7.0% 7.6%MARCH......................... 03 1389 7.9% 8.1%APRIL......................... 04 1434 8.1% 8.1%MAY........................... 05 1423 8.1% 7.9%JUNE.......................... 06 1375 7.8% 9.0%JULY.......................... 07 1500 8.5% 9.1%AUGUST........................ 08 1538 8.7% 9.0%SEPTEMBER..................... 09 1438 8.2% 8.3%OCTOBER....................... 10 1425 8.1% 8.5%NOVEMBER...................... 11 1391 7.9% 8.9%DECEMBER...................... 12 1410 8.0% 8.4% RESERVED CODES: MISSING.................... 98 786 4.5% (MISS) ----- ----- ----- TOTALS: 17610 100.0% 100.0%
K-450

F2: Parent ComponentData File User's Manual
-------------------Question F2BIRTHY Tape Pos. 472-473------------------- Format: I2
F2BIRTHY TEEN'S BIRTH YEAR
This variable was created by using an updated version ofF1BIRTHY which included data for base year ineligiblestudents and other teen sample members for whom birth datawere previously missing. For first follow-upnonrespondents and students who were freshened in thesecond follow-up, the second follow-up New StudentSupplement data were used.
PER- WGTD RESPONSE CODES FREQ CENT PCT ---------- -------- ----- ----- -----1972 OR BEFORE................ 72 1039 5.9% 6.4%1973.......................... 73 5119 29.1% 31.6%1974.......................... 74 10612 60.3% 60.9%1975 OR AFTER................. 75 194 1.1% 1.1% RESERVED CODES: MISSING.................... 98 646 3.7% (MISS) ----- ----- ----- TOTALS: 17610 100.0% 100.0%
NOTE: This variable was recoded by NCES in the public usecodebook in accordance with the confidentiality provisionsof PL 100-297.
K-451

F2: Parent ComponentData File User's Manual
-------------------Question F2LOCUS1 Tape Pos. 474-477------------------- Format: R4.2
F2LOCUS1 TEEN LOCUS OF CONTROL, VERSION 1
This composite of three locus of control items in thesecond follow-up student and dropout questionnaires isdesigned to be as comparable as possible to HS&B and NLS-72data.
PER- WGTD RESPONSE CODES FREQ CENT PCT ---------- -------- ----- ----- ------3.06 TO 1.49................. 01.00 15794 89.7% 100.0% RESERVED CODES: MISSING.................... 99.98 1816 10.3% (MISS) ----- ----- ----- TOTALS: 17610 100.0% 100.0%
K-452

F2: Parent ComponentData File User's Manual
-------------------Question F2LOCUS2 Tape Pos. 478-481------------------- Format: R4.2
F2LOCUS2 TEEN LOCUS OF CONTROL, VERSION 2
This composite uses all of the second follow-up locus ofcontrol items in student question 66 (and dropout question57).
PER- WGTD RESPONSE CODES FREQ CENT PCT ---------- -------- ----- ----- ------3.02 TO 1.43................. 01.00 15812 89.8% 100.0% RESERVED CODES: MISSING.................... 99.98 1798 10.2% (MISS) ----- ----- ----- TOTALS: 17610 100.0% 100.0%
K-453

F2: Parent ComponentData File User's Manual
-------------------Question F2LOCU2Q Tape Pos. 482-482------------------- Format: I1
F2LOCU2Q TEEN LOCUS OF CONTROL, V.2 QUARTILE
Quartile distribution of F2LOCUS2. It was constructed byrecoding F2LOCUS2 into four categories based on theweighted (F2QWT) marginal distribution.
PER- WGTD RESPONSE CODES FREQ CENT PCT ---------- -------- ----- ----- -----QUARTILE 1 LOW................ 1 3739 21.2% 24.5%QUARTILE 2.................... 2 3237 18.4% 20.6%QUARTILE 3.................... 3 4673 26.5% 29.1%QUARTILE 4 HIGH............... 4 4163 23.6% 25.9% RESERVED CODES: MISSING.................... 8 1798 10.2% (MISS) ----- ----- ----- TOTALS: 17610 100.0% 100.0%
K-454

F2: Parent ComponentData File User's Manual
-------------------Question F2CNCPT1 Tape Pos. 483-486------------------- Format: R4.2
F2CNCPT1 TEEN SELF CONCEPT, VERSION 1
This composite of four self-concept items was designed tobe as comparable as possible to HS&B and NLS-72 data.
PER- WGTD RESPONSE CODES FREQ CENT PCT ---------- -------- ----- ----- ------3.68 TO 1.19................. 01.00 15826 89.9% 100.0% RESERVED CODES: MISSING.................... 99.98 1784 10.1% (MISS) ----- ----- ----- TOTALS: 17610 100.0% 100.0%
K-455

F2: Parent ComponentData File User's Manual
-------------------Question F2CNCPT2 Tape Pos. 487-490------------------- Format: R4.2
F2CNCPT2 TEEN SELF CONCEPT, VERSION 2
This composite employs all of the self-concept items instudent question 66 (and dropout question 57).
PER- WGTD RESPONSE CODES FREQ CENT PCT ---------- -------- ----- ----- ------3.68 TO 1.24................. 01.00 15826 89.9% 100.0% RESERVED CODES: MISSING.................... 99.98 1784 10.1% (MISS) ----- ----- ----- TOTALS: 17610 100.0% 100.0%
K-456

F2: Parent ComponentData File User's Manual
-------------------Question F2CNCP2Q Tape Pos. 491-491------------------- Format: I1
F2CNCP2Q TEEN SELF CONCEPT, V.2 QUARTILE
Quartile distribution of F2CNCPT2. It was constructed byrecoding F2CNCPT2 into four categories based on theweighted (F2QWT) marginal distribution.
PER- WGTD RESPONSE CODES FREQ CENT PCT ---------- -------- ----- ----- -----QUARTILE 1 LOW................ 1 3908 22.2% 24.9%QUARTILE 2.................... 2 4014 22.8% 24.9%QUARTILE 3.................... 3 3836 21.8% 24.8%QUARTILE 4 HIGH............... 4 4068 23.1% 25.4% RESERVED CODES: MISSING.................... 8 1784 10.1% (MISS) ----- ----- ----- TOTALS: 17610 100.0% 100.0%
K-457

F2: Parent ComponentData File User's Manual
-------------------Question F2BYFMSZ Tape Pos. 492-493------------------- Format: I2
F2BYFMSZ BASE YEAR FAMILY SIZE
This composite reports the teen sample member's estimatedfamily size in the base year. It was computed using boththe parent and student base year questionnaires.
PER- WGTD RESPONSE CODES FREQ CENT PCT ---------- -------- ----- ----- -----2............................. 02 476 2.7% 3.5%3............................. 03 2109 12.0% 14.2%4............................. 04 5489 31.2% 37.0%5............................. 05 3740 21.2% 25.6%6............................. 06 1601 9.1% 10.7%7............................. 07 689 3.9% 4.8%8............................. 08 313 1.8% 2.4%9............................. 09 221 1.3% 1.3%10+........................... 10 51 0.3% 0.4% RESERVED CODES: N/A - NO BY PARENT QUEX.... 2791 15.8% (MISS) MISSING.................... 98 130 0.7% (MISS) ----- ----- ----- TOTALS: 17610 100.0% 100.0%
K-458

F2: Parent ComponentData File User's Manual
-------------------Question F2BYPMAR Tape Pos. 494-494------------------- Format: I1
F2BYPMAR BASE YEAR PARENT MARITAL STATUS
This composite characterizes the parent's base year maritalstatus. It was taken directly from BYP7. Note, however,that the categories for this composite have been revised tomatch the categories used in the second follow-up parentquestionnaire, item F2P7.
PER- WGTD RESPONSE CODES FREQ CENT PCT ---------- -------- ----- ----- -----SINGLE, NEVER MARRIED......... 1 324 1.8% 2.4%MARRIED....................... 2 11598 65.9% 78.7%DIVORCED/SEPARATED............ 3 1970 11.2% 14.9%WIDOWED....................... 4 356 2.0% 2.6%NOT MARRIED BUT LIVING IN AMARRIAGE-LIKE RELATIONSHIP.... 5 208 1.2% 1.4% RESERVED CODES: N/A - NO BY PARENT QUEX.... 2791 15.8% (MISS) MISSING.................... 8 363 2.1% (MISS) ----- ----- ----- TOTALS: 17610 100.0% 100.0%
K-459

F2: Parent ComponentData File User's Manual
-------------------Question F2BYSPFG Tape Pos. 495-495------------------- Format: I1
F2BYSPFG BASE YEAR SPANISH PARENT QUEX FLAG
Indicates whether the base year parent questionnaire wascompleted in English or Spanish.
PER- WGTD RESPONSE CODES FREQ CENT PCT ---------- -------- ----- ----- -----PARENT COMPLETEDENGLISH-LANGUAGEQUESTIONNAIRE................. 0 14503 82.4% 82.3%PARENT COMPLETEDSPANISH-LANGUAGEQUESTIONNAIRE................. 1 316 1.8% 2.0%N/A - DID NOT COMPLETE BASEYEAR PARENT QUESTIONNAIRE..... 2 2791 15.8% 15.8% ----- ----- ----- TOTALS: 17610 100.0% 100.0%
K-460

F2: Parent ComponentData File User's Manual
-------------------Question F2BYFCMP Tape Pos. 496-497------------------- Format: I2
F2BYFCMP BASE YEAR FAMILY COMPOSITION
Indicates the family or household composition in the baseyear. It was constructed from the student responses toBYS8A-I. Note, however, that the data for this compositehave been recoded from 1 digit in the base year to twodigits in the second follow-up.
PER- WGTD RESPONSE CODES FREQ CENT PCT ---------- -------- ----- ----- -----MOTHER + FATHER............... 01 10278 58.4% 65.7%MOTHER + MALE GUARDIAN........ 02 1376 7.8% 11.7%FATHER + FEMALE GUARDIAN...... 03 265 1.5% 2.4%MOTHER ONLY................... 04 2091 11.9% 14.9%FATHER ONLY................... 05 318 1.8% 2.4%OTHER RELATIVE OR NON-RELATIVE 06 361 2.0% 2.9% RESERVED CODES: N/A - NO BY PARENT QUEX.... 2791 15.8% (MISS) MISSING.................... 98 130 0.7% (MISS) ----- ----- ----- TOTALS: 17610 100.0% 100.0%
K-461

F2: Parent ComponentData File User's Manual
-------------------Question F2F1FCMP Tape Pos. 498-499------------------- Format: I2
F2F1FCMP F1 FAMILY COMPOSITION
Indicates the family or household composition, and is basedentirely on base year parent questionnaire data. It isderived from question 1 in the base year parentquestionnaire (BYP1A1, BYP1A2) and indicates the adultcomposition of the sample member's household as of the baseyear.
PER- WGTD RESPONSE CODES FREQ CENT PCT ---------- -------- ----- ----- -----MOTHER + FATHER............... 01 10185 57.8% 66.1%MOTHER + MALE GUARDIAN........ 02 1388 7.9% 11.6%FATHER + FEMALE GUARDIAN...... 03 303 1.7% 2.9%OTHER FEMALE AND MALE FAMILIES 04 143 0.8% 1.2%MOTHER ONLY, OR OTHER FEMALE.. 05 2210 12.5% 16.3%FATHER ONLY, OR OTHER MALE.... 06 247 1.4% 1.9% RESERVED CODES: N/A - NO BY PARENT QUEX.... 2791 15.8% (MISS) MISSING.................... 98 343 1.9% (MISS) ----- ----- ----- TOTALS: 17610 100.0% 100.0%
K-462

F2: Parent ComponentData File User's Manual
-----------------Question F2FCMP Tape Pos. 500-501----------------- Format: I2
F2FCMP F2 FAMILY COMPOSITION
Indicates the family or household composition, and is basedentirely on second follow-up parent questionnaire itemsF2P8A-F.
PER- WGTD RESPONSE CODES FREQ CENT PCT ---------- -------- ----- ----- -----MOTHER + FATHER............... 01 10155 57.7% 57.0%MOTHER + MALE GUARDIAN........ 02 1660 9.4% 12.4%FATHER + FEMALE GUARDIAN...... 03 388 2.2% 2.7%OTHER FEMALE AND MALE FAMILIES 04 275 1.6% 2.0%MOTHER ONLY, OR OTHERFEMALE(S)..................... 05 2852 16.2% 19.7%FATHER ONLY, OR OTHER MALE(S). 06 448 2.5% 3.1%INDEPENDENT TEEN, OR LIVINGWITH A FRIEND OR SPOUSE....... 07 409 2.3% 3.2% RESERVED CODES: N/A - NO F2 PARENT QUEX.... 1215 6.9% (MISS) MISSING.................... 98 208 1.2% (MISS) ----- ----- ----- TOTALS: 17610 100.0% 100.0%
K-463

F2: Parent ComponentData File User's Manual
-------------------Question F2FAMSIZ Tape Pos. 502-503------------------- Format: I2
F2FAMSIZ F2 FAMILY SIZE
This composite estimates the teen sample member's secondfollow-up family size. F2FAMSIZ was constructed entirelyfrom the second follow-up parent questionnaire, itemsF2P10A-B.
PER- WGTD RESPONSE CODES FREQ CENT PCT ---------- -------- ----- ----- -----1............................. 01 197 1.1% 1.4%2............................. 02 1095 6.2% 7.5%3............................. 03 3689 20.9% 22.4%4............................. 04 5162 29.3% 30.9%5............................. 05 3369 19.1% 20.8%6............................. 06 1544 8.8% 9.5%7............................. 07 643 3.7% 4.3%8............................. 08 246 1.4% 1.7%9............................. 09 109 0.6% 0.7%10+........................... 10 104 0.6% 0.9% RESERVED CODES: N/A - NO F2 PARENT QUEX.... 1215 6.9% (MISS) MISSING.................... 98 237 1.3% (MISS) ----- ----- ----- TOTALS: 17610 100.0% 100.0%
K-464

F2: Parent ComponentData File User's Manual
------------------Question F2PARED Tape Pos. 504-505------------------ Format: I2
F2PARED F2 PARENT'S HIGHEST EDUCATION LEVEL
This composite characterizes the level of educationattained by the parent with the highest reported educationlevel. It was constructed using second follow-up parentquestionnaire data; other sources were used if F2 parentdata were missing.
PER- WGTD RESPONSE CODES FREQ CENT PCT ---------- -------- ----- ----- -----DID NOT FINISH H.S............ 01 1936 11.0% 11.3%H.S. GRAD OR GED.............. 02 3454 19.6% 21.4%GREATER THAN H.S. AND LESSTHAN 4-YEAR DEGREE............ 03 6636 37.7% 40.9%COLLEGE GRADUATE.............. 04 2660 15.1% 13.7%M.A. OR EQUIVALENT............ 05 1690 9.6% 8.5%Ph.D, M.D., OR OTHER.......... 06 1069 6.1% 4.0%DON'T KNOW.................... 07 48 0.3% 0.1% RESERVED CODES: MISSING.................... 98 117 0.7% (MISS) ----- ----- ----- TOTALS: 17610 100.0% 100.0%
K-465

F2: Parent ComponentData File User's Manual
-----------------Question F2SES2 Tape Pos. 506-510----------------- Format: R5.3
F2SES2 F2 TEEN'S SOCIO-ECONOMIC STATUS, V.2
This is the second of three socio-economic statusindicators of the teen that have been constructed for thesecond follow-up data files. Like F2SES1, F2SES2 utilizesthe original occupational scale used for HS&B, but isconstructed using second follow-up parent questionnairedata (F2SES1 uses base year parent data or, if missing,other early sources). F2SES3 employs a newer occupationalscale and also uses second follow-up parent data. Inaddition, F2SES2 has valid values only for cases where thesecond follow-up parent questionnaire was completed.
PER- WGTD RESPONSE CODES FREQ CENT PCT ---------- -------- ----- ----- ------2.949 TO 2.427............... 01.000 16364 92.9% 100.0% RESERVED CODES: N/A - NO F2 PARENT QUEX.... 1215 6.9% (MISS) MISSING.................... 99.998 31 0.2% (MISS) ----- ----- ----- TOTALS: 17610 100.0% 100.0%
K-466

F2: Parent ComponentData File User's Manual
------------------Question F2SES2Q Tape Pos. 511-511------------------ Format: I1
F2SES2Q F2 TEEN'S SES QUARTILE, V.2
F2SES2Q is the quartile distribution of F2SES2. It wasconstructed by recoding F2SES2 into quartiles based on theweighted (F2PAQWT) marginal distribution.
PER- WGTD RESPONSE CODES FREQ CENT PCT ---------- -------- ----- ----- -----QUARTILE 1 LOW................ 1 3758 21.3% 24.8%QUARTILE 2.................... 2 3805 21.6% 25.0%QUARTILE 3.................... 3 3854 21.9% 25.1%QUARTILE 4 HIGH............... 4 4947 28.1% 25.1% RESERVED CODES: N/A - NO F2 PARENT QUEX.... 1215 6.9% (MISS) MISSING.................... 8 31 0.2% (MISS) ----- ----- ----- TOTALS: 17610 100.0% 100.0%
K-467

F2: Parent ComponentData File User's Manual
-----------------Question F2SES3 Tape Pos. 512-516----------------- Format: R5.3
F2SES3 F2 TEEN'S SOCIO-ECONOMIC STATUS, V.3
F2SES3 is constructed in exactly the same way as F2SES2,except that prestige scores used for this construct weredeveloped in the 1989 GSS (whereas F2SES2 uses the originalDuncan SEI scores). Please see Appendix J of the SecondFollow-Up: Parent Component Data File User's Manual foradditional information.
PER- WGTD RESPONSE CODES FREQ CENT PCT ---------- -------- ----- ----- ------2.949 TO 2.427............... 01.000 16364 92.9% 100.0% RESERVED CODES: N/A - NO F2 PARENT QUEX.... 1215 6.9% (MISS) MISSING.................... 99.998 31 0.2% (MISS) ----- ----- ----- TOTALS: 17610 100.0% 100.0%
K-468
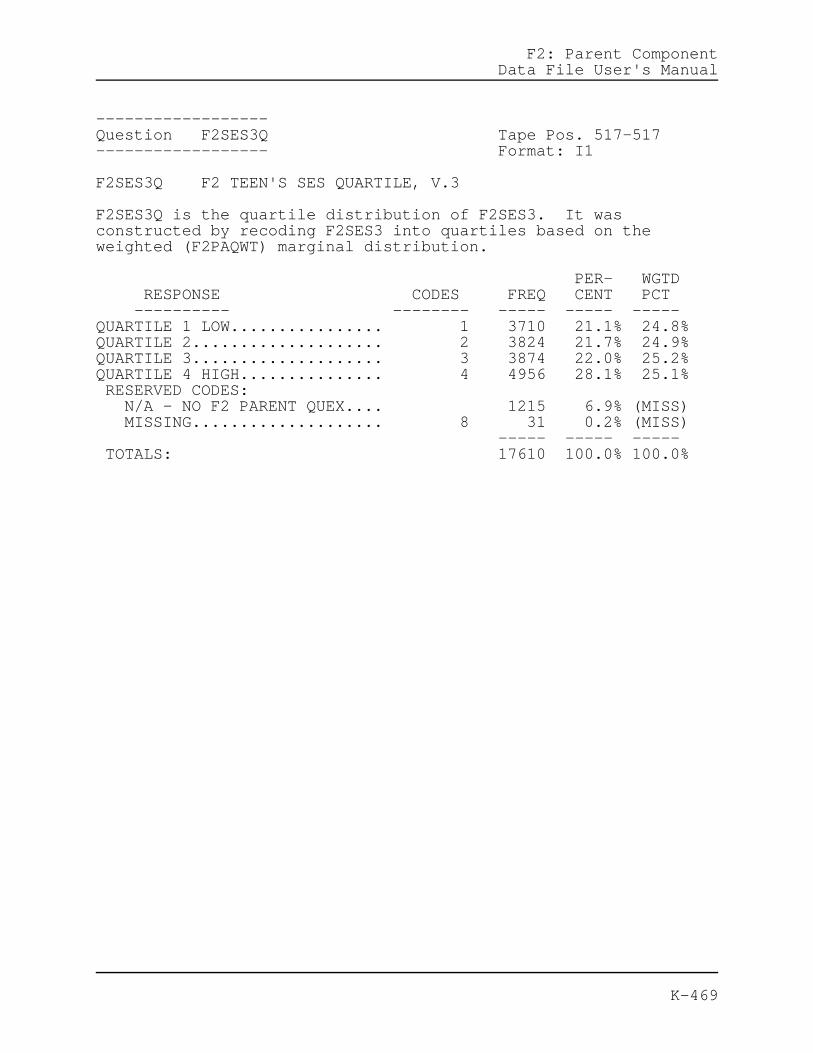
F2: Parent ComponentData File User's Manual
------------------Question F2SES3Q Tape Pos. 517-517------------------ Format: I1
F2SES3Q F2 TEEN'S SES QUARTILE, V.3
F2SES3Q is the quartile distribution of F2SES3. It wasconstructed by recoding F2SES3 into quartiles based on theweighted (F2PAQWT) marginal distribution.
PER- WGTD RESPONSE CODES FREQ CENT PCT ---------- -------- ----- ----- -----QUARTILE 1 LOW................ 1 3710 21.1% 24.8%QUARTILE 2.................... 2 3824 21.7% 24.9%QUARTILE 3.................... 3 3874 22.0% 25.2%QUARTILE 4 HIGH............... 4 4956 28.1% 25.1% RESERVED CODES: N/A - NO F2 PARENT QUEX.... 1215 6.9% (MISS) MISSING.................... 8 31 0.2% (MISS) ----- ----- ----- TOTALS: 17610 100.0% 100.0%
K-469

F2: Parent ComponentData File User's Manual
-------------------Question G12CTRL1 Tape Pos. 518-519------------------- Format: I2
G12CTRL1 SCHOOL CLASSIFICATION REPORTED BY SCHOOL
Classifies the teen sample member's second follow-up schooltype into public, Catholic or other private.
PER- WGTD RESPONSE CODES FREQ CENT PCT ---------- -------- ----- ----- -----PUBLIC........................ 01 12877 73.1% 75.6%CATHOLIC...................... 02 905 5.1% 4.4%PRIVATE/OTHER RELIGIOUS....... 03 428 2.4% 1.8%PRIVATE/NON-RELIGIOUS......... 04 957 5.4% 1.2%PRIVATE/TYPE UNKNOWN.......... 05 68 0.4% 0.5%STUDENT NOT ENROLLED.......... 06 2333 13.2% 16.5% RESERVED CODES: MISSING.................... 98 42 0.2% (MISS) ----- ----- ----- TOTALS: 17610 100.0% 100.0%
NOTE: In the second follow-up student version of thisvariable, dropouts who identified their last schoolattended were removed from value 06 (Student Not Enrolled),and recoded with the appropiate value for the last schoolthey attended. Therefore, for the most comprehensivecoding of this variable, refer to the student codebook inthe Second Follow-Up: Student Component Data File User'sManual.
NOTE: This variable was recoded by NCES in the public usecodebook in accordance with the confidentiality provisionsof PL 100-297.
K-470

F2: Parent ComponentData File User's Manual
-------------------Question G12URBN3 Tape Pos. 520-520------------------- Format: I1
G12URBN3 TYPE OF SCHL DISTRICT, DIOCESE, COUNTY
Trichotomizes the urbanicity of the area in which the teensample member's second follow-up school is located. Thismetropolitan status is defined by QED for public schooldistricts, for Catholic dioceses, or in some cases for thecounty in which the school is located. QED bases theclassifications on the Federal Information ProcessingStandards as used by the U.S. Census.
PER- WGTD RESPONSE CODES FREQ CENT PCT ---------- -------- ----- ----- -----URBAN......................... 1 4473 25.4% 23.7%SUBURBAN...................... 2 6044 34.3% 34.0%RURAL/OUTSIDE MSA............. 3 4690 26.6% 25.8%STUDENT NOT ENROLLED, OR NOTENROLLED IN TRADITIONALDIPLOMA-GRANTING SCHOOL....... 4 2333 13.2% 16.5% RESERVED CODES: MISSING.................... 8 70 0.4% (MISS) ----- ----- ----- TOTALS: 17610 100.0% 100.0%
NOTE: In the second follow-up student version of thisvariable, dropouts who identified their last schoolattended were removed from value 04 (Student Not Enrolled),and recoded with the appropiate value for the last schoolthey attended. Therefore, for the most comprehensivecoding of this variable, refer to the student codebook inthe Second Follow-Up: Student Component Data File User'sManual.
NOTE: This variable was recoded by NCES in the public usecodebook in accordance with the confidentiality provisionsof PL 100-297.
K-471

F2: Parent ComponentData File User's Manual
-------------------Question G12REGON Tape Pos. 521-522------------------- Format: I2
G12REGON REGION OF THE COUNTRY (4 CENSUS REGIONS)
Indicates in which of the four U.S. Census regions the teensample member's school is located, created by collapsingthe states into census regions.
PER- WGTD RESPONSE CODES FREQ CENT PCT ---------- -------- ----- ----- -----NORTHEAST..................... 01 3004 17.1% 16.5%MIDWEST....................... 02 4072 23.1% 21.1%SOUTH......................... 03 5214 29.6% 29.4%WEST.......................... 04 2947 16.7% 16.4%STUDENT NOT ENROLLED, OR NOTENROLLED IN TRADITIONALDIPLOMA-GRANTING SCHOOL....... 05 2333 13.2% 16.5% RESERVED CODES: MISSING.................... 98 40 0.2% (MISS) ----- ----- ----- TOTALS: 17610 100.0% 100.0%
NOTE: In the second follow-up student version of thisvariable, dropouts who identified their last schoolattended were removed from value 05 (Student Not Enrolled),and recoded with the appropiate value for the last schoolthey attended. Therefore, for the most comprehensivecoding of this variable, refer to the student codebook inthe Second Follow-Up: Student Component Data File User'sManual.
K-472

F2: Parent ComponentData File User's Manual
-------------------Question F2HSPROG Tape Pos. 523-524------------------- Format: I2
F2HSPROG F2 TEEN-REPORTED HIGH SCHOOL PROGRAM
This composite categorizes the teen-reported high schoolprogram--either the type of high school program in whichthe student is enrolled or the last program in which thedropout was enrolled (as reported in the second follow-up).
PER- WGTD RESPONSE CODES FREQ CENT PCT ---------- -------- ----- ----- -----GENERAL HIGH SCHOOL PROGRAM... 01 6731 38.2% 41.4%ACADEMIC/COLLEGE PREP PROGRAM. 02 7173 40.7% 36.6%VOCATIONAL/TECHNICAL PROGRAM.. 03 1892 10.7% 11.4%OTHER SPECIALIZED HIGH SCHOOLPROGRAM....................... 04 321 1.8% 2.5%SPECIAL EDUCATION PROGRAM..... 05 130 0.7% 1.0%ALTERNATIVE/DROPOUTPREVENTION PROGRAM............ 06 250 1.4% 2.1%DON'T KNOW.................... 07 858 4.9% 5.0% RESERVED CODES: MISSING.................... 98 255 1.4% (MISS) ----- ----- ----- TOTALS: 17610 100.0% 100.0%
K-473

F2: Parent ComponentData File User's Manual
Appendix L
Glossary of NELS:88 Terms

F2: Parent ComponentData File User's Manual
GLOSSARY OF NELS:88 TERMS
Note: Words in the glossary have been cross-referenced. If a wordused in a definition has its own entry elsewhere in the glossary,the word appears in italics in its first usage under each entry.
Alternative completer: The NELS:88 second follow-up distinguishedthree levels of enrollment status: students enrolled in a regularhigh school program, dropouts who had enrolled in (or hadcompleted) some alternative (non-diploma) high school equivalencyaccrediting program (for example, preparation classes for the GEDtest), and dropouts receiving no alternative instruction. The term"alternative completer" was used for dropouts receiving any sort ofinstruction to prepare them for equivalency certification, and fordropouts who had already received the GED or other equivalencycertification. In terms of questionnaire completion, alternativecompleters were treated in two ways. Dropouts receivingalternative instruction in preparation for possible equivalencycertification were administered the dropout questionnaire. Thosedropouts who had received the GED or other high school equivalencycertification were treated as school completers, and wereadministered the student questionnaire.
Augmentation students: See State augmentation students.
Base year ineligible (BYI) study: A NELS:88 first follow-up studywhich sought to locate and survey eligible respondents who werepart of the Base Year sample, yet were ineligible to participate inthe Base Year due to mental or physical incapacity, languagebarrier, or other factors. (See entry for "Followback study ofexcluded students.")
Bias (due to nonresponse): Difference that occurs when respondentsdiffer as a group from nonrespondents on a characteristic beingstudied.
Bias (due to undercoverage): This bias arises because some portionof the potential sampling frame is missed or excluded. Forexample, if the school list from which a school sample is drawn isincomplete or inaccurate, school undercoverage may occur. InNELS:88 the most important potential source of undercoverage biaswas exclusion of 5.37 percent of the potential sample of eighthgraders in the base year. (See entry for "Base year ineligiblestudy" and "Followback study of excluded students.")
Bias (of an estimate): The difference between the expected valueof a sample estimate and the corresponding true value for thepopulation.
Burden: Formally, this is the aggregate hours realisticallyrequired for data providers to participate in a data collection.Burden also has a subjective or psychological dimension: the
L-1

F2: Parent ComponentData File User's Manual
degree to which providing information is regarded as onerous maydepend on the salience to the respondent of the questions that arebeing posed and on other factors such as competing time demands.
BY: NELS:88 Base Year Study conducted in 1988.
Carnegie units: A standard of measurement used for secondaryeducation that represents the completion of a course that meets oneperiod per day for one year.
CCD: Common Core of Data. Data annually collected from all publicschools in the United States by the National Center for EducationStatistics.
CD-ROM: Compact Disc Read-Only Memory. A computer storage disk inthe same physical form as an audio CD. A CD-ROM can storeapproximately 650 megabytes of digital data. NELS:88 data areavailable both in magnetic media, such as tapes, as well as inoptical laser disc media, such as CD-ROM.
Ceiling effect: The result of a cognitive test having insufficientnumbers of the more difficult items. In a longitudinal study,ceiling effects in the follow-up testings can cause change scoresto be artificially constrained for high ability examinees. Moreinformation (that is, smaller error of measurement) is obtainedwith respect to ability level if high ability individuals receiverelatively harder items (and if low ability individuals receiveproportionately easier items). The matching of item difficulty toa person's ability level yields increased reliability at theextremes of the score distribution where it is most needed forstudies of longitudinal change. That is, the measurement problemsrelated to floor and ceiling effects in combination with regressioneffects found at the extreme score ranges seriously hamper theaccuracy of change measures in longitudinal studies. Hence onestrategy employed in NELS:88 to minimize ceiling effects was todevelop test forms that are "adaptive" to the ability level of theexaminee. The multilevel tests used in the first and secondfollow-ups of NELS:88--with test assignment based on prior testperformance--work to minimize the possibility of ceiling effectsbiasing the estimates of the score gains. (See entry for "Flooreffect.")
Certainty school: A first or second follow-up school attended byfour or more NELS:88 sample members, as determined by tracing anddata collection efforts. These schools are included in the samplewith certainty (probability=1). All NELS:88 first follow-up samplemembers in the school at the time of data collection were includedin the second follow-up.
Closed-ended: A type of question in which the data provider'sresponses are limited to given alternatives, as opposed to an open-ended question. (See entry for "Open-ended.")
L-2

F2: Parent ComponentData File User's Manual
Cluster size: The number of NELS:88 sample members attending aparticular high school.
Codebook: A record of each variable being measured, includingvariable name, columns occupied by each variable in the datamatrix, values used to define each variable, unweightedfrequencies, unweighted percents, and weighted valid percents.(See entry for "Electronic Codebook.")
Cognitive test battery: One of the two parts of the Student Survey(the second part being the student questionnaire). Fourachievement areas (mathematics, reading, science, and socialstudies [history/citizenship/geography]) were measured.
Cohort: A group of individuals who have a statistical factor incommon, for example, year of birth or grade in school or year ofhigh school graduation. NELS:88 embraces three overlapping butdistinct nationally-representative grade cohorts: 1987-88 eighthgraders, 1989-90 high school sophomores, and 1991-92 high schoolseniors.
Composite variables: A composite variable is one that isconstructed through either the combination of two or more variables(socioeconomic status, for example) or calculated through theapplication of a mathematical function to a variable. Also calleda "derived variable" or "constructed variable."
Confidence interval: A sample-based estimate expressed as aninterval or range of values within which the true population valueis expected to be located (with a specified degree of confidence).
Contextual data: In NELS:88, the primary unit of analysis is thestudent (or dropout), and information from the other studycomponents, referred to as the contextual data, should be viewed asextensions of the student data--for example, as schooladministrator, teacher, and parent reports on the student's schoollearning environment or home situation.
Core school: School that was selected between Phases 1 and 2 ofthe second follow-up to receive the full complement (SchoolAdministrator, Teacher, Transcript) of study components, and forin-school data collection sessions.
Core student: Students who are part of the primary cohort ofNELS:88, in contrast to state augmentation or School EffectivenessStudy students. The core students include those chosen as eighthgraders in the 1988 Base Year Study and those added to the samplethrough freshening procedures during the first or second follow-up.
Core study: The original NELS:88 study, in contrast to the studywith additions and follow-up additions like the state augmentationstudies and the School Effectiveness Study.
L-3

F2: Parent ComponentData File User's Manual
Course offerings: School-level summaries of courses offered; whilein HS&B course offerings data were collected for all schools, inNELS:88 such data have been collected only for schools in theSchool Effectiveness Study.
Cross-sectional survey: A cross-sectional design represents eventsand statuses at a single point in time. For example, a cross-sectional survey may measure the cumulative educational attainment(achievements, attitudes, statuses) of students at a particularstage of schooling (for example, eighth grade, tenth grade, ortwelfth grade). In contrast, a longitudinal (or repeatedmeasurement of the same sample units) survey measures the change orgrowth in educational attainments that occurs over a particularperiod of schooling. The longitudinal design of NELS:88 generates--by means of sample "freshening"--three representative cross-sections (eighth graders in 1988, high school sophomores in 1990,seniors in 1992) and permits analysis of individual level changeover time through longitudinal analysis and of group level andintercohort change through the cross-sectional comparisons. (Seeentry for "Longitudinal or Panel Survey.")
Data element: The most basic unit of information. In dataprocessing it is the fundamental data structure. It is defined byits size (in characters) and data type (e.g. alphanumeric, numericonly, true/false, date) and may include a specific set of values orrange of values.
Design effect: A measure of sample efficiency. The design effect(DEFF) is the variance of an estimate divided by the variance ofthe estimate that would have occurred if a sample of the same sizehad been selected using simple random sampling. Sometimes it ismore useful to work with standard errors than with variances. Theroot design effect (DEFT) expresses the relation between the actualstandard error of an estimate and the standard error of thecorresponding estimates from a simple random sample.
Dropout: The term is used both to describe an event--leavingschool before graduating--and a status--an individual who is not inschool and is not a graduate at a defined point in time. The"cohort dropout rate" in NELS:88 is based on measurement ofenrollment status of 1988 eighth graders two and four years later(that is, in the spring term of 1990 and the spring term of 1992)and of 1990 sophomores two years later. A respondent who has notgraduated from high school or attained an equivalency certificateand who has not attended high school for 20 consecutive days (notcounting any excused absences) is considered to be a dropout. Incontrast, transferring schools--for example, from a public to aprivate school--is not regarded as a dropout event, nor is delayedgraduation (as when a student is continuously enrolled but takes anadditional year to complete school). A person who drops out ofschool may later return and graduate: at the time the person leftschool initially, he or she is called a "dropout," and at the timethe person returns to school, he or she is called a "stopout."
L-4

F2: Parent ComponentData File User's Manual
Early graduate: A student who graduated from high school in lessthan the typical amount of time. For example, if a studentgraduated in December of his/her senior year (when the majority ofhis/her classmates graduate the following May or June), the studentis categorized as an early graduate. In the main study datacollection, early graduates were administered a special supplementin the student questionnaire along with the cognitive test battery.
Electronic codebook (ECB): While hardcopy codebooks with itemstems, response categories, associated response frequencydistributions, unweighted percents, and weighted valid percents arecontained within the NELS:88 user's manuals, NELS:88 data are alsoavailable on CD-ROM in an electronic codebook (ECB) format. Forexample, the electronic codebook created for the combined base yearfirst follow-up NELS:88 data is a menu-driven system that allowsusers to perform functions such as the following: (a) search alist of NELS:88 BY-F1 database variables based upon key words orvariable names/labels; (b) display weighted and unweightedpercentages for each variable in the database; (c) display questiontext for each variable in the database; (d) select or tag variablesfor subsequent analysis; (e) generate SAS-PC or SPSS-PC+ programcode/command statements for subsequently constructing a system fileof the selected variables; and (f) generate a codebook of theselected variables. An electronic codebook is also being preparedfor the NELS:88 second follow-up data, and will again be housed ona CD-ROM.
ETS: Educational Testing Service. NORC's subcontractor forNELS:88 cognitive test development and evaluation. F1: The NELS:88 first follow-up, conducted in 1990.
F2: The NELS:88 second follow-up, conducted in 1992.
File: Refers to a data file containing a set of relatedcomputerized records.
Floor effect: The result of a cognitive test being too difficultfor a large number of the examinees, causing the low abilityexaminees to receive chance scores on the first testing, and onsubsequent testings if the test remains too difficult. Flooreffects result in an inability to discriminate among low abilityindividuals at time one or time two, and there will be no reliablediscrimination among examinees with respect to amounts of change.A possible solution, utilized in NELS:88, is to develop test formsthat are "adaptive" to the ability level of the examinee, whichtends to minimize the possibility of floor effects biasing theestimates of the score gains.
Followback study of excluded students: A continuation in theNELS:88 second follow-up of a special substudy begun in the firstfollow-up as (see entry for) the base year ineligibles study.
L-5

F2: Parent ComponentData File User's Manual
Freshening: A NELS:88 sampling procedure by which high schoolsophomores were added in the first follow-up who were not in theeighth grade in the U.S. two years before. This process wasrepeated in the second follow-up, adding high school seniors whowere not in the eighth grade in the U.S. four years before, and notin the tenth grade in the U.S. two years before. This processensured that the sample would be representative of the 1992 seniorclass by allowing 1992 seniors who did not have a chance forselection into the base year (or the first follow-up) sample tohave some probability of 1992 selection.GED recipient: A person who has obtained certification of highschool equivalency by meeting state requirements and passing anapproved exam, which is intended to provide an appraisal of theperson's achievement or performance in the broad subject matterareas usually required for high school graduation. (See entry for"GED test" and "Alternative completer.")
GED test: General Educational Development test. A testadministered by the American Council on Education as the basis forawarding a high school equivalent certification.
HS&B: High School and Beyond. The second in the series oflongitudinal education studies sponsored by NCES. The HS&B BaseYear study surveyed sophomore and senior students in 1980.
IEP: Individualized Education Program in special education forstudents with a mental or physical disability.
IRT: Item Response Theory. A method of estimating achievementlevel by considering the pattern of right, wrong, and omittedresponses on all items administered to an individual student.Rather than merely counting right and wrong responses, the IRTprocedure also considers characteristics of each of the test items,such as their difficulty, and the likelihood that they could beguessed correctly by low-ability individuals. IRT scores are lesslikely than simple number-right or formula scores to be distortedby correct guesses on difficult items if a student's responsevector also contains incorrect answers to easier questions.Another attribute of IRT that makes it useful for NELS:88 is thecalibration of item parameters for all items administered to allstudents. This makes it possible to obtain scores on the samescale for students who took harder or easier forms of the test.IRT also permits vertical scaling of the three grade levels (grade8 in 1988, grade 10 in 1990, grade 12 in 1992).
Item nonresponse: The amount of missing information when a validresponse to an item or variable was expected. (See entry for"Unit-nonresponse.")
LEP: Limited English Proficient. A concept developed to assist inidentifying those language-minority students (individuals from non-English language backgrounds) who need language assistanceservices, in their own language or in English, in the schools.
L-6

F2: Parent ComponentData File User's Manual
(See entries for "NEP" and "LM.") The Bilingual Education Act,reauthorized in 1988 (PL 100-297), describes a limited Englishproficient student as one who:
1) meets one or more of the following conditions:a) the student was born outside of the United States or
the student's native language is not English;b) the student comes from an environment where a language
other than English is dominant; orc) the student is American Indian or Alaskan Native and
comes from an environment where a language other thanEnglish has had a significant impact on his/her levelof English language proficiency; and
2) has sufficient difficulty speaking, reading, writing, orunderstanding the English language to deny him or her theopportunity to learn successfully in English-only classrooms.
LM: Language Minority. A fully English proficient student inwhose home a non-English language is typically spoken. This groupsincludes students whose English is fluent enough to benefit frominstruction in academic subjects offered in English.
Longitudinal or panel survey: In a longitudinal design, similarmeasurements--of the same sample of individuals, institutions,households or of some other defined unit--are taken at multipletime points. NELS:88 employs a longitudinal design that follows thesame individuals over time, and permits the analysis of individual-level change. (See entry for "Cross-sectional survey.")
Machine editing: Also called forced data cleaning or logicalediting. Uses computerized instructions in the data cleaningprogram that ensure common sense consistency within and across theresponses from a data provider.
Microdata (microrecords): Observations of individual samplemembers, such as those contained on the NELS:88 data files.
MSA: Metropolitan statistical area. A large population nucleusand the nearby communities which have a high degree of economic andsocial integration with that nucleus. Each MSA consists of one ormore entire counties (or county equivalents) that meet specifiedstandards pertaining to population, commuting ties, andmetropolitan character. (However, in New England, towns andcities, rather than counties, are the basic units.) MSAs aredesignated by the Office of Management and Budget (OMB). An MSAincludes a city and, generally, its entire urban area and theremainder of the county or counties in which the urban area islocated. A MSA also includes such additional outlying countieswhich meet specified criteria relating to metropolitan characterand level of community of workers into the central city orcounties.
Multidimensional raking: An adjustment procedure in weightingwhereby the sum of the weights for each marginal category of
L-7

F2: Parent ComponentData File User's Manual
respondents in the follow-up rounds of NELS:88 was made equal tothe corresponding sum of the final prior round weights for thatgroup.
NAEP: The National Assessment of Educational Progress.
NAIS: The National Association of Independent Schools. Thisorganization endorsed NELS:88. NAIS schools form a base year schoolsampling stratum in NELS:88, and NAIS constitutes a category withinthe restricted use file school control type variable.
NCEA: The National Catholic Educational Association. Thisorganization endorsed NELS:88.
NCES: The National Center for Education Statistics, Office ofEducational Research and Improvement, of the U.S. Department ofEducation. This governmental agency is the primary sponsor ofNELS:88, and is also the sponsoring agency for (among otherstudies) NAEP, HS&B, and NLS-72.
NELS:88: The National Education Longitudinal Study of 1988. Thirdin the series of longitudinal education studies sponsored by NCES.The study began in 1988 with the eighth-grade class of that year.The study has collected data in 1988, 1990, and 1992 on student'sschool experiences, as well as background information from schooladministrators, teachers and parents (in the base year and secondfollow-up only). The study seeks to learn about students'educational experiences and outcomes from eighth grade through highschool and beyond.
NEP: No English Proficiency. A student who does not speakEnglish. (See entry for "LEP.")
NLS-72: The National Longitudinal Study of the High School Classof 1972. This project was the first in the series of longitudinaleducation studies sponsored by NCES.Noncertainty schools: Schools in which fewer than four (three, twoor one) NELS:88 students attended. These schools were notsubsampled for participation in the School Administrator, Teacher,and Transcript components. Additionally, the survey instrumentswere not administered in group sessions in the schools, as was donein the certainty schools.
Nonresponse: (See entry for "Item nonresponse" and "Unitnonresponse.")
Nonsampling error: An error in sample estimates that cannot beattributed to sampling fluctuations. Such errors may arise frommany sources including imperfect implementation of samplingprocedures, differential unit or item nonresponse across subgroups,bias in estimation, or errors in observation and recording.
L-8

F2: Parent ComponentData File User's Manual
NORC: The National Opinion Research Center at The University ofChicago. NORC conducts NELS:88 for the National Center forEducation Statistics.
NSF: The National Science Foundation, which is one of the sponsorsof NELS:88. The National Science Foundation awards grants andcontracts to individuals and organizations to conduct research.NSF sponsored two components of the second follow-up: 1) additionsto the student questionnaire to learn about students' experiencesand their exposure to mathematics and science curricula, and 2) ateacher survey of mathematics and science teachers to obtainevaluations of their NELS:88 student(s) and to learn about theirclassroom practices and background preparation for teaching.
OBEMLA: The Office of Bilingual Education and Minority LanguagesAffairs, U.S. Department of Education. OBEMLA funded a NELS:88supplement that inquired into the education experiences of studentswhose native language is other than English.
OMB: The Office of Management and Budget, U.S. Executive Branch.OMB is a federal agency with the responsibility for reviewing allstudies funded by executive branch agencies. OMB reviewed,commented on, and approved the NELS:88 questionnaires, as indicatedby their approval number and its expiration date in the top rightcorner of the questionnaire covers.
Open-ended: A type of question in which the data provider'sresponses are not limited to given alternatives.
Optical disk: A disk that is read optically (e.g., by lasertechnology), rather than magnetically. (See entry for "CD-ROM.")
Optical scanning: A system of recording responses that transfersresponses into machine-readable data through optical mark reading.This method of data capture was used for the NELS:88 studentquestionnaires and cognitive tests, as well as for the parent andteacher questionnaires. (In contrast, responses to certain otherquestionnaires, such as the school administrator questionnaire,were keyed by using conventional data entry methods.) Out-of-sequence: This term means that a student is not in thegrade that he/she would be in if progressing with the majority ofthe cohort through school. For example, most NELS:88 samplemembers were in the tenth grade in the 1989-90 school year; onewould be described as out-of-sequence if found to be in theeleventh grade in the 1989-90 school year.
Parent, NELS-targeted parent/guardian: The NELS:88 ParentComponent sought to collect information from parents of eligiblestudent/dropout respondents. It was asked that the parent orguardian who knew most about his or her child's educationalexperience complete the questionnaire.
L-9

F2: Parent ComponentData File User's Manual
PIN: Personal Identification Number. A unique number assigned toeach district and school.
Population: All individuals in the group to which conclusions froma data collection activity are to be applied. Weighted results ofNELS:88 data provide estimates for populations and subgroups.
Population variance: A measure of dispersion defined as theaverage of the squared deviations between the observed values ofthe elements of a population or sample and the population mean ofthose values.
Postsecondary education: The provision of formal instructionalprograms with a curriculum designed primarily for students who havecompleted the requirements for a high school diploma or equivalent.This includes programs of an academic, vocational, and continuingprofessional education purpose, and excludes avocational and adultbasic education programs.
Poststratification adjustment: A weight adjustment that forcessurvey estimates to match independent population totals withinselected poststrata (adjustment cells).
Precision: The difference between a sample-based estimate and itsexpected value. Precision is measured by the sampling error (orstandard error) of an estimate.
Probability sample: A sample selected by a method such that eachunit has a fixed and determined probability of selection.
QED: Quality Education Data. QED is a commercial firm thatpublishes national directories of all public and private schoolsand districts. Its list of schools in the U.S. constituted thesampling frame for the base year, and provided importantinformation on school location, principal's name, minorityenrollment, and other characteristics.
Range check: A determination of whether responses fall within apredetermined set of acceptable values.
Record format: The layout of the information contained in a datarecord (includes the name, type, and size of each field in therecord).
Records: A logical grouping of data elements within a file uponwhich a computer program acts.
Reliability: The consistency in results of a test or measurementincluding the tendency of the test or measurement to produce thesame results when applied twice to some entity or attributebelieved not to have changed in the interval between measurements.
Sample: Subgroup selected from the entire population.
L-10

F2: Parent ComponentData File User's Manual
Sampling error: The part of the difference between a value for anentire population and an estimate of that value derived from aprobability sample that results from observing only a sample ofvalues.
Sampling variance: A measure of dispersion of values of astatistic that would occur if the survey were repeated a largenumber of times using the same sample design, instrument and datacollection methodology. The square root of the sampling varianceis the standard error.
School administrator questionnaire: This questionnaire was to becompleted by the principal and/or someone designated by theprincipal. The questionnaire sought basic information about schoolpolicies, number of students in each class, curriculum offered,programs for disadvantaged and disabled students, and other schoolcharacteristics.
School climate: The social system and culture of the school,including the organizational structure of the school and values andexpectations within it.
School Coordinator: A person designated in each school to act asa contact person between the school and NORC. This person assistedwith establishing a survey day in the school, and in some caseswhere the school cluster size was very small, the SchoolCoordinator administered the student instruments.
School Effectiveness Study: A component of NELS:88 added to thefirst follow-up to permit the study of school effects. Thesupplement substantially increased cluster sizes and provided in-school representative student samples at approximately 250 urbanand suburban schools in the thirty largest MSAs in order to permitresearchers to assess the impact of various school characteristics(such as structural and management characteristics and schoolclimate) on student outcomes (such as student achievement andeducational experience). This component was continued in thesecond follow-up, and included student, school administrator,teacher, and parent questionnaires, transcript surveys, as well asa course offerings component.
Standard deviation: The most widely used measure of dispersion ofa frequency distribution. It is equal to the positive square rootof the population variance.
Standard error: The positive square root of the sampling variance.It is a measure of the dispersion of the sampling distribution ofa statistic. Standard errors are used to establish confidenceintervals for the statistics being analyzed.
State augmentation students: In the base year, certain statesfunded a sample of additional schools in the state to produce arepresentative sample of schools in the state. In this sense, the
L-11

F2: Parent ComponentData File User's Manual
state's sample was "augmented" to maximize the utility of theNELS:88 data for those states. The students from those base yearschools were designated as "augmentation" students, and werefollowed and surveyed in the first follow-up, though the studentshad dispersed to many tenth-grade schools. In the second follow-upthese students were surveyed again.
Stopout: A student who had one or more occurrences of school non-attendance for 20 or more days (not including any excused absences)who subsequently returned to school. In NELS:88, this term wasused for temporary dropouts within a round (e.g., out of school infall 1989 but back spring 1990, as contrasted to 1990 dropouts whowere back in school in spring term of 1992).
Student questionnaire: One of the two parts of the student survey(the other part is the cognitive test battery). This instrumentcontained a locator section for tracing sample members for futurewaves of NELS:88 and a series of questions about courses taken,hours spent on homework, and perceptions of the school and the homeenvironment.
Survey day: A day chosen by the school during the data collectionperiod when an NORC interviewer and a clerical assistant (or theSchool Coordinator in schools with only a small group of samplemembers) administered the survey to the school's sample ofstudents. The survey day session lasted about three hours for theactual data collection, with about thirty minutes each forpreparation and clean-up/preparation of completed materials formailing.
Teacher questionnaire: Math and science teachers of selectedstudents were asked to complete a teacher questionnaire, whichcollected data on school and teacher characteristics (includingteacher qualifications and experience), evaluations of studentperformance, and classroom teaching practices.
Teacher, NELS-targeted teacher sample: In the base year and firstfollow-up, two teacher reports were sought for each student,reflecting a combination of two subjects from four subject areas(English, social studies, science, mathematics). In the secondfollow-up, one teacher report per pupil was sought for thosestudents who were enrolled mathematics, science, or both, in one ofthe schools designated for school contextual data collection.
Tracing: The locating (and ascertaining of school enrollmentstatus) of NELS:88 sample members. Sample members were traced atsix points in time subsequent to eighth grade: autumn term 1988,autumn term 1989, spring term 1990, autumn term 1990, autumn term1991, and spring term 1992.
Transfer student: A NELS:88 sample member who moved from oneschool to another after the subsampling of schools between Phase 1(the tracing of sample members to their school of enrollment) and
L-12

F2: Parent ComponentData File User's Manual
Phase 2 (the re-verification of sample members' school ofenrollment).
Unit nonresponse: Failure of a survey unit (for example, at theinstitutional level, a school, or at the individual level, arespondent, such as a student or a teacher) to cooperate orcomplete survey instrument. Unit nonresponse may be contrasted toitem nonresponse, which is the failure of a participating samplemember to give a valid response to a particular question on asurvey instrument.
Validity: The capacity of an item or measuring instrument tomeasure what it was designed to measure; stated most often in termsof the correlation between scores in the instrument and measures ofperformance on some external criterion. Reliability, on the otherhand, refers to consistency of measurement over time. (See entryfor "Reliability.")
Variance: See entry for "Population variance" and "Samplingvariance."
Weighted estimates: Estimates from a sample survey in which thesample data are statistically weighted (multiplied) by factorsreflecting the sample design. The weights (referred to as samplingweights) are typically equal to the reciprocals of the overallselection probabilities, multiplied by a nonresponse orpoststratification adjustment. Thus, for example, the 1,035completed school administrator questionnaires in the NELS:88 baseyear represent a population of 38,774 schools. Individualcompleted cases (that is, base year school administratorquestionnaires) may "represent" anywhere from a minimum of 1.5schools to a maximum of 387.3 schools. To take another example,12,111 base year questionnaire respondents reported themselves tobe male, and a slightly greater number (12,244) reported themselvesto be female. When these cases are multiplied by the nonresponse-adjusted student weights to yield a weighted percent that reflectsthe national population of eighth graders, the estimate for malesis 50.1 percent of the 1988 eighth-grade cohort while females areestimated to comprise 49.9 percent of the nation's 1988 eighthgraders.
L-13