Community Solar Marketing - Alexandria (UniSG)
150
Community Solar Marketing DISSERTATION of the University of St.Gallen, School of Management, Economics, Law, Social Sciences, International Affairs and Computer Science, to obtain the title of Doctor of Philosophy in Management submitted by Alexander Stauch from Germany Approved on the application of Prof. Dr. Rolf Wüstenhagen and Prof. Dr. Dr. h.c. Torsten Tomczak Dissertation no. 5078 Difo-Druck GmbH, Untersiemau 2021
-
Upload
khangminh22 -
Category
Documents
-
view
1 -
download
0
Transcript of Community Solar Marketing - Alexandria (UniSG)

Community Solar Marketing
DISSERTATION of the University of St.Gallen,
School of Management, Economics, Law, Social Sciences,
International Affairs and Computer Science, to obtain the title of
Doctor of Philosophy in Management
submitted by
Alexander Stauch
from
Germany
Approved on the application of
Prof. Dr. Rolf Wüstenhagen
and
Prof. Dr. Dr. h.c. Torsten Tomczak
Dissertation no. 5078
Difo-Druck GmbH, Untersiemau 2021

The University of St.Gallen, School of Management, Economics, Law, Social Sciences, International Affairs and Computer Science, hereby consents to the printing of the present dissertation, without hereby expressing any opinion on the views herein expressed. St.Gallen, October 23, 2020 The President: Prof. Dr. Bernhard Ehrenzeller

III
ACKNOWLEDGEMENT Writing this dissertation was a varied and challenging journey. During this exciting time, I was able to learn a lot in the field of scientific research and the application of empirical methods. I also had my first experiences with journal publications and the review process, which was very valuable. In summary, it can be said that I have learned a lot about the whole academic research process. This learning process was of course not always easy. But, thanks to a very supportive team at IWOE, which always provided me with valuable input and feedback, I was able to master all challenges and difficulties. Special thanks go to my two co-authors, Pascal Vuichard and Karoline Gamma, who were both willing to offer me valuable feedback on my work, even beyond the co-authored papers. Special thanks also go to Prof. Rolf Wüstenhagen, who, as supervisor of my dissertation, always provided me with guidance and inspiring feedback as well. A further thank you goes to the local utility of St.Gallen (St.Galler Stadtwerke (SGSW)), which, based on their industry experience, agreed to review the community solar offerings used in the experiments for their practical suitability. Additional thanks go to the institutions that provided funding for the research conducted in this dissertation. Namely, the Swiss National Science Foundation (SNF), NRP70 Energy Turnaround (Project Number 407040_153909), and the Swiss Competence Center for Energy Research SCCER CREST. Last but not least, I would also like to thank Simon John Milton, who proofread this dissertation. St.Gallen, December 2020 Alexander Stauch

IV
TABLE OF CONTENTS
ACKNOWLEDGEMENT ........................................................................................... II
TABLE OF CONTENTS ........................................................................................... IV
LIST OF ABBREVIATIONS .................................................................................. VII
LIST OF FIGURES ................................................................................................ VIII
LIST OF TABLES ...................................................................................................... IX
ABSTRACT .................................................................................................................. X
ZUSAMMENFASSUNG ............................................................................................ XI
REFEREED DISSERTATION PAPERS ............................................................... XII
1. INTRODUCTION ..................................................................................................... 1
2. COMMUNITY SOLAR ........................................................................................... 4
2.1 ABOUT COMMUNITY SOLAR ...................................................................................... 4 2.2 MARKETS AND DEVELOPMENT ................................................................................. 5 2.3 CUSTOMER SATISFACTION AND ENGAGEMENT ......................................................... 6 2.4 COMMUNITY SOLAR IN THE ACADEMIC LITERATURE ................................................ 7
3. RESEARCH QUESTIONS AND OBJECTIVES .................................................. 9
4. THEORY AND LITERATURE ............................................................................ 12
4.1 PAPER 1: SOLAR ADOPTION LITERATURE ............................................................... 12 4.2 PAPER 2: MOTIVATION THEORY AND CROWDING OUT ........................................... 13 4.3 PAPER 3: THE CONCEPT OF BUNDLING IN MARKETING LITERATURE ..................... 14
5. CONCEPTUAL FRAMEWORK AND STRUCTURE ...................................... 16
6. METHODS, DATA AND ANALYSES ................................................................. 19
7. OVERALL FINDINGS AND CONCLUSIONS .................................................. 21
7.1 RESEARCH FINDINGS, CONCLUSIONS, AND LITERATURE CONTRIBUTIONS ................ 21 7.2 PRACTICAL IMPLICATIONS: MARKETING FOR COMMUNITY SOLAR ........................... 23 7.3 POLICY RECOMMENDATIONS ................................................................................. 26
8. LIMITATIONS AND OUTLOOK ........................................................................ 27
REFERENCES ............................................................................................................ 29
PAPER 1: COMMUNITY SOLAR AS AN INNOVATIVE BUSINESS MODEL FOR BUILDING-INTEGRATED PHOTOVOLTAICS - AN EXPERIMENTAL ANALYSIS WITH SWISS ELECTRICITY CONSUMERS ................................. 37
ABSTRACT ................................................................................................................... 38 1. INTRODUCTION ....................................................................................................... 39

V
2. LITERATURE REVIEW AND HYPOTHESIS DEVELOPMENT ........................................... 42 2.1 Adoption of (BI)PV .......................................................................................... 42 2.2 Community Solar as an Innovative business model for PV ............................. 44
3. METHODOLOGY AND DATA ...................................................................................... 47 3.1 Experimental stimulus and treatment .............................................................. 47 3.2 Recruitment and procedure for participants ................................................... 49 3.3 Measures and variables ................................................................................... 50 3.4 Sample ............................................................................................................. 50
4. RESULTS AND DISCUSSION ....................................................................................... 52 4.1 Results .............................................................................................................. 52 4.2 Discussion ........................................................................................................ 54
5. CONCLUSIONS AND IMPLICATIONS ........................................................................... 55 5.1 Conclusions and implications for policy makers and practitioners ................ 56 5.2 Limitations and Further Research ................................................................... 57
ACKNOWLEDGMENTS .................................................................................................. 58 REFERENCES ............................................................................................................... 59 APPENDIX ................................................................................................................... 68
PAPER 2: CASH VS. SOLAR POWER: AN EXPERIMENTAL INVESTIGATION OF THE REMUNERATION-RELATED DESIGN OF COMMUNITY SOLAR OFFERINGS ..................................................................... 71
ABSTRACT ................................................................................................................... 72 1. INTRODUCTION ....................................................................................................... 73 2. THEORY AND HYPOTHESIS DEVELOPMENT ................................................................ 76 2.1. Generic community solar models in practice ................................................. 76 2.2. Customer segments ......................................................................................... 78 2.3. The attractiveness of different community solar models for different customer segments: Motivation theory ................................................................................. 78
3. METHODOLOGY AND DATA ...................................................................................... 82 3.1 Experimental stimulus and treatment .............................................................. 82 3.2. Procedure ....................................................................................................... 84 3.3. Measures and variables .................................................................................. 84 3.4. Sample ............................................................................................................ 85
4. RESULTS AND DISCUSSION ....................................................................................... 87 5. CONCLUSIONS AND POLICY IMPLICATIONS ............................................................... 90 6. LIMITATIONS AND FURTHER RESEARCH .................................................................... 93 ACKNOWLEDGMENTS .................................................................................................. 94 REFERENCES ............................................................................................................... 94 APPENDIX ................................................................................................................. 100
PAPER 3: INCREASING WILLINGNESS TO BUY AN ELECTRIC CAR: THE ADDED VALUE OF COMMUNITY SOLAR - AN EXPERIMENTAL INVESTIGATION OF PRODUCT-BUNDLING OPPORTUNITIES IN GERMANY ............................................................................................................... 102

VI
ABSTRACT ................................................................................................................. 103 1. INTRODUCTION ..................................................................................................... 104 2. LITERATURE REVIEW AND HYPOTHESES DEVELOPMENT ........................................ 107 2.1. Product Bundling in Marketing Literature ................................................... 107 2.2. The bundling of EVs and Solar Power ......................................................... 108 2.3. The bundling of EVs and Community Solar ................................................. 109 2.4. Policy Support: The Role of Financial Incentive Mechanisms .................... 111
3. METHODOLOGY AND DATA .................................................................................... 113 3.1 Experimental Survey Design ......................................................................... 113 3.2. Treatments .................................................................................................... 114 3.3. Measures and variables ................................................................................ 115 3.4 Recruitment and procedure for participants ................................................. 117 3.5. Sample .......................................................................................................... 118
4. RESULTS AND DISCUSSION ..................................................................................... 120 4.1 Results ............................................................................................................ 120 4.2 Discussion ...................................................................................................... 124
5. CONCLUSIONS AND IMPLICATIONS ......................................................................... 126 5.1 Theoretical conclusions ................................................................................. 126 5.2 Practical and political implications .............................................................. 126 5.3 Limitations and further research ................................................................... 127
ACKNOWLEDGEMENTS .............................................................................................. 129 REFERENCES ............................................................................................................. 129 APPENDIX ................................................................................................................. 136
CURRICULUM VITAE ........................................................................................... 138

VII
LIST OF ABBREVIATIONS ANOVA Analysis of variance ANCOVA Analysis of covariance BIPV Building integrated photovoltaics CHF Swiss Francs CO2 Carbon dioxide e.g. Exempli gratia (“for example”) EMBC Ethically-minded consumer behavior et al. Et alia (“and others”) etc. Et cetera (“and so forth”) EV Electric vehicle ewz Elektrizitätswerke Zürich (“electric utility company of
Zürich”) GW Gigawatt IEA International Energy Association kWh Kilowatt hour MW Megawatt n.a. Not applicable NRP National research project No. Number p. Page PV Photovoltaic(s) SEIA Solar Energy Industry Agency SNF Swiss National Science Foundation SPSS Statistical package for the social sciences U.S. United States (of America) WTB Willingness to buy

VIII
LIST OF FIGURES FIGURE 1: COMMUNITY SOLAR - CUMULATIVE INSTALLED MEGAWATTS
IN THE U.S. (SEIA, 2020B) .................................................................................... 6 FIGURE 2: CONCEPTUAL FRAMEWORK OF DISSERTATION PAPERS .......... 16 FIGURE 3: DISSERTATION PAPERS CLASSIFIED ACCORDING TO THE 4 P
MARKETING MIX (BASED ON MCCARTHY, 1960) FOR COMMUNITY SOLAR .................................................................................................................. 17
Paper 1 FIGURE 1: BIPV SOLAR MODULES FOR COMMUNITY SOLAR (GROUP 1) .. 48 FIGURE 2: CONVENTIONAL SOLAR PANELS FOR COMMUNITY SOLAR
(GROUP 2) ............................................................................................................ 49 FIGURE 3: WTB SCALE OUTCOME (FIVE-POINT LIKERT SCALE) PER
GROUP .................................................................................................................. 52 FIGURE 4: COMPARISON OF WTB MEANS PER GROUP ................................... 53 Paper 2 FIGURE 1: GENDER AND AGE DISTRIBUTION OF SAMPLE AND SWISS
POPULATION (SWISS FEDERAL OFFICE OF STATISTICS, 2018) ............. 85 FIGURE 2: INCOME DISTRIBUTION OF SAMPLE AND SWISS POPULATION
(SWISS FEDERAL OFFICE OF STATISTICS, 2014) ........................................ 86 FIGURE 3: POLITICAL ATTITUDES OF SAMPLE AND SWISS
PARLIAMENTARY SEATS (SWISS PARLIAMENT, 2018) ........................... 86 FIGURE 4: SHARE OF GREEN ELECTRICITY CUSTOMERS IN SAMPLE AND
SWISS POPULATION (SWISS FEDERAL OFFICE OF ENERGY, 2018B) ..... 86 FIGURE 5: MEAN OF WILLINGNESS TO BUY SOLAR PANELS – ACROSS ALL
GROUPS ............................................................................................................... 89 Paper 3 FIGURE 1: INTEREST AND WILLINGNESS TO BUY AN EV/BUNDLE PER
GROUP ................................................................................................................ 121 FIGURE 2: SHARE OF PARTICIPANTS WHO “AGREED” OR “FULLY AGREED”
THAT ITEMS FROM THE ADDED VALUE SCALE ADDED VALUE TO THE BUNDLE ............................................................................................................. 122

IX
LIST OF TABLES TABLE 1: OVERVIEW OF ALL REFEREED DISSERTATION PAPERS ............ XII TABLE 2: OVERVIEW OF ALL RESEARCH QUESTIONS AND OBJECTIVES
FOR EACH RESEARCH PAPER ........................................................................ 11 TABLE 3: OVERVIEW OF DISSERTATION PAPERS ............................................ 18 TABLE 4: SUMMARY OF 4 P MARKETING MIX FOR COMMUNITY SOLAR . 25 Paper 1 TABLE 1: SAMPLE CONFIGURATION AND COMPARISON WITH SWISS
POPULATION ...................................................................................................... 51 TABLE 2: ANCOVA SPSS OUTPUT TABLE ........................................................... 54 Paper 2 TABLE 1: COMMUNITY SOLAR MODELS AND ASSOCIATED CUSTOMER
REMUNERATION ............................................................................................... 77 TABLE 2: TYPES OF REWARD PER REMUNERATION MODEL ....................... 79 TABLE 3: EXPERIMENTAL TREATMENT PER REMUNERATION MODEL .... 83 Paper 3 TABLE 1: SURVEY ITEMS USED TO MEASURE THE ADDED VALUE OF AN
EV AND COMMUNITY SOLAR BUNDLE ..................................................... 116 TABLE 2: DATA SAMPLE CONFIGURATION: TOTAL AND PER GROUP ..... 119 TABLE 3: MULTIPLE REGRESSION ANALYSIS ON WILLINGNESS TO BUY
THE BUNDLE – SPSS OUTPUT ...................................................................... 123

X
ABSTRACT In order to remain within the two-degree target agreed on by almost all countries in the world at the Climate Conference in Paris in 2015, new business models that promote the spread of renewable energies such as wind, hydro, and solar power are extremely relevant. One of these new business models is community solar. Community solar allows all electricity customers, regardless of whether they own a house with a suitable roof, to participate in a local solar installation and in return receive compensation in the form of solar power or a financial equivalent. In order to formulate practically relevant marketing recommendations that promote the spread of community solar, this dissertation examined various marketing aspects in more detail through the creation of three research papers. The basis for the related research was scientific theories, literature analyses, and observations about best-practice examples. Based on experimental online surveys, representative samples were then collected for all three research papers to identify how electricity customers react to variations in different experimental factors within community solar offerings. The results of the three studies contribute to the newly emerging scientific literature stream on community solar, and have many relevant implications for practice and policy makers. One general finding is the very significant market potential of more than 60% of all electricity customers in Switzerland for community solar. Furthermore, it was shown that community solar can be implemented using different photovoltaic technologies without influencing customer adoption. It was also found that customer segmentation based on customer motivation and communication designed specifically for such segments may be particularly worthwhile, as advertising messages based on extrinsic factors can have the opposite effect on these customer segments. Paper 3 examined product bundling opportunities in terms of combining community solar with electric vehicles. It was found that such bundling creates added value for customers, significantly increasing willingness to buy a bundle compared to willingness to buy an electric vehicle without community solar. This indicates that electric vehicle dealers are best positioned to be indirect and additional distribution channels, as well as general partners of community solar providers. The findings of this dissertation help create a 4 P marketing mix that provides practical guidance for successful community solar marketing.
XI
ZUSAMMENFASSUNG Damit das zwei-Grad Ziel, welches an der Klimakonferenz 2015 in Paris von nahezu allen Ländern der Welt vereinbart wurde, erreicht werden kann, sind neue Geschäftsmodelle welche die Verbreitung von erneuerbaren Energien wie Wind-, Wasser- und Solarstrom fördern äusserst relevant. Eines dieser neuartigen Geschäftsmodelle ist Community Solar. Community Solar erlaubt es allen Stromkunden, unabhängig davon ob man ein Haus mit passendem Dach dazu besitzt, sich an einer lokalen Solaranlage zu beteiligen und im Gegenzug dafür eine Vergütung in Form von Solarstrom oder einem finanziellen Gegenwert zu erhalten. Um praktisch relevante Marketingempfehlungen zu formulieren, welche die Verbreitung von Community Solar fördern sollen, wurden in dieser Dissertation anhand von drei Forschungsartikeln verschiedene Marketingaspekte genauer untersucht. Die Grundlage dazu wurde durch wissenschaftliche Theorien, Literaturanalysen und Beobachtungen von Best Practice Beispielen geschaffen. Basierend auf experimentellen online Fragebögen wurden dann für alle drei Forschungspaper repräsentative Stichproben erhoben, um herauszufinden, wie Stromkunden auf das Variieren von verschiedenen experimentellen Faktoren innerhalb von Community Solar Angeboten reagieren. Die Ergebnisse der drei Studien tragen dabei zum neu aufkommenden wissenschaftlichen Literaturstrang über Community Solar bei und haben viele relevante Implikationen für die Praxis, aber auch für politische Entscheidungsträger. Grundsätzlich wurde für Community Solar ein sehr hohes Marktpotential von über 60% aller Stromkunden in der Schweiz festgestellt. Des weiteren konnte aufgezeigt werden, das Community Solar mit verschiedenen Photovoltaiktechnologien realisiert werden kann, ohne das es einen Einfluss auf die Kundenadoption hat. Es wurde auch festgestellt, dass sich eine Kundensegmentierung basierend auf der Kundenmotivation sowie eine separate Kommunikation für diese Segmente besonders lohnen kann, da Werbebotschaften basierend auf extrinsischen Faktoren für diese Kundensegmente entgegengesetzte Wirkungen erzielen. In der dritten Studie wurden Produkt-bündelungsmöglichkeiten von Community Solar mit Elektroautos untersucht, wobei zum Vorschein kam, dass durch diese Bündelung ein Zusatznutzen für Kunden entsteht wodurch sich die Kaufbereitschaft im Vergleich zu einem Elektroauto ohne Community Solar signifikant erhöht. Dies zeigt auf, dass Elektroautohändler als indirekte Vertriebswege sowie als generelle Partner von Community Solar Anbietern bestens geeignet sind. Die Ergebnisse dieser Dissertation wurden in einem 4 P Marketing-Mix zusammengefasst.

XII
REF
EREE
D D
isser
tatio
n Pa
pers
Ta
ble
1: O
verv
iew
of a
ll re
fere
ed d
isse
rtatio
n pa
pers
a Institute for Economy and the Environment (IWÖ-HSG), University of St.Gallen, Switzerland
b European Photovoltaic Solar Energy Conference
The
EU P
VSE
C is
the
larg
est i
nter
natio
nal c
onfe
renc
e fo
r pho
tovo
ltaic
rese
arch
, tec
hnol
ogie
s an
d ap
plic
atio
ns, a
nd to
p in
tern
atio
nal P
V in
dustr
y ex
hibi
tions
. It g
athe
rs th
e gl
obal
PV
com
mun
ity to
con
duct
bus
ines
s, to
net
wor
k, a
nd to
pre
sent
and
disc
uss t
he la
test
deve
lopm
ents
and
inno
vatio
ns in
pho
tovo
ltaic
s. It
is th
e w
orld
-reno
wne
d, sc
ienc
e-to
-sci
ence
, bus
ines
s-to
-bus
ines
s and
scie
nce-
to-in
dustr
y pl
atfo
rm w
ith a
full
and
sole
focu
s on
the
glob
al P
V so
lar s
ecto
r. c Behavior, Energy, and Climate Change Conference
The
Beha
vior
, Ene
rgy
& C
limat
e Ch
ange
Con
fere
nce
(BEC
C) is
the
prem
ier i
nter
natio
nal c
onfe
renc
e fo
cuse
d on
und
ersta
ndin
g hu
man
beh
avio
r and
dec
ision
mak
ing
and
usin
g th
at k
now
ledg
e to
acc
eler
ate
the
trans
ition
to a
low
-car
bon
futu
re.
d Renewable Energy Management Forum
The
Rene
wab
le E
nerg
y M
anag
emen
t For
um is
the
lead
ing
rene
wab
le e
nerg
y co
nfer
ence
in S
witz
erla
nd, a
t whi
ch a
cade
mic
s an
d in
dustr
y pr
actit
ione
rs m
eet t
o ta
lk a
bout
the
late
st in
dustr
y tre
nds a
nd a
cade
mic
rese
arch
insig
hts.
The
foru
m is
ann
ually
org
aniz
ed b
y th
e ch
air o
f ren
ewab
le e
nerg
y m
anag
emen
t at t
he U
nive
rsity
of S
t.Gal
len.
No.
T
itle
Aut
hor(
s)
Publ
icat
ion
Stat
us
Pres
enta
tions
1 C
omm
unity
Sol
ar a
s an
Inno
vativ
e B
usin
ess
Mod
el fo
r Bui
ldin
g -In
tegr
ated
Pho
tovo
ltaic
s A
n Ex
perim
enta
l Ana
lysi
s with
Sw
iss
Elec
trici
ty C
onsu
mer
s
Stau
cha ,
Ale
xand
er;
Vui
char
da , Pa
scal
Publ
ishe
d in Energy & Buildings
, V
olum
e 20
4, 2
019
Acc
epte
d 11
Oct
ober
201
9
EU P
VSE
Cb 2
019,
Mar
seill
e (b
est p
oste
r aw
ard)
R
EMd F
orum
201
9, S
t.Gal
len
2 C
ash
vs. S
olar
Pow
er:
An
expe
rimen
tal i
nves
tigat
ion
of th
e re
mun
erat
ion -
rela
ted
desi
gn o
f com
mun
ity
sola
r off
erin
gs
Stau
ch,
Ale
xand
er;
Gam
maa ,
Kar
olin
e
Publ
ishe
d in
Energy Policy,
V
olum
e 13
8, 2
020
Acc
epte
d 23
Dec
embe
r 201
9
BEC
Cc 2
018,
Was
hing
ton
D.C
. R
EM F
orum
201
8, S
t.Gal
len
3 In
crea
sing
Will
ingn
ess t
o B
uy a
n El
ectri
c C
ar: t
he A
dded
Val
ue o
f Com
mun
ity S
olar
A
n ex
perim
enta
l inv
estig
atio
n of
pro
duct
-bu
ndlin
g op
portu
nitie
s in
Ger
man
y
Stau
ch,
Ale
xand
er
Subm
itted
to Energy Research &
Social Science
on
1 M
ay 2
020
St
atus
: und
er re
view
EU P
VSE
C 2
020
(exp
ecte
d in
Sep
tem
ber
2020
) R
EM F
orum
202
0 (e
xpec
ted
in S
epte
mbe
r 20
20)

1
1. Introduction Climate change is one of the most pressing societal and environmental long-term challenges that humanity is facing. The negative consequences of climate change, such as rising sea level, air pollution, an increasing number of droughts and extreme weather events, and a loss of biodiversity (Ciscar et al., 2011; Lavaniegos, 2018), as well as indirect negative consequences such as an increase in health-related issues resulting from air pollution and an increase in temperature, along with agricultural problems stemming from a change in climate zones (Dellink et al., 2019; Kellogg, 2019) are already becoming visible around the globe, and will become even more pronounced in the coming years if our behavior and our global economic system do not change fundamentally (Jacobson et al, 2017; Peters et al., 2020). In order to prevent these negative consequences from ocurring, political leaders of nearly all countries in the world agreed in 2015 at the Paris Climate Conference to attempt to limit global warming by a maximum of two degrees Celsius by 2050 (Spash, 2016). The Paris climate agreement showed that nations and governments have understood that climate change is a global problem, leading to an international and collective consensus to act against the negative consequences. In order to maintain state sovereignty, however, all countries can decide for themselves and on their own responsibility what measures they want to take to reduce their greenhouse gases in order to meet the two-degree target. Since 86% of anthropogenic carbon dioxide (CO2) emissions are a result of burning fossil energy sources, such as oil, gas, and coal (Podbregar, 2019), it will be crucial to replace these energy sources with other sources of energy, such as renewable energy from solar, wind, hydro, and biomass. To facilitate the transition from fossil energy to renewable energy, many countries have introduced policy support measures, such as feed-in tariffs for electricity produced from renewables or direct purchasing subsidies for electric vehicles (EVs), or renewable energy installations for increasing the share of renewable energy (Solangi et al., 2011; Hardman et al., 2017; Rosen, 2020). Besides all the international and national effort to increase the deployment of renewable energies to mitigate climate change, global CO2 emissions have still increased with every year that has passed since the Paris Agreement (Peters et al., 2020). The reasons for this are manifold. On the one hand, renewable energy projects often have problems with local acceptance when it comes to implementation, as such projects often involve

2
interventions that affect nature or landscapes respectively townscapes. Second, political measures for energy system transformation have not been designed with enough ambition, because although renewable energies have been and continue to be promoted, the consumption of fossil energy has not yet been made less attractive (Chepeliev & van der Mensbrugghe, 2020). Consequently, political actors and businesses worldwide need to increase their efforts to meet the two-degree target and prevent our planet from irreparable climate damage. Besides more ambitious political measures for reducing fossil energy consumption, more environmental products and climate solutions must also make the shift from niche options to mass market ones to increase the variety of cost-competitive green alternatives to fossil energy-based technologies (Minx et al., 2017). These green alternatives include the production of renewable energy from wind, sun, hydro, and biomass, which should replace fossil energy sources in the long term. However, considering the global share of 18% of renewable energies in total energy consumption (World Bank, 2020), it is clear that there is still a long way to go before the Paris climate goal is reached. But there is also light at the end of the tunnel. Many green technologies, such as electric vehicles and battery storage systems, but also renewable electricity generation from solar and wind power, have developed very significantly over the last few years and their importance and competitiveness have increased significantly (Jacobson et al, 2017). Solar energy in particular is seen as one of the most promising sources of green electricity for the future (Creutzig et al., 2017), which is why it has received strong political support in many countries over the last 20 years (Ryan et al., 2019; Solangi et al., 2011). This has led to a significant and rapid reduction in the production price of solar power, while the efficiency of solar panels has steadily improved. The production price of solar power in Switzerland has fallen by more than 88% over the last 20 years, from nearly 1.00 CHF per kilowatt hour (kwh) in the year 2000 (Schweizerische Energiestiftung, 2020) to around 0.12 CHF per kWh as of today (Swissolar, 2020), while efficiency has improved over the same period from 11% to 22% (Wirth & Schneider, 2012; Wirth, 2020). This makes solar power a good example of a product that has undergone the shift from niche to mass market quite successfully. Also in relation to Switzerland, it is assumed that solar energy will be one important pillar of a successful energy transition, and could cover up to 25% of total domestic electricity demand by 2035 if its deployment is continuously expanded (Schweizerische

3
Energiestiftung, 2020). In addition, solar energy creates positive emotions for many customers, which makes it to one of the most preferred sources of electricity (Gamma et al, 2017; Volken et al., 2018). Home solar power systems in particular are enjoying ever greater popularity thanks to the aforementioned ever-lower prices and improved efficiency, resulting in high growth rates in several countries, including Switzerland (Curtius et al., 2018; SEIA, 2020a). The problem with home solar systems is that they require significant initial investment and are typically only available to property and house owners, which excludes the large majority of electricity customers (in Switzerland, around 62% of the population are tenants and do not own property on which to install a solar system. This share is even higher in urban areas (Swiss Federal Office of Statistics, 2019)). Thus, in order to exploit the full potential of solar energy, which will be important for staying within the two-degree target, additional, new solutions are needed that reach a wider range of customers and maintain the high growth rates of solar power. One of these new solutions is “community solar,” which is the focus of this dissertation.

4
2. Community Solar 2.1 About community solar Community solar1 is an innovative business model for increasing the diffusion of solar energy. This new business model enables all electricity customers to participate financially in a local solar system to a self-determined extent, and in return receive remuneration, financial or non-financial, for a predetermined period of time. Customers can participate by buying, or in some cases by leasing, shares in the form of solar panels, solar square meters, or solar units from a local solar system. In return, financial remuneration includes annual electricity bill reductions or direct cash payments to a customer’s account, while non-financial remuneration in most cases is represented by solar energy that comes directly from the system, for use at the customer’s home (Funkhouser et al., 2015). Contract duration can range up to 20 years, which corresponds with the guaranteed minimum lifetime of a photovoltaic (PV) system. In most cases, the contract duration has a long-time horizon but includes the possibility for cancellation at any time. Providers of community solar can be local utility companies2 or a third party (e.g. community solar start-ups, solar power companies, or non-profit organizations such as cooperatives or citizens' associations), while the electricity that is produced is fed directly into the local power grid of the utility company. Community solar addresses several of the prevailing barriers to home solar system adoption. Specifically, customers do not need to make a large capital investment, nor have their own property on which to install a solar system in order to benefit from community solar. Additionally, customers do not have to worry about the installation and planning process, maintenance, or insurance, nor the disassembly and recycling of the solar system, since this is all done by the utility company or a third-party entity, which creates further customer benefits in terms of increased convenience, as well as a reduction in complexity and cost (Augustine & McGavisk; Chan et al., 2017; Mah, 2019; SEIA, 2020b) . As a result, community solar projects can take various different forms in practice, depending on the provider and its purpose, as well as on community solar offering configuration in terms of remuneration design, contract duration, and form of
1 In the literature, but also in practice, community solar is sometimes also referred to as shared solar. In this dissertation, the term “community solar” is used; the term has also become more frequently used in literature and practice (SEIA, 2020b). 2 This dissertation focuses on utility-based community solar offerings, because in Switzerland only local utility companies are allowed to sell electricity to private customers (due to the partial liberalization of the electricity market).

5
participation (Chan et al., 2017; Mah, 2019). There are multiple definitions of community solar (Funkhouser et al., 2015), although the ultimate basic idea always remains the same: to make the economic and ecological benefits of local solar power accessible to all community members by offering different forms of financial participation, regardless of whether individuals are tenants or house-owners (SEIA, 2020b). Depending on the configuration, community solar projects come with various advantages for their providers, such as business development opportunities, increased customer engagement and stronger customer retention, new revenue and profit streams, and access to almost free investment capital raised from customers’ financial participation. Additionally, community solar can also support utilities by contributing to the building of a stronger, more distributed, and resilient power grid, since it can be installed at many beneficial locations within the community (Augustine & McGavisk; Chan et al., 2017; Funkhouser et al., 2015). In summary, community solar offers a lot of benefits, not only for providers, but also for customers. By reducing the need for a large upfront investment, and by eliminating the need for suitable private property for a solar system installation, community solar has the potential to make solar energy accessible to electricity customers throughout the world. 2.2 Markets and development Community solar programs started around 2010, and have their origin in the U.S. (United States) (Funkhouser et al., 2015), where the number has increased significantly in recent years due to high customer popularity (see Figure 1, based on SEIA, 2020b). Figure 1 indicates that we are at the beginning of an S-curve for the diffusion of community solar in the U.S., suggesting the huge potential of and expectations for the latter. As of 2019, U.S. community solar capacity exceeded 2,000 megawatts (MW) in cumulative installed solar power production, which is equivalent to the power consumption of about 400’000 homes in the U.S. (SEIA, 2020b). Forecasts estimate that community solar uptake will continue growing strongly, also outside the United States (Joshi & Yenneti, 2020; SEIA, 2020b). Approximately six years ago, community solar projects also started in Switzerland and other European countries, with some success (Koch & Christ, 2018; Joshi & Yenneti, 2020; Mah, 2019).

6
In Switzerland, the local utility company of Zurich (ewz) was among the first providers of community solar, selling one square meter of a local solar system for 250 CHF (Swiss Francs) in return for 80 kWh of solar power per square meter and year for a duration of 20 years (Koch & Christ, 2018; ewz, 2020). The ewz project was very successful; all solar square meters sold out within minutes. Other utilities from Swiss cities, such as Baden (miinstrom, 2020), Bern (Sunraising, 2020), and St.Gallen (St.Galler Solar Community, 2020), but also many other small municipalities in the countryside followed the example of ewz and launched community solar programs as well. Unfortunately, data about community solar for Switzerland are neither as detailed nor readily available as they are for the United States. Besides the fact that the number is growing, the exact number of community solar projects and MW installed in Switzerland currently remains unknown.
Looking at Figure 1, it becomes clear that community solar projects are also contributing to solar power development in general. Solar power production data show that community solar accounted for up to 3% of total solar power capacity in 2019 in the U.S. (SEIA, 2020a & 2020b). Additionally, community solar projects around the world are leading to more people having direct access to their own solar power and the related economic and environmental benefits. 2.3 Customer Satisfaction and Engagement One of the most fundamental problems with electricity is that it is an intangible good associated with little emotional value for customers (Litvine & Wüstenhagen, 2011). However, community solar solves this problem in an elegant way. By participating in community solar, customers become co-owners and thus are directly involved in local
1 27 36 42 71 123347
7341023
2056
0
500
1000
1500
2000
2500
2010 2011 2012 2013 2014 2015 2016 2017 2018 2019
Community Solar - Cumulative Installed Megawatts in the US
Figure 1: Community Solar - Cumulative Installed Megawatts in the U.S. (SEIA, 2020b)

7
and sustainable power production. This form of direct participation and co-ownership increases customer engagement and satisfaction, which also increases customer loyalty (Augustine & McGavisk, 2016; Funkhouser et al., 2015; Chan et al., 2017). One explanation for this effect is the so-called endowment-effect; a theory taken from psychology and behavioral economics that claims that ownership of a good increases the personal value of this good compared to a situation in which it is not owned (Koch & Christ, 2018; Morewedge & Giblin. 2015). Studies have shown that customers basically have four main sources of motivation for participating in a community solar program: the environmental benefit of solar power, the contribution to the well-being of one’s own community, greater independence from electricity imports, and the financial benefit of lower electricity bills (Augustine & McGavisk, 2016; Gamma et al., 2017; Koch & Christ, 2018; Rogers et al., 2008). Consequently, community solar suggests various new marketing opportunities that employ different arguments and messages compared to conventional electricity products. 2.4 Community Solar in the Academic Literature The uptake of community solar is also reflected in the literature. Community solar was first mentioned in academic literature by Asmus (2008), who wrote an article called “Exploring New Models of Solar Energy Development” that was published in the Electricity Journal. This article was at the forefront since it mentioned community solar as a model of solar deployment with high potential, even before it was available on the market. Asmus (2008, p. 63) defined community solar as “the ability of multiple users – often lacking the proper on-site solar resource or fiscal capacity or building ownership rights – to purchase a portion of their electricity from a solar facility located off-site.” After the first project introductions in the U.S. in 2010, the next articles in academic journals were not produced until 2015. In the meantime, several reports on community solar from governmental agencies, power associations, and private consulting companies were published. Paired with growing success on the U.S. market, community solar was then taken up again in the literature in 2015. In 2015, Funkhouser et al. published an article called “Business model innovations for deploying distributed generation: The emerging landscape of community solar in the U.S” in the Journal of Energy Research and Social Science. This article mainly outlined the different community solar models in the U.S., as well as the strategic value for local

8
utilities of satisfying consumer demand and regulatory requirements for renewable energy, but also alleviating revenue losses caused by the increase in residential solar PV. In 2016, Augustine & McGavisk followed with another article called “The next big thing in renewable energy: Shared solar” to illustrate the fast growing, significant potential of community solar for future electricity markets based on a list of advantages for consumers and suppliers. They defined community solar as “a PV system that provides power and/or financial benefit to multiple community members” (p. 37). The authors also pointed out that the terms “community solar” and “shared solar” have been used interchangeably so far, but they preferred to use the term shared solar – which did not later find acceptance in the academic literature. Almost all ensuing publications used the term community solar, which then became better established. Since 2016, an increasing number of articles on community solar have been published in different academic journals. For instance, Chan et al. (2017) wrote about the design choices and equity implications of community solar for utility companies, while Ngar-yin Mah (2019) pointed out, based on a comparison of two Asian cities, that community solar plays an important role in urban energy transitions. Further articles on community solar from Shakouri et al. (2017) were published, analyzing the financial outcome of different scenarios for community solar investors. Koch & Christ (2018) analyzed the ewz community solar model, Michaud (2020) gave us his perspectives on community solar policy adoption in the U.S., and Hess & Lee (2020) reviewed and compared the development of community solar in the states of California and New York. It can therefore be stated that, over the last five years, a stream of academic literature related to community solar has emerged that is growing almost as fast as the number of community solar projects worldwide. So far, most research papers on community solar cover aspects about supportive policy schemas, comparisons of offering models and the emerging community solar markets and its potential, while marketing aspects for community solar were not yet the subject of academic research.

9
3. Research Questions and Objectives This dissertation investigates different opportunities for successful community solar marketing. Since community solar is a rather new business model and means of offering solar power, almost no academic research about the marketing aspects of community solar has been conducted. As outlined in Chapter 2, community solar offers based on the co-ownership form of participation, as well as its offer-related design options, suggest various new marketing-related opportunities for its promotion. By investigating specific aspects of marketing for community solar, this dissertation is designed to develop practical marketing implications that support the further diffusion of community solar projects. Despite the practical focus of the dissertation, there are also contributions to academic literature based on the application of scientific theories and methods. In the following part of the document, all research questions and objectives related to the three dissertation papers are briefly explained and put into the necessary research context. Paper 1 investigated whether building-integrated PV (BIPV) is as suitable for community solar as conventional solar panels are. BIPV is a solar technology that is integrated into regular building materials used in construction work. This new solar cell technology ensures on the one hand that the entire surface of a building can be used for sustainable electricity production, and on the other that solar cells, due to their integrative design in the material, are practically invisible on the building (Osseweijer et al., 2018). Given these circumstances, community solar with BIPV has huge potential for application, especially in urban and densely populated areas. The actual diffusion of BIPV, however, remains far behind the potential. Reasons for this include, among others, the high initial cost (Heinstein et al., 2013), the high level of complexity (Koinegg et al., 2013), a lack of awareness (Temby et al., 2014), and unreliable government policies (Curtius et al., 2018). Since the barriers to the adoption of BIPV are similar to the barriers to conventional PV panels for homeowners (Curtius et al., 2018; Faiers & Neame, 2006; Karakaya & Sriwannawit, 2015; Strupeit & Palm, 2016; Zhang et al., 2012), it is argued that community solar could help to overcome these barriers similarly as it was the case for conventional solar panels too. As a result, general BIPV adoption could be increased, additionally contributing to the research challenge of finding new ways to keep the global growth rate of solar power at a high level (Michas et al., 2019).

10
The first paper therefore examined whether community solar based on BIPV is associated with similar customer acceptance in terms of adoption rates as community solar offerings solely based on conventional rooftop PV, and thus can also contribute to BIPV growth in general. Paper 2 investigated the effect of the remuneration-related designs and communication aspects of community solar offerings on customers’ willingness to buy (WTB). Given the heterogeneity in customer preferences and motivation for buying community solar (Augustine & McGavisk, 2016; Gamma et al., 2017; Koch & Christ, 2018; Rogers et al., 2008), the paper examined the effect of extrinsically based financial incentives versus non-financial intrinsic incentives in remuneration design on customers’ WTB. Looking at the various practical examples from Switzerland and the U.S. (Augustine & McGavisk, 2016; Koch & Christ, 2018), however, it quickly becomes clear that so far both forms of remuneration have been equally well received by customers, thus offerings with an intrinsic form of remuneration are not received noticeably better or worse than offerings with an extrinsic form of remuneration. Consequently, the isolated effect of extrinsic or intrinsic community solar remuneration on customers’ WTB remains unclear. Or, from another perspective: with which form of remuneration community solar providers could theoretically reach more customers remains a mystery. However, the answer to this mystery may be of high relevance to providers in relation to asserting themselves in the market, especially in a situation of increased competition, or in a situation wherein providers aim for strong growth by trying to serve as many customers as possible. Since not all customers are intrinsically motivated by environmental and community well-being benefits to buy community solar, it is important to understand the motivation of all customer segments and how they can be influenced in order to optimize marketing activities and maximize customer uptake. Therefore, the second paper examines the effect of the inclusion of financial, extrinsically based incentives in community solar offerings on willingness to buy for different customer segments; namely, customers with high intrinsic motivation, and customers with low intrinsic motivation. Paper 3 investigated whether a bundle offering of an electric vehicle (EV) combined with community solar for EV-charging creates added value for customers. Since the bundling literature suggests that a combination of two or more complementary products in one offering can lead to added value for customers compared to a situation in which customers have to buy these products separately (Stremersch & Tellis, 2002), the third

11
paper explores whether this also holds true for a combined offering of an EV with community solar. Bundled offerings of EVs and community solar may not only increase the customer value of an EV and therefore help to further diffuse EVs, but may also increase sales channel opportunities for community solar through car dealers and car companies that sell EVs. Additionally, such bundles can ensure that EVs are charged with sustainable energy, which is crucial for them to be environmentally superior to cars with internal combustion engines (carboncounter, 2020). Despite the understood complementarity of EVs and community solar based on the (sustainable) electricity need of EVs, it is unclear whether customers perceive this complementarity as an added value that results in a higher WTB, especially because the bundle has a higher total price than the EV without community solar. Since such kinds of bundles do not exist on the market so far, the last paper in the dissertation examines the general evaluation of such a bundle by customers, and investigates whether a bundle offering of an EV with community solar creates added value and is therefore superior in terms of customers’ WTB compared to their WTB for a stand-alone EV.
Table 2: Overview of all research questions and objectives for each research paper
Paper
No.
Research Question(s) Research Objectives
1 Can community solar offers exclusively based on BIPV lead to similar customer adoption rates as community solar offers solely based on conventional rooftop PV and therefore contribute to maintaining the high growth rate of solar PV?
Technology (BIPV) acceptance of community solar offerings BIPV growth opportunities
2 How does the inclusion and communication of financial benefits affect the willingness to buy community solar of different electricity customer segments?
Remuneration design of community solar offerings Customer motivation to buy community solar
3 Does a bundle offer of community solar and an EV increase the willingness to buy of customers compared to that for a standalone EV? Does a bundle offer of community solar and an EV lead to added value for customers compared to that for a standalone EV? How does emphasizing policy-based financial support affect customers’ willingness to buy an EV and community solar bundle?
Product bundling with electric vehicles Added value of community solar for electric vehicles Alternative sales channels

12
4. Theory and Literature To collect the first indicators for addressing the research questions presented in Chapter Three, each of the three research papers started with a dive into the academic literature. Based on these literature reviews, hypotheses and experimental study designs were then developed. The following sections briefly summarize the literature and theory basis of each paper. Additionally, the gaps in the literature that the papers aimed to fill as well as the contributions to the academic community by answering the research questions are explained. 4.1 Paper 1: Solar Adoption Literature Solar energy is seen as one of the most promising technologies for sustainably generating power without causing greenhouse gas emissions (Creutzig et al., 2017). As already described in the introductory chapter, there has been enormous progress in PV technology over the last 20 years, leading to a sharp drop in prices and an increase in the efficiency of electricity production. Based on this development, solar power has become the fastest growing power-generating technology in terms of annual capacity installed worldwide (Solar Power Europe, 2018; D’Adamo, 2018). Despite this strong growth, the great potential of solar power is still far from realized in practically all countries. These circumstances are also increasingly reflected within the academic community. The main research focus on solar power has moved from finding ways to increase efficiency on the one hand, and lower prices on the other, to finding ways to keep the global growth rates of solar power at a high level (Michas et al., 2019). The first paper in this dissertation followed the research call from Michas et al. (2019) to investigate how solar power growth can be maintained at a high level. Looking at the increasing number of community solar offerings around the world, and particularly in the U.S., it can be safely stated that community solar has already contributed to conventional solar growth. In the U.S., community solar projects account for around 3% of total solar power generation (2 gigawatt (GW) from a total of 78 GW solar power installed, according to SEIA, 2020a). Even if this share seems to be rather small, the installed capacity of community solar has doubled every year over the last three years, and the trend is expected to continue in the following years as many more community solar projects are in the pipeline (SEIA, 2020a). The high growth rate for community solar offerings is due to the numerous advantages for customers that are based on the elimination of barriers to conventional home PV system adoption, such as the limited ownership of suitable rooftop space (Karakaya & Sriwannawit, 2015), high

13
investment cost and long payback period (Zhang et al., 2012; Strupeit & Palm, 2016), high planning and installation effort, (Zhang et al., 2012) as well as general product and policy support complexity (Curtius et al., 2018; Faiers & Neame, 2006). In addition to community solar as a new business model for the distribution of solar power, new technologies are also required that can further increase the range of application of solar power. One of these new technologies is BIPV. Despite the great potential and diverse application opportunities of BIPV, its growth remains well below expectations. The reasons for this are mainly the same barriers that initially also affected the deployment of conventional solar panels. Based on these considerations, it is argued in Paper 1 that community solar can eliminate not only several barriers to the further adoption of conventional PV, but especially also barriers to the further adoption of BIPV: these include the need to own a suitable roof or façade (Horváth & Szabó, 2018), the high upfront investment cost (Curtius et al, 2018; Heinstein et al., 2013), and the high level of product complexity (Curtius et al, 2018), as well as high maintenance and planning cost (Brummer, 2018; Roberts et al., 2019). Therefore, if customers accept BIPV as much as they accept conventional PV in community solar offerings, community solar can be used as innovative business model to increase the deployment and adoption of the former, consequently helping total solar power capacity to grow. As a result, Paper 1 contributes to the research challenge of maintaining global PV growth rates at a high level. Additionally, it addresses potential solutions regarding how barriers to BIPV adoption can be overcome. Last but not least, it is the first paper to illustrate and evaluate community solar offerings purely based on BIPV. 4.2 Paper 2: Motivation Theory and Crowding Out To understand how intrinsic and extrinsic incentives affect consumer behavior, it is worth looking at motivation theory in general, and more particularly, motivational crowding out theory, which is based on over-justification and self-perception theory (Bem, 1965 & 1967; deCharms, 1968; Deci, 1971; Deci & Ryan, 1985; Deci et al., 1999). Motivation theory basically says that there are two different forms of motivators – namely, intrinsic and extrinsic factors – that can shape our motivation and behavior (Ryan & Deci, 2000a & 2000b). Extrinsic motivation refers to behavior driven by external rewards such as money or other tangible rewards, while intrinsic motivation refers to behavior that is driven by internal rewards, such as personal satisfaction or happiness (the motivation to engage in behavior comes from within the individual because it is naturally satisfying). Going one step further, the motivational crowding out effect describes the impact of extrinsic rewards on a behavior that is naturally based on

14
intrinsic motivation. The theory says that extrinsic rewards undermine people’s intrinsic motivation because they start to attribute their behavior to the extrinsic reward rather than to their intrinsic motivation. As a result, intrinsically motivated people are less willing to engage in an activity when extrinsic rewards are provided for this activity (Deci et al., 1999). But why is this important when it comes to community solar offerings? First, consumer segments are not all associated with having the same level of intrinsic motivation to participate in community solar. Second, community solar can offer both, intrinsic and extrinsic kinds of customer rewards, such as environmental benefits, community well-being, and some sort of remuneration (see Chapter 2). A distinction should be made between two generic forms of remuneration. Either customers receive a financial compensation (e.g. annual electricity bill reduction or money transfers) or they receive solar power proportionated to their participation in the solar system. These two generic kinds of remuneration can be classified as intrinsic reward (sustainable solar electricity) and extrinsic reward (financial compensation). As a result, different types of rewards address different forms of customer motivation, indicating that customer segmentation based on motivation is important. Therefore, it is also important to understand which types of rewards affect which customer segments in which direction in order to design effective communication and remuneration designs for community solar. Since a lot of studies (e.g. Schwartz et al, 2015 or d'Adda, 2011) and literature reviews (Deci et al., 1999) have already proven the validity of the motivational crowding out effect in different surroundings and contexts, Paper 2 contributes to the literature stream related to motivational crowding theory. Additionally, it also contributes to the emerging community solar literature, since it is the first paper to examine the effect of remuneration design based on different types of customer motivation on the WTB for community solar. 4.3 Paper 3: The Concept of Bundling in Marketing Literature The concept of bundling in marketing literature goes back to Adams and Yellen (1976), when it was first introduced. Since then, a lot of academic research on the concept of bundling, resulting in numerous studies, has been conducted. Stremersch & Tellis (2002) published an article in the Journal of Marketing that summarized and reviewed the academic research on bundling. There are several definitions that describe the concept of bundling, but the most frequently used is “the sale of two or more separate products in one package” (Stremersch & Tellis, 2002, p. 56). According to Stremersch & Tellis (2002), there are two dimensions that define a bundling strategy: the bundle

15
form, on the one hand, and the bundle focus, on the other. A bundle can take three different forms: pure (a company sells its products only in bundles), mixed (a company sells its products in bundles, but also separately) or unbundled (a company sells its products only separately). The bundle focus can be either price bundling or product bundling. Price bundling describes a bundle that is sold at a lower price than the sum of the prices of each separate product within the bundle. In contrast, a product bundle is supposed to create added value for customers. The added value creation of a product bundle arises from (1) reduced risk caused by positive product spillover, (2) complementarity, because the additional product(s) is needed anyway, and (3) increased convenience, due to reduced search and assembly efforts. As a result of this added value creation, a product bundle can be sold at a higher price than the sum of the prices of each separate product within the bundle. Following this argumentation, the third paper argues that a bundle of an EV with community solar creates added value for customers based on the three listed dimensions of added value creation. A first hint of this effect can be found in a study by Priessner & Hampl (2020), who found that customers’ willingness to pay for an EV, home solar and home battery storage system increases when it is sold in a bundle. Other studies have found an increased willingness to buy when an EV was bundled with additional services, such as IT-based parking or smart charging point searchers (Fojcik & Proff, 2014; Hinz et al., 2015). By investigating the added value of a bundle of community solar and an EV, the third paper not only contributes to the bundling literature in marketing, but also answers the research call from Cherubini et al. (2015), who called for further research on EV bundling opportunities to increase customers’ EV acceptance. Additionally, since Paper 3 was the first to empirically evaluate a bundle of community solar and an EV, it also contributes to the emerging community solar literature.

16
5. Conceptual Framework and Structure As outlined in Chapter Three, all three papers in this dissertation investigate specific aspects of community solar marketing with the aim of formulating practically relevant contributions for increasing successful deployment in the market. This chapter, therefore, summarizes the research objectives of all papers and puts them into a conceptual framework that describes the overall structure and purpose of the dissertation papers. Additionally, the three papers will be classified in relation to the 4 P Marketing Mix (McCarthy, 1960; Capaul & Steingruber, 2016; Kotler, 2019). Paper 1 investigated the acceptance of BIPV in community solar offerings compared to community solar based on conventional rooftop solar. Paper 2 explored the effect of different remuneration designs (cash as extrinsic reward, and solar power as intrinsic reward) on customers’ willingness to buy. Additionally, Paper 1 and Paper 2 applied the same pricing approach based on a cost-oriented penetration strategy within the experimental community solar offerings, which was also tested in terms of customer perception. Paper 3 investigated the opportunity for product bundling with EVs and the possibility of identifying promising sales and deployment channels for community solar.
Paper 1: Acceptance of different
technologies; price testing
Paper 2: Communication and remuneration design;
price testing
Paper 3: Sales channels and
bundling opportunities
Community Solar Marketing
Figure 2: Conceptual Framework of Dissertation Papers

17
Even though the three papers do not directly build upon each other, they all strive towards the same goal: investigating specific aspects of community solar marketing so as to develop practical recommendations for manifold and expedient marketing plans. Figure 2 provides an overview of the different marketing aspects that have been investigated in order to formulate a comprehensive marketing plan for community solar suppliers. Additionally, Table 3 displays a more detailed overview of the dissertation papers corresponding to the research objectives, and to the marketing aspects that were investigated, as shown in the framework from Figure 2. Since this dissertation does not investigate all marketing aspects of community solar, the following Figure 3 illustrates which marketing aspects within this dissertation based on the 4 P marketing mix have been investigated. To complete the 4 P mix, the missing marketing elements will be derived from best practice projects and from the experimental treatments used in the online surveys (see Chapter 7.3). The 4 P marketing mix presented in Figure 3 is based on the original 4 P framework which was first introduced by McCarthy in 1960, and which has since then been further developed by many different marketing scholars (see also Kotler, 2019 and/or Capaul & Steingruber, 2016). By focusing on the relevant offer attributes for community solar, especially in the product dimension, the 4 P marketing mix in Figure 3 has already been adapted to community solar (e.g. elements such as packaging are not included (since community solar does not need packaging)).
Figure 3: Dissertation Papers classified according to the 4 P Marketing Mix (based on McCarthy,
1960) for Community Solar
Community Solar Marketing Mix
Product
Technology
Remuneration design
Contract duration
Sales Unit
Price
Premium price (skimming strategy)
Cost covering price (penetration
strategy)
Place
Direct sales channels
Indirect sales channels and partnerships
Promotion
Target-group specific
communication
Communication channels
Paper 1
Paper 2
Paper 3
Paper 2
Paper 1 & 2

18
Tabl
e 3:
Ove
rvie
w o
f Dis
serta
tion
Pape
rs
No.
A
utho
r(s)
a T
itle
Res
earc
h O
bjec
tives
M
etho
d
Sam
ple
Pu
blic
atio
nd Sta
tus
1 St
auch
, A
lexa
nder
; V
uich
ardb ,
Pasc
al
Com
mun
ity S
olar
as a
n In
nova
tive
Bus
ines
s Mod
el fo
r B
uild
ing -
Inte
grat
ed P
hoto
volta
ics
An
Expe
rimen
tal A
naly
sis w
ith
Swis
s Ele
ctric
ity C
onsu
mer
s
(1) T
echn
olog
y (B
IPV
) ac
cept
ance
for c
omm
unity
so
lar o
ffer
ings
(2
) BIP
V g
row
th
oppo
rtuni
ties
Expe
rimen
tal
onlin
e su
rvey
w
ith a
1x2
be
twee
n -su
bjec
t de
sign
N =
413
Pu
blis
hed
in Energy & Buildings,
Vol
ume
204,
201
9 5
Yea
r Im
pact
Fac
tor:
4.82
3 V
HB
: n.a
.
2 St
auch
, A
lexa
nder
; G
amm
ac , K
arol
ine
Cas
h vs
. Sol
ar P
ower
: A
n ex
perim
enta
l inv
estig
atio
n of
th
e re
mun
erat
ion -
rela
ted
desi
gn o
f co
mm
unity
sola
r off
erin
gs
(1) R
emun
erat
ion
desi
gn o
f co
mm
unity
sola
r off
erin
gs
(2) C
usto
mer
mot
ivat
ion
to
buy
com
mun
ity so
lar
Expe
rimen
tal
onlin
e su
rvey
w
ith a
1x2
be
twee
n -su
bjec
t de
sign
N =
496
Pu
blis
hed
in Energy Policy,
Vol
ume
138,
202
0 5
Yea
r Im
pact
Fac
tor:
5.45
8 V
HB
: B
3 St
auch
, A
lexa
nder
Incr
easi
ng W
illin
gnes
s to
Buy
an
Elec
tric
Car
: the
Add
ed V
alue
of
Com
mun
ity S
olar
A
n ex
perim
enta
l inv
estig
atio
n of
pr
oduc
t -bun
dlin
g op
portu
nitie
s in
Ger
man
y
(1) P
rodu
ct b
undl
ing
with
el
ectri
c ve
hicl
es
(2) A
dded
val
ue o
f co
mm
unity
sola
r for
ele
ctric
ve
hicl
es
(3) A
ltern
ativ
e sa
les
chan
nels
Expe
rimen
tal
onlin
e su
rvey
w
ith a
1x2
be
twee
n -su
bjec
t de
sign
and
a
1x2
with
in-
subj
ect d
esig
n
N =
488
Su
bmitt
ed to
Energy Research &
Social Science o
n th
e 1st
of M
ay
2020
. 5
Yea
r Im
pact
Fac
tor:
5.52
5 V
HB
: n.a
.
aAll listed authors are formal team members of the Institute for Economy and the Environment (IWÖ-HSG), University of St.Gallen, Switzerland.
b Pascal Vuichard contributed to this paper by conducting and writing the main parts of the literature review in Chapter Two, and additionally some parts of the discussion and
conclusion section. After receiving a revise and resubmit invitation from the journal, he also contributed to the revision of the paper.
c Karoline Gamma contributed to this paper by providing her expertise in relation to the methodical approach, as well as by analyzing the survey data and writing the results
chapter (Chapter Four). She also contributed by writing parts of the theory chapter and the conclusions section. After receiving a revise and resubmit invitation from the
journal, she also contributed to the revision of the paper.
d All three journals that were chosen for publication are leading international journals with Q1 classification in their subject area of research. All articles were peer-reviewed
before their official journal publication.

19
6. Methods, Data and Analyses To come up with a comprehensive marketing plan for community solar, it was important to collect data from potential customers of community solar. Therefore, all three papers methodically followed a classical deductive and empirical research approach. Based on literature reviews, hypotheses were formulated for all three papers, which were then empirically tested. The empirical testing was operationalized by using experimental online surveys to collect customer data. According to Sarris (1992, p. 129), an experiment can be defined as follows: "[An experiment is] a systematic observation process, on the basis of which the investigator generates and varies the phenomenon of interest (‘manipulation’) and at the same time eliminates or controls (‘control’) systematic and/or unsystematic disturbing factors by means of suitable techniques.” The application of empirical experiments is a widely used and acknowledged technique in academic research (Aaker et al., 2013; Deci et al., 1999; Kirk, 2012; Sarris, 1992). Using experimental surveys offers unique opportunities to investigate the effect of a varying factor on the outcome of a dependent variable, while all other factors can be held constant (Aaker et al., 2013; Kirk, 2012). This is ensured by the comparability of the groups based on a randomized assignment of participants to groups on the one hand, and through the application of identical questionnaires, apart from the experimental treatment, on the other. Another advantage of the experimental research design is that the research setup becomes more transparent and the analysis of the data becomes more accurate, since fewer interfering factors have to be “deducted” afterwards. Experiments have high internal validity, since internal interfering factors, such as a vague experimental treatment or description, selection bias, or events that occur in the meantime are assumed to be the same for all participants and can therefore be neglected. In principle, empirical experiments distinguish between two different design forms: a between-subject and a within-subject design (Aaker et al., 2013; Koschate, 2008; Kirk, 2012). A between-subject design was applied in all three papers and is used to test the effect of an experimental treatment by applying different experimental treatments to different samples. The experimental treatment describes the variation of a factor or stimulus. The purpose of a stimulus is to make the research scenario more appealing and interactive for participants by reflecting real life conditions as much as possible (Kirk, 2012). Paper 1 showed one community solar offering purely based on conventional rooftop PV as a stimulus to one group, and a community solar offering purely based on BIPV as experimental treatment to another group to investigate the effect of BIPV compared to

20
conventional PV on customers’ WTB for community solar. Paper 2 compared different community solar offerings in terms of including or excluding financial benefits as a form of extrinsic reward, and analyzed how this affects the WTB of different customer segments for community solar offerings. Paper 3 included an emphasis on financial policy support additional to the bundle offer of community solar and an EV for one group, while this was excluded for the other sample group in order to investigate the effect on customers’ WTB for the bundle. In summary, all three papers varied specific factors that are assumed to influence particular target variables, such as customers’ WTB. A within-subject design is used to analyze the effect of an experimental treatment within the same sample. Therefore, a within-subject design always has two separate measurement points for the same dependent variable (Koschate, 2008). Before the first point of measurement of the independent variable is reached, the experimental stimulus is given to the participants to measure the effect of this stimulus on the dependent variable before treatment happens. The experimental treatment then happens in between these two measurement points to investigate the effect of the treatment on the outcome of the dependent variable compared to the effect of the stimulus. A within-subject design was applied in Paper 3 by using an EV offering as stimulus and a bundle of an EV with community solar as the experimental treatment to investigate the bundling effect on customers’ WTB compared to their WTB for an EV. Data was collected in Switzerland (Paper 1 and Paper 2) and also in Germany (Paper 3) by professional market research institutes to ensure the representativeness of the samples in terms of the demographic characteristics of the participants on the one hand, and to ensure sufficient data quality on the other. The data was then analyzed using SPSS (statistical package for the social sciences, a statistics software developed by IBM). To compare the variable characteristics of groups, mainly ANOVAs (analysis of variance) and standardized t-tests, which are the methods most commonly used for analyzing empirical experiments, were used (Backhaus et at., 2016; Kirk, 2012; Rutherford, 2011). Additionally, to prove the effects of demographic or attitude variables, multiple regression analyses were undertaken. Besides the acknowledged advantages of using empirical experiments in academic research, there are also some limitations of this approach (Aaker et al., 2013; Koschate, 2008). All three papers address these limitations at their end. Similarly to the dissertation papers, the limitations created by the choice of methodology will be discussed in the final limitation and outlook chapter on page 27 (Chapter 8).

21
7. Overall Findings and Conclusions 7.1 Research findings, conclusions, and literature contributions The research for this dissertation demonstrates that there is significant market potential for community solar in Switzerland. Paper 1 and Paper 2 revealed that more than 60% of the surveyed participants would be willing to participate in community solar with at least one solar panel. These results support those of Gamma et al. (2017) and Cousse & Wüstenhagen (2018), who also found that more than 60% of their study respondents would participate with at least 500 CHF in a local solar system. This generally strong market potential, coupled with various customer benefits, demonstrates that community solar is a promising business model for electricity companies in relation to increase their customer satisfaction and solar power supply simultaneously, suggesting various opportunities for business development. In the following, the overall research results of the three papers will be briefly presented, as well as the corresponding conclusions and literature contributions. Finally, Section 7.2 will translate the findings and conclusions into practical recommendations for community solar marketing, while Chapter 7.3 will outline the recommendations for creating a vital policy environment that can support the diffusion of community solar. The limitations associated with the findings of this dissertation will be discussed in Chapter 8. Results from Paper 1 demonstrate that community solar offerings solely based on BIPV lead to similar customer adoption rates as community solar offerings solely based on conventional rooftop PV. No significant difference could be identified between the WTB for each of the community solar offerings based on different technologies. Based on the findings of Paper 1, it can be concluded that the former approach may increase the opportunities for the application of community solar offerings, particularly in urban areas where rooftop space might be limited. Based on this finding, it is further concluded that community solar based on BIPV can lead to additional (BI)PV growth, which will contribute to keep the high level of PV growth in general. Paper 2 illustrated that it is relevant to distinguish two main customer segments for community solar; namely, default electricity mix customers with lower intrinsic motivation, and green electricity customers, who have high intrinsic motivation to purchase sustainable electricity. Each of the two segments reacts differently to the emphasis on extrinsic and financial rewards. While default electricity mix customers are

22
more motivated by an emphasis on financial rewards, green electricity customers experience a motivational crowding out effect because their intrinsic motivation is undermined by extrinsic rewards. The results show that emphasizing financial rewards increases the WTB of default customers significantly, while the WTB of green electricity customers significantly decreases when financial rewards are emphasized. Based on the findings of Paper 2, it can be concluded that customer segmentation based on customer motivation on the one hand, and segment-based communication on the other, are of great relevance for reaching all customers equally efficiently. The findings of Paper 3 reveal that bundling community solar with an EV is appreciated by customers and results in a significant increase in WTB for a bundle compared to a situation in which an EV without community solar is offered. Emphasizing financial policy support for EVs, however, has no significant effect on the WTB a bundle. Participants of the experiment agreed (59% on average) that bundling community solar with an EV adds value. Based on the findings of Paper 3, it can be concluded that EV dealers and companies are relevant partners that can represent additional sales channels for community solar on the one hand, and that bundling community solar and an EV creates added value for customers, which is resistant to the financial discounts offered by policy support on the other. Finally, this dissertation has also made some contributions to the academic literature. First of all, by reacting to research calls from Michas et al. (2019) in Paper 1 and from Cherubini et al. (2015) in Paper 3, a direct contribution to identifying ways to support PV growth at a high level and a description of the effects of EV bundling and increased WTB have been achieved. Second, this research also contributes to the psychology and behavior literature by demonstrating the crowding-out effect based on experimental community solar offerings on the one hand, and to marketing literature by the application of bundling theory and added value creation on the other. Third, all three papers generally contribute to the emerging literature stream on community solar (see Section 2.4) and, in the broadest sense, also to the Solar (BI)PV adoption and energy transition literature in general.

23
7.2 Practical implications: marketing for community solar Based on the research findings and conclusions of all three papers, the following implications for a marketing mix based on the 4 Ps were formulated. First, the marketing implications based on the experimental findings are outlined. However, since this is not sufficient for a complete marketing mix, in a second step, the missing elements are derived based on the offer treatments that were applied in the experiments and on best practice observations. Since it does not matter to customers whether community solar is offered with BIPV or with conventional rooftop PV, providers have the possibility to adapt their offers to the conditions and budgetary constraints of their community (e.g. urban vs. rural areas). This allows suppliers to offer community solar in almost any environment. Customer segmentation should be based on the underlying customer motivation to buy green electricity, as segments are differently responsive to messages based on extrinsic rewards. This segmentation is relatively easy for electricity suppliers, as they have already defined default electricity customers and green power customers as customer segments based on their electricity product offerings. Communication about remuneration should therefore be different for each of the two customer segments. The annual remuneration per solar panel itself should be the solar power produced by one panel. Communication of this remuneration for green electricity customers should emphasize the amount of kWh of solar power that a customer will receive every year (e.g. 220 kWh per year), but not a financial equivalent since this would be counterproductive for green electricity customers. For default electricity customers, a translation of the annual solar power remuneration into a financial equivalent (e.g. 220 kWh solar power = 25 CHF reduction in electricity bill per year) is more relevant, since default electricity consumers can be successfully motivated with extrinsic rewards to participate in community solar. Suppliers can either develop a separate communication strategy for each of the segments, or alternatively first target green electricity customers and later, by adding the translation of the financial equivalent into the communication message, target default electricity customers in order to maximize the customer base for community solar. The opportunity to bundle community solar with EVs opens up new possibilities for business development based on (strategic) partnerships. Since bundling with community solar can increase customers’ WTB for an EV, community solar suppliers have strong arguments for EV providers partnering up with them on a long-term basis. Consequently, EV providers can be seen as promising indirect sales channels for

24
community solar. Additionally, EV providers and their communication channels can be used to further promote and leverage knowledge about community solar. The missing marketing elements can be derived based on the offer treatments applied in the experiments. Since the experiments in Paper 1 and Paper 2 revealed that over 60% of customers would participate in community solar with at least one panel, it can be assumed that the offer attributes used in Paper 1 and Paper 2 will also be appreciated by customers in practice. The missing attributes cover the selling unit, the contract duration, the pricing strategy, direct sales channels, and the use of different promotion channels. The selling unit in the treatments was determined as solar panels or BIPV modules in the case of BIPV community solar offerings. The duration was set to 20 years, with the possibility to cancel at the end of every month and obtain a refund for the remaining contract duration. It is important to emphasize this flexibility to customers so that they do not feel bound for 20 years without the possibility of cancellation. The price of 499 CHF for one solar panel or BIPV module was based on the total cost of the community solar project. Thus, utility companies have the opportunity to use the solar system for a longer time after the contract duration of 20 years expires to generate further revenue based on selling the solar power from the system. This revenue can be used to generate a small profit for the whole community solar project. This pricing approach corresponds to a penetration strategy, since it is based on project costs and on the idea that customers can cover their investment by the end of the contract duration based on accumulated remuneration over 20 years. A penetration strategy was also chosen because it was assumed that more customers could be reached compared to a skimming strategy. Since the share of default customers is higher in Switzerland than the share of green electricity customers (between 32% and 43% of all Swiss electricity customers have actively decided to buy green electricity, according to the Swiss Federal Office of Energy (2020)), it is argued that a skimming strategy that uses higher prices would not be equally successful. Higher prices decrease the financial value of the cumulative remuneration for customers with respect to their investment sum, which might have a negative impact on the WTB of mostly extrinsically motivated default customers. The direct sales channels described in the treatment were company homepages, and the options to order by phone or directly at the power company shop-counter. Unfortunately, it was not possible to address and explore different direct sales channels within the experimental treatment, because it was not possible to simulate them within the online survey (e.g. phone or shop-counter orders). The same accounts also for promotion channels. For example, a simulation of large poster advertisements is not possible in an online setting. However, practical examples, such as the ewz community solar offering

25
(ewz, 2020; Koch & Christ, 2018), show that a mix of different direct sales channels including online platforms, direct mailing to customers (online and offline), ordering at the shop-counter or by phone can lead to successful sales results. Further, based on the ewz example, it was identified that social media channels (Facebook and YouTube), direct mailing to customers, and local newspaper advertisements and large posters within the community are promising means of successful promotion. The following table (Table 4) summarizes the marketing implications for community solar in relation to the 4 P Marketing Mix.
Product Price Place Promotion
BIPV or conventional PV, based on the local surroundings
Selling unit: Solar panels or BIPV modules
Contract duration of 20 years including cancellation option, adjustment of contract duration to EV lifetime (⁓10 years) for bundling is recommended
Remuneration: solar power from the system, which also reduces the electricity bill
Pricing must be aligned with contract duration and remuneration for community solar offering
A cost-based pricing (penetration strategy) including a small margin is required
Price of selling unit should be equal (or, if possible, lower) than cumulative remuneration over the contract duration
Direct distribution:
- Electricity companies should sell through direct mailing, ordering at shop counter, via phone and online platforms on company homepages
Indirect distribution
- Partnerships, particularly with e-mobility providers (strategic business development)
Online (company homepage), social media, direct mailing, posters within the community, local newspapers, partnership channels (e.g. through e-mobility providers)
Segment-based communication:
- For default electricity customers: Emphasis on financial rewards in terms of electricity bill reduction should be included
- For green electricity customers: exclude emphasis on financial rewards, only emphasize solar power delivery
Table 4: Summary of 4 P Marketing Mix for Community Solar

26
7.3 Policy recommendations In order for community solar to spread further and contribute to achieving the two-degree climate target defined in the Paris Agreement, not only an appealing marketing plan becomes relevant, but also supportive political conditions. Based on the findings and conclusions from the three dissertation papers, policy recommendations for stimulating community solar projects have also been formulated. Given the identified market potential of more than 60% of all electricity customers, a community solar assessment for newly constructed public buildings should become mandatory. Community solar based on BIPV and/or conventional rooftop PV could be an opt-out solution, requiring that city planners provide valid reasons for not including a community solar model in the public building planning process. The city of Uppsala in Sweden has already drafted some guidelines that include community solar as part of the planning process for public buildings (International Energy Association (IEA), 2018). Policy measures that employ financial means could involve direct subsidies or tax deductions for community solar providers, similarly to financial incentives for homeowners who want to install their own solar system. Additionally, electricity grid providers could lower the grid tariffs for local community solar projects. Since community solar power is consumed locally within the community, it does not require the use of the whole national grid infrastructure. Last but not least, since community solar bundling with EVs can increase the adoption of EVs, policy makers might be interested in promoting bundling offers to increase the share of green solar power and EVs simultaneously. Policy measures that can foster bundling offers of community solar and EVs include direct purchasing subsidies for EVs that are charged only with green electricity, and/or tax deductions for suppliers on revenues from sold bundles.

27
8. Limitations and Outlook Besides the application of comprehensive research designs based on acknowledged empirical methods that have led to relevant findings about robust community solar marketing plans, there are also some noteworthy limitations associated with the research in this dissertation. From a methodical perspective, the limitations to each of the three research papers are equivalent due to the application of the same research method (an experimental survey). As already described in Chapter 6, results from such experiments have the advantage of high internal validity. On the other hand, they have rather low external validity, which results in some limitations. Factors that potentially decrease external validity include non-controllable external environmental influences such as noise or distraction by unexpected events when participants are undergoing the experiment, the reactive effects of the experimental situation (participants are aware that they are participating in a study, which may also affect their behavior), and unexpected interaction effects between the bias in the selection of participants and the experimental treatment. Further limitations include the formulated treatments themselves, and the geographical scope of the survey. Since many relevant offer attributes, including price and contract duration, were given as fixed values in the treatment, these might have had an effect on the experimental outcome. The geographical scope was limited to Switzerland in Paper 1 and Paper 2, and in Paper 3 it was limited to Germany. Even if the cultural differences between Switzerland and Germany are rather small (see Gassler et al., 2016 based on Hofstede & Hofstede, 2015), the experimental outcomes could still have been influenced by cultural factors which prevent the results of the experiments from being regarded as internationally valid (or valid outside of German-speaking areas). Additionally, some limitations also come from the method of surveying. Since participants in the experiments gave self-reported answers about their attitudes and WTB, their real behavior in practice could differ from their survey statements. So-called social desirability bias describes differences between real behavior and that described by participants’ answers to questionnaires. It describes the phenomenon that people tend to report in surveys what they perceive to be socially desirable behavior (e.g. positive environmental action) rather than their real behavior (Hebert et al., 1995). Based on the listed limitations, further research about community solar marketing should aim to overcome these limitations by applying other research methods, such as

28
qualitative stakeholder interviews, case studies, or real field experiments. Qualitative stakeholder interviews with customers and providers, as well as case studies using real projects, could be used to further investigate the role of fixed offer attributes, such as price per panel and contract duration. Additionally, these methods could help to overcome the low external validity of experiments by validating results with external stakeholders who did not take part in the experiment. To overcome geographical limitations, the same experiments could be repeated and enlarged with new methods in different countries (e.g. UK, Spain, Italy, etc.) to test whether there are different preferences for community solar offerings based on cultural factors. To overcome the risk of social desirability bias based on self-reported survey answers, future research should also involve real field experiments that measure and observe real customer behavior. Further avenues for research also include the investigation of community solar bundling opportunities with a wider range of e-mobility appliances, such as e-bikes, e-scooters, and e-motorbikes.

29
References Aaker, D. A., Kumar, V., Leone, R. P. & Day, G. S. (2013). Marketing Research (11th
Ed.). Singapore: John Wiley & Sons. Adams, W.J. & Yellen, J.L. (1976). Commodity Bundling and the Burden of Monopoly.
The Quarterly Journal of Economics, 90, 475–498. Asmus, P. (2008). Exploring new models of solar energy development. The electricity
journal, 21(3), 61-70. Augustine, P. & McGavisk, E. (2016). The next big thing in renewable energy: Shared
solar. The Electricity Journal, 29(4), 36-42. Backhaus, K., Erichson, B., Plinke, W., & Weiber, R. (2016). Multivariate
Analysemethoden. Berlin, Heidelberg: Springer Berlin Heidelberg. Bem, D. J. (1965). An experimental analysis of self-persuasion. Journal of Experimental
Social Psychology, 1(3), 199-218. Bem, D. J. (1967). Self-perception: An alternative interpretation of cognitive dissonance
phenomena. Psychological review, 74(3), 183. Brummer, V. (2018). Community energy – benefits and barriers: A comparative
literature review of Community Energy in the UK, Germany and the USA, the benefits it provides for society and the barriers it faces. Renewable and Sustainable Energy Reviews, 94, 187-196.
Capaul, R. & Steingruber, D. (2016). Betriebswirtschaft verstehen: Das St.Galler Management-Modell (3. Auflage). Berlin: Cornelsen Schulverlag GmbH.
Carboncounter (2020). Cars evaluated against climate targets. Retrieved on 01.06.2020 from: http://carboncounter.com/
Chan, G., Evans, I., Grimley, M., Ihde, B., & Mazumder, P. (2017). Design choices and equity implications of community shared solar. The Electricity Journal, 30(9), 37-41.
Chepeliev, M., & van der Mensbrugghe, D. (2020). Global fossil-fuel subsidy reform and Paris Agreement. Energy Economics, 85, 104598.
Cherubini, S., Iasevoli, G., & Michelini, L. (2015). Product-service systems in the EV industry: critical success factors in marketing. Journal of Cleaner Production, 97, 40-49.
Ciscar, J. C., Iglesias, A., Feyen, L., Szabó, L., Van Regemorter, D., Amelung, B., ... & Garrote, L. (2011). Physical and economic consequences of climate change in Europe. Proceedings of the National Academy of Sciences, 108(7), 2678-2683.

30
Cousse, J. & Wüstenhagen, R. (2018). 7th consumer barometer of renewable energy. University of St. Gallen. Retrieved on 01.06.2020 from: https://iwoe.unisg.ch/-/media/dateien/instituteundcenters/iwoe/publikationen/kundenbarometer/8th-consumer-barometer-of-renewable-energy.pdf?la=de&hash=A8DDAD1D92227E47D9F949E57CF6E10371D7B59A
Creutzig, F., Agoston, P., Goldschmidt, J. C., Luderer, G., Nemet, G., & Pietzcker, R. C. (2017). The underestimated potential of solar energy to mitigate climate change. Nature Energy, 2(9), 17140.
Curtius, H. C., Hille, S. L., Berger, C., Hahnel, U. J. J., & Wüstenhagen, R. (2018). Shotgun or snowball approach? Accelerating the diffusion of rooftop solar photovoltaics through peer effects and social norms. Energy policy, 118, 596-602.
D’Adamo, I. (2018). The profitability of residential photovoltaic systems. A new scheme of subsidies based on the price of CO2 in a developed PV market. Social Sciences, 7(9), 148.
d'Adda, G. (2011). Motivation crowding in environmental protection: Evidence from an artefactual field experiment. Ecological Economics, 70(11), 2083-2097.
deCharms, R. (1968). Personal causation: The internal affective determinants of behavior. New York, NY: Academic Press.
Deci, E. L. (1971). Effects of externally mediated rewards on intrinsic motivation. Journal of personality and Social Psychology, 18(1), 105.
Deci, E. L., & Ryan, R. M. (1985). The general causality orientations scale: Self-determination in personality. Journal of research in personality, 19(2), 109-134.
Deci, E. L., Koestner, R., & Ryan, R. M. (1999). A meta-analytic review of experiments examining the effects of extrinsic rewards on intrinsic motivation. Psychological Bulletin, 125, 627–668.
Dellink, R., Lanzi, E., & Chateau, J. (2019). The sectoral and regional economic consequences of climate change to 2060. Environmental and resource economics, 72(2), 309-363.
Delmas, M.A., Kahn, M.E. & Locke, S.L. (2017). The private and social consequences of purchasing an electric vehicle and solar panels: Evidence from California. Research in Economics, 71(2), 225–235.
ewz, (2020). Ewz.solarzüri – Beteiligen Sie sich an einer Zürcher Solaranlage. Retrieved on 01.06.2020 from:

31
https://www.ewz.ch/webportal/de/privatkunden/solaranlagen/solarstrom-fuer-mieter/ewz-solarzueri.html
Faiers, A. & Neame, C. (2006). Consumer attitudes towards domestic solar power systems. Energy Policy, 34, 1797-1806.
Fojcik, T. M., & Proff, H. (2014). Accelerating market diffusion of battery electric vehicles through alternative mobility concepts. International Journal of Automotive Technology and Management 20, 14(3-4), 347-368.
Funkhouser, E., Blackburn, G., Magee, C., & Rai, V. (2015). Business model innovations for deploying distributed generation: The emerging landscape of community solar in the US. Energy Research & Social Science, 10, 90-101.
Gamma, K., Stauch, A., & Wüstenhagen, R. (2017). 7th consumer barometer of renewable energy. University of St. Gallen. Retrieved on 01.06.2020 from: https://iwoe.unisg.ch/-/media/dateien/instituteundcenters/iwoe/publikationen/kundenbarometer/7th-consumer-barometer-of-renewable-energy.pdf?la=de&hash=C2568413A9AF8083628B65C7716113E0CFEE30E7
Gassler, B., von Meyer-Höfer, M., & Spiller, A. (2016). Exploring consumers' expectations of sustainability in mature and emerging markets. Journal of Global Marketing, 29(2), 71-84.
Hardman, S., Chandan, A., Tal, G., & Turrentine, T. (2017). The effectiveness of financial purchase incentives for battery electric vehicles–A review of the evidence. Renewable and Sustainable Energy Reviews, 80, 1100-1111.
Hebert, J. R., Clemow, L., Pbert, L., Ockene, I. S., & Ockene, J. K. (1995). Social desirability bias in dietary self-report may compromise the validity of dietary intake measures. International journal of epidemiology, 24(2), 389-398.
Heinstein, P., Ballif, C., & Perret-Aebi, L. E. (2013). Building integrated photovoltaics (BIPV): review, potentials, barriers and myths. Green, 3(2), 125-156.
Hess, D. J., & Lee, D. (2020). Energy decentralization in California and New York: Conflicts in the politics of shared solar and community choice. Renewable and Sustainable Energy Reviews, 121, 109716.
Hinz, O., Schlereth, C., & Zhou, W. (2015). Fostering the adoption of electric vehicles by providing complementary mobility services: a two-step approach using Best–Worst Scaling and Dual Response. Journal of Business Economics, 85(8), 921-951.

32
Hofstede, G., & Hofstede, G. J. (2015). Dimension DataMatrix. “Six dimensions for website.csv”–version 2015/12/08. Retrieved on 01.06.2020 from: https://geerthofstede.com/research-and-vsm/dimension-data-matrix/
Horváth, D. & Szabó, R. (2018). Evolution of photovoltaic business models: Overcoming the main barriers of distributed energy deployment. Renewable and Sustainable Energy Reviews, 90, 623-635.
Kellogg, W. W. (2019). Climate change and society: consequences of increasing atmospheric carbon dioxide. Routledge.
Kirk, R. E. (2012). Experimental design. Handbook of Psychology, Second Edition, 2. Koch, J., & Christ, O. (2018). Household participation in an urban photovoltaic project
in Switzerland: Exploration of triggers and barriers. Sustainable cities and society, 37, 420-426.
Koinegg, J., Brudermann, T., Posch, A. & Mrotzek, M. (2013). “It Would Be a Shame if We Did Not Take Advantage of the Spirit of the Times”. An Analysis of Prospects and Barriers of Building Integrated Photovoltaics. GAIA Ecological Perspectives for Science and Society, 22, 39–45.
IEA (2018). Transition towards sound BIPV business models. Retrieved on 02.06.2020 from http://iea-pvps.org/index.php?id=365
Jacobson, M. Z., Delucchi, M. A., Bauer, Z. A., Goodman, S. C., Chapman, W. E., Cameron, M. A., ... & Erwin, J. R. (2017). 100% clean and renewable wind, water, and sunlight all-sector energy roadmaps for 139 countries of the world. Joule, 1(1), 108-121.
Joshi, G., & Yenneti, K. (2020). Community solar energy initiatives in India: A pathway for addressing energy poverty and sustainability? Energy and Buildings, 210, 109736.
Karakaya, E. & Sriwannawit, P. (2015). Barriers to the adoption of photovoltaic systems: The state of the art. Renewable and Sustainable Energy Reviews, 49, 60-66.
Koschate, N. (2008). Experimentelle Marktforschung. Handbuch Marktforschung, 3, 107-121.
Kotler, P. T. (2019). Marketing management. Pearson UK. Lavaniegos, B. E. (2018). Consequences of Climate Change on the Oceans. In Widening
the Scope of Environmental Policies in North America (pp. 95-110). Palgrave Macmillan, Cham.

33
Litvine, D. & Wüstenhagen, R. (2011). Helping "light green" consumers walk the talk: Results of a behavioural intervention survey in the Swiss electricity market. Ecological Economics, 70 (2011), 462–474.
Mah, D. N. Y. (2019). Community solar energy initiatives in urban energy transitions: A comparative study of Foshan, China and Seoul, South Korea. Energy Research & Social Science, 50, 129-142.
McCarthy, E. J. (1960). Basic marketing: a managerial approach. Homewood, IL: Richard D. Irwin.
Michas, S., Stavrakas, V., Spyridaki, N. A., & Flamos, A. (2019). Identifying Research Priorities for the further development and deployment of Solar Photovoltaics. International Journal of Sustainable Energy, 38(3), 276-296.
Michaud, G. (2020). Perspectives on community solar policy adoption across the United States. Renewable Energy Focus, 33, 1-15.
Miinstrom, (2020). Werden Sie Ihr eigener Solarstromproduzent. Retrieved on 04.06.2020 from: http://www.miinstrom.ch/
Minx, J. C., Callaghan, M., Lamb, W. F., Garard, J., & Edenhofer, O. (2017). Learning about climate change solutions in the IPCC and beyond. Environmental Science & Policy, 77, 252-259.
Morewedge, C. K., & Giblin, C. E. (2015). Explanations of the endowment effect: an integrative review. Trends in cognitive sciences, 19(6), 339-348.
Osseweijer, F. J. W., van den Hurk, L. B. P., Teunissen, E. J. H. M. & van Sark, W. (2018). A comparative review of building integrated photovoltaics ecosystems in selected European countries. Renewable and Sustainable Energy Reviews, 90, 1027-1040.
Peters, G. P., Andrew, R. M., Canadell, J. G., Friedlingstein, P., Jackson, R. B., Korsbakken, J. I., ... & Peregon, A. (2020). Carbon dioxide emissions continue to grow amidst slowly emerging climate policies. Nature Climate Change, 10(1), 3-6.
Podbregar, N. (2019). CO2-Emissionen erreichen neue Höchstwerte. Science XX, December 2019. Retrieved on 04.06.2020 from: https://www.scinexx.de/news/geowissen/co2-emissionen-erreichen-neue-hoechstwerte/
Priessner, A., & Hampl, N. (2020). Can product bundling increase the joint adoption of electric vehicles, solar panels and battery storage? Explorative evidence from a choice-based conjoint study in Austria. Ecological Economics, 167, 106381.

34
Roberts, M. B., Bruce, A., & MacGill, I. (2019). Opportunities and barriers for photovoltaics on multi-unit residential buildings: Reviewing the Australian experience. Renewable and Sustainable Energy Reviews, 104, 95-110.
Rogers, J. C., Simmons, E. A., Convery, I., & Weatherall, A. (2008). Public perceptions of opportunities for community-based renewable energy projects. Energy policy, 36(11), 4217-4226.
Rosen, M. A. (2020). Mitigation of Climate Change: Crucial Energy Actions. Environmental Sciences, 14(1), 1-4.
Rutherford, A. (2011). ANOVA and ANCOVA: a GLM approach. John Wiley & Sons. Ryan, A. J., Donou-Adonsou, F., & Calkins, L. N. (2019). Subsidizing the sun: The
impact of state policies on electricity generated from solar photovoltaic. Economic Analysis and Policy, 63, 1-10.
Ryan, R. M., & Deci, E. L. (2000a). Intrinsic and extrinsic motivations: Classic definitions and new directions. Contemporary educational psychology, 25(1), 54-67.
Ryan, R. M., & Deci, E. L. (2000b). Self-determination theory and the facilitation of intrinsic motivation, social development, and well-being. American psychologist, 55(1), 68.
Sarris, V. (1992). Methodologische Grundlagen der Experimentalpsychologie I: Erkenntnisgewinnung und Methodik. München: Ernst Reinhardt.
Shakouri, M., Lee, H. W., & Kim, Y. W. (2017). A probabilistic portfolio-based model for financial valuation of community solar. Applied energy, 191, 709-726.
Schwartz, D., de Bruin, W.D., Fischhoff, B. & Lave, L. (2015). Advertising energy savings programs: The potential environmental cost of emphasizing monetary savings. Journal of Experimental Psychology, 21(2), 158-166.
Schweizerische Energiestiftung, (2020): Photovoltaik kann bis 2035 25% des Strombedarfs decken. Retrieved on 02.06.2020 from: https://www.energiestiftung.ch/erneuerbare-energien-solarstrom.html
SEIA, (2020a). Solar Industry Research Data. Retrieved on 05.06.2020 from: https://www.seia.org/solar-industry-research-data
SEIA, (2020b). Community Solar. Retrieved on 05.06.2020 from: https://www.seia.org/initiatives/community-solar
Solangi, K. H., Islam, M. R., Saidur, R., Rahim, N. A., & Fayaz, H. (2011). A review on global solar energy policy. Renewable and sustainable energy reviews, 15(4), 2149-2163.

35
Solar Power Europe (2018). Global Market Outlook For Solar Power / 2018 – 2022. Retrieved on 08.06.2020 from: https://www.solarpowereurope.org/wp-content/uploads/2018/09/Global-Market-Outlook-2018-2022.pdf
Spash, C. L. (2016). This changes nothing: The Paris Agreement to ignore reality. Globalizations, 13(6), 928-933.
St.Galler Solar Community, (2020). St.Galler Solar Community – gemeinsam zum eigenen Solarstrom. Retrieved on 04.06.2020 from: https://www.sgsw.ch/home/strom/solar-community.html
Stremersch, S. & Tellis, G.J. (2002). Strategic Bundling of Products and Prices: A New Synthesis for Marketing. Journal of Marketing, 66(1), 55–72.
Strupeit, L. & Palm, A. (2016). Overcoming Barriers to Renewable Energy Diffusion: Business Models for Customer-Sited Solar Photovoltaics in Japan, Germany and the United States. Journal of Cleaner Production, 123, 124-136.
Sunraising, (2020). Sunraising – die Berner Solardach Challenge. Retrieved on 04.06.2020 from: https://sunraising.ch/
Swiss Federal Office of Energy (2020). Stromversorgung – Stromprodukte aus erneurbaren Energien - Strom- und Biogasprodukte - Der Markt für erneuerbare Energieprodukte 2018. Retrieved on 09.06.2020 from: https://www.bfe.admin.ch/bfe/de/home/versorgung/stromversorgung/herkunftsnachweis-fuer-elektrizitaet-und-stromkennzeichnung.exturl.html/aHR0cHM6Ly9wdWJkYi5iZmUuYWRtaW4uY2gvZGUvcHVibGljYX/Rpb24vZG93bmxvYWQvMTAwMjQ=.html
Swiss Federal Office of Statistics (2019). Bau- und Wohnungswesen 2018. Retrieved on 04.06.2020 from: https://www.bfs.admin.ch/bfs/de/home/statistiken/bau-wohnungswesen.assetdetail.12507412.html
Swissolar (2020). Strom von der Sonne – Faktenblatt. April 2020. Retrieved on 04.06.2020 from: https://www.swissolar.ch/fileadmin/user_upload/Solarenergie/Fakten-und-Zahlen/Branchen-Faktenblatt_PV_CH_d.pdf
Temby, O., Kapsis, K., Berton, H., Rosenbloom, D., Gibson, G., Athienitis, A. & Meadowcroft, J. (2014). Building-integrated photovoltaics: distributed energy development for urban sustainability. Environment: Science and Policy for Sustainable Development, 56(6), 4-17.
Volken, S. P., Xexakis, G., & Trutnevyte, E. (2018). Perspectives of informed citizen panel on low-carbon electricity portfolios in Switzerland and longer-term

36
evaluation of informational materials. Environmental science & technology, 52(20), 11478-11489.
Wirth, H., & Schneider, K. (2012). Aktuelle fakten zur photovoltaik in deutschland. Fraunhofer ISE, 201(2). Retrieved on 04.06.2020 from: https://www.pv.de/media/140217_fakten_zur_pv.pdf
Wirth, H. (2020). Aktuelle Fakten zur Photovoltaik in Deutschland. Retrieved on 04.06.2020 from: https://www.ise.fraunhofer.de/content/dam/ise/de/documents/publications/studies/aktuelle-fakten-zur-photovoltaik-in-deutschland.pdf
World Bank (2020). Renewable energy consumption (% of total final energy consumption). World Bank, Sustainable Energy for All (SE4ALL) database from the SE4ALL Global Tracking Framework led jointly by the World Bank, International Energy Agency, and the Energy Sector Management Assistance Program. Retrieved on 05.06.2020 from: https://data.worldbank.org/indicator/EG.FEC.RNEW.ZS
Zhang, X., Shen, L. & Chan, S. Y. (2012). The diffusion of solar energy use in HK: what are the barriers? Energy Policy, 41, 241-249.

37
Paper 1: Community Solar as an Innovative Business Model for
Building-Integrated Photovoltaics - An Experimental Analysis with
Swiss Electricity Consumers
Authors:
Alexander Stauch, University of St.Gallen ([email protected])
Pascal Vucihard, University of St.Gallen ([email protected])
Institute for Economy and the Environment
Müller-Friedbergstrasse 6/8
CH-9000 St. Gallen
Bibliography:
Stauch, A., & Vuichard, P. (2019). Community solar as an innovative business model
for building-integrated photovoltaics: An experimental analysis with Swiss electricity
consumers. Energy and Buildings, 204, 109526.
Publication date: 12th of October 2019

38
Abstract
A currently pertinent research challenge is to find ways to keep the growth rate of solar power at a high level. The adoption of new technologies, such as building-integrated photovoltaics (BIPV), but also new and innovative business models such as community solar, have both been identified as relevant drivers. However, the adoption of BIPV is still encountering numerous barriers that hinder its more widespread deployment within the solar PV market. The goal of this research effort was to assess whether community solar as a successful business model for the adoption of conventional solar PV could be equally promising in relation to the further adoption of BIPV. For this purpose, we conducted an experimental survey (n=413) to compare customers’ willingness to buy a community solar offer exclusively associated with BIPV to a community solar offer solely designed with conventional rooftop solar PV. Our results revealed no significant difference between willingness to buy based on our experimental treatment (BIPV vs. conventional PV), indicating that community solar can be a successful distribution channel for the further adoption of BIPV. As findings about specific business models for BIPV are rare, our research creates an important foundation upon which policy makers and project developers can build. Keywords: community solar; building integrated PV (BIPV); experiment; PV adoption Highlights:
• Identification of ways to maintain market growth of solar PV • Empirical evidence for community solar as successful channel for distributing
BIPV • Recommendations for public building planning authorities to increase BIPV
adoption • Recommendations for utilities to achieve RE-targets and increase customer
loyalty

39
1. Introduction Tackling climate change and achieving the Paris climate goals requires a transformation of energy systems towards a broad portfolio of low-carbon technologies (Rogelj et al., 2016). Among those technologies, solar power has been proven to be one of the key technologies for power generation from renewable sources (Strupeit & Palm, 2016; SolarPower Europe, 2018; Michas et al., 2019). Solar power is unique, as it allows homeowners and through new business models also tenants (Kalkbrenner & Roosen, 2016; Thapar et al., 2016) to produce and consume their own electricity with minimal maintenance and zero fuel costs. Measured in terms of installed capacity, the photovoltaic sector is the fastest growing power generating technology worldwide (SolarPower Europe, 2018; D’Adamo, 2018). However, even though there has been strong growth in the photovoltaics (PV) sector, and the cost of photovoltaic modules have been falling for years, a large gap remains between estimates of solar potential and the actual scale of deployment (SolarPower Europe, 2018). Many countries still produce significantly less solar energy than would be technically and economically feasible and necessary for a successful energy transition (Swissolar, 2017; Energiewende-Index, 2018).
These circumstances are also reflected in research: until a few years ago, much of the research effort was focused on finding ways to reduce the cost of the related technology and increase its operational efficiency. Nowadays, the research focus has shifted towards finding ways to keep the growth rate of solar power at a high level (Michas et al., 2019).
One important aspect of this challenge involves targeting new and innovative business models, as well as financing mechanisms for solar power (Parag & Sovacool, 2016). One example of a new and innovative business model for promoting the adoption of solar PV is community solar. The core of the community solar business model is the idea of allowing customers to invest in solar installations that are not located on their own premises (Funkhouser et al., 2015; Augustine & McGavisk, 2016). This increases the size of the market segment (thus the number of potential customers) as tenants in particular can also invest. In return, participants receive either financial compensation or the physical delivery of solar power from a plant (Koch & Christ, 2018). Consequently, community solar helps to eliminate several barriers to PV adoption from a customer perspective, such as the ownership of a roof or property, as well as high

40
upfront investment, planning and maintenance costs (Funkhouser et al., 2015; Augustine & McGavisk, 2016; Horváth & Szabó, 2018).
Community solar has already seen significant growth, especially in utility-led commercial and industrial PV projects (Koch & Christ, 2018; SOLSTICE, 2018). New community solar offers in Switzerland sold out within hours, indicating its high potential (ewz, 2015; miinstrom, 2019). In the USA, new installations added over 480 MW to the grid in 2017, exceeding projections by 18%. The community solar industry in the USA has doubled in size in each of the past three years (SOLSTICE, 2018).
Moreover, a new solar market segment is emerging: building integrated photovoltaics (BIPV), which involves integrating PV into the building envelope (Frontini et al., 2015; Zanetti et al., 2017; Hille et al., 2018; Osseweijer et al., 2018). BIPV systems have the potential to become a mainstream option within renewable energy technologies (Hao et al., 2008; Attoye et al., 2017; Biyik et al., 2017) and have proven to be a viable technology for generating renewable energy (Osseweijer et al., 2018). The technology has been steadily optimized by improving system efficiency through ventilation, resulting in higher yields (Biyik et al., 2017). Together with new thin-film technologies, BIPV installations are economically competitive in comparison to conventional PV installations (Biyik et al., 2017). However, the adoption rate of BIPV is still low compared to conventional PV systems. In 2016, BIPV added 1% (3.4GW) to the overall added solar PV capacity of 303 GW, indicating that the adoption rate is still limited (Attoye et al., 2018). This is mainly due to barriers such as the high initial cost (Heinstein et al., 2013), the high level of complexity (Koinegg et al., 2013), a lack of awareness (Temby et al., 2014), and unreliable government policies (Curtius, 2018).
As outlined, community solar has grown significantly by addressing several of the prevailing barriers to PV adoption: these developments are important for maintaining high levels of growth in the wider PV market. For BIPV to add to the overall PV growth rate, it is necessary that the understanding of new and innovative business models for BIPV projects is also improved. Based on the existing barriers to BIPV adoption, we believe that the new and innovative business model community solar can increase the adoption of BIPV in the same way as it has for conventional PV systems. Accordingly, this article investigates the potential of community solar as a new distribution channel for BIPV.3 In order to achieve this goal, the article compares community solar offers
3 So far, community solar for BIPV projects has been used very rarely; one example involves a project in Denver (Facilitiesnet, 2014).

41
based exclusively on BIPV to community solar offers based solely on conventional roof-top PV. The related research question was thus formulated:
Can community solar offers exclusively based on BIPV lead to similar customer adoption rates as community solar offers solely based on conventional rooftop PV and therefore contribute to maintaining the high growth rate of solar PV?
The remainder of this article is structured as follows: The next section discusses and reviews relevant literature in the field of innovative business models for and the adoption of photovoltaics with a focus on community solar and BIPV. Building on this, we derive our hypothesis. Section 3 illustrates our research design and presents the sample used in the analysis. Section 4 contains the results of our study and discusses the verification of our hypothesis. We close our paper in Section 5 by offering general conclusions and policy implications, as well as a discussion of the limitations of our results and avenues for further research.

42
2. Literature Review and Hypothesis Development Section 2 provides a comprehensive literature review of the field of the adoption of PV as well as BIPV, specifying the prevailing barriers as well as business models that address those barriers. Based on the findings from this literature we state our hypotheses.
2.1 Adoption of (BI)PV
Solar PV has become more cost-effective and popular in recent years (Holstenkamp & Kahla, 2016; Osseweijer et al., 2018). However, numerous barriers still limit the further adoption of solar PV, as identified in several research projects.
Barriers to the further adoption of conventional solar PV One of the main barriers is the limited ownership of suitable roofspace (Karakaya & Sriwannawit, 2015). The National Renewable Energy Laboratory (NREL) estimates that 49% of US households are unable to install their own PV systems because they either do not own the building they live in, the building is part of an apartment block, or the relevant roof area is insufficient for solar PV (Augustine & McGavisk, 2016; Abreu et al., 2019). Other relevant barriers include consumer inertia, high investment costs, and long payback periods (Zhang et al., 2012; Strupeit & Palm, 2016). Finally, process barriers also play an important role. Issues such as the extensive effort required in the phases of planning and installation (Zhang et al., 2012), a lack of access to information (Augustine & McGavisk, 2016), difficult and lengthy permitting processes, as well as low trialability are defined as process barriers (Zhang et al., 2012; Augustine & McGavisk, 2016; Strupeit & Palm, 2016). Additionally, soft factors such as the different motivations and priorities of customer segments influence preferences for installing solar PV (Balcombe et al., 2013; Karakaya & Sriwannawit, 2015; Curtius et al., 2018). In order to promote the faster adoption of solar PV, mobilizing mainstream customer groups is of significant importance (Strupeit & Palm, 2016). According to Faiers & Neame (2006), as well as Schleicher-Tappeser (2012), this requires product offers which are affordable and associated with a low level of financial risk, are visually attractive, have low process costs (i.e. low maintenance demands, simple installation processes), and which are based on proven, well-known business models.

43
Specific barriers to the further adoption of BIPV Unlike conventional solar PV, building-integrated photovoltaics (BIPV) are still at an early stage of development, partly due to the belief that BIPV systems are more expensive than conventional solar PV installations. This belief is mistaken as shown by Biyik (2017). Nevertheless, the potential is estimated to be significant (El Gammal et al., 2016; Aguacil et al., 2019; Petrichenko et al., 2019). Roof and facade BIPV potential have been estimated at 1TWp capacity for the European Union (Defaix et al., 2012). For Switzerland, the potential for BIPV is also high, while the potential surface area is estimated at 700,000m2 (Frontini, 2017). Delponte et al. (2015) provided useful insights into the currently most common applications of BIPV in Europe: Half of the BIPV components are embedded in facades, one-third are installed on roofs, and the rest are employed as combined roof/facade products. BIPV has been implemented in residential buildings (19%), public infrastructure (14%), showroom offices (13%), universities and schools (9%), and historical buildings (7%). This situation also corresponds to findings detailed within the national survey reports of PV power applications in various European countries such as Germany, France and Switzerland: In the years 2016 and 2017, new BIPV installations were mainly implemented in the residential sector, whereas development has been slower in the commercial and industrial sector (IEA, 2017; IEA, 2018a, IEA, 2018b; IEA, 2018c). Based on these considerations, it is clear that BIPV is seen as a potentially large global market (Tabakovic et al., 2017; Kang et al., 2019). However, numerous studies have highlighted the different barriers which are limiting the faster adoption of BIPV. Curtius (2018) distinguishes in his study between product-specific, stakeholder, and institutional barriers. Product-specific barriers include high initial costs as well as the high level of complexity characterized by complex investment calculations and a restriction on use to new constructions or renovations (Azadian & Radzi, 2013; Koinegg et al., 2013; Yang, 2016). Stakeholder barriers include a lack of awareness and knowledge gaps among stakeholders (Ritzen et al., 2016; Tabakovic et al., 2017; Roberts et al., 2019), information overload as well as the reluctance of architects as gatekeepers. Finally, institutional barriers include unreliable policies, as well as a dependence on building codes and restrictive building permits (Curtius, 2018).

44
One potential way of overcoming these barriers is to develop new and innovative business models (Parag & Sovacool, 2016; IEA, 2019) for conventional solar PV as well as for BIPV. The next section of the paper discusses new and innovative business models for the PV sector with a focus on community solar.
2.2 Community Solar as an Innovative business model for PV
Grid parity for solar PV has already been reached in certain markets (IRENA, 2017; Karnayeva & Wüstenhagen, 2017). As a result, national policy ambitions have shifted towards the goal of sustaining the level of growth of PV deployment, while simultaneously moving away from the deployment of financial incentive systems such as the commonly applied feed-in-tariff schemes (Strunz et al., 2019). Alongside introducing alternative financing schemes such as lease models or lease-and-lease-back models (Rai & Sigrin, 2013; Dunlop & Roesch, 2016), the development of new business models for the further deployment of solar PV is key (Michas et al., 2019). Research has already identified and examined several new business models for the further deployment of solar PV. Michas et al. (2019) point out critical issues which new business models should address: among other things they should clearly define the revenue streams for new market agents such as prosumers, as well as for utilities. An example of such a business model are peer-to-peer models (Bruton et al., 2014; Parag & Sovacool, 2016), wherein a platform is provided through which consumers and producers can directly sell and buy electricity from each other. Another business model which fulfills the criteria is community solar which is hereafter discussed in more detail (Burger & Luke, 2017; Chan et al., 2017; Brummer, 2018; Ngar-yin Mah, 2019).
Community solar4 as a business model for the further deployment of PV With community solar, customers buy a freely selectable number of panels from a larger photovoltaic system at a fixed price per solar panel (e.g. 400 euros per panel, depending on the provider). This minimizes the barrier of the high up-front investment cost of solar PV systems. The community solar system is owned by the community solar provider, usually a utility. In return, customers receive a fixed amount of solar power annually (e.g. 220 kWh (kilo watt hour) per year, depending on the provider) or financial compensation (e.g. financial compensation of 30 euros per panel and year, depending on the provider) for a pre-determined number of years (normally between 5 and 20 years). In practice,
4 The literature uses various terms for this concept, such as “community solar,” “community shared solar,” and “shared solar” interchangeably (Augustine & McGavisk, 2016; Chan et al., 2017). We exclusively use the term “community solar” in this article.

45
community solar offers can have different types of configuration, including leasing models. However, the core idea remains the same: community members are offered an opportunity to financially participate in large solar PV systems and share the environmental and economic benefits (Coughlin et al, 2012; Funkhouser et al., 2015; Chan et al., 2017; Koch & Christ, 2018). The advantages of community solar are manifold: Customers do not bear any financial risks because the utility company ensures the supply of the defined quantity of electricity, while consumers can — for example, if they change their place of residence — sell their panels back to the utility at any time or pass them on to another customer (Koch & Christ, 2018). Depending on the exact design of the model, a community solar offer can also generate a positive revenue and serve to hedge against rising electricity prices (Augustine & McGavisk, 2016). Chan et al. (2017) point out that customers can take part in such schemes even if they do not own a roof on which to install solar panels (e.g. as tenants), which increases the size of market segment for PV significantly and eliminates the requirement of possessing suitable roof space. Additionally, the planning and installation steps are quick and easy for both the customer and the community solar provider. With a separate homepage on which the offer and benefits are explained, related information can be provided in a clear, understandable and simple manner. This helps to reduce the complexity and the lack of information associated with conventional PV, as well as BIPV offers. Overall, the community solar model represents a cost-effective alternative for a large customer base (Horváth & Szabó, 2018; Brummer, 2018). As Klocke et al. (2017) point out, community solar not only creates an alternative to individuals installing solar PV systems on their own roofs, but can also help educate, raise awareness and trigger discussion regarding how energy systems can work at a local scale. Koch & Christ (2018) describe the overall benefits as follows: compared to building a personal installation, the resources required in terms of financial investment, time, and cognitive effort are much lower for community solar. For the providers of community solar (mainly utilities), community solar also creates several advantages. Additional to increasing customer loyalty and customer satisfaction, community solar is also a means of satisfying increasing customer demand for electricity from renewable sources (Augustine & McGavisk, 2016). An added benefit of community solar is its positive effect on the overall quality of the grid power supply, as it allows utilities to control utility-scale solar PV installations (Augustine & McGavisk, 2016). Recent market

46
trends show that community solar providers have emerged to capitalize on economies of scale and enable customers located in unsuitable areas to procure their own solar PV (Funkhouser et al., 2015). Several studies (Ebers & Wüstenhagen, 2015; Ebers & Wüstenhagen, 2016; Gamma et al., 2017) have found customer adoption rates for community solar offers of above 60%, indicating further market potential.
Based on these findings from the literature, we argue that community solar can eliminate not only several barriers to the further adoption of conventional PV, but especially also barriers to the further adoption of BIPV: these include the need to own a suitable roof or facade, the high upfront investment costs, and the high level of complexity as well as high maintenance and planning costs (Klocke et al., 2017; Brummer, 2018; Horváth & Szabó, 2018). Additionally, the use of community solar can reduce the information deficit through its educational potential and ability to raise awareness (Klocke et al., 2017). Based on these considerations, we posit the following hypothesis:
Community solar BIPV offers are liable to have similar customer adoption rates as community solar offers with conventional solar PV and can therefore be a successful distribution channel for the further adoption of BIPV.

47
3. Methodology and data An experimental study design was chosen to investigate customers’ willingness to buy a community solar offer exclusively involving BIPV compared to an offer involving only conventional solar panels. The experimental stimulus was a community solar offer that was applicable to all communities in Switzerland. The experimental treatment covered the relevant type of solar module, illustrated with images, while everything else within the offer was held constant. Consequently, the experimental design was based on one factor with two different levels (BIVP modules vs. conventional solar PV panels). This experimental setting allowed for the isolated observation of the effect of BIPV on customer willingness to buy within the frame of a community solar offering. Experimental surveys are a widely used and well-accepted method (see also Cardella et al., 2017 and Imam et al., 2016) for measuring the effects of the variability associated with specific variables (Aaker et al., 2013; Kirk, 2012).
3.1 Experimental stimulus and treatment
The community solar offer5 used as a stimulus included an illustrative picture (see Figures 1 and 2) and details of the most relevant product characteristics, such as price per unit (499 Swiss Francs per panel), the contract duration (20 years), and details of the solar power delivery per unit and year (220 kWh per year). Further, it emphasized the fact that anyone could participate, independent of the availability of ownership of suitable roof space. The offer also promoted the fact that 220 kWh of solar power would reduce the purchaser’s electricity bill by 25 Swiss Francs per year and panel. Additionally, the offer emphasized local and environmental benefits, and also highlighted the fact that customers could exercise their right to cancel the offer at any time, including getting a refund on their investment, to minimize any feelings of being trapped in a long-term contract. Benefits and product attributes were presented using a headline message and bullet points listed below. All of the stimulus-related factors mentioned above except for the illustrative picture were identical in both experimental treatments. The treatment of the community solar offer was only different with regard to the solar module type (choice of technology) that was offered, while all other factors were held constant. The BIPV offer was exclusively based on building-integrated photovoltaic (BIPV) modules, which were illustrated and described for participants in detail before
5 Both community solar offers used in this experiment were based on practical observations of other projects (see for example Coughlin (2014), ewz (2015) or Koch & Christ (2018)) and were additionally discussed and reviewed with industry experts to ensure a realistic experimental design.

48
the latter were shown the offer (see survey introduction text included in Appendix A, translated from German to English and only shown to the BIPV group). The group which was confronted with the community solar offer exclusively based on conventional solar panels was faced with a different introductory text (introducing the concept of community solar) before starting the survey. Besides the introductory text, the difference between both offers was based on three elements. First, we used different illustrative images (1) for each of the solar module types used in the community solar model (see Figures 1 and 2). Second, based on the different solar module types, the wording (2) of the offers was slightly adjusted (e.g. “solar facade” and “BIPV modules” for the BIVP offer and “solar plant” and “solar panels” for community solar offer with conventional solar PV panels). Third, the background picture (3) in the offer information section was also different for each offer. While the BIPV offer information included a solar facade as the background picture, the conventional offer included a picture of a solar plant with conventional roof-top solar panels. Both offers were translated from German to English and are included in Appendix B.
Figure 1: BIPV solar modules6 for community solar (Group 1)
6 The colour-framed facade elements are white solar modules. Such modules are developed for example by the Swiss company Solaxess (https://www.solaxess.ch)

49
Figure 2: Conventional solar panels for community solar (Group 2)
3.2 Recruitment and procedure for participants
The experimental study was conducted using an online questionnaire. Participants were recruited by a professional Swiss market research company, which also ensured a quota-based assignment of participants for each of the experimental groups. Quotas used by the market research company were based on the actual demographics of the Swiss population7 and included the variables gender, age and political orientation, which ensured representative and comparable samples for each of the experimental groups as well as for the overall sample. Participants were only faced with one of the two treatments. The whole procedure can be summarized in four steps: First, participants were asked to read an introduction containing general information about community solar, including some information on BIPV modules for the BIPV group only. Second, participants were presented with one of the two offers, as explained in Section 3.1 and illustrated in Appendix B. Third, participants were asked to indicate willingness to buy one or more solar modules/panels from a local community solar facade/plant using a five-point Likert scale. The fourth step included several questions about demographics, attitudes, and personal electricity mix. Additionally, an attention-check question8 was included
7 According to the Swiss Federal Office of Statistics (2018), the following values are representative of the Swiss population. Male/female ratio: 49%/51%; Age 18-29 years 16%, 30-44 years 26%, 45-59 years 28%, 60 years and older 30%; Average primary monthly gross household income (based on information from 2015): 8,0000 Swiss Francs; Income segments for monthly gross household income: below 4,880 CHF (16.1%), 4,880 - 9,702 CHF (49.4%), more than 9,702 CHF (34.5%); Political attitudes based on Swiss Parliament (2018) party seats: right-wing (50.5%), center (22%) and left-wing (27.5%). 8 The attention check was used to check if participants had paid attention to the content of the questions.

50
which asked participants to choose one specific answer (out of five different options) which was given in the text of the question.
3.3 Measures and variables
Participants’ willingness to buy (WTB) was measured using a five-point Likert scale9 and represented the dependent variable. The two different offer types were computed as categorical dummy variables, meaning that the BIPV offer was modeled using Code 1 and the offer based on conventional solar panels was modeled as Code 2. Additionally, we also assessed participants’ attitudes in relation to pro-social and pro-environmental consumption behavior. The literature has identified pro-social and pro-environmental consumption behavior as a significant driver of participation in community energy models (Kilbourne & Pickett, 2008; Rogers et al., 2008; Boon & Dieperink, 2014; Kalkbrenner & Roosen, 2016). To measure pro-social and pro-environmental consumption behavior, the 10-item scale “ethically minded consumer behavior” (EMCB) developed by Sudbury-Riley & Kohlbacher (2016) was used. Further variables which were recorded included demographic information such as age (in years), gender (male/female), monthly gross household income10 and political orientation (indicated by selecting the Swiss political party which reflected respondents’ political orientation the best—or, alternatively, no answer).
3.4 Sample
A final sample of 413 participants who had completed the whole questionnaire, including providing demographic information and answering the attention check question correctly, was collected.11 The following sample table (table 1) illustrates the data of participants per group, and in total. Further, the data is compared with actual values relating to the Swiss population to illustrate the representativeness of both the data for each of the groups and the overall sample.
9 We asked participants the following: “As of today, are you willing to buy one or more panels from the community solar offer?” Participants could indicate their opinion using a 5-point Likert scale ranging from “no,” “rather no,” “don’t know,” “rather yes” to “yes.” 10 Household income could be reported using five different income classes, presented in Swiss Francs, or by selecting “no indication” field. 11 Eighty-four participants were sorted out of the total sample (12 participants failed to answer the attention check question correctly, and 72 participants did not complete the full survey).

51
BIPV Offer (n=210)
Conventional Offer (n=203)
Total Sample (n=413)
Swiss Population12
Agea 18-29 16.7% 16.3% 16.5% 16%
Age 30-44 24.3% 22.7% 23.5% 26%
Age 45-59 27.6% 28.6% 28% 28%
Age 60+ 31.4% 32.5% 32% 30%
Men/Women 50% / 50% 46% / 54% 48% / 52% 49% / 51%
Political Attitudeb: Conservative
47.1% 52.2% 49.6% 50.5%
Political Attitudeb: Centrist
27.6% 32% 29.8% 22%
Political Attitudeb: Left-wing
14.8% 11.8% 13.3% 27.5%
Income: Lowc 9% 10.3% 9.7% 16.1%
Income: Midc 41.4% 42.9% 42.1% 49.4%
Income: Highc 36.7% 30.5% 33.7% 34.5%
a Non-adult (below 18 years old) were excluded from the survey as they are typically not responsible for making decisions about the household electricity mix. The age values provided by the Swiss Federal Office of Statistics also excluded non-adults.
b Political attitude is based on the variable political orientation (see Section 3.3). The seven different party indications were merged into the following political attitudes: conservative (SVP, FDP), centrist (CVP, BDP, GLF) and left-wing (SP, Green). 7.3% of the total sample indicated “other political party” (other than the seven parties represented in the Swiss parliament).
c Income was indicated as monthly gross income per household. The five measured income classes were collated into the following three income segments: Low Income = below 4,880 CHF, Med Income = 4,880 - 9,702 CHF, High Income = more than 9,702 CHF. 14.5% of the total sample selected “no indication” for the income question.
Table 1: Sample configuration and comparison with Swiss population
12 Swiss Federal Office of Statistics (2018); Swiss Parliament (2018): Seat Distribution; see also Footnote 7.

52
4. Results and discussion
4.1 Results
The following results are all based on our final sample of 413 participants (n = 413), according to the sample table in Section 3.4. First, we applied a single 1x2 ANOVA13 without control variables to compare the means of our dependent variable, the willingness to buy for each of the groups. We used SPSS Version 25 for the entire analysis of our data. The single ANOVA14 revealed no significant difference (F(1,411) = 1.061, p = 0.304) between the WTB mean of the BIVP group (m = 3.129, SD = 1.144, n = 210) and that of the conventional PV group (m = 3.241, SD = 1.079, n = 203). The effect size was, according to the partial eta squared, very small (ηp2 = 0.003), which corresponds to the insignificant difference between the WTB means of each of the experimental groups (Cohen, 1988; Ellis, 2010). The following two figures (Figures 3 and 4) illustrate the WTB values for each of the two groups. Figure 3 illustrates the distribution of our dependent variable WTB per experimental group, which was measured on a five-point Likert scale (see also Section 3.3), as shown on the x-axis of Figure 3. Figure 4 illustrates the comparison of the WTB means for each of the experimental groups.
Figure 3: WTB scale outcome (five-point Likert scale) per group
13 ANOVA: Analysis of variance (ANOVA) tests the hypothesis that the mean values of two or more populations are equal. ANOVAs evaluate the significance of one or more factors by comparing the mean values of the response variables at the different factor levels. The null hypothesis is that all mean values of the populations (the mean values of the factor levels) are equal, while the alternative hypothesis is that at least one mean value differs from the others (Rutherford, 2011; Tabachnick et al., 2007). A 1x2 ANOVA corresponds to one factor (Treatment) with two levels (BIPV and Conventional PV). Using ANOVAs to analyze experimental study designs is a widely used and well-accepted technique (see also Brøgger et al, 2018; Iovino & Migliaccio, 2019; Lienert et al., 2018; Li et al., 2018) as pointed out by Cox as early as 1958 and then reemphasized by Cox & Reid in 2000, but also by many other famous scholars of methodical research such as Kirk (2012) and Aaker et al. (2013). Especially if researchers want to compare different group outcomes (which is naturally a given for experimental research designs based on group treatments), ANOVAs are one of the best acknowledged and most appropriate techniques. 14 Test of homogeneity of variances: Levene Statistic (1,411) =0.990, p=0.320
9.0%
23.8%21.0%
37.6%
8.6%6.9%
20.2% 22.7%
42.4%
7.9%
0.0%5.0%
10.0%15.0%20.0%25.0%30.0%35.0%40.0%45.0%50.0%
No Rather no Don't know Rather yes Yes
WTB Scale Outcome per Group
WTB BIPV WTB Conventional
9.0%
23.8% 21.0%
37.6%
8.6%6.9%
20.2% 22.7%
42.4%
7.9%
0.0%
10.0%
20.0%
30.0%
40.0%
50.0%
No Rather no Don't know Rather yes Yes
WTB Scale Outcome per Group
WTB BIPV WTB Conventional

53
Figure 4: Comparison of WTB means per group
Subsequently, we added covariates to our 1x2 ANOVA, applying an 1x2 ANCOVA15 to control for the effect of the treatment on the dependent variable for additional variables. We added gender (coded as dummy variable, 1 = male and 2 = female), age in years, monthly gross household income (coded as ordinal variable, 0 = no indication, 1 = low income, 2 = medium income and 3 = high income), political attitude (coded as categorical variable, 0 = other, 1 = conservative, 2 = centrist, 3 = left-wing) and EMCB (coded with the mean values of the 10-item scale) as covariates for our ANCOVA. Table 2 summarizes the outcome of our model. The overall model was significant (F = 10.203, p = 0.000, n = 413) and no heteroskedasticity was detected. The ANCOVA model still reveals no significant effect of the treatment (p = 0.366) on the dependent variable WTB, while the corresponding effect size remains almost nonexistent (ηp2 = 0.002). Instead, covariates such as EMCB (medium effect size ηp2 = 0.057, positive), age (small effect size ηp2 = 0.025, negative), income (small effect size ηp2 = 0.009, positive) and political attitude (small effect size ηp2 = 0.021, positive) revealed significant effects on the WTB.
15 ANCOVA: ANCOVA, or analysis of covariance, is a statistical method that, similar to ANOVA or analysis of variance, examines a metric dependent variable for differences between groups. In contrast to ANOVA, ANCOVA includes one or more additional variables— also called covariates—in the model. The outcome of an ANCOVA is the same as that of a multiple linear regression model that uses a dummy variable to code the treatment (Rutherford, 2011; Tabachnick et al., 2007).
3.1286 3.2414
1.001.502.002.503.003.504.004.505.00
Mean WTB BIPV Mean WTB Conventional
WTB
Comparison of WTB Means per Group

54
Variable B Standard Error t F Sig.
Treatment 0.093 0.103 -0.904 0.818 0.366
EMCBa 0.383† 0.078 4.933 24.331 0.000
Age -0.011*** 0.003 -3.221 10.372 0.001
Gender 0.138 0.107 1.287 1.655 0.199
Income 0.100* 0.053 1.900 3.612 0.058
Political Attitude 0.192*** 0.065 2.979 8.876 0.003
Intercept 1.749† 0.348 5.033 24.717 0.000
* p < 0.1; ** p < 0.05; *** p < 0.01, † p < 0.001
a 10-item EMCB scale Cronbach’s Alpha = 0.912 (based on n = 413)
F-test of total model: n = 413; F = 10.203; df = 6; Sig. = 0.000; R squared = 0.131; Adjusted R squared = 0.118
Levene’s test of equality of error variances: F = 0.942; df1 = 1, df2 = 411; Sig. 0.332 (null hypothesis = equal error variances of the dependent variable across groups)
Test for heteroskedasticity, Breusch-Pagan Test: Chi-Square = 0.050; df = 6; Sig. = 0.418 (null hypothesis = no heteroskedasticity)
Table 2: ANCOVA SPSS output table
4.2 Discussion
Based on the presented results, our hypothesis that “Community solar BIPV offers are liable to have similar customer adoption rates as community solar offers with conventional solar PV and can therefore be a successful distribution channel for the further adoption of BIPV.” cannot be rejected. The overall effect from the single ANOVA (p = 0.304, ηp2 = 0.003, n = 413) as well as the results from the general model (ANCOVA: p = 0.366, ηp2 = 0.002, n = 413) indicate no significant differences between the WTB means of the BIPV group versus the conventional solar PV group. This finding shows that participants were indifferent concerning the technology associated with the community solar offer. Additionally, community solar as a business model performed strongly: the high adoption rate did not depend on the type of solar technology, as can be observed when considering the mean WTB for the BIPV offer (m = 3.1286) and the mean WTB for the conventional solar PV offer (m = 3.2414, see Figure 4). A total of 46.2% of participants within the BIPV offer group indicated “rather yes” or “yes” when asked if they would be willing to buy one or more solar panels from a local community solar plant. For the community solar

55
offer with conventional solar PV 50.3% of participants responded “rather yes” or “yes” (see Figure 3). The high adoption rates shown in our results confirm the attractiveness of community solar as a business model for the further deployment of solar PV, and in particular also for the further deployment of BIPV. Our results also support the findings of other scholars (see Section 2.2) that community solar as a business model is able to successfully address several barriers to the further adoption of solar PV, and in particular also to the further adoption of BIVP. The high adoption rate of both community solar offers also shows the potential of community solar to mobilize new customer segments, such as tenants,16 an important segment, as already noted by Strupeit & Palm (2016). The mobilization of large potential customer segments is especially critical for BIPV as it is still at an early stage of deployment. In contrast to the experimental treatment, different covariates had a significant impact on the WTB of the study participants. We found that pro-environmental and pro-social consumption behavior (measured with the EMCB scale) has a significant and positive medium effect size (p = 0.000) on the WTB of the overall model. This finding agrees with work presented in the work of Rogers et al. (2008), Boon & Dieperink (2014) and Kalkbrenner & Roosen (2016). Our results also show that political attitude has a small but significant impact. The more conservative a person, the lower their WTB compared to centrist or left-wing voters WTB (p = 0.003). These results were also found in a study by Karlstrøm & Ryghaug (2014). The same holds true for age; younger people report a higher WTB compared to older people (p = 0.001). Not surprisingly, income also has a significant but small impact on WTB: the higher the income, the higher the willingness to buy (p = 0.058). Consequently, the results of our model indicate that EMCB has the strongest effect on the final WTB of participants, while the effect sizes of the discussed demographic variables remain small, especially compared to the effect size of EMCB. Overall, these impacts of our covariates strengthen our assumption that the treatment (i.e. different forms of technology within community solar offers) is not decisive in relation to WTB, thus community solar as a successful business model is not limited to the use of conventional roof-top solar PV systems. Based on these findings, we argue that community solar can be a successful distribution channel for the further deployment of BIPV, as is already the case for conventional PV. 5. Conclusions and Implications
16 In Switzerland, around 60% of the population are tenants (Swiss Federal Office of Statistics, 2017). In Swiss cities, the share of tenants increases to as much as 80% (NZZ, 2018). This illustrates the large potential of this customer segment, especially in cities.

56
This paper contributes to the research stream of new and innovative business models concerning the further adoption of solar PV, specifically for BIPV, and adds value by experimentally exploring the differences between customer’s willingness to buy into community solar offers exclusively based on BIPV and community solar offers with conventional solar PV systems. The research described in our paper was designed to answer the following research question:
Can community solar offers exclusively based on BIPV lead to similar customer adoption rates as community solar offers solely based on conventional rooftop PV and therefore contribute to maintaining the high growth rate of solar PV?
Results show that community solar offers exclusively based on BIPV may have similar adoption rates as those with conventional solar PV panels, indicating the potential of the former as a successful distribution channel for the further adoption of BIPV. This leads to several conclusions and implications. As literature about new and innovative business models for the further adoption of solar PV, especially for BIPV, is rare, our findings represent important insights upon which policy makers may build to increase the adoption rates of community solar BIPV projects, as well as highlight to project developers involved with the further adoption of BIPV the market potential of such an approach.
5.1 Conclusions and implications for policy makers and practitioners
Our research illustrated that in a hypothetical scenario there were no significant differences between WTB means between a community solar BIPV group and a community solar conventional solar PV group. Our investigation therefore finds experimental evidence that the technology associated with community solar as a business model is not a decisive factor in its attractiveness. Combining the potential of tenants as a new and large customer segment with the high overall adoption rate for the community solar BIVP group indicates that community solar can be a successful distribution channel for increasing the adoption of BIPV and thus can also help maintain the growth rates of the PV sector more generally. Our results illustrate that community solar based on BIPV may be a potential growth driver for BIPV, helping increase overall PV growth as well. Regarding the different control variables, our research shows that, in contrast to our treatment (different forms of technology within a community solar offer), mainly pro-environmental and pro-social consumption behavior, but additionally also age, income, and political attitude have significant impacts on the willingness to buy, both for BIPV as well as conventional PV offers. These findings lend support to those of Rogers et al. (2008), Boon & Dieperink (2014), Kalkbrenner & Roosen (2016)

57
or Karlstrøm & Ryghaug (2014) who also found that pro-environmental and pro-social consumption behavior, in addition to political party preferences, have a significant impact on willingness to invest in and support the deployment of renewable energies such as solar PV.
Our research has illustrated that community solar as a business model can be a successful distribution channel for the further adoption of BIPV. This finding leads to conclusions for policy makers and practitioners.
Authorities at the state as well as local level would be well advised to draft guidelines (as it was successfully implemented in Uppsala, Sweden; IEA, 2018d) that include community solar based on BIPV as part of the planning process for public buildings. Community solar could be an opt-out solution, requiring that city planners provide valid reasons for not including a community solar model in the public building planning process. Such guidelines would represent a helpful instrument not only for establishing community solar as part of the building planning process in the public sector, but also for addressing and reducing additional barriers to the further adoption of BIPV such as the unreliable government policies mentioned by Curtius (2018), a related lack of awareness, knowledge gaps, and issues with the overall trialability of BIPV, as mentioned by Ritzen et al. (2016), Strupeit & Palm (2016), Tabakovic et al. (2017) as well as Chang et al. (2019). Our research paper also has practical implications. SOLSTICE (2018) identified the issue of the leadership of utilities as well as authorities (Lu et al., 2019) as a key driver for the further embedding of community solar. By promoting community solar BIPV, utilities can further meet increasing customer demand for renewable energy and also increase customer loyalty and satisfaction (Coughlin et al., 2012; Funkhouser et al., 2015; Augustine & McGavisk, 2016). City or state governments, which are often significant majority owners of local or regional utilities, could exert an influence and insist on the introduction of community solar business models within utilities’ product portfolios. 5.2 Limitations and Further Research
Although we believe that our article has some notable strengths, such as its data-based, straightforward, comprehensive methodology, there are also some limitations to the results. First, our results are limited to the stimulus used in our experiment. This stimulus was a community solar offer based on practical observations and industry expert reviews. However, some attributes of the stimulus, such as price and contract duration,

58
may additionally have influenced the willingness to buy. The effect was minimized as both experimental groups faced the same stimulus except for the type of solar panels. Further, we measured participants’ intentions, not their real behavior. Participants indicated their willingness to buy in the form of self-reported intention, which does not necessarily reflect real behavior (this may also be influenced by a social desirability bias; Hebert et al., 1995). Another notable limitation is the geographical context. Swiss citizens have the third highest disposable average income in Europe (behind Luxembourg and Norway; Swiss Federal Office of Statistics, 2015), which may also influence their willingness to invest in community solar projects. Additionally, other cultural factors such as high institutional trust (Swiss Federal Office of Statistics, 2016) compared to other European countries and a broad democratic consensus regarding the need for national renewable energy development (UVEK, 2017) geographically limit our results. Based on these limitations, several avenues for further research are suggested. Scholars could attempt to validate our results by either changing the attributes of the experimental stimulus such as the price or contract duration of the offer, or by changing the geographical context of the experiment (for instance, by repeating the same study in another country). Since our results, as well as results from other studies (Kalkbrenner & Roosen, 2016; Gamma et al., 2017; Hyland & Bertsch, 2018), provide evidence for a high willingness to support local community energy, research could also investigate if the community finance approach would also be suitable for use with other renewable energy technologies. Researchers could therefore use a similar experimental setting to the one applied in this article to compare customer willingness to buy in relation to different technologies. Another further research stream could focus on comparing BIPV adoption rates between homeowners who install BIPV on their property and tenants who adopt BIPV by participating in community solar projects. Last but not least, researchers could investigate real community solar BIPV projects through a qualitative research approach by interviewing different key stakeholders, such as customers and developers, in order to identify the critical factors in successful project implementation.
Acknowledgments
This research project was supported by industry experts from the local utility of St. Gallen who provided their expertise in terms of reviewing the community solar offer. Funding: The research this paper is based on was financially supported by the Swiss National Science Foundation (SNF, CH-3001 Berne).

59
References Aaker, D. A., Kumar, V., Leone, R. P. & Day, G. S. (2013). Marketing Research (11th
Ed.). Singapore: John Wiley & Sons. Abreu, J., Wingartz, N. & Hardy, N. (2019). New trends in solar: A comparative study
assessing the attitudes towards the adoption of rooftop PV. Energy Policy, 128, 347-363.
Aguacil, S., Lufkin, S. & Rey, E. (2019). Active surfaces selection method for building-integrated photovoltaics (BIPV) in renovation projects based on self-consumption and self-sufficiency. Energy and Buildings, 193, 15-28.
Attoye, D.E., Aoul, K. & Hassan, A. (2017). A Review on Building Integrated Photovoltaic Façade Customization Potentials. Sustainability, 9, 2287-2311.
Attoye, D.E., Adekunle, O., Kheira, A., Aoul, T., Ahmed, H. & Attoye, S.O. (2018). A Conceptual Framework for a Building Integrated Photovoltaics (BIPV) Educative-Communication Approach. Sustainability, 10, 3781-3802.
Augustine, P. & McGavisk, E. (2016). The next big thing in renewable energy: Shared solar. The Electricity Journal, 29, 36-42.
Azadian, F. & Radzi, M.A.M. (2013). A general approach toward building integrated photovoltaic systems and its implementation barriers: A review. Renewable & Sustainable Energy Reviews, 22, 527–538.
Balcombe, P., Rigby, D. & Azapagic, A. (2013). Motivations and barriers associated with adopting microgeneration energy technologies in the UK. Renewable and Sustainable Energy Reviews, 22, 655-666.
Biyik, E., Araz, M., Hepbasli, A., Shahrestani, M., Yao, R., Shao, L., Essah, E., Oliveira, A. C., del Caño, T., Rico, E., Lechón, J. L., Andrade, L., Mendes, A. & Atli, Y. B. (2017). A key review of building integrated photovoltaics (BIPV) systems. Engineering Science and Technology, an International Journal, 20, 833-858.
Boon, F. P. & Dieperink, C. (2014). Local civil society based renewable energy organisations in the Netherlands: Exploring the factors that stimulate their emergence and development. Energy Policy, 69, 297-307.
Brøgger, M., Bacher, P., Madsen, H., & Wittchen, K. B. (2018). Estimating the influence of rebound effects on the energy-saving potential in building stocks. Energy and Buildings, 181, 62-74.
Brummer, V. (2018). Community energy – benefits and barriers: A comparative literature review of Community Energy in the UK, Germany and the USA, the

60
benefits it provides for society and the barriers it faces. Renewable and Sustainable Energy Reviews, 94, 187-196.
Bruton, G., Khavul, S., Siegel, D. & Wright, M. (2014). New Financial Alternatives in Seeding Entrepreneurship: Microfinance, Crowdfunding, and Peer-to-Peer Innovations. Retrieved on 23.01.2019 from https://journals.sagepub.com/doi/pdf/10.1111/etap.12143
Burger, S. P. & Luke, M. (2017). Business models for distributed energy resources: A review and empirical analysis. Energy Policy, 109, 230-248.
Cardella, E., Ewing, B. T., & Williams, R. B. (2017). Price volatility and residential electricity decisions: Experimental evidence on the convergence of energy generating source. Energy Economics, 62, 428-437.
Chan, G., Evans, I., Grimley, M., Ihde, B. & Mazumder, P. (2017). Design choices and equity implications of community shared solar. The Electricity Journal, 30 (9), 37-41.
Chang, R., Cao, Y., Lu, Y., & Shabunko, V. (2019). Should BIPV technologies be empowered by innovation policy mix to facilitate energy transitions? Revealing stakeholders' different perspectives using Q methodology. Energy policy, 129, 307-318.
Cohen, J. (1988). Statistical Power Analysis for the Behavioral Sciences. Hoboken: Taylor and Francis.
Coughlin, J., Grove, J., Irvine, L., Jacobs, J. F., Phillips, S. J., Sawyer, A. & Wiedman, J. (2012). A guide to community shared solar: utility, private, and nonprofit project development. National Renewable Energy Laboratory, 1-68.
Cox, D. R. (1958). Planning of experiments. Oxford, England: Wiley. Cox, D. R. & Reid, N. (2000). The theory of the design of experiments. Chapman and
Hall/CRC. Curtius, H. C. (2018). The adoption of building-integrated photovoltaics: barriers and
facilitators. Renewable Energy, 126, 783-790. Curtius, H. C., Hille, S. L., Berger, C., Hahnel, U. J. J. & Wüstenhagen, R. (2018).
Shotgun or snowball approach? Accelerating the diffusion of rooftop solar photovoltaics through peer effects and social norms. Energy Policy, 118, 596-602.
D’Adamo, I. (2018). The profitability of residential photovoltaic systems. A new scheme of subsidies based on the price of CO2 in a developed PV market. Social Sciences, 7(9), 148.

61
Defaix, P. R., Van Sark, W. G. J. H. M., Worrell, E. & de Visser, E. (2012). Technical potential for photovoltaics on buildings in the EU-27. Solar Energy, 86(9), 2644-2653.
Delponte, E., Marchi, F., Frontini, F., Polo, C., Fath, K. & Batey, M. (2015). BIPV in EU28, from niche to mass market: an assessment of current projects and the potential for growth through product innovation. In: Proceedings of the 31st European photovoltaic solar energy conference and exhibition; p. 3046–3050.
Dunlop, S. & Roesch, A. (2016). Eu-Wide Solar PV Business Models Guidelines for Implementation. PV Financing Project D4.4.
Ebers, A. & Wüstenhagen, R. (2015). 5th Consumer Barometer of Renewable Energy. Retrieved on 07.02.2019 from: https://iwoe.unisg.ch/de/lehrstuhlmanagementee/publikationen/kundenbarometer
Ebers, A. & Wüstenhagen, R. (2016). 6th Consumer Barometer of Renewable Energy. Retrieved on 07.02.2019 from: https://iwoe.unisg.ch/de/lehrstuhlmanagementee/publikationen/kundenbarometer
El Gammal, A., Mueller, D., Buerkstuemmer, H., Vignal, R. & Macé, P. (2016). Technical evaluation of BIPV power generation potential in EU-28. In: Proceedings of the 33nd European photovoltaic solar energy conference and exhibition; p. 2518–2522.
Ellis, P. D. (2010). The essential guide to effect sizes: Statistical power, meta-analysis, and the interpretation of research results. Cambridge, New York: Cambridge University Press.
Energiewende-Index (2018). Der Energiewende-Index. Retrieved on 15.02.2019 from energiewende-index.ch
ewz (2015). Strom auf dem eigenen Dach produzieren und beziehen. Retrieved on 10.01.2019 from https://www.ewz.ch/de/ueber-ewz/medien/medienmitteilungen/2015/ewz-meinsolar.html
Facilitiesnet (2014). Retrieved on 16.01.2019 from https://www.facilitiesnet.com/green/article/Former-Air-Force-Hanger-Hosts-Community-Shared-BIPV-System---14676
Faiers, A. & Neame, C. (2006). Consumer attitudes towards domestic solar power systems. Energy Policy, 34, 1797-1806.
Frontini, F. (2017). Innovation und Multifunktionalität: was bietet der BIPV-Markt heute? Retrieved on 16.01.2019 from

62
https://www.swissolar.ch/fileadmin/user_upload/Tagungen/PV-Tagung_2016/4.1_Innovation_und_Multifunktionalitaet_Was_bietet_der_BIPV_Markt_heute_FRANCESCO_FRONTINI.pdf
Frontini, F., Bonomo, P., Chatzipanagi, A., Verberne, G., van den Donker, M., Sinapis, K. & Folkerts, W. (2015). Building Integrated Photovoltaics – Report 2015. Retrieved on 20.02.2019 from: http://repository.supsi.ch/7202/1/160112_BIPV_digitale.pdf
Funkhouser, E., Blackburn, G., Magee, C. & Rai, V. (2015). Business model innovations for deploying distributed generation: The emerging landscape of community solar in the U.S. Energy Research & Social Science, 10, 90-101.
Gamma, K., Stauch, A. & Wüstenhagen, R. (2017). 7th Consumer Barometer of Renewable Energy. Retrieved on 07.02.2019 from: https://iwoe.unisg.ch/de/iwoe-news/2017/20170424_7teskundenbarometer
Hao G. et al. (2008) Application and Development of Building-Integrated Photovoltaics (BIPV) System in China. In: Goswami, D.Y., Zhao, Y. (eds) In Proceedings of ISES World Congress 2007 (Vol. I – Vol. V).
Hebert, J. R., Clemow, L., Pbert, L., Ockene, I. S., & Ockene, J. K. (1995). Social desirability bias in dietary self-report may compromise the validity of dietary intake measures. International journal of epidemiology, 24(2), 389-398.
Heinstein, P., Ballif, C., & Perret-Aebi, L. E. (2013). Building integrated photovoltaics (BIPV): review, potentials, barriers and myths. Green, 3(2), 125-156.
Hille, S. L., Curtius, H. C. & Wüstenhagen, R. (2018). Red is the new blue – The role of color, building integration and country-of-origin in homeowners’ preferences for residential photovoltaics. Energy and Buildings, 162, 21-31.
Holstenkamp, L. & Kahla, F. (2016). What are community energy companies trying to accomplish? An empirical investigation of investment motives in the German case. Energy Policy, 97, 112-122.
Horváth, D. & Szabó, R. (2018). Evolution of photovoltaic business models: Overcoming the main barriers of distributed energy deployment. Renewable and Sustainable Energy Reviews, 90, 623-635.
Hyland, M. & Bertsch, V. (2018). The Role of Community Involvement Mechanisms in Reducing Resistance to Energy Infrastructure Development. Ecological Economics, 146, 447-474.
IEA (2017). National Survey Report of PV Power Applications in Switzerland 2016. Retrieved on 14.01.2019 from http://www.iea-

63
pvps.org/index.php?id=93&no_cache=1&tx_damfrontend_pi1%5BshowUid%5D=740&tx_damfrontend_pi1%5BbackPid%5D=93
IEA (2018a). National Survey Report of Photovoltaic Applications in France. Retrieved on 14.01.2019 from http://www.iea-pvps.org/index.php?id=93&no_cache=1&tx_damfrontend_pi1%5BshowUid%5D=740&tx_damfrontend_pi1%5BbackPid%5D=93
IEA (2018b). National Survey Report of Photovoltaic Applications in Switzerland. Retrieved on 14.01.2019 from http://www.iea-pvps.org/index.php?id=93&no_cache=1&tx_damfrontend_pi1%5BshowUid%5D=740&tx_damfrontend_pi1%5BbackPid%5D=93
IEA (2018c). National Survey Report of PV Power Applications in Germany. Retrieved on 14.01.2019 from http://www.iea-pvps.org/index.php?id=93&no_cache=1&tx_damfrontend_pi1%5BshowUid%5D=740&tx_damfrontend_pi1%5BbackPid%5D=93
IEA (2018d). Transition towards sound BIPV business models. Retrieved on 22.01.2019 from http://iea-pvps.org/index.php?id=365
IEA (2019). PV in Buildings & BIPV. Retrieved on 20.01.2019 from http://iea-pvps.org/index.php?id=365
IRENA (2017). Renewable Power Generation Costs in 2017. Retrieved on 13.01.2019 from https://www.irena.org/publications/2018/Jan/Renewable-power-generation-costs-in-2017
Imam, M. T., Afshari, S., & Mishra, S. (2016). An experimental survey of feedback control methodologies for advanced lighting systems. Energy and Buildings, 130, 600-612.
Iovino, F. & Migliaccio, G. (2019). Energy companies and sizes: An opportunity? Some empirical evidences. Energy Policy, 128, 431-439.
Kalkbrenner, B. J. & Roosen, J. (2016). Citizens’ willingness to participate in local renewable energy projects: The role of community and trust in Germany. Energy Research & Social Science, 13, 60-70.
Kang, H., Hong, T., Jung, S., & Lee, M. (2019). Techno-economic performance analysis of the smart solar photovoltaic blinds considering the photovoltaic panel type and the solar tracking method. Energy and Buildings, 193, 1-14.
Karakaya, E. & Sriwannawit, P. (2015). Barriers to the adoption of photovoltaic systems: The state of the art. Renewable and Sustainable Energy Reviews, 49, 60-66.

64
Karlstrøm, H. & Ryghaug, M. (2014). Public attitudes towards renewable energy technologies in Norway. The role of party preferences. Energy Policy, 67, 656-663.
Karnayeva, Y. & Wüstenhagen, R. (2017). Solar feed-in tariffs in a post-grid parity world: The role of risk, investor diversity and business models. Energy Policy, 106, 445-456.
Kilbourne, W. & Pickett, G. (2008). How materialism affects environmental beliefs, concern, and environmentally responsible behavior. Journal of Business Research, 61(9), 885-893.
Kirk, R. E. (2012). Experimental design. Handbook of Psychology, Second Edition, 2. Klocke, S., Prehoda, E., Pudas, S., Schimmel, L., Valenti, K. & Winkler, R. (2017).
L’Anse Community Solar Social and Economic Feasibility Study. Retrieved on 10.03.2019 from https://www.mtu.edu/social-sciences/research/reports/lanse-cs-report2.pdf
Koch, J. & Christ, O. (2018). Household participation in an urban photovoltaic project in Switzerland: Exploration of triggers and barriers. Sustainable Cities and Society, 37, 420-426.
Koinegg, J., Brudermann, T., Posch, A. & Mrotzek, M. (2013). “It Would Be a Shame if We Did Not Take Advantage of the Spirit of the Times”. An Analysis of Prospects and Barriers of Building Integrated Photovoltaics. GAIA Ecological Perspectives for Science and Society, 22, 39–45.
Lienert, P., Sütterlin, B. & Siegrist, M. (2018). Public acceptance of high-voltage power lines: The influence of information provision on undergrounding. Energy Policy, 112, 305-315.
Li, M., Allinson, D., & He, M. (2018). Seasonal variation in household electricity demand: A comparison of monitored and synthetic daily load profiles. Energy and Buildings, 179, 292-300.
Lu, Y., Chang, R., Shabunko, V., & Yee, A. T. L. (2019). The implementation of building-integrated photovoltaics in Singapore: drivers versus barriers. Energy, 168, 400-408.
NZZ – Neue Züricher Zeitung - (2018). Basel und Genf haben die höchsten Mieteranteile. Retrieved on 17.02.2019 from: https://www.nzz.ch/schweiz/basel-stadt-und-genf-haben-die-hoechsten-mieter-anteile-ld.1352119

65
Michas, S., Stavrakas, V., Spyridaki, N. A., & Flamos, A. (2019). Identifying Research Priorities for the further development and deployment of Solar Photovoltaics. International Journal of Sustainable Energy, 38(3), 276-296.
Miinstrom (2019). Werden Sie Ihr eigener Solarstromproudzent. Retrieved on 10.01.2019 from: http://www.miinstrom.ch
Ngar-yin Mah, D. (2019). Community solar energy initiatives in urban energy transitions: A comparative study of Foshan, China and Seoul, South Korea. Energy Research & Social Science 50, 129-142.
Osseweijer, F. J. W., van den Hurk, L. B. P., Teunissen, E. J. H. M. & van Sark, W. (2018). A comparative review of building integrated photovoltaics ecosystems in selected European countries. Renewable and Sustainable Energy Reviews, 90, 1027-1040.
Parag, Y. & Sovacool, B. K. (2016). Electricity market design for the prosumer era. Nature energy, 1(4), 16032.
Petrichenko, K., Ürge-Vorsatz, D., & Cabeza, L. F. (2019). Modeling global and regional potentials for building-integrated solar energy generation. Energy and Buildings.
Rai, V. & Sigrin, B. (2013). Diffusion of environmentally-friendly energy technologies: buy versus lease differences in residential PV markets. Environmental Research Letters, 8(1), 014022.
Ritzen, M., Reijenga, T., El Gammal, A., Warneryd, M., Sprenger, W., Rose-Wilson, H. & Boddaert, S. (2016, November). IEA-PVPS Task 15: Enabling Framework for BIPV Acceleration. (IEA-PVPS). In Proceedings of the 48th IEA PVPS Executive Committee Meeting, Vienna, Austria (Vol. 16).
Roberts, M. B., Bruce, A., & MacGill, I. (2019). Opportunities and barriers for photovoltaics on multi-unit residential buildings: Reviewing the Australian experience. Renewable and Sustainable Energy Reviews, 104, 95-110.
Rogelj, J., Den Elzen, M., Höhne, N., Fransen, T., Fekete, H., Winkler, H. & Meinshausen, M. (2016). Paris Agreement climate proposals need a boost to keep warming well below 2 C. Nature, 534(7609), 631.
Rogers, J. C., Simmons, E. A., Convery, I. & Weatherall, A. (2008). Public perceptions of opportunities for community-based renewable energy projects. Energy Policy, 36, 4217-4226.
Rutherford, A. (2011). ANOVA and ANCOVA: a GLM approach. John Wiley & Sons. Schleicher-Tappeser, R. (2012). How renewables will change electricity markets in the
next five years. Energy policy, 48, 64-75.

66
Solar Power Europe (2018). Global Market Outlook For Solar Power / 2018 – 2022. Retrieved on 14.02.2019 from: https://www.solarpowereurope.org/wp-content/uploads/2018/09/Global-Market-Outlook-2018-2022.pdf
SOLSTICE (2018). What’s Behind the Explosive Growth In the Community Solar Market? Retrieved on 13.01.2019 from: https://www.solstice.us/solstice-blog/explosive-growth-in-the-community-solar-market/
Strunz S., Gawel E., Lehmann P. Söderholm P. (2019) Policy Convergence as a Multi-faceted Concept: The Case of Renewable Energy Policies in the EU. In: Gawel E., Strunz S., Lehmann P., Purkus A. (eds) The European Dimension of Germany’s Energy Transition (p. 147 – 171). Cham: Springer.
Strupeit, L. & Palm, A. (2016). Overcoming Barriers to Renewable Energy Diffusion: Business Models for Customer-Sited Solar Photovoltaics in Japan, Germany and the United States. Journal of Cleaner Production, 123, 124-136.
Sudbury-Riley, L. & Kohlbacher, F. (2016). Ethically minded consumer behavior: Scale review, development, and validation. Journal of Business Research, 69, 2697-2710.
Swiss Federal Office of Statistics (2015). Statistiken finden – Wirtschaftliche und soziale Situation der Bevölkerung - Einkommensverteilung. Retrieved on 15.09.2018 from: https://www.bfs.admin.ch/bfs/de/home/statistiken/wirtschaftliche-soziale-situation-bevoelkerung/wohlbefinden-armut/ungleichheit-einkommensverteilung/einkommensverteilung.html
Swiss Federal Office of Statistics (2016). Statistiken finden - Querschnittsthemen -Wohlfahrtsmessung - Bestände Sozialkapital - Vertrauen in Institutionen: Retrieved on 16.02.2019 from: https://www.bfs.admin.ch/bfs/de/home/statistiken/querschnittsthemen/wohlfahrtsmessung/bestaende/sozialkapital/vertrauen-institutionen.html
Swiss Federal Office of Statistics (2017). Statistiken finden – Bau- und Wohnungswesen – Wohnungen – Wohnverhältnisse – Mieter/Eigentümer. Retrieved on 17.02.2019 from: https://www.bfs.admin.ch/bfs/de/home/statistiken/bau-wohnungswesen/wohnungen/wohnverhaeltnisse/mieter-eigentuemer.html
Swiss Federal Office of Statistics (2018). Statistiken finden – Bevölkerung – Stand und Entwicklung; Bevölkerung - Wirtschaftliche und soziale Situation der Bevölkerung. Retrieved on 15.09.2018 from: https://www.bfs.admin.ch/bfs/de/home/statistiken/bevoelkerung/stand-

67
entwicklung.html and https://www.bfs.admin.ch/bfs/de/home/statistiken/wirtschaftliche-soziale-situation-bevoelkerung/einkommen-verbrauch-vermoegen/haushaltsbudget.html
Swiss Parliament (2018). Seat Distribution per Party. Organe – Nationalrat – Sitzordnung. Retrieved on 28.09.2018 from: https://www.parlament.ch/de/organe/nationalrat/sitzordnung-nr
Swissolar (2017). Der Atomausstieg kommt: Roadmap für den Ausbau der Photovoltaik in der Schweiz. Retrieved on 10.01.2019 from https://www.swissolar.ch/fileadmin/user_upload/Swissolar/Top_Themen/Roadmap_PV_Kurzversion_de.pdf
Tabachnick, B. G., Fidell, L. S., & Ullman, J. B. (2007). Using multivariate statistics (Vol. 5). Boston, MA: Pearson.
Tabakovic, M., Fechner, H., van Sark, W., Louwen, A., Georghiou, G., Makrides, G., Loucaidou, E., Ioannidou, M., Weiss, I., Arancon, S. & Betz, S. (2017). Status and outlook for building integrated photovoltaics (BIPV) in relation to educational needs in the BIPV sector. Energy Procedia 111, 993-999.
Temby, O., Kapsis, K., Berton, H., Rosenbloom, D., Gibson, G., Athienitis, A. & Meadowcroft, J. (2014). Building-integrated photovoltaics: distributed energy development for urban sustainability. Environment: Science and Policy for Sustainable Development, 56(6), 4-17.
Thapar, S., Sharma, S. & Verma, A. (2016). Economic and environmental effectiveness of renewable energy policy instruments: Best practices from India. Renewable and Sustainable Energy Reviews, 66, 487-498.
UVEK - Eidgenössisches Departement für Umwelt, Verkehr, Energie und
Kommunikation – (2017). Das UVEK - Abstimmungen – Energiegesetzt. Retrieved on 26.02.2019 from: https://www.uvek.admin.ch/uvek/de/home/uvek/abstimmungen/abstimmung-zum-energiegesetz.html
Wong-Parodi, G., Krishnamurti, T., Gluck, J. & Agarwal, Y. (2019). Encouraging energy conservation at work: A field study testing social norm feedback and awareness of monitoring. Energy Policy, 130, 197-205.

68
Yang, R.J. & Zou, P.X. (2016). Building integrated photovoltaics (BIPV): Costs, benefits, risks, barriers and improvement strategy. International Journal of Construction Management, 16, 39–53.
Zanetti, I., Bonomo, P., Frontini, F., Saretta, E., van den Donker, M., Vossen, F. & Folkerts, W. (2017). Building Integrated Photovoltaics: Product overview for solar building skins. Retrieved on 20.02.2019 from: https://www.seac.cc/wp content/uploads/2017/11/171102_SUPSI_BIPV.pdf
Zhang, X., Shen, L. & Chan, S. Y. (2012). The diffusion of solar energy use in HK: what are the barriers? Energy Policy, 41, 241-249.
Appendix
Appendix A - Explanation and visual illustration of BIPV for the purpose of community solar
***Survey introduction text for BIPV Group (only)*** In the context of this survey, the first thing you will be presented with is a new solar power offering from your local utility company. This is a Community Solar offering

69
(the name for an offer to participate in regional community/community solar plants), which offers ‘building-integrated solar modules.’ In practice, this new module type is referred to as BIPV module, BIPV being an abbreviation for ‘building-integrated photovoltaic.’ Instead of conventional solar panels, BIPV modules can also be used as building facades (in different colors, such as black or white). The following picture shows three currently existing examples in Switzerland:
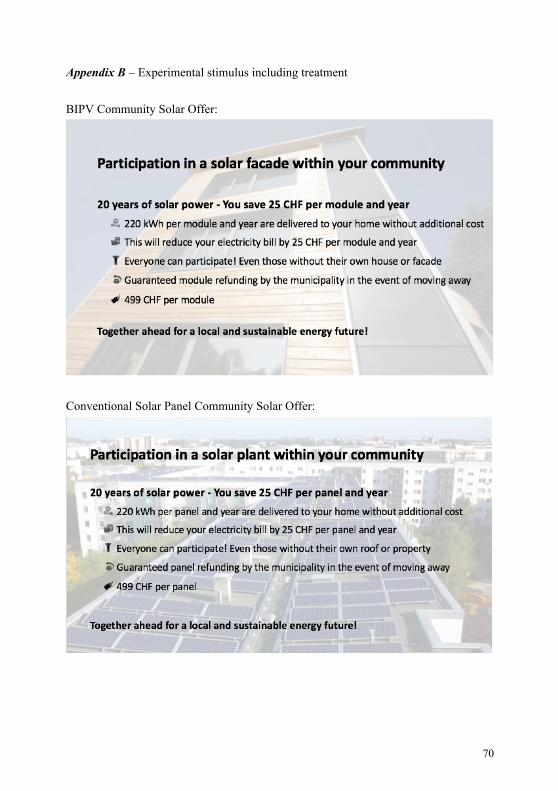
70
Appendix B – Experimental stimulus including treatment BIPV Community Solar Offer:
Conventional Solar Panel Community Solar Offer:

71
Paper 2: Cash vs. solar power: An experimental investigation of the
remuneration-related design of community solar offerings
Authors:
Alexander Stauch, University of St.Gallen ([email protected])
Karoline Gamma, University of St.Gallen ([email protected])
Institute for Economy and the Environment
Müller-Friedbergstrasse 6/8
CH-9000 St. Gallen
Bibliography:
Stauch, A., & Gamma, K. (2020). Cash vs. solar power: An experimental investigation
of the remuneration-related design of community solar offerings. Energy Policy, 138,
111216.
Publication date: 14th of January 2020

72
Abstract
This paper investigates the effect of two different community solar remuneration models on the overall willingness to buy of Swiss electricity customers (n=496). Based on practical observation, the two main remuneration models that dominate today’s implementation landscape for community solar were identified. The first of the former delivers solar power directly from community solar plants, while the second delivers financial compensation instead of solar power. A between-subject-design experiment applying pro-environmental behavior as approximation for intrinsic motivation demonstrated that remuneration schemes which avoid mentioning financial benefits and instead compensate customers with the solar power are particularly attractive to green electricity customers who have higher intrinsic motivation to consume pro-environmental electricity. Offering financial benefits may even discourage these customers from participating in community solar. On the other hand, offering financial benefits appeals to default electricity customers whose intrinsic motivation for pro-environmental behavior is too weak to trigger a reaction to the ecological and local benefits of community solar alone. When designing policies around community solar or implementing community solar projects, policy makers and practitioners should thus carefully analyze the customer base and its composition in order to match remuneration schemes to customer preferences.
Keywords: community solar; remuneration; motivation theory; crowding-out
Highlights:
• Empirical examination of practice-based community solar remuneration models
• Experimental survey with Swiss electricity customers (n=496)
• Customer segmentation based on customers’ intrinsic motivation
• Statistical evidence supports theory-based argumentation
• Relevant practical and political implications

73
1. Introduction
Community-based energy projects, especially community solar – a new and innovative offering involving locally produced solar power – have enjoyed increasing popularity in recent years due to the various benefits they offer to customers (Augustine & McGavisk, 2016; Coughlin et al., 2012; Rogers et al. 2008; Walker & Devine-Wright, 2008). As a result, the number of community solar offerings is rising, and the latter are also increasingly offered by local power companies. Examples17 show that projects in large cities in particular have significant potential to attract many thousands of customers and to generate investment of several million euros in the expansion of urban solar power generation. Community Solar enables all electricity customers, whether homeowners with a roof or tenants without a roof, to participate financially in a local solar system at low cost and without any effort regarding installation and maintenance of the system. In return, customers are remunerated per unit for a predetermined period of time. Participation in a local community solar program in most cases takes the form of a one-time payment18 per unit, whereby units are typically offered in the form of solar plant square meters, or solar panels (Chan et al., 2017; Funkhouser et al., 2015). In practice, but also in the literature, community solar offerings can take different forms and should therefore be considered as a sub-category from the general concept of community energy. According to Hicks and Ison (2018), an ideal concept of community energy involves five attributes: (1) the locally appropriate scale of technology deployment, (2) early and extensive community engagement, (3) participatory decision-making in the form of one vote per member, (4) the engagement of local actors, (5) and the communal distribution of financial benefits. The extent to which these attributes are present varies according to different situations of community energy projects. While attributes 1, 4 and 5 also apply to community solar, early and extensive community engagement as well as participatory decision-making through a one-vote-per-member system are not always necessary for community solar projects. This is, for example, the case when an energy provider offers community solar. In such a scenario, the decision about the site and size of the solar plant are made by the utility prior to offering customers a solar panel. Thus, no community engagement and participatory decision-making takes place before customers are confronted with the offer, as those initial decisions are made by the utility. Ngar-yin Mah (2019) illustrates eight different
17 One community solar project from Vienna has over 10,000 participants and raised over twenty million euros (Der Standard, 2017; Wien Energie, 2018). Another project from Zürich has around 2,500 participants and raised around three million Swiss Francs (EWZ, 2018). 18 Some suppliers from the United States additionally offer leasing schemes to support participation in community solar programs (Coughlin et al., 2015; Chan et al., 2017).

74
practical examples of community solar initiatives around the world, all initiated by different entities, which have resulted in a diversity of offer-related characteristics. The differences amount to the provider, the planning and implementation process (with or without community member involvement), the design of the offer’s attributes and its communication. Thus, the concept of community solar can take various forms which can be implemented by a variety of different actors, such as utilities, non-profit organizations, foundations or communities (Augustine & McGavisk, 2016; Chan et al., 2017; Coughlin et al., 2012; Ngar-yin Mah, 2019). A closer look at various practical examples of community solar projects indicates that the natural benefits of community solar, such as environmental benefits (increasing the share of local sustainable energy) and local benefits (increasing sustainability and promoting an innovative community image) are similarly communicated by suppliers, as these benefits represent the main purpose of community solar projects. However, the compensation a customer of community solar can obtain differs among offers. For instance, remuneration per solar unit can either involve a fixed amount of solar power, or monetary compensation in the form of electricity bill credits or financial interest returns, for example. These options are reflected in different product configurations and communication strategies (Chan et al., 2017; Coughlin et al., 2012; Funkhouser et al., 2015; Hoffman & High-Pippert, 2010; Ngar-yin Mah, 2019; Walker & Devine-Wright, 2008). If a fixed amount of solar power is provided as remuneration, some suppliers19 additionally emphasize its financial value, expressed as a reduction in the annual electricity bill, while others avoid making any reference to financial equivalents. Given the heterogeneity in customer characteristics and motivation for pro-environmental behavior (e.g. Wüstenhagen, 2000 or Park & Yoon, 2009), it remains unclear which customer segments are most strongly attracted by which form of remuneration. While there is an extensive body of literature on customer preferences and customer segmentation for green electricity (see e.g. Kowalska-Pyzalska, 2018; Litvine & Wüstenhagen, 2011; Lee & Heo, 2016; Ntanos et al., 2018) as well as on community energy (see e.g. Bamberg et al., 2015; Bauwens, 2016; Bauwens & Eyre, 2017; Hicks & Ison, 2018) this is not the case for community solar. Given the increasing popularity of community solar and the rising number of such offers in practice, an investigation of the design and communication of different forms of compensation for a community solar project and its appeal to different customer segments is of vital importance. For this reason, this article examines the effect of different forms of
19 For instance, see United Power Cooperative Solar Farm (United Power, 2018), Florida Keys Electric (2018), Municipality of Frauenfeld (Werkbetriebe Frauenfeld, 2018), or Vienna Energy (Wien Energie, 2018).

75
community solar remuneration on the willingness to buy of different electricity customer segments to reveal how compensation should be designed and communicated in practice. This article is structured as follows: In Section 2.1, we start by offering observations about different practical examples of community solar in which two generic forms of remuneration are identified. Section 2.2 outlines theoretical considerations about how these two generic forms of remuneration can affect the willingness to buy of different customer segments, resulting in the development of two hypotheses. To test these hypotheses, we developed an experimental study design which is outlined in Section 3. Section 4 shows the results of our experiment. The fifth and last section presents conclusions and based on these suggests relevant practical and political implications. At the end of Section 5, some limitations of the research described herein which suggest further research opportunities are noted.

76
2. Theory and hypothesis development
2.1. Generic community solar models in practice
From an examination of a variety of preexisting offers in the USA, UK, Switzerland and Austria (see Footnotes 17-21) we identified two generic community solar remuneration models and the associated communication. Generically speaking, community solar involves one of two models of remuneration: solar power (electricity model), or a financial equivalent (investment model). The first model reimburses shares directly in the form of solar power proportionate to those shares, while the other model offers a purely financial return in the form of interest payments or other monetary compensation. With the electricity model,20 customers can directly consume the solar power associated with their share(s) at no additional cost, and customers mainly experience ecological benefits. As observed in practice, this form of exchange typically occurs when customers do not cover their costs or make a profit before a contract ends (e.g. EWZ, 2018 or Sun Raising Bern, 2018). The solar power consumption of the electricity model is credited to the customer via a reduction in the electricity bill. Although this also translates into some financial benefits, as the final electricity bill of the customer is reduced, this reduction is not communicated and quantified in the initial communication which aims to attract customers. Instead, the amount of solar power delivered annually in kWh is communicated. It may be the case that customers inquire about this financial value at a later point in time (e.g. through customer service, or in discussions when signing the contract) but we may assume that the lack of mention of financial benefits in the initial communication renders the electricity model more ecologically relevant in the eyes of customers. Further, financial benefits may also be small or nonexistent, especially when the bill reduction does not cover the initial costs of the panels. This is often the case when customers opt for a more expensive energy tariff (e.g. composed of renewable energy). Thus, the electricity model, in which initial communication is primarily based on ecological and pro-local arguments, may especially appeal to customers who value such features. The second generic model – “the investment model” – is based on the idea of conventional financial investment. With this model electricity customers purchase shares in a local solar system and in return receive direct financial compensation in the form of interest-based payments or an annual reduction in their electricity bill (but no solar electricity). In practice, such models are often used when customers can cover the
20 Such types of project can be found in Switzerland: for example, in Bern (Sun Raising Bern, 2018) and Zürich (EWZ, 2018), but also in the United States: for example, in St. George (Sun Smart, 2018).

77
initial investment cost and thus can make a profit before the contract ends.21 Instead of receiving solar power, this is distributed by a power plant and fed directly into the local power grid, so that the electricity customers themselves create not individual but collective ecological benefits for the local environment. This makes the community solar offering a sustainable, local, and profitable form of investment from the customer's point of view. Communication is based on financial, local, and environmental arguments. Customers who cannot be convinced by ecological and local benefits alone may thus be more attracted to such remuneration models. The following table outlines the main components and differences between these two generic models.
Electricity Model Investment Model
Form of remuneration for customers
Annual amount of free solar power in kWh per unit
Monetary compensation per unit/year
Long-term financial situation for customers
Unprofitable, or unclear:
Amount of kWh does not necessarily cover initial cost
Profitable:
Cumulative financial compensation exceeds initial cost
Communication of financial benefits
No: financial value not promoted: information about bill reduction is not communicated
Yes: financial remuneration is communicated as rate of return on investment or reduction in electricity bill
Table 1: Community solar models and associated customer remuneration
21 Examples of such types of project can be found in Vienna (Wien Energie, 2018), Switzerland (Optima Solar, 2018) and the United Kingdom: e.g., in Nottinghamshire (Nottinghamshire Community Energy, 2018).

78
2.2. Customer segments
The generic community solar models that dominate today’s implementation landscape in practice may appeal to different customer segments. When it comes to electricity consumption, two main segmentation approaches exist in practice. While the first – segmenting customers according to the amount of electricity they consume in the course of a year – is less relevant to the present work, the second approach – segmentation based on the kind of energy a customer consumes – is of vital importance. Besides being practicable for energy providers, this segmentation approach is also theoretically relevant for investigating how different community solar models and their remuneration schemes affect different customers. In general, Swiss electricity customers automatically receive the default electricity mix from their local electricity provider if they do not actively choose a different electricity mix: a situation which is similar to that which exists in many other countries (Litvine & Wüstenhagen, 2011; Kaenzig et al., 2013). In Switzerland, the preset default mix usually consists of about two-thirds renewable energy and one-third non-renewable energy (mainly nuclear power), which roughly corresponds to national electricity production according to source (Swiss Federal Office of Energy, 2018a). However, with most providers electricity customers have the option of actively registering for a 100% renewable electricity mix on a voluntary basis if they are willing to pay a surcharge. According to a market study published by the Swiss Federal Office of Energy (2018b), between 25% and 30% of Swiss private electricity consumers have actively opted for a green premium electricity mix instead of receiving the default electricity option. In this article we distinguish default customers from customers who voluntarily pay more for 100% renewable electricity by naming the first group default customers and the second group green electricity customers.
2.3. The attractiveness of different community solar models for different
customer segments: Motivation theory
The literature contains hints about how the remuneration and communication of the two generic models could affect the willingness to buy of different electricity customer segments. The main difference between the electricity and investment model is identified as the communication of financial benefits, which are highlighted in the latter but not mentioned in the former. From an economic perspective, financial benefits are a form of extrinsic reward which serve as an extrinsic motivator and complement intrinsic forms of motivation such as a desire to promote the well-being of community and environment. While the electricity model addresses only intrinsic motivation, the

79
investment model addresses intrinsic as well as extrinsic motivators in its communication (see Table 2). As different types of reward address different forms of customer motivation, customer segmentation based on motivation becomes important. According to Schwartz et al. (2015), customers can be segmented based on the degree of intrinsic motivation they have for environmentally-friendly behavior (see also Cruz et al., 2010; Deci et al., 1999; Park & Yoon, 2009). According to De Yong (2000), pro-environmental buying behavior is directly related to intrinsic motivation (see also Tabernero & Hernández, 2011). Thus, in the context of electricity consumption, we argue that the segmentation approach used in practice which distinguishes between green electricity customers and default electricity customers also reflects different levels of intrinsic motivation. Green electricity customers have a higher level of intrinsic motivation to behave pro-environmentally than default customers because they have voluntarily selected a more environmentally friendly electricity mix at a premium price (Litvine & Wüstenhagen, 2011).
Electricity Model Investment Model
Type of remuneration (‘reward’) that is communicated
Intrinsic reward only Mixture of intrinsic and extrinsic rewards
Example “You will receive an annual 200 kWh of solar power per unit, which covers about 10% of an average household’s electricity consumption”
“Your solar unit produces 200 kWh solar power per year, which will be compensated by 2% return on investment paid into your bank account / by a reduction in your annual electricity bill of 40 euros”
Table 2: Types of reward per remuneration model
Segmenting customers in respect to their level of intrinsic motivation is necessary for mitigating potential motivation-related crowding-out effects, which are explained by over-justification and self-perception theory (Bem, 1965 & 1967; deCharms, 1968): the latter claim that providing extrinsic rewards for behaviors that individuals – such as green electricity customers – would have engaged in regardless can undermine their intrinsic motivation (Bolderdijk et al., 2015; Deci & Ryan, 1985, Deci et al., 1999). This is because the former start to attribute their behavior to the extrinsic rewards rather than to their intrinsic motivation (Deci, 1971; Lepper et al., 1973; Palfrey & Rosenthal, 1988;

80
Schwartz et al., 2015; Tang & Hall, 1995). In other words, providing and communicating financial benefits may decrease green electricity customers’ willingness to buy community solar. Based on motivational crowding-out theory, the electricity model is better suited to attracting green electricity customers as it does not mention extrinsic rewards. Regarding the segment of default customers, motivational crowding-out might be less of a problem. We argue that this customer segment – compared to the green electricity customer segment – has a lower level of intrinsic motivation to behave in an environmentally friendly way regarding electricity consumption as such customers have not voluntarily opted for green electricity. Their level of intrinsic motivation may thus be too low for them to experience a crowding-out effect caused by the provision of extrinsic rewards. Hence, the provision of external rewards which occurs with the investment model can activate the default customer’s extrinsic motivation without crowding out intrinsic motivation. This may ultimately increase the willingness to buy a community solar panel of default customers. This argumentation is based on general motivation theory which claims that external rewards can induce interest and participation in something in which an individual had no initial interest (Kanfer, 1990; Plotnik & Kouyoumdjian, 2013; Ryan & Deci, 2000a & 2000b). Based on motivation theory we argue that customers with a low level of intrinsic motivation require for their participation a form of supplementary external reward that is more tangible than renewable electricity, and which is able to activate their extrinsic motivation (i.e. overcome their low intrinsic motivation) to buy a community solar panel. In summary, and in line with arguments from the literature, we assume that providing and communicating financial benefits increases willingness to buy community solar for default electricity customers due to the provision of complementary external rewards, while green electricity customers will experience a crowding-out effect on their intrinsic motivation to behave in an environmentally friendly way, decreasing willingness to buy.
Hypothesis 1: If financial benefits are excluded from (included in) a community solar remuneration model, green (default) electricity customers will have greater willingness to buy compared to a remuneration model in which financial benefits are included (excluded).
As we assume that green electricity consumers have higher intrinsic motivation than default customers (Schwartz et al., 2015), we argue that their willingness to buy is greater than that of default customers when no financial benefits are provided. When

81
financial benefits are provided it is likely that green electricity consumers will experience a crowding-out effect, while default customers will react to the extrinsic motivator. Thus, in the case of financial benefit provision default customers will have a greater willingness to buy than green electricity consumers.
Hypothesis 2: If financial benefits are excluded from (included in) a community solar remuneration model, green (default) electricity customers will have a greater willingness to buy than default (green) electricity customers.

82
3. Methodology and data Based on previous studies which analyzed the crowding out of motivation (d'Adda; 2011; Huang et al., 2014; Reeson & Tisdell, 2008; Schwartz et al.,2015), an experimental between-subject design was chosen to investigate how the two generic remuneration models for community solar affect customers’ willingness to buy, and whether providing financial benefits leads to the crowding out of intrinsic motivation. The experimental treatment covered the design and communication of the remuneration according to the two aforementioned solar community models (electricity model, and investment model). Consequently, the experimental design was based on one factor with two different levels, while the electricity mix customers consumed represented the moderating factor.
3.1 Experimental stimulus and treatment
The experimental stimulus was a generic community solar offering22 applicable to all areas and communities. It included the most relevant product information, such as price per unit (499 Swiss Francs), contract duration (20 Years), and electricity production per unit and year (220 kWh). Further, it promoted the fact that anyone could participate, regardless of whether personal property was available on which to install a solar system. Additionally, the offer promoted local and environmental benefits and, as is also common in practice (Coughlin et al., 2012), mentioned that customers could exercise their right to cancel the contract. This fact was mentioned to decrease any feelings of being trapped in a long-term contract. Benefits and product attributes were presented using a headline message with bullet points below it. The offer was purely based on building-integrated photovoltaic (BIPV) modules, which were illustrated and described for participants in detail before they saw the offer. The explanation and visual illustration of BIPV for the purpose of community solar which was integrated into the experiment is attached in Appendix A. BIPV was chosen because of its greater potential regarding the usable surface of urban buildings – it allows the installation of more solar modules compared to a situation in which only rooftops are available. Further, from the perspective of aesthetics, BIPV is less conspicuous and can be better integrated into the cityscape without bringing about significant visual changes. All factors mentioned in this section about the stimulus were identical in both experimental treatments.
22 Both community solar offerings used in this experiment were based on practical observations of other projects (see Footnotes 17-21) and were also discussed and reviewed with industry experts to increase their realism.

83
The treatment of the community solar offer was only different in regard to the remuneration that was offered, while all other factors were held constant. Regarding the electricity model, remuneration was only specified in terms of the amount of solar power (220 kWh) to be delivered, with no mention of the financial value of the annual reduction in electricity bill. As mentioned previously, such a reduction in the final electricity bill may translate into financial benefits if this reduction exceeds initial cost. However, this may not always be the case. As our goal was to investigate customers’ reactions to the initial communication of different community solar offers which dominate the practical implementation landscape at the moment, the electricity model thus communicated only intrinsic values such as ecological- (including the solar power as a form of remuneration) and local benefits. In the investment model, the headline message and the corresponding bullet points were adapted to the model. The main difference from the electricity model is that customers were told they would no longer receive the solar power themselves, but rather remuneration for the production of their modules delivered through an annual reduction in their electricity bill. The electricity bill reduction was quantified as 40 Swiss Francs per module/year which would result in a profit over the course of the 20 years of the contract duration. The following table illustrates how the remuneration was treated within the offer. All study materials were translated from German into English and are attached in Appendix B.
Electricity Model Investment Model
Headline message “20 years’ free solar power - 220 kWh per module/year”
“20 years of solar remuneration - you will receive CHF 40 per module/year”
First Bullet Point: Remuneration in kWh per Module
“220 kWh per module/year will be delivered to your home for free”
“220 kWh per module/year will be directly fed into the municipal power grid”
Second Bullet Point: Financial Value of Remuneration per Module
No financial value was indicated (i.e. this bullet point was not included)
“You will receive compensation of CHF 40 per module/year on your electricity bill (in the form of a reduction in your electricity bill)”
Table 3: Experimental treatment per remuneration model

84
3.2. Procedure
The experimental study was implemented using an online questionnaire. Participants were recruited by a professional Swiss market research company which ensured a quota-based assignment of participants for each of the experimental groups. Quotas used by the market research company were based on the actual demographics of the Swiss population, including the variables gender, age and political orientation. This procedure ensured representative and comparable samples for each of the offers. After seeing an initial introduction explaining community solar and BIPV, participants were randomly assigned to one of the treatments (electricity vs. investment model). After that, participants were asked to indicate their willingness to buy by choosing the number of modules they wanted from a drop-down menu. If they were not interested in buying a module, they could simply choose ‘zero modules’, which was the first option. In the fourth step, they responded to some questions about demographics and their electricity mix at home as well as indicating their environmental buying behavior. Additionally, we inserted one attention-check question which asked participants to choose a specific answer which was given in the text of the question from five different options.
3.3. Measures and variables
Participants’ willingness to buy was measured as the number of modules they wanted to buy, ranging from zero modules to more than five modules (seven answer options). The two offer types were computed as categorical dummy variables, meaning that the electricity model was modeled using Code 1 and the investment model was modeled as Code 2. We measured participants’ motivation for pro-environmental and pro-social buying behavior in general by using a 10-item scale developed by Sudbury-Riley & Kohlbacher (2016). This is called the Ethically-minded Consumer Behavior (‘EMCB’) scale and was used to approximate intrinsic motivation in the context of environmental buying decisions (De Yong, 2000; Tabernero & Hernández, 2011). Additional variables which were recorded included age (in years), gender (male or female), gross household income,23 electricity mix (default, green, or don’t know) and political orientation (indicated by selecting the Swiss political party which reflected political orientation the best – or, alternatively, no answer).
23 Household income could be indicated using five different income classes, presented in Swiss Francs, or by a «no indication» field.

85
3.4. Sample
A total of 496 participants started the online survey, looked at the offer, and entered a value into the dependent variable field. Six participants did not correctly answer the attention-check question, and seventy participants did not finish the questionnaire and thus did not respond to the attention test at all. A final sample of 420 participants who had completed the whole questionnaire, including providing demographic information and answering the attention check question correctly, was thus obtained. The share of green electricity customers (20%) was found to be close to the actual situation in the Swiss market in which between 25% and 30% of Swiss private electricity consumers have actively opted for a green premium electricity mix instead of receiving the default electricity option (Swiss Federal Office of Energy, 2018b). Figures 1 - 4 give an overview of the demographic data of the total sample, and the two experimental groups and compare this to the demographic distribution in Switzerland.
Figure 1: Gender and age distribution of sample and Swiss population (Swiss Federal Office of Statistics, 2018)
50%50%
Electricity Model (N=244)
52%48%
Investment Model (N=252)
51%49%
Total Sample(N=496)
49%51%
Swiss Population
Women Men
Gender
Age
15% 14% 15% 16%
27% 27% 27% 26%27% 27% 27% 28%31% 32% 31% 30%
Electricity Model (N=244) Investment Model (N=252) Total Sample (N=496) Swiss Population
Age 18-29 Age 30-44 Age 45-59 Age 60+

86
Figure 2: Income distribution of sample24 and Swiss population (Swiss Federal Office of Statistics,
2014)
Figure 3: Political attitudes of sample25 and Swiss parliamentary seats (Swiss Parliament, 2018)
Figure 4: Share of green electricity customers in sample26 and Swiss population (Swiss Federal Office of Energy, 2018b)
24 Income was indicated as monthly gross income per household. Fifteen percent of the total sample selected «no indication» in the survey. The five measured income classes were collated into the following three income segments: Low Income = below 4,880 CHF, Med Income = 4,880 - 9,702 CHF, High Income = more than 9,702 CHF. Seventeen percent of the total sample did not answer the income question. 25 Eight percent of the total sample indicated “other political party” (other than the seven parties represented in the Swiss parliament). 26 Ten percent of the total sample did not answer the question about their electricity mix.
10% 8% 9%16%
34% 32% 33%
50%
25% 28% 26%34%
Electricity Model (N=244) Investment Model (N=252) Total Sample (N=496) Swiss Population
Low Mid High
48% 52% 50% 50%
17% 16% 17%22%24% 26% 25% 28%
Electricity Model (N=244) Investment Model (N=252) Total Sample (N=496) Swiss Parliament
Right-Wing Centrist Left-Wing
20%
63%
7%
Electricity Model (N=244)
20%
62%
7%
Investment Model (N=252)
20%
63%
7%
Total Sample (N=496)
25%
75%
Swiss Population
Default electricity customers Green electricity customers Don‘t know

87
4. Results and discussion First of all, we assessed whether our argumentation that green electricity customers have higher intrinsic motivation than default electricity customers held true. To do so, we analyzed the EMCB scores which were used to approximate intrinsic motivation (De Yong, 2000; Tabernero & Hernández, 2011). The ten items that measure EMCB yielded a high reliability (N=431, Cronbach Alpha = 0.905). To investigate whether default customers differed from green electricity customers with regard to their EMCB scores we conducted an independent-samples t-test (N=398; 33 customers indicated that they did not know which customer type they were). The analysis revealed that default customers (N=301, EMCB mean=3.35, EMCB SD=0.70), scored significantly lower than green electricity customers (N=97, EMCB mean=3.80, EMCB SD=0.59), t(396) = 5.76, p < .001, d = 0.70. This supports our argumentation that green electricity customers are significantly more motivated to engage in pro-environmental and pro-social buying behavior than default customers – which, according to previous studies, is a good indicator of the higher intrinsic motivation of green electricity consumers. Second, we conducted an independent-samples t-test to compare the effect of financial benefits on willingness to buy solar panels in the community solar offer. All 496 participants who provided information concerning the dependent variable of willingness to buy were included in the analysis. The independent-samples t-test indicated that the provision of a financial benefit (N=252) resulted in a greater willingness to buy solar panels (M = 1.95, SD = 2.02) than when financial benefits were not communicated, and customers were only told that they would receive the solar power that was generated (M = 1.60, SD = 1.79, N=244), t(494) = 2.02, p = .044, d = 0.18. This effect disappears when only the 420 participants who answered the attention test correctly are analyzed (t(418) = 0.99, p = .324). To test whether the effect of providing financial benefits differed amongst customer groups, we conducted a 2x2 ANOVA with green electricity consumers (yes, no) and treatment (electricity model vs. investments model) as between-subject factors for willingness to buy solar panels. From the 444 participants that responded to the question about their electricity mix, 35 did not know whether they were consuming green electricity, so the total sample for this analysis consisted of 409 participants. The latter individuals (around 7% of the sample) were excluded from the analysis as we assumed that they were not directly involved in decisions about household electricity provision; besides this, they could not be classified based on their main motivation for pro-environmental behavior in electricity-purchasing-related decisions (green electricity

88
consumers or default electricity consumers). The 2x2 ANOVA revealed no main effects (p > .452) but a significant interaction effect F(1, 405) = 17.59, p < .001, ηp2=.04227. Thus, the treatment of providing financial benefits affects green and default electricity consumers differently. To test our hypotheses, we conducted a simple main effect analysis. This revealed that green electricity consumers had greater willingness to buy solar panels when financial benefits were not mentioned in the offer (M = 2.51, SD =1.84, N=49) compared to when they were (M = 1.42, SD =1.79, N=50), p = .005 (Bonferroni adjustment). For default electricity consumers, the opposite was true. Their willingness to buy solar panels increased when they were offered a remuneration model that included financial benefits (M = 2.25, SD =2.08, N=157) compared to one without financial benefits (M = 1.49, SD =1.79, N=153), p < .001 (Bonferroni adjustment). Thus, Hypothesis 1 was confirmed.
27 A Levene test was significant at p = .024. However, when only taking participants who also answered the attention test correctly (N= 387) into consideration, the result of the Levene test indicated insignificance at p = 0.174, while the interaction terms remained significant with effect F(1,383) = 14.63, p < .001, ηp2=.037.

89
The results also confirmed our second hypothesis. When no financial benefits were provided (electricity model), green electricity consumers had a greater willingness to buy solar panels through the community solar offer compared to default electricity consumers at p=.001 (Bonferroni adjustment). When financial benefits were included (investment model), default electricity consumers showed a greater willingness to buy solar panels compared to green electricity consumers (p=.008) (Bonferroni adjustment). Figure 5 illustrates the interaction effect.28
Figure 5: Mean of willingness to buy solar panels (y-axis) – across all groups
28 Results remain similar if we conduct the same analysis only for participants who answered the attention test correctly. For default electricity consumers, providing financial benefits resulted in a higher willingness to buy solar panels (M = 2.18, SD =2.03, N=147) compared to when financial benefits were not communicated, and customers were only told that they would receive the generated solar power (M = 1.53, SD =1.81, N=147), p = .003 (Bonferroni adjustment). For green electricity consumers, providing financial benefits resulted in a lower willingness to buy solar panels (M = 1.43, SD =1.83, N=46) compared to when financial benefits were not communicated, and customers were only told that they would receive the generated solar power (M = 2.51, SD =1.80, N=47), p = .007 (Bonferroni adjustment). When no financial benefits were provided, green electricity consumers showed a greater willingness to buy solar panels than default electricity consumers (p = .002; Bonferroni adjustment) while default electricity consumers showed a greater willingness to buy solar panels compared to green electricity consumers when financial benefits were provided (p = .020; Bonferroni adjustment).
1
1.2
1.4
1.6
1.8
2
2.2
2.4
2.6
2.8
3
Electricity Model (n=202) Investment Model (n=207)
Mean of willingness to buy solar panels (y-axis) – across all groups
Default electricity consumers (n=310)Green electricity consumers (n=99)

90
5. Conclusions and policy implications The results of our experiment reveal that willingness to buy a community solar panel depends on the design and communication of the related remuneration. Differences in overall willingness to buy a panel are due to whether consumers receive solar power instead of financial remuneration. However, as providing financial benefits only results in a statistically significant greater willingness to buy solar panels if we include all participants in our analysis – regardless of whether they carefully read the offer and answered the attention test correctly – we refrain from concluding that providing financial benefits in a community solar offering is a superior approach to using a model in which consumers receive solar power. More importantly, our results show that such a conclusion is also misleading if different customer segments are considered. Our results demonstrate that different customer segments react in opposing ways to the remuneration model and its communication. This can be explained by motivation theory and the different levels of intrinsic motivation. Default power customers (characterized by a relatively low level of intrinsic motivation to purchase green electricity) prefer the investment model over the electricity model, as reflected in the significant increase in their willingness to buy a panel when financial benefits were provided and communicated. As suggested by motivation theory, customers with a low level of intrinsic motivation may acknowledge the ecological benefits of community solar but still need a supplementary external reward that is more tangible than renewable electricity and is able to activate their extrinsic motivation and complement their low level of intrinsic motivation to stimulate them to buy a panel. Green electricity customers who are characterized by a rather high level of intrinsic motivation for green electricity purchasing prefer to receive solar power instead of financial remuneration as they are already mainly driven by intrinsic motivation and are therefore not interested in monetary compensation. Even more importantly, our findings support the assumption that the extrinsic motivator (communicating and providing financial benefits) crowds out the initial intrinsic motivation of green electricity consumers. Thus, we conclude that a crowding-out effect occurred, leading to a lower willingness to buy solar panels in the case of a community solar offer with financial remuneration for green electricity consumers. These findings are in line with other studies that investigated motivation crowding theory (e.g. d'Adda; 2011; Huang et al., 2014; Reeson & Tisdell, 2008; Schwartz et al., 2015). Accordingly, our results not only contribute to the emerging field of literature related to community solar marketing in

91
which academic findings based on experimental studies are currently hard to find, but also point to important practical implications. Based on this study, we re-emphasize that no solution fits all. Policy makers and practitioners should bear in mind that consumers may react differently to solar community offerings, depending on their initial intrinsic motivation. Offers and policies should therefore use target-group-specific communication when locally introducing community solar. One could argue that the investment model should be preferred, as default power customers – who usually represent the largest share of customers of electricity suppliers29 (e.g. Chassot et al. 2017 or Gan et al., 2007; Swiss Federal Office of Energy, 2018b) – favor this model. However, in some cases it might not be possible to provide enough remuneration to cover the initial cost for customers without significantly reducing profits. This may be an important factor for private energy providers, but less so for state-owned municipalities who do not have profit targets (see also Coughlin et al., 2012). Naturally, design choices regarding community solar remuneration directly affect the profits and equity of suppliers (e.g. Chan et al., 2017) and should therefore be calculated carefully. In such cases, policy makers could provide initial subsidies that support energy providers to create community solar offerings with associated financial remuneration for customers. Local and national policy makers could also design incentive schemes that support local community solar investment (e.g. by making community solar investment deductible from taxable income), thereby increasing their attractiveness to default power consumers. As default customers are more attracted by such offers, and as they usually compose the largest share of customers, this might ultimately lead to more solar plants being installed, which in turn would reduce cost and could decrease the need for subsidies or incentive schemes in the future. In countries where the grid parity of solar electricity has been reached or is approaching this state, a stable policy environment might be much more important than the temporary provision of subsidies (Karneyeva & Wüstenhagen, 2017). Alternatively, policy makers and practitioners could also think about sequentially introducing both solar community remuneration models. To attract green electricity consumers and prevent the undermining of their intrinsic motivation one could start with a community solar offering which remunerates customers with solar energy instead of financial benefits. At a later point in time (e.g. as soon as all available panels in the respective offering are bought or costs are reduced), financial remuneration could be introduced. However, careful reflection about how to communicate such a change would
29 In our study the share of default electricity consumers was also three times larger than that of green electricity consumers.

92
be warranted to prevent potential crowding-out effects. One could, for example, thank existing customers for their contribution to producing more solar energy in the region and highlight its importance for the local community and the environment. By acknowledging the effort of existing solar community customers and connecting this with future financial benefits, crowding-out could be prevented (i.e. instead of undermining intrinsic motivation such efforts could be acknowledged and perhaps even reinforced) (Hilton et al., 2014; Thøgersen, 1994). Finally, when offering financial remuneration which at least covers the initial cost to the customer, or even better, exceeds this, is possible but there is a predominant share of green electricity consumers, offering both remuneration models might be the best option. Customers could then pick the form of remuneration which best suits them. This might increase communication and marketing costs as more information about the different forms of remuneration and the reason why both of them exist may be necessary. However, these costs may be justifiable if more customers can be attracted by offering both forms of remuneration at the same time.

93
6. Limitations and further research
Although the research described in this article has some notable strengths, including i) testing practical and specific community solar offerings using BIPV as an example, ii) applying meaningful customer segmentation, and iii) producing significant and relevant results for practitioners and politicians, it has some limitations. The first limitation – applicable to many studies that are implemented using an online questionnaire – is that this method does not measure real behavior, but only the self-reported intentions of participants. Although intentions are a valid predictor of real behavior (Litvine & Wüstenhagen, 2011), future research should aim at measuring real behavior. Although the hypothetical community solar offering and its attributes, such as price, duration, deliverables, BIPV panels only, terms of cancellation, etc. were based on real-life observations and were the same for all participants in the experiment, the variables could still have influenced the willingness of individual participants to participate. Other research could investigate how changes in relevant product attributes, such as price and contract duration (e.g. reduced price and/or reduced contract duration), or the offer of conventional building-attached solar panels instead of only BIPV modules, affects overall willingness to subscribe. Using ethically-minded consumer behavior as approximation for intrinsic motivation instead of a dedicated measure for intrinsic motivation results in another limitation of this study. There might be other motives, such as social norms and increased self-esteem, which also shape customers’ decision on community solar participation. Therefore, further research should use a dedicated measure for intrinsic motivation (e.g. Grant, 2008; Noblet & McCoy, 2018; Pelletier et al. 1998) to assess the whole spectrum of intrinsic motives that shape customers’ decisions. It is interesting to speculate how customers would respond if both solar electricity and its translation into financial benefits were combined in the same offer and communicated equally; i.e., if the electricity model were enlarged by offering to customers the financial value of the electricity (e.g. stated as an annual reduction in the customer’s electricity bill). Further research should investigate to what extent translating metrics and communicating financial benefits in addition to communicating the benefits of delivering solar power is beneficial. Prior to the introduction of such a combined model, practitioners and researchers should consider that the potential exists for such a communication strategy to backfire, as it might increase complexity for some customers and also crowd out intrinsic motivation through highlighting financial considerations.

94
Acknowledgments
This research this paper is based on was financially supported by the Swiss Innovation Agency Innosuisse and is part of the Swiss Competence Center for Energy Research SCCER CREST. Further it was funded by the Swiss National Science Foundation (SNF), NRP70 Energy Turnaround (Project Number 407040_153909).
References Augustine, P., & McGavisk, E. (2016). The next big thing in renewable energy: shared
solar. The Electricity Journal, 29(4), 36-42.
Bamberg, S., Rees, J., Seebauer, S. (2015). Collective climate action: Determinants of participation intention in community-based pro-environmental initiatives. Journal of Environmental Psychology 43, 155-165.
Bauwens, T. (2016). Explaining the diversity of motivations behind community renewable energy. Energy Policy 93, 278-290.
Bauwens, T., Eyre, N. (2017). Exploring the links between community-based governance and sustainable energy use: Quantitative evidence from Flanders. Ecological Economics 137, 163-172.
Bem, D. J. (1965). An experimental analysis of self-persuasion. Journal of Experimental Social Psychology, 1(3), 199-218.
Bem, D. J. (1967). Self-perception: An alternative interpretation of cognitive dissonance phenomena. Psychological review, 74(3), 183.
Bolderdijk, J. W., Steg, L., Geller, E. S., Lehman, P. K., & Postmes, T. (2013). Comparing the effectiveness of monetary versus moral motives in environmental campaigning. Nature Climate Change, 3(4), 413-416.
Chan, G., Evans, I., Grimley, M., Ihde, B., & Mazumder, P. (2017). Design choices and equity implications of community shared solar. The Electricity Journal, 30(9), 37-41.
Chassot, S.,Wüstenhagen, R., Fahr, N. & Graf, P. (2017). Introducing Green Electricity as the Default Option. In Marketing Renewable Energy (109-122). Springer International Publishing.

95
Coughlin, J., Grove, J., Irvine, L., Jacobs, J. F., Phillips, S. J., Sawyer, A., & Wiedman, J. (2012). A guide to community shared solar: utility, private, and nonprofit project development. National Renewable Energy Laboratory, 1-68.
Cruz, P., Salo, J., Munoz-Gallego, P., & Laukkanen, T. (2010). Heavy users of e-banking and Customer Experience Management: evidences on intrinsic motivation. International Journal of Electronic Business, 8(2), 187-209.
d'Adda, G. (2011). Motivation crowding in environmental protection: Evidence from an artefactual field experiment. Ecological Economics, 70(11), 2083-2097.
De Young, R. (2000). Expanding and evaluating motives for environmentally responsible behavior. Journal of Social Issues, 56, 509-526.
deCharms, R. (1968). Personal causation: The internal affective determinants of behavior. New York, NY: Academic Press.
Deci, E. L. (1971). Effects of externally mediated rewards on intrinsic motivation. Journal of personality and Social Psychology, 18(1), 105.
Deci, E. L., & Ryan, R. M. (1985). The general causality orientations scale: Self-determination in personality. Journal of research in personality, 19(2), 109-134.
Deci, E. L., Koestner, R., & Ryan, R. M. (1999). A meta-analytic review of experiments examining the effects of extrinsic rewards on intrinsic motivation. Psychological Bulletin, 125, 627–668.
Der Standard (2017). Wien Energie errichtete 30 Bürgerkraftwerke mit 10.000 Beteiligten. Der Standard, May 19, 2017. Retrieved on 07.08.2018 from: https://derstandard.at/2000057919162/Wien-Energie-In-fuenf-Jahren-30-Buergerkraftwerke-10-000-Beteiligte
EWZ Elektrizitätswerke Zürich (2018). Private – Energie Produzieren - An Solaranlage beteiligen. Retrieved on 07.08.2018 from: https://www.ewz.ch/de/private/energie-produzieren/an-solaranlage-beteiligen.html
Florida Keys Electric (2018). Simple Solar: Cooperative Offers Hassle-Free Solar Energy. Retrieved on 07.08.2018 from: https://www.fkec.com/Green/simplesolar.cfm
Funkhouser, E., Blackburn, G., Magee, C., & Rai, V. (2015). Business model innovations for deploying distributed generation: The emerging landscape of community solar in the US. Energy Research & Social Science, 10, 90-101.

96
Gan, L., Eskeland, G. S., & Kolshus, H. H. (2007). Green electricity market development: Lessons from Europe and the US. Energy Policy, 35(1), 144-155.
Grant, A. M. (2008). Does intrinsic motivation fuel the prosocial fire? Motivational synergy in predicting persistence, performance, and productivity. Journal of Applied Psychology, 93, 48-58.
Hicks, J., Ison, N., (2018). An exploration of the boundaries of 'community' in community renewable energy projects: Navigating between motivations and context. Energy Policy 113, 523-534.
Hilton, D., Charalambides, L., Demarque, C., Waroquier, L., & Raux, C. (2014). A tax can nudge: The impact of an environmentally motivated bonus/malus fiscal system on transport preferences. Journal of Economic Psychology, 42, 17-27.
Hoffman, S. M., & High-Pippert, A. (2010). From private lives to collective action: Recruitment and participation incentives for a community energy program. Energy Policy, 38(12), 7567-7574.
Huang, H. C., Lin, T. H., Lai, M. C., & Lin, T. L. (2014). Environmental consciousness and green customer behavior: An examination of motivation crowding effect. International Journal of Hospitality Management, 40, 139-149.
Kaenzig, J., Heinzle, S. L., & Wüstenhagen, R. (2013). Whatever the customer wants, the customer gets? Exploring the gap between consumer preferences and default electricity products in Germany. Energy Policy, 53, 311-322.
Kanfer, R. (1990). Motivation theory and industrial and organizational psychology. Handbook of industrial and organizational psychology, 1(2), 75-130.
Karneyeva, Y., & Wüstenhagen, R. (2017). Solar feed-in tariffs in a post-grid parity world: The role of risk, investor diversity and business models. Energy Policy, 106, 445-456.
Kowalska-Pyzalska, A. (2018). An empirical analysis of green electricity adoption among residential consumers in poland. Sustainability, 10(7), 2281.
Lee, C. Y., & Heo, H. (2016). Estimating willingness to pay for renewable energy in South Korea using the contingent valuation method. Energy Policy, 94, 150-156.
Lepper, M. R., Greene, D., & Nisbett, R. E. (1973). Undermining children's intrinsic interest with extrinsic reward: A test of the" overjustification" hypothesis. Journal of Personality and social Psychology, 28(1), 129.

97
Litvine, D., & Wüstenhagen, R. (2011). Helping" light green" consumers walk the talk: Results of a behavioural intervention survey in the Swiss electricity market. Ecological Economics, 70(3), 462-474.
Ngar-yin Mah, D. (2019). Community solar energy initiatives in urban energy transitions: A comparative study of Foshan, China and Seoul, South Korea. Energy Research & Social Science, 50, 129-142.
Noblet, C. L., & McCoy, S. K. (2018). Does one good turn deserve another? Evidence of domain-specific licensing in energy behavior. Environment and Behavior, 50(8), 839-863.
Nottinghamshire Community Energy (2018). Become a shareholder or increase your existing share-holding. Retrieved on 07.08.2018 from: http://www.nce.coop/
Ntanos, S., Kyriakopoulos, G., Chalikias, M., Arabatzis, G., & Skordoulis, M. (2018). Public perceptions and willingness to pay for renewable energy: A case study from Greece. Sustainability, 10(3), 687.
Optima Solar (2018). Solarstrom für alle - Sich beteiligen. Retrieved on 07.08.2018 from: https://www.optimasolar-schweiz.ch/sich-beteiligen/kapital-zeichnen/
Palfrey, T. R., & Rosenthal, H. (1988). Private incentives in social dilemmas: The effects of incomplete information and altruism. Journal of Public Economics, 35(3), 309-332.
Park, D. B., & Yoon, Y. S. (2009). Segmentation by motivation in rural tourism: A Korean case study. Tourism management, 30(1), 99-108.
Pelletier, L. G., Tuson, K. M., Green‐Demers, I., Noels, K., & Beaton, A. M. (1998). Why are you doing things for the environment? The motivation toward the environment scale (mtes) 1. Journal of Applied Social Psychology, 28(5), 437-468.
Plotnik, R., & Kouyoumdjian, H. (2013). Introduction to psychology. Cengage Learning.
Reeson, A. F., & Tisdell, J. G. (2008). Institutions, motivations and public goods: An experimental test of motivational crowding. Journal of Economic Behavior & Organization, 68(1), 273-281.
Rogers, J. C., Simmons, E. A., Convery, I., & Weatherall, A. (2008). Public perceptions of opportunities for community-based renewable energy projects. Energy Policy, 36(11), 4217-4226.

98
Ryan, R. M., & Deci, E. L. (2000a). Intrinsic and extrinsic motivations: Classic definitions and new directions. Contemporary educational psychology, 25(1), 54-67.
Ryan, R. M., & Deci, E. L. (2000b). Self-determination theory and the facilitation of intrinsic motivation, social development, and well-being. American psychologist, 55(1), 68.
Schwartz, D., de Bruin, W.D., Fischhoff, B. & Lave, L. (2015). Advertising energy savings programs: The potential environmental cost of emphasizing monetary savings. Journal of Experimental Psychology, 21(2), 158-166.
Sudbury-Riley, L. & Kohlbacher, F. (2016). Ethically minded consumer behavior: Scale review, development, and validation. Journal of Business Research, 69, 2697-2710.
Sun Raising Bern (2018). Dein Solarstrom – Anleitung. Retrieved on 07.08.2018 from: https://sunraising.ch/challenge/anleitung
Sun Smart (2018). Sun Smart Brochure. Retrieved on 07.08.2018 from: http://www.sgsunsmart.com/index.htm
Swiss Federal Office of Energy (2018a). Schweizerische Elektrizitätsstatistik. Retrieved on 06.05.19 from:https://www.bfe.admin.ch/bfe/de/home/versorgung/statistik-und-geodaten/energiestatistiken/elektrizitaetsstatistik/_jcr_content/par/tabs/items/tab/tabpar/externalcontent.external.exturl.pdf/aHR0cHM6Ly9wdWJkYi5iZmUuYWRtaW4uY2gvZGUvcHVibGljYX/Rpb24vZG93bmxvYWQvOTM5Ni5wZGY=.pdf
Swiss Federal Office of Energy (2018b). Stromversorgung - Herkunftsnachweis für Elektrizität und Stromkennzeichnung - Strom- und Biogasprodukte - Der Markt für erneuerbare Energieprodukte 2016. Retrieved on 23.09.2018 from: http://www.bfe.admin.ch/themen/00612/00614/index.html?lang=de&dossier_id=06609
Swiss Federal Office of Statistics (2014). Einkommensverteilung. Retrieved on 07.08.2018 from: https://www.bfs.admin.ch/bfs/de/home/statistiken/wirtschaftliche-soziale-situation-bevoelkerung/einkommen-verbrauch-vermoegen/haushaltsbudget.html

99
Swiss Federal Office of Statistics (2018). Statistiken finden – Bevölkerung – Stand und Entwicklung; Bevölkerung - Wirtschaftliche und soziale Situation der Bevölkerung. Retrieved on 15.09.2018 from: https://www.bfs.admin.ch/bfs/de/home/statistiken/bevoelkerung/stand-entwicklung.html and https://www.bfs.admin.ch/bfs/de/home/statistiken/wirtschaftliche-soziale-situation-bevoelkerung/einkommen-verbrauch-vermoegen/haushaltsbudget.html
Swiss Parliament (2018). Seat Distribution per Party. Organe – Nationalrat – Sitzordnung. Retrieved on 28.09.2018 from: https://www.parlament.ch/de/organe/nationalrat/sitzordnung-nr
Tabernero, C., & Hernández, B. (2011). Self-efficacy and intrinsic motivation guiding environmental behavior. Environment and Behavior, 43(5), 658-675.
Tang, S. H., & Hall, V. C. (1995). The overjustification effect: a meta-analysis. Applied Cognitive Psychology, 9(5), 365-404.
Thøgersen, J. (1994). Monetary incentives and environmental concern: Effects of a differentiated garbage fee. Journal of Consumer Policy, 17, 407–442.
United Power (2018). Cooperative Solar Farm. Retrieved on 07.08.2018 from: http://www.unitedpower.com/cooperative-solar-farm/
Walker, G., & Devine-Wright, P. (2008). Community renewable energy: What should it mean? Energy policy, 36(2), 497-500.
Werkbetriebe Frauenfeld (2018). Strom – Produkte - Frauenfelder Soalrstrom. Retrieved on 07.08.2018 from: https://www.werkbetriebe-frauenfeld.ch/strom/bereich-strom/frauenfelder-solarstrom.html/882
Wien Energie (2018). Energieerzeugung – BürgerInnen Kraftwerke – Photovoltaik. Retrieved on 07.08.2018 from: https://www.wienenergie.at/eportal3/ep/channelView.do/pageTypeId/67831/channelId/-58100
Wüstenhagen, R. (2000). Ökostrom – von der Nische zum Massenmarkt: Entwicklungs-perspektiven und Marketingstrategien für eine zukunftsfähige Elektrizitätsbranche (Vol. 2). vdf Hochschulverlag AG.

100
Appendix
Appendix A - Explanation and visual illustration of BIPV for the purpose of community solar
***Survey introduction text*** In the context of this survey, the first thing you will be presented with is a new solar power offering from your municipality and electricity company. This is a Community Solar offering (the name for an offer to participate in regional community/community solar plants), which offers "building-integrated solar modules". In practice, these modules are referred to as BIPV modules, BIPV being the abbreviation for "building-integrated photovoltaic". BIPV modules can also be used as building facades. The following picture shows three current practical examples:

101
Appendix B – Experimental Community Solar Offers translated from German to English
***Electricity Model***
***Investment Model***

102
Paper 3: Increasing Willingness to Buy an Electric Car: the Added
Value of Community Solar - An experimental investigation of product-
bundling opportunities in Germany
Author:
Alexander Stauch, University of St.Gallen ([email protected])
Institute for Economy and the Environment
Müller-Friedbergstrasse 6/8
CH-9000 St. Gallen
Bibliography:
Stauch, A. (2020). Increasing Willingness to Buy an Electric Car: the Added Value of
Community Solar - An experimental investigation of product-bundling opportunities in
Germany. Energy Research and Social Science, (forthcoming).
Publication date: forthcoming

103
Abstract
To meet the global emission targets defined in the Paris Agreement, it is crucial that the rise of electric mobility is coupled with charging for decarbonized electricity. Accordingly, this paper investigates customers’ willingness to buy potential bundle offers made up of an electric vehicle (EV) and community solar power. According to literature, the bundling of products with high complementarity in a single offering, such as EVs and solar power, can create added value for customers, resulting in a higher willingness to buy compared to a situation in which customers have to buy both products separately. Further, literature also suggests that the adoption of EVs and solar power can be increased by financial policy incentives. To test whether community solar adds value to EVs for customers, an experimental online survey that applied a within-subject design was conducted. Additionally, the experimental online survey was extended with a between-subject design to test for the effect of emphasizing financial policy incentives on willingness to buy the bundle. A representative sample of German customers (n=488) provided empirical evidence for added value creation through bundling community solar with an EV in the form of a significantly higher willingness to buy the bundle compared to that for an EV alone. The between-subject analysis of the effect of emphasizing financial policy incentives revealed no further effects on customers’ willingness to buy the bundle. As a result, several practical and political suggestions for fostering the joint adoption of EVs and solar power are implied.
Keywords: community solar; electric vehicle; product bundling; marketing Highlights:
• First empirical evaluation (n=488) of a product bundle comprised of community solar and an EV
• Demonstration of community solar as added value for EVs • Bundling with community solar significantly increases willingness to buy an EV • Implications for simultaneously increasing sales of EVs and solar power

104
1. Introduction In the last few years, the use of electric mobility has significantly increased in many countries due to various factors such as political support schemes, a rise in product offers, a decline in price, and also because some people want to make a positive contribution to the environment (IEA, 2018; Priessner & Hampl, 2020). In order to make a positive environmental contribution in terms of reducing CO2 emissions to help meet the global emission targets defined in the Paris agreement, many studies — but also governmental and other public entities - have pointed out that e-mobility needs to be coupled with charging for decarbonized electricity (Bleijenberg & Egenhofer, 2013; Granovskii et al., 2006; IEA, 2016; United Nations, 2019). Consequently, people who already have an electric vehicle (EV) or are interested in buying one are increasingly looking for green electricity solutions for charging their EV at home. When it comes to renewable energies, many studies have illustrated that customers have strong positive preferences for solar power (Faiers & Neame, 2006; Gamma et al, 2017; Karasmanaki & Tsantopoulos, 2019; Volken et al., 2018). For instance, work by Cousse & Wüstenhagen (2019) and Delmas et al. (2017) showed that people who are interested in buying an EV are similarly interested in solar power (and vice versa), and are therefore likely to purchase both, but not necessarily at the same time. Recently, companies such as Tesla and Sonnen from Germany have recognized the increase in customer demand for combined offers of EVs and renewable energy, and have therefore started offering bundles made up of an EV and solar-power charging applications (Tesla, 2020; EE-News, 2019; Sonnen, 2020). Furthermore, a study from Priessner & Hampl (2020) revealed that combined offers of an EV and solar-power charging for homeowners increase intention to buy in comparison to purchasing a standalone EV. This is a particularly interesting finding, since it also means that bundle offers could increase the diffusion of EVs and solar power at the same time, which are, according to the emission gap report of the United Nations (2019), both highly relevant goals in terms of meeting global emission targets. Additionally, marketing literature suggests that products which are complimentary, such as EVs and solar power, and are offered together for a single price in a bundle, increase customer value due to their benefits to customers, such as their complementarity, reduced risk, or increased convenience (Stremersch & Tellis, 2002). In some cases, the added value of a combination packaged as one product even leads to a greater willingness to buy compared to a situation in which customers can buy both products

105
separately from different suppliers (Chiambaretto & Dumez, 2012; Stremersch & Tellis, 2002). However, people who do not own their own property, such as tenants, or people who are not able to install their own solar panels (e.g. due to the high upfront investment cost, or because they do not have enough sunlight on their property) currently have no options for charging their EVs using personal solar power at home. As a result, a large customer segment is currently excluded from the benefits offered by a product bundle of a solar power system and an EV. One potential solution for addressing this problem is community solar.30 Community solar permits all electricity customers, whether homeowners with a roof or tenants without a roof, to participate financially in a local solar system at low cost, and without any further effort regarding installation and maintenance of the system. This makes community solar one of the easiest and most convenient ways to obtain local and personal solar energy at home for all electricity customers. Customers are remunerated per unit with personal solar power for a predetermined period of time, which can also be used to charge an EV at home. Participation in a local community solar program takes the form, in most cases, of a one-time payment31 per unit, wherein units are typically offered in the form of solar plant square meters, or solar panels (Chan et al., 2017; Funkhouser et al., 2015; Stauch & Gamma, 2020). Therefore, bundling EVs with community solar instead of solar home installations not only reduces cost, effort, and complexity for customers, but can also reach a bigger customer segment that includes non-property owners and tenants, while the value to the customer of bundling EVs with personal solar power is potentially increased. This is not only interesting from a business perspective, but also from an environmental perspective, as it may increase the share of EVs and solar power simultaneously. A combined offer of an EV and community solar means that customers can directly buy an EV together with community solar panels in one offer from their car dealer, the latter which can then be used at home to charge their EV. Based on these considerations, as well as the aforementioned studies, I argue in this article that a combined offering of an EV and community solar creates added value based on reducing the perceived risk (of being harmful to the environment by driving an EV), complementarity (customers need to buy electricity in any case), and convenience (reduced search and assembly effort). Accordingly, this increases customers’ willingness to buy a product bundle compared to a standalone EV. Thus far, there has been no research into bundling EVs and
30 In practice, community solar offerings can take different forms (Mah, 2019; Stauch & Vuchiard, 2019; Stauch & Gamma, 2020). 31 Some suppliers in the United States additionally offer leasing schemes for participating in community solar programs (Coughlin et al., 2015; Chan et al., 2017).

106
community solar. As a result, the first two research questions were formulated as follows:
Does a bundle offer of community solar and an EV increase the willingness to buy of customers compared to that for a standalone EV? Does a bundle offer of community solar and an EV lead to added value for customers compared to that for a standalone EV?
Another interesting discussion that is taking place concerning the diffusion of EVs and solar power involves the effectiveness of political support mechanisms (Ryan et al., 2019; Stokes & Breetz, 2018). Several countries, including Germany, are currently offering financial support to people who want to buy an EV. Different studies (Hardman et al., 2017; Sierzchula et al., 2014; Sun et al., 2019) have illustrated that offering financial support for EVs increases the willingness to buy of customers. Similarly, financial policy incentives have also increased the adoption of solar power over the last two decades (Ryan et al., 2019; Solangi et al., 2011). Therefore, it seems logical that financial policy incentives may have the same effect on a community solar and EV bundle. However, no studies have yet investigated the effect of financial policy support on such bundle offers. Therefore, a third research question was formulated to investigate the effect of emphasizing financial policy measures on a community solar and EV bundle:
How does emphasizing policy-based financial support affect customers’ willingness to buy an EV and community solar bundle?
To answer the research questions, this paper presents a review of marketing literature on bundling strategies in Chapter Two and discuss the implications for an EV and community solar bundle. Also, a short review on the effectiveness of political support mechanisms for EVs and solar power is presented. Based on these, two hypotheses are formulated. Chapter Three describes the experimental study design chosen as research method and describes the data that was collected to test the two hypotheses. The results of the study and outcome of hypotheses testing are then shown and discussed in Chapter Four. Chapter Five completes the article with a general conclusion and suggests theoretical and practical implications. It also discusses the potential limitations of the results. The article closes with an outline of further research in the area of bundling community solar and EVs.

107
2. Literature Review and Hypotheses Development
2.1. Product Bundling in Marketing Literature
The concept of “bundling” was first introduced in the mid-1970s by Adams and Yellen (1976) and has since been applied and analyzed in business and marketing research (Chiambaretto & Dumez, 2012; Guiltinan, 1987; Stremersch & Tellis, 2002; Yadav, 1995). A variety of definitions of the former exist, but the most common one is “the sale of two or more separate products in one package” (Stremersch & Tellis, 2002). According to a widely recognized article from Stremersch & Tellis (2002), which includes a comprehensive review and analysis of bundling in marketing literature, bundling strategies can be categorized into two main dimensions. The first is the “bundle form,” which can be pure, mixed, or unbundled. This describes an organization’s strategy for creating product packages. “Pure bundling” involves a company only selling the bundle, not (all) the products separately, while “unbundling” involves a company only selling products separately. Mixed bundling means that a company sells both the bundle and all the products separately. The second dimension is called “bundle focus,” which is differentiated in the literature into “price bundling” and “product bundling” (Guiltinan, 1987; Reinders et al., 2010; Stremersch & Tellis, 2002). Price bundling describes a bundle of two or more products in one package with a discounted combined price for all the products within the bundle. In other words, bundling itself does not create added value for consumers, thus a discount must be offered to motivate at least some consumers to buy a bundle. In contrast, product bundling describes the integration and sale of products in a package at a premium price through generating value by adding complementary products to the package. The greater value of the package will increase consumers’ willingness to pay for the product bundle above that of their conditional willingness to pay for the (total cost of the) separate products. A product bundle can therefore be thought of as having an integral architecture (Ulrich & Eppinger 1995). It integrates the different functions of the bundled products into a single product that creates added value for customers compared to a situation in which customers have to buy each product separately. The added value of a product bundle may be due to (1) complementarity, (2) a decrease in (perceived) risk, or (3) an increase in convenience (Priessner & Hampl, 2020; Stremersch & Tellis, 2002). This distinction between price and product bundling is important, because it entails that companies should make different strategic choices with different consequences. Whereas price bundling represents a pricing and promotional tool, product bundling is

108
more strategic in the sense that it creates added value. Managers can therefore employ price bundling easily, at short notice, and for a short duration, whereas product bundling is more of a long-term differentiation strategy (Stremersch & Tellis, 2002).
2.2. The bundling of EVs and Solar Power
A glance at the literature reveals few studies that discuss or evaluate the potential of a bundle containing solar power and an EV. In contrast, several studies have analyzed the potential for bundling EVs with additional services. For instance, Hinz et al. (2015) and Fojcik & Proff (2014) evaluated the effect of a single add-on service (e.g. mobility guarantee, vehicle-to-grid, IT-based parking, smart charging system, charging point searcher, etc.) on the acceptance of EVs. They find that additional services may increase willingness to buy an EV, while the strength of the effect strongly depends on which sort of add-on service is included in the bundle. Cherubini et al. (2015) found that product or product-service bundles can be a key component to raise acceptance of EVs, and therefore called for deeper research into this subject. Delmas et al. (2017) used several data sets from California to document evidence of the growth in joint purchases of EVs and solar panels. The authors also discuss pricing and quality trends, such as likely price declines and an increase in the technological efficiency of both products which will further stimulate the joint adoption of solar power and EVs. Additionally, they emphasize the potential for a significant reduction in household emissions if both products are jointly adopted. However, the potential of bundling offers was not discussed in Delmas et al. (2017). One of the latest related studies, by Priessner & Hampl (2020), illustrates, using choice-based conjoint experiments in Austria, that product bundles of solar power, batteries, and EVs can create added value for customers. The data show that a majority of people who are interested in buying an EV would prefer to buy their EV through such a bundle offer. Further, the authors also found an increased willingness to buy based on the added value of such a bundle compared to that for a single EV. A look at practice also finds that only a few offers are available for customers in specific countries. The company Sonnen from Germany has released two new products for the German market. With “Sonnennow” customers rent a photovoltaic system and a solar battery for a monthly amount instead of buying them. As an alternative, customers with “Sonnendrive” can sign up for a brand-new EV at Sonnen without any long-term obligations. Customers can choose the type and brand of EV themselves, which makes the offer attractive for different customer segments. The former offers can be taken up

109
independently or as a complete package/bundle, but only in form of a subscription offer based on a monthly payment fee (EE-News, 2019; Sonnen, 2020). Not surprisingly, Tesla also makes use of its complementary product portfolio to introduce bundle-based offers of solar power, home batteries, and EVs. Somewhat more surprisingly is the fact that Tesla has no international product bundling strategy. In different areas of the United States some bundle offers are available for a limited period of time, usually with a discount on the EV if customers decide to buy a solar system, a battery, and an EV (Tesla, 2020). Further examples of bundling EVs with green electricity, but not necessarily solar power, are offered by Volvo (2020), which is currently offering 12 months of free electricity together with an EV or a plug-in hybrid car, and from Volkswagen (2020), which has launched a subsidiary company called Elli for green electricity production. Volkswagen is emphasizing that electric mobility only makes sense when the production of green electricity is equally expanded. Therefore, Volkswagen offers its customers green electricity tariffs from Elli for home consumption which include EV charging at home, but the company does not yet offer bundles of EVs and green electricity. However, since Volkswagen is very well prepared to offer such bundles, it is likely that they will start to offer EV and green electricity bundles in the near future.
2.3. The bundling of EVs and Community Solar
So far, no research has been undertaken to improve understanding of the potential of a community solar and EV bundle. Based on the three benefit criteria — (1) increased value through complementarity, (2) a decrease in (perceived) risk, and (3) an increase in convenience —, it is argued in the following that bundling community solar and EV creates added value for customers. At this point it must be made clear that the following argumentation would largely also apply to a bundle including EV and home solar, especially in terms of the dimensions of reduced risk and complementarity. The benefits of community solar and home solar differ mainly in the dimension of convenience, since community solar is less expensive and easier to obtain than a home solar installation. Additionally, community solar reaches significantly more customers, since all electricity customers can benefit from it. This makes an EV and community solar bundle equally promising from both a business and environmental perspective, as the effect of a larger customer base will have a positive impact on the general spread of solar energy and EVs. As electricity is needed in any case to charge an EV, community solar can be seen as complementary to EV ownership as it represents a source of clean solar power that can

110
be used this purpose. Also, many consumers are actively searching for renewable electricity, and especially solar power, to charge their EVs (Cousse & Wüstenhagen, 2019; Delmas et al., 2017), underlining the complementarity of solar power and EVs. According to literature, complementarity improves the utility of one or more products that are used simultaneously, leading to a more positive appraisal of bundles (e.g. Reinders et al., 2010; Simonin & Ruth, 1995; Stremersch & Tellis, 2002). Additionally, an EV and community solar bundle might also reduce customers’ perceived risk. Consumers who do not possess full information about products within the bundle (knowledge uncertainty) or have less confidence in their ability to make a prudent purchase choice (choice uncertainty), prefer pre-defined product bundles (Guiltinan, 1987; Urbany et al., 1989). An EV and community solar bundle reduces both knowledge uncertainty by introducing community solar as new charging option, and choice uncertainty. Also, many scholars argue that product bundles raise consumer acceptance by reducing customers’ perceived risk due to positive product spillover effects (e.g. Choi, 2003; Reinders et al., 2010; Simonin & Ruth, 1995). In relation to the present case, community solar might have a positive spill-over effect on an EV as it implies using clean energy for driving and could therefore make the perception of EVs more environmentally friendly. Also, the risk of charging an EV at home using carbonized electricity is eliminated by bundling with community solar. Last but not least, the increase in convenience created by a bundle is also an important source of added value for the customer. Being able to buy more than one product in a single purchasing event is in many cases more comfortable for customers (Stremersch & Tellis, 2002) and is associated with convenience benefits due to a reduction in assembly and search effort (Guiltinan, 1987; Harris & Blair, 2006; Kim et al., 2008). The more unfamiliar the potential customer with the product or the more complex the product, the higher the perceived value of reducing search-related costs associated with an incorporated product bundle (Harlam et al., 1995). As a result, a bundle offering of an EV with community solar leads to a higher added value based on reduced search and assembly efforts for many customers. Compared to a bundle of an EV with solar home installation, a bundle including an EV and community solar increases convenience even further, since the need for the installation and maintenance of the solar system is also avoided. Based on the listed arguments, all three benefit criteria (complementarity, reduced risk, and increased convenience) that create the added value of a bundle are fulfilled. Therefore, this article argues that community solar bundled with an EV in a single offering creates added value, resulting in a greater willingness to buy compared to a

111
situation in which an EV is sold separately. This also implies that an EV and community solar bundle should be categorized as a product bundle, not as a price bundle. As a result, the following hypothesis was formulated: Hypothesis 1: Bundling an EV and community solar increases value for customers, resulting in higher willingness to buy compared to that for an EV without community solar.
2.4. Policy Support: The Role of Financial Incentive Mechanisms
While literature about the bundling of EVs and solar power is rare, literature about political subsidies or other political support mechanisms dedicated to increasing the joint adaption or the number of bundled offers of both technologies is nonexistent. On the other hand, the literature about the effectiveness of political support incentives in relation to either solar power or EVs separately is plentiful. Almost all countries that utilize solar energy for power generation have or have had policies specifically tailored to solar energy (Solangi et al., 2011). For these countries (including Germany), the existence of solar energy policies has increased solar power generation significantly. Typical incentives for private home solar-power installations include feed-in tariffs, tax-related incentives, and one-time investment grants for the installation of such systems (Crago & Chernyakhovskiy, 2017; Ryan et al., 2019; Solangi et al., 2011, Wiser et al., 2011). Due to these political support mechanisms, the global deployment of solar-power-generating technologies has increased significantly, leading to a major decline in their cost (Ryan et al., 2019; Solangi et al., 2011). As with solar energy, EV adoption is also promoted in many countries through political measures. A study by Barth et al. (2016) found that EVs are perceived as more expensive than gas or diesel cars, thus cost-related factors are most relevant in terms of EV acceptance. Consequently, more studies have found that financial support based on policy measures can increase willingness to buy an EV (Hardman et al., 2017; Langbroek et al., 2016; Sierzchula et al., 2014; Sun et al., 2019). Financial incentives for EVs cover investment grants (direct purchase subsidies) and tax reductions (e.g. no/lower import tax, value added tax, or vehicle tax). The application of incentives differs from country to country; some countries use only tax-based incentives, while other countries only use direct subsidies, and others apply a mixed approach involving both incentives. Generally, both sorts of incentives may lead to an increase in EV adoption, depending on their financial impact for customers. Hardman et al. (2017) conducted a literature review of several studies from different countries about the

112
effectiveness of financial incentives on the adoption of EVs. The authors found that financial incentives are most effective when applied at the time of purchase of an EV, but not afterwards. The former incentives include direct purchase incentives and tax incentives which directly influence the purchasing price of the vehicle. In Germany, a direct purchase subsidy of 4,000 euros for EVs was introduced in 2016, but the number of applications remained low at the beginning. In 2018, only around 50,000 German citizens applied for the direct subsidy, but the number increased significantly in 2019 to more than 118,000 applications (WELT, 2019a). One explanation for this major increase in applications is the rise in product variety of EVs and an increase in awareness of the availability of financial purchase subsidies. In summary, different sorts of financial incentives based on policy measures have increased the adoption of both, EVs and solar power in many countries. Therefore, I argue that an emphasis on financial incentives increases willingness to buy a bundle that combines EVs with community solar in one product, compared to a situation in which financial incentives are not emphasized. As a result, the second hypothesis was formulated: Hypothesis 2: Placing emphasis on financial incentives based on policy measures leads to a higher willingness to buy the bundle compared to a situation where financial incentives are not emphasized.

113
3. Methodology and data
3.1 Experimental Survey Design
To test the two hypotheses from Chapter Two, this article applies an experimental design based on an online survey. Experimental surveys are often used in academic research to measure the effect of one factor or variable on a specific outcome or dependent variable (Aaker et al., 2013; Kirk, 2012). In this study, a within-subject and a between-subject design were simultaneously applied. To test the first hypothesis (whether an EV and community solar bundle increases willingness to buy compared to a stand-alone EV), a single factor within-subject design was chosen. The factor in the within-subject design is represented by the product, and has two levels; namely, an EV,32 and an EV and community solar bundle. To measure the effect of the bundle, willingness to buy an EV was measured before the bundle was introduced. Consequently, the within-subject design allows us to compare customers’ willingness to buy an EV before knowing about the bundle with their willingness to buy the bundle after its introduction. Based on this within-subject design, the random error that could result from individual differences between the participants in the experimental groups is eliminated (Aaker et al., 2013; Koschate, 2008). Further, this design permits the separate estimation of differences between subjects and between individual experimental conditions (Koschate, 2008), as also illustrated in studies by Litvine & Wüstenhagen (2011) and Baumer et al. (2017). To test the second hypothesis (the effect of emphasizing financial policy support on willingness to buy an EV and community solar bundle), a single factor between-subject design was added to the within-subject design. The factor used in the between-subject design was an emphasis on financial policy support, which had two different levels; namely, inclusion or exclusion after the presentation of the bundle. Accordingly, the bundle was presented to two groups: one control group for whom there was no emphasis on financial policy support after bundle presentation, and one experimental group in which the emphasis on financial policy support came after the bundle was presented. This between-subject design allowed us to measure the isolated effect of emphasizing financial policy support on willingness to buy the bundle, while everything else was held constant (Aaker et al., 2013). Similar designs were also applied in studies by Cardella et al. (2017), Schwartz et al. (2015) and Stauch & Gamma (2020).
32 The type of EV in the survey was not specified. It was only mentioned that the EV was one “as you would choose it (brand, model, further specifications).”
114
3.2. Treatments
The within-subject treatment was the bundle offer of an EV and community solar, which was presented in the same format to both experimental groups. First, participants were presented with a short introductory text, explaining that they would see a new product at their preferred car dealer that combines an EV with community solar in one offer. On the next page, the bundle offer was presented, using icons depicting an EV and solar panels, as well as bullet points to describe the attributes and benefits of the product. It was pointed out that the EV within the bundle could be any EV (“as you would choose it”) in terms of brand, model, and specification, and that the price of the EV would be their regular car dealer’s price. The community solar add-on was priced at 5,00033 euros for 10 solar panels that deliver enough solar power to drive approximately 12,00034 km per year. Duration was set to 10 years. After 10 years, customers were told they would have the choice of being refunded 1,000 euros for the residual value of the solar panels, or prolonging the contact duration for another 10 years at no further cost. It was also stated that the solar power surplus not needed for EV charging at home would be automatically available for household consumption. Thus, customers could still use the community solar electricity for their household even if they sold their EV or replaced it with a new one. Additionally, the benefits of the bundle were emphasized using three bullet-point messages. The first bullet point addressed the convenience of consumers’ having paid for the additional (solar) power needed to charge their EV. The second bullet point addressed environmental benefits, such as supporting the expansion of local solar power for supplying the additional power requirements of EVs, and making sure that one can drive using sustainable solar power. The third and last bullet point addressed the benefits that would be created through reducing the search and assembly efforts involved in identifying sustainable charging solutions. A German-to-English translated copy of the bundle offer and all the elements presented in the survey is attached in Appendix A. The between-subject treatment was the emphasis on financial policy support, which was only presented to the experimental group. The emphasis on financial policy support was
33 The pricing of the 10 community solar panels is based on the pure electricity price, which was calculated based on the price for solar power production in Germany (on average, 10 cents per kWh [Kost et al., 2018]), assuming production of 200 kWh per panel and year (Kost et al., 2018). Thus, the calculation was 10 cents per kWh x 200 kWh x 10 panels x 20 years = 4,000 euros. Five thousand euros was chosen as a rather conservative price, permitting sale of the bundle even under conditions of higher solar power prices (up to 12 cents per kWh) and/or integrating a margin/buffer for suppliers. Within the treatment, it was pointed out that the price excludes grid tariffs and other taxes. 34 The calculation of 12,000 driving kilometers was based on 2,000 kWh solar power per year (10 panels each with 200 kWh production per year) and consumption of 17 kWh for 100 km of driving, which is equivalent to the consumption of a VW e-Golf (ADAC, 2018). Within the treatment, it was also mentioned that German citizens drive on average 12,000 km per year (Bild, 2019). To keep it simple for participants, the calculation of driven kilometers was excluded from the treatment.

115
illustrated on a single survey page located after the bundle offer presentation, but prior to the page on which interest and willingness to buy the bundle was measured. Since the survey was conducted in Germany, the treatment was based on actual support measures offered by the German government. Since 2016, the German government has offered financial support of 4,000 euros in form of a direct payment for people who want to buy an EV (Welt, 2019a). Thus, the treatment emphasized the fact that customers would be supported to the value of 4,000 euros by the government if they buy the bundle. A German-to-English translation of the text concerning the emphasis on financial policy support that was used in the survey is attached in Appendix B.
3.3. Measures and variables
To measure interest in buying an EV, and later in the survey, interest in buying the bundle, participants were asked how much they were interested in buying an EV (or in buying the bundle). For both questions, responses were based on a five-point Likert scale (not at all interested, not interested, undecided, interested, strongly interested). To assess willingness to buy an EV, as well as willingness to buy the bundle later in the survey, participants were asked to record their level of agreement with the following statement: “The next car I’m going to buy will be an EV (or a bundle comprising an EV with community solar).” The five-point Likert scale used to measure willingness to buy contained responses ranging from totally disagree, disagree, don’t know, agree, to fully agree. To evaluate the bundle in more detail and to measure added value creation, six survey items based on the three (aforementioned) added value dimensions — reduced risk, complementarity and increased convenience (see Chapter 2.1) — were additionally formulated. Thus, two survey items were used to measure each of the added value dimensions. To assess reduced risk, the first survey item measured the potential of positive environmental spill-over effects from community solar on an EV within the bundle, while the second survey item measured the reduced risk of EV charging using CO2-intensive electricity. For the dimension of complementarity, survey item three measured whether community solar is sufficiently complementary to an EV that customers see the benefit of prepaying for the solar electricity they need for their EV. Survey item four measured if the bundle increases personal benefits for consumers based on the sense-making and purpose-driven complementarity between EVs and community solar. The last dimension of added value, increased convenience, was measured using survey items five and six. Survey item five measured the added value of the bundle related to the reduction in the search-and-assembly-related cost of identifying

116
environmentally friendly charging solutions. Survey item six assessed added value creation based on convenience through the illustration of potentially unfamiliar but convenient and appealing EV charging at home through community solar. The following table (Table 1) illustrates all six survey items according to the three dimensions of added value creation based on product bundling (Stremersch & Tellis, 2002). All six items were measured using the same five-point Likert scale that was also used to assess willingness to buy the bundle.
Added Value Creation
Survey Item
Reduced Risk
(1) Combination with local solar panels (community solar participation) for charging makes the EV more environmentally friendly.
(2) Combination with local solar panels (community solar participation) for charging reduces the risk of using CO2-intensive electricity to charge the EV.
Complementarity
(3) In addition to the EV, it makes sense to purchase local solar panels (community solar participation) because the (green) electricity needed for charging will already be paid for (excess electricity is automatically used in the household).
(4) Combination with local solar panels (community solar participation) for charging increases my personal benefit of buying an EV because using EVs and solar power together makes more sense than using EVs without a solar power add-on.
Increased Convenience
(5) The bundle offer reduces my search effort in relation to identifying environmentally friendly charging solutions.
(6) Since I did not know until now that one can obtain solar power directly for the household by participating in a local solar plant (community solar) offer, the present product represents a new and attractive possibility for sustainably charging an EV at home.
Table 1: Survey items used to measure the added value of an EV and community solar bundle
Additional variables which were recorded included age (years), gender (male or female), net household income,35 city36 resident (yes/no), car ownership (no car or at least one car owned by household), and political orientation (left-wing, centrist, or right-wing orientation). Also, participants’ attitude towards pro-environmental and pro-social
35 Household income could be indicated using three different income classes presented in euros. Low Income = below 2,000 EUR, Med Income = 2,000 - 4,000 EUR, High Income = more than 4,000 EUR. 36 A city was defined as having more than 100,000 inhabitants.

117
consumption behavior was measured using a 10-item scale developed by Sudbury-Riley & Kohlbacher (2016). The scale is called the “ethically minded consumer behavior” (“EMCB”’) scale and was also used, for instance, by Stauch & Gamma (2020) and Das et al. (2019).
3.4 Recruitment and procedure for participants
The experimental study was implemented using an online questionnaire. Participants were recruited by a professional German market research company which ensured a randomized assignment of participants for each of the experimental groups. Additionally, the former monitored both groups to meet demographic quotas. These were based on the actual demographics of the German population, including the variables gender, age, income (monthly net household income), and political orientation. When the number of respondents needed to meet quota criteria were found, no more participants who matched those criteria were recruited. This procedure ensured representative and comparable samples for each of the groups. Only adult people with permanent residence in Germany were permitted to complete the survey. The survey procedure for participants consisted of four stages. The first stage covered questions about the ownership of different means of transport. Additionally, participants were asked about their interest in buying an EV and their general willingness to buy an EV. At the second stage participants had to answer questions about their general mobility-related behavior. This stage was also used as an intermediate section to create mental distance between the first stage (interest and willingness to buy an EV), and the third stage of the questionnaire (interest and willingness to buy the bundle). Thus, the third stage of the survey presented the EV and community solar bundle to participants, with an emphasis on financial policy support, while participants assigned to the control group only saw details of the bundle without financial policy support. After seeing the bundle, both groups of participants were asked to indicate their interest and willingness to buy the bundle, and then to respond to some questions which further evaluated the bundle and added value creation (including the six survey items from Table 1). The fourth and last stage of the questionnaire collected control and demographic variables and was the same for both survey groups. Additionally, one attention-check question was inserted into the fourth stage of the survey, which asked participants to choose a specific answer which was given in the text of the question from five different options.

118
3.5. Sample
A total of 552 participants started the online survey, looked at the bundle offer, and entered a value into the dependent variable field. Sixty-four participants did not finish the survey, or did not correctly answer the attention-check question and were thus filtered out. A final sample of 488 participants who had completed the whole questionnaire, including providing all requested information and answering the attention check question correctly, was thus obtained. The sample (both groups) is comparable and representative for the German population in terms of age, gender, income and political orientation. However, the sample data include slightly more city inhabitants and car owners than the average in the German population. The following sample table (Table 2) includes data about all 488 participants.
Control Group (n=243)
Experimental Group (n=245)
Total Sample (n=488)
German Populatione
Agea 18-29 18.5% 20.8% 19.7% 20%
Age 30-39 19.3% 18.8% 19% 19%

119
Age 40-49 19.8% 18.8% 19.3% 19%
Age 50-59 23.9% 24.1% 24% 24%
Age 60+ 18.5% 17.6% 18% 18%
Men/Women 49% / 51% 49.8% / 50.2% 49.4% / 50.6% 50% / 50%
Political Attitude: Right-wing
23.9% 24.5% 24.2% 28%
Political Attitude: Centrist
53.1% 52.6% 52.8% 50%
Political Attitude: Left-wing
23% 22.9% 23% 22%
Income: Lowb 27.6% 27.3% 27.5% 28%
Income: Midb 45.3% 45.7% 45.5% 45%
Income: Highb 27.2% 26.9% 27% 27%
Cityc Inhabitants 39.1% 37.6% 38.3% 31%
Car ownershipd 87% 85% 86% 77.1%
a Non-adults (below 18 years) were excluded from the survey as they are not allowed to drive in Germany and are not allowed to buy an (electric) car. The age values provided by Best for Planning (2018) also excluded non-adults.
b Income was indicated as monthly net income per household. The three measured income classes were: Low Income = below 2,000 EUR, Med Income = 2,000 - 4,000 EUR, High Income = more than 4,000 EUR.
c A city was defined as having a population of more than 100,000 inhabitants.
d Car ownership means at least one car is owned by the household
e Statistics for German population demographics were provided by the German market research institute Based on Best for Planning (2018). Additionally, data from ZEIT (2017) for city inhabitants and WELT (2019b) for car ownership were used.
Table 2: Data sample configuration: Total and per group

120
4. Results and discussion
4.1 Results
To analyze the within-subject design (the difference between the willingness to buy an EV and the willingness to buy the bundle), a paired samples t-test was conducted for the total sample and for each of the experimental groups. The analysis revealed a significant effect of the bundle on willingness to buy, meaning that willingness to buy the bundle (M=2.68, SD=1.21, n=488) was significantly higher (MD= 0.320, SD=1.03, t=6.860, df=487, p=0.000) than willingness to buy an EV for the total sample (M=2.36, SD=1.19, n=488). These findings also apply for the control group (MD= 0.333, SD=0.98, t=5.307, df=242, p=0.000) and the experimental group (MD= 0.306, SD=1.08, t=4.441, df=244, p=0.000). The same findings also apply to the interest variable (interest in buying an EV and interest in buying the bundle), for the total sample (MD=0.283, SD=1.15, t=5.454, df=487, p=0.000) and the control group (MD= 0.329, SD=1.01, t=4.691, df=242, p=0.000) as well as for the experimental group (MD= 0.237, SD=1.20, t=3.102, df=244, p=0.002). To analyze the between-subject design (the effect of emphasizing financial policy support on willingness to buy the bundle), a 1x2 (single factor) ANOVA37 was implemented. The single factor used in the ANOVA was the emphasis on financial policy support, which was represented by the two different sample groups (mention of support excluded in the control group and included in the experimental group). The ANOVA revealed no significant difference between the control and the experimental group, either for willingness to buy the bundle (F=0.785, df=1, n=488, p=0.376)38 or for interest in buying the bundle (F=0.013, df=1, n=488, p=0.910).39 The following figure (Figure 1) illustrates the results from the within-subject and the between-subject analysis.
37 ANOVA: Analysis of variance (ANOVA) tests the hypothesis that the mean values of two or more populations are equal. ANOVAs evaluate the significance of one or more factors by comparing the mean values of the response variables at the different factor levels. The null hypothesis is that all mean values of the populations (the mean values of the factor levels) are equal, while the alternative hypothesis is that at least one mean value differs from the others (Rutherford, 2011; Tabachnick et al., 2011). A 1x2 ANOVA corresponds to one factor (treatment) with two levels (emphasizing financial policy support: no and yes). 38 The Levene’s test of equality of error variances (F = 0.131; df1 = 1, df2 = 486; p = 0.718; null hypothesis = equal error variances of the dependent variable across groups) was not significant, which indicates that the dependent variable across both groups is comparable. 39 The Levene’s test of equality of error variances (F = 0.024; df1 = 1, df2 = 486; p = 0.876) was not significant, which indicates that the dependent variable across both groups is comparable.

121
Figure 1: Interest and Willingness to Buy an EV/Bundle per Group
A deeper analysis of the participants in the control group showed that 64.2 % (n=156) indicated at the end of the survey that they already knew about the financial policy incentives from the German government before they started the online survey. Again, using a 1x2 (single factor) ANOVA to compare the mean willingness to buy the bundle of the 87 participants from the control group (M=2.63, SD=1.23, N=87) who indicated that they did not knew about the German policy measures with the mean of willingness to buy the bundle of the experimental group (M=2.73, SD=1.21, N=245) revealed no significant difference (F=0.387, df=1, n=332, p=0.534).40 To analyze the added value scale for the bundle (see Table 1), a descriptive approach was selected. The analysis revealed that a majority (more than 50%) of the total sample “agree” or “fully agree” with all six survey items. For the dimensions “reduced risk” and “complementarity,” the share of participants who agreed or fully agreed exceeded 60%. Fifty-nine per cent of all participants agreed or fully agreed with all six items on average. The following figure (Figure 2) illustrates all the items included in the added value scale and the share of participants who agreed or fully agreed with them. The Cronbach Alpha for the added-value scale items was 0.929 (n=488 with six items), which illustrates the latter’s validity as a scale. The average score for all items for the
40 The Levene’s test of equality of error variances (F = 0.091; df1 = 1, df2 = 330; p = 0.764) was not significant, which indicates that the dependent variable across both groups is comparable.
1.001.502.002.503.003.504.004.505.00
Interest in an electric car Interest in the bundle Willingness to buy anelectric car
Willingness to buy thebundle
Interest and Willingness to Buy an EV/Bundle per Group
Control Group (n=243) Experiemntal Group (n=245)

122
control group was 60%, while the average score for all items for the experimental group was 58%. Thus, the added value was similarly evaluated in both sample groups, as illustrated in further detail in Appendix C. All results in this chapter were calculated using SPSS version 25.
Figure 2: Share of participants who “agreed” or “fully agreed” that items from the added value scale added value to the bundle
A multiple regression analysis for the total sample (F=13.963, df=8, n=488, p=0.000) concerning willingness to buy the bundle that included all control variables (gender:1=female, 2=male), age (in years), income (three levels), political attitude (three levels), car ownership (yes/no), city inhabitant (yes/no) and EMCB), and the treatment variable (two levels, emphasizing financial benefits: yes/no) revealed further significant effects on willingness to buy the bundle associated with age (B = -0.13, p = 0.000), gender (B = 0.451, p = 0.000), and EMCB (B=0.552, p=0.000). The complete regression output is presented in Table 3.
59.1%
57.2%
52.7%
56.8%
63.7%
61.3%
62.7%
0.0% 10.0% 20.0% 30.0% 40.0% 50.0% 60.0% 70.0% 80.0% 90.0% 100.0%
Average of all items
Item 6 (Convenience)
Item 5 (Convenience)
Item 4 (Complementarity)
Item 3 (Complementarity)
Item 2 (Reduced Risk)
Item 1 (Reduced Risk)
Share of participants who selected agree or fully agree for the added value scale of the bundle (n=488)

123
Variable B Standard Error t F Sig.
Treatmenta 0.093 0.099 0.618 0.382 0.537
EMCBb 0.552† 0.061 8.979 80.619 0.000
Age -0.013† 0.004 -3.796 14.412 0.000
Gender (1=f, 2=m) 0.451† 0.103 4.385 19.231 0.000
Incomec -0.011 0.072 -0.152 0.023 0.879
Political Attituded -0.123 0.076 -1.619 2.620 0.106
Car Ownership (1=no, 2=yes) 0.112 0.161 0.700 0.489 0.485
City Inhabitant (1=yes, 2=no) -0.067 0.107 -0.631 0.399 0.528
Intercept 0.966** 0.449 2.154 5.003 0.032
* p < 0.1; ** p < 0.05; *** p < 0.01, † p < 0.001.
a The treatment variable was coded as 1 = control group, and 2 = experimental group.
b 10-item EMCB scale Cronbach’s Alpha = 0.941 (based on n = 488).
c Income was coded according to the following categorization (see also Chapter 3.3 and Chapter 3.5), low income = 1, medium income =2, and high income = 3.
d Political attitude was coded as 1 = left-wing, 2 = centrist, and 3 = right-wing.
F-test of total model: n = 488; F = 13.963; df = 8; Sig. = 0.000; R squared = 0.189; Adjusted R squared = 0.176.
Levene’s test of equality of error variances: F = 1.351; df1 = 1, df2 = 486; Sig. 0.246 (null hypothesis = equal error variances of the dependent variable across groups).
Dependent variable = Willingness to buy the bundle.
Table 3: Multiple Regression Analysis on willingness to buy the bundle – SPSS Output

124
4.2 Discussion
Based on the presented results, the first hypothesis, that “Bundling an EV and community solar increases value for customers, resulting in higher willingness to buy compared to that for an EV without community solar” can be accepted. Based on the within-subject analysis of the experiment, a significantly higher willingness to buy the bundle was identified compared to an EV that is not bundled with community solar. Additionally, the scale for measuring the added value of the bundle (see Table 1) revealed strong agreement, indicating that participants perceived the added value of the bundling of an EV with community solar. A closer look at the added value scale reveals that the first two items, which both belong to the dimension of “reduced risk,” and the third item, which is associated with complementarity, were agreed with most strongly. This illustrates that the main drivers for the added value creation of the bundle are related to environmental benefits (reduced risk of harming the environment) and the fact that electricity which is needed in any case would come from solar power and would already be paid for (complementarity). These results show that bundling an EV with community solar makes the perception of an EV more environmentally friendly, meaning community solar has a positive spill-over effect on the EV which reduces the perceived risk for customers of being harmful to the environment. This result supports the findings of Krishna & Rajan (2009), who found that the cause-related marketing of a product can have a positive spillover effect on the perception of another product that is linked to the first product. The strong agreement with the third item (complementarity) implies that participants see the sense behind combining an EV and prepaid solar power. This result finds support from so-called “prospect accounting” which is part of the theory of mental accounting described by Prelec & Loewenstein (1998). According to prospect accounting, having already paid for something that is needed anyway leads to greater satisfaction in consumption, as later consumption is felt to be for “free.” Additional support for the finding of high complementarity between community solar and EVs comes from Delmas et al. (2017) and Priessner & Hampl (2020), who have demonstrated that the adoption of solar power and an EV in most cases happens equally but not necessarily at the same time. The second hypothesis, that “Placing emphasis on financial incentives based on policy measures leads to a higher willingness to buy the bundle compared to a situation where financial incentives are not emphasized” must be rejected. Based on the between-subject analysis of the experiment, no significant difference was found between willingness to buy the bundle when financial policy support was

125
emphasized compared to the situation when an emphasis on financial policy support was excluded. This result remains the same even if the control variables are added into the multiple regression analysis. This finding contradicts the literature, as the latter generally proposes that financial policy incentives have a positive impact on the adoption of EVs or solar power (see Section 2.4). One reason for the lack of effect may be the fact that 64.2 % of all participants (n=156) from the control group indicated that they already knew about the financial policy incentives from the German government before they did the online survey. However, since the follow up analysis of the participants from the control group who did not know about the German policy incentives (n=87) compared to the participants of the experimental group (n=245) also revealed no significant difference in willingness to buy the bundle, this explanation is weakened by a lack of data-supported evidence. The second explanation why the emphasis on financial policy support did not lead to a significant increase in willingness to buy the bundle could be the added value created by the bundle itself. Since the creation of the bundle increased willingness to buy based on added value alone, direct financial policy incentives, which can also be interpreted as a sort of financial product discount in the broadest sense, may have had no further effect on willingness to buy the bundle. Consequently, financial discounts for the bundle did not lead to further benefits for customers. According to Stremersch & Tellis (2002), this result implies that a bundle of an EV with community solar can be classified as a product bundle, not as a price bundle. This suggests several practical and political implications, which are presented in the next chapter.

126
5. Conclusions and implications
5.1 Theoretical conclusions
This paper has described an investigation of two research objectives. First, whether community solar bundled with an EV in one offer creates added value for customers and therefore increases willingness to buy compared to that for a stand-alone EV. Second, whether emphasizing financial policy support increases willingness to buy a bundle compared to a situation in which it is not emphasized. By conducting an experimental survey that applied a within- and between-subject design simultaneously, this paper found empirical evidence for a higher willingness to buy a bundle than a stand-alone EV, but no empirical evidence for the effect of emphasizing financial policy support on willingness to buy the bundle. Further analysis of the results illustrated that participants perceived the added value of the EV and community solar bundle. This leads to the theoretical conclusion that an EV and community solar bundle can be classified as a product bundle based on the added value that is created for customers, not as price bundle (Stremersch & Tellis, 2002), since financial incentives (interpreted as a financial product discount in the broadest sense) had no additional effect on willingness to buy the bundle.
5.2 Practical and political implications
The results of this paper suggest several implications for policy actors and industry practitioners. Since financial incentives had no significant impact on willingness to buy, car companies should consider introducing strategic product bundling of EVs with community solar power, instead of price bundling. Since the bundling of community solar and EVs creates added value for consumers, car companies could launch a global bundling strategy that includes EVs and community solar energy which could potentially create a competitive advantage for first movers based on a strategy of short-term differentiation from competitors. Opting for product bundles instead of price bundles is also likely to have a more positive effect on revenue streams, since product bundling permits the setting of higher prices. Car companies should emphasize environmental benefits (clean and local solar power), convenience (products from a single supplier reduce customer effort, and there is no installation and maintenance effort related to the solar system) and complementarity (prepaid, electricity is needed anyway) to communicate the added value of the bundle to customers. By bundling EVs with community solar instead of (or simultaneously with) home solar installations, companies can also reach a much larger customer base compared to a situation in which

127
they only offer bundles with home solar installations. Additionally, car companies could even think about launching their own subsidiaries to offer community solar, just like Volkswagen did with Elli for green electricity. Alternatively, community solar suppliers could consider actively making strategic partnerships with local car dealers or car companies. Since customers are even more willing to buy an EV when it is coupled with community solar, car dealers and companies may turn out to be promising sales channels for community solar suppliers. On a national level, political actors should consider creating an additional regulatory incentive framework for suppliers that fosters the creation of bundled offers of EVs and solar power from industry actors, instead of only offering direct purchasing incentives for customers. Such a framework could, for instance, include tax incentives for revenues generated through product bundles of EVs and solar power. Additionally, direct purchasing incentives for EVs should be coupled with green electricity charging, meaning that only customers who charge their EV with green electricity at home can receive direct purchasing incentives for their EV.
5.3 Limitations and further research
Although this article has some notable strengths, such as a data- and literature-based framework combined with straightforward and comprehensive methodology, there are some limitations. The first is the geographical scope of the survey. Besides the fact that the sample in this paper was representative of the German population in terms of gender, age, income, and political attitude, the results are still limited to the German population. Second, the data collected in this study were all self-reported, thus do not necessarily correspond to citizen behavior in practice. Self-reported intentions in surveys may be biased by social desirability (Hebert et al., 1995). The third limitation is related to the treatment applied in the experimental survey; namely, concerning the bundle offer and its presented attributes. Changing the attributes of the bundle offer, such as the number and price of proposed solar panels, or the duration of electricity delivery, might lead to other results. However, in terms of analyzing the difference between willingness to buy the bundle and an EV, this effect is minimized since all participants responded to the same bundle offer. The last limitation concerns the interpretation of direct financial policy incentives as a kind of financial product discount in the broadest sense. The fact that the experimental survey tested financial policy incentives and not product discounts directly naturally limits the interpretation of financial policy incentives as a form of financial discount.

128
Based on these limitations, several further avenues for research are suggested. To verify the international application of the results, the study could be repeated in other European countries, the United States, or in Asian countries. This would also permit the investigation of national and cultural differences among customer preferences for bundles of EVs and community solar. Further, the bundle itself could be adapted to test the effect of changing relevant bundle attributes, such as the price or duration of the contract, on willingness to buy the bundle. To test whether the interpretation of direct financial policy incentives as a form of financial product discount is valid, future studies should focus on investigating the role of product discounts by testing different levels of discount and their effect on willingness to buy a bundle. Last but not least, researchers could conduct real field experiments together with industry partners (car dealers and/or community solar suppliers) to test the survey-based findings in reality.

129
Acknowledgements
The research this paper is based on was financially supported through the Swiss Competence Center for Energy Research SCCER CREST. Further, researchers from the Institute for Economy and the Environment (IWOE-HSG) at the University of St.Gallen provided their feedback and expertise in terms of reviewing the bundle offer and the experimental survey. References
Aaker, D. A., Kumar, V., Leone, R. P. & Day, G. S. (2013). Marketing Research (11th Ed.). Singapore: John Wiley & Sons.
Adams, W.J. & Yellen, J.L. (1976). Commodity Bundling and the Burden of Monopoly. The Quarterly Journal of Economics, 90, 475–498.
ADAC (2018). Elektroautos im Test: So hoch ist der Stromverbrauch. Retrieved on 12.01.2020 from: https://www.adac.de/rund-ums-fahrzeug/tests/elektromobilitaet/stromverbrauch-elektroautos-adac-test/?redirectId=quer.stronverbrauch%20e-autos
Baumer, E. P., Polletta, F., Pierski, N., & Gay, G. K. (2017). A simple intervention to reduce framing effects in perceptions of global climate change. Environmental Communication, 11(3), 289-310.
Barth, M., Jugert, P., & Fritsche, I. (2016). Still underdetected–Social norms and collective efficacy predict the acceptance of electric vehicles in Germany. Transportation research part F: traffic psychology and behaviour, 37, 64-77.
Best for planning (2018). Demografische Zielgruppen-Modelle. Retrieved on 05.09.2019 from: https://gik.media/best-4-planning/zielgruppen/
Bild (2019). Deutsche fahren jährlich 11 672 Kilometer Auto. Retrieved on 06.03.2020 from: https://www.bild.de/auto/mobilitaet-reisen-motorrad/mobilitaet-und-mehr/11672-kilometer-im-schnitt-so-viel-fahren-deutsche-jaehrlich-auto-59935828.bild.html
Bleijenberg, A. & Egenhofer, C. (2013). Pathways to low carbon transport in the EU: From possibility to reality: Report of the CEPS Task Force on Transport and Climate Change. Centre for European Policy Studies, Brussels.

130
Cardella, E., Ewing, B. T., & Williams, R. B. (2017). Price volatility and residential electricity decisions: Experimental evidence on the convergence of energy generating source. Energy Economics, 62, 428-437.
Cherubini, S., Iasevoli, G., & Michelini, L. (2015). Product-service systems in the EV industry: critical success factors in marketing. Journal of Cleaner Production, 97, 40-49.
Crago, C. L., & Chernyakhovskiy, I. (2017). Are policy incentives for solar power effective? Evidence from residential installations in the Northeast. Journal of Environmental Economics and Management, 81, 132-151.
Chiambaretto, P. & Dumez, H. (2012). The Role of Bundling in Firms’ Marketing Strategies: A Synthesis. Transport Reviews, 32(2), 261–262
Choi, J.P. (2003). Bundling new products with old to signal quality, with application to the sequencing of new products. International Journal of Industrial Organization, 21(8), 1179–1200.
Chan, G., Evans, I., Grimley, M., Ihde, B., & Mazumder, P. (2017). Design choices and equity implications of community shared solar. The Electricity Journal, 30(9), 37-41.
Coughlin, J., Grove, J., Irvine, L., Jacobs, J. F., Phillips, S. J., Sawyer, A., & Wiedman, J. (2012). A guide to community shared solar: utility, private, and nonprofit project development. National Renewable Energy Laboratory, 1-68.
Cousse, J. & Wüstenhagen, R. (2019). 9th Consumer Barometer on Renewable Energies. Retrieved on 09.12.2019 from: https://iwoe.unisg.ch/-/media/dateien/instituteundcenters/iwoe/publikationen/kundenbarometer/kundenbarometer_2019_e.pdf?la=en&hash=03D352BF572F41ADBD9D4F923A5DF5B8E0C26758
Das, G., Agarwal, J., Malhotra, N. K., & Varshneya, G. (2019). Does brand experience translate into brand commitment? A mediated-moderation model of brand passion and perceived brand ethicality. Journal of Business Research, 95, 479-490.
Delmas, M.A., Kahn, M.E. & Locke, S.L. (2017). The private and social consequences of purchasing an electric vehicle and solar panels: Evidence from California. Research in Economics, 71(2), 225–235.

131
EE-News (2019): Einstieg in die Elektromobilität: Sonnen stellt Abo-Modell für Elektroautos und Photovoltaik-Anlagen mit Batteriespeichern vor. Retrieved on 10.12.2019 from: https://www.ee-news.ch/de/article/42417/einstieg-in-die-elektromobilitat-sonnen-stellt-abo-modell-fur-elektroautos-und-photovoltaik-anlagen-mit-batteriespeichern-vor
Faiers, A., & Neame, C. (2006). Consumer attitudes towards domestic solar power systems. Energy policy, 34(14), 1797-1806.
Fojcik, T. M., & Proff, H. (2014). Accelerating market diffusion of battery electric vehicles through alternative mobility concepts. International Journal of Automotive Technology and Management 20, 14(3-4), 347-368.
Funkhouser, E., Blackburn, G., Magee, C. & Rai, V. (2015). Business model innovations for deploying distributed generation: The emerging landscape of community solar in the U.S. Energy Research & Social Science, 10, 90-101.
Gamma, K., Stauch, A., & Wüstenhagen, R. (2017). 7th consumer barometer of renewable energy. University of St. Gallen. Retrieved October, 16, 2017.
Granovskii, M., Dincer, I. & Rosen, M.A. (2006). Economic and environmental comparison of conventional, hybrid, electric and hydrogen fuel cell vehicles. Journal of Power Sources, 159, 1186–1193.
Guiltinan, J.P. (1987). The Price Bundling of Services: A Normative Framework. Journal of Marketing, 51(2), 74–85.
Hardman, S., Chandan, A., Tal, G., & Turrentine, T. (2017). The effectiveness of financial purchase incentives for battery electric vehicles–A review of the evidence. Renewable and Sustainable Energy Reviews, 80, 1100-1111.
Harlam, B.A., Krishna, A., Lehmann, D.R. & Mela, C. (1995). Impact of bundle type, price framing and familiarity on purchase intention for the bundle. Journal of Business Research, 33(1), 57–66.
Harris, J. & Blair, E. (2006). Functional Compatibility Risk and Consumer Preference for Product Bundles. Journal of the Academy of Marketing Science, 34(1), 19–26.
Hebert, J. R., Clemow, L., Pbert, L., Ockene, I. S., & Ockene, J. K. (1995). Social desirability bias in dietary self-report may compromise the validity of dietary intake measures. International journal of epidemiology, 24(2), 389-398.

132
Hinz, O., Schlereth, C., & Zhou, W. (2015). Fostering the adoption of electric vehicles by providing complementary mobility services: a two-step approach using Best–Worst Scaling and Dual Response. Journal of Business Economics, 85(8), 921-951.
IEA (2016). Global EV Outlook 2016: Beyond one million EVs. International Energy Agency, Paris.
IEA (2018). Global EV Outlook 2018: Towards cross-modal electrification. International Energy Agency, Paris.
Karasmanaki, E., & Tsantopoulos, G. (2019). Exploring future scientists' awareness about and attitudes towards renewable energy sources. Energy Policy, 131, 111-119.
Kim, J., Bojanic, D.C. & Warnick, R.B. (2008). Price Bundling and Travel Product Pricing Practices Used by Online Channels of Distribution. Journal of Travel Research, 47(4), 403–412.
Kirk, R. E. (2012). Experimental design. Handbook of Psychology, Second Edition, 2.
Krishna, A., & Rajan, U. (2009). Cause marketing: spillover effects of cause-related products in a product portfolio. Management Science, 55(9), 1469-1485.
Koschate, N. (2008). Experimentelle Marktforschung. Handbuch Marktforschung, 3, 107-121.
Kost, C., Shammugam, S., Jülch, V., Nguyen, H. T., & Schlegl, T. (2018). Stromgestehungskosten erneuerbare energien.
Langbroek, J. H., Franklin, J. P., & Susilo, Y. O. (2016). The effect of policy incentives on electric vehicle adoption. Energy Policy, 94, 94-103.
Litvine, D., & Wüstenhagen, R. (2011). Helping" light green" consumers walk the talk: Results of a behavioural intervention survey in the Swiss electricity market. Ecological Economics, 70(3), 462-474.
Mah, D. N. Y. (2019). Community solar energy initiatives in urban energy transitions: A comparative study of Foshan, China and Seoul, South Korea. Energy Research & Social Science, 50, 129-142.
Prelec, D., & Loewenstein, G. (1998). The red and the black: Mental accounting of savings and debt. Marketing science, 17(1), 4-28.

133
Priessner, A., & Hampl, N. (2020). Can product bundling increase the joint adoption of electric vehicles, solar panels and battery storage? Explorative evidence from a choice-based conjoint study in Austria. Ecological Economics, 167, 106381.
Reinders, M.J., Frambach, R.T. & Schoormans, J.P.L. (2010). Using Product Bundling to Facilitate the Adoption Process of Radical Innovations. Journal of Product Innovation Management, 27(7), 1127–1140.
Rogers, J. C., Simmons, E. A., Convery, I. & Weatherall, A. (2008). Public perceptions of opportunities for community-based renewable energy projects. Energy Policy, 36, 4217-4226.
Rutherford, A. (2011). ANOVA and ANCOVA: a GLM approach. John Wiley & Sons.
Ryan, A. J., Donou-Adonsou, F., & Calkins, L. N. (2019). Subsidizing the sun: The impact of state policies on electricity generated from solar photovoltaic. Economic Analysis and Policy, 63, 1-10.
Schwartz, D., Bruine de Bruin, W., Fischhoff, B., & Lave, L. (2015). Advertising energy saving programs: The potential environmental cost of emphasizing monetary savings. Journal of Experimental Psychology: Applied, 21(2), 158.
Sierzchula, W., Bakker, S., Maat, K., & Van Wee, B. (2014). The influence of financial incentives and other socio-economic factors on electric vehicle adoption. Energy Policy, 68, 183-194.
Simonin, B.L. & Ruth, J.A. (1995). Bundling as a Strategy for New Product Introduction Effects on Consumers' Reservation Prices for the Bundle, the New Product, and Its Tie-in. Journal of Business Research, 33, 219–230.
Solangi, K. H., Islam, M. R., Saidur, R., Rahim, N. A., & Fayaz, H. (2011). A review on global solar energy policy. Renewable and sustainable energy reviews, 15(4), 2149-2163.
Sonnen (2020): Sonnen Produkte (Company Homepage). Retrieved on 19.02.2020 from: https://sonnen.de/produkte/
Stauch, A., & Gamma, K. (2020). Cash vs. solar power: An experimental investigation of the remuneration-related design of community solar offerings. Energy Policy, 138, 111216.
Stauch, A., & Vuichard, P. (2019). Community solar as an innovative business model for building-integrated photovoltaics: An experimental analysis with Swiss electricity consumers. Energy and Buildings, 204, 109526.

134
Stremersch, S. & Tellis, G.J. (2002). Strategic Bundling of Products and Prices: A New Synthesis for Marketing. Journal of Marketing, 66(1), 55–72.
Stokes, L. C., & Breetz, H. L. (2018). Politics in the US energy transition: Case studies of solar, wind, biofuels and electric vehicles policy. Energy Policy, 113, 76-86.
Sudbury-Riley, L. & Kohlbacher, F. (2016). Ethically minded consumer behavior: Scale review, development, and validation. Journal of Business Research, 69, 2697-2710.
Sun, X., Liu, X., Wang, Y., & Yuan, F. (2019). The effects of public subsidies on emerging industry: An agent-based model of the electric vehicle industry. Technological Forecasting and Social Change, 140, 281-295.
Tabachnick, B. G., Fidell, L. S., & Ullman, J. B. (2007). Using multivariate statistics (Vol. 5). Boston, MA: Pearson.
Tesla (2020): Exclusive Green Mountain Power Solar and Powerwall Offer. Retrieved on 18.02.2020 from: https://www.tesla.com/gmp-bundle
Ulrich, Karl T. & Steven D. Eppinger (1995). Product Design and Development. New York: McGraw-Hill.
United Nations (2019): Cut global emissions by 7.6 percent every year for next decade to meet 1.5°C Paris target – UN Emissions Gap Report 2019. Retrieved on 22.03.2020 from: https://www.unenvironment.org/resources/emissions-gap-report-2019
Urbany, J.E., Dickson, P.R. & Wilkie, W.L. (1989). Buyer Uncertainty and Information Search. Journal of Consumer Research, 16(2), 208–215.
Volken, S. P., Xexakis, G., & Trutnevyte, E. (2018). Perspectives of informed citizen panel on low-carbon electricity portfolios in Switzerland and longer-term evaluation of informational materials. Environmental science & technology, 52(20), 11478-11489.
Volkswagen (2020): Ökostrom-Anbieter Elli zieht positive Bilanz. Retrieved on 25.03.2020 from: https://www.volkswagenag.com/de/news/stories/2020/01/green-energy-supplier-elli-draws-a-positive-conclusion.html
Volvo (2020): Elektrifizierung – ein Jahr gratis Strom. Retrieved on 23.03.2020 from: https://www.volvocars.com/de-ch/weshalb-volvo/human-innovation/elektrifizierung/plug-in-hybrid/ein-jahr-gratis-strom
135
Walker, G., & Devine-Wright, P. (2008). Community renewable energy: What should it mean? Energy policy, 36(2), 497-500.
Welt (2019a): Altmaiers Spitze gegen Scheuer offenbart Deutschlands E-Auto-Problem. Retrieved on 23.01.2020 from: https://www.welt.de/wirtschaft/article194451901/Umweltboni-Praemie-fuer-Elektroautos-wird-verlaengert.html
Welt (2019b): Deutsche besitzen so wenig Neuwagen wie nie. Retrieved on 25.02.2020 from: https://www.welt.de/wirtschaft/article203651852/Neue-Statistik-Immer-weniger-Deutsche-haben-einen-Neuwagen-in-der-Garage.html
Wiser, R., Barbose, G., & Holt, E. (2011). Supporting solar power in renewables portfolio standards: Experience from the United States. Energy Policy, 39(7), 3894-3905.
Yadav, M.S. (1995). Bundle evaluation in different market segments: The effects of discount framing and buyers' preference heterogeneity. Journal of the Academy of Marketing Science, 23(3), 206–2015.
Zeit (2017): Stadt, Land, Vorurteil. Retrieved on 22.02.2020 from: https://www.zeit.de/feature/deutsche-bevoelkerung-stadt-land-unterschiede-vorurteile

136
Appendix
Appendix A - Bundle Offer – Within-subject treatment
Appendix B - Emphasis on financial policy support – Between-subject treatment

137
Appendix C - Added value evaluation for each sample group
0.0% 10.0% 20.0% 30.0% 40.0% 50.0% 60.0% 70.0% 80.0% 90.0% 100.0%
Average of all items
Item 6 (Convenience)
Item 5 (Convenience)
Item 4 (Complementarity)
Item 3 (Complementarity)
Item 2 (Reduced Risk)
Item 1 (Reduced Risk)
Share of participants who selected agree or fully agree for the added value scale of the bundle per sample group and for the total sample
Experimental Group (n=245) Control Group (n=243) Total Sample (n=488)

138
CURRICULUM VITAE
Name: Stauch, Alexander Date of birth: 12.11.1989 Place of birth: Aarau, Switzerland Nationality: Germany Address: Dietlistrasse 26 CH-9000 St.Gallen Email: [email protected] Mobile phone: +41 79 442 61 01
Education
01/2017 - 12/2020 PhD Student at the University of St.Gallen 09/2014 - 10/2016 Master of Arts in Business Management at the University of St.Gallen 04/2015 Participant of the International Business Game St.Gallen 01/2013 - 09/2014 Member of the “Management Talents UZH”, University of Zürich 09/2009 - 07/2013 Bachelor of Arts in Business Administration at the University of Zürich 08/2005 - 06/2009 Eidgenössische Gymnasial Matura: Kantonsschule Zofingen, Aargau
Work Experience
Since 02/2019 School of Engineering, ZHAW, Winterthur Lecturer for fundamentals in business administration (20%) Since 01/2017 Institute for Economy and the Environment, University of St.Gallen,
St.Gallen Research Associate and Assistant of Prof. Rolf Wüstenhagen (50-70%) 07/2014 - 10/2016 IBM Switzerland – GTS SO Delivery, Storage Team CH+AT, Zürich Work-Student Controlling Advisory (40%)
02/2014 - 06/2014 IBM Switzerland – GTS, Transition and Transformation Team DACH,
Zürich Intern / Management Assistant (100%) 04/2011 - 09/2013 CSK Management GmbH, Herrliberg ZH Business Analyst (20 - 100%) 07/2011 - 08/2011 Service Solution Group (SSG), Franke Inc. USA, Smyrna in Tennessee Intern / Trainee Credit and Risk Management (2 months, 100%)
Passport foto