Antioxidant status and its association with elevated depressive symptoms among US adults: National...
17
British Journal of Nutrition http://journals.cambridge.org/BJN Additional services for British Journal of Nutrition: Email alerts: Click here Subscriptions: Click here Commercial reprints: Click here Terms of use : Click here Antioxidant status and its association with elevated depressive symptoms among US adults: National Health and Nutrition Examination Surveys 2005–6 May A. Beydoun, Hind A. Beydoun, Adel Boueiz, Monal R. Shroff and Alan B. Zonderman British Journal of Nutrition / FirstView Article / December 2012, pp 1 16 DOI: 10.1017/S0007114512003467, Published online: 31 August 2012 Link to this article: http://journals.cambridge.org/abstract_S0007114512003467 How to cite this article: May A. Beydoun, Hind A. Beydoun, Adel Boueiz, Monal R. Shroff and Alan B. Zonderman Antioxidant status and its association with elevated depressive symptoms among US adults: National Health and Nutrition Examination Surveys 2005–6. British Journal of Nutrition, Available on CJO 2012 doi:10.1017/S0007114512003467 Request Permissions : Click here Downloaded from http://journals.cambridge.org/BJN, IP address: 137.187.163.1 on 12 Dec 2012
Transcript of Antioxidant status and its association with elevated depressive symptoms among US adults: National...

British Journal of Nutritionhttp://journals.cambridge.org/BJN
Additional services for British Journal of Nutrition:
Email alerts: Click hereSubscriptions: Click hereCommercial reprints: Click hereTerms of use : Click here
Antioxidant status and its association with elevated depressive symptoms among US adults: National Health and Nutrition Examination Surveys 2005–6
May A. Beydoun, Hind A. Beydoun, Adel Boueiz, Monal R. Shroff and Alan B. Zonderman
British Journal of Nutrition / FirstView Article / December 2012, pp 1 16DOI: 10.1017/S0007114512003467, Published online: 31 August 2012
Link to this article: http://journals.cambridge.org/abstract_S0007114512003467
How to cite this article:May A. Beydoun, Hind A. Beydoun, Adel Boueiz, Monal R. Shroff and Alan B. Zonderman Antioxidant status and its association with elevated depressive symptoms among US adults: National Health and Nutrition Examination Surveys 2005–6. British Journal of Nutrition, Available on CJO 2012 doi:10.1017/S0007114512003467
Request Permissions : Click here
Downloaded from http://journals.cambridge.org/BJN, IP address: 137.187.163.1 on 12 Dec 2012

Antioxidant status and its association with elevated depressive symptomsamong US adults: National Health and Nutrition Examination Surveys2005–6
May A. Beydoun1*, Hind A. Beydoun2, Adel Boueiz3, Monal R. Shroff4 and Alan B. Zonderman1
1NIH Biomedical Research Center, National Institute on Aging, IRP, 251 Bayview Boulevard, Suite 100,
Room no. 04B118, Baltimore, MD 21224, USA2Graduate Program in Public Health, Eastern Virginia Medical School, Norfolk, VA, USA3Department of Internal Medicine, Johns Hopkins University, Baltimore, MD, USA4Department of Epidemiology, University of Michigan at Ann Arbor, Ann Arbor, MI, USA
(Submitted 29 February 2012 – Final revision received 9 July 2012 – Accepted 9 July 2012)
Abstract
We examined the relationship of elevated depressive symptoms with antioxidant status. Cross-sectional data from the National Health and
Nutrition Examination Surveys 2005–6 on US adults aged 20–85 years were analysed. Depressive symptoms were measured using the
Patient Health Questionnaire with a score cut-off point of 10 to define ‘elevated depressive symptoms’. Serum antioxidant status was
measured by serum levels of carotenoids, retinol (free and retinyl esters), vitamin C and vitamin E. The main analyses consisted of multiple
logistic and zero-inflated Poisson regression models, taking into account sampling design complexity. The final sample consisted of 1798
US adults with complete data. A higher total serum carotenoid level was associated with a lower likelihood of elevated depressive
symptoms with a reduction in the odds by 37 % overall with each SD increase in exposure, and by 34 % among women (P,0·05).
A dose–response relationship was observed when total serum carotenoids were expressed as quartiles (Q4 (1·62–10·1mmol/l) v.
Q1 (0·06–0·86mmol/l): OR 0·41; 95 % CI 0·23, 0·76, P,0·001; P for trend¼0·035), though no significant associations were found with the
other antioxidant levels. Among carotenoids, b-carotene (men and women combined) and lutein þ zeaxanthins (women only, after control
for dietary lutein þ zeaxanthin intake and supplement use) had an independent inverse association with elevated depressive symptoms
among US adults. None of the other serum antioxidants had a significant association with depressive symptoms, independently of total
carotenoids and other covariates. In conclusion, total carotenoids (mainly b-carotene and lutein þ zeaxanthins) in serum were associated
with reduced levels of depressive symptoms among community-dwelling US adults.
Key words: Depressive symptoms: Antioxidants: Carotenoids: Adults
Depressive symptoms are the most common outcomes of
stress-induced reactions in humans(1) and have been studied
in relation to a wide array of diseases and conditions including
CVD(2,3), cancer(4,5), type 2 diabetes mellitus(6,7) and allergic
responses(8,9). Recent research has pointed to a link between
oxidative stress and psychological stressors conducive to
elevated depressive symptoms(10).
Dietary antioxidants include a number of micronutrients
that have been shown to reduce oxidative stress triggered
by injury, characterising the pathogenesis of many chronic dis-
eases, including type 2 diabetes, CVD, rheumatological con-
ditions and carcinogenesis(11). In fact, serum levels of
antioxidants reflected their dietary intakes based on several
studies(12,13). One class of antioxidants, known as carotenoids,
are found primarily in fruits and vegetables (FV), while their
secondary sources are bread, eggs, beverages, fats and
oils(14). Even though the human diet contains over forty
different types of carotenoids, only b-carotene, a-carotene,
b-cryptoxanthin, lycopene, lutein and zeaxanthin have detect-
able concentrations in human serum(14). Other micronutrients
with well-established antioxidative properties include
vitamin C, retinol (sparing provitamin A) and vitamin E(15–17).
Evidence from basic experimental and epidemiological
studies has triggered a number of hypotheses regarding the
possible direction of the association between serum antioxi-
dant levels and depressive symptoms in humans as follows:
*Corresponding author: Dr M. A. Beydoun, email [email protected]
Abbreviations: FV, fruits and vegetables; MEC, mobile examination centre; NHANES, National Health and Nutrition Examination Survey; PHQ, Patient
Health Questionnaire; ZIP, zero-inflated Poisson.
British Journal of Nutrition, page 1 of 16 doi:10.1017/S0007114512003467q NIH Biomedical Research Center 2012
British
Journal
ofNutrition

(1) depression is the outcome of low serum antioxidant status;
(2) antioxidant status is the outcome of poor diet resulting
from depression; (3) both depression and antioxidant status
are markers of a third factor (e.g. a genetic variant), which
makes them non-causally related. However, assuming the
first scenario is true, one possible hypothesis (hypothesis A)
is that depressive symptoms caused by external stressors
trigger oxidative stress which in turn causes reduced concen-
trations of certain antioxidants in serum, independently of the
dietary intake of those antioxidants(18–22). Another hypothesis
(hypothesis B) is that increased intake of antioxidants in the
diet reduces oxidative stress by increasing serum antioxidant
levels(12,13), thereby reducing the incidence of elevated
depressive symptoms by reducing lipid peroxidation in the
brain(23–25). While both hypotheses are possible, hypothesis
B is more amenable to dietary intervention. In order to test
hypothesis B, it is important to allow dietary intakes of the
specific antioxidant to vary while adjusting for other poten-
tially confounding covariates. To test hypothesis A, additional
adjustment for dietary intake of antioxidants is required.
To date, however, few epidemiological studies have directly
assessed the association between antioxidant status (or dietary
intakes of antioxidants) and elevated depressive symptoms
among adults(22,26–32), and none so far have used nationally
representative US data.
The present study uses national data on US adults to examine
the relationship of elevated depressive symptoms with anti-
oxidant status. We hypothesise that there is an inverse associ-
ation between serum antioxidant status and the number and
severity of depressive symptoms among US adult men and
women, which is partially accounted for by dietary intake of
those antioxidants (hypotheses A and B).
Materials and methods
Database and study subjects
The National Health and Nutrition Examination Surveys
(NHANES) include a series of cross-sectional surveys providing
nationally representative data on the nutrition and health status
of the US civilian population. The National Center for Health
Statistics, Centers for Disease Control, conducted three earlier
waves of NHANES (NHANES I, II and III) in 1971–5, 1976–80
and 1988–94, respectively. Since 1999, the NHANES became
a continuous survey. Using a stratified, multistage probability
cluster sampling design, the NHANES consists of an in-home
interview for demographic and basic health information and
a health examination in a mobile examination centre (MEC).
Household interviews were conducted by trained staff and
the MEC consists of physicians, medical and health technicians,
and dietary and health interviewers. Detailed descriptions of
the sample design, interview procedures and physical examin-
ations conducted have been published elsewhere(33). The pre-
sent study was conducted according to the guidelines laid
down in the Declaration of Helsinki and all procedures invol-
ving human subjects/patients were approved by the Insti-
tutional Review Board of the Centers for Disease Control,
National Center for Health Statistics. Written or verbal informed
consent was obtained from all subjects/patients. Verbal consent
was witnessed and formally recorded(34).
We analysed NHANES data on adults aged 20–85 years from
2005 to 2006. Among a sample of 4979 adult subjects (2387
men and 2592 women) with complete basic demographic data
(sample 1), 3097 had complete serum antioxidant status and diet-
ary data. Among those, complete data on other covariates of
interest including physical activity, smoking status, supplement
use, weight and height, serum 25-hydroxyvitamin D, folate,
vitamin B12, homocysteine and total cholesterol were available
for 2859 participants (sample 2). Among those in sample 2,
complete data on depressive symptoms were available for
1798 participants (i.e. study sample: sample 3). Sample 3 differed
from sample 1 on some basic demographic variables. Specifi-
cally, sample 3 participants were younger, more likely to be
women, non-Hispanic black or Mexican-Americans, with an
education level above high school and to be current or former
smokers compared with those selected only in sample 1.
Outcome assessment
The questionnaire section of NHANES 2005–6 included the
Patient Health Questionnaire (PHQ). This set of ten questions
reflects self-reported depressive signs and symptoms that are
derived from the diagnostic and statistical manual IV criteria.
There are nine signs and symptoms in diagnostic and statistical
manual IV that were scored between 0 (not at all) and 3 (nearly
every day), and an additional follow-up question to assess
overall impairment ascribed to depressive symptoms. The
PHQ was validated in primary care settings and shown as a
reliable tool for depression diagnosis(35,36). Summing scores
on ten PHQ items potentially yields a total score between 0
and 30. In our sample, the 90th percentile on the total PHQ
score corresponded to a value of 10. This cut-off point was
similarly used elsewhere and had a sensitivity of 88 % and a
specificity of 88 % for major depression(35,36).
Exposure assessment
Using HPLC with photodiode array detection, serum concen-
trations of key antioxidants were measured. In the present
study, retinol and retinyl esters (defined as the sum of retinyl
palmitate and retinyl stearate) were of interest separately and
as their sum. Additionally, carotenoids grouped as a-carotene,
b-carotene (cis þ trans), b-cryptoxanthin, lutein þ zeaxanthin,
total lycopene and total carotenoids were considered as
exposures. Vitamin E was defined as the sum of a- and
g-tocopherol. Vitamin C was also measured by HPLC with
electrochemical detection(37,38).
Covariates
Sociodemographic covariates included age, sex, race/
ethnicity, education, marital status and family income,
measured by the poverty:income ratio (,100 % of the poverty
line, 100– , 200 % and $200 %). An objective measure for
physical activity was constructed based on individual leisure-
time activities with an intensity score assessed by metabolic
M. A. Beydoun et al.2
British
Journal
ofNutrition

equivalents multiplied by duration of the activity and fre-
quency converted to per week unit. This metabolic
equivalent £ h/week value was summed for each subject
depending on the number of leisure-time physical activities
elicited, with participants not eliciting any activity being con-
sidered as sedentary (score 0)(39–41). This continuous score
was categorised as ‘0– , 5’, ‘5–10’ and ‘ . 10’, in the main
part of the analysis. Cigarette smoking status was defined as
never, former or current smoker. All NHANES participants
were eligible for two 24 h recalls in the 2005–6 wave. The
first one was administered during MEC examinations and the
second 3–10 d later by telephone interview. The average of
the two 24 h recalls was examined from which nutrient intakes
were estimated using a revised nutrient database(42). Total
dietary intakes of alcohol, selected antioxidants (a-carotene,
b-carotene, b-cryptoxanthin, lutein þ zeaxanthin, lycopene,
total carotenoids (i.e. the sum of previously listed micronutri-
ents in mg/d), vitamin C and vitamin E in mg/d) and n-3 PUFA
(sum of DHA þ EPA þ n-3 docosapentaenoic acid (C $ 20),
in g/d) were considered as potential confounders, given
their putative associations with elevated depressive sympt-
oms(26,43–45). Moreover, total energy intake was added into
statistical models as a covariate to obtain energy-adjusted
associations between nutrients and outcome. Using another
database to obtain MyPyramid Equivalents(46) of each food
group, cup equivalents of FV were estimated per individual
and averaged out between the two 24 h recalls. Participants
with only one 24 h recall were excluded in the final analysis.
A general measure of dietary supplement use over the past
30 d was computed as follows: 0, non-users; 1, using one sup-
plement; 2, using two supplements or more. Another measure
of antidepressant use was obtained from the medication data
file with the first-level category being ‘242’ and the second-
level category being ‘249’, using Multum’s therapeutic classifi-
cation system(47). The final variable was coded as ‘having used
an antidepressant’ (1 ¼ yes; 0 ¼ no) over the past 30 d.
Serum folate and vitamin B12 were measured using the
‘Quantaphase II Folate’ radioassaykit (Bio-RadLaboratories)(48,49).
Total homocysteine in serum was measured using the fully
automated Abbott IMx Homocysteine assay method (Abbott
Laboratories)(50). Serum 25-hydroxyvitamin D was measured
by RIA (Diasorin, Inc.)(51). Those nutritional biomarkers
were associated with mood disorders and cognitive function
in a number of previous studies(52–68).
Moreover, because depressive symptoms are usually
increased in number and severity in the presence of co-
morbid chronic conditions, we created three measures using
self-reports for history of ‘type 2 diabetes’, ‘CVD’ (i.e. conges-
tive heart failure, CVD, angina, heart attack or stroke) and
‘cancer of any type’. Finally, many of the lipophilic vitamins
are highly correlated with serum lipids, and thus total choles-
terol was also adjusted for in the analysis as was done in a
previous study(69).
Statistical analysis
Using Stata (release 11.0; StataCorp LP), we first described
NHANES 2005–06 study sample characteristics by sex and
elevated depressive symptoms status. Differences in means
across groups and associations between categorical variables
were tested with t and x 2 tests, respectively. Second, we
used Pearson’s correlations to examine the associations
between loge-transformed serum antioxidant variables, first,
between each other and, second, with selected dietary factors
and the continuous PHQ score. Partial correlations were
additionally conducted to examine the degree to which the
association between serum antioxidants and the correspond-
ing dietary antioxidant is explained by dietary intakes of FV
and by dietary supplement use. A full multiple regression
model of covariates and dietary factors as predictors of
serum antioxidants has been published elsewhere using
NHANES 2001–6 data(69). Third, multiple logistic regression
models were conducted to test the associations between anti-
oxidant status (standardised z-scores computed from the total
NHANES sample aged 20–85 years with available antioxidant
data) and ‘elevated depressive symptoms’, controlling for
potential confounders (i.e. all covariates as described earlier,
entered simultaneously) and stratifying by sex, as was done
in a previous study(68). These associations were tested for
depressive symptoms count score (range 0–30) as well
using multiple zero-inflated Poisson (ZIP) regression
models(70). The choice of the ZIP model over Poisson and
negative binomial models was based on a previous similar
analysis that compared the three models(71). To test hypoth-
eses A and B, two sets of models were carried out, as
described earlier. One set controlled for all factors except for
dietary antioxidants while another set, in addition to all
factors, controlled for dietary antioxidants. Models were
compared between hypotheses B and A, in terms of change-
in-estimate(72), when dietary antioxidants and supplement
use were entered into the model.
To test dose–response relationships, quartiles of main anti-
oxidants (Q2, Q3, Q4 v. Q1) were entered into multiple logistic
regression models and P values for trend were computed. In
all analyses, sampling design complexity was taken into
account and adequate sampling weights, strata and primary
sampling units were specified using Stata survey commands.
For most sample estimations, 2-year MEC examination weights
were used, and masked variance units were used to estimate
variances using the Taylor series linearisation method(73).
To additionally account for potential selection bias in all
main analyses (logistic and ZIP regression models), given
missing data on the outcome variable compared with
the MEC examination sample, we constructed a two-stage
Heckman selection model(74), as was done previously in
another study using a similar sample(68). To this end, a
probit model was conducted at first in which the main selec-
tion variable (i.e. belonging to sample 3 v. not, among those
in sample 1) was modelled against basic sociodemographic
variables that were pseudo-complete for the total NHANES
adult sample (i.e. sample 1). These variables included age,
sex, race/ethnicity, marital status, education, poverty:income
ratio and smoking status. A dummy variable for missing data
on those variables was included. From the probit model, the
conditional probability of being selected was predicted from
which an inverse Mills ratio, a function of that predicted
Antioxidant status and depression in adults 3
British
Journal
ofNutrition

probability, was computed and entered at a second stage as a
covariate into the main statistical models(75).
In addition, confounding effects of various covariates
included in the model were explored using a change-in-
estimate type of analysis, in which all main exposures were
retained in the model while other covariates were backward
eliminated sequentially from each model. The effect of elimi-
nating each covariate on the main effects of interest was
assessed accordingly by examining the percentage change in
the estimate of OR associated with each exposure when
each covariate was eliminated(76). This analysis, however,
did not take design complexity into account.
To test for sex differences in main associations, multiple
logistic and ZIP regression models were re-ran in a non-
stratified model, adding a main effect for sex and an inter-
action term for each of the antioxidant exposure with sex.
Sex difference in the association between each serum antiox-
idant and the PHQ was deemed significant if the interaction
term was significant at a level of 0·10, given the lower
power of interaction terms compared with the main effects(72).
All other P values presented were two-tailed with P,0·05
being considered as statistically significant and P,0·10 con-
sidered as marginally significant, before correction for mul-
tiple testing. Multiple testing correction was done by
considering a P value ,0·001 as statistically significant when
comparing one quartile of a predictor with the referent cat-
egory (e.g. Q4 v. Q1) or examining standardised predictor vari-
ables in relation to the outcome (i.e. per SD). The same cut-off
was applied to the P value for trend and the P value for
interaction.
Results
Study sample characteristics
Table 1 presents the distribution of sample characteristics by
sex and depressive symptoms status based on the PHQ
score. The mean PHQ score was significantly higher among
women compared with men (4·5 (SEM 0·2) v. 3·9 (SEM 0·2),
P,0·05). Participants with elevated depressive symptoms
were generally less educated, more likely to belong to the
poverty:income ratio ,100 % category, be unmarried, less
physically active and had a higher proportion with history of
cancer. Women with elevated depressive symptoms were
more likely to be current smokers and had a higher mean
BMI. Men and women with elevated depressive symptoms
had consistently lower serum levels of b-carotene and total
carotenoids combined compared with their non-depressed
counterparts and were more likely to use antidepressants.
Women with elevated depressive symptoms had lower
serum levels of vitamins E and C as well as all carotenoids
compared with their non-depressed counterparts. They
additionally reported lower intakes of b-carotene, b-cryptox-
anthin, lutein þ zeaxanthin, total carotenoids, vitamin C,
vitamin E, n-3 PUFA and a lower consumption of FV.
Moreover, they exhibited lower serum folate and 25-hydroxy-
vitamin D status. Men with elevated depressive symptoms
had higher mean total homocysteine compared with their
non-depressed counterparts. Sex differences in dietary intakes
and other covariates were also observed, including intakes of
carotenoids, vitamin E, n-3 PUFA, antidepressant use, dietary
supplement use, consumption of FV as well as serum levels
of folate and total homocysteine.
Correlation between key study variables
Pearson’s correlation coefficients between the loge-trans-
formed serum antioxidant status variables (between each
other (analysis I); with other dietary variables and the PHQ
continuous score (analysis II)) are presented in Table 2. For
analysis I, correlation coefficients between the serum antioxi-
dant variables ranged between ,0·10 and non-significant (e.g.
lycopene and retinol þ retinyl esters), and .0·70 (e.g. a-caro-
tene and b-carotene). For analysis II, most correlations were
weak to moderate (,0·10–0·40), with the strongest coeffi-
cients being 0·42 (supplement use v. serum vitamin E). As
expected, the PHQ score was inversely related to most
serum antioxidant variables.
Partial correlations of serum antioxidants with their corre-
sponding dietary intake variable, controlling for FV consump-
tion and supplement use, indicated that both sources were
important in explaining those correlations, with the partial
correlation being attenuated by 14 % (retinol) to 77 %
(vitamin E).
Antioxidant status and depressive symptoms
The findings from a series of multiple logistic and ZIP models
examining the associations between the selected serum anti-
oxidant status variables and depressive symptoms (measured
by the PHQ) are presented in Table 3. In all the presented
models, dietary antioxidants and supplement use were not
among the covariates that were adjusted for. In a first series
of models (model 1), serum carotenoids, retinol, retinyl
esters, vitamins C and E were entered separately as predictors
for depressive symptoms along with potential confounding
covariates. Significant inverse associations were found
between elevated depressive symptoms and three different
carotenoids (b-carotene (all, women), lutein þ zeaxanthin
(all, women) and lycopene (all)) and with retinyl esters in
women only. Among those, only b-carotene remained signifi-
cantly inversely related to elevated depressive symptoms
after correction for multiple testing (all: OR 0·52, 95 % CI
0·39, 0·70 P,0·001).
Similar patterns of association were found when the
PHQ count (model 1) was the outcome in the series of
ZIP models, though only the inverse relationship between reti-
nyl esters and the PHQ count was deemed significant after
correction for multiple testing, in both the total population
and among women.
In model 2, when all antioxidants were entered into the
same model simultaneously along with potential confounding
covariates, some of the previously observed inverse
associations remained significant (though slightly attenuated)
but not others. In particular, while the association bet-
ween lycopene and elevated depressive symptoms became
M. A. Beydoun et al.4
British
Journal
ofNutrition

Table 1. Selected baseline characteristics of National Health and Nutrition Examination Survey 2005–6 participants by sex and ‘elevated depressive symptoms’ status*
(Mean values with their standard errors; percentages and standard errors of the proportion (SEP), n 1798)
Men Women
PHQ score , 10
(n 675)
PHQ score $ 10
(n 75)
All men
(n 750)
PHQ score , 10
(n 928)
PHQ score $ 10
(n 120)
All women
(n 1048) P
Mean SEM Mean SEM Mean SEM Mean SEM Mean SEM Mean SEM
Men v.
women
PHQ $10
v. ,10
(men)
PHQ $10
v. ,10
(women)
Sociodemographic, lifestyle factors
Age (years) 45·5 1·0 46·3 2·6 45·5 1·0 47·3 1·0 45·7 1·8 47·1 1·0 0·011 0·759 0·447
Race/ethnicity 0·269 0·458 0·270
Non-Hispanic white
% 74·9 68·3 74·3 73·0 65·7 72·2
SEP 3·1 5·7 3·1 2·8 4·9 2·8
Non-Hispanic black
% 8·6 13·9 9·0 11·0 14·5 11·4
SEP 1·5 3·2 1·5 2·1 3·8 2·1
Mexican-American
% 8·3 7·5 8·2 6·9 8·4 7·1
SEP 1·4 3·2 1·4 0·8 1·9 0·8
Other ethnicity
% 8·1 10·3 8·3 9·1 11·4 9·3
SEP 1·8 4·4 1·6 1·8 3·1 1·8
Married 0·048 0·024 0·019
% 61·8 46·9 60·6 57·2 45·5 56·0
SEP 2·2 6·4 2·3 2·6 4·3 2·5
Education 0·067 0·036 ,0·001
, High school
% 6·0 7·6 6·1 4·7 7·3 4·9
SEP 0·8 2·6 0·7 0·7 1·7 0·7
High school
% 34·8 47·5 35·9 31·3 50·7 33·4
SEP 2·3 5·3 2·3 2·2 4·5 2·2
. High school
% 59·2 44·9 58·0 64·1 41·9 61·6
SEP 2·4 4·7 2·4 2·6 4·4 2·5
Poverty:income ratio 0·140 0·043 ,0·001
, 100 %
% 8·7 16·1 9·3 10·0 26·3 11·8
SEP 1·4 4·4 1·4 1·1 4·7 1·2
100– , 200 %
% 18·6 24·3 19·1 20·7 29·6 21·7
SEP 2·3 4·8 2·3 1·8 5·2 1·9
$ 200 %
% 72·7 59·7 71·6 69·3 44·1 66·6
SEP 2·7 6·7 2·8 2·7 5·6 2·7
Smoking status ,0·001 0·271 0·018
Never smoker
% 42·0 27·9 40·8 57·1 45·4 55·9
SEP 2·7 10·6 2·9 2·5 5·6 2·4
Antio
xid
antstatu
san
ddepre
ssion
inad
ults
5
British Journal of Nutrition

Table 1. Continued
Men Women
PHQ score , 10
(n 675)
PHQ score $ 10
(n 75)
All men
(n 750)
PHQ score , 10
(n 928)
PHQ score $ 10
(n 120)
All women
(n 1048) P
Mean SEM Mean SEM Mean SEM Mean SEM Mean SEM Mean SEM
Men v.
wom-
en
PHQ $10
v. ,10
(men)
PHQ $10
v. ,10
(women)
Former smoker
% 30·0 32·9 30·3 22·4 19·1 22·1
SEP 1·5 7·1 1·7 1·9 5·3 1·9
Current smoker
% 27·9 39·2 28·9 20·4 35·4 22·1
SEP 2·4 9·8 2·6 1·8 4·5 1·9
Physical activity
(MET £ h/week)
7·8 0·6 4·0 0·7 7·5 0·6 6·1 0·5 4·2 0·9 5·9 0·4 0·001 0·033 0·045
BMI (kg/m2) 28·7 0·3 29·1 1·2 28·7 0·3 28·3 0·3 30·8 1·0 28·6 0·3 0·167 0·846 0·039
History of selected chronic conditions
Type 2 diabetes 0·613 0·154 0·656
% 7·4 12·6 7·9 8·6 9·7 8·8
SEP 1·1 3·5 1·0 1·1 2·5 1·1
CVD 0·548 0·434 0·125
% 7·4 9·7 7·6 7·9 12·1 8·4
SEP 0·8 3·0 0·7 1·2 3·6 1·3
Cancer 0·002 0·004 0·582
% 4·7 16·7 5·8 9·5 11·8 9·7
SEP 1·0 4·3 0·9 1·1 3·9 0·9
Antioxidant status
Retinol (mmol/l) 2·23 0·03 2·40 0·08 2·24 0·03 2·00 0·04 1·90 0·08 1·99 0·03 ,0·001 ,0·001 0·835
Retinyl esters (mmol/l) 0·121 0·003 0·106 0·009 0·120 0·003 0·116 0·004 0·080 0·004 0·112 0·003 0·075 0·531 ,0·001
Total retinol þ
retinyl esters (mmol/l)
2·35 0·03 2·51 0·08 2·36 0·03 2·12 0·04 1·98 0·04 2·10 0·04 ,0·001 0·001 0·500
a-Carotene (mmol/l) 0·07 0·01 0·04 0·00 0·07 0·01 0·11 0·09 0·06 0·00 0·11 0·01 ,0·001 0·065 0·001
b-Carotene (mmol/l) 0·30 0·01 0·19 0·02 0·29 0·01 0·51 0·03 0·24 0·02 0·48 0·01 ,0·001 0·003 ,0·001
b-Cryptoxanthin (mmol/l) 0·17 0·01 0·15 0·02 0·17 0·01 0·19 0·01 0·14 0·02 0·18 0·01 0·001 0·135 0·045
Lutein þ zeaxanthin (mmol/l) 0·28 0·01 0·24 0·02 0·28 0·01 0·24 0·02 0·31 0·01 0·30 0·01 0·091 0·067 ,0·001
Lycopene (mmol/l) 0·48 0·02 0·41 0·02 0·47 0·01 0·44 0·01 0·39 0·02 0·43 0·01 0·04 0·063 0·009
Total carotenoids (mmol/l) 1·30 0·03 1·03 0·07 1·28 0·03 1·56 0·05 1·05 0·04 1·50 0·04 ,0·001 0·006 ,0·001
Vitamin E (mmol/l) 28·9 0·4 28·4 2·0 28·8 0·4 30·4 0·7 26·3 1·5 30·0 0·6 0·059 0·742 0·005
Vitamin C (mmol/l) 48·3 1·1 46·1 5·2 48·2 1·15 60·3 1·7 42·9 3·8 58·4 1·6 ,0·001 0·413 ,0·001
Dietary intake
Total energy intake (MJ/d) 11·74 0·28 11·44 0·82 11·71 0·30 8·03 0·11 6·94 0·30 7·54 0·11 ,0·001 0·849 0·073
Alcohol intake (g/d) 15·3 1·7 20·6 7·0 15·8 1·5 5·6 0·9 3·7 1·1 5·4 0·8 ,0·001 0·535 0·535
a-Carotene (mg/d) 442·9 52·7 296·0 70·7 430·3 47·1 443·9 31·0 266·2 45·8 424·3 29·1 0·813 0·830 0·207
b-Carotene (mg/d) 2190·2 160·2 1535·7 156·9 2134·2 141·8 2364·5 120·7 1368·4 258·1 2254·8 117·5 0·715 0·577 0·004
b-Cryptoxanthin (mg/d) 137·9 10·2 156·0 43·1 139·4 9·8 123·9 5·3 77·8 10·6 118·8 4·9 0·335 0·979 0·008
Lutein þ zeaxanthin (mg/d) 1414·7 139·4 1203·3 145·6 1396·0 135·1 1603·4 88·4 1001·2 158·3 1537·1 80·8 0·350 0·724 0·031
Lycopene (mg/d) 6520·8 474·9 6180·8 1349·0 6491·7 453·6 5039·9 320·6 4253·6 1134·0 4953·3 311·0 ,0·001 0·596 0·628
Total carotenoids (mg/d) 12 453 727 10 611 1471 12 296 625 11 496 538 8069 1592 11 118 553 0·017 0·471 0·013
Vitamin C (mg/d) 91·6 4·0 101·4 13·7 92·4 3·4 82·7 2·6 67·1 7·6 81·0 2·6 0·070 0·353 0·039
Vitamin E (mg/d) 8·6 0·3 6·9 0·6 8·4 0·3 6·9 0·1 5·5 0·4 6·7 0·1 ,0·001 0·147 0·002
n-3 PUFA (g/d) 0·19 0·01 0·14 0·03 0·19 0·01 0·13 0·01 0·06 0·01 0·13 0·01 ,0·001 0·366 0·031
M.A.Beydoun
eta
l.6
British Journal of Nutrition

Table 1. Continued
Men Women
PHQ score , 10
(n 675)
PHQ score $ 10
(n 75)
All men
(n 750)
PHQ score , 10
(n 928)
PHQ score $ 10
(n 120)
All women
(n 1048) P
Mean SEM Mean SEM Mean SEM Mean SEM Mean SEM Mean SEM
Men v.
wom-
en
PHQ $10
v. ,10
(men)
PHQ $10
v. ,10
(women)
Dietary supplement use,
past 30 d
,0·001 0·326 0·147
None
% 43·7 37·9 43·2 32·1 41·5 33·1
SEP 1·9 6·6 2·1 2·3 5·7 2·4
One
% 30·0 28·8 29·9 28·3 25·8 28·0
SEP 2·1 5·6 1·9 1·0 4·1 1·1
Two or more
% 26·3 33·3 26·9 39·6 32·7 38·8
SEP 1·9 3·4 1·9 2·6 5·6 2·6
Fruit and vegetable intake (cup
equivalents/d)
2·78 0·09 2·63 0·22 2·77 0·09 2·5 0·1 1·88 0·13 2·43 0·10 0·003 0·502 ,0·001
Antidepressant medication use ,0·001 0·005 ,0·001
% yes 6·8 18·0 7·7 15·9 38·6 18·4
SEP 1·2 4·4 1·2 0·8 6·4 1·0
Folate, Vitamin B12, tHcy and 25-hydroxyvitamin D in serum
Folate (nmol/l) 27·7 0·7 26·2 2·1 27·6 0·7 33·9 1·0 25·5 1·6 33·0 0·9 ,0·001 0·505 ,0·001
Vitamin B12 (pmol/l) 376·4 10·9 356·9 31·3 374·8 10·8 393·7 9·6 377·4 24·7 391·9 8·6 0·137 0·384 0·804
t Hcy (mmol/l) 8·9 0·2 10·1 0·5 8·9 0·1 7·6 0·2 8·3 0·5 7·7 0·2 ,0·001 0·030 0·106
25-Hydroxyvitamin D (ng/ml) 21·8 0·5 20·9 0·9 21·2 0·5 21·8 0·5 18·3 0·9 21·4 0·4 0·269 0·792 ,0·001
PHQ, Patient Health Questionnaire; MET, metabolic equivalents; tHcy, total homocysteine.* Sampling design complexity is taken into account in all analyses. This analysis is done among participants with complete data for the PHQ and other key variables of interest (n 1798).†P value was based on t test when the row variable was continuous and design-based x 2 test when the row variable was categorical.
Antio
xid
antstatu
san
ddepre
ssion
inad
ults
7
British Journal of Nutrition
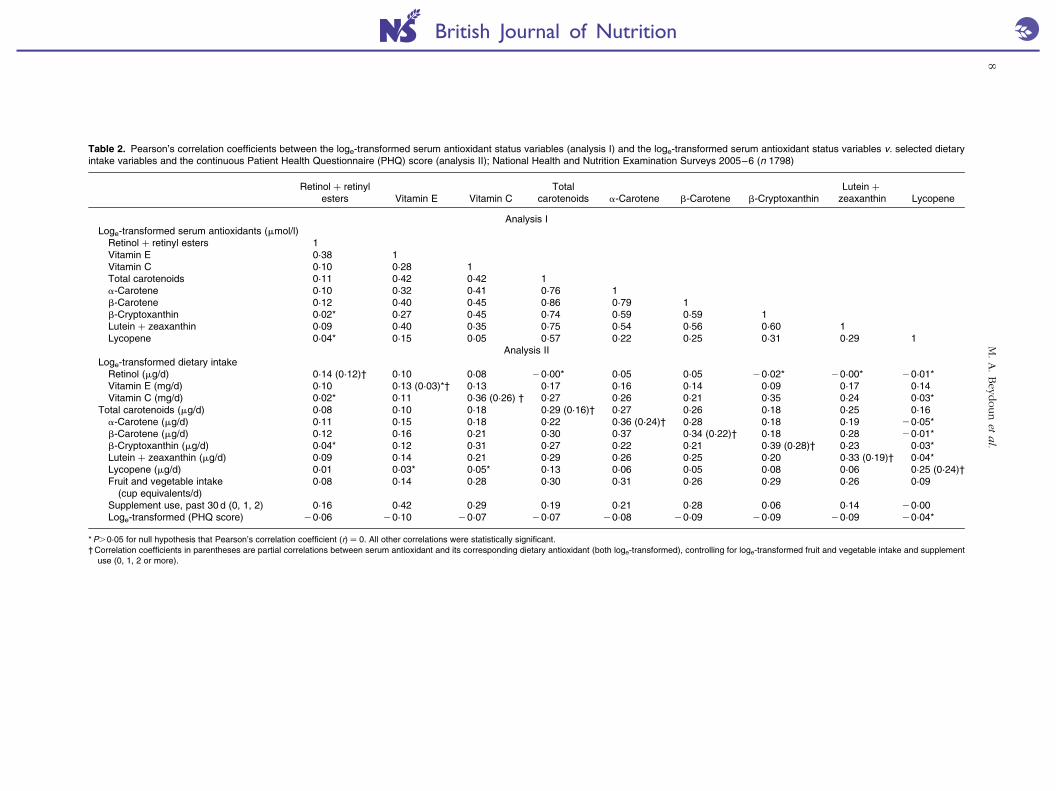
Table 2. Pearson’s correlation coefficients between the loge-transformed serum antioxidant status variables (analysis I) and the loge-transformed serum antioxidant status variables v. selected dietaryintake variables and the continuous Patient Health Questionnaire (PHQ) score (analysis II); National Health and Nutrition Examination Surveys 2005–6 (n 1798)
Retinol þ retinylesters Vitamin E Vitamin C
Totalcarotenoids a-Carotene b-Carotene b-Cryptoxanthin
Lutein þ
zeaxanthin Lycopene
Analysis ILoge-transformed serum antioxidants (mmol/l)
Retinol þ retinyl esters 1Vitamin E 0·38 1Vitamin C 0·10 0·28 1Total carotenoids 0·11 0·42 0·42 1a-Carotene 0·10 0·32 0·41 0·76 1b-Carotene 0·12 0·40 0·45 0·86 0·79 1b-Cryptoxanthin 0·02* 0·27 0·45 0·74 0·59 0·59 1Lutein þ zeaxanthin 0·09 0·40 0·35 0·75 0·54 0·56 0·60 1Lycopene 0·04* 0·15 0·05 0·57 0·22 0·25 0·31 0·29 1
Analysis IILoge-transformed dietary intake
Retinol (mg/d) 0·14 (0·12)† 0·10 0·08 20·00* 0·05 0·05 20·02* 20·00* 20·01*Vitamin E (mg/d) 0·10 0·13 (0·03)*† 0·13 0·17 0·16 0·14 0·09 0·17 0·14Vitamin C (mg/d) 0·02* 0·11 0·36 (0·26) † 0·27 0·26 0·21 0·35 0·24 0·03*
Total carotenoids (mg/d) 0·08 0·10 0·18 0·29 (0·16)† 0·27 0·26 0·18 0·25 0·16a-Carotene (mg/d) 0·11 0·15 0·18 0·22 0·36 (0·24)† 0·28 0·18 0·19 20·05*b-Carotene (mg/d) 0·12 0·16 0·21 0·30 0·37 0·34 (0·22)† 0·18 0·28 20·01*b-Cryptoxanthin (mg/d) 0·04* 0·12 0·31 0·27 0·22 0·21 0·39 (0·28)† 0·23 0·03*Lutein þ zeaxanthin (mg/d) 0·09 0·14 0·21 0·29 0·26 0·25 0·20 0·33 (0·19)† 0·04*Lycopene (mg/d) 0·01 0·03* 0·05* 0·13 0·06 0·05 0·08 0·06 0·25 (0·24)†Fruit and vegetable intake
(cup equivalents/d)0·08 0·14 0·28 0·30 0·31 0·26 0·29 0·26 0·09
Supplement use, past 30 d (0, 1, 2) 0·16 0·42 0·29 0·19 0·21 0·28 0·06 0·14 20·00Loge-transformed (PHQ score) 20·06 20·10 20·07 20·07 20·08 20·09 20·09 20·09 20·04*
*P.0·05 for null hypothesis that Pearson’s correlation coefficient (r) ¼ 0. All other correlations were statistically significant.† Correlation coefficients in parentheses are partial correlations between serum antioxidant and its corresponding dietary antioxidant (both loge-transformed), controlling for loge-transformed fruit and vegetable intake and supplement
use (0, 1, 2 or more).
M.A.Beydoun
eta
l.8
British Journal of Nutrition

Table 3. Associations between selected serum antioxidant status (per 1 SD increase) and depressive symptoms: multiple logistic and zero-inflated Poisson regression models, uncontrolled for dietaryantioxidant intakes or supplement use (hypothesis B); two-stage Heckman selection models; National Health and Nutrition Examination Surveys 2005–6†
(Odds ratio and 95 % confidence intervals or b coefficients with their standard errors of the estimate (SEE))
PHQ score $10 v. ,10 PHQ count score
All Men Women All Men Women
OR 95 % CI OR 95 % CI OR 95 % CI b SEE b SEE b SEE
Model 1‡ n 1776 n 736 n 1040 n 1776 n 736 n 1040Retinol (per 0·63mmol/l) 1·05 0·82, 1·35 1·20 0·90, 1·60 0·97 0·60, 1·56 þ0·01 0·02 þ0·04 0·04 20·02 0·04Retinyl esters (per 0·09mmol/l) 0·63 0·37, 1·08 0·87 0·54, 1·40 0·46* 0·21, 0·99 20·15** 0·03 20·11* 0·05 20·18** 0·04a-Carotene (per 0·11mmol/l) 0·70* 0·50, 0·97 0·57 0·26, 1·24 0·79 0·61, 1·03 20·05* 0·02 20·05 0·03 20·05 0·03b-Carotene (per 0·41mmol/l) 0·52** 0·39, 0·70 0·57 0·26, 1·23 0·58* 0·42, 0·79 20·06 0·04 20·09 0·06 20·04 0·04b-Cryptoxanthin (per 0·16mmol/l) 0·95 0·76, 1·19 0·99 0·72, 1·37 1·00 0·70, 1·42 20·02 0·02 20·07 0·03 þ0·01 0·03Lutein þ zeaxanthin (per 0·16mmol/l) 0·67* 0·49, 0·91 0·79 0·49, 1·28 0·65* 0·44, 0·97 20·07* 0·02 20·04 0·05 20·07* 0·02Lycopene (per 0·20mmol/l) 0·81* 0·70, 0·94 0·79 0·60, 1·04 0·84 0·68, 1·04 20·08* 0·03 20·09 0·05 20·05 0·03Vitamin E (per 14·6mmol/l) 0·83 0·55, 1·23 1·16 0·53, 2·53 0·85 0·45, 1·60 20·00 0·04 20·00 0·08 þ0·04 0·04Vitamin C (per 28·5mmol/l) 0·85 0·58, 1·26 1·04 0·67, 1·62 0·82 0·50, 1·36 20·03 0·04 20·01 0·06 20·03 0·06
Model 2§ n 1776 n 736 n 1040 n 1776 n 736 n 1040Retinol (per 0·63mmol/l) 1·07 0·83, 1·39 1·18 0·85, 1·63 0·99 0·58, 1·68 þ0·01 0·02 þ0·04 0·04 20·03 0·04Retinyl esters (per 0·09mmol/l) 0·81 0·48, 1·39 0·88 0·44, 1·78 0·60 0·28, 1·29 20·13* 0·04 20·10* 0·05 20·16* 0·06a-Carotene (per 0·11mmol/l) 1·02 0·63, 1·65 0·66 0·26, 1·69 1·16 0·72, 1·87 20·01 0·02 20·01 0·04 20·01 0·03b-Carotene (per 0·41mmol/l) 0·58* 0·36, 0·94 0·78 0·30, 1·65 0·60* 0·39, 0·92 20·02 0·04 20·03 0·08 20·01 0·05b-Cryptoxanthin (per 0·16mmol/l) 1·31* 1·10, 1·56 1·27 0·97, 1·65 1·36 1·00, 1·85 þ0·03 0·02 20·04 0·03 þ0·05 0·03Lutein þ zeaxanthin (per 0·16mmol/l) 0·75 0·54, 1·04 0·80 0·50, 1·28 0·72 0·50, 1·04 20·04 0·03 þ0·00 0·05 20·06* 0·03Lycopene (per 0·20mmol/l) 0·92 0·76, 1·10 0·89 0·62, 1·26 0·99 0·77, 1·28 20·04 0·02 20·06 0·05 20·00 0·03Vitamin E (per 14·6mmol/l) 0·97 0·62, 1·39 1·19 0·67, 1·80 1·04 0·56, 1·94 þ0·04 0·04 þ0·04 0·08 þ0·09 0·04Vitamin C (per 28·5mmol/l) 0·97 0·67, 1·39 1·10 0·67, 1·80 0·93 0·61, 1·41 20·01 0·05 þ0·01 0·08 20·01 0·05
Model 3k n 1776 n 736 n 1040 n 1776 n 736 n 1040Total retinol þ retinyl esters (per 0·66mmol/l) 1·06 0·80, 1·42 1·15 0·80, 1·65 0·95 0·55, 1·65 20·01 0·02 þ0·02 0·05 20·05 0·04Total carotenoids (per 0·73mmol/l) 0·62** 0·51, 0·76 0·62 0·37, 1·03 0·68** 0·55, 0·83 20·08* 0·03 20·12 0·06 20·06 0·03Vitamin E (per 14·6mmol/l) 0·89 0·60, 1·32 1·12 0·48, 2·60 0·95 0·51, 1·74 þ0·01 0·04 20·00 0·08 þ0·07 0·04Vitamin C (per 28·5mmol/l) 0·96 0·66, 1·40 1·10 0·67, 1·83 0·90 0·59, 1·40 20·01 0·05 þ0·01 0·07 20·02 0·06
PHQ, Patient Health Questionnaire.*P,0·05; **P,0·001 for null hypothesis that b ¼ 0 or loge(OR) ¼ 0 based on the Wald test.† Sampling design complexity is taken into account in all analyses.‡ Model 1 included each antioxidant exposure separately and adjusted for sociodemographic factors: age, sex, race/ethnicity, marital status, educational level and poverty:income ratio, and other potential confounders – lifestyle
and health-related factors (smoking status, BMI, physical activity: metabolic equivalents £ h/week, recoded as ‘0– , 5’; ‘5–10’; ‘ . 10’, history of selected chronic conditions (i.e. type 2 diabetes, CVD and cancer)), antidepress-ant use and dietary intakes (total energy intake, alcohol, n-3 PUFA), serum folate, total homocysteine, vitamin B12, 25-hydroxyvitamin D and total serum cholesterol levels, and the inverse Mills ratio, two-stage Heckman selectionmodel.
§ Model 2 included all serum antioxidant exposures simultaneously, controlling for the same covariates as above.kModel 3 is model 2 (i.e. controlling for the same covariates as above) but with main exposures being the total retinol þ retinyl esters, total carotenoids, vitamin E and vitamin C.
Antio
xid
antstatu
san
ddepre
ssion
inad
ults
9
British Journal of Nutrition

non-significant, the significance of the inverse association was
retained for b-carotene (all, women), while b-cryptoxanthin
became associated with elevated depressive symptoms in
the total population (OR 1·31, 95 % CI 1·10, 1·56). In ZIP
models, an inverse relationship between lutein þ zeaxanthin
and the PHQ count score was found only among women. In
addition, those models indicated that retinyl esters were inver-
sely related to the PHQ count score among both men and
women. None of these associations was deemed statistically
significant when correcting for multiple testing (P.0·001).
In model 3, all antioxidants were similarly entered simul-
taneously while combining total carotenoids and retinol þ
retinyl esters together as two main exposures and adjusting
for the same covariates as in model 1. In logistic regression
models, among both sexes combined and in women, there
was an inverse association between the total carotenoid
level and elevated depressive symptoms with a reduction in
the odds by 38 % overall and 32 % in women (P,0·001).
In ZIP models, this inverse association was observed only in
both sexes combined, but did not reach significance after cor-
rection for multiple testing (P.0·001). None of the other anti-
oxidants had a significant association with depressive
symptoms independently of total carotenoids and other cov-
ariates. Although some of the associations were found to be
significant in women and not in men, it is worth noting that
sex differences as tested in a separate model with interaction
terms were not statistically significant at the 0·10 level.
In models presented in Table 4, when additional control
was made on dietary antioxidants and supplement use, most
of the findings remained consistent with those presented in
Table 3, even after correction for multiple testing.
In order to further examine the dose–response relation-
ships between antioxidant status and elevated depressive
symptoms, quartiles of main exposures were used and the
P value for trend was obtained (Fig. 1) for men and women
combined. This particular analysis was uncontrolled for diet-
ary antioxidants or supplement use. Among all serum anti-
oxidant exposures entered into the model, only total
carotenoids showed an apparent linear dose–response
relationship with a P value for trend of 0·035 and the OR for
elevated depressive symptoms and quartiles of carotenoids
was only significant when comparing Q4 (1·62–10·1mmol/l) with
Q1 (0·06–0·86mmol/l) (OR 0·41; 95 % CI 0·23, 0·76; P,0·001),
suggesting a possible threshold of 1·62mmol/l before a signifi-
cant association can be detected between serum carotenoids
and elevated depressive symptoms. When dietary antioxidants
and supplement use were introduced into the same model
(Fig. 2), the results remained similar, with a P value for
trend of 0·041 for total serum carotenoids expressed as
quartiles. However, the linear dose–response relationship
was no longer significant in both Figs. 1 and 2 when taking
multiple testing into account (P for trend.0·001). A sensitivity
analysis that additionally controlled for employment status
and medical insurance coverage resulted in a slight attenu-
ation of effects, though the OR for Q4 v. Q1 for total caroten-
oids in relation to elevated depressive symptoms remained
statistically significant in the analyses shown in both Figs. 1
and 2 (P¼0·02). Another sensitivity analysis in which subjects
with inadequate dietary intakes of antioxidants were excluded
did not alter the present findings appreciably.
Potential confounding by various covariates entered into the
main statistical models, particularly the logistic regression
model of Fig. 2, was assessed using a change-in-estimate anal-
ysis, which did not take into account sampling design com-
plexity (data not shown). The present findings suggest that
when covariates aside from main antioxidant exposures
were backward eliminated (model presented in Fig. 2, with
antioxidant quartiles entered as an ordinal variable to assess
the dose–response relationship), change-in-estimate of the
OR did not exceed 10 % (for total serum carotenoids as a cov-
ariate, when main exposure was serum vitamin C), suggesting
a weak confounding effect exerted by each of the other anti-
oxidants and the remaining covariates in the model. More
notably, dietary antioxidants did not act as significant con-
founders in the association between serum antioxidants and
elevated depressive symptoms.
Discussion
The present study used national data on US adults to examine
the relationship of elevated depressive symptoms with anti-
oxidant status as measured by serum levels of carotenoids,
retinol (free and retinyl esters), vitamin C and vitamin
E. There were several key findings. First, we found an inverse
association between the total serum carotenoid level and elev-
ated depressive symptoms with a reduction in the odds by
38 % overall with each SD increase in exposure, and by 32 %
among women (P,0·05). Second, we found a dose–response
relationship when total carotenoids were expressed as quar-
tiles (Q4 (1·62–10·1mmol/l) v. Q1 (0·06–0·86mmol/l): OR 0·41, 95 % CI
0·23, 0·76, P,0·001; P for trend¼0·035), though no significant
associations were found with the other antioxidant levels.
Third, among carotenoids, b-carotene (both sexes combined)
and lutein þ zeaxanthins (among women, after control for
dietary intake and supplement use) were associated inversely
with elevated depressive symptoms among US adults.
To date, only a handful of studies have evaluated the role
played by antioxidants in depressive symptoms(22,26,30,32) or
depression(22,26–28,3031). The majority of those studies focused
on elderly populations(26,30–32) and the most frequently stu-
died antioxidant was vitamin E(26–28,3031). Moreover, one
study(26) examined carotene and vitamin C in relation to
depressive symptoms, another focused on total serum caro-
tenoids(32), while a third study(22) tested several antioxidants
simultaneously. In a case–control study, Maes et al.(27)
found significantly lower serum levels of vitamin E among
forty-two patients with major depressive disorder compared
with twenty-six healthy volunteers. Owen et al. measured
both serum and dietary levels of vitamin E among depressed
adults based on the Beck Depression Inventory. Their results
suggested no significant association between the dietary level
of vitamin E and major depression, but a significantly lower
serum vitamin E level among depressed adults compared
with the general population(28). Shibata et al. used the short
version of the Geriatric Depression Scale to assess the cross-
sectional and longitudinal effects of blood levels of vitamin E
M. A. Beydoun et al.10
British
Journal
ofNutrition

Table 4. Associations between selected serum antioxidant status (per 1 SD increase) and depressive symptoms: multiple logistic and zero-inflated Poisson regression models, controlled for dietaryantioxidant intakes and supplement use (hypothesis A); two-stage Heckman selection models; National Health and Nutrition Examination Surveys 2005–6†
(Odds ratio and 95 % confidence intervals or b coefficients with their standard errors of the estimate (SEE))
PHQ score $10 v. ,10 PHQ count score
All Men Women All Men Women
OR 95 % CI OR 95 % CI OR 95 % CI b SEE b SEE b SEE
Model 1‡ n 1776 n 736 n 1040 n 1776 n 736 n 1040Retinol (per 0·63mmol/l) 1·06 0·81, 1·37 1·18 0·87, 1·63 0·97 0·61, 1·56 þ 0·00 0·02 þ0·03 0·05 20·03 0·04Retinyl esters (per 0·09mmol/l) 0·60 0·34, 1·06 0·82 0·49, 1·37 0·42* 0·19, 0·90 20·17** 0·03 20·13* 0·05 20·20** 0·04a-Carotene (per 0·11mmol/l) 0·71* 0·52, 0·97 0·59 0·26, 1·33 0·79 0·62, 1·00 20·06* 0·02 20·05 0·04 20·05 0·03b-Carotene (per 0·41mmol/l) 0·52** 0·37, 0·74 0·55 0·25, 1·21 0·58* 0·37, 0·90 20·06 0·04 20·10 0·06 20·04 0·05b-Cryptoxanthin (per 0·16mmol/l) 0·94 0·73, 1·21 0·86 0·55, 1·33 1·07 0·78, 1·47 20·02 0·02 20·10 0·05 þ 0·02 0·03Lutein þ zeaxanthin (per 0·16mmol/l) 0·66* 0·48, 0·92 0·74 0·45, 1·24 0·65* 0·43, 0·99 20·07* 0·02 20·06 0·05 20·08* 0·03Lycopene (per 0·20mmol/l) 0·80* 0·70, 0·92 0·79 0·60, 1·04 0·83 0·64, 1·07 20·08* 0·02 20·09 0·05 20·06 0·03Vitamin E (per 14·6mmol/l) 0·75 0·47, 1·18 0·98 0·41, 2·34 0·78 0·38, 1·61 20·03 0·04 20·05 0·08 þ 0·01 0·05Vitamin C (per 28·5mmol/l) 0·78 0·51, 1·22 0·87 0·50, 1·50 0·80 0·46, 1·39 20·06 0·05 20·05 0·07 20·04 0·06
Model 2§ n 1776 n 736 n 1040 n 1776 n 736 n 1040Retinol (per 0·63mmol/l) 1·08 0·82, 1·43 1·12 0·80, 1·58 1·02 0·59, 1·74 þ 0·01 0·02 þ0·04 0·05 20·03 0·04Retinyl esters (per 0·09mmol/l) 0·83 0·47, 1·47 0·91 0·42, 1·97 0·54 0·24, 1·21 20·13* 0·03 20·09 0·05 20·17* 0·06a-Carotene (per 0·11mmol/l) 1·08 0·68, 1·72 0·77 0·29, 2·01 1·19 0·75, 1·90 20·01 0·02 þ0·00 0·04 20·01 0·03b-Carotene (per 0·41mmol/l) 0·56* 0·32, 0·97 0·80 0·35, 1·86 0·60* 0·38, 0·93 20·03 0·04 20·04 0·08 20·02 0·05b-Cryptoxanthin (per 0·16mmol/l) 1·37* 1·07, 1·75 1·15 0·79, 1·68 1·54* 1·11, 2·13 þ0·04* 0·02 20·06 0·04 þ0·08* 0·03Lutein þ zeaxanthin (per 0·16mmol/l) 0·74 0·54, 1·03 0·86 0·54, 1·37 0·67* 0·46, 0·98 20·04 0·02 þ0·01 0·05 20·06* 0·03Lycopene (per 0·20mmol/l) 0·91 0·79, 1·06 0·84 0·60, 1·18 0·99 0·74, 1·34 20·04 0·02 20·06 0·05 20·01 0·03Vitamin E (per 14·6mmol/l) 0·84 0·52, 1·34 0·99 0·31, 3·13 0·86 0·46, 1·62 þ 0·01 0·04 20·02 0·08 þ 0·06 0·05Vitamin C (per 28·5mmol/l) 0·89 0·58, 1·35 0·91 0·46, 1·82 0·93 0·60, 1·43 20·03 0·05 20·02 0·08 20·02 0·06
Model 3k n 1776 n 736 n 1040 n 1776 n 736 n 1040Total retinol þ retinyl esters (per 0·66mmol/l) 1·07 0·81, 1·42 1·13 0·79, 1·63 0·97 0·58, 1·60 20·00 0·02 þ0·02 0·05 20·05 0·04Total carotenoids (per 0·73mmol/l) 0·62** 0·51, 0·76 0·63 0·36, 1·08 0·65** 0·47, 0·89 20·09* 0·03 20·12 0·07 20·07 0·04Vitamin E (per 14·6mmol/l) 0·79 0·51, 1·22 0·97 0·39, 2·42 0·84 0·46, 1·55 20·01 0·04 20·05 0·08 þ0·04 0·05Vitamin C (per 28·5mmol/l) 0·88 0·57, 1·35 0·92 0·47, 1·80 0·88 0·55, 1·42 20·03 0·05 20·02 0·07 20·03 0·06
PHQ, Patient Health Questionnaire.*P,0·05; **P,0·01 for null hypothesis that b ¼ 0 or loge(OR) ¼ 0 based on the Wald test.† Sampling design complexity is taken into account in all analyses.‡ Model 1 included each antioxidant exposure separately and adjusted for sociodemographic factors: age, sex, race/ethnicity, marital status, educational level and poverty:income ratio, and other potential confounders – lifestyle
and health-related factors (smoking status, BMI, physical activity: metabolic equivalents £ h/week, recoded as ‘0– , 5’; ‘5–10’; ‘ . 10’, history of selected chronic conditions (i.e. type 2 diabetes, CVD and cancer)) and dietaryintakes (total energy intake, alcohol, dietary antioxidant (or group of antioxidants), n-3 PUFA, dietary supplement use), serum folate, total homocysteine, vitamin B12, 25-hydroxyvitamin D and total serum cholesterol levels, anti-depressant use, and the inverse Mills ratio, two-stage Heckman selection model.
§ Model 2 included all antioxidant exposures simultaneously, controlling for the same covariates as above.kModel 3 is model 2 (i.e. controlling for the same covariates as above) but with main exposures being the total retinol þ retinyl esters, total carotenoids, vitamin E and vitamin C.
Antio
xid
antstatu
san
ddepre
ssion
inad
ults
11
British Journal of Nutrition

on depressive status among 504 elderly residents of a rural
community. While cross-sectional analysis revealed no signifi-
cant findings, longitudinal analysis showed a protective effect
of vitamin E on depressive status among men only, after
adjustment for age, education and baseline Geriatric
Depression Scale score(31). In the Rotterdam study, Tiemeir
et al. investigated the association of blood vitamin E level
with depressive symptoms as determined by the Center for
Epidemiologic Studies Depression Scale, comparing 262
cases with 459 randomly selected controls. After adjustment
for biological and behavioural factors, no significant associ-
ations were observed between blood vitamin E level and
depressive symptoms or depression among elderly men and
women(30). Oishi et al. conducted a cross-sectional study of
279 community-dwelling Japanese elderly persons to evaluate
dietary factors, including several antioxidants, in relation to
depressive symptoms measured using the Center for Epide-
miologic Studies Depression Scale. Among males, the
observed OR for the depressive state were 0·36 (95 % CI
0·13, 0·98) in the highest tertile of carotene intake, 0·33
(95 % CI 0·12, 0·93) in the highest tertile of vitamin C intake
and 0·33 (95 % CI 0·12, 0·92) in the medium tertile of
vitamin E intake(26). Among females, similar results were
observed, but these results were not statistically significant(26).
Recently, a longitudinal study using InChianti data found a
clear inverse relationship between total serum carotenoids at
baseline and the incidence of elevated depressive symptoms
after a 6-year follow-up period (OR 0·72, 95 % CI 0·52, 0·99,
P¼0·04), adjusting for important confounders. This associ-
ation has been shown to be partially mediated by inflamma-
tory markers such as IL-1 receptor antagonist(32).
The present findings of an association between total serum
carotenoids, b-carotene and lutein þ zeaxanthin and elevated
depressive symptoms are similar to that study(32), and unlike
the study by Oishi et al.(26), we did not observe a strong
association between depressive symptoms and dietary caro-
tenoids. In addition, while our unadjusted analyses indicated
that depressed women had lower levels of vitamins C and E
compared with non-depressed women, this association
became null after adjustment for potentially confounding fac-
tors and other serum antioxidants. These findings indicate that
only total carotenoids are associated with a reduced risk of
depression especially after reaching a threshold correspond-
ing to the uppermost quartile in our sample (.1·62mmol/l).
Since this effect was not attenuated by dietary or supplemental
intake, this suggests that hypothesis A is more likely than
hypothesis B. In other words, depressive symptoms caused
by external stressors(10) trigger oxidative stress which in turn
causes reduced concentrations of total carotenoids in serum,
independently of dietary intake of this class of antioxidants.
The differential effect of total carotenoids as opposed to
vitamins C and E should be studied further. Nevertheless,
reverse causation whereby lower carotenoid levels among
depressed individuals is due to poor diet can only be ruled
out in a longitudinal study.
0·0
0·5
1·0
1·5
2·0
2·5
3·0
Q1 Q2 Q3 Q4 Q1 Q2 Q3 Q4 Q1 Q2 Q3 Q4 Q1 Q2 Q3 Q4
Retinol+retinylestersµmol/l
Vitamin Eµmol/l
Vitamin Cµmol/l
OR
Total carotenoidsµmol/l
**
Fig. 1. Adjusted OR (with 95 % CI) of the major serum antioxidant levels (expressed as quartiles, Q2, Q3, Q4 v. Q1) and elevated depressive symptoms among
US adults, uncontrolled for dietary antioxidant intakes or supplement use; National Health and Nutrition Examination Surveys 2005–6. Ranges (in mmol/l) for each
antioxidant quartile are as follows: retinol þ retinyl esters (Q1: 0·07–1·7; Q2: 1·7–2·1; Q3: 2·1–2·5; Q4: 2·5–8·9; P for trend¼0·775); total carotenoids (Q1:
0·06–0·86; Q2: 0·86–1·18; Q3: 1·18–1·62; Q4: 1·62–10·1; P for trend¼0·035); vitamin E (Q1: 0·2–26·7; Q2: 21·7–27·3; Q3: 27·4–35·9; Q4: 35·9–303·8; P for
trend¼0·678); vitamin C (Q1: 0·6–34·6; Q2: 35·2–54·5; Q3: 55·1–70·4; Q4: 71·0–274·2; P for trend¼0·299). Analyses were based on multiple logistic regression
models that included all antioxidant exposures simultaneously adjusted for sociodemographic factors: lifestyle and health-related factors (smoking status, BMI,
physical activity: metabolic equivalents h/week, recoded as ‘0–,5’; ‘5–10’; ‘ . 10’, history of selected chronic conditions (i.e. type 2 diabetes, CVD and cancer)),
antidepressant use and dietary intakes (total energy intake, alcohol, n-3 PUFA), serum folate, total homocysteine, vitamin B12, 25-hydroxyvitamin D and total serum
cholesterol levels, antidepressant use, and the inverse Mills ratio, two-stage Heckman selection model. **P,0·001 for null hypothesis that loge(OR) ¼ 0.
M. A. Beydoun et al.12
British
Journal
ofNutrition

The biological mechanisms behind the putative causal
association between antioxidant status and depression, in
general, can be outlined as follows: the brain is considered
particularly vulnerable to oxidative stress due to its high
oxygen consumption, its modest antioxidant defences and
its lipid-rich constitution(77,78). The brain is also susceptible
to secondary and self-perpetuating damage from oxidative
cellular injury via the neurotoxic effects of released excitatory
amines (mainly glutamate) and Fe, and the activated inflam-
matory response(77). Oxidative stress, an imbalance between
the production of reactive oxygen species and the cell’s ability
to scavenge those species with various antioxidants, has been
implicated in the pathogenesis of many chronic diseases,
including type 2 diabetes mellitus, CVD, rheumatological
disorders and carcinogenesis(11). Oxidative stress induces
damage to DNA and cell membranes in both animal exper-
iments(17) and human epidemiological studies(79). Many
studies have found evidence of an increase in reactive
oxygen species with age and their deleterious effects on
lipids, especially PUFA. The increase in lipid peroxidation
affects the oxidation of structurally important proteins disrupt-
ing transmembrane ion movements and cellular metabolic
processes(80,81), the most notable one of which is brain
synaptic function.
Furthermore, oxidative damage may cause an autoimmune
response by changing the chemical structures of otherwise
ubiquitous molecules to generate a variety of new, highly
immunogenic epitopes(82). Overall, these oxidative insults
lead to a decrease in membrane fluidity, an inactivation of
enzymes, ion channels and receptors, and, as a result, altera-
tions of neurotransmission, neuronal function and general
brain activity(80,81).
In animal studies, adding immobilisation stress on rats trig-
gered increased levels of lipid peroxidation and a weakened
endogenous antioxidant system in plasma(18,19). In mice,
adding another form of stressor, a communication box para-
digm with electric stress, has been shown to increase lipid
peroxidation activity in the brain(20). Those stress-induced
changes in lipid peroxidation and levels of antioxidants have
also been recently shown in human subjects(21,22).
The present study has notable strengths, which include its
selection of a large nationally representative sample, the
collection of antioxidant status biomarker data and use of a
validated questionnaire for assessment of depressive symp-
toms. However, the present study also suffers from some limi-
tations. First, although use of dietary supplements over a 30 d
period was considered a proxy or crude measure for individ-
ual micronutrient supplementation, it was previously shown
to be directly associated with each of the serum antioxidant
status measures, with a clear dose–response relationship, inde-
pendently of sociodemographic, lifestyle and health-related
factors(69). Second, because of the study’s cross-sectional
0·0
0·5
1·0
1·5
2·0
2·5
3·0
Q1 Q2 Q3 Q4 Q1 Q2 Q3 Q4 Q1 Q2 Q3 Q4 Q1 Q2 Q3 Q4
Retinol+retinylestersµmol/l
Vitamin Eµmol/l
Vitamin Cµmol/l
OR
Total carotenoidsµmol/l
**
Fig. 2. Adjusted OR (with 95 % CI) of the major serum antioxidant levels (expressed as quartiles, Q2, Q3, Q4 v. Q1) and elevated depressive symptoms among
US adults, controlled for dietary antioxidant intakes and supplement use; National Health and Nutrition Examination Surveys 2005–6. Ranges (in mmol/l) for each
antioxidant quartile are as follows: retinol þ retinyl esters (Q1: 0·07–1·7; Q2: 1·7–2·1; Q3: 2·1–2·5; Q4: 2·5–8·9; P for trend¼0·656); total carotenoids (Q1:
0·06–0·86; Q2: 0·86–1·18; Q3: 1·18–1·62; Q4: 1·62–10·1; P for trend¼0·041); vitamin E (Q1: 0·2–26·7; Q2: 21·7–27·3; Q3: 27·4–35·9; Q4: 35·9–303·8; P for
trend¼0·286); vitamin C (Q1: 0·6–34·6; Q2: 35·2–54·5; Q3: 55·1–70·4; Q4: 71·0–274·2; P for trend¼0·180). Analyses were based on multiple logistic regression
models that included all antioxidant exposures simultaneously adjusted for sociodemographic factors: age, sex, race/ethnicity, marital status, educational level and
poverty:income ratio, and other potential confounders – lifestyle and health-related factors (smoking status, BMI, physical activity: metabolic equivalents h/week,
recoded as ‘0– , 5’; ‘5–10’; ‘ . 10’, history of selected chronic conditions (i.e. type 2 diabetes, CVD and cancer)) and dietary intakes (total energy intake, alcohol,
dietary antioxidant (or group of antioxidants), n-3 PUFA, dietary supplement use), serum folate, total homocysteine, vitamin B12, 25-hydroxyvitamin D and
total serum cholesterol levels, antidepressant use, and the inverse Mills ratio, two-stage Heckman selection model. **P,0·001 for null hypothesis that loge(OR) ¼ 0.
Antioxidant status and depression in adults 13
British
Journal
ofNutrition

design, it was not possible to make causal inference through
ascertaining temporality of associations. Hence, we were not
able to ascertain the temporality of the associations between
serum antioxidants, depressive symptoms and oxidative
stress, though it was clear that serum carotenoids were a
direct reflection of an increased consumption of FV as well
as dietary supplement use. Lower intake of fruits, vegetables
and fibres may mediate the relationship between lower caro-
tenoid levels and depression. Indeed, depression is directly
associated with a reduction in dietary quality, thus a reduction
in the consumption of antioxidants(69). Finally, residual con-
founding by unmeasured covariates cannot be totally
discounted.
In conclusion, we found a relationship between carotenoids
and depressive symptoms with some dose–response. Further
investigation is needed through randomised controlled trials
and longitudinal studies to examine the nature of the tempor-
ality of the relationship. Currently, there is limited evidence to
support the role of antioxidants, in general, and carotenoids,
in particular, for the prevention of depression or depressive
symptoms. Thus, additional intervention research is needed
before making any prescriptive or policy recommendations
for antioxidants in the prevention of depression.
Acknowledgements
This study was fully supported by the Intramural Research
Program of the National Institute on Aging, NIA/NIH/IRP.
The contributions of each author are as follows: M. A. B. con-
tributed to the conceptualisation of the study, the literature
review, the plan of the analysis, the data management and
statistical analysis, and the writing and revision of the manu-
script; H. A. B. contributed to the literature search and
review, the plan of the analysis, the writing of part of the
paper and the revision of the manuscript; A. B. carried out
the literature search and review, wrote part of the paper and
revised the manuscript; M. R. S. carried out the literature
search, drafted the plan of the analysis, wrote part of the
paper and revised the manuscript; A. B. Z. drafted the plan
of the analysis, wrote part of the paper and revised the manu-
script. The authors declare that there is no conflict of interest.
References
1. Leonard BE (2001) Stress, norepinephrine and depression.J Psychiatry Neurosci 26, S11–S16.
2. Lesperance F & Frasure-Smith N (2000) Depression inpatients with cardiac disease: a practical review. J PsychosomRes 48, 379–391.
3. Ketterer MW, Mahr G & Goldberg AD (2000) Psychologicalfactors affecting a medical condition: ischemic coronaryheart disease. J Psychosom Res 48, 357–367.
4. Newport DJ & Nemeroff CB (1998) Assessment and treat-ment of depression in the cancer patient. J Psychosom Res45, 215–237.
5. Spiegel D (1996) Cancer and depression. Br J PsychiatrySuppl 168, Suppl. 30, 109–116.
6. Talbot F & Nouwen A (2000) A review of the relationshipbetween depression and diabetes in adults: is there a link?Diabetes Care 23, 1556–1562.
7. Kawakami N, Takatsuka N, Shimizu H, et al. (1999) Depress-ive symptoms and occurrence of type 2 diabetes amongJapanese men. Diabetes Care 22, 1071–1076.
8. Cuffel B, Wamboldt M, Borish L, et al. (1999) Economic con-sequences of comorbid depression, anxiety, and allergicrhinitis. Psychosomatics 40, 491–496.
9. Bell IR, Jasnoski ML, Kagan J, et al. (1991) Depression andallergies: survey of a nonclinical population. PsychotherPsychosom 55, 24–31.
10. Moller P, Wallin H & Knudsen LE (1996) Oxidative stressassociated with exercise, psychological stress and life-stylefactors. Chem Biol Interact 102, 17–36.
11. Soory M (2009) Relevance of nutritional antioxidants inmetabolic syndrome, ageing and cancer: potential for thera-peutic targeting. Infect Disord Drug Targets 9, 400–414.
12. Campbell DR, Gross MD, Martini MC, et al. (1994) Plasmacarotenoids as biomarkers of vegetable and fruit intake.Cancer Epidemiol Biomarkers Prev 3, 493–500.
13. Stryker WS, Kaplan LA, Stein EA, et al. (1988) The relation ofdiet, cigarette smoking, and alcohol consumption to plasmabeta-carotene and alpha-tocopherol levels. Am J Epidemiol127, 283–296.
14. Rao AV & Rao LG (2007) Carotenoids and human health.Pharmacol Res 55, 207–216.
15. Paolisso G, D’Amore A, Balbi V, et al. (1994) Plasmavitamin C affects glucose homeostasis in healthy subjectsand in non-insulin-dependent diabetics. Am J Physiol Endo-crinol Metab 266, E261–E268.
16. Ford ES, Mokdad AH, Giles WH, et al. (2003) The metabolicsyndrome and antioxidant concentrations: findings from theThird National Health and Nutrition Examination Survey.Diabetes 52, 2346–2352.
17. Sies H & Stahl W (1995) Vitamins E and C, beta-carotene, andother carotenoids as antioxidants. Am J Clin Nutr 62,Suppl. 6, 1315S–1321S.
18. Liu J, Wang X & Mori A (1994) Immobilization stress-inducedantioxidant defense changes in rat plasma: effect of treat-ment with reduced glutathione. Int J Biochem 26, 511–517.
19. Davydov VV & Shvets VN (2001) Lipid peroxidation in theheart of adult and old rats during immobilization stress.Exp Gerontol 36, 1155–1160.
20. Matsumoto K, Yobimoto K, Huong NT, et al. (1999) Psycho-logical stress-induced enhancement of brain lipid per-oxidation via nitric oxide systems and its modulation byanxiolytic and anxiogenic drugs in mice. Brain Res 839,74–84.
21. Cernak I, Savic V, Kotur J, et al. (2000) Alterations in mag-nesium and oxidative status during chronic emotionalstress. Magnes Res 13, 29–36.
22. Tsuboi H, Shimoi K, Kinae N, et al. (2004) Depressive symp-toms are independently correlated with lipid peroxidation ina female population: comparison with vitamins and caroten-oids. J Psychosom Res 56, 53–58.
23. Irwin M (1999) Immune correlates of depression. Adv ExpMed Biol 461, 1–24.
24. Maddock C & Pariante CM (2001) How does stress affectyou? An overview of stress, immunity, depression and dis-ease. Epidemiol Psichiatr Soc 10, 153–162.
25. Craft NE, Haitema TB, Garnett KM, et al. (2004) Carotenoid,tocopherol, and retinol concentrations in elderly humanbrain. J Nutr Health Aging 8, 156–162.
26. Oishi J, Doi H & Kawakami N (2009) Nutrition and depress-ive symptoms in community-dwelling elderly persons inJapan. Acta Med Okayama 63, 9–17.
27. Maes M, De Vos N, Pioli R, et al. (2000) Lower serumvitamin E concentrations in major depression. Another
M. A. Beydoun et al.14
British
Journal
ofNutrition

marker of lowered antioxidant defenses in that illness.J Affect Disord 58, 241–246.
28. Owen AJ, Batterham MJ, Probst YC, et al. (2005) Low plasmavitamin E levels in major depression: diet or disease? EurJ Clin Nutr 59, 304–306.
29. Sher L (2008) Depression and suicidal behavior in alcoholabusing adolescents: possible role of selenium deficiency.Minerva Pediatr 60, 201–209.
30. Tiemeier H, Hofman A, Kiliaan AJ, et al. (2002) Vitamin Eand depressive symptoms are not related. The RotterdamStudy. J Affect Disord 72, 79–83.
31. Shibata H, Kumagai S, Watanabe S, et al. (1999) Relationshipof serum cholesterols and vitamin E to depressive status inthe elderly. J Epidemiol 9, 261–267.
32. Milaneschi Y, Bandinelli S, Penninx BW, et al. (2011) Therelationship between plasma carotenoids and depressivesymptoms in older persons. World J Biol Psychiatry (Epubli-cation ahead of print version 20 September 2011).
33. Ogden CL, Carroll MD, Curtin LR, et al. (2006) Prevalence ofoverweight and obesity in the United States, 1999–2004.JAMA 295, 1549–1555.
34. Center for Disease Control and Prevention (CDC) (2006)National Health and Nutrition Examination Survey. http://www.cdc.gov/nchs/nhanes.htm (accessed 25 September2006, updated 2006, cited 25 September 2006).
35. Kroenke K, Spitzer RL & Williams JB (2001) The PHQ-9:validity of a brief depression severity measure. J GenIntern Med 16, 606–613.
36. Spitzer RL, Kroenke K & Williams JB (1999) Validation andutility of a self-report version of PRIME-MD: the PHQ pri-mary care study. Primary Care Evaluation of Mental Dis-orders. Patient Health Questionnaire. JAMA 282, 1737–1744.
37. Centers for Disease Control and Prevention (CDC) (2009)National Health and Nutrition Examination Surveys(NHANES 2005–06): Laboratory Procedure Manual: Fat Sol-uble Micronutrients (Vitamins A, E and Carotenoids) – UV–Visible Detection. Hyatsville, MD: Centers for Disease Controland Prevention. http://www.cdc.gov/nchs/data/nhanes/nhanes_05_06/vitaec_d_met_aecar.pdf (updated 2009, cited).
38. Centers for Disease Control and Prevention (CDC) (2009)National Health and Nutrition Examination Surveys(NHANES 2005–06): Laboratory Procedure Manual:Vitamin C. Hyatsville, MD: Centers for Disease Control andPrevention. http://www.cdc.gov/nchs/data/nhanes/nhanes_05_06/vic_d_met.pdf (updated 2009, cited).
39. Cheng YJ, Gregg EW, De Rekeneire N, et al. (2007) Muscle-strengthening activity and its association with insulin sensi-tivity. Diabetes Care 30, 2264–2270.
40. Lagerros YT & Lagiou P (2007) Assessment of physicalactivity and energy expenditure in epidemiological researchof chronic diseases. Eur J Epidemiol 22, 353–362.
41. McCullough ML, Feskanich D, Rimm EB, et al. (2000) Adher-ence to the dietary guidelines for Americans and risk ofmajor chronic disease in men. Am J Clin Nutr 72,1223–1231.
42. United States Department of Agriculture (USDA) (2008) Agri-culture Research Service FSRG. Food and Nutrient Databasefor Dietary Studies, 3.0. Beltsville, MD: USDA. http://www.ars.usda.gov/Services/docs.htm?docid¼17,031 (accessedMarch 2008, updated 2008, cited).
43. Silvers KM & Scott KM (2002) Fish consumption and self-reported physical and mental health status. Public HealthNutr 5, 427–431.
44. Hasin DS & Glick H (1993) Depressive symptoms andDSM-III-R alcohol dependence: general population results.Addiction 88, 1431–1436.
45. Raimo EB & Schuckit MA (1998) Alcohol dependence andmood disorders. Addict Behav 23, 933–946.
46. United States Department of Agriculture (USDA) (2007) Agri-culture Research Service. MyPyramid Equivalents Databasefor USDA Survey Food Codes version 1.0. Beltsville, MD:USDA. http://www.ars.usda.gov/Services/docs.htm?docid¼8503(accessed July 2007, updated 2007, cited).
47. Center for Disease Control and Prevention (CDC) (2010)National Health and Nutrition Examination Survey 1988–2008 Data Documentation, Codebook, and Frequencies.http://www.cdc.gov/nchs/nhanes/nhanes2005-2006/RXQ_RX_D.htm (updated 2010, cited 25 April 2011).
48. Centers for Disease Control and Prevention (CDC) (2008)National Health and Nutrition Examination Surveys(NHANES 2005–06): Description of Laboratory Methodology:Vitamin B-12. Hyatsville, MD: Centers for Disease Controland Prevention. http://www.cdc.gov/nchs/nhanes/nhanes2005-2006/B12_D.htm#Description_of_Laboratory_Meth-odology (updated 2008, cited).
49. Centers for Disease Control and Prevention (CDC) (2008)National Health and Nutrition Examination Surveys(NHANES 2005–06): Description of Laboratory Methodology:Folate. Hyatsville, MD: Centers for Disease Control andPrevention. http://www.cdc.gov/nchs/nhanes/nhanes2005-2006/FOLATE_D.htm#Description_of_Laboratory_Method-ology (updated 2008, cited).
50. Pernet P, Lasnier E & Vaubourdolle M (2000) Evaluation ofthe AxSYM homocysteine assay and comparison with theIMx homocysteine assay. Clin Chem 46, 1440–1441.
51. Centers for Disease Control and Prevention (CDC) (2008)National Health and Nutrition Examination Surveys(NHANES 2005–06): Description of Laboratory Methodology:Vitamin D. Hyatsville, MD: Centers for Disease Control andPrevention. http://www.cdc.gov/nchs/nhanes/nhanes2005-2006/VID_D.htm#Description_of_Laboratory_Methodology(updated 2008, cited).
52. Wilkins CH, Sheline YI, Roe CM, et al. (2006) Vitamin Ddeficiency is associated with low mood and worse cognitiveperformance in older adults. Am J Geriatr Psychiatry 14,1032–1040.
53. Forti P, Rietti E, Pisacane N, et al. (2010) Blood homocysteineand risk of depression in the elderly. Arch Gerontol Geriatr51, 21–25.
54. Almeida OP, McCaul K, Hankey GJ, et al. (2008) Homocys-teine and depression in later life. Arch Gen Psychiatry 65,1286–1294.
55. Tiemeier H, van Tuijl HR, Hofman A, et al. (2002)Vitamin B12, folate, and homocysteine in depression: theRotterdam Study. Am J Psychiatry 159, 2099–2101.
56. Bottiglieri T, Laundy M, Crellin R, et al. (2000) Homocys-teine, folate, methylation, and monoamine metabolism indepression. J Neurol Neurosurg Psychiatry 69, 228–232.
57. Dimopoulos N, Piperi C, Salonicioti A, et al. (2007) Corre-lation of folate, vitamin B12 and homocysteine plasmalevels with depression in an elderly Greek population. ClinBiochem 40, 604–608.
58. Kim JM, Stewart R, Kim SW, et al. (2008) Predictive value offolate, vitamin B12 and homocysteine levels in late-lifedepression. Br J Psychiatry 192, 268–274.
59. Nanri A, Mizoue T, Matsushita Y, et al. (2010) Serum folateand homocysteine and depressive symptoms amongJapanese men and women. Eur J Clin Nutr 64, 289–296.
60. Kendrick T, Dunn N, Robinson S, et al. (2008) A longitudinalstudy of blood folate levels and depressive symptomsamong young women in the Southampton Women’sSurvey. J Epidemiol Community Health 62, 966–972.
Antioxidant status and depression in adults 15
British
Journal
ofNutrition
61. Beydoun MA, Fanelli Kuczmarski MT, Beydoun HA, et al.(2010) The sex-specific role of plasma folate in mediatingthe association of dietary quality with depressive symptoms.J Nutr 140, 338–347.
62. Sachdev PS, Parslow RA, Lux O, et al. (2005) Relationship ofhomocysteine, folic acid and vitamin B12 with depression ina middle-aged community sample. Psychol Med 35,529–538.
63. Bjelland I, Tell GS, Vollset SE, et al. (2003) Folate, vitaminB12, homocysteine, and the MTHFR 677C ! T polymorph-ism in anxiety and depression: the Hordaland HomocysteineStudy. Arch Gen Psychiatry 60, 618–626.
64. Kim JM, Kim SW, Shin IS, et al. (2008) Folate, vitamin B(12),and homocysteine as risk factors for cognitive decline in theelderly. Psychiatry Investig 5, 36–40.
65. Astorg P, Couthouis A, de Courcy GP, et al. (2008) Associ-ation of folate intake with the occurrence of depressiveepisodes in middle-aged French men and women. Br JNutr 100, 183–187.
66. Sanchez-Villegas A, Doreste J, Schlatter J, et al. (2009)Association between folate, vitamin B(6) and vitamin B(12)intake and depression in the SUN cohort study. J HumNutr Diet 22, 122–133.
67. Tolmunen T, Hintikka J, Ruusunen A, et al. (2004) Dietaryfolate and the risk of depression in Finnish middle-agedmen. A prospective follow-up study. Psychother Psychosom73, 334–339.
68. Beydoun MA, Shroff MR, Beydoun HA, et al. (2010) Serumfolate, vitamin B-12, and homocysteine and their associationwith depressive symptoms among U.S. adults. PsychosomMed 72, 862–873.
69. Beydoun MA, Shroff MR, Chen X, et al. (2011) Serum antiox-idant status is associated with metabolic syndrome amongU.S. adults in recent national surveys. J Nutr 141, 903–913.
70. Long JS (1997) Regression Models for Categorical andLimited Dependent Variables. Thousand Oaks, CA: Sage.
71. Bandiera FC, Arheart KL, Caban-Martinez AJ, et al. (2010)Secondhand smoke exposure and depressive symptoms.Psychosom Med 72, 68–72.
72. Selvin S (2004) Statistical Analysis of Epidemiologic Data,3rd ed. New York: Oxford University Press.
73. Lohr SL (2010) Sampling: Design and Analysis, 2nd ed.Pacific Grove, CA: Brooks/Cole.
74. Heckman JJ (1979) Sample selection bias as a specificationerror. Econometrica 47, 153–161.
75. Puhani P (2000) The Heckman correction for sampleselection and its critique. J Econ Surveys 14, 53–68.
76. Wang Z (2007) Two postestimation commands for assessingconfounding effects in epidemiological studies. Stata J 7,183–196.
77. Halliwell B (2006) Oxidative stress and neurodegeneration:where are we now? J Neurochem 97, 1634–1658.
78. Valko M, Leibfritz D, Moncol J, et al. (2007) Free radicals andantioxidants in normal physiological functions and humandisease. Int J Biochem Cell Biol 39, 44–84.
79. Florence TM (1995) The role of free radicals in disease. AustN Z J Ophthalmol 23, 3–7.
80. Mason RP, Walter MF & Mason PE (1997) Effect of oxidativestress on membrane structure: small-angle X-ray diffractionanalysis. Free Radic Biol Med 23, 419–425.
81. Tirosh O, Kohen R, Katzhendler J, et al. (1997) Oxidativestress effect on the integrity of lipid bilayers is modulatedby cholesterol level of bilayers. Chem Phys Lipids 87, 17–22.
82. Maes M, Galecki P, Chang YS, et al. (2011) A review on theoxidative and nitrosative stress (O&NS) pathways in majordepression and their possible contribution to the (neuro)degenerative processes in that illness. Prog Neuropsycho-pharmacol Biol Psychiatry 35, 676–692.
M. A. Beydoun et al.16
British
Journal
ofNutrition