Anomalous consistency in Mild Cognitive Impairment: A complex networks approach
14
arXiv:1311.4700v1 [q-bio.NC] 19 Nov 2013 1 Anomalous Consistency in Mild Cognitive Impairment: a complex networks approach J. H. Mart´ ınez 1,2,∗ , J. M. Pastor 1 , P. Ariza 3 , M. Zanin 5,6 , D. Papo 4 , F. Maest´ u 7,8 , R. Bajo 7 , S. Boccaletti 9 J. M. Buld´ u 3,10 1 Complex Systems Group, Technical University of Madrid, Madrid, Spain 2 Modelling and Simulation Laboratory, Universidad del Rosario de Colombia, Bogot´ a, Colombia 3 Laboratory of Biological Networks, Centre for Biomedical Technology (UPM-URJC), Madrid, Spain 4 Computational Systems Biology Group, Centre for Biomedical Technology (UPM), Madrid, Spain 5 Faculdade de Ciˆ encias e Tecnologia, Departamento de Engenharia Electrot´ ecnica, Universidade Nova de Lisboa, Lisboa, Portugal 6 The INNAXIS foundation and Research Institute, Madrid, Spain 7 Laboratory of Cognitive and Computational Neuroscience, Centre for Biomedical Technology (UPM-UCM), Madrid, Spain 8 Department of Basic Psychology, Complutense University of Madrid, Madrid, Spain 9 CNR-Istituto dei Sistemi Complessi, Via Madonna del Piano, 10, 50019 Sesto Fiorentino, Italy 10 Complex Systems Group, Universidad Rey Juan Carlos, Madrid, Spain ∗ E-mail: [email protected] Abstract Increased variability in performance has been associated with the emergence of several neurological and psychiatric pathologies. However, whether and how consistency of neuronal activity may also be in- dicative of an underlying pathology is still poorly understood. Here we propose a novel method for evaluating consistency from non-invasive brain recordings. We evaluate the consistency of the cortical activity recorded with magnetoencephalography in a group of subjects diagnosed with Mild Cognitive Impairment (MCI), a condition sometimes prodromal of dementia, during the execution of a memory task. We use metrics coming from nonlinear dynamics to evaluate the consistency of cortical regions. A representation known as parenclitic networks is constructed, where atypical features are endowed with a network structure, the topological properties of which can be studied at various scales. Pathological conditions correspond to strongly heterogeneous networks, whereas typical or normative conditions are characterized by sparsely connected networks with homogeneous nodes. The analysis of this kind of net- works allows identifying the extent to which consistency is affecting the MCI group and the focal points where MCI is specially severe. To the best of our knowledge, these results represent the first attempt at evaluating the consistency of brain functional activity using complex networks theory. Introduction Excessive variability in performance negatively impacts people’s ability to carry out activities of daily living. Increased short-term fluctuations, particularly in reaction times, that cannot be attributed to systematic effects, such as learning, have been associated with a wide range of cognitive disorders including impaired top-down executive and attentional control processes, and with conditions including healthy ageing, and various neurological and psychiatric disorders ranging from Parkinson’s disease [1,2], multiple sclerosis [3], traumatic brain injury [4], schizophrenia [5] and various forms of dementia [6,7]. A number of studies attest an association between behavioral inconsistency and structural and functional brain
Transcript of Anomalous consistency in Mild Cognitive Impairment: A complex networks approach

arX
iv:1
311.
4700
v1 [
q-bi
o.N
C]
19
Nov
201
3
1
Anomalous Consistency in Mild Cognitive Impairment: acomplex networks approachJ. H. Martınez1,2,∗, J. M. Pastor1, P. Ariza3, M. Zanin5,6, D. Papo4, F. Maestu7,8, R. Bajo7, S.Boccaletti9 J. M. Buldu3,10
1 Complex Systems Group, Technical University of Madrid, Madrid, Spain2 Modelling and Simulation Laboratory, Universidad del Rosario de Colombia, Bogota,Colombia3 Laboratory of Biological Networks, Centre for Biomedical Technology (UPM-URJC),Madrid, Spain4 Computational Systems Biology Group, Centre for Biomedical Technology (UPM),Madrid, Spain5 Faculdade de Ciencias e Tecnologia, Departamento de Engenharia Electrotecnica,Universidade Nova de Lisboa, Lisboa, Portugal6 The INNAXIS foundation and Research Institute, Madrid, Spain7 Laboratory of Cognitive and Computational Neuroscience, Centre for BiomedicalTechnology (UPM-UCM), Madrid, Spain8 Department of Basic Psychology, Complutense University of Madrid, Madrid, Spain9 CNR-Istituto dei Sistemi Complessi, Via Madonna del Piano, 10, 50019 SestoFiorentino, Italy10 Complex Systems Group, Universidad Rey Juan Carlos, Madrid, Spain∗ E-mail: [email protected]
Abstract
Increased variability in performance has been associated with the emergence of several neurological andpsychiatric pathologies. However, whether and how consistency of neuronal activity may also be in-dicative of an underlying pathology is still poorly understood. Here we propose a novel method forevaluating consistency from non-invasive brain recordings. We evaluate the consistency of the corticalactivity recorded with magnetoencephalography in a group of subjects diagnosed with Mild CognitiveImpairment (MCI), a condition sometimes prodromal of dementia, during the execution of a memorytask. We use metrics coming from nonlinear dynamics to evaluate the consistency of cortical regions. Arepresentation known as parenclitic networks is constructed, where atypical features are endowed witha network structure, the topological properties of which can be studied at various scales. Pathologicalconditions correspond to strongly heterogeneous networks, whereas typical or normative conditions arecharacterized by sparsely connected networks with homogeneous nodes. The analysis of this kind of net-works allows identifying the extent to which consistency is affecting the MCI group and the focal pointswhere MCI is specially severe. To the best of our knowledge, these results represent the first attempt atevaluating the consistency of brain functional activity using complex networks theory.
Introduction
Excessive variability in performance negatively impacts people’s ability to carry out activities of dailyliving. Increased short-term fluctuations, particularly in reaction times, that cannot be attributed tosystematic effects, such as learning, have been associated with a wide range of cognitive disorders includingimpaired top-down executive and attentional control processes, and with conditions including healthyageing, and various neurological and psychiatric disorders ranging from Parkinson’s disease [1,2], multiplesclerosis [3], traumatic brain injury [4], schizophrenia [5] and various forms of dementia [6,7]. A numberof studies attest an association between behavioral inconsistency and structural and functional brain

2
abnormalities. For instance, diffusion tensor imaging showed a relationship between intra-individualvariability in reaction times and white matter integrity, with variability increasing with white matterdegradation, pathway connectivity degradation and brain dysfunction [8–10]. Behavioural inconsistencywas also associated with neurotransmitter dysfunction, stress, and fatigue [7, 11–14]. However, whetherand how behavioural inconsistency stems from a corresponding loss of consistency of functional brainactivity is still unclear.
In physics, consistency [15] has been studied with a series of different dynamical models [16–18].The emergence of a consistent response requires a high synchronization between different outputs of anonlinear system (i.e., different realizations with different initial conditions) when the same external inputis applied. Nevertheless, consistency does not imply the observation of a synchronized state between theexternal input and the system’s response as it is the case of an entrained or driven system. Figure 1shows schematically the difference between a driven system and a consistent/inconsistent system.
Here we propose a new methodology for quantifying neuronal consistency that can be applied tononinvasive diagnostic procedures. This method involves constructing a parenclitic [19, 20] network rep-resentation based on anomalous behaviour of a certain set of features. The topological characteristicsof the parenclitic network can be used to extract information about how consistency is lost/maintainedacross the whole functional network. In such a representation, atypical or pathological conditions corre-spond to strongly heterogeneous networks, whereas typical or normative conditions are characterized bysparsely connected networks with homogeneous nodes. In essence, a parenclitic representation equips theset of abnormalities of a system with a network characterization with topological properties at variousscales.
Specifically, we study the consistency of functional brain activity in a group of patients diagnosed withmild cognitive impairment (MCI). MCI is a clinical condition in which subjects experience memory loss toa greater extent than would be expected for age, who while not meeting the criteria for clinically probableAlzheimer’s Disease (AD) are nonetheless at increased risk of developing it. Behavioural evidence showsthat, compared to cognitively healthy ageing, MCI has been associated with increased response timevariability and particularly in those subjects later developing AD [8,9, 11–13,21]. Abnormal consistencyin MCI may therefore represent a measure of functional integrity that may help identifying those patientswho lapse into fully-fledged dementia. We used magnetoencephalography (MEG) to record the brainactivity of a group of patients suffering from MCI and a healthy control group, both at rest and asthey carried out the Sternberg short-term memory task, we then computed the consistency of each brainsite for each individual of each group and finally constructed the parenclitic network for the differencesin consistency between MCIs and controls (see Materials and Methods for details). The structure ofthe parenclitic networks highlights those regions whose consistency is most affected by the disease andsuggests ways in which the effects of MCI may propagate through the functional brain network.
Material and Methods
Subjects
All subjects or legal representatives provided written consent to participate in the study, which was ap-proved by the local ethics committee of the Hospital Clınico Universitario San Carlos (Madrid, Spain).Fourteen right handed patients with MCI were recruited from the Geriatric Unit of the “Hospital ClınicoUniversitario San Carlos Madrid”. In addition, fourteen age-matched elderly participants without cogni-tive impairment were included as the control group. In addition to age, years of education were matchedto the MCI group (for details see [22]): 10 years for the MCI group and 11 years for controls. To confirmthe absence of memory complaints, a score of 0 was required in a 4-question questionnaire [23]. None ofthe participants had a history of neurological or psychiatric condition. The diagnosis of MCI was madeaccording to the criteria proposed by Petersen [24, 25]. None of the subjects with MCI had evidence

3
of depression as measured using the geriatric depression scale (score lower than 9) [26]. MCI subjectsand healthy participants underwent a neuropsychological assessment in order to establish their cognitivestatus with respect to multiple cognitive functions. Specifically, memory impairment was assessed usingthe Logical Memory immediate (LM1) and delayed (LM2) subtests of the Wechsler Memory Scale-III-Revised. Two scales of cognitive and functional status were applied as well: the Spanish version of theMMSE [27], and the Global Deterioration Scale/Functional Assessment Staging (GDS/FAST).
Task
Magnetoencephalography (MEG) scans were obtained in the context of a modified version of the Stern-berg’s letter-probe task [28, 29] in which a set of five letters was presented and subjects were asked tokeep the letters in mind. After the presentation of the five-letter set, a series of single letters (1000 ms induration) was introduced one at a time, and participants were asked to press a button with their righthand when a letter of the previous set was detected. Subjects undertook a training series before the actualtest. Subjects’ responses were classified into four different categories: hits, false alarms, correct rejectionsand omissions. Only hits were considered for further analysis because the authors were interested inevaluating the functional connectivity patterns which support recognition success. The percentage of hits(80% control group and 84% MCI group) and correct rejections (92% control group and 89% MCI group)was high enough in both groups, indicating that participants actively engaged in the task. No significantdifference between the two groups during the memory task was revealed.
MEG recording
MEG signals were recorded with a 254 Hz sampling frequency and a band pass of 0.5 to 50 Hz, using a 147-channel whole-head magnetometer (MAGNES 2500 WH, 4-D Neuroimaging) confined in a magneticallyshielded room. Prior to functional connectivity analysis, all recordings were visually inspected by anexperienced investigator, and all of them containing visible blinks, eye movements or muscular artifactswere excluded from further analysis.
Analyses
For each individual, Synchronization Likelihood (SL) [22, 30] was calculated between each pair of MEGtime series within the same channel, considering only successful identifications of the target letters. SLis a nonlinear measure of correlation indicating complete synchronization for values close to one andthe absence of any correlation when approaching zero. This way, we evaluate if the cortical activitymeasured at each channel during a positive identification of a letter is consistent, e.g., has similar temporalevolution when repeating the same task, despite initial conditions be intrinsically different. We calculatethe average of the pairwise SL of all non-repeated permutations of the 30 time series recorded withineach magnetometer in order to get the Channel Consistency (CC). At this stage, we had a dataset basedon 147 CC values for the 14 subjects of the two different groups (MCIs and controls), which were usedto build the corresponding parenclitic networks [20].
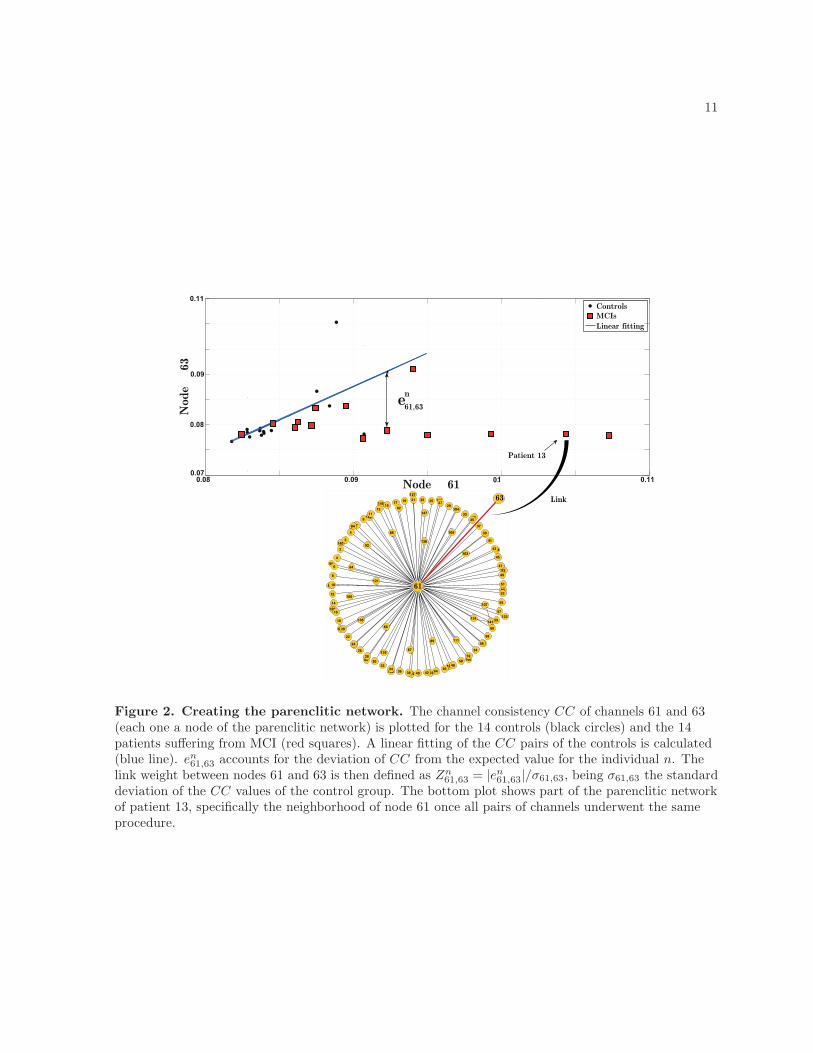
The method for the network construction is explained in Fig. 2, which shows a specific example withchannels i = 61 and j = 63. Black dots represent the CC of these two magnetometers for all controlsubjects and the blue line is their respective linear fitting. The errors of the control group are adjustedto a normal distribution in order to obtain its standard deviation σi,j . Red squares correspond to the CCof the same pair of channels for the 14 MCI patients. The deviation from the expected value given bythe linear fitting is designated as the error ei,j of the joint consistency of channels i and j. The z-scoreof each pair of channels associated to a subject n will measure how far the consistency of both channelsis from the expected value and it is obtained as Zn
i,j = |eni,j |/σi,j . The next step is to project the z-scoredataset into a parenclitic network. In general, the links of a parenclitic network are created with a weight

4
that is proportional to the deviations of a certain feature from an expected value [20]. These networks areweighted and non-directed, and they unveil important topological differences between a reference groupand a group with a certain anomaly [19]. In our case, the nodes of the network will be the channelsmeasuring the activity of a certain cortical region and the links between a pair of nodes i and j will bethe z-score Zn
i,j measuring their deviation from its expected value.The procedure followed to obtain the links and weights of nodes i = 61 and j = 63 is repeated for the
CC of the 147*146 possible pairs of channels in order to obtain all links of the networks. Finally, onlythe 400 links with the largest Zn
i,j are considered in the analysis (thresholding method). This way, weobtain a set of weighted networks for the control and MCI subjects with the same number of nodes Nand links L and we will be able to compare whether the networks differ in their topological organizationand what are the kind of network structures associated to each group.
Results
We characterize the following properties of the parenclitic network: a) the degree and strength of thenodes, b) the clustering coefficient, c) the characteristic path length, d) the local and global efficiencyand e) the eigenvector centrality of the nodes (i.e., the identification of the hubs of the networks).
Degree, strength and hubs
Our first inspection of the network topology focuses on the local properties of its nodes. Specifically, wecompute the highest degree Kmax of the network, which gives the highest number of connections a nodehas. If we take into account the weight associated to the links, we can also compute the node strengthS(i), which is given by the sum of all weights of the links attached to node i. The maximum strengthSmax and the average strength S of the networks are obtained as the maximum/average over all nodes.Figure 3 shows a comparison of the highest degree Kmax, maximum strength Smax and the averagestrength S of the control and MCI groups. We use the box & whisker representation which highlights themain quantities of the datasets, i.e., the first, second and third quartile and the mean. When lookingat the highest degree Kmax we can see how, in the MCI group, the mean, median (or second quartile),third quartile and, in general, all values are around 50 % higher than the corresponding values of thecontrol group (Fig. 3A). This finding evidences the presence of hubs with higher number of links in theparenclitic network associated to the MCI group. Since in both groups we have limited the number oflinks to L = 400, the fact that large hubs arise in the MCI networks also reveal the formation of moreheterogeneous structures.
Figure 3B shows the maximum strength Smax for each group. Red stars are outliers that make thedistribution of maximum strengths of the MCI group to become not a normal but a skewed distribution.The behaviour of Smax remains similar to Kmax and evidences that the existence of stronger hubs in theMCI group is reinforced when considering the weight of the links.
In Fig. 3C we plot the average strength S of the networks to confirm that the MCI patients havehigher deviations from the reference value than the control individuals. As expected, the average strengthof the MCI group SMCI = 18.72 is much higher than the control group (Scontrol = 7.02), since the nodestrength accumulates the errors of all its links (see Materials and Methods). It is important to remark thedifference between the maximum and average strength of both groups, which is much higher in the MCIgroup. This facts reveals the more heterogeneous structure of the MCI networks, where nodes with strongdeviations from the expected value arise (i.e. the higher the strength of a node, the more anomalous itsconsistency is).
Finally, we calculate the cumulative distribution function (CDF) of the degree and strength of thenodes both in the control and MCI groups. For each node i (i.e., cortical region), we compute itscorresponding average degree 〈k(i)〉 with regard to the subjects of each group. Next, we obtain the CDF
5
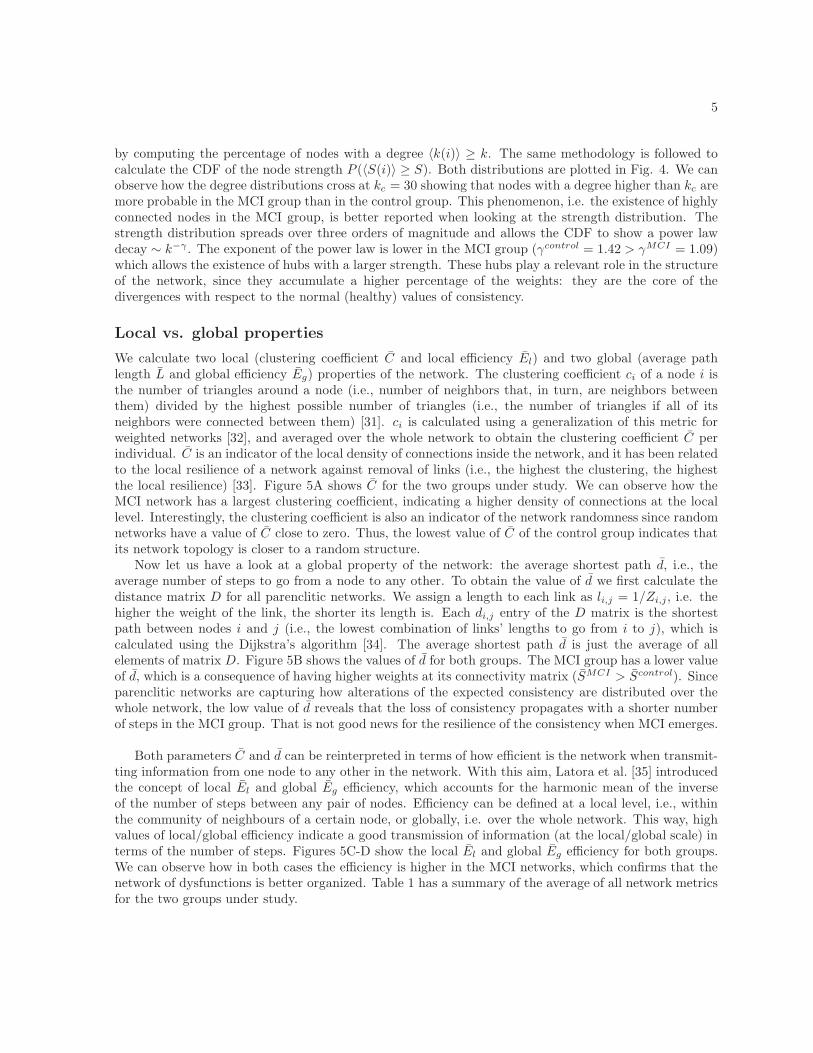
by computing the percentage of nodes with a degree 〈k(i)〉 ≥ k. The same methodology is followed tocalculate the CDF of the node strength P (〈S(i)〉 ≥ S). Both distributions are plotted in Fig. 4. We canobserve how the degree distributions cross at kc = 30 showing that nodes with a degree higher than kc aremore probable in the MCI group than in the control group. This phenomenon, i.e. the existence of highlyconnected nodes in the MCI group, is better reported when looking at the strength distribution. Thestrength distribution spreads over three orders of magnitude and allows the CDF to show a power lawdecay ∼ k−γ . The exponent of the power law is lower in the MCI group (γcontrol = 1.42 > γMCI = 1.09)which allows the existence of hubs with a larger strength. These hubs play a relevant role in the structureof the network, since they accumulate a higher percentage of the weights: they are the core of thedivergences with respect to the normal (healthy) values of consistency.
Local vs. global properties
We calculate two local (clustering coefficient C and local efficiency El) and two global (average pathlength L and global efficiency Eg) properties of the network. The clustering coefficient ci of a node i isthe number of triangles around a node (i.e., number of neighbors that, in turn, are neighbors betweenthem) divided by the highest possible number of triangles (i.e., the number of triangles if all of itsneighbors were connected between them) [31]. ci is calculated using a generalization of this metric forweighted networks [32], and averaged over the whole network to obtain the clustering coefficient C perindividual. C is an indicator of the local density of connections inside the network, and it has been relatedto the local resilience of a network against removal of links (i.e., the highest the clustering, the highestthe local resilience) [33]. Figure 5A shows C for the two groups under study. We can observe how theMCI network has a largest clustering coefficient, indicating a higher density of connections at the locallevel. Interestingly, the clustering coefficient is also an indicator of the network randomness since randomnetworks have a value of C close to zero. Thus, the lowest value of C of the control group indicates thatits network topology is closer to a random structure.
Now let us have a look at a global property of the network: the average shortest path d, i.e., theaverage number of steps to go from a node to any other. To obtain the value of d we first calculate thedistance matrix D for all parenclitic networks. We assign a length to each link as li,j = 1/Zi,j, i.e. thehigher the weight of the link, the shorter its length is. Each di,j entry of the D matrix is the shortestpath between nodes i and j (i.e., the lowest combination of links’ lengths to go from i to j), which iscalculated using the Dijkstra’s algorithm [34]. The average shortest path d is just the average of allelements of matrix D. Figure 5B shows the values of d for both groups. The MCI group has a lower valueof d, which is a consequence of having higher weights at its connectivity matrix (SMCI > Scontrol). Sinceparenclitic networks are capturing how alterations of the expected consistency are distributed over thewhole network, the low value of d reveals that the loss of consistency propagates with a shorter numberof steps in the MCI group. That is not good news for the resilience of the consistency when MCI emerges.
Both parameters C and d can be reinterpreted in terms of how efficient is the network when transmit-ting information from one node to any other in the network. With this aim, Latora et al. [35] introducedthe concept of local El and global Eg efficiency, which accounts for the harmonic mean of the inverseof the number of steps between any pair of nodes. Efficiency can be defined at a local level, i.e., withinthe community of neighbours of a certain node, or globally, i.e. over the whole network. This way, highvalues of local/global efficiency indicate a good transmission of information (at the local/global scale) interms of the number of steps. Figures 5C-D show the local El and global Eg efficiency for both groups.We can observe how in both cases the efficiency is higher in the MCI networks, which confirms that thenetwork of dysfunctions is better organized. Table 1 has a summary of the average of all network metricsfor the two groups under study.

6
Localizing focal nodes
Parenclitic networks detect the nodes whose features (consistency in our case) diverge the most from theexpected behaviour. This task is carried out by detecting the hubs and quantifying their importance inthe network. With this aim, we calculate the degree k(i), strength S(i) and eigenvector centrality ec(i) ofnodes belonging to both groups, all these metrics commonly used as quantifiers of the network hubs. Asexplained in the previous section, the degree and strength account respectively for the number of links andtotal accumulated weight of a node. Both metrics rely on the local properties of the nodes, which is notthe case of ec(i). Eigenvector centrality is a global measure of importance that takes into account not onlythe number of connections/weights of a node, but the number of connections/weights of its neighbors [36].ec(i) is calculated from the eigenvector associated to the largest eigenvalue of the weighted connection
matrix W whose elements are Zi,j . We proceed as follows: two vectors ~kMCI and ~kcontrol of lengthN = 147 (one element per node) contain the average degrees of a node of each specified group. The
difference of the elements of both vectors ∆〈~kMCI,control〉 = ~kMCI − ~kcontrol is calculated and plotted inFig. 6A. Clearly, two peaks stand out over the rest of the degree variations. Nodes 32 and 61 have a muchhigher degree in the MCI parenclitic networks than in the control ones. This fact indicates that thesetwo nodes accumulate the majority of variations related to the consistent behaviour. In a similar way, weobtain the variations of the strength ~SMCI,control and eigenvector centrality ~ecMCI,control. Figure 6B-C
shows the difference of these two metrics ∆〈~SMCI,control〉 (B), ∆〈~ecMCI,control〉 (C). Independent of themetric, again two peaks appear at nodes 32 and 61, confirming that they are the nodes whose consistencyis affected the most by the disease. In Fig. 6D we plot a 3D representation of these focal nodes togetherwith their local network of interactions. This plot shows the local basin of influence of the network hubsand give an idea about where the disease is being more severe, at least when consistency is taken intoaccount.
Discussion
The effect of MCI on the structure of functional brain networks has been investigated intensively duringthe last years [37, 38]. Nevertheless, the studies focused on the coordinated activity between corticalregions and on how the disease alters the topology of connections within the functional networks. Inthe current work, we are concerned with another type of consequences of the emergence of MCI: theloss of a consistent response [15], i.e., in our case, the impairment of the ability of a cortical regionto behave in the same way when undergoing the same cognitive task, despite having different initialconditions. We have taken advantage of a new kind of network representation, the parenclitic network [20],where a link between two nodes quantifies the deviations of a certain feature of these nodes from anexpected (healthy) behaviour. We have measured the consistency of 147 cortical brain regions by meansof magnetoencephalography (see Materials and Methods) and constructed a parenclitic network capturingdysfunctions of the expected consistency. The analysis of the topological features of a control group ofhealthy individuals and a group of patients suffering from MCI shows that the parenclitic networks canprovide useful information to evaluate how the disease has altered the consistency of the cortical regions.First, we report a higher network strength in the MCI group when the same number of links are consideredin both groups. This fact indicates higher deviations from the expected consistency performance in theMCI group. Furthermore, we observe the appearance of strong hubs in the patients group, which revealsthat the disease is specially severe at certain cortical regions. Specifically, nodes 32 (frontal lobe) andnode 61 (occipital lobe) are detected to be the focal points of the consistency impairment. Nevertheless,the loss of consistency is not restricted to certain specific regions, since global network parameters suchas the average path length or the global efficiency reveal a global organization of the parenclitic networkthat is not purely random. On the contrary, the number of steps needed to go from one node to any otherin the parenclitic network is much lower in the MCI group, which indicates that the disease alters network
7
consistency in quite a fundamental way. At the local scale, the MCI group shows high values of clusteringand local efficiency of the parenclitic network indicating that inconsistency does not emerge in isolatedregions but in groups of densely interconnected nodes. From the best of our knowledge this is the firstresult concerning the construction of parenclitic networks in order to understand brain functioning andspecifically, the effect of a neurodegenerative disease. We believe that this technique could be extremelyuseful to evaluate how different brain diseases deteriorate the normal functioning of the brain activity.
Acknowledgments
This work was supported by the Spanish Ministry of S&T [FIS2009-07072], the Community of Madrid un-der the R&D Program of activities MODELICO-CM [S2009ESP-1691], the Spanish Ministry of economyand competitiveness [PSI2012-38375-C03-01,MTM2012-39101], Fundacion Carolina Doctoral ScholarshipProgram and Colciencias Doctoral Program 568, as well to a grant from the CAM [S2010/BMD-2460].
References
1. Camicioli RM, Wieler M, de Frias CM, Wayne Martin WR (2008) Early, untreated Parkinson’sdisease patients show reaction time variability. Neurosci Lett 441, 77-80.
2. de Frias CM, Dixon RA, Camicioli R (2012) Neurocognitive speed and inconsistency in Parkin-son’s disease with and without incipient dementia: An 18-month prospective cohort study. J IntNeuropsychol Soc 18, 746-772.
3. Bodling AM, Denney DR, Lynch SG (2012) Individual variability in speed of information process-ing: An index of cognitive impairment in Multiple Sclerosis. Neuropsychology 26, 357-367.
4. Collins LF, Long CJ (1996) Visual reaction time and its relationship to neuropsychological testperformance. Arch Clin Neuropsychol 11, 613-623.
5. Manoach DS (2003) Prefrontal cortex dysfunction during working memory performance inschizophrenia: Reconciling discrepant findings. Schizophr Res 60, 285-298.
6. Hultsch DF, MacDonald SWS, Hunter MA, Levy-Bencheton J, Strauss E (2000) Intraindividualvariability in cognitive performance in older adults: Comparison of adults with mild dementia,adults with arthritis and healthy adults. Neuropsychology 14: 588-598.
7. Tractenberg RE, Pietrzak RH (2011) Intra-individual variability in Alzheimers disease and cogni-tive aging: Definitions, context, and effect sizes. PLoS One. 2011; 6(4): e16973.
8. Fjell AM, Westlye LT, Amlien IK, Walhovd KB (2011) Reduced white matter integrity is relatedto cognitive instability. J Neurosci 31: 18060-18072.
9. Tamnes CK, Fjell AM, Westlye LT, Østby Y, Walhovd KB (2012) Becoming consistent: devel-opmental reductions in intraindividual variability in reaction time are related to white matterintegrity. J Neurosci 32: 972-982.
10. Teipel SJ, Meindl T, Wagner M, Stieltjes B, Reuter S, Hauenstein K-H, Filippi M, Ernemann U,Reiser MF, Hampel H (2010) Longitudinal changes in fiber tract integrity in healthy ageing andmild cognitive impairment: A DTI followup study. J Alzheimers Dis 22: 507-522.
11. Christensen H, Deart KBG, Anstey KJ, Parslow RA, Sachdev P, Jorm AF (2005) Within-occasionintraindividual variability and preclinical diagnostic status: Is intraindividual variability an indi-cator of mild cognitive impairment? Neuropsychology 19: 309-317.

8
12. Dixon RA, Garret DD, Lentz TL, MacDonald SWS, Strauss E, Hultsch DF (2007) Neurocognitivemarkers of cognitive impairment: Exploring the roles of speed and inconsistency. Neuropsychology21: 382-399.
13. Duchek JM, Balota DA, Holtzman DM, Fagan AM, Tse C-S, Goate AM (2009) The utility ofintraindividual variability in selective attention tasks as an early marker for Alzheimer’s disease.Neuropsychology 23: 746-758.
14. Moy G, Millet P, Haller S, Baudois S, De Bilbao F, Weber K, Lvblad K, Lazeyras F, GiannakopoulosP, Delaloye C (2011) Magnetic resonance imaging determinants of intraindividual variability in theelderly: Combined analysis of grey and white matter. Neuroscience 186: 88-93.
15. Uchida A, McAllister R (2004) Consistency of Nonlinear System Response to Complex DriveSignals. Phys. Rev. Lett. 93: 244102.
16. Uchida A, Yoshimura K, Davis P, Yoshimori S, Roy R (2008) Local conditional Lyapunov exponentcharacterization of consistency of dynamical response of the driven Lorenz system. Phys. Rev. E78: 036203.
17. Goldobin DS (2008) Coherence versus reliability of stochastic oscillators with delayed feedback.Phys. Rev. E 78: 060104(R).
18. Perez T, Uchida A (2011) Reliability and synchronization in a delay-coupled neuronal networkwith synaptic plasticity Phys. Rev. E 83: 061915.
19. Zanin M, Boccaletti S (2011) Complex networks analysis of obstructive nephropathy data. Chaos21, 033103.
20. Zanin M, Medina Alcazar J, Vicente Carbajosa J, Sousa P, Papo D, Menasalvas E, Boccaletti S(2013) Parenclitic networks’ representation of data sets. arXiv:1304.1896 [physics.soc-ph]
21. Gorus E, De Raedt R, Lambert M, Lemper J-C, Mets T (2008) Reaction times and performancevariability in normal aging, mild cognitive impairment, and Alzheimer’s disease. J Geriatr Psychi-atry Neurol 21: 204-218.
22. Bajo R, Maestu F, Nevado A, Sancho M, Gutierrez R, et al. (2010) Functional connectivity inmild cognitive impairment during a memory task: Implication for the disconnection hypotesis. JAlzheimers Dis 22: 183-193.
23. Mitchell, A.J. (2008) Is it time to separate subjective cognitive complaints from the diagnosis ofmild cognitive impairment?. Age and ageing, 37(5), pp.497?9.
24. Grundman, M. et al (2004) Mild cognitive impairment can be distinguished from Alzheimer diseaseand normal aging for clinical trials. Archives of Neurology 61(1): 59-66.
25. Petersen, R.C. (2004) Mild cognitive impairment as a diagnostic entity. Journal of internalmedicine, 256(3), pp.183-94.
26. Yesavage, J.A., Brooks, J.O. (1991) On the importance of longitudinal research in Alzheimer’sdisease. Journal of the American Geriatrics Society, 39(9), pp.942-4.
27. Lobo, A. et al (1979) Cognocitive mini-test (a simple practical test to detect intellectual changesin medical patients). Actas luso-espanolas de neurologia, psiquiatria y ciencias afines, 7(3), pp.189-202.

9
28. Maestu F, Fernandez A, Simos PG, Gil-Gregorio P, Amo C, et al. (2001) Spatio-temporal patternsof brain magnetic activity during a memory task in alzheimer’s disease. NeuroReport 12: 3917-3922.
29. de Toledo Morrell L, Evers S, Hoeppner TJ, Morrell F, Garron DC, et al. (1991) A ’stress’ test formemory dysfunction: Electrophysiologic manifestations of early Alzheimer’s disease. Archives ofNeurology 48: 605-609.
30. Stam CJ, Dijk BWv (2002) Synchronization likelihood: an unbiased measure of generalized syn-chronization in multivariate data sets. Physica D 163: 236-251.
31. Watss DJ, Strogatz SH (1998) Collective dynamics of small word networks. Nature 393.
32. Onnela JP, ASaramaki J, Kertesz J, Kaski K (2005) Intensity and coherence of motifs in weightedcomplex networks. Phy Rev E Stat Nonliinear Soft Matter Phys 71.
33. Bocaletti S, Latora V, Moreno Y, Chavez M, Hwang D (2006) Complex networks: Structure anddynamics. Physics Reports 424: 175-308.
34. Dijkstra EW (1959) A note on two problems in connexion with graphs. Numerische Mathematik1: 269-271.
35. Latora V, Marchiori M (2001) Efficient behavior of small-world networks. Physical Review Letters87: 198701.
36. Newman. M. E. J (2010) Networks: An introduction. (Oxford University Press, New York, 2010)
37. Buldu JM, Bajo R, Maestu F, Castellanos N, Leyva I, Gil P, et al. (2011) Reorganization offunctional networks in mild cognitive impairment. PLoS One 6: e19584.
38. Navas A, Papo D, Boccaletti S, del-Pozo F, Bajo R, Maestu F, Gil P, Sendina-Nadal I, Buldu JM(2013) Functional Hubs in Mild Cognitive Impairment. arXiv:1307.0969.
Figure Legends

10
Figure 1. The phenomenon of consistency. The consistency of a dynamical system relies on itsability to respond in the same way when the the same external input is applied. In all panels (A, B, C),the same external perturbation is applied and the response of the system with two different initialconditions (~x0 and ~x′
0) is (qualitatively) shown. In A, we show an example of a driven system, wherethe output of a nonlinear system always behaves in the same way (as the input) due to a strong forcingof the external input. In B, the external forcing is not able to drive the output which responds in adifferent way when the same perturbation is applied (due to different initial conditions). In C, the sameexternal perturbation is applied under different initial conditions. Consistency arises when the system’soutput always behaves in the same way despite not following the driving.
11
Link0.08 0.09 0..1 0.11
0.07
0.08
0.09
0.11
Node 61
Node 63
Controls
Linear fitting
MCIs
Patient 13
en
61,63
19
82
17
127
21
14515
13
25
147
11027
29
23
8233
30104
37
35
63
142
7
11
84
9
5
140
3
2
92
4
109
138
8580
128
103
45
43
41
39
121111
146
108
56
54
52
50
48
46
106
120
105
12866
22
20
18
16
14
12
62
80
55
47
107
53
51
49
88
121
64
65
10
8
6
61
138
86
12587
89
30
28
26
24
124
58
141
60
59
123
57
44143424014438126 36
3432
Link
Figure 2. Creating the parenclitic network. The channel consistency CC of channels 61 and 63(each one a node of the parenclitic network) is plotted for the 14 controls (black circles) and the 14patients suffering from MCI (red squares). A linear fitting of the CC pairs of the controls is calculated(blue line). en
61,63 accounts for the deviation of CC from the expected value for the individual n. Thelink weight between nodes 61 and 63 is then defined as Zn
61,63 = |en61,63|/σ61,63, being σ61,63 the standard
deviation of the CC values of the control group. The bottom plot shows part of the parenclitic networkof patient 13, specifically the neighborhood of node 61 once all pairs of channels underwent the sameprocedure.

12
0
50
100
150
Kmax
MCIs
0
500
1000
1500
2000
2500
3000
Smax0
5
10
15
20
25
30
35
40
S
Controls
A CB
Figure 3. Highest degree, maximum strength and average strength. From left to right, box &whisker representation showing the first, second, third quartile and the average of: the highest degreeKmax (A), maximum strength Smax (B) and average strength S (C). Patient and Control groups are inorange and green, respectively. Red stars account for outlier values.
k ( Degree)
P(k
(i)>
K)
100
102
10410
−4
10−3
10−2
10−1
100
S (Strength)
P(S
(i)>
S)
100
102
10410
−4
10−3
10−2
10−1
100
A
γ = -1.09MCIs
γ = -1.42Controls
B
Figure 4. CDF of the degree and strength distributions. Cumulative Distribution Functions(CDF) of the probability of finding a node with a degree (strength in B) higher than k (S in B). Greencircles correspond to the control group and orange circles to the MCI group. When the strength of thenodes is considered, we obtain the power law distribution P (S(i) ≥ S) ∼ S−γ in both cases.

13
0
0.02
0.04
0.06
0.08
0.1
0.12
0.14
0.16
0.18
C
MCIs
0
0.2
0.4
0.6
0.8
1
1.2
1.4
1.6
1.8
2
d0
0.5
1
1.5
2
2.5
3
3.5
4
El0
1
2
3
4
5
6
7
8
Eg
Controls
A B C D
Figure 5. Clustering, shortest path length, local efficiency and global efficiency. Box &whisker representation of: the clustering C (A), shortest path length d (B), local efficiency El (C) andglobal efficiency Eg (D). MCI patients and control values are, respectively, in orange and green. Redstars correspond to the outlier values.
30 60 90 120−20
0
20
40
30 60 90 120−200
0
200
400
Node Number
30 60 90 120−0.1
0
0.1
0.2
0.3
∆〈k
〉
Co
ntro
lM
CI,
∆〈S
〉
Co
ntro
lM
CI,
∆〈e
c 〉
Co
ntro
lM
CI,
32 61
A
B
C
Figure 6. Localizing focal nodes in the consistency impairment. We calculate the differences inthe node degree k(i) (A), node strength s(i) (B) and eigenvector centrality ec(i) (C). In all cases, nodes32 and 61 accumulate the highest variations, indicating that are the nodes whose consistency is affectedthe most by the disease. On the right plot, we show the position and the local network of connections ofthese two nodes, where only the 30 links with higher weights have been plot.

14
Tables
Kmax Smax S
Controls MCIs Controls MCIs Controls MCIs
62.42 95.28 164.60 809.04 7.02 18.71
C d El Eg
Controls MCIs Controls MCIs Controls MCIs Controls MCIs
0.03 0.07 1.00 0.51 0.12 1.67 0.48 2.37
Table 1. Summary of the network metrics for the control and MCI groups: Highest degree Kmax,maximum strength Smax, average strength S, clustering C, average shortest path d, local efficiency El,and global efficiency Eg.