Annual Report FY-2005-06.pdf
240
-
Upload
khangminh22 -
Category
Documents
-
view
1 -
download
0
Transcript of Annual Report FY-2005-06.pdf


Program Management Unit Annual Monitoring Report 2005-06
ACKNOWLEDGMENTS
This report aims to provide an account of physical and
financial achievements made during the second year (2005-06)
of the program implementation. It encompasses district wise
information along with details of activities, performed for
execution of works on watercourses. It also analyzes the
quantum of work accomplished against the targets assigned for the year. Given
the magnitude & the size of the Project, naturally, it required a lot of data
collection, information analysis & commitment on part of the entire team
members of Program Management Unit (PMU).
This annual report in your hand, is the result of team efforts of all the
PMU officers and officials. The report in its present form would not have been
possible without the dedicated efforts, commitment & support of all them. I am
appreciative of the professional input & analysis of Dr. Ijaz Mansoor, Director
(Finance). I also thank Hafiz Muhammad Ilyas, Director (M&E) and Mr. Tariq
Mahmood Assistant Director (M&E) for their contribution. In addition, all the
officers viz. Mr. Hassan Abdullah Khan, Director (MIS), Mr. Ijaz Ahmed Minhas,
Deputy Director (Finane), Mr. Zulfiqar Ali Kharal, Assistant Project Director, Dr.
Ahmad Afnan, Assistant Director (Admin) made substantial contribution in
bringing out this report. My thanks and appreciations are especially due for Mr.
Zafar Abbas, Deputy Director (Technical), Mr. Ahmad Kamal, Assistant Director
(Technical) and Mr. Yasir Mushtaq, Assistant who have been a driving force
behind this report, giving sterling service in preparing this report and were
extremely helpful in providing any information that was needed. Infact, efforts
of all these officers made this document worth reading. I hope that they shall
continue to work in their respective areas of responsibility in a highly
professional and zealous manner as they have been doing, this before.
National Program for Improvement of Watercourses (Punjab Component) i
(Dr. Pervez Ahmed Khan) Project Director /
Additional Secretary to CM

Program Management Unit Annual Monitoring Report 2005-06
National Program for Improvement of Watercourses (Punjab Component) ii

Program Management Unit Annual Monitoring Report 2005-06
National Program for Improvement of Watercourses (Punjab Component) iii
CONTENTS
SECTION Page No.
1 Acknowledgements i
2 Contents iii
3 Abbreviations & Acronyms iv
4 Executive Summary v
5 Performance Analysis for the year 2005 – 06 1-148
6 Fixation & Analysis of Construction Material Rates 149-156
7 Financial Aspects of NPIW – Demanding Attention 157-161
8 Performance Management System – A Prime Challenge 162-174
9 Role of Media – Building the Motivation Level of Farmers 175-184
10 The Role of Water User Associations (WUAs) 185-188
11 Management Information Services (MIS) at PMU 189-199
12 Implementation of LAN / WAN at PMU 200-210
13 Precast Parabolic Lining (PCPL) 211-218
14 Activities of the Program (Pictorial View) 219-225
15 Introduction of Officers of PMU 226-
Program Management Unit Annual Monitoring Report 2005-06
National Program for Improvement of Watercourses (Punjab Component) iv
ABBREVIATIONS & ACRONYMS
AAE ARM DAO DCO DIC DGA (WM) DO DRAC EDO EIS F&P FCRs FGW FITMAS GIS ICR-I ICR-II LAN MIS MonEva NPIW NRSP NTC OFWM PAFs PC PC-I PCPL PITD PMS PMU PRSP PSDP PWMC RM SGW TBAP TERMS W/C WAN WM WMO WUAs
: : : : : : : : : : : : : : : : : : : : : : : : : : : : : : : : : : : : : : : : : : :
Assistant Agriculture Engineer Assistant Regional Manager District Accounts Officer District Coordination Officer District Implementation Committee Director General Agriculture (Water Management) District Officer District Rates Assessment Committee Executive District Officer Enterprise Information Service Finance & Planning Department Final Completion Reports Fresh Ground Water Financial Tracking & Monitoring System Graphical Information System Initial Completion Report-I Initial Completion Report-II Local Area Network Management Information Services Monitoring & Evaluation Application National Program for Improvement of Watercourses National Rural Support Program National Telecommunication Corporation On Farm Water Management Performance Appraisal Forms Punjab Component Planning Commission Proforma-I Precast Parabolic Lining Performance Management System Punjab Information Technology Department Program Management Unit Punjab Rural Support Program Public Sector Development Program Punjab Water Management Consultants Regional Manager Saline Ground Water Time Bound Action Plan Technical Rectification & Monitoring System Watercourse Wide Area Network Water Management Water Management Officer Water User Associations
Program Management Unit Annual Monitoring Report 2005-06
National Program for Improvement of Watercourses (Punjab Component) v
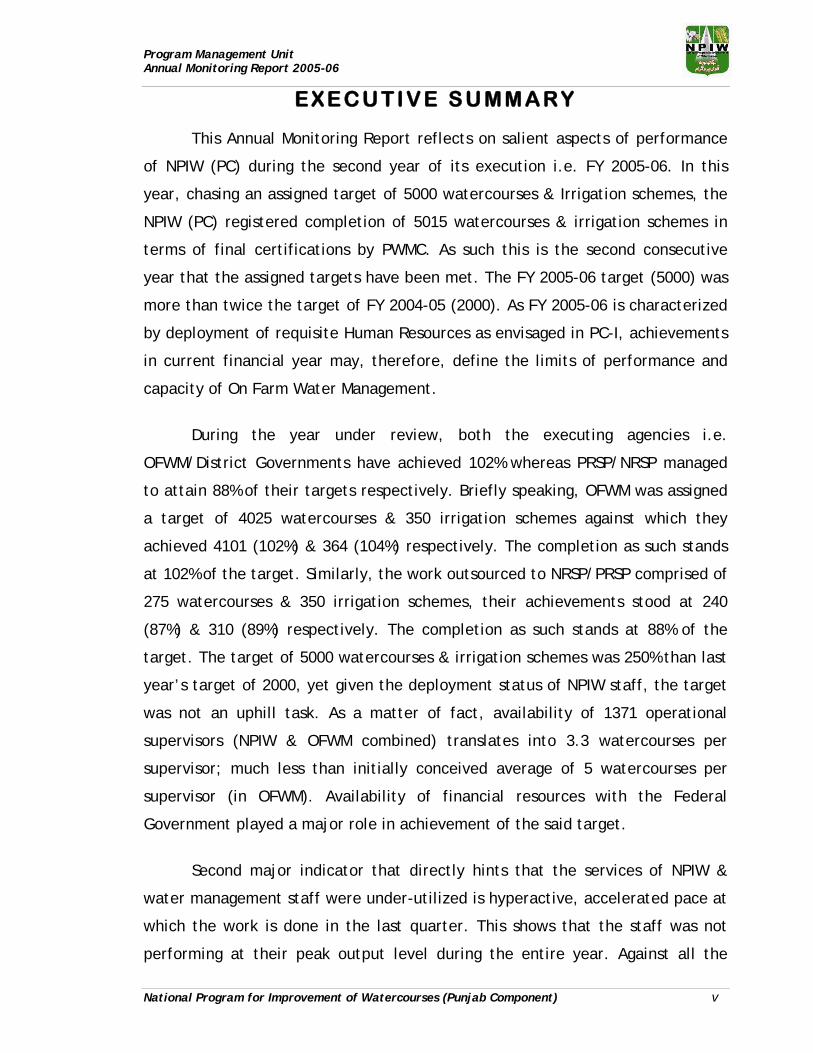
EXECUTIVE SUMMARY
This Annual Monitoring Report reflects on salient aspects of performance
of NPIW (PC) during the second year of its execution i.e. FY 2005-06. In this
year, chasing an assigned target of 5000 watercourses & Irrigation schemes, the
NPIW (PC) registered completion of 5015 watercourses & irrigation schemes in
terms of final certifications by PWMC. As such this is the second consecutive
year that the assigned targets have been met. The FY 2005-06 target (5000) was
more than twice the target of FY 2004-05 (2000). As FY 2005-06 is characterized
by deployment of requisite Human Resources as envisaged in PC-I, achievements
in current financial year may, therefore, define the limits of performance and
capacity of On Farm Water Management.
During the year under review, both the executing agencies i.e.
OFWM/District Governments have achieved 102% whereas PRSP/NRSP managed
to attain 88% of their targets respectively. Briefly speaking, OFWM was assigned
a target of 4025 watercourses & 350 irrigation schemes against which they
achieved 4101 (102%) & 364 (104%) respectively. The completion as such stands
at 102% of the target. Similarly, the work outsourced to NRSP/PRSP comprised of
275 watercourses & 350 irrigation schemes, their achievements stood at 240
(87%) & 310 (89%) respectively. The completion as such stands at 88% of the
target. The target of 5000 watercourses & irrigation schemes was 250% than last
year’s target of 2000, yet given the deployment status of NPIW staff, the target
was not an uphill task. As a matter of fact, availability of 1371 operational
supervisors (NPIW & OFWM combined) translates into 3.3 watercourses per
supervisor; much less than initially conceived average of 5 watercourses per
supervisor (in OFWM). Availability of financial resources with the Federal
Government played a major role in achievement of the said target.
Second major indicator that directly hints that the services of NPIW &
water management staff were under-utilized is hyperactive, accelerated pace at
which the work is done in the last quarter. This shows that the staff was not
performing at their peak output level during the entire year. Against all the

Program Management Unit Annual Monitoring Report 2005-06
National Program for Improvement of Watercourses (Punjab Component) vi
attempts by the executing department for planning & scheduling of work, most
of the work remained concentrated in second half of the year, especially the
last quarter. This is evident from the fact that 26% of ICR-I, 93% of ICR-II & 99%
of FCRs were submitted after March 2006 i.e. last quarter & onwards.
Erratic pace of work poses some unusual challenges. Interestingly, the last
quarter of the financial year (April-June) coincides with wheat harvesting season
when farmer community is neither inclined to devote time, energy & effort
towards watercourse improvement work nor is there plenty of labour available.
Moreover, in order to certify the release of second government installment, and
final completion report, engineers of PWMC have to physically visit the site &
take measurements. An achievement of 5015 watercourses/irrigation schemes
translates into 20,060 mandatory visits by PWMC engineers certifying each phase
and enabling the work to progress into next phase. A look at the daily progress
report transpires that out of 20,060 certifications, 51% were conducted after
March, 2006 i.e. last quarter & onwards. Sudden increase of work followed by
submission of ICR-II & FCRs caused undue strain on PWMC staff. This
phenomenon may well be appreciated by noting the fact that during one day i.e.
on 24-06-2005, 1720 FCRs were submitted to PWMC that accounts for 42% of the
entire year’s work. In the last three months of the financial year, PMWC had to
certify almost 4400 cases of ICR-II & 4865 cases of FCRs in sharp contrast with
613 ICR-II & 149 FCRs during the first nine months of the year.
For certain purposes, watercourse improvement work has been divided
into various phases. Quantum of work and effort in each phase gives a clear
indication that collection of share by the farmers and especially earthen
improvement of katcha section done by the farmers is the step that is not so
easier. This component of the program has gone so wayward that now the
district governments are regularly employing the Revenue machinery to keep
progress on track. It also reflects upon the efficacy of role of WMOs and the
approaches undertaken by the Agriculture Department in mobilizing and
generating awareness amongst the farmers. In future, this factor may become a
significant bottleneck unless some critical confidence building measures are

Program Management Unit Annual Monitoring Report 2005-06
National Program for Improvement of Watercourses (Punjab Component) vii
introduced to revive the interest of farmer’s community leading to voluntary
undertaking of work and sharing of their contribution.
The need for re-validating, refreshing & updating the current inventory of
all the watercourses has assumed greater importance. With each passing year, it
is becoming difficult to identify sufficient number of watercourses for
improvement. This exercise of refreshing the inventory may take a while to
complete, it is therefore, imperative that spade work is started at the earliest.
Throughout the year, Program Management Unit continued to play its role
of coordinating, facilitating & monitoring at various tiers. At district & field
team level, the Regional Managers & Assistant Regional Managers, through
countless interventions, field visits and meetings played their role, interalia,
motivating the district functionaries and ensuring that the quality of works is not
compromised at any stage. PMU head office played the key role in providing
strategic & tactical leadership simultaneously interacting with Federal
Government, Provincial Agriculture Department, OFWM Directorate General
(Agriculture) and 35 District Governments. In more than 7000 references that
the PMU initiated during FY 2005-06, all types of issues relating to policy
matters, quality aspects, human resource management etc. were taken up with
the relevant stakeholders.
Concept of monitoring & evaluation in public sector in developing
countries is not configured & employed on modern lines. PMU team, however,
attempted to introduce MIS concepts & tools within monitoring, coordination &
facilitation framework, thus enriching its scope & dimensions. To add a flavor of
objectivity, visual aids to monitoring were introduced. All the Regional Offices
have been equipped with latest image capturing devices (camcorders). Aspects
of monitoring that can be visually captured are received by the Headquarter and
are analyzed & fed into a rectification mechanism. Besides,
watercourses/irrigation schemes improved during FY 2005-06 have been
captured as a visual evidence of the works done as well as serving as an aid to
future impact analysis exercises. A total of 6956 pictures capturing 2646
Program Management Unit Annual Monitoring Report 2005-06
National Program for Improvement of Watercourses (Punjab Component) viii
watercourses / irrigation schemes were aggregated in an organized database
designed with the help of MIS Wing along with essential identifiers.
Upon completion of project cycle for two years i.e. FY 2004-05 & 2005-06,
next financial year 2006-07 would prove a test case for Sponsors, Executors &
Monitors alike to exhibit performance reflective of & based upon the lessons
learnt during previous years. It would also test our abilities to exhibit
adaptability & dynamic re-fixing of priorities necessitated by the past
experiences.

Program Management Unit Annual Monitoring Report 2005-06
National Program for Improvement of Watercourses (Punjab Component) 1
2005 - 06PERFORMANCE ANALYSIS
ANALYSIS PAGE NO
PUNJAB OVERVIEW 02-03
OFWM OVERVIEW 04-06
PRSP/NRSP OVERVIEW 07-08
OFWM REGION WISE 09-32
• GRAPHICAL MEASURES 33-35
OFWM DISTRICT WISE 36-140
• GRAPHICAL MEASURES 141-148

Program Management Unit Annual Monitoring Report 2005-06
National Program for Improvement of Watercourses (Punjab Component) 2
PERFORMANCE OVERVIEW OF PUNJAB During the last year, i.e. FY 2004-05, Punjab achieved 127% of the targets by completing 2541 watercourses / schemes against the assigned target of 2000.
During the year under review, the performance has been excellent. The target was set 2.5 times than last year, i.e. 5000, yet Punjab registered completion / verification of 5015 watercourses / schemes (100.3%). Overall Watercourse Statistics:
Improved under NPIW Total W/Cs Improved Un-
improved
Planned for improvement under NPIW FY 2004-5 FY 2005-6 Total
Remaining W/Cs
*57879 24405 33474 27557 2209 4341 6550 21007
Barani Areas 332 674 1006 -
Total (irrigated & barani) 2541 5015 7556 -
* b e c au s e o f n e w f i g u r e s i n N an k a n a S a h i b
Civil Works executed in FY 2005-06 (major indicators):
IRRIGATED BARANI TOTAL
Target FY 2005-06: 4300 700 5000
Achievement / FCRs verified: 4341 (101%) 674 (96%) 5015 (100.3%)
Quantum of Civil Works (Verified):
Irrigated Area:
Earthen improved length: 12803 km
Lined length: 3698 km (0.85 km per w/c)
Total length of 4341 w/cs: 16500 km
Nakkas installed (Nos.): 176517 (40.7 per w/c)
Culverts constructed (Nos.): 8616 (1.98 per w/c)
Av. length of improved w/c: 3.80 km
Barani Area:
Total lining of 674 schemes: 270.37 km
Water storage tanks (Nos.): 34
Nakkas installed (Nos.): 7733 (11.5 per w/c)
Culverts constructed (Nos.): 13
Av. lining of improved schemes: 0.40 km

Program Management Unit Annual Monitoring Report 2005-06
National Program for Improvement of Watercourses (Punjab Component) 3
This graph depicts the percentage lining of the watercourses improved & verified in the irrigated area.
Utilization of Funds in Civil Works:
In the Irrigated area, on an average, Rs. 632,882 have been expended on each watercourse as the government’s share. The average cost per meter of construction comes to Rs. 743.
In the Barani area, on an average, Rs. 134,648 have been expended on each scheme as the government’s share. The average cost per meter of construction comes to Rs. 335.
Government Funds (Rs.) Av. material cost (Rs.) Area Verified
w/cs
Farmers' share
Deposited (Rs.) Utilized on verified w/cs per w/c per meter
Irrigated 4341 740,003,000 2,747,341,126 632,882 743
Barani 674 56,365,000 90,752,520 134,648 335
Total 5015 796,368,000 2,838,093,646 - -
Bricklining %age
78% 22%
BrickliningEarthen works

Program Management Unit Annual Monitoring Report 2005-06
National Program for Improvement of Watercourses (Punjab Component) 4
PERFORMANCE OVERVIEW OF OFWM (PUNJAB)
During the last year, i.e. FY 2004-05, On-Farm Water Management (OFWM) overall achieved 129% of the targets by completing 2350 watercourses / schemes against the assigned target of 1820.
During the year under review, the performance has been excellent. The target was set to 2.4 times than last year, i.e. 4375, yet OFWM registered completion / verification of 4465 watercourses / schemes (102%) with the deployment of following staff.
AAEs/DDOs : 242 WMOs : 256 Supervisors : 1371 Watercourses per supervisor
:
3.3 watercourses
Overall Watercourse Statistics:
Improved under NPIW
FY 2004-5 FY 2005-6 Total
Irrigated Areas 2122 4101 6223
Barani Areas 228 364 592
Total (irrigated & barani) 2350 4465 6815
Civil Works executed in FY 2005-06 (major indicators):
IRRIGATED BARANI TOTAL
Target FY 2005-06: 4025 350 4375
Civil works undertaken: 4495 379 4874
FCRs submitted: 4207 367 4574
Achievement / FCRs verified: 4101 (102%) 364 (104%) 4465 (102%)
Watercourses deferred: 106 3 109
Quantum of Civil Works (Verified):
Irrigated Area:
Earthen improved length: 12130 km
Lined length: 3496 km (0.85 km per w/c)
Total length of 4101 w/cs: 15626 km
167710 (40.9 per w/c)

Program Management Unit Annual Monitoring Report 2005-06
National Program for Improvement of Watercourses (Punjab Component) 5
Culverts constructed (Nos.): 8111 (1.98 per w/c)
Av. length of improved w/c: 3.81 km
Barani Area:
Total lining of 364 schemes: 159.44 km
Water storage tanks (Nos.): 16
Nakkas installed (Nos.): 4661 (12.8 per w/c)
Culverts constructed (Nos.): 13
Av. lining of improved schemes: 0.44 km
This graph depicts the percentage lining of the watercourses improved & verified in the irrigated area under OFWM.
PHYSICAL VERIFICATIONS: PWMC has to conduct four mandatory visits to each under improvement watercourse / scheme in order to certify the works executed at site. A target of 4375 translates into 17500 site visits certifying S&D, ICR-I, ICR-II & FCR. Following graph portrays that 9648 certifications were made after March, 2006 i.e. during last quarter & onwards. The chart given below depicts activity level during various months.
Bricklining %age
78% 22%BrickliningEarthen works
ICR-I, ICR-II & FCR Verifications
0
500
1000
1500
2000
2500
3000
3500
4000
4500
5000
01-1
2-05
02-0
1-06
01-0
2-06
01-0
3-06
04-0
4-06
29-0
4-06
01-0
6-06
01-0
7-06
02-0
8-06
30-0
8-06
Veri
ficat
ions
ICR-I ICR-IIFCR
Program Management Unit Annual Monitoring Report 2005-06
National Program for Improvement of Watercourses (Punjab Component) 6
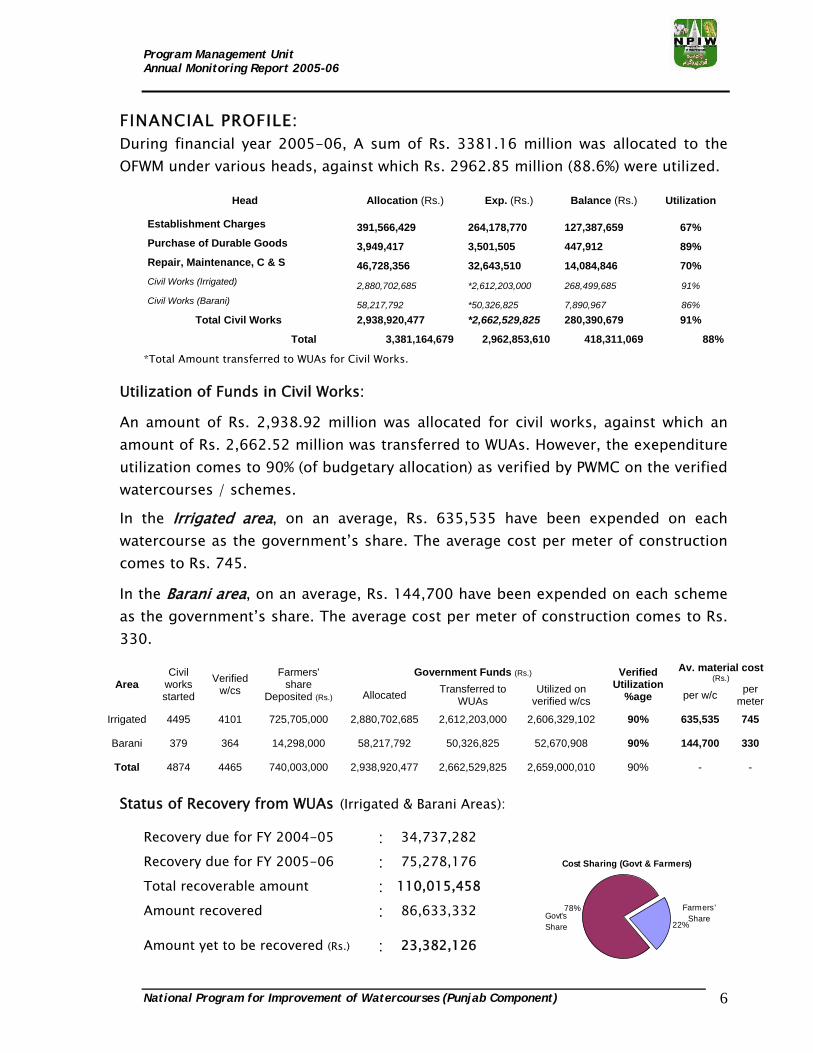
FINANCIAL PROFILE: During financial year 2005-06, A sum of Rs. 3381.16 million was allocated to the OFWM under various heads, against which Rs. 2962.85 million (88.6%) were utilized.
Head Allocation (Rs.) Exp. (Rs.) Balance (Rs.) Utilization
Establishment Charges 391,566,429 264,178,770 127,387,659 67% Purchase of Durable Goods 3,949,417 3,501,505 447,912 89% Repair, Maintenance, C & S 46,728,356 32,643,510 14,084,846 70% Civil Works (Irrigated) 2,880,702,685 *2,612,203,000 268,499,685 91% Civil Works (Barani) 58,217,792 *50,326,825 7,890,967 86% Total Civil Works 2,938,920,477 *2,662,529,825 280,390,679 91%
Total 3,381,164,679 2,962,853,610 418,311,069 88%
*Total Amount transferred to WUAs for Civil Works.
Utilization of Funds in Civil Works:
An amount of Rs. 2,938.92 million was allocated for civil works, against which an amount of Rs. 2,662.52 million was transferred to WUAs. However, the exependiture utilization comes to 90% (of budgetary allocation) as verified by PWMC on the verified watercourses / schemes.
In the Irrigated area, on an average, Rs. 635,535 have been expended on each watercourse as the government’s share. The average cost per meter of construction comes to Rs. 745.
In the Barani area, on an average, Rs. 144,700 have been expended on each scheme as the government’s share. The average cost per meter of construction comes to Rs. 330.
Government Funds (Rs.) Av. material cost (Rs.) Area
Civil works started
Verified w/cs
Farmers' share
Deposited (Rs.) Allocated Transferred to WUAs
Utilized on verified w/cs
Verified Utilization
%age per w/c per meter
Irrigated 4495 4101 725,705,000 2,880,702,685 2,612,203,000 2,606,329,102 90% 635,535 745
Barani 379 364 14,298,000 58,217,792 50,326,825 52,670,908 90% 144,700 330
Total 4874 4465 740,003,000 2,938,920,477 2,662,529,825 2,659,000,010 90% - -
Status of Recovery from WUAs (Irrigated & Barani Areas):
Recovery due for FY 2004-05 : 34,737,282
Recovery due for FY 2005-06 : 75,278,176
Total recoverable amount : 110,015,458
Amount recovered : 86,633,332
Amount yet to be recovered (Rs.) : 23,382,126
Cost Sharing (Govt & Farmers)
22%
78% Farmers'ShareGovt's
Share

Program Management Unit Annual Monitoring Report 2005-06
National Program for Improvement of Watercourses (Punjab Component) 7
PERFORMANCE OVERVIEW OF PRSP/NRSP (PUNJAB)
During the last year, i.e. FY 2004-05, PRSP / NRSP achieved 106% of the targets by completing 191 watercourses / schemes against the assigned target of 180.
During the year under review, the performance is satisfactory. The target was set to 3.5 times than last year, i.e. 625, yet the region registered completion / verification of 550 watercourses / schemes (88%).
Overall Watercourse Statistics:
Improved under NPIW
FY 2004-5 FY 2005-6 Total
Irrigated Areas 87 240 327
Barani Areas 104 310 414
Total (irrigated & barani) 191 550 741
Civil Works executed in FY 2005-06 (major indicators):
IRRIGATED BARANI TOTAL
Target FY 2005-06: 275 350 625
Achievement / FCRs verified: 240 (87%) 310 (89%) 550 (88%)
Quantum of Civil Works (Verified):
Irrigated Area:
Earthen improved length: 680.9 km
Lined length: 201.3 km (0.84 km per w/c)
Total length of 240 w/cs: 882.3 km
Nakkas installed (Nos.): 8807 (36.7 per w/c)
Culverts constructed (Nos.): 505 (2.10 per w/c)
Av. length of improved w/c: 3.67 km
Barani Area:
Total lining of 310 schemes: 110.930 km
Water storage tanks (Nos.): 18
Nakkas installed (Nos.): 3072 (9.9 per w/c)
Culverts constructed (Nos.): 0
Av. lining of improved schemes: 0.36 km

Program Management Unit Annual Monitoring Report 2005-06
National Program for Improvement of Watercourses (Punjab Component) 8
This graph depicts the percentage lining of the watercourses improved & verified in the irrigated area under PRSP/NRSP.
Utilization of Funds in Civil Works:
In the Irrigated area, on an average, Rs. 746,224 have been expended on each watercourse as the government’s share. The average cost per meter of construction comes to Rs. 700.
In the Barani area, on an average, Rs. 122,844 have been expended on each scheme as the government’s share. The average cost per meter of construction comes to Rs. 343.
Government Funds (Rs.) Av. material cost (Rs.) Area Verified
w/cs
Farmers' share
Deposited (Rs.) Utilized on verified w/cs per w/c per meter
Irrigated 240 53,339,000 141,012,024 746,224 700
Barani 310 3.026,000 38,081,612 122,844 343
Total 550 56,365,000 179,093,636 - -
Bricklining %age
77% 23%BrickliningEarthen works
Program Management Unit Annual Monitoring Report 2005-06
National Program for Improvement of Watercourses (Punjab Component) 9
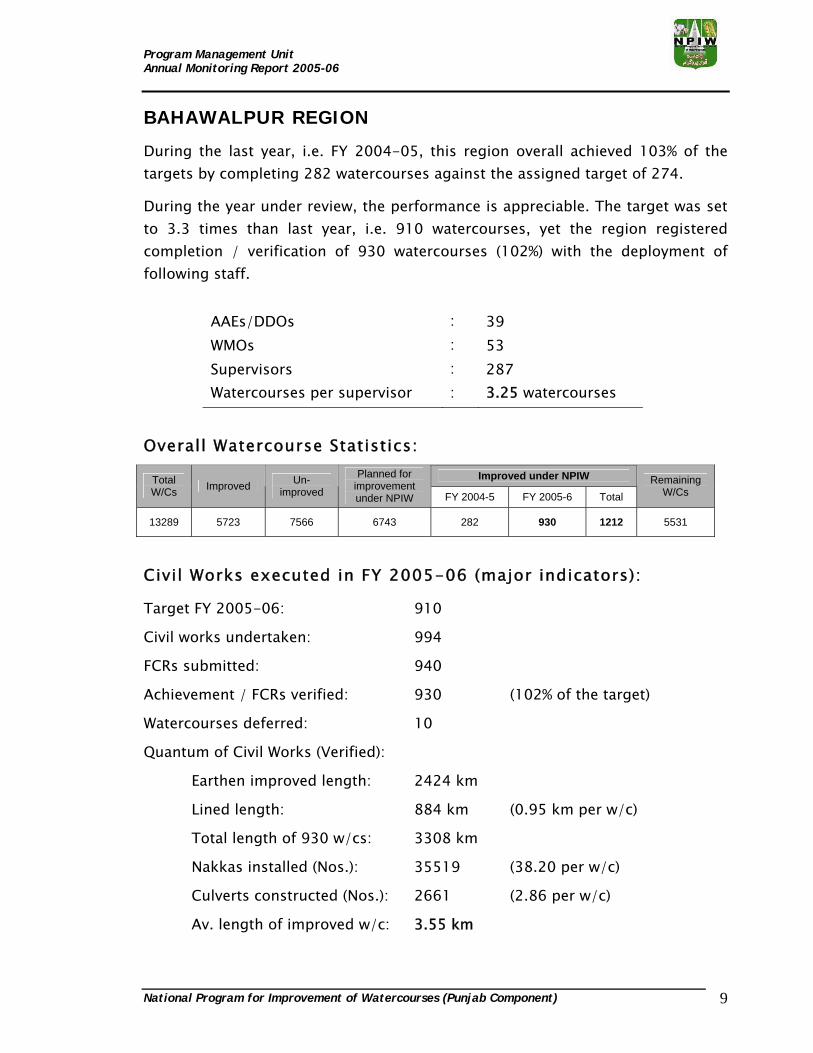
BAHAWALPUR REGION
During the last year, i.e. FY 2004-05, this region overall achieved 103% of the targets by completing 282 watercourses against the assigned target of 274.
During the year under review, the performance is appreciable. The target was set to 3.3 times than last year, i.e. 910 watercourses, yet the region registered completion / verification of 930 watercourses (102%) with the deployment of following staff.
AAEs/DDOs : 39 WMOs : 53 Supervisors : 287 Watercourses per supervisor
:
3.25 watercourses
Overall Watercourse Statistics:
Improved under NPIW Total W/Cs Improved Un-
improved
Planned for improvement under NPIW FY 2004-5 FY 2005-6 Total
Remaining W/Cs
13289 5723 7566 6743 282 930 1212 5531
Civil Works executed in FY 2005-06 (major indicators):
Target FY 2005-06: 910
Civil works undertaken: 994
FCRs submitted: 940
Achievement / FCRs verified: 930 (102% of the target)
Watercourses deferred: 10
Quantum of Civil Works (Verified):
Earthen improved length: 2424 km
Lined length: 884 km (0.95 km per w/c)
Total length of 930 w/cs: 3308 km
Nakkas installed (Nos.): 35519 (38.20 per w/c)
Culverts constructed (Nos.): 2661 (2.86 per w/c)
Av. length of improved w/c: 3.55 km

Program Management Unit Annual Monitoring Report 2005-06
National Program for Improvement of Watercourses (Punjab Component) 10
This graph depicts the percentage lining of the watercourses improved & verified in the region.
PHYSICAL VERIFICATIONS: PWMC has to conduct four mandatory visits to each under improvement watercouse in order to certify the works executed at site. A target of 910 translates into 3640 site visits certifying S&D, ICR-I, ICR-II & FCR. Following graph portrays that 2111 certifications were made after March, 2006 i.e. during last quarter & onwards. The chart given below depicts activity level during various months. FINANCIAL PROFILE: During financial year 2005-06, A sum of Rs. 793.78 million was allocated to the region under various heads, against which Rs. 692.48 million (87%) were utilized.
Head Allocation (Rs.) Exp. (Rs.) Balance (Rs.) Utilization
Establishment Charges 87,265,358 58,481,745 28,783,613 67% Purchase of Durable Goods 2,340 0 2,340 0% Repair, Maintenance, C & S 9,274,418 5,187,398 4,087,020 56% Civil Works (Total) 697,238,130 *628,813,360 68,424,770 90% Total 793,780,246 692,482,503 101,297,743 87%
*Total Amount transferred to WUAs for Civil Works.
Bricklining %age
73%27%BrickliningEarthen works
ICR-I, ICR-II & FCR Verifications
-50
150
350
550
750
950
1150
01-1
2-05
02-0
1-06
01-0
2-06
01-0
3-06
04-0
4-06
29-0
4-06
01-0
6-06
01-0
7-06
02-0
8-06
30-0
8-06
Period
Verif
icat
ions
ICR-I ICR-IIFCR

Program Management Unit Annual Monitoring Report 2005-06
National Program for Improvement of Watercourses (Punjab Component) 11
Utilization of Funds in Civil Works:
An amount of Rs. 697.23 million was allocated for civil works in the region, against which an amount of Rs. 628.81 million was transferred to WUAs. However, the exependiture utilization comes to 95% (of budgetary allocation) as verified by PWMC on the verified watercourses.
In the region, on average, Rs. 711,461 have been expended on each watercourse as the government’s share. The average cost per meter of construction comes to Rs. 747.
Government Funds (Rs.) Av. material cost (Rs.) Civil works started
Verified w/cs
Farmers' share
Deposited (Rs.) Allocated Transferred to WUAs
Utilized on verified w/cs
Verified Utilization
%age per W/C per meter
962 930 194,368,000 697,238,130 628,813,360 661,658,738 95% 711,461 747
Status of Recovery from WUAs:0
Recovery due for FY 2004-05 : 1,060,362
Recovery due for FY 2005-06 : 14,853,636
Total recoverable amount : 15,913,998
Amount recovered : 14,179,718
Amount yet to be recovered (Rs.) : 1,734,280
Cost Sharing (Govt & Farmers)
24%
76% Farmers'ShareGovt's
Share

Program Management Unit Annual Monitoring Report 2005-06
National Program for Improvement of Watercourses (Punjab Component) 12
DERA GHAZI KHAN REGION
During the last year, i.e. FY 2004-05, this region achieved 100% of the targets by completing 230 watercourses against the assigned target of 230. During the year under review, the performance is again good. The target was 2.7 times than last year, i.e. 627 watercourses, yet the region registered completion / verification of 625 watercourses (99.7%) with the deployment of following staff.
AAEs/DDOs : 35 WMOs : 52 Supervisors : 222 Watercourses per supervisor
:
2.8 watercourses
Overall Watercourse Statistics:
Improved under NPIW Total W/Cs Improved Un-
improved
Planned for improvement under NPIW FY 2004-5 FY 2005-6 Total
Remaining W/Cs
10765 5110 5655 4954 230 625 855 4100
Civil Works executed in FY 2005-06 (major indicators):
Target FY 2005-06: 627
Civil works undertaken: 675
FCRs submitted: 628
Achievement / FCRs verified: 625 (99.7% of the target)
Watercourses deferred: 3
Quantum of Civil Works (Verified):
Earthen improved length: 1466 km
Lined length: 504 km (0.81 km per w/c)
Total length of 625 w/cs: 1970 km
Nakkas installed (Nos.): 32415 (51.86 per w/c)
Culverts constructed (Nos.): 1533 (2.45 per w/c)
Av. length of improved w/c: 3.15 km

Program Management Unit Annual Monitoring Report 2005-06
National Program for Improvement of Watercourses (Punjab Component) 13
This graph depicts the percentage lining of the watercourses improved & verified in the region.
PHYSICAL VERIFICATIONS: PWMC has to conduct four mandatory visits to each under improvement watercourse in order to certify the works executed at site. A target of 627 translates into 2508 site visits certifying S&D, ICR-I, ICR-II & FCR. Following graph portrays that 1295 certifications were made after March, 2006 i.e. during last quarter & onwards. The chart given below depicts activity level during various months.
FINANCIAL PROFILE: During financial year 2005-06, A sum of Rs. 547.69 million was allocated to the region under various heads, against which Rs. 501.37 million (92%) were utilized.
Head Allocation (Rs.) Exp. (Rs.) Balance (Rs.) Utilization
Establishment Charges 64,296,600 44,062,211 20,234,389 69% Purchase of Durable Goods - - - - Repair, Maintenance, C & S 6,325,640 5,643,181 682,459 89% Civil Works (Total) 477,070,996 *451,664,880 25,406,116 95% Total 547,693,236 501,370,272 46,322,964 92%
*Total Amount transferred to WUAs for Civil Works.
Bricklining %age
74%26%
BrickliningEarthen works
ICR-I, ICR-II & FCR Verifications
-100
0
100
200
300
400
500
600
700
800
01-1
2-05
02-0
1-06
01-0
2-06
01-0
3-06
04-0
4-06
29-0
4-06
01-0
6-06
01-0
7-06
02-0
8-06
30-0
8-06
Period
Ver
ifica
tions
ICR-I ICR-II
FCR
Program Management Unit Annual Monitoring Report 2005-06
National Program for Improvement of Watercourses (Punjab Component) 14
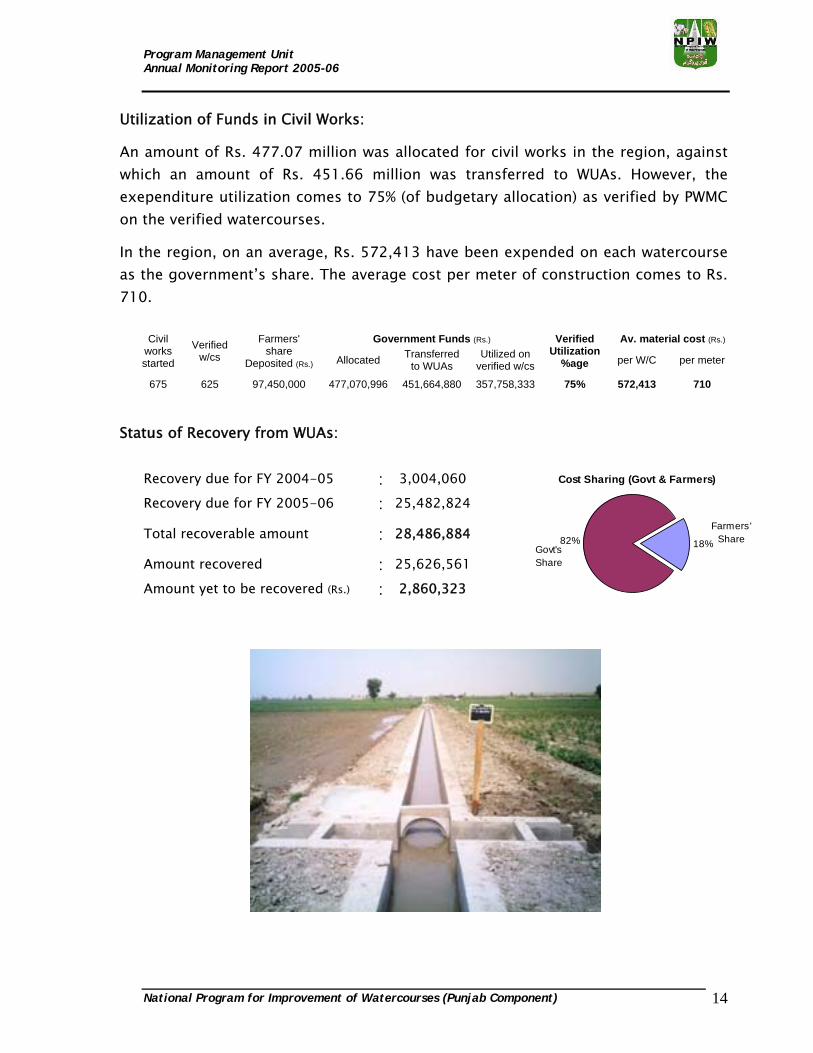
Utilization of Funds in Civil Works:
An amount of Rs. 477.07 million was allocated for civil works in the region, against which an amount of Rs. 451.66 million was transferred to WUAs. However, the exependiture utilization comes to 75% (of budgetary allocation) as verified by PWMC on the verified watercourses.
In the region, on an average, Rs. 572,413 have been expended on each watercourse as the government’s share. The average cost per meter of construction comes to Rs. 710.
Government Funds (Rs.) Av. material cost (Rs.) Civil works started
Verified w/cs
Farmers' share
Deposited (Rs.) Allocated Transferred to WUAs
Utilized on verified w/cs
Verified Utilization
%age per W/C per meter
675 625 97,450,000 477,070,996 451,664,880 357,758,333 75% 572,413 710
Status of Recovery from WUAs:
Recovery due for FY 2004-05 : 3,004,060
Recovery due for FY 2005-06 : 25,482,824
Total recoverable amount : 28,486,884
Amount recovered : 25,626,561
Amount yet to be recovered (Rs.) : 2,860,323
Cost Sharing (Govt & Farmers)
18%82%Farmers'
ShareGovt'sShare

Program Management Unit Annual Monitoring Report 2005-06
National Program for Improvement of Watercourses (Punjab Component) 15
FAISALABAD REGION
During the last year, i.e. FY 2004-05, this region overall achieved 93% of the targets by completing 338 watercourses against the assigned target of 363.
During the year under review, the performance is up to the mark. The target was set to 1.2 times than last year, i.e. 440 watercourses, yet the region registered completion / verification of 438 watercourses (99.5%) with the deployment of following staff.
AAEs/DDOs : 27 WMOs : 24 Supervisors : 142 Watercourses per supervisor
:
3.1 watercourses
Overall Watercourse Statistics:
Improved under NPIW Total W/Cs Improved Un-
improved
Planned for improvement under NPIW FY 2004-5 FY 2005-6 Total
Remaining W/Cs
6479 3493 2986 2509 338 438 776 1733
Civil Works executed in FY 2005-06 (major indicators):
Target FY 2005-06: 440
Civil works undertaken: 464
FCRs submitted: 458
Achievement / FCRs verified: 438 (99.5% of the target)
Watercourses deferred: 50
Quantum of Civil Works (Verified):
Earthen improved length: 1532 km
Lined length: 389 km (0.89 km per w/c)
Total length of 438 w/cs: 1921 km
Nakkas installed (Nos.): 5476.2 (12.50 per w/c)
Culverts constructed (Nos.): 489 (1.12 per w/c)
Av. length of improved w/c: 4.38 km

Program Management Unit Annual Monitoring Report 2005-06
National Program for Improvement of Watercourses (Punjab Component) 16
This graph depicts the percentage lining of the watercourses improved & verified in the region.
PHYSICAL VERIFICATIONS: PWMC has to conduct four mandatory visits to each under improvement watercourse in order to certify the works executed at site. A target of 440 translates into 1760 site visits certifying S&D, ICR-I, ICR-II & FCR. Following graph portrays that 888 certifications were made after March, 2006 i.e. during last quarter & onwards. The chart given below depicts activity level during various months. FINANCIAL PROFILE: During financial year 2005-06, A sum of Rs. 362.53 million was allocated to the region under various heads, against which Rs. 323.98 million (89%) were utilized.
Head Allocation (Rs.) Exp. (Rs.) Balance (Rs.) Utilization
Establishment Charges 42,400,816 29,525,802 12,875,014 70% Purchase of Durable Goods 740,000 668,270 71,730 90% Repair, Maintenance, C & S 4,913,584 3,693,097 1,220,487 75% Civil Works (Total) 314,480,728 *290,101,971 24,378,757 92% Total 362,535,128 323,989,140 38,545,988 89%
*Total Amount transferred to WUAs for Civil Works.
Bricklining %age
80%20%
BrickliningEarthen works
ICR-I, ICR-II & FCR Verifications
-50
50
150
250
350
450
550
01-1
2-05
02-0
1-06
01-0
2-06
01-0
3-06
04-0
4-06
29-0
4-06
01-0
6-06
01-0
7-06
02-0
8-06
30-0
8-06
Period
Veri
ficat
ions
ICR-I ICR-II
FCR

Program Management Unit Annual Monitoring Report 2005-06
National Program for Improvement of Watercourses (Punjab Component) 17
Utilization of Funds in Civil Works:
An amount of Rs. 314.48 million was allocated for civil works in the region, against which an amount of Rs. 290.10 million was transferred to WUAs. However, the exependiture utilization comes to 91% (of budgetary allocation) as verified by PWMC on the verified watercourses.
In the region, on average, Rs. 651,455 have been expended on each watercourse as the government’s share. The average cost per meter of construction comes to Rs. 734.
Government Funds (Rs.) Av. material cost (Rs.) Civil works started
Verified w/cs
Farmers' share
Deposited (Rs.) Allocated Transferred to WUAs
Utilized on verified w/cs
Verified Utilization
%age per W/C per meter
464 438 59,197,000 314,480,728 290,101,971 285,336,873 91% 651,455 734
Status of Recovery from WUAs:
Recovery due for FY 2004-05 : 8,456,256
Recovery due for FY 2005-06 : 8,278,345
Total recoverable amount : 16,734,601
Amount recovered : 12,222,204
Amount yet to be recovered (Rs.) : 4,512,397
Cost Sharing (Govt & Farmers)
17%83%
Farmers'Share
Govt'sShare

Program Management Unit Annual Monitoring Report 2005-06
National Program for Improvement of Watercourses (Punjab Component) 18
GUJRANWALA REGION
During the last year, i.e. FY 2004-05, this region overall achieved 108% of the targets by completing 363 watercourses against the assigned target of 336.
During the year under review, the performance is again up to the mark. The target was set to 1.2 times than last year, i.e. 407, yet the region registered completion / verification of 422 watercourses / schemes (104%) with the deployment of following staff.
AAEs/DDOs : 27 WMOs : 22 Supervisors : 123 Watercourses per supervisor
:
3.94 watercourses
Overall Watercourse Statistics:
Improved under NPIW Total W/Cs Improved Un-
improved
Planned for improvement under NPIW FY 2004-5 FY 2005-6 Total
Remaining W/Cs
4820 1766 3054 2415 277 341 618 1797
Barani Areas 86 81 167 -
Total (irrigated & barani) 363 422 785 -
Civil Works executed in FY 2005-06 (major indicators):
IRRIGATED BARANI TOTAL
Target FY 2005-06: 333 74 407
Civil works undertaken: 441 93 534
FCRs submitted: 387 84 471
Achievement / FCRs verified: 341 (102%) 81 (110%) 422 (104%)
Watercourses deferred: 46 3 49
Quantum of Civil Works (Verified):
Irrigated Area:
Earthen improved length: 902.9 km
Lined length: 186.2 km (0.55 km per w/c)
Total length of 341 w/cs: 1096.8 km
Nakkas installed (Nos.): 10029 (29.4 per w/c)

Program Management Unit Annual Monitoring Report 2005-06
National Program for Improvement of Watercourses (Punjab Component) 19
Culverts constructed (Nos.): 580 (1.70 per w/c)
Av. length of improved w/c: 3.22 km
Barani Area:
Total lining of 81 schemes: 25.078 km
Water storage tanks (Nos.): 1
Nakkas installed (Nos.): 871 (10.75 per w/c)
Culverts constructed (Nos.): 3
Av. length of improved schemes: 0.31 km
This graph depicts the percentage lining of the watercourses improved & verified in the irrigated area of the region.
PHYSICAL VERIFICATIONS: PWMC has to conduct four mandatory visits to each under improvement watercourse / scheme in order to certify the works executed at site. A target of 407 translates into 1628 site visits certifying S&D, ICR-I, ICR-II & FCR. Following graph portrays that 1155 certifications were made after March, 2006 i.e. during last quarter & onwards. The chart given below depicts activity level during various months.
Bricklining %age
83%
17%
BrickliningEarthen works
ICR-I, ICR-II & FCR Verifications
-100
0
100
200
300
400
500
600
01-1
2-05
02-0
1-06
01-0
2-06
01-0
3-06
04-0
4-06
29-0
4-06
01-0
6-06
01-0
7-06
02-0
8-06
30-0
8-06
Period
Ver
ifica
tions
ICR-I ICR-II
FCR

Program Management Unit Annual Monitoring Report 2005-06
National Program for Improvement of Watercourses (Punjab Component) 20
FINANCIAL PROFILE: During financial year 2005-06, A sum of Rs. 249.06 million was allocated to the region under various heads, against which Rs. 194.15 million (78%) were utilized.
Head Allocation (Rs.) Exp. (Rs.) Balance (Rs.) Utilization
Establishment Charges 33,326,291 22,968,458 10,357,833 69% Purchase of Durable Goods 1,330,500 1,329,881 619 100% Repair, Maintenance, C & S 6,264,265 3,398,582 2,865,683 54% Civil Works (Total Irrigated) 193,842,411 156,357,400 37,485,011 81% Civil Works (Total Barani) 14,305,486 10,105,217 4,200,269 71% Total 249,068,953 194,159,538 54,909,415 78%
*Total Amount transferred to WUAs for Civil Works.
Utilization of Funds in Civil Works:
An amount of Rs. 208.14 million was allocated for civil works in the region, against which an amount of Rs. 166.46 million was transferred to WUAs. However, the exependiture utilization comes to 69% (of budgetary allocation) as verified by PWMC on the verified watercourses / schemes.
In the Irrigated area of the region, on an average, Rs. 392,144 have been expended on each watercourse as the government’s share. The average cost per meter of construction comes to Rs. 718.
In the Barani area of the region, on an average, Rs. 131,376 have been expended on each scheme as the government’s share. The average cost per meter of construction comes to Rs. 424.
Government Funds (Rs.) Av. material cost (Rs.) Area
Civil works started
Verified w/cs
Farmers' share
Deposited (Rs.) Allocated Transferred to WUAs
Utilized on verified w/cs
Verified Utilization
%age per w/c per meter
Irrigated 441 341 59,290,000 193,842,411 156,357,400 133,721,264 69% 392,144 718
Barani 93 81 3,407,000 14,305,486 10,105,217 10,641,482 74% 131,376 424
Total 534 422 62,697,000 208,147,897 166,462,617 144,362,746 69% - -
Status of Recovery from WUAs (Irrigated & Barani Areas):
Recovery due for FY 2004-05 : 3,572,245Recovery due for FY 2005-06 : 2,196,192Total recoverable amount : 5,768,437Amount recovered : 2,780,383Amount yet to be recovered (Rs.) : 2,988,054
Cost Sharing (Govt & Farmers)
27%
73%Farmers'
ShareGovt'sShare

Program Management Unit Annual Monitoring Report 2005-06
National Program for Improvement of Watercourses (Punjab Component) 21
LAHORE REGION
During the last year, i.e. FY 2004-05, this region overall achieved 98% of the targets by completing 310 watercourses against the assigned target of 317. During the year under review, the performance is up to the mark. The target was set to 1.5 times than last year, i.e. 465, yet the region registered completion / verification of 489 watercourses (105%) with the deployment of following staff.
AAEs/DDOs : 34 WMOs : 30 Supervisors : 189 Watercourses per supervisor
:
2.6 watercourses
Overall Watercourse Statistics:
Improved under NPIW Total W/Cs Improved Un-
improved
Planned for improvement under NPIW FY 2004-5 FY 2005-6 Total
Remaining W/Cs
6425 2489 3936 3328 310 489 799 2529
Civil Works executed in FY 2005-06 (major indicators):
Target FY 2005-06: 465
Civil works undertaken: 587
FCRs submitted: 499
Achievement / FCRs verified: 489 (105% of the target)
Watercourses deferred: 10
Quantum of Civil Works (Verified):
Earthen improved length: 1563 km
Lined length: 344 km (0.70 km per w/c)
Total length of 489 w/cs: 1908 km
Nakkas installed (Nos.): 17062 (34.90 per w/c)
Culverts constructed (Nos.): 736 (1.50 per w/c)
Av. length of improved w/c: 3.90 km

Program Management Unit Annual Monitoring Report 2005-06
National Program for Improvement of Watercourses (Punjab Component) 22
This graph depicts the percentage lining of the watercourses improved & verified in the region.
PHYSICAL VERIFICATIONS: PWMC has to conduct four mandatory visits to each under improvement watercourse in order to certify the works executed at site. A target of 465 translates into 1860 site visits certifying S&D, ICR-I, ICR-II & FCR. Following graph portrays that 1066 certifications were made after March, 2006 i.e. during last quarter & onwards. The chart given below depicts activity level during various months. FINANCIAL PROFILE: During financial year 2005-06, A sum of Rs. 390.83 million was allocated to the region under various heads, against which Rs. 367.87 million (94%) were utilized.
Head Allocation (Rs.) Exp. (Rs.) Balance (Rs.) Utilization
Establishment Charges 53,230,733 32,305,707 20,925,026 61% Purchase of Durable Goods 182,000 - 182,000 - Repair, Maintenance, C & S 5,965,401 4,462,244 1,503,157 75% Civil Works (Total) 331,455,702 *331,105,678 350,024 100% Total 390,833,836 367,873,629 22,960,207 94%
*Total Amount transferred to WUAs for Civil Works.
Bricklining %age
82%18%
BrickliningEarthen works
ICR-I, ICR-II & FCR Verifications
-50
50
150
250
350
450
550
650
01-1
2-05
02-0
1-06
01-0
2-06
01-0
3-06
04-0
4-06
29-0
4-06
01-0
6-06
01-0
7-06
02-0
8-06
30-0
8-06
Period
Verif
icat
ions
ICR-I ICR-II
FCR
Program Management Unit Annual Monitoring Report 2005-06
National Program for Improvement of Watercourses (Punjab Component) 23
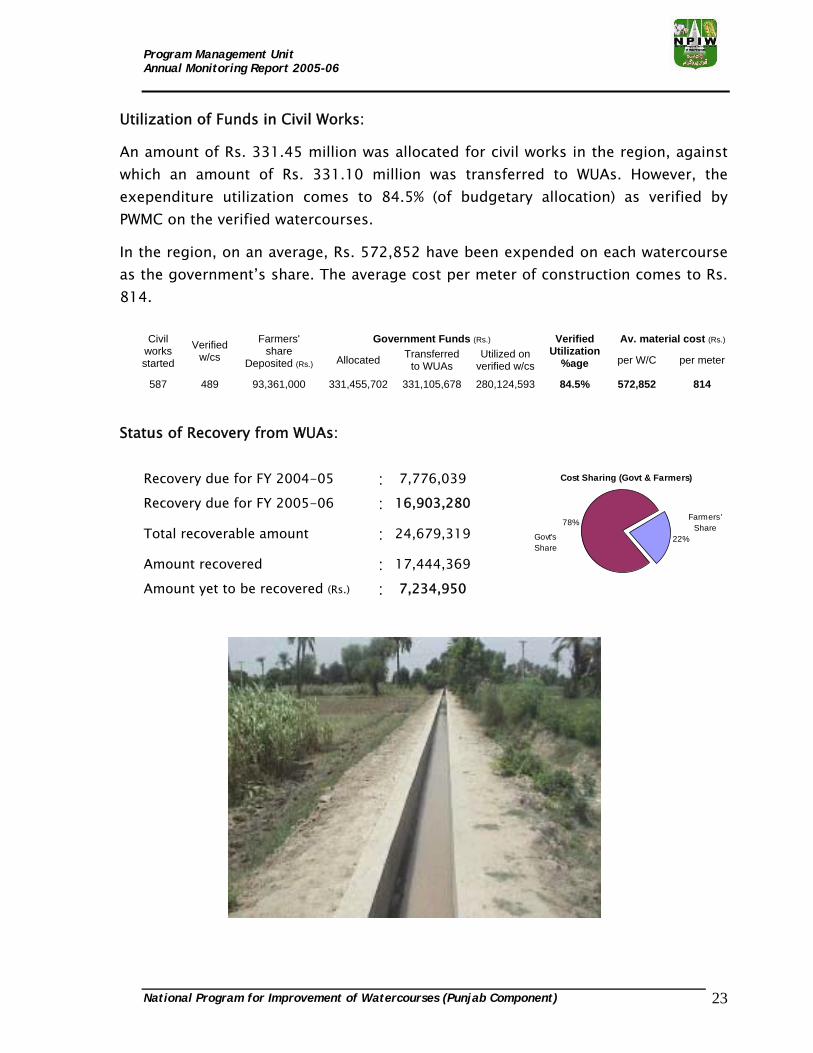
Utilization of Funds in Civil Works:
An amount of Rs. 331.45 million was allocated for civil works in the region, against which an amount of Rs. 331.10 million was transferred to WUAs. However, the exependiture utilization comes to 84.5% (of budgetary allocation) as verified by PWMC on the verified watercourses.
In the region, on an average, Rs. 572,852 have been expended on each watercourse as the government’s share. The average cost per meter of construction comes to Rs. 814.
Government Funds (Rs.) Av. material cost (Rs.) Civil works started
Verified w/cs
Farmers' share
Deposited (Rs.) Allocated Transferred to WUAs
Utilized on verified w/cs
Verified Utilization
%age per W/C per meter
587 489 93,361,000 331,455,702 331,105,678 280,124,593 84.5% 572,852 814
Status of Recovery from WUAs:
Recovery due for FY 2004-05 : 7,776,039
Recovery due for FY 2005-06 : 16,903,280
Total recoverable amount : 24,679,319
Amount recovered : 17,444,369
Amount yet to be recovered (Rs.) : 7,234,950
Cost Sharing (Govt & Farmers)
22%
78%Farmers'
ShareGovt'sShare

Program Management Unit Annual Monitoring Report 2005-06
National Program for Improvement of Watercourses (Punjab Component) 24
MULTAN REGION
During the last year, i.e. FY 2004-05, this region overall achieved 117% of the targets by completing 453 watercourses against the assigned target of 388.
During the year under review, the performance is again up to the mark. The target was set to 2.2 times than last year, i.e. 845 watercourses, yet the region registered completion / verification of 858 watercourses (101.5%) with the deployment of following staff.
AAEs/DDOs : 35 WMOs : 39 Supervisors : 226 Watercourses per supervisor
:
3.8 watercourses
Overall Watercourse Statistics:
Improved under NPIW Total W/Cs Improved Un-
improved
Planned for improvement under NPIW FY 2004-5 FY 2005-6 Total
Remaining W/Cs
10405 3806 6599 4772 453 858 1311 3461
Civil Works executed in FY 2005-06 (major indicators):
Target FY 2005-06: 845
Civil works undertaken: 883
FCRs submitted: 863
Achievement / FCRs verified: 858 (101.5% of the target)
Watercourses deferred: 5
Quantum of Civil Works (Verified):
Earthen improved length: 2861 km
Lined length: 866 km (1.01 km per w/c)
Total length of 858 w/cs: 3727 km
Nakkas installed (Nos.): 38030 (44.32 per w/c)
Culverts constructed (Nos.): 1498 (1.75 per w/c)
Av. length of improved w/c: 4.35 km

Program Management Unit Annual Monitoring Report 2005-06
National Program for Improvement of Watercourses (Punjab Component) 25
This graph depicts the percentage lining of the watercourses improved & verified in the region.
PHYSICAL VERIFICATIONS: PWMC has to conduct four mandatory visits to each under improvement watercourse in order to certify the works executed at site. A target of 845 translates into 3380 site visits certifying S&D, ICR-I, ICR-II & FCR. Following graph portrays that 1681 certifications were made after March, 2006 i.e. during last quarter & onwards. The chart given below depicts activity level during various months. FINANCIAL PROFILE: During financial year 2005-06, A sum of Rs. 723.06 million was allocated to the region under various heads, against which Rs. 589.18 million (81%) were utilized.
Head Allocation (Rs.) Exp. (Rs.) Balance (Rs.) Utilization
Establishment Charges 73,456,691 48,184,809 25,271,882 66% Purchase of Durable Goods 1,160,457 1,019,970 140,487 88% Repair, Maintenance, C & S 6,943,673 5,290,436 1,653,237 76% Civil Works (Total) 641,500,876 *534,691,749 106,809,127 83% Total 723,061,697 589,186,964 133,874,733 81%
*Total Amount transferred to WUAs for Civil Works.
Bricklining %age
77% 23%BrickliningEarthen works
ICR-I, ICR-II & FCR Verifications
-50
50
150
250
350
450
550
650
750
850
950
01-1
2-05
02-0
1-06
01-0
2-06
01-0
3-06
04-0
4-06
29-0
4-06
01-0
6-06
01-0
7-06
02-0
8-06
30-0
8-06
Period
Ver
ifica
tions
ICR-I ICR-II
FCR

Program Management Unit Annual Monitoring Report 2005-06
National Program for Improvement of Watercourses (Punjab Component) 26
Utilization of Funds in Civil Works:
An amount of Rs. 641.50 million was allocated for civil works in the region, against which an amount of Rs. 534.69 million was transferred to WUAs. However, the exependiture utilization comes to 90% (of budgetary allocation) as verified by PWMC on the verified watercourses.
In the region, on an average, Rs. 670,345 have been expended on each watercourse as the government’s share. The average cost per meter of construction comes to Rs. 664.
Government Funds (Rs.) Av. material cost (Rs.) Civil works started
Verified w/cs
Farmers' share
Deposited (Rs.) Allocated Transferred to WUAs
Utilized on verified w/cs
Verified Utilization
%age per W/C per meter
883 858 149,730,000 641,500,876 534,691,749 575,156,493 90% 670,345 664
Status of Recovery from WUAs:
Recovery due for FY 2004-05 : 10,024,154
Recovery due for FY 2005-06 : 6,770,925
Total recoverable amount : 16,795,079
Amount recovered : 13,040,605
Amount yet to be recovered (Rs.) : 3,754,474
Cost Sharing (Govt & Farmers)
22%
78% Farmers'ShareGovt's
Share

Program Management Unit Annual Monitoring Report 2005-06
National Program for Improvement of Watercourses (Punjab Component) 27
SARGODHA REGION
During the last year, i.e. FY 2004-05, this region overall achieved 97% of the targets by completing 232 watercourses against the assigned target of 239.
During the year under review, the performance has advanced. The target was set to 1.7 times than last year, i.e. 405 watercourses, yet the region registered completion / verification of 420 watercourses (104%) with the deployment of following staff.
AAEs/DDOs : 31 WMOs : 29 Supervisors : 161 Watercourses per supervisor
:
2.6 watercourses
Overall Watercourse Statistics:
Improved under NPIW Total W/Cs Improved Un-
improved
Planned for improvement under NPIW FY 2004-5 FY 2005-6 Total
Remaining W/Cs
5696 2018 3678 2836 232 420 652 2184
Civil Works executed in FY 2005-06 (major indicators):
Target FY 2005-06: 405
Civil works undertaken: 451
FCRs submitted: 432
Achievement / FCRs verified: 420 (104% of the target)
Watercourses deferred: 12
Quantum of Civil Works (Verified):
Earthen improved length: 1373 km
Lined length: 321 km (0.77 km per w/c)
Total length of 420 w/cs: 1694 km
Nakkas installed (Nos.): 19149 (45.60 per w/c)
Culverts constructed (Nos.): 614 (1.46 per w/c)
Av. length of improved w/c: 4.03 km
Program Management Unit Annual Monitoring Report 2005-06
National Program for Improvement of Watercourses (Punjab Component) 28
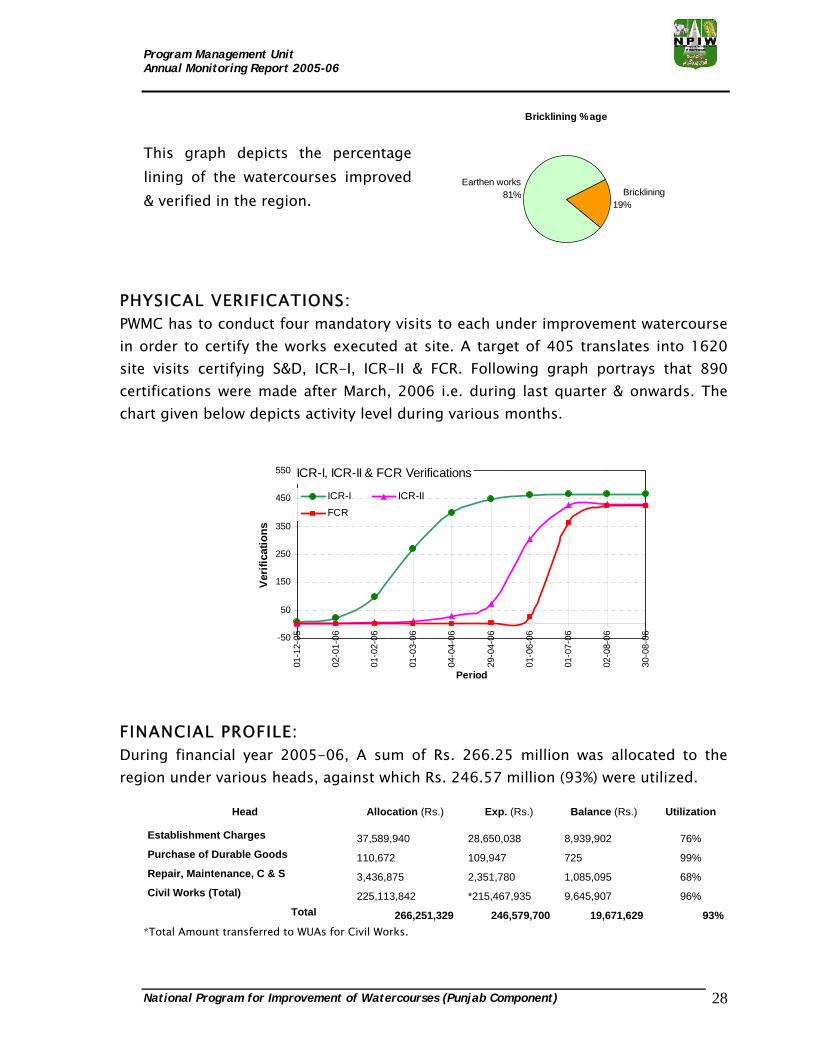
This graph depicts the percentage lining of the watercourses improved & verified in the region.
PHYSICAL VERIFICATIONS: PWMC has to conduct four mandatory visits to each under improvement watercourse in order to certify the works executed at site. A target of 405 translates into 1620 site visits certifying S&D, ICR-I, ICR-II & FCR. Following graph portrays that 890 certifications were made after March, 2006 i.e. during last quarter & onwards. The chart given below depicts activity level during various months. FINANCIAL PROFILE: During financial year 2005-06, A sum of Rs. 266.25 million was allocated to the region under various heads, against which Rs. 246.57 million (93%) were utilized.
Head Allocation (Rs.) Exp. (Rs.) Balance (Rs.) Utilization
Establishment Charges 37,589,940 28,650,038 8,939,902 76% Purchase of Durable Goods 110,672 109,947 725 99% Repair, Maintenance, C & S 3,436,875 2,351,780 1,085,095 68% Civil Works (Total) 225,113,842 *215,467,935 9,645,907 96% Total 266,251,329 246,579,700 19,671,629 93%
*Total Amount transferred to WUAs for Civil Works.
Bricklining %age
81%19%
BrickliningEarthen works
ICR-I, ICR-II & FCR Verifications
-50
50
150
250
350
450
550
01-1
2-05
02-0
1-06
01-0
2-06
01-0
3-06
04-0
4-06
29-0
4-06
01-0
6-06
01-0
7-06
02-0
8-06
30-0
8-06
Period
Verif
icat
ions
ICR-I ICR-II
FCR

Program Management Unit Annual Monitoring Report 2005-06
National Program for Improvement of Watercourses (Punjab Component) 29
Utilization of Funds in Civil Works:
An amount of Rs. 225.11 million was allocated for civil works in the region, against which an amount of Rs. 215.46 million was transferred to WUAs. However, the exependiture utilization comes to 105% (of budgetary allocation) as verified by PWMC on the verified watercourses.
In the region, on an average, Rs. 563,269 have been expended on each watercourse as the government’s share. The average cost per meter of construction comes to Rs. 737.
Government Funds (Rs.) Av. material cost (Rs.) Civil works started
Verified w/cs
Farmers' share
Deposited (Rs.) Allocated Transferred to WUAs
Utilized on verified w/cs
Verified Utilization
%age per W/C per meter
451 420 72,309,000 225,113,842 215,467,935 236,573,005 105% 563,269 737
Status of Recovery from WUAs:
Recovery due for FY 2004-05 : 843,570
Recovery due for FY 2005-06 : 753,292
Total recoverable amount : 1,596,862
Amount recovered : 1,299,214
Amount yet to be recovered (Rs.) : 297,648
Cost Sharing (Govt & Farmers)
25%
75%Farmers'
ShareGovt'sShare

Program Management Unit Annual Monitoring Report 2005-06
National Program for Improvement of Watercourses (Punjab Component) 30
RAWALPINDI REGION
During the last year, i.e. FY 2004-05, this region overall achieved 114% of the targets by completing 142 schemes against the assigned target of 125. During the year under review, the performance is again up to the mark. The target was set to 2.2 times than last year, i.e. 276, yet the region registered completion / verification of 283 schemes (102.5%) with the deployment of following staff.
AAEs/DDOs : 14 WMOs : 7 Supervisors : 21 Watercourses per supervisor
:
13.5 watercourses
Overall Watercourse Statistics:
Watercourses improved under NPIW
FY 2004-5 FY 2005-6 Total
135 283 425
Civil Works executed in FY 2005-06 (major indicators):
Target FY 2005-06: 276
Civil works undertaken: 286
FCRs submitted: 283
Achievement / FCRs verified: 283 (102.5% of the target)
Watercourses deferred: 0
Quantum of Civil Works (Verified):
Total lining of 283 schemes: 134.367 km
Water storage tanks (Nos.): 15
Nakkas installed (Nos.): 3790 (13.4 per w/c)
Culverts constructed (Nos.): 10
Av. length of improved schemes: 0.48 km

Program Management Unit Annual Monitoring Report 2005-06
National Program for Improvement of Watercourses (Punjab Component) 31
PHYSICAL VERIFICATIONS:
PWMC has to conduct four mandatory visits to each under improvement watercourse / scheme in order to certify the works executed at site. A target of 276 translates into 1104 site visits certifying S&D, ICR-I, ICR-II & FCR. Following graph portrays that 562 certifications were made after March, 2006 i.e. during last quarter & onwards. The chart given below depicts activity level during various months. FINANCIAL PROFILE:
During financial year 2005-06, A sum of Rs. 47.94 million was allocated to the region under various heads, against which Rs. 43.21 million (90%) were utilized.
Head Allocation (Rs.) Exp. (Rs.) Balance (Rs.) Utilization
Establishment Charges - - - - Purchase of Durable Goods 423,448 373,437 50,011 88% Repair, Maintenance, C & S 3,604,500 2,616,792 987,708 73% Civil Works (Total) 43,912,306 *40,221,608 3,690,698 92% Total 47,940,254 43,211,837 4,728,417 90%
*Total Amount transferred to WUAs for Civil Works.
Utilization of Funds in Civil Works:
An amount of Rs. 43.91 million was allocated for civil works in the region, against which an amount of Rs. 40.22 million was transferred to WUAs. However, the exependiture utilization comes to 96% (of budgetary allocation) as verified by PWMC on the verified watercourses.
ICR-I, ICR-II & FCR Verifications
-50
0
50
100
150
200
250
300
350
01-1
2-05
02-0
1-06
01-0
2-06
01-0
3-06
04-0
4-06
29-0
4-06
01-0
6-06
01-0
7-06
02-0
8-06
30-0
8-06
Period
Verif
icat
ions
ICR-I ICR-II
FCR

Program Management Unit Annual Monitoring Report 2005-06
National Program for Improvement of Watercourses (Punjab Component) 32
In the region, on average, Rs. 148,514 have been expended on each scheme as the government’s share. The average cost per meter of construction comes to Rs. 313.
Government Funds (Rs.) Av. material cost (Rs.) Civil works started
Verified w/cs
Farmers' share
Deposited (Rs.) Allocated Transferred to WUAs
Utilized on verified w/cs
Verified Utilization
%age per W/C per meter
286 283 10,891,000 43,912,306 40,221,608 42,029,426 96% 148,514 313
Status of Recovery from WUAs:
Recovery due for FY 2004-05 : 596
Recovery due for FY 2005-06 : 39,682
Total recoverable amount : 40,278
Amount recovered : 40,278
Amount yet to be recovered (Rs.) : 0
Cost Sharing (Govt & Farmers)
27%
73%Farmers'
ShareGovt'sShare

Program Management Unit Annual Monitoring Report 2005-06
National Program for Improvement of Watercourses (Punjab Component) 33
OFWM Regions: Allocation of Targets (Share Percentage)
Bahawalpur20.8%
D.G. Khan14.3%
Faisalabad10.1%Gujranwala
9.3%
Lahore10.6%
Multan19.3%
Sargodha9.3%
Rawalpindi6.3%
BahawalpurD.G. KhanFaisalabadGujranwalaLahoreMultanSargodhaRawalpindi
OFWM Regions: Achievements (Share Percentage)
Bahawalpur20.8%
D.G. Khan14.0%
Faisalabad9.8%Gujranwala
9.5%
Lahore11.0%
Multan19.2%
Sargodha9.4%
Rawalpindi6.3%
BahawalpurD.G. KhanFaisalabadGujranwalaLahoreMultanSargodhaRawalpindi

Program Management Unit Annual Monitoring Report 2005-06
National Program for Improvement of Watercourses (Punjab Component) 34
OFWM: Targets vs Achievements (Region wise)
627
440
407 46
5
845
405
276
930
625
438
422 48
9
858
420
283
910
0
200
400
600
800
Baha
wal
pur
D.G
. Kha
n
Fais
alab
ad
Guj
ranw
ala
Laho
re
Mul
tan
Sarg
odha
Raw
alpi
ndi
Wat
erco
urse
s
Target
Achievement
OFWM: Percentage Achievements (Region wise)
99.5 99.7 101.5 102.2 102.5 103.7 103.7 105.2
0
10
20
30
40
50
60
70
80
90
100
Fais
alab
ad
D.G
. Kha
n
Mul
tan
Bah
awal
pur
Raw
alpi
ndi
Guj
ranw
ala
Sar
godh
a
Laho
re
Perc
enta
ge A
chie
vem
ent

Program Management Unit Annual Monitoring Report 2005-06
National Program for Improvement of Watercourses (Punjab Component) 35
OFWM: Bricklining / Lining per Watercourse (Region wise)
0.850.95
0.810.89
0.77
1.01
0.70
0.55
0.400.48
0.31
0
0.25
0.5
0.75
1
Irrig
ated
Are
as
Bah
awal
pur
D. G
. Kha
n
Fais
alab
ad
Sar
godh
a
Mul
tan
Laho
re
Guj
ranw
ala
Bar
ani
Are
as
Raw
alpi
ndi
Bar
ani
Guj
ranw
ala
Bar
ani
Bric
klin
ed /
Line
d Le
ngth
(Km
)
OFWM: Cost per Meter of Lining (Region wise)
743664
710 718 734 737 747814
335 313
414
0
100
200
300
400
500
600
700
800
Irrig
ated
Are
as
Mul
tan
D.G
. Kha
n
Guj
ranw
ala
Fais
alab
ad
Sar
godh
a
Bah
awal
pur
Laho
re
Bar
ani A
reas
Raw
alpi
ndi
Gjw
Bar
ani
Cost
per
Met
er o
f Wat
erco
urse
(Rs.
)

Program Management Unit Annual Monitoring Report 2005-06
National Program for Improvement of Watercourses (Punjab Component) 36
BAHAWALNAGAR
During the last year, i.e. FY 2004-05, this district achieved 106% of the targets by completing 109 watercourses against the assigned target of 103.
During the year under review, the performance is again up to the mark. Although the target was 3 times than last year i.e. 319 watercourses, yet the district registered completion / verification of 319 watercourses (100%) with the deployment of following staff.
Mr. Gulzar Muhammad : EDO (Agriculture) Mr. Maqbool Ahmad Gill : DO (OFWM) AAEs/DDOs : 13 WMOs : 17 Supervisors : 94 Watercourses per supervisor
:
3.4 watercourses
Overall Watercourse Statistics:
Improved under NPIW Total W/Cs Improved Un-
improved
Planned for improvement under NPIW FY 2004-5 FY 2005-6 Total
Remaining W/Cs
4078 2138 1940 1688 109 319 428 1260
Civil Works executed in FY 2005-06 (major indicators):
Target FY 2005-06: 319
Civil works undertaken: 327
FCRs submitted: 319
Achievement / FCRs verified: 319 (100% of the target)
Watercourses deferred: 0
Quantum of Civil Works (Verified):
Earthen improved length: 848.6 km
Lined length: 325.6 km (1.02 km per w/c)
Total length of 319 w/cs: 1174.2 km
Nakkas installed (Nos.): 13082 (41 per w/c)
Culverts constructed (Nos.): 1061 (3.3 per w/c)
Av. length of improved w/c: 3.68 km

Program Management Unit Annual Monitoring Report 2005-06
National Program for Improvement of Watercourses (Punjab Component) 37
This graph depicts the percentage lining of the watercourses improved & verified in the district.
PHYSICAL VERIFICATIONS: PWMC has to conduct four mandatory visits to each under improvement watercourse in order to certify the works executed at site. A target of 319 translates into 1276 site visits for certifying S&D, ICR-I, ICR-II & FCR. Following graph portrays that 651 certifications were made after March, 2006 i.e. during last quarter & onwards. The chart given below depicts activity level during various months. FINANCIAL PROFILE: During financial year 2005-06, an amount of Rs. 262.97 million was allocated to the district under various heads, against which Rs. 239.87 million (91%) were utilized .
Head Allocation (Rs.) Exp. (Rs.) Balance (Rs.) Utilization
Establishment Charges 21,401,000 16,941,751 4,459,249 79%
Purchase of Durable Goods - - - -
Repair, Maintenance, C & S 2,452,000 1,561,868 890,132 64%
Civil Works (Total) 239,119,237 *221,370,870 17,748,367 93%
Total 262,972,237 239,874,489 23,097,748 91%
*Total Amount transferred to WUAs for Civil Works.
Bricklining %age
72%
28% BrickliningEarthen works
ICR-I, ICR-II & FCR Verifications
-50
0
50
100
150
200
250
300
350
01-1
2-05
02-0
1-06
01-0
2-06
01-0
3-06
04-0
4-06
29-0
4-06
01-0
6-06
01-0
7-06
02-0
8-06
30-0
8-06
Period
Verif
icat
ions
ICR-I ICR-II
FCR

Program Management Unit Annual Monitoring Report 2005-06
National Program for Improvement of Watercourses (Punjab Component) 38
Utilization of Funds in Civil Works:
A sum of Rs. 239.11 million was allocated for civil works in the district, against which an amount of Rs. 221.37 million was transferred to WUAs. However, the expenditure utilization comes to 102% (of budgetary allocation) as verified by PWMC on the verified watercourses, signifying some amount is yet to be paid to the WUAs.
In the district, on an average, Rs. 766,998 have been expended on each watercourse as the government’s share. The average cost per meter of construction comes to Rs. 751.
Government Funds (Rs.) Av. material cost (Rs.) Civil
works started
Verified w/cs
Farmers' share Deposited (Rs.) Allocated Transferred
to WUAs Utilized on
verified w/cs
Verified Utilization
%age per W/C per meter
327 319 63,762,000 239,119,237 221,370,870 244,672,363 102% 766,998 751
Status of Recovery from WUAs:
Recovery due for FY 2004-05 : 212,398
Recovery due for FY 2005-06 : 4,752,359
Total recoverable amount : 4,964,757
Amount recovered : 4,964,757
Amount yet to be recovered (Rs.) : -
Cost Sharing (Govt & Farmers)
22%
78%
Farmers'Share
Govt'sShare

Program Management Unit Annual Monitoring Report 2005-06
National Program for Improvement of Watercourses (Punjab Component) 39
BAHAWALPUR
During the last year, i.e. FY 2004-05, this district achieved 100% of the targets by completing 79 watercourses against the assigned target of 79.
During the year under review, the performance has been much better than last year. Even though the target was 3.4 times the previous year, i.e. 272 watercourses, yet the district registered completion/verification of 278 watercourses (102%) with the deployment of following staff.
Mr. Ali Ahmad Mehais : EDO (Agriculture) Mr. Mushtaq Ahmad Gill : DO (OFWM) AAEs/DDOs : 12 WMOs : 15 Supervisors : 99 Watercourses per supervisor
:
2.8 watercourses
Overall Watercourse Statistics:
Improved under NPIW Total W/Cs Improved Un-
improved
Planned for improvement under NPIW FY 2004-5 FY 2005-6 Total
Remaining W/Cs
3844 1739 2105 1944 79 278 357 1587
Civil Works executed in FY 2005-06 (major indicators):
Target FY 2005-06: 272
Civil works undertaken: 304
FCRs submitted: 282
Achievement / FCRs verified: 278 (102% of the target)
Watercourses deferred: 4
Quantum of Civil Works (Verified):
Earthen improved length: 573.7 km
Lined length: 217.2 km (0.78 km per w/c)
Total length of 278 w/cs: 790.8 km
Nakkas installed (Nos.): 9678 (34.8 per w/c)
Culverts constructed (Nos.): 683 (2.45 per w/c)
Av. length of improved w/c: 2.84 km

Program Management Unit Annual Monitoring Report 2005-06
National Program for Improvement of Watercourses (Punjab Component) 40
This graph depicts the percentage lining of the watercourses improved & verified in the district.
PHYSICAL VERIFICATIONS: PWMC has to conduct four mandatory visits to each under improvement watercourse in order to certify the works executed at site. A target of 272 translates into 1088 site visits certifying S&D, ICR-I, ICR-II & FCR. Following graph portrays that 651 certifications were made after March, 2006 i.e. during last quarter & onwards. The chart given below depicts activity level during various months. FINANCIAL PROFILE: During financial year 2005-06, an amount of Rs. 233.37 million was allocated to the district under various heads, against which Rs. 192.43 million (82%) were utilized .
Head Allocation (Rs.) Exp. (Rs.) Balance (Rs.) Utilization
Establishment Charges 26,377,573 18,148,122 8,229,451 69%
Purchase of Durable Goods 300 - 300 -
Repair, Maintenance, C & S 3,042,271 1,420,767 1,621,504 47%
Civil Works (Total) 203,952,959 *172,864,110 31,088,849 85%
Total 233,373,103 192,432,999 40,939,804 82%
*Total Amount transferred to WUAs for Civil Works.
Bricklining %age
73%
27%BrickliningEarthen works
ICR-I, ICR-II & FCR Verifications
-50
0
50
100
150
200
250
300
350
01-1
2-05
02-0
1-06
01-0
2-06
01-0
3-06
04-0
4-06
29-0
4-06
01-0
6-06
01-0
7-06
02-0
8-06
30-0
8-06Period
Verif
icat
ions
ICR-I ICR-II
FCR
Program Management Unit Annual Monitoring Report 2005-06
National Program for Improvement of Watercourses (Punjab Component) 41
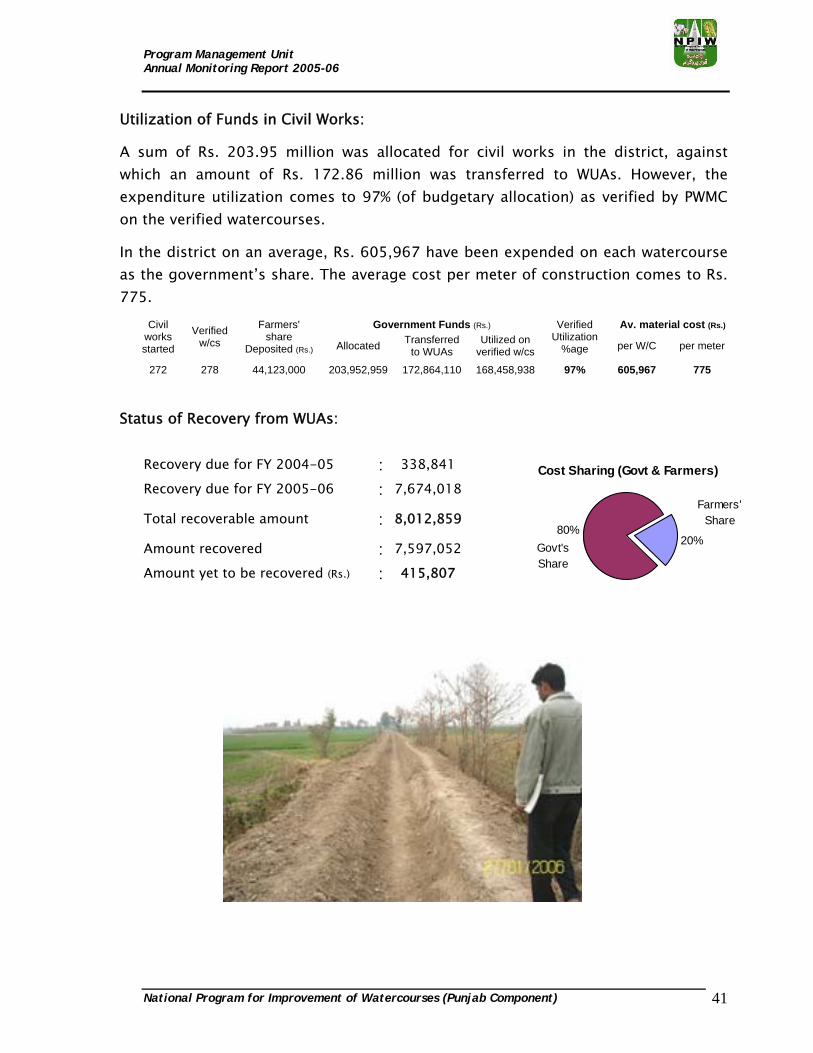
Utilization of Funds in Civil Works:
A sum of Rs. 203.95 million was allocated for civil works in the district, against which an amount of Rs. 172.86 million was transferred to WUAs. However, the expenditure utilization comes to 97% (of budgetary allocation) as verified by PWMC on the verified watercourses.
In the district on an average, Rs. 605,967 have been expended on each watercourse as the government’s share. The average cost per meter of construction comes to Rs. 775.
Government Funds (Rs.) Av. material cost (Rs.) Civil works started
Verified w/cs
Farmers' share
Deposited (Rs.) Allocated Transferred to WUAs
Utilized on verified w/cs
Verified Utilization
%age per W/C per meter
272 278 44,123,000 203,952,959 172,864,110 168,458,938 97% 605,967 775
Status of Recovery from WUAs:
Recovery due for FY 2004-05 : 338,841
Recovery due for FY 2005-06 : 7,674,018
Total recoverable amount : 8,012,859
Amount recovered : 7,597,052
Amount yet to be recovered (Rs.) : 415,807
Cost Sharing (Govt & Farmers)
20%80%
Farmers'Share
Govt'sShare

Program Management Unit Annual Monitoring Report 2005-06
National Program for Improvement of Watercourses (Punjab Component) 42
RAHIM YAR KHAN
During the last year, i.e. FY 2004-05, this district achieved 102% of the targets by completing 94 watercourses against the assigned target of 92.
During the year under review, the performance is again up to the mark. The target was set to 3.5 times than last year, i.e. 319 watercourses, yet the district registered completion / verification of 333 watercourses (104%) with the deployment of following staff.
Mr. Zafar Yab Shah : EDO (Agriculture) Mr. Saif-ur-Rehman : DO (OFWM) AAEs/DDOs : 14 WMOs : 21 Supervisors : 94 Watercourses per supervisor
:
3.5 watercourses
Overall Watercourse Statistics:
Improved under NPIW Total W/Cs Improved Un-
improved
Planned for improvement under NPIW FY 2004-5 FY 2005-6 Total
Remaining W/Cs
5367 1846 3521 3111 94 333 427 2684
Civil Works executed in FY 2005-06 (major indicators):
Target FY 2005-06: 319
Civil works undertaken: 363
FCRs submitted: 339
Achievement / FCRs verified: 333 (104% of the target)
Watercourses deferred: 6
Quantum of Civil Works (Verified):
Earthen improved length: 1001.7 km
Lined length: 341.6 km (1.03 km per w/c)
Total length of 333 w/cs: 1343.3 km
Nakkas installed (Nos.): 12759 (38.31 per w/c)
Culverts constructed (Nos.): 917 (2.75 per w/c)
Av. length of improved w/c: 4.03 km

Program Management Unit Annual Monitoring Report 2005-06
National Program for Improvement of Watercourses (Punjab Component) 43
This graph depicts the percentage lining of the watercourses improved & verified in the district.
PHYSICAL VERIFICATIONS: PWMC has to conduct four mandatory visits to each under improvement watercourse in order to certify the works executed at site. A target of 319 translates into 1276 site visits certifying S&D, ICR-I, ICR-II & FCR. Following graph portrays that 820 certifications were made after March, 2006 i.e. during last quarter & onwards. The chart given below depicts activity level during various months. FINANCIAL PROFILE: During financial year 2005-06, A sum of Rs. 297.43 million was allocated to the district under various heads, against which Rs. 260.17 million (87%) were utilized.
Head Allocation (Rs.) Exp. (Rs.) Balance (Rs.) Utilization
Establishment Charges 39,486,785 23,391,872 8,229,451 59% Purchase of Durable Goods 2040 - - - Repair, Maintenance, C & S 3,780,147 2,204,763 1,621,504 58% Civil Works (Total) 254,165,934 *234,578,380 31,088,849 92% Total 297,434,906 260,175,015 37,259,891 87%
*Total Amount transferred to WUAs for Civil Works.
Bricklining %age
75%25%
BrickliningEarthen works
ICR-I, ICR-II & FCR Verifications
-50
0
50
100
150
200
250
300
350
400
01-1
2-05
02-0
1-06
01-0
2-06
01-0
3-06
04-0
4-06
29-0
4-06
01-0
6-06
01-0
7-06
02-0
8-06
30-0
8-06
Period
Ver
ifica
tions
ICR-I ICR-II
FCR
Program Management Unit Annual Monitoring Report 2005-06
National Program for Improvement of Watercourses (Punjab Component) 44
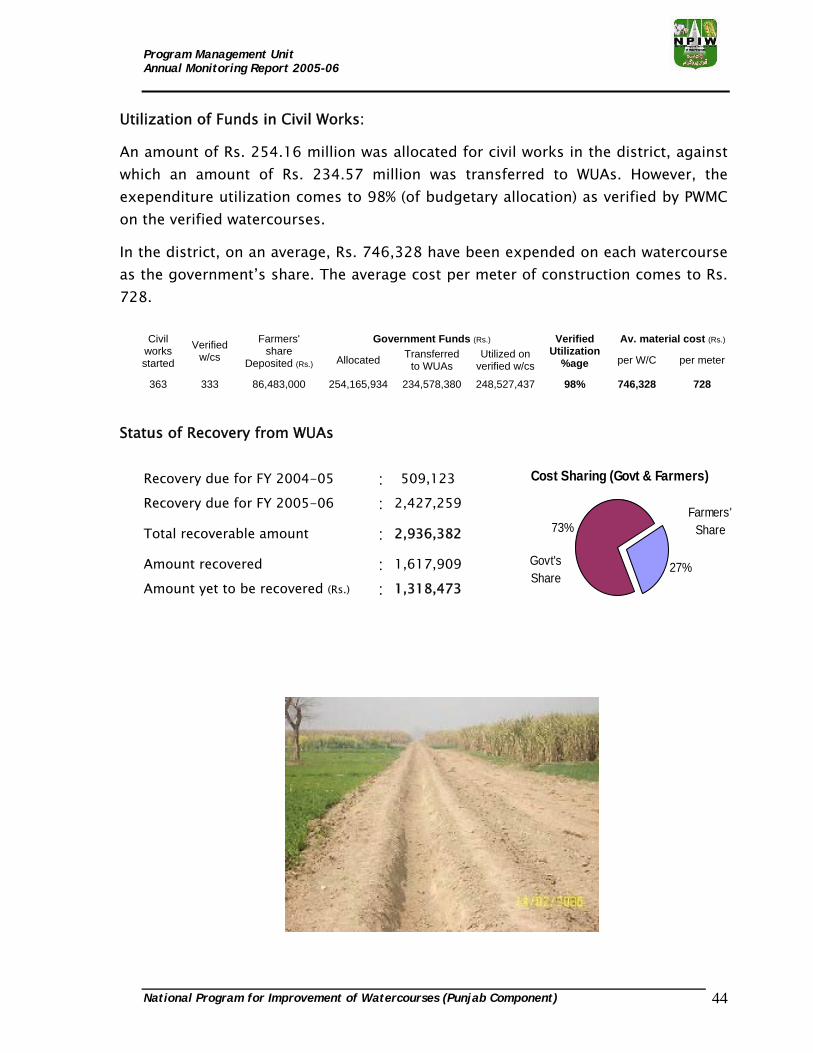
Utilization of Funds in Civil Works:
An amount of Rs. 254.16 million was allocated for civil works in the district, against which an amount of Rs. 234.57 million was transferred to WUAs. However, the exependiture utilization comes to 98% (of budgetary allocation) as verified by PWMC on the verified watercourses.
In the district, on an average, Rs. 746,328 have been expended on each watercourse as the government’s share. The average cost per meter of construction comes to Rs. 728.
Government Funds (Rs.) Av. material cost (Rs.) Civil works started
Verified w/cs
Farmers' share
Deposited (Rs.) Allocated Transferred to WUAs
Utilized on verified w/cs
Verified Utilization
%age per W/C per meter
363 333 86,483,000 254,165,934 234,578,380 248,527,437 98% 746,328 728
Status of Recovery from WUAs
Recovery due for FY 2004-05 : 509,123
Recovery due for FY 2005-06 : 2,427,259
Total recoverable amount : 2,936,382
Amount recovered : 1,617,909
Amount yet to be recovered (Rs.) : 1,318,473
Cost Sharing (Govt & Farmers)
27%
73%Farmers'
Share
Govt'sShare

Program Management Unit Annual Monitoring Report 2005-06
National Program for Improvement of Watercourses (Punjab Component) 45
DERA GHAZI KHAN
During the last year, i.e. FY 2004-05, this district had achieved 100% targets by completing 55 watercourses against the assigned target of 55.
During the year under review, the district has performed well. Even though the target was 3.6 times the last year, i.e. 200 watercourses, yet the district registered completion/verification of 198 watercourses (99%) with the deployment of following staff.
Mr. Zafarullah Sindhu : EDO (Agriculture) Mr. Zafarullah Sindhu : DO (OFWM) AAEs/DDOs : 5 WMOs : 19 Supervisors : 75 Watercourses per supervisor
:
2.6 watercourses
Overall Watercourse Statistics:
Improved under NPIW Total W/Cs Improved Un-
improved
Planned for improvement under NPIW FY 2004-5 FY 2005-6 Total
Remaining W/Cs
2840 753 2087 1861 55 198 253 1608
Civil Works executed in FY 2005-06 (major indicators):
Target FY 2005-06: 200
Civil works undertaken: 217
FCRs submitted: 201
Achievement / FCRs verified: 198 (99% of the target)
Watercourses deferred: 3
Quantum of Civil Works (Verified):
Earthen improved length: 333.4 km
Lined length: 117.5 km (0.59 km per w/c)
Total length of 198 w/cs: 450.9 km
Nakkas installed (Nos.): 6799 (34.34 per w/c)
Culverts constructed (Nos.): 398 (2.01 per w/c)
Av. length of improved w/c: 2.28 km

Program Management Unit Annual Monitoring Report 2005-06
National Program for Improvement of Watercourses (Punjab Component) 46
This graph depicts the percentage lining of the watercourses improved & verified in the district.
PHYSICAL VERIFICATIONS: PWMC has to conduct four mandatory visits to each under improvement watercourse in order to certify the works executed at site. A target of 200 translates into 800 site visits certifying S&D, ICR-I, ICR-II & FCR. Following graph portrays that 460 certifications were made after March, 2006 i.e. during last quarter & onwards. The chart given below depicts activity level during various months. FINANCIAL PROFILE: During financial year 2005-06, an amount of Rs. 176.48 million was allocated to the district under various heads, against which Rs. 154.88 million (88%) was utilized.
Head Allocation (Rs.) Exp. (Rs.) Balance (Rs.) Utilization
Establishment Charges 23,722,217 14,439,419 9,282,798 61% Purchase of Durable Goods - - - - Repair, Maintenance, C & S 2616635 2,891,429 (274,794) 111% Civil Works (Total) 150,148,775 *137,556,832 137,556,832 92% Total 176,487,627 154,887,680 21,599,947 88%
*Total Amount transferred to WUAs for Civil Works.
Bricklining %age
74%26%
BrickliningEarthen works
ICR-I, ICR-II & FCR Verifications
-50
0
50
100
150
200
250
01-1
2-05
02-0
1-06
01-0
2-06
01-0
3-06
04-0
4-06
29-0
4-06
01-0
6-06
01-0
7-06
02-0
8-06
30-0
8-06
Period
Verif
icat
ions
ICR-I ICR-II
FCR

Program Management Unit Annual Monitoring Report 2005-06
National Program for Improvement of Watercourses (Punjab Component) 47
Utilization of Funds in Civil Works:
A sum of Rs. 150.14 million was allocated for civil works in the district, against which an amount of Rs. 137.55 million was transferred to WUAs. However, the exependiture utilization comes to 76% (of budgetary allocation) as verified by PWMC on the verified watercourses.
In the district, on an average, Rs. 573,822 have been expended on each watercourse as the government’s share. The average cost per meter of construction comes to Rs. 967.
Government Funds (Rs.) Av. material cost (Rs.) Civil works started
Verified w/cs
Farmers' share Deposited (Rs.) Allocated Transferred
to WUAs Utilized on
verified w/cs
Verified Utilization
%age per W/C per meter
217 198 30,478,000 150,148,775 137,556,832 113,616,760 76% 573,822 967
Status of Recovery from WUAs:
Recovery due for FY 2004-05 : 617,562
Recovery due for FY 2005-06 : 10,713,290
Total recoverable amount : 11,330,852
Amount recovered : 9,600,125
Amount yet to be recovered (Rs.) : 1,730,727
Cost Sharing (Govt & Farmers)
18%82%
Farmers'Share
Govt'sShare

Program Management Unit Annual Monitoring Report 2005-06
National Program for Improvement of Watercourses (Punjab Component) 48
LAYYAH
During the last year, i.e. FY 2004-05, this district accomplished 100% of the targets by completing 32 watercourses against the assigned target of 32.
During the year under review, the performance is up to the mark. The target was smaller than last year, i.e. 22 watercourses, the district registered completion / verification of 22 watercourses (100%) with the deployment of following staff.
Mr. Abdul Majeed : EDO (Agriculture) Mr. Sadiq Raza Cheema : DO (OFWM) AAEs/DDOs : 3 WMOs : 2 Supervisors : 4 Watercourses per supervisor
:
5.5 watercourses
Overall Watercourse Statistics:
Improved under NPIW Total W/Cs Improved Un-
improved
Planned for improvement under NPIW FY 2004-5 FY 2005-6 Total
Access W/Cs
Improved
1121 1028 93 51 32 22 54 3
Civil Works executed in FY 2005-06 (major indicators):
Target FY 2005-06: 22
Civil works undertaken: 25
FCRs submitted: 22
Achievement / FCRs verified: 22 (100% of the target)
Watercourses deferred: 0
Quantum of Civil Works (Verified):
Earthen improved length: 68.1 km
Lined length: 25.8 km (1.17 km per w/c)
Total length of 22 w/cs: 93.9 km
Nakkas installed (Nos.): 1659 (75.41 per w/c)
Culverts constructed (Nos.): 58 (2.63 per w/c)
Av. length of improved w/c: 4.27 km

Program Management Unit Annual Monitoring Report 2005-06
National Program for Improvement of Watercourses (Punjab Component) 49
This graph depicts the percentage lining of the watercourses improved & verified in the district.
PHYSICAL VERIFICATIONS: PWMC has to conduct four mandatory visits to each under improvement watercourse in order to certify the works executed at site. A target of 22 translates into 88 site visits certifying S&D, ICR-I, ICR-II & FCR. Following graph portrays that 37 certifications were made after March, 2006 i.e. during last quarter & onwards. The chart given below depicts activity level during various months. FINANCIAL PROFILE: During financial year 2005-06, an amount of Rs. 20.32 million was allocated to the district under various heads, against which Rs. 19.86 million (98%) were utilized.
Head Allocation (Rs.) Exp. (Rs.) Balance (Rs.) Utilization
Establishment Charges - - - 0% Purchase of Durable Goods - - - 0% Repair, Maintenance, C & S - - - 0% Civil Works (Total) 20,326,382 *19,866,942 459,440 98% Total 20,326,382 19,866,942 459,440 98%
*Total Amount transferred to WUAs for Civil Works.
Bricklining %age
73%
27%BrickliningEarthen works
ICR-I, ICR-II & FCR Verifications
-5
0
5
10
15
20
25
30
01-1
2-05
02-0
1-06
01-0
2-06
01-0
3-06
04-0
4-06
29-0
4-06
01-0
6-06
01-0
7-06
02-0
8-06
30-0
8-06
Period
Ver
ifica
tions
ICR-I ICR-II
FCR
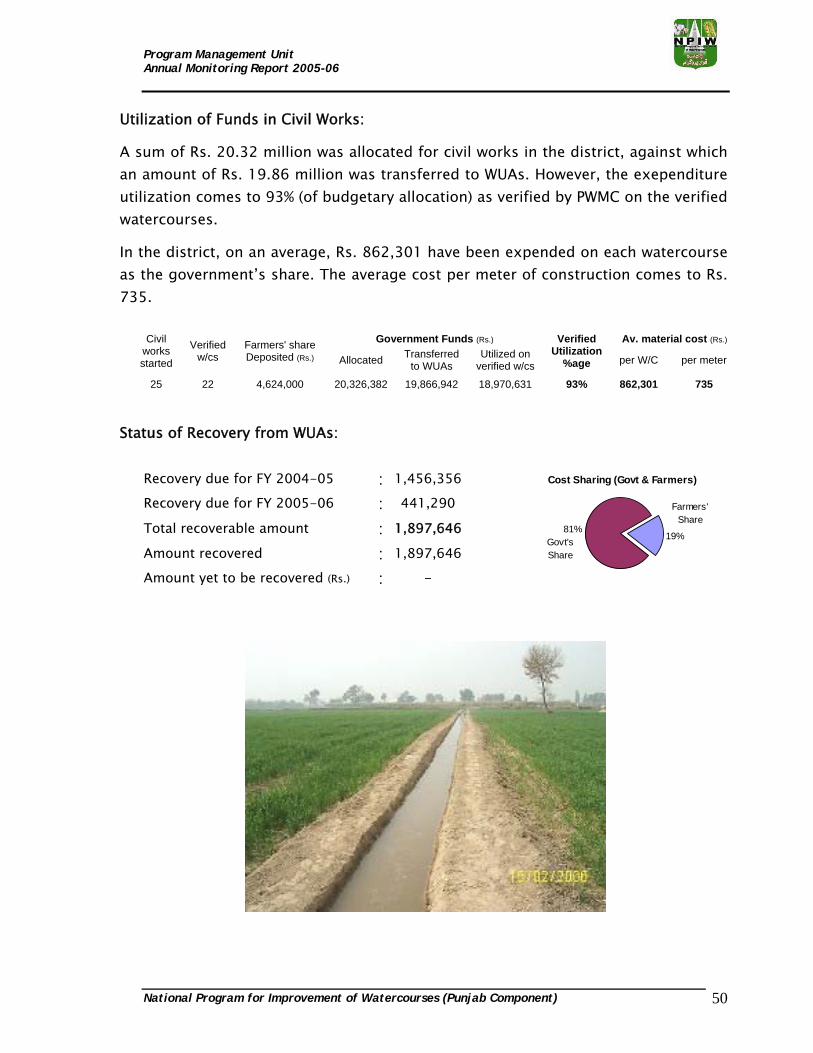
Program Management Unit Annual Monitoring Report 2005-06
National Program for Improvement of Watercourses (Punjab Component) 50
Utilization of Funds in Civil Works:
A sum of Rs. 20.32 million was allocated for civil works in the district, against which an amount of Rs. 19.86 million was transferred to WUAs. However, the exependiture utilization comes to 93% (of budgetary allocation) as verified by PWMC on the verified watercourses.
In the district, on an average, Rs. 862,301 have been expended on each watercourse as the government’s share. The average cost per meter of construction comes to Rs. 735.
Government Funds (Rs.) Av. material cost (Rs.) Civil works started
Verified w/cs
Farmers' share Deposited (Rs.) Allocated Transferred
to WUAs Utilized on
verified w/cs
Verified Utilization
%age per W/C per meter
25 22 4,624,000 20,326,382 19,866,942 18,970,631 93% 862,301 735
Status of Recovery from WUAs:
Recovery due for FY 2004-05 : 1,456,356
Recovery due for FY 2005-06 : 441,290
Total recoverable amount : 1,897,646
Amount recovered : 1,897,646
Amount yet to be recovered (Rs.) : -
Cost Sharing (Govt & Farmers)
19%81%
Farmers'Share
Govt'sShare

Program Management Unit Annual Monitoring Report 2005-06
National Program for Improvement of Watercourses (Punjab Component) 51
MUZAFFARGARH
During the last year, i.e. FY 2004-05, this district achieved 100% of the targets by completing 90 watercourses against the assigned target of 90.
During the year under review, the performance is up to the mark. Although the target was 3 times than last year i.e. 270 watercourses, yet the district registered completion / verification of 270 watercourses (100%) with the deployment of following staff.
Mr. Zafar Ahmad Nasir : EDO (Agriculture) Mr. Rahim Bakhsh Khan : DO (OFWM) AAEs/DDOs : 17 WMOs : 20 Supervisors : 104 Watercourses per supervisor
:
2.6 watercourses
Overall Watercourse Statistics:
Improved under NPIW Total W/Cs Improved Un-
improved
Planned for improvement under NPIW FY 2004-5 FY 2005-6 Total
Remaining W/Cs
4447 2390 2057 1929 90 270 360 1569
Civil Works executed in FY 2005-06 (major indicators):
Target FY 2005-06: 270
Civil works undertaken: 278
FCRs submitted: 270
Achievement / FCRs verified: 270 (100% of the target)
Watercourses deferred: 0
Quantum of Civil Works (Verified):
Earthen improved length: 774.3 km
Lined length: 269.5 km (0.99 km per w/c)
Total length of 270 w/cs: 1043.8 km
Nakkas installed (Nos.): 17358 (64.28 per w/c)
Culverts constructed (Nos.): 797 (2.95 per w/c)
Av. length of improved w/c: 3.87 km

Program Management Unit Annual Monitoring Report 2005-06
National Program for Improvement of Watercourses (Punjab Component) 52
This graph depicts the percentage lining of the watercourses improved & verified in the district.
PHYSICAL VERIFICATIONS: PWMC has to conduct four mandatory visits to each under improvement watercourse in order to certify the works executed at site. A target of 270 translates into 1080 site visits certifying S&D, ICR-I, ICR-II & FCR. Following graph portrays that 522 certifications were made after March, 2006 i.e. during last quarter & onwards. The chart given below depicts activity level during various months. FINANCIAL PROFILE: During financial year 2005-06, an amount of Rs. 243.53 million was allocated to the district under various heads, against which Rs. 233.91 million (96%) were utilized.
Head Allocation (Rs.) Exp. (Rs.) Balance (Rs.) Utilization
Establishment Charges 24,996,162 19,317,815 5,678,347 77% Purchase of Durable Goods - - - - Repair, Maintenance, C & S 2055416 1,689,043 366,373 82% Civil Works (Total) 216,483,926 *212,908,225 3,575,701 98% Total 243,535,504 233,915,083 9,620,421 96%
*Total Amount transferred to WUAs for Civil Works.
Bricklining %age
74%26%
BrickliningEarthen works
ICR-I, ICR-II & FCR Verifications
-50
0
50
100
150
200
250
300
350
01-1
2-05
02-0
1-06
01-0
2-06
01-0
3-06
04-0
4-06
29-0
4-06
01-0
6-06
01-0
7-06
02-0
8-06
30-0
8-06
Period
Ver
ifica
tions
ICR-I ICR-II
FCR

Program Management Unit Annual Monitoring Report 2005-06
National Program for Improvement of Watercourses (Punjab Component) 53
Utilization of Funds in Civil Works:
A sum of Rs. 216.48 million was allocated for civil works in the district, against which an amount of Rs. 212.90 million was transferred to WUAs. However, the exependiture utilization comes to 104% (of budgetary allocation) as verified by PWMC on the verified watercourses, signifying that some amount is yet to be paid to WUAs.
In the district, on an average, Rs. 833,966 have been expended on each watercourse as the government’s share. The average cost per meter of construction comes to Rs. 835.
Government Funds (Rs.) Av. material cost (Rs.) Civil works started
Verified w/cs
Farmers' share Deposited (Rs.) Allocated Transferred
to WUAs Utilized on
verified w/cs
Verified Utilization
%age per W/C per meter
278 270 38,048,000 216,483,926 212,908,225 225,170,942 104% 833,966 835
Status of Recovery from WUAs:
Recovery due for FY 2004-05 : 322,165
Recovery due for FY 2005-06 : 11,533,471
Total recoverable amount : 11,855,636
Amount recovered : 11,401,326
Amount yet to be recovered (Rs.) : 454,310
Cost Sharing (Govt & Farmers)
15%85%
Farmers'Share
Govt'sShare
Program Management Unit Annual Monitoring Report 2005-06
National Program for Improvement of Watercourses (Punjab Component) 54
RAJANPUR
During the last year, i.e. FY 2004-05, this district accomplished 100% of the targets by completing 53 watercourses against the assigned target of 53.
During the year under review, the performance is again satisfactory. The target was 2.5 times than last year i.e. 135 watercourses, yet the district registered completion/verification of 135 watercourses (100%). Following team in the district accomplished the task
Mr. Noor Ahmad Khan : EDO (Agriculture) Mr. Munir Ahmed Khan : DO (OFWM) AAEs/DDOs : 10 WMOs : 11 Supervisors : 39 Watercourses per supervisor
:
3.5 watercourses
Overall Watercourse Statistics:
Improved under NPIW Total W/Cs Improved Un-
improved
Planned for improvement under NPIW FY 2004-5 FY 2005-6 Total
Remaining W/Cs
2357 939 1418 1113 53 135 188 925
Civil Works executed in FY 2005-06 (major indicators):
Target FY 2005-06: 135
Civil works undertaken: 155
FCRs submitted: 135
Achievement / FCRs verified: 135 (100% of the target)
Watercourses deferred: 0
Quantum of Civil Works (Verified):
Earthen improved length: 290.3 km
Lined length: 91.6 km (0.68 km per w/c)
Total length of 135 w/cs: 381.9 km
Nakkas installed (Nos.): 6599 (48.88 per w/c)
Culverts constructed (Nos.): 280 (2.07 per w/c)
Av. length of improved w/c: 2.83 km

Program Management Unit Annual Monitoring Report 2005-06
National Program for Improvement of Watercourses (Punjab Component) 55
This graph depicts the percentage lining of the watercourses improved & verified in the district.
PHYSICAL VERIFICATIONS: PWMC has to conduct four mandatory visits to each under improvement watercourse in order to certify the works executed at site. A target of 135 translates into 540 site visits certifying S&D, ICR-I, ICR-II & FCR. Following graph portrays that 276 certifications were made after March, 2006 i.e. during last quarter & onwards. The chart given below depicts activity level during various months.
FINANCIAL PROFILE: During financial year 2005-06, an amount of Rs. 107.34 million was allocated to the district under various heads, against which Rs. 92.70 million (86%) were utilized.
Head Allocation (Rs.) Exp. (Rs.) Balance (Rs.) Utilization
Establishment Charges 15,578,221 10,304,977 5,273,244 66% Purchase of Durable Goods - - - - Repair, Maintenance, C & S 1653589 1,062,709 590,880 64% Civil Works (Total) 90,111,913 *81,332,881 8,779,032 90% Total 107,343,723 92,700,567 14,643,156 86%
*Total Amount transferred to WUAs for Civil Works.
Bricklining %age
76% 24%BrickliningEarthen works
ICR-I, ICR-II & FCR Verifications
-20
0
20
40
60
80
100
120
140
160
180
01-1
2-05
02-0
1-06
01-0
2-06
01-0
3-06
04-0
4-06
29-0
4-06
01-0
6-06
01-0
7-06
02-0
8-06
30-0
8-06
Period
Ver
ifica
tions
ICR-I ICR-II
FCR

Program Management Unit Annual Monitoring Report 2005-06
National Program for Improvement of Watercourses (Punjab Component) 56
Utilization of Funds in Civil Works:
A sum of Rs. 90.11 million was allocated for civil works in the district, against which an amount of Rs. 81.33 million was transferred to WUAs. However, the exependiture utilization comes to 84% (of budgetary allocation) as verified by PWMC on the verified watercourses.
In the district, on an average, Rs. 562,961 have been expended on each watercourse as the government’s share. The average cost per meter of construction comes to Rs. 830.
Government Funds (Rs.) Av. material cost (Rs.) Civil works started
Verified w/cs
Farmers' share
Deposited (Rs.) Allocated Transferred to WUAs
Utilized on verified w/cs
Verified Utilization
%age per W/C per meter
155 135 24,300,000 90,111,913 81,332,881 75,999,804 84% 562,961 830
Status of Recovery from WUAs:
Recovery due for FY 2004-05 : 607,977
Recovery due for FY 2005-06 : 2,794,773
Total recoverable amount : 3,402,750
Amount recovered : 2,727,464
Amount yet to be recovered (Rs.) : 675,286
Cost Sharing (Govt & Farmers)
23%
77%Farmers'
Share
Govt'sShare

Program Management Unit Annual Monitoring Report 2005-06
National Program for Improvement of Watercourses (Punjab Component) 57
FAISLABAD During the last year, i.e. FY 2004-05, this district had achieved only 90% of the targets by completing 161 watercourses against the assigned target of 179.
However during the year under review, the performance has advanced. Chasing the target of 120 watercourses, the district registered completion / verification of 129 watercourses (107%) with the deployment of following staff.
Mr. M. Ashraf : EDO (Agriculture) Mr. Muhammad Aleem Rao : DO (OFWM) AAEs/DDOs : 9 WMOs : 9 Supervisors : 35 Watercourses per supervisor
:
3.7 watercourses
Overall Watercourse Statistics:
Improved under NPIW Total W/Cs Improved Un-
improved
Planned for improvement under NPIW FY 2004-5 FY 2005-6 Total
Remaining W/Cs
2741 1733 1008 733 161 129 290 443
Civil Works executed in FY 2005-06 (major indicators):
Target FY 2005-06: 120
Civil works undertaken: 130
FCRs submitted: 130
Achievement / FCRs verified: 129 (107% of the target)
Watercourses deferred: 1
Quantum of Civil Works (Verified):
Earthen improved length: 418.8 km
Lined length: 138.3 km (1.16 km per w/c)
Total length of 129 w/cs: 557.1 km
Nakkas installed (Nos.): 4363 (36.66 per w/c)
Culverts constructed (Nos.): 133 (1.12 per w/c)
Av. length of improved w/c: 4.32 km

Program Management Unit Annual Monitoring Report 2005-06
National Program for Improvement of Watercourses (Punjab Component) 58
This graph depicts the percentage lining of the watercourses improved & verified in the district.
PHYSICAL VERIFICATIONS: PWMC has to conduct four mandatory visits to each under improvement watercourse in order to certify the works executed at site. A target of 120 translates into 480 site visits certifying S&D, ICR-I, ICR-II & FCR. Following graph portrays that 242 certifications were made after March, 2006 i.e. during last quarter & onwards. The chart given below depicts activity level during various months.
FINANCIAL PROFILE: During financial year 2005-06, an amount of Rs. 116.36 million was allocated to the district under various heads, against which Rs. 107.91 million (93%) were utilized.
Head Allocation (Rs.) Exp. (Rs.) Balance (Rs.) Utilization
Establishment Charges 14,424,216 10,279,675 4,144,541 71% Purchase of Durable Goods 700000 629000 71,000 90% Repair, Maintenance, C & S 1842884 1,484,071 358,813 81% Civil Works (Total) 99,394,225 *95,524,864 3,869,361 96% Total 116,361,325 107,917,610 8,443,715 93%
*Total Amount transferred to WUAs for Civil Works.
Bricklining %age
75%25%
BrickliningEarthen works
ICR-I, ICR-II & FCR Verifications
-20
0
20
40
60
80
100
120
140
01-1
2-05
02-0
1-06
01-0
2-06
01-0
3-06
04-0
4-06
29-0
4-06
01-0
6-06
01-0
7-06
02-0
8-06
30-0
8-06
Period
Verif
icat
ions
ICR-I ICR-II
FCR

Program Management Unit Annual Monitoring Report 2005-06
National Program for Improvement of Watercourses (Punjab Component) 59
Utilization of Funds in Civil Works:
A sum of Rs. 99.39 million was allocated for civil works in the district, against which an amount of Rs. 95.52 million was transferred to WUAs. A bit higher amount was verified by PWMC on the verified watercourses than the budgetary allocation which is to be paid to WUAs.
In the district, on an average, Rs. 773,223 have been expended on each watercourse as the government’s share. The average cost per meter of construction comes to Rs. 721.
Government Funds (Rs.) Av. material cost (Rs.) Civil works started
Verified w/cs
Farmers' share
Deposited (Rs.) Allocated Transferred to WUAs
Utilized on verified w/cs
Verified Utilization
%age per W/C per meter
130 129 20,889,000 99,394,225 95,524,864 99,745,873 100% 773,223 721
Status of Recovery from WUAs:
Recovery due for FY 2004-05 : 3,755,002
Recovery due for FY 2005-06 : 3,402,467
Total recoverable amount : 7,157,469
Amount recovered : 5,210,503
Amount yet to be recovered (Rs.) : 1,946,966
Cost Sharing (Govt & Farmers)
18%82%
Farmers'Share
Govt'sShare

Program Management Unit Annual Monitoring Report 2005-06
National Program for Improvement of Watercourses (Punjab Component) 60
JHANG
During the last year, i.e. FY 2004-05, this district achieved 101% of the targets by completing 65 watercourses against the assigned target of 64.
During the year under review, the performance has been satisfactory again. The target was almost 3.6 times than last year i.e. 230 watercourses, yet the district registered completion / verification of 213 watercourses (93%) with the deployment of following staff.
Mr. Nazeer Hussain Javed : EDO (Agriculture) Mr. Sabtain Farooq Cheema : DO (OFWM) AAEs/DDOs : 12 WMOs : 10 Supervisors : 79 Watercourses per supervisor
:
2.7 watercourses
Overall Watercourse Statistics:
Improved under NPIW Total W/Cs Improved Un-
improved
Planned for improvement under NPIW FY 2004-5 FY 2005-6 Total
Remaining W/Cs
2377 904 1473 1405 65 213 278 1127
Civil Works executed in FY 2005-06 (major indicators):
Target FY 2005-06: 230
Civil works undertaken: 234
FCRs submitted: 230
Achievement / FCRs verified: 213 (93% of the target)
Watercourses deferred: 17
Quantum of Civil Works (Verified):
Earthen improved length: 745.8 km
Lined length: 149.4 km (0.70 km per w/c)
Total length of 213 w/cs: 895.2 km
Nakkas installed (Nos.): 7656 (35.94 per w/c)
Culverts constructed (Nos.): 272 (1.28 per w/c)
Av. length of improved w/c: 4.20 km

Program Management Unit Annual Monitoring Report 2005-06
National Program for Improvement of Watercourses (Punjab Component) 61
This graph depicts the percentage lining of the watercourses improved & verified in the district.
PHYSICAL VERIFICATIONS: PWMC has to conduct four mandatory visits to each under improvement watercourse in order to certify the works executed at site. A target of 230 translates into 920 site visits certifying S&D, ICR-I, ICR-II & FCR. Following graph portrays that 468 certifications were made after March, 2006 i.e. during last quarter & onwards. The chart given below depicts activity level during various months.
FINANCIAL PROFILE: During financial year 2005-06, an amount of Rs. 164.17 million was allocated to the district under various heads, against which Rs. 143.56 million (87%) were utilized.
Head Allocation (Rs.) Exp. (Rs.) Balance (Rs.) Utilization
Establishment Charges 19,599,758 14,214,887 5,384,871 73% Purchase of Durable Goods - - - - Repair, Maintenance, C & S 1984242 1,396,401 587,841 70% Civil Works (Total) 142,591,225 *127,957,997 14,633,228 90% Total 164,175,225 143,569,285 20,605,940 87%
*Total Amount transferred to WUAs for Civil Works.
Bricklining %age
83%
17%
BrickliningEarthen works
ICR-I, ICR-II & FCR Verifications
-50
0
50
100
150
200
250
300
01-1
2-05
02-0
1-06
01-0
2-06
01-0
3-06
04-0
4-06
29-0
4-06
01-0
6-06
01-0
7-06
02-0
8-06
30-0
8-06
Period
Verif
icat
ions
ICR-I ICR-II
FCR

Program Management Unit Annual Monitoring Report 2005-06
National Program for Improvement of Watercourses (Punjab Component) 62
Utilization of Funds in Civil Works:
A sum of Rs. 142.59 million was allocated for civil works in the district, against which an amount of Rs. 127.95 million was transferred to WUAs. However, the exependiture utilization comes to 80% (of budgetary allocation) as verified by PWMC on the verified watercourses.
In the district, on an average, Rs. 669,442 have been expended on each watercourse as the government’s share. The average cost per meter of construction comes to Rs. 954.
Government Funds (Rs.) Av. material cost (Rs.) Civil works started
Verified w/cs
Farmers' share Deposited (Rs.) Allocated Transferred
to WUAs Utilized on
verified w/cs
Verified Utilization
%age per W/C per meter
234 213 24,826,000 142,591,225 127,957,997 114,116,937 80% 669,442 954
Status of Recovery from WUAs:
Recovery due for FY 2004-05 : 581,126
Recovery due for FY 2005-06 : 3,973,898
Total recoverable amount : 4,555,024
Amount recovered : 2,779,460
Amount yet to be recovered (Rs.) : 1,775,564
Cost Sharing (Govt & Farmers)
16%84%Farmers'
Share
Govt'sShare

Program Management Unit Annual Monitoring Report 2005-06
National Program for Improvement of Watercourses (Punjab Component) 63
TOBA TEK SINGH
During the last year, i.e. FY 2004-05, this district was able to achieve 93% of the targets by completing 112 watercourses against the assigned target of 120. However during the year under review, the performance is up to the mark. Chasing the target of 90 watercourses, the district registered completion / verification of 96 watercourses (107%) with the deployment of following staff.
Mr. Shafiq Ahmad : EDO (Agriculture) Mr. Muhammad Rafiq Amjad : DO (OFWM) AAEs/DDOs : 6 WMOs : 5 Supervisors : 28 Watercourses per supervisor
:
3.4 watercourses
Overall Watercourse Statistics:
Improved under NPIW Total W/Cs Improved Un-
improved
Planned for improvement under NPIW FY 2004-5 FY 2005-6 Total
Remaining W/Cs
1361 856 505 371 112 96 208 163
Civil Works executed in FY 2005-06 (major indicators):
Target FY 2005-06: 90
Civil works undertaken: 100
FCRs submitted: 98
Achievement / FCRs verified: 96 (107% of the target)
Watercourses deferred: 2
Quantum of Civil Works (Verified):
Earthen improved length: 367.4 km
Lined length: 101.6 km (1.06 km per w/c)
Total length of 96 w/cs: 469 km
Nakkas installed (Nos.): 3497 (36.42 per w/c)
Culverts constructed (Nos.): 84 (0.87 per w/c)
Av. length of improved w/c: 4.89 km

Program Management Unit Annual Monitoring Report 2005-06
National Program for Improvement of Watercourses (Punjab Component) 64
This graph depicts the percentage lining of the watercourses improved & verified in the district.
PHYSICAL VERIFICATIONS: PWMC has to conduct four mandatory visits to each under improvement watercourse in order to certify the works executed at site. A target of 90 translates into 360 site visits certifying S&D, ICR-I, ICR-II & FCR. Following graph portrays that 178 certifications were made after March, 2006 i.e. during last quarter & onwards. The chart given below depicts activity level during various months.
FINANCIAL PROFILE: During financial year 2005-06, an amount of Rs. 81.99 million was allocated to the district under various heads, against which Rs. 72.50 million (88%) were utilized.
Head Allocation (Rs.) Exp. (Rs.) Balance (Rs.) Utilization
Establishment Charges 8,376,842 5,031,240 3,345,602 60% Purchase of Durable Goods 40000 39270 730 98% Repair, Maintenance, C & S 1086458 812,625 273,833 75% Civil Works (Total) 72,495,278 *66,619,110 5,876,168 92% Total 81,998,578 72,502,245 9,496,333 88%
*Total Amount transferred to WUAs for Civil Works.
Bricklining %age
78% 22%BrickliningEarthen works
ICR-I, ICR-II & FCR Verifications
-20
0
20
40
60
80
100
120
01-1
2-05
02-0
1-06
01-0
2-06
01-0
3-06
04-0
4-06
29-0
4-06
01-0
6-06
01-0
7-06
02-0
8-06
30-0
8-06
Period
Veri
ficat
ions
ICR-I ICR-IIFCR

Program Management Unit Annual Monitoring Report 2005-06
National Program for Improvement of Watercourses (Punjab Component) 65
Utilization of Funds in Civil Works:
A sum of Rs. 72.49 million was allocated for civil works in the district, against which an amount of Rs. 66.61 million was transferred to WUAs. However, the exependiture utilization comes to 98% (of budgetary allocation) as verified by PWMC on the verified watercourses.
In the district, on an average, Rs. 744,521 have been expended on each watercourse as the government’s share. The average cost per meter of construction comes to Rs. 703.
Government Funds (Rs.) Av. material cost (Rs.) Civil works started
Verified w/cs
Farmers' share
Deposited (Rs.) Allocated Transferred to WUAs
Utilized on verified w/cs
Verified Utilization
%age per W/C per meter
100 96 13,482,000 72,495,278 66,619,110 71,474,063 98% 744,521 703
Status of Recovery from WUAs:
Recovery due for FY 2004-05 : 4,120,128
Recovery due for FY 2005-06 : 901,980
Total recoverable amount : 5,022,108
Amount recovered : 4,232,241
Amount yet to be recovered (Rs.) : 789,867
Cost Sharing (Govt & Farmers)
17%83%
Farmers'Share
Govt'sShare
Program Management Unit Annual Monitoring Report 2005-06
National Program for Improvement of Watercourses (Punjab Component) 66
GUJRANWALA During the last year, i.e. FY 2004-05, this district attained only 88% of the targets by completing 79 watercourses against the assigned target of 90.
However during the year under review, the performance has advanced. Chasing the target of 95 watercourses, the district registered completion / verification of 109 watercourses (115%) with the deployment of following staff.
Mr. Shah Muhammad Alvi : EDO (Agriculture) Mr. Muhammad Zikriya Shah : DO (OFWM) AAEs/DDOs : 9 WMOs : 7 Supervisors : 40 Watercourses per supervisor
:
2.7 watercourses
Overall Watercourse Statistics:
Improved under NPIW Total W/Cs Improved Un-
improved
Planned for improvement under NPIW FY 2004-5 FY 2005-6 Total
Remaining W/Cs
1868 698 1170 842 79 109 188 654
Civil Works executed in FY 2005-06 (major indicators):
Target FY 2005-06: 95
Civil works undertaken: 141
FCRs submitted: 129
Achievement / FCRs verified: 109 (115% of the target)
Watercourses deferred: 20
Quantum of Civil Works (Verified):
Earthen improved length: 291.5 km
Lined length: 46.2 km (0.42 km per w/c)
Total length of 109 w/cs: 337.7 km
Nakkas installed (Nos.): 2528 (23.2 per w/c)
Culverts constructed (Nos.): 121 (1.11 per w/c)
Av. length of improved w/c: 3.10 km

Program Management Unit Annual Monitoring Report 2005-06
National Program for Improvement of Watercourses (Punjab Component) 67
This graph depicts the percentage lining of the watercourses improved & verified in the district.
PHYSICAL VERIFICATIONS: PWMC has to conduct four mandatory visits to each under improvement watercourse in order to certify the works executed at site. A target of 95 translates into 380 site visits certifying S&D, ICR-I, ICR-II & FCR. Following graph portrays that 328 certifications were made after March, 2006 i.e. during last quarter & onwards. The chart given below depicts activity level during various months.
FINANCIAL PROFILE: During financial year 2005-06, an amount of Rs. 61.85 million was allocated to the district under various heads, against which Rs. 50.85 million (82%) were utilized.
Head Allocation (Rs.) Exp. (Rs.) Balance (Rs.) Utilization
Establishment Charges 12,323,264 7,728,856 4,594,408 63% Purchase of Durable Goods 800000 800000 - 100% Repair, Maintenance, C & S 1102416 759,809 342,607 69% Civil Works (Total) 47,630,761 *41,570,358 6,060,403 87% Total 61,856,441 50,859,023 10,997,418 82%
*Total Amount transferred to WUAs for Civil Works.
Bricklining %age
86%
14%Bricklining
Earthen works
ICR-I, ICR-II & FCR Verifications
-20
0
20
40
60
80
100
120
140
01-1
2-05
02-0
1-06
01-0
2-06
01-0
3-06
04-0
4-06
29-0
4-06
01-0
6-06
01-0
7-06
02-0
8-06
30-0
8-06
Period
Verif
icat
ions
ICR-I ICR-II
FCR

Program Management Unit Annual Monitoring Report 2005-06
National Program for Improvement of Watercourses (Punjab Component) 68
Utilization of Funds in Civil Works:
A sum of Rs. 47.63 million was allocated for civil works in the district, against which an amount of Rs. 41.57 million was transferred to WUAs. However, the exependiture utilization comes to 72% (of budgetary allocation) as verified by PWMC on the verified watercourses.
In the district, on an average, Rs. 315,497 have been expended on each watercourse as the government’s share. The average cost per meter of construction comes to Rs. 744.
Government Funds (Rs.) Av. material cost (Rs.) Civil works started
Verified w/cs
Farmers' share Deposited (Rs.) Allocated Transferred
to WUAs Utilized on
verified w/cs
Verified Utilization
%age per W/C per meter
141 109 13,681,000 47,630,761 41,570,358 34,389,273 72% 315,497 744
Status of Recovery from WUAs:
Recovery due for FY 2004-05 : 1,121,637
Recovery due for FY 2005-06 : 874,311
Total recoverable amount : 1,995,948
Amount recovered : 720,577
Amount yet to be recovered (Rs.) : 1,275,371
Cost Sharing (Govt & Farmers)
25%
75% Farmers'ShareGovt's
Share

Program Management Unit Annual Monitoring Report 2005-06
National Program for Improvement of Watercourses (Punjab Component) 69
GUJRAT
During the last year, i.e. FY 2004-05, this district achieved 94% of the targets by completing 60 watercourses / schemes against the assigned target of 64.
However during the year under review, the performance is good. Chasing the target of 31, the district registered completion / verification of 37 watercourses / schemes (119%) with the deployment of following staff.
Mr. Shahid Awan : EDO (Agriculture) Mr. Safader Ali Cheema : DO (OFWM) AAEs/DDOs : 2 WMOs : 0 Supervisors : 3 Watercourses per supervisor
:
12.3 watercourses
Overall Watercourse Statistics:
Improved under NPIW Total W/Cs Improved Un-
improved
Planned for improvement under NPIW FY 2004-5 FY 2005-6 Total
Remaining W/Cs
248 125 123 55 23 16 39 16
Barani Areas 37 21 58 -
Total (irrigated & barani) 60 37 90 -
Civil Works executed in FY 2005-06 (major indicators):
IRRIGATED BARANI TOTAL
Target FY 2005-06: 15 16 31
Civil works undertaken: 19 24 43
FCRs submitted: 18 24 42
Achievement / FCRs verified: 16 (107%) 21 (131%) 37 (119%)
Watercourses deferred: 2 3 5
Quantum of Civil Works (Verified):
Irrigated Area:
Earthen improved length: 57.2 km
Lined length: 10.6 km (0.66 km per w/c)
Total length of 16 w/cs: 67.8 km
Nakkas installed (Nos.): 626 (39.12 per w/c)

Program Management Unit Annual Monitoring Report 2005-06
National Program for Improvement of Watercourses (Punjab Component) 70
Culverts constructed (Nos.): 15 (0.94 per w/c)
Av. length of improved w/c: 4.24 km
Barani Area:
Total lining of 21 schemes: 7.473 km
Water storage tanks (Nos.): 0
Nakkas installed (Nos.): 252 (12 per w/c)
Culverts constructed (Nos.): 2
Av. length of improved schemes: 0.36 km This graph depicts the percentage lining of the watercourses improved & verified in the irrigated area of district.
PHYSICAL VERIFICATIONS: PWMC has to conduct four mandatory visits to each under improvement watercourse / scheme in order to certify the works executed at site. A target of 31 translates into 124 site visits certifying S&D, ICR-I, ICR-II & FCR. Following graph portrays that 109 certifications were made after March, 2006 i.e. during last quarter & onwards. The chart given below depicts activity level during various months.
Bricklining %age
84%
16%Bricklining
Earthen works
ICR-I, ICR-II & FCR Verifications
-505
101520253035404550
01-1
2-05
02-0
1-06
01-0
2-06
01-0
3-06
04-0
4-06
29-0
4-06
01-0
6-06
01-0
7-06
02-0
8-06
30-0
8-06
Period
Veri
ficat
ions
ICR-I ICR-IIFCR

Program Management Unit Annual Monitoring Report 2005-06
National Program for Improvement of Watercourses (Punjab Component) 71
FINANCIAL PROFILE: During financial year 2005-06, an amount of Rs. 14.93 million was allocated to the district under various heads, against which Rs. 11.45 million (77%) were utilized.
Head Allocation (Rs.) Exp. (Rs.) Balance (Rs.) Utilization
Establishment Charges - - - - Purchase of Durable Goods - - - - Repair, Maintenance, C & S 2,622,311 790,881 1,831,430 30% Civil Works (Total Irrigated) 7,540,381 *7,758,326 (217,945) 103% Civil Works (Total Barani) 4,773,402 *2,903,958 1,869,444 61% Total 14,936,094 11,453,165 3,482,929 77%
*Total Amount transferred to WUAs for Civil Works.
Utilization of Funds in Civil Works:
A sum of Rs. 12.31 million was allocated for civil works in the district, against which an amount of Rs. 10.66 million was transferred to WUAs. However, the exependiture utilization comes to 86% (of budgetary allocation) as verified by PWMC on the verified watercourses / schemes.
In the Irrigated area of the district, on an average, Rs. 211,594 have been expended on each watercourse as the government’s share. The average cost per meter of construction comes to Rs. 738.
In the Barani area of the district, on an average, Rs. 130,473 have been expended on each scheme as the government’s share. The average cost per meter of construction comes to Rs. 367.
Government Funds (Rs.) Av. material cost (Rs.) Area
Civil works started
Verified w/cs
Farmers' share
Deposited (Rs.) Allocated Transferred to WUAs
Utilized on verified w/cs
Verified Utilization
%age per w/c per meter
Irrigated 19 16 4,213,000 7,540,381 7,758,326 7,828,990 104% 211,594 738
Barani 24 21 714,000 4,773,402 2,903,958 2,739,941 57% 130,473 367
Total 43 37 4,927,000 12,313,783 10,662,284 10,568,931 86% - -
Status of Recovery from WUAs (Irrigated & Barani Areas):
Recovery due for FY 2004-05 : 136,562 Recovery due for FY 2005-06 : 48,844
Total recoverable amount : 185,406
Amount recovered : 54,325 Amount yet to be recovered (Rs.) : 131,081
Cost Sharing (Govt & Farmers)
32%
68%
Farmers'ShareGovt's
Share

Program Management Unit Annual Monitoring Report 2005-06
National Program for Improvement of Watercourses (Punjab Component) 72
HAFIZABAD
During the last year, i.e. FY 2004-05, this district managed to achieve 92% of the targets by completing 35 watercourses against the assigned target of 38.
Now during the year under review, the operations remained successful. Chasing the target of 60 watercourses, the district registered completion / verification of 61 watercourses (102%) with the deployment of following staff.
Mr. Tanveer Ahmad : EDO (Agriculture) Mr. Gulzar Muhammad : DO (OFWM) AAEs/DDOs : 5 WMOs : 3 Supervisors : 17 Watercourses per supervisor
:
3.6 watercourses
Overall Watercourse Statistics:
Improved under NPIW Total W/Cs Improved Un-
improved
Planned for improvement under NPIW FY 2004-5 FY 2005-6 Total
Remaining W/Cs
840 338 502 443 35 61 96 347
Civil Works executed in FY 2005-06 (major indicators):
Target FY 2005-06: 60
Civil works undertaken: 79
FCRs submitted: 64
Achievement / FCRs verified: 61 (102% of the target)
Watercourses deferred: 3
Quantum of Civil Works (Verified):
Earthen improved length: 179.1 km
Lined length: 29 km (0.47 km per w/c)
Total length of 61 w/cs: 208.1 km
Nakkas installed (Nos.): 1526 (25.01 per w/c)
Culverts constructed (Nos.): 90 (1.47 per w/c)
Av. length of improved w/c: 3.41 km
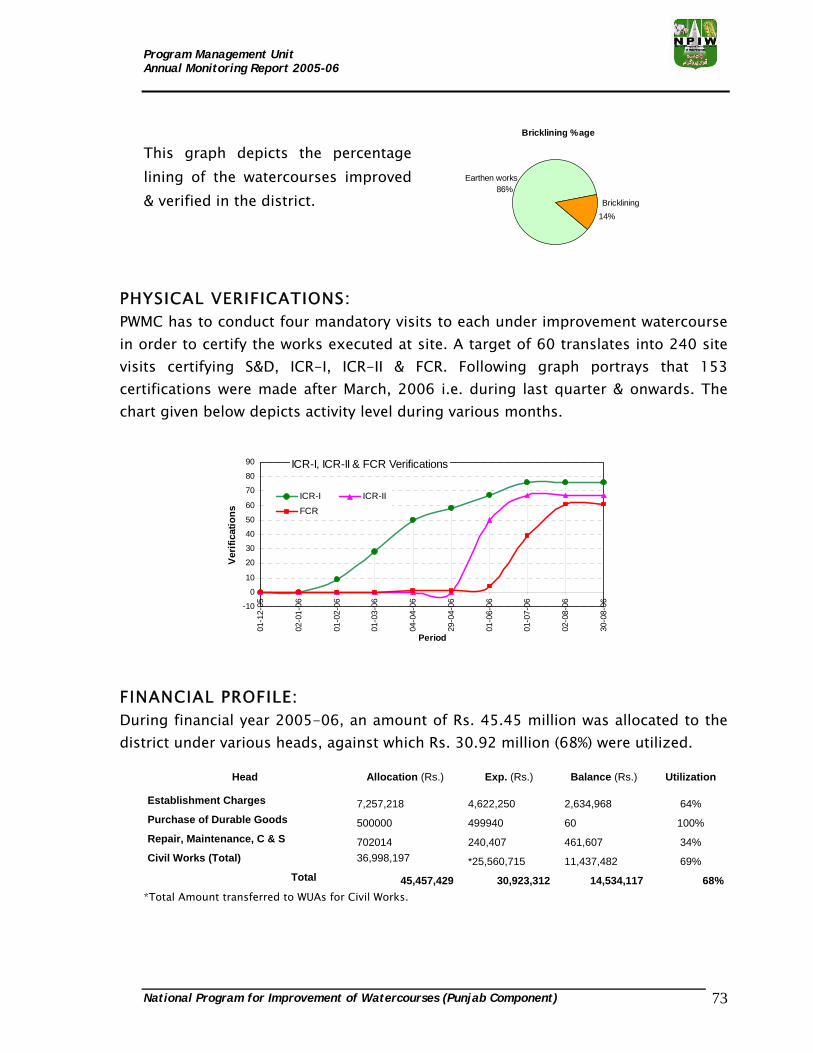
Program Management Unit Annual Monitoring Report 2005-06
National Program for Improvement of Watercourses (Punjab Component) 73
This graph depicts the percentage lining of the watercourses improved & verified in the district.
PHYSICAL VERIFICATIONS: PWMC has to conduct four mandatory visits to each under improvement watercourse in order to certify the works executed at site. A target of 60 translates into 240 site visits certifying S&D, ICR-I, ICR-II & FCR. Following graph portrays that 153 certifications were made after March, 2006 i.e. during last quarter & onwards. The chart given below depicts activity level during various months.
FINANCIAL PROFILE: During financial year 2005-06, an amount of Rs. 45.45 million was allocated to the district under various heads, against which Rs. 30.92 million (68%) were utilized.
Head Allocation (Rs.) Exp. (Rs.) Balance (Rs.) Utilization
Establishment Charges 7,257,218 4,622,250 2,634,968 64% Purchase of Durable Goods 500000 499940 60 100% Repair, Maintenance, C & S 702014 240,407 461,607 34% Civil Works (Total) 36,998,197 *25,560,715 11,437,482 69% Total 45,457,429 30,923,312 14,534,117 68%
*Total Amount transferred to WUAs for Civil Works.
Bricklining %age
86%
14%Bricklining
Earthen works
ICR-I, ICR-II & FCR Verifications
-10
0
10
20
30
40
50
60
70
80
90
01-1
2-05
02-0
1-06
01-0
2-06
01-0
3-06
04-0
4-06
29-0
4-06
01-0
6-06
01-0
7-06
02-0
8-06
30-0
8-06
Period
Veri
ficat
ions
ICR-I ICR-IIFCR

Program Management Unit Annual Monitoring Report 2005-06
National Program for Improvement of Watercourses (Punjab Component) 74
Utilization of Funds in Civil Works:
A sum of Rs. 36.99 million was allocated for civil works in the district, against which an amount of Rs. 25.56 million was transferred to WUAs. However, the exependiture utilization comes to 59% (of budgetary allocation) as verified by PWMC on the verified watercourses.
In the district, on an average, Rs. 360,392 have been expended on each watercourse as the government’s share. The average cost per meter of construction comes to Rs. 758.
Government Funds (Rs.) Av. material cost (Rs.) Civil works started
Verified w/cs
Farmers' share
Deposited (Rs.) Allocated Transferred to WUAs
Utilized on verified w/cs
Verified Utilization
%age per W/C per meter
79 61 9,942,000 36,998,197 25,560,715 21,983,966 59% 360,392 758
Status of Recovery from WUAs:
Recovery due for FY 2004-05 : 248,067
Recovery due for FY 2005-06 : 417,689
Total recoverable amount : 665,756
Amount recovered : 321,010
Amount yet to be recovered (Rs.) : 344,746
Cost Sharing (Govt & Farmers)
28%
72%Farmers'
ShareGovt'sShare

Program Management Unit Annual Monitoring Report 2005-06
National Program for Improvement of Watercourses (Punjab Component) 75
MANDI BAHA-UD-DIN
During the last year, i.e. FY 2004-05, this district accomplished 266% of the targets by completing 80 watercourses against the assigned target of 30.
However during the year under review, the performance is not as good. Chasing the target of 113 watercourses, the district registered completion / verification of 95 watercourses (84%) with the deployment of following staff.
Mr. Rasheed Ahmad Gondal : EDO (Agriculture) Mr. Akhtar Ali Kamboh : DO (OFWM) AAEs/DDOs : 6 WMOs : 6 Supervisors : 46 Watercourses per supervisor
:
2.0 watercourses
Overall Watercourse Statistics:
Improved under NPIW Total W/Cs Improved Un-
improved
Planned for improvement under NPIW FY 2004-5 FY 2005-6 Total
Remaining W/Cs
1218 457 761 700 80 95 175 525
Civil Works executed in FY 2005-06 (major indicators):
Target FY 2005-06: 113
Civil works undertaken: 130
FCRs submitted: 116
Achievement / FCRs verified: 95 (84% of the target)
Watercourses deferred: 21
Quantum of Civil Works (Verified):
Earthen improved length: 237.4 km
Lined length: 79.2 km (0.83 km per w/c)
Total length of 95 w/cs: 324.2 km
Nakkas installed (Nos.): 4485 (47.21 per w/c)
Culverts constructed (Nos.): 290 (3.05 per w/c)
Av. length of improved w/c: 3.41 km
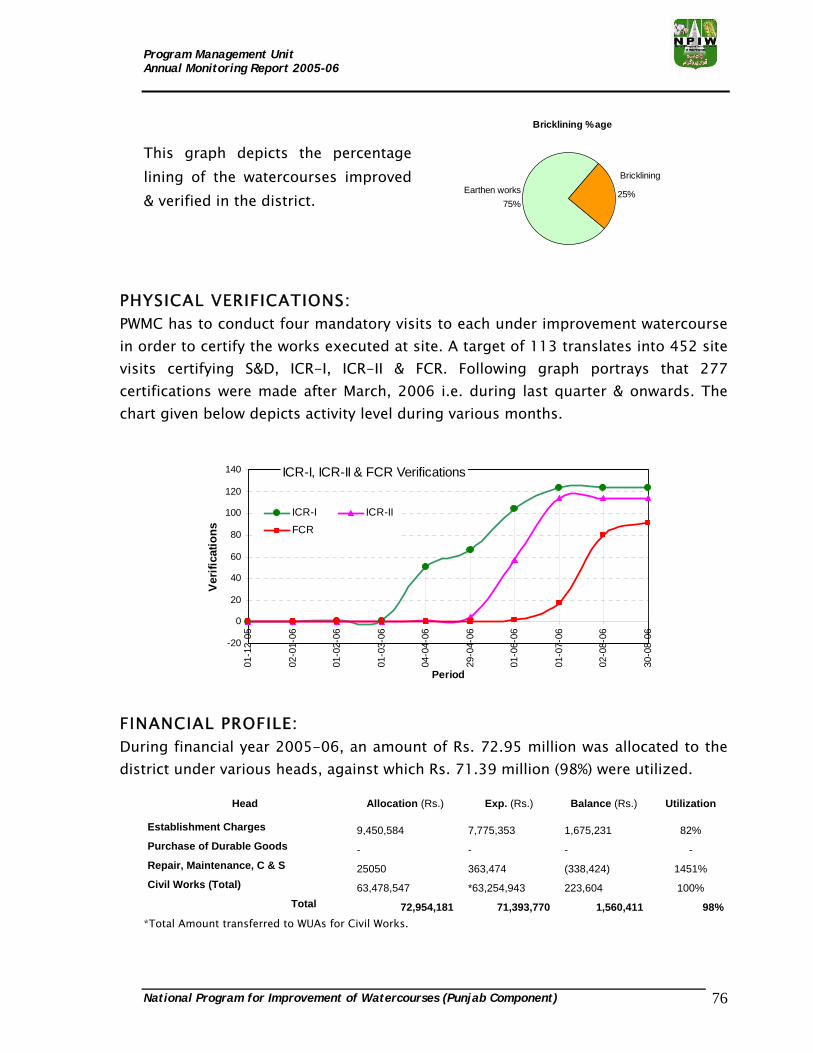
Program Management Unit Annual Monitoring Report 2005-06
National Program for Improvement of Watercourses (Punjab Component) 76
This graph depicts the percentage lining of the watercourses improved & verified in the district.
PHYSICAL VERIFICATIONS: PWMC has to conduct four mandatory visits to each under improvement watercourse in order to certify the works executed at site. A target of 113 translates into 452 site visits certifying S&D, ICR-I, ICR-II & FCR. Following graph portrays that 277 certifications were made after March, 2006 i.e. during last quarter & onwards. The chart given below depicts activity level during various months.
FINANCIAL PROFILE: During financial year 2005-06, an amount of Rs. 72.95 million was allocated to the district under various heads, against which Rs. 71.39 million (98%) were utilized.
Head Allocation (Rs.) Exp. (Rs.) Balance (Rs.) Utilization
Establishment Charges 9,450,584 7,775,353 1,675,231 82% Purchase of Durable Goods - - - - Repair, Maintenance, C & S 25050 363,474 (338,424) 1451% Civil Works (Total) 63,478,547 *63,254,943 223,604 100% Total 72,954,181 71,393,770 1,560,411 98%
*Total Amount transferred to WUAs for Civil Works.
Bricklining %age
75%25%
BrickliningEarthen works
ICR-I, ICR-II & FCR Verifications
-20
0
20
40
60
80
100
120
140
01-1
2-05
02-0
1-06
01-0
2-06
01-0
3-06
04-0
4-06
29-0
4-06
01-0
6-06
01-0
7-06
02-0
8-06
30-0
8-06
Period
Verif
icat
ions
ICR-I ICR-IIFCR

Program Management Unit Annual Monitoring Report 2005-06
National Program for Improvement of Watercourses (Punjab Component) 77
Utilization of Funds in Civil Works:
A sum of Rs. 63.47 million was allocated for civil works in the district, which was completely transferred to WUAs. However, the exependiture utilization comes to 87% (of budgetary allocation) as verified by PWMC on the verified watercourses.
In the district, on an average, Rs. 579,795 have been expended on each watercourse as the government’s share. The average cost per meter of construction comes to Rs. 695.
Government Funds (Rs.) Av. material cost (Rs.) Civil works started
Verified w/cs
Farmers' share
Deposited (Rs.) Allocated Transferred to WUAs
Utilized on verified w/cs
Verified Utilization
%age per W/C per meter
130 95 24,578,000 63,478,547 63,254,943 55,080,546 87% 579,795 695
Status of Recovery from WUAs:
Recovery due for FY 2004-05 : 349,384
Recovery due for FY 2005-06 : 208,674
Total recoverable amount : 558,058
Amount recovered : 216,000
Amount yet to be recovered (Rs.) : 342,058
Cost Sharing (Govt & Farmers)
28%
72% Farmers'ShareGovt's
Share

Program Management Unit Annual Monitoring Report 2005-06
National Program for Improvement of Watercourses (Punjab Component) 78
NAROWAL
During the last year, i.e. FY 2004-05, this district achieved only 84% of the targets by completing 41 watercourses/schemes against the assigned target of 49.
Providentially during the year under review, the performance is up to the mark. Chasing the target of 41, the district registered completion / verification of 42 watercourses / schemes (102%) with the deployment of following staff.
Mr. Hazoor Ahmad Hazoor : EDO (Agriculture) Mr. Muhammad Nasir Shah : DO (OFWM) AAEs/DDOs : 2 WMOs : 2 Supervisors : 4 Watercourses per supervisor
:
10.5 watercourses
Overall Watercourse Statistics:
Improved under NPIW Total W/Cs Improved Un-
improved
Planned for improvement under NPIW FY 2004-5 FY 2005-6 Total
Remaining W/Cs
172 29 143 83 23 18 41 42
Barani Areas 18 24 42 -
Total (irrigated & barani) 41 42 83 -
Civil Works executed in FY 2005-06 (major indicators):
IRRIGATED BARANI TOTAL
Target FY 2005-06: 18 23 41
Civil works undertaken: 25 33 58
FCRs submitted: 18 24 42
Achievement / FCRs verified: 18 (100%) 24 (104%) 42 (102%)
Watercourses deferred: 0 0 0
Quantum of Civil Works (Verified):
Irrigated Area:
Earthen improved length: 42.9 km
Lined length: 6.9 km (0.38 km per w/c)
Total length of 18 w/cs: 49.8 km

Program Management Unit Annual Monitoring Report 2005-06
National Program for Improvement of Watercourses (Punjab Component) 79
Nakkas installed (Nos.): 313 (17.38 per w/c)
Culverts constructed (Nos.): 12 (0.67 per w/c)
Av. length of improved w/c: 2.77 km
Barani Area:
Total lining of 24 schemes: 6.998 km
Water storage tanks (Nos.): 1
Nakkas installed (Nos.): 258 (10.75 per w/c)
Culverts constructed (Nos.): 0
Av. length of improved schemes: 0.29 km This graph depicts the percentage lining of the watercourses improved & verified in the irrigated area of district.
PHYSICAL VERIFICATIONS: PWMC has to conduct four mandatory visits to each under improvement watercourse / scheme in order to certify the works executed at site. A target of 41 translates into 164 site visits certifying S&D, ICR-I, ICR-II & FCR. Following graph portrays that 92 certifications were made after March, 2006 i.e. during last quarter & onwards. The chart given below depicts activity level during various months.
Bricklining %age
86%
14%Bricklining
Earthen works
ICR-I, ICR-II & FCR Verifications
-10
0
10
20
30
40
50
01-1
2-05
02-0
1-06
01-0
2-06
01-0
3-06
04-0
4-06
29-0
4-06
01-0
6-06
01-0
7-06
02-0
8-06
30-0
8-06
Period
Verif
icat
ions
ICR-I ICR-II
FCR

Program Management Unit Annual Monitoring Report 2005-06
National Program for Improvement of Watercourses (Punjab Component) 80
FINANCIAL PROFILE: During financial year 2005-06, an amount of Rs. 19.63 million was allocated to the district under various heads, against which Rs. 10.76 million (55%) were utilized.
Head Allocation (Rs.) Exp. (Rs.) Balance (Rs.) Utilization
Establishment Charges - - - - Purchase of Durable Goods - - - - Repair, Maintenance, C & S 750,994 510,000 240,994 68% Civil Works (Total Irrigated) 14,912,437 7,023,116 7,889,321 47% Civil Works (Total Barani) 3,967,675 3,230,603 737,072 81% Total 19,631,106 10,763,719 8,867,387 55%
*Total Amount transferred to WUAs for Civil Works.
Utilization of Funds in Civil Works:
A sum of Rs. 18.88 million was allocated for civil works in the district, against which an amount of Rs. 10.25 million was transferred to WUAs. However, the exependiture utilization remained 43% (of budgetary allocation) as verified by PWMC on the verified watercourses / schemes.
In the Irrigated area of the district, on an average, Rs. 272,346 have been expended on each watercourse as the government’s share. The average cost per meter of construction comes to Rs. 710.
In the Barani area of the district, on an average, Rs. 135,249 have been expended on each scheme as the government’s share. The average cost per meter of construction comes to Rs. 464.
Government Funds (Rs.) Av. material cost (Rs.) Area
Civil works started
Verified w/cs
Farmers' share
Deposited (Rs.) Allocated Transferred to WUAs
Utilized on verified w/cs
Verified Utilization
%age per w/c per meter
Irrigated 25 18 3,260,000 14,912,437 7,023,116 4,902,185 33% 272,346 710
Barani 33 24 1,016,000 3,967,675 3,230,603 3,245,977 82% 135,249 464
Total 58 42 4,276,000 18,880,112 10,253,719 8,148,162 43% - -
Status of Recovery from WUAs (Irrigated & Barani Areas):
Recovery due for FY 2004-05 : 946,136 Recovery due for FY 2005-06 : 233,536
Total recoverable amount : 1,179,672
Amount recovered : 602,417 Amount yet to be recovered (Rs.) : 577,255
Cost Sharing (Govt & Farmers)
29%
71%Farmers'
ShareGovt'sShare
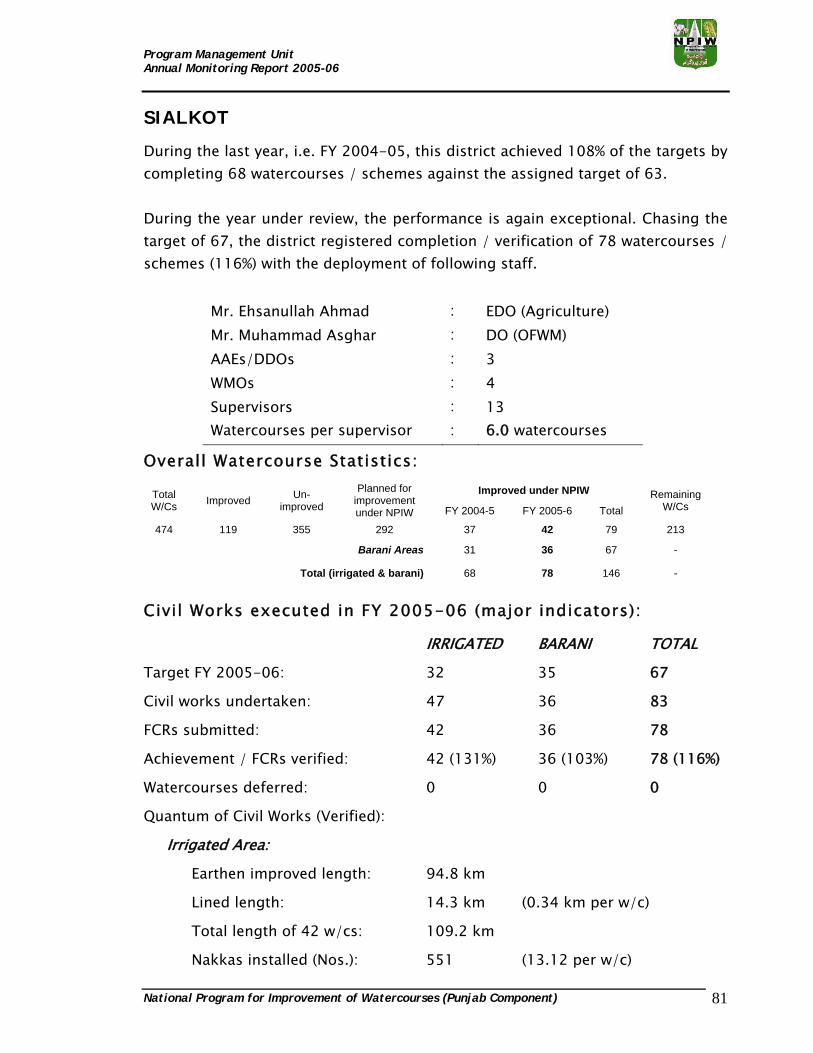
Program Management Unit Annual Monitoring Report 2005-06
National Program for Improvement of Watercourses (Punjab Component) 81
SIALKOT
During the last year, i.e. FY 2004-05, this district achieved 108% of the targets by completing 68 watercourses / schemes against the assigned target of 63. During the year under review, the performance is again exceptional. Chasing the target of 67, the district registered completion / verification of 78 watercourses / schemes (116%) with the deployment of following staff.
Mr. Ehsanullah Ahmad : EDO (Agriculture) Mr. Muhammad Asghar : DO (OFWM) AAEs/DDOs : 3 WMOs : 4 Supervisors : 13 Watercourses per supervisor
:
6.0 watercourses
Overall Watercourse Statistics:
Improved under NPIW Total W/Cs Improved Un-
improved
Planned for improvement under NPIW FY 2004-5 FY 2005-6 Total
Remaining W/Cs
474 119 355 292 37 42 79 213
Barani Areas 31 36 67 -
Total (irrigated & barani) 68 78 146 -
Civil Works executed in FY 2005-06 (major indicators):
IRRIGATED BARANI TOTAL
Target FY 2005-06: 32 35 67
Civil works undertaken: 47 36 83
FCRs submitted: 42 36 78
Achievement / FCRs verified: 42 (131%) 36 (103%) 78 (116%)
Watercourses deferred: 0 0 0
Quantum of Civil Works (Verified):
Irrigated Area:
Earthen improved length: 94.8 km
Lined length: 14.3 km (0.34 km per w/c)
Total length of 42 w/cs: 109.2 km
Nakkas installed (Nos.): 551 (13.12 per w/c)

Program Management Unit Annual Monitoring Report 2005-06
National Program for Improvement of Watercourses (Punjab Component) 82
Culverts constructed (Nos.): 52 (1.24 per w/c)
Av. length of improved w/c: 2.60 km
Barani Area:
Total lining of 36 schemes: 10.607 km
Water storage tanks (Nos.): 0
Nakkas installed (Nos.): 361 (10 per w/c)
Culverts constructed (Nos.): 1
Av. length of improved schemes: 0.29 km This graph depicts the percentage lining of the watercourses improved & verified in the Irrigated area of district.
PHYSICAL VERIFICATIONS: PWMC has to conduct four mandatory visits to each under improvement watercourse / scheme in order to certify the works executed at site. A target of 67 translates into 268 site visits certifying S&D, ICR-I, ICR-II & FCR. Following graph portrays that 196 certifications were made after March, 2006 i.e. during last quarter & onwards. The chart given below depicts activity level during various months.
Bricklining %age
86%
14%Bricklining
Earthen works
ICR-I, ICR-II & FCR Verifications
-100
10203040
506070
8090
01-1
2-05
02-0
1-06
01-0
2-06
01-0
3-06
04-0
4-06
29-0
4-06
01-0
6-06
01-0
7-06
02-0
8-06
30-0
8-06
Verif
icat
ions
ICR-I ICR-II
FCR
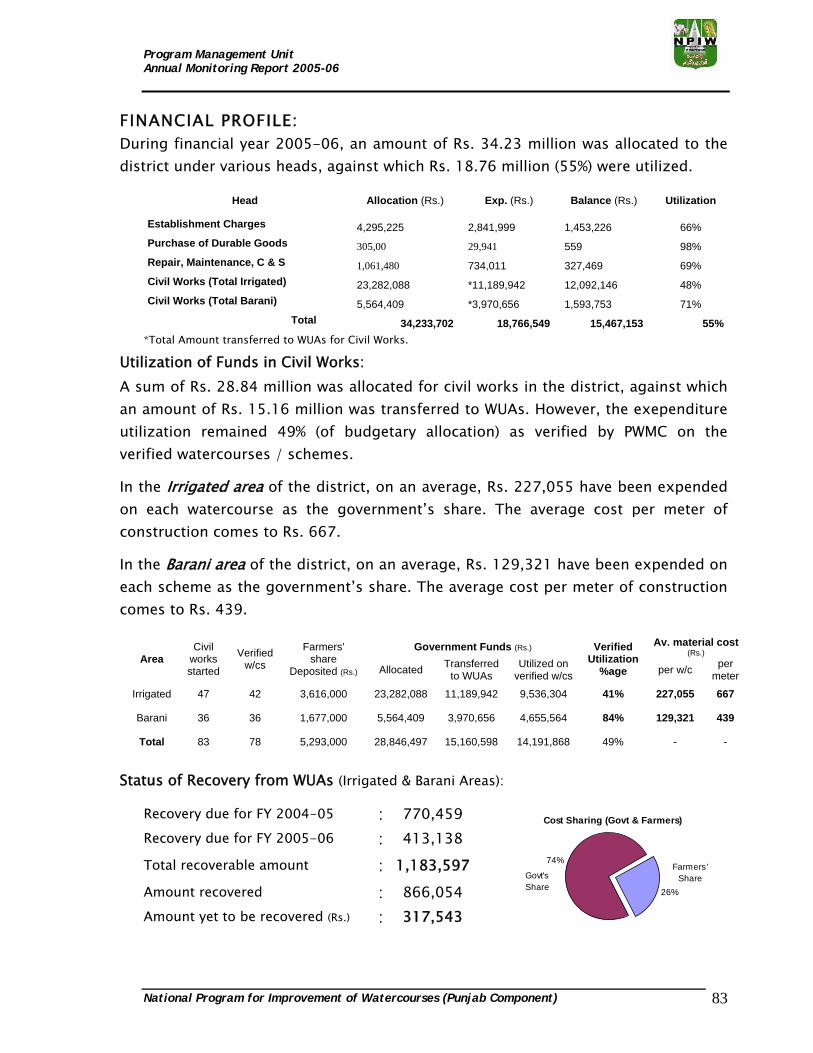
Program Management Unit Annual Monitoring Report 2005-06
National Program for Improvement of Watercourses (Punjab Component) 83
FINANCIAL PROFILE: During financial year 2005-06, an amount of Rs. 34.23 million was allocated to the district under various heads, against which Rs. 18.76 million (55%) were utilized.
Head Allocation (Rs.) Exp. (Rs.) Balance (Rs.) Utilization
Establishment Charges 4,295,225 2,841,999 1,453,226 66% Purchase of Durable Goods 305,00 29,941 559 98% Repair, Maintenance, C & S 1,061,480 734,011 327,469 69% Civil Works (Total Irrigated) 23,282,088 *11,189,942 12,092,146 48% Civil Works (Total Barani) 5,564,409 *3,970,656 1,593,753 71% Total 34,233,702 18,766,549 15,467,153 55%
*Total Amount transferred to WUAs for Civil Works.
Utilization of Funds in Civil Works:
A sum of Rs. 28.84 million was allocated for civil works in the district, against which an amount of Rs. 15.16 million was transferred to WUAs. However, the exependiture utilization remained 49% (of budgetary allocation) as verified by PWMC on the verified watercourses / schemes.
In the Irrigated area of the district, on an average, Rs. 227,055 have been expended on each watercourse as the government’s share. The average cost per meter of construction comes to Rs. 667.
In the Barani area of the district, on an average, Rs. 129,321 have been expended on each scheme as the government’s share. The average cost per meter of construction comes to Rs. 439.
Government Funds (Rs.) Av. material cost (Rs.) Area
Civil works started
Verified w/cs
Farmers' share
Deposited (Rs.) Allocated Transferred to WUAs
Utilized on verified w/cs
Verified Utilization
%age per w/c per meter
Irrigated 47 42 3,616,000 23,282,088 11,189,942 9,536,304 41% 227,055 667
Barani 36 36 1,677,000 5,564,409 3,970,656 4,655,564 84% 129,321 439
Total 83 78 5,293,000 28,846,497 15,160,598 14,191,868 49% - -
Status of Recovery from WUAs (Irrigated & Barani Areas):
Recovery due for FY 2004-05 : 770,459 Recovery due for FY 2005-06 : 413,138
Total recoverable amount : 1,183,597
Amount recovered : 866,054 Amount yet to be recovered (Rs.) : 317,543
Cost Sharing (Govt & Farmers)
26%
74%Farmers'
ShareGovt'sShare

Program Management Unit Annual Monitoring Report 2005-06
National Program for Improvement of Watercourses (Punjab Component) 84
KASUR
During the last year, i.e. FY 2004-05, this district achieved 99% of the targets by completing 98 watercourses against the assigned target of 99.
However during the year under review, the performance has matched again. Chasing the target of 95 watercourses, the district registered completion / verification of 94 watercourses (99%) with the deployment of following staff.
Mr. Ch. Muhammad Ashraf : EDO (Agriculture) Mr. Manzoor Ahmad : DO (OFWM) AAEs/DDOs : 9 WMOs : 6 Supervisors : 48 Watercourses per supervisor
:
2.0 watercourses
Overall Watercourse Statistics:
Improved under NPIW Total W/Cs Improved Un-
improved
Planned for improvement under NPIW FY 2004-5 FY 2005-6 Total
Remaining W/Cs
1628 500 1128 874 98 94 192 682
Civil Works executed in FY 2005-06 (major indicators):
Target FY 2005-06: 95
Civil works undertaken: 110
FCRs submitted: 100
Achievement / FCRs verified: 94 (99% of the target)
Watercourses deferred: 6
Quantum of Civil Works (Verified):
Earthen improved length: 225.1 km
Lined length: 65.3 km (0.69 km per w/c)
Total length of 94 w/cs: 290.3 km
Nakkas installed (Nos.): 3821 (40.64 per w/c)
Culverts constructed (Nos.): 143 (1.52 per w/c)
Av. length of improved w/c: 3.09 km

Program Management Unit Annual Monitoring Report 2005-06
National Program for Improvement of Watercourses (Punjab Component) 85
This graph depicts the percentage lining of the watercourses improved & verified in the district.
PHYSICAL VERIFICATIONS: PWMC has to conduct four mandatory visits to each under improvement watercourse in order to certify the works executed at site. A target of 95 translates into 380 site visits certifying S&D, ICR-I, ICR-II & FCR. Following graph portrays that 196 certifications were made after March, 2006 i.e. during last quarter & onwards. The chart given below depicts activity level during various months.
FINANCIAL PROFILE: During financial year 2005-06, an amount of Rs. 92.54 million was allocated to the district under various heads, against which Rs. 91.95 million (99%) were utilized.
Head Allocation (Rs.) Exp. (Rs.) Balance (Rs.) Utilization
Establishment Charges 14,858,164 10,161,917 4,696,247 68% Purchase of Durable Goods - - - - Repair, Maintenance, C & S 1741836 1,578,664 163,172 91% Civil Works (Total) 75,942,905 *80,218,431 (4,275,526) 106% Total 92,542,905 91,959,012 583,893 99%
*Total Amount transferred to WUAs for Civil Works.
Bricklining %age
78% 22%
BrickliningEarthen works
ICR-I, ICR-II & FCR Verifications
-20
0
20
40
60
80
100
120
01-1
2-05
02-0
1-06
01-0
2-06
01-0
3-06
04-0
4-06
29-0
4-06
01-0
6-06
01-0
7-06
02-0
8-06
30-0
8-06
Period
Verif
icat
ions
ICR-I ICR-IIFCR

Program Management Unit Annual Monitoring Report 2005-06
National Program for Improvement of Watercourses (Punjab Component) 86
Utilization of Funds in Civil Works:
A sum of Rs. 75.94 million was allocated for civil works in the district, against which an amount of Rs. 80.21 million was transferred to WUAs. However, the exependiture utilization comes to 81% (of budgetary allocation) as verified by PWMC on the verified watercourses.
In the district, on an average, Rs. 653,955 have been expended on each watercourse as the government’s share. The average cost per meter of construction comes to Rs. 941.
Government Funds (Rs.) Av. material cost (Rs.) Civil works started
Verified w/cs
Farmers' share
Deposited (Rs.) Allocated Transferred to WUAs
Utilized on verified w/cs
Verified Utilization
%age per W/C per meter
110 94 30,883,000 75,942,905 80,218,431 61,471,807 81% 653,955 941
Status of Recovery from WUAs:
Recovery due for FY 2004-05 : 2,848,885
Recovery due for FY 2005-06 : 9,181,194
Total recoverable amount : 12,030,079
Amount recovered : 8,327,837
Amount yet to be recovered (Rs.) : 3,702,242
Cost Sharing (Govt & Farmers)
28%
72%Farmers'
ShareGovt'sShare

Program Management Unit Annual Monitoring Report 2005-06
National Program for Improvement of Watercourses (Punjab Component) 87
LAHORE
During the last year, i.e. FY 2004-05, this district achieved 102% of the targets by completing 52 watercourses against the assigned target of 51.
During the year under review, the performance is up to the mark. Chasing the target of 35 watercourses, the district registered completion / verification of 48 watercourses (137%) with the deployment of following staff.
Mr. Mumtaz Ahmad Awan : EDO (Agriculture) Mr. Malik Muhammad Akram : DO (OFWM) AAEs/DDOs : 2 WMOs : 6 Supervisors : 16 Watercourses per supervisor
:
3.0 watercourses
Overall Watercourse Statistics:
Improved under NPIW Total W/Cs Improved Un-
improved
Planned for improvement under NPIW FY 2004-5 FY 2005-6 Total
Remaining W/Cs
644 144 500 378 52 48 100 278
Civil Works executed in FY 2005-06 (major indicators):
Target FY 2005-06: 35
Civil works undertaken: 51
FCRs submitted: 48
Achievement / FCRs verified: 48 (137% of the target)
Watercourses deferred: 0
Quantum of Civil Works (Verified):
Earthen improved length: 76.3 km
Lined length: 27.6 km (0.57 km per w/c)
Total length of 48 w/cs: 103.9 km
Nakkas installed (Nos.): 1713 (35.7 per w/c)
Culverts constructed (Nos.): 26 (0.54 per w/c)
Av. length of improved w/c: 2.17 km
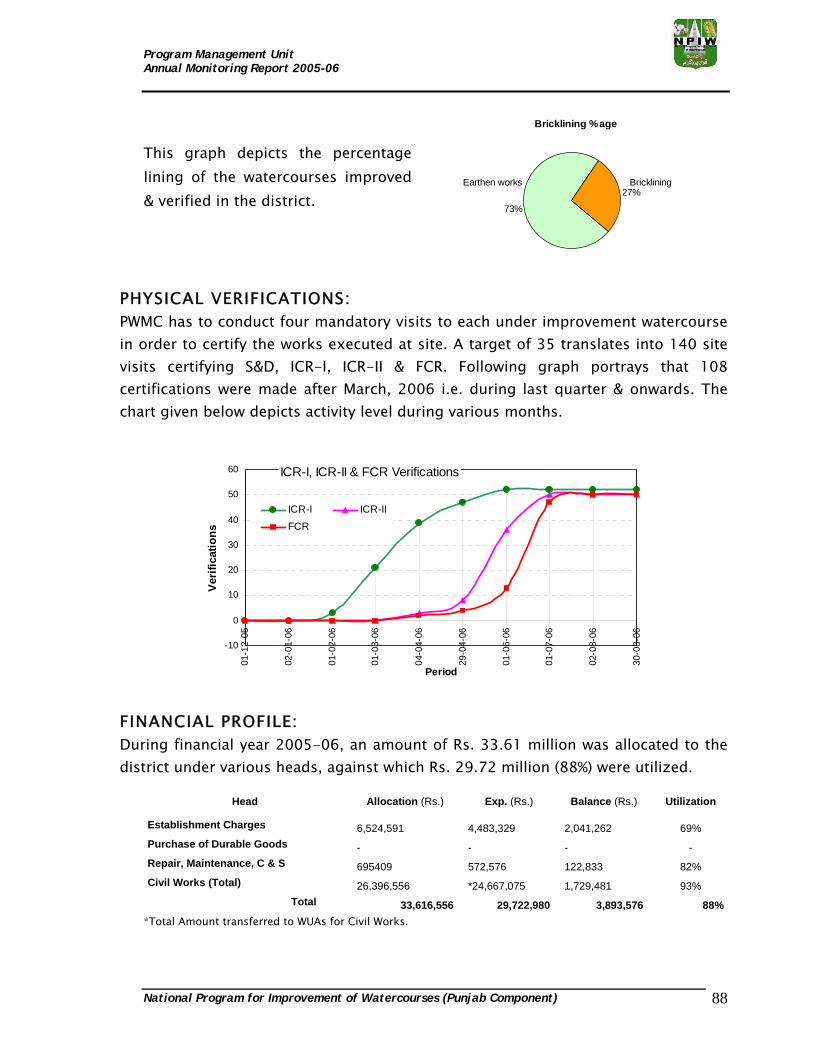
Program Management Unit Annual Monitoring Report 2005-06
National Program for Improvement of Watercourses (Punjab Component) 88
This graph depicts the percentage lining of the watercourses improved & verified in the district.
PHYSICAL VERIFICATIONS: PWMC has to conduct four mandatory visits to each under improvement watercourse in order to certify the works executed at site. A target of 35 translates into 140 site visits certifying S&D, ICR-I, ICR-II & FCR. Following graph portrays that 108 certifications were made after March, 2006 i.e. during last quarter & onwards. The chart given below depicts activity level during various months.
FINANCIAL PROFILE: During financial year 2005-06, an amount of Rs. 33.61 million was allocated to the district under various heads, against which Rs. 29.72 million (88%) were utilized.
Head Allocation (Rs.) Exp. (Rs.) Balance (Rs.) Utilization
Establishment Charges 6,524,591 4,483,329 2,041,262 69% Purchase of Durable Goods - - - - Repair, Maintenance, C & S 695409 572,576 122,833 82% Civil Works (Total) 26,396,556 *24,667,075 1,729,481 93% Total 33,616,556 29,722,980 3,893,576 88%
*Total Amount transferred to WUAs for Civil Works.
Bricklining %age
73%
27%BrickliningEarthen works
ICR-I, ICR-II & FCR Verifications
-10
0
10
20
30
40
50
60
01-1
2-05
02-0
1-06
01-0
2-06
01-0
3-06
04-0
4-06
29-0
4-06
01-0
6-06
01-0
7-06
02-0
8-06
30-0
8-06
Period
Veri
ficat
ions
ICR-I ICR-II
FCR

Program Management Unit Annual Monitoring Report 2005-06
National Program for Improvement of Watercourses (Punjab Component) 89
Utilization of Funds in Civil Works:
A sum of Rs. 26.39 million was allocated for civil works in the district, against which an amount of Rs. 24.66 million was transferred to WUAs. However, the exependiture utilization comes to 88% (of budgetary allocation) as verified by PWMC on the verified watercourses.
In the district, on an average, Rs. 481,734 have been expended on each watercourse as the government’s share. The average cost per meter of construction comes to Rs. 838.
Government Funds (Rs.) Av. material cost (Rs.) Civil works started
Verified w/cs
Farmers' share
Deposited (Rs.) Allocated Transferred to WUAs
Utilized on verified w/cs
Verified Utilization
%age per W/C per meter
51 48 8,810,000 26,396,556 24,667,075 23,123,226 88% 481,734 838
Status of Recovery from WUAs:
Recovery due for FY 2004-05 : 3,361,016
Recovery due for FY 2005-06 : 525,597
Total recoverable amount : 3,886,613
Amount recovered : 3,682,908
Amount yet to be recovered (Rs.) : 203,705
Cost Sharing (Govt & Farmers)
26%
74% Farmers'ShareGovt's
Share

Program Management Unit Annual Monitoring Report 2005-06
National Program for Improvement of Watercourses (Punjab Component) 90
NANKANA SAHIB
After becoming a separate district from District Sheikhupura, upon the basis of survey data received, the watercourse statistics were updated. During the FY 2005-06, chasing the target of 100 watercourses, the district registered completion / verification of 102 watercourses (102%) with the deployment of following staff.
Mr. Abdul Ghafoor : EDO (Agriculture) Mr. Mansha Ali : DO (OFWM) AAEs/DDOs : 8 WMOs : 5 Supervisors : 34 Watercourses per supervisor
:
3.0 watercourses
Overall Watercourse Statistics:
Improved under NPIW Total W/Cs Improved Un-
improved
Planned for improvement under NPIW FY 2004-5 FY 2005-6 Total
Remaining W/Cs
1014 550 464 464 45 102 147 317
Civil Works executed in FY 2005-06 (major indicators):
Target FY 2005-06: 100
Civil works undertaken: 126
FCRs submitted: 102
Achievement / FCRs verified: 102 (102% of the target)
Watercourses deferred: 0
Quantum of Civil Works (Verified):
Earthen improved length: 336.7 km
Lined length: 59.2 km (0.58 km per w/c)
Total length of 102 w/cs: 395.8 km
Nakkas installed (Nos.): 3410 (33.43 per w/c)
Culverts constructed (Nos.): 129 (1.26 per w/c)
Av. length of improved w/c: 3.88 km

Program Management Unit Annual Monitoring Report 2005-06
National Program for Improvement of Watercourses (Punjab Component) 91
This graph depicts the percentage lining of the watercourses improved & verified in the district.
PHYSICAL VERIFICATIONS: PWMC has to conduct four mandatory visits to each under improvement watercourse in order to certify the works executed at site. A target of 100 translates into 400 site visits certifying S&D, ICR-I, ICR-II & FCR. Following graph portrays that 246 certifications were made after March, 2006 i.e. during last quarter & onwards. The chart given below depicts activity level during various months.
FINANCIAL PROFILE: During financial year 2005-06, an amount of Rs. 61.74 million was allocated to the district under various heads, against which Rs. 61.84 million were utilized.
Head Allocation (Rs.) Exp. (Rs.) Balance (Rs.) Utilization
Establishment Charges 5,038,264 4,990,538 47,726 99% Purchase of Durable Goods 182000 - 182,000 - Repair, Maintenance, C & S 1046870 877,378 169,492 84% Civil Works (Total) 55,480,000 *55,977,582 (497,582) 101% Total 61,747,134 61,845,498 (98,364) 100%
*Total Amount transferred to WUAs for Civil Works.
Bricklining %age
85%
15%
Bricklining
Earthen works
ICR-I, ICR-II & FCR Verifications
-20
0
20
40
60
80
100
120
140
01-1
2-05
02-0
1-06
01-0
2-06
01-0
3-06
04-0
4-06
29-0
4-06
01-0
6-06
01-0
7-06
02-0
8-06
30-0
8-06
Period
Veri
ficat
ions
ICR-I ICR-II
FCR

Program Management Unit Annual Monitoring Report 2005-06
National Program for Improvement of Watercourses (Punjab Component) 92
Utilization of Funds in Civil Works:
A sum of Rs. 55.48 million was allocated for civil works in the district, but a little higher amount (101%) was transferred to WUAs. However, the exependiture utilization comes to 88% (of budgetary allocation) as verified by PWMC on the verified watercourses.
In the district on an average, Rs. 479,805 have been expended on each watercourse as the government’s share. The average cost per meter of construction comes to Rs. 826.
Government Funds (Rs.) Av. material cost (Rs.) Civil works started
Verified w/cs
Farmers' share Deposited (Rs.) Allocated Transferred
to WUAs Utilized on
verified w/cs
Verified Utilization
%age per W/C per meter
126 102 18,188,000 55,480,000 55,977,582 48,940,199 88% 479,805 826
Status of Recovery from WUAs:
Recovery due for FY 2004-05 : 367,704
Recovery due for FY 2005-06 : 1,943,539
Total recoverable amount : 2,311,243
Amount recovered : 1,291,962
Amount yet to be recovered (Rs.) : 1,019,281
Cost Sharing (Govt & Farmers)
25%
75%Farmers'
ShareGovt'sShare

Program Management Unit Annual Monitoring Report 2005-06
National Program for Improvement of Watercourses (Punjab Component) 93
OKARA
During the last year, i.e. FY 2004-05, this district achieved 94% of the targets by completing 77 watercourses against the assigned target of 82. However during the year under review, the performance is up to the mark. Chasing the target of 150 watercourses, the district registered completion / verification of 152 watercourses (101%) with the deployment of following staff.
Mr. Gulzar Muhammad : EDO (Agriculture) Mr. Rashid Hamid Zafar : DO (OFWM) AAEs/DDOs : 10 WMOs : 9 Supervisors : 59 Watercourses per supervisor
:
2.6 watercourses
Overall Watercourse Statistics:
Improved under NPIW Total W/Cs Improved Un-
improved
Planned for improvement under NPIW FY 2004-5 FY 2005-6 Total
Remaining W/Cs
1903 513 1390 1158 77 152 229 929
Civil Works executed in FY 2005-06 (major indicators):
Target FY 2005-06: 150
Civil works undertaken: 180
FCRs submitted: 154
Achievement / FCRs verified: 152 (101% of the target)
Watercourses deferred: 2
Quantum of Civil Works (Verified):
Earthen improved length: 589.3 km
Lined length: 136.4 km (0.89 km per w/c)
Total length of 152 w/cs: 725.7 km
Nakkas installed (Nos.): 5047 (33.2 per w/c)
Culverts constructed (Nos.): 341 (2.24 per w/c)
Av. length of improved w/c: 4.77 km
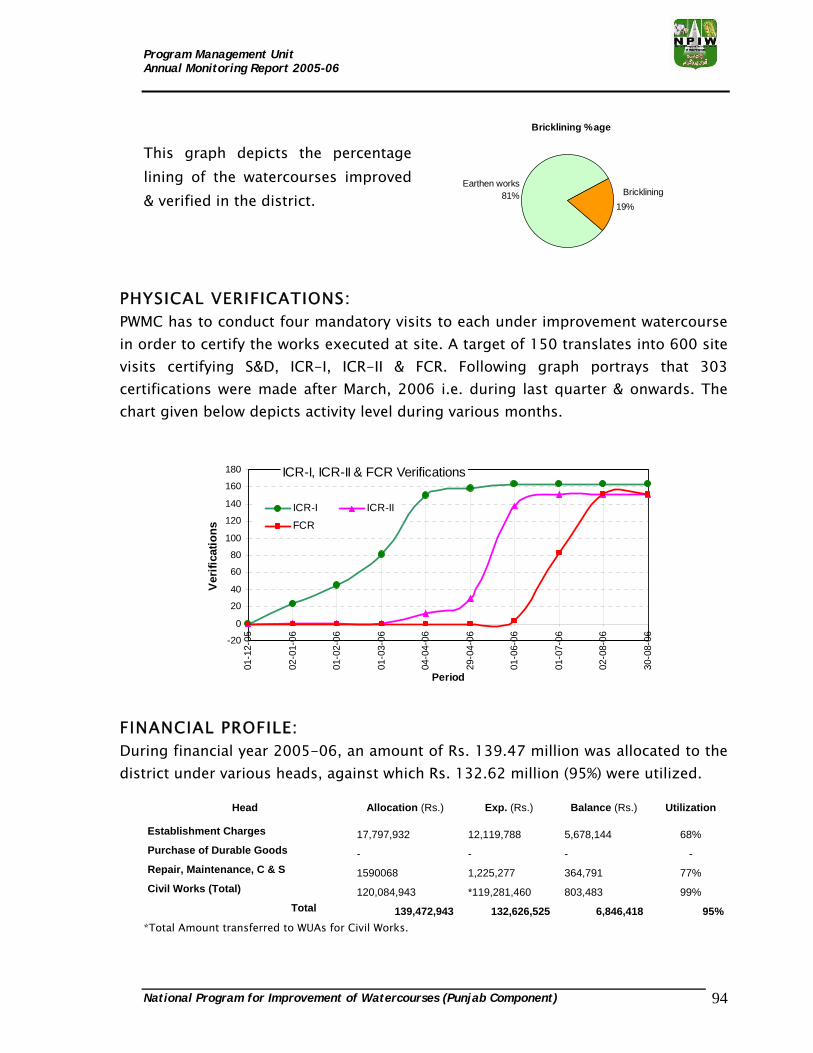
Program Management Unit Annual Monitoring Report 2005-06
National Program for Improvement of Watercourses (Punjab Component) 94
This graph depicts the percentage lining of the watercourses improved & verified in the district.
PHYSICAL VERIFICATIONS: PWMC has to conduct four mandatory visits to each under improvement watercourse in order to certify the works executed at site. A target of 150 translates into 600 site visits certifying S&D, ICR-I, ICR-II & FCR. Following graph portrays that 303 certifications were made after March, 2006 i.e. during last quarter & onwards. The chart given below depicts activity level during various months. FINANCIAL PROFILE: During financial year 2005-06, an amount of Rs. 139.47 million was allocated to the district under various heads, against which Rs. 132.62 million (95%) were utilized.
Head Allocation (Rs.) Exp. (Rs.) Balance (Rs.) Utilization
Establishment Charges 17,797,932 12,119,788 5,678,144 68% Purchase of Durable Goods - - - - Repair, Maintenance, C & S 1590068 1,225,277 364,791 77% Civil Works (Total) 120,084,943 *119,281,460 803,483 99% Total 139,472,943 132,626,525 6,846,418 95%
*Total Amount transferred to WUAs for Civil Works.
Bricklining %age
81%19%
BrickliningEarthen works
ICR-I, ICR-II & FCR Verifications
-20
0
20
40
60
80
100
120
140
160
180
01-1
2-05
02-0
1-06
01-0
2-06
01-0
3-06
04-0
4-06
29-0
4-06
01-0
6-06
01-0
7-06
02-0
8-06
30-0
8-06
Period
Verif
icat
ions
ICR-I ICR-II
FCR

Program Management Unit Annual Monitoring Report 2005-06
National Program for Improvement of Watercourses (Punjab Component) 95
Utilization of Funds in Civil Works:
A sum of Rs. 120.08 million was allocated for civil works in the district, against which an amount of Rs. 119.28 million was transferred to WUAs. However, the exependiture utilization comes to 84% (of budgetary allocation) as verified by PWMC on the verified watercourses.
In the district, on an average, Rs. 662,960 have been expended on each watercourse as the government’s share. The average cost per meter of construction comes to Rs. 738.
Government Funds (Rs.) Av. material cost (Rs.) Civil works started
Verified w/cs
Farmers' share
Deposited (Rs.) Allocated Transferred to WUAs
Utilized on verified w/cs
Verified Utilization
%age per W/C per meter
180 152 23,160,000 120,084,943 119,281,460 100,770,026 84% 662,960 738
Status of Recovery from WUAs:
Recovery due for FY 2004-05 : 455,017
Recovery due for FY 2005-06 : 4,497,692
Total recoverable amount : 4,952,709
Amount recovered : 3,081,896
Amount yet to be recovered (Rs.) : 1,870,813
Cost Sharing (Govt & Farmers)
16%84%Farmers'
Share
Govt'sShare

Program Management Unit Annual Monitoring Report 2005-06
National Program for Improvement of Watercourses (Punjab Component) 96
SHEIKHUPURA
After the break up of the district into District Sheikhupura & District Nankana Sahib, upon the basis of survey data received, the watercourse statistics were updated. During the FY 2005-06, chasing the target of 85 watercourses, the district registered completion / verification of 93 watercourses (109%) with the deployment of following staff.
Mr. Abdul Razzaq : EDO (Agriculture) Mr. Allah Ditta Mansoor : DO (OFWM) AAEs/DDOs : 5 WMOs : 4 Supervisors : 32 Watercourses per supervisor
:
2.9 watercourses
Overall Watercourse Statistics:
Improved under NPIW Total W/Cs Improved Un-
improved
Planned for improvement under NPIW FY 2004-5 FY 2005-6 Total
Remaining W/Cs
1236 782 454 454 38 93 131 323
Civil Works executed in FY 2005-06 (major indicators):
Target FY 2005-06: 85
Civil works undertaken: 120
FCRs submitted: 95
Achievement / FCRs verified: 93 (109% of the target)
Watercourses deferred: 2
Quantum of Civil Works (Verified):
Earthen improved length: 335.7 km
Lined length: 56.0 km (0.60 km per w/c)
Total length of 93 w/cs: 391.7 km
Nakkas installed (Nos.): 3071 (33.02 per w/c)
Culverts constructed (Nos.): 97 (1.04 per w/c)
Av. length of improved w/c: 4.21 km

Program Management Unit Annual Monitoring Report 2005-06
National Program for Improvement of Watercourses (Punjab Component) 97
This graph depicts the percentage lining of the watercourses improved & verified in the district.
PHYSICAL VERIFICATIONS: PWMC has to conduct four mandatory visits to each under improvement watercourse in order to certify the works executed at site. A target of 85 translates into 340 site visits certifying S&D, ICR-I, ICR-II & FCR. Following graph portrays that 213 certifications were made after March, 2006 i.e. during last quarter & onwards. The chart given below depicts activity level during various months.
FINANCIAL PROFILE: During financial year 2005-06, an amount of Rs. 63.45 million was allocated to the district under various heads, against which Rs. 51.71 million (82%) were utilized.
Head Allocation (Rs.) Exp. (Rs.) Balance (Rs.) Utilization
Establishment Charges 9,011,782 550,135 8,461,647 6% Purchase of Durable Goods - - - - Repair, Maintenance, C & S 891218 208,349 682,869 23% Civil Works (Total) 53,551,298 *50,961,130 2,590,168 95% Total 63,454,298 51,719,614 11,734,684 82%
*Total Amount transferred to WUAs for Civil Works.
Bricklining %age
86%
14%
Bricklining
Earthen works
ICR-I, ICR-II & FCR Verifications
-20
0
20
40
60
80
100
120
01-1
2-05
02-0
1-06
01-0
2-06
01-0
3-06
04-0
4-06
29-0
4-06
01-0
6-06
01-0
7-06
02-0
8-06
30-0
8-06
Period
Verif
icat
ions
ICR-I ICR-II
FCR

Program Management Unit Annual Monitoring Report 2005-06
National Program for Improvement of Watercourses (Punjab Component) 98
Utilization of Funds in Civil Works:
A sum of Rs. 53.55 million was allocated for civil works in the district, against which an amount of Rs. 50.96 million was transferred to WUAs. However, the exependiture utilization comes to 86% (of budgetary allocation) as verified by PWMC on the verified watercourses.
In the district, on an average, Rs. 492,681 have been expended on each watercourse as the government’s share. The average cost per meter of construction comes to Rs. 818.
Government Funds (Rs.) Av. material cost (Rs.) Civil works started
Verified w/cs
Farmers' share
Deposited (Rs.) Allocated Transferred to WUAs
Utilized on verified w/cs
Verified Utilization
%age per W/C per meter
120 93 12,320,000 53,551,298 50,961,130 45,819,335 86% 492,681 818
Status of Recovery from WUAs:
Recovery due for FY 2004-05 : 743,417
Recovery due for FY 2005-06 : 755,258
Total recoverable amount : 1,498,675
Amount recovered : 1,059,766
Amount yet to be recovered (Rs.) : 438,909
Cost Sharing (Govt & Farmers)
19%81%
Farmers'Share
Govt'sShare

Program Management Unit Annual Monitoring Report 2005-06
National Program for Improvement of Watercourses (Punjab Component) 99
KHANEWAL
During the last year, i.e. FY 2004-05, this district achieved 120% of the targets by completing 73 watercourses against the assigned target of 61.
Again during the year under review, the performance is up to the mark. Even though target was 2.8 times than last year i.e. 173 watercourses, yet the district registered completion / verification of 174 watercourses (101%) with the deployment of following staff.
Mr. M. Saleem Nahang : EDO (Agriculture) Mr. Abdul Ghani : DO (OFWM) AAEs/DDOs : 8 WMOs : 11 Supervisors : 43 Watercourses per supervisor
:
4.0 watercourses
Overall Watercourse Statistics:
Improved under NPIW Total W/Cs Improved Un-
improved
Planned for improvement under NPIW FY 2004-5 FY 2005-6 Total
Remaining W/Cs
2017 759 1258 809 73 174 247 562
Civil Works executed in FY 2005-06 (major indicators):
Target FY 2005-06: 173
Civil works undertaken: 176
FCRs submitted: 174
Achievement / FCRs verified: 174 (101% of the target)
Watercourses deferred: 0
Quantum of Civil Works (Verified):
Earthen improved length: 585.9 km
Lined length: 147 km (0.84 km per w/c)
Total length of 174 w/cs: 732.9 km
Nakkas installed (Nos.): 6703 (38.5 per w/c)
Culverts constructed (Nos.): 279 (1.60 per w/c)
Av. length of improved w/c: 4.21 km

Program Management Unit Annual Monitoring Report 2005-06
National Program for Improvement of Watercourses (Punjab Component) 100
This graph depicts the percentage lining of the watercourses improved & verified in the district.
PHYSICAL VERIFICATIONS: PWMC has to conduct four mandatory visits to each under improvement watercourse in order to certify the works executed at site. A target of 173 translates into 692 site visits certifying S&D, ICR-I, ICR-II & FCR. Following graph portrays that 315 certifications were made after March, 2006 i.e. during last quarter & onwards. The chart given below depicts activity level during various months.
FINANCIAL PROFILE: During financial year 2005-06, an amount of Rs. 140.30 million was allocated to the district under various heads, against which Rs. 110.67 million (79%) were utilized.
Head Allocation (Rs.) Exp. (Rs.) Balance (Rs.) Utilization
Establishment Charges 12,539,698 9,569,480 2,970,218 76% Purchase of Durable Goods 800000 799970 30 100% Repair, Maintenance, C & S 1182931 899,382 283,549 76% Civil Works (Total) 125,782,474 *99,407,397 26,375,077 79% Total 140,305,103 110,676,229 29,628,874 79%
*Total Amount transferred to WUAs for Civil Works.
Bricklining %age
80%20%
BrickliningEarthen works
ICR-I, ICR-II & FCR Verifications
-200
20406080
100120140160180200
01-1
2-05
02-0
1-06
01-0
2-06
01-0
3-06
04-0
4-06
29-0
4-06
01-0
6-06
01-0
7-06
02-0
8-06
30-0
8-06
Period
Ver
ifica
tions
ICR-I ICR-IIFCR

Program Management Unit Annual Monitoring Report 2005-06
National Program for Improvement of Watercourses (Punjab Component) 101
Utilization of Funds in Civil Works:
A sum of Rs. 125.78 million was allocated for civil works in the district, against which an amount of Rs. 99.40 million was transferred to WUAs. However, the exependiture utilization comes to 83% (of budgetary allocation) as verified by PWMC on the verified watercourses.
In the district, on an average, Rs. 598,750 have been expended on each watercourse as the government’s share. The average cost per meter of construction comes to Rs. 708.
Government Funds (Rs.) Av. material cost (Rs.) Civil works started
Verified w/cs
Farmers' share
Deposited (Rs.) Allocated Transferred to WUAs
Utilized on verified w/cs
Verified Utilization
%age per W/C per meter
176 174 25,540,000 125,782,474 99,407,397 104,182,598 83% 598,750 708
Status of Recovery from WUAs:
Recovery due for FY 2004-05 : 1,412,909
Recovery due for FY 2005-06 : 865,989
Total recoverable amount : 2,278,898
Amount recovered : 2,071,304
Amount yet to be recovered (Rs.) : 207,594
Cost Sharing (Govt & Farmers)
20%80%
Farmers'Share
Govt'sShare

Program Management Unit Annual Monitoring Report 2005-06
National Program for Improvement of Watercourses (Punjab Component) 102
LODHRAN
During the last year, i.e. FY 2004-05, this district accomplished 167% of the targets by completing 60 watercourses against the assigned target of 36.
During the year under review, again the performance is good. Although the target was 3.8 times than last year i.e. 140 watercourses, yet the district registered completion / verification of 142 watercourses (101%) with the deployment of following staff.
Mr. Habib-ur-Rehman : EDO (Agriculture) Mr. Muhammad Ramzan : DO (OFWM) AAEs/DDOs : 5 WMOs : 5 Supervisors : 37 Watercourses per supervisor
:
3.8 watercourses
Overall Watercourse Statistics:
Improved under NPIW Total W/Cs Improved Un-
improved
Planned for improvement under NPIW FY 2004-5 FY 2005-6 Total
Remaining W/Cs
1542 411 1131 755 60 142 202 553
Civil Works executed in FY 2005-06 (major indicators):
Target FY 2005-06: 140
Civil works undertaken: 148
FCRs submitted: 144
Achievement / FCRs verified: 142 (101% of the target)
Watercourses deferred: 2
Quantum of Civil Works (Verified):
Earthen improved length: 455.1 km
Lined length: 161.2 km (1.13 km per w/c)
Total length of 142 w/cs: 616.3 km
Nakkas installed (Nos.): 7191 (50.6 per w/c)
Culverts constructed (Nos.): 310 (2.18 per w/c)
Av. length of improved w/c: 4.34 km

Program Management Unit Annual Monitoring Report 2005-06
National Program for Improvement of Watercourses (Punjab Component) 103
This graph depicts the percentage lining of the watercourses improved & verified in the district.
PHYSICAL VERIFICATIONS: PWMC has to conduct four mandatory visits to each under improvement watercourse in order to certify the works executed at site. A target of 140 translates into 560 site visits certifying S&D, ICR-I, ICR-II & FCR. Following graph portrays that 296 certifications were made after March, 2006 i.e. during last quarter & onwards. The chart given below depicts activity level during various months.
FINANCIAL PROFILE: During financial year 2005-06, an amount of Rs. 124.13 million was allocated to the district under various heads, against which Rs. 98.50 million (79%) were utilized.
Head Allocation (Rs.) Exp. (Rs.) Balance (Rs.) Utilization
Establishment Charges 11,080,738 7,567,389 3,513,349 68% Purchase of Durable Goods 238 - 238 - Repair, Maintenance, C & S 1087878 710,597 377,281 65% Civil Works (Total) 111,964,267 *90,223,261 21,741,006 81% Total 124,133,121 98,501,247 25,631,874 79%
*Total Amount transferred to WUAs for Civil Works.
Bricklining %age
74%26%
BrickliningEarthen works
ICR-I, ICR-II & FCR Verifications
-20
0
20
40
60
80
100
120
140
160
01-1
2-05
02-0
1-06
01-0
2-06
01-0
3-06
04-0
4-06
29-0
4-06
01-0
6-06
01-0
7-06
02-0
8-06
30-0
8-06
Period
Veri
ficat
ions
ICR-I ICR-II
FCR

Program Management Unit Annual Monitoring Report 2005-06
National Program for Improvement of Watercourses (Punjab Component) 104
Utilization of Funds in Civil Works:
A sum of Rs. 111.96 million was allocated for civil works in the district, against which an amount of Rs. 9.02 million was transferred to WUAs. However, the exependiture utilization comes to 91% (of budgetary allocation) as verified by PWMC on the verified watercourses.
In the district, on an average, Rs. 721,280 have been expended on each watercourse as the government’s share. The average cost per meter of construction comes to Rs. 635.
Government Funds (Rs.) Av. material cost (Rs.) Civil works started
Verified w/cs
Farmers' share Deposited (Rs.) Allocated Transferred
to WUAs Utilized on
verified w/cs
Verified Utilization
%age per W/C per meter
148 142 25,130,000 111,964,267 9,022,3261 102,421,793 91% 721,280 635
Status of Recovery from WUAs:
Recovery due for FY 2004-05 : 756,246
Recovery due for FY 2005-06 : 296,466
Total recoverable amount : 1,052,712
Amount recovered : 1,052,712
Amount yet to be recovered (Rs.) : -
Cost Sharing (Govt & Farmers)
22%
78%Farmers'
ShareGovt'sShare

Program Management Unit Annual Monitoring Report 2005-06
National Program for Improvement of Watercourses (Punjab Component) 105
MULTAN
During the last year, i.e. FY 2004-05, this district accomplished 146% of the targets by completing 82 watercourses against the assigned target of 56.
During the year under review, the performance has been admirable. Although the target was 2.8 times than last year i.e. 158 watercourses, yet the district registered completion / verification of 158 watercourses (100%) with the deployment of following staff.
Mr. Rana Farman Ali Khan : EDO (Agriculture) Mr. Rais Ahmed Rais : DO (OFWM) AAEs/DDOs : 8 WMOs : 9 Supervisors : 44 Watercourses per supervisor
:
3.6 watercourses
Overall Watercourse Statistics:
Improved under NPIW Total W/Cs Improved Un-
improved
Planned for improvement under NPIW FY 2004-5 FY 2005-6 Total
Remaining W/Cs
2233 565 1668 1301 82 158 240 1061
Civil Works executed in FY 2005-06 (major indicators):
Target FY 2005-06: 158
Civil works undertaken: 159
FCRs submitted: 158
Achievement / FCRs verified: 158 (100% of the target)
Watercourses deferred: 0
Quantum of Civil Works (Verified):
Earthen improved length: 490.3 km
Lined length: 148.9 km (0.94 km per w/c)
Total length of 158 w/cs: 639.3 km
Nakkas installed (Nos.): 7855 (49.7 per w/c)
Culverts constructed (Nos.): 252 (1.59 per w/c)
Av. length of improved w/c: 4.05 km

Program Management Unit Annual Monitoring Report 2005-06
National Program for Improvement of Watercourses (Punjab Component) 106
This graph depicts the percentage lining of the watercourses improved & verified in the district.
PHYSICAL VERIFICATIONS: PWMC has to conduct four mandatory visits to each under improvement watercourse in order to certify the works executed at site. A target of 158 translates into 632 site visits certifying S&D, ICR-I, ICR-II & FCR. Following graph portrays that 294 certifications were made after March, 2006 i.e. during last quarter & onwards. The chart given below depicts activity level during various months.
FINANCIAL PROFILE: During financial year 2005-06, an amount of Rs. 130.09 million was allocated to the district under various heads, against which Rs. 111.83 million (86%) were utilized.
Head Allocation (Rs.) Exp. (Rs.) Balance (Rs.) Utilization
Establishment Charges 17,663,277 10,214,230 7,449,047 58% Purchase of Durable Goods 140185 - 140,185 - Repair, Maintenance, C & S 1643342 1,065,928 577,414 65% Civil Works (Total) 110,646,872 *100,555,192 10,091,680 91% Total 130,093,676 111,835,350 18,258,326 86%
*Total Amount transferred to WUAs for Civil Works.
E
ICR-I, ICR-II & FCR Verifications
-20
0
20
40
60
80
100
120
140
160
180
01-1
2-05
02-0
1-06
01-0
2-06
01-0
3-06
04-0
4-06
29-0
4-06
01-0
6-06
01-0
7-06
02-0
8-06
30-0
8-06
Period
Ver
ifica
tions
ICR-I ICR-II
FCR
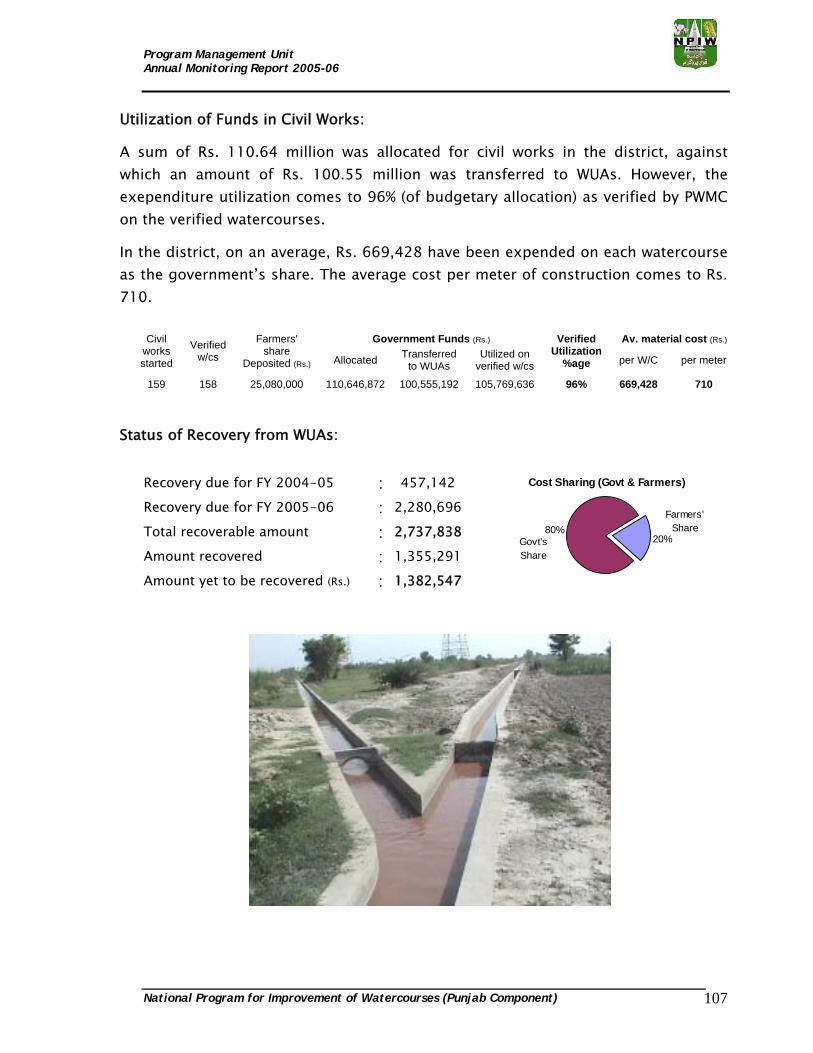
Program Management Unit Annual Monitoring Report 2005-06
National Program for Improvement of Watercourses (Punjab Component) 107
Utilization of Funds in Civil Works:
A sum of Rs. 110.64 million was allocated for civil works in the district, against which an amount of Rs. 100.55 million was transferred to WUAs. However, the exependiture utilization comes to 96% (of budgetary allocation) as verified by PWMC on the verified watercourses.
In the district, on an average, Rs. 669,428 have been expended on each watercourse as the government’s share. The average cost per meter of construction comes to Rs. 710.
Government Funds (Rs.) Av. material cost (Rs.) Civil works started
Verified w/cs
Farmers' share
Deposited (Rs.) Allocated Transferred to WUAs
Utilized on verified w/cs
Verified Utilization
%age per W/C per meter
159 158 25,080,000 110,646,872 100,555,192 105,769,636 96% 669,428 710
Status of Recovery from WUAs:
Recovery due for FY 2004-05 : 457,142
Recovery due for FY 2005-06 : 2,280,696
Total recoverable amount : 2,737,838
Amount recovered : 1,355,291
Amount yet to be recovered (Rs.) : 1,382,547
Cost Sharing (Govt & Farmers)
20%80%
Farmers'Share
Govt'sShare
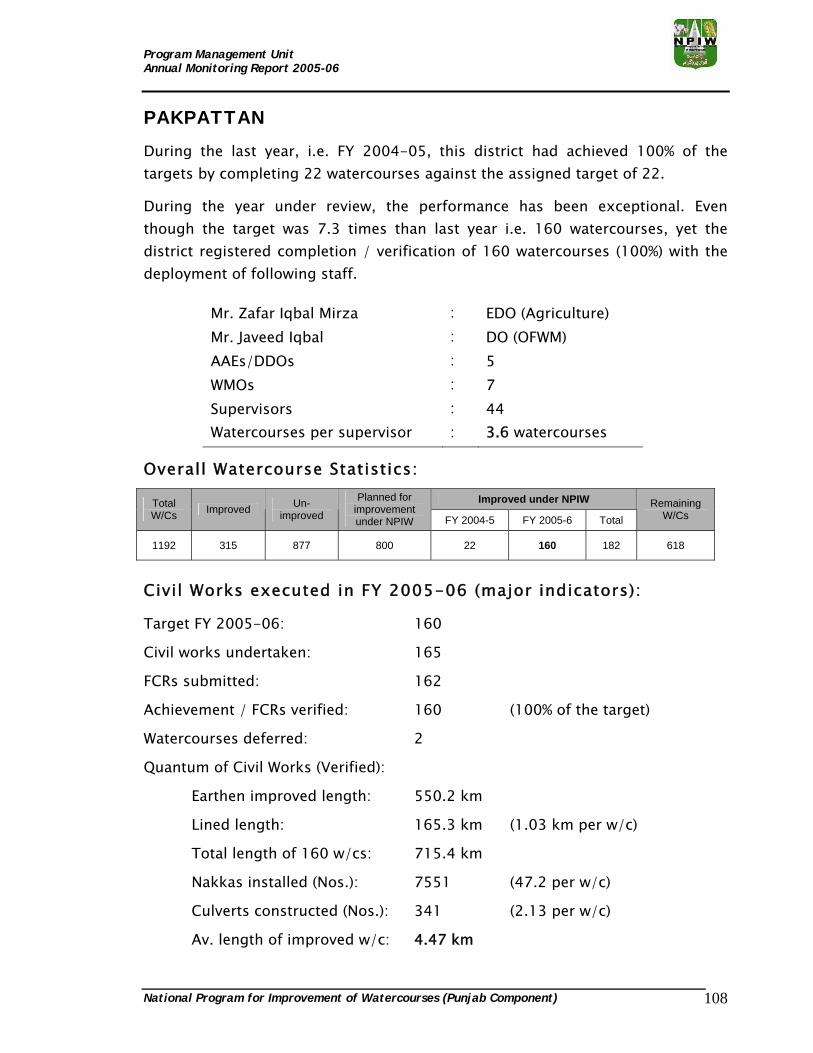
Program Management Unit Annual Monitoring Report 2005-06
National Program for Improvement of Watercourses (Punjab Component) 108
PAKPATTAN
During the last year, i.e. FY 2004-05, this district had achieved 100% of the targets by completing 22 watercourses against the assigned target of 22.
During the year under review, the performance has been exceptional. Even though the target was 7.3 times than last year i.e. 160 watercourses, yet the district registered completion / verification of 160 watercourses (100%) with the deployment of following staff.
Mr. Zafar Iqbal Mirza : EDO (Agriculture) Mr. Javeed Iqbal : DO (OFWM) AAEs/DDOs : 5 WMOs : 7 Supervisors : 44 Watercourses per supervisor
:
3.6 watercourses
Overall Watercourse Statistics:
Improved under NPIW Total W/Cs Improved Un-
improved
Planned for improvement under NPIW FY 2004-5 FY 2005-6 Total
Remaining W/Cs
1192 315 877 800 22 160 182 618
Civil Works executed in FY 2005-06 (major indicators):
Target FY 2005-06: 160
Civil works undertaken: 165
FCRs submitted: 162
Achievement / FCRs verified: 160 (100% of the target)
Watercourses deferred: 2
Quantum of Civil Works (Verified):
Earthen improved length: 550.2 km
Lined length: 165.3 km (1.03 km per w/c)
Total length of 160 w/cs: 715.4 km
Nakkas installed (Nos.): 7551 (47.2 per w/c)
Culverts constructed (Nos.): 341 (2.13 per w/c)
Av. length of improved w/c: 4.47 km

Program Management Unit Annual Monitoring Report 2005-06
National Program for Improvement of Watercourses (Punjab Component) 109
This graph depicts the percentage lining of the watercourses improved & verified in the district.
PHYSICAL VERIFICATIONS: PWMC has to conduct four mandatory visits to each under improvement watercourse in order to certify the works executed at site. A target of 160 translates into 640 site visits certifying S&D, ICR-I, ICR-II & FCR. Following graph portrays that 327 certifications were made after March, 2006 i.e. during last quarter & onwards. The chart given below depicts activity level during various months.
FINANCIAL PROFILE: During financial year 2005-06, an amount of Rs. 140.33 million was allocated to the district under various heads, against which Rs. 104.90 million (75%) were utilized.
Head Allocation (Rs.) Exp. (Rs.) Balance (Rs.) Utilization
Establishment Charges 11,628,000 7,971,072 3,656,928 69% Purchase of Durable Goods 34 - 34 - Repair, Maintenance, C & S 748500 671,557 76,943 90% Civil Works (Total) 127,959,101 *96,266,624 31,692,477 75% Total 140,335,635 104,909,253 35,426,382 75%
*Total Amount transferred to WUAs for Civil Works.
Bricklining %age
77% 23%
BrickliningEarthen works
ICR-I, ICR-II & FCR Verifications
-20
0
20
40
60
80
100
120
140
160
180
01-1
2-05
02-0
1-06
01-0
2-06
01-0
3-06
04-0
4-06
29-0
4-06
01-0
6-06
01-0
7-06
02-0
8-06
30-0
8-06
Period
Verif
icat
ions
ICR-I ICR-IIFCR

Program Management Unit Annual Monitoring Report 2005-06
National Program for Improvement of Watercourses (Punjab Component) 110
Utilization of Funds in Civil Works:
A sum of Rs. 127.95 million was allocated for civil works in the district, against which an amount of Rs. 96.26 million was transferred to WUAs. However, the exependiture utilization comes to 85% (of budgetary allocation) as verified by PWMC on the verified watercourses.
In the district, on an average, Rs. 682,020 have been expended on each watercourse as the government’s share. The average cost per meter of construction comes to Rs. 660.
Government Funds (Rs.) Av. material cost (Rs.) Civil works started
Verified w/cs
Farmers' share
Deposited (Rs.) Allocated Transferred to WUAs
Utilized on verified w/cs
Verified Utilization
%age per W/C per meter
165 160 33,030,000 127,959,101 96,266,624 109,123,082 85% 682,020 660
Status of Recovery from WUAs:
Recovery due for FY 2004-05 : -
Recovery due for FY 2005-06 : 202,645
Total recoverable amount : 202,645
Amount recovered : 171,283
Amount yet to be recovered (Rs.) : 31,362
Cost Sharing (Govt & Farmers)
26%
74% Farmers'Share
Govt'sShare

Program Management Unit Annual Monitoring Report 2005-06
National Program for Improvement of Watercourses (Punjab Component) 111
SAHIWAL
During the last year, i.e. FY 2004-05, this district achieved 103% of the targets by completing 124 watercourses against the assigned target of 120.
During the year under review, the performance is up to the mark. Chasing the target of 94 watercourses, yet the district registered completion / verification of 94 watercourses (100%) with the deployment of following staff.
Mr. Liaqat Ali : EDO (Agriculture) Mr. Ahmed Ali Khitchi : DO (OFWM) AAEs/DDOs : 4 WMOs : 3 Supervisors : 26 Watercourses per supervisor
:
3.6 watercourses
Overall Watercourse Statistics:
Improved under NPIW Total W/Cs Improved Un-
improved
Planned for improvement under NPIW FY 2004-5 FY 2005-6 Total
Remaining W/Cs
1568 749 819 416 124 94 218 198
Civil Works executed in FY 2005-06 (major indicators):
Target FY 2005-06: 94
Civil works undertaken: 97
FCRs submitted: 95
Achievement / FCRs verified: 94 (100% of the target)
Watercourses deferred: 1
Quantum of Civil Works (Verified):
Earthen improved length: 333.7 km
Lined length: 101.2 km (1.07 km per w/c)
Total length of 94 w/cs: 434.9 km
Nakkas installed (Nos.): 3585 (38.14 per w/c)
Culverts constructed (Nos.): 108 (1.15 per w/c)
Av. length of improved w/c: 4.63 km

Program Management Unit Annual Monitoring Report 2005-06
National Program for Improvement of Watercourses (Punjab Component) 112
This graph depicts the percentage lining of the watercourses improved & verified in the district.
PHYSICAL VERIFICATIONS: PWMC has to conduct four mandatory visits to each under improvement watercourse in order to certify the works executed at site. A target of 94 translates into 376 site visits certifying S&D, ICR-I, ICR-II & FCR. Following graph portrays that 192 certifications were made after March, 2006 i.e. during last quarter & onwards. The chart given below depicts activity level during various months.
FINANCIAL PROFILE: During financial year 2005-06, an amount of Rs. 83.65 million was allocated to the district under various heads, against which Rs. 68.10 million (81%) were utilized.
Head Allocation (Rs.) Exp. (Rs.) Balance (Rs.) Utilization
Establishment Charges 7,447,490 5,335,019 2,112,471 72% Purchase of Durable Goods - - - - Repair, Maintenance, C & S 1024510 946,508 78,002 92% Civil Works (Total) 75,187,960 *61,821,469 13,366,491 82% Total 83,659,960 68,102,996 15,556,964 81%
*Total Amount transferred to WUAs for Civil Works.
Bricklining %age
77% 23%
BrickliningEarthen works
ICR-I, ICR-II & FCR Verifications
-20
0
20
40
60
80
100
120
01-1
2-05
02-0
1-06
01-0
2-06
01-0
3-06
04-0
4-06
29-0
4-06
01-0
6-06
01-0
7-06
02-0
8-06
30-0
8-06
Period
Verif
icat
ions
ICR-I ICR-II
FCR

Program Management Unit Annual Monitoring Report 2005-06
National Program for Improvement of Watercourses (Punjab Component) 113
Utilization of Funds in Civil Works:
A sum of Rs. 75.18 million was allocated for civil works in the district, against which an amount of Rs. 61.82 million was transferred to WUAs. However, the exependiture utilization comes to 85% (of budgetary allocation) as verified by PWMC on the verified watercourses.
In the district, on an average, Rs. 677,925 have been expended on each watercourse as the government’s share. The average cost per meter of construction comes to Rs. 630.
Government Funds (Rs.) Av. material cost (Rs.) Civil works started
Verified w/cs
Farmers' share Deposited (Rs.) Allocated Transferred
to WUAs Utilized on
verified w/cs
Verified Utilization
%age per W/C per meter
97 94 16,650,000 75,187,960 61,821,469 63,724,935 85% 677,925 630
Status of Recovery from WUAs:
Recovery due for FY 2004-05 : 4,458,729
Recovery due for FY 2005-06 : 2,079,253
Total recoverable amount : 6,537,982
Amount recovered : 4,555,180
Amount yet to be recovered (Rs.) : 1,982,802
Cost Sharing (Govt & Farmers)
21%79%
Farmers'Share
Govt'sShare

Program Management Unit Annual Monitoring Report 2005-06
National Program for Improvement of Watercourses (Punjab Component) 114
VEHARI
During the last year, i.e. FY 2004-05, this district accomplished 99% of the targets by completing 92 watercourses against the assigned target of 93.
During the year under review, the performance has improved more. Chasing the target of 120 watercourses, the district registered completion / verification of 130 watercourses (108%) with the deployment of following staff.
Mr. Qamar Muhayyudin : EDO (Agriculture) Mr. Mehar Allah Ditta : DO (OFWM) AAEs/DDOs : 5 WMOs : 4 Supervisors : 32 Watercourses per supervisor
:
4.1 watercourses
Overall Watercourse Statistics:
Improved under NPIW Total W/Cs Improved Un-
improved
Planned for improvement under NPIW FY 2004-5 FY 2005-6 Total
Remaining W/Cs
1853 1007 846 691 92 130 222 469
Civil Works executed in FY 2005-06 (major indicators):
Target FY 2005-06: 120
Civil works undertaken: 138
FCRs submitted: 130
Achievement / FCRs verified: 130 (108% of the target)
Watercourses deferred: 0
Quantum of Civil Works (Verified):
Earthen improved length: 445.5 km
Lined length: 142.5 km (1.09 km per w/c)
Total length of 130 w/cs: 588.0 km
Nakkas installed (Nos.): 5145 (39.6 per w/c)
Culverts constructed (Nos.): 208 (1.6 per w/c)
Av. length of improved w/c: 4.52 km

Program Management Unit Annual Monitoring Report 2005-06
National Program for Improvement of Watercourses (Punjab Component) 115
This graph depicts the percentage lining of the watercourses improved & verified in the district.
PHYSICAL VERIFICATIONS: PWMC has to conduct four mandatory visits to each under improvement watercourse in order to certify the works executed at site. A target of 120 translates into 480 site visits certifying S&D, ICR-I, ICR-II & FCR. Following graph portrays that 257 certifications were made after March, 2006 i.e. during last quarter & onwards. The chart given below depicts activity level during various months.
FINANCIAL PROFILE: During financial year 2005-06, an amount of Rs. 104.53 million was allocated to the district under various heads, against which Rs. 95.16 million (91%) were utilized.
Head Allocation (Rs.) Exp. (Rs.) Balance (Rs.) Utilization
Establishment Charges 13,097,488 7,527,619 5,569,869 57% Purchase of Durable Goods 220000 220000 - 100% Repair, Maintenance, C & S 1256512 996,464 260,048 79% Civil Works (Total) 89,960,202 *86,417,806 3,542,396 96% Total 104,534,202 95,161,889 9,372,313 91%
*Total Amount transferred to WUAs for Civil Works.
Bricklining %age
76%24%
BrickliningEarthen works
ICR-I, ICR-II & FCR Verifications
-20
0
20
40
60
80
100
120
140
160
01-1
2-05
02-0
1-06
01-0
2-06
01-0
3-06
04-0
4-06
29-0
4-06
01-0
6-06
01-0
7-06
02-0
8-06
30-0
8-06
Period
Ver
ifica
tions
ICR-I ICR-IIFCR

Program Management Unit Annual Monitoring Report 2005-06
National Program for Improvement of Watercourses (Punjab Component) 116
Utilization of Funds in Civil Works:
A sum of Rs. 89.96 million was allocated for civil works in the district, against which an amount of Rs. 86.41 million was transferred to WUAs. However, the exependiture utilization comes to 99.9% (of budgetary allocation) as verified by PWMC on the verified watercourses.
In the district, on an average, Rs. 691,803 have been expended on each watercourse as the government’s share. The average cost per meter of construction comes to Rs. 631.
Government Funds (Rs.) Av. material cost (Rs.) Civil works started
Verified w/cs
Farmers' share
Deposited (Rs.) Allocated Transferred to WUAs
Utilized on verified w/cs
Verified Utilization
%age per W/C per meter
138 130 24,300,000 89,960,202 86,417,806 89,934,449 99.9% 691,803 631
Status of Recovery from WUAs:
Recovery due for FY 2004-05 : 2,939,128
Recovery due for FY 2005-06 : 1,045,876
Total recoverable amount : 3,985,004
Amount recovered : 3,834,835
Amount yet to be recovered (Rs.) : 150,169
Cost Sharing (Govt & Farmers)
22%78%
Farmers'Share
Govt'sShare

Program Management Unit Annual Monitoring Report 2005-06
National Program for Improvement of Watercourses (Punjab Component) 117
BHAKKAR
During the last year, i.e. FY 2004-05, this district managed to achieve 96% of the targets by completing 56 watercourses against the assigned target of 58.
During the year under review, the performance is up to the mark. Although the target was 2 times than last year i.e. 120 watercourses, yet the district registered completion / verification of 122 watercourses (102%) with the deployment of following staff.
Mr. Dr. Abdul Rauf : EDO (Agriculture) Mr. Ch. Muhammad Rafiq : DO (OFWM) AAEs/DDOs : 7 WMOs : 9 Supervisors : 44 Watercourses per supervisor
:
2.8 watercourses
Overall Watercourse Statistics:
Improved under NPIW Total W/Cs Improved Un-
improved
Planned for improvement under NPIW FY 2004-5 FY 2005-6 Total
Remaining W/Cs
1238 328 910 679 56 122 178 501
Civil Works executed in FY 2005-06 (major indicators):
Target FY 2005-06: 120
Civil works undertaken: 127
FCRs submitted: 122
Achievement / FCRs verified: 122 (102% of the target)
Watercourses deferred: 0
Quantum of Civil Works (Verified):
Earthen improved length: 492.9 km
Lined length: 82 km (0.67 km per w/c)
Total length of 122 w/cs: 574.9 km
Nakkas installed (Nos.): 6693 (54.8 per w/c)
Culverts constructed (Nos.): 161 (1.32 per w/c)
Av. length of improved w/c: 4.71 km

Program Management Unit Annual Monitoring Report 2005-06
National Program for Improvement of Watercourses (Punjab Component) 118
This graph depicts the percentage lining of the watercourses improved & verified in the district.
PHYSICAL VERIFICATIONS: PWMC has to conduct four mandatory visits to each under improvement watercourse in order to certify the works executed at site. A target of 120 translates into 480 site visits certifying S&D, ICR-I, ICR-II & FCR. Following graph portrays that 256 certifications were made after March, 2006 i.e. during last quarter & onwards. The chart given below depicts activity level during various months.
FINANCIAL PROFILE: During financial year 2005-06, an amount of Rs. 67.29 million was allocated to the district under various heads, against which Rs. 64.18 million (95%) were utilized.
Head Allocation (Rs.) Exp. (Rs.) Balance (Rs.) Utilization
Establishment Charges 9,450,584 8,257,682 1,192,902 87% Purchase of Durable Goods - - - - Repair, Maintenance, C & S 848500 686,019 162,481 81% Civil Works (Total) 56,997,864 *55,237,126 1,760,738 97% Total 67,296,948 64,180,827 3,116,121 95%
*Total Amount transferred to WUAs for Civil Works.
Bricklining %age
86%
14%
Bricklining
Earthen works
ICR-I, ICR-II & FCR Verifications
-20
0
20
40
60
80
100
120
140
01-1
2-05
02-0
1-06
01-0
2-06
01-0
3-06
04-0
4-06
29-0
4-06
01-0
6-06
01-0
7-06
02-0
8-06
30-0
8-06
Period
Ver
ifica
tions
ICR-I ICR-II
FCR

Program Management Unit Annual Monitoring Report 2005-06
National Program for Improvement of Watercourses (Punjab Component) 119
Utilization of Funds in Civil Works:
A sum of Rs. 56.99 million was allocated for civil works in the district, against which an amount of Rs. 55.23 million was transferred to WUAs. However, the exependiture utilization comes to 103% (of budgetary allocation) as verified by PWMC on the verified watercourses.
In the district, on an average, Rs. 479,412 have been expended on each watercourse as the government’s share. The average cost per meter of construction comes to Rs. 713.
Government Funds (Rs.) Av. material cost (Rs.) Civil works started
Verified w/cs
Farmers' share
Deposited (Rs.) Allocated Transferred to WUAs
Utilized on verified w/cs
Verified Utilization
%age per W/C per meter
127 122 18,873,000 56,997,864 55,237,126 58,488,325 103% 479,412 713
Status of Recovery from WUAs:
Recovery due for FY 2004-05 : 493,591
Recovery due for FY 2005-06 : 300,357
Total recoverable amount : 793,948
Amount recovered : 645,067
Amount yet to be recovered (Rs.) : 148,881
Cost Sharing (Govt & Farmers)
25%
75% Farmers'Share
Govt'sShare

Program Management Unit Annual Monitoring Report 2005-06
National Program for Improvement of Watercourses (Punjab Component) 120
KHUSHAB
During the last year, i.e. FY 2004-05, this district achieved 100% of the targets by completing 35 watercourses against the assigned target of 35. During the year under review, the performance has enhanced and is up to the mark. Chasing the target of 50 watercourses, the district registered completion / verification of 52 watercourses (104%) with the deployment of following staff.
Mr. Malik Waqar : EDO (Agriculture) Mr. Malik Sher Muhammad : DO (OFWM) AAEs/DDOs : 2 WMOs : 3 Supervisors : 22 Watercourses per supervisor
:
2.4 watercourses
Overall Watercourse Statistics:
Improved under NPIW Total W/Cs Improved Un-
improved
Planned for improvement under NPIW FY 2004-5 FY 2005-6 Total
Remaining W/Cs
788 362 426 279 35 52 87 192
Civil Works executed in FY 2005-06 (major indicators):
Target FY 2005-06: 50
Civil works undertaken: 54
FCRs submitted: 52
Achievement / FCRs verified: 52 (104% of the target)
Watercourses deferred: 0
Quantum of Civil Works (Verified):
Earthen improved length: 148.4 km
Lined length: 35.4 km (0.68 km per w/c)
Total length of 52 w/cs: 183.8 km
Nakkas installed (Nos.): 2029 (39.0 per w/c)
Culverts constructed (Nos.): 28 (0.53 per w/c)
Av. length of improved w/c: 3.54 km

Program Management Unit Annual Monitoring Report 2005-06
National Program for Improvement of Watercourses (Punjab Component) 121
This graph depicts the percentage lining of the watercourses improved & verified in the district.
PHYSICAL VERIFICATIONS: PWMC has to conduct four mandatory visits to each under improvement watercourse in order to certify the works executed at site. A target of 50 translates into 200 site visits certifying S&D, ICR-I, ICR-II & FCR. Following graph portrays that 116 certifications were made after March, 2006 i.e. during last quarter & onwards. The chart given below depicts activity level during various months.
FINANCIAL PROFILE: During financial year 2005-06, an amount of Rs. 28.40 million was allocated to the district under various heads, against which Rs. 26.26 million (92%) were utilized.
Head Allocation (Rs.) Exp. (Rs.) Balance (Rs.) Utilization
Establishment Charges 4,249,756 2,757,870 1,491,886 65% Purchase of Durable Goods 200 - 200 - Repair, Maintenance, C & S 437375 290,642 146,733 66% Civil Works (Total) 23,718,819 *23,211,762 507,057 98% Total 28,406,150 26,260,274 2,145,876 92%
*Total Amount transferred to WUAs for Civil Works.
Bricklining %age
81%19%
BrickliningEarthen works
ICR-I, ICR-II & FCR Verifications
-10
0
10
20
30
40
50
60
01-1
2-05
02-0
1-06
01-0
2-06
01-0
3-06
04-0
4-06
29-0
4-06
01-0
6-06
01-0
7-06
02-0
8-06
30-0
8-06
Period
Veri
ficat
ions
ICR-I ICR-IIFCR

Program Management Unit Annual Monitoring Report 2005-06
National Program for Improvement of Watercourses (Punjab Component) 122
Utilization of Funds in Civil Works:
A sum of Rs. 23.71 million was allocated for civil works in the district, against which an amount of Rs. 23.21 million was transferred to WUAs. However, the exependiture utilization comes to 107% (of budgetary allocation) as verified by PWMC on the verified watercourses.
In the district, on an average, Rs. 487,913 have been expended on each watercourse as the government’s share. The average cost per meter of construction comes to Rs. 716.
Government Funds (Rs.) Av. material cost (Rs.) Civil works started
Verified w/cs
Farmers' share Deposited (Rs.) Allocated Transferred
to WUAs Utilized on
verified w/cs
Verified Utilization
%age per W/C per meter
54 52 8,304,000 23,718,819 23,211,762 25,371,493 107% 487,913 716
Status of Recovery from WUAs:
Recovery due for FY 2004-05 : 146,921
Recovery due for FY 2005-06 : 335,843
Total recoverable amount : 482,764
Amount recovered : 400,553
Amount yet to be recovered (Rs.) : 82,211
Cost Sharing (Govt & Farmers)
26%
74% Farmers'Share
Govt'sShare
Program Management Unit Annual Monitoring Report 2005-06
National Program for Improvement of Watercourses (Punjab Component) 123
MIANWALI
During the last year, i.e. FY 2004-05, this district achieved 100% of the targets by completing 50 watercourses against the assigned target of 50.
During the year under review, the performance is again up to the mark. Chasing the target of 90 watercourses, the district registered completion / verification of 91 watercourses (101%) with the deployment of following staff.
Mr. Faiz Ahmad Kundi : EDO (Agriculture) Mr. Zaffar Iqbal Hussain Shah : DO (OFWM) AAEs/DDOs : 9 WMOs : 7 Supervisors : 36 Watercourses per supervisor
:
2.5 watercourses
Overall Watercourse Statistics:
Improved under NPIW Total W/Cs Improved Un-
improved
Planned for improvement under NPIW FY 2004-5 FY 2005-6 Total
Remaining W/Cs
1081 216 865 678 50 91 141 537
Civil Works executed in FY 2005-06 (major indicators):
Target FY 2005-06: 90
Civil works undertaken: 104
FCRs submitted: 98
Achievement / FCRs verified: 91 (101% of the target)
Watercourses deferred: 7
Quantum of Civil Works (Verified):
Earthen improved length: 266.3 km
Lined length: 53.9 km (0.59 km per w/c)
Total length of 91 w/cs: 320.2 km
Nakkas installed (Nos.): 4802 (52.7 per w/c)
Culverts constructed (Nos.): 138 (1.52 per w/c)
Av. length of improved w/c: 3.52 km

Program Management Unit Annual Monitoring Report 2005-06
National Program for Improvement of Watercourses (Punjab Component) 124
This graph depicts the percentage lining of the watercourses improved & verified in the district.
PHYSICAL VERIFICATIONS: PWMC has to conduct four mandatory visits to each under improvement watercourse in order to certify the works executed at site. A target of 90 translates into 360 site visits certifying S&D, ICR-I, ICR-II & FCR. Following graph portrays that 194 certifications were made after March, 2006 i.e. during last quarter & onwards. The chart given below depicts activity level during various months.
FINANCIAL PROFILE: During financial year 2005-06, an amount of Rs. 53.07 million was allocated to the district under various heads, against which Rs. 42.99 million (81%) were utilized.
Head Allocation (Rs.) Exp. (Rs.) Balance (Rs.) Utilization
Establishment Charges 9,290,400 6,846,192 2,444,208 74% Purchase of Durable Goods - - - - Repair, Maintenance, C & S 836500 547,249 289,251 65% Civil Works (Total) 42,950,901 *35,598,166 7,352,735 83% Total 53,077,801 42,991,607 10,086,194 81%
*Total Amount transferred to WUAs for Civil Works.
Bricklining %age
83%
17%
BrickliningEarthen works
ICR-I, ICR-II & FCR Verifications
-20
0
20
40
60
80
100
120
01-1
2-05
02-0
1-06
01-0
2-06
01-0
3-06
04-0
4-06
29-0
4-06
01-0
6-06
01-0
7-06
02-0
8-06
30-0
8-06
Period
Verif
icat
ions
ICR-I ICR-II
FCR

Program Management Unit Annual Monitoring Report 2005-06
National Program for Improvement of Watercourses (Punjab Component) 125
Utilization of Funds in Civil Works:
A sum of Rs. 42.95 million was allocated for civil works in the district, against which an amount of Rs. 35.59 million was transferred to WUAs. However, the exependiture utilization comes to 96% (of budgetary allocation) as verified by PWMC on the verified watercourses.
In the district, on an average, Rs. 452,948 have been expended on each watercourse as the government’s share. The average cost per meter of construction comes to Rs. 765.
Government Funds (Rs.) Av. material cost (Rs.) Civil works started
Verified w/cs
Farmers' share
Deposited (Rs.) Allocated Transferred to WUAs
Utilized on verified w/cs
Verified Utilization
%age per W/C per meter
104 91 16,112,000 42,950,901 35,598,166 41,218,355 96% 452,948 765
Status of Recovery from WUAs:
Recovery due for FY 2004-05 : 5,448
Recovery due for FY 2005-06 : 39,466
Total recoverable amount : 44,914
Amount recovered : 5,547
Amount yet to be recovered (Rs.) : 39,367
Cost Sharing (Govt & Farmers)
31%
69% Farmers'Share
Govt'sShare

Program Management Unit Annual Monitoring Report 2005-06
National Program for Improvement of Watercourses (Punjab Component) 126
SARGODHA
During the last year, i.e. FY 2004-05, this district achieved 95% of the targets by completing 91 watercourses against the assigned target of 96. However during the year under review, the performance has enhanced. Chasing the target of 145 watercourses, the district registered completion / verification of 155 watercourses (107%) with the deployment of following staff.
Mr. Abdul Majeed : EDO (Agriculture) Mr. Afzal Bajwa : DO (OFWM) AAEs/DDOs : 13 WMOs : 10 Supervisors : 59 Watercourses per supervisor
:
2.6 Watercourses
Overall Watercourse Statistics:
Improved under NPIW Total W/Cs Improved Un-
improved
Planned for improvement under NPIW FY 2004-5 FY 2005-6 Total
Remaining W/Cs
2589 1112 1477 1200 91 155 246 954
Civil Works executed in FY 2005-06 (major indicators):
Target FY 2005-06: 145
Civil works undertaken: 166
FCRs submitted: 160
Achievement / FCRs verified: 155 (107% of the target)
Watercourses deferred: 5
Quantum of Civil Works (Verified):
Earthen improved length: 465.4 km
Lined length: 150 km (0.97 km per w/c)
Total length of 155 w/cs: 615.4 km
Nakkas installed (Nos.): 5625 (36.3 per w/c)
Culverts constructed (Nos.): 287 (1.85 per w/c)
Av. length of improved w/c: 3.97 km

Program Management Unit Annual Monitoring Report 2005-06
National Program for Improvement of Watercourses (Punjab Component) 127
This graph depicts the percentage lining of the watercourses improved & verified in the district.
PHYSICAL VERIFICATIONS: PWMC has to conduct four mandatory visits to each under improvement watercourse in order to certify the works executed at site. A target of 145 translates into 580 site visits certifying S&D, ICR-I, ICR-II & FCR. Following graph portrays that 324 certifications were made after March, 2006 i.e. during last quarter & onwards. The chart given below depicts activity level during various months.
FINANCIAL PROFILE: During financial year 2005-06, an amount of Rs. 117.47 million was allocated to the district under various heads, against which Rs. 113.14 million (96%) were utilized.
Head Allocation (Rs.) Exp. (Rs.) Balance (Rs.) Utilization
Establishment Charges 14,599,200 10,788,294 3,810,906 74% Purchase of Durable Goods 110472 109947 525 100% Repair, Maintenance, C & S 1314500 827,870 486,630 63% Civil Works (Total) 101,446,258 *101,420,881 25,377 100% Total 117,470,430 113,146,992 4,323,438 96%
*Total Amount transferred to WUAs for Civil Works.
Bricklining %age
76%24%
BrickliningEarthen works
ICR-I, ICR-II & FCR Verifications
-50
0
50
100
150
200
01-1
2-05
02-0
1-06
01-0
2-06
01-0
3-06
04-0
4-06
29-0
4-06
01-0
6-06
01-0
7-06
02-0
8-06
30-0
8-06
Period
Ver
ifica
tions
ICR-I ICR-II
FCR

Program Management Unit Annual Monitoring Report 2005-06
National Program for Improvement of Watercourses (Punjab Component) 128
Utilization of Funds in Civil Works:
A sum of Rs. 101.44 million was allocated for civil works in the district, which was almost completely transferred to WUAs. However, the exependiture utilization comes to 110% (of budgetary allocation) as verified by PWMC on the verified watercourses, demonstrating that some amount is yet to be padi to WUAs.
In the district, on an average, Rs. 719,321 have been expended on each watercourse as the government’s share. The average cost per meter of construction comes to Rs. 743.
Government Funds (Rs.) Av. material cost (Rs.) Civil works started
Verified w/cs
Farmers' share Deposited (Rs.) Allocated Transferred
to WUAs Utilized on
verified w/cs
Verified Utilization
%age per W/C per meter
166 155 29,020,000 101,446,258 101,420,881 111,494,832 110% 719,321 743
Status of Recovery from WUAs:
Recovery due for FY 2004-05 : 197,610
Recovery due for FY 2005-06 : 77,626
Total recoverable amount : 275,236
Amount recovered : 248,047
Amount yet to be recovered (Rs.) : 27,189
Cost Sharing (Govt & Farmers)
22%
78%Farmers'
ShareGovt'sShare

Program Management Unit Annual Monitoring Report 2005-06
National Program for Improvement of Watercourses (Punjab Component) 129
ATTOCK
During the last year, i.e. FY 2004-05, this district achieved 100% of the targets by completing 40 watercourses / schemes against the assigned target of 40.
During the year under review, the performance is up to the mark. Chasing the target of 68, the district registered completion / verification of 68 watercourses / schemes (100%) with the deployment of following staff.
Dr. Muhammad Anwar : EDO (Agriculture) Mr. Muhammad Ishfaq : DO (OFWM) AAEs/DDOs : 5 WMOs : 2 Supervisors : 7 Watercourses per supervisor
:
9.7 watercourses
Overall Watercourse Statistics:
Watercourses improved under NPIW
FY 2004-5 FY 2005-6 Total
40 68 108
Civil Works executed in FY 2005-06 (major indicators):
Target FY 2005-06: 68
Civil works undertaken: 68
FCRs submitted: 68
Achievement / FCRs verified: 68 (100% of the target)
Watercourses deferred: 0
Quantum of Civil Works (Verified):
Total lining of 68 schemes: 31.941 km
Water storage tanks (Nos.): 2
Nakkas installed (Nos.): 1215 (17.9 per w/c)
Culverts constructed (Nos.): 10 (0.15 per w/c)
Av. lining of improved schemes: 0.47 km

Program Management Unit Annual Monitoring Report 2005-06
National Program for Improvement of Watercourses (Punjab Component) 130
PHYSICAL VERIFICATIONS:
PWMC has to conduct four mandatory visits to each under improvement watercourse / scheme in order to certify the works executed at site. A target of 68 translates into 272 site visits certifying S&D, ICR-I, ICR-II & FCR. Following graph portrays that 157 certifications were made after March, 2006 i.e. during last quarter & onwards. The chart given below depicts activity level during various months. FINANCIAL PROFILE:
During financial year 2005-06, an amount of Rs. 12.00 million was allocated to the district under various heads, against which Rs. 11.26 million (94%) were utilized.
Head Allocation (Rs.) Exp. (Rs.) Balance (Rs.) Utilization
Establishment Charges - - - - Purchase of Durable Goods 123122 121030 2,092 98% Repair, Maintenance, C & S 1074218 798,839 275,379 74% Civil Works (Total) 10,805,954 *10,347,896 458,058 96% Total 12,003,294 11,267,765 735,529 94%
*Total Amount transferred to WUAs for Civil Works.
Utilization of Funds in Civil Works:
A sum of Rs. 10.80 million was allocated for civil works in the district, against which an amount of Rs. 10.34 million was transferred to WUAs. However, the exependiture utilization comes to 96% (of budgetary allocation) as verified by PWMC on the verified watercourses / schemes.
ICR-I, ICR-II & FCR Verifications
-10
0
10
20
30
40
50
60
70
80
01-1
2-05
02-0
1-06
01-0
2-06
01-0
3-06
04-0
4-06
29-0
4-06
01-0
6-06
01-0
7-06
02-0
8-06
30-0
8-06
Period
Ver
ifica
tions
ICR-I ICR-IIFCR

Program Management Unit Annual Monitoring Report 2005-06
National Program for Improvement of Watercourses (Punjab Component) 131
In the district, on an average, Rs. 152,084 have been expended on each watercourse / scheme as the government’s share. The average cost per meter of construction comes to Rs. 324.
Government Funds (Rs.) Av. material cost (Rs.) Civil works started
Verified w/cs
Farmers' share Deposited (Rs.) Allocated Transferred
to WUAs Utilized on
verified w/cs
Verified Utilization
%age per W/C per meter
68 68 2,740,000 10,805,954 10,347,896 10,341,695 96% 152,084 324
Status of Recovery from WUAs:
Recovery due for FY 2004-05 : 340
Recovery due for FY 2005-06 : 6,201
Total recoverable amount : 6,541
Amount recovered : 6,541
Amount yet to be recovered (Rs.) : -
Cost Sharing (Govt & Farmers)
21%79%
Farmers'Share
Govt'sShare

Program Management Unit Annual Monitoring Report 2005-06
National Program for Improvement of Watercourses (Punjab Component) 132
CHAKWAL
During the last year, i.e. FY 2004-05, this district accomplished 105% of the targets by completing 21 watercourses / schemes against the assigned target of 20.
During the year under review, the performance is again up to the mark. Although the target was 3.5 times than last year i.e. 70, yet the district registered completion / verification of 70 watercourses/schemes (100%) with the deployment of following staff.
Mr. Iftikhar Qureshi : EDO (Agriculture) Mr. Bashir Ahmed Sara : DO (OFWM) AAEs/DDOs : 2 WMOs : 1 Supervisors : 5 Watercourses per supervisor
:
14 watercourses
Overall Watercourse Statistics:
Watercourses improved under NPIW
FY 2004-5 FY 2005-6 Total
21 70 91
Civil Works executed in FY 2005-06 (major indicators):
Target FY 2005-06: 70
Civil works undertaken: 70
FCRs submitted: 70
Achievement / FCRs verified: 70 (100% of the target)
Watercourses deferred: 0
Quantum of Civil Works (Verified):
Total lining of 70 schemes: 38.101 km
Water storage tanks (Nos.): 5
Nakkas installed (Nos.): 983 (14 per w/c)
Culverts constructed (Nos.): 0
Av. lining of improved schemes: 0.54 km

Program Management Unit Annual Monitoring Report 2005-06
National Program for Improvement of Watercourses (Punjab Component) 133
PHYSICAL VERIFICATIONS:
PWMC has to conduct four mandatory visits to each under improvement watercourse / scheme in order to certify the works executed at site. A target of 70 translates into 280 site visits certifying S&D, ICR-I, ICR-II & FCR. Following graph portrays that 142 certifications were made after March, 2006 i.e. during last quarter & onwards. The chart given below depicts activity level during various months. FINANCIAL PROFILE:
During financial year 2005-06, an amount of Rs. 11.77 million was allocated to the district under various heads, against which Rs. 8.55 million (73%) were utilized.
Head Allocation (Rs.) Exp. (Rs.) Balance (Rs.) Utilization
Establishment Charges - - - - Purchase of Durable Goods 87021 68912 18,109 79% Repair, Maintenance, C & S 696351 489,251 207,100 70% Civil Works (Total) 10,993,534 *7,995,776 2,997,758 73% Total 11,776,906 8,553,939 3,222,967 73%
*Total Amount transferred to WUAs for Civil Works.
Utilization of Funds in Civil Works:
A sum of Rs. 10.99 million was allocated for civil works in the district, against which an amount of Rs. 7.99 million was transferred to WUAs. However, the exependiture utilization comes to 89% (of budgetary allocation) as verified by PWMC on the verified watercourses/schemes.
ICR-I, ICR-II & FCR Verifications
-10
0
10
20
30
40
50
60
70
80
01-1
2-05
02-0
1-06
01-0
2-06
01-0
3-06
04-0
4-06
29-0
4-06
01-0
6-06
01-0
7-06
02-0
8-06
30-0
8-06
Period
Ver
ifica
tions
ICR-I ICR-II
FCR

Program Management Unit Annual Monitoring Report 2005-06
National Program for Improvement of Watercourses (Punjab Component) 134
In the district, on an average, Rs. 139,134 have been expended on each watercourse / scheme as the government’s share. The average cost per meter of construction comes to Rs. 256.
Government Funds (Rs.) Av. material cost (Rs.) Civil works started
Verified w/cs
Farmers' share
Deposited (Rs.) Allocated Transferred to WUAs
Utilized on verified w/cs
Verified Utilization
%age per W/C per meter
70 70 2,696,000 10,993,534 7,995,776 9,739,377 89% 139,134 256
Status of Recovery from WUAs:
Recovery due for FY 2004-05 : 256
Recovery due for FY 2005-06 : -
Total recoverable amount : 256
Amount recovered : 256
Amount yet to be recovered (Rs.) : -
Cost Sharing (Govt & Farmers)
25%
75% Farmers'Share
Govt'sShare

Program Management Unit Annual Monitoring Report 2005-06
National Program for Improvement of Watercourses (Punjab Component) 135
JHELUM
During the last year, i.e. FY 2004-05, this district accomplished 140% of the targets by completing 56 watercourses / schemes against the assigned target of 40.
During the year under review, the performance is again outstanding. Chasing the target of 70 watercourses, the district registered completion / verification of 74 watercourses/schemes (106%) with the deployment of following staff.
Dr. Khalid Khan : EDO (Agriculture) Mr. Muhammad Azam Virk : DO (OFWM) AAEs/DDOs : 3 WMOs : 2 Supervisors : 3 Watercourses per supervisor
:
24.6 watercourses
Overall Watercourse Statistics:
Watercourses improved under NPIW
FY 2004-5 FY 2005-6 Total
56 74 130
Civil Works executed in FY 2005-06 (major indicators):
Target FY 2005-06: 70
Civil works undertaken: 74
FCRs submitted: 74
Achievement / FCRs verified: 74 (106% of the target)
Watercourses deferred: 0
Quantum of Civil Works (Verified):
Total lining of 74 schemes: 31.332 km
Water storage tanks (Nos.): 6
Nakkas installed (Nos.): 407 (5.5 per w/c)
Culverts constructed (Nos.): 0
Av. lining of improved schemes: 0.42 km
PHYSICAL VERIFICATIONS:

Program Management Unit Annual Monitoring Report 2005-06
National Program for Improvement of Watercourses (Punjab Component) 136
PWMC has to conduct four mandatory visits to each under improvement watercourse / scheme in order to certify the works executed at site. A target of 70 translates into 280 site visits certifying S&D, ICR-I, ICR-II & FCR. Following graph portrays that 137 certifications were made after March, 2006 i.e. during last quarter & onwards. The chart given below depicts activity level during various months.
FINANCIAL PROFILE:
During financial year 2005-06, an amount of Rs. 12.31 million was allocated to the district under various heads, against which Rs. 11.99 million (97%) were utilized.
Head Allocation (Rs.) Exp. (Rs.) Balance (Rs.) Utilization
Establishment Charges - - - - Purchase of Durable Goods 123000 115430 7,570 94% Repair, Maintenance, C & S 980000 794,336 185,664 81% Civil Works (Total) 11,215,111 *11,087,706 127,405 99% Total 12,318,111 11,997,472 320,639 97%
*Total Amount transferred to WUAs for Civil Works.
Utilization of Funds in Civil Works:
A sum of Rs. 11.21 million was allocated for civil works in the district, against which an amount of Rs. 11.08 million was transferred to WUAs. However, the exependiture utilization comes to a 99% (of budgetary allocation) as verified by PWMC on the verified watercourses/schemes.
ICR-I, ICR-II & FCR Verifications
-10
0
10
20
30
40
50
60
70
80
01-1
2-05
02-0
1-06
01-0
2-06
01-0
3-06
04-0
4-06
29-0
4-06
01-0
6-06
01-0
7-06
02-0
8-06
30-0
8-06
Period
Verif
icat
ions
ICR-I ICR-II
FCR

Program Management Unit Annual Monitoring Report 2005-06
National Program for Improvement of Watercourses (Punjab Component) 137
In the district, on an average, Rs. 149,920 have been expended on each watercourse / scheme as the government’s share. The average cost per meter of construction comes to Rs. 354.
Government Funds (Rs.) Av. material cost (Rs.) Civil works started
Verified w/cs
Farmers' share
Deposited (Rs.) Allocated Transferred to WUAs
Utilized on verified w/cs
Verified Utilization
%age per W/C per meter
74 74 2,560,000 11,215,111 11,087,706 11,094,124 99% 149,920 354
Status of Recovery from WUAs:
Recovery due for FY 2004-05 : -
Recovery due for FY 2005-06 : 33,481
Total recoverable amount : 33,481
Amount recovered : 33,481
Amount yet to be recovered (Rs.) : -
Cost Sharing (Govt & Farmers)
19%81%
Farmers'Share
Govt'sShare

Program Management Unit Annual Monitoring Report 2005-06
National Program for Improvement of Watercourses (Punjab Component) 138
RAWALPINDI
During the last year, i.e. FY 2004-05, this district accomplished 100% of the targets by completing 25 watercourses / schemes against the assigned target of 25.
During the year under review, the performance is again good. Chasing the target of 68, the district registered completion / verification of 71 watercourses/ schemes (104%) with the deployment of following staff.
Dr. Abdullah Shah : EDO (Agriculture) Mr. Bashir Ahmad : DO (OFWM) AAEs/DDOs : 4 WMOs : 2 Supervisors : 6 Watercourses per supervisor
:
11.8 watercourses
Overall Watercourse Statistics:
Watercourses improved under NPIW
FY 2004-5 FY 2005-6 Total
25 71 96
Civil Works executed in FY 2005-06 (major indicators):
Target FY 2005-06: 68
Civil works undertaken: 74
FCRs submitted: 71
Achievement / FCRs verified: 71 (104% of the target)
Watercourses deferred: 0
Quantum of Civil Works (Verified):
Total lining of 71 schemes: 32.993 km
Water storage tanks (Nos.): 2
Nakkas installed (Nos.): 1185 (16.7 per w/c)
Culverts constructed (Nos.): 0
Av. lining of improved schemes: 0.46 km

Program Management Unit Annual Monitoring Report 2005-06
National Program for Improvement of Watercourses (Punjab Component) 139
PHYSICAL VERIFICATIONS:
PWMC has to conduct four mandatory visits to each under improvement watercourse / scheme in order to certify the works executed at site. A target of 68 translates into 272 site visits certifying S&D, ICR-I, ICR-II & FCR. Following graph portrays that 126 certifications were made after March, 2006 i.e. during last quarter & onwards. The chart given below depicts activity level during various months. FINANCIAL PROFILE:
During financial year 2005-06, an amount of Rs. 11.84 million was allocated to the district under various heads, against which Rs. 11.39 million (96%) were utilized.
Head Allocation (Rs.) Exp. (Rs.) Balance (Rs.) Utilization
Establishment Charges - - - - Purchase of Durable Goods 90,305 68,065 22,240 75% Repair, Maintenance, C & S 853,931 534,366 319,565 63% Civil Works (Total) 10,897,707 *10,790,230 107,477 99% Total 11,841,943 11,392,661 449,282 96%
*Total Amount transferred to WUAs for Civil Works.
Utilization of Funds in Civil Works:
A sum of Rs. 10.89 million was allocated for civil works in the district, against which an amount of Rs. 10.79 was transferred to WUAs. However, the exependiture utilization comes to 99.6% (of budgetary allocation) as verified by PWMC on the verified watercourses/schemes.
ICR-I, ICR-II & FCR Verifications
-10
0
10
20
30
40
50
60
70
80
01-1
2-05
02-0
1-06
01-0
2-06
01-0
3-06
04-0
4-06
29-0
4-06
01-0
6-06
01-0
7-06
02-0
8-06
30-0
8-06
Period
Verif
icat
ions
ICR-I ICR-II
FCR
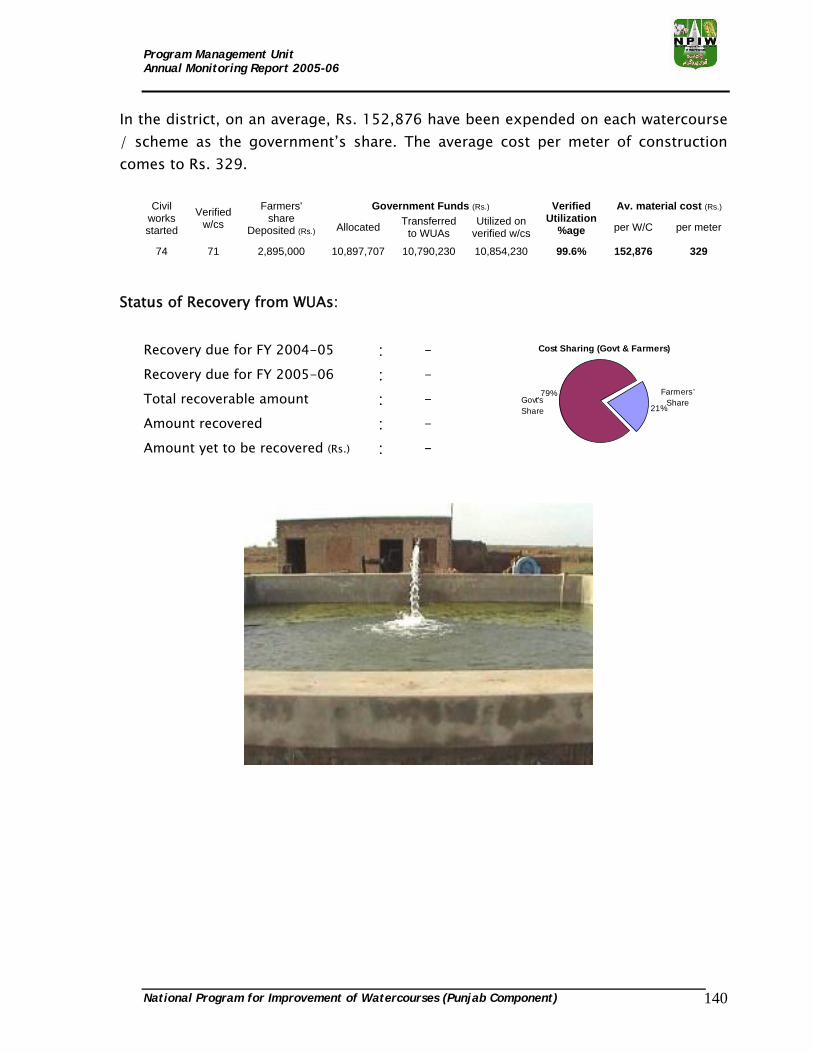
Program Management Unit Annual Monitoring Report 2005-06
National Program for Improvement of Watercourses (Punjab Component) 140
In the district, on an average, Rs. 152,876 have been expended on each watercourse / scheme as the government’s share. The average cost per meter of construction comes to Rs. 329.
Government Funds (Rs.) Av. material cost (Rs.) Civil works started
Verified w/cs
Farmers' share
Deposited (Rs.) Allocated Transferred to WUAs
Utilized on verified w/cs
Verified Utilization
%age per W/C per meter
74 71 2,895,000 10,897,707 10,790,230 10,854,230 99.6% 152,876 329
Status of Recovery from WUAs:
Recovery due for FY 2004-05 : -
Recovery due for FY 2005-06 : -
Total recoverable amount : -
Amount recovered : -
Amount yet to be recovered (Rs.) : -
Cost Sharing (Govt & Farmers)
21%
79% Farmers'ShareGovt's
Share

Program Management Unit Annual Monitoring Report 2005-06
National Program for Improvement of Watercourses (Punjab Component) 141
OFWM: Target vs Achievement (District Wise)
319
278
333
198
22
270
135
129
213
96
109
37
61
95
42
78
94
48
102
152
93
174
142
158
160
94
130
122
52
91
155
71
70
74
68
319
272
319
200
22
270
135
120
230
90
95
31
60
113
41
67
95
35
100
150
85
173
140
158
160
94
120
120
50
90
145
68
70
70
68
0 50 100 150 200 250 300
Bahawalnagar
Bahawalpur
R. Y Khan
D.G. Khan
Layyah
Muzaffargarh
Rajanpur
Faisalabad
Jhang
T.T. Singh
Gujranwala
Gujrat
Hafizabad
M.B.Din
Narowal
Sialkot
Kasur
Lahore
Nankana Sahib
Okara
Sheikhupura
Khanewal
Lodhran
Multan
Pakpattan
Sahiwal
Vehari
Bhakkar
Khushab
Mianwali
Sargodha
Rawalpindi
Chakwal
Jhelum
Attock
Dis
trict
s
Watercourses
Target
Achievement

Program Management Unit Annual Monitoring Report 2005-06
National Program for Improvement of Watercourses (Punjab Component) 142
OFWM: Percentage Achievement (District Wise)
137.1
119.4
116.4
114.7
109.4
108.3
107.5
106.9
106.7
105.7
104.4
104.4
104.0
102.4
102.2
102.0
101.7
101.7
101.4
101.3
101.1
100.6
100.0
100.0
100.0
100.0
100.0
100.0
100.0
100.0
100.0
99.0
98.9
92.6
84.1
0 20 40 60 80 100 120
Lahore
Gujrat
Sialkot
Gujranwala
Sheikhupura
Vehari
Faisalabad
Sargodha
T.T. Singh
Jhelum
Rawalpindi
R. Y Khan
Khushab
Narowal
Bahawalpur
Nankana Sahib
Bhakkar
Hafizabad
Lodhran
Okara
Mianwali
Khanewal
Attock
Bahawalnagar
Chakwal
Layyah
Multan
Muzaffargarh
Pakpattan
Rajanpur
Sahiwal
D.G. Khan
Kasur
Jhang
M.B.DinD
istri
cts
Percentage Achievement

Program Management Unit Annual Monitoring Report 2005-06
National Program for Improvement of Watercourses (Punjab Component) 143
OFWM: Watercourses per Supervisor (District Wise)
24.7
14.0
12.3
11.8
10.5
9.7
6.0
5.5
4.1
4.0
3.8
3.7
3.6
3.6
3.6
3.6
3.5
3.5
3.4
3.4
3.0
3.0
2.9
2.8
2.8
2.7
2.7
2.6
2.6
2.6
2.6
2.5
2.4
2.1
2.0
0.0 2.5 5.0 7.5 10.0 12.5 15.0 17.5 20.0 22.5
Jhelum
Chakwal
Gujrat
Rawalpindi
Narowal
Attock
Sialkot
Layyah
Vehari
Khanewal
Lodhran
Faisalabad
Pakpattan
Sahiwal
Multan
Hafizabad
R. Y Khan
Rajanpur
T.T. Singh
Bahawalnagar
Lahore
Nankana Sahib
Sheikhupura
Bahawalpur
Bhakkar
Gujranwala
Jhang
D.G. Khan
Sargodha
Muzaffargarh
Okara
Mianwali
Khushab
M.B.Din
Kasur
Dis
trict
s
Watercourses per Supervisors
On an average, there were 3.3 watercourses per supervisors in the OFWM.
Barani Areas or Irrigated+Barani Areas

Program Management Unit Annual Monitoring Report 2005-06
National Program for Improvement of Watercourses (Punjab Component) 144
OFWM: Watercourses per Supervisor & % Achievement (District Wise)
137.1
119.4
116.4
114.7
109.4
108.3
107.5
106.9
106.7
105.7
104.4
104.4
104
102.4
102.2
102
101.7
101.7
101.4
101.3
101.1
100.6
100
100
100
100
100
100
100
100
100
99
98.9
92.6
84.1
3.0
12.3
6.0
2.7
2.9
4.1
3.7
2.6
3.4
24.7
11.8
3.5
2.4
10.5
2.8
3.0
2.8
3.6
3.8
2.6
2.5
4.0
9.7
3.4
14.0
5.5
3.6
2.6
3.6
3.5
3.6
2.6
2.0
2.7
2.1
0.0 20.0 40.0 60.0 80.0 100.0 120.0
Lahore
Gujrat
Sialkot
Gujranwala
Sheikhupura
Vehari
Faisalabad
Sargodha
T.T. Singh
Jhelum
Rawalpindi
R. Y Khan
Khushab
Narowal
Bahawalpur
Nankana Sahib
Bhakkar
Hafizabad
Lodhran
Okara
Mianwali
Khanewal
Attock
Bahawalnagar
Chakwal
Layyah
Multan
Muzaffargarh
Pakpattan
Rajanpur
Sahiwal
D.G. Khan
Kasur
Jhang
M.B.DinDi
stric
ts
Watercourses per Supervisor & %Age Achievement
W/Cs per Supervisor
Achievement

Program Management Unit Annual Monitoring Report 2005-06
National Program for Improvement of Watercourses (Punjab Component) 145
OFWM: Lined Length in Irrigated Areas (District Wise)
1.02
0.78
1.03
0.59
1.17
1.00
0.68
1.07
0.70
1.06
0.67
0.68
0.59
0.97
0.84
1.14
0.94
1.03
1.08
1.10
0.69
0.57
0.58
0.90
0.60
0.42
0.66
0.48
0.83
0.38
0.34
0.00 0.20 0.40 0.60 0.80 1.00
Bahawalnagar
Bahawalpur
R.Y. Khan
D.G. Khan
Layyah
M. Garh
Rajanpur
Faisalabad
Jhang
T.T. Singh
Bhakkar
Khushab
Mianwali
Sargodha
Khanewal
Lodhran
Multan
Pakpattan
Sahiwal
Vehari
Kasur
Lahore
Nankana
Okara
Sheikhupura
Gujranwala
Gujrat
Hafizabad
M.B. Din
Narowal
SialkotD
istri
ct
Bricklined length (Km)

Program Management Unit Annual Monitoring Report 2005-06
National Program for Improvement of Watercourses (Punjab Component) 146
OFWM: Average Cost per Meter of Lining (District Wise)
751
775
728
967
735
835
830
721
954
703
744
738
367
758
695
710
464
667
439
941
838
826
738
818
708
635
710
660
630
631
713
716
765
743
324
256
354
329
0 100 200 300 400 500 600 700 800 900
Bahawalnagar
Bahawalpur
R. Y Khan
D.G. Khan
Layyah
Muzaffargarh
Rajanpur
Faisalabad
Jhang
T.T. Singh
Gujranwala
Gujrat (Irrigated)
Gujrat (Barani)
Hafizabad
M.B.Din
Narowal (Irrigated)
Narowal (Barani)
Sialkot (Irrigated)
Sialkot (Barani)
Kasur
Lahore
Nankana Sahib
Okara
Sheikhupura
Khanewal
Lodhran
Multan
Pakpattan
Sahiwal
Vehari
Bhakkar
Khushab
Mianwali
Sargodha
Attock
Chakwal
Jhelum
RawalpindiD
istri
cts
/ (A
rea)
Construction Cost (Rs.)
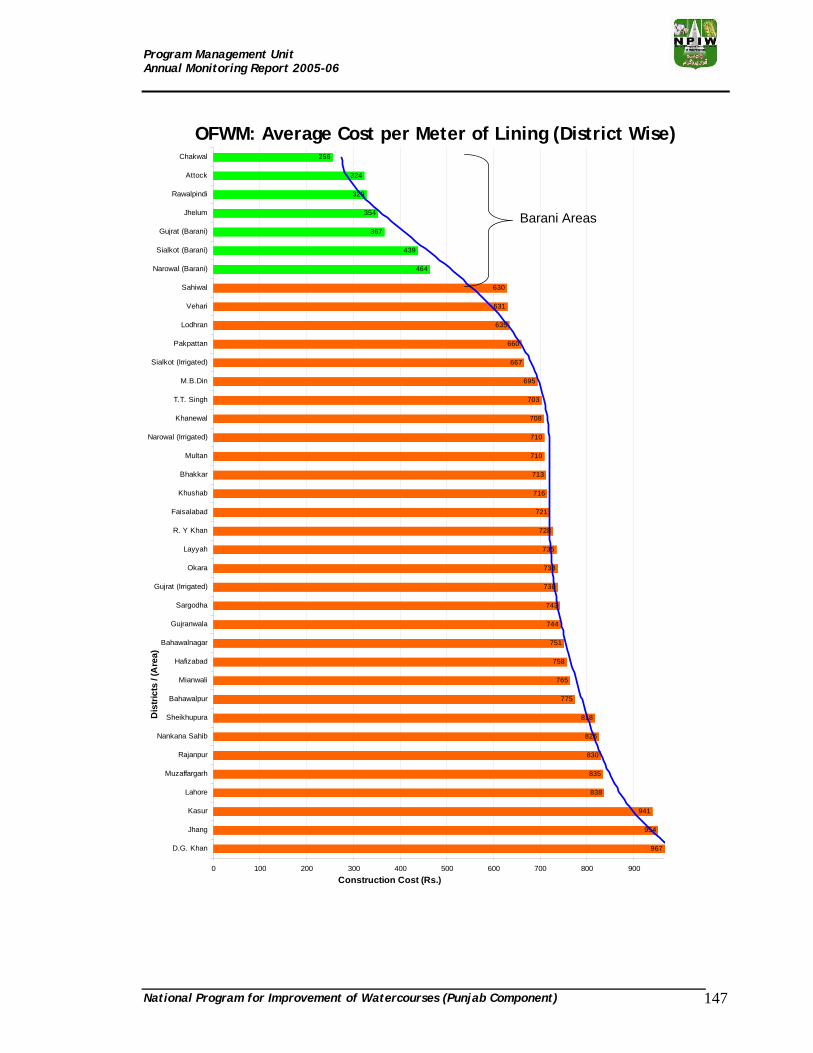
Program Management Unit Annual Monitoring Report 2005-06
National Program for Improvement of Watercourses (Punjab Component) 147
OFWM: Average Cost per Meter of Lining (District Wise)
967
954
941
838
835
830
826
818
775
765
758
751
744
743
738
738
735
728
721
716
713
710
710
708
703
695
667
660
635
631
630
464
439
367
354
329
324
256
0 100 200 300 400 500 600 700 800 900
D.G. Khan
Jhang
Kasur
Lahore
Muzaffargarh
Rajanpur
Nankana Sahib
Sheikhupura
Bahawalpur
Mianwali
Hafizabad
Bahawalnagar
Gujranwala
Sargodha
Gujrat (Irrigated)
Okara
Layyah
R. Y Khan
Faisalabad
Khushab
Bhakkar
Multan
Narowal (Irrigated)
Khanewal
T.T. Singh
M.B.Din
Sialkot (Irrigated)
Pakpattan
Lodhran
Vehari
Sahiwal
Narowal (Barani)
Sialkot (Barani)
Gujrat (Barani)
Jhelum
Rawalpindi
Attock
ChakwalD
istri
cts
/ (A
rea)
Construction Cost (Rs.)
Barani Areas

Program Management Unit Annual Monitoring Report 2005-06
National Program for Improvement of Watercourses (Punjab Component) 148
OFWM: Percentage Farmers’ Share (District Wise)
32
31
29
28
28
28
27
27
26
26
26
26
25
25
25
23
22
22
22
22
21
21
20
20
20
20
19
19
19
18
18
17
16
16
15
0 5 10 15 20 25 30
Gujrat
Mianwali
Narowal
Hafizabad
M.B.Din
Kasur
Chakwal
R. Y Khan
Khushab
Lahore
Sialkot
Pakpattan
Bhakkar
Gujranwala
Nankana Sahib
Rajanpur
Bahawalnagar
Sargodha
Vehari
Lodhran
Sahiwal
Attock
Khanewal
Bahawalpur
Multan
Jhelum
Sheikhupura
Layyah
Rawalpindi
D.G. Khan
Faisalabad
T.T. Singh
Okara
Jhang
MuzaffargarhD
istri
cts
Percentage Share by Farmers

Program Management Unit Annual Monitoring Report 2005-06
National Program for Improvement of Watercourses (Punjab Component) 149
FIXATION & ANALYSIS OF CONSTRUCTION MATERIAL RATES
1. FIXATION OF RATES BY DRACs: At every district, a District Implementation Committee (DIC) has been
constituted to implement the program. Its chairman is District Coordination
Officer while EDO (F&P), EDO (Agri), DO (OFWM) and Executive Engineer
(Irrigation) are its member. This committee is required to meet on monthly
basis. Its functions among others are to
1. Review physical and financial progress. 2. Review progress about the flow of funds. 3. Monitoring of physical progress. 4. Ensure effective implementation of program.
In order to keep constant vigilance on rates and review / refix them a
unique arrangement is existing. In every district, DIC has constituted its sub-
committee named District Rates Assessment Committee (DRAC) which constantly
meets and reviews/refixes rates of construction material. Its chairman is EDO
(F&P) while DO (Buildings), DO (OFWM), Field Engineer (PWMC) are its members.
All the members are required to make analysis of rates prevailing in local
areas/markets. Field Engineer PWMC is also required to analyze rates and
present in the meeting. DRAC fixes rates for a specific period and
reviews/refixes rates keeping in view the fluctuation of rates in local
areas/markets.
2. MONITORING OF RATES BY PMU:
Due to great significance of the rates of construction material PMU, NPIW
(PC) has been keeping constant vigilance and monitoring on the rates fixed by
DRACs. Assistant Regional Managers, PMU, NPIW (Punjab Component) have been
assigned the duty to monitor the rates in their respective regions by comparing
with prevailing market rates. In case if an abnormal increase in rates is found, it
is conveyed to the concerned DCO, DO (OFWM), EDO (F&P) and consultant of
PWMC for its rectification.
Mr. Ijaz Ahmed Minhas Deputy Director (Finance)

Program Management Unit Annual Monitoring Report 2005-06
National Program for Improvement of Watercourses (Punjab Component) 150
Rates of analysis is also being made regularly by PMU, NPIW (PC)
headquarter. If any abnormal difference is observed it is conveyed to Secretary,
Government of the Punjab, Agriculture Department, Director General,
Agriculture (WM), DCOs concerned for rectification.
3. RATES OF CONSTRUCTION MATERIAL FOR 2005-06: Rates of construction material fixed by DRACs in different districts of the
Punjab during the year 2005-06 are shown in table no. 1
Table No. 1: Rate of Construction Material for the year 2005-06
Sr. # Districts Bricks/1000 Sand (C.M) Cement/ Bag
Nakkas 20"
Nakkas 24"
1 Bahawalpur *1650-1800 400 310 410-435 510-535 2 Bahawalnagar *1420-1700 320-405 300-305 435 535 3 R. Y. Khan *1920 293 305 380 490 4 D. G. Khan 2100-2200 300 300 390 490 5 Muzaffargarh 2000-2500 450 280-320 415 520 6 Layyah 3000 350 320 415 520 7 Rajanpur 2250-2450 200-250 295 365 465 8 Multan 1900-2300 340 325 410 510 9 Lodhran 1850 315 330 395 490 10 Khanewal 2400 265 300 400 500 11 Vehari 2080 290 320 400 500 12 Pakpattan 2050-2300 240 310 340 440 13 Sahiwal 2650 320 300 425 525 14 Lahore 3750 340 315 425 525 15 Sheikhupura 3250 350 320 400 500 16 Kasur 3100 212 292 345 451 17 Okara 2300-2900 315 330 395 490 18 Nankana Sahib 2950-3240 320 300 425 525 19 Faisalabad 2691-2789 328-362 311 380 480 20 Jhang 2500-2700 325 310 390 490 21 T.T. Singh 2300-2650 325 292 412 515 22 Sargodha 3050-3200 340 350 385 450 23 Khushab *2500-2700 400 315 400 500 24 Bhakkar *1800-1900 300 290 425 525 25 Mianwali 2300-2500 380 290 425 525 26 Gujranwala 3000-3200 250-300 295 375 490

Program Management Unit Annual Monitoring Report 2005-06
National Program for Improvement of Watercourses (Punjab Component) 151
27 Hafizabad 3050 330 320 375-425 490-525 28 Narowal 2800-3000 350-420 315-335 375 450 29 Sialkot 3000-3200 250-300 325-330 390 450 30 M.B.Din 3000 340 325 360 455 31 Gujrat 2800-3200 240 290-310 330 430
Source: Regional Manager's Reports. * rate at source Graph No.1 demonstrates the Maximum rates of construction material in
various districts.
Graph No. 1
1800
1700
1920
2200
2500
3000
2450
2300
2650
2300
2400
2080
1850
3750
3250
3100
2900
3240
2789
2700
2650
3200
2700
1900
2500
3200
3050
3000
3200
3000
3200
400
405
293
300
450
350
250
340
320
240
265
290
315
340
350
212
315
320
362
325
325
340
400
300
380
300
330
420
300
340
240
310
305
305
300
320
320
295
325
300
310
300
320
330
315
320
292
330
300
311
310
292
350
315
290
290
295
320
335
330
325
310
435
435
380
390
415
415
365
410
425
340
400
400
395
425
400
345
395
425
380
390
412
385
400
425
425
375
425
375
390
360
330
535
535
490
490
520
520
465
510
525
440
500
500
490
500
451
490
525
480
490
515
450
500
525
525
490
525
450
450
455
430
0 500 1000 1500 2000 2500 3000 3500 4000 4500
Bahawalpur
Bahawalnagar
R.Y.Khan
D.G.Khan
Muzaffargard
Layyah
Rajanpur
Multan
Sahiwal
Pakpattan
Khanewal
Vehari
Lodhran
Lahore
Sheikhupura
Kasur
Okara
Nankana Sahib
Faisalabad
Jhang
T.T.Singh
Sargodha
Khushab
Bhakkar
Mianwali
Gujranwala
Hafizabad
Narowal
Sialkot
M.B.Din
Gujrat
Bricks/1000
Sand
Cement
Nakkas 20"
Nakkas 24"

Program Management Unit Annual Monitoring Report 2005-06
National Program for Improvement of Watercourses (Punjab Component) 152
4. ANALYSIS OF RATES OF CONSTRUCTION MATERIAL:
4.1 Rates of Bricks:
Bricks rates were found different in different areas. In the districts of Ex-
Bahawalpur division, Bricks rates ranged from Rs.1420 – 1920. In districts of Ex-
D.G.Khan division, rates were from Rs.2000 – 3000. In districts of Ex-Multan
division rates were from Rs.1850 – 2650. In districts of Lahore division rates were
from Rs.2300 – 3750. In districts of Ex-Faisalabad division, rates remained from
Rs.2300 – 2789. In districts of Ex-Sargodha division rates ranged from Rs.1800 –
3200. In districts of Ex-Gujranwala division, rates were from Rs.2800 – 3200.
Highest bricks rate in Punjab was Rs.3750 in district Lahore while lowest bricks
rate was Rs.1420 which was found in district Bahawalnagar. Graphically
maximum brick rates are shown in Graph No.2.
Graph No.2
Comparison of Maximum Rates of Bricks
1800
1700 19
20
2200
2500
3000
2450
2300
2650
2300 24
00
2080
1850
3750
3250
3100
2900
2789
2700
2650
3200
2700
1900
2500
3200
3050
3000 32
00
3000 32
00
3240
0
500
1000
1500
2000
2500
3000
3500
4000
Baha
wal
pur
Baha
wal
naga
r
R.Y
.Kha
n
D.G
.Kha
n
Muz
affa
rgar
d
Layy
ah
Raj
anpu
r
Mul
tan
Sahi
wal
Pakp
atta
n
Khan
ewal
Veha
ri
Lodh
ran
Laho
re
Shei
khup
ura
Kasu
r
Oka
ra
Nan
kana
Sah
ib
Fais
alab
ad
Jhan
g
T.T.
Sing
h
Sarg
odha
Khus
hab
Bhak
kar
Mia
nwal
i
Guj
ranw
ala
Haf
izab
ad
Nar
owal
Sial
kot
M.B
.Din
Guj
rat

Program Management Unit Annual Monitoring Report 2005-06
National Program for Improvement of Watercourses (Punjab Component) 153
4.2 Rates of Sand:
Sand rates were different in different areas. In the district of
Ex-Bahawalpur division, Sand rates ranged from Rs.320 – 405. In districts of Ex-
D.G.Khan division, rates were from Rs.200 – 450. In districts of Ex-Multan division
rates were from Rs.240 – 340. In districts of Ex-Lahore division rates were from
Rs.212 – 350. In districts of Ex-Faisalabad division, rates remained from Rs.325 -
362. In districts of Ex-Sargodha division rates were ranged from Rs.300 – 400. In
districts of Ex-Gujranwala division, rates were from Rs.250 – 420. Highest sand
rate in Punjab was Rs.450 in district Muzaffargarh while lowest sand rate was
Rs.200 which was found in district Rajanpur. Graphical representation of
Maximum Sand rates in different districts is as shown in Graph No. 3.
Graph No.3
4.3 Rates of Cement:
Cement rates were different in different areas. In the district of Ex-
Bahawalpur division, Cement rates ranged from Rs.300 – 310. In districts of Ex-
D.G.Khan division, rates were from Rs.280 – 320. In districts of Ex-Multan division
Comparison of Maximum Rates of Sand (C.M)
400
405
293
300
450
350
250
340
320
240 26
5 290 31
5 340 350
212
315
320
362
325
325 34
0
400
300
380
300 33
0
420
300
340
240
0
50
100
150
200
250
300
350
400
450
500
Baha
wal
pur
Baha
wal
naga
r
R.Y
.Kha
n
D.G
.Kha
n
Muz
affa
rgar
d
Layy
ah
Raj
anpu
r
Mul
tan
Sahi
wal
Pakp
atta
n
Khan
ewal
Veha
ri
Lodh
ran
Laho
re
Shei
khup
ura
Kasu
r
Oka
ra
Nan
kana
Sah
ib
Fais
alab
ad
Jhan
g
T.T.
Sing
h
Sarg
odha
Khus
hab
Bhak
kar
Mia
nwal
i
Guj
ranw
ala
Haf
izab
ad
Nar
owal
Sial
kot
M.B
.Din
Guj
rat

Program Management Unit Annual Monitoring Report 2005-06
National Program for Improvement of Watercourses (Punjab Component) 154
rates were from Rs.300 – 330. In districts of Ex-Lahore division rates were from
Rs.292 – 320. In districts of Ex-Faisalabad division, rates remained from Rs.292 –
311. In Ex-Sargodha division rates were ranged from Rs.290 – 350. In districts of
Ex-Gujranwala division, rates were from Rs.290 – 335. Highest cement rates in
Punjab was found Rs.350 which was in district Sargodha while lowest Cement
rate was Rs.290 which was found in Bhakkar and Mianwali districts. Graphical
representation of Maximum Rates of Cement in various districts is shown in
Graph No. 4.
Graph No.4
4.4 Rates of Nakkas 20”:
Nakkas 20” rates were different in different areas. In the district of Ex-
Bahawalpur division, nakkas 20”rates ranged from Rs.380 – 435. In districts of
Ex-D.G.Khan division, rates were from Rs.365 – 415. In districts of Ex-Multan
division rates were from Rs.400 – 425. In districts of Ex-Lahore division rates
were from Rs.345 – 425. In districts of Ex-Faisalabad division, rates remained
from Rs.380 – 412. In districts of Ex-Sargodha division rates were ranged from
Rs.385 – 425. In districts of Ex-Gujranwala division, rates were from Rs.350 –
Comparison of Maximum Rates of Cement/Bag
310
305
305
300 32
0
320
295 32
5
300
310
300 32
0 330
315
320
292 33
0
300 311
310
292
350
315
290
290
295 32
0 335
330
325
310
0
50
100
150
200
250
300
350
400
Baha
wal
pur
Baha
wal
naga
r
R.Y
.Kha
n
D.G
.Kha
n
Muz
affa
rgar
d
Layy
ah
Raj
anpu
r
Mul
tan
Sahi
wal
Pakp
atta
n
Khan
ewal
Veha
ri
Lodh
ran
Laho
re
Shei
khup
ura
Kasu
r
Oka
ra
Nan
kana
Sah
ib
Fais
alab
ad
Jhan
g
T.T.
Sing
h
Sarg
odha
Khus
hab
Bhak
kar
Mia
nwal
i
Guj
ranw
ala
Haf
izab
ad
Nar
owal
Sial
kot
M.B
.Din
Guj
rat

Program Management Unit Annual Monitoring Report 2005-06
National Program for Improvement of Watercourses (Punjab Component) 155
425. Highest rate of Nakkas 20” in Punjab was Rs.435 which was found in
districts Bahawalpur & Bahawalnagar while lowest Nakkas 20” rate was Rs.340
which was found in district Pakpattan. Graphical representation of Maximum
Rates of Nakkas 20” has been shown in Graph No. 5.
Graph No.5
4.5 Rates of Nakkas 24”:
Nakkas 24” rates were different in different areas. In the district of Ex-
Bahawalpur division, Nakkas 24” rates ranged from Rs.490 – 535. In Ex-D.G.Khan
division, rates were from Rs.465 – 520. In districts of Ex-Multan division rates
were from Rs.440 – 525. In districts of Ex-Lahore division rates were from Rs.451
– 525. In districts of Ex-Faisalabad division, rates remained from Rs.480 – 515. In
districts of Ex-Sargodha division rates ranged from Rs.450 – 525. In districts of
Ex-Gujranwala division, rates were from Rs.450 – 525. Highest Nakkas 24” rate in
Punjab was found to be Rs.535 which was in districts Bahawalpur &
Bahawalnagar while lowest Nakka 24” rate was Rs.440 which was found in
Comparison of Maximum Rates of Nakkas 20"
435
435
380 390 41
5
415
365
410 42
5
340
400
400
395 42
5
400
345
395 42
5
380 390 41
2
385 40
0 425
425
375
425
375 39
0
360
330
0
50
100
150
200
250
300
350
400
450
500

Program Management Unit Annual Monitoring Report 2005-06
National Program for Improvement of Watercourses (Punjab Component) 156
district Pakpattan. Graphical representation of Maximum Rates of Nakkas 24” in
various districts have been shown in Graph No.6.
Graph No.6
5. CONCLUSION:
One of the important activities of NPIW is the fixation of rates of
construction material on the basis of which estimates for the
construction/improvement of watercourses are finalized. It is required that
rates may be fixed rationally on the basis of market rates. It will have an
economical benefit on the program. Regular monitoring of rates of construction
material by PMU, NPIW (PC) has certainly resulted in controlling unrealistic
prices of items of construction material in the Punjab. It would also result in
keeping the prices close to the cost estimates provided in PC-I.
Comparison of Maximum Rates of Nakkas 24"
535
535
490
490 52
0
520
465 51
0
525
440 50
0
500
490 52
5
500
451 49
0 525
480
490 51
5
450 50
0 525
525
490 52
5
450
450
455
430
0
100
200
300
400
500
600
Baha
wal
pur
Baha
wal
naga
r
R.Y
.Kha
n
D.G
.Kha
n
Muz
affa
rgar
d
Layy
ah
Raj
anpu
r
Mul
tan
Sahi
wal
Pakp
atta
n
Khan
ewal
Veha
ri
Lodh
ran
Laho
re
Shei
khup
ura
Kasu
r
Oka
ra
Nan
kana
Sah
ib
Fais
alab
ad
Jhan
g
T.T.
Sing
h
Sarg
odha
Khus
hab
Bhak
kar
Mia
nwal
i
Guj
ranw
ala
Haf
izab
ad
Nar
owal
Sial
kot
M.B
.Din
Guj
rat

Program Management Unit Annual Monitoring Report 2005-06
National Program for Improvement of Watercourses (Punjab Component) 157
FINANCIAL ASPECTS OF NPIW
1. FINANCIAL ASPECTS OF NPIW DEMANDING ATTENTION:
1.1 Govt & Farmers’ Share Proportions: During the year 2005-06 Rs. 740.003 million were contributed by the
farmers against the government releases of Rs. 2662.530 million. Government
releases to the WUAs amounting to Rs.75.278 million remained un-utilized and
were outstanding against these WUAs at the end of the year 2005-06. If an
amount of Rs.34.737 million recoverable from the year 2004-05 is also added, a
total of Rs.110.015 million was outstanding on 1st July 2006 against the WUAs. It
means that this much amount was paid to the WUAs in excess of the actual
requirements. Reasons for these amounts being surplus with the WUAs and
recoverable, interalia, includes the following:
• Incorrect cost estimation of work by the DO (OFWM) and PWMC.
• Lack of effective financial monitoring which led to release of 2nd and 3rd
installment without looking into the actual expenditure/requirement.
• Certification of lesser amount by the PWMC owing to certain shortfalls.
• Advance payments for the Pre-cast Parabolic Lining (PCPL) segments to
the manufacturing firms.
Recovery of this huge amount of Rs. 110.015 million has turned out to be
one of the major issues faced by the NPIW during the first six months of the
financial year 2006-07. An effective campaign for the recovery was initiated by
the PMU for speedy recovery of the government revenues. As a result of this
campaign, along with the active participation of Secretary Agriculture and
sincere efforts made by the Water Management Department and the district
government, 78% of the total recoverable amount had been recovered and
deposited into the government account by the end of December 2006. Recovery
Dr. Ijaz Mansoor Director (Finance)

Program Management Unit Annual Monitoring Report 2005-06
National Program for Improvement of Watercourses (Punjab Component) 158
position of the fifteen districts having the highest recoverable amount is given
below:-
Sr.# Districts
Total Amount recoverable for the year 2004-05 & 2005-06
Amount Recovered (RM & DOs
figures)
Percentage Recovery Balance
1 Kasur 12,030,079 8,327,837 69.23 3,702,242
2 Muzaffargarh 11,855,636 11,401,326 96.17 454,310
3 D.G.Khan 11,330,852 9,600,125 84.73 1,730,727
4 Bahawalpur 8,012,859 7,597,052 94.81 415,807
5 Faisalabad 7,157,469 5,210,503 72.80 1,946,966
6 Sahiwal 6,537,982 4,555,180 69.67 1,982,802
7 T.T.Sing 5,022,108 4,232,241 84.27 789,867
8 Bahawalnagar 4,964,757 4,964,757 100.0 -
9 Okara 4,952,709 3,081,896 62.23 1,870,813
10 Jhang 4,555,024 2,779,460 61.02 1,775,564
11 Vehari 3,985,004 3,834,835 96.23 150,169
12 Lahore 3,886,613 3,682,908 94.76 203,705
13 Rajanpur 3,402,750 2,727,464 80.15 675,286
14 R.Y.Khan 2,936,382 1,617,909 55.10 1,318,473
15 Multan 2,737,838 1,355,291 49.50 1,382,547
16 Other Districts 16,647,396 11,664,548 70.07 4,982,848
GRAND TOTAL 110,015,458 86,633,332 78.75 23,382,126
No doubt this progress is a great success as compared to the recovery
position in the previous projects of same nature where crores of rupees are still
recoverable, it does not relieve the water management department and the
consultant of their duties of being vigilant and watchful about the correct
assessment of the capital requirements for a particular water course and the
actual expenditure being incurred. Quality of work, which was one of the factors

Program Management Unit Annual Monitoring Report 2005-06
National Program for Improvement of Watercourses (Punjab Component) 159
for increase in recoverable amount as mentioned above, is to be ensured by the
consultants and the NPIW staff through periodical site visits and application of
quality checks.
Water management department and the consultants are required to
strengthen and devise an elaborate system for correct cost estimation, financial
monitoring and quality assurance to avoid such overpayments to the WUAs in
future. By avoiding repetition of the same financial mismanagement precious
man hours of the PMU, the department and the district governments being
consumed on effecting recoveries would be saved for utilization on some
positive and more productive work.
1.2 Maintenance of NPIW Accounts:
Basic purpose of accounting is to provide decision makers with correct
information useful in making economic decisions. An accounting system consists
of the personnel, procedures, devices and records used by an entity in
developing accounting information and communicating this information to the
decision makers/stakeholders.
An elaborate accounting system to maintain the accounts of the NPIW
does not seem to exist at departmental level. Maintenance of accounting record
and flow of accounting information from the WUA and the DO (OFWM) is not well
structured. Professional accountants are not available at the grass root level of
the water management department and same is the situation at the supervisory
level at the top. The main document maintained in the DO (OFWM) office is a
small register in which the budget, expenditure and the balance is entered.
Expenditure is entered when advice to the District Accounts Office (DAO) for
payment to the WUAs is issued. Definitely, it is not the cash book and is not
signed by the authorized officer. Monthly reconciliation of expenditure with the
Accounts Office, which plays pivotal role in good financial management, is not in
vogue as per codal requirements in many districts. In one of the districts this

Program Management Unit Annual Monitoring Report 2005-06
National Program for Improvement of Watercourses (Punjab Component) 160
reconciliation process was confined only to taking the figures from DAO for
acceptance by the department.
As a result of absence of an adequate and comprehensive system of
accounting in the department, the accounting information being produced by
the department and the consultant usually does not tally and leads to confusion
and raises doubts on reliability of the accounting data. Example of difference of
figures of unspent balance at the end of the year 2005-06 and expenditure on
civil works during the same year, as given below, are sufficient to prove this
point.
Expenditure head Departmental
figures (Rs. in million)
Consultant’s figures
(Rs. in million)
Difference (Rs. in million)
Un-spent balance (civil works as on 30. 6.06)
243.497 283.173 39.676
Expenditure on civil works (2005-06) 2667.251 2662.530 4.721
In order to establish reliability of the accounting data and to report the
correct figure to the decision makers in time, an elaborate & comprehensive
accounting system is indispensable for this program. Having a financial outlay of
more than Rs. 28000 million, the program definitely deserves a better
accounting system.
1.3 Strengthening Internal Control System/Internal Audit:
Internal controls are all measures taken by an organization for the
purpose of (1) protecting its resources against waste, fraud or inefficient use; (2)
ensuring the reliability of accounting data; (3) securing compliance with the
management’s policies; and (4) evaluating the performance of all employees,
managers and the departments within the organization.

Program Management Unit Annual Monitoring Report 2005-06
National Program for Improvement of Watercourses (Punjab Component) 161
As already mentioned the primary objective of the accounting system is to
provide useful information to the decision makers. The objective of the internal
control system is to keep the activities “on track”. These two systems are
closely related; in fact each depends greatly on the other. Internal controls fall
into two broad categories: accounting controls and administrative controls.
Accounting controls are measures that relate directly to the protection of assets
or to the reliability of accounting information while the administrative controls
are measures designed to increase operational efficiency.
Internal audit, a management tool to evaluate the organizational
performance, is an important part of the internal controls. With a good internal
audit system in place, a lot of improvement in the organizational performance
can be achieved. Every large organization has an internal auditing wing which
test and evaluate both accounting controls and the administrative controls in all
areas of the organization and report to the top management. The internal audit
reports serve as wake up calls for the management about possibility of any
wrong doings within the organization. Thus timely corrective measures become
possible with the help of these reports.
Water management department and the district governments, which are
the executing agencies of this multi billion rupees program, lack a well defined
system of internal controls/internal audit. It is required that the agencies
executing this program should strengthen their internal controls and set up
internal audit wing which should regularly submit reports to the management.

Program Management Unit Annual Monitoring Report 2005-06
National Program for Improvement of Watercourses (Punjab Component) 162
PERFORMANCE MANAGEMENT SYSTEM
A PRIME CHALLENGE
Performance appraisal remains the corner stone of Human Resource
Management. The Admin Wing of Program Management Unit, National Program
for Improvement of Watercourses has designed a Performance Management
System by devising Performance Appraisal Forms (FY- 2005-06) for three critical
posts in NPIW Field Teams i.e. Assistant Agriculture Engineer, Water
Management Officer & Supervisor.
Systematic evaluation of development program is generally conceived and
formulized with an idea to have ‘Objective’ assessments done by ‘Independent’
persons using ‘Professional’ methods of data collection and analysis. This is a
formative evaluation commonly done more than once for a particular scheme.
The concepts of “Evaluation”, “Appraisal” and “Monitoring”
interchangeable as they may seem, are different in connotation and nuances.
Appraisal is the critical examination of a proposal / Program / Project. The first
step in the performance appraisal process is identifying what is to be measured.
This process seems fairly simple at the first glance. In practice, however, it can
be quite complicated. Identification of performance dimensions is the important
first step in the performance appraisal process. If a significant dimension is
overlooked, employee’s morale is likely to suffer because one who does well on
that dimension will not be recognized or rewarded. If otherwise, employee may
perceive the whole appraisal process as meaningless. Moreover, it is often
difficult to quantify performance dimensions.
METHODOLOGY / OUT LOOK:
There are 260 NPIW field teams in the irrigated areas of Punjab. Each
field team is constituted by an Assistant Agriculture Engineer, Water
Management officer, five Supervisors and a Data Entry Operator. However, in
field constitution of teams in terms of number of Supervisors is different in every
Mr. Zulfiqar Ali Kharal Assistant Project Director
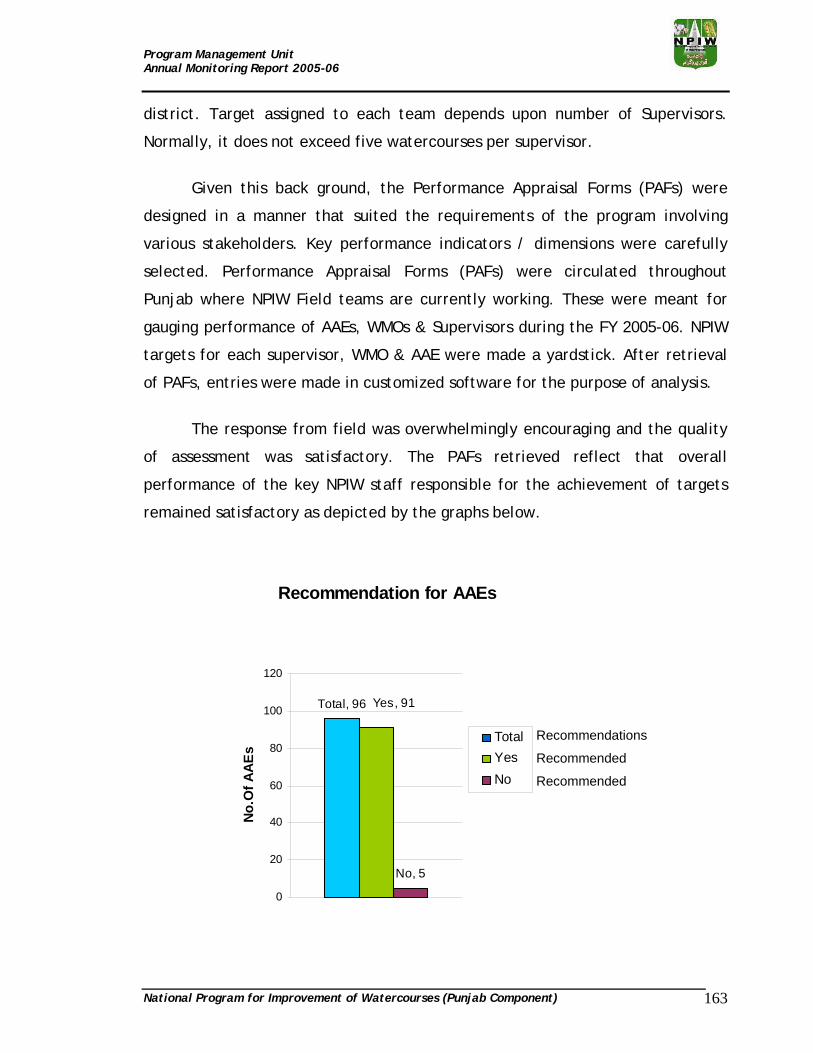
Program Management Unit Annual Monitoring Report 2005-06
National Program for Improvement of Watercourses (Punjab Component) 163
district. Target assigned to each team depends upon number of Supervisors.
Normally, it does not exceed five watercourses per supervisor.
Given this back ground, the Performance Appraisal Forms (PAFs) were
designed in a manner that suited the requirements of the program involving
various stakeholders. Key performance indicators / dimensions were carefully
selected. Performance Appraisal Forms (PAFs) were circulated throughout
Punjab where NPIW Field teams are currently working. These were meant for
gauging performance of AAEs, WMOs & Supervisors during the FY 2005-06. NPIW
targets for each supervisor, WMO & AAE were made a yardstick. After retrieval
of PAFs, entries were made in customized software for the purpose of analysis.
The response from field was overwhelmingly encouraging and the quality
of assessment was satisfactory. The PAFs retrieved reflect that overall
performance of the key NPIW staff responsible for the achievement of targets
remained satisfactory as depicted by the graphs below.
Recommendation for AAEs
Total, 96
No, 5
Yes, 91
0
20
40
60
80
100
120
No.
Of A
AEs
TotalYesNo
Recommendations
Recommended
Recommended

Program Management Unit Annual Monitoring Report 2005-06
National Program for Improvement of Watercourses (Punjab Component) 164
Recommendations
Recommended
Recommended
Recommendation for WMOs
No, 4
Total, 130 Yes, 126
0
20
40
60
80
100
120
140
No. o
f WM
Os Total
YesNo
Recommendation for Supervisors
Total, 946 Yes, 899
No, 47
0
100
200
300
400
500
600
700
800
900
1000
No.
of S
uper
viso
rs
Total
Yes
No
Recommendations
Recommended
Recommended

Program Management Unit Annual Monitoring Report 2005-06
National Program for Improvement of Watercourses (Punjab Component) 165
This is the first performance appraisal exercise in this program. It will help key
stakeholders in assessing the performance of key team members and comparing
them with the actual targets as per the Time Bound Action Plan (TBAP). The
PMU has intentionally kept these PAFs simple, focused and target oriented.
However, in the FY 2006-07, some major changes will be brought about in the
said forms taking stock of present year’s performance and key lessons learned in
FY 2005-06. The Performance Appraisal forms have achieved the fundamental
purpose of monitoring i.e. assessing performance of personnel, relating to
various components of watercourse improvement.
The specimens of PAFs for AAEs, WMOs and Supervisors have been enclosed in
the following pages.

Program Management Unit Annual Monitoring Report 2005-06
National Program for Improvement of Watercourses (Punjab Component) 166

Program Management Unit Annual Monitoring Report 2005-06
National Program for Improvement of Watercourses (Punjab Component) 167

Program Management Unit Annual Monitoring Report 2005-06
National Program for Improvement of Watercourses (Punjab Component) 168

Program Management Unit Annual Monitoring Report 2005-06
National Program for Improvement of Watercourses (Punjab Component) 169

Program Management Unit Annual Monitoring Report 2005-06
National Program for Improvement of Watercourses (Punjab Component) 170

Program Management Unit Annual Monitoring Report 2005-06
National Program for Improvement of Watercourses (Punjab Component) 171

Program Management Unit Annual Monitoring Report 2005-06
National Program for Improvement of Watercourses (Punjab Component) 172

Program Management Unit Annual Monitoring Report 2005-06
National Program for Improvement of Watercourses (Punjab Component) 173

Program Management Unit Annual Monitoring Report 2005-06
National Program for Improvement of Watercourses (Punjab Component) 174

Program Management Unit Annual Monitoring Report 2005-06
National Program for Improvement of Watercourses (Punjab Component) 175
ROLE OF MEDIA
This mega project with a record allocation is meant solely, for the
welfare of the farming community of Punjab. This community has to be
mobilized and motivated to fully participate in the implementation of the
program by organizing active and dynamic watercourse associations for this
purpose.
The salient feature and benefits of the project need to be highlighted to
persuade the farmers. Besides programs of awareness in the shape of seminars,
workshops, festivals, farmers’ days etc, print and electronic media, as per plan
given here, will be used for motivating farmers through highlighting envisaged
benefits of the program, procedures and prescribed standards with
specifications.
Though Mass media can reach a common farmer easily at comparitivelly
lesser cost. Television & Radio are now available in almost every nook and
corner of the Province and people are tuned to this powerful media. It can pay
high dividends in the shape of high productivity and prosperity to common
farmer, if the mass media outlets are fully utilized in propagation of agriculture
messages in time.
Role of Media in NPIW is significant because of the vast magnitude of the
program. In the present world of Globalization no one can ignore importance of
Media and advertising. Accordingly Media campaign was launched to create
awareness about NPIW amongst the masses.
1. ROLE OF PRINT MEDIA: a) Newspapers: Newspapers are most important component of Media campaign and are
being used to disseminate the message of NPIW. Advertisements with the
captions of improved Watercourses and photographs of President and C.M. were
published in all Newspapers having national circulation. The procedure and
Dr. Ahmad Afnan Assistant Director (Admin)

Program Management Unit Annual Monitoring Report 2005-06
National Program for Improvement of Watercourses (Punjab Component) 176
specifications of Construction of Watercourses were given in these
advertisements in a very simple but convincing manner. The farmers were
advised to organize WUA (Water users association) and get the same registered
with concerned DO (OFWM).
Newspapers with wide range of circulation are vital in Media campaign.
These are effective even in remote areas where other Medias like T.V are
unavailable for want of electricity. These advertisements were given in Urdu
that is easily understandable by farmers.
In the last quarter of financial year 2006 Media campaign was launched
with full vigour. Advertisements were given in Newspaper having wide
circulation like “Daily Jang”, “Nawa-e-waqt” & “Khabrain” at the cost of
Rs.804117/-. Message for improvement of Watercourses for water conservation
was widely spread out. It created great impact for watercourses completion by
persuading the community to participate volunatarily in the program of National
interest.
b) Newsletter: PMU took an initiative to bring out a newsletter on monthly basis with an
objective to depict program activities. Newsletters were published in October &
December, 2006. October edition contained message of C.M, Report of meeting
of Federal Coordination Committee, Visit of PMU by Federal Secretary
Agriculture, details of Regional Managers Conference, Visit of Federal Project
Director to Barani districts, installation of local area Network in PMU, Assistant
Regional Manager’s Conference and tours of D.G. Agriculture. Overview of
progress of NPIW, made during two years along with strategy of this year was
also included. December edition contained message of canal closure, details of
meeting of Chief Secretary and meetings of Secretary Agriculture, Punjab to
review the progress of districts, along with the report on training of WUAs.
Dr. Pervez Ahmed Khan (Project Director, PMU) as Patron, Mr. Zafar
Abbas (Deputy Director Technical, PMU) as Editor and Dr. Ahmad Afnan

Program Management Unit Annual Monitoring Report 2005-06
National Program for Improvement of Watercourses (Punjab Component) 177
(Assistant Director Admin, PMU) being Co-editor participated for its publications.
Copies of Newsletters were sent to Ministers, Secretaries, Heads of departments
and stakeholders. Regional officers of PMU were given the task to disseminate
NPIW message at Tehsile & WUA level.
2. ROLE OF ELECTRONIC MEDIA: a) T.V: Television is the most powerful medium of communication now-a-days. Its
importance in Media in today’s world is many folds. Both audio and visual
techniques are used in T.V. Any advertisement in T.V. has more effect on
audience as message is delivered in seconds. It is important that video clip
should be purpose oriented and eye-catching. It should be displayed on timings
when farming is accustomed to watch it.
b) Radio: It is the most favorite medium of our rural community. Farmers and
agriculturists in far flung areas are used to listen radio & transistors. Crisp
messages were broadcasted to create awareness among villagers to make them
familiar with the program. Pakistan Broadcasting Corporation was paid
Rs.908227/- out of NPIW funds.
3. OBJECTIVES OF MEDIA CAMPAIGN:
To create awareness among target audience regarding NPIW.
To establish goodwill between the Government Departments & Farming community.
To persuade farmers to take part in development activities.
To disseminate information regarding modalities and procedures of
program implementation.
To provide information material to target audience continuously.
To sensitize the general public about water shortage, prevention of its
wastage and ways to conserve it.
To motivate stakeholders for effective participation & implementation.
To solicit farmers interaction in the building of water courses

Program Management Unit Annual Monitoring Report 2005-06
National Program for Improvement of Watercourses (Punjab Component) 178
To build up an atmosphere for proper utilization of public money.
4. MEDIA STRATEGY: a) Electronic:
Television ads
Video Documentaries
News, Flashes
Interviews & Talk shows
b) Radio:
Radio ads
Jingles
News Bulletins
Interviews & Talk shows
c) Print:
Newspapers
Supplements
Advertisement
Ads in Agricultural Magazines
Pamphlets, Brochures, Posters & leaflets
d) Cinema Publicity:
e) Publicity through C.C. T.V. at Railway Stations:
f) Mass awareness through Farmer’s day & Conventions:
5. TARGET AUDIENCE:
NPIW staff
Irrigation/Agriculture Department
NGO’s/Development Agencies
Journalists/Opinion leaders
FARMERS
WHAT WILL HELP US GET THERE?

Program Management Unit Annual Monitoring Report 2005-06
National Program for Improvement of Watercourses (Punjab Component) 179
6. COMMUNICATION:
a) For NPIW Staff:
In-house Meetings/Presentation
Periodical updates
Notice Board (local rural level)
Newsletter b) For Agriculture Departments:
Presentation
Periodical updates flyer/presentation
Newsletter
Workshops c) For NGO’s/Development Agencies:
NPIW
Radio ads
TVC/
Documentaries
Workshops/
Seminars
Caravans/ Awareness
Walks
Press Ads
Hoardings/ Banners/ Posters
PR Articles/ Newspaper
Supplements Farmer’s Days Fairs/
Panchayat

Program Management Unit Annual Monitoring Report 2005-06
National Program for Improvement of Watercourses (Punjab Component) 180
Presentation
Periodical updates
Newsletter
Workshop
Banners
Awareness walks d) For Journalists/Opinion Leaders:
Press Conferences
Press Ads
Seminars
Internet
TV Documentary
News features
Newsletter
News Items
PR Articles
Opinion Making Columns
e) For Farmers:
TV Commercials
Radio Spots
Newsletters
Outdoor Signage
Fairs
Banners
Posters
Celebrity Endorsement
Wall Chalking
Milestone Chalking
Farmers days
FEW SAMPLES OF PRINT MEDIA COMPAIGN:

Program Management Unit Annual Monitoring Report 2005-06
National Program for Improvement of Watercourses (Punjab Component) 181

Program Management Unit Annual Monitoring Report 2005-06
National Program for Improvement of Watercourses (Punjab Component) 182

Program Management Unit Annual Monitoring Report 2005-06
National Program for Improvement of Watercourses (Punjab Component) 183

Program Management Unit Annual Monitoring Report 2005-06
National Program for Improvement of Watercourses (Punjab Component) 184
THE ROLE OF WATER USER ASSOCIATIONS (WUAs)
1. INTRODUCTION:
The National Program for Improvement of Watercourses (NPIW) started in
2004-05, designed for effective utilization of the available water at the farm
level for enhancing productivity of scarce irrigation resources through
improvement of 28000 watercourses in canal commanded and barani areas of the
Punjab province. Funds have been arranged entirely through local resources;
federal government being the main sponsor contributing Rs. 20,823 million in the
total estimated cost of Rs. 28,233 million. Farmers are the second major
contributor having proposed share of Rs. 7,400 million in the program.
One of the main objectives of the program is strengthening the farmer’s
participation in the program implementation for better management of water at
the farm level. As compared to the previous projects of similar nature, farmers
have been assigned far greater role in implementation of this program including
handling of all the financial matters and execution of all the civil works. They
have also been entrusted to pay the entire labour cost which is about 36% of the
total project cost.
Government has restricted its role to provide funds and technical
assistance only. Funds are provided to the registered WUAs through district
government while the technical assistance is being rendered by Punjab Water
Management Consultants (PWMC). As the main source of funds is the federal
government, the funds are transferred from the federal government to Account-I
of the provincial government. Provincial Steering Committee distributes these
funds to all the district governments depending upon their needs. In the district
government the DCO, being principal accounting officer, authorizes the DO
(OFWM) to utilize these funds in accordance with the applicable rules and
regulations. On the advice of the DO (OFWM) funds are transferred by the
District accounts Office from Account-IV to the accounts of WUAs.
Hafiz Muhammad Ilyas Director (M& E)

Program Management Unit Annual Monitoring Report 2005-06
National Program for Improvement of Watercourses (Punjab Component) 185
Major responsibility of Program Management Unit (PMU) is monitoring and
evaluation of the work being done under the program. PMU is also serving as a
linkage, not only between the PWMC, Water Management Department & WUA
but also between the federal, provincial and district governments.
2. ROLE OF WATER USERS ASSOCIATIONS (WUAs):
It is imperative that role of WUA in implementation of this program is the
understood properly for better understanding of the overview of the financial
administration of the NPIW which is the main theme of this paper.
A WUA, registered under “On Farm Water Management and Water Users
ordinance 1981”, is responsible for the following vital program activities:
• Collection of farmer’s share.
• Arrange skilled and un-skilled labor required for improvement of
watercourses/irrigation schemes.
• Procure construction material for carrying out civil works out of the
project funds.
• Settle matters of disputes between the water users.
• Carry out work in accordance with the specifications.
• Regularly undertake O&M of improved watercourses.
To carry out the above mentioned functions the WUA opens a bank account
jointly operated by the Chairman and Treasurer of that WUA. The government
share for the program, as already mentioned, is transferred from Account-IV of
the district government to the account of the WUA on the authorization by the
DO (OFWM). Farmers’ share is also deposited in the same account. All the
financial transactions required to be carried out for improvement of that water
course are carried out by the WUA itself. Release of funds to the WUA is in
three installments. Each installment is released subject to completion of already
designed protocol of verification by the consultant.

Program Management Unit Annual Monitoring Report 2005-06
National Program for Improvement of Watercourses (Punjab Component) 186
3. MONITORING LEVEL OF COMMUNITY:
NPIW is a development program involving effective participation of the
community in all field activities. This hoped that better results will be achieved
due to community’s interest in the program. In order to sensitize the WUAs
about their role in the program implementation, following activities were
made:-
i. Capacity building through short training courses.
ii. Meetings with the Community.
iii. Interviews of the shareholders of the watercourse.
iv. Photographs of the watercourse at different times during improvement.
v. Brochures / Guidelines for the NPIW staff and the members of WUAs.
4. COMMENTS OF COMMUNITY ABOUT THE NPIW:
i. Farmers’ community have appreciated and welcomed the National
Program for Improvement of Watercourses in Pakistan. The rural
community is of the view that the project is unmatched in the history of
the country when compared with the projects previously launched for the
purpose.
ii. It is appreciated by the Water Users that the procurement of the material
as well as the construction has been left at the disposal of WUA. Farmers’
participation to such an extent has helped a lot towards motivation and
sensitization of the community for the task.
iii. Timely release of Govt share to the WUAs has been highly appreciated by
the community. Earthen improvement work after removal of trees from
the watercourse is a factor which often hinders the pace of work.
iv. The involvement of the District Govt through Revenue field staff for
earthen improvement work as well as collection of farmers’ share is
another aspect appreciated by the farmers’ community.

Program Management Unit Annual Monitoring Report 2005-06
National Program for Improvement of Watercourses (Punjab Component) 187
v. Certain short comings have also been pointed out by the farmers’
community, which are considered by them against the provision/spirit of
the program.
vi. It has been criticized in most of the districts that maximum lining length
to the extent of 30% and 15% in SGW (Saline Ground Water) & FGW (Fresh
Ground Water) areas respectively does not serve the purpose particularly
in sandy areas where katcha watercourse can not be maintained properly.
vii. The water users falling in the earthen portion of the watercourses are of
the view that they have double work as compare to the water users of the
portions to be lined. They often show their willingness to pay farmers’
share even at a higher rate if the lining work is extended beyond the
maximum limit of 30% & 15%.
viii. The cold behaviour of the Forest Department showing reluctance in the
necessary removal of trees growing on the portions irrigating their lands is
another fact or which offends the farmers’ community.
The farmers are of the considered view that if the shortcomings
mentioned above are made up, the program can prove gate way to a green
revolution in the country.
5. CONCLUSION:
All possible efforts were made by all corners i.e. OFWM staff, PMU,
District Administration for the full involvement of the community. All financial
activities were carried out by farmers so that they can have feeling of ownership
and responsibility. By active community involvement, better quality of civil
works and better utilization of financial resources have been achieved.

Program Management Unit Annual Monitoring Report 2005-06
National Program for Improvement of Watercourses (Punjab Component) 188
MANAGEMENT INFORMATION SERVICES AT PMU
INTRODUCTION:
A Management Information Services or MIS wing has been set up at the
Program Management Unit of National Program for Improvement of Watercourses
(Punjab Component). The mandate for the MIS wing is to create watercourse
database system and an application that should assist in analyzing the progress
and status of the project.
This document provides an overview of the Local Area Network (LAN), the
databases and the reporting mechanism that the MIS wing has developed. This
document also provides an overview of the software and design of the software
developed.
THE MANAGEMENT INFORMATION SERVICES AT THE PMU:
There are four departments or wings at the PMU namely, Administration,
Finance, Technical and MIS. Each of the other wings depend on the MIS wing for
relevant and timely information on technical aspects, financial status,
watercourse improvement activities, and performance of the field teams. The
PMU management team envisions a web based application which allows them to
retrieve this information on their desktops instantaneously.
To serve these requirements, the MIS wing has developed the application
in two phases. In the first phase, we set up an intranet and a Local Area Network
(LAN) at the PMU office. It provides internet connectivity, intra and inter office
email communications, and file/data sharing.
In the second phase we developed the watercourse database and the web
application. This application enabled the decision makers to get real time
Mr. Hasan Abdullah Khan Director (MIS)

Program Management Unit Annual Monitoring Report 2005-06
National Program for Improvement of Watercourses (Punjab Component) 189
reports on watercourse technical data, its financial status, region and individual
level performance etc.
PHASE ONE – MIS INFRA STRUCTURE SETUP:
In this phase, a LAN was set up in the PMU office. The LAN provides the
following functionality.
Hardware Interconnectivity:
The LAN interconnects all the hardware like desktop PCs, laptop PCs,
printers, faxes, scanners etc. This allows us to share hardware resources among
all the users. For example, one can print a document from his or her PC without
being directly connected to the printer. The document may be sent to the
networked printer for printing. Logical view of a typical LAN is shown below.
Databases
Desktop PCs
InternetFirewallWeb Server
Email Server Laptops
Printers, Scanners & Faxes
User Authentication
Ethernet Network

Program Management Unit Annual Monitoring Report 2005-06
National Program for Improvement of Watercourses (Punjab Component) 190
All networked hardware is connected to each other by standard
10/100mbs CAT5 Ethernet cabling and connectors. When a user wants to use a
PC, he must log in the PC using his user name and password. After the user has
been authenticated, he is allowed to use the resources available to him on the
network. Users can also send emails to internal and external users and surf the
internet. Follwing are the main components of the LAN that have been
established at the PMU office.
Ethernet:
Ethernet is LAN technology that transmits information between computers
at 10, 100 or 1000 million bits per second (10/100/1000 mbps). There are
several LAN technologies (token ring, daisy chaining etc.) but Ethernet is by far
the most popular technology for departmental networks. The vast majority of
computer vendors provide equipment with Ethernet attachments making it
possible to link all manner of computers with each other and with peripherals
like printers, scanners and copiers.
The equipment connected to Ethernet, also called stations, operates
independently of all other stations on the network and there is no central
controller. All attached stations are connected to a shared media system. Signals
are broadcasted over the medium (usually a CAT5 cable) to every attached
station. A station listens to the medium and receives signals addressed only to
itself. A station may transmit only when the medium is quiet and no other
station on the network is transmitting. This way all stations get a fair chance at
using the network resources.
User Machines: Users are connected to the network through their machines like laptops
and desktops. Once the machine is plugged in, it becomes part of the network. It
can view and use other resources on the network as per the roles and privileges
assigned to it. In most Ethernet configurations, by default, no other station on

Program Management Unit Annual Monitoring Report 2005-06
National Program for Improvement of Watercourses (Punjab Component) 191
the network may look at any data on the machine. The user must grant explicit
permission to share files and data on his machine.
Email Server:
This server will provide email services to the users. Each user who is
allowed to log in can use his username as his or her email address. Emails may
be sent to internal or external users. Email is not only used to exchange
messages but it can also be used to exchange documents as attachments to
messages.
Currently this functionality has not been implemented rather email
services provided by Punjab Information Technology Department (PITD) are
being used.
Authentication Server:
In a networked environment, all resources and data are visible to all users
all the time. Someone with ill intentions or even accidentally can damage the
resources. For security purposes, all users intending to use the network are
authenticated and then assigned an access privilege level. What this means is
that all users have to log in the system and once they have been identified as
authentic by the server, they have limited access to resources. For example they
are not allowed to access other users’ PCs, if there is a color printer with
expensive print outs, only officers and stenographer may be allowed to print to
it. This is accomplished by assigning roles to users. These roles may be officers,
system administrator, secretary, data entry operator etc.
Web Server:
A web server houses all the information that the general public as well as
internal users can access. This information is served up as web pages in web
browsers. Anyone with an internet connection is allowed to access them. Since

Program Management Unit Annual Monitoring Report 2005-06
National Program for Improvement of Watercourses (Punjab Component) 192
this server also houses internal documents for intra office consumption, only the
users with appropriate access privileges are allowed to view them.
The Firewall:
Since the internal network and the web server are connected to the wide
open Internet, some malicious outside users and hackers might try to break into
our network and cause damage. A software called firewall has been installed to
protect our network from hackers. Firewall allows only certain well known
internet protocols (http, ftp etc.) through and blocks all other
applications/protocols. If an external user wants to access our internal network,
he or she must be authenticated by the system.
PHASE TWO - APPLICATION DEVELOPMENT:
Once the infra structure was set up, the next phase was the development
of the Monitoring and Evaluation Application called MonEva Application from
here on.
There are three databases envisioned, Technical Rectification and
Monitoring System (TERMS), Human Resource (HR), and Financial Tracking and
Monitoring System (FITMAS). These three databases together contain all the
technical, HR, and financial data to enable the decision makers in the four PMU
wings to better do their jobs. These three databases are front ended with a web
based application to enter and view data as well as generate reports as shown in
the figure below.
The whole application is organized into a layered and multi tiered
architecture. Application is split into three tiers to help distribute running loads
into three different server processes. It also enhances security, control, and
efficient use of available resources such as application execution threads,
database connections, memory etc. This Monitoring and Evaluation Application
as a whole is MonEva.

Program Management Unit Annual Monitoring Report 2005-06
National Program for Improvement of Watercourses (Punjab Component) 193
MonEva has three tiers as explained below.
1. Enterprise Information Service (EIS) Tier:
This tier represents the organization’s business information. This tier is
considered the most critical and fundamental part of an enterprise. This tier
must be given the most amount of thought and design time. The EIS essentially
represents the organization’s business and since the business rarely changes
radically, the EIS tier tends to be the most stable tier. Other tiers might evolve
with time but the EIS tier remains relatively stable.
In our case the three databases will constitute the EIS tier. Here is a brief
overview of these databases.
Technical Rectification and Monitoring System (TERMS):
The technical wing of the PMU, NPIW collects data on such aspects of
watercourses as location of watercourse, command area, WUA, civil works
details like how much cement, sand, bricks etc. are being used, progress of the
watercourse improvement over time and so on. Different sections of this
database are shown below.
• Location of the watercourse in terms of village, district, tehsil etc.
EIS Tier Middle Tier
Dat
abas
e A
cces
s L
ayer
(PH
P)
Web
Acc
ess L
ayer
(PH
P, H
TML)
Web Server TERMS
FITMAS HR/PT
Intranet Access To Analytical Reports
Public Access Web Site
Region Data Entry
Internet

Program Management Unit Annual Monitoring Report 2005-06
National Program for Improvement of Watercourses (Punjab Component) 194
• Various attributes of the water course like, amount of allocated water
discharge from the canal, command area, total length.
• WUA details like number of members, names of the members, etc.
• Watercourse Improvement progress details like, sanction date, start and
end dates, etc.
• Civil works details like amount of building material (cement, sand, bricks
etc.) used.
• Monitoring activities like PMU staff visits.
Financial Tracking and Monitoring System (FITMAS): The finance wing of the PMU, NPIW is required to monitor flow of Rs.28.22
billion over a four year period of 2004 to 2008 from federal PSDP all the down to
the 28000 WUAs. The FITMAS database keeps all the data necessary to track and
consolidate flow of funds. A break down of financial information is given below.
• WUA is required to pay its 36% share in two installments. These
installments are recorded.
• The remaining 64% of the expense is paid by the government in three
installments. These installments are tracked in this database.
• Building material costs such as price of cement, sand, bricks and nakkas.
• Labor rates.
• Estimated cost of completion of a water course.
• Actual cost of completion of a water course.
• Monthly balance of WUA bank accounts.
Human Resource (HR) Database:
The admin wing is required to coordinate, monitor, and facilitate the 260
field teams. All personal and professional information about every member of
each team is stored in this database. In addition to this information, a
performance tracking system is built upon this database. Contents of this
database are as shown below.

Program Management Unit Annual Monitoring Report 2005-06
National Program for Improvement of Watercourses (Punjab Component) 195
• Personal details such as name, address, phone numbers, health related
information etc.
• Academic qualifications.
• Performance evaluation information provided by the district offices.
2. The Middle Tier:
The middle tier contains all the business logic associated with the EIS tier.
For example, the data for HR is in the EIS tier but the business logic of
procedures and formulae to calculate performance and incentives is kept in the
middle tier. This tier may be a full blown application server with transaction
control, connection pooling, messaging, business objects etc. or simply SQL
scripts, javascript or PHP. For performance and security reasons, access to the
EIS tier is provided only through the middle tier. No user or application may
connect to or access data directly from EIS.
Database Access Layer: This layer provides isolation of the EIS tier and provides a consistent
interface to the information. A JDBC driver, or a standard API by the database
vendor are examples of this layer. This layer is not developed by the application
developers instead it is provided by the database vendor.
3. The Client Tier:
The client tier provides user interface and access points to the
application. Client tier might be a thin client like a web browser; a fat client
like GUI based application connected to the middle tier, or a communication
application like hyperterminal etc.
MonEva provides access to data only through web browsers. The Data
Entry Operators in different regions are external users who are given a secure
access to the intranet. This allows them to submit their watercourse data via
dial up.
Reporting:

Program Management Unit Annual Monitoring Report 2005-06
National Program for Improvement of Watercourses (Punjab Component) 196
All types of reports are distributed over the intranet to internal PMU users
and through internet to all external users. There are two types of reports, fixed
and real time.
Fixed reports like fortnightly and monthly reports are pre-generated and
available as html documents and in PDF downloadable format which may be
instantly viewed or printed from the web browser. The other group of reports is
real time reports, meaning that a report may be generated at any time and
spanning any period of time.
There is one exception to this web access rule…sometimes a report is
needed that doesn’t fit into the pre-defined report format and contents. In this
case, a special request is made to the MIS wing and the report will be generated
by directly accessing the Database Access layer of the middle tier.
PHASE THREE:
There is a third phase in the development of MonEva. The management of
NPIW has also envisioned graphical information system (GIS) based
representation of a multi-dimensional information system. This system will link
census database, NPIW database and a digital maps database together. This will
allow the decision makers to click on map of an area and get watercourses
information for the area, they can find out what impact OFWM has had on the
area’s residents, and they can find out what has been the impact on poverty
reduction in the area. The possibilities of applications of such a
multidimensional database are unlimited.
Phase three is being designed at this time therefore it is beyond the scope
of this document.

Program Management Unit Annual Monitoring Report 2005-06
National Program for Improvement of Watercourses (Punjab Component) 197
Physical Architecture of MonEva:
The figure below shows physical architecture of the MonEva application
components as deployed over different networked resources.
Web Server:
Currently the web server hosted at the PITD offices. PMU web site is
deployed there along with the PHP dlls. Once the PMU has enough resources, the
web server shall be moved to the HQ premises.
This server hosts the web pages for information, data entry and reporting
screens. The entire user interface of MonEva is through this server.
Database Server:
This machine hosts MonEva database server. All access to end users to this
database is only through MonEva web screens.
Desktop PCs and Laptops:
These machines are interconnected and connected to the servers via LAN.
The end users at the PMU HQ access MonEva via these machines on web
browsers. Regional offices access MonEva though the web site by logging in and
then perform data entry operations.
Program Management Unit Annual Monitoring Report 2005-06
National Program for Improvement of Watercourses (Punjab Component) 198
Network Server:
This is the server machine that enables all the above servers and clients
to talk to each other securely but transparently. This machine is a proxy server,
authentication server and also performs functionality of a firewall.
OPEN SOURCE TECHNOLOGIES EMPLOYED:
Currently there are two schools of thought in software development
business. One claims that software is intellectual property and must be
protected by copyrights and the source code is closed and proprietary.
Businesses are built around selling software licenses to the users. Users have
limited rights as far as copying and installation of software is concerned. Users
have no right as far as ownership of source code is concerned.
The other school believes that software should be open sourced and
shared by all. Users must be allowed to view, change and use the software as
they please thus the term Open Source and Free(OSF) software. Even though
most of the open source software is free of cost, but free here does not
necessarily mean free of cost. It just means that one is free to modify and use
the software as one wants. Also software may open sourced but not free. But
OSF is not allowed to be sold. Businesses are built around selling support services
and not around selling licenses to use the software.
The MIS wing has decided to use the OSF for all of the software installed
in the central server. Examples are, GNU/Linux Operating System, iptables
firewall, Samba file sharing, PHP and various other GNU utilities. This has saved
PMU large amount of cost in license fees.

Program Management Unit Annual Monitoring Report 2005-06
National Program for Improvement of Watercourses (Punjab Component) 199
IMPLEMENTATION OF LAN / WAN AT PMU
1. EXECUTIVE SUMMARY:
The MIS Department, Program Management Unit, NPIW (PC) have
configured a LAN/ WAN environment in Client/Server mode using Open Source
based Red Hat Linux Advanced Server AS 4.0. Latest Dell PowerEdge 2800, which
was purchased with three hot swappable SCSI hard drives configured in RAID 5
configuration. A high speed DSL connection was purchased from NTC to fulfill
the Internet needs of head office in shared manners. To establish the LAN in
domain based client/server environment (intranet) and to configure the email
and web domain of the organization we need:
1. Latest branded server based Pentium IV Computer
2. Hardware Accessories
3. Software Packages
4. Email and Web domain registration with coordination of Punjab I.T
Department
5. High speed Internet Link
6. Direct Telephone Lines
Mr. Nadeem Ashraf System Analyst

Program Management Unit Annual Monitoring Report 2005-06
National Program for Improvement of Watercourses (Punjab Component) 200
The official website of NPIW (http://npiw.punjab.gov.pk) has been
registered and official email accounts are setup (e.g. [email protected]),
we consulted the representatives from Punjab I.T Department who provided us
these WAN based facilities. The website and emails are hosted on their servers
and are accessed through using Internet. In future we may modify and update
this setup according to our needs. As we have implemented the Open source
technologies, so changes in the setup, like switching to in house email server
setup, web server etc, would not be problematic and we need not to purchase
email or web server.
2. INTRODUCTION:
According to the preliminary analysis of existing setup, present in head
office of PMU (Punjab), there were total thirteen computers, which included
eight Desktop and five laptops, present in this office. Windows Xp based
computers are interlinked as workgroup environment. No central authentication
and control was established in the network. Every user was an administrator of
its own computer. If users needed to use Internet then separate dialup
connections were used from these computers as no high speed Internet Link &
common Internet sharing was available. No official email account was available
and for official correspondence yahoo or ISP based email accounts were used.
Security against viruses was not implemented. No monitoring and control
mechanism was present, which can log the user’s activities, such as Internet
surfing, data sharing, security checks etc.
To overcome all these problems a Client/Server based network was
proposed and configured in PMU head office. This was one of the mandates of
MIS Wing of PMU.
2.1 LAN Topology of Network:
In order to interconnect the computers at PMU office we need to establish
a Local Area Network (LAN) so that these computers can communicate with in

Program Management Unit Annual Monitoring Report 2005-06
National Program for Improvement of Watercourses (Punjab Component) 201
the client server environment. The Star topology has been implemented to
establish this LAN setup. Each computer (Client as well as Server) is connected
directly to the Ethernet switch through UTP cables. The basic layout of this
topology is shown in the following diagram.
Figure 1 Generic Star Topology of LAN
The cabling and layout for this topology was already configured but
neither the environment nor the server computer existed. Because of which all
desktop as well as laptop computers were working as detached entities. The
sharing of data was not proper and the most important was the security issue.
Every user was logged in and authenticated from its own computer thus no
central control was available. No common computer existed which could act as a
server to serve all the security, authentications and resource management
centrally. Resources, such as common Internet access, domain based email
access, access control policy implementation, were not available in this
scenario.
3. TOPOLOGY COMPONENTS:
To meet all the organizational needs we had to re-configure the existing
topology. Following were the requirements in this regard.

Program Management Unit Annual Monitoring Report 2005-06
National Program for Improvement of Watercourses (Punjab Component) 202
1. Domain Server
2. Domain Registration and Email setup with coordination of Punjab IT
Department
3. High Speed Internet Link (DSL or Cable net)
4. Backup Dialup Connection
5. Accessories
3.1 Domain Server Computer:
To address the major issues Client/ Server environment was established
by using server computer. All client computers then logged in to this server
which validates these clients and provide central management of whole
network. By introducing this Server the LAN topology looks like as depicted in
the following diagram.

Program Management Unit Annual Monitoring Report 2005-06
National Program for Improvement of Watercourses (Punjab Component) 203
The Description of this figure 2 is mentioned in following table
Device Name Device User
Desktop PC1 Receptionist Computer
Desktop PC2 Private secretary to PD
Desktop PC3 Data Entry Operator (Technical)
Desktop PC4 Data Entry Operator (Finance)
Desktop PC5 Stenographer
Desktop PC6 Data Entry Operator (Admn.)
Desktop PC7 Data Entry Operator (MIS)
Laptop 1 Asstt. Director (Monit.)
Laptop 2 Director (MIS)
Laptop3 Director (Technical)
Laptop 4 Director (Finance)
Laptop 5 Deputy Project Director
In this diagram there is an “Added New Services” block shows the
required network objects. There is another Ethernet Switch, shown in this block,
which is required to connect server computer with the present network via
existing Ethernet switch. The server is a domain controller and performs the
following tasks:
• Authenticate the client computers
• Resolve the computer names into IP addresses
• Give controlled access to the users on the network objects (Shared
folders, printers, Internet etc)
• Allocate IP Addresses to the connecting computers
• Provide single shared Internet connection
• Domain based Email access.
• Logs the user’s activities
• Central Data sharing

Program Management Unit Annual Monitoring Report 2005-06
National Program for Improvement of Watercourses (Punjab Component) 204
The logical view, which depicts some of functionalities performed by the
server, is shown in the following diagram.
Figure 3: Logical representation of Domain
Server functionality and LAN Topology
Server Specifications:
We needed both hardware and software to configure this server.

Program Management Unit Annual Monitoring Report 2005-06
National Program for Improvement of Watercourses (Punjab Component) 205
3.1.1 Software:
In general, to configure this server following software packages are
required:
i. Server Based Operating System
ii. Anti Virus
iii. Proxy Server
iv. Firewall/ Access Control List
v. Office tools
vi. Network Management utilities
To specify the actual packages there were two proposals given to the
management for consideration in this regard.
3.1.1.1 Proposal 1 --- Open Source Technologies:
We can configure the required server using open source technologies. The
primary benefit of this option is that all the software packages fall in this
category are free to use and there is no need to purchase any license to
use them at corporate level without violating the software piracy policy &
copy rights. Second advantage is that their development is also open
which gives a chance of development and bug fixing to large number of
developers so the bug fixing is faster as well as the stability and reliability
is more than the software developed by some specific organization with
limited development resources.
In these technologies “Linux Red Hat Advanced Server AS 4.0” was
used. This operating system has built in
i. Proxy server, named as Squid Server, for Single Internet connection
sharing.
ii. Open Office for Word, Excel and Power point applications.
iii. Access control list for Firewall and network traffic control.

Program Management Unit Annual Monitoring Report 2005-06
National Program for Improvement of Watercourses (Punjab Component) 206
iv. Versatile Network management tools are also available in this
operating system.
v. DHCP Server for automatic IP address allocations.
vi. SAMBA server, which integrates Windows XP clients with Linux
Server.
3.1.1.2 Proposal 2 --- Microsoft based Technologies:
We have to purchase the License of each and every product for this setup
implementation. We need to buy
i. MS-Windows 2003 server or MS- Windows 2000 Advanced Server.
ii. MS- Internet Security & Acceleration Server (ISA) 2000 to use the
proxy services.
iii. MS-Office 2003.
iv. Third party network utilities.
Even after spending the cost of ownership of their license the risk of
instability of these products is higher than the Linux Red Hat.
3.1.1.3 Comparison of these Platforms:
Advantages & drawbacks of both proposals are as in the following table.
Open source Platform Microsoft Platform
Free of cost. Need to buy.
Stable and versatile. Risk of failure is higher.
Most of the big organizations are
using them.
Used in small organizations.
As the open source technology
approach is not popular in Pakistan so
its support and expert opinion is rare.
As Microsoft technologies are very
common so experience is easily
available.
Versions up gradation in these
technologies are not completely
different than the previous. So the
New versions can differ greatly from
the existing one so another
certification course may be required

Program Management Unit Annual Monitoring Report 2005-06
National Program for Improvement of Watercourses (Punjab Component) 207
expertise in existing used version the
updated versions can be handled.
to handle newer one in some cases.
Bug fixing is very rapid and stable as
it is developed by large and open
community.
Buy fixing and patching installations
produces some conflicts with the
existing setup.
These technologies are used in the
large environment but these are not
common so expert opinion may not be
available easily in Pakistan.
These setups are used very common
and large numbers of communities in
Pakistan are using them so their
expertise is not a problem.
Future Aspects
As in the current proposed network
topology we will use the services of
Email which will be provided by
Punjab I.T Department. If we want to
setup our own mail server then
“Sendmail” is available in Linux which
can be configured without purchasing
any of its licenses. However SPAM
guard and some security software
packages may be required to
purchase for its smooth and stable
operations.
To configure in house Email Server we
need to purchase MS-Exchange server
2003 and SPAM guard for this mail
server. Its Administration and working
is more time consuming if we need its
complete functionality.
3.1.2 Hardware:
Branded Intel based Pentium IV computer, Dell PowerEdge 2800, was
purchased to install our Domain server whose specifications are mentioned
below.
1. Intel based Pentium dual processors Board
Program Management Unit Annual Monitoring Report 2005-06
National Program for Improvement of Watercourses (Punjab Component) 208
2. Pentium IV Processors
3. 1 Giga Byte RAM
4. 3 x 73 GB SCSI Hard disks
5. Raid Adapter
6. CD- Writer
7. 1.44 MB Floppy
8. 2 x 100/1000 Mbps Ethernet Card
9. VGA Card
10. 17 “ Color monitor
11. Keyboard
12. Mouse
3.2 Domain Registration & Email Setup:
To economize the budget and resources domain
(http://npiw.punjab.gov.pk) was registered with collaboration of Punjab I.T.
department. They provide these facilities by registering our domain
(http://npiw.punjab.gov.pk) and configure POP based Email accounts in their
email server. These accounts are accessible to officers/ officials of PMU through
Internet.
3.2.1 High Speed Internet Connection (DSL/ Cable):
To access Internet we need Internet connection with high bandwidth
(with at least 128 kbs downlink and 64 kbs uplink). This is accomplished
by Digital Subscriber Link (DSL) from NTC.
3.3 Accessories: Following accessories were also configured.

Program Management Unit Annual Monitoring Report 2005-06
National Program for Improvement of Watercourses (Punjab Component) 209
Software: Symantec Antivirus Corporate Edition version 10:- This software
provides security to existing Windows based clients. This setup can be
configured in Server based mode to manage and control all the securities
centrally. We actually designate any of the windows clients as Symantec
Anti virus server and all other computers will become its clients. If we
update the virus definition on server then it will automatically be updated
on all clients.
Hardware: 1. UPS for Server Computer
2. Heavy duty Electric Wires extension board (5 sockets)
3. 4 Power cables
4. 3 USB Cables with jacks A & B
5. 2x 80 GB Hard disks
6. 2 x 256 MB RAM (Server Compatible)
7. Network interface card
8. 10/100/1000 mbps 3Com Ethernet Switch with 8 ports
9. Mouse pad
10. Multimedia speakers
11. Infrared mouse

Program Management Unit Annual Monitoring Report 2005-06
National Program for Improvement of Watercourses (Punjab Component) 210
PRECAST PARABOLIC LINING (PCPL)
BACKGROUND:
In order to cartail huge water losses from 54000 watercourses of the
Punjab, On Farm Water Management (OFWM) project was initiated during the
year 1976-77. It involved partial brick lining of watercourses alongwith
installation of structures. This project gained wide acceptance from the farming
community owing to its tangible benefits.
Rapid depletion of underground water resources due to excessive pumping
and low rainfalls in the country has threatened agriculture, the back bone of our
economy. Resultantly, on the directions of the President of Pakistan, a program
has been launched to conserve the scare water being lost through seepage from
unlined watercourses, throughout the country. National Programme for
Improvement of Watercourses in Pakistan (Punjab Component) is being
implemented for improvement of 28000 watercourse in irrigated areas and 2000
irrigation schemes in Barani areas. Lining is the most essential component of
watercourse improvement work, aimed to minimize water losses and to enhance
water conveyance efficiency.
1. RATIONALE:
Traditional brick lining with 23 cm thick walls is being practiced since
inception of the OFWM project. In earlier watercourse improvement projects,
availability of construction material at local level coupled with ease in finding
appropriate skilled labour supported brick lining. Consequently, brick lining was
preferred over other techniques. The present scenario is however,
comparatively different that demands for seeking an innovated alternative due
to:-
i. The prices of bricks are increasing continuously.
Mr. Zafar Abbas Deputy Director (Technical)

Program Management Unit Annual Monitoring Report 2005-06
National Program for Improvement of Watercourses (Punjab Component) 211
ii. The available capacity of kiln industry will not suffice to meet the heavy
demand of bricks for construction of 30000 watercourses/irrigation
scheme. More than 2 billion bricks are required per year for the project to
complete the targets. The Government has launched many other
infrastructure development projects, which are consuming a large
quantity of bricks. Private sector development projects are the third
major consumer of bricks.
iii. Continuous rise in demand for bricks has created monopoly of the kiln
owners. There is no price control and the kiln owners demand rates of
their own choice.
iv. Quality of the produce is dwindling day by day. Mineral coal is rarely used
for firing of bricks. Dry bushes, weeds, rice husk and raw wood are used
by most of the brick kilns for the purpose which do not create uniform
heat in the kiln chambers. As a result, outer side of brick, facing towards
fire is over burnt while the opposite side does not fetch enough heat.
v. Twin meanance of water logging & salinity is bringing considerable
damage to cultivable lands in the country. The areas where underground
water is brackish vis-à-vis soils contains injurious salts in abundance, brick
lining denotes deterioration even in early stages. Plaster starts chipping
off, followed by distortion of bricks.
vi. Brick lining requires adequate curing which is not generally practiced by
WUAs.
Under such circumstances, there is need to adopt an innovative approach
in selecting alternate technique for lining to address the multifarious problems
being faced in the field.
The following factors are required to be kept in view while making choice
for a particular type of lining.
• Hydraulic efficiency
• Economic viability
• Durability
Program Management Unit Annual Monitoring Report 2005-06
National Program for Improvement of Watercourses (Punjab Component) 212
• Availability of materials.
• O&M requirements
• Acceptability by the users
In order to overcome the anticipated shortage of good quality bricks in
the wake of unprecedented development projects in the province, Precast
Parabolic Lining (PCPL) could be an alternative option. It is being implemented
successfully in NWFP for the last 7 – 8 years and has been widely accepted by the
WUAs. The purpose of quality assurance vis-à-vis cost and speed of work is being
achieved there.
2. MERITS & DEMERITS:
• PCPL is an emerging technology. Its manufacturing in Punjab is yet to be
established. There is only limited number of manufacturers producing
PCPL segments.
• The quality can be managed as the production is in controlled
environment with very less manufactures.
• Skilled manpower is required which is not so commonly available.
Therefore, project staff has to impart training to the masons.
• Effective supervision is needed on segment lying and jointing.
• The segments can be re-adjusted, in case an error is detected in bed
elevation.
• PCPL is two to three times faster than brick lining.
• Curing is only involved in jointing the PCPL segments.
• PCPL segments are difficult to handle due to their weight and size.
Therefore, transportation is difficult and costly.
• PCPL has limitation for
o Watercourse sections passing through populated area.
o Having less slope.

Program Management Unit Annual Monitoring Report 2005-06
National Program for Improvement of Watercourses (Punjab Component) 213
3. WATERCOURSE DESIGN IN PARAPBOLIC SHAPE:
The consultants have developed computer worksheet/spreadsheet to
make it easier and time saving for preparation of watercourse design. Design
worksheet developed for the purpose is shown as figure 1; and procedure to use
the same is given in the following section.
Procedure to Use Design Worksheet:
• Open “Parabolic-Des” Worksheet.
• Fill watercourse identification information in Part “A”.
• Input Data: In part B, enter the followings:
o Watercourse Section (Main or Branch).
o Watercouse RD (from:to)
o Design Discharge (Q), Manning’s Coefficient (n) and Longitudinal
Slope (S).
• Select the Segment No. (from amongst the segment sizes available as
given in the Table and Press “Ctrl P”.
• Output Data:
o Selected Flow Depth, d.
o Max Allowed Flow Depth, Max d.
o Difference (in the Selected Flow Depth and max Allowed Flow
Depth).
o Free Board, FB.
o Check for FB and decide (if the FB is sufficient, select the Segment
Size and if not, then select the next Segment Size & Press “Ctrl P”.
o Repeat till the FB is sufficient and Segment Size is selected.

Program Management Unit Annual Monitoring Report 2005-06
National Program for Improvement of Watercourses (Punjab Component) 214
Watercourse Section
lpsQ 65.00nS
12345678
389 mm410 mm21 mm91 mm
FB is Sufficient. Select This Segment
Fig. 1
616 0.523 0.002097
1.00
Ratio (m)
1.016
460
920 X 610 920760 X 530 760
cu.m0.065
Size
0.01400.00040
DischargeRoughness CoefficientLongitudinal Slope (m/m)
2.296
No.
R P P_cal
0.412
(m/sec)
A. Identification
0.155 1.016
0.004214Segment No.
d
cfs
70
1144 X 686
(mm) (mm) (sq.m)
389.01 607.66 0.158
70
(m)
Select when "P" and "P_cal" are almost equalt A
1144 686
(m) (P_cal/P)
V
Constant "a"Maximum "d" 410.00
5
390 0.19670
460 0.269 0.003670610 70 540 0.0028830.374
0.004492675 X 480 675 480 70 410 0.216 0.004214640 X 460 640
0.005842600 X 360 600 360 70 290 0.144 0.004000
457 305
Eq. Coefficient (a)
(mm) (sq.m)
Total Depth (D)(mm) (mm)
0.093
Length (m)4500
235
Max. Flow Depth (d)
Flow Area(A)
155
From (RD) 00 0
To (RD)450
Free Board, FBCheck for FB and Decide
70
Segment Size AvailableFree Board
(FB)
70457 X 305
Segment
530
Difference
Punjab Water Management ConsultantsDesign Work Sheet for Parabolic Shaped Watercourse
National Program for Improvement of Watercourses in Pakistan (The Punjab Component)
Max. Allowed Flow Depth, Max. d
0.054 0.006944
Branch
Select Flow Depth, d
(mm x mm) (mm)
Watercourse No.Chak No./ VillageMinor/Disty.Tehsil
B. Design Requirement
Hydraulic Data
Main
Fiscal YearImplementing AgencyField Team/UnitDistrict
SEGMENT NO. 5
INPUT DATA
Select the Segment No. and Press "Ctrl P"
Top Width (T)
360 X 225 360 225
T
D d
t F.BF.B
T
t
d D

Program Management Unit Annual Monitoring Report 2005-06
National Program for Improvement of Watercourses (Punjab Component) 215
4. SPECIFICATIONS:
Concrete:
i. Suggested mix ratio of 1:1:2.
ii. 28 days curing cylinder compressive strength of 4500 psi.
iii. 70% of specified strength after 7 days & 85–90% after 14 days curing.
iv. Maximum 1” slump.
v. Precast only under approved conditions, with compaction by
vibrating table, to be cast in only PWMC approved steel moulds.
vi. Recommended water cemet ration of 0.36.
vii. Minimum 5 days curing (water) or fully covered by steam.
viii. Aggregate sizes vary from minimum 3/8” to maximum of 3/4".
Manufacturer wil adjust proportions of aggregate size to achieve
the specified strength. For Segment No. 1, 2 and 3, maximum
aggregate size recommended is 1/2".
Mortar in Joints (placed at site):
Mortar of 1:3 cemet sand ratio. Cement to be of fine ground quality. Sand
grain size not greater than 0.20 mm (US Sieve 70).
5. EXECUTION OF PCPL ON WATERCOURSES DURING FY 2005-06:
During the year 2005-06, 386 watercourses were improved with PCP
lining, mainly in the districts of Kasur, Bahawalpur, Bahawalnagar, Muzafargarh
and D. G. Khan. The rates for the segments were decided by the concerned
district rate committee (DRACs). In the meantime, considerable reduction in
cost of cement (a major cost component in PCPLs being 80% of material cost)
made it imperative to review and rationalize existing rates. Moreover, the scope
of work attracted various firms that started PCP segment production on

Program Management Unit Annual Monitoring Report 2005-06
National Program for Improvement of Watercourses (Punjab Component) 216
commercial scale locally. In view of the above narrated facts, existing rates
applied by the various districts were monitored and found on higher side.
In order to rationalize the same, Punjab Water management Consultants
(PWMC) were assigned the task of assessment of reasonable rates. On receipt of
report from PWMC, representative of firms fabricating PCP segments, Team
Leader PWMC, DOs (OFWM) Kasur, Bahawalpur, Muzaffargarh, D. G. Khan &
representative of PMU attended a meeting on 23-05-06 in the chairmanship of
DGA (WM) wherein rates were rationalized as given below.
SEGMENT NO. 1 2 3 4 5 6 7
size in inches (14 x 9)
(18 x 12)
(24 x 14)
(24 x 18)
(27 x 19)
(30 x 21)
(36 x 24)
Ex-factory Rate (Rs.) 297 352 420 557 592 781 977
Carriage charges upto 50 Km (Rs.) 44 50 62 87 83 87 182
Carriage charges beyond 50 Km (Rs.) 61 69 85 120 115 120 250
This exercise resulted in brining the rates at reasonable level in all the
districts. It also provided a guideline in deciding rates for this newly adopted
technology.
The detail of watercourses improved with PCPL in various districts is given
as under. OFWM
Sr. District No. of Watercourses
Length lined (km) Total Cost
1 Bahawalpur 69 43.886 44,130,113 2 Bahawalnagar 19 19.588 19,462,830 3 D. G. Khan 158 92.795 94,421,948 4 Muzaffargarh 49 41.425 44,076,506 5 Layyah 5 6.018 5,084,676 6 Bhakkar 6 2.804 2,332,409 7 Mianwali 1 0.41 362,890 8 Multan 2 1.966 1,913,965 9 Lahore 1 1.089 786,378 10 Sheikhupura 2 0.877 701,789

Program Management Unit Annual Monitoring Report 2005-06
National Program for Improvement of Watercourses (Punjab Component) 217
11 Nankana Sahib 12 8.016 7,812,831 12 Kasur 47 31.258 30,722,476 13 Okara 4 3.711 3,033,166 14 Gujranwala 5 2.755 2,479,626
Total 380 256.60 257,321,603
PRSP/NRSP
Sr. District No. of Watercourses
Length lined (km) Total Cost
1 Muzaffargarh 2 2.596 3,307,947 2 Layyah 2 1.777 1,489,290 3 Bahawalpur 2 0.8 855,091
Total 6 5.173 5,652,328
Grand Total (OFWM+PRSP/NRSP) 386 262 262,973,931
Source: PWMC Reports
6. CONCLUSIONS:
i. As PCP lining has been executed mainly in five districts of Punjab during the
year, its impact, advantages, disadvantages and farmers’ response is
required to be studied carefully.
ii. Monitoring of PCP segments’ rate in certain districts revealed that same
were on much higher side. A ban on percent parabolic lining was, therefore,
imposed by the Federal PMU. The rates for these segments were
rationalized by the DGA (WM) and were implemented apart from recovery of
excess amounts; a committee has been constituted to accord permission
only for justified cases where PCPL was in progress.
iii. A committee has also been constituted to examine its technical and
economical aspects apart from evolving strict measures for quality control.
A final decision may therefore be made on the receipt of report from the
said committee.

Program Management Unit Annual Monitoring Report 2005-06
National Program for Improvement of Watercourses (Punjab Component) 218
ACTIVITIES OF THE PROGRAM (PICTORIAL VIEW)
Mr. Ismail Qureshi Federal Secertary Agriculture
& Mr. Nasir Mahmood Khosa, Federal Project Director, During their visit to PMU Lahore
Meeting with PWMC Consultants at PMU Lahore
Assistant Regional Managers’ Conference

Program Management Unit Annual Monitoring Report 2005-06
National Program for Improvement of Watercourses (Punjab Component) 219
Assistant Regional Managers’ Conference
Regional Managers’ Conference
NWFP Delegation visiting PMU Lahore
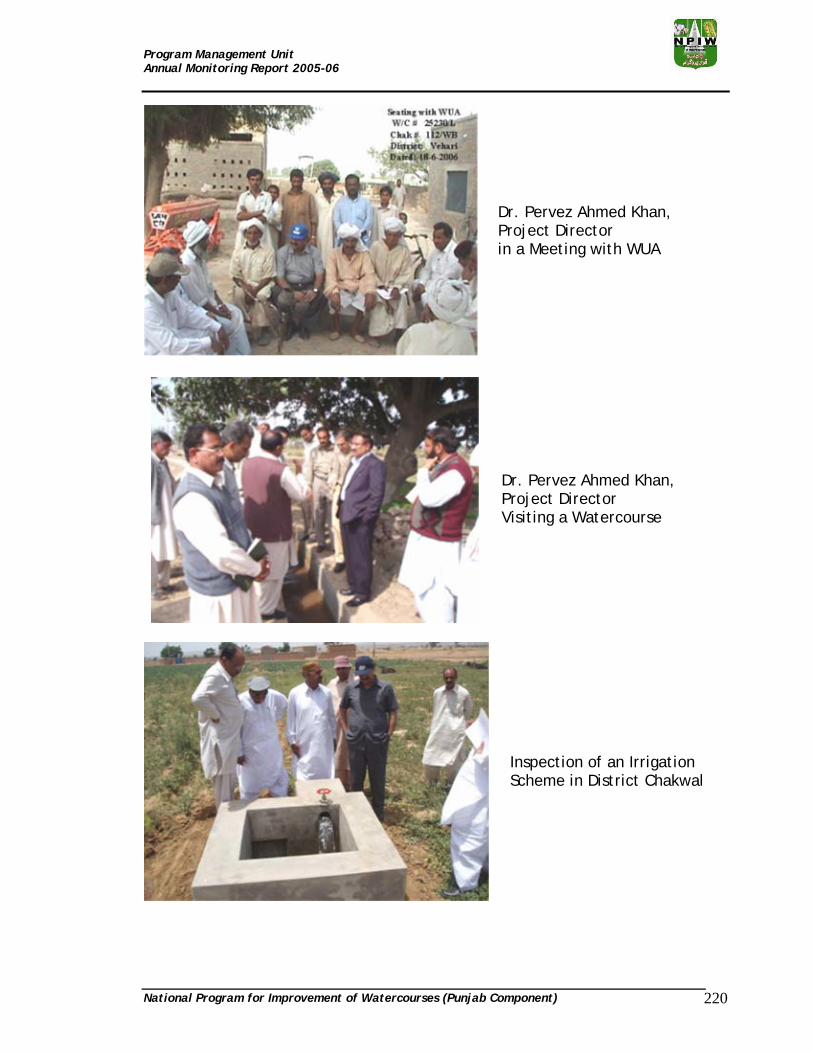
Program Management Unit Annual Monitoring Report 2005-06
National Program for Improvement of Watercourses (Punjab Component) 220
Dr. Pervez Ahmed Khan, Project Director in a Meeting with WUA
Dr. Pervez Ahmed Khan, Project Director Visiting a Watercourse
Inspection of an Irrigation Scheme in District Chakwal

Program Management Unit Annual Monitoring Report 2005-06
National Program for Improvement of Watercourses (Punjab Component) 221
Farmers’ Gathering at Water User Association Meeting
Earthen Work in-progress
Watercourse Lining in-progress

Program Management Unit Annual Monitoring Report 2005-06
National Program for Improvement of Watercourses (Punjab Component) 222
Watercourse Lining in-progress
Watercourse Lining in-progress
Nakkas installed at Watercourse

Program Management Unit Annual Monitoring Report 2005-06
National Program for Improvement of Watercourses (Punjab Component) 223
Nakkas Installed at junction
Irrigation Scheme in Barani Area
Pre-cast Parabolic Lining

Program Management Unit Annual Monitoring Report 2005-06
National Program for Improvement of Watercourses (Punjab Component) 224
Improved Watercourse at a Glance
Improved Watercourse at a Glance
Improved Watercourse at a Glance

Program Management Unit Annual Monitoring Report 2005-06
National Program for Improvement of Watercourses (Punjab Component) 225
INTRODUCTION OF OFFICERS OF PMU
Project Director Dr. Pervez Ahmed Khan is a career civil servant belonging to District Management Group. He has been educated at prestigious institutes of learning like Cadet College Hassanabdal, & KE Medical College Lahore. He enjoys a vast management & administrative experience ranging from serving as Assistant Commissioner, Additional Deputy Commissioner General & Deputy Secretary in Punjab Civil Secretariat. He has also done his MBA (Marketing) from IBA, Punjab University, Lahore. Before joining PMU, he was serving as Additional Secretary (Health) GoP. Due to his sound academic & professional profile, he was selected for this challenging assignment. He has been serving as Project Director / Additional Secretary to CM since the establishment of PMU in August, 2004.
Director (M&E) Hafiz Muhammad Ilyas joined the PMU in January 2006. He is a PCS officer and was posted as City Magestrate, Traffic Magestrate and Colony Assistant at different stations, i.e. Bahawalnagar, Lodhran, Pakpatan, Multan, and Khanewal. Then he worked as Assistant Commisioner Khanewal, Mian Channo and Chishtian. After the devolution he was posted as DDOC/Secratary TRA Jhang. Then he was promoted to Deputy Secratary and posted as DOC Jhang. He has multiple degrees of M.A. in Islamiat, Political Science and LLB. As Director (M&E) at PMU, he is resposible for monitoring of watercourse improvement progress in all of Punjab. He makes frequent visits to all the districts to monitor and evaluate watercourse improvement.
Director (Finance) Dr. Ijaz Mansoor, an officer of Pakistan Audit and Accounts Service. He is an MBA (Finance) and Masters in Accounting from University of Stockholm. He has represented Pakistan SAI at various international seminars and conferences. The officer has gained vast experience in the fields of Accounting and Auditing through serving the federal & provincial governments and autonomous organizations. Before joining the PMU in October 2006, he has served as Assistant Accountant General (Punjab), Director Finance Shaikh Zayed Hospital Lahore, Director Finance Parks and Horticulture Authority, Director Audit WAPDA and Director Audit Revenue Receipts. As Director Finance, PMU he is responsible for monitoring of all the financial matters of NPIW in Punjab and monitoring of physical activities in Gujranwala region.
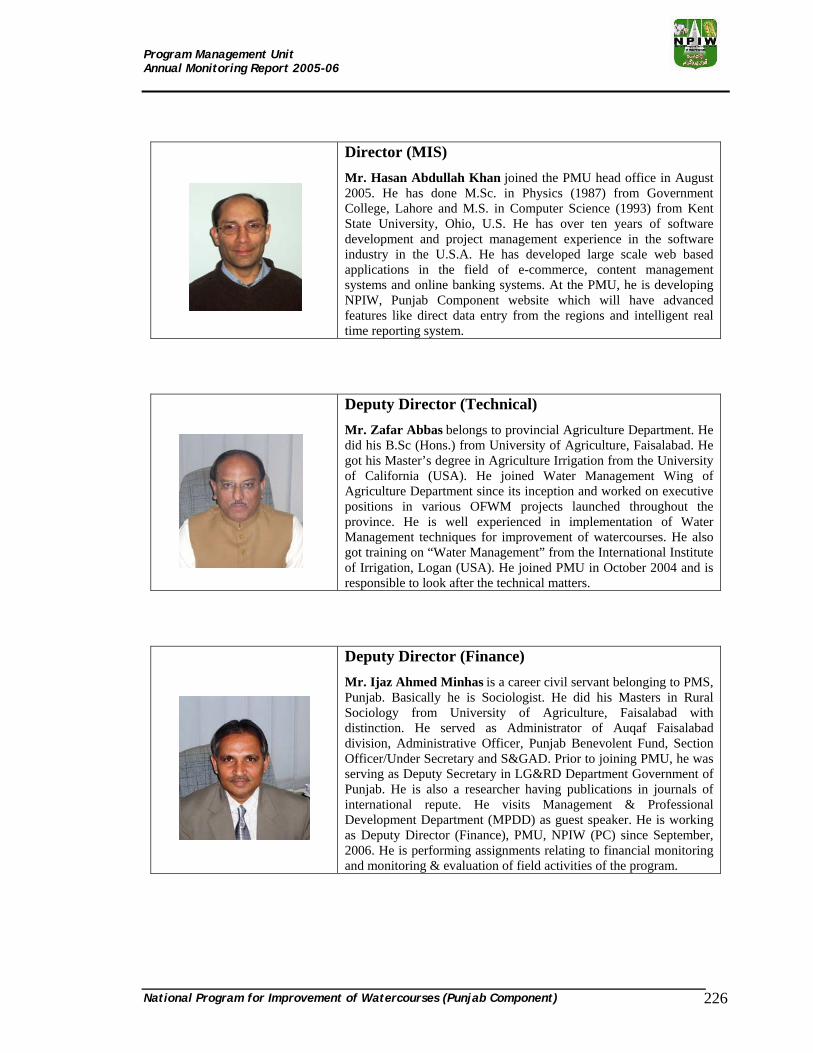
Program Management Unit Annual Monitoring Report 2005-06
National Program for Improvement of Watercourses (Punjab Component) 226
Director (MIS) Mr. Hasan Abdullah Khan joined the PMU head office in August 2005. He has done M.Sc. in Physics (1987) from Government College, Lahore and M.S. in Computer Science (1993) from Kent State University, Ohio, U.S. He has over ten years of software development and project management experience in the software industry in the U.S.A. He has developed large scale web based applications in the field of e-commerce, content management systems and online banking systems. At the PMU, he is developing NPIW, Punjab Component website which will have advanced features like direct data entry from the regions and intelligent real time reporting system.
Deputy Director (Technical) Mr. Zafar Abbas belongs to provincial Agriculture Department. He did his B.Sc (Hons.) from University of Agriculture, Faisalabad. He got his Master’s degree in Agriculture Irrigation from the University of California (USA). He joined Water Management Wing of Agriculture Department since its inception and worked on executive positions in various OFWM projects launched throughout the province. He is well experienced in implementation of Water Management techniques for improvement of watercourses. He also got training on “Water Management” from the International Institute of Irrigation, Logan (USA). He joined PMU in October 2004 and is responsible to look after the technical matters.
Deputy Director (Finance) Mr. Ijaz Ahmed Minhas is a career civil servant belonging to PMS, Punjab. Basically he is Sociologist. He did his Masters in Rural Sociology from University of Agriculture, Faisalabad with distinction. He served as Administrator of Auqaf Faisalabad division, Administrative Officer, Punjab Benevolent Fund, Section Officer/Under Secretary and S&GAD. Prior to joining PMU, he was serving as Deputy Secretary in LG&RD Department Government of Punjab. He is also a researcher having publications in journals of international repute. He visits Management & Professional Development Department (MPDD) as guest speaker. He is working as Deputy Director (Finance), PMU, NPIW (PC) since September, 2006. He is performing assignments relating to financial monitoring and monitoring & evaluation of field activities of the program.

Program Management Unit Annual Monitoring Report 2005-06
National Program for Improvement of Watercourses (Punjab Component) 227
Assistant Project Director Mr. Zulfiqar Ali Kharal is a carreer civil servant belonging to provincial management service (PMS). He joined provinicial service on 19-09-99. He has been working in the provincial civil secretariat and autonomous bodies on a variety of assignments ranging from section officer, labor and human resource department, S&GAD, health department and as Assistant Director Education, Punjab Workers Welfare Board. As APD at PMU his role is that of advisor for eight regional offices on administrative matters. Besides his administrative duties he has been disignated as monitoring officer of the head office for Sargodha region responsible for providing information regarding various issues concerning NPIW activities in the said region.
Assistant Director (Admin) Dr. Ahamd Afnan is a career civil servant belonging to PCS (Executive). He did his F.Sc. from Cadet College Hasan Abdal and graduation from Allama Iqbal Medical College, Lahore. He joined civil service on 03-09-01. He served as DDO(G) and Secretary District Public Safety Commision, Sheikhupura. Then he was appointed as Assistant Director (Inv) Anticorruption, as Assistant Director (Inv) NAB, Punjab and District Monitoring Officer (PESRP) Kasur. He joined the PMU, NPIW on 24-12-2005. His responsibilities at the PMU include admnistration and media management. He also has responsibility of monitoring of Multan Region.
Assistant Director (Technical) Mr. Ahmed Kamal is a career civil servant belonging to Provincial Management Service. Prior to joining PMU, he has worked in Local Government & Rural Development Department & Communication & Works Department, Government of the Punjab Lahore. His three year tenure at LG&RD Department was during the transition to new local government system under PLGO-2001 where he remained actively involved in resolution of various administrative issues that emerged as a result of implementation of devolution plan. He did his BSc. in mathematics & physics from Punjab University & studied for his Masters in Physics from Government College Lahore. He joined PMU in January, 2005 as Assistant Director (Technical) and remained actively involved in preparation of Progress Status Reports / Monitoring Plan etc.

Program Management Unit Annual Monitoring Report 2005-06
National Program for Improvement of Watercourses (Punjab Component) 228
Assistant Director (M&E) Mr. Tariq Mahmood belongs to Punjab Agriculture Department. He did his B.Sc. in Statistics & Applied Psychology from Punjab University & studied for his Masters in Statistics at Islamia University, Bahawalpur. He started his career as Statistical Investigator at Barani Agricultural Research Institute, Chakwal. After serving there for one year he joined Planning & Evaluation Cell of Agriculture Department in September, 1990 and has been working in various local and foreign funded projects launched throughout the province. He is well experienced in PC-I preparation and monitoring & evaluation of on-going projects. He joined PMU in January 2007 and is engaged in monitoring & evaluation of the NPIW activities in the districts Chakwal, Jehlum, Okara, Sheikhupura and Lahore.
Regional Manager (Bahawalpur) Mr. Ghazi Aman Ullah belongs to district Rahim Yar Khan. After
completing his education, he served as lecturer in Federal
Government’s Sir Syed College Rawalpindi form 1981 to 1989.
Afterwards, he joined Provincial Executive Service and has been
working on different assignments in Provincial Government as EAC,
DO (Cooperative), DDO(R) & Assistant Director (Investigation)
NAB. As such he has a diversified experience of administration. He
joined Program Management Unit in September, 2004.
Regional Manager (D. G. Khan) Mr. Ghulam Yaseen is a PMS Officer. He did his Master’s Degree
from Punjab University, Lahore. He served as section officer in
various Departments e.g. FWF&T department, Industries Mines and
Mineral department, Services and General Administration and Sports
department. He also served as District Monitoring Officer (PESRP)
Layyah. He has joined PMU in January 2007.

Program Management Unit Annual Monitoring Report 2005-06
National Program for Improvement of Watercourses (Punjab Component) 229
Regional Manager (Faisalabad) Muhammad Irshad Hussain Shah has done his Masters in
Chemistry from Quaid-e-Azam University Islamabad. He has
previously served in Mianwali, Bhakkar, Jhang, Faisalabad &
Rawalpindi as EAC/Magistrate. Mr. Shah is an officer with rich and
diversified experience on managerial & administrative assignments.
On the basis of his profile he was selected for posting as Regional
Manager Faisalabad where he has been serving since September
2004.
Regional Manager (Gujranawala) Mr. Rai Javed Ahmad before joining provincial executive service in 1988-89 he served as a lecturer in English in Government Islamia College Gujranwala & Government Dial Singh College, Lahore for three years. He has not only served on administrative posts as Extra Assistant Commissioner / DDO (Coordination), Assistant Commissioner but also has the privilege to serve in important policy making & controlling departments such as Finance, Home & Board of Revenue. Before joining the PMU in November, 2004 as RM Gujranwala, he was serving as Assistant Director in Anti Corruption Establishment.
Regional Manager (Lahore) Ahmed Mustjab Karamat initially served in merchant navy form
1984 to 1988. He did his Bachelor in Law from Punjab University.
He also holds a masters degree in arts from Punjab University. Later
on, he joined provincial executive service as EAC/Magistrate in
1992. He has been serving in various parts of the province in that
capacity. He also remained associated with NAB as investigation
officer. He is a widely traveled person having the privilege to visit
more than 25 countries across the globe.

Program Management Unit Annual Monitoring Report 2005-06
National Program for Improvement of Watercourses (Punjab Component) 230
Regional Manager (Multan) Mr. Muhammad Amin Chaudhary belongs to district Khanewal.
He joined the Provincial Executive Service in 1986. To his credit are
number of assignments relating to administration and management
mostly at district & tehsil level. He has also worked as District Food
Officer and Assistant Director Anticorruption. He is very good at
numbers being a B.Sc in mathematics & physics. He joined Program
Management Unit in October, 2004.
Regional Manager (Rawalpindi) Mr. Abdur Rasheed Razi joined service as a PCS (Executive)
officer in 1987. He has served as EAC / Magistrate in Rawalpindi,
Gujar Khan & Chakwal and remained working with Food
Department as District Food Controller from April 1998 to July
2004. As such he has vast experience of administration. He joined
PMU in August, 2004 as Regional Manager Rawalpindi.
Regional Manager (Sargodha) Mr. Ubaid Ullah Sial belongs to the Provincial Executive Service.
He is Masters in English as well in Islamic Studies. He started his
career as lecturer but later on chose to serve the province as an
administrator. In a career spread over 30 years he has been serving
the Government of the Punjab on various positions viz. Extra
Assistant Commissioner, District Food Controller, Assistant
Commissioner & DDO(R). He joined PMU as Regional Manager
Sargodha in August, 2004.

NATIONAL PROGRAM FOR IMPROVEMENT OF WATERCOURSES
(PUNJAB COMPONENT)
Program Management Unit, CHIEF MINISTER SECRETARIATE,
41-A, Lawrance Road, Lahore. Ph: +92 42 6271249-50
http:.npiw.punjab.gov.pk
National Program for Improvement of Watercourses (Punjab Component)