Annual Report and Financial Statements 2019 A nnu al R ...
192
Annual Report and Financial Statements 2019
-
Upload
khangminh22 -
Category
Documents
-
view
2 -
download
0
Transcript of Annual Report and Financial Statements 2019 A nnu al R ...

Annual Report andFinancial Statements2019
Annual Report and Financial Statements 2019

Forward-looking statements This Annual Report contains forward-looking statements within the meaning of Section 27A of the US Securities Act of 1933, as amended, and Section 21E of the US Securities Exchange Act of 1934, as amended. These statements are subject to risks and uncertainties that could cause actual results or outcomes of RELX PLC (together with its subsidiaries, “RELX”, “we” or “our”) to differ materially from those expressed in any forward-looking statement. The terms “outlook”, “estimate”, “project”, “plan”, “intend”, “expect”, “should”, “will”, “believe”, “trends” and similar expressions may indicate a forward-looking statement. Important factors that could cause actual results or outcomes to differ materially from estimates or forecasts contained in the forward-looking statements include, among others, current and future economic, political and market forces; changes in law and legal interpretations affecting RELX intellectual property rights and internet communications; regulatory and other changes regarding the collection, transfer or use of third-party content and data; demand for RELX products and services; competitive factors in the industries in which RELX operates; ability to realise the future anticipated benefits of acquisitions; significant failure or interruption of our systems; compromises of our data security systems or other unauthorised access to our databases; legislative, fiscal, tax and regulatory developments and political risks; exchange rate fluctuations; and other risks referenced from time to time in the filings of RELX PLC with the US Securities and Exchange Commission.
RELX is a global provider of information-based analytics and decision tools for professional and business customers. We help scientists make new discoveries, doctors and nurses improve the lives of patients and lawyers win cases. We prevent online fraud and money laundering, and help insurance companies evaluate and predict risk. Our events enable customers to learn about markets, source products and complete transactions. In short, we enable our customers to make better decisions, get better results and be more productive.
1RELX Annual report and financial statements 2019
Overview*
2 2019 Financial highlights3 Chair’s statement4 Chief Executive Officer’s report5 RELX business overview
Market segments*
12 Scientific, Technical & Medical18 Risk & Business Analytics24 Legal30 Exhibitions
Corporate Responsibility*
37 Corporate Responsibility overview
Financial review*
52 Chief Financial Officer’s report58 Principal and emerging risks
Governance64 Board Directors66 RELX Senior Executives68 Chair’s introduction to corporate governance70 Corporate governance review85 Report of the Nominations Committee88 Directors’ remuneration report112 Report of the Audit Committee115 Directors’ report
Financial statements and other information120 Independent auditor’s report128 Consolidated financial statements177 RELX PLC annual report and financial statements182 Summary financial information in euros183 Summary financial information in US dollars184 Reconciliation of adjusted to GAAP measures 186 Shareholder informationIBC 2020 financial calendar
* Comprises the Strategic Report in accordance with The (UK) Companies Act 2006 (Strategic Report and Directors’ Report) Regulations 2013.
Contents
Get more information onlineA PDF of the full Annual Report and further information about our businesses can be found online at our website: www.relx.com
Market segm
entsGovernance
Financial statements and
other information
Financial reviewCorporate Responsibility
Overview
2 RELX Annual report and financial statements 2019 | Overview
2019 Financial highlights
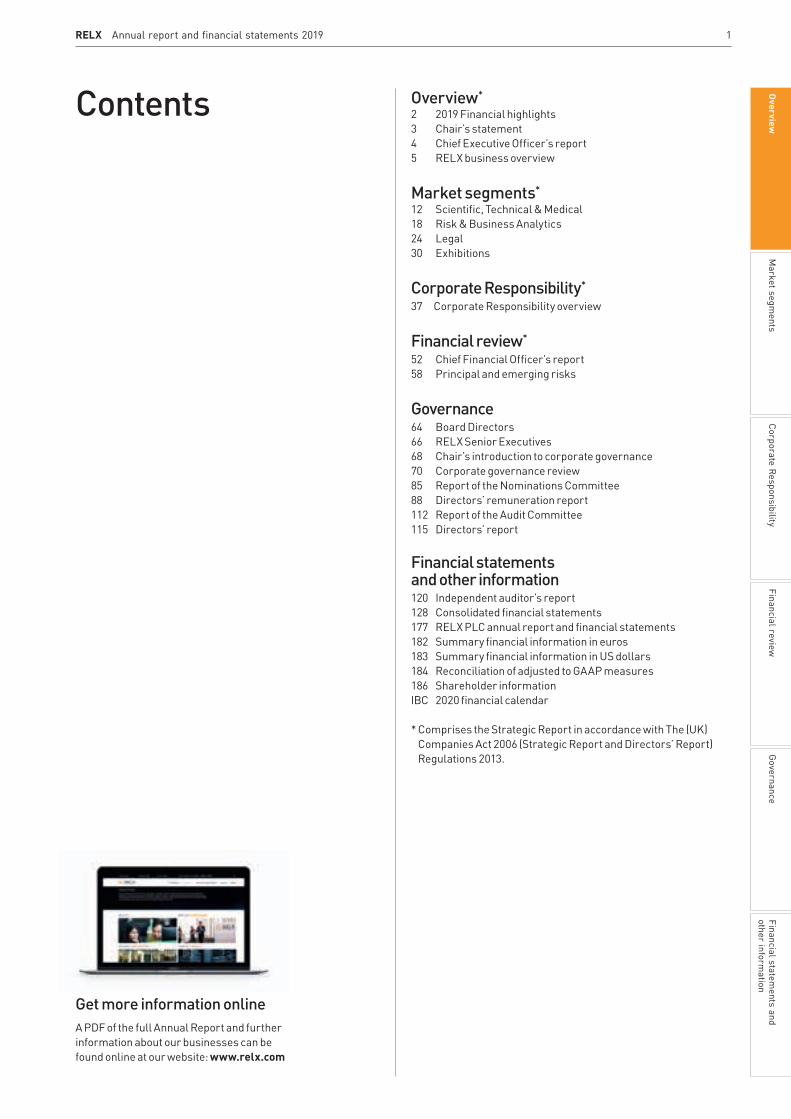
§ Underlying revenue growth of 4%
§ Underlying adjusted operating profit growth of 5%
§ Reported operating profit £2,101m (£1,964m)
§ Adjusted EPS at constant currency up 7%; in sterling up 10% to 93.0p
§ Reported EPS 77.4p (71.9p)
§ Full-year dividend up 9% to 45.7p
§ Strong financial position and cash flow; cash flow conversion at 96%
RELX financial summaryREPORTED FIGURES
2019£m
2018£m Change
Change atconstant
currenciesChange
underlyingFor the year ended 31 December
Revenue 7,874 7,492 +5% +2% +4%Operating profit 2,101 1,964 +7%Profit before tax 1,847 1,720 +7%Net profit attributable to RELX PLC shareholders 1,505 1,422 +6%Net margin 19.1% 19.0%Net borrowings 6,191 6,177Reported earnings per share 77.4p 71.9p +8%Ordinary dividend per RELX PLC share 45.7p 42.1p +9%
ADJUSTED FIGURES2019
£m2018
£m Change
Change atconstant
currenciesChange
underlyingFor the year ended 31 December
Operating profit 2,491 2,346 +6% +3% +5%Operating margin 31.6% 31.3%Profit before tax 2,200 2,145 +3% 0%Net profit attributable to RELX PLC shareholders 1,808 1,674 +8% +5%Net margin 23.0% 22.3%Cash flow 2,402 2,243 +7%Cash flow conversion 96% 96%Return on invested capital 13.6% 13.2%Adjusted earnings per share 93.0p 84.7p +10% +7%The shares of RELX PLC are traded on the London, Amsterdam and New York stock exchanges. RELX PLC and its subsidiaries, joint ventures and associates are together known as ‘RELX’.
RELX uses adjusted and underlying figures as additional performance measures. Adjusted figures primarily exclude the amortisation of acquired intangible assets and other items related to acquisitions and disposals, and the associated deferred tax movements. In 2018, we excluded exceptional tax credits, see note 9 on page 145. Reconciliations between the reported and adjusted figures are set out on page 184. Underlying growth rates are calculated at constant currencies, excluding the results of acquisitions until twelve months after purchase, and excluding the results of disposals and assets held for sale. Underlying revenue growth rates also exclude exhibition cycling. Constant currency growth rates are based on 2018 full-year average and hedge exchange rates.

3RELX Annual report and financial statements 2019
We continued to execute well on our strategic priorities in 2019. This was reflected in strong earnings. We also continued to build on our strong environmental, social and governance performance during the year, and this was again recognised in the high ratings given to us by a number of external agencies.RELX continued to execute well on its strategic priorities aimed at achieving more predictable revenues, a higher growth profile and improving returns. Underlying revenue growth was again 4%, with underlying adjusted operating profits up 5%, as we continued to grow revenues ahead of costs. Adjusted earnings per share grew 10% in sterling to 93.0p (84.7p), and 7% at constant currencies. Reported earnings per share were 77.4p (71.9p).
DividendsWe are proposing a full year dividend increase of 9% to 45.7p. The long-term dividend policy is unchanged.
Balance sheetNet debt was £6.2bn at 31 December 2019, unchanged from last year. Net debt/EBITDA including pensions and leases was 2.5x, compared with 2.4x in 2018. Capital expenditure represented 5% of revenues.
Share buybacksIn 2019, we deployed £600m on share buybacks. We intend to deploy a total of £400m in 2020. By 13 February, £100m of this year’s total had already been completed, leaving a further £300m to be deployed during the year.
The BoardAs announced in February, after over ten years as Chair, I have decided to retire from the Board when a successor has been appointed. A comprehensive search is underway. The Group has
made great progress over the past decade and is well positioned for future growth. As a result, I believe that this is the year both from my own perspective and from that of the company in which to make a change of Chair.
At the 2019 Annual General Meeting, Ben van der Veer stood down from the Board after nine years’ service, Carol Mills, a Non-Executive director since 2016 left the Board, and Andrew Sukawaty was appointed a Non-Executive Director. Andrew has had a 30-year career in the telecoms industry, he is Chairman of Inmarsat and was a Non-Executive Director of Sky between 2013 and 2018. In December Charlotte Hogg was appointed a Non-Executive Director. Ms Hogg is currently Executive Vice President and Chief Executive Officer for the European operations of Visa, a Board Director of Visa Europe and a member of Visa’s global executive committee. In 2020, Suzanne Wood will take over from Adrian Hennah as Chair of the Audit Committee. Adrian, who has been on the Board since 2011, will be stepping down as a Non-Executive Director after the next Annual General Meeting. I would like to thank Ben, Adrian and Carol for their support and advice, and am delighted that Andrew and Charlotte have joined the Board.
Stakeholder consultationWe conducted our biennial survey to understand what matters to different stakeholders: we asked investors, customers, employees, suppliers, and representatives from government and non-governmental organisations among others, to rank the issues they believe have the biggest impact on RELX. The top two issues were having the right people and data privacy and security. We also asked them to identify where we have the biggest impact on society and the environment – our unique contributions as a business came first, followed by access to information.
Corporate responsibilityCorporate responsibility (CR) has been a priority at RELX for many years. The Board of Directors regularly takes time to engage on the subject, overseeing our CR objectives and performance, ensuring we are operating at the highest commercial and ethical standards. Our belief remains firmly that good governance and sustainability are integral to good financial performance.
We believe that CR is a core strength of RELX and it is significant that Environmental, Social and Governance (ESG) performance is increasingly being recognised as an important indicator of a company’s overall health, the sustainability of its market positions, its attractiveness to key employees and its ability to generate growing long-term returns to shareholders. As a company with a long-standing record of leadership in this broad field, RELX is now benefitting from the greater profile that is being given to ESG and the increasingly rigorous and objective ways in which it is being measured, monitored and indexed. In 2019 RELX was ranked second in the S&P Global 1200 for ESG performance by CSRHub, and sixth in the newly launched Responsibility 100 index of FTSE 100 companies measured against the United Nations 17 Sustainable Development Goals. In 2019 RELX retained its AAA ESG rating with MSCI for the fourth consecutive year, and in January 2020 a Sustainalytics ESG report put RELX in the top one percent of over 12,000 companies covered.
Our corporate responsibility objectives for the year ahead align with the findings of our stakeholder survey (the full listing is available in the 2019 RELX Corporate Responsibility Report).
Anthony HabgoodChair
Sir Anthony Habgood Chair
Chair’s statement
Market segm
entsGovernance
Financial statements and
other information
Financial reviewCorporate Responsibility
Overview
4 RELX Annual report and financial statements 2019 | Overview
Erik Engstrom Chief Executive Officer
Chief Executive Officer’s report
RELX continued to make good progress in 2019. Our number one strategic priority is unchanged: the organic development of increasingly sophisticated information-based analytics and decision tools that deliver enhanced value to our customers, supplemented by selective acquisitions of targeted data, analytics and exhibition assets that support our organic growth strategies2019 progress Our positive financial performance continued in 2019 with underlying revenue growth across all four business areas. Underlying revenue growth was 4%. Underlying operating profit growth was 5%, and adjusted earnings per share grew 7% at constant currencies.
The underlying growth rate reflects good growth in electronic and face-to-face revenues (91% of the total), and the further organic development of our analytics and decision tools.
We also continued to reshape our portfolio through selective acquisitions of targeted data, analytics and exhibitions assets that support our organic growth strategies. We completed 14 acquisitions for a total consideration of £416m, the largest of which was Mack Brooks, a leading organiser of complementary events. Since the year end we acquired ID Analytics, a provider of credit and fraud risk solutions, and Emailage, a provider of email based fraud prevention solutions, both will complement our existing fraud prevention services within Risk & Business Analytics.
With a strong balance sheet and an inherently cash-generative business, the strategic priority order for using our cash is unchanged. First, to invest in the organic development of our business to drive underlying revenue growth; second to support our organic growth strategy with targeted acquisitions; third to grow dividends predictably, broadly in line with EPS growth; fourth to maintain our leverage in a comfortable range; and finally use any remaining cash to buy back shares. As part of this we bought back shares for £600m in 2019 and announced £400m in buybacks for 2020.
Corporate responsibility We have long recognised that corporate responsibility is important to RELX and is critical to the company’s long-term success. We define corporate responsibility as the way we do business, working to increase our positive impact and reduce any negative impact. It ensures good management of risks and opportunities, helps us attract and retain the best people and strengthens our corporate reputation.
During 2019, RELX remained committed to advancing its unique contributions as a business, which are aligned with the United Nations Sustainable Development Goals (SDGs). Knowledge is critical to achieving the SDGs by 2030, and during the year we strengthened the free RELX SDG Resource Centre, reaching 1000 sources from across our business and from partners, including UN University and the Global Partnership for Sustainable Development Data. We used our Scopus citations database and SciVal analytical tool to produce two new SDG graphics on water (SDG 6) and sustainable cities (SDG 11), which reveal the state of research underpinning these goals.
To progress corporate responsibility (CR) across RELX, we prioritised training for employees on our culture of integrity; expanded ISO27001 data protection compliance certification to more parts of our business; focused on inclusion, and increased the number of women in our tech mentoring programme to 95 pairs. We reached 30% women on our executive team. We rolled out our updated Editorial Policy and helped embed accessibility further by creating an Accessibility Advisory Board. Globally 45% of staff volunteered in our communities and 56% of our businesses reached the RELX Environmental Standards.
We also launched the LexisNexis Rule of Law Foundation to facilitate projects with key partners on the rule of law. We held Rule of Law Cafés in London, Singapore and Malaysia to bring together the legal community, business, government and non-governmental organisations to share information on going beyond legal minimums to advance the rule of law.
In the year ahead we will work to further strengthen our CR performance.
Outlook Key business trends in the early part of 2020 are consistent with the full year 2019, and we are confident that, by continuing to execute on our strategy, we will deliver another year of underlying growth in revenue and in adjusted operating profit, together with growth in adjusted earnings per share on a constant currency basis.
Erik EngstromChief Executive Officer

5RELX Annual report and financial statements 2019
RELX is a global provider of information-based analytics and decision tools for professional and business customers. We leverage deep customer understanding to combine leading content and data sets with powerful global technology platforms to build sophisticated analytics and decision tools that deliver enhanced value to our customers.
These products are generally sold through dedicated sales forces direct to customers and are priced on a subscription or transactional basis, often under multi-year contracts. They are predominantly delivered in electronic and face-to-face formats, and, to a small extent, in print.
Our products often account for less than 1% of our customers‘ total cost base but can have a significant and positive impact on the economics of the remaining 99%. Our objective is to continue to enhance the value that we deliver to our customers and over time to grow our own total cost base below our rate of revenue growth on an underlying basis.
RELX business overview
Strategic directionOur number one strategic priority is the organic development of increasingly sophisticated information-based analytics and decision tools that deliver enhanced value to professional and business customers across the industries that we serve.
Our goal is to help our customers make better decisions, get better results and be more productive. We do this by leveraging a deep understanding of our customers to create innovative solutions which combine content and data with analytics and technology in global platforms.
We aim to build leading positions in long-term global growth markets and leverage our skills, assets and resources across RELX, both to build solutions for our customers and to pursue cost efficiencies.
We are systematically migrating all of our information solutions across RELX towards higher value-add decision tools, adding
broader data sets, embedding more sophisticated analytics and leveraging more powerful technology, primarily through organic development.
We are transforming our core business, building out new products and expanding into higher growth adjacencies and geographies. We are supplementing this organic development with selective acquisitions of targeted data sets and analytics, and assets in high-growth markets that support our organic growth strategies, and are natural additions to our existing businesses.
By focusing on evolving the fundamentals of our business we believe that, over time, we are improving our business profile and the quality of our earnings. This has led to more predictable revenues through a better asset mix and geographic balance; a higher growth profile as we expand in higher growth segments, exit from structurally challenged businesses, and gradually reduce the drag from print format declines; and improved returns by focusing on organic development with strong cash generation.
RELX business model
§§ Deliver improved outcomes to professional customers§§ Combine content & data with
analytics & technology in global platforms§§ Build leading positions in
long-term global growth markets
§§ Organic development: Investment in transforming core business; build-out of new products§§ Portfolio reshaping:
Selective acquisitions; selective divestments§§ Leverage institutional
skills, assets and resources across RELX
§§ More predictable revenues§§ Higher growth profile§§ Improving returns
WHERE WE ARE GOING HOW WE ARE GETTING THERE IMPLICATIONS FOR BUSINESS PROFILE
REVENUE BY FORMAT REVENUE BY GEOGRAPHICAL MARKET REVENUE BY TYPE
£7,874m
ElectronicFace-to-facePrint
9%
16%
75%
£7,874m
North AmericaEuropeRest of world
21%
23% 56%
£7,874m
SubscriptionsTransactionalAdvertising
1%
47%52%
Market segm
entsGovernance
Financial statements and
other information
Financial reviewCorporate Responsibility
Overview

6 RELX Annual report and financial statements 2019 | Overview
Key performance indicatorsRELX’s key performance indicators (KPIs) track progress against long-term priorities. At the group level, given the diverse nature of our end markets, we look at the continued migration of the business towards electronic delivery, the increasing introduction of electronic decision tools, group level financial metrics, and corporate responsibility and sustainability metrics. The executive directors’ remuneration policy includes measures linked to the financial KPIs and may also include non-financials. See pages 97 to 109 for details of the implementation of the policy in 2019,
page 110 for the implementation in 2020 and pages 88 to 96 for the remuneration policy to be proposed for approval by shareholders at the Annual General Meeting to be held in April 2020.
In addition, we track KPIs within each market segment, at the product level, relevant to the performance of the specific business units.
Significant group financial KPIs are set out below.
For non-financial KPIs a summary of the corporate responsibility and sustainability performance metrics and targets are set out on pages 37 to 49 in the Corporate Responsibility overview.
Revenue by category
PrintFace-to-faceElectronic
REVENUE BY FORMAT
20012000 2002 2003 2004 2005 2006 2007 2008 2009 2010 2011 2012 2013 2014 2015 2016 20182017
22%22% 28% 30% 32% 35% 37%48% 50% 59% 61% 63% 64% 66% 66% 70%
74% 74%
14% 14%12% 12% 12%
13% 12%
15% 17%14% 14% 15% 15% 15% 16% 15%
15%
64% 64% 60% 58% 56% 52% 51%37%
33% 27% 25% 22% 21% 19% 18% 15% 11%
16%
10%
2019
75%
16%
9%
72%
15%
13%
Financial KPIsUNDERLYING ADJUSTED OPERATING PROFIT GROWTH
ADJUSTED EARNINGS PER SHARE GROWTHConstant currencyUNDERLYING REVENUE GROWTH
RETURN ON INVESTED CAPITAL ADJUSTED CASH FLOW CONVERSION DIVIDEND PER SHARE
20192015 2017 20182016
20192015 2017 20182016
20192015 2017 20182016
+3% +4%+4% +4% +4%
20192015 2017 20182016
+5% +6%+6% +6% +5%+8% +8% +7% +7% +7%
12.7% 13.0% 13.2% 13.6%12.9%
20192015 2017 20182016 20192015 2017 20182016
94% 96% 96% 96% 96%Pence
42.145.7
39.435.9529.7

7RELX Annual report and financial statements 2019 | RELX business overview
Segment position
Scientific, Technical & Medical provides information and analytics that help institutions and professionals progress science, advance healthcare and improve performance
Global #1
Risk & Business Analytics provides customers with information-based analytics and decision tools that combine public and industry-specific content with advanced technology and algorithms to assist them in evaluating and predicting risk and enhancing operational efficiency
Key verticals #1
Legal provides legal, regulatory and business information and analytics that help customers increase their productivity, improve decision-making and achieve better outcomes
US #2 Outside US #1 or 2
Exhibitions is a leading global events business. It combines face-to-face with data and digital tools to help customers learn about markets, source products and complete transactions at over 500 events in almost 30 countries, attracting more than 7m participants
Global #2
Financial summary by market segmentRevenue Adjusted operating profit
2019 £m
Change underlying
2019 £m
Change underlying
Scientific, Technical & Medical 2,637 +2% 982 +3%Risk & Business Analytics 2,316 +7% 853 +8%Legal 1,652 +2% 330 +8%Exhibitions 1,269 +6% 331 -1%Unallocated items (5)
7,874 +4% 2,491 +5%RELX uses adjusted and underlying figures as additional performance measures. Adjusted figures primarily exclude the amortisation of acquired intangible assets and other items related to acquisitions and disposals, and the associated deferred tax movements. In 2018, we excluded exceptional tax credits, see note 9 on page 145. Reconciliations between the reported and adjusted figures are set out on page 184. Underlying growth rates are calculated at constant currencies, excluding the results of acquisitions until twelve months after purchase, and excluding the results of disposals and assets held for sale. Underlying revenue growth rates also exclude exhibition cycling. Constant currency growth rates are based on 2018 full-year average and hedge exchange rates.
Market segmentsRELX serves customers in more than 180 countries and has offices in about 40 countries. It employs over 33,000 people, of whom almost half are in North America.
REVENUEREVENUE ADJUSTED OPERATING PROFIT
£7,874m
16%
34%
29%
21%
£2,491m
13%
39%
35%
13%
Scientific, Technical & MedicalRisk & Business AnalyticsLegalExhibitions
Scientific, Technical & MedicalRisk & Business AnalyticsLegalExhibitions
Market segm
entsGovernance
Financial statements and
other information
Financial reviewCorporate Responsibility
Overview

8 RELX Annual report and financial statements 2019 | Overview
Harnessing technology across RELX
Helping discover new drugs to treat rare diseases
Chronic pancreatitis, which affects about one million people globally, is a painful disease with no current cure. Because of the high cost and low return for finding treatments for such relatively rare diseases, drug makers devote little time and effort to finding cures.
Elsevier, with its vast stores of drug data and artificial intelligence (AI) technologies, including Entellect, its newest AI-powered life sciences platform, felt this was the perfect opportunity to make a difference in the community. Elsevier teamed with non-profit organisations, industry and academic partners, as well as researchers across the globe to find drugs already in existence that could be repurposed to treat the rare disease.
The company hosted a datathon collaboration ‘Repurposing Drugs for Rare Diseases’ with non-profit organisations Cures Within Reach, Mission: Cure, and the Pistoia Alliance (which represents 14 of the top 20 global pharmaceutical companies), life sciences and technology companies including Ariel Precision Medicine, and academia including Cincinnati Children’s Hospital Medical Center and University of Northern Iowa.
The datathon leveraged Elsevier’s expertise, with Entellect as the underpinning AI platform. They combined data from Elsevier’s Life Sciences products (including Reaxys) and third party external data from Open Targets, including data scientists and researchers from the participating organisations.
After 60 days of intense work, the datathon revealed four drugs that could potentially be repurposed to treat chronic pancreatitis. These drugs were validated by independent experts and will now be taken for clinical testing.
We are enthusiastic about the discoveries made in the Elsevier-Pistoia Alliance datathon. The problem-solving and teamwork focused on chronic pancreatitis were inspiring. We look forward to taking the promising candidates to the next step where we hope they will help us find effective treatments for this difficult, rare disease. The datathon exceeded our expectations, producing four repurposing candidates to address multiple chronic pancreatitis targets.
Megan Goldenco-founder and co-director, Mission: Cure
Around 9,000 technologists, half of whom are software engineers, work at RELX. Annually, the company spends $1.4bn on technology. The combination of our rich data assets, technology infrastructure and knowledge of how to use next generation technologies, such as machine learning and natural language processing, allows us to create effective solutions for our customers.
4new drug candidates to treat chronic pancreatitis, identified on Elsevier’s AI-powered life sciences platform Entellect in 60 days through analysis of 10 million drug target interactions

9RELX Annual report and financial statements 2019
Managing complex financial data quickly and efficiently with HPCC Systems
DataSeers is a Georgia-based company that was created in 2017 and provides a reconciliation, analytics and fraud-prevention engine (FinanSeer) for the financial services space. The DataSeers platform is comprised of four modules, one of which is ReconSeer – a rule-based engine that oversees reconciliation of millions of prepaid cards and accounts at unprecedented speeds, helping make monetary decisions in a fast and efficient manner.
The global market for prepaid cards is expected to reach $3,600bn by 2022. Much of this growth is fuelled by the rising need for financial inclusion of unbanked consumers, increasing volumes of online transactions, and the demand for cost-effective payment solutions. The industry continues to be plagued with problems when it comes to back office data management.
Prepaid cards generate a tremendous amount of data that need to be linked and analysed quickly. Companies must replicate data within multiple systems which can create trust issues.
DataSeers needed a big data partner that could handle what it termed the 4V big data conundrum – volume, velocity, variety, and veracity. DataSeers decided to leverage the robust capabilities of LexisNexis Risk Solutions’ HPCC Systems to create a machine learning-based approach to managing financial data.
Typically it takes hours to reconcile records, but with ReconSeer, millions of records on various platforms can be reconciled within seconds, enabling clients to make smarter decisions faster than ever before. The system identifies fraud and compliance issues using machine learning capabilities from HPCC Systems, which is important since FinTech companies have very little to no time to react to these transactions. Ultimately, this helps increase trust in the use of prepaid cards and helps prevent fraud and money laundering.
DataSeers is based in Atlanta, Georgia
Our choice of HPCC Systems as a core technology has allowed us to reduce our integration time to customers and provide results back in a timeline that was not possible before. A great partnership with LexisNexis Risk Solutions around Know Your Customer and Know Your Business helps us even further, and we can now provide a completely unified experience from onboarding to account closure all on a single platform.
Adwait Joshi CEO and founder, DataSeers
10m financial transactions processed every day using machine learning capabilities from LexisNexis Risk Solutions’ HPCC Systems
OverviewFinancial statem
ents and other inform
ationGovernance
Financial reviewCorporate Responsibility
Market segm
ents

10 RELX Annual report and financial statements 2019 | Market segments

RELX Annual report and financial statements 2019 11
Market segmentsIn this section12 Scientific, Technical & Medical18 Risk & Business Analytics24 Legal30 Exhibitions
Market segm
entsGovernance
Financial statements and
other information
Financial reviewCorporate Responsibility
Overview

12 RELX Annual report and financial statements 2019 | Market segments
Business overviewScientific, Technical & Medical provides information and analytics that help institutions and professionals progress science, advance healthcare and improve performance.
Elsevier is headquartered in Amsterdam, with further principal operations in Boston, New York, Philadelphia, St. Louis and Berkeley in North America, London, Oxford, Frankfurt, Munich, Madrid and Paris in Europe, Beijing, Chennai, Delhi, Singapore and Tokyo in Asia Pacific and Rio de Janeiro in South America. It has 8,100 employees and serves customers in over 180 countries.
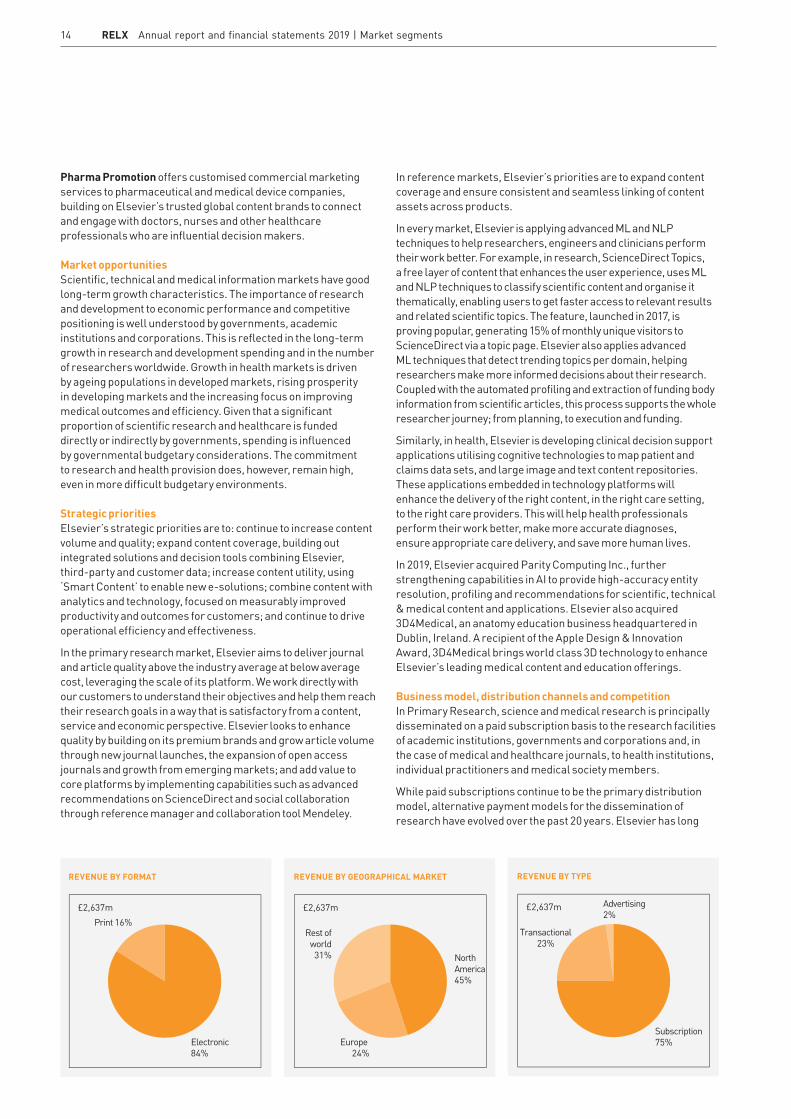
Revenues for the year ended 31 December 2019 were £2,637m, compared with £2,538m in 2018 and £2,473m in 2017. In 2019, 45% of revenue came from North America, 24% from Europe and the remaining 31% from the rest of the world. Subscription sales generated 75% of revenue, transactional sales 23% and advertising 2%.
Elsevier serves the needs of scientific, technical and medical markets by organising the review, editing and dissemination of primary research, reference and professional education content. Growing from its roots in publishing, Elsevier is creating analytical solutions to serve the needs of science and health, applying technology to authoritative information, providing tools that enable faster and more efficient ways of working, freeing up users to focus on their goals.
Elsevier’s customers are scientists, academic institutions, research leaders and administrators, medical researchers, doctors, nurses, allied health professionals and students, as well as hospitals, research institutions, health insurers, managed healthcare organisations, research-intensive corporations and governments.
Elsevier services fall into four market categories: Primary Research, Databases & Tools, Reference and Pharma Promotion.
Primary Research accounts for around half of revenues. Elsevier serves the global scientific research community, publishing over 496,000 articles in 2019, 60% more than a decade ago. 2019 saw continued strong growth both in article submissions and usage, with over 2m articles submitted and 1bn articles consumed by researchers. In 2019, Elsevier published over 49,000 gold open access articles, a double-digit growth on the previous year, making it one of the largest open access publishers in the world.
Elsevier’s portfolio of 2,500 journals is managed by more than 22,000 editors and many of its journals are the foremost publications in their field. They include flagship titles such as Cell and The Lancet family of journals. Elsevier’s article output accounts for 18% of global research output while garnering a 26% share of citations, demonstrating Elsevier’s commitment to delivering research quality significantly ahead of the industry average.
In 2019, Elsevier launched six new subscription and 100 full open access journals, including Physics Open , Cell Press’ Patterns and JACC: Case Reports.
Research content is distributed and accessed via ScienceDirect, the world’s largest platform dedicated to peer-reviewed primary scientific and medical research. Elsevier continues to invest in and deploy advanced Machine Learning (ML) and Artificial Intelligence (AI) capabilities to help power personalised article recommenders on ScienceDirect, suggesting new knowledge to ScienceDirect readers to expand the scope of their search and discovery.
Scientific, Technical & Medical
We help researchers make new discoveries, collaborate with their colleagues and give them the knowledge they need to find funding. We help governments and universities evaluate and improve their research strategies. We help doctors and nurses improve the lives of patients, providing insight to find the right clinical answers.
§§ We enhance the quality of scientific research output by organising the review, editing and dissemination of 18% of the world’s scientific articles
§§ ScienceDirect, the world’s largest platform dedicated to peer-reviewed primary scientific and medical research, hosts over 17m pieces of content including from over 40,000 e-books and has over 17m monthly unique visitors
§§ Scopus is a leading source-neutral abstract and citation database of research literature, with over 76m records across 25,000 journals, sourced from more than 5,000 publishers
§§ SciVal offers insights into the research performance of over 16,000 research institutions
§§ ClinicalKey, the flagship clinical reference platform, is accessed in around 100 countries and territories, and by over 1,900 institutions in North America alone
§§ Elsevier journals have at some point featured articles by 195 of 196 science and economics Nobel Prize winners since 2000
13RELX Annual report and financial statements 2019 | Scientific, Technical & Medical
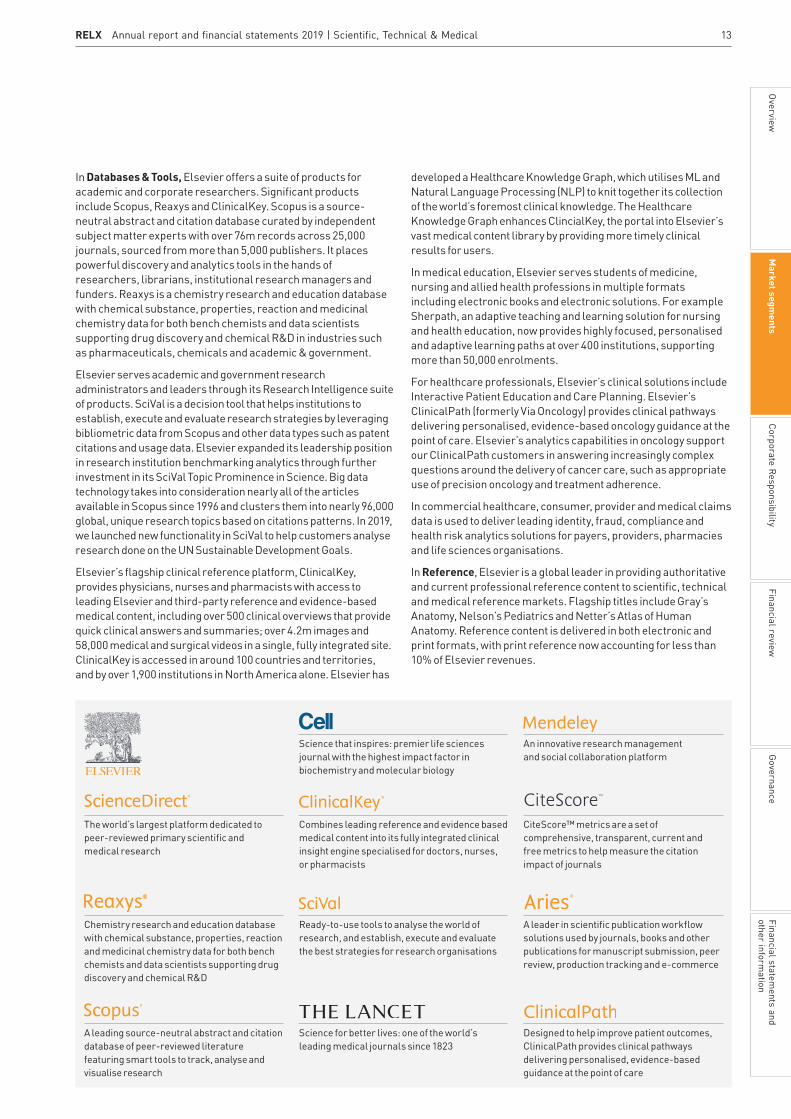
Science that inspires: premier life sciences journal with the highest impact factor in biochemistry and molecular biology
An innovative research management and social collaboration platform
The world’s largest platform dedicated to peer-reviewed primary scientific and medical research
Combines leading reference and evidence based medical content into its fully integrated clinical insight engine specialised for doctors, nurses, or pharmacists
CiteScore™ metrics are a set of comprehensive, transparent, current and free metrics to help measure the citation impact of journals
Chemistry research and education database with chemical substance, properties, reaction and medicinal chemistry data for both bench chemists and data scientists supporting drug discovery and chemical R&D
Ready-to-use tools to analyse the world of research, and establish, execute and evaluate the best strategies for research organisations
A leader in scientific publication workflow solutions used by journals, books and other publications for manuscript submission, peer review, production tracking and e-commerce
A leading source-neutral abstract and citation database of peer-reviewed literature featuring smart tools to track, analyse and visualise research
Science for better lives: one of the world’s leading medical journals since 1823
Designed to help improve patient outcomes, ClinicalPath provides clinical pathways delivering personalised, evidence-based guidance at the point of care
developed a Healthcare Knowledge Graph, which utilises ML and Natural Language Processing (NLP) to knit together its collection of the world’s foremost clinical knowledge. The Healthcare Knowledge Graph enhances ClincialKey, the portal into Elsevier’s vast medical content library by providing more timely clinical results for users.
In medical education, Elsevier serves students of medicine, nursing and allied health professions in multiple formats including electronic books and electronic solutions. For example Sherpath, an adaptive teaching and learning solution for nursing and health education, now provides highly focused, personalised and adaptive learning paths at over 400 institutions, supporting more than 50,000 enrolments.
For healthcare professionals, Elsevier’s clinical solutions include Interactive Patient Education and Care Planning. Elsevier’s ClinicalPath (formerly Via Oncology) provides clinical pathways delivering personalised, evidence-based oncology guidance at the point of care. Elsevier’s analytics capabilities in oncology support our ClinicalPath customers in answering increasingly complex questions around the delivery of cancer care, such as appropriate use of precision oncology and treatment adherence.
In commercial healthcare, consumer, provider and medical claims data is used to deliver leading identity, fraud, compliance and health risk analytics solutions for payers, providers, pharmacies and life sciences organisations.
In Reference, Elsevier is a global leader in providing authoritative and current professional reference content to scientific, technical and medical reference markets. Flagship titles include Gray’s Anatomy, Nelson’s Pediatrics and Netter’s Atlas of Human Anatomy. Reference content is delivered in both electronic and print formats, with print reference now accounting for less than 10% of Elsevier revenues.
In Databases & Tools, Elsevier offers a suite of products for academic and corporate researchers. Significant products include Scopus, Reaxys and ClinicalKey. Scopus is a source-neutral abstract and citation database curated by independent subject matter experts with over 76m records across 25,000 journals, sourced from more than 5,000 publishers. It places powerful discovery and analytics tools in the hands of researchers, librarians, institutional research managers and funders. Reaxys is a chemistry research and education database with chemical substance, properties, reaction and medicinal chemistry data for both bench chemists and data scientists supporting drug discovery and chemical R&D in industries such as pharmaceuticals, chemicals and academic & government.
Elsevier serves academic and government research administrators and leaders through its Research Intelligence suite of products. SciVal is a decision tool that helps institutions to establish, execute and evaluate research strategies by leveraging bibliometric data from Scopus and other data types such as patent citations and usage data. Elsevier expanded its leadership position in research institution benchmarking analytics through further investment in its SciVal Topic Prominence in Science. Big data technology takes into consideration nearly all of the articles available in Scopus since 1996 and clusters them into nearly 96,000 global, unique research topics based on citations patterns. In 2019, we launched new functionality in SciVal to help customers analyse research done on the UN Sustainable Development Goals.
Elsevier’s flagship clinical reference platform, ClinicalKey, provides physicians, nurses and pharmacists with access to leading Elsevier and third-party reference and evidence-based medical content, including over 500 clinical overviews that provide quick clinical answers and summaries; over 4.2m images and 58,000 medical and surgical videos in a single, fully integrated site. ClinicalKey is accessed in around 100 countries and territories, and by over 1,900 institutions in North America alone. Elsevier has
Market segm
entsGovernance
Financial statements and
other information
Financial reviewCorporate Responsibility
Overview
14 RELX Annual report and financial statements 2019 | Market segments
In reference markets, Elsevier’s priorities are to expand content coverage and ensure consistent and seamless linking of content assets across products.
In every market, Elsevier is applying advanced ML and NLP techniques to help researchers, engineers and clinicians perform their work better. For example, in research, ScienceDirect Topics, a free layer of content that enhances the user experience, uses ML and NLP techniques to classify scientific content and organise it thematically, enabling users to get faster access to relevant results and related scientific topics. The feature, launched in 2017, is proving popular, generating 15% of monthly unique visitors to ScienceDirect via a topic page. Elsevier also applies advanced ML techniques that detect trending topics per domain, helping researchers make more informed decisions about their research. Coupled with the automated profiling and extraction of funding body information from scientific articles, this process supports the whole researcher journey; from planning, to execution and funding.
Similarly, in health, Elsevier is developing clinical decision support applications utilising cognitive technologies to map patient and claims data sets, and large image and text content repositories. These applications embedded in technology platforms will enhance the delivery of the right content, in the right care setting, to the right care providers. This will help health professionals perform their work better, make more accurate diagnoses, ensure appropriate care delivery, and save more human lives.
In 2019, Elsevier acquired Parity Computing Inc., further strengthening capabilities in AI to provide high-accuracy entity resolution, profiling and recommendations for scientific, technical & medical content and applications. Elsevier also acquired 3D4Medical, an anatomy education business headquartered in Dublin, Ireland. A recipient of the Apple Design & Innovation Award, 3D4Medical brings world class 3D technology to enhance Elsevier’s leading medical content and education offerings.
Business model, distribution channels and competition In Primary Research, science and medical research is principally disseminated on a paid subscription basis to the research facilities of academic institutions, governments and corporations and, in the case of medical and healthcare journals, to health institutions, individual practitioners and medical society members.
While paid subscriptions continue to be the primary distribution model, alternative payment models for the dissemination of research have evolved over the past 20 years. Elsevier has long
Pharma Promotion offers customised commercial marketing services to pharmaceutical and medical device companies, building on Elsevier’s trusted global content brands to connect and engage with doctors, nurses and other healthcare professionals who are influential decision makers.
Market opportunitiesScientific, technical and medical information markets have good long-term growth characteristics. The importance of research and development to economic performance and competitive positioning is well understood by governments, academic institutions and corporations. This is reflected in the long-term growth in research and development spending and in the number of researchers worldwide. Growth in health markets is driven by ageing populations in developed markets, rising prosperity in developing markets and the increasing focus on improving medical outcomes and efficiency. Given that a significant proportion of scientific research and healthcare is funded directly or indirectly by governments, spending is influenced by governmental budgetary considerations. The commitment to research and health provision does, however, remain high, even in more difficult budgetary environments.
Strategic prioritiesElsevier’s strategic priorities are to: continue to increase content volume and quality; expand content coverage, building out integrated solutions and decision tools combining Elsevier, third-party and customer data; increase content utility, using ‘Smart Content’ to enable new e-solutions; combine content with analytics and technology, focused on measurably improved productivity and outcomes for customers; and continue to drive operational efficiency and effectiveness.
In the primary research market, Elsevier aims to deliver journal and article quality above the industry average at below average cost, leveraging the scale of its platform. We work directly with our customers to understand their objectives and help them reach their research goals in a way that is satisfactory from a content, service and economic perspective. Elsevier looks to enhance quality by building on its premium brands and grow article volume through new journal launches, the expansion of open access journals and growth from emerging markets; and add value to core platforms by implementing capabilities such as advanced recommendations on ScienceDirect and social collaboration through reference manager and collaboration tool Mendeley.
Electronic84%
Print 16%£2,637m
REVENUE BY FORMAT
Rest ofworld31%
Europe 24%
NorthAmerica45%
£2,637m
REVENUE BY GEOGRAPHICAL MARKET
Advertising2%
Transactional23%
Subscription75%
£2,637m
REVENUE BY TYPE

15RELX Annual report and financial statements 2019 | Scientific, Technical & Medical
invested in all business models to support the preferences of authors and research institutions. Author pays open access is one example, with over 1,900 of Elsevier’s journals now offering the option of funding publication and distribution via a sponsored article fee. In addition, Elsevier now publishes over 370 full open access titles.
For well over a decade, content has been provided for free or at very low cost in more than 100 countries and territories in the developing world through Research4Life, a United Nations partnership initiative. For some journals, advertising and promotional income represents a small proportion of revenues, predominantly from pharmaceutical companies in healthcare titles.
Next to journals, Elsevier has also invested in other solutions to serve the needs of the research community. SSRN is an open access online preprint community where researchers post early-stage research, prior to publication in academic journals. Mendeley data enables researchers to make their research data publicly available through an open research data repository, while
Digital Commons helps academic libraries showcase and share their institutions’ research via institutional repositories for greatest impact.
Electronic products, such as ScienceDirect, Scopus and ClinicalKey, are generally sold direct to customers through a dedicated sales force that has offices around the world. Subscription agents facilitate the sales and administrative process for remaining print journal sales. Reference and educational content is sold directly to institutions and individuals and accessed on Elsevier platforms, while printed books are sold through retailers, wholesalers and directly to end users.
Competition within science and medical reference content is generally on a title-by-title and product-by-product basis and is typically with learned societies and professional information providers, such as Springer Nature, Clarivate Analytics and Wolters Kluwer. Decision tools face similar competition, as well as from software companies and internal solutions developed by customers.
Key business trends remained positive in 2019, with underlying revenue growth in line with the prior year.
Underlying revenue growth was +2%. The reported revenue growth rate of +4% benefited from the strength of the US dollar versus sterling, with the difference between constant currency and underlying growth rates reflecting the impact of portfolio changes.
Underlying adjusted operating profit growth was +3%, slightly ahead of underlying revenue growth.
Electronic revenues saw continued good growth, partially offset by print declines. In primary research we continued to enhance customer value by providing broader content sets across our research offering, increasing the sophistication of our analytics, and evolving our technology platforms.
The number of article submissions to our subscription journals continued to grow strongly. Our open access publishing programme, which now includes over 370 dedicated open access
journals, saw its growth rate in articles submitted and published accelerate further as we continue to gain market share.
Databases & tools continued to drive growth across our market segments through content development and enhanced machine learning and natural language processing based functionality.
Print book revenues were down in a market that declined in line with historical trends, and print pharma promotion revenues continued to decline.
In 2019 we made three small acquisitions, including 3D4Medical, a provider of advanced 3D anatomy solutions, and disposed of minor print assets.
2020 outlookOur customer environment remains largely unchanged from recent years, and we expect another year of modest underlying revenue growth, with underlying operating profit growth exceeding underlying revenue growth.
2019 financial performance2019
£m2018
£mUnderlying
growthPortfoliochanges
Currency effects
Total growth
Revenue 2,637 2,538 +2% -1% +3% +4%Adjusted operating profit 982 942 +3% -1% +2% +4%
REVENUE
2019
2,6372,538
Underlying growth +2%
2018
£m
ADJUSTED OPERATING PROFIT
2019
982942
Underlying growth +3%
2018
£m
Market segm
entsGovernance
Financial statements and
other information
Financial reviewCorporate Responsibility
Overview

Pure: Building a scholarly reporting system to capture university success
1000 number of faculty days saved annually by using CityU Scholars based on Pure to maintain a comprehensive and up-to-date overview of research production data across CityU.
16 RELX Annual report and financial statements 2019 | Market segments
17RELX Annual report and financial statements 2019 | Scientific, Technical & Medical
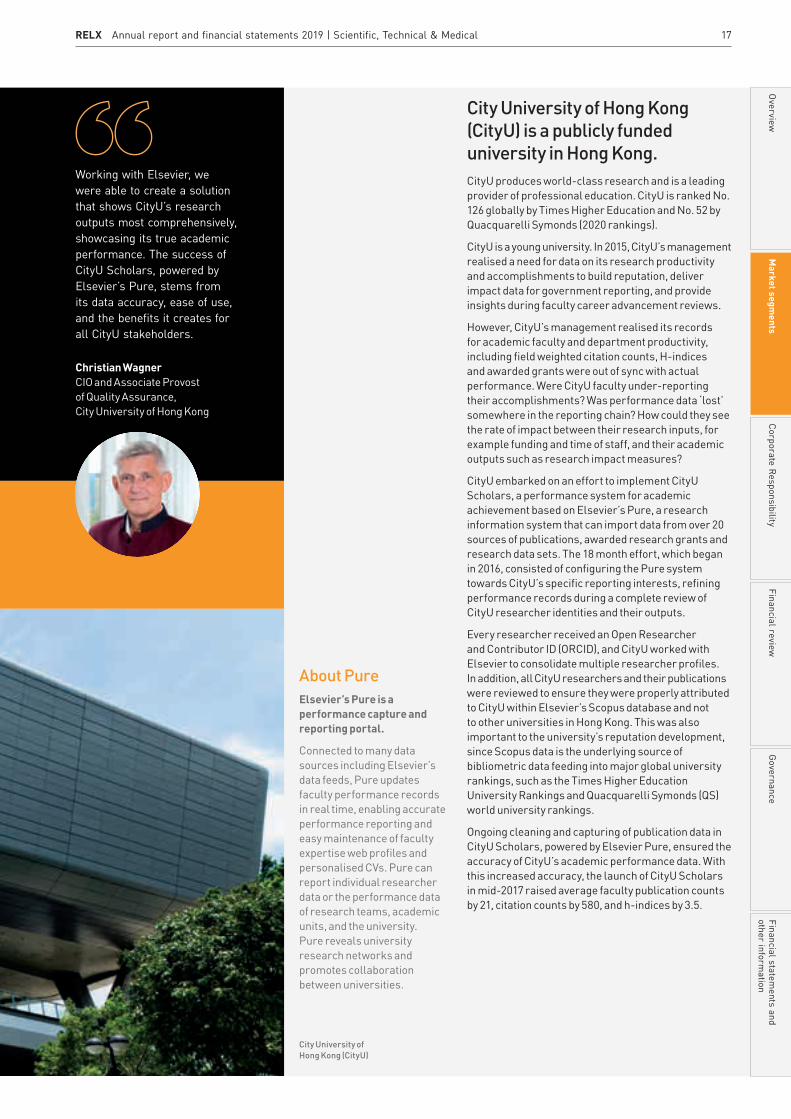
City University of Hong Kong (CityU) is a publicly funded university in Hong Kong. CityU produces world-class research and is a leading provider of professional education. CityU is ranked No. 126 globally by Times Higher Education and No. 52 by Quacquarelli Symonds (2020 rankings).
CityU is a young university. In 2015, CityU’s management realised a need for data on its research productivity and accomplishments to build reputation, deliver impact data for government reporting, and provide insights during faculty career advancement reviews.
However, CityU’s management realised its records for academic faculty and department productivity, including field weighted citation counts, H-indices and awarded grants were out of sync with actual performance. Were CityU faculty under-reporting their accomplishments? Was performance data ‘lost’ somewhere in the reporting chain? How could they see the rate of impact between their research inputs, for example funding and time of staff, and their academic outputs such as research impact measures?
CityU embarked on an effort to implement CityU Scholars, a performance system for academic achievement based on Elsevier’s Pure, a research information system that can import data from over 20 sources of publications, awarded research grants and research data sets. The 18 month effort, which began in 2016, consisted of configuring the Pure system towards CityU’s specific reporting interests, refining performance records during a complete review of CityU researcher identities and their outputs.
Every researcher received an Open Researcher and Contributor ID (ORCID), and CityU worked with Elsevier to consolidate multiple researcher profiles. In addition, all CityU researchers and their publications were reviewed to ensure they were properly attributed to CityU within Elsevier’s Scopus database and not to other universities in Hong Kong. This was also important to the university’s reputation development, since Scopus data is the underlying source of bibliometric data feeding into major global university rankings, such as the Times Higher Education University Rankings and Quacquarelli Symonds (QS) world university rankings.
Ongoing cleaning and capturing of publication data in CityU Scholars, powered by Elsevier Pure, ensured the accuracy of CityU’s academic performance data. With this increased accuracy, the launch of CityU Scholars in mid-2017 raised average faculty publication counts by 21, citation counts by 580, and h-indices by 3.5.
About PureElsevier’s Pure is a performance capture and reporting portal.
Connected to many data sources including Elsevier’s data feeds, Pure updates faculty performance records in real time, enabling accurate performance reporting and easy maintenance of faculty expertise web profiles and personalised CVs. Pure can report individual researcher data or the performance data of research teams, academic units, and the university. Pure reveals university research networks and promotes collaboration between universities.
City University of Hong Kong (CityU)
Market segm
entsGovernance
Financial statements and
other information
Financial reviewCorporate Responsibility
Overview
Working with Elsevier, we were able to create a solution that shows CityU’s research outputs most comprehensively, showcasing its true academic performance. The success of CityU Scholars, powered by Elsevier’s Pure, stems from its data accuracy, ease of use, and the benefits it creates for all CityU stakeholders.
Christian WagnerCIO and Associate Provost of Quality Assurance, City University of Hong Kong

18 RELX Annual report and financial statements 2019 | Market segments
Business overviewRisk & Business Analytics provides customers with information-based analytics and decision tools that combine public and industry-specific content with advanced technology and algorithms to assist them in evaluating and predicting risk and enhancing operational efficiency.
Risk & Business Analytics, headquartered in Alpharetta, Georgia, has principal operations in California, Florida, Illinois, New York and Ohio in North America as well as London and Paris in Europe and Beijing and Singapore in Asia Pacific. It has about 9,100 employees and serves customers in more than 170 countries.
Revenues for the year ended 31 December 2019 were £2,316m, compared with £2,117m in 2018 and £2,073m in 2017. In 2019, 79% of revenue came from North America, 14% from Europe and the remaining 7% from the rest of the world. Subscription sales generated 37% of revenues, transactional sales 62% and advertising 1%.
Risk & Business Analytics comprises the following market-facing industry/sector groups: Insurance Solutions, Business Services, Data Services (including banking, energy and chemicals, aviation, agriculture and human resources) and Government Solutions.
Insurance Solutions, the largest segment, provides comprehensive data, analytics and decision tools for personal, commercial and life insurance carriers in the US to improve critical aspects of their business. Information solutions, including the most comprehensive US personal loss history database, C.L.U.E., help insurers assess risks and provide important inputs to pricing and underwriting insurance policies. Additional key products include LexisNexis Data Prefill, which provides information on insureds directly into the insurance work stream for 89% of the insurance auto market and LexisNexis Current Carrier, which identifies insurance coverage details and any lapses in coverage.
The focus is on delivering innovative decision tools through a single point of access within an insurer’s infrastructure. LexisNexis Active Insights, our solution for active risk management, connects proprietary linking algorithms with vast amounts of data to proactively inform insurers of key events impacting their policyholders. Insurance Solutions is advancing its strategy to drive more consistency and efficiency in claims through its solution suite, Claims Compass, with Claims Datafill providing data and decisions at first notice of loss and throughout the claim life cycle. Risk Classifier solution, which uses public and motor vehicle records and predictive modelling, is used by around a quarter of the top 50 life insurers to better understand risk and improve underwriting efficiency.
Insurance Solutions continues to make progress outside the US. In the UK, contributory solutions including No Claims Discount module, which automates verification of claims history and Policy Insights, a predictor of motor claims loss, are delivered through the LexisNexis Informed Quotes platform to provide real-time data in the quoting process. In China, Genilex is delivering key vehicle data to auto insurers and is looking to add more analytics solutions. In Brazil, Insurance Solutions is delivering telematics solutions, data and analytics to help motor insurers in underwriting.
Risk & Business Analytics
We combine data and analytics with deep industry expertise to help customers make better decisions and manage risk. We deliver insight to insurance companies and help detect and prevent online fraud and money laundering. We provide digital tools that help airlines and farmers improve their operations.
§ 85% of new US auto insurance policies issued to consumers in 2019 benefited from our products
§ We do business with 95 out of the top 100 personal lines insurance companies; 78% of the Fortune 500; and seven of the world’s top ten banks
§ The LexisNexis Digital Identity Network analyses more than 100m transactions daily, or over 38bn transactions annually. Every week, activities on more than 70,000 websites are captured and analysed within the LexisNexis Digital Identity Network
§ Accuity has information on nearly 22,000 banks, and hosts over 700,000 documents in its Bankers Almanac data set. Over 95 of the world’s largest 100 banks use its data
§ Cirium tracks over 100,000 commercial flights every day, monitors 90m passenger itineraries a year, analyses over 2.5bn travel segments per annum worth about $380bn and holds up to 300 datapoints on every commercial aircraft
§ ICIS enables trading in the energy and chemicals sectors, providing pricing intelligence to over 130 markets. 90% of the world’s top 20 chemical companies use its data
§ The Homestead Exemption Fraud Detection Solution helped six Florida counties uncover more than $16m in new tax revenue in 2019 and place over $140m back on tax rolls

19RELX Annual report and financial statements 2019 | Risk & Business Analytics
Risk Intelligence Network World ComplianceThe Risk Intelligence Network provides government agencies with the first step of identity assessment across a number of services including benefits applications, claims filing and tax return filing. With a powerful combination of contributory systems and analytics, emerging threats can be identified before they have a significant impact
Our curated content related to economic sanctions, financial crime enforcement actions, politically exposed persons (PEPs), and adverse media enables customers to comprehensively and efficiently protect their enterprises from reputational, regulatory, legal and enforcement risks
LexisNexis Active Insights Risk Defense PlatformAn active risk management solution that provides timely alerts of recent changes occurring in the household to help insurers enhance customer relationships with better service
Leading provider of trusted and accurate data and analytics that transform how payments and compliance professionals manage accounts and transactions with confidence across the global financial ecosystem
A fraud prevention and identity management platform that seamlessly delivers the broadest of solutions, including the latest in machine learning that adapts to ever changing fraud schemes, simplifying efforts to detect and prevent risks associated with the merging of digital and physical identities
Claims Compass Accurint® Virtual Crime Center LexisNexis® Digital Identity Network®
Data analytics suite with LexisNexis Claims Datafill and LexisNexis Police Records that improves the claims process from first notice of loss, triage, investigation and resolution through recovery
Policing platform used for analytics, crime analysis and investigations linking public records to national law enforcement data for a complete picture across jurisdictions
A network that provides insight into true digital identity, by analysing global shared intelligence across more than 38bn annual transactions to distinguish legitimate consumers versus fraudsters
Aviation and air travel data and analytics for the world’s airlines, airports, aircraft finance, manufacturers, tech giants and travel companies
Global source of Independent Commodity Intelligence Services, connecting data, markets and customers to create a comprehensive, trusted view of global commodities markets
A global agricultural network, empowering customers to be better connected, to make more informed decisions, driving better decisions from seed, to field, to fork
Business Services enables global financial transparency and inclusion by providing holistic and actionable insights for all risk and compliance segments. We address some of the greatest challenges facing financial institutions, small businesses and e-commerce today, including identity theft, financial inclusion, cybercrime, bribery and corruption, trafficking, economic sanctions, global terrorism, and abusive practices. We leverage machine learning (ML) and artificial intelligence (AI) in our solutions to provide our customers greater insights, enabling faster decisions with a greater degree of confidence.
The growth strategy for Business Services is primarily driven by maximising penetration in our current markets across our customers’ workflow and through deeper international expansion.
In 2018, LexisNexis Risk Solutions added digital identity capability as a natural complement to its existing robust physical identity suite through the acquisition of ThreatMetrix. As a result, our customers gained access to solutions that provide a physical, digital, device and behavioural view into an identity. This perspective helps customers make decisions that thwart bad actors while enabling legitimate consumers to transact more securely and seamlessly.
The ThreatMetrix integration was completed in November 2019, creating a combined go-to-market organisation that consists of global sales and marketing teams; combining our physical and digital identity solutions into a holistic fraud prevention and
identity management solution; and expanding the Digital Identity Network into new use cases and markets.
Data Services provides indispensable business information, data, software and analytics solutions to professionals in many of the world’s biggest industries. Our brands include: Accuity, a provider of services and technology solutions to financial, corporate and government sectors focused on financial crime screening, payment services and counterparty Know Your Customer (KYC), and benefits eligibility; ICIS, an independent intelligence and services provider for global petrochemical and energy markets; Cirium, an aviation and air travel data and analytics company for the wider travel industry; Proagrica, a provider of connectivity solutions, workflow tools and actionable insight for the global agriculture and animal health segment; XpertHR, a compliance and benchmarking business driving global HR topics from pay equality to compliance and HR policies; EG, which delivers data analytics, decision tools and high-value analysis and news for the UK’s commercial real estate segment; and Nextens, a provider of workflow solutions, content and analytics for tax professionals.
Data Services has continued to reshape its portfolio, exiting areas not core to its strategy, divesting the publishing and events business (FlightGlobal) of Cirium during 2019 and Farmers Weekly early in 2020.
Government Solutions provides a variety of identity assessment, fraud detection and prevention, collections and recovery, data quality management, due diligence, regulatory compliance, and
Market segm
entsGovernance
Financial statements and
other information
Financial reviewCorporate Responsibility
Overview

20 RELX Annual report and financial statements 2019 | Market segments
criminal investigation and analysis solutions to US federal, state and local and government agencies. These solutions assist health and human services agencies in verifying the identity of, and delivering access for, those in need of public programmes and benefits. We help tax and regulatory agencies verify identities and confirm businesses and assets within the workflow of automated enterprise systems. Our data sharing solutions help public safety agencies find missing children and solve criminal investigations. Our solutions prevent fraud in government programmes, recapture lost revenue, keep communities safe and further national security initiatives.
Market opportunitiesWe operate in markets with strong long-term growth in demand for high-quality advanced analytics based on industry information and insight, including: insurance underwriting transactions; insurance acquisition, retention and claims handling; tax and public benefits fraud; financial crime compliance; business risk; fraud and identity solutions; due diligence requirements surrounding customer enrolment; security and privacy considerations; and data and advanced analytics for the banking, energy and chemicals, aviation and human resources sectors.
In the insurance segment, growth is supported by increasing transactional activity in the auto, commercial and life insurance markets and the increasing adoption by insurance carriers of more sophisticated data and analytics in the prospecting, underwriting and claims evaluation processes, to assess risk, increase competitiveness and improve operating cost efficiency. Transactional activity is driven by growth in insurance quoting and policy switching, as consumers seek better policy terms.
This activity is stimulated by competition among insurance companies, high levels of carrier advertising and rising levels of internet quoting and policy binding. We continue to expand our services to make it easier for the consumer to transact with an insurer throughout the insurance process. We are developing solutions that bridge insurers and automakers, utilising connectivity as a means to leverage and monetise the data from Advanced Driver Assistance Systems and connected cars, and engage consumers with driving behaviour information, collision detection and other insurance-related services. Our relationships with automakers, currently representing more than 25% of new car sales in the US market, and ability to provide insights to insurers in their workflows make this possible.
Within Business Services, growth opportunities are spurred by evolving fraud schemes resulting in mounting fraud losses, anti-money laundering fines, sanctions, anti-bribery and corruption enforcement, consumer and business credit expansion, and heightened regulatory scrutiny. Demand for compliance solutions in banking and financial services markets includes cross-border payments and trade finance levels. In collections, demand is driven mainly by the ongoing escalation of consumer debt and the prospect of recovering that debt.
Expansion of mobile and digital use cases will continue driving opportunity for solutions that incorporate global data and drive efficiency in risk decision making. Increased regional and country-level demand for data consortia and compliance utilities is also expected to continue.
The increasing demand for our contributory solutions and enriched data to combat criminal activity and deliver better access to services for citizens and businesses is driving growth in government markets. It is about secure, near frictionless service through a multi-layered approach. The level and timing of demand in this market is influenced by government funding and revenue considerations.
Growth in the global energy and chemicals markets is led by changing trade patterns, a drive to embrace sustainability and demand for more sophisticated supply chain solutions. Aviation information markets are being driven by increases in air traffic and the number of aircraft transactions and the digital transformation of the airline industry. Growth in agriculture markets is being driven by adoption of technology and data solutions plus increasing supply chain connectivity.
Strategic prioritiesOur strategic goal is to help businesses and governments achieve better outcomes with information and decision support through better insight into the risks and opportunities associated with individuals, other businesses, transactions and regulations. By providing high quality industry data and decision tools, we assist customers in understanding their markets and managing risks efficiently and cost effectively. To achieve this, we are focused on: delivering innovative new products; expanding the range of risk management solutions across adjacent markets; addressing international opportunities in selected markets to meet local needs; further growing our data services businesses, continuing to strengthen our content, technology and analytical capabilities and investing in sales and marketing.
Print 1%
Face-to-face 1%
Electronic98%
£2,316m
REVENUE BY FORMAT
Rest of world 7%
Europe14%
North America79%
£2,316m
REVENUE BY GEOGRAPHICAL MARKET
Advertising 1%
Transactional62%
Subscription37%
£2,316m
REVENUE BY TYPE

21RELX Annual report and financial statements 2019 | Risk & Business Analytics
Risk & Business Analytics has been developing AI and ML techniques for a number of years to generate the actionable insights that help our customers to make accurate, better informed and more timely decisions. The successful deployment of AI and ML techniques starts with a deep understanding of customer needs and leverages the breadth and depth of our data sets, coupled with the expertise and domain knowledge to discern which AI/ML algorithm to use, in what context, to solve our customers’ business problems most effectively.
Business model, distribution channels and competitionOur products are mainly sold directly, typically on a subscription or transactional basis. Pricing is predominantly on a transactional basis in the Insurance and Business Services segments, and primarily on a subscription basis in Data Services and Government.
In the insurance sector, our competitor Verisk sells data and analytics solutions to insurance carriers but largely addresses different activities to ours. Principal competitors in the Business Services and Government Solutions segment include the major credit bureaus, which in many cases address various capabilities within each solution offering.
Data Services competes with a number of information providers on a service and title-by-title basis including S&P Global Platts, Thomson Reuters and IHS Markit as well as a number of niche and privately owned competitors.
Strong underlying revenue growth continued in 2019.
Underlying revenue growth was +7%. The reported revenue growth rate of +9% benefited from the strength of the US dollar versus sterling, with the difference between constant currency and underlying growth reflecting the impact of portfolio changes.
Underlying adjusted operating profit growth of +8% was slightly ahead of underlying revenue growth and in line with the prior year.
In Insurance, we continued to drive growth through the roll-out of enhanced analytics, the extension of data sets, and by further expansion in adjacent verticals. The US market environment for the year as a whole was less supportive than in the prior year, but improved gradually throughout 2019. International initiatives continued to progress well.
In Business Services, further development of analytics that help our customers to detect and prevent fraud and to manage risk continued to drive growth. The US and international market environment was in line with historic trends for the year as a whole after a brief period of variability at the beginning of the year.
In Data Services, organic development of innovative new products and expansion of the range of decision tools drove strong growth in all key market verticals. In Government, we continued to drive customer value through the introduction of sophisticated analytics.
In 2019 we made two small acquisitions and disposed of minor print assets. Since the year end we have completed the acquisition of ID Analytics, a provider of credit and fraud risk solutions, and agreed to acquire Emailage, a provider of email based fraud prevention solutions.
2020 outlookThe fundamental growth drivers of Risk & Business Analytics remain strong, in line with recent years, and we expect underlying operating profit growth to continue to broadly match underlying revenue growth.
2019 financial performance2019
£m2018
£mUnderlying
growthPortfoliochanges
Currency effects
Total growth
Revenue 2,316 2,117 +7% -2% +4% +9%Adjusted operating profit 853 776 +8% -3% +5% +10%
REVENUE
2019
2,3162,117
Underlying growth +7%
2018
£m
ADJUSTED OPERATING PROFIT
2019
853776
Underlying growth +8%
2018
£m
Market segm
entsGovernance
Financial statements and
other information
Financial reviewCorporate Responsibility
Overview

22 RELX Annual report and financial statements 2019 | Market segments
LexisNexis Risk Solutions: reducing customer friction and stopping fraud for Commercial Bank of Dubai
87% decrease in managing the number of Commercial Bank of Dubai’s policies leading to improved efficiency and a reduction in overall operating cost

23RELX Annual report and financial statements 2019 | Risk & Business Analytics
Moving from static business rules to more dynamic rules with LexisNexis Risk Solutions means we have developed a trusted area for customer transactions. This incorporates rolling windows of time and averages per user so that when there is a significant change to that behaviour, we see it in real time.
Vinay SugunanandanHead of Fraud Risk Management Commercial Bank of Dubai
Headquartered in Deira, Dubai, the Commercial Bank of Dubai (CBD) is one of the largest banking and financial services corporations in the United Arab Emirates, offering a full range of financial products and services .Simplicity and innovation lie at the heart of CBD’s core values. Championing these values in a climate of rising fraud, a diverse user base and a huge proliferation in online interactions has created a number of key challenges. CBD wanted to offer customers banking freedom through a market-leading mobile banking app that provided users with a creative, easy, fun and personalised interaction while striving to make the online banking experience as frictionless as possible.
The most effective way to tackle complex, global cybercrime is using the power of a global shared network. The LexisNexis Digital Identity Network
collects and processes global shared intelligence from millions of daily consumer interactions including logins, payments, and new account applications. Using this intelligence, CBD is now able to better distinguish between trusted customer behaviour and potential fraud, reducing false positives and improving genuine fraud detection.
Using Digital Identity Network helped CBD to make an end-to-end decision flow so that intelligence built in one channel or event can be used throughout the customer journey. In addition, CBD reduced step-up verification significantly which resulted in an increase in the number of trusted customer transactions, thereby streamlining the user experience.
About LexisNexis Digital Identity NetworkLexisNexis Risk Solutions leverages global digital and physical identity intelligence, machine learning and advanced big data analytics to accelerate risk management decisions and fortify fraud defences for businesses across the globe. Our solutions combine powerful LexisNexis Risk Solutions technology and intuitive analytics with around 95 billion data records augmented by the digital identity coverage of the LexisNexis Digital Identity Network to deliver a physical, digital, device and behavioural view into an identity at any point in the customer life cycle. LexisNexis Risk Solutions provides robust, actionable risk insights, enabling secure and seamless transactions while limiting friction intelligently across every channel via a multi-layered approach.
View across the marina, Dubai , UAE
Market segm
entsGovernance
Financial statements and
other information
Financial reviewCorporate Responsibility
Overview
24 RELX Annual report and financial statements 2019 | Market segments
Business overviewLegal provides legal, regulatory and business information and analytics that help customers increase their productivity, improve decision-making and achieve better outcomes.
LexisNexis Legal & Professional is headquartered in New York and has further principal operations in Ohio, North Carolina and Toronto in North America, London and Paris in Europe, and cities in several other countries in Africa and Asia Pacific. It has 10,600 employees worldwide and serves customers in more than 150 countries.
Revenues for the year ended 31 December 2019 were £1,652m, compared with £1,618m in 2018 and £1,686m in 2017. In 2019, 67% of revenue came from North America, 21% from Europe and the remaining 12% from the rest of the world. Subscription sales generated 78% of revenue and transactional sales 22%.
LexisNexis Legal & Professional is organised in market-facing groups. These are supported by global shared services organisations providing platform and product development, operational and distribution services, and other support functions.
In North America, electronic reference, decision tools and analytics help legal and business professionals make better informed decisions in the practice of law and in managing their businesses. The flagship product for legal research and analytics is Lexis Advance, which provides statutes and case law together with analysis and expert commentaries from secondary sources, such as Matthew Bender. Lexis Advance includes the leading citation service, Shepard’s, which advises on the continuing relevance of case law precedents. In North America, LexisNexis also provides customers with news and business information, ranging from daily news to company filings, public records information, legal analytics tools, practical guidance, and efficiency solutions. LexisNexis also partners with law schools to provide services to students as part of their training.
In 2019, LexisNexis continued to enhance Lexis Advance, an innovative web and mobile application designed to transform how legal professionals conduct research and use analytics and data to drive decision-making. Enabled by the New Lexis platform, Lexis Advance allows customers within legal and professional organisations to find relevant information more efficiently, helping drive better outcomes.
LexisNexis continues to invest in and deploy advanced Machine Learning (ML) and Artificial Intelligence (AI) capabilities that help power Lexis Advance. In 2019, these technologies expanded the capabilities of Lexis Answers, a service that semantically understands a user query and provides a starting point answer to legal research. Lexis Advance Answer Cards now include summaries and analytics on judges and expert witnesses, as well as supporting an extended array of question types.
In 2019, LexisNexis expanded the Lexis Advance legal product ecosystem to ensure a more seamless user experience by integrating Intelligize, an analytics solution for review and analysis of SEC filings; CourtLink, a leading supplier of court docket information in the United States; Lexis Advance Quicklaw, a leading research solution in Canada; and Lexis Practice Advisor Canada, a practical guidance solution for Canadian attorneys.
Legal
We help lawyers win cases, manage their work more efficiently, serve their clients better and grow their practices. We assist corporations in better understanding their markets and preventing bribery and corruption within their supply chains. We partner with leading global associations and customers to help advance the Rule of Law across the world.
§ The LexisNexis legal and news database contains 119bn documents and records
§ 1.3m new legal documents are added daily to the database from 69,000 sources, generating 70bn connections. In all, 28m legal documents are processed daily
§ Nexis news and business content includes 40,000 premium sources in 33 languages, covering more than 150 countries. It has data including 350m company profiles with a content archive that dates back 40 years
§ The LexisNexis database includes 250m court dockets and documents, more than 132m patent documents, 2.5m State Trial Orders, and 1.3m Jury verdict and settlement documents
§ PatentSight’s database includes objective ratings of the innovative strength (Patent Asset Index) of more than 97m patent documents from more than 80 countries
§ In 2019, Law360 produced over 50,000 news and analysis articles
§ Legal analytics tool Lex Machina has normalised over 47m counsel mentions and 29m party mentions since 2016
§ LexisNexis is committed to advancing the Rule of Law through operations and solutions that provide transparency into the law in more than 150 countries

25RELX Annual report and financial statements 2019 | Legal
Premier citations service LexisNexis enterprise contract intelligence offering
LexisNexis North American Research Solution’s practical guidance service
Litigation solution providing legal language analytics on judges and expert witnesses
Provides analytics and benchmarking of SEC filings to optimise compliance strategies
Flagship online legal research tool that transforms the way legal professionals conduct research
LexisNexis UK flagship legal online product
Patent analytics solution that provides insights into the strength, quality and value of patent portfolios
LexisNexis UK legal practical guidance service
Provides Legal Analytics to companies and law firms, enabling them to craft successful strategies, win cases and close business
LexisNexis continued to expand the reach of its decision tools and analytics. In 2019, LexisNexis further expanded the analytics offering of Lex Machina with four new practice areas including Environmental Litigation and Consumer Protection Litigation, bringing the total to 16 active practice areas; Context, with new analysis of Courts to complement Judge and Expert Witness modules released late in 2018; and a suite of new offerings from Intelligize, including M&A Market Analytics, No Action Letter, and SEC Comment Letter Analytics.
LexisNexis expanded its strong position in analytics by also introducing new tools to allow law firms to enrich and mine their own data stores. Lexis Search Advantage was enhanced with new ML and algorithmic capabilities for both for litigation and transactional attorneys.
During 2019, LexisNexis also added three new modules for Lexis Practice Advisor, the company’s practical guidance and ‘how to’ service, bringing the total to 20 practice area modules. The service also launched Evolving Guidance, a joint offering with LexisNexis’ news solution Law 360, that offers early analysis of legal changes that could impact businesses in rapidly developing areas such as Employment Law.
In July 2019, LexisNexis formed a joint venture with Knowable, a ML enabled enterprise contracts intelligence platform. By converting legal language into structured data, the solution provides users with insight into their contracts, portfolio risks, obligations and entitlements.
In the Intellectual Property analytics space, LexisNexis proprietary Patent Asset Index, created by PatentSight, is used by corporations worldwide to manage and value their intellectual property portfolios.
In Canada, LexisNexis enhanced Lexis Advance Quicklaw through the continued integration of international content and search enhancements.
LexisNexis also supplies Business of Law Software Solutions to law firms and corporate legal departments. These solutions
include practice management solutions, case management, and cost recovery services.
In international markets outside North America, LexisNexis serves legal, corporate, government, accounting and academic markets in Europe, Africa and Asia Pacific with local and international legal, regulatory and business information. The most significant of these businesses are in the UK, France, Australia and South Africa.
In the UK, LexisNexis is a leading legal information provider offering an extensive collection of primary and secondary legislation, case law, expert commentary, practical guidance, and current awareness. In 2019, LexisNexis continued to grow its content sets and improve user functionality. In Legal, the company re-platformed its market-leading LexisLibrary product, enabling ongoing improvements to the customer experience. LexisNexis UK also grew adoption of LexisPSL and introduced a range of Brexit-related content and tools. Contract productivity and proofreading tool LexisDraft, alongside the automation software VisualFiles, has grown LexisNexis’ footprint in legal workflow solutions. In Tax, LexisNexis continued to expand its reach, with firms of all sizes leveraging TolleyLibrary and TolleyGuidance.
In France, LexisNexis’ main offering, Lexis360, is a leading integrated solution combining legal information, in-depth analysis with JurisClasseur content, and practical guidance. In 2019, LexisNexis enhanced the Lexis360 solution by improving user experience, content and product functionality.
In South Africa, LexisNexis introduced Lexis MetroIQ, a subscription solution designed to assist South African municipalities in maintaining an accurate and up-to-date property registry.
In Austria, Lexis SmartScan, a recently launched advanced legal document analysis tool placed first in innovation at the Digital Impuls Award.
In the Middle East, LexisNexis launched the new Lexis Middle East platform, which features improved search relevancy and product performance.
Market segm
entsGovernance
Financial statements and
other information
Financial reviewCorporate Responsibility
Overview

26 RELX Annual report and financial statements 2019 | Market segments
In the Pacific region, LexisNexis continued its focus on providing authoritative local online content embedded in decision tools for legal professionals. In 2019, LexisNexis enhanced Lexis Advance Pacific by incorporating advanced data visualisation with the introduction of Search Term Maps and released integrated search results combining Lexis Advance and Practical Guidance content.
In Asia, LexisNexis successfully migrated all customers to the new Lexis Advance platform, providing new functionalities and an improved user experience to legal professionals across the region. In 2019, Lexis Advance launched new AI and deep-learning tools on the platform, such as Case Recommendation in Malaysia, and won the Technology Excellence Awards for Online Services – Legal in Hong Kong.
Supporting its Rule of Law mission, LexisNexis partnered with the Office of the Attorney-General to launch the consolidated Laws of Fiji online, the region’s first online version of the authorised legislation. LexisNexis Australia is also an official partner in a landmark inquiry led by the Australian Human Rights Commissioner into the challenges to human rights and freedoms presented by emerging technologies such as AI, social media, and big data. As part of this partnership LexisNexis Pacific jointly developed a Vietnamese language version of the Australian Human Rights Commission’s RightsApp.
LexisNexis signed a partnership with the Maldives Family Legal Clinic to provide plain language versions of domestic violence laws to be disseminated to 200 islands across the Maldives. LexisNexis also partnered with the East Malaysia Mobile Court Program and participated in the Matanggal Village expedition in Sabah to help adjudicate cases of statelessness.
Market opportunitiesLonger term growth in legal and regulatory markets worldwide is driven by increasing levels of legislation, regulation, regulatory complexity and litigation, and an increasing number of lawyers. Additional market opportunities are presented by the increasing demand for online information solutions, legal analytics and other solutions, along with decision support solutions that improve the quality and productivity of research, deliver better legal outcomes and improve business performance. Notwithstanding this, legal activity and legal information markets are also influenced by economic conditions and corporate activity, as has been seen with the continued subdued environment in North America and Europe.
Strategic prioritiesLexisNexis Legal & Professional’s strategic goal is to enable better legal outcomes and be the leading provider of productivity-enhancing information, analytics and information-based decision tools in its market. To achieve this, LexisNexis is focused on introducing next-generation products and solutions on the global New Lexis platform and infrastructure; incorporating advanced technologies including Machine Learning and Natural Language Processing; driving long-term international growth; and upgrading operational infrastructure, improving process efficiency and gradually improving margins.
In the US, LexisNexis is focused on the ongoing development of legal research and practice solutions that help lawyers make data-driven decisions. Over the coming years, progressive product introductions will combine advanced technologies, enriched content and sophisticated analytics to enable LexisNexis customers to make data-driven legal decisions and drive better outcomes for their organisations and clients.
Outside the US, LexisNexis is focused on growing online services and developing further high-quality actionable content and decision tools, including the development of additional practical guidance and analytics tools. Additionally, LexisNexis is focusing on the expansion of its activities in emerging markets.
LexisNexis is also continuing the mission of spreading equality, transparency and access to legal remedies globally through the recently formed LexisNexis Rule of Law Foundation, a non-profit entity that provides financial and other support for projects that aim to advance the Rule of Law around the world.
Business model, distribution channels and competition LexisNexis Legal & Professional products and services are generally sold directly to law firms and to corporate, government, accounting and academic customers on a paid subscription basis, with subscriptions with law firms often under multi-year contracts.
Principal competitors for LexisNexis in US legal markets are Westlaw (Thomson Reuters), CCH (Wolters Kluwer) and Bloomberg. In news and business information key competitors are Bloomberg and Factiva (News Corporation).
Significant international competitors include Thomson Reuters, Wolters Kluwer and Factiva.
Print15%
Electronic85%
£1,652m
REVENUE BY FORMAT
Rest of world12%
Europe21%
NorthAmerica67%
£1,652m
REVENUE BY GEOGRAPHICAL MARKET
Transactional22%
Subscription78%
£1,652m
REVENUE BY TYPE

27RELX Annual report and financial statements 2019 | Legal
Underlying revenue growth in 2019 was in line with the prior year.
Underlying revenue growth was +2%. The reported revenue growth rate of +2% benefited from the strength of the US dollar versus sterling, with the difference between the constant currency and underlying growth rates reflecting the impact of portfolio changes.
Underlying adjusted operating profit growth of +8% was ahead of underlying revenue growth reflecting continued efficiency gains. The increase in operating profit margin reflects ongoing process improvements as the platform transition process comes to an end.
The market environment for legal services, and for legal information providers, remained stable. Electronic revenues saw continued growth, partially offset by print declines.
The completion of the new platform roll-out has enabled the continued release of broader data sets and further application of machine learning and natural language processing technologies that enhance our research products and market leading analytics.
In 2019 we acquired a majority stake in Knowable, a US contract analytics business, and disposed of a number of small software assets.
2020 outlookTrends in our major customer markets remain largely unchanged, and we expect another year of modest underlying revenue growth. We expect good underlying operating profit growth to continue.
2019 financial performance2019
£m2018
£mUnderlying
growthPortfoliochanges
Currency effects
Total growth
Revenue 1,652 1,618 +2% -3% +3% +2%Adjusted operating profit 330 320 +8% -7% +2% +3%
REVENUE
2019
1,6521,618
Underlying growth +2%
2018
£m
ADJUSTED OPERATING PROFIT
2019
330320
Underlying growth +8%
2018
£m
Market segm
entsGovernance
Financial statements and
other information
Financial reviewCorporate Responsibility
Overview

28 RELX Annual report and financial statements 2019 | Market segments
LexisNexis Practical Guidance:helping specialist and boutique law firms to grow
80% time saved for Curlington Legal, when conducting research for clients using LexisNexis products

29RELX Annual report and financial statements 2019 | Legal
Practical Guidance is essential for my business. It streamlines research and information gathering and helps me understand the process; what’s meant to happen and when. I’m able to practise in areas I don’t traditionally delve into.
David SiglerPrincipal Lawyer, Curlington Legal
David Sigler is the sole practitioner at Curlington Legal, a boutique law firm in the Sydney Central Business District, specialising in technology law. While David has over 30 years’ experience in technology law, he is often asked by clients for advice on other aspects of their business. To offer a full service for his clients, and scale his firm, David relies on LexisNexis Practical Guidance to increase his capability and provide expertise in less familiar areas of law.
The highly practical workflow tools in Practical Guidance provide David with a clear research road map and access to relevant points of law to guide him in areas where he has less extensive experience.
Over the last year, David has used resources from Practical Guidance to act on several matters which he would normally hand over to a specialist practitioner. He estimates that Practical Guidance has helped him generate additional fees of AU$50,000 in the last 12 months alone.
To conduct deeper research, David takes advantage of Practical Guidance as a gateway to the extensive world class research available on Lexis Advance. Premium Australian legal publications including CaseBase Case Citator, LawNow Plus, Halsbury’s Laws of Australia and the Australian Encyclopaedia of Forms & Precedents form part of David’s powerful Lexis Advance library.
This has transformed the way David conducts legal research, allowing him to provide confident advice in broader areas of law, helping Curlington Law to diversify and scale.
About Lexis AdvanceLexis Advance in Australia is an innovative online research platform.
Via a single sign on and cutting-edge search technology, the platform provides centralised access to LexisNexis’ extensive range of trusted legal publications. This includes LexisNexis Practical Guidance, a powerful online solution offering practically-focused legal content across 24 Australian practice areas. Practical Guidance provides access to step-by-step guidance, legislation, cases, checklists, tools and forms and precedents all in one place in the context of a lawyer’s workflow.
Sydney Harbour Bridge east side at sunset
Market segm
entsGovernance
Financial statements and
other information
Financial reviewCorporate Responsibility
Overview

30 RELX Annual report and financial statements 2019 | Market segments
Business overviewExhibitions is a leading global events business. It combines face-to-face with data and digital tools to help customers learn about markets, source products and complete transactions at over 500 events in almost 30 countries, attracting more than 7m participants.
Reed Exhibitions has its headquarters in London and has further principal offices in Paris, Vienna, Düsseldorf, Moscow, Norwalk (Connecticut), Mexico City, São Paulo, Abu Dhabi, Beijing, Shanghai, Tokyo, Singapore and Sydney. Reed Exhibitions has 4,600 employees worldwide and its portfolio of events serves 43 industry sectors.
Revenues for the year ended 31 December 2019 were £1,269m compared with £1,219m in 2018 and £1,109m in 2017. In 2019, 20% of Reed Exhibitions’ revenue came from North America, 40% from Europe and the remaining 40% from the rest of the world on an event location basis.
Reed Exhibitions organises influential events in key markets focused on addressing the needs of the industry, where participants from around the world meet face-to-face to do business, to network and to learn. Its events encompass a wide range of sectors. They include construction, cosmetics, electronics, energy and alternative energy, engineering, entertainment, gifts and jewellery, healthcare, hospitality, interior design, logistics, manufacturing, media, pharmaceuticals, real estate, recreation, security and safety, transport and travel. Following the acquisition of Mack Brooks, Reed Exhibitions now has strong and growing global positions in new sectors including sheet metal processing (through the Blech portfolio), rail (through the Railtex portfolio), airports (through the Inter Airport portfolio) and industrial fasteners (through the Fastener Fair portfolio).
Market opportunitiesGrowth in the exhibitions market is influenced both by business-to-business marketing spend and by business investment. Historically, these have been driven by levels of corporate profitability, which in turn has followed overall growth in gross domestic product. Emerging markets and higher growth sectors provide additional opportunities. Reed Exhibitions’ broad geographical footprint and sector coverage allows it to effectively respond to changes in global trade and capture growth opportunities as they emerge.
As some events are held other than annually, growth in any one year is affected by the cycle of non-annual exhibitions.
Exhibitions
Our events leverage industry expertise, large data sets and technology to enable our customers to generate billions of dollars of revenues for the economic development of local markets and national economies around the world.
§ More than 500 events are in the Reed Exhibitions portfolio
§ In 2019 Reed Exhibitions launched 50 new events
§ 43 industry sectors are served in almost 30 countries across the globe
§ Each year around 130,000 businesses choose to exhibit at our events. They connect with the more than 7m people who attend to find new products or suppliers, learn about their industry and be inspired
§ Our digital products increase the value of our events to participants, enabling them to make new contacts and meet face-to-face to do business. In 2019, 283 events offered proactive matchmaking to around 3.2 million customers. Direct customer feedback from around 100,000 customers demonstrates those who use the service tend to have a better event, reporting higher levels of value and satisfaction
.
31RELX Annual report and financial statements 2019 | Exhibitions
Strategic prioritiesReed Exhibitions’ strategic goal is to deliver measurably higher value and improved outcomes to its customers. It is achieving this organically by focusing on understanding and responding to individual customers’ needs and business objectives.
Reed Exhibitions delivers a platform for industry communities to conduct business, network and learn through a range of market-leading events in all major geographic markets and higher growth sectors, enabling exhibitors to target and reach new customers quickly and cost effectively.
Organic growth will be achieved by continuing to generate greater customer value through combining the best of face-to-face with data and decision tools, launching new events, and by leveraging its global network and technology platforms for faster and more agile development and deployment of innovation. Reed Exhibitions is also actively shaping its portfolio through a combination of new launches, strategic partnerships and selective acquisitions in faster growing sectors and geographies, as well as by withdrawing from markets and industries with lower long-term growth prospects.
Reed Exhibitions is committed to continuously improving customer solutions and experience by developing global technology platforms based on industry databases, digital tools and analytics. By providing a variety of services, including its integrated web platform, the company continues to increase customer value and satisfaction by proactively putting the right buyers and sellers together on the event floor. Increasingly, digital and multichannel services such as active matchmaking are becoming a normal part of the customer expectation and product offering, enhancing the value delivered through attendance at the event. Using customer insights, Reed Exhibitions has developed an innovative product offering that underpins the value proposition for exhibitors by broadening their options in terms of the type and location of stand they take and the channels through which they can address potential buyers.
In 2019 Reed Exhibitions launched 50 new events. These included many events which delivered on the strategy of taking sector expertise, customer relationships and leading brands from one market and extending them into new geographies using local operational capability.
Strong brands and value propositions in long established sectors continued to be cloned into new geographic markets, with CMEF (medical equipment) expanding into Indonesia.
There was also rapid cloning of successful launches and recently acquired brands into new markets. Bar Convent Berlin, in the bar equipment sector, was successfully extended into the USA in 2018 and in 2019 taken to South America with the launch of Bar Convent São Paulo. After launching in London in 2018, Proud Experiences (serving the LGBTQ+ travel community) was successfully run in New York in 2019.
In Japan more events were launched outside the venue-restricted Tokyo area including Industrial AI & IoT Expo in Osaka and Administration, Human Resources & Accounting in Nagoya.
Reed Exhibitions continued to work with carefully selected media partners to offer new live events to highly targeted audiences such as Outside Experience and Complex Con Chicago in the US. Reed Exhibitions announced the acquisition of Mack Brooks in January 2019, a business with a portfolio of more than 30 events in 14 countries, including Germany and the United Kingdom, serving nine industry sectors.
In addition Reed Exhibitions made several small acquisitions to secure positions in high growth markets. These included Big 7 (corporate gifts) and PackPlus (packaging) in India and Florida Supercon (entertainment) in the US.
Business model, distribution channels and competitionOver 70% of Reed Exhibitions’ revenue is derived from exhibitor fees, with the balance primarily consisting of admission charges, conference fees, sponsorship fees and online and offline advertising. Exhibition space is sold directly or through local agents where applicable. Reed Exhibitions often works in collaboration with trade associations, which use the events to promote access for members to domestic and export markets, and with governments, for which events can provide important support to stimulate foreign investment and promote regional and national economic activity. Increasingly, Reed Exhibitions is offering visitors and exhibitors the opportunity to interact before and after the show through the use of digital tools such as online directories, matchmaking and mobile apps.
Reed Exhibitions is one of the largest global event organisers in a fragmented industry, holding a global market share of less than 10%. Other international exhibition organisers include Informa, Clarion and some of the larger German Messen, including Messe Frankfurt, Messe Düsseldorf and Messe Munich. Competition also comes from industry trade associations and convention centre and exhibition hall owners.
Market segm
entsGovernance
Financial statements and
other information
Financial reviewCorporate Responsibility
Overview

32 RELX Annual report and financial statements 2019 | Market segments
The world’s property market Asia’s sourcing and networking platform for the complete aluminium industry chain
International trade fair for the building industry
CHINA DAILY-USE ARTICLES TRADE FAIR China’s event for suppliers and buyers in the housewares industry
A premier comic book and pop culture convention
Latin America’s event for hardware, electronics and construction
The leading international trade show for fitness, wellness & health
Asia Pacific’s luxury travel event International exhibition for airport equipment, technology, design and services
LAS VEGAS
The North American jewellery industry’s premier event
International perfumery and cosmetics exhibition
The No.1 machine tools and metalworking exhibition serving ASEAN
Leading international exhibition for personal care ingredients
International Security Conference & Exposition An exhibition gathering equipment, solutions and services for electronics manufacturing
Japan’s one-stop shop for office related products and services
Premier global event for the travel industry International trade fair for autoparts, equipment and services
International art fair for photography
Face-to-face96%
Electronic4%
£1,269m
REVENUE BY FORMAT REVENUE BY GEOGRAPHICAL MARKET
Rest ofworld
40%
Europe40%
NorthAmerica20%
£1,269m
EVENTS REVENUE BY SOURCE
Admissions and other28%
Exhibitorfees72%
£1,269m

33RELX Annual report and financial statements 2019 | Exhibitions
Exhibitions achieved strong underlying revenue growth in 2019, in line with the prior year.
Underlying revenue growth was +6%. After portfolio changes and six percentage points of cycling-out effects, constant currency growth was +2%. Reported revenue growth of +4% benefited from the strength of the US dollar versus sterling.
Underlying adjusted operating profit declined by -1%, primarily reflecting cycling-out effects. Constant currency adjusted operating profit growth was +4%, and the margin increased to 26.1% after portfolio effects and integration benefits.
We continued to pursue organic growth opportunities, launching 50 new events during the year, and piloting and rolling out further data analytics initiatives. In addition we acquired Mack Brooks, a leading organiser of over 30 highly complementary events, and we made a number of minor disposals.
In 2019 market conditions were good in Europe and the US, and remained strong in China. The negative impact of venue constraints associated with the Tokyo Olympics was offset by higher growth elsewhere, supported by our active launch programme.
In 2020 the Tokyo venue constraints could negatively impact the overall divisional revenue growth rate by one or two percentage points, before the new and expanded permanent venue capacity comes on stream at the end of the year. The extent to which the novel coronavirus outbreak will impact our business in China, or other regions, remains uncertain.
2020 outlookWe expect underlying revenue growth trends to continue in line with recent years, the above temporary venue constraints and coronavirus impacts aside, and we expect cycling-in effects to increase the reported revenue growth rate by around five percentage points.
2019 financial performance2019
£m2018
£mUnderlying
growthPortfoliochanges
Currencyeffects
Total growth
Revenue 1,269 1,219 +6% +2% +2% +4%Adjusted operating profit 331 313 -1% +5% +2% +6%
Underlying revenue growth rates exclude exhibition cycling effects.
REVENUE
2019
1,2691,219
Underlying growth +6%
2018
£m
ADJUSTED OPERATING PROFIT
2019
331313
Underlying growth -1%
2018
£m
Market segm
entsGovernance
Financial statements and
other information
Financial reviewCorporate Responsibility
Overview

We have a lot of people who ask us how to get started in this business and we say there’s one show you have to go to and that’s the National Hardware Show.
Bob ThorsenFounder The Little Burros
34 RELX Annual report and financial statements 2019 | Market segments

RELX Annual report and financial statements 2019 | Exhibitions 35
The Little Burros is a family operated, garden tool brand, co-founded, owned and run by innovator Bob Thorsen and his family. The family of five launched their brand at The National Hardware Show in 2014 and in five years have built an impressive following by providing innovative solutions to everyday garden problems.
Based in Virginia, US, Bob and his wife Sudie were working in the garden when Bob thought up an ingenious tool organiser for attaching to your wheelbarrow. The whole family came together to build a 3D prototype of the ‘Original Little Burro’ and decided to present it at the National Hardware Show. They ended up securing their first order of 1,200 pieces from a major retailer at the show.
The Thorsen family, who have won countless awards for their innovative product, attribute their initial success to The National Hardware Show, and return to the event each year with their expanded offering of garden products.
About the National Hardware Show The National Hardware Show, which takes place annually in Las Vegas, is a showcase for home improvement innovations and retail trends.
Each year it brings together over 25,000+ home improvement professionals and some 120 media outlets for three days of face-to-face sourcing, trading, networking and learning.
1200Little Burros secured its first order of 1,200 pieces from a major retailer at the National Hardware Show
The Little Burros Burro Buddy in use
The National Hardware Show: the event that powers businesses
Market segm
entsGovernance
Financial statements and
other information
Financial reviewCorporate Responsibility
Overview

36 RELX Annual report and financial statements 2019 | Corporate responsibility

RELX Annual report and financial statements 2019 37
Corporate ResponsibilityThe Corporate Responsibility Report is an integral part of our Annual Report and Financial Statements. This section highlights progress on our 2019 corporate responsibility objectives. The full 2019 Corporate Responsibility Report is available at www.relx.com/go/CRReport
Non-financial information statementRELX is required to comply with the reporting requirements of sections 414CA and 414CB of the Companies Act 2006, which relate to non-financial information. The list below outlines for our stakeholders where this information for RELX can be found:
Reporting Requirement:Environmental matters 48-49Employees 45-46Social matters 38-42, 44-47
Human rights38, 40-42, 44, 46-48
Anti-corruption and anti-bribery matters
40, 42-43, 47-48
Policies, due diligence processes and outcomes 42-43, 47-48Description and management of principal and emerging risks and impact of business activity 58-61Description of business model
5, 14-15, 21, 26, 31
Non-financial metrics12, 18, 24, 30, 38, 45-49
Market segm
entsGovernance
Financial statements and
other information
Financial reviewCorporate Responsibility
Overview

38 RELX Annual report and financial statements 2019 | Corporate responsibility
Corporate responsibility overview
We define corporate responsibility (CR) as the way we do business, working to increase our positive impact and reduce any negative impact. It ensures good management of risks and opportunities, helps us attract and retain the best people and strengthens our corporate reputation. It means performing to the highest commercial and ethical standards and channelling our knowledge and strengths, as global leaders in our industries, to make a difference to society. We regularly survey key stakeholders including, in 2019, shareholders, employees, governments and the communities where we operate, to help us identify our material CR issues and to set and test our CR objectives. The Board of Directors, senior management and our Corporate Responsibility Forum oversee CR objectives and performance.
We concentrate on the contributions we make as a business and on good management of the material areas that affect all companies:
1. Our unique contributions
2. Governance
3. People
4. Customers
5. Community
6. Supply chain
7. Environment
We are a signatory of the United Nations Global Compact (UNGC) and are dedicated to advancing the UN’s Sustainable Development Goals (SDGs) by 2030. These aim to end poverty, protect the planet and ensure prosperity for all people by 2030.
1. Our unique contributionsWe make a positive impact on society through our knowledge, resources and skills, including:
§§ Universal sustainable access to information§§ Advance of science and health§§ Protection of society§§ Promotion of the rule of law and justice§§ Fostering communities
Scientific, Technical & MedicalElsevier, the world’s leading provider of scientific, technical and medical information, plays an important role in advancing human welfare and economic progress through its science and health information, which spurs innovation and enables critical decision-making. Elsevier makes a significant contribution to SDG 3 (Good Health and Well-being). To broaden access to its content, Elsevier supports programmes where resources are often scarce. Among them is Research4Life, a partnership with UN agencies and up to 160 publishers; we provide core and cutting-edge scientific information to researchers in more than 100 developing countries. As a founding partner and leading contributor, Elsevier provides over a quarter of the material available in Research4Life, encompassing approximately 23,500 journals and 86,000 e-books. In 2019, there were over 1.3m Research4Life downloads from ScienceDirect.
Elsevier serves the global scientific research community, publishing over 496,000 articles in 2019. In addition, the Elsevier Foundation supports partnerships to advance inclusion and diversity in science, research in developing countries and global health. In 2019, 35 women scientists from across Africa participated in a Water First! three-day workshop in Accra, Ghana. The aim was to empower African women researchers to advance their work, helping address the disparity of African women on the forefront of the struggle for water security without a proportionate share of agency to affect change. The workshop was led by Elsevier Foundation Board member, Dr. Geri Richmond, who founded the University of Oregon’s COACh programme which aims to increase the scientific success and leadership capacity of women scientists and engineers.
In the year, we created new SDG Graphics to explore the state of science underpinning the SDGs, including for SDG 6 (Clean Water and Sanitation). Research in the field between 2014-2018 had an annual compound growth rate of 8.5% (compared to 2% for all research fields), yet only 1% of the share of output was from low income countries, those most affected by access to decent water and sanitation.
To help address the output gap for low income countries, Elsevier runs Research Without Borders in association with the African Journals Partnership Program, supported by the US National Library of Medicine, US National Institute of Health and the Council of Science Editors. Elsevier experts help their African peers improve the visibility of their research by funding skilled volunteers who provide strategic, editorial communication, and operational guidance. In 2019, participants included Anne Roca, Deputy Editor of Lancet Global Health, and Christine Aime Sempe, a publisher with Elsevier Paris, who worked with Annales Africaines de Medecine in the Democratic Republic of Congo and held author workshops with African editors at Amref’s African Health Agenda International Conference in Rwanda.

Technology unites missing people with their families
“ I’ve lost touch with someone and am not sure what to do.” This statement on the website of Missing People – the only British organisation focused on uniting missing children and adults with their families and others of importance in their lives – is apt. According to Missing People, 186,000 people are reported missing each year in the United Kingdom.
According to Missing People, 186,000 people are reported missing each year in the United Kingdom.
In 2019, with free access to LexisNexis Risk Solutions’ TraceIQ, Missing People re-launched its Lost Contact service. Lost Contact helps people reconnect with someone missing who is not at risk or missing in the eyes of the law.
TraceIQ allowed Missing People to find more people through faster and more efficient searches. During 2019, the relaunch led to over 300 applications for support. Of completed cases, 64% of missing family members were found and given the chance to reconnect. This was the result for three brothers, separated for over a decade: “We lost contact with my younger brother 12 years ago and had been unable to find him through other channels but Missing People found him and we had an amazing reunion with all the family so thank you for your amazing work.”
300 applications to Missing People’s Lost Contact service in 2019
TraceIQ has enabled Missing People to reinvigorate our vital Lost Contact service which can reunite the missing with the people who matter most to them.
Jo YouleCEO Missing People
39RELX Annual report and financial statements 2019 | Corporate responsibility overview
Missing People’s Lost Contact service uses LexisNexis Risk Solutions tools to reconnect missing people with their families and others
Corporate ResponsibilityFinancial statem
ents and other inform
ationGovernance
Financial reviewM
arket segments
Overview

40 RELX Annual report and financial statements 2019 | Corporate responsibility
Risk & Business AnalyticsRisk & Business Analytics’ (RBA) tools and resources help law enforcement keep communities safe and protect society by detecting and preventing fraud across a range of business sectors and at US federal, state and local government levels. In the year, LexisNexis Risk Solutions partnered with local police departments, including the Graham Police Department, North Carolina, to provide community crime maps with automated alerts notifying citizens of crimes in their area.
RBA colleagues developed the ADAM programme in 2000 to help the National Center for Missing and Exploited Children find missing children. ADAM distributes missing child alert posters to law enforcement, hospitals, libraries and businesses within specific geographic search areas. In 2019, two children were found through the ADAM programme. In the United Kingdom, Missing People is a key partner and LexisNexis Risk Solutions tools helped reconnect the missing with those searching for them.
It is a catch 22 that you need to have credit to access credit. LexisNexis Risk Solutions is working to address a lending blind spot for those seeking to advance personal objectives likely to be creditworthy (like higher education or professional objectives like expanding a small business) but unable to gain credit because of missing or outdated negative information. Lenders need the right data to lend responsibly, ensuring they only provide loans to those with an ability to pay them back. Our RiskView tool widens financial inclusion for marginalised groups, including those without credit history, by providing alternative data sets not in traditional credit reports, such as home ownership, education status and professional licences. In 2019, we held an event with US organisations, including consumer advocacy groups such as the Center for Responsible Lending, UnidosUS, the Pew Charitable Trusts and the Annie E. Casey Foundation to explore improving equality of access to financial services for more citizens.
Issues can be magnified in developing economies as there are two primary challenges to financial inclusion: identity verification and credit risk. LexisNexis Risk Solutions’ ThreatMetrix, in partnership with fintech partners, is deriving alternative data that can be used to assess risk from consumers who use smartphones. We launched a pilot in Mexico with plans to spread the pilot to more countries and also deploy an account opening fraud detection service for developing economy lenders in 2020.
LegalLexisNexis Legal & Professional promotes the rule of law and access to justice through its products and services. In 2019, advancing SDG 16 (Peace, Justice and Strong Institutions), LexisNexis Middle East & North Africa launched a new Lexis Middle East platform, an online database providing access to case law, legislation and regulations in English and Arabic, as well as expert commentary in English for Middle East jurisdictions. Drawn from over 300 regional sources, Lexis Middle East is updated daily to inform the legal community.
In 2019, we launched the LexisNexis Rule of Law Foundation to partner with a wide range of stakeholders on rule of law projects around the world. A key tool on the Foundation site is the LexisNexis Rule of Law Impact Tracker, updated with 2019 data, visualising how key measures such as child mortality, corruption, and life expectancy decrease when the rule of law grows.
In the year, we supported the development of the UNGC’s SDG 16 Action Platform and held the first country consultation in Timor-Leste. During the full day workshop, in collaboration with the Timor-Leste Office of Foreign Affairs, seventy entrepreneurs explored how supporting the SDGs can help their businesses and their country.
We also held Rule of Law Cafés throughout 2019 in London, Singapore and Malaysia, bringing together stakeholders, including customers, government, NGOs and law societies, to discuss opportunities to go beyond legal minimums to advance the rule of law. During UN General Assembly week 2019, we held a public event on business and human rights with Ambassador Keith Harper, former US representative to the Council on Human Rights, live-streamed to RELX employees and made available afterward on the RELX SDG Resource Centre.
ExhibitionsReed Exhibitions events strengthen communities and support the SDGs. In 2019, we held the 12th annual World Future Energy Summit (WFES) which aims to accelerate global commitment to climate change solutions. The event engaged some 34,000 attendees, including 15 heads of state, 100 ministers and more than 3000 business leaders and students, as well as 800 exhibiting companies from over 40 countries. WFES facilitated sustainability deals that will impact 20 countries with a combined estimated value of more than $10 billion. These included Solar Energy Corporation of India’s plans for a $7 billion Cold Desert Regions Ultra-Mega Solar Power project and Abu Dhabi National Energy Company PJSC and LakeDiamond partnership agreement on photovoltaic cells and power-beaming technology.
In the year, planning advanced for the first Smart Cities Expo & Forum at World Future Energy Summit 2020 to bring together governments and municipalities with leaders in smart infrastructure, future transportation and next-generation building technology to advance sustainable cities.
On the theme of SDG 11, Sustainable Cities and Communities, colleagues at Reed Exhibitions India supported our Good Cities 2019 SDG Inspiration Day in Delhi which connected necessary contributors to more sustainable cities including government, business, and civil society. Among others, Amit Sharma, Head of Energy and Sustainability Services at Schneider Electric India, and Aditi Haldar, South-Asia Director of GRI, explored the challenges of health planning for urban populations and the future jobs and skills required to deliver smart city data and infrastructure.
1. Our unique contributions (continued)

RELX Annual report and financial statements 2019 | Corporate responsibility overview 41RELX Annual report and financial statements 2019 | Corporate responsibility
During Reed Exhibition’s World Travel Market 2019, we explored resilient destinations in an age of increased disaster risk. Jamaica’s Tourism Minister Edmund Bartlett and the Global Business Coalition for Education’s Jake Taesang Cho argued for improved support for disaster relief preparedness. During the session we revealed research underpinning our SDG 11 Graphic on sustainable cities, available on the RELX SDG Resource Centre.
Across RELXRecognising that across RELX we have products, services, tools and events that advance the UN’s 17 SDGs, we created the free RELX SDG Resource Centre in 2017 to advance their awareness, knowledge and implementation. In the year, we added new partners such as UN University; its original research on the site includes the 2019 report Unlocking Potential, which explores public-private partnerships that puts the financial sector at the heart of global efforts to end modern slavery and human trafficking.
In the year, we improved the search functionality of the RELX SDG Resource Centre to ensure queries are returned with greater accuracy and enhanced the SDG News Tracker – which provides up-to-the minute news from over 70,000 global sources in all the UN languages plus German – to allow searching for SDG news by keyword and geography. We also reached the milestone of 1,000 content items from our business and partners on the site and will increase this further in 2020. In addition, we indexed the content of Elsevier’s Scopus (a leading citations database with over 76m records) to the SDGs, which will accelerate research underpinning the RELX SDG Graphics.
2019 marked the ninth year of the RELX Environmental Challenge, focused on providing improved and sustainable access to water and sanitation where it is presently at risk. The $50,000 first-prize winner, SolarSack, uses ultraviolet radiation from direct sunlight to purify water at an exceptionally low cost. The funding will bring the system to people living in refugee camps in Uganda. The $25,000 second-prize winner was Christopher Mtalimanja, an educator and disability-rights activist, who is creating dry bio latrine system at three primary schools in Malawi. Liquid waste is transformed into fertiliser used to grow seedlings for revenue, while solid waste is transferred to a digester to produce energy for the schools. The winners joined us and past awardees at World Water Week in Stockholm and will also be featured in Elsevier’s journal Water Research and gain access to Science Direct.
2019 OBJECTIVES Achievement
Advance of science and health: Meaningful support to advance SDG3 (Good Health and Well-being), including Elsevier Foundation Women in Water in Africa leadership workshops
§§ Water First! three-day workshop in Accra, Ghana in September 2019 with 35 women researchers from across Africa§§ Research Without Borders, African
Journals Partnership Program, eight volunteers (12 weeks in total) in 2019; 40 volunteers since 2017 providing expertise in publishing, marketing, operations and technology across the continent, including in Malawi, Ethiopia, Sierra Leone, DRC, Uganda, Mali, Kenya, and Rwanda§§ Increasing capacity at Epicentre’s
Niger Research Centre encompassing access to ScienceDirect, Scopus, Scival, Clinical Key, and Mendeley, as well as media and speaker assistance for Epicentre Scientific Day – $300,000 provided of the $600,000 committed to 2022
Advance of science and health: Create new RELX SDG Graphics on the state of the knowledge underpinning the SDGs
§§ Two created in 2019: – SDG 6 (Clean Water and Sanitation) – SDG 11 (Sustainable Cities and
Communities)
Protection of society: Workstream on improving financial inclusion for low-income citizens
§§ Engaged with US organisations including consumer advocacy groups such as the Center for Responsible Lending, UnidosUS, the Pew Charitable Trusts, and the Annie E. Casey Foundation to discuss how LexisNexis Risk Solutions’ alternative data sets in its RiskView tool (e.g., home ownership, education, and bankruptcies) can support access to credit for low scorers in traditional credit bureau reports§§ Pilot in Mexico analysing risk attributes
from digital devices, using LexisNexis Risk Solutions’ ThreatMetrix to address challenges to financial inclusion for middle income citizens in emerging markets, including identity verification and credit risk
Promotion of the rule of law and access to justice: Meaningful support of SDG 16 (Peace, Justice and Strong Institutions), including support for UNGC SDG 16 Action Platform
§§ Launched LexisNexis Rule of Law Foundation§§ Rule of Law Cafés in London, Singapore
and Malaysia§§ Supported UNGC SDG 16 Action
Platform; hosted first in-country consultation in Timor-Leste§§ UN General Assembly week event
with Ambassador Keith Harper, former US representative to the Council on Human Rights on business and human rights
Market segm
entsGovernance
Financial statements and
other information
Financial reviewCorporate Responsibility
Overview

42 RELX Annual report and financial statements 2019 | Corporate responsibility
2019 OBJECTIVES Achievement
Fostering communities: Meaningful support of SDG 11 (Sustainable Cities and Communities), including focus at relevant Reed Exhibition shows, and a ‘Good Cities’ 2019 SDG Inspiration Day India
§§ SDG Inspiration Day Delhi, India focused on SDG 11 (Sustainable Cities and Communities): participation from government, peers, media, foundations, NGOs and youth; front page coverage in India’s largest circulation newspaper of four million daily§§ Organised panel discussion at World
Travel Market focused on disaster relief preparedness with Jamaican Tourism Ministry at which sustainable cities research launched; planning for a first Smart Cities Expo & Forum at World Future Energy Summit 2020
Universal, sustainable access to information: Broaden RELX SDG Resource Centre to include content from new partners and enhance functionality, including for SDG News Tracker
§§ New partner content from UN University and Partnership for Sustainable Development Data; new search function and dedicated news section
2020 OBJECTIVES
§§ Advance of science and health: Meaningful support of SDG 3 (Good Health and Well-being) including development of MSF/Epicentre Medical Day in Niger, and Water First! Workshops for Women in Water, encompassing skills training through Elsevier’s Research without Borders§§ Protection of society: Meaningful support of SDG 16 (Peace,
Justice and Strong Institutions), including expansion of activities to find missing children and adults through US ADAM programme and UK Missing People; SDG 10 (Reduced Inequalities): Advance financial inclusion pilots to more countries including India§§ Promotion of the rule of law and access to justice: Meaningful
support of SDG 16 (Peace, Justice and Strong Institutions), including expansion of Rule of Law Cafés to new locations including South Africa; development of new LexisNexis Rule of Law Foundation§§ Fostering communities: SDG 11 (Sustainable Cities and
Communities): Enhance sustainability of trade show events§§ Create SDG Champions network§§ More RELX SDG Graphics on the state of knowledge
underpinning the SDGs§§ Increase RELX SDG Resource Centre content by 25%
OUR 2030 VISION*Use our products and expertise to advance the SDGs, among them:§§ SDG 3: Good Health and Well-being§§ SDG 4: Quality Education§§ SDG 10: Reduced Inequalities§§ SDG 13: Climate Action§§ SDG 16: Peace, Justice and Strong Institutions
Enrich the SDG Resource Centre to ensure essential content, tools and events on the SDGs are freely available to all
* 2030 is the deadline for the UN’s Sustainable Development Goals; we aim to do our part toward their achievement.
2. GovernanceOur Board recognises the importance of maintaining high standards of corporate governance, which underpins our ability to deliver consistent financial performance, and value to our stakeholders. The 2018 UK Corporate Governance Code (UK Code) applied to RELX PLC from 1 January 2019. During the year, the Board took steps to ensure that RELX fully addressed the requirements of the UK Code. This included reviewing the Company’s approach to engaging with key stakeholders, assessing RELX’s culture, aligning our purpose, strategy and values, and assessing the Group’s Workforce Policies.
RELX PLC is the sole parent company of the group. It owns 100% of the shares in RELX Group plc which, in turn, holds all of the operating businesses, subsidiaries and financing activities of the group. RELX PLC, its subsidiaries, associates and joint ventures are together known as RELX.
Following the simplification of our corporate structure which took place in 2018, the shares of RELX PLC are traded through its primary listing on the London Stock Exchange and its secondary listing on Euronext Amsterdam, while its securities are also traded on the New York Stock Exchange under its American Depositary Share Programme. Accordingly, the Board has implemented standards of corporate governance and disclosure applicable to a UK incorporated company, with listings in London, Amsterdam and New York.
During the year the Board took steps to ensure we fully addressed the requirements of the UK Code. This included reviewing the company’s approach to engaging with key stakeholders, assessing the company culture and aligning our purpose, values, strategy and workforce policies.
Information and documents detailing our governance procedures are available to stakeholders online at www.relx.com. The RELX financial statements are prepared in accordance with International Financial Reporting Standards.
The RELX Code of Ethics and Business Conduct (the Code) sets the standard for our corporate and individual conduct and, among key issues, covers fair competition, anti-bribery, conflicts of interest, employment practices, data protection and appropriate use of company property and information. It also encourages reporting of violations – with an anonymous reporting option where legally permissible – and prohibits retaliation against anyone for reporting a violation they believe may have occurred.
The Code supports the principles of the UNGC and stresses our commitment to human rights. In accordance with the UN’s Guiding Principles on Business and Human Rights, we have considered where and how we operate to ensure we uphold human rights. In 2019, we updated our Modern Slavery Act Statement, available from the RELX homepage, which states how we are working to avoid human trafficking and modern slavery in our direct operations and in our supply chain.
We maintain a comprehensive set of compliance policies and procedures in support of the Code reviewed at least annually to ensure they remain current and effective. Our policies and procedures help us comply with the law and conduct our business in an open, honest, ethical and principled way, and they comprise part of our antibribery adequate procedures for compliance with applicable laws.
1. Our unique contributions (continued)
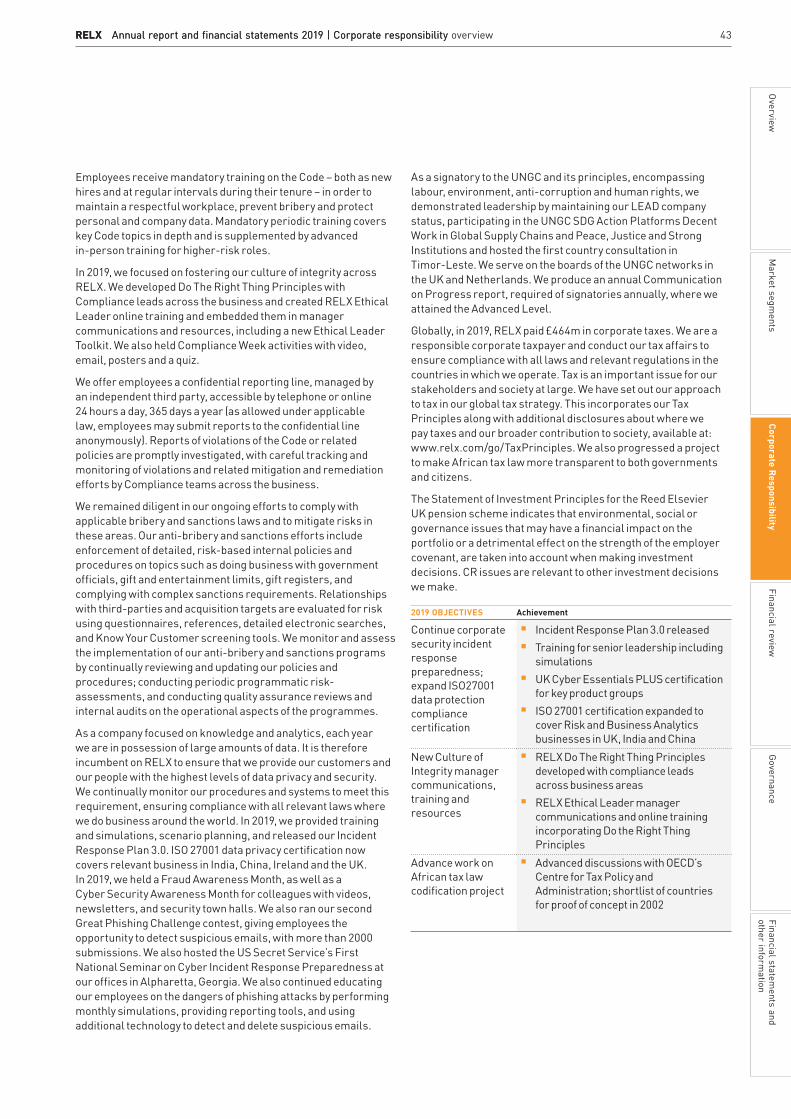
RELX Annual report and financial statements 2019 | Corporate responsibility overview 43RELX Annual report and financial statements 2019 | Corporate responsibility
Employees receive mandatory training on the Code – both as new hires and at regular intervals during their tenure – in order to maintain a respectful workplace, prevent bribery and protect personal and company data. Mandatory periodic training covers key Code topics in depth and is supplemented by advanced in-person training for higher-risk roles.
In 2019, we focused on fostering our culture of integrity across RELX. We developed Do The Right Thing Principles with Compliance leads across the business and created RELX Ethical Leader online training and embedded them in manager communications and resources, including a new Ethical Leader Toolkit. We also held Compliance Week activities with video, email, posters and a quiz.
We offer employees a confidential reporting line, managed by an independent third party, accessible by telephone or online 24 hours a day, 365 days a year (as allowed under applicable law, employees may submit reports to the confidential line anonymously). Reports of violations of the Code or related policies are promptly investigated, with careful tracking and monitoring of violations and related mitigation and remediation efforts by Compliance teams across the business.
We remained diligent in our ongoing efforts to comply with applicable bribery and sanctions laws and to mitigate risks in these areas. Our anti-bribery and sanctions efforts include enforcement of detailed, risk-based internal policies and procedures on topics such as doing business with government officials, gift and entertainment limits, gift registers, and complying with complex sanctions requirements. Relationships with third-parties and acquisition targets are evaluated for risk using questionnaires, references, detailed electronic searches, and Know Your Customer screening tools. We monitor and assess the implementation of our anti-bribery and sanctions programs by continually reviewing and updating our policies and procedures; conducting periodic programmatic risk-assessments, and conducting quality assurance reviews and internal audits on the operational aspects of the programmes.
As a company focused on knowledge and analytics, each year we are in possession of large amounts of data. It is therefore incumbent on RELX to ensure that we provide our customers and our people with the highest levels of data privacy and security. We continually monitor our procedures and systems to meet this requirement, ensuring compliance with all relevant laws where we do business around the world. In 2019, we provided training and simulations, scenario planning, and released our Incident Response Plan 3.0. ISO 27001 data privacy certification now covers relevant business in India, China, Ireland and the UK. In 2019, we held a Fraud Awareness Month, as well as a Cyber Security Awareness Month for colleagues with videos, newsletters, and security town halls. We also ran our second Great Phishing Challenge contest, giving employees the opportunity to detect suspicious emails, with more than 2000 submissions. We also hosted the US Secret Service’s First National Seminar on Cyber Incident Response Preparedness at our offices in Alpharetta, Georgia. We also continued educating our employees on the dangers of phishing attacks by performing monthly simulations, providing reporting tools, and using additional technology to detect and delete suspicious emails.
As a signatory to the UNGC and its principles, encompassing labour, environment, anti-corruption and human rights, we demonstrated leadership by maintaining our LEAD company status, participating in the UNGC SDG Action Platforms Decent Work in Global Supply Chains and Peace, Justice and Strong Institutions and hosted the first country consultation in Timor-Leste. We serve on the boards of the UNGC networks in the UK and Netherlands. We produce an annual Communication on Progress report, required of signatories annually, where we attained the Advanced Level.
Globally, in 2019, RELX paid £464m in corporate taxes. We are a responsible corporate taxpayer and conduct our tax affairs to ensure compliance with all laws and relevant regulations in the countries in which we operate. Tax is an important issue for our stakeholders and society at large. We have set out our approach to tax in our global tax strategy. This incorporates our Tax Principles along with additional disclosures about where we pay taxes and our broader contribution to society, available at: www.relx.com/go/TaxPrinciples. We also progressed a project to make African tax law more transparent to both governments and citizens.
The Statement of Investment Principles for the Reed Elsevier UK pension scheme indicates that environmental, social or governance issues that may have a financial impact on the portfolio or a detrimental effect on the strength of the employer covenant, are taken into account when making investment decisions. CR issues are relevant to other investment decisions we make.
2019 OBJECTIVES Achievement
Continue corporate security incident response preparedness; expand ISO27001 data protection compliance certification
§§ Incident Response Plan 3.0 released§§ Training for senior leadership including
simulations§§ UK Cyber Essentials PLUS certification
for key product groups§§ ISO 27001 certification expanded to
cover Risk and Business Analytics businesses in UK, India and China
New Culture of Integrity manager communications, training and resources
§§ RELX Do The Right Thing Principles developed with compliance leads across business areas§§ RELX Ethical Leader manager
communications and online training incorporating Do the Right Thing Principles
Advance work on African tax law codification project
§§ Advanced discussions with OECD’s Centre for Tax Policy and Administration; shortlist of countries for proof of concept in 2002
Market segm
entsGovernance
Financial statements and
other information
Financial reviewCorporate Responsibility
Overview

44 RELX Annual report and financial statements 2019 | Corporate responsibility
Inspiring Action on the SDGs in DelhiOn 2 May 2019, we held the fourth RELX SDG Inspiration Day in Delhi, India to catalyse action on the UN Sustainable Development Goals (SDGs). The focus, in partnership with the Ban Ki-Moon Centre for Global Citizens, (UN) Global Compact India, and the Responsible Media Forum, was SDG 11, Sustainable Cities and Communities, and the interconnection with the other 16 SDGs, including Good Health and Well-being (SDG 3) and the Rule of Law (SDG 16).
4thglobal RELX SDG Inspiration Day
Business, government, investors, academia, youth and NGOs – all stakeholders needed to advance the SDGs – came together to discuss positive, collaborative action.
Kamal Singh, Executive Director of Global Compact India, cited the importance of India; if India achieves the goals , he said, the world is half way to realising the SDGs. Yet the task globally, according to Anna French, Deputy Director of the UK’s Department for International Development India, requires around $5tn USD each year. New approaches are needed to fund the goals, she said, and business must do its part.
There was an Expert Café allowing participants to engage with experts including Arunava Dasgupta, Head of Urban Design at Delhi’s School of Planning and Architecture; Amit Sharma, Head of Energy and Sustainability Services at Schneider Electric India and Aditi Haldar, South-Asia Director of GRI. Themes included: health and urban populations, the role of data and technology, green city energy systems and the implications for skills and jobs.
Barbara Müller, Senior Manager at BMW Foundation, highlighted the Foundation’s Responsible Leader Networks mobilising leaders to collaborate for a sustainable and just future, such as Yash Ranga, Stakeholder Engagement Partner at Jaipur Rugs Foundation. Ranga stated, “hope is a beggar that makes you walk on fire,” don’t hope for change, make it happen.
Ambassador Kim Won-Soo, former UN High Representative for Disarmament Affairs and Board Member of the Ban Ki-moon Centre for Global Citizens, made the case for smaller, smart municipalities.
RELX SDG Inspiration Day Delhi in May 2019 engaged stakeholders on SDG 11, Sustainable Cities and Communities
The RELX SDG Inspiration Day positively connected those working to achieve the SDGs in India.
Kamal SinghExecutive Director (UN) Global Compact India
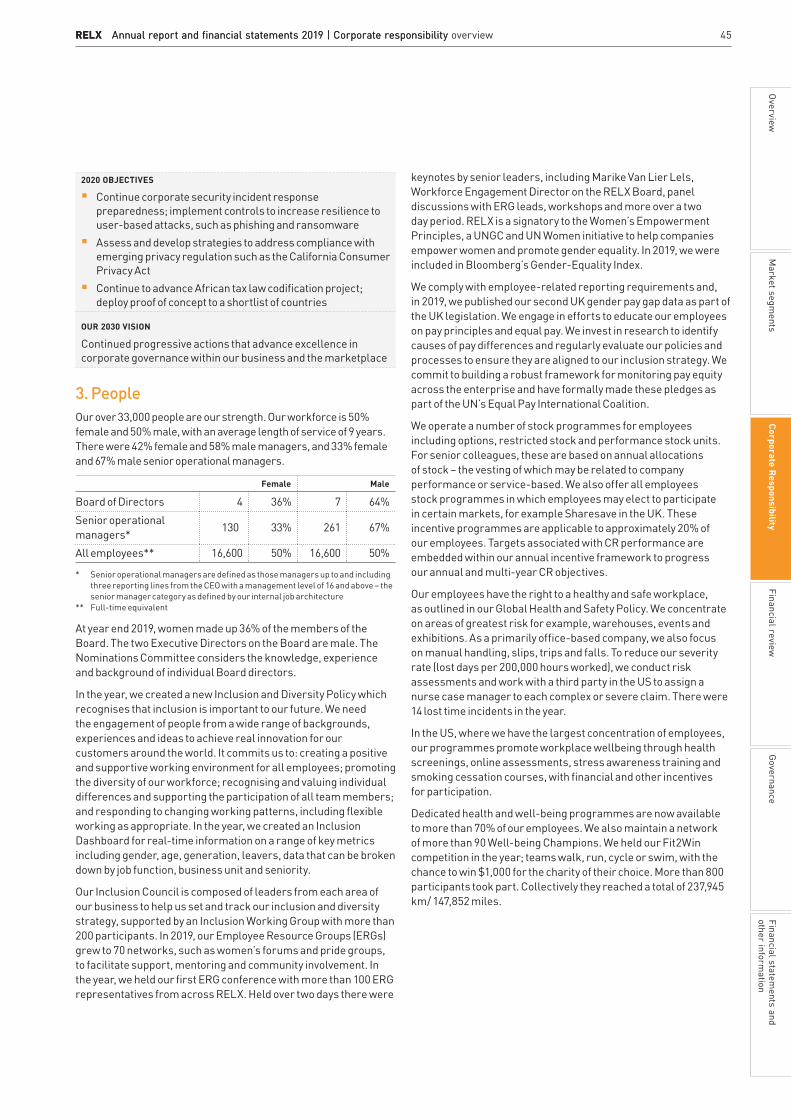
RELX Annual report and financial statements 2019 | Corporate responsibility overview 45RELX Annual report and financial statements 2019 | Corporate responsibility
2020 OBJECTIVES
§§ Continue corporate security incident response preparedness; implement controls to increase resilience to user-based attacks, such as phishing and ransomware§§ Assess and develop strategies to address compliance with
emerging privacy regulation such as the California Consumer Privacy Act§§ Continue to advance African tax law codification project;
deploy proof of concept to a shortlist of countries
OUR 2030 VISION
Continued progressive actions that advance excellence in corporate governance within our business and the marketplace
3. PeopleOur over 33,000 people are our strength. Our workforce is 50% female and 50% male, with an average length of service of 9 years. There were 42% female and 58% male managers, and 33% female and 67% male senior operational managers.
Female Male
Board of Directors 4 36% 7 64%Senior operational managers* 130 33% 261 67%
All employees** 16,600 50% 16,600 50%
* Senior operational managers are defined as those managers up to and including three reporting lines from the CEO with a management level of 16 and above – the senior manager category as defined by our internal job architecture
** Full-time equivalent
At year end 2019, women made up 36% of the members of the Board. The two Executive Directors on the Board are male. The Nominations Committee considers the knowledge, experience and background of individual Board directors.
In the year, we created a new Inclusion and Diversity Policy which recognises that inclusion is important to our future. We need the engagement of people from a wide range of backgrounds, experiences and ideas to achieve real innovation for our customers around the world. It commits us to: creating a positive and supportive working environment for all employees; promoting the diversity of our workforce; recognising and valuing individual differences and supporting the participation of all team members; and responding to changing working patterns, including flexible working as appropriate. In the year, we created an Inclusion Dashboard for real-time information on a range of key metrics including gender, age, generation, leavers, data that can be broken down by job function, business unit and seniority.
Our Inclusion Council is composed of leaders from each area of our business to help us set and track our inclusion and diversity strategy, supported by an Inclusion Working Group with more than 200 participants. In 2019, our Employee Resource Groups (ERGs) grew to 70 networks, such as women’s forums and pride groups, to facilitate support, mentoring and community involvement. In the year, we held our first ERG conference with more than 100 ERG representatives from across RELX. Held over two days there were
keynotes by senior leaders, including Marike Van Lier Lels, Workforce Engagement Director on the RELX Board, panel discussions with ERG leads, workshops and more over a two day period. RELX is a signatory to the Women’s Empowerment Principles, a UNGC and UN Women initiative to help companies empower women and promote gender equality. In 2019, we were included in Bloomberg’s Gender-Equality Index.
We comply with employee-related reporting requirements and, in 2019, we published our second UK gender pay gap data as part of the UK legislation. We engage in efforts to educate our employees on pay principles and equal pay. We invest in research to identify causes of pay differences and regularly evaluate our policies and processes to ensure they are aligned to our inclusion strategy. We commit to building a robust framework for monitoring pay equity across the enterprise and have formally made these pledges as part of the UN’s Equal Pay International Coalition.
We operate a number of stock programmes for employees including options, restricted stock and performance stock units. For senior colleagues, these are based on annual allocations of stock – the vesting of which may be related to company performance or service-based. We also offer all employees stock programmes in which employees may elect to participate in certain markets, for example Sharesave in the UK. These incentive programmes are applicable to approximately 20% of our employees. Targets associated with CR performance are embedded within our annual incentive framework to progress our annual and multi-year CR objectives.
Our employees have the right to a healthy and safe workplace, as outlined in our Global Health and Safety Policy. We concentrate on areas of greatest risk for example, warehouses, events and exhibitions. As a primarily office-based company, we also focus on manual handling, slips, trips and falls. To reduce our severity rate (lost days per 200,000 hours worked), we conduct risk assessments and work with a third party in the US to assign a nurse case manager to each complex or severe claim. There were 14 lost time incidents in the year.
In the US, where we have the largest concentration of employees, our programmes promote workplace wellbeing through health screenings, online assessments, stress awareness training and smoking cessation courses, with financial and other incentives for participation.
Dedicated health and well-being programmes are now available to more than 70% of our employees. We also maintain a network of more than 90 Well-being Champions. We held our Fit2Win competition in the year; teams walk, run, cycle or swim, with the chance to win $1,000 for the charity of their choice. More than 800 participants took part. Collectively they reached a total of 237,945 km/ 147,852 miles.
Market segm
entsGovernance
Financial statements and
other information
Financial reviewCorporate Responsibility
Overview

46 RELX Annual report and financial statements 2019 | Corporate responsibility
3. People (continued)2019 OBJECTIVES Achievement
Progress UN Equal Pay International Coalition commitments
§§ Job architecture project completed and integrated into new human resources information system, Workday §§ Pay equity audits in key functions
and geographies completed in 2018, with adjustments made as necessary in 2019
Establish a dashboard for inclusion metrics
§§ Inclusion Dashboard created covering gender, age, generation, joiners and leavers by job function, business unit and seniority§§ Our Workforce Engagement Director
held a number of meetings with employees across Europe, the US and APAC and reported to the Board
Develop mental health metrics and response plans
§§ Mental health metrics developed utilising absence, percentage of annual leave taken and exit interview data§§ Peer benchmarking to identify common
indicators and best practice§§ Response plans include expanding
Well-being Champions Network and training mental health employee leads
2020 OBJECTIVES
§§ Introduce suite of 2020-2025 inclusion goals§§ Provide manager training on pay principles and equal pay§§ Map and expand Well-being Champions Network and train
more mental health employee leads
OUR 2030 VISION
Continued high-performing and satisfied workforce through talent development, D&I and wellbeing; scale support for external human capital initiatives
4. CustomersIn 2019, we surveyed more than 510,000 customers through Net Promoter Score (measuring customer advocacy) and business dashboard programmes. This allows us to deepen our understanding of customer needs and drive improvements. Results are reviewed by the CEO and senior operational managers and communicated to staff.
In the year, we disseminated our updated Editorial Policy to employees, along with a new video series to hear from colleagues on how the Editorial Policy underpins their work. The Editorial Policy indicates our respect for human rights and encourages pluralism of sources, ideas and participants. It makes clear our commitment to data privacy and security and the responsible use of artificial intelligence.
We are committed to improving access to our products and services for all users, regardless of physical ability. Our Accessibility Policy aims to lead the industry in providing accessibility solutions to customers, with products that are operable, understandable and robust. In 2019, members of the
Accessibility Working Group logged over 230 accessibility projects and Elsevier’s Global Books Digital Archive fulfilled more than 4,400 disability requests, 87% of them through AccessText.org, a service we helped set-up. We established an Accessibility Advisory Board in the year comprised of accessibility leaders in the business to review approaches to training, customer inquiries, compliance models, and screen reader tools. We also established the second RELX Accessibility Leadership Awards to celebrate employees who show exceptional leadership in advancing accessibility.
CR as a Sales Tool is one of our key CR networks helping employees share information about our commitment to CR with their customers as a way of differentiating the company and creating dialogue to understand customer CR priorities and opportunities for collaboration. In 2019, with the creation of a new global RELX intranet site, we refreshed existing content and added resources such as Talking to Our Customers About the SDGs.
2019 OBJECTIVES Achievement
Roll out new Editorial Policy training
§§ Updated Editorial Policy launched for all staff by Chief Legal Officer and General Counsel§§ New video series, RELX Editorial Policy
in Action, made available to all employees
Expand online content for CR as a Sales Tool
§§ Migration to new intranet; refresh of all content and introduction of Talking to Our Customers About the SDGs
Develop Accessibility Advisory Board
§§ Accessibility Board created representing all business areas focused on standardising accessibility training, compliance models, automated testing and enterprise-wide communications
2020 OBJECTIVES
§§ New SDG Customer Award to be presented at annual flagship RELX SDG Inspiration Day§§ Map customer feedback mechanisms across business areas§§ Develop framework for product accessibility self-audits
OUR 2030 VISION
Continue to expand customer base across our four business units through excellence in products and services, active listening and engagement, editorial and quality standards, and accessibility; a recognised advocate for ethical marketplace practice
5. CommunityRE Cares, our global community programme, supports employee volunteering and giving that makes a positive impact on society. In addition to local initiatives of importance to employees, the programme’s core focus is on education for disadvantaged young people that advances one or more of our unique contributions as a business. Staff have up to two days paid leave per year for their own community work. We donated £4m in cash (including through matching gifts) and the equivalent of £14.7m in products, services and staff time in 2019. Globally, 45% of employees were engaged in volunteering through RE Cares and we reached 26,500

RELX Annual report and financial statements 2019 | Corporate responsibility overview 47RELX Annual report and financial statements 2019 | Corporate responsibility
disadvantaged young people through time, in-kind and cash donations. A network of over 240 RE Cares Champions ensures the vibrancy of our community engagement.
Each September, we hold RE Cares Month to celebrate our community commitment. Throughout 2019, we raised funds ($60,866 to date) to help global fundraising partner, Hope and Homes for Children (HHC), which aims to ensure children grow up in families rather than institutions. Employees will be working to raise $100,000 over a two-year period to support Hope and Homes’ work with hearing-impaired children in Moldova. The country has three orphanages for children with hearing impairment as disability is a common impetus for institutionalising children. Funding will support inclusive education to help hearing-impaired children integrate into mainstream education, through speech therapy, quality hearing aids, support for parents and teacher training. In early September, HHC ran a two-day training course on the issues for 38 representatives from 35 municipalities across Moldova.
We held our annual global book drive, yielding 8,937 books for local and developing world readers and announced the winners of the ninth Recognising Those Who Care Awards to highlight the exceptional contributions to RE Cares of eight individuals. Individual winners from across the business travelled to RELX-supported projects in Ghana with Book Aid International, a charity working to foster a love of reading in children across Africa through book provision and programmes that increase the educational capacity of schools and libraries. RELX has worked with Book Aid for over 20 years and has donated more than one million books including some 143,908 in 2019.
2019 OBJECTIVES Achievement
New RELX global fundraising partnership
§§ Hope and Homes for Children project in Moldova to help children with hearing impairment access specialised speech and language therapy chosen from a shortlist in an all-employee vote§§ Aiming to raise at least$100,000 during
next two years, with almost $61,000 already raised§§ 35 children assessed by year-end; internal
team travelled to Moldova to create a video to be shared with all employees
Create guidance for calculating pro bono contributions
§§ Worked with LBG and key stakeholders to improve methodology for calculating in-kind contributions§§ Developed guidance note shared with
finance colleagues and lead RE Cares Champions
2020 OBJECTIVES
§§ Progress new partnership with global fundraising partner, Hope and Homes for Children §§ Develop RE Cares Manager training §§ Create RE Cares module for staff induction across RELX
OUR 2030 VISION
Through our unique contributions, significant, measurable advancement of education for disadvantaged young people; investments with partners for maximum impact
6. Supply chainGiven the importance of maintaining an ethical supply chain, we have a Socially Responsible Supplier (SRS) programme encompassing all our businesses, supported by colleagues with expertise in operations, distribution and procurement and a dedicated SRS Director from our global procurement function.
We have a comprehensive Supplier Code of Conduct (Supplier Code) available in 16 languages, which we ask suppliers to sign and display prominently in the workplace. It commits them to following applicable laws and best practice in areas such as human rights, labour and the environment. We ask suppliers to require the same standards in their supply chains, including requesting subcontractors to enter into a written commitment to uphold the Supplier Code. The Supplier Code states that where local industry standards are higher than applicable legal requirements, we expect suppliers to meet the higher standards.
Through our SRS database, we track key suppliers and those located in medium and high-risk countries as designated by our supplier risk tool. This incorporates ten indicators, including human trafficking information from the US State Department and Environmental Performance Index results produced by Yale University and partners. The tracking list changes year-on-year based on the suppliers we engage to meet the needs of our business. In 2019, there were 354 suppliers on the SRS tracking list, of which 102 are in high and medium risk countries. At year end, 91% of suppliers on the tracking list were signatories to our Supplier Code. Of the 33 non-signatories, 9 suppliers are in high or medium risk countries. We continue to work with non-signatories to gain agreement to our Code, and/or assess whether they have equivalent standards in place, in order to ultimately decide whether to continue doing business with them. We have embedded the Supplier Code into our sourcing process, and have a total of 3,202 suppliers who have agreed to the Supplier Code in 2019, up from 3,082 in 2018.
We engage a specialist supply chain auditor who undertook 93 external audits on our behalf in 2019. Incidence of non-compliance triggers continuous improvement reports summarising audit results, with remediation plans and submission dates agreed and signed by both the auditor and supplier.
We are committed to proactive engagement with suppliers to ensure our supply chain reflects the diversity of our communities. In 2019, we continued to focus on rolling out our supplier diversity programme. We launched the new RELX Supplier Registration portal to assist our procurement colleagues in identifying qualified diverse suppliers and encouraged diverse supplier inclusion in our sourcing processes. In 2019, 11.9% of our US spend was with diverse suppliers.
We aim to partner with suppliers which uphold the same standards we set for ourselves. One of them, BCD Travel, has maintained their top EcoVadis sustainability rating for four years in a row.
Market segm
entsGovernance
Financial statements and
other information
Financial reviewCorporate Responsibility
Overview

48 RELX Annual report and financial statements 2019 | Corporate responsibility
6. Supply chain (continued)2019 OBJECTIVES Achievement
Increase the number of suppliers as Code signatories
§§ 96% core (target 95%) §§ 100% high risk core (target 100%) §§ 91% total tracking list (target 85%)§§ 3,202 total Code signatories (3,082
YE 2018Continue using audits to ensure continuous improvement in supplier performance and compliance
§§ 93 audits completed§§ 2 audits scheduled, 6 in progress§§ Reduced open audit points by 21%
over 2018
Continue to advance US Supplier Diversity and Inclusion programme
§§ 11.9% diversity spend (US rolling four quarters)
2020 OBJECTIVES
§§ Increase number of suppliers as Code signatories§§ Continue using audits to ensure continuous improvement in
supplier performance and compliance §§ Advance US Supplier Diversity and Inclusion programme
OUR 2030 VISION
Reduce supply chain risks related to human rights, labour, the environment and anti-bribery by ensuring adherence to our Supplier Code of Conduct through training, auditing and remediation; drive supply chain innovation, quality and efficiencies through a strong, diverse network of suppliers
7. EnvironmentOur environmental targets reflect our environmental impacts and input from stakeholders and use science-based methodology. They include a commitment to certify 50% of the business against the ISO 14001 Environmental Management System standard by 2020. In 2019, we purchased 96% of our electricity from renewable energy and Renewable Energy Certificates. Full performance data can be found in the 2019 Corporate Responsibility Report (www.relx.com/go/crreport).
In the year, we attained an A- grade in CDP’s climate change programme. RELX is one of the Mayor of London’s London Business Climate Leaders committed to cutting pollution and emissions in excess of UK government thresholds. The goal is to help London, where we are headquartered, to become a zero carbon city by 2050.
Our Environmental Champions group, employee-led Green Teams and external networks, such as the Publishers’ Database for Responsible Environmental Paper Sourcing, provide significant insight into managing our environmental impacts. Our Environmental Standards programme sets benchmark performance and inspires green competition between offices. In 2019, 45 sites (56% of key locations) achieved five or more standards and attained green status. The RELX CFO, our most senior environmental champion, wrote to all staff on World Environment Day, sharing our environmental priorities and recognising environmental achievements across the business.
We have a positive environmental impact through our environmental products and services, which spread good practice, encourage debate and aid researchers and decision makers. The most recent results from the independent Market Analysis System show that our share of citations in environmental science represented 63% of the total market and 49% in energy and fuels.
The €50,000 winner of Elsevier’s 2019 Green and Sustainable Chemistry Challenge was Ramia Albakain, Associate Professor at the University of Jordan, who developed a green technique to remove toxic metal from wastewater, making it safe for agricultural irrigation and addressing chronic water shortages due to Jordan’s arid climate.
2019 OBJECTIVES Achievement
55% of locations to achieve five or more RELX Environmental Standards
§§ 56% achieved
Purchase renewable electricity equal to 90% of global consumption
§§ Achieved through green tariff purchases in Europe, green-e certified RECs purchase in the United States, and GoldPower iRECs in Asia Pacific
Achieve ISO 14001 Environmental Management System (EMS) certification at three additional locations
§§ Additional five sites certified including Alpharetta, Richmond, Horsham, Chennai and Gurgaon
2020 OBJECTIVES
§§ Set new environment targets for 2020-2025§§ Purchase renewable electricity equal to 100% of global
consumption§§ Achieve ISO 14001 Environmental Management System
(EMS) certification at 50% of the business by headcount
OUR 2030 VISION
Further environmental knowledge and positive action through our products and services and, accordingly, conduct our business with the lowest environmental impact possible
2019 ENVIRONMENTAL PERFORMANCE
Absolute performanceIntensity ratio
(per £m revenue)
2019 Variance 2018 2019 Variance 2018
Scope 1 (direct emissions) tCO2e
7,848 5% 7,477 1.00 0% 1.00
Scope 2 (location-based emissions) tCO2e
68,229 -8% 74,279 8.67 -13% 9.91
Scope 2 (market-based emissions) tCO2e
17,704 11% 16,004 2.25 5% 2.14
Total energy (MWh) 163,628 -9% 179,228 20.78 -13% 23.92UK energy (MWh) 15,050 -16% 18,000 1.91 -20% 2.40Water (m3) 331,913 0% 332,490 42.15 -5% 44.38Waste sent to landfill (t)*
546 -17% 658 0.07 -22% 0.09
Production paper (t)
34,599 -3% 35,555 4.39 -8% 4.75
* From reporting locations

RELX Annual report and financial statements 2019 | Corporate responsibility overview 49
ENVIRONMENTAL TARGETS 2019
PerformanceFocus area Targets 2020Climate change Reduce Scope 1 and 2 location-based carbon emissions by 40% against a 2010 baseline -52%Energy Reduce energy and fuel consumption by 30% against a 2010 baseline -41%
Purchase renewable electricity equivalent to 100% of RELX’s global electricity consumption 96%Waste Decrease total waste generated at reporting locations by 40% against a 2010 baseline -66%
90% of waste from reporting locations to be diverted from landfill 85%Production paper* 100% of RELX production papers, graded in PREPS, to be rated as ‘known and responsible sources’ 100%Environmental Management System
Achieve ISO 14001 certification for 50% of the business by 2020 42%Reporting locations achieving five or more RELX Environmental Standards 56%
* All paper we graded in 2019 – 96% of total production stock – was graded 3 or 5 stars (known and responsible sources).
We have reported on all emission sources required under the Companies Act 2006 (Strategic Report and Directors’ Report) Regulations 2013. We have included emissions from all operating companies within the Group.We have used the GHG Protocol Corporate Accounting and Reporting Standard (revised edition) and the data has been assured by an independent third party, EY. Details on methodology and the assurance statement can be viewed in the 2019 Corporate Responsibility Report at www.relx.com/go/CRReport.
2019 investor and other recognition
Constituent of the Ethibel Sustainability Index Included in– Excellence Europe – Excellence Global
CDP– Climate programme score:
A- – Forest programme score: B– Water programme score: B
Green Power Partnership– National Top 100
FTSE4Good IndexIncluded in– FTSE4Good Global Index– FTSE4Good UK Index– FTSE4Good Europe Index
RE100 – Member
Dow Jones Sustainability Index Europe – Constituent
ISO 14001 – Certified
STOXX Global ESG Leaders Indices– Included
ECPI Indices– Included
Tortoise Responsibility100 Index – 6th out of 100
ISS-Oekom Corporate Responsibility Rating – Prime status
ESG S&P 1200 – 2nd out of 1200 companies for ESG performance based on CSRHub data
The full 2019 Corporate Responsibility Report is available at www.relx.com/go/CRReport
Market segm
entsGovernance
Financial statements and
other information
Financial reviewCorporate Responsibility
Overview

50 RELX Annual report and financial statements 2019 | Financial review

RELX Annual report and financial statements 2019 51
Financial reviewIn this section52 Chief Financial Officer’s report58 Principal and emerging risks
Market segm
entsGovernance
Financial statements and
other information
Financial reviewCorporate Responsibility
Overview

52 RELX Annual report and financial statements 2019 | Financial review
Chief Financial Officer’s report
RevenueUnderlying revenue growth was 4%, with all four market segments contributing to underlying growth. The underlying growth rate reflects good growth in electronic and face-to-face revenues, partially offset by continued print revenue declines.
Reported revenue, including the effects of exhibition cycling, portfolio changes and currency movements, was £7,874m (2018: £7,492m), up 5%.
Exhibition cycling effects decreased revenue growth by 1%, and the net impact of acquisitions and disposals reduced revenue growth by 1%. The impact of currency movements was to increase revenue by 3%.
ProfitUnderlying adjusted operating profit grew at 5%, ahead of underlying revenue, reflecting the benefit of process innovation across the Group.
The net impact of acquisitions and disposals decreased adjusted operating profit by 2%. Currency effects increased adjusted operating profit by 3%.
Total adjusted operating profit, including the impact of acquisitions and disposals and currency effects, was £2,491m (2018: £2,346m), up 6%.
Underlying operating cost growth was 2%, reflecting investment in global technology platforms and the launch of new products and services, partly offset by continued process innovation. Actions continue to be taken across our businesses to improve cost-efficiency. Total operating costs, including the impact of acquisitions, disposals and currency effects, increased by 5%.
The overall adjusted operating margin of 31.6% was 0.3 percentage points higher than in the prior year. On an underlying basis, including cycling effects, the margin improved by 0.6 percentage points. Acquisitions and disposals reduced the margin by 0.3 percentage points and currency effects had no net impact on the margin.
Nick LuffChief Financial Officer
Underlying revenue and adjusted operating profit growth in 2019 were 4% and 5% respectively, and adjusted earnings per share grew at 7% at constant currency. We have maintained leverage at an appropriate level and our balance sheet remains strong, with Return on Invested Capital of 13.6%.
REVENUE
20192016 20182017
5,9717,341 7,492 7,874
2015
£m
6,889
ADJUSTED OPERATING PROFIT
20192016 20182017
1,8222,114
2,346 2,4912,284
2015
£m

53RELX Annual report and financial statements 2019 | Chief Financial Officer’s report
2019£m
2018£m Change
Changeat constantcurrencies
Change underlying
Reported figuresRevenue 7,874 7,492 +5% +2% +4%Operating profit 2,101 1,964 +7%Profit before tax 1,847 1,720 +7%Net profit attributable to RELX PLC shareholders 1,505 1,422 +6%Net margin 19.1% 19.0%Net borrowings 6,191 6,177Earnings per share 77.4p 71.9p +8%
Adjusted figuresOperating profit 2,491 2,346 +6% +3% +5%Operating margin 31.6% 31.3%Profit before tax 2,200 2,145 +3%Net profit attributable to RELX PLC shareholders 1,808 1,674 +8%Net margin 23.0% 22.3%Cash flow 2,402 2,243 +7%Cash flow conversion 96% 96%Return on invested capital 13.6% 13.2%Earnings per share 93.0p 84.7p +10% +7%RELX uses adjusted and underlying figures as additional performance measures. Adjusted figures primarily exclude the amortisation of acquired intangible assets and other items related to acquisitions and disposals, and the associated deferred tax movements. In 2018 we excluded exceptional tax credits, see note 9 on page 145. Reconciliations between the reported and adjusted figures are set out on page 184. Underlying growth rates are calculated at constant currencies, excluding the results of acquisitions until twelve months after purchase, and excluding the results of disposals and assets held for sale. Underlying revenue growth rates also exclude exhibition cycling. Constant currency growth rates are based on 2018 full-year average and hedge exchange rates.
Reported operating profit, after amortisation of acquired intangible assets and acquisition-related costs, was £2,101m (2018: £1,964m).
The amortisation charge in respect of acquired intangible assets, including the share of amortisation in joint ventures, increased to £295m (2018: £288m), with the impact of acquisitions largely offset by disposals and assets which have become fully amortised. Acquisition-related costs were the same as the prior year, at £84m (2018: £84m).
Adjusted interest expense was £291m (2018: £201m). This primarily excludes the net pension financing charge of £12m (2018: £9m). In 2019, the adjusted interest expense includes a charge of £99m in respect of the early redemption of bonds that were due to be repaid in October 2022.
Reported net finance costs were £305m (2018: £211m).
The net pre-tax gain on disposals and non-operating items was £51m (2018: £33m loss) arising largely from the disposal of certain Legal assets and venture capital investments. These gains are partly offset by an associated tax charge of £11m (2018: £14m credit).
Adjusted profit before tax was £2,200m (2018: £2,145m), up 3%.
The reported profit before tax was £1,847m (2018: £1,720m).
The adjusted tax charge was £388m (2018: £465m) including a credit of £89m in respect of the substantial resolution of certain historical tax issues. The adjusted effective tax rate was 17.6% (2018: 21.7%). Excluding the £89m credit, the adjusted effective tax rate would have been 21.7%, in line with the prior year. The adjusted effective tax rate excludes movements in deferred taxation assets and liabilities related to goodwill and acquired intangible assets, but includes the benefit of tax amortisation
ADJUSTED OPERATING PROFIT MARGIN
20192016 20182017
30.5% 31.1% 31.3% 31.6%30.7%
2015
ADJUSTED CASH FLOW CONVERSION
20192016 20182017
94% 96% 96% 96% 96%
2015
Market segm
entsGovernance
Financial statements and
other information
Financial reviewCorporate Responsibility
Overview
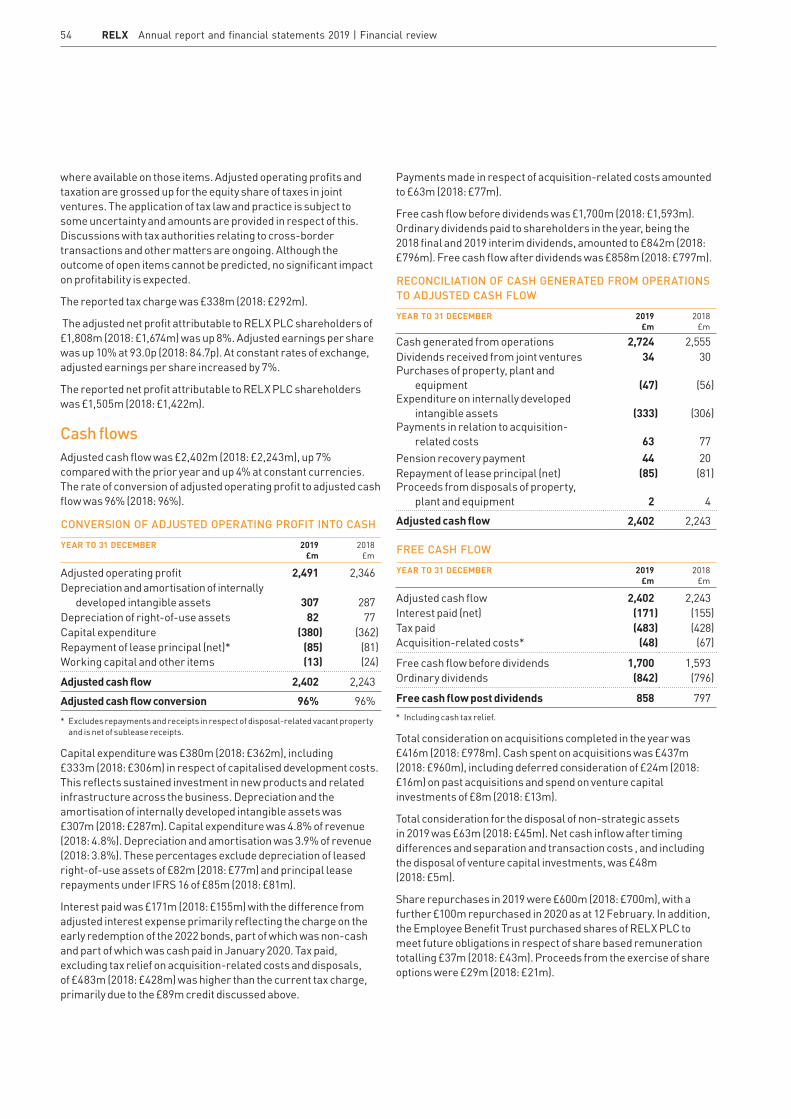
54 RELX Annual report and financial statements 2019 | Financial review
where available on those items. Adjusted operating profits and taxation are grossed up for the equity share of taxes in joint ventures. The application of tax law and practice is subject to some uncertainty and amounts are provided in respect of this. Discussions with tax authorities relating to cross-border transactions and other matters are ongoing. Although the outcome of open items cannot be predicted, no significant impact on profitability is expected.
The reported tax charge was £338m (2018: £292m).
The adjusted net profit attributable to RELX PLC shareholders of £1,808m (2018: £1,674m) was up 8%. Adjusted earnings per share was up 10% at 93.0p (2018: 84.7p). At constant rates of exchange, adjusted earnings per share increased by 7%.
The reported net profit attributable to RELX PLC shareholders was £1,505m (2018: £1,422m).
Cash flowsAdjusted cash flow was £2,402m (2018: £2,243m), up 7% compared with the prior year and up 4% at constant currencies. The rate of conversion of adjusted operating profit to adjusted cash flow was 96% (2018: 96%).
CONVERSION OF ADJUSTED OPERATING PROFIT INTO CASHYEAR TO 31 DECEMBER 2019
£m2018
£m
Adjusted operating profit 2,491 2,346Depreciation and amortisation of internally
developed intangible assets 307 287Depreciation of right-of-use assets 82 77Capital expenditure (380) (362)Repayment of lease principal (net)* (85) (81)Working capital and other items (13) (24)
Adjusted cash flow 2,402 2,243Adjusted cash flow conversion 96% 96%* Excludes repayments and receipts in respect of disposal-related vacant property
and is net of sublease receipts.
Capital expenditure was £380m (2018: £362m), including £333m (2018: £306m) in respect of capitalised development costs. This reflects sustained investment in new products and related infrastructure across the business. Depreciation and the amortisation of internally developed intangible assets was £307m (2018: £287m). Capital expenditure was 4.8% of revenue (2018: 4.8%). Depreciation and amortisation was 3.9% of revenue (2018: 3.8%). These percentages exclude depreciation of leased right-of-use assets of £82m (2018: £77m) and principal lease repayments under IFRS 16 of £85m (2018: £81m).
Interest paid was £171m (2018: £155m) with the difference from adjusted interest expense primarily reflecting the charge on the early redemption of the 2022 bonds, part of which was non-cash and part of which was cash paid in January 2020. Tax paid, excluding tax relief on acquisition-related costs and disposals, of £483m (2018: £428m) was higher than the current tax charge, primarily due to the £89m credit discussed above.
Payments made in respect of acquisition-related costs amounted to £63m (2018: £77m).
Free cash flow before dividends was £1,700m (2018: £1,593m). Ordinary dividends paid to shareholders in the year, being the 2018 final and 2019 interim dividends, amounted to £842m (2018: £796m). Free cash flow after dividends was £858m (2018: £797m).
RECONCILIATION OF CASH GENERATED FROM OPERATIONS TO ADJUSTED CASH FLOWYEAR TO 31 DECEMBER 2019
£m2018
£m
Cash generated from operations 2,724 2,555Dividends received from joint ventures 34 30Purchases of property, plant and
equipment (47) (56)Expenditure on internally developed
intangible assets (333) (306)Payments in relation to acquisition-
related costs 63 77Pension recovery payment 44 20Repayment of lease principal (net) (85) (81)Proceeds from disposals of property,
plant and equipment 2 4Adjusted cash flow 2,402 2,243
FREE CASH FLOWYEAR TO 31 DECEMBER 2019
£m2018
£m
Adjusted cash flow 2,402 2,243Interest paid (net) (171) (155)Tax paid (483) (428)Acquisition-related costs* (48) (67)
Free cash flow before dividends 1,700 1,593Ordinary dividends (842) (796)
Free cash flow post dividends 858 797* Including cash tax relief.
Total consideration on acquisitions completed in the year was £416m (2018: £978m). Cash spent on acquisitions was £437m (2018: £960m), including deferred consideration of £24m (2018: £16m) on past acquisitions and spend on venture capital investments of £8m (2018: £13m).
Total consideration for the disposal of non-strategic assets in 2019 was £63m (2018: £45m). Net cash inflow after timing differences and separation and transaction costs , and including the disposal of venture capital investments, was £48m (2018: £5m).
Share repurchases in 2019 were £600m (2018: £700m), with a further £100m repurchased in 2020 as at 12 February. In addition, the Employee Benefit Trust purchased shares of RELX PLC to meet future obligations in respect of share based remuneration totalling £37m (2018: £43m). Proceeds from the exercise of share options were £29m (2018: £21m).

55RELX Annual report and financial statements 2019 | Chief Financial Officer’s report
RECONCILIATION OF NET DEBT YEAR-ON-YEARYEAR TO 31 DECEMBER 2019
£m2018
£m
Net debt at 1 January (6,177) (5,042)Free cash flow post dividends 858 797Net disposal proceeds 48 5Acquisition cash spend (including
borrowings in acquired businesses) (437) (960)Share repurchases (600) (700)Purchase of shares by the Employee
Benefit Trust (37) (43)Other* (117) 12Currency translation 271 (246)
Movement in net debt (14) (1,135)
Net debt at 31 December (6,191) (6,177)* Cash tax relief on disposals, distributions to non-controlling interests, pension
deficit payments, leases , share option exercise proceeds and the net debt impact of the bond redemption.
FundingDebtNet borrowings at 31 December 2019 were £6,191m, an increase of £14m since 31 December 2018. The majority of our borrowings are denominated in US dollars and euros, and sterling being stronger at the end of the year reduced net borrowings when translated into sterling. Excluding currency translation effects, net borrowings increased by £285m. Expressed in US dollars, net borrowings at 31 December 2019 were $8,211m, an increase of $337m.
Gross borrowings of £6,414m (31 December 2018: £6,365m) are comprised of bank and bond borrowings of £6,072m (31 December 2018: £6,005m) and lease liabilities under IFRS 16 of £342m (31 December 2018: £360m). The fair value of related derivative net assets was £52m (31 December 2018: £25m), finance lease receivables totalled £33m (31 December 2018: £49m) and cash and cash equivalents totalled £138m (31 December 2018: £114m). In aggregate, these give the net borrowings figure of £6,191m (31 December 2018: £6,177m).
The effective interest rate on gross bank and bond borrowings was 4.5% in 2019. Excluding the one-off charge relating to the early bond redemption it was 2.9%, 0.3 percentage points lower than the prior year reflecting the benefit of refinancing historical bonds that had higher rates of interest. As at 31 December 2019, gross bank and bond borrowings had a weighted average life remaining of 3.9 years and a total of 46% of them were at fixed rates, after taking into account interest rate derivatives.
The ratio of net debt (including leases and pensions) to 12-month trailing EBITDA (adjusted earnings before interest, tax, depreciation and amortisation) was 2.5x (31 December 2018: 2.4x), calculated in US dollars. Excluding leases and pensions, the ratio was 2.2x (31 December 2018: 2.2x).
LiquidityIn March 2019, $950m of dollar denominated fixed rate term debt was issued with a coupon of 4.0% and a maturity of ten years. The Group has ample liquidity and access to debt capital markets, providing the ability to repay or refinance borrowings as they mature and to fund ongoing requirements. In January 2020, $950m of US term debt maturing in October 2022 was redeemed early, taking advantage of the make-whole election.
In addition, the Group has access to committed bank facilities aggregating $3bn with various maturities through to 2024. At 31 December 2019 these facilities were undrawn.
Invested capital and returnsNet capital employed was £9,237m at 31 December 2019 (2018: £9,435m), a decrease of £186m. The carrying value of goodwill and acquired intangible assets decreased by £204m. An amount of £245m was capitalised in the year in respect of acquired intangible assets and £257m was recorded as goodwill. This increase was more than offset by the weakening of the dollar against sterling from the beginning to the end of 2019, and disposals.
RETURN ON INVESTED CAPITAL
20192016 20182017
12.7% 13.0% 12.9% 13.2% 13.6%
2015
RELX TERM DEBT MATURITIES AT 31 DECEMBER 2019
850561
819 842 761950
70
1,568
561
43
2020 2021 2022 2023 2024 2025 2026 2027 >20292028 2029
$m
Term debt translated at 31 December 2019 exchange rates, stated at par value
Market segm
entsGovernance
Financial statements and
other information
Financial reviewCorporate Responsibility
Overview

56 RELX Annual report and financial statements 2019 | Financial review
SUMMARY BALANCE SHEETAS AT 31 DECEMBER 2019
£m2018
£m
Goodwill and acquired intangible assets* 9,012 9,216Internally developed intangible assets* 1,264 1,217Property, plant and equipment*,
right-of-use assets* and investments 695 716Net assets held for sale – (3)Net pension obligations (520) (433)Working capital (1,214) (1,278)
Net capital employed 9,237 9,435* Net of accumulated depreciation and amortisation.
Development costs of £333m (2018: £304m) were capitalised within internally developed intangible assets, most notably investment in new products and related infrastructure across RELX.
Net pension obligations, i.e. pension obligations less pension assets, increased to £520m (2018: £433m). There was a net deficit of £267m (2018: £203m) in respect of funded schemes, which were on average 95% funded at the end of the year on an IFRS basis. The higher deficit mainly reflects lower discount rates in both the UK and US, partly offset by increased asset values.
The post-tax return on average invested capital in the year was 13.6% (2018: 13.2%). The increase is largely due to the change in effective tax rate, discussed on page 53. At an effective tax rate of 21.7%, return on invested capital would have been 13.0%.
RETURN ON INVESTED CAPITALAS AT 31 DECEMBER 2019
£m2018
£m
Adjusted operating profit 2,491 2,346Tax at effective rate (438) (509)Effective tax rate 17.6% 21.7%
Adjusted operating profit after tax 2,053 1,837Average invested capital* 15,050 13,924
Return on invested capital 13.6% 13.2%* Average of invested capital at the beginning and the end of the year, retranslated
at average exchange rates for the year. Invested capital is calculated as net capital employed, adjusted to add back accumulated amortisation, impairment of acquired intangible assets and goodwill and to exclude the gross up to goodwill in respect of deferred tax.
Reported earnings per share and dividends2019
£m2018
£m Change
Reported earnings per share 77.4p 71.9p +8%Ordinary dividend per share 45.7p 42.1p +9%
The reported earnings per share was 77.4p (2018: 71.9p).
The final dividend proposed by the Board is 32.1p per share. This gives total dividends for the year of 45.7p (2018: 42.1p), 9% higher than the prior year.
Dividend cover, being adjusted earnings per share divided by the total interim and proposed final dividends for the year, is 2.0x. The dividend policy is, subject to currency considerations, to grow dividends broadly in line with adjusted earnings per share while maintaining dividend cover of at least two times over the longer term.
During 2019 a total of 33.5m of RELX PLC shares were repurchased at an average price of 1,789p. Total consideration for these repurchases was £600m. A further 2.2m shares were purchased by the Employee Benefit Trust. During 2019, 33.3m shares held in treasury were cancelled. As at 31 December 2019, total shares in issue, net of shares held in treasury and shares held by the Employee Benefit Trust, amounted to 1,932m. A further 5.0m shares have been repurchased in 2020 as at 12 February.
Distributable reserves and parent company balance sheetAs at 31 December 2019, RELX PLC had distributable reserves of £6.8bn. In line with UK legislation, distributable reserves are derived from the non-consolidated RELX PLC balance sheet.The consolidated reserves reflect adjustments such as the amortisation of acquired intangible assets that are not taken into account when calculating distributable reserves. The increase in distributable reserves when compared to the prior year is due to the capitalisation and subsequent capital reduction of £4bn of the merger reserve, as approved by RELX PLC shareholders at the 2019 AGM.
The parent company balance sheet net assets are higher than those of the group due to the investment in RELX Group plc being carried at value of £18bn, which is not reflected on the consolidated balance sheet. Additionally the standalone parent company has few liabilities. The parent company balance sheet can be found on page 178.
Further information on the distributable reserves can be found in the parent company financial statements on page 179.
Alternative performance measuresRELX uses adjusted figures, which are not defined by generally accepted accounting principles (‘GAAP’) such as IFRS. Adjusted figures and underlying growth rates are presented as additional performance measures used by management, as they provide relevant information in assessing the Group’s performance, position and cash flows. We believe that these measures enable investors to track more clearly the core operational performance of the Group by separating out items of income or expenditure relating to acquisitions, disposals and capital items, and by excluding exceptional tax credits. This provides our investors with a clear basis for assessing our ability to raise debt and invest in new business opportunities.
Management uses these financial measures, along with IFRS financial measures, in evaluating the operating performance of the Group as a whole and of the individual business segments. Adjusted financial measures should not be considered in isolation

57RELX Annual report and financial statements 2019 | Chief Financial Officer’s report
from, or as a substitute for, financial information presented in compliance with IFRS. The measures may not be directly comparable to similarly reported measures by other companies. Please see page 184 for reconciliations of adjusted measures.
Accounting policiesThe consolidated financial statements are prepared in accordance with International Financial Reporting Standards as adopted by the European Union and as issued by the International Accounting Standards Board following the accounting policies shown in the notes to the financial statements on pages 128 to 174. The accounting policies and estimates which require the most significant judgement relate to the valuation of goodwill and intangible assets, the capitalisation of development costs, taxation and accounting for defined benefit pension schemes. Further detail is provided in the accounting policies on pages 133 and in the relevant notes to the accounts.
Tax principlesTaxation is an important issue for us and our stakeholders, including our shareholders, governments, customers, suppliers, employees and the global communities in which we operate. We have set out our approach to tax in our global tax strategy. This incorporates our Tax Principles along with additional disclosures around where we pay taxes and our broader contribution to society. This is all made publicly available on our website: www.relx.com/go/TaxPrinciples
We maintain an open dialogue with tax authorities, and are vigilant in ensuring that we comply with current tax legislation. We have clear and consistent tax policies and tax matters are dealt with by a professional tax function, supported by external advisers. We proactively seek to agree arm’s-length pricing with tax authorities to mitigate tax risks of significant cross-border operations. We actively engage with policy makers, tax administrators, industry bodies and international institutions to provide informed input on proposed tax measures, so that we and they can understand how those proposals would affect our businesses. In addition, we participate in consultations with the Organisation for Economic Co-operation and Development (‘OECD’), European bodies and the United Nations.
Treasury policies The Board of RELX PLC agrees policies for managing treasury risks. The key policies address security of funding requirements, the target fixed/floating interest rate exposure for debt and foreign currency hedging and place limits on counterparty exposures. A more extensive summary of these policies is provided in note 18 to the financial statements on pages 157 to 162. Financial instruments are used to finance the RELX businesses and to hedge transactions. The Group’s businesses do not enter into speculative transactions.
Capital and liquidity managementThe capital structure is managed to support RELX’s objective of maximising long-term shareholder value through appropriate security of funding, ready access to debt and capital markets, cost-effective borrowing and flexibility to fund business and acquisition opportunities while maintaining appropriate leverage to ensure an efficient capital structure.
Over the long-term, RELX seeks to maintain cash flow conversion of 90% or higher and credit rating agency metrics that are consistent with a solid investment grade credit rating. These metrics as defined by the rating agencies include net debt to EBITDA, including and excluding pensions and leases, and various measures of cash flow as a percentage of net debt.
RELX uses the cash flow it generates to fund capital expenditure required to drive organic growth, to make selective acquisitions and to provide a growing dividend to shareholders, while retaining balance sheet strength to maintain access to cost-effective sources of borrowing. Share repurchases are undertaken to maintain an efficient balance sheet. Further detail on capital and liquidity management is provided on pages 157 and 158.
Corporate responsibilityWe moved closer in 2019 to achieving our 2015-2020 environmental targets by reaching 96% of electricity needs from renewable sources, European green tariff, and green-e certified US and Asian Gold Power renewable energy certificates. We have reduced Scope 1 and Scope 2 (location-based) carbon emissions by 52% from a 2010 baseline. We were part of the London Business Climate Leaders initiative which commits us to taking action to bring about a zero-carbon London, where we are headquartered. We also remained a signatory to We Are Still In, joining more than 2,800 businesses, universities, cities, states and other organisations, aiming to meet the objectives of the 2016 Paris Agreement on climate.
We believe our most important environmental impact is in the environmental knowledge we disseminate through our content, solutions and events. In the year, we published the latest Lancet Countdown on health and climate change which tracks 41 indicators. The Elsevier Foundation Green and Sustainable Chemistry Challenge stimulates innovative chemistry research that benefits the environment and low-resource communities; the 2019 €50,000 first prize was awarded to Dr. Ramia Albakain, Associate Professor at the University of Jordan, for a green technique to remove toxic metal from wastewater. We also held World Future Energy Summit with 800 exhibitors and more than 33,000 visitors from 170 countries, showcasing innovation in areas ranging from energy to water and waste.
Our Supplier Code of Conduct requires suppliers to meet the same standards we set for ourselves. In 2019, 91% of our key suppliers were signatories to the Supplier Code. Intertek conducted 93 audits including nine second tier audits, and reduced open audit points by 21% over 2018. Nearly 12% of our US spend was from diverse suppliers.
For further details on Corporate Responsibility please see pages 38 to 49.
Nick Luff Chief Financial Officer
Market segm
entsGovernance
Financial statements and
other information
Financial reviewCorporate Responsibility
Overview

58 RELX Annual report and financial statements 2019 | Financial review
Principal and emerging risks
RELX has established risk management practices that are embedded into the operations of the businesses, based on the Internal Control-Integrated Framework (2013) by the Committee of Sponsoring Organisations of the Treadway Commission (COSO). The principal and emerging risks facing the business, which have been assessed by the Audit Committee and Board, are described below. The directors confirm this process is robust and includes consideration of risks, including emerging risks, that could threaten RELX’s business models, future performance, solvency, liquidity or reputation.
It is not possible to identify every risk that could affect our businesses, and the actions taken to mitigate the risks described below cannot provide absolute assurance that a risk will not materialise and/or adversely affect our business or financial performance.
Our risk management and internal control processes are described in the corporate governance section. A description of the business and a discussion of factors affecting performance is set out in the Chief Executive Officer’s report and the RELX Business Overview and Market Segments sections. Our assessment of RELX’s prospects and viability is on page 84. Our approach to the promotion of human rights and to managing corporate responsibility, environmental and other non-financial risks is set out in the RELX Business Overview and Market Segments sections and the separate Corporate Responsibility Report.
EXTERNAL RISKS
Risk Description and impact MitigationEconomy and market conditions
Demand for our products and services may be adversely impacted by factors beyond our control, such as the economic environment in the United States, Europe and other major economies, international trading relations, political uncertainties, epidemics, acts of war and civil unrest, and levels of government funding available to our customers.
Our businesses are focused on professional markets which have generally been more resilient in periods of economic downturn. We deliver information solutions, many on a subscription and recurring revenue basis, which are important to our customers’ effectiveness and efficiency. We operate diversified businesses in terms of sectors, markets, customers, geographies and products and services. We have extended our position in long-term global growth markets through organic new launches supported by the selective acquisition of small content and data sets.
We continue to dispose of businesses that no longer fit our strategy. We continuously monitor economic and political developments to assess their impact on our strategy which is designed to mitigate these risks. In response to specific uncertainties, our businesses engage in scenario planning and develop contingency plans where relevant.
Intellectual property rights
Our products and services include and utilise intellectual property. We rely on trademark, copyright, patent and other intellectual property laws to establish and protect our proprietary rights in this intellectual property. There is a risk that our proprietary rights could be challenged, limited, invalidated or circumvented, which may impact demand for and pricing of our products and services. Copyright laws are subject to national legislative initiatives, as well as cross- border initiatives such as those from the European Commission and increased judicial scrutiny in several jurisdictions in which we operate. This creates additional challenges for us in protecting our proprietary rights in content delivered through the internet and electronic platforms.
We actively engage in developing and promoting the legal protection of intellectual property rights. Our subscription contracts with customers contain provisions regarding the use of proprietary content. We are vigilant as to the use of our intellectual property and, as appropriate, take legal action to challenge illegal content distribution sources.

59RELX Annual report and financial statements 2019 | Principal and emerging risks
EXTERNAL RISKS
Risk Description and impact MitigationData resources and data privacy
Our businesses rely extensively upon content and data from external sources. Data is obtained from public records, governmental authorities, customers and other information companies, including competitors. The disruption or loss of data sources, either because of data privacy laws or because data suppliers decide not to supply them, may impose limits on our collection and use of certain kinds of information about individuals and our ability to communicate such information effectively with our customers. Examples of data privacy laws relating to internet communications, privacy and data protection, e-commerce, information governance and use of public records include the European Union’s General Data Protection Regulation (‘GDPR’) and the California Consumer Privacy Act (‘CCPA’), as well as evolving regulation in many jurisdictions where RELX operates.
Compromise of data privacy, through a failure of our cyber security measures (see ‘Cyber security’ below), other data loss incidents or failure to comply with requirements for proper collection, storage and transmittal of data, by ourselves or our third-party service providers, may damage our reputation and expose us to risk of loss, fines and penalties, litigation and increased regulation.
We use a mix of publicly available, proprietary, contributory and licensed content. Where content is supplied to us by third parties, we aim to have contracts which provide mutual commercial benefit. We also maintain an active dialogue with regulatory authorities on privacy and other data related issues, and promote, with others, the responsible use of data.
We have established data privacy principles, governance structures and control programmes designed to ensure data privacy requirements are met and which protect data and individual’s privacy across all jurisdictions where we operate. We have put in place and test response plans to manage incidents where data privacy might be compromised. We embed our data privacy principles in agreements with third parties.
We have assurance programmes to monitor compliance and conduct training and awareness programmes.
Paid subscriptions
Our Scientific, Technical & Medical (‘STM’) primary research content, like that of most of our competitors, is sold largely on a paid subscription basis. There is continued debate in government, academic and library communities, which are the principal customers for our STM content, regarding to what extent such content should be funded instead through fees charged to authors or authors’ funders and/or made freely available in some form after a period following publication. Some of these methods, if widely adopted, could adversely affect our revenue from paid subscriptions.
We engage extensively with stakeholders in the STM community to better understand their needs and deliver value to them. We are open to serving the STM community under any payment model that can sustainably provide researchers with the critical information tools that they need. In particular, the number of articles we publish on an author pays, open access basis, and the associated revenues, are growing rapidly. We focus on the integrity and quality of research through the editorial and peer review process; we invest in efficient editorial and distribution platforms and in innovation in platforms and tools to make content and data more accessible and actionable; and we develop our research systems to provide capabilities to manage different payment models. We ensure vigilance on plagiarism and the long-term preservation of research findings.
STRATEGIC RISKS
Risk Description and impact MitigationCustomer demand for our products
Our businesses are dependent on the continued demand by our customers for our products and services and the value placed on them. Failure to deliver enhanced value to our customers could impact demand for our products and services and consequently adversely affect our revenue or the long-term returns from our investment in electronic product and platform initiatives.
We are focused on the needs and economics of our customers. We leverage agile development methods and robust customer discovery processes and invest in new and enhanced technologies, to provide content and innovative solutions that help our customers achieve better outcomes and enhance productivity.
Market Disruption
Our businesses operate in highly competitive and dynamic markets, and the means of delivering our products and services, and the products and services themselves, continue to change in response to rapid technological innovations, legislative and regulatory changes, the entrance of new competitors and other factors. Failure to anticipate and quickly adapt to these changes could impact the competitiveness of our products and services and consequently adversely affect our revenue.
We gain insights into our markets, evolving customer needs, the potential application of new technologies and business models, and the actions of competitors and disrupters. These insights inform our market strategies and operational priorities. We continuously invest significant resources in our products and services, and the infrastructure to support them.
Acquisitions We supplement our organic development with selected acquisitions. If we are unable to generate the anticipated benefits such as revenue growth and/or cost savings associated with these acquisitions this could adversely affect return on invested capital and financial condition or lead to an impairment of goodwill.
Acquisitions are made within the framework of our overall strategy, which emphasises organic development. We have a well formulated process for reviewing and executing acquisitions and for managing the post-acquisition integration. This process is underpinned with clear strategic, financial and ethical criteria. We closely monitor the integration and performance of acquisitions.
Market segm
entsGovernance
Financial statements and
other information
Financial reviewCorporate Responsibility
Overview
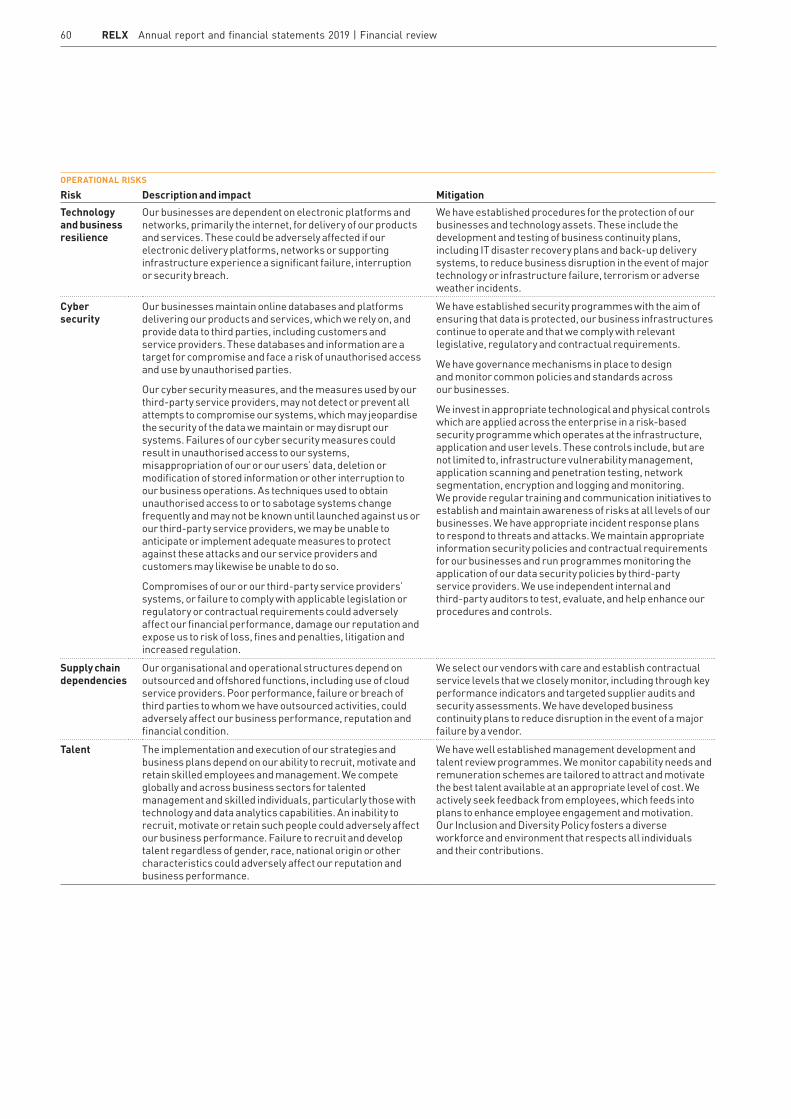
60 RELX Annual report and financial statements 2019 | Financial review
OPERATIONAL RISKS
Risk Description and impact MitigationTechnology and business resilience
Our businesses are dependent on electronic platforms and networks, primarily the internet, for delivery of our products and services. These could be adversely affected if our electronic delivery platforms, networks or supporting infrastructure experience a significant failure, interruption or security breach.
We have established procedures for the protection of our businesses and technology assets. These include the development and testing of business continuity plans, including IT disaster recovery plans and back-up delivery systems, to reduce business disruption in the event of major technology or infrastructure failure, terrorism or adverse weather incidents.
Cyber security
Our businesses maintain online databases and platforms delivering our products and services, which we rely on, and provide data to third parties, including customers and service providers. These databases and information are a target for compromise and face a risk of unauthorised access and use by unauthorised parties.
Our cyber security measures, and the measures used by our third-party service providers, may not detect or prevent all attempts to compromise our systems, which may jeopardise the security of the data we maintain or may disrupt our systems. Failures of our cyber security measures could result in unauthorised access to our systems, misappropriation of our or our users’ data, deletion or modification of stored information or other interruption to our business operations. As techniques used to obtain unauthorised access to or to sabotage systems change frequently and may not be known until launched against us or our third-party service providers, we may be unable to anticipate or implement adequate measures to protect against these attacks and our service providers and customers may likewise be unable to do so.
Compromises of our or our third-party service providers’ systems, or failure to comply with applicable legislation or regulatory or contractual requirements could adversely affect our financial performance, damage our reputation and expose us to risk of loss, fines and penalties, litigation and increased regulation.
We have established security programmes with the aim of ensuring that data is protected, our business infrastructures continue to operate and that we comply with relevant legislative, regulatory and contractual requirements.
We have governance mechanisms in place to design and monitor common policies and standards across our businesses.
We invest in appropriate technological and physical controls which are applied across the enterprise in a risk-based security programme which operates at the infrastructure, application and user levels. These controls include, but are not limited to, infrastructure vulnerability management, application scanning and penetration testing, network segmentation, encryption and logging and monitoring. We provide regular training and communication initiatives to establish and maintain awareness of risks at all levels of our businesses. We have appropriate incident response plans to respond to threats and attacks. We maintain appropriate information security policies and contractual requirements for our businesses and run programmes monitoring the application of our data security policies by third-party service providers. We use independent internal and third-party auditors to test, evaluate, and help enhance our procedures and controls.
Supply chain dependencies
Our organisational and operational structures depend on outsourced and offshored functions, including use of cloud service providers. Poor performance, failure or breach of third parties to whom we have outsourced activities, could adversely affect our business performance, reputation and financial condition.
We select our vendors with care and establish contractual service levels that we closely monitor, including through key performance indicators and targeted supplier audits and security assessments. We have developed business continuity plans to reduce disruption in the event of a major failure by a vendor.
Talent The implementation and execution of our strategies and business plans depend on our ability to recruit, motivate and retain skilled employees and management. We compete globally and across business sectors for talented management and skilled individuals, particularly those with technology and data analytics capabilities. An inability to recruit, motivate or retain such people could adversely affect our business performance. Failure to recruit and develop talent regardless of gender, race, national origin or other characteristics could adversely affect our reputation and business performance.
We have well established management development and talent review programmes. We monitor capability needs and remuneration schemes are tailored to attract and motivate the best talent available at an appropriate level of cost. We actively seek feedback from employees, which feeds into plans to enhance employee engagement and motivation. Our Inclusion and Diversity Policy fosters a diverse workforce and environment that respects all individuals and their contributions.

61RELX Annual report and financial statements 2019 | Principal and emerging risks
FINANCIAL RISKS
Risk Description and impact MitigationPensions We operate a number of pension schemes around the world,
including local versions of the defined benefit type in the UK and the United States. The US scheme is closed to future accruals. The UK scheme has been closed to new hires since 2010. The members who continue to accrue benefits now represent a small portion of the overall UK based workforce. The assets and obligations associated with those pension schemes are sensitive to changes in the market values of the scheme’s investments and the market-related assumptions used to value scheme liabilities. Adverse changes to asset values, discount rates, longevity assumptions or inflation could increase funding requirements.
We have professional management of our pension schemes and we focus on maintaining appropriate asset allocation and plan designs. We review our funding requirements on a regular basis with the assistance of independent actuaries and ensure that the funding plans are appropriate.
Tax Our businesses operate globally, and our profits are subject to taxation in many different jurisdictions and at differing tax rates. The Organisation for Economic Co-operation and Development (‘OECD’) is continuing to explore changes to the way in which profits are allocated for tax purposes between jurisdictions and other reforms. As a result of the OECD’s work and other initiatives, tax laws that currently apply to our businesses may be amended by the relevant authorities or interpreted differently by them, and these changes could adversely affect our reported results.
We maintain an open dialogue with tax authorities and are vigilant in ensuring that we comply with current tax legislation. We have clear and consistent tax policies and tax matters are dealt with by a professional tax function, supported by external advisers. As outlined in the Chief Financial Officer’s report on page 52 we engage with tax authorities and international organisations. We continue to monitor further developments arising from the OECD process and consider potential impacts of proposals under various scenarios. The principles we adopt in our approach to tax matters can be found on our website at www.relx.com/go/taxprinciples.
Treasury The RELX consolidated financial statements are expressed in pounds sterling and are subject to movements in exchange rates on the translation of the financial information of businesses whose operational currencies are other than sterling. The United States is our most important market and, accordingly, significant fluctuations in the US dollar exchange rate could significantly affect our reported results. We also earn revenues and incur costs in a range of other currencies, including the euro and the yen, and significant fluctuations in these exchange rates could also significantly impact our reported results.
Macroeconomic, political and market conditions may adversely affect the availability and terms of short and long-term funding, volatility of interest rates, the credit quality of our counterparties, currency exchange rates and inflation. The majority of our outstanding debt instruments are, and any of our future debt instruments may be, publicly rated by independent rating agencies. Our borrowing costs and access to capital may be adversely affected if the credit ratings assigned to our debt are downgraded.
Our approach to capital structure and funding are described in the Chief Financial Officer’s report on pages 52 to 57. The approach to the management of treasury risks is described in note 18 to the consolidated financial statements.
REPUTATIONAL RISKS
Risk Description and impact MitigationEthics As a global provider of professional information solutions
to the STM, risk & business analytics, legal and exhibitions markets we, our employees and major suppliers are expected to adhere to high standards of integrity and ethical conduct, including those related to anti-bribery and anti-corruption, sanctions, competition and principled business conduct. A breach of generally accepted ethical business standards or applicable laws could adversely affect our business performance, reputation and financial condition.
Our Code of Ethics and Business Conduct is provided to every employee and is supported by training and communication. It encompasses such topics as competing fairly, prohibiting corrupt business practices, fair employment practices and encouraging open and principled behaviour. We have well-established processes for monitoring, reporting and investigating instances of unethical conduct. Our major suppliers are required to adhere to our Supplier Code of Conduct.
The Strategic Report, as set out on pages 2 to 61 has been approved by the Board of RELX PLC.
By order of the Board Registered OfficeHenry Udow 1-3 StrandCompany Secretary London12 February 2020 WC2N 5JR
Market segm
entsGovernance
Financial statements and
other information
Financial reviewCorporate Responsibility
Overview

62 RELX Annual report and financial statements 2019 | Governance
RELX Annual report and financial statements 2019 63
In this section64 Board Directors66 RELX Senior Executives68 Chair’s introduction to
corporate governance70 Corporate Governance Review85 Report of the Nominations Committee88 Directors’ Remuneration Report112 Report of the Audit Committee115 Directors’ Report
Governance
Market segm
entsGovernance
Financial statements and
other information
Financial reviewCorporate Responsibility
Overview

64 RELX Annual report and financial statements 2019 | Governance
Executive Directors Non-Executive Directors
Erik Engstrom (56) Chief Executive Officer
Appointed: Chief Executive Officer of RELX since November 2009. Joined as Chief Executive Officer of Elsevier in 2004. Other appointments: Non-Executive Director of Smith & Nephew plc and Bonnier Group.Past appointments: Prior to joining was a partner at General Atlantic Partners. Before that was President and Chief Operating Officer of Random House Inc and President and Chief Executive Officer of Bantam Doubleday Dell, North America. Began his career as a consultant with McKinsey. Served as a Non-Executive Director of Eniro AB and Svenska Cellulosa Aktiebolaget SCA.Education: Holds a BSc from Stockholm School of Economics, an MSc from the Royal Institute of Technology in Stockholm, and gained an MBA from Harvard Business School as a Fulbright Scholar.Nationality: Swedish
Nick Luff (52) Chief Financial Officer
Appointed: September 2014Other appointments: Non-Executive Director of Rolls-Royce Holdings plc.Past appointments: Prior to joining the Group was Group Finance Director of Centrica plc from 2007. Before that was Chief Financial Officer at The Peninsular & Oriental Steam Navigation Company (P&O) and its affiliated companies, having previously held a number of senior finance roles at P&O. Began his career as an accountant with KPMG. Formerly a Non-Executive Director of QinetiQ Group plc and Lloyds Banking Group plc.Education: Has a degree in Mathematics from Oxford University and is a qualified UK Chartered Accountant.Nationality: British
Sir Anthony Habgood (73) R N C Chair
Appointed: June 2009Other appointments: Chair of Preqin Holding Limited and Deputy Chair of RG Carter Holdings Limited.Past appointments: Previously was Chair of the Court of the Bank of England, Whitbread plc, Bunzl plc, Mölnlycke Health Care Limited and Norwich Research Partners LLP and served as Chief Executive of Bunzl plc, Chief Executive of Tootal Group plc and a Director of The Boston Consulting Group. Formerly Non-Executive Director of Geest plc, Marks and Spencer plc, National Westminster Bank plc, Powergen plc, SVG Capital plc, and Norfolk and Norwich University Hospitals Trust. Education: Holds an MA in Economics from Cambridge University, an MS in Industrial Administration from Carnegie Mellon University and an Honorary Doctorate of Civil Law from the University of East Anglia. He is a visiting Fellow at Oxford University.Nationality: British
Board Directors
Adrian Hennah (62) A N C Non-Executive Director Chair of the Audit Committee
Appointed: April 2011Other appointments: Chief Financial Officer of Reckitt Benckiser Group plc.Past appointments: Chief Financial Officer of Smith & Nephew plc from 2006 to 2012. Before that was Chief Financial Officer of Invensys plc, having previously held various senior finance and management positions with GlaxoSmithKline for 18 years. Formerly, a Non-Executive Director of Indivior PLC. Nationality: British
Wolfhart Hauser (70) R N C Non-Executive Director Senior Independent Director Chair of the Remuneration Committee
Appointed: April 2013Other appointments: Non-Executive Director of Associated British Foods plc.Past appointments: Chair of FirstGroup plc until July 2019. Chief Executive Officer of Intertek Group plc from 2005 until 2015. Prior to that he was Chief Executive Officer of TÜV Sud AG between 1998 and 2002 and Chief Executive Officer of TÜV Product Service GmbH for ten years. Formerly a Non-Executive Director of Logica plc.Education: Holds a master’s degree in Medicine from Ludwig-Maximilian-University Munich and a Medical Doctorate from Technical University Munich. Nationality: German
Charlotte Hogg (49) C Non-Executive Director
Appointed: December 2019Other appointments: Executive Vice President and Chief Executive Officer for the European Region of Visa Inc. Executive Director of Visa Europe Limited. Non-Executive Director of UK Finance and NowTeach. Past appointments: Chief Operating Officer at the Bank of England. Before that was Head of Retail Banking for Santander UK, Managing Director UK and Ireland for Experian plc, and held senior roles at Morgan Stanley in New York and London. Nationality: British and American

65RELX Annual report and financial statements 2019 | Board Directors
Board Committee membership keyA Audit CommitteeR Remuneration CommitteeN Nominations CommitteeC Corporate Governance Committee
Committee Chair
Andrew Sukawaty (64) A C Non-Executive Director
Appointed: April 2019Other appointments: Chairman of Inmarsat, Director of HG Capital LLP and Corten Advisors UK LLP. Past appointments: He was formerly a Non-Executive Director and the Senior Independent Director of Sky plc between 2013 and 2018. Previously he was Chairman of Ziggo NV, Xyratex Group Ltd, and Telenet Group holdings NV, and deputy Chairman of O2 plc. He also served as a Non-Executive Director of Telefonica Europe and Powerwave Technologies Inc, and additionally as Chief Executive of Inmarsat plc, Sprint Corp and NTL Group Ltd.Nationality: American
Linda Sanford (67) R C Non-Executive Director
Appointed: December 2012Other appointments: An independent Director of Consolidated Edison, Inc, Pitney Bowes, Inc and Interpublic Group of Companies, Inc.Serves on the board of trustees of the New York Hall of Science.Past appointments: Senior Vice President, Enterprise Transformation, IBM Corporation until 2014, having joined the company in 1975. A consultant to The Carlyle Group from 2015 to July 2018. Formerly a Non-Executive Director of ITT Corporation, served on the boards of directors of The Business Council of New York State and the Partnership for New York City, and on the boards of trustees of the State University of New York, St John’s University and Rensselaer Polytechnic Institute.Nationality: American
Robert MacLeod (55) R N C Non-Executive Director
Appointed: April 2016Other appointments: Appointed as Chief Executive of Johnson Matthey plc in June 2014 after five years as Group Finance Director.Past appointments: Prior to joining Johnson Matthey, spent five years as Group Finance Director of WS Atkins plc, having joined as Group Financial Controller in 2003. From 1993 to 2002, held a variety of senior finance and M&A roles with Enterprise Oil plc in the UK and US. Formerly a Non-Executive Director of Aggreko plc.Nationality: British
Marike van Lier Lels (60) N C Non-Executive Director Workforce Engagement Director
Appointed: July 2015 Other appointments: Member of the Supervisory Boards of NS (Dutch Railways), Dura Vermeer, Post NL and Innovation Quarter. Past appointments: Member of the Supervisory Boards of TKH Group NV, Royal Imtech NV, Maersk BV, KPN NV, USG People NV and Eneco Holding NV, and Executive Vice President and Chief Operating Officer of the Schiphol Group. Prior to joining Schiphol Group, was a member of the Executive Board of Deutsche Post Euro Express and held various senior positions with Nedlloyd. Member of various Dutch governmental advisory boards.Nationality: Dutch
Suzanne Wood (59) A C Non-Executive Director
Appointed: September 2017Other appointments: Senior Vice President and Chief Financial Officer of Vulcan Materials Company. Past appointments: Served as Group Finance Director of Ashtead Group plc from 2012 to 2018. Chief Financial Officer of Ashtead Group’s largest subsidiary, Sunbelt Rentals Inc, from 2003 until 2012. Previously, she also served as Chief Financial Officer of two US publicly listed companies, Oakwood Homes Corporation and Tultex Corporation. Nationality: American
Market segm
entsGovernance
Financial statements and
other information
Financial reviewCorporate Responsibility
Overview

66 RELX Annual report and financial statements 2019 | Governance
RELX Senior Executives
Mark Kelsey Chief Executive Officer Risk & Business Analytics
Kumsal Bayazit Chief Executive Officer Scientific, Technical & Medical and Chair, RELX Technology Forum
Mike Walsh Chief Executive Officer Legal
Hugh M Jones IV Chief Executive Officer Exhibitions
Joined in 1983. Appointed to current position in 2012.
Joined in 2004. Appointed to current position in 2019.
Joined in 2003. Appointed to current position in 2011.
Joined in 2011. Appointed to current position in 2020.
Has held a number of senior positions across the Group over the past 30 years. Previously Chief Operating Officer and then Chief Executive Officer of Reed Business Information. Studied at Liverpool University and received his MBA from Bradford University.
Previously President, Exhibitions Europe, Chief Strategy Officer, RELX, and Executive Vice President of Global Strategy and Business Development for LexisNexis. Prior to that worked with Bain & Company in New York, Los Angeles, Johannesburg and Sydney. Holds an MBA from Harvard Business School and is a Graduate of the University of California at Berkeley.
Previously CEO of LexisNexis US Legal Markets and Director of Strategic Business Development Home Depot. Prior to that was a practising attorney at Weil, Gotshal and Manges in Washington DC and served as a consultant with The Boston Consulting Group. Holds a Juris Doctor degree from Harvard Law School and is a graduate of Yale University.
Previously Group Managing Director, Accuity, ICIS, Cirium, and EG within Risk & Business Analytics. Prior to that was Chief Executive Officer, Accuity. Holds an MBA from the Ross School of Business at the University of Michigan and is a graduate of Yale University.

67RELX Annual report and financial statements 2019 | RELX Senior Executives
Gunjan Aggarwal Chief Human Resources Officer
Henry Udow Chief Legal Officer and Company Secretary
Jelena Sevo Chief Strategy Officer
Youngsuk “YS” Chi Director of RELX Corporate Affairs and Chair, Elsevier
Joined in 2017. Appointed to current position at that time.
Joined in 2011. Appointed to current position at that time.
Joined in 2011. Appointed to current position in 2019.
Joined in 2005. Appointed to current position in 2011.
Previously head of Human Resources for Ericsson’s global media business in California and for Ericsson North America. Prior Human Resources positions in Asia, Europe and North America at Unilever and Novartis. Holds an MBA from Xavier School of Management, Jamshedpur, India, and is a graduate from JMI Institute of Technology.
Previously Chief Legal Officer and Company Secretary of Cadbury plc having spent 23 years working with the company. Prior to that worked at Shearman & Sterling in New York and London. Holds a Juris Doctor degree from the University of Michigan Law School and a bachelor’s degree from the University of Rochester.
Previously Director of Tax Markets for LexisNexis UK. Prior to that, various senior management roles in LexisNexis and Elsevier. Previously a consultant at Bain & Co and Booz Allen Hamilton. Holds an MBA from Harvard Business School, a master’s degree in law from Georgetown University and a degree in law from the University of Belgrade.
Previously was President and Chief Operating Officer of Random House, founding Chairman of Random House Asia and Chief Operating Officer for Ingram Book Group. Holds an MBA from Columbia University and is a graduate of Princeton University.
Market segm
entsGovernance
Financial statements and
other information
Financial reviewCorporate Responsibility
Overview

68 RELX Annual report and financial statements 2019 | Governance
Chair’s introduction to corporate governance
UK Corporate Governance Code complianceAs a premium listed company, RELX is required to describe how it has complied with the principles of the Code during the year. Details of how we have done so are set out in this report and those of the Board Committees which follow. RELX is also required to report on whether it has chosen to comply with each of the provisions of the Code, or alternatively explain why it has chosen not to do so.
For 2019, the Board deemed it to be in the interests of the Group’s stakeholders to comply with each of the provisions of the Code, with the exception of provision 19 (length of tenure of the Chair) and provision 38 (alignment of executive director pension contribution rates with those available to the workforce). For an explanation regarding executive directors’ pension benefits, please see page 70.
Having been appointed Chair in June 2009, I have served for over ten years. As the Group explained in its 2018 Annual Report and Accounts, the Board felt it appropriate and in the long-term interests of the Group’s stakeholders that I remain in the role to ensure continuity of Board leadership, following the corporate simplification which completed in September 2018 with RELX PLC becoming the sole parent company of the Group. As corporate governance processes implemented upon completion of the corporate simplification have now been fully embedded, I have decided that this is the year to retire from the Board. The succession process is being led by the Senior Independent Director, Wolfhart Hauser, and overseen by the Nominations Committee.
CultureAs part of its leadership role, the Board is responsible for developing a corporate culture across RELX which promotes integrity, transparency and an understanding of RELX’s responsibilities to its stakeholders and the communities in which it operates. In addition, the Board recognises the importance of its role in setting and monitoring the Group’s culture, and embedding supporting policies, processes and training throughout the Group . The Code of Ethics and Business Conduct (Code of Ethics), clearly sets out the standards expected of employees, as well as third parties who represent us, and is available on the Company’s website at www.relx.com. During the year, the Board spent considerable time receiving regular updates from the Chief Human Resources Officer, Workforce Engagement Director and Chief Compliance Officer on the alignment between the Group’s culture and values, and how these support its strategy and performance.
Inclusion and diversityThe Board understands the importance of inclusion and diversity. Since our 2018 Annual Report, the Company has updated its Board Diversity Policy, which is applicable to the RELX PLC Board. The policy recognises the benefits that inclusion and diversity can bring to the effectiveness of Board discussions through incorporating different perspectives and ideas. The Board believes that appointments to it should be made on merit, with the benefits of diversity being considered as part of succession planning and Board composition review . Therefore, with respect to inclusion and diversity, no formal targets have been set by the Board in respect of its membership.
High standards of corporate governance underpin long-term, sustainable value creation. In 2019, we continued to evolve our corporate governance reporting in response to the requirements of the updated UK Corporate Governance Code.Our governance frameworkThe Board recognises the importance of maintaining high standards of corporate governance, which underpin RELX’s ability to deliver long-term value and sustainable success for our members, provides confidence to our many and varied stakeholders that the governance of the Group is appropriate for its size and profile as a UK listed company, and supports our culture of acting with integrity in all we do. In 2019, we continued to evolve our corporate governance reporting to respond to changing requirements in the UK, driven principally by the new UK Corporate Governance Code (Code) which applied to RELX from the start of the year, as well as other legislative requirements which now apply to large UK companies.
Stakeholder engagementA central theme of the new requirements has been an increased emphasis on the relationships between a company and a wide range of its stakeholders, its reporting of these and how the Board has discharged its duty to promote the success of the Company having regard, particularly, to certain matters set out in Section 172 of the Companies Act 2006 (the Act).
Constructive, transparent and open engagement with our stakeholders is imperative in ensuring that the Board’s discussions and decision-making are informed, considered and balanced. The Board has historically recognised and acknowledged that stakeholder relationships, such as those with our customers, employees, suppliers and the communities in which we operate, are an important consideration at all levels of business interaction and conduct across an organisation of our size and diversity. However, we have taken the opportunity to assess and, where necessary, supplement our corporate governance arrangements to ensure that consideration of our stakeholders remains appropriate as the Group continues to grow and develop its business.
The Board appointed Marike van Lier Lels as Workforce Engagement Director with effect from 1 January 2019. The breadth of Marike’s engagement with our workforce has been wide, and she has provided periodic updates to the Board on engagement activities and outcomes, which the Board has considered in its discussions. Further information relating to the programme of activity undertaken by Marike as Workforce Engagement Director can be found on page 76.
69RELX Annual report and financial statements 2019 | Chair’s introduction to corporate governance
The Board also approved an updated Inclusion and Diversity Policy, now applicable across the Group. It seeks to ensure that RELX meets corporate responsibility expectations and is a place where all employees feel valued, and that inclusion and diversity is built into the Group’s appointment and promotion processes.
The Board also welcomes the Hampton-Alexander Review, which proposes to increase Board and senior leadership gender diversity.
This, along with the wider aspects of inclusion and diversity, is considered by the Nominations Committee when reviewing the balance and composition of the Board and the structuring of talent development initiatives across the Group.
Board changes A number of changes have continued the progressive evolution of the Board in 2019. Following the conclusion of the 2019 Annual General Meeting, Ben van der Veer and Carol Mills stepped down from the Board. I would like to thank them both for their wise counsel, support and contribution during their period of service. Andrew Sukawaty joined the Board, which is already benefiting from his considerable international experience in the technology sector, his significant and recent listed company experience, and his understanding of the US business and governance environment. In December, the Board also appointed Charlotte Hogg as a Non-Executive Director. She brings a wealth of strategic and operational experience, and her exposure to big data technology companies is particularly pertinent to our business.
Adrian Hennah will not seek re-election at our 2020 Annual General Meeting, as he will by that time have served for nine years as a valued member of the Board and its Committees. I would like to take this opportunity to thank Adrian for his considerable contribution to the Board and he leaves RELX with our very best wishes for the future.
Board effectiveness As Chair, I am responsible for ensuring that the effectiveness of the Board, its Committees and each individual Director is evaluated annually. For 2019, an internal evaluation process was carried out. The outcome of the evaluation confirmed that the Board and Committees continue to operate effectively, and that all of our Directors continue to demonstrate commitment to their role. Further information relating to the Board evaluation can be found on page 81 of this report.
Sir Anthony HabgoodChair12 February 2020
Market segm
entsGovernance
Financial statements and
other information
Financial reviewCorporate Responsibility
Overview

70 RELX Annual report and financial statements 2019 | Governance
Corporate Governance Review
OverviewThe Board remains committed to high standards of corporate governance. During the year, its principal focus in this area was on ensuring the implementation of processes and completion of actions which allowed the Company to address the requirements of the 2018 UK Corporate Governance Code (the Code), which applied to it from 1 January 2019.
As a result, the Board’s annual programme was updated, particularly with regard to its oversight of the Group’s engagement with its key stakeholders, consideration of their views, assessment of RELX’s culture and its alignment with our purpose, values and strategy, and review of the Group’s workforce policies.
It has been supported throughout the year by its Committees, which have also taken on new responsibilities under the Code. A summary of how each Committee has approached these can be found in the reports on pages 85 to 114 . An explanation of how the Company has applied each principle of the Code related to remuneration is set out in the Directors’ Remuneration Report on pages 88 to 111.
This Review also contains an explanation of how the Directors of the Company have discharged their duty under the Companies Act 2006 (the Act) to promote the success of the Company having regard, particularly, to certain matters set out in Section 172 of the Act. The Board’s Section 172 Statement can be found on pages 74 to 78 and is incorporated into the Strategic Report by reference.
The Board has been mindful that it must fulfil this duty to promote the success of the Company when assessing the principles and provisions of the Code, and in deciding how RELX should follow and apply these.
Following the corporate simplification which took place in 2018, the shares of RELX PLC are traded through its primary listing on the London Stock Exchange and its secondary listing on Euronext Amsterdam, whilst its securities are also traded on the New York Stock Exchange under its American Depositary Share programme. The Board has therefore implemented standards of corporate governance and disclosure policies applicable to a UK incorporated Company, with listings in London, Amsterdam and New York.
The Company and its Directors are required by the Code to make certain statements in relation to provisions contained within it. The locations of those statements are as follows:
§§ Pages 5, 12 to 33, 58 to 61 and 71 to 72 for a description of how opportunities and risks to the future success of the business have been considered and addressed, the sustainability of RELX’s business model and how its governance contributes towards the delivery of its strategy
Corporate governance compliance statements
The 2018 UK Corporate Governance Code (the Code) applied to the Company during the year.
The Company, which has its primary listing on the main market of the London Stock Exchange, has complied with the provisions of the Code throughout the year ended 31 December 2019, with the exception of provision 19 (length of tenure of the Chair) and provision 38 (alignment of executive director pension contribution rates with those available to the workforce). For an explanation regarding the tenure of our Chair, please see pages 68 and 87.
The value of pension benefits for current Executive Directors has decreased over the last several years, prior to the Code coming into force. As part of the proposed new remuneration policy, the Committee is proposing a revised pension policy for newly appointed Executive Directors which is aligned to the general workforce. Existing Executive Directors will transition from their current arrangements to the level of pension benefits provided under the Company’s regular defined contribution plans (currently capped at 11% in the UK) by the end of 2022, in line with the recommendations of the Investment Association.
The pension benefits received by the Executive Directors in 2019 have been in line with the terms of our shareholder approved Directors’ Remuneration Policy. Notwithstanding provision 38 of the UK Corporate Governance Code, the Board viewed it as appropriate that there be a phased transition of existing pension benefits for Executive Directors to 2022.
A description of how the Company has applied the main principles of the Code is set out on pages 71 to 114.
A copy of the Code can be found on the FRC website at www.frc.org.uk
§§ Page 73 for an explanation of the Board’s activities in assessing and monitoring RELX’s culture
§§ Page 45 for an explanation of RELX’s approach to investing in and rewarding its workforce
§§ Pages 74 to 78 for a description of how the interests of RELX’s key stakeholders and the matters set out in Section 172 of the Act have been considered in Board discussions and decision-making
§§ Page 58 for confirmation that the Directors have carried out a robust assessment of the emerging and principal risks facing RELX, including a description of its principal risks, what procedures are in place to identify emerging risks, and an explanation of how these are being managed or mitigated
§§ Page 83 for confirmation that the Annual Report and Accounts is fair, balanced and understandable and provides the information necessary for shareholders to assess RELX’s position and performance, business model and strategy
§§ Page 84 for an explanation of how the Directors have assessed the prospects of RELX, taking into account its current position and its emerging and principal risks
§§ Page 83 for the statement on the status of RELX as a going concern

RELX Annual report and financial statements 2019 | Corporate Governance Review 71
Application of UK Corporate Governance Code Principles
Our governance frameworkRELX has in place a corporate governance framework of processes, leadership bodies and supporting documentation to ensure that it is appropriately led, directed and controlled. It brings clarity to those who work for RELX, both in respect of what they are expected to deliver through the setting of strategic and financial objectives, and the values, standards and principles that they must act in accordance with in the course of delivering those objectives.
This framework also helps our organisation to run efficiently by giving clear instructions on decision-making processes and authorities, allowing effective use of our resources whilst facilitating appropriate levels of oversight and involvement for the Board and its Committees. It exists to support our businesses as they grow and develop. It therefore reflects a number of considerations. These include the appropriate implementation of systems and processes which define the rights, responsibilities and accountabilities of individuals throughout the Group, compliance with statutory and regulatory requirements that apply to RELX, the protection of our reputation and meeting our own expectations to act with integrity in all we do. It also seeks to allow our four business area organisations to operate with the speed, agility and flexibility required to address the needs of their customers in a timely and responsive manner.
As set out on pages 71 to 72, each part of the framework plays a significant part in delivering the Group’s strategy.
Our purpose, strategy, values and culturePurposeRELX is a global provider of information-based analytics and decision tools for professional and business customers. Our primary corporate purpose is to add value for our professional customers, enabling them to make better decisions, get better results and be more productive. Specifically, we are focused on helping our customers further science and health, prevent fraud, promote the rule of law and justice and bring together business communities to learn about markets, source products and complete transactions. In pursuing this purpose, we are mindful of a wide range of stakeholders, including, but not limited to, employees, customers, suppliers and business partners, and the communities in which we operate, as well as providing a return for shareholders that permits us to attract capital and further invest in the future.
StrategyOur number one strategic priority is the organic development of increasingly sophisticated information-based analytics and decision tools that deliver enhanced value to professional business customers across the industries that we serve. We aim to achieve leading positions in long-term global growth markets and leverage our skills, assets and resources across RELX, both to build solutions for our customers and to pursue cost efficiencies. We are systematically migrating all of our information solutions across RELX towards higher value-add decision tools, adding broader data sets, embedding more sophisticated analytics and leveraging more powerful technology, primarily through organic development. We are transforming our core business, building out new products and expanding into higher growth adjacencies and geographies.
We are supplementing this organic development with selective acquisitions of targeted data sets and analytics, and assets in high-growth markets that support our organic growth strategies and are natural additions to our existing business. Our products often account for less than 1% of our customers’ total cost base, but we can have a significant and positive impact on the economics of the remaining 99%. Our objective is to continue to enhance the value that we deliver to our customers and over time to keep the growth of our own total cost base below our rate of revenue growth on an underlying basis.
Values We operate in an open, honest and principled way as outlined in our Code of Ethics and Business Conduct and require our suppliers to meet the same standards. We believe in doing the ‘RIGHT’ thing: Respecting each other, Incorporating ethics into all our actions, Growing our business with integrity, Holding ourselves and each other accountable, and taking the Time to ask questions and report concerns.
CultureAs an information-based analytics and decision tool provider, our corporate culture is fact based, data-driven and analytical. We are transparent and non-political in our decision-making. We prioritise corporate responsibility and value acting with integrity, benefiting from inclusiveness and diversity and being passionate about remaining focused on customer outcomes. Our culture encourages community engagement and environmental responsibility.
Board leadershipIn line with the Board’s responsibility for overall strategic direction, strategy related issues are discussed at Board meetings. These regular discussions are supported by a dedicated annual strategy review process, which holistically assesses RELX’s strategic position and its key strategic options.
The Board routinely discusses potential opportunities for growth, including through its review of the Group’s products and markets during its strategy review. In addition, the Board frequently receives presentations from senior management leaders and RELX product specialists, during deep dives into the Group’s individual business units or other areas which are regarded as being of strategic importance.
Market segm
entsGovernance
Financial statements and
other information
Financial reviewCorporate Responsibility
Overview

72 RELX Annual report and financial statements 2019 | Governance
The Board plays a central role within our governance framework, which allows it to discharge its statutory duty under section 172 of the Act to promote the long-term sustainable success of RELX. Through the schedule of matters reserved for its decision making, the Board provides the Group with leadership, approves the annual budget ensuring that necessary resources are in place for the Company to meet its objectives, and sets and approves RELX’s strategy. It also sets supporting financial and non-financial targets, and the purpose, strategy, values and culture of the Group, as described in this report.
Also reserved for the Board’s decision-making are other matters which are deemed material to either the delivery of strategy, or RELX’s future financial performance. These include the approval of material acquisitions, major capital expenditure and investment, the Group’s financial statements and its dividend policy. The Board also approves RELX’s Operating and Governance Principles document, which serves as a first reference point for management, and explains the relationship between risk, internal policies and control procedures as they apply across the Group. Our control procedures follow the three lines of defence model as set out on page 82.
Our Committees support the Board in delivering the Group’s strategy. The work of the Remuneration Committee ensures that our executive and senior management teams are appropriately incentivised to deliver RELX’s strategic objectives, and also that the Group can retain its best talent to deliver these. Our Nominations Committee oversees that there is a healthy and diverse pipeline of talent in place for those positions deemed critical to strategy delivery. It also reviews the composition of the Board to ensure that it has the right balance of skills to set an effective strategy, provide appropriate levels of constructive challenge and oversight of management in implementing its delivery, and review performance against agreed objectives.
The Audit Committee, through reports from management, internal audit and the external auditor, provides independent assurance that business processes which underpin the delivery of our strategy operate as intended, are fit for purpose, and generate reliable management information. This ensures that decisions made by the Board in respect of strategy are taken on the basis of correct information and assumptions. The Audit Committee also reviews the process by which risks to the delivery of strategy are continuously monitored, assessed and mitigated.
The Board also has a major role in setting RELX’s values through its approval of the Code of Ethics, and ensuring that these support and are aligned with delivery of the approved strategy. It considers the Company’s key stakeholders in its decision-making, as set out on pages 74 to 78, and ensures that the Group’s workforce policies and practices support its long-term sustainable success. It also reviews, provides direction on and approves annually our extensive Corporate Responsibility programme, RE Cares. Further detail on our RE Cares programme, and the way in which it allows us to contribute to wider society, including through our Unique Contributions, is set out on pages 46 and 47.
Board induction and developmentThe Chair and the Company Secretary are responsible for ensuring that an effective induction programme takes place for all new Directors. Following appointment and as required, all Directors receive a full, formal and tailored induction, which is designed to meet individual requirements based on knowledge and experience. It includes meetings with members of the Group’s Executive Directors and Senior Management teams, and visits to the offices of the Group’s main business areas in order to understand how they operate. It also includes the provision of a comprehensive briefing pack which contains information on the Group’s businesses, as well as other information to assist the Directors in performing their duties.
External appointmentsThe Nominations Committee assesses the external commitments of each Board member to ensure that they have the time to properly fulfil the responsibilities to RELX which come with that position. When receiving recommendations from the Nominations Committee for the appointment of any new Non-Executive Director, the Board always takes into account other demands on a potential Director’s time. Following a review by the Nominations Committee, the Board has noted the changes in external appointments of the Non-Executive Directors during the year and does not perceive these to have any impact on their independence or responsibilities to the Company.
Non-Executive Director appointment letterAs a general rule, letters of appointment for Non-Executive Directors provide that, subject to annual re-election by shareholders, individuals will serve for an initial period of three years, and are typically expected to be available to serve for a second three-year period. If invited to do so, they may also serve for a third period of three years. The Non-Executive Director letter of appointment sets out the expected time commitment required by the Company from Non-Executive Directors. The notice period applicable to the Non-Executive Directors is one month.
Conflicts of interestThe Company’s Articles of Association allow the Board to review and authorise situations where a Director has an interest that conflicts, or may possibly conflict, with those of the Group, and further to impose any conditions on that authorisation. The Board has in place formal procedures for managing and authorising actual or potential conflicts of interest.
Board CommitteesThe governance framework also enables the Board to delegate a number of other responsibilities to its four principal Committees, allowing it time to focus on key matters. The responsibilities are set out within the Terms of Reference for each Committee, which can be found on our website at www.relx.com. The membership and activities of the Committees are described on pages 85 to 114.
Delegated Authorities There are additionally a number of approved delegated authorities in place from the Board to the Chief Executive Officer and other senior executives which relate principally to the day-to-day management of the business. The Executive Leadership team supports the Chief Executive Officer in the performance of his duties. Further delegated authorities and rules applicable to each Business Area are overlayed and approved at that level.

RELX Annual report and financial statements 2019 | Corporate Governance Review 73
The Board
Board Committees The structure of the Board’s four main Committees and a summary of their key responsibilities are set out below. Each Committee has its own Chair who reports back to the Board on its activities. Details on how these Committees have addressed their responsibilities are set out on pages 85 to 114. All of the Committees have written Terms of Reference, which are available on our website, www.relx.com.
Board Committees are principally supported by the Chief Executive Officer, Chief Financial Officer, Chief Legal Officer & Company Secretary, and the Chief Human Resources Officer, although senior managers within the Group are invited to attend meetings where appropriate. The Board’s annual programme and the agendas for the Committees are prepared by their respective Chairs with support from the Company Secretary.
Audit CommitteeResponsible for the oversight of financial reporting, risk management and internal control policies, and the effectiveness of the internal and external audit processes. The Committee comprises only independent Non-Executive Directors.
Remuneration CommitteeResponsible for approving the remuneration policy for, and setting the remuneration of, the Group’s Executive Directors, the Chair, and Senior Executives below Board level. The Committee comprises only Non-Executive Directors.
Nominations CommitteeResponsible for keeping under review the composition of the Board and its Committees; the recruitment of new Directors; ensuring orderly succession plans for both the Board and senior management; and reporting on the Board evaluation, and inclusion and diversity. The Committee comprises only Non-Executive Directors.
Corporate Governance CommitteeResponsible for developing and recommending corporate governance principles to the Board; reviewing ongoing developments and best practice in corporate governance, and monitoring the structure and operation of the Board Committees. The Committee comprises only Non-Executive Directors.
Report of the Audit Committee page 112
Directors’ Remuneration Report page 88
Report of the Nominations Committee page 85
The 2018 UK Corporate Governance Code We have explained the Board’s programme of activities for 2019 in more detail on pages 74 and 75. This programme was refreshed to ensure that it considered and addressed the requirements of the Code.
Our culture During the year, the Board reviewed and considered the Group’s culture, and was able to satisfy itself that it supported and was aligned with its purpose, strategy and values. In order to assist its assessment, the Board received a presentation from the Chief Human Resources Officer, which highlighted the role of the Code of Ethics in contributing to the culture of the Group, and summarised the metrics that RELX uses to monitor culture, including voluntary employee turnover and demographics by gender, tenure, age and wider diversity characteristics. It also confirmed that pay equity programmes were monitored to ensure that they aligned with RELX’s core pay philosophy. The Board reviewed and discussed the results of the most recent Group-wide employee opinion survey, and received feedback from the Group’s Workforce Engagement Director on employees’ views and perspectives regarding how the Group operates, including its activities and culture. Further detail on the Workforce Engagement Programme and its outcomes can be found on page 76.
The Board also received a presentation from the Chief Compliance Officer on workforce concerns submitted during the year in confidence. This provided the Board with oversight of the number and type of breaches of our values and required standards of conduct, as set out by the Board in the Code of Ethics.
Workforce Policies During the year, the Board placed a significant focus on its review of RELX’s approach to inclusion and diversity. Following a review of this area by both the Nominations Committee and the Board, updated inclusion and diversity policies, separately applicable to each of the Board and the rest of the Group, were approved. The Board also reviewed Workforce Policies relating to Reward, Flexible Working and Recruitment to ensure that these supported, encouraged and incentivised the workforce to adhere to and operate in accordance with the Group’s values. In 2020, as part of its annual programme, the Board will review Workforce Policies relating to promotion, retention, performance management and training & development. An explanation of the Company’s approach to investing in and rewarding its workforce can be found within the Corporate Responsibility Report on page 45.
Market segm
entsGovernance
Financial statements and
other information
Financial reviewCorporate Responsibility
Overview

74 RELX Annual report and financial statements 2019 | Governance
Directors’ duties and Section 172 StatementThe Directors of RELX PLC – and those of all UK companies – must act in accordance with their duties under the Companies Act 2006 (the Act). These include a fundamental duty to promote the success of the Company for the benefit of its members as a whole. This duty has been central to the Board’s decision-making processes and outcomes over many years. The information which follows on pages 74 to 78 describes how, in performing their duties during the year, the Directors have had regard to the matters set out in Section 172(1) (a) to (f) of the Act, and constitutes the Board’s Section 172 Statement for 2019. This section is incorporated by reference into the RELX 2019 Strategic Report.
Long-term decision-making (s.172)The Board delegates day-to-day management and decision-making to its senior management team, but it maintains oversight of the Company’s performance, and reserves to itself specific matters for approval, including significant new business initiatives. Then, by receiving regular updates on business programmes and objectives, the Board monitors that management is acting in accordance with agreed strategy. Processes are in place to ensure that the Board receives all relevant information to enable it to make well-judged decisions in support of the Company’s long-term success.
In 2019, the Board:
§§ Received presentations on the business areas and, through ongoing discussion with the business leaders and the Chief Strategy Officer, determined strategic priorities for a three year period, and the development of robust supporting operating plans. A two day Strategy Review was held in September 2019 to debate and determine a three-year strategy plan for the Group for 2020-2022
§§ Conducted an annual review of its invested capital and capital structure. This embraced financial performance, acquisitions history and prospects, net debt, target returns, credit ratings and forecasts, and financial market conditions. The Board also received regular updates on RELX’s capital position throughout the year and was able to ensure that appropriate and cost-effective financial instruments were put in place, as part of its Corporate Finance Strategy, to meet the long-term funding requirements of the Group
§§ Considered and approved a number of acquisition and disposal proposals. The Board only approves such a transaction if it is satisfied, after full consideration, that it meets the Section 172(1) requirement that it is most likely to promote the success of the Company for the benefit of its members as a whole, and it considers the value forecasted to be added to the Group by an acquisition, over a defined future period. This judgement is recorded. The Board also conducts an annual acquisition review process in which historical acquisitions are reviewed and the financial performance and strategic rationale for them revisited
§§ Approved comprehensive Treasury and Tax Policies and principles to support Company success and minimise risk over the long-term. When taken together with the setting of annual budgets and capital allocation, and its oversight of business performance against targets, this work enabled the Board to confirm the Company’s outlook for the year ahead, the going concern statement and its longer-term viability
§§ Reviewed Board and Senior Management succession, and the Remuneration Policy and plans for its Executive Directors and business leaders, to ensure that both short and longer-term incentives are aligned with Company and stakeholder interests, and Company values and culture. Internal talent reviews and career progression plans were shared with the Board, as were Workforce Engagement and inclusion and diversity policies and practices. All of these activities are intended to contribute to the development of a motivated and aligned workforce, the prospect of orderly succession and successful management and leadership capabilities for the future
§§ Agreed the Group’s principal risks, considered emerging risks and received regular risk management and internal control reviews throughout the year, including specific consideration of information and cyber security risk
Reputation for high standards of business conduct (s.172)The Board is responsible for developing a corporate culture across RELX which promotes integrity and transparency. It has established comprehensive systems of corporate governance, and approves policies and procedures which promote corporate responsibility and ethical behaviour. Central to these policies is the Group’s Code of Ethics. This was updated in 2018, applies to all Directors and employees, and is embedded into the Group’s operations.
In 2019, the Board:
§§ Received and endorsed a comprehensive report from the Global Head of Corporate Responsibility outlining activities throughout RELX designed to progress our unique contributions to society, strengthen governance and compliance, advance customer relationships, ensure an ethical supply chain and reach environmental targets. The Board also approved the Group’s annual Corporate Responsibility Report
§§ Approved the Company’s Modern Slavery Act Statement describing the steps it had taken to ensure that slavery and human trafficking were not taking place in the context of business carried out in 2019
§§ Approved, as part of the Annual Report and Accounts 2018 process, statements describing how the Company had applied the principles of the UK Corporate Governance Code during 2018, and indicating its full compliance with the provisions of the 2016 UK Corporate Governance Code
§§ Put in place actions to address the requirements of the 2018 UK Corporate Governance Code for 2019
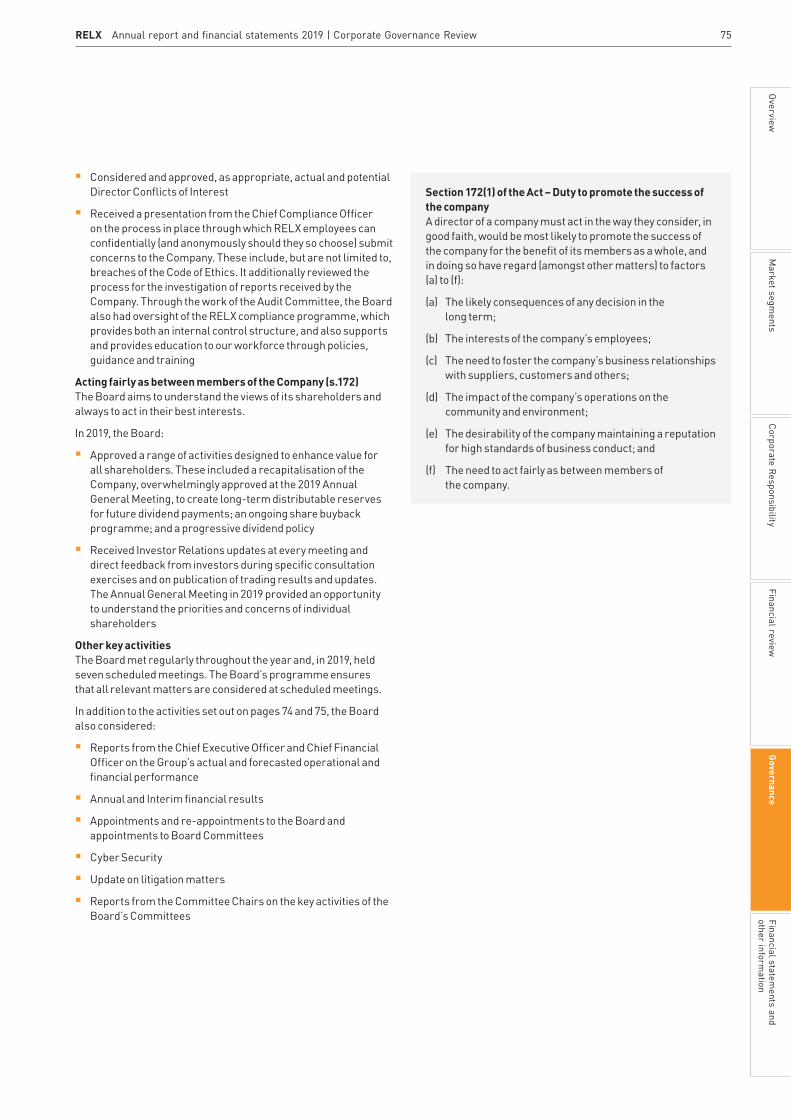
RELX Annual report and financial statements 2019 | Corporate Governance Review 75
§§ Considered and approved, as appropriate, actual and potential Director Conflicts of Interest
§§ Received a presentation from the Chief Compliance Officer on the process in place through which RELX employees can confidentially (and anonymously should they so choose) submit concerns to the Company. These include, but are not limited to, breaches of the Code of Ethics. It additionally reviewed the process for the investigation of reports received by the Company. Through the work of the Audit Committee, the Board also had oversight of the RELX compliance programme, which provides both an internal control structure, and also supports and provides education to our workforce through policies, guidance and training
Acting fairly as between members of the Company (s.172)The Board aims to understand the views of its shareholders and always to act in their best interests.
In 2019, the Board:
§§ Approved a range of activities designed to enhance value for all shareholders. These included a recapitalisation of the Company, overwhelmingly approved at the 2019 Annual General Meeting, to create long-term distributable reserves for future dividend payments; an ongoing share buyback programme; and a progressive dividend policy
§§ Received Investor Relations updates at every meeting and direct feedback from investors during specific consultation exercises and on publication of trading results and updates. The Annual General Meeting in 2019 provided an opportunity to understand the priorities and concerns of individual shareholders
Other key activities The Board met regularly throughout the year and, in 2019, held seven scheduled meetings. The Board’s programme ensures that all relevant matters are considered at scheduled meetings.
In addition to the activities set out on pages 74 and 75, the Board also considered:
§§ Reports from the Chief Executive Officer and Chief Financial Officer on the Group’s actual and forecasted operational and financial performance
§§ Annual and Interim financial results
§§ Appointments and re-appointments to the Board and appointments to Board Committees
§§ Cyber Security
§§ Update on litigation matters
§§ Reports from the Committee Chairs on the key activities of the Board’s Committees
Section 172(1) of the Act – Duty to promote the success of the companyA director of a company must act in the way they consider, in good faith, would be most likely to promote the success of the company for the benefit of its members as a whole, and in doing so have regard (amongst other matters) to factors (a) to (f):
(a) The likely consequences of any decision in the long term;
(b) The interests of the company’s employees;
(c) The need to foster the company’s business relationships with suppliers, customers and others;
(d) The impact of the company’s operations on the community and environment;
(e) The desirability of the company maintaining a reputation for high standards of business conduct; and
(f) The need to act fairly as between members of the company.
Market segm
entsGovernance
Financial statements and
other information
Financial reviewCorporate Responsibility
Overview

76 RELX Annual report and financial statements 2019 | Governance
Stakeholder engagement The Board recognises that relationships with RELX’s key stakeholders, including its investors, employees, customers, suppliers and the communities in which we operate, are important in allowing the Company to achieve its business aims. Engagement takes place with our stakeholders at all levels across RELX, and the size, diversity of our business and global nature of the Group means that it can take many different forms. Much of it takes place at an operational level, and this is especially true in respect of our customers and suppliers, with whom we deal in the ordinary course of business on a day-to-day basis. In addition to the activities set out on pages 76 to 78, in 2019 to help the organisation and the Board understand the issues that our stakeholders believe we should be focused on, we asked an external third party to test our ranking of 14 issues that we consider to be material with our stakeholders. The results of this engagement, which are seen by the Board and indicate that RELX is focusing on the right issues, are set out on page 8 of our 2019 Corporate Responsibility Report.
Stakeholder: InvestorsWhy effective engagement is important:
This helps investors to understand our strategy, performance and governance arrangements, and to make informed and effective investment decisions concerning RELX. It also makes clear our prioritisation of the long-term in our decision-making and focus on delivery of consistent financial performance.
How the Board ensures effective engagement with investors, understands their views and considered these in its discussions and decision-making in 2019:
RELX’s material communications to investors, such as its trading results and updates, other regulatory announcements, Annual Report and Accounts and Notice of Annual General Meeting must be reviewed and approved by the Board under our corporate governance framework. The Board also receives regular reports on investor engagement activities and outcomes from each of the Chief Executive Officer, Chief Financial Officer, Head of Investor Relations and Director of Corporate Responsibility. In 2019, these updates provided the Board with information arising from or relating to: the completion of investor roadshows; ad hoc interaction with institutional shareholders on significant issues; and ongoing dialogue with investors through our dedicated Investor Relations, Corporate Responsibility and Treasury teams, concerning our recent and proposed activities. The Board also received a full update from the Chair of the Remuneration Committee on the results of a consultation exercise with major investors concerning the proposed 2020 Directors’ Remuneration Policy, and had direct interaction with shareholders at the 2019 Annual General Meeting, at which it received their thoughts and views on Company performance.
During the year, the views of our investors informed Board discussions and decision-making in respect of its: approval of the quantum of the Company’s share buy back programme, dividend declarations and dividend policy; recommendation to shareholders to increase the distributable reserves of the Company through a capital reduction; approval of the RELX three-year strategy plan, priority order for the use of cash generated by the Group, and annual budgets and targets; and approval of the Group’s risk appetite. It also assisted the Board in recommending the proposed 2020 Directors’ Remuneration Policy be put to shareholders for approval at the Company’s 2020 AGM, and in respect of its approval of the Group’s 2019 annual and interim results announcements and reports.
Stakeholder: Employees Why effective engagement is important:
Our people are essential to our success, future growth, and our aim to build leading positions in long-term global growth markets. We continue to invest substantial time and effort to employ, train, develop and retain employees who are passionate about our markets and have up-to-date knowledge and world class expertise in our key functional areas. Hearing their views on what we do well, and what we can do better, is an important driver for improvement and retaining our best talent.
How the Board ensures effective engagement with employees, understands their views and considered these in its discussions and decision-making in 2019:
In accordance with the Code, the Board appointed Marike van Lier Lels as Workforce Engagement Director, with effect from 1 January 2019. In this role, and supported by the Chief Human Resources Officer, she has overseen the RELX Workforce Engagement Programme for 2019. During the year, she met with European, US and Asia-Pacific workforce representatives, and reported to the Board on engagement processes, outcomes and findings. A wide range of topics were discussed, which included employee views and perspectives on areas including pay and benefits, career development, training, inclusion and diversity, working environment, flexible working, corporate responsibility and the effectiveness and frequency of employee surveys. The Directors’ Remuneration Policy, in so far as it applies to the Executive Directors and how it aligns with broader workforce policies, was also discussed. As a result of the findings, the Board provided direction on providing employees with greater transparency on career development, and its review of flexible working policies and their implementation in 2020. Marike will continue the programme of engagement in 2020, which will be broadened to include her meeting with HR Business Leaders, Heads of Talent and Heads of Recruitment. Additionally in 2019, the Board also reviewed net promoter score survey results for individual business areas, and met and received presentations from Group employees in London, Atlanta and Amsterdam. As a regular item on its agendas, the Board received internal Group-wide communications to employees, and received an update from the Chief Compliance Officer on reports submitted by RELX employees, in confidence, on potential breaches of RELX approved policies or procedures.
The Board considered the information provided to it to assist in its discussions and decision-making in the following areas: its assessment and monitoring of RELX’s culture, and its alignment with our strategy, values and purpose; its discussion and approval of updated RELX Inclusion and Diversity Policies, applicable to each of the Board and the rest of the Group; its review and approval of RELX Workforce Policies in the areas of reward, recruitment and flexible working; and its approval of the proposed Workforce Engagement programme for 2020.

RELX Annual report and financial statements 2019 | Corporate Governance Review 77
Stakeholder: Customers Why effective engagement is important:
Our goal is to help customers make better decisions, get better results and be more productive. We can only do this by leveraging a deep understanding of their needs and views to create innovative solutions which combine content and data with analytics and technology in global platforms.
How the Board ensures effective engagement with customers, understands their views and considered these in its discussions and decision-making in 2019:
RELX’s engagement with its customers takes place mainly at an operational level within our business areas through face-to-face meetings, customer training and workshops, ongoing dialogue through dedicated sales and operations teams, customer relationship managers, and in respect of material customer issues, through our business area senior management teams. The Board received presentations throughout the year from these individuals, including a wide range of customer-facing employees and RELX product matter experts. These assisted the Board in maintaining and developing its understanding of current customer and market trends, issues and likely future needs, and how these could be addressed, during the two strategy discussion days held during the year, and several deep dive business reviews included in its 2019 annual agenda cycle.
In addition, the Board reviewed customer survey data to further inform its discussions and decision-making when reviewing, discussing and approving the RELX three-year strategy plan from 2020-2022 and the supporting 2020 budget, focused on migrating all of our information solutions across the Group towards higher value-add decision tools, adding broader data sets, embracing more sophisticated analytics and leveraging more powerful technology, primarily through organic development. Customer-related views, behaviours and profiles provided to the Board during the year as a result of its oversight of engagement in this area also assisted it when considering the approval of selective acquisitions of targeted data sets, analytics and assets in high-growth markets that support our organic growth strategies, and which are natural additions to our existing businesses. These included its approval of the acquisition of Mack Brooks Exhibitions by our Reed Exhibitions business, which expands its portfolio by more than 30 business-to-business events in 14 countries. Additionally, during the year, the Board approved the acquisition of ID Analytics, a provider of credit and fraud risk solutions for US$375m, which complements our existing fraud prevention services within Risk & Business Analytics. Combined with our existing strengths of verifying and authenticating physical and digital identities, our customers will benefit from an even more comprehensive approach to detecting and preventing fraud and managing risk.
Stakeholder: SuppliersWhy effective engagement is important:
We aim to be fair and ethical in dealings with our suppliers, pay them on agreed terms and be a collaborative and responsive partner.
How the Board ensures effective engagement with suppliers, understands their views and considered these in its discussions and decision-making in 2019:
The Board received a full update from the Global Head of Purchasing on the RELX Socially Responsible Supplier Programme (RSRSP), supporting risk management and audit processes, and associated targets. It was also provided with detail on feedback from surveys completed by our suppliers on how RELX supports them in meeting their obligation to comply with our defined standards and principles as set out in our Supplier Code of Conduct, the ongoing roll-out of our supplier diversity programme, and on supplier forums and meetings held to enhance our supplier interactions and support the development of innovation and efficiencies in our relationships. This information assisted the Board in its review of RSRSP targets for 2020. The Board received an update from the Director of Corporate Responsibility on further Group engagement with suppliers, as part of its review and approval of the annual RELX Modern Slavery Act Statement.
Market segm
entsGovernance
Financial statements and
other information
Financial reviewCorporate Responsibility
Overview

78 RELX Annual report and financial statements 2019 | Governance
Stakeholder: Community Why effective engagement is important:
Contributing to our local and global communities is a responsibility and an opportunity. Our employees feel passionately about supporting scientific research throughout the scientific community and advancing the rule of law throughout the global community. Our commitments help us to be an employer of choice.
How the Board ensures effective engagement with the community, understands its views and considered these in its discussions and decision-making in 2019:
The Company’s engagement with the community is completed primarily through our annual RE Cares programme, by which our businesses pursue Corporate Responsibility activities that maximise RELX’s positive impact on society through its Unique Contributions, which include fostering communities. The Board receives an update on the RE Cares programme, and our engagement with the communities in which we operate, from the Director of Corporate Responsibility. This included detail on our UN Sustainable Development Goals (SDG) Resource Centre, participation in UN SDG Action Platforms, and engagement processes through which RELX individuals serve on the boards of UN Global Compact networks in the UK and the Netherlands. The Board was also provided with an overview of the materials provided on the corporate responsibility section of our website, and received updates on our involvement and participation in corporate responsibility forums, initiatives and workshops through our dedicated team and network of 240 RE Cares Champions across our businesses, who ensure the vibrancy of our engagement with the community.
Attendance at meetings of the Board and Board Committees The table below shows the attendance of Directors at meetings of the Board and its Committees during the year. Attendance is expressed as the number of meetings attended out of the number eligible to be attended.
DirectorCommittee
appointments Board (1) Audit Remuneration NominationsCorporate
Governance
Anthony Habgood (Chair) R N C 7/7 – 3/3 4/4 6/6
Board Committee membership keyA AuditR RemunerationN NominationsC Corporate Governance
Committee Chair
Erik Engstrom – 7/7 – – – –Nick Luff – 7/7 – – – –Wolfhart Hauser R N C 7/7 – 3/3 4/4 6/6Adrian Hennah A N C 7/7 4/4 – 4/4 6/6Marike van Lier Lels (2) A N C 6/7 1/2 – 3/4 5/6Robert MacLeod (3) R N C 7/7 – 3/3 1/1 6/6Carol Mills (4) A C 2/2 1/1 – – 2/2Linda Sanford R C 7/7 – 3/3 – 6/6Ben van der Veer (4) C 2/2 – – – 2/2Andrew Sukawaty (5) A C 5/5 3/3 – – 4/4Suzanne WoodCharlotte Hogg (6)
A CC
7/7–
4/4–
––
––
6/6–
(1) In addition to the seven scheduled meetings, serving Directors also attended two full-day strategy and business review meetings.(2) Ms van Lier Lels stepped down as a member of the Audit Committee on 6 June 2019, to focus on her responsibilities as Workforce Engagement Director. She was unable to
attend the February Board and Committee meetings due to unforeseen personal circumstances. (3) Robert MacLeod was appointed to the Nominations Committee on 25 September 2019.(4) Ms Mills and Mr van der Veer each stepped down as a member of the Board on 25 April 2019. Ms Mills also stepped down as a member of the Audit Committee from that time. (5) Andrew Sukawaty was appointed as a member of the Board and Corporate Governance Committee on 25 April 2019, and as a member of the Audit Committee with effect
from 6 June 2019.(6) Charlotte Hogg was appointed to the Board with effect from 16 December 2019. Therefore, she did not attend any Board or Committee meetings during the year.
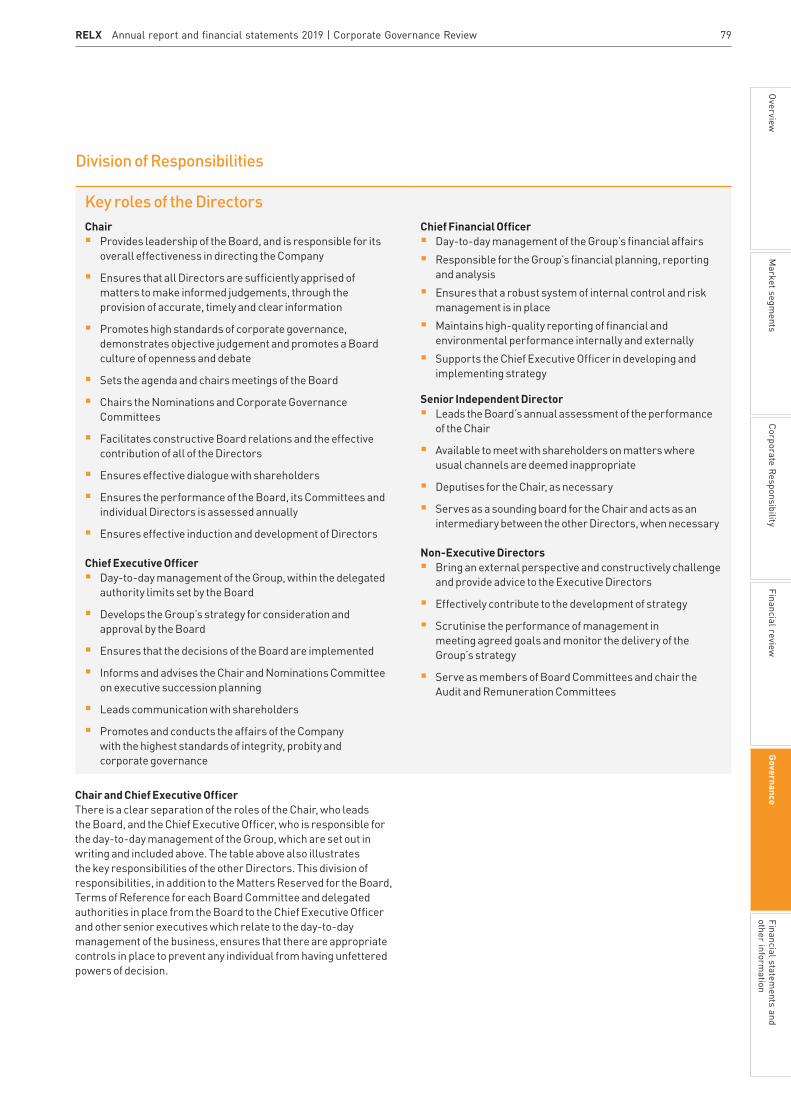
RELX Annual report and financial statements 2019 | Corporate Governance Review 79
Division of Responsibilities
Key roles of the DirectorsChair§§ Provides leadership of the Board, and is responsible for its
overall effectiveness in directing the Company
§§ Ensures that all Directors are sufficiently apprised of matters to make informed judgements, through the provision of accurate, timely and clear information
§§ Promotes high standards of corporate governance, demonstrates objective judgement and promotes a Board culture of openness and debate
§§ Sets the agenda and chairs meetings of the Board
§§ Chairs the Nominations and Corporate Governance Committees
§§ Facilitates constructive Board relations and the effective contribution of all of the Directors
§§ Ensures effective dialogue with shareholders
§§ Ensures the performance of the Board, its Committees and individual Directors is assessed annually
§§ Ensures effective induction and development of Directors
Chief Executive Officer§§ Day-to-day management of the Group, within the delegated
authority limits set by the Board
§§ Develops the Group’s strategy for consideration and approval by the Board
§§ Ensures that the decisions of the Board are implemented
§§ Informs and advises the Chair and Nominations Committee on executive succession planning
§§ Leads communication with shareholders
§§ Promotes and conducts the affairs of the Company with the highest standards of integrity, probity and corporate governance
Chief Financial Officer§§ Day-to-day management of the Group’s financial affairs§§ Responsible for the Group’s financial planning, reporting
and analysis§§ Ensures that a robust system of internal control and risk
management is in place§§ Maintains high-quality reporting of financial and
environmental performance internally and externally§§ Supports the Chief Executive Officer in developing and
implementing strategy
Senior Independent Director§§ Leads the Board’s annual assessment of the performance
of the Chair
§§ Available to meet with shareholders on matters where usual channels are deemed inappropriate
§§ Deputises for the Chair, as necessary
§§ Serves as a sounding board for the Chair and acts as an intermediary between the other Directors, when necessary
Non-Executive Directors§§ Bring an external perspective and constructively challenge
and provide advice to the Executive Directors
§§ Effectively contribute to the development of strategy
§§ Scrutinise the performance of management in meeting agreed goals and monitor the delivery of the Group’s strategy
§§ Serve as members of Board Committees and chair the Audit and Remuneration Committees
Chair and Chief Executive OfficerThere is a clear separation of the roles of the Chair, who leads the Board, and the Chief Executive Officer, who is responsible for the day-to-day management of the Group, which are set out in writing and included above. The table above also illustrates the key responsibilities of the other Directors. This division of responsibilities, in addition to the Matters Reserved for the Board, Terms of Reference for each Board Committee and delegated authorities in place from the Board to the Chief Executive Officer and other senior executives which relate to the day-to-day management of the business, ensures that there are appropriate controls in place to prevent any individual from having unfettered powers of decision.
Market segm
entsGovernance
Financial statements and
other information
Financial reviewCorporate Responsibility
Overview
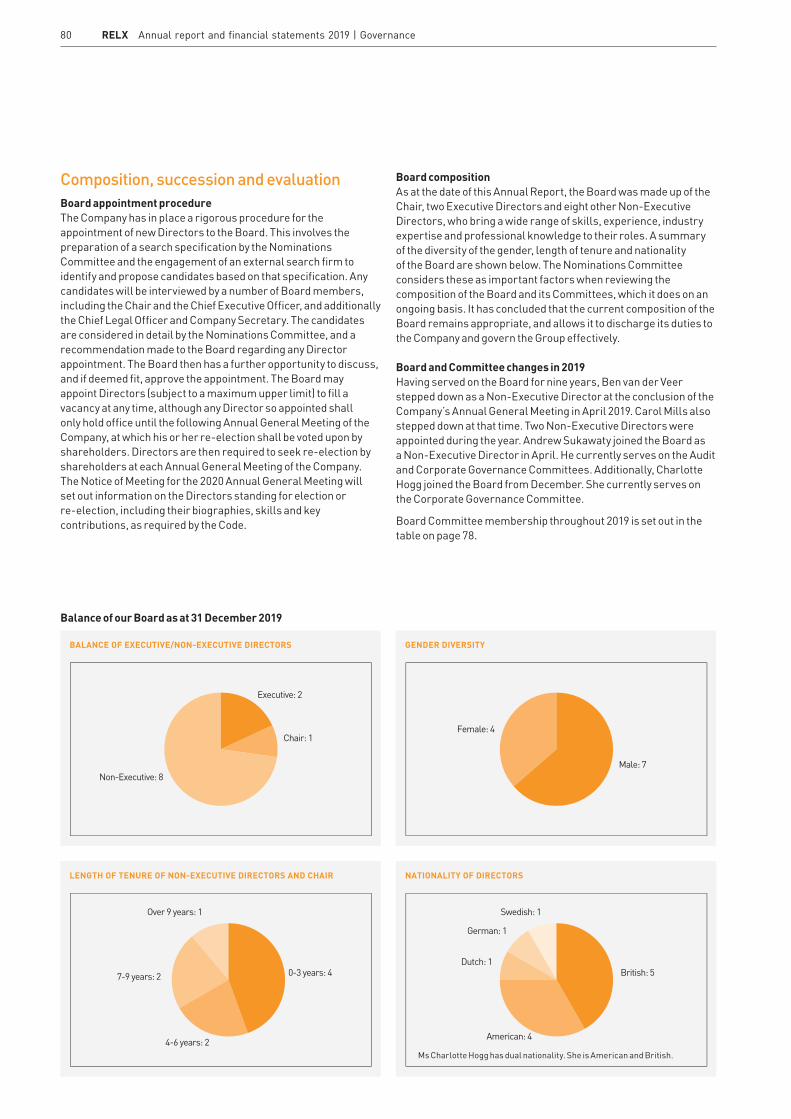
80 RELX Annual report and financial statements 2019 | Governance
Composition, succession and evaluation Board appointment procedureThe Company has in place a rigorous procedure for the appointment of new Directors to the Board. This involves the preparation of a search specification by the Nominations Committee and the engagement of an external search firm to identify and propose candidates based on that specification. Any candidates will be interviewed by a number of Board members, including the Chair and the Chief Executive Officer, and additionally the Chief Legal Officer and Company Secretary. The candidates are considered in detail by the Nominations Committee, and a recommendation made to the Board regarding any Director appointment. The Board then has a further opportunity to discuss, and if deemed fit, approve the appointment. The Board may appoint Directors (subject to a maximum upper limit) to fill a vacancy at any time, although any Director so appointed shall only hold office until the following Annual General Meeting of the Company, at which his or her re-election shall be voted upon by shareholders. Directors are then required to seek re-election by shareholders at each Annual General Meeting of the Company. The Notice of Meeting for the 2020 Annual General Meeting will set out information on the Directors standing for election or re-election, including their biographies, skills and key contributions, as required by the Code.
Board compositionAs at the date of this Annual Report, the Board was made up of the Chair, two Executive Directors and eight other Non-Executive Directors, who bring a wide range of skills, experience, industry expertise and professional knowledge to their roles. A summary of the diversity of the gender, length of tenure and nationality of the Board are shown below. The Nominations Committee considers these as important factors when reviewing the composition of the Board and its Committees, which it does on an ongoing basis. It has concluded that the current composition of the Board remains appropriate, and allows it to discharge its duties to the Company and govern the Group effectively.
Board and Committee changes in 2019Having served on the Board for nine years, Ben van der Veer stepped down as a Non-Executive Director at the conclusion of the Company’s Annual General Meeting in April 2019. Carol Mills also stepped down at that time. Two Non-Executive Directors were appointed during the year. Andrew Sukawaty joined the Board as a Non-Executive Director in April. He currently serves on the Audit and Corporate Governance Committees. Additionally, Charlotte Hogg joined the Board from December. She currently serves on the Corporate Governance Committee.
Board Committee membership throughout 2019 is set out in the table on page 78.
BALANCE OF EXECUTIVE/NON-EXECUTIVE DIRECTORS
Non-Executive: 8
Executive: 2
Chair: 1
GENDER DIVERSITY
Male: 7
Female: 4
LENGTH OF TENURE OF NON-EXECUTIVE DIRECTORS AND CHAIR
7-9 years: 2
Over 9 years: 1
0-3 years: 4
4-6 years: 2
NATIONALITY OF DIRECTORS
Dutch: 1
German: 1
Swedish: 1
American: 4
British: 5
Balance of our Board as at 31 December 2019
Ms Charlotte Hogg has dual nationality. She is American and British.

RELX Annual report and financial statements 2019 | Corporate Governance Review 81
Board skills and expertiseThe Board collectively has a diverse range of skills, including in the following areas:
§§ Corporate Governance for listed companies
§§ Corporate Strategy and Organisation
§§ Operational experience in the Group’s product markets
§§ Executive Board member and leadership experience in large international listed companies
§§ Corporate Responsibility, Human resources management and executive remuneration
§§ Financial Expertise
For further information on the skills of each individual director, please see pages 8 to 10 of the Notice of Meeting for our 2020 Annual General Meeting.
Board information and support All Directors have complete and timely access to the information required to discharge their responsibilities fully and effectively. They have access to the services of the Company Secretary, who is responsible for the accurate and timely flow of information to the Board, advising the Board on all corporate governance matters, and ensuring that all Board procedures are followed correctly.
The Directors also have access to other members of the Group’s management, staff and external advisers, and may take independent professional advice in the furtherance of their duties, at the Company’s expense. Each of the Directors is expected to attend all meetings of the Board and Committees of which they are a member.
Where a Director is unable to attend a Board or Committee meeting, they are provided with the papers relating to that meeting and are able to discuss issues arising with the respective Chair and other Board and Committee members. They are also provided with a copy of the meeting minutes.
Board evaluationThe Directors consider the evaluation of the Board, its Committees and members to be an important aspect of corporate governance. The Board undertakes an annual evaluation of its own effectiveness and performance, and that of its Committees and individual Directors. In 2019, an internal evaluation was completed, supported by the Company Secretary. Using questionnaires completed by all Directors, key areas were explored including: Board composition; Board succession planning; Board and Group diversity; the performance of the Board and Committees and their effectiveness in achieving objectives and fulfilling their terms of reference; talent management and executive leadership succession; setting the Group’s culture; risk management, corporate governance and compliance; quality of information provided by management; and stakeholder engagement including the Board’s understanding and visibility of the views of the Group’s stakeholders, and incorporation of them into the Board’s decision-making process.
The Chair conducted interviews with each of the Directors. The review of the performance of the Chair was led by the Senior Independent Director. The Chair was not present during the discussion among the Non-Executive Directors relating to his performance. The conclusions of the full evaluation were initially reviewed by the Nominations Committee, with a particular focus on Board composition, succession and diversity. The Board then received an update from the Nominations Committee which it had a further opportunity to discuss and, where appropriate, provide direction on.
Conclusions of the 2019 evaluationThe evaluation confirmed that, overall, the Directors believe that the Board and each of its Committees continue to function effectively in achieving objectives and fulfilling their responsibilities, and that each Director continues to contribute effectively. Directors believe that the Board has the right blend of experience, skills and diversity in the context of the challenges currently facing the Group. The evaluation also confirmed that the Board believes it has adequately addressed the new requirements of the Code, especially with regards to its involvement in the setting and maintenance of the Group’s culture, its understanding and visibility of the views of the Group’s key stakeholders, and its incorporation of those views into the Board’s decision-making process. The Board noted that the feedback received and communicated from its Workforce Engagement Director had increased this visibility. It recognised that the Group needs to keep assessing its responsibilities to the Group’s key stakeholders, and that whilst it consistently considered their views, further visibility of the views of the Group’s suppliers should be incorporated into the Board’s agenda for 2020.
All Directors commended the Chair and his effective leadership of the Board, noting amongst other things that he facilitates: (i) the effective contribution of each Non-Executive Director, and (ii) the development of constructive relationships and communications within the Board. The Board also highlighted the importance of the leadership provided by the Chair, both to the Board to provide it with a strong culture, and alongside the Chief Executive Officer, to the wider organisation over the previous ten-year period, including during the period of corporate governance change following the corporate simplification in September 2018.
The Nominations Committee determined and recommended to the Board that its composition remained appropriate, and that the evaluation would not in itself result in any membership changes outside of the normal controlled and structured evolution of the Board over time.
Audit, Risk and Internal ControlInternal control and risk management RELX has established internal controls and risk management practices that are embedded into the operations of the businesses, based on the Internal Control Integrated Framework (2013) issued by the Committee of Sponsoring Organisations of the Treadway Commission. Details of the principal and emerging risks facing the Group and how these are mitigated are set out on pages 58 to 61.
Market segm
entsGovernance
Financial statements and
other information
Financial reviewCorporate Responsibility
Overview

82 RELX Annual report and financial statements 2019 | Governance
Additionally, in order to provide reasonable assurance against material inaccuracies or loss, and on the effectiveness of the systems of internal control and risk management, RELX has adopted the three lines of defence assurance model as set out below.
Syst
em of
Inte
rnal
Con
trol
1st line of defenceRELX businesses maintain systems of internal control which are appropriate to the nature and scale of their activities and address all significant strategic, operational, financial and legal compliance risks that they face
2nd line of defenceCentral functions that are responsible for 1) designing policies, 2) introducing and sharing best practice, 3) monitoring and evaluating compliance with RELX policies and relevant legislation and regulation and appropriate remediation
RELX
Ope
ratin
g an
d Go
vern
ance
Prin
ciple
s
3rd line of defenceInternal audit provides independent assurance on the effectiveness of the 1st and 2nd lines of defence
The Board and Audit Committee
Note: In addition to RELX’s internal controls, RELX is also audited externally. The report of the external auditor has been included from pages 120 to 127.
The Board has adopted a schedule of matters which are required to be brought to it for decision. The Board is responsible for the system of risk management and internal control of RELX and has implemented an ongoing process for identifying, assessing, monitoring and managing the principal and emerging risks faced by its businesses. This process was in place throughout the year ended 31 December 2019, and up to the date of approval of the Annual Report and Financial Statements 2019. The Board monitors these systems of internal control and risk management and annually carries out a review of their effectiveness.
RELX has an established framework of procedures and internal control, with which the management of each business is required to comply. RELX operates authorisation and approval processes throughout all of its operations. Access controls exist where processes have been automated to ensure the security of data. Management information systems have been developed to identify risks and to enable assessment of the effectiveness of the systems of internal control.
RELX has a Code of Ethics and Business Conduct that provides a guide for achieving its business goals and requires officers and employees to behave in an open, honest, ethical and principled manner. The Code of Ethics also outlines confidential procedures enabling employees to report any concerns about compliance, or about the Group’s financial reporting practice. The Code of Ethics is available on our website at www.relx.com.
Each business area has identified and evaluated its principal and emerging risks, the controls in place to manage those risks and the levels of residual risk accepted. Risk management and control
procedures are embedded into the operations of the business and include the monitoring of progress in areas for improvement that come to management and Board attention.
Principal and emerging risks facing RELX businesses are regularly reported to and assessed by the Board and Audit Committee. With the close involvement of business management and central functions, the risk management and control procedures ensure that RELX is managing its business risks effectively and in a coordinated manner across the businesses with clarity on the respective responsibilities and interdependencies. Litigation, and other legal and regulatory matters, are managed by legal directors in the businesses.
The risk assessment included consideration of emerging risks and risk appetite. RELX defines emerging risks as new or changing risks which are highly uncertain in terms of defining impact or likelihood and are more usually external to RELX. In line with the Code, the risk assessment identifies and considers the likelihood and impact of emerging risks on our business models, future performance, solvency, liquidity or reputation. The assessment also considers the need for mitigation of emerging risks. Risk appetite (defined as RELX’s willingness to take on risk) is based on an assessment of the level of residual risk, taking account of inherent risk and mitigation efforts. The assessment is rated, in relation to RELX’s objectives for the current level of residual risk, in three broad categories: reduce, accept and willing to extend. The level of residual risk which RELX is prepared to accept will vary, with a high level of mitigation effort over operational, financial and compliance risks. The residual risk level for external and strategic risks may be extended if doing so is in line with RELX’s strategic objectives, values and stakeholder interests and if shareholder returns could be increased.
The Audit Committee also receives regular reports from both internal and external auditors on internal control and risk management matters. In addition, each business area is required, at the end of the financial year, to review the effectiveness of internal controls and risk management and report its findings on a detailed basis to the management of RELX. These reports are summarised and, as part of the annual review of effectiveness, submitted to the Audit Committee. The Chair of the Audit Committee reports to the Board on any significant internal control matters arising.
Annual reviewAs part of the year-end procedures, the Audit Committee and Board reviewed the effectiveness of the systems of internal control and risk management during the 2019 financial year. The objective of these systems of internal control and risk management is to manage, rather than eliminate, the risk of failure to achieve business objectives. Accordingly, they can only provide reasonable, but not absolute, assurance against material mis-statement or loss. The Board has confirmed, subject to the above, that as regards financial reporting risks, the respective risk management and control systems provide reasonable assurance against material inaccuracies or loss and have functioned properly throughout the year. In accordance with the Code, the Board has also considered the Group’s long-term viability, following a robust and thorough assessment of its principal and emerging risks. The resulting Viability Statement is set out on page 84.

RELX Annual report and financial statements 2019 | Corporate Governance Review 83
Responsibilities in respect of financial statementsThe Directors are required to prepare financial statements as at the end of each financial period, in accordance with applicable laws and regulations, which give a true and fair view of the state of affairs, and of the profit or loss, of the Company and its subsidiaries, joint ventures and associates. They are responsible for maintaining proper accounting records, for safeguarding assets and for taking reasonable steps to prevent and detect fraud and other irregularities.
The Directors are also responsible for selecting suitable accounting policies and applying them on a consistent basis, and making judgements and estimates that are prudent and reasonable. Applicable accounting standards have been followed and the RELX consolidated financial statements, which are the responsibility of the Directors of the Company, are prepared using accounting policies which comply with International Financial Reporting Standards as issued by the International Accounting Standards Board and as adopted by the European Union. Having taken into account all of the matters considered by the Board and brought to the attention of the Board, the Directors are satisfied that the Annual Report and Financial Statements, taken as a whole, is fair, balanced and understandable, and provides the information necessary for shareholders to assess the Group’s position and performance, business model and strategy.
Going ConcernThe Directors, having made appropriate enquiries, consider that adequate resources exist for the Group to continue in operational existence for the foreseeable future and that, therefore, it is appropriate to adopt the going concern basis in preparing the 2019 financial statements. In reaching these conclusions, the Directors have had due regard to the Group’s financial position as at 31 December 2019, the strong free cash flow of the Group, the Group’s ability to access capital markets and the principal risks facing the Group. A commentary on the Group’s cash flows, financial position and liquidity for the year ended 31 December 2019 is set out in the Chief Financial Officer’s report on pages 54 to 57. This shows that after taking account of available cash resources and committed bank facilities that back up short-term borrowings, all of the Group’s borrowings that mature in the next twelve months can be covered. The Group’s policies on liquidity, capital management and management of risks relating to interest rate, foreign exchange and credit exposures are set out on pages 157 to 162. The principal risks and emerging risks facing the Group are set out on pages 58 to 61.
US certificatesAs required by Section 302 of the US Sarbanes-Oxley Act 2002 and by related rules issued by the US Securities and Exchange Commission (the Commission), the Chief Executive Officer and Chief Financial Officer of the Company certify in the Annual Report 2019 on Form 20-F to be filed with the Commission that they are responsible for establishing and maintaining disclosure controls and procedures and that they have:
§§ designed such disclosure controls and procedures to ensure that material information relating to the Group is made known to them
§§ evaluated the effectiveness of the Group’s disclosure controls and procedures
§§ based on their evaluation, disclosed to the Audit Committee and the external auditors all significant deficiencies in the design or operation of disclosure controls and procedures and any frauds, whether or not material, that involve management or other employees who have a significant role in the Group’s internal controls
§§ presented in the Annual Report 2019 on Form 20-F their conclusions about the effectiveness of the disclosure controls and procedures
A Disclosure Committee, comprising the Company Secretary and other senior managers of the Group, provides assurance to the Chief Executive Officer and Chief Financial Officer regarding their Section 302 certifications.
Section 404 of the US Sarbanes-Oxley Act 2002 requires the Chief Executive Officer and Chief Financial Officer of the Company to certify in the Annual Report 2019 on Form 20-F that they are responsible for maintaining adequate internal control structures and procedures for financial reporting and to conduct an assessment of their effectiveness. The conclusions of the assessment of internal control structures and financial reporting procedures, which are unqualified, are presented in the Annual Report 2019 on Form 20-F.
Annual General MeetingAll holders of RELX PLC ordinary shares may attend the Company’s Annual General Meeting (AGM) in April 2020. The AGM provides an opportunity for the Board to communicate with individual shareholders, and for shareholders to provide their views on the performance and progress of the Group. The Chairman, the Chief Executive Officer, the Chief Financial Officer, the Chairs of the Board Committees, other Directors and a representative of the external auditors are available to answer questions from shareholders. The Chief Executive also presents a review of the key business developments during the year. The Company offers electronic voting facilities in relation to proxy voting at shareholder meetings. Details of proxy voting by shareholders, including votes withheld, are given at the AGM and then posted on our website following the AGM.
Market segm
entsGovernance
Financial statements and
other information
Financial reviewCorporate Responsibility
Overview

84 RELX Annual report and financial statements 2019 | Governance
Viability statementThe Code requires Directors to assess the prospects of the Group over a period significantly longer than twelve months and to state whether they have a reasonable expectation that the Company will be able to continue in operation and meet its liabilities as they fall due over the period of their assessment.
Assessing the Group’s prospectsThe Group develops information-based analytics and decision tools for professional and business customers in the Scientific, Technical & Medical, Risk and Business Analytics, Legal and Exhibitions sectors. The Group has leading positions in long-term growth markets, deep customer understanding and has developed innovative solutions that often account for about 1% of our customers’ cost base but can have a significant and positive impact on the economics of the remaining 99%. Having effectively transitioned the business from print to digital, the Group is systematically migrating its information solutions toward higher value-add decision tools, adding broader data sets, embedding more sophisticated analytics and leveraging more powerful technology. We believe this evolution is improving our business profile and positions the Group for future business success.
The Group’s prospects are assessed through the annual strategy planning process. This process includes a review of assumptions made and assesses each business area’s longer-term plan. The resulting three-year strategy plan forms the basis for Group and divisional targets and in-year budgets. Objectives are set with consideration given to the economic and regulatory environment, and to customer trends, as well as incorporating risks and opportunities. The most recent three-year strategy business plan was agreed by the Directors in September 2019.
In assessing the Group’s prospects, our current position and principal risks are considered as follows:
Current position and business model§§ Diversified business in terms of sectors, markets,
customers, geographies and products and services so that we are not dependent on any one business, customer, region or product§§ High percentage of subscription and recurring revenue streams§§ Leading positions in long-term global growth markets§§ Low working capital and capital investment requirements
leading to high levels of cash generation§§ Clear strategy focused on organic growth supplemented by
selective acquisitions in higher growth areas§§ Continued development of increasingly sophisticated
information-based analytics and decision tools§§ Expansion into higher growth adjacencies and geographies
primarily through organic investment augmented with selective acquisitions
Further details on our strategy and 2019 progress are on pages 4 and 5.
Principal risks related to our business model§§ Challenges to the intellectual property rights of content
embedded in our products and services§§ Disruption or loss of data sources that our businesses rely
on due to regulation or other reasons§§ Changes to the paid subscription model for our primary
research business within Scientific, Technical and Medical§§ Technological failure of our electronic platforms and networks
§§ Failure of our cyber security measures resulting in unauthorised access to our systems and breach of data privacy
Detailed descriptions of all principal and emerging risks and mitigations are on pages 58-61
Assessing the Group’s viability The three-year strategy plan for our businesses includes management’s assessment of the anticipated operational risks affecting the business and assumes that current economic conditions broadly persist, financing will be available on similar terms to those negotiated recently and interest rates will follow market expectations. Management then considers the viability of the business should unexpected events, linked to the principal and emerging risks, occur. To first make the assessment, the financial impact of each principal risk on revenue and cashflow is estimated. Owing to the diversified nature of the Group, no individual risk was estimated to have an impact necessary for a breach in the Group’s $3.0bn committed bank facility, broadly estimated at one third of total Group cashflow assuming no mitigating actions.
The assessment then considers various stress-test scenarios under which multiple risks occur simultaneously accompanied by an inability to access the debt capital markets to refinance scheduled liabilities as they become due, together with an increase in interest rates faster than currently expected. The resulting analysis, which assumes share buybacks and acquisition activity are suspended but dividends continue uninterrupted, then considers the impact on available headroom and whether any scenario results in breaching the covenant in the committed bank facility.
The worst-case stress case modelled a combination of the following risks: (a) the inability to use certain third-party data resources; (b) an adverse impact on revenue from a shift away from the paid subscription model; and (c) having our systems disrupted by a cyber security event. The analysis concluded that with the simultaneous occurrence of these three risks, no access to the debt capital markets and a rising interest rate environment, the Group would still have sufficient funds to trade, settle its liabilities as they come due and remain compliant with the covenant in its committed bank facility, whilst still paying dividends.
In addition to scenario modelling, the Directors bi-annually review the Group’s principal risks, assess the likelihood and impact of each risk together with the effectiveness of mitigating controls, and consider emerging risks. The Directors also receive regular updates from management on treasury, tax, acquisitions and divestments, and significant risk areas including information security, technology and legal and regulatory matters. Finally, separate from the annual strategy plan, the Directors periodically receive updates from business area management on their operations, prospects and risks. Whilst these reviews and discussions naturally focus more closely on the quantifiable risks facing the business within the three-year planning period, they also cover longer-term risks.
As a result of stress-testing the three-year strategy plan, supported by regular reviews of risk during the year, the Directors confirm that they have a reasonable expectation that the Group will be able to continue its operations and meet its liabilities as they fall due over the next three years and are not aware of any longer-term operational or strategic risks that would result in a different outcome from the three-year review.
Viability statement

85
This report has been prepared by the Nominations Committee and has been approved by the Board.
MembershipThe Committee comprises only Non-Executive Directors. The members of the Committee who served during the year were:
§§ Sir Anthony Habgood (Chair of the Committee)
§§ Wolfhart Hauser
§§ Adrian Hennah
§§ Marike van Lier Lels
§§ Robert Macleod (from 25 September 2019)
ResponsibilitiesThe principal purpose of the Committee is to provide assistance to the Board by identifying individuals qualified to become Directors and recommending to the Board the appointment of such individuals.
The role and responsibilities of the Committee are set out in written Terms of Reference and are available on the company’s website at www.relx.com. These include:
§§ to keep under review the size and composition of the Board
§§ to ensure that plans are in place for orderly Board and Senior Management succession and to oversee a diverse pipeline for such succession
§§ to agree the specification for the recruitment of new Directors
§§ to procure the recruitment of new Directors
§§ to recommend to the Board the appointment of candidates as RELX PLC Directors
§§ to recommend Directors to serve on the Committees of the Board and to recommend members to serve as the Chair of those Committees
§§ to make recommendations to the Board in relation to the re-appointment of any Non-Executive Director at the conclusion of his/her specified term of office and the election or re-election of Directors by shareholders
§§ to review and make recommendations to the Board on the authorisation of Directors’ conflicts of interest, including any terms to be imposed in relation to a Director’s conflict of interest
Activities of the Committee During the year, the Committee met four times and its main areas of focus were:
§§ the continued appointment of Sir Anthony Habgood as Chair, considering amongst other things, the Code provision related to the length of tenure for that role
§§ the re-appointments of Wolfhart Hauser and Robert MacLeod at the conclusion of their specified terms of office
§§ the impact on Board composition and balance, and Board Committee membership, of the retirements of Ben van der Veer and Carol Mills as Non-Executive Directors
§§ the appointment of Charlotte Hogg as an independent Non-Executive Director
§§ a review of the composition of the Audit and Nominations Committees resulting in the following changes: appointments of Andrew Sukawaty as a member of the Audit Committee and Robert MacLeod as a member of the Nominations Committee; and Marike van Lier Lels stepping down as a member of the Audit Committee in order to allow her sufficient time to focus on her responsibilities as Workforce Engagement Director
§§ a review of RELX’s approach to inclusion and diversity, both at Board level and across the Group, including progress made against objectives, and of the updated Inclusion and Diversity Policy
§§ succession planning for Board and Senior Management roles
§§ ongoing review of Directors’ actual and potential conflicts of interest and the recommendation to the Board of the suitability of Directors’ external non-executive director appointments
§§ a review of the Committee’s Terms of Reference which now reflect the increased remit of the Committee under the Code
§§ the continued independence of Adrian Hennah as a Non-Executive Director in advance of nine years of service in April 2020, and its possible impact on Board and Committee membership
Role of the Nominations Committee The Nominations Committee is responsible for ensuring that the Board, its Committees and RELX’s senior management have the correct balance of skills, knowledge and experience, to effectively lead the Group both now, and over the longer term. This is achieved through effective succession planning and talent development, and an understanding of the changing competencies required to support the Company’s strategy, purpose, culture and values.
Report of the Nominations Committee
Market segm
entsGovernance
Financial statements and
other information
Financial reviewCorporate Responsibility
Overview
RELX Annual report and financial statements 2019

86 RELX Annual report and financial statements 2019 | Governance
Board ChangesWhen reviewing Board composition, the Committee considers (amongst other things) overall length of service and the need for membership to be regularly refreshed. The Company has in place a formal, rigorous and transparent procedure for the appointment of new Directors. In advance of the retirement of Carol Mills from the Board with effect from the 2019 Annual General Meeting, the Committee started a search process. This involved the preparation of a specification and the engagement of the independent global search firm, Russell Reynolds Associates (which has no other connection to RELX), to identify and propose Non-Executive Director candidates based on that specification. During the process, all short-listed candidates were interviewed by a number of Board members, including the Chair and Chief Executive, and additionally the Chief Legal Officer and Company Secretary. The candidates were then considered in detail by the Committee, and a recommendation made to the Board regarding the appointment, which it then had a further chance to discuss and approve. Following the completion of this process, Andrew Sukawaty was appointed as an independent Non-Executive Director with effect from 25 April 2019. The Board is already benefiting from his considerable international experience in the technology sector, his significant and recent listed company experience with Inmarsat plc and Sky plc, and his understanding of the US business and governance environment. In addition, Charlotte Hogg was appointed as an independent Non-Executive Director with effect from 16 December 2019. She brings with her relevant strategic and operational experience gained from previous roles, a deep understanding of the financial services sector and exposure to working with big data technologies. These two appointments continued the progressive evolution of the RELX PLC Board. The experience and sector knowledge brought by the new Directors will ensure that new and diverse perspectives are brought to Board discussions, as well as the independence of thought and vision that new appointments to the Board generally bring.
Independence of the Non-Executive DirectorsDuring 2019, the Committee considered the tenure and independence of existing Non-Executive Directors, and whether a Director’s length of service had in any way impacted his or her ability to remain independent in character and judgement in performing his or her duties. The Board considers all of the Non-Executive Directors (other than the Chair whose independence was not assessed, but who was independent on appointment) to be independent of management and free from any business or other relationship which could materially interfere with their ability to exercise independent judgement.
The Committee agreed with Adrian Hennah that he would retire from the Board following the conclusion of the Company’s 2020 Annual General Meeting, having served for nine years. During 2019, the Committee had carried out a robust assessment with regards to his ongoing independence and determined that: (i) he continued to make thoughtful and valuable contributions to the Board, (ii) he continued to constructively challenge management and other members of the Board as appropriate, and (iii) that none of the other factors weighing against his independence was present in terms of Adrian’s relationship with the Company, its directors or shareholders. The Board therefore deemed that he remained independent and would likely do so past the completion of nine years of service as a Non-Executive Director.
Board succession planningIn accordance with its Terms of Reference, the remit of the Committee widened to include monitoring and reviewing succession planning for both Board and Senior Management positions within the Group. Succession planning for the Board was discussed in every Committee meeting in 2019, emphasising its importance and the Committee’s focus on this area. It received a detailed presentation from the Chief Executive Officer on succession plans for Senior Management, including broad views on potential timings and implications for diversity in those positions. It satisfied itself that appropriate succession planning arrangements were in place for the orderly succession to both Board and Senior Management positions, supported by a diverse pipeline for such succession. Committee members have regular contact with succession candidates for Senior Management positions. The Board is also updated annually on succession planning and, during the year, it received a detailed presentation from the Chief Human Resources Officer on the first three tiers of management below the Chief Executive Officer.
Since the last Annual Report, the Committee has recommended the adoption of an updated Board Diversity Policy, which the Board subsequently approved. Its primary objectives are: to ensure that the Board’s operating environment and procedure for new appointments respects individuals and their contributions regardless of any member’s gender, ethnic origin, disability, age, sexual orientation or any other individual characteristic; and to ensure that there is at all times a diverse pipeline for succession at Board level. The policy stresses that the Board’s composition should be designed to advance the Group’s strategy for the benefit of all its stakeholders, and that the benefits of all aspects of diversity should be considered including, but not limited to, gender and ethnicity. The policy requires that when searches for an appointment to the Board are conducted by the Company or by external search firms, they will identify and present a gender-balanced list of diverse and qualified potential candidates. The Board Diversity Policy was applied and considered by the

RELX Annual report and financial statements 2019 | 87
Committee during the process of appointing Charlotte Hogg as a Non-Executive Director during the year. The wider results of the application of the policy can be found within the ‘Balance of our Board’ section set out on page 80.
Group succession planning In order to assist in providing a diverse pipeline for succession across the rest of the Group, during the year the Committee undertook a review of the Group’s approach to inclusion and diversity, its objectives and linkage to Company strategy, their implementation and the gender balance of those in Senior Management and their direct reports. Following the review, the Group Inclusion and Diversity Policy was updated to underpin and support the requirements in the Code that succession plans across the Group are based on merit and objective criteria, and promote diversity of gender, social and ethnic backgrounds, and cognitive and personal strengths. The primary objective of the Group Inclusion and Diversity Policy is to make RELX a place to work where our employees feel valued regardless of their gender, national origin, ethnicity, religion, sexual orientation or identity, age or disability status. It underpins our Group strategy, by ensuring the engagement of people from a wide range of backgrounds and experiences, to generate innovative ideas, products and solutions that drive significant value for our customers. Inclusion and diversity across our workforce is important to our future.
Our approach to inclusion and diversity is supported by the Group’s activities in this area during the year. We have 70 ERGs (Employee Resource Groups) across the Group, each focusing on areas such as Gender Balance, Pride, Race, Culture and Ethnicity, Disability and Young Professionals. We have an inclusion and diversity governance framework whereby the ERGs interact with business leaders and HR leaders in the organisation with the objective of providing input into diversity and inclusion planning. RELX hosted its first Global ERG conference attended by 80 ERG leaders and representatives across all RELX businesses. The objective of this conference was to create meaningful connections among the ERG groups and encourage sharing of best practices, innovation and future ways of working to enhance further a culture of inclusion in the Group.
As at 12 February 2020, the Group’s Senior Management team and its direct reports is comprised of 67% male and 33% female.
Chair SuccessionSir Anthony Habgood has decided that this is the year to retire from the RELX Board. The succession process is being led by the Senior Independent Director, Wolfhart Hauser, and overseen by the Nominations Committee. Sir Anthony joined RELX as Chair in June 2009, and both the Committee and the Board are deeply grateful to him for his leadership over a period of significant development and growth for the Company. During his tenure, the Group has systematically transitioned from print to electronic and face-to-face formats, and has been migrating its information solutions towards higher value-add decision tools, adding broader data sets, embedding more sophisticated analytics and leveraging more powerful technology. The Company has experienced strong and consistent financial performance alongside strong shareholder returns during his tenure. Under his leadership, the Company has continued to build on its strong ESG performance. RELX has been ranked second in 2019 in the S&P Global 1200 for ESG performance (by CSR HUB), and sixth in the new Responsibility 100 index of FTSE 100 companies measured against the United Nations sustainable development goals.
Whilst the Company has been non-compliant with provision 19 of the Code with respect to the Chair’s tenure during the year, the Board believes that this approach has been in the best interest of the Company’s stakeholders. As explained on page 84 of our 2018 Annual Report and Accounts, the Board felt that with RELX PLC becoming the sole parent of the Group, following the corporate simplification which completed in 2018, continuity of Board leadership under the current Chair was important for a period whilst the new single parent governance structure and processes were embedded.
Market segm
entsGovernance
Financial statements and
other information
Financial reviewCorporate Responsibility
Overview
RELX Annual report and financial statements 2019 | Report of the Nominations Committee

88 RELX Annual report and financial statements 2019 | Governance
Directors’ Remuneration Report
The Directors’ Remuneration Report (the Report) has been prepared by the Remuneration Committee (the Committee) in accordance with the UK Corporate Governance Code, the UK Listing Rules and Schedule 8 of the Large and Medium-sized Companies and Groups (Accounts and Reports) Regulations 2008, as amended (the UK Regulations).
The Report was approved by the Board.
IntroductionThe current remuneration policy was approved by shareholders at the 2017 Annual General Meetings (AGM) for three years and can be found at www.relx.com/go/remunerationpolicy or on pages 84 to 90 of the 2016 Annual Reports and Financial Statements. As a result, an updated remuneration policy is being proposed to shareholders for approval (by way of a binding vote) at the 2020 AGM, with the first awards under the new policy to be granted in the first quarter of 2021. The updated remuneration policy, which is proposed to apply for three years from the conclusion of the 2020 AGM, is set out on pages 90 to 96.
The implementation of the current remuneration policy during 2019 is described on pages 99 to 111 (the Annual Remuneration Report). Shareholders will be invited to vote (by way of a non-binding advisory vote) on the 2019 Annual Remuneration Report at the 2020 AGM.
Our report therefore has two parts, the first part starts immediately below and relates to the new proposed remuneration policy and the second part starts on page 97 and describes the implementation of the current remuneration policy in 2019.
Proposed new remuneration policyThe Committee reviewed the Directors’ current remuneration policy during 2019. In doing so, it took into account the Company’s desire to retain and attract top executive talent, promote the continued strong strategic and financial performance of the business and maintain executive alignment with long-term shareholder interests. The Committee considered feedback received from shareholders since the adoption of the current policy in 2017, as well as developments in UK corporate governance and trends in market practice. The Committee also reviewed the pay practices of the FTSE 30, reflective of the Company’s position around the middle of this group and considered the fact that, as a global data analytics and technology-driven business with half of its revenue derived from the US market, the Group primarily competes for talent with global information and technology companies.
In 2019, the Committee undertook a review of workforce remuneration and related policies and the alignment of incentives and rewards with culture. Further detail is set out on page 98. The Committee took this into account when considering the proposed new remuneration policy for Executive Directors. The Committee was also mindful to ensure that the proposed new remuneration policy is transparent, easy to understand, consistent with the Company’s purpose, values and strategy and provides an appropriate link to long-term performance.
Earlier this year, we consulted with shareholders (representing a total of c60% of our issued share capital) and shareholder representative bodies. I would like to express my gratitude for the feedback received, which confirmed our proposal to maintain the same overall incentive structure as previously and helped to shape the changes to the current policy which we have decided to propose. We had a high level of engagement and are pleased to report that virtually all investors who provided feedback indicated support for the proposed approach.
Aspects of the current policy which we are proposing to keep the same
Incentive structure: In our last remuneration policy review, we simplified our incentive structure by reducing the number of plans we operated to one Annual Incentive Plan (AIP) (with a share deferral element) and one Long Term Incentive Plan (LTIP). The Committee is comfortable with this simplified incentive structure and is therefore proposing to continue with it under the new policy.
Performance measures: The Committee proposes to use the same combination of financial performance measures for the incentive plans as these have supported consistent, predictable and strong financial performance by the business and significant value creation for shareholders over the last eight years. Our business strategy continues to be to grow the core business through organic investment and the build-out of new products, with bolt-on acquisitions where we are the natural owner, as well as portfolio rationalisation through selective divestments. The EPS, ROIC and TSR performance metrics for the LTIP align with, and support, our strategy by focussing on sustained earnings growth, return on invested capital and shareholder returns.
Discretion and recovery provisions: The Committee has discretion to vary the level of payout under the AIP and LTIP, taking into account RELX’s overall business performance including environmental, social and governance matters and value created for shareholders over the period and other relevant factors. AIP and LTIP are also subject to malus and claw-back provisions in case of materially misstated financial or other data, serious misconduct and breach of post-termination restrictive covenants.

89RELX Annual report and financial statements 2019 | Directors’ Remuneration Report
Proposed changes to the remuneration policy Overall quantum: As a result of our plans to reduce the value of the pension benefits for Executive Directors, the overall compensation opportunity for Executive Directors will go down during the new policy period. It is proposed to maintain the overall quantum of the other components of pay at the same levels as under the current policy, therefore no changes are proposed to the policy on base salary and benefits or to the maximum awards under the AIP and the LTIP. The Committee believes that the overall level of remuneration is appropriate given comparisons to the FTSE 30 and taking into account the US market in which we compete for talent. The full range of performance outcomes applicable to each of the CEO and CFO have been set out in the performance scenario charts.
Pension alignment with the workforce: The Committee reviewed the existing pension policy for Executive Directors in light of the arrangements for the wider workforce and, as a result, is proposing a new pension policy which provides that newly appointed Executive Directors will receive pension benefits that are of no higher value than the level of pension benefits provided under the Company’s regular defined contribution pension plans (currently capped at 11% of base salary in the UK). This is designed to ensure alignment of the maximum values of pension benefits for Executive Directors and the wider workforce. The existing Executive Directors will transition from their current arrangements over the period 2020 to 2022 and will be subject to this new appointment Executive Director pension policy and hence be aligned with the wider workforce after 31 December 2022.
In the case of the CEO, who is a member of a legacy UK defined benefit pension scheme, during this transition period he will pay significantly increasing Total Plan Fees (which include contributions and a participation fee) amounting to 25% of pensionable earnings in 2020, 30% of pensionable earnings in 2021 and 35% of pensionable earnings in 2022, and will then cease to accrue further benefits under this scheme at the end of 2022. The CFO currently receives a company contribution paid as cash in lieu of pension. This contribution is reduced to 20% of base salary for 2020 and will further decrease to 18% for 2021 and to 16% for 2022. After 31 December 2022, the existing Executive Directors will both be subject to the new appointment Executive Director pension policy (currently capped at 11% of base salary in the UK).
Annual Incentive Plan (AIP): It is proposed to formalise our current practice by increasing the minimum weighting of financial measures from 70% to 85% in our policy. Any non-financial measures will be focused on sustainability metrics thereby increasing their weighting compared with current practice.
The Committee also proposes to lower the AIP payout at target performance from 150% to 135% of base salary. The maximum remains at 200% of base salary. Given the Company’s financial profile, value drivers and business model, the Committee does not believe it is appropriate to provide executives the opportunity to double their AIP payout from the target payout levels, and proposes to cap the AIP opportunity at approximately 50% above target payout. The Committee believes it sets stretching but achievable targets and while executives should be eligible to receive payouts above target for outperformance, the emphasis should be on long-term performance.
Consistent with our emphasis on long-term performance, the AIP currently operates on the basis of a one-third deferral into shares which are released after three years. The Committee is proposing to increase the deferral amount to 50% of the AIP earned, with effect from the 2021 AIP.
Shareholding requirements: In order to further strengthen the alignment of Executive Directors’ interests to those of shareholders, the shareholding requirement for the CEO will be increased from 400% of salary to 450% of salary. The CFO’s shareholding requirement will remain at 300% of salary.
It is proposed to adjust the current policy on post-termination shareholding requirements to make Executive Directors subject to their full shareholding requirement for two years after leaving the Company.
In line with evolving and accepted market practice, it is proposed that earned AIP deferred shares which are within their three-year deferral period will only count towards the shareholding requirement on a notional net of tax basis.
In summary, we believe that our remuneration policy has contributed to RELX’s strong and consistent financial performance and significant value creation for shareholders over the past eight years, and that the proposed changes to pension, AIP and shareholding requirements reflect evolving shareholder preferences and current UK corporate governance principles.
Wolfhart HauserChair, Remuneration Committee
Market segm
entsGovernance
Financial statements and
other information
Financial reviewCorporate Responsibility
Overview

90 RELX Annual report and financial statements 2019 | Governance
Remuneration Policy Report
Set out in this section is the Company’s proposed new remuneration policy for Directors, which, subject to approval by shareholders, will apply for three years from the conclusion of the RELX PLC AGM to be held on 23 April 2020. The key changes from the previous remuneration policy (which was first published on pages 84 to 90 of the 2016 Annual Reports and Financial Statements and was approved by shareholders at the April 2017 Annual General Meetings) and the rationale for the changes are explained in the Committee Chair’s introduction on pages 88 and 89.
Remuneration policy table – Executive DirectorsAll footnotes to the policy table can be found on page 93.
ANNUAL BASE SALARY
Purpose and link to strategyTo recruit and retain the best executive talent globally to execute our strategic objectives at appropriate cost.OperationSalaries for Executive Directors are set and reviewed annually by the Remuneration Committee (the Committee) with changes typically taking effect on 1 January. In exceptional circumstances, the Committee may review salaries more frequently.
When reviewing salaries, the Committee considers the executive’s role and sustained value to the Company in terms of skill, experience and overall contribution and the Company’s guidelines for salaries for all employees for the year. Periodically, competitiveness with companies which are comparable in respect of industry, size, international scope and complexity is also considered in order to ensure the Company’s ability to attract and retain executives.
For the last eight years, Executive Directors’ salary increases have been 2.5% per annum.Performance frameworkN/AMaximum valueSalary increases will continue to be aligned with the range of increases for the wider employee population and subject to annual all-employee guidelines. However, as for all employees, the Committee has discretion to exceed this to take account of individual circumstances such as change in responsibility, increases in scale or complexity of the business, inflation or alignment to market level.Recovery of sums paidNo provision.
RETIREMENT BENEFITS
Purpose and link to strategyRetirement plans are part of remuneration packages designed to recruit and retain the best executive talent at appropriate cost.OperationPolicy for new appointmentsExecutive Directors appointed after the effective date of this policy will receive pension benefits up to the value equivalent to the maximum level of pension benefits provided under the Company’s regular defined contribution pension plans as may be in effect or amended from time to time (currently capped at 11% of base salary in the UK). The defined contribution pension plans are designed to be competitive and sustainable long-term. Any amount payable may be paid wholly or partly as cash in lieu and may be subject to tax and social security deductions in various jurisdictions.
Transition arrangements for existing Executive Directors The existing directors will transition from their current arrangements to the above new appointment policy by the end of 2022.
The CFO currently receives a company contribution paid as cash in lieu of pension. The CFO’s company contribution decreased by five percentage points to 20% of base salary from January 2020 and further decreases to 18% from January 2021, to 16% from January 2022 and from the end of 2022, he will be subject to the above new appointment policy (currently capped at 11% of base salary in the UK).
The CEO is a member of a UK legacy defined benefit pension scheme, accruing 1/30th of final year pensionable earnings for each year (pro-rated for part years) of service, with a normal retirement age of 60. In line with all UK defined benefit scheme members, the CEO’s contributions to the plan and fees he pays to participate in the plan (together the ‘Total Plan Fees’) have been increasing annually since 2011. However, the CEO now pays a higher percentage of pensionable earnings as Total Plan Fees in each calendar year than other legacy members. In 2019, his Total Plan Fees were 20% of pensionable earnings, up from 12.5% in 2018. His total Plan Fees are 25% in 2020 and increase to 30% in 2021 and to 35% in 2022. A cap applies of 2% per annum on the increase in the CEO’s pensionable earnings (in place since 2017). Like all other members of the legacy defined benefit pension scheme, the CEO is allowed to switch to the defined contribution plan at any time. At the end of 2022, the CEO will cease to accrue any further benefits under the legacy defined benefit pension scheme. After 31 December 2022, he will be subject to the above new appointment policy (currently capped at 11% of base salary in the UK).Performance frameworkN/A
91RELX Annual report and financial statements 2019 | Directors’ Remuneration Report
RETIREMENT BENEFITS CONTINUED
Maximum valuePolicyFor Executive Directors hired or promoted to the Board after the effective date of this policy, the maximum value is equivalent to the maximum level of pension benefits provided under the Company’s regular defined contribution pension plans as may be in effect or amended from time to time (currently capped at 11% of base salary in the UK).
Transition arrangements for existing Executive Directors For the current CFO, until 31 December 2022, the maximum values applicable are in accordance with the annual reductions in the company contribution as detailed above under ‘Operation’. After 31 December 2022, he will be subject to the pension policy and maximum value described above for new appointments.
For the current CEO, the maximum value under the legacy defined benefit scheme is an accrual of 1/30th of final year pensionable earnings for every year of service until 31 December 2022, minus his applicable annual Total Plan Fees paid whilst accruing the benefit. As noted above under ‘Operation’, the CEO is subject to increases in the Total Plan Fees which he pays annually as part of his ongoing membership of this scheme until 31 December 2022, after which he will be subject to the pension policy and maximum value described above for new appointments.Recovery of sums paidNo provision.
OTHER BENEFITS
Purpose and link to strategyTo provide competitive benefits at appropriate cost.OperationOther benefits, subject to periodic review, may include private medical and dental cover, life assurance, tax return preparation costs, car benefits, directors’ and officers’ liability insurance, relocation benefits and expatriate allowances and other benefits available to employees generally, including, where appropriate, the tax on such benefits.Performance frameworkN/AMaximum valueThe maximum for ongoing benefits for Executive Directors will not normally exceed 10% of salary (excluding any one-off items, such as immigration support or relocation benefits, and any tax related charge on benefits which is met by the Company). However, the Committee may provide reasonable benefits beyond this amount in exceptional situations, such as a change in the individual’s circumstances caused by the Company, or if there is a significant increase in the cost of providing the agreed benefit.
ANNUAL INCENTIVE PLAN (AIP)
Purpose and link to strategyThe annual incentive provides focus on the delivery of annual financial targets and the achievement of annual objectives and milestones which are chosen to align with the Company’s strategy and create a platform for sustainable future performance. The compulsory deferral of 50% of any annual incentive earned into RELX shares for three years promotes longer-term alignment of Executive Directors’ interests with shareholders’ interests, including an element of post-termination shareholding.Why performance measures are chosen and how targets are setPerformance measures include a balanced set of financial measures which are appropriately weighted and which support current strategy and incentivise the Executive Directors to achieve the desired outcomes without undue risk of focusing on any one financial measure. The financial targets are designed to be challenging and are set with reference to the previous year’s performance and internal and external forecasts for the following year.
Performance measures may also include non-financial measures, for example linked to sustainability.OperationThe Committee reviews and sets the financial targets and, if applicable, non-financial targets, annually, taking into account internal forecasts and strategic plans. Following year end, the Committee compares actual performance with the financial targets and assesses the achievement of any non-financial targets. The targets and outcomes are fully disclosed in the Remuneration Report published after year end.
50% of any annual incentive earned is paid in cash to the Executive Director and the remaining 50% is deferred into RELX shares, which are released to the Executive Director after three years. Dividend equivalents accrued during the deferral period are payable in respect of the shares. On a change in control, the default position is that deferred shares are released to the Executive Director. Alternatively, the Committee may determine that deferred shares will instead be exchanged for equivalent share awards in the acquiring company.
Market segm
entsGovernance
Financial statements and
other information
Financial reviewCorporate Responsibility
Overview

92 RELX Annual report and financial statements 2019 | Governance
AIP CONTINUED
Performance frameworkThe AIP includes financial measures with a weighting of at least 85% and may also include non-financial measures with a weighting of up to 15%. Each measure is assessed separately.
§§ The minimum payout is zero.§§ Each measure is assessed independently and payout for each measure at threshold is 10% of the maximum opportunity for that
measure. If the financial measures have a weighting of 100% and threshold is reached for each of the financial measures, the overall payout for the financial measures is 13.5% of salary. If the financial measures have a weighting of 85% and threshold is reached for each of the financial measures, the overall payout for the financial measures is 11.5% of salary.§§ Payout for target performance is 135% of salary.
Following an assessment of financial achievement, and scoring of any non-financial measures, the Committee agrees the overall level of earned incentive for each Executive Director.
Committee discretion applies.1,2,3
Maximum valueThe maximum potential annual incentive is 200% of annual base salary. This includes the deferred share element but excludes dividend equivalents payable in respect of the deferred shares.Recovery of sums paidClaw-back applies.4
LONG TERM INCENTIVE PLAN (LTIP)
Purpose and link to strategyThe Long-Term Incentive Plan (LTIP) is designed to provide a long-term incentive for Executive Directors to achieve the key performance measures that support the Company’s strategy, and to align their interests with shareholders.Why performance measures are chosen and how targets are setOur strategic focus is on continuing to transform the core business through organic investment and the build-out of new products into adjacent markets and geographies, supplemented by selective portfolio acquisitions and divestments. The performance measures in the LTIP are chosen to support this strategy by focusing on sustained earnings growth, return on invested capital and shareholder return.
Targets are set with regard to previous results and internal and external forecasts for the performance period and the strategic plan for the business. They are designed to provide exceptional reward for exceptional performance, whilst allowing a reasonable expectation that reward at the lower end of the scale is attainable, subject to robust performance.OperationAnnual awards of performance shares, with vesting subject to:§§ performance measured over three financial years§§ continued employment (subject to the provisions set out in the Policy on payments for loss of office section)§§ meeting shareholding requirements (450% of salary for the CEO and 300% of salary for the CFO)
Executive Directors are to retain their net (after tax) vested shares for a holding period of two years after vesting.
Dividend equivalents accrued during the performance period are payable in respect of the performance shares that vest.
On a change of control, the default position is that awards vest on a pro-rated basis, subject to an assessment of performance against targets at that time. Alternatively, the Committee may determine that the awards will not vest and will instead be exchanged for equivalent awards in the acquiring company.Performance frameworkThe performance measures are EPS, ROIC and relative TSR, weighted 40%:40%:20% respectively and assessed independently, such that a payout can be received under any one of the measures (or, for TSR, in respect of one of the three comparator groups).
§§ The minimum payout is zero.§§ Each measure is assessed independently and payout for each measure at threshold is 25% of the maximum opportunity for that
measure. If only one measure vests at threshold, and it has a weighting of 40%, then the overall payout would be 10% of the maximum award. If only one measure with a weighting of 20% vests at threshold, the overall payout would be 5% of the maximum award. §§ Payout in line with expectations is 50% of the maximum award.
Dividend equivalents are not taken into account in the above payout levels.Committee discretion applies.1,2,3
Maximum valueThe maximum grant in any year is up to 450% of base salary for the CEO and up to 375% of base salary for other Executive Directors (not including dividend equivalents).Recovery of sums paidClaw-back applies.4

93RELX Annual report and financial statements 2019 | Directors’ Remuneration Report
Notes to the Remuneration policy table (1) Discretion in respect of AIP and LTIP payout levels: In determining the level of payout under the AIP and vesting under the LTIP, the
Committee takes into account RELX’s overall business performance and value created for shareholders over the period in review and other relevant factors. It has discretion to adjust the vesting and payout levels (subject always to the maximum individual limits) if it believes this would result in a fairer outcome. This discretion will only be used in exceptional circumstances and the Committee will explain in the next Remuneration Report the extent to which it has been exercised and the reasons for doing so.
(2) Discretion to vary performance measures under the AIP and the LTIP: The Committee may vary the financial measures applying to a current annual incentive year and performance measures for LTIP awards already granted if a change in circumstances leads it to believe that the arrangement is no longer a fair measure of performance. Any new measures will not be materially less, or more, challenging than the original ones.
(3) Discretion on termination of employment under the AIP and the LTIP: The Committee’s discretion on termination of employment is described under the ‘Policy on payments for loss of office’ section on page 95.
(4) Malus and claw-back under the AIP and the LTIP: Under the AIP and the LTIP, the Committee has discretion to apply malus and claw-back (i) if the payout (including the AIP deferred shares element) was calculated on the basis of materially misstated financial or other data, in which case it can withhold a payout and can seek to recover the difference in value between the incorrect payout and the amount that would have been paid had the correct data been used or (ii) if there has been serious misconduct on the part of the individual, in which case the Committee may withhold an AIP payout, lapse unvested LTIP awards and may require repayment of AIP and LTIP gains arising during a specified period. Under the LTIP, the Committee also has discretion to apply malus and claw-back if a participant breaches post-termination restrictive covenants, in which case unvested awards would lapse and the Committee may require repayment of gains arising during the period beginning six months before termination and ending on the date the post-termination restrictive covenants are stated to expire.
(5) Explanation of differences between the Company’s policy on Executive Directors’ remuneration and the policy for other employees: Incentives: A larger percentage of Executive Directors’ remuneration is performance related than that of other employees. All managers participate in an annual incentive plan, but participation levels, measures and targets vary according to their role, seniority and local business priorities. Approximately 100 senior executives currently participate in the LTIP and about 1,000 participate in the Executive Share Option Scheme (ESOS). Grant levels under the plans vary according to role and seniority. In considering the remuneration policy for Executive Directors, under which the Executive Directors only participate in the AIP and the LTIP, the Committee considered the incentive plan participation for the wider senior management population. Other benefits: The range and level of retirement and other benefits provided to employees may vary according to local market practice, role and seniority. This is to ensure that we provide competitive packages which are appropriate to specific roles. However, as noted above in the pension section of the policy table, the proposed policy on Executive Directors’ pension arrangements results in alignment of the maximum values of pension benefits for newly appointed Executive Directors and the wider workforce following shareholder approval of the remuneration policy and for existing Executive Directors by the end of 2022.
(6) Changes to pay components: The changes which were made since the previous remuneration policy, together with the rationale for the changes, are described in the Committee Chair’s introduction on pages 88 and 89.
Remuneration outcomes in different performance scenariosThe Committee considers the level of remuneration that may be paid in the context of the performance delivered and value added for shareholders. The charts below are an illustration of how the CEO’s and CFO’s regular annual remuneration could vary under different performance scenarios. The salary, benefits and pension levels are the same in all three scenarios in each chart. Salary is based on 2020 salary. Benefits is based on the 2019 Single Total Figure table. Pension, annual incentive and LTIP are all based on full implementation of all aspects of the policy table’s award levels and percentages (including 11% pension), applied to the 2020 salary. Annual incentive amounts include the portion which is subject to compulsory deferral into RELX shares for three years. The performance assumptions which have been used are as follows: Minimum means no AIP payout and no LTIP vesting. In line with expectations means AIP payout at 135% of salary (of which a portion is deferred into shares) and LTIP vesting at 50% of the award. Maximum means AIP payout at 200% of salary (of which a portion is deferred into shares) and LTIP vesting at 100% of the award. The three bars in each chart assume no share price movement. As required by the UK Regulations, assuming maximum performance achievement (as described above) and 50% share price growth over the performance period, the CEO’s maximum remuneration would increase to £12.7m and the CFO’s maximum remuneration to £6.6m. Any dividend equivalents payable in respect of the AIP deferred shares and the LTIP are not included.
LTIPAIP cash and deferred sharesSalary, benefits, pension
CEO REMUNERATION (£’000)
Minimum In line withexpectations
Maximum
100% 25% 15%
28%
47%
26%
59%
1,507
6,115
9,828LTIPAIP cash and deferred shares Salary, benefits, pension
CFO REMUNERATION (£’000)
Minimum In line withexpectations
Maximum100% 26% 16%
31%
43%29%
55%
851
3,282
5,186
Market segm
entsGovernance
Financial statements and
other information
Financial reviewCorporate Responsibility
Overview

94 RELX Annual report and financial statements 2019 | Governance
Approach to recruitment remuneration – Executive DirectorsWhen agreeing the components of a remuneration package on the appointment of a new Executive Director, or an internal promotion to the Board, the Committee would seek to align the package with the remuneration policy stated in the policy table.
The Committee’s general principle on recruitment is to offer a competitive remuneration package to attract high-calibre candidates from a global talent pool. Basic salary would be set at an appropriate level for the candidate, taking into account all relevant factors. As a data analytics and technology-driven business, with half of its revenue in the US, the Company primarily competes for talent with global information and technology companies.
The various components and the Company’s approach are as follows:
Standard package on recruitment*To offer remuneration in line with the policy table (including the limits), taking into account the principles set out above.Compensation for forfeited entitlementsThe Committee may make awards and payments on hiring an external candidate to compensate him or her for entitlements forfeited on leaving the previous employer. If such a decision is made, the Committee will attempt to reflect previous entitlements as closely as possible using a variety of tools, including cash and share based awards. Malus and claw-back provisions will apply where appropriate. If necessary to facilitate the grant of awards, the Committee may rely on the one person exemption from shareholder approval in the UK Listing Rules.Relocation allowances and expensesThe type and size of relocation allowances and expenses will be determined by the specific circumstances of the new recruit.* The standard package comprises annual base salary, retirement benefits, other benefits, AIP and LTIP.
Shareholding requirementThe Executive Directors are subject to shareholding requirements. These are a minimum of 450% of annual base salary for the CEO and 300% of annual base salary for other Executive Directors. On joining or promotion to the Board, Executive Directors are given a period of time, typically up to five years, to build up to their requirement. On termination of employment, Executive Directors are to maintain their full shareholding requirement (or, if lower, their actual level of shareholding at the time of leaving) for two years after leaving employment.
Shares which count for shareholding purposes are shares beneficially owned by the Executive Director, their spouse, civil partner or dependent child and AIP deferred shares which are within their three-year deferral period, on a notional net of tax basis.
Policy on payments for loss of officeIn line with the Company’s policy, the service contracts of the existing Executive Directors contain 12-month notice periods.
The circumstances in which an Executive Director’s employment is terminated will affect the Committee’s determination of any payment for loss of office, but it expects to apply the principles outlined in the table on the next page. The Committee reserves the right to depart from these principles where appropriate in light of any taxation requirements to which the Company or the Executive Director is subject (including, without limitation, section 409A of the US Internal Revenue Code), or other legal obligations.

95RELX Annual report and financial statements 2019 | Directors’ Remuneration Report
Policy on payments for loss of office (continued)GENERAL1 INCENTIVES
Mutually agreed termination/termination by the Company other than for cause2
(includes retirement with customary notice)
The Executive Director would be entitled to salary, benefits and other contractual payments in the normal way up to the termination date and would be paid for any accrued but untaken holiday.
Salary: Payment of up to 12 months’ salary to reflect the notice period or payment in lieu of notice.
Other benefits: Where possible, benefits would be continued for up to the duration of any unworked period of notice (not exceeding the maximum stated in the policy table) or the Executive Director would receive a cash payment (not exceeding the cost to the Company of providing those benefits).
Pension: Deferred or immediate pension in accordance with scheme rules, with a credit in respect of, or payment for up to, the full period of any unworked period of notice. There is provision under the defined benefit pension scheme for members leaving Company service by reason of permanent incapacity to make an application to the scheme trustee for early payment of their pension.
Other: The Company may pay compensation in respect of any statutory employment rights and may make other appropriate and customary payments.
The Company would have due regard to principles of mitigation of loss. Reductions would be applied to reflect any portion of the notice period that is worked and/or spent on gardening leave.
On injury, disability, ill-health or death, the Committee reserves the right to vary the treatment outlined in this section.
Annual incentive: Any unpaid annual incentive for the previous year and a pro-rata payment in respect of the part of the financial year up to the termination date would generally be payable (subject to the deferral provisions), with the amount being determined by reference to the original performance criteria. However, the Committee has discretion to decide otherwise depending on the reason for termination and other specific circumstances. The Company would not pay any annual incentive in respect of any part of the financial year following the termination date (e.g. for any unworked period of notice). AIP deferred shares would be released to the Executive Directors in full at the end of the deferral period. The annual incentive claw-back provisions would apply.
LTIP: The default position is that unvested LTIP awards would be pro-rated to reflect time employed and would vest subject to performance measured at the end of the relevant performance period and subject to the Executive Director continuing to meet his full shareholding requirement for two years after the termination date. The Committee has discretion to allow unvested LTIP awards to vest earlier and to adjust the application of time pro-rating and performance conditions, subject to the plan rules. The requirement to retain net (after tax) vested LTIP shares for a holding period of two years after vesting ceases to apply on termination of employment.
Employee instigated resignationThe Executive Director would not receive any payments for loss of office. The Executive Director would be entitled to salary, benefits and other contractual payments in the normal way up to the termination date and would be paid for any accrued but untaken holiday.
Pension: A deferred or immediate pension would be payable in accordance with the scheme rules.
Annual incentive: The Executive Director would be entitled to receive an annual incentive for a completed previous year (subject to the deferral provisions), but not a pro-rated annual incentive in respect of a part year up to the termination date, unless the Committee decides otherwise in the specific circumstances. Any AIP deferred shares would be released to the Executive Director in full at the end of the deferral period. Annual incentive claw-back provisions would apply.
LTIP: All outstanding LTIP awards would lapse on the date of notice. Dismissal for causeThe Executive Director would be entitled to salary, benefits and other contractual payments in the normal way up to the termination date and would be paid for any accrued but untaken holiday but would not receive any payments for loss of office.
Pension: A deferred or immediate pension would be payable in accordance with the scheme rules.
Annual incentive: The Executive Director would not receive any unpaid annual incentive. Any AIP deferred shares lapse on the date of dismissal.
LTIP: All outstanding LTIP awards would lapse on the date of dismissal.
(1) In addition to what is set out in this section, on termination for any reason, Erik Engstrom will be entitled to payment of amounts held in his ‘Retirement Account’. Before he joined the Company’s UK defined benefit scheme, he was not a member of any company pension scheme and RELX made annual contributions of 19.5% of base salary to a deferred compensation plan. Contributions to this Retirement Account ceased when he became a member of the UK defined benefit arrangement.
(2) In cases where the approved leaver treatment applies, the AIP and LTIP have a default position as well as giving the Committee discretion to adjust the default treatment within certain parameters. The Committee would only expect to exercise such discretion where the Committee believes the personal circumstances of the Executive Director so require.
Market segm
entsGovernance
Financial statements and
other information
Financial reviewCorporate Responsibility
Overview

96 RELX Annual report and financial statements 2019 | Governance
Remuneration policy table – Non-Executive DirectorsFEES
Purpose and link to strategyTo enable RELX to recruit Non-Executive Directors with the right balance of personal skills and experience to make a major contribution to the Board and Committees of a global business which is listed in London, Amsterdam and New York.OperationRELX Chair: Receives an aggregate annual fee with no additional fees, for example, Committee Chair fees. The Committee determines the Chair’s fee on the advice of the Senior Independent Director. Other Non-Executive Directors: Receive an annual fee with additional fees payable as appropriate for specific roles and duties. These additional fees include fees for the Senior Independent Director and Committee Chairs, for membership of Board Committees, as well as a workforce engagement fee and international travel fees. In future, other fees may be payable, for example attendance fees. The Board determines the level of fees, subject to applicable law.Fees may be reviewed annually, although in practice they have changed on a less frequent basis. When reviewing fees, consideration is given to the time commitment required, the complexity of the role and the calibre of the individual. Periodically, comparative market data is also reviewed, the primary source for which is the practice of FTSE 30 companies, with reference also to the Euronext Amsterdam (AEX) index and US-listed companies.Maximum valueThe aggregate annual fee limit for fees paid to the Chair and the Non-Executive Directors is £2m. Additional fees for membership of or chairing Board Committees and assuming additional responsibilities such as acting as Senior Independent Director, are not subject to this maximum limit.
OTHER BENEFITS
Purpose and link to strategyTo provide competitive benefits at appropriate cost.OperationOther benefits for Non-Executive Directors are reviewed periodically and may include private medical cover, tax return preparation costs, secretarial benefits, car benefits, travel and related subsistence costs, including, where appropriate, the tax on such benefits.Maximum valueThere is no prescribed maximum amount.
Approach to recruitment remuneration – Non-Executive DirectorsFollowing recruitment, a new Non-Executive Director will be entitled to fees and other benefits in accordance with the Company’s remuneration policy. No additional remuneration is paid on recruitment. However, any reasonable expenses incurred during the recruitment process will be reimbursed.
Policy on payments for loss of office – Non-Executive DirectorsIn addition to unpaid accrued fees, the Non-Executive Directors are entitled to receive one month’s fees for loss of office if their appointment is terminated before the end of its term.
Service contracts and letters of appointmentThere are no further obligations in the Directors’ service contracts and letters of appointment which are not otherwise disclosed in this Report which could give rise to a remuneration payment or loss of office payment. All Directors’ service contracts and letters of appointment are available for inspection at the Company’s registered office. The Executive Directors’ service contracts do not have a fixed expiry date.
Consideration of employment conditions elsewhere in the CompanyWhen the Committee reviews the Executive Directors’ salaries annually, it takes into account the Company’s guidelines for salaries for all employees in the Company’s major operating locations for the forthcoming year. The Committee also considers market practice in the FTSE 30 as well as pay practices of other global information and technology companies when determining the quantum and structure of Directors’ pay.
Since 2019, the Committee annually reviews various aspects of workforce remuneration and related policies in order to deepen its understanding of pay structures throughout the organisation.
Also since 2019, our designated non-executive director responsible for workforce engagement meets with employees representing our global employee population in order to understand a wide-range of employee views on a variety of topics. The feedback is reported back to the Board at least once per year and forms part of the Board’s discussions and decision making. As part of this process, the non-executive director responsible for workforce engagement explains how executive remuneration aligns with wider pay policy.
Consideration of shareholder viewsOur practice is to consult shareholders and consider their views when formulating, or changing, our policy. The Committee consulted extensively with shareholders (representing c60% of the Company’s issued share capital) and shareholder representative bodies on the proposed new remuneration policy. We were grateful for the constructive feedback, which was taken into account in our final proposals.
Previous remuneration policy and prior commitmentsAny payments which are still to be made under arrangements made and awards granted under previous remuneration policies (which are included in the 2013 and 2016 Annual Reports and Financial Statements) will be made consistent with the applicable policy. The provisions of the previous policies which relate to arrangements and awards granted under those previous policies will therefore continue to apply until all payments in relation to those arrangements and awards have been made. The Committee also reserves the right to make any remuneration or loss of office payments if the terms were agreed prior to the approval of the 2013 or 2016 policy or prior to an individual being appointed as a Director.
Minor amendments The Committee may make minor amendments for regulatory, tax or administrative purpose.
97RELX Annual report and financial statements 2019 | Directors’ Remuneration Report
The Annual Remuneration Report reflects the 2019 annual incentives earned and the vesting outcomes for multi-year incentives granted under the remuneration policy applicable to the 2017–2019 cycle of the multi-year plans.
As you will have read in the Annual Report, the Company’s strategic priority is the organic development of increasingly sophisticated information-based analytics and decision tools that deliver enhanced value to customers. During 2019, RELX continued to successfully execute this strategy, which is aimed at achieving more predictable revenues, a higher growth profile and improving returns. Underlying revenue growth was 4%, underlying adjusted operating profit growth was 5% and adjusted earnings per share (EPS at constant currencies) grew 7%. We also continued to build on our strong ESG performance during the year, and this was again recognised by the positive ratings given to us by a number of external agencies. In 2019 RELX was ranked second in the S&P Global 1200 for ESG performance based on CSRHub data, and sixth in the newly launched Responsibility 100 index of FTSE 100 companies measured against the United Nations 17 Sustainable Development Goals (SDGs). In 2019 RELX also retained its AAA ESG rating with MSCI for the fourth consecutive year, and in January 2020 a Sustainalytics ESG report put RELX in the top one percent of over twelve thousand companies covered.
The performance measures in the incentive plans align with and support the strategy by focussing on sustained earnings growth, return on invested capital and shareholder returns. The performance measures are based on adjusted figures as they provide relevant information in assessing the Company’s performance, position and cash flows and we believe they track the core operational performance of RELX and how it contributes to shareholder value creation. The Annual Report includes a reconciliation of adjusted measures to IFRS measures. The Committee also considers environmental, social and governance performance when determining variable pay outcomes.
2019 OutcomesThe strong financial performance of the business is reflected in the 2019 annual incentive achievement for Executive Directors of slightly ahead of the target level. Two-thirds of the amount earned will be paid in cash to the Executive Directors in March 2020 and the remaining one-third is deferred into RELX shares which will be released in Q1 2023.
The continued strong long-term performance of the Company is reflected in the vesting of the 2017–2019 cycles of the multi-year plans. The 2017–2019 cycle of the Long-Term Incentive Plan (LTIP) vested at 71%. The discontinued Bonus Investment Plan (BIP) and the Executive Share Option Scheme (ESOS), which is the last cycle of these plans, vested at 89% and 88% respectively. These outcomes reflect strong returns and earnings growth achieved by the business and how the challenging targets set by the Committee have been perceived by the market. In determining the level of payout under the annual incentive and the multi-year incentives, the Committee took into account RELX’s overall business performance and value created for shareholders over the period in review and other relevant factors and concluded that the reward outcomes were proportionate in light of the Company’s performance and had operated as intended in terms of quantum. As a result, the Committee did not exercise any discretion to adjust the 2019 reward outcomes.
The Committee is also satisfied that the overall remuneration for Executive Directors is appropriate and fair based on comparisons to the FTSE 30, reflective of the Company’s position in the middle of this group and taking into account that the Company primarily competes for talent with global information and technology companies. The Committee also considered senior executive pay levels and wider workforce remuneration across RELX, as well as CEO to UK employee pay ratios.
Updated Corporate Governance Code Following publication by the Financial Reporting Council (FRC) of the updated Corporate Governance Code in July 2018, the Committee reviewed a number of areas and implemented several changes during 2019. The Committee also monitored investor guidance and evolving best practice. A summary of areas reviewed and changes made is set out below:
§§ The Committee’s remit was expanded to include setting pay for senior management, i.e. the CEO’s direct reports.
§§ The Committee’s Terms of Reference were updated to reflect the new requirement that an appointee should have served on a remuneration committee for at least 12 months before appointment as chair of the Committee.
§§ The Committee reviewed its policy on post-termination shareholding requirements for Executive directors, and has proposed an update as part of the new Directors’ remuneration policy being put to shareholders for approval in April 2020. Further information is set out on page 94.
§§ The value of pension benefits for current Executive Directors has decreased over the last several years, prior to the new UK Corporate Governance Code coming into force. As part of the proposed new remuneration policy, the Committee is proposing a revised pension policy for newly appointed Executive Directors which is aligned to the general workforce. Transition arrangements for existing Executive Directors have been put in place so that the value of their pension benefits will be aligned with the regular defined contribution plans (currently capped at 11% in the UK) by the end of 2022. Further information is set out on page 104.
§§ In addition to disclosing the target amount for each of the 2019 AIP financial measures, we have provided the actual threshold and maximum amounts in the 2019 AIP table to further improve the clarity and simplicity of our disclosures.
Foreword to the Annual Remuneration Report
Market segm
entsGovernance
Financial statements and
other information
Financial reviewCorporate Responsibility
Overview
98 RELX Annual report and financial statements 2019 | Governance
Broader employee rewardThe Committee has previously reviewed certain aspects of wider-workforce remuneration (such as annual salary increase guidelines globally and executive share plan participation). In 2019 the Committee undertook a more wide-ranging review to increase its understanding of broader employee reward so that it can consider this to an even greater extent when making decisions about Executive Directors’ pay.
The Committee reviewed the RELX global reward philosophy, which aims to support the Company’s ability to attract, motivate and retain high performing employees. The Company’s reward principles are underpinned by external equity, internal equity and pay for performance and we aim to pay around the median of the relevant local operating market for base salary and benefits with opportunity towards the upper quartile for sustained superior performance. The Committee also considered and reviewed the following aspects of workforce remuneration and related policies:
§§ key statistics on the composition of the RELX workforce such as location, gender, age and length of service;
§§ pay philosophy and the evolution of our pay practices, including pay equity processes;
§§ details of the pension plan arrangements in our top five countries by number of employees;
§§ a summary of our main benefits policies globally;
§§ participation data on annual incentives (sales and non-sales), including gender splits;
§§ participation data related to the executive share plans and local ‘all-employee’ share plans;
§§ Employee Opinion Survey responses on reward related questions.
The Committee took into account its review of workforce remuneration when designing the proposed new remuneration policy for Executive Directors. The Committee will continue to review workforce remuneration as a regular agenda item each year.
The Committee also considered the alignment of incentives and rewards with culture and is satisfied that the incentive schemes drive the desired behaviours to support the Company’s purpose, values and strategy.
Our designated non-executive director responsible for workforce engagement, Marike van Lier Lels, met with employee representatives from Europe, US and Asia Pacific during 2019 in order to understand a wide-range of employee views. She reported back to the Board and the feedback and insights gathered formed part of the Board’s discussions and decision making. Further information on the workforce engagement process is provided in the Governance section on page 76. As part of this process, Ms van Lier Lels explained how executive remuneration aligned with wider pay policy.
As required under the Companies (Miscellaneous Reporting) Regulations 2018, we have included in the annual remuneration report ratios of the CEO’s 2019 single total figure of remuneration to the median, the 25th percentile and the 75th percentile UK employees ranked by total remuneration using prescribed methodology A (see page 109).
2020 Implementation of Remuneration PolicyIn line with increases for the wider employee population, and consistent with the 2020 salary increase guidelines for UK-based employees, the Committee has approved 2020 salary increases for the Executive Directors of 2.5%. After taking into account the increasing pension Total Plan Fees, which the CEO pays as part of his ongoing membership of the legacy defined benefit pension plan, his 2020 salary after these increasing fees will decrease again in 2020 compared to 2019.
The Board conducted its biennial review of Non-Executive Directors’ fees at the end of 2019 and considered, among other things, relevant market data for the FTSE 30 in making its adjustments. The fees for 2020 are set out on page 103.
The audited sections of the Report are clearly marked.
Wolfhart HauserChair, Remuneration Committee

99RELX Annual report and financial statements 2019 | Directors’ Remuneration Report
Single Total Figure of Remuneration – Executive Directors (audited)(a) (b) (c) (d) (e) (f)
Annual incentiveShare based
awards(3) Pension(4) Total£’000 Salary Benefits(1) CashDeferred
Shares(2)
Erik Engstrom 2019 1,249 86 1,276 638 4,894 539 8,6812018 1,218 85 1,269 635 5,388 545 9,141
Nick Luff 2019 735 15 749 375 2,449 186 4,5102018 717 14 753 376 2,697 196 4,754
(1) Benefits are typically comprised of a car allowance, private medical/dental insurance and the cost of tax return preparation. (2) One-third of the 2018 and 2019 AIP is paid in shares deferred for three years. Dividend equivalents accrue on these shares. (3) The 2019 figures reflect the vesting of the 2017–2019 cycle of BIP, LTIP and ESOS. As the BIP, LTIP and ESOS vest after the approval
date of this Report, the average share prices and exchange rates for the last quarter of 2019 have been used to arrive at an estimated figure in respect of these awards, in line with the methodology prescribed by the Regulations.
The estimated figures for 2018 disclosed in last year’s Report have been restated to reflect the actual amount vested and the actual share prices and exchange rates, which increased the 2018 disclosed figure by £726k for the CEO and by £356k for the CFO. The vesting percentages were determined on 22 February 2019 and were in line with those disclosed on pages 90 and 91 of the 2018 Remuneration Report.
For Erik Engstrom, the amount that directly reflects share price appreciation is £2.2m for 2018 and £1.5m for 2019 (of which £0.6m relates to the LTIP, £0.3m relates to the BIP and £0.7m relates to the ESOS). For Nick Luff, these numbers are £1.1m for 2018 and £0.7m for 2019 (of which £0.3m relates to the LTIP, £0.2m relates to the BIP and £0.3m relates to the ESOS). The figures add up to different amounts than the totals due to rounding. The slight differences to the numbers in the table are also solely due to rounding. The awards are due to vest in February 2020 and the 2019 figures will be restated in next year’s report to reflect actual values at vesting.
No discretion was applied by the Remuneration Committee in determining the vesting outcome percentages.(4) The pension figure for Erik Engstrom reflects his current membership of the UK legacy defined benefit pension scheme and has
been calculated in accordance with the prescribed methodology set out in the Regulations. This figure does not represent a contribution by the Company. In 2019, the Company contributed £53,297 to the funded portion of his defined benefit pension plan. The remainder of his accrued pension is an unfunded liability of the Company.
In 2019, the CEO contributed a total of £246,353 (20% of his pensionable earnings) by way of Total Plan Fees, up from £151,306 (12.5% of pensionable earnings) in 2018. The pension figures for 2019 and 2018 in the table are reduced by these Total Plan Fees. For details of Mr Engstrom’s accrued pension as at 31 December 2019, and further information on his pension reduction in 2020 and the coming years, see page 104.
Nick Luff receives a cash allowance in lieu of pension which reduced from 27% of salary to 25% of salary effective 1 March 2019. For details on the reduction of the CFO’s allowance in 2020 and the coming years, see page 104.
Annual Remuneration Report
Market segm
entsGovernance
Financial statements and
other information
Financial reviewCorporate Responsibility
Overview
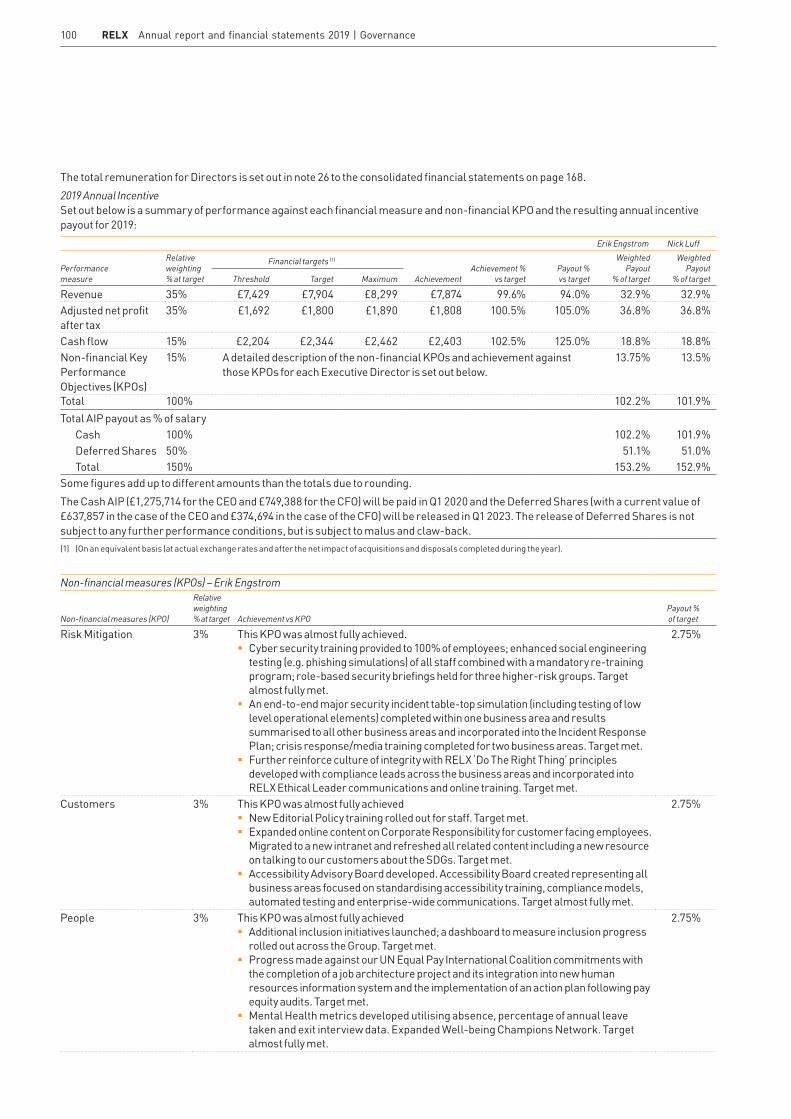
100 RELX Annual report and financial statements 2019 | Governance
The total remuneration for Directors is set out in note 26 to the consolidated financial statements on page 168.2019 Annual Incentive Set out below is a summary of performance against each financial measure and non-financial KPO and the resulting annual incentive payout for 2019:
Erik Engstrom Nick Luff
Performance measure
Relative weighting% at target
Financial targets (1)
AchievementAchievement %
vs targetPayout %vs target
Weighted Payout
% of target
Weighted Payout
% of targetThreshold Target Maximum
Revenue 35% £7,429 £7,904 £8,299 £7,874 99.6% 94.0% 32.9% 32.9%Adjusted net profit after tax
35% £1,692 £1,800 £1,890 £1,808 100.5% 105.0% 36.8% 36.8%
Cash flow 15% £2,204 £2,344 £2,462 £2,403 102.5% 125.0% 18.8% 18.8%Non-financial Key Performance Objectives (KPOs)
15% A detailed description of the non-financial KPOs and achievement against those KPOs for each Executive Director is set out below.
13.75% 13.5%
Total 100% 102.2% 101.9%Total AIP payout as % of salary Cash 100% 102.2% 101.9% Deferred Shares 50% 51.1% 51.0% Total 150% 153.2% 152.9%Some figures add up to different amounts than the totals due to rounding.The Cash AIP (£1,275,714 for the CEO and £749,388 for the CFO) will be paid in Q1 2020 and the Deferred Shares (with a current value of £637,857 in the case of the CEO and £374,694 in the case of the CFO) will be released in Q1 2023. The release of Deferred Shares is not subject to any further performance conditions, but is subject to malus and claw-back.(1) (On an equivalent basis (at actual exchange rates and after the net impact of acquisitions and disposals completed during the year).
Non-financial measures (KPOs) – Erik Engstrom
Non-financial measures (KPO)
Relative weighting% at target Achievement vs KPO
Payout %of target
Risk Mitigation 3% This KPO was almost fully achieved. § Cyber security training provided to 100% of employees; enhanced social engineering
testing (e.g. phishing simulations) of all staff combined with a mandatory re-training program; role-based security briefings held for three higher-risk groups. Target almost fully met.
§ An end-to-end major security incident table-top simulation (including testing of low level operational elements) completed within one business area and results summarised to all other business areas and incorporated into the Incident Response Plan; crisis response/media training completed for two business areas. Target met.
§ Further reinforce culture of integrity with RELX ‘Do The Right Thing’ principles developed with compliance leads across the business areas and incorporated into RELX Ethical Leader communications and online training. Target met.
2.75%
Customers 3% This KPO was almost fully achieved § New Editorial Policy training rolled out for staff. Target met. § Expanded online content on Corporate Responsibility for customer facing employees.
Migrated to a new intranet and refreshed all related content including a new resource on talking to our customers about the SDGs. Target met.
§ Accessibility Advisory Board developed. Accessibility Board created representing all business areas focused on standardising accessibility training, compliance models, automated testing and enterprise-wide communications. Target almost fully met.
2.75%
People 3% This KPO was almost fully achieved § Additional inclusion initiatives launched; a dashboard to measure inclusion progress
rolled out across the Group. Target met. § Progress made against our UN Equal Pay International Coalition commitments with
the completion of a job architecture project and its integration into new human resources information system and the implementation of an action plan following pay equity audits. Target met.
§ Mental Health metrics developed utilising absence, percentage of annual leave taken and exit interview data. Expanded Well-being Champions Network. Target almost fully met.
2.75%

101RELX Annual report and financial statements 2019 | Directors’ Remuneration Report
Non-financial measures (KPOs) – Erik Engstrom
Non-financial measure (KPO)
Relative weighting% at target Achievement vs KPO
Payout % of target
Process 3% This KPO was almost fully achieved § Number of suppliers signed up to the RELX Supplier Code of Conduct increased by 3.9% from last year.
Target met. § Continued use of audits to ensure continuous improvement in supplier performance and compliance;
number of supplier audits completed increased over prior year. Target met. § Continued to advance the US Supplier Diversity & Inclusion programme – spend with veteran, women
and minority-owned businesses increased, with overall spend with diverse suppliers increased compared to previous year at 11.9%. Target almost fully met.
2.5%
Environment 3% This KPO was fully achieved § Renewable electricity purchased as a percentage of global consumption increased to 96%. Reduced
Scope 1 and Scope 2 CO2 emissions by 52% below the 2010 baseline ahead of the 2020 target of 40%. Target exceeded.
§ Reduced our energy and fuel consumption by 41% below the 2010 baseline, ahead of our 2020 target of 30%. Target exceeded.
§ Reduced waste generated at reporting locations by 66% below the 2010 baseline, ahead of our 2020 target of 40%. Target exceeded.
3%
Total 15% 13.75%
Non-financial measures (KPOs) – Nick LuffNon-financial measure ( KPO)
Relative weighting% at target Achievement vs KPO
Payout % of target
Risk Mitigation
3% This KPO was almost fully achieved § Cyber security training provided to 100% of employees; enhanced social engineering testing (e.g.
phishing simulations) of all staff combined with a mandatory re-training program; role-based security briefings held for three higher-risk groups. Target almost fully met.
§ An end-to-end major security incident table-top simulation (including testing of low level operational elements) completed within one business area and results summarised to all other business areas and incorporated into the Incident Response Plan; crisis response/media training completed for two business areas. Target met.
§ Further reinforce culture of integrity with RELX ‘Do The Right Thing’ principles developed with compliance leads across the business areas and incorporated into RELX Ethical Leader communications and online training. Target met.
2.75%
Corporate Structure
3% This KPO was almost fully achieved § Optimised the Group’s distributable reserves position, with shareholder approval, following the
corporate structure simplification last year. Target met. § Further reduced the number of legal entities in the Group’s corporate structure. Target almost fully met. § Internal funding arrangements realigned within the simplified corporate structure. Target met.
2.5%
Finance Function
3% This KPO was almost fully achieved § Further improvements made to the effectiveness and efficiency of the finance function. Target almost
fully met. § Increased use of robotic process automation in the finance function. Target almost fully met. § Actively promoted inclusion and diversity in the finance function with Talent Boards launched in the UK
and the US. Target met.
2.5%
Financing / Benefits
3% This KPO was almost fully achieved § External bond financing resulting in a reduction in interest costs. Target met. § UK pension triennial modification plan completed and resulting follow up actions implemented. Target
almost fully met. § Reviewed and standardised US employee benefits. Target met.
2.75%
Environment 3% This KPO was fully achieved § Renewable electricity purchased as a percentage of global consumption increased to 96%. Reduced
Scope 1 and Scope 2 CO2 emissions by 52% below the 2010 baseline ahead of the 2020 target of 40%. Target exceeded.
§ Reduced our energy and fuel consumption by 41% below the 2010 baseline, ahead of our 2020 target of 30%. Target exceeded.
§ Reduced waste generated at reporting locations by 66% below the 2010 baseline, ahead of our 2020 target of 40%. Target exceeded.
3%
Total 15% 13.5%
Market segm
entsGovernance
Financial statements and
other information
Financial reviewCorporate Responsibility
Overview

102 RELX Annual report and financial statements 2019 | Governance
Multi-year incentives (granted under the Remuneration Policy in effect prior to the approval by shareholders of the current Remuneration Policy at the Annual General Meetings in April 2017)Multi-year incentives with a performance period ended 31 December 2019 were the 2017–2019 cycles of BIP, LTIP and ESOS granted to Executive Directors. Following the simplification of the remuneration plans approved by shareholders at the Annual General Meetings in 2017, these are the final cycles of the BIP and, for Executive Directors, the ESOS.
The Committee assessed the performance measures for these awards and made an overall assessment of underlying business performance and other relevant factors. The vesting outcome resulting from this review is summarised below.
LTIP: 2017–2019 cycle performance outcome
Performance measure Weighting
Performance range and vesting levels set at grant (1)
Achievement against the performance range
Resulting vesting percentage
TSR over the three-year performance period(2)
1/3rd below medianmedian
upper quartile
0%30%100%
Between median and upper quartile of sterling and euro
comparator groups just above median of
US dollar group
59.5%
Average growth in adjusted EPS over the three-year performance period(3)
1/3rd below 5% p.a.5% p.a.6% p.a.7% p.a.8% p.a.9% p.a.10% p.a.
11% p.a. and above
0%33%
52.5%65%75%85%
92.5%100%
6.8% p.a 62.5%
ROIC in the third year of the performance period(3)
1/3rd below 12.5%12.5%12.75%13.0%
13.25%13.5%13.75%
14.0% and above
0%33%
52.5%65%75%85%
92.5%100%
13.7%(4) 91%
Total vesting percentage: 71.0%(1) Calculated on a straight-line basis for performance between the points.(2) In respect of the euro TSR comparator group, RELX NV shares were, subsequent to the merger of RELX NV into RELX PLC, replaced with Euronext Amsterdam listed
RELX PLC shares priced in euros and, in respect of the US dollar TSR comparator group, RELX NV ADRs were, subsequent to the merger, replaced with RELX PLC ADRs. (3) Growth in adjusted EPS at constant currencies and ROIC are calculated as set out in the Chief Financial Officer’s report on pages 52 to 57 and note 10 to the consolidated
financial statements on page 148, with adjustments made to remove the effect on ROIC of changes in exchange rates, pension deficits and accounting standards over the three-year performance period.
(4) For 2019, ROIC on pages 55 and 56 of the Chief Financial Officer’s report of 13.6% equates to ROIC of 13.7% under the plan methodology after adjustments for changes in exchange rates, pension deficits and accounting standards and impact of acquisition related integration costs.
BIP: 2017–2019 cycle performance outcome (final cycle of the discontinued BIP)
Performance measure Weighting
Performance range and vesting levels set at grant (1)
Achievement against the performance range
Resulting vesting percentage
Average growth in adjusted EPS over the three-year performance period(2)
50% below 4% p.a.4% p.a.
6.5% p.a.9% p.a. or above
0%50%75%
100%
6.8% p.a. 78%
ROIC in the third year of the performance period(2)
50% below 12.5%12.5%13.0%
13.5% or above
0%50%75%
100%
13.7%(3) 100%
Total vesting percentage: 89.0%(1) Calculated on a straight-line basis for performance between the points.(2) Growth in adjusted EPS at constant currencies and ROIC are calculated as set out in the Chief Financial Officer’s report on pages 52 to 57 and note 10 to the consolidated
financial statements on page 148, with adjustments made to remove the effect on ROIC of changes in exchange rates, pension deficits and accounting standards over the three-year performance period.
(3) For 2019, ROIC on pages 55 and 56 of the Chief Financial Officer’s report of 13.6% equates to ROIC of 13.7% under the plan methodology after adjustments for changes in exchange rates, pension deficits and accounting standards and impact of acquisition related integration costs.

103RELX Annual report and financial statements 2019 | Directors’ Remuneration Report
ESOS: 2017–2019 cycle performance outcome (final cycle of ESOS, now discontinued for the Executive Directors)
Performance measure Weighting
Performance range and vesting levels set at grant(1)
Achievement against the performance range
Resulting vesting percentage
Average growth in adjusted EPS over the three-year performance period(2)
100% below 4% p.a.4% p.a.6% p.a.
8% p.a. or above
0%33%80%100%
6.8% p.a. 88%
(1) Calculated on a straight-line basis for performance between the stated average adjusted EPS growth percentages.(2) Growth in adjusted EPS at constant currencies is calculated as set out in the Chief Financial Officer’s report on pages 52 to 57 and note 10 to the consolidated financial
statements on page 148.
Single Total Figure of Remuneration – Non-Executive Directors (audited)Total fee Benefits(1) Total
2019 2018 2019 2018 2019 2018
Anthony Habgood £650,000 £650,000 £1,665 £2,360 £651,665 £652,360Wolfhart Hauser £159,500 £159,500 £780 £159,500 £160,280Adrian Hennah £129,500 £118,990 £780 £129,500 £119,770Charlotte Hogg (2) £3,269 N/A N/A £3,269 N/AMarike van Lier Lels(3) £124,583 € 126,651 £840 € 949 £125,423 € 127,600Robert MacLeod £109,667 £107,000 £780 £109,667 £107,780Carol Mills(4) £41,984 £125,000 £840 £1,620 £42,824 £126,620Linda Sanford £120,500 £125,000 £840 £1,620 £121,340 £126,620Andrew Sukawaty(5) £76,699 N/A N/A £76,699 N/ABen van der Veer(3)(4) £27,353 € 124,696 £840 € 949 £28,193 € 125,645Suzanne Wood £120,500 £116,000 £840 £121,340 £116,000(1) Benefits comprise the notional benefit of tax filing support provided to Non-Executive Directors for filings outside their home country resulting from their directorships
with RELX. The incremental assessable benefit charge per tax return for 2019 was £840 (unchanged from 2018) for a UK tax return. Anthony Habgood’s benefits comprise £1,665 (£1,580 in 2018) in respect of private medical insurance. Further, the Company meets all reasonable travel, subsistence, accommodation and other expenses, including any tax where such expenses are deemed taxable, incurred by the Non-Executive Directors and the Chair in the course of performing their duties.
(2) Appointed on 16 December 2019.(3) The pound sterling equivalent of the total fees and benefits for Marike van Lier Lels and Ben van der Veer for 2018 (converted at the average exchange rate for 2018) were
£112,920 and £111,190 respectively. For the purposes of reporting the total fees and benefits for these two Directors for 2018, the pound sterling benefit relating to the UK tax return preparation was converted into euros at the average exchange rate for 2018. From 2019, their fees are denominated in pound sterling.
(4) Retired at the 2019 AGM.(5) Appointed on 25 April 2019.(6) The total remuneration for Directors is set out in note 26 to the consolidated financial statements on page 168.
Non-Executive Directors’ feesThe fees in the Single Total Figure table for Non-Executive Directors reflect the following fees in 2019:
Annual fee 2020 Annual fee 2019
Chair £650,000 £650,000Non-Executive Directors £90,000 £85,000Senior Independent Director £30,000 £30,000Chair of:– Audit Committee £30,000 £30,000– Remuneration Committee £30,000 £30,000Workforce engagement fee £17,500 £17,500Committee membership fee:– Audit Committee £17,500 £17,500– Remuneration Committee £17,500 £17,500– Nominations Committee £10,000 £10,000
In addition, an intercontinental travel fee of £4,500 was payable to any Non-Executive Director (excluding the Chair) in respect of each transatlantic journey made in order to attend a RELX Board or Committee meeting during 2019. In 2020, this fee will remain at £4,500.
Fees may be reviewed annually, although in practice they have changed on a less frequent basis. At the end of 2019, the Non-Executive Director and the Chair fees were each reviewed, taking into account comparative benchmark data, market practice and general governance trends. As a result, certain changes were approved which took effect on 1 January 2020 as set out in the table above. Before that, the last review took place at the end of 2017, as a result of which changes were approved which took effect on 1 January 2018.
Market segm
entsGovernance
Financial statements and
other information
Financial reviewCorporate Responsibility
Overview

104 RELX Annual report and financial statements 2019 | Governance
Total pension entitlements (audited) Erik Engstrom is a member of the legacy UK defined benefit pension plan. Subject to approval of the new remuneration policy being put forward for shareholder approval at the 2020 AGM, he will cease to accrue benefits under this plan at the end of 2022, at which point he will receive pension benefits of equivalent value to the level of pension benefits provided under the Company’s regular defined contribution pension plans as may be in effect or amended from time to time (currently capped at 11% of base salary in the UK). Mr Engstrom’s contributions and participation fee (together, the Total Plan Fees), which are payable by him as part of his ongoing membership of the scheme, have been increasing annually since 2011. In 2019, his Total Plan Fees were 20% of his pensionable earnings (i.e. £246,353), up from 12.5% in 2018. His Total Plan Fees will increase to 25% of pensionable earnings in 2020, 30% in 2021 and 35% in 2022. Mr Engstrom is also subject to a cap of 2% on annual increases in pensionable earnings.
Nick Luff receives a cash allowance in lieu of pension, which reduced from 27% of salary to 25% of salary on 1 March 2019 and reduced to 20% of base salary on 1 January 2020 and will continue to reduce each year until the end of 2022, at which time Mr Luff will receive pension benefits of equivalent value to the level of pension benefits provided under the Company’s regular defined contribution pension plans as may be in effect or amended from time to time (currently capped at 11% of base salary in the UK).
Erik Engstrom – pension information
Age at December 2019 Normal retirement age CEO’s Total Plan FeesAccrued annual pension at
31 December 20192019 single figure
pensions value
56 60 £246,353 £499,568 £538,862 (1)
(1) The 2019 single figure pensions value is the difference between the accrued annual pension as at 31 December 2018 (adjusted for inflation) and the accrued annual pension as at 31 December 2019, multiplied by 20 in accordance with the UK Regulations and is net of the CEO’s Total Plan Fees.
Scheme interests awarded during the financial year (audited)LTIP – PERFORMANCE SHARE AWARDS
Basis on which award is made
Face value of award at grant(1)
Value of awards if vest in line with expectations(2)
Percentage of maximum that would be received if threshold performance achieved
End of performance period
Erik Engstrom 450% of salary £5,482,809 £2,741,405 If each measure pays out at threshold, the overall payout is 25%
31 December 2021
Nick Luff 375% of salary £2,690,533 £1,345,267
AIP – DEFERRED SHARES
Erik Engstrom 1/3 of 2018 AIP payout £634,639 N/A. The release of AIP Deferred Shares in Q1 2022 is not subject to any
further performance conditions, but is subject to malus and claw-back.Nick Luff 1/3 of 2018 AIP payout
£376,409
(1) The face value of the LTIP awards and AIP Deferred Shares granted in February 2019 was calculated using the middle market quotation of a PLC ordinary share (£17.6975). This share price was used to determine the number of awards granted.
(2) Vesting in line with expectations for LTIP is as per the performance scenario chart disclosed on page 87 of the 2016 Remuneration Report, i.e. 50%.
The LTIP awards granted in 2019 are based on ROIC, EPS and TSR weighted 40%:40%:20% respectively and assessed independently. The targets and vesting scales applicable to these awards are set out on pages 97 and 98 of the 2018 Remuneration Report.

105RELX Annual report and financial statements 2019 | Directors’ Remuneration Report
Statement of Directors’ shareholdings and other share interests (audited)Shareholding requirement The Committee believes that a closer alignment of interests can be created between senior management and shareholders if executives build and maintain a significant personal stake in RELX. The shareholding requirements applicable to the Executive Directors are set out in the table below Shares that count for this purpose are (i) any type of RELX security of which the Director, their spouse, civil partner or dependent child has beneficial ownership of and (ii) AIP deferred shares which are within their three-year deferral period, on a notional net (after tax) basis. There has been no change to the interests reported below between 31 December 2019 and 12 February 2020.
Meeting the shareholding requirement is both a vesting condition for LTIP awards granted and a requirement to maintain eligibility for future LTIP awards.
On 31 December 2019, the Executive Directors’ shareholdings were as follows (valued using the middle market closing prices of the relevant securities):
Shareholding requirement (% of 31 December 2019 annual base salary)
Shareholding as at 31 December 2019 (% of 31 December 2019
annual base salary) (1)
Erik Engstrom 400% 1,620%Nick Luff 300% 742%(1) Includes AIP deferred shares which are within their three-year deferral period, on a notional net (after tax) basis (19,005 for Erik Engstrom and 11,272 for Nick Luff).
Share interests (number of RELX ordinary shares held)1 January 2019 31 December 2019
Erik Engstrom 1,010,617 1,014,006 (1)
Nick Luff 265,971 270,203 (1)
Anthony Habgood 88,450 88,450Wolfhart Hauser 14,633 14,633Adrian Hennah 10,508 10,508Charlotte Hogg (from 16 December 2019) N/A 0 (2)
Marike van Lier Lels 8,000 10,907Robert MacLeod 6,950 6,950Carol Mills (until 25 April 2019) 9,700 N/ALinda Sanford 9,700 9,700Andrew Sukawaty (from 25 April 2019) N/A 10,000 (3)
Ben van der Veer (until 25 April 2019) 10,766 N/ASuzanne Wood 5,100 5,100N/A denotes that the individual was not a Director at the relevant date.
(1) Number excludes AIP deferred shares which are within their three-year deferral period. If these were included on a notional net (after tax) basis, the totals at 31 December 2019 would be 1,033,011 for Erik Engstrom and 281,475 for Nick Luff.
(2) Charlotte Hogg was appointed effective 16 December 2019. (3) Andrew Sukawaty was appointed effective 25 April 2019.
Market segm
entsGovernance
Financial statements and
other information
Financial reviewCorporate Responsibility
Overview

106 RELX Annual report and financial statements 2019 | Governance
Multi-year incentive interests (audited)The tables below and on page 107 set out vested but unexercised and unvested options, unvested share awards and AIP deferred shares held by the Executive Directors including details of awards granted, options exercised and awards vested during the year of reporting.
All outstanding unvested options and share awards are subject to performance conditions. For disclosure purposes, any PLC ADRs awarded under the multi-year incentive plans are included as ordinary shares. Between 31 December 2019 and the date of this Report, there have been no changes in the options or share awards held by the Executive Directors.
Erik Engstrom OPTIONS
Year ofgrant
No. of options held on
1 Jan2019
No. of options granted
during2019
Option price on
date ofgrant
No. of options
exercisedduring
2019
Market price pershare atexercise
No. of options held on31 Dec
2019
Unvestedoptions
vesting on
Optionsexercisable
until
2014 145,604 £9.245 145,604 07 Apr 24158,166 €10.286 158,166 07 Apr 24
2015 114,584 £11.520 114,584 02 Apr 25120,886 €15.003 120,886 02 Apr 25
2016(1) 112,690 £12.550 101,421 15 Mar 26119,312 €15.285 107,380 15 Mar 26
2017 96,996 £14.945 96,996 Feb 20 27 Feb 27102,405 €16.723 102,405 Feb 20 27 Feb 27
Total 970,643 947,442
SHARES (2)
Year ofgrant
No. ofunvested
sharesheld on
1 Jan 2019
No. of shares
awardedduring
2019
Market price pershare at
award
No. of shares vested during
2019
Market price per share at vesting
No. of unvested
sharesheld on
31 Dec 2019
End of performance
periodDate of vesting
BIP 2016(1) 94,965 €15.285 83,094 €20.4002017 81,781 €16.723 81,781 Dec 2019 Feb 2020
LTIP 2016(1) 112,690 £12.550 77,305 £17.698119,312 €15.285 81,848 €20.400
2017 96,996 £14.945 96,996 Dec 2019 Feb 2020102,405 €16.723 102,405 Dec 2019 Feb 2020
2018 179,318 £14.915 179,318 Dec 2020 Feb 2021178,482 €16.870 178,482 Dec 2020 Feb 2021
2019 309,807 £17.698 309,807 Dec 2021 Feb 2022Total 965,949 309,807 242,247 948,789 (1) The performance outcomes for the 2016 ESOS options, BIP and LTIP were disclosed on pages 90 and 91 of the 2018 Remuneration Report.(2) In addition, Mr Engstrom has 35,860 AIP deferred shares (pre-tax) awarded in 2019 with a market price at award of £17.698. The release of these AIP deferred shares in
February 2022 is not subject to any further performance conditions. Including these AIP deferred shares increases the number of shares awarded during 2019 to 345,667 and the number of unvested shares held on 31 December 2019 to 984,649.

107RELX Annual report and financial statements 2019 | Directors’ Remuneration Report
Nick Luff OPTIONS
Year ofgrant
No. of options held on
1 Jan2019
No. of options granted
during2019
Option price on
date ofgrant
No. of options
exercisedduring
2019
Market price pershare atexercise
No. of options held on31 Dec
2019
Unvestedoptions
vesting on
Optionsexercisable
until
ESOS 2014 65,656 £9.900 65,656 02 Sep 2472,228 €11.378 72,228 02 Sep 24
2015 53,979 £11.520 53,979 02 Apr 2556,948 €15.003 56,948 02 Apr 25
2016(1) 53,087 £12.550 47,778 15 Mar 2656,207 €15.285 50,586 15 Mar 26
2017 45,694 £14.945 45,694 Feb 20 27 Feb 2748,242 €16.723 48,242 Feb 20 27 Feb 27
Total 452,041 441,111
SHARES (2)
Year ofgrant
No. ofunvested
sharesheld on
1 Jan 2019
No. of shares
awardedduring
2019
Market price pershare at
award
No. of shares vested during
2019
Market price per share at vesting
No. of unvested
sharesheld on
31 Dec 2019
End of performance
periodDate of vesting
BIP 2016(1) 26,543 £12.550 23,225 £17.69828,103 €15.285 24,590 €20.400
2017 22,847 £14.945 22,847 Dec 2019 Feb 202024,121 €16.723 24,121 Dec 2019 Feb 2020
LTIP 2016(1) 53,087 £12.550 36,417 £17.69856,207 €15.285 38,558 €20.400
2017 45,694 £14.945 45,694 Dec 2019 Feb 202048,242 €16.723 48,242 Dec 2019 Feb 2020
2018 87,996 £14.915 87,996 Dec 2020 Feb 202187,585 €16.870 87,585 Dec 2020 Feb 2021
2019 152,029 £17.698 152,029 Dec 2021 Feb 2022Total 480,425 152,029 122,790 468,514 (1) The performance outcomes for the 2016 ESOS options, BIP and LTIP were disclosed on pages 90 and 91 of the 2018 Remuneration Report.(2) In addition, Mr Luff has 21,269 AIP deferred shares (pre-tax) awarded in 2019 with a market price at award of £17.698. The release of these AIP deferred shares in February
2022 is not subject to any further performance conditions. Including these AIP deferred shares increases the number of shares awarded during 2019 to 173,298 and the number of unvested shares held on 31 December 2019 to 489,783.
Market segm
entsGovernance
Financial statements and
other information
Financial reviewCorporate Responsibility
Overview

108 RELX Annual report and financial statements 2019 | Governance
Performance graphsThe graphs below show total shareholder returns for RELX calculated on the basis of the average share price in the 30 trading days before the respective year end and assuming dividends were reinvested. RELX’s performance is compared with the FTSE 100. The three-year chart covers the performance period of the 2017–2019 cycle of the LTIP.
3 years 5 years 10 years
Dec-19
RELX vs FTSE 100 – 3-YEAR TSR
Dec-16
Dec-18
Dec-17
+21%
+45%
∆=24%
RELX FTSE 100
0
25
50
75
100
125
150
175% %
RELX vs FTSE 100 – 5-YEAR TSR
+38%
+94%
Dec-14
Dec-15
Dec-16
Dec-19
Dec-18
Dec-17
RELX FTSE 100
∆=56%
0
25
50
75
100
125
150
175
200
225
Dec-09
Dec-12
Dec-11
Dec-10
Dec-14
Dec-13
Dec-19
Dec-18
Dec-17
Dec-16
Dec-15
%RELX vs FTSE 100 – 10-YEAR TSR
+104%
+422%
∆=318%
RELX FTSE 100
050
100150200250300350400450500550
CEO historical pay tableThe table below shows the historical CEO pay over a ten-year period. £’000 2010 2011 2012 2013 2014 2015 2016 2017 2018 2019
Annualised base salary 1,000 1,025 1,051 1,077 1,104 1,131 1,160 1,189 1,218 1,249
Annual incentive payout as a % of maximum
67% 66% 73% 70% 71% 70% 68% 69% 78% 77%
Multi-year incentive vesting as a % of maximum
0% 0% 70%(1) 96%(1) 90%(1) 97%(1) 97%(1) 92%(1) 81%(1) 81%(1)
CEO total 3,140 2,738 11,145(2) 5,463 17,447(3) 11,416(4) 11,399(5) 8,748(6) 9,141(7) 8,681(8)
(1) The 2019, 2018, 2017, 2016 and 2015 percentages reflect BIP, LTIP and ESOS. The 2014 percentage reflects the final tranche of the discontinued Reed Elsevier Growth Plan (REGP), BIP and ESOS. The 2013 percentage reflects BIP and ESOS only and the 2012 percentage reflects BIP and the first tranche of the discontinued REGP.
(2) The 2012 figure reflects the vesting of the first tranche of the discontinued REGP and includes the entire amount that was performance tested over the 2010–12 period, including the 50% of shares deferred until 2015 in accordance with the plan rules including £3m attributed to share price appreciation.
(3) The 2014 figure includes the vesting of the second and final tranche of the discontinued REGP and includes £8.8m attributed to share price appreciation.(4) The 2015 figure includes £4.4m attributed to share price appreciation.(5) The 2016 figure includes £4.2m attributed to share price appreciation. (6) The 2017 figure includes £1.7m attributed to share price appreciation. (7) The 2018 figure includes £2.2m attributed to share price appreciation. The share award value has been restated for actual share prices and exchange rates applicable on
the dates of vesting (see page 99 for further detail). (8) The 2019 figure includes £1.5m attributed to share price appreciation.

109RELX Annual report and financial statements 2019 | Directors’ Remuneration Report
Comparison of change in CEO pay with change in employee pay The table below shows the percentage change in remuneration (salary, benefits and annual cash incentive) from 2018 to 2019 for the CEO compared with the average employee.
% change from 2018 to 2019
CEOAverage
employee(1)
Salary 2.5%(2) 3.0%Benefits 1.9% 3.4%Annual cash incentive 0.5% 2.2%(1) The average employee data has been determined based on a review of employees
representing over 80% of the total employee population. The average salary increase in the UK, where the CEO is based, was 2.5%.
UK pay ratiosThe UK Companies (Miscellaneous Reporting) Regulations 2018 require the disclosure of the ratio of total CEO remuneration to median (P50), 25th percentile (P25) and 75th percentile (P75) UK employee total remuneration (calculated on a full-time equivalent basis). UK employees represent less than 20% of our global employee population.
Pay ratios for total remuneration are likely to vary, potentially significantly, over time, since the CEO’s total remuneration each year is driven largely by his performance-related pay outcomes and is affected by share price movements. We have therefore also shown the UK ratios for the salary component.
For the purposes of the ratios below, the CEO’s total remuneration is his 2019 total single figure and salary as disclosed on page 99. The P25, P50 and P75 UK employee were selected from the UK employee population as at 1 October 2019.Total remuneration
Pay Ratio All employee £’000Year Method P25 P50 P75 P25 P50 P75
2019 A 225:1 149:1 100:1 £39 £58 £86
SalaryPay Ratio All employee £’000
Year Method P25 P50 P75 P25 P50 P75
2019 A 35:1 25:1 18:1 £35 £51 £71
Slight differences compared with ratios calculated using data shown in the tables due to rounding.
The ratios are calculated using Option A, meaning that the median, 25th percentile and 75th percentile UK employees were determined based on total remuneration for 2019 using the single total figure valuation methodology, except for 2019 annual incentives (other than sales incentives) which are based on estimated pay-out as individual final payout levels are still to be finalised and pension was valued based on the cost to the Company of providing the benefit.
We chose Option A as we believe it is the most robust and accurate way to identify the median, 25th percentile and 75th percentile UK employee.
The Committee is satisfied that the overall picture presented by the 2019 pay ratios is consistent with the pay, reward and progression policies for the Group’s UK employees.
§§ Salaries for all UK employees, including the Executive Directors, are set based on a wide range of factors, including market practice, scope and impact of the role and experience.
§§ The provision of certain benefits and the level of benefit provided vary depending on the role and level of seniority.
§§ Participation in annual incentive plans varies by business and reflects the culture and the nature of the business, as well as role.
§§ Whilst none of the comparator employees participate in the executive share plans, they do have the opportunity to receive company shares via the UK Sharesave Option Plan. A greater proportion of performance-related variable pay and share based awards applies to more senior executives, including the Executive Directors, who have a greater influence over performance outcomes.
Relative importance of spend on payThe following table sets out the total employee costs for all employees, as well as the amounts paid in dividends and share repurchases.
2019 £m
2018 £m
% change
Employee costs(1) 2,498 2,350 +6.3%Dividends 842 796 +5.8%Share repurchases 600 700 -14.3%(1) Employee costs include wages and salaries, social security costs, pensions and
share based and related remuneration.
Payments to past Directors and payments for loss of office (audited)There have been no payments for loss of office in 2019.
Market segm
entsGovernance
Financial statements and
other information
Financial reviewCorporate Responsibility
Overview
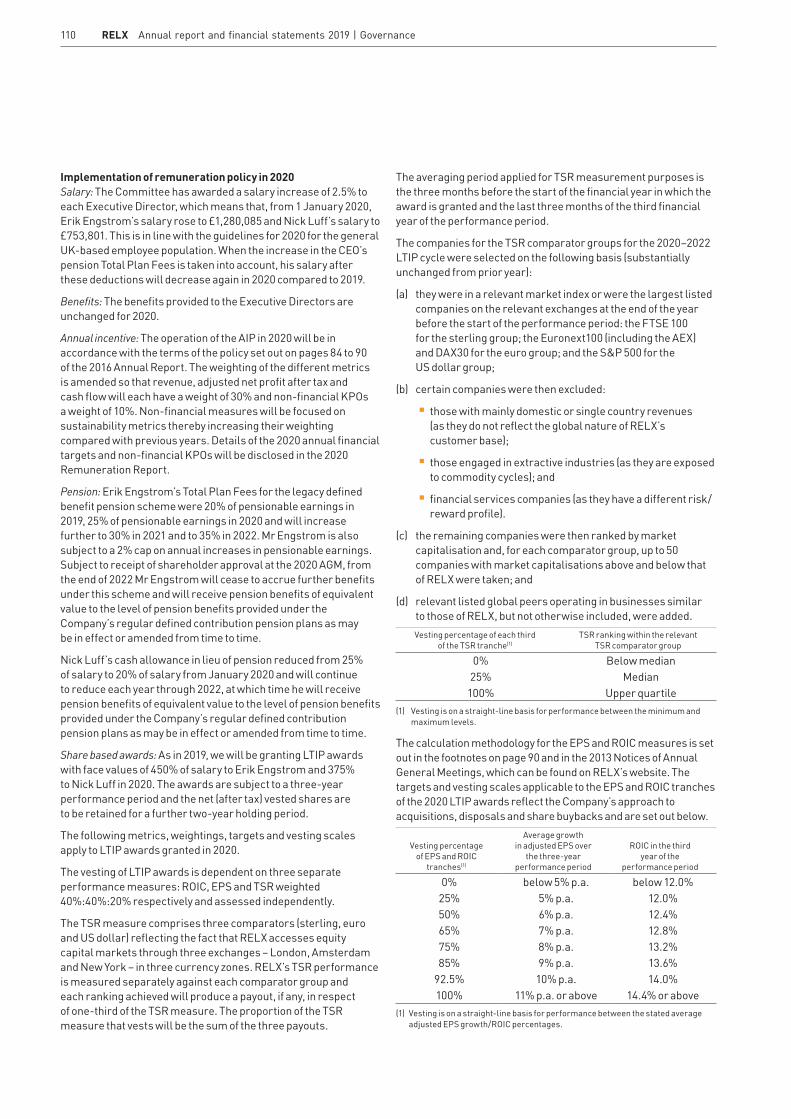
110 RELX Annual report and financial statements 2019 | Governance
Implementation of remuneration policy in 2020Salary: The Committee has awarded a salary increase of 2.5% to each Executive Director, which means that, from 1 January 2020, Erik Engstrom’s salary rose to £1,280,085 and Nick Luff’s salary to £753,801. This is in line with the guidelines for 2020 for the general UK-based employee population. When the increase in the CEO’s pension Total Plan Fees is taken into account, his salary after these deductions will decrease again in 2020 compared to 2019.
Benefits: The benefits provided to the Executive Directors are unchanged for 2020.
Annual incentive: The operation of the AIP in 2020 will be in accordance with the terms of the policy set out on pages 84 to 90 of the 2016 Annual Report. The weighting of the different metrics is amended so that revenue, adjusted net profit after tax and cash flow will each have a weight of 30% and non-financial KPOs a weight of 10%. Non-financial measures will be focused on sustainability metrics thereby increasing their weighting compared with previous years. Details of the 2020 annual financial targets and non-financial KPOs will be disclosed in the 2020 Remuneration Report.
Pension: Erik Engstrom’s Total Plan Fees for the legacy defined benefit pension scheme were 20% of pensionable earnings in 2019, 25% of pensionable earnings in 2020 and will increase further to 30% in 2021 and to 35% in 2022. Mr Engstrom is also subject to a 2% cap on annual increases in pensionable earnings. Subject to receipt of shareholder approval at the 2020 AGM, from the end of 2022 Mr Engstrom will cease to accrue further benefits under this scheme and will receive pension benefits of equivalent value to the level of pension benefits provided under the Company’s regular defined contribution pension plans as may be in effect or amended from time to time.
Nick Luff’s cash allowance in lieu of pension reduced from 25% of salary to 20% of salary from January 2020 and will continue to reduce each year through 2022, at which time he will receive pension benefits of equivalent value to the level of pension benefits provided under the Company’s regular defined contribution pension plans as may be in effect or amended from time to time.
Share based awards: As in 2019, we will be granting LTIP awards with face values of 450% of salary to Erik Engstrom and 375% to Nick Luff in 2020. The awards are subject to a three-year performance period and the net (after tax) vested shares are to be retained for a further two-year holding period.
The following metrics, weightings, targets and vesting scales apply to LTIP awards granted in 2020.
The vesting of LTIP awards is dependent on three separate performance measures: ROIC, EPS and TSR weighted 40%:40%:20% respectively and assessed independently.
The TSR measure comprises three comparators (sterling, euro and US dollar) reflecting the fact that RELX accesses equity capital markets through three exchanges – London, Amsterdam and New York – in three currency zones. RELX’s TSR performance is measured separately against each comparator group and each ranking achieved will produce a payout, if any, in respect of one-third of the TSR measure. The proportion of the TSR measure that vests will be the sum of the three payouts.
The averaging period applied for TSR measurement purposes is the three months before the start of the financial year in which the award is granted and the last three months of the third financial year of the performance period.
The companies for the TSR comparator groups for the 2020–2022 LTIP cycle were selected on the following basis (substantially unchanged from prior year):
(a) they were in a relevant market index or were the largest listed companies on the relevant exchanges at the end of the year before the start of the performance period: the FTSE 100 for the sterling group; the Euronext100 (including the AEX) and DAX30 for the euro group; and the S&P 500 for the US dollar group;
(b) certain companies were then excluded:
§§ those with mainly domestic or single country revenues (as they do not reflect the global nature of RELX’s customer base);
§§ those engaged in extractive industries (as they are exposed to commodity cycles); and
§§ financial services companies (as they have a different risk/reward profile).
(c) the remaining companies were then ranked by market capitalisation and, for each comparator group, up to 50 companies with market capitalisations above and below that of RELX were taken; and
(d) relevant listed global peers operating in businesses similar to those of RELX, but not otherwise included, were added.Vesting percentage of each third
of the TSR tranche(1)TSR ranking within the relevant
TSR comparator group
0% Below median25% Median
100% Upper quartile (1) Vesting is on a straight-line basis for performance between the minimum and
maximum levels.
The calculation methodology for the EPS and ROIC measures is set out in the footnotes on page 90 and in the 2013 Notices of Annual General Meetings, which can be found on RELX’s website. The targets and vesting scales applicable to the EPS and ROIC tranches of the 2020 LTIP awards reflect the Company’s approach to acquisitions, disposals and share buybacks and are set out below.
Vesting percentage of EPS and ROIC
tranches(1)
Average growth in adjusted EPS over
the three-year performance period
ROIC in the third year of the
performance period
0% below 5% p.a. below 12.0%25% 5% p.a. 12.0%50% 6% p.a. 12.4%65% 7% p.a. 12.8%75% 8% p.a. 13.2%85% 9% p.a. 13.6%
92.5% 10% p.a. 14.0%100% 11% p.a. or above 14.4% or above
(1) Vesting is on a straight-line basis for performance between the stated average adjusted EPS growth/ROIC percentages.

111RELX Annual report and financial statements 2019 | Directors’ Remuneration Report
Remuneration Committee adviceThe Committee consists of independent Non-Executive Directors and the Chair of RELX. Details of members and their attendance are contained in the Corporate Governance Review on page 78. The Chief Legal Officer and Company Secretary attends meetings as secretary to the Committee. At the invitation of the Chair of the Committee, the CEO attends appropriate parts of the meetings. The CEO is not in attendance during discussions about his remuneration.
The Chief Human Resources Officer advised the Committee during the year.
Willis Towers Watson is the external adviser, appointed by the Committee through a competitive process. Willis Towers Watson also provided actuarial and other human resources consultancy services to some RELX companies during the year. The Committee is satisfied that the firm’s advice continues to be objective and independent, and that no conflict of interest exists. The individual consultants who work with the Committee do not provide advice to the Executive Directors or act on their behalf. Willis Towers Watson is a member of the Remuneration Consultants’ Group and conducts its work in line with the UK Code of Conduct for executive remuneration consulting. During 2019, Willis Towers Watson received fees of £18,250 for advice given to the Committee, charged on a time and expense basis.
Shareholder voting at 2019 Annual General MeetingAt the Annual General Meeting of RELX PLC on 25 April 2019, votes cast by proxy and at the meeting in respect of the Directors’ remuneration were as follows:Resolution Votes For % For Votes Against % Against Total votes cast Votes Withheld
Remuneration Report (advisory) 1,356,104,243 93.60% 92,695,095 6.40% 1,448,799,338 104,649,672
The current Remuneration Policy had been approved at the RELX PLC Annual General Meeting held on 20 April 2017 with 94.95% of votes cast and approved at the RELX NV Annual General Meeting held on 19 April 2017 with 95.7% of votes cast.
Wolfhart HauserChair, Remuneration Committee 12 February 2020
Market segm
entsGovernance
Financial statements and
other information
Financial reviewCorporate Responsibility
Overview

112 RELX Annual report and financial statements 2019 | Governance
Report of the Audit Committee
This report has been prepared by the Audit Committee of RELX PLC and has been approved by the Board. It provides an overview of the membership, responsibilities and activities of the Committee.
MembershipThe Committee comprises at least three independent Non-Executive Directors. The members of the Committee who served during the year were:
§§ Adrian Hennah (Chair of the Committee)§§ Marike van Lier Lels (until 6 June 2019)§§ Carol Mills (until 25 April 2019)§§ Suzanne Wood
§§ Andrew Sukawaty (from 6 June 2019)
Of the current members of the Committee, Adrian Hennah, a UK chartered accountant and Suzanne Wood, a US chartered accountant are considered to have significant, recent and relevant financial experience.
The Committee as a whole is deemed to have competence relevant to the sectors in which RELX operates.
Please see pages 64 and 65 for full profiles of Audit Committee members.
ResponsibilitiesThe main role and responsibility of the Committee is to assist the Board in fulfilling its oversight responsibilities regarding:
§§ the integrity of the interim and full-year financial statements and financial reporting processes;§§ risk management and internal controls, and the
effectiveness of the internal auditors; and§§ the performance of the external auditors and the
effectiveness of the external audit process, including monitoring the independence and objectivity of Ernst & Young.
The Committee reports to the Board on its activities, identifying any matters in respect of which it considers that action or improvement is needed and making recommendations as to the steps to be taken.
The terms of reference of the Audit Committee are reviewed annually and a copy is published on the RELX website,
www.relx.com
Financial reportingIn discharging its responsibilities in respect of the 2019 interim and full-year financial statements, the Committee reviewed the following:
AREAS OF SIGNIFICANT JUDGEMENTPAGE REFERENCE IN ANNUAL REPORT
Specific areas of significant judgement focussed on by the Committee were:
§§ Carrying values of goodwill and intangible assets: The significant judgements in respect of asset carrying values relate to the assumptions underlying the value in use calculations including discount rates and long-term growth assumptions. The Committee received and discussed reports from the RELX Financial Controller on the methodology and the basis of the assumptions used;
§§ Capitalisation of internally generated intangible assets: The capitalisation of costs related to the development of new products and business infrastructure, together with the useful economic lives applied to the resulting assets, requires the exercise of judgement. The Committee received reports from the RELX Financial Controller on the amounts capitalised and asset lives selected for major projects;
§§ Uncertain tax positions: Assessing potential liabilities across numerous jurisdictions is complex and requires judgement in making tax determinations. The Committee received and discussed reports from the RELX Head of Taxation on the potential liabilities identified and judgements applied;
§§ Pensions: The recognition of certain pension scheme liabilities is subject to judgement. The Committee received and discussed reports from the RELX Financial Controller on the methodology and the basis of the assumptions used.
The Committee was satisfied that all judgements had been appropriately made.
151-154
153-154
145
140-143
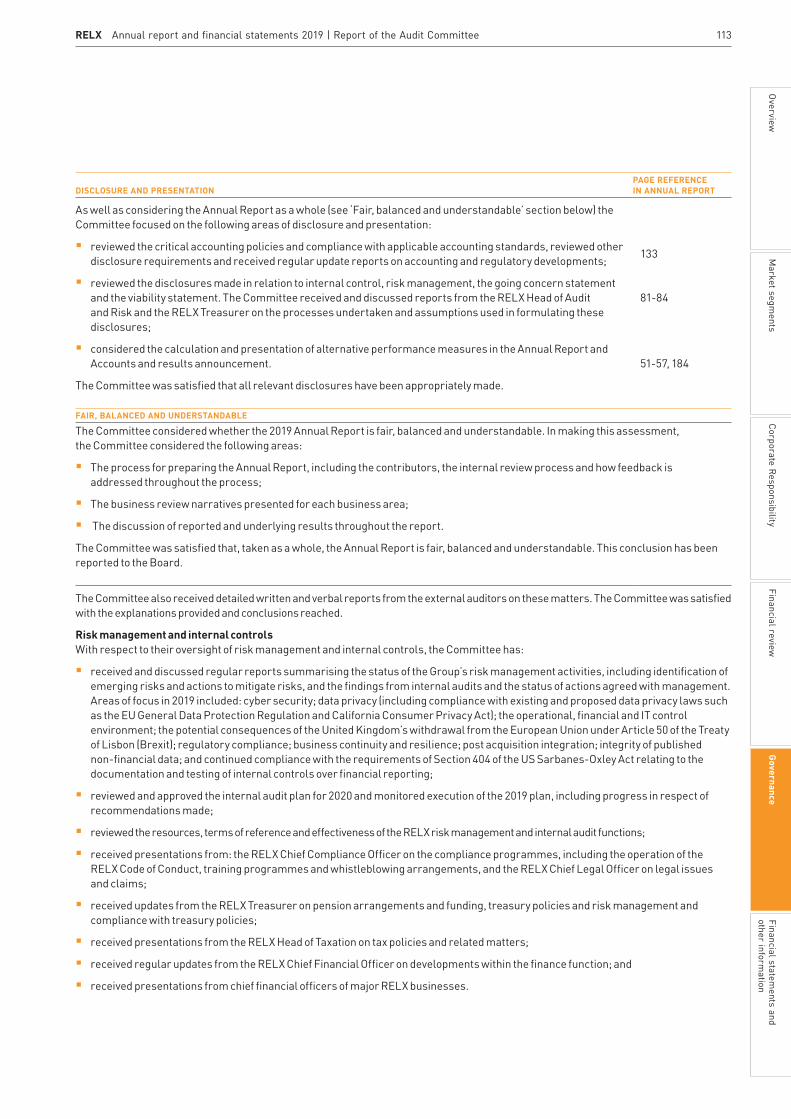
113RELX Annual report and financial statements 2019 | Report of the Audit Committee
DISCLOSURE AND PRESENTATIONPAGE REFERENCE IN ANNUAL REPORT
As well as considering the Annual Report as a whole (see ‘Fair, balanced and understandable’ section below) the Committee focused on the following areas of disclosure and presentation:
§§ reviewed the critical accounting policies and compliance with applicable accounting standards, reviewed other disclosure requirements and received regular update reports on accounting and regulatory developments;
§§ reviewed the disclosures made in relation to internal control, risk management, the going concern statement and the viability statement. The Committee received and discussed reports from the RELX Head of Audit and Risk and the RELX Treasurer on the processes undertaken and assumptions used in formulating these disclosures;
§§ considered the calculation and presentation of alternative performance measures in the Annual Report and Accounts and results announcement.
The Committee was satisfied that all relevant disclosures have been appropriately made.
133
81-84
51-57, 184
FAIR, BALANCED AND UNDERSTANDABLE
The Committee considered whether the 2019 Annual Report is fair, balanced and understandable. In making this assessment, the Committee considered the following areas:
§§ The process for preparing the Annual Report, including the contributors, the internal review process and how feedback is addressed throughout the process;
§§ The business review narratives presented for each business area;
§§ The discussion of reported and underlying results throughout the report.
The Committee was satisfied that, taken as a whole, the Annual Report is fair, balanced and understandable. This conclusion has been reported to the Board.
The Committee also received detailed written and verbal reports from the external auditors on these matters. The Committee was satisfied with the explanations provided and conclusions reached.
Risk management and internal controlsWith respect to their oversight of risk management and internal controls, the Committee has:
§§ received and discussed regular reports summarising the status of the Group’s risk management activities, including identification of emerging risks and actions to mitigate risks, and the findings from internal audits and the status of actions agreed with management. Areas of focus in 2019 included: cyber security; data privacy (including compliance with existing and proposed data privacy laws such as the EU General Data Protection Regulation and California Consumer Privacy Act); the operational, financial and IT control environment; the potential consequences of the United Kingdom’s withdrawal from the European Union under Article 50 of the Treaty of Lisbon (Brexit); regulatory compliance; business continuity and resilience; post acquisition integration; integrity of published non-financial data; and continued compliance with the requirements of Section 404 of the US Sarbanes-Oxley Act relating to the documentation and testing of internal controls over financial reporting;
§§ reviewed and approved the internal audit plan for 2020 and monitored execution of the 2019 plan, including progress in respect of recommendations made;
§§ reviewed the resources, terms of reference and effectiveness of the RELX risk management and internal audit functions;
§§ received presentations from: the RELX Chief Compliance Officer on the compliance programmes, including the operation of the RELX Code of Conduct, training programmes and whistleblowing arrangements, and the RELX Chief Legal Officer on legal issues and claims;
§§ received updates from the RELX Treasurer on pension arrangements and funding, treasury policies and risk management and compliance with treasury policies;
§§ received presentations from the RELX Head of Taxation on tax policies and related matters;
§§ received regular updates from the RELX Chief Financial Officer on developments within the finance function; and
§§ received presentations from chief financial officers of major RELX businesses.
Market segm
entsGovernance
Financial statements and
other information
Financial reviewCorporate Responsibility
Overview

114 RELX Annual report and financial statements 2019 | Governance
The Committee has, each quarter, reviewed and agreed the non-audit services provided in 2019, together with the associated fees which are set out in note 4 to the consolidated financial statements. The non-audit services provided were in the areas of audit-related activities, such as royalty assurance, and due diligence. The lower level of non-audit fees in 2019 compared to the prior year reflects a move away from using EY for work such as due diligence and transaction-related services. The fees remain below the 70% threshold as per the most recent FRC guidance.
From March 2020, the Revised Ethical Standard will become effective, and the non-audit services provided will be restricted to only providing non-audit services where required by laws and regulations, or where the work is closely linked to the audit work.
Tenure of auditorErnst &Young LLP were first appointed auditor of RELX PLC for the financial year ended 31 December 2016. The auditor is required to rotate the lead audit partners responsible for the audit engagements every five years. The year ended 31 December 2019 was the second year for the lead engagement partner Hywel Ball. The Audit Committee confirms that they were in compliance with the provisions of The Statutory Audit Services for Large Companies Market Investigation (Mandatory Use of Competitive Tender Processes and Audit Committee Responsibilities) Order 2014 during the financial year ended 31 December 2019.
Audit Committee effectivenessThe effectiveness of the Audit Committee was reviewed as part of the 2019 evaluation of the Board which confirmed that the Committee continues to function effectively. Details of the evaluation are set out on page 81.
Adrian HennahChair of the Audit Committee 12 February 2020
Committee MeetingsThe Committee met four times during 2019. The Audit Committee meetings are typically attended by the RELX Chief Executive Officer, the RELX Chief Financial Officer, the RELX Financial Controller, the RELX Chief Legal Officer, the RELX Head of Audit and Risk, and audit partners from the external auditors.
External audit effectiveness and independenceThe Group has a well-established policy on audit effectiveness and independence of auditors that sets out amongst other things: the responsibilities of the Audit Committee in the selection of auditors to be proposed for appointment or re-appointment and for agreement on the terms of their engagement, scope and remuneration; the auditor independence requirements and the policy on the provision of non-audit services; the rotation of audit partners and staff; and the conduct of meetings between the auditors and the Audit Committee. The policy on the provision of non-audit services has been updated to reflect the Financial Reporting Council’s Revised Ethical Standard 2019. The policy is available on the website, www.relx.com
The Committee has conducted its review of the performance of the external auditors and the effectiveness of the external audit process for the year ended 31 December 2019. The review was based on a survey of key stakeholders across RELX, consideration of public reports by regulatory authorities on key Ernst & Young member firms and the quality of the auditors’ reporting to and interaction with the Audit Committee.
Additionally in 2019, the Committee received and reviewed the Financial Reporting Council’s audit quality review of Ernst & Young’s audit of the Group’s financial statements for the year ended 31 December 2018. The findings have been discussed with the auditors, and EY have made minor adjustments to their audit plan as a result.
Based on this review, the Audit Committee was satisfied with the performance of the auditors and the effectiveness of the audit process.
The external auditors have confirmed their independence and compliance with the policy on auditor independence to the Audit Committee.
Non-audit servicesThe auditors are precluded from engaging in non-audit services that would compromise their independence or violate any professional requirements or regulations affecting their appointment as auditors. The auditors may, however, provide non-audit services which do not conflict with their independence.
115RELX Annual report and financial statements 2019
Directors’ Report
The Directors present their report, together with the financial statements of the Group and RELX PLC (the Company), for the year ended 31 December 2019. The Company is incorporated as a public limited company and is registered in England and Wales with registered number 77536. Its registered office is 1-3 Strand, London, WC2N 5JR.
Corporate structureThe Company’s ordinary shares are traded on the London Stock Exchange and Euronext Amsterdam. It also has in place an American Depositary Share programme, under which its securities are traded on the New York Stock Exchange. For the purposes of this Directors’ Report, and the Corporate Governance Review from pages 70 to 84, the Company and its subsidiaries, joint ventures and associates are together known as ‘RELX’ or ‘the Group’.
Financial statement presentationThis Directors’ Report and the financial statements of the Group and Company should be read in conjunction with the other reports set out on pages 2 to 114. A review of the Group’s performance during the year is set out on pages 5 to 57, the principal and emerging risks facing the Group are set out on pages 58 to 61, and the Group statement on corporate responsibility is set out on pages 38 to 49.
In addition to the reported figures, adjusted figures are presented as additional performance measures used by management to assess the performance of the business. These exclude the Group’s share of amortisation of acquired intangible assets, acquisition-related costs, tax in joint ventures, disposal gains, finance income and losses and other non-operating items, related tax effects, and movements in deferred taxation assets and liabilities related to acquired intangible assets, and include the benefit of tax amortisation where available on acquired goodwill and intangible assets.
Company financial statementsThe individual company financial statements of the Company are presented on page 178, and were prepared under Financial Reporting Standard 101 (FRS 101). Distributable reserves as at 31 December 2019 were £6,795m (2018: £2,689m), comprising reserves less shares held in treasury. Shareholders’ funds as at 31 December 2019 were £19,878m (2018: £19,739m).
Strategic ReportThe Companies Act 2006 requires the Company to present a fair review of the Group during the financial year. The Strategic Report which includes a review of the Group’s business areas, a financial review, the principal and emerging risks facing the Group, any important events affecting the Group since 31 December 2019, and the likely future developments in the Group’s business, is set out on pages 2 to 61 which are incorporated into this Directors’ Report by reference. The Directors’ Report, inclusive of the Strategic Report incorporated therein, forms the management report for the purposes of the Financial Conduct Authority’s Disclosure and Transparency Rule 4.1.8R.
DividendsThe Board is recommending a final dividend of 32.1p (2019: 29.7p) per ordinary share to be paid on 28 May 2020 to shareholders appearing on the Register of Members at the close of business on 27 April 2020. Payment of this final dividend remains subject to the
approval of the Company’s shareholders at its 2020 Annual General Meeting (AGM). Together with the interim dividend of 13.6p (2018: 12.4p) per ordinary share, paid in September 2019, the total ordinary dividends for the year will be 45.7p (2018: 42.1p). Details of dividend cover and dividend policy are set out on page 56.
Corporate governanceWith the exception of provision 19 (length of tenure of the Chairman) and provision 38 (rates of contribution for Executive Pensions), the Company has complied throughout the year with the provisions of the 2018 UK Corporate Governance Code (the Code), which is publicly available on the Financial Reporting Council website (www.frc.org.uk). Details of how the main principles of the Code have been applied and the Directors’ statement on internal control are set out in the Corporate Governance Review on pages 71 to 84, which are incorporated into this Directors’ Report by reference.
Greenhouse gas emissionsThe Company is required to state the annual quantity of emissions in tonnes of carbon dioxide equivalent from Group operational activities. Details of our emissions during the year ended 31 December 2019 and the actions being taken to reduce them are set out in the Corporate Responsibility section of the Strategic Report on pages 48 and 49, which are incorporated into this Directors’ Report by reference. Further details can be found in our online Corporate Responsibility Report at
www.relx.com/go/CRReport.
DirectorsThe names of the Directors who served on the Board during the year are set out on pages 64, 65, and 78, which are incorporated into this Directors’ Report by reference.
Share capitalThe Company’s issued share capital comprises a single class of ordinary shares, all of which are listed on the London and Amsterdam stock exchanges. It also has securities, in the form of American Depositary Shares, traded on the New York Stock Exchange. All issued shares are fully paid up and carry no additional obligations or special rights. Each share carries the right to one vote at general meetings of the Company.
In a general meeting, subject to any rights and restrictions attached to any shares, on a show of hands every member who is present in person shall have one vote and every proxy present who has been duly appointed by one or more members entitled to vote on the resolution has one vote (although a proxy has one vote for and one vote against the resolution if: (i) the proxy has been duly appointed by more than one member entitled to vote on the resolution; and (ii) the proxy has been instructed by one or more of those members to vote for the resolution and by one or more other of those members to vote against it). Subject to any rights or restrictions attached to any shares, on a vote on a resolution on a poll every member present in person or by proxy shall have one vote for every share of which he/she is the holder.
Proxy appointments and voting instructions must be received by the registrars not less than 48 hours before a general meeting. There are no specific restrictions on the size of a holding nor on the transfer of shares, which are both governed by the general provisions of the Articles and prevailing legislation. The Company is not aware of any agreements between shareholders that may
Market segm
entsGovernance
Financial statements and
other information
Financial reviewCorporate Responsibility
Overview
116 RELX Annual report and financial statements 2019 | Governance
result in restrictions on the transfer of shares or on voting rights attached to the shares. At the 2019 AGM, shareholders passed a resolution authorising the Directors to issue shares for cash on a non-pre-emptive basis up to a nominal value of £14.1m, representing less than 5% of the Company’s issued share capital, and authorising the Directors to issue up to an additional 5% of the issued share capital for cash on a non-pre-emptive basis in connection with an acquisition or specified investment. Since the 2019 AGM, no shares have been issued under this authority. The shareholder authority also permitted the Directors to issue shares in order to satisfy entitlements under employee share plans and details of such allotments are described below.
During the year, 3,059,588 ordinary shares in the Company were issued in order to satisfy entitlements under employee share plans as follows: 614,653 under a UK Sharesave option scheme at prices between 596.00p and 1,316.80p per share; 440,537 under the Dutch Debenture Scheme at prices between EUR 5.34 and EUR 19.165, which is now satisfied by way of Company shares; and 2,004,398 under executive share option schemes at prices between 466.50p and 1,769.75p per share. The issued share capital as at 31 December 2019 is shown in note 24 to the consolidated financial statements.
Authority to purchase sharesAt the 2019 AGM, shareholders passed a resolution authorising the purchase of up to 201m ordinary shares in the Company (representing less than 10% of the issued ordinary shares) by market purchase. During the year, 33,544,007 ordinary shares with a nominal value of 14 51/116p (representing 1.69% of the ordinary shares in issue on 31 December 2019) were purchased under this and the previous authority, for a total consideration of £600m, including expenses, and subsequently transferred to be held in treasury. The purpose of the share buyback is to reduce the capital of the Company.
On 6 December 2019, the Company cancelled 33.3m ordinary shares held in treasury. Therefore, as at 31 December 2019 there were 42,267,027 ordinary shares held in treasury, representing 2.1% of the issued ordinary shares. A further 4,993,953 ordinary shares were purchased between 2 January 2020 and the date of this report. The authority to make market purchases will expire at the 2020 AGM, at which a resolution to further extend the authority will be submitted to shareholders.
Substantial share interestsAs at 31 December 2019, the Company had been notified by the following shareholders that they held an interest of 3% or more in voting rights of its issued share capital pursuant to Rule 5 of the Disclosure and Transparency Rules (DTR):
Notifications received as at 31 December 2019 % of voting rights
§§ BlackRock, Inc 7.84%
§§ Invesco Limited 4.99%
The percentage interests stated above are as disclosed at the date on which the interests were notified to the Company and, as at 12 February 2020, the Company had not received any further notifications under DTR 5.
Employee Benefit TrustThe trustee of the Employee Benefit Trust held an interest in 6,753,010 ordinary shares in the Company (representing 0.3% of the issued ordinary shares) as at 31 December 2019. The trustee may vote or abstain from voting any shares it holds in any way it sees fit.
Significant agreements – change of controlThere are a number of borrowing agreements including credit facilities that, in the event of a change of control of RELX PLC and, in some cases, a consequential credit rating downgrade to sub-investment grade may, at the option of the lenders, require repayment and/or cancellation as appropriate. There are no arrangements between the Company and its Directors or employees providing for compensation for loss of office or employment that occurs specifically because of a takeover, merger or amalgamation with the exception of provisions in the Company’s share plans which could result in options or awards vesting or becoming exercisable on a change of control.
ArticlesThe Company’s Articles of Association (the ‘Articles’), which were amended once during the year at the Company’s 2019 Annual General Meeting, may only be amended by a special resolution of shareholders passed at a general meeting of the Company.
Appointment and replacement of DirectorsThe appointment, re-appointment and replacement of Directors is governed by the Articles, the Companies Act 2006 and related legislation. Shareholders maintain their right to appoint and re-appoint Directors by way of an ordinary resolution in accordance with the Articles. The Directors may appoint additional or replacement Directors, who may only serve until the following AGM of the Company, at which time they must retire and, if appropriate, seek election by the Company’s shareholders. A Director may be removed from office by the Company as provided for by applicable law, in certain circumstances set out in the Articles, and at a general meeting of the Company by the passing of an ordinary resolution.
The Articles provide for a Board of Directors consisting of not fewer than two, but not more than 20 Directors, who manage the business and affairs of the Company.
Powers of DirectorsSubject to the provisions of the Companies Act 2006, the Articles and any directions given by special resolutions, the business of the Company shall be managed by the Board which may exercise all the powers of the Company.
Directors’ indemnityIn accordance with its Articles, the Company has granted its Directors an indemnity, to the extent permitted by law, in respect of liabilities incurred as a result of their office. This indemnity was in place for Directors that served at any time during the 2019 financial year, and also for each serving Director as at the date of approval of this report. The Company also purchased and maintained throughout the year directors’ and officers’ liability insurance in respect of itself and its Directors.

117RELX Annual report and financial statements 2019 | Directors’ Report
Related party transactionsInternal controls are in place to ensure that any related party transactions involving Directors or their connected persons are carried out on an arm’s-length basis and are properly recorded and disclosed where appropriate.
Conflicts of interestUnder the Companies Act 2006, the Directors have a duty to avoid situations in which they have, or could have, a direct or indirect interest that conflicts with the interests of the Company. The Board has established formal procedures for identifying, assessing and reviewing any situations where a Director has an interest that conflicts, or may possibly conflict, with the interests of the Company.
The Nominations Committee considers any such conflict or potential conflict and makes a recommendation to the Board on whether to authorise it, as permitted under the Company’s Articles. In reaching its decision, the Board is required to act in a way it considers would be most likely to promote the success of the Company and may impose limits or conditions when giving its authorisation, if it thinks this is appropriate. Actual or potential conflicts of interest are reviewed annually by the Nominations Committee.
No contract existed during the year in relation to the Company’s business in which any Director was materially interested.
Financial InstrumentsThe Group’s financial risk management objectives and policies, including hedging activities and exposure to risks, are described in note 18 to the consolidated financial statements on pages 157 to 162.
Political donationsThe Group does not make donations to European Union (EU) political organisations or incur EU political expenditure. In the US, Group companies donated £60,351 (2018: £58,763) to political organisations. In line with US law, these donations were not made at federal level, but only to candidates and political parties at state and local levels.
Employee relationsThe Group is committed to employee involvement and participation. Where appropriate, major announcements are communicated to employees through internal briefings. Information on performance, development, organisational changes and other matters of interest is communicated through briefings and electronic bulletins.
The Company is an equal opportunity employer and does not discriminate on the grounds of race, gender or other characteristics in its recruitment or employment policies. The Group seeks opinions from employees through a triennial survey. The last employee survey was carried out in 2018. Certain employees throughout the Group are eligible to participate in the Group’s share incentive plans.
Disabled personsRELX has a positive approach to inclusion and diversity. Details of the Group’s Inclusion and Diversity Policy are set out on page 87, which is incorporated into this Directors’ Report by reference. The Group is committed to the full and fair treatment of people with disabilities in relation to job applications, training, promotion and career development. Where existing employees become disabled, our policy is to provide continuing employment, support and training wherever practicable.
Disclosures required under UK Listing Rule 9.8.4The information required by Listing Rule 9.8.4 is set out on the pages below:
Information required Page
(1) Interest capitalised by the Group n/a
(2) Publication of unaudited financial information n/a
(4) Long-term incentive schemes n/a
(5) Waiver of emoluments by a director n/a
(6) Waiver of future emoluments by a director n/a
(7) Non pro-rata allotments for cash (issuer) n/a
(8) Non pro-rata allotments for cash (major subsidiaries) n/a
(9) Parent participation in a placing by a listed subsidiary n/a
(10) Contracts of significance n/a
(11) Provision of services by a controlling shareholder n/a
(12) Shareholder waiver of dividends 150
(13) Shareholder waiver of future dividends 150
(14) Agreements with controlling shareholders n/a
Financial statements and accounting recordsThe Directors are responsible for preparing the Directors’ Report and the financial statements in accordance with applicable law and regulations.
Company law requires the Directors to prepare financial statements for each financial year. Under that law the Directors are required to prepare the consolidated financial statements in accordance with International Financial Reporting Standards (IFRS) as adopted by the EU and Article 4 of the IAS Regulation. The Directors have elected to prepare the individual company financial statements in accordance with Financial Reporting Standard 101 Reduced Disclosure Framework. Under company law the Directors must not approve the accounts unless they are satisfied that they give a true and fair view of the state of affairs of the Company and of the profit or loss of the Company for that period.
In preparing the individual company financial statements, the Directors are required to: select suitable accounting policies and then apply them consistently; make judgements and accounting estimates that are reasonable and prudent; state whether Financial Reporting Standard 101 Reduced Disclosure Framework has been followed, subject to any material departures being disclosed and explained in the financial statements; and prepare the financial statements on a going concern basis unless it is inappropriate to presume that the Company will continue in business.
Market segm
entsGovernance
Financial statements and
other information
Financial reviewCorporate Responsibility
Overview

118 RELX Annual report and financial statements 2019 | Governance
In preparing the Group financial statements, IAS1 requires that Directors: properly select and apply accounting policies; present information, including accounting policies, in a manner that provides relevant, reliable, comparable and understandable information; provide additional disclosures when compliance with the specific requirements of IFRS are insufficient to enable users to understand the impact of particular transactions, other events and conditions on the entity’s financial position and financial performance; and make an assessment of the Company’s ability to continue as a going concern.
The Directors are responsible for keeping adequate accounting records that are sufficient to show and explain the Company’s transactions and disclose with reasonable accuracy at any time the financial position of the Company and enable them to ensure that the financial statements comply with the Companies Act 2006. They are also responsible for safeguarding the assets of the Company and hence for taking reasonable steps for the prevention and detection of fraud and other irregularities.
Directors’ responsibility statementEach of the Directors, whose names and roles can be found on pages 64 and 65, confirms that, to the best of their knowledge:
§§ the consolidated financial statements, prepared in accordance with International Financial Reporting Standards as issued by the International Accounting Standards Board and as adopted by the European Union, give a true and fair view of the assets, liabilities, financial position and profit or loss of the Group;
§§ the individual company financial statements, prepared in accordance with Financial Reporting Standard 101 ‘Reduced Disclosure Framework’ (FRS 101), give a true and fair view of the assets, liabilities, financial position and profit or loss of the Company; and
§§ the Directors’ Report includes a fair review of the development and performance of the business and the position of the Group, together with a description of the principal and emerging risks and uncertainties that it faces.
Having taken into account all of the matters considered by the Board and brought to the attention of the Board during the year, the Directors are satisfied that the Annual Report and Financial Statements, taken as a whole, is fair, balanced and understandable and provides the information necessary for shareholders to assess the Company’s position and performance, business model and strategy.
Neither the Company nor the Directors accept any liability to any person in relation to the Annual Report except to the extent that such liability could arise under English law. Accordingly, any liability to a person who has demonstrated reliance on any untrue or misleading statement or omission shall be determined in accordance with Section 90A of the Financial Services and Markets Act 2000.
Disclosure of information to auditorsIn accordance with Section 418 of the Companies Act 2006, each Director in office at the date of this Directors’ Report is approved, confirms that:
§§ so far as the Director is aware, there is no relevant audit information of which the Company’s auditors are unaware; and
§§ he/she has taken all the steps that he/she ought to have taken as a Director to make himself/herself aware of any relevant audit information and to establish that the Company’s auditors are aware of that information.
Going concernThe Directors’ statement regarding the appropriateness of adopting the going concern basis of accounting is set out on page 83, which is incorporated into this Directors’ Report by reference.
Viability statementThe Directors’ statement regarding the long-term viability of the Group is set out on page 84, which is incorporated into this Directors’ Report by reference.
AuditorsResolutions for the re-appointment of Ernst & Young LLP as auditors of the Company and to authorise the Audit Committee, on behalf of the Board, to determine their remuneration will be submitted to shareholders at the 2020 AGM.
Annual General MeetingThe 2020 Annual General Meeting will be held at 10.00am on 23 April 2020 at the Amba Hotel, Strand, London, WC2N 5HX.
By order of the Board
Henry UdowCompany Secretary 12 February 2020
Registered Office 1-3 Strand London WC2N 5JR

Financial statements and other inform
ationFinancial review
Business reviewOverview
119RELX Annual report and financial statements 2019
Financial statements and other informationIn this section120 Independent auditor’s report128 Consolidated financial statements133 Notes to the consolidated
financial statements175 5 year summary
RELX Annual report and financial statements 2019 M
arket segments
GovernanceFinancial statem
ents and other inform
ationFinancial review
Corporate ResponsibilityOverview
120 RELX Annual report and financial statements 2019 | Financial statements and other information
Independent auditor’s report to the members of RELX PLCOPINIONIn our opinion: §§ RELX PLC and its subsidiaries, joint ventures and associates (“RELX”)’s group financial statements and parent company financial
statements (the “financial statements”) give a true and fair view of the state of the group’s and of the parent company’s affairs as at 31 December 2019 and of the group’s profit for the year then ended;
§§ the group financial statements have been properly prepared in accordance with IFRSs as adopted by the European Union;
§§ the parent company financial statements have been properly prepared in accordance with United Kingdom Generally Accepted Accounting Practice; and
§§ the financial statements have been prepared in accordance with the requirements of the Companies Act 2006, and, as regards the group financial statements, Article 4 of the IAS Regulation.
We have audited the financial statements of RELX PLC which comprise:
Group Parent companyConsolidated income statement for the year then ended Statement of financial position as at 31 December 2019
Consolidated statement of comprehensive income for the year then ended
Statement of changes in equity for the year then ended
Consolidated statement of cash flows for the year then ended Related notes 1 to 4 to the financial statements including a summary of significant accounting policies
Consolidated statement of financial position as at 31 December 2019
Consolidated statement of changes in equity for the year then ended
Related notes 1 to 29 to the financial statements, including a summary of significant accounting policies
The financial reporting framework that has been applied in the preparation of the group financial statements is applicable law and International Financial Reporting Standards (IFRSs) as adopted by the European Union. The financial reporting framework that has been applied in the preparation of the parent company financial statements is applicable law and United Kingdom Accounting Standards, including FRS 101 “Reduced Disclosure Framework” (United Kingdom Generally Accepted Accounting Practice).
BASIS FOR OPINION We conducted our audit in accordance with International Standards on Auditing (UK) (ISAs (UK)) and applicable law. Our responsibilities under those standards are further described in the Auditor’s responsibilities for the audit of the financial statements section of our report below. We are independent of the group and parent company in accordance with the ethical requirements that are relevant to our audit of the financial statements in the UK, including the FRC’s Ethical Standard as applied to listed public interest entities, and we have fulfilled our other ethical responsibilities in accordance with these requirements.
We believe that the audit evidence we have obtained is sufficient and appropriate to provide a basis for our opinion.
CONCLUSIONS RELATING TO PRINCIPAL RISKS, GOING CONCERN AND VIABILITY STATEMENTWe have nothing to report in respect of the following information in the annual report, in relation to which the ISAs (UK) require us to report to you whether we have anything material to add or draw attention to:
§§ the disclosures in the annual report set out on pages 58 to 61 that describe the principal risks and explain how they are being managed or mitigated;
§§ the directors’ confirmation set out on page 58 in the annual report that they have carried out a robust assessment of the principal risks facing the entity, including those that would threaten its business model, future performance, solvency or liquidity;
§§ the directors’ statement set out on page 83 in the financial statements about whether they considered it appropriate to adopt the going concern basis of accounting in preparing them, and their identification of any material uncertainties to the entity’s ability to continue to do so over a period of at least twelve months from the date of approval of the financial statements.
§§ whether the directors’ statement in relation to going concern required under the Listing Rules in accordance with Listing Rule 9.8.6R(3) is materially inconsistent with our knowledge obtained in the audit; or
§§ the directors’ explanation set out on page 84 in the annual report as to how they have assessed the prospects of the entity, over what period they have done so and why they consider that period to be appropriate, and their statement as to whether they have a reasonable expectation that the entity will be able to continue in operation and meet its liabilities as they fall due over the period of their assessment, including any related disclosures drawing attention to any necessary qualifications or assumptions.

121RELX Annual report and financial statements 2019 | Independent auditors’ report to the members of RELX PLC
OVERVIEW OF OUR AUDIT APPROACH
Key audit matters §§ Uncertain tax positions
§§ Internally developed intangible assets
§§ Revenue recognition
§§ Finance systemsAudit scope §§ We performed an audit of the complete financial information of six components and audit
procedures on specific balances for a further six components. We also instructed one location to perform specified procedures.
§§ The components where we performed full or specific audit procedures accounted for 84% of absolute profit before tax, 82% of revenue and 78% of total assets.
Materiality §§ Overall materiality of £90m which represents 5% of profit before tax.
KEY AUDIT MATTERSKey audit matters are those matters that, in our professional judgment, were of most significance in our audit of the financial statements of the current period and include the most significant assessed risks of material misstatement (whether or not due to fraud) that we identified. These matters included those which had the greatest effect on: the overall audit strategy, the allocation of resources in the audit; and directing the efforts of the engagement team. These matters were addressed in the context of our audit of the financial statements as a whole, and in our opinion thereon, and we do not provide a separate opinion on these matters.
RISK OUR RESPONSE TO THE RISK
KEY OBSERVATIONS COMMUNICATED TO THE AUDIT COMMITTEE
Uncertain tax positionsAs described in note 9 to the consolidated financial statements and in the audit committee report (page 112), the Group is subject to tax in numerous jurisdictions. Its operational structure gives rise to potential tax exposures that require management to exercise judgement in making determinations as to the amount of tax that is payable.
The Group reports cross-border transactions undertaken between subsidiaries on an arm’s-length basis in tax returns in accordance with Organisation for Economic Co-operation and Development (OECD) guidelines. Transfer pricing relies on the exercise of judgement and it is reasonably possible for there to be a significant range of potential outcomes.
The Group is subject to tax authority audits in multiple jurisdictions at any point in time and has a number of open tax enquiries.
As a result, it has recognised a number of provisions against uncertain tax positions, the valuation of which requires significant assumptions and judgement, as described in note 9.
We focused on this area due to the subjectivity in the quantification of the provision and the judgement around the trigger for recognition or release impacting the provision and the effective tax rate.
Our procedures included obtaining an understanding of the tax provisioning processes and evaluating their design, as well as testing internal controls over the tax provisioning process. For example, we tested controls over management’s review of the uncertain tax position provisions recorded, including the controls over the development of significant assumptions and judgments.
Our procedures on the uncertain tax positions were performed centrally by the group team supported by overseas teams including professionals with specialised skills. Procedures included, among others (i) meeting with members of management responsible for tax to understand the Group cross-border transactions, status of significant provisions, and any changes to management’s judgements in the year; (ii) reading correspondence with tax authorities and external advisors to inform our assessment of recorded estimates and evaluate the completeness of the provisions recorded; (iii) independently assessing management’s significant assumptions and judgements to record or release provisions following tax audits, settlements and the expiry of timeframes with reference to other similar tax positions the Group has historically held and our knowledge of developments in the jurisdictions in which RELX maintain tax provisions; (iv) testing the underlying schedules for arithmetic accuracy, as well as with reference to applicable tax laws; and (v) evaluating the adequacy of tax disclosures.
We reported our conclusions to the Audit Committee that we challenged the robustness of the key management judgements. We confirmed that we were satisfied that management’s judgements in relation to the extent of provisions for uncertain tax positions are appropriate. We noted further that there continues to be a high degree of uncertainty about the eventual outcome of many of these provisions.
Market segm
entsGovernance
Financial statements and
other information
Financial reviewCorporate Responsibility
Overview
122 RELX Annual report and financial statements 2019 | Financial statements and other information
RISK OUR RESPONSE TO THE RISK
KEY OBSERVATIONS COMMUNICATED TO THE AUDIT COMMITTEE
Internally developed intangible assets The Group capitalised internally developed intangible assets of £333 million in the current year (2018: £304 million) and has a year end net book value of £1,264 million (2018: £1,217 million). As described in note 15 to the consolidated financial statements and in the audit committee report (page 112), the capitalisation of costs related to the development of new products and business infrastructure, together with the economic useful lives applied to the resulting assets, requires the exercise of significant judgement.
We focused on this area as it is inherently judgemental with respect to technical feasibility, intention and ability to complete the intangible asset, ability to use or sell the asset, ability to generate future economic benefits and ability to measure the costs reliably. As a result these expenditures may be inappropriately capitalised, amortised or valued.
We performed full and specific scope audit procedures over internally developed intangible assets in 4 locations, which covered 71% of the account balance. Procedures included obtaining an understanding of the processes which support the expenditure and subsequent capitalisation of internally developed intangible assets and evaluating their design, as well as testing controls for the capitalisation of internally generated intangible assets. For example, we tested controls over management’s review and approval of new capital projects and the capitalisation criteria for costs incurred for the projects.
Additionally, procedures included, among others (i) assessing the accounting policy and methodology for capitalisation of expenditures; (ii) evaluating the accuracy and valuation of amounts capitalised to assess that costs are directly attributable and necessary to create, produce, and prepare the asset to be capable of operating in the manner intended by management, which was done by assessing if capitalised costs related to an authorised capital project and met the criteria to be capitalised; and (iii) assessing the useful lives adopted based on related business cases and historical experience.
Based on the procedures performed, we did not identify any evidence of material misstatement in the capitalisation of internally developed intangible assets.
Revenue recognitionAs described in note 2 to the consolidated financial statements, the group earns revenue (£7.9bn recorded in 2019, compared to £7.5bn recorded in 2018) from a variety of sources among the different business areas, including annual subscriptions, transactional usage and exhibition fees. The nature of the risk associated with the accurate recording of revenue varies.
We recognise that revenue is a key metric upon which the group is judged, that the group has annual internal targets, and that the group has incentive schemes that are partially impacted by revenue growth.
We have determined that there is a risk in each of the business areas related to the opportunity to commit fraud in the respective revenue streams through manual adjustments or override of controls by management.
We performed full and specific scope audit procedures over revenue in 12 locations, which covered 82% of revenue. We performed procedures to address the specific risk in each business area. Procedures included, among others, (i) assessing the processes and testing controls over each significant revenue stream; (ii) evaluating the appropriateness of journal entries impacting revenue, as well as other adjustments made in the preparation of the financial statements; (iii) evaluating management’s controls over such adjustments; (iv) inspecting a sample of contracts to check that revenue recognition was in accordance with the contract terms and the group’s revenue recognition policies; (v) testing a sample of transactions around period end to test that revenue was recorded in the correct period; and (vi) for revenue streams that have judgemental elements, evaluating management’s assumptions.
Based on the procedures performed, we did not identify evidence of material misstatement in the revenue recognised in the year.
Finance systemsThe group has many IT systems that are vital to the ongoing operations and to the integrity of the financial reporting process. Owing to the global nature of the group and its operations, the applications, associated infrastructure and IT processes that support significant business and financial processes are spread across a number of locations. These are delivered by a mix of in-house teams and third party support providers some of whom reside in different countries from the physical location of the IT infrastructure or the location of the RELX business users. Additionally, due to the rapidly changing IT landscape, the group undergoes numerous IT system migrations. Understanding the IT environment including interfaces between them was an area of audit focus to assess if transactions were being processed accurately.
We utilised professionals with specialised skills to support our evaluation of the design and operation of IT controls to address the group’s control objectives and financial reporting risks. Procedures included, among others, (i) holding enquiries of management to understand the IT environment and walking through the financial processes end-to-end in order to understand where IT systems were integral to the group accounting processes; (ii) performing data analytic procedures in certain locations and business areas to understand the flow of transactions and perform specific test procedures; (iii) testing the IT general controls environment for the key applications; (iv) where appropriate, receiving reports from the service auditors of the outsourced systems and evaluating the adequacy of the work performed and following up on matters arising, performing further procedures as necessary; (v) testing system migrations, including testing of controls surrounding the migration; and (vi) where required, testing compensating controls or performing alternative procedures to complement the controls based audit approach.
Based on the procedures performed, we have not identified any misstatements in the financial statements due to any limitations of the IT systems. Our understanding and testing of IT systems and controls supported our audit approach.

123RELX Annual report and financial statements 2019 | Independent auditors’ report to the members of RELX PLC
In the prior year, our auditor’s report included key audit matters in relation to carrying value of goodwill and acquired intangible assets, acquisition accounting for significant new business combinations and corporate simplification. In the current year, these matters were no longer identified as key audit matters as they related to either i) one-time occurrences in 2018 and are no longer significant in 2019, or ii) matters that are no longer deemed to have the greatest effect on overall audit strategy, the allocation of resources in the audit or directing the efforts of the engagement team.
AN OVERVIEW OF THE SCOPE OF OUR AUDIT Tailoring the scopeOur assessment of audit risk, our evaluation of materiality and our allocation of performance materiality determine our audit scope for each entity within the group. Taken together, this enables us to form an opinion on the consolidated financial statements. We take into account size, risk profile, the organisation of the group and effectiveness of group-wide controls, changes in the business environment and other factors such as recent Internal audit results when assessing the level of work to be performed at each entity.
The group has centralised processes for key judgements and determination of accounting policies. Certain areas of audit focus, namely internally developed intangible assets, revenue recognition, and IT system management are decentralised processes delineated by business area. We have tailored our audit response accordingly and procedures for the areas of focus were performed or directed by the group audit team.
In assessing the risk of material misstatement to the group financial statements, and to ensure we had adequate quantitative coverage of significant accounts in the financial statements, we selected twelve components covering entities within the United Kingdom, the Netherlands, the United States, France, Switzerland, and Japan, which represent the principal business units within the group.
Of the twelve components selected, we performed an audit of the complete financial information of six components (“full scope components”) which were selected based on their size or risk characteristics. For the remaining six components (“specific scope components”), we performed audit procedures on specific accounts within that component that we considered had the potential for the greatest impact on the significant accounts in the financial statements either because of the size of these accounts or their risk profile. We also instructed one location to perform specified procedures over manual journal entries to revenue.
The reporting components where we performed audit procedures accounted for 84% (2018: 81%) of the group’s profit before tax on an absolute basis1, 82% (2018: 80%) of the group’s revenue and 78% (2018: 75%) of the group’s total assets. For the current year, the full scope components contributed 60% (2018: 57%) of the group’s profit before tax on an absolute basis, 72% (2018: 70%) of the group’s revenue and 72% (2018: 67%) of the group’s total assets. The specific scope components contributed 24% (2018 23%) of the group’s profit before tax on an absolute basis, 10% (2018: 10%) of the group’s revenue and 6% (2018: 8%) of the group’s total assets. The audit scope of these components may not have included testing of all significant accounts of the component but will have contributed to the coverage of significant accounts tested for the group.
Of the remaining components that together represent 16% of the group’s profit before tax on an absolute basis, none are individually greater than 1% of the group’s profit before tax on an absolute basis. For these components, we performed other procedures, including analytical review, review of internal audit reports, and testing of consolidation journals, intercompany eliminations and foreign currency translation recalculations at the group level to respond to any potential risks of material misstatement to the group financial statements.
The charts below illustrate the coverage obtained from the work performed by our audit teams.
PROFIT BEFORE TAX (ABSOLUTE)
16%
24% 60%
Full scope Specific scope Other procedures
REVENUE
18%
10%
72%
TOTAL ASSETS
22%
6%
72%
(1) Coverage of profit before tax measured on an absolute basis for each component (components with a loss would be added to both the numerator and denominator).
Market segm
entsGovernance
Financial statements and
other information
Financial reviewCorporate Responsibility
Overview

124 RELX Annual report and financial statements 2019 | Financial statements and other information
Changes from the prior year Changes from the prior year include instructing one location to perform specified procedures around revenue manual journal entries in the current year. In the prior year, we performed procedures around the accounting for significant acquisitions made in the prior year, which are no longer applicable in the current year in those locations.
Involvement with component teams In establishing our overall approach to the Group audit, we determined the type of work that needed to be undertaken at each of the components by us, as the primary audit engagement team, or by component auditors from other EY global network firms operating under our instruction. Of the six full scope components, audit procedures were performed on three of these directly by the primary audit team. For the six specific scope components, where the work was performed by component auditors, we determined the appropriate level of involvement to enable us to determine that sufficient audit evidence had been obtained as a basis for our opinion on the Group as a whole.
The Group audit team continued to follow a programme of planned visits that has been designed to ensure that the Senior Statutory Auditor, or another Group audit partner, visit all full scope locations and specific scope locations on a rotational basis. During the current year’s audit cycle, visits were undertaken by the primary audit team to the component teams in the United Kingdom, the Netherlands, the United States, France and Japan. These visits involved meeting local management and discussing the audit approach with the component audit team and any issues arising from their work. The Group audit team also participated in key discussions, via conference calls with all full and specific scope locations. The primary team interacted regularly with the component teams where appropriate during various stages of the audit, reviewed key working papers and were responsible for the scope and direction of the audit process. This, together with the additional procedures performed at Group level, gave us appropriate evidence for our opinion on the Group financial statements.
OUR APPLICATION OF MATERIALITY We apply the concept of materiality in planning and performing the audit, in evaluating the effect of identified misstatements on the audit and in forming our audit opinion.
MaterialityThe magnitude of an omission or misstatement that, individually or in the aggregate, could reasonably be expected to influence the economic decisions of the users of the financial statements. Materiality provides a basis for determining the nature and extent of our audit procedures.
We determined materiality for the group to be £90 million (2018: £90 million), which is 5% (2018: 5%) of profit before tax. We believe that profit before tax provides us with the best assessment of the requirements of the users of the financial statements.
We determined materiality for the Parent Company to be £90 million (2018: £90 million), which is 0.5% (2018: 0.5%) of equity.
Performance materialityThe application of materiality at the individual account or balance level. It is set at an amount to reduce to an appropriately low level the probability that the aggregate of uncorrected and undetected misstatements exceeds materiality.
On the basis of our risk assessments, together with our assessment of the Group’s overall control environment, our judgement was that performance materiality was 75% (2018: 75%) of our planning materiality, namely £68 million (2018: £67.5m). We have set performance materiality at this percentage due to our assessment of the control environment and the historic lack of significant audit findings.
Audit work at component locations for the purpose of obtaining audit coverage over significant financial statement accounts is undertaken based on a percentage of total performance materiality. The performance materiality set for each component is based on the relative scale and risk of the component to the group as a whole and our assessment of the risk of misstatement at that component. In the current year, the range of performance materiality allocated to components was £8.5 million to £53.5 million (2018: £19.4 million to £48.4 million).
Reporting thresholdAn amount below which identified misstatements are considered as being clearly trivial.
We agreed with the Audit Committee that we would report to them all uncorrected audit differences in excess of £4.5 million (2018: £4.5 million), which is set at 5% of planning materiality, as well as differences below that threshold that, in our view, warranted reporting on qualitative grounds.
We evaluate any uncorrected misstatements against both the quantitative measures of materiality discussed above and in light of other relevant qualitative considerations in forming our opinion.

125RELX Annual report and financial statements 2019 | Independent auditors’ report to the members of RELX PLC
OTHER INFORMATION The other information comprises the information included in the annual report set out on pages 2 to 118, other than the financial statements and our auditor’s report thereon. The directors are responsible for the other information.
Our opinion on the financial statements does not cover the other information and, except to the extent otherwise explicitly stated in this report, we do not express any form of assurance conclusion thereon.
In connection with our audit of the financial statements, our responsibility is to read the other information and, in doing so, consider whether the other information is materially inconsistent with the financial statements or our knowledge obtained in the audit or otherwise appears to be materially misstated. If we identify such material inconsistencies or apparent material misstatements, we are required to determine whether there is a material misstatement in the financial statements or a material misstatement of the other information. If, based on the work we have performed, we conclude that there is a material misstatement of the other information, we are required to report that fact.
We have nothing to report in this regard.
In this context, we also have nothing to report in regard to our responsibility to specifically address the following items in the other information and to report as uncorrected material misstatements of the other information where we conclude that those items meet the following conditions:
§§ Fair, balanced and understandable set out on page 83 – the statement given by the directors that they consider the annual report and financial statements taken as a whole is fair, balanced and understandable and provides the information necessary for shareholders to assess the group’s performance, business model and strategy, is materially inconsistent with our knowledge obtained in the audit; or
§§ Audit committee reporting set out on page 112 – the section describing the work of the audit committee does not appropriately address matters communicated by us to the audit committee; or
§§ Directors’ statement of compliance with the UK Corporate Governance Code set out on page 70 – the parts of the directors’ statement required under the Listing Rules relating to the company’s compliance with the UK Corporate Governance Code containing provisions specified for review by the auditor in accordance with Listing Rule 9.8.10R(2) do not properly disclose a departure from a relevant provision of the UK Corporate Governance Code.
Opinions on other matters prescribed by the Companies Act 2006In our opinion, the part of the directors’ remuneration report to be audited has been properly prepared in accordance with the Companies Act 2006.
In our opinion, based on the work undertaken in the course of the audit:
§§ the information given in the strategic report and the directors’ report for the financial year for which the financial statements are prepared is consistent with the financial statements; and
§§ the strategic report and the directors’ report have been prepared in accordance with applicable legal requirements.
Matters on which we are required to report by exceptionIn the light of the knowledge and understanding of the group and the parent company and its environment obtained in the course of the audit, we have not identified material misstatements in the strategic report or the directors’ report.
We have nothing to report in respect of the following matters in relation to which the Companies Act 2006 requires us to report to you if, in our opinion:
§§ adequate accounting records have not been kept by the parent company, or returns adequate for our audit have not been received from branches not visited by us; or
§§ the parent company financial statements and the part of the Directors’ Remuneration Report to be audited are not in agreement with the accounting records and returns; or
§§ certain disclosures of directors’ remuneration specified by law are not made; or
§§ we have not received all the information and explanations we require for our audit.
Market segm
entsGovernance
Financial statements and
other information
Financial reviewCorporate Responsibility
Overview
126 RELX Annual report and financial statements 2019 | Financial statements and other information
Responsibilities of directorsAs explained more fully in the directors’ responsibilities statement set out on page 117, the directors are responsible for the preparation of the financial statements and for being satisfied that they give a true and fair view, and for such internal control as the directors determine is necessary to enable the preparation of financial statements that are free from material misstatement, whether due to fraud or error.
In preparing the financial statements, the directors are responsible for assessing the group and parent company’s ability to continue as a going concern, disclosing, as applicable, matters related to going concern and using the going concern basis of accounting unless the directors either intend to liquidate the group or the parent company or to cease operations, or have no realistic alternative but to do so.
Auditor’s responsibilities for the audit of the financial statements Our objectives are to obtain reasonable assurance about whether the financial statements as a whole are free from material misstatement, whether due to fraud or error, and to issue an auditor’s report that includes our opinion. Reasonable assurance is a high level of assurance, but is not a guarantee that an audit conducted in accordance with ISAs (UK) will always detect a material misstatement when it exists. Misstatements can arise from fraud or error and are considered material if, individually or in the aggregate, they could reasonably be expected to influence the economic decisions of users taken on the basis of these financial statements.
Explanation as to what extent the audit was considered capable of detecting irregularities, including fraud The objectives of our audit, in respect to fraud, are; to identify and assess the risks of material misstatement of the financial statements due to fraud; to obtain sufficient appropriate audit evidence regarding the assessed risks of material misstatement due to fraud, through designing and implementing appropriate responses; and to respond appropriately to fraud or suspected fraud identified during the audit. However, the primary responsibility for the prevention and detection of fraud rests with both those charged with governance of the entity and management.
Our approach was as follows:
§§ We obtained an understanding of the legal and regulatory frameworks that are applicable to the group and determined that the most significant are those that relate to the reporting framework (IFRS, FRS 101, the Companies Act 2006 and UK Corporate Governance Code) and the relevant tax compliance regulations in the jurisdictions in which the group operates.
§§ We understood how RELX PLC is complying with those frameworks by making enquiries of management, internal audit, those responsible for legal and compliance procedures and the company secretary. We corroborated our enquiries through our review of board minutes and papers provided to the Audit Committee.
§§ We assessed the susceptibility of the group’s financial statements to material misstatement, including how fraud might occur by meeting with management from various parts of the business to understand where it considered there was susceptibility to fraud. We also considered performance targets and their propensity to influence on efforts made by management to manage earnings. We considered the programmes and controls that the group has established to address risks identified, or that otherwise prevent, deter and detect fraud; and how senior management monitors those programmes and controls. Where the risk was considered to be higher, we performed audit procedures to address each identified fraud risk. These procedures included testing manual journals and were designed to provide reasonable assurance that the financial statements were free from fraud or error.
§§ Based on this understanding we designed our audit procedures to identify non-compliance with such laws and regulations. Our procedures involved: journal entry testing, with a focus on manual consolidation journals and journals indicating large or unusual transactions based on our understanding of the business; enquiries of legal counsel, group management, internal audit, business area management at all full and specific scope management; and focused testing. In addition, we completed procedures to conclude on the compliance of the disclosures in the annual report and accounts with all applicable requirements.
§§ Any instances of non-compliance with laws and regulations were communicated by/to components and considered in our audit approach, if applicable.
A further description of our responsibilities for the audit of the financial statements is located on the Financial Reporting Council’s website at https://www.frc.org.uk/auditorsresponsibilities. This description forms part of our auditor’s report.

127RELX Annual report and financial statements 2019 | Independent auditors’ report to the members of RELX PLC
Other matters we are required to address §§ We were appointed by the company on 21 April 2016 to audit the financial statements for the year ending 31 December and subsequent
financial periods.
The period of total uninterrupted engagement including previous renewals and reappointments is four years, covering the years ending 2016 to 2019.
§§ The non-audit services prohibited by the FRC’s Ethical Standard were not provided to the group or the parent company and we remain independent of the group and the parent company in conducting the audit.
§§ The audit opinion is consistent with the additional report to the audit committee.
USE OF OUR REPORTThis report is made solely to the company’s members, as a body, in accordance with Chapter 3 of Part 16 of the Companies Act 2006. Our audit work has been undertaken so that we might state to the company’s members those matters we are required to state to them in an auditor’s report and for no other purpose. To the fullest extent permitted by law, we do not accept or assume responsibility to anyone other than the company and the company’s members as a body, for our audit work, for this report, or for the opinions we have formed.
Hywel Ball (Senior statutory auditor) for and on behalf of Ernst & Young LLP, Statutory Auditor London 12 February 2020Notes:(1) The maintenance and integrity of the RELX PLC web site is the responsibility of the directors; the work carried out by the auditors does not involve consideration
of these matters and, accordingly, the auditors accept no responsibility for any changes that may have occurred to the financial statements since they were initially presented on the web site.
(2) Legislation in the United Kingdom governing the preparation and dissemination of financial statements may differ from legislation in other jurisdictions.
Market segm
entsGovernance
Financial statements and
other information
Financial reviewCorporate Responsibility
Overview

128 RELX Annual report and financial statements 2019 | Financial statements and other information
Consolidated income statement
FOR THE YEAR ENDED 31 DECEMBERNote
2019£m
2018£m
2017£m
Revenue 2 7,874 7,492 7,341Cost of sales (2,755) (2,644) (2,628)Gross profit 5,119 4,848 4,713Selling and distribution costs (1,292) (1,191) (1,163)Administration and other expenses (1,767) (1,725) (1,682)Share of results of joint ventures 41 32 37Operating profit 3 2,101 1,964 1,905Finance income 7 9 6 6Finance costs 7 (314) (217) (205)Net finance costs (305) (211) (199)Disposals and other non-operating items 8 51 (33) 15Profit before tax 1,847 1,720 1,721Current tax (382) (297) (439)Deferred tax 44 5 374Tax expense 9 (338) (292) (65)Net profit for the year 1,509 1,428 1,656
Attributable to:RELX PLC shareholders 1,505 1,422 1,648Non-controlling interests 4 6 8Net profit for the year 1,509 1,428 1,656
Earnings per shareFOR THE YEAR ENDED 31 DECEMBER 2019 2018 2017
Basic earnings per shareRELX PLC 10 77.4p 71.9p 81.6p
Diluted earnings per shareRELX PLC 10 76.9p 71.4p 81.0p

RELX Annual report and financial statements 2019 129M
arket segments
GovernanceFinancial statem
ents and other inform
ationFinancial review
Corporate ResponsibilityOverview
Consolidated statement of comprehensive income
FOR THE YEAR ENDED 31 DECEMBERNote
2019£m
2018£m
2017£m
Net profit for the year 1,509 1,428 1,656
Items that will not be reclassified to profit or loss:Actuarial (losses)/gains on defined benefit pension schemes 6 (137) (91) 233Tax on items that will not be reclassified to profit or loss 9 23 15 (59)Total items that will not be reclassified to profit or loss (114) (76) 174
Items that may be reclassified subsequently to profit or loss:Exchange differences on translation of foreign operations (82) 207 (507)Fair value movements on cash flow hedges 18 16 (59) 137Transfer to net profit from cash flow hedge reserve 18 35 17 25Tax on items that may be reclassified to profit or loss 9 (8) 9 (30)Total items that may be reclassified to profit or loss (39) 174 (375)Other comprehensive (loss)/income for the year (153) 98 (201)Total comprehensive income for the year 1,356 1,526 1,455
Attributable to:RELX PLC shareholders 1,352 1,520 1,447Non-controlling interests 4 6 8Total comprehensive income for the year 1,356 1,526 1,455

130 RELX Annual report and financial statements 2019 | Financial statements and other information
Consolidated statement of cash flows
FOR THE YEAR ENDED 31 DECEMBERNote
2019£m
2018£m
2017£m
Cash flows from operating activitiesCash generated from operations 11 2,724 2,555 2,526Interest paid (including lease interest) (175) (179) (169)Interest received 4 24 6Tax paid (net) (464) (415) (449)Net cash from operating activities 2,089 1,985 1,914
Cash flows from investing activitiesAcquisitions 11 (423) (935) (131)Purchases of property, plant and equipment (47) (56) (51)Expenditure on internally developed intangible assets (333) (306) (303)Purchase of investments (8) (13) (10)Proceeds from disposals of property, plant and equipment 2 4 1Gross proceeds from business disposals 82 34 84Payments on business disposals (40) (29) (43)Dividends received from joint ventures 34 30 38Net cash used in investing activities (733) (1,271) (415)
Cash flows from financing activitiesDividends paid to shareholders 13 (842) (796) (762)Distributions to non-controlling interests (9) (8) (10)Increase/(decrease) in short-term bank loans, overdrafts and commercial paper 11 98 147 (148)Issuance of term debt 11 729 958 873Repayment of term debt 11 (617) (211) (712)Repayment of leases 11 (102) (95) (89)Receipts in respect of subleases 11 16 14 11Disposal of non-controlling interest 6 – –Repurchase of ordinary shares 24 (600) (700) (700)Purchase of shares by Employee Benefit Trust 24 (37) (43) (39)Proceeds on issue of ordinary shares 29 21 32Net cash used in financing activities (1,329) (713) (1,544)
Increase/(decrease) in cash and cash equivalents 11 27 1 (45)
Movement in cash and cash equivalentsAt start of year 114 111 162Increase/(decrease) in cash and cash equivalents 27 1 (45)Exchange translation differences (3) 2 (6)At end of year 138 114 111

RELX Annual report and financial statements 2019 131M
arket segments
GovernanceFinancial statem
ents and other inform
ationFinancial review
Corporate ResponsibilityOverview
Consolidated statement of financial position
AS AT 31 DECEMBERNote
2019£m
2018£m
Non-current assetsGoodwill 14 6,824 6,899Intangible assets 15 3,452 3,534Investments in joint ventures 16 118 104Other investments 16 133 151Property, plant and equipment 17 180 198Right-of-use assets 23 264 263Other receivables 31 –Deferred tax assets 9 239 455Net pension assets 6 45 6Derivative financial instruments 18 58 37
11,344 11,647Current assetsInventories and pre-publication costs 19 217 212Trade and other receivables 20 2,067 2,015Derivative financial instruments 18 23 10Cash and cash equivalents 11 138 114
2,445 2,351Assets held for sale – 1Total assets 13,789 13,999
Current liabilitiesTrade and other payables 21 3,479 3,432Derivative financial instruments 18 24 32Borrowings 22 2,060 1,392Taxation 372 450Provisions 12 15
5,947 5,321Non-current liabilitiesDerivative financial instruments 18 10 37Borrowings 22 4,354 4,973Deferred tax liabilities 9 593 830Net pension obligations 6 565 439Other payables 108 –Provisions 22 36
5,652 6,315Liabilities associated with assets held for sale – 4Total liabilities 11,599 11,640Net assets 2,190 2,359
Capital and reservesShare capital 24 286 290Share premium 24 1,443 1,415Shares held in treasury 24 (834) (734)Translation reserve 292 374Other reserves 25 979 984Shareholders’ equity 2,166 2,329Non-controlling interests 24 30Total equity 2,190 2,359
The consolidated financial statements were approved by the Board of Directors and authorised for issue on 12 February 2020. They were signed on its behalf by:
A J Habgood N L Luff Chair Chief Financial Officer

132 RELX Annual report and financial statements 2019 | Financial statements and other information
Consolidated statement of changes in equity
Note
Sharecapital
£m
Share premium
£m
Shares held in treasury
£m
Translation reserve
£m
Other reserves
£m
Shareholders’equity
£m
Non-controlling
interests£m
Total equity
£m
Balance at 1 January 2017 226 3,003 (1,471) 727 (215) 2,270 38 2,308Total comprehensive income
for the year – – – (507) 1,954 1,447 8 1,455Dividends paid 13 – – – – (762) (762) (10) (772)Issue of ordinary shares,
net of expenses – 32 – – – 32 – 32Repurchase of ordinary shares – – (737) – – (737) – (737)Cancellation of shares 24 (4) – 570 – (566) – – –Increase in share based
remuneration reserve (net of tax) – – – – 42 42 – 42
Settlement of share awards – – 37 – (37) – –Acquisitions – – – – – – 1 1Disposal of business – – – – – – (15) (15)Exchange differences on
translation of capital and reserves 2 69 (30) (50) 9 – (1) (1)
Balance at 1 January 2018 224 3,104 (1,631) 170 425 2,292 21 2,313Total comprehensive income
for the year – – – 207 1,313 1,520 6 1,526Dividends paid 13 – – – – (796) (796) (8) (804)Issue of ordinary shares,
net of expenses 24 134 114 – – (227) 21 – 21Repurchase of ordinary shares – – (743) – – (743) – (743)Cancellation of shares 24 (68) (1,795) 1,601 – 262 – – –Increase in share based
remuneration reserve (net of tax) – – – – 35 35 – 35
Settlement of share awards – – 35 – (35) – – –Acquisitions – – – – – – 11 11Exchange differences on
translation of capital and reserves – (8) 4 (3) 7 – – –
Balance at 1 January 2019 290 1,415 (734) 374 984 2,329 30 2,359Total comprehensive income
for the year – – – (82) 1,434 1,352 4 1,356Dividends paid 13 – – – – (842) (842) (9) (851)Issue of ordinary shares,
net of expenses 24 1 28 – – – 29 – 29Repurchase of ordinary shares – – (637) – – (637) – (637)Bonus issue of ordinary share 24 4,000 – – – (4,000) – – –Cancellation of bonus share 24 (4,000) – – – 4,000 – – –Cancellation of shares 24 (5) – 504 – (499) – – –Increase in share based
remuneration reserve (net of tax) – – – – 33 33 – 33
Settlement of share awards – – 33 – (33) – – –Acquisitions – – – – – – (1) (1)Put option – – – – (103) (103) – (103)Disposal of non-controlling
interest – – – – 5 5 1 6Exchange differences on
translation of capital and reserves – – – – – – (1) (1)
Balance at 31 December 2019 286 1,443 (834) 292 979 2,166 24 2,190

133M
arket segments
GovernanceFinancial statem
ents and other inform
ationFinancial review
Corporate ResponsibilityOverview
RELX Annual report and financial statements 2019
Notes to the consolidated financial statementsfor the year ended 31 December 2019
1 Basis of preparation and accounting policiesBasis of preparationThe shares of RELX PLC are traded on the London, Amsterdam and New York stock exchanges. RELX PLC and its subsidiaries, joint ventures and associates are together known as ‘RELX’.
In preparing the consolidated financial statements, subsidiaries are accounted for under the acquisition method and investments in associates and joint ventures are accounted for under the equity method. All intra-group transactions and balances are eliminated.
On acquisition of a subsidiary, or interest in an associate or joint venture, fair values, reflecting conditions at the date of acquisition, are attributed to the net assets, including identifiable intangible assets acquired. Adjustments are made to bring accounting policies into line with those of the Group. The results of subsidiaries sold or acquired are included in the consolidated financial statements up to or from the date that control passes from or to the Group.
Non-controlling interests in the net assets of the Group are identified separately from shareholders’ equity. Non-controlling interests consist of the amount of those interests at the date of the original acquisition and the non-controlling share of changes in equity since the date of acquisition.
The Directors of RELX PLC, having made appropriate enquiries, consider that adequate resources exist for the Group to continue in operational existence for the foreseeable future and that, therefore, it is appropriate to adopt the going concern basis in preparing the consolidated financial statements for the year ended 31 December 2019.
Accounting policiesThe Group’s consolidated financial statements are prepared in accordance with International Financial Reporting Standards (IFRS) as adopted by the European Union and as issued by the International Accounting Standards Board (IASB). The accounting policies under IFRS are included in the relevant notes to the consolidated financial statements. The accounting policies below are applied throughout the financial statements and are unchanged from those applied in preparing the consolidated financial statements for the year ended 31 December 2018.
Foreign exchange translationThe consolidated financial statements are presented in sterling.
Transactions in foreign currencies are recorded at the rate of exchange prevailing on the date of the transaction. Non-monetary assets and liabilities that are measured at historical cost in foreign currencies are translated using the exchange rate at the date of the transaction. At each statement of financial position date, monetary assets and liabilities that are denominated in foreign currencies are retranslated at the rate prevailing on the statement of financial position date. Exchange differences arising are recorded in the income statement other than where hedge accounting applies, as set out on pages 157 to 162.
Assets and liabilities of foreign operations are translated at exchange rates prevailing on the statement of financial position date. Income and expense items and cash flows of foreign operations are translated at the average exchange rate for the period. Significant individual items of income and expense and cash flows in foreign operations are translated at the rate prevailing on the date of transaction. Exchange differences arising are classified as equity and transferred to the translation reserve. When foreign operations are disposed of, the related cumulative translation differences are recognised within the income statement in the period.
The Group uses derivative financial instruments, primarily forward contracts, to hedge its exposure to certain foreign exchange risks. Details of the Group’s accounting policies in respect of derivative financial instruments are set out on page 157.
Critical judgements and key sources of estimation uncertaintyThe most significant accounting policies in determining the financial condition and results of the Group, and those requiring the most subjective or complex judgement, relate to and are included in the following notes:
§§ valuation of goodwill and intangible assets – notes 14 and 15;§§ capitalisation of development spend – note 15;§§ taxation – note 9; and§§ accounting for defined benefit pension schemes – note 6.

134 RELX Annual report and financial statements 2019 | Financial statements and other information
Notes to the consolidated financial statementsfor the year ended 31 December 2019
1 Basis of preparation and accounting policies (continued)Other significant accounting policiesThe accounting policy in respect of revenue recognition is also significant in determining the financial condition and results of the Group. The application of this policy is straightforward, and is included in note 2.
Standards and amendments effective for the yearRELX adopted IFRS 16 Leases for the year ended 31 December 2018, a year earlier than its mandatory effective date. The impact of the adoption of IFRS 16 was reflected in the consolidated financial statements for the year ended 31 December 2018. Other interpretations and amendments to IFRS effective for 2019 have not had a significant impact on the Group’s accounting policies or reporting.
Standards, amendments and interpretations not yet effectiveA number of amendments and interpretations have been issued which are not expected to have any significant impact on the accounting policies and reporting.
2 Revenue and segment analysis
Accounting policyThe Group’s reported segments are based on the internal reporting structure and financial information provided to the Board.
Adjusted operating profit is the key segmental profit measure used by the Group in assessing performance. Adjusted operating profit is reconciled to operating profit on page 137.
Revenue arises from the provision of products and services under contracts with customers. In all cases, revenue is recognised to depict the transfer of promised goods or services to customers in an amount that reflects the consideration to which the entity expects to be entitled in exchange for those goods or services, and is recognised when the customer obtains control of the good or service.
Revenue is stated at the transaction price, which includes allowance for anticipated discounts and returns and excludes customer sales taxes and other amounts to be collected on behalf of third-parties.
Where the goods or services promised within a contract are distinct, they are identified as separate performance obligations and are accounted for separately.
Where separate performance obligations are identified, total revenue is allocated on the basis of relative stand-alone selling prices or management’s best estimate of relative value where stand-alone selling prices do not exist. Management estimates may include a cost-plus method or comparable product approach, but must be supported by objective evidence. A residual approach may be applied where it is not possible to derive a reliable management estimate for a specific component.
Revenue is recognised for the various categories as follows:
§§ Subscriptions – revenue comprises income derived from the periodic distribution or update of a product. Subscription revenue is generally invoiced in advance and recognised systematically over the period of the subscription. Recognition is either on a straight-line basis where the transaction involves the transfer of goods and services to the customer in a consistent manner over a specific period of time; or based on the value received by the customer where the goods and services are not delivered in a consistent manner.
§§ Transactional – revenue is recognised when control of the product is passed to the customer or the service has been performed. For exhibitions, revenue primarily comprises income from exhibitors and attendees at exhibitions. Exhibition revenue is recognised on occurrence of the exhibition.
§§ Advertising – revenue is recognised on publication or over the period of online display.
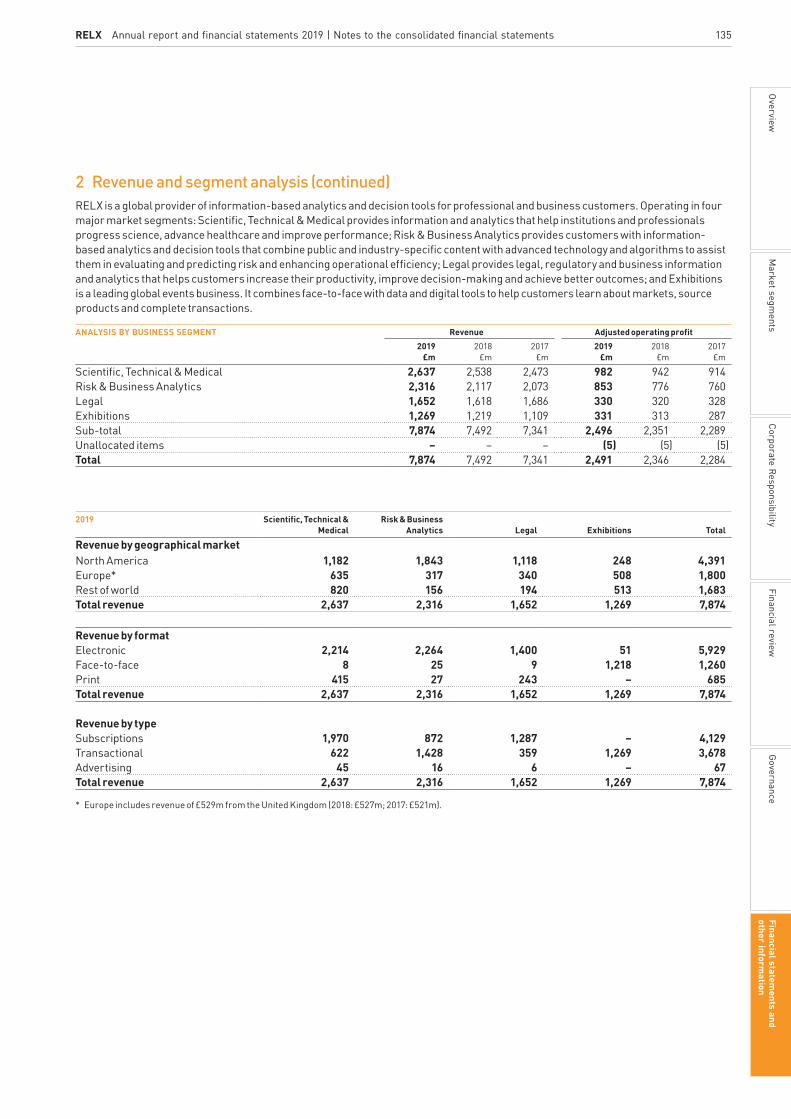
RELX Annual report and financial statements 2019 | Notes to the consolidated financial statements 135M
arket segments
GovernanceFinancial statem
ents and other inform
ationFinancial review
Corporate ResponsibilityOverview
2 Revenue and segment analysis (continued)RELX is a global provider of information-based analytics and decision tools for professional and business customers. Operating in four major market segments: Scientific, Technical & Medical provides information and analytics that help institutions and professionals progress science, advance healthcare and improve performance; Risk & Business Analytics provides customers with information-based analytics and decision tools that combine public and industry-specific content with advanced technology and algorithms to assist them in evaluating and predicting risk and enhancing operational efficiency; Legal provides legal, regulatory and business information and analytics that helps customers increase their productivity, improve decision-making and achieve better outcomes; and Exhibitions is a leading global events business. It combines face-to-face with data and digital tools to help customers learn about markets, source products and complete transactions.
ANALYSIS BY BUSINESS SEGMENT Revenue Adjusted operating profit2019
£m2018
£m2017
£m2019
£m2018
£m2017
£m
Scientific, Technical & Medical 2,637 2,538 2,473 982 942 914Risk & Business Analytics 2,316 2,117 2,073 853 776 760Legal 1,652 1,618 1,686 330 320 328Exhibitions 1,269 1,219 1,109 331 313 287Sub-total 7,874 7,492 7,341 2,496 2,351 2,289Unallocated items – – – (5) (5) (5)Total 7,874 7,492 7,341 2,491 2,346 2,284
2019 Scientific, Technical & Medical
Risk & Business Analytics Legal Exhibitions Total
Revenue by geographical marketNorth America 1,182 1,843 1,118 248 4,391Europe* 635 317 340 508 1,800Rest of world 820 156 194 513 1,683Total revenue 2,637 2,316 1,652 1,269 7,874
Revenue by format Electronic 2,214 2,264 1,400 51 5,929Face-to-face 8 25 9 1,218 1,260Print 415 27 243 – 685Total revenue 2,637 2,316 1,652 1,269 7,874
Revenue by typeSubscriptions 1,970 872 1,287 – 4,129Transactional 622 1,428 359 1,269 3,678Advertising 45 16 6 – 67Total revenue 2,637 2,316 1,652 1,269 7,874
* Europe includes revenue of £529m from the United Kingdom (2018: £527m; 2017: £521m).

136 RELX Annual report and financial statements 2019 | Financial statements and other information
2 Revenue and segment analysis (continued)2018 Scientific, Technical &
MedicalRisk & Business
Analytics Legal Exhibitions Total
Revenue by geographical marketNorth America 1,118 1,669 1,083 221 4,091Europe 611 322 340 535 1,808Rest of world 809 126 195 463 1,593Total revenue 2,538 2,117 1,618 1,219 7,492
Revenue by format Electronic 2,094 2,030 1,338 51 5,513Face-to-face 7 36 10 1,168 1,221Print 437 51 270 – 758Total revenue 2,538 2,117 1,618 1,219 7,492
Revenue by typeSubscriptions 1,877 765 1,247 – 3,889Transactional 615 1,322 365 1,219 3,521Advertising 46 30 6 – 82Total revenue 2,538 2,117 1,618 1,219 7,492
2017 Scientific, Technical & Medical
Risk & Business Analytics Legal Exhibitions Total
Revenue by geographical marketNorth America 1,045 1,658 1,145 230 4,078 Europe 617 308 340 429 1,694Rest of world 811 107 201 450 1,569 Total revenue 2,473 2,073 1,686 1,109 7,341
Revenue by format Electronic 1,995 1,967 1,384 42 5,388 Face-to-face 10 38 7 1,067 1,122 Print 468 68 295 – 831 Total revenue 2,473 2,073 1,686 1,109 7,341
Revenue by typeSubscriptions 1,776 732 1,291 1 3,800 Transactional 646 1,301 389 1,108 3,444 Advertising 51 40 6 – 97 Total revenue 2,473 2,073 1,686 1,109 7,341
Around half of RELX’s revenue comes from subscription arrangements, and revenue for these is generally recognised on a straight-line basis over the time period covered by the agreement, in line with the provision of services. There are a number of multi-year contracts, mainly in Risk & Business Analytics, where revenue is recognised on the achievement of delivery milestones or other specified performance obligations. As at 31 December 2019, the aggregate amount of the transaction price of such contracts which relates to performance obligations which have not yet been delivered was approximately £162m (2018: £210m). It is expected that revenue will be recognised in relation to this amount over the next nine years.
ANALYSIS OF REVENUE BY GEOGRAPHICAL ORIGIN 2019£m
2018£m
2017£m
North America 4,308 4,013 3,998Europe 2,832 2,790 2,644Rest of world 734 689 699Total 7,874 7,492 7,341
Revenue by geographical origin from the United Kingdom in 2019 was £1,320m (2018: £1,144m; 2017: £1,085m).
Notes to the consolidated financial statementsfor the year ended 31 December 2019

RELX Annual report and financial statements 2019 | Notes to the consolidated financial statements 137M
arket segments
GovernanceFinancial statem
ents and other inform
ationFinancial review
Corporate ResponsibilityOverview
2 Revenue and segment analysis (continued)ANALYSIS BY BUSINESS SEGMENT Expenditure on
acquired goodwill and intangible assets
Capital expenditure additions
Amortisation of acquired intangible assets
Depreciation and other amortisation
2019£m
2018£m
2017£m
2019£m
2018£m
2017£m
2019£m
2018£m
2017£m
2019£m
2018£m
2017£m
Scientific, Technical & Medical 65 106 94 104 100 95 62 58 77 109 109 100Risk & Business Analytics 47 852 – 96 92 83 170 161 141 89 73 64Legal 139 30 6 155 145 153 24 33 52 150 147 142Exhibitions 251 61 33 26 28 24 39 36 44 41 35 37Total 502 1,049 133 381 365 355 295 288 314 389 364 343
Capital expenditure comprises additions to property, plant and equipment and internally developed intangible assets. Depreciation and other amortisation includes depreciation on right-of-use assets. Amortisation of acquired intangible assets includes amounts in respect of joint ventures of £1m (2018: £1m; 2017: £1m) in Exhibitions.
ANALYSIS OF NON-CURRENT ASSETS BY GEOGRAPHICAL LOCATION 2019£m
2018£m
2017£m
North America 8,365 8,692 7,408Europe 2,156 1,996 2,016Rest of world 481 461 459Total 11,002 11,149 9,883
Non-current assets held in the United Kingdom totalled £1,248m (2018: £988m; 2017: £1,026m). Non-current assets by geographical location exclude amounts relating to deferred tax, pension assets and derivative financial instruments.
Operating profit is reconciled to adjusted operating profit as follows:
RECONCILIATION OF OPERATING PROFIT TO ADJUSTED OPERATING PROFIT 2019£m
2018£m
2017£m
Operating profit 2,101 1,964 1,905Adjustments: Amortisation of acquired intangible assets 295 288 314 Acquisition-related costs 84 84 56 Reclassification of tax in joint ventures 12 11 10 Reclassification of finance income in joint ventures (1) (1) (1)Adjusted operating profit 2,491 2,346 2,284
The share of post-tax results of joint ventures of £41m (2018: £32m; 2017: £37m) included in operating profit comprised £3m (2018: nil; 2017: £5m) relating to Legal, £36m (2018: £31m; 2017: £32m) relating to Exhibitions and £2m (2018: £1m; 2017: nil) relating to Risk & Business Analytics.
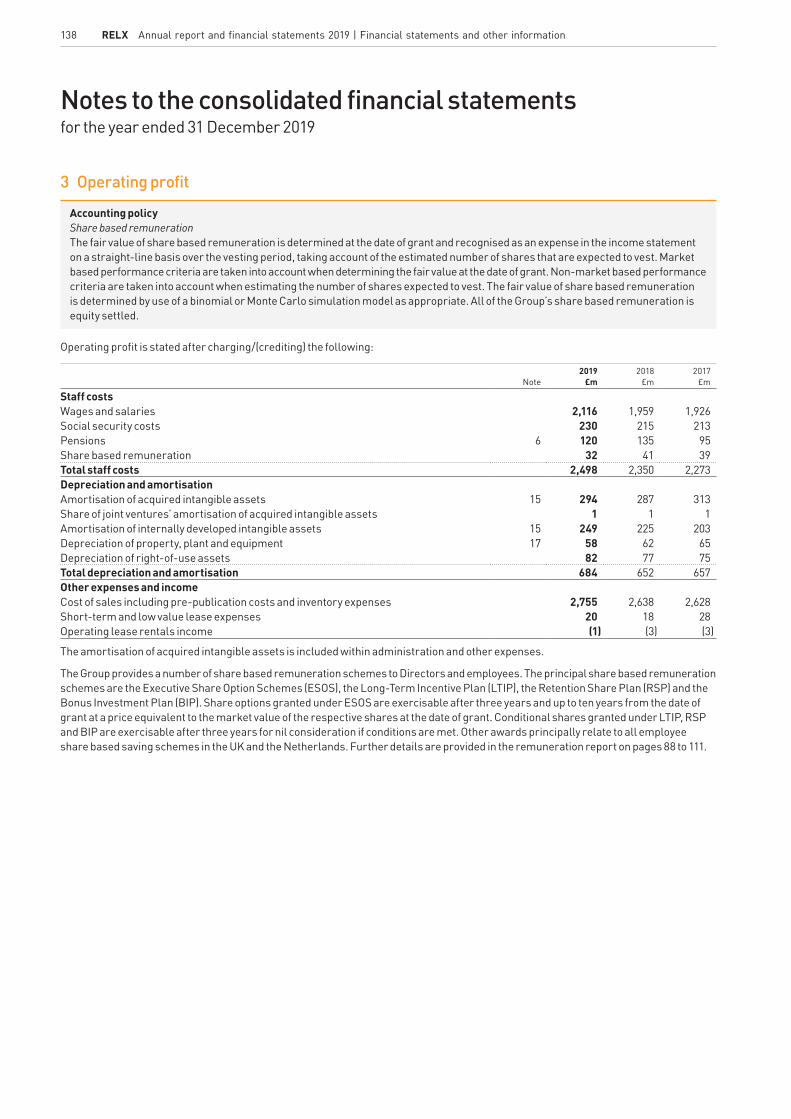
138 RELX Annual report and financial statements 2019 | Financial statements and other information
3 Operating profit
Accounting policyShare based remunerationThe fair value of share based remuneration is determined at the date of grant and recognised as an expense in the income statement on a straight-line basis over the vesting period, taking account of the estimated number of shares that are expected to vest. Market based performance criteria are taken into account when determining the fair value at the date of grant. Non-market based performance criteria are taken into account when estimating the number of shares expected to vest. The fair value of share based remuneration is determined by use of a binomial or Monte Carlo simulation model as appropriate. All of the Group’s share based remuneration is equity settled.
Operating profit is stated after charging/(crediting) the following:
Note2019
£m2018
£m2017
£m
Staff costsWages and salaries 2,116 1,959 1,926Social security costs 230 215 213Pensions 6 120 135 95Share based remuneration 32 41 39Total staff costs 2,498 2,350 2,273Depreciation and amortisationAmortisation of acquired intangible assets 15 294 287 313Share of joint ventures’ amortisation of acquired intangible assets 1 1 1Amortisation of internally developed intangible assets 15 249 225 203Depreciation of property, plant and equipment 17 58 62 65Depreciation of right-of-use assets 82 77 75Total depreciation and amortisation 684 652 657Other expenses and incomeCost of sales including pre-publication costs and inventory expenses 2,755 2,638 2,628Short-term and low value lease expenses 20 18 28Operating lease rentals income (1) (3) (3)
The amortisation of acquired intangible assets is included within administration and other expenses.
The Group provides a number of share based remuneration schemes to Directors and employees. The principal share based remuneration schemes are the Executive Share Option Schemes (ESOS), the Long-Term Incentive Plan (LTIP), the Retention Share Plan (RSP) and the Bonus Investment Plan (BIP). Share options granted under ESOS are exercisable after three years and up to ten years from the date of grant at a price equivalent to the market value of the respective shares at the date of grant. Conditional shares granted under LTIP, RSP and BIP are exercisable after three years for nil consideration if conditions are met. Other awards principally relate to all employee share based saving schemes in the UK and the Netherlands. Further details are provided in the remuneration report on pages 88 to 111.
Notes to the consolidated financial statementsfor the year ended 31 December 2019
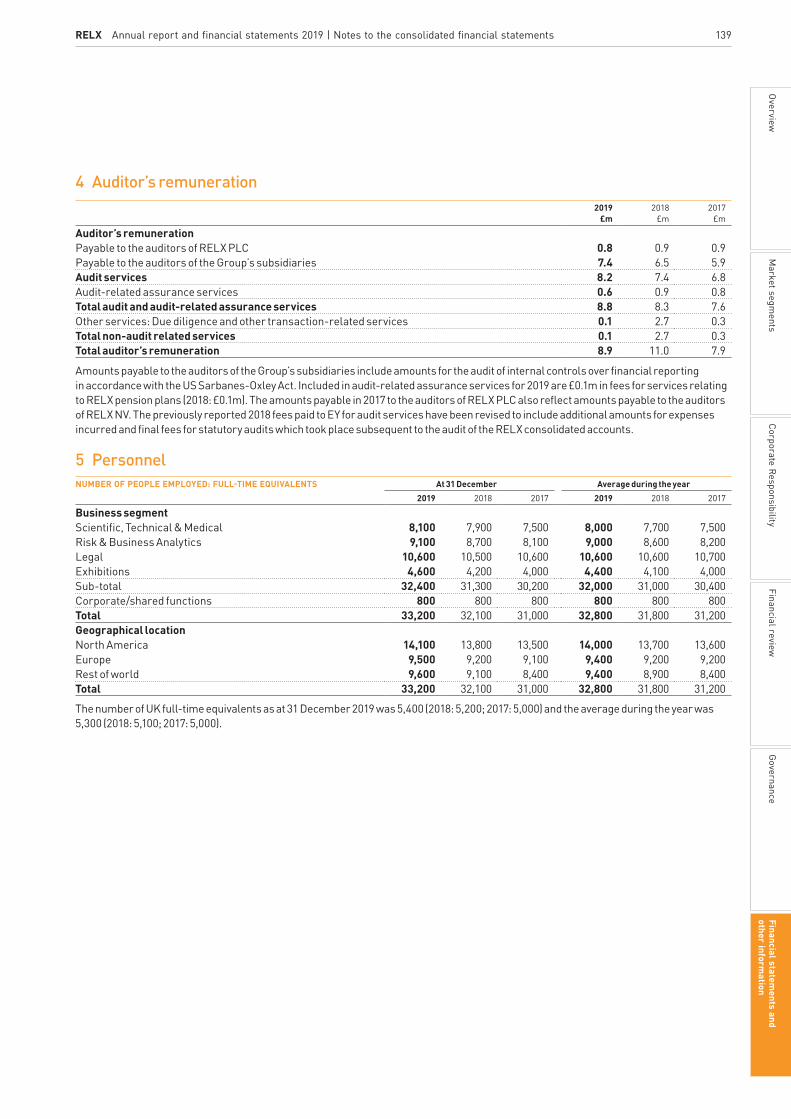
RELX Annual report and financial statements 2019 | Notes to the consolidated financial statements 139M
arket segments
GovernanceFinancial statem
ents and other inform
ationFinancial review
Corporate ResponsibilityOverview
4 Auditor’s remuneration2019
£m2018
£m2017
£m
Auditor’s remunerationPayable to the auditors of RELX PLC 0.8 0.9 0.9Payable to the auditors of the Group’s subsidiaries 7.4 6.5 5.9Audit services 8.2 7.4 6.8Audit-related assurance services 0.6 0.9 0.8Total audit and audit-related assurance services 8.8 8.3 7.6Other services: Due diligence and other transaction-related services 0.1 2.7 0.3Total non-audit related services 0.1 2.7 0.3Total auditor’s remuneration 8.9 11.0 7.9
Amounts payable to the auditors of the Group’s subsidiaries include amounts for the audit of internal controls over financial reporting in accordance with the US Sarbanes-Oxley Act. Included in audit-related assurance services for 2019 are £0.1m in fees for services relating to RELX pension plans (2018: £0.1m). The amounts payable in 2017 to the auditors of RELX PLC also reflect amounts payable to the auditors of RELX NV. The previously reported 2018 fees paid to EY for audit services have been revised to include additional amounts for expenses incurred and final fees for statutory audits which took place subsequent to the audit of the RELX consolidated accounts.
5 PersonnelNUMBER OF PEOPLE EMPLOYED: FULL-TIME EQUIVALENTS At 31 December Average during the year
2019 2018 2017 2019 2018 2017
Business segmentScientific, Technical & Medical 8,100 7,900 7,500 8,000 7,700 7,500Risk & Business Analytics 9,100 8,700 8,100 9,000 8,600 8,200Legal 10,600 10,500 10,600 10,600 10,600 10,700Exhibitions 4,600 4,200 4,000 4,400 4,100 4,000Sub-total 32,400 31,300 30,200 32,000 31,000 30,400Corporate/shared functions 800 800 800 800 800 800Total 33,200 32,100 31,000 32,800 31,800 31,200Geographical locationNorth America 14,100 13,800 13,500 14,000 13,700 13,600Europe 9,500 9,200 9,100 9,400 9,200 9,200Rest of world 9,600 9,100 8,400 9,400 8,900 8,400Total 33,200 32,100 31,000 32,800 31,800 31,200
The number of UK full-time equivalents as at 31 December 2019 was 5,400 (2018: 5,200; 2017: 5,000) and the average during the year was 5,300 (2018: 5,100; 2017: 5,000).

140 RELX Annual report and financial statements 2019 | Financial statements and other information
6 Pension schemes
Accounting policyThe expense of defined benefit pension schemes and other post-retirement employee benefits is determined using the projected unit credit method and charged in the income statement as an operating expense, based on actuarial assumptions reflecting market conditions at the beginning of the financial year. Actuarial gains and losses are recognised in full in the statement of comprehensive income in the period in which they occur.
Past service costs and credits are recognised immediately at the earlier of when plan amendments or curtailments occur and when related restructuring costs or termination benefits are recognised. Settlements are recognised when they occur.
Net pension obligations in respect of defined benefit schemes are included in the statement of financial position at the present value of scheme liabilities, less the fair value of scheme assets. Where schemes are in surplus, i.e. assets exceed liabilities, the net pension assets are separately included in the statement of financial position. Any net pension asset is limited to the extent that the asset is recoverable.
The expense of defined contribution pension schemes and other employee benefits is charged in the income statement as incurred.
Critical judgement and key source of estimation uncertaintyAt 31 December 2019, the Group operates defined benefit pension schemes in the UK and the US. These schemes require management to exercise judgement in estimating the ultimate cost of providing post-employment benefits, especially given the length of each scheme’s liabilities. Accounting for defined benefit pension schemes involves judgement about uncertain events, including the life expectancy of the members, salary and pension increases, inflation, the future operation of each scheme and the rate at which the future pension payments are discounted. Estimates for these factors are used in determining the pension cost and liabilities reported in the financial statements. The estimates made around future developments of each of the critical assumptions are made in conjunction with independent actuaries, and each scheme is subject to a periodic review by independent actuaries. Information regarding the more significant assumptions used for valuation is provided below, together with a sensitivity analysis.
A number of pension schemes are operated around the world. The largest defined benefit schemes as at 31 December 2019 were in the UK and the US, and are summarised below.
Major defined benefit schemes in place at 31 December 2019The UK scheme is a final salary scheme and is closed to new hires. Members accrue a portion of their final pensionable earnings based on the number of years of service. The US scheme is a cash balance scheme and was closed to future accruals effective 1 January 2019.
Each of the major defined benefit schemes is administered by a separate fund that is legally separated from the Group. The trustees of the pension funds in the UK and plan fiduciaries of the US scheme are required by law to act in the interest of the funds’ beneficiaries. In the UK, the trustees of the pension fund are responsible for the investment policy with regard to the assets of the fund. The board of trustees consists of an equal number of company-appointed and member-nominated Directors. In the US, the fiduciary duties for the scheme are allocated between committees which are staffed by senior employees of the Group; the investment committee has the primary responsibility for the investment and management of plan assets. The funding of the Group’s major schemes reflects the different rules within each jurisdiction.
Notes to the consolidated financial statementsfor the year ended 31 December 2019

RELX Annual report and financial statements 2019 | Notes to the consolidated financial statements 141M
arket segments
GovernanceFinancial statem
ents and other inform
ationFinancial review
Corporate ResponsibilityOverview
6 Pension schemes (continued)In the UK, the level of funding is determined by statutory triennial actuarial valuations in accordance with pensions legislation. Where the scheme falls below 100% funded status, the Group and the scheme trustees must agree on how the deficit is to be remedied. The UK Pensions Regulator has significant powers and sets out in codes and guidance the parameters for scheme funding. As a result of the 2018 triennial valuation, the Group’s remaining deficit funding contributions to the scheme over the period 2020 to 2022 are £132m.
The US scheme has an annual statutory valuation which forms the basis for establishing the employer contribution each year (subject to ERISA and IRS minimums). Should the statutory funded status fall to below 100%, the US Pension Protection Act requires the deficit to be rectified with additional contributions over a seven-year period. The US scheme’s funded status is in excess of 100%.
Employer cash contributions to defined benefit pension schemes in respect of 2020 are expected to be approximately £58m including a £44m pension deficit funding contribution relating to the UK scheme recovery plan.
The pension expense (excluding interest amounts) recognised in the income statement consists of:
2019£m
2018£m
2017£m
Defined benefit pension expense 11 47 4Defined contribution pension expense 109 95 91Total 120 142 95
£120m (2018 £135m; 2017: £95m) of the total pension cost is recognised within operating profit.
The amounts recognised in the income statement in respect of defined benefit pension schemes during the year are presented by major scheme as follows:
2019 2018 2017UK£m
US£m
Total£m
UK£m
US£m
Total£m
UK£m
US£m
Total£m
Service cost 21 3 24 27 9 36 33 14 47Settlement and past service (credits)/cost (8) (5) (13) 11 – 11 (42) (1) (43)Defined benefit pension expense 13 (2) 11 38 9 47 (9) 13 4Net interest on net defined benefit obligation 9 3 12 6 3 9 10 5 15Net defined benefit pension expense 22 1 23 44 12 56 1 18 19
In 2019, the past service credit relates to changes to both the UK and US schemes. In 2018, a past service cost was recognised to account for the impact of GMP equalisation in the UK. In 2017 settlement and past service credits primarily related to changes to the UK scheme.
Net interest on net defined benefit pension scheme liabilities is presented within net finance costs in the income statement.
The significant valuation assumptions, determined for each major scheme in conjunction with the respective independent actuaries, are presented below. The net defined benefit pension expense for each year is based on the assumptions and scheme valuations set at 31 December of the prior year.
AS AT 31 DECEMBER 2019 2018 2017UK US UK US UK US
Discount rate 2.05% 3.25% 2.85% 4.20% 2.60% 3.55%Inflation 2.95% 2.50% 3.15% 2.50% 3.15% 2.50%
Discount rates are set by reference to high-quality corporate bond yields.
Mortality assumptions make allowance for future improvements in longevity and have been determined by reference to applicable mortality statistics. The average life expectancy assumptions are set out below:
AS AT 31 DECEMBER 2019 Male average life expectancy
Female average life expectancy
UK US UK US
Member currently aged 60 years 85 86 88 88Member currently aged 45 years 86 87 89 89

142 RELX Annual report and financial statements 2019 | Financial statements and other information
6 Pension schemes (continued)The amount recognised in the statement of financial position in respect of defined benefit pension schemes at the start and end of the year and the movements during the year were as follows:
2019 2018UK£m
US£m
Total£m
UK£m
US£m
Total£m
Defined benefit obligationAt start of year (3,772) (1,040) (4,812) (3,854) (1,075) (4,929)Service cost (21) (3) (24) (27) (9) (36)Past service credits/(cost) 8 5 13 (11) – (11)Interest on pension scheme liabilities (104) (42) (146) (98) (38) (136)Actuarial (loss)/gain on financial assumptions (495) (116) (611) 91 85 176Actuarial gain/(loss) arising from experience assumptions 22 (5) 17 4 2 6Contributions by employees (9) – (9) (8) – (8)Liabilities transferred on settlement – 65 65 – – –Benefits paid 120 77 197 131 56 187Exchange translation differences – 41 41 – (61) (61)At end of year (4,251) (1,018) (5,269) (3,772) (1,040) (4,812)
Fair value of scheme assetsAt start of year 3,413 966 4,379 3,589 1,012 4,601Interest income on plan assets 95 39 134 92 35 127Return on assets excluding amounts included in interest income 304 166 470 (184) (89) (273)Contributions by employer 66 6 72 39 7 46Contributions by employees 9 – 9 8 – 8Assets transferred on settlement – (65) (65) – – –Benefits paid (120) (77) (197) (131) (56) (187)Exchange translation differences – (40) (40) – 57 57At end of year 3,767 995 4,762 3,413 966 4,379
Opening net deficit (359) (74) (433) (265) (63) (328)Service cost (21) (3) (24) (27) (9) (36)Net interest on net defined benefit obligation (9) (3) (12) (6) (3) (9)Settlement and past service credits/(cost) 8 5 13 (11) – (11)Contributions by employer 66 6 72 39 7 46Actuarial (losses)/gains (169) 45 (124) (89) (2) (91)Exchange translation differences – 1 1 – (4) (4)Net pension obligation (484) (23) (507) (359) (74) (433)Impact of asset ceiling – (13) (13) – – –Overall net pension obligation (484) (36) (520) (359) (74) (433)
As at 31 December 2019, the defined benefit obligations comprised £5,016m (2018: £4,582m) in relation to funded schemes and £253m (2018: £230m) in relation to unfunded schemes.
The weighted average duration of defined benefit scheme liabilities is 19 years in the UK (2018: 19 years) and 13 years in the US (2018: 12 years). Deferred tax assets of £96m (2018: £86m) are recognised in respect of the pension scheme deficits.
A net pension asset has been recognised in relation to the US funded scheme after considering the guidance in IAS 19 – Employee Benefits and IFRIC 14. The split between net pension obligations and net pension assets is as follows:
2019£m
2018£m
Net pension asset recognised 45 6Net pension obligation (565) (439)Overall net pension obligation (520) (433)
Notes to the consolidated financial statementsfor the year ended 31 December 2019

RELX Annual report and financial statements 2019 | Notes to the consolidated financial statements 143M
arket segments
GovernanceFinancial statem
ents and other inform
ationFinancial review
Corporate ResponsibilityOverview
6 Pension schemes (continued)Amounts recognised in the statement of comprehensive income are set out below:
2019£m
2018£m
2017£m
Gains and losses arising during the year: Experience gains/(losses) on scheme liabilities 17 6 (38) Experience gains/(losses) on scheme assets 470 (273) 287Actuarial (losses)/gains on the present value of scheme liabilities due to changes in: – discount rates (743) 242 (102) – inflation 142 – 69 – other actuarial assumptions (10) (66) 17
(124) (91) 233Net cumulative losses at start of year (704) (613) (846)Net cumulative losses at end of year (828) (704) (613)
Additionally a loss of £13m (2018: nil) is recognised in the statement of comprehensive income in relation to the asset ceiling.
The major categories and fair values of scheme assets at the end of the reporting period are as follows:
FAIR VALUE OF SCHEME ASSETS 2019 2018UK£m
US£m
Total£m
UK£m
US£m
Total£m
Equities 1,358 126 1,484 1,128 115 1,243Liability matching assets 1,414 850 2,264 1,363 831 2,194Property funds and ground leases 715 – 715 723 – 723Direct lending 182 – 182 151 – 151Cash and cash equivalents 75 13 88 26 4 30Other 23 6 29 22 16 38Total 3,767 995 4,762 3,413 966 4,379
Included within liability matching assets are government bonds totalling £1,486m (2018: £1,448m).
Assets and obligations associated with the schemes are sensitive to changes in the market values of assets and the market-related assumptions used to value scheme liabilities. In particular, adverse changes to asset values, discount rates or inflation could increase future pension costs and funding requirements.
Typically, the Group’s schemes are exposed to: investment risks, whereby actual rates of return on plan assets may be below those rates used to determine the defined benefit obligations, and interest rate risks, whereby scheme deficits may increase if bond yields in the UK and the US decline and are not offset by returns in liability matching and other assets. The schemes are also exposed to other risks, such as unanticipated future increases in member longevity patterns and inflation, all potentially leading to an increase in scheme liabilities.
Investment policies of each scheme are intended to ensure continuous payment of defined benefit pensions in the short-term and long-term. Efforts are made to limit risks on marketable securities by adopting investment policies that diversify assets across geographies and among equities, liability matching assets, property funds, cash and other assets. Asset allocations are dependent on a variety of factors including the duration of scheme liabilities and the funded position of the plan.
All equities and bonds have quoted prices in active markets.
Sensitivity analysisThe valuation of the Group’s pension scheme liabilities involves significant actuarial assumptions, being the life expectancy of the members, inflation and the rate at which the future pension payments are discounted. Differences arising from actual experience or future changes in assumptions may materially affect future pension charges. In particular, changes in assumptions for discount rates, inflation and life expectancies that are reasonably possible would have the following approximate effects on the defined benefit pension obligations:
£m
Increase/decrease of 0.25% in discount rate 228Increase/decrease of 0.25% in the expected inflation rate 105Increase/decrease of one year in assumed life expectancy 193
The above analysis has been calculated on the same basis used to determine the defined benefit obligation recognised in the statement of financial position. There has been no change in the methods used to prepare the analysis compared with prior years. This sensitivity analysis may not be representative of the actual change in the defined benefit obligation as it is unlikely that changes in the above assumptions would occur in isolation as some of the assumptions may be correlated.

144 RELX Annual report and financial statements 2019 | Financial statements and other information
7 Net finance costs
Accounting policyBorrowing costs that are directly attributable to the acquisition, construction or production of an asset that takes a substantial period of time to bring to use are capitalised. All other interest on borrowings is expensed as incurred. The cost of issuing borrowings is generally expensed over the period of borrowing so as to produce a constant periodic rate of charge.
2019£m
2018£m
2017£m
Interest on short-term bank loans, overdrafts and commercial paper (20) (22) (10)Interest on term debt (266) (161) (154)Interest on lease liabilities (15) (14) (17)Total borrowing costs (301) (197) (181)Losses on loans and derivatives not designated as hedges – (10) (9)Fair value losses on designated fair value hedge relationships – (1) –Net financing charge on defined benefit pension schemes and other (13) (9) (15)Finance costs (314) (217) (205)Interest on bank deposits 3 4 3Interest income on net finance lease receivables 2 2 2Fair value gains on designated fair value hedge relationships 1 – 1Gains on loans and derivatives not designated as hedges 3 – –Finance income 9 6 6Net finance costs (305) (211) (199)
A loss of £1m (2018: losses of £8m; 2017: gains of £63m) on interest rate derivatives designated as cash flow hedges was recognised in other comprehensive income and accumulated in the hedge reserve, and may be reclassified to the income statement in future periods. Gains of nil (2018: gains of £3m; 2017: gains of £65m) in total were transferred from the hedge reserve in the period. The movements in 2017 included gains of £78m related to foreign exchange movements on debt hedges which were reclassified immediately to the income statement and offset £78m of foreign exchange losses on the related debt.
The interest charge on term debt includes a charge of £99m in respect of the early redemption of bonds that were due to be repaid in October 2022. The redemption of these bonds took place in January 2020 and was committed to at 31 December 2019.
8 Disposals and other non-operating items
Accounting policyAssets of businesses that are available for immediate sale in their current condition and for which a sales process is considered highly probable to complete are classified as assets held for sale and are carried at the lower of carrying value and fair value less costs to sell. Fair value is based on anticipated disposal proceeds, typically derived from firm or indicative offers from potential acquirers. Non-current assets are not amortised or depreciated following their classification as held for sale. Liabilities of businesses held for sale are also separately classified on the statement of financial position. Fair value movements in the venture capital portfolio are reported within disposals and other items – see note 16.
2019£m
2018£m
2017£m
Revaluation of investments 25 (11) 5Gain/(loss) on disposal of businesses and assets held for sale 26 (22) 10Net gain/(loss) on disposals and other non-operating items 51 (33) 15
Notes to the consolidated financial statementsfor the year ended 31 December 2019
RELX Annual report and financial statements 2019 | Notes to the consolidated financial statements 145M
arket segments
GovernanceFinancial statem
ents and other inform
ationFinancial review
Corporate ResponsibilityOverview
9 Taxation
Accounting policyTax expense comprises current and deferred tax. Current and deferred tax are charged or credited in the income statement except to the extent that the tax arises from a transaction or event which is recognised, in the same or a different period, outside the income statement (either in other comprehensive income, directly in equity, or through a business combination), in which case the tax appears in the same statement as the transaction that gave rise to it.Current tax is the amount of corporate income taxes expected to be payable or recoverable based on the profit for the period as adjusted for items that are not taxable or not deductible, and is calculated using tax rates and laws that were enacted or substantively enacted at the date of the statement of financial position. Management periodically evaluates positions taken in tax returns with respect to situations in which applicable tax regulation is subject to interpretation. Provisions are established where appropriate on the basis of amounts expected to be paid to the tax authorities.Current tax includes amounts provided in respect of uncertain tax positions when management expects that, upon examination of the uncertainty by a tax authority in possession of all relevant knowledge, it is more likely than not that an economic outflow will occur. Changes in facts and circumstances underlying these provisions are reassessed at the date of each statement of financial position, and the provisions are remeasured as required to reflect current information.Deferred tax is recognised on temporary differences arising between the tax bases of assets and liabilities and their carrying amounts in the statement of financial position. Deferred tax is calculated using tax rates and laws that have been enacted or substantively enacted at the end of the reporting period, and which are expected to apply when the related deferred tax asset is realised or the deferred tax liability is settled.Deferred tax liabilities are generally recognised for all taxable temporary differences but not recognised for taxable temporary differences arising on investments in subsidiaries, associates and joint ventures where the reversal of the temporary difference can be controlled and it is probable that the difference will not reverse in the foreseeable future. Deferred tax liabilities are not recognised on temporary differences that arise from goodwill which is not deductible for tax purposes.Deferred tax assets are recognised to the extent it is probable that taxable profits will be available against which the deductible temporary differences can be utilised, and are reviewed at the end of each reporting period and reduced to the extent that it is no longer probable that sufficient taxable profits will be available to allow all or part of the asset to be recovered.Deferred tax assets and liabilities are not recognised in respect of temporary differences that arise on initial recognition of assets and liabilities acquired other than in a business combination. Deferred tax is not discounted.Critical judgement and key source of estimation uncertaintyThe Group is subject to tax in numerous jurisdictions, giving rise to complex tax issues that require management to exercise judgement in making tax determinations. As a multinational enterprise, our tax returns in the countries in which we operate are subject to tax authority audits as a matter of routine. While the Group is confident that tax returns are appropriately prepared and filed, amounts are provided in respect of uncertain tax positions that reflect the risk with respect to tax matters under active discussion with tax authorities, or which are otherwise considered to involve uncertainty. Provisions against uncertain tax positions are measured using one of the following methods, depending on which of the methods management expects will better predict the amount it will pay over to the tax authority:§§ The Single Best Estimate – where there is a single outcome that is more likely than not to occur. This will happen, for example,
where the tax outcome is binary (such as whether an entity can deduct an item of expenditure) or the range of possible outcomes is narrow or concentrated on a single value. The most likely outcome may be that no tax is expected to be payable, in which case the provision is nil; or
§§ A Probability-Weighted Expected Value – where, on the balance of probabilities, something will be paid to the tax authority but the possible outcomes are widely dispersed with low individual probabilities (i.e. there is no single outcome more likely than not to occur). In this case, the provision is the sum of the probability-weighted amounts in the range.
In assessing provisions against uncertain tax positions, management uses in-house tax experts, professional firms and previous experience to inform the evaluation of risk. However, it remains possible that uncertainties will ultimately be resolved at amounts greater or smaller than the liabilities recorded.In particular, although we report cross-border transactions undertaken between Group subsidiaries on an arm’s-length basis in tax returns in accordance with OECD guidelines, transfer pricing relies on the exercise of judgement and it is frequently possible for there to be a range of legitimate and reasonable views. This means that it is impossible to be certain that the returns basis will be sustained on examination. Discussions with tax authorities relating to cross-border transactions and other matters are ongoing in each of our major trading jurisdictions. Although the timing and amount of final resolution of these uncertain tax positions cannot be reliably predicted, no significant impact on the profitability of the Group is expected in the near term.Estimation of income taxes also includes assessments of the recoverability of deferred tax assets. Deferred tax assets are only recognised to the extent that they are considered recoverable based on existing tax laws and forecasts of future taxable profits against which the underlying tax deductions can be utilised. The recoverability of these assets is reassessed at the end of each reporting period, and changes in recognition of deferred tax assets will affect the tax liability in the period of that reassessment.

146 RELX Annual report and financial statements 2019 | Financial statements and other information
9 Taxation (continued)2019
£m2018
£m2017
£m
Current tax United Kingdom (141) (71) (104) Rest of world (241) (226) (335)Total current tax charge (382) (297) (439)Deferred tax 44 5 374Tax expense (338) (292) (65)
Cash tax paid in the year was £464m (2018: £415m; 2017: £449m), which is different to the tax expense for the year set out above.
There are a number of reasons why the cash tax payments in a particular year will be different from the tax expense in the accounts:
Deferred tax:
§§ Tax expense includes deferred tax, which is an accounting adjustment arising from temporary differences;
§§ Temporary differences occur when an item has to be included in the income statement in one year but is taxed in another year; and
§§ For the purposes of acquisition accounting only, the Group recognises deferred tax liabilities arising on intangible assets. Any unwind of these deferred tax liabilities from the amortisation of intangible assets does not result in cash tax payments.
Timing differences:
§§ Tax payments relating to a particular year’s profits are typically due partly in the year and partly in the following year.
Prior period adjustments:
§§ Current tax expense is the best estimate at the end of the period of cash tax expected to be paid; and
§§ To the extent the final liability is higher or lower than that estimate, any cash tax impact will occur in a later period.
Items recorded in equity and other comprehensive income:
§§ Some of the benefits of tax deductions related to share based payments, pensions and hedging are credited to equity or other comprehensive income rather than to tax expense, and so the cash tax liability will be different to the current tax expense in the income statement in years when those deductions are available.
Set out below is a reconciliation of the difference between tax expense for the period and the theoretical expense calculated by multiplying accounting profit by the applicable tax rate.
We believe the most meaningful applicable rate is that obtained by multiplying the accounting profits and losses of all consolidated entities by the applicable domestic rate in each of those entities’ jurisdictions.
The net tax expense charged on profit before tax differs from the theoretical amount that would arise using the weighted average of tax rates applicable to accounting profits and losses of the consolidated entities, as follows:
2019 2018 2017£m % £m % £m %
Profit before tax 1,847 1,720 1,721Tax at average applicable rates (418) 22.6% (361) 21.0% (407) 23.6%Tax effect of share of results of joint ventures 10 (0.5)% 8 (0.5)% 7 (0.4)%Expenses not deductible for tax purposes (3) 0.2% (24) 1.4% (15) 0.9%Non-deductible costs of share based remuneration (1) 0.1% (1) 0.1% (1) 0.1%Non-deductible disposal-related gains and losses 4 (0.2)% – 0.0% (36) 2.1%Deferred tax assets of the period not recognised (15) 0.8% (24) 1.4% (10) 0.6%Change in recognition of deferred tax assets or liabilities 12 (0.6)% (15) 0.9% 16 (0.9)%Other adjustments in respect of prior periods 73 (4.0)% 13 (0.8)% 35 (2.1)%Exceptional tax credit – – 112 (6.5)% 346 (20.1)%Tax expense (338) 18.3% (292) 17.0% (65) 3.8%
The weighted average applicable tax rate for the year was 22.6% (2018: 21.0%, 2017: 23.6%), reflecting the applicable rates in the countries where the Group operates. The Group’s future tax charge will be sensitive to the geographic mix of profits and losses and the tax rates and laws in force in the jurisdictions in which we operate.
Notes to the consolidated financial statementsfor the year ended 31 December 2019
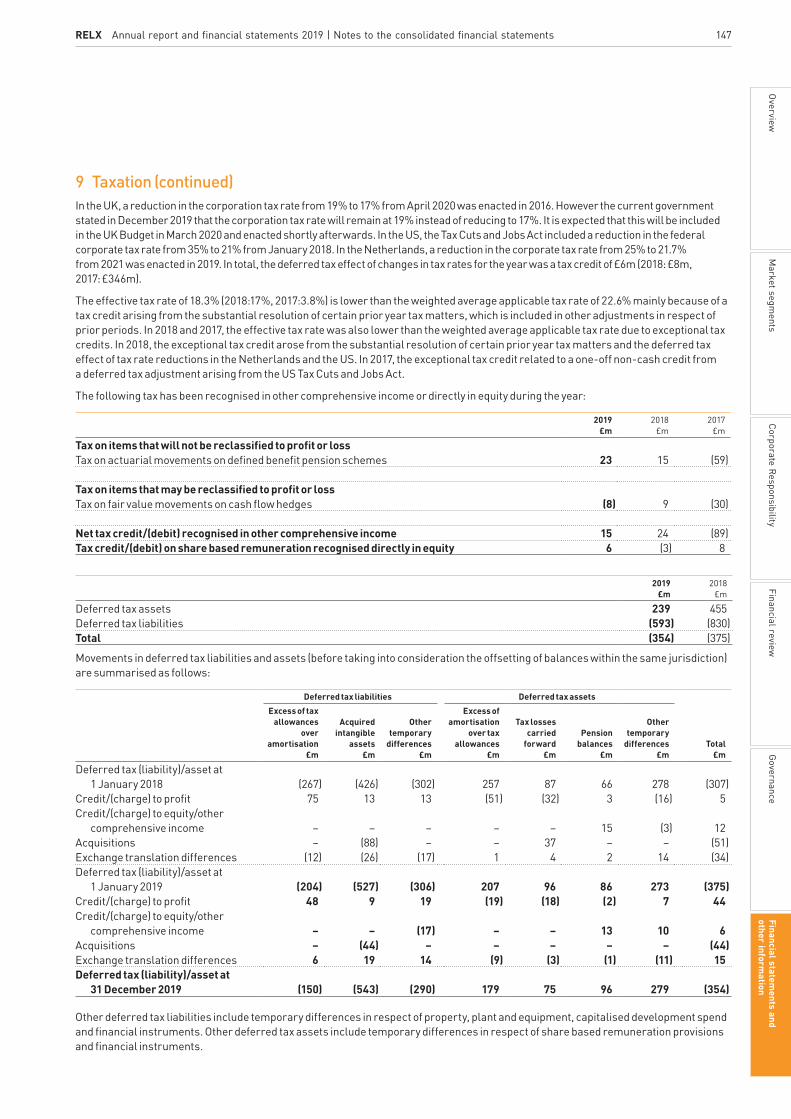
RELX Annual report and financial statements 2019 | Notes to the consolidated financial statements 147M
arket segments
GovernanceFinancial statem
ents and other inform
ationFinancial review
Corporate ResponsibilityOverview
9 Taxation (continued)In the UK, a reduction in the corporation tax rate from 19% to 17% from April 2020 was enacted in 2016. However the current government stated in December 2019 that the corporation tax rate will remain at 19% instead of reducing to 17%. It is expected that this will be included in the UK Budget in March 2020 and enacted shortly afterwards. In the US, the Tax Cuts and Jobs Act included a reduction in the federal corporate tax rate from 35% to 21% from January 2018. In the Netherlands, a reduction in the corporate tax rate from 25% to 21.7% from 2021 was enacted in 2019. In total, the deferred tax effect of changes in tax rates for the year was a tax credit of £6m (2018: £8m, 2017: £346m).
The effective tax rate of 18.3% (2018:17%, 2017:3.8%) is lower than the weighted average applicable tax rate of 22.6% mainly because of a tax credit arising from the substantial resolution of certain prior year tax matters, which is included in other adjustments in respect of prior periods. In 2018 and 2017, the effective tax rate was also lower than the weighted average applicable tax rate due to exceptional tax credits. In 2018, the exceptional tax credit arose from the substantial resolution of certain prior year tax matters and the deferred tax effect of tax rate reductions in the Netherlands and the US. In 2017, the exceptional tax credit related to a one-off non-cash credit from a deferred tax adjustment arising from the US Tax Cuts and Jobs Act.
The following tax has been recognised in other comprehensive income or directly in equity during the year:
2019£m
2018£m
2017£m
Tax on items that will not be reclassified to profit or lossTax on actuarial movements on defined benefit pension schemes 23 15 (59)
Tax on items that may be reclassified to profit or lossTax on fair value movements on cash flow hedges (8) 9 (30)
Net tax credit/(debit) recognised in other comprehensive income 15 24 (89)Tax credit/(debit) on share based remuneration recognised directly in equity 6 (3) 8
2019£m
2018£m
Deferred tax assets 239 455Deferred tax liabilities (593) (830)Total (354) (375)
Movements in deferred tax liabilities and assets (before taking into consideration the offsetting of balances within the same jurisdiction) are summarised as follows:
Deferred tax liabilities Deferred tax assetsExcess of tax
allowances over
amortisation£m
Acquired intangible
assets£m
Other temporary
differences£m
Excess of amortisation
over tax allowances
£m
Tax losses carried
forward£m
Pension balances
£m
Other temporary
differences£m
Total£m
Deferred tax (liability)/asset at 1 January 2018 (267) (426) (302) 257 87 66 278 (307)
Credit/(charge) to profit 75 13 13 (51) (32) 3 (16) 5Credit/(charge) to equity/other
comprehensive income – – – – – 15 (3) 12Acquisitions – (88) – – 37 – – (51)Exchange translation differences (12) (26) (17) 1 4 2 14 (34)Deferred tax (liability)/asset at
1 January 2019 (204) (527) (306) 207 96 86 273 (375)Credit/(charge) to profit 48 9 19 (19) (18) (2) 7 44Credit/(charge) to equity/other
comprehensive income – – (17) – – 13 10 6Acquisitions – (44) – – – – – (44)Exchange translation differences 6 19 14 (9) (3) (1) (11) 15Deferred tax (liability)/asset at
31 December 2019 (150) (543) (290) 179 75 96 279 (354)
Other deferred tax liabilities include temporary differences in respect of property, plant and equipment, capitalised development spend and financial instruments. Other deferred tax assets include temporary differences in respect of share based remuneration provisions and financial instruments.

148 RELX Annual report and financial statements 2019 | Financial statements and other information
9 Taxation (continued)As a result of exemptions on dividends from subsidiaries and capital gains on disposal there are no significant taxable temporary differences associated with investments in subsidiaries, branches, associates and interests in joint arrangements.
Deferred tax assets in respect of tax losses and other deductible temporary differences have only been recognised to the extent that it is more likely than not that sufficient taxable profits will be available to allow the asset to be recovered. Accordingly, no deferred tax asset has been recognised in respect of unused trading losses and interest expenses of approximately £255m (2018: £213m) carried forward at year end. The deferred tax asset not recognised in respect of these losses and interest expenses is approximately £66m (2018: £52m). Of the unrecognised losses and interest expenses, £124m (2018: £93m) will expire if not utilised within ten years and £131m (2018: £121m) will expire after more than ten years or have no expiration date.
Deferred tax assets of approximately £6m (2018: £4m) have not been recognised in respect of tax losses and other temporary differences carried forward of £33m (2018: £24m), which can only be used to offset future capital gains.
10 Earnings per share
Accounting policyEarnings per share (‘EPS’) is calculated by taking the reported net profit attributable to shareholders and dividing this by the total weighted average number of shares.
Adjusted earnings per share is calculated by dividing adjusted net profit attributable to RELX PLC shareholders by the total weighted average number of shares.
EARNINGS PER SHARE – FOR THE YEAR ENDED 31 DECEMBER 2019 2018 2017
Net profitattributableto RELX PLC
shareholders£m
Weighted averagenumber
of shares(millions)
EPS(pence)
Net profitattributableto RELX PLC
shareholders£m
Weightedaveragenumber
of shares(millions)
EPS(pence)
Net profit attributable to RELX PLC
shareholders£m
Weightedaveragenumber
of shares(millions)
EPS(pence)
Basic earnings per share 1,505 1,943.5 77.4p 1,422 1,977.2 71.9p 1,648 2,019.4 81.6pDiluted earnings per share 1,505 1,956.2 76.9p 1,422 1,990.8 71.4p 1,648 2,035.2 81.0p
The diluted figures are calculated after taking account of potential additional ordinary shares arising from share options and conditional shares.
ADJUSTED EARNINGS PER SHARE 2019 2018 2017Adjusted net
profit attributable to RELX PLC
shareholders£m
Weightedaveragenumber
of shares(millions)
AdjustedEPS
(pence)
Adjusted netprofit
attributable toRELX PLC
shareholders£m
Weightedaverage
number ofshares
(millions)
AdjustedEPS
(pence)
Adjusted netprofit
attributable toRELX PLC
shareholders£m
Weightedaverage
number ofshares
(millions)
AdjustedEPS
(pence)
Adjusted earnings per share 1,808 1,943.5 93.0p 1,674 1,977.2 84.7p 1,620 2,019.4 80.2p
RECONCILIATION OF ADJUSTED NET PROFIT ATTRIBUTABLE TO RELX PLC SHAREHOLDERS 2019£m
2018£m
2017£m
Net profit attributable to RELX PLC shareholders 1,505 1,422 1,648Adjustments (post-tax): Amortisation of acquired intangible assets 321 322 356 Acquisition-related costs 69 71 43 Net interest on net defined benefit pension obligation and other 10 7 11 Disposals and other non-operating items (40) 19 1 Other deferred tax credits from intangible assets* (57) (55) (93) Exceptional tax credit – (112) (346)Adjusted net profit attributable to RELX PLC shareholders 1,808 1,674 1,620* Movements on deferred tax liabilities arising on acquired intangible assets that do not qualify for tax amortisation.
Notes to the consolidated financial statementsfor the year ended 31 December 2019

RELX Annual report and financial statements 2019 | Notes to the consolidated financial statements 149M
arket segments
GovernanceFinancial statem
ents and other inform
ationFinancial review
Corporate ResponsibilityOverview
11 Statement of cash flows
Accounting policyCash and cash equivalents comprise cash balances, call deposits and other short-term highly liquid investments and are held in the statement of financial position at fair value.
RECONCILIATION OF OPERATING PROFIT TO CASH GENERATED FROM OPERATIONS 2019
£m2018
£m2017
£m
Operating profit 2,101 1,964 1,905Share of results of joint ventures (41) (32) (37)Amortisation of acquired intangible assets 294 287 313Amortisation of internally developed intangible assets 249 225 203Depreciation of property, plant and equipment 58 62 65Depreciation of right-of-use assets 82 77 75Share based remuneration 32 41 39Total non-cash items 715 692 695(Increase)/decrease in inventories and pre-publication costs (14) (7) 2(Increase)/decrease in receivables (116) (89) 37Increase/(decrease) in payables 79 27 (76)Increase in working capital (51) (69) (37)Cash generated from operations 2,724 2,555 2,526 CASH FLOW ON ACQUISITIONS
Note2019
£m2018
£m2017
£m
Purchase of businesses 12 (399) (919) (117)Investment in joint ventures – – (1)Deferred payments relating to prior year acquisitions (24) (16) (13)Total (423) (935) (131) RECONCILIATION OF NET BORROWINGS
Cash and cash
equivalents£m
Borrowings£m
Related derivative
financial instruments
£m
Finance lease
receivable£m
2019£m
2018£m
2017£m
At start of year 114 (6,365) 25 49 (6,177) (5,042) (5,050)
Increase/(decrease) in cash and cash equivalents 27 – – – 27 1 (45)(Increase)/decrease in short-term bank loans,
overdrafts and commercial paper – (98) – – (98) (147) 148Issuance of term debt – (729) – – (729) (958) (873)Repayment of term debt – 617 – – 617 211 712Repayment of leases – 102 – (16) 86 81 78Change in net borrowings resulting from cash flows 27 (108) – (16) (97) (812) 20Borrowings in acquired businesses – (6) – – (6) (12) –Remeasurement and derecognition of leases – (28) – – (28) (12) (6)Inception of leases – (62) – 2 (60) (28) (36)Fair value and other adjustments to borrowings
and related derivatives – (123) 29 – (94) (25) (11)Exchange translation differences (3) 278 (2) (2) 271 (246) 41At end of year 138 (6,414) 52 33 (6,191) (6,177) (5,042)
Net borrowings comprise cash and cash equivalents, loan capital, lease liabilities and receivables, promissory notes, bank and other loans, derivative financial instruments that are used to hedge certain borrowings and adjustments in respect of cash collateral received/paid. The Group monitors net borrowings as part of capital and liquidity management.

150 RELX Annual report and financial statements 2019 | Financial statements and other information
Notes to the consolidated financial statementsfor the year ended 31 December 2019
12 AcquisitionsDuring the year, a number of acquisitions were made. The net assets of the businesses acquired are incorporated at their fair value to the Group. Provisional fair values of the consideration given and of the assets and liabilities acquired are summarised below.
Fair value2019
£m
Fair value2018
£m
Fair value2017
£m
Goodwill 257 626 77Intangible assets 245 423 56Property, plant and equipment 1 5 –Current assets 20 24 3Non current assets 4 12 –Current liabilities (53) (72) (16)Borrowings (6) (12) –Deferred tax (44) (51) (2)Net assets acquired 424 955 118Consideration (after taking account of £32m (2018: £27m; 2017: £7m) net cash acquired) 424 955 118Less: consideration deferred to future years (10) (36) (1)Less: acquisition date fair value of equity interest (15) – –Net cash flow 399 919 117
Goodwill, being the excess of the consideration over the net tangible and intangible assets acquired, represents benefits which do not qualify for recognition as intangible assets, including: the ability of a business to generate higher returns than individual assets; skilled workforces; and acquisition synergies that are specific to the Group. In addition, goodwill arises on the recognition of deferred tax liabilities in respect of intangible assets for which amortisation does not qualify for tax deductions.
The fair values of the assets and liabilities acquired in the last 12 months are provisional pending the completion of the valuation exercises. Final fair values will be incorporated in the 2020 consolidated financial statements. There were no significant adjustments to the provisional fair values of prior year acquisitions established in 2018.
The businesses acquired in 2019 contributed £51m to revenue, increased adjusted operating profit by £8m, decreased net profit by £9m (after charging £17m of integration costs and amortisation of acquired intangibles) and contributed £3m to net cash outflow from operating activities for the part year under the Group’s ownership and before taking account of acquisition financing costs. Had the businesses been acquired at the beginning of the year, on a pro forma basis the Group revenues, adjusted operating profit and net profit attributable to RELX PLC shareholders for the year would have been £7,897m, £2,487m and £1,501m respectively, before taking account of acquisition financing costs.
Since 31 December 2019, the Group has acquired or committed to acquire a number of businesses, for aggregate consideration of £0.6bn. These acquisitions include ID Analytics, a provider of credit and fraud solutions, and Emailage, a provider of email based fraud solutions, both of which will become part of Risk & Business Analytics.
13 Equity dividendsORDINARY DIVIDENDS PAID IN THE YEAR 2019
£m2018
£m2017
£m
RELX PLC 842 420 400RELX NV – 376 362Total 842 796 762
The RELX NV amount shown relates to dividends paid prior to the corporate simplification.
Ordinary dividends declared and paid in the year ended 31 December 2019, in amounts per ordinary share, comprise: a 2018 final dividend of 29.7p (2018: 27.7p; 2017: 25.7p) and a 2019 interim dividend of 13.6p (2018: 12.4p; 2017: 11.7p), giving a total of 43.3p (2018: 40.1p; 2017: 37.4p).
The Directors of RELX PLC have proposed a final dividend of 32.1p (2018: 29.7p; 2017: 27.7p), giving a total for the financial year of 45.7p (2018: 42.1p; 2017: 39.4p). The total cost of funding the proposed final dividend is expected to be £620m, for which no liability has been recognised at the statement of financial position date.
The Employee Benefit Trust has currently waived the right to receive dividends on RELX PLC shares. This waiver has been applied to dividends paid in 2019, 2018 and 2017.

RELX Annual report and financial statements 2019 | Notes to the consolidated financial statements 151M
arket segments
GovernanceFinancial statem
ents and other inform
ationFinancial review
Corporate ResponsibilityOverview
14 Goodwill
Accounting policyOn the acquisition of a subsidiary or business, the purchase consideration is allocated between the net tangible and intangible assets on a fair value basis, with any excess purchase consideration representing goodwill. Goodwill arising on acquisitions also includes amounts corresponding to deferred tax liabilities recognised in respect of acquired intangible assets.
Goodwill is recognised as an asset and reviewed for impairment when there is an indicator that the asset may be impaired and at least annually. Any impairment is recognised immediately in the income statement and not subsequently reversed.
On disposal of a subsidiary or business, the attributable amount of goodwill is included in the determination of the profit or loss on disposal.
At each statement of financial position date, the carrying amounts of tangible and intangible assets and goodwill are reviewed to determine whether there is any indication that those assets have suffered an impairment loss. If any such indication exists, the recoverable amount, which is the higher of value in use and fair value less costs to sell, of the asset is estimated in order to determine the extent, if any, of the impairment loss. Where the asset does not generate cash flows that are independent from other assets, value in use estimates are made based on the cash flows of the cash generating unit to which the asset belongs. Intangible assets with an indefinite useful life are tested for impairment at least annually and whenever there is any indication that the asset may be impaired.
If the recoverable amount of an asset or cash generating unit is estimated to be less than its net carrying amount, the net carrying amount of the asset or cash generating unit is reduced to its recoverable amount. Impairment losses are recognised immediately in the income statement in administration and other expenses.
Critical judgement and key source of estimation uncertaintyThe carrying amounts of goodwill and indefinite lived intangible assets in each business are reviewed for impairment at least annually. The carrying amounts of all other intangible assets are reviewed where there are indications of possible impairment. An impairment review involves a comparison of the carrying value of the asset with estimated values in use based on the latest management cash flow projections, approved by the Board. Key areas of judgement in estimating the values in use of businesses are the growth in cash flows over a forecast period of up to five years, the long-term growth rate assumed thereafter and the discount rate applied to the forecast cash flows. A description of the key assumptions and sensitivities is provided below.
2019£m
2018£m
At start of year 6,899 5,965Acquisitions 257 626Disposals/reclassified as held for sale (64) (25)Exchange translation differences (268) 333At end of year 6,824 6,899
The carrying amount of goodwill is after cumulative amortisation of £1,178m (2018: £1,222m), which was charged prior to the adoption of IFRS, and £9m (2018: £9m) of subsequent impairment charges recorded in prior years.

152 RELX Annual report and financial statements 2019 | Financial statements and other information
Notes to the consolidated financial statementsfor the year ended 31 December 2019
14 Goodwill (continued)Impairment reviewImpairment testing of goodwill and indefinite lived intangible assets is performed at least annually in accordance with the methodology described above. There were no charges for impairment of goodwill or indefinite lived intangible assets in 2019 (2018: nil).
Goodwill is compiled and assessed among groups of cash generating units, which represent the lowest level at which goodwill is monitored by management. Typically, acquisitions are integrated into existing business units, and the goodwill arising is allocated to the groups of cash generating units (CGUs) that are expected to benefit from the synergies of the acquisition. As the business areas have become increasingly integrated and globalised, the current CGU allocation reflects the global leverage of assets, skills, knowledge and technology platforms, and the monitoring of goodwill by management.
GOODWILL 2019£m
2018£m
Scientific, Technical & Medical 1,594 1,620Risk & Business Analytics 3,186 3,283Legal 1,428 1,465Exhibitions 616 531Total 6,824 6,899
The key assumptions used for each group of cash generating units are disclosed below:
KEY ASSUMPTIONS 2019 2018
Pre-tax discount
rate
Nominal long-term
market growth rate
Pre-tax discount rate
Nominal long-term
market growth rate
Scientific, Technical & Medical 9.4% 3% 10.0% 3%Risk & Business Analytics 10.0% 3% 11.5% 3%Legal 10.6% 2% 12.2% 2%Exhibitions 11.6% 3% 12.7% 3%
The pre-tax discount rates used are based on the Group’s weighted average cost of capital, adjusted to reflect a risk premium specific to each business. The Group’s weighted average cost of capital is derived from a risk free rate, a market risk premium, a risk adjustment (beta) and a cost of debt adjustment. The key assumptions within the forecast growth in the cash flows over a forecast period of up to five years are revenue growth, operating margin and cash conversion. Revenue growth and operating profit margin forecasts for each CGU are derived from past results adjusted by management based on salient current and future considerations. Cash conversion rates for each CGU are based on historical cash conversion rates. Nominal long-term market growth rates, which are applied after the forecast period of up to five years, do not exceed the long-term average growth prospects for the sectors and territories in which the businesses operate.
A sensitivity analysis has been performed based on changes in key assumptions considered to be reasonably possible by management: an increase in the discount rate of 0.5%, a decrease in the compound annual growth rate for cash flow in the five-year forecast period of 2.0%, and a decrease in the nominal long-term market growth rates of 0.5%. The sensitivity analysis shows that no impairment charges would result from these scenarios.
RELX Annual report and financial statements 2019 | Notes to the consolidated financial statements 153M
arket segments
GovernanceFinancial statem
ents and other inform
ationFinancial review
Corporate ResponsibilityOverview
15 Intangible assets
Accounting policyIntangible assets acquired as part of a business combination are stated in the statement of financial position at their fair value as at the date of acquisition, less accumulated amortisation. Internally generated intangible assets are stated in the statement of financial position at the directly attributable cost of creation of the asset, less accumulated amortisation.
Intangible assets acquired as part of business combinations comprise: market-related assets (e.g. trademarks, imprints, brands); customer-related assets (e.g. subscription bases, customer lists, customer relationships); editorial content; software and systems (e.g. application infrastructure, product delivery platforms, in-process research and development); contract-based assets (e.g. publishing rights, exhibition rights, supply contracts); and other intangible assets. Internally generated intangible assets typically comprise software and systems development where an identifiable asset is created that is probable to generate future economic benefits.
Intangible assets, other than journal titles determined to have indefinite lives, are amortised on a straight-line basis over their estimated useful lives. The estimated useful lives of intangible assets with finite lives are as follows: market and customer-related assets – 3 to 40 years; content, software and other acquired intangible assets – 3 to 20 years; and internally developed intangible assets – 3 to 10 years. Journal titles determined to have indefinite lives are not amortised and are subject to impairment review at least annually, including a review of events and circumstances to ensure that they continue to support an indefinite useful life.
Critical judgements and key sources of estimation uncertaintyOn acquisition of a subsidiary or business, the purchase consideration is allocated between the net tangible and intangible assets other than goodwill on a fair value basis, with any excess purchase consideration representing goodwill. The valuation of acquired intangible assets represents the estimated economic value in use, using standard valuation methodologies, including as appropriate, discounted cash flow, relief from royalty and comparable market transactions. Acquired intangible assets are capitalised and amortised systematically over their estimated useful lives, subject to impairment review. The assumptions used are subject to management judgement.
Appropriate amortisation periods are selected based on assessments of the longevity of the brands and imprints, the strength and stability of customer relationships, the market positions of the acquired assets and the technological and competitive risks that they face. Certain intangible assets in relation to acquired science and medical publishing businesses have been determined to have indefinite lives. The longevity of these assets is evidenced by their long-established and well-regarded journal titles, and their characteristically stable market positions. The assumptions used are subject to management judgement.
Development spend encompasses investment in new products and other initiatives, ranging from the building of online delivery platforms, to launch costs of new services, to building new infrastructure and applications. Launch costs and other ongoing operating expenses of new products and services are expensed as incurred. The costs of building product applications, platforms and infrastructure are capitalised as intangible assets, where the investment they represent has demonstrable value and the technical and commercial feasibility is assured. Costs eligible for capitalisation must be incremental, clearly identified and directly attributable to a particular project. The resulting assets are amortised over their estimated useful lives. Impairment reviews are carried out at least annually where indicators of impairment are identified. Judgement is required in the assessment of the potential value of a development project, the identification of costs eligible for capitalisation and the selection of appropriate asset lives.

154 RELX Annual report and financial statements 2019 | Financial statements and other information
Notes to the consolidated financial statementsfor the year ended 31 December 2019
15 Intangible assets (continued)
Market and customer-
related£m
Content, softwareand other
£m
Total acquired
intangible assets
£m
Internally developed intangible
assets£m
Total£m
CostAt 1 January 2018 3,519 3,492 7,011 2,691 9,702Acquisitions 310 113 423 – 423Additions – – – 304 304Disposals/reclassified as held for sale (15) (11) (26) (148) (174)Exchange translation differences 211 130 341 99 440At 1 January 2019 4,025 3,724 7,749 2,946 10,695Acquisitions 161 84 245 – 245Additions – – – 333 333Disposals/reclassified as held for sale (28) (57) (85) (130) (215)Exchange translation differences (158) (116) (274) (108) (382)At 31 December 2019 4,000 3,635 7,635 3,041 10,676
Accumulated amortisationAt 1 January 2018 1,907 3,046 4,953 1,555 6,508Charge for the year 169 118 287 225 512Disposals/reclassified as held for sale (15) (11) (26) (111) (137)Exchange translation differences 105 113 218 60 278At 1 January 2019 2,166 3,266 5,432 1,729 7,161Charge for the year 182 112 294 249 543Disposals/reclassified as held for sale (28) (57) (85) (130) (215)Exchange translation differences (91) (103) (194) (71) (265)At 31 December 2019 2,229 3,218 5,447 1,777 7,224
Net book amountAt 31 December 2018 1,859 458 2,317 1,217 3,534At 31 December 2019 1,771 417 2,188 1,264 3,452
Included in content, software and other acquired intangible assets are assets with a net book value of £54m (2018: £80m) that arose on acquisitions completed prior to the adoption of IFRS that have not been allocated to specific categories of intangible assets. Internally developed intangible assets typically comprise software and systems development where an identifiable asset is created that is expected to generate future economic benefits.
Included in market and customer-related intangible assets are £114m (2018: £119m) of journal titles relating to Scientific, Technical & Medical determined to have indefinite lives based on an assessment of their historical longevity and stable market positions. Indefinite lived intangibles are tested for impairment at least annually. See note 14 for details of impairment testing.

RELX Annual report and financial statements 2019 | Notes to the consolidated financial statements 155M
arket segments
GovernanceFinancial statem
ents and other inform
ationFinancial review
Corporate ResponsibilityOverview
16 Investments
Accounting policyInvestments, other than investments in joint arrangements and associates, are stated in the statement of financial position at fair value. Changes in the fair value of investments held as part of the venture capital portfolio are reported in disposals and other non-operating items in the income statement. All items recognised in the income statement relating to investments, other than investments in joint arrangements and associates, are reported as disposals and other non-operating items.
Venture capital investments and equity investments represent interests in unlisted securities. The fair value of unlisted securities is based on management’s estimate of fair value based on standard valuation techniques, including market comparisons and discounts of future cash flows, having regard to maximising the use of observable inputs and adjusting for risk. Advice from valuation experts is used as appropriate.
All joint arrangements are classified as joint ventures because the Group shares joint control and has rights to the net assets of the arrangements. Investments in joint ventures and associates are accounted for under the equity method and stated in the statement of financial position at cost as adjusted for post-acquisition changes in the Group’s share of net assets, less any impairment in value.
2019£m
2018£m
Investments in joint ventures 118 104Venture capital investments 133 151Total 251 255
The value of venture capital investments and equity investments has been determined by reference to other observable market inputs or, when these are not available, by reference to inputs we believe would reflect the assumptions market participants would use. Gains and losses included in the consolidated income statement are provided in note 8.
An analysis of changes in the carrying value of investments in joint ventures is set out below:
2019£m
2018£m
At start of year 104 102Share of results of joint ventures 41 32Dividends received from joint ventures (34) (30)Additions 24 2Disposals (11) –Exchange translation differences (6) (2)At end of year 118 104
Summarised aggregate information in respect of the Group’s share of joint ventures is set out below:
RELX’s share2019
£m2018
£m
Revenue 123 101Net profit for the year 41 32
Total assets 112 96Total liabilities (58) (49)Net assets 54 47Goodwill 64 57Total 118 104
The Group’s consolidated other comprehensive income includes no income or losses relating to joint ventures in either period.

156 RELX Annual report and financial statements 2019 | Financial statements and other information
Notes to the consolidated financial statementsfor the year ended 31 December 2019
17 Property, plant and equipment
Accounting policyProperty, plant and equipment are stated in the statement of financial position at cost less accumulated depreciation. No depreciation is provided on freehold land. Freehold buildings and long leaseholds are depreciated over their estimated useful lives up to a maximum of 50 years. Short leases are written off over the duration of the lease. Depreciation is provided on other assets on a straight-line basis over their estimated useful lives as follows:
– land and buildings: land – not depreciated; leasehold improvements – shorter of life of lease and 10 years;
– fixtures and equipment: plant – 3 to 20 years; office furniture, fixtures and fittings – 5 to 10 years; computer systems, communication networks and equipment – 3 to 7 years.
2019 2018Land and buildings
£m
Fixtures and equipment
£mTotal
£m
Land and buildings
£m
Fixtures and equipment
£mTotal
£m
CostAt start of year 223 640 863 217 599 816Acquisitions 1 – 1 – 5 5Capital expenditure 5 42 47 5 51 56Disposals/reclassified
as held for sale (8) (59) (67) (8) (40) (48)Exchange translation differences (8) (21) (29) 9 25 34At end of year 213 602 815 223 640 863
Accumulated depreciationAt start of year 146 519 665 137 485 622Charge for the year 9 49 58 9 53 62Disposals/reclassified as held for sale (7) (59) (66) (6) (40) (46)Exchange translation differences (5) (17) (22) 6 21 27At end of year 143 492 635 146 519 665
Net book amount 70 110 180 77 121 198
No depreciation is provided on freehold land of £14m (2018: £14m).
Amounts relating to right-of-use assets under IFRS 16 can be found in note 23.

RELX Annual report and financial statements 2019 | Notes to the consolidated financial statements 157M
arket segments
GovernanceFinancial statem
ents and other inform
ationFinancial review
Corporate ResponsibilityOverview
18 Financial instruments
Accounting policyFinancial instruments comprise investments (other than investments in joint ventures or associates), trade receivables, cash and cash equivalents, payables and accruals, borrowings and derivative financial instruments.
Investments (other than investments in joint ventures and associates) are described in note 16. The fair value of such investments is based on standard valuation techniques, including market comparisons and discounts of future cash flows, having regard to maximising the use of observable inputs and adjusting for risk. (These investments are typically classified as either Level 2 or 3 in the IFRS 13 fair value hierarchy).
Trade receivables are carried in the statement of financial position at invoiced value less allowance for expected credit losses. Expected credit losses are based on the ageing of trade receivables, experience and circumstance. Borrowings and payables are recorded initially at fair value and subsequently carried at amortised cost (other than fixed rate borrowings in designated hedging relationships for which the carrying amount of the hedged portion of the borrowings is subsequently adjusted for the gain or loss attributable to the hedged risk).
Derivative financial instruments are used to hedge interest rate and foreign exchange risks. Where an effective hedge is in place against changes in the fair value of fixed rate borrowings, the hedged borrowings are adjusted for changes in fair value attributable to the risk being hedged with a corresponding income or expense included in the income statement within finance costs. The offsetting gains or losses from remeasuring the fair value of the related derivatives are also recognised in the income statement within finance costs. When the related derivative expires, is sold or terminated, or no longer qualifies for hedge accounting, the cumulative change in fair value of the hedged borrowing is amortised in the income statement over the period to maturity of the borrowing using the effective interest method.
Changes in the fair value of derivative financial instruments that are designated and effective as hedges of future cash flows are recognised (net of tax) in other comprehensive income and accumulated in the hedge reserve. With effect from 1 January 2018, the fair value amounts relating to foreign currency basis spreads are recorded in a separate component of equity in the cost of hedging reserve. If a hedged firm commitment or forecasted transaction results in the recognition of a non-financial asset or liability, then, at the time that the asset or liability is recognised, the associated gains or losses on the derivative that had previously been recognised in other comprehensive income are included in the initial measurement of the asset or liability. For hedges that do not result in the recognition of an asset or a liability, amounts deferred in the hedge reserve are recognised in the income statement in the same period in which the hedged item affects net profit or loss. Any ineffective portion of hedges is recognised immediately in the income statement.
Cash flow hedge accounting is discontinued when a hedging instrument expires or is sold, terminated or exercised, or no longer qualifies for hedge accounting. At that time, any cumulative gain or loss on the hedging instrument recognised in other comprehensive income is either retained in the hedge reserve until the firm commitment or forecasted transaction occurs, or, where a hedged transaction is no longer expected to occur, is immediately credited or expensed in the income statement.
Derivative financial instruments that are not designated as hedging instruments are recorded in the statement of financial position at fair value, with changes in fair value recognised in the income statement.
The fair values of derivative financial instruments represent the replacement costs calculated using observable market rates of interest and exchange. The fair value of long-term borrowings is calculated by discounting expected future cash flows at observable market rates. (These instruments are accordingly classified as Level 2 in the IFRS 13 fair value hierarchy.)
The main financial risks faced by the Group are liquidity risk, market risk – comprising interest rate risk and foreign exchange risk – and credit risk. Financial instruments are used to finance the Group’s businesses and to manage interest rate and foreign exchange risks. The Group’s businesses do not enter into speculative derivative transactions. Details of financial instruments subject to liquidity, market and credit risks are described below.
Liquidity riskThe Group maintains a range of borrowing facilities and debt programmes to fund its requirements at competitive rates.
The balance of long-term debt, short-term debt and committed bank facilities is managed to provide security of funding, taking into account the cash generation cycle of the business and the uncertain size and timing of acquisition spend. To accommodate the significant free cash flow generated by the Group and to capitalise on an inexpensive source of funding, a meaningful portion of the overall debt portfolio is typically kept short-term as long as there exists acceptable liquidity in the commercial paper markets and sufficient capacity under committed credit lines. The Group’s treasury policies ensure adequate liquidity by requiring that (a) no more than $1.5bn of term debt matures in any 12-month period, (b) the sum of term debt maturing over the ensuing 12 months plus short-term borrowings is less than the sum of available cash plus committed facilities and (c) minimum levels of borrowing with maturities over three and five years are maintained.
The treasury policies ensure debt efficiency by (a) targeting certain levels of short-term borrowings across a given year, (b) maintaining a weighted average maturity of the gross debt portfolio of approximately five years and (c) minimising surplus cash balances. From time to time, based on cash flow and market conditions, the Group may redeem term debt early or repurchase outstanding debt in the open market.

158 RELX Annual report and financial statements 2019 | Financial statements and other information
Notes to the consolidated financial statementsfor the year ended 31 December 2019
18 Financial instruments (continued)Debt is issued to meet the funding requirements of various jurisdictions and in the currencies that are needed. It is recognised that debt can act as a natural translation hedge of earnings, net assets and net cash flow in currencies other than the reporting currency. For this reason, the majority of the Group’s net debt is denominated in US dollars and euros, reflecting the Group’s largest geographical markets.
There were no changes to the Group’s long-term approach to capital and liquidity management during the year.
The remaining contractual maturities for borrowings and derivative financial instruments are shown in the table below. The table shows undiscounted principal and interest cash flows and includes contractual gross cash flows to be exchanged as part of cross-currency interest rate swaps and forward foreign exchange contracts where there is a legal right of set-off.
AT 31 DECEMBER 2019 Contractual cash flowCarrying
amount£m
Within1 year
£m1-2 years
£m2-3 years
£m3-4 years
£m4-5 years
£m
More than5 years
£mTotal
£m
BorrowingsFixed rate borrowings (5,293) (1,332) (528) (134) (732) (498) (2,791) (6,015)Floating rate borrowings (779) (779) – – – – – (779)Lease liabilities (342) (104) (92) (62) (50) (32) (48) (388)
Derivative financial liabilitiesInterest rate derivatives (4) (1) – – – (1) (2) (4)Cross-currency interest rate swaps (1) (41) (16) (16) (35) (15) (512) (635)Forward foreign exchange contracts (29) (1,984) (351) (179) (34) – – (2,548)
Derivative financial assetsInterest rate derivatives 35 19 10 8 8 3 – 48Cross-currency interest rate swaps 14 31 7 7 26 7 515 593Forward foreign exchange contracts 32 1,977 354 185 35 – – 2,551Total (6,367) (2,214) (616) (191) (782) (536) (2,838) (7,177)
AT 31 DECEMBER 2018 Contractual cash flowCarrying
amount£m
Within1 year
£m1-2 years
£m2-3 years
£m3-4 years
£m4-5 years
£m
More than5 years
£mTotal
£m
BorrowingsFixed rate borrowings (5,315) (752) (610) (552) (879) (732) (2,555) (6,080)Floating rate borrowings (690) (686) – – – – (4) (690)Lease liabilities (360) (104) (92) (75) (47) (30) (63) (411)
Derivative financial liabilitiesInterest rate derivatives (15) (2) (2) (2) (2) (3) (8) (19)Cross-currency interest rate swaps (1) (48) (21) (21) (21) (39) (557) (707)Forward foreign exchange contracts (53) (1,498) (375) (181) (25) – – (2,079)
Derivative financial assetsInterest rate derivatives 21 12 13 3 1 5 3 37Cross-currency interest rate swaps 13 33 8 8 8 25 553 635Forward foreign exchange contracts 13 1,473 361 173 26 – – 2,033Total (6,387) (1,572) (718) (647) (939) (774) (2,631) (7,281)
The carrying amount of derivative financial liabilities comprises £4m (2018: £15m) in relation to fair value hedges, £13m (2018: £41m) in relation to cash flow hedges and £17m (2018: £13m) not designated as hedging instruments. The carrying amount of derivative financial assets comprises £50m (2018: £33m) in relation to fair value hedges, £27m (2018: £7m) in relation to cash flow hedges and £4m (2018: £7m) not designated as hedging instruments.
Other payables balance of £108m (2018: nil), including put options, are currently expected to be settled in 4 to 5 years.

RELX Annual report and financial statements 2019 | Notes to the consolidated financial statements 159M
arket segments
GovernanceFinancial statem
ents and other inform
ationFinancial review
Corporate ResponsibilityOverview
18 Financial instruments (continued)At 31 December 2019, the Group had access to a $3,000m committed bank facility, consisting of various tranches with maturities through to July 2024, which was undrawn. This facility backs up short-term borrowings. All borrowings that mature within the next twelve months can be covered by the facility and by utilising available cash resources.
The committed bank facility is subject to a financial covenant typical to the Group’s size and financial strength. The Group had significant headroom within this covenant for the year ended 31 December 2019. There are no financial covenants in any outstanding public bonds.
Market riskThe Group’s primary market risks are interest rate fluctuations and exchange rate movements. Derivatives are used to manage the risks associated with interest rate and exchange rate movements and the Group does not enter into speculative derivatives. Where the impact of derivatives on the income statement and the statement of financial position could be significant, hedge accounting is applied (subject to satisfying the required criteria) as described in ‘Hedge accounting’ below. Derivatives used by the Group for hedging a particular risk are not specialised and are generally available from numerous sources. The impact of market risks on net post-employment benefit obligations and taxation is excluded from the following market risk sensitivity analysis.
Interest rate exposure managementThe Group’s interest rate exposure management policy aims to minimise interest costs with an acceptable level of year on year volatility. To achieve this, the Group uses fixed rate term debt and interest rate swaps to give a target mix of fixed rate and floating rate borrowings. Interest rate derivatives are used only to hedge an underlying risk and no net market positions are held.
At 31 December 2019, 46% of gross bank and bond borrowings were at fixed rate. A 100 basis point reduction in interest rates would result in an estimated decrease in net finance costs of £31m (2018: £32m), based on the composition of financial instruments including cash, cash equivalents, bank loans and commercial paper borrowings at 31 December 2019. A 100 basis point rise in interest rates would result in an estimated increase in net finance costs of £31m (2018: £32m).
The impact on net equity of a theoretical change in interest rates as at 31 December 2019 is restricted to the change in carrying value of floating rate to fixed rate interest rate derivatives in a designated cash flow hedge relationship and undesignated interest rate derivatives. A 100 basis point reduction in interest rates would result in an estimated decrease in net equity of £1m (2018: £1m) and a 100 basis point increase in interest rates would increase net equity by an estimated £1m (2018: £1m). The impact of a change in interest rates on the carrying value of fixed rate borrowings in a designated fair value hedge relationship would be offset by the change in carrying value of the related interest rate derivative. Fixed rate borrowings not in a designated hedging relationship are carried at amortised cost.
Foreign currency exposure managementTranslation exposures arise on the earnings and net assets of individual businesses whose operational currencies are other than sterling. Some of these exposures are offset by denominating borrowings in US dollars, euros and other currencies. Currency exposures on transactions denominated in a foreign currency are generally hedged using forward contracts. In addition, recurring transactions and future investment exposures may be hedged, in advance of becoming contractual. The precise policy differs according to the specific circumstances of the individual businesses. Highly predictable future cash flows may be covered for transactions expected to occur during the next 24 months (50 months for the Scientific, Technical & Medical subscription businesses) within limits defined according to the period before the transaction is expected to become contractual. Cover takes the form of foreign exchange forward contracts. Further information is provided in ‘Cash flow hedges’ below.
A theoretical weakening of all currencies by 10% against sterling at 31 December 2019 would decrease the carrying value of net assets, excluding net borrowings, by £749m (2018: £782m). This would be offset to a degree by a decrease in net borrowings of £526m (2018: £625m). A strengthening of all currencies by 10% against sterling at 31 December 2019 would increase the carrying value of net assets, excluding net borrowings, by £749m (2018: £782m) and increase net borrowings by £526m (2018: £625m).
A retranslation of the Group’s net profit for the year, assuming a 10% weakening of all foreign currencies against sterling but excluding transactional exposures, would reduce net profit by £129m (2018: £127m). A 10% strengthening of all foreign currencies against sterling on this basis would increase net profit for the year by £129m (2018: £127m).

160 RELX Annual report and financial statements 2019 | Financial statements and other information
Notes to the consolidated financial statementsfor the year ended 31 December 2019
18 Financial instruments (continued)Credit riskThe Group seeks to manage interest rate risk and limit foreign exchange risks described above by the use of financial instruments and as a result has a credit risk from the potential non-performance by the counterparties to these financial instruments, which are unsecured. The amount of this credit risk is normally restricted to the amounts of any hedge gain and not the principal amount being hedged. The Group also has a credit exposure to counterparties for the full principal amount of cash and cash equivalents. Credit risks are controlled by monitoring the credit quality of these counterparties, principally licensed commercial banks and investment banks with strong long-term credit ratings, and the amounts outstanding with each of them.
The Group has treasury policies in place which do not allow concentrations of risk with individual counterparties and do not allow significant treasury exposures with counterparties which are rated lower than A-/A3 by Standard & Poor’s, Moody’s and Fitch. At 31 December 2019, cash and cash equivalents totalled £138m (2018: £114m), of which 93% (2018: 93%) was held with banks rated A-/A3 or better.
The Group also has credit risk with respect to trade receivables due from its customers, which include national and state governments, academic institutions and large and small enterprises including law firms, book stores and wholesalers. The concentration of credit risk from trade receivables is limited due to the large and broad customer base. Trade receivable exposures are managed locally in the business units where they arise. Where appropriate, business units seek to minimise this exposure by taking payment in advance and through management of credit terms. Expected credit losses are based on management’s assessment of the risk taking into account the ageing profile, experience and circumstance. The maximum exposure to credit risk is represented by the carrying amount of each financial asset, including derivative financial instruments, recorded in the statement of financial position.
Included within trade receivables are the following amounts which are past due, after considering loss allowance: past due up to one month £215m (2018: £181m); past due two to three months £108m (2018: £93m); past due four to six months £39m (2018: £37m); and past due greater than six months £45m (2018: £35m).
Hedge accountingThe hedging relationships that are designated under IFRS 9 – Financial Instruments with effect from 1 January 2018, and/or that were previously designated under IAS 39 – Financial Instruments are described below.
Fair value hedgesThe Group has entered into interest rate swaps and cross-currency interest rate swaps to hedge the exposure to changes in the fair value of fixed rate borrowings due to interest rate and foreign currency movements which could affect the income statement. The table below details the designated fair value hedge relationships that were in place at 31 December 2019, swapping fixed rate term debt issues denominated in US dollars (USD) and euros to floating rate USD and euro debt respectively for the whole or part of their term, together with the related fixed and floating rates.
FAIR VALUE HEDGE RELATIONSHIPS 31 December2019
Principalamount
£m
31 December2018
Principalamount
£m Fixed rate Floating rate
€550m loan notes and €550m interest rate swaps maturing 2020 (466) (494) 2.5% LIBOR+1.1%
€500m bond and €500m interest rate swaps maturing 2021 (423) (449) 0.4% LIBOR+0.3%
$700m bond and $700m interest rate swaps maturing 2023 (528) (549) 3.5% LIBOR+0.8%
€500m bond and €500m interest rate swaps maturing 2024 (423) (449) 1.0% LIBOR+0.7%
€600m bond and €600m/$669.3m cross-currency interest rate swaps maturing 2025 (505) (525) 1.3% LIBOR+1.3%
$200m bond and $200m interest rate swaps maturing 2027 (151) (157) 7.2% LIBOR+5.8%(2,496) (2,623)
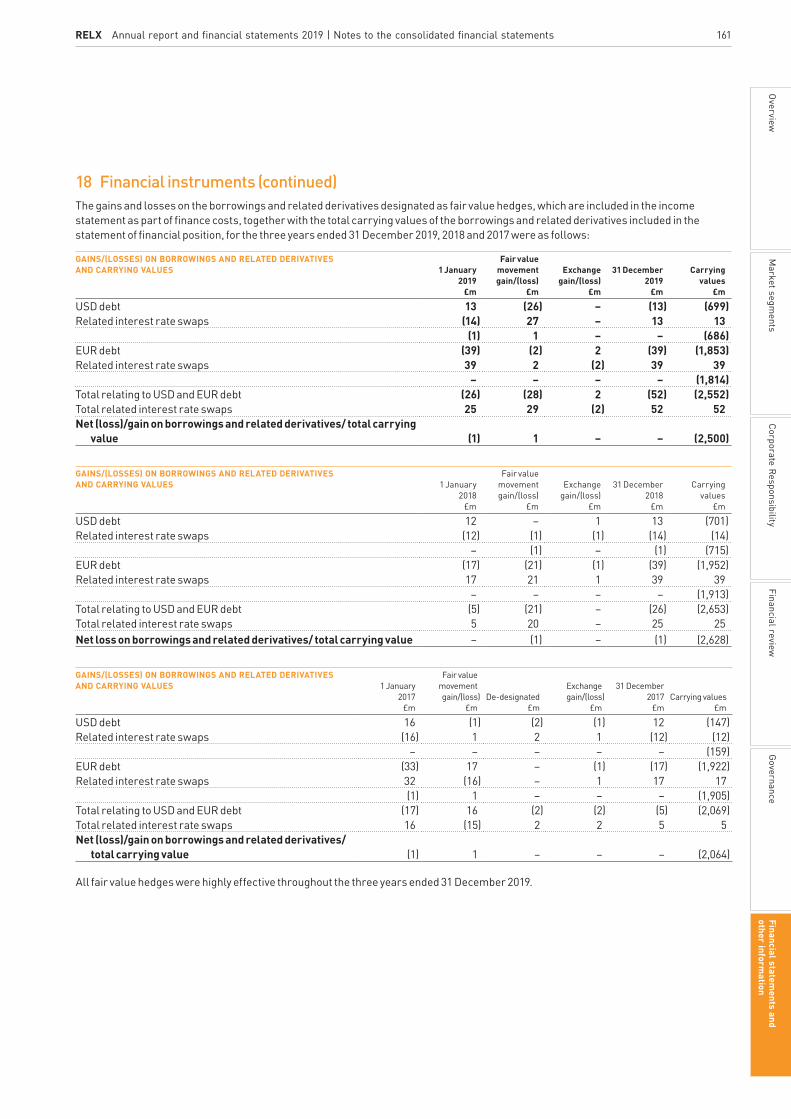
RELX Annual report and financial statements 2019 | Notes to the consolidated financial statements 161M
arket segments
GovernanceFinancial statem
ents and other inform
ationFinancial review
Corporate ResponsibilityOverview
18 Financial instruments (continued)The gains and losses on the borrowings and related derivatives designated as fair value hedges, which are included in the income statement as part of finance costs, together with the total carrying values of the borrowings and related derivatives included in the statement of financial position, for the three years ended 31 December 2019, 2018 and 2017 were as follows:
GAINS/(LOSSES) ON BORROWINGS AND RELATED DERIVATIVES AND CARRYING VALUES 1 January
2019£m
Fair value movement gain/(loss)
£m
Exchange gain/(loss)
£m
31 December 2019
£m
Carrying values
£m
USD debt 13 (26) – (13) (699)Related interest rate swaps (14) 27 – 13 13
(1) 1 – – (686)EUR debt (39) (2) 2 (39) (1,853)Related interest rate swaps 39 2 (2) 39 39
– – – – (1,814)Total relating to USD and EUR debt (26) (28) 2 (52) (2,552)Total related interest rate swaps 25 29 (2) 52 52Net (loss)/gain on borrowings and related derivatives/ total carrying
value (1) 1 – – (2,500)
GAINS/(LOSSES) ON BORROWINGS AND RELATED DERIVATIVES AND CARRYING VALUES 1 January
2018£m
Fair value movement gain/(loss)
£m
Exchange gain/(loss)
£m
31 December 2018
£m
Carrying values
£m
USD debt 12 – 1 13 (701)Related interest rate swaps (12) (1) (1) (14) (14)
– (1) – (1) (715)EUR debt (17) (21) (1) (39) (1,952)Related interest rate swaps 17 21 1 39 39
– – – – (1,913)Total relating to USD and EUR debt (5) (21) – (26) (2,653)Total related interest rate swaps 5 20 – 25 25Net loss on borrowings and related derivatives/ total carrying value – (1) – (1) (2,628)
GAINS/(LOSSES) ON BORROWINGS AND RELATED DERIVATIVES AND CARRYING VALUES 1 January
2017£m
Fair valuemovement gain/(loss)
£mDe-designated
£m
Exchange gain/(loss)
£m
31 December2017
£mCarrying values
£m
USD debt 16 (1) (2) (1) 12 (147)Related interest rate swaps (16) 1 2 1 (12) (12)
– – – – – (159)EUR debt (33) 17 – (1) (17) (1,922)Related interest rate swaps 32 (16) – 1 17 17
(1) 1 – – – (1,905)Total relating to USD and EUR debt (17) 16 (2) (2) (5) (2,069)Total related interest rate swaps 16 (15) 2 2 5 5Net (loss)/gain on borrowings and related derivatives/
total carrying value (1) 1 – – – (2,064)
All fair value hedges were highly effective throughout the three years ended 31 December 2019.

162 RELX Annual report and financial statements 2019 | Financial statements and other information
18 Financial instruments (continued)Gross borrowings as at 31 December 2019 included £19m (2018: £23m) in relation to fair value adjustments to borrowings previously designated in a fair value hedge relationship which were de-designated in 2008. The related derivatives were closed out on de-designation with a cash inflow of £62m. £3m (2018: £3m) of these fair value adjustments were amortised in the year as a reduction to finance costs.
Cash flow hedgesAs part of the Group’s interest rate exposure management, it has entered into certain cross-currency interest rate derivatives, individual components of which have been accounted for as cash flow hedges (with the remaining components accounted for as fair value hedges, as described above). These comprised the following:1 Interest rate derivatives which swapped a fixed rate CHF 275m bond, issued in June 2013 and maturing in December 2018, to floating
rate USD debt for the whole of its term. The component relating to the swap of fixed rate CHF coupons to fixed rate USD cash flows was accounted for as a cash flow hedge under IAS 39 and was de-designated on 31 December 2017. The gains which had accumulated in the cash flow hedge reserve up to the date of de-designation were reclassified to the income statement as part of finance costs during 2018.
2 Interest rate derivatives which swapped a fixed rate €600m bond, issued in May 2015 and maturing in May 2025, to floating rate USD debt for the whole of its term. The component relating to the swap of floating rate euro cash flows to floating rate USD cash flows (including credit margin) was accounted for as a cash flow hedge under IAS 39 up to 31 December 2017. From 1 January 2018 the component relating to the swap of the euro credit margin to USD is being accounted for a cash flow hedge under IFRS 9, with the amount associated with foreign currency basis spreads recorded in the cost of hedging reserve.
As part of the Group’s foreign currency exposure management, it has entered into forward foreign exchange contracts which fix the exchange rate on a portion of future foreign currency subscription revenues forecast by the businesses for up to 50 months. These have been accounted for as cash flow hedges under IAS 39 and under IFRS 9 of the forecast foreign currency revenues, with gains and losses on the forward contracts deferred in the hedge reserve until the related revenue is recognised, at which time the accumulated gains and losses are reclassified to the income statement.Movements in the hedge reserve in 2018 and 2019 and, with effect from 1 January 2018, the cost of hedging reserve, including gains and losses on cash flow hedging instruments, were as follows:
Interest rate hedge reserve
£m
Cost of hedgingreserve
£m
Foreigncurrency
hedge reserve£m
Total£m
Hedge reserve at 31 December 2017: gains/(losses) deferred 5 – (7) (2)Reclassification on 1 January 2018 (1) 1 – –Losses arising in 2018 – (8) (51) (59)Amounts recognised in income statement (3) – 20 17Hedge reserve at 31 December 2018: gains/(losses) deferred 1 (7) (38) (44)(Losses)/gains arising in 2019 (1) – 17 16Amounts recognised in income statement – – 35 35Hedge reserve at 31 December 2019: (losses) /gains deferred – (7) 14 7
All cash flow hedges were highly effective throughout the two years ended 31 December 2019.A deferred tax credit of nil (2018: £8m) in respect of the above gains and losses at 31 December 2019 was also deferred in the hedge reserve.Of the amounts recognised in the income statement in the year, losses of £35m (2018: £20m) were recognised in revenue, and gains of nil (2018: £3m) were recognised in finance costs. A tax credit of £6m (2018: £3m) was recognised in relation to these items.The deferred gains and losses on foreign currency cash flow hedges at 31 December 2019 are currently expected to be recognised in the income statement in future years as shown in the table below, together with the principal amount of hedges relating to each year and their total carrying values included within derivative assets and liabilities in the statement of financial position:
Foreign currency
hedge reserve£m
Principalamount of
hedges£m
Carrying values
£m
2020 7 502 52021 2 394 22022 4 221 42023 1 34 1Total 14 1,151 12
The cash flows for these hedges are expected to occur in line with the recognition of the gains and losses in the income statement, or in the preceding year. These cash flows are included in the table on page 158.
Notes to the consolidated financial statementsfor the year ended 31 December 2019

RELX Annual report and financial statements 2019 | Notes to the consolidated financial statements 163M
arket segments
GovernanceFinancial statem
ents and other inform
ationFinancial review
Corporate ResponsibilityOverview
19 Inventories and pre-publication costs
Accounting policyInventories and pre-publication costs are stated at the lower of cost, including appropriate attributable overhead, and estimated net realisable value. Such costs typically comprise direct internal labour costs and externally commissioned editorial and other fees.
Pre-publication costs, representing costs incurred in the origination of content prior to publication, are expensed systematically reflecting the expected sales profile over the estimated economic lives of the related products, generally up to five years.
Annual reviews are carried out to assess the recoverability of carrying amounts.
2019£m
2018£m
Raw materials 2 2Pre-publication costs 181 171Finished goods 34 39Total 217 212
20 Trade and other receivables2019
£m2018
£m
Trade receivables 1,858 1,829Loss allowance (88) (87)
1,770 1,742Prepayments and accrued income 236 224Current tax receivable 28 –Net finance lease receivable 33 49Total 2,067 2,015
Trade receivables are predominantly non-interest bearing and their carrying amounts approximate to their fair value.
Trade receivables are stated net of a loss allowance for expected credit losses. The movements in the loss allowance during the year were as follows:
2019£m
2018£m
At start of year 87 79Charge for the year 8 14Trade receivables written off (4) (8)Exchange translation differences (3) 2At end of year 88 87
21 Trade and other payables
Accounting policyDeferred income is recognised when either a customer has paid consideration, or RELX has an unconditional right to an amount of consideration, in advance of the goods and services being delivered.
2019£m
2018£m
Trade payables 173 187Accruals 684 711Social security and other taxes 129 127Other payables 422 407Deferred income 2,071 2,000Total 3,479 3,432
Trade and other payables are predominantly non-interest bearing and their carrying amounts approximate to their fair value.

164 RELX Annual report and financial statements 2019 | Financial statements and other information
Notes to the consolidated financial statementsfor the year ended 31 December 2019
22 Borrowings
Accounting policyBorrowings are recorded initially at fair value and subsequently carried at amortised cost, other than fixed rate borrowings in designated hedging relationships for which the carrying amount of the hedged portion of the borrowings is subsequently adjusted for the gain or loss attributable to the hedged risk. When the related derivative in such a hedging relationship expires, is sold or terminated, or no longer qualifies for hedge accounting, the cumulative change in fair value of the hedged borrowing is amortised in the income statement over the period to maturity of the borrowing using the effective interest method.
2019 2018Falling due
within 1 year
£m
Falling due in more than
1 year£m
Total£m
Falling due within 1 year
£m
Falling due in more than
1 year£m
Total£m
Financial liabilities measured at amortised cost: Short-term bank loans, overdrafts and commercial paper 779 – 779 686 – 686 Term debt 716 1,792 2,508 614 1,808 2,422 Lease liabilities 93 249 342 92 268 360Term debt in fair value hedging relationships 472 2,080 2,552 – 2,652 2,652Term debt previously in fair value hedging relationships – 233 233 – 245 245Total 2,060 4,354 6,414 1,392 4,973 6,365
The total fair value of financial liabilities measured at amortised cost (excluding lease liabilities) is £3,491m (2018: £3,254m). The total fair value of term debt in fair value hedging relationships is £2,629m (2018: £2,742m). The total fair value of term debt previously in fair value hedging relationships is £276m (2018: £283m).
RELX PLC has given guarantees in respect of certain long-term and short-term borrowings issued by subsidiaries. Included within term debt above are debt securities issued by RELX Capital Inc., a 100% indirectly owned finance subsidiary of RELX PLC, which have been registered with the US Securities and Exchange Commission. RELX PLC has fully and unconditionally guaranteed these securities, which are not guaranteed by any other subsidiary of RELX PLC.
Analysis by year of repayment 2019 2018
Short-term bank loans, overdrafts
and commercial
paper£m
Term debt£m
Lease liabilities
£mTotal
£m
Short-term bank loans, overdrafts
and commercial
paper£m
Term debt£m
Lease liabilities
£mTotal
£m
Within 1 year 779 1,188 93 2,060 686 614 92 1,392Within 1 to 2 years – 425 87 512 – 508 87 595Within 2 to 3 years – 33 57 90 – 451 70 521Within 3 to 4 years – 658 47 705 – 688 42 730Within 4 to 5 years – 433 29 462 – 669 27 696After 5 years – 2,556 29 2,585 – 2,389 42 2,431After 1 year – 4,105 249 4,354 – 4,705 268 4,973Total 779 5,293 342 6,414 686 5,319 360 6,365
Short-term bank loans, overdrafts and commercial paper were backed up at 31 December 2019 by a $3,000m (£2,262m) committed bank facility, consisting of tranches of: $31m maturing in 2021, $1,219m maturing in 2022, $44m maturing in 2023 and $1,706m maturing in 2024. The committed bank facility was undrawn.

RELX Annual report and financial statements 2019 | Notes to the consolidated financial statements 165M
arket segments
GovernanceFinancial statem
ents and other inform
ationFinancial review
Corporate ResponsibilityOverview
22 Borrowings (continued)Analysis by currency
2019 2018Short-term bank loans, overdrafts
and commercial
paper£m
Term debt
£m
Lease liabilities
£mTotal
£m
Short-term bank loans, overdrafts
and commercial
paper£m
Term debt
£m
Lease liabilities
£mTotal
£m
US dollars 309 2,915 168 3,392 19 2,493 177 2,689£ sterling – – 71 71 317 300 66 683Euro 423 2,378 70 2,871 318 2,526 85 2,929Other currencies 47 – 33 80 32 – 32 64Total 779 5,293 342 6,414 686 5,319 360 6,365
Included in the US dollar amounts for term debt above is £525m (2018: £544m) of debt denominated in euros (€600m) (2018: €600m) that was swapped into US dollars on issuance and against which there are related derivative financial instruments, which, as at 31 December 2019, had a fair value of £21m (2018: £19m).
23 Lease arrangements
Accounting policyAll leases where RELX is the lessee (with the exception of short-term and low-value leases) are recognised in the statement of financial position. A lease liability is recognised based on the present value of the future lease payments, and a corresponding right-of-use asset is recognised. The right-of-use asset is depreciated over the shorter of the lease term or the useful life of the asset. Lease payments are apportioned between finance charges and a reduction of the lease liability.
Low-value items and short-term leases with a term of 12 months or less are not required to be recognised on the balance sheet and payments made in relation to these leases are recognised on a straight-line basis in the income statement.
The leases held by the Group can be split into two categories: property and non-property. The Group leases various properties, principally offices, which have varying terms and renewal rights that are typical to the territory in which they are located. Non-property includes all other leases, such as cars and printers.
Right-of-use assets
Property £m
Non- property
£m2019
£mProperty
£m
Non-property
£m2018
£m
At start of year 246 17 263 264 23 287Additions 57 5 62 26 5 31Acquisitions 4 – 4 7 5 12Remeasurement 29 – 29 13 – 13Disposals (2) (1) (3) (2) (8) (10)Depreciation (74) (8) (82) (68) (9) (77)Exchange translation differences (9) – (9) 6 1 7At end of year 251 13 264 246 17 263
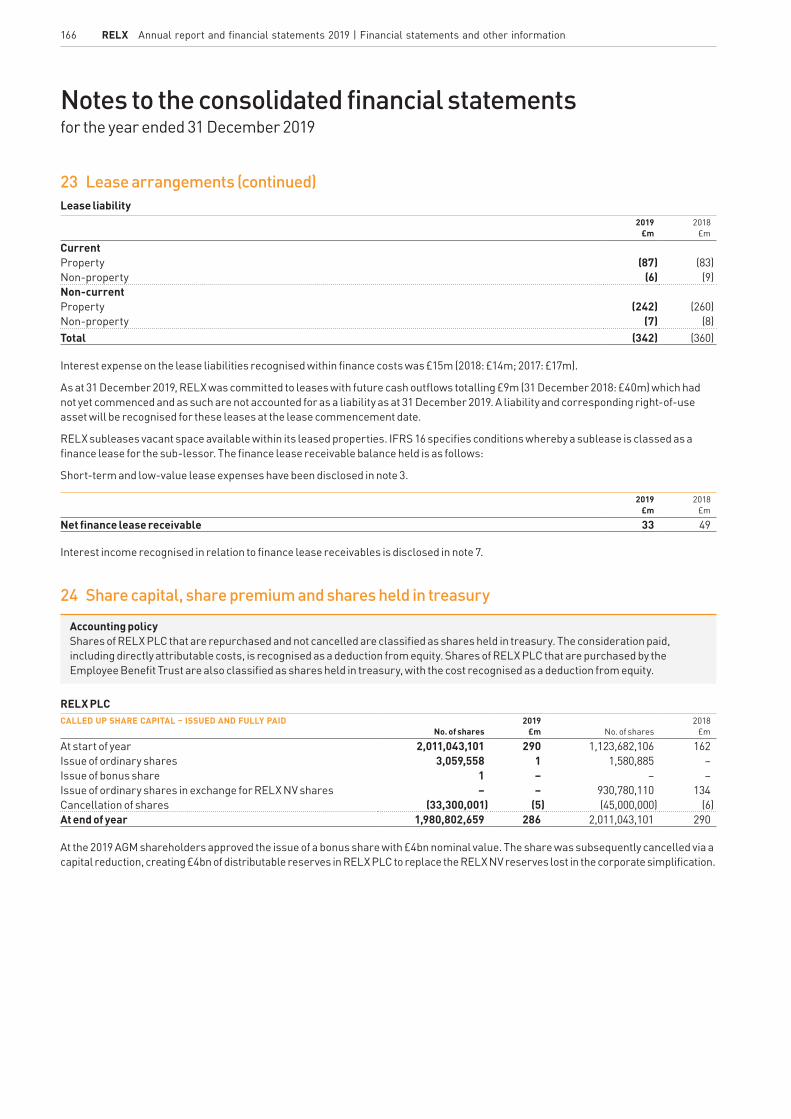
166 RELX Annual report and financial statements 2019 | Financial statements and other information
Notes to the consolidated financial statementsfor the year ended 31 December 2019
23 Lease arrangements (continued)Lease liability
2019£m
2018£m
CurrentProperty (87) (83)Non-property (6) (9)Non-currentProperty (242) (260)Non-property (7) (8)Total (342) (360)
Interest expense on the lease liabilities recognised within finance costs was £15m (2018: £14m; 2017: £17m).
As at 31 December 2019, RELX was committed to leases with future cash outflows totalling £9m (31 December 2018: £40m) which had not yet commenced and as such are not accounted for as a liability as at 31 December 2019. A liability and corresponding right-of-use asset will be recognised for these leases at the lease commencement date.
RELX subleases vacant space available within its leased properties. IFRS 16 specifies conditions whereby a sublease is classed as a finance lease for the sub-lessor. The finance lease receivable balance held is as follows:
Short-term and low-value lease expenses have been disclosed in note 3.
2019£m
2018£m
Net finance lease receivable 33 49
Interest income recognised in relation to finance lease receivables is disclosed in note 7.
24 Share capital, share premium and shares held in treasury
Accounting policyShares of RELX PLC that are repurchased and not cancelled are classified as shares held in treasury. The consideration paid, including directly attributable costs, is recognised as a deduction from equity. Shares of RELX PLC that are purchased by the Employee Benefit Trust are also classified as shares held in treasury, with the cost recognised as a deduction from equity.
RELX PLCCALLED UP SHARE CAPITAL – ISSUED AND FULLY PAID
No. of shares2019
£m No. of shares2018
£m
At start of year 2,011,043,101 290 1,123,682,106 162Issue of ordinary shares 3,059,558 1 1,580,885 –Issue of bonus share 1 – – –Issue of ordinary shares in exchange for RELX NV shares – – 930,780,110 134Cancellation of shares (33,300,001) (5) (45,000,000) (6)At end of year 1,980,802,659 286 2,011,043,101 290
At the 2019 AGM shareholders approved the issue of a bonus share with £4bn nominal value. The share was subsequently cancelled via a capital reduction, creating £4bn of distributable reserves in RELX PLC to replace the RELX NV reserves lost in the corporate simplification.

RELX Annual report and financial statements 2019 | Notes to the consolidated financial statements 167M
arket segments
GovernanceFinancial statem
ents and other inform
ationFinancial review
Corporate ResponsibilityOverview
24 Share capital, share premium and shares held in treasury (continued)NUMBER OF ORDINARY SHARES Year ended 31 December
Shares in issue
(millions)
Treasury shares
(millions)
2019 Shares in
issue net of treasury
shares(millions)
2018 Shares in
issue net of treasury
shares (millions)
RELX PLCAt start of year 2,011.0 (49.1) 1,961.9 1,060.1Issue of ordinary shares 3.1 – 3.1 1.6Issue of ordinary shares in exchange for RELX NV shares – – – 927.3Repurchase of ordinary shares – (33.5) (33.5) (26.9)Net release/(purchase) of shares by the Employee Benefit Trust – 0.4 0.4 (0.2)Cancellation of shares (33.3) 33.3 – –At end of year 1,980.8 (48.9) 1,931.9 1,961.9
During the year, RELX PLC repurchased 33.5m (2018: 26.9m; 2017: 23.1m) RELX PLC ordinary shares for an average price of 1,789p; these shares are held in treasury. The total consideration for the RELX PLC repurchases was £600m (2018: £700m, including consideration for 17.5m shares purchased by RELX NV prior to the corporate simplification).
In 2018, as a result of the corporate simplification, RELX NV shares were cancelled and replaced with RELX PLC shares. This amounted to 930,780,110 RELX NV shares being cancelled and the same number of RELX PLC shares issued in exchange.
The Employee Benefit Trust purchases RELX PLC shares which, at the trustees’ discretion, can be used in respect of the exercise of share options and to meet commitments under conditional share awards. During the year, the Employee Benefit Trust purchased 2.2m shares for a total cost of £37m (2018: £43m; 2017: £39m). At 31 December 2019, shares held by the Employee Benefit Trust were £94m (2018: £90m; 2017: £82m) at cost.
The issue of ordinary shares in the year relates to the exercise of share options.
All of the RELX PLC ordinary shares rank equally with respect to voting rights and rights to receive dividends, except for shares held in treasury, which do not attract voting or dividend rights. There are no restrictions on the rights to transfer shares.
At 31 December 2019, RELX PLC shares held in treasury related to 6,753,010 (2018: 7,130,366; 2017: 3,493,817) RELX PLC ordinary shares held by the Employee Benefit Trust; and 42,267,027 (2018: 42,023,020; 2017: 60,077,786) RELX PLC ordinary shares held by the parent company. During December 2019, 33.3m (2018: 45m) RELX PLC ordinary shares held in treasury were cancelled.
On 6 December 2019, RELX PLC announced a non-discretionary programme to repurchase further ordinary shares up to the value of £100m. At 31 December 2019, an accrual of £100m was recognised in respect of this non-discretionary commitment. A further 5.0m RELX PLC ordinary shares have been repurchased in January and February 2020 under this programme.
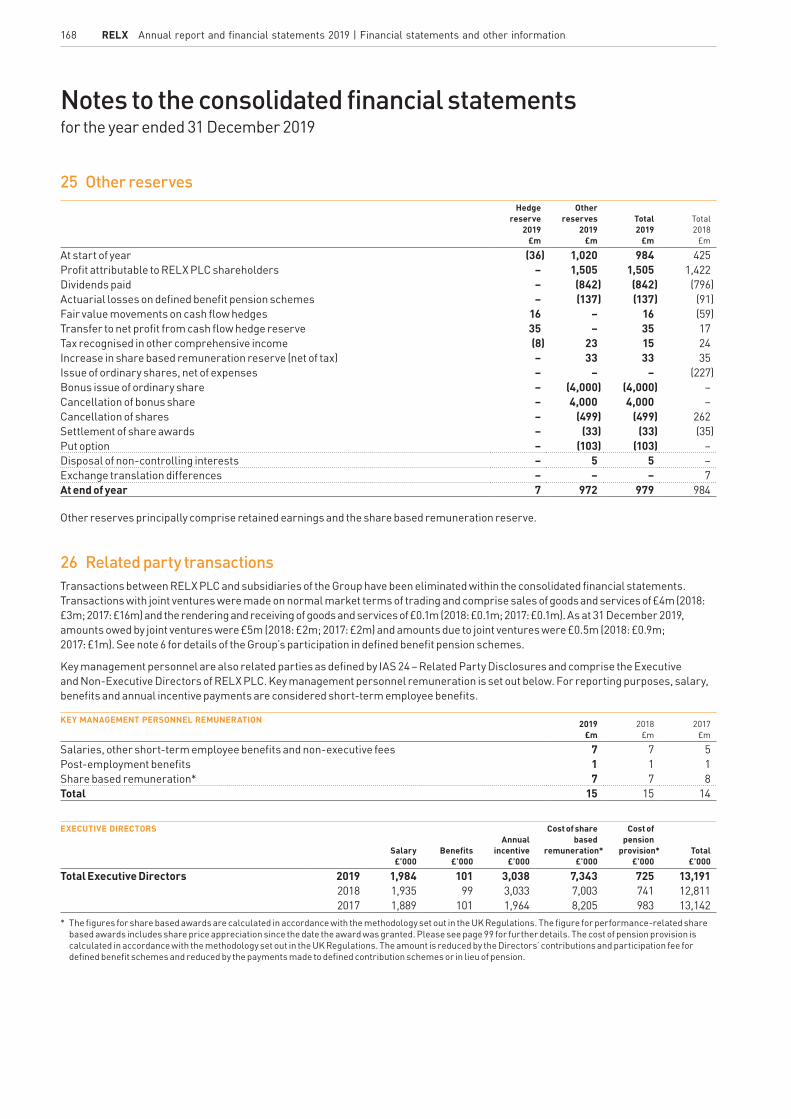
168 RELX Annual report and financial statements 2019 | Financial statements and other information
Notes to the consolidated financial statementsfor the year ended 31 December 2019
25 Other reservesHedge
reserve2019
£m
Other reserves
2019£m
Total2019
£m
Total2018
£m
At start of year (36) 1,020 984 425Profit attributable to RELX PLC shareholders – 1,505 1,505 1,422Dividends paid – (842) (842) (796)Actuarial losses on defined benefit pension schemes – (137) (137) (91)Fair value movements on cash flow hedges 16 – 16 (59)Transfer to net profit from cash flow hedge reserve 35 – 35 17Tax recognised in other comprehensive income (8) 23 15 24Increase in share based remuneration reserve (net of tax) – 33 33 35Issue of ordinary shares, net of expenses – – – (227)Bonus issue of ordinary share – (4,000) (4,000) –Cancellation of bonus share – 4,000 4,000 –Cancellation of shares – (499) (499) 262Settlement of share awards – (33) (33) (35)Put option – (103) (103) –Disposal of non-controlling interests – 5 5 –Exchange translation differences – – – 7At end of year 7 972 979 984
Other reserves principally comprise retained earnings and the share based remuneration reserve.
26 Related party transactionsTransactions between RELX PLC and subsidiaries of the Group have been eliminated within the consolidated financial statements. Transactions with joint ventures were made on normal market terms of trading and comprise sales of goods and services of £4m (2018: £3m; 2017: £16m) and the rendering and receiving of goods and services of £0.1m (2018: £0.1m; 2017: £0.1m). As at 31 December 2019, amounts owed by joint ventures were £5m (2018: £2m; 2017: £2m) and amounts due to joint ventures were £0.5m (2018: £0.9m; 2017: £1m). See note 6 for details of the Group’s participation in defined benefit pension schemes.
Key management personnel are also related parties as defined by IAS 24 – Related Party Disclosures and comprise the Executive and Non-Executive Directors of RELX PLC. Key management personnel remuneration is set out below. For reporting purposes, salary, benefits and annual incentive payments are considered short-term employee benefits.
KEY MANAGEMENT PERSONNEL REMUNERATION 2019£m
2018£m
2017£m
Salaries, other short-term employee benefits and non-executive fees 7 7 5Post-employment benefits 1 1 1Share based remuneration* 7 7 8Total 15 15 14
EXECUTIVE DIRECTORS
Salary£’000
Benefits£’000
Annual incentive
£’000
Cost of share based
remuneration*£’000
Cost ofpension
provision*£’000
Total£’000
Total Executive Directors 2019 1,984 101 3,038 7,343 725 13,1912018 1,935 99 3,033 7,003 741 12,8112017 1,889 101 1,964 8,205 983 13,142
* The figures for share based awards are calculated in accordance with the methodology set out in the UK Regulations. The figure for performance-related share based awards includes share price appreciation since the date the award was granted. Please see page 99 for further details. The cost of pension provision is calculated in accordance with the methodology set out in the UK Regulations. The amount is reduced by the Directors’ contributions and participation fee for defined benefit schemes and reduced by the payments made to defined contribution schemes or in lieu of pension.

RELX Annual report and financial statements 2019 | Notes to the consolidated financial statements 169M
arket segments
GovernanceFinancial statem
ents and other inform
ationFinancial review
Corporate ResponsibilityOverview
26 Related party transactions (continued)NON-EXECUTIVE DIRECTORS 2019
£’0002018
£’0002017
£’000
Fees and benefits 1,569 1,634 1,396
The remuneration of non-executive directors comprises fees for services, and benefits primarily relating to tax filing support in respect of filings resulting from their directorships. No deemed benefits were provided during 2019 to former Directors (2018: nil; 2017: £2,460). No loans, advances or guarantees have been provided on behalf of any Director. The aggregate gains made by Executive Directors on the exercise of options during 2019 were nil (2018: nil; 2017: £2,804,358).
27 Exchange ratesThe following exchange rates have been applied in preparing the consolidated financial statements:
Income statement
Statement offinancial position
2019 2018 2017 2019 2018
Euro to sterling 1.14 1.13 1.14 1.18 1.11US dollar to sterling 1.28 1.34 1.29 1.33 1.27
28 Approval of financial statementsThe consolidated financial statements were approved and authorised for issue by the Board of Directors on 12 February 2020.
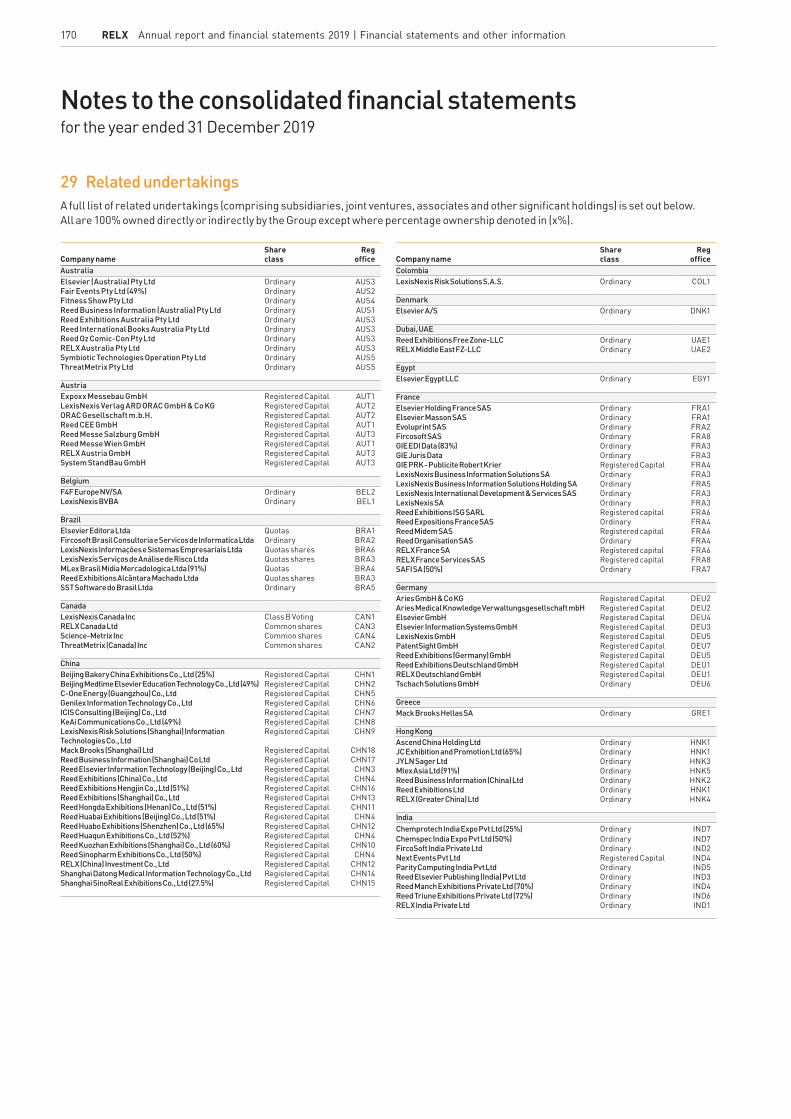
170 RELX Annual report and financial statements 2019 | Financial statements and other information
Company nameShare class
Reg office
AustraliaElsevier (Australia) Pty Ltd Ordinary AUS3Fair Events Pty Ltd (49%) Ordinary AUS2Fitness Show Pty Ltd Ordinary AUS4Reed Business Information (Australia) Pty Ltd Ordinary AUS1Reed Exhibitions Australia Pty Ltd Ordinary AUS3Reed International Books Australia Pty Ltd Ordinary AUS3Reed Oz Comic-Con Pty Ltd Ordinary AUS3RELX Australia Pty Ltd Ordinary AUS3Symbiotic Technologies Operation Pty Ltd Ordinary AUS5ThreatMetrix Pty Ltd Ordinary AUS5
AustriaExpoxx Messebau GmbH Registered Capital AUT1LexisNexis Verlag ARD ORAC GmbH & Co KG Registered Capital AUT2ORAC Gesellschaft m.b.H. Registered Capital AUT2Reed CEE GmbH Registered Capital AUT1Reed Messe Salzburg GmbH Registered Capital AUT3Reed Messe Wien GmbH Registered Capital AUT1RELX Austria GmbH Registered Capital AUT3System StandBau GmbH Registered Capital AUT3
BelgiumF4F Europe NV/SA Ordinary BEL2LexisNexis BVBA Ordinary BEL1
BrazilElsevier Editora Ltda Quotas BRA1Fircosoft Brasil Consultoria e Servicos de Informatica Ltda Ordinary BRA2LexisNexis Informações e Sistemas Empresariais Ltda Quotas shares BRA6LexisNexis Serviços de Análise de Risco Ltda Quotas shares BRA3MLex Brasil Midia Mercadologica Ltda (91%) Quotas BRA4Reed Exhibitions Alcântara Machado Ltda Quotas shares BRA3SST Software do Brasil Ltda Ordinary BRA5
CanadaLexisNexis Canada Inc Class B Voting CAN1RELX Canada Ltd Common shares CAN3Science-Metrix Inc Common shares CAN4ThreatMetrix (Canada) Inc Common shares CAN2
ChinaBeijing Bakery China Exhibitions Co., Ltd (25%) Registered Capital CHN1Beijing Medtime Elsevier Education Technology Co., Ltd (49%) Registered Capital CHN2C-One Energy (Guangzhou) Co., Ltd Registered Capital CHN5Genilex Information Technology Co., Ltd Registered Capital CHN6ICIS Consulting (Beijing) Co., Ltd Registered Capital CHN7KeAi Communications Co., Ltd (49%) Registered Capital CHN8LexisNexis Risk Solutions (Shanghai) Information Technologies Co., Ltd
Registered Capital CHN9
Mack Brooks (Shanghai) Ltd Registered Capital CHN18Reed Business Information (Shanghai) Co Ltd Registered Captial CHN17Reed Elsevier Information Technology (Beijing) Co., Ltd Registered Capital CHN3Reed Exhibitions (China) Co., Ltd Registered Capital CHN4Reed Exhibitions Hengjin Co., Ltd (51%) Registered Capital CHN16Reed Exhibitions (Shanghai) Co., Ltd Registered Capital CHN13Reed Hongda Exhibitions (Henan) Co., Ltd (51%) Registered Capital CHN11Reed Huabai Exhibitions (Beijing) Co., Ltd (51%) Registered Capital CHN4Reed Huabo Exhibitions (Shenzhen) Co., Ltd (65%) Registered Capital CHN12Reed Huaqun Exhibitions Co., Ltd (52%) Registered Capital CHN4Reed Kuozhan Exhibitions (Shanghai) Co., Ltd (60%) Registered Capital CHN10Reed Sinopharm Exhibitions Co., Ltd (50%) Registered Capital CHN4RELX (China) Investment Co., Ltd Registered Capital CHN12Shanghai Datong Medical Information Technology Co., Ltd Registered Capital CHN14Shanghai SinoReal Exhibitions Co., Ltd (27.5%) Registered Capital CHN15
Company nameShare class
Reg office
ColombiaLexisNexis Risk Solutions S.A.S. Ordinary COL1
DenmarkElsevier A/S Ordinary DNK1
Dubai, UAEReed Exhibitions Free Zone-LLC Ordinary UAE1RELX Middle East FZ-LLC Ordinary UAE2
EgyptElsevier Egypt LLC Ordinary EGY1
FranceElsevier Holding France SAS Ordinary FRA1Elsevier Masson SAS Ordinary FRA1Evoluprint SAS Ordinary FRA2Fircosoft SAS Ordinary FRA8GIE EDI Data (83%) Ordinary FRA3GIE Juris Data Ordinary FRA3GIE PRK - Publicite Robert Krier Registered Capital FRA4LexisNexis Business Information Solutions SA Ordinary FRA3LexisNexis Business Information Solutions Holding SA Ordinary FRA5LexisNexis International Development & Services SAS Ordinary FRA3LexisNexis SA Ordinary FRA3Reed Exhibitions ISG SARL Registered capital FRA6Reed Expositions France SAS Ordinary FRA4Reed Midem SAS Registered capital FRA6Reed Organisation SAS Ordinary FRA4RELX France SA Registered capital FRA6RELX France Services SAS Registered capital FRA8SAFI SA (50%) Ordinary FRA7
GermanyAries GmbH & Co KG Registered Capital DEU2Aries Medical Knowledge Verwaltungsgesellschaft mbH Registered Capital DEU2Elsevier GmbH Registered Capital DEU4Elsevier Information Systems GmbH Registered Capital DEU3LexisNexis GmbH Registered Capital DEU5PatentSight GmbH Registered Capital DEU7Reed Exhibitions (Germany) GmbH Registered Capital DEU5Reed Exhibitions Deutschland GmbH Registered Capital DEU1RELX Deutschland GmbH Registered Capital DEU1Tschach Solutions GmbH Ordinary DEU6
GreeceMack Brooks Hellas SA Ordinary GRE1
Hong KongAscend China Holding Ltd Ordinary HNK1JC Exhibition and Promotion Ltd (65%) Ordinary HNK1JYLN Sager Ltd Ordinary HNK3Mlex Asia Ltd (91%) Ordinary HNK5Reed Business Information (China) Ltd Ordinary HNK2Reed Exhibitions Ltd Ordinary HNK1RELX (Greater China) Ltd Ordinary HNK4
IndiaChemprotech India Expo Pvt Ltd (25%) Ordinary IND7Chemspec India Expo Pvt Ltd (50%) Ordinary IND7FircoSoft India Private Ltd Ordinary IND2Next Events Pvt Ltd Registered Capital IND4Parity Computing India Pvt Ltd Ordinary IND5Reed Elsevier Publishing (India) Pvt Ltd Ordinary IND3Reed Manch Exhibitions Private Ltd (70%) Ordinary IND4Reed Triune Exhibitions Private Ltd (72%) Ordinary IND6RELX India Private Ltd Ordinary IND1
29 Related undertakingsA full list of related undertakings (comprising subsidiaries, joint ventures, associates and other significant holdings) is set out below. All are 100% owned directly or indirectly by the Group except where percentage ownership denoted in (x%).
Notes to the consolidated financial statementsfor the year ended 31 December 2019

RELX Annual report and financial statements 2019 | Notes to the consolidated financial statements 171M
arket segments
GovernanceFinancial statem
ents and other inform
ationFinancial review
Corporate ResponsibilityOverview
29 Related undertakings (continued)
Company nameShare class
Reg office
IndonesiaPT Reed Exhibitions Indonesia (70%) Class A
Class BIDN2
PT Reed Panorama Exhibitions (50%) Ordinary IDN1
IrelandElsevier Services Ireland Ltd Ordinary IRL2LexisNexis Risk Solutions (Europe) Ltd Ordinary IRL1LexisNexis Risk Solutions (Ireland) Ltd Ordinary IRL13D4Medical Ltd3D4Medical Support Services Ltd
OrdinaryOrdinary
IRL3IRL3
IsraelLexisNexis Israel Ltd Ordinary ISR1
ItalyElsevier SRL Registered Capital ITA1ICIS Italia SRL Ordinary ITA2Reed Exhibitions ISG Italy SRL Ordinary ITA1Reed Exhibitions Italia SRL Ordinary ITA1
JapanAscend Japan KK Ordinary JPN1Elsevier Japan KK Ordinary JPN2LexisNexis Japan KK Common Stock JPN3PatentSight Japan Inc Common Shares JPN6Reed Exhibitions Japan KK Ordinary JPN4Reed ISG Japan KK Ordinary JPN5ThreatMetrix GK Membership Interest JPN7
Korea (South)Elsevier Korea LLC Ordinary KOR1LexisNexis Legal and Professional Service Korea Ltd Ordinary KOR2Reed Exhibitions Korea Ltd Ordinary KOR3Reed Exporum Ltd (60%) Ordinary KOR4Reed K. Fairs Ltd (70%) Ordinary KOR3
MalaysiaLexisNexis Malaysia Sdn Bhd Ordinary MYS1Reed Exhibitions Sdn Bhd Ordinary MYS1
MexicoMasson-Doyma Mexico, S.A. Ordinary MEX1Reed Exhibitions Mexico S.A. de C.V. Ordinary MEX1
MoroccoReed Exhibitions Morocco SARL Ordinary MAR1
New ZealandLexisNexis NZ Ltd Ordinary NZL1
PhilippinesReed Elsevier Shared Services (Philippines) Inc. Common Shares PHL1
PolandAI Digital Contracts Sp. z.o.o. (75%) Ordinary POL1Elsevier Sp. z.o.o. Ordinary POL2
RussiaEcwatech Company OOO Ordinary RUS1Elsevier OOO Participation Shares RUS1LexisNexis OOO Registered Capital RUS1Real Estate Events Direct OOO (80%) Ordinary RUS2RELX OOO Ordinary RUS13D4Medical OOO Ordinary RUS3
Saudi ArabiaReed Sunaidi Exhibitions LLC(50%) Ordinary SAU1
Company nameShare class
Reg office
SingaporeElsevier (Singapore) Pte Ltd Ordinary SGP1Lexis-Nexis Philippines Pte Ltd (75%) Ordinary B
Preference sharesSGP2
Mack Brooks Asia Pte Ltd Ordinary SGP5Reed Business Information Pte Ltd Ordinary SGP3RE (HAPL) Pte Ltd Ordinary SGP1RELX (Singapore) Pte. Ltd Ordinary SGP2ThreatMetrix Pte Ltd Ordinary SGP4
South AfricaFircosoft South Africa (Pty) Ltd Ordinary ZAF1Globalrange SA (Pty) Ltd Ordinary ZAF2Korbitec (Pty) Ltd (78%) Ordinary ZAF3LegalPerfectTSoftware Solutions (Pty) Ltd (78%) Ordinary ZAF3LexisNexis (Pty) Ltd (78%) Ordinary ZAF3LexisNexis Academic (Pty) Ltd (78%) Ordinary ZAF3LexisNexis Risk Management (Pty) Ltd (78%) Ordinary ZAF3Property Payment Exchange (SA) (Pty) Ltd (78%) Ordinary ZAF3RELX (Pty) Ltd Ordinary ZAF3Reed Exhibitions (Pty) Ltd (90%) A-shares ZAF3Reed Events Management (Pty) Ltd (90%) Ordinary ZAF3Reed Exhibitions Group(Pty) Ltd (90%) Ordinary ZAF3Reed Venue Management (Pty) Ltd (90%) A-shares ZAF3Winsearch Services (Pty) Ltd (78%) Ordinary ZAF3
SpainElsevier Espana SL Participations ESP1
SwitzerlandElsevier Finance SA Ordinary CHE1Fircosoft Schweiz GmbH Ordinary CHE2RELX Risks SA Ordinary CHE1RELX Swiss Holdings SA Ordinary CHE1
TaiwanElsevier Taiwan LLC Ordinary TWN1
ThailandMackBrooks Exhibitions Asia Ltd (49%) Ordinary THA3Reed Tradex Company Ltd (49%) Ordinary THA1RELX Holding (Thailand) Co., LtdRELX Information Analytics (Thailand) Co., Ltd
OrdinaryOrdinary
THA2THA4
The NetherlandsAGRM Solutions C.V. Partnership Interest NLD1Elsevier B.V. Ordinary NLD1Elsevier Employment Services B.V. Ordinary NLD1ICIS Benchmarking Europe B.V Ordinary NLD1LexisNexis Business Information Solutions B.V. Ordinary NLD1LexisNexis Univentio B.V. Ordinary NLD2Misset Uitgeverij B.V.(49%) Ordinary NLD4One Business B.V. (33%) Registered Capital NLD5Reed Business B.V. Ordinary NLD1RELX Finance B.V. Ordinary NLD1RELX Holdings B.V. Ordinary NLD1RELX Nederland B.V. Ordinary NLD1RELX Overseas B.V. RE Shares NLD1ThreatMetrix BV Ordinary NLD3
TurkeyElsevier STM Bilgi Hizmetleri Limited Şirketi Ordinary TUR1Mack Brooks Fuarcilik A.S Registered Capital TUR 3Reed Tüyap Fuarcilik A.Ș.(50%) A Ordinary
B OrdinaryTUR2

172 RELX Annual report and financial statements 2019 | Financial statements and other information
29 Related undertakings (continued)
Company nameShare class
Reg office
United KingdomAdaptris Group Ltd Ordinary GBR2Bradfield Brett Holdings Ltd 7 1/2% Preferred
Income, OrdinaryGBR1
Butterworths Ltd Ordinary GBR5Cordery Ltd (71%) Ordinary GBR5Cordery Compliance Ltd (71%) Ordinary GBR5Crediva Ltd Ordinary GBR6Dew Events Ltd Ordinary GBR3Digital Foundry Network (50%) Ordinary GBR3Drayton Legal Recoveries Ltd Ordinary GBR7E & P Events LLP (50%) No Shares GBR3Elsevier Ltd Ordinary GBR8Elsevier Life Sciences IP Ltd Ordinary GBR8Fastener Fairs Ltd Ordinary,
Ordinary-A, Ordinary-B
GBR4
Formpart (EPS) Ltd Ordinary GBR1Formpart (HPL) Ltd Ordinary GBR1Gamer Edition Ltd Ordinary GBR3Gamer Events Ltd Ordinary GBR3Gamer Network Ltd Ordinary GBR3Imbibe Media Ltd Ordinary GBR3Information Handling Ltd (85%) Ordinary GBR1Insurance Initiatives Ltd Ordinary GBR10Knowable Ltd (75%) Ordinary GBR1Knowable Holdings Ltd (75%) Ordinary GBR1Legend Exhibitions Ltd Ordinary GBR13LexisNexis Risk Solutions UK Ltd Ordinary GBR9Mack Brooks Events Ltd Ordinary GBR3Mack-Brooks Exhibitions Ltd Ordinary GBR3Mack Brooks (France) Ltd Ordinary GBR3Mack-Brooks Publishing Ltd Ordinary, A Ordinary GBR3Mack Brook Speciality Publishing Ltd Ordinary GBR3MCM Central Ltd Ordinary GBR2MCM Expo Ltd Ordinary GBR2Mendeley Ltd Ordinary GBR7MLex Ltd Ordinary GBR4Newsflo Ltd Ordinary GBR1NLife Ltd (23.5%) Ordinary GBR12Offshore Europe (Management) Ltd Ordinary GBR3Offshore Europe Partnership (50%) Partnership Interest GBR3Out There Gaming Ltd (70%) Ordinary GBR3Oxford Spires Management Co; Ltd (55%) Ordinary GBR10Prean Holdings Ltd Deferred, Ordinary GBR1RE Directors (No.1) Limited Ordinary GBR1RE Directors (No.2) Limited Ordinary GBR1RE (RCB) Ltd Ordinary GBR1RE Secretaries Ltd Ordinary GBR1RE (SOE) Ltd Ordinary GBR3Reed Business Information Ltd Ordinary GBR2Reed Business Information (Holdings) Ltd Ordinary GBR2Reed Elsevier (UIG) Ltd Ordinary GBR1Reed Events Ltd Ordinary GBR3Reed Exhibitions Ltd Ordinary GBR3Reed Nominees Ltd Ordinary GBR1Reed Publishing Corporation Ltd Ordinary GBR1RELX (Holdings) Ltd Ordinary GBR1RELX (Investments) plc Ordinary GBR1RELX (UK) Ltd Ordinary GBR1RELX Finance Ltd Ordinary GBR1RELX Group plc Ordinary
‘R’ OrdinaryGBR1
RELX Overseas Holdings Ltd Ordinary GBR1REV Venture Partners Ltd Ordinary GBR1Symbiotic Technologies Operations Ltd Ordinary GBR9Tracesmart Ltd Ordinary GBR5Whitehall Debenture Company Limited A Ordinary
B Ordinary GBR1
Wunelli Ltd Ordinary GBR11
Company nameShare class
Reg office
United StatesAccuity Inc. Common Stock USA1Accuity Asset Verification Services Inc. Common Stock USA1American Textile Machinery Exhibitions International Inc. (40%) Common Stock USA3Aries Systems Corporation Common Stock USA3Derman, Inc. Common Stock USA4Dunlap-Hanna Publishers (50%) Partnership Interest USA7Elsevier Holdings Inc. Common Stock USA3Elsevier Inc. Common Stock USA3Elsevier Medical Information LLC Membership Interest USA3Elsevier STM Inc. Common Stock USA3Enclarity, Inc. Common Stock USA2ExitCare LLC Membership Interest USA3Gamer Network Inc. Common Stock USA3Gaming Business Asia LLC (50%) Membership Interest USA3Health Market Science, Inc. Common Stock USA2IDG-RBI China Publishers LLC (50%) Membership Interest USA3Intelligize, Inc. Common Stock USA3Knovel Corporation Common Stock USA3Knowable Inc (75%) Common Stock USA8LexisNexis Claims Solutions Inc. Common Stock USA2LexisNexis Coplogic Solutions Inc. Common Stock USA2LexisNexis of Puerto Rico Inc. Common Stock USA9LexisNexis Risk Assets Inc. Common Stock USA2LexisNexis Risk Data Management Inc. Common Stock USA2LexisNexis Risk Holdings Inc. Common Stock USA2LexisNexis Risk Solutions Inc . LexisNexis Risk Solutions FL Inc.
Common StockCommon Stock
USA2USA2
LexisNexis Special Services Inc. Common Stock USA6LexisNexis VitalChek Network Inc. Common Stock USA2Mack Brooks Exhibitions Inc. Common Stock USA3Matthew Bender & Company, Inc. Common Stock USA3MLex US, Inc. (91%) Common Stock USA3Parity Computing, Inc. Common Stock USA3PCLaw Time Matters LLC (51%) No Stock USA2PoliceReports.US, LLC Membership Interest USA2Portfolio Media, Inc. Common Stock USA3Reed Business Information Inc. Common Stock USA5Reed Technology and Information Services Inc. Common Stock USA3RELX Capital Inc. Common Stock USA4RELX Inc. Common Stock USA3RELX Risks Inc. Common Stock USA2RELX US Holdings Inc. Common Stock USA3Reman, Inc. Common Stock USA3REV IV Partnership LP No Stock USA4SAFI Americas LLC (50%) Membership Interest USA3The Reed Elsevier Ventures 2005 Partnership LP Partnership Interest USA4The Reed Elsevier Ventures 2006 Partnership LP Partnership Interest USA4The Reed Elsevier Ventures 2009 Partnership LP Partnership Interest USA4The Reed Elsevier Ventures 2010 Partnership LP Partnership Interest USA4The Reed Elsevier Ventures 2011 Partnership LP Partnership Interest USA4The Reed Elsevier Ventures 2012 Partnership LP Partnership Interest USA4The Reed Elsevier Ventures 2013 Partnership LP Partnership Interest USA4The Remick Publishers (50%) Partnership Interest USA7ThreatMetrix, Inc. Common Stock USA2World Compliance, Inc. Common Stock USA43D4Medical.com, LLC Membership I nterest USA103D4Medical Inc. Common Stock USA10
VietnamReed Tradex Vietnam LLC (49%) Ordinary VIE1
Notes to the consolidated financial statementsfor the year ended 31 December 2019

RELX Annual report and financial statements 2019 | Notes to the consolidated financial statements 173M
arket segments
GovernanceFinancial statem
ents and other inform
ationFinancial review
Corporate ResponsibilityOverview
29 Related undertakings (continued)Registered officesAustraliaAUS1: Building B, Level 2, Unit 11, 1 Maitland Place, Baulkham Hills NSW 2153,AustraliaAUS2: 383 Kent Street, Sydney NSW 2000, AustraliaAUS3: ‘Tower 2’ Level 10, 475 Victoria Avenue, Chatswood NSW 2067AUS4: Fordham Business Advisors Pty Ltd, Rialto South Tower Level 35, 525 Collins
Street, Melbourne, Vic, 3000AUS5: 1303, 799 Pacific Highway, Chatswood, NSW 2067
AustriaAUT1: Messeplatz 1, 1020, Wien, AustriaAUT2: Marxergasse 25, 1030, Wien, AustriaAUT3: Am Messezentrum 6, 5020, Salzburg, Austria
BelgiumBEL1: Oudenaardseheerweg 129, 9810 Nazareth, BelgiumBEL2: Guldensporenpark 36D, 9820 Merelbeke, Belgium
BrazilBRA1: Rua da Assembleia no 100, 6th Floor, RJ Centro, Rio de Janiero, 20011-904, BrazilBRA2: Rua Bela Cintra 2305, São Paulo, 01415-009,BrazilBRA3: Rua Bela Cintra no. 1200, 10th floor, Sâo Paulo, 01415-001, BrazilBRA4: Avenida paulista, 2300-Piso Pilotis room 28, Sao Paulo, 01310-300,BrazilBRA5: Rua Cel Fonseca, 203 A-Centro, Botucatu, SP, 18600-200,BrazilBRA6: Rua Bela Cintra no. 1200, 5th floor, Sâo Paulo, 01415-002, Brazil
CanadaCAN1: 123 Commerce Valley Drive East, Suite 700, Markham, Ontario, L3T 7W8, CanadaCAN2: 177 King Street West, Suite 400, Toronto-Dominion Centre Toronto, Ontario, M5K
0A1, CanadaCAN3: 555 RIichmond Street West, Toronto, Ontario,M5V 3B1, CanadaCAN4: 26E-1501 av. McGill College, Montreal, Quebec, H3A 3N9, Canada
ChinaCHN1: Zhongkun Building, Room 612, Gaoliangqiaoxie Street, No. 59, Haidan District,
Beijing, 100044, ChinaCHN2: West Building of Administration Building, Xueyuan Road No. 38 Peking University
Health Science Center, Haidan District, Beijing, 100191, ChinaCHN3: Oriental Plaza, No. 1 East Chang An Ave, Tower W1, 7th Floor, Unit 1-7, Dong Cheng
District, Beijing, 100738, ChinaCHN4: Ping An International Finance Center, Room 1504, 15th Floor, Tower A-101, 3-24
floor, Xinyuan South Road, Chaoyang District, Beijing, 100027, ChinaCHN5: Unit 2480, Building 2, No. 7, Chuangxin Road, Science Park of Changping District,
Beijing, ChinaCHN6: Unit B1303-1 & 1305, 13F Center Plaza, 161 Linhe Road West, Tianhe District
Guangzhou, ChinaCHN7: 404 F4, No.9 Shangdi 9th Street, Haidian District, Beijing, 100085, ChinaCHN8: Room 5106, Raffle City, 268 Middle Xizang Road, Huangpu District, Shanghai,
200001, ChinaCHN9: Room A 100 of Room 0307, Floor 3, Building 3, 7 Middle Dongsanhuan road,
Chaoyang District, BeijingCHN10: Intercontinental Center, 42F, 100 Yutong Road, Zhabei District, Shanghai, 200070,
ChinaCHN11: Shenzhen International Chamber of Commerce Tower, Room 1801-1802, 1805,
Fuhua 3rd Road, Futian District, Shenzhen, 518048, ChinaCHN12: Room 319, 238 Jiangchangsan Road, Jing’an District, Shanghai, ChinaCHN13: Room 304, Sanlian Building, No.8, Huajing Road, Pudong District, Shanghai,
200070, ChinaCHN14: Building 2, Room No. 3895, Changjiang Avenue, No. 161, Changliang Farm,
Chongming County, Shanghai Municipality CHN15: FL2, No.979, Yunhan Road, Nicheng Town, Pudong New Area CHN16: Floor 2, No.979, Yunhan Road, Nicheng Town, Pudong New Area, ShanghaiCHN17: CHN18:
4/F Block C, No 999 Jingzhong Road, Changning District, Shanghai, ChinaRoom Jia301-22, No15, Lane152, Yanchang Road, Shanghai, China
ColombiaCOL1: Philippe Prietocarrizosa & Uria Abogados, Carrera 9 No. 74-08 Oficina 105, Bogotá,
d.c., 76600, Colombia
DenmarkDNK1: Niels Jernes Vej 10, 9220, Aalborg Øst, Denmark
Dubai, UAEUAE1: Office G-49, Building No 9, Dubai Media City, Post Box 502425, Dubai, United Arab
EmiratesUAE2: Al Sufouh Complex, Floor 3, No. 304, Dubai, United Arab Emirates
EgyptEGY1: Land Mark Office Building, 2nd Floor, 90th Street, City Center, 5th Settlement,
New Cairo, Cairo, Egypt
Registered officesFranceFRA1: 65, rue Camille Desmoulins, 92130, Issy les Moulineaux, FranceFRA2: Parc Euronord – 10, rue du Parc – 31150 BruguieresFRA3: 141 rue de Javel, 75015 ParisFRA4: 52 Quai de Dion Bouton 92800 PuteauxFRA5: Immeuble « Technopolis », 350 rue Georges Besse –Nîmes (30000)FRA6: 27-33 quai Alphonse Le Gallo, 92100, Boulogne-Billancourt, FranceFRA7: 6-8 Rue Chaptal, 75009 ParisFRA8: 151-155 Rue de Bercy, 75012 Paris, France
GermanyDEU1: Völklinger Strasse 4, 40219, Düsseldorf, GermanyDEU2:DEU3:
Leichlinger Street 14,40764,Langenfeld,GermanyTheodor-Heuss-Allee 108, D-60488, Frankfurt am Main, Hesse, Germany
DEU4: Hackerbrücke 6, 80335, Munich, GermanyDEU5: Heerdter Sandberg 30, 40549, Düsseldorf, GermanyDEU6: Steinhäuserstrasse 9, 76135, Karlsruhe, GermanyDEU7: Joseph-Schumpeter-Allee 33, 53227, Bonn
GreeceGRE1: 188A, Filolaou Str.,Athens, 11632, Greece
Hong KongHNK1: 20/F Alexandra House, 18 Chater Road, Central, Hong KongHNK2: Level 54 Hopewell Center, 183 Queens Road East (Tricor Office), Hong KongHNK3: Flat 1506, 15/F, Lucky Center, No. 165-171 Wan Chai Road, Wan Chai, Hong KongHNK4:HNK5:
11/F Oxford House, Taikoo Place, 979 King’s Road, Quarry Bay, Hong Kong3901, 39th Floor Hopewell Center, 183 Queens Road East, Wanchai, Hong Kong
IndiaIND1: 818, 8th Floor, Indraprakash Builing, 21 Barakhamba Road, New Delhi, 110001,
IndiaIND2: S21 Vatika Centre, No 471 Anna Salai, Taynampet, Chennai, 600035, IndiaIND3: 818, 8th Floor, Indraprakash Builing, 21 Barakhamba Road, New Delhi, 110001,
IndiaIND4: Unit no 03,04,05 first floor, Southern Park D2 Saket, New Delhi, South Delhi ,110017,
India IND5: 99/100, Prestige Towers Unit No. 505, Fifth Floor, Residency Road, Bangalore ,
Karnataka, 560025, IndiaIND6: #25, 3rd floor, 8th Main Road, Vasanthnager, Bangalore, 560052, IndiaIND7: B-602, Godrej coliseum, K. J. Hospital Road, Sion (E), Mumbai, 400 022, India
IndonesiaIDN1: Panorama Building, 5th Floor, Jalan Tomang Raya No. 63, Jakarta, 11440, IndonesiaIDN2: Menara Citicon Level 8. Unit 8011 & 8012 Jl. Letjen S. Parman No. 8 Kav 72 Slipi
Palmerah Jakarta Barat 11410 Indonesia
IrelandIRL1: 80 Harcourt Street, Dublin 2, IrelandIRL2:IRL3:
Suite 4320, Atlantic Avenue, Westpark Business Campus, Shannon, Clare, Ireland1st Floor The Grange Stillorgan Road, Blackrock, Co Dublin, Ireland
IsraelISR1: Meitar, attorneys at Law, 16 Abba Hillel Road, Ramat Gan, 5250608, Israel
ItalyITA1: Via Marostica 1, 20146, Milan, ItalyITA2: Studio Colombo e Associati, Via Cino del Duca 5, 20122, Milano, Italy
JapanJPN1: Kyodo Tsushin Kaikam 2F, 2-2-5 Toronomon, Minato-ku, Tokyo, 105-0001JPN2: Ark Mori Building, 1-12-32 Akasaka, Minato-ku, Tokyo, 107-6029, Japan JPN3: 1-9-15, Higashi Azabu, Minato-ku Tokyo JapanJPN4: Shinjuku-Nomura Bldg., 1-26-2 Nishi-shinjuku, Shinjuku-ku, Tokyo, JapanJPN5: 13-12 Rokubancho, Chiyoda-ku, Tokyo, JapanJPN6: 7F Cross Office Uchisaiwaicho, 1-18-6 Nishi-Shinbashi, Minato-ku, TokyoJPN7: 2-6, Kasumigaseki 3-chome, Chiyoda-ku, Tokyo
Korea (South)KOR1: Chunwoo Building, 4th floor, 534 Itaewon-dong, Yongsan-gu, Seoel, 140-861,
Korea, Republic ofKOR2: 206 Noksapyeong-daero, Yongsan-gu, Seoel, Korea, Republic ofKOR3: Room 4401, Trade Tower, 159-1, Samseong-dong, Gangnam-gu Seoul, 135-729,
Republic of KoreaKOR4: 1324 Block A Tera Tower II, 201, Songpa-daero, Songpa-gu, Seoul, 05854

174 RELX Annual report and financial statements 2019 | Financial statements and other information
Registered officesMalaysiaMYS1: 6th Floor, Akademi Etiqa, No. 23 Jalan Melaka, 50100 Kuala Lumpur, Malaysia
MexicoMEX1: Insurgentes Sur # 1388 Piso 8, Col. Actipan, Deleg. Benito Juarez, C.P. 03230 Ciudad
de México, México
MoroccoMAR1: 104 bis, Boulevard Abdelmoumen, 4 eme etage, Casablanca, Morocco
New ZealandNZL1: Level 1, 138 The Terrace, P.O. Box 472, Wellington 6011, New Zealand
PhilippinesPHL1: Building H, 2nd Floor, U.P. Ayalaland TechnoHub, Commonwealth Avenue, Quezon
City, Metro Manila, 1101, Philippines
PolandPOL1:POL2:
Sw. Antoniego 2/4 50-073, Wrocław,PolandNatpoll Building, ul. Migdalowa 4/59, 02-796, Warsaw, Poland
RussiaRUS1: 2-y Syromyatnichesky per.1, Delta Plaza business center, 105120, Moscow, Russian
FederationRUS2:
RUS3:
Petrozavodskaya street 28/4, Building VI, room 2, 125475, Moscow, Russian FederationKrasnykh Partizan st. 152, Office 505, 350049, Krasnodar, Russian Federation
Saudi ArabiaSAU1: Al Fadl Commercial Center, Jeddah, 21411, Saudi Arabia
SingaporeSGP1: 3 Killiney Road, #08-01 Winsland House 1, Singapore, 239119, SingaporeSGP2: 80 Robinson Road, #02-00, Singapore, 068898, SingaporeSGP3: 1 Changi Business Park Crescent, #06-01 Plaza 8 & CBP, Singapore, 48602551,
SingaporeSGP4:SGP5:
8 Robinson Road #03-00 ASO Building Singapore 048544120 Lower Delta Road #12-02, Cendex Centre, Singapore, 169208
South AfricaZAF1: Regus Brooklyn Bridge, 3rd Floor Steven House, Brooklyn Bridge Office Park,
Fehrsen Street, Brooklyn, PretoriaZAF2: Fourways Gold Park, 1st Floor – Wentworth Building, 32 Roos Street, Fourways,
2191, South AfricaZAF3: 215 Peter Mokaba Road (North Ridge Road), Morningside, Durban, Kwa-Zulu Natal,
4001, South Africa
SpainESP1: C/ Josep Tarradellas 20-30, 1º / 20029, Barcelona, Spain
SwitzerlandCHE1: Espace de L’Europe 3, 2002 Neuchatel, SwitzerlandCHE2: Regus Brooklyn Bridge, 3rd Floor Steven House Brooklyn, 570 Fehrsen Street,
0181, Brooklyn, Pretoria, Switzerland
TaiwanTWN1: Rm N818, 8F, Chia Hsin Building II, No.9 , Lane 3, Minsheng West Road, Taipei
10449, Taiwan
Registered officesThailandTHA1: Sathorn Nakorn Building, Floor 32, No. 100/68-69 North Sathon Road, Silom,
Bangrak, Bangkok, 10500, ThailandTHA2: 14th Floor, CTI Tower, 191/70-73 Ratchadapisek Road, Khwaeng Klongtoey, Khet,
Klongtoey, Bangkok, ThailandTHA3:THA4:
140/36, New ITF Tower, 17th Floor, Silom Road, Bangrak 10500, Bangkok, Thailand2 Ploenchit Centre, Room 7, Floor G., Sukhumvit Road, Klongtoey, Bangkok, 10110, Thailand
The NetherlandsNLD1: Radarweg 29, 1043 NX Amsterdam, NetherlandsNLD2: Galileiweg 8, 2333 BD Leiden, NetherlandsNLD3: Evert van de Beekstraat 1 The Base 3 / F, 1118CL SchipholNLD4: Prins Hendrikstraat 17, 7001GK DoetinchemNLD5: Spaklerweg 53, 1114 AE Amsterdam-Duivendrecht
TurkeyTUR1: Maslak Mah. Bilim Sokak Sun Plaza Kat:13 Şişli-Maslak, Istanbul, TurkeyTUR2: E - 5 Karayolu Üzeri, Gürpınar Kavşağı 34500, Büyükçekmece ,Istanbul, 34500,
TurkeyTUR3: Fulya Mah. Hakkı Yeten Cad. No:10/C, Selenium Plaza Kat:5,6 Fulya, Beşiktaş
İstanbul, Turkey
United KingdomGBR1: 1-3 Strand, London, WC2N 5JR, United KingdomGBR2: Quadrant House, The Quadrant, Sutton, Surrey, SM2 5AS, United KingdomGBR3: Gateway House 28 The Quadrant, Richmond, Surrey, TW9 1DN, United KingdomGBR4: Lexis House, 30 Farringdon Street, London, EC4A 4HH, United KingdomGBR5: Global Reach, Dunleavy Drive, Cardiff, CF11 0SN, United KingdomGBR6: The Eye, 1 Procter Street, London, WC1V 6EU, United KingdomGBR7: The Boulevard, Langford Lane, Kidlington, Oxford, OX5 1GB, United KingdomGBR8: 35 – 37 St. Marys Gate, Nottingham, United Kingdom, NG1 1PUGBR9: 1st Floor 80 Moorbridge Road, Maidenhead, Berkshire, SL6 8BW GBR10: 40 Kimbolton Road, Bedford, England, MK40 2NRGBR11: 1000 Lakeside, Western Road, Portsmouth, PO6 3EN, United KingdomGBR12: 5 Oakwood Drive, Loughborough, England, LE11 3QFGBR13: 28 The Quadrant, Richmond, Surrey, England, TW9 1DN
United StatesUSA1: 1007 Church Street, Evanston IL 60201USA2: 1000 Alderman Dr., Alpharetta, GA 30005USA3: 230 Park Ave, New York, NY 10169USA4: 1105 North Market St, Wilmington, DE 19801USA5: 3355 West Alabama Street, Houston, TX 77098USA6: Puerta Del Condado #1095, Wilson Ave, Local #3, San Juan, PR 00907USA7: 313 Washington Street, Suite 400, Newton, MA 02458USA8: 1209 Orange Street, Wilmington, DE 19801USA9: USA10:
9443 Springboro Pike, Miamisburg, OH 4534215633 Rising River PL N, San Diego, CA 92127-5100
VietnamVIE1: 2nd Floor, Kova Center, 92G-92H Nguyen Huu Canh Street, Ward no. 22, District.
Binh Thanh, Ho Chi Minh City, Vietnam
29 Related undertakings (continued)
Notes to the consolidated financial statementsfor the year ended 31 December 2019
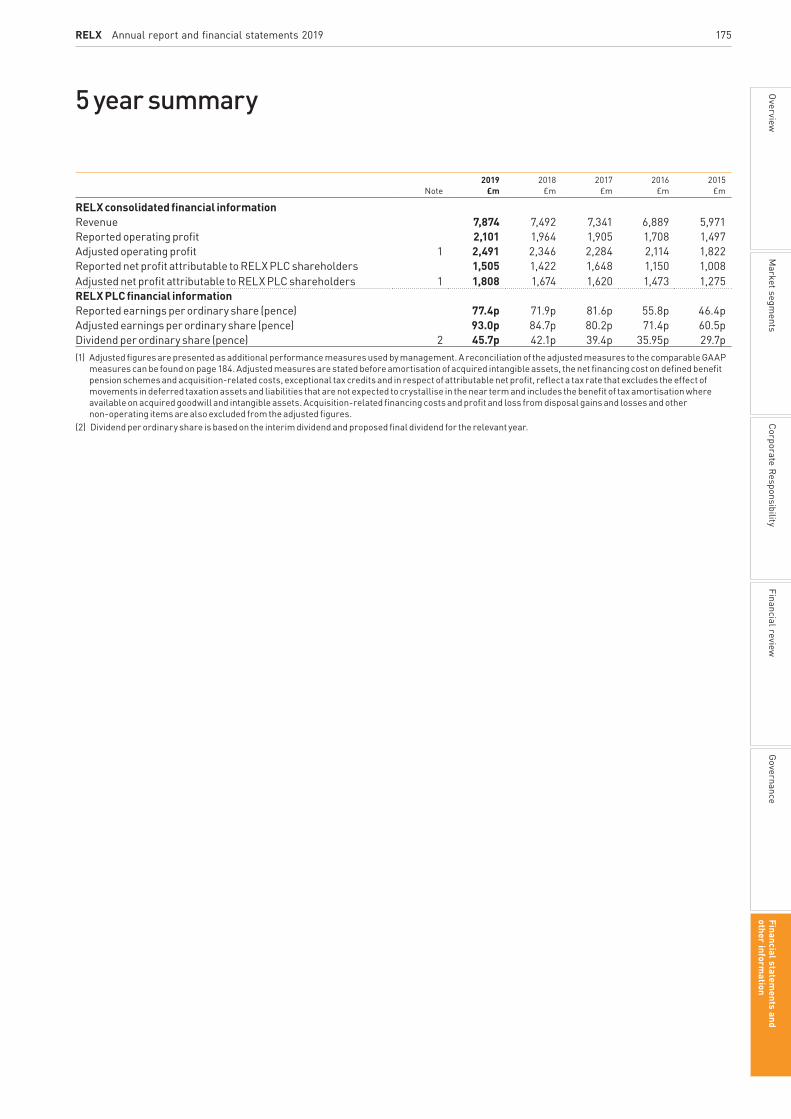
RELX Annual report and financial statements 2019 175M
arket segments
GovernanceFinancial statem
ents and other inform
ationFinancial review
Corporate ResponsibilityOverview
5 year summary
Note2019
£m2018
£m2017
£m2016
£m2015
£m
RELX consolidated financial informationRevenue 7,874 7,492 7,341 6,889 5,971Reported operating profit 2,101 1,964 1,905 1,708 1,497Adjusted operating profit 1 2,491 2,346 2,284 2,114 1,822Reported net profit attributable to RELX PLC shareholders 1,505 1,422 1,648 1,150 1,008Adjusted net profit attributable to RELX PLC shareholders 1 1,808 1,674 1,620 1,473 1,275RELX PLC financial information Reported earnings per ordinary share (pence) 77.4p 71.9p 81.6p 55.8p 46.4pAdjusted earnings per ordinary share (pence) 93.0p 84.7p 80.2p 71.4p 60.5pDividend per ordinary share (pence) 2 45.7p 42.1p 39.4p 35.95p 29.7p(1) Adjusted figures are presented as additional performance measures used by management. A reconciliation of the adjusted measures to the comparable GAAP
measures can be found on page 184. Adjusted measures are stated before amortisation of acquired intangible assets, the net financing cost on defined benefit pension schemes and acquisition-related costs, exceptional tax credits and in respect of attributable net profit, reflect a tax rate that excludes the effect of movements in deferred taxation assets and liabilities that are not expected to crystallise in the near term and includes the benefit of tax amortisation where available on acquired goodwill and intangible assets. Acquisition-related financing costs and profit and loss from disposal gains and losses and other non-operating items are also excluded from the adjusted figures.
(2) Dividend per ordinary share is based on the interim dividend and proposed final dividend for the relevant year.

176 RELX Annual report and financial statements 2019 | Financial statements and other information

In this section178 RELX PLC statement of financial position179 RELX PLC statement of changes in equity179 RELX PLC accounting policies180 Notes to the RELX PLC financial statements
RELX PLCAnnual Report andFinancial Statements
RELX Annual report and financial statements 2019 177177Financial statem
ents and other inform
ationM
arket segments
GovernanceFinancial review
Corporate ResponsibilityOverview

178 RELX Annual report and financial statements 2019 | Financial statements and other information
RELX PLC statement of financial position
AS AT 31 DECEMBERNote
2019£m
2018£m
Non-current assetsInvestments in subsidiary undertakings 1 18,318 18,314Investments in joint ventures 1 – –
18,318 18,314Current assetsCash and cash equivalents – 1Trade and other receivables – 1Receivables: amounts due from subsidiary undertakings 1,662 1,536Total assets 19,980 19,852
Current liabilitiesTaxation – 4Other payables 102 109
102 113Net assets 19,878 19,739
Capital and reservesShare capital 286 290Share premium 1,443 1,415Shares held in treasury (739) (643)Capital redemption reserve 36 31Other reserves 168 164Merger reserve 11,150 15,150Net profit 1,548 2,063Reserves 5,986 1,269Shareholders’ equity 19,878 19,739
The RELX PLC Company financial statements were approved by the Board of Directors and authorised for issue on 12 February 2020. They were signed on its behalf by:
A J Habgood N L LuffChair Chief Financial Officer
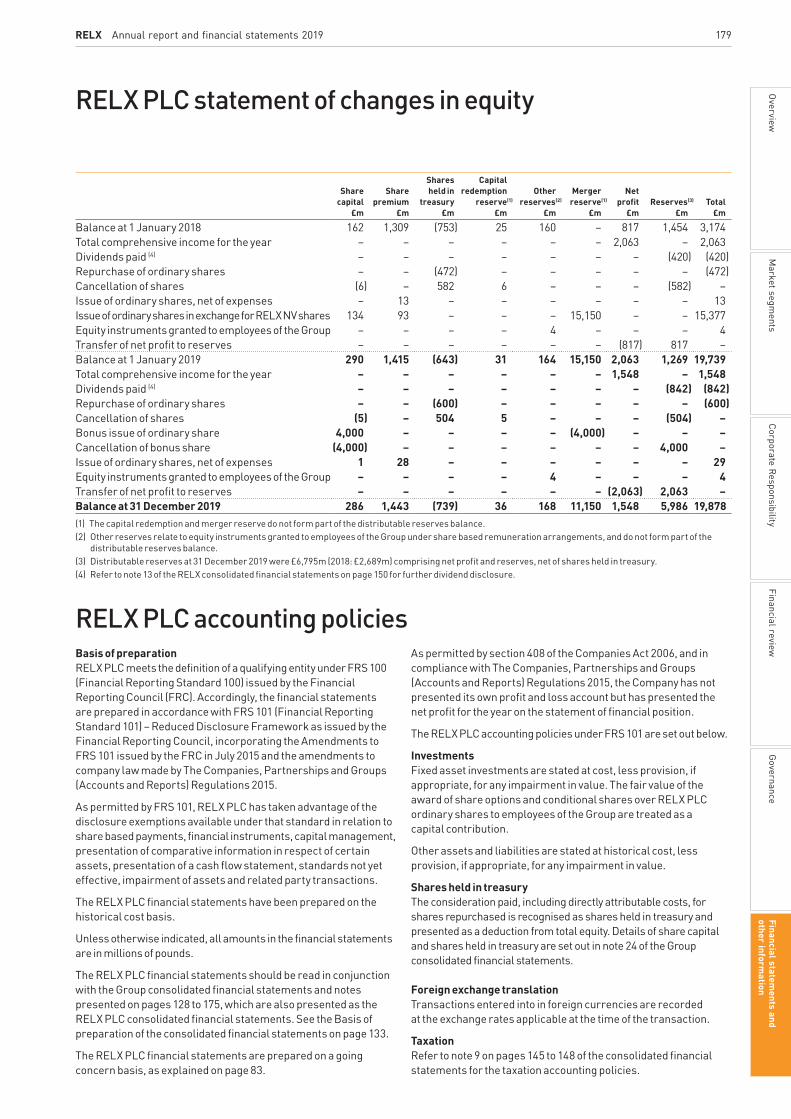
179RELX Annual report and financial statements 2019
RELX PLC statement of changes in equity
Sharecapital
£m
Share premium
£m
Sharesheld in
treasury£m
Capitalredemption
reserve(1)
£m
Otherreserves(2)
£m
Merger reserve(1)
£m
Net profit
£mReserves(3)
£mTotal
£m
Balance at 1 January 2018 162 1,309 (753) 25 160 – 817 1,454 3,174Total comprehensive income for the year – – – – – – 2,063 – 2,063Dividends paid (4) – – – – – – – (420) (420)Repurchase of ordinary shares – – (472) – – – – – (472)Cancellation of shares (6) – 582 6 – – – (582) –Issue of ordinary shares, net of expenses – 13 – – – – – – 13Issue of ordinary shares in exchange for RELX NV shares 134 93 – – – 15,150 – – 15,377Equity instruments granted to employees of the Group – – – – 4 – – – 4Transfer of net profit to reserves – – – – – – (817) 817 –Balance at 1 January 2019 290 1,415 (643) 31 164 15,150 2,063 1,269 19,739Total comprehensive income for the year – – – – – – 1,548 – 1,548Dividends paid (4) – – – – – – – (842) (842)Repurchase of ordinary shares – – (600) – – – – – (600)Cancellation of shares (5) – 504 5 – – – (504) –Bonus issue of ordinary share 4,000 – – – – (4,000) – – –Cancellation of bonus share (4,000) – – – – – – 4,000 –Issue of ordinary shares, net of expenses 1 28 – – – – – – 29Equity instruments granted to employees of the Group – – – – 4 – – – 4Transfer of net profit to reserves – – – – – – (2,063) 2,063 –Balance at 31 December 2019 286 1,443 (739) 36 168 11,150 1,548 5,986 19,878(1) The capital redemption and merger reserve do not form part of the distributable reserves balance.(2) Other reserves relate to equity instruments granted to employees of the Group under share based remuneration arrangements, and do not form part of the
distributable reserves balance.(3) Distributable reserves at 31 December 2019 were £6,795m (2018: £2,689m) comprising net profit and reserves, net of shares held in treasury.(4) Refer to note 13 of the RELX consolidated financial statements on page 150 for further dividend disclosure.
RELX PLC accounting policiesBasis of preparationRELX PLC meets the definition of a qualifying entity under FRS 100 (Financial Reporting Standard 100) issued by the Financial Reporting Council (FRC). Accordingly, the financial statements are prepared in accordance with FRS 101 (Financial Reporting Standard 101) – Reduced Disclosure Framework as issued by the Financial Reporting Council, incorporating the Amendments to FRS 101 issued by the FRC in July 2015 and the amendments to company law made by The Companies, Partnerships and Groups (Accounts and Reports) Regulations 2015.
As permitted by FRS 101, RELX PLC has taken advantage of the disclosure exemptions available under that standard in relation to share based payments, financial instruments, capital management, presentation of comparative information in respect of certain assets, presentation of a cash flow statement, standards not yet effective, impairment of assets and related party transactions.
The RELX PLC financial statements have been prepared on the historical cost basis.
Unless otherwise indicated, all amounts in the financial statements are in millions of pounds.
The RELX PLC financial statements should be read in conjunction with the Group consolidated financial statements and notes presented on pages 128 to 175, which are also presented as the RELX PLC consolidated financial statements. See the Basis of preparation of the consolidated financial statements on page 133.
The RELX PLC financial statements are prepared on a going concern basis, as explained on page 83.
As permitted by section 408 of the Companies Act 2006, and in compliance with The Companies, Partnerships and Groups (Accounts and Reports) Regulations 2015, the Company has not presented its own profit and loss account but has presented the net profit for the year on the statement of financial position.
The RELX PLC accounting policies under FRS 101 are set out below.
InvestmentsFixed asset investments are stated at cost, less provision, if appropriate, for any impairment in value. The fair value of the award of share options and conditional shares over RELX PLC ordinary shares to employees of the Group are treated as a capital contribution.
Other assets and liabilities are stated at historical cost, less provision, if appropriate, for any impairment in value.
Shares held in treasury The consideration paid, including directly attributable costs, for shares repurchased is recognised as shares held in treasury and presented as a deduction from total equity. Details of share capital and shares held in treasury are set out in note 24 of the Group consolidated financial statements.
Foreign exchange translationTransactions entered into in foreign currencies are recorded at the exchange rates applicable at the time of the transaction.
TaxationRefer to note 9 on pages 145 to 148 of the consolidated financial statements for the taxation accounting policies.
Market segm
entsGovernance
Financial statements and
other information
Financial reviewCorporate Responsibility
Overview
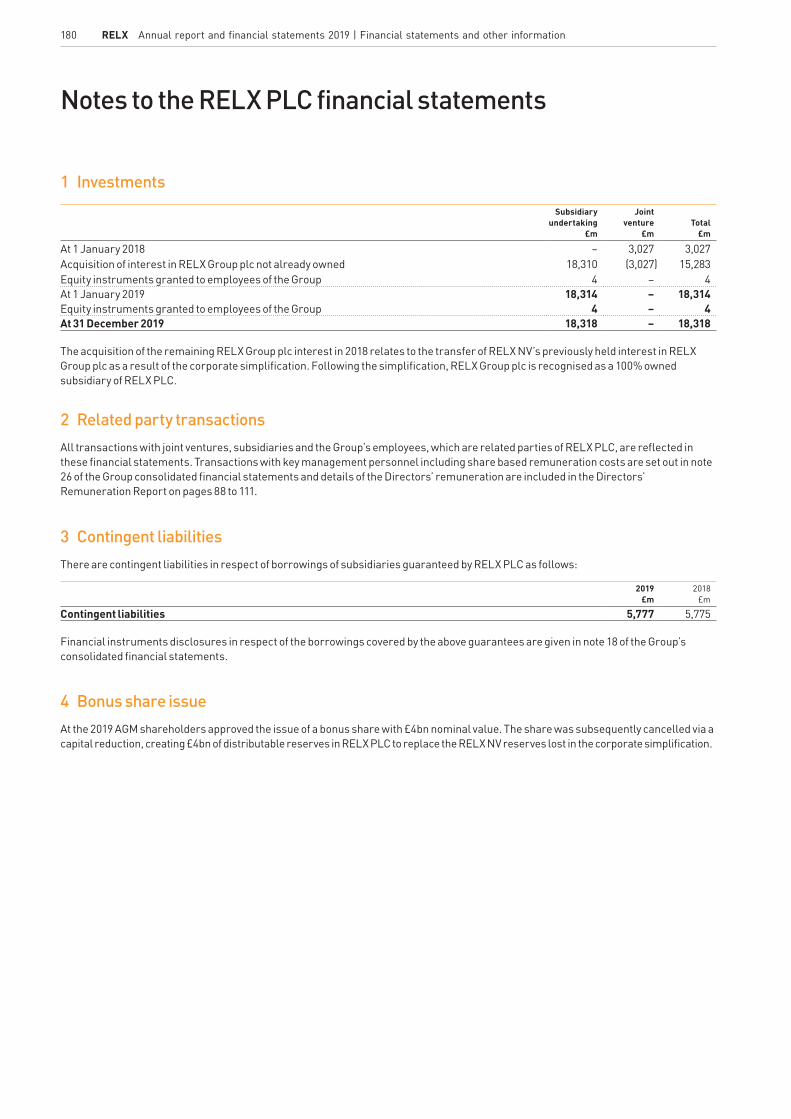
180 RELX Annual report and financial statements 2019 | Financial statements and other information
1 InvestmentsSubsidiary
undertaking£m
Jointventure
£mTotal
£m
At 1 January 2018 – 3,027 3,027Acquisition of interest in RELX Group plc not already owned 18,310 (3,027) 15,283Equity instruments granted to employees of the Group 4 – 4At 1 January 2019 18,314 – 18,314Equity instruments granted to employees of the Group 4 – 4At 31 December 2019 18,318 – 18,318
The acquisition of the remaining RELX Group plc interest in 2018 relates to the transfer of RELX NV’s previously held interest in RELX Group plc as a result of the corporate simplification. Following the simplification, RELX Group plc is recognised as a 100% owned subsidiary of RELX PLC.
2 Related party transactionsAll transactions with joint ventures, subsidiaries and the Group’s employees, which are related parties of RELX PLC, are reflected in these financial statements. Transactions with key management personnel including share based remuneration costs are set out in note 26 of the Group consolidated financial statements and details of the Directors’ remuneration are included in the Directors’ Remuneration Report on pages 88 to 111.
3 Contingent liabilitiesThere are contingent liabilities in respect of borrowings of subsidiaries guaranteed by RELX PLC as follows:
2019£m
2018£m
Contingent liabilities 5,777 5,775
Financial instruments disclosures in respect of the borrowings covered by the above guarantees are given in note 18 of the Group’s consolidated financial statements.
4 Bonus share issueAt the 2019 AGM shareholders approved the issue of a bonus share with £4bn nominal value. The share was subsequently cancelled via a capital reduction, creating £4bn of distributable reserves in RELX PLC to replace the RELX NV reserves lost in the corporate simplification.
Notes to the RELX PLC financial statements

181Financial statem
ents and other inform
ationM
arket segments
GovernanceFinancial review
Corporate ResponsibilityOverviewOther financial
informationIn this section182 Summary financial information in euros183 Summary financial information in US dollars184 Reconciliation of adjusted to GAAP measures
RELX Annual report and financial statements 2019
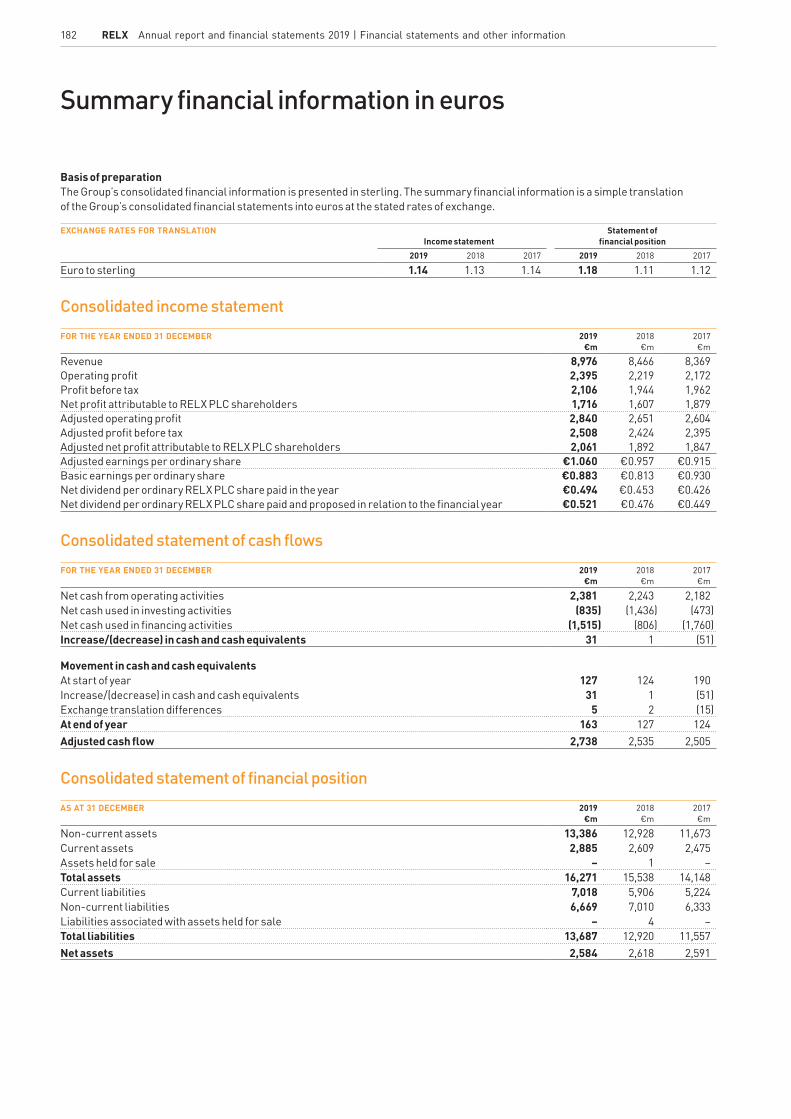
Summary financial information in euros
Basis of preparationThe Group’s consolidated financial information is presented in sterling. The summary financial information is a simple translation of the Group’s consolidated financial statements into euros at the stated rates of exchange.
EXCHANGE RATES FOR TRANSLATIONIncome statement
Statement of financial position
2019 2018 2017 2019 2018 2017
Euro to sterling 1.14 1.13 1.14 1.18 1.11 1.12
Consolidated income statementFOR THE YEAR ENDED 31 DECEMBER 2019
€m2018
€m2017
€m
Revenue 8,976 8,466 8,369Operating profit 2,395 2,219 2,172Profit before tax 2,106 1,944 1,962Net profit attributable to RELX PLC shareholders 1,716 1,607 1,879Adjusted operating profit 2,840 2,651 2,604Adjusted profit before tax 2,508 2,424 2,395Adjusted net profit attributable to RELX PLC shareholders 2,061 1,892 1,847Adjusted earnings per ordinary share €1.060 €0.957 €0.915Basic earnings per ordinary share €0.883 €0.813 €0.930Net dividend per ordinary RELX PLC share paid in the year €0.494 €0.453 €0.426Net dividend per ordinary RELX PLC share paid and proposed in relation to the financial year €0.521 €0.476 €0.449
Consolidated statement of cash flowsFOR THE YEAR ENDED 31 DECEMBER 2019
€m2018
€m2017
€m
Net cash from operating activities 2,381 2,243 2,182Net cash used in investing activities (835) (1,436) (473)Net cash used in financing activities (1,515) (806) (1,760)Increase/(decrease) in cash and cash equivalents 31 1 (51)
Movement in cash and cash equivalentsAt start of year 127 124 190Increase/(decrease) in cash and cash equivalents 31 1 (51)Exchange translation differences 5 2 (15)At end of year 163 127 124Adjusted cash flow 2,738 2,535 2,505
Consolidated statement of financial positionAS AT 31 DECEMBER 2019
€m2018
€m2017
€m
Non-current assets 13,386 12,928 11,673Current assets 2,885 2,609 2,475Assets held for sale – 1 –Total assets 16,271 15,538 14,148Current liabilities 7,018 5,906 5,224Non-current liabilities 6,669 7,010 6,333Liabilities associated with assets held for sale – 4 –Total liabilities 13,687 12,920 11,557Net assets 2,584 2,618 2,591
182 RELX Annual report and financial statements 2019 | Financial statements and other information

Summary financial information in US dollars
Basis of preparationThe Group’s consolidated financial information is presented in sterling. The summary financial information is a simple translation of the Group’s consolidated financial statements into US dollars at the stated rates of exchange. It does not represent a restatement under US GAAP which would be different in some significant respects.
EXCHANGE RATES FOR TRANSLATIONIncome statement
Statement of financial position
2019 2018 2017 2019 2018 2017
US dollars to sterling 1.28 1.34 1.29 1.33 1.27 1.35
Consolidated income statementFOR THE YEAR ENDED 31 DECEMBER 2019
US$m2018
US$m2017
US$m
Revenue 10,079 10,039 9,470Operating profit 2,689 2,632 2,457Profit before tax 2,364 2,305 2,220Net profit attributable to RELX PLC shareholders 1,926 1,905 2,126Adjusted operating profit 3,188 3,144 2,946Adjusted profit before tax 2,816 2,874 2,710Adjusted net profit attributable to RELX PLC shareholders 2,314 2,243 2,090Adjusted earnings per American Depositary Share (ADS) $1.191 $1.134 $1.035Basic earnings per ADS $0.991 $0.963 $1.053Net dividend per RELX PLC ADS paid in the year $0.554 $0.537 $0.482Net dividend per RELX PLC ADS paid and proposed in relation to the financial year $0.585 $0.564 $0.508
Consolidated statement of cash flowsFOR THE YEAR ENDED 31 DECEMBER 2019
US$m2018
US$m2017
US$m
Net cash from operating activities 2,674 2,660 2,469Net cash used in investing activities (938) (1,703) (535)Net cash used in financing activities (1,701) (956) (1,992)Increase/(decrease) in cash and cash equivalents 35 1 (58)
Movement in cash and cash equivalentsAt start of year 145 150 199Increase/(decrease) in cash and cash equivalents 35 1 (58)Exchange translation differences 4 (6) 9At end of year 184 145 150Adjusted cash flow 3,075 3,006 2,834
Consolidated statement of financial positionAS AT 31 DECEMBER 2019
US$m2018
US$m2017
US$m
Non-current assets 15,088 14,792 14,070Current assets 3,252 2,986 2,984Assets held for sale – 1 –Total assets 18,340 17,779 17,054Current liabilities 7,910 6,758 6,296Non-current liabilities 7,517 8,020 7,635Liabilities associated with assets held for sale – 5 –Total liabilities 15,427 14,783 13,931Net assets 2,913 2,996 3,123
183RELX Annual report and financial statements 2019M
arket segments
GovernanceFinancial statem
ents and other inform
ationFinancial review
Corporate ResponsibilityOverview

The Group uses adjusted figures, which are not defined by generally accepted accounting principles (‘GAAP’) such as IFRS, as additional performance measures. These measures are used by management, alongside the comparable GAAP measures, in evaluating the business performance. The measures may not be comparable to similarly reported measures by other companies.
A reconciliation of non-GAAP measures to relevant GAAP measures is as follows:
YEAR ENDED 31 DECEMBER 2019£m
2018£m
Operating profit 2,101 1,964Adjustments: Amortisation of acquired intangible assets 295 288 Acquisition-related costs 84 84 Reclassification of tax in joint ventures 12 11 Reclassification of finance income in joint ventures (1) (1)Adjusted operating profit 2,491 2,346
Profit before tax 1,847 1,720Adjustments: Amortisation of acquired intangible assets 295 288 Acquisition-related costs 84 84 Reclassification of tax in joint ventures 12 11 Net interest on net defined benefit pension obligation and other 13 9 Disposals and other non-operating items (51) 33Adjusted profit before tax 2,200 2,145
Tax charge (338) (292)Adjustments: Deferred tax movements on goodwill and acquired intangible assets 26 34 Tax on acquisition-related costs (15) (13) Reclassification of tax in joint ventures (12) (11) Tax on net interest on net defined benefit pension obligation and other (3) (2) Tax on disposals and other non-operating items 11 (14) Other deferred tax credits from intangible assets* (57) (55) Exceptional tax credit** – (112)Adjusted tax charge (388) (465)
Net profit attributable to RELX PLC shareholders 1,505 1,422Adjustments (post-tax): Amortisation of acquired intangible assets 321 322 Acquisition-related costs 69 71 Net interest on net defined benefit pension obligation and other 10 7 Disposals and other non-operating items (40) 19 Other deferred tax credits from intangible assets* (57) (55) Exceptional tax credit** – (112)Adjusted net profit attributable to RELX PLC shareholders 1,808 1,674
Cash generated from operations 2,724 2,555Adjustments: Dividends received from joint ventures 34 30 Purchases of property, plant and equipment (47) (56) Proceeds from disposals of property, plant and equipment 2 4 Expenditure on internally developed intangible assets (333) (306) Payments in relation to acquisition-related costs 63 77 Pension recovery payment 44 20 Repayment of lease principal (86) (82) Sublease payments received 1 1Adjusted cash flow 2,402 2,243* Movements on deferred tax liabilities arising on acquired intangible assets that do not qualify for tax amortisation. ** In 2018 relates to the substantial resolution of certain prior year tax matters and deferred tax effect of tax rate reductions in the Netherlands and US.
Reconciliation of adjusted to GAAP measures
184 RELX Annual report and financial statements 2019 | Financial statements and other information

185RELX Annual report and financial statements 2019
Shareholder informationIn this section186 Shareholder information188 Shareholder information and contactsIBC 2020 financial calendar
Market segm
entsGovernance
Financial statements and
other information
Financial reviewCorporate Responsibility
Overview
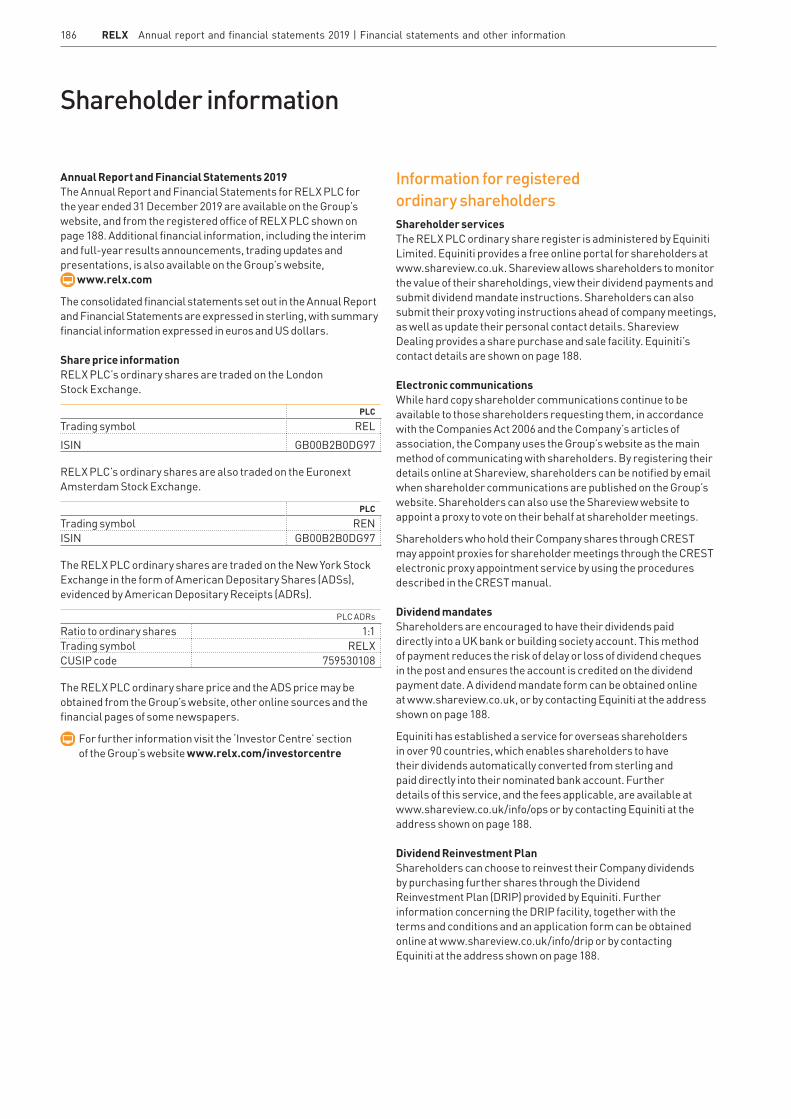
186 RELX Annual report and financial statements 2019 | Financial statements and other information
Shareholder information
Annual Report and Financial Statements 2019The Annual Report and Financial Statements for RELX PLC for the year ended 31 December 2019 are available on the Group’s website, and from the registered office of RELX PLC shown on page 188. Additional financial information, including the interim and full-year results announcements, trading updates and presentations, is also available on the Group’s website,
www.relx.com
The consolidated financial statements set out in the Annual Report and Financial Statements are expressed in sterling, with summary financial information expressed in euros and US dollars.
Share price information RELX PLC’s ordinary shares are traded on the London Stock Exchange.
PLC
Trading symbol RELISIN GB00B2B0DG97
RELX PLC’s ordinary shares are also traded on the Euronext Amsterdam Stock Exchange.
PLC
Trading symbol RENISIN GB00B2B0DG97
The RELX PLC ordinary shares are traded on the New York Stock Exchange in the form of American Depositary Shares (ADSs), evidenced by American Depositary Receipts (ADRs).
PLC ADRs
Ratio to ordinary shares 1:1Trading symbol RELXCUSIP code 759530108
The RELX PLC ordinary share price and the ADS price may be obtained from the Group’s website, other online sources and the financial pages of some newspapers.
For further information visit the ‘Investor Centre’ section of the Group’s website www.relx.com/investorcentre
Information for registered ordinary shareholdersShareholder services The RELX PLC ordinary share register is administered by Equiniti Limited. Equiniti provides a free online portal for shareholders at www.shareview.co.uk. Shareview allows shareholders to monitor the value of their shareholdings, view their dividend payments and submit dividend mandate instructions. Shareholders can also submit their proxy voting instructions ahead of company meetings, as well as update their personal contact details. Shareview Dealing provides a share purchase and sale facility. Equiniti’s contact details are shown on page 188.
Electronic communications While hard copy shareholder communications continue to be available to those shareholders requesting them, in accordance with the Companies Act 2006 and the Company’s articles of association, the Company uses the Group’s website as the main method of communicating with shareholders. By registering their details online at Shareview, shareholders can be notified by email when shareholder communications are published on the Group’s website. Shareholders can also use the Shareview website to appoint a proxy to vote on their behalf at shareholder meetings.
Shareholders who hold their Company shares through CREST may appoint proxies for shareholder meetings through the CREST electronic proxy appointment service by using the procedures described in the CREST manual.
Dividend mandates Shareholders are encouraged to have their dividends paid directly into a UK bank or building society account. This method of payment reduces the risk of delay or loss of dividend cheques in the post and ensures the account is credited on the dividend payment date. A dividend mandate form can be obtained online at www.shareview.co.uk, or by contacting Equiniti at the address shown on page 188.
Equiniti has established a service for overseas shareholders in over 90 countries, which enables shareholders to have their dividends automatically converted from sterling and paid directly into their nominated bank account. Further details of this service, and the fees applicable, are available at www.shareview.co.uk/info/ops or by contacting Equiniti at the address shown on page 188.
Dividend Reinvestment Plan Shareholders can choose to reinvest their Company dividends by purchasing further shares through the Dividend Reinvestment Plan (DRIP) provided by Equiniti. Further information concerning the DRIP facility, together with the terms and conditions and an application form can be obtained online at www.shareview.co.uk/info/drip or by contacting Equiniti at the address shown on page 188.

187RELX Annual report and financial statements 2019 | Shareholder information
Share dealing service A telephone and internet dealing service is available through Equiniti, which provides a simple way for UK resident shareholders to buy or sell their shares. For telephone dealing call 0345 603 7037 between 8.30am and 5.30pm (UK time), Monday to Friday (excluding public holidays in England and Wales), and for internet dealing log on to www.shareview.co.uk/dealing. You will need your shareholder reference number shown on your dividend confirmation.
ShareGift The Orr Mackintosh Foundation operates a charity share donation scheme for shareholders with small parcels of shares whose value makes it uneconomic to sell them. Details of the scheme can be obtained from the ShareGift website at www.sharegift.org, or by telephoning ShareGift on 020 7930 3737.
Sub-division of ordinary shares and share consolidation On 28 July 1986, each RELX PLC ordinary share of £1 nominal value was sub-divided into four ordinary shares of 25p each. On 2 May 1997, each 25p ordinary share was sub-divided into two ordinary shares of 12.5p each. On 7 January 2008, the ordinary shares of 12.5p each were consolidated on the basis of 58 new ordinary shares of 1451⁄116p nominal value for every 67 ordinary shares of 12.5p each held.
Capital gains tax The mid-market price of RELX PLC’s £1 ordinary shares on 31 March 1982 was 282p. Adjusting for the sub-divisions and share consolidation referred to above results in an equivalent mid-market price of 40.72p for each existing ordinary share of 1451⁄116p nominal value.
Warning to shareholders – unsolicited investment advice§§ From time to time shareholders may receive unsolicited calls
from fraudsters
§§ Fraudsters use persuasive and high-pressure tactics to lure investors into scams, sometimes known as boiler room scams
§§ They may offer to sell shares that turn out to be worthless or non-existent, or to buy shares at an inflated price in return for an upfront payment
§§ While high profits are promised, if you buy or sell shares in this way you will probably lose your money
§§ Thousands of people contact the Financial Conduct Authority about investment fraud each year, with victims losing an average of £32,000
How to avoid share fraud and boiler room scams The Financial Conduct Authority (FCA) has issued some guidance on how to recognise and avoid investment fraud:
§§ Legitimate firms authorised by the FCA are unlikely to contact you unexpectedly with an offer to buy or sell shares
§§ If you receive an unsolicited phone call, do not get into a conversation, note the name of the person and firm contacting you and then end the call
§§ Check the Financial Services Register available at https://register.fca.org.uk/ to see if the person and firm contacting you is authorised by the FCA. If you wish to call the person or firm back, only use the contact details listed on the Register
§§ Call the FCA on 0800 111 6768 if the firm does not have any contact details on the Register, or if you are told that they are out of date
§§ Search the list of unauthorised firms to avoid at https://www.fca.org.uk/consumers/unauthorised-firms-individuals#list
§§ If you do buy or sell shares through an unauthorised firm, you will not have access to the Financial Ombudsman Service or the Financial Services Compensation Scheme
§§ Consider obtaining independent financial and professional advice before you hand over any money. If it sounds too good to be true, it probably is.
How to report a scam If you are approached by fraudsters, please tell the FCA using the share fraud reporting form at www.fca.org.uk/consumers/report-scam-unauthorised-firm, where you can find out more about investment scams. You can also call the FCA Consumer Helpline on 0800 111 6768.
If you have already paid money to share fraudsters, you should contact Action Fraud on 0300 123 2040 or use their online tool: http://www.actionfraud.police.uk/report_fraud
Market segm
entsGovernance
Financial statements and
other information
Financial reviewCorporate Responsibility
Overview

188 RELX Annual report and financial statements 2019 | Financial statements and other information
Shareholder information and contacts
Information for holders of ordinary shares held through Euroclear NederlandShareholders with enquiries concerning RELX PLC ordinary shares that are not held directly on the Register of Members and are ultimately held through Nederlands Centraal Instituut voor Giraal Effectenverkeer BV (Euroclear Nederland) should direct their enquiries to the broker, financial intermediary, bank or other financial institution that holds the shares on their behalf.
Dividend Reinvestment PlanShareholders can choose to reinvest their dividends by purchasing shares through the Dividend Reinvestment Plan (DRIP) provided by ABN AMRO Bank NV. Further information concerning the DRIP facility can be obtained online at www.securitiesinfo.com.
Information for ADR holdersADR shareholder services Enquiries concerning RELX PLC ADRs should be addressed to the ADR Depositary, Citibank NA, at the address shown below. Dividend payments on RELX PLC ADRs are converted into US dollars by the ADR Depositary.
Annual Report on Form 20-F The RELX Annual Report on Form 20-F is filed electronically with the United States Securities and Exchange Commission. A copy of the Form 20-F is available on the Group’s website, or from the ADR Depositary at the address shown below.
Dividend currency electionsShareholders appearing on the Register of Members or holding their shares through CREST will continue to receive their dividends in Pounds Sterling, but will have the option to elect to receive their dividends in Euro. Euro payments will be made by cheque only.
Shareholders who appear on the Register of Members and wish to receive their dividend in Euro should contact our Registrar, Equiniti on 0371 384 2960 (UK) or +44 (0) 121 415 0165 (from outside the UK) for a dividend election form and further information regarding the Euro dividend option. Alternatively, shareholders can view and update their current dividend elections by registering for a Shareview Portfolio at www.shareview.co.uk/register.
Shareholders who hold their shares through CREST and wish to receive their dividend in Euro, must do so by following the CREST Elections process.
Shareholders who hold RELX PLC shares through Euroclear Nederland (via banks and brokers), will automatically receive their dividends in Euro, but will have the option to elect to receive their dividends in Pounds Sterling.
Shareholders who hold their shares through Euroclear Nederland and wish to receive their dividends in Pounds Sterling should contact their broker, financial intermediary, bank or other financial institution that holds the shares on their behalf.
ContactsRELX PLC Head Office and Registered Office 1-3 Strand London WC2N 5JR United Kingdom Tel: +44 (0)20 7166 5500 Fax: +44 (0)20 7166 5799
Auditors Ernst & Young LLP 1 More London Place London SE1 2AF United Kingdom
Registrar Equiniti Limited Aspect House Spencer Road Lancing BN99 6DA West Sussex United Kingdom
www.shareview.co.uk
Tel: 0371 384 2960 (UK callers) Tel: +44 121 415 0165 (callers outside the UK)
Listing/paying agent for shares listed on Euronext Amsterdam held through Euroclear NederlandABN AMRO Bank NV Department Corporate Broking and Issuer Services HQ7212Gustav Mahlerlaan 10 1082 PP Amsterdam The Netherlands
Email: [email protected]
www.securitiesinfo.com
RELX PLC ADR Depositary Citibank Depositary Receipt Services PO Box 43077 Providence, RI 02940-3077 USA
www.citi.com/dr
Email: [email protected] Tel: +1 877 248 4327 +1 781 575 4555 (callers outside the US)

CreditsDesigned and produced byConran Design Group Board photography by Douglas Fry, Piranha Photography Printed by Pureprint Group, ISO14001, FSC® certified and CarbonNeutral®
Printed on Revive 100 Silk which is made from 100% recovered waste. All of the pulp is bleached using an elemental chlorine free process (ECF). Printed in the UK by Pureprint using their environmental printing technology; vegetable inks were used throughout. Pureprint is a CarbonNeutral® company. Both manufacturing mill and printer are ISO14001 registered and are Forest Stewardship Council® (FSC) chain-of-custody certified.
2020 financial calendar
13 February Results announcement for the year ended 31 December 2019 23 April Trading update issued in relation to the 2020 financial year 23 April Annual General Meeting – Amba Hotel , Strand, London WC2N 5HX24 April Ex-dividend date – 2019 final dividend, ordinary shares and ADRs 27 April Record date – 2019 final dividend, ordinary shares and ADRs 13 May Dividend currency and DRIP election deadline18 May Euro dividend equivalent announcement28 May Payment date – 2019 final dividend, ordinary shares 2 June Payment date – 2019 final dividend, ADRs 23 July Interim results announcement for the six months to 30 June 2020 30 July* Ex-dividend date – 2020 interim dividend, ordinary shares and ADRs 31 July* Record date – 2020 interim dividend, ordinary shares and ADRs
* Please note that these dates are provisional and subject to change. The 2020 Interim Dividend payment dates in respect of ordinary shares and ADRs will be confirmed by the Company in its 2020 Interim Results announcement, currently scheduled for release on 23 July 2020.
Dividend historyThe following tables set out dividends paid (or proposed) in relation to the three financial years 2017–2019.
ORDINARY SHARES pence per PLC ordinary share Payment date
Final dividend for 2019** 32.10 28 May 2020Interim dividend for 2019 13.60 2 September 2019Final dividend for 2018 29.70 4 June 2019Interim dividend for 2018 12.40 24 August 2018Final dividend for 2017 27.70 22 May 2018Interim dividend for 2017 11.70 25 August 2017**Proposed dividend, to be submitted for approval at the Annual General Meeting of RELX PLC in April 2020
ADRS $ per PLC ADR Payment date
Final Dividend for 2019*** *** 2 June 2020Interim Dividend for 2019 0.16398 5 September 2019Final Dividend for 2018 0.37612 7 June 2019Interim Dividend for 2018 0.15914 29 August 2018Final dividend for 2017 0.37159 25 May 2018Interim dividend for 2017 0.15085 30 August 2017***Payment will be determined using the appropriate £/US$ exchange rate on 28 May 2020.

Annual Report and Financial Statements 2019
www.relx.com