annual report and audited accounts - title (40–50 characters)
514
ANNUAL REPORT AND AUDITED ACCOUNTS BLACKROCK STRATEGIC FUNDS (BSF) R.C.S. LUXEMBOURG: B 127481 31 MAY 2016
-
Upload
khangminh22 -
Category
Documents
-
view
59 -
download
0
Transcript of annual report and audited accounts - title (40–50 characters)

TITLE (40–50 CHARACTERS)SUBTITLE (40-50 CHARACTERS)
ANNUAL REPORT AND AUDITED ACCOUNTSBLACKROCK STRATEGIC FUNDS (BSF) R.C.S. LUXEMBOURG: B 127481
31 MAY 2016


Annual Report and Audited Accounts 1
Subscriptions can only be made on the basis of the current Prospectus, the Key Investor Information Document (“KIID”) supplemented by the most recent annual report and audited accounts and unaudited
interim report and accounts, if published after such annual report. Copies are available from the Local Investor Servicing team, the Transfer Agent, the Management Company or any of the Distributors.
ContentsBSF Chairman’s Letter to Shareholders 2
BSF Investment Adviser’s Report 4
Directors’ Report 8
Report on Remuneration 12
Board of Directors 15
Management and Administration 15
Statement of Net Assets 17
Three Year Summary of Net Asset Values 23
Statement of Operations and Changes in Net Assets 30
Statement of Changes in Shares Outstanding 36
Portfolio of Investments 42BlackRock Americas Diversified Equity Absolute Return Fund 42
BlackRock Asia Extension Fund 112
BlackRock Emerging Markets Absolute Return Fund 121
BlackRock Emerging Markets Allocation Fund 124
BlackRock Emerging Markets Equity Strategies Fund 141
BlackRock Emerging Markets Flexi Dynamic Bond Fund 143
BlackRock Euro Dynamic Diversified Growth Fund 147
BlackRock European Absolute Return Fund 153
BlackRock European Credit Strategies Fund 158
BlackRock European Diversified Equity Absolute Return Fund 170
BlackRock European Opportunities Extension Fund 195
BlackRock European Select Strategies Fund 199
BlackRock Fixed Income Strategies Fund 209
BlackRock Global Absolute Return Bond Fund 225
BlackRock Global Event Driven Fund 273
BlackRock Global Long/Short Equity Fund 277
BlackRock Impact World Equity Fund 319
BlackRock Latin American Opportunities Fund 325
BlackRock Managed Index Portfolios – Defensive 327
BlackRock Managed Index Portfolios – Growth 329
BlackRock Managed Index Portfolios – Moderate 331
BlackRock Multi-Manager Alternative Strategies Fund 333
BlackRock Multi-Strategy Absolute Return Fund 355
BlackRock Style Advantage Fund 411
BlackRock Systematic European Equity Fund 477
BlackRock Systematic Global Equity Fund 480
Notes to the Financial Statements 489
Report of the Réviseur d’entreprises agréé 504
General Information 506
Appendix I - Global Exposure and Leverage (Unaudited) 508

2 BlackRock Strategic Funds (BSF)
The information stated in this report is historical and not necessarily indicative of future performance.
BSF Chairman’s Letter to ShareholdersMay 2016
Dear Shareholder,
I am writing to update you on the activities of BlackRock Strategic Funds (the “Company”) over the 12 month period ended 31 May 2016. The Company offered shares in 26 funds (each a “Fund”, together the “Funds”) as at 31 May 2016.
Political risk troubled markets over the period. The potential for a ‘Brexit’ from the European Union weighed on sentiment towards UK and, latterly, European assets. Markets also considered the impact of a change of leadership in the US, as the presidential election loomed.
Central bank policy was also a preoccupation. Further US interest rate rises were deferred as economic data weakened, with a particularly weak jobless report in May. UK rate rises seemed increasingly unlikely, while Europe and Japan expanded their quantitative easing (“QE”) programmes. In particular, the ECB surprised markets with the size and scope of its expanded programme, announced in March.
Sentiment towards China – which had been a dominant theme at the start of the year - recovered somewhat as the government eased monetary policy and some of investors’ worst fears abated. Equally, a stabilisation in the oil price and other commodities also acted to calm investor nerves.
In equity markets, the turbulence at the start of the year gave way to a nervous holding pattern in the latter part of the period under review. Investors seemed to be waiting to see the outcome of a number of key votes – the EU referendum and the US election – before committing further capital.
There was significant divergence between markets over the period, although most global stock markets were lower overall. The US once again fared relatively well, as investors sought out the only developed market where economic growth seemed relatively robust. QE failed to provide support for the Japanese and Eurozone markets over the period. Emerging markets recovered somewhat after a significant period of weakness, buoyed by a recovery in the oil price, the deferral of US rate rises and a stronger performance from Brazilian markets following moves to impeach President Dilma Rouseff.
For much of the period investors retained their preference for strong, cash generative companies with reliable earnings and dividends, rather than cheaper ‘value’ stocks. There were signs that this was starting to adjust towards the end of the period.
There was considerable volatility seen in bonds, but most developed market bond yields fell over the period. German 10-year bund yields continued to move lower during the period, and once again touched negative territory. Investment grade bonds also saw relatively strong performance over the period.
The performance of the Funds is covered in more detail in the separate Investment Adviser's Report, which also sets out some views regarding the investment outlook.
Overall, the Company’s assets under management have continued to grow from USD 10,864m at 31 May 2015 to USD 15,685m at 31 May 2016, which reflected a strong appetite for equity absolute return and other new funds in the range over the period.
Some of the fastest growing funds over the period within the range were: the BlackRock Americas Diversified Equity Absolute Return Fund which grew from USD 151.5m to USD 620.9m, the BlackRock European Diversified Equity Absolute Return Fund which grew from EUR 441.9m to EUR 1,076.9m and the BlackRock Fixed Income Strategies Fund which grew from EUR 3,387.8m to EUR 5,875.1m. The BlackRock European Absolute Return Fund also had a strong twelve months, growing to EUR 1,918.9m from EUR 1,129.4m.
BlackRock is fully committed to remaining at the forefront of the European mutual funds industry by bringing innovative investment products to our clients and is actively working on adding other funds to the range as our product development process brings forward appropriate investment opportunities for clients.
With this in mind, we took the decision to launch the BlackRock European Select Strategies Fund in August 2015. The Fund invests across bond and equity markets, with a 65/35 fixed income/equity starting point. It will typically hold 350-400 stocks and currently has EUR 174.1m in assets. During the period, we also launched the BlackRock Systematic Global Equity Fund, the BlackRock Impact World Equity Fund, the BlackRock Emerging Markets Equity Strategies Fund, the BlackRock Global Event Driven Fund, the BlackRock Style Advantage Fund and the BlackRock Multi-Manager Alternative Strategies Fund.

Annual Report and Audited Accounts 3
The information stated in this report is historical and not necessarily indicative of future performance.
BSF Chairman’s Letter to ShareholdersMay 2016 continued
The BlackRock Systematic Global Equity Fund uses a quantitative approach to stock selection in global equities. The BlackRock Impact World Equity Fund is an innovative new strategy built to invest in better societal outcomes while still achieving strong financial returns. It does this using the latest technology and ‘big data’. The Blackrock Emerging Markets Equity Strategies Fund will invest in diversified emerging markets exposure, while the BlackRock Global Event Driven Fund aims to take long, synthetic long and synthetic short positions in response to global ‘events’ such as merger and acquisition activity.
The BlackRock Style Advantage Fund launched in February 2016, aiming to harness different market ‘styles’ – momentum, carry, value and defensive – to outperform the market. The BlackRock Multi-Manager Alternative Strategies Fund launched in January 2016, allocates to a range of different, externally managed sub-strategies, across a range of asset classes.
In November 2015 we took the decision to close the BlackRock European Constrained Credit Strategies Fund, which had experienced significant outflows since the start of 2015. The Fund’s net assets had fallen below the Euro equivalent of USD 50m and it was no longer commercially viable for the Fund to operate.
Regulatory change continued throughout Europe and a number of these future changes could have implications for investors. Key changes included:
} Revisions to the Markets in Financial Instruments Directive (MiFID II) and the new Markets in Financial Instruments Regulation (MiFIR): the revised directive and new regulation have been finalised and are due to come into effect at the beginning of 2018. Requirements being introduced include restrictions on how financial advisers may be remunerated which could result in advisers amending their services.
} European Market Infrastructure Regulation (EMIR): the Joint Committee of the European Supervisory Authorities has published the final draft of the Regulatory Technical Standards in March 2016, which provide the framework for EMIR. This aims to increase the safety of over-the-counter derivatives.
} Packaged Retail Investment and Insurance-based Investment Products (PRIIPs): the text of this Regulation is now agreed and will introduce similar documents to the UCITS Key Investor Information Document (KIID) for PRIIPs. Existing UCITS funds are provided with a grace period until 2019 after which the UCITS KIID may need to be amended.
} UCITS V came into effect in March 2016. UCITS V aims to increase the level of protection already offered to investors in UCITS and to improve investor confidence in UCITS. It aims to do so by enhancing the rules on the responsibilities of depositaries and by introducing remuneration policy requirements for UCITS fund managers. It also aims to ensure that all EU regulators responsible for the supervision of UCITS funds and their managers have a common minimum set of powers available to investigate infringements.
} The Common Reporting Standard (CRS) came into effect in January 2016. CRS introduces a global standard for the automatic exchange of information (AEoI), developed by the Organisation for Economic Co-operation and Development (OECD).
Should you have any questions on any of this letter, please contact us via our website: www.blackrockinternational.com
Yours faithfully,
Nicholas C.D. HallChairman
June 2016

4 BlackRock Strategic Funds (BSF)
The information stated in this report is historical and not necessarily indicative of future performance.
BSF Investment Adviser’s ReportPerformance Overview1 June 2015 – 31 May 2016
Market ReviewIt was a mixed picture for global equity markets over the twelve month period ended 31 May 2016, with the FTSE All-World Index down by 5.3% (USD). Initially markets were troubled by the weakness in China and the sliding oil price, which in turn left them fearing for the strength of global growth. By the end of the period, markets had stabilized somewhat, but the path of US interest rates and a number of political risks weighed on sentiment.
QE, previously a significant boost to markets, could not protect the Eurozone and Japan from the volatility across wider stock markets. The MSCI Europe ex UK Index fell 12.5% (EUR) over the period, supported by a stronger performance from more defensive areas such as France. Peripheral European markets such as Spain and Italy were weaker, with both markets seeing double digit falls.
Japan was also weak, down 11.2% (EUR) over the period, as growth continued to disappoint and quantitative easing failed to have the desired effect. Asian markets were weak in aggregate, dragged lower by the weakness of the Chinese markets. That said, this trend had abated by the period end, and the second quarter of 2016 saw Asian markets recover some ground.
Returns from wider emerging markets were initially dismal, with the MSCI Emerging Markets Index down 19.6% (USD) for the period as a whole. However, sentiment improved towards the end of the period as commodity prices stabilized, the Federal Reserve (the “Fed”) deferred rate rises and Brazil acted to impeach Dilma Rouseff. Many emerging markets saw double-digit gains from March to May 2016.
US equities were relatively strong over the period with the MSCI North America Index down just 1.2% (USD). The US markets were stronger in the second half, bouncing strongly from their lows in August 2015. US economic data continued to be relatively buoyant, but not buoyant enough to merit a second rate rise after the initial 0.25% rise in December, which markets liked.
In general the UK lagged the other major markets, initially because of its high weighting to commodities companies, but in the latter part of the period under review, fears of a disruptive exit from the European Union pushed UK assets lower. The FTSE 100 Index dropped 10.8% (GBP) in spite of the relative strength of the UK economy. Interest rate rises remained firmly off the cards, as Bank of England Governor Mark Carney pushed expectations of the first hike into 2016 and potentially beyond should Britain choose to leave the European Union.
From the sector perspective, markets initially continued their preference for reliable growth with technology and consumer staples the strongest areas. However, this started to reverse in March 2016 with the energy and mining sectors staging a comeback.
Fixed income markets were increasingly volatile, although yields on developed market government bonds continued to narrow over the period. Credit markets were relatively buoyant, with both high yield and investment grade bond indices seeing a
stronger performance in the second half of the period. Emerging market debt also started to recover from March 2016 onwards.
Fund Performance
Equity Fund PerformanceIt was a difficult period for the long-only equity funds in the BlackRock Strategic Funds range. In general, the absolute return funds performed as expected, preserving capital in difficult market conditions. The BlackRock Asia Extension Fund was the worst performer in the range, dropping 19.1% (USD), behind its benchmark, the MSCI All Country Asia ex Japan Index, which was down by 17.2% (USD). While other emerging market areas were weak, the BlackRock Latin American Opportunities Fund cushioned investors from the worst losses over the period, falling only 5.4% (USD), compared to a fall of 16.3% (USD) in the MSCI Emerging Market Latin America Index.
The absolute return strategies fared better, though some still lost capital. The BlackRock European Diversified Equity Absolute Return Fund fell 3.3% (EUR) over the period, behind its benchmark, which was flat. The BlackRock European Absolute Return Fund rose by 2.6% (EUR) ahead of its benchmark which was flat over the period. These funds are designed to provide positive performance within a low-volatility and risk-aware strategy. Both of these funds are based on model-driven investment insights.
The BlackRock Emerging Markets Absolute Return Fund rose 0.3% (USD), marginally behind its benchmark which rose 0.4% (USD). The BlackRock Americas Diversified Equity Absolute Return Fund gained 3.5% (USD), outperforming the LIBOR 3 Month Index, which was up by 0.4% (USD). The BlackRock Global Long/Short Equity Fund fell 8.5% (USD) significantly behind its benchmark, the BofA Merrill Lynch 3 Month US Treasury Bill, which was flat. The Fund’s underperformance was largely attributable to weak long and short positioning in Japan and the US, and to a poor performance from its ‘sentiment’ factor.
The BlackRock European Opportunities Extension Fund was the best-performing fund within the range over the period, returning 8.6% (EUR) and outperforming its benchmark, the S&P Europe BMI Index (Developed Markets Only), which fell 9.4% (EUR).
The BlackRock Systematic European Equity Fund fell 8.7% (EUR), but this was ahead of its benchmark, the MSCI Europe Index, (Net Total Return), which fell 11.3% (EUR).
In relation to the new Funds, the BlackRock Systematic Global Equity Fund was up 1.3% (USD) since its launch on September 2015, just behind its benchmark, which was up 3.7%(USD). The BlackRock Impact World Equity Fund was down 1.1% (USD) since its launch in August 2015, behind its benchmark, which rose 0.3% (USD). The BlackRock Emerging Markets Equity Strategies Fund, also launched in September 2015, performed ahead of its benchmark, returning 13.3% (USD), compared to a fall of 1.6% (USD) in its benchmark. The BlackRock Global Event Driven Fund was marginally ahead of its benchmark since its launch in
Annual Report and Audited Accounts 5
The information stated in this report is historical and not necessarily indicative of future performance.
BSF Investment Adviser’s ReportPerformance Overview1 June 2015 – 31 May 2016 continued
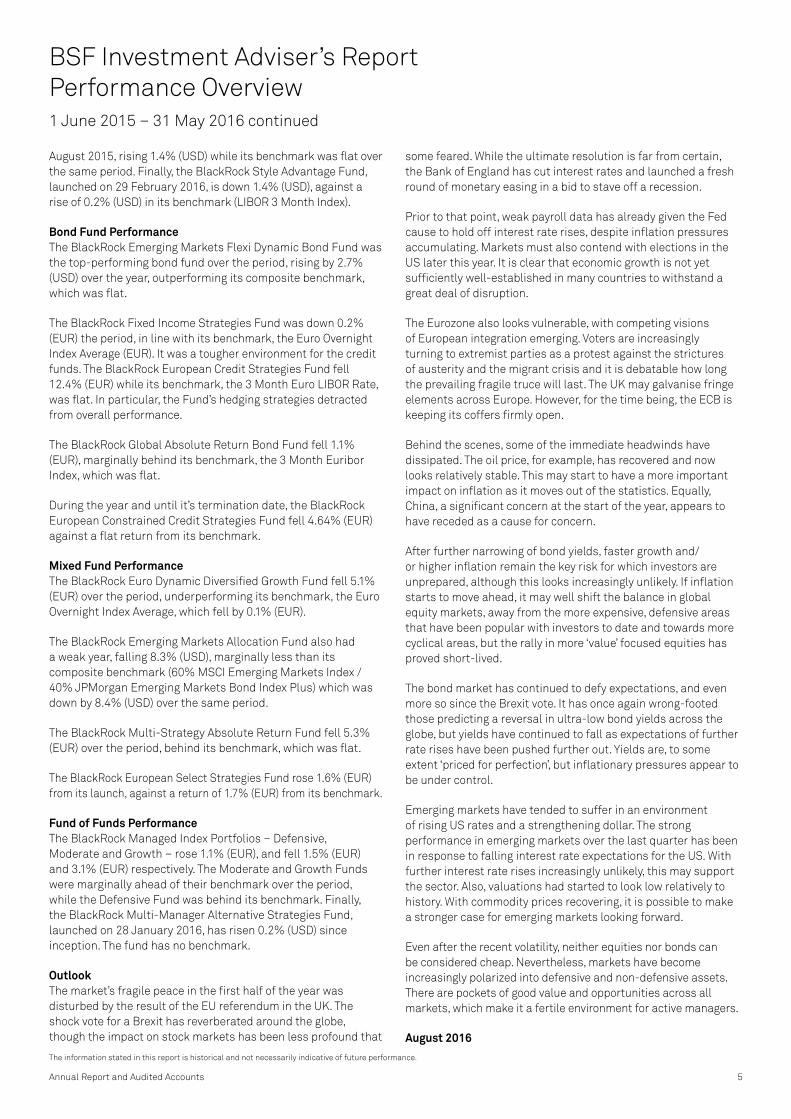
August 2015, rising 1.4% (USD) while its benchmark was flat over the same period. Finally, the BlackRock Style Advantage Fund, launched on 29 February 2016, is down 1.4% (USD), against a rise of 0.2% (USD) in its benchmark (LIBOR 3 Month Index).
Bond Fund PerformanceThe BlackRock Emerging Markets Flexi Dynamic Bond Fund was the top-performing bond fund over the period, rising by 2.7% (USD) over the year, outperforming its composite benchmark, which was flat.
The BlackRock Fixed Income Strategies Fund was down 0.2% (EUR) the period, in line with its benchmark, the Euro Overnight Index Average (EUR). It was a tougher environment for the credit funds. The BlackRock European Credit Strategies Fund fell 12.4% (EUR) while its benchmark, the 3 Month Euro LIBOR Rate, was flat. In particular, the Fund’s hedging strategies detracted from overall performance.
The BlackRock Global Absolute Return Bond Fund fell 1.1% (EUR), marginally behind its benchmark, the 3 Month Euribor Index, which was flat.
During the year and until it’s termination date, the BlackRock European Constrained Credit Strategies Fund fell 4.64% (EUR) against a flat return from its benchmark.
Mixed Fund PerformanceThe BlackRock Euro Dynamic Diversified Growth Fund fell 5.1% (EUR) over the period, underperforming its benchmark, the Euro Overnight Index Average, which fell by 0.1% (EUR).
The BlackRock Emerging Markets Allocation Fund also had a weak year, falling 8.3% (USD), marginally less than its composite benchmark (60% MSCI Emerging Markets Index / 40% JPMorgan Emerging Markets Bond Index Plus) which was down by 8.4% (USD) over the same period.
The BlackRock Multi-Strategy Absolute Return Fund fell 5.3% (EUR) over the period, behind its benchmark, which was flat.
The BlackRock European Select Strategies Fund rose 1.6% (EUR) from its launch, against a return of 1.7% (EUR) from its benchmark.
Fund of Funds PerformanceThe BlackRock Managed Index Portfolios – Defensive, Moderate and Growth – rose 1.1% (EUR), and fell 1.5% (EUR) and 3.1% (EUR) respectively. The Moderate and Growth Funds were marginally ahead of their benchmark over the period, while the Defensive Fund was behind its benchmark. Finally, the BlackRock Multi-Manager Alternative Strategies Fund, launched on 28 January 2016, has risen 0.2% (USD) since inception. The fund has no benchmark.
OutlookThe market’s fragile peace in the first half of the year was disturbed by the result of the EU referendum in the UK. The shock vote for a Brexit has reverberated around the globe, though the impact on stock markets has been less profound that
some feared. While the ultimate resolution is far from certain, the Bank of England has cut interest rates and launched a fresh round of monetary easing in a bid to stave off a recession.
Prior to that point, weak payroll data has already given the Fed cause to hold off interest rate rises, despite inflation pressures accumulating. Markets must also contend with elections in the US later this year. It is clear that economic growth is not yet sufficiently well-established in many countries to withstand a great deal of disruption.
The Eurozone also looks vulnerable, with competing visions of European integration emerging. Voters are increasingly turning to extremist parties as a protest against the strictures of austerity and the migrant crisis and it is debatable how long the prevailing fragile truce will last. The UK may galvanise fringe elements across Europe. However, for the time being, the ECB is keeping its coffers firmly open.
Behind the scenes, some of the immediate headwinds have dissipated. The oil price, for example, has recovered and now looks relatively stable. This may start to have a more important impact on inflation as it moves out of the statistics. Equally, China, a significant concern at the start of the year, appears to have receded as a cause for concern.
After further narrowing of bond yields, faster growth and/or higher inflation remain the key risk for which investors are unprepared, although this looks increasingly unlikely. If inflation starts to move ahead, it may well shift the balance in global equity markets, away from the more expensive, defensive areas that have been popular with investors to date and towards more cyclical areas, but the rally in more ‘value’ focused equities has proved short-lived.
The bond market has continued to defy expectations, and even more so since the Brexit vote. It has once again wrong-footed those predicting a reversal in ultra-low bond yields across the globe, but yields have continued to fall as expectations of further rate rises have been pushed further out. Yields are, to some extent ‘priced for perfection’, but inflationary pressures appear to be under control.
Emerging markets have tended to suffer in an environment of rising US rates and a strengthening dollar. The strong performance in emerging markets over the last quarter has been in response to falling interest rate expectations for the US. With further interest rate rises increasingly unlikely, this may support the sector. Also, valuations had started to look low relatively to history. With commodity prices recovering, it is possible to make a stronger case for emerging markets looking forward.
Even after the recent volatility, neither equities nor bonds can be considered cheap. Nevertheless, markets have become increasingly polarized into defensive and non-defensive assets. There are pockets of good value and opportunities across all markets, which make it a fertile environment for active managers.
August 2016

6 BlackRock Strategic Funds (BSF)
The information stated in this report is historical and not necessarily indicative of future performance.
Disclosed in the table below are the performance returns for the primary share class for each Fund, which has been selected as a representative share class. In accordance with the respective investment objective detailed in the prospectus, the Funds do not aim to track the performance of a specific benchmark index. The benchmark index returns included in the below table are provided for reference only for the purpose of this annual report.
Past performance is not a guide to future performance and should not be the sole factor of consideration when selecting a product. All financial investments involve an element of risk. Therefore, the value of your investment and the income from it will vary and your initial investment amount cannot be guaranteed. The Funds invest a large portion of assets which are denominated in multiple currencies; hence changes in the relevant exchange rate will affect the value of the investment. The performance figures do not consider charges and fees that may be levied at the time of subscription or redemption of shares. Levels and bases of taxation may change from time to time. Subscriptions can only be made on the basis of the current Prospectus, the KIID supplemented by the most recent annual report and audited accounts and unaudited interim report and accounts, if published after such annual report. Copies are available from the Local Investor Servicing team*, the Transfer Agent, the Management Company or any of the Distributors. The Funds are only available for investment by non-US citizens who are not residents of the US. The Funds are not offered for sale or sold in the US, its territories or possessions.
Financial Year Performance
to 31 May 2016 Calendar Year Performance
1 year 2015 2014 2013 Launch Date
BlackRock Americas Diversified Equity Absolute Return Fund 'A' Class Non Dist (USD) 3.45% 9.00% 3.54% (0.98)% 17 February 2012
LIBOR 3 Month Index (USD) 0.38% 0.23% 0.23% 0.29%
BlackRock Asia Extension Fund 'A' Class Non Dist (USD) (19.11)% (10.78)% 5.77% 6.71% 10 February 2012
MSCI All Country Asia ex Japan SM (USD) (17.22)% (8.90)% 5.11% 3.07%
BlackRock Emerging Markets Absolute Return Fund 'D' Class Non Dist (USD) 0.26% (0.15)% (0.15)% 4.84% 15 November 2012
LIBOR 3 Month Index (USD) 0.38% 0.23% 0.23% 0.29%
BlackRock Emerging Markets Allocation Fund 'A' Class Non Dist (USD) (8.34)% (10.42)% 2.55% (0.94)% 15 November 2013
60% MSCI Emerging Markets Index / 40% JPMorgan Emerging Markets Bond Index Plus (USD) (8.43)% (8.33)% 1.16% (0.02)%
BlackRock Emerging Markets Equity Strategies Fund 'A' Class Non Dist (USD) (1) 13.25% 4.69% – – 18 September 2015
MSCI Emerging Markets Index (USD) (1.63)% (3.87)% – –
BlackRock Emerging Markets Flexi Dynamic Bond Fund 'A' Class Non Dist (USD) 2.70% 2.64 % (0.31)% (0.34)% 12 June 2013
50% JPMorgan EMBI Global Diversified / 50% JPMorgan Government Bond Index – Emerging Markets Global Diversified Index (USD) (0.14)% (7.14)% 0.71% (1.99)%
BlackRock Euro Dynamic Diversified Growth Fund 'A' Class Non Dist (EUR) (5.14)% (1.26)% 4.42% 6.40% 28 January 2011
Euro Overnight Index Average (EUR) (0.20)% (0.11)% 0.10% 0.09%
BlackRock European Absolute Return Fund 'A' Class Non Dist (EUR) 2.65% 7.66% 0.64% 3.66% 27 February 2009
3 Month Euro LIBOR Rate (EUR) (0.13)% (0.03)% 0.18% 0.15%
BlackRock European Constrained Credit Strategies Fund 'I' Class Non Dist (EUR) (2) (4.64)% (1.49)% 1.64% 4.75% 22 September 2011
3 Month Euro LIBOR Rate (EUR) (0.02)% (0.01)% 0.18% 0.15%
BlackRock European Credit Strategies Fund 'H' Class Non Dist (EUR) (12.42)% (3.59)% 1.25% 5.22% 16 February 2011
3 Month Euro LIBOR Rate (EUR) (0.13)% (0.03)% 0.18% 0.15%
BlackRock European Diversified Equity Absolute Return Fund 'A' Class Non Dist (EUR) (3.34)% 4.59% 3.73% 18.00% 6 August 2010
3 Month Euro LIBOR Rate (EUR) (0.13)% (0.03)% 0.18% 0.15%
* The local BlackRock Group companies or branches or their administrators.
BSF Investment Adviser’s ReportPerformance Overview1 June 2015 – 31 May 2016 continued

Annual Report and Audited Accounts 7
The information stated in this report is historical and not necessarily indicative of future performance.
BSF Investment Adviser’s ReportPerformance Overview1 June 2015 – 31 May 2016 continued
Financial Year Performance
to 31 May 2016 Calendar Year Performance
1 year 2015 2014 2013 Launch Date
BlackRock European Opportunities Extension Fund 'A' Class Non Dist (EUR) 8.60% 36.91% 19.97% 44.94% 31 August 2007
S&P Europe BMI Index (Developed Markets only) (EUR) b1 (9.43)% 10.85% 7.95% 22.32%
BlackRock European Select Strategies Fund 'A' Class Non Dist (EUR) (1) 1.56% 0.58% – – 19 August 2015
75% Barclays Pan European Aggregate Index (Hedged EUR) / 25% MSCI Europe Index (Hedged EUR) 1.74% (0.35)% – –75% Barclays Pan European Aggregate Index (Hedged EUR) / 25% MSCI Europe Index (Hedged EUR) 1.74% (0.35)% – –
BlackRock Fixed Income Strategies Fund 'A' Class Non Dist (EUR) (0.19)% 2.09% 3.70% 3.80% 30 September 2009
Euro Overnight Index Average (EUR) (0.20)% (0.11)% 0.10% 0.09%
BlackRock Global Absolute Return Bond Fund 'A' Class Non Dist (EUR) (1.09)% 0.31% (0.46)% 1.51% 25 May 2012
3 month Euribor Index (EUR) (0.06)% 0.03% 0.26% 0.20%
BlackRock Global Event Driven Fund 'A' Class Non Dist (USD) (1) 1.38% 0.57% – – 5 August 2015
BofA Merrill Lynch 3 Month US Treasury Bill (USD) 0.16% 0.05% – –BofA Merrill Lynch 3 Month US Treasury Bill (GO01) (USD) 0.16% 0.05% – –
BlackRock Global Long/Short Equity Fund 'A' Class Non Dist (USD) (8.50)% (1.42)% 3.75% – 2 June 2014
BofA Merrill Lynch 3 Month US Treasury Bill (USD) 0.15% 0.05% 0.02% –
BlackRock Impact World Equity Fund 'A' Class Non Dist (USD) (1) (1.11)% (1.80)% – – 20 August 2015
MSCI World Index (Net Total Return) (USD) 0.32% (1.45)% – –
BlackRock Latin American Opportunities Fund 'A' Class Non Dist (USD) (5.44)% (28.52)% (10.67)% (13.15)% 14 November 2007
MSCI Emerging Market Latin America 10/40 (net) (USD) (16.25)% (31.04)% (12.30)% (13.36)%
BlackRock Managed Index Portfolios – Defensive 'D' Class Dist (EUR) 1.10% (3.87)% – – 10 April 2015
90% Barclays Global Aggregate Index (Euro Hedged) / 10% MSCI All Country World Net TR Index (EUR) 2.34% (1.97)% – –
BlackRock Managed Index Portfolios – Growth 'D' Class Dist (EUR) (3.14)% (6.44)% – – 10 April 2015
80% MSCI All Country World Net TR Index (EUR) / 20% Barclays Global Aggregate Index (Euro Hedged) (4.71)% (7.41)% – –
BlackRock Managed Index Portfolios – Moderate 'D' Class Dist (EUR) (1.45)% (5.70)% – – 10 April 2015
50% Barclays Global Aggregate Index (Euro Hedged) / 50% MSCI All Country World Net TR Index (EUR) (1.60)% (5.00)% – –
BlackRock Multi-Manager Alternative Strategies Fund 'A' Class Non Dist (USD) (1) 0.21% – – – 28 January 2016
BlackRock Multi-Strategy Absolute Return Fund 'A' Class Non Dist (EUR) (5.27)% (1.77)% (0.48)% – 25 June 2014
3 month LIBOR Index (EUR) (0.13)% (0.03)% 0.05% –
BlackRock Style Advantage Fund 'A' Class Non Dist (USD) (1) (1.39)% – – – 29 February 2016
3 month LIBOR Index (USD) 0.15% – – –
BlackRock Systematic European Equity Fund 'A' Class Non Dist (EUR) (8.65)% (2.90)% – – 16 March 2015
MSCI Europe Index (Net Total Return) (EUR) (11.31)% (7.60)% – –
BlackRock Systematic Global Equity Fund 'A' Class Non Dist (USD) (1) 1.28% 1.27% – – 18 September 2015
MSCI All Country World Index (Net Total Return) (USD) 3.70% 1.82% – –
(1) New Fund launch, see Note 1 for further details.(2) Fund terminated, see Note 1 for further details.b1 Previously known as Citigroup BMI Europe Index.Fund performance returns are based on dealing prices with net dividends (after deduction of withholding tax) reinvested and are shown net of fees. Index Sources: Indices – Financial Times, MSCI, Citigroup, DataStream, MorningStar; Funds – BlackRock Investment Management (UK) Limited.

8 BlackRock Strategic Funds (BSF)
Directors’ Report
Corporate Governance Statement
IntroductionBlackRock Strategic Funds (the “Company”) is a public limited company (société anonyme) established under the laws of the Grand Duchy of Luxembourg as an open ended variable capital investment company (société d’investissement à capital variable). The Company has been authorised by the Commission de Surveillance du Secteur Financier (the “CSSF”) as an undertaking for collective investment in transferable securities (“UCITS”) pursuant to the provisions of Part I of the law of 17 December 2010, as amended from time to time and is regulated pursuant to such law. The Company complies with the principles set out in the Association of the Luxembourg Fund Industry (“ALFI”) Code of Conduct Revision 2013 (the “Code”) issued by ALFI in June 2013.
The Board of Directors of the Company (the “Board”) is committed to maintaining the highest standards of corporate governance and is accountable to shareholders for the governance of the Company’s affairs. The Board has considered the principles and recommendations of the Code and has put in place a framework for corporate governance which it believes is appropriate for adherence to the principles of the Code given the nature of its structure as an Investment Company. This statement summarises the corporate governance structure and processes in place for the Company for the period under review from 1 June 2015 to 31 May 2016.
Board Composition The Board currently consists of six non-executive Directors, (including one independent Director). The Board is committed to maintaining an appropriate balance of skills, experience, independence and knowledge amongst its members.
The Directors’ biographies, on pages 10 and 11, collectively demonstrate a breadth of investment knowledge and experience, business and financial skills and legal and regulatory familiarity which enables them to provide effective strategic leadership, oversight and proper governance of the Company. BlackRock considers the current compositions to be a suitable and appropriate balance for the Board.
Article 13 of the Company’s Articles of Incorporation, in accordance with Luxembourg law, provides that Directors shall be elected by the shareholders at their annual general meeting for a period ending at the next annual general meeting and until their successors are elected. Any Director who resigns his/her position is obliged to confirm to the Board and the CSSF that the resignation is not connected with any issues with or claims against the Company.
The Board supports a planned and progressive renewal of the Board. BlackRock is committed to ensuring that Directors put forward for election by the shareholders possess the skills needed to maintain this balance. The Board is committed to carrying out an annual review of its performance and activities.
The Directors have a continuing obligation to ensure they have sufficient time to discharge their duties. The details of each Director’s (including the Chairman), other appointments and commitments are made available to the Board and BlackRock Investment Management (U.K.) Limited (“BIM UK”) for inspection. All new appointments or significant commitments require the prior approval of BIM UK.
Before a new Director is proposed to the shareholders for appointment he or she will receive a full induction incorporating relevant information regarding the Company and his or her duties and responsibilities as a Director. In addition, a new Director is required to spend some time with representatives of BIM UK so that the new Director will become familiar with the various processes which are considered necessary for the proper performance of his or her duties and responsibilities to the Company.
The Company’s policy is to encourage Directors to keep up to date with developments relevant to the Company. The Directors have attended and will continue to attend updates and briefings run by BIM UK and affiliated entities in the U.S. and elsewhere. The Directors also receive regular briefings from, amongst others, the auditors, investment strategists, risk specialists, custodian and legal advisers regarding any proposed product developments or changes in laws or regulations that could affect the Company.
Board’s ResponsibilitiesThe Board meets at least quarterly and also on an ad hoc basis as required. The Board is supplied with information in a timely manner and in a form and of a quality appropriate to enable it to discharge its duties. The Board is responsible for the long-term success of the Company and recognises its responsibility to provide leadership, direction and control to the Company within a framework of prudent and effective controls which enables risk to be assessed and managed. The Board reserves to itself decisions relating to the determination of investment policy and objectives, any change in investment strategy and entering into any material contracts. The Board also approves the prospectus and any addenda to it, circulars to shareholders, financial statements and other relevant legal documentation.
The Chairman's main responsibility is to lead and manage the Board, encourage critical discussions and promote effective communication within the Board. In addition, he is responsible for promoting best practice corporate governance and effective communication with shareholders.
The Directors have access to the advice and services of external counsel and the resources of BIM UK and BlackRock (Luxembourg) S.A. (the “Management Company”) should they be needed. Where necessary, in the furtherance of their duties, the Board and individual Directors may seek independent professional advice. The Board has responsibility for ensuring that the Company keeps proper accounting records which disclose with reasonable accuracy

Annual Report and Audited Accounts 9
Directors’ Report continued
at any time the financial position of the Company and which enable it to ensure that the financial statements comply with relevant accounting standards. It is the Board’s responsibility to present a balanced and understandable assessment of the Company’s financial position, which extends to interim financial statements and other reports made available to shareholders and the public. The Board is responsible for taking reasonable steps for safeguarding the assets of the Company and for taking reasonable steps in the prevention and detection of fraud and other irregularities.
InsuranceThe Company maintains appropriate Directors’ and Officers’ liability insurance cover.
Delegation of Responsibilities As an open ended variable capital investment company most of the Company’s day-to-day management and administration is delegated to BlackRock group companies such as the Management Company which employs dedicated compliance and risk professionals, the Investment Advisers and other third party service providers. The Board has delegated the following areas of responsibility:
Management and Administration
The Board has delegated the investment management, distribution and administration of the Company and its Funds to the Management Company. The Management Company has delegated the management of the investment portfolio to the Investment Advisers. The Investment Advisers operate under guidelines determined by the Board and as detailed in the Company’s prospectus relating to the Company’s Funds. The relevant Investment Advisers have direct responsibility for the decisions relating to the day-to-day running of the Company’s Funds and are accountable to both the Management Company and the Company for the investment performance of the Funds. The Board has also delegated the exercise of voting rights attaching to the securities held in the portfolio to the respective Investment Advisers who may in turn delegate to BIM UK. Voting of behalf of shareholders is done so in a manner which is believed to be in the best economic interest of shareholders as long-term investors.
The Management Company has delegated its responsibilities for administrative services of the Company and its Funds to State Street Bank Luxembourg S.C.A. (the “Administrator”). The Administrator has responsibility for the administration of the Company’s affairs including the calculation of the net asset value and preparation of the financial statements of the Company, subject to the overall supervision of the Directors and the Management Company. The Administrator is a subsidiary of State Street Bank & Trust Co. The Company has appointed State Street Bank Luxembourg S.C.A. as Custodian of its assets, which has responsibility for safe-keeping of such assets, pursuant to the regulations. The Custodian is a subsidiary of State Street Bank & Trust Co. The Management
Company has delegated transfer agent and share registration services to J.P. Morgan Bank Luxembourg S.A..
The Management Company reports to the Board on a quarterly basis and by exception where necessary. Reporting is in place to ensure that the Board can effectively oversee the actions of its delegates.
The Management Company is responsible for the risk management and internal controls of the Company and for reviewing their effectiveness, for ensuring that financial information published or used within the business is reliable, and for regularly monitoring compliance with regulations governing the operation of the Company. The Management Company reviews the effectiveness of the internal control and risk management systems on an on-going basis to identify, evaluate and manage the Company’s significant risks. As part of that process, there are procedures designed to capture and evaluate any failings or weaknesses. Should a case be categorised by the Board as significant, procedures exist to ensure that necessary action is taken to remedy the failings.
The Board is also responsible for establishing and maintaining adequate internal control and risk management systems of the Company in relation to the financial reporting process. Such systems are designed to manage rather than eliminate the risk of failure to achieve the Company’s financial reporting objectives. The Company has procedures in place to ensure all relevant accounting records are properly maintained and are readily available, including production of annual and half-yearly financial statements. These procedures include appointing the Administrator to maintain the accounting records of the Company independently of the Investment Manager and the Custodian. The financial statements are prepared in accordance with applicable law and Generally Accepted Accounting Principles (“GAAP”) and are approved by the Board of Directors of the Company. The accounting information given in the annual report is required to be audited and the report of the réviseur d'entreprises agréé, including any qualifications, is reproduced in full in the annual report of the Company.
The control processes over the risks identified, covering financial, operational, compliance and risk management, is embedded in the operations of the Management Company, BIM UK and other parties including the Administrator and the Custodian. There is a monitoring and reporting process to review these controls, which has been in place throughout the period under review and up to the date of this report, carried out by BIM UK’s corporate audit department.
BIM UK’s internal audit and operational risk units report to the Board through the Management Company on a quarterly basis. The Management Company also receives a report from the Administrator and the Custodian on the internal controls of the administrative and custodial operations of the Company. The Board recognises that these control systems can only be designed to manage rather than eliminate the

10 BlackRock Strategic Funds (BSF)
risk of failure to achieve fund objectives, and to provide reasonable, but not absolute, assurance against material misstatement or loss, and relies on the operating controls established by the service providers.
Financial Reporting The Company prepares its financial statements under Luxembourg GAAP and on a going concern basis.
RemunerationThe Company is an investment company and has no employees or executive Directors. No Director (past or present) has any entitlement to a pension from the Company, and the Company has not awarded any share options or long-term performance incentives. No element of Directors’ remuneration is performance-related. Those Directors who are also employees of the BlackRock group are not entitled to receive a Director’s fee. All other Directors are paid fees which are submitted for approval by the shareholders at the annual general meeting and are disclosed on page 497. The Board believes that the level of remuneration for those Directors who take a fee properly reflects the time commitment and responsibilities of their roles. The maximum amount of remuneration payable to the Directors is approved by the Board.
Communication with ShareholdersThe Board is responsible for convening the annual general meeting and all other general meetings of the Company. Shareholders have the opportunity to, and are encouraged to attend and vote at general meetings. Notice of general meetings is issued in accordance with the Articles of Incorporation of the Company and notice of the annual general meeting is sent out at least 8 days in advance of the meeting. All substantive matters put before a general meeting are dealt with by way of separate resolution. Proxy voting figures are noted by the chairman of the general meeting.
The proceedings of general meetings are governed by the Articles of Incorporation of the Company.
The Board has reporting procedures in place such that client communication with BIM UK is reported to the Board, including shareholder complaints. BIM UK has been appointed Principal Distributor (appointed 18 January 2016) and is tasked with actively managing the relationship between the Company and its shareholders.
Directors’ Biographies
Nicholas C.D. Hall (Chairman) (British): Mr Hall was, until he retired in May 2009, General Counsel of BlackRock International (previously known as Merrill Lynch Investment Managers International) based in London which position he held from his appointment in August 1998. He joined the Group in 1983. He was educated at St. Catharine's College, Cambridge graduating with a MA (Law) degree in 1975. He qualified as a solicitor in England and Wales in 1978 and in Hong Kong in 1987. He is a non-executive director of BlackRock Investment Management (UK) Limited, BlackRock
Advisors (UK) Limited, BlackRock Group Limited, Chairman of BlackRock Life Limited, BlackRock Global Funds and BlackRock Global Index Funds and serves on the Boards of a number of other BlackRock entities and sponsored funds. Mr Hall chairs the BlackRock Group Limited EMEA Conflicts Management Committee and is a member of the BlackRock Group Limited EMEA Audit Committee, Nominations Committee and Risk Committee.
Francine Keiser (Luxembourger): Ms Keiser is a former Partner of Linklaters LLP and is now a consultant to the firm. She has been a member of the Luxembourg Bar since 1989. Ms Keiser is an experienced investment funds lawyer with wide expertise in all legal aspects of investment management, in particular in the UCITS area. She serves as a Director on the Board of the Management Company and also on the Boards of flagship funds of several major fund promotors, including BlackRock Global Funds and BlackRock Global Index Funds.
Alexander Hoctor-Duncan (British): Mr Hoctor-Duncan is a Managing Director of BlackRock and is Head of BlackRock's Europe, Middle East and Africa Retail business. He is a member of the Global Client Group Executive Committee, Leadership Committee, and European Executive Committee, and also serves as a Director on the Boards of BlackRock Global Funds and BlackRock Global Index Funds. Mr Hoctor-Duncan is based in London.
Prior to moving to his current role, Mr Hoctor-Duncan was Head of Retail Sales in the EMEA region. Mr Hoctor-Duncan's service with the firm dates back to 1997, including his years with Mercury Asset Management and Merrill Lynch Investment Management (MLIM), which merged with Blackrock in 2006. At MLIM, he was head of the UK Retail business and Head of Sales in the UK retail market.
Frank Le Feuvre (British nationality, Jersey resident): Mr Le Feuvre is the Country Manager for the Channel Islands and a member of BlackRock's Global Client Group. He is also the Managing Director of BlackRock (Channel Islands) Limited. Mr Le Feuvre’s service with the firm dates back to 1972, including his years with Merrill Lynch Investment Managers (MLIM), which merged with BlackRock in 2006. At MLIM, he was Head of the Jersey business and Managing Director of Merrill Lynch Investment Management (Channel Islands) Limited. Mr Le Feuvre also serves as Director on the Boards of BlackRock Global Funds and BlackRock Global Index Funds.
Geoffrey D. Radcliffe (British nationality, Luxembourg resident): Mr Radcliffe is a Managing Director of BlackRock and is based in Luxembourg. He is a member of the BlackRock Business Operations Global Fund Services team and heads Fund Administration for EMEA, with responsibilities extending into Asia Pacific. Mr Radcliffe is a Fellow of The Institute of Chartered Accountants in England & Wales and an Associate of The Chartered Institute of Bankers.
Directors’ Report continued

Annual Report and Audited Accounts 11
He has 30 years of banking, accounting and fund experience in the Isle of Man, London, Bermuda and Luxembourg. Mr Radcliffe joined the BlackRock Group in 1998. He serves as a Director on the Board of the Management Company and also on the Boards of a number of BlackRock funds including BlackRock Global Funds and BlackRock Global Index Funds.
Bruno Rovelli (Italian): Mr Rovelli is Head of Investment Advisory for BlackRock in Italy. Before joining Blackrock in 2011 Mr Rovelli has been working for over 11 years at Eurizon Capital, the largest asset manager in Italy. At Eurizon Capital Mr Rovelli served in various roles including Chief Strategist, Chief Investment Officer of the institutional business, Head of Quantitative Strategies and, from 2005 onwards, Chief Investment Officer for the mutual funds business. Prior to joining Eurizon Capital Mr Rovelli served as an economist and fixed income strategist for Citigroup, Bank of America and Unicredit. Mr Rovelli is a graduate in economics (First Class Honours) from Luigi Bocconi University in Milan. Mr Rovelli also serves as a Director on the Board of BlackRock Global Funds and BlackRock Global Index Funds.
Directors’ Report continued

12 BlackRock Strategic Funds (BSF)
Report on Remuneration
The below disclosures are made in respect of the remuneration policies of the BlackRock group (“BlackRock”), as they apply to BlackRock (Luxembourg) S.A. (the “Manager”). The disclosures are made in accordance with the Directive 2009/65/EC on the coordination of laws, regulations and administrative provisions relating to undertakings for collective investment in transferable securities (“UCITS”), as amended, including in particular by Directive 2014/91/EU of the European Parliament and of the council of 23 July 2014, (the “Directive”), and the “Guidelines on sound remuneration policies under the UCITS Directive and AIFMD” issued by the European Securities and Markets Authority.
BlackRock’s UCITS Remuneration Policy (the “UCITS Remuneration Policy”) will apply to the EEA entities within the BlackRock group authorised as a manager of UCITS funds in accordance with the Directive, and will ensure compliance with the requirements of Article 14b of the Directive.
The Manager has adopted the UCITS Remuneration Policy, a summary of which is set out below.
Role of the Compensation Committees Remuneration governance is a tiered structure including the Management Development and Compensation Committee (“MDCC”) of BlackRock, Inc.’s board of directors (the “BlackRock, Inc. Board”) (BlackRock Inc.’s independent remuneration committee), complemented by the EMEA Compensation Committee (the “Committee”) and the Manager’s board of directors (the “Manager’s Board”). These bodies are responsible for the determination of the Manager’s remuneration policies.
(a) MDCC
The MDCC’s primary purposes include:
} to provide oversight of:} BlackRock’s executive compensation programmes;} BlackRock’s employee benefit plans; } such other compensation plans as may be established
by BlackRock from time to time for which the MDCC is deemed as administrator; and
} review and discuss the compensation discussion and analysis included in the BlackRock, Inc. annual proxy statement with management and approval of the MDCC report for inclusion in the proxy statement.
The MDCC directly retains its own independent compensation consultant, Semler Brossy Consulting Group LLC, who has no relationship with BlackRock, Inc. or the BlackRock, Inc. Board that would interfere with its ability to provide independent advice to the MDCC on compensation matters.
The MDCC is currently composed of Messrs. Gerber (Chairman), Komansky, Grosfeld, Maughan and Mills. The BlackRock, Inc. Board has determined that all of the members of the MDCC are “independent” within the meaning of the listing standards of
the New York Stock Exchange (NYSE), which requires each meet a “non-employee director” standard.
The MDCC held 10 meetings during 2015. The MDCC charter is available on BlackRock, Inc.’s website (www.blackrock.com).
(b) EMEA Compensation Committee
The Committee is established for the purpose of reviewing compensation policies, practices, and principles as required by local/regional rules set by regulatory bodies. Specifically, the Committee’s primary purposes are to review and make recommendations concerning:
} executive compensation programmes; } employee benefit plans; } such other compensation plans as may be established from
time to time; and} other local/regional compensation policies, practices, and
principles as required to comply with local/regional rules as set by regulators.
The Committee consists of a minimum of three members and is constituted in a way that enables it to exercise its judgment and demonstrate its ability to make decisions which are consistent with the current and future financial status of the business. The current members are: David Blumer, Head of the EMEA Region; Dan Dunay, Global Head of Compensation; and Karen Dennehy, EMEA Head of Human Resources. Only members of the Committee have the right to attend Committee meetings and the Committee may request the attendance of any executive or other person as deemed appropriate to facilitate the review of remuneration recommendations and policy design to ensure that the remuneration practices are consistent with effective risk management and do not encourage excessive risk taking.
Examples of additional attendees may include individuals from the Operational Risk and Regulatory Compliance functions.
Decision-making process Compensation decisions for employees are made once annually in January following the end of the performance year. This timing allows full-year financial results to be considered along with other non-financial goals and objectives. Although the framework for compensation decision-making is tied to financial performance, significant discretion is used to determine individual compensation based on achievement of strategic and operating results and other considerations such as management and leadership capabilities.
No set formulas are established and no fixed benchmarks are used in determining annual incentive awards. In determining specific individual compensation amounts, a number of factors are considered including non-financial goals and objectives and overall financial and investment performance. These results are viewed in the aggregate without any specific weighting, and there is no direct correlation between

Annual Report and Audited Accounts 13
any particular performance measure and the resulting annual incentive award.
Annual incentive awards are generated from a bonus pool.
The size of the projected bonus pool, including cash and equity awards, is reviewed throughout the year by the MDCC and the final total bonus pool is approved after year-end. As part of this review, the MDCC receives actual and projected financial information over the course of the year as well as final year-end information. The financial information that the MDCC receives and considers includes the current year projected income statement and other financial measures compared with prior year results and the current year budget. The MDCC additionally reviews other metrics of Blackrock’s financial performance (e.g., net inflows of AUM and investment performance) as well as information regarding market conditions and competitive compensation levels.
The MDCC regularly considers management’s recommendation as to the percentage of pre-incentive operating income that will be accrued and reflected as a compensation expense throughout the year for the cash portion of the total annual bonus pool (the “accrual rate”). The accrual rate of the cash portion of the total annual bonus pool may be modified by the MDCC during the year based on its review of the financial information described above. The MDCC does not apply any particular weighting or formula to the information it considers when determining the size of the total bonus pool or the accruals made for the cash portion of the total bonus pool.
Following the end of the performance year, the MDCC approves the final bonus pool amount.
As part of the year-end review process the Operational Risk and Regulatory Compliance departments report to the Committee on any activities, incidents or events that warrant consideration in making compensation decisions.
Individuals are not involved in setting their own remuneration.
Control functionsEach of the control functions (Operational Risk, Legal & Compliance, and Internal Audit) has its own organisational structure which is independent of the business units. The head of each control function is either a member of the Global Executive Committee, BlackRock’s global management committee, or has a reporting obligation to the Manager’s Board.
Functional bonus pools are determined with reference to the performance of each individual function. The remuneration of the senior members of control functions is directly overseen by the Committee.
Link between pay and performance There is a clear and well defined pay-for-performance philosophy and compensation programmes which are designed to meet five key objectives as detailed below:
} attracting, retaining and motivating employees capable of making significant contributions to the long-term success of the business;
} aligning the interests of senior employees with those of shareholders by awarding BlackRock, Inc. stock as a significant part of both annual and long-term incentive awards;
} controlling fixed costs by ensuring that compensation expense varies with profitability;
} linking a significant portion of an employee’s total compensation to the financial and operational performance of the business as well as its common stock performance; and
} discouraging excessive risk-taking.
Driving a high-performance culture is dependent on the ability to measure performance against objectives, values and behaviours in a clear and consistent way. Managers use a 5-point rating scale to provide an overall assessment of an employee’s performance, and employees also provide a self-evaluation. The overall, final rating is reconciled during each employee’s performance appraisal. Employees are assessed on the manner in which performance is attained as well as the absolute performance itself.
In keeping with the pay-for-performance philosophy, ratings are used to differentiate and reward individual performance – but don’t pre-determine compensation outcomes. Compensation decisions remain discretionary and are made as part of the year-end compensation process.
When setting remuneration levels other factors are considered, as well as individual performance, which may include:
} the performance of the Manager, the funds managed by the Manager and/or the relevant functional department;
} factors relevant to an employee individually (e.g. relevant working arrangements (including part-time status if applicable); relationships with clients and colleagues; teamwork; skills; any conduct issues; and, subject to any applicable policy, the impact that any relevant leave of absence may have on contribution to the business);
} the management of risk within the risk profiles appropriate for BlackRock's clients;
} strategic business needs, including intentions regarding retention;
} market intelligence; and
} criticality to business.
Report on Remuneration continued

14 BlackRock Strategic Funds (BSF)
A primary product tool is risk management and, while employees are compensated for strong performance in their management of client assets, they are required to manage risk within the risk profiles appropriate for their clients. Therefore, employees are not rewarded for engaging in high-risk transactions outside of established parameters. Compensation practices do not provide undue incentives for short-term planning or short-term financial rewards, do not reward unreasonable risk and provide a reasonable balance between the many and substantial risks inherent within the business of investment management, risk management and advisory services.
The compensation model includes a basic salary, which is contractual, and a discretionary bonus scheme. Although all employees are eligible to be considered for a bonus, there is no contractual obligation to make any award to an employee under its discretionary bonus scheme. In exercising discretion to award a discretionary bonus, the factors listed above (under the heading “Link between pay and performance”) may be taken into account in addition to any other matters which become relevant to the exercise of discretion in the course of the performance year.
Discretionary bonus awards for all employees, including executive officers, are subject to a guideline that determines the portion paid in cash and the portion paid in stock and subject to additional vesting/clawback conditions. As annual compensation increases, a greater portion is paid in stock. The MDCC adopted this approach in 2006 to substantially increase the retention value and shareholder alignment of the compensation package for eligible employees, including the executive officers. The portion deferred into stock vests in equal instalments over the three years following grant.
Supplementary to the annual discretionary bonus as described above, equity awards from the “Partner Plan” and “Enterprise Leadership Acceleration at BlackRock Plan” are made to select senior leaders to provide greater linkage with future business results. These long-term incentive awards have been established individually to provide meaningful incentives for continued performance over a multi-year period recognizing the scope of the individual’s role, business expertise and leadership skills. These awards usually vest fully three years after they are granted.
Selected senior leaders are eligible to receive performance-adjusted equity-based awards from the “BlackRock Performance Incentive Plan” (“BPIP”). Awards made from the BPIP have a three-year performance period based on a measurement of As Adjusted Operating Margin 1 and Organic Revenue Growth 2. Determination of pay-out will be made based on BlackRock’s achievement relative to target financial results at the conclusion of the performance period. The maximum number of shares that can be earned is 165% of the award in those situations where both metrics achieve pre-determined financial targets. No shares will be earned where BlackRock’s financial performance in both of the above metrics is below a pre-determined performance threshold.
These metrics have been selected as key measures of shareholder value which endure across market cycles.
A limited number of investment professionals have a portion of their annual discretionary bonus (as described above) awarded as deferred cash that notionally tracks investment in selected products managed by the relevant employee. The intention of these awards is to align investment professionals with the investment returns of the products they manage through the deferral of compensation into those products. Clients and external evaluators have increasingly viewed more favourably those products where key investors have “skin in the game” through significant personal investments. These awards vest in equal instalments over the three years following grant.
Identified StaffThe UCITS Remuneration Policy sets out the process that will be applied to identify staff as Identified Staff, being categories of staff of the Manager, including senior management, risk takers, control functions and any employee receiving total remuneration that takes them into the same remuneration bracket as senior management and risk takers, whose professional activities have a material impact on the risk profiles of the Manager or of the funds it manages.
The list of Identified Staff will be subject to regular review, being formally reviewed in the event of, but not limited to:
} Organisational changes} New business initiatives} Changes in significant influence function lists} Changes in role responsibilities} Revised regulatory direction
Quantitative Remuneration DisclosureAppropriate disclosures will be made in due course in accordance with Article 69(3) of the Directive once a full performance year has been completed.
1 As Adjusted Operating Margin: As reported in BlackRock, Inc.’s external filings, reflects
adjusted Operating Income divided by Total Revenue net of distribution and servicing
expenses and amortisation of deferred sales commission.2 Organic Revenue Growth: Equal to net new base fees plus net new Aladdin revenue
generated in the year (in dollars).
Report on Remuneration continued

Annual Report and Audited Accounts 15
Board of Directors Management and Administration continued
Nicholas C.D. Hall (Chairman)Frank Le FeuvreAlexander Hoctor-DuncanFrancine KeiserGeoffrey D. RadcliffeBruno Rovelli
1 All Directors are non-executive Directors.2 Frank Le Feuvre, Alexander Hoctor-Duncan, Geoffrey D. Radcliffe and Bruno Rovelli are
employees of the BlackRock Group (the BlackRock group of companies, the ultimate holding
company of which is BlackRock, Inc., of which the Management Company and Investment
Advisers are part of), and Nicholas C.D. Hall is a former employee of the BlackRock Group.3 Francine Keiser is an independent Director.
Management and AdministrationManagement CompanyBlackRock (Luxembourg) S.A. 35A, avenue J.F. Kennedy,L-1855 Luxembourg,Grand Duchy of Luxembourg
Investment Advisers BlackRock Financial Management, Inc.,Park Avenue Plaza,55 East 52nd Street,New York, NY 10055,USA
BlackRock Institutional Trust Company N.A.400 Howard Street,San Francisco CA 94105,USA
BlackRock Investment Management, LLC100 Bellevue Parkway,Wilmington,Delaware 19809,USA
BlackRock Investment Management (UK) Limited12 Throgmorton Avenue,London EC2N 2DL,United Kingdom
BlackRock (Singapore) Limited#18-01 Twenty Anson,20 Anson Road,Singapore, 079912
Sub-Investment AdvisersBlackRock Asset Management North Asia Limited16/F Cheung Kong Center,2 Queen’s Road Central,Hong Kong
BlackRock Investment Management (Australia) LimitedLevel 26, 101 Collins Street,Melbourne 3000,Australia
BlackRock Japan Co., Ltd.1-8-3 Marunouchi,Chiyoda-ku,Tokyo 100-8217,Japan
External Sub-Investment AdvisersFrom 14 January 2016Benefit Street Partners LLC9 West 57th Street, Suite 4920,New York, NY 10019,USA
From 19 January 2016Boussard & Gavaudan Asset Management, LP1 Vine Street,London W1J 0AH,United Kingdom
From 5 January 2016GSA Capital Partners, LLP5 Stratton Street,London W1J8LA,United Kingdom
From 5 January 2016LibreMax Capital, LLC600 Lexington Avenue, 19th Floor,New York, NY 10022,USA
From 24 February 2016Pine River Capital Management LP601 Carlson Parkway, Suite 330, Minnetonka, MN 55305,USA
From 19 January 2016QMS Capital Management LP240 Leigh Farm Road, Suite 230,Durham, NC 27707,USA
Principal DistributorUntil 18 January 2016:BlackRock (Channel Islands) LimitedOne Waverley Place,Union Street St. Helier,Jersey JE1 0BR,Channel Islands
As from 18 January 2016:BlackRock Investment Management (UK) Limited12 Throgmorton Avenue,London EC2N 2DL, United Kingdom
1, 2, 3

16 BlackRock Strategic Funds (BSF)
Custodian Bank and Fund Administrative AgentState Street Bank Luxembourg S.C.A.49, avenue J.F. Kennedy,L-1855 Luxembourg,Grand Duchy of Luxembourg
Transfer Agent and RegistrarJ.P. Morgan Bank Luxembourg S.A.6C, route de Trèves,L-2633 Senningerberg,Grand Duchy of Luxembourg
Cabinet de Révision AgrééDeloitte Audit, Société à responsabilité limitée560, rue de Neudorf,L-2220 Luxembourg,Grand Duchy of Luxembourg
Legal AdviserLinklaters LLP35, avenue J.F. Kennedy,L-1855 Luxembourg,Grand Duchy of Luxembourg
Paying AgentsA list of Paying Agents is to be found on pages 506 and 507.
Registered Office49, avenue J.F. KennedyL-1855 Luxembourg,Grand Duchy of Luxembourg
EnquiriesIn the absence of other arrangements, enquiries regarding the Company should be addressed as follows:Written Enquiries:BlackRock Investment Management (UK) Limited, c/o BlackRock (Luxembourg) S.A.P.O. Box 1058,L-1010 Luxembourg,Grand Duchy of Luxembourg
All other enquiries: Telephone: + 44 207 743 3300, Fax: + 44 207 743 1143Email: [email protected]
Management and Administration continued

Annual Report and Audited Accounts 17
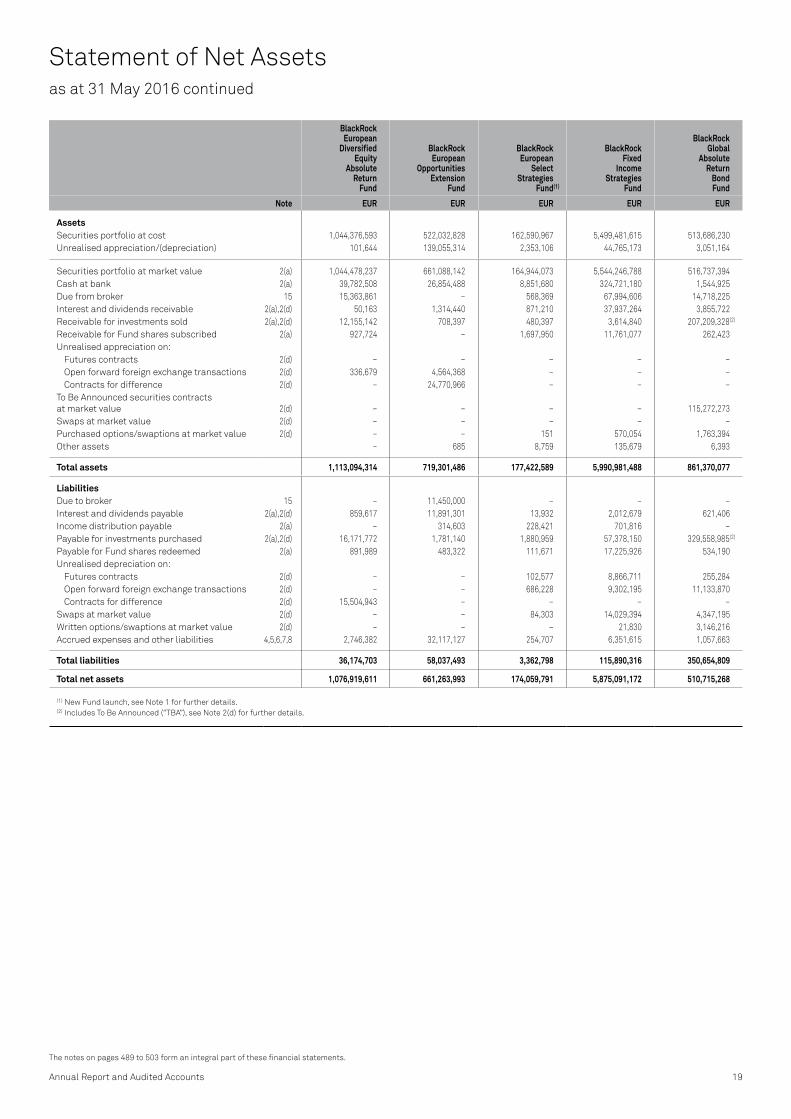
The notes on pages 489 to 503 form an integral part of these financial statements.
Statement of Net Assets as at 31 May 2016
BlackRock Strategic
Funds Combined
BlackRock Americas
Diversified Equity
Absolute Return
Fund
BlackRock Asia
Extension Fund
BlackRock Emerging
Markets Absolute
Return Fund
BlackRock Emerging
Markets Allocation
Fund
BlackRock Emerging
Markets Equity
Strategies Fund(1)
Note USD USD USD USD USD USD
Assets Securities portfolio at cost 14,721,684,992 583,944,088 103,577,416 79,811,646 46,761,020 6,632,648 Unrealised appreciation/(depreciation) 271,139,820 4,608 (465) (2,312,806) 571,161 21,507
Securities portfolio at market value 2(a) 14,992,824,812 583,948,696 103,576,951 77,498,840 47,332,181 6,654,155 Cash at bank 2(a) 730,287,064 29,322,701 5,160,470 4,466,119 1,493,763 294,677 Due from broker 15 190,299,360 – – 4,066,853 – 4,204 Interest and dividends receivable 2(a),2(d) 69,032,081 1,498,194 449,421 87,148 641,579 4,041 Receivable for investments sold 2(a),2(d) 288,503,763 173,670 1,495 1,614,879 – 86,830 Receivable for Fund shares subscribed 2(a) 42,971,652 17,912,057 – 2,243 – – Unrealised appreciation on:
Futures contracts 2(d) 944,947 – 360,115 – 92,715 – Open forward foreign exchange transactions 2(d) 12,176,796 – 30,275 – – – Contracts for difference 2(d) 49,979,216 6,895,803 5,211,307 210,151 2,219,729 12,123
To Be Announced securities contracts at market value 2(d) 140,192,843 – – – – – Swaps at market value 2(d) 3,250,020 257,186 – – – – Purchased options/swaptions at market value 2(d) 10,073,366 – – – – – Other assets 1,150,282 – – 20,765 1,377 20,872
Total assets 16,531,686,202 640,008,307 114,790,034 87,966,998 51,781,344 7,076,902
Liabilities Due to broker 15 18,921,970 3,673,000 2,388,304 – 71,585 – Interest and dividends payable 2(a),2(d) 35,397,456 658,752 66,158 1,083,698 44,139 14,703 Income distribution payable 2(a) 1,828,902 – – – – – Payable for investments purchased 2(a),2(d) 540,143,251 218,820 612,596 2,005,015 1,348,445 141,639 Payable for Fund shares redeemed 2(a) 48,644,504 965,033 – 43,938 – – Unrealised depreciation on:
Futures contracts 2(d) 20,968,212 – – 166,854 – – Open forward foreign exchange transactions 2(d) 50,265,855 9,897,292 – 1,379,916 119,609 19,760 Contracts for difference 2(d) 18,969,645 – – – – –
Swaps at market value 2(d) 20,975,923 – – – 19,545 – Written options/swaptions at market value 2(d) 13,575,977 – – – – – Accrued expenses and other liabilities 4,5,6,7,8 77,396,855 3,694,923 162,481 409,335 221,436 26,731
Total liabilities 847,088,550 19,107,820 3,229,539 5,088,756 1,824,759 202,833
Total net assets 15,684,597,652 620,900,487 111,560,495 82,878,242 49,956,585 6,874,069
(1) New Fund launch, see Note 1 for further details.
Approved on behalf of the Board of Directors
Director
Date 28 September 2016
Director
Date 28 September 2016

The notes on pages 489 to 503 form an integral part of these financial statements.
18 BlackRock Strategic Funds (BSF)
Statement of Net Assetsas at 31 May 2016 continued
BlackRock Emerging
Markets Flexi
Dynamic Bond Fund
BlackRock Euro
Dynamic Diversified
Growth Fund
BlackRock European Absolute
Return Fund
BlackRock European
Constrained Credit
Strategies Fund(1)
BlackRock European
Credit Strategies
Fund
Note USD EUR EUR EUR EUR
AssetsSecurities portfolio at cost 287,335,865 954,079,616 1,900,728,720 – 385,597,822 Unrealised appreciation/(depreciation) 9,385,837 40,340,457 36,440,915 – (36,611,486)
Securities portfolio at market value 2(a) 296,721,702 994,420,073 1,937,169,635 – 348,986,336 Cash at bank 2(a) 72,286,186 6,516,748 10,242,931 290,860 57,735,490 Due from broker 15 179,998 17,810,610 31,698,752 – 918,429 Interest and dividends receivable 2(a),2(d) 6,020,580 303,154 1,474,946 – 4,835,657 Receivable for investments sold 2(a),2(d) – 257,346 5,530,917 – 6,400,304 Receivable for Fund shares subscribed 2(a) 100,198 4,564,444 – – – Unrealised appreciation on:
Futures contracts 2(d) – – – – – Open forward foreign exchange transactions 2(d) 687,365 – 514,126 – 4,231,752 Contracts for difference 2(d) – – 5,976,453 – 46,989
To Be Announced securities contracts at market value 2(d) – – – – – Swaps at market value 2(d) 1,489,914 138,152 – – 796,148 Purchased options/swaptions at market value 2(d) – 5,674,592 – – 160,829 Other assets – 426,266 13,215 – 305,616
Total assets 377,485,943 1,030,111,385 1,992,620,975 290,860 424,417,550
LiabilitiesDue to broker 15 – – – – – Interest and dividends payable 2(a),2(d) 1,424,422 51,215 11,930,894 – 750,716 Income distribution payable 2(a) 436,789 – – – – Payable for investments purchased 2(a),2(d) – 1,049,465 23,804,398 – 6,545,028 Payable for Fund shares redeemed 2(a) 20,202 7,544,731 13,631,982 – – Unrealised depreciation on:
Futures contracts 2(d) – 555,140 7,904,223 – 368,443 Open forward foreign exchange transactions 2(d) – 7,381,550 – – – Contracts for difference 2(d) – – – – –
Swaps at market value 2(d) – – – – – Written options/swaptions at market value 2(d) – 8,597,308 – – 10,582 Accrued expenses and other liabilities 4,5,6,7,8 782,773 1,198,443 16,404,647 290,860 1,272,864
Total liabilities 2,664,186 26,377,852 73,676,144 290,860 8,947,633
Total net assets 374,821,757 1,003,733,533 1,918,944,831 – 415,469,917
(1) Fund terminated, see Note 1 for further details.
Annual Report and Audited Accounts 19
The notes on pages 489 to 503 form an integral part of these financial statements.
Statement of Net Assetsas at 31 May 2016 continued
BlackRock European
Diversified Equity
Absolute Return
Fund
BlackRock European
Opportunities Extension
Fund
BlackRock European
Select Strategies
Fund(1)
BlackRock Fixed
Income Strategies
Fund
BlackRock Global
Absolute Return
Bond Fund
Note EUR EUR EUR EUR EUR
AssetsSecurities portfolio at cost 1,044,376,593 522,032,828 162,590,967 5,499,481,615 513,686,230 Unrealised appreciation/(depreciation) 101,644 139,055,314 2,353,106 44,765,173 3,051,164
Securities portfolio at market value 2(a) 1,044,478,237 661,088,142 164,944,073 5,544,246,788 516,737,394 Cash at bank 2(a) 39,782,508 26,854,488 8,851,680 324,721,180 1,544,925 Due from broker 15 15,363,861 – 568,369 67,994,606 14,718,225 Interest and dividends receivable 2(a),2(d) 50,163 1,314,440 871,210 37,937,264 3,855,722 Receivable for investments sold 2(a),2(d) 12,155,142 708,397 480,397 3,614,840 207,209,328(2)
Receivable for Fund shares subscribed 2(a) 927,724 – 1,697,950 11,761,077 262,423 Unrealised appreciation on:
Futures contracts 2(d) – – – – – Open forward foreign exchange transactions 2(d) 336,679 4,564,368 – – – Contracts for difference 2(d) – 24,770,966 – – –
To Be Announced securities contracts at market value 2(d) – – – – 115,272,273 Swaps at market value 2(d) – – – – – Purchased options/swaptions at market value 2(d) – – 151 570,054 1,763,394 Other assets – 685 8,759 135,679 6,393
Total assets 1,113,094,314 719,301,486 177,422,589 5,990,981,488 861,370,077
LiabilitiesDue to broker 15 – 11,450,000 – – – Interest and dividends payable 2(a),2(d) 859,617 11,891,301 13,932 2,012,679 621,406 Income distribution payable 2(a) – 314,603 228,421 701,816 – Payable for investments purchased 2(a),2(d) 16,171,772 1,781,140 1,880,959 57,378,150 329,558,985(2)
Payable for Fund shares redeemed 2(a) 891,989 483,322 111,671 17,225,926 534,190 Unrealised depreciation on:
Futures contracts 2(d) – – 102,577 8,866,711 255,284 Open forward foreign exchange transactions 2(d) – – 686,228 9,302,195 11,133,870 Contracts for difference 2(d) 15,504,943 – – – –
Swaps at market value 2(d) – – 84,303 14,029,394 4,347,195 Written options/swaptions at market value 2(d) – – – 21,830 3,146,216 Accrued expenses and other liabilities 4,5,6,7,8 2,746,382 32,117,127 254,707 6,351,615 1,057,663
Total liabilities 36,174,703 58,037,493 3,362,798 115,890,316 350,654,809
Total net assets 1,076,919,611 661,263,993 174,059,791 5,875,091,172 510,715,268
(1) New Fund launch, see Note 1 for further details. (2) Includes To Be Announced (“TBA”), see Note 2(d) for further details.

The notes on pages 489 to 503 form an integral part of these financial statements.
20 BlackRock Strategic Funds (BSF)
Statement of Net Assetsas at 31 May 2016 continued
BlackRock Global Event
Driven Fund(1)
BlackRock Global
Long/Short Equity
Fund
BlackRock Impact
World Equity
Fund(1)
BlackRock Latin
American Opportunities
Fund
BlackRock Managed
Index Portfolios –
Defensive
Note USD USD USD USD EUR
AssetsSecurities portfolio at cost 227,945,383 232,704,874 230,649,243 36,930,146 27,283,948 Unrealised appreciation/(depreciation) 252,242 (1,960) 2,087,577 (3,034,058) (132,126)
Securities portfolio at market value 2(a) 228,197,625 232,702,914 232,736,820 33,896,088 27,151,822 Cash at bank 2(a) 9,109,569 31,492,742 2,647,794 479,772 41,361 Due from broker 15 2,224,898 4,694,648 55,427 – – Interest and dividends receivable 2(a),2(d) 571,878 37,864 627,352 27,544 51,402 Receivable for investments sold 2(a),2(d) 2,381,011 293,016 312,515 – – Receivable for Fund shares subscribed 2(a) – 1,495,511 245,791 – 33,385 Unrealised appreciation on:
Futures contracts 2(d) – 292,841 91,587 – – Open forward foreign exchange transactions 2(d) – – – – – Contracts for difference 2(d) 574,865 – – – –
To Be Announced securities contracts at market value 2(d) – – – – – Swaps at market value 2(d) – – – – – Purchased options/swaptions at market value 2(d) – – – – – Other assets 90 – 7,178 6,326 13,503
Total assets 243,059,936 271,009,536 236,724,464 34,409,730 27,291,473
LiabilitiesDue to broker 15 – – – – – Interest and dividends payable 2(a),2(d) 196,268 177,537 – – – Income distribution payable 2(a) – – – – 1,273 Payable for investments purchased 2(a),2(d) 2,540 8,586,450 225,225 15,782 42,221 Payable for Fund shares redeemed 2(a) – 811,330 – – 41,048 Unrealised depreciation on:
Futures contracts 2(d) 12,293 – – – – Open forward foreign exchange transactions 2(d) 1,955,705 3,029,310 3,295 – 211,356 Contracts for difference 2(d) – 285,900 – – –
Swaps at market value 2(d) 56,258 – – – – Written options/swaptions at market value 2(d) – – – – – Accrued expenses and other liabilities 4,5,6,7,8 668,268 1,046,828 41,145 270,893 29,823
Total liabilities 2,891,332 13,937,355 269,665 286,675 325,721
Total net assets 240,168,604 257,072,181 236,454,799 34,123,055 26,965,752
(1) New Fund launch, see Note 1 for further details.
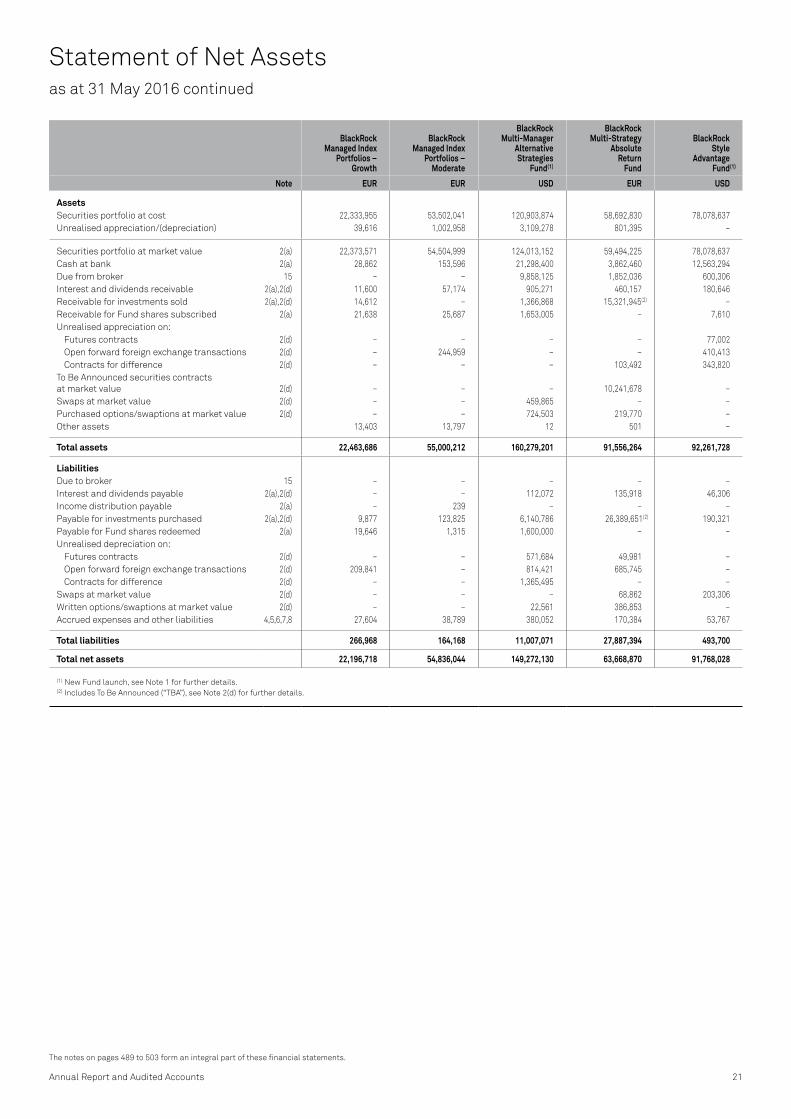
Annual Report and Audited Accounts 21
The notes on pages 489 to 503 form an integral part of these financial statements.
Statement of Net Assetsas at 31 May 2016 continued
BlackRock Managed Index
Portfolios – Growth
BlackRock Managed Index
Portfolios – Moderate
BlackRock Multi-Manager
Alternative Strategies
Fund(1)
BlackRock Multi-Strategy
Absolute Return
Fund
BlackRock Style
Advantage Fund(1)
Note EUR EUR USD EUR USD
Assets Securities portfolio at cost 22,333,955 53,502,041 120,903,874 58,692,830 78,078,637 Unrealised appreciation/(depreciation) 39,616 1,002,958 3,109,278 801,395 –
Securities portfolio at market value 2(a) 22,373,571 54,504,999 124,013,152 59,494,225 78,078,637 Cash at bank 2(a) 28,862 153,596 21,298,400 3,862,460 12,563,294 Due from broker 15 – – 9,858,125 1,852,036 600,306 Interest and dividends receivable 2(a),2(d) 11,600 57,174 905,271 460,157 180,646 Receivable for investments sold 2(a),2(d) 14,612 – 1,366,868 15,321,945(2) – Receivable for Fund shares subscribed 2(a) 21,638 25,687 1,653,005 – 7,610 Unrealised appreciation on:
Futures contracts 2(d) – – – – 77,002 Open forward foreign exchange transactions 2(d) – 244,959 – – 410,413 Contracts for difference 2(d) – – – 103,492 343,820
To Be Announced securities contracts at market value 2(d) – – – 10,241,678 – Swaps at market value 2(d) – – 459,865 – – Purchased options/swaptions at market value 2(d) – – 724,503 219,770 – Other assets 13,403 13,797 12 501 –
Total assets 22,463,686 55,000,212 160,279,201 91,556,264 92,261,728
LiabilitiesDue to broker 15 – – – – – Interest and dividends payable 2(a),2(d) – – 112,072 135,918 46,306 Income distribution payable 2(a) – 239 – – – Payable for investments purchased 2(a),2(d) 9,877 123,825 6,140,786 26,389,651(2) 190,321 Payable for Fund shares redeemed 2(a) 19,646 1,315 1,600,000 – – Unrealised depreciation on:
Futures contracts 2(d) – – 571,684 49,981 – Open forward foreign exchange transactions 2(d) 209,841 – 814,421 685,745 – Contracts for difference 2(d) – – 1,365,495 – –
Swaps at market value 2(d) – – – 68,862 203,306 Written options/swaptions at market value 2(d) – – 22,561 386,853 – Accrued expenses and other liabilities 4,5,6,7,8 27,604 38,789 380,052 170,384 53,767
Total liabilities 266,968 164,168 11,007,071 27,887,394 493,700
Total net assets 22,196,718 54,836,044 149,272,130 63,668,870 91,768,028
(1) New Fund launch, see Note 1 for further details. (2) Includes To Be Announced (“TBA”), see Note 2(d) for further details.

The notes on pages 489 to 503 form an integral part of these financial statements.
22 BlackRock Strategic Funds (BSF)
Statement of Net Assetsas at 31 May 2016 continued
BlackRock Systematic
European Equity
Fund
BlackRock Systematic
Global Equity
Fund(1)
Note EUR USD
AssetsSecurities portfolio at cost 14,872,902 225,602,071 Unrealised appreciation/(depreciation) (188,257) 3,168,467
Securities portfolio at market value 2(a) 14,684,645 228,770,538 Cash at bank 2(a) 121,604 2,723,305 Due from broker 15 – 105,213 Interest and dividends receivable 2(a),2(d) 43,391 719,799 Receivable for investments sold 2(a),2(d) 38,296 1,102,835 Receivable for Fund shares subscribed 2(a) 19,091 – Unrealised appreciation on:
Futures contracts 2(d) – 30,687 Open forward foreign exchange transactions 2(d) – – Contracts for difference 2(d) – –
To Be Announced securities contracts at market value 2(d) – – Swaps at market value 2(d) – – Purchased options/swaptions at market value 2(d) – – Other assets 35,064 8,580
Total assets 14,942,091 233,460,957
LiabilitiesDue to broker 15 – – Interest and dividends payable 2(a),2(d) – – Income distribution payable 2(a) – – Payable for investments purchased 2(a),2(d) 38,296 1,530,327 Payable for Fund shares redeemed 2(a) 10,092 – Unrealised depreciation on:
Futures contracts 2(d) – – Open forward foreign exchange transactions 2(d) – 88 Contracts for difference 2(d) – –
Swaps at market value 2(d) – – Written options/swaptions at market value 2(d) – – Accrued expenses and other liabilities 4,5,6,7,8 86,077 339,260
Total liabilities 134,465 1,869,675
Total net assets 14,807,626 231,591,282
(1) New Fund launch, see Note 1 for further details.

Annual Report and Audited Accounts 23
The notes on pages 489 to 503 form an integral part of these financial statements.
Three Year Summary of Net Asset Values as at 31 May 2016
Currency 31 May 2016 31 May 2015 31 May 2014
BlackRock Americas Diversified Equity Absolute Return FundTotal net assets USD 620,900,487 151,528,217 120,996,553Net asset value per:
A Class non-distributing share AUD 172.06 157.07 119.84A Class non-distributing share USD 124.09 119.95 111.12A Class non-distributing share EUR hedged EUR 123.05 119.32 110.64A Class non-distributing share SEK hedged SEK 125.06 121.55 112.54A Class non-distributing UK reporting fund share GBP 134.72 124.58 105.36D Class non-distributing share USD 104.46 100.28 –D Class non-distributing share CHF hedged CHF 102.32 – –D Class non-distributing share GBP hedged GBP 105.96 – –D Class non-distributing UK reporting fund share EUR hedged EUR 124.57 120.31 111.13E Class non-distributing share EUR hedged EUR 101.01 – –I Class non-distributing share EUR hedged EUR 101.01 – –X Class non-distributing share USD 137.11 128.66 114.97
BlackRock Asia Extension FundTotal net assets USD 111,560,495 157,012,688 202,666,153Net asset value per:
A Class non-distributing share AUD – – 128.84A Class non-distributing share USD 112.48 139.05 119.72A Class non-distributing UK reporting fund share GBP hedged GBP 112.39 139.10 119.64D Class non-distributing share USD 114.43 140.90 121.15E Class non-distributing share USD 110.41 137.23 118.74X Class non-distributing share USD 103.86 126.29 106.07
BlackRock Emerging Markets Absolute Return FundTotal net assets USD 82,878,242 120,780,911 42,070,995Net asset value per:
A Class distributing UK reporting fund share GBP hedged GBP 100.15 100.23 102.05A Class non-distributing share USD 100.75 101.01 103.08A Class non-distributing share EUR hedged EUR 98.23 99.12 101.48D Class distributing UK reporting fund share GBP hedged GBP 102.41 102.00 103.31D Class non-distributing share USD 106.99 106.71 108.31D Class non-distributing share EUR hedged EUR 105.28 105.80 107.81E Class non-distributing share EUR hedged EUR 97.58 98.99 101.96I Class distributing UK reporting fund share GBP 101.21 96.38 89.16I Class distributing UK reporting fund share GBP hedged GBP 102.00 101.26 102.34I Class non-distributing share EUR 132.64 134.07 109.63I Class non-distributing share USD 102.18 101.64 102.93I Class non-distributing share EUR hedged EUR 106.67 106.81 108.61X Class non-distributing share USD – 111.87 112.17
BlackRock Emerging Markets Allocation FundTotal net assets USD 49,956,585 55,271,903 51,601,993Net asset value per:
A Class non-distributing share USD 97.31 106.16 103.20C Class non-distributing share USD 94.80 104.51 102.67D Class non-distributing share USD 99.11 107.34 103.64E Class non-distributing share USD 96.03 105.29 102.89E Class non-distributing share EUR hedged EUR 91.35 101.00 –I Class non-distributing share USD 99.67 107.72 103.76X Class non-distributing share USD 101.59 108.97 104.18
BlackRock Emerging Markets Equity Strategies Fund(1)
Total net assets USD 6,874,069 – –Net asset value per:
A Class non-distributing share USD 113.25 – –D Class non-distributing share EUR 101.32 – –D Class non-distributing share USD 106.13 – –D Class non-distributing share EUR hedged EUR 107.27 – –E Class non-distributing share EUR 100.77 – –X Class non-distributing share USD 114.65 – –Z Class non-distributing share USD 114.23 – –
(1) New Fund launch, see Note 1 for further details.

The notes on pages 489 to 503 form an integral part of these financial statements.
24 BlackRock Strategic Funds (BSF)
Three Year Summary of Net Asset Valuesas at 31 May 2016 continued
Currency 31 May 2016 31 May 2015 31 May 2014
BlackRock Emerging Markets Flexi Dynamic Bond FundTotal net assets USD 374,821,757 211,673,770 147,999,972Net asset value per:
A Class distributing UK reporting fund share GBP hedged GBP 96.69 97.75 –A Class non-distributing share USD 104.33 101.59 100.69A Class non-distributing share EUR hedged EUR 102.96 101.00 100.47D Class distributing share USD 102.72 – –D Class distributing share GBP hedged GBP 96.38 97.42 –D Class distributing UK reporting fund share GBP 89.26 86.35 80.82D Class non-distributing share USD 107.02 103.43 101.74D Class non-distributing share EUR hedged EUR 106.51 103.67 102.34E Class non-distributing share USD 102.90 100.71 100.31E Class non-distributing share EUR hedged EUR 102.85 101.39 101.31I Class distributing share EUR hedged EUR 99.82 – –I Class non-distributing share USD 105.26 101.53 –X Class non-distributing share USD 111.33 106.62 103.94X Class non-distributing share GBP hedged GBP 105.35 – –
BlackRock Euro Dynamic Diversified Growth FundTotal net assets EUR 1,003,733,533 884,380,906 433,851,421Net asset value per:
A Class non-distributing share EUR 111.52 117.56 113.16A Class non-distributing share SEK hedged SEK 114.12 120.74 115.99D Class non-distributing share EUR 114.99 120.49 115.29E Class non-distributing share EUR 109.20 115.69 111.92I Class non-distributing share EUR 116.65 121.94 116.40I Class non-distributing share CAD hedged CAD 100.82 – –I Class non-distributing share SEK hedged SEK 117.43 123.22 117.36X Class non-distributing share EUR 120.07 124.70 118.26
BlackRock European Absolute Return FundTotal net assets EUR 1,918,944,831 1,129,393,101 1,295,759,972Net asset value per:
A Class distributing share EUR 132.43 129.01 123.97A Class non-distributing share EUR 132.59 129.17 123.97A Class non-distributing share SEK hedged SEK – – 126.39D Class distributing share EUR 133.89 129.89 124.49D Class non-distributing share EUR 136.16 132.11 126.48D Class non-distributing share CHF hedged CHF 134.50 131.43 125.70D Class non-distributing UK reporting fund share GBP hedged GBP 138.40 133.38 127.26E Class non-distributing share EUR 129.02 126.19 121.63I Class non-distributing share EUR 137.34 132.95 127.07
BlackRock European Constrained Credit Strategies Fund(1)
Total net assets EUR – 58,879,701 137,397,974Net asset value per:
I Class non-distributing share EUR – 117.77 115.42
(1) Fund terminated, see Note 1 for further details.

Annual Report and Audited Accounts 25
The notes on pages 489 to 503 form an integral part of these financial statements.
Three Year Summary of Net Asset Valuesas at 31 May 2016 continued
Currency 31 May 2016 31 May 2015 31 May 2014
BlackRock European Credit Strategies FundTotal net assets EUR 415,469,917 1,541,928,953 1,493,888,250Net asset value per:
H Class non-distributing share EUR 105.58 120.55 118.60H Class non-distributing share CHF hedged CHF 103.50 119.20 118.02H Class non-distributing share USD hedged USD 106.29 120.76 118.66H Class non-distributing UK reporting fund share GBP hedged GBP 107.17 121.85 119.38I Class non-distributing share CHF hedged CHF 88.37 – –I Class non-distributing share SEK hedged SEK 917.10 1,043.34 1,016.19I Class non-distributing UK reporting fund share EUR 108.28 122.77 120.16I Class non-distributing UK reporting fund share GBP hedged GBP 110.19 124.47 121.31I Class non-distributing UK reporting fund share USD hedged USD 109.29 123.29 120.39T Class non-distributing share EUR 96.96 109.94 107.58U Class non-distributing share EUR 107.05 121.62 119.25U Class non-distributing share CHF hedged CHF 89.59 – –U Class non-distributing UK reporting fund share GBP 81.58 87.40 96.93U Class non-distributing UK reporting fund share USD hedged USD 108.02 122.07 119.48X Class non-distributing share EUR 120.11 135.06 130.31X Class non-distributing share USD hedged USD – 100.94 –
BlackRock European Diversified Equity Absolute Return FundTotal net assets EUR 1,076,919,611 441,906,089 235,880,089Net asset value per:
A Class non-distributing share AUD – – 169.30A Class non-distributing share EUR 127.72 132.14 117.39A Class non-distributing share CHF hedged CHF 125.01 130.13 116.10A Class non-distributing share SEK hedged SEK 131.38 135.91 120.53A Class non-distributing UK reporting fund share GBP hedged GBP 130.47 134.37 118.88D Class non-distributing share CHF hedged CHF 96.53 100.02 –D Class non-distributing share USD hedged USD 129.11 132.09 116.81D Class non-distributing UK reporting fund share EUR 129.22 132.77 117.43D Class non-distributing UK reporting fund share GBP hedged GBP 134.35 136.91 120.65E Class non-distributing share EUR 125.04 129.63 115.61I Class non-distributing share EUR 133.67 136.91 120.86I Class non-distributing share SEK hedged SEK 955.04 – –X Class non-distributing share EUR 154.30 156.06 132.28
BlackRock European Opportunities Extension FundTotal net assets EUR 661,263,993 707,416,049 512,216,924Net asset value per:
A Class distributing UK reporting fund share GBP 219.61 190.69 155.86A Class non-distributing share EUR 291.04 268.00 193.42D Class distributing (G) share EUR 111.05 – –D Class distributing share EUR – 138.25 –D Class distributing UK reporting fund share GBP 222.74 192.62 156.82D Class non-distributing share EUR 295.59 271.10 194.50E Class non-distributing share EUR 282.90 261.56 189.50I Class non-distributing share EUR 155.39 142.19 101.73X Class non-distributing share EUR 165.64 143.23 –
BlackRock European Select Strategies Fund(1)
Total net assets EUR 174,059,791 – –Net asset value per:
A Class distributing share EUR 102.05 – –A Class non-distributing share EUR 101.56 – –D Class distributing share USD hedged USD 101.24 – –D Class non-distributing share EUR 102.03 – –E Class distributing share EUR 101.16 – –E Class non-distributing share EUR 101.16 – –I Class distributing share EUR 101.43 – –X Class non-distributing share EUR 102.61 – –
(1) New Fund launch, see Note 1 for further details.

The notes on pages 489 to 503 form an integral part of these financial statements.
26 BlackRock Strategic Funds (BSF)
Three Year Summary of Net Asset Valuesas at 31 May 2016 continued
Currency 31 May 2016 31 May 2015 31 May 2014
BlackRock Fixed Income Strategies FundTotal net assets EUR 5,875,091,172 3,387,780,513 625,525,641Net asset value per:
A Class distributing share EUR 103.36 103.56 101.21A Class distributing share CHF hedged CHF 101.45 102.41 100.53A Class distributing share USD hedged USD 103.49 103.07 100.57A Class non-distributing share EUR 118.67 118.90 115.84A Class non-distributing share CHF hedged CHF 101.77 102.72 100.67A Class non-distributing share USD hedged USD 103.88 103.47 100.71A Class non-distributing UK reporting fund share GBP hedged GBP 100.65 100.20 –D Class distributing share EUR 102.23 102.11 –D Class distributing share USD hedged USD 101.38 100.64 –D Class distributing UK reporting fund share GBP hedged GBP 103.04 102.34 –D Class non-distributing share EUR 121.77 121.52 117.92D Class non-distributing share CHF hedged CHF 101.83 102.35 –D Class non-distributing share USD hedged USD 103.77 102.94 –D Class non-distributing UK reporting fund share GBP hedged GBP 103.49 102.55 –E Class non-distributing share EUR 115.02 115.83 113.40I Class distributing share EUR 120.91 120.81 –I Class non-distributing share EUR 121.65 121.16 117.34I Class non-distributing share SEK hedged SEK 1,028.92 1,028.18 –X Class distributing share EUR 100.22 – –X Class non-distributing share EUR 126.28 125.02 120.35
BlackRock Global Absolute Return Bond FundTotal net assets EUR 510,715,268 576,128,552 298,603,652Net asset value per:
A Class non-distributing share EUR 102.85 103.98 104.38A Class non-distributing share SEK hedged SEK 1,007.77 1,022.18 1,024.74A Class non-distributing share USD hedged USD 100.94 101.17 101.36D Class non-distributing share EUR 104.74 105.37 105.29D Class non-distributing share CHF hedged CHF 99.18 – –E Class non-distributing share EUR 100.93 102.56 103.50I Class non-distributing share EUR 100.41 100.82 –I Class non-distributing share SEK hedged SEK 1,000.77 1,008.15 –X Class non-distributing share EUR 108.33 108.23 107.37
BlackRock Global Event Driven Fund(1)
Total net assets USD 240,168,604 – –Net asset value per:
A Class non-distributing share USD 101.38 – –A Class non-distributing share CHF hedged CHF 100.34 – –A Class non-distributing UK reporting fund share EUR hedged EUR 98.34 – –D Class non-distributing share USD 101.75 – –D Class non-distributing share CHF hedged CHF 100.09 – –D Class non-distributing UK reporting fund share EUR hedged EUR 98.61 – –D Class non-distributing UK reporting fund share GBP hedged GBP 98.77 – –E Class non-distributing share EUR 104.54 – –E Class non-distributing share EUR hedged EUR 100.97 – –I Class non-distributing share EUR hedged EUR 98.79 – –X Class non-distributing share USD 103.76 – –Z Class non-distributing share USD 102.59 – –Z Class non-distributing share CHF hedged CHF 102.05 – –Z Class non-distributing UK reporting fund share EUR hedged EUR 102.19 – –Z Class non-distributing UK reporting fund share GBP hedged GBP 102.68 – –
(1) New Fund launch, see Note 1 for further details.

Annual Report and Audited Accounts 27
The notes on pages 489 to 503 form an integral part of these financial statements.
Three Year Summary of Net Asset Valuesas at 31 May 2016 continued
Currency 31 May 2016 31 May 2015 31 May 2014
BlackRock Global Long/Short Equity FundTotal net assets USD 257,072,181 344,153,917 –Net asset value per:
A Class non-distributing share USD 95.75 104.65 –A Class non-distributing share EUR hedged EUR 91.62 100.64 –A Class non-distributing share SEK hedged SEK 921.40 1,015.10 –A Class non-distributing UK reporting fund share GBP hedged GBP 94.22 102.84 –C Class non-distributing share USD 90.50 99.92 –D Class non-distributing share USD 92.62 100.62 –D Class non-distributing share EUR hedged EUR 96.12 104.97 –D Class non-distributing UK reporting fund share GBP hedged GBP 95.14 103.22 –E Class non-distributing share EUR hedged EUR 94.08 103.85 –I Class non-distributing share EUR hedged EUR 93.26 101.53 –J Class distributing share USD 96.93 105.31 –X Class non-distributing share USD 99.86 106.89 –
BlackRock Impact World Equity Fund(1)
Total net assets USD 236,454,799 – –Net asset value per:
A Class non-distributing share USD 98.89 – –D Class non-distributing share EUR 99.20 – –E Class non-distributing share EUR 104.39 – –I Class non-distributing share JPY 9,671.26 – –I Class non-distributing share JPY hedged JPY 10,467.85 – –X Class distributing share AUD 213.64 – –X Class non-distributing share GBP 106.48 – –
BlackRock Latin American Opportunities FundTotal net assets USD 34,123,055 82,914,424 125,907,391Net asset value per:
A Class non-distributing share EUR 74.16 79.47 87.58A Class non-distributing share USD 85.21 90.11 123.22A Class non-distributing UK reporting fund share GBP 56.38 56.53 70.49C Class non-distributing share USD 77.45 82.75 114.30D Class non-distributing share EUR 76.73 82.68 90.43D Class non-distributing share USD 86.39 91.16 123.70D Class non-distributing UK reporting fund share GBP 57.58 57.61 71.29
BlackRock Managed Index Portfolios – DefensiveTotal net assets EUR 26,965,752 19,561,291 –Net asset value per:
A Class distributing share EUR 101.22 – –A Class non-distributing share USD hedged USD 103.91 – –A Class non-distributing UK reporting fund share EUR 102.04 – –D Class distributing share EUR 97.46 97.74 –D Class distributing share USD hedged USD 103.03 – –D Class distributing UK reporting fund share GBP hedged GBP 98.18 97.81 –D Class non-distributing share EUR 102.90 – –D Class non-distributing share CHF hedged CHF 97.97 97.62 –D Class non-distributing share USD hedged USD 104.52 – –D Class non-distributing UK reporting fund share GBP hedged GBP 99.49 97.81 –X Class non-distributing share EUR 99.33 97.80 –
BlackRock Managed Index Portfolios – GrowthTotal net assets EUR 22,196,718 19,643,536 –Net asset value per:
A Class distributing share EUR 100.88 – –A Class non-distributing share USD hedged USD 108.78 – –A Class non-distributing UK reporting fund share EUR 98.41 – –D Class distributing share EUR 94.00 97.35 –D Class distributing share USD hedged USD 100.19 – –D Class distributing UK reporting fund share GBP hedged GBP 93.91 97.38 –D Class non-distributing share EUR 105.66 – –D Class non-distributing share CHF hedged CHF 93.23 97.22 –D Class non-distributing share USD hedged USD 108.35 – –D Class non-distributing UK reporting fund share GBP hedged GBP 94.09 97.35 –X Class non-distributing share EUR 94.79 97.41 –
(1) New Fund launch, see Note 1 for further details.
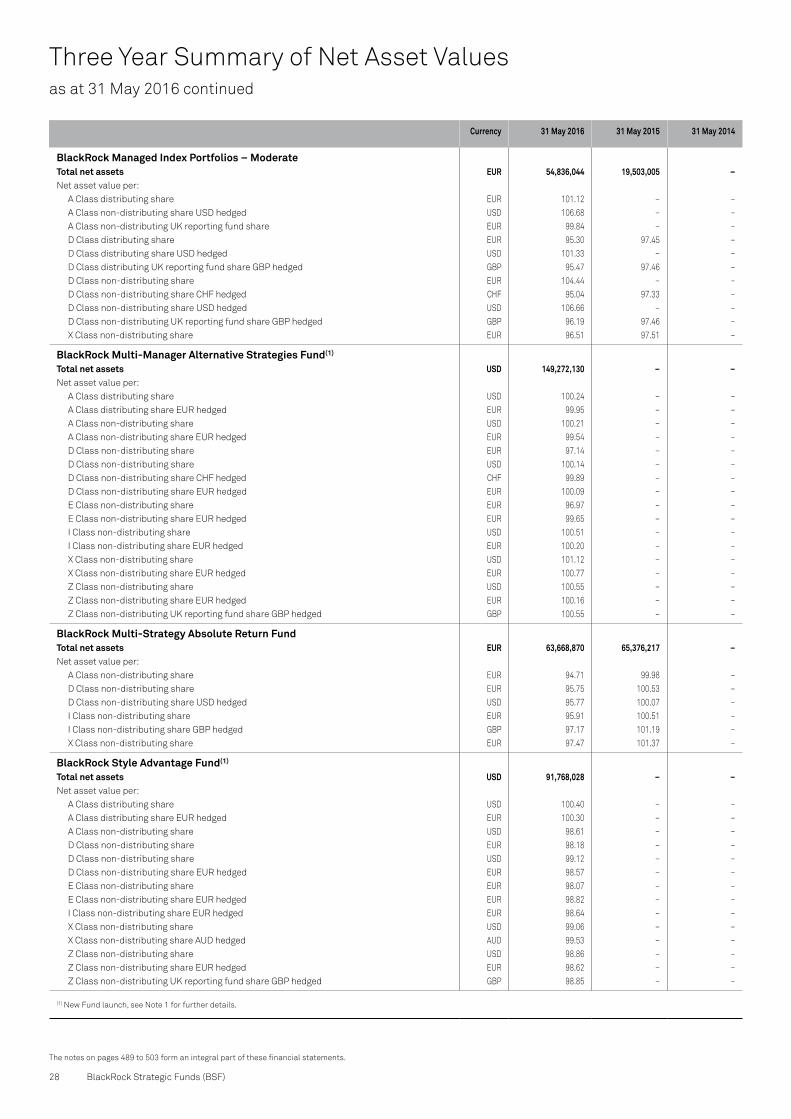
The notes on pages 489 to 503 form an integral part of these financial statements.
28 BlackRock Strategic Funds (BSF)
Three Year Summary of Net Asset Valuesas at 31 May 2016 continued
Currency 31 May 2016 31 May 2015 31 May 2014
BlackRock Managed Index Portfolios – ModerateTotal net assets EUR 54,836,044 19,503,005 –Net asset value per:
A Class distributing share EUR 101.12 – –A Class non-distributing share USD hedged USD 106.68 – –A Class non-distributing UK reporting fund share EUR 99.84 – –D Class distributing share EUR 95.30 97.45 –D Class distributing share USD hedged USD 101.33 – –D Class distributing UK reporting fund share GBP hedged GBP 95.47 97.46 –D Class non-distributing share EUR 104.44 – –D Class non-distributing share CHF hedged CHF 95.04 97.33 –D Class non-distributing share USD hedged USD 106.66 – –D Class non-distributing UK reporting fund share GBP hedged GBP 96.19 97.46 –X Class non-distributing share EUR 96.51 97.51 –
BlackRock Multi-Manager Alternative Strategies Fund(1)
Total net assets USD 149,272,130 – –Net asset value per:
A Class distributing share USD 100.24 – –A Class distributing share EUR hedged EUR 99.95 – –A Class non-distributing share USD 100.21 – –A Class non-distributing share EUR hedged EUR 99.54 – –D Class non-distributing share EUR 97.14 – –D Class non-distributing share USD 100.14 – –D Class non-distributing share CHF hedged CHF 99.89 – –D Class non-distributing share EUR hedged EUR 100.09 – –E Class non-distributing share EUR 96.97 – –E Class non-distributing share EUR hedged EUR 99.65 – –I Class non-distributing share USD 100.51 – –I Class non-distributing share EUR hedged EUR 100.20 – –X Class non-distributing share USD 101.12 – –X Class non-distributing share EUR hedged EUR 100.77 – –Z Class non-distributing share USD 100.55 – –Z Class non-distributing share EUR hedged EUR 100.16 – –Z Class non-distributing UK reporting fund share GBP hedged GBP 100.55 – –
BlackRock Multi-Strategy Absolute Return FundTotal net assets EUR 63,668,870 65,376,217 –Net asset value per:
A Class non-distributing share EUR 94.71 99.98 –D Class non-distributing share EUR 95.75 100.53 –D Class non-distributing share USD hedged USD 95.77 100.07 –I Class non-distributing share EUR 95.91 100.51 –I Class non-distributing share GBP hedged GBP 97.17 101.19 –X Class non-distributing share EUR 97.47 101.37 –
BlackRock Style Advantage Fund(1)
Total net assets USD 91,768,028 – –Net asset value per:
A Class distributing share USD 100.40 – –A Class distributing share EUR hedged EUR 100.30 – –A Class non-distributing share USD 98.61 – –D Class non-distributing share EUR 98.18 – –D Class non-distributing share USD 99.12 – –D Class non-distributing share EUR hedged EUR 98.57 – –E Class non-distributing share EUR 98.07 – –E Class non-distributing share EUR hedged EUR 98.82 – –I Class non-distributing share EUR hedged EUR 98.64 – –X Class non-distributing share USD 99.06 – –X Class non-distributing share AUD hedged AUD 99.53 – –Z Class non-distributing share USD 98.86 – –Z Class non-distributing share EUR hedged EUR 98.62 – –Z Class non-distributing UK reporting fund share GBP hedged GBP 98.85 – –
(1) New Fund launch, see Note 1 for further details.

Annual Report and Audited Accounts 29
The notes on pages 489 to 503 form an integral part of these financial statements.
Three Year Summary of Net Asset Valuesas at 31 May 2016 continued
Currency 31 May 2016 31 May 2015 31 May 2014
BlackRock Systematic European Equity FundTotal net assets EUR 14,807,626 9,782,097 –Net asset value per:
A Class non-distributing share EUR 93.84 102.73 –D Class non-distributing share EUR 94.28 102.82 –E Class non-distributing share EUR 93.26 102.63 –X Class non-distributing share EUR 95.05 102.97 –
BlackRock Systematic Global Equity Fund(1)
Total net assets USD 231,591,282 – –Net asset value per:
A Class non-distributing share USD 101.28 – –D Class non-distributing share EUR 103.70 – –E Class non-distributing share EUR 102.99 – –E Class non-distributing share EUR hedged EUR 100.55 – –I Class non-distributing share EUR 101.65 – –X Class non-distributing share GBP 108.76 – –
(1) New Fund launch, see Note 1 for further details.

The notes on pages 489 to 503 form an integral part of these financial statements.
30 BlackRock Strategic Funds (BSF)
Statement of Operations and Changes in Net Assetsfor the year ended 31 May 2016
BlackRock Strategic
Funds Combined
BlackRock Americas
Diversified Equity
Absolute Return Fund
BlackRock Asia
Extension Fund
BlackRock Emerging
Markets Absolute
Return Fund
BlackRock Emerging
Markets Allocation
Fund
BlackRock Emerging
Markets Equity
Strategies Fund(1)
Note USD USD USD USD USD USD
Net assets at the beginning of the year/period 10,864,366,212 151,528,217 157,012,688 120,780,911 55,271,903 – Income Bank interest 2(c) 2,321,485 889,074 65,048 – 4,661 – Bond interest 2(c) 163,298,129 1,039,322 270,896 50,554 1,528,007 – Swap interest and dividends 2(c) 28,219 27,921 – – 298 – Dividends, net of withholding taxes 2(c) 36,596,664 – – 1,518,783 – 57,424 Contracts for difference dividends, net of withholding taxes 2(d) 136,541,589 25,419,932 4,031,460 244,528 1,595,982 16,003 Securities lending 2(c) 78,753 – – – – 86 Management fee rebate 4 925,033 – – 181 – – Other income 208 – – – – –
Total income 2(c) 339,790,080 27,376,249 4,367,404 1,814,046 3,128,948 73,513
ExpensesBank interest 2(c) 1,746,740 – – 1,160 – 1,431 Contracts for difference interest 2(d) 48,030,489 9,968,265 1,804,150 1,133,955 604,948 8,143 Swap interest and dividends 2(c) 27,185,130 – – – – – Negative yield on financial assets 2(c) 5,601,600 115 – 749 – – Contracts for difference dividends, net of withholding taxes 2(d) 133,905,620 23,401,097 934,765 2,398,965 706,144 18,459Administration fees 5 26,087,913 981,458 99,217 133,632 122,546 2,219 Custodian and depositary fees 2(j),6 5,504,518 454,124 106,526 233,804 100,546 24,964 Taxes 8 5,564,516 196,853 16,035 21,821 23,322 598 Performance fees 7 51,974,235 2,353,871 7 – – – Distribution fees 4 6,713,840 1,926 145 994 6,072 18 Management fees and external sub-advisory fees 4 130,631,467 4,292,736 209,397 1,027,707 735,241 1,213 Other charges 11,094 – – – – –
Total expenses before reimbursement 442,957,162 41,650,445 3,170,242 4,952,787 2,298,819 57,045
Reimbursement of expenses 4 211,525 – – – – 21,301
Total expenses after reimbursement 442,745,637 41,650,445 3,170,242 4,952,787 2,298,819 35,744
Net investment income/(deficit) (102,955,557) (14,274,196) 1,197,162 (3,138,741) 830,129 37,769 Net realised gain/(loss) on:
Investments 2(a),2(b) 44,607,918 (254,720) 32,583 (614,354) (194,863) 518,415 To Be Announced securities contracts 2(d) (1,846,496) – – – – – Contracts for difference 2(d) 167,578,563 17,599,416 (22,415,341) 8,778,977 (4,190,813) 73,498 Futures contracts 2(d) (113,661,558) – (1,196,644) 318,774 (285,564) – Foreign currencies and forward foreign exchange transactions
2(d),2(e), 2(k) 73,285,388 12,875,339 91,190 (4,179,688) 68,049 23,253
Swap transactions 2(d) (21,306,373) 409,062 – – 183,722 – Options contracts 2(d) 3,573,799 – – – – –
Net realised gain/(loss) for the year/period 152,231,241 30,629,097 (23,488,212) 4,303,709 (4,419,469) 615,166
Net change in unrealised appreciation/(depreciation) on:
Investments 2(a) (123,506,032) (1,655) (6,875) (1,246,812) (45,553) 21,507 To Be Announced securities contracts 2(d) 895,855 – – – – – Foreign currencies and forward foreign exchange transactions
2(d),2(e), 2(k) (45,670,380) (7,022,559) 76,335 (12,410) (107,436) (19,678)
Contracts for difference 2(d) (16,833,402) 7,545,286 (6,208,230) (2,312,985) (923,352) 12,123 Futures contracts 2(d) (24,253,021) – 355,000 (116,460) 91,308 – Swap transactions 2(d) (9,534,944) 480,681 – – (65,001) – Options contracts 2(d) (1,298,580) – – – – –
Net change in unrealised appreciation/(depreciation) for the year/period (220,200,504) 1,001,753 (5,783,770) (3,688,667) (1,050,034) 13,952
Increase/(Decrease) in net assets as a result of operations (170,924,820) 17,356,654 (28,074,820) (2,523,699) (4,639,374) 666,887
Movements in share capitalNet receipts as a result of issue of shares 11,533,916,352 596,643,772 – 91,605,292 751,347 6,207,182 Net payments as a result of repurchase of shares (6,715,252,561) (144,628,156) (17,377,373) (126,984,262) (1,427,291) –
Increase/(Decrease) in net assets as a result of movements in share capital 4,818,663,791 452,015,616 (17,377,373) (35,378,970) (675,944) 6,207,182
Dividends declared 11 (3,018,294) – – – – – Foreign exchange adjustment 2(f) 175,510,763* – – – – –Net assets at the end of the year/period 15,684,597,652 620,900,487 111,560,495 82,878,242 49,956,585 6,874,069
* The combined figures have been calculated using the average exchange rates throughout the year. The resulting Foreign exchange adjustment of USD 175,510,763 represents the movement in exchange rates between 31 May 2015 and 31 May 2016. This is a notional amount, which has no impact on the Net Assets of the individual Funds.
(1) New fund launch, see Note 1 for further details.

Annual Report and Audited Accounts 31
The notes on pages 489 to 503 form an integral part of these financial statements.
Statement of Operations and Changes in Net Assets for the year ended 31 May 2016 continued
BlackRock Emerging
Markets Flexi Dynamic Bond
Fund
BlackRock Euro Dynamic
Diversified Growth Fund
BlackRock European Absolute
Return Fund
BlackRock European
Constrained Credit
Strategies Fund(1)
BlackRock European
Credit Strategies
Fund
Note USD EUR EUR EUR EUR
Net assets at the beginning of the year/period 211,673,770 884,380,906 1,129,393,101 58,879,701 1,541,928,953 IncomeBank interest 2(c) – – – 5,080 – Bond interest 2(c) 18,651,357 2,650,545 1,447,673 1,138,719 50,721,415 Swap interest and dividends 2(c) – – – – – Dividends, net of withholding taxes 2(c) – 2,240,871 6,428,601 123,202 2,869,176 Contracts for difference dividends, net of withholding taxes 2(d) – – 10,112,194 8,378 687,401Securities lending 2(c) – 169 13,215 – – Management fee rebate 4 – 207,594 – – 305,616 Other income – – – – –
Total income 2(c) 18,651,357 5,099,179 18,001,683 1,275,379 54,583,608
ExpensesBank interest 2(c) 102,170 257,400 99,328 – 202,937 Contracts for difference interest 2(d) – – 4,791,022 18,489 952,567 Swap interest and dividends 2(c) 2,446,349 4,143,236 – 183,352 11,522,158 Negative yield on financial assets 2(c) 4,681 690,253 1,028,896 155,722 131,417 Contracts for difference dividends, net of withholding taxes 2(d) – – 19,536,078 6,845 273,831Administration fees 5 340,477 905,998 4,919,296 13,366 997,671 Custodian and depositary fees 2(j),6 401,905 174,810 274,604 53,396 328,279 Taxes 8 84,028 39,555 868,956 – 206,599Performance fees 7 – – 13,270,717 – 3,271 Distribution fees 4 7,176 41,477 403,144 – – Management fees and external sub-advisory fees 4 1,197,746 6,193,020 24,631,770 267,322 11,080,938 Other charges – – – 10,000 –
Total expenses before reimbursement 4,584,532 12,445,749 69,823,811 708,492 25,699,668
Reimbursement of expenses 4 44,936 – – – –
Total expenses after reimbursement 4,539,596 12,445,749 69,823,811 708,492 25,699,668
Net investment income/(deficit) 14,111,761 (7,346,570) (51,822,128) 566,887 28,883,940 Net realised gain/(loss) on:
Investments 2(a),2(b) (12,827,461) 3,364,680 1,382,477 (1,192,081) (59,333,184) To Be Announced securities contracts 2(d) – – – – – Contracts for difference 2(d) – – 85,041,469 762,274 23,863,114 Futures contracts 2(d) (5,303,312) (4,010,102) 36,976,758 (95,868) (11,230,375) Foreign currencies and forward foreign exchange transactions
2(d),2(e), 2(k) 8,585,830 10,622,360 (9,995,231) 1,802,884 27,894,149
Swap transactions 2(d) (1,990,142) (7,361,939) – (2,572,422) (14,011,882) Options contracts 2(d) (2,321,479) (6,259,755) – 671,426 11,554,131
Net realised gain/(loss) for the year/period (13,856,564) (3,644,756) 113,405,473 (623,787) (21,264,047)
Net change in unrealised appreciation/(depreciation) on:
Investments 2(a) 10,168,321 (15,373,983) 2,694,417 (3,986,917) (147,402,198) To Be Announced securities contracts 2(d) – – – – – Foreign currencies and forward foreign exchange transactions
2(d),2(e), 2(k) (1,832,935) (5,352,127) 83,389 (30,421) (5,519,517)
Contracts for difference 2(d) – – (9,529,047) 7,549 (128,110) Futures contracts 2(d) (171,068) (2,996,076) (5,879,424) 103,424 362,784 Swap transactions 2(d) 1,355,171 (6,102,291) – 1,382,022 656,892 Options contracts 2(d) 1,326,554 (1,873,177) – 32,007 305,006
Net change in unrealised appreciation/(depreciation) for the year/period 10,846,043 (31,697,654) (12,630,665) (2,492,336) (151,725,143)
Increase/(Decrease) in net assets as a result of operations 11,101,240 (42,688,980) 48,952,680 (2,549,236) (144,105,250)
Movements in share capitalNet receipts as a result of issue of shares 249,390,985 330,864,688 1,724,622,997 306,984 273,905,144 Net payments as a result of repurchase of shares (96,801,149) (168,823,081) (984,023,947) (56,637,449) (1,256,258,930)
Increase/(Decrease) in net assets as a result of movements in share capital 152,589,836 162,041,607 740,599,050 (56,330,465) (982,353,786)
Dividends declared 11 (543,089) – – – – Foreign exchange adjustment 2(f) – – – – –Net assets at the end of the year/period 374,821,757 1,003,733,533 1,918,944,831 – 415,469,917
(1) Fund terminated, see Note 1 for further details.

The notes on pages 489 to 503 form an integral part of these financial statements.
32 BlackRock Strategic Funds (BSF)
Statement of Operations and Changes in Net Assets for the year ended 31 May 2016 continued
BlackRock European
Diversified Equity Absolute
Return Fund
BlackRock European
Opportunities Extension
Fund
BlackRock European
Select Strategies
Fund(1)
BlackRock Fixed Income
Strategies Fund
BlackRock Global
Absolute Return Bond
Fund
Note EUR EUR EUR EUR EUR
Net assets at the beginning of the year/period 441,906,089 707,416,049 – 3,387,780,513 576,128,552 IncomeBank interest 2(c) 1,222,826 – – – – Bond interest 2(c) 88,185 – 479,953 54,157,834 13,847,792 Swap interest and dividends 2(c) – – – – – Dividends, net of withholding taxes 2(c) 1,024 8,993,811 968,702 1,404,180 501 Contracts for difference dividends, net of withholding taxes 2(d) 66,497,571 7,695,567 – – – Securities lending 2(c) – 750 5,052 2,269 416 Management fee rebate 4 – – 732 133,410 – Other income – – – – –
Total income 2(c) 67,809,606 16,690,128 1,454,439 55,697,693 13,848,709
ExpensesBank interest 2(c) – 52,109 9,462 719,295 54,631 Contracts for difference interest 2(d) 17,490,336 4,080,848 73 – – Swap interest and dividends 2(c) – – 21,466 5,994,382 225,539 Negative yield on financial assets 2(c) 610,459 220,465 13,544 1,395,681 55,974Contracts for difference dividends, net of withholding taxes 2(d) 61,710,094 6,333,920 – – – Administration fees 5 2,026,387 1,938,110 86,502 9,055,330 701,553 Custodian and depositary fees 2(j),6 693,469 144,796 51,153 111,865 722,810 Taxes 8 372,161 326,424 31,199 2,415,590 173,313Performance fees 7 421,046 30,683,576 – – – Distribution fees 4 35,418 563,804 77,621 4,381,135 7,356 Management fees and external sub-advisory fees 4 9,826,967 8,767,451 365,804 40,090,537 3,212,928 Other charges – – – – –
Total expenses before reimbursement 93,186,337 53,111,503 656,824 64,163,815 5,154,104
Reimbursement of expenses 4 – – 8,320 – –
Total expenses after reimbursement 93,186,337 53,111,503 648,504 64,163,815 5,154,104
Net investment income/(deficit) (25,376,731) (36,421,375) 805,935 (8,466,122) 8,694,605 Net realised gain/(loss) on:
Investments 2(a),2(b) 22,332 46,774,086 (390,589) 68,732,815 912,919 To Be Announced securities contracts 2(d) – – – – (1,427,456) Contracts for difference 2(d) 10,856,760 45,377,352 (3,911) – – Futures contracts 2(d) – – (117,211) (106,112,738) (10,289,687) Foreign currencies and forward foreign exchange transactions
2(d),2(e), 2(k) (1,036,361) (7,057,702) 229,611 22,235,891 20,377,077
Swap transactions 2(d) – – 58,606 4,353,645 2,030,300 Options contracts 2(d) – – – (108,484) (208,199)
Net realised gain/(loss) for the year/period 9,842,731 85,093,736 (223,494) (10,898,871) 11,394,954
Net change in unrealised appreciation/(depreciation) on:
Investments 2(a) 59,055 (8,549,050) 2,353,106 44,037,159 (14,043,324) To Be Announced securities contracts 2(d) – – – – 726,800 Foreign currencies and forward foreign exchange transactions
2(d),2(e), 2(k) 1,014,082 4,510,720 (681,988) (17,076,211) (9,089,069)
Contracts for difference 2(d) (9,779,933) 6,741,711 – – – Futures contracts 2(d) – – (102,577) (13,075,410) (296,038) Swap transactions 2(d) – – (2,476) (4,188,373) (1,249,379) Options contracts 2(d) – – (20,096) (1,191,060) 654,193
Net change in unrealised appreciation/(depreciation) for the year/period (8,706,796) 2,703,381 1,545,969 8,506,105 (23,296,817)
Increase/(Decrease) in net assets as a result of operations (24,240,796) 51,375,742 2,128,410 (10,858,888) (3,207,258)
Movements in share capitalNet receipts as a result of issue of shares 957,711,760 98,458,250 228,478,147 4,542,883,609 241,395,103 Net payments as a result of repurchase of shares (298,457,442) (194,961,028) (56,302,696) (2,043,873,242) (303,601,129)
Increase/(Decrease) in net assets as a result of movements in share capital 659,254,318 (96,502,778) 172,175,451 2,499,010,367 (62,206,026)
Dividends declared 11 – (1,025,020) (244,070) (840,820) – Foreign exchange adjustment 2(f) – – – – –Net assets at the end of the year/period 1,076,919,611 661,263,993 174,059,791 5,875,091,172 510,715,268
(1) New Fund launch, see Note 1 for further details.

Annual Report and Audited Accounts 33
The notes on pages 489 to 503 form an integral part of these financial statements.
Statement of Operations and Changes in Net Assets for the year ended 31 May 2016 continued
BlackRock Global Event
Driven Fund(1)
BlackRock Global
Long/Short Equity
Fund
BlackRock Impact
World Equity
Fund(1)
BlackRock Latin
American Opportunities
Fund
BlackRock Managed
Index Portfolios –
Defensive
Note USD USD USD USD EUR
Net assets at the beginning of the year/period – 344,153,917 – 82,914,424 19,561,291 IncomeBank interest 2(c) – – 8 – – Bond interest 2(c) 587,202 596,481 – 264,590 – Swap interest and dividends 2(c) – – – – – Dividends, net of withholding taxes 2(c) 6,752 – 3,660,752 1,001,539 289,118 Contracts for difference dividends, net of withholding taxes 2(d) 1,074,085 7,989,416 – – – Securities lending 2(c) – – 30,332 – 75 Management fee rebate 4 – – – – 48,271 Other income – – – – –
Total income 2(c) 1,668,039 8,585,897 3,691,092 1,266,129 337,464
ExpensesBank interest 2(c) 2,840 29,059 – 39,768 487 Contracts for difference interest 2(d) 694,672 2,820,594 – – – Swap interest and dividends 2(c) 29,006 – – – – Negative yield on financial assets 2(c) – 783 2,266 – 416 Contracts for difference dividends, net of withholding taxes 2(d) 535,821 6,677,188 – – – Administration fees 5 272,653 759,855 79,852 159,843 7,347 Custodian and depositary fees 2(j),6 82,221 406,006 26,490 122,046 23,856 Taxes 8 62,198 125,966 19,008 22,396 3,444 Performance fees 7 375,549 – – 8,876 – Distribution fees 4 334 575,832 129 7,066 – Management fees and external sub-advisory fees 4 494,048 5,108,057 2,740 1,048,229 11,651 Other charges – – – – –
Total expenses before reimbursement 2,549,342 16,503,340 130,485 1,408,224 47,201
Reimbursement of expenses 4 7,440 – – 6,326 19,281
Total expenses after reimbursement 2,541,902 16,503,340 130,485 1,401,898 27,920
Net investment income/(deficit) (873,863) (7,917,443) 3,560,607 (135,769) 309,544 Net realised gain/(loss) on:
Investments 2(a),2(b) 48,202 2,600 (5,068,809) 947,447 (622,446) To Be Announced securities contracts 2(d) – – – – – Contracts for difference 2(d) 3,548,073 (18,385,958) – – – Futures contracts 2(d) (2,778) (256,079) 244,188 – – Foreign currencies and forward foreign exchange transactions
2(d),2(e), 2(k) 3,614,524 683,224 376,907 (21,448,275) 274,131
Swap transactions 2(d) 366 – – – – Options contracts 2(d) – – – – –
Net realised gain/(loss) for the year/period 7,208,387 (17,956,213) (4,447,714) (20,500,828) (348,315)
Net change in unrealised appreciation/(depreciation) on:
Investments 2(a) 252,242 (14,750) 2,087,577 12,272,046 633,203 To Be Announced securities contracts 2(d) – – – – – Foreign currencies and forward foreign exchange transactions
2(d),2(e), 2(k) (1,956,298) 1,970,539 (8,063) 6,274 (43,388)
Contracts for difference 2(d) 574,865 (695,623) – – – Futures contracts 2(d) (12,293) 325,539 91,587 – – Swap transactions 2(d) (12,258) – – – – Options contracts 2(d) (175,306) – – – –
Net change in unrealised appreciation/(depreciation) for the year/period (1,329,048) 1,585,705 2,171,101 12,278,320 589,815
Increase/(Decrease) in net assets as a result of operations 5,005,476 (24,287,951) 1,283,994 (8,358,277) 551,044
Movements in share capitalNet receipts as a result of issue of shares 258,345,226 164,125,212 240,816,117 11,611,449 7,350,987 Net payments as a result of repurchase of shares (23,182,098) (226,918,997) (5,645,282) (52,044,541) (483,186)
Increase/(Decrease) in net assets as a result of movements in share capital 235,163,128 (62,793,785) 235,170,835 (40,433,092) 6,867,801
Dividends declared 11 – – (30) – (14,384) Foreign exchange adjustment 2(f) – – – – –Net assets at the end of the year/period 240,168,604 257,072,181 236,454,799 34,123,055 26,965,752
(1) New Fund launch, see Note 1 for further details.

The notes on pages 489 to 503 form an integral part of these financial statements.
34 BlackRock Strategic Funds (BSF)
Statement of Operations and Changes in Net Assets for the year ended 31 May 2016 continued
BlackRock Managed
Index Portfolios –
Growth
BlackRock Managed
Index Portfolios –
Moderate
BlackRock Multi-
Manager Alternative Strategies
Fund(1)
BlackRock Multi-
Strategy Absolute
Return Fund
BlackRock Style
Advantage Fund(1)
Note EUR EUR USD EUR USD
Net assets at the beginning of the year/period 19,643,536 19,503,005 – 65,376,217 – IncomeBank interest 2(c) – – – – 391 Bond interest 2(c) – – 1,109,717 910,259 28,320 Swap interest and dividends 2(c) – – – – – Dividends, net of withholding taxes 2(c) 95,033 344,264 142,654 15,339 – Contracts for difference dividends, net of withholding taxes 2(d) – – 295,847 812,800 667,932Securities lending 2(c) 6 161 – 501 – Management fee rebate 4 50,586 87,445 – – – Other income – – 208 – –
Total income 2(c) 145,625 431,870 1,548,426 1,738,899 696,643
ExpensesBank interest 2(c) 68 1,100 2,696 14,942 –Contracts for difference interest 2(d) – – – 527,697 85,288 Swap interest and dividends 2(c) – – 90,383 98,035 3,616 Negative yield on financial assets 2(c) 190 964 280,437 480,910 405 Contracts for difference dividends, net of withholding taxes 2(d) – – 314,167 902,735 440,180Administration fees 5 6,555 16,833 64,548 33,523 11,491 Custodian and depositary fees 2(j),6 23,343 20,127 67,188 136,603 15,942 Taxes 8 2,509 11,016 17,274 6,670 7,575 Performance fees 7 – – – – – Distribution fees 4 – – – – – Management fees and external sub-advisory fees 4 10,097 72,543 331,975 161,099 20,257 Other charges – – – – –
Total expenses before reimbursement 42,762 122,583 1,168,668 2,362,214 584,754
Reimbursement of expenses 4 19,313 12,455 – – –
Total expenses after reimbursement 23,449 110,128 1,168,668 2,362,214 584,754
Net investment income/(deficit) 122,176 321,742 379,758 (623,315) 111,889 Net realised gain/(loss) on:
Investments 2(a),2(b) (1,251,206) (1,124,806) 828,079 125,908 – To Be Announced securities contracts 2(d) – – – (236,876) – Contracts for difference 2(d) – – 189,953 (925,239) (647,534) Futures contracts 2(d) – – (718,922) (1,213,221) (79,022) Foreign currencies and forward foreign exchange transactions
2(d),2(e), 2(k) 241,741 (1,119,411) (280,213) 1,366,898 173,006
Swap transactions 2(d) – – 19,441 (236,094) (249,032) Options contracts 2(d) – – (304,648) (62,104) –
Net realised gain/(loss) for the year/period (1,009,465) (2,244,217) (266,310) (1,180,728) (802,582)
Net change in unrealised appreciation/(depreciation) on:
Investments 2(a) 613,057 1,660,002 3,109,278 (547,935) – To Be Announced securities contracts 2(d) – – – 80,675 – Foreign currencies and forward foreign exchange transactions
2(d),2(e), 2(k) (174,958) 329,532 (830,819) (709,596) 407,793
Contracts for difference 2(d) – – (1,365,495) 245,820 343,820 Futures contracts 2(d) – – (571,684) (67,442) 77,002 Swap transactions 2(d) – – (570,775) (113,690) (54,203) Options contracts 2(d) – – (136,887) 7,989 –
Net change in unrealised appreciation/(depreciation) for the year/period 438,099 1,989,534 (366,382) (1,104,179) 774,412
Increase/(Decrease) in net assets as a result of operations (449,190) 67,059 (252,934) (2,908,222) 83,719
Movements in share capitalNet receipts as a result of issue of shares 3,317,161 37,757,071 215,319,727 1,634,030 91,684,309 Net payments as a result of repurchase of shares (314,123) (2,385,062) (65,794,663) (433,155) –
Increase/(Decrease) in net assets as a result of movements in share capital 3,003,038 35,372,009 149,525,064 1,200,875 91,684,309
Dividends declared 11 (666) (106,029) – – – Foreign exchange adjustment 2(f) – – – – –Net assets at the end of the year/period 22,196,718 54,836,044 149,272,130 63,668,870 91,768,028
(1) New Fund launch, see Note 1 for further details.

Annual Report and Audited Accounts 35
The notes on pages 489 to 503 form an integral part of these financial statements.
Statement of Operations and Changes in Net Assets for the year ended 31 May 2016 continued
BlackRock Systematic
European Equity
Fund
BlackRock Systematic
Global Equity
Fund(1)
Note EUR USD
Net assets at the beginning of the year/period 9,782,097 – IncomeBank interest 2(c) – – Bond interest 2(c) – – Swap interest and dividends 2(c) – – Dividends, net of withholding taxes 2(c) 368,459 3,424,563 Contracts for difference dividends, net of withholding taxes 2(d) – – Securities lending 2(c) 1,357 21,740 Management fee rebate 4 – – Other income – –
Total income 2(c) 369,816 3,446,303
ExpensesBank interest 2(c) – 1,396 Contracts for difference interest 2(d) – – Swap interest and dividends 2(c) – – Negative yield on financial assets 2(c) 101 3,600 Contracts for difference dividends, net of withholding taxes 2(d) – – Administration fees 5 8,564 75,772 Custodian and depositary fees 2(j),6 72,058 321,749 Taxes 8 1,945 19,982 Performance fees 7 – – Distribution fees 4 983 37 Management fees and external sub-advisory fees 4 7,238 4,602 Other charges – –
Total expenses before reimbursement 90,889 427,138
Reimbursement of expenses 4 59,167 12
Total expenses after reimbursement 31,722 427,126
Net investment income/(deficit) 338,094 3,019,177 Net realised gain/(loss) on:
Investments 2(a),2(b) (492,746) (1,945,310) To Be Announced securities contracts 2(d) – – Contracts for difference 2(d) – – Futures contracts 2(d) – 226,844 Foreign currencies and forward foreign exchange transactions 2(d),2(e), 2(k) (140,221) (181,725) Swap transactions 2(d) – – Options contracts 2(d) – –
Net realised gain/(loss) for the year/period (632,967) (1,900,191)
Net change in unrealised appreciation/(depreciation) on:Investments 2(a) (298,839) 3,168,467 To Be Announced securities contracts 2(d) – – Foreign currencies and forward foreign exchange transactions 2(d),2(e), 2(k) 639 (20,073) Contracts for difference 2(d) – – Futures contracts 2(d) – 30,687 Swap transactions 2(d) – – Options contracts 2(d) – –
Net change in unrealised appreciation/(depreciation) for the year/period (298,200) 3,179,081
Increase/(Decrease) in net assets as a result of operations (593,073) 4,298,067
Movements in share capitalNet receipts as a result of issue of shares 6,116,776 227,293,215 Net payments as a result of repurchase of shares (498,174) –
Increase/(Decrease) in net assets as a result of movements in share capital 5,618,602 227,293,215
Dividends declared 11 – – Foreign exchange adjustment 2(f) – –Net assets at the end of the year/period 14,807,626 231,591,282
(1) New Fund launch, see Note 1 for further details.

The notes on pages 489 to 503 form an integral part of these financial statements.
36 BlackRock Strategic Funds (BSF)
Statement of Changes in Shares Outstandingas at 31 May 2016
Shares outstanding at the beginning
of the yearShares issued
Shares repurchased
Shares outstandingat the end of the
year
BlackRock Americas Diversified Equity Absolute Return FundA Class non-distributing share AUD 383 391 – 774A Class non-distributing share USD 9,840 171,744 79,266 102,318A Class non-distributing share EUR hedged 177,688 414,859 155,924 436,623A Class non-distributing share SEK hedged 4,714,569 9,372,819 2,861,620 11,225,768A Class non-distributing UK reporting fund share GBP 90 1,330 30 1,390D Class non-distributing share USD 50 312,231 44,538 267,743D Class non-distributing share CHF hedged – 142,033 23,645 118,388D Class non-distributing share GBP hedged – 20,113 518 19,595D Class non-distributing UK reporting fund share EUR hedged 257,565 2,003,136 368,401 1,892,300E Class non-distributing share EUR hedged – 12,884 1,094 11,790I Class non-distributing share EUR hedged – 504,655 – 504,655X Class non-distributing share USD 197,722 10,579 105,394 102,907
BlackRock Asia Extension FundA Class non-distributing share USD 154,618 – 153,396 1,222A Class non-distributing UK reporting fund share GBP hedged 32 – – 32D Class non-distributing share USD 101 – – 101E Class non-distributing share USD 316 – 215 101X Class non-distributing share USD 1,072,533 – – 1,072,533
BlackRock Emerging Markets Absolute Return FundA Class distributing UK reporting fund share GBP hedged 13,281 35 13,280 36A Class non-distributing share USD 31,485 5,578 17,684 19,379A Class non-distributing share EUR hedged 2,478 212,185 35,467 179,196D Class distributing UK reporting fund share GBP hedged 80 – – 80D Class non-distributing share USD 33,513 13,449 42,699 4,263D Class non-distributing share EUR hedged 192,756 168,024 270,910 89,870E Class non-distributing share EUR hedged 1,307 3,987 1,181 4,113I Class distributing UK reporting fund share GBP 32,538 2,792 35,297 33I Class distributing UK reporting fund share GBP hedged 2,851 5,367 4,364 3,854I Class non-distributing share EUR 35 – – 35I Class non-distributing share USD 171,622 94,304 206,949 58,977I Class non-distributing share EUR hedged 398,498 336,924 373,167 362,255X Class non-distributing share USD 175,676 – 175,676 –
BlackRock Emerging Markets Allocation FundA Class non-distributing share USD 502,788 977 2,021 501,744C Class non-distributing share USD 50 – – 50D Class non-distributing share USD 50 – – 50E Class non-distributing share USD 13,919 3,229 9,408 7,740E Class non-distributing share EUR hedged 3,693 3,301 3,389 3,605I Class non-distributing share USD 50 – – 50X Class non-distributing share USD 50 – – 50
BlackRock Emerging Markets Equity Strategies Fund(1)
A Class non-distributing share USD – 50 – 50D Class non-distributing share EUR – 47 – 47D Class non-distributing share USD – 50 – 50D Class non-distributing share EUR hedged – 9,378 – 9,378E Class non-distributing share EUR – 67 – 67X Class non-distributing share USD – 49,900 – 49,900Z Class non-distributing share USD – 50 – 50
(1) New Fund launch, see Note 1 for further details.
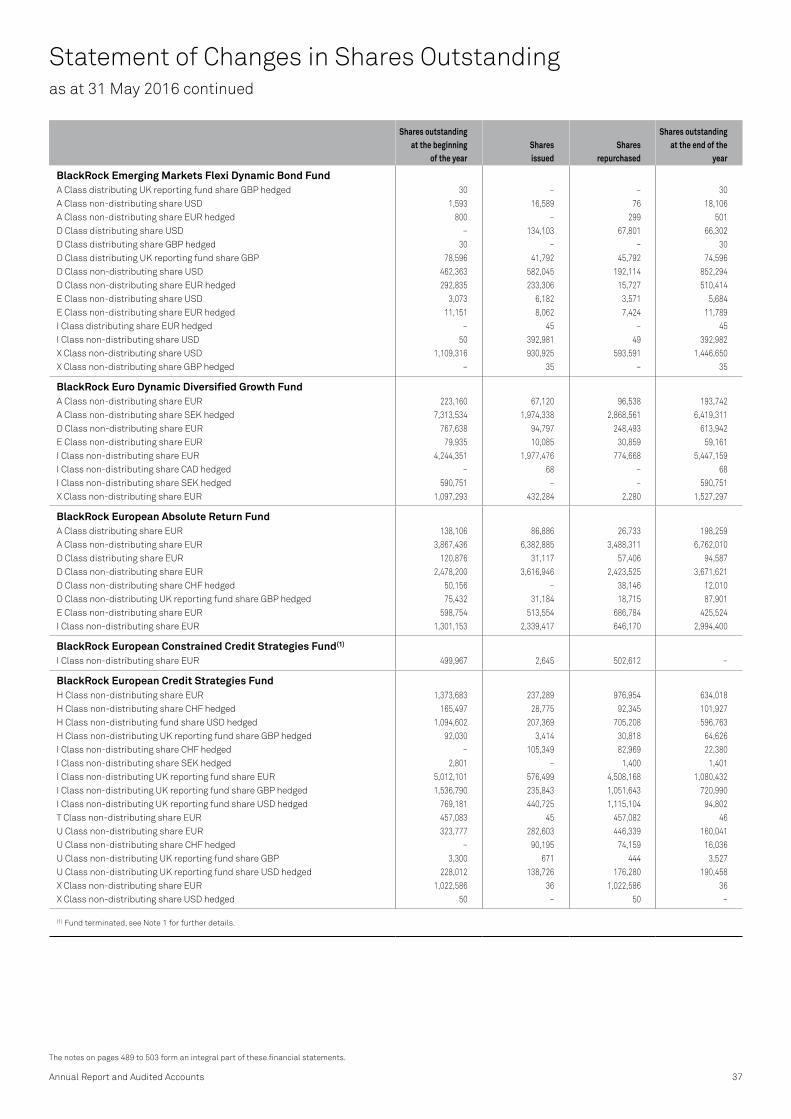
Annual Report and Audited Accounts 37
The notes on pages 489 to 503 form an integral part of these financial statements.
Statement of Changes in Shares Outstandingas at 31 May 2016 continued
Shares outstanding at the beginning
of the yearShares issued
Shares repurchased
Shares outstandingat the end of the
year
BlackRock Emerging Markets Flexi Dynamic Bond FundA Class distributing UK reporting fund share GBP hedged 30 – – 30A Class non-distributing share USD 1,593 16,589 76 18,106A Class non-distributing share EUR hedged 800 – 299 501D Class distributing share USD – 134,103 67,801 66,302D Class distributing share GBP hedged 30 – – 30D Class distributing UK reporting fund share GBP 78,596 41,792 45,792 74,596D Class non-distributing share USD 462,363 582,045 192,114 852,294D Class non-distributing share EUR hedged 292,835 233,306 15,727 510,414E Class non-distributing share USD 3,073 6,182 3,571 5,684E Class non-distributing share EUR hedged 11,151 8,062 7,424 11,789I Class distributing share EUR hedged – 45 – 45I Class non-distributing share USD 50 392,981 49 392,982X Class non-distributing share USD 1,109,316 930,925 593,591 1,446,650X Class non-distributing share GBP hedged – 35 – 35
BlackRock Euro Dynamic Diversified Growth FundA Class non-distributing share EUR 223,160 67,120 96,538 193,742A Class non-distributing share SEK hedged 7,313,534 1,974,338 2,868,561 6,419,311D Class non-distributing share EUR 767,638 94,797 248,493 613,942E Class non-distributing share EUR 79,935 10,085 30,859 59,161I Class non-distributing share EUR 4,244,351 1,977,476 774,668 5,447,159I Class non-distributing share CAD hedged – 68 – 68I Class non-distributing share SEK hedged 590,751 – – 590,751X Class non-distributing share EUR 1,097,293 432,284 2,280 1,527,297
BlackRock European Absolute Return FundA Class distributing share EUR 138,106 86,886 26,733 198,259A Class non-distributing share EUR 3,867,436 6,382,885 3,488,311 6,762,010D Class distributing share EUR 120,876 31,117 57,406 94,587D Class non-distributing share EUR 2,478,200 3,616,946 2,423,525 3,671,621D Class non-distributing share CHF hedged 50,156 – 38,146 12,010D Class non-distributing UK reporting fund share GBP hedged 75,432 31,184 18,715 87,901E Class non-distributing share EUR 598,754 513,554 686,784 425,524I Class non-distributing share EUR 1,301,153 2,339,417 646,170 2,994,400
BlackRock European Constrained Credit Strategies Fund(1)
I Class non-distributing share EUR 499,967 2,645 502,612 –
BlackRock European Credit Strategies FundH Class non-distributing share EUR 1,373,683 237,289 976,954 634,018H Class non-distributing share CHF hedged 165,497 28,775 92,345 101,927H Class non-distributing fund share USD hedged 1,094,602 207,369 705,208 596,763H Class non-distributing UK reporting fund share GBP hedged 92,030 3,414 30,818 64,626I Class non-distributing share CHF hedged – 105,349 82,969 22,380I Class non-distributing share SEK hedged 2,801 – 1,400 1,401I Class non-distributing UK reporting fund share EUR 5,012,101 576,499 4,508,168 1,080,432I Class non-distributing UK reporting fund share GBP hedged 1,536,790 235,843 1,051,643 720,990I Class non-distributing UK reporting fund share USD hedged 769,181 440,725 1,115,104 94,802T Class non-distributing share EUR 457,083 45 457,082 46U Class non-distributing share EUR 323,777 282,603 446,339 160,041U Class non-distributing share CHF hedged – 90,195 74,159 16,036U Class non-distributing UK reporting fund share GBP 3,300 671 444 3,527U Class non-distributing UK reporting fund share USD hedged 228,012 138,726 176,280 190,458X Class non-distributing share EUR 1,022,586 36 1,022,586 36X Class non-distributing share USD hedged 50 – 50 –
(1) Fund terminated, see Note 1 for further details.

The notes on pages 489 to 503 form an integral part of these financial statements.
38 BlackRock Strategic Funds (BSF)
Statement of Changes in Shares Outstandingas at 31 May 2016 continued
Shares outstanding at the beginning
of the yearShares issued
Shares repurchased
Shares outstandingat the end of the
year
BlackRock European Diversified Equity Absolute Return FundA Class non-distributing share EUR 422,193 1,926,173 808,085 1,540,281A Class non-distributing share CHF hedged 1,811 8,189 4,735 5,265A Class non-distributing share SEK hedged 15,404,252 15,788,250 3,419,843 27,772,659A Class non-distributing UK reporting fund share GBP hedged 1,223 2,825 296 3,752D Class non-distributing share CHF hedged 47 132,957 51,077 81,927D Class non-distributing share USD hedged 288,208 450,095 365,239 373,064D Class non-distributing UK reporting fund share EUR 685,521 1,469,843 636,300 1,519,064D Class non-distributing UK reporting fund share GBP hedged 50,445 20,549 11,089 59,905E Class non-distributing share EUR 26,562 98,279 11,255 113,586I Class non-distributing share EUR 158,514 1,333,342 35,727 1,456,129I Class non-distributing share SEK hedged – 88,307 – 88,307X Class non-distributing share EUR 7,307 8,554 3,336 12,525
BlackRock European Opportunities Extension FundA Class distributing UK reporting fund share GBP 13,883 – 2,788 11,095A Class non-distributing share EUR 1,300,217 1,299 221,232 1,080,284D Class distributing (G) share EUR – 470,272 43 470,229D Class distributing share EUR 353,572 353,571 707,143 –D Class distributing UK reporting fund share GBP 3,518 – 2 3,516D Class non-distributing share EUR 604,156 2,759 44,748 562,167E Class non-distributing share EUR 479,310 3,015 98,065 384,260I Class non-distributing share EUR 114,563 – 14,563 100,000X Class non-distributing share EUR 37 – – 37
BlackRock European Select Strategies Fund(1)
A Class distributing share EUR – 1,068 41 1,027A Class non-distributing share EUR – 1,483 – 1,483D Class distributing share USD hedged – 169,948 164,961 4,987D Class non-distributing share EUR – 818,203 42,284 775,919E Class distributing share EUR – 190,269 2,995 187,274E Class non-distributing share EUR – 471,283 28,376 442,907I Class distributing share EUR – 340,050 40,000 300,050X Class non-distributing share EUR – 299,793 299,750 43
BlackRock Fixed Income Strategies FundA Class distributing share EUR 2,789,848 2,649,350 530,074 4,909,124A Class distributing share CHF hedged 73,973 44,772 20,514 98,231A Class distributing share USD hedged 30,153 30,585 13,905 46,833A Class non-distributing share EUR 6,237,281 9,401,801 4,329,973 11,309,109A Class non-distributing share CHF hedged 611,484 781,074 234,572 1,157,986A Class non-distributing share USD hedged 764,989 885,320 465,133 1,185,176A Class non-distributing UK reporting fund share GBP hedged 34 4,769 463 4,340D Class distributing share EUR 324,078 203,159 57,863 469,374D Class distributing share USD hedged 74,680 8,000 74,678 8,002D Class distributing UK reporting fund share GBP hedged 10,382 31,673 3,218 38,837D Class non-distributing share EUR 8,155,645 12,854,507 7,485,264 13,524,888D Class non-distributing share CHF hedged 496,488 478,181 78,702 895,967D Class non-distributing share USD hedged 546,354 2,661,261 330,017 2,877,598D Class non-distributing UK reporting fund share GBP hedged 129,635 64,923 33,483 161,075E Class non-distributing share EUR 5,684,557 4,680,357 2,383,126 7,981,788I Class distributing share EUR 295,334 287,262 – 582,596I Class non-distributing share EUR 2,214,036 3,384,396 1,423,366 4,175,066I Class non-distributing share SEK hedged 51,695 – – 51,695X Class distributing share EUR – 896,848 44 896,804X Class non-distributing share EUR 755,792 279,508 4,452 1,030,848
(1) New Fund launch, see Note 1 for further details.

Annual Report and Audited Accounts 39
The notes on pages 489 to 503 form an integral part of these financial statements.
Statement of Changes in Shares Outstandingas at 31 May 2016 continued
Shares outstanding at the beginning
of the yearShares issued
Shares repurchased
Shares outstandingat the end of the
year
BlackRock Global Absolute Return Bond FundA Class non-distributing share EUR 104,471 45,998 119,467 31,002A Class non-distributing share SEK hedged 1,575,694 1,381,706 100,200 2,857,200A Class non-distributing share USD hedged 50 1,940 242 1,748D Class non-distributing share EUR 385,818 267,886 361,134 292,570D Class non-distributing share CHF hedged – 192,100 67,755 124,345E Class non-distributing share EUR 15,452 4,208 6,330 13,330I Class non-distributing share EUR 453,999 143,621 501,282 96,338I Class non-distributing share SEK hedged 1,138,692 115,170 1,237,662 16,200X Class non-distributing share EUR 1,680,894 146,550 510,764 1,316,680
BlackRock Global Event Driven Fund(1)
A Class non-distributing share USD – 93,109 55 93,054A Class non-distributing share CHF hedged – 49 – 49A Class non-distributing UK reporting fund share EUR hedged – 117 – 117D Class non-distributing share USD – 118,130 150 117,980D Class non-distributing share CHF hedged – 8,179 – 8,179D Class non-distributing UK reporting fund share EUR hedged – 219,596 – 219,596D Class non-distributing UK reporting fund share GBP hedged – 39,198 7 39,191E Class non-distributing share EUR – 2,477 510 1,967E Class non-distributing share EUR hedged – 45 – 45I Class non-distributing share EUR hedged – 45 – 45X Class non-distributing share USD – 199,850 199,801 49Z Class non-distributing share USD – 197,976 2,005 195,971Z Class non-distributing share CHF hedged – 52,930 – 52,930Z Class non-distributing UK reporting fund share EUR hedged – 1,045,664 12,979 1,032,685Z Class non-distributing UK reporting fund share GBP hedged – 298,631 3,662 294,969
BlackRock Global Long/Short Equity FundA Class non-distributing share USD 327,802 41,628 76,842 292,588A Class non-distributing share EUR hedged 2,048 295,042 553 296,537A Class non-distributing share SEK hedged 237,822 60,095 290,334 7,583A Class non-distributing UK reporting fund share GBP hedged 1,611 – 30 1,581C Class non-distributing share USD 5,352 11,093 5,599 10,846D Class non-distributing share USD 171,580 117,146 49,775 238,951D Class non-distributing share EUR hedged 339,683 387,690 421,797 305,576D Class non-distributing UK reporting fund share GBP hedged 32,996 2,594 33,727 1,863E Class non-distributing share EUR hedged 963,792 588,022 710,888 840,926I Class non-distributing share EUR hedged 410,995 – 211,994 199,001J Class distributing share USD 596,310 10,338 272,673 333,975X Class non-distributing share USD 49 – – 49
BlackRock Impact World Equity Fund(1)
A Class non-distributing share USD – 1,560 49 1,511D Class non-distributing share EUR – 46 – 46E Class non-distributing share EUR – 3,252 – 3,252I Class non-distributing share JPY – 9,904 1,084 8,820I Class non-distributing share JPY hedged – 2,439 500 1,939X Class distributing share AUD – 32 – 32X Class non-distributing share GBP – 1,541,850 35,000 1,506,850
BlackRock Latin American Opportunities FundA Class non-distributing share EUR 65,719 1,349 10,510 56,558A Class non-distributing share USD 421,756 17,004 302,397 136,363A Class non-distributing UK reporting fund share GBP 422,738 6,177 229,173 199,742C Class non-distributing share USD 12,035 – 4,147 7,888D Class non-distributing share EUR 9,505 118,241 121,832 5,914D Class non-distributing share USD 8,566 529 6,103 2,992D Class non-distributing UK reporting fund share GBP 65 1,749 – 1,814
(1) New Fund launch, see Note 1 for further details.
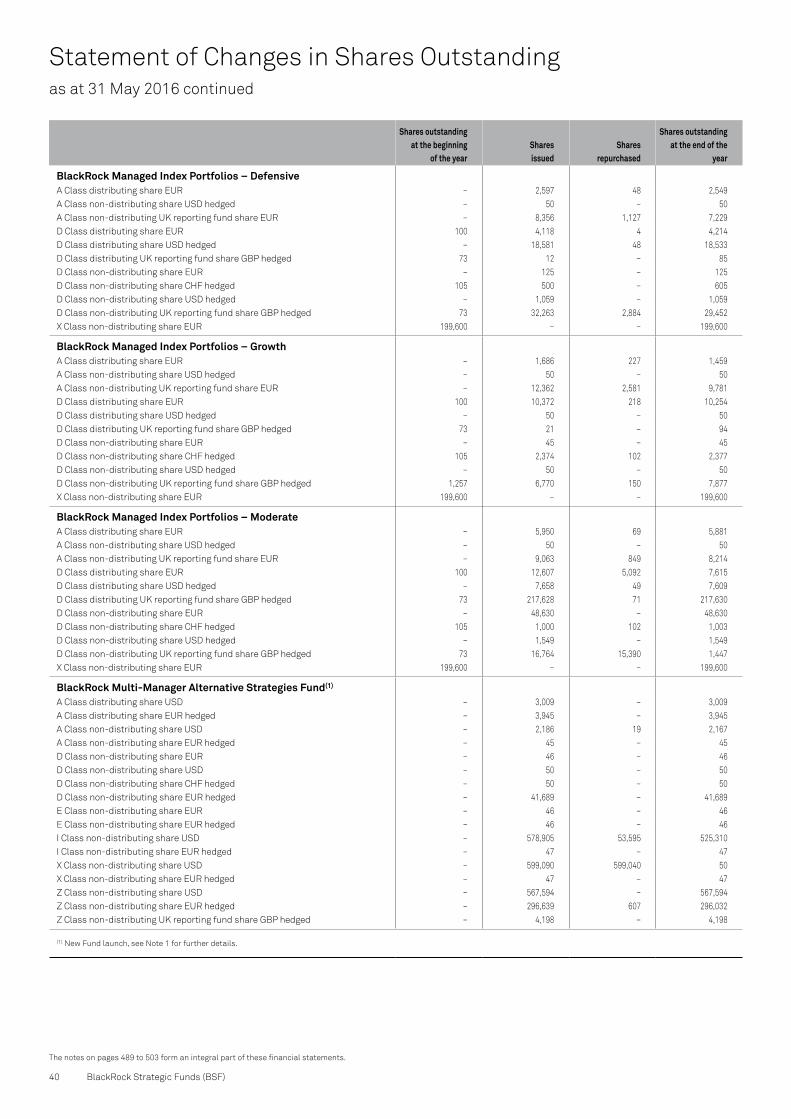
The notes on pages 489 to 503 form an integral part of these financial statements.
40 BlackRock Strategic Funds (BSF)
Shares outstanding at the beginning
of the yearShares issued
Shares repurchased
Shares outstandingat the end of the
year
BlackRock Managed Index Portfolios – DefensiveA Class distributing share EUR – 2,597 48 2,549A Class non-distributing share USD hedged – 50 – 50A Class non-distributing UK reporting fund share EUR – 8,356 1,127 7,229D Class distributing share EUR 100 4,118 4 4,214D Class distributing share USD hedged – 18,581 48 18,533D Class distributing UK reporting fund share GBP hedged 73 12 – 85D Class non-distributing share EUR – 125 – 125D Class non-distributing share CHF hedged 105 500 – 605D Class non-distributing share USD hedged – 1,059 – 1,059D Class non-distributing UK reporting fund share GBP hedged 73 32,263 2,884 29,452X Class non-distributing share EUR 199,600 – – 199,600
BlackRock Managed Index Portfolios – GrowthA Class distributing share EUR – 1,686 227 1,459A Class non-distributing share USD hedged – 50 – 50A Class non-distributing UK reporting fund share EUR – 12,362 2,581 9,781D Class distributing share EUR 100 10,372 218 10,254D Class distributing share USD hedged – 50 – 50D Class distributing UK reporting fund share GBP hedged 73 21 – 94D Class non-distributing share EUR – 45 – 45D Class non-distributing share CHF hedged 105 2,374 102 2,377D Class non-distributing share USD hedged – 50 – 50D Class non-distributing UK reporting fund share GBP hedged 1,257 6,770 150 7,877X Class non-distributing share EUR 199,600 – – 199,600
BlackRock Managed Index Portfolios – ModerateA Class distributing share EUR – 5,950 69 5,881A Class non-distributing share USD hedged – 50 – 50A Class non-distributing UK reporting fund share EUR – 9,063 849 8,214D Class distributing share EUR 100 12,607 5,092 7,615D Class distributing share USD hedged – 7,658 49 7,609D Class distributing UK reporting fund share GBP hedged 73 217,628 71 217,630D Class non-distributing share EUR – 48,630 – 48,630D Class non-distributing share CHF hedged 105 1,000 102 1,003D Class non-distributing share USD hedged – 1,549 – 1,549D Class non-distributing UK reporting fund share GBP hedged 73 16,764 15,390 1,447X Class non-distributing share EUR 199,600 – – 199,600
BlackRock Multi-Manager Alternative Strategies Fund(1)
A Class distributing share USD – 3,009 – 3,009A Class distributing share EUR hedged – 3,945 – 3,945A Class non-distributing share USD – 2,186 19 2,167A Class non-distributing share EUR hedged – 45 – 45D Class non-distributing share EUR – 46 – 46D Class non-distributing share USD – 50 – 50D Class non-distributing share CHF hedged – 50 – 50D Class non-distributing share EUR hedged – 41,689 – 41,689E Class non-distributing share EUR – 46 – 46E Class non-distributing share EUR hedged – 46 – 46I Class non-distributing share USD – 578,905 53,595 525,310I Class non-distributing share EUR hedged – 47 – 47X Class non-distributing share USD – 599,090 599,040 50X Class non-distributing share EUR hedged – 47 – 47Z Class non-distributing share USD – 567,594 – 567,594Z Class non-distributing share EUR hedged – 296,639 607 296,032Z Class non-distributing UK reporting fund share GBP hedged – 4,198 – 4,198
(1) New Fund launch, see Note 1 for further details.
Statement of Changes in Shares Outstandingas at 31 May 2016 continued

Annual Report and Audited Accounts 41
The notes on pages 489 to 503 form an integral part of these financial statements.
Statement of Changes in Shares Outstandingas at 31 May 2016 continued
Shares outstanding at the beginning
of the yearShares issued
Shares repurchased
Shares outstandingat the end of the
year
BlackRock Multi-Strategy Absolute Return FundA Class non-distributing share EUR 1,053 – – 1,053D Class non-distributing share EUR 50 – – 50D Class non-distributing share USD hedged 50 5,022 5,070 2I Class non-distributing share EUR 175,001 – – 175,001I Class non-distributing share GBP hedged 21,910 8,780 – 30,690X Class non-distributing share EUR 439,850 – – 439,850
BlackRock Style Advantage Fund(1)
A Class distributing share USD – 51 – 51A Class distributing share EUR hedged – 45 – 45A Class non-distributing share USD – 400 – 400D Class non-distributing share EUR – 46 – 46D Class non-distributing share USD – 50 – 50D Class non-distributing share EUR hedged – 753 – 753E Class non-distributing share EUR – 46 – 46E Class non-distributing share EUR hedged – 47 – 47I Class non-distributing share EUR hedged – 46 – 46X Class non-distributing share USD – 249,650 – 249,650X Class non-distributing share AUD hedged – 71 – 71Z Class non-distributing share USD – 50 – 50Z Class non-distributing share EUR hedged – 75,396 – 75,396Z Class non-distributing UK reporting fund share GBP hedged – 404,567 – 404,567
BlackRock Systematic European Equity FundA Class non-distributing share EUR 100 50 – 150D Class non-distributing share EUR 100 60,133 5,519 54,714E Class non-distributing share EUR 100 6,693 – 6,793X Class non-distributing share EUR 94,700 – – 94,700
BlackRock Systematic Global Equity Fund(1)
A Class non-distributing share USD – 50 – 50D Class non-distributing share EUR – 45 – 45E Class non-distributing share EUR – 64 – 64E Class non-distributing share EUR hedged – 45 – 45I Class non-distributing share EUR – 93,055 – 93,055X Class non-distributing share GBP – 1,387,621 – 1,387,621
(1) New Fund launch, see Note 1 for further details.

Transferable Securities and Money Market Instruments Admitted to an Official Stock Exchange Listing or Dealt in on Another Regulated Market
Transferable Securities and Money Market Instruments Admitted to an Official Stock Exchange Listing or Dealt in on Another Regulated Market
Holding
Description
Market Value
USD
% of Net
Assets
Holding
Description
Market Value
USD
% of Net
Assets
42 BlackRock Strategic Funds (BSF)
The notes on pages 489 to 503 form an integral part of these financial statements.
BlackRock Americas Diversified Equity Absolute Return FundPortfolio of Investments as at 31 May 2016
BONDS
Canada USD 4,350,000 Toronto-Dominion Bank/The FRN
8/7/2016 4,351,074 0.70
4,351,074 0.70
United States USD 5,000,000 Fannie Mae Discount Notes
3/6/2016 (Zero Coupon) 4,999,875 0.80 USD 2,669,000 Fannie Mae Discount Notes
6/7/2016 (Zero Coupon) 2,668,093 0.43 USD 1,000,000 Fannie Mae Discount Notes
20/7/2016 (Zero Coupon) 999,528 0.16 USD 6,000,000 Federal Home Loan Bank Discount
Notes 20/6/2016 (Zero Coupon) 5,998,998 0.97 USD 6,566,000 Federal Home Loan Bank Discount
Notes 22/6/2016 (Zero Coupon) 6,564,798 1.06 USD 15,000,000 Federal Home Loan Bank Discount
Notes 24/6/2016 (Zero Coupon) 14,997,000 2.41 USD 2,700,000 Federal Home Loan Bank Discount
Notes 22/7/2016 (Zero Coupon) 2,698,674 0.43 USD 2,000,000 Federal Home Loan Banks FRN
21/6/2016 2,000,228 0.32 USD 5,000,000 Federal Home Loan Banks FRN
23/1/2017 5,002,770 0.81 USD 7,000,000 Freddie Mac Discount Notes
2/6/2016 (Zero Coupon) 6,999,881 1.13 USD 9,750,000 Freddie Mac Discount Notes
10/6/2016 (Zero Coupon) 9,749,191 1.57 USD 1,600,000 United States Treasury Bill
23/6/2016 (Zero Coupon) 1,599,781 0.26
64,278,817 10.35
Total Bonds 68,629,891 11.05
CERTIFICATES OF DEPOSIT
United States USD 5,000,000 Mizuho Bank Ltd 0.61% 7/7/2016 5,000,000 0.80 USD 20,650,000 Norinchukin Bank 0.67% 19/9/2016 20,650,000 3.33 USD 5,000,000 State Street Bank and Trust
Company 0.793% 23/9/2016 5,000,000 0.81 USD 10,000,000 Sumitomo Mitsui Trust Bank Ltd
0.62% 21/6/2016 10,000,000 1.61 USD 5,900,000 Toronto-Dominion Bank 0.47%
1/8/2016 5,897,427 0.95
46,547,427 7.50
Total Certificates of Deposit 46,547,427 7.50
COMMERCIAL PAPER
Luxembourg USD 8,195,000 Rabobank Nederland NV
27/6/2016 (Zero Coupon) 8,191,123 1.32
8,191,123 1.32
United States USD 15,000,000 ABN AMRO Funding USA LLC
25/7/2016 (Zero Coupon) 14,986,050 2.41 USD 7,800,000 Albion Capital LLC 22/6/2016
(Zero Coupon) 7,797,010 1.26 USD 2,650,000 American Honda Finance Corp
28/7/2016 (Zero Coupon) 2,647,644 0.43 USD 5,000,000 Antalis SA 4/8/2016 (Zero Coupon) 4,993,956 0.80 USD 27,000,000 Bank Nederlandse Gemeenten '144A'
2/6/2016 (Zero Coupon) 26,997,660 4.35
USD 10,075,000 Barton Capital Corp 14/7/2016 (Zero Coupon) 10,067,433 1.62
USD 7,000,000 Bennington Stark Capital Co 7/6/2016 (Zero Coupon) 6,999,393 1.13
USD 25,000,000 BMW US Capital LLC 27/6/2016 (Zero Coupon) 24,991,333 4.03
USD 18,900,000 BNP Paribas Fortis Funding SA/NV 3/6/2016 (Zero Coupon) 18,898,640 3.04
USD 11,000,000 Caisse Centrale Desjardins du Quebec 23/6/2016 (Zero Coupon) 10,996,740 1.77
USD 14,000,000 Caisse Centrale Desjardins du Quebec 29/6/2016 (Zero Coupon) 13,994,773 2.25
USD 18,000,000 Cancara Asset Securitisation LLC 5/7/2016 (Zero Coupon) 17,989,800 2.90
USD 3,000,000 Charta LLC 6/7/2016 (Zero Coupon) 2,997,550 0.48
USD 10,500,000 CRC Funding LLC 1/8/2016 (Zero Coupon) 10,485,411 1.69
USD 6,000,000 CRC Funding LLC 22/8/2016 (Zero Coupon) 5,990,748 0.97
USD 25,350,000 Gotham Funding Corp 28/6/2016 (Zero Coupon) 25,339,543 4.08
USD 3,000,000 ING US Funding LLC 5/7/2016 (Zero Coupon) 2,998,045 0.48
USD 24,250,000 ING US Funding LLC 2/9/2016 (Zero Coupon) 24,205,521 3.90
USD 15,000,000 LMA Americas LLC 7/6/2016 (Zero Coupon) 14,998,775 2.42
USD 10,000,000 LMA Americas LLC 8/7/2016 (Zero Coupon) 9,994,861 1.61
USD 3,000,000 Matchpoint Finance Plc 16/8/2016 (Zero Coupon) 2,994,617 0.48
USD 28,200,000 Natixis 6/6/2016 (Zero Coupon) 28,198,512 4.54 USD 3,950,000 Nieuw Amsterdam Receivables
Corp 1/8/2016 (Zero Coupon) 3,946,118 0.64 USD 23,500,000 NRW.Bank 13/6/2016
(Zero Coupon) 23,496,357 3.78 USD 5,296,000 PepsiCo Inc 1/6/2016
(Zero Coupon) 5,296,000 0.85 USD 8,700,000 PSP Capital Inc 17/8/2016
(Zero Coupon) 8,690,324 1.40 USD 250,000 Rabobank Nederland NV
20/7/2016 (Zero Coupon) 249,728 0.04 USD 7,499,000 Regency Markets No.1 LLC
20/6/2016 (Zero Coupon) 7,496,159 1.21 USD 1,000,000 Starbird Funding Corp 16/8/2016
(Zero Coupon) 998,670 0.16 USD 3,000,000 Sumitomo Mitsui Banking Corp
22/6/2016 (Zero Coupon) 2,998,933 0.48 USD 14,300,000 Sumitomo Mitsui Banking Corp
1/9/2016 (Zero Coupon) 14,274,419 2.30 USD 9,000,000 Sumitomo Mitsui Banking Corp
'144A' 26/8/2016 (Zero Coupon) 8,981,940 1.45 USD 15,000,000 Sumitomo Mitsui Trust Bank Ltd
15/8/2016 (Zero Coupon) 14,977,812 2.41 USD 10,615,000 Swedbank AB 19/8/2016
(Zero Coupon) 10,600,325 1.71 USD 10,000,000 Toyota Credit Canada Inc 25/7/2016
(Zero Coupon) 9,990,250 1.61 USD 10,000,000 Versailles CDS LLC 10/6/2016
(Zero Coupon) 9,998,450 1.61 USD 6,900,000 Victory Receivables Corp 12/7/2016
(Zero Coupon) 6,896,071 1.11 USD 20,000,000 Victory Receivables Corp 6/7/2016
(Zero Coupon) 19,990,083 3.22 USD 8,000,000 Working Capital Management Co
3/6/2016 (Zero Coupon) 7,999,778 1.29
United States continued

Transferable Securities and Money Market Instruments Admitted to an Official Stock Exchange Listing or Dealt in on Another Regulated Market
Holding
Description
Market Value
USD
% of Net
Assets
Annual Report and Audited Accounts 43
The notes on pages 489 to 503 form an integral part of these financial statements.
BlackRock Americas Diversified Equity Absolute Return Fund continued
USD 2,000,000 Working Capital Management Co 20/6/2016 (Zero Coupon) 1,999,504 0.32
USD 12,150,000 Working Capital Management Co 15/8/2016 (Zero Coupon) 12,135,319 1.95
460,580,255 74.18
Total Commercial Paper 468,771,378 75.50
Total Transferable Securities and Money Market Instruments Admitted to an Official Stock Exchange Listing or Dealt in on Another Regulated Market 583,948,696 94.05
Securities portfolio at market value 583,948,696 94.05
Other Net Assets 36,951,791 5.95
Total Net Assets (USD) 620,900,487 100.00
Portfolio of Investments as at 31 May 2016
United States continued

Contracts for difference as at 31 May 2016
Holding
Description Counterparty
Unrealised appreciation/
(depreciation) USD
Holding
Description Counterparty
Unrealised appreciation/
(depreciation) USD
44 BlackRock Strategic Funds (BSF)
The notes on pages 489 to 503 form an integral part of these financial statements.
Barbados 10,041 Brookfield Property
Partners LP Morgan Stanley (111,692)
(111,692)
Brazil 251 AES Tiete Energia SA (Pref) Goldman Sachs (856) 127,174 AES Tiete Energia SA (Unit) Goldman Sachs (13,960) 13,100 Agrenco Ltd/Brazil BDR Morgan Stanley (307) 107,500 Aliansce Shopping Centers SA Goldman Sachs (49,205) 16,061 Aliansce Shopping Centers SA Morgan Stanley 8,520 (4,500) Alpargatas SA (Pref) Goldman Sachs (29) (41,925) Alpargatas SA (Pref) Morgan Stanley (34,206) (7,226) Alupar Investimento SA (Right) Morgan Stanley (544) (95) Alupar Investimento SA (Right) Goldman Sachs (7) (745) Alupar Investimento SA (Unit) Goldman Sachs 268 (56,338) Alupar Investimento SA (Unit) Morgan Stanley 118,570 3,900 Ambev SA Goldman Sachs (213) (15,500) Arezzo Industria e
Comercio SA Goldman Sachs 10,628 (1,400) Arteris SA Morgan Stanley (6) 140,680 Banco ABC Brasil SA (Pref) Goldman Sachs 102,061 79,962 Banco ABC Brasil SA (Pref) Morgan Stanley 1,299 55,440 Banco Bradesco SA (Pref) Morgan Stanley 27,249 24,230 Banco Bradesco SA (Pref) Goldman Sachs (16,844) 101,400 Banco do Brasil SA Morgan Stanley 22,525 91,100 Banco do Brasil SA Goldman Sachs (64,106) 201,000 Banco do Estado do Rio
Grande do Sul SA 'B' (Pref) Goldman Sachs (38,743) 281,899 Banco do Estado do Rio
Grande do Sul SA 'B' (Pref) Morgan Stanley (191,707) (188,100) BB Seguridade
Participacoes SA Morgan Stanley (35,039) 310,600 BM&FBovespa SA - Bolsa de
Valores Mercadorias e Futuros Goldman Sachs (165,927)
31,700 BM&FBovespa SA - Bolsa de Valores Mercadorias e Futuros Morgan Stanley 12,144
14,605 BR Insurance Corretora de Seguros SA Morgan Stanley 22,723
11,085 BR Insurance Corretora de Seguros SA Goldman Sachs (2,135)
(350,740) BR Malls Participacoes SA Goldman Sachs 87,439 (345,023) Brasil Brokers
Participacoes SA Morgan Stanley 92,979 (33,952) Brasil Pharma SA Goldman Sachs 9,115 82,300 Braskem SA 'A' (Pref) Goldman Sachs 4,727 60,901 Braskem SA 'A' (Pref) Morgan Stanley (19,143) 13,000 BRF SA Goldman Sachs (11,320) 400 BRF SA Morgan Stanley (737) 19,200 BTG Pactual Group (Unit) Morgan Stanley 3,948 (551,100) CCR SA Goldman Sachs 248,403 (816,463) Centrais Eletricas
Brasileiras SA Morgan Stanley (696,323) 37,600 CETIP SA - Mercados
Organizados Morgan Stanley 22,344 88,200 CETIP SA - Mercados
Organizados Goldman Sachs (24,344) (28,400) Cia Brasileira de
Distribuicao (Pref) Goldman Sachs 25,301 (3,600) Cia de Saneamento Basico do
Estado de Sao Paulo Goldman Sachs 1,299 87,100 Cia de Saneamento de Minas
Gerais-COPASA Goldman Sachs (43,241) 11,900 Cia de Saneamento de Minas
Gerais-COPASA Morgan Stanley 42,393 5,158 Cia de Saneamento de Minas
Gerais-COPASA (Right) Goldman Sachs 8,158 704 Cia de Saneamento de Minas
Gerais-COPASA (Right) Morgan Stanley 1,113 7,151 Cia Ferro Ligas da Bahia -
FERBASA (Pref) Morgan Stanley 2,332
53,100 Cia Ferro Ligas da Bahia - FERBASA (Pref) Goldman Sachs (9,917)
(16,280) Cia Hering Morgan Stanley 39,066 (390,521) Cielo SA Morgan Stanley (573,007) (170,800) Cosan Logistica SA Morgan Stanley (11,006) (2,900) Cosan SA Industria e
Comercio Goldman Sachs 1,801 (22,579) Cosan SA Industria e
Comercio Morgan Stanley (82,960) 52,900 CVC Brasil Operadora e
Agencia de Viagens SA Goldman Sachs 2,926 233,635 CVC Brasil Operadora e
Agencia de Viagens SA Morgan Stanley 181,899 (169,700) Cyrela Brazil Realty SA
Empreendimentos e Participacoes Goldman Sachs 81,690
53,800 Direcional Engenharia SA Morgan Stanley 2,793 3,400 Direcional Engenharia SA Goldman Sachs (1,196) (553,511) Duratex SA Goldman Sachs 195,447 (206,718) Duratex SA Morgan Stanley 256,938 (486,000) EcoRodovias Infraestrutura
e Logistica SA Goldman Sachs 74,439 (705,700) EcoRodovias Infraestrutura
e Logistica SA Morgan Stanley (222,117) (9,700) Embraer SA Goldman Sachs 1,041 (1,159) Embraer SA Morgan Stanley 2,622 137,700 Equatorial Energia SA Morgan Stanley 443,551 25,700 Equatorial Energia SA Goldman Sachs (4,322) (30,300) Estacio Participacoes SA Goldman Sachs 5,195 336,800 Eternit SA Goldman Sachs (10,466) 163,217 Eternit SA Morgan Stanley (150,834) 100 Even Construtora e
Incorporadora SA Goldman Sachs (5) 130,703 Ez Tec Empreendimentos e
Participacoes SA Morgan Stanley 138,385 48,400 Fibria Celulose SA Goldman Sachs 27,511 83,400 Fibria Celulose SA Morgan Stanley (97,889) (84,500) Fleury SA Goldman Sachs 954 65,700 FPC Par Corretora de
Seguros SA Goldman Sachs 1,989 40,753 FPC Par Corretora de
Seguros SA Morgan Stanley 18,686 (78,600) GAEC Educacao SA Goldman Sachs (3,050) (209,450) GAEC Educacao SA Morgan Stanley 167,779 17,200 Gerdau SA (Pref) Morgan Stanley 11,527 94,100 Gerdau SA (Pref) Goldman Sachs (17,921) 95,300 Grendene SA Goldman Sachs (8,416) 207,628 Grendene SA Morgan Stanley (63,026) (98,650) Helbor Empreendimentos SA Goldman Sachs 1,822 (826,859) Helbor Empreendimentos SA Morgan Stanley 384,592 (58,013) Hypermarcas SA Morgan Stanley (235,402) (10,600) Hypermarcas SA Goldman Sachs 10,451 (12,000) Iguatemi Empresa de
Shopping Centers SA Goldman Sachs 7,843 (67,071) Iguatemi Empresa de
Shopping Centers SA Morgan Stanley 13,623 139,500 International Meal Co
Alimentacao SA Goldman Sachs (1,817) 93,900 International Meal Co
Alimentacao SA Morgan Stanley (119,646) 32,600 Iochpe Maxion SA Goldman Sachs 6,213 121,800 Iochpe Maxion SA Morgan Stanley (22,033) 60,500 Itau Unibanco Holding SA
(Pref) Goldman Sachs (25,274) 12,800 Itau Unibanco Holding SA
(Pref) Morgan Stanley (9,675) 1,140,021 Itausa - Investimentos
Itau SA (Pref) Morgan Stanley 358,388 4,070 Itausa - Investimentos
Itau SA (Pref) Goldman Sachs (623) 71,500 JBS SA Morgan Stanley 18,688 442,800 JBS SA Goldman Sachs (298,045)
BlackRock Americas Diversified Equity Absolute Return Fund continued
Brazil continued

Contracts for difference as at 31 May 2016
Holding
Description Counterparty
Unrealised appreciation/
(depreciation) USD
Holding
Description Counterparty
Unrealised appreciation/
(depreciation) USD
Annual Report and Audited Accounts 45
The notes on pages 489 to 503 form an integral part of these financial statements.
BlackRock Americas Diversified Equity Absolute Return Fund continued
77,600 JHSF Participacoes SA Goldman Sachs (4,161) 72,331 JHSF Participacoes SA Morgan Stanley (22,274) 1,905 JSL SA Morgan Stanley 412 7,400 JSL SA Goldman Sachs (597) 9,500 Kepler Weber SA Goldman Sachs (417) (121,600) Klabin SA (Unit) Goldman Sachs (10,774) (536,712) Klabin SA (Unit) Morgan Stanley 285,280 181,900 Kroton Educacional SA Goldman Sachs (43,984) 68,500 Kroton Educacional SA Morgan Stanley (7,081) 13,700 Laep Investments Ltd BDR Goldman Sachs (27) 24,300 Laep Investments Ltd BDR Morgan Stanley (998) 2,200 Linx SA Morgan Stanley (2,950) (66,900) Localiza Rent a Car SA Goldman Sachs 58,848 (249,900) Lojas Americanas SA (Pref) Goldman Sachs 17,159 (25,740) Lojas Americanas SA (Pref) Morgan Stanley (31,481) (141,700) Lojas Renner SA Goldman Sachs 92,557 (22,165) Lojas Renner SA Morgan Stanley (23,215) (24,900) M Dias Branco SA Goldman Sachs 13,550 (64,100) M Dias Branco SA Morgan Stanley (323,934) 1,990 Magazine Luiza SA Morgan Stanley 13,610 27,896 Magazine Luiza SA Goldman Sachs (5,719) (2,540) Magnesita Refratarios SA Goldman Sachs 417 (28,415) Magnesita Refratarios SA Morgan Stanley 93,618 3,800 Mahle-Metal Leve SA Morgan Stanley 481 18,500 Mahle-Metal Leve SA Goldman Sachs (4,901) (904,300) Marcopolo SA (Pref) Goldman Sachs (3,023) (556,800) Marcopolo SA (Pref) Morgan Stanley (95,198) 386,500 Marfrig Global Foods SA Goldman Sachs (55,109) (849,600) Metalurgica Gerdau SA (Pref) Goldman Sachs 98,891 (44,700) Mills Estruturas e Servicos
de Engenharia SA Morgan Stanley 428,238 (374,367) Mills Estruturas e Servicos
de Engenharia SA Goldman Sachs (41,192) (21,600) Minerva SA/Brazil Goldman Sachs 6,028 201,513 MRV Engenharia e
Participacoes SA Morgan Stanley 80,067 334,700 MRV Engenharia e
Participacoes SA Goldman Sachs (243,516) 31,600 Multiplan Empreendimentos
Imobiliarios SA Morgan Stanley 69,805 43,900 Multiplan Empreendimentos
Imobiliarios SA Goldman Sachs (74,028) 102,300 Multiplus SA Goldman Sachs (60,616) 84,000 Multiplus SA Morgan Stanley (29,198) 73,490 Odontoprev SA Morgan Stanley 38,437 11,300 Odontoprev SA Goldman Sachs (1,416) 159,700 Paranapanema SA Goldman Sachs (4,462) 151,430 Paranapanema SA Morgan Stanley (43,501) (160,700) Petroleo Brasileiro SA (Pref) Morgan Stanley (50,199) (56,100) Porto Seguro SA Goldman Sachs 12,543 (479,990) Prumo Logistica SA Goldman Sachs 74,259 (22,800) QGEP Participacoes SA Morgan Stanley 192 (305,200) Qualicorp SA Goldman Sachs (4,589) 49,000 Raia Drogasil SA Goldman Sachs (35,113) 57,800 Raia Drogasil SA Morgan Stanley 84,172 40,717 Randon SA Implementos e
Participacoes Morgan Stanley 7,280 228,800 Randon SA Implementos e
Participacoes (Pref) Morgan Stanley (7,025) (567,500) Rumo Logistica Operadora
Multimodal SA Goldman Sachs (52,289) (46,665) Santos Brasil
Participacoes SA (Unit) Morgan Stanley (16,954) (3,800) Santos Brasil
Participacoes SA (Unit) Goldman Sachs 491 (83,783) Sao Martinho SA Morgan Stanley (401,210) 29,000 Ser Educacional SA ‘144A’ Goldman Sachs (16,523) 1,376 Ser Educacional SA ‘144A’ Morgan Stanley 1,673 (59,800) SLC Agricola SA Goldman Sachs 18,308 (4,200) SLC Agricola SA Morgan Stanley 250 (32,900) Smiles SA Goldman Sachs 25,479 (206,350) Somos Educacao SA Goldman Sachs (20,941)
50,000 Sonae Sierra Brasil SA Goldman Sachs (15,403) 21,800 Sonae Sierra Brasil SA Morgan Stanley (40,143) 12,800 Sul America SA (Unit) Goldman Sachs (2,537) 105,100 Sul America SA (Unit) Morgan Stanley (16,454) 263,900 Suzano Papel e
Celulose SA 'A' (Pref) Goldman Sachs 2,076 173,963 Suzano Papel e
Celulose SA 'A' (Pref) Morgan Stanley 9,532 25,478 Tegma Gestao Logistica SA Morgan Stanley 7,836 27,500 Tegma Gestao Logistica SA Goldman Sachs (3,854) 13,200 Telefonica Brasil SA (Pref) Goldman Sachs (4,018) 12,800 Telefonica Brasil SA (Pref) Morgan Stanley 3,369 85,200 Tim Participacoes SA Goldman Sachs (10,748) 124,600 Tim Participacoes SA Morgan Stanley (368) 12,698 Tractebel Energia SA Morgan Stanley 16,825 65,700 Tractebel Energia SA Goldman Sachs (30,386) 211,456 Transmissora Alianca de
Energia Eletrica SA (Unit) Morgan Stanley 5,356 131,900 Transmissora Alianca de
Energia Eletrica SA (Unit) Goldman Sachs (43,619) 10,900 Tupy SA Goldman Sachs (4,514) 6,300 Ultrapar Participacoes SA Morgan Stanley 12,547 26,900 Ultrapar Participacoes SA Goldman Sachs (29,519) (6,358) Usinas Siderurgicas de
Minas Gerais SA Morgan Stanley (593) (423,500) Usinas Siderurgicas de
Minas Gerais SA 'A' (Pref) Goldman Sachs 23,278 (123,882) Usinas Siderurgicas de
Minas Gerais SA 'A' (Pref) Morgan Stanley 166,018 (25,088) Usinas Siderurgicas de
Minas Gerais SA (Right) Morgan Stanley (70) 98,800 Vale SA (Pref) Goldman Sachs (23,943) 66,300 Vale SA (Pref) Morgan Stanley (23,481) (1,200) Valid Solucoes e Servicos
de Seguranca em Meios de Pagamento e Identificacao SA Goldman Sachs 894
(24,321) Valid Solucoes e Servicos de Seguranca em Meios de Pagamento e Identificacao SA Morgan Stanley 91,973
(12,958) Vanguarda Agro SA Morgan Stanley 438,069 215,000 Via Varejo SA (Unit) Goldman Sachs (84,230) 102,700 Via Varejo SA (Unit) Morgan Stanley 32,836 (772,423) WEG SA Morgan Stanley 50,418
266,385
Canada 57,822 Absolute Software Corp Morgan Stanley 51,634 141,060 Advantage Oil & Gas Ltd Morgan Stanley 111,240 79,140 Aecon Group Inc Morgan Stanley 256,873 (11,066) Ag Growth International Inc Morgan Stanley (111,708) 240,172 AGF Management Ltd 'B' Morgan Stanley 169,873 5,614 AGT Food & Ingredients Inc Morgan Stanley (8,092) (137,423) Aimia Inc Morgan Stanley (91,596) 122,581 Air Canada Morgan Stanley 257,042 (57,143) AirBoss of America Corp Morgan Stanley 54,474 216,430 Alacer Gold Corp Morgan Stanley 109,822 (42,878) Alaris Royalty Corp Morgan Stanley (241,329) 467,611 Algonquin Power &
Utilities Corp Morgan Stanley 534,025 92,112 Allied Properties Real Estate
Investment Trust (Reit) Morgan Stanley 345,096 44,711 AltaGas Ltd Morgan Stanley 14,904 17,113 Altius Minerals Corp Morgan Stanley (8,660) (52,501) Altus Group Ltd/Canada Morgan Stanley (184,804) 2,048 Amaya Inc Morgan Stanley 3,163 4,247 Aralez Pharmaceuticals Inc Morgan Stanley 36 243,976 Argonaut Gold Inc Morgan Stanley 205,069 252,727 Artis Real Estate Investment
Trust (Reit) Morgan Stanley 405,913 (149,372) Asanko Gold Inc Morgan Stanley (205,306) (89,988) Atco Ltd/Canada 'I' Morgan Stanley (661,328)
Brazil continued Brazil continued

Holding
Description Counterparty
Unrealised appreciation/
(depreciation) USD
Holding
Description Counterparty
Unrealised appreciation/
(depreciation) USD
46 BlackRock Strategic Funds (BSF)
The notes on pages 489 to 503 form an integral part of these financial statements.
Contracts for difference as at 31 May 2016
(185,355) Athabasca Oil Corp Morgan Stanley (20,239) 221,898 Atlantic Power Corp Morgan Stanley 109,678 (129,721) ATS Automation Tooling
Systems Inc Morgan Stanley (196,173) 7,783 AutoCanada Inc Morgan Stanley 13,561 (33,365) Avigilon Corp Morgan Stanley (58,768) 202,241 B2Gold Corp Morgan Stanley 186,884 28,661 Badger Daylighting Ltd Morgan Stanley 44,106 (145,561) Ballard Power Systems Inc Morgan Stanley (10,325) 39,172 Baytex Energy Corp Morgan Stanley 8,413 304,433 Bellatrix Exploration Ltd Morgan Stanley (50,022) (80,680) Birchcliff Energy Ltd Morgan Stanley (67,314) 67,365 Bird Construction Inc Morgan Stanley 101,468 90,425 Black Diamond Group Ltd Morgan Stanley 77,638 (83,530) Boardwalk Real Estate
Investment Trust (Reit) Morgan Stanley (705,777) 189,877 Bonavista Energy Corp Morgan Stanley 204,554 (23,467) Bonterra Energy Corp Morgan Stanley (111,179) (104,568) Boralex Inc 'A' Morgan Stanley (370,317) (117,377) Boston Pizza Royalties
Income Fund (Unit) Morgan Stanley (245,616) 33,856 Boyd Group Income Fund (Unit) Morgan Stanley 347,505 87,556 Brookfield Canada Office
Properties (Reit) Morgan Stanley 58,068 (135,504) Brookfield Property
Partners LP Morgan Stanley (459,362) (105,103) Brookfield Renewable
Partners LP Morgan Stanley (133,164) 43,720 BRP Inc/CA Morgan Stanley 129,192 58,582 BTB Real Estate Investment
Trust (Reit) Morgan Stanley 15,517 207,238 CAE Inc Morgan Stanley 428,693 121,129 Calfrac Well Services Ltd Morgan Stanley 108,415 2,107 Callidus Capital Corp Morgan Stanley 11,647 (155,216) Canaccord Genuity Group Inc Morgan Stanley (51,953) 31,989 Canacol Energy Ltd Morgan Stanley 25,230 (141,810) Canadian Apartment
Properties REIT (Reit) Morgan Stanley (217,718) 161,384 Canadian Energy Services &
Technology Corp Morgan Stanley 31,485 (94,293) Canadian Real Estate
Investment Trust (Reit) Morgan Stanley (501,129) (99,812) Canadian Utilities Ltd 'A' Morgan Stanley (473,978) (82,524) Canadian Western Bank Morgan Stanley (316,381) 31,779 Canam Group Inc Morgan Stanley 41,179 (132,243) Canexus Corp Morgan Stanley (21,729) (55,733) Canfor Corp Morgan Stanley (88,457) 83,991 Canfor Pulp Products Inc Morgan Stanley (410) 88,657 Canyon Services Group Inc Morgan Stanley 102,070 167,645 Capital Power Corp Morgan Stanley 317,254 33,126 Cardinal Energy Ltd Morgan Stanley 78,343 (28,715) Cargojet Inc Morgan Stanley (218,279) 88,029 Cascades Inc Morgan Stanley (37,984) 3,711 CCL Industries Inc 'B' Morgan Stanley 92,009 102,506 Celestica Inc Morgan Stanley 63,982 94,548 Centerra Gold Inc Morgan Stanley 53,870 362,620 Chartwell Retirement
Residences (Unit) Morgan Stanley 452,503 103,791 Chemtrade Logistics Income
Fund (Unit) Morgan Stanley 98,480 (62,159) Chesswood Group Ltd Morgan Stanley (45,289) 186,836 China Gold International
Resources Corp Ltd Morgan Stanley 37,366 318,698 Choice Properties Real Estate
Investment Trust (Reit) Morgan Stanley 614,413 191,011 Chorus Aviation Inc Morgan Stanley 210,845 (84,633) CI Financial Corp Morgan Stanley (111,422) 47,425 Cineplex Inc Morgan Stanley 173,923 (39,748) Cipher Pharmaceuticals Inc Morgan Stanley (96,056) (76,630) Clearwater Seafoods Inc Morgan Stanley (171,167) 31,586 Cogeco Communications Inc Morgan Stanley 78,024 32,064 Cogeco Inc Morgan Stanley 174,514
52,480 Colliers International Group Inc Morgan Stanley 340,090
302,087 Cominar Real Estate Investment Trust (Reit) Morgan Stanley 737,843
(78,930) Computer Modelling Group Ltd Morgan Stanley (144,584) 2,463 Concordia Healthcare Corp Morgan Stanley 20,797 (143,281) Continental Gold Inc Morgan Stanley (107,205) 38,742 Corby Spirit and Wine Ltd Morgan Stanley 37,883 41,013 Corus Entertainment Inc 'B' Morgan Stanley 18,461 (107,212) Cott Corp Morgan Stanley (488,315) 5,800 CPI Card Group Inc Morgan Stanley 1,041 (157,098) Crew Energy Inc Morgan Stanley (288,850) (107,047) CRH Medical Corp Morgan Stanley (103,827) 46,741 Crius Energy Trust (Unit) Morgan Stanley 27,822 (296,463) Crombie Real Estate
Investment Trust (Reit) Morgan Stanley (412,444) 216,312 CT Real Estate Investment
Trust (Reit) Morgan Stanley 353,697 167,305 Delphi Energy Corp Morgan Stanley 36,339 (59,853) Descartes Systems Group
Inc/The Morgan Stanley (170,232) 29,022 Detour Gold Corp Morgan Stanley 109,301 (29,550) DH Corp Morgan Stanley (141,207) 120,404 DHX Media Ltd Morgan Stanley 36,541 (10,133) DHX Media Ltd Morgan Stanley 17,480 47,425 DirectCash Payments Inc Morgan Stanley 107,085 (101,105) DIRTT Environmental
Solutions Morgan Stanley 16,468 (465,082) Diversified Royalty Corp Morgan Stanley (130,275) 44,329 Dominion Diamond Corp Morgan Stanley (20,347) (25,986) Dorel Industries Inc 'B' Morgan Stanley (148,060) (444,756) Dream Global Real Estate
Investment Trust (Reit) Morgan Stanley (452,925) 136,736 Dream Industrial Real Estate
Investment Trust (Reit) Morgan Stanley 139,750 93,750 Dream Office Real Estate
Investment Trust (Reit) Morgan Stanley (12,655) 77,258 DREAM Unlimited Corp 'A' Morgan Stanley 29,255 (72,261) Dundee Corp 'A' Morgan Stanley (101,205) 115,460 Dundee Precious Metals Inc Morgan Stanley 83,445 (11,669) Echelon Financial
Holdings Inc Morgan Stanley 10,035 59,377 Element Financial Corp Morgan Stanley 89,965 (61,164) Emera Inc Morgan Stanley (190,984) (87,354) Empire Co Ltd 'A' Morgan Stanley (28,876) 70,372 Enbridge Income Fund
Holdings Inc Morgan Stanley 204,016 (9,580) Endeavour Mining Corp Morgan Stanley (557) 59,494 Endeavour Silver Corp Morgan Stanley 57,947 (111,143) Enercare Inc Morgan Stanley (179,495) 75,272 Enerflex Ltd Morgan Stanley (1,326) 73,112 Enerplus Corp Morgan Stanley 189,743 10,289 Enghouse Systems Ltd Morgan Stanley 39,022 (91,208) Ensign Energy Services Inc Morgan Stanley (135,011) (6,319) Epsilon Energy Ltd/Canada Morgan Stanley (3,748) 17,571 Equitable Group Inc Morgan Stanley 182,327 67,346 Essential Energy Services
Trust Morgan Stanley 3,797 66,803 Evertz Technologies Ltd Morgan Stanley 103,356 (115,712) exactEarth Ltd Morgan Stanley 845,302 (36,220) Exchange Income Corp Morgan Stanley (142,917) 49,558 Exco Technologies Ltd Morgan Stanley 17,312 69,969 Extendicare Inc Morgan Stanley 34,168 2,423 Fairfax Financial Holdings Ltd Morgan Stanley (82,683) (55,905) Fairfax India Holdings Corp
‘144A’ Morgan Stanley (39,692) 64,092 Fiera Capital Corp Morgan Stanley 39,220 (79,629) Finning International Inc Morgan Stanley (240,858) (207,525) First Capital Realty Inc Morgan Stanley (482,120) (56,248) First Majestic Silver Corp Morgan Stanley (237,382) 46,206 First National Financial Corp Morgan Stanley 403,478 50,039 FirstService Corp Morgan Stanley 355,297
BlackRock Americas Diversified Equity Absolute Return Fund continued
Canada continued Canada continued

Holding
Description Counterparty
Unrealised appreciation/
(depreciation) USD
Holding
Description Counterparty
Unrealised appreciation/
(depreciation) USD
Annual Report and Audited Accounts 47
The notes on pages 489 to 503 form an integral part of these financial statements.
BlackRock Americas Diversified Equity Absolute Return Fund continued
87,687 Fortuna Silver Mines Inc Morgan Stanley 235,533 (71,356) Freehold Royalties Ltd Morgan Stanley (94,909) 54,540 Gear Energy Ltd Morgan Stanley 13,535 (23,314) Genworth MI Canada Inc Morgan Stanley (24,784) 54,861 Gibson Energy Inc Morgan Stanley (43,725) (53,227) Gluskin Sheff &
Associates Inc Morgan Stanley (30,610) (179,291) GMP Capital Inc Morgan Stanley (216,026) (25,815) goeasy Ltd Morgan Stanley (28,312) (194,780) Gran Tierra Energy Inc Morgan Stanley (166,477) 58,818 Granite Oil Corp Morgan Stanley (9,527) 42,359 Granite Real Estate
Investment Trust (Reit) Morgan Stanley 168,142 46,102 Great Canadian Gaming Corp Morgan Stanley 67,059 138,873 Great-West Lifeco Inc Morgan Stanley 359,137 (105,787) Guyana Goldfields Inc Morgan Stanley (231,692) 267,845 H&R Real Estate Investment
Trust (Reit) Morgan Stanley 564,447 69,639 Hardwoods Distribution Inc Morgan Stanley (16,197) 220,987 High Arctic Energy Services Inc Morgan Stanley 181,924 29,335 High Liner Foods Inc Morgan Stanley 113,385 25,205 Home Capital Group Inc Morgan Stanley 174,112 (216,717) Horizon North Logistics Inc Morgan Stanley (61,017) (51,400) HudBay Minerals Inc Morgan Stanley (35,097) (88,257) Hudson's Bay Co Morgan Stanley 103,078 (161,109) IAMGOLD Corp Morgan Stanley (143,159) (114,989) IGM Financial Inc Morgan Stanley (369,314) (21,134) Imperial Metals Corp Morgan Stanley (20,170) 55,819 Industrial Alliance Insurance
& Financial Services Inc Morgan Stanley 192,803 (186,788) Innergex Renewable Energy
Inc Morgan Stanley (579,544) 37,372 Intact Financial Corp Morgan Stanley 302,122 (79,571) Interfor Corp Morgan Stanley (168,842) (483,455) InterRent Real Estate
Investment Trust (Reit) Morgan Stanley (371,346) (67,789) Intertain Group Ltd/The Morgan Stanley (221,317) 44,458 Intertape Polymer Group Inc Morgan Stanley 113,045 (111,473) Jean Coutu Group PJC Inc/
The 'A' Morgan Stanley (210,113) 159,480 Just Energy Group Inc Morgan Stanley (11,306) (138,169) Kelt Exploration Ltd Morgan Stanley (151,999) 44,790 Keyera Corp Morgan Stanley 115,980 (218,060) Killam Apartment Real Estate
Investment Trust (Reit) Morgan Stanley (282,818) (112,982) Killam Properties Inc Morgan Stanley 2,763 (20,637) Kinaxis Inc Morgan Stanley (122,986) 56,490 Kirkland Lake Gold Inc Morgan Stanley 183,648 152,997 Klondex Mines Ltd Morgan Stanley 72,650 (129,360) Knight Therapeutics Inc Morgan Stanley (129,783) (45,224) KP Tissue Inc Morgan Stanley (132,507) (76,398) Labrador Iron Ore Royalty Corp Morgan Stanley (34,832) (75,517) Laurentian Bank of Canada Morgan Stanley (391,383) 19,115 Linamar Corp Morgan Stanley (100,247) (77,112) Liquor Stores N.A. Ltd Morgan Stanley (33,128) 16,409 Logistec Corp 'B' Morgan Stanley 67,783 68,898 Lucara Diamond Corp Morgan Stanley 100,770 (35,695) Lumenpulse Inc Morgan Stanley (30,935) 157,013 Lundin Mining Corp Morgan Stanley 139,733 (21,000) MacDonald Dettwiler &
Associates Ltd Morgan Stanley (49,900) (47,693) MAG Silver Corp Morgan Stanley (158,306) 43,367 Magellan Aerospace Corp Morgan Stanley 150,075 (11,022) Mainstreet Equity Corp Morgan Stanley (62,432) (99,789) Major Drilling Group
International Inc Morgan Stanley (101,426) 91,846 Maple Leaf Foods Inc Morgan Stanley 466,318 112,367 Martinrea International Inc Morgan Stanley 119,701 19,197 McCoy Global Inc Morgan Stanley (3,520) 8,940 McEwen Mining Inc Morgan Stanley (3,341) 70,531 Medical Facilities Corp Morgan Stanley 231,043 (27,828) MEG Energy Corp Morgan Stanley (32,557)
113,534 Merus Labs International Inc Morgan Stanley (185) (23,895) Methanex Corp Morgan Stanley (83,490) 186,125 Milestone Apartments Real
Estate Investment Trust (Reit) Morgan Stanley 363,625 54,337 Mitel Networks Corp Morgan Stanley 23,464 160,466 Morguard North American
Residential Real Estate Investment Trust (Reit) Morgan Stanley 244,234
146,672 Morguard Real Estate Investment Trust (Reit) Morgan Stanley 317,907
(81,785) Morneau Shepell Inc Morgan Stanley (233,349) (22,784) Mountain Province
Diamonds Inc Morgan Stanley (70) (22,852) MTY Food Group Inc Morgan Stanley (216,850) (89,227) Mullen Group Ltd Morgan Stanley (67,938) 190,277 Nevsun Resources Ltd Morgan Stanley 86,271 (58,141) New Flyer Industries Inc Morgan Stanley (244,253) 212,149 New Gold Inc Morgan Stanley (3,736) 194,668 Newalta Corp Morgan Stanley (55,880) (59,513) Newmarket Gold Inc Morgan Stanley 7,482 (46,661) Nobilis Health Corp Morgan Stanley (14,703) 170,411 Noranda Income Fund (Unit) Morgan Stanley (36,543) (47,408) Norbord Inc Morgan Stanley (249,407) 41,139 North American Energy
Partners Inc Morgan Stanley 56,114 62,127 North West Co Inc/The Morgan Stanley 162,160 89,275 Northern Blizzard
Resources Inc Morgan Stanley 83,786 (120,262) Northland Power Inc Morgan Stanley (450,200) (210,775) Northview Apartment Real
Estate Investment Trust (Reit) Morgan Stanley (585,917) 140,722 NorthWest Healthcare
Properties Real Estate Investment Trust (Reit) Morgan Stanley 30,850
(58,112) Novadaq Technologies Inc Morgan Stanley 22,960 (103,032) Novagold Resources Inc Morgan Stanley (41,563) (100,071) NuVista Energy Ltd Morgan Stanley (192,023) 171,619 OceanaGold Corp Morgan Stanley 123,835 (498,790) OneREIT (Reit) Morgan Stanley (147,468) 40,332 Onex Corp Morgan Stanley 133,225 17,173 Open Text Corp Morgan Stanley 207,715 (35,847) Osisko Gold Royalties Ltd Morgan Stanley (43,514) 34,438 Pacific Exploration and
Production Corp Morgan Stanley (36,375) (78,660) Painted Pony Petroleum Ltd Morgan Stanley (209,974) (68,309) Pan American Silver Corp Morgan Stanley (237,614) 38,678 Paramount Resources Ltd 'A' Morgan Stanley 22,485 66,973 Parex Resources Inc Morgan Stanley 100,767 (56,062) Parkland Fuel Corp Morgan Stanley (97,102) (84,157) Pason Systems Inc Morgan Stanley (107,133) 153,818 Pengrowth Energy Corp Morgan Stanley 120,230 153,286 Penn West Petroleum Ltd Morgan Stanley (51,663) (113,677) Performance Sports Group
Ltd Morgan Stanley 95,619 44,768 Peyto Exploration &
Development Corp Morgan Stanley 205,607 (25,810) PHX Energy Services Corp Morgan Stanley (32,615) (26,058) Poseidon Concepts Corp Morgan Stanley (5,174) (138,350) Power Financial Corp Morgan Stanley (272,835) (52,856) PrairieSky Royalty Ltd Morgan Stanley (49,922) (197,091) Premier Gold Mines Ltd Morgan Stanley 43,446 15,248 Premium Brands
Holdings Corp Morgan Stanley 6,989 (99,245) Pretium Resources Inc Morgan Stanley (232,721) 207,983 Primero Mining Corp Morgan Stanley (10,721) 849 Progressive Waste
Solutions Ltd Morgan Stanley 1,470 (132,170) ProMetic Life Sciences Inc Morgan Stanley (70,770) (149,658) Pulse Seismic Inc Morgan Stanley (28,550) 892,983 Pure Industrial Real Estate
Trust (Reit) Morgan Stanley 737,484 (38,449) Quebecor Inc 'B' Morgan Stanley (141,807)
Contracts for difference as at 31 May 2016
Canada continued Canada continued

48 BlackRock Strategic Funds (BSF)
The notes on pages 489 to 503 form an integral part of these financial statements.
(113,139) Raging River Exploration Inc Morgan Stanley (192,560) (216,957) Redknee Solutions Inc Morgan Stanley (46,631) (136,771) Reitmans Canada Ltd 'A' Morgan Stanley (84,468) 50,988 Resolute Forest Products Inc Morgan Stanley 22,345 (68,169) Richelieu Hardware Ltd Morgan Stanley (61,332) 23,108 Richmont Mines Inc Morgan Stanley 68,080 (154,770) RioCan Real Estate
Investment Trust (Reit) Morgan Stanley (448,882) 58,073 Ritchie Bros Auctioneers Inc Morgan Stanley 411,881 265,529 RMP Energy Inc Morgan Stanley 10,859 139,035 Rocky Mountain
Dealerships Inc Morgan Stanley 139,791 240,739 Rogers Sugar Inc Morgan Stanley 262,892 (49,973) Russel Metals Inc Morgan Stanley (112,413) (110,523) Sandstorm Gold Ltd Morgan Stanley (84,385) 78,859 Sandvine Corp Morgan Stanley (9,759) 354,615 Savanna Energy Services Corp Morgan Stanley 177,844 (25,028) Seabridge Gold Inc Morgan Stanley (59,468) 12,100 Sears Canada Inc Morgan Stanley (1,781) (76,805) Secure Energy Services Inc Morgan Stanley (206,514) 169,954 SEMAFO Inc Morgan Stanley 171,450 (31,971) Seven Generations
Energy Ltd 'A' Morgan Stanley (251,401) 42,036 ShawCor Ltd Morgan Stanley 179,598 (11,346) Shopify Inc 'A' Morgan Stanley (97,732) 87,922 Sienna Senior Living Inc Morgan Stanley 176,909 (6,502) Sierra Wireless Inc Morgan Stanley (39,724) 52,655 Silver Standard Resources Inc Morgan Stanley 160,070 38,186 Silvercorp Metals Inc Morgan Stanley 40,396 (268,173) Slate Office REIT (Reit) Morgan Stanley (265,691) 18,286 Sleep Country Canada
Holdings Inc ‘144A’ Morgan Stanley 78,887 (125,547) Smart Real Estate
Investment Trust (Reit) Morgan Stanley (586,909) (91,105) Solium Capital Inc Morgan Stanley (39,758) 172,471 Spartan Energy Corp Morgan Stanley 78,218 21,257 Spin Master Corp ‘144A’ Morgan Stanley 37,641 (180,883) Sprott Inc Morgan Stanley (117,619) (49,683) Stantec Inc Morgan Stanley (184,373) 22,587 Stella-Jones Inc Morgan Stanley 112,585 70,772 Street Capital Group Inc Morgan Stanley (2,173) 102,091 Stuart Olson Inc Morgan Stanley 115,469 (79,470) Student Transportation Inc Morgan Stanley (91,718) 62,652 Summit Industrial Income
REIT (Reit) Morgan Stanley (2,211) 3,700 SunOpta Inc Morgan Stanley (2,247) 142,999 Superior Plus Corp Morgan Stanley 242,471 147,669 Supremex Inc Morgan Stanley 105,396 (144,645) Surge Energy Inc Morgan Stanley (63,619) (40,988) Tahoe Resources Inc Morgan Stanley (151,709) 40,393 Tamarack Valley Energy Ltd Morgan Stanley (1,903) (21,716) Temple Hotels Inc Morgan Stanley (12,254) (27,628) TMX Group Ltd Morgan Stanley (341,221) (50,023) TORC Oil & Gas Ltd Morgan Stanley (97,053) (500,779) Torex Gold Resources Inc Morgan Stanley (129,131) (58,262) Toromont Industries Ltd Morgan Stanley (379,251) (21,662) Torstar Corp 'B' Morgan Stanley (4,537) (92,565) Total Energy Services Inc Morgan Stanley (111,430) 46,857 Tourmaline Oil Corp Morgan Stanley 289,104 110,108 TransAlta Corp Morgan Stanley (35,280) (154,139) TransAlta Renewables Inc Morgan Stanley (267,322) 62,433 Transat AT Inc Morgan Stanley 53,858 55,170 Transcontinental Inc 'A' Morgan Stanley 117,443 71,668 TransForce Inc Morgan Stanley 152,864 189,755 TransGlobe Energy Corp Morgan Stanley 54,718 133,392 Trican Well Service Ltd Morgan Stanley 33,367 139,817 Tricon Capital Group Inc Morgan Stanley 132,093 775 Trillium Therapeutics Inc Morgan Stanley (856) 70,909 Trilogy Energy Corp Morgan Stanley 93,765 (128,483) Trinidad Drilling Ltd Morgan Stanley (96,717)
(397,499) TSO3 Inc Morgan Stanley (139,909) 1,770 Tucows Inc 'A' Morgan Stanley (420) 296,409 Turquoise Hill Resources Ltd Morgan Stanley 186,741 12,549 Uni-Select Inc Morgan Stanley 316,689 210,192 Uranium Participation Corp Morgan Stanley (119,943) 203,123 Valener Inc Morgan Stanley 893,156 (103,890) Veresen Inc Morgan Stanley (204,973) (32,915) Vermilion Energy Inc Morgan Stanley (123,529) (66,935) Wajax Corp Morgan Stanley 63 (22,713) West Fraser Timber Co Ltd Morgan Stanley (70,919) (90,359) Western Energy Services Corp Morgan Stanley (18,200) 577,937 Western Forest Products Inc Morgan Stanley 184,010 87,311 WestJet Airlines Ltd Morgan Stanley 286,106 30,330 Westport Innovations Inc Morgan Stanley (14,469) (25,529) Westshore Terminals
Investment Corp Morgan Stanley (87,043) 24,474 Whistler Blackcomb
Holdings Inc Morgan Stanley 39,590 (60,377) Whitecap Resources Inc Morgan Stanley (63,694) 127,697 Wi-LAN Inc Morgan Stanley 117,565 (27,997) Winpak Ltd Morgan Stanley (130,396) (50,204) WSP Global Inc Morgan Stanley (325,074) 211,648 Xtreme Drilling & Coil
Services Corp Morgan Stanley 162,808 11,433 Yellow Pages Ltd/Canada Morgan Stanley 42,150
(1,005,402)
Chile 32,689 Administradora de Fondos
de Pensiones Habitat SA Morgan Stanley 5,366 (188,997) AES Gener SA Morgan Stanley 9,921 3,586,971 Aguas Andinas SA 'A' Morgan Stanley 88,853 1,229,197 Banco de Chile Morgan Stanley (5,548) 4,447 Banco de Credito e
Inversiones Morgan Stanley 2,709 907 Besalco SA Morgan Stanley 30 643 Bupa Chile SA* Morgan Stanley — 23 CAP SA Morgan Stanley 20 11,187 Cencosud SA Morgan Stanley 1,696 109 Coca-Cola Embonor SA 'B'
(Pref) Morgan Stanley (123) 284,287 E.CL SA Morgan Stanley 53,395 2,971 Embotelladora Andina SA 'B'
(Pref) Morgan Stanley 434 558,367 Empresa Nacional de
Electricidad SA/Chile Morgan Stanley (191,120) 209,260 Endesa Americas SA Morgan Stanley 88,150 7,656,331 Enersis Americas SA Morgan Stanley (439,761) 842,894 Enersis Chile SA Morgan Stanley 96,529 24,682 Forus SA Morgan Stanley 11,117 209,073 Inversiones Aguas
Metropolitanas SA Morgan Stanley 18,580 36,280 Inversiones La
Construccion SA Morgan Stanley (25,130) 50,858,625 Itau CorpBanca Morgan Stanley (16,081) 917,264 Masisa SA Morgan Stanley 2,468 1,746,939 Parque Arauco SA Morgan Stanley 158,043 1,151,049 Ripley Corp SA Morgan Stanley 20,629 892,483 Salfacorp SA Morgan Stanley (52,228) 455,260 Sociedad Matriz del Banco
de Chile SA 'B' Morgan Stanley (2,202) 1,332,691 SONDA SA Morgan Stanley (16,848) 125,089 Vina Concha y Toro SA Morgan Stanley (1,418)
(192,519)
Colombia 60 Almacenes Exito SA Morgan Stanley 66 192,750 Avianca Holdings SA (Pref) Morgan Stanley (27,860) 33 Bancolombia SA Morgan Stanley 53
BlackRock Americas Diversified Equity Absolute Return Fund continued
Canada continued Canada continued
Holding
Description Counterparty
Unrealised appreciation/
(depreciation) USD
Holding
Description Counterparty
Unrealised appreciation/
(depreciation) USD
* Amounts which are less than 0.5 USD have been rounded down to zero.
Contracts for difference as at 31 May 2016

Annual Report and Audited Accounts 49
The notes on pages 489 to 503 form an integral part of these financial statements.
BlackRock Americas Diversified Equity Absolute Return Fund continued
1,939 Cementos Argos SA Morgan Stanley 46 10,788 Cemex Latam Holdings SA Morgan Stanley 14,749 1,136,641 Ecopetrol SA Morgan Stanley 33,188 53 Grupo Argos SA/Colombia Morgan Stanley 58 13,949 Grupo de Inversiones
Suramericana SA Morgan Stanley 9,970 152,659 Interconexion Electrica SA
ESP Morgan Stanley 99,935
130,205
Italy (1,170) Rizzoli Corriere Della Sera Bank of America
Mediagroup SpA Merrill Lynch (59)
(59)
Mexico 2,565,221 Alfa SAB de CV 'A' Goldman Sachs 25,569 61,000 Alfa SAB de CV 'A' Morgan Stanley (355) 1,165,392 Alpek SAB de CV Goldman Sachs (52,708) 807,005 Alpek SAB de CV Morgan Stanley 119,765 (195,480) Alsea SAB de CV Goldman Sachs 12,013 1,402,100 America Movil SAB de CV 'L' Goldman Sachs (27,610) 456,600 America Movil SAB de CV 'L' Morgan Stanley (59,651) (331,599) Arca Continental SAB de CV Goldman Sachs 617 (42,462) Arca Continental SAB de CV Morgan Stanley (47,832) (131,332) Asesor de Activos Prisma
SAPI de CV (Reit) Goldman Sachs 4,747 (949,085) Axtel SAB de CV (Unit) Goldman Sachs 29,413 (258,683) Banregio Grupo Financiero
SAB de CV Goldman Sachs 44,805 (458,942) Bolsa Mexicana de Valores
SAB de CV Goldman Sachs (7,491) (492,044) Bolsa Mexicana de Valores
SAB de CV Morgan Stanley (93,059) 1,643,280 Cemex SAB de CV (Unit) Goldman Sachs (14,111) 151,300 Cemex SAB de CV (Unit) Morgan Stanley (2,783) (54) Coca-Cola Femsa SAB
de CV 'L' Morgan Stanley (77) (117,240) Coca-Cola Femsa SAB
de CV 'L' Goldman Sachs 9,131 (309,552) Concentradora Fibra Hotelera
Mexicana SA de CV (Reit) Goldman Sachs 7,162 (340,449) Concentradora Fibra Hotelera
Mexicana SA de CV (Reit) Morgan Stanley 108,955 1,789,716 Consorcio ARA SAB de CV Goldman Sachs (12,233) 1,309,642 Consorcio ARA SAB de CV Morgan Stanley (28,694) 122,320 Controladora Comercial
Mexicana SAB de CV (Unit) Goldman Sachs (2,817) 359,300 Controladora Vuela Cia de
Aviacion SAB de CV 'A' Goldman Sachs (56,576) 299,584 Controladora Vuela Cia de
Aviacion SAB de CV 'A' Morgan Stanley 84,067 (249,971) Corp Inmobiliaria Vesta SAB
de CV Goldman Sachs 24,922 (458,408) Corp Inmobiliaria Vesta SAB
de CV Morgan Stanley 128,380 300 Credito Real SAB de CV
SOFOM ER Goldman Sachs (2) 305,055 Credito Real SAB de CV
SOFOM ER Morgan Stanley (31,053) (808,342) Empresas ICA SAB de CV Goldman Sachs 14,159 (290,481) Empresas ICA SAB de CV Morgan Stanley 89,375 (240,702) Fibra Shop Portafolios
Inmobiliarios SAPI de CV (Reit) Goldman Sachs 1,180 (179,142) Fibra Shop Portafolios
Inmobiliarios SAPI de CV (Reit) Morgan Stanley 32,073 (1,627,234) Fibra Uno Administracion
SA de CV (Reit) Goldman Sachs 49,525 (129,197) Fomento Economico Mexicano
SAB de CV (Unit) Goldman Sachs 10,924
(203,362) Genomma Lab Internacional SAB de CV 'B' Goldman Sachs (14,284)
(237,900) Genomma Lab Internacional SAB de CV 'B' Morgan Stanley (43,200)
(94,155) Gentera SAB de CV Goldman Sachs 7,287 (252,300) Gentera SAB de CV Morgan Stanley 37,524 273,993 Gruma SAB de CV 'B' Goldman Sachs 127,163 54,785 Gruma SAB de CV 'B' Morgan Stanley (45,809) 299,390 Grupo Aeromexico SAB de CV Goldman Sachs (26,557) 444,436 Grupo Aeromexico SAB de CV Morgan Stanley 197,305 95,002 Grupo Aeroportuario del
Centro Norte SAB de CV Morgan Stanley 64,797 114,540 Grupo Aeroportuario del
Centro Norte SAB de CV Goldman Sachs (4,128) 55,442 Grupo Aeroportuario del
Pacifico SAB de CV 'B' Goldman Sachs 2,067 33,500 Grupo Aeroportuario del
Pacifico SAB de CV 'B' Morgan Stanley 25,121 13,501 Grupo Aeroportuario del
Sureste SAB de CV 'B' Morgan Stanley 15,706 26,970 Grupo Aeroportuario del
Sureste SAB de CV 'B' Goldman Sachs (3,852) 119,039 Grupo Bimbo SAB de CV 'A' Morgan Stanley 35,347 915,501 Grupo Bimbo SAB de CV 'A' Goldman Sachs (6,112) (672,043) Grupo Carso SAB de CV 'A1' Goldman Sachs (28,763) 209,448 Grupo Comercial Chedraui
SA de CV Goldman Sachs 1,009 126,930 Grupo Comercial Chedraui
SA de CV Morgan Stanley (53,987) 13,685 Grupo Elektra SAB DE CV Goldman Sachs (4,454) 30,134 Grupo Elektra SAB DE CV Morgan Stanley (134,640) (32,490) Grupo Famsa SAB de CV 'A' Goldman Sachs 6,607 (501,454) Grupo Famsa SAB de CV 'A' Morgan Stanley 201,813 (4,300) Grupo Financiero Banorte
SAB de CV 'O' Goldman Sachs 435 (521,630) Grupo Financiero Banorte
SAB de CV 'O' Morgan Stanley 22,428 (1,436,479) Grupo Financiero Inbursa
SAB de CV 'O' Goldman Sachs 114,323 (94,000) Grupo Financiero Inbursa
SAB de CV 'O' Morgan Stanley (9,658) (36,665) Grupo Financiero
Interacciones SA de CV 'O' Goldman Sachs 4,140 (331,847) Grupo Financiero Santander
Mexico SAB de CV 'B' Goldman Sachs 31,481 (67,500) Grupo Financiero Santander
Mexico SAB de CV 'B' Morgan Stanley (16,042) 98,211 Grupo GICSA SA de CV Morgan Stanley (23,294) 32,762 Grupo GICSA SA de CV Goldman Sachs 489 (864,070) Grupo Herdez SAB de CV Goldman Sachs 19,613 (62,941) Grupo Herdez SAB de CV Morgan Stanley 27,500 (625,191) Grupo Lala SAB de CV Goldman Sachs 66,325 242,000 Grupo Mexico SAB de CV 'B' Morgan Stanley 7,490 751,100 Grupo Mexico SAB de CV 'B' Goldman Sachs (3,826) (137,045) Grupo Rotoplas SAB de CV Morgan Stanley (20,657) (230,039) Grupo Rotoplas SAB de CV Goldman Sachs 2,823 30,871 Grupo Simec SAB de CV 'B' Morgan Stanley 5,199 129,300 Grupo Simec SAB de CV 'B' Goldman Sachs (14,131) (216,589) Grupo Televisa SAB (Unit) Morgan Stanley (15,394) (2,400) Grupo Televisa SAB (Unit) Goldman Sachs (251) (289,231) Hoteles City Express SAB
de CV Morgan Stanley 17,018 396,315 Industrias Bachoco SAB
de CV 'B' Goldman Sachs 19,905 452,203 Industrias Bachoco SAB
de CV 'B' Morgan Stanley (166,169) (116,362) Industrias CH SAB de CV 'B' Goldman Sachs (22,031) (307,181) Industrias CH SAB de CV 'B' Morgan Stanley (238,093) 16,175 Industrias Penoles SAB de CV Goldman Sachs (17,608) 16,480 Industrias Penoles SAB de CV Morgan Stanley 51,175 (409,847) Infraestructura Energetica
Nova SAB de CV Goldman Sachs (63,592)
Mexico continued Colombia continued
Holding
Description Counterparty
Unrealised appreciation/
(depreciation) USD
Holding
Description Counterparty
Unrealised appreciation/
(depreciation) USD
Contracts for difference as at 31 May 2016
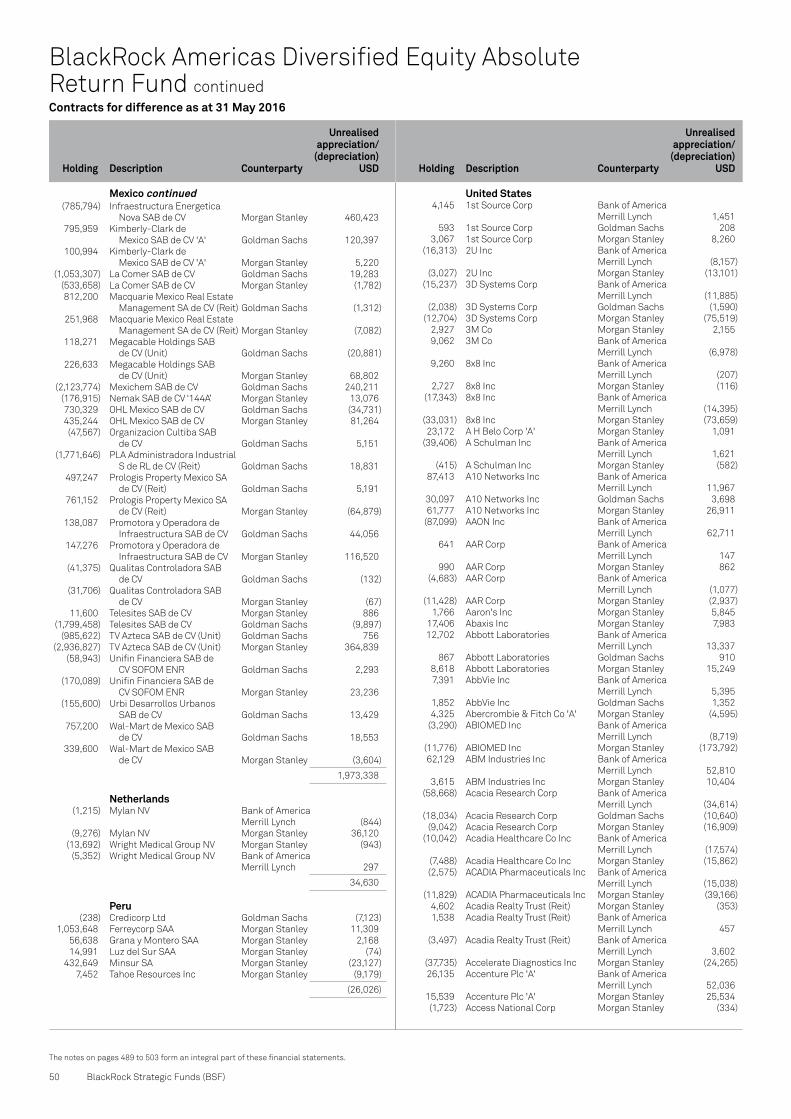
50 BlackRock Strategic Funds (BSF)
The notes on pages 489 to 503 form an integral part of these financial statements.
(785,794) Infraestructura Energetica Nova SAB de CV Morgan Stanley 460,423
795,959 Kimberly-Clark de Mexico SAB de CV 'A' Goldman Sachs 120,397
100,994 Kimberly-Clark de Mexico SAB de CV 'A' Morgan Stanley 5,220
(1,053,307) La Comer SAB de CV Goldman Sachs 19,283 (533,658) La Comer SAB de CV Morgan Stanley (1,782) 812,200 Macquarie Mexico Real Estate
Management SA de CV (Reit) Goldman Sachs (1,312) 251,968 Macquarie Mexico Real Estate
Management SA de CV (Reit) Morgan Stanley (7,082) 118,271 Megacable Holdings SAB
de CV (Unit) Goldman Sachs (20,881) 226,633 Megacable Holdings SAB
de CV (Unit) Morgan Stanley 68,802 (2,123,774) Mexichem SAB de CV Goldman Sachs 240,211 (176,915) Nemak SAB de CV ‘144A’ Morgan Stanley 13,076 730,329 OHL Mexico SAB de CV Goldman Sachs (34,731) 435,244 OHL Mexico SAB de CV Morgan Stanley 81,264 (47,567) Organizacion Cultiba SAB
de CV Goldman Sachs 5,151 (1,771,646) PLA Administradora Industrial
S de RL de CV (Reit) Goldman Sachs 18,831 497,247 Prologis Property Mexico SA
de CV (Reit) Goldman Sachs 5,191 761,152 Prologis Property Mexico SA
de CV (Reit) Morgan Stanley (64,879) 138,087 Promotora y Operadora de
Infraestructura SAB de CV Goldman Sachs 44,056 147,276 Promotora y Operadora de
Infraestructura SAB de CV Morgan Stanley 116,520 (41,375) Qualitas Controladora SAB
de CV Goldman Sachs (132) (31,706) Qualitas Controladora SAB
de CV Morgan Stanley (67) 11,600 Telesites SAB de CV Morgan Stanley 886 (1,799,458) Telesites SAB de CV Goldman Sachs (9,897) (985,622) TV Azteca SAB de CV (Unit) Goldman Sachs 756 (2,936,827) TV Azteca SAB de CV (Unit) Morgan Stanley 364,839 (58,943) Unifin Financiera SAB de
CV SOFOM ENR Goldman Sachs 2,293 (170,089) Unifin Financiera SAB de
CV SOFOM ENR Morgan Stanley 23,236 (155,600) Urbi Desarrollos Urbanos
SAB de CV Goldman Sachs 13,429 757,200 Wal-Mart de Mexico SAB
de CV Goldman Sachs 18,553 339,600 Wal-Mart de Mexico SAB
de CV Morgan Stanley (3,604)
1,973,338
Netherlands (1,215) Mylan NV Bank of America
Merrill Lynch (844) (9,276) Mylan NV Morgan Stanley 36,120 (13,692) Wright Medical Group NV Morgan Stanley (943) (5,352) Wright Medical Group NV Bank of America
Merrill Lynch 297
34,630
Peru (238) Credicorp Ltd Goldman Sachs (7,123) 1,053,648 Ferreycorp SAA Morgan Stanley 11,309 56,638 Grana y Montero SAA Morgan Stanley 2,168 14,991 Luz del Sur SAA Morgan Stanley (74) 432,649 Minsur SA Morgan Stanley (23,127) 7,452 Tahoe Resources Inc Morgan Stanley (9,179)
(26,026)
United States 4,145 1st Source Corp Bank of America
Merrill Lynch 1,451 593 1st Source Corp Goldman Sachs 208 3,067 1st Source Corp Morgan Stanley 8,260 (16,313) 2U Inc Bank of America
Merrill Lynch (8,157) (3,027) 2U Inc Morgan Stanley (13,101) (15,237) 3D Systems Corp Bank of America
Merrill Lynch (11,885) (2,038) 3D Systems Corp Goldman Sachs (1,590) (12,704) 3D Systems Corp Morgan Stanley (75,519) 2,927 3M Co Morgan Stanley 2,155 9,062 3M Co Bank of America
Merrill Lynch (6,978) 9,260 8x8 Inc Bank of America
Merrill Lynch (207) 2,727 8x8 Inc Morgan Stanley (116) (17,343) 8x8 Inc Bank of America
Merrill Lynch (14,395) (33,031) 8x8 Inc Morgan Stanley (73,659) 23,172 A H Belo Corp 'A' Morgan Stanley 1,091 (39,406) A Schulman Inc Bank of America
Merrill Lynch 1,621 (415) A Schulman Inc Morgan Stanley (582) 87,413 A10 Networks Inc Bank of America
Merrill Lynch 11,967 30,097 A10 Networks Inc Goldman Sachs 3,698 61,777 A10 Networks Inc Morgan Stanley 26,911 (87,099) AAON Inc Bank of America
Merrill Lynch 62,711 641 AAR Corp Bank of America
Merrill Lynch 147 990 AAR Corp Morgan Stanley 862 (4,683) AAR Corp Bank of America
Merrill Lynch (1,077) (11,428) AAR Corp Morgan Stanley (2,937) 1,766 Aaron's Inc Morgan Stanley 5,845 17,406 Abaxis Inc Morgan Stanley 7,983 12,702 Abbott Laboratories Bank of America
Merrill Lynch 13,337 867 Abbott Laboratories Goldman Sachs 910 8,618 Abbott Laboratories Morgan Stanley 15,249 7,391 AbbVie Inc Bank of America
Merrill Lynch 5,395 1,852 AbbVie Inc Goldman Sachs 1,352 4,325 Abercrombie & Fitch Co 'A' Morgan Stanley (4,595) (3,290) ABIOMED Inc Bank of America
Merrill Lynch (8,719) (11,776) ABIOMED Inc Morgan Stanley (173,792) 62,129 ABM Industries Inc Bank of America
Merrill Lynch 52,810 3,615 ABM Industries Inc Morgan Stanley 10,404 (58,668) Acacia Research Corp Bank of America
Merrill Lynch (34,614) (18,034) Acacia Research Corp Goldman Sachs (10,640) (9,042) Acacia Research Corp Morgan Stanley (16,909) (10,042) Acadia Healthcare Co Inc Bank of America
Merrill Lynch (17,574) (7,488) Acadia Healthcare Co Inc Morgan Stanley (15,862) (2,575) ACADIA Pharmaceuticals Inc Bank of America
Merrill Lynch (15,038) (11,829) ACADIA Pharmaceuticals Inc Morgan Stanley (39,166) 4,602 Acadia Realty Trust (Reit) Morgan Stanley (353) 1,538 Acadia Realty Trust (Reit) Bank of America
Merrill Lynch 457 (3,497) Acadia Realty Trust (Reit) Bank of America
Merrill Lynch 3,602 (37,735) Accelerate Diagnostics Inc Morgan Stanley (24,265) 26,135 Accenture Plc 'A' Bank of America
Merrill Lynch 52,036 15,539 Accenture Plc 'A' Morgan Stanley 25,534 (1,723) Access National Corp Morgan Stanley (334)
BlackRock Americas Diversified Equity Absolute Return Fund continued
Mexico continued
Holding
Description Counterparty
Unrealised appreciation/
(depreciation) USD
Holding
Description Counterparty
Unrealised appreciation/
(depreciation) USD
Contracts for difference as at 31 May 2016

Annual Report and Audited Accounts 51
The notes on pages 489 to 503 form an integral part of these financial statements.
BlackRock Americas Diversified Equity Absolute Return Fund continued
5,845 ACCO Brands Corp Morgan Stanley (87) 16,504 Accretive Health Inc Bank of America
Merrill Lynch (9,077) 2,449 Accretive Health Inc Goldman Sachs (1,347) 1,084 Accretive Health Inc Morgan Stanley (694) 295,598 Accuride Corp Bank of America
Merrill Lynch 26,604 42,111 Accuride Corp Goldman Sachs 3,790 85,600 Accuride Corp Morgan Stanley 57,754 (27,586) AcelRx Pharmaceuticals Inc Bank of America
Merrill Lynch (7,678) (46,193) Aceto Corp Bank of America
Merrill Lynch (45,099) (5,464) Aceto Corp Morgan Stanley (13,114) 47,691 Achaogen Inc Morgan Stanley (14,307) 32,700 Achaogen Inc Bank of America
Merrill Lynch 10,791 22,489 Achaogen Inc Goldman Sachs 7,421 (11,639) ACI Worldwide Inc Bank of America
Merrill Lynch (6,518) (18,283) ACI Worldwide Inc Morgan Stanley (10,253) (2,795) Aclaris Therapeutics Inc Bank of America
Merrill Lynch (2,879) (3,477) Aclaris Therapeutics Inc Morgan Stanley (458) 5,125 Activision Blizzard Inc Morgan Stanley 24,629 5,201 Activision Blizzard Inc Bank of America
Merrill Lynch (208) (12,955) Actua Corp Bank of America
Merrill Lynch (2,701) (3,957) Actua Corp Morgan Stanley (5,302) (36,788) Actuant Corp 'A' Bank of America
Merrill Lynch (43,558) (11,155) Actuant Corp 'A' Morgan Stanley (25,829) 964 Acuity Brands Inc Bank of America
Merrill Lynch 11,917 833 Acuity Brands Inc Morgan Stanley 9,479 (209) Acuity Brands Inc Bank of America
Merrill Lynch (2,251) 4,877 Acxiom Corp Bank of America
Merrill Lynch (1,739) 10,781 Acxiom Corp Morgan Stanley (17,822) (1,585) Adams Resources & Bank of America
Energy Inc Merrill Lynch 32 (657) Adams Resources &
Energy Inc Morgan Stanley (198) (793) Adeptus Health Inc 'A' Bank of America
Merrill Lynch (5,551) (1,973) Adeptus Health Inc 'A' Morgan Stanley (11,321) 13,996 Adobe Systems Inc Bank of America
Merrill Lynch 42,659 11,762 Adobe Systems Inc Morgan Stanley 34,149 (28,620) ADTRAN Inc Bank of America
Merrill Lynch (14,216) (24,987) ADTRAN Inc Morgan Stanley (14,669) (3,680) Advance Auto Parts Inc Bank of America
Merrill Lynch (24,997) (2,533) Advance Auto Parts Inc Morgan Stanley (570) (2,240) Advanced Drainage
Systems Inc Goldman Sachs (2,811) (23,267) Advanced Drainage
Systems Inc Morgan Stanley (24,010) (7,462) Advanced Drainage Bank of America
Systems Inc Merrill Lynch (10,892) 38,059 Advanced Emissions
Solutions Inc Morgan Stanley 154,520 (748) Advanced Energy
Industries Inc Morgan Stanley (2,758) 17,685 Advanced Energy Bank of America
Industries Inc Merrill Lynch 44,692 837 Advanced Energy Industries
Inc Goldman Sachs 772 (98,727) Advanced Micro Devices Inc Bank of America
Merrill Lynch (80,007)
19,168 Advisory Board Co/The Morgan Stanley 19,205 (9,706) Advisory Board Co/The Bank of America
Merrill Lynch 10,288 6,909 Advisory Board Co/The Bank of America
Merrill Lynch (7,324) (1,157) AECOM Morgan Stanley (1,738) 67,960 Aegon NV Reg Morgan Stanley (10,330) 51,272 Aegon NV Reg Bank of America
Merrill Lynch 13,425 238 AEP Industries Inc Morgan Stanley 59 (5,497) AerCap Holdings NV Bank of America
Merrill Lynch (6,272) (12,344) AerCap Holdings NV Morgan Stanley (15,115) (10,266) Aerie Pharmaceuticals Inc Bank of America
Merrill Lynch (37,428) (2,350) Aerie Pharmaceuticals Inc Goldman Sachs (8,484) (53,855) Aerie Pharmaceuticals Inc Morgan Stanley (141,824) (51,931) Aerovironment Inc Bank of America
Merrill Lynch (54,008) 32,350 AES Corp/VA Morgan Stanley (517) (287,973) AES Corp/VA Morgan Stanley (70,967) 61,874 AES Corp/VA Bank of America
Merrill Lynch 4,126 983 Aetna Inc Bank of America
Merrill Lynch 3,529 9,291 Aetna Inc Morgan Stanley 15,331 9,475 Affiliated Managers Group Inc Morgan Stanley 92,681 6,656 Affiliated Managers Group Inc Bank of America
Merrill Lynch 64,963 15,692 Aflac Inc Bank of America
Merrill Lynch 11,334 667 Aflac Inc Morgan Stanley 3,046 (115,916) AG Mortgage Investment Bank of America
Trust Inc (Reit) Merrill Lynch (16,967) (3,834) AG Mortgage Investment
Trust Inc (Reit) Morgan Stanley (11,042) (16,465) AGCO Corp Bank of America
Merrill Lynch (7,080) (11,275) AGCO Corp Goldman Sachs (4,848) (5,698) AGCO Corp Morgan Stanley (25,152) (31,171) Agile Therapeutics Inc Morgan Stanley (62,357) 18,654 Agilent Technologies Inc Bank of America
Merrill Lynch 52,239 6,386 Agilent Technologies Inc Morgan Stanley 38,730 (7,847) Agilysys Inc Bank of America
Merrill Lynch (9,495) (85,665) Agilysys Inc Morgan Stanley (113,934) (4,480) Agios Pharmaceuticals Inc Bank of America
Merrill Lynch (21,549) 1,924 Agree Realty Corp (Reit) Bank of America
Merrill Lynch (1,505) 25,955 AgroFresh Solutions Inc Bank of America
Merrill Lynch (2,076) 7,617 AgroFresh Solutions Inc Goldman Sachs (609) 30,412 AgroFresh Solutions Inc Morgan Stanley (29,543) 2,879 Air Lease Corp Morgan Stanley (4,760) 19,685 Air Lease Corp Bank of America
Merrill Lynch 24,213 14,902 Air Products & Chemicals Inc Bank of America
Merrill Lynch (5,878) (30,404) Aircastle Ltd Morgan Stanley (13,108) (20,727) AK Steel Holding Corp Goldman Sachs (15,545) (76,823) AK Steel Holding Corp Morgan Stanley (155,951) 3,945 AK Steel Holding Corp Bank of America
Merrill Lynch 2,959 (744) Akamai Technologies Inc Morgan Stanley (2,709) 2,350 Akamai Technologies Inc Bank of America
Merrill Lynch 7,426 (1,531) Akorn Inc Bank of America
Merrill Lynch 342 426 Akorn Inc Bank of America
Merrill Lynch (159) (3,629) Akorn Inc Morgan Stanley (4,571)
United States continued United States continued
Holding
Description Counterparty
Unrealised appreciation/
(depreciation) USD
Holding
Description Counterparty
Unrealised appreciation/
(depreciation) USD
Contracts for difference as at 31 May 2016

52 BlackRock Strategic Funds (BSF)
The notes on pages 489 to 503 form an integral part of these financial statements.
(111,122) Alamos Gold Inc 'A' Morgan Stanley 204,448 45,259 Alamos Gold Inc 'A' Morgan Stanley (29,683) 2,274 Alarm.com Holdings Inc Morgan Stanley (4,147) (2,355) Alaska Air Group Inc Morgan Stanley 11,824 (463) Albany International Corp 'A' Bank of America
Merrill Lynch (20) (42,138) Albany Molecular Research
Inc Morgan Stanley (20,832) 7,087 Albemarle Corp Bank of America
Merrill Lynch 21,696 2,732 Albemarle Corp Morgan Stanley 28,917 (39,012) Alcoa Inc Bank of America
Merrill Lynch (3,121) (33,273) Alcoa Inc Goldman Sachs (2,662) 7,095 Alexander & Baldwin Inc Bank of America
Merrill Lynch 16,693 21,376 Alexander & Baldwin Inc Morgan Stanley 23,383 7,663 Alexandria Real Estate Bank of America
Equities Inc (Reit) Merrill Lynch (7,816) 495 Alexandria Real Estate
Equities Inc (Reit) Morgan Stanley (666) (4,433) Alexion Pharmaceuticals Inc Bank of America
Merrill Lynch (35,375) (531) Alexion Pharmaceuticals Inc Morgan Stanley (7,291) (11,418) Alico Inc Bank of America
Merrill Lynch 12,446 (2,495) Alico Inc Goldman Sachs 2,720 (26,064) Alico Inc Morgan Stanley (125,376) 7,626 Align Technology Inc Bank of America
Merrill Lynch 17,311 317 Align Technology Inc Goldman Sachs 720 (358) Alleghany Corp Morgan Stanley (17,108) (24,802) Allegheny Technologies Inc Bank of America
Merrill Lynch 24,706 (24,772) Allegheny Technologies Inc Goldman Sachs 21,654 (4,199) Allegheny Technologies Inc Morgan Stanley (10,791) (10,059) Allegiance Bancshares Inc Morgan Stanley (5,889) (9,593) Allegiant Travel Co Bank of America
Merrill Lynch 52,948 (2,811) Allegiant Travel Co Morgan Stanley 28,906 (2,096) Allegion Plc Bank of America
Merrill Lynch (1,043) (2,263) Allegion Plc Morgan Stanley (2,801) 2,100 Allegion Plc Bank of America
Merrill Lynch 3,528 179 Allergan Plc Bank of America
Merrill Lynch 1,948 1,908 Allergan Plc Morgan Stanley 53,590 5,986 ALLETE Inc Bank of America
Merrill Lynch 2,155 5,289 ALLETE Inc Morgan Stanley 10,607 (6,025) Alliance Data Systems Corp Bank of America
Merrill Lynch (49,485) (3,271) Alliance Data Systems Corp Morgan Stanley (105,980) 3,956 Alliance HealthCare Services Bank of America
Inc Merrill Lynch (593) 5,003 Alliance HealthCare Services
Inc Goldman Sachs (750) 22,776 Alliance HealthCare Services
Inc Morgan Stanley 17,538 (2,133) Alliance One International Inc Bank of America
Merrill Lynch 12,819 (4,404) Alliance One International Inc Morgan Stanley 9,322 8,202 Alliant Energy Corp Bank of America
Merrill Lynch (451) 12,991 Alliant Energy Corp Morgan Stanley 479,758 (2,137) Allied Motion Technologies Inc Bank of America
Merrill Lynch 556 (16,017) Allied Motion Technologies Inc Morgan Stanley (87,933) 32,488 Allied World Assurance
Co Holdings AG Morgan Stanley 16,385 18,059 Allied World Assurance Bank of America
Co Holdings AG Merrill Lynch 7,897
(111,812) Alliqua BioMedical Inc Morgan Stanley 23,481 75,947 Allison Transmission
Holdings Inc Morgan Stanley 1,494 17,636 Allison Transmission Bank of America
Holdings Inc Merrill Lynch 1,799 109,226 Allscripts Healthcare
Solutions Inc Morgan Stanley (7,050) 53,956 Allscripts Healthcare Bank of America
Solutions Inc Merrill Lynch (3,235) (306) Allstate Corp/The Morgan Stanley (237) (4,187) Allstate Corp/The Bank of America
Merrill Lynch (1,534) (4,608) Almost Family Inc Bank of America
Merrill Lynch (5,345) (3,415) Almost Family Inc Morgan Stanley (19,739) (2,610) Alnylam Pharmaceuticals Inc Bank of America
Merrill Lynch (41,212) (604) Alnylam Pharmaceuticals Inc Morgan Stanley (8,051) 6,623 Alon USA Energy Inc Morgan Stanley (13,791) 145,270 Alpha & Omega Bank of America
Semiconductor Ltd Merrill Lynch 40,676 930 Alpha & Omega
Semiconductor Ltd Goldman Sachs 260 8,257 Alpha & Omega
Semiconductor Ltd Morgan Stanley 16,710 220 Alphabet Inc 'A' Bank of America
Merrill Lynch 4,233 24,347 Alphatec Holdings Inc Morgan Stanley 373 2,315 Altisource Portfolio
Solutions SA Goldman Sachs (18) 4,819 Altisource Portfolio Bank of America
Solutions SA Merrill Lynch 2,345 511 Altisource Portfolio
Solutions SA Morgan Stanley 916 10,235 Altisource Residential
Corp (Reit) Morgan Stanley 12,691 (9,034) Altisource Residential Bank of America
Corp (Reit) Merrill Lynch 6,776 (6,557) Altisource Residential
Corp (Reit) Goldman Sachs 4,918 (8,917) Altisource Residential
Corp (Reit) Morgan Stanley 14,833 10,165 Altisource Residential Bank of America
Corp (Reit) Merrill Lynch (7,624) (1,968) Altria Group Inc Morgan Stanley 585 64,078 Altria Group Inc Bank of America
Merrill Lynch (71,127) 128 Amazon.com Inc Bank of America
Merrill Lynch 1,920 59 Amazon.com Inc Morgan Stanley 1,125 (1,895) Ambarella Inc Bank of America
Merrill Lynch (6,955) (15,607) Amber Road Inc Goldman Sachs (15,451) 29,471 Ambev SA ADR Goldman Sachs (1,031) 6,845 AMC Entertainment
Holdings Inc 'A' Morgan Stanley 61,331 22,295 AMC Networks Inc 'A' Bank of America
Merrill Lynch (37,275) 9,888 AMC Networks Inc 'A' Morgan Stanley (16,288) 19,851 Amdocs Ltd Bank of America
Merrill Lynch 12,506 37,892 Amdocs Ltd Morgan Stanley 119,903 (1,411) Amec Foster Wheeler Plc ADR Morgan Stanley (9,143) (12,733) Amedisys Inc Bank of America
Merrill Lynch 4,378 (3,612) Amedisys Inc Morgan Stanley 1,419 2,537 AMERCO Bank of America
Merrill Lynch 43,054 1,654 AMERCO Morgan Stanley 30,960 (93,720) Ameren Corp Bank of America
Merrill Lynch (122,149) (103,913) Ameren Corp Morgan Stanley (372,278)
BlackRock Americas Diversified Equity Absolute Return Fund continued
United States continued United States continued
Holding
Description Counterparty
Unrealised appreciation/
(depreciation) USD
Holding
Description Counterparty
Unrealised appreciation/
(depreciation) USD
Contracts for difference as at 31 May 2016

Annual Report and Audited Accounts 53
The notes on pages 489 to 503 form an integral part of these financial statements.
BlackRock Americas Diversified Equity Absolute Return Fund continued
35,029 Ameresco Inc 'A' Bank of America Merrill Lynch 5,955
1,322 Ameresco Inc 'A' Goldman Sachs 225 6,167 Ameresco Inc 'A' Morgan Stanley 2,349 58,916 America Movil SAB de
CV 'L' ADR Goldman Sachs (22,823) 34,329 America Movil SAB de
CV 'L' ADR Morgan Stanley (78,194) (8,132) America's Car-Mart Inc/TX Bank of America
Merrill Lynch (9,596) (42,033) America's Car-Mart Inc/TX Morgan Stanley (54,643) (33,172) American Airlines Group Inc Bank of America
Merrill Lynch 22,557 (517) American Airlines Group Inc Morgan Stanley 2,937 4,579 American Axle &
Manufacturing Holdings Inc Goldman Sachs 4,945 26,135 American Axle & Bank of America
Manufacturing Holdings Inc Merrill Lynch 28,226 (7,521) American Axle &
Manufacturing Holdings Inc Morgan Stanley (32,596) 7,047 American Campus Bank of America
Communities Inc (Reit) Merrill Lynch (8,386) (38,801) American Capital Agency Corp
(Reit) Morgan Stanley (3,261) (55,041) American Capital Agency Corp Bank of America
(Reit) Merrill Lynch 12,900 (201,320) American Capital Mortgage Bank of America
Investment Corp (Reit) Merrill Lynch (76,502) 2,714 American Eagle Outfitters Inc Bank of America
Merrill Lynch 4,098 11,693 American Eagle Outfitters Inc Morgan Stanley 17,868 (24,595) American Electric Power Co Inc Morgan Stanley 17,687 27,538 American Electric Power Co Inc Bank of America
Merrill Lynch (26,704) 141 American Electric Power Co Inc Goldman Sachs (223) (10,605) American Electric Power Co Inc Bank of America
Merrill Lynch 16,756 6,275 American Equity Investment Bank of America
Life Holding Co Merrill Lynch 11,546 26,862 American Equity Investment
Life Holding Co Morgan Stanley 55,604 (2,109) American Express Co Bank of America
Merrill Lynch (4,543) (8,223) American Express Co Morgan Stanley (15,333) (5,142) American Financial Group
Inc/OH Morgan Stanley (3,352) (1,839) American Financial Group Bank of America
Inc/OH Merrill Lynch (1,804) 2,424 American Homes 4 Rent 'A' Bank of America
(Reit) Merrill Lynch 1,091 3,721 American Homes 4 Rent 'A'
(Reit) Morgan Stanley 10,056 2,169 American National
Insurance Co Goldman Sachs 3,774 7,460 American National
Insurance Co Morgan Stanley 175,119 12,532 American National Bank of America
Insurance Co Merrill Lynch 21,806 1,461 American Public Education Inc Bank of America
Merrill Lynch 1,535 1,046 American Public Education Inc Goldman Sachs 1,563 (3,946) American Railcar Industries Inc Morgan Stanley 5,864 (1,577) American Railcar Industries Inc Goldman Sachs (2,854) (7,417) American Railcar Industries Inc Bank of America
Merrill Lynch (11,459) 13,664 American Renal Associates Bank of America
Holdings Inc Merrill Lynch (5,897) 4,179 American Renal Associates
Holdings Inc Morgan Stanley (761) 1,288 American Renal Associates
Holdings Inc Goldman Sachs (90) (11,875) American Science & Bank of America
Engineering Inc Merrill Lynch (17,931)
(21,867) American Science & Engineering Inc Morgan Stanley (182,037)
59,090 American Software Inc/GA 'A' Bank of America Merrill Lynch 30,136
25,358 American Software Inc/GA 'A' Goldman Sachs 12,933 24,580 American Software Inc/GA 'A' Morgan Stanley 16,714 (6,524) American States Water Co Bank of America
Merrill Lynch 5,154 (4,226) American States Water Co Morgan Stanley 7,880 10,430 American States Water Co Bank of America
Merrill Lynch (8,240) 950 American States Water Co Goldman Sachs (751) 265 American States Water Co Morgan Stanley (236) (23,832) American Superconductor
Corp Morgan Stanley (34,399) 391 American Tower Corp (Reit) Goldman Sachs (321) 20,499 American Tower Corp (Reit) Morgan Stanley 77,705 6,520 American Tower Corp (Reit) Bank of America
Merrill Lynch (5,346) (53,544) American Vanguard Corp Bank of America
Merrill Lynch (15,528) 28,590 American Water Works Co Inc Bank of America
Merrill Lynch (29,162) 52,377 American Water Works Co Inc Morgan Stanley 237,392 (12,949) American Woodmark Corp Bank of America
Merrill Lynch (107,995) 18,156 Ameriprise Financial Inc Bank of America
Merrill Lynch 139,438 14,563 Ameriprise Financial Inc Morgan Stanley 113,793 (135,861) Ameris Bancorp Bank of America
Merrill Lynch (110,047) (20,265) Ameris Bancorp Morgan Stanley (5,308) 8,716 AMERISAFE Inc Bank of America
Merrill Lynch 25,232 533 AMERISAFE Inc Goldman Sachs 1,002 6,052 AMERISAFE Inc Morgan Stanley 21,436 23,271 AmerisourceBergen Corp Bank of America
Merrill Lynch (4,189) 2,535 AmerisourceBergen Corp Goldman Sachs (456) 1,423 AmerisourceBergen Corp Morgan Stanley (14,206) (6,843) AmerisourceBergen Corp Bank of America
Merrill Lynch (1,723) (817) AmerisourceBergen Corp Morgan Stanley (131) (4,630) AMETEK Inc Morgan Stanley (4,559) (27,720) AMETEK Inc Bank of America
Merrill Lynch (14,639) 5,789 Amgen Inc Bank of America
Merrill Lynch 26,593 3,643 Amgen Inc Morgan Stanley 39,364 5,302 Amkor Technology Inc Bank of America
Merrill Lynch 3,446 2,260 Amkor Technology Inc Goldman Sachs 1,635 20,456 Amkor Technology Inc Morgan Stanley 18,115 15,571 AMN Healthcare Services Inc Bank of America
Merrill Lynch (767) 12,500 AMN Healthcare Services Inc Morgan Stanley 132,542 1,542 Ampco-Pittsburgh Corp Bank of America
Merrill Lynch (571) 10,771 Amphenol Corp 'A' Bank of America
Merrill Lynch 23,321 9,679 Amphenol Corp 'A' Morgan Stanley 7,288 19,302 Amplify Snack Brands Inc Morgan Stanley (31,047) 21,870 Amplify Snack Brands Inc Bank of America
Merrill Lynch 1,531 5,218 Amplify Snack Brands Inc Goldman Sachs 365 (692) Amsurg Corp Morgan Stanley 2,862 (4,094) Amsurg Corp Bank of America
Merrill Lynch 532 25,494 AmTrust Financial Services Inc Morgan Stanley 36,284 3,574 AmTrust Financial Services Inc Goldman Sachs (107) 10,069 AmTrust Financial Services Inc Bank of America
Merrill Lynch (302)
United States continued United States continued
Holding
Description Counterparty
Unrealised appreciation/
(depreciation) USD
Holding
Description Counterparty
Unrealised appreciation/
(depreciation) USD
Contracts for difference as at 31 May 2016

54 BlackRock Strategic Funds (BSF)
The notes on pages 489 to 503 form an integral part of these financial statements.
(2,758) Anacor Pharmaceuticals Inc Bank of America Merrill Lynch 3,613
1,334 Anadarko Petroleum Corp Goldman Sachs 4,029 57,072 Analog Devices Inc Bank of America
Merrill Lynch 165,883 1,757 Analog Devices Inc Goldman Sachs 5,201 81,811 Analog Devices Inc Morgan Stanley 232,952 (33,814) Analogic Corp Bank of America
Merrill Lynch (56,386) (20,757) Analogic Corp Morgan Stanley (81,222) (25,547) Andersons Inc/The Morgan Stanley (146,247) (55,492) Andersons Inc/The Bank of America
Merrill Lynch (520,830) (42,125) Angie's List Inc Morgan Stanley 16,429 (2,146) Angie's List Inc Bank of America
Merrill Lynch (64) 108,376 AngioDynamics Inc Bank of America
Merrill Lynch 11,921 26,157 AngioDynamics Inc Morgan Stanley 49,175 (97) ANI Pharmaceuticals Inc Bank of America
Merrill Lynch (806) (7,722) ANI Pharmaceuticals Inc Morgan Stanley (87,994) 717 Anika Therapeutics Inc Morgan Stanley 2,426 (45,542) Anixter International Inc Bank of America
Merrill Lynch (149,833) (24,992) Anixter International Inc Morgan Stanley (18,040) (118,355) Annaly Capital Management
Inc (Reit) Morgan Stanley (13,946) (121,271) Annaly Capital Management Bank of America
Inc (Reit) Merrill Lynch 61,848 (20,239) ANSYS Inc Bank of America
Merrill Lynch (46,757) (16,824) ANSYS Inc Morgan Stanley (66,307) 322 Antero Resources Corp Goldman Sachs 847 5,765 Antero Resources Corp Morgan Stanley 16,501 9,051 Antero Resources Corp Bank of America
Merrill Lynch 22,753 4,845 Anthem Inc Bank of America
Merrill Lynch (28,381) 555 Anthem Inc Goldman Sachs (3,319) 192 Anthem Inc Morgan Stanley (1,342) (502,131) Anworth Mortgage Asset Bank of America
Corp (Reit) Merrill Lynch 27,231 (2,617) AO Smith Corp Morgan Stanley (12,505) (11,202) AO Smith Corp Bank of America
Merrill Lynch (46,650) 2,133 AO Smith Corp Bank of America
Merrill Lynch 8,873 1,326 AO Smith Corp Goldman Sachs 5,516 21,607 Aon Plc Bank of America
Merrill Lynch 72,600 298 Aon Plc Goldman Sachs 1,001 20,430 Aon Plc Morgan Stanley 105,119 5,111 Apache Corp Bank of America
Merrill Lynch 18,298 465 Apache Corp Goldman Sachs 1,697 1,877 Apache Corp Morgan Stanley 8,181 1,292 Apigee Corp Goldman Sachs 78 2,617 Apigee Corp Morgan Stanley 3,663 37,399 Apogee Enterprises Inc Bank of America
Merrill Lynch 177,952 5,371 Apogee Enterprises Inc Goldman Sachs 25,046 14,946 Apogee Enterprises Inc Morgan Stanley 83,366 9,062 Apollo Commercial Real Estate
Finance Inc (Reit) Morgan Stanley 2,149 4,779 Apple Inc Bank of America
Merrill Lynch 29,821 5,530 Apple Inc Morgan Stanley 32,350 4,319 Applied Genetic Technologies Bank of America
Corp/DE Merrill Lynch 8,206 1,298 Applied Genetic Technologies
Corp/DE Goldman Sachs 2,466
5,019 Applied Genetic Technologies Corp/DE Morgan Stanley 23,087
(5,664) Applied Industrial Technologies Inc Morgan Stanley (6,327)
(7,846) Applied Industrial Bank of America Technologies Inc Merrill Lynch (9,112)
37,565 Applied Materials Inc Bank of America Merrill Lynch 147,989
823 Applied Materials Inc Goldman Sachs 440 143,920 Applied Materials Inc Morgan Stanley 606,559 (6,925) Applied Micro Circuits Corp Bank of America
Merrill Lynch (2,909) (25,168) Applied Micro Circuits Corp Morgan Stanley (39,010) (2,910) Applied Optoelectronics Inc Bank of America
Merrill Lynch (3,812) (38,083) Applied Optoelectronics Inc Goldman Sachs (49,889) (16,228) Applied Optoelectronics Inc Morgan Stanley 67,194 (13,563) AptarGroup Inc Bank of America
Merrill Lynch 5,425 (26,601) AptarGroup Inc Morgan Stanley 27,345 (27,252) Aqua America Inc Bank of America
Merrill Lynch 12,069 (37,556) Aqua America Inc Morgan Stanley (20,034) (3,970) Aralez Pharmaceuticals Inc Goldman Sachs (1,826) 7,412 Aramark Bank of America
Merrill Lynch 593 3,207 Aramark Morgan Stanley (2,051) (8,583) Aratana Therapeutics Inc Morgan Stanley (9,100) 418,288 Arbor Realty Trust Inc (Reit) Morgan Stanley 389,008 248,403 ARC Document Solutions Inc Bank of America
Merrill Lynch 81,973 29,049 ARC Document Solutions Inc Goldman Sachs 9,586 164,548 ARC Document Solutions Inc Morgan Stanley 90,101 25,211 ARC Group Worldwide Inc Morgan Stanley 21,681 (11,439) Arcadia Biosciences Inc Morgan Stanley 14,120 21,866 ArcBest Corp Bank of America
Merrill Lynch 27,225 10,532 ArcBest Corp Goldman Sachs 13,363 31,603 ArcBest Corp Morgan Stanley (52,385) (42,564) Arch Capital Group Ltd Bank of America
Merrill Lynch (15,203) (236) Arch Capital Group Ltd Goldman Sachs (66) (29,119) Arch Capital Group Ltd Morgan Stanley (83,139) (55,497) Archer-Daniels-Midland Co Morgan Stanley (161,548) 2,210 Archer-Daniels-Midland Co Bank of America
Merrill Lynch 11,934 (8,476) Archer-Daniels-Midland Co Bank of America
Merrill Lynch (34,760) 38,083 Archrock Inc Bank of America
Merrill Lynch 34,275 46,416 Archrock Inc Morgan Stanley 158,279 (11,383) Arctic Cat Inc Bank of America
Merrill Lynch (17,985) (16,827) Arctic Cat Inc Morgan Stanley (37,019) 17,761 Ares Commercial Real Estate Bank of America
Corp (Reit) Merrill Lynch 10,657 5,287 Ares Commercial Real Estate
Corp (Reit) Goldman Sachs 67 18,199 Ares Commercial Real Estate
Corp (Reit) Morgan Stanley 5,908 (28,378) Argan Inc Bank of America
Merrill Lynch (31,500) (9,943) Argan Inc Morgan Stanley (50,226) 31,393 Argo Group International
Holdings Ltd Morgan Stanley (27,379) 86,686 Argo Group International Bank of America
Holdings Ltd Merrill Lynch (67,890) 4,479 Argo Group International
Holdings Ltd Goldman Sachs (3,960) (6,563) Arista Networks Inc Bank of America
Merrill Lynch (32,838) (140) Arista Networks Inc Goldman Sachs (703)
BlackRock Americas Diversified Equity Absolute Return Fund continued
United States continued United States continued
Holding
Description Counterparty
Unrealised appreciation/
(depreciation) USD
Holding
Description Counterparty
Unrealised appreciation/
(depreciation) USD
Contracts for difference as at 31 May 2016

Annual Report and Audited Accounts 55
The notes on pages 489 to 503 form an integral part of these financial statements.
BlackRock Americas Diversified Equity Absolute Return Fund continued
(1,030) Arlington Asset Investment Corp 'A' Morgan Stanley (659)
20,270 Armada Hoffler Properties Inc (Reit) Morgan Stanley 22,504
169,957 Armada Hoffler Properties Bank of America Inc (Reit) Merrill Lynch (2,289)
22,613 Armada Hoffler Properties Inc (Reit) Goldman Sachs (2,940)
3,560 ARMOUR Residential Bank of America REIT Inc (Reit) Merrill Lynch (2,812)
(48,961) ARMOUR Residential Bank of America REIT Inc (Reit) Merrill Lynch 25,759
3,577 Armstrong Flooring Inc Morgan Stanley 61,417 15,116 Armstrong World
Industries Inc Morgan Stanley 2,380 (9,198) Armstrong World Bank of America
Industries Inc Merrill Lynch (6,014) 8,237 Armstrong World Bank of America
Industries Inc Merrill Lynch 5,766 8,050 ARRIS International Plc Bank of America
Merrill Lynch 11,995 680 ARRIS International Plc Goldman Sachs 1,013 28,038 ARRIS International Plc Morgan Stanley 31,055 (24,482) Arrow Electronics Inc Bank of America
Merrill Lynch (81,986) (13,455) Arrow Electronics Inc Morgan Stanley (46,004) (118,666) Arrow Financial Corp Bank of America
Merrill Lynch (72,386) (37,410) Arrow Financial Corp Morgan Stanley (106,619) 7,522 Artesian Resources Corp 'A' Bank of America
Merrill Lynch 7,447 1,033 Artesian Resources Corp 'A' Goldman Sachs 1,023 3,394 Artesian Resources Corp 'A' Morgan Stanley 5,249 (19,990) Arthur J Gallagher & Co Bank of America
Merrill Lynch (16,561) (32,566) Arthur J Gallagher & Co Morgan Stanley (60,291) (5,765) Artisan Partners Asset Bank of America
Management Inc 'A' Merrill Lynch (13,144) 7,039 Artisan Partners Asset
Management Inc 'A' Morgan Stanley 23,010 (7,105) Asbury Automotive Group Inc Morgan Stanley (4,156) 19,196 Asbury Automotive Group Inc Bank of America
Merrill Lynch 50,760 976 Asbury Automotive Group Inc Morgan Stanley 2,722 (5,662) Asbury Automotive Group Inc Bank of America
Merrill Lynch (15,650) 25,973 Ascena Retail Group Inc Bank of America
Merrill Lynch 1,039 4,700 Ascena Retail Group Inc Morgan Stanley (10,107) 2,147 Ascent Capital Group Inc 'A' Bank of America
Merrill Lynch 7,901 2,838 Ascent Capital Group Inc 'A' Goldman Sachs 8,399 1,571 Ascent Capital Group Inc 'A' Morgan Stanley 1,935 10,660 Ashford Hospitality Prime
Inc (Reit) Morgan Stanley 9,168 2,138 Ashford Inc Bank of America
Merrill Lynch 4,264 232 Ashford Inc Goldman Sachs 582 5,846 Ashford Inc Morgan Stanley 42,191 350 Ashland Inc Morgan Stanley 703 (9,589) Ashland Inc Bank of America
Merrill Lynch (10,215) (12,934) ASML Holding NV Reg Bank of America
Merrill Lynch (55,746) 115,480 Aspen Aerogels Inc Morgan Stanley 56,092 5,442 Aspen Aerogels Inc Bank of America
Merrill Lynch (925) 46,749 Aspen Insurance Holdings Ltd Bank of America
Merrill Lynch 31,757 46,845 Aspen Insurance Holdings Ltd Morgan Stanley 28,455 (7,745) Aspen Technology Inc Bank of America
Merrill Lynch 245
123,206 Aspen Technology Inc Bank of America Merrill Lynch 82,548
1,393 Aspen Technology Inc Goldman Sachs 933 2,424 Aspen Technology Inc Morgan Stanley 3,981 (16,628) Assembly Biosciences Inc Morgan Stanley 1,995 (102,304) Associated Banc-Corp Morgan Stanley (159,509) (46,498) Associated Banc-Corp Bank of America
Merrill Lynch (48,481) 7,492 Associated Capital Group Bank of America
Inc 'A' Merrill Lynch (4,196) (12,534) Assurant Inc Bank of America
Merrill Lynch (7,395) 16,948 Assured Guaranty Ltd Bank of America
Merrill Lynch 33,388 1,181 Assured Guaranty Ltd Goldman Sachs 2,327 15,217 Assured Guaranty Ltd Morgan Stanley 33,515 (20,833) Astec Industries Inc Bank of America
Merrill Lynch (62,499) (11,167) Astec Industries Inc Morgan Stanley (82,965) (7,907) Astoria Financial Corp Morgan Stanley (7,512) 232 Astronics Corp 'B' Morgan Stanley 1,974 (54,108) AT&T Inc Bank of America
Merrill Lynch 8,657 (1,027) athenahealth Inc Bank of America
Merrill Lynch 1,100 (1,336) athenahealth Inc Goldman Sachs 6,747 (1,457) athenahealth Inc Morgan Stanley 15,347 29,947 Atlantic Capital Bank of America
Bancshares Inc Merrill Lynch 2,396 8,086 Atlantic Capital
Bancshares Inc Morgan Stanley 14,767 (11,658) Atlantic Tele-Network Inc Morgan Stanley (9,808) (26,845) Atlantic Tele-Network Inc Bank of America
Merrill Lynch 6,443 2,128 Atlantica Yield Plc Goldman Sachs 1,479 18,065 Atlantica Yield Plc Morgan Stanley 8,362 33,226 Atlantica Yield Plc Bank of America
Merrill Lynch 39,853 661 Atlas Air Worldwide
Holdings Inc Morgan Stanley 3,984 4,832 Atlas Air Worldwide Bank of America
Holdings Inc Merrill Lynch 3,866 (648) Atlas Financial Holdings Inc Bank of America
Merrill Lynch 246 2,006 Atlassian Corp Plc 'A' Morgan Stanley (508) 2,677 Atlassian Corp Plc 'A' Bank of America
Merrill Lynch 1,071 708 Atlassian Corp Plc 'A' Goldman Sachs 283 (7,693) Atmos Energy Corp Bank of America
Merrill Lynch 17,386 (16,126) Atmos Energy Corp Morgan Stanley 11,749 1,464 Atrion Corp Morgan Stanley 23,464 1,382 Atrion Corp Bank of America
Merrill Lynch (12,507) (3,042) Atwood Oceanics Inc Morgan Stanley (8,295) (9,859) Atwood Oceanics Inc Goldman Sachs 8,084 54,226 aTyr Pharma Inc Bank of America
Merrill Lynch 10,303 15,351 aTyr Pharma Inc Goldman Sachs 2,917 652 Autobytel Inc Morgan Stanley (1,650) 1,583 Autobytel Inc Bank of America
Merrill Lynch 3,024 (4,735) Autodesk Inc Bank of America
Merrill Lynch 1,326 (1,260) Autoliv Inc Morgan Stanley (28,085) (828) Autoliv Inc Bank of America
Merrill Lynch 889 (2,328) Autoliv Inc Goldman Sachs 2,817 8,297 Automatic Data Processing Bank of America
Inc Merrill Lynch 11,865 (669) Automatic Data Processing
Inc Morgan Stanley 282
United States continued United States continued
Holding
Description Counterparty
Unrealised appreciation/
(depreciation) USD
Holding
Description Counterparty
Unrealised appreciation/
(depreciation) USD
Contracts for difference as at 31 May 2016

56 BlackRock Strategic Funds (BSF)
The notes on pages 489 to 503 form an integral part of these financial statements.
(2,183) Automatic Data Processing Bank of America Inc Merrill Lynch (3,122)
(4,755) AutoNation Inc Bank of America Merrill Lynch (18,259)
(57,217) AutoNation Inc Morgan Stanley (139,242) 1,019 AutoZone Inc Bank of America
Merrill Lynch (18,271) (468) AutoZone Inc Bank of America
Merrill Lynch 2,359 (2,236) AutoZone Inc Morgan Stanley 16,789 93,568 AV Homes Inc Bank of America
Merrill Lynch 69,240 15,202 AV Homes Inc Morgan Stanley 53,663 594 AvalonBay Communities Inc
(Reit) Morgan Stanley (720) 736 AvalonBay Communities Inc Bank of America
(Reit) Merrill Lynch (1,272) 30,602 Avangrid Inc Morgan Stanley 10,613 7,576 Avenue Financial Holdings Inc Bank of America
Merrill Lynch 7,879 1,792 Avenue Financial Holdings Inc Morgan Stanley 3,674 27,139 Avery Dennison Corp Bank of America
Merrill Lynch (57,325) 13,003 Avery Dennison Corp Morgan Stanley (312) 772 AVG Technologies NV Morgan Stanley (131) 1,336 AVG Technologies NV Bank of America
Merrill Lynch 214 2,531 AVG Technologies NV Goldman Sachs 405 (9,833) Avis Budget Group Inc Bank of America
Merrill Lynch (35,600) (9,575) Avis Budget Group Inc Morgan Stanley (36,083) 1,626 Avista Corp Morgan Stanley 329 18,615 Avista Corp Bank of America
Merrill Lynch (23,083) (78,867) Avnet Inc Bank of America
Merrill Lynch (107,861) (61,995) Avnet Inc Morgan Stanley 76,204 (33,252) Avon Products Inc Morgan Stanley (21,946) (36,656) Avon Products Inc Bank of America
Merrill Lynch 4,399 109,369 AVX Corp Bank of America
Merrill Lynch 75,465 7,671 Axalta Coating Systems Ltd Morgan Stanley 3,203 5,279 Axalta Coating Systems Ltd Bank of America
Merrill Lynch (2,112) 89,410 Axcelis Technologies Inc Bank of America
Merrill Lynch 24,141 20,100 Axcelis Technologies Inc Morgan Stanley 8,844 2,096 Axis Capital Holdings Ltd Morgan Stanley (811) (1,949) AxoGen Inc Bank of America
Merrill Lynch (331) (2,192) AxoGen Inc Morgan Stanley (1,650) 8,470 AZZ Inc Bank of America
Merrill Lynch 22,764 5,226 AZZ Inc Morgan Stanley 18,539 9,515 B&G Foods Inc Morgan Stanley 95,250 (13,163) B/E Aerospace Inc Bank of America
Merrill Lynch (16,356) (6,346) B/E Aerospace Inc Morgan Stanley (4,446) 37,457 B/E Aerospace Inc Bank of America
Merrill Lynch 21,725 2,972 Babcock & Wilcox
Enterprises Inc Goldman Sachs (1,070) 27,625 Babcock & Wilcox Bank of America
Enterprises Inc Merrill Lynch (9,945) 33,713 Babcock & Wilcox
Enterprises Inc Morgan Stanley 37,789 (1,877) Badger Meter Inc Bank of America
Merrill Lynch 751 (11,512) Badger Meter Inc Morgan Stanley (83,799) (28,497) Balchem Corp Bank of America
Merrill Lynch 34,555
(1,277) Balchem Corp Morgan Stanley 2,666 1,200 Baldwin & Lyons Inc 'B' Bank of America
Merrill Lynch 67 554 Baldwin & Lyons Inc 'B' Morgan Stanley 21 (36,778) Ball Corp Morgan Stanley (178,423) (27,017) Ball Corp Bank of America
Merrill Lynch 25,725 24,648 Banc of California Inc Bank of America
Merrill Lynch 23,456 9,404 Banc of California Inc Morgan Stanley 4,900 84,955 Banco Bradesco SA ADR Morgan Stanley 128,322 24,709 Banco Bradesco SA ADR Goldman Sachs (16,802) 10,432 Banco de Chile ADR Goldman Sachs (6,421) 1,067 Banco de Chile ADR Morgan Stanley (1,976) 9,055 Banco Latinoamericano de Bank of America
Comercio Exterior SA Merrill Lynch 4,980 3,093 Banco Latinoamericano de
Comercio Exterior SA Morgan Stanley 16,919 (176,910) Banco Santander
Brasil SA ADR Goldman Sachs 49,535 (39,770) Banco Santander
Brasil SA ADR Morgan Stanley (41,674) (22,005) Banco Santander Chile ADR Goldman Sachs 5,026 (41,823) Banco Santander Chile ADR Morgan Stanley 9,700 (20,284) Banco Santander SA ADR Morgan Stanley 75,106 (33,814) Bancolombia SA ADR Goldman Sachs 94,347 (62,602) BancorpSouth Inc Bank of America
Merrill Lynch (106,308) (82,545) BancorpSouth Inc Morgan Stanley (330,289) (4,984) Bank Mutual Corp Bank of America
Merrill Lynch (1,047) (1,407) Bank Mutual Corp Morgan Stanley (971) (101,939) Bank of America Corp Morgan Stanley 601 (14,085) Bank of Hawaii Corp Bank of America
Merrill Lynch (47,889) (26,236) Bank of New York Bank of America
Mellon Corp/The Merrill Lynch (70,312) 8,422 Bank of the Ozarks Inc Morgan Stanley (13,126) 14,386 Bank of the Ozarks Inc Bank of America
Merrill Lynch 12,932 (5,282) Bank of the Ozarks Inc Bank of America
Merrill Lynch (13,522) 12,119 BankFinancial Corp Bank of America
Merrill Lynch 2,303 11,358 BankFinancial Corp Goldman Sachs 2,158 98,927 BankFinancial Corp Morgan Stanley 62,754 66,392 Bankrate Inc Bank of America
Merrill Lynch 14,606 1,875 Bankrate Inc Morgan Stanley 396 (10,225) BankUnited Inc Bank of America
Merrill Lynch (3,170) (2,076) Bankwell Financial
Group Inc Morgan Stanley 274 27,545 Banner Corp Bank of America
Merrill Lynch 71,861 2,145 Banner Corp Morgan Stanley 5,627 (2,264) Banner Corp Bank of America
Merrill Lynch (758) (6,363) Banner Corp Morgan Stanley (8,502) (17,646) Barnes & Noble Inc Bank of America
Merrill Lynch (2,272) (8,322) Barnes & Noble Inc Morgan Stanley (427) 1,952 Barracuda Networks Inc Bank of America
Merrill Lynch 2,050 6,861 Barracuda Networks Inc Morgan Stanley 14,009 (14,995) Barrett Business Services Inc Bank of America
Merrill Lynch (122,809) 19,843 Baxter International Inc Bank of America
Merrill Lynch (46,023) 326 Baxter International Inc Goldman Sachs (763) 42,744 Baxter International Inc Morgan Stanley (82,446) (291,677) Bazaarvoice Inc Morgan Stanley (160,779)
BlackRock Americas Diversified Equity Absolute Return Fund continued
United States continued United States continued
Holding
Description Counterparty
Unrealised appreciation/
(depreciation) USD
Holding
Description Counterparty
Unrealised appreciation/
(depreciation) USD
Contracts for difference as at 31 May 2016

Annual Report and Audited Accounts 57
The notes on pages 489 to 503 form an integral part of these financial statements.
BlackRock Americas Diversified Equity Absolute Return Fund continued
32,416 BB&T Corp Bank of America Merrill Lynch 99,193
(2,003) BB&T Corp Bank of America Merrill Lynch (6,129)
101,872 BB&T Corp Morgan Stanley 108,167 972 BBCN Bancorp Inc Bank of America
Merrill Lynch 1,069 1,303 BBCN Bancorp Inc Morgan Stanley 1,531 (9,462) BBX Capital Corp 'A' Bank of America
Merrill Lynch (2,839) (3,633) BBX Capital Corp 'A' Morgan Stanley (9,083) 36,440 Beacon Roofing Supply Inc Bank of America
Merrill Lynch 10,987 371 Beacon Roofing Supply Inc Goldman Sachs 440 13,114 Beacon Roofing Supply Inc Morgan Stanley (4,607) 6,733 Bear State Financial Inc Bank of America
Merrill Lynch 2,155 5,432 Bear State Financial Inc Goldman Sachs 1,738 25,883 Bear State Financial Inc Morgan Stanley 26,367 (982) Becton Dickinson and Co Morgan Stanley (7,983) (6,906) Bed Bath & Beyond Inc Bank of America
Merrill Lynch (13,605) (7,772) Bed Bath & Beyond Inc Morgan Stanley 13,053 9,830 Belden Inc Bank of America
Merrill Lynch 36,862 468 Belden Inc Goldman Sachs 1,880 3,991 Belden Inc Morgan Stanley 9,833 (3,660) Belmond Ltd 'A' Goldman Sachs (842) (147,656) Belmond Ltd 'A' Morgan Stanley (94,793) (23,739) Bemis Co Inc Bank of America
Merrill Lynch (42,185) 18,498 Bemis Co Inc Morgan Stanley 52,037 (22,675) Benchmark Electronics Inc Bank of America
Merrill Lynch (16,785) (46,849) Benchmark Electronics Inc Morgan Stanley 34,958 16,626 Beneficial Bancorp Inc Bank of America
Merrill Lynch 983 18,986 Beneficial Bancorp Inc Morgan Stanley 16,330 (9,024) Benefitfocus Inc Bank of America
Merrill Lynch (15,168) (901) Benefitfocus Inc Morgan Stanley (824) (24,233) Berkshire Hathaway Inc 'B' Bank of America
Merrill Lynch (51,593) 62,165 Berkshire Hills Bancorp Inc Bank of America
Merrill Lynch 66,583 6,444 Berkshire Hills Bancorp Inc Goldman Sachs 6,306 28,427 Berkshire Hills Bancorp Inc Morgan Stanley 43,080 12,185 Berry Plastics Group Inc Bank of America
Merrill Lynch 8,361 7,158 Berry Plastics Group Inc Morgan Stanley 6,974 22,616 Best Buy Co Inc Bank of America
Merrill Lynch 10,177 7,119 Best Buy Co Inc Goldman Sachs 2,278 4,011 Best Buy Co Inc Morgan Stanley 4,067 18,318 BFC Financial Corp 'A' Morgan Stanley (733) 57,793 BGC Partners Inc 'A' Bank of America
Merrill Lynch 20,228 57,923 BGC Partners Inc 'A' Morgan Stanley 18,881 8,458 Big 5 Sporting Goods Corp Bank of America
Merrill Lynch (1,015) 5,502 Big 5 Sporting Goods Corp Goldman Sachs (660) 3,011 Big 5 Sporting Goods Corp Morgan Stanley (8,824) 38,848 Big Lots Inc Bank of America
Merrill Lynch 310,567 1,501 Big Lots Inc Goldman Sachs 12,751 1,635 Big Lots Inc Morgan Stanley 11,860 (364) Big Lots Inc Bank of America
Merrill Lynch (2,894) (9,809) Big Lots Inc Morgan Stanley (73,507) (1,506) Biglari Holdings Inc Bank of America
Merrill Lynch (58,824) (72) Biglari Holdings Inc Goldman Sachs (2,812)
(3,545) Biglari Holdings Inc Morgan Stanley 2,468 (14,045) Bio-Path Holdings Inc Morgan Stanley (20,365) (1,239) Bio-Rad Laboratories Inc 'A' Morgan Stanley (6,892) (3,457) Bio-Rad Laboratories Inc 'A' Bank of America
Merrill Lynch (8,880) 24,918 Bio-Techne Corp Morgan Stanley 498,858 13,613 Bio-Techne Corp Bank of America
Merrill Lynch 98,014 (20,605) BioDelivery Sciences
International Inc Morgan Stanley 27,366 (14,993) BioDelivery Sciences Bank of America
International Inc Merrill Lynch (3,149) (5,223) BioDelivery Sciences
International Inc Goldman Sachs (1,097) 840 Biogen Inc Bank of America
Merrill Lynch 21,230 274 Biogen Inc Goldman Sachs 7,052 79 Biogen Inc Morgan Stanley 1,474 (8,152) BioMarin Pharmaceutical Inc Bank of America
Merrill Lynch (30,978) 12,242 BJ's Restaurants Inc Bank of America
Merrill Lynch 2,081 756 BJ's Restaurants Inc Goldman Sachs 129 (62,029) Black Diamond Inc Bank of America
Merrill Lynch 3,854 (65,776) Black Diamond Inc Morgan Stanley (4,568) 13,209 Black Hills Corp Bank of America
Merrill Lynch 5,036 25,932 Black Hills Corp Morgan Stanley 10,186 (7,669) Black Knight Financial
Services Inc 'A' Morgan Stanley (26,910) (5,725) Black Knight Financial Bank of America
Services Inc 'A' Merrill Lynch (3,157) 3,656 Blackbaud Inc Bank of America
Merrill Lynch 7,122 1,469 Blackbaud Inc Morgan Stanley (1,548) (10,811) Blackbaud Inc Bank of America
Merrill Lynch (16,217) 4,089 Blackhawk Network Holdings Bank of America
Inc Merrill Lynch 8,765 960 Blackhawk Network Holdings
Inc Morgan Stanley 770 51,752 Blackstone Mortgage Trust
Inc 'A' (Reit) Morgan Stanley 114,822 8,545 Blackstone Mortgage Trust Bank of America
Inc 'A' (Reit) Merrill Lynch (2,734) 5,497 Bloomin' Brands Inc Goldman Sachs 220 1,219 Bloomin' Brands Inc Bank of America
Merrill Lynch (157) 2,891 Bloomin' Brands Inc Morgan Stanley 8,528 (13,693) Blucora Inc Bank of America
Merrill Lynch (4,245) 4,167 Blue Buffalo Pet Products Inc Bank of America
Merrill Lynch 347 1,150 Blue Buffalo Pet Products Inc Goldman Sachs 115 14,317 Blue Buffalo Pet Products Inc Morgan Stanley 17,446 (82,954) Blue Hills Bancorp Inc Bank of America
Merrill Lynch 10,777 (196,497) Blue Hills Bancorp Inc Morgan Stanley (165,057) 10,140 Blue Nile Inc Bank of America
Merrill Lynch 2,738 2,174 Blue Nile Inc Goldman Sachs 587 7,658 Blue Nile Inc Morgan Stanley 4,899 (1,789) Bluebird Bio Inc Bank of America
Merrill Lynch (11,414) (3,626) Bluebird Bio Inc Morgan Stanley 12,850 (15,434) BMC Stock Holdings Inc Bank of America
Merrill Lynch (16,206) (21,722) BNC Bancorp Bank of America
Merrill Lynch (25,521) (1,947) BNC Bancorp Morgan Stanley (6,551) (5,215) Boeing Co/The Morgan Stanley 23,042
United States continued United States continued
Holding
Description Counterparty
Unrealised appreciation/
(depreciation) USD
Holding
Description Counterparty
Unrealised appreciation/
(depreciation) USD
Contracts for difference as at 31 May 2016

58 BlackRock Strategic Funds (BSF)
The notes on pages 489 to 503 form an integral part of these financial statements.
1,098 Boeing Co/The Bank of America Merrill Lynch (6,961)
(5,489) Boeing Co/The Bank of America Merrill Lynch 33,483
7,258 BofI Holding Inc Bank of America Merrill Lynch 7,621
14,186 BofI Holding Inc Morgan Stanley (4,139) 56,950 Boingo Wireless Inc Bank of America
Merrill Lynch 30,184 2,831 Boingo Wireless Inc Goldman Sachs 1,500 21,185 Boingo Wireless Inc Morgan Stanley 38,345 16,960 Boise Cascade Co Bank of America
Merrill Lynch 15,435 3,482 Boise Cascade Co Goldman Sachs 1,106 4,391 Boise Cascade Co Morgan Stanley 12,533 (5,903) BOK Financial Corp Bank of America
Merrill Lynch (15,216) (2,577) BOK Financial Corp Goldman Sachs (14,663) 104,635 Booz Allen Hamilton Holding Bank of America
Corp Merrill Lynch 83,010 3,167 Booz Allen Hamilton Holding
Corp Goldman Sachs 3,346 30,525 Booz Allen Hamilton Holding
Corp Morgan Stanley 26,377 (3,230) Boston Beer Co Inc/The 'A' Bank of America
Merrill Lynch (21,964) (4,763) Boston Beer Co Inc/The 'A' Morgan Stanley 158,438 (3,443) Boston Beer Co Inc/The 'A' Goldman Sachs (23,412) (64,175) Boston Private Financial Bank of America
Holdings Inc Merrill Lynch (29,829) (118,951) Boston Private Financial
Holdings Inc Morgan Stanley (143,881) (8,581) Boston Properties Inc (Reit) Morgan Stanley 27,482 (9,021) Boston Properties Inc (Reit) Bank of America
Merrill Lynch 45,957 3,545 Boston Scientific Corp Morgan Stanley 11,317 (53,297) Bottomline Technologies
de Inc Morgan Stanley 209,040 (94,030) Bottomline Technologies Bank of America
de Inc Merrill Lynch (1,728) 34,657 Box Inc 'A' Bank of America
Merrill Lynch 28,777 16,350 Box Inc 'A' Morgan Stanley 2,330 (26,044) Boyd Gaming Corp Bank of America
Merrill Lynch (3,184) (11,552) Boyd Gaming Corp Morgan Stanley 12,101 4,656 Brady Corp 'A' Morgan Stanley 25,614 200 Brady Corp 'A' Bank of America
Merrill Lynch 781 (14,941) Brandywine Realty Trust (Reit) Bank of America
Merrill Lynch (2,859) (28,139) Brandywine Realty Trust (Reit) Morgan Stanley (2,242) 69,994 Braskem SA ADR Goldman Sachs 7,738 87,435 Bravo Brio Restaurant Bank of America
Group Inc Merrill Lynch 27,979 2,076 Bravo Brio Restaurant
Group Inc Goldman Sachs 664 118,346 Bravo Brio Restaurant
Group Inc Morgan Stanley 14,202 10,647 BRF SA ADR Goldman Sachs (9,582) (1,210) Bridge Bancorp Inc Bank of America
Merrill Lynch (399) (6,530) Bridgepoint Education Inc Bank of America
Merrill Lynch 3,722 26,636 Briggs & Stratton Corp Bank of America
Merrill Lynch 12,519 8,139 Briggs & Stratton Corp Goldman Sachs 3,825 24,627 Briggs & Stratton Corp Morgan Stanley 52,948 (26,927) Briggs & Stratton Corp Bank of America
Merrill Lynch (13,114) (27,147) Briggs & Stratton Corp Morgan Stanley (14,360) 2,320 Bright Horizons Family Bank of America
Solutions Inc Merrill Lynch (1,972)
1,796 Bright Horizons Family Solutions Inc Morgan Stanley (2,073)
67,674 Brightcove Inc Bank of America Merrill Lynch 26,393
29,052 Brightcove Inc Goldman Sachs 11,330 99,053 Brightcove Inc Morgan Stanley 150,010 (12,751) Brink's Co/The Morgan Stanley 10,734 (19,181) Brink's Co/The Bank of America
Merrill Lynch (2,302) (514) Brinker International Inc Bank of America
Merrill Lynch (31) (54,573) Brinker International Inc Morgan Stanley 68,146 4,447 Brinker International Inc Bank of America
Merrill Lynch (1,290) (705) Bristol-Myers Squibb Co Morgan Stanley (354) (2,783) Bristol-Myers Squibb Co Bank of America
Merrill Lynch 4,397 4,272 Bristol-Myers Squibb Co Bank of America
Merrill Lynch (6,750) (15,374) Bristow Group Inc Bank of America
Merrill Lynch 24,598 (24,154) Brixmor Property Group Inc
(Reit) Morgan Stanley (33,631) (12,572) Brixmor Property Group Inc Bank of America
(Reit) Merrill Lynch 5,406 (1,331) Broadcom Ltd Morgan Stanley (38,455) 4,705 Broadcom Ltd Bank of America
Merrill Lynch 49,338 15,260 Broadcom Ltd Morgan Stanley 189,927 1,214 Broadridge Financial
Solutions Inc Goldman Sachs 2,659 5,152 Broadridge Financial
Solutions Inc Morgan Stanley 56,878 7,193 Broadridge Financial Bank of America
Solutions Inc Merrill Lynch 15,753 833 BroadSoft Inc Bank of America
Merrill Lynch (77) (9,437) Brocade Communications Bank of America
Systems Inc Merrill Lynch 70,436 53,098 Brocade Communications Bank of America
Systems Inc Merrill Lynch 55,908 1,544 Brocade Communications
Systems Inc Goldman Sachs 1,668 43,352 Brocade Communications
Systems Inc Morgan Stanley 44,197 (19,074) Brookdale Senior Living Inc Bank of America
Merrill Lynch (4,006) (58,309) Brookdale Senior Living Inc Morgan Stanley (17,299) (145,697) Brookline Bancorp Inc Bank of America
Merrill Lynch (42,834) (3,526) Brown & Brown Inc Morgan Stanley (708) 16,425 Brown-Forman Corp 'B' Morgan Stanley 38,536 27,211 Brown-Forman Corp 'B' Bank of America
Merrill Lynch 4,830 (14,543) Brunswick Corp/DE Morgan Stanley 6,502 7,869 Brunswick Corp/DE Bank of America
Merrill Lynch (2,361) (2,418) Brunswick Corp/DE Bank of America
Merrill Lynch 716 (44,715) BSB Bancorp Inc/MA Morgan Stanley (64,390) (21,488) Buckle Inc/The Bank of America
Merrill Lynch (8,380) (14,065) Buffalo Wild Wings Inc Bank of America
Merrill Lynch (111,717) (2,839) Buffalo Wild Wings Inc Goldman Sachs (12,469) (2,156) Buffalo Wild Wings Inc Morgan Stanley (17,697) (3,440) Builders FirstSource Inc Bank of America
Merrill Lynch (1,961) (15,998) Builders FirstSource Inc Morgan Stanley (53,566) (989) Bunge Ltd Morgan Stanley (282) (2,438) Burlington Stores Inc Bank of America
Merrill Lynch (16,944) 37,907 BWX Technologies Inc Bank of America
Merrill Lynch 24,644
BlackRock Americas Diversified Equity Absolute Return Fund continued
United States continued United States continued
Holding
Description Counterparty
Unrealised appreciation/
(depreciation) USD
Holding
Description Counterparty
Unrealised appreciation/
(depreciation) USD
Contracts for difference as at 31 May 2016

Annual Report and Audited Accounts 59
The notes on pages 489 to 503 form an integral part of these financial statements.
BlackRock Americas Diversified Equity Absolute Return Fund continued
43,126 BWX Technologies Inc Morgan Stanley 52,492 4,428 C1 Financial Inc Bank of America
Merrill Lynch 6,465 40,676 CA Inc Bank of America
Merrill Lynch 32,541 44,452 CA Inc Morgan Stanley 104,233 (13,036) Cabela's Inc Morgan Stanley 37,371 (24,457) Cabela's Inc Bank of America
Merrill Lynch (18,098) (7,205) Cabela's Inc Goldman Sachs (5,332) (3,279) Cable One Inc Bank of America
Merrill Lynch (2,532) (545) Cable One Inc Morgan Stanley (1,386) (27,744) Cabot Corp Bank of America
Merrill Lynch (23,174) (24,951) Cabot Corp Morgan Stanley (34,756) 4,932 Cabot Corp Bank of America
Merrill Lynch 1,378 (60,720) Cabot Microelectronics Corp Bank of America
Merrill Lynch (53,661) (3,608) Cabot Microelectronics Corp Morgan Stanley (6,839) (21,961) Cabot Oil & Gas Corp Bank of America
Merrill Lynch (5,607) (7,579) Cabot Oil & Gas Corp Morgan Stanley (1,904) (8,400) Cadence Design Systems Inc Bank of America
Merrill Lynch (6,274) (7,156) Cadence Design Systems Inc Morgan Stanley (2,147) 5,643 Cadence Design Systems Inc Bank of America
Merrill Lynch 5,587 (53,115) Caesars Entertainment Corp Morgan Stanley (42,802) 1,421 Caesarstone Sdot-Yam Ltd Bank of America
Merrill Lynch 753 4,526 Caesarstone Sdot-Yam Ltd Morgan Stanley 18,955 35,785 CAI International Inc Bank of America
Merrill Lynch 15,388 21,328 CAI International Inc Morgan Stanley 53,519 20,435 Cal-Maine Foods Inc Bank of America
Merrill Lynch (68,662) 16,727 Cal-Maine Foods Inc Morgan Stanley (49,867) (31,333) Calamos Asset Management Bank of America
Inc 'A' Merrill Lynch (10,340) 17,930 CalAtlantic Group Inc Bank of America
Merrill Lynch 48,443 25,946 CalAtlantic Group Inc Morgan Stanley 171,464 (34,400) CalAtlantic Group Inc Bank of America
Merrill Lynch (88,686) (1,807) Calavo Growers Inc Morgan Stanley (159) (19,485) Calavo Growers Inc Bank of America
Merrill Lynch 15,277 8,320 Caleres Inc Morgan Stanley (114) 13,402 Caleres Inc Bank of America
Merrill Lynch 21,916 1,586 Caleres Inc Goldman Sachs 2,458 (59,764) Calgon Carbon Corp Bank of America
Merrill Lynch 26,296 (4) California Resources Corp* Bank of America
Merrill Lynch — 88,607 California Resources Corp Bank of America
Merrill Lynch (2,658) 5,864 California Resources Corp Goldman Sachs (176) 39,951 California Resources Inc Morgan Stanley (4,379) (102,955) California Water Service Group Bank of America
Merrill Lynch (36,034) (43,925) California Water Service Group Morgan Stanley (108,269) (10,735) Calix Inc Bank of America
Merrill Lynch 2,040 7,972 Callaway Golf Co Morgan Stanley 5,774 (3,092) Callidus Software Inc Bank of America
Merrill Lynch (3,772) 2,972 Callidus Software Inc Morgan Stanley 16,648
20,050 Callon Petroleum Co Bank of America Merrill Lynch 6,817
27,122 Callon Petroleum Co Morgan Stanley 29,377 5,652 Calpine Corp Bank of America
Merrill Lynch (113) 3,191 Calpine Corp Morgan Stanley 8,073 121,763 Cambium Learning Group Inc Morgan Stanley 120,545 (799) Cambrex Corp Bank of America
Merrill Lynch (439) (5,416) Cambrex Corp Morgan Stanley 1,050 23,209 Camden National Corp Bank of America
Merrill Lynch 16,943 (2,065) Camden Property Trust (Reit) Morgan Stanley (866) 26,230 Camden Property Trust (Reit) Bank of America
Merrill Lynch (50,624) 49 Camden Property Trust (Reit) Goldman Sachs (95) 3,739 Camden Property Trust (Reit) Morgan Stanley 17,779 (962) Camden Property Trust (Reit) Bank of America
Merrill Lynch 649 (42,790) Campbell Soup Co Morgan Stanley (17,560) (20,162) Campbell Soup Co Bank of America
Merrill Lynch 46,617 19,847 Canadian Solar Inc Bank of America
Merrill Lynch 23,618 10,873 Canadian Solar Inc Morgan Stanley 12,693 20,714 Cantel Medical Corp Bank of America
Merrill Lynch (32,936) 5,357 Cantel Medical Corp Morgan Stanley (424) 780 Capella Education Co Goldman Sachs 757 500 Capella Education Co Morgan Stanley 103 465 Capella Education Co Bank of America
Merrill Lynch (51) 8,080 Capital Bank Financial Corp 'A' Bank of America
Merrill Lynch 9,060 750 Capital Bank Financial Corp 'A' Goldman Sachs 647 3,034 Capital Bank Financial Corp 'A' Morgan Stanley 2,457 2,534 Capital City Bank Group Inc Bank of America
Merrill Lynch 963 1,077 Capital City Bank Group Inc Goldman Sachs 409 1,390 Capital City Bank Group Inc Morgan Stanley 896 11,578 Capital One Financial Corp Bank of America
Merrill Lynch 53,027 11,181 Capital One Financial Corp Morgan Stanley 39,957 15,537 Capital Senior Living Corp Bank of America
Merrill Lynch (10,565) (535,881) Capitol Federal Financial Inc Bank of America
Merrill Lynch (81,224) (120,035) Capitol Federal Financial Inc Morgan Stanley (165,725) (117,986) Capstead Mortgage Corp (Reit) Bank of America
Merrill Lynch 45,425 (178,239) Capstead Mortgage Corp (Reit) Morgan Stanley (26,767) (13,799) CARBO Ceramics Inc Morgan Stanley 36,291 (4,931) CARBO Ceramics Inc Bank of America
Merrill Lynch (6,509) 38,850 Carbonite Inc Bank of America
Merrill Lynch 9,113 6,514 Carbonite Inc Goldman Sachs 679 950 Carbonite Inc Morgan Stanley 391 1,609 Cardinal Financial Corp Goldman Sachs 1,706 9,919 Cardinal Health Inc Morgan Stanley (34,991) 17,383 Cardinal Health Inc Bank of America
Merrill Lynch 21,277 520 Cardinal Health Inc Goldman Sachs 629 (804) Cardiovascular Systems Inc Bank of America
Merrill Lynch (1,897) (6,727) Cardiovascular Systems Inc Morgan Stanley (19,431) (2,718) Cardtronics Inc Morgan Stanley 709 2,206 Cardtronics Inc Morgan Stanley (150) (5,460) Cardtronics Inc Bank of America
Merrill Lynch (4,641)
United States continued United States continued
Holding
Description Counterparty
Unrealised appreciation/
(depreciation) USD
Holding
Description Counterparty
Unrealised appreciation/
(depreciation) USD
* Amounts which are less than 0.5 USD have been rounded down to zero.
Contracts for difference as at 31 May 2016

60 BlackRock Strategic Funds (BSF)
The notes on pages 489 to 503 form an integral part of these financial statements.
49,464 Care Capital Properties Inc (Reit) Morgan Stanley 48,340
22,377 Care Capital Properties Inc Bank of America (Reit) Merrill Lynch 2,685
1,259 Care Capital Properties Inc (Reit) Goldman Sachs 269
(33,739) Career Education Corp Bank of America Merrill Lynch (3,037)
(18,632) Career Education Corp Morgan Stanley (23,117) 3,341 CareTrust REIT Inc (Reit) Goldman Sachs (134) 34,889 CareTrust REIT Inc (Reit) Bank of America
Merrill Lynch (1,396) 35,372 Carlisle Cos Inc Bank of America
Merrill Lynch 73,300 1,632 Carlisle Cos Inc Goldman Sachs 2,875 45,036 Carlisle Cos Inc Morgan Stanley 582,710 (20,182) CarMax Inc Bank of America
Merrill Lynch (65,188) (1,440) CarMax Inc Morgan Stanley (15,466) 47,534 Carnival Corp Bank of America
Merrill Lynch (41,295) 479 Carnival Corp Goldman Sachs (623) 25,664 Carnival Corp Morgan Stanley (33,488) 20,287 Carpenter Technology Corp Morgan Stanley (47,563) 3,199 Carpenter Technology Corp Bank of America
Merrill Lynch 5,485 (6,941) Carriage Services Inc Bank of America
Merrill Lynch 2,082 10,540 Carrizo Oil & Gas Inc Bank of America
Merrill Lynch 19,921 15,226 Carrizo Oil & Gas Inc Morgan Stanley 211,410 90,153 Carrols Restaurant Group Inc Bank of America
Merrill Lynch (67,796) 10,933 Carrols Restaurant Group Inc Goldman Sachs (10,714) 24,607 Carrols Restaurant Group Inc Morgan Stanley (16,607) 324 Carter's Inc Goldman Sachs 518 154 Carter's Inc Morgan Stanley (77) 6,096 Carter's Inc Bank of America
Merrill Lynch 9,754 (409) Carter's Inc Bank of America
Merrill Lynch (810) 360,230 Cascade Bancorp Bank of America
Merrill Lynch (14,409) 3,007 Cascade Bancorp Goldman Sachs (120) 31,914 Cascade Bancorp Morgan Stanley 8,936 10,619 Cascade Microtech Inc Bank of America
Merrill Lynch 3,823 10,752 Cascade Microtech Inc Goldman Sachs 3,871 64,982 Cascade Microtech Inc Morgan Stanley 56,322 6,485 Casella Waste Systems Inc 'A' Bank of America
Merrill Lynch 163 5,111 Casella Waste Systems Inc 'A' Goldman Sachs 767 2,781 Casella Waste Systems Inc 'A' Morgan Stanley 167 16,876 Casey's General Stores Inc Morgan Stanley 99,368 5,247 Casey's General Stores Inc Bank of America
Merrill Lynch 20,333 (28,526) Cass Information Systems Inc Bank of America
Merrill Lynch 6,704 (8,712) Cass Information Systems Inc Morgan Stanley 10,324 (26,889) Catalent Inc Bank of America
Merrill Lynch (70,203) (31,952) Catalent Inc Morgan Stanley (98,951) 12,646 Catalyst Biosciences Inc Morgan Stanley (4,553) (6,641) Caterpillar Inc Bank of America
Merrill Lynch (13,764) (34,936) Caterpillar Inc Morgan Stanley (35,732) 29,830 Cathay General Bancorp Bank of America
Merrill Lynch 47,708 24,741 Cathay General Bancorp Morgan Stanley 35,399 550 Cato Corp/The 'A' Morgan Stanley 1,471 10,337 Cato Corp/The 'A' Bank of America
Merrill Lynch 24,292
5,881 Cavium Inc Morgan Stanley (38,824) (6,500) Cavium Inc Bank of America
Merrill Lynch (23,335) (456) Cavium Inc Morgan Stanley (1,587) 36,203 CBL & Associates Properties
Inc (Reit) Morgan Stanley (11,223) (23,233) CBOE Holdings Inc Morgan Stanley 3,510 (14,572) CBOE Holdings Inc Bank of America
Merrill Lynch 341 1,409 CBRE Group Inc 'A' Morgan Stanley 7,637 4,571 CBS Corp 'B' Morgan Stanley 54,486 (292) CBS Corp 'B' Bank of America
Merrill Lynch (2) (14,804) CDI Corp Bank of America
Merrill Lynch (8,306) 2,256 CDK Global Inc Bank of America
Merrill Lynch 6,827 5,735 CDK Global Inc Morgan Stanley 20,354 (3,944) CDK Global Inc Bank of America
Merrill Lynch (12,148) (181) CDK Global Inc Morgan Stanley (2,288) 2,969 CDW Corp/DE Bank of America
Merrill Lynch 238 (11,374) CEB Inc Bank of America
Merrill Lynch (34,190) (10,348) CECO Environmental Corp Morgan Stanley (13,950) (606) Cedar Fair LP Bank of America
Merrill Lynch (951) (353,209) Cedar Realty Trust Inc (Reit) Bank of America
Merrill Lynch 116,030 (1,916) Cedar Realty Trust Inc (Reit) Goldman Sachs 671 27,061 Celanese Corp 'A' Bank of America
Merrill Lynch (1,353) 28,267 Celanese Corp 'A' Morgan Stanley 77,291 744 Celanese Corp 'A' Goldman Sachs (37) 5,608 Celgene Corp Bank of America
Merrill Lynch 30,430 797 Celgene Corp Morgan Stanley 3,021 101,259 Cemex SAB de CV ADR Goldman Sachs (10,287) 77,992 Cemex SAB de CV ADR Morgan Stanley 160,978 (14,545) Cempra Inc Bank of America
Merrill Lynch (45,380) (7,022) Cempra Inc Morgan Stanley (11,314) (31,802) Centene Corp Bank of America
Merrill Lynch (172,367) (15,736) Centene Corp Morgan Stanley (39,136) 112,864 CenterPoint Energy Inc Bank of America
Merrill Lynch 40,631 77,074 CenterPoint Energy Inc Morgan Stanley 185,528 (1,302) Central European Media
Enterprises Ltd (Wts 2/5/2018) Morgan Stanley — 5,965 Central Garden & Pet Co 'A' Morgan Stanley 19,301 1,927 Central Garden & Pet Co 'A' Bank of America
Merrill Lynch (39) 6,948 Central Garden & Pet Co 'A' Goldman Sachs (139) 128,858 Central Pacific Financial Corp Bank of America
Merrill Lynch 132,074 7,134 Central Pacific Financial Corp Goldman Sachs 8,204 117,814 Central Pacific Financial Corp Morgan Stanley 477,474 (3,321) Century Aluminum Co Bank of America
Merrill Lynch (232) (14,756) Century Aluminum Co Morgan Stanley (34,824) 1,378 Century Bancorp Inc/MA 'A' Bank of America
Merrill Lynch 14 1,101 Century Bancorp Inc/MA 'A' Morgan Stanley 3,671 69,140 Century Casinos Inc Bank of America
Merrill Lynch (21,433) 3,369 Century Casinos Inc Goldman Sachs (1,044) 120,984 Century Casinos Inc Morgan Stanley (75,010) 29,073 Century Communities Inc Bank of America
Merrill Lynch 21,968 3,834 Century Communities Inc Goldman Sachs 1,820
BlackRock Americas Diversified Equity Absolute Return Fund continued
United States continued United States continued
Holding
Description Counterparty
Unrealised appreciation/
(depreciation) USD
Holding
Description Counterparty
Unrealised appreciation/
(depreciation) USD
Contracts for difference as at 31 May 2016

Annual Report and Audited Accounts 61
The notes on pages 489 to 503 form an integral part of these financial statements.
BlackRock Americas Diversified Equity Absolute Return Fund continued
5,793 Century Communities Inc Morgan Stanley 11,955 38,808 CenturyLink Inc Morgan Stanley (210,036) (18,238) CenturyLink Inc Bank of America
Merrill Lynch 13,086 10,324 Cepheid Bank of America
Merrill Lynch 18,920 1,221 Cepheid Goldman Sachs 2,418 7,511 Cerner Corp Morgan Stanley (15,628) (6,191) Cerner Corp Morgan Stanley (7,058) 3,506 Cerner Corp Bank of America
Merrill Lynch 4,312 (173,330) Cerus Corp Morgan Stanley 30,608 (82,294) Cerus Corp Bank of America
Merrill Lynch (3,385) (1,187) Cerus Corp Goldman Sachs (119) (8,193) CF Industries Holdings Inc Bank of America
Merrill Lynch 10,487 2,077 CH Robinson Worldwide Inc Bank of America
Merrill Lynch 378 (12,250) CH Robinson Worldwide Inc Morgan Stanley (25,153) (5,617) CH Robinson Worldwide Inc Bank of America
Merrill Lynch (14,243) 15,997 Charles River Laboratories Bank of America
International Inc Merrill Lynch 36,313 8,699 Charles River Laboratories
International Inc Morgan Stanley 54,038 87,326 Charles Schwab Corp/The Bank of America
Merrill Lynch 245,228 89,475 Charles Schwab Corp/The Morgan Stanley 203,586 (9,267) Chart Industries Inc Bank of America
Merrill Lynch (17,422) 1,606 Charter Communications Bank of America
Inc 'A' Merrill Lynch (12,680) 2,160 Charter Communications
Inc 'A' Morgan Stanley (27,465) 3,343 Charter Financial Corp/MD Bank of America
Merrill Lynch 1,772 3,408 Charter Financial Corp/MD Goldman Sachs 1,806 11,682 Charter Financial Corp/MD Morgan Stanley 2,705 95,876 Chatham Lodging Trust (Reit) Morgan Stanley 207,095 34,709 Chatham Lodging Trust (Reit) Bank of America
Merrill Lynch (12,842) 558 Chatham Lodging Trust (Reit) Goldman Sachs (206) 2,498 CHC Group Ltd Morgan Stanley (2,498) (1,659) Check Point Software
Technologies Ltd Morgan Stanley (860) 6,864 Check Point Software Bank of America
Technologies Ltd Merrill Lynch 10,090 11,253 Cheesecake Factory Inc/The Morgan Stanley (25,232) (814) Cheesecake Factory Inc/The Bank of America
Merrill Lynch 98 23,724 Cheesecake Factory Inc/The Bank of America
Merrill Lynch (2,847) (57,278) Chefs' Warehouse Inc/The Bank of America
Merrill Lynch (3,437) (804) Chemed Corp Bank of America
Merrill Lynch (2,203) (6,855) Chemed Corp Morgan Stanley 21,368 (8,389) Chemical Financial Corp Bank of America
Merrill Lynch (13,650) 46,640 Chemical Financial Corp Bank of America
Merrill Lynch 65,095 1,271 Chemical Financial Corp Goldman Sachs 2,046 3,636 Chemical Financial Corp Morgan Stanley 4,874 (12,380) Chemours Co/The Bank of America
Merrill Lynch 16,156 16,588 Chemtura Corp Bank of America
Merrill Lynch 10,978 7,680 Chemtura Corp Morgan Stanley 3,804 (12,633) Cheniere Energy Inc Bank of America
Merrill Lynch 26,277 (10,728) Cheniere Energy Inc Morgan Stanley 728
(722) Cheniere Energy Partners LP Holdings LLC Morgan Stanley (276)
(46,793) Cherokee Inc Bank of America Merrill Lynch 30,649
(19,111) Cherokee Inc Morgan Stanley 44,425 35,402 Cherry Hill Mortgage Bank of America
Investment Corp (Reit) Merrill Lynch 12,871 2,645 Cherry Hill Mortgage
Investment Corp (Reit) Morgan Stanley 3,466 39,213 Chesapeake Energy Corp Bank of America
Merrill Lynch 14,117 5,587 Chesapeake Energy Corp Goldman Sachs 2,011 335 Chesapeake Energy Corp Morgan Stanley 43 6,945 Chesapeake Lodging Trust
(Reit) Morgan Stanley (3,379) 145,658 Chesapeake Lodging Trust Bank of America
(Reit) Merrill Lynch (15,231) (395) Chesapeake Utilities Corp Bank of America
Merrill Lynch 1,371 (14,797) Chevron Corp Bank of America
Merrill Lynch 10,506 (10,857) Chevron Corp Morgan Stanley 10,269 (28,891) Chicago Bridge & Iron Co NV Bank of America
Merrill Lynch (24,475) 4,808 Chico's FAS Inc Morgan Stanley (2,506) (412) Children's Place Inc/The Bank of America
Merrill Lynch (1,516) (596) Children's Place Inc/The Morgan Stanley (2,366) 12,214 Children's Place Inc/The Bank of America
Merrill Lynch 44,948 (12,977) Chimera Investment Corp
(Reit) Morgan Stanley (16,525) (14,549) Chimera Investment Corp Bank of America
(Reit) Merrill Lynch 2,910 (3,069) Chipotle Mexican Grill Inc Bank of America
Merrill Lynch 5,849 (15) Chipotle Mexican Grill Inc Goldman Sachs 23 (1,185) Chipotle Mexican Grill Inc Morgan Stanley 15,180 (1,711) Choice Hotels International Inc Bank of America
Merrill Lynch 1 4,975 Choice Hotels International Inc Bank of America
Merrill Lynch (3,384) 1,472 Choice Hotels International Inc Goldman Sachs (1,251) 922 Choice Hotels International Inc Morgan Stanley (2,403) (16,392) Choice Hotels International Inc Morgan Stanley (5,945) (5,865) Chubb Ltd Bank of America
Merrill Lynch (12,023) (12,712) Chubb Ltd Morgan Stanley (73,776) 10,422 Church & Dwight Co Inc Bank of America
Merrill Lynch 21,782 (1,103) Church & Dwight Co Inc Morgan Stanley (3,911) (2,263) Churchill Downs Inc Bank of America
Merrill Lynch 6,376 (2,903) Churchill Downs Inc Morgan Stanley 11,491 1,485 Chuy's Holdings Inc Goldman Sachs 817 925 Chuy's Holdings Inc Morgan Stanley 2,602 (64,134) Cia Brasileira de Distribuicao
ADR Goldman Sachs 54,686 (11,411) Cia Cervecerias Unidas SA
ADR Goldman Sachs (13,465) (42,273) Cia Cervecerias Unidas SA
ADR Morgan Stanley (30,121) (106,075) Cia de Minas Buenaventura
SAA ADR Goldman Sachs 80,897 26,994 Ciena Corp Bank of America
Merrill Lynch 25,350 24,758 Ciena Corp Morgan Stanley 24,867 1,727 CIFC Corp Goldman Sachs (35) 2,864 CIFC Corp Bank of America
Merrill Lynch (57) (233) Cimarex Energy Co Bank of America
Merrill Lynch (347)
United States continued United States continued
Holding
Description Counterparty
Unrealised appreciation/
(depreciation) USD
Holding
Description Counterparty
Unrealised appreciation/
(depreciation) USD
Contracts for difference as at 31 May 2016

62 BlackRock Strategic Funds (BSF)
The notes on pages 489 to 503 form an integral part of these financial statements.
(8,725) Cimpress NV Bank of America Merrill Lynch (39,677)
(788) Cimpress NV Morgan Stanley (586) (241,561) Cincinnati Bell Inc Bank of America
Merrill Lynch (41,065) (9,614) Cincinnati Financial Corp Bank of America
Merrill Lynch (13,891) (84,540) Cincinnati Financial Corp Morgan Stanley (310,072) 15,638 Cinedigm Corp 'A' Morgan Stanley (15,624) 13,034 Cinemark Holdings Inc Bank of America
Merrill Lynch 5,089 442 Cinemark Holdings Inc Goldman Sachs 434 11,303 Cinemark Holdings Inc Morgan Stanley 42,628 20,873 Cintas Corp Bank of America
Merrill Lynch 73,473 (7,123) Cintas Corp Morgan Stanley (26,760) (16,258) CIRCOR International Inc Bank of America
Merrill Lynch (10,636) (22,635) CIRCOR International Inc Morgan Stanley (328,490) (9,986) Cirrus Logic Inc Bank of America
Merrill Lynch (37,647) 96,896 Cisco Systems Inc Bank of America
Merrill Lynch 183,982 83,599 Cisco Systems Inc Morgan Stanley 187,866 (13,345) CIT Group Inc Bank of America
Merrill Lynch (36,782) (42,420) CIT Group Inc Morgan Stanley (69,624) (1,276) Citi Trends Inc Bank of America
Merrill Lynch 242 (5,794) Citigroup Inc Bank of America
Merrill Lynch (20,685) (65,746) Citizens & Northern Corp Bank of America
Merrill Lynch 11,834 (131,939) Citizens & Northern Corp Morgan Stanley (53,517) 70,969 Citizens Financial Group Inc Bank of America
Merrill Lynch 135,974 324,514 Citizens Financial Group Inc Morgan Stanley 486,074 12,989 Citrix Systems Inc Bank of America
Merrill Lynch 11,620 6,192 Citrix Systems Inc Morgan Stanley 4,944 (57,330) City Holding Co Bank of America
Merrill Lynch (63,063) (7,732) Civitas Solutions Inc Bank of America
Merrill Lynch (7,113) (894) Civitas Solutions Inc Morgan Stanley (1,560) 9,618 CLARCOR Inc Bank of America
Merrill Lynch 23,737 6,881 CLARCOR Inc Morgan Stanley 18,366 (3,630) CLARCOR Inc Bank of America
Merrill Lynch (6,679) (1,485) CLARCOR Inc Morgan Stanley (20,092) (24,680) Clean Harbors Inc Bank of America
Merrill Lynch (61,041) (27,907) Clean Harbors Inc Morgan Stanley (195,027) (106,885) Clear Channel Outdoor
Holdings Inc 'A' Morgan Stanley (231,824) (68,094) Clear Channel Outdoor Bank of America
Holdings Inc 'A' Merrill Lynch — (8,246) Clearfield Inc Bank of America
Merrill Lynch (1,319) (31,751) Clearfield Inc Morgan Stanley (131,767) (9,512) Clearwater Paper Corp Bank of America
Merrill Lynch (15,397) (5,969) Clearwater Paper Corp Morgan Stanley (10,770) 2,234 Clearwater Paper Corp Bank of America
Merrill Lynch 3,842 2,886 Clearwater Paper Corp Morgan Stanley 70,302 (59,015) Clifton Bancorp Inc Bank of America
Merrill Lynch (3,038) (372) Clifton Bancorp Inc Goldman Sachs (15) (387,957) Clifton Bancorp Inc Morgan Stanley (335,574) 39,729 Clorox Co/The Morgan Stanley 107,299 32,890 Clorox Co/The Bank of America
Merrill Lynch (88,096)
489 Clorox Co/The Goldman Sachs (1,462) (45,754) ClubCorp Holdings Inc Bank of America
Merrill Lynch 10,981 27,662 CME Group Inc/IL Bank of America
Merrill Lynch 96,540 29,924 CME Group Inc/IL Morgan Stanley 176,701 114,514 CMS Energy Corp Bank of America
Merrill Lynch 24,487 23,759 CMS Energy Corp Morgan Stanley 12,333 9,505 CNA Financial Corp Bank of America
Merrill Lynch 8,364 2,824 CNA Financial Corp Goldman Sachs 2,485 23,732 CNA Financial Corp Morgan Stanley 71,671 (14,600) CNB Financial Corp/PA Bank of America
Merrill Lynch (292) (19,485) CNB Financial Corp/PA Morgan Stanley (4,472) (76,707) CNH Industrial NV Bank of America
Merrill Lynch (13,040) 99,724 CNO Financial Group Inc Bank of America
Merrill Lynch 125,652 3,739 CNO Financial Group Inc Morgan Stanley 9,986 (56,839) Coach Inc Bank of America
Merrill Lynch (60,596) (86,956) Coach Inc Morgan Stanley (19,935) 18,595 Cobalt International Bank of America
Energy Inc Merrill Lynch (5,021) 2,187 CoBiz Financial Inc Bank of America
Merrill Lynch 940 (2,513) Coca-Cola Bottling Co
Consolidated Morgan Stanley 89,730 199 Coca-Cola Bottling Co Bank of America
Consolidated Merrill Lynch (2,581) (169,949) Coca-Cola Co/The Morgan Stanley 158,353 (38,837) Coca-Cola Co/The Bank of America
Merrill Lynch 30,624 28,047 Coca-Cola European Bank of America
Partners Plc Merrill Lynch (398,828) 229 Coca-Cola European
Partners Plc Goldman Sachs (3,256) 1,007 Coca-Cola European
Partners Plc Morgan Stanley (10,744) (2,839) Coca-Cola Femsa SAB
de CV ADR Goldman Sachs 2,016 (9,014) Coca-Cola Femsa SAB
de CV ADR Morgan Stanley (14,387) 4,550 Codexis Inc Bank of America
Merrill Lynch 2,321 7,674 Coeur Mining Inc Bank of America
Merrill Lynch (6,983) 2,609 Coeur Mining Inc Goldman Sachs (2,374) 9,094 Cogent Communications Bank of America
Holdings Inc Merrill Lynch 4,456 (883) Cogent Communications
Holdings Inc Morgan Stanley (1,219) 2,966 Cognex Corp Bank of America
Merrill Lynch 10,566 930 Cognex Corp Morgan Stanley 261 (7,948) Cognex Corp Bank of America
Merrill Lynch (25,712) (5,379) Cognizant Technology
Solutions Corp 'A' Morgan Stanley 2,973 (8,421) Cognizant Technology Bank of America
Solutions Corp 'A' Merrill Lynch (1,776) (4,398) Cohen & Steers Inc Bank of America
Merrill Lynch (672) (6,001) Cohen & Steers Inc Morgan Stanley (2,775) 9,129 Coherent Inc Bank of America
Merrill Lynch 88,734 (34,773) Cohu Inc Bank of America
Merrill Lynch (17,039) 3,394 Colfax Corp Bank of America
Merrill Lynch 6,434 3,287 Collectors Universe Inc Bank of America
Merrill Lynch (296)
BlackRock Americas Diversified Equity Absolute Return Fund continued
United States continued United States continued
Holding
Description Counterparty
Unrealised appreciation/
(depreciation) USD
Holding
Description Counterparty
Unrealised appreciation/
(depreciation) USD
Contracts for difference as at 31 May 2016

Annual Report and Audited Accounts 63
The notes on pages 489 to 503 form an integral part of these financial statements.
BlackRock Americas Diversified Equity Absolute Return Fund continued
5,805 Collectors Universe Inc Goldman Sachs (522) 17,513 Collectors Universe Inc Morgan Stanley 81,961 (4,933) Collegium Pharmaceutical Inc Goldman Sachs (2,319) 59,364 Colony Capital Inc 'A' (Reit) Morgan Stanley 151,972 225,889 Colony Capital Inc 'A' (Reit) Bank of America
Merrill Lynch 6,777 41,267 Colony Starwood Homes (Reit) Bank of America
Merrill Lynch 54,472 276 Colony Starwood Homes (Reit) Goldman Sachs 364 8,240 Colony Starwood Homes (Reit) Morgan Stanley 24,524 (10,278) Columbia Banking System Inc Bank of America
Merrill Lynch (7,431) (9,519) Columbia Banking System Inc Morgan Stanley (16,772) 1,880 Columbia Pipeline Group Inc Bank of America
Merrill Lynch (38) (38,342) Columbia Property Trust
Inc (Reit) Morgan Stanley 25,644 (15,837) Columbia Property Trust Bank of America
Inc (Reit) Merrill Lynch 18,054 34,405 Comcast Corp 'A' Bank of America
Merrill Lynch 22,707 9,366 Comcast Corp 'A' Morgan Stanley 15,199 (32,353) Comerica Inc Bank of America
Merrill Lynch (109,386) (26,143) Comerica Inc Morgan Stanley (98,461) 16,747 Comfort Systems USA Inc Bank of America
Merrill Lynch 12,451 5,475 Comfort Systems USA Inc Goldman Sachs 3,723 50,331 Comfort Systems USA Inc Morgan Stanley 295,685 5,508 Commercial Metals Co Morgan Stanley (1,179) (14,265) Commercial Metals Co Morgan Stanley (7,500) 87,739 Commercial Vehicle Group Inc Bank of America
Merrill Lynch 76,333 45,745 Commercial Vehicle Group Inc Goldman Sachs 39,798 191,637 Commercial Vehicle Group Inc Morgan Stanley 216,191 13,662 CommScope Holding Co Inc Bank of America
Merrill Lynch 14,015 11,105 CommScope Holding Co Inc Morgan Stanley 49,432 16,692 Communications Sales & Bank of America
Leasing Inc (Reit) Merrill Lynch 6,844 552 Communications Sales &
Leasing Inc (Reit) Goldman Sachs 226 17,861 Communications Sales &
Leasing Inc (Reit) Morgan Stanley 52,248 (18,978) Community Bank System Inc Bank of America
Merrill Lynch (35,679) (41,292) Community Bank System Inc Morgan Stanley (161,476) 10,082 Community Health Bank of America
Systems Inc Merrill Lynch 4,582 906 Community Health
Systems Inc Goldman Sachs (26) 11,020 Community Health
Systems Inc Morgan Stanley (22,898) (9,088) Community Health
Systems Inc (Right) Goldman Sachs 3 7,586 Community Healthcare Trust Bank of America
Inc (Reit) Merrill Lynch (2,579) 1,287 Community Healthcare Trust
Inc (Reit) Goldman Sachs (438) 2,440 Community Healthcare Trust
Inc (Reit) Morgan Stanley 937 731 Community Trust Bancorp Inc Morgan Stanley 349 (2,926) CommunityOne Bancorp Bank of America
Merrill Lynch (1,463) (1,647) CommunityOne Bancorp Morgan Stanley (1,548) 793 CommVault Systems Inc Morgan Stanley 1,150 1,306 Compass Minerals
International Inc Morgan Stanley 13,465 (4,322) Compass Minerals Bank of America
International Inc Merrill Lynch (2,723) (1,497) Compass Minerals
International Inc Goldman Sachs (156)
(312) Compass Minerals International Inc Morgan Stanley (315)
(54,055) Computer Sciences Corp Bank of America Merrill Lynch (799,473)
(41,733) Computer Sciences Corp Morgan Stanley (732,376) 35,353 Computer Task Group Inc Bank of America
Merrill Lynch 12,727 13,539 Computer Task Group Inc Goldman Sachs 4,874 160,392 Computer Task Group Inc Morgan Stanley (46,609) 10,347 comScore Inc Bank of America
Merrill Lynch 41,954 15,953 comScore Inc Morgan Stanley 55,476 (4,292) comScore Inc Morgan Stanley 14,378 (9,324) comScore Inc Bank of America
Merrill Lynch (26,462) (440) comScore Inc Goldman Sachs (1,751) 12,537 ConAgra Foods Inc Bank of America
Merrill Lynch 20,475 11,887 ConAgra Foods Inc Morgan Stanley 19,799 (10,686) ConAgra Foods Inc Bank of America
Merrill Lynch (4,381) (2,269) Concho Resources Inc Bank of America
Merrill Lynch (11,422) (6,086) Concho Resources Inc Morgan Stanley (109,441) (8,853) ConforMIS Inc Morgan Stanley (2,175) (31,150) CONMED Corp Bank of America
Merrill Lynch 28,589 (9,419) CONMED Corp Morgan Stanley 25,421 (4,307) Connecticut Water Service Inc Bank of America
Merrill Lynch 1,637 (221,813) ConnectOne Bancorp Inc Bank of America
Merrill Lynch (74,888) (43,342) ConnectOne Bancorp Inc Morgan Stanley (35,107) 4,791 Connecture Inc Bank of America
Merrill Lynch (1,198) 3,529 Connecture Inc Goldman Sachs (882) 4,852 Connecture Inc Morgan Stanley (4,901) (12,428) ConocoPhillips Bank of America
Merrill Lynch (9,818) (29,035) ConocoPhillips Morgan Stanley 49,071 (19,101) CONSOL Energy Inc Bank of America
Merrill Lynch (24,067) (3,927) CONSOL Energy Inc Morgan Stanley (9,175) (19,648) Consolidated Communications Bank of America
Holdings Inc Merrill Lynch 22,332 (37,715) Consolidated Communications
Holdings Inc Goldman Sachs 46,767 (68,433) Consolidated Communications
Holdings Inc Morgan Stanley (369,999) (10,469) Consolidated Edison Inc Bank of America
Merrill Lynch 5,316 (35,227) Consolidated Edison Inc Morgan Stanley (38,165) 36,724 Consolidated Water Co Ltd Bank of America
Merrill Lynch (27,910) 1,610 Consolidated Water Co Ltd Goldman Sachs (1,224) 5,570 Consolidated Water Co Ltd Morgan Stanley 12,023 12,905 Constellation Brands Inc 'A' Bank of America
Merrill Lynch (31,212) 8,703 Constellation Brands Inc 'A' Morgan Stanley (32,035) 29,543 Consumer Portfolio Bank of America
Services Inc Merrill Lynch 12,999 7,210 Consumer Portfolio
Services Inc Goldman Sachs 3,172 219,190 Consumer Portfolio
Services Inc Morgan Stanley (10,960) (2,022) Contango Oil & Gas Co Bank of America
Merrill Lynch 2,730 35,253 Continental Building Bank of America
Products Inc Merrill Lynch 68,941 9,905 Continental Building
Products Inc Goldman Sachs 21,099 5,511 Continental Building
Products Inc Morgan Stanley 10,619
United States continued United States continued
Holding
Description Counterparty
Unrealised appreciation/
(depreciation) USD
Holding
Description Counterparty
Unrealised appreciation/
(depreciation) USD
Contracts for difference as at 31 May 2016

64 BlackRock Strategic Funds (BSF)
The notes on pages 489 to 503 form an integral part of these financial statements.
13,408 Continental Resources Inc/OK Bank of America Merrill Lynch 22,698
6,364 Continental Resources Inc/OK Morgan Stanley 43,856 33,862 Control4 Corp Bank of America
Merrill Lynch 9,007 3,778 Control4 Corp Goldman Sachs 1,813 14,977 Control4 Corp Morgan Stanley 1,221 21,873 Convergys Corp Bank of America
Merrill Lynch 5,031 14,048 Convergys Corp Morgan Stanley 17,025 (2,538) Convergys Corp Bank of America
Merrill Lynch (584) 4,752 Cooper Cos Inc/The Morgan Stanley 729 4,799 Cooper Cos Inc/The Bank of America
Merrill Lynch 11,966 (7,181) Cooper Cos Inc/The Bank of America
Merrill Lynch (18,599) (197) Cooper Cos Inc/The Morgan Stanley (6,034) 20,054 Cooper Tire & Rubber Co Bank of America
Merrill Lynch 777 2,324 Cooper Tire & Rubber Co Morgan Stanley 1,241 471 Cooper-Standard Holding Inc Goldman Sachs 848 923 Cooper-Standard Holding Inc Morgan Stanley 877 (453) Cooper-Standard Holding Inc Morgan Stanley (4,288) 12,564 Cooper-Standard Holding Inc Bank of America
Merrill Lynch 11,032 2,546 Copa Holdings SA 'A' Goldman Sachs (6,263) (1,453) Copa Holdings SA 'A' Morgan Stanley (3,124) (6,377) Copa Holdings SA 'A' Bank of America
Merrill Lynch 16,202 6,454 Copart Inc Bank of America
Merrill Lynch 35,820 478 Copart Inc Goldman Sachs 2,653 (1,166) Copart Inc Bank of America
Merrill Lynch (6,471) (5,141) Copart Inc Morgan Stanley (27,978) 8,370 Corcept Therapeutics Inc Bank of America
Merrill Lynch 3,568 20,119 Corcept Therapeutics Inc Goldman Sachs 10,146 13,637 Corcept Therapeutics Inc Morgan Stanley 29,183 (764) Core Laboratories NV Bank of America
Merrill Lynch (3,774) (2,173) Core Laboratories NV Goldman Sachs (10,735) 5,834 Core Molding Technologies Inc Goldman Sachs 1,108 4,572 Core Molding Technologies Inc Morgan Stanley 12,344 14,039 Core-Mark Holding Co Inc Bank of America
Merrill Lynch 26,214 886 Core-Mark Holding Co Inc Goldman Sachs 1,444 918 Core-Mark Holding Co Inc Morgan Stanley 4,012 (538) Core-Mark Holding Co Inc Morgan Stanley (2,398) (14,836) CoreLogic Inc/United States Morgan Stanley (7,832) (15,591) CoreLogic Inc/United States Bank of America
Merrill Lynch (7,994) (9,762) CorEnergy Infrastructure Bank of America
Trust Inc (Reit) Merrill Lynch (15,752) (6,269) CorEnergy Infrastructure
Trust Inc (Reit) Morgan Stanley (23,747) 13,257 CoreSite Realty Corp (Reit) Morgan Stanley 153,115 4,437 CoreSite Realty Corp (Reit) Bank of America
Merrill Lynch (4,483) (20,973) Cornerstone OnDemand Inc Bank of America
Merrill Lynch (48,867) (2,362) Cornerstone OnDemand Inc Morgan Stanley (13,749) (96,603) Corning Inc Bank of America
Merrill Lynch (152,182) (117,508) Corning Inc Morgan Stanley (240,936) 3,312 Corrections Corp of America
(Reit) Morgan Stanley 6,354 (25,393) Corrections Corp of America Bank of America
(Reit) Merrill Lynch (3,301) (732) CorVel Corp Bank of America
Merrill Lynch (1,091)
2,196 Corvus Pharmaceuticals Inc Bank of America Merrill Lynch 6,259
1,463 Corvus Pharmaceuticals Inc Goldman Sachs 4,170 181,739 Cosan Ltd 'A' Morgan Stanley 421,552 54,407 Cosan Ltd 'A' Bank of America
Merrill Lynch (3,808) 77,090 Cosan Ltd 'A' Goldman Sachs (4,262) 455 CoStar Group Inc Bank of America
Merrill Lynch 4,122 7,716 Costco Wholesale Corp Bank of America
Merrill Lynch 34,914 21,165 Costco Wholesale Corp Morgan Stanley 11,406 (596) Coty Inc 'A' Bank of America
Merrill Lynch (662) (23,354) Coty Inc 'A' Goldman Sachs (19,303) (9,997) Coty Inc 'A' Morgan Stanley 18,611 (25,131) Cousins Properties Inc (Reit) Bank of America
Merrill Lynch 1,634 20,893 Covanta Holding Corp Morgan Stanley 8,192 15,196 Covanta Holding Corp Bank of America
Merrill Lynch (6,534) (6,544) Covanta Holding Corp Bank of America
Merrill Lynch 2,814 (40,299) Covanta Holding Corp Morgan Stanley (146,285) (831) Covenant Transportation
Group Inc 'A' Morgan Stanley 364 (20,436) Covenant Transportation Bank of America
Group Inc 'A' Merrill Lynch (40,471) (628) Covenant Transportation
Group Inc 'A' Goldman Sachs (1,287) (79,346) Cowen Group Inc 'A' Bank of America
Merrill Lynch (5,237) (57,121) Cowen Group Inc 'A' Goldman Sachs (9,996) 8,691 CPI Card Group Inc Morgan Stanley (37,136) 9,271 CPI Card Group Inc Bank of America
Merrill Lynch 2,583 3,162 CPI Card Group Inc Goldman Sachs 443 13,881 CR Bard Inc Bank of America
Merrill Lynch (35,520) 94 CR Bard Inc Goldman Sachs (290) 1,540 CR Bard Inc Morgan Stanley 323 47,500 CRA International Inc Bank of America
Merrill Lynch 11,400 8,062 Cracker Barrel Old Country
Store Inc Morgan Stanley 29,857 4,113 Cracker Barrel Old Country Bank of America
Store Inc Merrill Lynch 14,479 5,091 Crane Co Bank of America
Merrill Lynch 11,637 14,423 Crane Co Morgan Stanley 44,770 (3,151) Crane Co Bank of America
Merrill Lynch (7,184) 15,120 Crawford & Co 'B' Bank of America
Merrill Lynch 11,340 1,801 Crawford & Co 'B' Morgan Stanley 6,098 (14,227) Cray Inc Morgan Stanley 48,896 (8,041) Cray Inc Bank of America
Merrill Lynch (11,406) 6,214 Credicorp Ltd Goldman Sachs 73,365 2,119 Credicorp Ltd Morgan Stanley 12,645 (4,574) Credicorp Ltd Bank of America
Merrill Lynch 2,817 (5,163) Credicorp Ltd Morgan Stanley (1,729) (430) Credit Acceptance Corp Bank of America
Merrill Lynch (4,979) (239) Credit Acceptance Corp Goldman Sachs (850) (2,326) Credit Acceptance Corp Morgan Stanley (7,666) (14,847) Cree Inc Bank of America
Merrill Lynch (24,349) (5,997) Cree Inc Goldman Sachs (9,835) (42,922) Crocs Inc Bank of America
Merrill Lynch (23,607)
BlackRock Americas Diversified Equity Absolute Return Fund continued
United States continued United States continued
Holding
Description Counterparty
Unrealised appreciation/
(depreciation) USD
Holding
Description Counterparty
Unrealised appreciation/
(depreciation) USD
Contracts for difference as at 31 May 2016
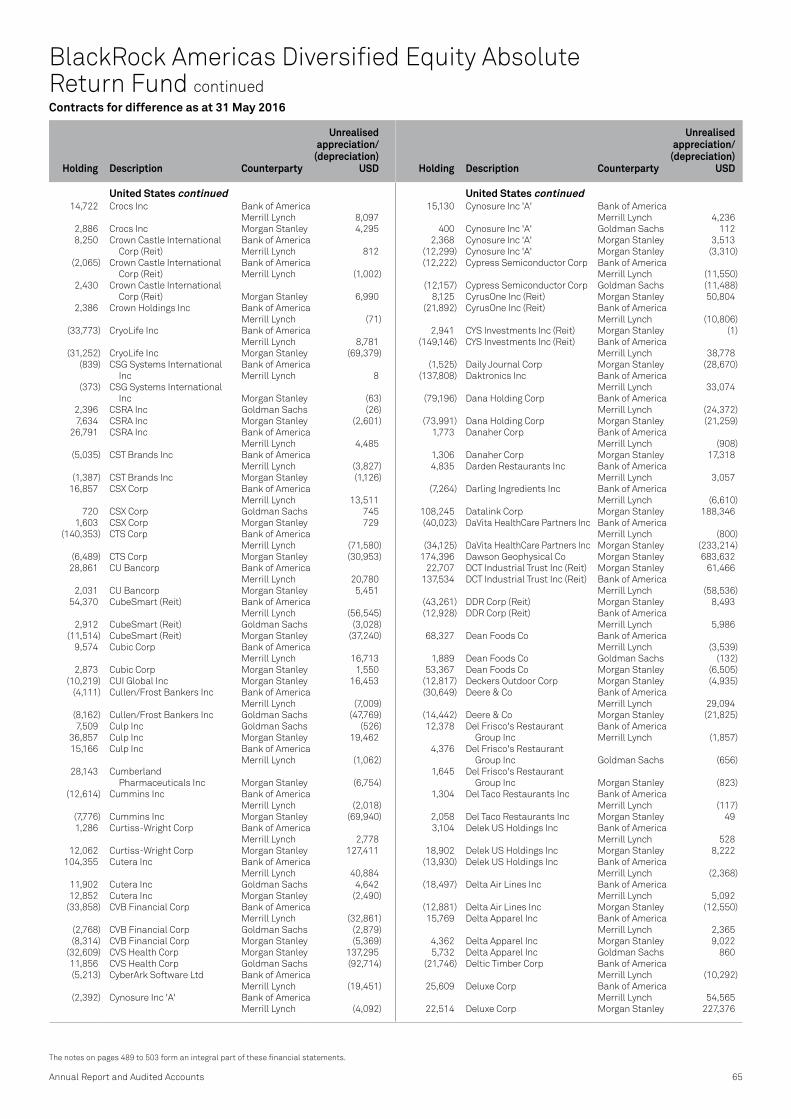
Annual Report and Audited Accounts 65
The notes on pages 489 to 503 form an integral part of these financial statements.
BlackRock Americas Diversified Equity Absolute Return Fund continued
14,722 Crocs Inc Bank of America Merrill Lynch 8,097
2,886 Crocs Inc Morgan Stanley 4,295 8,250 Crown Castle International Bank of America
Corp (Reit) Merrill Lynch 812 (2,065) Crown Castle International Bank of America
Corp (Reit) Merrill Lynch (1,002) 2,430 Crown Castle International
Corp (Reit) Morgan Stanley 6,990 2,386 Crown Holdings Inc Bank of America
Merrill Lynch (71) (33,773) CryoLife Inc Bank of America
Merrill Lynch 8,781 (31,252) CryoLife Inc Morgan Stanley (69,379) (839) CSG Systems International Bank of America
Inc Merrill Lynch 8 (373) CSG Systems International
Inc Morgan Stanley (63) 2,396 CSRA Inc Goldman Sachs (26) 7,634 CSRA Inc Morgan Stanley (2,601) 26,791 CSRA Inc Bank of America
Merrill Lynch 4,485 (5,035) CST Brands Inc Bank of America
Merrill Lynch (3,827) (1,387) CST Brands Inc Morgan Stanley (1,126) 16,857 CSX Corp Bank of America
Merrill Lynch 13,511 720 CSX Corp Goldman Sachs 745 1,603 CSX Corp Morgan Stanley 729 (140,353) CTS Corp Bank of America
Merrill Lynch (71,580) (6,489) CTS Corp Morgan Stanley (30,953) 28,861 CU Bancorp Bank of America
Merrill Lynch 20,780 2,031 CU Bancorp Morgan Stanley 5,451 54,370 CubeSmart (Reit) Bank of America
Merrill Lynch (56,545) 2,912 CubeSmart (Reit) Goldman Sachs (3,028) (11,514) CubeSmart (Reit) Morgan Stanley (37,240) 9,574 Cubic Corp Bank of America
Merrill Lynch 16,713 2,873 Cubic Corp Morgan Stanley 1,550 (10,219) CUI Global Inc Morgan Stanley 16,453 (4,111) Cullen/Frost Bankers Inc Bank of America
Merrill Lynch (7,009) (8,162) Cullen/Frost Bankers Inc Goldman Sachs (47,769) 7,509 Culp Inc Goldman Sachs (526) 36,857 Culp Inc Morgan Stanley 19,462 15,166 Culp Inc Bank of America
Merrill Lynch (1,062) 28,143 Cumberland
Pharmaceuticals Inc Morgan Stanley (6,754) (12,614) Cummins Inc Bank of America
Merrill Lynch (2,018) (7,776) Cummins Inc Morgan Stanley (69,940) 1,286 Curtiss-Wright Corp Bank of America
Merrill Lynch 2,778 12,062 Curtiss-Wright Corp Morgan Stanley 127,411 104,355 Cutera Inc Bank of America
Merrill Lynch 40,884 11,902 Cutera Inc Goldman Sachs 4,642 12,852 Cutera Inc Morgan Stanley (2,490) (33,858) CVB Financial Corp Bank of America
Merrill Lynch (32,861) (2,768) CVB Financial Corp Goldman Sachs (2,879) (8,314) CVB Financial Corp Morgan Stanley (5,369) (32,609) CVS Health Corp Morgan Stanley 137,295 11,856 CVS Health Corp Goldman Sachs (92,714) (5,213) CyberArk Software Ltd Bank of America
Merrill Lynch (19,451) (2,392) Cynosure Inc 'A' Bank of America
Merrill Lynch (4,092)
15,130 Cynosure Inc 'A' Bank of America Merrill Lynch 4,236
400 Cynosure Inc 'A' Goldman Sachs 112 2,368 Cynosure Inc 'A' Morgan Stanley 3,513 (12,299) Cynosure Inc 'A' Morgan Stanley (3,310) (12,222) Cypress Semiconductor Corp Bank of America
Merrill Lynch (11,550) (12,157) Cypress Semiconductor Corp Goldman Sachs (11,488) 8,125 CyrusOne Inc (Reit) Morgan Stanley 50,804 (21,892) CyrusOne Inc (Reit) Bank of America
Merrill Lynch (10,806) 2,941 CYS Investments Inc (Reit) Morgan Stanley (1) (149,146) CYS Investments Inc (Reit) Bank of America
Merrill Lynch 38,778 (1,525) Daily Journal Corp Morgan Stanley (28,670) (137,808) Daktronics Inc Bank of America
Merrill Lynch 33,074 (79,196) Dana Holding Corp Bank of America
Merrill Lynch (24,372) (73,991) Dana Holding Corp Morgan Stanley (21,259) 1,773 Danaher Corp Bank of America
Merrill Lynch (908) 1,306 Danaher Corp Morgan Stanley 17,318 4,835 Darden Restaurants Inc Bank of America
Merrill Lynch 3,057 (7,264) Darling Ingredients Inc Bank of America
Merrill Lynch (6,610) 108,245 Datalink Corp Morgan Stanley 188,346 (40,023) DaVita HealthCare Partners Inc Bank of America
Merrill Lynch (800) (34,125) DaVita HealthCare Partners Inc Morgan Stanley (233,214) 174,396 Dawson Geophysical Co Morgan Stanley 683,632 22,707 DCT Industrial Trust Inc (Reit) Morgan Stanley 61,466 137,534 DCT Industrial Trust Inc (Reit) Bank of America
Merrill Lynch (58,536) (43,261) DDR Corp (Reit) Morgan Stanley 8,493 (12,928) DDR Corp (Reit) Bank of America
Merrill Lynch 5,986 68,327 Dean Foods Co Bank of America
Merrill Lynch (3,539) 1,889 Dean Foods Co Goldman Sachs (132) 53,367 Dean Foods Co Morgan Stanley (6,505) (12,817) Deckers Outdoor Corp Morgan Stanley (4,935) (30,649) Deere & Co Bank of America
Merrill Lynch 29,094 (14,442) Deere & Co Morgan Stanley (21,825) 12,378 Del Frisco's Restaurant Bank of America
Group Inc Merrill Lynch (1,857) 4,376 Del Frisco's Restaurant
Group Inc Goldman Sachs (656) 1,645 Del Frisco's Restaurant
Group Inc Morgan Stanley (823) 1,304 Del Taco Restaurants Inc Bank of America
Merrill Lynch (117) 2,058 Del Taco Restaurants Inc Morgan Stanley 49 3,104 Delek US Holdings Inc Bank of America
Merrill Lynch 528 18,902 Delek US Holdings Inc Morgan Stanley 8,222 (13,930) Delek US Holdings Inc Bank of America
Merrill Lynch (2,368) (18,497) Delta Air Lines Inc Bank of America
Merrill Lynch 5,092 (12,881) Delta Air Lines Inc Morgan Stanley (12,550) 15,769 Delta Apparel Inc Bank of America
Merrill Lynch 2,365 4,362 Delta Apparel Inc Morgan Stanley 9,022 5,732 Delta Apparel Inc Goldman Sachs 860 (21,746) Deltic Timber Corp Bank of America
Merrill Lynch (10,292) 25,609 Deluxe Corp Bank of America
Merrill Lynch 54,565 22,514 Deluxe Corp Morgan Stanley 227,376
United States continued United States continued
Holding
Description Counterparty
Unrealised appreciation/
(depreciation) USD
Holding
Description Counterparty
Unrealised appreciation/
(depreciation) USD
Contracts for difference as at 31 May 2016

66 BlackRock Strategic Funds (BSF)
The notes on pages 489 to 503 form an integral part of these financial statements.
59,237 Demand Media Inc Morgan Stanley 48,574 40,398 Demand Media Inc Bank of America
Merrill Lynch (7,272) 12,148 Demand Media Inc Goldman Sachs (2,187) (4,445) Demandware Inc Bank of America
Merrill Lynch (14,002) (6,645) Demandware Inc Goldman Sachs (20,932) (4,706) Demandware Inc Morgan Stanley (52,555) 1,929 Demandware Inc Bank of America
Merrill Lynch 6,076 38,975 Denbury Resources Inc Morgan Stanley 72,694 (30,367) Denbury Resources Inc Bank of America
Merrill Lynch 4,859 17,314 Denbury Resources Inc Bank of America
Merrill Lynch (2,770) 8,226 Denbury Resources Inc Goldman Sachs (1,316) (15,122) Denbury Resources Inc Morgan Stanley (5,700) 4,082 Denny's Corp Morgan Stanley (211) 161,717 Denny's Corp Bank of America
Merrill Lynch (1,768) 2,479 DENTSPLY SIRONA Inc Bank of America
Merrill Lynch 347 35,657 DENTSPLY SIRONA Inc Morgan Stanley 67,613 (27,323) Depomed Inc Bank of America
Merrill Lynch (35,467) (9,177) Depomed Inc Morgan Stanley (25,204) 13,409 Derma Sciences Inc Bank of America
Merrill Lynch — 23,347 Derma Sciences Inc Goldman Sachs — 39,063 Derma Sciences Inc Morgan Stanley 33,985 (17,413) Dermira Inc Bank of America
Merrill Lynch (22,811) (1,754) Dermira Inc Morgan Stanley (14,425) (12,958) Destination Maternity Corp Bank of America
Merrill Lynch 12,699 (14,125) Destination Maternity Corp Morgan Stanley 20,623 2,658 Devon Energy Corp Morgan Stanley 40,561 10,125 DeVry Education Group Inc Morgan Stanley 9,721 13,623 DeVry Education Group Inc Bank of America
Merrill Lynch (17,574) (6,741) DexCom Inc Bank of America
Merrill Lynch (6,652) (7,727) DexCom Inc Morgan Stanley (3,785) 68,439 DHT Holdings Inc Bank of America
Merrill Lynch (9,660) 13,804 DHT Holdings Inc Goldman Sachs (2,209) 58,632 DHT Holdings Inc Morgan Stanley 14,724 (1,145) Diamond Hill Investment Bank of America
Group Inc Merrill Lynch 160 7,213 Diamond Offshore Drilling Inc Bank of America
Merrill Lynch 15,508 (2,073) Diamond Offshore Drilling Inc Bank of America
Merrill Lynch (1,289) 3,070 Diamond Resorts
International Inc Morgan Stanley 7,524 15,845 Diamond Resorts Bank of America
International Inc Merrill Lynch 53,853 (3,037) Diamondback Energy Inc Bank of America
Merrill Lynch (18,586) 677 Diamondback Energy Inc Bank of America
Merrill Lynch 4,143 93,792 DiamondRock Hospitality
Co (Reit) Morgan Stanley 38,886 51,656 DiamondRock Hospitality Bank of America
Co (Reit) Merrill Lynch (30,994) (27,693) Dick's Sporting Goods Inc Morgan Stanley 95,608 (10,150) Dick's Sporting Goods Inc Bank of America
Merrill Lynch (28,014) 7,439 Diebold Inc Bank of America
Merrill Lynch 5,282 10,904 Diebold Inc Morgan Stanley (7,306) (37,020) Diebold Inc Bank of America
Merrill Lynch (33,968)
(483) Diebold Inc Goldman Sachs (343) (214) Diebold Inc Morgan Stanley (187) 75,458 Digi International Inc Morgan Stanley 203,591 25,686 Digi International Inc Bank of America
Merrill Lynch (771) 30,093 Digi International Inc Goldman Sachs (903) 7,075 Digirad Corp Morgan Stanley 774 31,144 Digirad Corp Bank of America
Merrill Lynch (8,702) 12,140 Digirad Corp Goldman Sachs (3,521) 2,299 Digital Realty Trust Inc (Reit) Bank of America
Merrill Lynch (5,839) (15,998) Dillard's Inc 'A' Bank of America
Merrill Lynch (42,634) (13,621) Dillard's Inc 'A' Morgan Stanley 3,439 (120,622) Dime Community Bank of America
Bancshares Inc Merrill Lynch (79,611) (65,267) Dime Community
Bancshares Inc Morgan Stanley (131,187) (2,627) DineEquity Inc Morgan Stanley (771) 1,067 Diplomat Pharmacy Inc Bank of America
Merrill Lynch 570 2,051 Diplomat Pharmacy Inc Morgan Stanley 3,017 (14,930) Diplomat Pharmacy Inc Bank of America
Merrill Lynch (20,983) (2,571) Diplomat Pharmacy Inc Goldman Sachs (4,011) (1,866) Diplomat Pharmacy Inc Morgan Stanley (5,571) (35,913) Discover Financial Services Bank of America
Merrill Lynch (91,219) 14,590 Discovery Communications
Inc 'A' Morgan Stanley 1,796 4,245 Discovery Communications Bank of America
Inc 'A' Merrill Lynch 1,592 (63,335) DISH Network Corp 'A' Bank of America
Merrill Lynch (178,236) (274) DISH Network Corp 'A' Goldman Sachs (896) (25,356) DISH Network Corp 'A' Morgan Stanley (50,576) (43,199) Dixie Group Inc/The Morgan Stanley 41,903 12,701 Dolby Laboratories Inc 'A' Bank of America
Merrill Lynch 16,257 4,067 Dolby Laboratories Inc 'A' Morgan Stanley 4,146 4,444 Dollar General Corp Bank of America
Merrill Lynch 27,953 3,697 Dollar General Corp Morgan Stanley 18,044 4,099 Dollar Tree Inc Bank of America
Merrill Lynch 37,321 2,361 Dollar Tree Inc Morgan Stanley 30,229 (17,005) Dollar Tree Inc Bank of America
Merrill Lynch (161,207) (1,071) Dollar Tree Inc Morgan Stanley (15,380) 27,839 Dominion Diamond Corp Morgan Stanley (11,414) 67,119 Dominion Resources Inc/VA Morgan Stanley 52,537 7,926 Dominion Resources Inc/VA Bank of America
Merrill Lynch (5,390) 324 Domino's Pizza Inc Morgan Stanley (3,748) (7,239) Domino's Pizza Inc Morgan Stanley (624) 8,586 Domino's Pizza Inc Bank of America
Merrill Lynch (12,364) (1,407) Domino's Pizza Inc Bank of America
Merrill Lynch (934) 7,605 Domtar Corp Bank of America
Merrill Lynch 10,419 (6,825) Domtar Corp Morgan Stanley (3,578) (98,771) Donaldson Co Inc Bank of America
Merrill Lynch (75,064) (12,534) Donaldson Co Inc Morgan Stanley (34,023) 10,408 Donegal Group Inc 'A' Bank of America
Merrill Lynch 3,859 3,525 Donegal Group Inc 'A' Morgan Stanley 2,970 (18,268) Dorman Products Inc Bank of America
Merrill Lynch (34,166) (41,187) Dorman Products Inc Goldman Sachs (63,840)
BlackRock Americas Diversified Equity Absolute Return Fund continued
United States continued United States continued
Holding
Description Counterparty
Unrealised appreciation/
(depreciation) USD
Holding
Description Counterparty
Unrealised appreciation/
(depreciation) USD
Contracts for difference as at 31 May 2016

Annual Report and Audited Accounts 67
The notes on pages 489 to 503 form an integral part of these financial statements.
BlackRock Americas Diversified Equity Absolute Return Fund continued
16,607 Douglas Dynamics Inc Bank of America Merrill Lynch 4,982
6,116 Douglas Dynamics Inc Goldman Sachs 1,835 9,620 Douglas Dynamics Inc Morgan Stanley 10,744 (20,963) Douglas Emmett Inc (Reit) Morgan Stanley (89,317) (20,567) Douglas Emmett Inc (Reit) Bank of America
Merrill Lynch (7,056) (14,149) Dover Corp Bank of America
Merrill Lynch (4,811) (12,735) Dover Corp Morgan Stanley (30,575) (52,545) DR Horton Inc Bank of America
Merrill Lynch (40,912) (12,050) DR Horton Inc Morgan Stanley (15,980) 30,504 Dr Pepper Snapple Group Inc Bank of America
Merrill Lynch (78,395) (1,731) Dr Pepper Snapple Group Inc Morgan Stanley 419 (2,920) Dream Office Real Estate
Investment Trust (Reit) Morgan Stanley 32,796 41,708 Drew Industries Inc Bank of America
Merrill Lynch 129,295 16,620 Drew Industries Inc Morgan Stanley 280,134 1,119 Dril-Quip Inc Goldman Sachs 2,764 10,468 Dril-Quip Inc Morgan Stanley 110,334 2,626 Dril-Quip Inc Bank of America
Merrill Lynch 6,486 69,948 DSP Group Inc Morgan Stanley 141,295 1,814 DSW Inc 'A' Bank of America
Merrill Lynch 82 (15,131) DSW Inc 'A' Bank of America
Merrill Lynch 13,315 45,826 DTE Energy Co Bank of America
Merrill Lynch (16,006) 31,651 DTE Energy Co Morgan Stanley 21,756 507 DTE Energy Co Goldman Sachs (319) (2,997) DTS Inc/CA Morgan Stanley 4,976 (82,740) DTS Inc/CA Bank of America
Merrill Lynch (191,957) 6,887 Ducommun Inc Morgan Stanley 19,603 1,922 Ducommun Inc Bank of America
Merrill Lynch (1,442) 3,813 Ducommun Inc Goldman Sachs (2,860) (24,116) Duke Energy Corp Bank of America
Merrill Lynch 33,660 (25,296) Duke Energy Corp Morgan Stanley 25,928 (1,662) Duke Realty Corp (Reit) Morgan Stanley (1,222) 61,396 Duke Realty Corp (Reit) Bank of America
Merrill Lynch 2,456 (6,803) Duke Realty Corp (Reit) Bank of America
Merrill Lynch (3,860) (10,399) Dun & Bradstreet Corp/The Morgan Stanley (241,356) 13,868 Dunkin' Brands Group Inc Morgan Stanley (27,274) (7,851) Dunkin' Brands Group Inc Bank of America
Merrill Lynch 10,363 6,745 Dunkin' Brands Group Inc Bank of America
Merrill Lynch (8,823) (8,481) DuPont Fabros Technology
Inc (Reit) Morgan Stanley (52,644) (22,461) DuPont Fabros Technology Bank of America
Inc (Reit) Merrill Lynch 16,621 (19,595) Durect Corp Bank of America
Merrill Lynch (196) 324 Dycom Industries Inc Bank of America
Merrill Lynch 4,909 10,274 Dycom Industries Inc Morgan Stanley 167,963 (4,020) Dycom Industries Inc Bank of America
Merrill Lynch (51,889) (18,403) Dynamic Materials Corp Bank of America
Merrill Lynch (5,889) (40,174) Dynamic Materials Corp Morgan Stanley (181,185) (6,464) Dynegy Inc Bank of America
Merrill Lynch (1,132) 11,429 E*TRADE Financial Corp Morgan Stanley 60,891
22,717 Eagle Bancorp Inc Bank of America Merrill Lynch 18,174
785 Eagle Bancorp Inc Goldman Sachs 628 78,422 Eagle Bancorp Inc Morgan Stanley 393,762 (13,089) Eagle Materials Inc Bank of America
Merrill Lynch (35,864) (1,016) Eagle Materials Inc Morgan Stanley (9,639) 290,399 EarthLink Holdings Corp Bank of America
Merrill Lynch 64,643 11,797 EarthLink Holdings Corp Goldman Sachs 2,831 9,522 EarthLink Holdings Corp Morgan Stanley 3,005 19,590 East West Bancorp Inc Bank of America
Merrill Lynch 52,567 8,499 East West Bancorp Inc Morgan Stanley 33,011 (19,716) EastGroup Properties
Inc (Reit) Morgan Stanley (153,164) 137 Eastman Chemical Co Goldman Sachs 9 7,950 Eastman Chemical Co Bank of America
Merrill Lynch 385 3,398 Eastman Chemical Co Morgan Stanley (2,195) 609 Eaton Corp Plc Goldman Sachs 894 4,555 Eaton Corp Plc Bank of America
Merrill Lynch 122 (18,393) Eaton Vance Corp Bank of America
Merrill Lynch (37,890) (38,597) Eaton Vance Corp Morgan Stanley (247,340) (25,003) eBay Inc Bank of America
Merrill Lynch (17,981) (12,096) Ebix Inc Bank of America
Merrill Lynch (9,145) (10,728) Ebix Inc Goldman Sachs (4,556) (5,832) Ebix Inc Morgan Stanley (80,746) (30,198) EchoStar Corp 'A' Bank of America
Merrill Lynch 5,436 (27,944) EchoStar Corp 'A' Morgan Stanley 81,939 6,187 Eclipse Resources Corp Goldman Sachs (186) (2,460) Ecolab Inc Bank of America
Merrill Lynch (4,203) (137) Ecolab Inc Morgan Stanley (162) (11,821) Edgewell Personal Care Co Bank of America
Merrill Lynch (30,144) (811) Edgewell Personal Care Co Goldman Sachs (2,068) 3,205 Edgewell Personal Care Co Bank of America
Merrill Lynch 7,394 14,502 Edgewell Personal Care Co Morgan Stanley 17,039 (11,928) Edison International Bank of America
Merrill Lynch (16,356) 14,871 Education Realty Trust
Inc (Reit) Morgan Stanley 7,364 2,255 Education Realty Trust Bank of America
Inc (Reit) Merrill Lynch 444 (11,887) Education Realty Trust Bank of America
Inc (Reit) Merrill Lynch (4,398) 925 Edwards Lifesciences Corp Bank of America
Merrill Lynch (4,117) 248 Edwards Lifesciences Corp Goldman Sachs (510) 1,935 Edwards Lifesciences Corp Morgan Stanley (5,238) (1,249) Egalet Corp Goldman Sachs (649) (57,284) Egalet Corp Morgan Stanley 105,975 (1,588) EI du Pont de Nemours & Co Bank of America
Merrill Lynch (4,145) (3,507) EI du Pont de Nemours & Co Morgan Stanley (31,703) (22,666) El Paso Electric Co Morgan Stanley 15,214 11,962 Eldorado Resorts Inc Bank of America
Merrill Lynch 8,732 50,752 Eldorado Resorts Inc Morgan Stanley 263,722 (76,941) Electro Rent Corp Bank of America
Merrill Lynch (202,844) (1,200) Electro Rent Corp Goldman Sachs (3,084) (1,488) Electro Rent Corp Morgan Stanley (5,292) 50,306 Electro Scientific Bank of America
Industries Inc Merrill Lynch 10,564
United States continued United States continued
Holding
Description Counterparty
Unrealised appreciation/
(depreciation) USD
Holding
Description Counterparty
Unrealised appreciation/
(depreciation) USD
Contracts for difference as at 31 May 2016
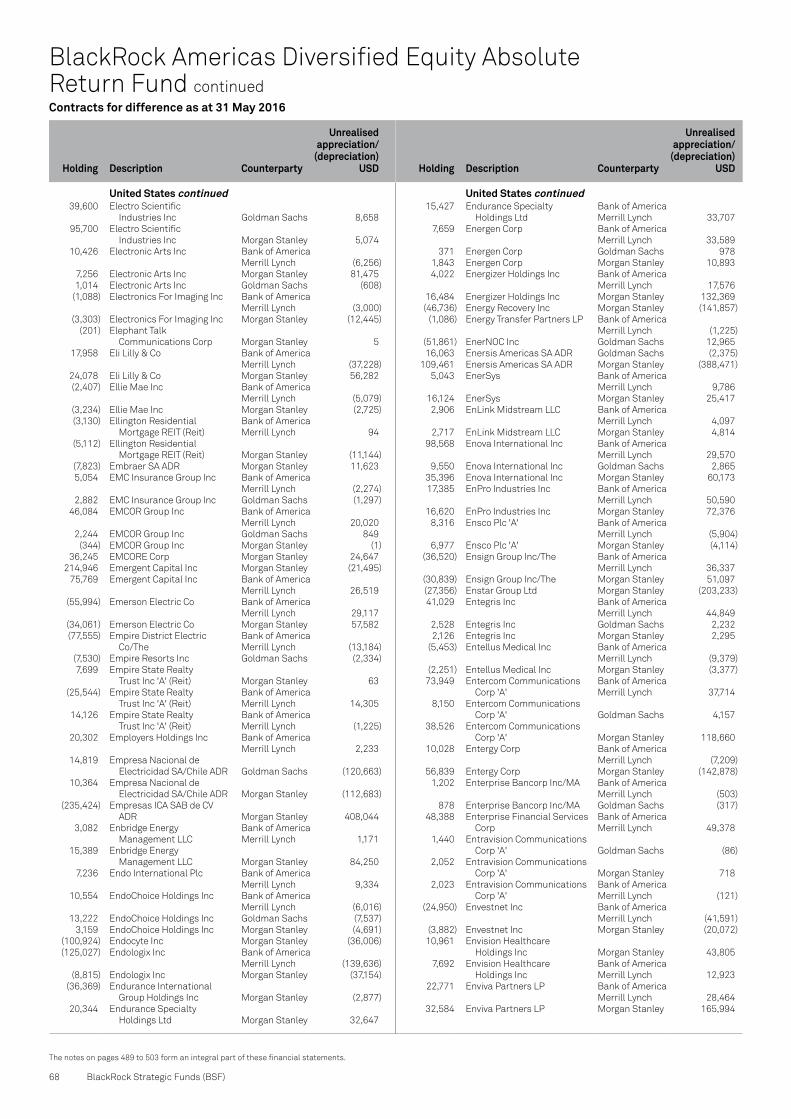
68 BlackRock Strategic Funds (BSF)
The notes on pages 489 to 503 form an integral part of these financial statements.
39,600 Electro Scientific Industries Inc Goldman Sachs 8,658
95,700 Electro Scientific Industries Inc Morgan Stanley 5,074
10,426 Electronic Arts Inc Bank of America Merrill Lynch (6,256)
7,256 Electronic Arts Inc Morgan Stanley 81,475 1,014 Electronic Arts Inc Goldman Sachs (608) (1,088) Electronics For Imaging Inc Bank of America
Merrill Lynch (3,000) (3,303) Electronics For Imaging Inc Morgan Stanley (12,445) (201) Elephant Talk
Communications Corp Morgan Stanley 5 17,958 Eli Lilly & Co Bank of America
Merrill Lynch (37,228) 24,078 Eli Lilly & Co Morgan Stanley 56,282 (2,407) Ellie Mae Inc Bank of America
Merrill Lynch (5,079) (3,234) Ellie Mae Inc Morgan Stanley (2,725) (3,130) Ellington Residential Bank of America
Mortgage REIT (Reit) Merrill Lynch 94 (5,112) Ellington Residential
Mortgage REIT (Reit) Morgan Stanley (11,144) (7,823) Embraer SA ADR Morgan Stanley 11,623 5,054 EMC Insurance Group Inc Bank of America
Merrill Lynch (2,274) 2,882 EMC Insurance Group Inc Goldman Sachs (1,297) 46,084 EMCOR Group Inc Bank of America
Merrill Lynch 20,020 2,244 EMCOR Group Inc Goldman Sachs 849 (344) EMCOR Group Inc Morgan Stanley (1) 36,245 EMCORE Corp Morgan Stanley 24,647 214,946 Emergent Capital Inc Morgan Stanley (21,495) 75,769 Emergent Capital Inc Bank of America
Merrill Lynch 26,519 (55,994) Emerson Electric Co Bank of America
Merrill Lynch 29,117 (34,061) Emerson Electric Co Morgan Stanley 57,582 (77,555) Empire District Electric Bank of America
Co/The Merrill Lynch (13,184) (7,530) Empire Resorts Inc Goldman Sachs (2,334) 7,699 Empire State Realty
Trust Inc 'A' (Reit) Morgan Stanley 63 (25,544) Empire State Realty Bank of America
Trust Inc 'A' (Reit) Merrill Lynch 14,305 14,126 Empire State Realty Bank of America
Trust Inc 'A' (Reit) Merrill Lynch (1,225) 20,302 Employers Holdings Inc Bank of America
Merrill Lynch 2,233 14,819 Empresa Nacional de
Electricidad SA/Chile ADR Goldman Sachs (120,663) 10,364 Empresa Nacional de
Electricidad SA/Chile ADR Morgan Stanley (112,683) (235,424) Empresas ICA SAB de CV
ADR Morgan Stanley 408,044 3,082 Enbridge Energy Bank of America
Management LLC Merrill Lynch 1,171 15,389 Enbridge Energy
Management LLC Morgan Stanley 84,250 7,236 Endo International Plc Bank of America
Merrill Lynch 9,334 10,554 EndoChoice Holdings Inc Bank of America
Merrill Lynch (6,016) 13,222 EndoChoice Holdings Inc Goldman Sachs (7,537) 3,159 EndoChoice Holdings Inc Morgan Stanley (4,691) (100,924) Endocyte Inc Morgan Stanley (36,006) (125,027) Endologix Inc Bank of America
Merrill Lynch (139,636) (8,815) Endologix Inc Morgan Stanley (37,154) (36,369) Endurance International
Group Holdings Inc Morgan Stanley (2,877) 20,344 Endurance Specialty
Holdings Ltd Morgan Stanley 32,647
15,427 Endurance Specialty Bank of America Holdings Ltd Merrill Lynch 33,707
7,659 Energen Corp Bank of America Merrill Lynch 33,589
371 Energen Corp Goldman Sachs 978 1,843 Energen Corp Morgan Stanley 10,893 4,022 Energizer Holdings Inc Bank of America
Merrill Lynch 17,576 16,484 Energizer Holdings Inc Morgan Stanley 132,369 (46,736) Energy Recovery Inc Morgan Stanley (141,857) (1,086) Energy Transfer Partners LP Bank of America
Merrill Lynch (1,225) (51,861) EnerNOC Inc Goldman Sachs 12,965 16,063 Enersis Americas SA ADR Goldman Sachs (2,375) 109,461 Enersis Americas SA ADR Morgan Stanley (388,471) 5,043 EnerSys Bank of America
Merrill Lynch 9,786 16,124 EnerSys Morgan Stanley 25,417 2,906 EnLink Midstream LLC Bank of America
Merrill Lynch 4,097 2,717 EnLink Midstream LLC Morgan Stanley 4,814 98,568 Enova International Inc Bank of America
Merrill Lynch 29,570 9,550 Enova International Inc Goldman Sachs 2,865 35,396 Enova International Inc Morgan Stanley 60,173 17,385 EnPro Industries Inc Bank of America
Merrill Lynch 50,590 16,620 EnPro Industries Inc Morgan Stanley 72,376 8,316 Ensco Plc 'A' Bank of America
Merrill Lynch (5,904) 6,977 Ensco Plc 'A' Morgan Stanley (4,114) (36,520) Ensign Group Inc/The Bank of America
Merrill Lynch 36,337 (30,839) Ensign Group Inc/The Morgan Stanley 51,097 (27,356) Enstar Group Ltd Morgan Stanley (203,233) 41,029 Entegris Inc Bank of America
Merrill Lynch 44,849 2,528 Entegris Inc Goldman Sachs 2,232 2,126 Entegris Inc Morgan Stanley 2,295 (5,453) Entellus Medical Inc Bank of America
Merrill Lynch (9,379) (2,251) Entellus Medical Inc Morgan Stanley (3,377) 73,949 Entercom Communications Bank of America
Corp 'A' Merrill Lynch 37,714 8,150 Entercom Communications
Corp 'A' Goldman Sachs 4,157 38,526 Entercom Communications
Corp 'A' Morgan Stanley 118,660 10,028 Entergy Corp Bank of America
Merrill Lynch (7,209) 56,839 Entergy Corp Morgan Stanley (142,878) 1,202 Enterprise Bancorp Inc/MA Bank of America
Merrill Lynch (503) 878 Enterprise Bancorp Inc/MA Goldman Sachs (317) 48,388 Enterprise Financial Services Bank of America
Corp Merrill Lynch 49,378 1,440 Entravision Communications
Corp 'A' Goldman Sachs (86) 2,052 Entravision Communications
Corp 'A' Morgan Stanley 718 2,023 Entravision Communications Bank of America
Corp 'A' Merrill Lynch (121) (24,950) Envestnet Inc Bank of America
Merrill Lynch (41,591) (3,882) Envestnet Inc Morgan Stanley (20,072) 10,961 Envision Healthcare
Holdings Inc Morgan Stanley 43,805 7,692 Envision Healthcare Bank of America
Holdings Inc Merrill Lynch 12,923 22,771 Enviva Partners LP Bank of America
Merrill Lynch 28,464 32,584 Enviva Partners LP Morgan Stanley 165,994
BlackRock Americas Diversified Equity Absolute Return Fund continued
United States continued United States continued
Holding
Description Counterparty
Unrealised appreciation/
(depreciation) USD
Holding
Description Counterparty
Unrealised appreciation/
(depreciation) USD
Contracts for difference as at 31 May 2016

Annual Report and Audited Accounts 69
The notes on pages 489 to 503 form an integral part of these financial statements.
BlackRock Americas Diversified Equity Absolute Return Fund continued
2,355 EOG Resources Inc Bank of America Merrill Lynch 2,779
(1,203) EOG Resources Inc Bank of America Merrill Lynch (463)
(5,694) EOG Resources Inc Morgan Stanley (7,534) 11,348 EP Energy Corp 'A' Goldman Sachs (2,497) (15,661) EP Energy Corp 'A' Morgan Stanley (11,510) 25,591 EP Energy Corp 'A' Bank of America
Merrill Lynch (5,630) 11,183 EP Energy Corp 'A' Morgan Stanley 13,660 (39,203) EPAM Systems Inc Bank of America
Merrill Lynch (120,734) (3,509) EPAM Systems Inc Morgan Stanley (12,707) (79,009) Epiq Systems Inc Bank of America
Merrill Lynch (43,455) 19,958 EPIRUS Biopharmaceuticals Bank of America
Inc Merrill Lynch (3,592) (13,946) ePlus Inc Bank of America
Merrill Lynch (20,501) 38,591 EPR Properties (Reit) Bank of America
Merrill Lynch (26,628) (5,154) EPR Properties (Reit) Bank of America
Merrill Lynch (681) (10,200) EPR Properties (Reit) Morgan Stanley (5,382) (14,348) EQT Corp Bank of America
Merrill Lynch (44,192) (1,872) EQT Corp Morgan Stanley (6,969) 13,071 Equifax Inc Bank of America
Merrill Lynch 28,233 (1,582) Equifax Inc Bank of America
Merrill Lynch (3,682) (2,781) Equifax Inc Morgan Stanley (13,002) (3,018) Equinix Inc (Reit) Bank of America
Merrill Lynch (60,100) (751) Equinix Inc (Reit) Morgan Stanley (177) (9,116) Equity Bancshares Inc 'A' Bank of America
Merrill Lynch (20,511) (30,176) Equity Bancshares Inc 'A' Morgan Stanley (3,980) (31,212) Equity Commonwealth (Reit) Bank of America
Merrill Lynch (16,854) 14,559 Equity Commonwealth (Reit) Bank of America
Merrill Lynch 7,862 760 Equity LifeStyle Properties
Inc (Reit) Goldman Sachs (699) (23,068) Equity LifeStyle Properties
Inc (Reit) Morgan Stanley (42,658) 2,395 Equity LifeStyle Properties Bank of America
Inc (Reit) Merrill Lynch (2,203) (14,084) Equity One Inc (Reit) Morgan Stanley 9,055 (42,671) Equity One Inc (Reit) Bank of America
Merrill Lynch 24,322 (7,252) Equity Residential (Reit) Bank of America
Merrill Lynch 9,283 (2,819) Equity Residential (Reit) Morgan Stanley 12,441 (3,135) Era Group Inc Morgan Stanley (6,928) (5,608) Erie Indemnity Co 'A' Bank of America
Merrill Lynch (9,311) (3,762) Escalade Inc Bank of America
Merrill Lynch (2,633) (5,633) Escalade Inc Morgan Stanley (225) (27,940) Essendant Inc Bank of America
Merrill Lynch (39,954) 38,308 Essendant Inc Bank of America
Merrill Lynch 43,224 (30,410) Essendant Inc Morgan Stanley 46,157 102,833 Essent Group Ltd Bank of America
Merrill Lynch 150,461 48,476 Essent Group Ltd Morgan Stanley 153,280 2,063 Essex Property Trust Inc (Reit) Morgan Stanley (1,449) 49 Essex Property Trust Inc (Reit) Goldman Sachs 21 15,042 Essex Property Trust Inc (Reit) Bank of America
Merrill Lynch (58,284)
8,179 Estee Lauder Cos Inc/The 'A' Morgan Stanley 18,158 12,631 Ethan Allen Interiors Inc Bank of America
Merrill Lynch 19,831 (2,823) Etsy Inc Bank of America
Merrill Lynch (1,045) (6,392) Etsy Inc Goldman Sachs (2,365) (35,561) Etsy Inc Morgan Stanley (80,368) 21,684 Euronet Worldwide Inc Bank of America
Merrill Lynch 63,127 3,841 Euronet Worldwide Inc Morgan Stanley 5,934 94,290 EverBank Financial Corp Bank of America
Merrill Lynch 116,920 8,424 EverBank Financial Corp Goldman Sachs 10,446 99,627 EverBank Financial Corp Morgan Stanley 226,153 (4,416) EverBank Financial Corp Bank of America
Merrill Lynch (5,476) (1,606) Evercore Partners Inc 'A' Bank of America
Merrill Lynch (773) (1,519) Evercore Partners Inc 'A' Morgan Stanley (843) 2,936 Eversource Energy Bank of America
Merrill Lynch (7,076) (73,811) Eversource Energy Morgan Stanley 154,692 4,769 EVERTEC Inc Bank of America
Merrill Lynch 6,629 2,393 EVERTEC Inc Goldman Sachs 3,326 872 EVERTEC Inc Morgan Stanley 996 71,815 Everyday Health Inc Bank of America
Merrill Lynch 47,326 48,276 Everyday Health Inc Goldman Sachs 31,814 28,636 Everyday Health Inc Morgan Stanley 65,602 11,102 EVINE Live Inc Morgan Stanley (46) (11,906) Evolent Health Inc 'A' Morgan Stanley (25,365) 2,693 Evolution Petroleum Corp Bank of America
Merrill Lynch 458 2,930 Evolution Petroleum Corp Goldman Sachs 498 87,204 Evolution Petroleum Corp Morgan Stanley 95,924 (19,083) EW Scripps Co/The 'A' Morgan Stanley 14,776 (69,570) EW Scripps Co/The 'A' Bank of America
Merrill Lynch (100,877) 94,828 Exa Corp Morgan Stanley 179,225 17,277 Exactech Inc Bank of America
Merrill Lynch 19,696 11,497 Exactech Inc Goldman Sachs 13,107 25,708 Exactech Inc Morgan Stanley 137,863 (7,003) Exelon Corp Bank of America
Merrill Lynch 3,081 6,243 Exelon Corp Bank of America
Merrill Lynch (2,684) 10,811 Exelon Corp Morgan Stanley (8,976) 5,115 ExlService Holdings Inc Bank of America
Merrill Lynch 13,452 28,272 ExlService Holdings Inc Morgan Stanley 204,187 244 Expedia Inc Bank of America
Merrill Lynch 208 2,356 Expedia Inc Morgan Stanley 1,305 (32,699) Exponent Inc Morgan Stanley (152,815) 138,308 Express Inc Bank of America
Merrill Lynch (267,350) 8,609 Express Inc Goldman Sachs (16,381) 42,597 Express Inc Morgan Stanley (119,627) (30,131) Express Scripts Holding Co Bank of America
Merrill Lynch (71,000) (15,855) Express Scripts Holding Co Morgan Stanley (39,487) 1,192 Express Scripts Holding Co Bank of America
Merrill Lynch 2,777 82,491 Extended Stay America Inc
(Unit) Morgan Stanley 211,560 53,569 Extended Stay America Inc Bank of America
(Unit) Merrill Lynch 14,272 40,207 Exterran Corp Bank of America
Merrill Lynch (31,764) 992 Exterran Corp Goldman Sachs (5,158)
United States continued United States continued
Holding
Description Counterparty
Unrealised appreciation/
(depreciation) USD
Holding
Description Counterparty
Unrealised appreciation/
(depreciation) USD
Contracts for difference as at 31 May 2016

70 BlackRock Strategic Funds (BSF)
The notes on pages 489 to 503 form an integral part of these financial statements.
8,331 Exterran Corp Morgan Stanley (7,248) 3,394 Extra Space Storage Inc (Reit) Morgan Stanley 3,562 (5,848) Extra Space Storage Inc (Reit) Bank of America
Merrill Lynch 6,257 4,341 Extra Space Storage Inc (Reit) Bank of America
Merrill Lynch (281) (20,838) Exxon Mobil Corp Bank of America
Merrill Lynch (6,346) (39,240) Exxon Mobil Corp Morgan Stanley (56,331) 20,952 EZCORP Inc 'A' Bank of America
Merrill Lynch 20,323 6,982 F5 Networks Inc Bank of America
Merrill Lynch 9,872 20,900 Fabrinet Bank of America
Merrill Lynch 21,527 3,032 Fabrinet Goldman Sachs 3,123 10,414 Fabrinet Morgan Stanley 68,591 15,522 FactSet Research Bank of America
Systems Inc Merrill Lynch 103,679 12,642 FactSet Research
Systems Inc Morgan Stanley 71,102 (5,218) Fair Isaac Corp Bank of America
Merrill Lynch (8,589) (1,207) Fair Isaac Corp Morgan Stanley (3,555) (4,184) Fairmount Santrol Bank of America
Holdings Inc Merrill Lynch (5,941) (25,378) Fairmount Santrol
Holdings Inc Morgan Stanley (102,736) 64,567 FairPoint Communications Inc Bank of America
Merrill Lynch (57,465) 15,752 FairPoint Communications Inc Goldman Sachs (14,019) 54,575 FairPoint Communications Inc Morgan Stanley (46,357) (9,238) Farmer Brothers Co Bank of America
Merrill Lynch 6,559 (8,504) Farmer Brothers Co Morgan Stanley (15,477) (57,211) Farmers Capital Bank Corp Bank of America
Merrill Lynch 30,894 (19,797) Farmers Capital Bank Corp Morgan Stanley (29,121) 5,310 Farmland Partners Inc (Reit) Goldman Sachs (1,221) 6,110 Farmland Partners Inc (Reit) Morgan Stanley 4,031 (19,865) FARO Technologies Inc Bank of America
Merrill Lynch (35,757) (7,376) FARO Technologies Inc Morgan Stanley (82,195) (5,365) Fastenal Co Bank of America
Merrill Lynch (2,039) (10,713) Fastenal Co Goldman Sachs (4,071) 24,058 Fate Therapeutics Inc Goldman Sachs 481 10,572 Fate Therapeutics Inc Morgan Stanley (2,220) 28,228 Fate Therapeutics Inc Bank of America
Merrill Lynch 565 4,013 FBL Financial Group Inc 'A' Bank of America
Merrill Lynch 11,236 477 FBL Financial Group Inc 'A' Goldman Sachs 1,336 234 FBL Financial Group Inc 'A' Morgan Stanley 489 (27,533) FBR & Co Bank of America
Merrill Lynch 9,122 (64,662) FBR & Co Morgan Stanley (169,460) 18,805 FCB Financial Holdings Inc 'A' Morgan Stanley 136,336 18,741 Federal Home Loan Mortgage
Corp Goldman Sachs 11,994 (4,063) Federal Realty Investment Bank of America
Trust (Reit) Merrill Lynch 11,122 (5,953) Federal Realty Investment
Trust (Reit) Morgan Stanley 800 6,317 Federal Signal Corp Morgan Stanley (7,265) (96,758) Federal-Mogul Holdings Corp Morgan Stanley (465,406) (51,987) Federal-Mogul Holdings Corp Bank of America
Merrill Lynch 6,238 (19,384) Federated Investors Inc 'B' Bank of America
Merrill Lynch (28,301) (31,634) Federated Investors Inc 'B' Morgan Stanley (89,462)
9,830 FedEx Corp Bank of America Merrill Lynch 54,784
13,946 FedEx Corp Morgan Stanley 77,608 2,275 FEI Co Bank of America
Merrill Lynch 44,567 (558) FEI Co Bank of America
Merrill Lynch (10,931) 34,528 FelCor Lodging Trust Inc (Reit) Morgan Stanley (30,373) 42,752 FelCor Lodging Trust Inc (Reit) Bank of America
Merrill Lynch (25,651) 3,699 FelCor Lodging Trust Inc (Reit) Goldman Sachs (2,219) (10,598) Ferrari NV Bank of America
Merrill Lynch 8,386 25,568 Ferro Corp Morgan Stanley 21,717 27,098 Ferro Corp Bank of America
Merrill Lynch (2,524) 97,842 Ferroglobe Plc Morgan Stanley (181,436) 43,414 Ferroglobe Plc Bank of America
Merrill Lynch 22,450 (17,282) Fiat Chrysler Automobiles NV Bank of America
Merrill Lynch 6,049 44,096 Fibria Celulose SA ADR Goldman Sachs 24,253 86,395 Fibria Celulose SA ADR Morgan Stanley 41,826 4,068 FibroGen Inc Bank of America
Merrill Lynch 4,072 931 FibroGen Inc Morgan Stanley 968 9,133 Fidelity National Information
Services Inc Morgan Stanley 54,238 962 Fidelity National Information Bank of America
Services Inc Merrill Lynch 2,007 (16,197) Fidelity National Information Bank of America
Services Inc Merrill Lynch (26,401) 14,838 Fidelity Southern Corp Bank of America
Merrill Lynch 11,277 5,414 Fidelity Southern Corp Goldman Sachs 4,115 130,683 Fidelity Southern Corp Morgan Stanley 218,400 24,952 Fiesta Restaurant Group Inc Morgan Stanley (183,514) 2,519 Fiesta Restaurant Group Inc Bank of America
Merrill Lynch 1,562 20,311 Fifth Street Asset Bank of America
Management Inc Merrill Lynch 17,874 913 Fifth Street Asset
Management Inc Morgan Stanley 2,812 (18,470) Financial Engines Inc Goldman Sachs (32,323) 3,988 Financial Engines Inc Morgan Stanley 5,902 (7,851) Financial Institutions Inc Bank of America
Merrill Lynch (4,632) (29,555) Financial Institutions Inc Morgan Stanley (43,446) (1,660) Finisar Corp Morgan Stanley (1,648) 5,684 Finish Line Inc/The 'A' Bank of America
Merrill Lynch (6,309) 1,828 Finish Line Inc/The 'A' Goldman Sachs (2,029) 1,504 Finish Line Inc/The 'A' Morgan Stanley (2,353) (4,177) Finish Line Inc/The 'A' Morgan Stanley (2,812) (1,910) Finish Line Inc/The 'A' Bank of America
Merrill Lynch 2,241 (9,425) FireEye Inc Morgan Stanley (14,897) 2,402 First American Financial Corp Morgan Stanley 519 12,000 First American Financial Corp Bank of America
Merrill Lynch 14,138 1,742 First American Financial Corp Goldman Sachs 1,621 1,821 First Bancorp Inc/ME Bank of America
Merrill Lynch 1,530 2,114 First Bancorp Inc/ME Goldman Sachs 1,776 2,679 First Bancorp Inc/ME Morgan Stanley 2,011 (53,385) First Bancorp/Southern Bank of America
Pines NC Merrill Lynch (16,549) (125,586) First Bancorp/Southern
Pines NC Morgan Stanley (170,304) 54,204 First Busey Corp Bank of America
Merrill Lynch 60,166
BlackRock Americas Diversified Equity Absolute Return Fund continued
United States continued United States continued
Holding
Description Counterparty
Unrealised appreciation/
(depreciation) USD
Holding
Description Counterparty
Unrealised appreciation/
(depreciation) USD
Contracts for difference as at 31 May 2016

Annual Report and Audited Accounts 71
The notes on pages 489 to 503 form an integral part of these financial statements.
BlackRock Americas Diversified Equity Absolute Return Fund continued
9,595 First Busey Corp Goldman Sachs 10,650 141,683 First Busey Corp Morgan Stanley 459,053 (6,510) First Business Financial Bank of America
Services Inc Merrill Lynch (1,367) (11,793) First Business Financial
Services Inc Morgan Stanley (40,804) (56,825) First Cash Financial Bank of America
Services Inc Merrill Lynch 62,222 (14,096) First Cash Financial
Services Inc Morgan Stanley (42,096) (24,983) First Citizens BancShares Bank of America
Inc/NC 'A' Merrill Lynch (204,413) (5,069) First Citizens BancShares
Inc/NC 'A' Morgan Stanley (139,926) (218,131) First Commonwealth Bank of America
Financial Corp Merrill Lynch (115,609) (3,190) First Commonwealth
Financial Corp Goldman Sachs (1,691) (46,370) First Community Bank of America
Bancshares Inc/VA Merrill Lynch (38,487) (21,406) First Community
Bancshares Inc/VA Morgan Stanley (88,835) 114,993 First Connecticut Bank of America
Bancorp Inc/Farmington CT Merrill Lynch (9,199) 3,834 First Connecticut
Bancorp Inc/Farmington CT Goldman Sachs (307) 45,962 First Connecticut
Bancorp Inc/Farmington CT Morgan Stanley 16,546 24,547 First Data Corp 'A' Bank of America
Merrill Lynch 37,302 5,634 First Data Corp 'A' Goldman Sachs 11,311 12,448 First Data Corp 'A' Morgan Stanley 12,997 141,857 First Defiance Financial Corp Bank of America
Merrill Lynch 27,345 1,558 First Defiance Financial Corp Goldman Sachs 296 65,963 First Defiance Financial Corp Morgan Stanley 172,228 (2,826) First Financial Bancorp Bank of America
Merrill Lynch (1,441) (50,328) First Foundation Inc Morgan Stanley (32,381) 119,493 First Horizon National Corp Bank of America
Merrill Lynch 91,371 4,421 First Horizon National Corp Morgan Stanley 8,221 (6,733) First Horizon National Corp Morgan Stanley (1,323) 18,904 First Industrial Realty
Trust Inc (Reit) Morgan Stanley 92,699 628 First Industrial Realty
Trust Inc (Reit) Goldman Sachs (57) 6,026 First Industrial Realty Bank of America
Trust Inc (Reit) Merrill Lynch (542) 18,305 First Internet Bancorp Bank of America
Merrill Lynch 26,542 4,825 First Internet Bancorp Goldman Sachs 6,996 2,866 First Internet Bancorp Morgan Stanley 5,089 6,687 First Majestic Silver Corp Morgan Stanley 8,326 8,204 First Majestic Silver Corp Bank of America
Merrill Lynch (7,137) (7,561) First Marblehead Corp/The Morgan Stanley 3,176 44,528 First Merchants Corp Bank of America
Merrill Lynch 30,279 61,440 First Midwest Bancorp Inc/IL Bank of America
Merrill Lynch 65,357 75,437 First Midwest Bancorp Inc/IL Morgan Stanley 180,256 (63,920) First Niagara Financial
Group Inc Morgan Stanley (117,613) (21,540) First Northwest Bancorp Morgan Stanley (24,771) (2,152) First of Long Island Corp/The Bank of America
Merrill Lynch (2,130) (76,744) First Potomac Realty Bank of America
Trust (Reit) Merrill Lynch (19,805) (33,301) First Potomac Realty
Trust (Reit) Morgan Stanley 80,511
41,316 First Republic Bank/CA Bank of America Merrill Lynch 183,181
339 First Republic Bank/CA Goldman Sachs 1,698 14,512 First Republic Bank/CA Morgan Stanley 68,511 (1,513) First Solar Inc Bank of America
Merrill Lynch 542 3,020 FirstEnergy Corp Morgan Stanley 1,625 4,098 Fiserv Inc Bank of America
Merrill Lynch 4,169 2,586 Fiserv Inc Morgan Stanley 13,892 (4,406) Fiserv Inc Bank of America
Merrill Lynch (4,482) 3,319 Fitbit Inc 'A' Bank of America
Merrill Lynch 365 3,883 Fitbit Inc 'A' Goldman Sachs 427 15,659 Fitbit Inc 'A' Morgan Stanley 7,067 1,376 Five Below Inc Morgan Stanley 3,512 1,160 Five Below Inc Bank of America
Merrill Lynch 2,917 (18,784) Five Oaks Investment Corp
(Reit) Morgan Stanley 7,926 2,789 Five Prime Therapeutics Inc Bank of America
Merrill Lynch 10,542 17,972 Five9 Inc Bank of America
Merrill Lynch 22,645 2,210 Five9 Inc Morgan Stanley 4,889 59,254 Flagstar Bancorp Inc Bank of America
Merrill Lynch 40,157 93,412 Flagstar Bancorp Inc Morgan Stanley 370,934 (8,544) FleetCor Technologies Inc Bank of America
Merrill Lynch (34,261) (7,255) FleetCor Technologies Inc Morgan Stanley (75,453) (976) Fleetmatics Group Plc Bank of America
Merrill Lynch 198 19,901 Flex Pharma Inc Bank of America
Merrill Lynch 52,141 19,346 Flex Pharma Inc Goldman Sachs 50,687 15,353 Flex Pharma Inc Morgan Stanley 85,912 (11,195) Flexsteel Industries Inc Bank of America
Merrill Lynch (7,948) (5,011) Flexsteel Industries Inc Morgan Stanley (8,970) 30,782 Flextronics International Ltd Morgan Stanley 47,580 93,029 Flextronics International Ltd Bank of America
Merrill Lynch (1,861) 2,068 Flextronics International Ltd Goldman Sachs (41) 56,398 FLIR Systems Inc Bank of America
Merrill Lynch 30,455 18,406 FLIR Systems Inc Morgan Stanley (14,728) (46,854) Flotek Industries Inc Goldman Sachs (49,197) (19,346) Flotek Industries Inc Morgan Stanley (111,046) 38,934 Flowers Foods Inc Morgan Stanley (15,732) (1,174) Flowers Foods Inc Bank of America
Merrill Lynch (543) (48,383) Flowserve Corp Bank of America
Merrill Lynch (128,215) (40,245) Flowserve Corp Morgan Stanley (131,768) (2,011) Fluidigm Corp Bank of America
Merrill Lynch (1,006) 12,336 Fluor Corp Bank of America
Merrill Lynch 22,698 (736) Fluor Corp Bank of America
Merrill Lynch (235) (21,154) FMC Corp Bank of America
Merrill Lynch (18,404) (20,621) FNB Corp/PA Morgan Stanley (5,008) (83,814) FNB Corp/PA Bank of America
Merrill Lynch (50,077) (12,350) FNF Group Morgan Stanley (19,959) 9,397 FNF Group Goldman Sachs 8,833 1,498 FNF Group Morgan Stanley 1,956 6,731 FNFV Group Goldman Sachs 1,952 (1,917) Foamix Pharmaceuticals Ltd Goldman Sachs (479)
United States continued United States continued
Holding
Description Counterparty
Unrealised appreciation/
(depreciation) USD
Holding
Description Counterparty
Unrealised appreciation/
(depreciation) USD
Contracts for difference as at 31 May 2016

72 BlackRock Strategic Funds (BSF)
The notes on pages 489 to 503 form an integral part of these financial statements.
(53,052) Foamix Pharmaceuticals Ltd Morgan Stanley (57,386) (2,320) Fomento Economico
Mexicano SAB de CV ADR Goldman Sachs 2,459 (10,600) Fomento Economico
Mexicano SAB de CV ADR Morgan Stanley 766 8,729 Foot Locker Inc Bank of America
Merrill Lynch (35,003) 17,195 Foot Locker Inc Morgan Stanley (105,575) 55,168 Ford Motor Co Bank of America
Merrill Lynch 10,758 995 Ford Motor Co Goldman Sachs 194 40,210 Ford Motor Co Morgan Stanley 40,840 21,038 Forest City Realty Trust Inc
'A' (Reit) Morgan Stanley 76,683 (26,678) Forest City Realty Trust Inc Bank of America
'A' (Reit) Merrill Lynch (9,071) 725 Forest City Realty Trust Inc Bank of America
'A' (Reit) Merrill Lynch 247 (22,763) Forestar Group Inc Bank of America
Merrill Lynch (18,438) (85,404) Forestar Group Inc Morgan Stanley (280,533) (96,396) FormFactor Inc Bank of America
Merrill Lynch (46,570) (26,169) Forrester Research Inc Bank of America
Merrill Lynch (11,581) 27,025 Fortinet Inc Bank of America
Merrill Lynch 43,780 14,718 Fortinet Inc Morgan Stanley 87,003 37,756 Fortress Transportation & Bank of America
Infrastructure Investors LLC Merrill Lynch 26,052 13,527 Fortune Brands Home & Bank of America
Security Inc Merrill Lynch 28,960 541 Fortune Brands Home &
Security Inc Goldman Sachs 1,143 15,956 Fortune Brands Home &
Security Inc Morgan Stanley 48,259 15,107 Forum Energy Technologies Inc Morgan Stanley 120,554 (31,274) Forum Energy Technologies Inc Bank of America
Merrill Lynch (36,278) 7,349 Forward Air Corp Bank of America
Merrill Lynch 3,623 3,849 Forward Air Corp Morgan Stanley 6,873 (58,130) Forward Air Corp Bank of America
Merrill Lynch (141,612) (2,716) Fossil Group Inc Bank of America
Merrill Lynch (615) (1,327) Fossil Group Inc Morgan Stanley 7,299 15,917 Four Corners Property Trust
Inc (Reit) Morgan Stanley 27,477 26,550 Four Corners Property Trust Bank of America
Inc (Reit) Merrill Lynch 8,496 256 Four Corners Property Trust
Inc (Reit) Goldman Sachs 82 (15,288) Fox Chase Bancorp Inc Bank of America
Merrill Lynch (6,935) 8,981 Fox Factory Holding Corp Bank of America
Merrill Lynch 3,862 8,268 Fox Factory Holding Corp Goldman Sachs 3,555 3,984 Fox Factory Holding Corp Morgan Stanley 3,436 20,148 Francesca's Holdings Corp Bank of America
Merrill Lynch (90,062) 1,624 Francesca's Holdings Corp Goldman Sachs (7,259) 3,519 Francesca's Holdings Corp Morgan Stanley (26,861) 8,520 Frank's International NV Morgan Stanley 21,328 (20,404) Franklin Electric Co Inc Bank of America
Merrill Lynch (17,343) (683) Franklin Electric Co Inc Morgan Stanley (409) 490 Franklin Financial Network Inc Goldman Sachs (212) 958 Franklin Financial Network Inc Morgan Stanley (126) 495 Franklin Financial Network Inc Bank of America
Merrill Lynch 96 (72,682) Franklin Resources Inc Morgan Stanley (282,233)
(57,157) Franklin Street Properties Bank of America Corp (Reit) Merrill Lynch (12,003)
(15,077) Franklin Street Properties Corp (Reit) Morgan Stanley (37,240)
(10,380) Fred's Inc 'A' Bank of America Merrill Lynch (12,975)
(65,447) Fred's Inc 'A' Morgan Stanley (117,805) (15,983) Freeport-McMoRan Inc Morgan Stanley (114,302) (10,310) Freeport-McMoRan Inc Bank of America
Merrill Lynch (2,681) (557) Freeport-McMoRan Inc Goldman Sachs (145) (10,618) Fresh Del Monte Produce Inc Bank of America
Merrill Lynch (14,035) 32,615 Frontier Communications Bank of America
Corp Merrill Lynch (2,609) 12,845 Frontier Communications
Corp Morgan Stanley (3,010) 4,709 Frontline Ltd/Bermuda Morgan Stanley 2,601 6,147 Frontline Ltd/Bermuda Bank of America
Merrill Lynch 3,731 975 FRP Holdings Inc Bank of America
Merrill Lynch (144) 4,583 FRP Holdings Inc Morgan Stanley 1,801 (31,821) FTI Consulting Inc Bank of America
Merrill Lynch (23,866) (26,734) Fuel Systems Solutions Inc Morgan Stanley (45,180) (177,170) Fulton Financial Corp Bank of America
Merrill Lynch (136,011) (69,367) Fulton Financial Corp Morgan Stanley (24,979) (8,488) G&K Services Inc 'A' Morgan Stanley (42,434) (4,432) G&K Services Inc 'A' Bank of America
Merrill Lynch (6,177) 2,738 G-III Apparel Group Ltd Morgan Stanley (9,505) (9,989) G-III Apparel Group Ltd Bank of America
Merrill Lynch (10,089) 6,432 G-III Apparel Group Ltd Bank of America
Merrill Lynch 7,218 (134,454) Gafisa SA ADR Morgan Stanley 28,034 (2,197) Gaiam Inc 'A' Morgan Stanley (297) 1,792 GAIN Capital Holdings Inc Bank of America
Merrill Lynch (54) (6,126) GAMCO Investors Inc 'A' Bank of America
Merrill Lynch 735 (9,635) GAMCO Investors Inc 'A' Morgan Stanley (49,895) 22,026 GameStop Corp 'A' Bank of America
Merrill Lynch (1,690) 8,762 GameStop Corp 'A' Morgan Stanley (7,022) (14,138) Gaming and Leisure
Properties Inc (Reit) Morgan Stanley (17,933) (15,849) Gaming and Leisure Bank of America
Properties Inc (Reit) Merrill Lynch 19,494 (4,470) Gannett Co Inc Bank of America
Merrill Lynch 2,593 (917) Gannett Co Inc Goldman Sachs 532 (2,703) Gannett Co Inc Morgan Stanley 1,482 (83,689) Gap Inc/The Morgan Stanley 695,183 (69,627) Gap Inc/The Bank of America
Merrill Lynch (21,584) (7,389) Garmin Ltd Goldman Sachs (12,561) 753 Garmin Ltd Morgan Stanley 1,397 9,526 Gartner Inc Bank of America
Merrill Lynch 41,000 546 Gartner Inc Goldman Sachs 2,353 (562) Gartner Inc Morgan Stanley (1,353) 25,989 Gas Natural Inc Bank of America
Merrill Lynch — 4,253 Gas Natural Inc Goldman Sachs — 14,578 Gas Natural Inc Morgan Stanley (10,721) (17,032) GATX Corp Morgan Stanley (18,418) 43,783 GCP Applied Technologies Inc Morgan Stanley 203,293 30,318 GCP Applied Technologies Inc Bank of America
Merrill Lynch 5,952
BlackRock Americas Diversified Equity Absolute Return Fund continued
United States continued United States continued
Holding
Description Counterparty
Unrealised appreciation/
(depreciation) USD
Holding
Description Counterparty
Unrealised appreciation/
(depreciation) USD
Contracts for difference as at 31 May 2016
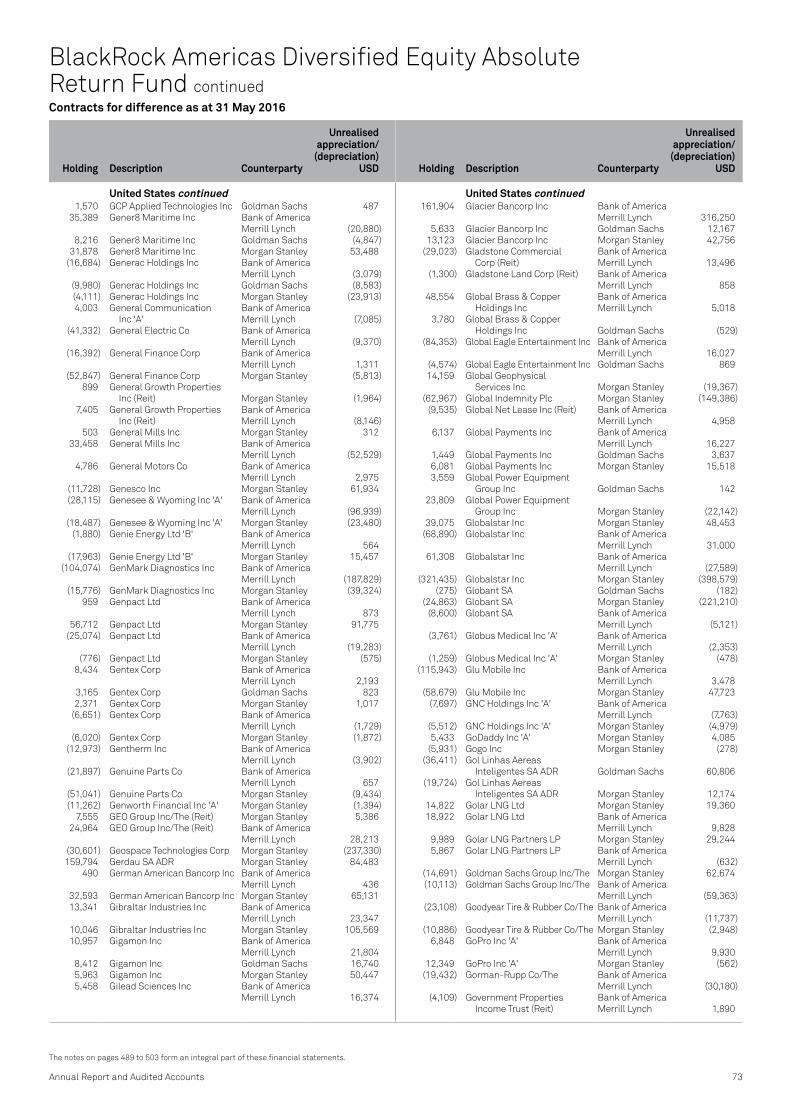
Annual Report and Audited Accounts 73
The notes on pages 489 to 503 form an integral part of these financial statements.
BlackRock Americas Diversified Equity Absolute Return Fund continued
1,570 GCP Applied Technologies Inc Goldman Sachs 487 35,389 Gener8 Maritime Inc Bank of America
Merrill Lynch (20,880) 8,216 Gener8 Maritime Inc Goldman Sachs (4,847) 31,878 Gener8 Maritime Inc Morgan Stanley 53,488 (16,684) Generac Holdings Inc Bank of America
Merrill Lynch (3,079) (9,980) Generac Holdings Inc Goldman Sachs (8,583) (4,111) Generac Holdings Inc Morgan Stanley (23,913) 4,003 General Communication Bank of America
Inc 'A' Merrill Lynch (7,085) (41,332) General Electric Co Bank of America
Merrill Lynch (9,370) (16,392) General Finance Corp Bank of America
Merrill Lynch 1,311 (52,847) General Finance Corp Morgan Stanley (5,813) 899 General Growth Properties
Inc (Reit) Morgan Stanley (1,964) 7,405 General Growth Properties Bank of America
Inc (Reit) Merrill Lynch (8,146) 503 General Mills Inc Morgan Stanley 312 33,458 General Mills Inc Bank of America
Merrill Lynch (52,529) 4,786 General Motors Co Bank of America
Merrill Lynch 2,975 (11,728) Genesco Inc Morgan Stanley 61,934 (28,115) Genesee & Wyoming Inc 'A' Bank of America
Merrill Lynch (96,939) (18,487) Genesee & Wyoming Inc 'A' Morgan Stanley (23,480) (1,880) Genie Energy Ltd 'B' Bank of America
Merrill Lynch 564 (17,963) Genie Energy Ltd 'B' Morgan Stanley 15,457 (104,074) GenMark Diagnostics Inc Bank of America
Merrill Lynch (187,829) (15,776) GenMark Diagnostics Inc Morgan Stanley (39,324) 959 Genpact Ltd Bank of America
Merrill Lynch 873 56,712 Genpact Ltd Morgan Stanley 91,775 (25,074) Genpact Ltd Bank of America
Merrill Lynch (19,283) (776) Genpact Ltd Morgan Stanley (575) 8,434 Gentex Corp Bank of America
Merrill Lynch 2,193 3,165 Gentex Corp Goldman Sachs 823 2,371 Gentex Corp Morgan Stanley 1,017 (6,651) Gentex Corp Bank of America
Merrill Lynch (1,729) (6,020) Gentex Corp Morgan Stanley (1,872) (12,973) Gentherm Inc Bank of America
Merrill Lynch (3,902) (21,897) Genuine Parts Co Bank of America
Merrill Lynch 657 (51,041) Genuine Parts Co Morgan Stanley (9,434) (11,262) Genworth Financial Inc 'A' Morgan Stanley (1,394) 7,555 GEO Group Inc/The (Reit) Morgan Stanley 5,386 24,964 GEO Group Inc/The (Reit) Bank of America
Merrill Lynch 28,213 (30,601) Geospace Technologies Corp Morgan Stanley (237,330) 159,794 Gerdau SA ADR Morgan Stanley 84,483 490 German American Bancorp Inc Bank of America
Merrill Lynch 436 32,593 German American Bancorp Inc Morgan Stanley 65,131 13,341 Gibraltar Industries Inc Bank of America
Merrill Lynch 23,347 10,046 Gibraltar Industries Inc Morgan Stanley 105,569 10,957 Gigamon Inc Bank of America
Merrill Lynch 21,804 8,412 Gigamon Inc Goldman Sachs 16,740 5,963 Gigamon Inc Morgan Stanley 50,447 5,458 Gilead Sciences Inc Bank of America
Merrill Lynch 16,374
161,904 Glacier Bancorp Inc Bank of America Merrill Lynch 316,250
5,633 Glacier Bancorp Inc Goldman Sachs 12,167 13,123 Glacier Bancorp Inc Morgan Stanley 42,756 (29,023) Gladstone Commercial Bank of America
Corp (Reit) Merrill Lynch 13,496 (1,300) Gladstone Land Corp (Reit) Bank of America
Merrill Lynch 858 48,554 Global Brass & Copper Bank of America
Holdings Inc Merrill Lynch 5,018 3,780 Global Brass & Copper
Holdings Inc Goldman Sachs (529) (84,353) Global Eagle Entertainment Inc Bank of America
Merrill Lynch 16,027 (4,574) Global Eagle Entertainment Inc Goldman Sachs 869 14,159 Global Geophysical
Services Inc Morgan Stanley (19,367) (62,967) Global Indemnity Plc Morgan Stanley (149,386) (9,535) Global Net Lease Inc (Reit) Bank of America
Merrill Lynch 4,958 6,137 Global Payments Inc Bank of America
Merrill Lynch 16,227 1,449 Global Payments Inc Goldman Sachs 3,637 6,081 Global Payments Inc Morgan Stanley 15,518 3,559 Global Power Equipment
Group Inc Goldman Sachs 142 23,809 Global Power Equipment
Group Inc Morgan Stanley (22,142) 39,075 Globalstar Inc Morgan Stanley 48,453 (68,890) Globalstar Inc Bank of America
Merrill Lynch 31,000 61,308 Globalstar Inc Bank of America
Merrill Lynch (27,589) (321,435) Globalstar Inc Morgan Stanley (398,579) (275) Globant SA Goldman Sachs (182) (24,863) Globant SA Morgan Stanley (221,210) (8,600) Globant SA Bank of America
Merrill Lynch (5,121) (3,761) Globus Medical Inc 'A' Bank of America
Merrill Lynch (2,353) (1,259) Globus Medical Inc 'A' Morgan Stanley (478) (115,943) Glu Mobile Inc Bank of America
Merrill Lynch 3,478 (58,679) Glu Mobile Inc Morgan Stanley 47,723 (7,697) GNC Holdings Inc 'A' Bank of America
Merrill Lynch (7,763) (5,512) GNC Holdings Inc 'A' Morgan Stanley (4,979) 5,433 GoDaddy Inc 'A' Morgan Stanley 4,085 (5,931) Gogo Inc Morgan Stanley (278) (36,411) Gol Linhas Aereas
Inteligentes SA ADR Goldman Sachs 60,806 (19,724) Gol Linhas Aereas
Inteligentes SA ADR Morgan Stanley 12,174 14,822 Golar LNG Ltd Morgan Stanley 19,360 18,922 Golar LNG Ltd Bank of America
Merrill Lynch 9,828 9,989 Golar LNG Partners LP Morgan Stanley 29,244 5,867 Golar LNG Partners LP Bank of America
Merrill Lynch (632) (14,691) Goldman Sachs Group Inc/The Morgan Stanley 62,674 (10,113) Goldman Sachs Group Inc/The Bank of America
Merrill Lynch (59,363) (23,108) Goodyear Tire & Rubber Co/The Bank of America
Merrill Lynch (11,737) (10,886) Goodyear Tire & Rubber Co/The Morgan Stanley (2,948) 6,848 GoPro Inc 'A' Bank of America
Merrill Lynch 9,930 12,349 GoPro Inc 'A' Morgan Stanley (562) (19,432) Gorman-Rupp Co/The Bank of America
Merrill Lynch (30,180) (4,109) Government Properties Bank of America
Income Trust (Reit) Merrill Lynch 1,890
United States continued United States continued
Holding
Description Counterparty
Unrealised appreciation/
(depreciation) USD
Holding
Description Counterparty
Unrealised appreciation/
(depreciation) USD
Contracts for difference as at 31 May 2016

74 BlackRock Strategic Funds (BSF)
The notes on pages 489 to 503 form an integral part of these financial statements.
(87,483) Government Properties Income Trust (Reit) Goldman Sachs 40,242
(56,665) GP Strategies Corp Bank of America Merrill Lynch (5,100)
(5,304) GP Strategies Corp Morgan Stanley (5,657) (5,078) Graco Inc Bank of America
Merrill Lynch (4,288) (497) Graco Inc Morgan Stanley (443) (31,606) Graham Corp Bank of America
Merrill Lynch (4,425) (644) Graham Holdings Co 'B' Bank of America
Merrill Lynch (18,283) (48) Graham Holdings Co 'B' Goldman Sachs (1,363) (55) Graham Holdings Co 'B' Morgan Stanley (1,533) 286 Graham Holdings Co 'B' Bank of America
Merrill Lynch 5,232 208 Graham Holdings Co 'B' Morgan Stanley 3,650 (69,459) Gramercy Property Trust (Reit) Morgan Stanley (112,567) (552,344) Gramercy Property Trust (Reit) Bank of America
Merrill Lynch 77,801 (395) Grand Canyon Education Inc Morgan Stanley (311) (14,920) Granite Construction Inc Bank of America
Merrill Lynch 10,352 (1,160) Granite Construction Inc Morgan Stanley 333 2,216 Graphic Packaging Holding Co Bank of America
Merrill Lynch 355 41,310 Graphic Packaging Holding Co Morgan Stanley 67,335 29,312 Gray Television Inc Bank of America
Merrill Lynch 7,328 9,894 Gray Television Inc Goldman Sachs 2,474 12,918 Gray Television Inc Morgan Stanley (5,072) 11,723 Great Ajax Corp (Reit) Morgan Stanley 42,554 (19,079) Great Lakes Dredge & Bank of America
Dock Corp Merrill Lynch (1,145) (1,950) Great Lakes Dredge &
Dock Corp Morgan Stanley (2,477) 25,404 Great Plains Energy Inc Bank of America
Merrill Lynch (63,489) 65,713 Great Plains Energy Inc Morgan Stanley (202,776) 10,703 Great Southern Bancorp Inc Bank of America
Merrill Lynch 8,455 5,686 Great Southern Bancorp Inc Goldman Sachs 4,492 4,014 Great Southern Bancorp Inc Morgan Stanley 6,366 38,029 Great Western Bancorp Inc Bank of America
Merrill Lynch 72,255 53,569 Great Western Bancorp Inc Morgan Stanley 273,362 19,396 Greatbatch Inc Morgan Stanley (47,988) (1,236) Greatbatch Inc Bank of America
Merrill Lynch (705) (30,005) Green Brick Partners Inc Bank of America
Merrill Lynch (9,002) (43,533) Green Brick Partners Inc Morgan Stanley (97,911) 1,380 Green Dot Corp 'A' Bank of America
Merrill Lynch 182 2,053 Green Dot Corp 'A' Morgan Stanley 773 (43,134) Green Dot Corp 'A' Bank of America
Merrill Lynch 54,780 (1,803) Green Plains Inc Bank of America
Merrill Lynch (6,274) 600 Green Plains Partners LP Morgan Stanley 30 6,058 Greenbrier Cos Inc/The Morgan Stanley 11,350 27,270 Greenbrier Cos Inc/The Bank of America
Merrill Lynch 66,811 (46,733) Greenlight Capital Re Ltd 'A' Morgan Stanley 12,588 60,171 Greif Inc 'A' Bank of America
Merrill Lynch 29,413 12,663 Greif Inc 'A' Morgan Stanley 18,388 969 Group 1 Automotive Inc Bank of America
Merrill Lynch 1,792 380 Group 1 Automotive Inc Goldman Sachs 982 1,313 Group 1 Automotive Inc Morgan Stanley 1,462 16,949 Groupon Inc Morgan Stanley (9,821)
(7,668) Groupon Inc Bank of America Merrill Lynch (1,610)
(12,234) Groupon Inc Morgan Stanley (4,135) 82,804 Groupon Inc Bank of America
Merrill Lynch 17,389 6,404 Groupon Inc Goldman Sachs 1,345 (23,156) GrubHub Inc Bank of America
Merrill Lynch 2,396 (30,430) GrubHub Inc Goldman Sachs 16,128 (1,892) GrubHub Inc Morgan Stanley (10,236) 25,487 Grupo Aeroportuario del
Centro Norte SAB de CV ADR Goldman Sachs (7,950) 549 Grupo Aeroportuario del
Centro Norte SAB de CV ADR Morgan Stanley (81) 3,356 Grupo Aeroportuario del
Sureste SAB de CV ADR Morgan Stanley 18,453 1,857 Grupo Aeroportuario del
Sureste SAB de CV ADR Goldman Sachs (3,380) (33,913) Grupo Televisa SAB ADR Morgan Stanley (13,053) (9,465) Grupo Televisa SAB ADR Goldman Sachs (4,733) (884) GTT Communications Inc Bank of America
Merrill Lynch (1,476) (31,023) GTT Communications Inc Morgan Stanley (165,009) 1,003 Guaranty Bancorp Morgan Stanley (232) (69,125) Guess? Inc Bank of America
Merrill Lynch 28,979 14,818 Guess? Inc Morgan Stanley (8,222) 8,072 Guess? Inc Bank of America
Merrill Lynch (3,881) (98,741) Guidance Software Inc Morgan Stanley (174,772) (9,172) Guidewire Software Inc Morgan Stanley (23,356) 51,813 Gulf Island Fabrication Inc Bank of America
Merrill Lynch 6,573 15,180 Gulf Island Fabrication Inc Goldman Sachs 2,160 52,917 Gulf Island Fabrication Inc Morgan Stanley (87,705) 6,953 Gulfport Energy Corp Bank of America
Merrill Lynch 8,277 1,704 Gulfport Energy Corp Goldman Sachs 2,223 9,940 Gulfport Energy Corp Morgan Stanley 22,052 (8,024) H&E Equipment Services Inc Bank of America
Merrill Lynch (6,660) 66,886 H&R Block Inc Bank of America
Merrill Lynch 68,162 (6,688) H&R Block Inc Bank of America
Merrill Lynch (6,822) 31,119 H&R Block Inc Morgan Stanley 28,658 28,807 Hackett Group Inc/The Bank of America
Merrill Lynch (3,452) 15,609 Hackett Group Inc/The Goldman Sachs (1,751) 10,313 Hackett Group Inc/The Morgan Stanley (833) (4,779) Haemonetics Corp Bank of America
Merrill Lynch (1,094) 3,516 Haemonetics Corp Morgan Stanley 92 (7,384) Haemonetics Corp Morgan Stanley (1,207) (17,244) Hain Celestial Group Inc/The Bank of America
Merrill Lynch (28,804) (14,760) Hain Celestial Group Inc/The Morgan Stanley (88,399) 6,128 Hallador Energy Co Goldman Sachs (1,164) 5,753 Hallador Energy Co Morgan Stanley (4,746) (14,814) Halliburton Co Bank of America
Merrill Lynch (36,343) (10,944) Halliburton Co Morgan Stanley (29,581) 121,040 Hallmark Financial Bank of America
Services Inc Merrill Lynch (33,891) 21,468 Hallmark Financial
Services Inc Goldman Sachs (6,011) 59,285 Hallmark Financial
Services Inc Morgan Stanley (3,977) (2,825) Halyard Health Inc Bank of America
Merrill Lynch (5,827) (1,016) Halyard Health Inc Morgan Stanley (1,735)
BlackRock Americas Diversified Equity Absolute Return Fund continued
United States continued United States continued
Holding
Description Counterparty
Unrealised appreciation/
(depreciation) USD
Holding
Description Counterparty
Unrealised appreciation/
(depreciation) USD
Contracts for difference as at 31 May 2016
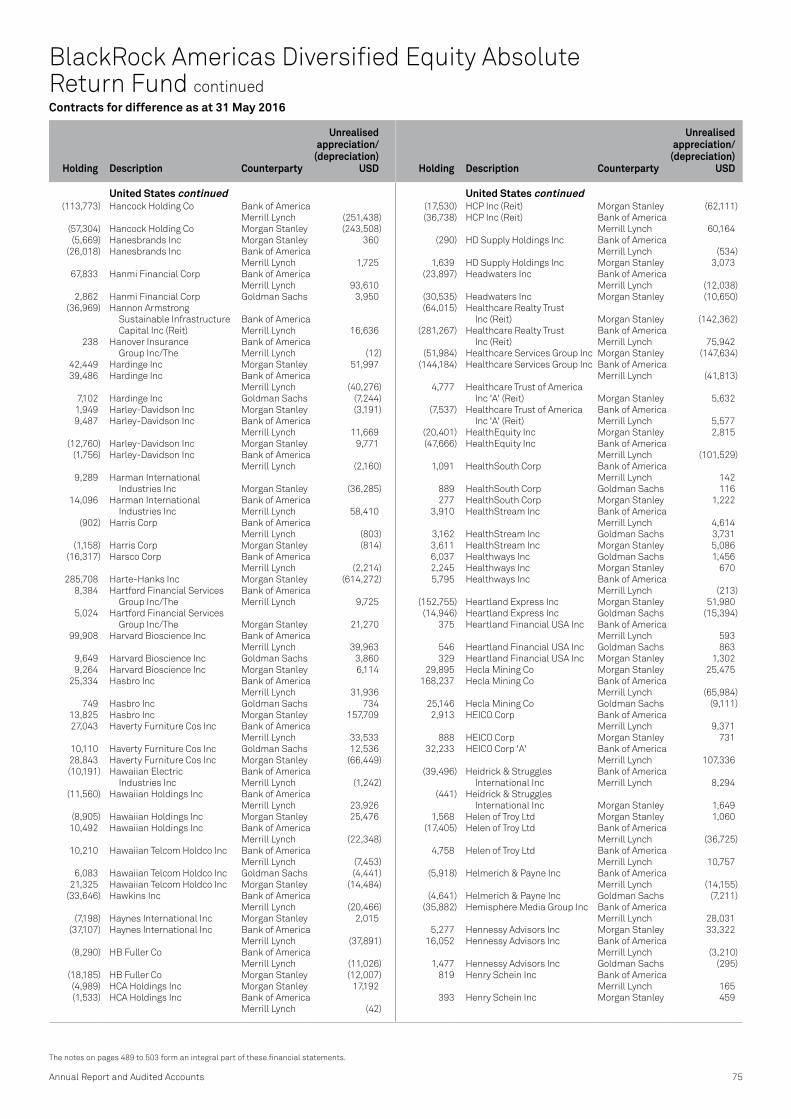
Annual Report and Audited Accounts 75
The notes on pages 489 to 503 form an integral part of these financial statements.
BlackRock Americas Diversified Equity Absolute Return Fund continued
(113,773) Hancock Holding Co Bank of America Merrill Lynch (251,438)
(57,304) Hancock Holding Co Morgan Stanley (243,508) (5,669) Hanesbrands Inc Morgan Stanley 360 (26,018) Hanesbrands Inc Bank of America
Merrill Lynch 1,725 67,833 Hanmi Financial Corp Bank of America
Merrill Lynch 93,610 2,862 Hanmi Financial Corp Goldman Sachs 3,950 (36,969) Hannon Armstrong
Sustainable Infrastructure Bank of America Capital Inc (Reit) Merrill Lynch 16,636
238 Hanover Insurance Bank of America Group Inc/The Merrill Lynch (12)
42,449 Hardinge Inc Morgan Stanley 51,997 39,486 Hardinge Inc Bank of America
Merrill Lynch (40,276) 7,102 Hardinge Inc Goldman Sachs (7,244) 1,949 Harley-Davidson Inc Morgan Stanley (3,191) 9,487 Harley-Davidson Inc Bank of America
Merrill Lynch 11,669 (12,760) Harley-Davidson Inc Morgan Stanley 9,771 (1,756) Harley-Davidson Inc Bank of America
Merrill Lynch (2,160) 9,289 Harman International
Industries Inc Morgan Stanley (36,285) 14,096 Harman International Bank of America
Industries Inc Merrill Lynch 58,410 (902) Harris Corp Bank of America
Merrill Lynch (803) (1,158) Harris Corp Morgan Stanley (814) (16,317) Harsco Corp Bank of America
Merrill Lynch (2,214) 285,708 Harte-Hanks Inc Morgan Stanley (614,272) 8,384 Hartford Financial Services Bank of America
Group Inc/The Merrill Lynch 9,725 5,024 Hartford Financial Services
Group Inc/The Morgan Stanley 21,270 99,908 Harvard Bioscience Inc Bank of America
Merrill Lynch 39,963 9,649 Harvard Bioscience Inc Goldman Sachs 3,860 9,264 Harvard Bioscience Inc Morgan Stanley 6,114 25,334 Hasbro Inc Bank of America
Merrill Lynch 31,936 749 Hasbro Inc Goldman Sachs 734 13,825 Hasbro Inc Morgan Stanley 157,709 27,043 Haverty Furniture Cos Inc Bank of America
Merrill Lynch 33,533 10,110 Haverty Furniture Cos Inc Goldman Sachs 12,536 28,843 Haverty Furniture Cos Inc Morgan Stanley (66,449) (10,191) Hawaiian Electric Bank of America
Industries Inc Merrill Lynch (1,242) (11,560) Hawaiian Holdings Inc Bank of America
Merrill Lynch 23,926 (8,905) Hawaiian Holdings Inc Morgan Stanley 25,476 10,492 Hawaiian Holdings Inc Bank of America
Merrill Lynch (22,348) 10,210 Hawaiian Telcom Holdco Inc Bank of America
Merrill Lynch (7,453) 6,083 Hawaiian Telcom Holdco Inc Goldman Sachs (4,441) 21,325 Hawaiian Telcom Holdco Inc Morgan Stanley (14,484) (33,646) Hawkins Inc Bank of America
Merrill Lynch (20,466) (7,198) Haynes International Inc Morgan Stanley 2,015 (37,107) Haynes International Inc Bank of America
Merrill Lynch (37,891) (8,290) HB Fuller Co Bank of America
Merrill Lynch (11,026) (18,185) HB Fuller Co Morgan Stanley (12,007) (4,989) HCA Holdings Inc Morgan Stanley 17,192 (1,533) HCA Holdings Inc Bank of America
Merrill Lynch (42)
(17,530) HCP Inc (Reit) Morgan Stanley (62,111) (36,738) HCP Inc (Reit) Bank of America
Merrill Lynch 60,164 (290) HD Supply Holdings Inc Bank of America
Merrill Lynch (534) 1,639 HD Supply Holdings Inc Morgan Stanley 3,073 (23,897) Headwaters Inc Bank of America
Merrill Lynch (12,038) (30,535) Headwaters Inc Morgan Stanley (10,650) (64,015) Healthcare Realty Trust
Inc (Reit) Morgan Stanley (142,362) (281,267) Healthcare Realty Trust Bank of America
Inc (Reit) Merrill Lynch 75,942 (51,984) Healthcare Services Group Inc Morgan Stanley (147,634) (144,184) Healthcare Services Group Inc Bank of America
Merrill Lynch (41,813) 4,777 Healthcare Trust of America
Inc 'A' (Reit) Morgan Stanley 5,632 (7,537) Healthcare Trust of America Bank of America
Inc 'A' (Reit) Merrill Lynch 5,577 (20,401) HealthEquity Inc Morgan Stanley 2,815 (47,666) HealthEquity Inc Bank of America
Merrill Lynch (101,529) 1,091 HealthSouth Corp Bank of America
Merrill Lynch 142 889 HealthSouth Corp Goldman Sachs 116 277 HealthSouth Corp Morgan Stanley 1,222 3,910 HealthStream Inc Bank of America
Merrill Lynch 4,614 3,162 HealthStream Inc Goldman Sachs 3,731 3,611 HealthStream Inc Morgan Stanley 5,086 6,037 Healthways Inc Goldman Sachs 1,456 2,245 Healthways Inc Morgan Stanley 670 5,795 Healthways Inc Bank of America
Merrill Lynch (213) (152,755) Heartland Express Inc Morgan Stanley 51,980 (14,946) Heartland Express Inc Goldman Sachs (15,394) 375 Heartland Financial USA Inc Bank of America
Merrill Lynch 593 546 Heartland Financial USA Inc Goldman Sachs 863 329 Heartland Financial USA Inc Morgan Stanley 1,302 29,895 Hecla Mining Co Morgan Stanley 25,475 168,237 Hecla Mining Co Bank of America
Merrill Lynch (65,984) 25,146 Hecla Mining Co Goldman Sachs (9,111) 2,913 HEICO Corp Bank of America
Merrill Lynch 9,371 888 HEICO Corp Morgan Stanley 731 32,233 HEICO Corp 'A' Bank of America
Merrill Lynch 107,336 (39,496) Heidrick & Struggles Bank of America
International Inc Merrill Lynch 8,294 (441) Heidrick & Struggles
International Inc Morgan Stanley 1,649 1,568 Helen of Troy Ltd Morgan Stanley 1,060 (17,405) Helen of Troy Ltd Bank of America
Merrill Lynch (36,725) 4,758 Helen of Troy Ltd Bank of America
Merrill Lynch 10,757 (5,918) Helmerich & Payne Inc Bank of America
Merrill Lynch (14,155) (4,641) Helmerich & Payne Inc Goldman Sachs (7,211) (35,882) Hemisphere Media Group Inc Bank of America
Merrill Lynch 28,031 5,277 Hennessy Advisors Inc Morgan Stanley 33,322 16,052 Hennessy Advisors Inc Bank of America
Merrill Lynch (3,210) 1,477 Hennessy Advisors Inc Goldman Sachs (295) 819 Henry Schein Inc Bank of America
Merrill Lynch 165 393 Henry Schein Inc Morgan Stanley 459
United States continued United States continued
Holding
Description Counterparty
Unrealised appreciation/
(depreciation) USD
Holding
Description Counterparty
Unrealised appreciation/
(depreciation) USD
Contracts for difference as at 31 May 2016

76 BlackRock Strategic Funds (BSF)
The notes on pages 489 to 503 form an integral part of these financial statements.
(54) Henry Schein Inc Bank of America Merrill Lynch 50
13,642 Heritage Commerce Corp Bank of America Merrill Lynch 3,274
242,108 Heritage Commerce Corp Morgan Stanley 370,425 51,541 Heritage Financial Corp/WA Bank of America
Merrill Lynch 6,381 8,087 Heritage Financial Corp/WA Goldman Sachs 1,213 122,683 Heritage Financial Corp/WA Morgan Stanley 63,429 1,520 Heritage Insurance Bank of America
Holdings Inc Merrill Lynch (426) 2,680 Heritage Insurance
Holdings Inc Goldman Sachs (750) 5,265 Heritage Oaks Bancorp Goldman Sachs (369) (13,624) Heritage-Crystal Clean Inc Bank of America
Merrill Lynch (20,708) 114,770 Herman Miller Inc Bank of America
Merrill Lynch 98,627 55,994 Herman Miller Inc Morgan Stanley 453,997 2,249 Hersha Hospitality Trust (Reit) Goldman Sachs (2,744) 52,429 Hersha Hospitality Trust (Reit) Morgan Stanley (115,328) 33,322 Hersha Hospitality Trust (Reit) Bank of America
Merrill Lynch (40,653) (31,790) Hershey Co/The Morgan Stanley (20,067) 1,393 Hershey Co/The Bank of America
Merrill Lynch 167 (22,159) Hershey Co/The Bank of America
Merrill Lynch (11,113) 1,273 Hertz Global Holdings Inc Bank of America
Merrill Lynch 2,151 (16,685) Hertz Global Holdings Inc Morgan Stanley 11,755 (11,774) Hertz Global Holdings Inc Bank of America
Merrill Lynch (19,898) 13,522 Heska Corp Bank of America
Merrill Lynch (27,368) 5,882 Heska Corp Goldman Sachs (12,293) 6,136 Heska Corp Morgan Stanley 32,507 (3,463) Hess Corp Bank of America
Merrill Lynch (7,896) (14,284) Hess Corp Morgan Stanley (104,117) 792 Hewlett Packard Enterprise Co Bank of America
Merrill Lynch 1,576 24,855 Hexcel Corp Morgan Stanley 29,819 13,250 Hexcel Corp Bank of America
Merrill Lynch (11,925) 1,249 HFF Inc 'A' Morgan Stanley 6,911 (6,868) HFF Inc 'A' Bank of America
Merrill Lynch (10,302) 2,684 hhgregg Inc Bank of America
Merrill Lynch (295) 9,342 hhgregg Inc Goldman Sachs (1,028) 23,974 hhgregg Inc Morgan Stanley (719) (2,056) Hibbett Sports Inc Bank of America
Merrill Lynch (2,448) (7,479) Hibbett Sports Inc Goldman Sachs (20,642) 128,608 Higher One Holdings Inc Morgan Stanley 33,438 (849) Highwoods Properties
Inc (Reit) Morgan Stanley (22) (54,580) Highwoods Properties Bank of America
Inc (Reit) Merrill Lynch (59,658) 19,286 Hill-Rom Holdings Inc Morgan Stanley 40,201 5,559 Hill-Rom Holdings Inc Bank of America
Merrill Lynch 5,670 (20,818) Hillenbrand Inc Bank of America
Merrill Lynch (8,535) 2,383 Hillenbrand Inc Bank of America
Merrill Lynch 1,967 2,557 Hillenbrand Inc Morgan Stanley 2,014 (7,873) Hilltop Holdings Inc Bank of America
Merrill Lynch (10,717)
(12,612) Hilltop Holdings Inc Morgan Stanley (67,853) (135,128) Hilton Worldwide Holdings Inc Bank of America
Merrill Lynch 86,807 (49,794) Hilton Worldwide Holdings Inc Morgan Stanley 3,068 30,820 HNI Corp Bank of America
Merrill Lynch 61,520 559 HNI Corp Goldman Sachs 398 4,980 HNI Corp Morgan Stanley 14,012 (3,046) HollyFrontier Corp Bank of America
Merrill Lynch 2,440 2,446 Hollysys Automation Bank of America
Technologies Ltd Merrill Lynch (3,131) 728 Hollysys Automation
Technologies Ltd Morgan Stanley (2,921) 8,296 Hologic Inc Bank of America
Merrill Lynch 2,406 (1,355) Hologic Inc Bank of America
Merrill Lynch (393) 45,012 Home BancShares Inc/AR Morgan Stanley 71,162 156,594 Home BancShares Inc/AR Bank of America
Merrill Lynch 441,529 16,258 Home Depot Inc/The Morgan Stanley (33,607) 4,766 Home Depot Inc/The Bank of America
Merrill Lynch (11,295) 55,217 HomeStreet Inc Bank of America
Merrill Lynch 3,785 1,389 HomeStreet Inc Goldman Sachs 207 4,423 HomeStreet Inc Morgan Stanley (1,372) 12,003 Honeywell International Inc Morgan Stanley 1,890 8,175 Honeywell International Inc Bank of America
Merrill Lynch (5,723) (13,504) Hooker Furniture Corp Morgan Stanley 38,081 (21,447) Hooker Furniture Corp Bank of America
Merrill Lynch (10,724) 3,167 Horace Mann Educators Corp Morgan Stanley 2,151 10,915 Horace Mann Educators Corp Bank of America
Merrill Lynch 2,497 1,334 Horace Mann Educators Corp Goldman Sachs 641 (17,537) Horizon Bancorp/IN Bank of America
Merrill Lynch (17,186) 54,536 Horizon Global Corp Bank of America
Merrill Lynch (3,818) 5,429 Horizon Global Corp Morgan Stanley 16,938 (6,121) Horizon Pharma Plc Bank of America
Merrill Lynch (12,364) (231) Horizon Pharma Plc Goldman Sachs (467) (3,702) Horizon Pharma Plc Morgan Stanley (8,062) 18,732 Hormel Foods Corp Morgan Stanley (82,840) (26,176) Hornbeck Offshore
Services Inc Goldman Sachs 39,002 (18,063) Hornbeck Offshore
Services Inc Morgan Stanley (5,425) (21,092) Hortonworks Inc Bank of America
Merrill Lynch (25,336) 8,867 Hortonworks Inc Bank of America
Merrill Lynch 9,931 11,199 Hospitality Properties
Trust (Reit) Morgan Stanley 37,293 22,967 Hospitality Properties Bank of America
Trust (Reit) Merrill Lynch (17,225) 22,247 Host Hotels & Resorts Bank of America
Inc (Reit) Merrill Lynch (9,344) 13,495 Host Hotels & Resorts
Inc (Reit) Goldman Sachs (5,668) 34,923 Host Hotels & Resorts
Inc (Reit) Morgan Stanley (19,207) (78,536) Houghton Mifflin Harcourt Co Bank of America
Merrill Lynch (15,650) (5,316) Houghton Mifflin Harcourt Co Morgan Stanley (362) (1,840) Houston Wire & Cable Co Morgan Stanley 94
BlackRock Americas Diversified Equity Absolute Return Fund continued
United States continued United States continued
Holding
Description Counterparty
Unrealised appreciation/
(depreciation) USD
Holding
Description Counterparty
Unrealised appreciation/
(depreciation) USD
Contracts for difference as at 31 May 2016

Annual Report and Audited Accounts 77
The notes on pages 489 to 503 form an integral part of these financial statements.
BlackRock Americas Diversified Equity Absolute Return Fund continued
(65,908) Houston Wire & Cable Co Bank of America Merrill Lynch (6,591)
(31,512) Hovnanian Enterprises Inc 'A' Bank of America Merrill Lynch (10,084)
(65,368) Hovnanian Enterprises Inc 'A' Morgan Stanley (35,952) (5,981) Howard Hughes Corp/The Bank of America
Merrill Lynch (13,936) (7,055) Howard Hughes Corp/The Morgan Stanley (28,212) (15,838) HP Inc Bank of America
Merrill Lynch (25,420) (33,247) HP Inc Morgan Stanley (32,696) 12,250 HRG Group Inc Morgan Stanley (1,335) (15,282) HRG Group Inc Morgan Stanley (42,331) (166,489) HRG Group Inc Bank of America
Merrill Lynch 58,271 (3,540) HSN Inc Bank of America
Merrill Lynch (10,549) (811) HSN Inc Goldman Sachs (2,417) (2,216) HSN Inc Morgan Stanley (1,991) 109,399 Hub Group Inc 'A' Bank of America
Merrill Lynch 261,409 38,980 Hub Group Inc 'A' Morgan Stanley 105,397 (20,519) HubSpot Inc Bank of America
Merrill Lynch (36,253) (14,429) HubSpot Inc Goldman Sachs (22,654) (518) HubSpot Inc Morgan Stanley (493) 1,565 Hudson Pacific Properties
Inc (Reit) Goldman Sachs (1,252) 37,918 Hudson Pacific Properties
Inc (Reit) Morgan Stanley (49,625) 22,981 Hudson Pacific Properties Bank of America
Inc (Reit) Merrill Lynch (18,385) (35,644) Hudson Technologies Inc Bank of America
Merrill Lynch 1,069 (600) Hudson Technologies Inc Goldman Sachs 18 6,716 Huntington Bancshares
Inc/OH Morgan Stanley 8,358 78,446 Huntington Bancshares Bank of America
Inc/OH Merrill Lynch 66,679 (6,333) Huntington Ingalls
Industries Inc Morgan Stanley (93,881) (5,958) Huntington Ingalls Bank of America
Industries Inc Merrill Lynch 2,085 (7,959) Huntsman Corp Bank of America
Merrill Lynch (8,834) 395 Hurco Cos Inc Bank of America
Merrill Lynch (356) 832 Hurco Cos Inc Goldman Sachs (749) (22,090) Huron Consulting Group Inc Bank of America
Merrill Lynch (56,251) (5,715) Huron Consulting Group Inc Morgan Stanley (49,479) (43,380) Hutchinson Technology Inc Bank of America
Merrill Lynch 3,037 (301,427) Hutchinson Technology Inc Morgan Stanley 28,050 5,406 Hyatt Hotels Corp 'A' Bank of America
Merrill Lynch (9,406) (1,564) Hyatt Hotels Corp 'A' Bank of America
Merrill Lynch 314 (2,118) Hyatt Hotels Corp 'A' Morgan Stanley (185) 410 Hyster-Yale Materials Bank of America
Handling Inc Merrill Lynch (82) 233 Hyster-Yale Materials
Handling Inc Goldman Sachs 378 3,374 IAC/InterActiveCorp Morgan Stanley 30,761 22,100 IBERIABANK Corp Morgan Stanley 339,381 (104,292) IBERIABANK Corp Bank of America
Merrill Lynch (372,192) (8,084) ICF International Inc Bank of America
Merrill Lynch 485 (70,043) Iconix Brand Group Inc Bank of America
Merrill Lynch 5,712
16,988 ICU Medical Inc Bank of America Merrill Lynch 52,833
5,409 ICU Medical Inc Morgan Stanley 40,584 458 IDACORP Inc Goldman Sachs 539 4,553 IDACORP Inc Morgan Stanley 1,358 49,910 IDACORP Inc Bank of America
Merrill Lynch (47,415) 4,847 IDEX Corp Bank of America
Merrill Lynch 5,283 12,251 IDEX Corp Morgan Stanley 59,747 793 IDEXX Laboratories Inc Goldman Sachs 376 15,030 IDEXX Laboratories Inc Morgan Stanley 117,568 9,294 IDEXX Laboratories Inc Bank of America
Merrill Lynch 8,363 19,592 IDT Corp 'B' Bank of America
Merrill Lynch (22,335) 2,060 IDT Corp 'B' Goldman Sachs (2,348) 1,983 IDT Corp 'B' Morgan Stanley (1,238) (524) Ignite Restaurant Group Inc Morgan Stanley 304 10,584 IHS Inc 'A' Bank of America
Merrill Lynch 20,753 16,869 IHS Inc 'A' Morgan Stanley 45,502 (342) IHS Inc 'A' Morgan Stanley (875) 33,104 II-VI Inc Morgan Stanley (39,929) 161,325 II-VI Inc Bank of America
Merrill Lynch 65,075 13,030 Illinois Tool Works Inc Bank of America
Merrill Lynch 16,288 (10,293) Illumina Inc Bank of America
Merrill Lynch (34,455) (8,087) Illumina Inc Morgan Stanley (34,201) 2,556 IMAX Corp Bank of America
Merrill Lynch 2,326 52,324 Immersion Corp Bank of America
Merrill Lynch (20,406) 27,201 Immersion Corp Goldman Sachs (10,608) 27,880 Immersion Corp Morgan Stanley (21,189) 2,651 Impax Laboratories Inc Morgan Stanley 6,163 (9,712) Impax Laboratories Inc Bank of America
Merrill Lynch (35,484) 1,222 Imperva Inc Bank of America
Merrill Lynch 3,825 1,746 Imperva Inc Morgan Stanley 6,114 (21,471) Imprivata Inc Bank of America
Merrill Lynch (21,686) (1,413) Imprivata Inc Goldman Sachs (1,427) (2,573) IMS Health Holdings Inc Bank of America
Merrill Lynch (1,853) (2,690) INC Research Holdings Inc 'A' Bank of America
Merrill Lynch 259 4,811 INC Research Holdings Inc 'A' Bank of America
Merrill Lynch (241) (20,861) INC Research Holdings Inc 'A' Morgan Stanley (6,914) 1,166 Incyte Corp Bank of America
Merrill Lynch 3,107 1,550 Incyte Corp Goldman Sachs 12,072 1,397 Incyte Corp Morgan Stanley 10,243 (29,143) Independence Holding Co Morgan Stanley 8,743 (14,087) Independence Holding Co Bank of America
Merrill Lynch (2,536) 1,585 Independence Realty Trust Bank of America
Inc (Reit) Merrill Lynch (174) 1,787 Independence Realty Trust
Inc (Reit) Goldman Sachs (197) 1,756 Independence Realty Trust
Inc (Reit) Morgan Stanley 1,386 21,632 Independent Bank Corp/
Rockland MA Bank of America Merrill Lynch 61,478
5,658 Independent Bank Corp/ Rockland MA Morgan Stanley 13,079
United States continued United States continued
Holding
Description Counterparty
Unrealised appreciation/
(depreciation) USD
Holding
Description Counterparty
Unrealised appreciation/
(depreciation) USD
Contracts for difference as at 31 May 2016

78 BlackRock Strategic Funds (BSF)
The notes on pages 489 to 503 form an integral part of these financial statements.
(23,942) Independent Bank Group Inc Bank of America Merrill Lynch (41,260)
(5,354) Independent Bank Group Inc Morgan Stanley (17,284) 2,265 Infinera Corp Bank of America
Merrill Lynch 2,265 4,259 Infinera Corp Goldman Sachs 4,259 23,214 Infinera Corp Morgan Stanley (35,748) 849 Infinity Property &
Casualty Corp Goldman Sachs (102) 39,888 Infinity Property & Bank of America
Casualty Corp Merrill Lynch (4,787) 15,809 Infinity Property &
Casualty Corp Morgan Stanley (20,767) 38,085 Infoblox Inc Bank of America
Merrill Lynch 25,898 11,279 Infoblox Inc Morgan Stanley 24,468 2,666 Information Services
Group Inc Goldman Sachs (720) 52,428 InfraREIT Inc (Reit) Morgan Stanley (89,787) 37,153 InfraREIT Inc (Reit) Bank of America
Merrill Lynch (2,601) 2,451 InfraREIT Inc (Reit) Goldman Sachs (172) 1,026 Ingersoll-Rand Plc Goldman Sachs 635 11,835 Ingersoll-Rand Plc Morgan Stanley 68,097 20,730 Ingersoll-Rand Plc Bank of America
Merrill Lynch 8,208 682 Ingevity Corp Bank of America
Merrill Lynch 19,396 161 Ingevity Corp Morgan Stanley 4,579 2,286 Ingles Markets Inc 'A' Morgan Stanley 6,823 5,050 Ingles Markets Inc 'A' Bank of America
Merrill Lynch (1,111) 1,001 Ingredion Inc Bank of America
Merrill Lynch (673) 248 Ingredion Inc Goldman Sachs (303) 13,615 Ingredion Inc Morgan Stanley 168,879 105,230 InnerWorkings Inc Bank of America
Merrill Lynch 49,896 21,580 InnerWorkings Inc Goldman Sachs 11,437 35,882 InnerWorkings Inc Morgan Stanley 29,892 1,244 Innophos Holdings Inc Bank of America
Merrill Lynch 833 6,005 Innophos Holdings Inc Morgan Stanley 68,577 1,833 Innospec Inc Bank of America
Merrill Lynch 928 307 Innospec Inc Goldman Sachs 273 7,985 Innospec Inc Morgan Stanley 7,896 6,869 Innoviva Inc Goldman Sachs (819) 28,151 Innoviva Inc Morgan Stanley (6,134) 29,792 Innoviva Inc Bank of America
Merrill Lynch 10,093 (4,391) Inogen Inc Bank of America
Merrill Lynch (11,778) (10,120) Inogen Inc Morgan Stanley (65,076) 15,950 Inovalon Holdings Inc 'A' Bank of America
Merrill Lynch 11,713 7,249 Inovalon Holdings Inc 'A' Morgan Stanley 5,844 (1,168) Inphi Corp Bank of America
Merrill Lynch (1,962) (4,083) Inphi Corp Morgan Stanley (5,341) (622) Insight Enterprises Inc Bank of America
Merrill Lynch 219 45,503 Insperity Inc Bank of America
Merrill Lynch 141,372 5,580 Insperity Inc Morgan Stanley 160,258 7,249 Installed Building Products Inc Morgan Stanley 5,777 6,521 Installed Building Products Inc Bank of America
Merrill Lynch 7,040 15,080 Insteel Industries Inc Bank of America
Merrill Lynch 10,405 5,293 Insteel Industries Inc Goldman Sachs 3,652
40,837 Insteel Industries Inc Morgan Stanley 121,298 (7,165) Instructure Inc Bank of America
Merrill Lynch 4,693 5,813 Insulet Corp Bank of America
Merrill Lynch 4,675 1,095 Insulet Corp Goldman Sachs 2,633 3,245 Insulet Corp Morgan Stanley 2,927 817 Insys Therapeutics Inc Morgan Stanley (547) (9,313) Integra LifeSciences Bank of America
Holdings Corp Merrill Lynch (20,034) (8,877) Integrated Device Bank of America
Technology Inc Merrill Lynch (19,796) (8,515) Intel Corp Bank of America
Merrill Lynch (9,196) 91,139 Inteliquent Inc Bank of America
Merrill Lynch (2,738) 13,185 Inteliquent Inc Goldman Sachs (562) 22,560 Inteliquent Inc Morgan Stanley 5,452 (25,438) Inter Parfums Inc Bank of America
Merrill Lynch (6,412) (28,695) Interactive Brokers Group Bank of America
Inc 'A' Merrill Lynch (123,675) (29,619) Interactive Brokers Group
Inc 'A' Morgan Stanley (171,587) 71 Interactive Intelligence Bank of America
Group Inc Merrill Lynch 386 7,925 Interactive Intelligence
Group Inc Morgan Stanley 116,577 (20,606) Interactive Intelligence Bank of America
Group Inc Merrill Lynch (102,122) (1,841) Intercept Pharmaceuticals Inc Bank of America
Merrill Lynch (13,513) 3,148 Intercontinental Exchange Inc Bank of America
Merrill Lynch 26,317 2,893 Intercontinental Exchange Inc Morgan Stanley 93,114 (13,627) InterDigital Inc/PA Bank of America
Merrill Lynch (43,302) (6,570) InterDigital Inc/PA Morgan Stanley (14,746) 1,029 Interface Inc Bank of America
Merrill Lynch 545 38,915 Interface Inc Morgan Stanley 36,735 (1,107) International Bancshares Bank of America
Corp Merrill Lynch (2,756) 4,844 International Business Bank of America
Machines Corp Merrill Lynch 24,795 1,916 International Business
Machines Corp Morgan Stanley 8,576 (9,621) International Business Bank of America
Machines Corp Merrill Lynch (34,058) (5,180) International Flavors & Bank of America
Fragrances Inc Merrill Lynch (3,367) 3,679 International Flavors &
Fragrances Inc Morgan Stanley 34,653 1,777 International Flavors & Bank of America
Fragrances Inc Merrill Lynch 1,155 28,814 International Game
Technology Plc Morgan Stanley 30,231 37,619 International Game Bank of America
Technology Plc Merrill Lynch 60,719 3,210 International Game
Technology Plc Goldman Sachs 5,489 (6,874) International Paper Co Bank of America
Merrill Lynch (1,031) (4,389) International Paper Co Morgan Stanley (10,536) (1,170) International Speedway Bank of America
Corp 'A' Merrill Lynch (1,011) (838) International Speedway
Corp 'A' Morgan Stanley (734) 580 InterOil Corp Morgan Stanley 7,251 38,269 Interpublic Group of Bank of America
Cos Inc/The Merrill Lynch (3,866)
BlackRock Americas Diversified Equity Absolute Return Fund continued
United States continued United States continued
Holding
Description Counterparty
Unrealised appreciation/
(depreciation) USD
Holding
Description Counterparty
Unrealised appreciation/
(depreciation) USD
Contracts for difference as at 31 May 2016

Annual Report and Audited Accounts 79
The notes on pages 489 to 503 form an integral part of these financial statements.
BlackRock Americas Diversified Equity Absolute Return Fund continued
71,841 Interpublic Group of Cos Inc/The Morgan Stanley 202,849
20,617 Interpublic Group of Cos Inc/The Goldman Sachs (2,806)
71,762 Intersil Corp 'A' Bank of America Merrill Lynch 103,337
10,410 Intersil Corp 'A' Goldman Sachs 14,990 17,743 Intersil Corp 'A' Morgan Stanley 5,550 (102,014) Interval Leisure Group Inc Morgan Stanley (76,331) (9,185) InterXion Holding NV Bank of America
Merrill Lynch (20,035) (15,138) InterXion Holding NV Morgan Stanley (28,333) 10,357 Intevac Inc Bank of America
Merrill Lynch 4,246 2,261 Intevac Inc Goldman Sachs 927 8,224 Intevac Inc Morgan Stanley 4,669 (18,773) Intra-Cellular Therapies Inc Morgan Stanley (156,960) (16,685) Intra-Cellular Therapies Inc Bank of America
Merrill Lynch (60,954) (15,183) Intra-Cellular Therapies Inc Goldman Sachs (56,177) (521) Intrexon Corp Goldman Sachs (2,871) (1,157) Intrexon Corp Morgan Stanley (7,330) 26,123 Intuit Inc Bank of America
Merrill Lynch 120,702 36,408 Intuit Inc Morgan Stanley 241,952 (162) Intuitive Surgical Inc Morgan Stanley (1,231) (18,235) Invacare Corp Bank of America
Merrill Lynch (2,188) 2,156 InvenSense Inc Bank of America
Merrill Lynch 970 (14,159) Inventure Foods Inc Bank of America
Merrill Lynch (7,929) (42,696) Inventure Foods Inc Morgan Stanley (101,616) 75,529 Invesco Ltd Bank of America
Merrill Lynch 222,519 48,516 Invesco Ltd Morgan Stanley 55,734 45,119 Invesco Mortgage Capital
Inc (Reit) Morgan Stanley 112,691 4,291 Invesco Mortgage Capital Bank of America
Inc (Reit) Merrill Lynch 343 (19,367) Investment Technology Bank of America
Group Inc Merrill Lynch (12,589) (1,179) Investment Technology
Group Inc Goldman Sachs (766) 72,370 Investors Bancorp Inc Bank of America
Merrill Lynch 26,053 60,584 Investors Bancorp Inc Morgan Stanley 11,746 (170,836) Investors Real Estate
Trust (Reit) Goldman Sachs 17,544 (7,892) InVivo Therapeutics
Holdings Corp Goldman Sachs (4,972) 8,408 Invuity Inc Morgan Stanley (11,183) 11,113 Invuity Inc Bank of America
Merrill Lynch 8,335 1,558 Invuity Inc Goldman Sachs 1,169 (400) Ionis Pharmaceuticals Inc Bank of America
Merrill Lynch (307) 2,084 IPG Photonics Corp Bank of America
Merrill Lynch 8,836 4,534 IPG Photonics Corp Morgan Stanley (16,973) 3,035 iRadimed Corp Bank of America
Merrill Lynch 2,216 (4,977) IRIDEX Corp Morgan Stanley (1,202) (18,496) Iridium Communications Inc Bank of America
Merrill Lynch (5,179) (62,793) Iridium Communications Inc Morgan Stanley (145,052) (39,458) iRobot Corp Bank of America
Merrill Lynch (30,259) (36,181) Iron Mountain Inc (Reit) Morgan Stanley (176,923) (5,917) Iron Mountain Inc (Reit) Bank of America
Merrill Lynch 4,688
5,947 Isle of Capri Casinos Inc Bank of America Merrill Lynch 2,633
989 Isle of Capri Casinos Inc Goldman Sachs 582 7,464 Isle of Capri Casinos Inc Morgan Stanley 9,290 899 Isramco Inc Morgan Stanley 14,627 507 Isramco Inc Bank of America
Merrill Lynch (806) (18,299) iStar Inc (Reit) Morgan Stanley (26,217) (14,216) iStar Inc (Reit) Bank of America
Merrill Lynch (4,976) 15,710 Itau Unibanco Holding SA ADR Goldman Sachs (2,835) 62,361 Itau Unibanco Holding SA ADR Morgan Stanley 5,266 8,969 Itron Inc Bank of America
Merrill Lynch 12,781 405 Itron Inc Goldman Sachs 522 14,889 Itron Inc Morgan Stanley 29,258 (4,724) ITT Inc Bank of America
Merrill Lynch (5,271) (8,334) ITT Inc Morgan Stanley (10,270) 2,283 IXYS Corp Bank of America
Merrill Lynch 1,187 117,867 J Alexander's Holdings Inc Bank of America
Merrill Lynch 70,602 1,900 J Alexander's Holdings Inc Goldman Sachs 1,178 21,526 J Alexander's Holdings Inc Morgan Stanley 21,740 10,296 J&J Snack Foods Corp Bank of America
Merrill Lynch (5,457) (12,806) J&J Snack Foods Corp Morgan Stanley (19,467) (5,210) J&J Snack Foods Corp Bank of America
Merrill Lynch 366 (12,773) j2 Global Inc Bank of America
Merrill Lynch (32,848) 1,508 j2 Global Inc Bank of America
Merrill Lynch 6,937 6,672 j2 Global Inc Morgan Stanley 30,425 11,651 Jabil Circuit Inc Bank of America
Merrill Lynch 7,663 14,787 Jabil Circuit Inc Morgan Stanley 3,622 (19,104) Jabil Circuit Inc Bank of America
Merrill Lynch (36,107) (10,894) Jack Henry & Associates Inc Bank of America
Merrill Lynch 4,684 (2,594) Jack Henry & Associates Inc Morgan Stanley (5,529) (42,626) Jack in the Box Inc Bank of America
Merrill Lynch (367,075) 16,412 Jacobs Engineering Group Inc Bank of America
Merrill Lynch 13,524 152 Jacobs Engineering Group Inc Goldman Sachs 263 15,742 Jacobs Engineering Group Inc Morgan Stanley 18,496 (1,757) JAKKS Pacific Inc Morgan Stanley (391) (60,186) Jamba Inc Morgan Stanley 30,440 12,493 James River Group Bank of America
Holdings Ltd Merrill Lynch 51,596 11,283 James River Group
Holdings Ltd Morgan Stanley 44,794 (1,547) Janus Capital Group Inc Bank of America
Merrill Lynch (1,485) (18,753) Janus Capital Group Inc Morgan Stanley (67,698) 29,574 Jason Industries Inc Morgan Stanley 23,955 74 Jazz Pharmaceuticals Plc Goldman Sachs 110 (5,096) Jazz Pharmaceuticals Plc Morgan Stanley (139,327) 521 JB Hunt Transport Services Inc Morgan Stanley 208 9,251 JB Hunt Transport Services Inc Bank of America
Merrill Lynch 12,858 21,598 JC Penney Co Inc Bank of America
Merrill Lynch 8,639 2,302 JetBlue Airways Corp Bank of America
Merrill Lynch (806) 3,576 JetBlue Airways Corp Morgan Stanley (8,718) (25,691) Jive Software Inc Bank of America
Merrill Lynch (1,028) (14,117) Jive Software Inc Morgan Stanley (10,164)
United States continued United States continued
Holding
Description Counterparty
Unrealised appreciation/
(depreciation) USD
Holding
Description Counterparty
Unrealised appreciation/
(depreciation) USD
Contracts for difference as at 31 May 2016

80 BlackRock Strategic Funds (BSF)
The notes on pages 489 to 503 form an integral part of these financial statements.
13,310 JM Smucker Co/The Morgan Stanley (18,985) (5,559) JM Smucker Co/The Bank of America
Merrill Lynch 9,395 32,108 JM Smucker Co/The Bank of America
Merrill Lynch (52,263) 91,659 JMP Group LLC Morgan Stanley 39,413 (501) John B Sanfilippo & Son Inc Bank of America
Merrill Lynch 4,364 1,278 John Bean Technologies Corp Goldman Sachs 409 33,787 John Bean Technologies Corp Bank of America
Merrill Lynch 10,812 8,203 John Bean Technologies Corp Morgan Stanley 106,032 3,250 John Wiley & Sons Inc 'A' Bank of America
Merrill Lynch 10,173 3,974 John Wiley & Sons Inc 'A' Goldman Sachs 12,439 697 John Wiley & Sons Inc 'A' Morgan Stanley 4,643 (2,891) John Wiley & Sons Inc 'A' Bank of America
Merrill Lynch (9,049) 17,439 Johnson & Johnson Bank of America
Merrill Lynch (20,240) 26,121 Johnson & Johnson Morgan Stanley 37,132 3,619 Johnson Controls Inc Morgan Stanley 32,782 40,768 Johnson Outdoors Inc 'A' Bank of America
Merrill Lynch 38,144 13,911 Johnson Outdoors Inc 'A' Goldman Sachs 12,781 5,686 Johnson Outdoors Inc 'A' Morgan Stanley 22,444 3,831 Jones Lang LaSalle Inc Morgan Stanley (38,465) 10,776 Jones Lang LaSalle Inc Bank of America
Merrill Lynch 83,836 (15,684) Joy Global Inc Bank of America
Merrill Lynch (15,213) (6,127) Joy Global Inc Goldman Sachs (5,943) (1,329) Joy Global Inc Morgan Stanley (588) 985 JPMorgan Chase & Co Bank of America
Merrill Lynch 3,999 2,373 JPMorgan Chase & Co Morgan Stanley 2,823 (16,188) Juniper Networks Inc Bank of America
Merrill Lynch (4,321) (12,885) Juniper Networks Inc Morgan Stanley (951) 18,771 Juniper Pharmaceuticals Inc Bank of America
Merrill Lynch (6,570) 2,592 Juniper Pharmaceuticals Inc Goldman Sachs (907) 59,250 Juniper Pharmaceuticals Inc Morgan Stanley (30,218) (5,688) Juno Therapeutics Inc Bank of America
Merrill Lynch (27,115) 10,137 K12 Inc Bank of America
Merrill Lynch 2,046 5,517 K12 Inc Goldman Sachs 909 37,646 K12 Inc Morgan Stanley 80,918 4,546 Kaiser Aluminum Corp Morgan Stanley 50,769 27,439 Kaiser Aluminum Corp Bank of America
Merrill Lynch (17,287) (15,284) Kaman Corp Bank of America
Merrill Lynch (13,756) 31,429 Kansas City Life Insurance Co Bank of America
Merrill Lynch (39,286) 453 Kansas City Southern Bank of America
Merrill Lynch 950 2,457 Kansas City Southern Morgan Stanley 18,966 (6,035) Kansas City Southern Bank of America
Merrill Lynch (31,925) (77,588) KapStone Paper and Bank of America
Packaging Corp Merrill Lynch (62,070) (18,750) KapStone Paper and
Packaging Corp Morgan Stanley (93,237) 3,722 KAR Auction Services Inc Bank of America
Merrill Lynch 4,690 1,390 KAR Auction Services Inc Goldman Sachs 1,751 22,911 KAR Auction Services Inc Morgan Stanley 134,085 (19,777) Kate Spade & Co Bank of America
Merrill Lynch (4,021)
8,987 Kate Spade & Co Bank of America Merrill Lynch 1,258
(39,367) Kate Spade & Co Morgan Stanley 9,993 (102,974) KB Home Bank of America
Merrill Lynch (116,361) 31,903 KBR Inc Bank of America
Merrill Lynch 7,657 2,766 KBR Inc Goldman Sachs 664 41,624 KBR Inc Morgan Stanley (12,130) (31,008) KCG Holdings Inc 'A' Bank of America
Merrill Lynch (23,475) (34,755) KCG Holdings Inc 'A' Morgan Stanley (27,295) (329,882) Kearny Financial Corp/MD Bank of America
Merrill Lynch (69,364) (5,470) Kearny Financial Corp/MD Morgan Stanley (7,111) 5,160 Kearny Financial Corp/MD Bank of America
Merrill Lynch 1,187 4,696 Kearny Financial Corp/MD Morgan Stanley 3,368 (5,551) Kellogg Co Bank of America
Merrill Lynch (621) (3,122) Kellogg Co Morgan Stanley 1,238 12,417 Kellogg Co Bank of America
Merrill Lynch (33,153) 47,620 Kelly Services Inc 'A' Bank of America
Merrill Lynch 55,076 2,655 Kelly Services Inc 'A' Goldman Sachs 3,027 5,858 Kemet Corp Bank of America
Merrill Lynch 1,582 34,907 Kemet Corp Morgan Stanley 52,011 4,295 Kemper Corp Morgan Stanley 33,501 (160,826) Kemper Corp Bank of America
Merrill Lynch (222,765) (1,767) KemPharm Inc Bank of America
Merrill Lynch (1,007) (57) KemPharm Inc Goldman Sachs (32) (6,259) Kennametal Inc Bank of America
Merrill Lynch (3,792) (4,546) Kennametal Inc Morgan Stanley (2,564) 515 Kennametal Inc Bank of America
Merrill Lynch 613 2,013 Kennametal Inc Goldman Sachs 2,395 5,435 Kennedy-Wilson Holdings Inc Morgan Stanley 16,719 65,567 Key Tronic Corp Bank of America
Merrill Lynch 44,408 17,034 Key Tronic Corp Goldman Sachs 11,902 50,946 Key Tronic Corp Morgan Stanley 39,889 103,010 KeyCorp Bank of America
Merrill Lynch 107,130 1,507 KeyCorp Goldman Sachs 1,567 176,374 KeyCorp Morgan Stanley 424,141 (36,022) Keysight Technologies Inc Morgan Stanley (127,615) (28,691) Keysight Technologies Inc Bank of America
Merrill Lynch (125,953) (39,730) KEYW Holding Corp/The Morgan Stanley (83,959) 12,446 Kforce Inc Bank of America
Merrill Lynch 8,801 8,173 Kforce Inc Goldman Sachs 4,659 35,058 Kforce Inc Morgan Stanley 107,772 2,769 Kilroy Realty Corp (Reit) Morgan Stanley (1,201) 12,680 Kilroy Realty Corp (Reit) Bank of America
Merrill Lynch (11,036) 43,645 Kimball Electronics Inc Bank of America
Merrill Lynch 12,996 3,490 Kimball Electronics Inc Goldman Sachs 977 9,555 Kimball Electronics Inc Morgan Stanley 1,098 1,661 Kimball International Inc 'B' Bank of America
Merrill Lynch 581 27,190 Kimball International Inc 'B' Morgan Stanley 34,960 (40,364) Kimberly-Clark Corp Morgan Stanley 111,564 (383) Kimberly-Clark Corp Bank of America
Merrill Lynch 655
BlackRock Americas Diversified Equity Absolute Return Fund continued
United States continued United States continued
Holding
Description Counterparty
Unrealised appreciation/
(depreciation) USD
Holding
Description Counterparty
Unrealised appreciation/
(depreciation) USD
Contracts for difference as at 31 May 2016

Annual Report and Audited Accounts 81
The notes on pages 489 to 503 form an integral part of these financial statements.
BlackRock Americas Diversified Equity Absolute Return Fund continued
(79,176) Kimco Realty Corp (Reit) Morgan Stanley (20,332) 5,536 Kimco Realty Corp (Reit) Bank of America
Merrill Lynch (6,588) (12,469) Kimco Realty Corp (Reit) Bank of America
Merrill Lynch 6,441 (7,178) Kinder Morgan Inc/DE Morgan Stanley (7,253) 43,694 Kindred Biosciences Inc Bank of America
Merrill Lynch 8,302 22,414 Kindred Biosciences Inc Goldman Sachs 4,259 13,013 Kindred Biosciences Inc Morgan Stanley 9,128 4,255 Kindred Healthcare Inc Morgan Stanley 203 (51,711) Kindred Healthcare Inc Bank of America
Merrill Lynch 12,928 3,541 Kindred Healthcare Inc Bank of America
Merrill Lynch (843) (4,729) Kindred Healthcare Inc Morgan Stanley (17,612) (31,168) Kirby Corp Bank of America
Merrill Lynch (159,406) (753) Kirby Corp Goldman Sachs (3,870) (24,649) Kirby Corp Morgan Stanley (325,633) (568) Kite Pharma Inc Bank of America
Merrill Lynch (2,675) (5,178) Kite Pharma Inc Goldman Sachs (24,388) 4,371 Kite Realty Group Trust (Reit) Bank of America
Merrill Lynch 2,356 1,080 Kite Realty Group Trust (Reit) Morgan Stanley 184 (40,266) KLX Inc Bank of America
Merrill Lynch (44,153) (2,271) KLX Inc Morgan Stanley (1,805) 9,545 KMG Chemicals Inc Bank of America
Merrill Lynch (4,582) 3,185 KMG Chemicals Inc Goldman Sachs (1,529) 2,962 KMG Chemicals Inc Morgan Stanley (1,034) (102,015) Knight Transportation Inc Bank of America
Merrill Lynch (128,968) (105,046) Knight Transportation Inc Morgan Stanley (109,876) 184,686 Knoll Inc Bank of America
Merrill Lynch 244,313 101,716 Knoll Inc Morgan Stanley 397,054 (49,206) Knowles Corp Bank of America
Merrill Lynch (82,700) (3,535) Kohl's Corp Bank of America
Merrill Lynch (247) (7,900) Kohl's Corp Morgan Stanley 1,607 (44,776) Kona Grill Inc Morgan Stanley 1,590 (5,390) Kona Grill Inc Bank of America
Merrill Lynch (4,150) (41,332) Koninklijke Philips NV Morgan Stanley 9,580 (179,063) Kopin Corp Bank of America
Merrill Lynch (51,418) 5,537 Koppers Holdings Inc Bank of America
Merrill Lynch (166) 3,559 Koppers Holdings Inc Goldman Sachs (107) 3,081 Koppers Holdings Inc Morgan Stanley 18,865 14,095 Korn/Ferry International Bank of America
Merrill Lynch 15,088 11,069 Korn/Ferry International Morgan Stanley 12,005 (5,377) Korn/Ferry International Bank of America
Merrill Lynch (3,172) 11,652 Kosmos Energy Ltd Bank of America
Merrill Lynch 6,059 2,293 Kosmos Energy Ltd Goldman Sachs 1,192 2,775 Kosmos Energy Ltd Morgan Stanley (20) (36,292) Kraft Heinz Co/The Bank of America
Merrill Lynch 64,806 20,181 Kraton Performance Bank of America
Polymers Inc Merrill Lynch 13,521 5,804 Kraton Performance
Polymers Inc Morgan Stanley 47,086 (93,170) Kratos Defense & Security
Solutions Inc Morgan Stanley (90,781)
(5,347) Krispy Kreme Doughnuts Inc Bank of America Merrill Lynch (2,085)
47,179 Kroger Co/The Morgan Stanley 79 30,090 Kroger Co/The Bank of America
Merrill Lynch 18,646 388 Kroger Co/The Goldman Sachs 284 (2,701) Kronos Worldwide Inc Bank of America
Merrill Lynch (270) (41,169) Kronos Worldwide Inc Morgan Stanley (55,990) 5,169 Kulicke & Soffa Industries Inc Bank of America
Merrill Lynch 5,893 11,386 Kulicke & Soffa Industries Inc Morgan Stanley 15,635 2,400 Kura Oncology Inc Morgan Stanley (1,152) 1,783 Kura Oncology Inc Goldman Sachs (267) 21,927 L Brands Inc Morgan Stanley (215,505) 16,913 L Brands Inc Bank of America
Merrill Lynch 20,126 (20,477) La Quinta Holdings Inc Bank of America
Merrill Lynch (205) (11,226) La Quinta Holdings Inc Morgan Stanley (3,864) 6,961 La-Z-Boy Inc Morgan Stanley 9,330 50,769 La-Z-Boy Inc Bank of America
Merrill Lynch 53,305 4,120 Laboratory Corp of Bank of America
America Holdings Merrill Lynch 2,154 (1,115) Laboratory Corp of Bank of America
America Holdings Merrill Lynch (1,157) 4,644 Laboratory Corp of
America Holdings Morgan Stanley 7,032 22,386 Lakeland Bancorp Inc Bank of America
Merrill Lynch 3,582 4,581 Lakeland Bancorp Inc Goldman Sachs 733 991 Lakeland Bancorp Inc Morgan Stanley 1,169 6,840 Lakeland Financial Corp Bank of America
Merrill Lynch 9,029 3,474 Lakeland Financial Corp Goldman Sachs 4,586 1,419 Lakeland Financial Corp Morgan Stanley 7,443 (2,954) Lam Research Corp Bank of America
Merrill Lynch (571) 14,954 Lamar Advertising Co 'A' (Reit) Bank of America
Merrill Lynch 13,503 1,386 Lamar Advertising Co 'A' (Reit) Morgan Stanley 3,049 (453) Lancaster Colony Corp Morgan Stanley (1,916) 19,071 Lancaster Colony Corp Bank of America
Merrill Lynch 46,385 927 Lancaster Colony Corp Goldman Sachs 2,571 (2,357) Landauer Inc Bank of America
Merrill Lynch (1,320) (89,423) Landec Corp Bank of America
Merrill Lynch (6,442) (673) Lands' End Inc Goldman Sachs 1,366 1,579 Landstar System Inc Goldman Sachs 5,084 1,488 Landstar System Inc Morgan Stanley 5,940 19,965 Landstar System Inc Bank of America
Merrill Lynch 52,004 (1,731) Lannett Co Inc Bank of America
Merrill Lynch (2,565) 92,310 Lantheus Holdings Inc Morgan Stanley 12,064 63,628 Lantheus Holdings Inc Bank of America
Merrill Lynch (15,907) 40,773 Lantheus Holdings Inc Goldman Sachs (8,117) 47,479 Laredo Petroleum Inc Bank of America
Merrill Lynch 24,667 8,294 Laredo Petroleum Inc Goldman Sachs 2,057 9,262 Laredo Petroleum Inc Morgan Stanley 22,022 (6,778) Las Vegas Sands Corp Bank of America
Merrill Lynch (5,391) (27,613) Las Vegas Sands Corp Morgan Stanley (37,180) 65,898 LaSalle Hotel Properties (Reit) Bank of America
Merrill Lynch (68,136) 2,854 LaSalle Hotel Properties (Reit) Goldman Sachs (2,074)
United States continued United States continued
Holding
Description Counterparty
Unrealised appreciation/
(depreciation) USD
Holding
Description Counterparty
Unrealised appreciation/
(depreciation) USD
Contracts for difference as at 31 May 2016

82 BlackRock Strategic Funds (BSF)
The notes on pages 489 to 503 form an integral part of these financial statements.
28,977 LaSalle Hotel Properties (Reit) Morgan Stanley (49,624) (77,749) Latam Airlines Group SA ADR Morgan Stanley 37,000 (110,398) Lattice Semiconductor Corp Bank of America
Merrill Lynch (50,783) (24,133) Lattice Semiconductor Corp Goldman Sachs (11,101) (83,400) Lattice Semiconductor Corp Morgan Stanley (4,658) (7,354) Lawson Products Inc/DE Morgan Stanley (7,207) (30,219) Layne Christensen Co Bank of America
Merrill Lynch (1,946) (2,414) Layne Christensen Co Morgan Stanley (114) (2,347) Layne Christensen Co Goldman Sachs 141 (21,728) LB Foster Co 'A' Bank of America
Merrill Lynch 13,037 (931) LB Foster Co 'A' Morgan Stanley 5,910 (11,806) LDR Holding Corp Bank of America
Merrill Lynch 22,313 (17,213) LDR Holding Corp Morgan Stanley 96,886 4,538 Lear Corp Bank of America
Merrill Lynch 18,108 849 Lear Corp Goldman Sachs 3,175 3,835 Lear Corp Morgan Stanley 56,931 66,327 Lee Enterprises Inc Goldman Sachs (1,327) 34,631 Lee Enterprises Inc Morgan Stanley 28,051 (3,081) LegacyTexas Financial Bank of America
Group Inc Merrill Lynch (4,036) (3,406) LegacyTexas Financial
Group Inc Morgan Stanley (639) 909 Legg Mason Inc Bank of America
Merrill Lynch 3,200 3,789 Legg Mason Inc Morgan Stanley 27,001 18,589 Leggett & Platt Inc Bank of America
Merrill Lynch 10,719 40,140 Leggett & Platt Inc Morgan Stanley 126,561 876 Leidos Holdings Inc Bank of America
Merrill Lynch (27) 21,378 LeMaitre Vascular Inc Morgan Stanley 33,563 42,205 LeMaitre Vascular Inc Bank of America
Merrill Lynch (32,498) 6,513 LeMaitre Vascular Inc Goldman Sachs (5,015) 50,188 LendingClub Corp Bank of America
Merrill Lynch 45,078 31,900 LendingClub Corp Morgan Stanley 2,208 2,803 LendingTree Inc Morgan Stanley (26,403) 1,001 LendingTree Inc Bank of America
Merrill Lynch 13,103 979 LendingTree Inc Goldman Sachs 12,815 1,048 Lennar Corp 'A' Bank of America
Merrill Lynch (30) (25,078) Lennar Corp 'A' Bank of America
Merrill Lynch (47,107) (2,030) Lennar Corp 'B' Morgan Stanley 2,795 (4,790) Lennar Corp 'B' Bank of America
Merrill Lynch (8,526) (12,850) Lennox International Inc Morgan Stanley (97,676) (39,787) Leucadia National Corp Bank of America
Merrill Lynch (17,904) 26,083 Level 3 Communications Inc Bank of America
Merrill Lynch 39,884 2,449 Level 3 Communications Inc Goldman Sachs 3,625 17,801 Level 3 Communications Inc Morgan Stanley 28,699 92,394 Lexington Realty Trust (Reit) Morgan Stanley 244,844 51,613 Lexington Realty Trust (Reit) Bank of America
Merrill Lynch — (1,336) Lexmark International Inc 'A' Bank of America
Merrill Lynch (748) 19,384 LGI Homes Inc Bank of America
Merrill Lynch 26,310 1,375 LGI Homes Inc Goldman Sachs 2,198 14,025 Libbey Inc Bank of America
Merrill Lynch (4,208) 12,765 Libbey Inc Goldman Sachs (3,830)
4,582 Libbey Inc Morgan Stanley (3,050) 62 Liberty Braves Group 'A' Bank of America
Merrill Lynch (97) 156 Liberty Braves Group 'A' Morgan Stanley (743) (1,382) Liberty Braves Group 'C' Bank of America
Merrill Lynch 483 29 Liberty Braves Group (Right) Bank of America
Merrill Lynch 65 73 Liberty Braves Group (Right) Morgan Stanley 164 (1,175) Liberty Broadband Corp 'A' Morgan Stanley 1,344 (7,790) Liberty Broadband Corp 'A' Bank of America
Merrill Lynch 4,518 (13,015) Liberty Broadband Corp 'C' Bank of America
Merrill Lynch 11,063 (10,357) Liberty Global Plc 'A' Bank of America
Merrill Lynch (6,147) 5,001 Liberty Global Plc 'A' Bank of America
Merrill Lynch (6,101) (18,271) Liberty Global Plc 'A' Morgan Stanley (7,008) 1,408 Liberty Global Plc LiLAC 'A' Morgan Stanley 6,741 (9,897) Liberty Global Plc LiLAC 'C' Bank of America
Merrill Lynch (3,563) (6,179) Liberty Global Plc LiLAC 'C' Morgan Stanley (12,356) 3,733 Liberty Interactive Corp
QVC Group 'A' Morgan Stanley 16,127 17,187 Liberty Media Group 'A' Bank of America
Merrill Lynch 13,645 2,331 Liberty Media Group 'A' Goldman Sachs 1,583 2,760 Liberty Media Group 'A' Morgan Stanley 2,484 (30,337) Liberty Property Trust (Reit) Morgan Stanley (82,115) (22,695) Liberty Property Trust (Reit) Bank of America
Merrill Lynch (2,733) 2,003 Liberty SiriusXM Group 'A' Bank of America
Merrill Lynch 1,323 6,876 Liberty SiriusXM Group 'A' Morgan Stanley 1,356 (5,515) Liberty Tax Inc Bank of America
Merrill Lynch (1,434) (13,039) Liberty Ventures 'A' Bank of America
Merrill Lynch 8,867 1,786 Liberty Ventures 'A' Morgan Stanley (2,013) 935 Liberty Ventures 'A' Bank of America
Merrill Lynch 162 (33,928) LifeLock Inc Bank of America
Merrill Lynch (50,660) (7,079) LifeLock Inc Goldman Sachs (10,689) 12,418 LifePoint Health Inc Morgan Stanley (2,534) (1,224) LifePoint Health Inc Bank of America
Merrill Lynch (982) (6,090) Lifetime Brands Inc Bank of America
Merrill Lynch (7,186) (2,583) Lifetime Brands Inc Morgan Stanley (6,251) 16,888 Lifevantage Corp Bank of America
Merrill Lynch 20,896 4,501 Lifevantage Corp Goldman Sachs 5,626 5,520 Lifevantage Corp Morgan Stanley 23,684 1,298 Lifeway Foods Inc Bank of America
Merrill Lynch (227) 400 Lifeway Foods Inc Goldman Sachs (70) 4,049 Lifeway Foods Inc Morgan Stanley (3,461) 119 Ligand Pharmaceuticals Inc Morgan Stanley (67) 2,259 Ligand Pharmaceuticals Inc Bank of America
Merrill Lynch 6,117 116 Ligand Pharmaceuticals Inc Goldman Sachs 424 (1,692) Ligand Pharmaceuticals Inc Goldman Sachs (4,365) (215) Ligand Pharmaceuticals Inc Morgan Stanley (221) 263,641 Limelight Networks Inc Morgan Stanley 52,728 (895) Limoneira Co Bank of America
Merrill Lynch (689) (2,153) Limoneira Co Morgan Stanley (10,011) (18,267) Lincoln Electric Holdings Inc Morgan Stanley (11,312)
BlackRock Americas Diversified Equity Absolute Return Fund continued
United States continued United States continued
Holding
Description Counterparty
Unrealised appreciation/
(depreciation) USD
Holding
Description Counterparty
Unrealised appreciation/
(depreciation) USD
Contracts for difference as at 31 May 2016

Annual Report and Audited Accounts 83
The notes on pages 489 to 503 form an integral part of these financial statements.
BlackRock Americas Diversified Equity Absolute Return Fund continued
(13,516) Lincoln Electric Holdings Inc Bank of America Merrill Lynch (6,893)
12,739 Lincoln National Corp Bank of America Merrill Lynch 42,676
22,084 Lincoln National Corp Morgan Stanley 195,930 32,614 Lindblad Expeditions Bank of America
Holdings Inc Merrill Lynch 606 3,103 Lindblad Expeditions
Holdings Inc Goldman Sachs 151 2,470 Lindblad Expeditions
Holdings Inc Morgan Stanley 325 (2,388) Lindsay Corp Bank of America
Merrill Lynch 4,322 (5,559) Lindsay Corp Morgan Stanley 3,002 25,214 Linear Technology Corp Bank of America
Merrill Lynch 60,009 183 Linear Technology Corp Goldman Sachs 436 159 Linear Technology Corp Morgan Stanley 492 (1,170) Linear Technology Corp Bank of America
Merrill Lynch (2,785) (2,276) Linear Technology Corp Morgan Stanley (7,278) 846 LinkedIn Corp 'A' Morgan Stanley 14,073 2,911 Lionbridge Technologies Inc Bank of America
Merrill Lynch 291 19,227 Lionbridge Technologies Inc Goldman Sachs 1,923 137,142 Lionbridge Technologies Inc Morgan Stanley 32,914 17,765 Lions Gate Entertainment Corp Bank of America
Merrill Lynch 34,906 (620) Lithia Motors Inc 'A' Bank of America
Merrill Lynch (2,790) (6,048) Lithia Motors Inc 'A' Morgan Stanley (18,726) 927 Littelfuse Inc Bank of America
Merrill Lynch 3,652 744 Littelfuse Inc Goldman Sachs 2,931 631 Littelfuse Inc Morgan Stanley (2,609) 2,106 LivaNova Plc Morgan Stanley (2,755) 2,146 LivaNova Plc Bank of America
Merrill Lynch 1,645 52,305 Live Nation Entertainment Inc Bank of America
Merrill Lynch 61,173 960 Live Nation Entertainment Inc Goldman Sachs 640 64,734 Live Nation Entertainment Inc Morgan Stanley (6,803) (33,808) Live Oak Bancshares Inc Bank of America
Merrill Lynch (22,651) (88,648) LivePerson Inc Bank of America
Merrill Lynch (82,443) (42,397) LivePerson Inc Morgan Stanley (77,587) 686 LKQ Corp Bank of America
Merrill Lynch 100 (14,988) LKQ Corp Bank of America
Merrill Lynch (8,393) 728 LMI Aerospace Inc Morgan Stanley 14 400 LMI Aerospace Inc Bank of America
Merrill Lynch (25) (31,025) Loews Corp Bank of America
Merrill Lynch (30,107) (40,415) Loews Corp Morgan Stanley (46,544) 25,861 Logitech International SA Reg Morgan Stanley (12,299) 22,990 Logitech International SA Reg Bank of America
Merrill Lynch 14,714 41,963 LogMeIn Inc Bank of America
Merrill Lynch 121,543 351 LogMeIn Inc Goldman Sachs 1,023 12,009 LogMeIn Inc Morgan Stanley 192,127 (22,932) Loral Space & Bank of America
Communications Inc Merrill Lynch (48,077) (7,045) Loral Space &
Communications Inc Morgan Stanley (20,442) (23,112) Louisiana-Pacific Corp Bank of America
Merrill Lynch (1,558) (5,900) Louisiana-Pacific Corp Morgan Stanley (24,190)
25,722 Lowe's Cos Inc Bank of America Merrill Lynch 75,781
2,247 Lowe's Cos Inc Goldman Sachs 7,325 44,156 Lowe's Cos Inc Morgan Stanley 266,732 (5,588) LPL Financial Holdings Inc Bank of America
Merrill Lynch (18,059) 8,715 LS Starrett Co/The 'A' Bank of America
Merrill Lynch 14,903 (11,231) LSB Industries Inc Bank of America
Merrill Lynch 6,177 (6,599) LSB Industries Inc Morgan Stanley (53,914) (27,578) LSB Industries Inc Goldman Sachs 15,168 31,231 LSI Industries Inc Bank of America
Merrill Lynch (26,234) 13,221 LSI Industries Inc Goldman Sachs (11,106) 29,374 LSI Industries Inc Morgan Stanley 23,204 (6,168) LTC Properties Inc (Reit) Morgan Stanley (7,972) (8,159) LTC Properties Inc (Reit) Bank of America
Merrill Lynch 4,236 159,473 Luby's Inc Morgan Stanley 105,252 4,991 lululemon athletica Inc Bank of America
Merrill Lynch 3,381 6,168 lululemon athletica Inc Morgan Stanley 11,987 563 Lumentum Holdings Inc Goldman Sachs 1,182 12,713 Lumentum Holdings Inc Morgan Stanley 42,542 61,597 Luminex Corp Bank of America
Merrill Lynch 33,474 5,095 Luminex Corp Goldman Sachs 3,006 28,355 Luminex Corp Morgan Stanley 31,912 (79,678) Lumos Networks Corp Bank of America
Merrill Lynch (1,594) (6,772) Lumos Networks Corp Morgan Stanley (9,330) (729) Lumos Networks Corp Goldman Sachs (15) (12,170) Luxoft Holding Inc Bank of America
Merrill Lynch (38,309) (28,272) Luxoft Holding Inc Morgan Stanley (268,232) 12,603 Lydall Inc Bank of America
Merrill Lynch 9,074 3,791 Lydall Inc Goldman Sachs 2,730 1,797 Lydall Inc Morgan Stanley 12,912 19,296 LyondellBasell Bank of America
Industries NV 'A' Merrill Lynch (21,515) 1,520 LyondellBasell
Industries NV 'A' Goldman Sachs (123) 8,557 LyondellBasell
Industries NV 'A' Morgan Stanley (8,350) 7,169 M&T Bank Corp Morgan Stanley 7,414 (19,524) M&T Bank Corp Bank of America
Merrill Lynch (112,653) 2,149 M&T Bank Corp Bank of America
Merrill Lynch 1,497 (6,361) M&T Bank Corp Morgan Stanley (91,280) 1,815 M/A-COM Technology
Solutions Holdings Inc Morgan Stanley 674 (4,457) M/A-COM Technology Bank of America
Solutions Holdings Inc Merrill Lynch 10,474 (905) M/A-COM Technology
Solutions Holdings Inc Goldman Sachs 2,127 (2,334) M/A-COM Technology
Solutions Holdings Inc Morgan Stanley 5,028 19,457 Macatawa Bank Corp Bank of America
Merrill Lynch 3,113 3,517 Macatawa Bank Corp Goldman Sachs 563 11,818 Macatawa Bank Corp Morgan Stanley 3,848 7,353 Macerich Co/The (Reit) Morgan Stanley (20,174) 9,750 Macerich Co/The (Reit) Bank of America
Merrill Lynch 3,608 (14,651) Mack-Cali Realty Corp (Reit) Morgan Stanley (45,034) (50,852) Mack-Cali Realty Corp (Reit) Bank of America
Merrill Lynch 20,341 3,981 Macquarie Infrastructure Corp Morgan Stanley 15,823
United States continued United States continued
Holding
Description Counterparty
Unrealised appreciation/
(depreciation) USD
Holding
Description Counterparty
Unrealised appreciation/
(depreciation) USD
Contracts for difference as at 31 May 2016

84 BlackRock Strategic Funds (BSF)
The notes on pages 489 to 503 form an integral part of these financial statements.
(17,902) Macy's Inc Morgan Stanley 65,515 (17,265) Macy's Inc Bank of America
Merrill Lynch (34,248) (6,155) Madison Square Garden Bank of America
Co/The 'A' Merrill Lynch (19,558) (3,674) Madison Square Garden
Co/The 'A' Morgan Stanley (4,748) (3,593) Magellan Midstream
Partners LP Morgan Stanley 1,736 3,200 magicJack VocalTec Ltd Morgan Stanley (4,992) 8,949 Maiden Holdings Ltd Morgan Stanley (40) 98,209 Maiden Holdings Ltd Bank of America
Merrill Lynch 36,209 1,835 Maiden Holdings Ltd Goldman Sachs 697 18,241 MainSource Financial
Group Inc Morgan Stanley 43,709 (3,296) Mallinckrodt Plc Bank of America
Merrill Lynch (11,901) 1,188 Mallinckrodt Plc Bank of America
Merrill Lynch 4,110 45,987 Manhattan Associates Inc Bank of America
Merrill Lynch 196,824 692 Manhattan Associates Inc Goldman Sachs 2,962 15,850 Manhattan Associates Inc Morgan Stanley 188,252 (10,350) Manitex International Inc Bank of America
Merrill Lynch (2,588) (24,242) Manitex International Inc Goldman Sachs (6,061) (4,441) Manitex International Inc Morgan Stanley (9,104) 26,082 Manitowoc Co Inc/The Bank of America
Merrill Lynch (8,085) 4,401 Manitowoc Co Inc/The Goldman Sachs (1,364) (6,029) Manitowoc Foodservice Inc Goldman Sachs (3,738) (17,984) Manitowoc Foodservice Inc Morgan Stanley (294,578) 4,994 Manning & Napier Inc Bank of America
Merrill Lynch 1,798 2,309 Manning & Napier Inc Goldman Sachs 831 3,496 Manning & Napier Inc Morgan Stanley 10,085 3,258 ManpowerGroup Inc Morgan Stanley (2,969) 28,376 ManpowerGroup Inc Bank of America
Merrill Lynch 42,967 181 ManpowerGroup Inc Goldman Sachs 279 (10,447) ManTech International
Corp/VA 'A' Morgan Stanley (7,238) (3,774) ManTech International Bank of America
Corp/VA 'A' Merrill Lynch (1,849) 17,949 Marathon Oil Corp Bank of America
Merrill Lynch 10,423 5,158 Marathon Oil Corp Morgan Stanley 5,182 2,572 Marathon Petroleum Corp Morgan Stanley (12,980) 33,183 Marchex Inc 'B' Bank of America
Merrill Lynch (5,641) 6,096 Marchex Inc 'B' Goldman Sachs (1,036) 28,322 Marchex Inc 'B' Morgan Stanley (4,532) 35,041 Marcus & Millichap Inc Bank of America
Merrill Lynch 5,997 14,783 Marcus & Millichap Inc Goldman Sachs 3,253 7,584 Marcus & Millichap Inc Morgan Stanley 32,072 3,427 Marcus Corp/The Bank of America
Merrill Lynch 977 1,807 Marcus Corp/The Goldman Sachs 256 1,413 Marcus Corp/The Morgan Stanley 744 26,952 Marin Software Inc Morgan Stanley (17,272) 23,098 Marin Software Inc Bank of America
Merrill Lynch 3,234 37,768 Marin Software Inc Goldman Sachs 5,288 1,345 Marine Products Corp Goldman Sachs 67 71,348 Marine Products Corp Morgan Stanley 67,035 6,012 Marine Products Corp Bank of America
Merrill Lynch (107) (2,363) MarineMax Inc Bank of America
Merrill Lynch 1,843
21,180 Marinus Pharmaceuticals Inc Bank of America Merrill Lynch 15,461
1,640 Marinus Pharmaceuticals Inc Goldman Sachs 1,197 (923) Markel Corp Bank of America
Merrill Lynch (18,635) 226 Markel Corp Bank of America
Merrill Lynch 4,563 355 Markel Corp Morgan Stanley 6,673 (16,028) MarketAxess Holdings Inc Bank of America
Merrill Lynch (117,485) (10,174) MarketAxess Holdings Inc Morgan Stanley (149,774) (15,510) Marketo Inc Bank of America
Merrill Lynch (117,428) (649) Marketo Inc Goldman Sachs (2,368) 67,775 Marlin Business Services Corp Bank of America
Merrill Lynch (10,844) 35,555 Marlin Business Services Corp Morgan Stanley 34,438 (2,903) Marriott International
Inc/MD 'A' Morgan Stanley (167) 309 Marriott International
Inc/MD 'A' Morgan Stanley 320 15,317 Marriott International Bank of America
Inc/MD 'A' Merrill Lynch (21,597) (24,613) Marriott Vacations
Worldwide Corp Morgan Stanley (9,159) (260) Marriott Vacations Bank of America
Worldwide Corp Merrill Lynch (585) 33,040 Marsh & McLennan Cos Inc Bank of America
Merrill Lynch 51,699 (50,080) Marsh & McLennan Cos Inc Bank of America
Merrill Lynch (81,630) 19,727 Marsh & McLennan Cos Inc Morgan Stanley 39,384 (7,718) Marten Transport Ltd Bank of America
Merrill Lynch (9,921) (3,022) Martin Marietta Materials Inc Bank of America
Merrill Lynch (15,246) (99,417) Marvell Technology Group Ltd Bank of America
Merrill Lynch (42,252) (7,947) Masco Corp Bank of America
Merrill Lynch (7,598) (7,058) Masco Corp Morgan Stanley (2,446) 52,058 Masco Corp Bank of America
Merrill Lynch 58,305 803 Masco Corp Goldman Sachs 899 29,333 Masco Corp Morgan Stanley 183,660 20,963 Masimo Corp Bank of America
Merrill Lynch 31,626 29,512 Masimo Corp Morgan Stanley 269,141 17,664 Masonite International Corp Bank of America
Merrill Lynch 16,074 8,467 Masonite International Corp Morgan Stanley 84,964 4,869 MasTec Inc Morgan Stanley 3,877 4,561 MasterCard Inc 'A' Goldman Sachs 2,372 8,616 MasterCard Inc 'A' Morgan Stanley 20,708 (13,022) MasterCard Inc 'A' Morgan Stanley (13,063) 41,699 Matador Resources Co Bank of America
Merrill Lynch 47,954 16,625 Matador Resources Co Morgan Stanley 40,185 4,314 Match Group Inc Bank of America
Merrill Lynch (2,499) 6,859 Match Group Inc Goldman Sachs (3,772) 20,251 Match Group Inc Morgan Stanley 52,876 (10,255) Materion Corp Bank of America
Merrill Lynch (3,384) 6,466 Matrix Service Co Morgan Stanley (688) 19,593 Matrix Service Co Bank of America
Merrill Lynch 1,857 4,713 Matrix Service Co Goldman Sachs 1,047 24,320 Matson Inc Morgan Stanley (137,329) 40,808 Matson Inc Bank of America
Merrill Lynch 69,379
BlackRock Americas Diversified Equity Absolute Return Fund continued
United States continued United States continued
Holding
Description Counterparty
Unrealised appreciation/
(depreciation) USD
Holding
Description Counterparty
Unrealised appreciation/
(depreciation) USD
Contracts for difference as at 31 May 2016

Annual Report and Audited Accounts 85
The notes on pages 489 to 503 form an integral part of these financial statements.
BlackRock Americas Diversified Equity Absolute Return Fund continued
(28,344) Mattel Inc Bank of America Merrill Lynch (11,586)
(5,882) Mattel Inc Morgan Stanley (2,001) (68,865) Matthews International Bank of America
Corp 'A' Merrill Lynch (153,576) (41,025) Matthews International
Corp 'A' Morgan Stanley (287,050) (606) Mattress Firm Holding Corp Bank of America
Merrill Lynch (248) (3,342) Mattress Firm Holding Corp Morgan Stanley 18,278 34,268 Maxim Integrated Products Inc Bank of America
Merrill Lynch 39,980 953 Maxim Integrated Products Inc Goldman Sachs 1,325 5,673 Maxim Integrated Products Inc Morgan Stanley 11,379 (48,887) MAXIMUS Inc Bank of America
Merrill Lynch (130,367) (6,878) MAXIMUS Inc Morgan Stanley (11,174) 13,574 MaxLinear Inc 'A' Morgan Stanley 86,466 1,389 MaxPoint Interactive Inc Bank of America
Merrill Lynch 3,334 6,159 MaxPoint Interactive Inc Morgan Stanley 33,379 (36,190) Maxwell Technologies Inc Bank of America
Merrill Lynch 362 (19,306) Maxwell Technologies Inc Goldman Sachs 193 (24,417) Maxwell Technologies Inc Morgan Stanley 19,534 (108,633) MB Financial Inc Bank of America
Merrill Lynch (226,272) (57,095) MB Financial Inc Morgan Stanley (311,190) (56,760) MBIA Inc Bank of America
Merrill Lynch (32,921) (53,838) MBIA Inc Morgan Stanley (44,898) 83,946 MBT Financial Corp Bank of America
Merrill Lynch (14,271) 2,300 MBT Financial Corp Goldman Sachs (391) 47,201 MCBC Holdings Inc Bank of America
Merrill Lynch 120,961 12,958 MCBC Holdings Inc Goldman Sachs 33,043 7,502 MCBC Holdings Inc Morgan Stanley 17,335 14,966 McCormick & Co Inc/MD Bank of America
Merrill Lynch (15,864) 631 McCormick & Co Inc/MD Morgan Stanley 4,376 31,376 McDermott International Inc Bank of America
Merrill Lynch 7,762 45,431 McDermott International Inc Morgan Stanley 16,017 (9,749) McDonald's Corp Morgan Stanley 21,020 (7,395) McDonald's Corp Bank of America
Merrill Lynch 13,773 9,195 McKesson Corp Bank of America
Merrill Lynch 79,537 548 McKesson Corp Morgan Stanley 13,237 (2,182) McKesson Corp Bank of America
Merrill Lynch 2,488 (1,011) McKesson Corp Morgan Stanley (525) 961 MDC Holdings Inc Bank of America
Merrill Lynch 856 1,906 MDC Holdings Inc Morgan Stanley 2,652 (32,609) MDC Partners Inc 'A' Bank of America
Merrill Lynch (21,848) (6,429) MDC Partners Inc 'A' Morgan Stanley 28,496 (24,756) MDC Partners Inc 'A' Goldman Sachs (16,587) (2,616) MDU Resources Group Inc Bank of America
Merrill Lynch (1,674) (2,447) MDU Resources Group Inc Morgan Stanley (3,924) (488) Mead Johnson Nutrition Co Bank of America
Merrill Lynch 781 (9,285) Mead Johnson Nutrition Co Morgan Stanley 18,525 1,432 MedCath Corp Morgan Stanley (11,112) (203,591) Medical Properties
Trust Inc (Reit) Bank of America Merrill Lynch (28,503)
(37,946) Medical Properties Trust Inc (Reit) Morgan Stanley (93,256)
(20,490) Medicines Co/The Bank of America Merrill Lynch (41,595)
(22,483) Medicines Co/The Goldman Sachs (45,236) (12,137) Medicines Co/The Morgan Stanley (104,985) 2,530 Medidata Solutions Inc Bank of America
Merrill Lynch 1,333 1,074 Medidata Solutions Inc Goldman Sachs 1,289 8,543 Medidata Solutions Inc Morgan Stanley 9,079 13,593 Medifast Inc Bank of America
Merrill Lynch (28,545) 5,378 Medifast Inc Goldman Sachs (11,294) 4,163 Medifast Inc Morgan Stanley 13,378 1,784 Medley Management Inc 'A' Bank of America
Merrill Lynch 963 (30,265) MEDNAX Inc Bank of America
Merrill Lynch 10,593 (1,023) MEDNAX Inc Goldman Sachs 358 (21,722) MEDNAX Inc Morgan Stanley (26,852) 21,545 Medtronic Plc Bank of America
Merrill Lynch (23,641) 10,361 Medtronic Plc Morgan Stanley (11,130) (1,262) Medtronic Plc Morgan Stanley 1,090 (37,505) MeetMe Inc Bank of America
Merrill Lynch (4,876) (25,831) MeetMe Inc Morgan Stanley (13,547) 8,630 Mellanox Technologies Ltd Morgan Stanley (58,888) 11,405 Memorial Resource Bank of America
Development Corp Merrill Lynch 19,274 (3,625) MercadoLibre Inc Bank of America
Merrill Lynch (25,866) (1,757) MercadoLibre Inc Morgan Stanley (7,059) 29,232 Mercantile Bank Corp Bank of America
Merrill Lynch 13,761 6,683 Mercantile Bank Corp Goldman Sachs 2,220 7,878 Mercantile Bank Corp Morgan Stanley 2,513 (10,291) Merck & Co Inc Morgan Stanley 295 (15,063) Mercury General Corp Bank of America
Merrill Lynch (14,133) (441) Mercury General Corp Morgan Stanley (137) (7,912) Mercury Systems Inc Bank of America
Merrill Lynch (4,668) (81,245) Meridian Bancorp Inc Bank of America
Merrill Lynch (20,311) (7,696) Meridian Bancorp Inc Goldman Sachs (1,924) (17,147) Meridian Bancorp Inc Morgan Stanley (20,131) (33,222) Meridian Bioscience Inc Bank of America
Merrill Lynch (8,970) 29,550 Merit Medical Systems Inc Morgan Stanley 74,170 9,239 Merit Medical Systems Inc Bank of America
Merrill Lynch (1,709) (17,341) Meritage Homes Corp Bank of America
Merrill Lynch (29,453) (6,995) Meritage Homes Corp Morgan Stanley (5,936) 12,443 Meritor Inc Bank of America
Merrill Lynch 7,715 1,720 Meritor Inc Morgan Stanley 81 (19,134) Mesa Laboratories Inc Morgan Stanley (399,288) (2,354) Mesa Laboratories Inc Bank of America
Merrill Lynch 14,148 (20,776) Metaldyne Performance Bank of America
Group Inc Merrill Lynch (20,568) (4,049) Metaldyne Performance
Group Inc Goldman Sachs (4,009) (33,206) Metaldyne Performance
Group Inc Morgan Stanley (131,873) (49,597) Methode Electronics Inc Bank of America
Merrill Lynch (66,617) (676) Methode Electronics Inc Morgan Stanley (999) 1,028 MetLife Inc Goldman Sachs 2,611
United States continued United States continued
Holding
Description Counterparty
Unrealised appreciation/
(depreciation) USD
Holding
Description Counterparty
Unrealised appreciation/
(depreciation) USD
Contracts for difference as at 31 May 2016

86 BlackRock Strategic Funds (BSF)
The notes on pages 489 to 503 form an integral part of these financial statements.
41,223 MetLife Inc Morgan Stanley 73,542 37,402 MetLife Inc Bank of America
Merrill Lynch 92,733 (2,388) Mettler-Toledo
International Inc Morgan Stanley (9,768) (1,329) Mettler-Toledo
International Inc Bank of America Merrill Lynch (8,523)
31,228 MFA Financial Inc (Reit) Bank of America Merrill Lynch 1,874
(2,213) MGE Energy Inc Morgan Stanley (2,091) (115,773) MGE Energy Inc Bank of America
Merrill Lynch 87,987 (30,943) MGIC Investment Corp Bank of America
Merrill Lynch (20,577) 13,873 MGIC Investment Corp Bank of America
Merrill Lynch 9,226 19,812 MGIC Investment Corp Morgan Stanley 11,178 27,120 MGM Growth Properties Bank of America
LLC 'A' (Reit) Merrill Lynch 1,515 22,643 MGM Growth Properties
LLC 'A' (Reit) Morgan Stanley 3,967 (55,281) MGM Resorts International Bank of America
Merrill Lynch (52,015) (30,451) MGM Resorts International Morgan Stanley (56,187) (25,659) MGP Ingredients Inc Bank of America
Merrill Lynch (140,355) 1,744 Michael Kors Holdings Ltd Morgan Stanley (15,242) (853) Michael Kors Holdings Ltd Morgan Stanley (214) 9,071 Michael Kors Holdings Ltd Bank of America
Merrill Lynch 4,898 1,472 Michael Kors Holdings Ltd Goldman Sachs 795 (6,650) Michaels Cos Inc/The Morgan Stanley (4,762) 4,618 Michaels Cos Inc/The Bank of America
Merrill Lynch 3,694 2,854 Michaels Cos Inc/The Goldman Sachs 2,283 (43,629) Microchip Technology Inc Bank of America
Merrill Lynch (88,816) (25,555) Microchip Technology Inc Goldman Sachs (81,009) (20,410) Microchip Technology Inc Morgan Stanley (176,837) (95,643) Micron Technology Inc Bank of America
Merrill Lynch (248,672) (31,163) Micron Technology Inc Morgan Stanley (48,199) 19,667 Microsemi Corp Bank of America
Merrill Lynch 39,326 15,730 Microsemi Corp Morgan Stanley (35,967) (11,261) Microsemi Corp Bank of America
Merrill Lynch (22,184) (8,258) Microsoft Corp Bank of America
Merrill Lynch (9,368) (87,143) Microsoft Corp Morgan Stanley (32,103) 7,046 MicroStrategy Inc 'A' Bank of America
Merrill Lynch 45,869 (2,216) MicroStrategy Inc 'A' Bank of America
Merrill Lynch (14,041) (1,801) MicroStrategy Inc 'A' Morgan Stanley (7,997) 8,134 Mid-America Apartment
Communities Inc (Reit) Morgan Stanley 126,402 10,952 Mid-America Apartment Bank of America
Communities Inc (Reit) Merrill Lynch (20,809) 756 Middleby Corp/The Morgan Stanley 6,370 (2,821) Middleby Corp/The Bank of America
Merrill Lynch (17,011) 8,150 Middlesex Water Co Bank of America
Merrill Lynch 1,793 1,545 Middlesex Water Co Goldman Sachs 340 (283) MidWestOne Financial Bank of America
Group Inc Merrill Lynch (342) (8,879) MidWestOne Financial
Group Inc Morgan Stanley (19,978) (8,440) Milacron Holdings Corp Morgan Stanley (9,863)
53,339 Miller Industries Inc/TN Bank of America Merrill Lynch 41,096
2,075 Miller Industries Inc/TN Goldman Sachs 1,702 20,455 Miller Industries Inc/TN Morgan Stanley 11,713 (1,506) Minerals Technologies Inc Bank of America
Merrill Lynch (211) (3,397) Minerals Technologies Inc Morgan Stanley (2,021) 20,722 Mistras Group Inc Bank of America
Merrill Lynch 25,488 2,649 Mistras Group Inc Goldman Sachs 3,258 639 Mistras Group Inc Morgan Stanley (520) 9,482 Mitcham Industries Inc Morgan Stanley 12,990 6,626 MKS Instruments Inc Bank of America
Merrill Lynch 28,889 3,460 MKS Instruments Inc Morgan Stanley 10,833 (63,505) Mobile Mini Inc Bank of America
Merrill Lynch (254,321) 9,796 Mobile Mini Inc Morgan Stanley 75,095 (59,677) MobileIron Inc Morgan Stanley 40,521 (350) Mobileye NV Morgan Stanley 604 (10,922) Mobileye NV Bank of America
Merrill Lynch (2,774) (11,984) Model N Inc Bank of America
Merrill Lynch (22,410) 5,669 Modine Manufacturing Co Bank of America
Merrill Lynch (2,591) 7,336 Modine Manufacturing Co Morgan Stanley (1,955) (162,217) ModusLink Global
Solutions Inc Morgan Stanley 72,998 607 Moelis & Co 'A' Goldman Sachs 134 422 Moelis & Co 'A' Morgan Stanley (685) 584 Moelis & Co 'A' Bank of America
Merrill Lynch 128 2,534 Mohawk Industries Inc Morgan Stanley 1,621 (525) Mohawk Industries Inc Bank of America
Merrill Lynch (1,491) (42,577) Molina Healthcare Inc Bank of America
Merrill Lynch (94,638) (10,904) Molina Healthcare Inc Morgan Stanley (23,722) (10,074) Molson Coors Brewing Co 'B' Morgan Stanley (48,676) (14,036) Molson Coors Brewing Co 'B' Bank of America
Merrill Lynch 2,106 17,184 Monarch Casino & Resort Inc Bank of America
Merrill Lynch 22,683 2,734 Monarch Casino & Resort Inc Goldman Sachs 3,609 2,638 Monarch Casino & Resort Inc Morgan Stanley 3,798 27,245 Monarch Financial Bank of America
Holdings Inc Merrill Lynch 20,979 497 Monarch Financial
Holdings Inc Goldman Sachs 383 2,613 Monarch Financial
Holdings Inc Morgan Stanley 8,116 (4,549) Mondelez International Inc 'A' Bank of America
Merrill Lynch (546) (51,441) Mondelez International Inc 'A' Morgan Stanley (62,526) 26,687 MoneyGram International Inc Bank of America
Merrill Lynch 11,209 12,307 MoneyGram International Inc Morgan Stanley 12,220 413 Monmouth Real Estate
Investment Corp (Reit) Goldman Sachs (45) 49,666 Monmouth Real Estate Bank of America
Investment Corp (Reit) Merrill Lynch 2,989 4,676 Monmouth Real Estate
Investment Corp (Reit) Morgan Stanley 1,299 (96,439) Monogram Residential Bank of America
Trust Inc (Reit) Merrill Lynch 13,501 (6,074) Monogram Residential
Trust Inc (Reit) Morgan Stanley (7,153) (73,581) Monolithic Power Systems Inc Bank of America
Merrill Lynch (415,214) (3,526) Monolithic Power Systems Inc Morgan Stanley (19,971)
BlackRock Americas Diversified Equity Absolute Return Fund continued
United States continued United States continued
Holding
Description Counterparty
Unrealised appreciation/
(depreciation) USD
Holding
Description Counterparty
Unrealised appreciation/
(depreciation) USD
Contracts for difference as at 31 May 2016

Annual Report and Audited Accounts 87
The notes on pages 489 to 503 form an integral part of these financial statements.
BlackRock Americas Diversified Equity Absolute Return Fund continued
59,969 Monotype Imaging Holdings Inc Bank of America Merrill Lynch 2,998
3,064 Monotype Imaging Holdings Inc Goldman Sachs 153 38,651 Monotype Imaging Holdings Inc Morgan Stanley 12,368 (40,740) Monro Muffler Brake Inc Bank of America
Merrill Lynch 168,676 2,299 Monro Muffler Brake Inc Bank of America
Merrill Lynch (13,564) 821 Monro Muffler Brake Inc Morgan Stanley (6,106) (6,074) Monsanto Co Bank of America
Merrill Lynch (72,183) (11,071) Monsanto Co Morgan Stanley (212,044) (2,719) Monster Beverage Corp Morgan Stanley (1,841) (5,873) Monster Beverage Corp Bank of America
Merrill Lynch 3,847 (75,908) Monster Worldwide Inc Bank of America
Merrill Lynch (8,489) (20,668) Moody's Corp Morgan Stanley (129,151) 28,096 Moody's Corp Bank of America
Merrill Lynch 113,227 (9,743) Moody's Corp Bank of America
Merrill Lynch (30,912) (1,449) Moog Inc 'A' Bank of America
Merrill Lynch 166 (2,713) Moog Inc 'A' Morgan Stanley (5,745) (43,304) Morgan Stanley Bank of America
Merrill Lynch (70,586) (78,205) Morgans Hotel Group Co Bank of America
Merrill Lynch (3,440) (3,917) Morgans Hotel Group Co Morgan Stanley (5,169) (821) Morningstar Inc Bank of America
Merrill Lynch (1,404) (438) Morningstar Inc Morgan Stanley (1,751) (12,901) Mosaic Co/The Bank of America
Merrill Lynch 19,887 (1,373) Mosaic Co/The Morgan Stanley 1,209 (39,270) MoSys Inc Morgan Stanley 14,212 (56,814) Motorcar Parts of America Inc Bank of America
Merrill Lynch 24,430 (1,177) Motorcar Parts of America Inc Morgan Stanley 1,748 (2,110) Motorola Solutions Inc Bank of America
Merrill Lynch 3,608 (26,638) Motorola Solutions Inc Morgan Stanley 149,388 2,759 Movado Group Inc Bank of America
Merrill Lynch (8,222) 2,139 Movado Group Inc Goldman Sachs (6,374) 2,763 Movado Group Inc Morgan Stanley (15,513) (33,997) MRC Global Inc Bank of America
Merrill Lynch (340) 1,613 MRC Global Inc Bank of America
Merrill Lynch 897 21,202 MRV Communications Inc Bank of America
Merrill Lynch 29,259 6,276 MRV Communications Inc Goldman Sachs 8,661 12,289 MRV Communications Inc Morgan Stanley (492) (37,593) MSA Safety Inc Bank of America
Merrill Lynch (66,164) (452) MSA Safety Inc Morgan Stanley (3,934) 645 MSA Safety Inc Bank of America
Merrill Lynch 1,211 2,183 MSA Safety Inc Morgan Stanley 5,290 (11,231) MSC Industrial Direct
Co Inc 'A' Morgan Stanley (2,918) (17,343) MSC Industrial Direct Bank of America
Co Inc 'A' Merrill Lynch (16,563) 6,532 MSCI Inc Morgan Stanley 18,741 6,388 MSCI Inc Bank of America
Merrill Lynch 28,829 117 MSCI Inc Goldman Sachs 516 1,414 MSG Networks Inc 'A' Goldman Sachs 565 21,226 MSG Networks Inc 'A' Bank of America
Merrill Lynch 13,723
10,624 MSG Networks Inc 'A' Morgan Stanley 5,733 (20,045) Mueller Industries Inc Bank of America
Merrill Lynch (23,453) (14,802) Mueller Industries Inc Morgan Stanley (9,596) 18,091 Mueller Water Products Bank of America
Inc 'A' Merrill Lynch 4,342 (10,415) Multi Packaging Solutions
International Ltd Morgan Stanley 1,597 3,825 Multi-Color Corp Morgan Stanley 6,394 (23,932) Multi-Color Corp Bank of America
Merrill Lynch (18,906) (7,784) Multi-Color Corp Morgan Stanley (155,914) 3,073 Multi-Color Corp Bank of America
Merrill Lynch 2,004 (12,552) Murphy Oil Corp Bank of America
Merrill Lynch (17,196) (12,080) Murphy Oil Corp Morgan Stanley (13,042) 278 Murphy USA Inc Bank of America
Merrill Lynch (58) 27,744 Myers Industries Inc Bank of America
Merrill Lynch 3,534 2,633 Myers Industries Inc Goldman Sachs 2,274 10,161 Myers Industries Inc Morgan Stanley 7,920 (8,219) MyoKardia Inc Morgan Stanley (47,177) 5,691 Myriad Genetics Inc Bank of America
Merrill Lynch (3,707) 28,866 Nabors Industries Ltd Bank of America
Merrill Lynch 33,773 7,323 Nabors Industries Ltd Goldman Sachs 8,568 24,936 Nabors Industries Ltd Morgan Stanley 33,764 (37,860) NACCO Industries Inc 'A' Bank of America
Merrill Lynch (42,920) (6,156) NACCO Industries Inc 'A' Morgan Stanley (53,126) 10,297 Nanometrics Inc Bank of America
Merrill Lynch 7,543 11,396 Nanometrics Inc Goldman Sachs 9,600 1,861 Nanometrics Inc Morgan Stanley 9,807 (26,582) NanoString Technologies Inc Morgan Stanley (47,316) (32,368) NanoString Technologies Inc Bank of America
Merrill Lynch 1,975 (2,197) Nasdaq Inc Bank of America
Merrill Lynch (4,262) (3,375) Nasdaq Inc Morgan Stanley (8,912) (6,846) Nathan's Famous Inc Morgan Stanley 21,293 (67,409) National Bankshares Inc Morgan Stanley (212,480) 493 National Beverage Corp Bank of America
Merrill Lynch (345) 31,520 National CineMedia Inc Bank of America
Merrill Lynch 20,803 3,097 National CineMedia Inc Goldman Sachs 2,044 (54,564) National Commerce Corp Morgan Stanley 3,792 (47,655) National Fuel Gas Co Bank of America
Merrill Lynch (32,375) (6,265) National Fuel Gas Co Morgan Stanley (6,141) 39,153 National General Bank of America
Holdings Corp Merrill Lynch (21,746) 13,485 National General
Holdings Corp Morgan Stanley 1,831 6,563 National Health Bank of America
Investors Inc (Reit) Merrill Lynch 591 7,719 National Health
Investors Inc (Reit) Morgan Stanley 80,430 5,605 National Instruments Corp Bank of America
Merrill Lynch 9,080 756 National Instruments Corp Morgan Stanley 457 (3,954) National Instruments Corp Bank of America
Merrill Lynch (4,418) (8,064) National Instruments Corp Morgan Stanley (5,371) (34,127) National Oilwell Varco Inc Bank of America
Merrill Lynch (25,937) (35,579) National Oilwell Varco Inc Morgan Stanley (173,485) 4,728 National Research Corp 'A' Goldman Sachs (1,560)
United States continued United States continued
Holding
Description Counterparty
Unrealised appreciation/
(depreciation) USD
Holding
Description Counterparty
Unrealised appreciation/
(depreciation) USD
Contracts for difference as at 31 May 2016

88 BlackRock Strategic Funds (BSF)
The notes on pages 489 to 503 form an integral part of these financial statements.
17,391 National Research Corp 'A' Morgan Stanley (8,696) (25,267) National Retail Properties
Inc (Reit) Morgan Stanley (11,037) 23,556 National Storage Affiliates Bank of America
Trust (Reit) Merrill Lynch (38,632) 12,306 National Storage Affiliates
Trust (Reit) Goldman Sachs (20,182) 10,641 National Storage Affiliates
Trust (Reit) Morgan Stanley 28,694 (1,888) Nationstar Mortgage
Holdings Inc Morgan Stanley (322) 9,690 Nationstar Mortgage Bank of America
Holdings Inc Merrill Lynch 11,240 12,383 Nationstar Mortgage
Holdings Inc Morgan Stanley 20,110 41,923 Natural Grocers by Vitamin Bank of America
Cottage Inc Merrill Lynch (5,869) 5,463 Natural Grocers by Vitamin
Cottage Inc Goldman Sachs (765) 1,567 Natural Health Trends Corp Goldman Sachs (6,738) (26,893) Nature's Sunshine Bank of America
Products Inc Merrill Lynch 807 (9,741) Nature's Sunshine
Products Inc Morgan Stanley (19,190) (18,283) Natus Medical Inc Bank of America
Merrill Lynch (1,082) (15,928) Natus Medical Inc Morgan Stanley (10,110) 42,810 Nautilus Inc Bank of America
Merrill Lynch 35,104 13,612 Nautilus Inc Morgan Stanley 26,199 (23,651) Navient Corp Morgan Stanley (120,857) (16,685) Navigators Group Inc/The Bank of America
Merrill Lynch (46,551) (34,272) Navistar International Corp Goldman Sachs 6,854 (187,011) NBT Bancorp Inc Bank of America
Merrill Lynch (211,322) (71,794) NBT Bancorp Inc Morgan Stanley (285,740) 24,865 NCI Building Systems Inc Bank of America
Merrill Lynch 681 66,047 NCI Building Systems Inc Morgan Stanley 405,186 (17,944) NCR Corp Bank of America
Merrill Lynch (35,529) (27,790) NCR Corp Morgan Stanley (59,191) 13,715 Neenah Paper Inc Bank of America
Merrill Lynch 19,750 (334) Neenah Paper Inc Morgan Stanley (424) 49,857 Neff Corp 'A' Morgan Stanley 263,245 (81,656) Nektar Therapeutics Bank of America
Merrill Lynch (111,869) (17,624) Nektar Therapeutics Goldman Sachs (24,145) (35,944) Nektar Therapeutics Morgan Stanley (37,275) 24,963 Nelnet Inc 'A' Bank of America
Merrill Lynch (5,741) (8,896) Neogen Corp Bank of America
Merrill Lynch (4,052) (18,192) Neogen Corp Morgan Stanley (22,755) (91,646) NeoGenomics Inc Bank of America
Merrill Lynch (28,410) (2,050) Neos Therapeutics Inc Bank of America
Merrill Lynch (6,540) (4,884) Neos Therapeutics Inc Morgan Stanley (972) 125,677 NetApp Inc Bank of America
Merrill Lynch 265,894 56,193 NetApp Inc Morgan Stanley 125,773 (5,243) Netflix Inc Bank of America
Merrill Lynch (72,668) (3,372) Netflix Inc Morgan Stanley (18,401) 26,167 NETGEAR Inc Bank of America
Merrill Lynch 48,195 653 NETGEAR Inc Goldman Sachs 1,611 27,554 NETGEAR Inc Morgan Stanley 138,964
(74,932) NetScout Systems Inc Bank of America Merrill Lynch (47,207)
(5,679) NetScout Systems Inc Morgan Stanley (4,606) (2,068) NetSuite Inc Bank of America
Merrill Lynch (124) (10,316) NetSuite Inc Goldman Sachs (619) (4,044) NetSuite Inc Morgan Stanley (100,615) (14,375) Neurocrine Biosciences Inc Bank of America
Merrill Lynch (58,794) (1,819) NeuStar Inc 'A' Bank of America
Merrill Lynch (1,686) (5,089) Nevro Corp Bank of America
Merrill Lynch (24,086) (8,488) Nevro Corp Goldman Sachs (40,827) (8,842) Nevro Corp Morgan Stanley (72,844) (2,947) New Home Co Inc/The Bank of America
Merrill Lynch (3,713) 3,203 New Jersey Resources Corp Bank of America
Merrill Lynch (4,228) 11,316 New Jersey Resources Corp Morgan Stanley (5,567) 12,205 New Media Investment Bank of America
Group Inc Merrill Lynch 12,693 11,672 New Media Investment
Group Inc Goldman Sachs 12,139 18,740 New Media Investment
Group Inc Morgan Stanley 37,880 (1,626) New Relic Inc Bank of America
Merrill Lynch (5,577) (6,067) New Relic Inc Morgan Stanley (17,507) 519 New Relic Inc Bank of America
Merrill Lynch 1,780 5,133 New Relic Inc Morgan Stanley 19,172 27,642 New Residential Investment
Corp (Reit) Morgan Stanley 21,566 37,893 New Residential Investment Bank of America
Corp (Reit) Merrill Lynch 5,684 92,930 New Senior Investment
Group Inc (Reit) Morgan Stanley 144,971 172,326 New York & Co Inc Bank of America
Merrill Lynch (224,024) 37,205 New York & Co Inc Goldman Sachs (48,367) 36,060 New York & Co Inc Morgan Stanley (44,203) (78,587) New York Community Bank of America
Bancorp Inc Merrill Lynch (62,526) (128,552) New York Mortgage Bank of America
Trust Inc (Reit) Merrill Lynch (14,141) (50,501) New York Mortgage
Trust Inc (Reit) Goldman Sachs (5,555) (9,719) New York Mortgage
Trust Inc (Reit) Morgan Stanley (11,760) (360,795) New York REIT Inc (Reit) Morgan Stanley 110,796 (266,880) New York REIT Inc (Reit) Bank of America
Merrill Lynch 189,485 (162,962) New York Times Co/The 'A' Bank of America
Merrill Lynch 36,937 (19,570) New York Times Co/The 'A' Goldman Sachs 5,871 1,381 New York Times Co/The 'A' Bank of America
Merrill Lynch (414) 2,197 New York Times Co/The 'A' Morgan Stanley (1,604) (12,430) Newell Brands Inc Bank of America
Merrill Lynch 1,223 (10,182) Newell Brands Inc Goldman Sachs 1,120 34,569 Newfield Exploration Co Bank of America
Merrill Lynch 62,224 110 Newfield Exploration Co Goldman Sachs 198 40,109 Newfield Exploration Co Morgan Stanley 425,458 (2,547) NewMarket Corp Bank of America
Merrill Lynch (7,132) (871) NewMarket Corp Morgan Stanley (6,324) 7,309 Newmont Mining Corp Morgan Stanley 16,906
BlackRock Americas Diversified Equity Absolute Return Fund continued
United States continued United States continued
Holding
Description Counterparty
Unrealised appreciation/
(depreciation) USD
Holding
Description Counterparty
Unrealised appreciation/
(depreciation) USD
Contracts for difference as at 31 May 2016

Annual Report and Audited Accounts 89
The notes on pages 489 to 503 form an integral part of these financial statements.
BlackRock Americas Diversified Equity Absolute Return Fund continued
27,517 Newmont Mining Corp Bank of America Merrill Lynch (75,263)
(49,460) Newpark Resources Inc Bank of America Merrill Lynch 5,935
(27,174) Newpark Resources Inc Morgan Stanley (17,642) (53,011) News Corp 'A' Bank of America
Merrill Lynch (9,542) (88,326) News Corp 'A' Morgan Stanley (60,434) (55,829) News Corp 'B' Bank of America
Merrill Lynch (6,699) (421) News Corp 'B' Goldman Sachs (51) (1,145) NewStar Financial Inc Bank of America
Merrill Lynch (1,111) (49,515) NewStar Financial Inc Morgan Stanley (194,594) (19,648) Newtek Business Bank of America
Services Corp Merrill Lynch (2,253) (2,849) Newtek Business
Services Corp Morgan Stanley (444) 2,421 Nexstar Broadcasting Bank of America
Group Inc 'A' Merrill Lynch 2,687 (6,050) Nexstar Broadcasting Bank of America
Group Inc 'A' Merrill Lynch (6,615) 62,985 NextEra Energy Inc Morgan Stanley 249,162 34,656 NextEra Energy Inc Bank of America
Merrill Lynch (32,610) 72,094 NIC Inc Bank of America
Merrill Lynch 38,591 7,589 NIC Inc Morgan Stanley 4,843 62,656 Nicholas Financial Inc Bank of America
Merrill Lynch 10,652 1,980 Nicholas Financial Inc Goldman Sachs 337 10,482 Nicholas Financial Inc Morgan Stanley 2,569 9,213 Nielsen Holdings Plc Bank of America
Merrill Lynch 8,292 (1,287) Nielsen Holdings Plc Bank of America
Merrill Lynch 577 (13,940) NII Holdings Inc Bank of America
Merrill Lynch (15,055) (44,083) NII Holdings Inc Goldman Sachs (47,610) 27,383 NIKE Inc 'B' Bank of America
Merrill Lynch (40,321) 1,590 NIKE Inc 'B' Goldman Sachs (2,433) 73,943 NIKE Inc 'B' Morgan Stanley (107,545) (2,001) Nimble Storage Inc Goldman Sachs (5,023) 35,340 Nimble Storage Inc Morgan Stanley 107,080 2,352 NiSource Inc Bank of America
Merrill Lynch (470) 2,140 Nivalis Therapeutics Inc Bank of America
Merrill Lynch 514 5,024 Nivalis Therapeutics Inc Goldman Sachs 1,206 2,361 Nivalis Therapeutics Inc Morgan Stanley 387 8,137 NL Industries Inc Bank of America
Merrill Lynch 2,929 339,873 NMI Holdings Inc 'A' Bank of America
Merrill Lynch 91,766 59,747 NMI Holdings Inc 'A' Morgan Stanley 89,620 (1,250) NN Inc Bank of America
Merrill Lynch (800) (15,596) NN Inc Morgan Stanley (13,225) 13,350 Noble Corp Plc Bank of America
Merrill Lynch (6,008) 839 Noble Corp Plc Morgan Stanley (1,150) 22,582 Noble Energy Inc Morgan Stanley 4,366 17,642 Noble Energy Inc Bank of America
Merrill Lynch 2,168 16,818 Nordic American Tankers Ltd Bank of America
Merrill Lynch 20,893 3,182 Nordic American Tankers Ltd Goldman Sachs 3,405 24,072 Nordic American Tankers Ltd Morgan Stanley 101,449 28,946 Nordson Corp Bank of America
Merrill Lynch 282,095 25,706 Nordson Corp Morgan Stanley 307,169
(23,111) Nordstrom Inc Bank of America Merrill Lynch 17,268
(1,327) Nordstrom Inc Goldman Sachs 1,035 (7,335) Nordstrom Inc Morgan Stanley 114,913 (2,457) Nortek Inc Bank of America
Merrill Lynch 3,342 (13,072) Nortek Inc Morgan Stanley (170,626) 11,940 North Atlantic Drilling Ltd Bank of America
Merrill Lynch 4,060 11,214 North Atlantic Drilling Ltd Goldman Sachs 3,813 2,853 Northern Oil and Gas Inc Goldman Sachs (485) (8,852) Northern Tier Energy LP Morgan Stanley 16,853 1,693 Northern Trust Corp Bank of America
Merrill Lynch 3,534 14,041 Northern Trust Corp Morgan Stanley 99,829 (210,851) Northfield Bancorp Inc Bank of America
Merrill Lynch (63,255) 6,950 Northrim BanCorp Inc Bank of America
Merrill Lynch 2,572 6,009 Northrim BanCorp Inc Goldman Sachs 2,223 53,426 Northrim BanCorp Inc Morgan Stanley 79,292 3,464 Northrop Grumman Corp Morgan Stanley 10,217 6,565 Northrop Grumman Corp Bank of America
Merrill Lynch (7,000) 19,655 NorthStar Asset Management
Group Inc/New York Morgan Stanley 28,751 57,527 NorthStar Asset Management Bank of America
Group Inc/New York Merrill Lynch 39,633 (738) NorthStar Realty Europe Bank of America
Corp (Reit) Merrill Lynch (23) (8,707) NorthStar Realty Europe
Corp (Reit) Morgan Stanley 6,239 2,043 NorthStar Realty Finance
Corp (Reit) Goldman Sachs (163) 19,225 NorthStar Realty Finance Bank of America
Corp (Reit) Merrill Lynch (1,538) (6,421) Northwest Bancshares Inc Bank of America
Merrill Lynch (1,734) (47,513) Northwest Bancshares Inc Morgan Stanley (43,790) 11,551 Northwest Natural Gas Co Morgan Stanley 35,290 (6,439) Northwest Pipe Co Morgan Stanley (6,890) (37,022) Northwest Pipe Co Bank of America
Merrill Lynch 370 (18,234) NorthWestern Corp Bank of America
Merrill Lynch 9,302 (49,656) NorthWestern Corp Morgan Stanley 13,330 17,473 NorthWestern Corp Bank of America
Merrill Lynch (9,086) 8,145 Norwegian Cruise Line
Holdings Ltd Morgan Stanley (15,869) 10,327 Norwegian Cruise Line Bank of America
Holdings Ltd Merrill Lynch (4,750) 3,753 Novanta Inc Morgan Stanley 11,184 (35,340) Novavax Inc Goldman Sachs (49,476) (1,809) Novocure Ltd Morgan Stanley 718 (8,803) NOW Inc Bank of America
Merrill Lynch (3,873) (8,191) NOW Inc Goldman Sachs (3,604) 2,476 NRG Energy Inc Goldman Sachs 1,807 (3,333) NRG Energy Inc Bank of America
Merrill Lynch (2,611) (5,329) NRG Energy Inc Morgan Stanley (3,986) (2,455) NRG Yield Inc 'A' Bank of America
Merrill Lynch (663) (5,114) NRG Yield Inc 'A' Morgan Stanley (19,178) 5,721 NRG Yield Inc 'C' Bank of America
Merrill Lynch 1,716 16,527 NRG Yield Inc 'C' Morgan Stanley 19,741 17,650 Nuance Communications Inc Bank of America
Merrill Lynch 7,413 1,548 Nuance Communications Inc Morgan Stanley 625
United States continued United States continued
Holding
Description Counterparty
Unrealised appreciation/
(depreciation) USD
Holding
Description Counterparty
Unrealised appreciation/
(depreciation) USD
Contracts for difference as at 31 May 2016

90 BlackRock Strategic Funds (BSF)
The notes on pages 489 to 503 form an integral part of these financial statements.
2,793 Nucor Corp Bank of America Merrill Lynch 2,653
360 Nucor Corp Morgan Stanley 2,886 (19,794) Nucor Corp Morgan Stanley 5,996 (14,983) Nucor Corp Bank of America
Merrill Lynch (14,234) (14,582) Numerex Corp 'A' Bank of America
Merrill Lynch (1,750) (3,994) NuStar Energy LP Morgan Stanley (7,258) 31,505 Nutraceutical Bank of America
International Corp Merrill Lynch (2,520) 3,413 Nutraceutical
International Corp Goldman Sachs (273) 11,402 Nutraceutical
International Corp Morgan Stanley (6,792) (2,942) Nutrisystem Inc Bank of America
Merrill Lynch (3,530) 5,342 NuVasive Inc Bank of America
Merrill Lynch 4,504 1,775 NuVasive Inc Morgan Stanley 1,751 (1,056) NuVasive Inc Bank of America
Merrill Lynch (1,003) (13,534) Nuvectra Corp Bank of America
Merrill Lynch (7,002) 1,108 Nuvectra Corp Bank of America
Merrill Lynch 1,451 8,883 Nuvectra Corp Morgan Stanley 78,703 (2,837) NV5 Global Inc Bank of America
Merrill Lynch (3,263) (221) NV5 Global Inc Goldman Sachs (254) (10,382) NV5 Global Inc Morgan Stanley (114,513) (4,550) NVE Corp Bank of America
Merrill Lynch (1,092) 609 NVIDIA Corp Morgan Stanley 12,737 2,647 NVIDIA Corp Bank of America
Merrill Lynch 11,885 (11,236) NVIDIA Corp Morgan Stanley (66,828) (422) NVR Inc Bank of America
Merrill Lynch (27,146) (989) NVR Inc Morgan Stanley (74,073) (13,515) NXP Semiconductors NV Morgan Stanley (164,474) 17,272 NxStage Medical Inc Bank of America
Merrill Lynch 12,577 5,407 NxStage Medical Inc Goldman Sachs 4,299 19,873 NxStage Medical Inc Morgan Stanley 60,817 (3,360) O'Reilly Automotive Inc Morgan Stanley (14,340) (3,844) O'Reilly Automotive Inc Bank of America
Merrill Lynch (32,115) 2,048 O'Reilly Automotive Inc Bank of America
Merrill Lynch 7,414 (16,264) Oasis Petroleum Inc Bank of America
Merrill Lynch (10,246) 23,742 Oasis Petroleum Inc Bank of America
Merrill Lynch 11,717 17,888 Oasis Petroleum Inc Morgan Stanley 23,804 (17,231) Occidental Petroleum Corp Bank of America
Merrill Lynch 7,109 (10,413) Oceaneering International Inc Bank of America
Merrill Lynch (8,859) (12,417) Oceaneering International Inc Morgan Stanley (7,774) (51,591) OceanFirst Financial Corp Bank of America
Merrill Lynch (46,948) 3,149 OceanFirst Financial Corp Goldman Sachs 2,866 (8,806) Oclaro Inc Goldman Sachs (1,761) (2,702) Ocular Therapeutix Inc Bank of America
Merrill Lynch (2,810) (11,524) Ocular Therapeutix Inc Goldman Sachs (11,985) (29,480) Ocular Therapeutix Inc Morgan Stanley (76,202) 37,039 Ocwen Financial Corp Bank of America
Merrill Lynch (741) 7,347 Ocwen Financial Corp Morgan Stanley (740)
2,301 Office Depot Inc Bank of America Merrill Lynch 299
15,389 Office Depot Inc Morgan Stanley 3,121 (8,042) Office Depot Inc Bank of America
Merrill Lynch (1,032) (32,505) OFG Bancorp Morgan Stanley (20,209) 16,834 OGE Energy Corp Bank of America
Merrill Lynch (7,407) 22,727 Oil States International Inc Bank of America
Merrill Lynch 38,474 23,894 Oil States International Inc Morgan Stanley 176,975 (16,830) Oil States International Inc Bank of America
Merrill Lynch (29,202) 3,689 Oil-Dri Corp of America Morgan Stanley (13,354) 9,484 Old Dominion Freight Line Inc Morgan Stanley (42,097) 10,737 Old Line Bancshares Inc Bank of America
Merrill Lynch (8,375) 700 Old Line Bancshares Inc Goldman Sachs (546) 4,088 Old National Bancorp/IN Goldman Sachs 3,148 227,173 Old National Bancorp/IN Morgan Stanley (446,669) 115,978 Old National Bancorp/IN Bank of America
Merrill Lynch 89,303 122,273 Old Republic
International Corp Morgan Stanley 144,761 (13,258) Old Second Bancorp Inc Bank of America
Merrill Lynch (4,019) (68,901) Olin Corp Bank of America
Merrill Lynch (79,747) (17,883) Olin Corp Morgan Stanley (23,124) 8,464 Ollie's Bargain Outlet Bank of America
Holdings Inc Merrill Lynch 14,387 2,457 Ollie's Bargain Outlet
Holdings Inc Morgan Stanley 1,821 (7,525) Olympic Steel Inc Bank of America
Merrill Lynch (13,846) (12,680) Olympic Steel Inc Morgan Stanley (182,085) 19,932 OM Asset Management Plc Bank of America
Merrill Lynch 14,953 4,578 OM Asset Management Plc Goldman Sachs 2,625 6,942 Omega Flex Inc Bank of America
Merrill Lynch 6,873 2,010 Omega Flex Inc Goldman Sachs 1,990 370 Omega Flex Inc Morgan Stanley 1,521 5,293 Omega Healthcare Bank of America
Investors Inc (Reit) Merrill Lynch (2,813) 12,976 Omega Healthcare
Investors Inc (Reit) Morgan Stanley (12,043) (16,769) Omega Healthcare
Investors Inc (Reit) Bank of America Merrill Lynch 17,943
24,979 Omnicell Inc Bank of America Merrill Lynch 15,237
8,058 Omnicell Inc Goldman Sachs 4,915 10,933 Omnicell Inc Morgan Stanley 51,087 (45,853) Omnicom Group Inc Morgan Stanley 56,818 (9,377) Omnicom Group Inc Bank of America
Merrill Lynch 15,097 109,812 OMNOVA Solutions Inc Bank of America
Merrill Lynch 12,793 38,598 OMNOVA Solutions Inc Goldman Sachs 3,808 50,133 OMNOVA Solutions Inc Morgan Stanley 35,198 11,210 On Assignment Inc Morgan Stanley 34,268 (6,069) ON Semiconductor Corp Bank of America
Merrill Lynch (4,370) (49,622) ON Semiconductor Corp Morgan Stanley (19,799) 12,591 One Liberty Properties
Inc (Reit) Morgan Stanley 29,037 53,303 One Liberty Properties Bank of America
Inc (Reit) Merrill Lynch (26,652) 11,620 One Liberty Properties
Inc (Reit) Goldman Sachs (5,367)
BlackRock Americas Diversified Equity Absolute Return Fund continued
United States continued United States continued
Holding
Description Counterparty
Unrealised appreciation/
(depreciation) USD
Holding
Description Counterparty
Unrealised appreciation/
(depreciation) USD
Contracts for difference as at 31 May 2016
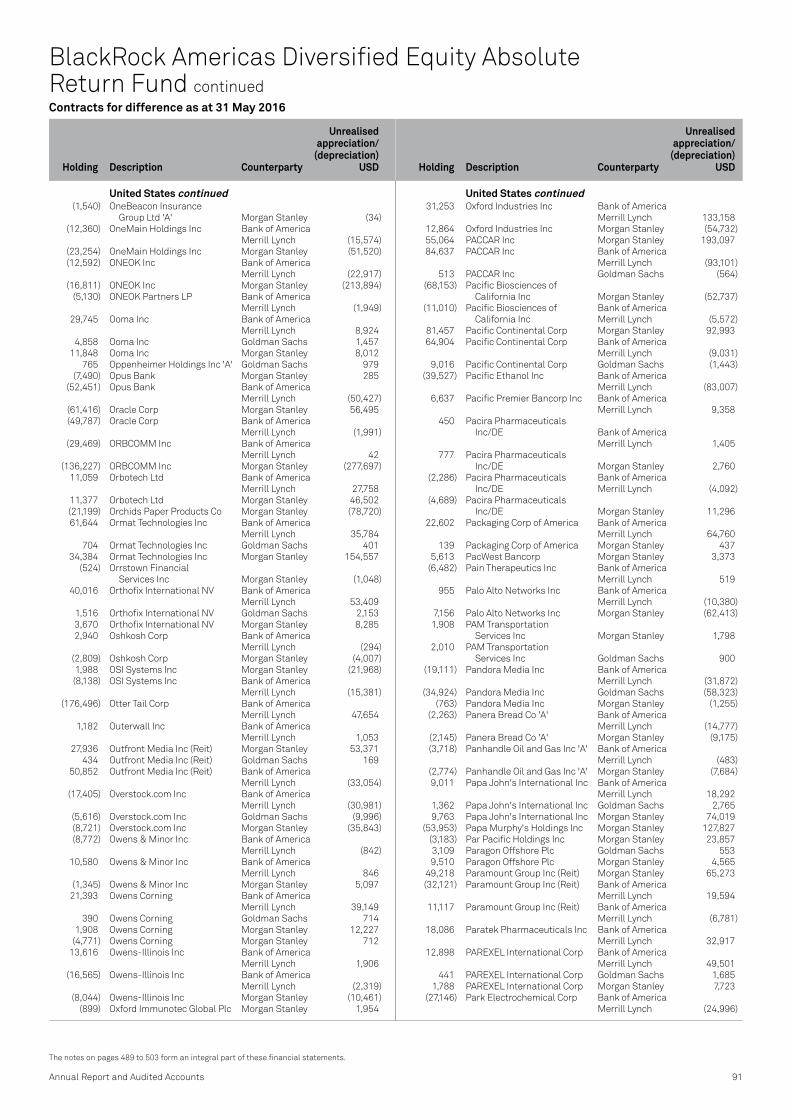
Annual Report and Audited Accounts 91
The notes on pages 489 to 503 form an integral part of these financial statements.
BlackRock Americas Diversified Equity Absolute Return Fund continued
(1,540) OneBeacon Insurance Group Ltd 'A' Morgan Stanley (34)
(12,360) OneMain Holdings Inc Bank of America Merrill Lynch (15,574)
(23,254) OneMain Holdings Inc Morgan Stanley (51,520) (12,592) ONEOK Inc Bank of America
Merrill Lynch (22,917) (16,811) ONEOK Inc Morgan Stanley (213,894) (5,130) ONEOK Partners LP Bank of America
Merrill Lynch (1,949) 29,745 Ooma Inc Bank of America
Merrill Lynch 8,924 4,858 Ooma Inc Goldman Sachs 1,457 11,848 Ooma Inc Morgan Stanley 8,012 765 Oppenheimer Holdings Inc 'A' Goldman Sachs 979 (7,490) Opus Bank Morgan Stanley 285 (52,451) Opus Bank Bank of America
Merrill Lynch (50,427) (61,416) Oracle Corp Morgan Stanley 56,495 (49,787) Oracle Corp Bank of America
Merrill Lynch (1,991) (29,469) ORBCOMM Inc Bank of America
Merrill Lynch 42 (136,227) ORBCOMM Inc Morgan Stanley (277,697) 11,059 Orbotech Ltd Bank of America
Merrill Lynch 27,758 11,377 Orbotech Ltd Morgan Stanley 46,502 (21,199) Orchids Paper Products Co Morgan Stanley (78,720) 61,644 Ormat Technologies Inc Bank of America
Merrill Lynch 35,784 704 Ormat Technologies Inc Goldman Sachs 401 34,384 Ormat Technologies Inc Morgan Stanley 154,557 (524) Orrstown Financial
Services Inc Morgan Stanley (1,048) 40,016 Orthofix International NV Bank of America
Merrill Lynch 53,409 1,516 Orthofix International NV Goldman Sachs 2,153 3,670 Orthofix International NV Morgan Stanley 8,285 2,940 Oshkosh Corp Bank of America
Merrill Lynch (294) (2,809) Oshkosh Corp Morgan Stanley (4,007) 1,988 OSI Systems Inc Morgan Stanley (21,968) (8,138) OSI Systems Inc Bank of America
Merrill Lynch (15,381) (176,496) Otter Tail Corp Bank of America
Merrill Lynch 47,654 1,182 Outerwall Inc Bank of America
Merrill Lynch 1,053 27,936 Outfront Media Inc (Reit) Morgan Stanley 53,371 434 Outfront Media Inc (Reit) Goldman Sachs 169 50,852 Outfront Media Inc (Reit) Bank of America
Merrill Lynch (33,054) (17,405) Overstock.com Inc Bank of America
Merrill Lynch (30,981) (5,616) Overstock.com Inc Goldman Sachs (9,996) (8,721) Overstock.com Inc Morgan Stanley (35,843) (8,772) Owens & Minor Inc Bank of America
Merrill Lynch (842) 10,580 Owens & Minor Inc Bank of America
Merrill Lynch 846 (1,345) Owens & Minor Inc Morgan Stanley 5,097 21,393 Owens Corning Bank of America
Merrill Lynch 39,149 390 Owens Corning Goldman Sachs 714 1,908 Owens Corning Morgan Stanley 12,227 (4,771) Owens Corning Morgan Stanley 712 13,616 Owens-Illinois Inc Bank of America
Merrill Lynch 1,906 (16,565) Owens-Illinois Inc Bank of America
Merrill Lynch (2,319) (8,044) Owens-Illinois Inc Morgan Stanley (10,461) (899) Oxford Immunotec Global Plc Morgan Stanley 1,954
31,253 Oxford Industries Inc Bank of America Merrill Lynch 133,158
12,864 Oxford Industries Inc Morgan Stanley (54,732) 55,064 PACCAR Inc Morgan Stanley 193,097 84,637 PACCAR Inc Bank of America
Merrill Lynch (93,101) 513 PACCAR Inc Goldman Sachs (564) (68,153) Pacific Biosciences of
California Inc Morgan Stanley (52,737) (11,010) Pacific Biosciences of Bank of America
California Inc Merrill Lynch (5,572) 81,457 Pacific Continental Corp Morgan Stanley 92,993 64,904 Pacific Continental Corp Bank of America
Merrill Lynch (9,031) 9,016 Pacific Continental Corp Goldman Sachs (1,443) (39,527) Pacific Ethanol Inc Bank of America
Merrill Lynch (83,007) 6,637 Pacific Premier Bancorp Inc Bank of America
Merrill Lynch 9,358 450 Pacira Pharmaceuticals
Inc/DE Bank of America Merrill Lynch 1,405
777 Pacira Pharmaceuticals Inc/DE Morgan Stanley 2,760
(2,286) Pacira Pharmaceuticals Bank of America Inc/DE Merrill Lynch (4,092)
(4,689) Pacira Pharmaceuticals Inc/DE Morgan Stanley 11,296
22,602 Packaging Corp of America Bank of America Merrill Lynch 64,760
139 Packaging Corp of America Morgan Stanley 437 5,613 PacWest Bancorp Morgan Stanley 3,373 (6,482) Pain Therapeutics Inc Bank of America
Merrill Lynch 519 955 Palo Alto Networks Inc Bank of America
Merrill Lynch (10,380) 7,156 Palo Alto Networks Inc Morgan Stanley (62,413) 1,908 PAM Transportation
Services Inc Morgan Stanley 1,798 2,010 PAM Transportation
Services Inc Goldman Sachs 900 (19,111) Pandora Media Inc Bank of America
Merrill Lynch (31,872) (34,924) Pandora Media Inc Goldman Sachs (58,323) (763) Pandora Media Inc Morgan Stanley (1,255) (2,263) Panera Bread Co 'A' Bank of America
Merrill Lynch (14,777) (2,145) Panera Bread Co 'A' Morgan Stanley (9,175) (3,718) Panhandle Oil and Gas Inc 'A' Bank of America
Merrill Lynch (483) (2,774) Panhandle Oil and Gas Inc 'A' Morgan Stanley (7,684) 9,011 Papa John's International Inc Bank of America
Merrill Lynch 18,292 1,362 Papa John's International Inc Goldman Sachs 2,765 9,763 Papa John's International Inc Morgan Stanley 74,019 (53,953) Papa Murphy's Holdings Inc Morgan Stanley 127,827 (3,183) Par Pacific Holdings Inc Morgan Stanley 23,857 3,109 Paragon Offshore Plc Goldman Sachs 553 9,510 Paragon Offshore Plc Morgan Stanley 4,565 49,218 Paramount Group Inc (Reit) Morgan Stanley 65,273 (32,121) Paramount Group Inc (Reit) Bank of America
Merrill Lynch 19,594 11,117 Paramount Group Inc (Reit) Bank of America
Merrill Lynch (6,781) 18,086 Paratek Pharmaceuticals Inc Bank of America
Merrill Lynch 32,917 12,898 PAREXEL International Corp Bank of America
Merrill Lynch 49,501 441 PAREXEL International Corp Goldman Sachs 1,685 1,788 PAREXEL International Corp Morgan Stanley 7,723 (27,146) Park Electrochemical Corp Bank of America
Merrill Lynch (24,996)
United States continued United States continued
Holding
Description Counterparty
Unrealised appreciation/
(depreciation) USD
Holding
Description Counterparty
Unrealised appreciation/
(depreciation) USD
Contracts for difference as at 31 May 2016

92 BlackRock Strategic Funds (BSF)
The notes on pages 489 to 503 form an integral part of these financial statements.
(10,810) Park Electrochemical Corp Morgan Stanley (11,891) (4,898) Park National Corp Bank of America
Merrill Lynch (14,400) (13,975) Park National Corp Morgan Stanley (50,151) 8,300 Park Sterling Corp Bank of America
Merrill Lynch 1,162 35,783 Park Sterling Corp Morgan Stanley 43,297 12,334 Park-Ohio Holdings Corp Bank of America
Merrill Lynch 48,843 902 Park-Ohio Holdings Corp Goldman Sachs 3,572 5,411 Park-Ohio Holdings Corp Morgan Stanley 34,959 (42,659) Parker Drilling Co Bank of America
Merrill Lynch 5,972 (26,198) Parker Drilling Co Morgan Stanley (31,962) (541) Parker-Hannifin Corp Bank of America
Merrill Lynch (2,756) (570) Parker-Hannifin Corp Morgan Stanley (2,376) 17,221 Parkway Properties
Inc/Md (Reit) Morgan Stanley 28,730 16,534 Parkway Properties Bank of America
Inc/Md (Reit) Merrill Lynch 81 31,193 Parsley Energy Inc 'A' Bank of America
Merrill Lynch 23,059 12,167 Parsley Energy Inc 'A' Morgan Stanley 3,940 3,377 Party City Holdco Inc Morgan Stanley (784) (10,565) Party City Holdco Inc Bank of America
Merrill Lynch (13,735) (7,685) Party City Holdco Inc Goldman Sachs (9,991) (5,344) Party City Holdco Inc Morgan Stanley 5,541 (9,972) Patriot Transportation
Holding Inc Morgan Stanley 7,978 (11,953) Pattern Energy Group Inc Bank of America
Merrill Lynch (12,790) (19,889) Pattern Energy Group Inc Morgan Stanley (51,238) 2,703 Pattern Energy Group Inc Bank of America
Merrill Lynch 877 6,780 Pattern Energy Group Inc Morgan Stanley 1,896 1,883 Patterson Cos Inc Bank of America
Merrill Lynch 5,950 59,730 Patterson Cos Inc Morgan Stanley 292,973 (785) Patterson Cos Inc Bank of America
Merrill Lynch (2,481) (17,521) Patterson-UTI Energy Inc Bank of America
Merrill Lynch (19,624) (8,847) Patterson-UTI Energy Inc Morgan Stanley (13,156) (155) Patterson-UTI Energy Inc Goldman Sachs (174) 25,420 Paychex Inc Bank of America
Merrill Lynch 56,257 705 Paychex Inc Goldman Sachs 1,565 737 Paychex Inc Morgan Stanley 1,294 (28,351) Paycom Software Inc Bank of America
Merrill Lynch (15,310) (13,229) Paycom Software Inc Morgan Stanley (81,366) (9,697) Paylocity Holding Corp Bank of America
Merrill Lynch (12,485) (7,182) PayPal Holdings Inc Bank of America
Merrill Lynch 10,852 (1,195) PayPal Holdings Inc Morgan Stanley 1,024 (12,768) PBF Energy Inc 'A' Bank of America
Merrill Lynch 23,420 (10,637) PBF Energy Inc 'A' Morgan Stanley 69,637 29,126 PC Connection Inc Bank of America
Merrill Lynch (8,155) 11,298 PC Connection Inc Goldman Sachs (3,163) 22,149 PC Connection Inc Morgan Stanley 20,300 3,946 PC-Tel Inc Bank of America
Merrill Lynch (197) 146,512 PC-Tel Inc Morgan Stanley (67,396) 2,006 PDC Energy Inc Bank of America
Merrill Lynch (8,766)
39,564 PDL BioPharma Inc Bank of America Merrill Lynch 9,674
33,626 PDL BioPharma Inc Morgan Stanley 7,330 (45,122) pdvWireless Inc Bank of America
Merrill Lynch 378,921 (1,441) pdvWireless Inc Morgan Stanley 3,803 2,020 Peapack Gladstone Bank of America
Financial Corp Merrill Lynch 1,919 18,703 Pebblebrook Hotel Trust (Reit) Morgan Stanley (45,855) 30,758 Pebblebrook Hotel Trust (Reit) Bank of America
Merrill Lynch (43,984) 6,814 Pebblebrook Hotel Trust (Reit) Goldman Sachs (9,744) 63,609 Pegasystems Inc Bank of America
Merrill Lynch 50,251 978 Pegasystems Inc Morgan Stanley 1,570 3,887 Penn National Gaming Inc Bank of America
Merrill Lynch 2,666 3,140 Penn National Gaming Inc Morgan Stanley 2,158 (4,015) Penn National Gaming Inc Bank of America
Merrill Lynch 642 (53,377) Penns Woods Bancorp Inc Morgan Stanley (81,083) (14,638) Pennsylvania Real Estate Bank of America
Investment Trust (Reit) Merrill Lynch 20,871 17,703 Pennsylvania Real Estate
Investment Trust (Reit) Morgan Stanley (9,119) 27,033 Pennsylvania Real Estate Bank of America
Investment Trust (Reit) Merrill Lynch (42,442) 42,450 Penske Automotive Group Inc Bank of America
Merrill Lynch 128,623 24,465 Penske Automotive Group Inc Morgan Stanley 124,958 (1,401) Pentair Plc Morgan Stanley (6,230) (8,118) Penumbra Inc Bank of America
Merrill Lynch (31,985) (4,024) Penumbra Inc Goldman Sachs (15,855) (70,627) People's United Financial Inc Goldman Sachs (48,026) (145,837) People's United Financial Inc Bank of America
Merrill Lynch (99,169) (85,938) Peoples Bancorp Inc/OH Bank of America
Merrill Lynch (93,672) (101,218) Peoples Bancorp Inc/OH Morgan Stanley (438,843) (30,549) Peoples Financial
Services Corp Morgan Stanley (46,513) 74,691 PepsiCo Inc Morgan Stanley 31,678 (9,377) PepsiCo Inc Bank of America
Merrill Lynch 23,349 (7,864) Perceptron Inc Bank of America
Merrill Lynch 2,792 (54,560) Perceptron Inc Morgan Stanley 36,010 11,877 Perficient Inc Bank of America
Merrill Lynch 3,957 1,361 Perficient Inc Goldman Sachs 509 37,327 Performance Food Group Co Bank of America
Merrill Lynch (23,056) 2,704 Performance Food Group Co Goldman Sachs (4,637) 19,438 Performance Food Group Co Morgan Stanley 22,286 (45,177) Performance Sports Group Ltd Goldman Sachs 3,118 13,020 Performant Financial Corp Bank of America
Merrill Lynch 1,562 9,871 Performant Financial Corp Goldman Sachs 1,185 28,085 PerkinElmer Inc Morgan Stanley 116,093 (4,915) PerkinElmer Inc Bank of America
Merrill Lynch 492 32,762 PerkinElmer Inc Bank of America
Merrill Lynch (3,276) 92,009 Pernix Therapeutics Bank of America
Holdings Inc Merrill Lynch (3,874) 70,079 Pernix Therapeutics
Holdings Inc Goldman Sachs (2,950) 31,066 Pernix Therapeutics
Holdings Inc Morgan Stanley (47,665) 2,854 Perrigo Co Plc Morgan Stanley (4,713)
BlackRock Americas Diversified Equity Absolute Return Fund continued
United States continued United States continued
Holding
Description Counterparty
Unrealised appreciation/
(depreciation) USD
Holding
Description Counterparty
Unrealised appreciation/
(depreciation) USD
Contracts for difference as at 31 May 2016

Annual Report and Audited Accounts 93
The notes on pages 489 to 503 form an integral part of these financial statements.
BlackRock Americas Diversified Equity Absolute Return Fund continued
(2,316) Perrigo Co Plc Morgan Stanley 79,909 61,483 Perry Ellis International Inc Bank of America
Merrill Lynch 179,788 10,360 Perry Ellis International Inc Goldman Sachs 31,805 10,889 Perry Ellis International Inc Morgan Stanley 12,226 16,404 PetMed Express Inc Bank of America
Merrill Lynch (1,804) 2,378 PetMed Express Inc Goldman Sachs (262) (48,768) Petroleo Brasileiro SA
ADR (Pref) Morgan Stanley 19,249 (17,510) Petroleo Brasileiro SA
ADR (Pref) Goldman Sachs 14,796 1,400 Pfenex Inc Goldman Sachs 126 (40,285) Pfizer Inc Bank of America
Merrill Lynch (38,073) (56,095) Pfizer Inc Morgan Stanley (82,125) (7,318) PFSweb Inc Bank of America
Merrill Lynch 3,659 (22,421) PFSweb Inc Morgan Stanley (33,295) (69,526) PG&E Corp Bank of America
Merrill Lynch (43,454) (11,905) PGT Inc Bank of America
Merrill Lynch (9,685) (21,390) PGT Inc Morgan Stanley (20,321) (2,645) PH Glatfelter Co Bank of America
Merrill Lynch (1,825) (8,793) PharMerica Corp Bank of America
Merrill Lynch (2,462) (53,269) PHH Corp Bank of America
Merrill Lynch (73,919) 18,262 PHI Inc Morgan Stanley 13,311 31,599 PHI Inc Bank of America
Merrill Lynch (47,714) 5,676 PHI Inc Goldman Sachs (8,571) 4,439 Phibro Animal Health Corp 'A' Morgan Stanley (6,727) 4,045 Phibro Animal Health Corp 'A' Bank of America
Merrill Lynch 2,265 (4,691) Phibro Animal Health Corp 'A' Morgan Stanley 38,635 (16,857) Philip Morris International Inc Morgan Stanley (9,376) (8,414) Philip Morris International Inc Bank of America
Merrill Lynch 25,663 (1,687) Phillips 66 Bank of America
Merrill Lynch (1,509) (754) Phillips 66 Morgan Stanley (230) (49,118) Photronics Inc Bank of America
Merrill Lynch 8,918 15,938 Physicians Realty Trust (Reit) Morgan Stanley 18,589 20,827 Physicians Realty Trust (Reit) Bank of America
Merrill Lynch (4,127) (2,383) Physicians Realty Trust (Reit) Bank of America
Merrill Lynch 667 (5,754) Piedmont Office Realty
Trust Inc 'A' (Reit) Morgan Stanley 1,443 (57,361) Piedmont Office Realty Bank of America
Trust Inc 'A' (Reit) Merrill Lynch 23,527 1,741 Pilgrim's Pride Corp Bank of America
Merrill Lynch (1,136) 568 Pilgrim's Pride Corp Morgan Stanley (500) 10,990 Pinnacle Financial Bank of America
Partners Inc Merrill Lynch 26,980 35,008 Pinnacle Foods Inc Morgan Stanley 37,210 6,332 Pinnacle Foods Inc Bank of America
Merrill Lynch (697) (29,579) Pinnacle West Capital Corp Morgan Stanley (30,316) (17,119) Pinnacle West Capital Corp Bank of America
Merrill Lynch 28,683 7,055 Pioneer Natural Resources Co Bank of America
Merrill Lynch (23,921) 3,389 Pioneer Natural Resources Co Morgan Stanley (8,174) (13,604) Pitney Bowes Inc Morgan Stanley 33,223 (40,524) Pitney Bowes Inc Bank of America
Merrill Lynch (22,896)
(2,493) PJT Partners Inc 'A' Morgan Stanley (6,987) (2,136) Plains All American
Pipeline LP Morgan Stanley 4,901 (3,846) Plains All American Bank of America
Pipeline LP Merrill Lynch 8,250 35,684 Plains GP Holdings LP 'A' Bank of America
Merrill Lynch (29,500) 3,993 Plains GP Holdings LP 'A' Morgan Stanley 4,727 (2,267) Planet Fitness Inc 'A' Morgan Stanley (4,915) 21,532 Planet Fitness Inc 'A' Morgan Stanley 84,836 225,509 Planet Payment Inc Bank of America
Merrill Lynch 47,357 15,420 Planet Payment Inc Goldman Sachs 2,849 12,984 Planet Payment Inc Morgan Stanley 4,407 24,828 Plantronics Inc Bank of America
Merrill Lynch 38,947 11,096 Plantronics Inc Morgan Stanley 64,776 (7,266) Platform Specialty
Products Corp Goldman Sachs (1,526) 27,255 Plexus Corp Bank of America
Merrill Lynch 34,157 (1,544) Plexus Corp Bank of America
Merrill Lynch (1,628) (6,000) Plexus Corp Morgan Stanley (55,200) 57,211 Ply Gem Holdings Inc Bank of America
Merrill Lynch 50,536 11,669 Ply Gem Holdings Inc Goldman Sachs 11,436 15,348 Ply Gem Holdings Inc Morgan Stanley 7,152 (11,562) PNM Resources Inc Morgan Stanley 5,295 (9,752) PNM Resources Inc Bank of America
Merrill Lynch 2,782 427 Polaris Industries Inc Bank of America
Merrill Lynch 1,870 1,438 Polaris Industries Inc Morgan Stanley 4,209 (2,213) Polaris Industries Inc Morgan Stanley (17,881) (36,354) Polycom Inc Morgan Stanley (11,673) 53,472 PolyOne Corp Bank of America
Merrill Lynch 46,145 2,709 PolyOne Corp Goldman Sachs 2,222 4,066 PolyOne Corp Morgan Stanley 3,948 12,882 Pool Corp Bank of America
Merrill Lynch 27,439 (740) Pool Corp Bank of America
Merrill Lynch (1,576) 1,568 Popeyes Louisiana Kitchen Inc Morgan Stanley 7,111 1,519 Popeyes Louisiana Kitchen Inc Bank of America
Merrill Lynch 8,610 (18,780) Popular Inc Bank of America
Merrill Lynch (22,612) (23,319) Popular Inc Morgan Stanley (38,160) 21,532 Portland General Electric Co Morgan Stanley 40,765 12,029 Portland General Electric Co Bank of America
Merrill Lynch (7,458) (6,312) Post Holdings Inc Bank of America
Merrill Lynch (9,468) 24,539 Post Properties Inc (Reit) Morgan Stanley 35,308 32,652 Post Properties Inc (Reit) Bank of America
Merrill Lynch (28,734) 3,194 Potbelly Corp Morgan Stanley (1,267) (34,335) Potlatch Corp (Reit) Bank of America
Merrill Lynch 27,468 1,042 Potlatch Corp (Reit) Bank of America
Merrill Lynch (834) 1,054 Powell Industries Inc Bank of America
Merrill Lynch (427) 1,375 Powell Industries Inc Morgan Stanley (769) (1,739) Power Integrations Inc Bank of America
Merrill Lynch (284) 29,390 Power Integrations Inc Bank of America
Merrill Lynch 77,883 2,165 Power Integrations Inc Goldman Sachs 5,737 3,550 Power Integrations Inc Morgan Stanley 14,126
United States continued United States continued
Holding
Description Counterparty
Unrealised appreciation/
(depreciation) USD
Holding
Description Counterparty
Unrealised appreciation/
(depreciation) USD
Contracts for difference as at 31 May 2016

94 BlackRock Strategic Funds (BSF)
The notes on pages 489 to 503 form an integral part of these financial statements.
(3,589) Power Integrations Inc Morgan Stanley 112 (1,436) PPG Industries Inc Bank of America
Merrill Lynch (804) 103,912 PPL Corp Morgan Stanley 9,938 5,109 PPL Corp Bank of America
Merrill Lynch (1,073) (30,510) PRA Group Inc Bank of America
Merrill Lynch (31,511) (914) PRA Group Inc Goldman Sachs (909) (745) PRA Group Inc Morgan Stanley (1,069) 10,236 PRA Health Sciences Inc Bank of America
Merrill Lynch 13,204 (8,115) PRA Health Sciences Inc Bank of America
Merrill Lynch (8,551) (13,511) PRA Health Sciences Inc Morgan Stanley (15,426) (1,345) Praxair Inc Bank of America
Merrill Lynch 3,228 7,493 Praxair Inc Bank of America
Merrill Lynch (16,632) 3,047 Praxair Inc Morgan Stanley (6,944) (90,975) Precision Drilling Corp Morgan Stanley (117,785) 39,665 Precision Drilling Corp Bank of America
Merrill Lynch 14,081 6,454 Preferred Bank/Los Angeles CA Bank of America
Merrill Lynch 8,255 4,216 Preferred Bank/Los Angeles CA Goldman Sachs 4,749 7,353 Preferred Bank/Los Angeles CA Morgan Stanley 29,153 (11,597) Preformed Line Products Co Bank of America
Merrill Lynch (14,530) (95) Preformed Line Products Co Goldman Sachs (144) (406) Preformed Line Products Co Morgan Stanley (4,385) 29,877 Premier Inc 'A' Morgan Stanley (48,387) (4,068) Press Ganey Holdings Inc Morgan Stanley (33,195) 32,889 Prestige Brands Holdings Inc Morgan Stanley 178,280 82,406 Prestige Brands Holdings Inc Bank of America
Merrill Lynch (186,238) 563 Prestige Brands Holdings Inc Goldman Sachs (1,272) 300 PRGX Global Inc Goldman Sachs 69 118,381 PRGX Global Inc Morgan Stanley 205,983 7 Priceline Group Inc/The Bank of America
Merrill Lynch (18) (470) Priceline Group Inc/The Morgan Stanley (12,313) (140) Priceline Group Inc/The Bank of America
Merrill Lynch (123) (38,608) PriceSmart Inc Bank of America
Merrill Lynch (75,929) (460) PriceSmart Inc Morgan Stanley (1,661) 2,630 Primerica Inc Bank of America
Merrill Lynch 12,887 14,152 Primerica Inc Morgan Stanley 184,092 163,517 Primo Water Corp Morgan Stanley 505,213 29,379 Primo Water Corp Bank of America
Merrill Lynch (4,787) 25,797 Primo Water Corp Goldman Sachs (3,984) (143,183) Primoris Services Corp Bank of America
Merrill Lynch (66,042) (15,436) Primoris Services Corp Morgan Stanley (1,261) 20,013 Principal Financial Group Inc Morgan Stanley 116,947 10,537 Principal Financial Group Inc Bank of America
Merrill Lynch 26,132 858 Principal Financial Group Inc Goldman Sachs 2,128 10,892 PrivateBancorp Inc Bank of America
Merrill Lynch 52,064 2,349 PrivateBancorp Inc Morgan Stanley 19,991 (38,825) ProAssurance Corp Bank of America
Merrill Lynch (128,894) (135) ProAssurance Corp Goldman Sachs (479) (50,537) ProAssurance Corp Morgan Stanley (147,450) (56,007) Procter & Gamble Co/The Bank of America
Merrill Lynch 6,621 (77,027) Procter & Gamble Co/The Morgan Stanley 51,002
(94,421) Progress Software Corp Bank of America Merrill Lynch (98,989)
(47,462) Progress Software Corp Morgan Stanley (31,695) (12,504) Progressive Corp/The Morgan Stanley (410) 235 Prologis Inc (Reit) Morgan Stanley (122) (42,955) Prologis Inc (Reit) Morgan Stanley (67,182) 37,827 Prologis Inc (Reit) Bank of America
Merrill Lynch (13,672) (8,531) Prologis Inc (Reit) Bank of America
Merrill Lynch 6,228 3,936 Proofpoint Inc Bank of America
Merrill Lynch 14,748 5,665 Proofpoint Inc Morgan Stanley 29,125 (33,251) PROS Holdings Inc Bank of America
Merrill Lynch (81,465) (8,354) Prosperity Bancshares Inc Bank of America
Merrill Lynch (35,402) (1,749) Proto Labs Inc Bank of America
Merrill Lynch (5,877) (10,279) Proto Labs Inc Goldman Sachs (35,028) (2,862) Providence Service Corp/The Morgan Stanley (12,421) (27,801) Providence Service Corp/The Bank of America
Merrill Lynch 61,440 3,601 Provident Financial Bank of America
Services Inc Merrill Lynch 2,881 1,080 Provident Financial
Services Inc Goldman Sachs 864 2,430 Provident Financial
Services Inc Morgan Stanley 2,388 16,102 Prudential Financial Inc Bank of America
Merrill Lynch 64,247 1,601 Prudential Financial Inc Goldman Sachs 6,388 4,581 Prudential Financial Inc Morgan Stanley 1,547 75,174 PS Business Parks Inc (Reit) Bank of America
Merrill Lynch (182,095) 27,209 PS Business Parks Inc (Reit) Morgan Stanley 408,834 (169,951) pSivida Corp Morgan Stanley (130,382) 6,066 PTC Inc Bank of America
Merrill Lynch 1,335 2,666 PTC Inc Goldman Sachs 587 999 PTC Inc Morgan Stanley 3,940 31,558 Public Service Enterprise
Group Inc Morgan Stanley (27,093) (59,588) Public Service Enterprise Bank of America
Group Inc Merrill Lynch 20,209 10,413 Public Service Enterprise Bank of America
Group Inc Merrill Lynch (11,451) (2,607) PulteGroup Inc Bank of America
Merrill Lynch (1,919) (4,436) PulteGroup Inc Morgan Stanley (1,720) (747) Puma Biotechnology Inc Bank of America
Merrill Lynch (6,514) (371) Puma Biotechnology Inc Goldman Sachs (3,235) (178) Puma Biotechnology Inc Morgan Stanley (210) 14,335 Pure Cycle Corp Morgan Stanley 2,294 7,763 Pure Cycle Corp Bank of America
Merrill Lynch (1,320) 3,429 Pure Cycle Corp Goldman Sachs (583) 1,370 Pure Storage Inc 'A' Bank of America
Merrill Lynch 158 3,139 Pure Storage Inc 'A' Morgan Stanley (1,641) 1,029 PVH Corp Bank of America
Merrill Lynch 7,359 2,723 PVH Corp Morgan Stanley 21,657 3,224 Pzena Investment
Management Inc 'A' Morgan Stanley 7,536 (85,090) Q2 Holdings Inc Bank of America
Merrill Lynch (183,794) (58,764) QAD Inc 'A' Bank of America
Merrill Lynch (11,753) (4,173) QAD Inc 'A' Morgan Stanley (6,987)
BlackRock Americas Diversified Equity Absolute Return Fund continued
United States continued United States continued
Holding
Description Counterparty
Unrealised appreciation/
(depreciation) USD
Holding
Description Counterparty
Unrealised appreciation/
(depreciation) USD
Contracts for difference as at 31 May 2016

Annual Report and Audited Accounts 95
The notes on pages 489 to 503 form an integral part of these financial statements.
BlackRock Americas Diversified Equity Absolute Return Fund continued
(14,677) QCR Holdings Inc Bank of America Merrill Lynch (19,080)
(54,359) QCR Holdings Inc Morgan Stanley (308,216) (15,666) QEP Resources Inc Bank of America
Merrill Lynch (9,762) (7,541) QEP Resources Inc Morgan Stanley (18,462) 20,334 QEP Resources Inc Bank of America
Merrill Lynch 12,607 1,044 QEP Resources Inc Morgan Stanley 5,867 (36,621) QIAGEN NV Bank of America
Merrill Lynch 5,127 (2,510) QIAGEN NV Morgan Stanley 1,829 5,091 Qlik Technologies Inc Bank of America
Merrill Lynch 4,801 1,512 Qlik Technologies Inc Goldman Sachs 1,625 2,552 Qlik Technologies Inc Morgan Stanley 2,815 3,287 QLogic Corp Bank of America
Merrill Lynch 1,841 (11,788) Qorvo Inc Bank of America
Merrill Lynch (54,983) (4,382) Qorvo Inc Morgan Stanley (3,475) 4,790 QTS Realty Trust Inc 'A' (Reit) Morgan Stanley 28,352 49,863 Quad/Graphics Inc Bank of America
Merrill Lynch 101,827 7,570 Quad/Graphics Inc Goldman Sachs 14,207 13,501 Quad/Graphics Inc Morgan Stanley 81,832 (703) Quaker Chemical Corp Bank of America
Merrill Lynch (2,179) (10,446) Quaker Chemical Corp Morgan Stanley (34,381) (24,649) QUALCOMM Inc Bank of America
Merrill Lynch (60,106) (32,967) QUALCOMM Inc Morgan Stanley (102,422) (10,577) Quality Systems Inc Bank of America
Merrill Lynch 21,894 1,266 Quality Systems Inc Morgan Stanley (83) (3,395) Quanex Building Bank of America
Products Corp Merrill Lynch (3,599) (4,223) Quanta Services Inc Morgan Stanley (6,214) 3,727 Quanta Services Inc Bank of America
Merrill Lynch 2,758 75,055 Quantum Corp Morgan Stanley (5,637) 9,483 Quest Diagnostics Inc Bank of America
Merrill Lynch 8,914 (24,367) Quidel Corp Morgan Stanley 7,570 (34,318) Quidel Corp Bank of America
Merrill Lynch (8,913) (5,917) Quidel Corp Goldman Sachs (1,479) 33,518 QuinStreet Inc Bank of America
Merrill Lynch 20,781 27,036 QuinStreet Inc Goldman Sachs 16,762 296,517 QuinStreet Inc Morgan Stanley 216,900 (947) Quorum Health Corp Morgan Stanley (12,661) 825 Quorum Health Corp Bank of America
Merrill Lynch 1,749 870 Quorum Health Corp Morgan Stanley 11,632 3,306 Rackspace Hosting Inc Bank of America
Merrill Lynch 2,130 2,839 Rackspace Hosting Inc Morgan Stanley 5,850 (34,986) Radian Group Inc Bank of America
Merrill Lynch (20,817) (49,640) Radian Group Inc Morgan Stanley (47,274) 200,346 Radiant Logistics Inc Bank of America
Merrill Lynch 103 20,298 Radiant Logistics Inc Morgan Stanley 3,756 3,938 Radiant Logistics Inc Goldman Sachs (819) 64,077 Radio One Inc 'D' Morgan Stanley 98,679 252,742 Radisys Corp Morgan Stanley 497,902 16,446 Radisys Corp Bank of America
Merrill Lynch (329) 11,827 Radisys Corp Goldman Sachs (237)
(2,403) Radius Health Inc Bank of America Merrill Lynch (12,255)
5,079 Radware Ltd Bank of America Merrill Lynch 5,790
11,882 Radware Ltd Morgan Stanley 17,229 (111,364) RAIT Financial Trust (Reit) Bank of America
Merrill Lynch (31,182) (43,122) RAIT Financial Trust (Reit) Morgan Stanley (49,066) 9,673 Ralph Lauren Corp Morgan Stanley (2,045) (138,487) Rambus Inc Morgan Stanley 12,303 (39,989) Rambus Inc Bank of America
Merrill Lynch (22,794) 6,349 Ramco-Gershenson
Properties Trust (Reit) Morgan Stanley 3,823 5,287 Ramco-Gershenson Bank of America
Properties Trust (Reit) Merrill Lynch (543) (5,630) Range Resources Corp Bank of America
Merrill Lynch (25,166) (4,116) Rapid7 Inc Bank of America
Merrill Lynch (4,980) (905) Rapid7 Inc Goldman Sachs (1,095) (14,570) Rapid7 Inc Morgan Stanley 10,455 (33,114) Raven Industries Inc Bank of America
Merrill Lynch (145,106) (7,148) Raymond James Financial Inc Bank of America
Merrill Lynch (36,169) (2,444) Raymond James Financial Inc Morgan Stanley (25,855) 4,444 Rayonier Advanced
Materials Inc Morgan Stanley 18,775 2,659 Rayonier Advanced Bank of America
Materials Inc Merrill Lynch (128) 2,952 Rayonier Advanced
Materials Inc Goldman Sachs (350) (28,473) Rayonier Inc (Reit) Bank of America
Merrill Lynch (5,354) (42,260) Rayonier Inc (Reit) Morgan Stanley (233,605) 7,462 Raytheon Co Bank of America
Merrill Lynch (8,954) 2,710 RBC Bearings Inc Bank of America
Merrill Lynch 5,079 6,688 RBC Bearings Inc Morgan Stanley 16,879 (8,625) RBC Bearings Inc Bank of America
Merrill Lynch (16,246) 14,686 RCI Hospitality Holdings Inc Morgan Stanley 41,268 136,620 RCI Hospitality Holdings Inc Bank of America
Merrill Lynch (4,099) 3,096 RE/MAX Holdings Inc 'A' Bank of America
Merrill Lynch 3,034 1,209 RE/MAX Holdings Inc 'A' Goldman Sachs 1,185 342 RE/MAX Holdings Inc 'A' Morgan Stanley 1,756 2,354 Reading International Inc 'A' Morgan Stanley 1,338 7,920 Reading International Inc 'A' Bank of America
Merrill Lynch (5,940) 8,310 Reading International Inc 'A' Goldman Sachs (6,233) 10,572 Real Industry Inc Bank of America
Merrill Lynch (8,352) 10,451 Real Industry Inc Goldman Sachs (8,256) 8,554 Real Industry Inc Morgan Stanley (2,344) (78,708) RealNetworks Inc Bank of America
Merrill Lynch 2,004 (4,365) RealNetworks Inc Morgan Stanley 555 17,282 Realogy Holdings Corp Bank of America
Merrill Lynch 13,480 18 Realogy Holdings Corp Goldman Sachs 14 10,084 Realogy Holdings Corp Morgan Stanley 26,667 (14,019) RealPage Inc Bank of America
Merrill Lynch 1,262 (22,935) Realty Income Corp (Reit) Morgan Stanley (196,615) (46,065) Realty Income Corp (Reit) Bank of America
Merrill Lynch 199,001
United States continued United States continued
Holding
Description Counterparty
Unrealised appreciation/
(depreciation) USD
Holding
Description Counterparty
Unrealised appreciation/
(depreciation) USD
Contracts for difference as at 31 May 2016

96 BlackRock Strategic Funds (BSF)
The notes on pages 489 to 503 form an integral part of these financial statements.
31,117 Red Hat Inc Bank of America Merrill Lynch 67,295
15,629 Red Hat Inc Morgan Stanley 42,328 (1,966) Red Lion Hotels Corp Morgan Stanley 586 (2,055) Red Lion Hotels Corp Bank of America
Merrill Lynch (473) 1,073 Red Robin Gourmet
Burgers Inc Morgan Stanley 1,144 3,751 Red Robin Gourmet Bank of America
Burgers Inc Merrill Lynch (18,770) 5,090 Redwood Trust Inc (Reit) Morgan Stanley 7,753 (92,145) Redwood Trust Inc (Reit) Bank of America
Merrill Lynch (73,716) (19,109) Redwood Trust Inc (Reit) Goldman Sachs (15,287) 14,114 Regal Beloit Corp Bank of America
Merrill Lynch 9,880 15,197 Regal Beloit Corp Morgan Stanley (69,987) (25,131) Regal Entertainment Group 'A' Bank of America
Merrill Lynch 1,302 (2,897) Regal Entertainment Group 'A' Morgan Stanley 516 (10,058) Regency Centers Corp (Reit) Morgan Stanley (8,687) 4,276 Regency Centers Corp (Reit) Bank of America
Merrill Lynch (4,404) (1,411) Regency Centers Corp (Reit) Bank of America
Merrill Lynch (847) (163) Regeneron Bank of America
Pharmaceuticals Inc Merrill Lynch (838) 160,974 Regions Financial Corp Bank of America
Merrill Lynch 144,072 58,744 Regions Financial Corp Morgan Stanley 126,585 11,081 Regis Corp Bank of America
Merrill Lynch 2,873 2,540 Regis Corp Goldman Sachs 411 2,240 Regis Corp Morgan Stanley 280 36,334 Reinsurance Group of Bank of America
America Inc Merrill Lynch 121,599 568 Reinsurance Group of
America Inc Goldman Sachs 2,042 23,890 Reinsurance Group of
America Inc Morgan Stanley 153,489 (10,403) Reis Inc Morgan Stanley (24,863) 36,936 Reliance Steel & Aluminum Co Bank of America
Merrill Lynch 23,203 505 Reliance Steel & Aluminum Co Goldman Sachs 268 7,784 Reliance Steel & Aluminum Co Morgan Stanley 29,405 (1,710) Relypsa Inc Bank of America
Merrill Lynch (4,338) (13,254) Relypsa Inc Goldman Sachs (52,883) (400) Relypsa Inc Morgan Stanley (128) (18,950) RenaissanceRe Holdings Ltd Bank of America
Merrill Lynch (21,931) (10,058) RenaissanceRe Holdings Ltd Morgan Stanley (10,848) (40,467) Renasant Corp Bank of America
Merrill Lynch (57,868) 1,589 Renewable Energy Group Inc Bank of America
Merrill Lynch (254) 1,343 Renewable Energy Group Inc Morgan Stanley (325) (5,667) Rent-A-Center Inc/TX Bank of America
Merrill Lynch (3,360) 20,632 Rent-A-Center Inc/TX Morgan Stanley 33,836 (36,650) Rentech Inc Bank of America
Merrill Lynch (1,833) (42,293) Rentech Inc Morgan Stanley (32,989) 5,103 Repligen Corp Bank of America
Merrill Lynch (5,203) 655 Repligen Corp Morgan Stanley (1,273) 78,040 Republic Bancorp Inc/KY 'A' Bank of America
Merrill Lynch 60,091 6,190 Republic Bancorp Inc/KY 'A' Goldman Sachs 4,540 8,424 Republic Bancorp Inc/KY 'A' Morgan Stanley 17,881 (230,970) Republic First Bancorp Inc Morgan Stanley (78,530)
26,085 Republic Services Inc Morgan Stanley 8,087 2,937 Republic Services Inc Bank of America
Merrill Lynch (969) (30,022) Research Frontiers Inc Bank of America
Merrill Lynch 901 (129,742) Research Frontiers Inc Morgan Stanley 102,683 10,270 ResMed Inc Bank of America
Merrill Lynch 7,086 1,533 ResMed Inc Goldman Sachs 1,058 270 ResMed Inc Morgan Stanley 87 (8,001) ResMed Inc Bank of America
Merrill Lynch (6,157) (32,705) ResMed Inc Morgan Stanley (43,698) (8,359) Resource Capital Corp (Reit) Bank of America
Merrill Lynch (669) (9,729) Resource Capital Corp (Reit) Goldman Sachs (778) (96,763) Resource Capital Corp (Reit) Morgan Stanley (290,289) 13,377 Resources Connection Inc Bank of America
Merrill Lynch 4,013 9,499 Resources Connection Inc Goldman Sachs 2,850 14,365 Resources Connection Inc Morgan Stanley 18,056 (12,929) Restoration Hardware
Holdings Inc Morgan Stanley 44,523 (29,743) Restoration Hardware
Holdings Inc Goldman Sachs 1,487 248,029 Retail Opportunity Bank of America
Investments Corp (Reit) Merrill Lynch (158,739) 619 Retail Opportunity
Investments Corp (Reit) Goldman Sachs (396) 2,824 Retail Opportunity
Investments Corp (Reit) Morgan Stanley 2,319 (7,777) Retail Properties of America
Inc 'A' (Reit) Morgan Stanley 763 (62,831) Retail Properties of America Bank of America
Inc 'A' (Reit) Merrill Lynch 25,666 (29,088) Revance Therapeutics Inc Bank of America
Merrill Lynch (63,821) (15,026) Revance Therapeutics Inc Goldman Sachs (32,606) (7,599) Revance Therapeutics Inc Morgan Stanley (21,961) (4,452) REX American Resources Corp Goldman Sachs (28,137) (4,978) REX American Resources Corp Morgan Stanley (30,828) 7,730 Rexford Industrial Realty
Inc (Reit) Morgan Stanley 5,537 18,215 Rexford Industrial Realty Bank of America
Inc (Reit) Merrill Lynch (2,853) 1,093 Rexnord Corp Bank of America
Merrill Lynch 1,319 73,060 Reynolds American Inc Morgan Stanley 92,000 23,878 Reynolds American Inc Bank of America
Merrill Lynch (18,379) 7,724 Rigel Pharmaceuticals Inc Goldman Sachs 541 32,041 Rigel Pharmaceuticals Inc Morgan Stanley 4,486 15,112 Rightside Group Ltd Bank of America
Merrill Lynch 1,058 6,439 Rightside Group Ltd Goldman Sachs 451 3,275 Rightside Group Ltd Morgan Stanley 871 (14,106) RigNet Inc Morgan Stanley (7,195) (3,505) RigNet Inc Bank of America
Merrill Lynch 3,084 (5,149) RigNet Inc Goldman Sachs 4,531 19,029 Ring Energy Inc Bank of America
Merrill Lynch 11,417 (11,574) RingCentral Inc 'A' Bank of America
Merrill Lynch (12,037) (2,117) RingCentral Inc 'A' Morgan Stanley (2,645) 1,227 RLI Corp Bank of America
Merrill Lynch 820 2,840 RLI Corp Morgan Stanley 477 (36,984) RLI Corp Bank of America
Merrill Lynch 24,409
BlackRock Americas Diversified Equity Absolute Return Fund continued
United States continued United States continued
Holding
Description Counterparty
Unrealised appreciation/
(depreciation) USD
Holding
Description Counterparty
Unrealised appreciation/
(depreciation) USD
Contracts for difference as at 31 May 2016

Annual Report and Audited Accounts 97
The notes on pages 489 to 503 form an integral part of these financial statements.
BlackRock Americas Diversified Equity Absolute Return Fund continued
122,538 RLJ Lodging Trust (Reit) Bank of America Merrill Lynch (180,131)
7,743 RLJ Lodging Trust (Reit) Goldman Sachs (11,382) 34,592 RLJ Lodging Trust (Reit) Morgan Stanley 5,353 15,698 RMR Group Inc/The 'A' Bank of America
Merrill Lynch (1,570) 2,449 RMR Group Inc/The 'A' Morgan Stanley 18,646 2,564 Roadrunner Transportation
Systems Inc Morgan Stanley (3,384) 7,995 Roadrunner Transportation Bank of America
Systems Inc Merrill Lynch 2,558 8,209 Roadrunner Transportation
Systems Inc Goldman Sachs 2,627 21,974 Robert Half International Inc Bank of America
Merrill Lynch 36,477 (2,292) Rockwell Automation Inc Bank of America
Merrill Lynch (10,220) (4,968) Rockwell Automation Inc Morgan Stanley (40,243) (27,137) Rockwell Collins Inc Bank of America
Merrill Lynch 36,984 (10,552) Rockwell Collins Inc Morgan Stanley 8,577 1,430 Rocky Brands Inc Morgan Stanley 901 41,900 Rocky Brands Inc Bank of America
Merrill Lynch (9,218) 3,904 Rogers Corp Bank of America
Merrill Lynch 8,451 14,284 Rogers Corp Morgan Stanley 68,325 118,624 Rollins Inc Bank of America
Merrill Lynch 109,400 5,778 Rollins Inc Goldman Sachs 6,009 47,644 Rollins Inc Morgan Stanley 55,199 (2,502) Roper Technologies Inc Bank of America
Merrill Lynch 15,688 (818) Roper Technologies Inc Morgan Stanley 6,897 35,187 Rosetta Stone Inc Bank of America
Merrill Lynch 2,815 15,962 Ross Stores Inc Bank of America
Merrill Lynch (33,041) 558 Ross Stores Inc Goldman Sachs (1,155) 4,828 Ross Stores Inc Morgan Stanley (15,345) 2,912 Rovi Corp Morgan Stanley (1,668) 955 Rowan Cos Plc 'A' Bank of America
Merrill Lynch 96 2,591 Rowan Cos Plc 'A' Goldman Sachs 259 517 Rowan Cos Plc 'A' Morgan Stanley 988 (5,133) Rowan Cos Plc 'A' Morgan Stanley (7,531) (5,840) Rowan Cos Plc 'A' Bank of America
Merrill Lynch (584) (7,014) Royal Caribbean Cruises Ltd Bank of America
Merrill Lynch (5,515) (4,396) Royal Caribbean Cruises Ltd Morgan Stanley (3,033) (4,559) Royal Gold Inc Bank of America
Merrill Lynch 7,035 (2,528) Royal Gold Inc Morgan Stanley (482) (14,750) RPC Inc Bank of America
Merrill Lynch (12,980) (3,589) RPC Inc Goldman Sachs (3,158) (4,548) RPM International Inc Morgan Stanley 346 (957) RPM International Inc Bank of America
Merrill Lynch (412) 148,112 RPX Corp Bank of America
Merrill Lynch 114,046 5,378 RPX Corp Goldman Sachs 4,141 66,153 RPX Corp Morgan Stanley 27,737 (55,428) RR Donnelley & Sons Co Bank of America
Merrill Lynch (21,063) 2,411 RR Donnelley & Sons Co Bank of America
Merrill Lynch 916 (28,855) RR Donnelley & Sons Co Morgan Stanley 762 5,291 RR Donnelley & Sons Co Morgan Stanley (2,779)
5,431 RSP Permian Inc Bank of America Merrill Lynch 2,351
(15,088) RSP Permian Inc Bank of America Merrill Lynch (8,751)
(2,000) RSP Permian Inc Morgan Stanley (28,040) 3,933 RSP Permian Inc Morgan Stanley 8,651 21,807 RTI Surgical Inc Bank of America
Merrill Lynch 1,308 155,940 RTI Surgical Inc Morgan Stanley 141,204 9,936 RTI Surgical Inc Goldman Sachs 596 1,444 Rubicon Project Inc/The Morgan Stanley (7,113) 1,344 Rubicon Project Inc/The Goldman Sachs 255 6,261 Rubicon Project Inc/The Bank of America
Merrill Lynch 1,190 (152,939) Rubicon Technology Inc Morgan Stanley 14,896 (6,280) Ruby Tuesday Inc Bank of America
Merrill Lynch 1,821 1,459 Rudolph Technologies Inc Goldman Sachs 1,021 3,424 Rudolph Technologies Inc Morgan Stanley 10,683 (18,561) Rush Enterprises Inc 'A' Bank of America
Merrill Lynch (48,259) 29,976 Ruth's Hospitality Group Inc Bank of America
Merrill Lynch (11,691) 5,007 Ruth's Hospitality Group Inc Goldman Sachs (1,953) 4,387 Ruth's Hospitality Group Inc Morgan Stanley (7,851) 10,843 Ryder System Inc Bank of America
Merrill Lynch 50,420 5,150 Ryder System Inc Morgan Stanley 30,299 56,709 Ryman Hospitality Bank of America
Properties Inc (Reit) Merrill Lynch (192,811) 1,668 Ryman Hospitality
Properties Inc (Reit) Goldman Sachs (5,671) 11,741 Ryman Hospitality
Properties Inc (Reit) Morgan Stanley (31,456) 723 S&P Global Inc Bank of America
Merrill Lynch 4,060 (11,725) S&P Global Inc Morgan Stanley (125,513) 126 S&P Global Inc Goldman Sachs 677 (3,253) Sabre Corp Morgan Stanley (533) (4,439) Sabre Corp Bank of America
Merrill Lynch 406 3,092 Sabre Corp Bank of America
Merrill Lynch (1,206) 4,316 Sabre Corp Goldman Sachs (1,683) 3,812 Sabre Corp Morgan Stanley 8,120 (4,804) Safeguard Scientifics Inc Bank of America
Merrill Lynch 961 (94,164) Safeguard Scientifics Inc Morgan Stanley (66,856) (30,077) Safety Insurance Group Inc Bank of America
Merrill Lynch 13,234 3,730 Safeway Casa Ley CVR* Goldman Sachs — 1,240 Safeway Casa Ley CVR* Morgan Stanley — 3,730 Safeway PDC LLC CVR* Goldman Sachs — 1,240 Safeway PDC LLC CVR* Morgan Stanley — (29,914) Saga Communications Inc 'A' Morgan Stanley (165,424) 8,489 Sagent Pharmaceuticals Inc Morgan Stanley (7,836) 92,024 Sagent Pharmaceuticals Inc Bank of America
Merrill Lynch 113,190 4,078 Sagent Pharmaceuticals Inc Goldman Sachs 5,016 9,890 Saia Inc Bank of America
Merrill Lynch 10,102 2,383 Saia Inc Goldman Sachs 3,575 6,671 Saia Inc Morgan Stanley 3,046 11,066 Salem Media Group Inc Bank of America
Merrill Lynch 6,197 4,493 Salem Media Group Inc Goldman Sachs 2,516 53,175 Salem Media Group Inc Morgan Stanley 155,750 25,996 salesforce.com Inc Bank of America
Merrill Lynch 168,194 4,765 salesforce.com Inc Morgan Stanley 37,760
United States continued United States continued
Holding
Description Counterparty
Unrealised appreciation/
(depreciation) USD
Holding
Description Counterparty
Unrealised appreciation/
(depreciation) USD
* Amounts which are less than 0.5 USD have been rounded down to zero.
Contracts for difference as at 31 May 2016

98 BlackRock Strategic Funds (BSF)
The notes on pages 489 to 503 form an integral part of these financial statements.
(553) salesforce.com Inc Bank of America Merrill Lynch (3,578)
(7,914) Sally Beauty Holdings Inc Bank of America Merrill Lynch 4,343
(470) Sanderson Farms Inc Goldman Sachs 1,166 (8,646) Sanderson Farms Inc Bank of America
Merrill Lynch (5,516) (3,427) Sanderson Farms Inc Morgan Stanley (1,556) 1,132 Sandy Spring Bancorp Inc Bank of America
Merrill Lynch 1,698 442 Sandy Spring Bancorp Inc Goldman Sachs 663 4,330 Sandy Spring Bancorp Inc Morgan Stanley 13,711 95,883 Sanmina Corp Bank of America
Merrill Lynch 104,869 14,864 Sanmina Corp Goldman Sachs 17,094 16,453 Sanmina Corp Morgan Stanley 100,909 (14,214) Santander Consumer USA Bank of America
Holdings Inc Merrill Lynch (14,356) (51,994) Santander Consumer USA
Holdings Inc Morgan Stanley (160,317) 7,125 Saul Centers Inc (Reit) Bank of America
Merrill Lynch 3,062 264 Saul Centers Inc (Reit) Morgan Stanley 372 1,364 Saul Centers Inc (Reit) Goldman Sachs 1,051 17,026 SBA Communications Corp 'A' Bank of America
Merrill Lynch (17,666) 82 SBA Communications Corp 'A' Goldman Sachs (118) 6,995 SBA Communications Corp 'A' Morgan Stanley (17,669) (109,984) SCANA Corp Morgan Stanley (253,477) (8,068) SCANA Corp Bank of America
Merrill Lynch 8,633 19,031 ScanSource Inc Morgan Stanley 42,357 44,433 ScanSource Inc Bank of America
Merrill Lynch (2,222) 2,287 Schlumberger Ltd Morgan Stanley 4,168 1,138 Schlumberger Ltd Bank of America
Merrill Lynch (36) (2,152) Schlumberger Ltd Bank of America
Merrill Lynch (6,413) 3,643 Schnitzer Steel Bank of America
Industries Inc 'A' Merrill Lynch (947) 1,117 Schnitzer Steel
Industries Inc 'A' Goldman Sachs (290) (21,170) Scholastic Corp Bank of America
Merrill Lynch (51,132) 10,396 Schweitzer-Mauduit
International Inc Morgan Stanley 37,190 3,127 Schweitzer-Mauduit Bank of America
International Inc Merrill Lynch 2,174 3,043 SciClone Pharmaceuticals Inc Goldman Sachs 3,317 16,672 SciClone Pharmaceuticals Inc Morgan Stanley 85,527 7,794 Science Applications
International Corp Morgan Stanley 4,240 14,932 Science Applications Bank of America
International Corp Merrill Lynch 16,596 776 Science Applications
International Corp Goldman Sachs 2,216 (46,040) Scientific Games Corp 'A' Bank of America
Merrill Lynch (68,139) (175) Scientific Games Corp 'A' Morgan Stanley (782) 14,583 SciQuest Inc Bank of America
Merrill Lynch 63,436 3,940 SciQuest Inc Goldman Sachs 17,139 109,238 SciQuest Inc Morgan Stanley 610,675 86,013 Scorpio Tankers Inc Bank of America
Merrill Lynch 3,263 43,490 Scorpio Tankers Inc Morgan Stanley (1,397) 36,456 Scripps Networks Bank of America
Interactive Inc 'A' Merrill Lynch (3,563)
742 Scripps Networks Interactive Inc 'A' Goldman Sachs 623
35,454 Scripps Networks Interactive Inc 'A' Morgan Stanley 32,436
(59,191) Seachange International Inc Morgan Stanley 135,809 (91,358) Seachange International Inc Bank of America
Merrill Lynch (3,654) 129,524 Seacoast Banking Corp Bank of America
of Florida Merrill Lynch 56,991 159,091 Seacoast Banking Corp
of Florida Morgan Stanley 392,955 (10,459) SEACOR Holdings Inc Bank of America
Merrill Lynch (26,271) (11,949) SEACOR Holdings Inc Morgan Stanley (109,423) 73,100 Seadrill Ltd Bank of America
Merrill Lynch (2,756) 24,198 Seadrill Ltd Goldman Sachs (2,336) 81,767 Seadrill Ltd Morgan Stanley (12,843) 12,097 Seadrill Partners LLC Morgan Stanley 38,287 (39,562) Seagate Technology Plc Bank of America
Merrill Lynch (104,024) 3,708 Seagate Technology Plc Bank of America
Merrill Lynch 10,642 472 Seagate Technology Plc Morgan Stanley (5,240) (24,966) Sealed Air Corp Bank of America
Merrill Lynch 184 (11,022) Sealed Air Corp Morgan Stanley 3,861 (9,904) Sears Holdings Corp Morgan Stanley 10,492 (17,881) Sears Holdings Corp Bank of America
Merrill Lynch (39,696) 17,802 Sears Hometown and Bank of America
Outlet Stores Inc Merrill Lynch 5,697 41,547 Sears Hometown and
Outlet Stores Inc Morgan Stanley 33,653 10,149 SeaSpine Holdings Corp Morgan Stanley (25,575) (6,854) Seattle Genetics Inc Bank of America
Merrill Lynch (45,442) (10,808) SeaWorld Entertainment Inc Bank of America
Merrill Lynch 2,972 (41,920) SeaWorld Entertainment Inc Goldman Sachs 11,221 22,352 SEI Investments Co Bank of America
Merrill Lynch 63,256 477 SEI Investments Co Goldman Sachs 1,350 20,699 SEI Investments Co Morgan Stanley 220,412 (97,591) Select Comfort Corp Bank of America
Merrill Lynch (53,493) (30,515) Select Comfort Corp Morgan Stanley (28,753) (11,115) Select Income REIT (Reit) Bank of America
Merrill Lynch (1,334) 3,199 Select Income REIT (Reit) Morgan Stanley 2,424 1,130 Select Income REIT (Reit) Bank of America
Merrill Lynch 136 (9,894) Select Medical Holdings Corp Bank of America
Merrill Lynch (2,572) (42,587) Select Medical Holdings Corp Morgan Stanley (198,455) 71,508 Selective Insurance Group Inc Bank of America
Merrill Lynch 70,827 1,743 Selective Insurance Group Inc Goldman Sachs 1,691 6,317 Selective Insurance Group Inc Morgan Stanley 10,385 (21,681) Selective Insurance Group Inc Morgan Stanley (72,094) 13,120 SemGroup Corp 'A' Bank of America
Merrill Lynch 10,627 13,494 SemGroup Corp 'A' Morgan Stanley 63,087 25,228 Semtech Corp Bank of America
Merrill Lynch 47,591 5,342 Semtech Corp Goldman Sachs 10,043 15,230 Semtech Corp Morgan Stanley 77,793 1,636 Seneca Foods Corp 'A' Morgan Stanley 4,291 53,142 Seneca Foods Corp 'A' Bank of America
Merrill Lynch (7,971)
BlackRock Americas Diversified Equity Absolute Return Fund continued
United States continued United States continued
Holding
Description Counterparty
Unrealised appreciation/
(depreciation) USD
Holding
Description Counterparty
Unrealised appreciation/
(depreciation) USD
Contracts for difference as at 31 May 2016

Annual Report and Audited Accounts 99
The notes on pages 489 to 503 form an integral part of these financial statements.
BlackRock Americas Diversified Equity Absolute Return Fund continued
(108,493) Senior Housing Properties Bank of America Trust (Reit) Merrill Lynch (17,609)
(21,342) Senior Housing Properties Trust (Reit) Morgan Stanley (38,641)
(61,559) Senomyx Inc Morgan Stanley 853 2,410 Sensata Technologies
Holding NV Goldman Sachs 6,844 4,889 Sensata Technologies
Holding NV Morgan Stanley 1,885 5,512 Sensata Technologies Bank of America
Holding NV Merrill Lynch 13,913 6,696 Senseonics Holdings Inc Goldman Sachs 3,281 3,433 Senseonics Holdings Inc Morgan Stanley 1,591 (25,464) Sensient Technologies Corp Bank of America
Merrill Lynch (39,056) (30,379) Sensient Technologies Corp Morgan Stanley (49,564) (60,986) Sequential Brands Group Inc Bank of America
Merrill Lynch (95,748) (10,283) Sequential Brands Group Inc Morgan Stanley (22,012) 5,377 Seritage Growth
Properties 'A' (Reit) Morgan Stanley (1,493) 2,888 Seritage Growth Bank of America
Properties 'A' (Reit) Merrill Lynch 996 (21,894) Service Corp International/US Morgan Stanley (17,164) (26,539) Service Corp International/US Bank of America
Merrill Lynch (11,412) (5,093) ServiceMaster Global
Holdings Inc Morgan Stanley (12,032) (12,206) ServiceMaster Global Bank of America
Holdings Inc Merrill Lynch (31,247) 2,150 ServiceMaster Global Bank of America
Holdings Inc Merrill Lynch 5,504 (543) ServiceNow Inc Bank of America
Merrill Lynch (125) (6,485) ServiceNow Inc Morgan Stanley 8,799 (15,031) ServiceSource
International Inc Goldman Sachs (1,052) (71,246) ServiceSource
International Inc Morgan Stanley (11,399) 1,046 ServisFirst Bancshares Inc Morgan Stanley 2,091 (30,951) ServisFirst Bancshares Inc Bank of America
Merrill Lynch (55,991) 1,036 Shake Shack Inc 'A' Morgan Stanley 1,279 4,108 Sherwin-Williams Co/The Bank of America
Merrill Lynch (23,292) 36,021 Shiloh Industries Inc Morgan Stanley 83,929 34,637 Shiloh Industries Inc Bank of America
Merrill Lynch (25,631) 20,974 Shiloh Industries Inc Goldman Sachs (15,521) 7,215 Ship Finance International Ltd Bank of America
Merrill Lynch 866 3,263 Shoe Carnival Inc Bank of America
Merrill Lynch (4,568) 3,635 Shoe Carnival Inc Goldman Sachs (5,089) 13,366 Shoe Carnival Inc Morgan Stanley (7,682) 55,201 ShoreTel Inc Morgan Stanley (27,048) 6,116 Shutterfly Inc Bank of America
Merrill Lynch 7,441 17,554 Shutterfly Inc Morgan Stanley 85,594 10,940 Shutterstock Inc Bank of America
Merrill Lynch 21,035 7,256 Shutterstock Inc Morgan Stanley 12,579 58,790 Sierra Bancorp Bank of America
Merrill Lynch 15,285 6,298 Sierra Bancorp Goldman Sachs 1,637 89,831 Sierra Bancorp Morgan Stanley 31,455 3,937 Signature Bank/New York NY Bank of America
Merrill Lynch 13,661 4,248 Signature Bank/New York NY Morgan Stanley (9,856) 4,033 Signet Jewelers Ltd Bank of America
Merrill Lynch (10,749) 5,778 Signet Jewelers Ltd Morgan Stanley (69,728)
(32,265) Silgan Holdings Inc Bank of America Merrill Lynch (11,641)
(9,219) Silgan Holdings Inc Morgan Stanley (1,842) (680) Silicon Laboratories Inc Bank of America
Merrill Lynch (2,468) 7,941 Silver Bay Realty Trust Bank of America
Corp (Reit) Merrill Lynch 7,941 13,418 Silver Bay Realty Trust
Corp (Reit) Goldman Sachs 13,418 6,458 Silver Bay Realty Trust
Corp (Reit) Morgan Stanley 12,618 6,987 Silver Spring Networks Inc Bank of America
Merrill Lynch 2,236 7,335 Silver Spring Networks Inc Goldman Sachs 2,347 6,945 Silver Spring Networks Inc Morgan Stanley 7,839 (903) Simmons First National Bank of America
Corp 'A' Merrill Lynch (2,637) 11,065 Simon Property Group
Inc (Reit) Morgan Stanley 74,985 18,314 Simon Property Group Bank of America
Inc (Reit) Merrill Lynch (25,725) 4,602 Simpson Manufacturing Co Inc Morgan Stanley 5,918 69,125 Sinclair Broadcast Bank of America
Group Inc 'A' Merrill Lynch 54,186 3,469 Sinclair Broadcast
Group Inc 'A' Goldman Sachs 1,774 30,622 Sinclair Broadcast
Group Inc 'A' Morgan Stanley 18,830 49,825 Sirius XM Holdings Inc Bank of America
Merrill Lynch 3,737 3,042 Sirius XM Holdings Inc Goldman Sachs 228 4,926 Six Flags Entertainment Corp Bank of America
Merrill Lynch (4,581) 1,951 Six Flags Entertainment Corp Goldman Sachs (1,814) 1,012 Six Flags Entertainment Corp Morgan Stanley 5,044 62,726 SJW Corp Bank of America
Merrill Lynch 8,154 3,280 SJW Corp Goldman Sachs 426 1,351 SJW Corp Morgan Stanley (2,469) 3,294 Skechers U.S.A. Inc 'A' Bank of America
Merrill Lynch (988) 1,205 Skechers U.S.A. Inc 'A' Morgan Stanley 3,255 (578) Skechers U.S.A. Inc 'A' Bank of America
Merrill Lynch (993) (1,753) Skechers U.S.A. Inc 'A' Morgan Stanley 580 94,715 Skullcandy Inc Bank of America
Merrill Lynch 26,520 26,474 Skullcandy Inc Goldman Sachs 7,413 39,379 Skullcandy Inc Morgan Stanley 24,162 3,019 SkyWest Inc Morgan Stanley 1,104 1,491 Skyworks Solutions Inc Bank of America
Merrill Lynch 5,606 22,392 SL Industries Inc Morgan Stanley 60,240 2,853 SM Energy Co Bank of America
Merrill Lynch 6,979 3,963 SM Energy Co Goldman Sachs 10,827 636 SM Energy Co Morgan Stanley 9,642 30,642 Smart & Final Stores Inc Bank of America
Merrill Lynch 2,145 9,772 Snap-on Inc Morgan Stanley 63,367 19,082 Snap-on Inc Bank of America
Merrill Lynch (17,555) (61,886) Snyder's-Lance Inc Bank of America
Merrill Lynch (17,298) (9,550) Sociedad Quimica y
Minera de Chile SA ADR Goldman Sachs (7,258) (29,389) Sociedad Quimica y
Minera de Chile SA ADR Morgan Stanley (37,289) 621 Sohu.com Inc Morgan Stanley 703 (16,405) SolarEdge Technologies Inc Bank of America
Merrill Lynch (55,172) (858) SolarEdge Technologies Inc Morgan Stanley 4,195
United States continued United States continued
Holding
Description Counterparty
Unrealised appreciation/
(depreciation) USD
Holding
Description Counterparty
Unrealised appreciation/
(depreciation) USD
Contracts for difference as at 31 May 2016

100 BlackRock Strategic Funds (BSF)
The notes on pages 489 to 503 form an integral part of these financial statements.
33,773 Sonic Automotive Inc 'A' Bank of America Merrill Lynch 24,992
10,205 Sonic Automotive Inc 'A' Goldman Sachs 7,552 40,768 Sonic Automotive Inc 'A' Morgan Stanley 42,493 942 Sonic Corp Bank of America
Merrill Lynch 691 1,118 Sonic Corp Morgan Stanley 248 (5,331) Sonic Corp Bank of America
Merrill Lynch 14,927 (1,349) Sonic Corp Morgan Stanley 7,143 62,936 Sonoco Products Co Bank of America
Merrill Lynch 56,642 2,370 Sonoco Products Co Goldman Sachs 2,133 72,162 Sonoco Products Co Morgan Stanley 164,458 5,423 Sonus Networks Inc Bank of America
Merrill Lynch 1,139 8,991 Sonus Networks Inc Goldman Sachs 1,888 6,958 Sonus Networks Inc Morgan Stanley 10,434 (18,505) Sotheby's Bank of America
Merrill Lynch (49,408) (42,544) Sotheby's Morgan Stanley (122,737) 85,311 South State Corp Bank of America
Merrill Lynch 267,089 58,087 South State Corp Morgan Stanley 602,966 5,718 Southern Co/The Morgan Stanley 125 (50,580) Southern Co/The Bank of America
Merrill Lynch 47,545 (71,682) Southern Copper Corp Bank of America
Merrill Lynch 46,593 (69,901) Southern Copper Corp Goldman Sachs 44,222 (22,978) Southern Copper Corp Morgan Stanley (36,765) (26,327) Southside Bancshares Inc Bank of America
Merrill Lynch (32,789) (105,510) Southside Bancshares Inc Morgan Stanley (813,777) 74,178 Southwest Airlines Co Bank of America
Merrill Lynch (8,960) 45,910 Southwest Airlines Co Morgan Stanley 31,341 2,949 Southwest Airlines Co Goldman Sachs (354) (34,512) Southwest Bancorp Inc Bank of America
Merrill Lynch (30,429) (3,319) Southwest Bancorp Inc Morgan Stanley (5,443) 2,308 Southwest Gas Corp Morgan Stanley 4,940 (1,893) Southwest Gas Corp Bank of America
Merrill Lynch 1,361 57,362 Southwest Gas Corp Bank of America
Merrill Lynch (67,843) 2,117 Southwest Gas Corp Goldman Sachs (2,604) 3,566 Southwestern Energy Co Bank of America
Merrill Lynch 7,952 (8,102) Southwestern Energy Co Bank of America
Merrill Lynch (11,385) (2,983) Sovran Self Storage Inc (Reit) Morgan Stanley 9,819 1,375 Sovran Self Storage Inc (Reit) Bank of America
Merrill Lynch (11,591) (2,555) Sovran Self Storage Inc (Reit) Bank of America
Merrill Lynch 15,519 (33,478) SP Plus Corp Bank of America
Merrill Lynch 4,352 6,414 Spark Energy Inc 'A' Morgan Stanley 27,067 17,420 Spark Energy Inc 'A' Bank of America
Merrill Lynch (8,536) 7,242 Spark Energy Inc 'A' Goldman Sachs (3,549) 28,225 Spark Networks Inc Morgan Stanley (49,676) (157,559) Spartan Motors Inc Bank of America
Merrill Lynch (45,692) 18,517 SpartanNash Co Bank of America
Merrill Lynch 27,546 3,054 SpartanNash Co Goldman Sachs 3,115 5,857 SpartanNash Co Morgan Stanley 11,442 (18,629) Sparton Corp Bank of America
Merrill Lynch (3,164)
12,926 Spectra Energy Corp Bank of America Merrill Lynch 6,334
901 Spectra Energy Corp Goldman Sachs 441 30,685 Spectra Energy Corp Morgan Stanley 39,856 (31,494) Spectranetics Corp/The Goldman Sachs (29,289) (849) Spectranetics Corp/The Morgan Stanley (3,592) 8,719 Spectrum Brands Holdings Inc Bank of America
Merrill Lynch (1,024) 25,713 Spectrum Brands Holdings Inc Morgan Stanley 35,518 (191) Spectrum Brands Holdings Inc Bank of America
Merrill Lynch 42 (12,516) Speedway Motorsports Inc Bank of America
Merrill Lynch (5,382) 278 Spire Inc Bank of America
Merrill Lynch (12) 1,025 Spirit AeroSystems
Holdings Inc 'A' Morgan Stanley 484 3,396 Spirit AeroSystems Bank of America
Holdings Inc 'A' Merrill Lynch 1,019 5,023 Spirit Airlines Inc Morgan Stanley (22,615) (3,023) Spirit Airlines Inc Bank of America
Merrill Lynch (5,955) (54,615) Spirit Realty Capital Inc (Reit) Morgan Stanley (30,854) (104,781) Spirit Realty Capital Inc (Reit) Bank of America
Merrill Lynch 16,679 456 Splunk Inc Bank of America
Merrill Lynch 1,543 342 Splunk Inc Goldman Sachs 2,746 458 Splunk Inc Morgan Stanley 501 36,917 Spok Holdings Inc Morgan Stanley 4,336 38,995 Spok Holdings Inc Bank of America
Merrill Lynch (4,289) (15,361) Sprint Corp Bank of America
Merrill Lynch (1,688) 22,817 Sprint Corp Bank of America
Merrill Lynch 7,986 6,499 Sprint Corp Morgan Stanley 6,706 3,424 SPS Commerce Inc Bank of America
Merrill Lynch 4,622 2,153 SPS Commerce Inc Morgan Stanley 32,039 30,150 SPX Corp Morgan Stanley 237,883 (759) SPX FLOW Inc Morgan Stanley (1,503) 3,632 SPX FLOW Inc Bank of America
Merrill Lynch (109) 7,895 Square Inc 'A' Bank of America
Merrill Lynch 1,376 11,933 Square Inc 'A' Morgan Stanley (15,081) (19,188) SS&C Technologies Bank of America
Holdings Inc Merrill Lynch (51,999) (2,203) SS&C Technologies
Holdings Inc Morgan Stanley (907) (5,317) St Joe Co/The Morgan Stanley (12,548) (28,313) St Joe Co/The Bank of America
Merrill Lynch (14,723) 5,504 St Jude Medical Inc Bank of America
Merrill Lynch 10,017 5,872 STAG Industrial Inc (Reit) Morgan Stanley 20,780 (46,631) STAG Industrial Inc (Reit) Bank of America
Merrill Lynch 2,332 (9,282) Stamps.com Inc Bank of America
Merrill Lynch (63,716) (2,833) Stamps.com Inc Morgan Stanley (25,007) (16,824) Standard Motor Products Inc Bank of America
Merrill Lynch (26,077) 2,998 Standex International Corp Morgan Stanley 42,991 5,520 Staples Inc Bank of America
Merrill Lynch 1,715 32,399 Staples Inc Morgan Stanley 14,051 23,489 Starbucks Corp Morgan Stanley (99,546) 42,750 Starbucks Corp Bank of America
Merrill Lynch (14,108)
BlackRock Americas Diversified Equity Absolute Return Fund continued
United States continued United States continued
Holding
Description Counterparty
Unrealised appreciation/
(depreciation) USD
Holding
Description Counterparty
Unrealised appreciation/
(depreciation) USD
Contracts for difference as at 31 May 2016

Annual Report and Audited Accounts 101
The notes on pages 489 to 503 form an integral part of these financial statements.
BlackRock Americas Diversified Equity Absolute Return Fund continued
(27,545) Starwood Property Trust Bank of America Inc (Reit) Merrill Lynch —
(8,639) Starz 'A' Morgan Stanley (4,233) (53,916) State Auto Financial Corp Bank of America
Merrill Lynch 4,137 (70,333) State Auto Financial Corp Morgan Stanley 64,003 (132,652) State Bank Financial Corp Bank of America
Merrill Lynch (184,386) (7,933) State Bank Financial Corp Morgan Stanley (28,906) 14,907 State National Cos Inc Morgan Stanley 6,493 170,122 State National Cos Inc Bank of America
Merrill Lynch (90,165) 2,319 State National Cos Inc Goldman Sachs (1,229) (35,441) State Street Corp Bank of America
Merrill Lynch (114,830) (17,086) State Street Corp Morgan Stanley (38,847) 63,661 Steel Dynamics Inc Bank of America
Merrill Lynch 33,713 2,176 Steel Dynamics Inc Goldman Sachs 849 10,153 Steel Dynamics Inc Morgan Stanley 6,211 259,632 Steelcase Inc 'A' Bank of America
Merrill Lynch 180,158 9,715 Steelcase Inc 'A' Goldman Sachs 6,384 101,613 Steelcase Inc 'A' Morgan Stanley 113,250 (9,214) Stein Mart Inc Bank of America
Merrill Lynch (9,675) (1,629) Stein Mart Inc Morgan Stanley 656 5,199 Stepan Co Goldman Sachs 4,367 35,516 Stepan Co Bank of America
Merrill Lynch 29,833 11,055 Stepan Co Morgan Stanley 124,374 (11,891) Stericycle Inc Bank of America
Merrill Lynch (26,993) (135,104) Sterling Bancorp/DE Bank of America
Merrill Lynch (104,747) (52,128) Sterling Bancorp/DE Morgan Stanley (121,239) (1,032) Steven Madden Ltd Bank of America
Merrill Lynch (19) (2,862) Stifel Financial Corp Bank of America
Merrill Lynch (8,954) (4,533) Stifel Financial Corp Morgan Stanley (2,692) 9,198 Stifel Financial Corp Bank of America
Merrill Lynch 39,643 4,601 Stillwater Mining Co Bank of America
Merrill Lynch (828) 1,748 Stillwater Mining Co Morgan Stanley (13) 9,544 Stonegate Bank Bank of America
Merrill Lynch 13,990 4,340 Stonegate Bank Goldman Sachs 5,579 1,453 Stonegate Bank Morgan Stanley 1,700 (26,878) Stonegate Mortgage Corp Bank of America
Merrill Lynch 2,483 1,089 Stoneridge Inc Bank of America
Merrill Lynch 1,187 855 Stoneridge Inc Goldman Sachs 932 9,493 STORE Capital Corp (Reit) Bank of America
Merrill Lynch (6,930) 31,960 STORE Capital Corp (Reit) Morgan Stanley (30,673) (537) Stratasys Ltd Bank of America
Merrill Lynch (1,058) (6,099) Stratasys Ltd Goldman Sachs (12,015) (24,286) Strattec Security Corp Bank of America
Merrill Lynch 83,202 (1,311) Strattec Security Corp Goldman Sachs 5,244 (3,166) Strattec Security Corp Morgan Stanley 3,356 300 Strayer Education Inc Goldman Sachs 264 286 Strayer Education Inc Morgan Stanley 457 3,114 Strongbridge Biopharma Plc Bank of America
Merrill Lynch (1,931) 2,212 Strongbridge Biopharma Plc Goldman Sachs (1,371) (21,593) Stryker Corp Morgan Stanley (219,511)
(3,575) Stryker Corp Bank of America Merrill Lynch 3,817
1,748 Sturm Ruger & Co Inc Bank of America Merrill Lynch (280)
3,152 Sturm Ruger & Co Inc Morgan Stanley (10,821) 34,784 Sucampo Bank of America
Pharmaceuticals Inc 'A' Merrill Lynch 13,343 4,870 Sucampo
Pharmaceuticals Inc 'A' Goldman Sachs 2,734 4,162 Sucampo
Pharmaceuticals Inc 'A' Morgan Stanley 2,048 (4,147) Sucampo Bank of America
Pharmaceuticals Inc 'A' Merrill Lynch (3,027) (12,002) Sucampo
Pharmaceuticals Inc 'A' Morgan Stanley (2,040) 4,359 Suffolk Bancorp Bank of America
Merrill Lynch 4,664 996 Suffolk Bancorp Goldman Sachs 1,066 3,165 Suffolk Bancorp Morgan Stanley 1,937 11,956 Summit Hotel Properties
Inc (Reit) Morgan Stanley (2,291) 271,737 Summit Hotel Properties Bank of America
Inc (Reit) Merrill Lynch (208,950) 7,822 Summit Hotel Properties
Inc (Reit) Goldman Sachs (5,645) 22,321 Summit Materials Inc 'A' Bank of America
Merrill Lynch 9,357 9,186 Summit Materials Inc 'A' Morgan Stanley 31,626 (86,116) Sun Bancorp Inc/NJ Bank of America
Merrill Lynch 53,232 (46,390) Sun Bancorp Inc/NJ Morgan Stanley (19,484) (14,824) Sun Communities Inc (Reit) Bank of America
Merrill Lynch 25,646 (16,634) Sun Hydraulics Corp Bank of America
Merrill Lynch 5,489 14,794 SunCoke Energy Inc Bank of America
Merrill Lynch 6,445 2,861 SunCoke Energy Inc Goldman Sachs 1,650 6,625 SunCoke Energy Inc Morgan Stanley 2,515 2,015 SunEdison Semiconductor Ltd Morgan Stanley (404) 4,149 SunPower Corp Bank of America
Merrill Lynch 3,672 6,315 SunPower Corp Morgan Stanley (1,501) 2,300 Sunrun Inc Bank of America
Merrill Lynch 230 (22,037) Sunrun Inc Bank of America
Merrill Lynch (2,204) (4,936) Sunrun Inc Morgan Stanley (1,876) (14,501) Sunrun Inc Goldman Sachs (1,450) 27,485 Sunstone Hotel Investors
Inc (Reit) Morgan Stanley (28,560) 150,118 Sunstone Hotel Investors Bank of America
Inc (Reit) Merrill Lynch (125,174) 1,106 Sunstone Hotel Investors
Inc (Reit) Goldman Sachs (940) 37,640 SunTrust Banks Inc Bank of America
Merrill Lynch 107,274 61,591 SunTrust Banks Inc Morgan Stanley 280,654 11,158 Super Micro Computer Inc Bank of America
Merrill Lynch 12,051 187 Super Micro Computer Inc Morgan Stanley (108) (8,640) Super Micro Computer Inc Bank of America
Merrill Lynch (7,919) (4,250) Super Micro Computer Inc Morgan Stanley (1,188) 9,225 Superior Energy Services Inc Goldman Sachs 17,989 3,981 Superior Energy Services Inc Morgan Stanley 6,418 (1,911) Superior Energy Services Inc Bank of America
Merrill Lynch (3,381) (64,681) SUPERVALU Inc Bank of America
Merrill Lynch 9,055 (38,177) SUPERVALU Inc Morgan Stanley 34,903
United States continued United States continued
Holding
Description Counterparty
Unrealised appreciation/
(depreciation) USD
Holding
Description Counterparty
Unrealised appreciation/
(depreciation) USD
Contracts for difference as at 31 May 2016

102 BlackRock Strategic Funds (BSF)
The notes on pages 489 to 503 form an integral part of these financial statements.
34,285 Supreme Industries Inc 'A' Bank of America Merrill Lynch 1,035
14,193 Supreme Industries Inc 'A' Goldman Sachs 50 70,112 Supreme Industries Inc 'A' Morgan Stanley 486,577 2,098 Surgical Care Affiliates Inc Morgan Stanley (997) (1,440) Surgical Care Affiliates Inc Bank of America
Merrill Lynch (317) (9,812) Surgical Care Affiliates Inc Morgan Stanley (21,999) 6,284 SurModics Inc Goldman Sachs 314 39,628 SurModics Inc Bank of America
Merrill Lynch 1,981 11,968 SurModics Inc Morgan Stanley 47,928 (2,474) SVB Financial Group Bank of America
Merrill Lynch (21,606) (2,894) SVB Financial Group Morgan Stanley (21,773) (14,209) Swift Transportation Co Morgan Stanley 22,466 (8,312) Sykes Enterprises Inc Bank of America
Merrill Lynch (256) (9,697) Sykes Enterprises Inc Morgan Stanley (1,113) 30,365 Symantec Corp Bank of America
Merrill Lynch 13,209 26,777 Symantec Corp Morgan Stanley 2,331 14,371 Synalloy Corp Bank of America
Merrill Lynch (2,730) 3,600 Synalloy Corp Goldman Sachs (684) 1,976 Synalloy Corp Morgan Stanley 988 (3,169) Synaptics Inc Bank of America
Merrill Lynch (14,896) (4,419) Synaptics Inc Morgan Stanley (18,956) (5,686) Synchronoss Technologies Inc Bank of America
Merrill Lynch (3,241) (3,990) Synchronoss Technologies Inc Morgan Stanley (15,356) 54,247 Synchrony Financial Bank of America
Merrill Lynch 86,373 35,364 Synchrony Financial Morgan Stanley 63,177 (9,268) Synergy Resources Corp Bank of America
Merrill Lynch (556) (17,098) Synergy Resources Corp Goldman Sachs (1,026) 27,437 Synergy Resources Corp Bank of America
Merrill Lynch 1,646 53,079 Synergy Resources Corp Morgan Stanley 2,264 2,527 SYNNEX Corp Bank of America
Merrill Lynch 12,927 3,469 SYNNEX Corp Morgan Stanley 1,072 (14,842) Synopsys Inc Morgan Stanley (73,531) 2,260 Synopsys Inc Bank of America
Merrill Lynch 7,342 62,534 Synovus Financial Corp Bank of America
Merrill Lynch 135,073 (19,546) Synovus Financial Corp Bank of America
Merrill Lynch (42,219) (53,553) Synovus Financial Corp Morgan Stanley (79,640) (8,934) Syntel Inc Bank of America
Merrill Lynch (25,641) (13,666) Syntel Inc Morgan Stanley (25,881) (56,523) Synutra International Inc Morgan Stanley 50,871 (39,557) Sysco Corp Morgan Stanley (17,464) (26,882) Sysco Corp Bank of America
Merrill Lynch 35,343 (39,432) Systemax Inc Bank of America
Merrill Lynch (789) 4,411 T Rowe Price Group Inc Bank of America
Merrill Lynch 11,821 (9,335) T Rowe Price Group Inc Bank of America
Merrill Lynch (25,018) (16,388) T Rowe Price Group Inc Morgan Stanley (41,612) 4,949 T-Mobile US Inc Bank of America
Merrill Lynch 9,898 17,915 T-Mobile US Inc Morgan Stanley 85,461 (6,355) Tableau Software Inc 'A' Bank of America
Merrill Lynch (13,536)
3,418 Tableau Software Inc 'A' Bank of America Merrill Lynch 6,013
128 Tableau Software Inc 'A' Goldman Sachs 273 142 Tableau Software Inc 'A' Morgan Stanley 813 (3,916) Tahoe Resources Inc Bank of America
Merrill Lynch 5,118 (31,857) Tailored Brands Inc Bank of America
Merrill Lynch (21,981) (2,051) Take-Two Interactive Bank of America
Software Inc Merrill Lynch (145) (1,995) Take-Two Interactive
Software Inc Morgan Stanley 136 45,469 Take-Two Interactive Bank of America
Software Inc Merrill Lynch 82,754 (2,436) TAL International Group Inc Bank of America
Merrill Lynch (4,507) 3,433 Talen Energy Corp Bank of America
Merrill Lynch (6,351) (24,581) Talen Energy Corp Bank of America
Merrill Lynch 45,475 2,458 Tallgrass Energy GP LP Bank of America
Merrill Lynch 3,465 11,787 Tallgrass Energy GP LP Morgan Stanley 120,293 (19,321) Talmer Bancorp Inc ‘144A’ Bank of America
Merrill Lynch (12,270) (28,936) Talmer Bancorp Inc ‘144A’ Morgan Stanley (13,499) (15,127) Tandem Diabetes Care Inc Bank of America
Merrill Lynch (3,328) (56,578) Tandem Diabetes Care Inc Goldman Sachs (12,447) (47,175) Tanger Factory Outlet
Centers Inc (Reit) Morgan Stanley 35,921 28,191 Tanger Factory Outlet Bank of America
Centers Inc (Reit) Merrill Lynch 5,356 (22,174) Tanger Factory Outlet Bank of America
Centers Inc (Reit) Merrill Lynch (4,213) (61,985) Tangoe Inc Morgan Stanley (25,664) (64,289) Tangoe Inc Bank of America
Merrill Lynch 3,857 (1,610) Targa Resources Corp Bank of America
Merrill Lynch 113 1,456 Targa Resources Corp Bank of America
Merrill Lynch (102) 49,924 Target Corp Bank of America
Merrill Lynch (223,537) 573 Target Corp Goldman Sachs (3,094) 24,836 Target Corp Morgan Stanley (156,758) (5,887) Taro Pharmaceutical Bank of America
Industries Ltd Merrill Lynch (67,171) 12,378 Taylor Morrison Home Corp 'A' Bank of America
Merrill Lynch 13,368 13,048 Taylor Morrison Home Corp 'A' Morgan Stanley 11,147 446,146 TCF Financial Corp Bank of America
Merrill Lynch 562,144 11,749 TCF Financial Corp Goldman Sachs 14,312 130,914 TCF Financial Corp Morgan Stanley 327,230 20,356 TD Ameritrade Holding Corp Bank of America
Merrill Lynch 78,981 28,462 TD Ameritrade Holding Corp Morgan Stanley 44,333 56,745 TE Connectivity Ltd Bank of America
Merrill Lynch 82,848 1,140 TE Connectivity Ltd Goldman Sachs 1,664 18,083 TE Connectivity Ltd Morgan Stanley (21,091) (5,713) Team Health Holdings Inc Morgan Stanley (7,895) (32,982) Team Inc Bank of America
Merrill Lynch (88,722) (11,290) Team Inc Morgan Stanley (73,745) 37,905 Tech Data Corp Bank of America
Merrill Lynch 394,790 1,197 Tech Data Corp Goldman Sachs 12,533 28,673 Tech Data Corp Morgan Stanley 278,990
BlackRock Americas Diversified Equity Absolute Return Fund continued
United States continued United States continued
Holding
Description Counterparty
Unrealised appreciation/
(depreciation) USD
Holding
Description Counterparty
Unrealised appreciation/
(depreciation) USD
Contracts for difference as at 31 May 2016

Annual Report and Audited Accounts 103
The notes on pages 489 to 503 form an integral part of these financial statements.
BlackRock Americas Diversified Equity Absolute Return Fund continued
13,947 Teekay Corp Bank of America Merrill Lynch 13,668
9,521 Teekay Corp Goldman Sachs 9,331 7,299 Teekay Corp Morgan Stanley 33,867 36,305 Teekay Tankers Ltd 'A' Bank of America
Merrill Lynch (14,885) 36,216 Teekay Tankers Ltd 'A' Morgan Stanley (11,336) (6,802) Tejon Ranch Co Bank of America
Merrill Lynch (16,770) (33,956) Teledyne Technologies Inc Bank of America
Merrill Lynch (128,014) (17,992) Teledyne Technologies Inc Morgan Stanley (183,951) (7,898) Teleflex Inc Bank of America
Merrill Lynch (3,796) (11,881) Teleflex Inc Morgan Stanley (139,747) 11,571 Telefonica Brasil SA ADR Goldman Sachs (3,052) 23,489 Telefonica Brasil SA ADR Morgan Stanley 5,338 5,846 Telenav Inc Bank of America
Merrill Lynch (818) 4,416 Telenav Inc Goldman Sachs (618) 11,990 Telenav Inc Morgan Stanley (13,064) 8,536 Telephone & Data Systems Inc Bank of America
Merrill Lynch 7,768 1,030 Telephone & Data Systems Inc Goldman Sachs 937 30,571 Telephone & Data Systems Inc Morgan Stanley 120,810 (92,552) TeleTech Holdings Inc Bank of America
Merrill Lynch (54,978) (11,325) TeleTech Holdings Inc Morgan Stanley (29,898) (11,106) Teligent Inc Bank of America
Merrill Lynch (5,553) (36,475) Teligent Inc Morgan Stanley 9,119 (8,668) Tempur Sealy International Inc Morgan Stanley 5,838 (1,802) Tempur Sealy International Inc Bank of America
Merrill Lynch (3,784) 600 Tenet Healthcare Corp Goldman Sachs (423) 605 Tenet Healthcare Corp Morgan Stanley (1,653) 20,396 Tenet Healthcare Corp Bank of America
Merrill Lynch (100) (10,271) Tennant Co Bank of America
Merrill Lynch (4,519) 1,406 Tenneco Inc Goldman Sachs 2,867 6,255 Tenneco Inc Morgan Stanley 25,379 63,661 Tenneco Inc Bank of America
Merrill Lynch 126,201 (5,177) Teradata Corp Bank of America
Merrill Lynch (9,065) (6,494) Teradata Corp Morgan Stanley (11,828) (33,799) Teradyne Inc Bank of America
Merrill Lynch (26,865) (64,739) Teradyne Inc Morgan Stanley (39,803) (3,488) Terex Corp Bank of America
Merrill Lynch (662) (18,281) TerraForm Global Inc 'A' Goldman Sachs (1,097) (23,057) TerraForm Global Inc 'A' Morgan Stanley 1,439 (12,819) TerraForm Power Inc 'A' Morgan Stanley 11,990 2,296 Territorial Bancorp Inc Bank of America
Merrill Lynch 551 2,787 Territorial Bancorp Inc Goldman Sachs 669 1,816 Territorial Bancorp Inc Morgan Stanley 550 (71,710) Tesco Corp Bank of America
Merrill Lynch 19,372 (5,264) Tesla Motors Inc Goldman Sachs (76,117) 383 Tesoro Corp Bank of America
Merrill Lynch 184 464 Tesoro Corp Goldman Sachs 223 (2,477) TESSCO Technologies Inc Morgan Stanley 6,564 57,279 Tessera Technologies Inc Bank of America
Merrill Lynch 90,735 5,815 Tessera Technologies Inc Goldman Sachs 8,291 57,963 Tessera Technologies Inc Morgan Stanley 282,083
33,216 Tetra Tech Inc Bank of America Merrill Lynch 27,569
48,830 Tetra Tech Inc Morgan Stanley 22,743 (8,095) Tetraphase
Pharmaceuticals Inc Morgan Stanley 5,050 (11,047) Tetraphase Bank of America
Pharmaceuticals Inc Merrill Lynch (7,291) (38,059) Texas Capital Bancshares Inc Bank of America
Merrill Lynch (256,848) (10,600) Texas Capital Bancshares Inc Morgan Stanley (107,737) (5,465) Texas Instruments Inc Bank of America
Merrill Lynch (15,014) (25,467) Texas Instruments Inc Morgan Stanley (79,794) 10,836 Texas Instruments Inc Bank of America
Merrill Lynch 31,966 12,659 Texas Roadhouse Inc Morgan Stanley 17,316 (20,882) Textainer Group Holdings Ltd Morgan Stanley 24,591 (4,714) TFS Financial Corp Morgan Stanley (11,455) (127,452) TherapeuticsMD Inc Bank of America
Merrill Lynch (105,012) (17,070) TherapeuticsMD Inc Goldman Sachs (15,704) (3,304) TherapeuticsMD Inc Morgan Stanley (8,789) (12,620) Theravance Biopharma Inc Bank of America
Merrill Lynch (49,500) (40,874) Theravance Biopharma Inc Goldman Sachs (192,517) (23,010) Theravance Biopharma Inc Morgan Stanley (158,340) (327) Thermo Fisher Scientific Inc Bank of America
Merrill Lynch (1,003) (3,849) Thermo Fisher Scientific Inc Morgan Stanley (7,037) (54,721) Thermon Group Holdings Inc Bank of America
Merrill Lynch (83,723) (883) Thermon Group Holdings Inc Goldman Sachs (1,351) (2,795) Thermon Group Holdings Inc Morgan Stanley (11,711) (234,069) Third Point Reinsurance Ltd Morgan Stanley (145,490) (29,397) Thomson Reuters Corp Bank of America
Merrill Lynch (24,987) 17,113 Thor Industries Inc Bank of America
Merrill Lynch 8,804 3,427 Thor Industries Inc Goldman Sachs 1,165 9,962 Thor Industries Inc Morgan Stanley 16,139 (33,154) Tidewater Inc Morgan Stanley 40,960 29,483 Tiffany & Co Bank of America
Merrill Lynch (78,680) 35,657 Tiffany & Co Morgan Stanley (296,919) 9,398 Tile Shop Holdings Inc Bank of America
Merrill Lynch 6,015 3,600 Tile Shop Holdings Inc Goldman Sachs 2,304 4,400 Tile Shop Holdings Inc Morgan Stanley 1,091 48,898 Tilly's Inc 'A' Morgan Stanley (10,370) 10,774 Tilly's Inc 'A' Bank of America
Merrill Lynch 4,310 13,870 Tilly's Inc 'A' Goldman Sachs 5,548 7,101 Tim Participacoes SA ADR Goldman Sachs (4,474) 4,299 Time Inc Bank of America
Merrill Lynch 4,801 55,739 Time Inc Morgan Stanley 25,838 19,678 Time Warner Inc Bank of America
Merrill Lynch 48,298 31,147 Time Warner Inc Morgan Stanley 228,254 (1,339) Timken Co/The Morgan Stanley 307 1,602 Timken Co/The Bank of America
Merrill Lynch 384 (3,176) Timken Co/The Bank of America
Merrill Lynch (710) (14,045) Tiptree Financial Inc 'A' (Reit) Bank of America
Merrill Lynch (4,494) (79,178) Titan International Inc Morgan Stanley (266,038) (14,389) Titan Machinery Inc Morgan Stanley (35,397) (41,367) Titan Machinery Inc Bank of America
Merrill Lynch 13,154 (1,572) Titan Machinery Inc Goldman Sachs 519
United States continued United States continued
Holding
Description Counterparty
Unrealised appreciation/
(depreciation) USD
Holding
Description Counterparty
Unrealised appreciation/
(depreciation) USD
Contracts for difference as at 31 May 2016

104 BlackRock Strategic Funds (BSF)
The notes on pages 489 to 503 form an integral part of these financial statements.
(8,500) Titan Pharmaceuticals Inc Bank of America Merrill Lynch (10,519)
29,705 TJX Cos Inc/The Bank of America Merrill Lynch 36,238
15,924 TJX Cos Inc/The Morgan Stanley 8,278 4,818 Tobira Therapeutics Inc Bank of America
Merrill Lynch 3,421 1,361 Tobira Therapeutics Inc Goldman Sachs 966 16,211 Tobira Therapeutics Inc Morgan Stanley 27,683 11,874 Tokai Pharmaceuticals Inc Bank of America
Merrill Lynch 3,206 (4,665) Toll Brothers Inc Bank of America
Merrill Lynch (10,450) 24,163 Toll Brothers Inc Bank of America
Merrill Lynch 55,153 20,890 Toll Brothers Inc Morgan Stanley 50,824 (55,097) Tompkins Financial Corp Bank of America
Merrill Lynch (72,728) (467) Tootsie Roll Industries Inc Bank of America
Merrill Lynch (191) 8,917 TopBuild Corp Bank of America
Merrill Lynch 13,131 1,351 TopBuild Corp Goldman Sachs 1,707 30,317 TopBuild Corp Morgan Stanley 113,023 (37,084) Torchmark Corp Bank of America
Merrill Lynch (93,801) (68,165) Torchmark Corp Morgan Stanley (187,235) (25,281) Total System Services Inc Bank of America
Merrill Lynch (16,180) (24,333) Total System Services Inc Morgan Stanley (109,489) 17,252 Tower International Inc Bank of America
Merrill Lynch 2,070 4,772 Tower International Inc Goldman Sachs 573 4,643 Tower International Inc Morgan Stanley (14,234) 51,742 Townsquare Media Inc 'A' Bank of America
Merrill Lynch (17,314) 40,563 Townsquare Media Inc 'A' Morgan Stanley (60,890) (3,192) Tractor Supply Co Bank of America
Merrill Lynch (8,874) 35,550 TransAtlantic Petroleum Ltd Bank of America
Merrill Lynch 2,133 15,803 TransAtlantic Petroleum Ltd Goldman Sachs 948 1,665 TransDigm Group Inc Bank of America
Merrill Lynch 25,275 (6,759) TransDigm Group Inc Bank of America
Merrill Lynch (102,602) 10,823 Transocean Ltd Bank of America
Merrill Lynch 6,602 549 Transocean Ltd Goldman Sachs 335 4,171 Transocean Ltd Morgan Stanley 5,724 4,203 TransUnion Bank of America
Merrill Lynch 6,167 2,531 TransUnion Morgan Stanley 8,401 12,003 TravelCenters of America LLC Bank of America
Merrill Lynch 1,680 11,699 TravelCenters of America LLC Goldman Sachs 1,638 25,040 TravelCenters of America LLC Morgan Stanley 4,507 (25,930) Travelers Cos Inc/The Morgan Stanley (88,851) (11,605) Travelers Cos Inc/The Bank of America
Merrill Lynch (35,508) 10,845 Travelport Worldwide Ltd Bank of America
Merrill Lynch 868 1,457 Travelport Worldwide Ltd Goldman Sachs 117 29,390 Travelport Worldwide Ltd Morgan Stanley (12,451) 2,207 Trecora Resources Bank of America
Merrill Lynch 927 2,801 Trecora Resources Goldman Sachs 1,176 4,711 Trecora Resources Morgan Stanley 7,658 (71,896) Tredegar Corp Bank of America
Merrill Lynch 9,346
(37,881) TreeHouse Foods Inc Bank of America Merrill Lynch (30,366)
(5,552) TreeHouse Foods Inc Morgan Stanley (42,293) 70,129 Tremor Video Inc Bank of America
Merrill Lynch (701) 41,693 Tremor Video Inc Goldman Sachs (417) 26,253 Tremor Video Inc Morgan Stanley 3,675 2,619 Trex Co Inc Bank of America
Merrill Lynch 8,747 825 Trex Co Inc Goldman Sachs 2,756 3,959 Trex Co Inc Morgan Stanley (8,813) 197,414 TRI Pointe Group Inc Bank of America
Merrill Lynch 122,718 5,846 TRI Pointe Group Inc Goldman Sachs 3,907 54,369 TRI Pointe Group Inc Morgan Stanley 69,886 2,929 Triangle Petroleum Corp Morgan Stanley (557) (1,217) Tribune Media Co 'A' Bank of America
Merrill Lynch (1,229) (8,258) Tribune Media Co 'A' Morgan Stanley (32,631) 1,581 Tribune Publishing Co Morgan Stanley 6,487 1,796 Tribune Publishing Co Bank of America
Merrill Lynch (4,634) 96,863 TriCo Bancshares Bank of America
Merrill Lynch 122,047 18,881 TriCo Bancshares Goldman Sachs 23,790 124,969 TriCo Bancshares Morgan Stanley 451,489 (1,041) TriMas Corp Bank of America
Merrill Lynch (593) (9,907) Trimble Navigation Ltd Bank of America
Merrill Lynch (14,960) (31,163) Trimble Navigation Ltd Morgan Stanley (53,688) (15,804) TriNet Group Inc Bank of America
Merrill Lynch (20,570) (16,114) TriNet Group Inc Morgan Stanley (62,259) (55,715) Trinity Industries Inc Bank of America
Merrill Lynch (66,282) (17,842) Trinity Industries Inc Morgan Stanley (13,527) 3,999 Trinseo SA Morgan Stanley 14,946 23,717 Trinseo SA Bank of America
Merrill Lynch 59,319 996 TripAdvisor Inc Bank of America
Merrill Lynch 2,460 11 TripAdvisor Inc Goldman Sachs 27 2,458 TripAdvisor Inc Morgan Stanley 10,319 (670) Triple-S Management Corp 'B' Morgan Stanley 73 (164,778) TriState Capital Holdings Inc Morgan Stanley (359,216) (1,494) Triumph Group Inc Bank of America
Merrill Lynch (1,765) (6,151) Triumph Group Inc Morgan Stanley (8,325) (21,311) Tronox Ltd 'A' Morgan Stanley (21,244) (124,108) Tronox Ltd 'A' Goldman Sachs 41,902 (8,716) TrueBlue Inc Morgan Stanley 47,135 (9,938) TrueBlue Inc Bank of America
Merrill Lynch (2,783) (67,539) TrueCar Inc Morgan Stanley (124,159) 213,707 TrustCo Bank Corp NY Bank of America
Merrill Lynch 53,427 62,159 TrustCo Bank Corp NY Morgan Stanley 67,973 (44,354) Trustmark Corp Bank of America
Merrill Lynch (37,815) (85,148) Trustmark Corp Morgan Stanley (45,740) (75,661) TTM Technologies Inc Bank of America
Merrill Lynch (94,576) (4,837) TTM Technologies Inc Morgan Stanley (6,282) (3,556) TubeMogul Inc Bank of America
Merrill Lynch 178 (62,524) TubeMogul Inc Morgan Stanley (13,582) (4,963) Tuesday Morning Corp Morgan Stanley 4,055 (62,325) Tuesday Morning Corp Bank of America
Merrill Lynch (14,335)
BlackRock Americas Diversified Equity Absolute Return Fund continued
United States continued United States continued
Holding
Description Counterparty
Unrealised appreciation/
(depreciation) USD
Holding
Description Counterparty
Unrealised appreciation/
(depreciation) USD
Contracts for difference as at 31 May 2016

Annual Report and Audited Accounts 105
The notes on pages 489 to 503 form an integral part of these financial statements.
BlackRock Americas Diversified Equity Absolute Return Fund continued
(2,060) Tupperware Brands Corp Bank of America Merrill Lynch (5,459)
(34,496) Tupperware Brands Corp Morgan Stanley (296,263) 861 Tutor Perini Corp Bank of America
Merrill Lynch 377 (26,685) Twenty-First Century Fox
Inc 'A' Morgan Stanley (69,325) (45,441) Twenty-First Century Fox Bank of America
Inc 'A' Merrill Lynch 909 (55,063) Twin Disc Inc Bank of America
Merrill Lynch (12,664) (314,787) Two Harbors Investment Bank of America
Corp (Reit) Merrill Lynch (18,887) (60,280) Two Harbors Investment
Corp (Reit) Morgan Stanley (43,459) (9,412) Tyco International Plc Bank of America
Merrill Lynch (17,102) (71,191) Tyco International Plc Morgan Stanley (208,046) (32,029) Tyler Technologies Inc Bank of America
Merrill Lynch (32,839) (450) Tyler Technologies Inc Goldman Sachs (396) (6,829) Tyler Technologies Inc Morgan Stanley (145,093) 545 Tyson Foods Inc 'A' Morgan Stanley (833) 7,939 Tyson Foods Inc 'A' Bank of America
Merrill Lynch (24,135) (11,766) Tyson Foods Inc 'A' Bank of America
Merrill Lynch (4,228) (9,201) Tyson Foods Inc 'A' Morgan Stanley (2,390) (5,416) Ubiquiti Networks Inc Bank of America
Merrill Lynch (12,370) 34,346 Ubiquiti Networks Inc Bank of America
Merrill Lynch 64,140 522 Ubiquiti Networks Inc Goldman Sachs 955 595 Ubiquiti Networks Inc Morgan Stanley 1,875 (18,263) UBS Group AG Reg Morgan Stanley 18,071 (2,967) UDR Inc (Reit) Morgan Stanley 1,919 3,451 UDR Inc (Reit) Goldman Sachs (3,037) 53,760 UDR Inc (Reit) Bank of America
Merrill Lynch (47,309) (2,443) UDR Inc (Reit) Bank of America
Merrill Lynch 2,150 (1,174) UGI Corp Bank of America
Merrill Lynch (564) 2,794 UGI Corp Morgan Stanley 8,415 301 Ulta Salon Cosmetics & Bank of America
Fragrance Inc Merrill Lynch 6,426 646 Ulta Salon Cosmetics &
Fragrance Inc Morgan Stanley 490 946 Ultimate Software Group
Inc/The Morgan Stanley 8,228 (1,297) Ultimate Software Group Bank of America
Inc/The Merrill Lynch (9,702) 6,693 Ultra Clean Holdings Inc Bank of America
Merrill Lynch 3,748 9,758 Ultra Clean Holdings Inc Goldman Sachs 5,464 23,906 Ultra Clean Holdings Inc Morgan Stanley 28,768 (1,642) Ultragenyx Pharmaceutical Inc Morgan Stanley (27,668) (3,109) Ultragenyx Pharmaceutical Inc Bank of America
Merrill Lynch (32,955) 5,967 Ultrapar Participacoes SA ADR Goldman Sachs (4,041) 20,467 Ultrapar Participacoes SA ADR Morgan Stanley 53,525 (57,626) Ultratech Inc Bank of America
Merrill Lynch (125,625) (25,459) UMB Financial Corp Bank of America
Merrill Lynch (90,634) (28,833) UMB Financial Corp Morgan Stanley (263,803) 421,326 Umpqua Holdings Corp Bank of America
Merrill Lynch 366,554 5,291 Umpqua Holdings Corp Goldman Sachs 4,603 257,806 Umpqua Holdings Corp Morgan Stanley 333,567
(9,007) Under Armour Inc 'A' Bank of America Merrill Lynch (9,007)
(879) Under Armour Inc 'A' Morgan Stanley 31,960 (11,403) Under Armour Inc 'A' Goldman Sachs (11,403) (44,972) UniFirst Corp/MA Bank of America
Merrill Lynch (179,183) (19,448) UniFirst Corp/MA Morgan Stanley (160,679) 91,778 Union Bankshares Corp Bank of America
Merrill Lynch 87,412 4,414 Union Bankshares Corp Goldman Sachs 4,502 17,041 Union Bankshares Corp Morgan Stanley 75,882 (3,900) Union Pacific Corp Bank of America
Merrill Lynch (6,294) (218) Union Pacific Corp Morgan Stanley (480) 16,657 Unisys Corp Morgan Stanley (31,648) 3,513 Unisys Corp Bank of America
Merrill Lynch 2,529 (3,985) Unit Corp Goldman Sachs (3,985) (82,686) United Bankshares Inc/WV Bank of America
Merrill Lynch (186,044) (54,755) United Bankshares Inc/WV Goldman Sachs (123,199) (32,136) United Community
Banks Inc/GA Morgan Stanley (35,983) 44,546 United Community Bank of America
Banks Inc/GA Merrill Lynch 11,649 6,906 United Community
Banks Inc/GA Morgan Stanley 4,046 (59,787) United Community Bank of America
Banks Inc/GA Merrill Lynch (35,274) 370,176 United Community Bank of America
Financial Corp/OH Merrill Lynch 59,228 34,486 United Community
Financial Corp/OH Goldman Sachs 5,518 105,487 United Community
Financial Corp/OH Morgan Stanley 29,257 (16,594) United Continental
Holdings Inc Morgan Stanley 193,538 (22,096) United Continental Bank of America
Holdings Inc Merrill Lynch 2,210 27,138 United Financial Bancorp Inc Bank of America
Merrill Lynch 7,870 8,348 United Financial Bancorp Inc Morgan Stanley 14,855 3,085 United Fire Group Inc Bank of America
Merrill Lynch 1,882 (4,173) United Insurance
Holdings Corp Morgan Stanley (13,437) (75,569) United Insurance Bank of America
Holdings Corp Merrill Lynch 33,250 10,998 United Natural Foods Inc Bank of America
Merrill Lynch 12,386 1,073 United Natural Foods Inc Goldman Sachs 2,102 1,099 United Natural Foods Inc Morgan Stanley 1,334 (31,509) United Parcel Service Inc 'B' Morgan Stanley (2,379) (14,651) United Parcel Service Inc 'B' Bank of America
Merrill Lynch (21,905) (15,392) United Rentals Inc Bank of America
Merrill Lynch (123,156) (9,742) United Rentals Inc Morgan Stanley (75,766) (3,970) United States Cellular Corp Bank of America
Merrill Lynch (2,025) (47,053) United States Lime & Bank of America
Minerals Inc Merrill Lynch (14,351) (940) United States Lime &
Minerals Inc Morgan Stanley (1,496) (14,514) United Technologies Corp Morgan Stanley (6,838) (25,117) United Technologies Corp Bank of America
Merrill Lynch 24,248 3,565 United Therapeutics Corp Bank of America
Merrill Lynch 18,861 673 United Therapeutics Corp Goldman Sachs 5,027 1,627 United Therapeutics Corp Morgan Stanley (2,685)
United States continued United States continued
Holding
Description Counterparty
Unrealised appreciation/
(depreciation) USD
Holding
Description Counterparty
Unrealised appreciation/
(depreciation) USD
Contracts for difference as at 31 May 2016

106 BlackRock Strategic Funds (BSF)
The notes on pages 489 to 503 form an integral part of these financial statements.
19,753 UnitedHealth Group Inc Bank of America Merrill Lynch 48,973
217 UnitedHealth Group Inc Goldman Sachs 807 15,015 UnitedHealth Group Inc Morgan Stanley 53,493 11,560 Univar Inc Bank of America
Merrill Lynch 4,439 26,489 Univar Inc Morgan Stanley 16,114 (25,929) Universal American Corp Bank of America
Merrill Lynch (5,964) (19,515) Universal American Corp Morgan Stanley (41,567) (4,519) Universal Corp/VA Morgan Stanley 5,044 (22,587) Universal Corp/VA Bank of America
Merrill Lynch 9,821 (12,742) Universal Corp/VA Goldman Sachs 6,215 (14,022) Universal Display Corp Bank of America
Merrill Lynch (181,704) (9,258) Universal Display Corp Morgan Stanley (113,987) (34,865) Universal Electronics Inc Bank of America
Merrill Lynch (59,721) (1,434) Universal Electronics Inc Morgan Stanley (1,792) (1,097) Universal Forest Products Inc Bank of America
Merrill Lynch (2,896) (903) Universal Forest Products Inc Morgan Stanley (2,724) 386 Universal Forest Products Inc Goldman Sachs 1,019 13,361 Universal Forest Products Inc Morgan Stanley 290,145 44,969 Universal Forest Products Inc Bank of America
Merrill Lynch 116,171 (5,651) Universal Health Realty
Income Trust (Reit) Morgan Stanley (14,813) (85,982) Universal Health Realty Bank of America
Income Trust (Reit) Merrill Lynch 196,899 (900) Universal Health Realty
Income Trust (Reit) Goldman Sachs 2,061 7,597 Universal Insurance
Holdings Inc Morgan Stanley 16,561 (28,628) Universal Logistics
Holdings Inc Morgan Stanley (3,435) 32,535 Univest Corp of Pennsylvania Bank of America
Merrill Lynch 15,291 3,019 Univest Corp of Pennsylvania Goldman Sachs 1,419 11,671 Unum Group Bank of America
Merrill Lynch 14,484 2,885 Unum Group Goldman Sachs 8,626 23,772 Unum Group Morgan Stanley 93,964 72,415 Upland Software Inc Morgan Stanley 15,207 (11,197) Urban Edge Properties (Reit) Morgan Stanley (33,252) (22,558) Urban Edge Properties (Reit) Bank of America
Merrill Lynch 13,830 1,712 Urban Outfitters Inc Bank of America
Merrill Lynch 3,062 960 Urban Outfitters Inc Goldman Sachs 242 574 Urban Outfitters Inc Morgan Stanley 156 (154,231) Urstadt Biddle Properties Bank of America
Inc 'A' (Reit) Merrill Lynch 50,896 (2,120) Urstadt Biddle Properties
Inc 'A' (Reit) Goldman Sachs 700 48,975 US Auto Parts Network Inc Morgan Stanley 57,790 (3,078) US Bancorp Bank of America
Merrill Lynch (4,494) (4,818) US Concrete Inc Bank of America
Merrill Lynch (2,850) (391) US Concrete Inc Morgan Stanley (25) (62,157) US Ecology Inc Bank of America
Merrill Lynch (113,110) (3,052) US Ecology Inc Morgan Stanley (13,335) 32,372 US Energy Corp Wyoming Morgan Stanley (2,913) (15,358) US Silica Holdings Inc Bank of America
Merrill Lynch (46,381) 2,631 US Silica Holdings Inc Bank of America
Merrill Lynch 7,946 (2,601) USA Technologies Inc Morgan Stanley (2,835)
3,547 USA Truck Inc Bank of America Merrill Lynch 3,973
3,543 USA Truck Inc Morgan Stanley 17,644 (913) USANA Health Sciences Inc Bank of America
Merrill Lynch 940 3,677 USANA Health Sciences Inc Bank of America
Merrill Lynch (4,462) 282 USANA Health Sciences Inc Goldman Sachs 39 297 USANA Health Sciences Inc Morgan Stanley (236) (4,722) USG Corp Bank of America
Merrill Lynch (2,909) (7,162) USG Corp Morgan Stanley (14,855) 2,819 USG Corp Bank of America
Merrill Lynch 2,734 (3,927) Utah Medical Products Inc Morgan Stanley (27,629) (17,580) Utah Medical Products Inc Bank of America
Merrill Lynch 4,219 (528) Utah Medical Products Inc Goldman Sachs 127 46,303 Vail Resorts Inc Bank of America
Merrill Lynch 107,187 16,597 Vail Resorts Inc Morgan Stanley 35,929 45,917 Vale SA ADR Goldman Sachs (10,561) 59,674 Vale SA ADR Morgan Stanley 8,193 1,358 Valero Energy Corp Bank of America
Merrill Lynch (652) (2,019) Valero Energy Corp Bank of America
Merrill Lynch (84) (1,705) Valero Energy Corp Morgan Stanley 635 7,987 Valhi Inc Morgan Stanley 9,185 (15,820) Validus Holdings Ltd Bank of America
Merrill Lynch (12,023) (47,427) Validus Holdings Ltd Morgan Stanley (99,568) (135,191) Valley National Bancorp Bank of America
Merrill Lynch (66,244) (16,975) Valley National Bancorp Goldman Sachs (8,318) (8,538) Valley National Bancorp Morgan Stanley (373) (17,317) Valmont Industries Inc Morgan Stanley (396,986) (11,803) Valmont Industries Inc Bank of America
Merrill Lynch (34,124) 8,020 Vantiv Inc 'A' Bank of America
Merrill Lynch (7,378) 24,859 Vantiv Inc 'A' Morgan Stanley 59,491 (55,218) Varian Medical Systems Inc Morgan Stanley (274,391) (16,113) Varian Medical Systems Inc Bank of America
Merrill Lynch 33,354 (18,323) Varonis Systems Inc Morgan Stanley (49,607) (13,254) VASCO Data Security Bank of America
International Inc Merrill Lynch (11,133) (952) VASCO Data Security
International Inc Morgan Stanley 887 (6,729) Vascular Solutions Inc Bank of America
Merrill Lynch 7,200 39,672 VCA Inc Bank of America
Merrill Lynch 30,498 2,667 VCA Inc Goldman Sachs 2,107 68,594 VCA Inc Morgan Stanley 930,660 50,874 Vector Group Ltd Bank of America
Merrill Lynch (6,252) 1,016 Vector Group Ltd Goldman Sachs (132) 82,123 Vector Group Ltd Morgan Stanley (67,741) (20,637) Vectren Corp Morgan Stanley (12,606) (45,263) Vectren Corp Bank of America
Merrill Lynch 36,661 41,175 Vectrus Inc Bank of America
Merrill Lynch 4,841 8,612 Vectrus Inc Goldman Sachs 1,183 19,770 Vectrus Inc Morgan Stanley 115,996 (58,643) Veeco Instruments Inc Bank of America
Merrill Lynch (64,507) (22,439) Veeco Instruments Inc Morgan Stanley (6,956) (2,351) Veeva Systems Inc 'A' Goldman Sachs (10,438)
BlackRock Americas Diversified Equity Absolute Return Fund continued
United States continued United States continued
Holding
Description Counterparty
Unrealised appreciation/
(depreciation) USD
Holding
Description Counterparty
Unrealised appreciation/
(depreciation) USD
Contracts for difference as at 31 May 2016

Annual Report and Audited Accounts 107
The notes on pages 489 to 503 form an integral part of these financial statements.
BlackRock Americas Diversified Equity Absolute Return Fund continued
22,120 Veeva Systems Inc 'A' Bank of America Merrill Lynch 82,081
19,392 Veeva Systems Inc 'A' Morgan Stanley 73,916 1,092 Ventas Inc (Reit) Goldman Sachs (1,420) (8,417) Ventas Inc (Reit) Morgan Stanley (54,319) (37,758) Vera Bradley Inc Bank of America
Merrill Lynch 4,909 (573) Vera Bradley Inc Goldman Sachs 74 (759) Vera Bradley Inc Morgan Stanley 1,033 (66,821) Veracyte Inc Morgan Stanley 21,822 (73,137) VEREIT Inc (Reit) Morgan Stanley (71,949) (221,767) VEREIT Inc (Reit) Bank of America
Merrill Lynch 76,485 1,112 VeriFone Systems Inc Goldman Sachs 191 40,226 VeriFone Systems Inc Morgan Stanley 4,992 23,028 VeriFone Systems Inc Bank of America
Merrill Lynch 2,659 8,388 Verint Systems Inc Bank of America
Merrill Lynch 847 16,715 Verint Systems Inc Morgan Stanley 607 1,835 VeriSign Inc Morgan Stanley (3,662) (1,438) VeriSign Inc Morgan Stanley (3,745) 15,079 VeriSign Inc Bank of America
Merrill Lynch 14,096 596 VeriSign Inc Goldman Sachs 715 (34,591) Verisk Analytics Inc Bank of America
Merrill Lynch (48,803) (11,089) Verisk Analytics Inc Morgan Stanley (19,773) (1,107) Veritex Holdings Inc Morgan Stanley (176) (4,316) Veritiv Corp Bank of America
Merrill Lynch (9,582) (8,836) Veritiv Corp Morgan Stanley (82,371) (35,203) Verizon Communications Inc Bank of America
Merrill Lynch 13,729 (45,952) Verizon Communications Inc Morgan Stanley 44,641 1,176 Vertex Pharmaceuticals Inc Bank of America
Merrill Lynch 11,490 271 Vertex Pharmaceuticals Inc Goldman Sachs 2,648 724 Vertex Pharmaceuticals Inc Morgan Stanley 4,415 4,239 VF Corp Morgan Stanley (9,119) (13,823) VF Corp Bank of America
Merrill Lynch (21,702) 450 Viacom Inc 'A' Bank of America
Merrill Lynch 2,445 635 Viacom Inc 'A' Goldman Sachs 3,556 (13,171) Viacom Inc 'B' Bank of America
Merrill Lynch (50,925) (4,075) Viacom Inc 'B' Morgan Stanley (2,960) (52,197) ViaSat Inc Morgan Stanley (581,958) (41,905) ViaSat Inc Bank of America
Merrill Lynch 217,506 (9,297) ViaSat Inc Goldman Sachs 35,800 56,114 Viavi Solutions Inc Morgan Stanley 53,308 (2,615) Vicor Corp Bank of America
Merrill Lynch (2,406) 24,435 Village Super Market Inc 'A' Bank of America
Merrill Lynch 41,539 115 Village Super Market Inc 'A' Goldman Sachs 196 789 Village Super Market Inc 'A' Morgan Stanley 2,363 (2,556) Vince Holding Corp Bank of America
Merrill Lynch (7) (8,789) Virgin America Inc Goldman Sachs (3,252) 16,116 Virtu Financial Inc 'A' Bank of America
Merrill Lynch (4,450) 5,079 Virtu Financial Inc 'A' Morgan Stanley (6,310) (1,997) Virtu Financial Inc 'A' Bank of America
Merrill Lynch 1,018 (4,153) Virtus Investment Partners Inc Morgan Stanley 826 (14,879) Virtus Investment Partners Inc Bank of America
Merrill Lynch (32,393)
3,488 Virtusa Corp Morgan Stanley (4,038) (36,663) Visa Inc 'A' Morgan Stanley (67,525) 11,819 Visa Inc 'A' Goldman Sachs 19,738 (14,674) Vishay Intertechnology Inc Morgan Stanley (6,198) 57,895 Vishay Precision Group Inc Bank of America
Merrill Lynch 16,211 10,430 Vishay Precision Group Inc Goldman Sachs 2,920 9,466 Vishay Precision Group Inc Morgan Stanley (13,991) (6,162) Vista Outdoor Inc Bank of America
Merrill Lynch (5,916) 9,689 Vista Outdoor Inc Bank of America
Merrill Lynch 10,472 2,749 Vista Outdoor Inc Morgan Stanley 4,943 4,207 Visteon Corp Bank of America
Merrill Lynch 2,356 (20,529) Visteon Corp Morgan Stanley 26,304 (7,396) Visteon Corp Bank of America
Merrill Lynch (9,422) (906) Vitamin Shoppe Inc Morgan Stanley 103 (26,982) Vitamin Shoppe Inc Bank of America
Merrill Lynch (56,662) (3,699) Vitamin Shoppe Inc Goldman Sachs (7,768) 2,782 VMware Inc 'A' Morgan Stanley 42,537 (2,026) VMware Inc 'A' Morgan Stanley (7,117) 20,694 Vocera Communications Inc Morgan Stanley (33,491) 41,833 Vocera Communications Inc Bank of America
Merrill Lynch 36,101 13,733 Vocera Communications Inc Goldman Sachs 10,966 931 Volt Information Sciences Inc Bank of America
Merrill Lynch (205) 2,524 Volt Information Sciences Inc Goldman Sachs (555) 34,094 Volt Information Sciences Inc Morgan Stanley (23,334) 131,790 Vonage Holdings Corp Bank of America
Merrill Lynch 50,913 26,378 Vonage Holdings Corp Goldman Sachs 10,781 15,014 Vonage Holdings Corp Morgan Stanley 2,373 (14,001) Vornado Realty Trust (Reit) Morgan Stanley 8,470 (12,693) Vornado Realty Trust (Reit) Bank of America
Merrill Lynch 20,737 3,038 VOXX International Corp Goldman Sachs (1,762) 3,727 VOXX International Corp Morgan Stanley (2,244) (16,979) Voya Financial Inc Morgan Stanley (6,191) (6,368) Voya Financial Inc Bank of America
Merrill Lynch (1,016) 4,030 Voyager Therapeutics Inc Bank of America
Merrill Lynch 11,405 1,276 Voyager Therapeutics Inc Goldman Sachs 3,611 (2,416) VSE Corp Bank of America
Merrill Lynch (5,001) (1,064) Vulcan Materials Co Morgan Stanley (2,386) 2,287 Vulcan Materials Co Bank of America
Merrill Lynch 3,819 (3,328) Vulcan Materials Co Bank of America
Merrill Lynch (3,488) 63,018 VWR Corp Bank of America
Merrill Lynch 2,108 3,515 VWR Corp Goldman Sachs 1,518 46,126 VWR Corp Morgan Stanley 127,408 98,171 Wabash National Corp Bank of America
Merrill Lynch (24,543) 6,813 Wabash National Corp Morgan Stanley 5,106 346 WABCO Holdings Inc Bank of America
Merrill Lynch 1,038 (516) WABCO Holdings Inc Bank of America
Merrill Lynch (880) (5,459) Wabtec Corp/DE Bank of America
Merrill Lynch (3,019) (14,506) Waddell & Reed
Financial Inc 'A' Morgan Stanley 6,725
United States continued United States continued
Holding
Description Counterparty
Unrealised appreciation/
(depreciation) USD
Holding
Description Counterparty
Unrealised appreciation/
(depreciation) USD
Contracts for difference as at 31 May 2016

108 BlackRock Strategic Funds (BSF)
The notes on pages 489 to 503 form an integral part of these financial statements.
(8,160) Waddell & Reed Bank of America Financial Inc 'A' Merrill Lynch (19,339)
(7,510) WageWorks Inc Bank of America Merrill Lynch (1,577)
142 WageWorks Inc Bank of America Merrill Lynch 30
1,046 WageWorks Inc Morgan Stanley 1,927 (415) Wal-Mart Stores Inc Goldman Sachs (2,000) (15,558) Wal-Mart Stores Inc Bank of America
Merrill Lynch (74,990) 4,912 Walgreens Boots Alliance Inc Bank of America
Merrill Lynch 263 (4,451) Walgreens Boots Alliance Inc Bank of America
Merrill Lynch 8,368 4,012 Walker & Dunlop Inc Morgan Stanley 4,009 (2,094) Walt Disney Co/The Morgan Stanley 1,644 (25,281) Walt Disney Co/The Bank of America
Merrill Lynch 13,966 46,474 Washington Federal Inc Bank of America
Merrill Lynch 34,391 326 Washington Federal Inc Goldman Sachs 241 24,732 Washington Federal Inc Morgan Stanley 92,745 (8,844) Washington Federal Inc Bank of America
Merrill Lynch (6,545) (5,500) Washington Federal Inc Morgan Stanley (2,940) (51,787) Washington Real Estate Bank of America
Investment Trust (Reit) Merrill Lynch 3,625 (43,143) Washington Real Estate
Investment Trust (Reit) Morgan Stanley (101,128) 51,400 Washington Trust Bancorp Inc Bank of America
Merrill Lynch 148,208 1,266 Washington Trust Bancorp Inc Goldman Sachs 3,646 4,434 Washington Trust Bancorp Inc Morgan Stanley 10,891 (3,310) Waste Connections Inc Bank of America
Merrill Lynch 9,996 13,524 Waste Management Inc Bank of America
Merrill Lynch 361 5,089 Waters Corp Bank of America
Merrill Lynch 9,771 1,708 Waters Corp Goldman Sachs 3,469 54 Waters Corp Morgan Stanley 102 (2,278) Waters Corp Bank of America
Merrill Lynch (4,917) (2,008) Waters Corp Morgan Stanley (7,526) (158,351) Waterstone Financial Inc Morgan Stanley (219,123) 13,636 Watsco Inc Goldman Sachs 21,954 (720) Watts Water Bank of America
Technologies Inc 'A' Merrill Lynch (914) (279) Watts Water
Technologies Inc 'A' Morgan Stanley (275) 1,973 Watts Water Bank of America
Technologies Inc 'A' Merrill Lynch 2,506 1,179 Watts Water
Technologies Inc 'A' Goldman Sachs 1,571 2,178 Watts Water
Technologies Inc 'A' Morgan Stanley 3,662 (14,444) Wayfair Inc 'A' Bank of America
Merrill Lynch (28,666) (1,880) Wayfair Inc 'A' Morgan Stanley (60) (151) WD-40 Co Bank of America
Merrill Lynch (409) (470) WD-40 Co Morgan Stanley (4,121) 1,965 WD-40 Co Bank of America
Merrill Lynch 5,325 20,563 Weatherford International Plc Morgan Stanley (13,172) (95,352) Weatherford International Plc Morgan Stanley (9,285) 59,368 Web.com Group Inc Morgan Stanley 39,650 124,597 Web.com Group Inc Bank of America
Merrill Lynch 2,492 6,705 Web.com Group Inc Goldman Sachs 134
(34,927) WebMD Health Corp Bank of America Merrill Lynch (34,836)
(15,159) WebMD Health Corp Morgan Stanley (131,831) 141,117 Webster Financial Corp Bank of America
Merrill Lynch 470,484 49,957 Webster Financial Corp Morgan Stanley 155,086 (13,828) WEC Energy Group Inc Morgan Stanley (42,843) (72,666) WEC Energy Group Inc Bank of America
Merrill Lynch 29,793 6,838 Weight Watchers Bank of America
International Inc Merrill Lynch 10,052 4,961 Weight Watchers
International Inc Morgan Stanley 7,112 36,606 Weingarten Realty Bank of America
Investors (Reit) Merrill Lynch (33,467) 55,365 Weingarten Realty
Investors (Reit) Morgan Stanley 99,572 (14,503) Weis Markets Inc Bank of America
Merrill Lynch (46,006) 19,154 WellCare Health Plans Inc Bank of America
Merrill Lynch 134,284 275 WellCare Health Plans Inc Goldman Sachs 1,910 (5,799) WellCare Health Plans Inc Bank of America
Merrill Lynch (40,825) (2,885) WellCare Health Plans Inc Morgan Stanley (26,932) (4,415) Welltower Inc (Reit) Morgan Stanley 1,505 (6,178) Welltower Inc (Reit) Bank of America
Merrill Lynch 9,708 (30,966) Wendy's Co/The Bank of America
Merrill Lynch 8,361 3,617 Wendy's Co/The Bank of America
Merrill Lynch (977) 5,789 Werner Enterprises Inc Morgan Stanley (12,085) (8,488) WesBanco Inc Bank of America
Merrill Lynch (6,745) 22,032 Wesco Aircraft Holdings Inc Bank of America
Merrill Lynch 220 44,730 Wesco Aircraft Holdings Inc Morgan Stanley (3,309) 3,925 WESCO International Inc Morgan Stanley 7,235 39,225 West Bancorporation Inc Bank of America
Merrill Lynch 26,115 17,350 West Bancorporation Inc Goldman Sachs 11,470 20,821 West Bancorporation Inc Morgan Stanley 11,713 (8,781) West Corp Morgan Stanley (6,990) (41,384) West Corp Bank of America
Merrill Lynch 8,277 133,773 West Marine Inc Morgan Stanley 134,711 37,874 West Marine Inc Bank of America
Merrill Lynch (12,743) 5,363 West Marine Inc Goldman Sachs (2,199) 190 West Pharmaceutical
Services Inc Goldman Sachs 52 12,959 West Pharmaceutical Bank of America
Services Inc Merrill Lynch 28,015 (78,474) Westamerica Bancorporation Bank of America
Merrill Lynch (145,748) (52,988) Westamerica Bancorporation Goldman Sachs (105,976) (25,355) Westamerica Bancorporation Morgan Stanley (101,166) (24,954) Westar Energy Inc Morgan Stanley (153,414) 42,130 Westell Technologies Inc 'A' Morgan Stanley (8,426) 136,262 Western Alliance Bancorp Bank of America
Merrill Lynch 436,486 759 Western Alliance Bancorp Goldman Sachs 2,512 28,252 Western Alliance Bancorp Morgan Stanley 140,019 (10,044) Western Asset Mortgage
Capital Corp (Reit) Morgan Stanley (2,596) (17,159) Western Digital Corp Bank of America
Merrill Lynch (142,089) (7,083) Western Digital Corp Morgan Stanley (2,592)
BlackRock Americas Diversified Equity Absolute Return Fund continued
United States continued United States continued
Holding
Description Counterparty
Unrealised appreciation/
(depreciation) USD
Holding
Description Counterparty
Unrealised appreciation/
(depreciation) USD
Contracts for difference as at 31 May 2016

Annual Report and Audited Accounts 109
The notes on pages 489 to 503 form an integral part of these financial statements.
BlackRock Americas Diversified Equity Absolute Return Fund continued
(5,287) Western Gas Partners LP Bank of America Merrill Lynch (6,714)
(3,226) Western Gas Partners LP Morgan Stanley (9,121) 2,982 Western Refining Inc Bank of America
Merrill Lynch 1,288 (49,111) Western Union Co/The Morgan Stanley (24,765) (2,996) Western Union Co/The Bank of America
Merrill Lynch (955) (4,554) Westfield Financial Inc Morgan Stanley 1,467 6,221 Westlake Chemical Corp Bank of America
Merrill Lynch 4,546 550 Westlake Chemical Corp Morgan Stanley (143) 4,096 WestRock Co Bank of America
Merrill Lynch 1,434 969 WestRock Co Morgan Stanley (26) (1,436) WestRock Co Morgan Stanley (580) 1,664 Westwood Holdings Group Inc Morgan Stanley 21,532 2,883 Westwood Holdings Group Inc Bank of America
Merrill Lynch (951) (6,621) WEX Inc Bank of America
Merrill Lynch (26,087) (6,252) WEX Inc Morgan Stanley (101,112) (22,639) Weyco Group Inc Bank of America
Merrill Lynch (11,219) (15,854) Weyco Group Inc Morgan Stanley (33,579) (5,645) Weyerhaeuser Co (Reit) Morgan Stanley (51,188) (6,010) WGL Holdings Inc Bank of America
Merrill Lynch 3,821 (18,196) WGL Holdings Inc Morgan Stanley 59,079 1,340 Whirlpool Corp Bank of America
Merrill Lynch 8,442 (2,543) Whirlpool Corp Bank of America
Merrill Lynch (9,732) (1,378) Whirlpool Corp Morgan Stanley (5,668) (1,116) White Mountains Insurance Bank of America
Group Ltd Merrill Lynch 37,620 2,607 WhiteWave Foods Co/The Bank of America
Merrill Lynch 2,887 483 WhiteWave Foods Co/The Morgan Stanley 191 35,549 Whiting Petroleum Corp Bank of America
Merrill Lynch 39,459 27,239 Whiting Petroleum Corp Morgan Stanley 103,312 6,650 Whole Foods Market Inc Bank of America
Merrill Lynch 10,507 (4,243) Whole Foods Market Inc Bank of America
Merrill Lynch (6,389) (18,768) Whole Foods Market Inc Morgan Stanley (25,190) 30,617 Willdan Group Inc Morgan Stanley 79,604 (742) Willis Lease Finance Corp Morgan Stanley (2,904) (176) Willis Towers Watson Plc Bank of America
Merrill Lynch (431) (15,727) Willis Towers Watson Plc Morgan Stanley (100,819) (163,043) Wilshire Bancorp Inc Bank of America
Merrill Lynch (152,228) (251,742) Wilshire Bancorp Inc Morgan Stanley (322,769) (2,675) Winmark Corp Bank of America
Merrill Lynch (15,997) (11,636) Winmark Corp Morgan Stanley (87,386) (693) Winnebago Industries Inc Bank of America
Merrill Lynch (506) 99,386 Winthrop Realty Trust (Reit) Bank of America
Merrill Lynch (12,920) 5,827 Winthrop Realty Trust (Reit) Goldman Sachs (758) 16,897 Winthrop Realty Trust (Reit) Morgan Stanley (47,512) 114,450 Wintrust Financial Corp Bank of America
Merrill Lynch 392,023 21,171 Wintrust Financial Corp Morgan Stanley 282,629 (1,746) Wintrust Financial Corp Bank of America
Merrill Lynch (4,924) (2,641) Wintrust Financial Corp Morgan Stanley (13,475)
(10,392) WisdomTree Investments Inc Bank of America Merrill Lynch (21,408)
(8,751) WisdomTree Investments Inc Goldman Sachs (18,027) (10,584) WisdomTree Investments Inc Morgan Stanley (24,132) (4,681) Wix.com Ltd Bank of America
Merrill Lynch (6,688) 9,486 Wix.com Ltd Bank of America
Merrill Lynch 12,427 526 Wix.com Ltd Goldman Sachs 734 5,027 Wix.com Ltd Morgan Stanley 6,663 (9,674) WMIH Corp Morgan Stanley 306 (25,016) Wolverine World Wide Inc Morgan Stanley 2,860 (68,650) Wolverine World Wide Inc Bank of America
Merrill Lynch (56,980) 11,881 Woodward Inc Bank of America
Merrill Lynch 22,426 374 Woodward Inc Goldman Sachs 722 8,063 Woodward Inc Morgan Stanley 28,168 (2,041) Workday Inc 'A' Bank of America
Merrill Lynch (7,919) (21,792) Workiva Inc Morgan Stanley (39,008) 2,602 World Fuel Services Corp Bank of America
Merrill Lynch 2,654 2,673 World Fuel Services Corp Goldman Sachs 2,726 (24,627) World Fuel Services Corp Morgan Stanley 23,098 (12,804) World Wrestling
Entertainment Inc 'A' Morgan Stanley (23,431) (7,533) World Wrestling Bank of America
Entertainment Inc 'A' Merrill Lynch 2,486 6,149 Worthington Industries Inc Morgan Stanley 4,687 22,954 Worthington Industries Inc Bank of America
Merrill Lynch 18,095 1,389 Worthington Industries Inc Goldman Sachs 1,111 (38,591) WP Carey Inc (Reit) Morgan Stanley (167,396) (57,801) WP Carey Inc (Reit) Bank of America
Merrill Lynch 14,450 (1,436) WP Carey Inc (Reit) Goldman Sachs 359 127,908 WP Glimcher Inc (Reit) Morgan Stanley 228,719 76,592 WP Glimcher Inc (Reit) Bank of America
Merrill Lynch (29,871) 36,374 WPX Energy Inc Bank of America
Merrill Lynch 36,738 15,718 WPX Energy Inc Goldman Sachs 15,875 41,535 WPX Energy Inc Morgan Stanley 144,707 (19,050) WR Berkley Corp Bank of America
Merrill Lynch (14,669) (2,164) WR Berkley Corp Morgan Stanley (1,311) 11,313 WR Grace & Co Morgan Stanley 97,365 (7,275) WR Grace & Co Bank of America
Merrill Lynch (8,852) (8,604) WW Grainger Inc Goldman Sachs 13,336 (11,161) WW Grainger Inc Bank of America
Merrill Lynch 10,086 (784) WW Grainger Inc Morgan Stanley (18,204) (15,496) Wynn Resorts Ltd Bank of America
Merrill Lynch (83,368) (2,760) Wynn Resorts Ltd Goldman Sachs (14,849) (25,804) Xactly Corp Bank of America
Merrill Lynch (38,448) (14,489) Xcel Energy Inc Bank of America
Merrill Lynch 11,301 (43,264) Xcel Energy Inc Morgan Stanley (6,830) (32,220) Xcerra Corp Bank of America
Merrill Lynch (20,943) (1,954) Xcerra Corp Morgan Stanley (2,648) (7,426) Xenia Hotels & Bank of America
Resorts Inc (Reit) Merrill Lynch (946) (42,870) Xenia Hotels &
Resorts Inc (Reit) Morgan Stanley (77,210)
United States continued United States continued
Holding
Description Counterparty
Unrealised appreciation/
(depreciation) USD
Holding
Description Counterparty
Unrealised appreciation/
(depreciation) USD
Contracts for difference as at 31 May 2016

110 BlackRock Strategic Funds (BSF)
The notes on pages 489 to 503 form an integral part of these financial statements.
(6,584) XenoPort Inc Bank of America Merrill Lynch (17,513)
(26,304) XenoPort Inc Morgan Stanley (81,279) 68,940 Xerium Technologies Inc Bank of America
Merrill Lynch 13,099 12,773 Xerium Technologies Inc Goldman Sachs 2,427 13,250 Xerium Technologies Inc Morgan Stanley (15,768) 43,337 Xilinx Inc Bank of America
Merrill Lynch 157,313 (4,116) Xilinx Inc Bank of America
Merrill Lynch 1,237 (8,295) Xilinx Inc Morgan Stanley (1,241) (2,546) XL Group Plc Bank of America
Merrill Lynch (701) (3,896) XL Group Plc Morgan Stanley (1,602) 61,126 XO Group Inc Morgan Stanley 133,255 6,501 XPO Logistics Inc Morgan Stanley (5,801) 4,930 XPO Logistics Inc Bank of America
Merrill Lynch 19,819 (32,858) Xura Inc Bank of America
Merrill Lynch (89,242) 21,557 Xylem Inc/NY Morgan Stanley 69,746 33,180 Xylem Inc/NY Bank of America
Merrill Lynch 38,821 (96,460) Yadkin Financial Corp Bank of America
Merrill Lynch (137,938) (67,667) Yadkin Financial Corp Morgan Stanley (371,433) (34,856) Yahoo! Inc Morgan Stanley (182,899) (52,406) Yahoo! Inc Bank of America
Merrill Lynch (14,008) 8,325 Yandex NV 'A' Bank of America
Merrill Lynch 9,651 777 Yandex NV 'A' Goldman Sachs 714 6,153 Yandex NV 'A' Morgan Stanley 6,576 3,764 Yelp Inc Bank of America
Merrill Lynch 2,975 12,763 Yelp Inc Morgan Stanley 29,966 4,167 York Water Co/The Bank of America
Merrill Lynch (8,501) 3,508 York Water Co/The Goldman Sachs (7,156) 5,106 York Water Co/The Morgan Stanley (2,109) 28,573 YRC Worldwide Inc Bank of America
Merrill Lynch 29,144 11,375 YRC Worldwide Inc Goldman Sachs 11,603 6,460 YRC Worldwide Inc Morgan Stanley 14,793 (353) Yum! Brands Inc Morgan Stanley (818) (13,839) Yum! Brands Inc Bank of America
Merrill Lynch (17,814)
(1,505) YuMe Inc Bank of America Merrill Lynch (75)
(27,857) YuMe Inc Goldman Sachs (1,393) (1,341) YuMe Inc Morgan Stanley (1,234) 3,933 ZAGG Inc Bank of America
Merrill Lynch (3,343) 3,280 ZAGG Inc Goldman Sachs (2,788) 16,186 ZAGG Inc Morgan Stanley (82,872) (46,085) ZAIS Financial Corp (Reit) Morgan Stanley 940 (4,568) Zayo Group Holdings Inc Bank of America
Merrill Lynch (3,928) (11,024) Zayo Group Holdings Inc Morgan Stanley (37,830) 346 Zebra Technologies Corp 'A' Bank of America
Merrill Lynch 1,052 3,861 Zebra Technologies Corp 'A' Morgan Stanley (39,140) (760) Zeltiq Aesthetics Inc Goldman Sachs (2,675) (549) Zeltiq Aesthetics Inc Morgan Stanley 861 (19,228) Zendesk Inc Bank of America
Merrill Lynch (15,185) (40,009) Zendesk Inc Goldman Sachs (37,208) (2,683) Zillow Group Inc 'A' Morgan Stanley (30,184) (2,691) Zillow Group Inc 'C' Goldman Sachs (484) (4,247) Zillow Group Inc 'C' Bank of America
Merrill Lynch (764) (8,561) Zimmer Biomet Holdings Inc Bank of America
Merrill Lynch (23,543) (1,290) Zimmer Biomet Holdings Inc Morgan Stanley (5,538) (1,758) Zions Bancorporation Morgan Stanley (3,831) 294,794 Zix Corp Bank of America
Merrill Lynch 68,381 75,969 Zix Corp Goldman Sachs 16,666 145,191 Zix Corp Morgan Stanley (974) (1,148) Zoe's Kitchen Inc Morgan Stanley 2,364 22,873 Zoetis Inc Bank of America
Merrill Lynch 12,438 19,463 Zoetis Inc Morgan Stanley 10,018 (8,872) Zogenix Inc Bank of America
Merrill Lynch (1,774) (3,933) Zogenix Inc Goldman Sachs (787) (16,301) Zogenix Inc Morgan Stanley (10,196) (38,303) Zumiez Inc Morgan Stanley 136,883 (4,511) Zynerba Pharmaceuticals Inc Goldman Sachs (6,315) 4,760 Zynga Inc 'A' Goldman Sachs (95) 60,401 Zynga Inc 'A' Morgan Stanley 25,368
5,826,943
Total (Gross underlying exposure - USD 3,826,901,223 ) 6,895,803
BlackRock Americas Diversified Equity Absolute Return Fund continued
United States continued United States continued
Holding
Description Counterparty
Unrealised appreciation/
(depreciation) USD
Holding
Description Counterparty
Unrealised appreciation/
(depreciation) USD
Contracts for difference as at 31 May 2016

TypeNominal
Value Description CounterpartyExpiration
date
Unrealised appreciation/
(depreciation) EUR
Market Value
EUR
Swaps as at 31 May 2016
Annual Report and Audited Accounts 111
The notes on pages 489 to 503 form an integral part of these financial statements.
CHF Hedged Share Class
CHF 12,920,851 USD 13,265,686 State Street Bank & Trust Company 15/6/2016 (204,883)USD 719,820 CHF 707,686 State Street Bank & Trust Company 15/6/2016 4,470
(200,413)
EUR Hedged Share Class
EUR 348,461,198 USD 395,820,080 State Street Bank & Trust Company 15/6/2016 (6,440,925)USD 4,473,041 EUR 3,964,870 State Street Bank & Trust Company 15/6/2016 42,598
(6,398,327)
GBP Hedged Share Class
GBP 2,106,023 USD 3,042,286 State Street Bank & Trust Company 15/6/2016 42,001 USD 17,628 GBP 12,023 State Street Bank & Trust Company 15/6/2016 21
42,022
SEK Hedged Share Class
SEK 1,439,526,638 USD 176,667,952 State Street Bank & Trust Company 15/6/2016 (3,382,243)USD 2,923,686 SEK 23,941,611 State Street Bank & Trust Company 15/6/2016 41,669
(3,340,574)
Total (Gross underlying exposure - USD 586,855,372) (9,897,292)
BlackRock Americas Diversified Equity Absolute Return Fund continued
Sector Breakdown as at 31 May 2016
% of Net Assets
Financial 82.05Government 10.35Consumer, Non-cyclical 0.85Basic Materials 0.80Energy 0.04
Securities portfolio at market value 94.05Other Net Assets 5.95
100.00
TRS USD 24,813 Fund receives 3 Month LIBOR and pays MSCI Daily TR Net Emerging Markets Chile USD Index Morgan Stanley 17/12/2016 276,888 276,888
TRS USD 9,113 Fund receives 3 Month LIBOR and pays MSCI Daily TR Net Emerging Markets Chile USD Index Morgan Stanley 11/03/2017 (19,702) (19,702)
Total (Gross underlying exposure - USD 10,432,352) 257,186 257,186
TRS: Total Return Swaps
Open forward foreign exchange transactions as at 31 May 2016
Currency Purchases Currency Sales CounterpartyMaturity
date
Unrealised appreciation/
(depreciation) USD

112 BlackRock Strategic Funds (BSF)
The notes on pages 489 to 503 form an integral part of these financial statements.
Transferable Securities and Money Market Instruments Admitted to an Official Stock Exchange Listing or Dealt in on Another Regulated Market
Transferable Securities and Money Market Instruments Admitted to an Official Stock Exchange Listing or Dealt in on Another Regulated Market
Holding
Description
Market Value
USD
% of Net
Assets
Holding
Description
Market Value
USD
% of Net
Assets
Portfolio of Investments as at 31 May 2016
BONDS
United States USD 3,000,000 Federal Farm Credit Banks FRN
22/11/2017 2,997,576 2.69 USD 3,001,000 Federal Home Loan Bank Discount
Notes 22/6/2016 (Zero Coupon) 3,000,451 2.69 USD 4,500,000 Federal Home Loan Bank Discount
Notes 24/8/2016 (Zero Coupon) 4,496,017 4.03 USD 3,000,000 Federal Home Loan Banks FRN
21/6/2016 3,000,342 2.69 USD 1,000,000 Freddie Mac Discount Notes
2/6/2016 (Zero Coupon) 999,983 0.90 USD 1,200,000 United States Treasury Bill 23/6/2016
(Zero Coupon) 1,199,836 1.07 USD 1,500,000 United States Treasury Bill 18/8/2016
(Zero Coupon) 1,498,544 1.34 USD 2,500,000 United States Treasury Bill
10/11/2016 (Zero Coupon) 2,495,052 2.24
19,687,801 17.65
Total Bonds 19,687,801 17.65
CERTIFICATES OF DEPOSIT
United States USD 1,000,000 Mizuho Bank Ltd 0.61% 7/7/2016 1,000,000 0.89 USD 3,000,000 Norinchukin Bank 0.67% 19/9/2016 3,000,000 2.69 USD 1,000,000 Sumitomo Mitsui Trust Bank Ltd
0.62% 21/6/2016 1,000,000 0.90
5,000,000 4.48
Total Certificates of Deposit 5,000,000 4.48
COMMERCIAL PAPER
Luxembourg USD 3,000,000 Rabobank Nederland NV
27/6/2016 (Zero Coupon) 2,998,581 2.69
2,998,581 2.69
United States USD 5,000,000 American Honda Finance Corp
28/7/2016 (Zero Coupon) 4,995,556 4.48 USD 4,500,000 Atlantic Asset Securitization LLC
23/6/2016 (Zero Coupon) 4,498,441 4.03 USD 5,000,000 Bank Nederlandse Gemeenten
'144A' 2/6/2016 (Zero Coupon) 4,999,567 4.48 USD 5,000,000 Barton Capital Corp 14/7/2016
(Zero Coupon) 4,996,244 4.48 USD 4,700,000 BMW US Capital LLC 27/6/2016
(Zero Coupon) 4,698,371 4.21
USD 1,750,000 BNP Paribas Fortis Funding SA/NV 3/6/2016 (Zero Coupon) 1,749,874 1.57
USD 4,400,000 Caisse Centrale Desjardins du Quebec 23/6/2016 (Zero Coupon) 4,398,696 3.94
USD 4,300,000 Coca-Cola Co/The 8/6/2016 (Zero Coupon) 4,299,674 3.85
USD 4,000,000 CRC Funding LLC 1/8/2016 (Zero Coupon) 3,994,442 3.58
USD 1,150,000 Gotham Funding Corp 28/6/2016 (Zero Coupon) 1,149,526 1.03
USD 2,000,000 ING US Funding LLC 5/7/2016 (Zero Coupon) 1,998,697 1.79
USD 525,000 LMA Americas LLC 14/6/2016 (Zero Coupon) 524,882 0.47
USD 3,390,000 Nieuw Amsterdam Receivables Corp 21/6/2016 (Zero Coupon) 3,389,115 3.04
USD 4,500,000 NRW.Bank 13/6/2016 (Zero Coupon) 4,499,303 4.03 USD 265,000 Rabobank Nederland NV 20/7/2016
(Zero Coupon) 264,711 0.24 USD 4,557,000 Regency Markets No.1 LLC
20/6/2016 (Zero Coupon) 4,555,273 4.08 USD 2,400,000 Sumitomo Mitsui Banking Corp
22/6/2016 (Zero Coupon) 2,399,146 2.15 USD 2,500,000 Sumitomo Mitsui Banking Corp
'144A' 26/8/2016 (Zero Coupon) 2,494,983 2.24 USD 4,000,000 Sumitomo Mitsui Trust Bank Ltd
15/8/2016 (Zero Coupon) 3,994,083 3.58 USD 5,000,000 Swedbank AB 19/8/2016
(Zero Coupon) 4,993,088 4.47 USD 1,000,000 Versailles CDS LLC 10/6/2016
(Zero Coupon) 999,845 0.90 USD 2,000,000 Victory Receivables Corp 6/7/2016
(Zero Coupon) 1,999,008 1.79 USD 3,000,000 Victory Receivables Corp 12/7/2016
(Zero Coupon) 2,998,292 2.69 USD 1,000,000 Working Capital Management
20/6/2016 (Zero Coupon) 999,752 0.90
75,890,569 68.02
Total Commercial Paper 78,889,150 70.71
Total Transferable Securities and Money Market Instruments Admitted to an Official Stock Exchange Listing or Dealt in on Another Regulated Market 103,576,951 92.84
Securities portfolio at market value 103,576,951 92.84
Other Net Assets 7,983,544 7.16
Total Net Assets (USD) 111,560,495 100.00
BlackRock Asia Extension Fund
United States continued

Annual Report and Audited Accounts 113
The notes on pages 489 to 503 form an integral part of these financial statements.
BlackRock Asia Extension Fund continued
Holding
Description Counterparty
Unrealised appreciation/
(depreciation) USD
Holding
Description Counterparty
Unrealised appreciation/
(depreciation) USD
Contracts for difference as at 31 May 2016
Hong Kong 746,000 Agricultural Bank of
China Ltd 'H' Morgan Stanley 8,957 153,800 AIA Group Ltd Bank of America
Merrill Lynch 34,296 127,600 AIA Group Ltd Morgan Stanley 30,261 468,000 Air China Ltd 'H' Morgan Stanley 19,419 (90,000) Alibaba Pictures Group Ltd Morgan Stanley (552) 176,000 Anhui Expressway Co Ltd 'H' Morgan Stanley (11,967) (14,600) ASM Pacific Technology Ltd Bank of America
Merrill Lynch (7,384) (1,500) ASM Pacific Technology Ltd Morgan Stanley (113) 1,228,000 Bank of China Ltd 'H' Bank of America
Merrill Lynch 28,264 2,325,000 Bank of China Ltd 'H' Morgan Stanley (112,151) 131,000 Bank of Communications Bank of America
Co Ltd 'H' Merrill Lynch 4,354 376,000 Bank of Communications
Co Ltd 'H' Morgan Stanley (38,832) 75,000 Beijing Enterprises Bank of America
Holdings Ltd Merrill Lynch 18,193 18,000 Beijing Enterprises
Holdings Ltd Morgan Stanley 925 22,000 Beijing Enterprises
Water Group Ltd Morgan Stanley 1,174 68,000 Beijing Jingneng Clean Bank of America
Energy Co Ltd 'H' Merrill Lynch 342 740,000 Beijing Jingneng Clean
Energy Co Ltd 'H' Morgan Stanley (8,163) 10,000 BOC Aviation Ltd '144A' Bank of America
Merrill Lynch (599) 98,000 BOC Hong Kong Holdings Ltd Morgan Stanley 53,551 (274,000) Brilliance China Automotive Bank of America
Holdings Ltd Merrill Lynch (9,542) (28,000) Brilliance China Automotive
Holdings Ltd Morgan Stanley (1,401) 24,000 BYD Co Ltd 'H' Morgan Stanley 21,879 54,500 BYD Electronic Bank of America
International Co Ltd Merrill Lynch 1,532 60,500 BYD Electronic
International Co Ltd Morgan Stanley (3,901) 663,000 China Communications
Construction Co Ltd 'H' Morgan Stanley 38,342 72,000 China Communications Bank of America
Construction Co Ltd 'H' Merrill Lynch (775) 394,000 China Communications Bank of America
Services Corp Ltd 'H' Merrill Lynch 12,103 660,000 China Communications
Services Corp Ltd 'H' Morgan Stanley 55,475 3,753,000 China Construction Bank Bank of America
Corp 'H' Merrill Lynch 197,194 576,000 China Construction Bank
Corp 'H' Morgan Stanley 27,098 118,000 China Dongxiang Bank of America
Group Co Ltd Merrill Lynch (1,224) 154,000 China Dongxiang Group Co Ltd Morgan Stanley (4,059) 476,000 China Everbright Bank Bank of America
Co Ltd 'H' Merrill Lynch 10,339 138,000 China Everbright Ltd Bank of America
Merrill Lynch 9,004 44,000 China Everbright Ltd Morgan Stanley 3,132 8,000 China Galaxy Securities Bank of America
Co Ltd 'H' Merrill Lynch 564 256,000 China Galaxy Securities
Co Ltd 'H' Morgan Stanley 45,415 17,500 China Harmony New Energy
Auto Holding Ltd Morgan Stanley (1,301) 134,500 China Harmony New Energy Bank of America
Auto Holding Ltd Merrill Lynch 5,338 406,000 China High Speed Transmission Bank of America
Equipment Group Co Ltd Merrill Lynch (1,175) 133,000 China High Speed Transmission
Equipment Group Co Ltd Morgan Stanley (5,706)
2,100 China International Marine Bank of America Containers Group Co Ltd 'H' Merrill Lynch 50
17,100 China International Marine Containers Group Co Ltd 'H' Morgan Stanley (4,011)
40,000 China Life Insurance Co Ltd 'H' Bank of America Merrill Lynch 3,783
87,000 China Life Insurance Co Ltd 'H' Morgan Stanley 9,221 190,000 China Machinery Engineering Bank of America
Corp 'H' Merrill Lynch (785) 99,000 China Machinery Engineering
Corp 'H' Morgan Stanley (2,429) 33,500 China Merchants Bank Bank of America
Co Ltd 'H' Merrill Lynch 2,782 125,500 China Merchants Bank
Co Ltd 'H' Morgan Stanley 22,177 (130,000) China Merchants Holdings Bank of America
International Co Ltd Merrill Lynch (11,374) 58,500 China Mobile Ltd Bank of America
Merrill Lynch 25,343 182,500 China Mobile Ltd Morgan Stanley 100,125 108,000 China Pacific Insurance Bank of America
Group Co Ltd 'H' Merrill Lynch 13,758 117,000 China Pacific Insurance
Group Co Ltd 'H' Morgan Stanley (7,847) 56,000 China Petroleum & Chemical Bank of America
Corp 'H' Merrill Lynch 1,283 1,302,000 China Petroleum & Chemical
Corp 'H' Morgan Stanley 146,890 786,000 China Power International Bank of America
Development Ltd Merrill Lynch 9,987 109,000 China Power International
Development Ltd Morgan Stanley 1,134 431,500 China Railway Construction Bank of America
Corp Ltd 'H' Merrill Lynch 18,674 352,500 China Railway Construction
Corp Ltd 'H' Morgan Stanley 41,563 208,000 China Railway Group Ltd 'H' Bank of America
Merrill Lynch 1,810 452,000 China Railway Group Ltd 'H' Morgan Stanley (17,785) (102,000) China Resources Beer Bank of America
Holdings Co Ltd Merrill Lynch 4,558 216,000 China Resources Land Ltd Bank of America
Merrill Lynch 28,608 114,000 China Resources Land Ltd Morgan Stanley 4,668 130,000 China Resources Power Bank of America
Holdings Co Ltd Merrill Lynch (4,438) (1,585,433) China Shanshui Cement Bank of America
Group Ltd Merrill Lynch 1,100,690 (359,000) China Shanshui Cement
Group Ltd Credit Suisse 89,778 (539,000) China Shanshui Cement
Group Ltd Morgan Stanley 372,196 (84,000) China Shipping Container
Lines Co Ltd 'H' Morgan Stanley (665) 284,000 China Shipping Development Bank of America
Co Ltd 'H' Merrill Lynch (7,266) 156,000 China Shipping Development
Co Ltd 'H' Morgan Stanley (8,326) (130,000) China South City Holdings Ltd Morgan Stanley (662) 424,000 China Telecom Corp Ltd 'H' Bank of America
Merrill Lynch (6,088) 240,000 China Telecom Corp Ltd 'H' Morgan Stanley (6,821) 61,700 China Vanke Co Ltd 'H' Morgan Stanley (7,834) 127,600 China Vanke Co Ltd 'H' Bank of America
Merrill Lynch 9,392 84,800 China Zhongwang Holdings Ltd Bank of America
Merrill Lynch 967 (431,000) CITIC Ltd Bank of America
Merrill Lynch (18,617) 29,068 CK Hutchison Holdings Ltd Bank of America
Merrill Lynch (5,380)
Hong Kong continued

114 BlackRock Strategic Funds (BSF)
The notes on pages 489 to 503 form an integral part of these financial statements.
Holding
Description Counterparty
Unrealised appreciation/
(depreciation) USD
Holding
Description Counterparty
Unrealised appreciation/
(depreciation) USD
Contracts for difference as at 31 May 2016
64,000 CLP Holdings Ltd Bank of America Merrill Lynch 25,305
124,000 CLP Holdings Ltd Morgan Stanley 59,709 55,000 CNOOC Ltd Bank of America
Merrill Lynch 2,169 49,000 CRRC Corp Ltd 'H' Bank of America
Merrill Lynch 1,054 143,000 CRRC Corp Ltd 'H' Morgan Stanley (3,743) 64,000 CSSC Offshore and Marine Bank of America
Engineering Group Co Ltd 'H' Merrill Lynch 1,938 34,000 CSSC Offshore and Marine
Engineering Group Co Ltd 'H' Morgan Stanley (1,930) (58,000) CT Environmental Group Ltd Morgan Stanley (689) 328,000 Dongfeng Motor Group Co Ltd 'H' Morgan Stanley (16,906) (46,000) FIH Mobile Ltd Bank of America
Merrill Lynch 497 66,000 First Pacific Co Ltd/Hong Kong Bank of America
Merrill Lynch 2,277 234,000 First Pacific Co Ltd/Hong Kong Morgan Stanley (15,135) (8,800) Fuyao Glass Industry
Group Co Ltd 'H' '144A' Morgan Stanley (1,130) 6,000 Galaxy Entertainment Bank of America
Group Ltd Merrill Lynch 919 55,000 Galaxy Entertainment Group Ltd Morgan Stanley 8,764 175,000 Geely Automobile Holdings Ltd Bank of America
Merrill Lynch 9,654 170,000 Geely Automobile Holdings Ltd Morgan Stanley 6,345 137,500 Great Wall Motor Co Ltd 'H' Bank of America
Merrill Lynch 6,155 127,000 Great Wall Motor Co Ltd 'H' Morgan Stanley (5,298) (110,500) Greentown China Holdings Ltd Bank of America
Merrill Lynch (4,238) 302,000 Guangzhou Automobile Bank of America
Group Co Ltd 'H' Merrill Lynch 20,473 364,000 Guangzhou Automobile Group
Co Ltd 'H' Morgan Stanley 52,784 10,000 Guangzhou Baiyunshan
Pharmaceutical Holdings Bank of America Co Ltd 'H' Merrill Lynch 247
22,000 Guangzhou Baiyunshan Pharmaceutical Holdings Co Ltd 'H' Morgan Stanley 1,719
107,000 Haier Electronics Group Co Ltd Bank of America Merrill Lynch 5,441
77,000 Haier Electronics Group Co Ltd Morgan Stanley 268 51,000 Haitian International Bank of America
Holdings Ltd Merrill Lynch 5,221 18,000 Haitian International
Holdings Ltd Morgan Stanley 1,024 15,000 Hang Lung Group Ltd Bank of America
Merrill Lynch 1,721 70,000 Hang Lung Group Ltd Morgan Stanley (388) 31,000 Henderson Land Bank of America
Development Co Ltd Merrill Lynch 11,302 530,000 HKT Trust & HKT Ltd (Unit) Bank of America
Merrill Lynch 3,779 485,000 HKT Trust & HKT Ltd (Unit) Morgan Stanley 32,044 (907,000) Hong Kong & China Gas Co Ltd Bank of America
Merrill Lynch (64,655) (7,000) Hong Kong & China Gas Co Ltd Morgan Stanley (378) 544,000 Huadian Power International Bank of America
Corp Ltd 'H' Merrill Lynch 25,105 170,000 Huadian Power International
Corp Ltd 'H' Morgan Stanley (7,132) 176,000 Huaneng Power Bank of America
International Inc 'H' Merrill Lynch 1,084 (320,000) IGG Inc Morgan Stanley (11,341) (17,600) IMAX China Holding Inc '144A' Bank of America
Merrill Lynch (12,865) 293,000 Industrial & Commercial
Bank of China Ltd 'H' Morgan Stanley 5,094
3,100,000 Industrial & Commercial Bank of America Bank of China Ltd 'H' Merrill Lynch 99,142
29,000 Jiangxi Copper Co Ltd 'H' Bank of America Merrill Lynch (648)
117,000 Jiangxi Copper Co Ltd 'H' Morgan Stanley (9,361) 24,000 Kerry Properties Ltd Bank of America
Merrill Lynch 965 (354,000) Kingdee International Bank of America
Software Group Co Ltd Merrill Lynch (10,437) (392,000) Kingdee International
Software Group Co Ltd Morgan Stanley (5,852) 38,000 Lee & Man Paper Bank of America
Manufacturing Ltd Merrill Lynch 1,213 140,000 Lee & Man Paper
Manufacturing Ltd Morgan Stanley (727) 140,000 Li & Fung Ltd Bank of America
Merrill Lynch (6,479) (367,000) Li Ning Co Ltd Morgan Stanley 21,712 (126,500) Luye Pharma Group Ltd Morgan Stanley 11,789 640,000 Metallurgical Corp of Bank of America
China Ltd 'H' Merrill Lynch 10,641 483,000 Metallurgical Corp of
China Ltd 'H' Morgan Stanley 2,841 (12,500) NetDragon Websoft Inc Morgan Stanley (8,313) 479,000 New World Development Bank of America
Co Ltd Merrill Lynch 17,705 1,068,000 New World Development
Co Ltd Morgan Stanley 159,229 119,000 NWS Holdings Ltd Bank of America
Merrill Lynch 536 196,000 NWS Holdings Ltd Morgan Stanley 24,869 120,000 PCCW Ltd Bank of America
Merrill Lynch (140) 897,000 People's Insurance Co Bank of America
Group of China Ltd/The 'H' Merrill Lynch 17,183 1,441,000 People's Insurance Co
Group of China Ltd/The 'H' Morgan Stanley (32,917) 176,000 PICC Property & Casualty Bank of America
Co Ltd 'H' Merrill Lynch 21,452 350,000 PICC Property & Casualty
Co Ltd 'H' Morgan Stanley 16,672 46,500 Ping An Insurance Group Bank of America
Co of China Ltd 'H' Merrill Lynch 7,101 (1,296,000) Poly Property Group Co Ltd Morgan Stanley 9,795 (383,000) Poly Property Group Co Ltd Bank of America
Merrill Lynch (3,905) (83,900) Prada SpA Morgan Stanley (16,201) 68,800 Sands China Ltd Bank of America
Merrill Lynch 19,830 11,600 Sands China Ltd Morgan Stanley 7,215 21,000 Shanghai Fosun
Pharmaceutical Group Bank of America Co Ltd 'H' Merrill Lynch 1,600
20,000 Shanghai Fosun Pharmaceutical Group Co Ltd 'H' Morgan Stanley 1,316
182,400 Shanghai Pharmaceuticals Bank of America Holding Co Ltd 'H' Merrill Lynch 8,295
12,600 Shanghai Pharmaceuticals Holding Co Ltd 'H' Morgan Stanley 4,777
(49,000) Shenzhen International Bank of America Holdings Ltd Merrill Lynch (1,817)
74,000 Sino Land Co Ltd Bank of America Merrill Lynch 5,863
234,000 Sino Land Co Ltd Morgan Stanley 57,749 139,500 Sinopec Engineering Bank of America
Group Co Ltd 'H' Merrill Lynch 5,653 25,000 Sinopec Engineering
Group Co Ltd 'H' Morgan Stanley 882 132,000 Sinopec Shanghai Bank of America
Petrochemical Co Ltd 'H' Merrill Lynch 5,074
BlackRock Asia Extension Fund continued
Hong Kong continued Hong Kong continued

Annual Report and Audited Accounts 115
The notes on pages 489 to 503 form an integral part of these financial statements.
Holding
Description Counterparty
Unrealised appreciation/
(depreciation) USD
Holding
Description Counterparty
Unrealised appreciation/
(depreciation) USD
Contracts for difference as at 31 May 2016
BlackRock Asia Extension Fund continued
482,000 Sinopec Shanghai Petrochemical Co Ltd 'H' Morgan Stanley 14,374
262,000 Sinotrans Ltd 'H' Morgan Stanley 7,434 305,000 Sinotrans Ltd 'H' Bank of America
Merrill Lynch (447) 292,000 SJM Holdings Ltd Bank of America
Merrill Lynch 8,356 149,000 SJM Holdings Ltd Morgan Stanley (610) 176,000 Skyworth Digital Holdings Ltd Bank of America
Merrill Lynch (1,857) 252,000 Skyworth Digital Holdings Ltd Morgan Stanley (18,262) (650,000) SOHO China Ltd Bank of America
Merrill Lynch 24,397 26,000 Sun Hung Kai Properties Ltd Bank of America
Merrill Lynch 15,279 221,000 Sun Hung Kai Properties Ltd Morgan Stanley (20,656) 2,500 Swire Pacific Ltd 'A' Bank of America
Merrill Lynch 681 17,000 Swire Pacific Ltd 'A' Morgan Stanley 4,725 184,400 Swire Properties Ltd Bank of America
Merrill Lynch 56,309 26,200 Swire Properties Ltd Morgan Stanley 8,235 6,000 Techtronic Industries Co Ltd Morgan Stanley 518 103,100 Tencent Holdings Ltd Bank of America
Merrill Lynch 166,207 121,800 Tencent Holdings Ltd Morgan Stanley 415,470 166,000 Tianneng Power
International Ltd Morgan Stanley 5,502 260,000 Tianneng Power Bank of America
International Ltd Merrill Lynch (7,782) (192,000) Tingyi Cayman Islands Bank of America
Holding Corp Merrill Lynch 38,651 (8,000) Tingyi Cayman Islands
Holding Corp Morgan Stanley 1,373 (429,000) Towngas China Co Ltd Bank of America
Merrill Lynch (8,240) (3,000) Towngas China Co Ltd Morgan Stanley (55) 109,000 TravelSky Technology Ltd 'H' Bank of America
Merrill Lynch 7,496 76,000 TravelSky Technology Ltd 'H' Morgan Stanley 3,023 (193,000) Want Want China Holdings Ltd Morgan Stanley 2,547 34,000 Weichai Power Co Ltd 'H' Bank of America
Merrill Lynch 684 11,000 Weichai Power Co Ltd 'H' Morgan Stanley 2,625 (1,430,000) West China Cement Ltd Bank of America
Merrill Lynch (18,295) (3,982,000) West China Cement Ltd Morgan Stanley (15,665) 536,000 WH Group Ltd '144A' Bank of America
Merrill Lynch (9,145) 260,000 WH Group Ltd '144A' Morgan Stanley 5,549 33,000 Wheelock & Co Ltd Bank of America
Merrill Lynch 8,901 17,000 Wheelock & Co Ltd Morgan Stanley 890 148,400 Xinjiang Goldwind Science & Bank of America
Technology Co Ltd 'H' Merrill Lynch 5,257 78,400 Xinjiang Goldwind Science &
Technology Co Ltd 'H' Morgan Stanley 26,218 146,000 Xinyi Glass Holdings Ltd Morgan Stanley 2,822 (92,000) Xinyi Solar Holdings Ltd Bank of America
Merrill Lynch (1,288) (546,000) Xinyi Solar Holdings Ltd Morgan Stanley (48,342) 27,500 Yue Yuen Industrial Holdings Ltd Morgan Stanley 1,610 20,500 Yue Yuen Industrial Holdings Ltd Bank of America
Merrill Lynch (563) (414,000) Zall Development Group Ltd Bank of America
Merrill Lynch 10,191 170,000 Zhejiang Expressway Co Ltd 'H' Morgan Stanley 7,719 206,000 Zijin Mining Group Co Ltd 'H' Bank of America
Merrill Lynch (7,188) 734,000 Zijin Mining Group Co Ltd 'H' Morgan Stanley (24,683)
130,520 ZTE Corp 'H' Bank of America Merrill Lynch 2,819
119,600 ZTE Corp 'H' Morgan Stanley 407
3,581,172
Indonesia 241,800 Bank Central Asia Tbk PT Bank of America
Merrill Lynch (3,738) 24,000 Bank Central Asia Tbk PT Morgan Stanley (151) 39,900 Bank Negara Indonesia Bank of America
Persero Tbk PT Merrill Lynch 988 257,700 Bank Rakyat Indonesia Bank of America
Persero Tbk PT Merrill Lynch 2,755 158,900 Bank Rakyat Indonesia
Persero Tbk PT Morgan Stanley (17,610) (1,491,200) Bumi Serpong Damai Tbk PT Morgan Stanley (3,814) (96,000) Charoen Pokphand Bank of America
Indonesia Tbk PT Merrill Lynch (2,904) 1,108,100 Global Mediacom Tbk PT Morgan Stanley 31 476,900 Global Mediacom Tbk PT Bank of America
Merrill Lynch (5,541) 128,800 Gudang Garam Tbk PT Morgan Stanley 71,048 136,400 Gudang Garam Tbk PT Bank of America
Merrill Lynch (38,118) 51,300 Indofood CBP Sukses Bank of America
Makmur Tbk PT Merrill Lynch 987 (1,653,000) Lippo Karawaci Tbk PT Bank of America
Merrill Lynch 468 238,200 Matahari Department Store
Tbk PT Morgan Stanley (3,834) (234,800) Summarecon Agung Tbk PT Morgan Stanley 1,072 (397,600) Summarecon Agung Tbk PT Bank of America
Merrill Lynch (5,527) 205,900 Surya Citra Media Tbk PT Morgan Stanley 5,624 1,815,100 Telekomunikasi Indonesia Bank of America
Persero Tbk PT Merrill Lynch (15,275) 4,457,200 Telekomunikasi Indonesia
Persero Tbk PT Morgan Stanley 61,967 (1,172,900) Tower Bersama Bank of America
Infrastructure Tbk PT Merrill Lynch 21,179 (249,200) Tower Bersama
Infrastructure Tbk PT Morgan Stanley (9,541) 78,900 United Tractors Tbk PT Bank of America
Merrill Lynch 4,126 225,000 United Tractors Tbk PT Morgan Stanley (49,768) 395,700 Waskita Karya Persero Tbk PT Morgan Stanley 15,458 2,060,500 Waskita Karya Persero Tbk PT Bank of America
Merrill Lynch (20,493)
9,389
Malaysia 43,900 Axiata Group Bhd Bank of America
Merrill Lynch (3,368) (247,800) DiGi.Com Bhd Morgan Stanley 30,973 1,311,000 KNM Group Bhd Bank of America
Merrill Lynch (2,072) 77,100 KNM Group Bhd Morgan Stanley (130) 50,600 Kuala Lumpur Kepong Bhd Bank of America
Merrill Lynch (7,906) 34,900 Kuala Lumpur Kepong Bhd Morgan Stanley (13,068) (46,800) Lafarge Malaysia Bhd Bank of America
Merrill Lynch 5,451 (29) Malaysia Airports Holdings Bhd Morgan Stanley (2) 265,600 MISC Bhd Bank of America
Merrill Lynch 5,889 206,500 MISC Bhd Morgan Stanley (50,064) 103,800 PPB Group Bhd Bank of America
Merrill Lynch 3,605 224,000 PPB Group Bhd Morgan Stanley (15,416)
Hong Kong continued Hong Kong continued

116 BlackRock Strategic Funds (BSF)
The notes on pages 489 to 503 form an integral part of these financial statements.
Holding
Description Counterparty
Unrealised appreciation/
(depreciation) USD
Holding
Description Counterparty
Unrealised appreciation/
(depreciation) USD
Contracts for difference as at 31 May 2016
54,600 SapuraKencana Petroleum Bhd Morgan Stanley (976) 224,600 Tenaga Nasional Bhd Bank of America
Merrill Lynch (20,377) 111,500 Tenaga Nasional Bhd Morgan Stanley (13,353) 481,500 Top Glove Corp Bhd Bank of America
Merrill Lynch (4,214) 196,600 Top Glove Corp Bhd Morgan Stanley (6,951) (163,100) UMW Holdings Bhd Morgan Stanley 65,729
(26,250)
Philippines 10 Aboitiz Equity Ventures Inc Bank of America
Merrill Lynch 2 106,800 Aboitiz Power Corp Morgan Stanley 4,222 58,500 Aboitiz Power Corp Bank of America
Merrill Lynch (1,642) 23,600 Ayala Land Inc Morgan Stanley (645) 4,130 Globe Telecom Inc Bank of America
Merrill Lynch 13,411 8,160 Globe Telecom Inc Morgan Stanley 95,643 1,376,000 Megaworld Corp Bank of America
Merrill Lynch 3,541 3,677,400 Metro Pacific Investments Corp Morgan Stanley 34,356 5,011,900 Metro Pacific Investments Corp Bank of America
Merrill Lynch (9,374) 128,800 Robinsons Land Corp Bank of America
Merrill Lynch (1,190)
138,324
Singapore 197,300 CapitaLand Commercial
Trust (Reit) Morgan Stanley (3,873) 128,900 CapitaLand Ltd Bank of America
Merrill Lynch 4,707 45,100 ComfortDelGro Corp Ltd Bank of America
Merrill Lynch (48) 40,200 ComfortDelGro Corp Ltd Morgan Stanley (792) 36,900 DBS Group Holdings Ltd Bank of America
Merrill Lynch 13,402 28,700 DBS Group Holdings Ltd Morgan Stanley 13,176 (257,000) Ezra Holdings Ltd Morgan Stanley 7,734 (580,700) First Resources Ltd Morgan Stanley 32,472 601,800 Golden Agri-Resources Ltd Bank of America
Merrill Lynch 10,424 368,500 Golden Agri-Resources Ltd Morgan Stanley 2,580 (2,600) Jardine Matheson Holdings Ltd Bank of America
Merrill Lynch (8,112) 75,300 Keppel Corp Ltd Bank of America
Merrill Lynch 7,806 (490,100) Mapletree Logistics Trust (Reit) Morgan Stanley 4,759 (2,277,300) Neptune Orient Lines Ltd/
Singapore Morgan Stanley (75,614) 165,100 Noble Group Ltd Bank of America
Merrill Lynch (1,987) 84,500 SATS Ltd Bank of America
Merrill Lynch (14,356) 109,600 SATS Ltd Morgan Stanley (18,610) 100,300 Singapore Airlines Ltd Bank of America
Merrill Lynch (11,202) 101,300 UOL Group Ltd Morgan Stanley 2,454 17,300 UOL Group Ltd Bank of America
Merrill Lynch (545) 40,900 Venture Corp Ltd Bank of America
Merrill Lynch 3,264 81,000 Venture Corp Ltd Morgan Stanley 2,566 13 Wilmar International Ltd Morgan Stanley (2) 607,400 Yangzijiang Shipbuilding Bank of America
Holdings Ltd Merrill Lynch 3,160 639,317 Yangzijiang Shipbuilding
Holdings Ltd Morgan Stanley (50,485)
(77,122)
South Korea 3,656 Able C&C Co Ltd Morgan Stanley 4,018 7,642 Able C&C Co Ltd Bank of America
Merrill Lynch (5,306) 827 AfreecaTV Co Ltd Morgan Stanley 1,002 10,378 AfreecaTV Co Ltd Bank of America
Merrill Lynch (19,641) 404 AK Holdings Inc Bank of America
Merrill Lynch 5,364 353 AK Holdings Inc Morgan Stanley 4,266 532 Amorepacific Corp Bank of America
Merrill Lynch (8,039) 227 Amorepacific Corp Morgan Stanley (3,141) 509 AMOREPACIFIC Group Bank of America
Merrill Lynch (2,869) (541) Bukwang Pharmaceutical Co Ltd Morgan Stanley (1,074) (1,176) Caregen Co Ltd Morgan Stanley 9,132 1,755 Cell Biotech Co Ltd Bank of America
Merrill Lynch (378) 4,226 Cell Biotech Co Ltd Morgan Stanley (6,308) (5,720) Changhae Ethanol Co Ltd Morgan Stanley 7,265 125 CJ CheilJedang Corp Bank of America
Merrill Lynch (820) 58 CJ CheilJedang Corp Morgan Stanley (504) (146) CJ Korea Express Corp Morgan Stanley (466) 144 Com2uSCorp Bank of America
Merrill Lynch (812) 977 Com2uSCorp Morgan Stanley (1,731) (794) Cosmax Inc Morgan Stanley (13,282) (4,739) COSON Co Ltd Bank of America
Merrill Lynch 6,214 (1,554) COSON Co Ltd Morgan Stanley 3,192 23 Coway Co Ltd Bank of America
Merrill Lynch 18 7,898 Coway Co Ltd Morgan Stanley 49,592 (201) Crown Confectionery Co Ltd Morgan Stanley 1,326 (1,824) CrucialTec Co Ltd Morgan Stanley 4,260 3,271 Daou Technology Inc Bank of America
Merrill Lynch 5,117 2,924 Daou Technology Inc Morgan Stanley 7,312 (962) DIO Corp Morgan Stanley 687 (386) Dong-A ST Co Ltd Morgan Stanley 1,438 (417) Dongwon Systems Corp Bank of America
Merrill Lynch 1,493 (1,636) Dongwon Systems Corp Morgan Stanley 39,864 (2,862) Eo Technics Co Ltd Bank of America
Merrill Lynch 13,381 (2,677) Fila Korea Ltd Morgan Stanley 6,877 (5,135) G-SMATT GLOBAL Co Ltd Bank of America
Merrill Lynch 6,635 (265) Genexine Co Ltd Morgan Stanley 2,496 15,274 Hana Financial Group Inc Morgan Stanley 46,845 (1,815) Hanon Systems Morgan Stanley (1,537) (1,471) Hansol Chemical Co Ltd Bank of America
Merrill Lynch (3,865) (43) Hansol Chemical Co Ltd Morgan Stanley (100) (6,149) Hansol Technics Co Ltd Morgan Stanley 6,055 13,420 Hanwha Chemical Corp Bank of America
Merrill Lynch 2,762 6,377 Hanwha Techwin Co Ltd Bank of America
Merrill Lynch (11,300) 1,745 Hanwha Techwin Co Ltd Morgan Stanley (1,890) 2,108 Hyosung Corp Bank of America
Merrill Lynch 1,407 3,404 Hyosung Corp Morgan Stanley (41,081) 2,335 Hyundai Development Bank of America
Co-Engineering & Construction Merrill Lynch 1,757
7,573 Hyundai Development Co-Engineering & Construction Morgan Stanley 2,924
(486) Hyundai Elevator Co Ltd Morgan Stanley (2,470) 1,642 Hyundai Engineering & Bank of America
Construction Co Ltd Merrill Lynch (2,162)
BlackRock Asia Extension Fund continued
Malaysia continued

Annual Report and Audited Accounts 117
The notes on pages 489 to 503 form an integral part of these financial statements.
Holding
Description Counterparty
Unrealised appreciation/
(depreciation) USD
Holding
Description Counterparty
Unrealised appreciation/
(depreciation) USD
* Amounts which are less than 0.5 USD have been rounded down to zero.
Contracts for difference as at 31 May 2016
BlackRock Asia Extension Fund continued
600 Hyundai Engineering & Construction Co Ltd Morgan Stanley (3,737)
2,111 Hyundai Glovis Co Ltd Bank of America Merrill Lynch (8,805)
431 Hyundai Glovis Co Ltd Morgan Stanley (3,752) 1,810 Hyundai Heavy Bank of America
Industries Co Ltd Merrill Lynch 7,940 692 Hyundai Heavy Industries Co Ltd Morgan Stanley 4,589 407 Hyundai Home Shopping Bank of America
Network Corp Merrill Lynch (2,204) 356 Hyundai Home Shopping
Network Corp Morgan Stanley (1,969) 2,599 Hyundai Mobis Co Ltd Morgan Stanley 5,328 2,712 Hyundai Mobis Co Ltd Bank of America
Merrill Lynch (2,602) 1,312 Hyundai Motor Co Bank of America
Merrill Lynch 2,848 1,828 Hyundai Motor Co Morgan Stanley (3,295) 2,300 Hyundai Motor Co (Pref) Bank of America
Merrill Lynch 16,412 4,774 Hyundai Motor Co (Pref) Morgan Stanley 9,340 3,572 Hyundai Motor Co (Pref) Bank of America
Merrill Lynch 15,679 1,803 Hyundai Motor Co (Pref) Morgan Stanley (2,243) (1,663) Hyundai Rotem Co Ltd Bank of America
Merrill Lynch (733) 52,638 Hyundai Securities Co Ltd Bank of America
Merrill Lynch (28,836) 12,697 Hyundai Steel Co Bank of America
Merrill Lynch (50,645) 3,016 Hyundai Steel Co Morgan Stanley (3,194) (3,503) Hyungkuk F&B Co Ltd Morgan Stanley 11,206 (909) i3system Inc Morgan Stanley (281) 5,953 Industrial Bank of Korea Bank of America
Merrill Lynch (341) 484 Industrial Bank of Korea Morgan Stanley (120) 5,692 Interpark Holdings Corp Morgan Stanley (10,430) (1) ISC Co Ltd* Bank of America
Merrill Lynch — (3,312) Jusung Engineering Co Ltd Morgan Stanley (1,158) (1,519) Kakao Corp Morgan Stanley 128 21,659 KB Financial Group Inc Bank of America
Merrill Lynch 11,900 10,562 Kia Motors Corp Bank of America
Merrill Lynch (1,547) 11,914 Kia Motors Corp Morgan Stanley (12,856) 14,409 Korea Electric Power Corp Bank of America
Merrill Lynch 23,832 6,324 Korea Investment Bank of America
Holdings Co Ltd Merrill Lynch 6,376 (1,632) Korea Mcnulty Co Ltd Bank of America
Merrill Lynch 5,727 (932) Korea Mcnulty Co Ltd Morgan Stanley 4,360 743 Korea Zinc Co Ltd Bank of America
Merrill Lynch (7,208) 117 Korea Zinc Co Ltd Morgan Stanley (1,916) 274 KT Corp Morgan Stanley 963 461 KT Corp Bank of America
Merrill Lynch (20) 4,295 KT&G Corp Morgan Stanley 7,104 5,444 KT&G Corp Bank of America
Merrill Lynch (11,819) (713) Kumho Petrochemical Co Ltd Morgan Stanley 1,439 (8,633) Kumho Tire Co Inc Bank of America
Merrill Lynch (2,144) (68,971) Kumho Tire Co Inc Morgan Stanley (11,916) 2,401 LG Corp Bank of America
Merrill Lynch 1,217 7,204 LG Electronics Inc Morgan Stanley 10,975
616 LG Household & Health Care Ltd Bank of America Merrill Lynch 53
24 LG Household & Health Care Ltd Morgan Stanley (270) (881) LIG Nex1 Co Ltd Morgan Stanley (2,748) 1,704 Lotte Chemical Corp Bank of America
Merrill Lynch (10,735) 400 Lotte Chemical Corp Morgan Stanley (719) 11,386 Meritz Securities Co Ltd Bank of America
Merrill Lynch (2,972) 5,971 Meritz Securities Co Ltd Morgan Stanley (3,362) (3,464) Modetour Network Inc Morgan Stanley (6,630) 1,901 NAVER Corp Bank of America
Merrill Lynch 33,151 1,248 NAVER Corp Morgan Stanley 127,369 (405) NeoPharm Co Ltd Morgan Stanley (136) (2,306) Next Entertainment
World Co Ltd Morgan Stanley (2,419) 9,398 NH Investment & Bank of America
Securities Co Ltd Merrill Lynch (4,492) 5,506 NH Investment &
Securities Co Ltd Morgan Stanley (500) 478 NongShim Co Ltd Bank of America
Merrill Lynch (16,385) (958) NUTRIBIOTECH Co Ltd Bank of America
Merrill Lynch (4,707) (2,779) NUTRIBIOTECH Co Ltd Morgan Stanley (22,246) 5,149 POSCO Morgan Stanley 22,279 6,849 POSCO Bank of America
Merrill Lynch (9,562) 8,233 Posco Daewoo Corp Bank of America
Merrill Lynch 1,092 3,729 Posco Daewoo Corp Morgan Stanley (2,619) 3,551 S-Oil Corp Bank of America
Merrill Lynch 1,533 2,207 S-Oil Corp Morgan Stanley (17,040) (2,282) Samsung C&T Corp Bank of America
Merrill Lynch 5,732 (491) Samsung C&T Corp Morgan Stanley 2,626 431 Samsung Card Co Ltd Morgan Stanley (281) (315) Samsung Electro-
Mechanics Co Ltd Morgan Stanley 1,066 (989) Samsung Electro-
Mechanics Co Ltd Bank of America Merrill Lynch (135)
3,097 Samsung Electronics Co Ltd Bank of America Merrill Lynch 68,302
911 Samsung Electronics Co Ltd Morgan Stanley 89,585 606 Samsung Electronics Bank of America
Co Ltd (Pref) Merrill Lynch 11,756 40 Samsung Electronics
Co Ltd (Pref) Morgan Stanley (829) (8,483) Samsung Engineering Co Ltd Morgan Stanley 12,394 (5,819) Samsung SDI Co Ltd Bank of America
Merrill Lynch (20,106) (74) Samsung SDI Co Ltd Morgan Stanley (286) 385 Samsung SDS Co Ltd Bank of America
Merrill Lynch 526 1,745 Samsung SDS Co Ltd Morgan Stanley 7,414 946 Seah Besteel Corp Bank of America
Merrill Lynch 389 3,097 Seah Besteel Corp Morgan Stanley (2,685) 19,224 Shinhan Financial Group Co Ltd Bank of America
Merrill Lynch (9,097) 14,519 Shinhan Financial Group Co Ltd Morgan Stanley (1,397) (458) Shinsegae Food Co Ltd Morgan Stanley 3,555 9,393 SHOWBOX Corp Morgan Stanley (2,252) 3,827 SK Hynix Inc Bank of America
Merrill Lynch 7,475 3,900 SK Innovation Co Ltd Bank of America
Merrill Lynch 27,886
South Korea continued South Korea continued

118 BlackRock Strategic Funds (BSF)
The notes on pages 489 to 503 form an integral part of these financial statements.
Holding
Description Counterparty
Unrealised appreciation/
(depreciation) USD
Holding
Description Counterparty
Unrealised appreciation/
(depreciation) USD
Contracts for difference as at 31 May 2016
4,538 SK Innovation Co Ltd Morgan Stanley 22,565 37,736 SK Networks Co Ltd Morgan Stanley 8,568 32,715 SK Networks Co Ltd Bank of America
Merrill Lynch (657) 2,807 Soulbrain Co Ltd Bank of America
Merrill Lynch 7,126 2,184 Soulbrain Co Ltd Morgan Stanley 3,372 (694) Tera Semicon Co Ltd Morgan Stanley (2,107) (7,342) Viatron Technologies Inc Morgan Stanley (8,600) 97 ViroMed Co Ltd Bank of America
Merrill Lynch 1,688 22,505 Woori Bank Morgan Stanley (1,903)
397,140
Taiwan 60,000 Accton Technology Corp Morgan Stanley 6,357 57,000 Advanced Semiconductor Bank of America
Engineering Inc Merrill Lynch 13,348 13,000 Advanced Semiconductor
Engineering Inc Morgan Stanley 2,862 336,000 Arcadyan Technology Corp Morgan Stanley 24,342 (1,280,000) Asia Pacific Telecom Co Ltd Morgan Stanley 8,752 78,000 Basso Industry Corp Morgan Stanley 18,924 500,000 Cathay Financial Holding Co Ltd Morgan Stanley 16,999 4,000 Chen Full International Co Ltd Bank of America
Merrill Lynch 330 40,000 Chen Full International Co Ltd Morgan Stanley 17,667 97,000 Chin-Poon Industrial Co Ltd Bank of America
Merrill Lynch 18,184 (190,000) China Airlines Ltd Morgan Stanley (2,423) 600,000 China Life Insurance Co Bank of America
Ltd/Taiwan Merrill Lynch 33,851 131,000 China Life Insurance Co
Ltd/Taiwan Morgan Stanley 6,564 281,000 Chunghwa Telecom Co Ltd Morgan Stanley 78,691 29,000 Cleanaway Co Ltd Bank of America
Merrill Lynch 711 (794,810) Evergreen Marine Corp
Taiwan Ltd Morgan Stanley 13,222 (57,570) Evergreen Marine Corp Bank of America
Taiwan Ltd Merrill Lynch (740) 180,000 Everlight Electronics Co Ltd Bank of America
Merrill Lynch 5,403 50,000 Everlight Electronics Co Ltd Morgan Stanley (3,734) (109,000) Far EasTone Bank of America
Telecommunications Co Ltd Merrill Lynch (434) (151,000) Far EasTone
Telecommunications Co Ltd Morgan Stanley (34,712) 35,960 Feng TAY Enterprise Co Ltd Bank of America
Merrill Lynch 11,818 21,000 Feng TAY Enterprise Co Ltd Morgan Stanley (21,941) 101,000 Formosa Chemicals & Bank of America
Fibre Corp Merrill Lynch 4,397 30,000 Formosa Chemicals &
Fibre Corp Morgan Stanley (973) 516,000 Formosa Petrochemical Corp Bank of America
Merrill Lynch 57,717 91,000 Formosa Petrochemical Corp Morgan Stanley 27,220 103,000 Formosa Plastics Corp Bank of America
Merrill Lynch 6,107 57,000 Formosa Plastics Corp Morgan Stanley 355 359,000 Formosa Taffeta Co Ltd Bank of America
Merrill Lynch 18,606 88,000 Formosa Taffeta Co Ltd Morgan Stanley 5,916 43,000 Foxconn Technology Co Ltd Bank of America
Merrill Lynch 8,257 288,000 Fubon Financial Holding Co Ltd Bank of America
Merrill Lynch 22,627 4,000 Fubon Financial Holding Co Ltd Morgan Stanley 176 (6,000) Giant Manufacturing Co Ltd Bank of America
Merrill Lynch (2,260)
9,000 Gintech Energy Corp Bank of America Merrill Lynch 990
56,000 Gintech Energy Corp Morgan Stanley (9,396) 28,000 Gourmet Master Co Ltd Morgan Stanley 49,464 339,000 Hon Hai Precision Bank of America
Industry Co Ltd Merrill Lynch 64,739 216,550 Hon Hai Precision
Industry Co Ltd Morgan Stanley (269) (76,000) HTC Corp Bank of America
Merrill Lynch (49,963) (13,000) HTC Corp Morgan Stanley (4,605) (26,000) Hu Lane Associate Inc Morgan Stanley (7,084) (799,000) Inotera Memories Inc Bank of America
Merrill Lynch 4,857 (6,000) IntelliEPI Inc Bank of America
Merrill Lynch (1,246) (3,000) IntelliEPI Inc Morgan Stanley 2,892 735,000 Inventec Corp Bank of America
Merrill Lynch 32,344 308,000 Inventec Corp Morgan Stanley (13,802) (8,000) King Slide Works Co Ltd Bank of America
Merrill Lynch 1,078 (21,000) King Slide Works Co Ltd Morgan Stanley 23,914 323,000 King Yuan Electronics Co Ltd Bank of America
Merrill Lynch 18,569 871,000 King Yuan Electronics Co Ltd Morgan Stanley 65,077 (8,000) Land Mark Optoelectronics
Corp Morgan Stanley 1,734 191,000 Lite-On Technology Corp Bank of America
Merrill Lynch 16,830 245,000 Lite-On Technology Corp Morgan Stanley 13,795 28,000 MediaTek Inc Bank of America
Merrill Lynch 9,052 63,000 MediaTek Inc Morgan Stanley 29,006 195,000 Micro-Star International Co Ltd Bank of America
Merrill Lynch 8,297 101,000 Micro-Star International Co Ltd Morgan Stanley 33,656 79,000 Novatek Microelectronics Corp Bank of America
Merrill Lynch (59,610) 172,000 Novatek Microelectronics Corp Morgan Stanley (112,676) 27,000 PChome Online Inc Bank of America
Merrill Lynch 20,274 15,000 PChome Online Inc Morgan Stanley 6,956 23,000 Phison Electronics Corp Bank of America
Merrill Lynch 16,520 48,000 Phison Electronics Corp Morgan Stanley 17,283 88,000 Powertech Technology Inc Bank of America
Merrill Lynch 18,106 217,000 Powertech Technology Inc Morgan Stanley 25,327 5,000 President Chain Store Corp Bank of America
Merrill Lynch 1,292 15,000 President Chain Store Corp Morgan Stanley 4,263 300,000 Quanta Computer Inc Bank of America
Merrill Lynch 52,299 134,000 Quanta Computer Inc Morgan Stanley 17,839 61,000 Realtek Semiconductor Corp Bank of America
Merrill Lynch (4,009) 60,000 Realtek Semiconductor Corp Morgan Stanley (1,902) 43,000 Sercomm Corp Bank of America
Merrill Lynch 6,733 5,000 Sercomm Corp Morgan Stanley 558 55,000 Sinbon Electronics Co Ltd Morgan Stanley 12,051 134,000 Sinbon Electronics Co Ltd Bank of America
Merrill Lynch (2,348) 3,000 St Shine Optical Co Ltd Bank of America
Merrill Lynch 2,490 20,000 St Shine Optical Co Ltd Morgan Stanley 54,021 (9,000) Swancor Ind Co Ltd Bank of America
Merrill Lynch (5,851) 282,000 Taiwan Semiconductor Bank of America
Manufacturing Co Ltd Merrill Lynch 105,925
BlackRock Asia Extension Fund continued
Taiwan continued South Korea continued

Annual Report and Audited Accounts 119
The notes on pages 489 to 503 form an integral part of these financial statements.
Holding
Description Counterparty
Unrealised appreciation/
(depreciation) USD
Holding
Description Counterparty
Unrealised appreciation/
(depreciation) USD
Contracts for difference as at 31 May 2016
BlackRock Asia Extension Fund continued
395,000 Taiwan Semiconductor Manufacturing Co Ltd Morgan Stanley 151,317
142,000 Tong Yang Industry Co Ltd Morgan Stanley 10,626 1,718,711 Yuanta Financial Holding Co Ltd Bank of America
Merrill Lynch 43,090
1,032,689
Thailand 15,200 Airports of Thailand PCL Bank of America
Merrill Lynch 159 30,500 Airports of Thailand PCL Morgan Stanley 20,678 57,400 Bangchak Petroleum PCL/The Bank of America
Merrill Lynch 13,766 85,300 Bangchak Petroleum PCL/The Morgan Stanley (677) 186,600 Bangkok Dusit Medical
Services PCL Morgan Stanley (983) 656,800 Bangkok Dusit Medical Bank of America
Services PCL Merrill Lynch 7,349 (42,800) Central Pattana PCL Morgan Stanley (3,401) 358,200 Charoen Pokphand Foods PCL Bank of America
Merrill Lynch 3,142 20,500 Charoen Pokphand Foods PCL Morgan Stanley 1,870 5,961,200 IRPC PCL Bank of America
Merrill Lynch (102,955) 819,000 Pruksa Real Estate PCL Bank of America
Merrill Lynch 100,290 43,700 PTT Exploration &
Production PCL Morgan Stanley 3,565 26,300 PTT Global Chemical PCL Bank of America
Merrill Lynch (794) 108,200 PTT Global Chemical PCL Morgan Stanley (1,859) 16,750 Siam Cement PCL/The Morgan Stanley 26,111 302,100 Thai Oil PCL Bank of America
Merrill Lynch (68,506) 274,600 Thai Oil PCL Morgan Stanley (19,018) 166,500 Thai Union Group PCL Bank of America
Merrill Lynch (872)
184,500 Tipco Asphalt PCL Bank of America Merrill Lynch (2,630)
46,400 Tipco Asphalt PCL Morgan Stanley (854) (2,570,893) True Corp PCL Morgan Stanley (89,626)
(115,245)
United States 10,002 Alibaba Group Holding Ltd ADR Bank of America
Merrill Lynch 13,291 8,598 Alibaba Group Holding Ltd ADR Morgan Stanley 115,551 1,053 HDFC Bank Ltd ADR Morgan Stanley 946 239 HDFC Bank Ltd ADR Bank of America
Merrill Lynch (7) 4,325 ICICI Bank Ltd ADR Morgan Stanley 5,968 55,662 Infosys Ltd ADR Bank of America
Merrill Lynch 31,171 31,589 Infosys Ltd ADR Morgan Stanley 12,775 (4,668) MakeMyTrip Ltd Bank of America
Merrill Lynch 12,837 18,825 Melco Crown
Entertainment Ltd ADR Morgan Stanley (6,723) 1,013 Momo Inc ADR Bank of America
Merrill Lynch 608 299 NetEase Inc ADR Bank of America
Merrill Lynch 2,469 525 NetEase Inc ADR Morgan Stanley 9,430 16,084 Tata Motors Ltd ADR Bank of America
Merrill Lynch 73,826 932 Vipshop Holdings Ltd ADR Bank of America
Merrill Lynch (1,053) 2,419 WNS Holdings Ltd ADR Bank of America
Merrill Lynch 121
271,210
Total (Gross underlying exposure - USD 143,906,861 ) 5,211,307
Taiwan continued Thailand continued

Open forward foreign exchange transactions as at 31 May 2016
Currency Purchases Currency Sales CounterpartyMaturity
date
Unrealised appreciation/
(depreciation) USD
Futures contracts as at 31 May 2016
Number of contracts
Currencyof contract Contract/Description
Expiration date
Gross underlying
exposureUSD
Unrealised appreciation/
(depreciation) USD
120 BlackRock Strategic Funds (BSF)
The notes on pages 489 to 503 form an integral part of these financial statements.
Sector Breakdown as at 31 May 2016
% of Net Assets
Financial 71.34Government 17.65Consumer, Non-cyclical 3.85
Securities portfolio at market value 92.84Other Net Assets 7.16
100.00
BlackRock Asia Extension Fund continued
544 USD SGX CNX NIFTY Index June 2016 8,909,088 360,115
Total 8,909,088 360,115
INR 569,397,104 USD 8,410,050 Bank of America Merrill Lynch 30/6/2016 30,201
30,201
GBP Hedged Share Class
GBP 3,643 USD 5,259 State Street Bank & Trust Company 15/6/2016 76 USD 167 GBP 115 State Street Bank & Trust Company 15/6/2016 (2)
74
Total (Gross underlying exposure - USD 8,445,753) 30,275

Annual Report and Audited Accounts 121
The notes on pages 489 to 503 form an integral part of these financial statements.
Portfolio of Investments as at 31 May 2016
COMMON / PREFERRED STOCKS (SHARES)
Austria 90,770 Erste Group Bank AG 2,469,753 2.98
2,469,753 2.98
Bermuda 1,844,000 Brilliance China Automotive
Holdings Ltd 1,785,313 2.15 321,733 VimpelCom Ltd ADR 1,200,064 1.45
2,985,377 3.60
Brazil 88,318 Cia Brasileira de Distribuicao
ADR (Pref) 995,344 1.20 181,170 Itau Unibanco Holding SA ADR (Pref) 1,494,652 1.80 486,576 Kroton Educacional SA 1,491,665 1.80
3,981,661 4.80
British Virgin Islands 34,225 Luxoft Holding Inc 2,189,031 2.64 146,725 Mail.ru Group Ltd GDR RegS 2,883,146 3.48
5,072,177 6.12
Cayman Islands 1,482,500 3SBio Inc '144A' 1,469,674 1.77 7,011 Baidu Inc ADR 1,283,574 1.55 52,418 JD.com Inc ADR 1,296,297 1.57 74,764 Melco Crown Entertainment Ltd ADR 1,102,769 1.33
5,152,314 6.22
China 6,201,000 Bank of China Ltd 'H' 2,522,809 3.05 150,378 China Life Insurance Co Ltd ADR 1,675,211 2.02 492,000 China Oilfield Services Ltd 'H' 372,458 0.45 1,988,000 China Petroleum & Chemical Corp 'H' 1,351,406 1.63 12,877 China Petroleum & Chemical Corp ADR 880,787 1.06
6,802,671 8.21
Greece 676,465 Alpha Bank AE 1,873,833 2.26 4,505,281 National Bank of Greece SA 1,489,524 1.80 261,613 OPAP SA 2,162,344 2.61
5,525,701 6.67
Hong Kong 564,000 China Merchants Holdings
International Co Ltd 1,615,640 1.95 38,194 China Mobile Ltd ADR 2,141,920 2.58
3,757,560 4.53
India 175,494 Indiabulls Housing Finance Ltd 1,874,396 2.26 334,045 ITC Ltd 1,747,549 2.11 1,378,035 NTPC Ltd 2,910,289 3.51 286,393 Sun TV Network Ltd 1,600,413 1.93
8,132,647 9.81
Poland 241,782 Powszechny Zaklad Ubezpieczen SA 1,948,280 2.35
1,948,280 2.35
Russia 120,838 MMC Norilsk Nickel PJSC ADR 1,715,899 2.07
1,715,899 2.07
Singapore 190,800 BOC Aviation Ltd '144A' 1,031,723 1.25
1,031,723 1.25
South Africa 129,533 Bidvest Group Ltd/The 1,007,806 1.22
1,007,806 1.22
South Korea 5,131 Lotte Shopping Co Ltd 983,750 1.19 1,712 NAVER Corp 1,034,267 1.25 9,200 POSCO 1,605,639 1.94 10,838 POSCO ADR 474,921 0.57
4,098,577 4.95
Thailand 227,600 PTT PCL NVDR 1,917,637 2.31
1,917,637 2.31
Turkey 116,550 Coca-Cola Icecek AS 1,447,821 1.75 74,323 Tupras Turkiye Petrol Rafinerileri AS 1,675,909 2.02 795,103 Turkiye Halk Bankasi AS 2,413,903 2.91
5,537,633 6.68
Total Common / Preferred Stocks (Shares) 61,137,416 73.77
COMMERCIAL PAPER
United States USD 3,748,000 Atlantic Asset Securitization LLC
25/7/2016 (Zero Coupon) 3,744,772 4.52 USD 3,790,000 Fairway Finance Co LLC 12/7/2016
(Zero Coupon) 3,788,058 4.57 USD 3,827,000 Gotham Funding Corp 5/7/2016
(Zero Coupon) 3,825,193 4.61
11,358,023 13.70
Total Commercial Paper 11,358,023 13.70
Total Transferable Securities and Money Market Instruments Admitted to an Official Stock Exchange Listing or Dealt in on Another Regulated Market 72,495,439 87.47
Collective Investment Schemes
Ireland 5,003,401 Institutional Cash Series Plc -
Institutional US Dollar Liquidity Fund 1 5,003,401 6.04
5,003,401 6.04
Total Collective Investment Schemes 5,003,401 6.04
Securities portfolio at market value 77,498,840 93.51
Other Net Assets 5,379,402 6.49
Total Net Assets (USD) 82,878,242 100.00
BlackRock Emerging Markets Absolute Return Fund
Transferable Securities and Money Market Instruments Admitted to an Official Stock Exchange Listing or Dealt in on Another Regulated Market
Transferable Securities and Money Market Instruments Admitted to an Official Stock Exchange Listing or Dealt in on Another Regulated Market
Holding
Description
Market Value
USD
% of Net
Assets
Holding
Description
Market Value
USD
% of Net
Assets
1 Investment in connected party fund, see further information in Note 10.

122 BlackRock Strategic Funds (BSF)
The notes on pages 489 to 503 form an integral part of these financial statements.
Holding
Description Counterparty
Unrealised appreciation/
(depreciation) USD
Holding
Description Counterparty
Unrealised appreciation/
(depreciation) USD
Contracts for difference as at 31 May 2016
BlackRock Emerging Markets Absolute Return Fund continued
Brazil (212,937) BM&FBovespa SA - Bolsa
de Valores Mercadorias e Futuros HSBC 36,680
(197,918) Raia Drogasil SA HSBC (78,378)
(41,698)
Hong Kong (447,400) AIA Group Ltd Credit Suisse (46,794) (543,000) Sunny Optical Technology
Group Co Ltd Deutsche Bank (205,361)
(252,155)
Hungary (35,968) MOL Hungarian Oil & Gas Plc HSBC 115,199 (109,286) OTP Bank Plc Deutsche Bank 47,411
162,610
Indonesia 4,760,600 Astra International Tbk PT Deutsche Bank 82,218 (3,517,200) Telekomunikasi Indonesia
Persero Tbk PT Citibank 7,848
90,066
Malaysia (1,684,200) IHH Healthcare Bhd Deutsche Bank 110,505 (388,300) Public Bank Bhd Deutsche Bank 32,477
142,982
Mexico (148,884) El Puerto de Liverpool SAB
de CV 'C1' Credit Suisse (105,560) (168,565) Fomento Economico
Mexicano SAB de CV (Unit) HSBC (50,119)
(155,679)
Netherlands (44,022) Boskalis Westminster Credit Suisse 180,329
180,329
Philippines (500,300) Ayala Land Inc Citibank 4,007 (1,837,050) Ayala Land Inc Deutsche Bank (854) (354,300) Ayala Land Inc HSBC (8,159) (905,776) Bank of the Philippine Islands Deutsche Bank 24,950
19,944
South Africa (36,348) Capitec Bank Holdings Ltd HSBC (9,000) (246,113) Liberty Holdings Ltd HSBC 294,206 203,146 Mr Price Group Ltd Credit Suisse 26,221 (89,536) Tiger Brands Ltd Credit Suisse (30,889)
280,538
Taiwan (798,350) Hon Hai Precision
Industry Co Ltd HSBC (170,194)
(170,194)
Thailand (215,558) Airports of Thailand PCL Deutsche Bank (7,145) (6,024,495) BTS Group Holdings PCL Deutsche Bank (10,565) (292,766) BTS Group Holdings PCL
(Wts 1/11/2018) Deutsche Bank 223 (1,331,600) CP ALL PCL Deutsche Bank (10,131)
(27,618)
Turkey (406,355) Akbank TAS Credit Suisse (41,720) (1,214,383) Eregli Demir ve Celik
Fabrikalari TAS Deutsche Bank 80,937 (811,428) Turk Telekomunikasyon AS Deutsche Bank (1,403)
37,814
United Arab Emirates (1,705,930) Aldar Properties PJSC HSBC (9,256) (480,709) Arabtec Holding PJSC Bank of America
Merrill Lynch 10,475 (502,552) Arabtec Holding PJSC Credit Suisse 11,088 (285,443) Ctrip.com International
Ltd ADR Deutsche Bank 38,894 8,399 DP World Ltd HSBC (1,337) (752,582) Dubai Islamic Bank PJSC Bank of America
Merrill Lynch 100,427 (41,767) Dubai Islamic Bank PJSC Credit Suisse 6,257 (188,146) Dubai Islamic Bank PJSC Bank of America
(Right) Merrill Lynch (95,274) (10,441) Dubai Islamic Bank PJSC
(Right) Credit Suisse (5,287) (1,706,863) Emaar Malls Group PJSC Bank of America
Merrill Lynch 9,329 (56,745) Emirates Telecommunications
Group Co PJSC HSBC 20,091 (188,449) First Gulf Bank PJSC HSBC 28,235 (260,821) First Gulf Bank PJSC Morgan Stanley (14,190)
99,452
United Kingdom (46,297) Coca-Cola HBC AG Credit Suisse 23,016 (244,859) Rosneft OAO GDR RegS Deutsche Bank 20,568
43,584
United States (10,091) Credicorp Ltd HSBC (49,648) (25,713) Ctrip.com International
Ltd ADR HSBC (72,253) (67,275) Taiwan Semiconductor
Manufacturing Co Ltd ADR HSBC (91,494) (10,857) Telekomunikasi Indonesia
Persero Tbk PT ADR Deutsche Bank 13,571
(199,824)
Total (Gross underlying exposure - USD 63,781,399 ) 210,151

Futures contracts as at 31 May 2016
Number of contracts
Currencyof contract Contract/Description
Expiration date
Gross underlying
exposureUSD
Unrealised appreciation/
(depreciation) USD
Annual Report and Audited Accounts 123
The notes on pages 489 to 503 form an integral part of these financial statements.
Sector Breakdown as at 31 May 2016
% of Net Assets
Financial 36.38Communications 13.81Consumer, Non-cyclical 9.85Energy 7.47Consumer, Cyclical 7.28Collective Investment Schemes 6.04Basic Materials 4.58Utilities 3.51Technology 2.64Diversified 1.95
Securities portfolio at market value 93.51Other Net Assets 6.49
100.00
BlackRock Emerging Markets Absolute Return Fund continued
(183) INR Bajaj Auto Ltd June 2016 1,435,442 (96,595) (273) INR Bharti Airtel Ltd June 2016 1,720,649 (44,665) (112) INR Ultratech Cement Ltd June 2016 1,082,680 (25,594)
Total 4,238,771 (166,854)
ZAR 38,543,000 USD 2,493,186 HSBC 10/8/2016 (79,486)ZAR 13,354,900 USD 831,628 Deutsche Bank 10/8/2016 4,704
(74,782)
EUR Hedged Share Class
EUR 66,280,189 USD 75,386,113 State Street Bank & Trust Company 15/6/2016 (1,322,992)USD 563,131 EUR 495,800 State Street Bank & Trust Company 15/6/2016 9,112
(1,313,880)
GBP Hedged Share Class
GBP 403,010 USD 581,465 State Street Bank & Trust Company 15/6/2016 8,746
8,746
Total (Gross underlying exposure - USD 78,457,382) (1,379,916)
Open forward foreign exchange transactions as at 31 May 2016
Currency Purchases Currency Sales CounterpartyMaturity
date
Unrealised appreciation/
(depreciation) USD

124 BlackRock Strategic Funds (BSF)
The notes on pages 489 to 503 form an integral part of these financial statements.
Transferable Securities and Money Market Instruments Admitted to an Official Stock Exchange Listing or Dealt in on Another Regulated Market
Transferable Securities and Money Market Instruments Admitted to an Official Stock Exchange Listing or Dealt in on Another Regulated Market
Holding
Description
Market Value
USD
% of Net
Assets
Holding
Description
Market Value
USD
% of Net
Assets
Portfolio of Investments as at 31 May 2016
BONDS
Argentina USD 60,000 Argentine Republic Government
International Bond 8.75% 2/6/2017 63,092 0.13 USD 294,428 Argentine Republic Government
International Bond 8.28% 31/12/2033 320,191 0.64
USD 102,349 Argentine Republic Government International Bond 8.28% 31/12/2033 109,730 0.22
USD 335,000 Argentine Republic Government International Bond 2.50% 31/12/2038 211,888 0.42
704,901 1.41
Brazil USD 150,000 Brazilian Government International
Bond 5.875% 15/1/2019 162,750 0.33 USD 100,000 Brazilian Government International
Bond 8.875% 15/4/2024 122,250 0.24 USD 200,000 Brazilian Government International
Bond 4.25% 7/1/2025 185,000 0.37 USD 100,000 Brazilian Government International
Bond 8.75% 4/2/2025 122,000 0.24 USD 100,000 Brazilian Government International
Bond 8.25% 20/1/2034 113,000 0.23 USD 100,000 Brazilian Government International
Bond 7.125% 20/1/2037 103,000 0.21 USD 200,000 Brazilian Government International
Bond 5.00% 27/1/2045 160,000 0.32
968,000 1.94
British Virgin Islands USD 100,000 Sinochem Overseas Capital Co Ltd
RegS 4.50% 12/11/2020 105,797 0.21 USD 200,000 Sinopec Group Overseas
Development 2013 Ltd RegS 4.375% 17/10/2023 213,228 0.43
USD 200,000 Sinopec Group Overseas Development 2015 Ltd RegS 2.50% 28/4/2020 200,189 0.40
USD 200,000 State Grid Overseas Investment 2013 Ltd RegS 3.125% 22/5/2023 204,869 0.41
724,083 1.45
Chile CLP 298,920,075 Bonos del Banco Central de Chile en
UF 3.00% 1/3/2022 481,285 0.96 USD 150,000 Chile Government International Bond
2.25% 30/10/2022 148,500 0.30 USD 200,000 Corp Nacional del Cobre de Chile
RegS 4.25% 17/7/2042 171,882 0.34
801,667 1.60
China USD 200,000 Export-Import Bank of China/The
RegS 3.625% 31/7/2024 211,193 0.42
211,193 0.42
Colombia USD 100,000 Colombia Government International
Bond 7.375% 18/3/2019 113,400 0.23 COP 4,100,000,000 Colombia Government International
Bond 7.75% 14/4/2021 1,326,590 2.65 USD 300,000 Colombia Government International
Bond 4.375% 12/7/2021 313,050 0.63
USD 375,000 Colombia Government International Bond 2.625% 15/3/2023 347,437 0.70
USD 200,000 Colombia Government International Bond 7.375% 18/9/2037 239,750 0.48
USD 200,000 Colombia Government International Bond 6.125% 18/1/2041 211,500 0.42
USD 200,000 Colombia Government International Bond 5.625% 26/2/2044 199,500 0.40
USD 200,000 Colombia Government International Bond 5.00% 15/6/2045 187,000 0.37
2,938,227 5.88
Indonesia USD 100,000 Indonesia Government International
Bond RegS 11.625% 4/3/2019 124,734 0.25 USD 200,000 Indonesia Government International
Bond RegS 3.75% 25/4/2022 203,332 0.41 USD 400,000 Indonesia Government International
Bond RegS 5.875% 15/1/2024 451,251 0.90 USD 150,000 Indonesia Government International
Bond RegS 7.75% 17/1/2038 195,791 0.39 USD 200,000 Indonesia Government International
Bond RegS 6.75% 15/1/2044 244,742 0.49
1,219,850 2.44
Kazakhstan USD 200,000 Kazakhstan Government
International Bond RegS 5.125% 21/7/2025 210,872 0.42
210,872 0.42
Lithuania USD 200,000 Lithuania Government International
Bond RegS 5.125% 14/9/2017 210,188 0.42 USD 500,000 Lithuania Government International
Bond RegS 7.375% 11/2/2020 590,905 1.18 USD 300,000 Lithuania Government International
Bond RegS 6.125% 9/3/2021 348,219 0.70 USD 400,000 Lithuania Government International
Bond RegS 6.625% 1/2/2022 482,740 0.97
1,632,052 3.27
Malaysia USD 100,000 Petroliam Nasional Bhd RegS
7.625% 15/10/2026 136,203 0.27 USD 100,000 Petronas Capital Ltd RegS 5.25%
12/8/2019 109,813 0.22 USD 200,000 Petronas Capital Ltd RegS 3.50%
18/3/2025 206,138 0.42
452,154 0.91
Mexico MXN 4,879,930 Mexican Udibonos 4.50% 4/12/2025 294,892 0.59 USD 50,000 Mexico Government International
Bond 5.95% 19/3/2019 55,737 0.11 USD 100,000 Mexico Government International
Bond 5.125% 15/1/2020 110,000 0.22 USD 300,000 Mexico Government International
Bond 3.50% 21/1/2021 313,200 0.63 USD 76,000 Mexico Government International
Bond 3.625% 15/3/2022 78,774 0.16 USD 400,000 Mexico Government International
Bond 4.00% 2/10/2023 419,000 0.84 USD 200,000 Mexico Government International
Bond 8.30% 15/8/2031 309,000 0.62 USD 200,000 Mexico Government International
Bond 6.05% 11/1/2040 236,250 0.47
BlackRock Emerging Markets Allocation Fund
Colombia continued

Annual Report and Audited Accounts 125
The notes on pages 489 to 503 form an integral part of these financial statements.
Transferable Securities and Money Market Instruments Admitted to an Official Stock Exchange Listing or Dealt in on Another Regulated Market
Transferable Securities and Money Market Instruments Admitted to an Official Stock Exchange Listing or Dealt in on Another Regulated Market
Holding
Description
Market Value
USD
% of Net
Assets
Holding
Description
Market Value
USD
% of Net
Assets
BlackRock Emerging Markets Allocation Fund continued
USD 200,000 Mexico Government International Bond 4.75% 8/3/2044 199,500 0.40
USD 300,000 Mexico Government International Bond 5.55% 21/1/2045 335,625 0.67
USD 200,000 Mexico Government International Bond 4.60% 23/1/2046 195,250 0.39
USD 260,000 Mexico Government International Bond 5.75% 12/10/2110 263,250 0.53
USD 100,000 Petroleos Mexicanos 5.50% 21/1/2021 104,100 0.21
USD 50,000 Petroleos Mexicanos 6.50% 2/6/2041 47,825 0.09
2,962,403 5.93
Netherlands USD 200,000 Kazakhstan Temir Zholy Finance BV
RegS 6.375% 6/10/2020 204,224 0.41
204,224 0.41
Panama USD 400,000 Panama Government International
Bond 4.00% 22/9/2024 416,000 0.84 USD 200,000 Panama Government International
Bond 7.125% 29/1/2026 255,500 0.51 USD 100,000 Panama Government International
Bond 6.70% 26/1/2036 126,250 0.25 USD 200,000 Panama Government International
Bond 4.30% 29/4/2053 190,000 0.38
987,750 1.98
Peru USD 200,000 Peruvian Government International
Bond 7.125% 30/3/2019 229,500 0.46 USD 100,000 Peruvian Government International
Bond 8.75% 21/11/2033 149,500 0.30 USD 200,000 Peruvian Government International
Bond 6.55% 14/3/2037 253,000 0.50 USD 300,000 Peruvian Government International
Bond 5.625% 18/11/2050 343,125 0.69
975,125 1.95
Philippines USD 150,000 Philippine Government International
Bond 8.375% 17/6/2019 180,368 0.36 USD 400,000 Philippine Government International
Bond 4.20% 21/1/2024 454,789 0.91 USD 200,000 Philippine Government International
Bond 10.625% 16/3/2025 326,695 0.65 USD 150,000 Philippine Government International
Bond 9.50% 2/2/2030 254,949 0.51 USD 225,000 Philippine Government International
Bond 7.75% 14/1/2031 347,282 0.70 USD 200,000 Philippine Government International
Bond 6.375% 15/1/2032 279,528 0.56 USD 200,000 Philippine Government International
Bond 6.375% 23/10/2034 284,080 0.57 USD 200,000 Philippine Government International
Bond 5.00% 13/1/2037 252,600 0.51 USD 200,000 Philippine Government International
Bond 3.95% 20/1/2040 220,853 0.44 USD 100,000 Power Sector Assets & Liabilities
Management Corp RegS 7.39% 2/12/2024 134,709 0.27
2,735,853 5.48
Poland USD 350,000 Poland Government International
Bond 6.375% 15/7/2019 397,607 0.80 USD 375,000 Poland Government International
Bond 5.00% 23/3/2022 420,627 0.84 USD 200,000 Poland Government International
Bond 3.00% 17/3/2023 202,313 0.41 USD 150,000 Poland Government International
Bond 4.00% 22/1/2024 160,781 0.32
1,181,328 2.37
Romania USD 100,000 Romanian Government International
Bond RegS 6.75% 7/2/2022 118,250 0.24 USD 600,000 Romanian Government International
Bond RegS 4.875% 22/1/2024 654,885 1.31 USD 126,000 Romanian Government International
Bond RegS 6.125% 22/1/2044 152,885 0.30
926,020 1.85
Russia USD 200,000 Russian Foreign Bond - Eurobond
RegS 3.50% 16/1/2019 203,310 0.41 USD 100,000 Russian Foreign Bond - Eurobond
RegS 5.00% 29/4/2020 105,599 0.21 USD 200,000 Russian Foreign Bond - Eurobond
RegS 4.875% 16/9/2023 212,450 0.42 USD 153,000 Russian Foreign Bond - Eurobond
RegS 12.75% 24/6/2028 263,734 0.53 USD 127,125 Russian Foreign Bond - Eurobond
RegS (Step-up coupon) FRN 31/3/2030 155,369 0.31
940,462 1.88
South Africa ZAR 4,645,260 South Africa Government Bond - CPI
Linked 5.50% 7/12/2023 372,519 0.75 USD 100,000 South Africa Government
International Bond 6.875% 27/5/2019 110,067 0.22
USD 100,000 South Africa Government International Bond 5.875% 30/5/2022 107,714 0.22
USD 200,000 South Africa Government International Bond 4.665% 17/1/2024 199,382 0.40
USD 400,000 South Africa Government International Bond 5.875% 16/9/2025 427,250 0.85
USD 100,000 South Africa Government International Bond 6.25% 8/3/2041 107,301 0.21
1,324,233 2.65
South Korea KRW 441,223,000 Inflation Linked Korea Treasury
Bond 1.125% 10/6/2023 374,036 0.75
374,036 0.75
Turkey USD 100,000 Turkey Government International
Bond 7.50% 14/7/2017 106,108 0.21 USD 100,000 Turkey Government International
Bond 6.75% 3/4/2018 107,250 0.21 USD 400,000 Turkey Government International
Bond 7.50% 7/11/2019 452,600 0.91
Portfolio of Investments as at 31 May 2016
Mexico continued

126 BlackRock Strategic Funds (BSF)
The notes on pages 489 to 503 form an integral part of these financial statements.
Transferable Securities and Money Market Instruments Admitted to an Official Stock Exchange Listing or Dealt in on Another Regulated Market
Transferable Securities and Money Market Instruments Admitted to an Official Stock Exchange Listing or Dealt in on Another Regulated Market
Holding
Description
Market Value
USD
% of Net
Assets
Holding
Description
Market Value
USD
% of Net
Assets
Portfolio of Investments as at 31 May 2016
USD 200,000 Turkey Government International Bond 5.125% 25/3/2022 209,024 0.42
USD 300,000 Turkey Government International Bond 5.75% 22/3/2024 323,023 0.65
USD 175,000 Turkey Government International Bond 6.875% 17/3/2036 202,618 0.40
USD 400,000 Turkey Government International Bond 4.875% 16/4/2043 363,362 0.73
USD 200,000 Turkey Government International Bond 6.625% 17/2/2045 228,074 0.46
1,992,059 3.99
Ukraine USD 160,000 Ukraine Government International
Bond RegS 7.75% 1/9/2020 153,164 0.31 USD 100,000 Ukraine Government International
Bond RegS 7.75% 1/9/2024 92,718 0.18
245,882 0.49
United Kingdom USD 200,000 HSBC Holdings Plc 6.50% 15/9/2037 238,657 0.48 USD 125,000 HSBC Holdings Plc 6.10% 14/1/2042 161,380 0.32
400,037 0.80
United States USD 50,000 3M Co 3.875% 15/6/2044 53,109 0.11 USD 75,000 Abbott Laboratories 5.30%
27/5/2040 86,590 0.17 USD 75,000 Amazon.com Inc 4.95% 5/12/2044 87,760 0.18 USD 100,000 Bristol-Myers Squibb Co 4.50%
1/3/2044 116,297 0.23 USD 75,000 Eli Lilly & Co 3.70% 1/3/2045 75,315 0.15 USD 125,000 Exxon Mobil Corp 4.114% 1/3/2046 132,482 0.26 USD 500,000 Federal Home Loan Bank Discount
Notes 21/6/2016 (Zero Coupon) 499,912 1.00 USD 1,801,000 Federal Home Loan Bank Discount
Notes 22/6/2016 (Zero Coupon) 1,800,670 3.60 USD 300,000 Federal Home Loan Bank Discount
Notes 22/7/2016 (Zero Coupon) 299,853 0.60 USD 600,000 Freddie Mac Discount Notes
2/6/2016 (Zero Coupon) 599,990 1.20 USD 250,000 Freddie Mac Discount Notes
10/6/2016 (Zero Coupon) 249,979 0.50 USD 125,000 General Electric Co 6.75% 15/3/2032 172,972 0.35 USD 200,000 General Electric Co 6.875% 10/1/2039 292,883 0.59 USD 50,000 General Electric Co 4.125% 9/10/2042 53,014 0.11 USD 100,000 General Electric Co 4.50% 11/3/2044 111,592 0.22 USD 100,000 Goldman Sachs Group Inc/The
6.125% 15/2/2033 123,284 0.25 USD 150,000 Goldman Sachs Group Inc/The 4.80%
8/7/2044 160,551 0.32 USD 75,000 Intel Corp 4.80% 1/10/2041 83,327 0.17 USD 100,000 Intel Corp 4.25% 15/12/2042 102,222 0.20 USD 50,000 Intel Corp 4.90% 29/7/2045 55,980 0.11 USD 50,000 International Business Machines
Corp 5.60% 30/11/2039 61,860 0.12 USD 75,000 International Business Machines
Corp 4.00% 20/6/2042 77,091 0.15 USD 150,000 Johnson & Johnson 4.375% 5/12/2033 172,494 0.35 USD 100,000 Johnson & Johnson 3.70% 1/3/2046 105,818 0.21 USD 100,000 Merck & Co Inc 6.50% 1/12/2033 135,677 0.27 USD 75,000 Merck & Co Inc 3.70% 10/2/2045 74,971 0.15 USD 125,000 Microsoft Corp 5.30% 8/2/2041 154,188 0.31 USD 200,000 Microsoft Corp 3.75% 12/2/2045 200,234 0.40
USD 125,000 Microsoft Corp 4.45% 3/11/2045 139,443 0.28 USD 50,000 NIKE Inc 3.875% 1/11/2045 52,450 0.10 USD 100,000 Oracle Corp 4.30% 8/7/2034 106,394 0.21 USD 100,000 Oracle Corp 3.90% 15/5/2035 101,508 0.20 USD 125,000 Oracle Corp 5.375% 15/7/2040 150,005 0.30 USD 100,000 Oracle Corp 4.125% 15/5/2045 103,053 0.21 USD 100,000 PepsiCo Inc 4.00% 5/3/2042 101,260 0.20 USD 50,000 PepsiCo Inc 4.25% 22/10/2044 53,062 0.11 USD 50,000 PepsiCo Inc 4.45% 14/4/2046 55,046 0.11 USD 50,000 Pfizer Inc 7.20% 15/3/2039 73,882 0.15 USD 125,000 Pfizer Inc 4.40% 15/5/2044 139,133 0.28 USD 125,000 Procter & Gamble Co/The 5.55%
5/3/2037 167,481 0.34 USD 75,000 QUALCOMM Inc 4.80% 20/5/2045 75,812 0.15 USD 300,000 United States Treasury Bill 2/6/2016
(Zero Coupon) 299,998 0.60 USD 200,000 United States Treasury Bill 23/6/2016
(Zero Coupon) 199,973 0.40 USD 175,000 Visa Inc 4.30% 14/12/2045 193,671 0.39 USD 150,000 Wal-Mart Stores Inc 5.25%
1/9/2035 189,481 0.38 USD 150,000 Wal-Mart Stores Inc 6.50%
15/8/2037 210,754 0.42 USD 200,000 Wal-Mart Stores Inc 5.625%
15/4/2041 257,921 0.52 USD 75,000 Wal-Mart Stores Inc 4.30%
22/4/2044 82,705 0.17
8,893,147 17.80
Uruguay USD 100,000 Uruguay Government International
Bond 4.50% 14/8/2024 106,000 0.21 USD 150,000 Uruguay Government International
Bond 4.125% 20/11/2045 127,875 0.26
233,875 0.47
Venezuela USD 135,000 Venezuela Government International
Bond 9.25% 15/9/2027 57,375 0.11 USD 40,000 Venezuela Government International
Bond RegS 7.00% 1/12/2018 18,250 0.04 USD 155,000 Venezuela Government International
Bond RegS 7.75% 13/10/2019 62,969 0.13 USD 200,000 Venezuela Government International
Bond RegS 12.75% 23/8/2022 90,000 0.18 USD 25,000 Venezuela Government International
Bond RegS 9.00% 7/5/2023 9,531 0.02 USD 210,000 Venezuela Government International
Bond RegS 8.25% 13/10/2024 78,225 0.16 USD 55,000 Venezuela Government International
Bond RegS 7.65% 21/4/2025 19,925 0.04 USD 165,000 Venezuela Government International
Bond RegS 11.75% 21/10/2026 69,506 0.14 USD 40,000 Venezuela Government International
Bond RegS 9.25% 7/5/2028 15,200 0.03 USD 300,000 Venezuela Government International
Bond RegS 11.95% 5/8/2031 125,625 0.25 USD 150,000 Venezuela Government International
Bond RegS 7.00% 31/3/2038 52,688 0.10
599,294 1.20
Total Bonds 34,838,727 69.74
BlackRock Emerging Markets Allocation Fund continued
United States continued Turkey continued

Annual Report and Audited Accounts 127
The notes on pages 489 to 503 form an integral part of these financial statements.
Transferable Securities and Money Market Instruments Admitted to an Official Stock Exchange Listing or Dealt in on Another Regulated Market
Transferable Securities and Money Market Instruments Admitted to an Official Stock Exchange Listing or Dealt in on Another Regulated Market
Holding
Description
Market Value
USD
% of Net
Assets
Holding
Description
Market Value
USD
% of Net
Assets
BlackRock Emerging Markets Allocation Fund continued
CERTIFICATES OF DEPOSIT
United States USD 600,000 Mitsubishi UFJ Trust & Banking Corp
20/6/2016 (Zero Coupon) 600,000 1.20 USD 500,000 Mizuho Bank Ltd 0.01% 7/7/2016 500,000 1.00 USD 850,000 Norinchukin Bank 19/9/2016
(Zero Coupon) 850,000 1.71 USD 350,000 State Street Bank and Trust Company
0.01% 23/9/2016 350,000 0.70 USD 550,000 Sumitomo Mitsui Trust Bank Ltd
21/6/2016 (Zero Coupon) 550,000 1.10
2,850,000 5.71
Total Certificates of Deposit 2,850,000 5.71
COMMERCIAL PAPER
United States USD 800,000 Bank Nederlandse Gemeenten '144A'
2/6/2016 (Zero Coupon) 799,931 1.60 USD 325,000 Barton Capital Corp 14/7/2016
(Zero Coupon) 324,756 0.65 USD 600,000 Caisse Centrale Desjardins du
Quebec 23/6/2016 (Zero Coupon) 599,822 1.20 USD 700,000 Coca-Cola Co/The 8/6/2016
(Zero Coupon) 699,947 1.40 USD 350,000 ING US Funding LLC 5/7/2016
(Zero Coupon) 349,772 0.70 USD 700,000 ING US Funding LLC 2/9/2016
(Zero Coupon) 698,716 1.40 USD 800,000 Naxitis 6/6/2016 (Zero Coupon) 799,958 1.60
USD 800,000 Nieuw Amsterdam Receivables Corp 1/8/2016 (Zero Coupon) 799,214 1.60
USD 375,000 Novartis Secs INVT Ltd 2/6/2016 (Zero Coupon) 374,996 0.75
USD 600,000 NRW.Bank 13/6/2016 (Zero Coupon) 599,907 1.20 USD 250,000 Rabobank Nederland (New York
Branch) 21/6/2016 (Zero Coupon) 249,903 0.50 USD 300,000 Rabobank Nederland NV 20/7/2016
(Zero Coupon) 299,673 0.60 USD 800,000 Regency Markets No.1 LLC 20/6/2016
(Zero Coupon) 799,697 1.60 USD 700,000 Sumitomo Mitsui Banking Corp
1/9/2016 (Zero Coupon) 698,748 1.40 USD 650,000 Swedbank AB 19/8/2016 (Zero Coupon) 649,101 1.30 USD 500,000 Toyota Credit Canada Inc 25/7/2016
(Zero Coupon) 499,512 1.00 USD 400,000 Victory Receivables Corp 6/7/2016
(Zero Coupon) 399,801 0.80
9,643,454 19.30
Total Commercial Paper 9,643,454 19.30
Total Transferable Securities and Money Market Instruments Admitted to an Official Stock Exchange Listing or Dealt in on Another Regulated Market 47,332,181 94.75
Securities portfolio at market value 47,332,181 94.75
Other Net Assets 2,624,404 5.25
Total Net Assets (USD) 49,956,585 100.00
Portfolio of Investments as at 31 May 2016
United States continued

Contracts for difference as at 31 May 2016
Holding
Description Counterparty
Unrealised appreciation/
(depreciation) USD
Holding
Description Counterparty
Unrealised appreciation/
(depreciation) USD
128 BlackRock Strategic Funds (BSF)
The notes on pages 489 to 503 form an integral part of these financial statements.
BlackRock Emerging Markets Allocation Fund continued
Brazil 30,100 AES Tiete Energia SA (Unit) Bank of America
Merrill Lynch (4,700) 18,300 Ambev SA Bank of America
Merrill Lynch (907) 46,870 Banco Bradesco SA (Pref) Bank of America
Merrill Lynch (30,415) 32,300 Banco do Brasil SA Bank of America
Merrill Lynch (25,244) 7,700 Banco do Estado do Rio Bank of America
Grande do Sul SA 'B' (Pref) Merrill Lynch (1,539) (7,600) BB Seguridade Participacoes SA Bank of America
Merrill Lynch 368 38,000 Bolsa de Valores Mercadorias Bank of America
e Futuros Merrill Lynch (18,751) 4,900 Braskem SA 'A' (Pref) Bank of America
Merrill Lynch 448 10,300 BRF SA Bank of America
Merrill Lynch (8,275) (32,200) Centrais Eletricas Bank of America
Brasileiras SA 'B' (Pref) Merrill Lynch 1,963 27,000 CETIP SA - Mercados Bank of America
Organizados Merrill Lynch (4,819) 5,200 Cia Brasileira de Bank of America
Distribuicao (Pref) Merrill Lynch (4,214) 12,900 Cia de Saneamento Basico Bank of America
do Estado de Sao Paulo Merrill Lynch (4,259) 14,300 Cia Energetica de Minas Bank of America
Gerais (Pref) Merrill Lynch (3,297) 66,500 Cia Energetica de Bank of America
Sao Paulo 'B' (Pref) Merrill Lynch (22,404) (52,388) Cielo SA Bank of America
Merrill Lynch 58,762 (71,481) EcoRodovias Infraestrutura Bank of America
e Logistica SA Merrill Lynch 10,797 3,300 Embraer SA Bank of America
Merrill Lynch (472) 8,000 Equatorial Energia SA Bank of America
Merrill Lynch (437) 26,400 Fibria Celulose SA Bank of America
Merrill Lynch 15,924 7,200 Gerdau SA (Pref) Bank of America
Merrill Lynch (1,359) 700 Grupo BTG Pactual (Unit) Bank of America
Merrill Lynch 19 18,300 Hypermarcas SA Bank of America
Merrill Lynch (17,409) 33,417 Itau Unibanco Holding SA (Pref) Bank of America
Merrill Lynch (16,713) 145,310 Itausa - Investimentos Bank of America
Itau SA (Pref) Merrill Lynch (21,793) 61,300 JBS SA Bank of America
Merrill Lynch (40,768) (55,000) Klabin SA (Unit) Bank of America
Merrill Lynch (5,126) 700 Lojas Renner SA Bank of America
Merrill Lynch (453) (30,600) Marcopolo SA (Pref) Bank of America
Merrill Lynch 292 54,200 Marfrig Global Foods SA Bank of America
Merrill Lynch (6,888) 31,100 Minerva SA/Brazil Bank of America
Merrill Lynch (7,613) 15,400 MRV Engenharia e Bank of America
Participacoes SA Merrill Lynch (10,946) 12,100 Multiplus SA Bank of America
Merrill Lynch (5,994) 4,900 Odontoprev SA Bank of America
Merrill Lynch (512) 28,600 Petroleo Brasileiro SA (Pref) Bank of America
Merrill Lynch (12,625)
(5,300) Qualicorp SA Bank of America Merrill Lynch (101)
2,000 Raia Drogasil SA Bank of America Merrill Lynch (1,477)
10,000 Smiles SA Bank of America Merrill Lynch (6,930)
2,800 Sul America SA (Unit) Bank of America Merrill Lynch (544)
56,500 Suzano Papel e Bank of America Celulose SA 'A' (Pref) Merrill Lynch 2,096
3,200 Telefonica Brasil SA (Pref) Bank of America Merrill Lynch (997)
6,500 Tim Participacoes SA Bank of America Merrill Lynch (688)
10,700 Tractebel Energia SA Bank of America Merrill Lynch (4,810)
19,600 Transmissora Alianca de Bank of America Energia Eletrica SA (Unit) Merrill Lynch (6,306)
12,700 Ultrapar Participacoes SA Bank of America Merrill Lynch (12,989)
(1,743) Valid Solucoes e Servicos de Seguranca em Meios de Bank of America Pagamento e Identificacao SA Merrill Lynch 1,343
(44,200) WEG SA Bank of America Merrill Lynch 8,632
(212,130)
Chile 64,481 Aguas Andinas SA 'A' Bank of America
Merrill Lynch (896) 556,170 Banco Santander Chile Bank of America
Merrill Lynch (347) 195,944 Enersis Americas SA Bank of America
Merrill Lynch (2,524) 79,854 Enersis Chile SA Bank of America
Merrill Lynch (165)
(3,932)
Czech Republic (7,197) CEZ AS Bank of America
Merrill Lynch 2,607 823 O2 Czech Republic AS Bank of America
Merrill Lynch (47)
2,560
Egypt 12,933 Global Telecom Holding SAE Bank of America
Merrill Lynch 422 7,049 Talaat Moustafa Group Bank of America
Merrill Lynch (111)
311
France 12 Alstom SA Deutsche Bank 12 11 LafargeHolcim Ltd Reg Deutsche Bank (353)
(341)
Greece 553 Alpha Bank AE Bank of America
Merrill Lynch 167 557 Eurobank Ergasias SA Bank of America
Merrill Lynch (28) 211 FF Group Bank of America
Merrill Lynch 216 1,767 Hellenic Telecommunications Bank of America
Organization SA Merrill Lynch (17)
Brazil continued

Contracts for difference as at 31 May 2016
Holding
Description Counterparty
Unrealised appreciation/
(depreciation) USD
Holding
Description Counterparty
Unrealised appreciation/
(depreciation) USD
Annual Report and Audited Accounts 129
The notes on pages 489 to 503 form an integral part of these financial statements.
592 JUMBO SA Bank of America Merrill Lynch 40
757 National Bank of Greece SA Bank of America Merrill Lynch 2
1,630 OPAP SA Bank of America Merrill Lynch 1,043
132 Piraeus Bank SA Bank of America Merrill Lynch (1)
301 Titan Cement Co SA Bank of America Merrill Lynch 188
1,610
Hong Kong 143,000 3SBio Inc '144A' Bank of America
Merrill Lynch (17,747) (17,500) AAC Technologies Holdings Inc Bank of America
Merrill Lynch (6,478) 12,000 Agile Property Holdings Ltd Bank of America
Merrill Lynch (404) 299,000 Agricultural Bank of Bank of America
China Ltd 'H' Merrill Lynch 4,566 238,000 Air China Ltd 'H' Bank of America
Merrill Lynch (16,500) (10,000) Alibaba Pictures Group Ltd Bank of America
Merrill Lynch (37) 131,000 Anhui Conch Cement Co Ltd 'H' Bank of America
Merrill Lynch 9,289 112,000 Anhui Expressway Co Ltd 'H' Bank of America
Merrill Lynch 679 2,000 ANTA Sports Products Ltd Bank of America
Merrill Lynch (559) (211,000) AviChina Industry & Bank of America
Technology Co Ltd 'H' Merrill Lynch (7,820) 546,000 Bank of China Ltd 'H' Bank of America
Merrill Lynch 12,545 409,000 Bank of Communications Bank of America
Co Ltd 'H' Merrill Lynch 13,582 168,000 Beijing Capital International Bank of America
Airport Co Ltd 'H' Merrill Lynch 11,161 10,000 Beijing Enterprises Holdings Ltd Bank of America
Merrill Lynch 2,384 56,000 Beijing Jingneng Clean Bank of America
Energy Co Ltd 'H' Merrill Lynch 280 116,000 Beijing North Star Co Ltd 'H' Bank of America
Merrill Lynch (462) 174,000 Belle International Holdings Ltd Bank of America
Merrill Lynch (5,424) (202,000) Brilliance China Automotive Bank of America
Holdings Ltd Merrill Lynch (9,410) 82,000 BYD Electronic Bank of America
International Co Ltd Merrill Lynch 2,302 88,000 CGN Meiya Power Bank of America
Holdings Co Ltd/Old '144A' Merrill Lynch 334 (444,000) CGN Power Co Ltd 'H' '144A' Bank of America
Merrill Lynch 4,632 (304,000) China Agri-Industries Bank of America
Holdings Ltd Merrill Lynch (3,482) 458,000 China Cinda Asset Bank of America
Management Co Ltd 'H' Merrill Lynch 5,825 100,000 China CITIC Bank Corp Ltd 'H' Bank of America
Merrill Lynch 1,521 241,000 China Communications Bank of America
Construction Co Ltd 'H' Merrill Lynch (2,605) 652,000 China Communications Bank of America
Services Corp Ltd 'H' Merrill Lynch 19,737 (28,000) China Conch Venture Bank of America
Holdings Ltd Merrill Lynch (3,145) 1,059,000 China Construction Bank Bank of America
Corp 'H' Merrill Lynch 55,612
305,000 China Everbright Bank Bank of America Co Ltd 'H' Merrill Lynch 6,613
(249,000) China Everbright Bank of America International Ltd Merrill Lynch (8,547)
28,000 China Everbright Ltd Bank of America Merrill Lynch 1,852
302,500 China Galaxy Securities Bank of America Co Ltd 'H' Merrill Lynch 21,302
(18,000) China Gas Holdings Ltd Bank of America Merrill Lynch (823)
119,500 China Harmony New Energy Bank of America Auto Holding Ltd Merrill Lynch 4,737
129,000 China High Speed Transmission Bank of America Equipment Group Co Ltd Merrill Lynch (377)
486,000 China Jinmao Holdings Bank of America Group Ltd Merrill Lynch 19,335
106,000 China Lesso Group Holdings Ltd Bank of America Merrill Lynch (573)
86,000 China Life Insurance Co Ltd 'H' Bank of America Merrill Lynch 10,320
(103,000) China Longyuan Power Bank of America Group Corp Ltd 'H' Merrill Lynch (1,425)
90,000 China Machinery Bank of America Engineering Corp 'H' Merrill Lynch (375)
(139,000) China Medical System Bank of America Holdings Ltd Merrill Lynch (13,882)
(106,000) China Mengniu Dairy Co Ltd Bank of America Merrill Lynch (5,102)
22,000 China Merchants Bank of America Bank Co Ltd 'H' Merrill Lynch 487
(164,074) China Merchants Holdings Bank of America International Co Ltd Merrill Lynch (11,427)
(46,000) China Minsheng Banking Bank of America Corp Ltd 'H' Merrill Lynch (1,641)
65,000 China Mobile Ltd Bank of America Merrill Lynch 28,153
(568,000) China National Building Bank of America Material Co Ltd 'H' Merrill Lynch (1,342)
(180,000) China Oilfield Services Ltd 'H' Bank of America Merrill Lynch 4,696
88,800 China Pacific Insurance Bank of America Group Co Ltd 'H' Merrill Lynch 11,288
222,000 China Petroleum & Bank of America Chemical Corp 'H' Merrill Lynch 5,069
384,000 China Power International Bank of America Development Ltd Merrill Lynch 4,702
186,000 China Railway Bank of America Construction Corp Ltd 'H' Merrill Lynch 8,034
456,000 China Railway Group Ltd 'H' Bank of America Merrill Lynch 3,775
778,000 China Resources Cement Bank of America Holdings Ltd Merrill Lynch 16,914
(28,000) China Resources Gas Bank of America Group Ltd Merrill Lynch 217
73,556 China Resources Land Ltd Bank of America Merrill Lynch 9,777
114,000 China Resources Power Bank of America Holdings Co Ltd Merrill Lynch (3,911)
(1,081,000) China Shanshui Cement Bank of America Group Ltd Merrill Lynch 750,487
(117,500) China Shenhua Energy Bank of America Co Ltd 'H' Merrill Lynch (7,789)
(93,000) China Shipping Container Bank of America Lines Co Ltd 'H' Merrill Lynch (111)
(124,000) China Southern Airlines Bank of America Co Ltd 'H' Merrill Lynch 4,024
37,600 China Taiping Insurance Bank of America Holdings Co Ltd Merrill Lynch 2,969
370,000 China Telecom Corp Ltd 'H' Bank of America Merrill Lynch (5,319)
BlackRock Emerging Markets Allocation Fund continued
Greece continued Hong Kong continued

Contracts for difference as at 31 May 2016
Holding
Description Counterparty
Unrealised appreciation/
(depreciation) USD
Holding
Description Counterparty
Unrealised appreciation/
(depreciation) USD
130 BlackRock Strategic Funds (BSF)
The notes on pages 489 to 503 form an integral part of these financial statements.
BlackRock Emerging Markets Allocation Fund continued
50,000 China Unicom Hong Kong Ltd Bank of America Merrill Lynch (3,435)
56,600 China Vanke Co Ltd 'H' Bank of America Merrill Lynch 4,162
(381,000) CITIC Ltd Bank of America Merrill Lynch (16,456)
132,000 CITIC Securities Co Ltd 'H' Bank of America Merrill Lynch 17,551
4,000 Cogobuy Group '144A' Bank of America Merrill Lynch 1,048
(128,002) COSCO Pacific Ltd Bank of America Merrill Lynch 1,102
(6,000) Cosmo Lady China Bank of America Holdings Co Ltd '144A' Merrill Lynch (106)
(569,000) Country Garden Bank of America Holdings Co Ltd Merrill Lynch (7,231)
(18,000) CRRC Corp Ltd 'H' Bank of America Merrill Lynch (385)
40,000 CSPC Pharmaceutical Bank of America Group Ltd Merrill Lynch 1,269
25,200 Dalian Wanda Commercial Bank of America Properties Co Ltd 'H' '144A' Merrill Lynch (6,573)
398,000 Datang International Power Bank of America Generation Co Ltd 'H' Merrill Lynch 2,512
43,000 Dongfang Electric Corp Ltd 'H' Bank of America Merrill Lynch 1,314
144,000 Dongfeng Motor Group Co Bank of America Ltd 'H' Merrill Lynch 15,316
4,000 ENN Energy Holdings Ltd Bank of America Merrill Lynch 479
(307,000) Far East Horizon Ltd Bank of America Merrill Lynch 892
(7,000) Fosun International Ltd Bank of America Merrill Lynch (626)
305,000 Geely Automobile Holdings Ltd Bank of America Merrill Lynch 16,821
5,800 GF Securities Co Ltd 'H' Bank of America Merrill Lynch 936
1,357,000 GOME Electrical Appliances Bank of America Holding Ltd Merrill Lynch 5,171
237,000 Great Wall Motor Co Ltd 'H' Bank of America Merrill Lynch 10,602
19,500 Greentown China Holdings Ltd Bank of America Merrill Lynch 748
52,000 Guangdong Investment Ltd Bank of America Merrill Lynch 1,034
(126,000) Guangshen Railway Co Ltd 'H' Bank of America Merrill Lynch (457)
6,000 Guangzhou Automobile Group Bank of America Co Ltd 'H' Merrill Lynch 300
74,000 Guangzhou Baiyunshan Pharmaceutical Holdings Bank of America Co Ltd 'H' Merrill Lynch 2,024
(7,200) Guangzhou R&F Properties Bank of America Co Ltd 'H' Merrill Lynch (552)
78,000 Haier Electronics Group Bank of America Co Ltd Merrill Lynch 3,960
(30,000) Haitian International Bank of America Holdings Ltd Merrill Lynch (3,071)
46,400 Haitong Securities Co Ltd 'H' Bank of America Merrill Lynch 4,988
(52,500) Hengan International Bank of America Group Co Ltd Merrill Lynch (16,710)
(692,000) Hopewell Highway Bank of America Infrastructure Ltd Merrill Lynch (749)
20,000 Huabao International Bank of America Holdings Ltd Merrill Lynch (235)
238,000 Huadian Fuxin Energy Bank of America Corp Ltd 'H' Merrill Lynch 1,204
264,000 Huadian Power International Bank of America Corp Ltd 'H' Merrill Lynch 12,176
304,000 Huaneng Power Bank of America International Inc 'H' Merrill Lynch 1,863
(116,000) Huaneng Renewables Bank of America Corp Ltd "H" Merrill Lynch (1,178)
70,000 Huatai Securities Co Ltd 'H' Bank of America '144A' Merrill Lynch 10,755
1,217,000 Industrial & Commercial Bank of America Bank of China Ltd 'H' Merrill Lynch 38,878
50,000 Jiangsu Expressway Co Ltd 'H' Bank of America Merrill Lynch 1,516
124,000 Jiangxi Copper Co Ltd 'H' Bank of America Merrill Lynch (2,774)
(342,000) Kunlun Energy Co Ltd Bank of America Merrill Lynch (14,859)
252,000 KWG Property Holding Ltd Bank of America Merrill Lynch 7,709
20,000 Lee & Man Paper Bank of America Manufacturing Ltd Merrill Lynch 638
(13,000) Li Ning Co Ltd Bank of America Merrill Lynch 119
106,500 Longfor Properties Co Ltd Bank of America Merrill Lynch 7,890
48,000 Lonking Holdings Ltd Bank of America Merrill Lynch 121
794,000 Metallurgical Corp of Bank of America China Ltd 'H' Merrill Lynch 13,193
30,700 New China Life Bank of America Insurance Co Ltd 'H' Merrill Lynch 8,652
(15,000) Nexteer Automotive Bank of America Group Ltd Merrill Lynch (553)
63,000 Nine Dragons Paper Bank of America Holdings Ltd Merrill Lynch 3,063
(61,000) Parkson Retail Group Ltd Bank of America Merrill Lynch 553
675,000 People's Insurance Co Bank of America Group of China Ltd/The 'H' Merrill Lynch 12,912
(174,000) PetroChina Co Ltd 'H' Bank of America Merrill Lynch (442)
152,000 PICC Property & Casualty Bank of America Co Ltd 'H' Merrill Lynch 19,048
101,000 Ping An Insurance Group Bank of America Co of China Ltd 'H' Merrill Lynch 15,377
(199,000) Poly Property Group Co Ltd Bank of America Merrill Lynch (2,029)
(2,195,000) Semiconductor Manufacturing Bank of America International Corp Merrill Lynch 76
(80,000) Shandong Weigao Group Bank of America Medical Polymer Co Ltd 'H' Merrill Lynch (290)
70,000 Shanghai Electric Group Bank of America Co Ltd 'H' Merrill Lynch 619
(110,000) Shanghai Industrial Bank of America Holdings Ltd Merrill Lynch (11,514)
84,000 Shanghai Pharmaceuticals Bank of America Holding Co Ltd 'H' Merrill Lynch 3,801
76,000 Shenzhen Expressway Co Ltd 'H' Bank of America Merrill Lynch (2,475)
(71,000) Shenzhen International Bank of America Holdings Ltd Merrill Lynch 2,605
(30,000) Shenzhou International Group Bank of America Holdings Ltd Merrill Lynch (6,380)
48,500 Shimao Property Holdings Ltd Bank of America Merrill Lynch 1,467
(952,500) Shui On Land Ltd Bank of America Merrill Lynch (2,356)
(458,000) Sichuan Expressway Co Ltd 'H' Bank of America Merrill Lynch (2,352)
137,000 Sino Biopharmaceutical Ltd Bank of America Merrill Lynch (578)
259,000 Sino-Ocean Land Holdings Ltd Bank of America Merrill Lynch 3,960
Hong Kong continued Hong Kong continued

Contracts for difference as at 31 May 2016
Holding
Description Counterparty
Unrealised appreciation/
(depreciation) USD
Holding
Description Counterparty
Unrealised appreciation/
(depreciation) USD
Annual Report and Audited Accounts 131
The notes on pages 489 to 503 form an integral part of these financial statements.
(19,500) Sinopec Engineering Group Bank of America Co Ltd 'H' Merrill Lynch (797)
408,000 Sinopec Shanghai Bank of America Petrochemical Co Ltd 'H' Merrill Lynch 15,668
60,400 Sinopharm Group Co Ltd 'H' Bank of America Merrill Lynch 24,386
220,000 Sinotrans Ltd 'H' Bank of America Merrill Lynch (328)
282,000 Skyworth Digital Holdings Ltd Bank of America Merrill Lynch (2,980)
(261,000) SOHO China Ltd Bank of America Merrill Lynch 9,797
(18,000) Sunac China Holdings Ltd Bank of America Merrill Lynch (390)
63,100 Tencent Holdings Ltd Bank of America Merrill Lynch 102,561
166,000 Tianjin Capital Environmental Bank of America Protection Group Co Ltd 'H' Merrill Lynch 1,455
272,000 Tianneng Power Bank of America International Ltd Merrill Lynch (8,154)
(176,000) Tingyi Cayman Islands Bank of America Holding Corp Merrill Lynch 35,431
(210,000) Tongda Group Holdings Ltd Bank of America Merrill Lynch (3,462)
(262,000) Towngas China Co Ltd Bank of America Merrill Lynch (3,980)
24,000 TravelSky Technology Ltd 'H' Bank of America Merrill Lynch 1,648
(49,000) Uni-President China Bank of America Holdings Ltd Merrill Lynch 2,737
(201,000) Want Want China Holdings Ltd Bank of America Merrill Lynch 6,801
76,000 Weichai Power Co Ltd 'H' Bank of America Merrill Lynch 1,521
(950,000) West China Cement Ltd Bank of America Merrill Lynch (11,683)
(80,000) WH Group Ltd '144A' Bank of America Merrill Lynch 1,370
56,200 Xinjiang Goldwind Science & Bank of America Technology Co Ltd 'H' Merrill Lynch 1,986
(768,000) Xinyi Solar Holdings Ltd Bank of America Merrill Lynch (10,747)
27,500 XTEP International Holdings Ltd Bank of America Merrill Lynch (220)
(540,000) Yuexiu Property Co Ltd Bank of America Merrill Lynch (2,753)
98,000 Zhejiang Expressway Co Ltd 'H' Bank of America Merrill Lynch 1,098
(12,000) Zhuzhou CRRC Times Bank of America Electric Co Ltd Merrill Lynch (1,131)
(184,000) Zijin Mining Group Co Ltd 'H' Bank of America Merrill Lynch 6,420
112,360 ZTE Corp 'H' Bank of America Merrill Lynch (68)
1,244,727
Hungary 6,472 MOL Hungarian Oil & Gas Plc Bank of America
Merrill Lynch (16,588) (5,134) OTP Bank Plc Bank of America
Merrill Lynch 10,587 (4,165) Richter Gedeon Nyrt Bank of America
Merrill Lynch (668)
(6,669)
Indonesia 47,100 Bank Central Asia Tbk PT Bank of America
Merrill Lynch (1,275) 102,200 Bank Tabungan Negara Bank of America
Persero Tbk PT Merrill Lynch (786)
5,200 Gudang Garam Tbk PT Bank of America Merrill Lynch (1,466)
261,900 Indofood Sukses Bank of America Makmur Tbk PT Merrill Lynch (5,479)
160,000 Matahari Department Store Tbk PT Bank of America Merrill Lynch (5,800)
908,300 Telekomunikasi Indonesia Bank of America Persero Tbk PT Merrill Lynch (7,719)
(83,000) Tower Bersama Bank of America Infrastructure Tbk PT Merrill Lynch 1,499
14,700 Unilever Indonesia Tbk PT Bank of America Merrill Lynch (1,129)
307,500 United Tractors Tbk PT Bank of America Merrill Lynch 15,876
(6,279)
Malaysia 5,900 Astro Malaysia Holdings Bhd Bank of America
Merrill Lynch (140) 22,000 British American Tobacco Bank of America
Malaysia Bhd Merrill Lynch 4,673 (13,667) Gamuda Bhd Bank of America
Merrill Lynch 727 (55,300) Gamuda Bhd (Wts) Bank of America
Merrill Lynch (956) (17,700) Genting Malaysia Bhd Bank of America
Merrill Lynch 200 (50,300) IJM Corp Bhd Bank of America
Merrill Lynch 1,166 100,700 IOI Corp Bhd Bank of America
Merrill Lynch (2,057) 755,300 KNM Group Bhd Bank of America
Merrill Lynch (1,124) 75,300 KNM Group Bhd (Wts) Bank of America
Merrill Lynch (149) 59,900 MISC Bhd Bank of America
Merrill Lynch 1,416 39,800 Petronas Chemicals Group Bhd Bank of America
Merrill Lynch 1,951 (3,800) Telekom Malaysia Bhd Bank of America
Merrill Lynch 57 80,400 Tenaga Nasional Bhd Bank of America
Merrill Lynch (7,179) 93,700 Top Glove Corp Bhd Bank of America
Merrill Lynch (783) 195,100 YTL Power International Bhd Bank of America
Merrill Lynch (2,704)
(4,902)
Mexico 318,100 Alfa SAB de CV 'A' Bank of America
Merrill Lynch 6,616 17,925 Alsea SAB de CV Bank of America
Merrill Lynch (685) 273,200 America Movil SAB de CV 'L' Bank of America
Merrill Lynch (4,462) (3,200) Arca Continental SAB de CV Bank of America
Merrill Lynch (124) 441,568 Cemex SAB de CV (Unit) Bank of America
Merrill Lynch (2,211) 4,300 Coca-Cola Femsa SAB de CV 'L' Bank of America
Merrill Lynch (125) 29,885 El Puerto De Liverpool SAB Bank of America
de CV 'C1' Merrill Lynch 9,789 (226,589) Fibra Uno Administracion SA Bank of America
de CV (Reit) Merrill Lynch 3,901 (2,400) Fomento Economico Bank of America
Mexicano SAB de CV (Unit) Merrill Lynch 120
BlackRock Emerging Markets Allocation Fund continued
Indonesia continued Hong Kong continued

Contracts for difference as at 31 May 2016
Holding
Description Counterparty
Unrealised appreciation/
(depreciation) USD
Holding
Description Counterparty
Unrealised appreciation/
(depreciation) USD
132 BlackRock Strategic Funds (BSF)
The notes on pages 489 to 503 form an integral part of these financial statements.
BlackRock Emerging Markets Allocation Fund continued
(126,666) Genomma Lab Internacional Bank of America SAB de CV 'B' Merrill Lynch (9,634)
47,300 Gentera SAB de CV Bank of America Merrill Lynch (3,141)
21,305 Gruma SAB de CV 'B' Bank of America Merrill Lynch 11,743
19,900 Grupo Aeroportuario del Bank of America Centro Norte SAB de CV 'B' Merrill Lynch (20)
23,600 Grupo Aeroportuario del Bank of America Pacifico SAB de CV 'B' Merrill Lynch 959
(2,420) Grupo Aeroportuario del Bank of America Sureste SAB de CV 'B' Merrill Lynch 114
176,743 Grupo Bimbo SAB de CV 'A' Bank of America Merrill Lynch 660
(46,600) Grupo Carso SAB de CV 'A1' Bank of America Merrill Lynch (3,265)
4,800 Grupo Comercial Chedraui Bank of America SA de CV Merrill Lynch 97
(26,800) Grupo Financiero Banorte Bank of America SAB de CV 'O' Merrill Lynch 1,789
(59,400) Grupo Financiero Inbursa Bank of America SAB de CV 'O' Merrill Lynch 4,938
(2,900) Grupo Financiero Santander Bank of America Mexico SAB de CV 'B' Merrill Lynch 242
(58,200) Grupo Lala SAB de CV Bank of America Merrill Lynch 5,299
(177,996) Grupo Mexico SAB de CV 'B' Bank of America Merrill Lynch (1,533)
11,600 Grupo Televisa SAB (Unit) Bank of America Merrill Lynch 1,583
4,905 Industrias Penoles SAB de CV Bank of America Merrill Lynch (4,961)
(148,500) Infraestructura Energetica Bank of America Nova SAB de CV Merrill Lynch (26,936)
112,100 Kimberly-Clark de Mexico Bank of America SAB de CV 'A' Merrill Lynch 18,463
(224,391) Mexichem SAB de CV Bank of America Merrill Lynch 24,050
(107,470) Nemak SAB de CV '144A' Bank of America Merrill Lynch (992)
43,900 OHL Mexico SAB de CV Bank of America Merrill Lynch (1,985)
25,080 Promotora y Operadora de Bank of America Infraestructura SAB de CV Merrill Lynch 9,778
76,500 Wal-Mart de Mexico SAB de CV Bank of America Merrill Lynch 2,752
42,819
Peru 350 Credicorp Ltd Bank of America
Merrill Lynch 18,489
18,489
Philippines (41,590) Aboitiz Equity Ventures Inc Bank of America
Merrill Lynch (7,331) 1,421,300 Energy Development Corp Bank of America
Merrill Lynch (8,407) 5,290 Globe Telecom Inc Bank of America
Merrill Lynch 17,060 80,000 Megaworld Corp Bank of America
Merrill Lynch 196 134,600 Metro Pacific Investments Bank of America
Corp Merrill Lynch (274) (225) Philippine Long Distance Bank of America
Telephone Co Merrill Lynch 5,766
7,010
Poland (256) Alior Bank SA Bank of America
Merrill Lynch 1,189 (256) Alior Bank SA Bank of America
Merrill Lynch (610) 326 Bank Handlowy w Bank of America
Warszawie SA Merrill Lynch (75) (1,023) CCC SA Bank of America
Merrill Lynch 1,423 36,039 Enea SA Bank of America
Merrill Lynch (11,114) 13,536 Energa SA Bank of America
Merrill Lynch (5,034) 5,744 Eurocash SA Bank of America
Merrill Lynch 1,041 422 Grupa Azoty SA Bank of America
Merrill Lynch (1,046) 1,393 Grupa Lotos SA Bank of America
Merrill Lynch 10 6,864 KGHM Polska Miedz SA Bank of America
Merrill Lynch (10,525) (13) LPP SA Bank of America
Merrill Lynch (882) 98 mBank SA Bank of America
Merrill Lynch (454) 1,133 PGE Polska Grupa Bank of America
Energetyczna SA Merrill Lynch (132) 16,534 Polski Koncern Naftowy Bank of America
Orlen SA Merrill Lynch (2,011) 1,002 Powszechna Kasa Bank of America
Oszczednosci Bank Polski SA Merrill Lynch 37 (7,379) Synthos SA Bank of America
Merrill Lynch 895 328,221 Tauron Polska Energia SA Bank of America
Merrill Lynch (14,876)
(42,164)
Qatar 8,770 Barwa Real Estate Co Bank of America
Merrill Lynch (4,200) 2,145 Doha Bank QSC Bank of America
Merrill Lynch (997) 2,397 Ezdan Holding Group QSC Bank of America
Merrill Lynch (782) 1,170 Qatar Electricity & Water Co QSC Bank of America
Merrill Lynch (2,551) 1,037 Qatar National Bank SAQ Bank of America
Merrill Lynch (1,336)
(9,866)
Russia 125,134 Aeroflot - Russian Airlines PJSC Bank of America
Merrill Lynch (1,097) 253,900 Alrosa PAO Bank of America
Merrill Lynch (20,354) 6,798,000 Inter RAO UES PJSC Bank of America
Merrill Lynch 4,969 313,300 Magnitogorsk Iron & Steel Bank of America
Works OJSC Merrill Lynch 2,478 480 MMC Norilsk Nickel PJSC Bank of America
Merrill Lynch 1,083 58,347 Moscow Exchange MICEX-
RTS PJSC Bank of America Merrill Lynch 3,620
7,470 Rosneft OAO Bank of America Merrill Lynch (829)
2,500 Sberbank of Russia PJSC Bank of America Merrill Lynch 401
1,724 Severstal PAO Bank of America Merrill Lynch (7)
Mexico continued

Contracts for difference as at 31 May 2016
Holding
Description Counterparty
Unrealised appreciation/
(depreciation) USD
Holding
Description Counterparty
Unrealised appreciation/
(depreciation) USD
Annual Report and Audited Accounts 133
The notes on pages 489 to 503 form an integral part of these financial statements.
54,900 Sistema JSFC Bank of America Merrill Lynch 582
20,710 Tatneft PAO Bank of America Merrill Lynch (4,854)
(14,008)
South Africa 2,542 Anglo American Plc Bank of America
Merrill Lynch 347 3,440 AngloGold Ashanti Ltd Bank of America
Merrill Lynch (5,977) (4,942) Aspen Pharmacare Bank of America
Holdings Ltd Merrill Lynch (3,644) 3,560 Barclays Africa Group Ltd Bank of America
Merrill Lynch 1,619 2,842 BHP Billiton Plc Bank of America
Merrill Lynch 114 15,481 BID Corp Ltd Bank of America
Merrill Lynch 288,009 15,481 Bidvest Group Ltd/The Bank of America
Merrill Lynch (227,257) 9,112 British American Tobacco Plc Bank of America
Merrill Lynch 7,842 3,258 Capitec Bank Holdings Ltd Bank of America
Merrill Lynch 6,160 17,880 Clicks Group Ltd Bank of America
Merrill Lynch 5,386 (4,290) Coronation Fund Managers Ltd Bank of America
Merrill Lynch 664 (9,118) Discovery Ltd Bank of America
Merrill Lynch (2,284) (4,655) Exxaro Resources Ltd Bank of America
Merrill Lynch 1,542 36,780 FirstRand Ltd Bank of America
Merrill Lynch 2,794 (12,730) Foschini Group Ltd/The Bank of America
Merrill Lynch (3,262) 943 Gold Fields Ltd Bank of America
Merrill Lynch (705) 33,563 Hyprop Investments Ltd (Reit) Bank of America
Merrill Lynch 6,400 (9,286) Impala Platinum Holdings Ltd Bank of America
Merrill Lynch 4,033 3,356 Imperial Holdings Ltd Bank of America
Merrill Lynch 2,275 12,320 Kumba Iron Ore Ltd Bank of America
Merrill Lynch (9,406) (74,479) Life Healthcare Group Bank of America
Holdings Ltd Merrill Lynch (5,219) 9,860 Mediclinic International PLC Bank of America
Merrill Lynch 9,763 2,356 Mondi Ltd Bank of America
Merrill Lynch 727 4,611 Mr Price Group Ltd Bank of America
Merrill Lynch 4,085 16,965 MTN Group Ltd Bank of America
Merrill Lynch (2,757) (47,767) Nampak Ltd Bank of America
Merrill Lynch 3,873 3,412 Naspers Ltd 'N' Bank of America
Merrill Lynch 45,252 150,673 Netcare Ltd Bank of America
Merrill Lynch 8,030 16,389 Pick n Pay Stores Ltd Bank of America
Merrill Lynch (1,509) (3,377) Rand Merchant Investment Bank of America
Holdings Ltd Merrill Lynch (263) 28,668 Redefine Properties Ltd (Reit) Bank of America
Merrill Lynch (474)
(22,806) Remgro Ltd Bank of America Merrill Lynch (9,002)
(17,810) Resilient Ltd (Reit) Bank of America Merrill Lynch (2,302)
(4,431) RMB Holdings Ltd Bank of America Merrill Lynch (172)
1,118 SABMiller Plc Bank of America Merrill Lynch 2,023
21,407 Sappi Ltd Bank of America Merrill Lynch 63
6,127 Sasol Ltd Bank of America Merrill Lynch 8,723
(918) Shoprite Holdings Ltd Bank of America Merrill Lynch 142
25,763 Sibanye Gold Ltd Bank of America Merrill Lynch (13,624)
2,075 SPAR Group Ltd/The Bank of America Merrill Lynch (1,243)
22,992 Standard Bank Group Ltd Bank of America Merrill Lynch 9,629
5,776 Steinhoff International Bank of America Holdings NV Merrill Lynch 2,334
12,337 Telkom SA SOC Ltd Bank of America Merrill Lynch 764
1,676 Truworths International Ltd Bank of America Merrill Lynch (248)
(4,318) Tsogo Sun Holdings Ltd Bank of America Merrill Lynch (342)
16,798 Vodacom Group Ltd Bank of America Merrill Lynch 3,339
(35,097) Woolworths Holdings Bank of America Ltd/South Africa Merrill Lynch 6,911
143,153
South Korea (1,051) Advanced Process Bank of America
Systems Corp Merrill Lynch 138 (171) Bukwang Bank of America
Pharmaceutical Co Ltd Merrill Lynch (337) 649 Cell Biotech Co Ltd Bank of America
Merrill Lynch (138) 62 CJ CheilJedang Corp Bank of America
Merrill Lynch (1,019) (385) CJ Corp Bank of America
Merrill Lynch 5,627 60 Com2uSCorp Bank of America
Merrill Lynch (338) 3,438 Coway Co Ltd Bank of America
Merrill Lynch 2,770 (1,481) Daelim Industrial Co Ltd Bank of America
Merrill Lynch (579) 995 Daesang Corp Bank of America
Merrill Lynch (418) (60) Dongbu Insurance Co Ltd Bank of America
Merrill Lynch (2) (1,352) GS Holdings Corp Bank of America
Merrill Lynch (297) 207 GS Home Shopping Inc Bank of America
Merrill Lynch (1,702) (3,414) Hankook Tire Co Ltd Bank of America
Merrill Lynch 1,529 (103) Hanmi Pharm Co Ltd Bank of America
Merrill Lynch (1,533) (5,647) Hanwha Chemical Corp Bank of America
Merrill Lynch (1,215) (9,551) Hanwha Life Insurance Co Ltd Bank of America
Merrill Lynch 1,335 (4,770) Hanwha Techwin Co Ltd Bank of America
Merrill Lynch 9,508
BlackRock Emerging Markets Allocation Fund continued
South Africa continued Russia continued

Contracts for difference as at 31 May 2016
Holding
Description Counterparty
Unrealised appreciation/
(depreciation) USD
Holding
Description Counterparty
Unrealised appreciation/
(depreciation) USD
134 BlackRock Strategic Funds (BSF)
The notes on pages 489 to 503 form an integral part of these financial statements.
BlackRock Emerging Markets Allocation Fund continued
(61) Hyundai Department Bank of America Store Co Ltd Merrill Lynch 406
3,092 Hyundai Development Co- Bank of America Engineering & Construction Merrill Lynch 2,338
2,608 Hyundai Engineering & Bank of America Construction Co Ltd Merrill Lynch (3,424)
(639) Hyundai Glovis Co Ltd Bank of America Merrill Lynch 3,185
325 Hyundai Home Shopping Bank of America Network Corp Merrill Lynch (1,753)
1,510 Hyundai Merchant Bank of America Marine Co Ltd Merrill Lynch 8,212
81 Hyundai Mipo Bank of America Dockyard Co Ltd Merrill Lynch 183
1,703 Hyundai Mobis Co Ltd Bank of America Merrill Lynch (1,570)
73 Hyundai Motor Co Bank of America Merrill Lynch 158
4,733 Hyundai Steel Co Bank of America Merrill Lynch (18,846)
991 Hyundai Wia Corp Bank of America Merrill Lynch (1,221)
11,265 Industrial Bank of Korea Bank of America Merrill Lynch (636)
7,621 Interpark Holdings Corp Bank of America Merrill Lynch (1,460)
8,008 Kangwon Land Inc Bank of America Merrill Lynch (3,276)
2,187 KB Financial Group Inc Bank of America Merrill Lynch 1,209
(3,741) KB Insurance Co Ltd Bank of America Merrill Lynch (2,296)
(276) KCC Corp Bank of America Merrill Lynch 617
297 Kia Motors Corp Bank of America Merrill Lynch (24)
(2,217) Korea Aerospace Bank of America Industries Ltd Merrill Lynch (3,589)
2,300 Korea Electric Power Corp Bank of America Merrill Lynch 3,824
2,674 Korea Investment Bank of America Holdings Co Ltd Merrill Lynch 2,706
2,892 Korea Real Estate Bank of America Investment & Trust Co Ltd Merrill Lynch 228
163 Korea Zinc Co Ltd Bank of America Merrill Lynch (2,800)
8,254 Korean Reinsurance Co Bank of America Merrill Lynch (4,407)
1,263 KT Corp Bank of America Merrill Lynch (28)
901 KT&G Corp Bank of America Merrill Lynch (2,134)
(195) LG Chem Ltd Bank of America Merrill Lynch 2,529
(96) LG Corp Bank of America Merrill Lynch 145
668 LG Display Co Ltd Bank of America Merrill Lynch 616
2,159 LG Electronics Inc Bank of America Merrill Lynch 1,455
(34) LG Hausys Ltd Bank of America Merrill Lynch 142
263 LG Household & Health Bank of America Care Ltd Merrill Lynch 40
773 LG Innotek Co Ltd Bank of America Merrill Lynch 7,344
72 LG International Corp Bank of America Merrill Lynch 138
334 LG Life Sciences Ltd Bank of America Merrill Lynch 422
5,693 LG Uplus Corp Bank of America Merrill Lynch 158
392 Lotte Chemical Corp Bank of America Merrill Lynch (2,453)
48 Lotte Food Co Ltd Bank of America Merrill Lynch 2,505
2,052 LS Corp Bank of America Merrill Lynch 6,819
335 LS Industrial Systems Co Ltd Bank of America Merrill Lynch 163
151 Medy-Tox Inc Bank of America Merrill Lynch (1,988)
(2,272) Mirae Asset Daewoo Co Ltd Bank of America Merrill Lynch 1,542
330 Mirae Asset Securities Co Ltd Bank of America Merrill Lynch (920)
858 NAVER Corp Bank of America Merrill Lynch 14,854
(631) NCSoft Corp Bank of America Merrill Lynch 1,328
1,137 Neowiz Games Corp Bank of America Merrill Lynch 948
178 NongShim Co Ltd Bank of America Merrill Lynch (6,096)
115 Orion Corp/Republic of Korea Bank of America Merrill Lynch (4,866)
594 POSCO Bank of America Merrill Lynch (818)
2,485 Posco Daewoo Corp Bank of America Merrill Lynch 69
(1,758) S-1 Corp Bank of America Merrill Lynch 2,283
1,606 S-Oil Corp Bank of America Merrill Lynch 174
(4,985) Samsung C&T Corp Bank of America Merrill Lynch 28,433
539 Samsung Card Co Ltd Bank of America Merrill Lynch (387)
(9,100) Samsung Electro- Mechanics Co Ltd Bank of America Merrill Lynch (1,256)
1,024 Samsung Electronics Co Ltd Bank of America Merrill Lynch 26,673
(547) Samsung Fire & Marine Bank of America Insurance Co Ltd Merrill Lynch 6,200
(2,565) Samsung Life Bank of America Insurance Co Ltd Merrill Lynch (2,015)
(3,351) Samsung SDI Co Ltd Bank of America Merrill Lynch (10,933)
634 Samsung SDS Co Ltd Bank of America Merrill Lynch 838
(2,475) SFA Engineering Corp Bank of America Merrill Lynch (47)
3,393 Shinhan Financial Group Co Ltd Bank of America Merrill Lynch (1,590)
384 Silicon Works Co Ltd Bank of America Merrill Lynch 835
(159) SK Chemicals Co Ltd Bank of America Merrill Lynch (392)
(247) SK Holdings Co Ltd Bank of America Merrill Lynch 390
15,461 SK Hynix Inc Bank of America Merrill Lynch 30,235
1,812 SK Innovation Co Ltd Bank of America Merrill Lynch 11,264
2,779 SK Networks Co Ltd Bank of America Merrill Lynch (55)
74 SK Telecom Co Ltd Bank of America Merrill Lynch 484
3,604 SKC Co Ltd Bank of America Merrill Lynch (4,847)
South Korea continued South Korea continued
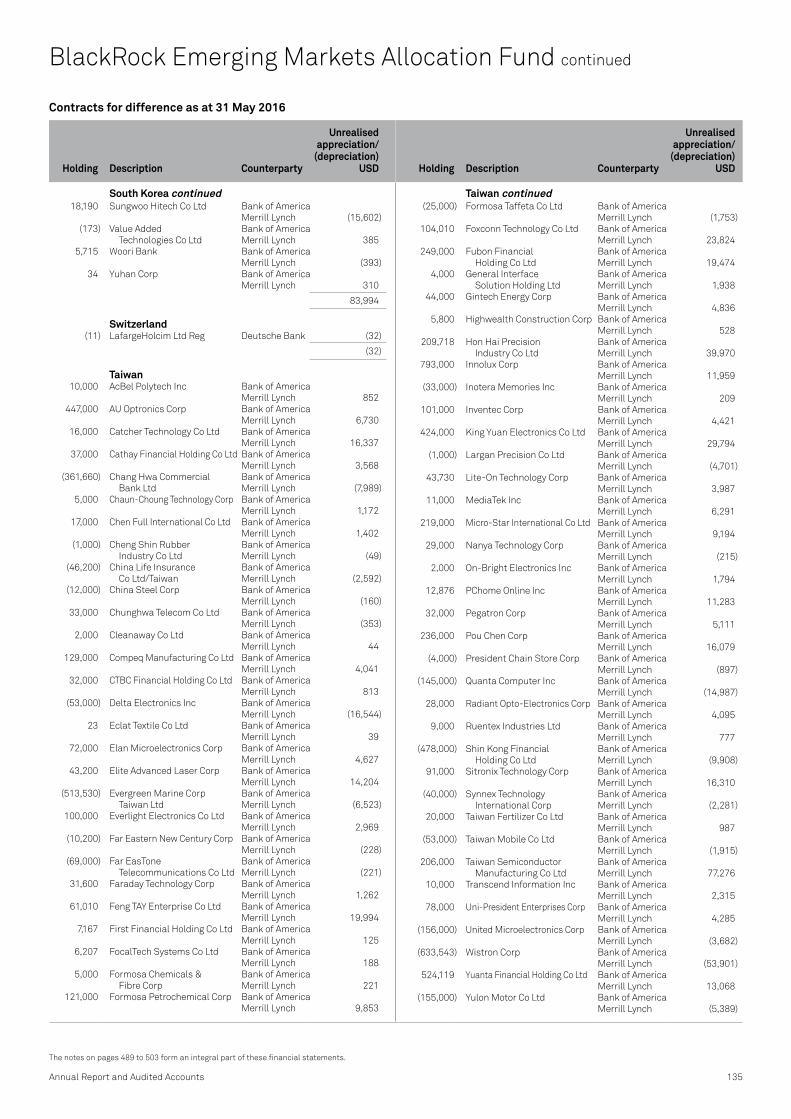
Contracts for difference as at 31 May 2016
Holding
Description Counterparty
Unrealised appreciation/
(depreciation) USD
Holding
Description Counterparty
Unrealised appreciation/
(depreciation) USD
Annual Report and Audited Accounts 135
The notes on pages 489 to 503 form an integral part of these financial statements.
18,190 Sungwoo Hitech Co Ltd Bank of America Merrill Lynch (15,602)
(173) Value Added Bank of America Technologies Co Ltd Merrill Lynch 385
5,715 Woori Bank Bank of America Merrill Lynch (393)
34 Yuhan Corp Bank of America Merrill Lynch 310
83,994
Switzerland (11) LafargeHolcim Ltd Reg Deutsche Bank (32)
(32)
Taiwan 10,000 AcBel Polytech Inc Bank of America
Merrill Lynch 852 447,000 AU Optronics Corp Bank of America
Merrill Lynch 6,730 16,000 Catcher Technology Co Ltd Bank of America
Merrill Lynch 16,337 37,000 Cathay Financial Holding Co Ltd Bank of America
Merrill Lynch 3,568 (361,660) Chang Hwa Commercial Bank of America
Bank Ltd Merrill Lynch (7,989) 5,000 Chaun-Choung Technology Corp Bank of America
Merrill Lynch 1,172 17,000 Chen Full International Co Ltd Bank of America
Merrill Lynch 1,402 (1,000) Cheng Shin Rubber Bank of America
Industry Co Ltd Merrill Lynch (49) (46,200) China Life Insurance Bank of America
Co Ltd/Taiwan Merrill Lynch (2,592) (12,000) China Steel Corp Bank of America
Merrill Lynch (160) 33,000 Chunghwa Telecom Co Ltd Bank of America
Merrill Lynch (353) 2,000 Cleanaway Co Ltd Bank of America
Merrill Lynch 44 129,000 Compeq Manufacturing Co Ltd Bank of America
Merrill Lynch 4,041 32,000 CTBC Financial Holding Co Ltd Bank of America
Merrill Lynch 813 (53,000) Delta Electronics Inc Bank of America
Merrill Lynch (16,544) 23 Eclat Textile Co Ltd Bank of America
Merrill Lynch 39 72,000 Elan Microelectronics Corp Bank of America
Merrill Lynch 4,627 43,200 Elite Advanced Laser Corp Bank of America
Merrill Lynch 14,204 (513,530) Evergreen Marine Corp Bank of America
Taiwan Ltd Merrill Lynch (6,523) 100,000 Everlight Electronics Co Ltd Bank of America
Merrill Lynch 2,969 (10,200) Far Eastern New Century Corp Bank of America
Merrill Lynch (228) (69,000) Far EasTone Bank of America
Telecommunications Co Ltd Merrill Lynch (221) 31,600 Faraday Technology Corp Bank of America
Merrill Lynch 1,262 61,010 Feng TAY Enterprise Co Ltd Bank of America
Merrill Lynch 19,994 7,167 First Financial Holding Co Ltd Bank of America
Merrill Lynch 125 6,207 FocalTech Systems Co Ltd Bank of America
Merrill Lynch 188 5,000 Formosa Chemicals & Bank of America
Fibre Corp Merrill Lynch 221 121,000 Formosa Petrochemical Corp Bank of America
Merrill Lynch 9,853
(25,000) Formosa Taffeta Co Ltd Bank of America Merrill Lynch (1,753)
104,010 Foxconn Technology Co Ltd Bank of America Merrill Lynch 23,824
249,000 Fubon Financial Bank of America Holding Co Ltd Merrill Lynch 19,474
4,000 General Interface Bank of America Solution Holding Ltd Merrill Lynch 1,938
44,000 Gintech Energy Corp Bank of America Merrill Lynch 4,836
5,800 Highwealth Construction Corp Bank of America Merrill Lynch 528
209,718 Hon Hai Precision Bank of America Industry Co Ltd Merrill Lynch 39,970
793,000 Innolux Corp Bank of America Merrill Lynch 11,959
(33,000) Inotera Memories Inc Bank of America Merrill Lynch 209
101,000 Inventec Corp Bank of America Merrill Lynch 4,421
424,000 King Yuan Electronics Co Ltd Bank of America Merrill Lynch 29,794
(1,000) Largan Precision Co Ltd Bank of America Merrill Lynch (4,701)
43,730 Lite-On Technology Corp Bank of America Merrill Lynch 3,987
11,000 MediaTek Inc Bank of America Merrill Lynch 6,291
219,000 Micro-Star International Co Ltd Bank of America Merrill Lynch 9,194
29,000 Nanya Technology Corp Bank of America Merrill Lynch (215)
2,000 On-Bright Electronics Inc Bank of America Merrill Lynch 1,794
12,876 PChome Online Inc Bank of America Merrill Lynch 11,283
32,000 Pegatron Corp Bank of America Merrill Lynch 5,111
236,000 Pou Chen Corp Bank of America Merrill Lynch 16,079
(4,000) President Chain Store Corp Bank of America Merrill Lynch (897)
(145,000) Quanta Computer Inc Bank of America Merrill Lynch (14,987)
28,000 Radiant Opto-Electronics Corp Bank of America Merrill Lynch 4,095
9,000 Ruentex Industries Ltd Bank of America Merrill Lynch 777
(478,000) Shin Kong Financial Bank of America Holding Co Ltd Merrill Lynch (9,908)
91,000 Sitronix Technology Corp Bank of America Merrill Lynch 16,310
(40,000) Synnex Technology Bank of America International Corp Merrill Lynch (2,281)
20,000 Taiwan Fertilizer Co Ltd Bank of America Merrill Lynch 987
(53,000) Taiwan Mobile Co Ltd Bank of America Merrill Lynch (1,915)
206,000 Taiwan Semiconductor Bank of America Manufacturing Co Ltd Merrill Lynch 77,276
10,000 Transcend Information Inc Bank of America Merrill Lynch 2,315
78,000 Uni-President Enterprises Corp Bank of America Merrill Lynch 4,285
(156,000) United Microelectronics Corp Bank of America Merrill Lynch (3,682)
(633,543) Wistron Corp Bank of America Merrill Lynch (53,901)
524,119 Yuanta Financial Holding Co Ltd Bank of America Merrill Lynch 13,068
(155,000) Yulon Motor Co Ltd Bank of America Merrill Lynch (5,389)
BlackRock Emerging Markets Allocation Fund continued
Taiwan continued South Korea continued

Contracts for difference as at 31 May 2016
Holding
Description Counterparty
Unrealised appreciation/
(depreciation) USD
Holding
Description Counterparty
Unrealised appreciation/
(depreciation) USD
136 BlackRock Strategic Funds (BSF)
The notes on pages 489 to 503 form an integral part of these financial statements.
BlackRock Emerging Markets Allocation Fund continued
19,000 Zhen Ding Technology Bank of America Holding Ltd Merrill Lynch 3,085
267,043
Thailand (8,700) Advanced Info Service PCL Bank of America
Merrill Lynch (4,157) 53,200 Airports of Thailand PCL Bank of America
Merrill Lynch 487,684 49,500 Bangchak Petroleum PCL/The Bank of America
Merrill Lynch 2,930 (53,350) Banpu PCL Reg Bank of America
Merrill Lynch (10,752) (69,400) Banpu PCL Reg Bank of America
Merrill Lynch 593 (173,100) BTS Group Holdings PCL Bank of America
Merrill Lynch (304) 11,400 Bumrungrad Hospital PCL Bank of America
Merrill Lynch (452) 273,100 Central Pattana PCL Bank of America
Merrill Lynch 159,821 (263,800) CP ALL PCL Bank of America
Merrill Lynch (3,337) 132,500 Delta Electronics Thailand PCL Bank of America
Merrill Lynch 33,098 252,800 Indorama Ventures PCL Bank of America
Merrill Lynch 13,998 (18,300) Kasikornbank PCL Bank of America
Merrill Lynch (5,694) 34,000 Pruksa Real Estate PCL Bank of America
Merrill Lynch 1,773 76,700 PTT Exploration & Bank of America
Production PCL Merrill Lynch 3,339 266,700 PTT Global Chemical PCL Bank of America
Merrill Lynch (8,891) (41,100) PTT PCL Bank of America
Merrill Lynch 36,578 3,500 Siam Cement PCL/The Reg Bank of America
Merrill Lynch (1,192) (1,200) Siam Commercial Bank PCL/The Bank of America
Merrill Lynch (244) 127,000 Thai Oil PCL Bank of America
Merrill Lynch (23,826) 206,300 Thai Union Group PCL Bank of America
Merrill Lynch (1,360) 75,200 Tipco Asphalt PCL Bank of America
Merrill Lynch (1,234)
678,371
Turkey (80,888) Akbank TAS Bank of America
Merrill Lynch (18,181) (53,491) Anadolu Efes Biracilik Ve Bank of America
Malt Sanayii AS Merrill Lynch 1,211 87,554 Arcelik AS Bank of America
Merrill Lynch 30,171 14,284 BIM Birlesik Magazalar AS Bank of America
Merrill Lynch (504) 1,295 Dogus Otomotiv Servis ve Bank of America
Ticaret AS Merrill Lynch 73 (453,480) Emlak Konut Gayrimenkul Bank of America
Yatirim Ortakligi AS (Reit) Merrill Lynch (4,999) 254,368 Enka Insaat ve Sanayi AS Bank of America
Merrill Lynch 12,756 405,822 Eregli Demir ve Celik Bank of America
Fabrikalari TAS Merrill Lynch (27,037) 2,903 Ford Otomotiv Sanayi AS Bank of America
Merrill Lynch 1,086 (12,876) Haci Omer Sabanci Holding AS Bank of America
Merrill Lynch (2,280)
134,752 KOC Holding AS Bank of America Merrill Lynch 25,211
22,638 Koza Altin Isletmeleri AS Bank of America Merrill Lynch 5,003
37,677 TAV Havalimanlari Holding AS Bank of America Merrill Lynch (3,143)
33,125 Tekfen Holding AS Bank of America Merrill Lynch 4,372
(4,526) Tofas Turk Otomobil Fabrikasi AS Bank of America Merrill Lynch (690)
(11,465) Tupras Turkiye Petrol Bank of America Rafinerileri AS Merrill Lynch (6,552)
168,542 Turk Hava Yollari AO Bank of America Merrill Lynch 11,963
93,574 Turk Telekomunikasyon AS Bank of America Merrill Lynch (18)
7,627 Turkcell Iletisim Hizmetleri AS Bank of America Merrill Lynch 549
(175,489) Turkiye Garanti Bankasi AS Bank of America Merrill Lynch (22,039)
221,562 Turkiye Is Bankasi 'C' Bank of America Merrill Lynch 20,717
13,339 Turkiye Vakiflar Bankasi TAO 'D' Bank of America Merrill Lynch 650
6,924 Vestel Beyaz Esya Sanayi ve Bank of America Ticaret AS Merrill Lynch 255
28,574
United Kingdom 72,957 Gazprom PAO ADR Bank of America
Merrill Lynch (38,491) 62,987 Global Telecom Holding Bank of America
SAE GDR Merrill Lynch 3,779 69,669 Hon Hai Precision Industry Bank of America
Co Ltd GDR RegS Merrill Lynch 25,777 (16,780) Larsen & Toubro Ltd GDR RegS Bank of America
Merrill Lynch (41,950) 8,062 Lukoil PJSC ADR Bank of America
Merrill Lynch (12,859) 9,411 Magnitogorsk Iron & Steel Bank of America
Works OJSC GDR RegS Merrill Lynch 988 1,999 MMC Norilsk Nickel PJSC ADR Bank of America
Merrill Lynch 240 556 Novatek OAO GDR RegS Bank of America
Merrill Lynch 2,084 288 Novolipetsk Steel PJSC Bank of America
GDR RegS Merrill Lynch (108) 2,964 Polymetal International PLC Bank of America
Merrill Lynch 2,128 3,589 Severstal PAO GDR RegS Bank of America
Merrill Lynch (108) 956 Sistema JSFC GDR RegS Bank of America
Merrill Lynch 139 6,210 Tatneft PAO ADR Bank of America
Merrill Lynch (9,750) 2,182 TMK PAO GDR RegS Bank of America
Merrill Lynch (185) 3,576 Uralkali PJSC GDR RegS Bank of America
Merrill Lynch (22) (13,440) VTB Bank PJSC GDR RegS Bank of America
Merrill Lynch 32
(68,306)
United States (5,593) 58.com Inc ADR Bank of America
Merrill Lynch (19,253) (19,878) Advanced Semiconductor Bank of America
Engineering Inc ADR Merrill Lynch (21,269) (49,824) AES Corp/VA Bank of America
Merrill Lynch (3,239)
Taiwan continued Turkey continued

Contracts for difference as at 31 May 2016
Holding
Description Counterparty
Unrealised appreciation/
(depreciation) USD
Holding
Description Counterparty
Unrealised appreciation/
(depreciation) USD
Annual Report and Audited Accounts 137
The notes on pages 489 to 503 form an integral part of these financial statements.
3,499 Alibaba Group Holding Ltd ADR Bank of America Merrill Lynch 4,549
(28,581) Ambev SA ADR Bank of America Merrill Lynch 1,000
(16,554) America Movil SAB Bank of America de CV 'L' ADR Merrill Lynch 6,622
29,953 AU Optronics Corp ADR Bank of America Merrill Lynch 4,193
(622) Baidu Inc ADR Bank of America Merrill Lynch (3,744)
6,114 Banco Bradesco SA ADR Bank of America Merrill Lynch (4,157)
(4,494) Banco Santander Chile ADR Bank of America Merrill Lynch 1,079
(3,970) Bancolombia SA ADR Bank of America Merrill Lynch 11,514
2,303 Braskem SA ADR Bank of America Merrill Lynch 253
2,204 BRF SA ADR Bank of America Merrill Lynch (1,984)
43,111 Cemex SAB de CV ADR Bank of America Merrill Lynch (4,742)
1,372 China Biologic Products Inc Bank of America Merrill Lynch 2,593
3,356 China Mobile Ltd ADR Bank of America Merrill Lynch 1,544
5,143 China Petroleum & Chemical Bank of America Corp ADR Merrill Lynch 7,026
849 ChipMOS TECHNOLOGIES Bank of America Bermuda Ltd Merrill Lynch 1,341
17,198 Chunghwa Telecom Co Ltd Bank of America ADR Merrill Lynch (3,772)
6,895 Cia Brasileira de Distribuicao Bank of America (Pref) ADR Merrill Lynch (5,922)
(10,929) Cia de Minas Buenaventura Bank of America SAA ADR Merrill Lynch 8,743
14,187 Cia de Saneamento Basico Bank of America do Estado de Sao Paulo ADR Merrill Lynch (4,635)
17,921 Cia Energetica de Minas Bank of America Gerais ADR Merrill Lynch (4,122)
(503) Cia Paranaense de Energia ADR Bank of America Merrill Lynch 392
(1,396) CNOOC Ltd ADR Bank of America Merrill Lynch (3,216)
(6,781) Copa Holdings SA 'A' Bank of America Merrill Lynch 16,681
(701) Cosan Ltd Bank of America Merrill Lynch 49
(21,701) CPFL Energia SA ADR Bank of America Merrill Lynch 18,319
1,556 Credicorp Ltd Bank of America Merrill Lynch 6,466
(10,788) Ctrip.com International Ltd ADR Bank of America Merrill Lynch (18,925)
(12,800) Dorian LPG Ltd Bank of America Merrill Lynch 1,691
(13,005) Embraer SA ADR Bank of America Merrill Lynch 5,332
5,061 Enersis Americas SA ADR Bank of America Merrill Lynch (227)
17,222 Fibria Celulose SA ADR Bank of America Merrill Lynch 9,472
(4,005) Fomento Economico Bank of America Mexicano SAB de CV ADR Merrill Lynch 1,565
15,897 Genpact Ltd Bank of America Merrill Lynch 14,947
(4,281) Gold Fields Ltd ADR Bank of America Merrill Lynch 3,339
107 Grupo Aeroportuario del Bank of America Pacifico SAB de CV ADR Merrill Lynch 32
(11,838) Grupo Televisa SAB ADR Bank of America Merrill Lynch (5,919)
(10,548) Hollysys Automation Bank of America Technologies Ltd Merrill Lynch 13,502
3,674 Itau Unibanco Holding Bank of America SA ADR (Pref) Merrill Lynch (2,094)
(23,262) JD.com Inc ADR Bank of America Merrill Lynch (30,974)
41,266 KT Corp ADR Bank of America Merrill Lynch 13,564
(13,910) LG Display Co Ltd ADR Bank of America Merrill Lynch (6,955)
(9,559) Luxoft Holding Inc Bank of America Merrill Lynch (22,464)
(14,864) MakeMyTrip Ltd Bank of America Merrill Lynch 40,856
4,428 Mobile TeleSystems PJSC ADR Bank of America Merrill Lynch (1,063)
3,720 NetEase Inc ADR Bank of America Merrill Lynch 62,236
2,665 New Oriental Education & Bank of America Technology Group Inc ADR Merrill Lynch 3,278
(13,952) Petroleo Brasileiro Bank of America SA ADR (Pref) Merrill Lynch 11,789
(698) Philippine Long Distance Bank of America Telephone Co Merrill Lynch (3,399)
225 Philippine Long Distance Bank of America Telephone Co ADR Merrill Lynch (14,839)
4,851 POSCO ADR Bank of America Merrill Lynch (1,019)
(5,484) Siliconware Precision Bank of America Industries Co Ltd ADR Merrill Lynch (5,835)
(3,461) SINA Corp/China Bank of America Merrill Lynch (24,158)
(15,753) Sociedad Quimica y Bank of America Minera de Chile SA ADR Merrill Lynch (11,175)
5,799 Sohu.com Inc Bank of America Merrill Lynch 1,798
(31,271) SouFun Holdings Ltd ADR Bank of America Merrill Lynch 5,785
1,288 Southern Copper Corp Bank of America Merrill Lynch (837)
3,087 Taiwan Semiconductor Bank of America Manufacturing Co Ltd ADR Merrill Lynch 5,001
(7,361) TAL Education Group ADR Bank of America Merrill Lynch (9,073)
(23,320) Telefonica Brasil SA ADR Bank of America Merrill Lynch 9,794
8,009 Telekomunikasi Indonesia Bank of America Persero Tbk PT ADR Merrill Lynch (9,999)
(17,763) Tim Participacoes SA ADR Bank of America Merrill Lynch 11,191
(53,174) Turkcell Iletisim Hizmetleri Bank of America AS ADR Merrill Lynch (8,508)
(44,273) United Microelectronics Bank of America Corp ADR Merrill Lynch (4,246)
(14,324) Vale SA ADR (Pref) Bank of America Merrill Lynch 3,295
(1,434) Vipshop Holdings Ltd ADR Bank of America Merrill Lynch 1,620
12,056 Yandex NV 'A' Bank of America Merrill Lynch 10,645
(1,163) Yanzhou Coal Mining Co Ltd ADR Bank of America Merrill Lynch (233)
(2,975) YY Inc ADR Bank of America Merrill Lynch 8,598
69,697
Total (Gross underlying exposure - USD 90,595,617 ) 2,219,729
BlackRock Emerging Markets Allocation Fund continued
United States continued United States continued
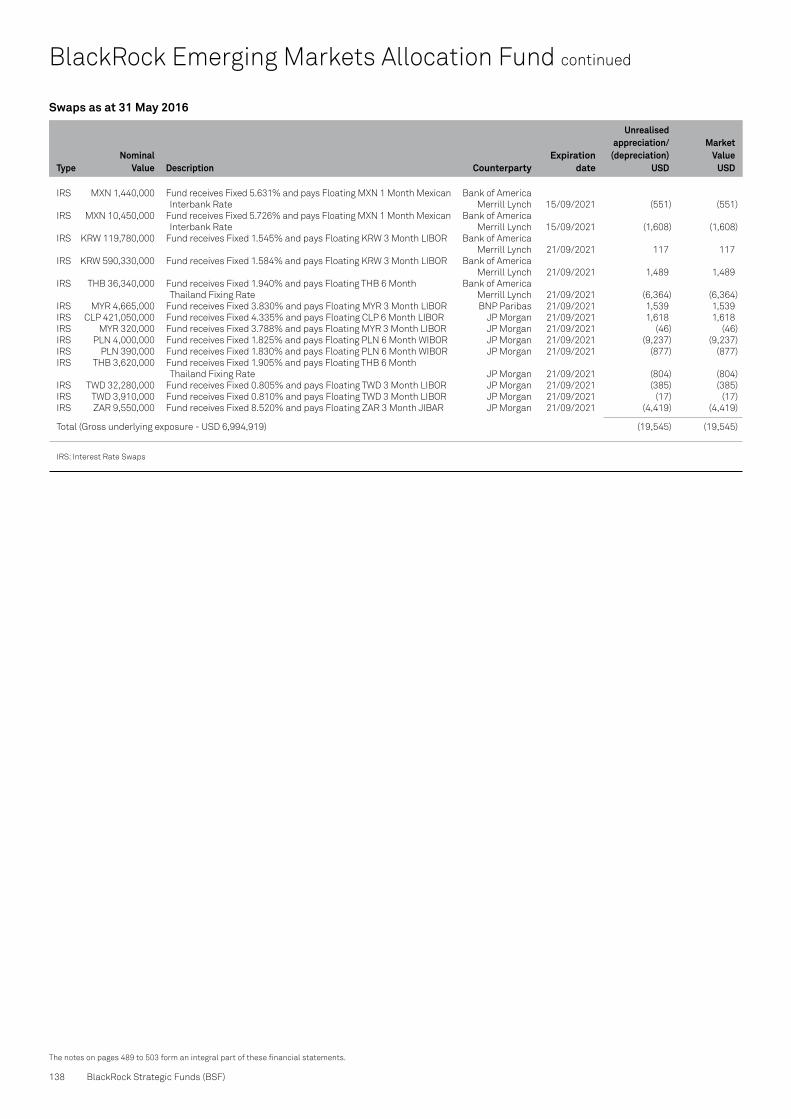
138 BlackRock Strategic Funds (BSF)
The notes on pages 489 to 503 form an integral part of these financial statements.
BlackRock Emerging Markets Allocation Fund continued
TypeNominal
Value Description CounterpartyExpiration
date
Unrealised appreciation/
(depreciation) USD
Market Value
USD
IRS MXN 1,440,000 Fund receives Fixed 5.631% and pays Floating MXN 1 Month Mexican Bank of America Interbank Rate Merrill Lynch 15/09/2021 (551) (551)
IRS MXN 10,450,000 Fund receives Fixed 5.726% and pays Floating MXN 1 Month Mexican Bank of America Interbank Rate Merrill Lynch 15/09/2021 (1,608) (1,608)
IRS KRW 119,780,000 Fund receives Fixed 1.545% and pays Floating KRW 3 Month LIBOR Bank of America Merrill Lynch 21/09/2021 117 117
IRS KRW 590,330,000 Fund receives Fixed 1.584% and pays Floating KRW 3 Month LIBOR Bank of America Merrill Lynch 21/09/2021 1,489 1,489
IRS THB 36,340,000 Fund receives Fixed 1.940% and pays Floating THB 6 Month Bank of America Thailand Fixing Rate Merrill Lynch 21/09/2021 (6,364) (6,364)
IRS MYR 4,665,000 Fund receives Fixed 3.830% and pays Floating MYR 3 Month LIBOR BNP Paribas 21/09/2021 1,539 1,539IRS CLP 421,050,000 Fund receives Fixed 4.335% and pays Floating CLP 6 Month LIBOR JP Morgan 21/09/2021 1,618 1,618IRS MYR 320,000 Fund receives Fixed 3.788% and pays Floating MYR 3 Month LIBOR JP Morgan 21/09/2021 (46) (46)IRS PLN 4,000,000 Fund receives Fixed 1.825% and pays Floating PLN 6 Month WIBOR JP Morgan 21/09/2021 (9,237) (9,237)IRS PLN 390,000 Fund receives Fixed 1.830% and pays Floating PLN 6 Month WIBOR JP Morgan 21/09/2021 (877) (877)IRS THB 3,620,000 Fund receives Fixed 1.905% and pays Floating THB 6 Month
Thailand Fixing Rate JP Morgan 21/09/2021 (804) (804)IRS TWD 32,280,000 Fund receives Fixed 0.805% and pays Floating TWD 3 Month LIBOR JP Morgan 21/09/2021 (385) (385)IRS TWD 3,910,000 Fund receives Fixed 0.810% and pays Floating TWD 3 Month LIBOR JP Morgan 21/09/2021 (17) (17)IRS ZAR 9,550,000 Fund receives Fixed 8.520% and pays Floating ZAR 3 Month JIBAR JP Morgan 21/09/2021 (4,419) (4,419)
Total (Gross underlying exposure - USD 6,994,919) (19,545) (19,545)
IRS: Interest Rate Swaps
Swaps as at 31 May 2016

Open forward foreign exchange transactions as at 31 May 2016
Currency Purchases Currency Sales CounterpartyMaturity
date
Unrealised appreciation/
(depreciation) USD
Open forward foreign exchange transactions as at 31 May 2016
Currency Purchases Currency Sales CounterpartyMaturity
date
Unrealised appreciation/
(depreciation) USD
Annual Report and Audited Accounts 139
The notes on pages 489 to 503 form an integral part of these financial statements.
AUD 344,000 USD 252,123 Deutsche Bank 15/6/2016 (2,708)AUD 431,000 USD 315,811 Credit Suisse 15/6/2016 (3,316)AUD 333,000 USD 239,113 Citibank 15/6/2016 2,327 BRL 403,000 USD 112,916 Citibank 15/6/2016 (928)BRL 403,000 USD 111,910 Deutsche Bank 15/6/2016 78 CAD 308,000 USD 235,224 Citibank 15/6/2016 703 CAD 1,534,000 USD 1,186,045 Credit Suisse 15/6/2016 (11,005)CHF 417,000 EUR 377,333 Citibank 15/6/2016 (125)CHF 30,000 EUR 27,148 HSBC 15/6/2016 (11)CHF 459,000 EUR 415,741 Credit Suisse 15/6/2016 (587) CLP 131,355,000 USD 193,739 Deutsche Bank 15/6/2016 (3,153)CLP 53,875,000 USD 76,903 JP Morgan 15/6/2016 1,268 CLP 121,857,000 USD 175,397 HSBC 15/6/2016 1,412 COP 390,121,000 USD 129,691 HSBC 15/6/2016 (3,587)COP 1,942,870,000 USD 647,578 Citibank 15/6/2016 (19,557)EUR 20,778 CHF 23,000 Credit Suisse 15/6/2016 (31)EUR 125,629 CHF 139,000 Citibank 15/6/2016 (125)EUR 476,259 HUF 150,284,000 Citibank 15/6/2016 (2,336)EUR 174,195 NOK 1,632,000 Citibank 15/6/2016 (689)EUR 601,596 NOK 5,620,000 Credit Suisse 15/6/2016 (438)EUR 94,615 NOK 887,000 UBS 15/6/2016 (442)EUR 53,238 PLN 233,000 HSBC 15/6/2016 133 EUR 22,383 PLN 99,000 UBS 15/6/2016 (209)EUR 35,734 PLN 157,000 Citibank 15/6/2016 (66)EUR 145,043 RON 653,000 UBS 15/6/2016 394 EUR 136,248 RON 614,000 Citibank 15/6/2016 222 EUR 641,081 SEK 5,941,000 Credit Suisse 15/6/2016 1,201 EUR 327,666 SEK 3,039,000 Citibank 15/6/2016 317 EUR 187,000 USD 208,883 Citibank 15/6/2016 76 EUR 80,000 USD 90,992 UBS 15/6/2016 (1,598)EUR 255,000 USD 289,036 Credit Suisse 15/6/2016 (4,093)EUR 222,000 USD 250,863 HSBC 15/6/2016 (2,795)GBP 59,000 USD 86,631 Credit Suisse 15/6/2016 (225)GBP 168,000 USD 243,594 Citibank 15/6/2016 2,443 GBP 38,000 USD 55,370 HSBC 15/6/2016 281 HUF 142,925,000 EUR 454,612 Citibank 15/6/2016 352 HUF 24,747,000 EUR 78,124 UBS 15/6/2016 721 HUF 221,111,000 EUR 701,289 Credit Suisse 15/6/2016 2,795 IDR 4,469,125,000 USD 333,442 Citibank 15/6/2016 (6,973)IDR 2,089,934,000 USD 156,257 Deutsche Bank 15/6/2016 (3,587)IDR 1,294,839,000 USD 94,857 UBS 15/6/2016 (269)INR 37,874,000 USD 562,974 UBS 15/6/2016 (1,365)INR 4,646,000 USD 69,285 Deutsche Bank 15/6/2016 (392)JPY 4,914,000 USD 44,692 Citibank 15/6/2016 (451)JPY 3,773,000 USD 34,615 UBS 15/6/2016 (646)JPY 15,967,000 USD 145,559 HSBC 15/6/2016 (1,807)JPY 12,085,000 USD 110,764 Credit Suisse 15/6/2016 (1,962)KRW 40,008,000 USD 33,879 UBS 15/6/2016 (319)KRW 486,134,000 USD 411,917 Deutsche Bank 15/6/2016 (4,127)KRW 421,508,000 USD 359,044 HSBC 15/6/2016 (5,465)MXN 9,005,000 USD 495,230 Credit Suisse 15/6/2016 (6,395)MXN 898,000 USD 50,038 UBS 15/6/2016 (1,291)MXN 5,182,000 USD 280,074 Citibank 15/6/2016 1,229 MXN 3,897,000 USD 214,149 Deutsche Bank 15/6/2016 (2,601)MYR 1,453,000 USD 358,251 Deutsche Bank 15/6/2016 (6,674)MYR 676,000 USD 167,555 UBS 15/6/2016 (3,985)MYR 222,000 USD 54,146 HSBC 15/6/2016 (430)NOK 2,128,000 EUR 229,702 Citibank 15/6/2016 (1,968)NOK 699,000 EUR 75,487 JP Morgan 15/6/2016 (685)NOK 1,968,000 EUR 210,978 UBS 15/6/2016 (197)NZD 311,000 USD 210,503 HSBC 15/6/2016 (427)NZD 488,000 USD 331,394 Credit Suisse 15/6/2016 (1,758)NZD 269,000 USD 183,211 Citibank 15/6/2016 (1,506)PHP 11,387,000 USD 243,733 UBS 15/6/2016 (433)PLN 215,000 EUR 48,697 Citibank 15/6/2016 355 PLN 453,000 EUR 102,328 UBS 15/6/2016 1,057 PLN 185,000 EUR 41,793 Bank of America Merrill Lynch 15/6/2016 428 RON 4,277,000 EUR 952,384 BNP Paribas 15/6/2016 (5,248)RON 178,000 EUR 39,538 HSBC 15/6/2016 (108)RON 330,000 EUR 73,328 Citibank 15/6/2016 (232)SEK 2,564,000 EUR 274,709 Citibank 15/6/2016 1,680
SEK 927,000 EUR 99,232 Credit Suisse 15/6/2016 705 SEK 156,000 EUR 16,857 HSBC 15/6/2016 (57)SGD 142,000 USD 103,578 JP Morgan 15/6/2016 (493)SGD 94,000 USD 68,095 Citibank 15/6/2016 144 SGD 585,000 USD 423,496 HSBC 15/6/2016 1,183 THB 79,630,000 USD 2,266,021 JP Morgan 15/6/2016 (37,507)TRY 996,000 USD 337,204 Credit Suisse 15/6/2016 (242)TRY 769,000 USD 258,629 Citibank 15/6/2016 1,536 TWD 19,037,000 USD 585,741 Citibank 15/6/2016 (1,847)USD 31,039 AUD 43,000 UBS 15/6/2016 (138)USD 461,881 AUD 637,000 Credit Suisse 15/6/2016 27 USD 428,463 AUD 592,000 Citibank 15/6/2016 (764)USD 107,276 BRL 382,000 Deutsche Bank 15/6/2016 1,124 USD 79,067 BRL 278,000 UBS 15/6/2016 1,815 USD 65,896 BRL 237,000 HSBC 15/6/2016 37 USD 95,330 CAD 125,000 HSBC 15/6/2016 (420)USD 222,988 CAD 289,000 Deutsche Bank 15/6/2016 1,615 USD 354,747 CAD 458,000 Credit Suisse 15/6/2016 3,921 USD 468,570 CLP 325,000,000 Goldman Sachs 15/6/2016 (2,991)USD 59,371 CLP 41,055,000 Citibank 15/6/2016 (198)USD 35,604 CLP 24,700,000 Credit Suisse 15/6/2016 (235)USD 941,289 CLP 631,285,000 JP Morgan 15/6/2016 25,322 USD 543,728 COP 1,775,000,000 Credit Suisse 15/6/2016 (30,030)USD 837,899 COP 2,675,000,000 BNP Paribas 15/6/2016 (26,779)USD 191,121 COP 576,445,000 Deutsche Bank 15/6/2016 4,789 USD 151,433 COP 466,839,000 HSBC 15/6/2016 531 USD 170,658 EUR 150,000 UBS 15/6/2016 3,044 USD 285,826 EUR 255,000 Credit Suisse 15/6/2016 883 USD 226,307 EUR 203,000 Citibank 15/6/2016 (530)USD 3,418 EUR 3,000 JP Morgan 15/6/2016 66 USD 173,831 GBP 119,000 HSBC 15/6/2016 (446)USD 778,914 GBP 539,000 Credit Suisse 15/6/2016 (10,456)USD 257,088 GBP 178,000 Citibank 15/6/2016 (3,594)USD 25,072 IDR 335,714,000 Citibank 15/6/2016 548 USD 16,601 IDR 227,926,000 HSBC 15/6/2016 (49)USD 38,920 IDR 533,432,000 UBS 15/6/2016 (48)USD 118,320 INR 7,993,000 HSBC 15/6/2016 (203)USD 274,666 INR 18,391,000 Citibank 15/6/2016 1,958 USD 45,090 INR 3,049,000 UBS 15/6/2016 (121)USD 71,037 JPY 7,750,000 Deutsche Bank 15/6/2016 1,263 USD 542,802 JPY 58,740,000 Credit Suisse 15/6/2016 13,960 USD 17,653 JPY 1,935,000 Citibank 15/6/2016 232 USD 976,697 KRW 1,155,478,000 HSBC 15/6/2016 7,433 USD 174,648 KRW 215,000,000 Goldman Sachs 15/6/2016 (5,703)USD 152,956 MXN 2,750,000 Morgan Stanley 15/6/2016 3,673 USD 152,066 MXN 2,750,000 Goldman Sachs 15/6/2016 2,783 USD 97,044 MXN 1,795,000 Citibank 15/6/2016 (398)USD 7,728 MXN 142,000 HSBC 15/6/2016 20 USD 716,667 MYR 2,881,000 HSBC 15/6/2016 19,561 USD 28,241 NZD 42,000 UBS 15/6/2016 (130)USD 88,951 NZD 132,000 Citibank 15/6/2016 (213)USD 206,654 NZD 308,000 HSBC 15/6/2016 (1,396)USD 852,295 PHP 40,175,000 HSBC 15/6/2016 (6,103)USD 337,210 PHP 15,832,000 Deutsche Bank 15/6/2016 (1,064)USD 27,009 SGD 37,000 Deutsche Bank 15/6/2016 149 USD 77,331 SGD 106,000 UBS 15/6/2016 381 USD 444,045 SGD 607,000 Credit Suisse 15/6/2016 3,395 USD 53,631 SGD 74,000 Citibank 15/6/2016 (89)USD 1,540,299 THB 54,619,000 HSBC 15/6/2016 11,740 USD 28,799 TRY 86,000 HSBC 15/6/2016 (296)USD 340,920 TRY 1,022,000 Citibank 15/6/2016 (4,839)USD 167,110 TWD 5,452,000 Deutsche Bank 15/6/2016 (112)USD 168,933 TWD 5,541,000 UBS 15/6/2016 (1,018)USD 370,548 ZAR 5,950,000 Royal Bank of Scotland 15/6/2016 (6,271)USD 408,092 ZAR 6,285,000 Citibank 15/6/2016 10,057 USD 379,132 ZAR 5,806,000 Credit Suisse 15/6/2016 11,433 USD 231,745 ZAR 3,625,000 HSBC 15/6/2016 2,170 ZAR 419,000 USD 27,417 HSBC 15/6/2016 (881)ZAR 1,877,000 USD 118,391 Citibank 15/6/2016 481 INR 145,656,070 USD 2,158,187 Barclays Bank 5/7/2016 (5,621)
(113,156)
BlackRock Emerging Markets Allocation Fund continued

Open forward foreign exchange transactions as at 31 May 2016
Currency Purchases Currency Sales CounterpartyMaturity
date
Unrealised appreciation/
(depreciation) USD
Futures contracts as at 31 May 2016
Number of contracts
Currencyof contract Contract/Description
Expiration date
Gross underlying
exposureUSD
Unrealised appreciation/
(depreciation) USD
140 BlackRock Strategic Funds (BSF)
The notes on pages 489 to 503 form an integral part of these financial statements.
BlackRock Emerging Markets Allocation Fund continued
EUR Hedged Share Class
EUR 339,994 USD 386,447 State Street Bank & Trust Company 15/6/2016 (6,530)USD 13,674 EUR 12,169 State Street Bank & Trust Company 15/6/2016 77
(6,453)
Total (Gross underlying exposure - USD 48,379,467) (119,609)
142 USD SGX CNX NIFTY Index June 2016 2,325,534 92,715
Total 2,325,534 92,715
Sector Breakdown as at 31 May 2016
% of Net Assets
Government 54.40Financial 28.00Technology 2.81Consumer, Non-cyclical 2.72Energy 2.30Industrial 1.79Consumer, Cyclical 1.59Utilities 0.41Basic Materials 0.34Diversified 0.21Communications 0.18
Securities portfolio at market value 94.75Other Net Assets 5.25
100.00

Annual Report and Audited Accounts 141
The notes on pages 489 to 503 form an integral part of these financial statements.
Transferable Securities and Money Market Instruments Admitted to an Official Stock Exchange Listing or Dealt in on Another Regulated Market
Transferable Securities and Money Market Instruments Admitted to an Official Stock Exchange Listing or Dealt in on Another Regulated Market
Holding
Description
Market Value
USD
% of Net
Assets
Holding
Description
Market Value
USD
% of Net
Assets
* Securities on loan, see Note 16, for further details.
Portfolio of Investments as at 31 May 2016
COMMON / PREFERRED STOCKS (SHARES)
Austria 8,657 Erste Group Bank AG 235,548 3.43
235,548 3.43
Bermuda 184,000 Brilliance China Automotive
Holdings Ltd 178,144 2.59 37,574 VimpelCom Ltd ADR 140,151 2.04
318,295 4.63
Brazil 6,746 Cia Brasileira de Distribuicao
ADR (Pref) 76,027 1.11 5,869 Embraer SA ADR 122,955 1.79 16,376 Itau Unibanco Holding SA ADR (Pref) 135,102 1.97 39,331 Kroton Educacional SA 120,575 1.75 28,522 Vale SA ADR * 114,944 1.67
569,603 8.29
British Virgin Islands 3,092 Luxoft Holding Inc 197,764 2.88 9,938 Mail.ru Group Ltd GDR RegS 195,282 2.84
393,046 5.72
Cayman Islands 121,000 3SBio Inc '144A' 119,953 1.75 575 Baidu Inc ADR 105,271 1.53 25,000 Hengan International Group Co Ltd 224,985 3.27 4,501 JD.com Inc ADR 111,310 1.62 8,700 Tencent Holdings Ltd 193,328 2.81 1,592 Tencent Holdings Ltd ADR 35,263 0.51
790,110 11.49
China 647,000 Bank of China Ltd 'H' 263,225 3.83 2,512 China Petroleum & Chemical
Corp ADR 171,821 2.50 269,000 Industrial & Commercial Bank
of China Ltd 'H' 142,687 2.07
577,733 8.40
Greece 52,194 Alpha Bank AE 144,579 2.10 14,918 OPAP SA 123,304 1.80
267,883 3.90
Hong Kong 16,500 China Mobile Ltd 188,427 2.74 1,949 China Mobile Ltd ADR 109,300 1.59 134,000 CNOOC Ltd 159,926 2.33 247 CNOOC Ltd ADR 29,650 0.43
487,303 7.09
India 4,477 Axis Bank Ltd GDR RegS 172,812 2.51 19,072 ICICI Bank Ltd ADR 137,891 2.01 10,019 Mahindra & Mahindra Ltd GDR 195,370 2.84
506,073 7.36
Indonesia 390,500 Astra International Tbk PT 188,675 2.75 3,240 Astra International Tbk PT ADR 31,833 0.46
220,508 3.21
Poland 4,757 KGHM Polska Miedz SA 74,433 1.08 14,941 Powszechny Zaklad Ubezpieczen SA 120,395 1.75
194,828 2.83
Russia 10,550 MMC Norilsk Nickel PJSC ADR 149,810 2.18
149,810 2.18
Singapore 15,300 BOC Aviation Ltd '144A' 82,733 1.20
82,733 1.20
South Africa 6,569 Bidvest Group Ltd/The 51,109 0.74
51,109 0.74
South Korea 2,007 KT&G Corp 214,711 3.12 2,894 LG Corp 160,022 2.33 501 Lotte Shopping Co Ltd 96,055 1.40 254 NAVER Corp 153,448 2.23 623 POSCO 108,730 1.58 1,407 POSCO ADR 61,655 0.90 3,279 Shinhan Financial Group Co Ltd 108,814 1.58 6,541 SK Hynix Inc 157,515 2.29 1 WONIK IPS Co Ltd 19 0.00
1,060,969 15.43
Taiwan 55,000 Formosa Chemicals & Fibre Corp 138,628 2.02
138,628 2.02
Thailand 63,900 Central Pattana PCL NVDR 103,295 1.50 15,400 PTT PCL NVDR 129,752 1.89 61,000 Thai Oil PCL NVDR 108,426 1.58
341,473 4.97
Turkey 7,140 Coca-Cola Icecek AS 88,695 1.29
88,695 1.29
United States 2,895 Cognizant Technology
Solutions Corp 'A' 179,808 2.62
179,808 2.62
Total Common / Preferred Stocks (Shares) 6,654,155 96.80
Total Transferable Securities and Money Market Instruments Admitted to an Official Stock Exchange Listing or Dealt in on Another Regulated Market 6,654,155 96.80
Securities portfolio at market value 6,654,155 96.80
Other Net Assets 219,914 3.20
Total Net Assets (USD) 6,874,069 100.00
BlackRock Emerging Markets Equity Strategies Fund

Contracts for difference as at 31 May 2016
Holding
Description Counterparty
Unrealised appreciation/
(depreciation) USD
Holding
Description Counterparty
Unrealised appreciation/
(depreciation) USD
Open forward foreign exchange transactions as at 31 May 2016
Currency Purchases Currency Sales CounterpartyMaturity
date
Unrealised appreciation/
(depreciation) USD
142 BlackRock Strategic Funds (BSF)
The notes on pages 489 to 503 form an integral part of these financial statements.
BlackRock Emerging Markets Equity Strategies Fund continued
Hong Kong (23,400) AIA Group Ltd Credit Suisse (2,448)
(2,448)
Hungary (5,436) OTP Bank Plc HSBC 6,322
6,322
India 1,725 Mahindra &
Mahindra Ltd GDR Deutsche Bank (614)
(614)
Philippines (42,600) Ayala Land Inc Deutsche Bank (928) (129,800) Ayala Land Inc HSBC 1,104
176
South Africa 13,631 Mr Price Group Ltd Credit Suisse 1,763
1,763
Spain 17,699 Telefonica SA Credit Suisse 2,940
2,940
Turkey 55,133 Turkiye Halk Bankasi AS HSBC (12,864) (72,647) Turkiye Vakiflar
Bankasi TAO 'D' Credit Suisse 6,737
(6,127)
United States 17,802 China Life Insurance
Co Ltd ADR HSBC 5,697 5,162 Melco Crown
Entertainment Ltd ADR Credit Suisse 1,703 (2,169) Telekomunikasi Indonesia
Persero Tbk PT ADR Deutsche Bank 2,711
10,111
Total (Gross underlying exposure – USD 1,454,139) 12,123
EUR Hedged Share Class
EUR 1,023,026 USD 1,163,006 State Street Bank & Trust Company 15/6/2016 (19,852)USD 25,097 EUR 22,378 State Street Bank & Trust Company 15/6/2016 92
(19,760)
Total (Gross underlying exposure - USD 1,168,160) (19,760)
Sector Breakdown as at 31 May 2016
% of Net Assets
Financial 23.95Communications 17.91Consumer, Cyclical 14.17Consumer, Non-cyclical 13.03Basic Materials 9.43Energy 8.73Technology 7.79Industrial 1.79
Securities portfolio at market value 96.80Other Net Assets 3.20
100.00

Annual Report and Audited Accounts 143
The notes on pages 489 to 503 form an integral part of these financial statements.
Transferable Securities and Money Market Instruments Admitted to an Official Stock Exchange Listing or Dealt in on Another Regulated Market
Transferable Securities and Money Market Instruments Admitted to an Official Stock Exchange Listing or Dealt in on Another Regulated Market
Holding
Description
Market Value
USD
% of Net
Assets
Holding
Description
Market Value
USD
% of Net
Assets
Portfolio of Investments as at 31 May 2016
BONDS
Argentina USD 19,592,092 Argentina Bonar Bonds 'X' 7.00%
17/4/2017 20,288,101 5.41 USD 1,440,000 Banco Hipotecario SA RegS 9.75%
30/11/2020 1,536,113 0.41 USD 722,000 Provincia de Buenos Aires/Argentina
RegS 10.875% 26/1/2021 809,961 0.22 USD 6,203,000 Provincia de Buenos Aires/Argentina
RegS 9.125% 16/3/2024 6,623,253 1.77 USD 1,677,000 Provincia de Buenos Aires/Argentina
RegS 9.625% 18/4/2028 1,870,283 0.50
31,127,711 8.31
Belarus USD 13,135,000 Belarus International Bond 8.95%
26/1/2018 13,783,081 3.68
13,783,081 3.68
Brazil USD 2,884,000 Banco Nacional de Desenvolvimento
Economico e Social RegS 5.50% 12/7/2020 2,922,934 0.78
2,922,934 0.78
Canada USD 3,576,000 Pacific Exploration and Production
Corp RegS 5.375% 26/1/2019 563,220 0.15 USD 7,716,000 Pacific Exploration and Production
Corp RegS 7.25% 12/12/2021 1,215,270 0.32
1,778,490 0.47
Colombia COP 14,385,000,000 Colombia Government International
Bond 7.75% 14/4/2021 4,654,390 1.24
COP 10,620,000,000 Colombia Government International Bond 9.85% 28/6/2027 3,906,779 1.04
COP 9,484,000,000 Colombian TES 'B' 10.00% 24/7/2024 3,444,383 0.92
12,005,552 3.20
Dominican Republic USD 10,138,000 Dominican Republic International
Bond RegS 7.45% 30/4/2044 10,746,280 2.87
10,746,280 2.87
Hungary USD 19,506,000 Hungary Government International
Bond 7.625% 29/3/2041 27,478,395 7.33
27,478,395 7.33
Indonesia IDR 134,873,000,000 Indonesia Treasury Bond 8.375%
15/9/2026 10,247,435 2.73 IDR 208,684,000,000 Indonesia Treasury Bond 8.375%
15/3/2034 15,761,218 4.21
26,008,653 6.94
Kazakhstan USD 5,671,000 Kazakhstan Government
International Bond RegS 6.50% 21/7/2045 6,132,676 1.64
USD 20,404,000 KazMunayGas National Co JSC RegS 5.75% 30/4/2043 18,381,760 4.90
24,514,436 6.54
Luxembourg USD 10,561,000 ALROSA Finance SA RegS
7.75% 3/11/2020 11,901,930 3.18 USD 7,563,000 Gazprom OAO Via Gaz Capital SA
RegS 8.625% 28/4/2034 9,235,331 2.46 USD 14,905,000 Gazprom OAO Via Gaz Capital SA
RegS 7.288% 16/8/2037 16,755,903 4.47
37,893,164 10.11
Mexico MXN 109,524,200 Mexican Bonos 'M'
7.75% 13/11/2042 6,603,346 1.76 USD 1,858,000 Mexico Government International
Bond 5.75% 12/10/2110 1,881,225 0.50 USD 4,151,000 Petroleos Mexicanos
5.625% 23/1/2046 3,542,878 0.95
12,027,449 3.21
Netherlands USD 34,370,000 Petrobras Global Finance BV 6.85%
5/6/2115 23,801,225 6.35 USD 3,144,375 Republic of Angola Via Northern
Lights III BV RegS 7.00% 16/8/2019 3,199,401 0.85
27,000,626 7.20
Nigeria USD 3,868,000 Nigeria Government International
Bond RegS 6.375% 12/7/2023 3,665,162 0.98
3,665,162 0.98
Republic of Cameroon USD 1,745,000 Republic of Cameroon
International Bond RegS 9.50% 19/11/2025 1,716,871 0.46
1,716,871 0.46
Romania USD 10,014,000 Romanian Government
International Bond RegS 6.125% 22/1/2044 12,150,697 3.24
12,150,697 3.24
Russia RUB 814,403,000 Russian Federal Bond -
OFZ 8.15% 3/2/2027 11,903,785 3.18 USD 3,400,000 Russian Foreign Bond - Eurobond
RegS 5.875% 16/9/2043 3,689,000 0.98
15,592,785 4.16
BlackRock Emerging Markets Flexi Dynamic Bond Fund

144 BlackRock Strategic Funds (BSF)
The notes on pages 489 to 503 form an integral part of these financial statements.
Transferable Securities and Money Market Instruments Admitted to an Official Stock Exchange Listing or Dealt in on Another Regulated Market
Holding
Description
Market Value
USD
% of Net
Assets
BlackRock Emerging Markets Flexi Dynamic Bond Fund continued
Serbia USD 15,799,000 Serbia International Bond RegS
5.875% 3/12/2018 16,760,685 4.47
16,760,685 4.47
South Africa USD 3,907,000 Eskom Holdings SOC Ltd RegS
7.125% 11/2/2025 3,575,960 0.95
3,575,960 0.95
Ukraine USD 3,798,000 Ukraine Government International
Bond RegS 7.75% 1/9/2019 3,689,282 0.98
3,689,282 0.98
Venezuela USD 6,200,000 Petroleos de Venezuela SA RegS
8.50% 2/11/2017 4,045,500 1.08 USD 21,523,159 Petroleos de Venezuela SA RegS
9.75% 17/5/2035 8,237,989 2.20
12,283,489 3.28
Total Bonds 296,721,702 79.16
Total Transferable Securities and Money Market Instruments Admitted to an Official Stock Exchange Listing or Dealt in on Another Regulated Market 296,721,702 79.16
Securities portfolio at market value 296,721,702 79.16
Other Net Assets 78,100,055 20.84
Total Net Assets (USD) 374,821,757 100.00
Portfolio of Investments as at 31 May 2016

TypeNominal
Value Description CounterpartyExpiration
date
Unrealised appreciation/
(depreciation) USD
Market Value
USD
Open forward foreign exchange transactions as at 31 May 2016
Currency Purchases Currency Sales CounterpartyMaturity
date
Unrealised appreciation/
(depreciation) USD
Open forward foreign exchange transactions as at 31 May 2016
Currency Purchases Currency Sales CounterpartyMaturity
date
Unrealised appreciation/
(depreciation) USD
Annual Report and Audited Accounts 145
The notes on pages 489 to 503 form an integral part of these financial statements.
CDS EUR 7,000,000 Fund receives default protection on Markit iTraxx Europe Crossover Series 24 Version 1 and pays Fixed 5.000% Barclays Bank 20/12/2020 (331,430) (531,638)
CDS EUR 10,500,000 Fund receives default protection on Markit iTraxx Europe Crossover Series 24 Version 1 and pays Fixed 5.000% Citibank 20/12/2020 (522,116) (797,457)
CDS EUR 17,000,000 Fund receives default protection on Markit iTraxx Europe Crossover Series 25 Version 1 and pays Fixed 5.000% Citibank 20/06/2021 (155,678) (1,650,400)
CDS USD 39,689,979 Fund receives default protection on Markit CDX.EM.25 and pays Fixed 1.000% Citibank 20/06/2021 6,790 3,538,095
CDS USD 21,000,000 Fund receives default protection on Markit CDX.NA.HY.26 and pays Fixed 5.000% Citibank 20/06/2021 (170,709) (590,709)
CDS USD 13,400,000 Fund receives default protection on Republic of Colombia and pays Fixed 1.000% Citibank 20/06/2021 (130,131) 806,912
CDS USD 9,200,000 Fund receives default protection on Republic of Colombia and pays Fixed 1.000% Citibank 20/06/2021 (122,050) 553,999
CDS USD 14,400,000 Fund receives default protection on Republic of Colombia and pays Fixed 1.000% Citibank 20/06/2021 (154,450) 868,129
CDS EUR 17,500,000 Fund receives default protection on Markit iTraxx Europe Crossover Series 25 Version 1 and pays Fixed 5.000% JP Morgan 20/06/2021 157,080 (1,698,941)
CDS USD 21,500,000 Fund receives default protection on Markit CDX.NA.HY.26 and pays Fixed 5.000% JP Morgan 20/06/2021 (240,778) (604,773)
IRS PLN 8,200,000 Fund receives Floating PLN 6 Month WIBOR and pays Fixed 2.415% Bank of America Merrill Lynch 09/05/2026 (4,132) (4,132)
IRS BRL 69,240,619 Fund receives Fixed 15.170% and pays Floating BRL 12 Month CETIP Citibank 02/01/2018 715,284 715,284IRS BRL 13,798,496 Fund receives Fixed 15.200% and pays Floating BRL 12 Month LIBOR Citibank 04/01/2021 409,988 409,988IRS BRL 13,205,114 Fund receives Fixed 16.280% and pays Floating BRL 12 Month LIBOR Citibank 04/01/2021 618,159 618,159IRS PLN 20,900,000 Fund receives Floating PLN 6 Month WIBOR and pays Fixed 2.325% Citibank 02/11/2025 13,075 13,075IRS EUR 6,423,238 Fund receives Floating EUR 6 Month EURIBOR and pays Fixed 1.095% Citibank 25/04/2046 124,435 124,435IRS USD 4,033,628 Fund receives Fixed 2.127% and pays Floating USD 3 Month LIBOR Citibank 10/05/2046 (53,433) (53,433)IRS USD 3,882,894 Fund receives Fixed 2.112% and pays Floating USD 3 Month LIBOR Citibank 13/05/2046 (75,131) (75,131)IRS PLN 22,300,000 Fund receives Floating PLN 6 Month WIBOR and pays Fixed 1.940% Goldman Sachs 11/12/2020 (6,714) (6,714)IRS PLN 9,400,000 Fund receives Floating PLN 6 Month WIBOR and pays Fixed 2.440% Goldman Sachs 11/12/2025 (15,931) (15,931)IRS PLN 32,600,000 Fund receives Floating PLN 6 Month WIBOR and pays Fixed 2.165% JP Morgan 30/07/2020 (98,168) (98,168)IRS PLN 6,000,000 Fund receives Floating PLN 6 Month WIBOR and pays Fixed 1.850% JP Morgan 10/11/2020 3,368 3,368IRS BRL 5,002,148 Fund receives Fixed 12.38% and pays Floating BRL 6 Month LIBOR JP Morgan 04/01/2021 (25,827) (25,827)IRS PLN 55,900,000 Fund receives Floating PLN 6 Month WIBOR and pays Fixed 2.435% JP Morgan 24/12/2025 (84,852) (84,852)IRS HUF 2,351,000,000 Fund receives Floating HUF 6 Month BUBOR and pays Fixed 2.255% JP Morgan 12/05/2026 76,576 76,576
Total (Gross underlying exposure - USD 270,035,008) (66,775) 1,489,914
CDS: Credit Default SwapsIRS: Interest Rate Swaps
BlackRock Emerging Markets Flexi Dynamic Bond Fund continued
Swaps as at 31 May 2016
PEN 58,429,083 USD 16,493,743 Credit Suisse 2/6/2016 864,868 USD 16,838,388 PEN 58,429,208 Goldman Sachs 2/6/2016 (520,259)ARS 70,805,572 USD 4,691,473 Citibank 21/6/2016 295,047 USD 47,619 ARS 762,375 JP Morgan 21/6/2016 (6,072)USD 1,648,506 ARS 23,639,571 Citibank 21/6/2016 (16,324)AUD 11,017,423 USD 7,904,263 Barclays Bank 28/6/2016 80,175 AUD 10,350,777 USD 7,460,022 HSBC 28/6/2016 41,291 AUD 2,446,160 USD 1,775,215 Deutsche Bank 28/6/2016 (2,458)AUD 2,617,375 USD 1,869,070 JP Morgan 28/6/2016 27,768 AUD 10,350,777 USD 7,445,759 Citibank 28/6/2016 55,554 BRL 84,650,376 USD 23,310,124 Goldman Sachs 28/6/2016 129,357 BRL 64,588,258 USD 18,030,849 Deutsche Bank 28/6/2016 (146,520)BRL 17,125,075 USD 4,707,200 BNP Paribas 28/6/2016 34,691 BRL 17,665,959 USD 4,920,880 JP Morgan 28/6/2016 (29,219)CAD 1,217,579 USD 930,849 JP Morgan 28/6/2016 1,817 CAD 4,931,811 USD 3,767,329 Goldman Sachs 28/6/2016 10,439 CAD 9,800,299 USD 7,534,930 Citibank 28/6/2016 (27,898)CLP 3,899,099,966 USD 5,601,784 HSBC 28/6/2016 49,328 CLP 1,270,702,768 USD 1,827,560 Credit Suisse 28/6/2016 14,117 CLP 2,565,007,527 USD 3,699,975 Goldman Sachs 28/6/2016 17,587 CLP 5,200,223,193 USD 7,562,861 BNP Paribas 28/6/2016 (25,982)
COP 23,446,216,920 USD 7,607,468 Credit Suisse 28/6/2016 (45,844)COP 33,565,901,045 USD 10,915,740 Citibank 28/6/2016 (90,423)COP 394,108,087 USD 129,009 Standard Chartered Bank 28/6/2016 (1,905)COP 24,096,868,059 USD 7,887,682 Goldman Sachs 28/6/2016 (116,216)COP 38,969,490,496 USD 12,664,768 HSBC 28/6/2016 (96,742)COP 11,544,116,251 USD 3,737,169 BNP Paribas 28/6/2016 (14,084)CZK 14,187,660 USD 592,681 Barclays Bank 28/6/2016 (5,835)CZK 14,187,660 USD 586,182 Citibank 28/6/2016 664 EUR 10,109,248 USD 11,285,358 Bank of America Merrill Lynch 28/6/2016 16,323 EUR 20,061,135 USD 22,662,763 UBS 28/6/2016 (235,323)EUR 6,649,414 USD 7,412,328 JP Morgan 28/6/2016 21,416 IDR 423,620,379,747 USD 30,916,752 HSBC 28/6/2016 90,449 IDR 70,450,071,727 USD 5,123,642 JP Morgan 28/6/2016 33,008 IDR 102,269,679,834 USD 7,504,379 Citibank 28/6/2016 (18,676)INR 504,927,049 USD 7,502,631 Bank of America Merrill Lynch 28/6/2016 (15,682)JPY 2,066,753,741 USD 18,760,019 HSBC 28/6/2016 (143,042)JPY 3,920,877,704 USD 35,770,646 Citibank 28/6/2016 (452,026)KRW 1,106,222,874 USD 931,556 Morgan Stanley 28/6/2016 (1,966)

Open forward foreign exchange transactions as at 31 May 2016
Currency Purchases Currency Sales CounterpartyMaturity
date
Unrealised appreciation/
(depreciation) USD
Open forward foreign exchange transactions as at 31 May 2016
Currency Purchases Currency Sales CounterpartyMaturity
date
Unrealised appreciation/
(depreciation) USD
146 BlackRock Strategic Funds (BSF)
The notes on pages 489 to 503 form an integral part of these financial statements.
BlackRock Emerging Markets Flexi Dynamic Bond Fund continued
MXN 34,816,261 USD 1,879,939 Royal Bank of Scotland 28/6/2016 7,319 MXN 141,001,259 USD 7,611,811 Goldman Sachs 28/6/2016 31,332 MXN 489,743,048 USD 26,580,774 HSBC 28/6/2016 (33,662)MXN 31,209,450 USD 1,686,235 Deutsche Bank 28/6/2016 5,511 MXN 139,163,664 USD 7,524,588 Citibank 28/6/2016 18,946 MYR 30,820,607 USD 7,500,756 HSBC 28/6/2016 (29,467)PHP 424,961,005 USD 9,082,304 Citibank 28/6/2016 (1,519)PHP 350,740,435 USD 7,507,287 HSBC 28/6/2016 (12,485)PLN 28,670,131 USD 7,260,264 JP Morgan 28/6/2016 41,103 PLN 21,842,882 USD 5,532,687 Deutsche Bank 28/6/2016 29,998 PLN 17,965,337 USD 4,542,385 Bank of America Merrill Lynch 28/6/2016 32,813 RUB 765,805,678 USD 11,471,488 Citibank 28/6/2016 68,198 RUB 2,426,947,709 USD 36,243,998 JP Morgan 28/6/2016 326,918 RUB 302,060,826 USD 4,459,121 HSBC 28/6/2016 92,540 RUB 62,230,764 USD 930,623 Morgan Stanley 28/6/2016 7,113 THB 319,960,985 USD 8,960,886 Morgan Stanley 28/6/2016 (8,323)TRY 38,861,980 USD 13,061,080 Citibank 28/6/2016 41,727 TRY 21,498,782 USD 7,133,731 Barclays Bank 28/6/2016 114,855 TRY 958,259 USD 317,978 Bank of America Merrill Lynch 28/6/2016 5,111 USD 7,460,022 AUD 10,350,777 HSBC 28/6/2016 (41,291)USD 8,226,499 AUD 11,466,575 Barclays Bank 28/6/2016 (83,444)USD 1,897,224 AUD 2,623,196 JP Morgan 28/6/2016 (3,833)USD 7,485,982 AUD 10,406,693 Citibank 28/6/2016 (55,854)USD 19,927,750 AUD 27,435,541 Westpac 28/6/2016 44,936 USD 4,537,615 AUD 6,288,479 Morgan Stanley 28/6/2016 (19,710)USD 20,318,486 BRL 72,590,215 Deutsche Bank 28/6/2016 218,434 USD 10,964,296 BRL 39,660,242 Goldman Sachs 28/6/2016 (17,527)USD 8,179,513 CAD 10,739,280 Bank of America Merrill Lynch 28/6/2016 (46,779)USD 1,506,931 CAD 1,972,724 Goldman Sachs 28/6/2016 (4,176)USD 2,127,978 CAD 2,751,222 JP Morgan 28/6/2016 20,541 USD 14,978,504 CAD 19,481,776 Citibank 28/6/2016 55,458 USD 5,601,784 CLP 3,899,099,966 HSBC 28/6/2016 (49,328)USD 12,592,544 CLP 8,729,781,349 Goldman Sachs 28/6/2016 (59,856)USD 12,664,768 COP 38,969,490,496 HSBC 28/6/2016 96,742 USD 13,195,329 COP 40,588,778,996 Credit Suisse 28/6/2016 105,068 USD 9,389,989 COP 28,930,557,603 Citibank 28/6/2016 59,614 USD 27,606,082 COP 84,336,579,264 Goldman Sachs 28/6/2016 406,745 USD 586,182 CZK 14,187,660 Citibank 28/6/2016 (664)USD 36,182,777 EUR 32,375,247 Bank of America Merrill Lynch 28/6/2016 (11,283)USD 1,888,437 HUF 531,991,556 Bank of America Merrill Lynch 28/6/2016 (3,452)USD 20,925,276 IDR 286,371,554,880 HSBC 28/6/2016 (35,897)USD 7,385,325 IDR 100,647,213,345 Citibank 28/6/2016 18,380 USD 45,423,261 IDR 612,759,785,890 State Street Bank & Trust Company 28/6/2016 571,864 USD 3,661,165 INR 246,799,112 HSBC 28/6/2016 1,681 USD 7,599,995 JPY 832,007,985 Citibank 28/6/2016 105,405 USD 27,099,811 JPY 2,985,532,031 HSBC 28/6/2016 206,631 USD 1,888,576 KRW 2,236,262,996 Citibank 28/6/2016 9,382 USD 3,744,862 KRW 4,453,089,888 HSBC 28/6/2016 2,806 USD 46,793,038 MXN 862,124,255 HSBC 28/6/2016 60,556 USD 4,698,802 MXN 87,040,653 Goldman Sachs 28/6/2016 (19,341)USD 9,389,089 MXN 173,756,435 Citibank 28/6/2016 (29,588)USD 9,127,475 MXN 168,854,268 JP Morgan 28/6/2016 (25,474)USD 15,458,534 MYR 63,519,116 HSBC 28/6/2016 60,728 USD 9,119,438 MYR 37,011,239 Morgan Stanley 28/6/2016 147,464 USD 9,138,302 MYR 37,078,659 JP Morgan 28/6/2016 149,984 USD 1,150,778 NZD 1,707,298 Bank of America Merrill Lynch 28/6/2016 (1,715)USD 19,688,076 NZD 29,256,493 Morgan Stanley 28/6/2016 (61,214)USD 9,105,657 PHP 424,961,005 HSBC 28/6/2016 24,872 USD 4,731,651 PLN 18,713,892 Bank of America Merrill Lynch 28/6/2016 (34,180)USD 17,831,359 PLN 69,624,138 Barclays Bank 28/6/2016 100,313 USD 7,240,576 PLN 28,553,826 JP Morgan 28/6/2016 (31,173)USD 4,459,121 RUB 302,060,826 HSBC 28/6/2016 (92,540)USD 7,619,720 RUB 506,430,212 Citibank 28/6/2016 (11,519)
USD 28,028,490 RUB 1,854,777,657 JP Morgan 28/6/2016 79,425 USD 4,471,408 RUB 295,325,296 Credit Suisse 28/6/2016 21,243 USD 7,538,531 SGD 10,406,279 JP Morgan 28/6/2016 (14,416)USD 8,969,402 THB 319,960,985 Citibank 28/6/2016 16,839 USD 13,161,130 TRY 39,159,874 Citibank 28/6/2016 (42,116)USD 18,096,605 TRY 54,269,909 Royal Bank of Scotland 28/6/2016 (201,180)USD 8,311,558 TWD 270,748,998 UBS 28/6/2016 3,014 USD 5,262,679 ZAR 82,637,039 HSBC 28/6/2016 42,870 USD 36,365,699 ZAR 576,284,237 Citibank 28/6/2016 (35,578)USD 7,786,553 ZAR 124,356,842 JP Morgan 28/6/2016 (68,508)USD 8,259,691 ZAR 131,273,985 Morgan Stanley 28/6/2016 (32,294)ZAR 481,787,676 USD 30,417,270 Citibank 28/6/2016 15,085 ZAR 82,637,039 USD 5,262,679 HSBC 28/6/2016 (42,870)ZAR 251,188,303 USD 15,871,311 Morgan Stanley 28/6/2016 (4,879)CNY 117,557,817 USD 17,859,144 Standard Chartered Bank 15/7/2016 (28,240)CNY 395,968,844 USD 60,192,142 HSBC 15/7/2016 (132,480)USD 282,616 CNY 1,840,867 Standard Chartered Bank 15/7/2016 3,398 USD 70,774,923 CNY 465,338,340 HSBC 15/7/2016 193,453 USD 16,323,267 CNY 108,304,877 Morgan Stanley 15/7/2016 (104,173)ARS 119,018,149 USD 6,669,029 BNP Paribas 9/1/2017 733,978 ARS 58,190,912 USD 3,322,582 JP Morgan 9/1/2017 296,931 USD 3,172,091 ARS 57,922,385 Citibank 9/1/2017 (430,719)USD 6,222,933 ARS 111,090,421 BNP Paribas 9/1/2017 (686,965)USD 157,621 ARS 2,766,257 JP Morgan 9/1/2017 (14,442)
1,804,573
EUR Hedged Share Class
EUR 56,676,068 USD 64,462,198 State Street Bank & Trust Company 15/6/2016 (1,130,959)USD 1,212,438 EUR 1,072,912 State Street Bank & Trust Company 15/6/2016 13,540
(1,117,419)
GBP Hedged Share Class
GBP 9,829 USD 14,182 State Street Bank & Trust Company 15/6/2016 213 USD 189 GBP 130 State Street Bank & Trust Company 15/6/2016 (2)
211
Total (Gross underlying exposure - USD 1,479,244,404) 687,365
Sector Breakdown as at 31 May 2016
% of Net Assets
Government 51.74Energy 22.88Basic Materials 3.18Utilities 0.95Financial 0.41
Securities portfolio at market value 79.16Other Net Assets 20.84
100.00

Annual Report and Audited Accounts 147
The notes on pages 489 to 503 form an integral part of these financial statements.
Transferable Securities and Money Market Instruments Admitted to an Official Stock Exchange Listing or Dealt in on Another Regulated Market
Transferable Securities and Money Market Instruments Admitted to an Official Stock Exchange Listing or Dealt in on Another Regulated Market
Holding
Description
Market Value
USD
% of Net
Assets
Holding
Description
Market Value
USD
% of Net
Assets
* Securities on loan, see Note 16, for further details.1 Investment in connected party fund, see further information in Note 10.
Portfolio of Investments as at 31 May 2016
COMMON STOCKS (SHARES)
Ireland 10,353 Accenture Plc 'A' 1,106,397 0.11 20,275 Mallinckrodt Plc 1,153,941 0.12
2,260,338 0.23
United States 7,035 3M Co 1,063,671 0.11 19,098 AbbVie Inc 1,079,575 0.11 18,485 Altria Group Inc 1,056,713 0.10 2,047 Amazon.com Inc 1,329,038 0.13 36,283 American Airlines Group Inc 1,040,010 0.10 27,933 Baxalta Inc 1,134,884 0.11 9,813 Boeing Co/The 1,111,979 0.11 9,971 Brown-Forman Corp 'B' 878,380 0.09 23,888 CBS Corp 'B non-voting share' 1,184,476 0.12 19,300 Cognizant Technology
Solutions Corp 'A' 1,065,163 0.11 11,798 Cummins Inc 1,213,130 0.12 17,682 DaVita HealthCare Partners Inc 1,228,091 0.12 24,033 Dow Chemical Co/The 1,108,767 0.11 16,276 Eastman Chemical Co 1,072,542 0.11 14,028 Edwards Lifesciences Corp 1,241,193 0.12 19,216 EI du Pont de Nemours & Co 1,129,054 0.11 15,306 Eli Lilly & Co 1,031,583 0.10 10,288 Equifax Inc 1,161,923 0.12 9,965 Facebook Inc 'A' 1,063,500 0.11 8,497 FedEx Corp 1,259,151 0.12 24,580 Fluor Corp 1,165,356 0.12 30,661 FMC Corp 1,307,964 0.13 38,552 Goodyear Tire & Rubber Co/The 968,605 0.10 59,308 H&R Block Inc 1,137,947 0.11 15,029 Harris Corp 1,063,404 0.11 28,212 International Paper Co 1,068,420 0.11 11,475 Intuit Inc 1,099,415 0.11 15,931 Kellogg Co 1,064,261 0.11 13,124 MasterCard Inc 'A' 1,130,556 0.11 20,660 Merck & Co Inc 1,044,089 0.10 12,805 Monsanto Co 1,293,670 0.13 16,187 Motorola Solutions Inc 1,007,207 0.10 5,555 Northrop Grumman Corp 1,061,201 0.11 64,040 Pitney Bowes Inc 1,071,696 0.11 20,861 Qualcomm Inc 1,029,137 0.10 8,488 Raytheon Co 988,672 0.10 13,339 Rockwell Collins Inc 1,059,212 0.10 12,820 S&P Global Inc 1,287,585 0.13 23,852 Southern Co/The 1,059,280 0.10 20,730 Texas Instruments Inc 1,128,442 0.11 22,413 Total System Services Inc 1,081,139 0.11 18,369 TripAdvisor Inc 1,117,733 0.11 11,707 United Parcel Service Inc 'B' 1,084,101 0.11 14,618 Varian Medical Systems Inc 1,087,109 0.11 12,434 VeriSign Inc 954,511 0.09 13,072 Vertex Pharmaceuticals Inc 1,093,786 0.11 30,473 Viacom Inc 'B' 1,214,541 0.12 14,854 Yum! Brands Inc 1,095,320 0.11
53,217,182 5.30
Total Common Stocks 55,477,520 5.53
BONDS
Portugal EUR 2,578,652 Portugal Obrigacoes do Tesouro OT
'144A' 2.875% 21/7/2026 2,540,231 0.25 EUR 5,597,667 Portugal Obrigacoes do Tesouro OT
'144A' 3.875% 15/2/2030 * 5,821,153 0.58 EUR 311,102 Portugal Obrigacoes do Tesouro OT
'144A' 4.10% 15/2/2045 314,190 0.03
8,675,574 0.86
United States USD 48,268,642 United States Treasury Inflation
Indexed Bonds 0.375% 15/7/2025 43,825,778 4.37 USD 17,189,767 United States Treasury Inflation
Indexed Bonds 0.625% 15/1/2026 15,950,142 1.59
59,775,920 5.96
Total Bonds 68,451,494 6.82
EXCHANGE TRADED FUNDS
Guernsey 1,923,661 Alcentra European Floating Rate
Income Fund Ltd 2,521,347 0.25 1,862,100 Better Capital PCC Ltd 803,409 0.08 271,187 BH Macro Ltd 5,111,875 0.51 305,258 HarbourVest Global Private Equity Ltd 3,763,556 0.38 2,173,930 NB Distressed Debt Investment
Fund Ltd (GBP) 1,847,475 0.18 3,385,853 NB Distressed Debt Investment
Fund Ltd (USD) 2,858,929 0.28 1,484,698 NB Global Floating Rate
Income Fund Ltd 1,802,352 0.18
18,708,943 1.86
Ireland 6,728,854 Carador Income Fund Plc 4,170,591 0.41 900,000 iShares Euro Ultrashort Bond
UCITS ETF 1 90,409,500 9.01 476,002 Source Physical Gold P-ETC 50,860,497 5.07
145,440,588 14.49
Jersey 6,427,005 CVC Credit Partners European
Opportunities Ltd 8,507,919 0.85 5,038,795 Foresight Solar Fund Ltd 6,439,663 0.64
14,947,582 1.49
United Kingdom 1,742,460 BlackRock Frontiers Investment
Trust Plc 1 2,562,920 0.26 6,126,365 Scottish Mortgage Investment
Trust Plc 21,017,757 2.09 3,901,011 Woodford Patient Capital Trust Plc * 4,954,954 0.49
28,535,631 2.84
Total Exchange Traded Funds 207,632,744 20.68
Total Transferable Securities and Money Market Instruments Admitted to an Official Stock Exchange Listing or Dealt in on Another Regulated Market 331,561,758 33.03
BlackRock Euro Dynamic Diversified Growth Fund

148 BlackRock Strategic Funds (BSF)
The notes on pages 489 to 503 form an integral part of these financial statements.
BlackRock Euro Dynamic Diversified Growth Fund continued
Ireland 3,631,732 BlackRock Developed World Index
Sub-Fund 1 70,971,306 7.07 155,170,331 Institutional Cash Series Plc -
Institutional Euro Liquidity Fund 1 155,170,331 15.46
459,565 Institutional Cash Series Plc - Institutional Ultra Short Bond Fund 1 51,218,001 5.10
277,359,638 27.63
Luxembourg 497,335 BlackRock Global Funds - ASEAN
Leaders X2 RF 1 4,735,460 0.47 911,518 BlackRock Global Funds - Emerging
Markets Equity Income Fund X2 (USD) 1 8,253,409 0.82
4,402,729 BlackRock Global Funds - Euro Corporate Bond Fund X2 (EUR) 1 75,066,529 7.48
821,731 BlackRock Global Funds - Euro Short Duration Bond Fund X2 (EUR) 1 13,772,211 1.37
14,107,458 BlackRock Global Funds - Global Corporate Bond Fund X2 (EUR) Hedged 1 190,732,840 19.00
2,532,539 BlackRock Global Funds - Global Equity Income X2 (USD) 1 36,580,490 3.65
263,444 Blackrock Strategic Funds - BlackRock Impact World Equity Fund X2G 1 36,675,498 3.66
134,690 BlackRock Strategic Funds - European Credit Strategies Fund I2RF 1 14,584,197 1.45
39,873 Schroder International Selection Fund - Frontier Markets Equity I 5,098,043 0.51
385,498,677 38.41
Total Collective Investment Schemes 662,858,315 66.04
Securities portfolio at market value 994,420,073 99.07
Other Net Assets 9,313,460 0.93
Total Net Assets (EUR) 1,003,733,533 100.00
Collective Investment Schemes
Collective Investment Schemes
Holding
Description
Market Value
USD
% of Net
Assets
Holding
Description
Market Value
USD
% of Net
Assets
1 Investment in connected party fund, see further information in Note 10.
Portfolio of Investments as at 31 May 2016
Luxembourg continued

TypeNominal
Value Description CounterpartyExpiration
date
Unrealised appreciation/
(depreciation) EUR
Market Value
EUR
Annual Report and Audited Accounts 149
The notes on pages 489 to 503 form an integral part of these financial statements.
TRS USD 8,209,546 Fund receives Merrill Lynch MLBXWUDB Total Return Index and Bank of America pays 12 Month LIBOR Merrill Lynch 18/11/2016 457,157 457,157
TRS USD 8,221,231 Fund receives Merrill Lynch MLBXWUDC Total Return Index and Bank of America pays 12 Month LIBOR Merrill Lynch 18/11/2016 515,026 515,026
TRS USD 8,021,561 Fund receives Merrill Lynch MLBXWDK5 Index and Bank of America pays 12 Month LIBOR Merrill Lynch 24/05/2017 85,544 85,544
TRS USD 21,490,007 Fund receives Vortex Alpha Index and pays Fixed 0.000% Bank of America Merrill Lynch 17/09/2018 1,079,891 1,079,891
TRS USD 5,949,252 Fund receives Emerging Lifestyle Trend Series 3 Basket Index and pays 12 Month LIBOR Citibank 02/09/2016 84,279 84,279
TRS USD 41,965,277 Fund receives Emerging Lifestyle Trend Series 3 Basket Index and pays 12 Month LIBOR Citibank 02/09/2016 2,591,102 2,591,102
TRS USD 16,118,343 Fund receives DB V2V Index and pays Fixed 0.000% Deutsche Bank 15/07/2016 (1,162,727) (1,162,727)TRS USD 22,270 Fund receives 12 Month LIBOR and pays DBD1BI1G Index Deutsche Bank 17/10/2016 (1,427,721) (1,427,721)TRS USD 26,357 Fund receives 12 Month LIBOR and pays DBD1BI1G Index Deutsche Bank 17/10/2016 (4,300,459) (4,300,459)TRS USD 8,269,031 Fund receives Goldman Sachs Vol Carry Basket Index B001 and
pays Fixed 0.000% Goldman Sachs 01/06/2016 111,230 111,230TRS USD 9,306,200 Fund receives JPEBEUOT Index and pays 12 Month LIBOR JP Morgan 01/02/2017 70,024 70,024TRS USD 36,531,035 Fund receives JPEBEUOT Index and pays 3 Month LIBOR JP Morgan 01/02/2017 2,004,928 2,004,928VOL USD 33,500 Fund buys 1 Year EURUSD FX volatility and sells 1 Year GBPUSD Bank of America
FX volatility Merrill Lynch 19/04/2017 58,561 58,561VOL USD 33,500 Fund buys 1 Year EURUSD FX volatility and sells 1 Year GBPUSD Bank of America
FX volatility Merrill Lynch 19/04/2017 (25,357) (25,357)VOL USD 33,566 Fund buys 1 Year EURUSD FX volatility and sells 1 Year GBPUSD
FX volatility Citibank 18/05/2017 16,866 16,866VOL USD 33,566 Fund buys 1 Year EURUSD FX volatility and sells 1 Year GBPUSD
FX volatility Citibank 18/05/2017 (20,192) (20,192)
Total (Gross underlying exposure - EUR 199,523,843) 138,152 138,152
TRS: Total Return SwapsVOL: Volatility Swaps
BlackRock Euro Dynamic Diversified Growth Fund continued
Swaps as at 31 May 2016

Open forward foreign exchange transactions as at 31 May 2016
Currency Purchases Currency Sales CounterpartyMaturity
date
Unrealised appreciation/
(depreciation) EUR
Open forward foreign exchange transactions as at 31 May 2016
Currency Purchases Currency Sales CounterpartyMaturity
date
Unrealised appreciation/
(depreciation) EUR
150 BlackRock Strategic Funds (BSF)
The notes on pages 489 to 503 form an integral part of these financial statements.
BlackRock Euro Dynamic Diversified Growth Fund continued
AUD 10,057,805 USD 7,688,664 Barclays Bank 30/6/2016 (358,334)AUD 5,137,031 USD 3,911,336 Morgan Stanley 30/6/2016 (169,018)CAD 20,253,932 USD 15,630,000 Royal Bank of Canada 30/6/2016 (103,705)CHF 1,527,046 USD 1,544,347 Barclays Bank 30/6/2016 366 CHF 15,879,362 USD 16,055,653 Credit Suisse 30/6/2016 7,047 CNY 210,046,900 USD 32,300,000 Standard Chartered Bank 30/6/2016 (366,444)CZK 270,575,000 EUR 10,000,000 Societe Generale 30/6/2016 11,134 EUR 18,498,269 CAD 27,575,000 Royal Bank of Canada 30/6/2016 (393,625)EUR 73,791,447 GBP 58,910,000 Deutsche Bank 30/6/2016 (3,381,624)EUR 21,599,089 JPY 2,740,000,000 Deutsche Bank 30/6/2016 (478,496)EUR 9,600,000 PLN 40,789,920 Barclays Bank 30/6/2016 309,737 EUR 191,268,913 USD 218,256,000 Deutsche Bank 30/6/2016 (3,944,759)EUR 32,432,669 USD 37,000,000 Nomura International 30/6/2016 (661,064)EUR 27,023,579 USD 30,500,000 Barclays Bank 30/6/2016 (256,391)EUR 1,665,419 USD 1,867,892 Credit Suisse 30/6/2016 (5,271)EUR 1,479,583 USD 1,659,360 Citibank 30/6/2016 (4,590)EUR 14,795,832 USD 16,602,182 Bank of America Merrill Lynch 30/6/2016 (53,579)EUR 2,959,166 USD 3,321,309 JP Morgan 30/6/2016 (11,496)GBP 4,893,955 EUR 6,150,000 Deutsche Bank 30/6/2016 261,161 GBP 5,708,000 EUR 7,175,000 Citibank 30/6/2016 302,573 GBP 5,723,677 EUR 7,175,000 Barclays Bank 30/6/2016 323,111 INR 1,421,566,000 USD 21,200,000 UBS 30/6/2016 (117,498)JPY 740,000,000 EUR 6,017,064 Deutsche Bank 30/6/2016 (54,505)JPY 367,422,786 USD 3,397,281 Goldman Sachs 30/6/2016 (78,100)JPY 909,277,208 USD 8,413,983 Credit Suisse 30/6/2016 (199,166)JPY 1,070,432,999 USD 9,908,738 Barclays Bank 30/6/2016 (237,597)JPY 1,132,646,764 USD 10,479,998 Morgan Stanley 30/6/2016 (247,259)KRW 3,773,885,000 USD 3,170,000 JP Morgan 30/6/2016 894 KRW 6,694,070,000 USD 5,630,000 Barclays Bank 30/6/2016 (4,758)KRW 3,356,465,250 USD 2,815,000 HSBC 30/6/2016 4,708 KRW 7,143,696,000 USD 5,985,000 UBS 30/6/2016 15,632 MXN 191,958,920 USD 10,960,000 Goldman Sachs 30/6/2016 (499,310)MYR 12,042,000 USD 3,000,000 Deutsche Bank 30/6/2016 (72,619)MYR 12,072,000 USD 3,000,000 Standard Chartered Bank 30/6/2016 (66,115)MYR 12,033,000 USD 3,000,000 HSBC 30/6/2016 (74,570)MYR 12,051,000 USD 3,000,000 Morgan Stanley 30/6/2016 (70,668)NOK 4,755,328 USD 585,775 Morgan Stanley 30/6/2016 (14,879)NOK 184,741,481 USD 22,664,225 Credit Suisse 30/6/2016 (495,084)PLN 24,976,063 EUR 5,636,268 JP Morgan 30/6/2016 52,250 PLN 7,980,627 EUR 1,800,935 Credit Suisse 30/6/2016 16,723 PLN 6,965,862 EUR 1,572,036 Bank of America Merrill Lynch 30/6/2016 14,500 PLN 2,617,763 EUR 590,761 Barclays Bank 30/6/2016 5,457 PLN 92,560,115 USD 23,800,000 JP Morgan 30/6/2016 (205,940)SEK 41,869,985 EUR 4,583,704 Barclays Bank 30/6/2016 (72,703)SEK 111,009,045 EUR 12,105,025 Credit Suisse 30/6/2016 (145,098)SEK 35,769,629 EUR 3,901,271 Morgan Stanley 30/6/2016 (47,511)TRY 3,714,908 USD 1,235,757 BNP Paribas 30/6/2016 15,165 TRY 23,411,176 USD 7,778,979 Barclays Bank 30/6/2016 103,354 TRY 32,909,212 USD 10,906,486 Deutsche Bank 30/6/2016 170,746 TRY 1,981,300 USD 658,399 HSBC 30/6/2016 8,693 TRY 14,117,074 USD 4,701,460 Goldman Sachs 30/6/2016 52,761
TRY 5,624,063 USD 1,875,000 Royal Bank of Scotland 30/6/2016 19,232 TRY 9,284,542 USD 3,093,919 Citibank 30/6/2016 33,041 USD 32,860,000 BRL 119,889,710 Deutsche Bank 30/6/2016 (277,616)USD 8,842,791 CAD 11,582,308 JP Morgan 30/6/2016 (25,934)USD 14,787,209 CAD 19,394,778 Citibank 30/6/2016 (61,493)USD 40,500,000 CHF 38,711,925 Deutsche Bank 30/6/2016 1,197,718 USD 22,150,000 CNY 145,482,554 HSBC 30/6/2016 55,596 USD 4,260,000 CNY 28,045,710 Goldman Sachs 30/6/2016 1,761 USD 4,260,000 CNY 27,992,460 BNP Paribas 30/6/2016 8,992 USD 2,130,000 CNY 14,002,620 JP Morgan 30/6/2016 3,628 USD 47,390,000 CNY 308,507,320 Standard Chartered Bank 30/6/2016 492,808 USD 10,762,497 EUR 9,430,000 UBS 30/6/2016 196,249 USD 29,368,041 GBP 20,560,888 HSBC 30/6/2016 (667,585)USD 23,800,000 HUF 6,609,550,925 JP Morgan 30/6/2016 265,018 USD 32,200,000 JPY 3,580,640,000 Morgan Stanley 30/6/2016 (50,561)USD 27,500,000 KRW 31,696,500,000 HSBC 30/6/2016 775,532 USD 10,960,000 MXN 196,765,976 Citibank 30/6/2016 266,329 USD 4,571,182 NZD 6,530,384 JP Morgan 30/6/2016 146,404 USD 18,197,230 NZD 26,162,302 Citibank 30/6/2016 482,745 USD 481,589 NZD 687,238 Bank of America Merrill Lynch 30/6/2016 15,882 USD 3,830,000 RUB 258,333,500 Citibank 30/6/2016 (53,397)USD 1,799,435 RUB 122,307,629 Credit Suisse 30/6/2016 (37,689)USD 2,145,000 RUB 145,581,150 Goldman Sachs 30/6/2016 (42,038)USD 3,825,565 RUB 258,990,719 Societe Generale 30/6/2016 (66,216)USD 3,000,000 SGD 4,112,100 JP Morgan 30/6/2016 13,977 USD 20,000,000 SGD 27,113,030 Goldman Sachs 30/6/2016 288,552 USD 3,000,000 SGD 4,114,500 Barclays Bank 30/6/2016 12,419 USD 3,000,000 SGD 4,111,470 Citibank 30/6/2016 14,386 USD 26,750,000 TRY 76,957,075 Morgan Stanley 30/6/2016 714,771 USD 3,500,000 TRY 10,391,850 Deutsche Bank 30/6/2016 (3,808)USD 3,500,000 TWD 113,750,000 JP Morgan 30/6/2016 8,468 USD 18,930,000 TWD 607,634,070 Barclays Bank 30/6/2016 254,144 USD 18,930,000 TWD 609,640,650 Goldman Sachs 30/6/2016 199,071 CNY 94,327,800 USD 14,800,000 Goldman Sachs 8/7/2016 (434,409)USD 14,800,000 CNY 94,527,600 HSBC 8/7/2016 407,298
(7,062,489)
CAD Hedged Share Class
CAD 6,826 EUR 4,628 State Street Bank & Trust Company 15/6/2016 58 EUR 13 CAD 19 State Street Bank & Trust Company 15/6/2016 0
58
SEK Hedged Share Class
EUR 1,582,718 SEK 14,735,416 State Street Bank & Trust Company 15/6/2016 (1,984)SEK 816,262,779 EUR 88,101,108 State Street Bank & Trust Company 15/6/2016 (317,135)
(319,119)
Total (Gross underlying exposure - EUR 1,840,689,587) (7,381,550)

Futures contracts as at 31 May 2016
Number of contracts
Currencyof contract Contract/Description
Expiration date
Gross underlying
exposureEUR
Unrealised appreciation/
(depreciation) EUR
Purchased Options as at 31 May 2016
Number of contracts
Call/Put Description Counterparty
Strike Price
Expiration date
Unrealised appreciation/
(depreciation) EUR
Market Value
EUR
Written Options as at 31 May 2016
Number of contracts
Call/Put Description Counterparty
Strike Price
Expiration date
Unrealised appreciation/
(depreciation) EUR
Market Value
EUR
Annual Report and Audited Accounts 151
The notes on pages 489 to 503 form an integral part of these financial statements.
BlackRock Euro Dynamic Diversified Growth Fund continued
897 USD E-Mini S&P 500 Consumer Staples Index June 2016 42,519,379 484,148 166 USD E-Mini S&P 500 Health Care Select Sector Index June 2016 10,657,105 88,354 (966) USD E-Mini S&P 500 Utilities Sector Index June 2016 42,822,465 (1,251,253) 349 EUR Euro STOXX 50 Index June 2016 10,654,970 33,150 (126) EUR German Euro Bund September 2016 13,668,102 21,740 (866) USD MSCI Mini Emerging Markets Index June 2016 31,333,920 (34,272) 285 EUR STOXX Europe 600 Health Care Index June 2016 10,637,625 11,400 97 USD US Ultra Bond September 2016 9,680,916 91,593
Total 171,974,482 (555,140)
59,000,000 Call OTC USD/JPY Citibank USD 115.00 01/08/2016 (159,830) 245,646 35,000,000 Call OTC USD/CHF Citibank USD 1.00 02/08/2016 64,015 398,275 1,425,000 Put OTC EUR/CZK Citibank EUR 25.75 10/08/2016 (7,635) 1,528 5,710,000 Put OTC EUR/CZK Citibank EUR 25.75 10/08/2016 (30,594) 6,121 984 Put EURO STOXX 50 Index Exchange Traded EUR 2,925.00 17/06/2016 (1,424,143) 127,920 111 Put S&P 500 Index Exchange Traded USD 2,050.00 17/06/2016 (215,487) 80,763 393 Put FTSE 100 Index Exchange Traded GBP 6,000.00 15/07/2016 (342,151) 434,179 4,814 Call CBOE SPX Volatility Index Exchange Traded USD 23.00 20/07/2016 (245,600) 389,185 1,138 Call S+P 500 INDEX Exchange Traded USD 2,225.00 19/08/2016 73,024 276,003 1,650 Call EURO STOXX 50 Index Exchange Traded EUR 2,925.00 16/09/2016 998,085 3,527,700 648 Call EURO STOXX 50 Index Exchange Traded EUR 4,000.00 15/12/2017 (701,406) 187,272
Total (Gross underlying exposure - EUR 96,633,695) (1,991,722) 5,674,592
(59,000,000) Call OTC USD/JPY Citibank USD 120.00 01/08/2016 74,003 (44,359) (35,000,000) Call OTC USD/CHF Citibank USD 1.02 02/08/2016 1,205 (143,584) (286) Call S&P 500 Index Exchange Traded USD 1,875.00 17/06/2016 (2,605,455) (5,472,087) (984) Put EURO STOXX 50 Index Exchange Traded EUR 2,800.00 17/06/2016 1,040,088 (42,312) (305) Put EURO STOXX 50 Index Exchange Traded EUR 2,975.00 17/06/2016 806,115 (64,965) (979) Put EURO STOXX Utilities Index Exchange Traded EUR 235.00 17/06/2016 466,004 (9,790) (111) Put S&P 500 Index Exchange Traded USD 1,975.00 17/06/2016 134,128 (17,948) (393) Put FTSE 100 Index Exchange Traded GBP 5,750.00 15/07/2016 231,862 (215,805) (9,628) Call CBOE SPX Volatility Index Exchange Traded USD 30.00 20/07/2016 375,328 (259,457) (114) Put S&P 500 Index Exchange Traded USD 1,850.00 19/08/2016 91,768 (104,451) (1,650) Call EURO STOXX 50 Index Exchange Traded EUR 3,050.00 16/09/2016 (704,550) (2,222,550)
Total (Gross underlying exposure – EUR 102,377,773) (89,504) (8,597,308)

152 BlackRock Strategic Funds (BSF)
The notes on pages 489 to 503 form an integral part of these financial statements.
BlackRock Euro Dynamic Diversified Growth Fund continued
Sector Breakdown as at 31 May 2016
% of Net Assets
Collective Investment Schemes 66.04Exchange Traded Funds 20.68Government 6.82Consumer, Non-cyclical 1.77Industrial 1.11Communications 0.78Basic Materials 0.70Technology 0.65Consumer, Cyclical 0.31Financial 0.11Utilities 0.10
Securities portfolio at market value 99.07Other Net Assets 0.93
100.00

Annual Report and Audited Accounts 153
The notes on pages 489 to 503 form an integral part of these financial statements.
Transferable Securities and Money Market Instruments Admitted to an Official Stock Exchange Listing or Dealt in on Another Regulated Market
Transferable Securities and Money Market Instruments Admitted to an Official Stock Exchange Listing or Dealt in on Another Regulated Market
Holding
Description
Market Value
EUR
% of Net
Assets
Holding
Description
Market Value
EUR
% of Net
Assets
* Securities on loan, see Note 16, for further details.
Portfolio of Investments as at 31 May 2016
COMMON STOCKS (SHARES)
Belgium 443,698 Ontex Group NV 12,904,956 0.67
12,904,956 0.67
Denmark 89,288 ALK-Abello A/S 14,922,478 0.78 528,515 Novo Nordisk A/S 'B' 26,342,477 1.37 224,094 Pandora A/S 29,994,954 1.57 247,761 Royal Unibrew A/S 10,190,351 0.53
81,450,260 4.25
Finland 4,212,107 Nokia OYJ 21,565,988 1.13 631,733 Sampo OYJ 'A' 25,401,984 1.32
46,967,972 2.45
France 10,779 Dassault Aviation SA 10,584,978 0.55 1,177,757 Elior Group '144A' 23,790,692 1.24 4,611 Remy Cointreau SA 344,211 0.02 268,658 Safran SA 16,936,200 0.88 481,271 SPIE SA 8,590,687 0.45 87,515 Unibail-Rodamco SE (Reit) 21,340,533 1.11
81,587,301 4.25
Germany 213,035 adidas AG 24,584,239 1.28 238,288 Fresenius Medical Care AG
& Co KGaA 18,674,631 0.97 654,285 Scout24 AG 22,180,261 1.16
65,439,131 3.41
Ireland 59,272,339 Bank of Ireland 16,359,165 0.85 771,469 CRH Plc 21,034,102 1.09 939,981 Glanbia Plc 15,702,383 0.82 63,722 Ryanair Holdings Plc 895,613 0.05
53,991,263 2.81
Italy 277,442 Luxottica Group SpA * 13,597,433 0.71
13,597,433 0.71
Luxembourg 249,019 Stabilus SA 12,062,480 0.63 2,312,480 Tenaris SA 27,703,511 1.44
39,765,991 2.07
Netherlands 7,285,718 Koninklijke KPN NV 26,133,870 1.36 674,563 NN Group NV 19,987,302 1.04
46,121,172 2.40
Spain 1,186,750 Euskaltel SA '144A' 10,671,256 0.56
10,671,256 0.56
Switzerland 192,362 Julius Baer Group Ltd 7,705,871 0.40 134,607 Lonza Group AG Reg 20,806,857 1.09 46,355 Straumann Holding AG Reg 15,984,653 0.83
139,324 Zurich Insurance Group AG 30,470,459 1.59
74,967,840 3.91
Total Common Stocks (Shares) 527,464,575 27.49
BONDS
Australia EUR 1,915,000 Commonwealth Bank of Australia
FRN 21/10/2016 1,916,915 0.10 EUR 1,280,000 Westpac Banking Corp
FRN 10/11/2016 1,281,370 0.07
3,198,285 0.17
Ireland EUR 4,980,000 Bank of Ireland FRN (Perpetual) 4,896,685 0.25 EUR 4,312,000 Bank of Ireland FRN (Perpetual) 4,239,860 0.22 EUR 8,102,000 Permanent TSB Plc FRN
(Perpetual) 7,056,437 0.37
16,192,982 0.84
Netherlands EUR 190,100,000 Cooperatieve Rabobank UA FRN
19/1/2017 190,308,159 9.92
190,308,159 9.92
Total Bonds 209,699,426 10.93
CERTIFICATES OF DEPOSIT
France EUR 10,000,000 Svenska Handelsbanken AB
22/7/2016 (Zero Coupon) 10,005,660 0.52
10,005,660 0.52
United Kingdom EUR 108,500,000 Citibank NA/London 4/7/2016
(Zero Coupon) 108,528,210 5.66 EUR 8,000,000 Credit Suisse AG/London
6/6/2016 (Zero Coupon) 8,000,200 0.42 EUR 32,000,000 Mitsubishi UFJ Trust and Banking
Corp 11/7/2016 (Zero Coupon) 32,014,464 1.67 EUR 18,500,000 Mitsubishi UFJ Trust and Banking
Corp 12/8/2016 (Zero Coupon) 18,513,172 0.96 EUR 86,500,000 Mizuho Bank Ltd/London
29/6/2016 (Zero Coupon) 86,518,597 4.51 EUR 15,000,000 Sumitomo Trust and Banking Co Ltd
14/7/2016 (Zero Coupon) 15,005,625 0.78 EUR 15,000,000 Sumitomo Trust and Banking Co Ltd
22/7/2016 (Zero Coupon) 15,006,375 0.78
283,586,643 14.78
Total Certificates of Deposit 293,592,303 15.30
COMMERCIAL PAPER
Belgium EUR 8,000,000 Sumitomo Mitsui Banking Corp
24/6/2016 (Zero Coupon) 8,000,562 0.42
8,000,562 0.42
France EUR 21,900,000 Matchpoint Finance Public Ltd
15/9/2016 (Zero Coupon) 21,900,000 1.14
21,900,000 1.14
BlackRock European Absolute Return Fund
Switzerland continued

154 BlackRock Strategic Funds (BSF)
The notes on pages 489 to 503 form an integral part of these financial statements.
Transferable Securities and Money Market Instruments Admitted to an Official Stock Exchange Listing or Dealt in on Another Regulated Market
Transferable Securities and Money Market Instruments Admitted to an Official Stock Exchange Listing or Dealt in on Another Regulated Market
Holding
Description
Market Value
EUR
% of Net
Assets
Holding
Description
Market Value
EUR
% of Net
Assets
* Securities on loan, see Note 16, for further details.1 Investment in connected party fund, see further information in Note 10.
BlackRock European Absolute Return Fund continued
Luxembourg EUR 11,500,000 Banque Federative du Credit Mutuel
SA 5/10/2016 (Zero Coupon) 11,510,283 0.60 EUR 10,000,000 Banque Federative du Credit Mutuel
SA 11/11/2016 (Zero Coupon) 10,008,838 0.52 EUR 8,000,000 Banque Federative du Credit Mutuel
SA RegS 1/8/2016 (Zero Coupon) 8,004,205 0.42 EUR 17,980,000 Banque Federative du Credit Mutuel
SA RegS 7/9/2016 (Zero Coupon) 17,990,532 0.94 EUR 36,000,000 Banque Federative du Credit Mutuel
SA RegS 16/9/2016 (Zero Coupon) 36,017,670 1.88 EUR 16,000,000 Collateralized Commercial Paper III
Co LLC 1/9/2016 (Zero Coupon) 16,007,776 0.83 EUR 25,000,000 Credit Suisse Australia Ltd 6/6/2016
(Zero Coupon) 25,000,799 1.30 EUR 74,500,000 DZ Bank AG Deutsche Zentral-
Genossenschaftsbank 29/7/2016 (Zero Coupon) 74,531,241 3.88
EUR 18,500,000 Honeywell International Inc 1/6/2016 (Zero Coupon) 18,500,000 0.96
EUR 5,000,000 Honeywell International Inc 13/6/2016 (Zero Coupon) 4,999,992 0.26
EUR 5,500,000 Honeywell International Inc 27/6/2016 (Zero Coupon) 5,500,556 0.29
EUR 19,000,000 Honeywell International Inc 2/11/2016 (Zero Coupon) 19,013,827 0.99
EUR 9,500,000 MetLife Short Term Funding LLC 7/10/2016 (Zero Coupon) 9,506,762 0.50
EUR 29,500,000 Nordea Bank AB 18/7/2016 (Zero Coupon) 29,512,336 1.54
EUR 65,000,000 Nordea Bank AB 7/10/2016 (Zero Coupon) 65,070,598 3.39
EUR 22,500,000 OP Corporate Bank Plc 17/11/2016 (Zero Coupon) 22,532,796 1.17
EUR 4,500,000 OP Corporate Bank Plc 24/11/2016 (Zero Coupon) 4,506,911 0.23
EUR 10,000,000 Procter & Gamble Co/The 22/6/2016 (Zero Coupon) 10,000,934 0.52
EUR 4,000,000 Procter & Gamble Co/The 22/6/2016 (Zero Coupon) 4,000,374 0.21
EUR 24,500,000 Procter & Gamble Co/The 28/6/2016 (Zero Coupon) 24,502,941 1.28
EUR 7,000,000 Procter & Gamble Co/The 29/6/2016 (Zero Coupon) 7,000,872 0.36
EUR 3,000,000 Procter & Gamble Co/The 1/7/2016 (Zero Coupon) 3,000,400 0.16
EUR 41,000,000 Procter & Gamble Co/The 13/7/2016 (Zero Coupon) 41,009,093 2.14
EUR 20,000,000 Procter & Gamble Co/The 17/8/2016 (Zero Coupon) 20,008,988 1.04
EUR 60,000,000 Sumitomo Mitsui Banking Corp 3/6/2016 (Zero Coupon) 60,000,367 3.13
EUR 12,000,000 Sumitomo Mitsui Banking Corp 8/7/2016 (Zero Coupon) 12,001,357 0.63
EUR 13,390,000 Svenska Handelsbanken AB 6/7/2016 (Zero Coupon) 13,391,368 0.70
EUR 52,000,000 Svenska Handelsbanken AB 19/9/2016 (Zero Coupon) 52,041,365 2.71
EUR 18,000,000 Svenska Handelsbanken AB 23/9/2016 (Zero Coupon) 18,014,840 0.94
EUR 12,800,000 Svenska Handelsbanken AB 28/11/2016 (Zero Coupon) 12,817,218 0.67
EUR 6,500,000 Toronto-Dominion Bank/The 25/8/2016 (Zero Coupon) 6,499,847 0.34
EUR 3,500,000 Unilever NV 13/6/2016 (Zero Coupon) 3,500,152 0.18
EUR 6,000,000 United Parcel Service Inc 9/8/2016 (Zero Coupon) 6,003,913 0.31
672,009,151 35.02
United States EUR 36,000,000 Unilever NV 30/6/2016
(Zero Coupon) 36,005,369 1.87
36,005,369 1.87
Total Commercial Paper 737,915,082 38.45
Total Transferable Securities and Money Market Instruments Admitted to an Official Stock Exchange Listing or Dealt in on Another Regulated Market 1,768,671,386 92.17
Collective Investment Schemes
Ireland 168,498,249 Institutional Cash Series Plc -
Institutional Euro Assets Liquidity Fund 1 168,498,249 8.78
168,498,249 8.78
Total Collective Investment Schemes 168,498,249 8.78
Securities portfolio at market value 1,937,169,635 100.95
Other Net Liabilities (18,224,804) (0.95)
Total Net Assets (EUR) 1,918,944,831 100.00
Portfolio of Investments as at 31 May 2016
Luxembourg continued

Contracts for difference as at 31 May 2016
Holding
Description Counterparty
Unrealised appreciation/
(depreciation) EUR
Holding
Description Counterparty
Unrealised appreciation/
(depreciation) EUR
Annual Report and Audited Accounts 155
The notes on pages 489 to 503 form an integral part of these financial statements.
Austria (336,627) OMV AG Goldman Sachs (990,816)
(990,816)
Denmark 230,378 Carlsberg A/S 'B' Citibank 1,352,349 (156,720) Vestas Wind Systems A/S JP Morgan (745,688) 1,671,630 William Demant Holding A/S JP Morgan 3,943,718
4,550,379
Finland (471,928) Fortum OYJ Bank of America
Merrill Lynch (212,368) (923,467) UPM-Kymmene OYJ JP Morgan (2,933,399)
(3,145,767)
France (873,724) Air France-KLM Barclays Bank 328,483 131,605 Capgemini SA Bank of America
Merrill Lynch 686,978 (257,706) Cie Generale des
Etablissements Michelin JP Morgan (89,045) (511,511) Engie SA Barclays Bank 194,112 (318,799) Gaztransport Et Technigaz SA Barclays Bank 269,385 (297,870) Technip SA Deutsche Bank (832,546) (364,512) Total SA JP Morgan (2,771,982) 464,607 Vinci SA Deutsche Bank 3,009,501
794,886
Germany (270,067) Bayerische Motoren Werke AG Bank of America
Merrill Lynch (1,513,927) (404,648) Deutsche Bank AG Reg Bank of America
Merrill Lynch (459,665) (978,446) Deutsche Lufthansa AG Reg Citibank 55,791 (547,281) Deutsche Post AG Barclays Bank 251,749 (426,674) Zalando SE Citibank 1,017,936
(648,116)
Italy (452,961) Assicurazioni Generali SpA Deutsche Bank (584,086) (8,213,608) Saras SpA Deutsche Bank 821,605
237,519
Jersey 454,019 Shire Plc JP Morgan 499,168
499,168
Netherlands (1,547,877) Fiat Chrysler Automobiles NV Goldman Sachs (1,076,332) (2,117,428) SNS REAAL NV Deutsche Bank —
(1,076,332)
Norway (801,579) Statoil ASA Barclays Bank (1,380,648)
(1,380,648)
Portugal (222,009,367) Banco Comercial
Portugues SA 'R' Citibank 709,890
709,890
Spain (6,219,822) Banco Popular
Espanol SA (Right) Citibank (1,380,801) (6,219,822) Banco Popular Espanol SA Citibank 3,587,873 (3,524,644) Banco Santander SA JP Morgan (966,403)
(1,621,968) Distribuidora Internacional de Alimentacion SA Goldman Sachs (77,854)
(575,021) Gas Natural SDG SA Deutsche Bank (540,520) (1,013,326) Repsol SA JP Morgan (2,591,634)
(1,969,339)
Sweden 302,942 Avanza Bank Holding AB JP Morgan 420,240 576,804 Hexagon AB 'B' Barclays Bank 646,180 (228,993) Millicom International
Cellular SA SDR Barclays Bank (431,671) 734,685 Thule Group AB/The Deutsche Bank 494,622 1,171,613 Volvo AB 'B' Barclays Bank 80,002
1,209,373
Switzerland (347,281) LafargeHolcim Ltd Reg Bank of America
Merrill Lynch 13,350
13,350
United Kingdom (941,348) Aggreko Plc Citibank (3,005,237) (1,305,762) Antofagasta Plc Bank of America
Merrill Lynch (116,018) 272,951 AstraZeneca Plc Bank of America
Merrill Lynch 472,045 2,716,149 Auto Trader Group Plc Barclays Bank 1,222,952 417,905 Berkeley Group Holdings Plc Citibank 1,725,892 1,462,861 Bodycote Plc Bank of America
Merrill Lynch 1,365,728 (1,045,672) British Land Co Plc/The (Reit) Bank of America
Merrill Lynch (446,271) (2,329,525) Carillion Plc JP Morgan 376,413 (6,072,418) Centrica Plc JP Morgan (143,304) 104,749 DCC Plc Bank of America
Merrill Lynch 233,466 388,942 Hargreaves Lansdown Plc Deutsche Bank 367,150 (2,322,347) HSBC Holdings Plc Bank of America
Merrill Lynch (774,468) 618,897 Hunting Plc JP Morgan 163,779 (402,534) InterContinental Hotels
Group Plc Barclays Bank 1,425,313 (4,125,498) J Sainsbury Plc Bank of America
Merrill Lynch (624,718) (980,484) Land Securities Bank of America
Group Plc (Reit) Merrill Lynch (441,063) 16,487,982 Lloyds Banking Group Plc Deutsche Bank (105,486) 800,209 London Stock Exchange
Group Plc JP Morgan 1,273,377 (1,931,103) Marks & Spencer Group Plc Deutsche Bank 1,055,765 (2,268,471) Ocado Group Plc JP Morgan (271,863) 171,752 Paddy Power Betfair Plc Deutsche Bank 439,099 (747,504) Polski Koncern Naftowy
Orlen SA Deutsche Bank (744,547) (433,224) Provident Financial Plc Bank of America
Merrill Lynch (349,813) 352,856 Rightmove Plc Bank of America
Merrill Lynch 1,281,454 925,495 Rio Tinto Plc JP Morgan (3,988,442) (1,453,604) Rolls-Royce Holdings Plc Bank of America
Merrill Lynch 733,724 (103,205,884) Rolls-Royce Holdings Plc 'C' Bank of America
Merrill Lynch — (4,235,115) Royal Bank of Scotland Bank of America
Group Plc Merrill Lynch (176,214) 3,274,343 RSA Insurance Group Plc JP Morgan 3,074,198 1,054,985 Smith & Nephew Plc Bank of America
Merrill Lynch 787,145 (1,944,401) Standard Life Plc Citibank (170,378)
BlackRock European Absolute Return Fund continued
Spain continued

Contracts for difference as at 31 May 2016
Holding
Description Counterparty
Unrealised appreciation/
(depreciation) EUR
156 BlackRock Strategic Funds (BSF)
The notes on pages 489 to 503 form an integral part of these financial statements.
BlackRock European Absolute Return Fund continued
1,095,591 UNITE Group Plc/The Barclays Bank 237,005 8,485,697 Vodafone Group Plc Barclays Bank 1,331,838 (2,012,209) William Hill Plc Bank of America
Merrill Lynch (261,577) (4,406,979) Wm Morrison
Supermarkets Plc Morgan Stanley (446,050) 8,335,320 Worldpay Group Plc Barclays Bank 1,672,012
7,172,906
Total (Gross underlying exposure - EUR 988,699,014) 5,976,453
United Kingdom continued

Futures contracts as at 31 May 2016
Number of contracts
Currencyof contract Contract/Description
Expiration date
Gross underlying
exposureEUR
Unrealised appreciation/
(depreciation) EUR
Open forward foreign exchange transactions as at 31 May 2016
Currency Purchases Currency Sales CounterpartyMaturity
date
Unrealised appreciation/
(depreciation) EUR
CHF Hedged Share Class
CHF 1,636,465 EUR 1,477,492 State Street Bank & Trust Company 15/6/2016 2,873 EUR 27,041 CHF 29,968 State Street Bank & Trust Company 15/6/2016 (68)
2,805
GBP Hedged Share Class
EUR 92,138 GBP 71,348 State Street Bank & Trust Company 15/6/2016 (1,371)GBP 12,177,665 EUR 15,447,368 State Street Bank & Trust Company 15/6/2016 512,692
511,321
Total (Gross underlying exposure - EUR 17,561,043) 514,126
Sector Breakdown as at 31 May 2016
% of Net Assets
Financial 60.42Consumer, Non-cyclical 14.99Collective Investment Schemes 8.78Industrial 7.85Communications 4.21Consumer, Cyclical 3.61Basic Materials 1.09
Securities portfolio at market value 100.95Other Net Liabilities (0.95)
100.00
Annual Report and Audited Accounts 157
The notes on pages 489 to 503 form an integral part of these financial statements.
BlackRock European Absolute Return Fund continued
(6,787) EUR STOXX Europe 600 Index June 2016 118,229,540 (4,808,588) (2,881) EUR STOXX Europe Mid 200 Index June 2016 58,887,640 (3,095,635)
Total 177,117,180 (7,904,223)

158 BlackRock Strategic Funds (BSF)
The notes on pages 489 to 503 form an integral part of these financial statements.
Transferable Securities and Money Market Instruments Admitted to an Official Stock Exchange Listing or Dealt in on Another Regulated Market
Transferable Securities and Money Market Instruments Admitted to an Official Stock Exchange Listing or Dealt in on Another Regulated Market
Holding
Description
Market Value
EUR
% of Net
Assets
Holding
Description
Market Value
EUR
% of Net
Assets
‡ A portion of these securities were pledged or given in guarantee, see Note 14, for further details.
Portfolio of Investments as at 31 May 2016
COMMON / PREFERRED STOCKS (SHARES)
Greece 4,719,492 National Bank of Greece SA 1,396,969 0.34
1,396,969 0.34
United Kingdom 131,038 Royal Bank of Scotland
Group Plc 'S' (Pref) 3,003,919 0.72
3,003,919 0.72
Total Common / Preferred Stocks (Shares) 4,400,888 1.06
BONDS
Bermuda USD 14,200,000 Golden Ocean Group Ltd
(Contingent Convertible Bond) 3.07% 30/1/2019 8,327,139 2.00
8,327,139 2.00
Brazil USD 6,600,000 Telemar Norte Leste SA
'144A' 5.50% 23/10/2020 1,743,139 0.42
1,743,139 0.42
Canada EUR 3,850,000 Valeant Pharmaceuticals
International Inc RegS 4.50% 15/5/2023 3,001,152 0.72
3,001,152 0.72
Cayman Islands USD 1,750,000 Magnetite IX Ltd '2014-9X'
25/7/2026 (Zero Coupon) 1,036,481 0.25 USD 1,750,000 Magnetite VIII Ltd '2014-8X'
15/4/2026 (Zero Coupon) 923,659 0.22 GBP 8,141,000 Punch Taverns Finance B Ltd 'A6'
5.943% 30/9/2022 10,026,338 2.41 USD 800,000 Sable International Finance Ltd
RegS 6.875% 1/8/2022 735,932 0.18
12,722,410 3.06
Cyprus EUR 6,700,000 Aroundtown Property Holdings
Plc 3.00% 9/12/2021 6,888,806 1.66 EUR 2,300,000 Aroundtown Property Holdings
Plc (Contingent Convertible Bond) 3.00% 5/5/2020 3,146,688 0.75
10,035,494 2.41
France EUR 5,700,000 Areva SA 3.125% 20/3/2023 4,117,566 0.99 EUR 2,600,000 Areva SA 4.875% 23/9/2024 1,925,456 0.47 EUR 2,300,000 BNP Paribas Cardif SA FRN
(Perpetual) 2,212,784 0.53 EUR 2,825,000 TOTAL SA FRN (Perpetual) ‡ 2,910,372 0.70
11,166,178 2.69
Germany EUR 1,700,000 Deutsche Bank AG 4.50%
19/5/2026 1,690,225 0.41 USD 26,056,000 HSH Nordbank AG 7.25%
(Perpetual) 5,128,501 1.24 EUR 4,000,000 Unitymedia Hessen GmbH &
Co KG Via Unitymedia NRW GmbH RegS 4.00% 15/1/2025 4,089,680 0.98
EUR 800,000 Unitymedia Hessen GmbH & Co KG Via Unitymedia NRW GmbH RegS 4.625% 15/2/2026 836,736 0.20
EUR 4,579,000 Unitymedia Hessen GmbH & Co KG Via Unitymedia NRW GmbH RegS 3.50% 15/1/2027 4,445,797 1.07
EUR 5,081,000 Unitymedia Hessen GmbH & Co KG Via Unitymedia NRW GmbH RegS 6.25% 15/1/2029 5,747,424 1.38
21,938,363 5.28
Ireland EUR 2,645,000 ALME Loan Funding II Ltd '2X F'
FRN 15/8/2027 2,088,877 0.50 EUR 3,710,000 Avoca Clo XV Ltd '15X E'
FRN 15/1/2029 3,288,127 0.79 EUR 1,385,000 Avoca Clo XV Ltd '15X F'
FRN 15/1/2029 1,131,896 0.27 EUR 4,009,000 Bank of Ireland FRN 11/6/2024 4,019,464 0.97 EUR 200,000 Caravela SME No 4 Ltd 'A'
FRN 14/9/2043 101,000 0.03
10,629,364 2.56
Italy EUR 1,800,000 Astaldi SpA (Contingent Convertible
Bond) 4.50% 31/1/2019 1,679,292 0.40 EUR 1,425,000 Intesa Sanpaolo SpA FRN
(Perpetual) 1,382,250 0.33 EUR 3,100,000 Telecom Italia SpA/Milano
3.25% 16/1/2023 3,278,250 0.79 EUR 5,500,000 Telecom Italia SpA/Milano
3.625% 19/1/2024 5,820,375 1.40 EUR 6,945,000 UniCredit SpA FRN 28/10/2025 7,418,302 1.79
19,578,469 4.71
Jersey EUR 2,013,992 Mercury Bondco Plc RegS
(Pay-in-kind) 8.25% 30/5/2021 2,062,650 0.50
2,062,650 0.50
Luxembourg USD 6,800,000 APERAM SA (Contingent Convertible
Bond) 0.625% 8/7/2021 7,083,608 1.71 EUR 4,092,318 Bilbao Luxembourg SA RegS
(Pay-in-kind) 10.50% 1/12/2018 4,012,681 0.97 EUR 2,750,000 CNH Industrial Finance Europe SA
2.875% 17/5/2023 2,729,375 0.66 EUR 2,800,000 Dakar Finance SA RegS
(Pay-in-kind) 9.00% 15/11/2020 2,801,652 0.67 GBP 2,200,000 Garfunkelux Holdco 3 SA
RegS 8.50% 1/11/2022 2,942,789 0.71 USD 1,624,000 Telecom Italia Capital SA
6.00% 30/9/2034 1,388,531 0.33 USD 1,615,000 Telecom Italia Capital SA
7.721% 4/6/2038 1,510,967 0.36 EUR 4,019,000 Telecom Italia Finance SA
7.75% 24/1/2033 5,439,777 1.31 EUR 1,300,000 Telecom Italia Finance SA RegS
(Contingent Convertible Bond) 6.125% 15/11/2016 1,422,707 0.34
EUR 3,435,000 Trinseo Materials Operating SCA Via Trinseo Materials Finance Inc RegS 6.375% 1/5/2022 3,564,912 0.86
USD 3,900,000 Wind Acquisition Finance SA '144A' 7.375% 23/4/2021 3,316,998 0.80
36,213,997 8.72
BlackRock European Credit Strategies Fund
Germany continued

Annual Report and Audited Accounts 159
The notes on pages 489 to 503 form an integral part of these financial statements.
Transferable Securities and Money Market Instruments Admitted to an Official Stock Exchange Listing or Dealt in on Another Regulated Market
Transferable Securities and Money Market Instruments Admitted to an Official Stock Exchange Listing or Dealt in on Another Regulated Market
Holding
Description
Market Value
EUR
% of Net
Assets
Holding
Description
Market Value
EUR
% of Net
Assets
BlackRock European Credit Strategies Fund continued
Netherlands EUR 600,000 ABN AMRO Bank NV FRN
(Perpetual) 582,048 0.14 EUR 100,000 ABN AMRO Bank NV FRN
(Perpetual) 97,008 0.02 GBP 1,980,000 Cable & Wireless International
Finance BV 8.625% 25/3/2019 2,849,019 0.69 EUR 1,200,000 Cooperatieve Rabobank UA
FRN (Perpetual) 1,224,396 0.29 EUR 3,700,000 Gas Natural Fenosa Finance BV
FRN (Perpetual) 3,322,156 0.80 EUR 8,169,993 Jubilee CDO VIII BV FRN
15/1/2024 5,706,343 1.37 EUR 1,800,000 Louis Dreyfus Co BV 4.00%
4/12/2020 1,737,000 0.42 USD 2,266,000 Louis Dreyfus Co BV FRN
(Perpetual) 2,025,087 0.49 EUR 3,000,000 North Westerly CLO IV 2013 BV
'E' FRN 15/1/2026 2,447,297 0.59 EUR 2,187,000 North Westerly CLO IV 2013 BV
'Sub' FRN 15/1/2026 1,736,664 0.42 GBP 5,225,000 Petrobras Global Finance BV
6.625% 16/1/2034 4,966,494 1.19 EUR 2,400,000 Repsol International Finance
BV FRN 25/3/2075 2,012,844 0.48 EUR 2,400,000 Telefonica Europe BV FRN
(Perpetual) 2,445,000 0.59 EUR 2,100,000 Telefonica Europe BV FRN
(Perpetual) 2,149,696 0.52
33,301,052 8.01
Norway EUR 2,200,000 Norske Skog AS RegS 11.75%
15/12/2019 1,548,228 0.37 USD 16,440,000 Norske Skogindustrier ASA '144A'
7.125% 15/10/2033 3,237,367 0.78 USD 1,060,000 Norske Skogindustrier ASA '144A'
7.125% 15/10/2033 208,735 0.05
4,994,330 1.20
Portugal EUR 24,500,000 Banco Espirito Santo SA
4.00% 21/1/2019 5,870,812 1.41 EUR 7,100,000 Banco Espirito Santo SA
RegS 4.75% 15/1/2018 1,710,497 0.41 USD 5,965,000 Portugal Government
International Bond RegS 5.125% 15/10/2024 5,347,804 1.29
12,929,113 3.11
Spain EUR 1,200,000 Banco Bilbao Vizcaya Argentaria
SA FRN (Perpetual) 1,242,960 0.30 EUR 4,000,000 Banco Bilbao Vizcaya Argentaria
SA RegS FRN (Perpetual) 3,730,000 0.90 EUR 1,200,000 Banco Popular Espanol SA
FRN (Perpetual) 1,059,372 0.25 EUR 2,600,000 Banco Popular Espanol SA
FRN (Perpetual) 2,690,077 0.65 EUR 1,100,000 Banco Santander SA FRN
(Perpetual) 985,875 0.24 EUR 10,000,000 Bankia SA FRN 22/5/2024 9,769,400 2.35
19,477,684 4.69
Sweden SEK 90,000,000 SAS AB (Contingent Convertible
Bond) 3.625% 1/4/2019 10,006,387 2.41
10,006,387 2.41
Switzerland USD 4,000,000 Credit Suisse Group AG '144A'
FRN (Perpetual) 3,462,554 0.84 EUR 1,600,000 UBS Group AG FRN (Perpetual) 1,634,448 0.39 USD 3,000,000 UBS Group AG FRN (Perpetual) 2,655,991 0.64
7,752,993 1.87
United Kingdom GBP 1,680 Annington Finance No 4 Plc 'B3'
FRN 10/1/2023 2,214 0.00 GBP 3,390,000 Annington Finance No 5 Plc RegS
(Pay-in-kind) 13.00% 15/1/2023 5,170,471 1.24 EUR 1,700,000 Barclays Plc FRN 11/11/2025 1,655,596 0.40 GBP 1,700,000 Iceland Bondco Plc RegS 6.25%
15/7/2021 2,013,681 0.49 GBP 5,545,000 New Look Secured Issuer Plc
RegS 6.50% 1/7/2022 7,171,917 1.73 GBP 1,700,000 Pizzaexpress Financing 1 Plc
Regs 8.625% 1/8/2022 2,190,838 0.53 GBP 1,700,000 Pizzaexpress Financing 2 Plc
RegS 6.625% 1/8/2021 2,233,308 0.54 GBP 1,077,000 Punch Taverns Finance Plc '
144A' FRN 15/10/2027 1,210,808 0.29 EUR 2,400,000 Synlab Unsecured Bondco Plc
RegS 8.25% 1/7/2023 2,470,152 0.59 USD 3,600,000 Tullow Oil Plc '144A' 6.00%
1/11/2020 2,610,680 0.63 USD 4,500,000 Tullow Oil Plc RegS 6.25%
15/4/2022 3,202,918 0.77 GBP 11,079,000 Unique Pub Finance Co Plc/
The 7.395% 28/3/2024 14,144,044 3.40 GBP 5,392,000 Unique Pub Finance Co Plc/
The 6.464% 30/3/2032 5,921,835 1.43 GBP 1,603,800 Virgin Media Secured Finance
Plc RegS 5.50% 15/1/2025 2,094,093 0.50 GBP 2,200,000 Virgin Media Secured Finance
Plc RegS 4.875% 15/1/2027 2,743,466 0.66 GBP 1,041,000 Virgin Media Secured Finance
Plc RegS 6.25% 28/3/2029 1,375,455 0.33
56,211,476 13.53
United States USD 4,260,000 Meccanica Holdings USA Inc
'144A' 7.375% 15/7/2039 4,138,143 1.00 USD 7,480,000 Meccanica Holdings USA Inc
'144A' 6.25% 15/1/2040 6,529,387 1.57 USD 4,200,000 Platform Specialty Products Corp
'144A' 10.375% 1/5/2021 3,826,043 0.92
14,493,573 3.49
Total Bonds 296,584,963 71.38
Total Transferable Securities and Money Market Instruments Admitted to an Official Stock Exchange Listing or Dealt in on Another Regulated Market 300,985,851 72.44
Portfolio of Investments as at 31 May 2016

160 BlackRock Strategic Funds (BSF)
The notes on pages 489 to 503 form an integral part of these financial statements.
Other Transferable Securities and Money Market Instruments Collective Investment Schemes1
Holding
Description
Market Value
EUR
% of Net
Assets
Holding
Description
Market Value
EUR
% of Net
Assets
* Amounts which are less than 0.5 EUR have been rounded down to zero.** Security subject to a fair value adjustment as detailed in Note 2(i).1 Investment in connected party fund, see further information in Note 10.
Portfolio of Investments as at 31 May 2016
PREFERRED STOCKS (SHARES)
Luxembourg 81,903 Concrete Investment II SCA (Pref) 9,132,185 2.20 101,923 Concrete Investment II SCA (Pref)*
— 0.00
9,132,185 2.20
Total Preferred Stocks (Shares) 9,132,185 2.20
BONDS
Jersey GBP 6,000,000 Enterprise Funding Ltd
(Contingent Convertible Bond) 3.50% 10/9/2020 6,297,183 1.52
6,297,183 1.52
Luxembourg EUR 14,788,422 Atalaya Luxco PIKco SCA
11.50% 30/5/2020 ** 14,196,885 3.42
14,196,885 3.42
United Kingdom GBP 67,270,000 Ludgate Funding Plc **
'2007-1' FRN 1/1/2061 2,548,853 0.61
2,548,853 0.61
Total Bonds 23,042,921 5.55
Total Other Transferable Securities and Money Market Instruments 32,175,106 7.75
Ireland 15,825,379 Institutional Cash Series Plc -
Institutional Euro Assets Liquidity Fund 15,825,379 3.81
15,825,379 3.81
Total Collective Investment Schemes 15,825,379 3.81
Securities portfolio at market value 348,986,336 84.00
Other Net Assets 66,483,581 16.00
Total Net Assets (EUR) 415,469,917 100.00
BlackRock European Credit Strategies Fund continued

Contracts for difference as at 31 May 2016
Holding
Description Counterparty
Unrealised appreciation/
(depreciation) EUR
Holding
Description Counterparty
Unrealised appreciation/
(depreciation) EUR
Annual Report and Audited Accounts 161
The notes on pages 489 to 503 form an integral part of these financial statements.
BlackRock European Credit Strategies Fund continued
France 57,967 Numericable-SFR SA Barclays Bank 43,765
43,765
Greece 1,230,441 Eurobank Ergasias SA Credit Suisse 166,110 273,967 Hellenic
Telecommunications Organization SA Credit Suisse 134,244
300,354
Netherlands (150,738) APERAM SA Goldman Sachs (512,146) 55,282 APERAM SA Credit Suisse 377,917
(134,229)
Norway (182,692) Golden Ocean Group Ltd Credit Suisse (20,557) (15,188) Golden Ocean Group Ltd Credit Suisse (1,416)
(21,973)
Spain (90,195) Banco Bilbao Vizcaya
Argentaria SA Credit Suisse (42,572)
(42,572)
Sweden (236,220) SAS AB Credit Suisse (17,812)
(17,812)
United Kingdom (186,350) Anglo American Plc Morgan Stanley (76,346) (310,642) J Sainsbury Plc Bank of America
Merrill Lynch (15,273) 284,721 Ladbrokes Plc Credit Suisse 74,658 (1,424,936) Lloyds Banking Group Plc Bank of America
Merrill Lynch (142,297) 300,994 Royal Bank of Scotland
Group Plc Barclays Bank 142,459 (280,597) Tullow Oil Plc Citibank (1,104)
(17,903)
United States (52,214) Abengoa Yield Plc Credit Suisse (62,641)
(62,641)
Total (Gross underlying exposure - EUR 21,162,568) 46,989

TypeNominal
Value Description CounterpartyExpiration
date
Unrealised appreciation/
(depreciation) EUR
Market Value
EUR
Swaps as at 31 May 2016
162 BlackRock Strategic Funds (BSF)
The notes on pages 489 to 503 form an integral part of these financial statements.
CDS EUR 1,170,000 Fund receives default protection on Hellenic Telecom Bank of America Organization SA and pays Fixed 5.000% Merrill Lynch 20/09/2017 (39,047) (47,983)
CDS EUR 4,475,000 Fund receives default protection on Volkswagen AG and Bank of America pays Fixed 1.000% Merrill Lynch 20/12/2017 (89,717) (40,231)
CDS EUR 1,310,000 Fund receives Fixed 5.000% and provides default protection on Bank of America Scandinavian Airlines System Merrill Lynch 20/03/2018 85,568 (38,882)
CDS EUR 3,510,000 Fund receives default protection on Portugal Telecom Bank of America International and pays Fixed 5.000% Merrill Lynch 20/06/2018 2,619,615 2,598,067
CDS EUR 1,870,000 Fund receives Fixed 5.000% and provides default protection Bank of America on CNH Industrial Finance Europe SA Merrill Lynch 20/03/2019 (125,694) 161,703
CDS EUR 1,755,000 Fund receives Fixed 5.000% and provides default protection Bank of America on Scandinavian Airlines System Merrill Lynch 20/06/2019 (113,744) (110,119)
CDS USD 8,386,000 Fund receives default protection on Federative Republic of Bank of America Brazil and pays Fixed 1.000% Merrill Lynch 20/06/2019 27,044 276,816
CDS EUR 340,000 Fund receives default protection on Lanxess AG and pays Bank of America Fixed 1.000% Merrill Lynch 20/12/2020 (9,825) (5,811)
CDS EUR 750,000 Fund receives default protection on STMicroelectronics NV Bank of America and pays Fixed 1.000% Merrill Lynch 20/12/2020 6,034 11,382
CDS EUR 2,600,000 Fund receives default protection on ArcelorMittal and Bank of America pays Fixed 5.000% Merrill Lynch 20/06/2021 17,742 (15,884)
CDS EUR 1,000,000 Fund receives default protection on Markit iTraxx Europe Bank of America Crossover Series 25 Version 1 and pays Fixed 5.000% Merrill Lynch 20/06/2021 5,943 (86,917)
CDS EUR 2,615,000 Fund receives default protection on OTE Plc and pays Fixed 5.000% Barclays Bank 20/06/2017 (174,968) (89,980)CDS EUR 2,040,000 Fund receives Fixed 5.000% and provides default protection
on Kabel BW Musketeer GmbH Barclays Bank 20/06/2017 (2,730) 106,619CDS EUR 675,000 Fund receives Fixed 5.000% and provides default protection
on Portugal Telecom International Barclays Bank 20/09/2017 (429,760) (487,135)CDS EUR 12,620,000 Fund receives Fixed 1.000% and provides default protection o
n Republic of Italy Barclays Bank 20/03/2018 719,984 115,482CDS USD 16,890,000 Fund receives default protection on Republic of Italy and
pays Fixed 1.000% Barclays Bank 20/03/2018 (909,556) (107,841)CDS USD 200,000 Fund receives Fixed 1.000% and provides default protection
on Republic of Italy Barclays Bank 20/03/2018 13,696 1,277CDS EUR 1,700,000 Fund receives default protection on Portugal Telecom
International Finance BV and pays Fixed 5.000% Barclays Bank 20/09/2018 1,155,018 1,265,518CDS EUR 1,900,000 Fund receives default protection on Portugal Telecom
International Finance BV and pays Fixed 5.000% Barclays Bank 20/09/2018 1,233,903 1,414,403CDS EUR 10,660,000 Fund receives default protection on iTraxx Europe Senior
Financials Series 20 Version 1 and pays Fixed 1.000% Barclays Bank 20/12/2018 (85,393) (133,537)CDS EUR 8,530,000 Fund receives Fixed 5.000% and provides default protection
on iTraxx Europe Sub Financials Series 20 Version 1 Barclays Bank 20/12/2018 (579,030) 874,346CDS EUR 880,000 Fund receives Fixed 5.000% and provides default protection
on Portugal Telecom International Finance BV Barclays Bank 20/09/2020 (563,159) (670,519)CDS EUR 374,000 Fund receives default protection on Clariant AG and pays Fixed 1.000% Barclays Bank 20/12/2020 (8,679) (3,381)CDS EUR 375,000 Fund receives default protection on Clariant AG and pays Fixed 1.000% Barclays Bank 20/12/2020 (8,355) (3,390)CDS EUR 375,000 Fund receives default protection on Clariant AG and pays Fixed 1.000% Barclays Bank 20/12/2020 (8,355) (3,390)CDS EUR 376,000 Fund receives default protection on Clariant AG and pays Fixed 1.000% Barclays Bank 20/12/2020 (8,377) (3,399)CDS EUR 5,220,000 Fund receives default protection on Iberdrola SA and pays Fixed 1.000% Barclays Bank 20/12/2020 (96,828) (79,632)CDS EUR 2,410,000 Fund receives default protection on ITV Plc and pays Fixed 5.000% Barclays Bank 20/12/2020 (29,725) (427,890)CDS EUR 289,000 Fund receives default protection on Lanxess AG and pays Fixed 1.000% Barclays Bank 20/12/2020 (4,385) (4,939)CDS EUR 750,000 Fund receives default protection on STMicroelectronics NV and
pays Fixed 1.000% Barclays Bank 20/12/2020 3,915 11,382CDS EUR 280,000 Fund receives Fixed 1.000% and provides default protection
on Casino Guichard Perrachon SA Barclays Bank 20/12/2020 30,454 (17,652)CDS EUR 700,000 Fund receives Fixed 1.000% and provides default protection
on Casino Guichard Perrachon SA Barclays Bank 20/12/2020 45,667 (44,131)CDS EUR 4,300,000 Fund receives default protection on Kingfisher Plc and
pays Fixed 1.000% Barclays Bank 20/06/2021 8,795 (96,637)CDS EUR 4,800,000 Fund receives default protection on Synlab Bondco Plc and
pays Fixed 5.000% Barclays Bank 20/06/2021 87,158 (307,330)CDS EUR 710,000 Fund receives Fixed 1.000% and provides default protection
on Casino Guichard Perrachon SA Barclays Bank 20/06/2021 8,513 (54,247)CDS EUR 710,000 Fund receives Fixed 1.000% and provides default protection
on Casino Guichard Perrachon SA Barclays Bank 20/06/2021 7,905 (54,247)CDS EUR 2,150,000 Fund receives default protection on Banca Monte dei Paschi di
Siena SpA and pays Fixed 5.000% BNP Paribas 20/06/2016 (335,907) 7,836CDS EUR 1,500,000 Fund receives Fixed 3.000% and provides default protection
on Banca Monte dei Paschi di Siena SpA BNP Paribas 20/09/2016 147,067 (39,212)CDS EUR 3,100,000 Fund receives default protection on Norske Skogindustrier ASA
and pays Fixed 5.000% BNP Paribas 20/09/2017 (416,360) 598,890CDS EUR 4,452,500 Fund receives default protection on Banco Comercial Portugues SA
and pays Fixed 5.000% BNP Paribas 20/12/2017 82,284 (7,971)
BlackRock European Credit Strategies Fund continued

TypeNominal
Value Description CounterpartyExpiration
date
Unrealised appreciation/
(depreciation) EUR
Market Value
EUR
Swaps as at 31 May 2016
Annual Report and Audited Accounts 163
The notes on pages 489 to 503 form an integral part of these financial statements.
BlackRock European Credit Strategies Fund continued
CDS EUR 4,452,500 Fund receives default protection on Banco Comercial Portugues SA and pays Fixed 5.000% BNP Paribas 20/12/2017 86,981 (7,971)
CDS USD 5,965,000 Fund receives default protection on Portuguese Republic and pays Fixed 1.000% BNP Paribas 20/09/2019 17,416 151,108
CDS EUR 516,000 Fund receives default protection on Banco Comercial Portugues SA and pays Fixed 5.000% BNP Paribas 20/12/2020 14,853 6,047
CDS EUR 450,000 Fund receives default protection on Clariant AG and pays Fixed 1.000% BNP Paribas 20/12/2020 (11,492) (4,068)CDS EUR 750,000 Fund receives default protection on Clariant AG and pays Fixed 1.000% BNP Paribas 20/12/2020 (10,351) (6,780)CDS EUR 2,400,000 Fund receives default protection on ITV Plc and pays Fixed 5.000% BNP Paribas 20/12/2020 (16,584) (426,115)CDS EUR 1,200,000 Fund receives default protection on Ladbrokes Plc and pays Fixed 1.000% BNP Paribas 20/12/2020 (8,237) 79,722CDS EUR 580,000 Fund receives default protection on Next Plc and pays Fixed 1.000% BNP Paribas 20/12/2020 6,934 (2,585)CDS EUR 1,640,000 Fund receives default protection on UPC Holding BV and pays
Fixed 5.000% BNP Paribas 20/12/2020 (62,774) (194,306)CDS EUR 4,520,000 Fund receives Fixed 5.000% and provides default protection on Altice
Finco SA BNP Paribas 20/12/2020 124,322 232,332CDS EUR 280,000 Fund receives Fixed 5.000% and provides default protection on Portugal
Telecom International Finance BV BNP Paribas 20/12/2020 (159,293) (213,893)CDS EUR 4,500,000 Fund receives default protection on Markit iTraxx Europe Crossover
Series 25 Version 1 and pays Fixed 5.000% BNP Paribas 20/06/2021 (42,412) (391,128)CDS EUR 2,500,000 Fund receives Fixed 1.000% and provides default protection on
UniCredit SpA BNP Paribas 20/06/2021 (1,652) (70,356)CDS EUR 5,100,000 Fund receives Fixed 5.000% and provides default protection on
Markit iTraxx Europe Crossover Series 25 Version 1 BNP Paribas 20/06/2021 20,678 443,278CDS EUR 1,500,000 Fund receives default protection on Banca Monte dei Paschi di Siena
SpA and pays Fixed 5.000% Citibank 20/09/2016 (25,263) 30,078CDS EUR 1,570,000 Fund receives default protection on Altice Finco SA and
pays Fixed 5.000% Citibank 20/12/2016 12,100 (37,837)CDS EUR 2,760,000 Fund receives default protection on Glencore International AG and
pays Fixed 5.000% Citibank 20/12/2016 (103,824) (70,180)CDS EUR 1,570,000 Fund receives default protection on Numericable-SFR SA and pays
Fixed 5.000% Citibank 20/12/2016 23,708 (39,895)CDS USD 3,500,000 Fund receives default protection on Ireland Government Bond and
pays Fixed 1.000% Citibank 20/03/2017 (532,264) (20,816)CDS EUR 3,330,000 Fund receives Fixed 5.000% and provides default protection on Kabel
BW Musketeer GmbH Citibank 20/06/2017 140,740 174,040CDS EUR 3,330,000 Fund receives Fixed 5.000% and provides default protection on Kabel
BW Musketeer GmbH Citibank 20/06/2017 7,540 174,040CDS EUR 1,330,000 Fund receives Fixed 5.000% and provides default protection on Kabel
BW Musketeer GmbH Citibank 20/06/2017 (314) 69,512CDS EUR 1,875,000 Fund receives default protection on Norske Skogindustrier ASA and
pays Fixed 5.000% Citibank 20/09/2017 (228,940) 362,232CDS EUR 1,500,000 Fund receives default protection on Norske Skogindustrier ASA and
pays Fixed 5.000% Citibank 20/09/2017 (295,214) 289,786CDS EUR 1,500,000 Fund receives Fixed 5.000% and provides default protection on
Scandinavian Airlines System Citibank 20/12/2017 182,513 (34,987)CDS EUR 670,000 Fund receives Fixed 5.000% and provides default protection on
Scandinavian Airlines System Citibank 20/12/2017 84,872 (15,628)CDS EUR 15,400,000 Fund receives default protection on Tranche and pays Fixed 5.000% Citibank 20/06/2018 (2,710,794) (1,055,294)CDS EUR 900,000 Fund receives default protection on Tranche and pays Fixed 5.000% Citibank 20/06/2018 (183,173) (61,673)CDS EUR 4,140,000 Fund receives default protection on Air France-KLM and pays
Fixed 5.000% Citibank 20/09/2018 (569,841) (424,941)CDS EUR 3,700,000 Fund receives default protection on British Airways Plc and pays
Fixed 5.000% Citibank 20/12/2018 (115,278) (410,376)CDS EUR 5,155,000 Fund receives default protection on iTraxx Europe Senior Financials
Series 20 Version 1 and pays Fixed 1.000% Citibank 20/12/2018 (112,595) (64,576)CDS EUR 22,870,000 Fund receives default protection on iTraxx Europe Senior Financials
Series 20 Version 1 and pays Fixed 1.000% Citibank 20/12/2018 (185,195) (286,491)CDS EUR 24,300,000 Fund receives default protection on iTraxx Europe Senior Financials
Series 20 Version 1 and pays Fixed 1.000% Citibank 20/12/2018 (147,923) (304,405)CDS EUR 3,780,000 Fund receives Fixed 5.000% and provides default protection on Grohe
Holding GmbH Citibank 20/12/2018 (237,736) 403,553CDS EUR 12,190,000 Fund receives Fixed 5.000% and provides default protection on iTraxx
Europe Sub Financials Series 20 Version 1 Citibank 20/12/2018 (808,747) 1,249,504CDS EUR 19,440,000 Fund receives Fixed 5.000% and provides default protection on iTraxx
Europe Sub Financials Series 20 Version 1 Citibank 20/12/2018 (1,320,585) 1,992,647CDS EUR 7,490,000 Fund receives Fixed 5.000% and provides default protection on CNH
Industrial Finance Europe SA Citibank 20/03/2019 (519,639) 647,676CDS USD 5,500,000 Fund receives default protection on Federative Republic of Brazil and
pays Fixed 1.000% Citibank 20/09/2019 154,959 228,263CDS EUR 128,235 Fund receives default protection on Norske Skogindustrier ASA and
pays Fixed 5.000% Citibank 20/12/2019 91,451 92,092CDS EUR 1,980,000 Fund receives default protection on R&R Ice Cream Plc and pays
Fixed 5.000% Citibank 20/06/2020 (45,467) (315,792)

TypeNominal
Value Description CounterpartyExpiration
date
Unrealised appreciation/
(depreciation) EUR
Market Value
EUR
Swaps as at 31 May 2016
164 BlackRock Strategic Funds (BSF)
The notes on pages 489 to 503 form an integral part of these financial statements.
BlackRock European Credit Strategies Fund continued
CDS EUR 1,415,000 Fund receives default protection on Ladbrokes Plc and pays Fixed 1.000% Citibank 20/09/2020 (27,935) 82,198CDS EUR 3,500,000 Fund receives default protection on ING Bank NV and pays Fixed 1.000% Citibank 20/12/2020 (91,145) 57,720CDS EUR 218,000 Fund receives default protection on Ladbrokes Plc and pays Fixed 1.000% Citibank 20/12/2020 (56) 14,483CDS EUR 1,031,000 Fund receives default protection on Lanxess AG and pays Fixed 1.000% Citibank 20/12/2020 (14,648) (17,621)CDS EUR 340,000 Fund receives default protection on Lanxess AG and pays Fixed 1.000% Citibank 20/12/2020 (9,189) (5,811)CDS EUR 437,000 Fund receives default protection on Lanxess AG and pays Fixed 1.000% Citibank 20/12/2020 (15,022) (7,469)CDS EUR 4,500,000 Fund receives default protection on Lloyds Bank Plc and pays Fixed 1.000% Citibank 20/12/2020 (57,417) (40,402)CDS EUR 1,210,000 Fund receives default protection on Melia Hotels International SA and
pays Fixed 5.000% Citibank 20/12/2020 16,903 (221,315)CDS EUR 500,000 Fund receives default protection on Melia Hotels International SA and
pays Fixed 5.000% Citibank 20/12/2020 (5,223) (91,453)CDS EUR 900,000 Fund receives default protection on New Look Secured Issuer Plc and
pays Fixed 5.000% Citibank 20/12/2020 (37,330) (21,188)CDS EUR 1,320,000 Fund receives default protection on Play Finance 1 SA and pays
Fixed 5.000% Citibank 20/12/2020 (44,332) (184,737)CDS EUR 7,640,000 Fund receives default protection on Safeway Ltd and pays Fixed 1.000% Citibank 20/12/2020 (223,863) 22,969CDS EUR 750,000 Fund receives default protection on STMicroelectronics NV and
pays Fixed 1.000% Citibank 20/12/2020 4,269 11,382CDS USD 9,000,000 Fund receives default protection on Peoples Republic of China and
pays Fixed 1.000% Citibank 20/12/2020 (125,324) 46,006CDS EUR 1,700,000 Fund receives default protection on Iceland Bondco Plc and
pays Fixed 5.000% Citibank 20/06/2021 (7,843) 30,971CDS EUR 5,000,000 Fund receives default protection on Markit iTraxx Europe Crossover
Series 25 Version 1 and pays Fixed 5.000% Citibank 20/06/2021 (33,631) (434,587)CDS EUR 5,000,000 Fund receives default protection on Markit iTraxx Europe Crossover
Series 25 Version 1 and pays Fixed 5.000% Citibank 20/06/2021 (33,631) (434,587)CDS EUR 5,000,000 Fund receives default protection on Markit iTraxx Europe Crossover
Series 25 Version 1 and pays Fixed 5.000% Citibank 20/06/2021 (56,956) (434,587)CDS EUR 5,300,000 Fund receives default protection on Markit iTraxx Europe Crossover
Series 25 Version 1 and pays Fixed 5.000% Citibank 20/06/2021 18,765 (460,662)CDS EUR 5,300,000 Fund receives default protection on Markit iTraxx Europe Crossover
Series 25 Version 1 and pays Fixed 5.000% Citibank 20/06/2021 29,641 (460,662)CDS EUR 5,100,000 Fund receives default protection on Markit iTraxx Europe Crossover
Series 25 Version 1 and pays Fixed 5.000% Citibank 20/06/2021 23,668 (443,278)CDS EUR 4,500,000 Fund receives default protection on Markit iTraxx Europe Crossover
Series 25 Version 1 and pays Fixed 5.000% Citibank 20/06/2021 (50,640) (391,128)CDS EUR 9,620,000 Fund receives default protection on Markit iTraxx Europe Crossover
Series 25 Version 1 and pays Fixed 5.000% Citibank 20/06/2021 (121,131) (836,145)CDS EUR 5,000,000 Fund receives Fixed 5.000% and provides default protection on Markit
iTraxx Europe Crossover Series 25 Version 1 Citibank 20/06/2021 40,139 434,587CDS USD 4,575,000 Fund receives default protection on Republic of South Africa and
pays Fixed 1.000% Citibank 20/06/2021 (149) 397,244CDS EUR 1,800,000 Fund receives Fixed 5.000% and provides default protection on
Virgin Media Finance Plc Citibank 20/12/2022 (28,678) 200,823CDS EUR 2,500,000 Fund receives Fixed 3.000% and provides default protection on
Banca Monte dei Paschi di Siena SpA Credit Suisse 20/06/2016 58,891 (11,881)CDS EUR 1,500,000 Fund receives default protection on Stena AB and pays Fixed 5.000% Credit Suisse 20/12/2016 (6,096) (34,848)CDS EUR 1,700,000 Fund receives default protection on Portugal Telecom International
Finance BV and pays Fixed 5.000% Credit Suisse 20/09/2018 1,091,268 1,265,518CDS EUR 1,350,000 Fund receives default protection on Portugal Telecom International
Finance BV and pays Fixed 5.000% Credit Suisse 20/09/2018 846,345 1,004,970CDS EUR 1,630,000 Fund receives default protection on Portugal Telecom International
Finance BV and pays Fixed 5.000% Credit Suisse 20/09/2018 968,909 1,213,409CDS EUR 7,500,000 Fund receives Fixed 5.000% and provides default protection on
Grohe Holding GmbH Credit Suisse 20/12/2018 (474,551) 800,699CDS EUR 4,655,000 Fund receives Fixed 1.000% and provides default protection on
Glencore Finance Europe SA Credit Suisse 20/03/2020 (333,619) (427,311)CDS EUR 6,635,000 Fund receives Fixed 1.000% and provides default protection on
Markit iTraxx Europe Series 23 Version 1 Credit Suisse 20/06/2020 (43,812) 87,804CDS EUR 1,015,000 Fund receives default protection on Ladbrokes Plc and
pays Fixed 1.000% Credit Suisse 20/12/2020 (2,345) 67,432CDS EUR 484,286 Fund receives default protection on Monitchem Holdco 3 SA and
pays Fixed 5.000% Credit Suisse 20/12/2020 4,965 (34,581)CDS EUR 240,000 Fund receives default protection on New Look Secured Issuer Plc and
pays Fixed 5.000% Credit Suisse 20/12/2020 (634) (5,650)CDS EUR 560,000 Fund receives default protection on New Look Secured Issuer Plc and
pays Fixed 5.000% Credit Suisse 20/12/2020 (3,857) (13,184)CDS EUR 2,637,108 Fund receives default protection on STMicroelectronics NV and
pays Fixed 1.000% Credit Suisse 20/12/2020 (90,615) 40,020CDS EUR 4,600,000 Fund receives default protection on Techem GmbH and
pays Fixed 5.000% Credit Suisse 20/12/2020 (21,433) (779,373)CDS USD 3,000,000 Fund receives default protection on Republic of Ireland and
pays Fixed 1.000% Deutsche Bank 20/09/2016 (540,369) (7,089)
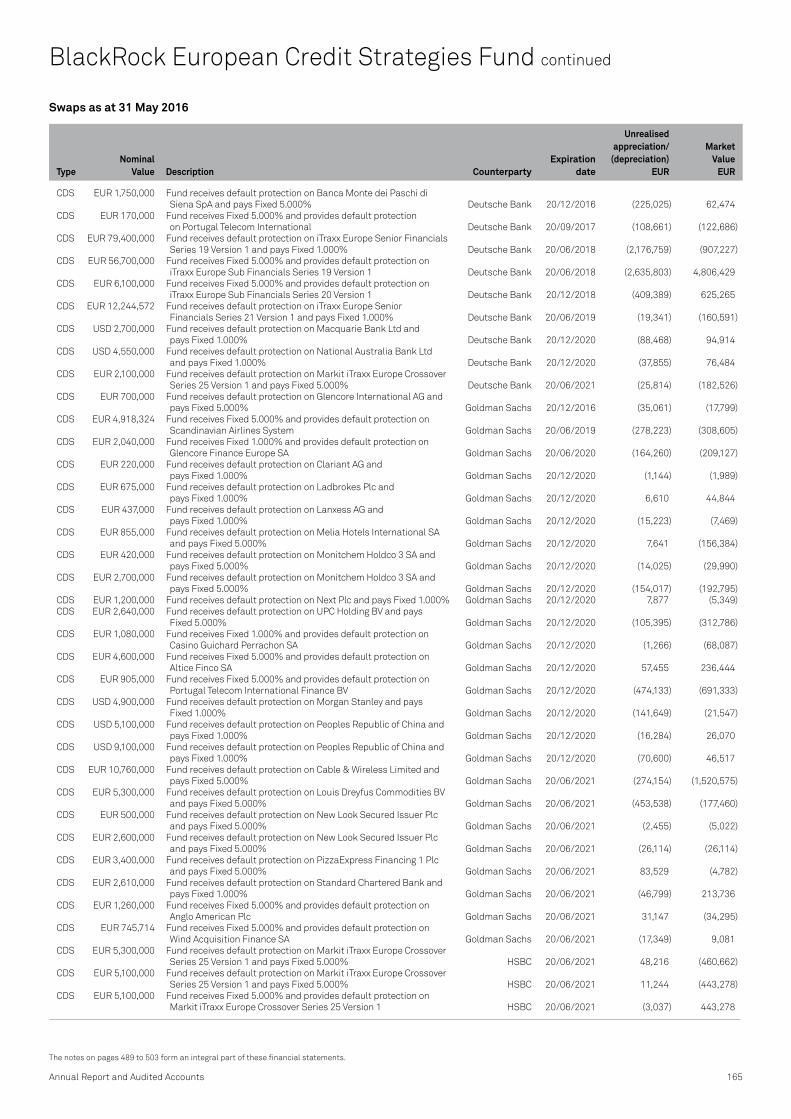
TypeNominal
Value Description CounterpartyExpiration
date
Unrealised appreciation/
(depreciation) EUR
Market Value
EUR
Swaps as at 31 May 2016
Annual Report and Audited Accounts 165
The notes on pages 489 to 503 form an integral part of these financial statements.
BlackRock European Credit Strategies Fund continued
CDS EUR 1,750,000 Fund receives default protection on Banca Monte dei Paschi di Siena SpA and pays Fixed 5.000% Deutsche Bank 20/12/2016 (225,025) 62,474
CDS EUR 170,000 Fund receives Fixed 5.000% and provides default protection on Portugal Telecom International Deutsche Bank 20/09/2017 (108,661) (122,686)
CDS EUR 79,400,000 Fund receives default protection on iTraxx Europe Senior Financials Series 19 Version 1 and pays Fixed 1.000% Deutsche Bank 20/06/2018 (2,176,759) (907,227)
CDS EUR 56,700,000 Fund receives Fixed 5.000% and provides default protection on iTraxx Europe Sub Financials Series 19 Version 1 Deutsche Bank 20/06/2018 (2,635,803) 4,806,429
CDS EUR 6,100,000 Fund receives Fixed 5.000% and provides default protection on iTraxx Europe Sub Financials Series 20 Version 1 Deutsche Bank 20/12/2018 (409,389) 625,265
CDS EUR 12,244,572 Fund receives default protection on iTraxx Europe Senior Financials Series 21 Version 1 and pays Fixed 1.000% Deutsche Bank 20/06/2019 (19,341) (160,591)
CDS USD 2,700,000 Fund receives default protection on Macquarie Bank Ltd and pays Fixed 1.000% Deutsche Bank 20/12/2020 (88,468) 94,914
CDS USD 4,550,000 Fund receives default protection on National Australia Bank Ltd and pays Fixed 1.000% Deutsche Bank 20/12/2020 (37,855) 76,484
CDS EUR 2,100,000 Fund receives default protection on Markit iTraxx Europe Crossover Series 25 Version 1 and pays Fixed 5.000% Deutsche Bank 20/06/2021 (25,814) (182,526)
CDS EUR 700,000 Fund receives default protection on Glencore International AG and pays Fixed 5.000% Goldman Sachs 20/12/2016 (35,061) (17,799)
CDS EUR 4,918,324 Fund receives Fixed 5.000% and provides default protection on Scandinavian Airlines System Goldman Sachs 20/06/2019 (278,223) (308,605)
CDS EUR 2,040,000 Fund receives Fixed 1.000% and provides default protection on Glencore Finance Europe SA Goldman Sachs 20/06/2020 (164,260) (209,127)
CDS EUR 220,000 Fund receives default protection on Clariant AG and pays Fixed 1.000% Goldman Sachs 20/12/2020 (1,144) (1,989)
CDS EUR 675,000 Fund receives default protection on Ladbrokes Plc and pays Fixed 1.000% Goldman Sachs 20/12/2020 6,610 44,844
CDS EUR 437,000 Fund receives default protection on Lanxess AG and pays Fixed 1.000% Goldman Sachs 20/12/2020 (15,223) (7,469)
CDS EUR 855,000 Fund receives default protection on Melia Hotels International SA and pays Fixed 5.000% Goldman Sachs 20/12/2020 7,641 (156,384)
CDS EUR 420,000 Fund receives default protection on Monitchem Holdco 3 SA and pays Fixed 5.000% Goldman Sachs 20/12/2020 (14,025) (29,990)
CDS EUR 2,700,000 Fund receives default protection on Monitchem Holdco 3 SA and pays Fixed 5.000% Goldman Sachs 20/12/2020 (154,017) (192,795)
CDS EUR 1,200,000 Fund receives default protection on Next Plc and pays Fixed 1.000% Goldman Sachs 20/12/2020 7,877 (5,349)CDS EUR 2,640,000 Fund receives default protection on UPC Holding BV and pays
Fixed 5.000% Goldman Sachs 20/12/2020 (105,395) (312,786)CDS EUR 1,080,000 Fund receives Fixed 1.000% and provides default protection on
Casino Guichard Perrachon SA Goldman Sachs 20/12/2020 (1,266) (68,087)CDS EUR 4,600,000 Fund receives Fixed 5.000% and provides default protection on
Altice Finco SA Goldman Sachs 20/12/2020 57,455 236,444CDS EUR 905,000 Fund receives Fixed 5.000% and provides default protection on
Portugal Telecom International Finance BV Goldman Sachs 20/12/2020 (474,133) (691,333)CDS USD 4,900,000 Fund receives default protection on Morgan Stanley and pays
Fixed 1.000% Goldman Sachs 20/12/2020 (141,649) (21,547)CDS USD 5,100,000 Fund receives default protection on Peoples Republic of China and
pays Fixed 1.000% Goldman Sachs 20/12/2020 (16,284) 26,070CDS USD 9,100,000 Fund receives default protection on Peoples Republic of China and
pays Fixed 1.000% Goldman Sachs 20/12/2020 (70,600) 46,517CDS EUR 10,760,000 Fund receives default protection on Cable & Wireless Limited and
pays Fixed 5.000% Goldman Sachs 20/06/2021 (274,154) (1,520,575)CDS EUR 5,300,000 Fund receives default protection on Louis Dreyfus Commodities BV
and pays Fixed 5.000% Goldman Sachs 20/06/2021 (453,538) (177,460)CDS EUR 500,000 Fund receives default protection on New Look Secured Issuer Plc
and pays Fixed 5.000% Goldman Sachs 20/06/2021 (2,455) (5,022)CDS EUR 2,600,000 Fund receives default protection on New Look Secured Issuer Plc
and pays Fixed 5.000% Goldman Sachs 20/06/2021 (26,114) (26,114)CDS EUR 3,400,000 Fund receives default protection on PizzaExpress Financing 1 Plc
and pays Fixed 5.000% Goldman Sachs 20/06/2021 83,529 (4,782)CDS EUR 2,610,000 Fund receives default protection on Standard Chartered Bank and
pays Fixed 1.000% Goldman Sachs 20/06/2021 (46,799) 213,736CDS EUR 1,260,000 Fund receives Fixed 5.000% and provides default protection on
Anglo American Plc Goldman Sachs 20/06/2021 31,147 (34,295)CDS EUR 745,714 Fund receives Fixed 5.000% and provides default protection on
Wind Acquisition Finance SA Goldman Sachs 20/06/2021 (17,349) 9,081CDS EUR 5,300,000 Fund receives default protection on Markit iTraxx Europe Crossover
Series 25 Version 1 and pays Fixed 5.000% HSBC 20/06/2021 48,216 (460,662)CDS EUR 5,100,000 Fund receives default protection on Markit iTraxx Europe Crossover
Series 25 Version 1 and pays Fixed 5.000% HSBC 20/06/2021 11,244 (443,278)CDS EUR 5,100,000 Fund receives Fixed 5.000% and provides default protection on
Markit iTraxx Europe Crossover Series 25 Version 1 HSBC 20/06/2021 (3,037) 443,278

TypeNominal
Value Description CounterpartyExpiration
date
Unrealised appreciation/
(depreciation) EUR
Market Value
EUR
Swaps as at 31 May 2016
166 BlackRock Strategic Funds (BSF)
The notes on pages 489 to 503 form an integral part of these financial statements.
CDS EUR 4,500,000 Fund receives Fixed 5.000% and provides default protection on Markit iTraxx Europe Crossover Series 25 Version 1 HSBC 20/06/2021 44,980 391,128
CDS EUR 2,000,000 Fund receives Fixed 3.000% and provides default protection on Banca Monte dei Paschi di Siena SpA JP Morgan 20/09/2016 82,185 (52,283)
CDS EUR 1,810,000 Fund receives Fixed 5.000% and provides default protection on Portugal Telecom International Finance BV JP Morgan 20/09/2016 (692,467) (945,867)
CDS EUR 3,175,000 Fund receives default protection on Unitymedia GmbH and pays Fixed 5.000% JP Morgan 20/12/2016 (329,448) (83,386)
CDS EUR 3,175,000 Fund receives Fixed 5.000% and provides default protection on Kabel BW Musketeer GmbH JP Morgan 20/12/2016 453,323 88,198
CDS EUR 3,253,001 Fund receives default protection on Astaldi Societa Per Azioni and pays Fixed 5.000% JP Morgan 20/12/2017 269,389 293,786
CDS EUR 825,000 Fund receives default protection on Volkswagen AG and pays Fixed 1.000% JP Morgan 20/12/2017 (16,538) (7,417)
CDS EUR 825,000 Fund receives default protection on Volkswagen AG and pays Fixed 1.000% JP Morgan 20/12/2017 (16,866) (7,417)
CDS EUR 510,000 Fund receives Fixed 5.000% and provides default protection on Glencore International AG JP Morgan 20/12/2017 55,790 26,465
CDS EUR 1,700,000 Fund receives Fixed 5.000% and provides default protection on Portugal Telecom International JP Morgan 20/12/2017 (1,136,326) (1,238,326)
CDS EUR 1,625,000 Fund receives Fixed 5.000% and provides default protection on Portugal Telecom International JP Morgan 20/12/2017 (1,199,944) (1,183,694)
CDS EUR 2,200,000 Fund receives default protection on Portugal Telecom International Finance BV and pays Fixed 5.000% JP Morgan 20/09/2018 1,483,729 1,637,730
CDS EUR 1,350,000 Fund receives default protection on Portugal Telecom International Finance BV and pays Fixed 5.000% JP Morgan 20/09/2018 777,158 1,004,970
CDS EUR 2,220,000 Fund receives default protection on British Airways Plc and pays Fixed 5.000% JP Morgan 20/12/2018 (75,394) (246,226)
CDS EUR 460,000 Fund receives Fixed 1.000% and provides default protection on Glencore Finance Europe SA JP Morgan 20/03/2020 (14,598) (42,226)
CDS EUR 900,000 Fund receives default protection on Stmicroelectronics NV and pays Fixed 1.000% JP Morgan 20/09/2020 9,497 10,381
CDS EUR 3,480,000 Fund receives default protection on Iberdrola SA and pays Fixed 1.000% JP Morgan 20/12/2020 (61,283) (53,088)CDS EUR 4,500,000 Fund receives default protection on ITV Plc and pays Fixed 5.000% JP Morgan 20/12/2020 13,609 (798,965)CDS EUR 2,390,000 Fund receives default protection on ITV Plc and pays Fixed 5.000% JP Morgan 20/12/2020 (23,110) (424,339)CDS EUR 4,480,000 Fund receives default protection on Marks & Spencer Plc and pays
Fixed 1.000% JP Morgan 20/12/2020 (23,377) 62,628CDS EUR 3,219,000 Fund receives default protection on RWE AG and pays Fixed 1.000% JP Morgan 20/12/2020 (37,454) 30,055CDS EUR 440,000 Fund receives Fixed 5.000% and provides default protection on
Portugal Telecom International Finance BV JP Morgan 20/12/2020 (232,718) (336,118)CDS EUR 1,790,000 Fund receives Fixed 5.000% and provides default protection on
Portugal Telecom International Finance BV JP Morgan 20/12/2020 (965,383) (1,367,388)CDS EUR 1,180,000 Fund receives Fixed 1.000% and provides default protection on
Casino Guichard Perrachon SA JP Morgan 20/06/2021 11,617 (90,157)CDS EUR 8,530,000 Fund receives Fixed 1.000% and provides default protection on
Deutsche Bank AG JP Morgan 20/06/2021 (75,901) (264,322)CDS EUR 3,175,000 Fund receives default protection on Kabel BW Musketeer GmbH and
pays Fixed 5.000% Morgan Stanley 20/12/2016 (56,448) (88,198)CDS EUR 3,175,000 Fund receives Fixed 5.000% and provides default protection on
Unitymedia GmbH Morgan Stanley 20/12/2016 142,908 83,376CDS EUR 1,039,546 Fund receives default protection on Astaldi SpA and pays
Fixed 5.000% Morgan Stanley 20/12/2017 146,432 93,884CDS EUR 1,650,000 Fund receives default protection on Volkswagen AG and pays
Fixed 1.000% Morgan Stanley 20/12/2017 (29,727) (14,834)CDS EUR 1,800,000 Fund receives Fixed 5.000% and provides default protection on
Altice Finco SA Morgan Stanley 20/12/2020 5,386 92,522CDS EUR 1,700,000 Fund receives default protection on Markit iTraxx Europe Crossover
Series 25 Version 1 and pays Fixed 5.000% UBS 20/06/2021 7,128 (147,759)TRS EUR 2,700,000 Fund receives 1 Month LIBOR and pays Areva SA Credit Suisse 16/02/2017 367,343 367,343TRS GBP 2,540,000 Fund receives 1 Month LIBOR and pays Enterprise Inns Plc Credit Suisse 28/02/2017 (31,535) (31,535)TRS EUR 1,700,000 Fund receives 1 Month LIBOR and pays Areva SA Credit Suisse 19/06/2017 184,441 184,441TRS USD 1,800,000 Fund receives 1 Month LIBOR and pays Banco Bradesco SA/
Cayman Islands Credit Suisse 28/09/2017 (142,956) (142,956)TRS EUR 895,000 Fund receives 1 Month LIBOR and pays Vale SA Credit Suisse 29/09/2017 (50,630) (50,630)TRS EUR 1,805,000 Fund receives 1 Month LIBOR and pays Vale SA Credit Suisse 30/09/2017 (101,892) (101,892)TRS EUR 900,000 Fund receives 1 Month LIBOR and pays Vale SA Credit Suisse 03/12/2017 (30,205) (30,205)TRS USD 2,700,000 Fund receives Fixed 1.500% and pays Corp Nacional del Cobre de Chile Credit Suisse 03/12/2017 (127,628) (127,628)TRS EUR 700,000 Fund receives 1 Month LIBOR and pays Astaldi SpA Credit Suisse 08/12/2017 (4,740) (4,740)TRS EUR 2,800,000 Fund receives 1 Month LIBOR and pays Grupo Antolin Dutch BV Credit Suisse 11/12/2017 (22,459) (22,459)TRS USD 4,500,000 Fund receives 1 Month LIBOR and pays Bank of Communications Co Ltd Credit Suisse 12/01/2018 (53,741) (53,741)TRS EUR 494,000 Fund receives Fixed 2.750% and pays Grupo Antolin Dutch BV Credit Suisse 15/01/2018 (34,839) (34,839)TRS EUR 2,700,000 Fund receives 1 Month LIBOR and pays SSE Plc Credit Suisse 01/02/2018 (30,567) (30,567)
BlackRock European Credit Strategies Fund continued
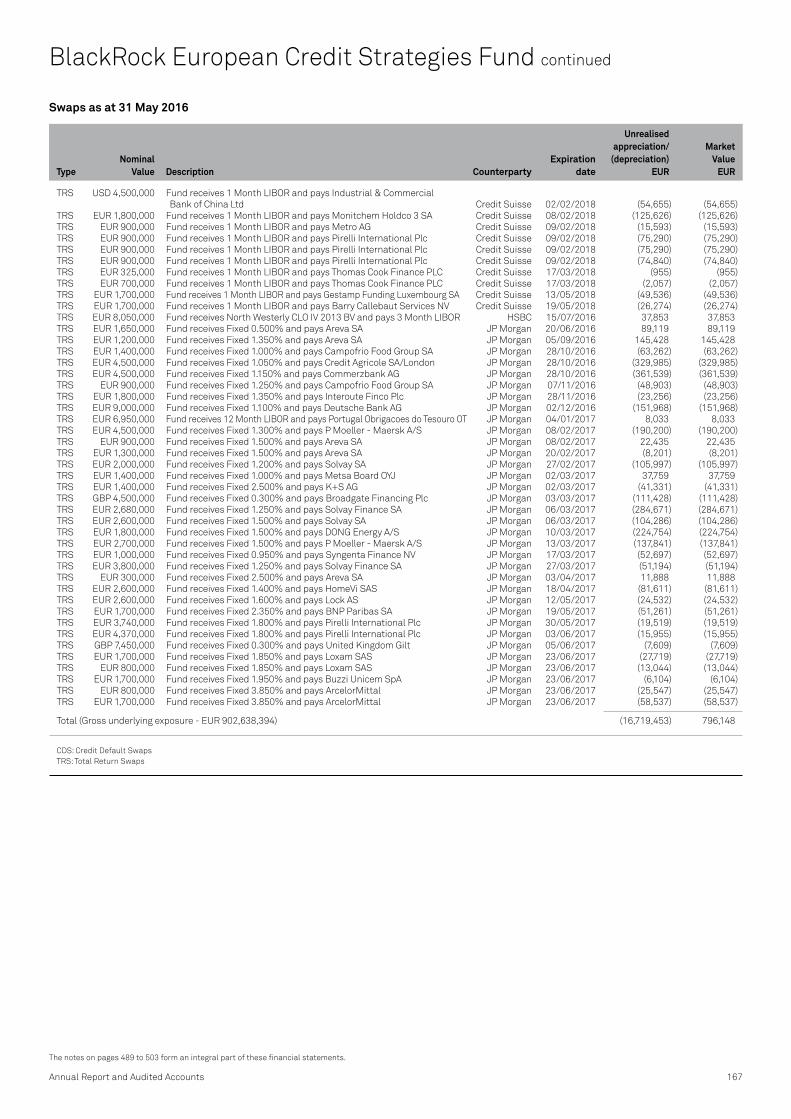
TypeNominal
Value Description CounterpartyExpiration
date
Unrealised appreciation/
(depreciation) EUR
Market Value
EUR
Swaps as at 31 May 2016
Annual Report and Audited Accounts 167
The notes on pages 489 to 503 form an integral part of these financial statements.
TRS USD 4,500,000 Fund receives 1 Month LIBOR and pays Industrial & Commercial Bank of China Ltd Credit Suisse 02/02/2018 (54,655) (54,655)
TRS EUR 1,800,000 Fund receives 1 Month LIBOR and pays Monitchem Holdco 3 SA Credit Suisse 08/02/2018 (125,626) (125,626)TRS EUR 900,000 Fund receives 1 Month LIBOR and pays Metro AG Credit Suisse 09/02/2018 (15,593) (15,593)TRS EUR 900,000 Fund receives 1 Month LIBOR and pays Pirelli International Plc Credit Suisse 09/02/2018 (75,290) (75,290)TRS EUR 900,000 Fund receives 1 Month LIBOR and pays Pirelli International Plc Credit Suisse 09/02/2018 (75,290) (75,290)TRS EUR 900,000 Fund receives 1 Month LIBOR and pays Pirelli International Plc Credit Suisse 09/02/2018 (74,840) (74,840)TRS EUR 325,000 Fund receives 1 Month LIBOR and pays Thomas Cook Finance PLC Credit Suisse 17/03/2018 (955) (955)TRS EUR 700,000 Fund receives 1 Month LIBOR and pays Thomas Cook Finance PLC Credit Suisse 17/03/2018 (2,057) (2,057)TRS EUR 1,700,000 Fund receives 1 Month LIBOR and pays Gestamp Funding Luxembourg SA Credit Suisse 13/05/2018 (49,536) (49,536)TRS EUR 1,700,000 Fund receives 1 Month LIBOR and pays Barry Callebaut Services NV Credit Suisse 19/05/2018 (26,274) (26,274)TRS EUR 8,050,000 Fund receives North Westerly CLO IV 2013 BV and pays 3 Month LIBOR HSBC 15/07/2016 37,853 37,853TRS EUR 1,650,000 Fund receives Fixed 0.500% and pays Areva SA JP Morgan 20/06/2016 89,119 89,119TRS EUR 1,200,000 Fund receives Fixed 1.350% and pays Areva SA JP Morgan 05/09/2016 145,428 145,428TRS EUR 1,400,000 Fund receives Fixed 1.000% and pays Campofrio Food Group SA JP Morgan 28/10/2016 (63,262) (63,262)TRS EUR 4,500,000 Fund receives Fixed 1.050% and pays Credit Agricole SA/London JP Morgan 28/10/2016 (329,985) (329,985)TRS EUR 4,500,000 Fund receives Fixed 1.150% and pays Commerzbank AG JP Morgan 28/10/2016 (361,539) (361,539)TRS EUR 900,000 Fund receives Fixed 1.250% and pays Campofrio Food Group SA JP Morgan 07/11/2016 (48,903) (48,903)TRS EUR 1,800,000 Fund receives Fixed 1.350% and pays Interoute Finco Plc JP Morgan 28/11/2016 (23,256) (23,256)TRS EUR 9,000,000 Fund receives Fixed 1.100% and pays Deutsche Bank AG JP Morgan 02/12/2016 (151,968) (151,968)TRS EUR 6,950,000 Fund receives 12 Month LIBOR and pays Portugal Obrigacoes do Tesouro OT JP Morgan 04/01/2017 8,033 8,033TRS EUR 4,500,000 Fund receives Fixed 1.300% and pays P Moeller - Maersk A/S JP Morgan 08/02/2017 (190,200) (190,200)TRS EUR 900,000 Fund receives Fixed 1.500% and pays Areva SA JP Morgan 08/02/2017 22,435 22,435TRS EUR 1,300,000 Fund receives Fixed 1.500% and pays Areva SA JP Morgan 20/02/2017 (8,201) (8,201)TRS EUR 2,000,000 Fund receives Fixed 1.200% and pays Solvay SA JP Morgan 27/02/2017 (105,997) (105,997)TRS EUR 1,400,000 Fund receives Fixed 1.000% and pays Metsa Board OYJ JP Morgan 02/03/2017 37,759 37,759TRS EUR 1,400,000 Fund receives Fixed 2.500% and pays K+S AG JP Morgan 02/03/2017 (41,331) (41,331)TRS GBP 4,500,000 Fund receives Fixed 0.300% and pays Broadgate Financing Plc JP Morgan 03/03/2017 (111,428) (111,428)TRS EUR 2,680,000 Fund receives Fixed 1.250% and pays Solvay Finance SA JP Morgan 06/03/2017 (284,671) (284,671)TRS EUR 2,600,000 Fund receives Fixed 1.500% and pays Solvay SA JP Morgan 06/03/2017 (104,286) (104,286)TRS EUR 1,800,000 Fund receives Fixed 1.500% and pays DONG Energy A/S JP Morgan 10/03/2017 (224,754) (224,754)TRS EUR 2,700,000 Fund receives Fixed 1.500% and pays P Moeller - Maersk A/S JP Morgan 13/03/2017 (137,841) (137,841)TRS EUR 1,000,000 Fund receives Fixed 0.950% and pays Syngenta Finance NV JP Morgan 17/03/2017 (52,697) (52,697)TRS EUR 3,800,000 Fund receives Fixed 1.250% and pays Solvay Finance SA JP Morgan 27/03/2017 (51,194) (51,194)TRS EUR 300,000 Fund receives Fixed 2.500% and pays Areva SA JP Morgan 03/04/2017 11,888 11,888TRS EUR 2,600,000 Fund receives Fixed 1.400% and pays HomeVi SAS JP Morgan 18/04/2017 (81,611) (81,611)TRS EUR 2,600,000 Fund receives Fixed 1.600% and pays Lock AS JP Morgan 12/05/2017 (24,532) (24,532)TRS EUR 1,700,000 Fund receives Fixed 2.350% and pays BNP Paribas SA JP Morgan 19/05/2017 (51,261) (51,261)TRS EUR 3,740,000 Fund receives Fixed 1.800% and pays Pirelli International Plc JP Morgan 30/05/2017 (19,519) (19,519)TRS EUR 4,370,000 Fund receives Fixed 1.800% and pays Pirelli International Plc JP Morgan 03/06/2017 (15,955) (15,955)TRS GBP 7,450,000 Fund receives Fixed 0.300% and pays United Kingdom Gilt JP Morgan 05/06/2017 (7,609) (7,609)TRS EUR 1,700,000 Fund receives Fixed 1.850% and pays Loxam SAS JP Morgan 23/06/2017 (27,719) (27,719)TRS EUR 800,000 Fund receives Fixed 1.850% and pays Loxam SAS JP Morgan 23/06/2017 (13,044) (13,044)TRS EUR 1,700,000 Fund receives Fixed 1.950% and pays Buzzi Unicem SpA JP Morgan 23/06/2017 (6,104) (6,104)TRS EUR 800,000 Fund receives Fixed 3.850% and pays ArcelorMittal JP Morgan 23/06/2017 (25,547) (25,547)TRS EUR 1,700,000 Fund receives Fixed 3.850% and pays ArcelorMittal JP Morgan 23/06/2017 (58,537) (58,537)
Total (Gross underlying exposure - EUR 902,638,394) (16,719,453) 796,148
CDS: Credit Default SwapsTRS: Total Return Swaps
BlackRock European Credit Strategies Fund continued

168 BlackRock Strategic Funds (BSF)
The notes on pages 489 to 503 form an integral part of these financial statements.
BlackRock European Credit Strategies Fund continued
Open forward foreign exchange transactions as at 31 May 2016
Currency Purchases Currency Sales CounterpartyMaturity
date
Unrealised appreciation/
(depreciation) EUR
EUR 39,977,138 GBP 31,125,000 HSBC 14/6/2016 (816,533)EUR 39,928,930 GBP 31,125,000 UBS 14/6/2016 (864,741)EUR 10,838,893 SEK 101,290,000 Barclays Bank 14/6/2016 (72,722)EUR 95,632,520 USD 105,990,000 Citibank 14/6/2016 777,047 GBP 3,600,000 USD 5,231,286 BNP Paribas 27/6/2016 36,974 USD 4,765,378 GBP 3,300,000 Morgan Stanley 27/6/2016 (60,701)USD 5,301,612 GBP 3,600,000 Barclays Bank 27/6/2016 25,934 EUR 1,230,000 USD 1,374,076 Bank of America Merrill Lynch 1/7/2016 1,037
(973,705)
CHF Hedged Share Class
CHF 15,299,861 EUR 13,813,639 State Street Bank & Trust Company 15/6/2016 26,784 EUR 1,148,141 CHF 1,270,572 State Street Bank & Trust Company 15/6/2016 (1,233)
25,551
GBP Hedged Share Class
EUR 3,636,556 GBP 2,847,329 State Street Bank & Trust Company 15/6/2016 (95,156)GBP 89,653,325 EUR 113,737,273 State Street Bank & Trust Company 15/6/2016 3,762,467
3,667,311
SEK Hedged Share Class
EUR 1,464 SEK 13,608 State Street Bank & Trust Company 15/6/2016 (2)SEK 1,304,086 EUR 140,743 State Street Bank & Trust Company 15/6/2016 (258)
(260)
USD Hedged Share Class
EUR 7,094,535 USD 8,040,944 State Street Bank & Trust Company 15/6/2016 (101,424)USD 102,902,725 EUR 90,474,886 State Street Bank & Trust Company 15/6/2016 1,614,279
1,512,855
Total (Gross underlying exposure - EUR 451,672,779) 4,231,752
Sector Breakdown as at 31 May 2016
% of Net Assets
Financial 26.05Consumer, Cyclical 15.58Communications 12.85Industrial 7.40Basic Materials 4,69Asset Backed Securities 4,44Collective Investment Schemes 3,81Energy 3,77Consumer, Non-cyclical 2,71Government 1,29Utilities 0,80Mortgage Securities 0,61
Securities portfolio at market value 84.00Other Net Assets 16.00
100.00

Purchased Options as at 31 May 2016
Number of contracts
Call/Put Description Counterparty
Strike Price
Expiration date
Unrealised appreciation/
(depreciation) EUR
Market Value
EUR
Written Swaptions as at 31 May 2016
Number of contracts
Call/Put Description Counterparty
Strike Price
Expiration date
Unrealised appreciation/
(depreciation) EUR
Market Value
EUR
Annual Report and Audited Accounts 169
The notes on pages 489 to 503 form an integral part of these financial statements.
BlackRock European Credit Strategies Fund continued
Futures contracts as at 31 May 2016
Number of contracts
Currencyof contract Contract/Description
Expiration date
Gross underlying
exposureEUR
Unrealised appreciation/
(depreciation) EUR
(33) USD 90 Day Euro December 2016 29,741,466 (53,550) (125) USD E-Mini S&P 500 Index June 2016 11,745,151 (256,371) 133 EUR Euro-Bund Put Option (Goldman Sachs) strike price EUR 162.00 June 2016 4,717,248 (34,773) (194) EUR Euro BOBL June 2016 22,021,134 (1,270) (67) EUR Euro Bund June 2016 6,989,106 (94,530) (96) EUR Euro Schatz June 2016 9,687,840 17,760 (41) GBP UK Long Gilt Bond September 2016 5,603,250 3,225 (230) USD US Treasury 10 Year Note September 2016 20,875,660 51,066
Total 111,380,855 (368,443)
5,600,000 Put OTC GBP/USD Bank of America Merrill Lynch GBP 1.42 27/06/2016 (92,774) 721 4,200,000 Put OTC GBP/USD Banque Nationale de Paris GBP 1.40 27/06/2016 (123,811) 382 7,100,000 Put OTC EUR/USD Citibank EUR 1.10 01/07/2016 (57,069) 370 9,000,000 Put OTC EUR/USD Citibank EUR 1.12 01/07/2016 37,658 105,858 2,100,000 Put OTC GBP/USD Deutsche Bank GBP 1.40 27/06/2016 (51,737) 191 3 Put S&P 500 Index Exchange Traded USD 2,050.00 17/06/2016 (6,204) 1,867 49 Put S&P 500 Index Exchange Traded USD 2,065.00 17/06/2016 (107,287) 40,141 47 Put EURO STOXX 50 INDEX Goldman Sachs EUR 3,000.00 17/06/2016 (1,550) 10,810 3,800,000 Put OTC GBP/USD JP Morgan GBP 1.42 27/06/2016 (70,092) 489
Total (Gross underlying exposure - EUR 16,544,463) (472,866) 160,829
(4,100,000) Put Fund writes an option to enter into a Credit Default Swap. If exercised Fund receives 5% Fixed quarterly from 20/6/2016; and provides default protection on Markit iTraxx EuropeSeries 24 Version 1 from 15/6/2016 JP Morgan EUR 325.00 15/06/2016 1,759 (10,582)
Total (Gross underlying exposure - EUR 1,412,023) 1,759 (10,582)

170 BlackRock Strategic Funds (BSF)
The notes on pages 489 to 503 form an integral part of these financial statements.
Transferable Securities and Money Market Instruments Admitted to an Official Stock Exchange Listing or Dealt in on Another Regulated Market
Transferable Securities and Money Market Instruments Admitted to an Official Stock Exchange Listing or Dealt in on Another Regulated Market
Holding
Description
Market Value
EUR
% of Net
Assets
Holding
Description
Market Value
EUR
% of Net
Assets
Portfolio of Investments as at 31 May 2016
BONDS
Australia EUR 2,050,000 Australia & New Zealand Banking
Group Ltd FRN 4/10/2016 2,052,009 0.19 EUR 2,015,000 Commonwealth Bank of Australia
4.25% 10/11/2016 2,054,111 0.19
4,106,120 0.38
Canada EUR 380,000 Bank of Nova Scotia/The
FRN 30/9/2016 380,318 0.04
380,318 0.04
Luxembourg EUR 447,000 Nestle Finance International Ltd
0.75% 17/10/2016 448,486 0.04
448,486 0.04
Netherlands EUR 15,000,000 Cooperatieve Rabobank UA
FRN 13/1/2017 15,014,700 1.40 EUR 75,000,000 Cooperatieve Rabobank UA
FRN 19/1/2017 75,082,125 6.97
90,096,825 8.37
Total Bonds 95,031,749 8.83
CERTIFICATES OF DEPOSIT
Belgium EUR 2,500,000 Sumitomo Mitsui Banking Corp
20/7/2016 (Zero Coupon) 2,501,015 0.23 EUR 21,000,000 Sumitomo Mitsui Banking Corp
22/7/2016 (Zero Coupon) 21,008,778 1.95
23,509,793 2.18
United Kingdom EUR 5,000,000 Citibank NA/London 5/8/2016
(Zero Coupon) 5,003,265 0.46 EUR 30,000,000 Citibank NA/London 4/7/2016
(Zero Coupon) 30,007,800 2.79 EUR 4,000,000 Credit Suisse AG/London 6/6/2016
(Zero Coupon) 4,000,100 0.37 EUR 2,000,000 Mitsubishi UFJ Trust And Banking
Corp 3/6/2016 (Zero Coupon) 2,000,000 0.18 EUR 15,000,000 Mitsubishi UFJ Trust And Banking
Corp 24/6/2016 (Zero Coupon) 15,003,150 1.39 EUR 10,000,000 Mitsubishi UFJ Trust And Banking
Corp 5/7/2016 (Zero Coupon) 10,003,930 0.93 EUR 3,000,000 Mitsubishi UFJ Trust and Banking
Corp 11/7/2016 (Zero Coupon) 3,001,356 0.28 EUR 10,000,000 Mitsubishi UFJ Trust And Banking
Corp 15/8/2016 (Zero Coupon) 10,007,340 0.93 EUR 3,000,000 Mizuho Bank Ltd/London 24/6/2016
(Zero Coupon) 3,000,540 0.28 EUR 23,000,000 Mizuho Bank Ltd/London 29/6/2016
(Zero Coupon) 23,004,945 2.14 EUR 10,000,000 Sumitomo Trust and Banking
Co Ltd 1/6/2016 (Zero Coupon) 10,000,000 0.93 EUR 20,000,000 Sumitomo Trust and Banking
Co Ltd 11/7/2016 (Zero Coupon) 20,006,940 1.86
135,039,366 12.54
Total Certificates of Deposit 158,549,159 14.72
COMMERCIAL PAPER
France EUR 4,000,000 Matchpoint Finance Plc 15/7/2016
(Zero Coupon) 4,000,746 0.37 EUR 4,500,000 Matchpoint Finance Plc 15/9/2016
(Zero Coupon) 4,500,000 0.42 EUR 10,000,000 Matchpoint Finance Plc 19/9/2016
(Zero Coupon) 10,001,222 0.93
18,501,968 1.72
Luxembourg EUR 5,000,000 Albion Capital Corp SA 16/6/2016
(Zero Coupon) 5,000,417 0.46 EUR 20,000,000 Antalis SA 13/6/2016 (Zero Coupon) 20,001,200 1.86 EUR 10,000,000 Antalis SA 17/6/2016 (Zero Coupon) 10,000,800 0.93 EUR 5,000,000 Antalis SA 30/6/2016 (Zero Coupon) 5,000,775 0.46 EUR 5,000,000 Banque Federative Du Credit
Mutuel SA 1/8/2016 (Zero Coupon) 5,002,628 0.46 EUR 10,000,000 Banque Federative Du Credit Mutuel
SA 16/9/2016 (Zero Coupon) 10,004,908 0.93 EUR 10,000,000 Banque Federative Du Credit Mutuel
SA 1/11/2016 (Zero Coupon) 10,007,231 0.93 EUR 15,000,000 Banque Federative Du Credit Mutuel
SA 7/11/2016 (Zero Coupon) 15,012,600 1.39 EUR 7,000,000 Caisse Centrale Desjardins
23/6/2016 (Zero Coupon) 7,001,262 0.65 EUR 5,000,000 Colgate-Palmolive Co 30/6/2016
(Zero Coupon) 5,001,417 0.46 EUR 23,000,000 Collateralized Commercial Paper II
20/7/2016 (Zero Coupon) 23,003,759 2.14 EUR 2,000,000 Collateralized Commercial Paper II
26/7/2016 (Zero Coupon) 2,000,046 0.19 EUR 1,000,000 Collateralized Commercial Paper II
29/7/2016 (Zero Coupon) 1,000,024 0.09 EUR 5,000,000 Collateralized Commercial Paper II
1/9/2016 (Zero Coupon) 5,002,430 0.46 EUR 12,000,000 Collateralized Commercial Paper II
7/9/2016 (Zero Coupon) 12,006,540 1.11 EUR 8,500,000 Collateralized Commercial Paper II
12/9/2016 (Zero Coupon) 8,504,869 0.79 EUR 1,000,000 Collateralized Commercial Paper II
15/9/2016 (Zero Coupon) 1,000,531 0.09 EUR 10,000,000 Cooperatieve Rabobank UA
27/10/2016 (Zero Coupon) 10,010,290 0.93 EUR 13,000,000 Credit Suisse Australia Ltd
6/6/2016 (Zero Coupon) 13,000,416 1.21 EUR 30,000,000 DZ Bank AG 20/6/2016
(Zero Coupon) 30,004,279 2.79 EUR 1,000,000 General Electric Co 6/6/2016
(Zero Coupon) 1,000,051 0.09 EUR 23,000,000 General Electric Co 7/6/2016
(Zero Coupon) 23,001,419 2.14 EUR 5,000,000 General Electric Co 13/6/2016
(Zero Coupon) 5,000,874 0.46 EUR 14,500,000 Honeywell International Inc
1/6/2016 (Zero Coupon) 14,500,000 1.35 EUR 2,000,000 Honeywell International Inc
8/6/2016 (Zero Coupon) 2,000,031 0.19 EUR 4,000,000 Honeywell International Inc
13/6/2016 (Zero Coupon) 3,999,993 0.37 EUR 4,500,000 Honeywell International Inc
27/6/2016 (Zero Coupon) 4,500,455 0.42 EUR 5,000,000 Honeywell International Inc
17/8/2016 (Zero Coupon) 5,001,391 0.46 EUR 4,000,000 Honeywell International Inc
19/8/2016 (Zero Coupon) 4,001,888 0.37
BlackRock European Diversified Equity Absolute Return Fund

Annual Report and Audited Accounts 171
The notes on pages 489 to 503 form an integral part of these financial statements.
Transferable Securities and Money Market Instruments Admitted to an Official Stock Exchange Listing or Dealt in on Another Regulated Market
Transferable Securities and Money Market Instruments Admitted to an Official Stock Exchange Listing or Dealt in on Another Regulated Market
Holding
Description
Market Value
EUR
% of Net
Assets
Holding
Description
Market Value
EUR
% of Net
Assets
1 Investment in connected party fund, see further information in Note 10.
BlackRock European Diversified Equity Absolute Return Fund continued
EUR 2,000,000 Honeywell International Inc 6/9/2016 (Zero Coupon) 2,000,917 0.19
EUR 4,500,000 Honeywell International Inc 9/9/2016 (Zero Coupon) 4,501,126 0.42
EUR 16,000,000 Honeywell International Inc 2/11/2016 (Zero Coupon) 16,011,644 1.49
EUR 10,000,000 Matchpoint Finance Plc 13/6/2016 (Zero Coupon) 10,000,033 0.93
EUR 2,000,000 Matchpoint Finance Plc 15/6/2016 (Zero Coupon) 2,000,008 0.19
EUR 12,000,000 Matchpoint Finance Plc 12/8/2016 (Zero Coupon) 11,999,760 1.11
EUR 13,500,000 MetLife Short Term Funding LLC 2/6/2016 (Zero Coupon) 13,500,041 1.25
EUR 2,500,000 MetLife Short Term Funding LLC 7/10/2016 (Zero Coupon) 2,501,780 0.23
EUR 10,000,000 Nordea Bank AB 3/6/2016 (Zero Coupon) 10,000,067 0.93
EUR 8,000,000 Nordea Bank AB 6/6/2016 (Zero Coupon) 8,000,145 0.74
EUR 5,000,000 Nordea Bank AB 12/9/2016 (Zero Coupon) 5,004,583 0.46
EUR 13,000,000 Nordea Bank AB 7/10/2016 (Zero Coupon) 13,014,120 1.21
EUR 10,500,000 Op Corporate Bank Plc 9/11/2016 (Zero Coupon) 10,514,109 0.98
EUR 1,000,000 Op Corporate Bank Plc 25/11/2016 (Zero Coupon) 1,001,536 0.09
EUR 20,000,000 Pohjola Bank Plc 1/6/2016 (Zero Coupon) 20,000,000 1.86
EUR 10,000,000 Pohjola Bank Plc 13/10/2016 (Zero Coupon) 10,010,810 0.93
EUR 10,000,000 Procter & Gamble Co/The 2/6/2016 (Zero Coupon) 10,000,025 0.93
EUR 3,000,000 Procter & Gamble Co/The 21/6/2016 (Zero Coupon) 3,000,283 0.28
EUR 3,000,000 Procter & Gamble Co/The 27/6/2016 (Zero Coupon) 3,000,347 0.28
EUR 1,000,000 Procter & Gamble Co/The 29/6/2016 (Zero Coupon) 1,000,125 0.09
EUR 4,000,000 Procter & Gamble Co/The 1/7/2016 (Zero Coupon) 4,000,534 0.37
EUR 2,000,000 Procter & Gamble Co/The 5/7/2016 (Zero Coupon) 2,000,302 0.19
EUR 2,000,000 Procter & Gamble Co/The 7/7/2016 (Zero Coupon) 2,000,380 0.19
EUR 2,000,000 Procter & Gamble Co/The 12/7/2016 (Zero Coupon) 2,000,433 0.19
EUR 10,000,000 Procter & Gamble Co/The 14/7/2016 (Zero Coupon) 10,002,271 0.93
EUR 2,500,000 Procter & Gamble Co/The 18/7/2016 (Zero Coupon) 2,500,620 0.23
EUR 2,000,000 Procter & Gamble Co/The 20/7/2016 (Zero Coupon) 2,000,517 0.19
EUR 5,000,000 Procter & Gamble Co/The 21/7/2016 (Zero Coupon) 5,001,320 0.46
EUR 20,000,000 Procter & Gamble Co/The 3/8/2016 (Zero Coupon) 20,007,354 1.86
EUR 10,000,000 Procter & Gamble Co/The 8/8/2016 (Zero Coupon) 10,003,969 0.93
EUR 1,000,000 Procter & Gamble Co/The 9/8/2016 (Zero Coupon) 1,000,403 0.09
EUR 6,000,000 Procter & Gamble Co/The 17/8/2016 (Zero Coupon) 6,002,696 0.56
EUR 7,000,000 Procter & Gamble Co/The 24/8/2016 (Zero Coupon) 7,003,432 0.65
EUR 9,000,000 Procter & Gamble Co/The 26/8/2016 (Zero Coupon) 9,004,885 0.84
EUR 20,000,000 Regency Assets Ltd 14/6/2016 (Zero Coupon) 20,000,578 1.86
EUR 15,000,000 Regency Assets Ltd 16/6/2016 (Zero Coupon) 15,000,500 1.39
EUR 15,000,000 Regency Assets Ltd 20/6/2016 (Zero Coupon) 15,000,933 1.39
EUR 25,000,000 Skandinaviska Enskilda Banken AB 11/11/2016 (Zero Coupon) 25,032,875 2.32
EUR 17,500,000 Sumitomo Mitsui Banking Corp 8/7/2016 (Zero Coupon) 17,501,980 1.63
EUR 1,000,000 Svenska Handelsbanken AB 6/7/2016 (Zero Coupon) 1,000,102 0.09
EUR 5,000,000 Svenska Handelsbanken AB 26/8/2016 (Zero Coupon) 5,002,092 0.46
EUR 10,000,000 Svenska Handelsbanken AB 19/9/2016 (Zero Coupon) 10,007,955 0.93
EUR 3,000,000 Svenska Handelsbanken AB 19/9/2016 (Zero Coupon) 3,002,203 0.28
EUR 3,000,000 Svenska Handelsbanken AB 23/9/2016 (Zero Coupon) 3,002,473 0.28
EUR 6,000,000 Svenska Handelsbanken AB 25/11/2016 (Zero Coupon) 6,007,984 0.56
EUR 17,000,000 Svenska Handelsbanken AB 28/11/2016 (Zero Coupon) 17,022,867 1.58
EUR 5,000,000 Svenska Handelsbanken AB (Contingent Convertible Bond) 25/10/2016 (Zero Coupon) 5,005,279 0.46
EUR 4,000,000 Toronto-Dominion Bank/The 25/8/2016 (Zero Coupon) 3,999,906 0.37
EUR 30,000,000 Toronto-Dominion Bank/The 9/11/2016 (Zero Coupon) 30,046,369 2.79
EUR 1,800,000 Unilever NV 13/6/2016 (Zero Coupon) 1,800,078 0.17
EUR 3,000,000 Unilever NV 12/8/2016 (Zero Coupon) 3,001,471 0.28
EUR 1,000,000 Unilever NV 19/9/2016 (Zero Coupon) 1,000,765 0.09
EUR 13,000,000 United Parcel Service Inc 9/8/2016 (Zero Coupon) 13,008,479 1.21
695,607,988 64.59
United States EUR 10,000,000 Unilever NV 30/6/2016
(Zero Coupon) 10,001,492 0.93
10,001,492 0.93
Total Commercial Paper 724,111,448 67.24
Total Transferable Securities and Money Market Instruments Admitted to an Official Stock Exchange Listing or Dealt in on Another Regulated Market 977,692,356 90.79
Ireland 66,785,881 Institutional Cash Series Plc -
Institutional Euro Assets Liquidity Fund 1 66,785,881 6.20
66,785,881 6.20
Total Collective Investment Schemes 66,785,881 6.20
Securities portfolio at market value 1,044,478,237 96.99
Other Net Assets 32,441,374 3.01
Total Net Assets (EUR) 1,076,919,611 100.00
Portfolio of Investments as at 31 May 2016
Luxembourg continued Luxembourg continued

Contracts for difference as at 31 May 2016
Holding
Description Counterparty
Unrealised appreciation/
(depreciation) EUR
Holding
Description Counterparty
Unrealised appreciation/
(depreciation) EUR
172 BlackRock Strategic Funds (BSF)
The notes on pages 489 to 503 form an integral part of these financial statements.
BlackRock European Diversified Equity Absolute Return Fund continued
Austria 74,424 Andritz AG Barclays Bank (143,705) 90,977 Andritz AG Goldman Sachs (77,795) 2,309 Andritz AG Morgan Stanley 3,054 (75,819) Andritz AG Goldman Sachs 100,017 (167,185) Atrium European Real
Estate Ltd Goldman Sachs (19,226) 169,021 Austria Technologie &
Systemtechnik AG Barclays Bank (100,243) 103,056 Austria Technologie &
Systemtechnik AG Goldman Sachs (127,748) 5,380 Austria Technologie &
Systemtechnik AG Morgan Stanley (6,498) 11,421 Buwog AG Goldman Sachs 8,154 3,091 Buwog AG Morgan Stanley 3,194 83,481 CA Immobilien Anlagen AG Barclays Bank (41,691) 66,378 CA Immobilien Anlagen AG Goldman Sachs (59,531) 53,597 CA Immobilien Anlagen AG Morgan Stanley (31,893) 58 Conwert Immobilien Invest SE Barclays Bank 62 7,786 Conwert Immobilien Invest SE Goldman Sachs 6,450 3 Conwert Immobilien Invest SE Morgan Stanley 3 2,463 DO & CO AG Barclays Bank (13,787) 2,916 DO & CO AG Goldman Sachs (24,082) 1,691 DO & CO AG Morgan Stanley (11,525) 80,876 Erste Group Bank AG Goldman Sachs (32,710) 51,999 Erste Group Bank AG Barclays Bank 14,124 (10,687) Flughafen Wien AG Goldman Sachs (25,198) (2,362,869) IMMOFINANZ AG Goldman Sachs (52,894) 26,932 Lenzing AG Barclays Bank 413,406 19,016 Lenzing AG Goldman Sachs 278,775 14,489 Lenzing AG Morgan Stanley 252,347 14,675 Mayr Melnhof Karton AG Goldman Sachs 38,155 16,483 Mayr Melnhof Karton AG Barclays Bank 34,614 2,294 Mayr Melnhof Karton AG Morgan Stanley (9,127) (161,248) Oesterreichische Post AG Goldman Sachs 442,812 (103) OMV AG Goldman Sachs 54 842 OMV AG Barclays Bank (351) (7,995) Raiffeisen Bank
International AG Barclays Bank 15,870 (88,256) RHI AG Morgan Stanley 13,547 (9,108) RHI AG Barclays Bank 10,930 (62,462) RHI AG Goldman Sachs 43,056 (56,530) Schoeller-Bleckmann Oilfield
Equipment AG Barclays Bank 199,307 (32) Semperit AG Holding Goldman Sachs 41 24,055 Uniqa Insurance Group AG Barclays Bank 4,763 7,617 Uniqa Insurance Group AG Goldman Sachs 2,034 12,338 Uniqa Insurance Group AG Morgan Stanley 2,229 (34,552) Vienna Insurance Group AG
Wiener Versicherung Gruppe Goldman Sachs (4,240) 60,091 voestalpine AG Barclays Bank (9,539) 111,821 voestalpine AG Goldman Sachs 123,881 13,350 voestalpine AG Morgan Stanley 18,501 50,657 Wienerberger AG Barclays Bank (15,902) 94,695 Wienerberger AG Goldman Sachs 41,825 177,413 Wienerberger AG Morgan Stanley (101,680) (408,070) Zumtobel Group AG Goldman Sachs (871,823)
290,017
Belgium 2,864 Ablynx NV Barclays Bank 2,415 3,149 Ablynx NV Goldman Sachs 771 9,269 Ablynx NV Morgan Stanley 5,353 (1,080) Aedifica SA Barclays Bank (4,860) (50,327) Aedifica SA Goldman Sachs (241,144) (164,192) Ageas Goldman Sachs (413,032) 947,517 AGFA-Gevaert NV Goldman Sachs 2,843 809,349 AGFA-Gevaert NV Barclays Bank (185,341) 258,829 AGFA-Gevaert NV Morgan Stanley (170,139) 14,787 Anheuser-Busch InBev SA/NV Goldman Sachs 29,713 4,915 Anheuser-Busch InBev SA/NV Barclays Bank (1,160)
47,149 Barco NV Barclays Bank 25,901 29,641 Barco NV Goldman Sachs 68,174 23,413 Barco NV Morgan Stanley 45,863 (16,769) Befimmo SA Barclays Bank (22,413) (257,792) Bekaert SA Goldman Sachs (833,583) (2,327) Bekaert SA Morgan Stanley (31,196) 8,817 Bekaert SA Barclays Bank 5,907 2,104 Bekaert SA Goldman Sachs 4,759 3,929 Bekaert SA Morgan Stanley 5,621 (16,433) bpost SA Goldman Sachs 10,592 201,019 bpost SA Barclays Bank (198,004) 6,789 bpost SA Morgan Stanley 4,475 170,688 bpost SA Goldman Sachs (111,801) (103) Cie d'Entreprises CFE Goldman Sachs (501) (96,224) Cofinimmo SA Goldman Sachs (250,896) (316,335) Colruyt SA Goldman Sachs (611,924) 55,656 D'ieteren SA/NV Barclays Bank 130,053 19,862 D'ieteren SA/NV Goldman Sachs 41,715 11,972 D'ieteren SA/NV Morgan Stanley 33,514 (16,802) Econocom Group SA/NV Goldman Sachs (18,230) (235,144) Econocom Group SA/NV Morgan Stanley (1,149,276) (403) Elia System Operator SA/NV Goldman Sachs (8) 350,683 Euronav NV Barclays Bank (90,945) 625,484 Euronav NV Goldman Sachs (156,997) 118,951 Euronav NV Morgan Stanley 1,719 (97,253) EVS Broadcast Equipment SA Barclays Bank (124,484) (17,696) EVS Broadcast Equipment SA Goldman Sachs (31,676) (11,588) EVS Broadcast Equipment SA Morgan Stanley 3,956 (19,158) Exmar NV Goldman Sachs (6,226) (123,886) Exmar NV Barclays Bank 27,007 (61,199) Exmar NV Morgan Stanley 149,051 (2,878) Ion Beam Applications Barclays Bank (8,375) (3,374) Ion Beam Applications Goldman Sachs (7,642) 674 KBC Groep NV Goldman Sachs 2,146 9,925 KBC Groep NV Barclays Bank 15,801 (52,569) Kinepolis Group NV Goldman Sachs (45,472) (29,375) Kinepolis Group NV Morgan Stanley (135,067) (12,906) Melexis NV Barclays Bank (76,016) (31,087) Melexis NV Goldman Sachs (166,160) (16,762) Ontex Group NV Goldman Sachs (9,387) 193,798 Orange Belgium SA Barclays Bank 442,938 177,064 Orange Belgium SA Goldman Sachs 286,844 21,202 Orange Belgium SA Morgan Stanley 38,657 113,165 Proximus SADP Barclays Bank 10,185 (9,910) Proximus SADP Goldman Sachs (6,031) 133,748 Proximus SADP Goldman Sachs 164,510 1,475 Proximus SADP Morgan Stanley 2,022 (39,579) Solvay SA Goldman Sachs (191,167) 87,026 Solvay SA Barclays Bank 322,764 80,936 Solvay SA Goldman Sachs 393,785 177,416 Telenet Group Holding NV Barclays Bank (67,517) 18,597 Telenet Group Holding NV Morgan Stanley (21,418) 248,312 Telenet Group Holding NV Goldman Sachs 319,459 27,299 Tessenderlo Chemie NV Barclays Bank 53,233 92,996 Tessenderlo Chemie NV Goldman Sachs 92,066 486 UCB SA Morgan Stanley (813) 9,505 UCB SA Barclays Bank 3,496 47,139 UCB SA Goldman Sachs 2,880 (311,990) Umicore SA Goldman Sachs (226,197) (3,801) Van de Velde NV Barclays Bank (14,292) (4,801) Van de Velde NV Goldman Sachs (5,761)
(2,884,963)
Denmark (19,798) ALK-Abello A/S Barclays Bank (497,783) (9,582) ALK-Abello A/S Morgan Stanley (298,868) 143,825 Alm Brand A/S Barclays Bank 19,366 73,243 Alm Brand A/S Goldman Sachs 7,878 84,252 Alm Brand A/S Morgan Stanley 44,107 (69,053) Ambu A/S Barclays Bank (403,450)
Belgium continued

Contracts for difference as at 31 May 2016
Holding
Description Counterparty
Unrealised appreciation/
(depreciation) EUR
Holding
Description Counterparty
Unrealised appreciation/
(depreciation) EUR
Annual Report and Audited Accounts 173
The notes on pages 489 to 503 form an integral part of these financial statements.
(66,966) Ambu A/S Morgan Stanley (943,719) (2,217) AP Moeller - Maersk A/S 'B' Barclays Bank 27,546 (503) AP Moeller - Maersk A/S 'B' Goldman Sachs 14,120 2,289 AP Moeller - Maersk A/S 'B' Barclays Bank (32,998) 1,911 AP Moeller - Maersk A/S 'B' Goldman Sachs (43,669) 53 AP Moeller - Maersk A/S 'B' Morgan Stanley (1,648) (5,351) Bavarian Nordic A/S Goldman Sachs (6,648) (23,690) Carlsberg A/S 'B' Barclays Bank (15,038) (14,004) Carlsberg A/S 'B' Goldman Sachs (28,195) (5,942) Chr Hansen Holding A/S Barclays Bank (7,860) (51,623) Chr Hansen Holding A/S Goldman Sachs (65,245) 50 Chr Hansen Holding A/S Goldman Sachs 63 (105,104) Coloplast A/S 'B' Barclays Bank (145,100) (36,483) Coloplast A/S 'B' Goldman Sachs (47,026) (181,328) Danske Bank A/S Barclays Bank (255,750) (168,779) Danske Bank A/S Goldman Sachs (262,313) 177,349 Dfds A/S Barclays Bank 1,601,634 43,927 Dfds A/S Goldman Sachs 77,371 63,895 DSV A/S Barclays Bank 120,914 61,273 DSV A/S Goldman Sachs 60,031 2,465 DSV A/S Morgan Stanley 1,387 (16,138) DSV A/S Barclays Bank (19,880) (9,351) DSV A/S Goldman Sachs (10,687) (16,914) Genmab A/S Barclays Bank (477,952) (542) Genmab A/S Goldman Sachs (11,509) (34,046) GN Store Nord A/S Barclays Bank (26,440) (105,786) GN Store Nord A/S Goldman Sachs (46,937) 30,353 H Lundbeck A/S Barclays Bank 185,339 36,425 H Lundbeck A/S Goldman Sachs 122,388 (25,193) H Lundbeck A/S Goldman Sachs (84,683) (454) ISS A/S Barclays Bank (647) (29,714) ISS A/S Goldman Sachs (48,741) 125,098 Jyske Bank A/S Reg Goldman Sachs 254,502 (81,178) Jyske Bank A/S Reg Barclays Bank (96,543) (39,596) Jyske Bank A/S Reg Goldman Sachs (81,557) 123,344 Matas A/S Barclays Bank (112,350) 11,681 Matas A/S Goldman Sachs (11,305) 32,042 Matas A/S Morgan Stanley (39,248) 9,411 NKT Holding A/S Barclays Bank 3,193 27,421 NKT Holding A/S Goldman Sachs 18,134 12,392 NKT Holding A/S Morgan Stanley 5,792 63,230 NNIT A/S Barclays Bank 435,569 40,811 NNIT A/S Goldman Sachs 265,799 13,349 NNIT A/S Morgan Stanley 69,647 6,760 Novo Nordisk A/S 'B' Morgan Stanley 7,806 76,280 Novo Nordisk A/S 'B' Barclays Bank 90,852 45,368 Novo Nordisk A/S 'B' Goldman Sachs 47,855 (7,689) Novozymes A/S 'B' Barclays Bank (7,473) (81,874) Novozymes A/S 'B' Goldman Sachs 6,605 (1,243) OW Bunker A/S Goldman Sachs 13,370 23,749 Pandora A/S Barclays Bank 82,646 34,889 Pandora A/S Goldman Sachs 141,300 283 Pandora A/S Morgan Stanley 6 69,935 Per Aarsleff Holding A/S Barclays Bank (145,748) 103,831 Per Aarsleff Holding A/S Goldman Sachs (258,271) 37,443 Per Aarsleff Holding A/S Morgan Stanley (239,247) 6,334 Rockwool International A/S 'B' Barclays Bank 156,061 6,445 Rockwool International A/S 'B' Goldman Sachs 142,983 297 Rockwool International A/S 'B' Morgan Stanley 7,959 (4,706) Rockwool International A/S 'B' Barclays Bank (117,901) 72,816 Royal Unibrew A/S Barclays Bank 122,033 30,977 Royal Unibrew A/S Goldman Sachs 63,485 5,144 Royal Unibrew A/S Morgan Stanley 9,839 29,701 SAS AB Morgan Stanley 552 85,648 SAS AB Barclays Bank (7) (708) Scandinavian Tobacco
Group A/S 'A' Goldman Sachs (723) 64,227 Schouw & Co Barclays Bank 224,527 35,135 Schouw & Co Goldman Sachs 136,998 22,350 Schouw & Co Morgan Stanley 49,881 (111,905) SimCorp A/S Barclays Bank (919,321)
354 Spar Nord Bank A/S Barclays Bank 30 3,226 Spar Nord Bank A/S Goldman Sachs (291) (310,488) Sydbank A/S Barclays Bank (510,802) (154,193) Sydbank A/S Goldman Sachs (319,997) 324,933 TDC A/S Barclays Bank 27,548 (147,780) TDC A/S Goldman Sachs 14,061 118,929 TDC A/S Goldman Sachs (11,993) (1,222,642) TDC A/S Barclays Bank (65,986) (132,349) Topdanmark A/S Barclays Bank (197,724) (54,941) Topdanmark A/S Goldman Sachs (68,762) 26,223 TORM Plc Barclays Bank (7,052) 13,863 TORM Plc Goldman Sachs (1,864) 23,007 TORM Plc Morgan Stanley (11,891) (64,044) Tryg A/S Goldman Sachs (33,583) 5,027 Vestas Wind Systems A/S Barclays Bank 21,441 13,505 Vestas Wind Systems A/S Goldman Sachs 56,277 431 Vestas Wind Systems A/S Morgan Stanley 1,978 (480,585) William Demant Holding A/S Barclays Bank (561,793) (374,280) William Demant Holding A/S Goldman Sachs (423,825)
(3,267,170)
Finland (2,410) Amer Sports OYJ Goldman Sachs (621) 125,753 Amer Sports OYJ Barclays Bank 148,635 127,605 Amer Sports OYJ Goldman Sachs 190,131 95,076 Cargotec OYJ 'B' Barclays Bank 178,503 63,661 Cargotec OYJ 'B' Goldman Sachs 99,948 (256,918) Cargotec OYJ 'B' Morgan Stanley (647,732) (424,706) Caverion Corp Barclays Bank 54,094 (409,886) Caverion Corp Goldman Sachs 34,339 (1,239,142) Citycon OYJ Barclays Bank (7,118) 247,108 Cramo OYJ Barclays Bank 484,332 124,572 Cramo OYJ Goldman Sachs 72,252 50,203 Cramo OYJ Morgan Stanley 28,147 19,397 Elisa OYJ Barclays Bank 32,199 5,222 Elisa OYJ Goldman Sachs 8,773 (89,744) Elisa OYJ Goldman Sachs (90,431) (245,287) F-Secure OYJ Barclays Bank (75,998) (514,345) F-Secure OYJ Goldman Sachs (164,590) 841 Finnair OYJ Barclays Bank 207 906 Finnair OYJ Morgan Stanley 99 23,945 Fortum OYJ Barclays Bank (3,298) 26,199 Fortum OYJ Goldman Sachs (737) (639,228) Fortum OYJ Goldman Sachs (287,653) (16,100) Huhtamaki OYJ Goldman Sachs (41,055) 50,708 Huhtamaki OYJ Barclays Bank 95,030 53,528 Huhtamaki OYJ Goldman Sachs 99,990 (113,153) Kemira OYJ Barclays Bank (29,420) (16,516) Kemira OYJ Goldman Sachs (2) (212,819) Kesko OYJ 'B' Goldman Sachs (304,812) 9,899 Kesko OYJ 'B' Barclays Bank 16,062 11,482 Kesko OYJ 'B' Goldman Sachs 19,634 144,220 Kone OYJ 'B' Barclays Bank 322,330 155,008 Kone OYJ 'B' Goldman Sachs 354,950 (31,919) Kone OYJ 'B' Goldman Sachs (15,207) 70,231 Lassila & Tikanoja OYJ Barclays Bank 65,315 11,479 Lassila & Tikanoja OYJ Goldman Sachs 16,185 451,711 Metsa Board OYJ Barclays Bank (41,177) (16,838) Metsa Board OYJ Barclays Bank (5,328) (162,641) Metsa Board OYJ Goldman Sachs (48,578) 506,595 Metsa Board OYJ Goldman Sachs 146,101 18,824 Metsa Board OYJ Morgan Stanley 5,537 (523,992) Neste OYJ Goldman Sachs (924,403) 1,197,980 Nokia OYJ Barclays Bank 201,784 872,986 Nokia OYJ Goldman Sachs 458,791 (137,149) Nokian Renkaat OYJ Goldman Sachs 53,654 180,221 Oriola-KD OYJ 'B' Barclays Bank (25,231) 267,431 Oriola-KD OYJ 'B' Goldman Sachs (2,674) 1,025 Oriola-KD OYJ 'B' Morgan Stanley (176) (200,629) Orion OYJ 'B' Goldman Sachs (403,264)
BlackRock European Diversified Equity Absolute Return Fund continued
Denmark continued Denmark continued

Contracts for difference as at 31 May 2016
Holding
Description Counterparty
Unrealised appreciation/
(depreciation) EUR
Holding
Description Counterparty
Unrealised appreciation/
(depreciation) EUR
174 BlackRock Strategic Funds (BSF)
The notes on pages 489 to 503 form an integral part of these financial statements.
BlackRock European Diversified Equity Absolute Return Fund continued
211 Orion OYJ 'B' Morgan Stanley 141 227,661 Outokumpu OYJ Barclays Bank 31,417 615,568 Outokumpu OYJ Goldman Sachs 188,392 (176,669) PKC Group OYJ Goldman Sachs (319,771) (60,384) PKC Group OYJ Morgan Stanley 297,119 (67,865) Ramirent OYJ Barclays Bank (33,932) (22,820) Ramirent OYJ Goldman Sachs (5,933) 22,232 Sampo OYJ 'A' Goldman Sachs (3,354) (149,850) Sampo OYJ 'A' Goldman Sachs (209,790) 18,630 Sampo OYJ 'A' Barclays Bank 423 (52,377) Sanoma OYJ Goldman Sachs (4,923) (950,333) Sanoma OYJ Morgan Stanley (908,041) (673,708) Sponda OYJ Morgan Stanley 3,564 200,676 Stora Enso OYJ 'R' Goldman Sachs 106,895 12,166 Stora Enso OYJ 'R' Morgan Stanley 4,644 197,119 Stora Enso OYJ 'R' Barclays Bank 44,486 (252,683) Tieto OYJ Goldman Sachs (341,202) (57,511) Tikkurila OYJ Barclays Bank (33,356) (2,457) Tikkurila OYJ Morgan Stanley 1,432 57,711 UPM-Kymmene OYJ Barclays Bank 37,512 17,410 UPM-Kymmene OYJ Morgan Stanley 12,731 226,811 UPM-Kymmene OYJ Goldman Sachs 164,869 (63,823) Uponor OYJ Barclays Bank (97,962) (92,746) Uponor OYJ Goldman Sachs (131,533) (592,003) Valmet OYJ Goldman Sachs (48,843) (213,026) Wartsila OYJ Abp Goldman Sachs (151,975) 948,873 YIT OYJ Barclays Bank 251,451
(1,078,022)
France (16,645) Accor SA Barclays Bank (84,446) (33,547) Accor SA Goldman Sachs (17,475) 1,951 Adocia Barclays Bank (14,984) 2,106 Adocia Goldman Sachs (358) 1,416 Adocia Morgan Stanley (11,298) 34,645 Aeroports de Paris Barclays Bank (25,456) 21,781 Aeroports de Paris Goldman Sachs (22,870) 29 Aeroports de Paris Morgan Stanley (79) (18,605) Aeroports de Paris Barclays Bank 40,562 (23,833) Aeroports de Paris Goldman Sachs 25,069 363,545 Air France-KLM Barclays Bank (174,253) 292,296 Air France-KLM Goldman Sachs (27,768) (1,322,711) Air France-KLM Barclays Bank 294,857 (10,749) Air Liquide SA Goldman Sachs (10,427) 7,918 Air Liquide SA Barclays Bank 11,509 80,360 Air Liquide SA Goldman Sachs 77,949 (147,981) Airbus Group SE Barclays Bank (325,415) (38,474) Airbus Group SE Goldman Sachs (55,641) (1,976) Albioma SA Barclays Bank (588) (8,058) Albioma SA Morgan Stanley (2,155) (156,798) Alstom SA Goldman Sachs (177,196) 149,978 Alstom SA Barclays Bank 169,454 17,180 Alstom SA Goldman Sachs 18,302 1,934 Alstom SA Morgan Stanley 1,576 (102,698) Alten SA Barclays Bank (325,077) (27,326) Alten SA Goldman Sachs (2,518) (533,633) Altran Technologies SA Goldman Sachs (192,108) (37,101) Arkema SA Goldman Sachs (99,431) 2,019 Arkema SA Barclays Bank 2,413 3,789 Arkema SA Goldman Sachs 5,370 90 Arkema SA Morgan Stanley 155 (28,144) Atos SE Barclays Bank (91,943) (52,382) Atos SE Goldman Sachs (196,676) 57,589 Atos SE Barclays Bank 315,857 90,404 Atos SE Goldman Sachs 342,631 129,545 AXA SA Barclays Bank 223,893 120,018 AXA SA Goldman Sachs 253,061 1,633 AXA SA Morgan Stanley 3,699 (87,744) Beneteau SA Goldman Sachs (60,982) (8,408) BioMerieux Goldman Sachs (26,196)
(23,984) BioMerieux Barclays Bank (101,831) 38,294 BNP Paribas SA Goldman Sachs 237,423 1,996,211 Bollore SA Goldman Sachs 437,170 (1,256,262) Bollore SA Barclays Bank 290,197 1,544,022 Bollore SA Barclays Bank (343,775) 416,259 Bollore SA Morgan Stanley (119,558) (552,584) Bollore SA Goldman Sachs (121,016) 33,330 Bouygues SA Barclays Bank 11,709 22,403 Bouygues SA Goldman Sachs 3,717 (448,572) Bureau Veritas SA Barclays Bank 596,503 (361,043) Bureau Veritas SA Goldman Sachs 124,528 (1,073) Capgemini SA Barclays Bank (4,842) 40,818 Capgemini SA Barclays Bank 208,080 62,756 Capgemini SA Goldman Sachs 308,154 (31,019) Carrefour SA Goldman Sachs (12,258) 52,118 Carrefour SA Barclays Bank 18,509 175,763 Carrefour SA Goldman Sachs 14,653 8,407 Carrefour SA Morgan Stanley 1,621 (17,534) Carrefour SA Barclays Bank (1,537) (30,826) Casino Guichard Perrachon SA Barclays Bank (99,980) 2,383 Christian Dior SE Morgan Stanley (444) 3,125 Christian Dior SE Barclays Bank 853 194 Christian Dior SE Goldman Sachs 168 115,796 Cie de Saint-Gobain Barclays Bank 87,978 179,846 Cie de Saint-Gobain Goldman Sachs 296,746 6,790 Cie Generale des
Etablissements Michelin Goldman Sachs 28,657 1,320 Cie Generale des
Etablissements Michelin Morgan Stanley 1,529 (570,069) CNP Assurances Barclays Bank (292,691) (95,827) CNP Assurances Goldman Sachs (109,348) 459,560 Credit Agricole SA Barclays Bank (49,046) 240,280 Credit Agricole SA Goldman Sachs 116,005 (1,726) Danone SA Barclays Bank (3,599) (3,681) Danone SA Goldman Sachs (6,851) 773 Dassault Aviation SA Barclays Bank (28,987) 972 Dassault Aviation SA Goldman Sachs (27,216) (56,091) Dassault Systemes Barclays Bank (184,644) (50,128) Dassault Systemes Goldman Sachs (155,397) 5,840 Dassault Systemes Barclays Bank 17,116 21,374 Dassault Systemes Goldman Sachs 70,155 1,800 Dassault Systemes Morgan Stanley 6,179 757,559 Derichebourg SA Barclays Bank (128,027) 662,817 Derichebourg SA Goldman Sachs (139,854) 27,816 Derichebourg SA Morgan Stanley (255) 139,105 Edenred Barclays Bank (62,112) 146,772 Edenred Goldman Sachs 16,145 2,744 Eiffage SA Goldman Sachs (1,042) 3,111 Eiffage SA Morgan Stanley (1,271) (8,472) Eiffage SA Goldman Sachs 6,425 (29,578) Eiffage SA Barclays Bank 15,480 276,944 Electricite de France SA Barclays Bank (128,912) 108,622 Electricite de France SA Goldman Sachs 73,320 (114,501) Electricite de France SA Barclays Bank (42,881) (676) Electricite de France SA Goldman Sachs (456) (317,695) Electricite de France SA Morgan Stanley (365,189) (98,987) Elior Group Barclays Bank (114,981) (20,117) Elior Group Goldman Sachs (26,152) (164,620) Elis SA Barclays Bank (161,120) 312,437 Engie SA Barclays Bank (100,993) (841) Engie SA Barclays Bank 53 435,885 Engie SA Goldman Sachs 191,293 10,364 Engie SA Morgan Stanley 4,670 10,709 Essilor International SA Barclays Bank 21,109 20,915 Essilor International SA Goldman Sachs 45,087 2,658 Essilor International SA Morgan Stanley 10,712 (4,545) Eurofins Scientific SE Goldman Sachs (114,988) 10,406 Euronext NV Barclays Bank (4,663) 1,206 Euronext NV Morgan Stanley (261) 7,483 Euronext NV Goldman Sachs 1,450 (4,930) Europcar Groupe SA Goldman Sachs (84)
Finland continued France continued

Contracts for difference as at 31 May 2016
Holding
Description Counterparty
Unrealised appreciation/
(depreciation) EUR
Holding
Description Counterparty
Unrealised appreciation/
(depreciation) EUR
Annual Report and Audited Accounts 175
The notes on pages 489 to 503 form an integral part of these financial statements.
(161,645) Europcar Groupe SA Barclays Bank 103,078 3,945 Eutelsat Communications SA Barclays Bank 326 (87,196) Eutelsat Communications SA Barclays Bank 32,865 (20,501) Eutelsat Communications SA Goldman Sachs 10,999 30,307 Faurecia Barclays Bank 20,187 113,982 Faurecia Goldman Sachs 65,381 7,465 Faurecia Morgan Stanley 1,762 1,319 Fonciere Des Regions Barclays Bank (2,525) (31,961) Gaztransport Et Technigaz SA Barclays Bank 67,917 (87,504) Gaztransport Et Technigaz SA Goldman Sachs 73,941 (79,319) Gecina SA Barclays Bank (33,762) (24,997) Gecina SA Goldman Sachs 101,238 13,769 Genfit Barclays Bank (20,522) 3,245 Genfit Goldman Sachs 2,190 (1,017,211) Groupe Eurotunnel SE Barclays Bank (442,094) 55,054 Groupe Fnac SA Barclays Bank 100,264 52,369 Groupe Fnac SA Goldman Sachs 163,915 27,368 Groupe Fnac SA Morgan Stanley (16,081) 6,458 Guerbet Morgan Stanley (36,707) 15,027 Guerbet Barclays Bank 58,479 19,319 Guerbet Goldman Sachs 101,762 92,224 Havas SA Barclays Bank 21,753 24,104 Havas SA Goldman Sachs 4,631 1,083 Havas SA Morgan Stanley 294 (6,349) Hermes International Barclays Bank (50,387) (5,474) Hermes International Goldman Sachs (41,698) 3,043 Hermes International Barclays Bank 30,654 2,937 Hermes International Goldman Sachs 19,671 793 Hermes International Morgan Stanley 8,129 1,594 ICADE Barclays Bank (2,110) 10,077 ICADE Goldman Sachs (17,259) (11,130) ICADE Barclays Bank 32,688 (2,073) ICADE Goldman Sachs 6,975 (6,194) Imerys SA Goldman Sachs (15,795) (31,253) Imerys SA Barclays Bank 11,975 (9,709) Ingenico Group SA Goldman Sachs (35,677) (6,937) Ipsen SA Goldman Sachs (19,111) 7,673 Ipsen SA Barclays Bank 30,279 13,476 Ipsen SA Goldman Sachs 37,868 56,521 IPSOS Barclays Bank 113,042 22,843 IPSOS Goldman Sachs 31,752 (20,024) JCDecaux SA Goldman Sachs (42,100) 778 JCDecaux SA Barclays Bank 539 4,822 JCDecaux SA Goldman Sachs 4,075 883 JCDecaux SA Morgan Stanley 837 (62,613) JCDecaux SA Barclays Bank 64,189 (60,670) JCDecaux SA Morgan Stanley 58,593 (19,235) Kering Goldman Sachs (51,934) 1,127 Kering Barclays Bank 1,711 1,824 Kering Goldman Sachs 3,242 (25,940) Kering Barclays Bank 69,831 172,714 Klepierre Barclays Bank 33,238 117,599 Klepierre Goldman Sachs 60,952 8,544 Klepierre Morgan Stanley 8,238 (10,214) Korian SA Barclays Bank (8,576) (72) Korian SA Goldman Sachs (61) (427) L'Oreal SA Barclays Bank (3,717) (17,189) L'Oreal SA Goldman Sachs (161,577) 8,471 L'Oreal SA Barclays Bank 85,793 87,417 Lagardere SCA Barclays Bank (62,001) 130,572 Lagardere SCA Goldman Sachs (73,394) 20,675 Lagardere SCA Morgan Stanley (18,027) 2,514 Legrand SA Barclays Bank (251) (14,225) Legrand SA Goldman Sachs (14,367) 4,384 Legrand SA Goldman Sachs 2,423 (56,710) Legrand SA Barclays Bank 14,178 1,973 LVMH Moet Hennessy Louis
Vuitton SE Morgan Stanley (65) 9,705 LVMH Moet Hennessy Louis
Vuitton SE Barclays Bank 6,404
5,562 LVMH Moet Hennessy Louis Vuitton SE Goldman Sachs 5,048
(2,360) LVMH Moet Hennessy Louis Vuitton SE Barclays Bank 354
(7,689) LVMH Moet Hennessy Louis Vuitton SE Goldman Sachs 769
(923) Marie Brizard Wine & Spirits SA Goldman Sachs (1,265) 1,841 Mercialys SA Barclays Bank 800 1,007 Mercialys SA Goldman Sachs 285 1,071 Mercialys SA Morgan Stanley 93 (404,318) Metropole Television SA Barclays Bank 42,422 (111,351) Metropole Television SA Goldman Sachs 31,178 1,252,705 Natixis SA Barclays Bank (99,856) 3,542 Natixis SA Morgan Stanley (104) 1,015,153 Natixis SA Goldman Sachs 171,302 (2,417) Naturex Goldman Sachs 3,408 (99,933) Neopost SA Goldman Sachs (225,119) (28,017) Nexans SA Goldman Sachs (55,442) 18,930 Nexans SA Barclays Bank 106,508 20,205 Nexans SA Goldman Sachs 40,006 2,767 Nexans SA Morgan Stanley 17,550 (47,020) Nexity SA Barclays Bank (56,158) (14,090) Nexity SA Goldman Sachs (903) 13,329 Nexity SA Goldman Sachs 6,531 633 Numericable-SFR SA Barclays Bank 239 2,107 Numericable-SFR SA Goldman Sachs 878 (68,288) Numericable-SFR SA Barclays Bank 7,784 (54,780) Numericable-SFR SA Goldman Sachs (30,541) 38,003 Orange SA Barclays Bank 13,846 219,779 Orange SA Goldman Sachs 99,450 (57,805) Orpea Goldman Sachs (180,510) 11,682 Orpea Barclays Bank 36,681 18,053 Orpea Goldman Sachs 58,131 63 Orpea Morgan Stanley 119 (13,027) Parrot SA Morgan Stanley 27,874 (55,819) Pernod Ricard SA Barclays Bank (219,777) (32,389) Pernod Ricard SA Goldman Sachs (72,419) 116,010 Peugeot SA Barclays Bank 33,605 438,852 Peugeot SA Goldman Sachs 276,272 2,453 Peugeot SA Morgan Stanley 1,848 (16,343) Plastic Omnium SA Goldman Sachs (24,188) 23,364 Plastic Omnium SA Barclays Bank 33,419 29,945 Plastic Omnium SA Goldman Sachs 49,176 (4,238) Publicis Groupe SA Barclays Bank (5,031) (103,039) Publicis Groupe SA Goldman Sachs (194,744) (60,392) Remy Cointreau SA Barclays Bank (143,475) (48,035) Remy Cointreau SA Goldman Sachs (169,364) (7,313) Renault SA Barclays Bank (12,515) (6,137) Renault SA Goldman Sachs (10,395) 6,930 Rexel SA Barclays Bank 5,362 5,410 Rexel SA Goldman Sachs 2,395 32,942 Rexel SA Morgan Stanley 24,609 12,370 Rubis SCA Morgan Stanley (7,556) 44,708 Rubis SCA Barclays Bank 32,190 19,115 Rubis SCA Goldman Sachs 38,612 (29,445) Safran SA Barclays Bank (6,580) 63,299 Safran SA Barclays Bank 226,120 41,432 Safran SA Goldman Sachs 140,996 4,591 Sanofi Barclays Bank 7,684 56,510 Sanofi Goldman Sachs 227,735 762 Sanofi Morgan Stanley 54 (3,601) Sartorius Stedim Biotech Barclays Bank (18,778) (30) Sartorius Stedim Biotech Goldman Sachs (149) 9,687 Sartorius Stedim Biotech Barclays Bank 37,572 7,646 Sartorius Stedim Biotech Goldman Sachs 33,263 3,012 Sartorius Stedim Biotech Morgan Stanley 7,735 (112,433) Schneider Electric SE Barclays Bank (215,451) (31,922) Schneider Electric SE Goldman Sachs (103,427) 4 Schneider Electric SE Barclays Bank 17 2,415 SCOR SE Morgan Stanley (916) 188,795 SCOR SE Barclays Bank 117,248
BlackRock European Diversified Equity Absolute Return Fund continued
France continued France continued
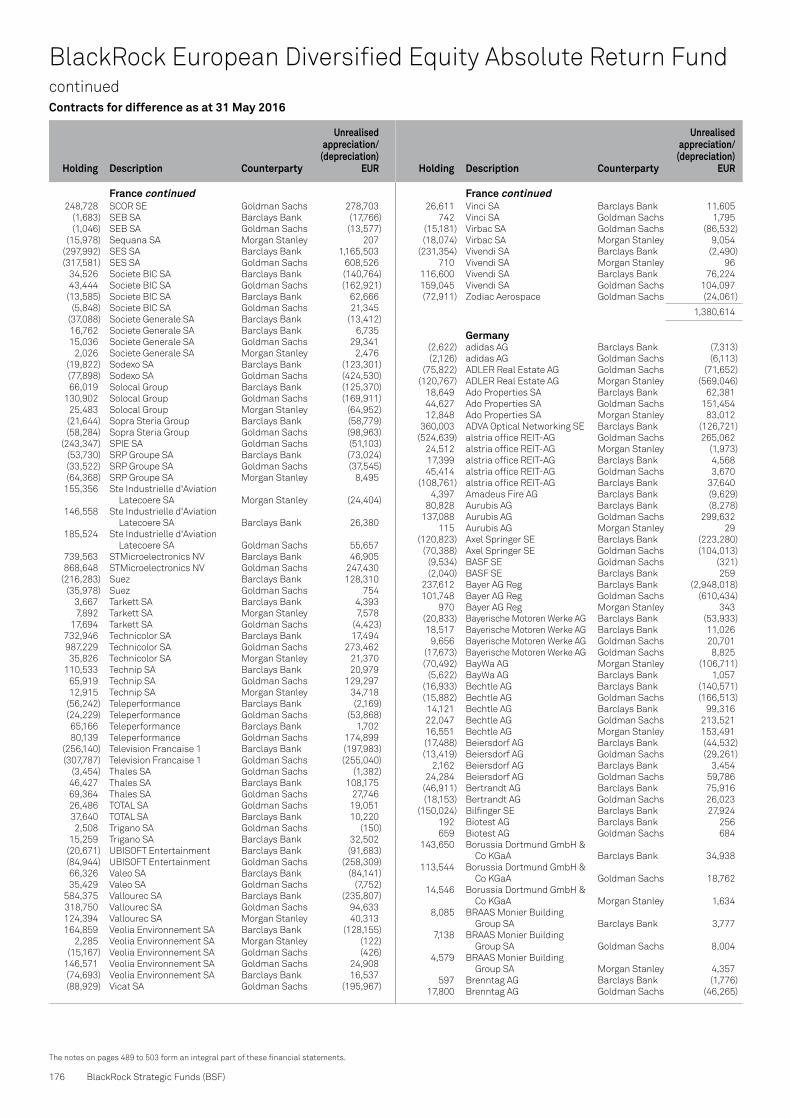
Contracts for difference as at 31 May 2016
Holding
Description Counterparty
Unrealised appreciation/
(depreciation) EUR
Holding
Description Counterparty
Unrealised appreciation/
(depreciation) EUR
176 BlackRock Strategic Funds (BSF)
The notes on pages 489 to 503 form an integral part of these financial statements.
BlackRock European Diversified Equity Absolute Return Fund continued
248,728 SCOR SE Goldman Sachs 278,703 (1,683) SEB SA Barclays Bank (17,766) (1,046) SEB SA Goldman Sachs (13,577) (15,978) Sequana SA Morgan Stanley 207 (297,992) SES SA Barclays Bank 1,165,503 (317,581) SES SA Goldman Sachs 608,526 34,526 Societe BIC SA Barclays Bank (140,764) 43,444 Societe BIC SA Goldman Sachs (162,921) (13,585) Societe BIC SA Barclays Bank 62,666 (5,848) Societe BIC SA Goldman Sachs 21,345 (37,088) Societe Generale SA Barclays Bank (13,412) 16,762 Societe Generale SA Barclays Bank 6,735 15,036 Societe Generale SA Goldman Sachs 29,341 2,026 Societe Generale SA Morgan Stanley 2,476 (19,822) Sodexo SA Barclays Bank (123,301) (77,898) Sodexo SA Goldman Sachs (424,530) 66,019 Solocal Group Barclays Bank (125,370) 130,902 Solocal Group Goldman Sachs (169,911) 25,483 Solocal Group Morgan Stanley (64,952) (21,644) Sopra Steria Group Barclays Bank (58,779) (58,284) Sopra Steria Group Goldman Sachs (98,963) (243,347) SPIE SA Goldman Sachs (51,103) (53,730) SRP Groupe SA Barclays Bank (73,024) (33,522) SRP Groupe SA Goldman Sachs (37,545) (64,368) SRP Groupe SA Morgan Stanley 8,495 155,356 Ste Industrielle d'Aviation
Latecoere SA Morgan Stanley (24,404) 146,558 Ste Industrielle d'Aviation
Latecoere SA Barclays Bank 26,380 185,524 Ste Industrielle d'Aviation
Latecoere SA Goldman Sachs 55,657 739,563 STMicroelectronics NV Barclays Bank 46,905 868,648 STMicroelectronics NV Goldman Sachs 247,430 (216,283) Suez Barclays Bank 128,310 (35,978) Suez Goldman Sachs 754 3,667 Tarkett SA Barclays Bank 4,393 7,892 Tarkett SA Morgan Stanley 7,578 17,694 Tarkett SA Goldman Sachs (4,423) 732,946 Technicolor SA Barclays Bank 17,494 987,229 Technicolor SA Goldman Sachs 273,462 35,826 Technicolor SA Morgan Stanley 21,370 110,533 Technip SA Barclays Bank 20,979 65,919 Technip SA Goldman Sachs 129,297 12,915 Technip SA Morgan Stanley 34,718 (56,242) Teleperformance Barclays Bank (2,169) (24,229) Teleperformance Goldman Sachs (53,868) 65,166 Teleperformance Barclays Bank 1,702 80,139 Teleperformance Goldman Sachs 174,899 (256,140) Television Francaise 1 Barclays Bank (197,983) (307,787) Television Francaise 1 Goldman Sachs (255,040) (3,454) Thales SA Goldman Sachs (1,382) 46,427 Thales SA Barclays Bank 108,175 69,364 Thales SA Goldman Sachs 27,746 26,486 TOTAL SA Goldman Sachs 19,051 37,640 TOTAL SA Barclays Bank 10,220 2,508 Trigano SA Goldman Sachs (150) 15,259 Trigano SA Barclays Bank 32,502 (20,671) UBISOFT Entertainment Barclays Bank (91,683) (84,944) UBISOFT Entertainment Goldman Sachs (258,309) 66,326 Valeo SA Barclays Bank (84,141) 35,429 Valeo SA Goldman Sachs (7,752) 584,375 Vallourec SA Barclays Bank (235,807) 318,750 Vallourec SA Goldman Sachs 94,633 124,394 Vallourec SA Morgan Stanley 40,313 164,859 Veolia Environnement SA Barclays Bank (128,155) 2,285 Veolia Environnement SA Morgan Stanley (122) (15,167) Veolia Environnement SA Goldman Sachs (426) 146,571 Veolia Environnement SA Goldman Sachs 24,908 (74,693) Veolia Environnement SA Barclays Bank 16,537 (88,929) Vicat SA Goldman Sachs (195,967)
26,611 Vinci SA Barclays Bank 11,605 742 Vinci SA Goldman Sachs 1,795 (15,181) Virbac SA Goldman Sachs (86,532) (18,074) Virbac SA Morgan Stanley 9,054 (231,354) Vivendi SA Barclays Bank (2,490) 710 Vivendi SA Morgan Stanley 96 116,600 Vivendi SA Barclays Bank 76,224 159,045 Vivendi SA Goldman Sachs 104,097 (72,911) Zodiac Aerospace Goldman Sachs (24,061)
1,380,614
Germany (2,622) adidas AG Barclays Bank (7,313) (2,126) adidas AG Goldman Sachs (6,113) (75,822) ADLER Real Estate AG Goldman Sachs (71,652) (120,767) ADLER Real Estate AG Morgan Stanley (569,046) 18,649 Ado Properties SA Barclays Bank 62,381 44,627 Ado Properties SA Goldman Sachs 151,454 12,848 Ado Properties SA Morgan Stanley 83,012 360,003 ADVA Optical Networking SE Barclays Bank (126,721) (524,639) alstria office REIT-AG Goldman Sachs 265,062 24,512 alstria office REIT-AG Morgan Stanley (1,973) 17,399 alstria office REIT-AG Barclays Bank 4,568 45,414 alstria office REIT-AG Goldman Sachs 3,670 (108,761) alstria office REIT-AG Barclays Bank 37,640 4,397 Amadeus Fire AG Barclays Bank (9,629) 80,828 Aurubis AG Barclays Bank (8,278) 137,088 Aurubis AG Goldman Sachs 299,632 115 Aurubis AG Morgan Stanley 29 (120,823) Axel Springer SE Barclays Bank (223,280) (70,388) Axel Springer SE Goldman Sachs (104,013) (9,534) BASF SE Goldman Sachs (321) (2,040) BASF SE Barclays Bank 259 237,612 Bayer AG Reg Barclays Bank (2,948,018) 101,748 Bayer AG Reg Goldman Sachs (610,434) 970 Bayer AG Reg Morgan Stanley 343 (20,833) Bayerische Motoren Werke AG Barclays Bank (53,933) 18,517 Bayerische Motoren Werke AG Barclays Bank 11,026 9,656 Bayerische Motoren Werke AG Goldman Sachs 20,701 (17,673) Bayerische Motoren Werke AG Goldman Sachs 8,825 (70,492) BayWa AG Morgan Stanley (106,711) (5,622) BayWa AG Barclays Bank 1,057 (16,933) Bechtle AG Barclays Bank (140,571) (15,882) Bechtle AG Goldman Sachs (166,513) 14,121 Bechtle AG Barclays Bank 99,316 22,047 Bechtle AG Goldman Sachs 213,521 16,551 Bechtle AG Morgan Stanley 153,491 (17,488) Beiersdorf AG Barclays Bank (44,532) (13,419) Beiersdorf AG Goldman Sachs (29,261) 2,162 Beiersdorf AG Barclays Bank 3,454 24,284 Beiersdorf AG Goldman Sachs 59,786 (46,911) Bertrandt AG Barclays Bank 75,916 (18,153) Bertrandt AG Goldman Sachs 26,023 (150,024) Bilfinger SE Barclays Bank 27,924 192 Biotest AG Barclays Bank 256 659 Biotest AG Goldman Sachs 684 143,650 Borussia Dortmund GmbH &
Co KGaA Barclays Bank 34,938 113,544 Borussia Dortmund GmbH &
Co KGaA Goldman Sachs 18,762 14,546 Borussia Dortmund GmbH &
Co KGaA Morgan Stanley 1,634 8,085 BRAAS Monier Building
Group SA Barclays Bank 3,777 7,138 BRAAS Monier Building
Group SA Goldman Sachs 8,004 4,579 BRAAS Monier Building
Group SA Morgan Stanley 4,357 597 Brenntag AG Barclays Bank (1,776) 17,800 Brenntag AG Goldman Sachs (46,265)
France continued France continued

Contracts for difference as at 31 May 2016
Holding
Description Counterparty
Unrealised appreciation/
(depreciation) EUR
Holding
Description Counterparty
Unrealised appreciation/
(depreciation) EUR
Annual Report and Audited Accounts 177
The notes on pages 489 to 503 form an integral part of these financial statements.
(50,972) Cancom SE Goldman Sachs (380,964) (1,541) Capital Stage AG Barclays Bank 1,053 (185,937) Capital Stage AG Goldman Sachs 190,957 (49,540) Capital Stage AG Morgan Stanley 70,630 (107,400) Carl Zeiss Meditec AG Goldman Sachs (636,868) (14,351) Carl Zeiss Meditec AG Morgan Stanley (163,565) 29,375 Cewe Stiftung & Co KGAA Barclays Bank 168,025 30,462 Cewe Stiftung & Co KGAA Goldman Sachs 41,733 5,356 Cewe Stiftung & Co KGAA Morgan Stanley 34,952 66 Commerzbank AG Goldman Sachs 42 (451,562) Commerzbank AG Barclays Bank 36,530 (228,734) Commerzbank AG Goldman Sachs 86,649 (127,194) CompuGroup Medical SE Barclays Bank (629,610) 18,439 Continental AG Barclays Bank 89,642 6,775 Continental AG Goldman Sachs 52,696 617 Continental AG Morgan Stanley 5,647 (4,896) Covestro AG Goldman Sachs (5,980) 46,646 Covestro AG Barclays Bank 154,165 32,099 Covestro AG Goldman Sachs 129,132 3,341 Covestro AG Morgan Stanley 22,043 (209,334) CTS Eventim AG & Co KGaA Barclays Bank (110,517) (16,868) CTS Eventim AG & Co KGaA Goldman Sachs (4,075) 43,558 Daimler AG Reg Barclays Bank 158,433 15,842 Daimler AG Reg Goldman Sachs 72,109 (122,237) Deutsche Bank AG Reg Barclays Bank (187,763) 122,566 Deutsche Bank AG Reg Barclays Bank 161,849 136,838 Deutsche Bank AG Reg Goldman Sachs 103,584 (446,592) Deutsche Lufthansa AG Reg Goldman Sachs 332,462 (736,190) Deutsche Lufthansa AG Reg Barclays Bank 248,798 192,062 Deutsche Pfandbriefbank AG Barclays Bank 245,839 87,297 Deutsche Pfandbriefbank AG Goldman Sachs 152,333 59,794 Deutsche Pfandbriefbank AG Morgan Stanley 64,368 192,752 Deutsche Post AG Reg Barclays Bank 38,248 272,227 Deutsche Post AG Reg Goldman Sachs 89,270 (41,317) Deutsche Post AG Reg Goldman Sachs 5,122 (51,684) Deutsche Post AG Reg Barclays Bank (13,419) 550,210 Deutsche Telekom AG Reg Goldman Sachs 93,148 314,606 Deutsche Telekom AG Reg Barclays Bank 203,414 257,531 Deutsche Wohnen AG Barclays Bank 314,687 46,675 Deutsche Wohnen AG Goldman Sachs 45,049 171,483 Deutz AG Goldman Sachs 6,482 22,576 Deutz AG Morgan Stanley 986 978,924 Deutz AG Barclays Bank (74,188) 122,491 Dialog Semiconductor Plc Barclays Bank (121,098) 111,303 Dialog Semiconductor Plc Goldman Sachs (262,387) (71,389) Dialog Semiconductor Plc Barclays Bank (4,840) (78,551) Dialog Semiconductor Plc Morgan Stanley 146,559 116,683 DIC Asset AG Barclays Bank 71,760 121,163 DIC Asset AG Goldman Sachs 70,032 (114,856) DMG Mori AG Barclays Bank 78,762 (73,309) DMG Mori AG Goldman Sachs 67,363 197 Draegerwerk AG & Co
KGaA (Pref) Barclays Bank 123 1,711 Draegerwerk AG & Co
KGaA (Pref) Goldman Sachs 384 434 Draegerwerk AG & Co
KGaA (Pref) Morgan Stanley 199 52,850 Drillisch AG Barclays Bank 46,244 44,075 Drillisch AG Goldman Sachs 111,866 2,606 Drillisch AG Morgan Stanley 441 (49,749) Drillisch AG Barclays Bank (43,698) (25,227) Drillisch AG Goldman Sachs (31,439) 49,541 Duerr AG Barclays Bank 70,253 4,258 Duerr AG Morgan Stanley 2,304 19,206 Duerr AG Goldman Sachs 14,821 345,483 E.ON SE Barclays Bank 41,023 301,721 E.ON SE Goldman Sachs 41,812 23,748 ElringKlinger AG Barclays Bank 29,870 6,689 ElringKlinger AG Goldman Sachs 8,464 9,759 ElringKlinger AG Morgan Stanley 11,137 (282,115) ElringKlinger AG Barclays Bank 197,882
(72,747) ElringKlinger AG Goldman Sachs 127,093 339,836 Evonik Industries AG Barclays Bank (170,392) 263,746 Evonik Industries AG Goldman Sachs (226,545) 5,011 Evonik Industries AG Morgan Stanley (475) 7,964 Evotec AG Barclays Bank 445 4,500 Evotec AG Morgan Stanley 113 (58,905) Fielmann AG Barclays Bank (55,575) (82,526) Fielmann AG Goldman Sachs 102,120 (139,004) Fraport AG Frankfurt Airport
Services Worldwide Barclays Bank (89,605) (31,992) Fraport AG Frankfurt Airport
Services Worldwide Goldman Sachs (4,533) 1,021 Freenet AG Goldman Sachs (2,430) (11,112) Freenet AG Goldman Sachs (6,708) (12,583) Freenet AG Barclays Bank 11,267 49,640 Fresenius Medical Care AG &
Co KGaA Barclays Bank 166,896 158,741 Fresenius Medical Care AG &
Co KGaA Goldman Sachs 265,740 1,203 Fresenius Medical Care AG &
Co KGaA Morgan Stanley 810 266 Fresenius SE & Co KGaA Barclays Bank 1,203 47,063 Fresenius SE & Co KGaA Goldman Sachs 210,733 18,528 Fuchs Petrolub SE (Pref) Barclays Bank (7,917) 11,536 Fuchs Petrolub SE (Pref) Goldman Sachs (9,608) 15,273 Fuchs Petrolub SE (Pref) Morgan Stanley (16,284) (863) Fuchs Petrolub SE (Pref) Goldman Sachs (281) (242,734) GEA Group AG Barclays Bank (277,997) (135,377) GEA Group AG Goldman Sachs (37,054) (10,018) Gerresheimer AG Barclays Bank (37,656) (9,506) Gerresheimer AG Goldman Sachs (47,744) 3,371 GFK SE Barclays Bank 2,157 422 GFK SE Goldman Sachs 17 7,564 GFK SE Morgan Stanley 20,817 (11,084) GFT Technologies SE Goldman Sachs 13,800 26,872 Grammer AG Barclays Bank 87,370 14,872 Grammer AG Goldman Sachs 38,071 24 Grammer AG Morgan Stanley 103 5,975 Grand City Properties SA Goldman Sachs 115 1,629 Grand City Properties SA Morgan Stanley 722 27,361 Grand City Properties SA Barclays Bank (11,078) 9,586 Grenke AG Goldman Sachs (59,318) 9,659 Grenke AG Barclays Bank 72,686 1,061 Grenke AG Morgan Stanley 486 (171,113) Hamburger Hafen und
Logistik AG Goldman Sachs (307,148) 19,308 Hannover Rueck SE Barclays Bank 58,393 14,469 Hannover Rueck SE Goldman Sachs 29,736 (2,686) HeidelbergCement AG Barclays Bank (4,724) (23,696) HeidelbergCement AG Goldman Sachs 10,690 (2,778) Heidelberger
Druckmaschinen AG Barclays Bank (651) (13,564) Heidelberger
Druckmaschinen AG Morgan Stanley (1,772) (9,343) Hella Kgaa Hueck & Co Barclays Bank (16) 8,398 Hella Kgaa Hueck & Co Goldman Sachs 8,015 (81,608) Hochtief AG Barclays Bank (33,786) (12,616) Hochtief AG Goldman Sachs (7,730) 35,546 Hochtief AG Barclays Bank 21,328 13,315 Hochtief AG Goldman Sachs 8,633 9,481 Hornbach Holding Ag & Co KGA Barclays Bank 55,141 15,700 Hornbach Holding Ag & Co KGA Goldman Sachs 99,671 7,235 Hornbach Holding Ag & Co KGA Morgan Stanley 44,481 31,463 Hugo Boss AG Goldman Sachs (121,558) (113,818) Hugo Boss AG Barclays Bank 122,773 (42,326) Hugo Boss AG Goldman Sachs 46,731 664 Hypoport AG Barclays Bank 2,613 233 Hypoport AG Goldman Sachs 1,655 180 Hypoport AG Morgan Stanley 459 (534) Indus Holding AG Barclays Bank (631) (348,945) Infineon Technologies AG Barclays Bank (355,878)
BlackRock European Diversified Equity Absolute Return Fund continued
Germany continued Germany continued

Contracts for difference as at 31 May 2016
Holding
Description Counterparty
Unrealised appreciation/
(depreciation) EUR
Holding
Description Counterparty
Unrealised appreciation/
(depreciation) EUR
178 BlackRock Strategic Funds (BSF)
The notes on pages 489 to 503 form an integral part of these financial statements.
BlackRock European Diversified Equity Absolute Return Fund continued
(259,667) Infineon Technologies AG Goldman Sachs (244,582) 172,303 Jenoptik AG Barclays Bank 121,606 174,870 Jenoptik AG Goldman Sachs 53,306 75,455 Jenoptik AG Morgan Stanley 78,976 7,341 Jungheinrich AG (Pref) Barclays Bank 21,568 3,417 Jungheinrich AG (Pref) Goldman Sachs 8,621 2,131 Jungheinrich AG (Pref) Morgan Stanley 5,525 (424) Jungheinrich AG (Pref) Barclays Bank (2,043) (941) Jungheinrich AG (Pref) Goldman Sachs (3,593) (262,437) K+S AG Barclays Bank (81,522) (54,556) K+S AG Morgan Stanley 21,353 119,666 KION Group AG Barclays Bank 280,391 112,994 KION Group AG Goldman Sachs (114,944) (392,345) Kloeckner & Co SE Barclays Bank (411,962) (2,215) Kloeckner & Co SE Goldman Sachs (3,529) (365,872) Kloeckner & Co SE Morgan Stanley (1,108,567) 685,632 Kloeckner & Co SE Barclays Bank 544,249 96,070 Kloeckner & Co SE Goldman Sachs 124,884 61,348 Kloeckner & Co SE Morgan Stanley 83,080 68,458 Koenig & Bauer AG Barclays Bank 818,073 7,839 Koenig & Bauer AG Goldman Sachs 96,537 (13,315) Krones AG Barclays Bank (96,476) (5,436) Krones AG Goldman Sachs (31,080) 58,423 Krones AG Barclays Bank 496,609 53,434 Krones AG Goldman Sachs 226,908 (4,779) KUKA AG Barclays Bank (96,365) (3,097) KWS Saat SE Goldman Sachs (25,732) (630) KWS Saat SE Morgan Stanley (30,248) (10,164) KWS Saat SE Barclays Bank 27,443 10,059 Lanxess AG Barclays Bank (4,157) 34,108 Lanxess AG Goldman Sachs 8,882 (3,572) Leoni AG Barclays Bank 2,045 (38,550) Leoni AG Goldman Sachs 34,441 (772) Linde AG Goldman Sachs (909) 14,044 Linde AG Barclays Bank 94,608 19,357 Linde AG Goldman Sachs 119,815 1,185 Linde AG Morgan Stanley 3,245 (1) Manz AG Barclays Bank (1) (115,443) Merck KGaA Barclays Bank (771,329) (18,649) Merck KGaA Goldman Sachs (106,449) (39,203) METRO AG Barclays Bank (80,280) (50,636) METRO AG Goldman Sachs (45,542) 5,767 MorphoSys AG Barclays Bank 38,466 2,707 MorphoSys AG Goldman Sachs 56 (120,598) MTU Aero Engines AG Barclays Bank (350,615) (53,183) MTU Aero Engines AG Goldman Sachs (120,278) (8,826) Muenchener
Rueckversicherungs- Gesellschaft AG in Muenchen Reg Barclays Bank (69,527)
(14,316) Muenchener Rueckversicherungs- Gesellschaft AG in Muenchen Reg Goldman Sachs 135,463
(3,572) Nemetschek SE Barclays Bank (5,231) (13,729) Nemetschek SE Goldman Sachs (78,048) (2,280) Nordex SE Barclays Bank 92 74,429 Norma Group SE Barclays Bank (1,746) 63,270 Norma Group SE Goldman Sachs (111,280) 16,070 Norma Group SE Morgan Stanley (4,190) (2,209) PATRIZIA Immobilien AG Barclays Bank (313) 703 PATRIZIA Immobilien AG Barclays Bank 625 13,470 Pfeiffer Vacuum Technology AG Barclays Bank (81,727) 14,555 Pfeiffer Vacuum Technology AG Goldman Sachs (95,403) 7,452 Pfeiffer Vacuum Technology AG Morgan Stanley (28,320) (2,210) Pfeiffer Vacuum Technology AG Barclays Bank 4,321 152,119 ProSiebenSat.1 Media SE Barclays Bank 172,521 295,036 ProSiebenSat.1 Media SE Goldman Sachs 285,884 7,750 ProSiebenSat.1 Media SE Morgan Stanley 406 (21,500) Puma SE Barclays Bank (202,130) 73,613 Qiagen NV Goldman Sachs 3,557
(93,530) Qiagen NV Barclays Bank 19,591 (36,014) Qiagen NV Goldman Sachs 28,013 7,586 Rational AG Barclays Bank (77,104) (7,252) Rational AG Barclays Bank 74,400 3,930 Rational AG Goldman Sachs (67,863) 2,066 Rational AG Morgan Stanley (29,028) 1,776 Rheinmetall AG Barclays Bank 3,490 5,148 Rheinmetall AG Goldman Sachs 14,690 29,357 Rhoen-Klinikum AG Barclays Bank 18,387 16,261 Rhoen-Klinikum AG Goldman Sachs 3,814 9,580 Rhoen-Klinikum AG Morgan Stanley 2,351 (68,218) RIB Software AG Morgan Stanley 59,881 15,439 Rocket Internet SE Barclays Bank (4,075) 5,703 Rocket Internet SE Goldman Sachs (2,251) 2,797 Rocket Internet SE Morgan Stanley (1,671) 2,260 RTL GROUP Barclays Bank 45 (77,199) RTL GROUP Barclays Bank (610,411) (27,304) RTL GROUP Goldman Sachs (219,284) 591 RTL GROUP Goldman Sachs 1,955 425 RTL GROUP Morgan Stanley 828 109,735 RWE AG Barclays Bank 45,689 31,218 RWE AG Morgan Stanley 8,545 114,295 RWE AG Goldman Sachs 10,691 33,603 SAF-Holland SA Morgan Stanley 20,904 67,728 SAF-Holland SA Barclays Bank 74,839 35,517 SAF-Holland SA Goldman Sachs 33,736 356 Salzgitter AG Barclays Bank (219) (281,497) Salzgitter AG Goldman Sachs 28,543 19,287 SAP SE Barclays Bank 93,018 72,869 SAP SE Goldman Sachs 384,265 (5,107) Sartorius AG Barclays Bank (172,173) (9,905) Sartorius AG Goldman Sachs (127,004) 85,343 Schaeffler AG Morgan Stanley 61,698 132,105 Schaeffler AG Barclays Bank 173,097 91,059 Schaeffler AG Goldman Sachs 96,941 2,207 Scout24 AG Barclays Bank 4,160 60,690 SHW AG Barclays Bank 192,344 53,032 SHW AG Goldman Sachs 199,451 24,433 SHW AG Morgan Stanley 84,266 (29,422) Siemens AG Reg Goldman Sachs (133,665) (4,376) Siemens AG Reg Barclays Bank (16,589) 1,454 Sixt SE Barclays Bank 3,490 (174) SLM Solutions Group AG Barclays Bank (16) (10,571) SLM Solutions Group AG Morgan Stanley (32,719) (30,298) Software AG Barclays Bank (38,373) (127,699) Software AG Goldman Sachs (152,112) 26,456 Stabilus SA Barclays Bank 114,758 15,155 Stabilus SA Goldman Sachs 70,389 29,140 Stabilus SA Morgan Stanley 188,380 (31,494) STADA Arzneimittel AG Barclays Bank (334,213) (63,146) STADA Arzneimittel AG Goldman Sachs (680,664) 103,080 Stroeer SE & Co KGaA Barclays Bank 595,936 46,463 Stroeer SE & Co KGaA Goldman Sachs 35,057 (9,353) Stroeer SE & Co KGaA Barclays Bank (54,575) (58,195) Suedzucker AG Barclays Bank (133,267) (35,095) Suedzucker AG Goldman Sachs (30,320) 111,782 Symrise AG Barclays Bank (95,500) 165,345 Symrise AG Goldman Sachs (173,851) (98,433) Symrise AG Barclays Bank 72,835 (56,083) Symrise AG Goldman Sachs 185,248 46,294 TAG Immobilien AG Goldman Sachs 22,453 (60,566) TAG Immobilien AG Morgan Stanley (76,221) 3,644 Takkt AG Goldman Sachs 10,586 197 Takkt AG Morgan Stanley 247 (31,740) Talanx AG Barclays Bank (27,202) (29,321) Talanx AG Goldman Sachs (26,050) (5,202) Tele Columbus AG Barclays Bank (2,147) 599,405 Telefonica Deutschland
Holding AG Barclays Bank (272,275) 635,329 Telefonica Deutschland
Holding AG Goldman Sachs (311,915)
Germany continued Germany continued

Contracts for difference as at 31 May 2016
Holding
Description Counterparty
Unrealised appreciation/
(depreciation) EUR
Holding
Description Counterparty
Unrealised appreciation/
(depreciation) EUR
Annual Report and Audited Accounts 179
The notes on pages 489 to 503 form an integral part of these financial statements.
86,722 thyssenkrupp AG Barclays Bank 75,359 50,521 thyssenkrupp AG Goldman Sachs 76,387 1,105 thyssenkrupp AG Morgan Stanley 1,125 (7,388) thyssenkrupp AG Barclays Bank 1,850 (163,011) thyssenkrupp AG Goldman Sachs 17,130 31,483 TLG Immobilien AG Barclays Bank 38,871 34,643 TLG Immobilien AG Goldman Sachs 35,849 6,527 TLG Immobilien AG Morgan Stanley 8,756 118,635 United Internet AG Reg Barclays Bank (66,476) 138,334 United Internet AG Reg Goldman Sachs (158,917) 77,305 VERBIO Vereinigte
BioEnergie AG Barclays Bank (196,326) 138,630 VERBIO Vereinigte
BioEnergie AG Goldman Sachs (334,166) 32,234 VERBIO Vereinigte
BioEnergie AG Morgan Stanley (27,598) 94,359 Vonovia SE Barclays Bank 155,710 180,039 Vonovia SE Goldman Sachs 162,820 (4,846) Vossloh AG Barclays Bank (8,970) (61,051) Vossloh AG Goldman Sachs (113,005) (4,846) Vossloh AG Barclays Bank 2,619 (61,051) Vossloh AG Goldman Sachs 88,298 (64,425) VTG AG Barclays Bank (125,307) (37,251) VTG AG Goldman Sachs (74,316) (8,653) VTG AG Morgan Stanley (20,921) (41,954) Wacker Chemie AG Goldman Sachs (220,364) (44,714) Wacker Neuson SE Barclays Bank (45,385) (2,417) Wacker Neuson SE Goldman Sachs (3,456) (4,288) Wacker Neuson SE Morgan Stanley (16,398) 17,299 Wirecard AG Barclays Bank 39,528 24,761 Wirecard AG Goldman Sachs 120,295 5,408 Wirecard AG Morgan Stanley 14,668 53,696 Wuestenrot &
Wuerttembergische AG Barclays Bank 73,832 9,698 Wuestenrot &
Wuerttembergische AG Goldman Sachs 10,086 (14,085) XING AG Barclays Bank (195,077) 6,496 Zalando SE Barclays Bank (5,277) 62,238 Zalando SE Goldman Sachs (17,621) 7,505 Zalando SE Morgan Stanley (7,794) (110,388) Zalando SE Barclays Bank 231,401 (70,874) Zalando SE Goldman Sachs 196,992 (3,401) Zeal Network SE Barclays Bank 13,043 (1,643) Zeal Network SE Goldman Sachs 7,615 (7,852) zooplus AG Morgan Stanley (74,723)
(3,794,068)
Ireland (330,712) Bank of Ireland Goldman Sachs (2,097) 4,212,194 Bank of Ireland Barclays Bank 75,821 6,545,237 Bank of Ireland Goldman Sachs 248,719 604,005 Bank of Ireland Morgan Stanley 15,146 (719,255) C&C Group Plc Barclays Bank (115,670) (39,126) C&C Group Plc Goldman Sachs (4,578) (160,875) Dalata Hotel Group Plc Goldman Sachs (83,494) (410,776) Dalata Hotel Group Plc Morgan Stanley (222,266) 171,676 Glanbia Plc Barclays Bank 87,053 370,645 Glanbia Plc Goldman Sachs 210,565 1,351 Glanbia Plc Morgan Stanley 100 132,361 Hibernia REIT Plc Barclays Bank 794 53,151 Hibernia REIT Plc Goldman Sachs 957 132,140 Hibernia REIT Plc Morgan Stanley (11,987) (49,469) Irish Residential Properties
REIT Plc Barclays Bank (1,336) (150,348) Irish Residential Properties
REIT Plc Morgan Stanley (7,102) (160,630) Kerry Group Plc Goldman Sachs (68,107) 79,023 Kingspan Group Plc Barclays Bank 161,997 138,758 Kingspan Group Plc Goldman Sachs 229,199 2,322 Kingspan Group Plc Morgan Stanley 7,416
(624,762) Origin Enterprises Plc Barclays Bank (57,478) (73,821) Origin Enterprises Plc Morgan Stanley 46,949 (35,608) Paddy Power Betfair Plc Morgan Stanley (53,744) (1,065,406) Permanent TSB Group
Holdings Plc Morgan Stanley 851,682 34,488 Ryanair Holdings Plc Barclays Bank 32,962 70,632 Ryanair Holdings Plc Goldman Sachs 65,173 4,872 Ryanair Holdings Plc Morgan Stanley 1,571 (7,596) Smurfit Kappa Group Plc Goldman Sachs (5,456)
1,402,789
Italy (2,812,770) A2A SpA Goldman Sachs (169,750) 797,187 A2A SpA Barclays Bank 39,043 232,483 ACEA SpA Barclays Bank 86,002 144,117 ACEA SpA Goldman Sachs 6,640 47,902 ACEA SpA Morgan Stanley 28,813 516,671 Amplifon SpA Barclays Bank 368,869 344,368 Amplifon SpA Goldman Sachs 103,310 (106,085) Anima Holding SpA Goldman Sachs (9,146) 340,100 Anima Holding SpA Barclays Bank 74,951 624,124 Anima Holding SpA Goldman Sachs 89,112 124,073 Anima Holding SpA Morgan Stanley 11,217 111,971 Assicurazioni Generali SpA Barclays Bank 16,041 153,064 Assicurazioni Generali SpA Goldman Sachs 85,716 (164,894) Astaldi SpA Goldman Sachs 13,851 54,182 ASTM SpA Barclays Bank 18,964 80,814 ASTM SpA Goldman Sachs 25,861 82,623 ASTM SpA Morgan Stanley 112,373 170,873 Atlantia SpA Barclays Bank (11,019) 263,932 Atlantia SpA Goldman Sachs 29,443 41,829 Atlantia SpA Morgan Stanley 6,817 401,316 Autogrill SpA Goldman Sachs 10,569 228,127 Autogrill SpA Barclays Bank 39,945 46,096 Autogrill SpA Morgan Stanley 23,477 (158,856) Azimut Holding SpA Goldman Sachs (99,752) 113,213 Banca Generali SpA Barclays Bank 49,253 71,734 Banca Generali SpA Goldman Sachs 43,091 17,121 Banca Generali SpA Morgan Stanley 1,705 (19,671) Banca Generali SpA Goldman Sachs (3,101) (44,930) Banca IFIS SpA Goldman Sachs (79,979) (7,019) Banca IFIS SpA Barclays Bank 1,003 (29,789) Banca Mediolanum SpA Barclays Bank (9,830) (1,234,069) Banca Mediolanum SpA Goldman Sachs (454,781) 8,830 Banca Monte dei Paschi di
Siena SpA Barclays Bank (653) 1,180,010 Banca Monte dei Paschi di
Siena SpA Goldman Sachs 87,321 (361,232) Banca Popolare dell'Emilia
Romagna SC Goldman Sachs (88,863) (751,650) Banca Popolare di Sondrio
SCARL Barclays Bank 216,475 (2,279,242) Banca Popolare di Sondrio
SCARL Goldman Sachs 13,675 (4,880,358) Beni Stabili SpA SIIQ Goldman Sachs (264,486) 55,908 Biesse SpA Barclays Bank (25,159) 17,157 Biesse SpA Morgan Stanley 764 40,045 Brembo SpA Goldman Sachs (18,020) (8,657) Brembo SpA Goldman Sachs 3,896 (44,610) Brunello Cucinelli SpA Barclays Bank (25,874) (115,800) Brunello Cucinelli SpA Goldman Sachs (35,414) (64,527) Brunello Cucinelli SpA Morgan Stanley (163,107) (82,933) Buzzi Unicem SpA Barclays Bank (118,594) (226,994) Buzzi Unicem SpA Goldman Sachs (149,687) 178,795 Cementir Holding SpA Morgan Stanley (172,857) 124,043 Cementir Holding SpA Barclays Bank 9,427 130,331 Cementir Holding SpA Goldman Sachs 18,246 2,466 Cerved Information
Solutions SpA Goldman Sachs 243
BlackRock European Diversified Equity Absolute Return Fund continued
Ireland continued Germany continued

Contracts for difference as at 31 May 2016
Holding
Description Counterparty
Unrealised appreciation/
(depreciation) EUR
Holding
Description Counterparty
Unrealised appreciation/
(depreciation) EUR
180 BlackRock Strategic Funds (BSF)
The notes on pages 489 to 503 form an integral part of these financial statements.
BlackRock European Diversified Equity Absolute Return Fund continued
468 Cerved Information Solutions SpA Morgan Stanley 87
673,051 CNH Industrial NV Goldman Sachs 137,975 1,321,613 CNH Industrial NV Barclays Bank (396,484) (3,354) Credito Emiliano SpA Barclays Bank (252) 775,705 Credito Valtellinese SC Barclays Bank (92,697) (1,084,427) Credito Valtellinese SC Goldman Sachs (542) 363,442 Credito Valtellinese SC Goldman Sachs 182 6,592 d'Amico International
Shipping SA Goldman Sachs (31) 34,554 d'Amico International
Shipping SA Barclays Bank 82 (24,874) Danieli & C Officine
Meccaniche SpA Goldman Sachs (23,879) 11,429 Datalogic SpA Barclays Bank 12,919 6,774 Datalogic SpA Goldman Sachs 6,948 4,977 Datalogic SpA Morgan Stanley 4,952 (644,296) Davide Campari-Milano SpA Goldman Sachs (99,866) (28,868) De' Longhi SpA Barclays Bank (112,297) (53,556) De' Longhi SpA Goldman Sachs (97,459) (88,560) DiaSorin SpA Goldman Sachs (177,120) 100 DiaSorin SpA Barclays Bank 31 14,753 DiaSorin SpA Goldman Sachs 29,429 (47,836) Ei Towers SpA Morgan Stanley 270,523 (539,545) Enel SpA Goldman Sachs (68,312) (128,369) Eni SpA Goldman Sachs (16,910) 6,003 ERG SpA Goldman Sachs (428) 7,128 ERG SpA Barclays Bank 1,780 43,198 ERG SpA Morgan Stanley 5,857 (46,713) ERG SpA Barclays Bank 17,374 (98,261) ERG SpA Goldman Sachs 71,458 178,670 Esprinet SpA Barclays Bank (183,353) 122,283 Esprinet SpA Goldman Sachs (107,275) 155,825 Esprinet SpA Morgan Stanley (201,373) (112,978) Ferrari NV Goldman Sachs 63,357 (164,404) FinecoBank Banca Fineco
SpA Barclays Bank 45,145 (167,767) FinecoBank Banca Fineco
SpA Goldman Sachs 3,355 706,669 Geox SpA Barclays Bank 163,947 65,218 Geox SpA Goldman Sachs 17,739 108,790 Hera SpA Barclays Bank 2,829 (902,948) Hera SpA Goldman Sachs (72,581) 1,310,358 Hera SpA Goldman Sachs 81,242 40,523 Hera SpA Morgan Stanley 7,815 (83,628) Industria Macchine
Automatiche SpA Goldman Sachs (309,424) (7,827) Industria Macchine
Automatiche SpA Morgan Stanley (54,652) (122,621) Infrastrutture Wireless
Italiane SpA Barclays Bank 21,581 (48,675) Infrastrutture Wireless
Italiane SpA Goldman Sachs 97 (47,716) Interpump Group SpA Barclays Bank (78,844) (67,444) Interpump Group SpA Goldman Sachs (74,197) 745,672 Intesa Sanpaolo SpA Barclays Bank (62,636) 704,900 Intesa Sanpaolo SpA Goldman Sachs 82,077 1,033,016 Iren SpA Barclays Bank 32,221 956,322 Iren SpA Goldman Sachs 37,297 1,112,375 Iren SpA Morgan Stanley 336,380 193,139 La Doria SpA Barclays Bank 7,726 72,651 La Doria SpA Goldman Sachs 24,701 106,558 La Doria SpA Morgan Stanley 128,075 (398,682) Leonardo-Finmeccanica SpA Goldman Sachs (51,404) (13,942) Luxottica Group SpA Goldman Sachs (15,754) 12 Luxottica Group SpA Barclays Bank 17 392,917 Maire Tecnimont SpA Morgan Stanley 57,381 599,546 Maire Tecnimont SpA Barclays Bank (64,604) 819,579 Maire Tecnimont SpA Goldman Sachs (57,371) (11,763) Massimo Zanetti Beverage
Group SpA Barclays Bank 1,882
(1,106) Massimo Zanetti Beverage Group SpA Goldman Sachs 133
(3,020,738) Mediaset SpA Goldman Sachs (990,153) 463,325 Mediaset SpA Barclays Bank 50,039 71,760 Mediobanca SpA Goldman Sachs 39,109 582,535 Mediobanca SpA Barclays Bank (81,555) (386,115) Mediobanca SpA Goldman Sachs (208,482) 78,550 Moncler SpA Barclays Bank 50,598 41,964 Moncler SpA Morgan Stanley 11,190 (20,355) Moncler SpA Goldman Sachs 14,859 83,563 Moncler SpA Goldman Sachs (53,219) 411,165 OVS SpA Barclays Bank 171,213 263,937 OVS SpA Goldman Sachs 116,760 166,335 OVS SpA Morgan Stanley 89,239 (1,073,403) Parmalat SpA Barclays Bank 47,199 (34,790) Piaggio & C SpA Barclays Bank 4,627 (301,669) Poste Italiane SpA Goldman Sachs (42,234) 149,332 Poste Italiane SpA Barclays Bank 27,810 193,411 Poste Italiane SpA Goldman Sachs 29,247 17,550 Poste Italiane SpA Morgan Stanley 3,566 182,731 Prysmian SpA Barclays Bank 253,294 66,416 Prysmian SpA Goldman Sachs 38,521 (250,977) Recordati SpA Goldman Sachs (361,869) 121,155 Recordati SpA Barclays Bank 496,117 78,887 Recordati SpA Goldman Sachs 174,340 12,972 Recordati SpA Morgan Stanley 39,102 (6,984) Reply SpA Barclays Bank (52,275) (14,870) Reply SpA Goldman Sachs (134,557) (2,003) Reply SpA Morgan Stanley (19,374) (632,446) Rizzoli Corriere Della Sera
Mediagroup SpA Goldman Sachs (35,101) 161,500 Safilo Group SpA Barclays Bank (51,485) 79,529 Safilo Group SpA Morgan Stanley (89,331) 50,261 Safilo Group SpA Goldman Sachs 19,351 333,442 Saipem SpA Morgan Stanley 1,614 6,694,060 Saipem SpA Barclays Bank (135,781) 7,263,333 Saipem SpA Goldman Sachs (31,131) (811,999) Salini Impregilo SpA Goldman Sachs 485,575 3,914 Salvatore Ferragamo SpA Barclays Bank (3,170) 6,990 Salvatore Ferragamo SpA Goldman Sachs (12,931) 7,113 Salvatore Ferragamo SpA Morgan Stanley (14,027) (6,394) Salvatore Ferragamo SpA Morgan Stanley 11,566 (2,051,136) Snam SpA Goldman Sachs (40,834) (244,636) Societa Cattolica di
Assicurazioni SCRL Goldman Sachs (126,188) 268,033 Societa Iniziative
Autostradali e Servizi SpA Barclays Bank (95,152) 160,952 Societa Iniziative
Autostradali e Servizi SpA Morgan Stanley (93,114) 164,655 Societa Iniziative
Autostradali e Servizi SpA Goldman Sachs 45,280 (3,743) Sogefi SpA Barclays Bank (755) (207,182) Sogefi SpA Goldman Sachs (36,050) 44,656 Tamburi Investment
Partners SpA Barclays Bank (759) 57,913 Tamburi Investment
Partners SpA Goldman Sachs (365) 42,843 Tamburi Investment
Partners SpA Morgan Stanley 17,459 (3,789,456) Telecom Italia SpA/Milano Goldman Sachs 58,737 6,395,746 Telecom Italia SpA/Milano Goldman Sachs (99,134) (436,503) Tenaris SA Goldman Sachs (118,306) (1,504,017) Terna Rete Elettrica
Nazionale SpA Goldman Sachs (230,115) 225,473 Terna Rete Elettrica
Nazionale SpA Barclays Bank 19,322 906,524 Terna Rete Elettrica
Nazionale SpA Goldman Sachs 138,698 15,787 Tod's SpA Barclays Bank (83,039) 5,080 Tod's SpA Goldman Sachs (3,810) 3,868 Tod's SpA Morgan Stanley (18,139)
Italy continued Italy continued

Contracts for difference as at 31 May 2016
Holding
Description Counterparty
Unrealised appreciation/
(depreciation) EUR
Holding
Description Counterparty
Unrealised appreciation/
(depreciation) EUR
Annual Report and Audited Accounts 181
The notes on pages 489 to 503 form an integral part of these financial statements.
(2,780) TREVI - Finanziaria Industriale SpA Barclays Bank (55)
4,825,888 UniCredit SpA Barclays Bank (1,295,425) 1,778,042 UniCredit SpA Goldman Sachs (424,248) 5,839 UniCredit SpA Morgan Stanley (602) 667,518 Unione di Banche
Italiane SpA Barclays Bank (201,930) 144,277 Unione di Banche
Italiane SpA Morgan Stanley (7,087) 487,285 Unione di Banche
Italiane SpA Goldman Sachs 975 314,623 Unipol Gruppo Finanziario SpA Barclays Bank (101,118) (828,618) Unipol Gruppo Finanziario SpA Goldman Sachs (106,660) 362,387 Unipolsai SpA Barclays Bank 3,250 411,164 Unipolsai SpA Goldman Sachs 2,228 (347,611) Unipolsai SpA Barclays Bank 84,122 (2,185,310) Unipolsai SpA Goldman Sachs 30,829 351,202 Unipolsai SpA Morgan Stanley (3,873) (22,559) Yoox Net-A-Porter Group SpA Barclays Bank 4,061 (95,432) Yoox Net-A-Porter Group SpA Goldman Sachs (17,178)
(3,849,824)
Jersey 994 Shire Plc Morgan Stanley (427) 18,894 Shire Plc Barclays Bank 3,508 113,748 Shire Plc Goldman Sachs 303,150
306,231
Luxembourg 42,127 Senvion SA Barclays Bank (17,861) 47,067 Senvion SA Goldman Sachs (21,397) 40,446 Senvion SA Morgan Stanley (38,405)
(77,663)
Netherlands (1,197) Aalberts Industries NV Barclays Bank (1,676) (553,705) Aalberts Industries NV Goldman Sachs (589,189) (121,922) ABN AMRO Group NV -CVA Goldman Sachs (81,660) 5 Akzo Nobel NV Goldman Sachs (10) (85,026) Akzo Nobel NV Goldman Sachs 9,353 (165,659) Altice NV 'A' Goldman Sachs (186,876) 92,901 Altice NV 'A' Barclays Bank 184,768 17,798 Altice NV 'A' Goldman Sachs 21,892 (22,231) AMG Advanced Metallurgical
Group NV Morgan Stanley (81,219) (6,635) Aperam SA Goldman Sachs (15,491) 104,420 Aperam SA Barclays Bank 214,729 68,065 Aperam SA Goldman Sachs 146,680 (145,298) Arcadis NV Goldman Sachs (81,801) 459,234 ArcelorMittal Barclays Bank 113,494 560,349 ArcelorMittal Goldman Sachs 107,760 8,435 ASM International NV Goldman Sachs (6,941) 1,421 ASM International NV Morgan Stanley (769) (238,492) ASM International NV Goldman Sachs (420,938) 61,686 ASM International NV Barclays Bank 11,660 3,751 ASML Holding NV Goldman Sachs 312 (13,343) ASML Holding NV Goldman Sachs (73,253) (104,769) BE Semiconductor
Industries NV Goldman Sachs (178,107) 209,023 BE Semiconductor
Industries NV Barclays Bank (229,925) (540,395) BinckBank NV Barclays Bank (206,141) (56,624) BinckBank NV Goldman Sachs (27,123) 83,530 Boskalis Westminster Barclays Bank (152,374) 84,891 Boskalis Westminster Goldman Sachs (42,547) 4,600 Boskalis Westminster Morgan Stanley (9,713) (37,517) Brunel International NV Barclays Bank 6,964 (179,688) Corbion NV Goldman Sachs (105,862)
(225,890) Delta Lloyd NV Goldman Sachs (154,602) 407,562 Delta Lloyd NV Barclays Bank 48,666 295,752 Delta Lloyd NV Goldman Sachs 203,182 (26,057) Eurocommercial
Properties NV Goldman Sachs (17,375) 94,844 Eurocommercial
Properties NV Barclays Bank 155,070 115,375 Eurocommercial
Properties NV Goldman Sachs 130,374 (218,693) Fiat Chrysler
Automobiles NV Goldman Sachs 71,075 (47,512) Flow Traders Goldman Sachs (57,014) (33,630) Flow Traders Barclays Bank 117,873 (409,707) Fugro NV -CVA Barclays Bank 643,049 13,204 Gemalto NV Barclays Bank 7,166 24,877 Gemalto NV Goldman Sachs 26,436 1,536 Gemalto NV Morgan Stanley 1,948 (3,048) Gemalto NV Barclays Bank 5,029 (135,989) GrandVision NV Barclays Bank (142,628) (72,584) GrandVision NV Goldman Sachs (122,667) 30,781 Heijmans NV -CVA Barclays Bank 6,772 26,115 Heijmans NV -CVA Goldman Sachs 15,643 88,597 Heineken NV Barclays Bank 42,163 49,474 Heineken NV Goldman Sachs 33,562 (80,574) IMCD Group NV Barclays Bank (158,938) (60,447) IMCD Group NV Goldman Sachs (132,077) 136,795 ING Groep NV -CVA Barclays Bank 118,350 206,510 ING Groep NV -CVA Goldman Sachs 216,534 6,558 ING Groep NV -CVA Morgan Stanley 8,292 (27,130) Intertrust NV Goldman Sachs 1,356 26 Kendrion NV Barclays Bank 630 98 Kendrion NV Goldman Sachs 55 55 Kendrion NV Morgan Stanley 157 297,714 Koninklijke Ahold NV Barclays Bank 277,602 276,643 Koninklijke Ahold NV Goldman Sachs 262,169 (748,228) Koninklijke BAM Groep NV Goldman Sachs (287,362) 104,647 Koninklijke BAM Groep NV Barclays Bank 8,028 (148,840) Koninklijke DSM NV Goldman Sachs (169,077) (1,231,251) Koninklijke KPN NV Goldman Sachs (129,313) (107,219) Koninklijke Philips NV Goldman Sachs (64,121) (59,870) Koninklijke Vopak NV Goldman Sachs 14,369 276,845 NN Group NV Barclays Bank 43,925 107,021 NN Group NV Goldman Sachs 63,900 18,381 NN Group NV Morgan Stanley 8,174 14,732 NSI NV Goldman Sachs (118) (70,778) Randstad Holding NV Goldman Sachs (196,763) (18,052) Refresco Group NV Goldman Sachs 4,671 834 RELX NV Barclays Bank 745 183,884 RELX NV Goldman Sachs 112,169 72 SBM Offshore NV Barclays Bank (23) 9,756 SBM Offshore NV Morgan Stanley (2,289) (303,416) SBM Offshore NV Goldman Sachs 259,773 (2,638) TKH Group NV Goldman Sachs (1,477) 78,035 TKH Group NV Barclays Bank 35,880 63,808 TKH Group NV Goldman Sachs 35,732 762,768 TomTom NV Barclays Bank 203,715 646,257 TomTom NV Goldman Sachs 393,662 (377,705) TomTom NV Goldman Sachs (230,400) 30 Unibail-Rodamco SE Goldman Sachs 236 308,607 Unilever NV -CVA Barclays Bank 544,361 187,541 Unilever NV -CVA Goldman Sachs 251,515 (23,474) Vastned Retail NV Barclays Bank (34,859) (43,702) Vastned Retail NV Goldman Sachs (51,350) 106,786 Wereldhave NV Barclays Bank 122,790 192,061 Wereldhave NV Goldman Sachs 362,995 3,493 Wereldhave NV Morgan Stanley 5,207 (373,818) Wessanen Barclays Bank (176,816) (153,718) Wessanen Morgan Stanley (227,023) (112,773) Wolters Kluwer NV Goldman Sachs (211,716)
622,989
BlackRock European Diversified Equity Absolute Return Fund continued
Netherlands continued Italy continued
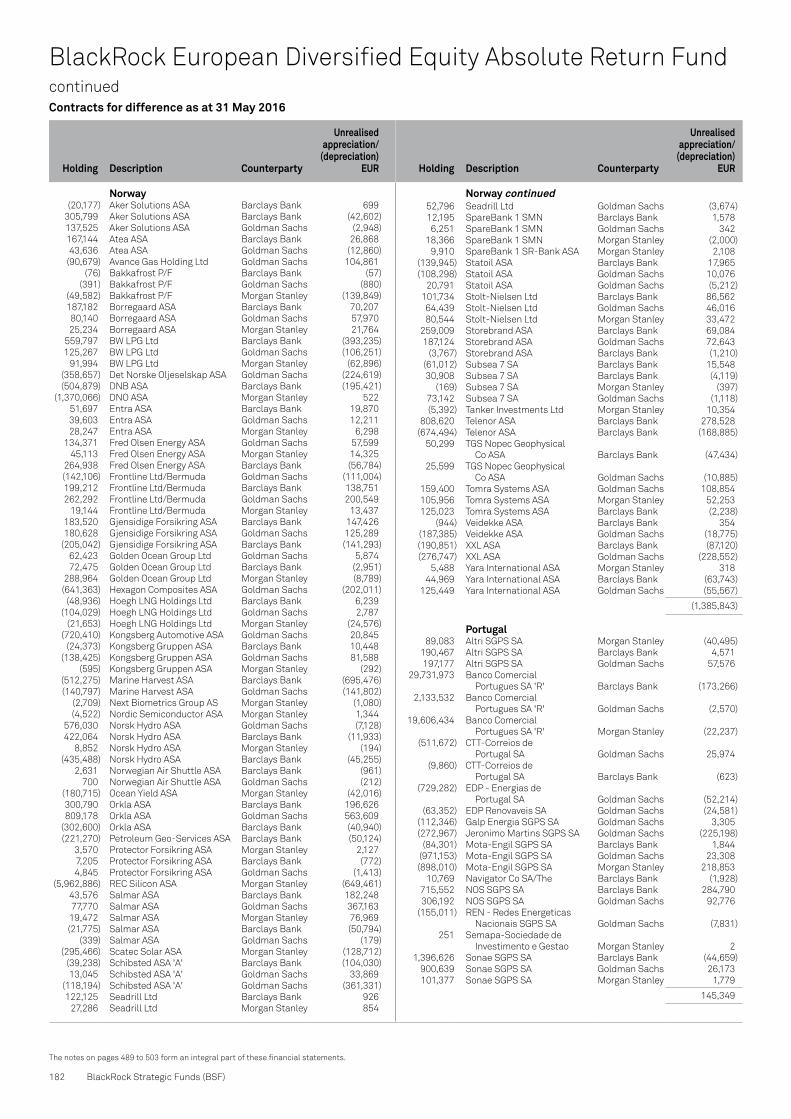
Contracts for difference as at 31 May 2016
Holding
Description Counterparty
Unrealised appreciation/
(depreciation) EUR
Holding
Description Counterparty
Unrealised appreciation/
(depreciation) EUR
182 BlackRock Strategic Funds (BSF)
The notes on pages 489 to 503 form an integral part of these financial statements.
BlackRock European Diversified Equity Absolute Return Fund continued
Norway (20,177) Aker Solutions ASA Barclays Bank 699 305,799 Aker Solutions ASA Barclays Bank (42,602) 137,525 Aker Solutions ASA Goldman Sachs (2,948) 167,144 Atea ASA Barclays Bank 26,868 43,636 Atea ASA Goldman Sachs (12,860) (90,679) Avance Gas Holding Ltd Goldman Sachs 104,861 (76) Bakkafrost P/F Barclays Bank (57) (391) Bakkafrost P/F Goldman Sachs (880) (49,582) Bakkafrost P/F Morgan Stanley (139,849) 187,182 Borregaard ASA Barclays Bank 70,207 80,140 Borregaard ASA Goldman Sachs 57,970 25,234 Borregaard ASA Morgan Stanley 21,764 559,797 BW LPG Ltd Barclays Bank (393,235) 125,267 BW LPG Ltd Goldman Sachs (106,251) 91,994 BW LPG Ltd Morgan Stanley (62,896) (358,657) Det Norske Oljeselskap ASA Goldman Sachs (224,619) (504,879) DNB ASA Barclays Bank (195,421) (1,370,066) DNO ASA Morgan Stanley 522 51,697 Entra ASA Barclays Bank 19,870 39,603 Entra ASA Goldman Sachs 12,211 28,247 Entra ASA Morgan Stanley 6,298 134,371 Fred Olsen Energy ASA Goldman Sachs 57,599 45,113 Fred Olsen Energy ASA Morgan Stanley 14,325 264,938 Fred Olsen Energy ASA Barclays Bank (56,784) (142,106) Frontline Ltd/Bermuda Goldman Sachs (111,004) 199,212 Frontline Ltd/Bermuda Barclays Bank 138,751 262,292 Frontline Ltd/Bermuda Goldman Sachs 200,549 19,144 Frontline Ltd/Bermuda Morgan Stanley 13,437 183,520 Gjensidige Forsikring ASA Barclays Bank 147,426 180,628 Gjensidige Forsikring ASA Goldman Sachs 125,289 (205,042) Gjensidige Forsikring ASA Barclays Bank (141,293) 62,423 Golden Ocean Group Ltd Goldman Sachs 5,874 72,475 Golden Ocean Group Ltd Barclays Bank (2,951) 288,964 Golden Ocean Group Ltd Morgan Stanley (8,789) (641,363) Hexagon Composites ASA Goldman Sachs (202,011) (48,936) Hoegh LNG Holdings Ltd Barclays Bank 6,239 (104,029) Hoegh LNG Holdings Ltd Goldman Sachs 2,787 (21,653) Hoegh LNG Holdings Ltd Morgan Stanley (24,576) (720,410) Kongsberg Automotive ASA Goldman Sachs 20,845 (24,373) Kongsberg Gruppen ASA Barclays Bank 10,448 (138,425) Kongsberg Gruppen ASA Goldman Sachs 81,588 (595) Kongsberg Gruppen ASA Morgan Stanley (292) (512,275) Marine Harvest ASA Barclays Bank (695,476) (140,797) Marine Harvest ASA Goldman Sachs (141,802) (2,709) Next Biometrics Group AS Morgan Stanley (1,080) (4,522) Nordic Semiconductor ASA Morgan Stanley 1,344 576,030 Norsk Hydro ASA Goldman Sachs (7,128) 422,064 Norsk Hydro ASA Barclays Bank (11,933) 8,852 Norsk Hydro ASA Morgan Stanley (194) (435,488) Norsk Hydro ASA Barclays Bank (45,255) 2,631 Norwegian Air Shuttle ASA Barclays Bank (961) 700 Norwegian Air Shuttle ASA Goldman Sachs (212) (180,715) Ocean Yield ASA Morgan Stanley (42,016) 300,790 Orkla ASA Barclays Bank 196,626 809,178 Orkla ASA Goldman Sachs 563,609 (302,600) Orkla ASA Barclays Bank (40,940) (221,270) Petroleum Geo-Services ASA Barclays Bank (50,124) 3,570 Protector Forsikring ASA Morgan Stanley 2,127 7,205 Protector Forsikring ASA Barclays Bank (772) 4,845 Protector Forsikring ASA Goldman Sachs (1,413) (5,962,886) REC Silicon ASA Morgan Stanley (649,461) 43,576 Salmar ASA Barclays Bank 182,248 77,770 Salmar ASA Goldman Sachs 367,163 19,472 Salmar ASA Morgan Stanley 76,969 (21,775) Salmar ASA Barclays Bank (50,794) (339) Salmar ASA Goldman Sachs (179) (295,466) Scatec Solar ASA Morgan Stanley (128,712) (39,238) Schibsted ASA 'A' Barclays Bank (104,030) 13,045 Schibsted ASA 'A' Goldman Sachs 33,869 (118,194) Schibsted ASA 'A' Goldman Sachs (361,331) 122,125 Seadrill Ltd Barclays Bank 926 27,286 Seadrill Ltd Morgan Stanley 854
52,796 Seadrill Ltd Goldman Sachs (3,674) 12,195 SpareBank 1 SMN Barclays Bank 1,578 6,251 SpareBank 1 SMN Goldman Sachs 342 18,366 SpareBank 1 SMN Morgan Stanley (2,000) 9,910 SpareBank 1 SR-Bank ASA Morgan Stanley 2,108 (139,945) Statoil ASA Barclays Bank 17,965 (108,298) Statoil ASA Goldman Sachs 10,076 20,791 Statoil ASA Goldman Sachs (5,212) 101,734 Stolt-Nielsen Ltd Barclays Bank 86,562 64,439 Stolt-Nielsen Ltd Goldman Sachs 46,016 80,544 Stolt-Nielsen Ltd Morgan Stanley 33,472 259,009 Storebrand ASA Barclays Bank 69,084 187,124 Storebrand ASA Goldman Sachs 72,643 (3,767) Storebrand ASA Barclays Bank (1,210) (61,012) Subsea 7 SA Barclays Bank 15,548 30,908 Subsea 7 SA Barclays Bank (4,119) (169) Subsea 7 SA Morgan Stanley (397) 73,142 Subsea 7 SA Goldman Sachs (1,118) (5,392) Tanker Investments Ltd Morgan Stanley 10,354 808,620 Telenor ASA Barclays Bank 278,528 (674,494) Telenor ASA Barclays Bank (168,885) 50,299 TGS Nopec Geophysical
Co ASA Barclays Bank (47,434) 25,599 TGS Nopec Geophysical
Co ASA Goldman Sachs (10,885) 159,400 Tomra Systems ASA Goldman Sachs 108,854 105,956 Tomra Systems ASA Morgan Stanley 52,253 125,023 Tomra Systems ASA Barclays Bank (2,238) (944) Veidekke ASA Barclays Bank 354 (187,385) Veidekke ASA Goldman Sachs (18,775) (190,851) XXL ASA Barclays Bank (87,120) (276,747) XXL ASA Goldman Sachs (228,552) 5,488 Yara International ASA Morgan Stanley 318 44,969 Yara International ASA Barclays Bank (63,743) 125,449 Yara International ASA Goldman Sachs (55,567)
(1,385,843)
Portugal 89,083 Altri SGPS SA Morgan Stanley (40,495) 190,467 Altri SGPS SA Barclays Bank 4,571 197,177 Altri SGPS SA Goldman Sachs 57,576 29,731,973 Banco Comercial
Portugues SA 'R' Barclays Bank (173,266) 2,133,532 Banco Comercial
Portugues SA 'R' Goldman Sachs (2,570) 19,606,434 Banco Comercial
Portugues SA 'R' Morgan Stanley (22,237) (511,672) CTT-Correios de
Portugal SA Goldman Sachs 25,974 (9,860) CTT-Correios de
Portugal SA Barclays Bank (623) (729,282) EDP - Energias de
Portugal SA Goldman Sachs (52,214) (63,352) EDP Renovaveis SA Goldman Sachs (24,581) (112,346) Galp Energia SGPS SA Goldman Sachs 3,305 (272,967) Jeronimo Martins SGPS SA Goldman Sachs (225,198) (84,301) Mota-Engil SGPS SA Barclays Bank 1,844 (971,153) Mota-Engil SGPS SA Goldman Sachs 23,308 (898,010) Mota-Engil SGPS SA Morgan Stanley 218,853 10,769 Navigator Co SA/The Barclays Bank (1,928) 715,552 NOS SGPS SA Barclays Bank 284,790 306,192 NOS SGPS SA Goldman Sachs 92,776 (155,011) REN - Redes Energeticas
Nacionais SGPS SA Goldman Sachs (7,831) 251 Semapa-Sociedade de
Investimento e Gestao Morgan Stanley 2 1,396,626 Sonae SGPS SA Barclays Bank (44,659) 900,639 Sonae SGPS SA Goldman Sachs 26,173 101,377 Sonae SGPS SA Morgan Stanley 1,779
145,349
Norway continued

Contracts for difference as at 31 May 2016
Holding
Description Counterparty
Unrealised appreciation/
(depreciation) EUR
Holding
Description Counterparty
Unrealised appreciation/
(depreciation) EUR
* Amounts which are less than 0.5 EUR have been rounded down to zero.
Annual Report and Audited Accounts 183
The notes on pages 489 to 503 form an integral part of these financial statements.
Spain (38,299) Abertis Infraestructuras SA Goldman Sachs 20,543 (38,299) Abertis Infraestructuras SA Goldman Sachs (26,541) (30,538) Acciona SA Goldman Sachs (38,784) (246,168) Acerinox SA Barclays Bank (53,519) (6,008) Acerinox SA Goldman Sachs (2,133) (228,889) Acerinox SA Morgan Stanley (114,639) (2,862) ACS Actividades de
Construccion y Servicios SA Goldman Sachs (5,046) 72,607 ACS Actividades de
Construccion y Servicios SA Barclays Bank 53,366 83,894 ACS Actividades de
Construccion y Servicios SA Goldman Sachs 160,238 67,553 Aena SA Barclays Bank (170,882) 14,895 Aena SA Goldman Sachs (3,515) 159,995 Almirall SA Barclays Bank 32,013 135,658 Almirall SA Goldman Sachs 157,583 39,109 Almirall SA Morgan Stanley 1,479 88,986 Amadeus IT Holding SA 'A' Barclays Bank 153,729 142,754 Amadeus IT Holding SA 'A' Goldman Sachs 262,290 179,627 Atresmedia Corp De
Medios DE Barclays Bank 57,481 (144,365) Atresmedia Corp De
Medios DE Morgan Stanley (75,760) 159,495 Atresmedia Corp De
Medios DE Goldman Sachs 98,887 25,839 Axiare Patrimonio SOCIMI SA Barclays Bank (7,881) 1,992 Axiare Patrimonio SOCIMI SA Morgan Stanley (23) 16,101 Axiare Patrimonio SOCIMI SA Goldman Sachs 7,970 (291,163) Banco Bilbao Vizcaya
Argentaria SA Goldman Sachs (77,446) 575,715 Banco de Sabadell SA Barclays Bank (23,078) 747,499 Banco de Sabadell SA Goldman Sachs (42,194) 116,829 Banco de Sabadell SA Morgan Stanley (536) (5,125,957) Banco de Sabadell SA Goldman Sachs 552,951 1,484,643 Banco Popular Espanol SA Barclays Bank 329,591 1,246,217 Banco Popular Espanol SA Goldman Sachs 276,660 48,552 Banco Popular Espanol SA Morgan Stanley 10,779 1,484,643 Banco Popular Espanol SA Barclays Bank (1,315,394) 1,246,217 Banco Popular Espanol SA Goldman Sachs (559,152) 48,552 Banco Popular Espanol SA Morgan Stanley (39,135) 86,104 Banco Santander SA Barclays Bank 14,937 587,446 Banco Santander SA Goldman Sachs 170,535 4,666,470 Bankia SA Barclays Bank 10,144 5,137,341 Bankia SA Goldman Sachs 91,444 365,388 Bankia SA Morgan Stanley 5,658 (134,295) Bankia SA Goldman Sachs (2,155) (743,832) Bankinter SA Goldman Sachs (399,438) 316,707 Bankinter SA Barclays Bank 66,825 364,543 CaixaBank SA Barclays Bank (44,856) 541,049 CaixaBank SA Goldman Sachs 40,038 (301,487) Cellnex Telecom SAU Goldman Sachs (131,147) 318,747 Cellnex Telecom SAU Barclays Bank 50,254 248,241 Cellnex Telecom SAU Goldman Sachs 107,985 200,763 Cia de Distribucion Integral
Logista Holdings SA Barclays Bank 229,797 204,636 Cia de Distribucion Integral
Logista Holdings SA Goldman Sachs 84,924 58,838 Cia de Distribucion Integral
Logista Holdings SA Morgan Stanley 95,694 194,717 CIE Automotive SA Barclays Bank 187,902 129,408 CIE Automotive SA Goldman Sachs 115,173 73,190 CIE Automotive SA Morgan Stanley 132,068 94,314 Codere SA Barclays Bank (2,265) 135,360 Codere SA Goldman Sachs (1,370) 173,307 Codere SA Morgan Stanley (2,309) (6,725) Construcciones y Auxiliar
de Ferrocarriles SA Goldman Sachs (110,696) 475,863 Distribuidora Internacional
de Alimentacion SA Barclays Bank 261,249 445,442 Distribuidora Internacional
de Alimentacion SA Goldman Sachs 21,279
94,052 Distribuidora Internacional de Alimentacion SA Morgan Stanley 76,198
(1,134,525) Distribuidora Internacional de Alimentacion SA Goldman Sachs (54,457)
(648,472) Duro Felguera SA Morgan Stanley 287,533 (140,307) Ebro Foods SA Goldman Sachs (58,725) 30,659 Ebro Foods SA Barclays Bank 32,229 29,139 Ebro Foods SA Goldman Sachs 10,153 14,964 Ebro Foods SA Morgan Stanley 10,088 (29,153) Enagas SA Goldman Sachs (15,888) 54,546 Enagas SA Barclays Bank 30,546 11,777 Enagas SA Goldman Sachs 6,418 29,357 Endesa SA Barclays Bank 13,318 126,919 Endesa SA Goldman Sachs 26,782 6,891 Endesa SA Morgan Stanley 2,777 (24,579) Euskaltel SA Barclays Bank 15,436 (92,981) Euskaltel SA Goldman Sachs 51,194 (248,944) Euskaltel SA Morgan Stanley 458,418 148,800 Faes Farma SA Morgan Stanley 48,079 224,402 Faes Farma SA Barclays Bank 81,907 202,107 Faes Farma SA Goldman Sachs 68,716 (373,330) Ferrovial SA Goldman Sachs (388,263) 190,784 Ferrovial SA Barclays Bank 62,768 121,681 Ferrovial SA Goldman Sachs 40,033 11,479 Ferrovial SA Morgan Stanley 3,777 197,685 Ferrovial SA Barclays Bank 61,241 145,911 Ferrovial SA Goldman Sachs 109,423 11,479 Ferrovial SA Morgan Stanley 1,488 (385,992) Ferrovial SA Goldman Sachs (126,991) (611,265) Fomento de Construcciones
y Contratas SA Barclays Bank (6,210) (4,342) Fomento de Construcciones
y Contratas SA Goldman Sachs (35) (188,165) Fomento de Construcciones
y Contratas SA Morgan Stanley (112,813) 51,179 Gamesa Corp Tecnologica SA Barclays Bank 16,823 56,255 Gamesa Corp Tecnologica SA Goldman Sachs 7,657 (544,889) Gas Natural SDG SA Goldman Sachs (395,849) 15,332 Grifols SA Goldman Sachs 30,741 16,935 Grupo Catalana Occidente SA Barclays Bank 9,653 19,658 Grupo Catalana Occidente SA Goldman Sachs 34,008 (33) Iberdrola SA * Goldman Sachs — 180,298 Inbesos SA Goldman Sachs (30,649) 75,916 Inbesos SA Morgan Stanley (32,102) 125,322 Industria de Diseno Textil SA Barclays Bank 288,967 328,189 Industria de Diseno Textil SA Goldman Sachs 774,200 (11,931,880) Inmobiliaria Colonial SA Goldman Sachs (680,616) (17,167) International Consolidated
Airlines Group SA Goldman Sachs (6,302) 43,212 Lar Espana Real Estate
Socimi SA Barclays Bank (9,463) 8,593 Lar Espana Real Estate
Socimi SA Goldman Sachs (318) 2,283 Lar Espana Real Estate
Socimi SA Morgan Stanley 1,021 (931,052) Liberbank SA Goldman Sachs (17,690) (3,556) Liberbank SA Barclays Bank 52 (330,966) Liberbank SA Morgan Stanley 295,109 (2,132,732) Mapfre SA Goldman Sachs (372,020) (1,018,755) Mediaset Espana
Comunicacion SA Goldman Sachs (497,533) 217,985 Mediaset Espana
Comunicacion SA Barclays Bank 141,690 86,381 Mediaset Espana
Comunicacion SA Goldman Sachs 43,622 307,564 Melia Hotels International SA Barclays Bank 31,659 13,878 Melia Hotels International SA Morgan Stanley 3,183 359,004 Melia Hotels International SA Goldman Sachs 160,804 670,508 Merlin Properties Socimi SA Barclays Bank (90,682) (5,353) Merlin Properties Socimi SA Morgan Stanley 1,510 341,870 NH Hotel Group SA Barclays Bank 126,727
BlackRock European Diversified Equity Absolute Return Fund continued
Spain continued

Contracts for difference as at 31 May 2016
Holding
Description Counterparty
Unrealised appreciation/
(depreciation) EUR
Holding
Description Counterparty
Unrealised appreciation/
(depreciation) EUR
184 BlackRock Strategic Funds (BSF)
The notes on pages 489 to 503 form an integral part of these financial statements.
BlackRock European Diversified Equity Absolute Return Fund continued
41,009 NH Hotel Group SA Goldman Sachs 20,504 5,860 NH Hotel Group SA Morgan Stanley 2,073 (10,033) NH Hotel Group SA Goldman Sachs (2,880) (714,162) Obrascon Huarte Lain SA Barclays Bank 470,828 (1,157,271) Obrascon Huarte Lain SA Morgan Stanley (219,171) 12,029 Pharma Mar SA Barclays Bank 2,854 (227,583) Promotora de Informaciones SA Morgan Stanley (575,619) (803,884) Prosegur Cia de Seguridad SA Goldman Sachs 217,463 (57,956) Red Electrica Corp SA Barclays Bank (147,276) 277,913 Repsol SA Barclays Bank 83,549 275,586 Repsol SA Goldman Sachs 17,427 (105,000) Sacyr SA Barclays Bank (9,546) (192,247) Sacyr SA Morgan Stanley (27,295) 14,736 Sacyr SA Morgan Stanley 2,987 71,468 Sacyr SA Barclays Bank 14,140 252,401 Sacyr SA Goldman Sachs 39,879 101,930 Saeta Yield SA Barclays Bank (36,695) 117,011 Saeta Yield SA Goldman Sachs (18,722) 73,428 Saeta Yield SA Morgan Stanley 7,027 (12,207) Talgo SA Goldman Sachs (1,172) (168,361) Talgo SA Morgan Stanley 10,130 105,656 Tecnicas Reunidas SA Barclays Bank (82,032) 73,290 Tecnicas Reunidas SA Goldman Sachs (4,740) 1,797 Tecnicas Reunidas SA Morgan Stanley 89 353,011 Telefonica SA Barclays Bank 87,494 202,426 Telefonica SA Goldman Sachs 59,941 (18,133) Telepizza Group SA Barclays Bank (270) (11,816) Tubacex SA Goldman Sachs (650) (17,580) Tubacex SA Morgan Stanley (2,658) (6,728) Vidrala SA Goldman Sachs (14,060) (39,457) Viscofan SA Goldman Sachs (74,376) (553,055) Zardoya Otis SA Goldman Sachs (193,545) 144,224 Zardoya Otis SA Barclays Bank 29,119 104,320 Zardoya Otis SA Goldman Sachs 34,919 132,958 Zardoya Otis SA Morgan Stanley 25,892
896,522
Sweden 42 AAK AB Barclays Bank 33 (77,376) AAK AB Barclays Bank (154,201) (76,975) AF AB Barclays Bank (5,191) (281,310) Alfa Laval AB Barclays Bank (5,695) (142,849) Alfa Laval AB Goldman Sachs (13,849) (155,714) Assa Abloy AB 'B' Goldman Sachs (122,445) 43,861 Assa Abloy AB 'B' Barclays Bank 49,411 59,811 Assa Abloy AB 'B' Goldman Sachs 44,506 (188,150) Assa Abloy AB 'B' Barclays Bank (109,439) 700 Atlas Copco AB 'A' Goldman Sachs 195 (101,764) Attendo AB Goldman Sachs (57,550) (111,606) Avanza Bank Holding AB Barclays Bank (325,001) (33,696) Avanza Bank Holding AB Goldman Sachs (132,484) 412,234 Axfood AB Barclays Bank 274,315 287,146 Axfood AB Goldman Sachs 216,963 11,500 Axfood AB Morgan Stanley 4,158 8,314 B&B Tools AB 'B' Barclays Bank 14,777 13,412 B&B Tools AB 'B' Goldman Sachs 6,501 3,416 B&B Tools AB 'B' Morgan Stanley 16,136 174,654 Betsson AB Barclays Bank 84,473 171,480 Betsson AB Goldman Sachs 82,938 50,847 Betsson AB Morgan Stanley 24,593 174,654 Betsson AB Barclays Bank 2,804 (63,495) Betsson AB Barclays Bank 23,127 (66,646) Betsson AB Goldman Sachs 13,833 (63,495) Betsson AB Barclays Bank (30,710) (66,646) Betsson AB Goldman Sachs (32,234) 182,305 Betsson AB Goldman Sachs (36,306) 50,847 Betsson AB Morgan Stanley (20,863) 64,496 Bilia AB Barclays Bank 6,947 (194,368) BillerudKorsnas AB Barclays Bank (85,521) (163,858) BillerudKorsnas AB Goldman Sachs (96,705)
114,136 Boliden AB Barclays Bank 109,610 252,705 Boliden AB Goldman Sachs 237,295 (109,716) Bravida Holding AB Barclays Bank (3,951) (6,039) Bravida Holding AB Morgan Stanley (706) (73,318) Bulten AB Barclays Bank (41,463) (113,170) Bulten AB Goldman Sachs (36,572) 42,069 Byggmax Group AB Morgan Stanley (59,911) 303,013 Byggmax Group AB Barclays Bank 81,601 179,923 Byggmax Group AB Goldman Sachs 72,679 81,291 Castellum AB Barclays Bank 161,121 10,507 Castellum AB Morgan Stanley 20,825 10,507 Castellum AB Morgan Stanley (14,222) (3,350) Catena Media Plc Barclays Bank (611) (669) Catena Media Plc Goldman Sachs (198) 76,519 Clas Ohlson AB 'B' Barclays Bank 17,401 44,942 Clas Ohlson AB 'B' Morgan Stanley 12,547 74,161 Clas Ohlson AB 'B' Goldman Sachs (27,101) 642,758 Cloetta AB 'B' Barclays Bank 76,161 654,160 Cloetta AB 'B' Goldman Sachs 56,372 264,438 Cloetta AB 'B' Morgan Stanley 58,685 143,353 Com Hem Holding AB Barclays Bank 26,514 45,531 Com Hem Holding AB Goldman Sachs 3,133 6,341 Dios Fastigheter AB Barclays Bank 1,878 11,081 Dometic Group AB Goldman Sachs 60 234,265 Electrolux AB 'B' Goldman Sachs 115,449 9,833 Electrolux AB 'B' Morgan Stanley 3,586 305,747 Electrolux AB 'B' Barclays Bank (51,704) 72,087 Elekta AB Barclays Bank 5,986 17,823 Elekta AB Morgan Stanley 73 (5,108) Evolution Gaming Group AB Barclays Bank (3,026) (4,829) Evolution Gaming Group AB Goldman Sachs (8,323) (72,051) Evolution Gaming Group AB Morgan Stanley (83,363) 257,526 Fabege AB Goldman Sachs (24,966) 235,252 Fabege AB Barclays Bank 38,012 183,738 Fabege AB Morgan Stanley 138,544 (208,143) Fabege AB Barclays Bank 24,691 (56,572) Fastighets AB Balder 'B' Goldman Sachs (23,392) (131,238) Fastighets AB Balder 'B' Barclays Bank (104,562) (50,849) Getinge AB 'B' Goldman Sachs (48,201) 132,370 Getinge AB 'B' Barclays Bank 147,904 153,160 Getinge AB 'B' Goldman Sachs 142,486 21,159 Getinge AB 'B' Morgan Stanley 20,869 (2,034) Granges AB Barclays Bank (1,809) (33,620) Granges AB Goldman Sachs (17,202) (46,649) Haldex AB Barclays Bank (48,001) (71,450) Haldex AB Morgan Stanley (94,280) 63,014 Hemfosa Fastigheter AB Barclays Bank 9,457 14,732 Hemfosa Fastigheter AB Goldman Sachs 2,380 3,469 Hemfosa Fastigheter AB Morgan Stanley 950 4,605 Hennes & Mauritz AB 'B' Morgan Stanley 2,770 311,208 Hennes & Mauritz AB 'B' Barclays Bank (74,246) 261,108 Hennes & Mauritz AB 'B' Goldman Sachs (91,882) (2,159) Hexagon AB 'B' Barclays Bank (1,084) 137 Hexagon AB 'B' Barclays Bank 68 91,749 Hexpol AB Barclays Bank 22,945 39,195 Hexpol AB Goldman Sachs 4,675 30,369 Hexpol AB Morgan Stanley 5,803 (9,337) Hexpol AB Goldman Sachs (1,008) (131,782) Holmen AB 'B' Barclays Bank (135,416) (1,170) Holmen AB 'B' Goldman Sachs (1,424) 178,191 Hufvudstaden AB 'A' Goldman Sachs 61,423 (585,582) Hufvudstaden AB 'A' Barclays Bank (371,450) (157,234) Husqvarna AB 'B' Barclays Bank (12,842) 165,659 Husqvarna AB 'B' Barclays Bank 10,505 154,460 Husqvarna AB 'B' Goldman Sachs 7,696 12,702 Husqvarna AB 'B' Morgan Stanley 612 16,593 ICA Gruppen AB Barclays Bank 23,392 49,003 ICA Gruppen AB Goldman Sachs 61,146 1,345 ICA Gruppen AB Morgan Stanley 2,211 (282,873) Indutrade AB Barclays Bank (635,429)
Spain continued Sweden continued

Contracts for difference as at 31 May 2016
Holding
Description Counterparty
Unrealised appreciation/
(depreciation) EUR
Holding
Description Counterparty
Unrealised appreciation/
(depreciation) EUR
Annual Report and Audited Accounts 185
The notes on pages 489 to 503 form an integral part of these financial statements.
(12,378) Indutrade AB Goldman Sachs (13,245) 216,037 Intrum Justitia AB Barclays Bank 69,748 181,700 Intrum Justitia AB Goldman Sachs 18,830 (2,020) INVISIO Communications AB Morgan Stanley 1,343 8,452 Inwido AB Morgan Stanley 5,576 (281,938) JM AB Barclays Bank (101,922) (34,200) Kambi Group Plc Barclays Bank (27,997) (19,212) Kambi Group Plc Goldman Sachs (23,799) (34,579) Kambi Group Plc Morgan Stanley (14,265) 546,491 KappAhl AB Barclays Bank (235,377) 222,948 KappAhl AB Goldman Sachs (16,811) 230,618 KappAhl AB Morgan Stanley (6,287) 26,067 Klovern AB (Pref) Barclays Bank 22,535 25,702 Klovern AB (Pref) Goldman Sachs 19,280 30,941 Klovern AB (Pref) Morgan Stanley 16,638 250,198 Kungsleden AB Barclays Bank 87,591 48,621 Kungsleden AB Goldman Sachs 14,403 (31,509) Lifco AB 'B' Barclays Bank (137,801) (20,089) Lifco AB 'B' Goldman Sachs (33,325) (303,066) Lindab International AB Barclays Bank (177,966) (19,034) Lindab International AB Morgan Stanley (6,005) 107,432 Loomis AB 'B' Barclays Bank 21,898 178,793 Loomis AB 'B' Goldman Sachs 331,295 797 Loomis AB 'B' Morgan Stanley 1,641 49,502 Medivir AB 'B' Goldman Sachs 12,798 45,014 Medivir AB 'B' Barclays Bank (25,720) 34,706 Medivir AB 'B' Morgan Stanley (20,843) (223,997) Mekonomen AB Goldman Sachs (46,795) (26,730) Mekonomen AB Morgan Stanley (59,881) (71,803) Millicom International
Cellular SA SDR Barclays Bank (203,418) 24,119 Millicom International
Cellular SA SDR Barclays Bank 68,688 8,589 Millicom International
Cellular SA SDR Goldman Sachs 16,191 843 Millicom International
Cellular SA SDR Morgan Stanley 2,534 7,441 Modern Times Group
MTG AB 'B' Morgan Stanley 1,114 (46,262) Modern Times Group
MTG AB 'B' Barclays Bank 5,561 (22,923) Modern Times Group
MTG AB 'B' Goldman Sachs 4,198 25,829 Modern Times Group MTG
AB 'B' Barclays Bank (1,100) 21,842 Modern Times Group MTG
AB 'B' Goldman Sachs (6,444) (75,176) Mycronic AB Barclays Bank (17,685) (31,584) NCC AB 'B' Barclays Bank (54,362) (3,455) NCC AB 'B' Goldman Sachs (9,341) (521,255) Net Insight AB 'B' Barclays Bank (53,342) (26,720) Net Insight AB 'B' Goldman Sachs (576) (3,284,670) Net Insight AB 'B' Morgan Stanley (780,242) 124,511 NetEnt AB Barclays Bank 97,714 206,833 NetEnt AB Goldman Sachs 181,971 8,043 NetEnt AB Morgan Stanley 5,558 37,092 Nibe Industrier AB 'B' Barclays Bank 11,144 65,828 Nibe Industrier AB 'B' Goldman Sachs 23,027 3,696 Nibe Industrier AB 'B' Morgan Stanley 992 (84,068) Nibe Industrier AB 'B' Barclays Bank (42,477) (12,692) Nibe Industrier AB 'B' Goldman Sachs (4,718) (108,851) Nobia AB Barclays Bank (40) (14,225) Nobia AB Goldman Sachs (4,444) 6,796 Nolato AB 'B' Barclays Bank — 39,100 Nordax Group AB Barclays Bank 5,289 23,645 Nordax Group AB Goldman Sachs 3,867 31,967 Nordax Group AB Morgan Stanley 6,179 57,728 Nordea Bank AB Barclays Bank 23,652 90,780 Nordea Bank AB Goldman Sachs 48,405 (52,814) Nordea Bank AB Barclays Bank (4,583) (629,899) Nordnet AB 'B' Morgan Stanley 31,757
(249,647) Nordnet AB 'B' Barclays Bank (9,900) (80,868) Nordnet AB 'B' Goldman Sachs (8,541) 4,129 Opus Group AB Barclays Bank 344 33,933 Opus Group AB Morgan Stanley 3,024 29,127 Oriflame Holding AG Barclays Bank 108,347 12,910 Oriflame Holding AG Goldman Sachs 27,718 42,574 Oriflame Holding AG Morgan Stanley 314,615 (70,608) Pandox AB Morgan Stanley 32,504 (77,087) Pandox AB Goldman Sachs (22,420) 175,548 Peab AB Barclays Bank 43,910 75,026 Peab AB Goldman Sachs 11,112 6,268 Peab AB Morgan Stanley 1,854 (569) Recipharm AB Barclays Bank (552) (66,026) Recipharm AB Morgan Stanley (64,010) (569) Recipharm AB 'B' Barclays Bank 429 (272) Recipharm AB 'B' Goldman Sachs 542 (66,026) Recipharm AB 'B' Morgan Stanley 31,065 373,924 Rezidor Hotel Group AB Goldman Sachs 84,349 337,355 Rezidor Hotel Group AB Barclays Bank (5,262) 274,410 Rezidor Hotel Group AB Morgan Stanley (51,565) (187,843) Saab AB 'B' Barclays Bank 25,691 (193,751) Saab AB 'B' Goldman Sachs 135,079 72,665 Sandvik AB Barclays Bank 18,793 307,562 Sandvik AB Goldman Sachs 47,876 (448,805) Sandvik AB Barclays Bank (20,084) 29,821 Scandi Standard AB Goldman Sachs — 50,459 Scandi Standard AB Morgan Stanley 38,976 10,830 Scandi Standard AB Barclays Bank 2,625 121,678 Scandic Hotels Group AB Barclays Bank 11,490 85,455 Scandic Hotels Group AB Goldman Sachs 580 28,013 Scandic Hotels Group AB Morgan Stanley 1,151 49,941 Securitas AB 'B' Barclays Bank 19,382 43,442 Securitas AB 'B' Goldman Sachs 30,201 296 Securitas AB 'B' Morgan Stanley 137 (340,729) Securitas AB 'B' Barclays Bank (201,054) (281,876) Securitas AB 'B' Goldman Sachs (221,653) (677,971) Skandinaviska Enskilda
Banken AB 'A' Barclays Bank (303,472) (342,580) Skandinaviska Enskilda
Banken AB 'A' Goldman Sachs (206,653) 54,866 Skanska AB 'B' Goldman Sachs 33,097 (140,037) Skanska AB 'B' Barclays Bank (107,802) (40,070) SKF AB 'B' Barclays Bank 3,766 1,632,010 SSAB AB 'A' Barclays Bank (1,689,953) 613,781 SSAB AB 'A' Goldman Sachs (562,151) 73,140 SSAB AB 'A' Morgan Stanley (63,696) 1,632,010 SSAB AB 'B' Barclays Bank 2,278,347 613,781 SSAB AB 'B' Goldman Sachs 856,861 73,140 SSAB AB 'B' Morgan Stanley 102,106 (20,716) Svenska Cellulosa AB SCA 'B' Barclays Bank (3,833) (57,761) Svenska Cellulosa AB SCA 'B' Goldman Sachs (60,004) (1,509,751) Svenska Handelsbanken AB 'A' Barclays Bank (112,253) (260,825) Svenska Handelsbanken AB 'A' Goldman Sachs (140,479) (7,163) Sweco AB 'B' Morgan Stanley (22,810) (205,743) Swedbank AB 'A' Goldman Sachs (314,706) (653,213) Swedbank AB 'A' Barclays Bank (876,484) (8,209) Swedish Match AB Barclays Bank 805 (1,398,745) Tele2 AB 'B' Barclays Bank 418,329 (272,152) Tele2 AB 'B' Goldman Sachs 181,684 530,727 Telefonaktiebolaget LM
Ericsson 'B' Goldman Sachs 74,320 1,224,690 Telefonaktiebolaget LM
Ericsson 'B' Barclays Bank (57,836) 13,855 Telia Co AB Barclays Bank 1,754 (108,191) Tethys Oil AB Goldman Sachs (55,358) 114,147 Trelleborg AB Barclays Bank 91,334 150,540 Trelleborg AB Goldman Sachs 69,729 4,663 Trelleborg AB Morgan Stanley 1,169 407,637 Unibet Group Plc SDR Barclays Bank 196,738 86,672 Unibet Group Plc SDR Goldman Sachs 5,627 427 Unibet Group Plc SDR Morgan Stanley 13
BlackRock European Diversified Equity Absolute Return Fund continued
Sweden continued Sweden continued

Contracts for difference as at 31 May 2016
Holding
Description Counterparty
Unrealised appreciation/
(depreciation) EUR
Holding
Description Counterparty
Unrealised appreciation/
(depreciation) EUR
186 BlackRock Strategic Funds (BSF)
The notes on pages 489 to 503 form an integral part of these financial statements.
BlackRock European Diversified Equity Absolute Return Fund continued
8,842 Vitrolife AB Goldman Sachs 40,479 206,474 Volvo AB 'B' Barclays Bank (4,522) 91,442 Volvo AB 'B' Goldman Sachs (493) 22,907 Wihlborgs Fastigheter AB Barclays Bank 15,545 8,696 Wihlborgs Fastigheter AB Goldman Sachs 5,995
(1,378,762)
Switzerland (162,286) ABB Ltd Reg Barclays Bank (63,332) (100,623) ABB Ltd Reg Goldman Sachs (32,150) 16,876 Actelion Ltd Reg Barclays Bank 118,166 143,753 Adecco Group AG Reg Barclays Bank 65,852 87,183 Adecco Group AG Reg Goldman Sachs 139,026 178,724 AFG Arbonia-Forster
Holding AG Reg Barclays Bank 250,560 (42,267) Allreal Holding AG Reg Barclays Bank (87,865) 67,711 ams AG Barclays Bank 149,075 115,809 ams AG Goldman Sachs 434,697 (39,240) ams AG Barclays Bank (87,041) (7,241) ams AG Goldman Sachs (10,061) 1,708 APG SGA SA Barclays Bank (10,814) 2,602 APG SGA SA Goldman Sachs (31,772) 26 APG SGA SA Morgan Stanley (285) (104,120) Aryzta AG Barclays Bank (58,412) (85,544) Aryzta AG Goldman Sachs 9,086 (120,989) Ascom Holding AG Reg Barclays Bank (48,122) 8,683 Autoneum Holding AG Barclays Bank 98,955 2,601 Autoneum Holding AG Goldman Sachs 57,872 (6,431) Baloise Holding AG Reg Barclays Bank (25,012) (25,524) Baloise Holding AG Reg Goldman Sachs (118,176) (878) Banque Cantonale
Vaudoise Reg Barclays Bank (14,253) (1,315) Banque Cantonale
Vaudoise Reg Goldman Sachs (24,614) 71 Banque Cantonale
Vaudoise Reg Goldman Sachs 1,734 (3,767) Barry Callebaut AG Reg Barclays Bank (113,710) (3,163) Barry Callebaut AG Reg Goldman Sachs (22,859) (250) Belimo Holding AG Reg Barclays Bank (60,502) 3,446 Bell AG Reg Barclays Bank 12,010 3,230 Bell AG Reg Morgan Stanley 11,708 2,838 Bell AG Reg Goldman Sachs (7,059) 9,584 Bobst Group SA Reg Barclays Bank 7,555 11,989 Bobst Group SA Reg Goldman Sachs 24,941 17,709 Bobst Group SA Reg Morgan Stanley 28,720 (16,960) Bossard Holding AG Reg 'A' Barclays Bank (111,981) (21,952) Bossard Holding AG Reg 'A' Goldman Sachs (81,169) (11,889) Bossard Holding AG Reg 'A' Morgan Stanley (146,668) (28,230) Bucher Industries AG Reg Barclays Bank (81,126) (2,546) Bucher Industries AG Reg Goldman Sachs (20,597) (15,900) Burckhardt Compression
Holding AG Barclays Bank (337,957) (6,192) Cembra Money Bank AG Barclays Bank (4,332) (16,780) Cembra Money Bank AG Goldman Sachs (6,830) (13) Chocoladefabriken Lindt &
Spruengli AG Barclays Bank (2,553) (91) Chocoladefabriken Lindt &
Spruengli AG Goldman Sachs (5,350) (70) Chocoladefabriken Lindt &
Spruengli AG Reg Barclays Bank (210,045) (28) Chocoladefabriken Lindt &
Spruengli AG Reg Goldman Sachs (23,806) 43,530 Cie Financiere
Richemont SA Reg Barclays Bank (85,888) 83,752 Cie Financiere
Richemont SA Reg Goldman Sachs (79,074) 241,544 Clariant AG Reg Barclays Bank (45,250) 140,410 Clariant AG Reg Goldman Sachs 1,183 12,690 Clariant AG Reg Morgan Stanley 735 (2,722) Comet Holding AG Reg Barclays Bank (110,789)
(4,428) Comet Holding AG Reg Goldman Sachs (229,977) (131) Comet Holding AG Reg Morgan Stanley (13,807) (630) Conzzeta AG Reg Goldman Sachs 4,730 (904) Conzzeta AG Reg Barclays Bank (588) (5,869) Cosmo Pharmaceuticals NV Goldman Sachs (56,991) 600,723 Credit Suisse Group AG Reg Barclays Bank 20,029 164,419 Credit Suisse Group AG Reg Goldman Sachs 8,990 (1,501) Daetwyler Holding AG Barclays Bank (9,866) (43,297) DKSH Holding AG Goldman Sachs 7,781 (73,279) DKSH Holding AG Barclays Bank (35,409) (2,146) Dorma+Kaba Holding AG
Reg 'B' Goldman Sachs (77,640) 8,118 Dorma+Kaba Holding AG
Reg 'B' Barclays Bank 291,729 5,035 Dorma+Kaba Holding AG
Reg 'B' Goldman Sachs 181,693 367 Dorma+Kaba Holding AG
Reg 'B' Morgan Stanley 11,626 (814) Dorma+Kkaba Holding AG
Reg 'B' Barclays Bank (33,783) (56,876) Dufry AG Reg Barclays Bank (421,356) (67,608) Dufry AG Reg Goldman Sachs (220,139) (28,745) EFG International AG Barclays Bank 10,624 (128,544) EFG International AG Goldman Sachs 20,928 (1,909) EMS-Chemie Holding AG Reg Barclays Bank (26,331) (5,558) EMS-Chemie Holding AG Reg Goldman Sachs (60,325) (521,933) Evolva Holding SA Morgan Stanley 226,411 (649,429) Evolva Holding SA Goldman Sachs (46,991) 5,162 Flughafen Zuerich AG Reg Barclays Bank (4,658) 19,814 Flughafen Zuerich AG Reg Goldman Sachs (20,043) 1,468 Forbo Holding AG Reg Barclays Bank 85,468 1,453 Forbo Holding AG Reg Goldman Sachs 52,568 85 Forbo Holding AG Reg Morgan Stanley 8,828 1,423 Galenica AG Reg Barclays Bank 2,931 2,943 Galenica AG Reg Goldman Sachs 50,792 42 Galenica AG Reg Morgan Stanley 648 (1,011) Galenica AG Reg Barclays Bank 11,971 275,270 GAM Holding AG Barclays Bank 9,503 203,791 GAM Holding AG Goldman Sachs 71,222 24,745 GAM Holding AG Morgan Stanley (6,591) 12,216 Geberit AG Reg Barclays Bank 124,687 15,588 Geberit AG Reg Goldman Sachs 150,334 374 Geberit AG Reg Morgan Stanley 4,406 (10,405) Geberit AG Reg Barclays Bank (19,850) (1,029) Geberit AG Reg Goldman Sachs (992) 6,333 Georg Fischer AG Reg Barclays Bank 123,724 6,593 Georg Fischer AG Reg Goldman Sachs 148,125 675 Georg Fischer AG Reg Morgan Stanley 15,108 311 Givaudan SA Reg Barclays Bank (7,016) 10,833 HBM Healthcare
Investments AG 'A' Barclays Bank 8,249 11,956 HBM Healthcare
Investments AG 'A' Goldman Sachs 42,827 6,742 HBM Healthcare
Investments AG 'A' Morgan Stanley 15,781 (5,905) Helvetia Holding AG Reg Barclays Bank (112,793) (1,135) Helvetia Holding AG Reg Goldman Sachs (21,295) 143 Implenia AG Reg Goldman Sachs 194 (9,949) Inficon Holding AG Reg Goldman Sachs (155,226) (158,012) Julius Baer Group Ltd Barclays Bank (530,698) (45,404) Julius Baer Group Ltd Goldman Sachs (173,302) 34,282 Kardex AG Reg Goldman Sachs (6,201) 54,323 Kardex AG Reg Barclays Bank 34,394 40,107 Kudelski SA Barclays Bank 120,420 25,069 Kudelski SA Goldman Sachs 55,292 39,908 Kudelski SA Morgan Stanley 88,620 14,774 Kuehne + Nagel
International AG Reg Goldman Sachs 22,908 10,745 Kuehne + Nagel
International AG Reg Barclays Bank 25,542 (105,314) Logitech International SA Reg Barclays Bank (15,305)
Sweden continued Switzerland continued

Contracts for difference as at 31 May 2016
Holding
Description Counterparty
Unrealised appreciation/
(depreciation) EUR
Holding
Description Counterparty
Unrealised appreciation/
(depreciation) EUR
* Amounts which are less than 0.5 EUR have been rounded down to zero.
Annual Report and Audited Accounts 187
The notes on pages 489 to 503 form an integral part of these financial statements.
(51,949) Logitech International SA Reg Goldman Sachs (6,706) 45,635 Lonza Group AG Reg Barclays Bank 466,416 28,903 Lonza Group AG Reg Goldman Sachs 60,127 (3) Lonza Group AG Reg * Barclays Bank — (13) Lonza Group AG Reg Goldman Sachs (22) (277,950) Mobilezone Holding AG Reg Goldman Sachs (251,399) (5,147) Mobimo Holding AG Reg Barclays Bank (11,186) 115,020 Nestle SA Reg Barclays Bank 226,813 68,320 Nestle SA Reg Goldman Sachs 70,966 (7,478) Nestle SA Reg Goldman Sachs 2,398 (1,737) Newron Pharmaceuticals SpA Goldman Sachs 864 (178,954) Novartis AG Reg Barclays Bank (513,196) (52,080) Novartis AG Reg Goldman Sachs (127,571) (169,456) OC Oerlikon Corp AG Reg Goldman Sachs (16,741) (454,423) OC Oerlikon Corp AG Reg Barclays Bank 144,040 287,033 OC Oerlikon Corp AG Reg Barclays Bank (44,277) 1,637 OC Oerlikon Corp AG Reg Morgan Stanley (58) 290,562 OC Oerlikon Corp AG Reg Goldman Sachs 31,811 (48,057) Panalpina Welttransport
Holding AG Reg Barclays Bank (303,537) 1,911 Partners Group Holding AG Barclays Bank 5,348 2,220 Partners Group Holding AG Goldman Sachs 10,311 706 Partners Group Holding AG Morgan Stanley 884 (5,945) Partners Group Holding AG Barclays Bank (124,514) (2,887) Partners Group Holding AG Goldman Sachs (55,062) 6,621 PSP Swiss Property AG Reg Goldman Sachs 8,084 417 PSP Swiss Property AG Reg Morgan Stanley 950 (24,760) PSP Swiss Property AG Reg Barclays Bank (21,275) (24,884) PSP Swiss Property AG Reg Goldman Sachs (30,384) 5,124 PSP Swiss Property AG Reg Barclays Bank 4,375 15,168 Rieter Holding AG Reg Barclays Bank 138,767 12,696 Rieter Holding AG Reg Goldman Sachs 165,358 4,564 Rieter Holding AG Reg Morgan Stanley 211,151 17,148 Roche Holding AG Barclays Bank 311,128 40,303 Roche Holding AG Goldman Sachs 544,905 34,594 Schindler Holding AG Barclays Bank 295,286 22,201 Schindler Holding AG Goldman Sachs 163,843 3,361 Schindler Holding AG Morgan Stanley 16,046 1,865,590 Schmolz + Bickenbach AG Reg Barclays Bank (84,369) 1,776,898 Schmolz + Bickenbach AG Reg Goldman Sachs — 1,761,787 Schmolz + Bickenbach AG Reg Morgan Stanley 233,793 (6,320) SFS Group AG Barclays Bank (8,289) (5,350) SGS SA Reg Barclays Bank (128,775) (3,722) SGS SA Reg Goldman Sachs (94,374) (30,000) Siegfried Holding AG Barclays Bank (144,347) (471) Sika AG Barclays Bank (90,736) (248) Sika AG Goldman Sachs (15,702) 679 Sika AG Barclays Bank 118,714 676 Sika AG Goldman Sachs 42,800 (1,524) Sonova Holding AG Reg Goldman Sachs (1,603) (25,353) Sonova Holding AG Reg Barclays Bank (9,248) (1,702) St Galler Kantonalbank AG Reg Barclays Bank (11,161) (2,892) St Galler Kantonalbank AG Reg Goldman Sachs (28,119) (1,011) Straumann Holding AG Goldman Sachs (5,922) 24,464 Straumann Holding AG Barclays Bank 442,117 8,739 Straumann Holding AG Reg Goldman Sachs 68,230 795 Straumann Holding AG Reg Morgan Stanley 57,519 (83,670) Sulzer AG Reg Goldman Sachs (170,274) 22,038 Sunrise Communications Group Barclays Bank (908) 11,267 Sunrise Communications Group Goldman Sachs (22,315) 16,377 Sunrise Communications Group Morgan Stanley (1,017) (21,385) Swatch Group AG/The Barclays Bank 537,360 (16,706) Swatch Group AG/The Morgan Stanley 756,205 63 Swiss Life Holding AG Reg Barclays Bank 797 44 Swiss Life Holding AG Reg Goldman Sachs 550 (7,011) Swiss Re AG Barclays Bank (18,934) 1,000 Swisscom AG Reg Barclays Bank 1,866 9,062 Swisscom AG Reg Goldman Sachs 81,268 (13,292) Swisscom AG Reg Barclays Bank 124,343 (7,016) Swisscom AG Reg Goldman Sachs 56,593
18,410 Tecan Group AG Reg Barclays Bank 223,158 12,507 Tecan Group AG Reg Goldman Sachs 95,781 579 Tecan Group AG Reg Morgan Stanley 4,494 (21,329) Temenos Group AG Reg Barclays Bank (9,877) (8,685) Temenos Group AG Reg Goldman Sachs (7,748) 13,229 U-Blox AG Barclays Bank 153,156 29,677 U-Blox AG Goldman Sachs 365,053 (3,425) U-Blox AG Barclays Bank (41,265) (2,728) U-Blox AG Goldman Sachs (33,557) (231,529) UBS Group AG Reg Goldman Sachs (160,243) (253,388) UBS Group AG Reg Barclays Bank 7,015 27,159 Valiant Holding AG Reg Barclays Bank (2,456) 3,414 Valiant Holding AG Reg Goldman Sachs 8,646 2,890 Valora Holding AG Reg Barclays Bank 65,411 3,062 Valora Holding AG Reg Goldman Sachs 44,376 1,023 Valora Holding AG Reg Morgan Stanley 22,509 (31,854) Vontobel Holding AG Reg Barclays Bank (84,993) (29,162) Ypsomed Holding AG Reg Barclays Bank (820,228) (3,897) Ypsomed Holding AG Reg Goldman Sachs (103,980) 35,346 Zehnder Group AG Reg Barclays Bank 62,341 (32,740) Zurich Insurance Group AG Barclays Bank (571,486) (13,883) Zurich Insurance Group AG Goldman Sachs (89,574)
1,180,869
United Kingdom (94,751) 888 Holdings Plc Barclays Bank (23,709) (145,710) A.G. Barr Plc Goldman Sachs (4,245) (97,780) AA Plc Barclays Bank (4,544) 41,535 Abcam Plc Barclays Bank 17,207 41,465 Abcam Plc Goldman Sachs 11,688 (1,210,637) Aberdeen Asset
Management Plc Goldman Sachs (260,306) (860,663) Aberdeen Asset
Management Plc Barclays Bank 173,512 (10,230) Acacia Mining Plc Morgan Stanley (15,743) (919,613) Acacia Mining Plc Barclays Bank 581,136 (186,919) Acacia Mining Plc Goldman Sachs 92,634 (110,296) Admiral Group Plc Barclays Bank (93,578) (170,978) Admiral Group Plc Goldman Sachs (197,264) (1,279) Advanced Medical
Solutions Group Plc Barclays Bank (305) (538,406) Aggreko Plc Barclays Bank (318,337) (94,867) Aggreko Plc Goldman Sachs (105,927) 192,501 Aldermore Group Plc Barclays Bank 60,521 183,293 Aldermore Group Plc Morgan Stanley 18,602 266,795 Amec Foster Wheeler Plc Barclays Bank (162,239) 287,323 Amec Foster Wheeler Plc Goldman Sachs (84,381) 29,036 Amec Foster Wheeler Plc Morgan Stanley 10,498 (273,468) Amec Foster Wheeler Plc Barclays Bank 33,179 (212,754) Amec Foster Wheeler Plc Goldman Sachs 33,179 37,026 Anglo American Plc Barclays Bank 9,997 28,744 Anglo American Plc Goldman Sachs 226 4,452 Anglo American Plc Morgan Stanley (100) (9,857) Anglo American Plc Goldman Sachs (78) (270,437) Anglo American Plc Morgan Stanley (22,088) (12,545) Antofagasta Plc Barclays Bank 9,030 (653,095) Antofagasta Plc Morgan Stanley 172,710 (46,056) AO World Plc Barclays Bank (425) (71,128) AO World Plc Morgan Stanley (4,319) 807,243 ARM Holdings Plc Barclays Bank 519,309 238,211 ARM Holdings Plc Goldman Sachs 136,319 8,278 ARM Holdings Plc Morgan Stanley 1,606 183,555 Arrow Global Group Plc Barclays Bank 21,727 185,615 Arrow Global Group Plc Goldman Sachs 24,335 232,807 Arrow Global Group Plc Morgan Stanley 39,844 (19,466) Ashmore Group Plc Morgan Stanley 4,254 (146,348) Ashtead Group Plc Barclays Bank (32,775) (11,866) Ashtead Group Plc Goldman Sachs (640) (14,677) ASOS Plc Barclays Bank 7,298
BlackRock European Diversified Equity Absolute Return Fund continued
Switzerland continued Switzerland continued

Contracts for difference as at 31 May 2016
Holding
Description Counterparty
Unrealised appreciation/
(depreciation) EUR
Holding
Description Counterparty
Unrealised appreciation/
(depreciation) EUR
188 BlackRock Strategic Funds (BSF)
The notes on pages 489 to 503 form an integral part of these financial statements.
BlackRock European Diversified Equity Absolute Return Fund continued
(41,001) ASOS Plc Goldman Sachs 130,356 6,533 ASOS Plc Goldman Sachs (577) 73,009 Associated British Foods Plc Barclays Bank (45,223) 179,447 Associated British Foods Plc Goldman Sachs (74,724) 2,166 Associated British Foods Plc Morgan Stanley 1,011 (2,036,521) Assura Plc Goldman Sachs 33,114 (684,649) Assura Plc Morgan Stanley (8,723) (25,905) AstraZeneca Plc Barclays Bank (38,268) (40,822) AstraZeneca Plc Goldman Sachs (71,717) 51,587 AstraZeneca Plc Barclays Bank 100,001 123,035 AstraZeneca Plc Goldman Sachs 216,280 437,170 Auto Trader Group Plc Barclays Bank 148,707 34,756 Auto Trader Group Plc Goldman Sachs 9,114 (1,730) Auto Trader Group Plc Barclays Bank (136) 9,099 AVEVA Group Plc Barclays Bank 11,654 1,393 AVEVA Group Plc Goldman Sachs 415 298,746 Aviva Plc Barclays Bank 95,825 (18,006) Aviva Plc Barclays Bank (565) (44,548) Aviva Plc Goldman Sachs 648 (63,554) B&M European Value Retail SA Barclays Bank (27,247) (469,757) B&M European Value Retail SA Goldman Sachs (181,686) (200,174) Babcock International
Group Plc Goldman Sachs (208,641) (450,449) Babcock International
Group Plc Barclays Bank (534,540) 364,234 Babcock International
Group Plc Barclays Bank 364,800 351,319 Babcock International
Group Plc Goldman Sachs 323,434 20,187 Babcock International
Group Plc Morgan Stanley 21,880 (16,188) BAE Systems Plc Goldman Sachs (720) (520,119) BAE Systems Plc Barclays Bank 17,261 (1,473,052) Balfour Beatty Plc Barclays Bank (170,712) (1,757,557) Balfour Beatty Plc Goldman Sachs (237,703) 374,558 Barclays Plc Goldman Sachs (2,918) 83,919 Barclays Plc Morgan Stanley (1,191) (737,291) Barclays Plc Goldman Sachs (205,411) (458,621) Barratt Developments Plc Barclays Bank (395,088) (394,648) Barratt Developments Plc Goldman Sachs (314,118) (4,023,500) BBA Aviation Plc Barclays Bank (263,839) (1,586,120) BBA Aviation Plc Goldman Sachs (247,065) 6,080 Beazley Plc Barclays Bank 2,108 450,319 Beazley Plc Barclays Bank 225,533 261,264 Beazley Plc Goldman Sachs 73,988 (91,174) Beazley Plc Barclays Bank (33,265) (80,861) Beazley Plc Goldman Sachs (21,514) (2,479) Bellway Plc Barclays Bank (7,780) (1,851) Bellway Plc Goldman Sachs (3,544) 72 Bellway Plc Goldman Sachs 201 184,066 Berendsen Plc Barclays Bank 79,637 530,991 Berendsen Plc Goldman Sachs 104,425 (13,523) Berkeley Group Holdings Plc Barclays Bank (51,827) 4,068 Berkeley Group Holdings Plc Barclays Bank 20,982 68,178 Berkeley Group Holdings Plc Goldman Sachs 281,566 35,173 BGEO Group Plc Barclays Bank 108,800 49,783 BGEO Group Plc Goldman Sachs 139,794 87,175 BGEO Group Plc Morgan Stanley 432,102 (629,346) BHP Billiton Plc Barclays Bank (118,815) (307,506) BHP Billiton Plc Goldman Sachs 40,522 1,333 Big Yellow Group Plc Morgan Stanley (222) (784,922) Bodycote Plc Barclays Bank (140,291) (72,601) Bodycote Plc Goldman Sachs (14,179) (76,032) boohoo.com Plc Barclays Bank (4,984) (330,136) boohoo.com Plc Goldman Sachs (14,067) 3,020,874 Booker Group Plc Barclays Bank 780,944 4,112,569 Booker Group Plc Goldman Sachs 878,376 6,287 Booker Group Plc Morgan Stanley 245 (284,145) Bovis Homes Group Plc Barclays Bank (510,677) (140,358) Bovis Homes Group Plc Goldman Sachs (205,761) 330,251 BP Plc Barclays Bank (30,951)
692,814 BP Plc Goldman Sachs (57,019) 10,136 BP Plc Morgan Stanley (347) (167,520) BP Plc Barclays Bank 3,423 (430,082) BP Plc Goldman Sachs 27,922 (461,205) Brammer Plc Barclays Bank (90,701) (1,521,124) Brammer Plc Goldman Sachs (184,473) (144,493) Brammer Plc Morgan Stanley (23,535) (530,761) Brewin Dolphin Holdings Plc Barclays Bank 112,012 204,914 British American Tobacco Plc Goldman Sachs (11,554) (25,973) British American Tobacco Plc Barclays Bank (43,154) (3,164) British American Tobacco Plc Goldman Sachs (659) 18,239 British American Tobacco Plc Barclays Bank 17,793 (185,454) British Land Co Plc/The Barclays Bank 20,392 (16,945) British Land Co Plc/The Goldman Sachs 1,177 683,018 Britvic Plc Barclays Bank (248,285) 631,759 Britvic Plc Goldman Sachs (341,328) 31,918 Britvic Plc Morgan Stanley (12,744) 1,127,864 BT Group Plc Barclays Bank 97,482 767,443 BT Group Plc Goldman Sachs 95,083 (6,991) BTG Plc Barclays Bank (639) (4,862) BTG Plc Goldman Sachs (5,833) 32,332 Bunzl Plc Goldman Sachs (13,565) 14,493 Bunzl Plc Morgan Stanley (4,343) 54,136 Bunzl Plc Barclays Bank 710 (56,527) Bunzl Plc Barclays Bank 10,338 (206,172) Bunzl Plc Goldman Sachs 74,845 377,015 Burberry Group Plc Barclays Bank (400,984) 278,050 Burberry Group Plc Goldman Sachs (194,314) 9,372 Burberry Group Plc Morgan Stanley 1,241 767,245 Cairn Energy Plc Barclays Bank (273,888) 757,312 Cairn Energy Plc Goldman Sachs (142,738) 188,941 Cairn Energy Plc Morgan Stanley (15,718) (1,724,491) Cairn Homes Plc Goldman Sachs (11,904) (72,160) Cairn Homes Plc Morgan Stanley (1,285) (404,697) Cairn Homes Plc Barclays Bank 14,164 (238,739) Capita Plc Goldman Sachs 28,170 57,260 Capita Plc Goldman Sachs (9,240) 19,585 Capita Plc Morgan Stanley (6,025) (369,717) Capita Plc Barclays Bank (351,532) (32,821) Capital & Counties
Properties Plc Goldman Sachs (5,809) (1,724,287) Capital & Counties
Properties Plc Barclays Bank 210,397 823,737 Capital & Regional Plc Barclays Bank (35,147) 1,192,193 Capital & Regional Plc Goldman Sachs (42,984) 230,586 Capital & Regional Plc Morgan Stanley (8,606) (8,249) Card Factory Plc Goldman Sachs (519) (83,053) Card Factory Plc Morgan Stanley (173,242) (603,547) Carillion Plc Barclays Bank (39,327) (99,386) Carillion Plc Goldman Sachs (7,938) (631) Carillion Plc Morgan Stanley 130 175,397 Carnival Plc Barclays Bank 35,728 217,432 Carnival Plc Goldman Sachs (134,087) 1,807 Carnival Plc Morgan Stanley (3,136) 2,182,415 Centamin Plc Goldman Sachs (586,566) 134 Centrica Plc Barclays Bank 1 (68,866) Chemring Group Plc Barclays Bank (3,259) (90,710) Chemring Group Plc Goldman Sachs (6,838) (19,655) Chemring Group Plc Morgan Stanley (864) 891,864 Cineworld Group Plc Barclays Bank 524,797 415,186 Cineworld Group Plc Goldman Sachs 220,457 (3,038) Cineworld Group Plc Barclays Bank (1,792) (207,876) Cineworld Group Plc Goldman Sachs (110,379) (104,094) Clarkson Plc Goldman Sachs (15,472) (25,939) Clarkson Plc Barclays Bank 45,911 (814) Clarkson Plc Morgan Stanley 328 (395,849) Clinigen Healthcare Ltd Barclays Bank (94,135) (272,018) Clinigen Healthcare Ltd Goldman Sachs (139,087) (138,536) Close Brothers Group Plc Barclays Bank (175,093) (106,191) Close Brothers Group Plc Goldman Sachs (124,087) 4,097 Close Brothers Group Plc Barclays Bank 8,817
United Kingdom continued United Kingdom continued

Contracts for difference as at 31 May 2016
Holding
Description Counterparty
Unrealised appreciation/
(depreciation) EUR
Holding
Description Counterparty
Unrealised appreciation/
(depreciation) EUR
Annual Report and Audited Accounts 189
The notes on pages 489 to 503 form an integral part of these financial statements.
4,271 Close Brothers Group Plc Goldman Sachs 9,239 3,248 Close Brothers Group Plc Morgan Stanley 6,711 (100,347) CMC Markets Plc Goldman Sachs 6,907 (35,817) CMC Markets Plc Morgan Stanley (9,309) (1,888,628) Cobham Plc Barclays Bank (19,823) (2,514,980) Cobham Plc Goldman Sachs 7,321 182,259 Coca-Cola HBC AG Barclays Bank (82,326) 262,472 Coca-Cola HBC AG Goldman Sachs (26,834) 53,548 Coca-Cola HBC AG Morgan Stanley (1,139) 166,946 Compass Group Plc Barclays Bank 45,374 126,528 Compass Group Plc Goldman Sachs 30,312 (449,371) Compass Group Plc Barclays Bank (91,144) (67,769) Compass Group Plc Goldman Sachs (6,601) 25,451 Computacenter Plc Barclays Bank 3,932 91,237 Computacenter Plc Goldman Sachs 9,569 (49,802) Countryside Properties Plc Goldman Sachs (22,118) (254,628) Countryside Properties Plc Morgan Stanley (132,954) (623,753) Countrywide Plc Barclays Bank (109,583) 125,565 Cranswick Plc Goldman Sachs (47,741) 31,276 Cranswick Plc Barclays Bank 31,164 41,501 Cranswick Plc Morgan Stanley 276,637 281,724 Crest Nicholson Holdings Plc Barclays Bank 254,858 364,900 Crest Nicholson Holdings Plc Goldman Sachs 196,148 (162,831) Crest Nicholson Holdings Plc Barclays Bank (144,344) (442,047) Crest Nicholson Holdings Plc Goldman Sachs (237,617) (272,344) CRH Plc Barclays Bank (246,071) (107,543) CRH Plc Goldman Sachs (76,524) 210,630 Croda International Plc Barclays Bank (333,491) 124,368 Croda International Plc Goldman Sachs (177,003) 793 Croda International Plc Morgan Stanley (1,667) (64,111) CVS Group Plc Barclays Bank (53,164) (128,774) CVS Group Plc Goldman Sachs (55,289) (155,406) CVS Group Plc Morgan Stanley (185,436) (142,207) CYBG Plc Goldman Sachs (93,222) (347,797) Daily Mail & General Trust Plc Barclays Bank 48,606 (507,393) Daily Mail & General Trust Plc Goldman Sachs 236,478 (516,709) Dairy Crest Group Plc Barclays Bank 77,139 418,969 Dart Group Plc Barclays Bank 54,516 355,633 Dart Group Plc Goldman Sachs 86,258 69,203 Dart Group Plc Morgan Stanley 19,219 12,635 DCC Plc Barclays Bank 16,528 9,470 DCC Plc Goldman Sachs 18,518 36,872 De La Rue Plc Barclays Bank 45,687 65,347 De La Rue Plc Goldman Sachs 67,440 57,074 De La Rue Plc Morgan Stanley 45,396 5,290,198 Debenhams Plc Barclays Bank (270,426) (1,201,815) Debenhams Plc Goldman Sachs (10,242) (237,368) Dechra Pharmaceuticals Plc Barclays Bank (195,443) (48,496) Derwent London Plc Goldman Sachs (18,439) (172,275) Derwent London Plc Barclays Bank 49,198 (132,906) Diageo Plc Barclays Bank (61,758) (51,437) Diageo Plc Goldman Sachs 3,372 46,711 Dignity Plc Barclays Bank 56,278 2,102 Dignity Plc Goldman Sachs 2,618 (509,471) Diploma Plc Barclays Bank (140,115) (5,031) Diploma Plc Morgan Stanley (7,673) 526,281 Direct Line Insurance Group Plc Barclays Bank 48,561 329,035 Direct Line Insurance Group Plc Goldman Sachs 13,203 (24,750) Direct Line Insurance Group Plc Barclays Bank (1,348) 429,017 Dixons Carphone Plc Barclays Bank 103,495 949,105 Dixons Carphone Plc Goldman Sachs 327,982 227,913 Domino's Pizza Group Plc Barclays Bank 430,439 171,780 Domino's Pizza Group Plc Goldman Sachs 132,877 (127,877) Domino's Pizza Group Plc Barclays Bank (214,401) (99,177) Domino's Pizza Group Plc Goldman Sachs (76,716) (74,669) Drax Group Plc Barclays Bank 8,321 (181,949) Drax Group Plc Goldman Sachs (44,370) (385,928) Drax Group Plc Morgan Stanley (15,754) 257,281 DS Smith Plc Barclays Bank 24,415 193,901 DS Smith Plc Goldman Sachs 14,704 15,656 DS Smith Plc Morgan Stanley 2,068 29,012 Dunelm Group Plc Barclays Bank 17,633
78,302 Dunelm Group Plc Goldman Sachs 32,357 47,073 Dunelm Group Plc Morgan Stanley 26,967 (34,048) easyJet Plc Barclays Bank 3,355 (49,123) easyJet Plc Goldman Sachs (3,359) (2,518,676) Electrocomponents Plc Barclays Bank (898,802) (662,903) Electrocomponents Plc Goldman Sachs (226,838) (5,041) Electrocomponents Plc Morgan Stanley (2,349) 731,422 Elementis Plc Barclays Bank (10,143) 113,799 Elementis Plc Morgan Stanley (9,579) (950,315) Elementis Plc Barclays Bank (51,706) 725,599 Elementis Plc Goldman Sachs 7,024 (54,240) EMIS Group Plc Barclays Bank (13,817) (8,323) EMIS Group Plc Goldman Sachs (1,562) (11,954) EMIS Group Plc Morgan Stanley (2,238) (1,850,123) Empiric Student Property Plc Goldman Sachs (66,705) 1,447,960 Enterprise Inns Plc Barclays Bank 237,297 1,180,160 Entertainment One Ltd Barclays Bank (15,473) 1,194,067 Entertainment One Ltd Goldman Sachs 205,081 (205,054) Equiniti Group Plc Barclays Bank (64,522) (32,617) Equiniti Group Plc Goldman Sachs (641) (27,866) Equiniti Group Plc Morgan Stanley (19,931) (125,825) Essentra Plc Barclays Bank (1,197) (93,875) esure Group Plc Goldman Sachs (16,000) 27,595 Eurasian Natural
Resources Corp Plc Goldman Sachs (79,040) 816,885 Evraz Plc Barclays Bank (317,014) 318,725 Evraz Plc Goldman Sachs (36,355) (181,593) Evraz Plc Barclays Bank 23,783 (286,121) Evraz Plc Goldman Sachs 36,899 308,804 Experian Plc Barclays Bank 170,352 323,071 Experian Plc Goldman Sachs 176,768 (67,179) Fenner Plc Barclays Bank (70) 288,707 Fevertree Drinks Plc Barclays Bank 416,366 5,547 Fevertree Drinks Plc Morgan Stanley 10,411 43,474 Fidessa Group Plc Barclays Bank (11,399) 84,726 Fidessa Group Plc Goldman Sachs 92,198 53,946 Fidessa Group Plc Morgan Stanley 294,830 (4,612,013) Firstgroup Plc Barclays Bank (555,920) (986,167) Firstgroup Plc Goldman Sachs (120,876) 1,419,765 Flybe Group Plc Barclays Bank (120,835) 910,072 Flybe Group Plc Goldman Sachs (47,727) (17,945) Foxtons Group Plc Morgan Stanley 6,177 (783,182) Foxtons Group Plc Barclays Bank (179,691) (181,927) Fresnillo Plc Barclays Bank 184,039 (124,716) Fresnillo Plc Goldman Sachs 171,249 (2,831,389) G4S Plc Barclays Bank 66,838 (1,103,351) G4S Plc Goldman Sachs 167 384,902 Galliford Try Plc Barclays Bank 539,592 262,194 Galliford Try Plc Goldman Sachs 345,240 88,994 Galliford Try Plc Morgan Stanley 101,169 (327,953) GKN Plc Goldman Sachs 3,209 (1,189,996) GKN Plc Barclays Bank (25,396) 1,823,345 GKN Plc Barclays Bank (48,075) 1,392,712 GKN Plc Goldman Sachs (55,032) 11,391 GKN Plc Morgan Stanley (1,203) (289,345) GlaxoSmithKline Plc Barclays Bank 65,320 (173,105) GlaxoSmithKline Plc Goldman Sachs 19,580 457,612 Glencore Plc Barclays Bank (22,020) 894,861 Glencore Plc Goldman Sachs (19,706) 218,597 Glencore Plc Morgan Stanley (3,257) (971,430) Glencore Plc Barclays Bank 140,352 (235,681) Glencore Plc Goldman Sachs 6,025 4,077,738 Globo Plc Barclays Bank (1,510,247) 849,333 Globo Plc Morgan Stanley (411,419) 38,583 Go-Ahead Group Plc Morgan Stanley (12,856) 239,712 Go-Ahead Group Plc Barclays Bank 15,947 57,928 Go-Ahead Group Plc Goldman Sachs 20,056 76,019 Grafton Group Plc Barclays Bank 54,637 74,111 Grafton Group Plc Goldman Sachs 60,055 193 Grafton Group Plc Morgan Stanley 80 (31,528) Grafton Group Plc Morgan Stanley (37,876) 170,750 Grainger Plc Goldman Sachs 6,079
BlackRock European Diversified Equity Absolute Return Fund continued
United Kingdom continued United Kingdom continued
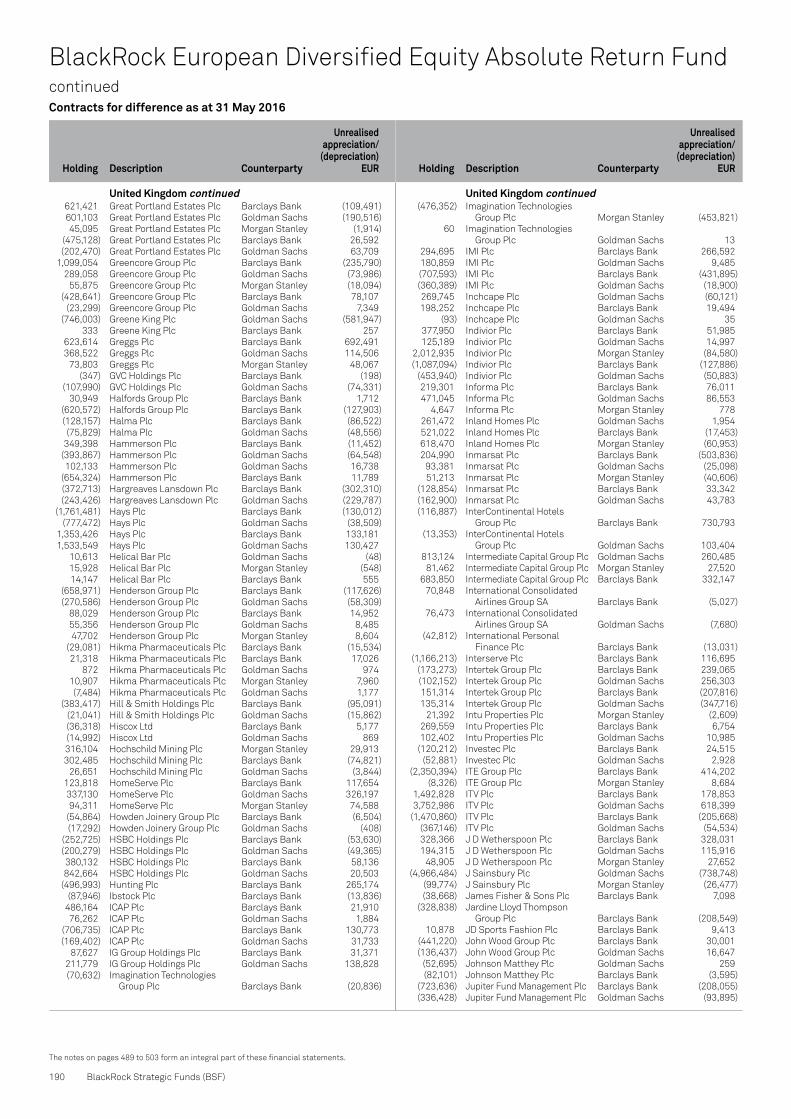
Contracts for difference as at 31 May 2016
Holding
Description Counterparty
Unrealised appreciation/
(depreciation) EUR
Holding
Description Counterparty
Unrealised appreciation/
(depreciation) EUR
190 BlackRock Strategic Funds (BSF)
The notes on pages 489 to 503 form an integral part of these financial statements.
BlackRock European Diversified Equity Absolute Return Fund continued
621,421 Great Portland Estates Plc Barclays Bank (109,491) 601,103 Great Portland Estates Plc Goldman Sachs (190,516) 45,095 Great Portland Estates Plc Morgan Stanley (1,914) (475,128) Great Portland Estates Plc Barclays Bank 26,592 (202,470) Great Portland Estates Plc Goldman Sachs 63,709 1,099,054 Greencore Group Plc Barclays Bank (235,790) 289,058 Greencore Group Plc Goldman Sachs (73,986) 55,875 Greencore Group Plc Morgan Stanley (18,094) (428,641) Greencore Group Plc Barclays Bank 78,107 (23,299) Greencore Group Plc Goldman Sachs 7,349 (746,003) Greene King Plc Goldman Sachs (581,947) 333 Greene King Plc Barclays Bank 257 623,614 Greggs Plc Barclays Bank 692,491 368,522 Greggs Plc Goldman Sachs 114,506 73,803 Greggs Plc Morgan Stanley 48,067 (347) GVC Holdings Plc Barclays Bank (198) (107,990) GVC Holdings Plc Goldman Sachs (74,331) 30,949 Halfords Group Plc Barclays Bank 1,712 (620,572) Halfords Group Plc Barclays Bank (127,903) (128,157) Halma Plc Barclays Bank (86,522) (75,829) Halma Plc Goldman Sachs (48,556) 349,398 Hammerson Plc Barclays Bank (11,452) (393,867) Hammerson Plc Goldman Sachs (64,548) 102,133 Hammerson Plc Goldman Sachs 16,738 (654,324) Hammerson Plc Barclays Bank 11,789 (372,713) Hargreaves Lansdown Plc Barclays Bank (302,310) (243,426) Hargreaves Lansdown Plc Goldman Sachs (229,787) (1,761,481) Hays Plc Barclays Bank (130,012) (777,472) Hays Plc Goldman Sachs (38,509) 1,353,426 Hays Plc Barclays Bank 133,181 1,533,549 Hays Plc Goldman Sachs 130,427 10,613 Helical Bar Plc Goldman Sachs (48) 15,928 Helical Bar Plc Morgan Stanley (548) 14,147 Helical Bar Plc Barclays Bank 555 (658,971) Henderson Group Plc Barclays Bank (117,626) (270,586) Henderson Group Plc Goldman Sachs (58,309) 88,029 Henderson Group Plc Barclays Bank 14,952 55,356 Henderson Group Plc Goldman Sachs 8,485 47,702 Henderson Group Plc Morgan Stanley 8,604 (29,081) Hikma Pharmaceuticals Plc Barclays Bank (15,534) 21,318 Hikma Pharmaceuticals Plc Barclays Bank 17,026 872 Hikma Pharmaceuticals Plc Goldman Sachs 974 10,907 Hikma Pharmaceuticals Plc Morgan Stanley 7,960 (7,484) Hikma Pharmaceuticals Plc Goldman Sachs 1,177 (383,417) Hill & Smith Holdings Plc Barclays Bank (95,091) (21,041) Hill & Smith Holdings Plc Goldman Sachs (15,862) (36,318) Hiscox Ltd Barclays Bank 5,177 (14,992) Hiscox Ltd Goldman Sachs 869 316,104 Hochschild Mining Plc Morgan Stanley 29,913 302,485 Hochschild Mining Plc Barclays Bank (74,821) 26,651 Hochschild Mining Plc Goldman Sachs (3,844) 123,818 HomeServe Plc Barclays Bank 117,654 337,130 HomeServe Plc Goldman Sachs 326,197 94,311 HomeServe Plc Morgan Stanley 74,588 (54,864) Howden Joinery Group Plc Barclays Bank (6,504) (17,292) Howden Joinery Group Plc Goldman Sachs (408) (252,725) HSBC Holdings Plc Barclays Bank (53,630) (200,279) HSBC Holdings Plc Goldman Sachs (49,365) 380,132 HSBC Holdings Plc Barclays Bank 58,136 842,664 HSBC Holdings Plc Goldman Sachs 20,503 (496,993) Hunting Plc Barclays Bank 265,174 (87,946) Ibstock Plc Barclays Bank (13,836) 486,164 ICAP Plc Barclays Bank 21,910 76,262 ICAP Plc Goldman Sachs 1,884 (706,735) ICAP Plc Barclays Bank 130,773 (169,402) ICAP Plc Goldman Sachs 31,733 87,627 IG Group Holdings Plc Barclays Bank 31,371 211,779 IG Group Holdings Plc Goldman Sachs 138,828 (70,632) Imagination Technologies
Group Plc Barclays Bank (20,836)
(476,352) Imagination Technologies Group Plc Morgan Stanley (453,821)
60 Imagination Technologies Group Plc Goldman Sachs 13
294,695 IMI Plc Barclays Bank 266,592 180,859 IMI Plc Goldman Sachs 9,485 (707,593) IMI Plc Barclays Bank (431,895) (360,389) IMI Plc Goldman Sachs (18,900) 269,745 Inchcape Plc Goldman Sachs (60,121) 198,252 Inchcape Plc Barclays Bank 19,494 (93) Inchcape Plc Goldman Sachs 35 377,950 Indivior Plc Barclays Bank 51,985 125,189 Indivior Plc Goldman Sachs 14,997 2,012,935 Indivior Plc Morgan Stanley (84,580) (1,087,094) Indivior Plc Barclays Bank (127,886) (453,940) Indivior Plc Goldman Sachs (50,883) 219,301 Informa Plc Barclays Bank 76,011 471,045 Informa Plc Goldman Sachs 86,553 4,647 Informa Plc Morgan Stanley 778 261,472 Inland Homes Plc Goldman Sachs 1,954 521,022 Inland Homes Plc Barclays Bank (17,453) 618,470 Inland Homes Plc Morgan Stanley (60,953) 204,990 Inmarsat Plc Barclays Bank (503,836) 93,381 Inmarsat Plc Goldman Sachs (25,098) 51,213 Inmarsat Plc Morgan Stanley (40,606) (128,854) Inmarsat Plc Barclays Bank 33,342 (162,900) Inmarsat Plc Goldman Sachs 43,783 (116,887) InterContinental Hotels
Group Plc Barclays Bank 730,793 (13,353) InterContinental Hotels
Group Plc Goldman Sachs 103,404 813,124 Intermediate Capital Group Plc Goldman Sachs 260,485 81,462 Intermediate Capital Group Plc Morgan Stanley 27,520 683,850 Intermediate Capital Group Plc Barclays Bank 332,147 70,848 International Consolidated
Airlines Group SA Barclays Bank (5,027) 76,473 International Consolidated
Airlines Group SA Goldman Sachs (7,680) (42,812) International Personal
Finance Plc Barclays Bank (13,031) (1,166,213) Interserve Plc Barclays Bank 116,695 (173,273) Intertek Group Plc Barclays Bank 239,065 (102,152) Intertek Group Plc Goldman Sachs 256,303 151,314 Intertek Group Plc Barclays Bank (207,816) 135,314 Intertek Group Plc Goldman Sachs (347,716) 21,392 Intu Properties Plc Morgan Stanley (2,609) 269,559 Intu Properties Plc Barclays Bank 6,754 102,402 Intu Properties Plc Goldman Sachs 10,985 (120,212) Investec Plc Barclays Bank 24,515 (52,881) Investec Plc Goldman Sachs 2,928 (2,350,394) ITE Group Plc Barclays Bank 414,202 (8,326) ITE Group Plc Morgan Stanley 8,684 1,492,828 ITV Plc Barclays Bank 178,853 3,752,986 ITV Plc Goldman Sachs 618,399 (1,470,860) ITV Plc Barclays Bank (205,668) (367,146) ITV Plc Goldman Sachs (54,534) 328,366 J D Wetherspoon Plc Barclays Bank 328,031 194,315 J D Wetherspoon Plc Goldman Sachs 115,916 48,905 J D Wetherspoon Plc Morgan Stanley 27,652 (4,966,484) J Sainsbury Plc Goldman Sachs (738,748) (99,774) J Sainsbury Plc Morgan Stanley (26,477) (38,668) James Fisher & Sons Plc Barclays Bank 7,098 (328,838) Jardine Lloyd Thompson
Group Plc Barclays Bank (208,549) 10,878 JD Sports Fashion Plc Barclays Bank 9,413 (441,220) John Wood Group Plc Barclays Bank 30,001 (136,437) John Wood Group Plc Goldman Sachs 16,647 (52,695) Johnson Matthey Plc Goldman Sachs 259 (82,101) Johnson Matthey Plc Barclays Bank (3,595) (723,636) Jupiter Fund Management Plc Barclays Bank (208,055) (336,428) Jupiter Fund Management Plc Goldman Sachs (93,895)
United Kingdom continued United Kingdom continued

Contracts for difference as at 31 May 2016
Holding
Description Counterparty
Unrealised appreciation/
(depreciation) EUR
Holding
Description Counterparty
Unrealised appreciation/
(depreciation) EUR
Annual Report and Audited Accounts 191
The notes on pages 489 to 503 form an integral part of these financial statements.
595,339 Jupiter Fund Management Plc Barclays Bank 161,158 415,410 Jupiter Fund Management Plc Goldman Sachs 120,563 16,210 Jupiter Fund Management Plc Morgan Stanley 2,629 249,770 Just Eat Plc Barclays Bank 115,900 191,862 Just Eat Plc Goldman Sachs 90,810 47,144 Just Eat Plc Morgan Stanley 17,599 (372,483) Just Eat Plc Barclays Bank (202,286) (186,694) Just Eat Plc Goldman Sachs (107,209) (20,928) Kainos Group Plc Morgan Stanley 1,599 (23,366) Kainos Group Plc Barclays Bank (536) 612,690 KCOM Group Plc Morgan Stanley (90,644) 439,437 KCOM Group Plc Barclays Bank 18,724 889,333 KCOM Group Plc Goldman Sachs 32,064 2,261 Keller Group Plc Morgan Stanley (377) 2,644 Keller Group Plc Barclays Bank 132 10,103 Keller Group Plc Goldman Sachs 1,831 30,943 Kier Group Plc Morgan Stanley (612) (96) Kier Group Plc Barclays Bank (67) (27,145) Kier Group Plc Goldman Sachs (26,051) 206,514 Kier Group Plc Barclays Bank 144,764 86,622 Kier Group Plc Goldman Sachs 82,552 (152,147) Kier Group Plc Morgan Stanley 11,805 (2,782,437) Kingfisher Plc Barclays Bank (225,050) (1,213,772) Kingfisher Plc Goldman Sachs (184,625) 1,917 Laird Plc Barclays Bank 243 676 Laird Plc Goldman Sachs 177 1,858 Laird Plc Morgan Stanley 86 (72,883) Lancashire Holdings Ltd Barclays Bank (16,880) (461,388) Lancashire Holdings Ltd Goldman Sachs (12,408) (105,400) Land Securities Group Plc Barclays Bank (33,132) (81,640) Land Securities Group Plc Goldman Sachs (40,674) (105,847) Legal & General Group Plc Barclays Bank (1,634) (4,361) Legal & General Group Plc Goldman Sachs (35) (8,802,995) Lloyds Banking Group Plc Barclays Bank (521,585) (4,315,221) Lloyds Banking Group Plc Goldman Sachs (299,765) (616,857) Lookers Plc Barclays Bank (65,679) (18,557) Majestic Wine Plc Goldman Sachs (7,177) (634,658) Majestic Wine Plc Morgan Stanley (1,216,214) (661,818) Man Group Plc Barclays Bank 63,282 1,237,529 Man Group Plc Barclays Bank (80,235) 1,703,905 Man Group Plc Goldman Sachs (141) 385,964 Man Group Plc Morgan Stanley (7,420) (407,941) Man Group Plc Goldman Sachs (10,431) 809,779 Marks & Spencer Group Plc Barclays Bank (125,587) 274,132 Marks & Spencer Group Plc Goldman Sachs (55,267) 158,825 Marshalls Plc Barclays Bank 19,990 79,945 Marshalls Plc Goldman Sachs (6,918) 150,471 Marston's Plc Barclays Bank 20,122 28,078 Marston's Plc Goldman Sachs 3,276 130,089 McCarthy & Stone Plc Barclays Bank 15,076 306,488 McCarthy & Stone Plc Goldman Sachs 77,522 46,288 McCarthy & Stone Plc Morgan Stanley 1,232 604 Meggitt Plc Morgan Stanley 68 2,707 Merlin Entertainments Plc Barclays Bank 126 87,150 Merlin Entertainments Plc Goldman Sachs 3,335 (1,182,877) Merlin Entertainments Plc Barclays Bank 88,069 (388,752) Merlin Entertainments Plc Goldman Sachs 17,329 220,320 Michael Page International Plc Barclays Bank (25,708) 279,373 Michael Page International Plc Goldman Sachs 32,232 (77,653) Michael Page International Plc Barclays Bank 4,085 (16,556) Michael Page International Plc Goldman Sachs 871 (218,198) Micro Focus International Plc Barclays Bank (258,935) (196,613) Micro Focus International Plc Goldman Sachs (269,725) 169,179 Micro Focus International Plc Barclays Bank 214,760 266,832 Micro Focus International Plc Goldman Sachs 353,483 1,503 Micro Focus International Plc Morgan Stanley 1,508 (95,195) Millennium & Copthorne
Hotels Plc Barclays Bank 8,753 136,463 Mitchells & Butlers Plc Barclays Bank 42,946 348,368 Mitchells & Butlers Plc Goldman Sachs 99,111 66,130 Mitchells & Butlers Plc Morgan Stanley 16,533
(1,263,611) Mitie Group Plc Barclays Bank (177,265) (629,940) Mitie Group Plc Goldman Sachs (73,697) (93,854) Mitie Group Plc Morgan Stanley (17,420) 66,007 Mondi Plc Barclays Bank 30,350 2,927 Mondi Plc Morgan Stanley 2,169 7,204 Mondi Plc Goldman Sachs (155) 945,840 Moneysupermarket.com
Group Plc Goldman Sachs 246,772 1,313,754 Moneysupermarket.com
Group Plc Barclays Bank 279,579 (126,954) Morgan Advanced Materials Plc Goldman Sachs (23,469) (452,911) Morgan Advanced Materials Plc Morgan Stanley (133,040) (690,214) N Brown Group Plc Barclays Bank 129,730 (94,275) N Brown Group Plc Morgan Stanley 71,651 (185,884) N Brown Group Plc Goldman Sachs (41,918) 1,613,155 National Express Group Plc Barclays Bank 230,885 383,996 National Express Group Plc Goldman Sachs 25,765 131,888 National Express Group Plc Morgan Stanley 18,498 (362,596) National Grid Plc Barclays Bank (36,430) (403,936) National Grid Plc Goldman Sachs (19,932) 261,199 NewRiver Retail Ltd Barclays Bank (12,671) 297,818 NewRiver Retail Ltd Goldman Sachs 3,124 (181,688) Next Plc Barclays Bank (619,153) (52,842) Next Plc Goldman Sachs (94,582) (98,475) NMC Health Plc Barclays Bank (118,779) (266,228) NMC Health Plc Goldman Sachs (359,515) 212,045 Northgate Plc Barclays Bank 4,393 179,707 Northgate Plc Goldman Sachs 13,923 70,104 Northgate Plc Morgan Stanley 2,972 19,529 Novae Group Plc Barclays Bank 9,473 678,975 Ocado Group Plc Barclays Bank (117,652) 63,156 Ocado Group Plc Morgan Stanley (5,108) 278,647 Ocado Group Plc Goldman Sachs 7,645 (228,686) Ocado Group Plc Barclays Bank 78,554 (10,819) Ocado Group Plc Morgan Stanley 10,518 (1,578,103) Old Mutual Plc Barclays Bank (56,824) (102,262) Old Mutual Plc Goldman Sachs (14,346) 47,407 OneSavings Bank Plc Barclays Bank 25,760 245,881 OneSavings Bank Plc Goldman Sachs 132,886 155,667 OneSavings Bank Plc Morgan Stanley 64,979 1,032,854 Ophir Energy Plc Goldman Sachs 46,718 328,794 Ophir Energy Plc Barclays Bank (14,441) 2,747 Oxford Instruments Plc Barclays Bank (343) 1,819 Oxford Instruments Plc Goldman Sachs (185) 8,857 Oxford Instruments Plc Morgan Stanley (646) (95,053) P2P Global Investments
Plc/Fund Goldman Sachs 28,040 (20,594) P2P Global Investments
Plc/Fund Morgan Stanley 14,816 154,425 Paragon Group of Cos Plc/The Barclays Bank 19,281 285,216 Paragon Group of Cos Plc/The Goldman Sachs 3,739 461 Paragon Group of Cos Plc/The Morgan Stanley 46 86,718 PayPoint Plc Barclays Bank 111,427 139,079 PayPoint Plc Goldman Sachs 183,962 108,389 PayPoint Plc Morgan Stanley 131,063 9,068 Paysafe Group Plc Barclays Bank 5,114 37,285 Paysafe Group Plc Goldman Sachs 21,893 (552,658) Pearson Plc Barclays Bank (258,341) (759,378) Pearson Plc Goldman Sachs (328,513) 6,729,967 Pendragon Plc Barclays Bank 638,818 1,501,890 Pendragon Plc Goldman Sachs 132,716 850,416 Pendragon Plc Morgan Stanley (14,245) 624,268 Pennon Group Plc Barclays Bank 455,153 864,750 Pennon Group Plc Goldman Sachs 725,787 9,015 Pennon Group Plc Morgan Stanley 7,630 (356,341) Pennon Group Plc Barclays Bank (273,863) (113,225) Pennon Group Plc Goldman Sachs (99,459) (102,893) Persimmon Plc Barclays Bank (100,986) (22,209) Persimmon Plc Goldman Sachs (14,106) 28,257 Persimmon Plc Barclays Bank 50,371 11,111 Persimmon Plc Goldman Sachs 20,686
BlackRock European Diversified Equity Absolute Return Fund continued
United Kingdom continued United Kingdom continued

Contracts for difference as at 31 May 2016
Holding
Description Counterparty
Unrealised appreciation/
(depreciation) EUR
Holding
Description Counterparty
Unrealised appreciation/
(depreciation) EUR
192 BlackRock Strategic Funds (BSF)
The notes on pages 489 to 503 form an integral part of these financial statements.
BlackRock European Diversified Equity Absolute Return Fund continued
(10,140) Petra Diamonds Ltd Barclays Bank 199 184,173 Petrofac Ltd Barclays Bank (24,335) 342,288 Petrofac Ltd Goldman Sachs (98,434) 8,822 Petrofac Ltd Morgan Stanley (4,193) (150,338) Petrofac Ltd Barclays Bank 101,434 (188,501) Petrofac Ltd Goldman Sachs 90,205 (4,220) Pets at Home Group Plc Morgan Stanley 567 (675,256) Pets at Home Group Plc Barclays Bank (178,627) 500,326 Phoenix Group Holdings Barclays Bank 196,186 434,927 Phoenix Group Holdings Goldman Sachs 271,402 19,900 Phoenix Group Holdings Morgan Stanley 7,085 616,715 Playtech Plc Barclays Bank 381,208 308,586 Playtech Plc Goldman Sachs 192,942 31,582 Playtech Plc Morgan Stanley 19,467 1,386,638 Poundland Group Plc Barclays Bank 67,528 725,155 Poundland Group Plc Goldman Sachs 63,045 367,926 Poundland Group Plc Morgan Stanley 74,752 434,058 Premier Farnell Plc Barclays Bank (16,503) 1,617,725 Premier Farnell Plc Goldman Sachs (130,438) (2,690,624) Premier Foods Plc Barclays Bank (126,317) 567,088 Premier Oil Plc Goldman Sachs (310) (319,183) Primary Health Properties Plc Goldman Sachs (15,693) 101,997 Provident Financial Plc Barclays Bank 24,280 57,664 Provident Financial Plc Goldman Sachs 59,551 19,186 Provident Financial Plc Morgan Stanley 11,393 (10,569) Provident Financial Plc Barclays Bank (674) (6,199) Provident Financial Plc Goldman Sachs 858 (978,856) Prudential Plc Barclays Bank (555,678) (176,769) Prudential Plc Goldman Sachs (244,024) (563,181) PZ Cussons Plc Barclays Bank (196,546) (19) PZ Cussons Plc Goldman Sachs (8) (611,931) PZ Cussons Plc Morgan Stanley (545,387) 691,956 QinetiQ Group Plc Barclays Bank 179,703 3,800,926 QinetiQ Group Plc Goldman Sachs 832,207 102,654 QinetiQ Group Plc Morgan Stanley 29,215 (14,788) Randgold Resources Ltd Barclays Bank 123,752 (9,037) Randgold Resources Ltd Goldman Sachs 64,075 34,925 Randgold Resources Ltd Barclays Bank (423,872) 26,647 Randgold Resources Ltd Goldman Sachs (166,587) 5,309 Randgold Resources Ltd Morgan Stanley (14,334) 667,185 Rank Group Plc Barclays Bank 121,877 345,056 Rank Group Plc Goldman Sachs 43,430 242,033 Rank Group Plc Morgan Stanley (65,318) (3,549) Reckitt Benckiser Group Plc Barclays Bank (4,860) (47,974) Reckitt Benckiser Group Plc Goldman Sachs (29,779) 116 Redcentric Plc Barclays Bank 24 7,795 Redcentric Plc Morgan Stanley 1,510 (15,078) Redde Plc Morgan Stanley 963 (637,715) Redde Plc Barclays Bank (88,061) (90,326) Redefine International Plc/
Isle of Man Barclays Bank 2,463 (3,289,496) Redefine International Plc/
Isle of Man Goldman Sachs 46,146 (171,208) Redefine International Plc/
Isle of Man Morgan Stanley (5,016) (52,366) Redrow Plc Goldman Sachs (28,904) (156,061) Regus Plc Barclays Bank (30,667) (236,129) Regus Plc Goldman Sachs (11,280) 1,227,563 Regus Plc Barclays Bank 349,747 304,810 Regus Plc Goldman Sachs 78,255 23,163 Regus Plc Morgan Stanley 4,195 (1,785) Relx Plc Goldman Sachs (823) (165,842) Relx Plc Barclays Bank (83,213) (1,034,398) Renewables Infrastructure
Group Ltd/The Goldman Sachs 25,925 (199,729) Renishaw Plc Barclays Bank (201,082) 2,089,401 Rentokil Initial Plc Barclays Bank 79,441 3,128,616 Rentokil Initial Plc Goldman Sachs 123,055 76,330 Restaurant Group Plc/The Barclays Bank 57,469 136,115 Restaurant Group Plc/The Goldman Sachs 31,439 5,521 Restaurant Group Plc/The Morgan Stanley 2,278 (152,185) Restaurant Group Plc/The Barclays Bank (108,239)
(109,227) Restaurant Group Plc/The Goldman Sachs (70,288) (119,649) Restore Plc Goldman Sachs (32,158) (505,303) Restore Plc Morgan Stanley (178,203) 10,072 Rightmove Plc Barclays Bank 21,894 44,695 Rightmove Plc Goldman Sachs 154,808 4,368 Rightmove Plc Morgan Stanley 14,006 (6,293) Rightmove Plc Barclays Bank 602 (11,826) Rightmove Plc Goldman Sachs 740 (197,742) Rio Tinto Plc Barclays Bank 715,446 (47,068) Rio Tinto Plc Goldman Sachs 36,409 (46,014,603) Rolls Royce Holdings Plc 'C' Barclays Bank (60,328) (67,076,540) Rolls Royce Holdings Plc 'C' Goldman Sachs — (845,811) Rolls Royce Holdings Plc 'C' Goldman Sachs — (727,459) Rolls-Royce Holdings Plc Barclays Bank 361,422 (1,071,789) Rolls-Royce Holdings Plc Goldman Sachs 504,895 (4,281,993) Rotork Plc Barclays Bank (520,571) (1,100,022) Rotork Plc Goldman Sachs (54,319) 275,882 Royal Bank of Scotland
Group Plc Barclays Bank 59,710 181,893 Royal Bank of Scotland
Group Plc Goldman Sachs 19,212 70,539 Royal Bank of Scotland
Group Plc Morgan Stanley (2,555) (122,944) Royal Bank of Scotland
Group Plc Barclays Bank (9,299) (256,772) Royal Bank of Scotland
Group Plc Goldman Sachs (45,670) 42,466 Royal Dutch Shell Plc 'B' Goldman Sachs (11,532) 651 Royal Dutch Shell Plc 'B' Morgan Stanley (30) 2,744 Royal Dutch Shell Plc 'B' Barclays Bank 341 (30,359) Royal Dutch Shell Plc 'B' Barclays Bank (1,286) (69,417) Royal Dutch Shell Plc 'B' Goldman Sachs 54,413 (622,629) Royal Mail Plc Barclays Bank (386,515) (927,244) Royal Mail Plc Goldman Sachs (433,041) (466,558) RPC Group Plc Barclays Bank (438,061) (161,286) RPC Group Plc Goldman Sachs (89,869) 397,536 RPC Group Plc Barclays Bank 248,245 324,534 RPC Group Plc Goldman Sachs 150,609 28,737 RPC Group Plc Morgan Stanley 18,239 169,036 RPS Group Plc Morgan Stanley (47,048) 128,355 RPS Group Plc Barclays Bank 15,145 99,855 RPS Group Plc Goldman Sachs 11,128 (179,418) RSA Insurance Group Plc Barclays Bank (73,630) (413,244) RSA Insurance Group Plc Goldman Sachs (99,074) 682,492 Safestore Holdings Plc Barclays Bank 84,111 578,720 Safestore Holdings Plc Goldman Sachs 78,150 247,127 Saga Plc Barclays Bank 10,447 264,445 Saga Plc Goldman Sachs 12,828 61,836 Saga Plc Morgan Stanley 6,264 353,886 Sage Group Plc/The Barclays Bank 106,216 472,704 Sage Group Plc/The Goldman Sachs 123,996 (29,514) Savills Plc Barclays Bank (14,317) (197,337) Scapa Group Plc Goldman Sachs (65,327) (300,329) Scapa Group Plc Morgan Stanley (310,374) (70,562) Schroders Plc Barclays Bank (191,791) (21,126) Schroders Plc Goldman Sachs (54,958) 336,078 Segro Plc Barclays Bank 91,649 (925,807) Senior Plc Barclays Bank 2,428 (15,792) Senior Plc Morgan Stanley 8,798 (798,630) Serco Group Plc Barclays Bank (150,418) (1,346,004) Serco Group Plc Goldman Sachs (266,327) 22,622 Severn Trent Plc Barclays Bank 21,058 341,265 Shaftesbury Plc Barclays Bank (74,056) 265,532 Shaftesbury Plc Goldman Sachs (62,411) 26,243 Shaftesbury Plc Morgan Stanley (6,404) (473,595) Shaftesbury Plc Barclays Bank (21,256) (240,977) Shaftesbury Plc Goldman Sachs 53,709 13,700 Shawbrook Group Plc Barclays Bank 1,773 46,316 Shawbrook Group Plc Goldman Sachs 18,035 72,786 Shawbrook Group Plc Morgan Stanley 17,797 (2,057,714) SIG Plc Barclays Bank (143,608) 538,523 Sky Plc Barclays Bank 221,309
United Kingdom continued United Kingdom continued

Contracts for difference as at 31 May 2016
Holding
Description Counterparty
Unrealised appreciation/
(depreciation) EUR
Holding
Description Counterparty
Unrealised appreciation/
(depreciation) EUR
Annual Report and Audited Accounts 193
The notes on pages 489 to 503 form an integral part of these financial statements.
652,369 Sky Plc Goldman Sachs 327,763 78,009 Smith & Nephew Plc Barclays Bank 14,358 67,946 Smith & Nephew Plc Goldman Sachs 21,380 150,038 Smiths Group Plc Barclays Bank 29,507 75,198 Smiths Group Plc Goldman Sachs 42,394 (150,763) Smiths Group Plc Barclays Bank (31,184) (91,905) Smiths Group Plc Goldman Sachs (51,812) 434,934 Softcat Plc Barclays Bank 207,290 314,156 Softcat Plc Goldman Sachs 165,988 384,561 Softcat Plc Morgan Stanley 155,797 (93,111) Sophos Group Plc Goldman Sachs 13,917 (146,768) Sophos Group Plc Morgan Stanley 83,956 (1,486,717) Sophos Group Plc Barclays Bank (67,666) (165,655) Spectris Plc Barclays Bank 247,570 (41,259) Spectris Plc Goldman Sachs 41,718 71,676 Spirax-Sarco Engineering Plc Barclays Bank 48,866 (12,671) Spirax-Sarco Engineering Plc Barclays Bank (7,222) (7,142) Spirax-Sarco Engineering Plc Goldman Sachs (951) 90,729 Spirax-Sarco Engineering Plc Goldman Sachs 9,516 159,122 Spire Healthcare Group Plc Barclays Bank 17,426 42,671 Spire Healthcare Group Plc Goldman Sachs 6,503 76,645 Spire Healthcare Group Plc Morgan Stanley 5,393 (879,512) Sports Direct International Plc Barclays Bank (6,011) (388,220) Sports Direct International Plc Goldman Sachs (45,164) (219,567) SSE Plc Barclays Bank (20,116) (55,076) SSE Plc Goldman Sachs (16,964) 675,404 SSP Group Plc Barclays Bank 153,804 174,148 SSP Group Plc Goldman Sachs 16,486 43,350 SSP Group Plc Morgan Stanley 2,232 (333,972) St James's Place Plc Barclays Bank (282,351) (230,581) St James's Place Plc Goldman Sachs (179,873) 1,979 St James's Place Plc Barclays Bank 2,159 87,146 St James's Place Plc Goldman Sachs 67,981 34,011 St Modwen Properties Plc Barclays Bank 8,293 15,505 St Modwen Properties Plc Goldman Sachs 3,247 (957,723) Stagecoach Group Plc Barclays Bank (13,245) (1,215,325) Stagecoach Group Plc Goldman Sachs (156,481) (741,176) Standard Chartered Plc Goldman Sachs (241,514) 180,181 Standard Chartered Plc Barclays Bank 72,762 111,908 Standard Chartered Plc Goldman Sachs 28,507 (1,203,399) Standard Chartered Plc Barclays Bank 145,930 (683,008) Standard Life Investment
Property Income Trust Ltd Goldman Sachs 6,492 572,598 Standard Life Plc Barclays Bank 85,459 596,262 Standard Life Plc Goldman Sachs 153,141 16,429 Standard Life Plc Morgan Stanley 1,545 215,370 SuperGroup Plc Barclays Bank 476,314 195,601 SuperGroup Plc Goldman Sachs 71,805 54,919 SuperGroup Plc Morgan Stanley 21,689 (433,163) Synthomer Plc Barclays Bank (90,655) 19,707 TalkTalk Telecom Group Plc Barclays Bank 661 255,903 TalkTalk Telecom Group Plc Goldman Sachs 10,107 2,144 TalkTalk Telecom Group Plc Morgan Stanley 159 (96,069) TalkTalk Telecom Group Plc Barclays Bank 157 196,949 Taylor Wimpey Plc Goldman Sachs (10,418) (104,801) Ted Baker Plc Barclays Bank (59,083) (395,995) Telecom Plus Plc Barclays Bank (425,725) 269,375 Telit Communications Plc Barclays Bank 103,302 22,090 Telit Communications Plc Goldman Sachs 8,471 295,481 Telit Communications Plc Morgan Stanley 75,071 (1,173,400) Tesco Plc Goldman Sachs (15,968) (1,387,388) Tesco Plc Barclays Bank 14,158 1,999,289 Thomas Cook Group Plc Barclays Bank (299,765) 2,291,969 Thomas Cook Group Plc Goldman Sachs (312,886) (84,539) Thomas Cook Group Plc Goldman Sachs (578) (264,247) Travis Perkins Plc Barclays Bank (256,916) (198,359) Travis Perkins Plc Goldman Sachs (371,682) 736,770 Trinity Mirror Plc Barclays Bank 86,028 538,674 Trinity Mirror Plc Goldman Sachs 19,422 5,903 Trinity Mirror Plc Morgan Stanley 208 103,279 TUI AG Barclays Bank 42,711
106,533 TUI AG Goldman Sachs 20,389 37,255 TUI AG Morgan Stanley 8,232 (9,753) TUI AG Barclays Bank (3,817) (6,859) TUI AG Goldman Sachs (270) (230,957) Tullett Prebon Plc Goldman Sachs (19,682) 42,488 Tullow Oil Plc Barclays Bank (8,265) 66,764 Tullow Oil Plc Goldman Sachs (8,260) 88,418 Tullow Oil Plc Morgan Stanley (11,159) (8,256) Tullow Oil Plc Goldman Sachs 1,181 (1,491,655) UBM Plc Barclays Bank (362,553) (521,389) UBM Plc Goldman Sachs (148,185) (216,770) UDG Healthcare Plc Barclays Bank 27,866 (220,727) Ultra Electronics Holdings Plc Barclays Bank 82,236 (5,066) Ultra Electronics Holdings Plc Goldman Sachs 133 73,852 UNITE Group Plc/The Barclays Bank 27,111 (127,042) United Utilities Group Plc Barclays Bank (50,903) (150,948) United Utilities Group Plc Goldman Sachs (40,400) 498,497 United Utilities Group Plc Barclays Bank 210,132 292,276 United Utilities Group Plc Goldman Sachs 78,555 4,567 United Utilities Group Plc Morgan Stanley 3,420 (1,054,195) Vectura Group Plc Barclays Bank 109,188 431,237 Vedanta Resources Plc Barclays Bank (138,127) 148,076 Vedanta Resources Plc Goldman Sachs (11,168) 69,280 Vedanta Resources Plc Morgan Stanley (11,758) 2,777,404 Vertu Motors Plc Barclays Bank 17,739 2,280,670 Vertu Motors Plc Goldman Sachs 73,728 1,147,600 Vertu Motors Plc Morgan Stanley (201,322) (366,227) Vesuvius Plc Barclays Bank (130,529) 9,395 Victrex Plc Barclays Bank (338) 47,705 Victrex Plc Goldman Sachs (21,946) 5,960 Victrex Plc Morgan Stanley 1,972 120,449 Virgin Money Holdings UK Plc Barclays Bank 5,053 58,766 Virgin Money Holdings UK Plc Goldman Sachs 23,268 26,885 Virgin Money Holdings UK Plc Morgan Stanley 5,132 372,091 Vodafone Group Plc Barclays Bank 44,791 1,378,904 Vodafone Group Plc Goldman Sachs 150,051 26,932 Vodafone Group Plc Morgan Stanley 1,937 (2,782) Weir Group Plc/The Goldman Sachs (2,152) (281,177) Weir Group Plc/The Barclays Bank (250,832) 421,054 WH Smith Plc Barclays Bank 487,220 138,291 WH Smith Plc Goldman Sachs 158,670 3,041 WH Smith Plc Morgan Stanley 1,523 (72,224) Whitbread Plc Barclays Bank (45,098) (76,384) Whitbread Plc Goldman Sachs (174,031) (561,329) William Hill Plc Goldman Sachs (79,382) (2,025,129) William Hill Plc Barclays Bank (93,809) 68,743 Wizz Air Holdings Plc Barclays Bank 48,668 37,991 Wizz Air Holdings Plc Goldman Sachs 31,380 42,001 Wizz Air Holdings Plc Morgan Stanley 60,585 (1,738,224) Wm Morrison Supermarkets Plc Morgan Stanley
(187,192) (86,478) Wolseley Plc Barclays Bank (18,034) (11,218) Wolseley Plc Goldman Sachs (5,504) 36,136 Workspace Group Plc Morgan Stanley 37,981 364,098 Workspace Group Plc Barclays Bank 115,478 237,198 Workspace Group Plc Goldman Sachs 163,432 1,322,976 Worldpay Group Plc Barclays Bank 247,220 806,336 Worldpay Group Plc Goldman Sachs 161,746 10,127 WPP Plc Barclays Bank 2,227 57,743 WPP Plc Goldman Sachs 14,470 329,414 WS Atkins Plc Barclays Bank 81,348 158,152 WS Atkins Plc Goldman Sachs 35,249 16,686 WS Atkins Plc Morgan Stanley 2,235 84,746 Xaar Plc Barclays Bank (4,167) 26,809 Xaar Plc Goldman Sachs (8,348) 10,779 Xaar Plc Morgan Stanley 1,681 (62,293) Zoopla Property Group Plc Barclays Bank (29,136) (428,520) Zoopla Property Group Plc Goldman Sachs (185,822)
(4,014,008)
Total (Gross underlying exposure - EUR 5,655,628,476) (15,504,943)
BlackRock European Diversified Equity Absolute Return Fund continued
United Kingdom continued United Kingdom continued

Open forward foreign exchange transactions as at 31 May 2016
Currency Purchases Currency Sales CounterpartyMaturity
date
Unrealised appreciation/
(depreciation) EUR
194 BlackRock Strategic Funds (BSF)
The notes on pages 489 to 503 form an integral part of these financial statements.
CHF Hedged Share Class
CHF 9,041,624 EUR 8,163,265 State Street Bank & Trust Company 15/6/2016 15,888 EUR 369,573 CHF 409,742 State Street Bank & Trust Company 15/6/2016 (1,084)
14,804
GBP Hedged Share Class
EUR 375,008 GBP 290,081 State Street Bank & Trust Company 15/6/2016 (5,172)GBP 8,895,581 EUR 11,288,975 State Street Bank & Trust Company 15/6/2016 369,582
364,410
SEK Hedged Share Class
EUR 11,828,528 SEK 110,425,510 State Street Bank & Trust Company 15/6/2016 (67,305)SEK 3,872,799,909 EUR 417,974,616 State Street Bank & Trust Company 15/6/2016 (768,634)
(835,939)
USD Hedged Share Class
EUR 3,684,630 USD 4,143,118 State Street Bank & Trust Company 15/6/2016 (23,107)USD 52,700,260 EUR 46,345,728 State Street Bank & Trust Company 15/6/2016 816,511
793,404
Total (Gross underlying exposure - EUR 500,560,340) 336,679
BlackRock European Diversified Equity Absolute Return Fund continued
Sector Breakdown as at 31 May 2016
% of Net Assets
Financial 67.15Consumer, Non-cyclical 11.23Industrial 9.16Collective Investment Schemes 6.20Consumer, Cyclical 3.25
Securities portfolio at market value 96.99Other Net Assets 3.01
100.00

Annual Report and Audited Accounts 195
The notes on pages 489 to 503 form an integral part of these financial statements.
Transferable Securities and Money Market Instruments Admitted to an Official Stock Exchange Listing or Dealt in on Another Regulated Market
Transferable Securities and Money Market Instruments Admitted to an Official Stock Exchange Listing or Dealt in on Another Regulated Market
Holding
Description
Market Value
USD
% of Net
Assets
Holding
Description
Market Value
USD
% of Net
Assets
* Securities on loan, see Note 16, for further details.1 Investment in connected party fund, see further information in Note 10.
Portfolio of Investments as at 31 May 2016
COMMON STOCKS (SHARES) & WARRANTS
Belgium 227,615 KBC Groep NV 12,204,716 1.84 562,553 Kinepolis Group NV 23,140,618 3.50
35,345,334 5.34
Denmark 198,996 Ambu A/S 'B' 7,157,228 1.08 167,727 Carlsberg A/S 'B' 14,557,136 2.20 497,333 DSV A/S 20,294,702 3.07 103,778 Genmab A/S 16,799,970 2.54 738,113 Novo Nordisk A/S 'B' 36,789,353 5.57 180,835 Pandora A/S 24,204,742 3.66 443,802 Royal Unibrew A/S 18,253,470 2.76
138,056,601 20.88
France 259,423 Alten SA 14,984,273 2.27 121,253 Ipsen SA 6,887,170 1.04
21,871,443 3.31
Germany 50,385 Continental AG 9,741,940 1.47 142,068 SAP SE 10,373,805 1.57 178,390 Scout24 AG 6,047,421 0.92 147,444 SHW AG 4,182,986 0.63 973,220 Tele Columbus AG 8,404,728 1.27
38,750,880 5.86
Ireland 18,176,108 Bank of Ireland 5,016,606 0.76 401,986 CRH Plc 10,962,253 1.66 160,136 DCC Plc 13,268,800 2.01 3,092,341 Irish Continental Group Plc (Unit) 16,760,488 2.53
46,008,147 6.96
Italy 119,306 Ei Towers SpA 6,066,710 0.92 1,148,533 Intesa Sanpaolo SpA 2,682,973 0.41 894,882 Moleskine SpA 2,006,326 0.30
10,756,009 1.63
Luxembourg 568,256 Stabilus SA 27,526,321 4.16
27,526,321 4.16
Netherlands 74,530 ASML Holding NV 6,683,105 1.01 566,123 Beter Bed Holding NV 11,356,427 1.72 47,873 IMCD Group NV 1,780,158 0.27 35,972 Lucas Bols BV'144A' 630,769 0.09 381,027 TKH Group NV 13,309,273 2.01
33,759,732 5.10
Sweden 244,417 AddLife AB 2,777,639 0.42 782,138 AddTech AB 'B' 9,141,240 1.38 434,174 Alimak Group AB'144A' 3,905,191 0.59 1,328,394 Assa Abloy AB 'B' * 24,855,282 3.76 300,367 Avanza Bank Holding AB 10,968,416 1.66 531,295 Hexagon AB 'B' 18,577,027 2.81 878,796 Loomis AB 'B' 20,617,591 3.12 113,442 Nobia AB 1,066,182 0.16 953,844 Thule Group AB/The'144A' 13,202,995 2.00
105,111,563 15.90
Switzerland 101,165 Actelion Ltd Reg 14,905,555 2.25 97,482 Cie Financiere Richemont SA Reg 5,188,809 0.79 16,593 Helvetia Holding AG Reg 8,059,275 1.22 168,673 Julius Baer Group Ltd 6,756,908 1.02 49,515 Partners Group Holding AG 18,832,135 2.85 43,234 Schindler Holding AG 7,206,884 1.09 23,756 Schindler Holding AG Reg 3,970,745 0.60 3,189 Sika AG 12,405,684 1.88 46,045 Straumann Holding AG Reg 15,877,755 2.40 116,532 Tecan Group AG Reg 15,493,849 2.34 27,038 U-Blox AG 4,969,298 0.75 125,539 VAT Group AG'144A' 6,228,050 0.94
119,894,947 18.13
United Kingdom 266,356 SABMiller Plc 14,904,331 2.26 1,457,435 Shield Therapeutics Plc
(Wts 30/6/2017) 621,009 0.09 2,706,666 Shield Therapeutics Plc 6,298,811 0.95
21,824,151 3.30
Total Common Stocks (Shares) & Warrants 598,905,128 90.57
Total Transferable Securities and Money Market Instruments Admitted to an Official Stock Exchange Listing or Dealt in on Another Regulated Market 598,905,128 90.57
Collective Investment Schemes
Ireland 62,183,014 Institutional Cash Series Plc -
Institutional Euro Assets Liquidity Fund 1 62,183,014 9.40
62,183,014 9.40
Total Collective Investment Schemes 62,183,014 9.40
Securities portfolio at market value 661,088,142 99.97
Other Net Assets 175,851 0.03
Total Net Assets (EUR) 661,263,993 100.00
BlackRock European Opportunities Extension Fund

Contracts for difference as at 31 May 2016
Holding
Description Counterparty
Unrealised appreciation/
(depreciation) EUR
Holding
Description Counterparty
Unrealised appreciation/
(depreciation) EUR
196 BlackRock Strategic Funds (BSF)
The notes on pages 489 to 503 form an integral part of these financial statements.
BlackRock European Opportunities Extension Fund continued
Austria 186,490 Verbund AG Bank of America
Merrill Lynch (96,042)
(96,042)
Denmark 146,523 GN Store Nord A/S Barclays Bank (138,188)
(138,188)
Finland 129,500 Fortum OYJ Bank of America
Merrill Lynch (58,275) 68,354 Kesko OYJ Goldman Sachs (116,885)
(175,160)
France 685,521 Air France-KLM Barclays Bank 65,125 56,272 Airbus Group SE Bank of America
Merrill Lynch (53,779) 34,944 Alten SA Deutsche Bank (1,048) 116,451 Bourbon SA Deutsche Bank (69,871) 129,024 Capgemini SA Bank of America
Merrill Lynch 673,505 73,173 Gaztransport Et Technigaz SA Barclays Bank (4,673) 106,373 Korian SA Bank of America
Merrill Lynch (458,805) 189,140 Teleperformance Barclays Bank 2,547,974 85,446 Total SA JP Morgan (728,505) 236,509 Vinci SA Deutsche Bank 470,653 513,310 Worldline SA Deutsche Bank 680,136
3,120,712
Germany 33,708 Bayerische Motoren Werke AG Bank of America
Merrill Lynch (69,438) 139,634 Deutsche Bank AG Reg Bank of America
Merrill Lynch 1,400,201 404,314 Deutsche Lufthansa AG Reg Citibank (109,846) 199,252 Gerry Weber International AG Deutsche Bank (78,705) 570,149 Kontron AG Deutsche Bank (35,349) 36,563 Krones AG Barclays Bank (230,827) 109,518 Rocket Internet SE Deutsche Bank (58,044) 31,277 Siemens AG Bank of America
Merrill Lynch 75,355 77,804 Software AG Barclays Bank (137,640) 113,297 Zalando SE Citibank 301,702
1,057,409
Greece 68,857 FF Group Deutsche Bank (80,563)
(80,563)
Ireland 220,232 Kingspan Group Plc Bank of America
Merrill Lynch 1,681,472 68,060 Paddy Power Betfair Plc Deutsche Bank 473,017 770,792 Permanent TSB Group
Holdings Plc Morgan Stanley (223,530)
1,930,959
Italy 199,931 Assicurazioni Generali SpA Deutsche Bank (111,962) 1,762,224 Saras SpA Deutsche Bank (49,342)
(161,304)
Jersey 200,000 Shire Plc JP Morgan 121,068
121,068
Netherlands 223,533 Brunel International NV Barclays Bank 110,649 367,816 Fiat Chrysler Automobiles NV Goldman Sachs 259,076 95,004 Flow Traders JP Morgan 71,596 161,519 GrandVision NV JP Morgan (38,764) 13,198 SNS Reaa NV Deutsche Bank —
402,557
Norway 56,725 Norwegian Air Shuttle ASA Bank of America
Merrill Lynch 83,281
83,281
Spain 659,775 Banco Popular
Espanol SA (Right) Citibank (146,470) 659,775 Banco Popular Espanol SA Citibank 381,350 110,229 Bolsas y Mercados
Espanoles SHMSF SA Deutsche Bank (44,643) 793,070 Distribuidora Internacional
de Alimentacion SA Goldman Sachs (38,068) 300,297 Industria de Diseno Textil SA Bank of America
Merrill Lynch 708,701 417,311 International Consolidated
Airlines Group SA Goldman Sachs (25,489) 255,703 Repsol SA JP Morgan 769,077
1,604,458
Sweden 144,528 Atlas Copco AB Deutsche Bank (93,410) 225,442 Concentric AB Deutsche Bank (157,848) 372,352 Haldex AB Barclays Bank (431,176) 345,965 Hexpol AB Bank of America
Merrill Lynch 154,106 500,000 New Wave Group AB JP Morgan (173,466) 303,782 Telefonaktiebolaget LM
Ericsson 'B' JP Morgan 490,855
(210,939)
Switzerland 73,565 BB Biotech AG Reg JP Morgan 298,529 2,205 Galenica AG Citibank 54,051 9,911 Swatch Group AG/The Barclays Bank 739,735
1,092,315
United Kingdom 176,612 Ashtead Group Plc Bank of America
Merrill Lynch (233,866) 264,465 AstraZeneca Plc Bank of America
Merrill Lynch 464,621 2,500,000 Auto Trader Group Plc JP Morgan 1,165,008 243,310 British American Tobacco Plc Bank of America
Merrill Lynch 697,862 126,139 Bunzl Plc Bank of America
Merrill Lynch 87,572 567,106 Carillion Plc JP Morgan 527,152 1,151,276 Centrica Plc JP Morgan 214,754 1,129,659 Cobham Plc Bank of America
Merrill Lynch 7,405 197,487 CRH Plc Deutsche Bank 126,870 81,435 Croda International Plc Bank of America
Merrill Lynch 158,750

Contracts for difference as at 31 May 2016
Holding
Description Counterparty
Unrealised appreciation/
(depreciation) EUR
Holding
Description Counterparty
Unrealised appreciation/
(depreciation) EUR
Annual Report and Audited Accounts 197
The notes on pages 489 to 503 form an integral part of these financial statements.
BlackRock European Opportunities Extension Fund continued
66,459 DCC Plc Bank of America Merrill Lynch 1,083,370
314,886 Dialight Plc Deutsche Bank 109,402 618,901 Domino's Pizza Group Plc Barclays Bank 2,702,035 186,813 easyJet Plc Bank of America
Merrill Lynch (244,925) 1,221,372 Elementis Plc Barclays Bank (9,608) 2,327,472 Firstgroup Plc Barclays Bank (331,472) 170,725 GlaxoSmithKline Plc Bank of America
Merrill Lynch 19,026 663,444 Hargreaves Lansdown Plc Deutsche Bank 626,271 165,996 Imperial Brands Plc Bank of America
Merrill Lynch 22,851 138,304 Inmarsat Plc Bank of America
Merrill Lynch 284,695 637,286 J Sainsbury Plc Bank of America
Merrill Lynch (96,503) 550,192 Laird Plc JP Morgan 45,837 15,794,878 Lloyds Banking Group Plc Deutsche Bank 1,172,083 488,690 London Stock Exchange
Group Plc JP Morgan 1,550,091 1,195,956 Marston's Plc Deutsche Bank (139,550) 153,637 McBride Plc 'B' JP Morgan — 567,462 Meggitt Plc Citibank 100,438 502,821 Melrose Industries Plc Deutsche Bank (68,560) 472,800 Mitie Group Plc Barclays Bank 55,090 823,219 N Brown Group Plc Barclays Bank (185,639) 587,918 Ocado Group Plc JP Morgan (6,166) 292,113 Pearson Plc Bank of America
Merrill Lynch (126,384)
261,972 Petrofac Ltd Barclays Bank (54,685) 185,169 Polski Koncern Naftowy
Orlen SA Deutsche Bank (22,956) 96,536 Renishaw Plc Barclays Bank 76,758 154,240 Rightmove Plc Bank of America
Merrill Lynch 560,147 265,278 Royal Dutch Shell Plc 'A' JP Morgan 579,479 1,040,741 Ryanair Holdings Plc Deutsche Bank 1,030,334 2,106,919 Senior Plc Deutsche Bank 325,953 91,829 Sepura Plc JP Morgan 82,676 7,397,744 Serco Group Plc Bank of America
Merrill Lynch 2,211,017 1,042,568 TalkTalk Telecom Group Plc Barclays Bank 167,535 3,036,591 Tesco Plc Deutsche Bank (55,737) 895,219 UNITE Group Plc/The Barclays Bank 1,007,561 4,586,499 Vodafone Group Plc Barclays Bank 499,097 265,442 Weir Group Plc/The JP Morgan 20,067 1,296,971 Wm Morrison Supermarkets Plc Morgan Stanley 55,766
16,261,522
United States 38,922 Royal Caribbean Cruises Ltd Bank of America
Merrill Lynch (41,119)
(41,119)
Total (Gross underlying exposure - EUR 474,621,860) 24,770,966
United Kingdom continued United Kingdom continued

Open forward foreign exchange transactions as at 31 May 2016
Currency Purchases Currency Sales CounterpartyMaturity
date
Unrealised appreciation/
(depreciation) EUR
198 BlackRock Strategic Funds (BSF)
The notes on pages 489 to 503 form an integral part of these financial statements.
Sector Breakdown as at 31 May 2016
% of Net Assets
Consumer, Non-cyclical 29.02Industrial 25.10Consumer, Cyclical 15.61Financial 9.76Collective Investment Schemes 9.40Technology 4.85Communications 2.59Energy 2.01 1.36Basic Materials 0.27
Securities portfolio at market value 99.97Other Net Assets 0.03
100.00
BlackRock European Opportunities Extension Fund continued
EUR 21,407,844 CHF 23,682,385 State Street Bank & Trust Company 17/6/2016 (16,095)GBP 114,418,803 EUR 145,311,248 State Street Bank & Trust Company 17/6/2016 4,637,231 NOK 56,112,980 EUR 6,066,773 State Street Bank & Trust Company 17/6/2016 (56,768)
Total (Gross underlying exposure - EUR 177,382,424) 4,564,368
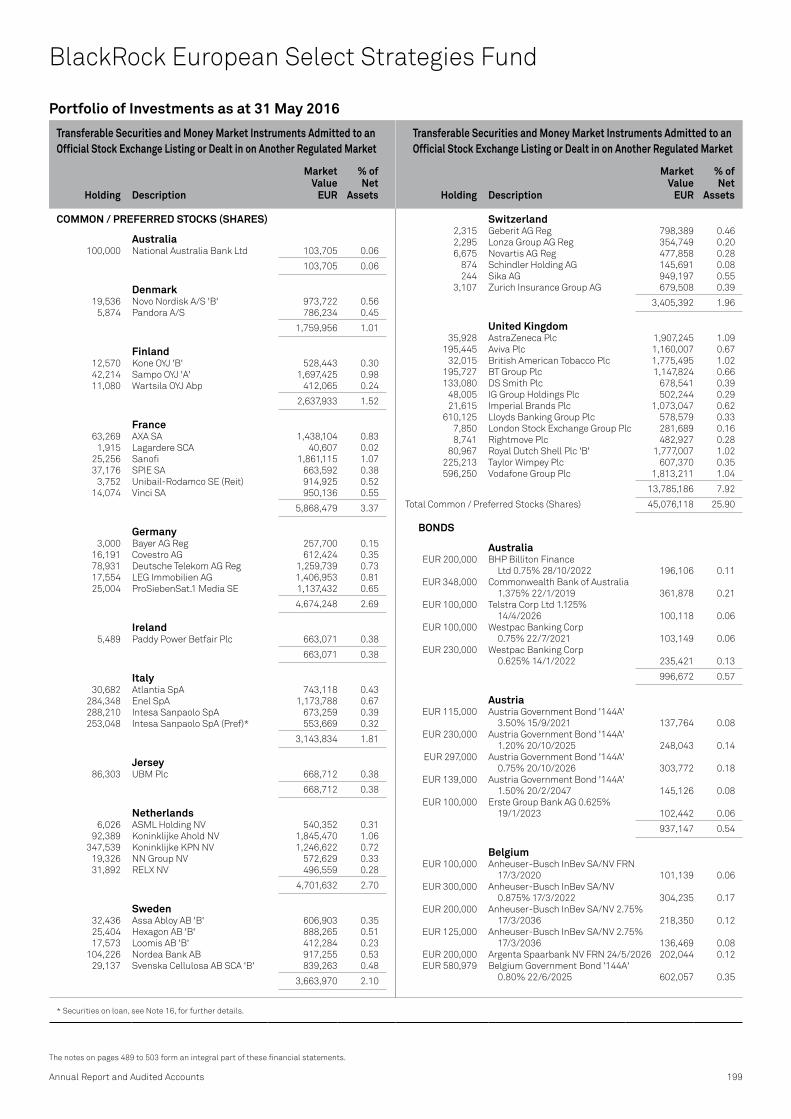
Annual Report and Audited Accounts 199
The notes on pages 489 to 503 form an integral part of these financial statements.
Transferable Securities and Money Market Instruments Admitted to an Official Stock Exchange Listing or Dealt in on Another Regulated Market
Transferable Securities and Money Market Instruments Admitted to an Official Stock Exchange Listing or Dealt in on Another Regulated Market
Holding
Description
Market Value
EUR
% of Net
Assets
Holding
Description
Market Value
EUR
% of Net
Assets
* Securities on loan, see Note 16, for further details.
Portfolio of Investments as at 31 May 2016
COMMON / PREFERRED STOCKS (SHARES)
Australia 100,000 National Australia Bank Ltd 103,705 0.06
103,705 0.06
Denmark 19,536 Novo Nordisk A/S 'B' 973,722 0.56 5,874 Pandora A/S 786,234 0.45
1,759,956 1.01
Finland 12,570 Kone OYJ 'B' 528,443 0.30 42,214 Sampo OYJ 'A' 1,697,425 0.98 11,080 Wartsila OYJ Abp 412,065 0.24
2,637,933 1.52
France 63,269 AXA SA 1,438,104 0.83 1,915 Lagardere SCA 40,607 0.02 25,256 Sanofi 1,861,115 1.07 37,176 SPIE SA 663,592 0.38 3,752 Unibail-Rodamco SE (Reit) 914,925 0.52 14,074 Vinci SA 950,136 0.55
5,868,479 3.37
Germany 3,000 Bayer AG Reg 257,700 0.15 16,191 Covestro AG 612,424 0.35 78,931 Deutsche Telekom AG Reg 1,259,739 0.73 17,554 LEG Immobilien AG 1,406,953 0.81 25,004 ProSiebenSat.1 Media SE 1,137,432 0.65
4,674,248 2.69
Ireland 5,489 Paddy Power Betfair Plc 663,071 0.38
663,071 0.38
Italy 30,682 Atlantia SpA 743,118 0.43 284,348 Enel SpA 1,173,788 0.67 288,210 Intesa Sanpaolo SpA 673,259 0.39 253,048 Intesa Sanpaolo SpA (Pref)* 553,669 0.32
3,143,834 1.81
Jersey 86,303 UBM Plc 668,712 0.38
668,712 0.38
Netherlands 6,026 ASML Holding NV 540,352 0.31 92,389 Koninklijke Ahold NV 1,845,470 1.06 347,539 Koninklijke KPN NV 1,246,622 0.72 19,326 NN Group NV 572,629 0.33 31,892 RELX NV 496,559 0.28
4,701,632 2.70
Sweden 32,436 Assa Abloy AB 'B' 606,903 0.35 25,404 Hexagon AB 'B' 888,265 0.51 17,573 Loomis AB 'B' 412,284 0.23 104,226 Nordea Bank AB 917,255 0.53 29,137 Svenska Cellulosa AB SCA 'B' 839,263 0.48
3,663,970 2.10
Switzerland 2,315 Geberit AG Reg 798,389 0.46 2,295 Lonza Group AG Reg 354,749 0.20 6,675 Novartis AG Reg 477,858 0.28 874 Schindler Holding AG 145,691 0.08 244 Sika AG 949,197 0.55 3,107 Zurich Insurance Group AG 679,508 0.39
3,405,392 1.96
United Kingdom 35,928 AstraZeneca Plc 1,907,245 1.09 195,445 Aviva Plc 1,160,007 0.67 32,015 British American Tobacco Plc 1,775,495 1.02 195,727 BT Group Plc 1,147,824 0.66 133,080 DS Smith Plc 678,541 0.39 48,005 IG Group Holdings Plc 502,244 0.29 21,615 Imperial Brands Plc 1,073,047 0.62 610,125 Lloyds Banking Group Plc 578,579 0.33 7,850 London Stock Exchange Group Plc 281,689 0.16 8,741 Rightmove Plc 482,927 0.28 80,967 Royal Dutch Shell Plc 'B' 1,777,007 1.02 225,213 Taylor Wimpey Plc 607,370 0.35 596,250 Vodafone Group Plc 1,813,211 1.04
13,785,186 7.92
Total Common / Preferred Stocks (Shares) 45,076,118 25.90
BONDS
Australia EUR 200,000 BHP Billiton Finance
Ltd 0.75% 28/10/2022 196,106 0.11 EUR 348,000 Commonwealth Bank of Australia
1.375% 22/1/2019 361,878 0.21 EUR 100,000 Telstra Corp Ltd 1.125%
14/4/2026 100,118 0.06 EUR 100,000 Westpac Banking Corp
0.75% 22/7/2021 103,149 0.06 EUR 230,000 Westpac Banking Corp
0.625% 14/1/2022 235,421 0.13
996,672 0.57
Austria EUR 115,000 Austria Government Bond '144A'
3.50% 15/9/2021 137,764 0.08 EUR 230,000 Austria Government Bond '144A'
1.20% 20/10/2025 248,043 0.14 EUR 297,000 Austria Government Bond '144A'
0.75% 20/10/2026 303,772 0.18 EUR 139,000 Austria Government Bond '144A'
1.50% 20/2/2047 145,126 0.08 EUR 100,000 Erste Group Bank AG 0.625%
19/1/2023 102,442 0.06
937,147 0.54
Belgium EUR 100,000 Anheuser-Busch InBev SA/NV FRN
17/3/2020 101,139 0.06 EUR 300,000 Anheuser-Busch InBev SA/NV
0.875% 17/3/2022 304,235 0.17 EUR 200,000 Anheuser-Busch InBev SA/NV 2.75%
17/3/2036 218,350 0.12 EUR 125,000 Anheuser-Busch InBev SA/NV 2.75%
17/3/2036 136,469 0.08 EUR 200,000 Argenta Spaarbank NV FRN 24/5/2026 202,044 0.12 EUR 580,979 Belgium Government Bond '144A'
0.80% 22/6/2025 602,057 0.35
BlackRock European Select Strategies Fund

200 BlackRock Strategic Funds (BSF)
The notes on pages 489 to 503 form an integral part of these financial statements.
Transferable Securities and Money Market Instruments Admitted to an Official Stock Exchange Listing or Dealt in on Another Regulated Market
Transferable Securities and Money Market Instruments Admitted to an Official Stock Exchange Listing or Dealt in on Another Regulated Market
Holding
Description
Market Value
EUR
% of Net
Assets
Holding
Description
Market Value
EUR
% of Net
Assets
BlackRock European Select Strategies Fund continued
EUR 205,000 Belgium Government Bond '144A' 1.90% 22/6/2038 227,478 0.13
EUR 181,000 Belgium Government Bond 3.75% 22/6/2045 279,567 0.16
EUR 72,000 Belgium Government Bond '144A' 1.60% 22/6/2047 72,523 0.04
EUR 435,000 Belgium Government Bond '144A' 2.15% 22/6/2066 460,504 0.26
EUR 400,000 KBC Bank NV 0.375% 1/9/2022 405,064 0.23 EUR 100,000 KBC Groep NV FRN (Perpetual) 96,964 0.06 EUR 100,000 Solvay SA 1.625% 2/12/2022 104,324 0.06
3,210,718 1.84
Canada EUR 205,000 Province of Quebec Canada 0.875%
15/1/2025 209,436 0.12 EUR 125,000 Toronto-Dominion Bank/The 0.375%
27/4/2023 125,557 0.07 EUR 125,000 Toronto-Dominion Bank/The 0.375%
12/1/2021 126,875 0.08
461,868 0.27
Cyprus EUR 104,000 Cyprus Government International
Bond 3.875% 6/5/2022 106,922 0.06 EUR 37,000 Cyprus Government International
Bond 4.25% 4/11/2025 38,654 0.02
145,576 0.08
Denmark EUR 125,000 Danica Pension
Livsforsikringsaktieselskab FRN 29/9/2045 126,149 0.07
GBP 100,000 Danske Bank A/S FRN 29/9/2021 136,491 0.08 EUR 100,000 Danske Bank A/S 0.125% 9/3/2021 100,510 0.06 EUR 250,000 Danske Bank A/S 0.50% 6/5/2021 250,300 0.14 DKK 1,090,000 Denmark Government Bond 4.00%
15/11/2019 168,686 0.10 DKK 3,695,000 Denmark Government Bond 3.00%
15/11/2021 581,472 0.33 DKK 239,000 Denmark Government Bond 1.75%
15/11/2025 36,109 0.02 DKK 1,667,000 Denmark Government Bond 1.75%
15/11/2025 251,858 0.14 DKK 289,000 Denmark Government Bond 4.50%
15/11/2039 67,697 0.04 DKK 1,039,898 Nordea Kredit Realkreditaktieselskab
2.00% 1/10/2047 131,640 0.08 DKK 3,100,000 Nykredit Realkredit A/S 1.00%
1/1/2021 429,646 0.25 DKK 2,900,000 Realkredit Danmark A/S 1.00%
1/1/2021 401,837 0.23
2,682,395 1.54
Finland EUR 133,000 Finland Government Bond '144A'
1.50% 15/4/2023 146,639 0.08 EUR 290,000 Finland Government Bond '144A'
0.875% 15/9/2025 303,511 0.17 EUR 260,000 Finland Government Bond RegS
'144A' 1.625% 15/9/2022 287,625 0.17 EUR 73,000 Finland Government Bond RegS
'144A' 2.625% 4/7/2042 99,283 0.06 EUR 100,000 OP Corporate Bank Plc 1.125%
17/6/2019 102,963 0.06
940,021 0.54
France EUR 400,000 Agence Francaise de
Developpement 0.50% 25/10/2022 409,208 0.24 EUR 300,000 Agence France Locale 0.25%
20/3/2023 298,482 0.17 EUR 300,000 Air Liquide Finance SA 0.375%
18/4/2022 299,583 0.17 EUR 200,000 Autoroutes du Sud de la France SA
1.00% 13/5/2026 198,182 0.11 EUR 50,000 AXA SA FRN 16/4/2040 55,306 0.03 EUR 600,000 Banque Federative du Credit Mutuel
SA FRN 3/6/2020 600,612 0.35 EUR 200,000 Banque Federative du Credit Mutuel
SA 1.625% 19/1/2026 210,318 0.12 EUR 100,000 Banque Federative du Credit Mutuel
SA 2.375% 24/3/2026 99,481 0.06 EUR 500,000 BNP Paribas SA 1.125% 15/1/2023 509,952 0.29 EUR 300,000 BNP Paribas SA 2.875% 1/10/2026 303,825 0.17 EUR 100,000 BPCE SA 1.375% 22/5/2019 103,552 0.06 EUR 200,000 BPCE SA 2.875% 22/4/2026 201,294 0.12 EUR 400,000 BPCE SFH SA 1.50% 30/1/2020 423,980 0.24 EUR 200,000 BPCE SFH SA 1.75% 27/6/2024 222,178 0.13 EUR 400,000 Caisse Francaise de Financement
Local 0.375% 16/9/2019 407,044 0.23 EUR 200,000 Capgemini SA 2.50% 1/7/2023 217,883 0.13 EUR 100,000 Cars Alliance Auto Loans Germany V
'2016-G1V A' FRN 18/5/2027 100,142 0.06 EUR 100,000 Casino Guichard Perrachon SA
3.157% 6/8/2019 108,052 0.06 EUR 100,000 Casino Guichard Perrachon SA
2.798% 5/8/2026 99,509 0.06 EUR 300,000 Cie de Financement Foncier SA
0.25% 16/3/2022 302,538 0.17 EUR 400,000 Cie de Financement Foncier SA
0.125% 18/2/2020 403,322 0.23 EUR 300,000 Cie de Financement Foncier SA
0.625% 10/2/2023 308,139 0.18 EUR 600,000 Cie de Financement Foncier SA
0.50% 4/9/2024 604,194 0.35 EUR 325,000 Credit Agricole Home Loan SFH SA
0.625% 11/9/2023 334,324 0.19 EUR 100,000 Credit Agricole SA/London
0.875% 19/1/2022 101,227 0.06 EUR 300,000 Credit Agricole SA/London 0.75%
1/12/2022 299,038 0.17 EUR 200,000 Credit Agricole SA/London 1.25%
14/4/2026 199,652 0.11 EUR 500,000 Credit Mutuel - CIC Home Loan SFH
1.125% 6/2/2019 517,620 0.30 EUR 100,000 Credit Mutuel Arkea SA 3.25%
1/6/2026 101,964 0.06 GBP 200,000 Dexia Credit Local SA 1.875%
17/7/2017 264,364 0.15 GBP 200,000 Dexia Credit Local SA 2.00%
17/6/2020 267,275 0.15 EUR 200,000 Dexia Credit Local SA 0.20% 16/3/2021 200,570 0.12 EUR 100,000 Dexia Credit Local SA 0.625%
21/1/2022 102,155 0.06 EUR 600,000 Dexia Credit Local SA 0.75%
25/1/2023 613,842 0.35 EUR 100,000 Engie SA 0.50% 13/3/2022 99,999 0.06 EUR 1,116,000 France Government Bond OAT 1.00%
25/5/2018 1,147,890 0.66 EUR 1,500,000 France Government Bond OAT 1.00%
25/5/2019 1,562,175 0.90 EUR 43,000 France Government Bond OAT 1.75%
25/5/2023 48,124 0.03 EUR 1,035,000 France Government Bond OAT 0.50%
25/5/2025 1,048,170 0.60
Portfolio of Investments as at 31 May 2016
Belgium continued

Annual Report and Audited Accounts 201
The notes on pages 489 to 503 form an integral part of these financial statements.
Transferable Securities and Money Market Instruments Admitted to an Official Stock Exchange Listing or Dealt in on Another Regulated Market
Transferable Securities and Money Market Instruments Admitted to an Official Stock Exchange Listing or Dealt in on Another Regulated Market
Holding
Description
Market Value
EUR
% of Net
Assets
Holding
Description
Market Value
EUR
% of Net
Assets
Portfolio of Investments as at 31 May 2016
EUR 554,000 France Government Bond OAT 3.50% 25/4/2026 717,469 0.41
EUR 581,000 France Government Bond OAT 0.50% 25/5/2026 580,550 0.33
EUR 262,000 France Government Bond OAT 5.75% 25/10/2032 452,657 0.26
EUR 137,000 France Government Bond OAT 4.75% 25/4/2035 221,737 0.13
EUR 453,270 France Government Bond OAT '144A' 1.25% 25/5/2036 452,635 0.26
EUR 1,601,603 France Government Bond OAT 3.25% 25/5/2045 2,271,674 1.30
EUR 39,000 France Government Bond OAT 4.00% 25/4/2060 66,352 0.04
EUR 322,000 France Government Bond OAT '144A' 1.75% 25/5/2066 312,941 0.18
EUR 100,000 Klepierre 1.875% 19/2/2026 105,742 0.06 EUR 100,000 La Banque Postale SA FRN 19/11/2027 101,758 0.06 EUR 100,000 Lafarge SA 4.75% 30/9/2020 118,424 0.07 EUR 100,000 Orange SA 1.00% 12/5/2025 99,474 0.06 EUR 200,000 Orange SA FRN 29/10/2049 204,250 0.12 GBP 50,000 RCI Banque SA 3.00% 9/5/2019 67,720 0.04 EUR 200,000 RTE Reseau de Transport d'Electricite
SA 1.625% 27/11/2025 207,912 0.12 EUR 200,000 RTE Reseau de Transport d'Electricite
SA 1.00% 19/10/2026 194,527 0.11 EUR 200,000 RTE Reseau de Transport d'Electricite
SA 2.00% 18/4/2036 194,381 0.11 EUR 100,000 SANEF SA 1.875% 16/3/2026 106,793 0.06 EUR 200,000 Societe Generale SA 0.75% 25/11/2020 203,588 0.12 EUR 200,000 Societe Generale SA 0.75% 26/5/2023 198,604 0.11 EUR 500,000 Suez 1.25% 19/5/2028 493,990 0.28 EUR 200,000 Total SA FRN (Perpetual) 192,654 0.11
20,960,997 12.04
Germany EUR 200,000 Allianz SE FRN 7/7/2045 188,696 0.11 GBP 100,000 BASF SE 1.375% 15/12/2017 132,081 0.08 EUR 150,000 Bayer AG FRN 1/7/2075 148,602 0.08 EUR 620,000 Bundesobligation 9/4/2021
(Zero Coupon) 630,726 0.36 EUR 2,494,000 Bundesrepublik Deutschland 2.50%
4/1/2021 2,829,455 1.62 EUR 434,000 Bundesrepublik Deutschland 2.00%
15/8/2023 502,238 0.29 EUR 2,098,000 Bundesrepublik Deutschland 0.50%
15/2/2025 2,184,207 1.25 EUR 1,329,000 Bundesrepublik Deutschland 0.50%
15/2/2026 1,370,930 0.79 EUR 30,296 Bundesrepublik Deutschland
5.50% 4/1/2031 51,886 0.03 EUR 1,000 Bundesrepublik Deutschland
4.75% 4/7/2040 1,869 0.00 EUR 32,000 Bundesrepublik Deutschland
2.50% 15/8/2046 45,662 0.03 EUR 2,180,000 Bundesschatzanweisungen
16/3/2018 (Zero Coupon) 2,199,620 1.26 EUR 200,000 Covestro AG 1.75% 25/9/2024 206,374 0.12 GBP 200,000 Daimler AG 1.75% 8/11/2017 263,926 0.15 EUR 100,000 Daimler AG 1.40% 12/1/2024 103,342 0.06 GBP 300,000 FMS Wertmanagement AoeR 1.00%
10/4/2018 394,601 0.23 GBP 300,000 FMS Wertmanagement AoeR 1.25%
8/3/2019 396,739 0.23 EUR 200,000 FMS Wertmanagement AoeR 0.05%
6/7/2021 201,696 0.12 EUR 200,000 FMS Wertmanagement AoeR 3.00%
8/9/2021 232,843 0.13
EUR 95,000 Gemeinsame Deutsche Bundeslaender 1.75% 13/6/2022 104,828 0.06
EUR 317,000 KFW 0.625% 15/1/2025 329,147 0.19 EUR 271,000 KFW 0.375% 23/4/2030 258,094 0.15 EUR 100,000 Landesbank Baden-Wuerttemberg
FRN 27/5/2026 100,465 0.06 EUR 225,000 Landesbank Baden-Wuerttemberg
0.05% 11/11/2021 225,810 0.13 EUR 90,000 NRW Bank 0.875% 10/11/2025 93,825 0.05 EUR 400,000 State of Baden-Wurttemberg 0.625%
9/2/2027 403,872 0.23 EUR 85,000 State of Berlin 0.50% 10/2/2025 85,970 0.05 EUR 100,000 State of Bremen 0.50% 7/10/2022 102,573 0.06 EUR 85,000 State of North Rhine-Westphalia
0.625% 17/11/2023 87,590 0.05 EUR 142,000 State of North Rhine-Westphalia
1.25% 14/3/2025 152,638 0.09 EUR 10,000 State of North Rhine-Westphalia
1.625% 24/10/2030 10,903 0.01 EUR 60,000 State of North Rhine-Westphalia
1.25% 12/5/2036 60,245 0.03
14,101,453 8.10
Ireland EUR 100,000 ESB Finance Ltd 2.125% 8/6/2027 108,398 0.06 EUR 89,925 German Residential Funding 2013-2
Ltd '1 D' FRN 27/8/2024 91,067 0.05 EUR 86,777 German Residential Funding 2013-2
Ltd '2 D' FRN 27/11/2024 87,523 0.05 EUR 1,033,147 Ireland Government Bond 4.50%
18/4/2020 1,219,268 0.70 EUR 679,000 Ireland Government Bond 5.00%
18/10/2020 829,959 0.48 EUR 220,878 Ireland Government Bond 5.40%
13/3/2025 308,953 0.18 EUR 751,605 Ireland Government Bond 1.00%
15/5/2026 766,656 0.44 EUR 137,000 Ireland Government Bond 2.40%
15/5/2030 157,827 0.09 EUR 227,202 Ireland Government Bond 2.00%
18/2/2045 239,284 0.14 EUR 100,000 Taurus Ltd '2015-2 DEU E' FRN
1/2/2026 96,700 0.05
3,905,635 2.24
Italy EUR 100,000 Autostrade per l'Italia SpA
1.125% 4/11/2021 102,610 0.06 EUR 250,000 Autostrade per l'Italia SpA
1.625% 12/6/2023 260,200 0.15 EUR 300,000 Banca Monte dei Paschi di Siena
SpA 1.25% 20/1/2022 306,009 0.18 EUR 150,000 Banca Monte dei Paschi di Siena
SpA 2.125% 26/11/2025 158,020 0.09 EUR 100,000 Buzzi Unicem SpA 2.125% 28/4/2023 100,225 0.06 EUR 200,000 Enel SpA FRN 15/1/2075 211,104 0.12 EUR 1,878,695 Italy Buoni Poliennali Del Tesoro
2.25% 22/4/2017 1,917,819 1.10 EUR 567,352 Italy Buoni Poliennali Del Tesoro
2.15% 12/11/2017 584,588 0.34 EUR 119,000 Italy Buoni Poliennali Del Tesoro
0.75% 15/1/2018 120,589 0.07 EUR 148,369 Italy Buoni Poliennali Del Tesoro
1.70% 15/9/2018 155,698 0.09 EUR 1,200,000 Italy Buoni Poliennali Del Tesoro
0.30% 15/10/2018 1,209,000 0.69 EUR 500,000 Italy Buoni Poliennali Del Tesoro
2.50% 1/5/2019 535,625 0.31
BlackRock European Select Strategies Fund continued
Germany continued France continued

202 BlackRock Strategic Funds (BSF)
The notes on pages 489 to 503 form an integral part of these financial statements.
Transferable Securities and Money Market Instruments Admitted to an Official Stock Exchange Listing or Dealt in on Another Regulated Market
Transferable Securities and Money Market Instruments Admitted to an Official Stock Exchange Listing or Dealt in on Another Regulated Market
Holding
Description
Market Value
EUR
% of Net
Assets
Holding
Description
Market Value
EUR
% of Net
Assets
BlackRock European Select Strategies Fund continued
EUR 693,305 Italy Buoni Poliennali Del Tesoro 1.65% 23/4/2020 733,153 0.42
EUR 113,000 Italy Buoni Poliennali Del Tesoro 0.70% 1/5/2020 115,192 0.07
EUR 781,000 Italy Buoni Poliennali Del Tesoro 3.75% 1/5/2021 907,038 0.52
EUR 100,000 Italy Buoni Poliennali Del Tesoro 4.50% 1/5/2023 124,477 0.07
EUR 839,000 Italy Buoni Poliennali Del Tesoro 3.75% 1/9/2024 1,007,828 0.58
EUR 1,465,850 Italy Buoni Poliennali Del Tesoro '144A' 2.35% 15/9/2024 1,688,176 0.97
EUR 570,000 Italy Buoni Poliennali Del Tesoro '144A' 5.00% 1/3/2025 746,572 0.43
EUR 951,000 Italy Buoni Poliennali Del Tesoro 1.60% 1/6/2026 963,720 0.55
EUR 875,611 Italy Buoni Poliennali Del Tesoro 3.10% 15/9/2026 1,087,132 0.62
EUR 802,818 Italy Buoni Poliennali Del Tesoro '144A' 1.25% 15/9/2032 840,109 0.48
EUR 24,000 Italy Buoni Poliennali Del Tesoro '144A' 2.25% 1/9/2036 24,130 0.01
EUR 283,112 Italy Buoni Poliennali Del Tesoro 2.55% 15/9/2041 361,824 0.21
EUR 530,000 Italy Buoni Poliennali Del Tesoro '144A' 4.75% 1/9/2044 769,692 0.44
EUR 297,000 Italy Buoni Poliennali Del Tesoro '144A' 3.25% 1/9/2046 342,137 0.20
EUR 989,000 Italy Buoni Poliennali Del Tesoro '144A' 2.70% 1/3/2047 1,019,214 0.59
EUR 38,672 SIENA PMI Srl '2015-1 A1B' FRN 5/11/2055 38,695 0.02
EUR 400,000 Snam SpA 3.875% 19/3/2018 426,650 0.24 EUR 350,000 UniCredit SpA 2.00% 4/3/2023 359,530 0.21 EUR 200,000 UniCredit SpA FRN 28/10/2025 213,630 0.12 EUR 100,000 UniCredit SpA FRN 3/1/2027 100,029 0.06
17,530,415 10.07
Luxembourg EUR 77,648 Compartment VCL 22 'A' FRN
21/8/2021 77,807 0.04 EUR 100,000 DH Europe Finance SA 1.70%
4/1/2022 105,557 0.06 EUR 200,000 DH Europe Finance SA 2.50%
8/7/2025 222,375 0.13 EUR 1,370,000 European Financial Stability
Facility 0.40% 31/5/2026 1,361,081 0.78 EUR 35,000 European Financial Stability
Facility 2.35% 29/7/2044 43,938 0.02 EUR 100,000 European Financial Stability
Facility 1.20% 17/2/2045 96,739 0.06 EUR 325,000 Holcim Finance Luxembourg SA
1.375% 26/5/2023 328,946 0.19
2,236,443 1.28
Mexico EUR 100,000 America Movil SAB de CV
1.50% 10/3/2024 100,230 0.06 EUR 100,000 Petroleos Mexicanos 3.75%
15/3/2019 103,500 0.06
203,730 0.12
Netherlands GBP 200,000 ABN AMRO Bank NV 2.375%
7/12/2021 268,592 0.15 EUR 225,000 ABN AMRO Bank NV 0.625%
31/5/2022 225,677 0.13 EUR 100,000 ABN AMRO Bank NV FRN
30/6/2025 103,364 0.06
EUR 100,000 ABN AMRO Bank NV FRN 18/1/2028 102,976 0.06
EUR 100,000 ABN AMRO Bank NV 1.50% 30/9/2030 106,905 0.06
EUR 200,000 ABN AMRO Bank NV 1.00% 13/4/2031 198,404 0.11
EUR 700,000 Airbus Group Finance BV 0.875% 13/5/2026 692,580 0.40
EUR 150,000 Akzo Nobel NV 1.125% 8/4/2026 148,902 0.08 EUR 100,000 ASML Holding NV 3.375% 19/9/2023 115,544 0.07 GBP 100,000 Cooperatieve Centrale Raiffeisen-
Boerenleenbank BA/Netherlands 2.25% 23/3/2022 133,038 0.08
GBP 100,000 Cooperatieve Centrale Raiffeisen-Boerenleenbank BA/Netherlands 4.625% 23/5/2029 137,395 0.08
EUR 175,000 Cooperatieve Centrale Raiffeisen-Boerenleenbank BA/Netherlands 1.25% 23/3/2026 175,429 0.10
EUR 100,000 CRH Finance BV 5.00% 25/1/2019 112,602 0.06 EUR 500,000 Deutsche Telekom International
Finance BV 0.625% 3/4/2023 498,865 0.29 EUR 100,000 Enel Finance International NV
4.125% 12/7/2017 104,556 0.06 EUR 150,000 Enel Finance International NV
1.966% 27/1/2025 159,870 0.09 EUR 100,000 Enexis Holding NV 0.875% 28/4/2026 98,820 0.06 EUR 200,000 Gas Natural Fenosa Finance BV FRN
(Perpetual) 179,576 0.10 EUR 100,000 Heineken NV 1.00% 4/5/2026 97,614 0.06 EUR 100,000 ING Bank NV 0.75% 22/2/2021 101,677 0.06 EUR 325,000 Nederlandse Gasunie NV 1.00%
11/5/2026 325,159 0.19 EUR 100,000 Nederlandse Waterschapsbank NV
0.50% 29/4/2030 93,801 0.05 EUR 412,000 Netherlands Government Bond
'144A' 2.00% 15/7/2024 475,036 0.27 EUR 267,817 Netherlands Government Bond
'144A' 0.25% 15/7/2025 267,702 0.15 EUR 1,544,000 Netherlands Government Bond
'144A' 0.50% 15/7/2026 1,562,127 0.90 EUR 44,729 Netherlands Government Bond
'144A' 2.75% 15/1/2047 65,118 0.04 EUR 200,000 NN Group NV 1.00% 18/3/2022 203,676 0.12 EUR 100,000 NN Group NV FRN 8/4/2044 104,952 0.06 USD 40,000 Petrobras Global Finance BV 8.375%
23/5/2021 35,633 0.02 USD 85,000 Petrobras Global Finance BV 8.75%
23/5/2026 72,790 0.04 EUR 200,000 SNS Bank NV FRN 5/11/2025 201,721 0.12 EUR 125,000 Unilever NV 29/4/2020 (Zero Coupon) 124,824 0.07 EUR 350,000 Unilever NV 0.50% 29/4/2024 345,198 0.20 EUR 100,000 Volkswagen International Finance
NV FRN (Perpetual) 98,918 0.06
7,739,041 4.45
Norway EUR 275,000 Eika Boligkreditt AS 0.375%
20/4/2023 276,045 0.16 NOK 1,187,000 Norway Government Bond '144A'
1.75% 13/3/2025 131,896 0.07
407,941 0.23
Poland PLN 460,000 Poland Government Bond 3.25%
25/7/2025 107,088 0.06
107,088 0.06
Portfolio of Investments as at 31 May 2016
Italy continued Netherlands continued

Annual Report and Audited Accounts 203
The notes on pages 489 to 503 form an integral part of these financial statements.
Transferable Securities and Money Market Instruments Admitted to an Official Stock Exchange Listing or Dealt in on Another Regulated Market
Transferable Securities and Money Market Instruments Admitted to an Official Stock Exchange Listing or Dealt in on Another Regulated Market
Holding
Description
Market Value
EUR
% of Net
Assets
Holding
Description
Market Value
EUR
% of Net
Assets
Portfolio of Investments as at 31 May 2016
Portugal EUR 805,000 Portugal Obrigacoes do Tesouro OT
'144A' 4.75% 14/6/2019 893,562 0.51 EUR 226,000 Portugal Obrigacoes do Tesouro OT
'144A' 4.80% 15/6/2020 255,195 0.15 EUR 27,000 Portugal Obrigacoes do Tesouro OT
'144A' 2.20% 17/10/2022 26,824 0.02 EUR 566,788 Portugal Obrigacoes do Tesouro OT
'144A' 2.875% 21/7/2026 557,340 0.32 EUR 113,000 Portugal Obrigacoes do Tesouro OT
'144A' 4.10% 15/2/2045 113,824 0.06
1,846,745 1.06
Spain EUR 200,000 Amadeus Capital Markets SA
Sociedad Unipersonal 1.625% 17/11/2021 207,670 0.12
EUR 200,000 Bankia SA FRN 22/5/2024 195,388 0.11 EUR 200,000 FADE - Fondo de Amortizacion del
Deficit Electrico 0.85% 17/9/2019 204,042 0.12 EUR 100,000 Santander Consumer Finance SA
1.50% 12/11/2020 102,815 0.06 EUR 234,000 Spain Government Bond 4.50%
31/1/2018 251,971 0.15 EUR 990,000 Spain Government Bond 1.40%
31/1/2020 1,033,609 0.59 EUR 595,000 Spain Government Bond 1.15%
30/7/2020 616,390 0.36 EUR 903,000 Spain Government Bond '144A'
3.80% 30/4/2024 1,082,742 0.62 EUR 1,001,000 Spain Government Bond '144A'
2.75% 31/10/2024 1,120,094 0.64 EUR 132,000 Spain Government Bond '144A'
5.15% 31/10/2028 181,203 0.10 EUR 133,000 Spain Government Bond '144A'
5.15% 31/10/2044 199,750 0.12 EUR 639,000 Spain Government Bond '144A'
2.90% 31/10/2046 663,314 0.38 EUR 115,000 Spain Government Bond '144A'
3.45% 30/7/2066 120,218 0.07 EUR 1,417,603 Spain Government Inflation Linked
Bond '144A' 0.55% 30/11/2019 1,462,683 0.84
7,441,889 4.28
Supranational GBP 621,000 European Investment Bank 1.50%
1/2/2019 826,846 0.48 EUR 47,000 European Investment Bank 2.625%
15/3/2035 59,424 0.03 EUR 200,000 European Stability Mechanism
0.10% 3/11/2020 203,124 0.12 EUR 460,000 European Stability Mechanism
0.50% 2/3/2026 465,028 0.27 EUR 35,000 European Stability Mechanism
1.75% 20/10/2045 38,534 0.02 EUR 178,000 European Union 1.50% 4/10/2035 191,499 0.11
1,784,455 1.03
Sweden EUR 100,000 Atlas Copco AB 2.50% 28/2/2023 112,332 0.07 GBP 100,000 Nordea Bank AB 2.375% 2/6/2022 133,846 0.08 EUR 445,000 Skandinaviska Enskilda Banken AB
0.625% 30/1/2023 456,917 0.26 EUR 100,000 Svenska Handelsbanken AB 1.125%
14/12/2022 103,105 0.06 SEK 1,610,000 Sweden Government Bond 5.00%
1/12/2020 214,004 0.12 SEK 3,200,000 Sweden Government Bond 2.50%
12/5/2025 404,198 0.23
1,424,402 0.82
Switzerland EUR 200,000 Credit Suisse AG/London FRN
30/3/2017 200,143 0.11 EUR 100,000 Credit Suisse AG/London 0.625%
20/11/2018 100,956 0.06 EUR 100,000 Credit Suisse AG/London 1.125%
15/9/2020 102,507 0.06 EUR 200,000 Credit Suisse AG/London 1.50%
10/4/2026 201,885 0.12 CHF 1,177,000 Switzerland Government Bond
1.50% 24/7/2025 1,252,496 0.72 CHF 195,000 Switzerland Government Bond
1.50% 30/4/2042 236,670 0.14 EUR 200,000 UBS AG FRN 12/2/2026 212,218 0.12
2,306,875 1.33
United Kingdom EUR 300,000 Abbey National Treasury Services
PLC/United Kingdom 0.875% 13/1/2020 303,069 0.17
EUR 100,000 Aon Plc 2.875% 14/5/2026 106,813 0.06 EUR 100,000 BAT International Finance Plc
0.875% 13/10/2023 98,753 0.06 EUR 100,000 BP Capital Markets Plc 1.109%
16/2/2023 100,651 0.06 GBP 90,000 Centrica Plc 7.00% 19/9/2018 132,467 0.08 GBP 100,000 Centrica Plc 4.375% 13/3/2029 146,259 0.08 GBP 230,000 Delamare Cards MTN Issuer Plc
FRN 19/5/2021 298,003 0.17 GBP 200,000 Duncan Funding Plc '2006-1X A1B'
FRN 17/4/2063 262,424 0.15 GBP 94,215 Duncan Funding Plc '2015-1 A1'
FRN 17/12/2062 123,358 0.07 EUR 170,577 Eddystone Finance Plc '2006-1 A1B'
FRN 19/4/2021 167,083 0.10 EUR 100,000 FCE Bank Plc 1.875% 18/4/2019 103,846 0.06 EUR 100,000 FCE Bank Plc 1.528% 9/11/2020 102,110 0.06 GBP 95,851 Gemgarto Plc '2015-2 A'
FRN 16/2/2054 125,896 0.07 GBP 100,000 Gemgarto Plc '2015-2 B'
FRN 16/2/2054 130,713 0.08 EUR 100,000 Gosforth Funding Plc '2016-2
A1A' FRN 24/7/2058 100,119 0.06 GBP 200,000 Great Rolling Stock Co Ltd/The
6.25% 27/7/2020 302,398 0.17 USD 200,000 Holmes Master Issuer Plc
'2016-1A A1' FRN 15/4/2017 179,077 0.10 EUR 300,000 HSBC Holdings Plc 1.50% 15/3/2022 305,155 0.18 GBP 50,000 John Lewis Plc 6.125% 21/1/2025 79,089 0.05 GBP 192,926 Lanark Master Issuer Plc '2012-2X
2A' FRN 22/12/2054 256,063 0.15 GBP 100,000 Lanark Master Issuer Plc '2014-2X
2A' FRN 22/12/2054 130,035 0.07 GBP 90,000 Lanark Master Issuer Plc '2015-1X
1A' FRN 22/12/2054 117,419 0.07 GBP 142,000 LCR Finance Plc RegS 4.50%
7/12/2028 234,634 0.14 EUR 100,000 Leek Finance Number Eighteen Plc
'18X BC' FRN 21/9/2038 98,845 0.06 EUR 100,000 Leek Finance Number Eighteen Plc
'18X MC' FRN 21/9/2038 99,082 0.06 EUR 225,000 Nationwide Building Society 0.50%
29/10/2019 224,845 0.13 GBP 100,000 Nationwide Building Society 3.00%
6/5/2026 133,099 0.08 EUR 124,000 Nationwide Building Society 2.25%
25/6/2029 142,969 0.08 EUR 100,000 NGG Finance Plc FRN 18/6/2076 104,750 0.06 GBP 97,047 Paragon Mortgages No 23 Plc 'A2'
FRN 15/1/2043 126,204 0.07
BlackRock European Select Strategies Fund continued

204 BlackRock Strategic Funds (BSF)
The notes on pages 489 to 503 form an integral part of these financial statements.
Transferable Securities and Money Market Instruments Admitted to an Official Stock Exchange Listing or Dealt in on Another Regulated Market
Transferable Securities and Money Market Instruments Admitted to an Official Stock Exchange Listing or Dealt in on Another Regulated Market
Holding
Description
Market Value
EUR
% of Net
Assets
Holding
Description
Market Value
EUR
% of Net
Assets
1 Investment in connected party fund, see further information in Note 10.
BlackRock European Select Strategies Fund continued
GBP 220,661 Paragon Mortgages No 24 Plc 'A2' FRN 15/7/2043 288,417 0.17
GBP 200,000 RELX Investments Plc 7.00% 11/12/2017 284,764 0.16
EUR 100,000 Sky Plc 2.25% 17/11/2025 103,450 0.06 EUR 100,000 Sky Plc 2.50% 15/9/2026 105,390 0.06 EUR 95,515 Taurus Plc '2013-GMF1 A' FRN
21/5/2024 96,419 0.06 GBP 49,072 Tesco Property Finance 3 Plc 5.744%
13/4/2040 59,726 0.03 GBP 167,000 United Kingdom Gilt 4.75%
7/3/2020 251,828 0.14 GBP 981,423 United Kingdom Gilt 3.75%
7/9/2020 1,446,581 0.83 GBP 775,439 United Kingdom Gilt 3.75%
7/9/2021 1,162,066 0.67 GBP 409,642 United Kingdom Gilt 5.00%
7/3/2025 697,959 0.40 GBP 915,728 United Kingdom Gilt 2.00%
7/9/2025 1,254,585 0.72 GBP 121,000 United Kingdom Gilt 4.75%
7/12/2030 216,400 0.12 GBP 75,000 United Kingdom Gilt 4.50%
7/9/2034 134,194 0.08 GBP 289,069 United Kingdom Gilt 4.25%
7/3/2036 506,607 0.29 GBP 497,000 United Kingdom Gilt 4.25%
7/9/2039 892,042 0.51 GBP 235,701 United Kingdom Gilt 3.25%
22/1/2044 371,381 0.21 GBP 1,791,271 United Kingdom Gilt 3.50%
22/1/2045 2,959,261 1.70 GBP 471,000 United Kingdom Gilt 4.25%
7/12/2046 892,786 0.51 GBP 293,000 United Kingdom Gilt 3.75%
22/7/2052 540,248 0.31 GBP 161,000 United Kingdom Gilt 4.25%
7/12/2055 334,951 0.19 GBP 141,000 United Kingdom Gilt 4.00%
22/1/2060 287,379 0.17 GBP 67,611 United Kingdom Gilt 3.50%
22/7/2068 128,881 0.07 GBP 215,800 United Kingdom Gilt Inflation Linked
1.875% 22/11/2022 342,141 0.20 GBP 300,000 Western Power Distribution Plc
3.625% 6/11/2023 404,676 0.23 EUR 350,000 WPP Finance 2013 0.75%
18/11/2019 354,259 0.20
18,951,619 10.89
United States EUR 100,000 Amgen Inc 1.25% 25/2/2022 102,327 0.06 GBP 300,000 AT&T Inc 5.875% 28/4/2017 410,150 0.23 EUR 100,000 AT&T Inc 2.75% 19/5/2023 109,780 0.06 EUR 100,000 Bank of America Corp 1.875%
10/1/2019 104,193 0.06 EUR 100,000 BMW US Capital LLC 0.625%
20/4/2022 100,104 0.06 EUR 150,000 Citigroup Inc 1.75% 28/1/2025 153,402 0.09 EUR 100,000 Discovery Communications LLC
1.90% 19/3/2027 88,355 0.05 EUR 150,000 Eastman Chemical Co 1.50%
26/5/2023 151,143 0.09
EUR 300,000 FedEx Corp 1.625% 11/1/2027 296,859 0.17 USD 200,000 Ford Motor Credit Co LLC FRN
6/12/2017 178,073 0.10 EUR 100,000 General Electric Co 1.25%
26/5/2023 104,548 0.06 EUR 100,000 Goldman Sachs Group Inc/The
3.00% 12/2/2031 106,938 0.06 EUR 425,000 Goldman Sachs Group Inc/The
FRN 29/4/2019 425,157 0.24 EUR 100,000 Goldman Sachs Group Inc/The
0.75% 10/5/2019 101,016 0.06 USD 185,000 Goodyear Tire & Rubber Co/The
5.00% 31/5/2026 167,700 0.10 EUR 200,000 Johnson & Johnson 0.25%
20/1/2022 201,111 0.11 EUR 100,000 JPMorgan Chase & Co 1.50%
29/10/2026 100,200 0.06 EUR 100,000 McDonald's Corp 0.50% 15/1/2021 100,209 0.06 GBP 100,000 McDonald's Corp 4.125% 11/6/2054 139,150 0.08 EUR 200,000 Morgan Stanley 1.75% 11/3/2024 203,108 0.12 GBP 400,000 Nestle Holdings Inc 1.625%
11/12/2017 531,623 0.30 EUR 100,000 Priceline Group Inc/The 2.15%
25/11/2022 103,436 0.06 EUR 100,000 Thermo Fisher Scientific Inc 1.50%
1/12/2020 102,981 0.06 EUR 100,000 Thermo Fisher Scientific Inc 1.50%
1/12/2020 103,038 0.06 USD 636,302 United States Treasury Inflation
Indexed Bonds 0.625% 15/1/2026 591,089 0.34 USD 80,890 United States Treasury Inflation
Indexed Bonds 0.75% 15/2/2045 69,598 0.04 EUR 100,000 Walgreens Boots Alliance Inc 2.125%
20/11/2026 99,672 0.06 EUR 100,000 Wells Fargo & Co 1.125% 29/10/2021 102,976 0.06 EUR 100,000 Wells Fargo & Co 2.00% 27/4/2026 106,302 0.06 EUR 100,000 ZF North America Capital
Inc 2.75% 27/4/2023 102,192 0.06
5,256,430 3.02
Total Bonds 115,579,555 66.40
Total Transferable Securities and Money Market Instruments Admitted to an Official Stock Exchange Listing or Dealt in on Another Regulated Market 160,655,673 92.30
Collective Investment Schemes
Ireland 4,288,400 Institutional Cash Series Plc -
Institutional Euro Assets Liquidity Fund 1 4,288,400 2.46
4,288,400 2.46
Total Collective Investment Schemes 4,288,400 2.46
Securities portfolio at market value 164,944,073 94.76
Other Net Assets 9,115,718 5.24
Total Net Assets (EUR) 174,059,791 100.00
Portfolio of Investments as at 31 May 2016
United Kingdom continued United States continued

TypeNominal
Value Description CounterpartyExpiration
date
Unrealised appreciation/
(depreciation) EUR
Market Value
EUR
Swaps as at 31 May 2016
Annual Report and Audited Accounts 205
The notes on pages 489 to 503 form an integral part of these financial statements.
BlackRock European Select Strategies Fund continued
CDS EUR 75,000 Fund receives default protection on Glencore International AG and Bank of America pays Fixed 1.000% Merrill Lynch 20/12/2016 (4,875) (218)
CDS EUR 300,000 Fund receives default protection on Banco Santander SA and Bank of America pays Fixed 1.000% Merrill Lynch 20/12/2020 1,052 20,062
CDS EUR 300,000 Fund receives default protection on Bouygues SA and pays Bank of America Fixed 1.000% Merrill Lynch 20/12/2020 (1,118) (7,377)
CDS EUR 33,000 Fund receives default protection on Deutsche Lufthansa AG and Bank of America pays Fixed 1.000% Merrill Lynch 20/12/2020 (1,231) (18)
CDS EUR 40,000 Fund receives default protection on Banco Santander SA and pays Fixed 1.000% Barclays Bank 20/12/2020 (878) 417
CDS EUR 100,000 Fund receives default protection on British Telecom Plc and pays Fixed 1.000% Barclays Bank 20/12/2020 (842) (1,363)
CDS EUR 50,000 Fund receives default protection on WPP 2005 Ltd and pays Fixed 1.000% Barclays Bank 20/12/2020 (428) (1,192)
CDS EUR 100,000 Fund receives Fixed 1.000% and provides default protection on Markit iTraxx Europe Series 24 Version 1 Barclays Bank 20/12/2020 832 1,284
CDS EUR 700,000 Fund receives default protection on Bayer AG and pays Fixed 1.000% Barclays Bank 20/06/2021 2,650 (13,274)
CDS EUR 150,000 Fund receives default protection on Deutsche Lufthansa AG and pays Fixed 1.000% Barclays Bank 20/06/2021 (691) 650
CDS EUR 150,000 Fund receives default protection on EnBW Energie Baden Wuerttemberg AG and pays Fixed 1.000% Barclays Bank 20/06/2021 (700) (3,483)
CDS EUR 50,000 Fund receives default protection on Markit iTraxx Europe Crossover Series 25 Version 1 and pays Fixed 5.000% Barclays Bank 20/06/2021 2 (4,346)
CDS EUR 150,000 Fund receives default protection on Markit iTraxx Europe Crossover Series 25 Version 1 and pays Fixed 5.000% Barclays Bank 20/06/2021 539 (13,038)
CDS EUR 370,000 Fund receives default protection on Markit iTraxx Europe Crossover Series 25 Version 1 and pays Fixed 5.000% Barclays Bank 20/06/2021 1,725 (32,159)
CDS EUR 35,000 Fund receives default protection on RWE AG and pays Fixed 1.000% Barclays Bank 20/06/2021 175 574CDS EUR 115,000 Fund receives default protection on RWE AG and pays Fixed 1.000% Barclays Bank 20/06/2021 519 1,886CDS EUR 150,000 Fund receives Fixed 1.000% and provides default protection on
Engie SA Barclays Bank 20/06/2021 1,213 3,293CDS EUR 50,000 Fund receives Fixed 1.000% and provides default protection on
Markit iTraxx Europe Series 25 Version 1 Barclays Bank 20/06/2021 (15) 707CDS EUR 100,000 Fund receives default protection on Barclays Bank Plc and pays
Fixed 1.000% BNP Paribas 20/12/2020 (1,247) (219)CDS EUR 50,000 Fund receives default protection on Sky Plc and pays Fixed 1.000% BNP Paribas 20/12/2020 (460) (413)CDS EUR 1,900,000 Fund receives default protection on Markit iTraxx Europe Series 25
Version 1 and pays Fixed 1.000% BNP Paribas 20/06/2021 1,016 (26,856)CDS EUR 50,000 Fund receives default protection on RWE AG and pays Fixed 1.000% BNP Paribas 20/06/2021 269 820CDS EUR 300,000 Fund receives default protection on Groupe Auchan SA and pays
Fixed 1.000% Citibank 20/12/2020 (569) (6,997)CDS EUR 50,000 Fund receives default protection on Markit iTraxx Europe Crossover
Series 25 Version 1 and pays Fixed 5.000% Citibank 20/06/2021 (336) (4,346)CDS EUR 100,000 Fund receives Fixed 1.000% and provides default protection on
Orange SA Citibank 20/06/2021 318 1,901CDS EUR 100,000 Fund receives default protection on Barclays Bank Plc and pays
Fixed 1.000% Credit Suisse 20/06/2021 (307) 44CDS EUR 100,000 Fund receives default protection on British Telecom Plc and pays
Fixed 1.000% Credit Suisse 20/06/2021 (406) (1,165)CDS EUR 100,000 Fund receives default protection on Lloyds Bank Plc and pays
Fixed 1.000% Credit Suisse 20/06/2021 (118) (725)CDS EUR 100,000 Fund receives default protection on Next Plc and pays Fixed 1.000% Credit Suisse 20/06/2021 (49) (99)CDS EUR 100,000 Fund receives default protection on Sky Plc and pays Fixed 1.000% Credit Suisse 20/06/2021 (162) (515)CDS EUR 500,000 Fund receives Fixed 1.000% and provides default protection on
Markit iTraxx Europe Series 25 Version 1 Credit Suisse 20/06/2021 (893) 7,067CDS EUR 100,000 Fund receives default protection on Markit iTraxx Europe Series 24
Version 1 and pays Fixed 1.000% Deutsche Bank 20/12/2020 287 (1,284)CDS EUR 600,000 Fund receives Fixed 1.000% and provides default protection on
Markit iTraxx Europe Series 24 Version 1 Deutsche Bank 20/12/2020 10,269 7,706CDS USD 100,000 Fund receives default protection on Australia and New Zealand
Banking Group Limited and pays Fixed 1.000% Deutsche Bank 20/12/2020 (306) (745)CDS USD 100,000 Fund receives default protection on Commonwealth Bank of
Australia and pays Fixed 1.000% Deutsche Bank 20/12/2020 (332) (771)CDS USD 100,000 Fund receives default protection on National Australia Bank Ltd and
pays Fixed 1.000% Deutsche Bank 20/12/2020 (106) (815)CDS USD 100,000 Fund receives default protection on Westpac Banking Corp and
pays Fixed 1.000% Deutsche Bank 20/12/2020 (322) (766)CDS EUR 150,000 Fund receives Fixed 1.000% and provides default protection on
Markit iTraxx Europe Series 25 Version 1 Deutsche Bank 20/06/2021 (59) 2,120CDS EUR 300,000 Fund receives default protection on Metro AG and pays Fixed 1.000% Goldman Sachs 20/06/2021 (360) 1,555

TypeNominal
Value Description CounterpartyExpiration
date
Unrealised appreciation/
(depreciation) EUR
Market Value
EUR
Swaps as at 31 May 2016
206 BlackRock Strategic Funds (BSF)
The notes on pages 489 to 503 form an integral part of these financial statements.
CDS EUR 106,000 Fund receives default protection on Banco Santander SA and pays Fixed 1.000% JP Morgan 20/12/2020 (2,596) 1,105
CDS EUR 53,000 Fund receives default protection on Banco Santander SA and pays Fixed 1.000% JP Morgan 20/12/2020 (1,239) 552
CDS EUR 100,000 Fund receives default protection on Lloyds Bank Plc and pays F ixed 1.000% JP Morgan 20/12/2020 (615) (898)
CDS EUR 100,000 Fund receives default protection on RELX Plc and pays Fixed 1.000% JP Morgan 20/12/2020 (681) (2,742)CDS EUR 300,000 Fund receives default protection on BASF SE and pays Fixed 1.000% JP Morgan 20/06/2021 (485) (7,929)CDS EUR 100,000 Fund receives default protection on Koninklijke KPN NV and pays F
ixed 1.000% JP Morgan 20/06/2021 24 (1,353)ILS GBP 300,000 Fund receives Fixed 2.660% and pays Floating GBP 12 Month UKRPI BNP Paribas 13/05/2021 (940) (940)
Total (Gross underlying exposure – EUR 9,042,896) (2,476) (84,303)
CDS: Credit Default SwapsILS: Inflation Linked Swaps
BlackRock European Select Strategies Fund continued

Open forward foreign exchange transactions as at 31 May 2016
Currency Purchases Currency Sales CounterpartyMaturity
date
Unrealised appreciation/
(depreciation) EUR
Open forward foreign exchange transactions as at 31 May 2016
Currency Purchases Currency Sales CounterpartyMaturity
date
Unrealised appreciation/
(depreciation) EUR
Annual Report and Audited Accounts 207
The notes on pages 489 to 503 form an integral part of these financial statements.
BlackRock European Select Strategies Fund continued
CHF 120,000 EUR 109,087 Citibank 2/6/2016 (550)EUR 300,704 CHF 332,000 JP Morgan 2/6/2016 418 EUR 7,875,033 CHF 8,636,000 HSBC 2/6/2016 63,984 EUR 331,596 CHF 365,000 Barclays Bank 2/6/2016 1,463 EUR 211,592 CHF 234,000 UBS 2/6/2016 (56)EUR 207,241 CHF 230,000 Bank of America Merrill Lynch 2/6/2016 (789)EUR 290,464 CZK 7,856,000 HSBC 2/6/2016 (267)EUR 126,762 DKK 943,000 JP Morgan 2/6/2016 (29)EUR 2,173,081 DKK 16,176,000 HSBC 2/6/2016 (1,862)EUR 79,965 DKK 595,000 Bank of America Merrill Lynch 2/6/2016 (35)EUR 1,022,219 GBP 809,000 JP Morgan 2/6/2016 (38,436)EUR 1,009,251 GBP 798,000 Barclays Bank 2/6/2016 (36,983)EUR 881,156 GBP 690,000 UBS 2/6/2016 (23,482)EUR 29,961,630 GBP 23,369,000 HSBC 2/6/2016 (676,743)EUR 938,473 GBP 740,000 Bank of America Merrill Lynch 2/6/2016 (31,719)EUR 152,755 GBP 118,000 Deutsche Bank 2/6/2016 (1,951)EUR 777,870 NOK 7,176,474 HSBC 2/6/2016 8,811 EUR 75,386 NOK 705,000 Bank of America Merrill Lynch 2/6/2016 (165)EUR 637,408 PLN 2,814,000 HSBC 2/6/2016 (4,623)EUR 82,192 PLN 365,000 Bank of America Merrill Lynch 2/6/2016 (1,085)EUR 3,511,350 SEK 32,221,000 HSBC 2/6/2016 40,538 EUR 189,584 SEK 1,750,000 JP Morgan 2/6/2016 1,076 EUR 91,751 SEK 847,000 Barclays Bank 2/6/2016 513 EUR 136,583 SEK 1,270,000 Bank of America Merrill Lynch 2/6/2016 (220)GBP 185,000 EUR 243,965 Bank of America Merrill Lynch 2/6/2016 (1,417)GBP 510,000 EUR 649,424 Citibank 2/6/2016 19,221 SEK 925,000 EUR 100,592 Citibank 2/6/2016 (952)CHF 145,000 EUR 132,380 BNP Paribas 14/6/2016 (1,213)CHF 1,542,000 EUR 1,409,329 JP Morgan 14/6/2016 (14,438)CHF 240,000 EUR 218,915 UBS 14/6/2016 (1,811)CHF 511,000 EUR 466,689 Bank of America Merrill Lynch 14/6/2016 (4,439)CHF 76,000 EUR 69,277 Barclays Bank 14/6/2016 (527)CZK 4,708,000 EUR 174,126 JP Morgan 14/6/2016 92 CZK 2,565,000 EUR 94,876 Bank of America Merrill Lynch 14/6/2016 41 CZK 1,000,000 EUR 36,991 UBS 14/6/2016 13 DKK 550,000 EUR 73,784 BNP Paribas 14/6/2016 167 DKK 370,000 EUR 49,608 UBS 14/6/2016 141 DKK 1,481,000 EUR 198,911 JP Morgan 14/6/2016 218 DKK 910,000 EUR 122,310 Bank of America Merrill Lynch 14/6/2016 45 DKK 490,000 EUR 65,902 Deutsche Bank 14/6/2016 (19)EUR 12,862 AUD 20,000 UBS 14/6/2016 (116)EUR 12,924 AUD 20,000 Morgan Stanley 14/6/2016 (54)EUR 12,867 AUD 20,000 Deutsche Bank 14/6/2016 (111)EUR 20,434 CAD 30,000 JP Morgan 14/6/2016 (131)EUR 248,194 CHF 270,000 Goldman Sachs 14/6/2016 3,952 EUR 54,548 CHF 60,000 Citibank 14/6/2016 272 EUR 1,056,381 CHF 1,170,000 HSBC 14/6/2016 (1,999)EUR 944,785 DKK 7,044,000 HSBC 14/6/2016 (2,319)EUR 252,192 DKK 1,880,000 Morgan Stanley 14/6/2016 (584)EUR 374,929 DKK 2,790,000 Goldman Sachs 14/6/2016 (201)EUR 921,466 GBP 720,000 Citibank 14/6/2016 (22,195)EUR 12,507 GBP 10,000 Royal Bank of Scotland 14/6/2016 (599)EUR 549,450 GBP 430,000 Morgan Stanley 14/6/2016 (14,126)EUR 1,904,533 GBP 1,490,000 Deutsche Bank 14/6/2016 (48,321)
EUR 379,745 GBP 300,000 Barclays Bank 14/6/2016 (13,447)EUR 505,103 GBP 395,000 Bank of America Merrill Lynch 14/6/2016 (12,600)EUR 4,945,248 GBP 3,900,000 UBS 14/6/2016 (166,248)EUR 698,225 GBP 550,000 JP Morgan 14/6/2016 (22,627)EUR 1,667,004 GBP 1,310,000 Goldman Sachs 14/6/2016 (49,935)EUR 314,691 GBP 240,000 BNP Paribas 14/6/2016 137 EUR 2,397 JPY 300,000 Barclays Bank 14/6/2016 (20)EUR 1,907 JPY 240,000 Deutsche Bank 14/6/2016 (26)EUR 2,476 JPY 310,000 State Street Bank & Trust Company 14/6/2016 (18)EUR 222,121 SEK 2,060,000 Morgan Stanley 14/6/2016 204 EUR 616,985 USD 690,000 Goldman Sachs 14/6/2016 (529)EUR 187,854 USD 210,000 UBS 14/6/2016 (85)EUR 17,939 USD 20,000 BNP Paribas 14/6/2016 40 EUR 541,367 USD 600,000 Citibank 14/6/2016 4,399 EUR 43,840 USD 50,000 HSBC 14/6/2016 (907)GBP 2,411,000 EUR 3,047,408 Bank of America Merrill Lynch 14/6/2016 112,545 GBP 2,687,000 EUR 3,398,890 JP Morgan 14/6/2016 122,800 GBP 548,000 EUR 693,848 Barclays Bank 14/6/2016 24,382 GBP 815,000 EUR 1,034,762 BNP Paribas 14/6/2016 33,409 GBP 1,945,000 EUR 2,488,747 UBS 14/6/2016 60,448 GBP 455,000 EUR 586,428 HSBC 14/6/2016 9,913 GBP 40,000 EUR 49,885 Citibank 14/6/2016 2,540 NOK 1,098,000 EUR 117,635 Bank of America Merrill Lynch 14/6/2016 (19)NOK 1,820,000 EUR 192,875 JP Morgan 14/6/2016 2,081 PLN 170,000 EUR 39,453 BNP Paribas 14/6/2016 (695)PLN 385,000 EUR 88,382 UBS 14/6/2016 (606)PLN 1,566,000 EUR 362,331 JP Morgan 14/6/2016 (5,299)PLN 291,000 EUR 67,679 Bank of America Merrill Lynch 14/6/2016 (1,334)SEK 3,045,000 EUR 330,116 Bank of America Merrill Lynch 14/6/2016 (2,089)SEK 845,000 EUR 91,527 UBS 14/6/2016 (498)SEK 3,626,000 EUR 393,889 JP Morgan 14/6/2016 (3,273)SEK 4,420,000 EUR 472,978 Barclays Bank 14/6/2016 3,173 SEK 1,120,000 EUR 121,490 BNP Paribas 14/6/2016 (836)EUR 102,867 RUB 8,503,000 Citibank 15/6/2016 (12,167)RUB 8,574,000 EUR 103,726 Citibank 15/6/2016 12,269 EUR 60,475 PLN 264,927 HSBC 8/7/2016 163 EUR 30,237 PLN 132,452 Deutsche Bank 8/7/2016 84 EUR 60,475 PLN 264,909 Credit Suisse 8/7/2016 168 EUR 81,016 PLN 355,066 JP Morgan 8/7/2016 184 EUR 30,237 PLN 132,646 Barclays Bank 8/7/2016 40 EUR 510,000 USD 577,142 Morgan Stanley 8/7/2016 (6,064)MXN 5,400,000 USD 297,261 BNP Paribas 8/7/2016 (4,384)PLN 294,649 EUR 66,507 Barclays Bank 8/7/2016 571 PLN 267,838 EUR 60,459 HSBC 8/7/2016 516 PLN 319,502 EUR 72,087 Credit Suisse 8/7/2016 649 PLN 268,011 EUR 60,458 JP Morgan 8/7/2016 556 USD 583,721 EUR 510,000 Deutsche Bank 8/7/2016 11,947
(694,090)
USD Hedged Share Class
EUR 1,190 USD 1,357 State Street Bank & Trust Company 15/6/2016 (24)USD 505,473 EUR 444,469 State Street Bank & Trust Company 15/6/2016 7,886
7,862
Total (Gross underlying exposure - EUR 89,557,992) (686,228)

Futures contracts as at 31 May 2016
Number of contracts
Currencyof contract Contract/Description
Expiration date
Gross underlying
exposureEUR
Unrealised appreciation/
(depreciation) EUR
Purchased Options as at 31 May 2016
Number of contracts
Call/Put Description Counterparty
Strike Price
Expiration date
Unrealised appreciation/
(depreciation) EUR
Market Value
EUR
208 BlackRock Strategic Funds (BSF)
The notes on pages 489 to 503 form an integral part of these financial statements.
BlackRock European Select Strategies Fund continued
(31) USD 90 Day Euro December 2017 27,938,953 13,078 31 USD 90 Day Euro December 2016 27,938,953 (4,286) 4 USD CBOE Volatility Index June 2016 54,864 (9,060) (8) USD E-Mini S&P 500 Index June 2016 751,690 (27,235) (17) EUR Euro BTP June 2016 2,228,241 (18,550) 24 EUR Euro STOXX 50 Index June 2016 736,080 12,153 23 EUR Euro STOXX Bank Index June 2016 122,590 1,070 (54) EUR Euro-OAT June 2016 7,005,582 (36,470) 18 EUR German Euro BOBL June 2016 19,981,170 1,980 (11) EUR German Euro BOBL June 2016 12,210,715 (950) (34) EUR German Euro Bund June 2016 3,546,710 (4,114) (9) EUR German Euro BUXL June 2016 1,689,039 (19,880) 54 EUR German Euro Schatz June 2016 5,449,410 (1,164) (10) EUR German Euro Schatz June 2016 1,009,150 100 (4) EUR Stoxx 600 Health Care Index June 2016 149,620 (8,880) 2 GBP UK Long Gilt Bond September 2016 273,329 (839) (2) GBP UK Long Gilt Bond September 2016 273,329 760 2 USD US Treasury 10 Year Note September 2016 181,527 (975) (2) USD US Treasury 5 Year Note September 2016 182,593 685
Total 111,723,545 (102,577)
1,144,000 Put OTC GBP/USD Citibank GBP 1.40 28/07/2016 (20,096) 151
Total (Gross underlying exposure - EUR 401,521) (20,096) 151
Sector Breakdown as at 31 May 2016
% of Net Assets
Government 43.22Financial 18.74Consumer, Non-cyclical 9.77Communications 5.57Industrial 4.73Utilities 2.72Collective Investment Schemes 2.46Consumer, Cyclical 2.18Basic Materials 1.65Mortgage Securities 1.49Energy 1.31Technology 0.63Asset Backed Securities 0.29
Securities portfolio at market value 94.76Other Net Assets 5.24
100.00

Annual Report and Audited Accounts 209
The notes on pages 489 to 503 form an integral part of these financial statements.
Transferable Securities and Money Market Instruments Admitted to an Official Stock Exchange Listing or Dealt in on Another Regulated Market
Transferable Securities and Money Market Instruments Admitted to an Official Stock Exchange Listing or Dealt in on Another Regulated Market
Holding
Description
Market Value
EUR
% of Net
Assets
Holding
Description
Market Value
EUR
% of Net
Assets
Portfolio of Investments as at 31 May 2016
BONDS
Argentina USD 14,050,000 Argentine Republic Government
International Bond RegS 6.875% 22/4/2021 13,207,839 0.23
13,207,839 0.23
Australia EUR 15,000,000 BHP Billiton Finance Ltd FRN
28/4/2020 14,728,200 0.25 EUR 2,000,000 Origin Energy Finance Ltd 2.50%
23/10/2020 1,985,000 0.03 EUR 4,865,000 Origin Energy Finance Ltd RegS
3.50% 4/10/2021 4,943,667 0.09 EUR 1,138,851 SMART ABS Series Trust '2014-2E
AE' FRN 14/6/2021 1,134,927 0.02 EUR 3,025,000 Telstra Corp Ltd 1.125% 14/4/2026 3,028,570 0.05
25,820,364 0.44
Austria EUR 20,000,000 Austria Government Bond '144A'
0.75% 20/10/2026 20,456,000 0.35 EUR 1,200,000 BAWAG PSK Bank fuer Arbeit und
Wirtschaft und Oesterreichische Postsparkasse AG 8.125% 30/10/2023 1,495,584 0.03
USD 7,400,000 Erste Group Bank AG FRN 26/5/2025 6,671,957 0.11
EUR 3,400,000 UniCredit Bank Austria AG 2.625% 30/1/2018 3,516,059 0.06
EUR 1,000,000 UNIQA Insurance Group AG FRN 27/7/2046 1,050,080 0.02
33,189,680 0.57
Belgium EUR 24,075,000 Anheuser-Busch InBev SA/NV FRN
17/3/2020 24,349,214 0.41 EUR 7,000,000 Anheuser-Busch InBev SA/NV
0.875% 17/3/2022 7,098,805 0.12 EUR 4,791,000 Anheuser-Busch InBev SA/NV
1.50% 17/3/2025 4,935,305 0.08 EUR 5,291,000 Anheuser-Busch InBev SA/NV 2.00%
17/3/2028 (traded in Belgium) 5,549,254 0.10 EUR 706,000 Anheuser-Busch InBev SA/NV
2.00% 17/3/2028 (traded in United Kingdom) 740,460 0.01
EUR 7,173,000 Anheuser-Busch InBev SA/NV 2.75% 17/3/2036 7,831,123 0.13
EUR 10,200,000 Argenta Spaarbank NV FRN 24/5/2026 10,304,244 0.18
EUR 3,100,000 Belfius Bank SA/NV 1.125% 22/5/2017 3,134,844 0.05
EUR 25,000,000 Belfius Bank SA/NV 1.25% 27/11/2017 25,514,750 0.43
EUR 22,119,762 Belgium Government Bond '144A' 1.60% 22/6/2047 22,280,572 0.38
EUR 77,400,000 Belgium Government Bond '144A' 2.15% 22/6/2066 81,937,962 1.40
EUR 13,100,000 KBC Bank NV 0.375% 1/9/2022 13,265,846 0.23 EUR 2,200,000 KBC Groep NV 1.00% 26/4/2021 2,224,805 0.04 EUR 5,955,000 KBC Groep NV FRN (Perpetual) 5,774,206 0.10
214,941,390 3.66
Bermuda EUR 2,000,000 Fidelity International Ltd 6.875%
24/2/2017 2,096,180 0.04
2,096,180 0.04
Canada EUR 13,950,000 Bank of Nova Scotia/The 0.25%
2/11/2017 14,032,723 0.24 EUR 3,575,000 Canadian Imperial Bank of
Commerce/Canada 0.375% 15/10/2019 3,628,929 0.06
17,661,652 0.30
Cayman Islands EUR 1,100,000 Principal Financial Global Funding II
LLC 4.50% 26/1/2017 1,129,992 0.02 GBP 400,000 Punch Taverns Finance B Ltd 5.943%
30/9/2022 492,634 0.01 GBP 667,618 Punch Taverns Finance B Ltd 5.267%
30/3/2024 780,106 0.01 GBP 627,077 Punch Taverns Finance B Ltd RegS
7.369% 30/9/2021 821,627 0.01 GBP 350,000 Trafford Centre Finance Ltd/The FRN
28/7/2035 397,006 0.01
3,621,365 0.06
Cyprus EUR 1,000,000 Aroundtown Property Holdings Plc
1.50% 3/5/2022 943,210 0.02 EUR 33,855,000 Cyprus Government International
Bond 3.875% 6/5/2022 34,805,987 0.59 EUR 23,117,000 Cyprus Government International
Bond 4.25% 4/11/2025 24,150,445 0.41
59,899,642 1.02
Denmark EUR 10,650,000 Danske Bank A/S 0.50% 6/5/2021 10,662,780 0.18 DKK 96,500,000 Nordea Kredit Realkreditaktieselskab
2.00% 1/10/2019 13,779,474 0.23 DKK 89,490,967 Nordea Kredit Realkreditaktieselskab
2.00% 1/10/2047 11,328,600 0.19 DKK 85,100,000 Nykredit Realkredit A/S 1.00%
1/10/2020 11,793,902 0.20 DKK 206,635,000 Nykredit Realkredit A/S 1.00%
1/1/2021 28,638,673 0.49 DKK 20,778,983 Nykredit Realkredit A/S 2.00%
1/10/2047 2,630,621 0.05 DKK 159,005,000 Realkredit Danmark A/S 2.00%
1/1/2020 22,787,133 0.39 DKK 193,365,000 Realkredit Danmark A/S 1.00%
1/1/2021 26,793,532 0.46
128,414,715 2.19
Finland EUR 8,200,000 OP Corporate Bank Plc 1.125%
17/6/2019 8,442,966 0.14 EUR 8,925,000 OP Corporate Bank Plc 0.75%
3/3/2022 9,037,812 0.16
17,480,778 0.30
France EUR 6,700,000 Agence France Locale 0.25%
20/3/2023 6,666,098 0.11 EUR 9,700,000 Air Liquide Finance SA 0.375%
18/4/2022 9,686,517 0.16 EUR 499,253 Auto ABS FCT Compartiment
'2013-2 A' FRN 27/1/2023 500,098 0.01
BlackRock Fixed Income Strategies Fund
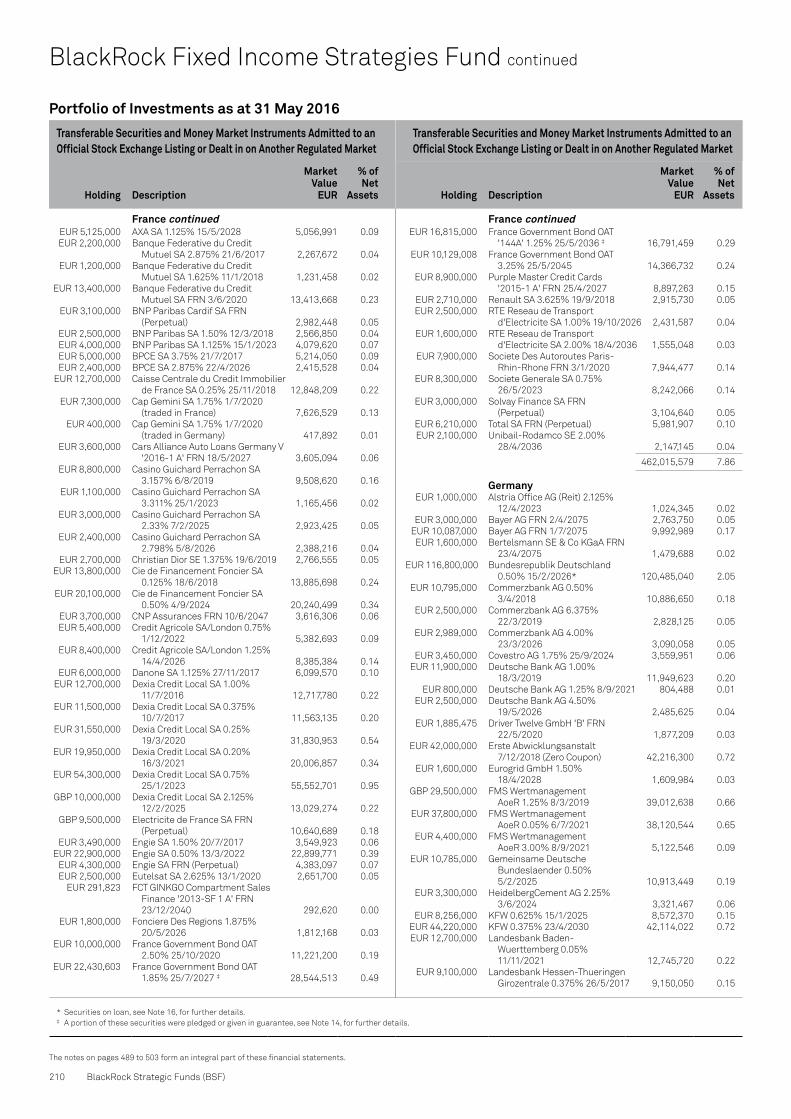
210 BlackRock Strategic Funds (BSF)
The notes on pages 489 to 503 form an integral part of these financial statements.
Transferable Securities and Money Market Instruments Admitted to an Official Stock Exchange Listing or Dealt in on Another Regulated Market
Transferable Securities and Money Market Instruments Admitted to an Official Stock Exchange Listing or Dealt in on Another Regulated Market
Holding
Description
Market Value
EUR
% of Net
Assets
Holding
Description
Market Value
EUR
% of Net
Assets
* Securities on loan, see Note 16, for further details.‡ A portion of these securities were pledged or given in guarantee, see Note 14, for further details.
BlackRock Fixed Income Strategies Fund continued
EUR 5,125,000 AXA SA 1.125% 15/5/2028 5,056,991 0.09 EUR 2,200,000 Banque Federative du Credit
Mutuel SA 2.875% 21/6/2017 2,267,672 0.04 EUR 1,200,000 Banque Federative du Credit
Mutuel SA 1.625% 11/1/2018 1,231,458 0.02 EUR 13,400,000 Banque Federative du Credit
Mutuel SA FRN 3/6/2020 13,413,668 0.23 EUR 3,100,000 BNP Paribas Cardif SA FRN
(Perpetual) 2,982,448 0.05 EUR 2,500,000 BNP Paribas SA 1.50% 12/3/2018 2,566,850 0.04 EUR 4,000,000 BNP Paribas SA 1.125% 15/1/2023 4,079,620 0.07 EUR 5,000,000 BPCE SA 3.75% 21/7/2017 5,214,050 0.09 EUR 2,400,000 BPCE SA 2.875% 22/4/2026 2,415,528 0.04 EUR 12,700,000 Caisse Centrale du Credit Immobilier
de France SA 0.25% 25/11/2018 12,848,209 0.22 EUR 7,300,000 Cap Gemini SA 1.75% 1/7/2020
(traded in France) 7,626,529 0.13 EUR 400,000 Cap Gemini SA 1.75% 1/7/2020
(traded in Germany) 417,892 0.01 EUR 3,600,000 Cars Alliance Auto Loans Germany V
'2016-1 A' FRN 18/5/2027 3,605,094 0.06 EUR 8,800,000 Casino Guichard Perrachon SA
3.157% 6/8/2019 9,508,620 0.16 EUR 1,100,000 Casino Guichard Perrachon SA
3.311% 25/1/2023 1,165,456 0.02 EUR 3,000,000 Casino Guichard Perrachon SA
2.33% 7/2/2025 2,923,425 0.05 EUR 2,400,000 Casino Guichard Perrachon SA
2.798% 5/8/2026 2,388,216 0.04 EUR 2,700,000 Christian Dior SE 1.375% 19/6/2019 2,766,555 0.05 EUR 13,800,000 Cie de Financement Foncier SA
0.125% 18/6/2018 13,885,698 0.24 EUR 20,100,000 Cie de Financement Foncier SA
0.50% 4/9/2024 20,240,499 0.34 EUR 3,700,000 CNP Assurances FRN 10/6/2047 3,616,306 0.06 EUR 5,400,000 Credit Agricole SA/London 0.75%
1/12/2022 5,382,693 0.09 EUR 8,400,000 Credit Agricole SA/London 1.25%
14/4/2026 8,385,384 0.14 EUR 6,000,000 Danone SA 1.125% 27/11/2017 6,099,570 0.10 EUR 12,700,000 Dexia Credit Local SA 1.00%
11/7/2016 12,717,780 0.22 EUR 11,500,000 Dexia Credit Local SA 0.375%
10/7/2017 11,563,135 0.20 EUR 31,550,000 Dexia Credit Local SA 0.25%
19/3/2020 31,830,953 0.54 EUR 19,950,000 Dexia Credit Local SA 0.20%
16/3/2021 20,006,857 0.34 EUR 54,300,000 Dexia Credit Local SA 0.75%
25/1/2023 55,552,701 0.95 GBP 10,000,000 Dexia Credit Local SA 2.125%
12/2/2025 13,029,274 0.22 GBP 9,500,000 Electricite de France SA FRN
(Perpetual) 10,640,689 0.18 EUR 3,490,000 Engie SA 1.50% 20/7/2017 3,549,923 0.06 EUR 22,900,000 Engie SA 0.50% 13/3/2022 22,899,771 0.39 EUR 4,300,000 Engie SA FRN (Perpetual) 4,383,097 0.07 EUR 2,500,000 Eutelsat SA 2.625% 13/1/2020 2,651,700 0.05 EUR 291,823 FCT GINKGO Compartment Sales
Finance '2013-SF 1 A' FRN 23/12/2040 292,620 0.00
EUR 1,800,000 Fonciere Des Regions 1.875% 20/5/2026 1,812,168 0.03
EUR 10,000,000 France Government Bond OAT 2.50% 25/10/2020 11,221,200 0.19
EUR 22,430,603 France Government Bond OAT 1.85% 25/7/2027 ‡ 28,544,513 0.49
EUR 16,815,000 France Government Bond OAT '144A' 1.25% 25/5/2036 ‡ 16,791,459 0.29
EUR 10,129,008 France Government Bond OAT 3.25% 25/5/2045 14,366,732 0.24
EUR 8,900,000 Purple Master Credit Cards '2015-1 A' FRN 25/4/2027 8,897,263 0.15
EUR 2,710,000 Renault SA 3.625% 19/9/2018 2,915,730 0.05 EUR 2,500,000 RTE Reseau de Transport
d'Electricite SA 1.00% 19/10/2026 2,431,587 0.04 EUR 1,600,000 RTE Reseau de Transport
d'Electricite SA 2.00% 18/4/2036 1,555,048 0.03 EUR 7,900,000 Societe Des Autoroutes Paris-
Rhin-Rhone FRN 3/1/2020 7,944,477 0.14 EUR 8,300,000 Societe Generale SA 0.75%
26/5/2023 8,242,066 0.14 EUR 3,000,000 Solvay Finance SA FRN
(Perpetual) 3,104,640 0.05 EUR 6,210,000 Total SA FRN (Perpetual) 5,981,907 0.10 EUR 2,100,000 Unibail-Rodamco SE 2.00%
28/4/2036 2,147,145 0.04
462,015,579 7.86
Germany EUR 1,000,000 Alstria Office AG (Reit) 2.125%
12/4/2023 1,024,345 0.02 EUR 3,000,000 Bayer AG FRN 2/4/2075 2,763,750 0.05 EUR 10,087,000 Bayer AG FRN 1/7/2075 9,992,989 0.17 EUR 1,600,000 Bertelsmann SE & Co KGaA FRN
23/4/2075 1,479,688 0.02 EUR 116,800,000 Bundesrepublik Deutschland
0.50% 15/2/2026* 120,485,040 2.05 EUR 10,795,000 Commerzbank AG 0.50%
3/4/2018 10,886,650 0.18 EUR 2,500,000 Commerzbank AG 6.375%
22/3/2019 2,828,125 0.05 EUR 2,989,000 Commerzbank AG 4.00%
23/3/2026 3,090,058 0.05 EUR 3,450,000 Covestro AG 1.75% 25/9/2024 3,559,951 0.06 EUR 11,900,000 Deutsche Bank AG 1.00%
18/3/2019 11,949,623 0.20 EUR 800,000 Deutsche Bank AG 1.25% 8/9/2021 804,488 0.01 EUR 2,500,000 Deutsche Bank AG 4.50%
19/5/2026 2,485,625 0.04 EUR 1,885,475 Driver Twelve GmbH 'B' FRN
22/5/2020 1,877,209 0.03 EUR 42,000,000 Erste Abwicklungsanstalt
7/12/2018 (Zero Coupon) 42,216,300 0.72 EUR 1,600,000 Eurogrid GmbH 1.50%
18/4/2028 1,609,984 0.03 GBP 29,500,000 FMS Wertmanagement
AoeR 1.25% 8/3/2019 39,012,638 0.66 EUR 37,800,000 FMS Wertmanagement
AoeR 0.05% 6/7/2021 38,120,544 0.65 EUR 4,400,000 FMS Wertmanagement
AoeR 3.00% 8/9/2021 5,122,546 0.09 EUR 10,785,000 Gemeinsame Deutsche
Bundeslaender 0.50% 5/2/2025 10,913,449 0.19
EUR 3,300,000 HeidelbergCement AG 2.25% 3/6/2024 3,321,467 0.06
EUR 8,256,000 KFW 0.625% 15/1/2025 8,572,370 0.15 EUR 44,220,000 KFW 0.375% 23/4/2030 42,114,022 0.72 EUR 12,700,000 Landesbank Baden-
Wuerttemberg 0.05% 11/11/2021 12,745,720 0.22
EUR 9,100,000 Landesbank Hessen-Thueringen Girozentrale 0.375% 26/5/2017 9,150,050 0.15
Portfolio of Investments as at 31 May 2016
France continued France continued

Annual Report and Audited Accounts 211
The notes on pages 489 to 503 form an integral part of these financial statements.
Transferable Securities and Money Market Instruments Admitted to an Official Stock Exchange Listing or Dealt in on Another Regulated Market
Transferable Securities and Money Market Instruments Admitted to an Official Stock Exchange Listing or Dealt in on Another Regulated Market
Holding
Description
Market Value
EUR
% of Net
Assets
Holding
Description
Market Value
EUR
% of Net
Assets
Portfolio of Investments as at 31 May 2016
EUR 990,000 Mahle GmbH 2.50% 14/5/2021 1,040,203 0.02 EUR 59,404 Red & Black Auto Germany 2
'A' FRN 15/9/2022 59,451 0.00 EUR 3,675,000 SAP SE FRN 20/11/2018 3,682,350 0.06 EUR 142,166 SC Germany Auto UG
haftungsbeschraenkt '2013-2 A' FRN 12/3/2023 142,319 0.00
EUR 272,683 SC Germany Auto UG haftungsbeschraenkt '2014-1 A' FRN 11/12/2023 272,871 0.00
EUR 10,785,000 State of Baden-Wurttemberg 0.625% 16/1/2025 11,061,366 0.19
EUR 14,375,000 State of Hesse 0.50% 17/2/2025 14,561,516 0.25 EUR 54,605,000 State of North Rhine-Westphalia
0.625% 17/11/2023 56,268,541 0.96 EUR 41,655,000 State of North Rhine-Westphalia
0.50% 11/3/2025 42,111,539 0.72 EUR 12,425,000 State of North Rhine-Westphalia
1.25% 12/5/2036 12,475,694 0.21 EUR 3,075,000 Symrise AG 1.75% 10/7/2019 3,173,046 0.05 EUR 2,759,000 Volkswagen Leasing GmbH FRN
11/8/2017 2,747,826 0.05
533,723,353 9.08
Greece EUR 8,000,000 Hellenic Republic Government Bond
'144A' 4.75% 17/4/2019 7,467,200 0.13 EUR 1,050,000 Hellenic Republic Government Bond
(Step-up Coupon) 3.00% 24/2/2023 833,469 0.02 EUR 1,050,000 Hellenic Republic Government Bond
(Step-up Coupon) 3.00% 24/2/2024 815,850 0.02 EUR 1,050,000 Hellenic Republic Government Bond
(Step-up Coupon) 3.00% 24/2/2025 800,667 0.02 EUR 1,050,000 Hellenic Republic Government Bond
(Step-up Coupon) 3.00% 24/2/2026 795,301 0.02 EUR 1,050,000 Hellenic Republic Government Bond
(Step-up Coupon) 3.00% 24/2/2027 770,889 0.01 EUR 1,050,000 Hellenic Republic Government Bond
(Step-up Coupon) 3.00% 24/2/2028 758,604 0.01 EUR 1,050,000 Hellenic Republic Government Bond
(Step-up Coupon) 3.00% 24/2/2029 743,484 0.01 EUR 1,050,000 Hellenic Republic Government Bond
(Step-up Coupon) 3.00% 24/2/2030 730,033 0.01 EUR 1,050,000 Hellenic Republic Government Bond
(Step-up Coupon) 3.00% 24/2/2031 718,525 0.01 EUR 1,050,000 Hellenic Republic Government Bond
(Step-up Coupon) 3.00% 24/2/2032 709,222 0.01 EUR 1,050,000 Hellenic Republic Government Bond
(Step-up Coupon) 3.00% 24/2/2033 699,300 0.01 EUR 1,050,000 Hellenic Republic Government Bond
(Step-up Coupon) 3.00% 24/2/2034 691,005 0.01 EUR 1,050,000 Hellenic Republic Government Bond
(Step-up Coupon) 3.00% 24/2/2035 683,130 0.01 EUR 1,050,000 Hellenic Republic Government Bond
(Step-up Coupon) 3.00% 24/2/2036 673,733 0.01 EUR 1,050,000 Hellenic Republic Government Bond
(Step-up Coupon) 3.00% 24/2/2037 670,005 0.01 EUR 1,050,000 Hellenic Republic Government Bond
(Step-up Coupon) 3.00% 24/2/2038 664,682 0.01 EUR 1,050,000 Hellenic Republic Government Bond
(Step-up Coupon) 3.00% 24/2/2039 664,692 0.01 EUR 1,050,000 Hellenic Republic Government Bond
(Step-up Coupon) 3.00% 24/2/2040 666,435 0.01 EUR 1,050,000 Hellenic Republic Government Bond
(Step-up Coupon) 3.00% 24/2/2041 664,755 0.01 EUR 1,050,000 Hellenic Republic Government Bond
(Step-up Coupon) 3.00% 24/2/2042 667,328 0.01
21,888,309 0.37
Guernsey EUR 3,195,000 Credit Suisse Group Funding
Guernsey Ltd 1.25% 14/4/2022 3,109,310 0.05
3,109,310 0.05
Iceland EUR 14,145,000 Iceland Government International
Bond 2.50% 15/7/2020 15,153,539 0.26
15,153,539 0.26
Ireland EUR 1,870,000 Allied Irish Banks Plc FRN
26/11/2025 1,789,253 0.03 EUR 275,000 Avoca Clo XIV Ltd 12/7/2028
(Zero Coupon) 231,742 0.01 EUR 100,000 Avoca Clo XIV Ltd 'E' FRN 12/7/2028 89,525 0.00 EUR 100,000 Avoca Clo XIV Ltd 'F' FRN 12/7/2028 81,772 0.00 EUR 2,490,000 Bank of Ireland FRN 11/6/2024 2,496,499 0.04 EUR 1,010,000 Bank of Ireland Mortgage Bank
1.875% 13/5/2017 1,028,382 0.02 SEK 7,345,847 Bluestep Mortgage Securities No2
Ltd 'AB' FRN 10/11/2055 791,797 0.01 EUR 2,000,000 ESB Finance Ltd 2.125% 8/6/2027 2,167,960 0.04 EUR 1,000,000 GE Capital European Funding
Unlimited Co 1.625% 15/3/2018 1,029,620 0.02 EUR 3,746,000 GE Capital European Funding
Unlimited Co 2.25% 20/7/2020 4,069,617 0.07 EUR 206,827 German Residential Funding Ltd
'2013-2 1 A' FRN 27/8/2024 208,935 0.00 EUR 103,413 German Residential Funding Ltd
'2013-2 1 B' FRN 27/8/2024 104,577 0.00 EUR 3,095,211 German Residential Funding Ltd
'2013-2 1 D' FRN 27/8/2024 3,134,513 0.05 EUR 130,445 German Residential Funding Ltd
'2013-2 1 E' FRN 27/8/2024 132,607 0.00 EUR 156,199 German Residential Funding Ltd
'2013-2 2 A' FRN 27/11/2024 157,506 0.00 EUR 211,737 German Residential Funding Ltd
'2013-2 2 B' FRN 27/11/2024 213,695 0.00 EUR 151,860 German Residential Funding Ltd
'2013-2 2 D' FRN 27/11/2024 153,165 0.00 EUR 275,952 German Residential Funding Ltd
'2013-2 2 E' FRN 27/11/2024 281,982 0.01 EUR 1,214,884 German Residential Funding Ltd
'2013-2 2 F' FRN 27/11/2024 1,233,107 0.02 EUR 300,000 Harvest Clo XI Ltd 'E' FRN 26/3/2029 269,373 0.01 EUR 14,593,000 Ireland Government Bond 4.50%
18/4/2020 17,221,929 0.29 EUR 26,454,675 Ireland Government Bond 5.00%
18/10/2020 32,336,211 0.55 EUR 123,698,817 Ireland Government Bond 1.00%
15/5/2026 126,175,886 2.15 EUR 5,271,000 Ireland Government Bond 2.00%
18/2/2045 5,551,312 0.10 EUR 1,329,711 Magellan Mortgages No4 Plc '4 A'
FRN 20/7/2059 1,121,745 0.02 EUR 800,000 Taurus Dac '2016-DE2 C' FRN
3/1/2027 800,400 0.01 EUR 848,000 Taurus Dac '2016-DE2 D' FRN
3/1/2027 848,424 0.02 EUR 1,153,331 Taurus Ltd '2015-2 DEU A' FRN
1/2/2026 1,139,635 0.02 EUR 986,000 Taurus Ltd '2015-2 DEU D' FRN
1/2/2026 960,364 0.02 EUR 1,366,000 Taurus Ltd '2015-2 DEU E' FRN
1/2/2026 1,320,922 0.02
207,142,455 3.53
BlackRock Fixed Income Strategies Fund continued
Germany continued

212 BlackRock Strategic Funds (BSF)
The notes on pages 489 to 503 form an integral part of these financial statements.
Transferable Securities and Money Market Instruments Admitted to an Official Stock Exchange Listing or Dealt in on Another Regulated Market
Transferable Securities and Money Market Instruments Admitted to an Official Stock Exchange Listing or Dealt in on Another Regulated Market
Holding
Description
Market Value
EUR
% of Net
Assets
Holding
Description
Market Value
EUR
% of Net
Assets
BlackRock Fixed Income Strategies Fund continued
Italy EUR 389,602 Asset Backed European
Securitisation Transaction Nine Srl 'A' FRN 10/12/2028 390,373 0.01
EUR 4,734,164 Asset-Backed European Securitisation Transaction Ten Srl 'A' FRN 10/12/2028 4,737,971 0.08
EUR 510,000 Assicurazioni Generali SpA FRN 27/10/2047 538,494 0.01
EUR 1,613,000 Atlantia SpA 3.625% 30/11/2018 1,751,863 0.03 EUR 895,000 Banca Monte dei Paschi di Siena SpA
2.875% 16/4/2021 (traded in Italy) 988,930 0.02 EUR 5,000 Banca Monte dei Paschi di Siena
SpA 2.875% 16/4/2021 (traded in Luxembourg) 5,525 0.00
EUR 16,080,000 Banca Monte dei Paschi di Siena SpA 1.25% 20/1/2022 16,402,082 0.28
EUR 4,865,000 Banca Popolare dell'Emilia Romagna SC 3.375% 22/10/2018 (traded in Italy) 5,265,098 0.09
EUR 600,000 Banca Popolare dell'Emilia Romagna SC 3.375% 22/10/2018 (traded in Luxembourg) 649,344 0.01
EUR 80,914 Berica PMI Srl 1 'A1X' FRN 31/5/2057 81,249 0.00
EUR 3,355,000 Buzzi Unicem SpA 2.125% 28/4/2023 3,362,532 0.06
EUR 1,170,000 Enel SpA FRN 15/1/2075 1,234,958 0.02 EUR 812,264 Fondi Immobili Pubblici
Funding Srl '1 A1' FRN 10/1/2023 802,217 0.01
USD 4,400,000 Intesa Sanpaolo SpA 5.25% 12/1/2024 4,278,271 0.07
EUR 704,000 Intesa Sanpaolo SpA 3.928% 15/9/2026 727,507 0.01
EUR 695,000 Intesa Sanpaolo SpA FRN (Perpetual) 674,150 0.01
EUR 57,344,326 Italy Buoni Poliennali Del Tesoro 2.10% 15/9/2016 57,837,488 0.99
EUR 41,445,329 Italy Buoni Poliennali Del Tesoro 2.55% 22/10/2016 41,864,963 0.71
EUR 153,642,827 Italy Buoni Poliennali Del Tesoro 2.25% 22/4/2017 156,842,439 2.67
EUR 43,378,878 Italy Buoni Poliennali Del Tesoro 2.15% 12/11/2017 44,696,729 0.76
EUR 30,000,000 Italy Buoni Poliennali Del Tesoro 0.25% 15/5/2018 30,176,250 0.51
EUR 53,251,196 Italy Buoni Poliennali Del Tesoro 1.70% 15/9/2018 55,881,805 0.95
EUR 115,089,617 Italy Buoni Poliennali Del Tesoro 1.65% 23/4/2020 121,704,393 2.07
EUR 27,754,414 Italy Buoni Poliennali Del Tesoro 1.25% 27/10/2020 29,087,320 0.50
EUR 1,725,000 Italy Buoni Poliennali Del Tesoro 3.75% 1/5/2021 2,003,380 0.04
EUR 1,450,000 Italy Buoni Poliennali Del Tesoro 4.50% 1/3/2024 1,819,373 0.03
EUR 125,288,582 Italy Buoni Poliennali Del Tesoro '144A' 2.35% 15/9/2024 144,291,101 2.46
EUR 33,902,136 Italy Buoni Poliennali Del Tesoro 3.10% 15/9/2026 42,091,874 0.72
EUR 81,629,184 Italy Buoni Poliennali Del Tesoro '144A' 1.25% 15/9/2032 85,420,859 1.45
EUR 60,603,000 Italy Buoni Poliennali Del Tesoro '144A' 2.70% 1/3/2047 62,454,422 1.06
EUR 12,275,000 Mediobanca SpA 0.875% 14/11/2017 12,376,821 0.21
EUR 4,925,000 Mediobanca SpA 1.125% 17/6/2019 5,095,306 0.09
EUR 1,473,421 SIENA PMI Srl '2015-1 A1B' FRN 5/11/2055 1,474,280 0.03
EUR 15,121,000 Snam SpA 2.375% 30/6/2017 15,498,949 0.26 EUR 148,683 Sunrise Srl '2014-1 A' FRN
27/5/2031 148,864 0.00 EUR 10,600,000 Sunrise Srl '2015-2 A' FRN
27/12/2032 10,657,145 0.18 EUR 776,040 Taurus Srl '2015-IT1 A' FRN
18/2/2027 768,667 0.01 EUR 703,000 Telecom Italia SpA/Milano 4.50%
20/9/2017 741,746 0.01 EUR 11,010,000 Terna Rete Elettrica Nazionale SpA
2.875% 16/2/2018 11,532,149 0.20 EUR 8,100,000 UniCredit SpA FRN 10/4/2017 8,141,958 0.14 EUR 1,530,000 UniCredit SpA 6.95% 31/10/2022 1,768,818 0.03 EUR 3,365,000 UniCredit SpA 2.00% 4/3/2023 3,456,629 0.06 EUR 6,490,000 UniCredit SpA FRN 28/10/2025 6,932,293 0.12 EUR 2,575,000 UniCredit SpA FRN 3/1/2027 2,575,747 0.04
999,232,332 17.01
Latvia EUR 2,000,000 Latvia Government International
Bond 1.375% 16/5/2036 1,980,200 0.03
1,980,200 0.03
Luxembourg EUR 9,000,000 Clariant Finance Luxembourg SA
5.625% 24/1/2017 9,311,760 0.16 EUR 2,500,000 CNH Industrial Finance Europe SA
6.25% 9/3/2018 2,706,887 0.05 GBP 3,305,628 Compartment Driver UK Three SA '3
A' FRN 25/1/2024 4,280,449 0.07 EUR 122,385 Compartment VCL 19 'B' FRN
21/11/2019 122,262 0.00 EUR 3,494,171 Compartment VCL 22 'A' FRN
21/8/2021 3,501,317 0.06 EUR 3,369,369 Compartment VCL 23 'A' FRN
21/1/2022 3,376,690 0.06 EUR 9,000,000 DH Europe Finance SA 1.70%
4/1/2022 9,500,130 0.16 EUR 134,528,000 European Financial Stability
Facility 0.40% 31/5/2026 133,652,223 2.27 EUR 6,150,000 Holcim Finance Luxembourg SA
1.375% 26/5/2023 6,224,661 0.11 EUR 5,625,000 Holcim Finance Luxembourg SA
2.25% 26/5/2028 5,758,425 0.10 EUR 2,252,380 Silver Arrow SA '5 A' FRN
15/10/2022 2,254,108 0.04 EUR 4,000,000 Telenet Finance VI Luxembourg
SCA RegS 4.875% 15/7/2027 4,085,000 0.07
184,773,912 3.15
Mexico EUR 1,800,000 America Movil SAB de CV
1.00% 4/6/2018 (traded in Luxembourg) 1,828,260 0.03
EUR 1,500,000 America Movil SAB de CV 1.00% 4/6/2018 (traded in Supranational) 1,523,550 0.03
MXN 1,162,500,000 Mexican Bonos 5.00% 11/12/2019 55,938,572 0.95 EUR 12,162,000 Petroleos Mexicanos 3.75%
15/3/2019 12,587,670 0.21
71,878,052 1.22
Portfolio of Investments as at 31 May 2016
Italy continued

Annual Report and Audited Accounts 213
The notes on pages 489 to 503 form an integral part of these financial statements.
Transferable Securities and Money Market Instruments Admitted to an Official Stock Exchange Listing or Dealt in on Another Regulated Market
Transferable Securities and Money Market Instruments Admitted to an Official Stock Exchange Listing or Dealt in on Another Regulated Market
Holding
Description
Market Value
EUR
% of Net
Assets
Holding
Description
Market Value
EUR
% of Net
Assets
* Securities on loan, see Note 16, for further details.
Portfolio of Investments as at 31 May 2016
Netherlands EUR 3,478,000 ABN AMRO Bank NV 3.625%
6/10/2017 3,649,605 0.06 EUR 4,250,000 ABN AMRO Bank NV 0.625%
31/5/2022 4,262,792 0.07 EUR 500,000 ABN AMRO Bank NV FRN (Perpetual)
(traded in Luxembourg) 485,040 0.01 EUR 200,000 ABN AMRO Bank NV FRN (Perpetual)
(traded in Netherlands) 194,016 0.00 EUR 6,950,000 Achmea Bank NV 0.875% 17/9/2018 7,057,725 0.12 EUR 5,975,000 Airbus Group Finance BV 1.375%
13/5/2031 5,840,443 0.10 EUR 5,632,000 ASML Holding NV 3.375%
19/9/2023 6,507,438 0.11 GBP 20,000,000 Bank Nederlandse Gemeenten NV
1.125% 7/3/2019 26,297,424 0.45 EUR 2,420,000 BMW Finance NV 0.50% 5/9/2018 2,443,353 0.04 EUR 1,000,000 Brenntag Finance BV 5.50%
19/7/2018 1,109,875 0.02 EUR 45,525,000 Cooperatieve Rabobank UA FRN
15/1/2018 45,590,101 0.78 EUR 8,400,000 Cooperatieve Rabobank UA 1.25%
23/3/2026 8,420,580 0.14 EUR 800,000 Cooperatieve Rabobank UA FRN
(Perpetual) 816,264 0.01 EUR 3,300,000 Demeter Investments BV for Zurich
Insurance Co Ltd FRN 1/10/2046 3,297,921 0.06 EUR 9,100,000 Deutsche Telekom International
Finance BV 0.625% 3/4/2023 9,079,343 0.16 EUR 2,500,000 EDP Finance BV 5.75% 21/9/2017 2,678,725 0.05 EUR 3,835,000 Enel Finance International NV
4.125% 12/7/2017 4,009,742 0.07 EUR 9,535,000 Enel Finance International NV
3.625% 17/4/2018 10,176,229 0.17 EUR 4,105,000 Enel Finance International NV 5.75%
24/10/2018 4,662,787 0.08 EUR 1,600,000 Enexis Holding NV 0.875% 28/4/2026 1,581,128 0.03 EUR 210,000 Euro-Galaxy IV CLO BV '2015-4X D'
FRN 30/7/2028 199,707 0.00 EUR 260,000 Euro-Galaxy IV CLO BV '2015-4X E'
FRN 30/7/2028 226,425 0.00 EUR 100,000 Euro-Galaxy IV CLO BV '2015-4X F'
FRN 30/7/2028 82,149 0.00 EUR 4,800,000 Gas Natural Fenosa Finance BV FRN
(Perpetual) 4,722,000 0.08 EUR 4,500,000 Gas Natural Fenosa Finance BV FRN
(Perpetual) 4,040,460 0.07 EUR 8,975,000 General Motors Financial
International BV 0.85% 23/2/2018 9,031,542 0.15 EUR 3,350,000 Goodyear Dunlop Tires Europe BV
RegS 3.75% 15/12/2023 3,498,338 0.06 EUR 7,600,000 Highway BV '2015-1 A' FRN
26/5/2025 7,612,570 0.13 EUR 1,700,000 LeasePlan Corp NV 1.00%
8/4/2020 1,711,654 0.03 EUR 2,300,000 Louis Dreyfus Co BV 3.875%
30/7/2018 2,336,386 0.04 EUR 7,800,000 Nederlandse Waterschapsbank
NV 0.50% 29/4/2030 7,316,478 0.13 EUR 650,000 North Westerly CLO IV 2013 BV
'X A-1' FRN 15/1/2026 650,765 0.01 EUR 1,471,000 North Westerly CLO IV 2013 BV
'X D' FRN 15/1/2026 1,477,707 0.03 EUR 1,425,000 PACCAR Financial Europe BV FRN
19/5/2017 1,426,910 0.02
EUR 4,175,000 PACCAR Financial Europe BV 0.125% 24/5/2019 4,175,731 0.07
USD 20,000,000 Petrobras Global Finance BV 8.375% 23/5/2021 17,816,370 0.30
USD 30,915,000 Petrobras Global Finance BV 8.75% 23/5/2026 26,474,050 0.45
EUR 2,500,000 Roche Finance Europe BV 2.00% 25/6/2018 2,605,837 0.04
EUR 7,567,000 SNS Bank NV FRN 5/11/2025 7,632,114 0.13 EUR 16,690 Storm BV '2012-IV A1' FRN
22/8/2054 16,707 0.00 EUR 5,100,000 Unilever NV 29/4/2020
(Zero Coupon) 5,092,809 0.09 EUR 8,500,000 Unilever NV 0.50% 29/4/2024 8,383,380 0.14 EUR 2,005,000 Volkswagen International
Finance NV FRN (Perpetual) 2,034,072 0.04 EUR 7,195,000 Volkswagen International
Finance NV FRN (Perpetual) 6,511,475 0.11 EUR 1,500,000 Volkswagen International
Finance NV FRN (Perpetual) 1,306,875 0.02 EUR 3,430,000 Volkswagen International
Finance NV RegS FRN (Perpetual) 3,392,887 0.06
EUR 1,100,000 Vonovia Finance BV 1.625% 15/12/2020 1,139,056 0.02
279,074,985 4.75
Norway EUR 8,325,000 Eika Boligkreditt AS 0.375%
20/4/2023 8,356,635 0.14 EUR 1,000,000 Santander Consumer Bank
AS 1.00% 10/6/2016 1,000,255 0.02 EUR 6,000,000 Santander Consumer Bank
AS 0.625% 20/4/2018 6,046,620 0.10
15,403,510 0.26
Portugal EUR 16,200,000 Banco Santander Totta SA
1.50% 3/4/2017 16,421,697 0.28 EUR 149,311 Gamma Sociedade de
Titularizacao de Creditos SA/Atlantes Finance '6 A' FRN 20/3/2033 150,067 0.00
EUR 761,820 Gamma Sociedade de Titularizacao de Creditos SA/Atlantes Mortgage '3 A' FRN 20/8/2061 664,909 0.01
EUR 12,870,000 Portugal Obrigacoes do Tesouro OT '144A' 4.45% 15/6/2018 13,899,150 0.24
EUR 116,240,000 Portugal Obrigacoes do Tesouro OT '144A' 4.75% 14/6/2019 129,028,144 2.20
EUR 71,525,828 Portugal Obrigacoes do Tesouro OT '144A' 4.80% 15/6/2020 80,765,534 1.37
EUR 183,715,000 Portugal Obrigacoes do Tesouro OT '144A' 2.20% 17/10/2022 182,520,853 3.11
EUR 37,344,869 Portugal Obrigacoes do Tesouro OT '144A' 2.875% 21/7/2026* 36,722,330 0.62
EUR 390,873 TAGUS - Sociedade de Titularizacao de Creditos SA/Volta Electricity Receivables 4.172% 16/2/2017 396,228 0.01
EUR 1,223,807 TAGUS - Sociedade de Titularizacao de Creditos SA/Volta II Electricity Receivables 2.98% 16/2/2018 1,234,821 0.02
461,803,733 7.86
BlackRock Fixed Income Strategies Fund continued
Netherlands continued

214 BlackRock Strategic Funds (BSF)
The notes on pages 489 to 503 form an integral part of these financial statements.
Transferable Securities and Money Market Instruments Admitted to an Official Stock Exchange Listing or Dealt in on Another Regulated Market
Transferable Securities and Money Market Instruments Admitted to an Official Stock Exchange Listing or Dealt in on Another Regulated Market
Holding
Description
Market Value
EUR
% of Net
Assets
Holding
Description
Market Value
EUR
% of Net
Assets
BlackRock Fixed Income Strategies Fund continued
Romania EUR 5,300,000 Romanian Government International
Bond 5.25% 17/6/2016 5,314,999 0.09
5,314,999 0.09
Slovenia EUR 2,850,000 Slovenia Government Bond 1.75%
9/10/2017 2,924,100 0.05
2,924,100 0.05
Spain EUR 8,500,000 Amadeus Capital Markets SA
Sociedad Unipersonal 4.875% 15/7/2016 8,548,195 0.15
EUR 3,100,000 Amadeus Capital Markets SA Sociedad Unipersonal 1.625% 17/11/2021 3,218,885 0.05
EUR 2,675,880 Auto ABS '2012-3 A' 0.60% 27/9/2024 2,679,184 0.05
EUR 700,000 Ayt Cedulas Cajas Global 4.00% 20/12/2016 715,330 0.01
EUR 12,400,000 Banco Bilbao Vizcaya Argentaria SA 3.625% 18/1/2017 12,689,292 0.22
EUR 10,000,000 Banco Bilbao Vizcaya Argentaria SA 3.50% 5/12/2017 10,553,000 0.18
EUR 600,000 Banco Bilbao Vizcaya Argentaria SA FRN (Perpetual) 621,480 0.01
EUR 5,100,000 Banco Popular Espanol SA 3.50% 11/9/2017 5,328,633 0.09
EUR 14,300,000 Bankia SA 3.625% 5/10/2016 14,477,749 0.25 EUR 3,000,000 Bankia SA 4.25% 25/5/2018 3,251,610 0.05 EUR 11,100,000 Bankia SA FRN 22/5/2024 10,844,034 0.18 EUR 6,200,000 Caja Rural de Castilla-La Mancha
SCC 0.875% 27/5/2024 6,245,322 0.11 EUR 2,000,000 Cajamar Caja Rural SCC 3.75%
22/11/2018 2,181,400 0.04 EUR 8,218,439 Driver Espana Three FT 'A' FRN
21/12/2026 8,267,506 0.14 EUR 1,300,000 Enagas Financiaciones SAU
1.375% 5/5/2028 1,296,412 0.02 EUR 5,000,000 Gas Natural Capital Markets SA
4.125% 24/4/2017 5,182,725 0.09 EUR 15,000,000 Gas Natural Capital Markets SA
5.00% 13/2/2018 16,245,525 0.28 EUR 8,400,000 Ibercaja Banco SA FRN 28/7/2025 7,981,344 0.14 EUR 23,175,000 Instituto de Credito Oficial 0.50%
15/12/2017 23,365,846 0.40 EUR 2,400,000 Mapfre SA 1.625% 19/5/2026 2,371,884 0.04 EUR 4,850,000 Merlin Properties Socimi SA
2.225% 25/4/2023 4,939,240 0.08 EUR 3,000,000 Santander Consumer Finance
SA 1.10% 30/7/2018 3,053,580 0.05 EUR 2,900,000 Santander Consumer Finance SA
1.50% 12/11/2020 2,981,621 0.05 EUR 6,700,000 Santander Consumer Finance SA
RegS 0.90% 18/2/2020 6,735,175 0.11 EUR 5,000,000 Spain Government Bond 1.40%
31/1/2020 5,220,250 0.09 EUR 11,207,000 Spain Government Bond '144A'
2.90% 31/10/2046 11,633,426 0.20 EUR 147,161,783 Spain Government Inflation Linked
Bond '144A' 0.55% 30/11/2019 151,841,528 2.58 EUR 24,993,000 Spain Government Inflation Linked
Bond '144A' 1.80% 30/11/2024 27,617,265 0.47
360,087,441 6.13
Supranational GBP 20,148,000 European Investment Bank
1.50% 1/2/2019 26,826,576 0.45 EUR 26,000,000 European Stability Mechanism
0.05% 17/12/2018 26,267,930 0.45 EUR 17,300,000 European Stability Mechanism
0.50% 2/3/2026 17,489,089 0.30
70,583,595 1.20
Sweden EUR 2,530,000 Scania CV AB 1.625% 14/9/2017 2,573,073 0.04
2,573,073 0.04
Switzerland EUR 900,000 Credit Suisse AG FRN 18/9/2025 970,875 0.02 USD 1,346,000 Credit Suisse AG RegS 6.50%
8/8/2023 1,283,384 0.02 EUR 8,875,000 Credit Suisse AG/Guernsey
0.75% 17/9/2021 9,139,653 0.16 EUR 3,800,000 Credit Suisse AG/London
3.875% 25/1/2017 3,896,064 0.07 EUR 14,800,000 Credit Suisse AG/London FRN
30/3/2017 14,810,582 0.25 EUR 11,625,000 Credit Suisse AG/London
0.625% 20/11/2018 11,736,135 0.20 EUR 1,900,000 Credit Suisse AG/London
1.50% 10/4/2026 1,917,908 0.03 EUR 19,001,000 UBS AG FRN 12/2/2026 20,161,771 0.34 EUR 9,500,000 UBS AG/London 0.50%
15/5/2018 9,587,447 0.16
73,503,819 1.25
United Arab Emirates EUR 1,745,000 Glencore Finance Dubai Ltd
2.625% 19/11/2018 1,758,088 0.03
1,758,088 0.03
United Kingdom EUR 939,463 Aire Valley Mortgages Plc '2004-1X
3A2' FRN 20/9/2066 922,252 0.02 EUR 1,702,000 Anglo American Capital Plc 1.75%
20/11/2017 1,696,571 0.03 EUR 5,250,000 Anglo American Capital Plc
1.75% 3/4/2018 5,194,403 0.09 EUR 3,157,000 Anglo American Capital Plc
2.75% 7/6/2019 3,084,515 0.05 GBP 70 Annington Finance No 4 Plc
'B3' FRN 10/1/2023 92 0.00 GBP 426,194 Auburn Securities 5 Plc 'A2'
FRN 1/12/2041 532,126 0.01 EUR 4,000,000 Barclays Bank Plc 4.00%
20/1/2017 4,102,780 0.07 GBP 5,000,000 Barclays Bank Plc 10.00%
21/5/2021 8,237,709 0.14 GBP 625,000 Broadgate Financing Plc FRN
5/1/2022 799,146 0.01 GBP 105,000 Broadgate Financing Plc FRN
5/10/2023 130,957 0.00 GBP 300,000 Canary Wharf Finance II Plc
'C2' FRN 22/10/2037 310,707 0.01 GBP 2,051,000 Canary Wharf Finance II Plc
'D2' FRN 22/10/2037 2,204,982 0.04 GBP 285,000 Co-operative Group Holdings
2011 Ltd (Step-up Coupon) 6.875% 8/7/2020 409,391 0.01
GBP 681,533 DECO 12-UK 4 Plc '2007-C4X B' FRN 27/1/2020 856,513 0.01
Portfolio of Investments as at 31 May 2016

Annual Report and Audited Accounts 215
The notes on pages 489 to 503 form an integral part of these financial statements.
Transferable Securities and Money Market Instruments Admitted to an Official Stock Exchange Listing or Dealt in on Another Regulated Market
Transferable Securities and Money Market Instruments Admitted to an Official Stock Exchange Listing or Dealt in on Another Regulated Market
Holding
Description
Market Value
EUR
% of Net
Assets
Holding
Description
Market Value
EUR
% of Net
Assets
Portfolio of Investments as at 31 May 2016
GBP 8,590,000 Delamare Cards '2015-1 A1' FRN 19/4/2020 11,172,550 0.19
GBP 2,157,521 Duncan Funding Plc '2015-1 A1' FRN 17/12/2062 2,824,888 0.05
GBP 12,400,000 Duncan Funding Plc '2016-1X A1B' FRN 17/4/2063 16,270,263 0.28
GBP 118,568 E-Carat 3 Plc 'A' FRN 18/3/2022 155,340 0.00 GBP 4,550,984 E-Carat 5 Plc 'A' FRN 18/4/2023 5,941,169 0.10 GBP 610,000 E-Carat 5 Plc 'B' FRN 18/4/2023 789,583 0.01 GBP 2,981,824 E-Carat 6 Plc 'A' FRN 18/6/2024 3,913,482 0.07 EUR 6,847,904 Eddystone Finance Plc '2006-1 A1B'
FRN 19/4/2021 6,707,624 0.11 GBP 192,975 Eddystone Finance Plc '2006-1 A2'
FRN 19/4/2021 246,554 0.00 GBP 150,000 Enterprise Inns Plc 6.875%
15/2/2021 207,108 0.00 GBP 4,800,000 Enterprise Inns Plc 6.00%
6/10/2023 6,169,755 0.11 GBP 2,516,860 Eurosail Plc '2006-1X A2C' FRN
10/6/2044 3,208,056 0.05 EUR 120,025 Eurosail Plc ‘2006-4X B1A' FRN
10/12/2044 84,817 0.00 GBP 2,148,422 Eurosail-UK Plc '2007-4X A2A'
FRN 13/6/2045 2,803,193 0.05 GBP 2,160,000 Eurosail-UK Plc '2007-4X A3'
FRN 13/6/2045 2,698,229 0.05 EUR 1,400,000 FCE Bank Plc 1.875% 18/4/2019 1,453,844 0.02 GBP 1,752,606 Fosse Master Issuer Plc '2014-1X
A2' FRN 18/10/2054 2,294,456 0.04 GBP 3,835,000 Fosse Master Issuer Plc '2015-1X
A3' FRN 18/10/2054 5,003,761 0.09 GBP 2,220,296 Gemgarto Plc '2015-1 A' FRN
16/2/2047 2,890,559 0.05 GBP 71,225 Gemgarto Plc '2015-1 X1' FRN
16/2/2047 92,069 0.00 GBP 1,797,199 Gemgarto Plc '2015-2 A' FRN
16/2/2054 2,360,548 0.04 GBP 275,000 Gemgarto Plc '2015-2 B' FRN
16/2/2054 359,460 0.01 GBP 118,400 Gemgarto Plc '2015-2 X1' FRN
16/2/2054 155,126 0.00 GBP 455,000 Gosforth Funding Plc '2014-1 A2'
FRN 19/10/2056 593,915 0.01 GBP 4,531,206 Gosforth Funding Plc '2015-1 A1'
FRN 16/6/2057 5,913,837 0.10 EUR 3,500,000 Gosforth Funding Plc '2016-1X A2A'
FRN 15/2/2058 3,495,506 0.06 EUR 1,720,000 Gosforth Funding Plc '2016-2X A1A'
FRN 24/7/2058 1,722,051 0.03 GBP 3,370,736 Greene King Finance Plc FRN
15/12/2033 4,308,424 0.07 GBP 1,150,000 Greene King Finance Plc 4.064%
15/3/2035 1,543,463 0.03 USD 10,960,000 Holmes Master Issuer Plc '2016-1A
A1' '144A' FRN 15/4/2017 9,813,414 0.17 USD 1,875,000 HSBC Holdings Plc FRN (Perpetual) 1,701,760 0.03 GBP 950,422 Kenrick No 2 Plc 'A' FRN 18/4/2049 1,244,422 0.02 EUR 2,538,140 Kensington Mortgage Securities Plc
'2007-1X A3B' FRN 14/6/2040 2,315,988 0.04 EUR 2,968,425 Lanark Master Issuer Plc '2014-2X
1A' FRN 22/12/2054 2,962,846 0.05 GBP 4,041,000 Lanark Master Issuer Plc '2015-1X
1A' FRN 22/12/2054 5,272,128 0.09 USD 331,552 Leek Finance Number Eighteen Plc
'18X A2B' FRN 21/9/2038 311,672 0.01 USD 207,220 Leek Finance Number Eighteen Plc
'18X A2D' FRN 21/9/2038 196,512 0.00 EUR 1,400,000 Leek Finance Number Eighteen Plc
'18X BC' FRN 21/9/2038 1,383,832 0.02
EUR 8,300,000 Leek Finance Number Eighteen Plc '18X MC' FRN 21/9/2038 8,223,786 0.14
GBP 4,500,000 Legal & General Group Plc FRN 27/10/2045 5,922,525 0.10
GBP 3,200,000 Logistics UK Plc '2015 1X A' FRN 20/8/2025 4,190,177 0.07
GBP 4,845,000 Logistics UK Plc '2015 1X E' FRN 20/8/2025 6,188,562 0.11
GBP 85,195 London & Regional Debt Securitisation No 2 Plc 'A' FRN 15/10/2018 111,585 0.00
EUR 600,000 Ludgate Funding Plc '2007-1 BB' FRN 1/1/2061 475,338 0.01
EUR 500,000 Ludgate Funding Plc '2007-1 MB' FRN 1/1/2061 406,200 0.01
GBP 300,000 Mitchells & Butlers Finance Plc 6.469% 15/9/2030 470,016 0.01
GBP 955,000 Mitchells & Butlers Finance Plc FRN 15/9/2034 949,345 0.02
GBP 798,000 Mitchells & Butlers Finance Plc FRN 15/6/2036 770,289 0.01
GBP 69,852 Morpheus European Loan Conduit No 19 Plc 'C' FRN 1/11/2029 91,199 0.00
GBP 4,602,525 MOTOR Plc '2015-1X A2' FRN 25/6/2022 6,027,711 0.10
GBP 8,260,000 National Westminster Bank Plc 6.50% 7/9/2021 12,280,574 0.21
GBP 78,544 Nemus II Arden Plc '2006-2 C' FRN 15/2/2020 95,171 0.00
USD 59,769 Paragon Mortgages No 13 Plc 'A2C' FRN 15/1/2039 47,063 0.00
EUR 2,387,369 Paragon Mortgages No 23 Plc 'A1' FRN 15/1/2043 2,363,034 0.04
GBP 2,440,745 Paragon Mortgages No 23 Plc 'A2' FRN 15/1/2043 3,174,036 0.05
GBP 555,000 Paragon Mortgages No 23 Plc 'C' FRN 15/1/2043 685,853 0.01
GBP 3,398,176 Paragon Mortgages No 24 Plc 'A2' FRN 15/7/2043 4,441,619 0.08
EUR 2,473,521 Paragon Mortgages No 7 Plc 'A1C' FRN 15/5/2034 2,273,593 0.04
GBP 135,466 Precise Mortgage Funding No 1 Plc 'A' FRN 12/3/2047 175,979 0.00
GBP 151,948 Premiertel Plc 6.175% 8/5/2032 232,324 0.00 GBP 207,199 Punch Taverns Finance Plc 7.32%
15/10/2025 295,422 0.01 GBP 76,000 Punch Taverns Finance Plc '144A'
7.32% 15/10/2025 107,799 0.00 GBP 1,055,640 Punch Taverns Finance Plc 7.274%
15/10/2026 1,480,898 0.03 GBP 380,000 Punch Taverns Finance Plc '144A'
7.274% 15/10/2026 536,506 0.01 GBP 1,394,449 Residential Mortgage Securities 25
Plc 'A1' FRN 16/12/2050 1,866,559 0.03 GBP 117,471 Residential Mortgage Securities 26
Plc 'A1' FRN 14/2/2041 157,218 0.00 GBP 200,000 Rochester Financing No1 Plc 'B' FRN
16/7/2046 258,651 0.00 EUR 2,000,000 Royal Bank of Scotland Plc /The
6.934% 9/4/2018 2,197,500 0.04 GBP 5,285,000 Santander UK Group Holdings Plc
3.625% 14/1/2026 6,942,927 0.12 GBP 10,552,000 Scottish Widows Ltd 5.50%
16/6/2023 14,436,543 0.25 GBP 68,434 Silk Road Finance Number Three
Plc '2012-1 A' FRN 21/6/2055 89,910 0.00 GBP 4,420,000 Silverstone Master Issuer Plc '
2015-1X 1A' FRN 21/1/2070 5,771,481 0.10 EUR 2,435,000 Sky Plc 1.50% 15/9/2021 2,489,982 0.04
BlackRock Fixed Income Strategies Fund continued
United Kingdom continued United Kingdom continued
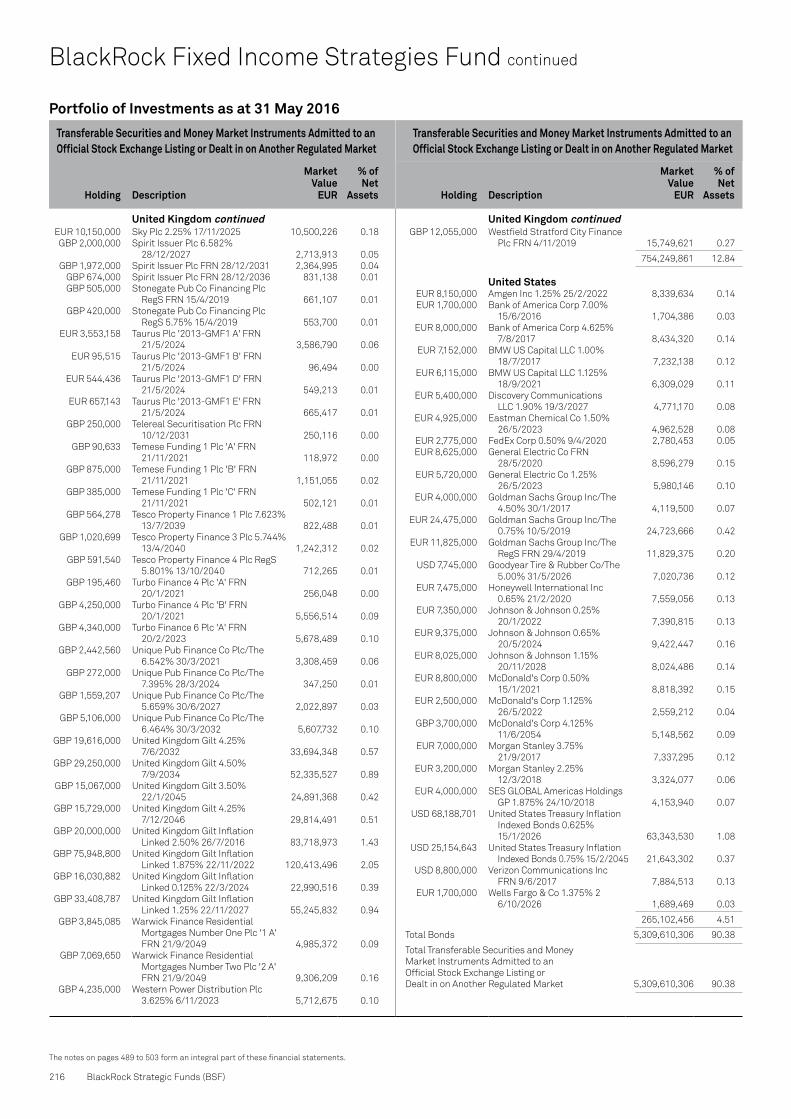
216 BlackRock Strategic Funds (BSF)
The notes on pages 489 to 503 form an integral part of these financial statements.
Transferable Securities and Money Market Instruments Admitted to an Official Stock Exchange Listing or Dealt in on Another Regulated Market
Transferable Securities and Money Market Instruments Admitted to an Official Stock Exchange Listing or Dealt in on Another Regulated Market
Holding
Description
Market Value
EUR
% of Net
Assets
Holding
Description
Market Value
EUR
% of Net
Assets
BlackRock Fixed Income Strategies Fund continued
EUR 10,150,000 Sky Plc 2.25% 17/11/2025 10,500,226 0.18 GBP 2,000,000 Spirit Issuer Plc 6.582%
28/12/2027 2,713,913 0.05 GBP 1,972,000 Spirit Issuer Plc FRN 28/12/2031 2,364,995 0.04 GBP 674,000 Spirit Issuer Plc FRN 28/12/2036 831,138 0.01 GBP 505,000 Stonegate Pub Co Financing Plc
RegS FRN 15/4/2019 661,107 0.01 GBP 420,000 Stonegate Pub Co Financing Plc
RegS 5.75% 15/4/2019 553,700 0.01 EUR 3,553,158 Taurus Plc '2013-GMF1 A' FRN
21/5/2024 3,586,790 0.06 EUR 95,515 Taurus Plc '2013-GMF1 B' FRN
21/5/2024 96,494 0.00 EUR 544,436 Taurus Plc '2013-GMF1 D' FRN
21/5/2024 549,213 0.01 EUR 657,143 Taurus Plc '2013-GMF1 E' FRN
21/5/2024 665,417 0.01 GBP 250,000 Telereal Securitisation Plc FRN
10/12/2031 250,116 0.00 GBP 90,633 Temese Funding 1 Plc 'A' FRN
21/11/2021 118,972 0.00 GBP 875,000 Temese Funding 1 Plc 'B' FRN
21/11/2021 1,151,055 0.02 GBP 385,000 Temese Funding 1 Plc 'C' FRN
21/11/2021 502,121 0.01 GBP 564,278 Tesco Property Finance 1 Plc 7.623%
13/7/2039 822,488 0.01 GBP 1,020,699 Tesco Property Finance 3 Plc 5.744%
13/4/2040 1,242,312 0.02 GBP 591,540 Tesco Property Finance 4 Plc RegS
5.801% 13/10/2040 712,265 0.01 GBP 195,460 Turbo Finance 4 Plc 'A' FRN
20/1/2021 256,048 0.00 GBP 4,250,000 Turbo Finance 4 Plc 'B' FRN
20/1/2021 5,556,514 0.09 GBP 4,340,000 Turbo Finance 6 Plc 'A' FRN
20/2/2023 5,678,489 0.10 GBP 2,442,560 Unique Pub Finance Co Plc/The
6.542% 30/3/2021 3,308,459 0.06 GBP 272,000 Unique Pub Finance Co Plc/The
7.395% 28/3/2024 347,250 0.01 GBP 1,559,207 Unique Pub Finance Co Plc/The
5.659% 30/6/2027 2,022,897 0.03 GBP 5,106,000 Unique Pub Finance Co Plc/The
6.464% 30/3/2032 5,607,732 0.10 GBP 19,616,000 United Kingdom Gilt 4.25%
7/6/2032 33,694,348 0.57 GBP 29,250,000 United Kingdom Gilt 4.50%
7/9/2034 52,335,527 0.89 GBP 15,067,000 United Kingdom Gilt 3.50%
22/1/2045 24,891,368 0.42 GBP 15,729,000 United Kingdom Gilt 4.25%
7/12/2046 29,814,491 0.51 GBP 20,000,000 United Kingdom Gilt Inflation
Linked 2.50% 26/7/2016 83,718,973 1.43 GBP 75,948,800 United Kingdom Gilt Inflation
Linked 1.875% 22/11/2022 120,413,496 2.05 GBP 16,030,882 United Kingdom Gilt Inflation
Linked 0.125% 22/3/2024 22,990,516 0.39 GBP 33,408,787 United Kingdom Gilt Inflation
Linked 1.25% 22/11/2027 55,245,832 0.94 GBP 3,845,085 Warwick Finance Residential
Mortgages Number One Plc '1 A' FRN 21/9/2049 4,985,372 0.09
GBP 7,069,650 Warwick Finance Residential Mortgages Number Two Plc '2 A' FRN 21/9/2049 9,306,209 0.16
GBP 4,235,000 Western Power Distribution Plc 3.625% 6/11/2023 5,712,675 0.10
GBP 12,055,000 Westfield Stratford City Finance Plc FRN 4/11/2019 15,749,621 0.27
754,249,861 12.84
United States EUR 8,150,000 Amgen Inc 1.25% 25/2/2022 8,339,634 0.14 EUR 1,700,000 Bank of America Corp 7.00%
15/6/2016 1,704,386 0.03 EUR 8,000,000 Bank of America Corp 4.625%
7/8/2017 8,434,320 0.14 EUR 7,152,000 BMW US Capital LLC 1.00%
18/7/2017 7,232,138 0.12 EUR 6,115,000 BMW US Capital LLC 1.125%
18/9/2021 6,309,029 0.11 EUR 5,400,000 Discovery Communications
LLC 1.90% 19/3/2027 4,771,170 0.08 EUR 4,925,000 Eastman Chemical Co 1.50%
26/5/2023 4,962,528 0.08 EUR 2,775,000 FedEx Corp 0.50% 9/4/2020 2,780,453 0.05 EUR 8,625,000 General Electric Co FRN
28/5/2020 8,596,279 0.15 EUR 5,720,000 General Electric Co 1.25%
26/5/2023 5,980,146 0.10 EUR 4,000,000 Goldman Sachs Group Inc/The
4.50% 30/1/2017 4,119,500 0.07 EUR 24,475,000 Goldman Sachs Group Inc/The
0.75% 10/5/2019 24,723,666 0.42 EUR 11,825,000 Goldman Sachs Group Inc/The
RegS FRN 29/4/2019 11,829,375 0.20 USD 7,745,000 Goodyear Tire & Rubber Co/The
5.00% 31/5/2026 7,020,736 0.12 EUR 7,475,000 Honeywell International Inc
0.65% 21/2/2020 7,559,056 0.13 EUR 7,350,000 Johnson & Johnson 0.25%
20/1/2022 7,390,815 0.13 EUR 9,375,000 Johnson & Johnson 0.65%
20/5/2024 9,422,447 0.16 EUR 8,025,000 Johnson & Johnson 1.15%
20/11/2028 8,024,486 0.14 EUR 8,800,000 McDonald's Corp 0.50%
15/1/2021 8,818,392 0.15 EUR 2,500,000 McDonald's Corp 1.125%
26/5/2022 2,559,212 0.04 GBP 3,700,000 McDonald's Corp 4.125%
11/6/2054 5,148,562 0.09 EUR 7,000,000 Morgan Stanley 3.75%
21/9/2017 7,337,295 0.12 EUR 3,200,000 Morgan Stanley 2.25%
12/3/2018 3,324,077 0.06 EUR 4,000,000 SES GLOBAL Americas Holdings
GP 1.875% 24/10/2018 4,153,940 0.07 USD 68,188,701 United States Treasury Inflation
Indexed Bonds 0.625% 15/1/2026 63,343,530 1.08
USD 25,154,643 United States Treasury Inflation Indexed Bonds 0.75% 15/2/2045 21,643,302 0.37
USD 8,800,000 Verizon Communications Inc FRN 9/6/2017 7,884,513 0.13
EUR 1,700,000 Wells Fargo & Co 1.375% 2 6/10/2026 1,689,469 0.03
265,102,456 4.51
Total Bonds 5,309,610,306 90.38
Total Transferable Securities and Money Market Instruments Admitted to an Official Stock Exchange Listing or Dealt in on Another Regulated Market 5,309,610,306 90.38
Portfolio of Investments as at 31 May 2016
United Kingdom continued United Kingdom continued

Annual Report and Audited Accounts 217
The notes on pages 489 to 503 form an integral part of these financial statements.
Other Transferable Securities and Money Market Instruments Collective Investment Schemes
Holding
Description
Market Value
EUR
% of Net
Assets
** Security subject to a fair value adjustment as detailed in Note 2(i). 1 Investment in connected party fund, see further information in Note 10.
BONDS
Ireland EUR 294,400 Talisman-4 Finance Plc 'B'
(Defaulted) FRN 22/7/2015** — 0.00
— 0.00
Total Bonds — 0.00
Total Other Transferable Securities and Money Market Instruments — 0.00
Ireland 234,636,482 Institutional Cash Series Plc -
Institutional Euro Assets Liquidity Fund 1 234,636,482 3.99
234,636,482 3.99Total Collective Investment Schemes 234,636,482 3.99
Securities portfolio at market value 5,544,246,788 94.37
Other Net Assets 330,844,384 5.63
Total Net Assets (EUR) 5,875,091,172 100.00
BlackRock Fixed Income Strategies Fund continued
Portfolio of Investments as at 31 May 2016

TypeNominal
Value Description CounterpartyExpiration
date
Unrealised appreciation/
(depreciation) EUR
Market Value
EUR
Swaps as at 31 May 2016
218 BlackRock Strategic Funds (BSF)
The notes on pages 489 to 503 form an integral part of these financial statements.
CDS EUR 600,000 Fund receives Fixed 1.000% and provides default protection on Bank of America Vodafone Group Plc Merrill Lynch 20/06/2019 (2,228) 8,784
CDS EUR 10,000,000 Fund receives default protection on Banco Santander SA and Bank of America pays Fixed 1.000% Merrill Lynch 20/12/2020 35,058 668,746
CDS EUR 1,114,000 Fund receives default protection on Credit Agricole SA and Bank of America pays Fixed 1.000% Merrill Lynch 20/12/2020 (60,987) 22,849
CDS EUR 724,000 Fund receives default protection on Deutsche Lufthansa AG and Bank of America pays Fixed 1.000% Merrill Lynch 20/12/2020 (27,013) (397)
CDS EUR 1,110,000 Fund receives default protection on Sky Plc and Bank of America pays Fixed 1.000% Merrill Lynch 20/12/2020 (2,766) (9,165)
CDS EUR 1,110,000 Fund receives default protection on Sky Plc and Bank of America pays Fixed 1.000% Merrill Lynch 20/12/2020 (2,766) (9,165)
CDS EUR 1,450,000 Fund receives default protection on Barclays Bank Plc and Bank of America pays Fixed 1.000% Merrill Lynch 20/06/2021 (33,189) 68,075
CDS EUR 14,640,000 Fund receives default protection on Continental AG and Bank of America pays Fixed 1.000% Merrill Lynch 20/06/2021 12,219 (263,499)
CDS EUR 6,820,000 Fund receives default protection on Koninklijke DSM NV and Bank of America pays Fixed 1.000% Merrill Lynch 20/06/2021 4,498 (215,504)
CDS EUR 55,500,000 Fund receives default protection on Markit iTraxx Europe Bank of America Series 25 Version 1 and pays Fixed 1.000% Merrill Lynch 20/06/2021 (10,573) (784,484)
CDS EUR 770,000 Fund receives default protection on Valeo SA and Bank of America pays Fixed 1.000% Merrill Lynch 20/06/2021 (2,027) (10,291)
CDS EUR 7,635,000 Fund receives default protection on Wolters Kluwer NV and Bank of America pays Fixed 1.000% Merrill Lynch 20/06/2021 8,445 (246,014)
CDS EUR 2,500,000 Fund receives default protection on Deutsche Telekom International Finance BV and pays Fixed 1.000% Barclays Bank 20/03/2019 (4,211) (54,881)
CDS EUR 1,150,000 Fund receives default protection on Vodafone Group Plc and pays Fixed 1.000% Barclays Bank 20/06/2020 (3,767) (13,432)
CDS EUR 340,000 Fund receives default protection on Vodafone Group Plc and pays Fixed 1.000% Barclays Bank 20/06/2020 (1,626) (3,971)
CDS EUR 7,310,000 Fund receives default protection on Banco Santander SA and pays Fixed 1.000% Barclays Bank 20/12/2020 (160,398) 76,197
CDS EUR 5,000,000 Fund receives default protection on British Telecom Plc and pays Fixed 1.000% Barclays Bank 20/12/2020 (42,106) (68,132)
CDS EUR 4,182,000 Fund receives default protection on Societe Generale and pays Fixed 1.000% Barclays Bank 20/12/2020 (45,734) (57,709)
CDS EUR 2,520,000 Fund receives default protection on WPP 2005 Ltd and pays Fixed 1.000% Barclays Bank 20/12/2020 (21,588) (60,072)
CDS EUR 4,182,000 Fund receives Fixed 1.000% and provides default protection on BNP Paribas SA Barclays Bank 20/12/2020 28,341 49,838
CDS EUR 2,721,000 Fund receives Fixed 1.000% and provides default protection on Markit iTraxx Europe Series 24 Version 1 Barclays Bank 20/12/2020 28,267 34,945
CDS EUR 1,360,000 Fund receives Fixed 1.000% and provides default protection on Markit iTraxx Europe Series 24 Version 1 Barclays Bank 20/12/2020 14,429 17,466
CDS EUR 3,160,000 Fund receives Fixed 1.000% and provides default protection on Markit iTraxx Europe Series 24 Version 1 Barclays Bank 20/12/2020 34,325 40,583
CDS EUR 820,000 Fund receives Fixed 1.000% and provides default protection on Markit iTraxx Europe Series 24 Version 1 Barclays Bank 20/12/2020 9,785 10,531
CDS EUR 2,500,000 Fund receives Fixed 1.000% and provides default protection on Markit iTraxx Europe Series 24 Version 1 Barclays Bank 20/12/2020 42,082 32,107
CDS EUR 1,650,000 Fund receives default protection on ArcelorMittal and pays Fixed 5.000% Barclays Bank 20/06/2021 (100,314) (10,080)
CDS EUR 1,649,000 Fund receives default protection on ArcelorMittal and pays Fixed 5.000% Barclays Bank 20/06/2021 (54,655) (10,074)
CDS EUR 1,370,000 Fund receives default protection on BAE Systems Plc and pays Fixed 1.000% Barclays Bank 20/06/2021 (8,076) (16,426)
CDS EUR 5,000,000 Fund receives default protection on Deutsche Lufthansa AG and pays Fixed 1.000% Barclays Bank 20/06/2021 (23,042) 21,651
CDS EUR 1,535,000 Fund receives default protection on Electricite de France SA and pays Fixed 1.000% Barclays Bank 20/06/2021 12,308 (5,918)
CDS EUR 4,880,000 Fund receives default protection on EnBW Energie Baden Wuerttemberg AG and pays Fixed 1.000% Barclays Bank 20/06/2021 (22,778) (113,330)
CDS EUR 2,260,000 Fund receives default protection on Koninklijke KPN NV and pays Fixed 1.000% Barclays Bank 20/06/2021 (2,006) (30,583)
CDS EUR 10,000,000 Fund receives default protection on Markit iTraxx Europe Crossover Series 25 Version 1 and pays Fixed 5.000% Barclays Bank 20/06/2021 384 (869,173)
CDS EUR 1,695,000 Fund receives default protection on RWE AG and pays Fixed 1.000% Barclays Bank 20/06/2021 8,488 27,805CDS EUR 5,910,000 Fund receives default protection on RWE AG and pays Fixed 1.000% Barclays Bank 20/06/2021 26,697 96,948CDS EUR 2,925,000 Fund receives Fixed 1.000% and provides default protection
on Aviva Plc Barclays Bank 20/06/2021 31,531 (88,731)CDS EUR 4,860,000 Fund receives Fixed 1.000% and provides default protection
on Engie SA Barclays Bank 20/06/2021 39,312 106,682
BlackRock Fixed Income Strategies Fund continued

TypeNominal
Value Description CounterpartyExpiration
date
Unrealised appreciation/
(depreciation) EUR
Market Value
EUR
Swaps as at 31 May 2016
Annual Report and Audited Accounts 219
The notes on pages 489 to 503 form an integral part of these financial statements.
BlackRock Fixed Income Strategies Fund continued
CDS EUR 5,140,000 Fund receives Fixed 1.000% and provides default protection on Engie SA Barclays Bank 20/06/2021 (44) 112,828
CDS EUR 2,395,000 Fund receives Fixed 1.000% and provides default protection on Markit iTraxx Europe Series 25 Version 1 Barclays Bank 20/06/2021 (723) 33,853
CDS EUR 2,260,000 Fund receives Fixed 1.000% and provides default protection on Markit iTraxx Europe Series 25 Version 1 Barclays Bank 20/06/2021 (624) 31,945
CDS EUR 2,740,000 Fund receives Fixed 1.000% and provides default protection on Rolls-Royce Holdings Plc Barclays Bank 20/06/2021 35,584 (29,509)
CDS EUR 6,500,000 Fund receives Fixed 1.000% and provides default protection on Volkswagen AG Barclays Bank 20/06/2021 202,538 (45,050)
CDS EUR 1,650,000 Fund receives Fixed 5.000% and provides default protection on Anglo American Plc Barclays Bank 20/06/2021 108,978 (44,910)
CDS EUR 1,319,000 Fund receives Fixed 5.000% and provides default protection on Anglo American Plc Barclays Bank 20/06/2021 63,267 (35,901)
CDS EUR 5,000,000 Fund receives default protection on Barclays Bank Plc and pays Fixed 1.000% BNP Paribas 20/12/2020 (62,332) (10,965)
CDS EUR 4,500,000 Fund receives default protection on Groupe Auchan SA and pays Fixed 1.000% BNP Paribas 20/12/2020 (8,585) (104,960)
CDS EUR 2,250,000 Fund receives default protection on Groupe Auchan SA and pays Fixed 1.000% BNP Paribas 20/12/2020 (4,292) (52,480)
CDS EUR 2,250,000 Fund receives default protection on Groupe Auchan SA and pays Fixed 1.000% BNP Paribas 20/12/2020 (4,265) (52,480)
CDS EUR 2,520,000 Fund receives default protection on Sky Plc and pays Fixed 1.000% BNP Paribas 20/12/2020 (23,180) (20,807)CDS EUR 3,039,000 Fund receives default protection on Standard Chartered Bank and
pays Fixed 1.000% BNP Paribas 20/12/2020 (279,383) 209,024CDS EUR 775,000 Fund receives Fixed 1.000% and provides default protection on
Markit iTraxx Europe Series 24 Version 1 BNP Paribas 20/12/2020 7,485 9,953CDS EUR 824,000 Fund receives Fixed 1.000% and provides default protection on
Markit iTraxx Europe Series 24 Version 1 BNP Paribas 20/12/2020 9,052 10,582CDS EUR 545,000 Fund receives Fixed 1.000% and provides default protection on
Markit iTraxx Europe Series 24 Version 1 BNP Paribas 20/12/2020 6,412 6,999CDS EUR 755,000 Fund receives Fixed 1.000% and provides default protection on
Markit iTraxx Europe Series 24 Version 1 BNP Paribas 20/12/2020 9,380 9,696CDS EUR 1,370,000 Fund receives Fixed 1.000% and provides default protection on
Markit iTraxx Europe Series 24 Version 1 BNP Paribas 20/12/2020 11,855 17,594CDS EUR 13,590,000 Fund receives default protection on Groupe Auchan SA and
pays Fixed 1.000% BNP Paribas 20/06/2021 24,160 (313,168)CDS EUR 3,270,000 Fund receives default protection on Koninklijke KPN NV and
pays Fixed 1.000% BNP Paribas 20/06/2021 (2,903) (44,251)CDS EUR 57,750,000 Fund receives default protection on Markit iTraxx Europe Series
25 Version 1 and pays Fixed 1.000% BNP Paribas 20/06/2021 (30,144) (816,287)CDS EUR 28,750,000 Fund receives default protection on Markit iTraxx Europe Series
25 Version 1 and pays Fixed 1.000% BNP Paribas 20/06/2021 (2,290) (406,377)CDS EUR 19,400,000 Fund receives default protection on Markit iTraxx Europe Series
25 Version 1 and pays Fixed 1.000% BNP Paribas 20/06/2021 (8,996) (274,216)CDS EUR 5,675,000 Fund receives default protection on Pernod Ricard SA and
pays Fixed 1.000% BNP Paribas 20/06/2021 (11,194) (92,652)CDS EUR 2,395,000 Fund receives default protection on RWE AG and pays Fixed 1.000% BNP Paribas 20/06/2021 12,875 39,288CDS EUR 5,560,000 Fund receives default protection on TDC A/S and pays Fixed 1.000% BNP Paribas 20/06/2021 (20,126) 36,056CDS EUR 2,485,000 Fund receives default protection on Valeo SA and pays Fixed 1.000% BNP Paribas 20/06/2021 (4,034) (33,211)CDS EUR 58,300,000 Fund receives Fixed 1.000% and provides default protection on
Markit iTraxx Europe Senior Financial Series 25 Version 1 BNP Paribas 20/06/2021 37,297 333,677CDS EUR 560,000 Fund receives default protection on Vodafone Group Plc and
pays Fixed 1.000% Citibank 20/06/2020 (3,226) (6,541)CDS EUR 1,150,000 Fund receives default protection on Vodafone Group Plc and
pays Fixed 1.000% Citibank 20/06/2020 (2,047) (13,432)CDS EUR 1,075,000 Fund receives default protection on Groupe Auchan SA and
pays Fixed 1.000% Citibank 20/09/2020 2,887 (25,226)CDS EUR 1,610,000 Fund receives default protection on Groupe Auchan SA and
pays Fixed 1.000% Citibank 20/09/2020 5,991 (37,780)CDS EUR 955,000 Fund receives default protection on Banco Santander SA and
pays Fixed 1.000% Citibank 20/12/2020 (9,521) 63,865CDS EUR 1,519,000 Fund receives default protection on Banco Santander SA and
pays Fixed 1.000% Citibank 20/12/2020 (98,076) 101,583CDS EUR 2,228,000 Fund receives default protection on Credit Agricole SA and
pays Fixed 1.000% Citibank 20/12/2020 (72,250) 45,698CDS EUR 1,114,000 Fund receives default protection on ING Bank NV and
pays Fixed 1.000% Citibank 20/12/2020 (34,948) 18,371CDS EUR 2,210,000 Fund receives default protection on Sky Plc and pays Fixed 1.000% Citibank 20/12/2020 (6,571) (18,247)CDS EUR 3,041,000 Fund receives default protection on Standard Chartered Bank and
pays Fixed 1.000% Citibank 20/12/2020 (247,874) 209,162CDS EUR 12,899,000 Fund receives Fixed 1.000% and provides default protection on
Markit iTraxx Europe Series 24 Version 1 Citibank 20/12/2020 71,437 165,658

TypeNominal
Value Description CounterpartyExpiration
date
Unrealised appreciation/
(depreciation) EUR
Market Value
EUR
Swaps as at 31 May 2016
220 BlackRock Strategic Funds (BSF)
The notes on pages 489 to 503 form an integral part of these financial statements.
CDS USD 11,932,000 Fund receives default protection on General Motors Co and pays Fixed 5.000% Citibank 20/12/2020 50,400 (1,538,585)
CDS EUR 2,925,000 Fund receives default protection on Aegon NV and pays Fixed 1.000% Citibank 20/06/2021 (30,780) 90,876CDS EUR 1,450,000 Fund receives default protection on Barclays Bank Plc and
pays Fixed 1.000% Citibank 20/06/2021 (38,058) 68,075CDS EUR 8,600,000 Fund receives default protection on Daimler AG and pays Fixed 1.000% Citibank 20/06/2021 (46,906) (161,338)CDS EUR 50,000 Fund receives default protection on Koninklijke KPN NV and
pays Fixed 1.000% Citibank 20/06/2021 12 (677)CDS EUR 825,000 Fund receives default protection on Lanxess AG and pays Fixed 1.000% Citibank 20/06/2021 (10,544) (12,219)CDS EUR 10,000,000 Fund receives default protection on Markit iTraxx Europe Crossover
Series 25 Version 1 and pays Fixed 5.000% Citibank 20/06/2021 (67,131) (869,173)CDS EUR 39,000,000 Fund receives default protection on Markit iTraxx Europe Crossover
Series 25 Version 1 and pays Fixed 5.000% Citibank 20/06/2021 180,951 (3,389,776)CDS EUR 29,000,000 Fund receives default protection on Markit iTraxx Europe Series 25
Version 1 and pays Fixed 1.000% Citibank 20/06/2021 (97,801) (409,910)CDS EUR 17,500,000 Fund receives default protection on Markit iTraxx Europe Series 25
Version 1 and pays Fixed 1.000% Citibank 20/06/2021 (65,997) (247,360)CDS EUR 2,900,000 Fund receives default protection on Royal Bank of Scotland Plc and
pays Fixed 1.000% Citibank 20/06/2021 (42,678) 183,699CDS EUR 4,420,000 Fund receives Fixed 1.000% and provides default protection on
Markit iTraxx Europe Crossover Series 25 Version 1 Citibank 20/06/2021 2,447 62,476CDS EUR 17,500,000 Fund receives Fixed 1.000% and provides default protection on
Markit iTraxx Europe Senior Financial Series 25 Version 1 Citibank 20/06/2021 93,660 100,160CDS EUR 515,000 Fund receives default protection on Louis Dreyfus Commodities BV and
pays Fixed 5.000% Credit Suisse 20/12/2019 48,187 (26,970)CDS EUR 1,610,000 Fund receives default protection on Markit iTraxx Europe Series 23
Version 1 and pays Fixed 1.000% Credit Suisse 20/06/2020 3,323 21,306CDS EUR 170,000 Fund receives default protection on Vodafone Group Plc and
pays Fixed 1.000% Credit Suisse 20/06/2020 (1,150) (1,986)CDS EUR 310,000 Fund receives default protection on Vodafone Group Plc and
pays Fixed 1.000% Credit Suisse 20/06/2020 (2,096) (3,621)CDS EUR 580,000 Fund receives default protection on Vodafone Group Plc and
pays Fixed 1.000% Credit Suisse 20/06/2020 (3,348) (6,775)CDS EUR 360,000 Fund receives default protection on Vodafone Group Plc and
pays Fixed 1.000% Credit Suisse 20/06/2020 (2,435) (4,205)CDS EUR 1,075,000 Fund receives Fixed 1.000% and provides default protection on
Markit iTraxx Europe Series 23 Version 1 Credit Suisse 20/06/2020 3,524 14,226CDS EUR 5,000,000 Fund receives default protection on J Sainsbury Plc and
pays Fixed 1.000% Credit Suisse 20/12/2020 (112,777) 74,107CDS EUR 5,000,000 Fund receives default protection on RELX Plc and pays Fixed 1.000% Credit Suisse 20/12/2020 (48,658) (137,125)CDS EUR 1,167,000 Fund receives default protection on Standard Chartered Bank and
pays Fixed 1.000% Credit Suisse 20/12/2020 (9,716) 80,267CDS EUR 691,000 Fund receives Fixed 1.000% and provides default protection on
Markit iTraxx Europe Series 24 Version 1 Credit Suisse 20/12/2020 3,898 8,874CDS EUR 825,000 Fund receives Fixed 1.000% and provides default protection on
Markit iTraxx Europe Series 24 Version 1 Credit Suisse 20/12/2020 9,122 10,595CDS EUR 1,370,000 Fund receives Fixed 1.000% and provides default protection on
Markit iTraxx Europe Series 24 Version 1 Credit Suisse 20/12/2020 14,763 17,594CDS EUR 1,295,000 Fund receives Fixed 1.000% and provides default protection on
Markit iTraxx Europe Series 24 Version 1 Credit Suisse 20/12/2020 12,859 16,631CDS EUR 1,265,000 Fund receives Fixed 1.000% and provides default protection on
Markit iTraxx Europe Series 24 Version 1 Credit Suisse 20/12/2020 13,184 16,246CDS EUR 633,000 Fund receives Fixed 1.000% and provides default protection on
Markit iTraxx Europe Series 24 Version 1 Credit Suisse 20/12/2020 6,202 8,129CDS EUR 1,560,000 Fund receives Fixed 1.000% and provides default protection on
Markit iTraxx Europe Series 24 Version 1 Credit Suisse 20/12/2020 16,483 20,035CDS EUR 2,520,000 Fund receives Fixed 1.000% and provides default protection on
Markit iTraxx Europe Series 24 Version 1 Credit Suisse 20/12/2020 30,887 32,364CDS EUR 1,810,000 Fund receives Fixed 1.000% and provides default protection on
Markit iTraxx Europe Series 24 Version 1 Credit Suisse 20/12/2020 22,185 23,245CDS EUR 1,370,000 Fund receives Fixed 1.000% and provides default protection on
Markit iTraxx Europe Series 24 Version 1 Credit Suisse 20/12/2020 12,353 17,595CDS EUR 2,500,000 Fund receives Fixed 1.000% and provides default protection on
Markit iTraxx Europe Series 24 Version 1 Credit Suisse 20/12/2020 40,678 32,107CDS EUR 2,021,000 Fund receives default protection on ArcelorMittal and
pays Fixed 5.000% Credit Suisse 20/06/2021 (107,334) (12,347)CDS EUR 6,995,000 Fund receives default protection on ITV Plc and pays Fixed 5.000% Credit Suisse 20/06/2021 31,958 (1,331,622)CDS EUR 5,000,000 Fund receives Fixed 1.000% and provides default protection on
Glencore International AG Credit Suisse 20/06/2021 129,022 (779,591)CDS EUR 3,660,000 Fund receives Fixed 1.000% and provides default protection on
Orange SA Credit Suisse 20/06/2021 13,051 69,593CDS EUR 1,340,000 Fund receives Fixed 1.000% and provides default protection on
Orange SA Credit Suisse 20/06/2021 3,564 25,479
BlackRock Fixed Income Strategies Fund continued
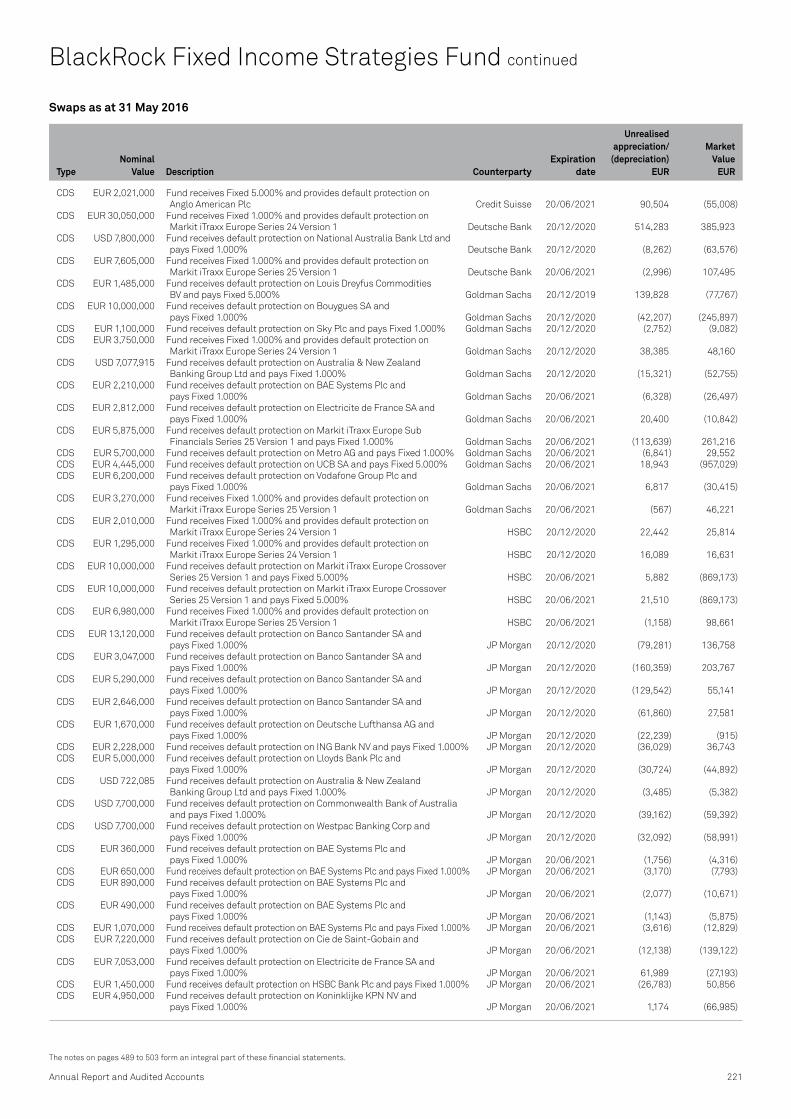
TypeNominal
Value Description CounterpartyExpiration
date
Unrealised appreciation/
(depreciation) EUR
Market Value
EUR
Swaps as at 31 May 2016
Annual Report and Audited Accounts 221
The notes on pages 489 to 503 form an integral part of these financial statements.
BlackRock Fixed Income Strategies Fund continued
CDS EUR 2,021,000 Fund receives Fixed 5.000% and provides default protection on Anglo American Plc Credit Suisse 20/06/2021 90,504 (55,008)
CDS EUR 30,050,000 Fund receives Fixed 1.000% and provides default protection on Markit iTraxx Europe Series 24 Version 1 Deutsche Bank 20/12/2020 514,283 385,923
CDS USD 7,800,000 Fund receives default protection on National Australia Bank Ltd and pays Fixed 1.000% Deutsche Bank 20/12/2020 (8,262) (63,576)
CDS EUR 7,605,000 Fund receives Fixed 1.000% and provides default protection on Markit iTraxx Europe Series 25 Version 1 Deutsche Bank 20/06/2021 (2,996) 107,495
CDS EUR 1,485,000 Fund receives default protection on Louis Dreyfus Commodities BV and pays Fixed 5.000% Goldman Sachs 20/12/2019 139,828 (77,767)
CDS EUR 10,000,000 Fund receives default protection on Bouygues SA and pays Fixed 1.000% Goldman Sachs 20/12/2020 (42,207) (245,897)
CDS EUR 1,100,000 Fund receives default protection on Sky Plc and pays Fixed 1.000% Goldman Sachs 20/12/2020 (2,752) (9,082)CDS EUR 3,750,000 Fund receives Fixed 1.000% and provides default protection on
Markit iTraxx Europe Series 24 Version 1 Goldman Sachs 20/12/2020 38,385 48,160CDS USD 7,077,915 Fund receives default protection on Australia & New Zealand
Banking Group Ltd and pays Fixed 1.000% Goldman Sachs 20/12/2020 (15,321) (52,755)CDS EUR 2,210,000 Fund receives default protection on BAE Systems Plc and
pays Fixed 1.000% Goldman Sachs 20/06/2021 (6,328) (26,497)CDS EUR 2,812,000 Fund receives default protection on Electricite de France SA and
pays Fixed 1.000% Goldman Sachs 20/06/2021 20,400 (10,842)CDS EUR 5,875,000 Fund receives default protection on Markit iTraxx Europe Sub
Financials Series 25 Version 1 and pays Fixed 1.000% Goldman Sachs 20/06/2021 (113,639) 261,216CDS EUR 5,700,000 Fund receives default protection on Metro AG and pays Fixed 1.000% Goldman Sachs 20/06/2021 (6,841) 29,552CDS EUR 4,445,000 Fund receives default protection on UCB SA and pays Fixed 5.000% Goldman Sachs 20/06/2021 18,943 (957,029)CDS EUR 6,200,000 Fund receives default protection on Vodafone Group Plc and
pays Fixed 1.000% Goldman Sachs 20/06/2021 6,817 (30,415)CDS EUR 3,270,000 Fund receives Fixed 1.000% and provides default protection on
Markit iTraxx Europe Series 25 Version 1 Goldman Sachs 20/06/2021 (567) 46,221CDS EUR 2,010,000 Fund receives Fixed 1.000% and provides default protection on
Markit iTraxx Europe Series 24 Version 1 HSBC 20/12/2020 22,442 25,814CDS EUR 1,295,000 Fund receives Fixed 1.000% and provides default protection on
Markit iTraxx Europe Series 24 Version 1 HSBC 20/12/2020 16,089 16,631CDS EUR 10,000,000 Fund receives default protection on Markit iTraxx Europe Crossover
Series 25 Version 1 and pays Fixed 5.000% HSBC 20/06/2021 5,882 (869,173)CDS EUR 10,000,000 Fund receives default protection on Markit iTraxx Europe Crossover
Series 25 Version 1 and pays Fixed 5.000% HSBC 20/06/2021 21,510 (869,173)CDS EUR 6,980,000 Fund receives Fixed 1.000% and provides default protection on
Markit iTraxx Europe Series 25 Version 1 HSBC 20/06/2021 (1,158) 98,661CDS EUR 13,120,000 Fund receives default protection on Banco Santander SA and
pays Fixed 1.000% JP Morgan 20/12/2020 (79,281) 136,758CDS EUR 3,047,000 Fund receives default protection on Banco Santander SA and
pays Fixed 1.000% JP Morgan 20/12/2020 (160,359) 203,767CDS EUR 5,290,000 Fund receives default protection on Banco Santander SA and
pays Fixed 1.000% JP Morgan 20/12/2020 (129,542) 55,141CDS EUR 2,646,000 Fund receives default protection on Banco Santander SA and
pays Fixed 1.000% JP Morgan 20/12/2020 (61,860) 27,581CDS EUR 1,670,000 Fund receives default protection on Deutsche Lufthansa AG and
pays Fixed 1.000% JP Morgan 20/12/2020 (22,239) (915)CDS EUR 2,228,000 Fund receives default protection on ING Bank NV and pays Fixed 1.000% JP Morgan 20/12/2020 (36,029) 36,743CDS EUR 5,000,000 Fund receives default protection on Lloyds Bank Plc and
pays Fixed 1.000% JP Morgan 20/12/2020 (30,724) (44,892)CDS USD 722,085 Fund receives default protection on Australia & New Zealand
Banking Group Ltd and pays Fixed 1.000% JP Morgan 20/12/2020 (3,485) (5,382)CDS USD 7,700,000 Fund receives default protection on Commonwealth Bank of Australia
and pays Fixed 1.000% JP Morgan 20/12/2020 (39,162) (59,392)CDS USD 7,700,000 Fund receives default protection on Westpac Banking Corp and
pays Fixed 1.000% JP Morgan 20/12/2020 (32,092) (58,991)CDS EUR 360,000 Fund receives default protection on BAE Systems Plc and
pays Fixed 1.000% JP Morgan 20/06/2021 (1,756) (4,316)CDS EUR 650,000 Fund receives default protection on BAE Systems Plc and pays Fixed 1.000% JP Morgan 20/06/2021 (3,170) (7,793)CDS EUR 890,000 Fund receives default protection on BAE Systems Plc and
pays Fixed 1.000% JP Morgan 20/06/2021 (2,077) (10,671)CDS EUR 490,000 Fund receives default protection on BAE Systems Plc and
pays Fixed 1.000% JP Morgan 20/06/2021 (1,143) (5,875)CDS EUR 1,070,000 Fund receives default protection on BAE Systems Plc and pays Fixed 1.000% JP Morgan 20/06/2021 (3,616) (12,829)CDS EUR 7,220,000 Fund receives default protection on Cie de Saint-Gobain and
pays Fixed 1.000% JP Morgan 20/06/2021 (12,138) (139,122)CDS EUR 7,053,000 Fund receives default protection on Electricite de France SA and
pays Fixed 1.000% JP Morgan 20/06/2021 61,989 (27,193)CDS EUR 1,450,000 Fund receives default protection on HSBC Bank Plc and pays Fixed 1.000% JP Morgan 20/06/2021 (26,783) 50,856CDS EUR 4,950,000 Fund receives default protection on Koninklijke KPN NV and
pays Fixed 1.000% JP Morgan 20/06/2021 1,174 (66,985)
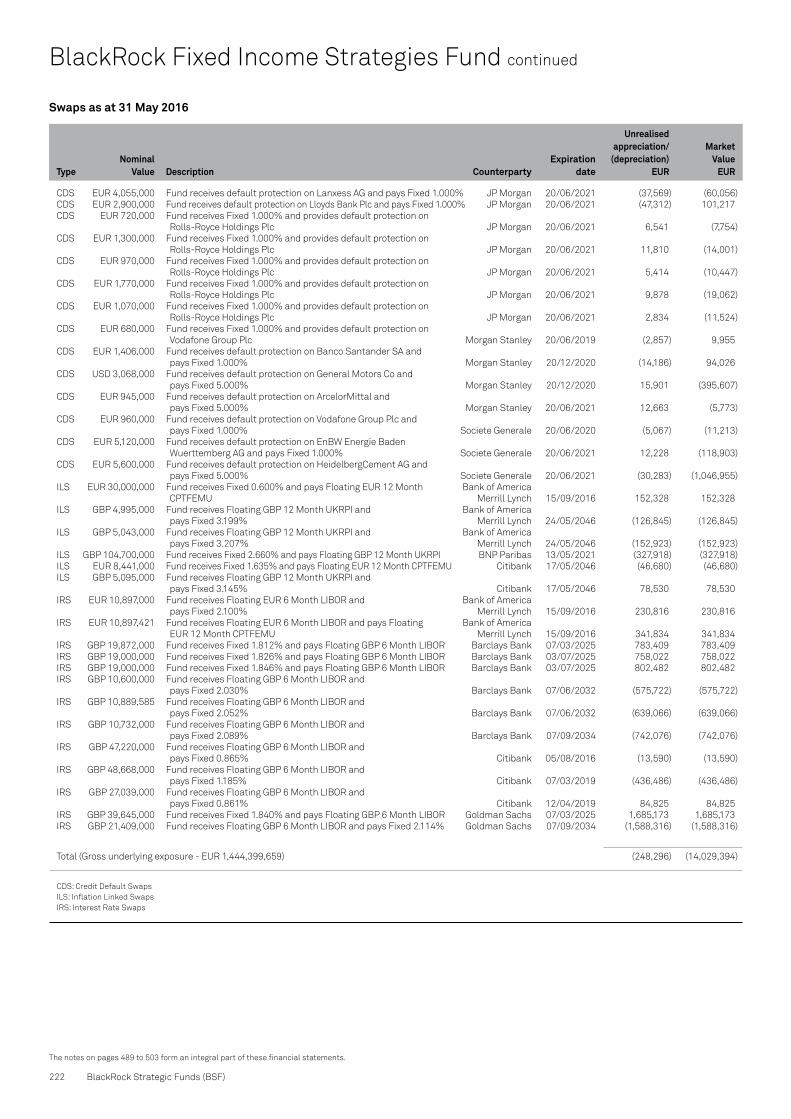
TypeNominal
Value Description CounterpartyExpiration
date
Unrealised appreciation/
(depreciation) EUR
Market Value
EUR
Swaps as at 31 May 2016
222 BlackRock Strategic Funds (BSF)
The notes on pages 489 to 503 form an integral part of these financial statements.
CDS EUR 4,055,000 Fund receives default protection on Lanxess AG and pays Fixed 1.000% JP Morgan 20/06/2021 (37,569) (60,056)CDS EUR 2,900,000 Fund receives default protection on Lloyds Bank Plc and pays Fixed 1.000% JP Morgan 20/06/2021 (47,312) 101,217CDS EUR 720,000 Fund receives Fixed 1.000% and provides default protection on
Rolls-Royce Holdings Plc JP Morgan 20/06/2021 6,541 (7,754)CDS EUR 1,300,000 Fund receives Fixed 1.000% and provides default protection on
Rolls-Royce Holdings Plc JP Morgan 20/06/2021 11,810 (14,001)CDS EUR 970,000 Fund receives Fixed 1.000% and provides default protection on
Rolls-Royce Holdings Plc JP Morgan 20/06/2021 5,414 (10,447)CDS EUR 1,770,000 Fund receives Fixed 1.000% and provides default protection on
Rolls-Royce Holdings Plc JP Morgan 20/06/2021 9,878 (19,062)CDS EUR 1,070,000 Fund receives Fixed 1.000% and provides default protection on
Rolls-Royce Holdings Plc JP Morgan 20/06/2021 2,834 (11,524)CDS EUR 680,000 Fund receives Fixed 1.000% and provides default protection on
Vodafone Group Plc Morgan Stanley 20/06/2019 (2,857) 9,955CDS EUR 1,406,000 Fund receives default protection on Banco Santander SA and
pays Fixed 1.000% Morgan Stanley 20/12/2020 (14,186) 94,026CDS USD 3,068,000 Fund receives default protection on General Motors Co and
pays Fixed 5.000% Morgan Stanley 20/12/2020 15,901 (395,607)CDS EUR 945,000 Fund receives default protection on ArcelorMittal and
pays Fixed 5.000% Morgan Stanley 20/06/2021 12,663 (5,773)CDS EUR 960,000 Fund receives default protection on Vodafone Group Plc and
pays Fixed 1.000% Societe Generale 20/06/2020 (5,067) (11,213)CDS EUR 5,120,000 Fund receives default protection on EnBW Energie Baden
Wuerttemberg AG and pays Fixed 1.000% Societe Generale 20/06/2021 12,228 (118,903)CDS EUR 5,600,000 Fund receives default protection on HeidelbergCement AG and
pays Fixed 5.000% Societe Generale 20/06/2021 (30,283) (1,046,955)ILS EUR 30,000,000 Fund receives Fixed 0.600% and pays Floating EUR 12 Month Bank of America
CPTFEMU Merrill Lynch 15/09/2016 152,328 152,328ILS GBP 4,995,000 Fund receives Floating GBP 12 Month UKRPI and Bank of America
pays Fixed 3.199% Merrill Lynch 24/05/2046 (126,845) (126,845)ILS GBP 5,043,000 Fund receives Floating GBP 12 Month UKRPI and Bank of America
pays Fixed 3.207% Merrill Lynch 24/05/2046 (152,923) (152,923)ILS GBP 104,700,000 Fund receives Fixed 2.660% and pays Floating GBP 12 Month UKRPI BNP Paribas 13/05/2021 (327,918) (327,918)ILS EUR 8,441,000 Fund receives Fixed 1.635% and pays Floating EUR 12 Month CPTFEMU Citibank 17/05/2046 (46,680) (46,680)ILS GBP 5,095,000 Fund receives Floating GBP 12 Month UKRPI and
pays Fixed 3.145% Citibank 17/05/2046 78,530 78,530IRS EUR 10,897,000 Fund receives Floating EUR 6 Month LIBOR and Bank of America
pays Fixed 2.100% Merrill Lynch 15/09/2016 230,816 230,816IRS EUR 10,897,421 Fund receives Floating EUR 6 Month LIBOR and pays Floating Bank of America
EUR 12 Month CPTFEMU Merrill Lynch 15/09/2016 341,834 341,834IRS GBP 19,872,000 Fund receives Fixed 1.812% and pays Floating GBP 6 Month LIBOR Barclays Bank 07/03/2025 783,409 783,409IRS GBP 19,000,000 Fund receives Fixed 1.826% and pays Floating GBP 6 Month LIBOR Barclays Bank 03/07/2025 758,022 758,022IRS GBP 19,000,000 Fund receives Fixed 1.846% and pays Floating GBP 6 Month LIBOR Barclays Bank 03/07/2025 802,482 802,482IRS GBP 10,600,000 Fund receives Floating GBP 6 Month LIBOR and
pays Fixed 2.030% Barclays Bank 07/06/2032 (575,722) (575,722)IRS GBP 10,889,585 Fund receives Floating GBP 6 Month LIBOR and
pays Fixed 2.052% Barclays Bank 07/06/2032 (639,066) (639,066)IRS GBP 10,732,000 Fund receives Floating GBP 6 Month LIBOR and
pays Fixed 2.089% Barclays Bank 07/09/2034 (742,076) (742,076)IRS GBP 47,220,000 Fund receives Floating GBP 6 Month LIBOR and
pays Fixed 0.865% Citibank 05/08/2016 (13,590) (13,590)IRS GBP 48,668,000 Fund receives Floating GBP 6 Month LIBOR and
pays Fixed 1.185% Citibank 07/03/2019 (436,486) (436,486)IRS GBP 27,039,000 Fund receives Floating GBP 6 Month LIBOR and
pays Fixed 0.861% Citibank 12/04/2019 84,825 84,825IRS GBP 39,645,000 Fund receives Fixed 1.840% and pays Floating GBP 6 Month LIBOR Goldman Sachs 07/03/2025 1,685,173 1,685,173IRS GBP 21,409,000 Fund receives Floating GBP 6 Month LIBOR and pays Fixed 2.114% Goldman Sachs 07/09/2034 (1,588,316) (1,588,316)
Total (Gross underlying exposure - EUR 1,444,399,659) (248,296) (14,029,394)
CDS: Credit Default SwapsILS: Inflation Linked SwapsIRS: Interest Rate Swaps
BlackRock Fixed Income Strategies Fund continued

Open forward foreign exchange transactions as at 31 May 2016
Currency Purchases Currency Sales CounterpartyMaturity
date
Unrealised appreciation/
(depreciation) EUR
Open forward foreign exchange transactions as at 31 May 2016
Currency Purchases Currency Sales CounterpartyMaturity
date
Unrealised appreciation/
(depreciation) EUR
Purchased Options as at 31 May 2016
Number of contracts
Call/Put Description Counterparty
Strike Price
Expiration date
Unrealised appreciation/
(depreciation) EUR
Market Value
EUR
Annual Report and Audited Accounts 223
The notes on pages 489 to 503 form an integral part of these financial statements.
BlackRock Fixed Income Strategies Fund continued
EUR 40,300 AUD 60,000 Deutsche Bank 14/6/2016 1,367 EUR 77,543 AUD 120,000 Morgan Stanley 14/6/2016 (324)EUR 68,738 CAD 100,000 JP Morgan 14/6/2016 186 EUR 26,983 CAD 40,000 Citibank 14/6/2016 (438)EUR 123,824,590 DKK 923,620,000 HSBC 14/6/2016 (361,097)EUR 351,323,580 GBP 273,530,000 HSBC 14/6/2016 (7,175,783)EUR 356,894,408 GBP 278,170,000 UBS 14/6/2016 (7,686,325)EUR 109,987,845 GBP 86,690,000 Barclays Bank 14/6/2016 (3,631,537)EUR 3,429,948 GBP 2,720,000 Bank of America Merrill Lynch 14/6/2016 (134,993)EUR 6,853,544 GBP 5,360,000 Deutsche Bank 14/6/2016 (171,487)EUR 22,206 JPY 2,780,000 State Street Bank & Trust Company 14/6/2016 (193)EUR 28,698,002 MXN 597,920,000 Citibank 14/6/2016 (352,522)EUR 28,104,048 MXN 579,510,000 JP Morgan 14/6/2016 (52,008)EUR 24,525 NZD 40,000 UBS 14/6/2016 344 EUR 821,825 SEK 7,680,000 Barclays Bank 14/6/2016 (5,514)EUR 32,517 SGD 50,000 Morgan Stanley 14/6/2016 33 EUR 39,240 SGD 60,000 Deutsche Bank 14/6/2016 259 EUR 16,449,710 USD 18,600,000 JP Morgan 14/6/2016 (196,311)EUR 48,091,455 USD 53,300,000 Citibank 14/6/2016 390,759 EUR 88,259,911 USD 99,610,000 Goldman Sachs 14/6/2016 (885,799)EUR 7,267,506 USD 8,200,000 Morgan Stanley 14/6/2016 (71,062)EUR 6,938,759 USD 7,780,000 Deutsche Bank 14/6/2016 (23,932)EUR 35,654 USD 40,000 Barclays Bank 14/6/2016 (144)EUR 9,535,822 USD 10,660,000 UBS 14/6/2016 (4,317)EUR 1,488,958 USD 1,660,000 BNP Paribas 14/6/2016 3,345 EUR 191,959,678 JPY 24,470,060,000 UBS 27/6/2016 (5,205,763)JPY 24,470,060,000 EUR 188,899,645 UBS 27/6/2016 8,265,796 USD 3,310,000 CAD 4,302,063 Commonwealth Bank of Australia 30/6/2016 13,163 USD 3,225,073 EUR 2,880,000 Commonwealth Bank of Australia 30/6/2016 4,587 USD 3,232,085 NZD 4,800,000 Commonwealth Bank of Australia 30/6/2016 (6,743)EUR 3,407,663 PLN 14,927,068 Credit Suisse 8/7/2016 9,453 EUR 3,407,617 PLN 14,928,054 HSBC 8/7/2016 9,183 EUR 4,565,097 PLN 20,007,222 JP Morgan 8/7/2016 10,369 EUR 1,703,815 PLN 7,474,295 Barclays Bank 8/7/2016 2,260 EUR 1,703,808 PLN 7,463,361 Deutsche Bank 8/7/2016 4,743 EUR 29,120,000 USD 32,953,648 Morgan Stanley 8/7/2016 (346,265)MXN 303,400,000 USD 16,701,648 BNP Paribas 8/7/2016 (246,290)PLN 15,101,834 EUR 3,406,667 JP Morgan 8/7/2016 31,329 PLN 18,003,268 EUR 4,061,945 Credit Suisse 8/7/2016 36,574 PLN 15,092,062 EUR 3,406,717 HSBC 8/7/2016 29,056 PLN 16,602,836 EUR 3,747,514 Barclays Bank 8/7/2016 32,191
USD 33,329,296 EUR 29,120,000 Deutsche Bank 8/7/2016 682,160
(17,031,690)
CHF Hedged Share Class
CHF 223,419,234 EUR 201,716,362 State Street Bank & Trust Company 15/6/2016 391,144 EUR 4,632,996 CHF 5,134,924 State Street Bank & Trust Company 15/6/2016 (12,113)
379,031
GBP Hedged Share Class
EUR 55,917 GBP 43,185 State Street Bank & Trust Company 15/6/2016 (682)GBP 21,093,501 EUR 26,951,852 State Street Bank & Trust Company 15/6/2016 693,311
692,629
SEK Hedged Share Class
EUR 34,435 SEK 319,437 State Street Bank & Trust Company 15/6/2016 23 SEK 53,282,880 EUR 5,750,997 State Street Bank & Trust Company 15/6/2016 (10,980)
(10,957)
USD Hedged Share Class
EUR 11,100,348 USD 12,570,808 State Street Bank & Trust Company 15/6/2016 (149,454)USD 439,065,384 EUR 386,107,835 State Street Bank & Trust Company 15/6/2016 6,818,246
6,668,792
Total (Gross underlying exposure - EUR 2,380,406,105) (9,302,195)
67,426,000 Put GBP/USD Citibank GBP 1.40 28/07/2016 (1,184,451) 8,920 4,220,000 Put OTC AUD/USD Commonwealth Bank of Australia AUD 0.70 26/08/2016 (49,952) 30,005 1,718 Put 90 Day Euro Futures Exchange Traded USD 98.50 16/12/2016 50,466 471,048 8,450,000 Put OTC AUD/USD HSBC AUD 0.70 26/08/2016 (100,653) 60,081
Total (Gross underlying exposure - EUR 484,905,980) (1,284,590) 570,054

Futures contracts as at 31 May 2016
Number of contracts
Currencyof contract Contract/Description
Expiration date
Gross underlying
exposureEUR
Unrealised appreciation/
(depreciation) EUR
Written Options as at 31 May 2016
Number of contracts
Call/Put Description Counterparty
Strike Price
Expiration date
Unrealised appreciation/
(depreciation) EUR
Market Value
EUR
224 BlackRock Strategic Funds (BSF)
The notes on pages 489 to 503 form an integral part of these financial statements.
(1,191) AUD 90 Day Bank Bill September 2016 776,605,387 (434,004) 1,585 AUD 90 Day Bank Bill March 2017 1,033,517,665 628,852 (394) AUD 90 Day Bank Bill December 2016 256,912,278 (109,688) 3,141 USD 90 Day Euro December 2016 2,830,846,819 (308,474) (3,141) USD 90 Day Euro December 2017 2,830,846,819 1,799,364 3,690 GBP 90 Day Sterling December 2016 2,405,516,532 (181,780) (5,368) GBP 90 Day Sterling December 2017 3,499,407,247 897,722 (430) AUD Australian 10 Year Bond June 2016 37,259,279 36,617 (5,012) EUR Euro BOBL June 2016 568,917,142 (644,084) (3,528) EUR Euro BTP June 2016 462,425,537 (4,332,355) (1,195) EUR Euro Bund June 2016 124,656,437 123,100 (1,574) EUR Euro Schatz June 2016 158,840,212 185,880 (1,332) EUR Euro-BUXL June 2016 249,977,779 (2,792,281) (5,576) EUR Euro-OAT June 2016 723,391,219 (4,985,555) (3,868) GBP UK Long Gilt Bond September 2016 528,618,790 1,435,054 1,800 USD US Treasury 10 Year Note September 2016 163,374,740 (859,343) (843) USD US Treasury 10 Year Note June 2016 76,513,837 349,910 (94) USD US Treasury 5 Year Note September 2016 8,581,860 32,217 (200) USD US Ultra Bond September 2016 20,027,002 292,137
Total 16,756,236,582 (8,866,711)
BlackRock Fixed Income Strategies Fund continued
(4,220,000) Put OTC AUD/USD Commonwealth Bank of Australia AUD 0.66 26/08/2016 32,079 (7,271) (8,450,000) Put OTC AUD/USD HSBC AUD 0.66 26/08/2016 61,451 (14,559)
Total (Gross underlying exposure - EUR 2,376,497) 93,530 (21,830)
Sector Breakdown as at 31 May 2016
% of Net Assets
Government 54.53Financial 19.58Collective Investment Schemes 3.99Mortgage Securities 2.76Consumer, Non-cyclical 2.75Utilities 2.48Consumer, Cyclical 1.99Asset Backed Securities 1.90Energy 1.06Basic Materials 1.03Communications 0.92Industrial 0.86Technology 0.51Diversified 0.01
Securities portfolio at market value 94.37Other Net Assets 5.63
100.00

Annual Report and Audited Accounts 225
The notes on pages 489 to 503 form an integral part of these financial statements.
Transferable Securities and Money Market Instruments Admitted to an Official Stock Exchange Listing or Dealt in on Another Regulated Market
Transferable Securities and Money Market Instruments Admitted to an Official Stock Exchange Listing or Dealt in on Another Regulated Market
Holding
Description
Market Value
EUR
% of Net
Assets
Holding
Description
Market Value
EUR
% of Net
Assets
Portfolio of Investments as at 31 May 2016
BONDS
Argentina USD 2,081,000 Argentine Republic Government
International Bond RegS 7.625% 22/4/2046 1,890,124 0.37
1,890,124 0.37
Australia USD 84,000 APT Pipelines Ltd RegS 3.875%
11/10/2022 76,522 0.01 GBP 978,000 BHP Billiton Finance Ltd FRN
22/10/2077 1,308,601 0.26 USD 200,000 Goodman Funding Pty Ltd RegS
6.00% 22/3/2022 204,924 0.04 EUR 100,000 Origin Energy Finance Ltd 2.50%
23/10/2020 99,250 0.02 EUR 1,071,000 Origin Energy Finance Ltd RegS
3.50% 4/10/2021 1,088,318 0.21 EUR 1,518,467 SMART ABS Series Trust
'2014-2E AE' FRN 14/6/2021 1,513,236 0.30 EUR 425,000 Telstra Corp Ltd 1.125% 14/4/2026 425,501 0.08 AUD 303,366 Torrens Series Trust '2013-1 A'
FRN 12/4/2044 194,190 0.04 USD 239,211 Virgin Australia 2013-1B Trust
'144A' 6.00% 23/10/2020 217,645 0.04
5,128,187 1.00
Austria EUR 300,000 BAWAG PSK Bank fuer Arbeit und
Wirtschaft und Oesterreichische Postsparkasse AG 8.125% 30/10/2023 373,896 0.07
USD 400,000 Erste Group Bank AG FRN 26/5/2025 360,646 0.07
EUR 200,000 UNIQA Insurance Group AG FRN 27/7/2046 210,016 0.04
944,558 0.18
Belgium EUR 963,000 Anheuser-Busch InBev SA/NV 1.50%
17/3/2025 992,006 0.20 EUR 1,952,000 Anheuser-Busch InBev SA/NV 2.00%
17/3/2028 (traded in Belgium) 2,047,277 0.40 EUR 110,000 Anheuser-Busch InBev SA/NV
2.00% 17/3/2028 (traded in United Kingdom) 115,369 0.02
EUR 1,454,000 Anheuser-Busch InBev SA/NV 2.75% 17/3/2036 1,587,404 0.31
EUR 300,000 Argenta Spaarbank NV FRN 24/5/2026 303,066 0.06
EUR 200,000 Belfius Bank SA/NV 3.125% 11/5/2026 202,642 0.04
EUR 400,000 KBC Groep NV 1.00% 26/4/2021 404,510 0.08 EUR 1,100,000 Solvay SA FRN 1/12/2017 1,106,463 0.22 EUR 100,000 Solvay SA 2.75% 2/12/2027 109,650 0.02
6,868,387 1.35
Bermuda USD 140,000 Aircastle Ltd 6.75% 15/4/2017 129,608 0.03 EUR 450,000 Fidelity International Ltd 6.875%
24/2/2017 471,641 0.09 USD 200,000 GCX Ltd RegS 7.00% 1/8/2019 171,684 0.03 USD 200,000 Noble Group Ltd FRN (Perpetual) 94,677 0.02
867,610 0.17
British Virgin Islands USD 300,000 Huarong Finance II Co Ltd 3.25%
3/6/2021 266,835 0.05 USD 200,000 Huarong Finance II Co Ltd 4.625%
3/6/2026 177,601 0.03 USD 275,000 Minmetals Bounteous Finance
BVI Ltd 4.75% 30/7/2025 251,150 0.05 USD 600,000 Proven Honour Capital Ltd
4.125% 19/5/2025 544,966 0.11
1,240,552 0.24
Canada USD 700,000 Bombardier Inc RegS 6.125%
15/1/2023 542,101 0.11 EUR 350,000 Glencore Finance Canada Ltd
5.25% 13/6/2017 364,875 0.07 USD 200,000 Kinross Gold Corp 5.95%
15/3/2024 169,865 0.03 USD 80,000 Teck Resources Ltd '144A'
8.50% 1/6/2024 73,414 0.02
1,150,255 0.23
Cayman Islands USD 200,000 361 Degrees International Ltd 7.25%
3/6/2021 179,747 0.04 USD 580,000 ARES Clo Ltd '2012-2A AR' '144A'
FRN 12/10/2023 517,314 0.10 USD 600,000 BlueMountain Clo Ltd '2013-4A A'
'144A' FRN 15/4/2025 537,687 0.11 USD 250,000 China Aoyuan Property Group Ltd
6.525% 25/4/2019 224,135 0.04 USD 400,000 China Overseas Finance Investment
Cayman V Ltd (Contingent Convertible Bond) 5/1/2023 (Zero Coupon) 357,670 0.07
EUR 200,000 CK Hutchison Finance 16 Ltd 1.25% 6/4/2023 198,713 0.04
USD 250,000 EI Sukuk Co Ltd 3.542% 31/5/2021 224,180 0.04 USD 350,000 Global A&T Electronics Ltd RegS
10.00% 1/2/2019 219,347 0.04 HKD 4,000,000 Hengan International Group Co Ltd
(Contingent Convertible Bond) 27/6/2018 (Zero Coupon) 488,104 0.10
USD 479,011 Madison Park Funding II Ltd '2006-2A A2A' '144A' FRN 25/3/2020 428,109 0.08
GBP 190,000 Punch Taverns Finance B Ltd 5.943% 30/9/2022 234,001 0.05
CNY 1,000,000 Shui On Development Holding Ltd 6.875% 26/2/2017 137,309 0.03
GBP 500,000 Yorkshire Water Services Bradford Finance Ltd FRN 24/4/2025 678,563 0.13
4,424,879 0.87
China USD 500,000 CRRC Corp Ltd (Contingent
Convertible Bond) 5/2/2021 (Zero Coupon) 472,828 0.09
USD 400,000 Sunshine Life Insurance Co Ltd 3.15% 20/4/2021 352,105 0.07
824,933 0.16
Cyprus EUR 300,000 Aroundtown Property Holdings Plc
1.50% 3/5/2022 282,963 0.06 EUR 85,000 Cyprus Government International
Bond 4.75% 25/6/2019 91,091 0.02 EUR 300,000 Cyprus Government International
Bond '144A' 4.625% 3/2/2020 320,115 0.06
694,169 0.14
BlackRock Global Absolute Return Bond Fund

226 BlackRock Strategic Funds (BSF)
The notes on pages 489 to 503 form an integral part of these financial statements.
Transferable Securities and Money Market Instruments Admitted to an Official Stock Exchange Listing or Dealt in on Another Regulated Market
Transferable Securities and Money Market Instruments Admitted to an Official Stock Exchange Listing or Dealt in on Another Regulated Market
Holding
Description
Market Value
EUR
% of Net
Assets
Holding
Description
Market Value
EUR
% of Net
Assets
BlackRock Global Absolute Return Bond Fund continued
Denmark EUR 1,100,000 AP Moeller - Maersk A/S FRN
18/3/2019 1,122,303 0.22 EUR 400,000 Carlsberg Breweries A/S 2.50%
28/5/2024 434,432 0.09 EUR 250,000 Danske Bank A/S 0.50% 6/5/2021 250,300 0.05 EUR 300,000 Danske Bank A/S 0.75% 2/6/2023 299,136 0.06 EUR 1,300,000 Danske Bank A/S FRN 4/10/2023 1,381,393 0.27 EUR 550,000 Danske Bank A/S FRN 19/5/2026 574,068 0.11 EUR 172,000 Vestas Wind Systems A/S 2.75%
11/3/2022 177,286 0.03
4,238,918 0.83
France GBP 781,000 AXA SA 7.125% 15/12/2020 1,234,448 0.24 EUR 1,100,000 AXA SA 1.125% 15/5/2028 1,085,403 0.21 EUR 313,000 AXA SA FRN (Perpetual) 315,141 0.06 EUR 700,000 BNP Paribas SA 2.875% 24/10/2022 793,495 0.16 EUR 475,000 BNP Paribas SA 1.125% 15/1/2023 484,455 0.09 EUR 175,000 BNP Paribas SA 2.875% 1/10/2026 177,231 0.03 EUR 500,000 BPCE SA 1.125% 14/12/2022 513,100 0.10 EUR 650,000 Carrefour SA 4.00% 9/4/2020 744,146 0.15 EUR 750,000 Casino Guichard Perrachon SA
4.379% 8/2/2017 770,287 0.15 EUR 200,000 Casino Guichard Perrachon SA
3.994% 9/3/2020 221,646 0.04 EUR 200,000 Casino Guichard Perrachon SA
5.976% 26/5/2021 231,702 0.05 EUR 100,000 Casino Guichard Perrachon SA
3.311% 25/1/2023 105,951 0.02 EUR 600,000 Casino Guichard Perrachon SA
3.248% 7/3/2024 624,720 0.12 EUR 600,000 Casino Guichard Perrachon SA
2.33% 7/2/2025 584,685 0.11 EUR 400,000 Casino Guichard Perrachon SA
2.798% 5/8/2026 398,036 0.08 EUR 100,000 CNP Assurances FRN 10/6/2047 97,738 0.02 EUR 1,300,000 Credit Agricole SA/London 0.875%
19/1/2022 1,315,951 0.26 GBP 2,700,000 Dexia Credit Local SA 2.125%
12/2/2025 3,517,904 0.69 EUR 136,264 Driver France 1 FCT 'A' FRN
21/7/2020 136,217 0.03 GBP 2,400,000 Electricite de France SA FRN
(Perpetual) 2,688,174 0.53 EUR 400,000 Engie SA 5.125% 19/2/2018 435,540 0.09 EUR 500,000 Engie SA FRN (Perpetual) 509,662 0.10 EUR 1,000,000 Eutelsat SA 2.625% 13/1/2020 1,060,680 0.21 EUR 693,080 FCT GINKGO Compartment Sales
Finance '2013-SF 1 A' FRN 23/12/2040 694,973 0.14
EUR 18,367 FCT Marsollier Mortgages '2009-1 A' FRN 27/9/2050 18,364 0.00
EUR 400,000 Fonciere Des Regions 1.875% 20/5/2026 402,704 0.08
EUR 2,700,000 HSBC France SA FRN 27/11/2019 2,710,908 0.53 EUR 300,000 ICADE 2.25% 16/4/2021 319,665 0.06 EUR 300,000 Orange SA 1.00% 12/5/2025 298,422 0.06 EUR 200,000 Orange SA FRN (Perpetual) 204,250 0.04 EUR 300,000 RCI Banque SA FRN 18/3/2019 303,372 0.06 EUR 650,000 Renault SA 5.625% 22/3/2017 678,863 0.13 EUR 350,000 Renault SA 4.625% 18/9/2017 370,009 0.07 EUR 600,000 Renault SA 3.625% 19/9/2018
(traded in France) 645,549 0.13 EUR 350,000 Renault SA 3.625% 19/9/2018
(traded in Germany) 376,570 0.07 EUR 200,000 RTE Reseau de Transport d'Electricite
SA 1.625% 27/11/2025 207,912 0.04 EUR 200,000 RTE Reseau de Transport d'Electricite
SA 1.00% 19/10/2026 194,527 0.04
EUR 100,000 RTE Reseau de Transport d'Electricite SA 2.75% 20/6/2029 112,475 0.02
EUR 300,000 RTE Reseau de Transport d'Electricite SA 2.00% 18/4/2036 291,572 0.06
EUR 200,000 Total SA FRN (Perpetual) 206,044 0.04 EUR 270,000 Unibail-Rodamco SE 2.50%
26/2/2024 303,070 0.06 EUR 350,000 Unibail-Rodamco SE 2.00%
28/4/2036 357,858 0.07 EUR 450,000 WPP Finance SA 2.25% 22/9/2026 480,787 0.09
27,224,206 5.33
Germany EUR 300,000 Allianz SE FRN 7/7/2045 283,044 0.06 EUR 200,000 Alstria Office AG (Reit) 2.125%
12/4/2023 204,869 0.04 EUR 400,000 Bertelsmann SE & Co KGaA
1.125% 27/4/2026 398,054 0.08 EUR 400,000 Bertelsmann SE & Co KGaA
FRN 23/4/2075 369,922 0.07 EUR 423,000 Commerzbank AG 4.00% 23/3/2026 437,302 0.09 EUR 1,300,000 Daimler AG FRN 12/1/2019 1,303,484 0.26 EUR 400,000 Deutsche Bank AG 4.50% 19/5/2026 397,700 0.08 EUR 255,219 Driver Ten GmbH 'A' FRN 21/3/2019 255,180 0.05 EUR 924,061 Driver Twelve GmbH 'A' FRN
22/5/2020 923,016 0.18 EUR 700,000 Eurogrid GmbH 1.50% 18/4/2028 704,368 0.14 GBP 2,900,000 FMS Wertmanagement AoeR 1.25%
8/3/2019 3,835,141 0.75 EUR 625,000 HeidelbergCement AG 2.25%
3/6/2024 629,065 0.12 EUR 316,825 Red & Black Auto Germany 2 'A'
FRN 15/9/2022 317,076 0.06 EUR 74,038 SC Germany Auto '2013-1 UG A'
FRN 12/10/2022 74,069 0.01 EUR 173,758 SC Germany Auto UG
haftungsbeschraenkt '2013-2 A' FRN 12/3/2023 173,945 0.03
10,306,235 2.02
Greece EUR 122,500 Hellenic Republic Government Bond
(Step-up Coupon) 3.00% 24/2/2023 97,238 0.02 EUR 122,500 Hellenic Republic Government Bond
(Step-up Coupon) 3.00% 24/2/2024 95,182 0.02 EUR 122,500 Hellenic Republic Government Bond
(Step-up Coupon) 3.00% 24/2/2025 93,411 0.02 EUR 122,500 Hellenic Republic Government Bond
(Step-up Coupon) 3.00% 24/2/2026 92,785 0.02 EUR 122,500 Hellenic Republic Government Bond
(Step-up Coupon) 3.00% 24/2/2027 89,937 0.02 EUR 122,500 Hellenic Republic Government Bond
(Step-up Coupon) 3.00% 24/2/2028 88,504 0.02 EUR 122,500 Hellenic Republic Government Bond
(Step-up Coupon) 3.00% 24/2/2029 86,740 0.02 EUR 122,500 Hellenic Republic Government Bond
(Step-up Coupon) 3.00% 24/2/2030 85,171 0.02 EUR 122,500 Hellenic Republic Government Bond
(Step-up Coupon) 3.00% 24/2/2031 83,828 0.02 EUR 122,500 Hellenic Republic Government Bond
(Step-up Coupon) 3.00% 24/2/2032 82,743 0.02 EUR 122,500 Hellenic Republic Government Bond
(Step-up Coupon) 3.00% 24/2/2033 81,585 0.02 EUR 122,500 Hellenic Republic Government Bond
(Step-up Coupon) 3.00% 24/2/2034 80,617 0.02 EUR 122,500 Hellenic Republic Government Bond
(Step-up Coupon) 3.00% 24/2/2035 79,699 0.02 EUR 122,500 Hellenic Republic Government Bond
(Step-up Coupon) 3.00% 24/2/2036 78,602 0.01
Portfolio of Investments as at 31 May 2016
France continued
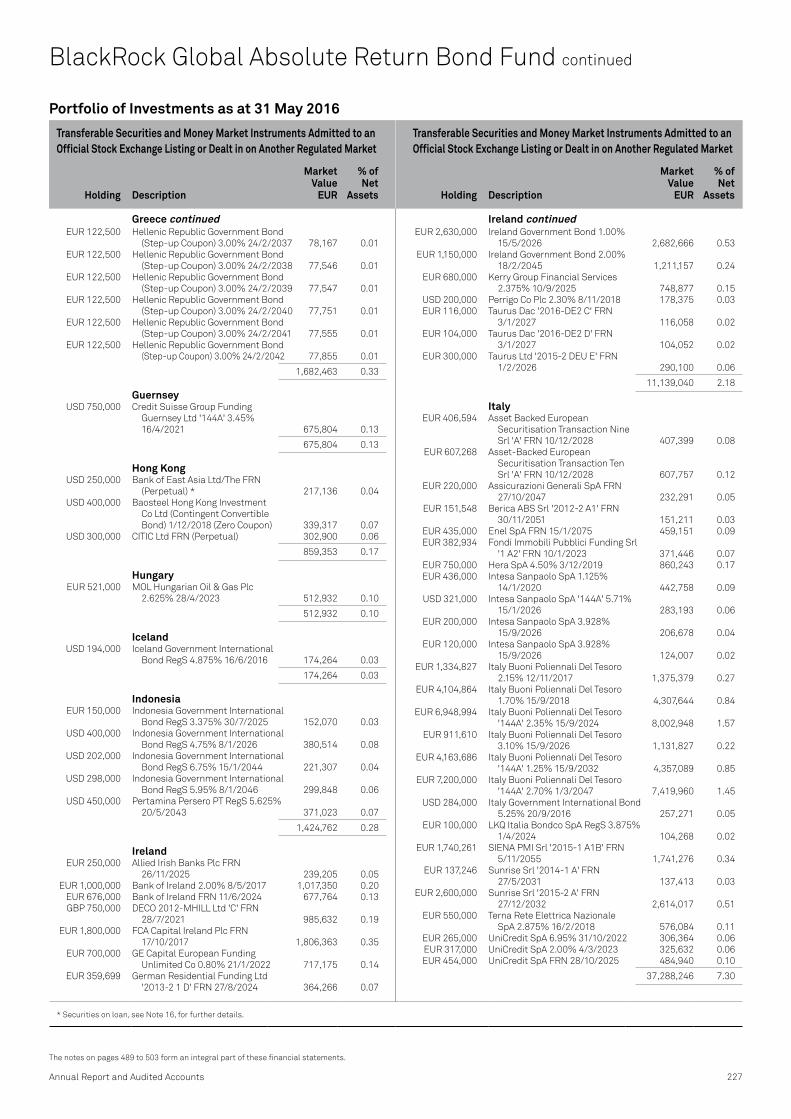
Annual Report and Audited Accounts 227
The notes on pages 489 to 503 form an integral part of these financial statements.
Transferable Securities and Money Market Instruments Admitted to an Official Stock Exchange Listing or Dealt in on Another Regulated Market
Transferable Securities and Money Market Instruments Admitted to an Official Stock Exchange Listing or Dealt in on Another Regulated Market
Holding
Description
Market Value
EUR
% of Net
Assets
Holding
Description
Market Value
EUR
% of Net
Assets
* Securities on loan, see Note 16, for further details.
Portfolio of Investments as at 31 May 2016
EUR 122,500 Hellenic Republic Government Bond (Step-up Coupon) 3.00% 24/2/2037 78,167 0.01
EUR 122,500 Hellenic Republic Government Bond (Step-up Coupon) 3.00% 24/2/2038 77,546 0.01
EUR 122,500 Hellenic Republic Government Bond (Step-up Coupon) 3.00% 24/2/2039 77,547 0.01
EUR 122,500 Hellenic Republic Government Bond (Step-up Coupon) 3.00% 24/2/2040 77,751 0.01
EUR 122,500 Hellenic Republic Government Bond (Step-up Coupon) 3.00% 24/2/2041 77,555 0.01
EUR 122,500 Hellenic Republic Government Bond (Step-up Coupon) 3.00% 24/2/2042 77,855 0.01
1,682,463 0.33
Guernsey USD 750,000 Credit Suisse Group Funding
Guernsey Ltd '144A' 3.45% 16/4/2021 675,804 0.13
675,804 0.13
Hong Kong USD 250,000 Bank of East Asia Ltd/The FRN
(Perpetual) * 217,136 0.04 USD 400,000 Baosteel Hong Kong Investment
Co Ltd (Contingent Convertible Bond) 1/12/2018 (Zero Coupon) 339,317 0.07
USD 300,000 CITIC Ltd FRN (Perpetual) 302,900 0.06
859,353 0.17
Hungary EUR 521,000 MOL Hungarian Oil & Gas Plc
2.625% 28/4/2023 512,932 0.10
512,932 0.10
Iceland USD 194,000 Iceland Government International
Bond RegS 4.875% 16/6/2016 174,264 0.03
174,264 0.03
Indonesia EUR 150,000 Indonesia Government International
Bond RegS 3.375% 30/7/2025 152,070 0.03 USD 400,000 Indonesia Government International
Bond RegS 4.75% 8/1/2026 380,514 0.08 USD 202,000 Indonesia Government International
Bond RegS 6.75% 15/1/2044 221,307 0.04 USD 298,000 Indonesia Government International
Bond RegS 5.95% 8/1/2046 299,848 0.06 USD 450,000 Pertamina Persero PT RegS 5.625%
20/5/2043 371,023 0.07
1,424,762 0.28
Ireland EUR 250,000 Allied Irish Banks Plc FRN
26/11/2025 239,205 0.05 EUR 1,000,000 Bank of Ireland 2.00% 8/5/2017 1,017,350 0.20 EUR 676,000 Bank of Ireland FRN 11/6/2024 677,764 0.13 GBP 750,000 DECO 2012-MHILL Ltd 'C' FRN
28/7/2021 985,632 0.19 EUR 1,800,000 FCA Capital Ireland Plc FRN
17/10/2017 1,806,363 0.35 EUR 700,000 GE Capital European Funding
Unlimited Co 0.80% 21/1/2022 717,175 0.14 EUR 359,699 German Residential Funding Ltd
'2013-2 1 D' FRN 27/8/2024 364,266 0.07
EUR 2,630,000 Ireland Government Bond 1.00% 15/5/2026 2,682,666 0.53
EUR 1,150,000 Ireland Government Bond 2.00% 18/2/2045 1,211,157 0.24
EUR 680,000 Kerry Group Financial Services 2.375% 10/9/2025 748,877 0.15
USD 200,000 Perrigo Co Plc 2.30% 8/11/2018 178,375 0.03 EUR 116,000 Taurus Dac '2016-DE2 C' FRN
3/1/2027 116,058 0.02 EUR 104,000 Taurus Dac '2016-DE2 D' FRN
3/1/2027 104,052 0.02 EUR 300,000 Taurus Ltd '2015-2 DEU E' FRN
1/2/2026 290,100 0.06
11,139,040 2.18
Italy EUR 406,594 Asset Backed European
Securitisation Transaction Nine Srl 'A' FRN 10/12/2028 407,399 0.08
EUR 607,268 Asset-Backed European Securitisation Transaction Ten Srl 'A' FRN 10/12/2028 607,757 0.12
EUR 220,000 Assicurazioni Generali SpA FRN 27/10/2047 232,291 0.05
EUR 151,548 Berica ABS Srl '2012-2 A1' FRN 30/11/2051 151,211 0.03
EUR 435,000 Enel SpA FRN 15/1/2075 459,151 0.09 EUR 382,934 Fondi Immobili Pubblici Funding Srl
'1 A2' FRN 10/1/2023 371,446 0.07 EUR 750,000 Hera SpA 4.50% 3/12/2019 860,243 0.17 EUR 436,000 Intesa Sanpaolo SpA 1.125%
14/1/2020 442,758 0.09 USD 321,000 Intesa Sanpaolo SpA '144A' 5.71%
15/1/2026 283,193 0.06 EUR 200,000 Intesa Sanpaolo SpA 3.928%
15/9/2026 206,678 0.04 EUR 120,000 Intesa Sanpaolo SpA 3.928%
15/9/2026 124,007 0.02 EUR 1,334,827 Italy Buoni Poliennali Del Tesoro
2.15% 12/11/2017 1,375,379 0.27 EUR 4,104,864 Italy Buoni Poliennali Del Tesoro
1.70% 15/9/2018 4,307,644 0.84 EUR 6,948,994 Italy Buoni Poliennali Del Tesoro
'144A' 2.35% 15/9/2024 8,002,948 1.57 EUR 911,610 Italy Buoni Poliennali Del Tesoro
3.10% 15/9/2026 1,131,827 0.22 EUR 4,163,686 Italy Buoni Poliennali Del Tesoro
'144A' 1.25% 15/9/2032 4,357,089 0.85 EUR 7,200,000 Italy Buoni Poliennali Del Tesoro
'144A' 2.70% 1/3/2047 7,419,960 1.45 USD 284,000 Italy Government International Bond
5.25% 20/9/2016 257,271 0.05 EUR 100,000 LKQ Italia Bondco SpA RegS 3.875%
1/4/2024 104,268 0.02 EUR 1,740,261 SIENA PMI Srl '2015-1 A1B' FRN
5/11/2055 1,741,276 0.34 EUR 137,246 Sunrise Srl '2014-1 A' FRN
27/5/2031 137,413 0.03 EUR 2,600,000 Sunrise Srl '2015-2 A' FRN
27/12/2032 2,614,017 0.51 EUR 550,000 Terna Rete Elettrica Nazionale
SpA 2.875% 16/2/2018 576,084 0.11 EUR 265,000 UniCredit SpA 6.95% 31/10/2022 306,364 0.06 EUR 317,000 UniCredit SpA 2.00% 4/3/2023 325,632 0.06 EUR 454,000 UniCredit SpA FRN 28/10/2025 484,940 0.10
37,288,246 7.30
BlackRock Global Absolute Return Bond Fund continued
Ireland continued Greece continued

228 BlackRock Strategic Funds (BSF)
The notes on pages 489 to 503 form an integral part of these financial statements.
Transferable Securities and Money Market Instruments Admitted to an Official Stock Exchange Listing or Dealt in on Another Regulated Market
Transferable Securities and Money Market Instruments Admitted to an Official Stock Exchange Listing or Dealt in on Another Regulated Market
Holding
Description
Market Value
EUR
% of Net
Assets
Holding
Description
Market Value
EUR
% of Net
Assets
BlackRock Global Absolute Return Bond Fund continued
Japan JPY 284,500,000 Japan Government 10 Year Bond
2.00% 20/6/2016 2,294,638 0.45 JPY 20,000,000 Unicharm Corp (Contingent
Convertible Bond) 25/9/2020 (Zero Coupon) 183,104 0.04
USD 200,000 Yamaguchi Financial Group Inc (Contingent Convertible Bond) FRN 26/3/2020 173,239 0.03
2,650,981 0.52
Jersey USD 21,506 Aircraft Lease Securitisation Ltd
'2007-1A G3' '144A' FRN 10/5/2032 19,069 0.00 USD 260,000 UBS Group Funding Jersey Ltd '144A'
3.00% 15/4/2021 233,485 0.05 EUR 250,000 UBS Group Funding Jersey Ltd
2.125% 4/3/2024 258,184 0.05
510,738 0.10
Luxembourg USD 75,000 Actavis Funding SCS 2.35%
12/3/2018 67,711 0.01 GBP 450,000 Belfius Financing Co FRN 9/2/2017 585,757 0.11 GBP 2,539,412 Compartment Driver UK Two SA 'A'
FRN 25/1/2023 3,306,540 0.65 EUR 388,241 Compartment VCL 22 'A' FRN
21/8/2021 389,035 0.08 EUR 2,406,693 Compartment VCL 23 'A' FRN
21/1/2022 2,411,921 0.47 EUR 976,284 E-Carat SA '2014-1 A' FRN
18/9/2021 977,801 0.19 EUR 410,000 GELF Bond Issuer I SA 3.125%
3/4/2018 429,916 0.08 EUR 488,038 German Mittelstand Equipment
Finance No SA '2 A' FRN 26/7/2024 488,198 0.10
EUR 650,000 Glencore Finance Europe SA 5.25% 22/3/2017 674,671 0.13
EUR 1,350,000 Glencore Finance Europe SA 2.75% 1/4/2021 1,314,144 0.26
EUR 425,000 Hanesbrands Finance Luxembourg SCA RegS 3.50% 15/6/2024 432,969 0.08
EUR 128,000 Harman Finance International SCA 2.00% 27/5/2022 126,928 0.03
USD 275,000 Pentair Finance SA 2.90% 15/9/2018 246,650 0.05
EUR 108,986 Silver Arrow SA '5 A' FRN 15/10/2022 109,070 0.02
EUR 1,366,000 Tyco International Finance SA 1.375% 25/2/2025 1,327,042 0.26
12,888,353 2.52
Malaysia MYR 4,000,000 Malaysia Government Bond
3.795% 30/9/2022 865,156 0.17 MYR 4,630,000 Malaysia Government Investment
Issue 3.99% 15/10/2025 993,888 0.19 MYR 9,850,000 Malaysia Government Investment
Issue 4.07% 30/9/2026 2,135,785 0.42
3,994,829 0.78
Mexico EUR 250,000 America Movil SAB de CV 1.50%
10/3/2024 250,575 0.05 MXN 42,500,000 Mexican Bonos 5.75% 5/3/2026 2,011,966 0.39 EUR 100,000 Petroleos Mexicanos 3.75%
15/3/2019 103,500 0.02
EUR 100,000 Petroleos Mexicanos 2.75% 21/4/2027 82,386 0.02
EUR 450,000 Petroleos Mexicanos RegS 6.375% 5/8/2016 454,734 0.09
2,903,161 0.57
Mongolia USD 200,000 Development Bank of Mongolia
LLC 5.75% 21/3/2017 178,300 0.04 USD 500,000 Trade & Development Bank of
Mongolia LLC RegS 9.375% 19/5/2020 424,198 0.08
602,498 0.12
Netherlands EUR 400,000 ABB Finance BV 0.625% 3/5/2023 400,356 0.08 EUR 1,200,000 Airbus Group Finance BV 1.375%
13/5/2031 1,172,976 0.23 EUR 400,000 Alliander NV 0.875% 22/4/2026 399,148 0.08 USD 496,000 Bank Nederlandse Gemeenten NV
'144A' 1.125% 25/5/2018 443,779 0.09 EUR 1,000,000 BMW Finance NV FRN 26/5/2017 999,170 0.19 EUR 650,000 BMW Finance NV 0.125% 15/4/2020 647,572 0.13 EUR 457,807 Bumper 6 NL Finance BV 'A' FRN
19/3/2029 458,146 0.09 EUR 500,000 Cooperatieve Rabobank UA 1.25%
23/3/2026 501,225 0.10 EUR 550,000 Demeter Investments BV for Zurich
Insurance Co Ltd FRN 1/10/2046 549,653 0.11 EUR 690,000 Deutsche Telekom International
Finance BV 0.25% 19/4/2021 686,119 0.13 EUR 1,550,000 EDP Finance BV 4.75% 26/9/2016 1,572,793 0.31 EUR 230,000 Enel Finance International NV
4.125% 12/7/2017 240,480 0.05 EUR 465,000 Enel Finance International NV
3.625% 17/4/2018 496,271 0.10 EUR 705,000 Enel Finance International NV 5.75%
24/10/2018 800,795 0.16 EUR 300,000 Enel Finance International NV
4.875% 11/3/2020 352,230 0.07 EUR 300,000 Enexis Holding NV 0.875% 28/4/2026 296,462 0.06 EUR 400,000 Gas Natural Fenosa Finance BV FRN
(Perpetual) 359,152 0.07 USD 200,000 Greenko Dutch BV RegS 8.00%
1/8/2019 192,488 0.04 EUR 725,000 Heineken NV 1.00% 4/5/2026 707,698 0.14 EUR 600,000 Iberdrola International BV 4.25%
11/10/2018 658,968 0.13 EUR 200,000 Iberdrola International BV 1.125%
21/4/2026 198,184 0.04 EUR 310,000 ING Bank NV 1.25% 13/12/2019 321,002 0.06 USD 200,000 Jababeka International BV RegS
7.50% 24/9/2019 183,915 0.03 EUR 800,000 LeasePlan Corp NV FRN 28/4/2017 800,924 0.15 EUR 450,000 Linde Finance BV 1.00% 20/4/2028 449,377 0.09 USD 2,889,000 Petrobras Global Finance BV 8.375%
23/5/2021 2,573,575 0.50 USD 845,000 Shell International Finance BV
1.375% 10/5/2019 752,072 0.15 EUR 325,000 SNS Bank NV FRN 5/11/2025 327,797 0.06 EUR 46,258 Storm BV '2014-2 A1' FRN 22/3/2051 46,296 0.01 EUR 450,000 Unilever NV 1.00% 3/6/2023 463,916 0.09 EUR 600,000 Unilever NV 1.125% 29/4/2028 600,609 0.12 GBP 625,000 Volkswagen Financial Services NV
1.25% 15/12/2016 818,484 0.16 EUR 1,120,000 Volkswagen International Finance
NV FRN (Perpetual) 1,013,600 0.20
Portfolio of Investments as at 31 May 2016
Mexico continued

Annual Report and Audited Accounts 229
The notes on pages 489 to 503 form an integral part of these financial statements.
Transferable Securities and Money Market Instruments Admitted to an Official Stock Exchange Listing or Dealt in on Another Regulated Market
Transferable Securities and Money Market Instruments Admitted to an Official Stock Exchange Listing or Dealt in on Another Regulated Market
Holding
Description
Market Value
EUR
% of Net
Assets
Holding
Description
Market Value
EUR
% of Net
Assets
Portfolio of Investments as at 31 May 2016
EUR 480,000 Volkswagen International Finance NV RegS FRN (Perpetual) 474,806 0.09
EUR 700,000 Vonovia Finance BV FRN 15/12/2017 706,279 0.14 EUR 300,000 Vonovia Finance BV 1.625%
15/12/2020 310,651 0.06 EUR 300,000 Vonovia Finance BV 2.25%
15/12/2023 322,074 0.06
22,299,042 4.37
New Zealand GBP 625,000 Westpac Securities NZ Ltd/London
FRN 2/10/2017 819,471 0.16
819,471 0.16
Philippines PHP 90,000,000 Philippine Government International
Bond 3.90% 26/11/2022 1,702,187 0.33
1,702,187 0.33
Portugal EUR 223,967 Gamma Sociedade de Titularizacao
de Creditos SA/Atlantes Finance '6 A' FRN 20/3/2033 225,101 0.04
EUR 2,450,000 Portugal Obrigacoes do Tesouro OT '144A' 2.20% 17/10/2022 2,434,075 0.48
EUR 1,320,000 Portugal Obrigacoes do Tesouro OT '144A' 2.875% 21/7/2026 1,297,996 0.25
EUR 3,677,000 Portugal Obrigacoes do Tesouro OT '144A' 4.10% 15/2/2045 3,703,805 0.73
EUR 325,727 TAGUS - Sociedade de Titularizacao de Creditos SA Via Volta Electricity Receivables 4.172% 16/2/2017 330,190 0.06
EUR 988,460 TAGUS - Sociedade de Titularizacao de Creditos SA Via Volta Electricity Receivables 2.98% 16/2/2018 997,355 0.20
8,988,522 1.76
Russia RUB 202,265,000 Russian Federal Bond - OFZ
8.15% 3/2/2027 2,646,870 0.52
2,646,870 0.52
Singapore USD 500,000 Berau Capital Resources Pte
Ltd RegS (Defaulted) 12.50% 8/7/2015 87,269 0.01
USD 380,000 Pratama Agung Pte Ltd 6.25% 24/2/2020 345,774 0.07
433,043 0.08
Slovenia USD 721,000 Slovenia Government International
Bond RegS 5.25% 18/2/2024 724,986 0.14
724,986 0.14
South Africa ZAR 56,505,000 South Africa Government Bond
8.75% 28/2/2048 2,822,206 0.55
2,822,206 0.55
Spain EUR 776,868 Auto ABS '2012-3 A' 0.60%
27/9/2024 777,828 0.15 EUR 400,000 Banco Bilbao Vizcaya Argentaria
SA 1.00% 20/1/2021 406,652 0.08
EUR 200,000 Bankia SA 3.50% 17/1/2019 214,388 0.04 EUR 600,000 Bankia SA FRN 22/5/2024 586,164 0.11 EUR 400,000 Enagas Financiaciones SAU
1.25% 6/2/2025 408,530 0.08 EUR 200,000 Enagas Financiaciones SAU
1.375% 5/5/2028 199,448 0.04 EUR 500,000 Gas Natural Capital Markets SA
5.00% 13/2/2018 541,517 0.11 EUR 100,000 Ibercaja Banco SA FRN 28/7/2025 95,016 0.02 EUR 450,000 Iberdrola Finanzas SAU 4.125%
23/3/2020 516,047 0.10 EUR 500,000 Mapfre SA 1.625% 19/5/2026 494,143 0.10 EUR 350,000 Merlin Properties Socimi SA
2.225% 25/4/2023 356,440 0.07 EUR 400,000 Red Electrica Financiaciones SAU
1.00% 21/4/2026 394,748 0.08 EUR 1,000,000 Santander Consumer Finance SA
FRN 7/7/2017 999,740 0.20 EUR 500,000 Santander International Debt SAU
1.375% 3/3/2021 516,457 0.10 EUR 740,000 Spain Government Bond '144A'
2.15% 31/10/2025 788,196 0.15 EUR 483,000 Spain Government Bond '144A'
1.95% 30/4/2026 503,552 0.10 EUR 1,883,473 Spain Government Inflation Linked
Bond '144A' 0.55% 30/11/2019 1,943,367 0.38 EUR 400,000 Telefonica Emisiones SAU 4.797%
21/2/2018 431,824 0.08
10,174,057 1.99
Sri Lanka USD 200,000 Sri Lanka Government International
Bond RegS 6.125% 3/6/2025 164,292 0.03 USD 200,000 Sri Lanka Government International
Bond RegS 6.85% 3/11/2025 171,454 0.04
335,746 0.07
Supranational GBP 2,695,000 European Investment Bank
1.50% 1/2/2019 3,588,328 0.70
3,588,328 0.70
Sweden EUR 341,000 Svenska Handelsbanken AB
4.375% 20/10/2021 413,055 0.08
413,055 0.08
Switzerland EUR 280,000 Credit Suisse AG FRN 18/9/2025 302,050 0.06 USD 330,000 Credit Suisse AG RegS 6.50%
8/8/2023 314,649 0.06 EUR 400,000 Credit Suisse AG/London 1.50%
10/4/2026 403,770 0.08 EUR 2,748,000 UBS AG FRN 12/2/2026 2,915,875 0.57
3,936,344 0.77
Taiwan USD 400,000 Advanced Semiconductor
Engineering Inc (Contingent Convertible Bond) 27/3/2018 (Zero Coupon) 339,764 0.07
339,764 0.07
BlackRock Global Absolute Return Bond Fund continued
Netherlands continued Spain continued
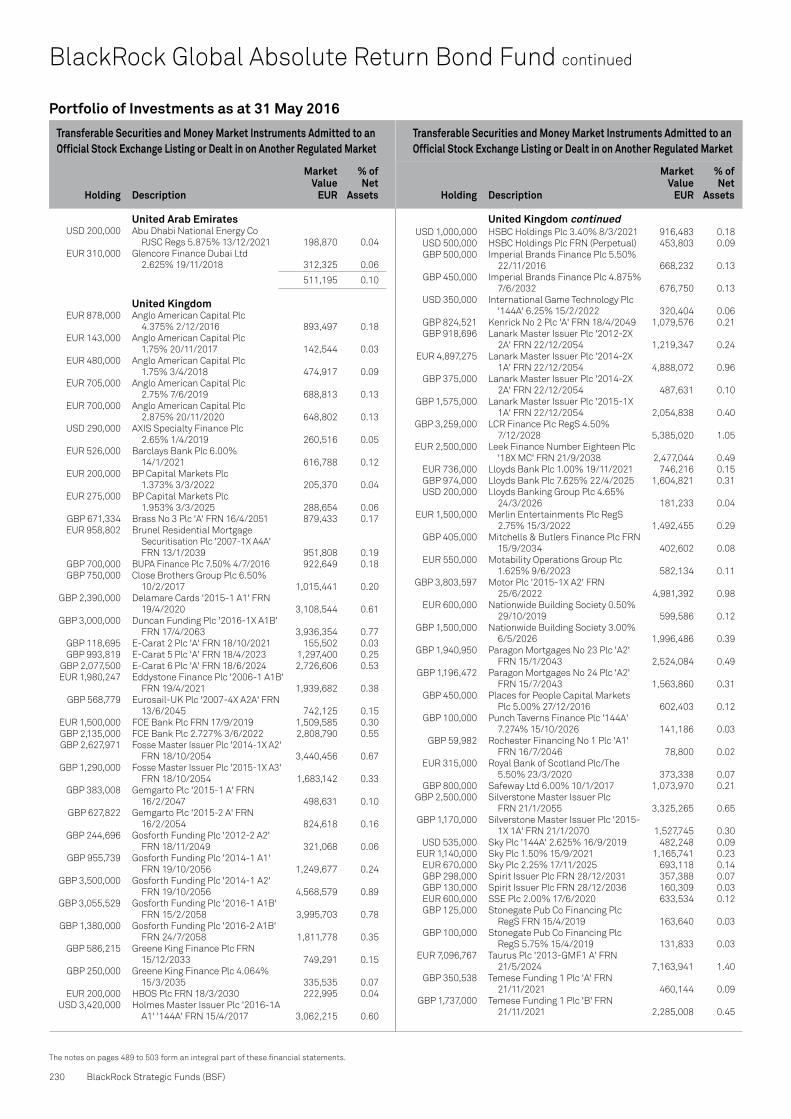
230 BlackRock Strategic Funds (BSF)
The notes on pages 489 to 503 form an integral part of these financial statements.
Transferable Securities and Money Market Instruments Admitted to an Official Stock Exchange Listing or Dealt in on Another Regulated Market
Transferable Securities and Money Market Instruments Admitted to an Official Stock Exchange Listing or Dealt in on Another Regulated Market
Holding
Description
Market Value
EUR
% of Net
Assets
Holding
Description
Market Value
EUR
% of Net
Assets
BlackRock Global Absolute Return Bond Fund continued
United Arab Emirates USD 200,000 Abu Dhabi National Energy Co
PJSC Regs 5.875% 13/12/2021 198,870 0.04 EUR 310,000 Glencore Finance Dubai Ltd
2.625% 19/11/2018 312,325 0.06
511,195 0.10
United Kingdom EUR 878,000 Anglo American Capital Plc
4.375% 2/12/2016 893,497 0.18 EUR 143,000 Anglo American Capital Plc
1.75% 20/11/2017 142,544 0.03 EUR 480,000 Anglo American Capital Plc
1.75% 3/4/2018 474,917 0.09 EUR 705,000 Anglo American Capital Plc
2.75% 7/6/2019 688,813 0.13 EUR 700,000 Anglo American Capital Plc
2.875% 20/11/2020 648,802 0.13 USD 290,000 AXIS Specialty Finance Plc
2.65% 1/4/2019 260,516 0.05 EUR 526,000 Barclays Bank Plc 6.00%
14/1/2021 616,788 0.12 EUR 200,000 BP Capital Markets Plc
1.373% 3/3/2022 205,370 0.04 EUR 275,000 BP Capital Markets Plc
1.953% 3/3/2025 288,654 0.06 GBP 671,334 Brass No 3 Plc 'A' FRN 16/4/2051 879,433 0.17 EUR 958,802 Brunel Residential Mortgage
Securitisation Plc '2007-1X A4A' FRN 13/1/2039 951,808 0.19
GBP 700,000 BUPA Finance Plc 7.50% 4/7/2016 922,649 0.18 GBP 750,000 Close Brothers Group Plc 6.50%
10/2/2017 1,015,441 0.20 GBP 2,390,000 Delamare Cards '2015-1 A1' FRN
19/4/2020 3,108,544 0.61 GBP 3,000,000 Duncan Funding Plc '2016-1X A1B'
FRN 17/4/2063 3,936,354 0.77 GBP 118,695 E-Carat 2 Plc 'A' FRN 18/10/2021 155,502 0.03 GBP 993,819 E-Carat 5 Plc 'A' FRN 18/4/2023 1,297,400 0.25 GBP 2,077,500 E-Carat 6 Plc 'A' FRN 18/6/2024 2,726,606 0.53 EUR 1,980,247 Eddystone Finance Plc '2006-1 A1B'
FRN 19/4/2021 1,939,682 0.38 GBP 568,779 Eurosail-UK Plc '2007-4X A2A' FRN
13/6/2045 742,125 0.15 EUR 1,500,000 FCE Bank Plc FRN 17/9/2019 1,509,585 0.30 GBP 2,135,000 FCE Bank Plc 2.727% 3/6/2022 2,808,790 0.55 GBP 2,627,971 Fosse Master Issuer Plc '2014-1X A2'
FRN 18/10/2054 3,440,456 0.67 GBP 1,290,000 Fosse Master Issuer Plc '2015-1X A3'
FRN 18/10/2054 1,683,142 0.33 GBP 383,008 Gemgarto Plc '2015-1 A' FRN
16/2/2047 498,631 0.10 GBP 627,822 Gemgarto Plc '2015-2 A' FRN
16/2/2054 824,618 0.16 GBP 244,696 Gosforth Funding Plc '2012-2 A2'
FRN 18/11/2049 321,068 0.06 GBP 955,739 Gosforth Funding Plc '2014-1 A1'
FRN 19/10/2056 1,249,677 0.24 GBP 3,500,000 Gosforth Funding Plc '2014-1 A2'
FRN 19/10/2056 4,568,579 0.89 GBP 3,055,529 Gosforth Funding Plc '2016-1 A1B'
FRN 15/2/2058 3,995,703 0.78 GBP 1,380,000 Gosforth Funding Plc '2016-2 A1B'
FRN 24/7/2058 1,811,778 0.35 GBP 586,215 Greene King Finance Plc FRN
15/12/2033 749,291 0.15 GBP 250,000 Greene King Finance Plc 4.064%
15/3/2035 335,535 0.07 EUR 200,000 HBOS Plc FRN 18/3/2030 222,995 0.04 USD 3,420,000 Holmes Master Issuer Plc '2016-1A
A1' '144A' FRN 15/4/2017 3,062,215 0.60
USD 1,000,000 HSBC Holdings Plc 3.40% 8/3/2021 916,483 0.18 USD 500,000 HSBC Holdings Plc FRN (Perpetual) 453,803 0.09 GBP 500,000 Imperial Brands Finance Plc 5.50%
22/11/2016 668,232 0.13 GBP 450,000 Imperial Brands Finance Plc 4.875%
7/6/2032 676,750 0.13 USD 350,000 International Game Technology Plc
'144A' 6.25% 15/2/2022 320,404 0.06 GBP 824,521 Kenrick No 2 Plc 'A' FRN 18/4/2049 1,079,576 0.21 GBP 918,696 Lanark Master Issuer Plc '2012-2X
2A' FRN 22/12/2054 1,219,347 0.24 EUR 4,897,275 Lanark Master Issuer Plc '2014-2X
1A' FRN 22/12/2054 4,888,072 0.96 GBP 375,000 Lanark Master Issuer Plc '2014-2X
2A' FRN 22/12/2054 487,631 0.10 GBP 1,575,000 Lanark Master Issuer Plc '2015-1X
1A' FRN 22/12/2054 2,054,838 0.40 GBP 3,259,000 LCR Finance Plc RegS 4.50%
7/12/2028 5,385,020 1.05 EUR 2,500,000 Leek Finance Number Eighteen Plc
'18X MC' FRN 21/9/2038 2,477,044 0.49 EUR 736,000 Lloyds Bank Plc 1.00% 19/11/2021 746,216 0.15 GBP 974,000 Lloyds Bank Plc 7.625% 22/4/2025 1,604,821 0.31 USD 200,000 Lloyds Banking Group Plc 4.65%
24/3/2026 181,233 0.04 EUR 1,500,000 Merlin Entertainments Plc RegS
2.75% 15/3/2022 1,492,455 0.29 GBP 405,000 Mitchells & Butlers Finance Plc FRN
15/9/2034 402,602 0.08 EUR 550,000 Motability Operations Group Plc
1.625% 9/6/2023 582,134 0.11 GBP 3,803,597 Motor Plc '2015-1X A2' FRN
25/6/2022 4,981,392 0.98 EUR 600,000 Nationwide Building Society 0.50%
29/10/2019 599,586 0.12 GBP 1,500,000 Nationwide Building Society 3.00%
6/5/2026 1,996,486 0.39 GBP 1,940,950 Paragon Mortgages No 23 Plc 'A2'
FRN 15/1/2043 2,524,084 0.49 GBP 1,196,472 Paragon Mortgages No 24 Plc 'A2'
FRN 15/7/2043 1,563,860 0.31 GBP 450,000 Places for People Capital Markets
Plc 5.00% 27/12/2016 602,403 0.12 GBP 100,000 Punch Taverns Finance Plc '144A'
7.274% 15/10/2026 141,186 0.03 GBP 59,982 Rochester Financing No 1 Plc 'A1'
FRN 16/7/2046 78,800 0.02 EUR 315,000 Royal Bank of Scotland Plc/The
5.50% 23/3/2020 373,338 0.07 GBP 800,000 Safeway Ltd 6.00% 10/1/2017 1,073,970 0.21 GBP 2,500,000 Silverstone Master Issuer Plc
FRN 21/1/2055 3,325,265 0.65 GBP 1,170,000 Silverstone Master Issuer Plc '2015-
1X 1A' FRN 21/1/2070 1,527,745 0.30 USD 535,000 Sky Plc '144A' 2.625% 16/9/2019 482,248 0.09 EUR 1,140,000 Sky Plc 1.50% 15/9/2021 1,165,741 0.23 EUR 670,000 Sky Plc 2.25% 17/11/2025 693,118 0.14 GBP 298,000 Spirit Issuer Plc FRN 28/12/2031 357,388 0.07 GBP 130,000 Spirit Issuer Plc FRN 28/12/2036 160,309 0.03 EUR 600,000 SSE Plc 2.00% 17/6/2020 633,534 0.12 GBP 125,000 Stonegate Pub Co Financing Plc
RegS FRN 15/4/2019 163,640 0.03 GBP 100,000 Stonegate Pub Co Financing Plc
RegS 5.75% 15/4/2019 131,833 0.03 EUR 7,096,767 Taurus Plc '2013-GMF1 A' FRN
21/5/2024 7,163,941 1.40 GBP 350,538 Temese Funding 1 Plc 'A' FRN
21/11/2021 460,144 0.09 GBP 1,737,000 Temese Funding 1 Plc 'B' FRN
21/11/2021 2,285,008 0.45
Portfolio of Investments as at 31 May 2016
United Kingdom continued

Annual Report and Audited Accounts 231
The notes on pages 489 to 503 form an integral part of these financial statements.
Transferable Securities and Money Market Instruments Admitted to an Official Stock Exchange Listing or Dealt in on Another Regulated Market
Transferable Securities and Money Market Instruments Admitted to an Official Stock Exchange Listing or Dealt in on Another Regulated Market
Holding
Description
Market Value
EUR
% of Net
Assets
Holding
Description
Market Value
EUR
% of Net
Assets
Portfolio of Investments as at 31 May 2016
GBP 2,055,000 Travis Perkins Plc 4.50% 7/9/2023 2,677,058 0.52 GBP 270,929 Turbo Finance 4 Plc 'A' FRN
20/1/2021 354,912 0.07 GBP 1,567,456 Turbo Finance 5 Plc 'A' FRN
20/8/2021 2,051,969 0.40 GBP 2,175,000 Turbo Finance 6 Plc 'A' FRN
20/2/2023 2,845,787 0.56 GBP 1,399,000 United Kingdom Gilt 4.25%
7/6/2032 2,403,058 0.47 GBP 673,800 United Kingdom Gilt 4.50%
7/9/2034 1,205,596 0.24 GBP 1,500,000 United Kingdom Gilt 4.25%
7/12/2046 2,843,266 0.56 GBP 2,764,000 United Kingdom Gilt Inflation
Linked 2.50% 26/7/2016 11,569,962 2.27 GBP 699,776 United Kingdom Gilt Inflation
Linked 0.125% 22/3/2046 1,217,989 0.24 GBP 121,293 United Kingdom Gilt Inflation
Linked 0.125% 22/11/2065 272,439 0.05 EUR 1,725,000 Vodafone Group Plc FRN
25/2/2019 1,744,975 0.34 GBP 4,051,776 Warwick Finance Residential
Mortgages Number Two Plc '2 A' FRN 21/9/2049 5,333,598 1.04
GBP 100,000 Westfield Stratford City Finance Plc FRN 4/11/2019 130,648 0.03
GBP 200,000 WM Morrison Supermarkets Plc 4.75% 4/7/2029 264,875 0.05
142,015,320 27.81
United States USD 925,000 AbbVie Inc 1.80% 14/5/2018 830,801 0.16 USD 297,000 AbbVie Inc 2.30% 14/5/2021 264,716 0.05 USD 630,000 AbbVie Inc 2.85% 14/5/2023 560,682 0.11 USD 577,000 AbbVie Inc 3.20% 14/5/2026 513,808 0.10 USD 242,000 AbbVie Inc 4.50% 14/5/2035 219,951 0.04 USD 377,000 Actavis Inc 1.875% 1/10/2017 338,208 0.07 USD 750,000 Advance Auto Parts Inc 4.50%
1/12/2023 702,797 0.14 GBP 600,000 Ahold Finance USA LLC 6.50%
14/3/2017 817,789 0.16 USD 350,000 Air Lease Corp 2.125% 15/1/2018 313,745 0.06 USD 315,000 Air Lease Corp 2.625% 4/9/2018 281,027 0.06 USD 50,000 Air Lease Corp 3.375% 15/1/2019 45,716 0.01 USD 216,000 Air Lease Corp 3.375% 1/6/2021 196,087 0.04 EUR 1,310,000 Albemarle Corp 1.875% 8/12/2021 1,320,290 0.26 USD 75,000 Ally Financial Inc 5.50% 15/2/2017 68,272 0.01 USD 133,000 Ally Financial Inc 6.25% 1/12/2017 124,194 0.02 USD 1,100,000 Altria Group Inc 4.00% 31/1/2024 1,080,792 0.21 USD 300,000 American Express Credit Account
Master Trust '2013-3 A' 0.98% 15/5/2019 268,512 0.05
USD 550,000 American Express Credit Account Master Trust '2014-2 A' 1.26% 15/1/2020 492,439 0.10
USD 150,000 American International Group Inc 3.30% 1/3/2021 137,900 0.03
USD 381,000 American International Group Inc 3.90% 1/4/2026 345,756 0.07
USD 145,000 American Tower Corp 3.30% 15/2/2021 133,175 0.03
USD 327,000 American Tower Corp 3.375% 15/10/2026 288,475 0.06
USD 700,000 AmeriCredit Automobile Receivables Trust '2015-1 A3' 1.26% 8/11/2019 624,840 0.12
USD 524,727 AmeriCredit Automobile Receivables Trust '2015-3 A2A' 1.07% 8/1/2019 468,931 0.09
USD 170,000 AmeriCredit Automobile Receivables Trust '2016-2 A3' 1.60% 9/11/2020 151,942 0.03
USD 240,000 Anheuser-Busch InBev Finance Inc 2.65% 1/2/2021 219,064 0.04
GBP 1,100,000 Apple Inc 3.05% 31/7/2029 1,468,979 0.29 USD 45,000 AT&T Inc 2.30% 11/3/2019 40,868 0.01 USD 135,000 AT&T Inc 2.45% 30/6/2020 121,423 0.02 EUR 300,000 AT&T Inc 1.30% 5/9/2023 303,756 0.06 USD 500,000 AT&T Inc 3.40% 15/5/2025 448,954 0.09 USD 83,000 AutoZone Inc 3.125% 21/4/2026 74,451 0.01 USD 50,000 Aviation Capital Group Corp '144A'
3.875% 27/9/2016 45,045 0.01 USD 235,000 Banc of America Commercial
Mortgage Trust '2007-4 AM' FRN 10/2/2051 219,457 0.04
USD 750,000 Banc of America Commercial Mortgage Trust '2007-5 AM' FRN 10/2/2051 690,375 0.14
EUR 1,300,000 Bank of America Corp 4.625% 7/2/2017 1,339,728 0.26
USD 900,000 Bank of America Corp 2.00% 11/1/2018 809,026 0.16
USD 500,000 Bank of America Corp 2.60% 15/1/2019 454,822 0.09
USD 250,000 Bank of America Corp 2.65% 1/4/2019 227,686 0.04
EUR 210,000 Bank of America Corp 2.375% 19/6/2024 225,773 0.04
USD 434,000 Bank of America Corp 3.95% 21/4/2025 388,541 0.08
USD 600,000 Bank of New York Mellon Corp/The 2.05% 3/5/2021 536,540 0.11
USD 168,000 Bank of New York Mellon Corp/The 2.80% 4/5/2026 151,213 0.03
USD 305,000 Bay Area Toll Authority 'S1' 6.918% 1/4/2040 391,425 0.08
USD 135,000 Baylor Scott & White Holdings 4.185% 15/11/2045 127,791 0.03
USD 381,637 Bear Stearns Asset Backed Securities I Trust '2007-HE3 2A' FRN 25/4/2037 252,498 0.05
USD 320,145 Bear Stearns Commercial Mortgage Securities Trust '2006-PWR14 A1A' 5.189% 11/12/2038 291,530 0.06
USD 659,982 Bear Stearns Commercial Mortgage Securities Trust '2007-PW17 A4' FRN 11/6/2050 612,265 0.12
EUR 300,000 Berkshire Hathaway Inc 1.625% 16/3/2035 279,714 0.06
USD 918,000 Branch Banking & Trust Co 1.45% 10/5/2019 818,153 0.16
USD 140,000 Burlington Northern Santa Fe LLC 3.90% 1/8/2046 125,717 0.02
USD 200,000 Cablevision Systems Corp 5.875% 15/9/2022 160,705 0.03
USD 150,000 California State Public Works Board 8.361% 1/10/2034 200,640 0.04
USD 300,000 Capital Auto Receivables Asset Trust '2014-1 A4' 1.69% 22/10/2018 268,843 0.05
USD 255,000 Capital One Bank USA NA 2.25% 13/2/2019 229,196 0.05
USD 5,000 Capital One NA/Mclean VA 2.35% 17/8/2018 4,523 0.00
USD 755,000 Carefree Portfolio Trust '2014-CARE A' '144A' FRN 15/11/2019 675,380 0.13
USD 595,229 CarMax Auto Owner Trust '2015-3 A2B' FRN 15/11/2018 533,571 0.10
USD 320,000 CarMax Auto Owner Trust '2016-2 A3' 1.52% 16/2/2021 286,785 0.06
USD 200,000 Carrington Mortgage Loan Trust Series '2006-NC5 A3' FRN 25/1/2037 96,504 0.02
BlackRock Global Absolute Return Bond Fund continued
United States continued United Kingdom continued

232 BlackRock Strategic Funds (BSF)
The notes on pages 489 to 503 form an integral part of these financial statements.
Transferable Securities and Money Market Instruments Admitted to an Official Stock Exchange Listing or Dealt in on Another Regulated Market
Transferable Securities and Money Market Instruments Admitted to an Official Stock Exchange Listing or Dealt in on Another Regulated Market
Holding
Description
Market Value
EUR
% of Net
Assets
Holding
Description
Market Value
EUR
% of Net
Assets
BlackRock Global Absolute Return Bond Fund continued
USD 135,000 Catholic Health Initiatives 4.35% 1/11/2042 119,955 0.02
USD 230,000 CD Mortgage Trust '2007-CD5 AJ' FRN 15/11/2044 211,157 0.04
USD 12,322,681 CFCRE Commercial Mortgage Trust '2016-C4 XA' FRN 10/5/2058 1,459,267 0.29
USD 285,000 Charter Communications Operating LLC Via Charter Communications Operating Capital '144A' 3.579% 23/7/2020 262,972 0.05
USD 500,000 Charter Communications Operating LLC Via Charter Communications Operating Capital '144A' 4.464% 23/7/2022 472,976 0.09
USD 325,000 Charter Communications Operating LLC Via Charter Communications Operating Capital '144A' 4.908% 23/7/2025 312,323 0.06
USD 650,000 Chase Issuance Trust '2014-1A A1' 1.15% 15/1/2019 582,331 0.11
USD 1,490,000 Chase Issuance Trust '2014-A6' 1.26% 15/7/2019 1,335,387 0.26
EUR 600,000 Chemours Co/The 6.125% 15/5/2023 541,584 0.11 USD 100,000 Cheniere Corpus Christi Holdings LLC
'144A' 7.00% 30/6/2024 92,103 0.02 USD 750,000 Chesapeake Funding II LLC '2016-1A
A2' '144A' FRN 15/3/2028 671,471 0.13 USD 850,000 Chesapeake Funding LLC '2014-1A C'
'144A' FRN 7/3/2026 756,952 0.15 USD 850,000 Chesapeake Funding LLC '2014-1A D'
'144A' FRN 7/3/2026 758,139 0.15 USD 754,273 Chrysler Capital Auto Receivables
Trust '2014-BA A3' '144A' 1.27% 15/5/2019 674,056 0.13
USD 330,000 CIT Group Inc 4.25% 15/8/2017 299,699 0.06 USD 105,000 Citibank Credit Card Issuance Trust
'2013-A6 A6' 1.32% 7/9/2018 94,080 0.02 USD 720,000 Citibank Credit Card Issuance Trust
'2014-A2' 1.02% 22/2/2019 643,796 0.13 USD 590,000 Citigroup Commercial Mortgage Trust
'2012-GC8 A2' 1.813% 10/9/2045 529,535 0.10 USD 550,000 Citigroup Commercial Mortgage Trust
'2014-388G A' '144A' FRN 15/6/2033 492,484 0.10 USD 23,477,848 Citigroup Commercial Mortgage Trust
'2014-GC19 XA' FRN 10/3/2047 1,402,686 0.27 USD 3,747,799 Citigroup Commercial Mortgage Trust
'2014-GC23 XA' FRN 10/7/2047 217,094 0.04 USD 10,947,891 Citigroup Commercial Mortgage Trust
'2015-P1 XA' FRN 15/9/2048 528,303 0.10 EUR 230,000 Citigroup Inc 2.375% 22/5/2024 247,228 0.05 USD 159,051 Citigroup Mortgage Loan Trust '2006-
HE1 M1' FRN 25/1/2036 139,226 0.03 USD 250,000 Citizens Bank NA Via Providence RI
2.55% 13/5/2021 223,691 0.04 USD 5,000 City of Atlanta GA Water &
Wastewater Revenue 5.00% 1 /11/2033 5,437 0.00
USD 325,000 City of Dallas TX Waterworks & Sewer System Revenue 'A' 5.00% 1/10/2031 358,793 0.07
USD 325,000 City of San Francisco CA Public Utilities Commission Water Revenue 5.00% 1/11/2030 359,236 0.07
USD 300,000 City of San Jose CA Airport Revenue 'A' 5.00% 1/3/2037 275,908 0.05
USD 5,000 City of Seattle WA Municipal Light & Power Revenue 'B' 5.00% 1/4/2023 5,496 0.00
USD 5,000 City of Seattle WA Municipal Light & Power Revenue 'B' 5.00% 1/4/2024 5,604 0.00
USD 5,000 City of Seattle WA Municipal Light & Power Revenue 'B' 5.00% 1/4/2025 5,683 0.00
USD 135,000 Clark County School District 'C' 5.00% 15/6/2026 151,367 0.03
USD 135,000 Clark County School District 'C' 5.00% 15/6/2027 149,832 0.03
USD 5,000 Clark County School District 'C' 5.00% 15/6/2028 5,519 0.00
USD 240,000 CNH Equipment Trust '2016-B A3' 1.63% 15/8/2021 214,817 0.04
USD 50,000 CNH Industrial Capital LLC 6.25% 1/11/2016 45,539 0.01
USD 170,000 COBALT CMBS Commercial Mortgage Trust '2007-C3 AM' FRN 15/5/2046 156,610 0.03
USD 215,000 Colorado Health Facilities Authority 5.25% 1/2/2031 216,099 0.04
USD 800,000 Comm Mortgage Trust '2013-CCRE11 C' '144A' FRN 10/10/2046 762,399 0.15
USD 420,000 Comm Mortgage Trust '2013-CCRE13 A2' 3.039% 10/12/2018 387,036 0.08
USD 4,266,510 Comm Mortgage Trust '2013-CR7 XA' FRN 10/3/2046 238,322 0.05
USD 2,447,940 Comm Mortgage Trust '2014-CCRE16 XA' FRN 10/4/2047 131,830 0.03
USD 250,000 Comm Mortgage Trust '2014-UBS2 A2' 2.82% 10/3/2047 229,458 0.05
USD 600,000 Comm Mortgage Trust '2015-CCRE23 A2' 2.852% 10/5/2048 552,784 0.11
USD 695,579 Comm Mortgage Trust '2015-CR23 XA' FRN 10/5/2048 35,855 0.01
USD 18,370,476 Comm Mortgage Trust '2015-CR24 XA' FRN 10/8/2055 961,634 0.19
USD 17,815,934 Comm Mortgage Trust '2015-CR25 XA' FRN 10/8/2048 1,021,225 0.20
USD 59,588,721 Comm Mortgage Trust '2015-LC21 XA' FRN 10/7/2048 2,622,244 0.51
USD 2,771,502 Commercial Mortgage Pass Through Certificates '2014-CR14 XA' FRN 10/2/2047 94,034 0.02
USD 200,000 Communications Sales & Leasing Inc Via CSL Capital LLC '144A' 6.00% 15/4/2023 178,164 0.04
USD 130,188 Continental Airlines Pass Through Trust '2009-1' 9.00% 8/7/2016 117,037 0.02
USD 110,202 Continental Airlines Pass Through Trust '2009-2 B' 9.25% 10/5/2017 104,329 0.02
USD 300,000 Contra Costa Community College District 6.504% 1/8/2034 364,832 0.07
USD 11,600,000 Core Industrial Trust '2015-WEST XA' '144A' FRN 10/2/2037 730,629 0.14
USD 170,731 Countrywide Asset-Backed Certificates '2007-4 A2' FRN 25/4/2047 181,919 0.04
USD 5,000 County of Miami-Dade FL 'A' 5.00% 1/7/2034 5,486 0.00
USD 5,000 County of Miami-Dade FL 'A' 5.00% 1/7/2036 5,419 0.00
USD 200,000 County of Sacramento CA Airport System Revenue 'B' 5.25% 1/7/2039 191,996 0.04
USD 650,000 Credit Acceptance Auto Loan Trust '2016-2A A' '144A' 2.42% 15/11/2023 581,807 0.11
USD 259,876 Credit Suisse Commercial Mortgage Trust Series '2006-C5 A3' 5.311% 15/12/2039 235,116 0.05
USD 42,000 Crown Castle International Corp 3.40% 15/2/2021 38,783 0.01
USD 74,000 Crown Castle International Corp 3.70% 15/6/2026 66,869 0.01
USD 320,000 CVS Health Corp 2.125% 1/6/2021 284,856 0.06
Portfolio of Investments as at 31 May 2016
United States continued United States continued
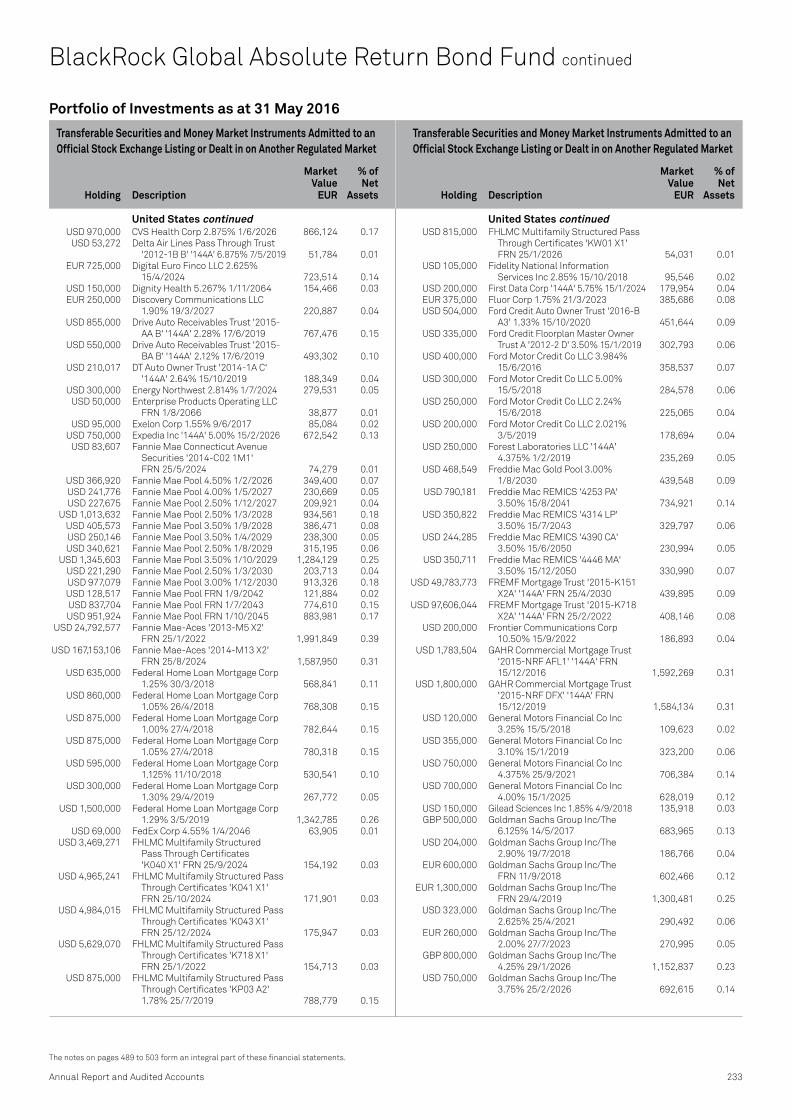
Annual Report and Audited Accounts 233
The notes on pages 489 to 503 form an integral part of these financial statements.
Transferable Securities and Money Market Instruments Admitted to an Official Stock Exchange Listing or Dealt in on Another Regulated Market
Transferable Securities and Money Market Instruments Admitted to an Official Stock Exchange Listing or Dealt in on Another Regulated Market
Holding
Description
Market Value
EUR
% of Net
Assets
Holding
Description
Market Value
EUR
% of Net
Assets
Portfolio of Investments as at 31 May 2016
USD 970,000 CVS Health Corp 2.875% 1/6/2026 866,124 0.17 USD 53,272 Delta Air Lines Pass Through Trust
'2012-1B B' '144A' 6.875% 7/5/2019 51,784 0.01 EUR 725,000 Digital Euro Finco LLC 2.625%
15/4/2024 723,514 0.14 USD 150,000 Dignity Health 5.267% 1/11/2064 154,466 0.03 EUR 250,000 Discovery Communications LLC
1.90% 19/3/2027 220,887 0.04 USD 855,000 Drive Auto Receivables Trust '2015-
AA B' '144A' 2.28% 17/6/2019 767,476 0.15 USD 550,000 Drive Auto Receivables Trust '2015-
BA B' '144A' 2.12% 17/6/2019 493,302 0.10 USD 210,017 DT Auto Owner Trust '2014-1A C'
'144A' 2.64% 15/10/2019 188,349 0.04 USD 300,000 Energy Northwest 2.814% 1/7/2024 279,531 0.05 USD 50,000 Enterprise Products Operating LLC
FRN 1/8/2066 38,877 0.01 USD 95,000 Exelon Corp 1.55% 9/6/2017 85,084 0.02 USD 750,000 Expedia Inc '144A' 5.00% 15/2/2026 672,542 0.13 USD 83,607 Fannie Mae Connecticut Avenue
Securities '2014-C02 1M1' FRN 25/5/2024 74,279 0.01
USD 366,920 Fannie Mae Pool 4.50% 1/2/2026 349,400 0.07 USD 241,776 Fannie Mae Pool 4.00% 1/5/2027 230,669 0.05 USD 227,675 Fannie Mae Pool 2.50% 1/12/2027 209,921 0.04 USD 1,013,632 Fannie Mae Pool 2.50% 1/3/2028 934,561 0.18 USD 405,573 Fannie Mae Pool 3.50% 1/9/2028 386,471 0.08 USD 250,146 Fannie Mae Pool 3.50% 1/4/2029 238,300 0.05 USD 340,621 Fannie Mae Pool 2.50% 1/8/2029 315,195 0.06 USD 1,345,603 Fannie Mae Pool 3.50% 1/10/2029 1,284,129 0.25 USD 221,290 Fannie Mae Pool 2.50% 1/3/2030 203,713 0.04 USD 977,079 Fannie Mae Pool 3.00% 1/12/2030 913,326 0.18 USD 128,517 Fannie Mae Pool FRN 1/9/2042 121,884 0.02 USD 837,704 Fannie Mae Pool FRN 1/7/2043 774,610 0.15 USD 951,924 Fannie Mae Pool FRN 1/10/2045 883,981 0.17 USD 24,792,577 Fannie Mae-Aces '2013-M5 X2'
FRN 25/1/2022 1,991,849 0.39 USD 167,153,106 Fannie Mae-Aces '2014-M13 X2'
FRN 25/8/2024 1,587,950 0.31 USD 635,000 Federal Home Loan Mortgage Corp
1.25% 30/3/2018 568,841 0.11 USD 860,000 Federal Home Loan Mortgage Corp
1.05% 26/4/2018 768,308 0.15 USD 875,000 Federal Home Loan Mortgage Corp
1.00% 27/4/2018 782,644 0.15 USD 875,000 Federal Home Loan Mortgage Corp
1.05% 27/4/2018 780,318 0.15 USD 595,000 Federal Home Loan Mortgage Corp
1.125% 11/10/2018 530,541 0.10 USD 300,000 Federal Home Loan Mortgage Corp
1.30% 29/4/2019 267,772 0.05 USD 1,500,000 Federal Home Loan Mortgage Corp
1.29% 3/5/2019 1,342,785 0.26 USD 69,000 FedEx Corp 4.55% 1/4/2046 63,905 0.01 USD 3,469,271 FHLMC Multifamily Structured
Pass Through Certificates 'K040 X1' FRN 25/9/2024 154,192 0.03
USD 4,965,241 FHLMC Multifamily Structured Pass Through Certificates 'K041 X1' FRN 25/10/2024 171,901 0.03
USD 4,984,015 FHLMC Multifamily Structured Pass Through Certificates 'K043 X1' FRN 25/12/2024 175,947 0.03
USD 5,629,070 FHLMC Multifamily Structured Pass Through Certificates 'K718 X1' FRN 25/1/2022 154,713 0.03
USD 875,000 FHLMC Multifamily Structured Pass Through Certificates 'KP03 A2' 1.78% 25/7/2019 788,779 0.15
USD 815,000 FHLMC Multifamily Structured Pass Through Certificates 'KW01 X1' FRN 25/1/2026 54,031 0.01
USD 105,000 Fidelity National Information Services Inc 2.85% 15/10/2018 95,546 0.02
USD 200,000 First Data Corp '144A' 5.75% 15/1/2024 179,954 0.04 EUR 375,000 Fluor Corp 1.75% 21/3/2023 385,686 0.08 USD 504,000 Ford Credit Auto Owner Trust '2016-B
A3' 1.33% 15/10/2020 451,644 0.09 USD 335,000 Ford Credit Floorplan Master Owner
Trust A '2012-2 D' 3.50% 15/1/2019 302,793 0.06 USD 400,000 Ford Motor Credit Co LLC 3.984%
15/6/2016 358,537 0.07 USD 300,000 Ford Motor Credit Co LLC 5.00%
15/5/2018 284,578 0.06 USD 250,000 Ford Motor Credit Co LLC 2.24%
15/6/2018 225,065 0.04 USD 200,000 Ford Motor Credit Co LLC 2.021%
3/5/2019 178,694 0.04 USD 250,000 Forest Laboratories LLC '144A'
4.375% 1/2/2019 235,269 0.05 USD 468,549 Freddie Mac Gold Pool 3.00%
1/8/2030 439,548 0.09 USD 790,181 Freddie Mac REMICS '4253 PA'
3.50% 15/8/2041 734,921 0.14 USD 350,822 Freddie Mac REMICS '4314 LP'
3.50% 15/7/2043 329,797 0.06 USD 244,285 Freddie Mac REMICS '4390 CA'
3.50% 15/6/2050 230,994 0.05 USD 350,711 Freddie Mac REMICS '4446 MA'
3.50% 15/12/2050 330,990 0.07 USD 49,783,773 FREMF Mortgage Trust '2015-K151
X2A' '144A' FRN 25/4/2030 439,895 0.09 USD 97,606,044 FREMF Mortgage Trust '2015-K718
X2A' '144A' FRN 25/2/2022 408,146 0.08 USD 200,000 Frontier Communications Corp
10.50% 15/9/2022 186,893 0.04 USD 1,783,504 GAHR Commercial Mortgage Trust
'2015-NRF AFL1' '144A' FRN 15/12/2016 1,592,269 0.31
USD 1,800,000 GAHR Commercial Mortgage Trust '2015-NRF DFX' '144A' FRN 15/12/2019 1,584,134 0.31
USD 120,000 General Motors Financial Co Inc 3.25% 15/5/2018 109,623 0.02
USD 355,000 General Motors Financial Co Inc 3.10% 15/1/2019 323,200 0.06
USD 750,000 General Motors Financial Co Inc 4.375% 25/9/2021 706,384 0.14
USD 700,000 General Motors Financial Co Inc 4.00% 15/1/2025 628,019 0.12
USD 150,000 Gilead Sciences Inc 1.85% 4/9/2018 135,918 0.03 GBP 500,000 Goldman Sachs Group Inc/The
6.125% 14/5/2017 683,965 0.13 USD 204,000 Goldman Sachs Group Inc/The
2.90% 19/7/2018 186,766 0.04 EUR 600,000 Goldman Sachs Group Inc/The
FRN 11/9/2018 602,466 0.12 EUR 1,300,000 Goldman Sachs Group Inc/The
FRN 29/4/2019 1,300,481 0.25 USD 323,000 Goldman Sachs Group Inc/The
2.625% 25/4/2021 290,492 0.06 EUR 260,000 Goldman Sachs Group Inc/The
2.00% 27/7/2023 270,995 0.05 GBP 800,000 Goldman Sachs Group Inc/The
4.25% 29/1/2026 1,152,837 0.23 USD 750,000 Goldman Sachs Group Inc/The
3.75% 25/2/2026 692,615 0.14
BlackRock Global Absolute Return Bond Fund continued
United States continued United States continued

234 BlackRock Strategic Funds (BSF)
The notes on pages 489 to 503 form an integral part of these financial statements.
Transferable Securities and Money Market Instruments Admitted to an Official Stock Exchange Listing or Dealt in on Another Regulated Market
Transferable Securities and Money Market Instruments Admitted to an Official Stock Exchange Listing or Dealt in on Another Regulated Market
Holding
Description
Market Value
EUR
% of Net
Assets
Holding
Description
Market Value
EUR
% of Net
Assets
BlackRock Global Absolute Return Bond Fund continued
USD 271,798 Government National Mortgage Association '1999-10 ZC' 6.50% 20/4/2029 276,220 0.05
USD 162,046 Government National Mortgage Association '1999-2 E' 6.50% 20/1/2029 163,829 0.03
USD 300,000 Grant County Public Utility District No 2 4.584% 1/1/2040 283,922 0.06
USD 150,000 GS Mortgage Securities Trust '2006-GG8 AM' 5.591% 10/11/2039 136,128 0.03
USD 140,000 GS Mortgage Securities Trust '2014-GSFL D' '144A' FRN 15/7/2031 121,623 0.02
USD 115,000 Harris Corp 2.70% 27/4/2020 102,980 0.02 USD 185,000 HCP Inc 6.00% 30/1/2017 170,387 0.03 USD 487,000 Hewlett Packard Enterprise Co
'144A' 2.85% 5/10/2018 443,667 0.09 USD 500,000 Hewlett Packard Enterprise Co
'144A' 4.40% 15/10/2022 473,383 0.09 USD 100,000 Hilton USA Trust '2013-HLT DFX'
'144A' 4.407% 5/11/2030 89,882 0.02 USD 100,000 Hilton USA Trust '2013-HLT EFX'
'144A' FRN 5/11/2030 89,840 0.02 USD 430,000 Honda Auto Receivables 2016-2
Owner Trust 'A3' 1.39% 15/4/2020 385,276 0.08 USD 557,833 Honda Auto Receivables Owner Trust
'2014-4 A3' 0.99% 17/9/2018 498,639 0.10 USD 215,000 Horry County School District/SC
5.00% 1/3/2024 242,387 0.05 USD 225,000 Horry County School District/SC
5.00% 1/3/2025 257,513 0.05 EUR 800,000 Huntsman International LLC 5.125%
15/4/2021 828,000 0.16 USD 695,000 Hyundai Auto Receivables Trust
'2016-A A2A' 1.21% 17/6/2019 622,456 0.12 USD 600,000 Hyundai Auto Receivables Trust
'2016-A A4' 1.73% 16/5/2022 539,821 0.11 USD 70,000 Hyundai Capital America '144A'
2.40% 30/10/2018 63,313 0.01 USD 100,000 Hyundai Floorplan Master Owner
Trust Series '2016-1A A2' '144A' 1.81% 15/3/2021 89,521 0.02
USD 50,000 Icahn Enterprises LP Via Icahn Enterprises Finance Corp 3.50% 15/3/2017 44,765 0.01
USD 500,000 Intercontinental Exchange Inc 3.75% 1/12/2025 467,284 0.09
USD 188,000 International Lease Finance Corp '144A' 6.75% 1/9/2016 170,316 0.03
USD 60,000 International Lease Finance Corp '144A' 7.125% 1/9/2018 58,821 0.01
USD 158,000 Interpublic Group of Cos Inc/The 2.25% 15/11/2017 141,704 0.03
USD 4,352,320 Invitation Homes Trust '2015-SFR3 A' '144A' FRN 17/8/2032 3,853,557 0.75
EUR 300,000 Johnson & Johnson 0.25% 20/1/2022 301,666 0.06 EUR 1,675,000 Johnson & Johnson 0.65% 20/5/2024 1,683,477 0.33 EUR 1,375,000 Johnson & Johnson 1.15% 20/11/2028 1,374,912 0.27 USD 1,507,996 JP Morgan Chase Commercial
Mortgage Securities Corp '2012-LC9 XA' FRN 15/12/2047 95,536 0.02
USD 138,983 JP Morgan Chase Commercial Mortgage Securities Trust '2006-CIBC16 A1A' 5.546% 12/5/2045 125,289 0.02
USD 275,999 JP Morgan Chase Commercial Mortgage Securities Trust '2007-CIBC18 A4' 5.44% 12/6/2047 251,212 0.05
USD 50,205 JP Morgan Chase Commercial Mortgage Securities Trust '2007-CIBC19 A1A' FRN 12/2/2049 46,330 0.01
USD 960,000 JP Morgan Chase Commercial Mortgage Securities Trust '2007-CIBC20' FRN 12/2/2051 886,700 0.17
USD 215,000 JP Morgan Chase Commercial Mortgage Securities Trust '2014-FL4 C' '144A' FRN 15/12/2030 188,853 0.04
USD 3,000,000 JP Morgan Chase Commercial Mortgage Securities Trust '2015-COSMO A' '144A' FRN 15/1/2032 2,658,174 0.52
USD 2,984,116 JPMBB Commercial Mortgage Securities Trust '2015-C28 XA' FRN 15/10/2048 176,577 0.03
USD 550,000 JPMorgan Chase & Co 2.35% 28/1/2019 500,216 0.10
GBP 1,230,000 JPMorgan Chase & Co 1.875% 10/2/2020 1,622,347 0.32
USD 1,250,000 JPMorgan Chase & Co 2.55% 1/3/2021 1,130,084 0.22
USD 1,050,000 JPMorgan Chase & Co 2.70% 18/5/2023 933,065 0.18
EUR 270,000 JPMorgan Chase & Co 1.50% 27/1/2025 277,113 0.05
EUR 300,000 JPMorgan Chase & Co 1.50% 29/10/2026 300,598 0.06
USD 65,000 Kansas City Southern '144A' FRN 28/10/2016 57,855 0.01
USD 750,000 Kraft Heinz Foods Co '144A' 3.50% 15/7/2022 701,429 0.14
USD 89,000 Kraft Heinz Foods Co '144A' 3.00% 1/6/2026 78,845 0.02
EUR 400,000 Kraft Heinz Foods Co 2.25% 25/5/2028 407,424 0.08
USD 68,000 Lam Research Corp 2.75% 15/3/2020 61,602 0.01 USD 105,000 Lam Research Corp 2.80% 15/6/2021 94,667 0.02 USD 194,000 Lam Research Corp 3.45% 15/6/2023 175,802 0.03 USD 245,000 Lam Research Corp 3.90% 15/6/2026 223,653 0.04 USD 381,830 LB-UBS Commercial Mortgage Trust
'2006-C7 A3' 5.347% 15/11/2038 345,675 0.07 USD 520,350 LB-UBS Commercial Mortgage Trust
'2007-C2 A1A' 5.387% 15/2/2040 477,019 0.09 USD 250,000 LB-UBS Commercial Mortgage Trust
'2007-C7 AM' FRN 15/9/2045 236,220 0.05 USD 300,000 Los Angeles Department of Water &
Power 6.603% 1/7/2050 406,914 0.08 USD 320,000 Lowe's Cos Inc 3.70% 15/4/2046 280,329 0.06 USD 57,000 Lubrizol Corp 8.875% 1/2/2019 60,898 0.01 USD 750,000 Marsh & McLennan Cos Inc 3.75%
14/3/2026 692,983 0.14 USD 245,000 Massachusetts Clean Water Trust/
The 5.00% 1/2/2025 280,473 0.06 USD 245,000 Massachusetts Clean Water Trust/
The 5.00% 1/2/2026 284,278 0.06 USD 300,000 Massachusetts Development
Finance Agency 'D' 5.00% 1/7/2044 305,331 0.06 USD 115,000 McDonald's Corp 2.75% 9/12/2020 105,788 0.02 USD 433,000 Mercedes-Benz Master Owner Trust
'2016-BA A' '144A' FRN 17/5/2021 387,623 0.08 USD 135,000 Metropolitan Transportation
Authority 6.687% 15/11/2040 169,483 0.03 USD 150,000 Metropolitan Washington Airports
Authority Dulles Toll Road Revenue 7.462% 1/10/2046 202,305 0.04
USD 295,000 Miami-Dade County Educational Facilities Authority 'B' 5.073% 1/4/2050 298,032 0.06
USD 240,000 Moody's Corp 2.75% 15/7/2019 220,152 0.04 GBP 1,250,000 Morgan Stanley 5.75% 14/2/2017 1,690,148 0.33 USD 300,000 Morgan Stanley 2.45% 1/2/2019 272,379 0.05 USD 246,000 Morgan Stanley 2.375% 23/7/2019 222,164 0.04
Portfolio of Investments as at 31 May 2016
United States continued United States continued

Annual Report and Audited Accounts 235
The notes on pages 489 to 503 form an integral part of these financial statements.
Transferable Securities and Money Market Instruments Admitted to an Official Stock Exchange Listing or Dealt in on Another Regulated Market
Transferable Securities and Money Market Instruments Admitted to an Official Stock Exchange Listing or Dealt in on Another Regulated Market
Holding
Description
Market Value
EUR
% of Net
Assets
Holding
Description
Market Value
EUR
% of Net
Assets
Portfolio of Investments as at 31 May 2016
USD 511,000 Morgan Stanley 2.50% 21/4/2021 457,127 0.09 USD 33,359,155 Morgan Stanley Bank of America
Merrill Lynch Trust '2013-C13 XA' FRN 15/11/2046 1,753,417 0.34
USD 863,535 Morgan Stanley Capital I Trust '2006-HQ9 AM' FRN 12/7/2044 779,891 0.15
USD 727,133 Morgan Stanley Capital I Trust '2007-HQ13 A3' 5.569% 15/12/2044 674,289 0.13
USD 637,113 Morgan Stanley Capital I Trust '2007-IQ13 A4' 5.364% 15/3/2044 581,551 0.11
USD 400,000 Morgan Stanley Capital I Trust '2007-IQ13 AM' 5.406% 15/3/2044 365,035 0.07
USD 695,784 Morgan Stanley Capital I Trust '2008-TOP29 A4FL' FRN 11/1/2043 632,225 0.12
USD 965,835 Morgan Stanley Re-REMIC Trust '2009-GG10 A4A' '144A' FRN 12/8/2045 885,350 0.17
USD 239,810 Morgan Stanley Re-REMIC Trust '2010-GG10 A4A' '144A' FRN 15/8/2045 220,291 0.04
USD 450,000 Mylan Inc 1.80% 24/6/2016 403,095 0.08 USD 200,000 Navient Corp 6.125% 25/3/2024 158,467 0.03 USD 300,000 New York State Thruway Authority
5.00% 1/1/2031 324,296 0.06 USD 250,000 New York State Thruway Authority 'A'
5.00% 1/5/2019 249,196 0.05 USD 220,000 New York State Urban Development
Corp 5.00% 15/3/2024 245,639 0.05 USD 220,000 New York State Urban Development
Corp 5.00% 15/3/2027 249,040 0.05 USD 225,000 New York Transportation
Development Corp 5.25% 1/1/2050 230,173 0.05 USD 600,000 Nissan Auto Receivables 2016-A
Owner Trust 'A4' 1.59% 15/7/2022 533,442 0.10 USD 590,000 Nissan Auto Receivables 2016-B
Owner Trust 1.32% 15/1/2021 528,121 0.10 USD 170,000 Nissan Motor Acceptance Corp
'144A' 2.00% 8/3/2019 152,143 0.03 USD 300,000 North Carolina Department of
Transportation 5.00% 30/6/2054 292,700 0.06 USD 320,000 North Carolina Medical Care
Commission 5.00% 1/6/2040 335,325 0.07 USD 750,000 Occidental Petroleum Corp 3.40%
15/4/2026 684,795 0.13 USD 150,000 Ochsner Clinic Foundation 5.897%
15/5/2045 166,253 0.03 USD 355,732 OneMain Financial Issuance Trust
'2014-1A A' '144A' 2.43% 18/6/2024 318,857 0.06 USD 162,000 ONEOK Inc 7.50% 1/9/2023 150,121 0.03 USD 325,000 Pennsylvania Economic Development
Financing Authority 5.00% 30/6/2042 329,079 0.06
USD 686,000 Penske Truck Leasing Co Lp Via PTL Finance Corp '144A' 3.75% 11/5/2017 626,399 0.12
USD 73,000 Penske Truck Leasing Co Lp Via PTL Finance Corp '144A' 2.875% 17/7/2018 66,102 0.01
USD 150,000 Penske Truck Leasing Co Lp Via PTL Finance Corp '144A' 3.05% 9 /1/2020 135,370 0.03
USD 350,000 PFS Financing Corp '2014-AA A' '144A' FRN 15/2/2019 312,496 0.06
USD 525,000 PFS Financing Corp '2015-AA A' '144A' FRN 15/4/2020 464,802 0.09
USD 132,389 PFS Tax Lien Trust '2014-1' '144A' 1.44% 15/5/2029 117,858 0.02
USD 70,000 Philip Morris International Inc 1.875% 25/2/2021 62,609 0.01
USD 190,000 Philip Morris International Inc 4.25% 10/11/2044 178,131 0.04
USD 350,000 Prestige Auto Receivables Trust '2013-1A B' '144A' 1.74% 15/5/2019 312,925 0.06
USD 125,000 Prestige Auto Receivables Trust '2014-1A C' '144A' 2.39% 15/5/2020 110,700 0.02
USD 150,000 Prestige Auto Receivables Trust '2014-1A D' '144A' 2.91% 15/7/2021 132,046 0.03
USD 2,668,854 Progress Residential Trust '2015-SFR2 A' '144A' 2.74% 12/6/2032 2,395,376 0.47
USD 293,000 QVC Inc 3.125% 1/4/2019 266,758 0.05 USD 135,000 Regents of the University of
California Medical Center Pooled Revenue 6.583% 15/5/2049 170,450 0.03
USD 850,000 Reynolds American Inc 3.50% 4/8/2016 764,453 0.15
USD 130,000 Reynolds American Inc 2.30% 12/6/2018 118,137 0.02
USD 1,200,000 Reynolds American Inc 4.45% 12/6/2025 1,181,555 0.23
USD 215,000 Sabine Pass LNG LP 7.50% 30/11/2016 197,421 0.04
USD 2,623 Santander Drive Auto Receivables Trust '2012-3 C' 3.01% 16/4/2018 2,350 0.00
USD 161,247 Santander Drive Auto Receivables Trust '2012-AA C' '144A' 1.78% 15/11/2018 144,514 0.03
USD 144,267 Santander Drive Auto Receivables Trust '2013-1 C' 1.76% 15/1/2019 129,308 0.03
USD 500,000 Santander Drive Auto Receivables Trust '2013-3 C' 1.81% 15/4/2019 448,363 0.09
USD 204,969 Santander Drive Auto Receivables Trust '2014-1 B' 1.59% 15/10/2018 183,692 0.04
USD 375,000 Santander Drive Auto Receivables Trust '2014-3 C' 2.13% 17/8/2020 337,188 0.07
USD 450,000 Santander Drive Auto Receivables Trust '2015-2 A3' 1.22% 15/4/2019 402,787 0.08
USD 160,000 Santander Drive Auto Receivables Trust '2016-2 A3' 1.56% 15/5/2020 143,008 0.03
USD 175,000 Schlumberger Holdings Corp '144A' 2.35% 21/12/2018 158,758 0.03
USD 357,368 SLM Private Education Loan Trust '2012-A A1' '144A' FRN 15/8/2025 320,735 0.06
USD 357,790 SLM Private Education Loan Trust '2012-B A2' '144A' 3.48% 15/10/2030 325,961 0.06
USD 351,536 SLM Private Education Loan Trust '2013-A A1' '144A' FRN 15/8/2022 314,153 0.06
USD 159,010 SLM Private Education Loan Trust '2013-B A1' '144A' FRN 15/7/2022 142,082 0.03
USD 99,940 SLM Student Loan Trust '2013-4 A' FRN 25/6/2027 85,733 0.02
USD 542,576 SMB Private Education Loan Trust '2015-C A1' '144A' FRN 15/7/2022 486,293 0.10
USD 150,000 SMB Private Education Loan Trust '2016-A A2A' '144A' 2.70% 15/5/2031 134,357 0.03
USD 594,909 SoFi Professional Loan Program LLC '2015-B A1' '144A' FRN 25/4/2035 522,213 0.10
USD 957,467 SoFi Professional Loan Program LLC '2015-D A1' '144A' FRN 27/10/2036 852,434 0.17
USD 150,000 Southern Baptist Hospital of Florida Inc 4.857% 15/7/2045 157,597 0.03
USD 220,000 Southern Co/The 1.85% 1/7/2019 197,766 0.04 USD 459,000 Southern Co/The 2.95% 1/7/2023 416,701 0.08 USD 404,000 Southern Co/The 3.25% 1/7/2026 366,648 0.07 USD 250,000 St Jude Medical Inc 2.00%
15/9/2018 225,578 0.04 USD 215,000 State of California 5.00% 1/9/2027 245,338 0.05
BlackRock Global Absolute Return Bond Fund continued
United States continued United States continued

236 BlackRock Strategic Funds (BSF)
The notes on pages 489 to 503 form an integral part of these financial statements.
Transferable Securities and Money Market Instruments Admitted to an Official Stock Exchange Listing or Dealt in on Another Regulated Market
Transferable Securities and Money Market Instruments Admitted to an Official Stock Exchange Listing or Dealt in on Another Regulated Market
Holding
Description
Market Value
EUR
% of Net
Assets
Holding
Description
Market Value
EUR
% of Net
Assets
1 Investment in connected party fund, see further information in Note 10.
BlackRock Global Absolute Return Bond Fund continued
USD 135,000 State of California 7.50% 1/4/2034 180,855 0.04 USD 135,000 State of California 4.988% 1/4/2039 130,426 0.03 USD 135,000 State of California 7.55% 1/4/2039 186,276 0.04 USD 275,000 State of North Carolina 'A' 5.00%
1/6/2025 317,283 0.06 USD 275,000 State of North Carolina 'A' 5.00%
1/6/2026 321,405 0.06 USD 5,000 State of North Carolina 'B' 5.00%
1/6/2025 5,769 0.00 USD 5,000 State of Ohio 5.00% 15/9/2025 5,740 0.00 USD 945,000 State of South Carolina 'A' 5.00%
1/10/2022 1,038,573 0.20 USD 245,000 State of Wisconsin 5.00% 1/5/2034 269,209 0.05 USD 740,000 State Street Corp 2.65% 19/5/2026 659,733 0.13 USD 200,000 Steel Dynamics Inc 5.50% 1/10/2024 184,164 0.04 USD 105,000 Stryker Corp 2.00% 8/3/2019 94,942 0.02 USD 67,000 Stryker Corp 3.50% 15/3/2026 62,542 0.01 USD 71,000 Stryker Corp 4.625% 15/3/2046 68,412 0.01 USD 415,000 Synchrony Credit Card Master Note
Trust '2015-1 A' 2.37% 15/3/2023 379,910 0.07 USD 975,000 Synchrony Credit Card Master Note
Trust '2016-2 A' 2.21% 15/5/2024 872,879 0.17 USD 500,000 Sysco Corp 3.30% 15/7/2026 455,589 0.09 USD 100,000 Texas Private Activity Bond Surface
Transportation Corp 5.00% 31/12/2055 101,469 0.02
USD 670,000 Thermo Fisher Scientific Inc 1.30% 1/2/2017 600,076 0.12
USD 842,000 Thermo Fisher Scientific Inc 3.00% 15/4/2023 757,104 0.15
USD 750,000 Total System Services Inc 4.80% 1/4/2026 707,801 0.14
USD 210,000 Toyota Auto Receivables Owner Trust '2016-B A3' 1.30% 15/4/2020 187,932 0.04
USD 206,840 UAL Pass Through Trust '2009-2A' 9.75% 15/1/2017 192,821 0.04
USD 90,000 United States Steel Corp '144A' 8.375% 1/7/2021 83,397 0.02
USD 5,941,355 United States Treasury Inflation Indexed Bonds 0.625% 15/1/2026 5,519,190 1.08
USD 778,562 United States Treasury Inflation Indexed Bonds 0.75% 15/2/2045 669,883 0.13
USD 2,752,339 United States Treasury Inflation Indexed Bonds 1.00% 15/2/2046 2,548,444 0.50
USD 125,000 Universal Health Services Inc '144A' 3.75% 1/8/2019 115,829 0.02
USD 5,000 University of Houston System 'B' 3.25% 15/2/2019 4,705 0.00
USD 500,000 Vector Group Ltd '144A' 7.75% 15/2/2021 468,911 0.09
USD 722,000 Verizon Communications Inc 3.65% 14/9/2018 679,263 0.13
USD 750,000 Verizon Communications Inc 5.15% 15/9/2023 770,815 0.15
EUR 100,000 Verizon Communications Inc 2.625% 1/12/2031 107,330 0.02
USD 235,000 Virginia Electric & Power Co 1.20% 15/1/2018 209,920 0.04
USD 200,000 Volkswagen Group of America Finance LLC '144A' 1.65% 22/5/2018 177,778 0.03
USD 323,000 Walgreens Boots Alliance Inc 2.60% 1/6/2021 290,658 0.06
USD 85,000 Walgreens Boots Alliance Inc 3.10% 1/6/2023 76,242 0.02
USD 210,000 Walgreens Boots Alliance Inc 3.45% 1/6/2026 188,307 0.04
EUR 1,510,000 Walgreens Boots Alliance Inc 2.125% 20/11/2026 1,505,047 0.29
USD 160,000 Wells Fargo & Co 2.55% 7/12/2020 145,681 0.03 EUR 300,000 Wells Fargo & Co 2.00% 27/4/2026 318,906 0.06 EUR 750,000 Wells Fargo & Co 1.375% 26/10/2026 745,354 0.15 USD 16,897,649 Wells Fargo Commercial Mortgage
Trust '2015-C30 XA' FRN 15/9/2058 1,008,990 0.20 USD 2,600,000 Wells Fargo Commercial Mortgage
Trust '2015-NXS3 C' FRN 15/9/2057 2,278,440 0.45 USD 140,000 Welltower Inc 6.20% 1/6/2016 125,341 0.02 USD 519,688 WFRBS Commercial Mortgage Trust
'2013-C15 XA' FRN 15/8/2046 12,934 0.00 USD 1,481,771 WFRBS Commercial Mortgage Trust
'2014-C22 XA' FRN 15/9/2057 69,392 0.01 USD 2,430,733 WFRBS Commercial Mortgage Trust
'2014-LC14 XA' FRN 15/3/2047 143,929 0.03 USD 750,000 World Financial Network Credit Card
Master Trust '2015-C A' 1.26% 15/3/2021 671,463 0.13
USD 70,000 Zimmer Biomet Holdings Inc 2.00% 1/4/2018 62,975 0.01
171,310,200 33.54
Vietnam USD 450,000 Vingroup JSC RegS 11.625%
7/5/2018 438,639 0.09
438,639 0.09
Total Bonds 516,609,412 101.15
Total Transferable Securities and Money Market Instruments Admitted to an Official Stock Exchange Listing or Dealt in on Another Regulated Market 516,609,412 101.15
Other Transferable Securities and Money Market Instruments
BONDS
Cayman Islands USD 200,000 Global A&T Electronics Ltd
RegS 10.00% 1/2/2019 125,341 0.03
125,341 0.03
Total Bonds 125,341 0.03
Total Other Transferable Securities and Money Market Instruments 125,341 0.03
Ireland 2,641 Institutional Cash Series Plc -
Institutional Euro Assets Liquidity Fund 1 2,641 0.00
2,641 0.00
Total Collective Investment Schemes 2,641 0.00
Securities portfolio at market value 516,737,394 101.18
Other Net Liabilities (6,022,126) (1.18)
Total Net Assets (EUR) 510,715,268 100.00
Portfolio of Investments as at 31 May 2016
United States continued United States continued
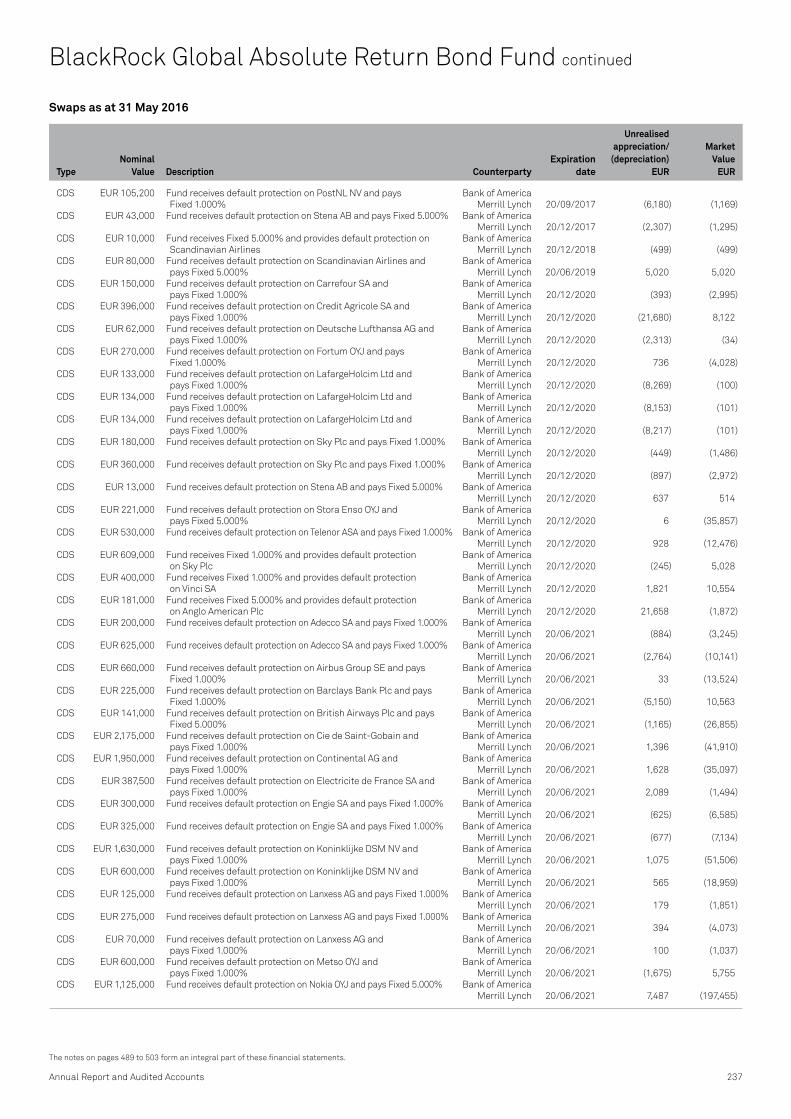
TypeNominal
Value Description CounterpartyExpiration
date
Unrealised appreciation/
(depreciation) EUR
Market Value
EUR
Swaps as at 31 May 2016
Annual Report and Audited Accounts 237
The notes on pages 489 to 503 form an integral part of these financial statements.
CDS EUR 105,200 Fund receives default protection on PostNL NV and pays Bank of America Fixed 1.000% Merrill Lynch 20/09/2017 (6,180) (1,169)
CDS EUR 43,000 Fund receives default protection on Stena AB and pays Fixed 5.000% Bank of America Merrill Lynch 20/12/2017 (2,307) (1,295)
CDS EUR 10,000 Fund receives Fixed 5.000% and provides default protection on Bank of America Scandinavian Airlines Merrill Lynch 20/12/2018 (499) (499)
CDS EUR 80,000 Fund receives default protection on Scandinavian Airlines and Bank of America pays Fixed 5.000% Merrill Lynch 20/06/2019 5,020 5,020
CDS EUR 150,000 Fund receives default protection on Carrefour SA and Bank of America pays Fixed 1.000% Merrill Lynch 20/12/2020 (393) (2,995)
CDS EUR 396,000 Fund receives default protection on Credit Agricole SA and Bank of America pays Fixed 1.000% Merrill Lynch 20/12/2020 (21,680) 8,122
CDS EUR 62,000 Fund receives default protection on Deutsche Lufthansa AG and Bank of America pays Fixed 1.000% Merrill Lynch 20/12/2020 (2,313) (34)
CDS EUR 270,000 Fund receives default protection on Fortum OYJ and pays Bank of America Fixed 1.000% Merrill Lynch 20/12/2020 736 (4,028)
CDS EUR 133,000 Fund receives default protection on LafargeHolcim Ltd and Bank of America pays Fixed 1.000% Merrill Lynch 20/12/2020 (8,269) (100)
CDS EUR 134,000 Fund receives default protection on LafargeHolcim Ltd and Bank of America pays Fixed 1.000% Merrill Lynch 20/12/2020 (8,153) (101)
CDS EUR 134,000 Fund receives default protection on LafargeHolcim Ltd and Bank of America pays Fixed 1.000% Merrill Lynch 20/12/2020 (8,217) (101)
CDS EUR 180,000 Fund receives default protection on Sky Plc and pays Fixed 1.000% Bank of America Merrill Lynch 20/12/2020 (449) (1,486)
CDS EUR 360,000 Fund receives default protection on Sky Plc and pays Fixed 1.000% Bank of America Merrill Lynch 20/12/2020 (897) (2,972)
CDS EUR 13,000 Fund receives default protection on Stena AB and pays Fixed 5.000% Bank of America Merrill Lynch 20/12/2020 637 514
CDS EUR 221,000 Fund receives default protection on Stora Enso OYJ and Bank of America pays Fixed 5.000% Merrill Lynch 20/12/2020 6 (35,857)
CDS EUR 530,000 Fund receives default protection on Telenor ASA and pays Fixed 1.000% Bank of America Merrill Lynch 20/12/2020 928 (12,476)
CDS EUR 609,000 Fund receives Fixed 1.000% and provides default protection Bank of America on Sky Plc Merrill Lynch 20/12/2020 (245) 5,028
CDS EUR 400,000 Fund receives Fixed 1.000% and provides default protection Bank of America on Vinci SA Merrill Lynch 20/12/2020 1,821 10,554
CDS EUR 181,000 Fund receives Fixed 5.000% and provides default protection Bank of America on Anglo American Plc Merrill Lynch 20/12/2020 21,658 (1,872)
CDS EUR 200,000 Fund receives default protection on Adecco SA and pays Fixed 1.000% Bank of America Merrill Lynch 20/06/2021 (884) (3,245)
CDS EUR 625,000 Fund receives default protection on Adecco SA and pays Fixed 1.000% Bank of America Merrill Lynch 20/06/2021 (2,764) (10,141)
CDS EUR 660,000 Fund receives default protection on Airbus Group SE and pays Bank of America Fixed 1.000% Merrill Lynch 20/06/2021 33 (13,524)
CDS EUR 225,000 Fund receives default protection on Barclays Bank Plc and pays Bank of America Fixed 1.000% Merrill Lynch 20/06/2021 (5,150) 10,563
CDS EUR 141,000 Fund receives default protection on British Airways Plc and pays Bank of America Fixed 5.000% Merrill Lynch 20/06/2021 (1,165) (26,855)
CDS EUR 2,175,000 Fund receives default protection on Cie de Saint-Gobain and Bank of America pays Fixed 1.000% Merrill Lynch 20/06/2021 1,396 (41,910)
CDS EUR 1,950,000 Fund receives default protection on Continental AG and Bank of America pays Fixed 1.000% Merrill Lynch 20/06/2021 1,628 (35,097)
CDS EUR 387,500 Fund receives default protection on Electricite de France SA and Bank of America pays Fixed 1.000% Merrill Lynch 20/06/2021 2,089 (1,494)
CDS EUR 300,000 Fund receives default protection on Engie SA and pays Fixed 1.000% Bank of America Merrill Lynch 20/06/2021 (625) (6,585)
CDS EUR 325,000 Fund receives default protection on Engie SA and pays Fixed 1.000% Bank of America Merrill Lynch 20/06/2021 (677) (7,134)
CDS EUR 1,630,000 Fund receives default protection on Koninklijke DSM NV and Bank of America pays Fixed 1.000% Merrill Lynch 20/06/2021 1,075 (51,506)
CDS EUR 600,000 Fund receives default protection on Koninklijke DSM NV and Bank of America pays Fixed 1.000% Merrill Lynch 20/06/2021 565 (18,959)
CDS EUR 125,000 Fund receives default protection on Lanxess AG and pays Fixed 1.000% Bank of America Merrill Lynch 20/06/2021 179 (1,851)
CDS EUR 275,000 Fund receives default protection on Lanxess AG and pays Fixed 1.000% Bank of America Merrill Lynch 20/06/2021 394 (4,073)
CDS EUR 70,000 Fund receives default protection on Lanxess AG and Bank of America pays Fixed 1.000% Merrill Lynch 20/06/2021 100 (1,037)
CDS EUR 600,000 Fund receives default protection on Metso OYJ and Bank of America pays Fixed 1.000% Merrill Lynch 20/06/2021 (1,675) 5,755
CDS EUR 1,125,000 Fund receives default protection on Nokia OYJ and pays Fixed 5.000% Bank of America Merrill Lynch 20/06/2021 7,487 (197,455)
BlackRock Global Absolute Return Bond Fund continued

TypeNominal
Value Description CounterpartyExpiration
date
Unrealised appreciation/
(depreciation) EUR
Market Value
EUR
Swaps as at 31 May 2016
238 BlackRock Strategic Funds (BSF)
The notes on pages 489 to 503 form an integral part of these financial statements.
BlackRock Global Absolute Return Bond Fund continued
CDS EUR 301,000 Fund receives default protection on Nokia OYJ and pays Fixed 5.000% Bank of America Merrill Lynch 20/06/2021 3,330 (52,830)
CDS EUR 113,000 Fund receives default protection on Peugeot SA and pays Fixed 5.000% Bank of America Merrill Lynch 20/06/2021 (692) (16,348)
CDS EUR 81,000 Fund receives default protection on Peugeot SA and pays Fixed 5.000% Bank of America Merrill Lynch 20/06/2021 (496) (11,719)
CDS EUR 146,000 Fund receives default protection on Peugeot SA and pays Fixed 5.000% Bank of America Merrill Lynch 20/06/2021 (894) (21,122)
CDS EUR 79,000 Fund receives default protection on Peugeot SA and pays Fixed 5.000% Bank of America Merrill Lynch 20/06/2021 (484) (11,429)
CDS EUR 62,000 Fund receives default protection on Peugeot SA and pays Fixed 5.000% Bank of America Merrill Lynch 20/06/2021 (380) (8,970)
CDS EUR 44,000 Fund receives default protection on Peugeot SA and pays Fixed 5.000% Bank of America Merrill Lynch 20/06/2021 (269) (6,366)
CDS EUR 275,000 Fund receives default protection on Peugeot SA and pays Fixed 5.000% Bank of America Merrill Lynch 20/06/2021 (7,223) (39,785)
CDS EUR 940,000 Fund receives default protection on PostNL NV and pays Fixed 1.000% Bank of America Merrill Lynch 20/06/2021 (1,224) (21,349)
CDS EUR 175,000 Fund receives default protection on Telecom Italia SpA and Bank of America pays Fixed 1.000% Merrill Lynch 20/06/2021 1,106 6,652
CDS EUR 450,000 Fund receives default protection on Telecom Italia SpA and Bank of America pays Fixed 1.000% Merrill Lynch 20/06/2021 2,843 17,105
CDS EUR 225,000 Fund receives default protection on Telecom Italia SpA and Bank of America pays Fixed 1.000% Merrill Lynch 20/06/2021 1,421 8,553
CDS EUR 280,000 Fund receives default protection on Tesco Plc and pays Fixed 1.000% Bank of America Merrill Lynch 20/06/2021 (3,227) 20,072
CDS EUR 173,000 Fund receives default protection on Valeo SA and pays Fixed 1.000% Bank of America Merrill Lynch 20/06/2021 (455) (2,312)
CDS EUR 112,000 Fund receives default protection on Valeo SA and pays Fixed 1.000% Bank of America Merrill Lynch 20/06/2021 (583) (1,497)
CDS EUR 1,705,000 Fund receives default protection on Wolters Kluwer NV and Bank of America pays Fixed 1.000% Merrill Lynch 20/06/2021 1,886 (54,938)
CDS EUR 350,000 Fund receives Fixed 1.000% and provides default protection on Bank of America British Telecom Plc Merrill Lynch 20/06/2021 1,798 4,076
CDS EUR 350,000 Fund receives Fixed 1.000% and provides default protection on Bank of America British Telecom Plc Merrill Lynch 20/06/2021 1,798 4,076
CDS EUR 475,000 Fund receives Fixed 1.000% and provides default protection on Bank of America British Telecom Plc Merrill Lynch 20/06/2021 2,441 5,532
CDS EUR 130,000 Fund receives Fixed 1.000% and provides default protection on Bank of America Casino Guichard Perrachon SA Merrill Lynch 20/06/2021 2,873 (9,933)
CDS EUR 475,000 Fund receives Fixed 1.000% and provides default protection on Bank of America Imperial Brands Plc Merrill Lynch 20/06/2021 1,320 1,320
CDS EUR 725,000 Fund receives Fixed 1.000% and provides default protection on Bank of America Imperial Brands Plc Merrill Lynch 20/06/2021 2,015 2,014
CDS EUR 380,000 Fund receives Fixed 1.000% and provides default protection on Bank of America Marks & Spencer Plc Merrill Lynch 20/06/2021 (304) (8,020)
CDS EUR 109,000 Fund receives Fixed 5.000% and provides default protection on Bank of America CNH Industrial NV Merrill Lynch 20/06/2021 350 11,277
CDS EUR 271,000 Fund receives Fixed 5.000% and provides default protection on Bank of America CNH Industrial NV Merrill Lynch 20/06/2021 1,072 28,036
CDS EUR 162,000 Fund receives Fixed 5.000% and provides default protection on Bank of America Galp Energia SGPS SA Merrill Lynch 20/06/2021 330 26,792
CDS EUR 176,000 Fund receives Fixed 5.000% and provides default protection on Bank of America HeidelbergCement AG Merrill Lynch 20/06/2021 (1,359) 32,904
CDS EUR 66,000 Fund receives Fixed 5.000% and provides default protection on Bank of America HeidelbergCement AG Merrill Lynch 20/06/2021 (510) 12,339
CDS EUR 140,000 Fund receives Fixed 5.000% and provides default protection on Bank of America Wendel SA Merrill Lynch 20/06/2021 2,828 25,923
CDS EUR 110,000 Fund receives Fixed 5.000% and provides default protection on Bank of America Wendel SA Merrill Lynch 20/06/2021 608 20,368
CDS USD 540,000 Fund receives Fixed 1.000% and provides default protection on Bank of America Rio Tinto Ltd Merrill Lynch 20/06/2021 (2,533) (19,778)
CDS USD 194,000 Fund receives default protection on Markit CDX.NA.HY.23 and pays Fixed 5.000% Barclays Bank 20/12/2019 (3,443) (10,570)
CDS USD 600,000 Fund receives Fixed 1.000% and provides default protection on Peoples Republic of China Barclays Bank 20/09/2020 2,814 (1,513)
CDS EUR 527,000 Fund receives default protection on Alstom SA and pays Fixed 1.000% Barclays Bank 20/12/2020 (18,377) (1,432)CDS EUR 513,000 Fund receives default protection on Bayerische Motoren Werke AG
and pays Fixed 1.000% Barclays Bank 20/12/2020 (14,023) (10,383)CDS EUR 329,000 Fund receives default protection on Bayerische Motoren Werke AG
and pays Fixed 1.000% Barclays Bank 20/12/2020 (9,379) (6,659)CDS EUR 382,000 Fund receives default protection on Bayerische Motoren Werke AG
and pays Fixed 1.000% Barclays Bank 20/12/2020 (10,802) (7,732)

TypeNominal
Value Description CounterpartyExpiration
date
Unrealised appreciation/
(depreciation) EUR
Market Value
EUR
Swaps as at 31 May 2016
Annual Report and Audited Accounts 239
The notes on pages 489 to 503 form an integral part of these financial statements.
CDS EUR 260,000 Fund receives default protection on Bayerische Motoren Werke AG and pays Fixed 1.000% Barclays Bank 20/12/2020 (7,701) (5,262)
CDS EUR 520,000 Fund receives default protection on Bayerische Motoren Werke AG and pays Fixed 1.000% Barclays Bank 20/12/2020 (10,770) (10,525)
CDS EUR 424,000 Fund receives default protection on Beni Stabili SpA SII Q and pays Fixed 5.000% Barclays Bank 20/12/2020 (9,455) (68,757)
CDS EUR 440,000 Fund receives default protection on Carrefour SA and pays Fixed 1.000% Barclays Bank 20/12/2020 (2,469) (8,785)
CDS EUR 200,000 Fund receives default protection on Carrefour SA and pays Fixed 1.000% Barclays Bank 20/12/2020 (1,229) (3,993)
CDS EUR 257,000 Fund receives default protection on Daimler AG and pays Fixed 1.000% Barclays Bank 20/12/2020 (3,746) (4,980)CDS EUR 513,000 Fund receives default protection on Daimler AG and pays Fixed 1.000% Barclays Bank 20/12/2020 (7,229) (9,940)CDS EUR 257,000 Fund receives default protection on Daimler AG and pays Fixed 1.000% Barclays Bank 20/12/2020 (3,872) (4,980)CDS EUR 1,270,000 Fund receives default protection on Daimler AG and pays Fixed 1.000% Barclays Bank 20/12/2020 (22,184) (24,608)CDS EUR 311,000 Fund receives default protection on Daimler AG and pays Fixed 1.000% Barclays Bank 20/12/2020 (6,764) (6,026)CDS EUR 424,000 Fund receives default protection on Daimler AG and pays Fixed 1.000% Barclays Bank 20/12/2020 (9,423) (8,216)CDS EUR 389,000 Fund receives default protection on Daimler AG and pays Fixed 1.000% Barclays Bank 20/12/2020 (8,647) (7,537)CDS EUR 156,000 Fund receives default protection on Daimler AG and pays Fixed 1.000% Barclays Bank 20/12/2020 (3,245) (3,023)CDS EUR 1,212,000 Fund receives default protection on Finmeccanica SpA and
pays Fixed 5.000% Barclays Bank 20/12/2020 (91,292) (194,154)CDS EUR 130,000 Fund receives default protection on Fortum OYJ and pays Fixed 1.000% Barclays Bank 20/12/2020 (1,319) (1,940)CDS EUR 800,000 Fund receives default protection on Fortum OYJ and pays Fixed 1.000% Barclays Bank 20/12/2020 2,244 (11,935)CDS EUR 190,000 Fund receives default protection on Koninklijke KPN NV and
pays Fixed 1.000% Barclays Bank 20/12/2020 738 2,914CDS EUR 153,000 Fund receives default protection on Melia Hotels International SA
and pays Fixed 5.000% Barclays Bank 20/12/2020 (3,711) (27,984)CDS EUR 952,000 Fund receives default protection on Societe Generale and
pays Fixed 1.000% Barclays Bank 20/12/2020 (10,411) (13,137)CDS EUR 260,000 Fund receives default protection on Telenor ASA and pays Fixed 1.000% Barclays Bank 20/12/2020 (2,252) (6,120)CDS EUR 1,090,000 Fund receives Fixed 1.000% and provides default protection on
Astrazeneca Plc Barclays Bank 20/12/2020 (3,570) 30,498CDS EUR 952,000 Fund receives Fixed 1.000% and provides default protection on
BNP Paribas SA Barclays Bank 20/12/2020 6,452 11,345CDS EUR 470,000 Fund receives Fixed 1.000% and provides default protection on
Koninklijke KPN NV Barclays Bank 20/12/2020 3,043 7,208CDS EUR 687,000 Fund receives Fixed 1.000% and provides default protection on
Markit iTraxx Europe Series 24 Version 1 Barclays Bank 20/12/2020 7,137 8,823CDS EUR 230,000 Fund receives Fixed 1.000% and provides default protection on
Markit iTraxx Europe Series 24 Version 1 Barclays Bank 20/12/2020 2,440 2,954CDS EUR 920,000 Fund receives Fixed 1.000% and provides default protection on
Markit iTraxx Europe Series 24 Version 1 Barclays Bank 20/12/2020 9,993 11,815CDS EUR 210,000 Fund receives Fixed 1.000% and provides default protection on
Markit iTraxx Europe Series 24 Version 1 Barclays Bank 20/12/2020 2,506 2,697CDS EUR 420,000 Fund receives Fixed 1.000% and provides default protection on
National Grid Plc Barclays Bank 20/12/2020 2,697 11,323CDS EUR 420,000 Fund receives Fixed 1.000% and provides default protection on
National Grid Plc Barclays Bank 20/12/2020 1,836 11,323CDS EUR 550,000 Fund receives Fixed 1.000% and provides default protection on
National Grid Plc Barclays Bank 20/12/2020 793 14,827CDS EUR 420,000 Fund receives Fixed 1.000% and provides default protection on
RELX Plc Barclays Bank 20/12/2020 3,115 11,519CDS EUR 160,000 Fund receives Fixed 1.000% and provides default protection on
Safeway Ltd Barclays Bank 20/12/2020 3,174 (481)CDS EUR 230,000 Fund receives Fixed 1.000% and provides default protection on
Safeway Ltd Barclays Bank 20/12/2020 4,862 (691)CDS EUR 1,333,000 Fund receives Fixed 1.000% and provides default protection on
Veolia Environnement SA Barclays Bank 20/12/2020 (5) 25,461CDS EUR 350,000 Fund receives Fixed 1.000% and provides default protection on
Vodafone Group Plc Barclays Bank 20/12/2020 5,863 2,890CDS EUR 460,000 Fund receives Fixed 1.000% and provides default protection on
Vodafone Group Plc Barclays Bank 20/12/2020 7,253 3,798CDS EUR 350,000 Fund receives Fixed 1.000% and provides default protection on
Vodafone Group Plc Barclays Bank 20/12/2020 5,537 2,890CDS JPY 15,857,728 Fund receives default protection on Mitsubishi Corp and
pays Fixed 1.000% Barclays Bank 20/12/2020 (1,237) (3,587)CDS JPY 8,312,552 Fund receives default protection on Sumitomo Corp and
pays Fixed 1.000% Barclays Bank 20/12/2020 (1,950) (1,578)CDS USD 5,940,000 Fund receives default protection on Markit CDX.NA.HY.25 and
pays Fixed 5.000% Barclays Bank 20/12/2020 (63,251) (199,947)CDS USD 5,940,000 Fund receives Fixed 5.000% and provides default protection on
Markit CDX.NA.HY.25 Barclays Bank 20/12/2020 127,320 199,947CDS EUR 175,000 Fund receives default protection on Adecco SA and pays Fixed 1.000% Barclays Bank 20/06/2021 (128) (2,839)
BlackRock Global Absolute Return Bond Fund continued

TypeNominal
Value Description CounterpartyExpiration
date
Unrealised appreciation/
(depreciation) EUR
Market Value
EUR
Swaps as at 31 May 2016
240 BlackRock Strategic Funds (BSF)
The notes on pages 489 to 503 form an integral part of these financial statements.
BlackRock Global Absolute Return Bond Fund continued
CDS EUR 400,000 Fund receives default protection on Adecco SA and pays Fixed 1.000% Barclays Bank 20/06/2021 (293) (6,490)CDS EUR 215,000 Fund receives default protection on Airbus Group SE and
pays Fixed 1.000% Barclays Bank 20/06/2021 8 (4,405)CDS EUR 325,000 Fund receives default protection on Airbus Group SE and
pays Fixed 1.000% Barclays Bank 20/06/2021 13 (6,659)CDS EUR 240,000 Fund receives default protection on ArcelorMittal and
pays Fixed 5.000% Barclays Bank 20/06/2021 (14,591) (1,466)CDS EUR 243,000 Fund receives default protection on ArcelorMittal and
pays Fixed 5.000% Barclays Bank 20/06/2021 (8,054) (1,485)CDS EUR 346,000 Fund receives default protection on Astaldi Societa Per Azioni and
pays Fixed 5.000% Barclays Bank 20/06/2021 20,912 80,741CDS EUR 360,000 Fund receives default protection on BAE Systems Plc and
pays Fixed 1.000% Barclays Bank 20/06/2021 (2,122) (4,316)CDS EUR 398,000 Fund receives default protection on Bayer AG and pays Fixed 1.000% Barclays Bank 20/06/2021 3,711 (7,547)CDS EUR 208,000 Fund receives default protection on Bayer AG and pays Fixed 1.000% Barclays Bank 20/06/2021 1,108 (3,944)CDS EUR 270,000 Fund receives default protection on Carrefour SA and
pays Fixed 1.000% Barclays Bank 20/06/2021 (2,162) (5,077)CDS EUR 265,000 Fund receives default protection on Clariant AG and pays Fixed 1.000% Barclays Bank 20/06/2021 (1,456) (1,456)CDS EUR 300,000 Fund receives default protection on Continental AG and
pays Fixed 1.000% Barclays Bank 20/06/2021 511 (5,400)CDS EUR 530,000 Fund receives default protection on Deutsche Lufthansa AG and
pays Fixed 1.000% Barclays Bank 20/06/2021 (1,715) 2,295CDS EUR 430,000 Fund receives default protection on Deutsche Lufthansa AG and
pays Fixed 1.000% Barclays Bank 20/06/2021 (1,390) 1,862CDS EUR 220,000 Fund receives default protection on Deutsche Lufthansa AG and
pays Fixed 1.000% Barclays Bank 20/06/2021 (709) 953CDS EUR 51,000 Fund receives default protection on E.On SE and pays Fixed 1.000% Barclays Bank 20/06/2021 (217) (243)CDS EUR 51,000 Fund receives default protection on E.On SE and pays Fixed 1.000% Barclays Bank 20/06/2021 (346) (243)CDS EUR 33,000 Fund receives default protection on E.On SE and pays Fixed 1.000% Barclays Bank 20/06/2021 (91) (157)CDS EUR 128,000 Fund receives default protection on E.On SE and pays Fixed 1.000% Barclays Bank 20/06/2021 (352) (609)CDS EUR 235,000 Fund receives default protection on Electricite de France SA and
pays Fixed 1.000% Barclays Bank 20/06/2021 1,884 (906)CDS EUR 1,360,000 Fund receives default protection on EnBW Energie Baden
Wuerttemberg AG and pays Fixed 1.000% Barclays Bank 20/06/2021 (6,348) (31,584)CDS EUR 500,000 Fund receives default protection on Engie SA and pays Fixed 1.000% Barclays Bank 20/06/2021 (4) (10,975)CDS EUR 400,000 Fund receives default protection on Koninklijke KPN NV and
pays Fixed 1.000% Barclays Bank 20/06/2021 (355) (5,413)CDS EUR 330,000 Fund receives default protection on Koninklijke Philips NV and
pays Fixed 1.000% Barclays Bank 20/06/2021 (131) (9,232)CDS EUR 201,000 Fund receives default protection on Linde AG and pays Fixed 1.000% Barclays Bank 20/06/2021 (504) (6,707)CDS EUR 402,000 Fund receives default protection on Linde AG and pays Fixed 1.000% Barclays Bank 20/06/2021 (1,001) (13,413)CDS EUR 268,000 Fund receives default protection on Merck KGaA and pays Fixed 1.000% Barclays Bank 20/06/2021 (975) (7,671)CDS EUR 104,000 Fund receives default protection on Nokia OYJ and pays Fixed 5.000% Barclays Bank 20/06/2021 790 (18,254)CDS EUR 775,000 Fund receives default protection on PostNL NV and pays Fixed 1.000% Barclays Bank 20/06/2021 (964) (17,601)CDS EUR 159,000 Fund receives default protection on Sanofi and pays Fixed 1.000% Barclays Bank 20/06/2021 179 (5,123)CDS EUR 650,000 Fund receives default protection on Stora Enso OYJ and
pays Fixed 5.000% Barclays Bank 20/06/2021 (3,684) (111,673)CDS EUR 650,000 Fund receives default protection on Tate & Lyle Plc and
pays Fixed 1.000% Barclays Bank 20/06/2021 151 (11,402)CDS EUR 254,000 Fund receives default protection on Telecom Italia SpA and
pays Fixed 1.000% Barclays Bank 20/06/2021 (1,839) 9,655CDS EUR 119,000 Fund receives default protection on Telecom Italia SpA and
pays Fixed 1.000% Barclays Bank 20/06/2021 (972) 4,523CDS EUR 119,000 Fund receives default protection on Telecom Italia SpA and
pays Fixed 1.000% Barclays Bank 20/06/2021 (972) 4,523CDS EUR 170,000 Fund receives default protection on Telefonaktiebolaget LM Ericsson
and pays Fixed 1.000% Barclays Bank 20/06/2021 (363) (873)CDS EUR 160,000 Fund receives default protection on Telefonaktiebolaget LM Ericsson
and pays Fixed 1.000% Barclays Bank 20/06/2021 900 (821)CDS EUR 220,000 Fund receives default protection on Telenor ASA and
pays Fixed 1.000% Barclays Bank 20/06/2021 (566) (5,216)CDS EUR 530,000 Fund receives Fixed 1.000% and provides default protection on
Anheuser-Busch InBev SA/NV Barclays Bank 20/06/2021 3,626 9,898CDS EUR 540,000 Fund receives Fixed 1.000% and provides default protection on
Anheuser-Busch InBev SA/NV Barclays Bank 20/06/2021 3,440 10,085CDS EUR 500,000 Fund receives Fixed 1.000% and provides default protection on
Aviva Plc Barclays Bank 20/06/2021 5,390 (15,168)CDS EUR 330,000 Fund receives Fixed 1.000% and provides default protection on
BP Plc Barclays Bank 20/06/2021 1,600 1,272CDS EUR 650,000 Fund receives Fixed 1.000% and provides default protection on
Carlsberg Breweries A/S Barclays Bank 20/06/2021 1,271 9,529CDS EUR 190,000 Fund receives Fixed 1.000% and provides default protection on
Casino Guichard Perrachon SA Barclays Bank 20/06/2021 2,693 (14,517)

TypeNominal
Value Description CounterpartyExpiration
date
Unrealised appreciation/
(depreciation) EUR
Market Value
EUR
Swaps as at 31 May 2016
Annual Report and Audited Accounts 241
The notes on pages 489 to 503 form an integral part of these financial statements.
CDS EUR 80,000 Fund receives Fixed 1.000% and provides default protection on Casino Guichard Perrachon SA Barclays Bank 20/06/2021 959 (6,112)
CDS EUR 620,000 Fund receives Fixed 1.000% and provides default protection on Casino Guichard Perrachon SA Barclays Bank 20/06/2021 6,903 (47,370)
CDS EUR 320,000 Fund receives Fixed 1.000% and provides default protection on Casino Guichard Perrachon SA Barclays Bank 20/06/2021 (1,390) (24,449)
CDS EUR 775,000 Fund receives Fixed 1.000% and provides default protection on Enel SpA Barclays Bank 20/06/2021 94 3,978
CDS EUR 300,000 Fund receives Fixed 1.000% and provides default protection on Enel SpA Barclays Bank 20/06/2021 36 1,540
CDS EUR 1,370,000 Fund receives Fixed 1.000% and provides default protection on Engie SA Barclays Bank 20/06/2021 11,082 30,073
CDS EUR 1,439,000 Fund receives Fixed 1.000% and provides default protection on Engie SA Barclays Bank 20/06/2021 (12) 31,587
CDS EUR 875,000 Fund receives Fixed 1.000% and provides default protection on GKN Holdings Plc Barclays Bank 20/06/2021 1,093 (20,347)
CDS EUR 200,000 Fund receives Fixed 1.000% and provides default protection on GKN Holdings Plc Barclays Bank 20/06/2021 250 (4,651)
CDS EUR 475,000 Fund receives Fixed 1.000% and provides default protection on Iberdrola SA Barclays Bank 20/06/2021 1,004 6,268
CDS EUR 1,175,000 Fund receives Fixed 1.000% and provides default protection on Iberdrola SA Barclays Bank 20/06/2021 2,484 15,506
CDS EUR 270,000 Fund receives Fixed 1.000% and provides default protection on Ladbrokes Plc Barclays Bank 20/06/2021 2,548 (22,298)
CDS EUR 400,000 Fund receives Fixed 1.000% and provides default protection on Markit iTraxx Europe Series 25 Version 1 Barclays Bank 20/06/2021 (110) 5,654
CDS EUR 270,000 Fund receives Fixed 1.000% and provides default protection on Marks & Spencer Plc Barclays Bank 20/06/2021 (358) (5,699)
CDS EUR 552,000 Fund receives Fixed 1.000% and provides default protection on Nestle SA Barclays Bank 20/06/2021 (659) 21,042CDS EUR 268,000 Fund receives Fixed 1.000% and provides default protection on Repsol SA Barclays Bank 20/06/2021 8,510 (12,241)CDS EUR 710,000 Fund receives Fixed 1.000% and provides default protection on
Rolls-Royce Holdings Plc Barclays Bank 20/06/2021 9,221 (7,647)CDS EUR 54,000 Fund receives Fixed 1.000% and provides default protection on
Royal Dutch Shell Plc Barclays Bank 20/06/2021 357 631CDS EUR 166,000 Fund receives Fixed 1.000% and provides default protection on
Royal Dutch Shell Plc Barclays Bank 20/06/2021 1,096 1,940CDS EUR 158,000 Fund receives Fixed 1.000% and provides default protection on
Technip SA Barclays Bank 20/06/2021 2,617 (838)CDS EUR 300,000 Fund receives Fixed 1.000% and provides default protection on
Telefonica SA Barclays Bank 20/06/2021 2,782 (1,189)CDS EUR 260,000 Fund receives Fixed 1.000% and provides default protection on Thales SA Barclays Bank 20/06/2021 109 5,623CDS EUR 150,000 Fund receives Fixed 1.000% and provides default protection on Total SA Barclays Bank 20/06/2021 219 3,257CDS EUR 300,000 Fund receives Fixed 1.000% and provides default protection on Total SA Barclays Bank 20/06/2021 437 6,514CDS EUR 1,250,000 Fund receives Fixed 1.000% and provides default protection on
Volkswagen AG Barclays Bank 20/06/2021 38,950 (8,664)CDS EUR 280,000 Fund receives Fixed 1.000% and provides default protection on
Wendel SA Barclays Bank 20/06/2021 800 (3,732)CDS EUR 169,000 Fund receives Fixed 5.000% and provides default protection on
Altice Luxembourg SA Barclays Bank 20/06/2021 2,845 1,071CDS EUR 761,000 Fund receives Fixed 5.000% and provides default protection on
Anglo American Plc Barclays Bank 20/06/2021 (336) (20,713)CDS EUR 240,000 Fund receives Fixed 5.000% and provides default protection on
Anglo American Plc Barclays Bank 20/06/2021 15,851 (6,532)CDS EUR 193,000 Fund receives Fixed 5.000% and provides default protection on
Anglo American Plc Barclays Bank 20/06/2021 9,257 (5,253)CDS EUR 112,000 Fund receives Fixed 5.000% and provides default protection on NXP BV Barclays Bank 20/06/2021 278 19,429CDS EUR 270,000 Fund receives Fixed 5.000% and provides default protection on NXP BV Barclays Bank 20/06/2021 1,330 46,838CDS EUR 330,000 Fund receives Fixed 5.000% and provides default protection on
Wendel SA Barclays Bank 20/06/2021 4,054 61,104CDS EUR 150,000 Fund receives Fixed 1.000% and provides default protection on
Securitas AB BNP Paribas 20/09/2019 1,522 3,096CDS EUR 140,000 Fund receives Fixed 1.000% and provides default protection on
Securitas AB BNP Paribas 20/09/2019 1,144 2,890CDS EUR 450,000 Fund receives default protection on Alstom SA and pays Fixed 1.000% BNP Paribas 20/12/2020 (15,653) (1,223)CDS EUR 370,000 Fund receives default protection on Carrefour SA and pays Fixed 1.000% BNP Paribas 20/12/2020 (2,513) (7,388)CDS EUR 15,000 Fund receives default protection on Electrolux AB and pays Fixed 1.000% BNP Paribas 20/12/2020 (300) (379)CDS EUR 71,000 Fund receives default protection on Electrolux AB and pays Fixed 1.000% BNP Paribas 20/12/2020 (1,419) (1,792)CDS EUR 146,000 Fund receives default protection on Electrolux AB and pays Fixed 1.000% BNP Paribas 20/12/2020 (3,060) (3,685)CDS EUR 132,000 Fund receives default protection on LafargeHolcim Ltd and
pays Fixed 1.000% BNP Paribas 20/12/2020 (7,918) (99)CDS EUR 3,000,000 Fund receives default protection on Markit iTraxx Europe Series 24
Version 1 and pays Fixed 1.000% BNP Paribas 20/12/2020 6,432 (38,528)CDS EUR 298,000 Fund receives default protection on Renault SA and pays Fixed 1.000% BNP Paribas 20/12/2020 (16,008) (1,144)
BlackRock Global Absolute Return Bond Fund continued

TypeNominal
Value Description CounterpartyExpiration
date
Unrealised appreciation/
(depreciation) EUR
Market Value
EUR
Swaps as at 31 May 2016
242 BlackRock Strategic Funds (BSF)
The notes on pages 489 to 503 form an integral part of these financial statements.
BlackRock Global Absolute Return Bond Fund continued
CDS EUR 322,000 Fund receives default protection on Renault SA and pays Fixed 1.000% BNP Paribas 20/12/2020 (17,297) (1,236)CDS EUR 265,000 Fund receives default protection on Renault SA and pays Fixed 1.000% BNP Paribas 20/12/2020 (11,885) (1,017)CDS EUR 265,000 Fund receives default protection on Renault SA and pays Fixed 1.000% BNP Paribas 20/12/2020 (11,885) (1,017)CDS EUR 265,000 Fund receives default protection on Renault SA and pays Fixed 1.000% BNP Paribas 20/12/2020 221 (1,017)CDS EUR 302,000 Fund receives default protection on Standard Chartered Bank and
pays Fixed 1.000% BNP Paribas 20/12/2020 (27,764) 20,772CDS EUR 250,000 Fund receives default protection on Standard Chartered Bank and
pays Fixed 1.000% BNP Paribas 20/12/2020 (2,437) 3,748CDS EUR 270,000 Fund receives default protection on Telenor ASA and pays Fixed 1.000% BNP Paribas 20/12/2020 (2,221) (6,356)CDS EUR 170,000 Fund receives Fixed 1.000% and provides default protection on
Markit iTraxx Europe Series 24 Version 1 BNP Paribas 20/12/2020 1,642 2,183CDS EUR 212,000 Fund receives Fixed 1.000% and provides default protection on
Markit iTraxx Europe Series 24 Version 1 BNP Paribas 20/12/2020 2,329 2,723CDS EUR 140,000 Fund receives Fixed 1.000% and provides default protection on
Markit iTraxx Europe Series 24 Version 1 BNP Paribas 20/12/2020 1,647 1,798CDS EUR 190,000 Fund receives Fixed 1.000% and provides default protection on
Markit iTraxx Europe Series 24 Version 1 BNP Paribas 20/12/2020 2,361 2,440CDS EUR 355,000 Fund receives Fixed 1.000% and provides default protection on
Markit iTraxx Europe Series 24 Version 1 BNP Paribas 20/12/2020 3,072 4,559CDS EUR 525,000 Fund receives Fixed 1.000% and provides default protection on
National Grid Plc BNP Paribas 20/12/2020 3,188 14,153CDS EUR 150,000 Fund receives Fixed 1.000% and provides default protection on
Safeway Ltd BNP Paribas 20/12/2020 3,147 (451)CDS EUR 180,000 Fund receives Fixed 1.000% and provides default protection on
Safeway Ltd BNP Paribas 20/12/2020 2,208 (541)CDS EUR 31,000 Fund receives Fixed 5.000% and provides default protection on
Galp Energia SGPS SA BNP Paribas 20/12/2020 (182) 4,886CDS EUR 3,100,000 Fund receives default protection on Bayerische Motoren Werke AG and
pays Fixed 1.000% BNP Paribas 20/06/2021 (5,999) (61,179)CDS EUR 800,000 Fund receives default protection on Clariant AG and pays Fixed 1.000% BNP Paribas 20/06/2021 (2,385) (4,395)CDS EUR 530,000 Fund receives default protection on
Compagnie Financiere du groupe Michelin Senard et Cie and pays Fixed 1.000% BNP Paribas 20/06/2021 (1,324) (12,566)
CDS EUR 287,000 Fund receives default protection on Continental AG and pays Fixed 1.000% BNP Paribas 20/06/2021 (297) (5,163)CDS EUR 143,000 Fund receives default protection on Continental AG and
pays Fixed 1.000% BNP Paribas 20/06/2021 (374) (2,574)CDS EUR 203,000 Fund receives default protection on Continental AG and pays Fixed 1.000% BNP Paribas 20/06/2021 (123) (3,654)CDS EUR 725,000 Fund receives default protection on Daimler AG and pays Fixed 1.000% BNP Paribas 20/06/2021 (313) (13,601)CDS EUR 625,000 Fund receives default protection on Daimler AG and
pays Fixed 1.000% BNP Paribas 20/06/2021 (269) (11,725)CDS EUR 350,000 Fund receives default protection on E.On SE and pays Fixed 1.000% BNP Paribas 20/06/2021 (895) (1,666)CDS EUR 270,000 Fund receives default protection on Finmeccanica SpA and
pays Fixed 5.000% BNP Paribas 20/06/2021 2,169 (45,733)CDS EUR 2,042,000 Fund receives default protection on Groupe Auchan SA and
pays Fixed 1.000% BNP Paribas 20/06/2021 3,630 (47,056)CDS EUR 270,000 Fund receives default protection on Kering and pays Fixed 1.000% BNP Paribas 20/06/2021 390 (3,862)CDS EUR 590,000 Fund receives default protection on Koninklijke KPN NV and
pays Fixed 1.000% BNP Paribas 20/06/2021 (524) (7,984)CDS EUR 120,000 Fund receives default protection on Koninklijke Philips NV and
pays Fixed 1.000% BNP Paribas 20/06/2021 (444) (3,357)CDS EUR 270,000 Fund receives default protection on Koninklijke Philips NV and
pays Fixed 1.000% BNP Paribas 20/06/2021 (587) (7,554)CDS EUR 467,000 Fund receives default protection on Linde AG and pays Fixed 1.000% BNP Paribas 20/06/2021 (2,215) (15,582)CDS EUR 4,140,000 Fund receives default protection on Markit iTraxx Europe Crossover
Series 25 Version 1 and pays Fixed 5.000% BNP Paribas 20/06/2021 14,779 (359,838)CDS EUR 12,695,000 Fund receives default protection on Markit iTraxx Europe Series 25
Version 1 and pays Fixed 1.000% BNP Paribas 20/06/2021 (1,011) (179,442)CDS EUR 390,000 Fund receives default protection on Pernod Ricard SA and
pays Fixed 1.000% BNP Paribas 20/06/2021 (456) (6,367)CDS EUR 1,125,000 Fund receives default protection on Pernod Ricard SA and
pays Fixed 1.000% BNP Paribas 20/06/2021 (2,219) (18,367)CDS EUR 270,000 Fund receives default protection on Peugeot SA and pays Fixed 5.000% BNP Paribas 20/06/2021 (585) (39,062)CDS EUR 275,000 Fund receives default protection on Peugeot SA and pays Fixed 5.000% BNP Paribas 20/06/2021 (6,231) (39,785)CDS EUR 1,385,000 Fund receives default protection on PostNL NV and pays Fixed 1.000% BNP Paribas 20/06/2021 (229) (31,455)CDS EUR 1,067,000 Fund receives default protection on RWE AG and pays Fixed 1.000% BNP Paribas 20/06/2021 4,204 17,503CDS EUR 1,050,000 Fund receives default protection on RWE AG and pays Fixed 1.000% BNP Paribas 20/06/2021 5,645 17,224CDS EUR 535,000 Fund receives default protection on Sanofi and pays Fixed 1.000% BNP Paribas 20/06/2021 143 (17,239)CDS EUR 225,000 Fund receives default protection on Tate & Lyle Plc and pays Fixed 1.000% BNP Paribas 20/06/2021 (61) (3,947)CDS EUR 475,000 Fund receives default protection on Tate & Lyle Plc and
pays Fixed 1.000% BNP Paribas 20/06/2021 (129) (8,333)CDS EUR 1,010,000 Fund receives default protection on TDC A/S and pays Fixed 1.000% BNP Paribas 20/06/2021 (3,656) 6,550CDS EUR 1,775,000 Fund receives default protection on Telecom Italia SpA and
pays Fixed 1.000% BNP Paribas 20/06/2021 17,053 67,470

TypeNominal
Value Description CounterpartyExpiration
date
Unrealised appreciation/
(depreciation) EUR
Market Value
EUR
Swaps as at 31 May 2016
Annual Report and Audited Accounts 243
The notes on pages 489 to 503 form an integral part of these financial statements.
CDS EUR 760,000 Fund receives default protection on Telecom Italia SpA and pays Fixed 1.000% BNP Paribas 20/06/2021 (4,307) 28,889
CDS EUR 825,000 Fund receives default protection on Telefonaktiebolaget LM Ericsson and pays Fixed 1.000% BNP Paribas 20/06/2021 (3,008) (4,235)
CDS EUR 627,000 Fund receives default protection on Valeo SA and pays Fixed 1.000% BNP Paribas 20/06/2021 (2,568) (8,380)CDS EUR 275,000 Fund receives default protection on Valeo SA and pays Fixed 1.000% BNP Paribas 20/06/2021 (327) (3,675)CDS EUR 200,000 Fund receives default protection on Valeo SA and pays Fixed 1.000% BNP Paribas 20/06/2021 (238) (2,673)CDS EUR 2,550,000 Fund receives default protection on Vattenfall AB and pays Fixed 1.000% BNP Paribas 20/06/2021 (1,401) (58,893)CDS EUR 250,000 Fund receives default protection on Wolters Kluwer NV and
pays Fixed 1.000% BNP Paribas 20/06/2021 (453) (8,055)CDS EUR 300,000 Fund receives default protection on Wolters Kluwer NV and
pays Fixed 1.000% BNP Paribas 20/06/2021 (544) (9,667)CDS EUR 550,000 Fund receives Fixed 1.000% and provides default protection on Accor SA BNP Paribas 20/06/2021 1,210 2,584CDS EUR 530,000 Fund receives Fixed 1.000% and provides default protection on
Anheuser-Busch InBev SA/NV BNP Paribas 20/06/2021 3,641 9,898CDS EUR 530,000 Fund receives Fixed 1.000% and provides default protection on
Anheuser-Busch InBev SA/NV BNP Paribas 20/06/2021 3,643 9,898CDS EUR 490,000 Fund receives Fixed 1.000% and provides default protection on
Anheuser-Busch InBev SA/NV BNP Paribas 20/06/2021 3,133 9,151CDS EUR 270,000 Fund receives Fixed 1.000% and provides default protection on BP Plc BNP Paribas 20/06/2021 1,309 1,041CDS EUR 650,000 Fund receives Fixed 1.000% and provides default protection on
British American Tobacco Plc BNP Paribas 20/06/2021 (448) 14,546CDS EUR 490,000 Fund receives Fixed 1.000% and provides default protection on
British American Tobacco Plc BNP Paribas 20/06/2021 (338) 10,966CDS EUR 880,000 Fund receives Fixed 1.000% and provides default protection on
British Telecom Plc BNP Paribas 20/06/2021 4,742 10,249CDS EUR 270,000 Fund receives Fixed 1.000% and provides default protection on
British Telecom Plc BNP Paribas 20/06/2021 1,455 3,144CDS EUR 1,290,000 Fund receives Fixed 1.000% and provides default protection on
Carlsberg Breweries A/S BNP Paribas 20/06/2021 11,037 18,912CDS EUR 40,000 Fund receives Fixed 1.000% and provides default protection on
Casino Guichard Perrachon SA BNP Paribas 20/06/2021 1,104 (3,056)CDS EUR 1,067,000 Fund receives Fixed 1.000% and provides default protection on E.On SE BNP Paribas 20/06/2021 (267) 5,080CDS EUR 2,550,000 Fund receives Fixed 1.000% and provides default protection on E.On SE BNP Paribas 20/06/2021 6,199 12,140CDS EUR 1,050,000 Fund receives Fixed 1.000% and provides default protection on E.On SE BNP Paribas 20/06/2021 252 4,999CDS EUR 639,000 Fund receives Fixed 1.000% and provides default protection on
GlaxoSmithKline Plc BNP Paribas 20/06/2021 1,397 19,612CDS EUR 260,000 Fund receives Fixed 1.000% and provides default protection on
J Sainsbury Plc BNP Paribas 20/06/2021 534 (5,929)CDS EUR 280,000 Fund receives Fixed 1.000% and provides default protection on
Ladbrokes Plc BNP Paribas 20/06/2021 2,256 (23,124)CDS EUR 271,000 Fund receives Fixed 1.000% and provides default protection on
Ladbrokes Plc BNP Paribas 20/06/2021 (1,194) (22,381)CDS EUR 1,075,000 Fund receives Fixed 1.000% and provides default protection on Nestle SA BNP Paribas 20/06/2021 (1,252) 40,979CDS EUR 280,000 Fund receives Fixed 1.000% and provides default protection on Repsol SA BNP Paribas 20/06/2021 1,998 (12,789)CDS EUR 160,000 Fund receives Fixed 1.000% and provides default protection on
Technip SA BNP Paribas 20/06/2021 1,884 (849)CDS EUR 270,000 Fund receives Fixed 1.000% and provides default protection on Total SA BNP Paribas 20/06/2021 (114) 5,863CDS EUR 330,000 Fund receives Fixed 5.000% and provides default protection on
CNH Industrial NV BNP Paribas 20/06/2021 2,705 34,140CDS EUR 275,000 Fund receives Fixed 5.000% and provides default protection on
EDP - Energias de Portugal SA BNP Paribas 20/06/2021 3,698 48,484CDS EUR 434,000 Fund receives Fixed 5.000% and provides default protection on
Glencore International AG BNP Paribas 20/06/2021 (11,821) 10,363CDS EUR 240,000 Fund receives Fixed 5.000% and provides default protection on
HeidelbergCement AG BNP Paribas 20/06/2021 (534) 44,869CDS EUR 470,000 Fund receives Fixed 5.000% and provides default protection on
HeidelbergCement AG BNP Paribas 20/06/2021 (1,046) 87,869CDS EUR 224,000 Fund receives Fixed 5.000% and provides default protection on
Jaguar Land Rover Automotive Plc BNP Paribas 20/06/2021 7,418 23,796CDS EUR 224,000 Fund receives Fixed 5.000% and provides default protection on
Jaguar Land Rover Automotive Plc BNP Paribas 20/06/2021 7,418 23,796CDS EUR 270,000 Fund receives Fixed 5.000% and provides default protection on NXP BV BNP Paribas 20/06/2021 392 46,838CDS EUR 220,000 Fund receives Fixed 5.000% and provides default protection on NXP BV BNP Paribas 20/06/2021 (897) 38,164CDS EUR 110,000 Fund receives Fixed 5.000% and provides default protection on Wendel SA BNP Paribas 20/06/2021 2,262 20,368CDS EUR 270,000 Fund receives Fixed 5.000% and provides default protection on
Wendel SA BNP Paribas 20/06/2021 4,071 50,009CDS USD 900,000 Fund receives Fixed 1.000% and provides default protection on
Markit CDX.NA.IG.26 BNP Paribas 20/06/2021 1,899 9,057CDS EUR 650,000 Fund receives default protection on Securitas AB 6.500% 2/4/2013
and pays Fixed 1.000% Citibank 20/09/2017 (9,275) (6,741)CDS EUR 60,000 Fund receives Fixed 1.000% and provides default protection on Next Plc Citibank 20/12/2017 899 552CDS EUR 280,000 Fund receives Fixed 5.000% and provides default protection on Wendel SA Citibank 20/06/2020 (8,355) 45,590
BlackRock Global Absolute Return Bond Fund continued

TypeNominal
Value Description CounterpartyExpiration
date
Unrealised appreciation/
(depreciation) EUR
Market Value
EUR
Swaps as at 31 May 2016
244 BlackRock Strategic Funds (BSF)
The notes on pages 489 to 503 form an integral part of these financial statements.
BlackRock Global Absolute Return Bond Fund continued
CDS EUR 560,000 Fund receives default protection on Metsa Board OYJ and pays Fixed 5.000% Citibank 20/09/2020 12,022 (93,487)
CDS EUR 310,000 Fund receives default protection on Banco Santander SA and pays Fixed 1.000% Citibank 20/12/2020 (3,091) 20,731
CDS EUR 221,000 Fund receives default protection on Banco Santander SA and pays Fixed 1.000% Citibank 20/12/2020 (14,269) 14,779
CDS EUR 104,000 Fund receives default protection on Beni Stabili SpA SII Q and pays Fixed 5.000% Citibank 20/12/2020 (5,516) (16,865)
CDS EUR 201,000 Fund receives default protection on Carrefour SA and pays Fixed 1.000% Citibank 20/12/2020 (2,043) (4,013)CDS EUR 380,000 Fund receives default protection on Carrefour SA and pays Fixed 1.000% Citibank 20/12/2020 (2,122) (7,587)CDS EUR 525,000 Fund receives default protection on Carrefour SA and pays Fixed 1.000% Citibank 20/12/2020 (1,059) (10,483)CDS EUR 975,000 Fund receives default protection on Compagnie Financiere du groupe
Michelin Senard et Cie and pays Fixed 1.000% Citibank 20/12/2020 228 (23,231)CDS EUR 792,000 Fund receives default protection on Credit Agricole SA and
pays Fixed 1.000% Citibank 20/12/2020 (25,683) 16,244CDS EUR 265,000 Fund receives default protection on Finmeccanica SpA and
pays Fixed 5.000% Citibank 20/12/2020 (19,939) (42,451)CDS EUR 520,000 Fund receives default protection on Gas Natural SDG SA and pays Fixed 1.000% Citibank 20/12/2020 (10,680) (3,451)CDS EUR 396,000 Fund receives default protection on ING Bank NV and pays Fixed 1.000% Citibank 20/12/2020 (12,423) 6,531CDS EUR 213,000 Fund receives default protection on Melia Hotels International SA and
pays Fixed 5.000% Citibank 20/12/2020 (5,880) (38,959)CDS EUR 720,000 Fund receives default protection on Sky Plc and pays Fixed 1.000% Citibank 20/12/2020 (2,141) (5,945)CDS EUR 440,000 Fund receives default protection on Standard Chartered Bank and
pays Fixed 1.000% Citibank 20/12/2020 (35,865) 30,263CDS EUR 605,000 Fund receives default protection on Stmicroelectronics NV and
pays Fixed 1.000% Citibank 20/12/2020 5,816 9,181CDS EUR 132,000 Fund receives default protection on Stora Enso OYJ and pays Fixed 5.000% Citibank 20/12/2020 (4,902) (21,417)CDS EUR 153,000 Fund receives default protection on Stora Enso OYJ and pays Fixed 5.000% Citibank 20/12/2020 (4,951) (24,824)CDS EUR 425,000 Fund receives default protection on TVN Finance Corp III AB and
pays Fixed 5.000% Citibank 20/12/2020 9,590 (83,060)CDS EUR 317,000 Fund receives Fixed 1.000% and provides default protection on
BAE Systems Plc Citibank 20/12/2020 (1,483) 4,416CDS EUR 525,000 Fund receives Fixed 1.000% and provides default protection on Danone SA Citibank 20/12/2020 198 13,773CDS EUR 1,018,000 Fund receives Fixed 1.000% and provides default protection on
Markit iTraxx Europe Series 24 Version 1 Citibank 20/12/2020 5,638 13,074CDS EUR 410,000 Fund receives Fixed 1.000% and provides default protection on
National Grid Plc Citibank 20/12/2020 881 11,053CDS EUR 320,000 Fund receives Fixed 1.000% and provides default protection on RELX Plc Citibank 20/12/2020 2,466 8,776CDS EUR 310,000 Fund receives Fixed 1.000% and provides default protection on RELX Plc Citibank 20/12/2020 2,115 8,502CDS EUR 130,000 Fund receives Fixed 1.000% and provides default protection on Safeway Ltd Citibank 20/12/2020 3,802 (391)CDS EUR 120,000 Fund receives Fixed 1.000% and provides default protection on Safeway Ltd Citibank 20/12/2020 2,518 (361)CDS EUR 230,000 Fund receives Fixed 1.000% and provides default protection on Safeway Ltd Citibank 20/12/2020 3,126 (691)CDS USD 300,000 Fund receives default protection on Westpac Banking Corp and
pays Fixed 1.000% Citibank 20/12/2020 (1,400) (2,298)CDS USD 200,000 Fund receives Fixed 1.000% and provides default protection on
Republic of Indonesia Citibank 20/12/2020 5,409 (5,616)CDS EUR 500,000 Fund receives default protection on Aegon NV and pays Fixed 1.000% Citibank 20/06/2021 (5,261) 15,534CDS EUR 650,000 Fund receives default protection on Airbus Group SE and pays Fixed 1.000% Citibank 20/06/2021 945 (13,319)CDS EUR 270,000 Fund receives default protection on Akzo Nobel NV and pays Fixed 1.000% Citibank 20/06/2021 (2,106) (6,153)CDS EUR 225,000 Fund receives default protection on Barclays Bank Plc and pays Fixed 1.000% Citibank 20/06/2021 (5,906) 10,563CDS EUR 454,000 Fund receives default protection on BASF SE and pays Fixed 1.000% Citibank 20/06/2021 (1,694) (12,000)CDS EUR 392,000 Fund receives default protection on Bayer AG and pays Fixed 1.000% Citibank 20/06/2021 1,883 (7,434)CDS EUR 1,125,000 Fund receives default protection on Bouygues SA and pays Fixed 1.000% Citibank 20/06/2021 (3,305) (27,495)CDS EUR 324,000 Fund receives default protection on Carrefour SA and pays Fixed 1.000% Citibank 20/06/2021 (2,137) (6,092)CDS EUR 500,000 Fund receives default protection on Cie de Saint-Gobain and pays Fixed 1.000% Citibank 20/06/2021 566 (9,634)CDS EUR 400,000 Fund receives default protection on Cie de Saint-Gobain and pays Fixed 1.000% Citibank 20/06/2021 (2,385) (7,708)CDS EUR 575,000 Fund receives default protection on Cie de Saint-Gobain and pays Fixed 1.000% Citibank 20/06/2021 (3,429) (11,080)CDS EUR 200,000 Fund receives default protection on Cie de Saint-Gobain and pays Fixed 1.000% Citibank 20/06/2021 (1,193) (3,854)CDS EUR 600,000 Fund receives default protection on Cie de Saint-Gobain and pays Fixed 1.000% Citibank 20/06/2021 (3,571) (11,555)CDS EUR 366,000 Fund receives default protection on Continental AG and pays Fixed 1.000% Citibank 20/06/2021 (1,157) (6,587)CDS EUR 280,000 Fund receives default protection on Daimler AG and pays Fixed 1.000% Citibank 20/06/2021 (1,234) (5,253)CDS EUR 1,440,000 Fund receives default protection on Daimler AG and pays Fixed 1.000% Citibank 20/06/2021 (7,854) (27,015)CDS EUR 390,000 Fund receives default protection on Deutsche Telekom AG and
pays Fixed 1.000% Citibank 20/06/2021 (1,595) (10,871)CDS EUR 260,000 Fund receives default protection on E.On SE and pays Fixed 1.000% Citibank 20/06/2021 (1,000) (1,238)CDS EUR 529,000 Fund receives default protection on E.On SE and pays Fixed 1.000% Citibank 20/06/2021 (3,317) (2,519)CDS EUR 530,000 Fund receives default protection on Engie SA and pays Fixed 1.000% Citibank 20/06/2021 (5,087) (11,634)CDS EUR 140,000 Fund receives default protection on Kering and pays Fixed 1.000% Citibank 20/06/2021 (313) (2,003)CDS EUR 194,000 Fund receives default protection on Koninklijke DSM NV and pays Fixed 1.000% Citibank 20/06/2021 278 (6,130)CDS EUR 375,000 Fund receives default protection on Koninklijke Philips NV and
pays Fixed 1.000% Citibank 20/06/2021 (791) (10,491)CDS EUR 475,000 Fund receives default protection on Koninklijke Philips NV and
pays Fixed 1.000% Citibank 20/06/2021 (1,002) (13,289)CDS EUR 784,000 Fund receives default protection on Lanxess AG and pays Fixed 1.000% Citibank 20/06/2021 1,526 (11,611)

TypeNominal
Value Description CounterpartyExpiration
date
Unrealised appreciation/
(depreciation) EUR
Market Value
EUR
Swaps as at 31 May 2016
Annual Report and Audited Accounts 245
The notes on pages 489 to 503 form an integral part of these financial statements.
CDS EUR 75,000 Fund receives default protection on Lanxess AG and pays Fixed 1.000% Citibank 20/06/2021 146 (1,111)CDS EUR 208,000 Fund receives default protection on Lanxess AG and pays Fixed 1.000% Citibank 20/06/2021 (2,658) (3,081)CDS EUR 12,805,000 Fund receives default protection on Markit iTraxx Europe Series 25 Version 1
and pays Fixed 1.000% Citibank 20/06/2021 (43,184) (180,997)CDS EUR 1,050,000 Fund receives default protection on Markit iTraxx Europe Series 25 Version 1
and pays Fixed 1.000% Citibank 20/06/2021 (3,735) (14,842)CDS EUR 2,500,000 Fund receives default protection on Markit iTraxx Europe Series 25 Version 1
and pays Fixed 1.000% Citibank 20/06/2021 (9,428) (35,337)CDS EUR 762,000 Fund receives default protection on Metsa Board OYJ and pays Fixed 5.000% Citibank 20/06/2021 4,159 (141,871)CDS EUR 239,000 Fund receives default protection on Metsa Board OYJ and pays Fixed 5.000% Citibank 20/06/2021 1,304 (44,498)CDS EUR 390,000 Fund receives default protection on Pernod Ricard SA and pays Fixed 1.000% Citibank 20/06/2021 (864) (6,367)CDS EUR 270,000 Fund receives default protection on Peugeot SA and pays Fixed 5.000% Citibank 20/06/2021 (4,157) (39,062)CDS EUR 450,000 Fund receives default protection on Royal Bank of Scotland Plc and
pays Fixed 1.000% Citibank 20/06/2021 (6,622) 28,505CDS EUR 110,000 Fund receives default protection on Sodexo SA and pays Fixed 1.000% Citibank 20/06/2021 67 (3,106)CDS EUR 5,550,000 Fund receives default protection on Standard Chartered Bank and
pays Fixed 1.000% Citibank 20/06/2021 (175) 109,677CDS EUR 110,000 Fund receives default protection on Stora Enso OYJ and pays Fixed 5.000% Citibank 20/06/2021 (317) (18,899)CDS EUR 430,000 Fund receives default protection on Telefonaktiebolaget LM Ericsson and
pays Fixed 1.000% Citibank 20/06/2021 (262) (2,207)CDS EUR 1,650,000 Fund receives default protection on Telekom Austria AG and
pays Fixed 1.000% Citibank 20/06/2021 (8,815) (27,941)CDS EUR 230,000 Fund receives default protection on Tesco Plc and pays Fixed 1.000% Citibank 20/06/2021 157 16,488CDS EUR 1,680,000 Fund receives default protection on Vodafone Group Plc and pays Fixed 1.000% Citibank 20/06/2021 (9,916) (8,242)CDS EUR 1,680,000 Fund receives Fixed 1.000% and provides default protection on
British Telecom Plc Citibank 20/06/2021 9,461 19,566CDS EUR 550,000 Fund receives Fixed 1.000% and provides default protection on
Casino Guichard Perrachon SA Citibank 20/06/2021 16,243 (42,022)CDS EUR 1,760,000 Fund receives Fixed 1.000% and provides default protection on
GlaxoSmithKline Plc Citibank 20/06/2021 3,847 54,016CDS EUR 625,000 Fund receives Fixed 1.000% and provides default protection on Heineken NV Citibank 20/06/2021 (953) 17,727CDS EUR 250,000 Fund receives Fixed 1.000% and provides default protection on Heineken NV Citibank 20/06/2021 (381) 7,091CDS EUR 500,000 Fund receives Fixed 1.000% and provides default protection on Heineken NV Citibank 20/06/2021 (763) 14,182CDS EUR 7,750,000 Fund receives Fixed 1.000% and provides default protection on HSBC Bank Plc Citibank 20/06/2021 21,053 48,444CDS EUR 424,000 Fund receives Fixed 1.000% and provides default protection on
Imperial Brands Plc Citibank 20/06/2021 (773) 1,178CDS EUR 375,000 Fund receives Fixed 1.000% and provides default protection on Kingfisher Plc Citibank 20/06/2021 (1,205) 8,428CDS EUR 525,000 Fund receives Fixed 1.000% and provides default protection on Kingfisher Plc Citibank 20/06/2021 (1,687) 11,799CDS EUR 500,000 Fund receives Fixed 1.000% and provides default protection on Kingfisher Plc Citibank 20/06/2021 (1,607) 11,237CDS EUR 680,000 Fund receives Fixed 1.000% and provides default protection on Markit
iTraxx Europe Crossover Series 25 Version 1 Citibank 20/06/2021 376 9,612CDS EUR 2,500,000 Fund receives Fixed 1.000% and provides default protection on Markit iTraxx
Europe Senior Financial Series 25 Version 1 Citibank 20/06/2021 13,380 14,309CDS EUR 540,000 Fund receives Fixed 1.000% and provides default protection on Marks &
Spencer Plc Citibank 20/06/2021 1,696 (11,397)CDS EUR 270,000 Fund receives Fixed 1.000% and provides default protection on Repsol SA Citibank 20/06/2021 133 (12,332)CDS EUR 320,000 Fund receives Fixed 1.000% and provides default protection on Total SA Citibank 20/06/2021 22 6,949CDS EUR 394,000 Fund receives Fixed 1.000% and provides default protection on Volkswagen AG Citibank 20/06/2021 (25) (2,731)CDS EUR 440,000 Fund receives Fixed 1.000% and provides default protection on Volvo AB Citibank 20/06/2021 2,548 779CDS EUR 270,000 Fund receives Fixed 1.000% and provides default protection on Volvo AB Citibank 20/06/2021 1,292 478CDS EUR 270,000 Fund receives Fixed 1.000% and provides default protection on Volvo AB Citibank 20/06/2021 1,292 478CDS EUR 202,000 Fund receives Fixed 5.000% and provides default protection on Jaguar
Land Rover Automotive Plc Citibank 20/06/2021 6,593 21,459CDS EUR 220,000 Fund receives Fixed 5.000% and provides default protection on Jaguar
Land Rover Automotive Plc Citibank 20/06/2021 5,178 23,372CDS EUR 108,000 Fund receives Fixed 5.000% and provides default protection on TUI AG Citibank 20/06/2021 (47) 18,525CDS USD 112,706 Fund receives default protection on Federation of Malaysia and
pays Fixed 1.000% Citibank 20/06/2021 47 2,877CDS EUR 20,000 Fund receives default protection on Infineon Technologies Holding BV
and pays Fixed 5.000% Credit Suisse 20/12/2017 942 (1,092)CDS EUR 40,000 Fund receives Fixed 1.000% and provides default protection on Havas SA Credit Suisse 20/03/2018 2,000 470CDS EUR 600,000 Fund receives Fixed 5.000% and provides default protection on Smurfit
Kappa Acquisitions Credit Suisse 20/09/2018 11,462 62,820CDS EUR 10,000 Fund receives default protection on Scandinavian Airlines and
pays Fixed 5.000% Credit Suisse 20/06/2019 648 627CDS EUR 100,000 Fund receives default protection on Scandinavian Airlines and
pays Fixed 5.000% Credit Suisse 20/06/2019 6,776 6,275CDS USD 252,200 Fund receives default protection on Markit CDX.NA.HY.23 and
pays Fixed 5.000% Credit Suisse 20/12/2019 (1,574) (13,742)CDS EUR 153,000 Fund receives default protection on Cerved Group SpA and
pays Fixed 5.000% Credit Suisse 20/12/2020 11,833 (19,769)CDS EUR 117,000 Fund receives default protection on Compagnie Financiere du groupe
Michelin Senard et Cie and pays Fixed 1.000% Credit Suisse 20/12/2020 (1,267) (2,788)
BlackRock Global Absolute Return Bond Fund continued

TypeNominal
Value Description CounterpartyExpiration
date
Unrealised appreciation/
(depreciation) EUR
Market Value
EUR
Swaps as at 31 May 2016
246 BlackRock Strategic Funds (BSF)
The notes on pages 489 to 503 form an integral part of these financial statements.
BlackRock Global Absolute Return Bond Fund continued
CDS EUR 1,060,000 Fund receives default protection on Engie SA and pays Fixed 1.000% Credit Suisse 20/12/2020 (9,544) (23,994)CDS EUR 571,000 Fund receives default protection on Standard Chartered Bank and
pays Fixed 1.000% Credit Suisse 20/12/2020 (4,754) 39,274CDS EUR 120,000 Fund receives Fixed 1.000% and provides default protection on
J Sainsbury Plc Credit Suisse 20/12/2020 2,876 (1,779)CDS EUR 130,000 Fund receives Fixed 1.000% and provides default protection on
J Sainsbury Plc Credit Suisse 20/12/2020 2,094 (1,927)CDS EUR 300,000 Fund receives Fixed 1.000% and provides default protection on
Markit iTraxx Europe Series 24 Version 1 Credit Suisse 20/12/2020 1,692 3,853CDS EUR 208,000 Fund receives Fixed 1.000% and provides default protection on
Markit iTraxx Europe Series 24 Version 1 Credit Suisse 20/12/2020 2,300 2,671CDS EUR 345,000 Fund receives Fixed 1.000% and provides default protection on
Markit iTraxx Europe Series 24 Version 1 Credit Suisse 20/12/2020 3,718 4,431CDS EUR 250,000 Fund receives Fixed 1.000% and provides default protection on
Markit iTraxx Europe Series 24 Version 1 Credit Suisse 20/12/2020 2,761 3,211CDS EUR 355,000 Fund receives Fixed 1.000% and provides default protection on
Markit iTraxx Europe Series 24 Version 1 Credit Suisse 20/12/2020 3,525 4,559CDS EUR 345,000 Fund receives Fixed 1.000% and provides default protection on
Markit iTraxx Europe Series 24 Version 1 Credit Suisse 20/12/2020 3,596 4,431CDS EUR 160,000 Fund receives Fixed 1.000% and provides default protection on
Markit iTraxx Europe Series 24 Version 1 Credit Suisse 20/12/2020 1,568 2,055CDS EUR 460,000 Fund receives Fixed 1.000% and provides default protection on
Markit iTraxx Europe Series 24 Version 1 Credit Suisse 20/12/2020 4,860 5,908CDS EUR 750,000 Fund receives Fixed 1.000% and provides default protection on
Markit iTraxx Europe Series 24 Version 1 Credit Suisse 20/12/2020 9,192 9,632CDS EUR 340,000 Fund receives Fixed 1.000% and provides default protection on
Markit iTraxx Europe Series 24 Version 1 Credit Suisse 20/12/2020 4,167 4,367CDS EUR 350,000 Fund receives Fixed 1.000% and provides default protection on
Markit iTraxx Europe Series 24 Version 1 Credit Suisse 20/12/2020 3,156 4,495CDS EUR 559,000 Fund receives default protection on Anglo American Plc and
pays Fixed 1.000% Credit Suisse 20/06/2021 (28,509) 111,924CDS EUR 1,041,000 Fund receives default protection on Anglo American Plc and
pays Fixed 1.000% Credit Suisse 20/06/2021 (57,992) 208,431CDS EUR 292,000 Fund receives default protection on ArcelorMittal and pays Fixed 5.000% Credit Suisse 20/06/2021 (15,508) (1,784)CDS EUR 60,000 Fund receives default protection on Beni Stabili SpA SII Q and
pays Fixed 5.000% Credit Suisse 20/06/2021 (264) (10,398)CDS EUR 675,000 Fund receives default protection on Bouygues SA and pays Fixed 1.000% Credit Suisse 20/06/2021 (1,631) (16,497)CDS EUR 265,000 Fund receives default protection on E.On SE and pays Fixed 1.000% Credit Suisse 20/06/2021 (1,662) (1,262)CDS EUR 265,000 Fund receives default protection on E.On SE and pays Fixed 1.000% Credit Suisse 20/06/2021 (1,796) (1,262)CDS EUR 112,000 Fund receives default protection on Elis SA and pays Fixed 5.000% Credit Suisse 20/06/2021 (79) (21,526)CDS EUR 1,345,000 Fund receives default protection on ITV Plc and pays Fixed 5.000% Credit Suisse 20/06/2021 6,145 (256,045)CDS EUR 270,000 Fund receives default protection on Kering and pays Fixed 1.000% Credit Suisse 20/06/2021 93 (3,862)CDS EUR 380,000 Fund receives default protection on Kering and pays Fixed 1.000% Credit Suisse 20/06/2021 (45) (5,436)CDS EUR 2,480,000 Fund receives default protection on Koninklijke KPN NV and
pays Fixed 1.000% Credit Suisse 20/06/2021 588 (33,560)CDS EUR 260,000 Fund receives default protection on Orange SA and pays Fixed 1.000% Credit Suisse 20/06/2021 (1,889) (4,941)CDS EUR 270,000 Fund receives default protection on Orange SA and pays Fixed 1.000% Credit Suisse 20/06/2021 (1,135) (5,134)CDS EUR 650,000 Fund receives default protection on Orange SA and pays Fixed 1.000% Credit Suisse 20/06/2021 (2,486) (12,359)CDS EUR 269,000 Fund receives default protection on Statoil ASA and pays Fixed 1.000% Credit Suisse 20/06/2021 (1,006) (5,955)CDS EUR 161,000 Fund receives default protection on Statoil ASA and
pays Fixed 1.000% Credit Suisse 20/06/2021 (602) (3,564)CDS EUR 370,000 Fund receives default protection on Telefonaktiebolaget LM Ericsson
and pays Fixed 1.000% Credit Suisse 20/06/2021 151 (1,899)CDS EUR 510,000 Fund receives default protection on Tesco Plc and pays Fixed 1.000% Credit Suisse 20/06/2021 (1,497) 36,560CDS EUR 194,000 Fund receives default protection on Tesco Plc and pays Fixed 1.000% Credit Suisse 20/06/2021 (839) 13,907CDS EUR 540,000 Fund receives default protection on Wolters Kluwer NV and
pays Fixed 1.000% Credit Suisse 20/06/2021 43 (17,400)CDS EUR 1,200,000 Fund receives Fixed 1.000% and provides default protection on
Anheuser-Busch InBev SA/NV Credit Suisse 20/06/2021 3,810 22,411CDS EUR 236,000 Fund receives Fixed 1.000% and provides default protection on AXA SA Credit Suisse 20/06/2021 1,329 5,330CDS EUR 355,000 Fund receives Fixed 1.000% and provides default protection on AXA SA Credit Suisse 20/06/2021 1,726 8,017CDS EUR 180,000 Fund receives Fixed 1.000% and provides default protection on Casino
Guichard Perrachon SA Credit Suisse 20/06/2021 4,459 (13,753)CDS EUR 1,025,000 Fund receives Fixed 1.000% and provides default protection on Glencore
International AG Credit Suisse 20/06/2021 28,955 (159,816)CDS EUR 380,000 Fund receives Fixed 1.000% and provides default protection on Marks
& Spencer Plc Credit Suisse 20/06/2021 1,201 (8,020)CDS EUR 1,820,000 Fund receives Fixed 1.000% and provides default protection on Orange SA Credit Suisse 20/06/2021 6,490 34,606CDS EUR 660,000 Fund receives Fixed 1.000% and provides default protection on Orange SA Credit Suisse 20/06/2021 1,755 12,550CDS EUR 330,000 Fund receives Fixed 1.000% and provides default protection on Repsol SA Credit Suisse 20/06/2021 753 (15,073)CDS EUR 270,000 Fund receives Fixed 1.000% and provides default protection on Safeway Ltd Credit Suisse 20/06/2021 1,682 (2,282)CDS EUR 270,000 Fund receives Fixed 1.000% and provides default protection on Safeway Ltd Credit Suisse 20/06/2021 1,541 (2,282)CDS EUR 270,000 Fund receives Fixed 1.000% and provides default protection on Safeway Ltd Credit Suisse 20/06/2021 99 (2,282)CDS EUR 292,000 Fund receives Fixed 5.000% and provides default protection on Anglo
American Plc Credit Suisse 20/06/2021 13,076 (7,948)

TypeNominal
Value Description CounterpartyExpiration
date
Unrealised appreciation/
(depreciation) EUR
Market Value
EUR
Swaps as at 31 May 2016
Annual Report and Audited Accounts 247
The notes on pages 489 to 503 form an integral part of these financial statements.
CDS EUR 270,000 Fund receives Fixed 5.000% and provides default protection on Anglo American Plc Credit Suisse 20/06/2021 12,091 (7,349)
CDS EUR 983,000 Fund receives Fixed 5.000% and provides default protection on Anglo American Plc Credit Suisse 20/06/2021 56,799 (26,756)
CDS EUR 389,000 Fund receives Fixed 5.000% and provides default protection on ArcelorMittal Credit Suisse 20/06/2021 (2,618) 2,377
CDS EUR 106,000 Fund receives Fixed 5.000% and provides default protection on International Game Technology Plc Credit Suisse 20/06/2021 512 14,190
CDS EUR 159,000 Fund receives Fixed 5.000% and provides default protection on International Game Technology Plc Credit Suisse 20/06/2021 780 21,285
CDS EUR 110,000 Fund receives Fixed 5.000% and provides default protection on Jaguar Land Rover Automotive Plc Credit Suisse 20/06/2021 2,698 11,686
CDS EUR 92,000 Fund receives Fixed 5.000% and provides default protection on Jaguar Land Rover Automotive Plc Credit Suisse 20/06/2021 1,541 9,774
CDS EUR 270,000 Fund receives Fixed 5.000% and provides default protection on Numericable-SFR SA Credit Suisse 20/06/2021 3,449 19,969
CDS EUR 313,000 Fund receives Fixed 5.000% and provides default protection on Schaeffler Finance BV Credit Suisse 20/06/2021 3,602 51,150
CDS EUR 237,000 Fund receives Fixed 5.000% and provides default protection on Schaeffler Finance BV Credit Suisse 20/06/2021 2,108 38,730
CDS EUR 108,000 Fund receives Fixed 5.000% and provides default protection on Schaeffler Finance BV Credit Suisse 20/06/2021 898 17,649
CDS EUR 95,000 Fund receives default protection on Bouygues SA and pays Fixed 1.000% Deutsche Bank 20/09/2017 (3,353) (1,094)CDS EUR 70,000 Fund receives Fixed 5.000% and provides default protection on
Infineon Technologies Holding BV Deutsche Bank 20/09/2018 (6,782) 5,419CDS EUR 180,000 Fund receives default protection on Lanxess AG and pays Fixed 1.000% Deutsche Bank 20/12/2018 (6,799) (3,286)CDS USD 114,740 Fund receives default protection on Federation of Malaysia and
pays Fixed 1.000% Deutsche Bank 20/06/2021 (367) 2,856CDS USD 24,030 Fund receives default protection on Qantas Airways Ltd and
pays Fixed 1.000% Deutsche Bank 20/06/2021 (48) 1,088CDS USD 192,510 Fund receives default protection on Qantas Airways Ltd and
pays Fixed 1.000% Deutsche Bank 20/06/2021 (384) 8,716CDS USD 540,000 Fund receives default protection on Qantas Airways Ltd and
pays Fixed 1.000% Deutsche Bank 20/06/2021 (261) 24,450CDS EUR 130,000 Fund receives default protection on Clariant Finance
Luxembourg SA and pays Fixed 1.000% Goldman Sachs 20/03/2018 (7,203) (1,692)CDS EUR 70,000 Fund receives Fixed 5.000% and provides default protection
on Imperial Tobacco Finance Plc Goldman Sachs 20/09/2018 (7,391) 5,419CDS EUR 60,000 Fund receives Fixed 5.000% and provides default protection
on Infineon Technologies Holding BV Goldman Sachs 20/09/2018 (5,192) 4,645CDS EUR 90,000 Fund receives Fixed 5.000% and provides default protection
on Scandinavian Airlines Goldman Sachs 20/12/2018 (3,144) (4,494)CDS EUR 20,000 Fund receives Fixed 5.000% and provides default protection
on Scandinavian Airlines Goldman Sachs 20/12/2018 (999) (999)CDS EUR 130,000 Fund receives default protection on Scandinavian Airlines and
pays Fixed 5.000% Goldman Sachs 20/03/2019 11,428 7,332CDS EUR 150,000 Fund receives Fixed 5.000% and provides default protection
on Infineon Technologies Holding Goldman Sachs 20/03/2019 (18,730) 13,431CDS EUR 230,000 Fund receives default protection on Carrefour SA and pays Fixed 1.000% Goldman Sachs 20/12/2020 (3,704) (4,592)CDS EUR 170,000 Fund receives default protection on Cerved Group SpA and
pays Fixed 5.000% Goldman Sachs 20/12/2020 13,825 (21,966)CDS EUR 274,000 Fund receives default protection on Cerved Group SpA and
pays Fixed 5.000% Goldman Sachs 20/12/2020 21,493 (35,404)CDS EUR 273,000 Fund receives default protection on Cerved Group SpA and
pays Fixed 5.000% Goldman Sachs 20/12/2020 20,834 (35,275)CDS EUR 125,000 Fund receives default protection on Cerved Group SpA and
pays Fixed 5.000% Goldman Sachs 20/12/2020 9,882 (16,151)CDS EUR 146,000 Fund receives default protection on Cerved Group SpA and
pays Fixed 5.000% Goldman Sachs 20/12/2020 11,529 (18,865)CDS EUR 260,000 Fund receives default protection on Cerved Group SpA and
pays Fixed 5.000% Goldman Sachs 20/12/2020 22,719 (33,595)CDS EUR 109,000 Fund receives default protection on Cerved Group SpA and
pays Fixed 5.000% Goldman Sachs 20/12/2020 9,724 (14,084)CDS EUR 270,000 Fund receives default protection on Fortum OYJ and
pays Fixed 1.000% Goldman Sachs 20/12/2020 413 (4,028)CDS EUR 260,000 Fund receives default protection on ITV Plc and pays Fixed 5.000% Goldman Sachs 20/12/2020 (1,542) (46,162)CDS EUR 128,000 Fund receives default protection on Melia Hotels International SA
and pays Fixed 5.000% Goldman Sachs 20/12/2020 (2,851) (23,412)CDS EUR 158,000 Fund receives default protection on Melia Hotels International SA
and pays Fixed 5.000% Goldman Sachs 20/12/2020 (5,623) (28,899)CDS EUR 632,000 Fund receives default protection on Melia Hotels International SA
and pays Fixed 5.000% Goldman Sachs 20/12/2020 (32,376) (115,596)CDS EUR 260,000 Fund receives default protection on Melia Hotels International SA
and pays Fixed 5.000% Goldman Sachs 20/12/2020 2,319 (47,555)
BlackRock Global Absolute Return Bond Fund continued

TypeNominal
Value Description CounterpartyExpiration
date
Unrealised appreciation/
(depreciation) EUR
Market Value
EUR
Swaps as at 31 May 2016
248 BlackRock Strategic Funds (BSF)
The notes on pages 489 to 503 form an integral part of these financial statements.
BlackRock Global Absolute Return Bond Fund continued
CDS EUR 260,000 Fund receives default protection on Melia Hotels International SA and pays Fixed 5.000% Goldman Sachs 20/12/2020 2,319 (47,555)
CDS EUR 111,000 Fund receives default protection on Metsa Board OYJ and pays Fixed 5.000% Goldman Sachs 20/12/2020 2,903 (19,250)
CDS EUR 70,000 Fund receives default protection on Metsa Board OYJ and pays Fixed 5.000% Goldman Sachs 20/12/2020 1,192 (12,139)
CDS EUR 94,000 Fund receives default protection on Metsa Board OYJ and pays Fixed 5.000% Goldman Sachs 20/12/2020 2,412 (16,302)
CDS EUR 180,000 Fund receives default protection on Sky Plc and pays Fixed 1.000% Goldman Sachs 20/12/2020 (450) (1,486)
CDS EUR 340,000 Fund receives default protection on Standard Chartered Bank and pays Fixed 1.000% Goldman Sachs 20/12/2020 1,497 5,097
CDS EUR 253,000 Fund receives default protection on Sudzucker International Finance BV and pays Fixed 1.000% Goldman Sachs 20/12/2020 (4,998) (3,559)
CDS EUR 510,000 Fund receives default protection on Suedzucker AG and pays Fixed 1.000% Goldman Sachs 20/12/2020 (9,599) (7,173)
CDS EUR 254,000 Fund receives default protection on Suedzucker AG and pays Fixed 1.000% Goldman Sachs 20/12/2020 (5,614) (3,573)
CDS EUR 401,000 Fund receives default protection on Suedzucker AG and pays Fixed 1.000% Goldman Sachs 20/12/2020 (11,832) (5,640)
CDS EUR 264,000 Fund receives default protection on Suedzucker AG and pays Fixed 1.000% Goldman Sachs 20/12/2020 (7,899) (3,713)
CDS EUR 263,000 Fund receives default protection on Suedzucker AG and pays Fixed 1.000% Goldman Sachs 20/12/2020 (7,869) (3,699)
CDS EUR 402,000 Fund receives Fixed 1.000% and provides default protection on Fresenius SE & Co KGAA Goldman Sachs 20/12/2020 1,111 5,911
CDS EUR 462,000 Fund receives Fixed 1.000% and provides default protection on Fresenius SE & Co KGAA Goldman Sachs 20/12/2020 1,277 6,793
CDS EUR 1,580,000 Fund receives Fixed 1.000% and provides default protection on Koninklijke Ahold NV Goldman Sachs 20/12/2020 11,848 37,694
CDS EUR 810,000 Fund receives Fixed 1.000% and provides default protection on Markit iTraxx Europe Series 24 Version 1 Goldman Sachs 20/12/2020 8,291 10,403
CDS EUR 190,000 Fund receives Fixed 1.000% and provides default protection on RELX Plc Goldman Sachs 20/12/2020 1,369 5,211
CDS EUR 200,000 Fund receives Fixed 1.000% and provides default protection on Rentokil Initial Plc Goldman Sachs 20/12/2020 (19) 4,319
CDS EUR 24,000 Fund receives Fixed 5.000% and provides default protection on Galp Energia SGPS SA Goldman Sachs 20/12/2020 295 3,782
CDS EUR 104,000 Fund receives Fixed 5.000% and provides default protection on Smurfit Kappa Acquisitions Goldman Sachs 20/12/2020 (1,533) 18,396
CDS JPY 9,775,171 Fund receives default protection on ITOCHU Corp and pays Fixed 1.000% Goldman Sachs 20/12/2020 (1,314) (1,940)CDS JPY 9,775,171 Fund receives default protection on ITOCHU Corp and pays Fixed 1.000% Goldman Sachs 20/12/2020 (1,355) (2,019)CDS JPY 5,000,000 Fund receives default protection on ITOCHU Corp and pays Fixed 1.000% Goldman Sachs 20/12/2020 (788) (1,033)CDS JPY 10,674,487 Fund receives default protection on ITOCHU Corp and pays Fixed 1.000% Goldman Sachs 20/12/2020 (1,449) (2,204)CDS JPY 9,775,171 Fund receives default protection on Mitsubishi Corp and
pays Fixed 1.000% Goldman Sachs 20/12/2020 (912) (2,211)CDS JPY 15,000,000 Fund receives default protection on Mitsui & Co Ltd and
pays Fixed 1.000% Goldman Sachs 20/12/2020 (2,261) (3,052)CDS JPY 9,775,171 Fund receives default protection on Mitsui & Co Ltd and
pays Fixed 1.000% Goldman Sachs 20/12/2020 (1,622) (1,989)CDS USD 600,000 Fund receives Fixed 1.000% and provides default protection on
Markit iTraxx Asia ex-Japan IG Series 24 Version 1 Goldman Sachs 20/12/2020 10,043 (5,358)CDS EUR 875,000 Fund receives default protection on Akzo Nobel NV and
pays Fixed 1.000% Goldman Sachs 20/06/2021 (878) (19,940)CDS EUR 900,000 Fund receives default protection on Akzo Nobel NV and
pays Fixed 1.000% Goldman Sachs 20/06/2021 (903) (20,509)CDS EUR 210,000 Fund receives default protection on BAE Systems Plc and
pays Fixed 1.000% Goldman Sachs 20/06/2021 (601) (2,518)CDS EUR 280,000 Fund receives default protection on Bouygues SA and pays Fixed 1.000% Goldman Sachs 20/06/2021 (1,949) (6,842)CDS EUR 270,000 Fund receives default protection on Cie de Saint-Gobain and
pays Fixed 1.000% Goldman Sachs 20/06/2021 (726) (5,203)CDS EUR 300,000 Fund receives default protection on Deutsche Lufthansa AG and
pays Fixed 1.000% Goldman Sachs 20/06/2021 698 1,299CDS EUR 280,000 Fund receives default protection on Deutsche Telekom AG and
pays Fixed 1.000% Goldman Sachs 20/06/2021 (1,107) (7,805)CDS EUR 280,000 Fund receives default protection on Deutsche Telekom AG and
pays Fixed 1.000% Goldman Sachs 20/06/2021 (1,445) (7,805)CDS EUR 432,000 Fund receives default protection on Electricite de France SA and
pays Fixed 1.000% Goldman Sachs 20/06/2021 3,134 (1,666)CDS EUR 400,000 Fund receives default protection on EnBW Energie Baden
Wuerttemberg AG and pays Fixed 1.000% Goldman Sachs 20/06/2021 (595) (9,289)CDS EUR 150,000 Fund receives default protection on EnBW Energie Baden
Wuerttemberg AG and pays Fixed 1.000% Goldman Sachs 20/06/2021 (223) (3,484)

TypeNominal
Value Description CounterpartyExpiration
date
Unrealised appreciation/
(depreciation) EUR
Market Value
EUR
Swaps as at 31 May 2016
Annual Report and Audited Accounts 249
The notes on pages 489 to 503 form an integral part of these financial statements.
CDS EUR 211,000 Fund receives default protection on LafargeHolcim Ltd and pays Fixed 1.000% Goldman Sachs 20/06/2021 (2,206) 1,008
CDS EUR 225,000 Fund receives default protection on LafargeHolcim Ltd and pays Fixed 1.000% Goldman Sachs 20/06/2021 (2,352) 1,075
CDS EUR 525,000 Fund receives default protection on LafargeHolcim Ltd and pays Fixed 1.000% Goldman Sachs 20/06/2021 (5,489) 2,508
CDS EUR 521,000 Fund receives default protection on Lanxess AG and pays Fixed 1.000% Goldman Sachs 20/06/2021 (1,715) (7,716)CDS EUR 475,000 Fund receives default protection on Lanxess AG and pays Fixed 1.000% Goldman Sachs 20/06/2021 (1,564) (7,035)CDS EUR 6,380,000 Fund receives default protection on Markit iTraxx Europe
Crossover Series 25 Version 1 and pays Fixed 5.000% Goldman Sachs 20/06/2021 (72,946) (554,533)CDS EUR 585,000 Fund receives default protection on Markit iTraxx Europe Sub
Financials Series 25 Version 1 and pays Fixed 1.000% Goldman Sachs 20/06/2021 (11,316) 26,010CDS EUR 424,000 Fund receives default protection on Novartis AG and pays Fixed 1.000% Goldman Sachs 20/06/2021 460 (15,985)CDS EUR 230,000 Fund receives default protection on Orange SA and pays Fixed 1.000% Goldman Sachs 20/06/2021 (826) (4,373)CDS EUR 550,000 Fund receives default protection on Pearson Plc and pays Fixed 1.000% Goldman Sachs 20/06/2021 (3,012) 1,323CDS EUR 125,000 Fund receives default protection on Pearson Plc and pays Fixed 1.000% Goldman Sachs 20/06/2021 (685) 301CDS EUR 220,000 Fund receives default protection on Peugeot SA and pays Fixed 5.000% Goldman Sachs 20/06/2021 (1,440) (31,828)CDS EUR 530,000 Fund receives default protection on Sanofi and pays Fixed 1.000% Goldman Sachs 20/06/2021 175 (17,078)CDS EUR 270,000 Fund receives default protection on Sodexo SA and
pays Fixed 1.000% Goldman Sachs 20/06/2021 312 (7,623)CDS EUR 1,125,000 Fund receives default protection on Stora Enso OYJ and
pays Fixed 5.000% Goldman Sachs 20/06/2021 (10,866) (193,281)CDS EUR 213,000 Fund receives default protection on Stora Enso OYJ and
pays Fixed 5.000% Goldman Sachs 20/06/2021 (736) (36,594)CDS EUR 725,000 Fund receives default protection on Telia Company AB and
pays Fixed 1.000% Goldman Sachs 20/06/2021 (1,672) (17,524)CDS EUR 1,040,000 Fund receives default protection on UCB SA and pays Fixed 5.000% Goldman Sachs 20/06/2021 4,432 (223,917)CDS EUR 875,000 Fund receives default protection on Vodafone Group Plc and
pays Fixed 1.000% Goldman Sachs 20/06/2021 (1,153) (4,293)CDS EUR 280,000 Fund receives Fixed 1.000% and provides default protection on
British Telecom Plc Goldman Sachs 20/06/2021 1,718 3,261CDS EUR 320,000 Fund receives Fixed 1.000% and provides default protection on
Casino Guichard Perrachon SA Goldman Sachs 20/06/2021 1,407 (24,449)CDS EUR 450,000 Fund receives Fixed 1.000% and provides default protection on
Eni SpA Goldman Sachs 20/06/2021 1,305 1,752CDS EUR 270,000 Fund receives Fixed 1.000% and provides default protection on
Ladbrokes Plc Goldman Sachs 20/06/2021 2,137 (22,298)CDS EUR 590,000 Fund receives Fixed 1.000% and provides default protection on
Markit iTraxx Europe Series 25 Version 1 Goldman Sachs 20/06/2021 (102) 8,340CDS EUR 1,075,000 Fund receives Fixed 1.000% and provides default protection on Nestle SA Goldman Sachs 20/06/2021 (105) 40,979CDS EUR 330,000 Fund receives Fixed 1.000% and provides default protection on Repsol SA Goldman Sachs 20/06/2021 2,360 (15,073)CDS EUR 250,000 Fund receives Fixed 1.000% and provides default protection on Repsol SA Goldman Sachs 20/06/2021 2,175 (11,419)CDS EUR 322,000 Fund receives Fixed 1.000% and provides default protection on Repsol SA Goldman Sachs 20/06/2021 4,474 (14,708)CDS EUR 340,000 Fund receives Fixed 1.000% and provides default protection on
Royal Dutch Shell Plc Goldman Sachs 20/06/2021 1,550 3,974CDS EUR 410,000 Fund receives Fixed 1.000% and provides default protection on
Royal Dutch Shell Plc Goldman Sachs 20/06/2021 1,869 4,792CDS EUR 477,000 Fund receives Fixed 1.000% and provides default protection on
Societe Generale Goldman Sachs 20/06/2021 (210) 5,983CDS EUR 260,000 Fund receives Fixed 1.000% and provides default protection on
Technip SA Goldman Sachs 20/06/2021 7,613 (1,380)CDS EUR 270,000 Fund receives Fixed 1.000% and provides default protection on
Thales SA Goldman Sachs 20/06/2021 273 5,839CDS EUR 2,500,000 Fund receives Fixed 1.000% and provides default protection on
Vodafone Group Plc Goldman Sachs 20/06/2021 2,532 12,264CDS EUR 540,000 Fund receives Fixed 1.000% and provides default protection on Volvo AB Goldman Sachs 20/06/2021 1,485 942CDS EUR 440,000 Fund receives Fixed 1.000% and provides default protection on Volvo AB Goldman Sachs 20/06/2021 889 779CDS EUR 220,000 Fund receives Fixed 5.000% and provides default protection on
Galp Energia SGPS SA Goldman Sachs 20/06/2021 2,921 36,384CDS EUR 272,000 Fund receives Fixed 5.000% and provides default protection on
Schaeffler Finance BV Goldman Sachs 20/06/2021 (82) 44,450CDS EUR 270,000 Fund receives Fixed 5.000% and provides default protection on
Smurfit Kappa Acquisitions Goldman Sachs 20/06/2021 (594) 51,015CDS USD 553,279 Fund receives Fixed 1.000% and provides default protection on
BHP Billiton Ltd Goldman Sachs 20/06/2021 (2,486) (16,702)CDS USD 2,047,982 Fund receives Fixed 1.000% and provides default protection on
Rio Tinto Ltd Goldman Sachs 20/06/2021 (15,458) (79,718)CDS EUR 188,709 Fund receives default protection on GDF Suez and pays Fixed 1.000% HSBC 20/12/2017 (2,329) (2,416)CDS EUR 1,900,000 Fund receives default protection on DNB ASA and pays Fixed 1.000% HSBC 20/12/2020 (12,584) (35,553)CDS EUR 580,000 Fund receives Fixed 1.000% and provides default protection on
Markit iTraxx Europe Series 24 Version 1 HSBC 20/12/2020 6,476 7,449CDS EUR 375,000 Fund receives Fixed 1.000% and provides default protection on
Markit iTraxx Europe Series 24 Version 1 HSBC 20/12/2020 4,659 4,816
BlackRock Global Absolute Return Bond Fund continued

TypeNominal
Value Description CounterpartyExpiration
date
Unrealised appreciation/
(depreciation) EUR
Market Value
EUR
Swaps as at 31 May 2016
250 BlackRock Strategic Funds (BSF)
The notes on pages 489 to 503 form an integral part of these financial statements.
BlackRock Global Absolute Return Bond Fund continued
CDS USD 900,000 Fund receives Fixed 1.000% and provides default protection on Republic of Indonesia HSBC 20/12/2020 31,606 (25,274)
CDS EUR 10,100,000 Fund receives default protection on Markit iTraxx Europe Series 25 Version 1 and pays Fixed 1.000% HSBC 20/06/2021 (4,634) (142,762)
CDS EUR 10,150,000 Fund receives Fixed 1.000% and provides default protection on Markit iTraxx Europe Senior Financial Series 25 Version 1 HSBC 20/06/2021 7,757 58,093
CDS EUR 1,070,000 Fund receives Fixed 1.000% and provides default protection on Markit iTraxx Europe Series 25 Version 1 HSBC 20/06/2021 (177) 15,124
CDS USD 252,556 Fund receives default protection on Federation of Malaysia and pays Fixed 1.000% HSBC 20/06/2021 (410) 6,286
CDS USD 168,370 Fund receives default protection on Federation of Malaysia and pays Fixed 1.000% HSBC 20/06/2021 (276) 4,191
CDS EUR 200,000 Fund receives default protection on Pearson Plc and pays Fixed 1.000% JP Morgan 20/06/2017 2,113 (1,549)CDS EUR 78,700 Fund receives default protection on BASF SE and pays Fixed 1.000% JP Morgan 20/09/2017 (570) (879)CDS EUR 220,000 Fund receives default protection on Metsa OYJ and pays Fixed 1.000% JP Morgan 20/12/2018 (7,734) (1,668)CDS EUR 542,000 Fund receives default protection on Deutsche Lufthansa AG and
pays Fixed 1.000% JP Morgan 20/06/2020 (7,372) (3,007)CDS EUR 212,000 Fund receives default protection on Deutsche Lufthansa AG and
pays Fixed 1.000% JP Morgan 20/06/2020 (2,883) (1,176)CDS EUR 441,000 Fund receives default protection on Banco Santander SA and
pays Fixed 1.000% JP Morgan 20/12/2020 (23,209) 29,492CDS EUR 530,000 Fund receives default protection on Bayerische Motoren Werke AG and
pays Fixed 1.000% JP Morgan 20/12/2020 (14,727) (10,727)CDS EUR 260,000 Fund receives default protection on Bayerische Motoren Werke AG and
pays Fixed 1.000% JP Morgan 20/12/2020 (8,553) (5,262)CDS EUR 430,000 Fund receives default protection on Carrefour SA and pays Fixed 1.000% JP Morgan 20/12/2020 (2,509) (8,586)CDS EUR 280,000 Fund receives default protection on Carrefour SA and pays Fixed 1.000% JP Morgan 20/12/2020 (1,412) (5,591)CDS EUR 750,000 Fund receives default protection on Compagnie Financiere du groupe
Michelin Senard et Cie and pays Fixed 1.000% JP Morgan 20/12/2020 (213) (17,870)CDS EUR 141,000 Fund receives default protection on Deutsche Lufthansa AG and
pays Fixed 1.000% JP Morgan 20/12/2020 (1,878) (77)CDS EUR 792,000 Fund receives default protection on ING Bank NV and pays Fixed 1.000% JP Morgan 20/12/2020 (12,807) 13,061CDS EUR 204,000 Fund receives default protection on Melia Hotels International SA and
pays Fixed 5.000% JP Morgan 20/12/2020 (3,959) (37,313)CDS EUR 169,000 Fund receives default protection on Melia Hotels International SA and
pays Fixed 5.000% JP Morgan 20/12/2020 (5,297) (30,911)CDS EUR 833,000 Fund receives default protection on Rexel SA and pays Fixed 5.000% JP Morgan 20/12/2020 (5,605) (119,914)CDS EUR 270,000 Fund receives default protection on Rexel SA and pays Fixed 5.000% JP Morgan 20/12/2020 (5,507) (38,868)CDS EUR 211,500 Fund receives default protection on Solvay and pays Fixed 1.000% JP Morgan 20/12/2020 56 (2,050)CDS EUR 220,000 Fund receives default protection on Solvay SA and pays Fixed 1.000% JP Morgan 20/12/2020 (7,966) (2,132)CDS EUR 59,000 Fund receives default protection on Stena AB and pays Fixed 5.000% JP Morgan 20/12/2020 3,699 2,332CDS EUR 150,000 Fund receives default protection on Telenor ASA and pays Fixed 1.000% JP Morgan 20/12/2020 (964) (3,531)CDS EUR 150,000 Fund receives default protection on Telenor ASA and pays Fixed 1.000% JP Morgan 20/12/2020 (1,172) (3,531)CDS EUR 230,000 Fund receives Fixed 1.000% and provides default protection on Cap Gemini SA JP Morgan 20/12/2020 (37) 2,797CDS EUR 825,000 Fund receives Fixed 1.000% and provides default protection on Imperial
Tobacco Group Plc JP Morgan 20/12/2020 (3,732) 5,139CDS EUR 190,000 Fund receives Fixed 1.000% and provides default protection on
Koninklijke KPN NV JP Morgan 20/12/2020 830 2,914CDS EUR 460,000 Fund receives Fixed 1.000% and provides default protection on RELX Plc JP Morgan 20/12/2020 3,426 12,615CDS EUR 970,000 Fund receives Fixed 1.000% and provides default protection on RELX Plc JP Morgan 20/12/2020 5,243 26,602CDS EUR 593,000 Fund receives Fixed 1.000% and provides default protection on Veolia
Environnement SA JP Morgan 20/12/2020 (860) 11,327CDS JPY 8,438,819 Fund receives default protection on Sumitomo Corp and pays Fixed 1.000% JP Morgan 20/12/2020 (2,229) (1,602)CDS USD 662,624 Fund receives default protection on Australia & New Zealand
Banking Group Ltd and pays Fixed 1.000% JP Morgan 20/12/2020 (1,987) (4,939)CDS USD 437,376 Fund receives default protection on Australia & New Zealand
Banking Group Ltd and pays Fixed 1.000% JP Morgan 20/12/2020 (1,116) (3,260)CDS USD 650,000 Fund receives default protection on Commonwealth Bank of
Australia and pays Fixed 1.000% JP Morgan 20/12/2020 (2,710) (5,014)CDS USD 300,000 Fund receives default protection on National Australia Bank Ltd and
pays Fixed 1.000% JP Morgan 20/12/2020 (2,060) (2,445)CDS EUR 187,500 Fund receives default protection on Akzo Nobel NV and pays Fixed 1.000% JP Morgan 20/06/2021 (571) (4,273)CDS EUR 387,500 Fund receives default protection on Akzo Nobel NV and pays Fixed 1.000% JP Morgan 20/06/2021 (1,180) (8,830)CDS EUR 90,000 Fund receives default protection on BAE Systems Plc and pays Fixed 1.000% JP Morgan 20/06/2021 (439) (1,079)CDS EUR 600,000 Fund receives default protection on BAE Systems Plc and pays Fixed 1.000% JP Morgan 20/06/2021 (2,926) (7,194)CDS EUR 330,000 Fund receives default protection on BAE Systems Plc and pays Fixed 1.000% JP Morgan 20/06/2021 (770) (3,957)CDS EUR 260,000 Fund receives default protection on BAE Systems Plc and
pays Fixed 1.000% JP Morgan 20/06/2021 (879) (3,117)CDS EUR 368,000 Fund receives default protection on Bouygues SA and pays Fixed 1.000% JP Morgan 20/06/2021 (1,789) (8,994)CDS EUR 280,000 Fund receives default protection on British Airways Plc and
pays Fixed 5.000% JP Morgan 20/06/2021 (3,831) (53,329)CDS EUR 1,365,000 Fund receives default protection on Cie de Saint-Gobain and
pays Fixed 1.000% JP Morgan 20/06/2021 (2,295) (26,302)

TypeNominal
Value Description CounterpartyExpiration
date
Unrealised appreciation/
(depreciation) EUR
Market Value
EUR
Swaps as at 31 May 2016
Annual Report and Audited Accounts 251
The notes on pages 489 to 503 form an integral part of these financial statements.
CDS EUR 435,000 Fund receives default protection on Continental AG and pays Fixed 1.000% JP Morgan 20/06/2021 5 (7,829)CDS EUR 542,000 Fund receives default protection on Daimler AG and pays Fixed 1.000% JP Morgan 20/06/2021 (2,954) (10,167)CDS EUR 320,000 Fund receives default protection on Deutsche Lufthansa AG and
pays Fixed 1.000% JP Morgan 20/06/2021 (1,349) 1,386CDS EUR 21,000 Fund receives default protection on E.On SE and pays Fixed 1.000% JP Morgan 20/06/2021 (26) (100)CDS EUR 1,083,000 Fund receives default protection on Electricite de France SA and
pays Fixed 1.000% JP Morgan 20/06/2021 9,519 (4,176)CDS EUR 975,000 Fund receives default protection on Engie SA and pays Fixed 1.000% JP Morgan 20/06/2021 (2,800) (21,402)CDS EUR 225,000 Fund receives default protection on HSBC Bank Plc and pays Fixed 1.000% JP Morgan 20/06/2021 (4,156) 7,891CDS EUR 320,000 Fund receives default protection on Kering and pays Fixed 1.000% JP Morgan 20/06/2021 (6) (4,578)CDS EUR 270,000 Fund receives default protection on Koninklijke Philips NV and
pays Fixed 1.000% JP Morgan 20/06/2021 206 (7,554)CDS EUR 330,000 Fund receives default protection on Koninklijke Philips NV and
pays Fixed 1.000% JP Morgan 20/06/2021 (1,222) (9,232)CDS EUR 700,000 Fund receives default protection on LafargeHolcim Ltd and pays Fixed 1.000% JP Morgan 20/06/2021 (11,984) 3,344CDS EUR 1,650,000 Fund receives default protection on Lanxess AG and pays Fixed 1.000% JP Morgan 20/06/2021 (1,946) (24,437)CDS EUR 942,000 Fund receives default protection on Lanxess AG and pays Fixed 1.000% JP Morgan 20/06/2021 (9,637) (13,951)CDS EUR 320,000 Fund receives default protection on Linde AG and pays Fixed 1.000% JP Morgan 20/06/2021 (1,294) (10,677)CDS EUR 450,000 Fund receives default protection on Lloyds Bank Plc and pays Fixed 1.000% JP Morgan 20/06/2021 (7,342) 15,706CDS EUR 1,300,000 Fund receives default protection on Markit iTraxx Europe Series 25
Version 1 and pays Fixed 1.000% JP Morgan 20/06/2021 (1,400) (18,375)CDS EUR 375,000 Fund receives default protection on Novartis AG and pays Fixed 1.000% JP Morgan 20/06/2021 (528) (14,138)CDS EUR 535,000 Fund receives default protection on Novartis AG and pays Fixed 1.000% JP Morgan 20/06/2021 (1,079) (20,170)CDS EUR 290,000 Fund receives default protection on Orange SA and pays Fixed 1.000% JP Morgan 20/06/2021 (2,103) (5,514)CDS EUR 210,000 Fund receives default protection on Orange SA and pays Fixed 1.000% JP Morgan 20/06/2021 (1,524) (3,993)CDS EUR 290,000 Fund receives default protection on Orange SA and pays Fixed 1.000% JP Morgan 20/06/2021 (1,811) (5,514)CDS EUR 431,000 Fund receives default protection on Sanofi and pays Fixed 1.000% JP Morgan 20/06/2021 (187) (13,888)CDS EUR 160,000 Fund receives default protection on Telefonaktiebolaget LM Ericsson
and pays Fixed 1.000% JP Morgan 20/06/2021 818 (821)CDS EUR 220,000 Fund receives default protection on Telefonaktiebolaget LM Ericsson
and pays Fixed 1.000% JP Morgan 20/06/2021 1,118 (1,129)CDS EUR 400,000 Fund receives default protection on Telia Company AB and
pays Fixed 1.000% JP Morgan 20/06/2021 (1,180) (9,668)CDS EUR 2,455,000 Fund receives default protection on UBS AG and pays Fixed 1.000% JP Morgan 20/06/2021 (15,981) 72,170CDS EUR 440,000 Fund receives default protection on Valeo SA and pays Fixed 1.000% JP Morgan 20/06/2021 (2,974) (5,880)CDS EUR 1,200,000 Fund receives default protection on Wolters Kluwer NV and pays Fixed 1.000% JP Morgan 20/06/2021 (2,034) (38,666)CDS EUR 270,000 Fund receives Fixed 1.000% and provides default protection on BP Plc JP Morgan 20/06/2021 1,041 1,041CDS EUR 330,000 Fund receives Fixed 1.000% and provides default protection on British
American Tobacco Plc JP Morgan 20/06/2021 (486) 7,385CDS EUR 480,000 Fund receives Fixed 1.000% and provides default protection on
British American Tobacco Plc JP Morgan 20/06/2021 (707) 10,742CDS EUR 550,000 Fund receives Fixed 1.000% and provides default protection on
Carlsberg Breweries A/S JP Morgan 20/06/2021 (328) 8,063CDS EUR 130,000 Fund receives Fixed 1.000% and provides default protection on
Casino Guichard Perrachon SA JP Morgan 20/06/2021 1,280 (9,933)CDS EUR 320,000 Fund receives Fixed 1.000% and provides default protection on Eni SpA JP Morgan 20/06/2021 (22) 1,246CDS EUR 270,000 Fund receives Fixed 1.000% and provides default protection on Ladbrokes Plc JP Morgan 20/06/2021 2,484 (22,298)CDS EUR 1,300,000 Fund receives Fixed 1.000% and provides default protection on Markit
iTraxx Europe Senior Financial Series 25 Version 1 JP Morgan 20/06/2021 2,487 7,440CDS EUR 270,000 Fund receives Fixed 1.000% and provides default protection on Repsol SA JP Morgan 20/06/2021 1,525 (12,332)CDS EUR 1,200,000 Fund receives Fixed 1.000% and provides default protection on
Rolls-Royce Holdings Plc JP Morgan 20/06/2021 10,901 (12,924)CDS EUR 190,000 Fund receives Fixed 1.000% and provides default protection on
Rolls-Royce Holdings Plc JP Morgan 20/06/2021 1,726 (2,046)CDS EUR 660,000 Fund receives Fixed 1.000% and provides default protection on
Rolls-Royce Holdings Plc JP Morgan 20/06/2021 3,683 (7,108)CDS EUR 260,000 Fund receives Fixed 1.000% and provides default protection on
Rolls-Royce Holdings Plc JP Morgan 20/06/2021 689 (2,800)CDS EUR 407,000 Fund receives Fixed 1.000% and provides default protection on
Royal Dutch Shell Plc JP Morgan 20/06/2021 1,643 4,757CDS EUR 1,280,000 Fund receives Fixed 1.000% and provides default protection on
Royal Dutch Shell Plc JP Morgan 20/06/2021 (9,825) 14,961CDS EUR 700,000 Fund receives Fixed 1.000% and provides default protection on Volvo AB JP Morgan 20/06/2021 888 1,239CDS EUR 175,000 Fund receives Fixed 1.000% and provides default protection on Volvo AB JP Morgan 20/06/2021 222 310CDS EUR 261,000 Fund receives Fixed 5.000% and provides default protection on Altice
Luxembourg SA JP Morgan 20/06/2021 5,243 1,655CDS EUR 975,000 Fund receives Fixed 5.000% and provides default protection on
Anglo American Plc JP Morgan 20/06/2021 (10,269) (26,538)CDS EUR 263,500 Fund receives Fixed 5.000% and provides default protection on
ArcelorMittal JP Morgan 20/06/2021 14,785 1,610CDS EUR 270,000 Fund receives Fixed 5.000% and provides default protection on
Galp Energia SGPS SA JP Morgan 20/06/2021 4,598 44,653
BlackRock Global Absolute Return Bond Fund continued

TypeNominal
Value Description CounterpartyExpiration
date
Unrealised appreciation/
(depreciation) EUR
Market Value
EUR
Swaps as at 31 May 2016
252 BlackRock Strategic Funds (BSF)
The notes on pages 489 to 503 form an integral part of these financial statements.
BlackRock Global Absolute Return Bond Fund continued
CDS EUR 270,000 Fund receives Fixed 5.000% and provides default protection on Galp Energia SGPS SA JP Morgan 20/06/2021 449 44,653
CDS EUR 450,000 Fund receives Fixed 5.000% and provides default protection on Glencore International AG JP Morgan 20/06/2021 (15,435) 10,745
CDS EUR 90,000 Fund receives Fixed 5.000% and provides default protection on Jaguar Land Rover Automotive Plc JP Morgan 20/06/2021 2,977 9,561
CDS EUR 130,000 Fund receives Fixed 5.000% and provides default protection on Wendel SA JP Morgan 20/06/2021 2,642 24,071
CDS EUR 160,000 Fund receives Fixed 5.000% and provides default protection on Wendel SA JP Morgan 20/06/2021 1,124 29,626
CDS USD 106,708 Fund receives default protection on Qantas Airways Ltd and pays Fixed 1.000% JP Morgan 20/06/2021 (253) 4,929
CDS USD 853,506 Fund receives default protection on Qantas Airways Ltd and pays Fixed 1.000% JP Morgan 20/06/2021 (2,020) 39,424
CDS USD 280,000 Fund receives default protection on Qantas Airways Ltd and pays Fixed 1.000% JP Morgan 20/06/2021 (1,207) 12,678
CDS USD 480,000 Fund receives default protection on Qantas Airways Ltd and pays Fixed 1.000% JP Morgan 20/06/2021 (790) 21,733
CDS USD 60,000 Fund receives default protection on Qantas Airways Ltd and pays Fixed 1.000% JP Morgan 20/06/2021 (246) 2,569
CDS EUR 186,000 Fund receives default protection on Banco Santander SA and pays Fixed 1.000% Morgan Stanley 20/12/2020 (1,877) 12,439
CDS EUR 86,000 Fund receives default protection on LafargeHolcim Ltd and pays Fixed 1.000% Morgan Stanley 20/12/2020 (3,181) (65)
CDS EUR 170,000 Fund receives default protection on LafargeHolcim Ltd and pays Fixed 1.000% Morgan Stanley 20/12/2020 (12,672) (128)
CDS EUR 190,000 Fund receives default protection on LafargeHolcim Ltd and pays Fixed 1.000% Morgan Stanley 20/12/2020 (16,792) (143)
CDS EUR 67,000 Fund receives default protection on Rexel SA and pays Fixed 5.000% Morgan Stanley 20/12/2020 1,301 (9,645)
CDS EUR 312,000 Fund receives default protection on Rexel SA and pays Fixed 5.000% Morgan Stanley 20/12/2020 6,059 (44,914)
CDS EUR 220,000 Fund receives default protection on Solvay SA and pays Fixed 1.000% Morgan Stanley 20/12/2020 (802) (2,132)
CDS EUR 130,000 Fund receives default protection on Standard Chartered Bank and pays Fixed 1.000% Morgan Stanley 20/12/2020 (1,330) 1,949
CDS EUR 825,000 Fund receives Fixed 1.000% and provides default protection on BAE Systems Plc Morgan Stanley 20/12/2020 (2,913) 11,492
CDS EUR 211,000 Fund receives Fixed 1.000% and provides default protection on Danone SA Morgan Stanley 20/12/2020 (307) 5,535
CDS EUR 270,000 Fund receives Fixed 1.000% and provides default protection on J Sainsbury Plc Morgan Stanley 20/12/2020 1,447 (4,002)
CDS EUR 550,000 Fund receives Fixed 1.000% and provides default protection on J Sainsbury Plc Morgan Stanley 20/12/2020 4,231 (8,152)
CDS EUR 200,000 Fund receives Fixed 1.000% and provides default protection on Vinci SA Morgan Stanley 20/12/2020 178 5,277CDS EUR 400,000 Fund receives Fixed 1.000% and provides default protection on Vinci SA Morgan Stanley 20/12/2020 425 10,554CDS EUR 190,000 Fund receives default protection on ArcelorMittal and
pays Fixed 5.000% Morgan Stanley 20/06/2021 2,546 (1,161)CDS EUR 270,000 Fund receives Fixed 5.000% and provides default protection on
Galp Energia SGPS SA Morgan Stanley 20/06/2021 1,301 44,653CDS EUR 230,000 Fund receives Fixed 5.000% and provides default protection on
HeidelbergCement AG Morgan Stanley 20/06/2021 221 43,000CDS EUR 910,000 Fund receives Fixed 5.000% and provides default protection on
HeidelbergCement AG Morgan Stanley 20/06/2021 875 170,130CDS USD 51,628 Fund receives default protection on Federation of Malaysia and
pays Fixed 1.000% Morgan Stanley 20/06/2021 (176) 1,285CDS USD 300,000 Fund receives default protection on Western Union Co/The and
pays Fixed 1.000% Morgan Stanley 20/06/2021 (1,088) 6,612CDS EUR 174,000 Fund receives default protection on Carrefour SA and pays Fixed 1.000% Societe Generale 20/12/2020 (1,850) (3,474)CDS EUR 270,000 Fund receives default protection on Carrefour SA and pays Fixed 1.000% Societe Generale 20/12/2020 (2,610) (5,391)CDS EUR 240,000 Fund receives default protection on Carrefour SA and pays Fixed 1.000% Societe Generale 20/12/2020 (5,368) (4,792)CDS EUR 800,000 Fund receives default protection on Fortum OYJ and pays Fixed 1.000% Societe Generale 20/12/2020 1,296 (11,935)CDS EUR 260,000 Fund receives default protection on Fortum OYJ and pays Fixed 1.000% Societe Generale 20/12/2020 395 (3,879)CDS EUR 520,000 Fund receives default protection on Fortum OYJ and pays Fixed 1.000% Societe Generale 20/12/2020 787 (7,758)CDS EUR 153,000 Fund receives default protection on Melia Hotels International SA
and pays Fixed 5.000% Societe Generale 20/12/2020 (3,133) (27,984)CDS EUR 260,000 Fund receives default protection on Metsa Board OYJ and
pays Fixed 5.000% Societe Generale 20/12/2020 2,562 (45,089)CDS EUR 510,000 Fund receives default protection on Renault SA and pays Fixed 1.000% Societe Generale 20/12/2020 (16,408) (1,958)CDS EUR 19,000 Fund receives default protection on Rexel SA and pays Fixed 5.000% Societe Generale 20/12/2020 (738) (2,735)CDS EUR 34,000 Fund receives default protection on Rexel SA and pays Fixed 5.000% Societe Generale 20/12/2020 (801) (4,894)CDS EUR 240,000 Fund receives Fixed 1.000% and provides default protection on
J Sainsbury Plc Societe Generale 20/12/2020 950 (3,557)
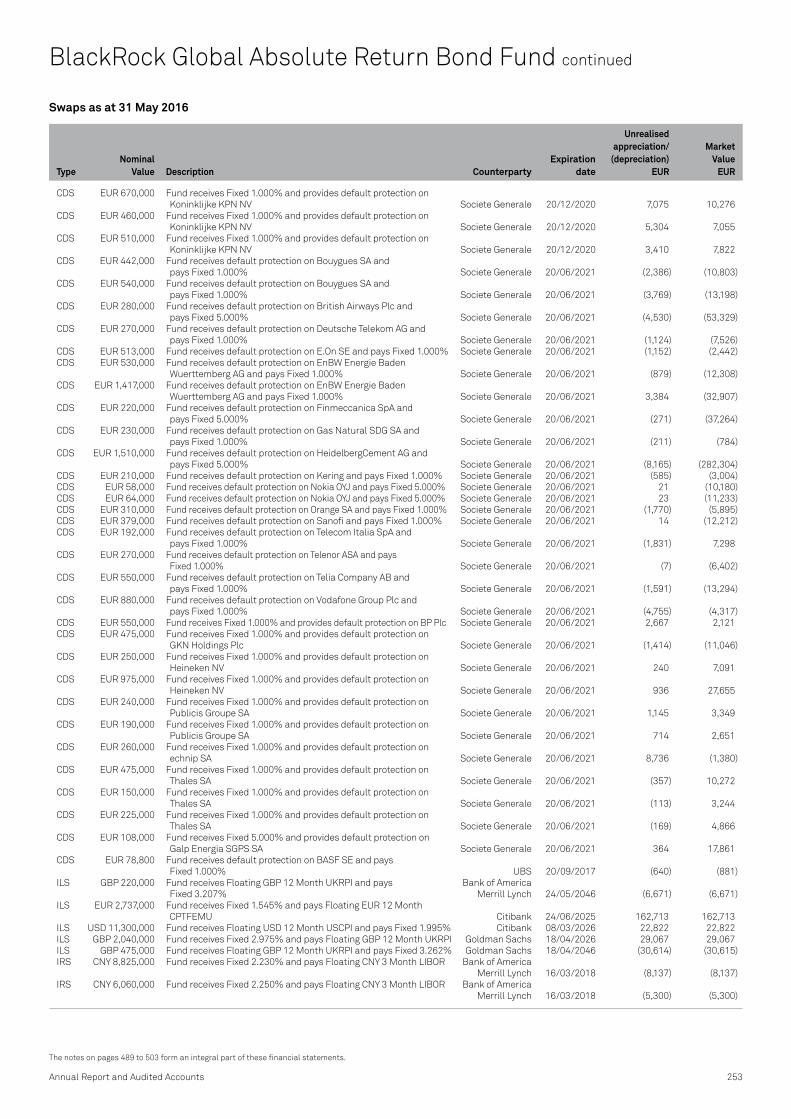
Annual Report and Audited Accounts 253
The notes on pages 489 to 503 form an integral part of these financial statements.
TypeNominal
Value Description CounterpartyExpiration
date
Unrealised appreciation/
(depreciation) EUR
Market Value
EUR
Swaps as at 31 May 2016
CDS EUR 670,000 Fund receives Fixed 1.000% and provides default protection on Koninklijke KPN NV Societe Generale 20/12/2020 7,075 10,276
CDS EUR 460,000 Fund receives Fixed 1.000% and provides default protection on Koninklijke KPN NV Societe Generale 20/12/2020 5,304 7,055
CDS EUR 510,000 Fund receives Fixed 1.000% and provides default protection on Koninklijke KPN NV Societe Generale 20/12/2020 3,410 7,822
CDS EUR 442,000 Fund receives default protection on Bouygues SA and pays Fixed 1.000% Societe Generale 20/06/2021 (2,386) (10,803)
CDS EUR 540,000 Fund receives default protection on Bouygues SA and pays Fixed 1.000% Societe Generale 20/06/2021 (3,769) (13,198)
CDS EUR 280,000 Fund receives default protection on British Airways Plc and pays Fixed 5.000% Societe Generale 20/06/2021 (4,530) (53,329)
CDS EUR 270,000 Fund receives default protection on Deutsche Telekom AG and pays Fixed 1.000% Societe Generale 20/06/2021 (1,124) (7,526)
CDS EUR 513,000 Fund receives default protection on E.On SE and pays Fixed 1.000% Societe Generale 20/06/2021 (1,152) (2,442)CDS EUR 530,000 Fund receives default protection on EnBW Energie Baden
Wuerttemberg AG and pays Fixed 1.000% Societe Generale 20/06/2021 (879) (12,308)CDS EUR 1,417,000 Fund receives default protection on EnBW Energie Baden
Wuerttemberg AG and pays Fixed 1.000% Societe Generale 20/06/2021 3,384 (32,907)CDS EUR 220,000 Fund receives default protection on Finmeccanica SpA and
pays Fixed 5.000% Societe Generale 20/06/2021 (271) (37,264)CDS EUR 230,000 Fund receives default protection on Gas Natural SDG SA and
pays Fixed 1.000% Societe Generale 20/06/2021 (211) (784)CDS EUR 1,510,000 Fund receives default protection on HeidelbergCement AG and
pays Fixed 5.000% Societe Generale 20/06/2021 (8,165) (282,304)CDS EUR 210,000 Fund receives default protection on Kering and pays Fixed 1.000% Societe Generale 20/06/2021 (585) (3,004)CDS EUR 58,000 Fund receives default protection on Nokia OYJ and pays Fixed 5.000% Societe Generale 20/06/2021 21 (10,180)CDS EUR 64,000 Fund receives default protection on Nokia OYJ and pays Fixed 5.000% Societe Generale 20/06/2021 23 (11,233)CDS EUR 310,000 Fund receives default protection on Orange SA and pays Fixed 1.000% Societe Generale 20/06/2021 (1,770) (5,895)CDS EUR 379,000 Fund receives default protection on Sanofi and pays Fixed 1.000% Societe Generale 20/06/2021 14 (12,212)CDS EUR 192,000 Fund receives default protection on Telecom Italia SpA and
pays Fixed 1.000% Societe Generale 20/06/2021 (1,831) 7,298CDS EUR 270,000 Fund receives default protection on Telenor ASA and pays
Fixed 1.000% Societe Generale 20/06/2021 (7) (6,402)CDS EUR 550,000 Fund receives default protection on Telia Company AB and
pays Fixed 1.000% Societe Generale 20/06/2021 (1,591) (13,294)CDS EUR 880,000 Fund receives default protection on Vodafone Group Plc and
pays Fixed 1.000% Societe Generale 20/06/2021 (4,755) (4,317)CDS EUR 550,000 Fund receives Fixed 1.000% and provides default protection on BP Plc Societe Generale 20/06/2021 2,667 2,121CDS EUR 475,000 Fund receives Fixed 1.000% and provides default protection on
GKN Holdings Plc Societe Generale 20/06/2021 (1,414) (11,046)CDS EUR 250,000 Fund receives Fixed 1.000% and provides default protection on
Heineken NV Societe Generale 20/06/2021 240 7,091CDS EUR 975,000 Fund receives Fixed 1.000% and provides default protection on
Heineken NV Societe Generale 20/06/2021 936 27,655CDS EUR 240,000 Fund receives Fixed 1.000% and provides default protection on
Publicis Groupe SA Societe Generale 20/06/2021 1,145 3,349CDS EUR 190,000 Fund receives Fixed 1.000% and provides default protection on
Publicis Groupe SA Societe Generale 20/06/2021 714 2,651CDS EUR 260,000 Fund receives Fixed 1.000% and provides default protection on
echnip SA Societe Generale 20/06/2021 8,736 (1,380)CDS EUR 475,000 Fund receives Fixed 1.000% and provides default protection on
Thales SA Societe Generale 20/06/2021 (357) 10,272CDS EUR 150,000 Fund receives Fixed 1.000% and provides default protection on
Thales SA Societe Generale 20/06/2021 (113) 3,244CDS EUR 225,000 Fund receives Fixed 1.000% and provides default protection on
Thales SA Societe Generale 20/06/2021 (169) 4,866CDS EUR 108,000 Fund receives Fixed 5.000% and provides default protection on
Galp Energia SGPS SA Societe Generale 20/06/2021 364 17,861CDS EUR 78,800 Fund receives default protection on BASF SE and pays
Fixed 1.000% UBS 20/09/2017 (640) (881)ILS GBP 220,000 Fund receives Floating GBP 12 Month UKRPI and pays Bank of America
Fixed 3.207% Merrill Lynch 24/05/2046 (6,671) (6,671)ILS EUR 2,737,000 Fund receives Fixed 1.545% and pays Floating EUR 12 Month
CPTFEMU Citibank 24/06/2025 162,713 162,713ILS USD 11,300,000 Fund receives Floating USD 12 Month USCPI and pays Fixed 1.995% Citibank 08/03/2026 22,822 22,822ILS GBP 2,040,000 Fund receives Fixed 2.975% and pays Floating GBP 12 Month UKRPI Goldman Sachs 18/04/2026 29,067 29,067ILS GBP 475,000 Fund receives Floating GBP 12 Month UKRPI and pays Fixed 3.262% Goldman Sachs 18/04/2046 (30,614) (30,615)IRS CNY 8,825,000 Fund receives Fixed 2.230% and pays Floating CNY 3 Month LIBOR Bank of America
Merrill Lynch 16/03/2018 (8,137) (8,137)IRS CNY 6,060,000 Fund receives Fixed 2.250% and pays Floating CNY 3 Month LIBOR Bank of America
Merrill Lynch 16/03/2018 (5,300) (5,300)
BlackRock Global Absolute Return Bond Fund continued

254 BlackRock Strategic Funds (BSF)
The notes on pages 489 to 503 form an integral part of these financial statements.
TypeNominal
Value Description CounterpartyExpiration
date
Unrealised appreciation/
(depreciation) EUR
Market Value
EUR
Swaps as at 31 May 2016
BlackRock Global Absolute Return Bond Fund continued
IRS CNY 2,570,000 Fund receives Fixed 2.495% and pays Floating CNY 3 Month LIBOR Bank of America Merrill Lynch 16/03/2021 (6,588) (6,588)
IRS USD 5,740,000 Fund receives Fixed 1.310% and pays Floating USD 3 Month LIBOR Barclays Bank 18/04/2020 (19,521) (19,521)IRS USD 4,280,000 Fund receives Floating USD 3 Month LIBOR and pays Fixed 1.333% Barclays Bank 08/05/2020 13,289 13,289IRS USD 3,970,000 Fund receives Floating USD 12 Month 1D Overnight Fed Funds
Effective Rate and pays Fixed 1.383% Barclays Bank 31/05/2020 (55,688) (55,688)IRS USD 5,930,000 Fund receives Floating USD 3 Month LIBOR and pays Fixed 1.480% Barclays Bank 31/05/2020 4,086 4,086IRS USD 20,600,000 Fund receives Floating USD 3 Month LIBOR and pays Fixed 1.320% Barclays Bank 30/11/2020 51,011 51,011IRS EUR 6,300,000 Fund receives Fixed 0.024% and pays Floating EUR 6 Month LIBOR Barclays Bank 04/01/2021 (2,716) (2,716)IRS JPY 1,320,000,000 Fund receives Fixed 0.086% and pays Floating JPY 6 Month LIBOR Barclays Bank 01/04/2021 5,218 5,218IRS USD 2,600,000 Fund receives Floating USD 3 Month LIBOR and pays Fixed 1.461% Barclays Bank 31/12/2022 8,555 8,555IRS EUR 1,710,000 Fund receives Fixed 0.421% and pays Floating EUR 6 Month EURIBOR Barclays Bank 15/02/2025 (3,320) (3,320)IRS GBP 1,290,000 Fund receives Fixed 1.812% and pays Floating GBP 6 Month LIBOR Barclays Bank 07/03/2025 50,855 50,855IRS GBP 1,230,000 Fund receives Fixed 1.826% and pays Floating GBP 6 Month LIBOR Barclays Bank 03/07/2025 49,072 49,072IRS GBP 1,230,000 Fund receives Fixed 1.846% and pays Floating GBP 6 Month LIBOR Barclays Bank 03/07/2025 51,950 51,950IRS USD 800,000 Fund receives Fixed 2.832% and pays Floating USD 3 Month LIBOR Barclays Bank 13/01/2026 8,079 8,079IRS USD 800,000 Fund receives Floating USD 3 Month LIBOR and pays Fixed 2.832% Barclays Bank 13/01/2026 (9,478) (9,478)IRS USD 700,000 Fund receives Floating USD 3 Month LIBOR and pays Fixed 1.714% Barclays Bank 04/05/2026 1,125 1,125IRS USD 660,000 Fund receives Fixed 1.688% and pays Floating USD 3 Month LIBOR Barclays Bank 05/05/2026 (2,497) (2,497)IRS USD 1,120,000 Fund receives Fixed 1.716% and pays Floating USD 3 Month LIBOR Barclays Bank 27/05/2026 (1,992) (1,992)IRS USD 850,000 Fund receives Floating USD 3 Month LIBOR and pays Fixed 1.726% Barclays Bank 27/05/2026 798 798IRS JPY 453,000,000 Fund receives Floating JPY 6 Month LIBOR and pays Fixed 0.345% Barclays Bank 01/04/2031 (38,271) (38,271)IRS GBP 700,000 Fund receives Floating GBP 6 Month LIBOR and pays Fixed 2.030% Barclays Bank 07/06/2032 (38,019) (38,019)IRS GBP 719,124 Fund receives Floating GBP 6 Month LIBOR and pays Fixed 2.052% Barclays Bank 07/06/2032 (42,203) (42,203)IRS GBP 698,000 Fund receives Floating GBP 6 Month LIBOR and pays Fixed 2.089% Barclays Bank 07/09/2034 (48,264) (48,264)IRS USD 200,000 Fund receives Floating USD 3 Month LIBOR and pays Fixed 2.363% Barclays Bank 19/01/2046 (6,997) (6,997)IRS SGD 4,750,000 Fund receives Floating SGD 6 Month LIBOR and pays Fixed 1.670% BNP Paribas 15/06/2018 7,208 7,208IRS SGD 4,750,000 Fund receives Floating SGD 6 Month LIBOR and pays Fixed 1.720% BNP Paribas 15/06/2018 4,169 4,169IRS CNY 8,725,000 Fund receives Fixed 2.165% and pays Floating CNY 3 Month LIBOR Citibank 16/03/2018 (9,390) (9,390)IRS CNY 21,040,000 Fund receives Fixed 2.575% and pays Floating CNY 3 Month LIBOR Citibank 15/06/2018 (3,417) (3,417)IRS GBP 5,702,000 Fund receives Floating GBP 6 Month LIBOR and pays Fixed 0.861% Citibank 12/04/2019 17,888 17,888IRS USD 15,290,000 Fund receives Floating USD 3 Month LIBOR and pays Fixed 1.321% Citibank 11/04/2020 48,315 48,315IRS CNY 3,780,000 Fund receives Fixed 2.415% and pays Floating CNY 3 Month LIBOR Citibank 16/03/2021 (11,530) (11,530)IRS CNY 3,835,000 Fund receives Fixed 2.505% and pays Floating CNY 3 Month LIBOR Citibank 16/03/2021 (9,597) (9,597)IRS THB 46,000,000 Fund receives Floating THB 6 Month LIBOR and pays Fixed 2.225% Citibank 16/03/2026 18,709 18,709IRS USD 600,000 Fund receives Floating USD 3 Month LIBOR and pays Floating USD
3 Month SIFMA Citibank 29/08/2034 5,867 5,867IRS USD 500,000 Fund receives Floating USD 3 Month LIBOR and pays Floating USD
3 Month SIFMA Citibank 12/09/2034 5,480 5,480IRS USD 600,000 Fund receives Floating 3 Month SIFMA and pays Floating USD
3 Month LIBOR Citibank 09/06/2035 5,249 5,249IRS USD 600,000 Fund receives Floating 3 Month SIFMA and pays Floating USD
3 Month LIBOR Citibank 09/06/2035 5,377 5,377IRS CAD 3,100,000 Fund receives Fixed 0.985% and pays Floating CAD 3 Month CDOR Credit Suisse 18/05/2018 (1,691) (1,691)IRS USD 2,400,000 Fund receives Floating USD 3 Month LIBOR and
pays Fixed 1.017% Credit Suisse 20/05/2018 1,897 1,897IRS USD 620,000 Fund receives Fixed 1.288% and pays Floating USD 3 Month LIBOR Deutsche Bank 20/05/2021 (2,365) (2,365)IRS USD 1,100,000 Fund receives Floating USD 3 Month LIBOR and pays Fixed 1.706% Deutsche Bank 03/05/2026 2,499 2,499IRS USD 560,000 Fund receives Fixed 1.716% and pays Floating USD 3 Month LIBOR Deutsche Bank 27/05/2026 (996) (996)IRS USD 1,000,000 Fund receives Floating USD 3 Month LIBOR and pays Floating USD
3 Month SIFMA Deutsche Bank 19/03/2034 16,013 16,013IRS CNY 21,040,000 Fund receives Fixed 2.475% and pays Floating CNY 3 Month LIBOR Goldman Sachs 15/06/2018 5,565 5,565IRS USD 15,015,000 Fund receives Floating USD 3 Month LIBOR and pays Fixed 1.486% Goldman Sachs 28/03/2020 2,690 2,690IRS SEK 118,625,000 Fund receives Fixed 0.420% and pays Floating SEK 3 Month STIBOR Goldman Sachs 29/03/2020 16,373 16,373IRS USD 18,230,000 Fund receives Fixed 1.320% and pays Floating USD 3 Month LIBOR Goldman Sachs 29/04/2021 (39,678) (39,678)IRS EUR 3,135,000 Fund receives Floating EUR 6 Month LIBOR and pays Fixed 0.014% Goldman Sachs 12/05/2021 4,803 4,803IRS CNY 8,775,000 Fund receives Fixed 2.560% and pays Floating CNY 3 Month LIBOR Goldman Sachs 15/06/2021 (21,223) (21,223)IRS INR 284,260,000 Fund receives Fixed 6.678% and pays Floating INR 6 Month MIBOR Goldman Sachs 21/09/2021 (44,276) (44,276)IRS EUR 3,350,000 Fund receives Fixed 0.407% and pays Floating EUR 6 Month EURIBOR Goldman Sachs 15/02/2025 (9,302) (9,302)IRS USD 250,000 Fund receives Floating USD 3 Month LIBOR and pays Fixed 1.806% Goldman Sachs 02/02/2026 (1,755) (1,755)IRS USD 125,000 Fund receives Floating USD 3 Month LIBOR and pays Fixed 1.728% Goldman Sachs 26/04/2026 48 48IRS USD 19,290,000 Fund receives Floating USD 3 Month LIBOR and pays Fixed 1.759% Goldman Sachs 29/04/2026 (44,332) (44,332)IRS USD 1,000,000 Fund receives Floating USD 3 Month LIBOR and pays Floating
3 Month SIFMA Goldman Sachs 08/07/2034 13,984 13,984IRS USD 175,000 Fund receives Floating USD 3 Month LIBOR and pays Fixed 2.298% Goldman Sachs 25/01/2046 (3,768) (3,768)IRS USD 290,000 Fund receives Floating USD 3 Month LIBOR and pays Fixed 2.216% Goldman Sachs 05/02/2046 (1,298) (1,298)IRS USD 225,000 Fund receives Floating USD 3 Month LIBOR and pays Fixed 2.165% Goldman Sachs 11/02/2046 1,371 1,371IRS USD 140,000 Fund receives Floating USD 3 Month LIBOR and pays Fixed 2.029% Goldman Sachs 12/02/2046 4,801 4,801IRS USD 235,000 Fund receives Floating USD 3 Month LIBOR and pays Fixed 2.124% Goldman Sachs 12/02/2046 3,429 3,429IRS USD 60,000 Fund receives Floating USD 3 Month LIBOR and pays Fixed 2.104% Goldman Sachs 08/04/2046 1,136 1,136IRS USD 4,100,000 Fund receives Fixed 2.255% and pays Floating USD 3 Month LIBOR Goldman Sachs 29/04/2046 52,142 52,142IRS EUR 2,990,000 Fund receives Fixed 0.948% and pays Floating EUR 6 Month EURIBOR HSBC 06/01/2026 118,732 118,732

Annual Report and Audited Accounts 255
The notes on pages 489 to 503 form an integral part of these financial statements.
TypeNominal
Value Description CounterpartyExpiration
date
Unrealised appreciation/
(depreciation) EUR
Market Value
EUR
Swaps as at 31 May 2016
IRS SEK 27,000,000 Fund receives Floating SEK 3 Month STIBOR and pays Fixed 1.590% HSBC 07/01/2026 (142,868) (142,868)IRS KRW 2,066,090,000 Fund receives Fixed 1.855% and pays Floating KRW 3 Month LIBOR HSBC 19/02/2026 31,914 31,914IRS KRW 1,366,955,000 Fund receives Fixed 1.890% and pays Floating KRW 3 Month LIBOR HSBC 19/02/2026 24,352 24,352IRS USD 1,715,000 Fund receives Floating USD 3 Month LIBOR and pays Fixed 1.900% HSBC 19/02/2026 (25,016) (25,016)IRS USD 1,140,000 Fund receives Floating USD 3 Month LIBOR and pays Fixed 1.940% HSBC 19/02/2026 (20,363) (20,363)IRS THB 10,000,000 Fund receives Floating THB 6 Month LIBOR and pays Fixed 2.605% HSBC 16/03/2026 (4,604) (4,604)IRS USD 800,000 Fund receives Fixed 3.030% and pays Floating USD 3 Month LIBOR JP Morgan 10/12/2025 (14,986) (14,986)IRS USD 1,000,000 Fund receives Floating USD-BMA Municipal Swap Index and pays
Floating USD 3 Month LIBOR JP Morgan 09/07/2034 13,038 13,038IRS USD 700,000 Fund receives Floating USD 3 Month LIBOR and pays Floating USD
3 Month SIFMA JP Morgan 19/08/2034 8,435 8,435IRS USD 500,000 Fund receives Floating USD 3 Month LIBOR and pays Floating
3 Month SIFMA JP Morgan 19/05/2035 2,741 2,741IRS USD 250,000 Fund receives Floating USD 3 Month LIBOR and pays Floating
3 Month SIFMA JP Morgan 21/05/2035 2,112 2,112IRS SEK 118,625,000 Fund receives Fixed 0.405% and pays Floating SEK 3 Month Royal Bank of
STIBOR Scotland 29/03/2020 12,504 12,504IRS KRW 1,366,955,000 Fund receives Fixed 1.872% and pays Floating KRW 3 Month LIBOR UBS 19/02/2026 22,734 22,734IRS USD 1,145,000 Fund receives Floating USD 3 Month LIBOR and
pays Fixed 1.922% UBS 19/02/2026 (18,764) (18,764)TRS EUR 133,929 Fund receives 3 Month LIBOR and pays iBoxx Corporate Overall
Performance Index JP Morgan 20/06/2016 (640,352) (640,352)TRS EUR 103,926 Fund receives Markit iBoxx Euro Corporates Overall Total Return
Index and pays 3 Month LIBOR JP Morgan 20/09/2016 112,376 112,376
Total (Gross underlying exposure - EUR 691,209,292) (772,268) (4,347,195)
CDS: Credit Default SwapsILS: Inflation Linked SwapsIRS: Interest Rate SwapsTRS: Total Return Swaps
BlackRock Global Absolute Return Bond Fund continued

Open forward foreign exchange transactions as at 31 May 2016
Currency Purchases Currency Sales CounterpartyMaturity
date
Unrealised appreciation/
(depreciation) EUR
Open forward foreign exchange transactions as at 31 May 2016
Currency Purchases Currency Sales CounterpartyMaturity
date
Unrealised appreciation/
(depreciation) EUR
256 BlackRock Strategic Funds (BSF)
The notes on pages 489 to 503 form an integral part of these financial statements.
BlackRock Global Absolute Return Bond Fund continued
BRL 1,180,000 USD 329,013 JP Morgan 2/6/2016 130 BRL 560,000 USD 157,265 Bank of America Merrill Lynch 2/6/2016 (944)BRL 1,290,000 USD 362,964 Deutsche Bank 2/6/2016 (2,794)BRL 280,000 USD 79,411 Morgan Stanley 2/6/2016 (1,169)BRL 2,290,000 USD 634,701 Citibank 2/6/2016 3,662 USD 196,235 BRL 695,000 Goldman Sachs 2/6/2016 2,118 USD 394,381 BRL 1,395,000 JP Morgan 2/6/2016 4,699 USD 832,240 BRL 2,900,000 BNP Paribas 2/6/2016 20,853 USD 153,464 BRL 550,000 Bank of America Merrill Lynch 2/6/2016 39 USD 16,697 BRL 60,000 Morgan Stanley 2/6/2016 (36)CAD 2,935,891 EUR 1,982,641 Morgan Stanley 6/6/2016 30,560 CAD 5,522,109 USD 4,287,553 State Street Bank & Trust Company 6/6/2016 (51,549)EUR 198,663 AUD 297,000 Royal Bank of Scotland 6/6/2016 5,830 EUR 2,005,668 CAD 2,929,000 Citibank 6/6/2016 (2,807)EUR 814,155 GBP 635,000 Citibank 6/6/2016 (18,289)EUR 1,759,132 USD 2,003,000 Royal Bank of Scotland 6/6/2016 (33,933)EUR 131,477,795 USD 150,222,725 Morgan Stanley 6/6/2016 (3,000,036)EUR 2,663,291 USD 3,011,000 State Street Bank & Trust Company 6/6/2016 (32,125)EUR 483,519 USD 554,000 Citibank 6/6/2016 (12,417)EUR 87,800 USD 100,000 HSBC 6/6/2016 (1,719)USD 4,281,530 CAD 5,529,000 Morgan Stanley 6/6/2016 41,432 USD 1,758,539 EUR 1,525,000 Morgan Stanley 6/6/2016 49,226 USD 1,085,750 EUR 968,247 State Street Bank & Trust Company 6/6/2016 3,706 EUR 25,049,663 USD 28,807,363 HSBC 7/6/2016 (737,632)EUR 76,977 USD 87,979 Royal Bank of Scotland 7/6/2016 (1,779)EUR 2,513,467 USD 2,856,639 BNP Paribas 7/6/2016 (43,692)USD 96,254 CNY 627,094 HSBC 7/6/2016 870 USD 1,406,460 EUR 1,251,404 Citibank 7/6/2016 7,608 USD 1,193,508 EUR 1,047,733 Royal Bank of Scotland 7/6/2016 20,652 USD 177,805 EUR 154,666 JP Morgan 7/6/2016 4,499 USD 5,332,871 EUR 4,654,103 BNP Paribas 7/6/2016 119,688 USD 319,158 EUR 286,004 HSBC 7/6/2016 (306)USD 597,495 HKD 4,635,497 UBS 7/6/2016 577 USD 161,685 JPY 17,314,000 BNP Paribas 7/6/2016 5,236 USD 182,782 SGD 250,000 Citibank 7/6/2016 1,142 IDR 23,193,286,375 USD 1,697,768 Citibank 8/6/2016 4,468 IDR 22,438,085,163 USD 1,674,484 State Street Bank & Trust Company 8/6/2016 (24,319)IDR 5,343,400,000 USD 391,171 UBS 8/6/2016 1,003 IDR 1,395,022,244 USD 104,379 Deutsche Bank 8/6/2016 (1,756)MYR 10,155,622 USD 2,592,568 Bank of America Merrill Lynch 8/6/2016 (116,316)MYR 2,864,062 USD 731,748 JP Morgan 8/6/2016 (33,339)MYR 2,044,116 USD 512,015 Deutsche Bank 8/6/2016 (14,626)THB 2,535,048 USD 72,187 Bank of New York 8/6/2016 (1,104)USD 3,929,179 IDR 52,179,497,015 Goldman Sachs 8/6/2016 88,051 USD 3,904,968 KRW 4,502,427,933 UBS 8/6/2016 108,195 USD 365,105 MYR 1,543,848 Deutsche Bank 8/6/2016 (8,290)USD 2,114,920 MYR 8,702,159 State Street Bank & Trust Company 8/6/2016 4,246 USD 837,457 MYR 3,570,080 JP Morgan 8/6/2016 (25,286)USD 293,876 MYR 1,221,642 HSBC 8/6/2016 (2,111)USD 1,972,796 PHP 93,175,161 UBS 8/6/2016 (18,050)AUD 300,000 EUR 197,558 Morgan Stanley 15/6/2016 (2,905)AUD 5,567,815 USD 4,147,814 Citibank 15/6/2016 (99,306)AUD 2,994,910 USD 2,250,342 Morgan Stanley 15/6/2016 (70,640)AUD 3,935,216 USD 2,926,575 Bank of America Merrill Lynch 15/6/2016 (65,701)AUD 110,000 USD 82,535 Deutsche Bank 15/6/2016 (2,489)AUD 2,533,980 USD 1,940,412 Credit Suisse 15/6/2016 (92,350)AUD 1,168,404 USD 866,611 Westpac 15/6/2016 (17,433)
AUD 528,777 USD 392,152 JP Morgan 15/6/2016 (7,850)AUD 1,020,436 USD 749,968 Goldman Sachs 15/6/2016 (9,056)AUD 710,000 USD 541,748 Barclays Bank 15/6/2016 (24,140)AUD 130,462 USD 100,269 BNP Paribas 15/6/2016 (5,083)AUD 400,000 USD 299,096 UBS 15/6/2016 (8,129)AUD 80,000 USD 60,497 HSBC 15/6/2016 (2,233)CAD 1,700,000 EUR 1,162,658 Barclays Bank 15/6/2016 2,686 CAD 1,343,724 USD 1,043,944 Morgan Stanley 15/6/2016 (13,123)CAD 4,974,385 USD 3,823,753 Credit Suisse 15/6/2016 (12,010)CAD 2,855,609 USD 2,203,308 Goldman Sachs 15/6/2016 (14,263)CAD 1,694,464 USD 1,284,152 BNP Paribas 15/6/2016 12,342 CAD 7,694,025 USD 5,862,509 Citibank 15/6/2016 27,780 CAD 2,202,696 USD 1,669,144 Barclays Bank 15/6/2016 16,199 CAD 532,359 USD 409,734 Deutsche Bank 15/6/2016 (1,747)CAD 1,241,651 USD 964,542 Bank of America Merrill Lynch 15/6/2016 (12,035)CAD 478,994 USD 374,514 JP Morgan 15/6/2016 (6,810)CAD 964,912 USD 735,288 HSBC 15/6/2016 3,423 CAD 513,893 USD 396,321 Westpac 15/6/2016 (2,402)CAD 200,000 USD 152,536 Royal Bank of Canada 15/6/2016 592 CAD 146,286 USD 108,921 UBS 15/6/2016 2,804 CHF 80,000 USD 82,057 Credit Suisse 15/6/2016 (1,065)CHF 350,000 USD 360,654 Morgan Stanley 15/6/2016 (6,141)CHF 420,000 USD 432,883 HSBC 15/6/2016 (7,457)CHF 80,000 USD 82,393 Bank of America Merrill Lynch 15/6/2016 (1,366)CHF 320,000 USD 333,085 JP Morgan 15/6/2016 (8,607)CHF 240,000 USD 247,893 Citibank 15/6/2016 (4,737)CHF 80,000 USD 82,271 UBS 15/6/2016 (1,257)CLP 839,000,000 USD 1,237,166 Credit Suisse 15/6/2016 (17,763)CLP 261,000,000 USD 379,572 HSBC 15/6/2016 (791)CLP 371,000,000 USD 534,890 Goldman Sachs 15/6/2016 3,041 CLP 36,139,488 USD 54,902 Citibank 15/6/2016 (2,208)CLP 158,000,000 USD 236,256 BNP Paribas 15/6/2016 (6,275)CLP 70,860,512 USD 105,005 Deutsche Bank 15/6/2016 (1,962)CLP 40,000,000 USD 58,936 JP Morgan 15/6/2016 (805)COP 2,020,600,708 USD 673,102 HSBC 15/6/2016 (17,858)COP 906,250,912 USD 284,807 Credit Suisse 15/6/2016 7,279 COP 2,619,199,153 USD 868,912 Deutsche Bank 15/6/2016 (19,931)COP 320,000,000 USD 105,320 Bank of America Merrill Lynch 15/6/2016 (1,684)COP 695,000,000 USD 219,454 BNP Paribas 15/6/2016 4,654 COP 80,000,000 USD 27,109 Goldman Sachs 15/6/2016 (1,119)COP 520,000,000 USD 161,491 JP Morgan 15/6/2016 5,903 COP 418,949,227 USD 141,872 Citibank 15/6/2016 (5,772)EUR 146,702 AUD 220,000 Deutsche Bank 15/6/2016 3,957 EUR 46,974 AUD 70,000 JP Morgan 15/6/2016 1,555 EUR 240,002 AUD 360,000 Goldman Sachs 15/6/2016 6,419 EUR 230,169 CAD 330,000 State Street Bank & Trust Company 15/6/2016 3,956 EUR 612,645 CAD 900,000 Bank of New York 15/6/2016 (4,301)EUR 136,422 CAD 200,000 Morgan Stanley 15/6/2016 (677)EUR 104,798 CAD 150,000 HSBC 15/6/2016 1,973 EUR 6,140,494 GBP 4,755,000 Barclays Bank 15/6/2016 (91,414)EUR 811,232 HUF 254,813,841 Citibank 15/6/2016 175 EUR 1,735,304 HUF 542,621,476 Barclays Bank 15/6/2016 8,174 EUR 1,000,048 HUF 314,433,748 Credit Suisse 15/6/2016 (774)EUR 215,563 HUF 67,593,935 Bank of America Merrill Lynch 15/6/2016 415 EUR 528,722 HUF 166,410,787 JP Morgan 15/6/2016 (953)EUR 693,709 HUF 217,059,932 Deutsche Bank 15/6/2016 2,821 EUR 275,712 HUF 86,587,709 HSBC 15/6/2016 109 EUR 419,139 HUF 130,750,000 Morgan Stanley 15/6/2016 2,970 EUR 168,256 HUF 52,600,000 BNP Paribas 15/6/2016 834 EUR 65,422 HUF 20,602,507 Goldman Sachs 15/6/2016 (155)EUR 52,900 HUF 16,526,064 UBS 15/6/2016 298 EUR 731,883 IDR 11,200,000,000 State Street Bank & Trust Company 15/6/2016 (3,471)EUR 592,375 PLN 2,605,962 JP Morgan 15/6/2016 (1,720)

Open forward foreign exchange transactions as at 31 May 2016
Currency Purchases Currency Sales CounterpartyMaturity
date
Unrealised appreciation/
(depreciation) EUR
Open forward foreign exchange transactions as at 31 May 2016
Currency Purchases Currency Sales CounterpartyMaturity
date
Unrealised appreciation/
(depreciation) EUR
Annual Report and Audited Accounts 257
The notes on pages 489 to 503 form an integral part of these financial statements.
EUR 203,975 PLN 891,281 Bank of America Merrill Lynch 15/6/2016 785 EUR 1,282,241 PLN 5,596,696 Credit Suisse 15/6/2016 6,333 EUR 1,293,272 PLN 5,623,866 Citibank 15/6/2016 11,170 EUR 744,676 PLN 3,240,010 HSBC 15/6/2016 6,034 EUR 3,005,404 PLN 13,002,623 Barclays Bank 15/6/2016 41,129 EUR 206,806 PLN 890,618 Morgan Stanley 15/6/2016 3,767 EUR 339,847 PLN 1,480,000 BNP Paribas 15/6/2016 2,443 EUR 15,802 PLN 69,575 UBS 15/6/2016 (60)EUR 2,800,000 USD 3,147,963 HSBC 15/6/2016 (17,159)EUR 2,719,274 USD 3,041,861 Citibank 15/6/2016 (2,932)EUR 3,048,619 USD 3,423,248 Goldman Sachs 15/6/2016 (14,896)EUR 174,561 USD 199,735 BNP Paribas 15/6/2016 (4,185)EUR 1,392,386 USD 1,571,170 Barclays Bank 15/6/2016 (13,677)EUR 1,790,824 USD 2,007,333 Morgan Stanley 15/6/2016 (5,567)EUR 8,720,029 USD 9,894,138 Bank of America Merrill Lynch 15/6/2016 (134,381)EUR 5,436,342 USD 5,916,902 UBS 15/6/2016 141,219 EUR 202,141 USD 231,413 JP Morgan 15/6/2016 (4,954)EUR 608,243 USD 697,497 Westpac 15/6/2016 (15,958)EUR 40,000 USD 45,326 Credit Suisse 15/6/2016 (563)EUR 10,834,141 USD 12,207,325 Deutsche Bank 15/6/2016 (90,374)EUR 1,740,947 ZAR 30,210,000 Citibank 15/6/2016 28,870 GBP 1,200,000 EUR 1,549,129 Deutsche Bank 15/6/2016 23,593 GBP 1,200,000 EUR 1,503,157 Barclays Bank 15/6/2016 69,565 GBP 2,000,000 USD 2,845,538 HSBC 15/6/2016 74,688 GBP 1,010,135 USD 1,440,967 Barclays Bank 15/6/2016 34,342 GBP 1,416,131 USD 2,017,675 Citibank 15/6/2016 50,337 GBP 323,150 USD 470,279 Credit Suisse 15/6/2016 2,660 GBP 110,000 USD 161,465 Westpac 15/6/2016 (332)GBP 165,000 USD 233,635 Deutsche Bank 15/6/2016 7,166 GBP 1,216,128 USD 1,706,752 Morgan Stanley 15/6/2016 66,461 GBP 149,456 USD 215,179 JP Morgan 15/6/2016 3,310 HUF 347,757,884 EUR 1,112,197 Barclays Bank 15/6/2016 (5,306)HUF 521,516,558 EUR 1,660,315 Credit Suisse 15/6/2016 (361)HUF 183,818,882 EUR 587,737 Citibank 15/6/2016 (2,653)HUF 211,910,000 EUR 681,647 BNP Paribas 15/6/2016 (7,151)HUF 41,298,045 EUR 131,199 Bank of America Merrill Lynch 15/6/2016 250 HUF 126,121,117 EUR 403,554 Deutsche Bank 15/6/2016 (2,119)HUF 54,090,073 EUR 172,284 HSBC 15/6/2016 (119)HUF 34,885,737 EUR 110,896 JP Morgan 15/6/2016 143 HUF 16,601,707 EUR 53,438 UBS 15/6/2016 (596)HUF 105,058,590 USD 381,546 Bank of America Merrill Lynch 15/6/2016 (7,056)HUF 645,338,110 USD 2,340,866 Credit Suisse 15/6/2016 (40,805)HUF 74,040,000 USD 269,210 BNP Paribas 15/6/2016 (5,255)HUF 397,348,361 USD 1,437,816 Deutsche Bank 15/6/2016 (21,988)HUF 101,928,133 USD 367,602 JP Morgan 15/6/2016 (4,541)HUF 278,807,278 USD 1,003,029 Barclays Bank 15/6/2016 (10,200)HUF 1,589,073 USD 5,707 HSBC 15/6/2016 (50)HUF 2,716,902 USD 9,636 Morgan Stanley 15/6/2016 24 HUF 11,500,000 USD 41,951 Goldman Sachs 15/6/2016 (939)HUF 23,673,554 USD 84,093 UBS 15/6/2016 96 HUF 4,000,000 USD 14,558 Societe Generale 15/6/2016 (297)HUF 100,000,000 USD 349,693 Citibank 15/6/2016 5,348 IDR 11,200,000,000 EUR 735,874 HSBC 15/6/2016 (520)IDR 8,316,804,518 USD 621,776 HSBC 15/6/2016 (10,384)IDR 4,228,195,482 USD 318,413 Morgan Stanley 15/6/2016 (7,344)IDR 3,592,000,000 USD 271,350 Deutsche Bank 15/6/2016 (6,997)IDR 9,093,000,000 USD 682,090 UBS 15/6/2016 (13,397)IDR 1,810,000,000 USD 134,569 Citibank 15/6/2016 (1,590)ILS 1,768,709 USD 461,359 Deutsche Bank 15/6/2016 (1,410)ILS 2,011,442 USD 527,119 Bank of America Merrill Lynch 15/6/2016 (3,791)ILS 139,153 USD 37,057 Morgan Stanley 15/6/2016 (790)ILS 1,602,694 USD 419,286 Citibank 15/6/2016 (2,379)ILS 11,707,966 USD 3,084,800 Credit Suisse 15/6/2016 (36,925)ILS 1,078,043 USD 276,501 BNP Paribas 15/6/2016 3,348 ILS 2,481,440 USD 640,682 Goldman Sachs 15/6/2016 3,920
ILS 1,382,574 USD 367,220 HSBC 15/6/2016 (6,993)ILS 355,973 USD 92,475 JP Morgan 15/6/2016 56 ILS 272,006 USD 71,647 Barclays Bank 15/6/2016 (839)INR 59,948,912 USD 889,750 Morgan Stanley 15/6/2016 835 INR 32,020,207 USD 475,516 JP Morgan 15/6/2016 198 INR 122,444,618 USD 1,803,813 Citibank 15/6/2016 13,775 INR 357,119,025 USD 5,265,799 HSBC 15/6/2016 35,844 INR 8,926,835 USD 133,172 NOMURA 15/6/2016 (486)INR 70,896,998 USD 1,047,967 UBS 15/6/2016 4,811 INR 16,900,000 USD 252,752 Deutsche Bank 15/6/2016 (1,488)INR 20,250,000 USD 300,462 Goldman Sachs 15/6/2016 358 INR 27,302,797 USD 407,294 BNP Paribas 15/6/2016 (1,473)INR 24,050,000 USD 351,548 Bank of America Merrill Lynch 15/6/2016 5,165 INR 61,950,609 USD 920,106 Barclays Bank 15/6/2016 284 INR 3,390,000 USD 50,507 Standard Chartered Bank 15/6/2016 (125)JPY 96,593,649 USD 859,449 HSBC 15/6/2016 9,124 JPY 15,567,417 USD 143,079 Morgan Stanley 15/6/2016 (2,616)JPY 6,287,649 USD 56,871 BNP Paribas 15/6/2016 (235)JPY 109,057,749 USD 998,665 Citibank 15/6/2016 (15,039)JPY 26,000,000 USD 232,338 Goldman Sachs 15/6/2016 1,560 JPY 14,221,777 USD 132,497 JP Morgan 15/6/2016 (3,988)JPY 31,465,201 USD 287,183 Barclays Bank 15/6/2016 (3,489)JPY 5,806,558 USD 53,100 Bank of America Merrill Lynch 15/6/2016 (736)KRW 2,649,483,898 USD 2,242,366 Deutsche Bank 15/6/2016 (13,699)KRW 553,511,195 USD 478,258 Barclays Bank 15/6/2016 (11,631)KRW 2,835,604,009 USD 2,396,217 Morgan Stanley 15/6/2016 (11,377)KRW 3,898,590,583 USD 3,330,426 HSBC 15/6/2016 (47,801)KRW 949,547,734 USD 817,101 Bank of America Merrill Lynch 15/6/2016 (16,955)KRW 1,069,097,305 USD 899,968 UBS 15/6/2016 (1,185)KRW 291,905,128 USD 245,627 Goldman Sachs 15/6/2016 (235)KRW 245,000,000 USD 214,264 Standard Chartered Bank 15/6/2016 (7,451)KRW 510,939,483 USD 422,292 Citibank 15/6/2016 6,430 KRW 321,320,665 USD 274,610 State Street Bank & Trust Company 15/6/2016 (4,044)MXN 18,495,592 USD 1,018,434 Bank of America Merrill Lynch 15/6/2016 (12,923)MXN 34,835,767 USD 1,924,133 Morgan Stanley 15/6/2016 (29,666)MXN 91,550,484 USD 5,143,123 Citibank 15/6/2016 (155,273)MXN 25,844,509 USD 1,455,417 JP Morgan 15/6/2016 (46,987)MXN 20,605,886 USD 1,144,421 Barclays Bank 15/6/2016 (23,156)MXN 27,612,701 USD 1,537,599 Goldman Sachs 15/6/2016 (34,636)MXN 6,244,679 USD 345,734 BNP Paribas 15/6/2016 (6,046)MXN 15,987,488 USD 902,227 Credit Suisse 15/6/2016 (30,768)MXN 20,122,892 USD 1,119,260 Deutsche Bank 15/6/2016 (24,102)MYR 13,024,903 USD 3,236,473 Deutsche Bank 15/6/2016 (69,801)MYR 6,246,416 USD 1,553,954 HSBC 15/6/2016 (35,107)MYR 7,298,680 USD 1,824,108 Morgan Stanley 15/6/2016 (48,517)MYR 1,420,000 USD 352,691 UBS 15/6/2016 (7,471)MYR 2,275,000 USD 574,841 Bank of America Merrill Lynch 15/6/2016 (20,730)MYR 350,000 USD 86,644 Goldman Sachs 15/6/2016 (1,585)MYR 1,000,000 USD 248,559 Citibank 15/6/2016 (5,427)MYR 425,000 USD 109,114 State Street Bank & Trust Company 15/6/2016 (5,418)MYR 300,000 USD 73,117 JP Morgan 15/6/2016 (330)NOK 5,666,452 USD 689,573 Barclays Bank 15/6/2016 (10,152)NOK 18,136,991 USD 2,194,113 Credit Suisse 15/6/2016 (20,816)NOK 6,947,450 USD 831,416 JP Morgan 15/6/2016 123 NOK 21,326,131 USD 2,565,111 Citibank 15/6/2016 (11,226)NOK 389,428 USD 47,866 Bank of America Merrill Lynch 15/6/2016 (1,123)NOK 5,700,000 USD 667,182 BNP Paribas 15/6/2016 13,480 NOK 5,179,035 USD 624,824 Morgan Stanley 15/6/2016 (4,417)NOK 3,088,223 USD 372,019 Goldman Sachs 15/6/2016 (2,133)NOK 4,700,000 USD 555,762 HSBC 15/6/2016 6,076
BlackRock Global Absolute Return Bond Fund continued

Open forward foreign exchange transactions as at 31 May 2016
Currency Purchases Currency Sales CounterpartyMaturity
date
Unrealised appreciation/
(depreciation) EUR
Open forward foreign exchange transactions as at 31 May 2016
Currency Purchases Currency Sales CounterpartyMaturity
date
Unrealised appreciation/
(depreciation) EUR
258 BlackRock Strategic Funds (BSF)
The notes on pages 489 to 503 form an integral part of these financial statements.
BlackRock Global Absolute Return Bond Fund continued
NOK 9,166,290 USD 1,082,229 Deutsche Bank 15/6/2016 13,336 NZD 4,338,576 USD 2,897,672 JP Morgan 15/6/2016 29,449 NZD 1,772,809 USD 1,201,423 Morgan Stanley 15/6/2016 (3,529)NZD 3,462,089 USD 2,335,372 Citibank 15/6/2016 2,834 NZD 4,104,295 USD 2,735,366 Goldman Sachs 15/6/2016 33,079 NZD 654,306 USD 441,695 HSBC 15/6/2016 241 NZD 347,494 USD 235,718 Deutsche Bank 15/6/2016 (891)NZD 1,103,753 USD 752,859 Credit Suisse 15/6/2016 (6,539)NZD 469,788 USD 315,108 UBS 15/6/2016 1,987 NZD 625,578 USD 428,445 Bank of America Merrill Lynch 15/6/2016 (5,267)NZD 10,577 USD 7,286 Barclays Bank 15/6/2016 (126)NZD 1,010,733 USD 693,002 BNP Paribas 15/6/2016 (9,201)PHP 79,110,293 USD 1,687,794 HSBC 15/6/2016 3,501 PHP 39,473,548 USD 829,173 Citibank 15/6/2016 13,366 PHP 80,613,403 USD 1,736,548 Morgan Stanley 15/6/2016 (11,365)PHP 16,053,976 USD 344,013 JP Morgan 15/6/2016 (638)PHP 37,980,401 USD 814,840 Deutsche Bank 15/6/2016 (2,382)PHP 10,201,750 USD 218,739 Goldman Sachs 15/6/2016 (522)PHP 51,765,410 USD 1,092,499 UBS 15/6/2016 12,941 PHP 801,220 USD 17,294 Barclays Bank 15/6/2016 (144)PHP 31,900,000 USD 679,229 NOMURA 15/6/2016 2,618 PLN 1,205,000 EUR 278,741 BNP Paribas 15/6/2016 (4,031)PLN 5,696,439 EUR 1,304,150 Credit Suisse 15/6/2016 (5,503)PLN 11,180,986 EUR 2,588,743 Barclays Bank 15/6/2016 (39,756)PLN 355,483 EUR 82,043 Bank of America Merrill Lynch 15/6/2016 (1,001)PLN 9,138,160 EUR 2,100,962 JP Morgan 15/6/2016 (17,688)PLN 184,995 EUR 42,592 HSBC 15/6/2016 (417)PLN 628,898 EUR 144,174 Citibank 15/6/2016 (800)PLN 1,587,014 EUR 366,727 Deutsche Bank 15/6/2016 (4,927)PLN 23,655 EUR 5,339 UBS 15/6/2016 54 PLN 12,953,256 USD 3,393,685 Credit Suisse 15/6/2016 (84,038)PLN 3,668,449 USD 943,349 BNP Paribas 15/6/2016 (7,902)PLN 22,713 USD 5,852 UBS 15/6/2016 (59)PLN 24,648 USD 6,504 Morgan Stanley 15/6/2016 (201)PLN 7,525,349 USD 1,951,143 Barclays Bank 15/6/2016 (30,514)PLN 1,893,262 USD 491,994 JP Morgan 15/6/2016 (8,676)PLN 1,865,009 USD 484,497 Deutsche Bank 15/6/2016 (8,407)PLN 724,590 USD 191,647 Bank of America Merrill Lynch 15/6/2016 (6,320)PLN 200,000 USD 52,474 Citibank 15/6/2016 (1,364)PLN 1,200,000 USD 302,618 Goldman Sachs 15/6/2016 2,753 PLN 22,723 USD 5,853 HSBC 15/6/2016 (57)RON 2,425,000 USD 608,773 BNP Paribas 15/6/2016 (7,477)RON 125,000 USD 31,157 JP Morgan 15/6/2016 (185)RON 750,000 USD 190,571 Bank of America Merrill Lynch 15/6/2016 (4,362)RON 350,000 USD 88,878 Societe Generale 15/6/2016 (1,987)RUB 36,520,425 USD 546,183 JP Morgan 15/6/2016 5,285 RUB 64,712,618 USD 975,913 Barclays Bank 15/6/2016 2,116 RUB 57,915,198 USD 780,652 Credit Suisse 15/6/2016 84,898 RUB 3,782,212 USD 56,681 Goldman Sachs 15/6/2016 443 RUB 26,069,547 USD 387,784 Citibank 15/6/2016 5,652 RUB 39,900,000 USD 558,704 Bank of America Merrill Lynch 15/6/2016 39,801 SEK 12,200,810 USD 1,472,888 Citibank 15/6/2016 (3,750)SEK 950,000 USD 116,796 BNP Paribas 15/6/2016 (2,182)SEK 25,327,589 USD 3,084,344 Credit Suisse 15/6/2016 (31,754)SEK 2,409,104 USD 292,716 Deutsche Bank 15/6/2016 (2,430)SEK 4,100,000 USD 506,715 Barclays Bank 15/6/2016 (11,785)SEK 20,666,015 USD 2,430,604 JP Morgan 15/6/2016 51,109 SEK 16,590,328 USD 1,990,727 Bank of America Merrill Lynch 15/6/2016 5,699 SEK 5,511,155 USD 667,394 Morgan Stanley 15/6/2016 (3,559)SEK 900,000 USD 108,737 Westpac 15/6/2016 (356)SEK 1,444,999 USD 179,396 Goldman Sachs 15/6/2016 (4,879)SGD 105,096 USD 77,394 Goldman Sachs 15/6/2016 (985)SGD 1,793,728 USD 1,309,608 Deutsche Bank 15/6/2016 (6,689)SGD 2,417,652 USD 1,775,977 Citibank 15/6/2016 (18,715)SGD 697,754 USD 514,595 BNP Paribas 15/6/2016 (7,222)SGD 530,000 USD 386,530 Credit Suisse 15/6/2016 (1,596)
SGD 770,780 USD 565,811 Morgan Stanley 15/6/2016 (5,613)SGD 1,807,717 USD 1,334,585 JP Morgan 15/6/2016 (19,953)SGD 570,704 USD 420,736 Barclays Bank 15/6/2016 (5,764)SGD 103,081 USD 75,908 UBS 15/6/2016 (964)SGD 1,270,000 USD 906,304 HSBC 15/6/2016 13,993 SGD 463,488 USD 340,171 Bank of America Merrill Lynch 15/6/2016 (3,319)SGD 40,000 USD 29,344 Westpac 15/6/2016 (274)THB 17,000,000 USD 485,115 UBS 15/6/2016 (8,378)THB 69,045,000 USD 1,959,768 Goldman Sachs 15/6/2016 (24,618)THB 32,975,000 USD 933,465 Barclays Bank 15/6/2016 (9,525)THB 8,000,000 USD 225,993 Citibank 15/6/2016 (1,887)THB 16,770,000 USD 478,349 JP Morgan 15/6/2016 (8,083)THB 5,700,000 USD 161,225 Deutsche Bank 15/6/2016 (1,528)THB 8,750,000 USD 249,344 Credit Suisse 15/6/2016 (4,001)THB 107,600,000 USD 3,062,799 HSBC 15/6/2016 (46,141)THB 5,025,000 USD 143,901 Bank of America Merrill Lynch 15/6/2016 (2,930)THB 6,835,000 USD 195,493 State Street Bank & Trust Company 15/6/2016 (3,770)TRY 1,129,642 USD 381,586 Deutsche Bank 15/6/2016 657 TRY 926,000 USD 318,276 Morgan Stanley 15/6/2016 (4,365)TRY 1,739,915 USD 602,367 JP Morgan 15/6/2016 (12,085)TRY 3,900,509 USD 1,325,979 Citibank 15/6/2016 (5,258)TRY 185,284 USD 62,022 UBS 15/6/2016 614 TRY 474,060 USD 164,194 Goldman Sachs 15/6/2016 (3,357)TRY 670,940 USD 233,295 Credit Suisse 15/6/2016 (5,566)TRY 1,212,908 USD 412,760 Barclays Bank 15/6/2016 (2,022)TRY 820,741 USD 276,775 Bank of America Merrill Lynch 15/6/2016 895 TRY 860,000 USD 285,520 HSBC 15/6/2016 4,959 TWD 36,244,476 USD 1,099,428 Deutsche Bank 15/6/2016 11,776 TWD 8,420,905 USD 260,063 Bank of America Merrill Lynch 15/6/2016 (1,404)TWD 11,792,816 USD 361,748 BNP Paribas 15/6/2016 226 TWD 26,190,418 USD 807,154 Morgan Stanley 15/6/2016 (2,859)TWD 10,302,589 USD 316,864 Goldman Sachs 15/6/2016 (545)TWD 18,589,634 USD 570,768 HSBC 15/6/2016 (114)TWD 18,873,377 USD 581,412 Citibank 15/6/2016 (1,845)TWD 24,584,203 USD 756,405 UBS 15/6/2016 (1,567)TWD 3,956,592 USD 121,015 JP Morgan 15/6/2016 393 TWD 11,800,000 USD 359,099 Standard Chartered Bank 15/6/2016 2,794 TWD 20,247,213 USD 616,476 Barclays Bank 15/6/2016 4,517 TWD 2,697,777 USD 82,652 Credit Suisse 15/6/2016 144 TWD 3,500,000 USD 106,157 Westpac 15/6/2016 1,147 USD 310,453 AUD 404,311 Credit Suisse 15/6/2016 15,495 USD 3,075,362 AUD 4,114,297 Morgan Stanley 15/6/2016 82,657 USD 2,615,484 AUD 3,513,772 Citibank 15/6/2016 60,751 USD 89,660 AUD 117,640 JP Morgan 15/6/2016 3,909 USD 304,676 AUD 414,647 Deutsche Bank 15/6/2016 3,619 USD 2,978,335 AUD 3,986,053 Bank of America Merrill Lynch 15/6/2016 79,036 USD 254,232 AUD 340,000 UBS 15/6/2016 6,909 USD 3,474,315 AUD 4,802,505 Westpac 15/6/2016 (6,853)USD 253,874 AUD 350,000 HSBC 15/6/2016 101 USD 92,695 AUD 123,571 Goldman Sachs 15/6/2016 2,776 USD 419,664 AUD 550,000 Barclays Bank 15/6/2016 18,700 USD 95,854 AUD 133,203 BNP Paribas 15/6/2016 (646)USD 170,147 CAD 219,588 Westpac 15/6/2016 1,740 USD 3,995,156 CAD 5,248,527 Citibank 15/6/2016 (22,522)USD 694,616 CAD 890,000 Deutsche Bank 15/6/2016 11,530 USD 1,256,196 CAD 1,638,072 Morgan Stanley 15/6/2016 1,296 USD 3,375,360 CAD 4,452,837 Goldman Sachs 15/6/2016 (31,744)USD 1,256,208 CAD 1,637,888 Bank of America Merrill Lynch 15/6/2016 1,432 USD 2,173,608 CAD 2,913,001 Barclays Bank 15/6/2016 (51,658)USD 1,566,575 CAD 2,041,651 Credit Suisse 15/6/2016 2,407 USD 494,596 CAD 636,796 JP Morgan 15/6/2016 6,100 USD 880,625 CAD 1,140,747 BNP Paribas 15/6/2016 6,107 USD 256,869 CAD 337,220 Royal Bank of Canada 15/6/2016 (1,287)
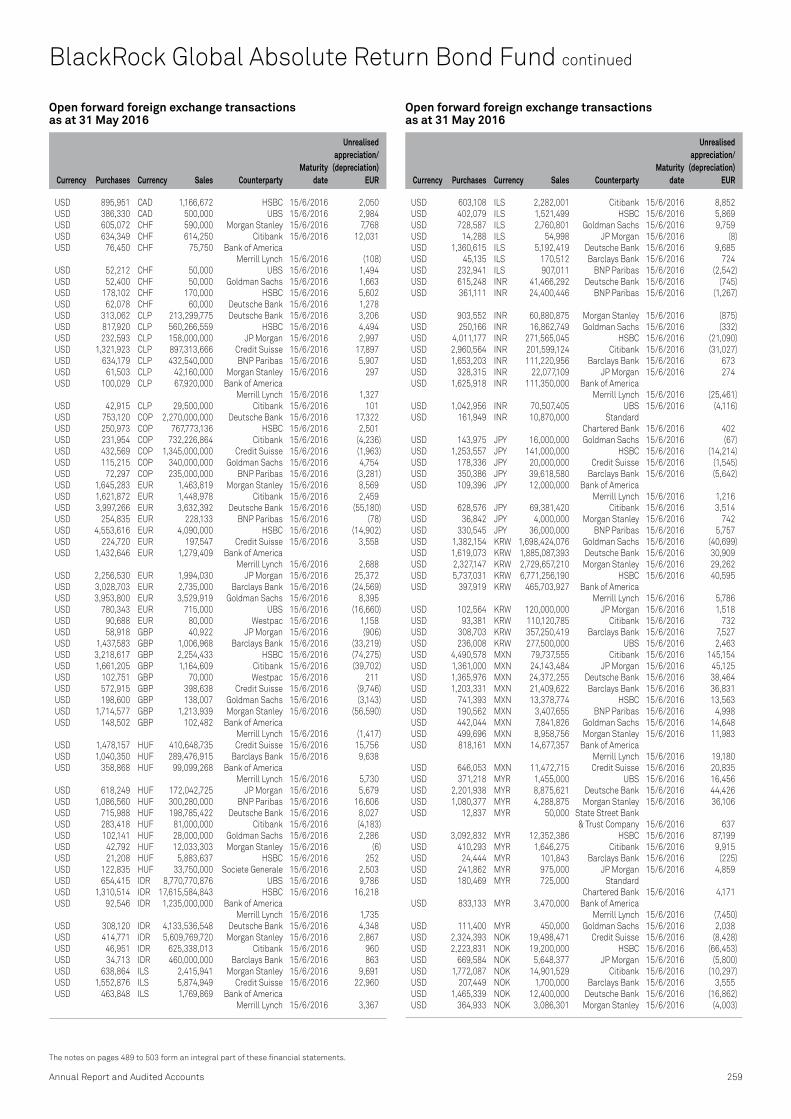
Open forward foreign exchange transactions as at 31 May 2016
Currency Purchases Currency Sales CounterpartyMaturity
date
Unrealised appreciation/
(depreciation) EUR
Open forward foreign exchange transactions as at 31 May 2016
Currency Purchases Currency Sales CounterpartyMaturity
date
Unrealised appreciation/
(depreciation) EUR
Annual Report and Audited Accounts 259
The notes on pages 489 to 503 form an integral part of these financial statements.
USD 895,951 CAD 1,166,672 HSBC 15/6/2016 2,050 USD 386,330 CAD 500,000 UBS 15/6/2016 2,984 USD 605,072 CHF 590,000 Morgan Stanley 15/6/2016 7,768 USD 634,349 CHF 614,250 Citibank 15/6/2016 12,031 USD 76,450 CHF 75,750 Bank of America Merrill Lynch 15/6/2016 (108)USD 52,212 CHF 50,000 UBS 15/6/2016 1,494 USD 52,400 CHF 50,000 Goldman Sachs 15/6/2016 1,663 USD 178,102 CHF 170,000 HSBC 15/6/2016 5,602 USD 62,078 CHF 60,000 Deutsche Bank 15/6/2016 1,278 USD 313,062 CLP 213,299,775 Deutsche Bank 15/6/2016 3,206 USD 817,920 CLP 560,266,559 HSBC 15/6/2016 4,494 USD 232,593 CLP 158,000,000 JP Morgan 15/6/2016 2,997 USD 1,321,923 CLP 897,313,666 Credit Suisse 15/6/2016 17,897 USD 634,179 CLP 432,540,000 BNP Paribas 15/6/2016 5,907 USD 61,503 CLP 42,160,000 Morgan Stanley 15/6/2016 297 USD 100,029 CLP 67,920,000 Bank of America Merrill Lynch 15/6/2016 1,327 USD 42,915 CLP 29,500,000 Citibank 15/6/2016 101 USD 753,120 COP 2,270,000,000 Deutsche Bank 15/6/2016 17,322 USD 250,973 COP 767,773,136 HSBC 15/6/2016 2,501 USD 231,954 COP 732,226,864 Citibank 15/6/2016 (4,236)USD 432,569 COP 1,345,000,000 Credit Suisse 15/6/2016 (1,963)USD 115,215 COP 340,000,000 Goldman Sachs 15/6/2016 4,754 USD 72,297 COP 235,000,000 BNP Paribas 15/6/2016 (3,281)USD 1,645,283 EUR 1,463,819 Morgan Stanley 15/6/2016 8,569 USD 1,621,872 EUR 1,448,978 Citibank 15/6/2016 2,459 USD 3,997,266 EUR 3,632,392 Deutsche Bank 15/6/2016 (55,180)USD 254,835 EUR 228,133 BNP Paribas 15/6/2016 (78)USD 4,553,616 EUR 4,090,000 HSBC 15/6/2016 (14,902)USD 224,720 EUR 197,547 Credit Suisse 15/6/2016 3,558 USD 1,432,646 EUR 1,279,409 Bank of America Merrill Lynch 15/6/2016 2,688 USD 2,256,530 EUR 1,994,030 JP Morgan 15/6/2016 25,372 USD 3,028,703 EUR 2,735,000 Barclays Bank 15/6/2016 (24,569)USD 3,953,800 EUR 3,529,919 Goldman Sachs 15/6/2016 8,395 USD 780,343 EUR 715,000 UBS 15/6/2016 (16,660)USD 90,688 EUR 80,000 Westpac 15/6/2016 1,158 USD 58,918 GBP 40,922 JP Morgan 15/6/2016 (906)USD 1,437,583 GBP 1,006,968 Barclays Bank 15/6/2016 (33,219)USD 3,218,617 GBP 2,254,433 HSBC 15/6/2016 (74,275)USD 1,661,205 GBP 1,164,609 Citibank 15/6/2016 (39,702)USD 102,751 GBP 70,000 Westpac 15/6/2016 211 USD 572,915 GBP 398,638 Credit Suisse 15/6/2016 (9,746)USD 198,600 GBP 138,007 Goldman Sachs 15/6/2016 (3,143)USD 1,714,577 GBP 1,213,939 Morgan Stanley 15/6/2016 (56,590)USD 148,502 GBP 102,482 Bank of America Merrill Lynch 15/6/2016 (1,417)USD 1,478,157 HUF 410,648,735 Credit Suisse 15/6/2016 15,756 USD 1,040,350 HUF 289,476,915 Barclays Bank 15/6/2016 9,638 USD 358,868 HUF 99,099,268 Bank of America Merrill Lynch 15/6/2016 5,730 USD 618,249 HUF 172,042,725 JP Morgan 15/6/2016 5,679 USD 1,086,560 HUF 300,280,000 BNP Paribas 15/6/2016 16,606 USD 715,988 HUF 198,785,422 Deutsche Bank 15/6/2016 8,027 USD 283,418 HUF 81,000,000 Citibank 15/6/2016 (4,183)USD 102,141 HUF 28,000,000 Goldman Sachs 15/6/2016 2,286 USD 42,792 HUF 12,033,303 Morgan Stanley 15/6/2016 (6)USD 21,208 HUF 5,883,637 HSBC 15/6/2016 252 USD 122,835 HUF 33,750,000 Societe Generale 15/6/2016 2,503 USD 654,415 IDR 8,770,770,876 UBS 15/6/2016 9,786 USD 1,310,514 IDR 17,615,584,843 HSBC 15/6/2016 16,218 USD 92,546 IDR 1,235,000,000 Bank of America Merrill Lynch 15/6/2016 1,735 USD 308,120 IDR 4,133,536,548 Deutsche Bank 15/6/2016 4,348 USD 414,771 IDR 5,609,769,720 Morgan Stanley 15/6/2016 2,867 USD 46,951 IDR 625,338,013 Citibank 15/6/2016 960 USD 34,713 IDR 460,000,000 Barclays Bank 15/6/2016 863 USD 638,864 ILS 2,415,941 Morgan Stanley 15/6/2016 9,691 USD 1,552,876 ILS 5,874,949 Credit Suisse 15/6/2016 22,960 USD 463,848 ILS 1,769,869 Bank of America Merrill Lynch 15/6/2016 3,367
USD 603,108 ILS 2,282,001 Citibank 15/6/2016 8,852 USD 402,079 ILS 1,521,499 HSBC 15/6/2016 5,869 USD 728,587 ILS 2,760,801 Goldman Sachs 15/6/2016 9,759 USD 14,288 ILS 54,998 JP Morgan 15/6/2016 (8)USD 1,360,615 ILS 5,192,419 Deutsche Bank 15/6/2016 9,685 USD 45,135 ILS 170,512 Barclays Bank 15/6/2016 724 USD 232,941 ILS 907,011 BNP Paribas 15/6/2016 (2,542)USD 615,248 INR 41,466,292 Deutsche Bank 15/6/2016 (745)USD 361,111 INR 24,400,446 BNP Paribas 15/6/2016 (1,267)
USD 903,552 INR 60,880,875 Morgan Stanley 15/6/2016 (875)USD 250,166 INR 16,862,749 Goldman Sachs 15/6/2016 (332)USD 4,011,177 INR 271,565,045 HSBC 15/6/2016 (21,090)USD 2,960,564 INR 201,599,124 Citibank 15/6/2016 (31,027)USD 1,653,203 INR 111,220,956 Barclays Bank 15/6/2016 673 USD 328,315 INR 22,077,109 JP Morgan 15/6/2016 274 USD 1,625,918 INR 111,350,000 Bank of America Merrill Lynch 15/6/2016 (25,461)USD 1,042,956 INR 70,507,405 UBS 15/6/2016 (4,116)USD 161,949 INR 10,870,000 Standard Chartered Bank 15/6/2016 402 USD 143,975 JPY 16,000,000 Goldman Sachs 15/6/2016 (67)USD 1,253,557 JPY 141,000,000 HSBC 15/6/2016 (14,214)USD 178,336 JPY 20,000,000 Credit Suisse 15/6/2016 (1,545)USD 350,386 JPY 39,618,580 Barclays Bank 15/6/2016 (5,642)USD 109,396 JPY 12,000,000 Bank of America Merrill Lynch 15/6/2016 1,216 USD 628,576 JPY 69,381,420 Citibank 15/6/2016 3,514 USD 36,842 JPY 4,000,000 Morgan Stanley 15/6/2016 742 USD 330,545 JPY 36,000,000 BNP Paribas 15/6/2016 5,757 USD 1,382,154 KRW 1,698,424,076 Goldman Sachs 15/6/2016 (40,699)USD 1,619,073 KRW 1,885,087,393 Deutsche Bank 15/6/2016 30,909 USD 2,327,147 KRW 2,729,657,210 Morgan Stanley 15/6/2016 29,262 USD 5,737,031 KRW 6,771,256,190 HSBC 15/6/2016 40,595 USD 397,919 KRW 465,703,927 Bank of America Merrill Lynch 15/6/2016 5,786 USD 102,564 KRW 120,000,000 JP Morgan 15/6/2016 1,518 USD 93,381 KRW 110,120,785 Citibank 15/6/2016 732 USD 308,703 KRW 357,250,419 Barclays Bank 15/6/2016 7,527 USD 236,008 KRW 277,500,000 UBS 15/6/2016 2,463 USD 4,490,578 MXN 79,737,555 Citibank 15/6/2016 145,154 USD 1,361,000 MXN 24,143,484 JP Morgan 15/6/2016 45,125 USD 1,365,976 MXN 24,372,255 Deutsche Bank 15/6/2016 38,464 USD 1,203,331 MXN 21,409,622 Barclays Bank 15/6/2016 36,831 USD 741,393 MXN 13,378,774 HSBC 15/6/2016 13,563 USD 190,562 MXN 3,407,655 BNP Paribas 15/6/2016 4,998 USD 442,044 MXN 7,841,826 Goldman Sachs 15/6/2016 14,648 USD 499,696 MXN 8,958,756 Morgan Stanley 15/6/2016 11,983 USD 818,161 MXN 14,677,357 Bank of America Merrill Lynch 15/6/2016 19,180 USD 646,053 MXN 11,472,715 Credit Suisse 15/6/2016 20,835 USD 371,218 MYR 1,455,000 UBS 15/6/2016 16,456 USD 2,201,938 MYR 8,875,621 Deutsche Bank 15/6/2016 44,426 USD 1,080,377 MYR 4,288,875 Morgan Stanley 15/6/2016 36,106 USD 12,837 MYR 50,000 State Street Bank & Trust Company 15/6/2016 637 USD 3,092,832 MYR 12,352,386 HSBC 15/6/2016 87,199 USD 410,293 MYR 1,646,275 Citibank 15/6/2016 9,915 USD 24,444 MYR 101,843 Barclays Bank 15/6/2016 (225)USD 241,862 MYR 975,000 JP Morgan 15/6/2016 4,859 USD 180,469 MYR 725,000 Standard Chartered Bank 15/6/2016 4,171 USD 833,133 MYR 3,470,000 Bank of America Merrill Lynch 15/6/2016 (7,450)USD 111,400 MYR 450,000 Goldman Sachs 15/6/2016 2,038 USD 2,324,393 NOK 19,498,471 Credit Suisse 15/6/2016 (8,428)USD 2,223,831 NOK 19,200,000 HSBC 15/6/2016 (66,453)USD 669,584 NOK 5,648,377 JP Morgan 15/6/2016 (5,800)USD 1,772,087 NOK 14,901,529 Citibank 15/6/2016 (10,297)USD 207,449 NOK 1,700,000 Barclays Bank 15/6/2016 3,555 USD 1,465,339 NOK 12,400,000 Deutsche Bank 15/6/2016 (16,862)USD 364,933 NOK 3,086,301 Morgan Stanley 15/6/2016 (4,003)
BlackRock Global Absolute Return Bond Fund continued

Open forward foreign exchange transactions as at 31 May 2016
Currency Purchases Currency Sales CounterpartyMaturity
date
Unrealised appreciation/
(depreciation) EUR
Open forward foreign exchange transactions as at 31 May 2016
Currency Purchases Currency Sales CounterpartyMaturity
date
Unrealised appreciation/
(depreciation) EUR
260 BlackRock Strategic Funds (BSF)
The notes on pages 489 to 503 form an integral part of these financial statements.
BlackRock Global Absolute Return Bond Fund continued
USD 242,263 NOK 2,065,322 Bank of America Merrill Lynch 15/6/2016 (4,421)USD 169,453 NOK 1,400,000 Goldman Sachs 15/6/2016 1,686 USD 687,884 NZD 1,010,735 BNP Paribas 15/6/2016 4,620 USD 3,224,798 NZD 4,730,996 Morgan Stanley 15/6/2016 26,087 USD 1,973,006 NZD 2,913,856 Citibank 15/6/2016 4,280 USD 1,483,509 NZD 2,161,585 Credit Suisse 15/6/2016 20,962 USD 551,310 NZD 813,267 Bank of America Merrill Lynch 15/6/2016 1,765 USD 1,853,402 NZD 2,711,089 JP Morgan 15/6/2016 19,815 USD 1,894,221 NZD 2,813,046 HSBC 15/6/2016 (5,288)USD 557,793 NZD 828,164 Goldman Sachs 15/6/2016 (1,438)USD 393,446 NZD 580,000 Westpac 15/6/2016 1,497 USD 308,277 NZD 460,667 UBS 15/6/2016 (2,586)USD 240,945 NZD 356,594 Deutsche Bank 15/6/2016 69 USD 544,672 PHP 25,337,551 Goldman Sachs 15/6/2016 2,551 USD 1,004,835 PHP 46,946,542 Citibank 15/6/2016 826 USD 2,633,679 PHP 122,996,602 HSBC 15/6/2016 3,134 USD 1,781,317 PHP 83,105,033 Morgan Stanley 15/6/2016 3,747 USD 425,200 PHP 19,820,000 Deutsche Bank 15/6/2016 1,223 USD 428,503 PHP 20,111,351 JP Morgan 15/6/2016 (1,397)USD 135,964 PHP 6,300,162 Barclays Bank 15/6/2016 1,110 USD 139,052 PHP 6,500,000 UBS 15/6/2016 50 USD 165,626 PHP 7,768,770 Bank of America Merrill Lynch 15/6/2016 (450)USD 53,715 PHP 2,503,988 BNP Paribas 15/6/2016 152 USD 285,319 PHP 13,400,000 NOMURA 15/6/2016 (1,100)USD 123,647 PHP 5,710,000 Credit Suisse 15/6/2016 1,381 USD 2,098,940 PLN 8,083,558 Barclays Bank 15/6/2016 35,522 USD 4,530 PLN 17,617 HSBC 15/6/2016 38 USD 7,411 PLN 28,710 UBS 15/6/2016 87 USD 160,625 PLN 627,083 BNP Paribas 15/6/2016 786 USD 1,701,775 PLN 6,399,251 Credit Suisse 15/6/2016 64,073 USD 83,899 PLN 325,000 Societe Generale 15/6/2016 991 USD 445,336 PLN 1,708,936 Deutsche Bank 15/6/2016 8,943 USD 48,592 PLN 183,412 Morgan Stanley 15/6/2016 1,672 USD 78,711 PLN 300,000 Citibank 15/6/2016 2,047 USD 475,136 PLN 1,832,766 JP Morgan 15/6/2016 7,381 USD 11,136 PLN 43,668 Bank of America Merrill Lynch 15/6/2016 11 USD 1,303,716 PLN 5,200,000 Goldman Sachs 15/6/2016 (18,757)USD 1,028,339 RON 4,070,000 BNP Paribas 15/6/2016 18,459 USD 45,585 RON 180,000 Goldman Sachs 15/6/2016 911 USD 3,445,353 RUB 237,100,000 Citibank 15/6/2016 (124,347)USD 666,998 RUB 46,931,177 JP Morgan 15/6/2016 (38,009)USD 144,897 RUB 10,700,000 Credit Suisse 15/6/2016 (15,086)USD 455,794 RUB 30,400,000 Barclays Bank 15/6/2016 (3,374)USD 111,661 RUB 7,468,823 Goldman Sachs 15/6/2016 (1,116)USD 373,124 RUB 27,100,000 Bank of America Merrill Lynch 15/6/2016 (32,712)USD 2,499,069 SEK 20,484,282 Citibank 15/6/2016 29,739 USD 5,612,296 SEK 45,757,103 Credit Suisse 15/6/2016 93,240 USD 346,049 SEK 2,800,000 Barclays Bank 15/6/2016 8,049 USD 673,388 SEK 5,479,967 Goldman Sachs 15/6/2016 12,283 USD 927,363 SEK 7,910,667 JP Morgan 15/6/2016 (22,283)USD 828,592 SEK 6,817,595 Morgan Stanley 15/6/2016 7,078 USD 119,945 SEK 1,000,000 Deutsche Bank 15/6/2016 (387)USD 2,580,053 SEK 21,456,765 Bank of America Merrill Lynch 15/6/2016 (2,550)USD 639,955 SEK 5,393,621 BNP Paribas 15/6/2016 (8,334)USD 72,492 SEK 600,000 Westpac 15/6/2016 237 USD 263,673 SGD 356,641 Bank of America Merrill Lynch 15/6/2016 4,272 USD 1,427,576 SGD 1,931,434 BNP Paribas 15/6/2016 22,798 USD 655,436 SGD 894,987 Goldman Sachs 15/6/2016 5,130 USD 968,254 SGD 1,340,000 HSBC 15/6/2016 (4,029)USD 997,748 SGD 1,367,415 Morgan Stanley 15/6/2016 4,556 USD 1,623,570 SGD 2,210,342 Citibank 15/6/2016 17,003 USD 810,971 SGD 1,097,016 JP Morgan 15/6/2016 13,071 USD 888,073 SGD 1,209,079 Deutsche Bank 15/6/2016 9,269 USD 480,357 SGD 663,111 Credit Suisse 15/6/2016 (913)USD 167,753 SGD 229,974 Barclays Bank 15/6/2016 722
USD 117,374 SGD 160,000 Westpac 15/6/2016 1,096 USD 309,176 SGD 420,000 UBS 15/6/2016 3,832 USD 1,900,688 THB 67,100,000 Goldman Sachs 15/6/2016 20,459 USD 992,829 THB 35,200,000 Barclays Bank 15/6/2016 6,927 USD 292,829 THB 10,300,000 BNP Paribas 15/6/2016 4,098 USD 1,115,083 THB 39,334,958 HSBC 15/6/2016 12,775 USD 517,829 THB 18,200,000 Deutsche Bank 15/6/2016 7,600 USD 279,037 THB 9,800,000 JP Morgan 15/6/2016 4,277 USD 159,681 THB 5,600,000 Credit Suisse 15/6/2016 2,651 USD 39,022 THB 1,365,042 Morgan Stanley 15/6/2016 735 USD 326,352 THB 11,450,000 UBS 15/6/2016 5,296 USD 372,657 THB 13,150,000 Bank of America Merrill Lynch 15/6/2016 4,160 USD 880,923 THB 31,400,000 Citibank 15/6/2016 1,949 USD 1,168,700 TRY 3,478,649 Deutsche Bank 15/6/2016 (7,721)USD 1,093,445 TRY 3,206,125 Citibank 15/6/2016 7,474 USD 69,472 TRY 200,000 BNP Paribas 15/6/2016 1,596 USD 117,130 TRY 346,542 Bank of America Merrill Lynch 15/6/2016 (138)USD 870,456 TRY 2,553,056 Barclays Bank 15/6/2016 5,719 USD 835,679 TRY 2,443,025 JP Morgan 15/6/2016 7,922 USD 219,513 TRY 640,753 Morgan Stanley 15/6/2016 2,375 USD 217,753 TRY 641,850 HSBC 15/6/2016 468 USD 123,352 TRY 360,000 Credit Suisse 15/6/2016 1,354 USD 235,715 TRY 690,000 Royal Bank of Scotland 15/6/2016 1,959 USD 1,448,080 TWD 46,850,443 Morgan Stanley 15/6/2016 8,882 USD 1,328,270 TWD 42,984,504 Goldman Sachs 15/6/2016 7,863 USD 47,457 TWD 1,541,559 JP Morgan 15/6/2016 122 USD 580,610 TWD 18,776,435 Deutsche Bank 15/6/2016 3,790 USD 667,582 TWD 21,741,780 Citibank 15/6/2016 161 USD 32,489 TWD 1,061,828 BNP Paribas 15/6/2016 (95)USD 101,459 TWD 3,285,119 Bank of America Merrill Lynch 15/6/2016 552 USD 188,359 TWD 6,144,167 Barclays Bank 15/6/2016 (221)USD 267,163 TWD 8,690,815 HSBC 15/6/2016 343 USD 507,057 TWD 16,524,338 UBS 15/6/2016 (166)USD 436,420 TWD 14,099,012 Credit Suisse 15/6/2016 3,246 USD 465,612 TWD 15,300,000 Standard Chartered Bank 15/6/2016 (3,623)USD 55,057 ZAR 900,000 Credit Suisse 15/6/2016 (1,734)USD 98,247 ZAR 1,500,000 Citibank 15/6/2016 2,914 USD 33,354 ZAR 500,000 JP Morgan 15/6/2016 1,513 USD 20,111 ZAR 300,000 Bank of America Merrill Lynch 15/6/2016 996 USD 79,488 ZAR 1,200,000 Deutsche Bank 15/6/2016 3,128 ZAR 3,050,000 USD 195,927 Citibank 15/6/2016 (2,487)ZAR 1,050,000 USD 71,690 JP Morgan 15/6/2016 (4,650)ZAR 600,000 USD 41,336 Bank of America Merrill Lynch 15/6/2016 (2,988)ZAR 300,000 USD 20,441 Deutsche Bank 15/6/2016 (1,291)USD 2,643,133 JPY 287,345,000 State Street Bank & Trust Company 20/6/2016 49,754 USD 150,000 CAD 194,958 Commonwealth Bank of Australia 30/6/2016 597 USD 145,576 EUR 130,000 Commonwealth Bank of Australia 30/6/2016 207 USD 148,137 NZD 220,000 Commonwealth Bank of Australia 30/6/2016 (309)BRL 4,520,000 USD 1,238,585 JP Morgan 5/7/2016 9,117 USD 628,611 BRL 2,290,000 Citibank 5/7/2016 (3,637)USD 79,300 BRL 290,000 JP Morgan 5/7/2016 (734)AUD 300,000 CAD 281,781 Westpac 6/7/2016 1,340 AUD 300,000 NZD 319,508 Westpac 6/7/2016 1,574 CAD 280,974 AUD 300,000 HSBC 6/7/2016 (1,893)USD 215,889 NZD 320,000 Westpac 6/7/2016 (17)EUR 102,178 USD 113,647 Citibank 11/7/2016 568 CLP 1,211,700,000 USD 1,760,929 JP Morgan 15/7/2016 (7,089)CLP 101,000,000 USD 144,471 Credit Suisse 15/7/2016 1,473 CLP 103,000,000 USD 153,069 Goldman Sachs 15/7/2016 (3,626)COP 940,000,000 USD 303,912 JP Morgan 15/7/2016 (1,549)COP 940,000,000 USD 304,503 Deutsche Bank 15/7/2016 (2,077)

Open forward foreign exchange transactions as at 31 May 2016
Currency Purchases Currency Sales CounterpartyMaturity
date
Unrealised appreciation/
(depreciation) EUR
Open forward foreign exchange transactions as at 31 May 2016
Currency Purchases Currency Sales CounterpartyMaturity
date
Unrealised appreciation/
(depreciation) EUR
Annual Report and Audited Accounts 261
The notes on pages 489 to 503 form an integral part of these financial statements.
EUR 710,000 USD 803,205 Deutsche Bank 15/7/2016 (8,037)EUR 140,000 USD 157,569 Goldman Sachs 15/7/2016 (861)EUR 280,000 USD 316,739 JP Morgan 15/7/2016 (3,153)HUF 218,000,000 USD 788,021 Deutsche Bank 15/7/2016 (11,528)HUF 44,000,000 USD 156,302 Goldman Sachs 15/7/2016 130 IDR 7,570,000,000 USD 566,083 HSBC 15/7/2016 (12,186)IDR 5,370,000,000 USD 399,646 Deutsche Bank 15/7/2016 (6,927)IDR 2,080,000,000 USD 151,958 JP Morgan 15/7/2016 (144)INR 42,800,000 USD 634,055 HSBC 15/7/2016 (1,059)JPY 38,000,000 USD 349,292 JP Morgan 15/7/2016 (6,077)JPY 70,000,000 USD 655,501 Deutsche Bank 15/7/2016 (21,984)JPY 18,000,000 USD 165,892 Citibank 15/7/2016 (3,270)JPY 17,000,000 USD 152,646 Goldman Sachs 15/7/2016 514 MXN 16,850,000 USD 942,694 Citibank 15/7/2016 (27,774)MXN 3,000,000 USD 168,021 JP Morgan 15/7/2016 (5,108)MXN 8,400,000 USD 460,712 Goldman Sachs 15/7/2016 (5,588)MXN 5,900,000 USD 317,987 Deutsche Bank 15/7/2016 1,089 MYR 1,900,000 USD 487,642 HSBC 15/7/2016 (24,412)MYR 1,000,000 USD 248,911 JP Morgan 15/7/2016 (5,927)PEN 2,110,000 USD 624,907 JP Morgan 15/7/2016 (1,043)PEN 1,080,000 USD 328,277 Goldman Sachs 15/7/2016 (8,061)PHP 18,300,000 USD 394,771 HSBC 15/7/2016 (3,619)PHP 11,300,000 USD 241,866 Deutsche Bank 15/7/2016 (537)PLN 1,250,000 USD 317,076 JP Morgan 15/7/2016 1,010 PLN 4,900,000 USD 1,267,190 Goldman Sachs 15/7/2016 (17,721)RON 1,300,000 USD 322,404 Goldman Sachs 15/7/2016 (339)RUB 55,000,000 USD 805,918 JP Morgan 15/7/2016 16,739 THB 6,100,000 USD 173,641 Citibank 15/7/2016 (2,694)THB 10,200,000 USD 285,538 Goldman Sachs 15/7/2016 (203)TRY 680,000 USD 233,489 Deutsche Bank 15/7/2016 (4,547)TRY 710,000 USD 241,431 JP Morgan 15/7/2016 (2,639)USD 312,088 CLP 213,000,000 Credit Suisse 15/7/2016 3,518 USD 155,960 CLP 105,000,000 BNP Paribas 15/7/2016 3,624 USD 332,226 CLP 225,000,000 Deutsche Bank 15/7/2016 6,001 USD 2,401,117 CNY 15,650,000 Citibank 15/7/2016 24,611 USD 813,746 CNY 5,290,000 HSBC 15/7/2016 10,216 USD 144,499 COP 440,000,000 Citibank 15/7/2016 2,730 USD 944,578 COP 2,940,000,000 JP Morgan 15/7/2016 (479)USD 147,601 COP 440,000,000 Deutsche Bank 15/7/2016 5,503 USD 1,289,276 EUR 1,130,000 Deutsche Bank 15/7/2016 22,568 USD 319,978 HUF 88,000,000 Citibank 15/7/2016 6,332 USD 628,450 HUF 174,000,000 Deutsche Bank 15/7/2016 8,735 USD 319,233 IDR 4,270,000,000 Barclays Bank 15/7/2016 6,805 USD 161,556 IDR 2,160,000,000 Citibank 15/7/2016 3,505 USD 1,112,331 INR 75,100,000 Deutsche Bank 15/7/2016 1,654 USD 313,743 INR 21,300,000 HSBC 15/7/2016 (1,085)USD 1,317,689 JPY 143,000,000 Citibank 15/7/2016 25,774 USD 135,000 MXN 2,364,286 Credit Suisse 15/7/2016 6,335 USD 155,426 MXN 2,800,000 JP Morgan 15/7/2016 3,522 USD 24,882 MXN 435,714 Citibank 15/7/2016 1,170 USD 304,752 MXN 5,400,000 HSBC 15/7/2016 11,263 USD 323,054 MXN 5,700,000 Deutsche Bank 15/7/2016 13,115 USD 86,037 MYR 350,000 Deutsche Bank 15/7/2016 1,108 USD 477,169 MYR 1,900,000 JP Morgan 15/7/2016 15,049 USD 166,881 MYR 650,000 Citibank 15/7/2016 8,401 USD 314,548 PEN 1,080,000 JP Morgan 15/7/2016 (4,213)USD 316,728 PHP 14,700,000 Deutsche Bank 15/7/2016 2,565 USD 161,847 PHP 7,500,000 Citibank 15/7/2016 1,533 USD 476,081 PLN 1,800,000 Deutsche Bank 15/7/2016 15,971 USD 490,266 PLN 1,900,000 Barclays Bank 15/7/2016 5,894 USD 314,551 PLN 1,200,000 Citibank 15/7/2016 8,111 USD 321,719 PLN 1,250,000 JP Morgan 15/7/2016 3,141 USD 641,367 RON 2,520,000 Goldman Sachs 15/7/2016 15,317 USD 329,109 RON 1,300,000 JP Morgan 15/7/2016 6,333 USD 321,819 RUB 21,800,000 Citibank 15/7/2016 (4,505)USD 1,128,408 RUB 75,100,000 JP Morgan 15/7/2016 2,142 USD 292,624 THB 10,300,000 Deutsche Bank 15/7/2016 4,038 USD 871,628 THB 30,600,000 JP Morgan 15/7/2016 14,032 USD 1,536,535 THB 54,000,000 Citibank 15/7/2016 23,303 USD 323,317 TRY 940,000 Citibank 15/7/2016 6,780 USD 156,240 TRY 450,000 Barclays Bank 15/7/2016 4,551 USD 651,074 ZAR 9,600,000 Citibank 15/7/2016 41,875
ZAR 7,200,000 USD 471,013 Deutsche Bank 15/7/2016 (15,947)ZAR 4,800,000 USD 316,924 JP Morgan 15/7/2016 (13,237)ZAR 5,100,000 USD 335,341 Goldman Sachs 15/7/2016 (12,821)AUD 170,000 EUR 109,000 Citibank 20/7/2016 1,029 EUR 276,761 AUD 420,000 JP Morgan 20/7/2016 4,926 EUR 61,012 CAD 90,000 JP Morgan 20/7/2016 (608)EUR 132,290,654 GBP 105,882,000 Royal Bank of Scotland 20/7/2016 (6,340,379)EUR 1,325,043 GBP 1,050,000 HSBC 20/7/2016 (49,719)EUR 3,528,490 GBP 2,750,000 Barclays Bank 20/7/2016 (72,078)EUR 1,571,552 GBP 1,240,000 Bank of America Merrill Lynch 20/7/2016 (51,977)EUR 383,845 GBP 300,000 Deutsche Bank 20/7/2016 (8,945)EUR 4,011,411 GBP 3,170,000 BNP Paribas 20/7/2016 (139,062)EUR 81,932 JPY 10,130,000 Morgan Stanley 20/7/2016 313 EUR 12,952,726 USD 14,840,000 Deutsche Bank 20/7/2016 (311,516)EUR 3,268,679 USD 3,650,000 Barclays Bank 20/7/2016 6,248 EUR 3,568,791 USD 4,080,000 UBS 20/7/2016 (77,982)EUR 1,709,342 ZAR 29,370,000 Royal Bank of Scotland 20/7/2016 58,646 EUR 1,147,368 ZAR 20,730,000 Barclays Bank 20/7/2016 (17,731)EUR 568 ZAR 10,000 Goldman Sachs 20/7/2016 6 GBP 4,780,000 EUR 6,286,973 Barclays Bank 20/7/2016 (28,531)GBP 120,000 EUR 149,930 Royal Bank of Scotland 20/7/2016 7,186 GBP 2,360,000 EUR 3,036,483 Deutsche Bank 20/7/2016 53,459 GBP 2,400,000 EUR 3,110,763 Goldman Sachs 20/7/2016 31,551 GBP 4,880,000 EUR 6,081,126 JP Morgan 20/7/2016 308,246 USD 3,000,000 EUR 2,637,254 Barclays Bank 20/7/2016 44,197 USD 210,000 EUR 181,752 HSBC 20/7/2016 5,949 USD 3,640,000 EUR 3,191,614 Morgan Stanley 20/7/2016 61,879 USD 160,000 EUR 138,913 UBS 20/7/2016 4,098 USD 2,080,000 EUR 1,831,563 Goldman Sachs 20/7/2016 27,576 ZAR 29,370,000 EUR 1,778,171 JP Morgan 20/7/2016 (127,474)
USD 510,094 EUR 450,000 Royal Bank of Scotland 5/8/2016 5,686 MYR 3,228,648 USD 803,346 JP Morgan 11/8/2016 (19,404)PHP 10,727,776 USD 228,981 Goldman Sachs 11/8/2016 (267)USD 162,491 EUR 147,078 Bank of America Merrill Lynch 11/8/2016 (1,950)USD 2,845,985 MYR 11,608,773 HSBC 11/8/2016 31,822 USD 2,538,598 MYR 10,260,463 State Street Bank & Trust Company 11/8/2016 48,813 USD 187,253 PHP 8,888,888 Citibank 11/8/2016 (1,992)AUD 800,000 USD 580,800 Royal Bank of Scotland 16/8/2016 (1,808)CAD 750,000 USD 571,647 Citibank 16/8/2016 2,586 CHF 1,710,000 USD 1,747,394 Deutsche Bank 16/8/2016 (12,317)CNY 3,800,000 USD 578,428 Citibank 16/8/2016 (3,132)CNY 3,860,000 USD 589,538 HSBC 16/8/2016 (4,947)EUR 2,027,107 MXN 42,400,000 JP Morgan 16/8/2016 (14,724)EUR 1,030,000 USD 1,176,368 Goldman Sachs 16/8/2016 (20,487)IDR 7,460,000,000 USD 550,757 JP Morgan 16/8/2016 (8,354)IDR 7,950,000,000 USD 574,339 HSBC 16/8/2016 2,343 INR 68,360,000 USD 1,013,416 JP Morgan 16/8/2016 (6,623)INR 68,360,000 USD 1,013,491 UBS 16/8/2016 (6,691)INR 60,350,000 USD 891,301 Deutsche Bank 16/8/2016 (2,839)KRW 1,380,000,000 USD 1,164,754 HSBC 16/8/2016 (5,504)MXN 47,100,000 USD 2,577,118 Citibank 16/8/2016 (33,179)MXN 9,650,000 USD 527,221 JP Morgan 16/8/2016 (6,095)MYR 2,400,000 USD 592,300 Citibank 16/8/2016 (10,160)NOK 9,600,000 USD 1,169,336 Barclays Bank 16/8/2016 (18,276)SEK 19,080,000 USD 2,349,678 UBS 16/8/2016 (42,016)SGD 1,210,000 USD 879,828 Deutsche Bank 16/8/2016 (2,139)THB 10,400,000 USD 291,940 Deutsche Bank 16/8/2016 (1,050)USD 1,165,216 AUD 1,590,000 Goldman Sachs 16/8/2016 13,304 USD 1,159,133 CAD 1,500,000 Citibank 16/8/2016 8,972 USD 578,214 CAD 750,000 Deutsche Bank 16/8/2016 3,279 USD 2,344,751 CHF 2,270,000 Goldman Sachs 16/8/2016 38,773 USD 576,923 CHF 570,000 Citibank 16/8/2016 (843)USD 869,433 CNY 5,730,000 Deutsche Bank 16/8/2016 2,244
BlackRock Global Absolute Return Bond Fund continued

Open forward foreign exchange transactions as at 31 May 2016
Currency Purchases Currency Sales CounterpartyMaturity
date
Unrealised appreciation/
(depreciation) EUR
Open forward foreign exchange transactions as at 31 May 2016
Currency Purchases Currency Sales CounterpartyMaturity
date
Unrealised appreciation/
(depreciation) EUR
Futures contracts as at 31 May 2016
Number of contracts
Currencyof contract Contract/Description
Expiration date
Gross underlying
exposureEUR
Unrealised appreciation/
(depreciation) EUR
262 BlackRock Strategic Funds (BSF)
The notes on pages 489 to 503 form an integral part of these financial statements.
BlackRock Global Absolute Return Bond Fund continued
USD 294,064 CNY 1,930,000 HSBC 16/8/2016 1,844 USD 1,742,501 EUR 1,540,000 Barclays Bank 16/8/2016 16,039 USD 547,322 IDR 7,460,000,000 Deutsche Bank 16/8/2016 5,287 USD 1,157,105 JPY 126,000,000 Barclays Bank 16/8/2016 18,166 USD 584,421 KRW 685,000,000 Deutsche Bank 16/8/2016 8,326 USD 594,271 KRW 695,000,000 Citibank 16/8/2016 9,625 USD 1,091,633 MXN 20,300,000 Deutsche Bank 16/8/2016 (2,756)USD 584,566 NOK 4,800,000 Deutsche Bank 16/8/2016 9,047 USD 1,154,636 NZD 1,720,000 Goldman Sachs 16/8/2016 (3,259)USD 565,967 PLN 2,250,000 Citibank 16/8/2016 (5,785)USD 591,502 SEK 4,900,000 Citibank 16/8/2016 139 USD 1,466,211 SGD 2,010,000 Barclays Bank 16/8/2016 7,732 USD 564,808 SGD 780,000 Citibank 16/8/2016 (723)USD 299,376 THB 10,600,000 Deutsche Bank 16/8/2016 2,698 USD 581,099 THB 20,500,000 Barclays Bank 16/8/2016 7,108 USD 581,717 TWD 18,900,000 JP Morgan 16/8/2016 1,717 USD 594,727 TWD 19,400,000 Deutsche Bank 16/8/2016 (362)
(10,550,835)
CHF Hedged Share Class
CHF 12,650,632 EUR 11,421,451 State Street Bank & Trust Company 15/6/2016 22,450 EUR 301,936 CHF 334,410 State Street Bank & Trust Company 15/6/2016 (576)
21,874
SEK Hedged Share Class
EUR 4,754,332 SEK 44,304,894 State Street Bank & Trust Company 15/6/2016 (18,511)SEK 2,937,881,408 EUR 317,079,090 State Street Bank & Trust Company 15/6/2016 (589,282)
(607,793)
USD Hedged Share Class
EUR 2,583 USD 2,895 State Street Bank & Trust Company 15/6/2016 (7)USD 178,832 EUR 157,149 State Street Bank & Trust Company 15/6/2016 2,891
2,884
Total (Gross underlying exposure - EUR 1,723,581,040) (11,133,870)
136 AUD 90 Day Bank Bill March 2017 88,680,380 52,676 (100) AUD 90 Day Bank Bill September 2016 65,206,162 (36,291) (36) AUD 90 Day Bank Bill December 2016 23,474,218 (9,169) (153) USD 90 Day Euro December 2017 137,892,252 66,621 35 USD 90 Day Euro December 2016 31,543,979 (7,039) (15) USD 90 Day Euro March 2019 13,518,851 1,343 40 USD 90 Day Euro March 2018 36,050,262 (24,580) (107) USD 90 Day Euro December 2018 96,434,451 24,036 78 USD 90 Day Euro December 2017 70,298,011 (24,677) 186 GBP 90 Day Sterling December 2016 121,253,679 (8,358) (512) GBP 90 Day Sterling December 2017 333,773,568 107,049 (488) AUD Australian 10 Year Bond June 2016 42,284,950 (577,630) 378 CAD Canadian 10 Year Bond September 2016 28,312,107 15,637 (171) EUR Euro BOBL June 2016 19,410,381 (12,270) 55 EUR Euro BOBL June 2016 6,243,105 10,440 67 EUR Euro BTP June 2016 8,781,891 49,230 (388) EUR Euro BTP June 2016 50,856,323 (228,700) (332) EUR Euro Bund June 2016 34,632,583 82,270 6 EUR Euro Bund June 2016 625,890 (2,873) (4) EUR Euro Schatz June 2016 403,660 210 1 EUR Euro Schatz June 2016 100,915 70 1 EUR Euro-BUXL June 2016 187,671 4,660 (20) EUR Euro-BUXL June 2016 3,753,420 (17,820) (100) EUR Euro-OAT June 2016 12,973,300 6,040 258 GBP UK Long Gilt Bond September 2016 35,259,480 (37,817) (270) GBP UK Long Gilt Bond September 2016 36,899,455 56,808 (70) USD US Long Bond September 2016 8,632,515 56,663 26 USD US Long Bond September 2016 3,206,363 (18,098) 67 USD US Treasury 10 Year Note September 2016 6,081,171 (20,706) (875) USD US Treasury 10 Year Note September 2016 79,418,277 184,213 (174) USD US Treasury 2 Year Note September 2016 31,667,015 17,788 (413) USD US Treasury 5 Year Note September 2016 37,705,407 71,352 190 USD US Treasury 5 Year Note September 2016 17,346,313 (61,586) (3) USD US Ultra Bond September 2016 265,083 723 (23) USD US Ultra Bond September 2016 2,303,105 24,501
Total 1,485,476,193 (255,284)

Purchased Options as at 31 May 2016
Number of contracts
Call/Put Description Counterparty
Strike Price
Expiration date
Unrealised appreciation/
(depreciation) EUR
Market Value
EUR
Written Options as at 31 May 2016
Number of contracts
Call/Put Description Counterparty
Strike Price
Expiration date
Unrealised appreciation/
(depreciation) EUR
Market Value
EUR
Annual Report and Audited Accounts 263
The notes on pages 489 to 503 form an integral part of these financial statements.
BlackRock Global Absolute Return Bond Fund continued
250,000 Put OTC AUD/USD Commonwealth Bank of Australia AUD 0.70 26/08/2016 (2,959) 1,778 66 Put Eurodollar Futures Exchange Traded USD 97.88 13/06/2016 (12,039) 369 66 Put Eurodollar Futures Exchange Traded USD 98.63 13/06/2016 (38,315) 369 38 Put E-Mini S&P 500 Index Exchange Traded USD 2,070.00 15/07/2016 (59,535) 47,630 21 Put US Treasury 10 Year Note Futures Goldman Sachs USD 129.00 22/07/2016 3,060 16,157 30 Call US Treasury 10 Year Note Futures Goldman Sachs USD 131.50 26/08/2016 (14,979) 13,430 500,000 Put OTC AUD/USD HSBC AUD 0.70 26/08/2016 (5,956) 3,555
Total (Gross underlying exposure - EUR 5,015,875) (130,723) 83,288
(250,000) Put OTC AUD/USD Commonwealth Bank of Australia AUD 0.66 26/08/2016 1,901 (431) (132) Put Eurodollar Futures Exchange Traded USD 98.25 13/06/2016 43,055 (739) (30) Call US Treasury 10 Year Note Exchange Traded USD 133.00 24/06/2016 7,223 (629) (23) Call 90 Day Euro Futures Exchange Traded USD 99.25 19/12/2016 7,596 (1,802) (23) Put 90 Day Euro Futures Exchange Traded USD 99.25 19/12/2016 (3,987) (13,385) (500,000) Put OTC AUD/USD HSBC AUD 0.66 26/08/2016 3,636 (861)
Total (Gross underlying exposure - EUR 22,441,465) 59,424 (17,847)

Purchased Swaptions as at 31 May 2016
Number of contracts
Call/Put Description Counterparty
Strike Price
Expiration date
Unrealised appreciation/
(depreciation) EUR
Market Value
EUR
264 BlackRock Strategic Funds (BSF)
The notes on pages 489 to 503 form an integral part of these financial statements.
1,700,000 Put Fund purchases an option to enter into an Interest Rate Swap. If exercised Fund receives Floating USD LIBOR 3 Month BBA quarterly from 3/5/2021; and pays 3.5% Bank of America Fixed semi-annually from 3/2/2021 Merrill Lynch USD 3.50 01/02/2021 (13,809) 36,079
2,750,000 Call Fund purchases an option to enter into an Interest Rate Swap. If exercised Fund receives 1.5% Fixed semi-annually from 6/2/2019; and pays Floating USD LIBOR 3 Month BBA quarterly from 6/5/2019 Bank of New York USD 1.50 04/02/2019 9,332 70,518
2,750,000 Put Fund purchases an option to enter into an Interest Rate Swap. If exercised Fund receives Floating USD LIBOR 3 Month BBA quarterly from 6/5/2019; and pays 3% Fixed semi-annually from 6/2/2019 Bank of New York USD 3.00 04/02/2019 (13,062) 48,325
1,310,000 Put Fund purchases an option to enter into an Interest Rate Swap. If exercised Fund receives Floating USD LIBOR 3 Month BBA quarterly from 19/7/2017; and pays 2.4% Fixed semi-annually from 19/4/2017 Barclays Bank USD 2.40 13/04/2017 (1,305) 58,262
1,980,000 Call Fund purchases an option to enter into an Interest Rate Swap. If exercised Fund receives 1.65% Fixed semi-annually from 9/1/2019; and pays Floating USD LIBOR 3 Month BBA quarterly from 9/4/2019 Barclays Bank USD 1.65 07/01/2019 23,324 57,765
1,980,000 Put Fund purchases an option to enter into an Interest Rate Swap. If exercised Fund receives Floating USD LIBOR 3 Month BBA quarterly from 9/4/2019; and pays 3.65% Fixed semi-annually from 9/1/2019 Barclays Bank USD 3.65 07/01/2019 (15,793) 15,502
1,900,000 Call Fund purchases an option to enter into an Interest Rate Swap. If exercised Fund receives 1.385% Fixed semi-annually from 22/11/2016; and pays Floating USD LIBOR 3 Month BBA quarterly from 22/2/2017 Citibank USD 1.39 18/11/2016 (5,161) 13,462
1,900,000 Put Fund purchases an option to enter into an Interest Rate Swap. If exercised Fund receives Floating USD LIBOR 3 Month BBA quarterly from 22/2/2017; and pays 1.385% Fixed semi-annually from 22/11/2016 Citibank USD 1.39 18/11/2016 3,167 21,791
26,000,000 Call Fund purchases an option to enter into an Interest Rate Swap. If exercised Fund receives 1.55% Fixed semi-annually from 29/1/2018; and pays Floating USD LIBOR 3 Month BBA quarterly from 29/4/2018 Citibank USD 1.55 25/01/2018 (17,006) 186,896
500,000 Call Fund purchases an option to enter into an Interest Rate Swap. If exercised Fund receives 2.47% Fixed semi- annually from 24/1/2019; and pays Floating USD LIBOR 3 Month BBA quarterly from 24/4/2019 Citibank USD 2.47 22/01/2019 2,222 54,985
500,000 Put Fund purchases an option to enter into an Interest Rate Swap. If exercised Fund receives Floating USD LIBOR 3 Month BBA quarterly from 24/4/2019; and pays 2.47% Fixed semi-annually from 24/1/2019 Citibank USD 2.47 22/01/2019 (10,234) 42,529
2,070,000 Put Fund purchases an option to enter into an Interest Rate Swap. If exercised Fund receives Floating USD LIBOR 3 Month BBA quarterly from 8/7/2019; and pays 2.55% Fixed semi-annually from 8/4/2019 Citibank USD 2.55 04/04/2019 (2,296) 168,732
333,000,000 Put Fund purchases an option to enter into an Interest Rate Swap. If exercised Fund receives Floating JPY LIBOR 6 Month BBA semi-annually from 23/11/2019; and pays 1.25% Fixed semi-annually from 23/11/2019 Citibank JPY 1.25 21/05/2019 (41,571) 5,291
333,000,000 Put Fund purchases an option to enter into an Interest Rate Swap. If exercised Fund receives Floating JPY LIBOR 6 Month BBA semi-annually from 30/11/2019; and pays 1.25% Fixed semi-annually from 30/11/2019 Citibank JPY 1.25 28/05/2019 (40,607) 5,372
470,000 Call Fund purchases an option to enter into an Interest Rate Swap. If exercised Fund receives 2.4% Fixed semi- annually from 10/2/2021; and pays Floating USD LIBOR 3 Month BBA quarterly from 10/5/2021 Citibank USD 2.40 08/02/2021 (4,599) 56,164
470,000 Put Fund purchases an option to enter into an Interest Rate Swap. If exercised Fund receives Floating USD LIBOR 3 Month BBA quarterly from 10/5/2021; and pays 2.4% Fixed semi-annually from 10/2/2021 Citibank USD 2.40 08/02/2021 (3,987) 56,776
1,900,000 Call Fund purchases an option to enter into an Interest Rate Swap. If exercised Fund receives 1.35% Fixed semi- annually from 21/11/2016; and pays Floating USD LIBOR 3 Month BBA quarterly from 21/2/2017 Deutsche Bank USD 1.35 17/11/2016 (6,004) 12,304
1,900,000 Put Fund purchases an option to enter into an Interest Rate Swap. If exercised Fund receives Floating USD LIBOR 3 Month BBA quarterly from 21/2/2017; and pays 1.35% Fixed semi-annually from 21/11/2016 Deutsche Bank USD 1.35 17/11/2016 5,134 23,442
BlackRock Global Absolute Return Bond Fund continued

Purchased Swaptions as at 31 May 2016
Nominal Value
Call/Put Description Counterparty
Strike Price
Expiration date
Unrealised appreciation/
(depreciation) EUR
Market Value
EUR
Annual Report and Audited Accounts 265
The notes on pages 489 to 503 form an integral part of these financial statements.
BlackRock Global Absolute Return Bond Fund continued
1,980,000 Call Fund purchases an option to enter into an Interest Rate Swap. If exercised Fund receives 1.65% Fixed semi- annually from 9/1/2019; and pays Floating USD LIBOR 3 Month BBA quarterly from 9/4/2019 Deutsche Bank USD 1.65 07/01/2019 23,094 57,765
1,980,000 Put Fund purchases an option to enter into an Interest Rate Swap. If exercised Fund receives Floating USD LIBOR 3 Month BBA quarterly from 9/4/2019; and pays 3.65% Fixed semi-annually from 9/1/2019 Deutsche Bank USD 3.65 07/01/2019 (15,794) 15,502
350,000,000 Put Fund purchases an option to enter into an Interest Rate Swap. If exercised Fund receives Floating JPY LIBOR 6 Month BBA semi-annually from 11/1/2020; and pays 1.25% Fixed semi-annually from 11/1/2020 Deutsche Bank JPY 1.25 09/07/2019 (38,766) 6,227
100,000,000 Put Fund purchases an option to enter into an Interest Rate Swap. If exercised Fund receives Floating JPY LIBOR 6 Month BBA semi-annually from 19/1/2020; and pays 1.25% Fixed semi-annually from 19/1/2020 Deutsche Bank JPY 1.25 17/07/2019 (10,561) 1,812
100,000,000 Put Fund purchases an option to enter into an Interest Rate Swap. If exercised Fund receives Floating JPY LIBOR 6 Month BBA semi-annually from 1/2/2020; and pays 1.25% Fixed semi-annually from 1/2/2020 Deutsche Bank JPY 1.25 30/07/2019 (9,786) 1,866
100,000,000 Put Fund purchases an option to enter into an Interest Rate Swap. If exercised Fund receives Floating JPY LIBOR 6 Month BBA semi-annually from 8/2/2020; and pays 1.25% Fixed semi-annually from 8/2/2020 Deutsche Bank JPY 1.25 06/08/2019 (9,444) 1,895
100,000,000 Put Fund purchases an option to enter into an Interest Rate Swap. If exercised Fund receives Floating JPY LIBOR 6 Month BBA semi-annually from 15/2/2020; and pays 1.25% Fixed semi-annually from 15/2/2020 Deutsche Bank JPY 1.25 13/08/2019 (8,658) 1,924
100,000,000 Put Fund purchases an option to enter into an Interest Rate Swap. If exercised Fund receives Floating JPY LIBOR 6 Month BBA semi-annually from 19/2/2020; and pays 1.25% Fixed semi-annually from 19/2/2020 Deutsche Bank JPY 1.25 15/08/2019 (8,613) 1,935
100,000,000 Put Fund purchases an option to enter into an Interest Rate Swap. If exercised Fund receives Floating JPY LIBOR 6 Month BBA semi-annually from 29/2/2020; and pays 1.25% Fixed semi-annually from 29/2/2020 Deutsche Bank JPY 1.25 28/08/2019 (8,255) 1,988
7,000,000 Put Fund purchases an option to enter into an Interest Rate Swap. If exercised Fund receives Floating USD LIBOR 3 Month BBA quarterly from 5/12/2019; and pays 4% Fixed semi-annually from 5/3/2020 Deutsche Bank USD 4.00 03/09/2019 (191,384) 59,293
250,000,000 Put Fund purchases an option to enter into an Interest Rate Swap. If exercised Fund receives Floating JPY LIBOR 6 Month BBA semi-annually from 11/5/2020; and pays 1.25% Fixed semi-annually from 11/5/2020 Deutsche Bank JPY 1.25 07/11/2019 (20,566) 5,753
900,000 Call Fund purchases an option to enter into an Interest Rate Swap. If exercised Fund receives 2.48% Fixed semi- annually from 27/3/2020; and pays USD Libor 3-month-BBA quarterly from 27/6/2020 Deutsche Bank USD 2.48 25/03/2020 (7,205) (7,205)
900,000 Put Fund purchases an option to enter into an Interest Rate Swap. If exercised Fund receives USD Libor 3-month -BBA quarterly from 27/6/2020; and pays 2.48% Fixed semi-annually from 27/3/2020 Deutsche Bank USD 2.48 25/03/2020 (27,579) (27,579)
400,000 Call Fund purchases an option to enter into an Interest Rate Swap. If exercised Fund receives 3.12% Fixed semi- annually from 21/3/2021; and pays USD Libor 3-month-BBA quarterly from 21/12/2020 Deutsche Bank USD 3.12 17/09/2020 35,374 35,374
400,000 Put Fund purchases an option to enter into an Interest Rate Swap. If exercised Fund receives USD Libor 3-month-BBA quarterly from 21/12/2020; and pays 3.12% Fixed semi-annually from 21/9/2020 Deutsche Bank USD 3.12 17/09/2020 (21,789) (21,789)
800,000 Call Fund purchases an option to enter into an Interest Rate Swap. If exercised Fund receives 2.85% Fixed semi- annually from 7/11/2020; and pays USD Libor 3-month-BBA quarterly from 7/8/2020 Goldman Sachs USD 2.85 05/05/2020 38,841 38,842
800,000 Put Fund purchases an option to enter into an Interest Rate Swap. If exercised Fund receives USD Libor 3-month-BBA quarterly from 07/8/2020; and pays 2.85% Fixed semi-annually from 07/11/2020 Goldman Sachs USD 2.85 05/05/2020 (36,127) (36,127)
1,190,000 Put Fund purchases an option to enter into an Interest Rate Swap. If exercised Fund receives Floating USD LIBOR 3 Month BBA quarterly from 21/12/2016; and pays 3.3% Fixed semi-annually from 21/09/2016 JP Morgan USD 3.30 19/09/2016 (26,650) 130

Purchased Swaptions as at 31 May 2016
Nominal Value
Call/Put Description Counterparty
Strike Price
Expiration date
Unrealised appreciation/
(depreciation) EUR
Market Value
EUR
266 BlackRock Strategic Funds (BSF)
The notes on pages 489 to 503 form an integral part of these financial statements.
1,190,000 Put Fund purchases an option to enter into an Interest Rate Swap. If exercised Fund receives Floating USD LIBOR 3 Month BBA quarterly from 23/12/2016; and pays 3.3% Fixed semi-annually from 23/9/2016 JP Morgan USD 3.30 21/09/2016 (30,577) 140
50,000,000 Call Fund purchases an option to enter into an Interest Rate Swap. If exercised Fund receives 1.2% Fixed semi- annually from 11/10/2017; and pays Floating USD LIBOR 3 Month BBA quarterly from 11/7/2017 JP Morgan USD 1.20 07/04/2017 (35,550) 88,679
334,000,000 Put Fund purchases an option to enter into an Interest Rate Swap. If exercised Fund receives Floating JPY LIBOR 6 Month BBA semi-annually from 20/12/2019; and pays 1.25% Fixed semi-annually from 20/12/2019 JP Morgan JPY 1.25 18/06/2019 (40,586) 5,662
27,100,000 Put Fund purchases an option to enter into an Interest Rate Floor. If exercised Fund receives Max 0 - 1.75% USD LIBOR 3 Month BBA quaterly from 9/1/2019; and pays 1.75% on 7/10/2014 JP Morgan USD 1.75 09/10/2019 82,280 154,309
37,900,000 Put Fund purchases an option to enter into an Interest Rate Floor. If exercised Fund receives Max 0 - 1.75% USD LIBOR 3 Month BBA quaterly from 10/1/2019; and pays 1.75% on 8/10/2014 JP Morgan USD 1.75 10/10/2019 114,841 216,077
400,000 Call Fund purchases an option to enter into an Interest Rate Swap. If exercised Fund receives 3.12% Fixed semi- annually from 21/12/2020; and pays USD Libor 3-month-BBA semi-annually from 21/12/2021 JP Morgan USD 3.12 17/09/2020 35,014 35,014
400,000 Put Fund purchases an option to enter into an Interest Rate Swap. If exercised Fund receives USD Libor 3-month-BBA quarterly from 21/12/2020; and pays 3.12% Fixed semi-annually from 21/3/2021 JP Morgan USD 3.12 17/09/2020 (22,149) (22,149)
470,000 Call Fund purchases an option to enter into an Interest Rate Swap. If exercised Fund receives 2.42% Fixed semi- annually from 10/2/2021; and pays Floating USD LIBOR 3 Month BBA quarterly from 10/5/2021 JP Morgan USD 2.42 08/02/2021 (3,221) 56,909
470,000 Put Fund purchases an option to enter into an Interest Rate Swap. If exercised Fund receives Floating USD LIBOR 3 Month BBA quarterly from 10/5/2021; and pays 2.42% Fixed semi-annually from 10/2/2021 JP Morgan USD 2.42 08/02/2021 (4,295) 55,834
710,000 Call Fund purchases an option to enter into an Interest Rate Swap. If exercised Fund receives 2.5% Fixed semi- annually from 29/4/2021; and pays Floating USD LIBOR 3 Month BBA quaterly from 29/7/2021 JP Morgan USD 2.50 27/04/2021 6,971 6,971
710,000 Put Fund purchases an option to enter into an Interest Rate Swap. If exercised Fund receives Floating USD LIBOR 3 Month BBA quaterly from 29/7/2021; and pays 2.5% Fixed semi-annually from 29/4/2021 JP Morgan USD 2.50 27/04/2021 (7,707) (7,707)
800,000 Call Fund purchases an option to enter an into Interest Rate Swap. If exercised Fund receives 3.03% Fixed semi- annually from 12/6/2026; and pays USD Libor 3-month-BBA semi-annually from 12/3/2026 JP Morgan USD 3.03 10/12/2025 13,864 13,864
1,500,000 Put Fund purchases an option to enter into an Interest Rate Swap. If exercised Fund receives Floating USD LIBOR 3 Month BBA quarterly from 18/1/2017; and pays 2.85% Fixed semi-annually from 18/10/2016 UBS USD 2.85 14/10/2016 (6,734) 4,702
Total (Gross underlying exposure - EUR 89,628,003) (373,972) 1,680,106
BlackRock Global Absolute Return Bond Fund continued

Annual Report and Audited Accounts 267
The notes on pages 489 to 503 form an integral part of these financial statements.
BlackRock Global Absolute Return Bond Fund continued
Written Swaptions as at 31 May 2016
Nominal Value
Call/Put Description Counterparty
Strike Price
Expiration date
Unrealised appreciation/
(depreciation) EUR
Market Value
EUR
(4,250,000) Put Fund writes an option to enter into an Interest Rate Swap. If exercised Fund receives 5.5% Fixed semi-annually from 3/2/2021; and pays Floating USD LIBOR 3 Month Bank of America BBA quarterly from 3/5/2021 Merrill Lynch USD 5.50 01/02/2021 3,002 (26,977)
(9,000,000) Call Fund writes an option to enter into an Interest Rate Swap. If exercised Fund receives Floating USD LIBOR 3 Month BBA quarterly from 13/3/2017; and pays 2.5% Fixed semi-annually from 13/12/2016 Bank of New York USD 2.50 09/12/2016 44,611 (4,287)
(2,200,000) Call Fund writes an option to enter into an Interest Rate Swap. If exercised Fund receives Floating USD LIBOR 3 Month BBA quarterly from 6/5/2019; and pays 2.15% Fixed semi-annually from 6/2/2019 Bank of New York USD 2.15 04/02/2019 (7,814) (100,399)
(2,200,000) Put Fund writes an option to enter into an Interest Rate Swap. If exercised Fund receives 2.35% Fixed semi-annually from 6/2/2019; and pays Floating USD LIBOR 3 Month BBA quarterly from 6/5/2019 Bank of New York USD 2.35 04/02/2019 17,563 (75,022)
(600,000) Call Fund writes an option to enter into an Interest Rate Swap. If exercised Fund receives Floating USD LIBOR 3 Month BBA quarterly from 22/9/2016; and pays 3.4075% Fixed semi-annually from 22/12/2016 Barclays Bank USD 3.41 20/06/2016 (65,213) (82,357)
(600,000) Put Fund writes an option to enter into an Interest Rate Swap. If exercised Fund receives 3.4075% Fixed semi-annually from 22/12/2016; and pays Floating USD LIBOR 3 Month BBA quarterly from 22/9/2016 Barclays Bank USD 3.41 20/06/2016 17,144 —
(2,140,000) Call Fund writes an option to enter into an Interest Rate Swap. If exercised Fund receives Floating EUR EURIBOR 6 Month semi-annually from 21/8/2017; and pays 0.01% Fixed annually from 21/2/2017 Barclays Bank EUR 0.01 17/02/2017 443 (8,896)
(2,850,000) Put Fund writes an option to enter into an Interest Rate Swap. If exercised Fund receives 0.51% Fixed annually from 21/2/2017; and pays Floating EUR EURIBOR 6 Month semi-annually from 21/8/2017 Barclays Bank EUR 0.51 17/02/2017 10,938 (4,737)
(6,100,000) Put Fund writes an option to enter into an Interest Rate Swap. If exercised Fund receives 0.45% Fixed annually from 27/2/2017; and pays Floating EUR EURIBOR 6 Month semi-annually from 27/8/2017 Barclays Bank EUR 0.45 23/02/2017 18,074 (13,341)
(6,400,000) Put Fund writes an option to enter into an Interest Rate Swap. If exercised Fund receives 1.6% Fixed semi-annually from 19/4/2017; and pays Floating USD LIBOR 3 Month BBA quarterly from 19/7/2017 Barclays Bank USD 1.60 13/04/2017 (10,855) (75,961)
(11,400,000) Call Fund writes an option to enter into an Interest Rate Swap. If exercised Fund receives Floating USD LIBOR 3 Month BBA quarterly from 19/3/2018; and pays 1.05% Fixed semi-annually from 19/12/2017 Barclays Bank USD 1.05 15/12/2017 13,816 (40,131)
(11,400,000) Put Fund writes an option to enter into an Interest Rate Swap. If exercised Fund receives 1.9525% Fixed semi-annually from 19/12/2017; and pays Floating USD LIBOR 3 Month BBA quarterly from 19/3/2018 Barclays Bank USD 1.95 15/12/2017 60,405 (34,538)
(3,200,000) Call Fund writes an option to enter into an Interest Rate Swap. If exercised Fund receives Floating USD LIBOR 3 Month BBA quarterly from 10/4/2018; and pays 0.88% Fixed semi-annually from 10/1/2018 Barclays Bank USD 0.88 08/01/2018 5,564 (8,864)
(3,200,000) Put Fund writes an option to enter into an Interest Rate Swap. If exercised Fund receives 1.8825% Fixed semi-annually from 10/1/2018; and pays Floating USD LIBOR 3 Month BBA quarterly from 10/4/2018 Barclays Bank USD 1.88 08/01/2018 14,447 (11,511)
(7,600,000) Call Fund writes an option to enter into an Interest Rate Swap. If exercised Fund receives Floating USD LIBOR 3 Month BBA quarterly from 14/5/2018; and pays 0.9% Fixed semi-annually from 14/2/2018 Barclays Bank USD 0.90 12/02/2018 9,360 (22,971)
(7,600,000) Put Fund writes an option to enter into an Interest Rate Swap. If exercised Fund receives 1.9% Fixed semi-annually from 14/2/2018; and pays Floating USD LIBOR 3 Month BBA quarterly from 14/5/2018 Barclays Bank USD 1.90 12/02/2018 (5,496) (29,061)
(12,600,000) Put Fund writes an option to enter into an Interest Rate Swap. If exercised Fund receives 0.75% Fixed annually from 7/3/2018; and pays Floating EUR EURIBOR 6 Month semi-annually from 7/9/2018 Barclays Bank EUR 0.75 05/03/2018 42,034 (75,461)

Written Swaptions as at 31 May 2016
Nominal Value
Call/Put Description Counterparty
Strike Price
Expiration date
Unrealised appreciation/
(depreciation) EUR
Market Value
EUR
268 BlackRock Strategic Funds (BSF)
The notes on pages 489 to 503 form an integral part of these financial statements.
(1,300,000) Call Fund writes an option to enter into an Interest Rate Swap. If exercised Fund receives Floating EUR EURIBOR 6 Month semi-annually from 14/9/2018; and pays 0.25% Fixed annually from 14/3/2018 Barclays Bank EUR 0.25 12/03/2018 (1,099) (14,032)
(1,300,000) Put Fund writes an option to enter into an Interest Rate Swap. If exercised Fund receives 0.65% Fixed annually from 14/3/2018; and pays Floating EUR EURIBOR 6 Month semi-annually from 14/9/2018 Barclays Bank EUR 0.65 12/03/2018 4,458 (9,575)
(1,600,000) Call Fund writes an option to enter into an Interest Rate Swap. If exercised Fund receives Floating USD LIBOR 3 Month BBA quarterly from 9/4/2019; and pays 2.5% Fixed semi-annually from 9/1/2019 Barclays Bank USD 2.50 07/01/2019 (30,487) (97,430)
(1,600,000) Put Fund writes an option to enter into an Interest Rate Swap. If exercised Fund receives 2.8% Fixed semi-annually from 9/1/2019; and pays Floating USD LIBOR 3 Month BBA quarterly from 9/4/2019 Barclays Bank USD 2.80 07/01/2019 25,738 (33,766)
(2,200,000) Put Fund writes an option to enter into an Interest Rate Swap. If exercised Fund receives 2.1% Fixed semi-annually from 13/1/2017; and pays Floating USD LIBOR 3 Month BBA quarterly from 13/4/2017 Citibank USD 2.10 11/01/2017 14,250 (5,590)
(6,900,000) Put Fund writes an option to enter into an Interest Rate Swap. If exercised Fund receives 0.85% Fixed annually from 7/9/2018; and pays Floating EUR EURIBOR 6 Month semi-annually from 7/3/2018 Citibank EUR 0.85 05/09/2017 37,295 (2,208)
(5,200,000) Put Fund writes an option to enter into an Interest Rate Swap. If exercised Fund receives 2.2% Fixed semi-annually from 4/10/2017; and pays Floating USD LIBOR 3 Month BBA quarterly from 4/1/2018 Citibank USD 2.20 02/10/2017 47,755 (36,276)
(9,800,000) Put Fund writes an option to enter into an Interest Rate Swap. If exercised Fund receives 0.9% Fixed annually from 19/10/2018; and pays Floating EUR EURIBOR 6 Month annually from 19/4/2018 Citibank EUR 0.90 17/10/2017 47,971 (3,577)
(500,000) Put Fund writes an option to enter into an Interest Rate Swap. If exercised Fund receives 0.5% Fixed annually from 25/10/2017; and pays Floating EUR EURIBOR 6 Month semi-annually from 25/4/2018 Citibank EUR 0.50 23/10/2017 1,162 (2,039)
(1,000,000) Put Fund writes an option to enter into an Interest Rate Swap. If exercised Fund receives 1% Fixed annually from 25/10/2017; and pays Floating EUR EURIBOR 6 Month semi-annually from 25/4/2018 Citibank EUR 1.00 23/10/2017 8,008 (2,092)
(39,000,000) Call Fund writes an option to enter into an Interest Rate Swap. If exercised Fund receives Floating USD LIBOR 3 Month BBA quarterly from 29/4/2018; and pays 1.05% Fixed semi-annually from 29/1/2018 Citibank USD 1.05 25/01/2018 6,190 (144,938)
(13,000,000) Put Fund writes an option to enter into an Interest Rate Swap. If exercised Fund receives 2.3% Fixed semi-annually from 29/1/2018; and pays Floating USD LIBOR 3 Month BBA quarterly from 29/4/2018 Citibank USD 2.30 25/01/2018 31,303 (25,070)
(24,000,000) Call Fund writes an option to enter into an Interest Rate Swap. If exercised Fund receives Floating USD LIBOR 3 Month BBA quarterly from 21/6/2018; and pays 1% Fixed semi-annually from 21/3/2018 Citibank USD 1.00 19/03/2018 17,394 (88,656)
(24,000,000) Put Fund writes an option to enter into an Interest Rate Swap. If exercised Fund receives 2% Fixed semi-annually from 21/3/2018; and pays Floating USD LIBOR 3 Month BBA quarterly from 21/6/2018 Citibank USD 2.00 19/03/2018 12,384 (87,302)
(8,700,000) Put Fund writes an option to enter into an Interest Rate Swap. If exercised Fund receives 1.85% Fixed semi-annually from 4/4/2018; and pays Floating USD LIBOR 3 Month BBA quarterly from 4/7/2018 Citibank USD 1.85 29/03/2018 509 (39,678)
(10,100,000) Call Fund writes an option to enter into an Interest Rate Swap. If exercised Fund receives Floating USD LIBOR 3 Month BBA quarterly from 10/7/2018; and pays 0.85% Fixed semi-annually from 10/4/2018 Citibank USD 0.85 06/04/2018 16,625 (30,383)
(10,100,000) Put Fund writes an option to enter into an Interest Rate Swap. If exercised Fund receives 1.85% Fixed semi-annually from 10/4/2018; and pays Floating USD LIBOR 3 Month BBA quarterly from 10/7/2018 Citibank USD 1.85 06/04/2018 (9,010) (46,704)
(7,500,000) Call Fund writes an option to enter into an Interest Rate Swap. If exercised Fund receives Floating USD LIBOR 3 Month BBA quarterly from 1/8/2018; and pays 0.9% Fixed semi-annually from 1/5/2018 Citibank USD 0.90 27/04/2018 2,367 (25,133)
BlackRock Global Absolute Return Bond Fund continued

Written Swaptions as at 31 May 2016
Number of contracts
Call/Put Description Counterparty
Strike Price
Expiration date
Unrealised appreciation/
(depreciation) EUR
Market Value
EUR
Annual Report and Audited Accounts 269
The notes on pages 489 to 503 form an integral part of these financial statements.
BlackRock Global Absolute Return Bond Fund continued
(7,500,000) Put Fund writes an option to enter into an Interest Rate Swap. If exercised Fund receives 1.9% Fixed semi-annually from 1/5/2018; and pays Floating USD LIBOR 3 Month BBA quarterly from 1/8/2018 Citibank USD 1.90 27/04/2018 536 (33,923)
(23,000,000) Put Fund writes an option to enter into an Interest Rate Swap. If exercised Fund receives 1.75% Fixed semi-annually from 8/4/2019; and pays Floating USD LIBOR 3 Month BBA quarterly from 8/7/2019 Citibank USD 1.75 04/04/2019 (2,934) (198,567)
(333,000,000) Put Fund writes an option to enter into an Interest Rate Swap. If exercised Fund receives 1.75% Fixed semi-annually from 23/11/2019; and pays Floating JPY LIBOR 6 Month BBA semi-annually from 23/11/2019 Citibank JPY 1.75 21/05/2019 31,337 (1,587)
(333,000,000) Put Fund writes an option to enter into an Interest Rate Swap. If exercised Fund receives 1.75% Fixed semi-annually from 30/11/2019; and pays Floating JPY LIBOR 6 Month BBA semi-annually from 30/11/2019 Citibank JPY 1.75 28/05/2019 30,010 (1,600)
(600,000) Put Fund writes an option to enter into an Interest Rate Swap. If exercised Fund receives 2.15% Fixed semi-annually from 30/9/2019; and pays Floating EUR EURIBOR 6 Month quarterly from 31/3/2020 CItibank EUR 2.15 26/09/2019 10,940 (2,800)
(2,300,000) Put Fund writes an option to enter into an Interest Rate Swap. If exercised Fund receives 0.75% Fixed annually from 6/9/2016; and pays Floating EUR EURIBOR 6 Month semi-annually from 6/3/2017 Deutsche Bank EUR 0.75 02/09/2016 16,284 (46)
(1,500,000) Call Fund writes an option to enter into an Interest Rate Swap. If exercised Fund receives Floating USD LIBOR 3 Month BBA quarterly from 7/3/2017; and pays 2.1% Fixed semi-annually from 7/12/2016 Deutsche Bank USD 2.10 05/12/2016 (20,631) (41,681)
(7,100,000) Put Fund writes an option to enter into an Interest Rate Swap. If exercised Fund receives 0.45% Fixed annually from 27/2/2017; and pays Floating EUR EURIBOR 6 Month semi-annually from 27/8/2017 Deutsche Bank EUR 0.45 23/02/2017 22,812 (15,528)
(2,200,000) Put Fund writes an option to enter into an Interest Rate Swap. If exercised Fund receives 0.8% Fixed annually from 12/9/2018; and pays Floating EUR EURIBOR 6 Month semi-annually from 12/3/2018 Deutsche Bank EUR 0.80 08/09/2017 11,554 (766)
(2,900,000) Put Fund writes an option to enter into an Interest Rate Swap. If exercised Fund receives 0.8% Fixed annually from 6/12/2018; and pays Floating EUR EURIBOR 6 Month semi-annually from 6/6/2018 Deutsche Bank EUR 0.80 04/12/2017 12,487 (1,505)
(16,500,000) Call Fund writes an option to enter into an Interest Rate Swap. If exercised Fund receives Floating USD LIBOR 3 Month BBA quarterly from 13/5/2018; and pays 0.7% Fixed semi-annually from 13/2/2018 Deutsche Bank USD 0.70 09/02/2018 26,137 (34,626)
(16,500,000) Put Fund writes an option to enter into an Interest Rate Swap. If exercised Fund receives 1.7% Fixed semi-annually from 13/2/2018; and pays Floating USD LIBOR 3 Month BBA quarterly from 13/5/2018 Deutsche Bank USD 1.70 09/02/2018 (14,515) (82,799)
(12,150,000) Put Fund writes an option to enter into an Interest Rate Swap. If exercised Fund receives 0.35% Fixed annually from 13/3/2018; and pays Floating EUR EURIBOR 6 Month semi-annually from 13/9/2018 Deutsche Bank EUR 0.35 09/03/2018 35,028 (154,512)
(14,900,000) Call Fund writes an option to enter into an Interest Rate Swap. If exercised Fund receives Floating USD LIBOR 3 Month BBA quarterly from 26/6/2018; and pays 1% Fixed semi-annually from 26/3/2018 Deutsche Bank USD 1.00 22/03/2018 12,284 (55,227)
(14,900,000) Put Fund writes an option to enter into an Interest Rate Swap. If exercised Fund receives 2% Fixed semi-annually from 26/3/2018; and pays Floating USD LIBOR 3 Month BBA quarterly from 26/6/2018 Deutsche Bank USD 2.00 22/03/2018 7,102 (54,667)
(5,600,000) Call Fund writes an option to enter into an Interest Rate Swap. If exercised Fund receives Floating USD LIBOR 3 Month BBA quarterly from 2/8/2018; and pays 0.9% Fixed semi-annually from 2/5/2018 Deutsche Bank USD 0.90 30/04/2018 3,716 (18,846)
(5,600,000) Put Fund writes an option to enter into an Interest Rate Swap. If exercised Fund receives 1.9% Fixed semi-annually from 2/5/2018; and pays Floating USD LIBOR 3 Month BBA quarterly from 2/8/2018 Deutsche Bank USD 1.90 30/04/2018 (757) (25,429)
(1,700,000) Call Fund writes an option to enter into an Interest Rate Swap. If exercised Fund receives Floating USD LIBOR 3 Month BBA quarterly from 9/4/2019; and pays 2.5% Fixed semi-annually from 9/1/2019 Deutsche Bank USD 2.50 07/01/2019 (32,393) (103,519)

Written Swaptions as at 31 May 2016
Nominal Value
Call/Put Description Counterparty
Strike Price
Expiration date
Unrealised appreciation/
(depreciation) EUR
Market Value
EUR
270 BlackRock Strategic Funds (BSF)
The notes on pages 489 to 503 form an integral part of these financial statements.
(1,700,000) Put Fund writes an option to enter into an Interest Rate Swap. If exercised Fund receives 2.8% Fixed semi-annually from 9/1/2019; and pays Floating USD LIBOR 3 Month BBA quarterly from 9/4/2019 Deutsche Bank USD 2.80 07/01/2019 27,347 (35,877)
(350,000,000) Put Fund writes an option to enter into an Interest Rate Swap. If exercised Fund receives 1.75% Fixed semi-annually from 11/1/2020; and pays Floating JPY LIBOR 6 Month BBA semi-annually from 11/1/2020 Deutsche Bank JPY 1.75 09/07/2019 29,204 (2,064)
(100,000,000) Put Fund writes an option to enter into an Interest Rate Swap. If exercised Fund receives 1.75% Fixed semi-annually from 19/1/2020; and pays Floating JPY LIBOR 6 Month BBA semi-annually from 19/1/2020 Deutsche Bank JPY 1.75 17/07/2019 7,978 (610)
(100,000,000) Put Fund writes an option to enter into an Interest Rate Swap. If exercised Fund receives 1.75% Fixed semi-annually from 1/2/2020; and pays Floating JPY LIBOR 6 Month BBA semi-annually from 1/2/2020 Deutsche Bank JPY 1.75 30/07/2019 7,331 (644)
(100,000,000) Put Fund writes an option to enter into an Interest Rate Swap. If exercised Fund receives 1.75% Fixed semi-annually from 8/2/2020; and pays Floating JPY LIBOR 6 Month BBA semi-annually from 8/2/2020 Deutsche Bank JPY 1.75 06/08/2019 7,092 (662)
(100,000,000) Put Fund writes an option to enter into an Interest Rate Swap. If exercised Fund receives 1.75% Fixed semi-annually from 15/2/2020; and pays Floating JPY LIBOR 6 Month BBA semi-annually from 15/2/2020 Deutsche Bank JPY 1.75 13/08/2019 6,435 (681)
(100,000,000) Put Fund writes an option to enter into an Interest Rate Swap. If exercised Fund receives 1.75% Fixed semi-annually from 19/2/2020; and pays Floating JPY LIBOR 6 Month BBA semi-annually from 19/2/2020 Deutsche Bank JPY 1.75 15/08/2019 6,511 (691)
(100,000,000) Put Fund writes an option to enter into an Interest Rate Swap. If exercised Fund receives 1.75% Fixed semi-annually from 29/2/2020; and pays Floating JPY LIBOR 6 Month BBA semi-annually from 29/2/2020 Deutsche Bank JPY 1.75 28/08/2019 6,284 (721)
(14,000,000) Put Fund writes an option to enter into an Interest Rate Swap. If exercised Fund receives 5.5% Fixed semi-annually from 5/3/2020; and pays Floating USD LIBOR 3 Month BBA quarterly from 5/12/2019 Deutsche Bank USD 5.50 03/09/2019 174,811 (22,530)
(250,000,000) Put Fund writes an option to enter into an Interest Rate Swap. If exercised Fund receives 1.75% Fixed semi-annually from 11/5/2020; and pays Floating JPY LIBOR 6 Month BBA semi-annually from 11/5/2020 Deutsche Bank JPY 1.75 07/11/2019 14,070 (4,178)
(2,850,000) Put Fund writes an option to enter into an Interest Rate Swap. If exercised Fund receives 0.5% Fixed annually from 1/11/2017; and pays Floating EUR EURIBOR 6 Month semi-annually from 1/5/2018 Goldman Sachs EUR 0.50 30/10/2017 6,965 (11,976)
(700,000) Call Fund writes an option to enter into an Interest Rate Swap. If exercised Fund receives Floating USD LIBOR 3 Month BBA quarterly from 27/9/2016; and pays 3.425% Fixed semi-annually from 27/12/2016 JP Morgan USD 3.43 23/06/2016 (76,702) (96,938)
(700,000) Put Fund writes an option to enter into an Interest Rate Swap. If exercised Fund receives 3.425% Fixed semi-annually from 27/12/2016; and pays Floating USD LIBOR 3 Month BBA quarterly from 27/9/2016 JP Morgan USD 3.43 23/06/2016 20,236 —
(5,000,000) Put Fund writes an option to enter into an Interest Rate Swap. If exercised Fund receives 2.45% Fixed semi-annually from 21/9/2016; and pays Floating USD LIBOR 3 Month BBA quarterly from 21/12/2016 JP Morgan USD 2.45 19/09/2016 27,012 (613)
(5,000,000) Put Fund writes an option to enter into an Interest Rate Swap. If exercised Fund receives 2.45% Fixed semi-annually from 23/9/2016; and pays Floating USD LIBOR 3 Month BBA quarterly from 23/12/2016 JP Morgan USD 2.45 21/09/2016 31,354 (645)
(3,600,000) Put Fund writes an option to enter into an Interest Rate Swap. If exercised Fund receives 2.2% Fixed semi-annually from 11/1/2017; and pays Floating USD LIBOR 3 Month BBA quarterly from 11/4/2017 JP Morgan USD 2.20 09/01/2017 23,157 (6,643)
(50,000,000) Call Fund writes an option to enter into an Interest Rate Swap. If exercised Fund receives Floating USD LIBOR 3 Month BBA quarterly from 11/7/2017; and pays 0.6% Fixed semi-annually from 11/10/2017 JP Morgan USD 0.60 07/04/2017 31,865 (14,146)
(50,000,000) Call Fund writes an option to enter into an Interest Rate Swap. If exercised Fund receives Floating USD LIBOR 3 Month BBA quarterly from 11/7/2017; and pays 0.9% Fixed semi-annually from 11/10/2017 JP Morgan USD 0.90 07/04/2017 35,751 (39,706)
BlackRock Global Absolute Return Bond Fund continued

Written Swaptions as at 31 May 2016
Number of contracts
Call/Put Description Counterparty
Strike Price
Expiration date
Unrealised appreciation/
(depreciation) EUR
Market Value
EUR
Annual Report and Audited Accounts 271
The notes on pages 489 to 503 form an integral part of these financial statements.
BlackRock Global Absolute Return Bond Fund continued
(5,300,000) Put Fund writes an option to enter into an Interest Rate Swap. If exercised Fund receives 1.15% Fixed annually from 13/9/2017; and pays Floating EUR EURIBOR 6 Month semi-annually from 13/3/2018 JP Morgan EUR 1.15 11/09/2017 48,596 (6,265)
(5,700,000) Put Fund writes an option to enter into an Interest Rate Swap. If exercised Fund receives 1% Fixed annually from 1/11/2017; and pays Floating EUR EURIBOR 6 Month semi-annually from 1/5/2018 JP Morgan EUR 1.00 30/10/2017 37,856 (12,380)
(5,000,000) Call Fund writes an option to enter into an Interest Rate Swap. If exercised Fund receives Floating EUR EURIBOR 6 Month semi-annually from 6/6/2018; and pays 0.15% Fixed annually from 6/12/2017 JP Morgan EUR 0.15 04/12/2017 13,277 (42,240)
(5,000,000) Put Fund writes an option to enter into an Interest Rate Swap. If exercised Fund receives 0.65% Fixed annually from 6/12/2017; and pays Floating EUR EURIBOR 6 Month semi-annually from 6/6/2018 JP Morgan EUR 0.65 04/12/2017 50,530 (26,720)
(4,500,000) Call Fund writes an option to enter into an Interest Rate Swap. If exercised Fund receives Floating USD LIBOR 3 Month BBA quarterly from 20/6/2018; and pays 1% Fixed semi-annually from 20/3/2018 JP Morgan USD 1.00 16/03/2018 3,375 (16,550)
(4,500,000) Put Fund writes an option to enter into an Interest Rate Swap. If exercised Fund receives 2% Fixed semi-annually from 20/3/2018; and pays Floating USD LIBOR 3 Month BBA quarterly from 20/6/2018 JP Morgan USD 2.00 16/03/2018 3,641 (16,285)
(14,900,000) Call Fund writes an option to enter into an Interest Rate Swap. If exercised Fund receives Floating USD LIBOR 3 Month BBA quarterly from 16/7/2018; and pays 0.75% Fixed semi-annually from 16/4/2018 JP Morgan USD 0.75 12/04/2018 24,585 (38,165)
(14,900,000) Put Fund writes an option to enter into an Interest Rate Swap. If exercised Fund receives 1.75% Fixed semi-annually from 16/4/2018; and pays Floating USD LIBOR 3 Month BBA quarterly from 16/7/2018 JP Morgan USD 1.75 12/04/2018 (16,260) (79,319)
(10,000,000) Call Fund writes an option to enter into an Interest Rate Swap. If exercised Fund receives Floating USD LIBOR 3 Month BBA quarterly from 1/8/2018; and pays 0.85% Fixed semi-annually from 1/5/2018 JP Morgan USD 0.85 27/04/2018 4,647 (31,004)
(10,000,000) Put Fund writes an option to enter into an Interest Rate Swap. If exercised Fund receives 1.75% Fixed semi-annually from 1/5/2018; and pays Floating USD LIBOR 3 Month BBA quarterly from 1/8/2018 JP Morgan USD 1.75 27/04/2018 (815) (54,711)
(150,000,000) Put Fund writes an option to enter into an Interest Rate Swap. If exercised Fund receives 1% Fixed semi-annually from 13/3/2019; and pays Floating JPY LIBOR 6 Month BBA semi-annually from 13/9/2019 JP Morgan JPY 1.00 11/03/2019 1,685 (2,597)
(334,000,000) Put Fund writes an option to enter into an Interest Rate Swap. If exercised Fund receives 1.75% Fixed semi-annually from 20/12/2019; and pays Floating JPY LIBOR 6 Month BBA semi-annually from 20/12/2019 JP Morgan JPY 1.75 18/06/2019 30,244 (1,792)
(54,200,000) Put Fund writes an option to enter into an Interest Rate Floor. If exercised Fund receives 1% on 7/10/2014; and pays Max 0 - 1.00% USD LIBOR 3 Month BBA quaterly from 9/1/2019 JP Morgan USD 1.00 09/10/2019 (84,514) (148,826)
(75,800,000) Put Fund writes an option to enter into an Interest Rate Floor. If exercised Fund receives 1% on 10/10/2018; and pays Max 0 - 1% USD LIBOR 3 Month BBA quaterly from 10/1/2019 JP Morgan USD 1.00 10/10/2019 (119,026) (208,748)
(2,000,000) Call Fund writes an option to enter into an Interest Rate Swap. If exercised Fund receives EUR Euribor 6-month semi-annually from 17/7/2020; and pays 1.15% Fixed annually from 17/1/2020 JP Morgan EUR 1.15 15/01/2020 (15,143) (15,143)
(2,000,000) Put Fund writes an option to enter into an Interest Rate Swap. If exercised Fund receives 1.15% Fixed annually from 17/1/2021; and pays EUR Euribor 6-month semi-annually from 17/7/2020 JP Morgan EUR 1.15 15/01/2020 21,384 21,384
(1,900,000) Put Fund writes an option to enter into an Interest Rate Swap. If exercised Fund receives 2.1% Fixed annually from 14/10/2020; and pays Floating EUR EURIBOR Royal Bank 6 Month semi-annually from 14/10/2020 of Scotland EUR 2.10 10/10/2019 32,728 (9,595)
(150,000,000) Put Fund writes an option to enter into an Interest Rate Swap. If exercised Fund receives 1% Fixed semi-annually from 6/3/2019; and pays Floating JPY LIBOR 6 Month Sumitomo BBA semi-annually from 6/9/2019 Mitsui Banking JPY 1.00 04/03/2019 1,676 (2,555)
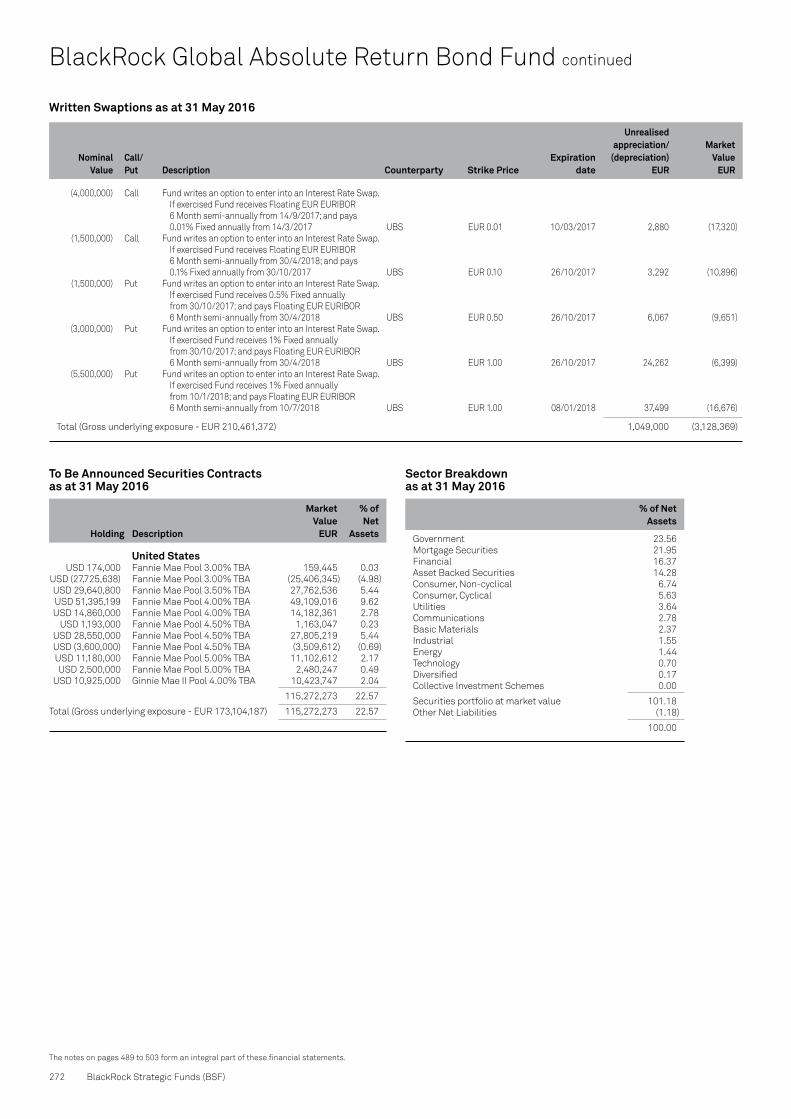
Written Swaptions as at 31 May 2016
Nominal Value
Call/Put Description Counterparty
Strike Price
Expiration date
Unrealised appreciation/
(depreciation) EUR
Market Value
EUR
272 BlackRock Strategic Funds (BSF)
The notes on pages 489 to 503 form an integral part of these financial statements.
(4,000,000) Call Fund writes an option to enter into an Interest Rate Swap. If exercised Fund receives Floating EUR EURIBOR 6 Month semi-annually from 14/9/2017; and pays 0.01% Fixed annually from 14/3/2017 UBS EUR 0.01 10/03/2017 2,880 (17,320)
(1,500,000) Call Fund writes an option to enter into an Interest Rate Swap. If exercised Fund receives Floating EUR EURIBOR 6 Month semi-annually from 30/4/2018; and pays 0.1% Fixed annually from 30/10/2017 UBS EUR 0.10 26/10/2017 3,292 (10,896)
(1,500,000) Put Fund writes an option to enter into an Interest Rate Swap. If exercised Fund receives 0.5% Fixed annually from 30/10/2017; and pays Floating EUR EURIBOR 6 Month semi-annually from 30/4/2018 UBS EUR 0.50 26/10/2017 6,067 (9,651)
(3,000,000) Put Fund writes an option to enter into an Interest Rate Swap. If exercised Fund receives 1% Fixed annually from 30/10/2017; and pays Floating EUR EURIBOR 6 Month semi-annually from 30/4/2018 UBS EUR 1.00 26/10/2017 24,262 (6,399)
(5,500,000) Put Fund writes an option to enter into an Interest Rate Swap. If exercised Fund receives 1% Fixed annually from 10/1/2018; and pays Floating EUR EURIBOR 6 Month semi-annually from 10/7/2018 UBS EUR 1.00 08/01/2018 37,499 (16,676)
Total (Gross underlying exposure - EUR 210,461,372) 1,049,000 (3,128,369)
BlackRock Global Absolute Return Bond Fund continued
Sector Breakdown as at 31 May 2016
% of Net Assets
Government 23.56Mortgage Securities 21.95Financial 16.37Asset Backed Securities 14.28Consumer, Non-cyclical 6.74Consumer, Cyclical 5.63Utilities 3.64Communications 2.78Basic Materials 2.37Industrial 1.55Energy 1.44Technology 0.70Diversified 0.17Collective Investment Schemes 0.00
Securities portfolio at market value 101.18Other Net Liabilities (1.18)
100.00
To Be Announced Securities Contracts as at 31 May 2016
Holding Description
Market Value
EUR
% of Net
Assets
United States USD 174,000 Fannie Mae Pool 3.00% TBA 159,445 0.03 USD (27,725,638) Fannie Mae Pool 3.00% TBA (25,406,345) (4.98) USD 29,640,800 Fannie Mae Pool 3.50% TBA 27,762,536 5.44 USD 51,395,199 Fannie Mae Pool 4.00% TBA 49,109,016 9.62 USD 14,860,000 Fannie Mae Pool 4.00% TBA 14,182,361 2.78 USD 1,193,000 Fannie Mae Pool 4.50% TBA 1,163,047 0.23 USD 28,550,000 Fannie Mae Pool 4.50% TBA 27,805,219 5.44 USD (3,600,000) Fannie Mae Pool 4.50% TBA (3,509,612) (0.69) USD 11,180,000 Fannie Mae Pool 5.00% TBA 11,102,612 2.17 USD 2,500,000 Fannie Mae Pool 5.00% TBA 2,480,247 0.49 USD 10,925,000 Ginnie Mae II Pool 4.00% TBA 10,423,747 2.04
115,272,273 22.57
Total (Gross underlying exposure - EUR 173,104,187) 115,272,273 22.57

Annual Report and Audited Accounts 273
The notes on pages 489 to 503 form an integral part of these financial statements.
Transferable Securities and Money Market Instruments Admitted to an Official Stock Exchange Listing or Dealt in on Another Regulated Market
Transferable Securities and Money Market Instruments Admitted to an Official Stock Exchange Listing or Dealt in on Another Regulated Market
Holding
Description
Market Value
USD
% of Net
Assets
Holding
Description
Market Value
USD
% of Net
Assets
Portfolio of Investments as at 31 May 2016
COMMON STOCKS (SHARES)
United States 610 Aetna Inc 69,595 0.03 1,479 Anthem Inc 194,119 0.08 2,003 Brookdale Senior Living Inc 36,014 0.01 2,850 Olin Corp 65,122 0.03 562 Zimmer Biomet Holdings Inc 68,761 0.03
433,611 0.18
Total Common Stocks (Shares) 433,611 0.18
BONDS
United States USD 1,580,000 Federal Home Loan Bank Discount
Notes 24/6/2016 (Zero Coupon) 1,579,684 0.66 USD 3,500,000 Federal Home Loan Bank Discount
Notes 20/7/2016 (Zero Coupon) 3,498,348 1.46 USD 10,000,000 Federal Home Loan Bank Discount
Notes 22/7/2016 (Zero Coupon) 9,995,090 4.16 USD 5,000,000 JPMorgan Chase & Co 1.35%
15/2/2017 5,011,150 2.09 USD 1,000,000 MPLX LP '144A' 4.875% 1/12/2024 951,485 0.39 USD 1,892,000 Neptune Finco Corp '144A' 10.875%
15/10/2025 2,156,880 0.90 USD 681,000 Solera LLC Via Solera Finance Inc
'144A' 10.50% 1/3/2024 735,480 0.31 USD 1,985,000 United States Treasury Bill 0.50%
31/8/2016 1,985,667 0.83 USD 1,000,000 Wells Fargo Bank NA FRN
19/9/2016 999,337 0.41
26,913,121 11.21
Total Bonds 26,913,121 11.21
CERTIFICATES OF DEPOSIT
United States USD 250,000 Bank of Montreal/Chicago
30/11/2016 (Zero Coupon) 250,000 0.11 USD 4,500,000 Bank of Nova Scotia/Houston
7/11/2016 (Zero Coupon) 4,500,000 1.87 USD 5,000,000 Canadian Imperial Bank of
Commerce 2/8/2016 (Zero Coupon) 5,000,000 2.08 USD 7,000,000 Norinchukin Bank/New York
30/8/2016 (Zero Coupon) 7,000,000 2.92 USD 2,000,000 Royal Bank of Canada/New York
10/3/2017 (Zero Coupon) 2,000,000 0.83 USD 5,000,000 Svenska Handelsbanken AB/New
York 21/4/2017 (Zero Coupon) 5,000,000 2.08 USD 250,000 Toronto-Dominion Bank/New York
17/10/2016 (Zero Coupon) 250,000 0.11 USD 250,000 Wells Fargo Bank NA 13/10/2016
(Zero Coupon) 250,000 0.10 USD 250,000 Westpac Banking Corp/New York
21/10/2016 (Zero Coupon) 250,000 0.10
24,500,000 10.20
Total Certificates of Deposit 24,500,000 10.20
COMMERCIAL PAPER
United Kingdom USD 3,000,000 Omnicom Capital Inc '144A'
20/6/2016 (Zero Coupon) 2,998,876 1.25
2,998,876 1.25
United States USD 1,000,000 Anheuser-Busch InBev Worldwide Inc
17/8/2016 (Zero Coupon) 998,075 0.42 USD 3,000,000 Anheuser-Busch InBev Worldwide Inc
'144A' 7/7/2016 (Zero Coupon) 2,997,450 1.25 USD 5,000,000 ANZ New Zealand International Ltd/
London 26/4/2017 (Zero Coupon) 5,000,000 2.08 USD 3,500,000 Atlantic Asset Securitization LLC
27/7/2016 (Zero Coupon) 3,496,733 1.46 USD 4,500,000 AutoZone Inc 3/6/2016
(Zero Coupon) 4,499,825 1.87 USD 4,000,000 AutoZone Inc 13/6/2016
(Zero Coupon) 3,999,067 1.67 USD 4,000,000 Bank of Nova Scotia '144A'
15/8/2016 (Zero Coupon) 3,992,833 1.66 USD 1,000,000 BAT International Finance Plc
16/6/2016 (Zero Coupon) 999,633 0.42 USD 1,500,000 BAT International Finance Plc
20/6/2016 (Zero Coupon) 1,499,303 0.63 USD 6,500,000 BAT International Finance Plc
24/6/2016 (Zero Coupon) 6,496,346 2.71 USD 9,000,000 Caisse Des Depots Et Consignations
24/8/2016 (Zero Coupon) 8,985,970 3.74 USD 5,000,000 Chevron Corp 3/4/2017
(Zero Coupon) 4,955,375 2.06 USD 2,000,000 Clorox Company/The 27/6/2016
(Zero Coupon) 1,998,946 0.83 USD 1,500,000 Coca-Cola Company/The 1/3/2017
(Zero Coupon) 1,488,966 0.62 USD 5,500,000 Commonwealth Bank of Australia
13/4/2017 (Zero Coupon) 5,500,000 2.29 USD 2,000,000 Credit Agricole CIB/New York
9/9/2016 (Zero Coupon) 1,995,000 0.83 USD 3,000,000 Deutsche Telekom AG 10/6/2016
(Zero Coupon) 2,999,363 1.25 USD 6,000,000 Deutsche Telekom AG 17/6/2016
(Zero Coupon) 5,998,133 2.50 USD 7,000,000 Ford Motor Credit Company LLC
7/6/2016 (Zero Coupon) 6,999,008 2.91 USD 8,500,000 Harley-Davidson Financial Services
8/7/2016 (Zero Coupon) 8,493,972 3.54 USD 8,800,000 Hyundai Capital America '144A'
6/6/2016 (Zero Coupon) 8,799,144 3.66 USD 6,000,000 ING US Funding LLC 25/8/2016
(Zero Coupon) 5,989,942 2.49 USD 5,000,000 ING US Funding LLC 2/9/2016
(Zero Coupon) 4,990,829 2.08 USD 5,000,000 Kells Funding LLC 8/8/2016
(Zero Coupon) 4,994,428 2.08 USD 4,500,000 LMA Americas LLC 6/7/2016
(Zero Coupon) 4,496,850 1.87 USD 7,700,000 Macquarie Bank Ltd 23/6/2016
(Zero Coupon) 7,697,035 3.21 USD 4,500,000 Mattel Inc 6/6/2016 (Zero Coupon) 4,498,725 1.87 USD 6,000,000 Nissan Motor Acceptance Corp
8/7/2016 (Zero Coupon) 5,994,882 2.50 USD 4,250,000 Old Line Funding LLC '144A'
11/10/2016 (Zero Coupon) 4,236,287 1.76 USD 6,300,000 Omnicom Capital Inc '144A'
14/6/2016 (Zero Coupon) 6,298,339 2.62 USD 4,500,000 Rabobank Nederland/New York
7/10/2016 (Zero Coupon) 4,485,600 1.87 USD 7,790,000 Southern Company/The
20/6/2016 (Zero Coupon) 7,786,711 3.24 USD 7,000,000 United Technologies Corp 27/6/2016
(Zero Coupon) 6,996,512 2.91 USD 1,400,000 Victory Receivables Corp 6/6/2016
(Zero Coupon) 1,399,903 0.58
BlackRock Global Event Driven Fund

274 BlackRock Strategic Funds (BSF)
The notes on pages 489 to 503 form an integral part of these financial statements.
Transferable Securities and Money Market Instruments Admitted to an Official Stock Exchange Listing or Dealt in on Another Regulated Market
Holding
Description
Market Value
USD
% of Net
Assets
BlackRock Global Event Driven Fund continued
USD 8,300,000 Victory Receivables Corp 6/7/2016 (Zero Coupon) 8,295,965 3.45
USD 3,000,000 Virginia Electric and Power Company 18/7/2016 (Zero Coupon) 2,996,867 1.25
173,352,017 72.18
Total Commercial Paper 176,350,893 73.43
Total Transferable Securities and Money Market Instruments Admitted to an Official Stock Exchange Listing or Dealt in on Another Regulated Market 228,197,625 95.02
Securities portfolio at market value 228,197,625 95.02
Other Net Assets 11,970,979 4.98
Total Net Assets (USD) 240,168,604 100.00
Portfolio of Investments as at 31 May 2016
United States continued

Contracts for difference as at 31 May 2016
Holding
Description Counterparty
Unrealised appreciation/
(depreciation) USD
Holding
Description Counterparty
Unrealised appreciation/
(depreciation) USD
Annual Report and Audited Accounts 275
The notes on pages 489 to 503 form an integral part of these financial statements.
United Kingdom 190,010 Rexam Plc Morgan Stanley (2,783) 4,025 SABMiller Plc Goldman Sachs 3,006 27,360 SABMiller Plc Citibank (801) 316,963 SABMiller Plc Morgan Stanley (9,283)
(9,861)
United States (118,026) Abbott Laboratories Goldman Sachs (127,053) (69) Aetna Inc Citibank (276) (36,958) Aetna Inc Morgan Stanley (147,832) (331,607) Annaly Capital
Management Inc (Reit) Morgan Stanley 52,259 (1,296) Anthem Inc Citibank 2,501 (10,648) Anthem Inc Morgan Stanley 20,551 91,176 Astoria Financial Corp Citibank 43,526 477,633 Astoria Financial Corp Morgan Stanley 286,580 2,568 Avenue Financial Holdings Inc Morgan Stanley 565 (8,645) Ball Corp Morgan Stanley (1,956) 988 Baxalta Inc Credit Suisse 321 241 Baxalta Inc Citibank 282 1,110 Baxalta Inc Goldman Sachs 3,286 422,211 Baxalta Inc Morgan Stanley 473,279 18 Brocade Communications
Systems Inc Goldman Sachs 20 20,000 Cablevision Systems Corp 'A' Citibank 800 40,499 Cablevision Systems Corp 'A' Morgan Stanley 1,620 2,514 Cigna Corp Citibank 5,204 20,666 Cigna Corp Morgan Stanley 42,779 277,571 Columbia Pipeline Group Inc Morgan Stanley 5,551 32,781 Cvent Inc Goldman Sachs 7,540 (99) Dow Chemical Co/The Citibank 28 26,651 DreamWorks Animation
SKG Inc 'A' Citibank 1,333 261,317 DreamWorks Animation
SKG Inc 'A' Goldman Sachs 26,132 (59) Eastman Chemical Co Citibank (31) (55) EI du Pont de Nemours & Co Citibank 3 571,101 EMC Corp/MA Morgan Stanley 62,821 75,341 Fairchild Semiconductor
International Inc Morgan Stanley 919 19,497 Fidelity & Guaranty Life Goldman Sachs (25,541) 150,075 Fidelity & Guaranty Life Morgan Stanley (180,090) 1,145 Fidelity & Guaranty Life Citibank (1,374) 780,573 First Niagara Financial
Group Inc Morgan Stanley 219,696 170,697 FirstMerit Corp Morgan Stanley 84,098 335,166 Hatteras Financial Corp Morgan Stanley (45,140) 83 Humana Inc Citibank 321 44,132 Humana Inc Morgan Stanley 170,791
(293,596) Huntington Bancshares Inc/OH Morgan Stanley (103,685)
388,982 inContact Inc Morgan Stanley 13,614 18,128 Ingram Micro Inc 'A' Goldman Sachs 19,379 166,260 Ingram Micro Inc 'A' Morgan Stanley (20,384) (271) Johnson & Johnson Citibank (89) (27,585) Johnson Controls Inc Morgan Stanley (40,826) (530,882) KeyCorp Morgan Stanley (199,761) 48,612 KLA-Tencor Corp Citibank 138,544 14,190 KLA-Tencor Corp Goldman Sachs 61,316 99,311 KLA-Tencor Corp Morgan Stanley 227,248 (24,306) Lam Research Corp Citibank (130,037) (7,069) Lam Research Corp Goldman Sachs (57,183) (49,638) Lam Research Corp Morgan Stanley (210,893) (232,762) Marriott
International Inc/MD 'A' Morgan Stanley (335,177) (477,716) New York Community
Bancorp Inc Morgan Stanley (260,355) (91,165) New York Community
Bancorp Inc Citibank (39,617) 36,840 Northern Tier Energy LP Morgan Stanley (2,465) (925) Pinnacle Financial Partners Inc Morgan Stanley (634) 216,359 Rite Aid Corp Goldman Sachs (54,090) 104,352 Rite Aid Corp Citibank 5,218 682,857 Rite Aid Corp Morgan Stanley 34,143 1,351 Rouse Properties Inc Goldman Sachs 13 (36) Shire Plc ADR Citibank (80) (165) Shire Plc ADR Goldman Sachs (1,865) (62,574) Shire Plc ADR Morgan Stanley (123,251) (146) Shire Plc ADR Credit Suisse 307 135,536 St Jude Medical Inc Goldman Sachs 205,656 290,950 Starwood Hotels & Resorts
Worldwide Inc Morgan Stanley 331,683 (157) Stryker Corp Citibank (135) 7,562 Syngenta AG ADR Citibank (3,025) 60,318 Syngenta AG ADR Morgan Stanley (24,127) 23,987 Tyco International Plc Morgan Stanley 35,261 (711) UnitedHealth Group Inc Citibank (2,801) 11,347 Valspar Corp/The Citibank 13,389 48,207 Valspar Corp/The Morgan Stanley 54,699 31,187 Virgin America Inc Goldman Sachs 11,539 72,939 Virgin America Inc Morgan Stanley 14,725 (63,392) VMware Inc 'A' Morgan Stanley (19,652) (10,990) Western Refining Inc Morgan Stanley 4,895 (49) Westlake Chemical Corp Citibank (50) 231,567 XenoPort Inc Citibank 39,366 120,000 XenoPort Inc Morgan Stanley 20,400
584,726
Total (Gross underlying exposure - USD 281,993,662) 574,865
BlackRock Global Event Driven Fund continued
United States continued

Futures contracts as at 31 May 2016
Number of contracts
Currencyof contract Contract/Description
Expiration date
Gross underlying
exposureUSD
Unrealised appreciation/
(depreciation) USD
Purchased Options as at 31 May 2016
Number of contracts
Call/Put Description Counterparty
Strike Price
Expiration date
Unrealised appreciation/
(depreciation) USD
Market Value
USD
Open forward foreign exchange transactions as at 31 May 2016
Currency Purchases Currency Sales CounterpartyMaturity
date
Unrealised appreciation/
(depreciation) USD
TypeNominal
Value Description CounterpartyExpiration
date
Unrealised appreciation/
(depreciation) USD
Market Value
USD
Swaps as at 31 May 2016
276 BlackRock Strategic Funds (BSF)
The notes on pages 489 to 503 form an integral part of these financial statements.
(3) USD E-Mini S&P 500 Index June 2016 314,850 (12,293)
Total 314,850 (12,293)
36,251 Call Shire Plc Citibank USD 205.00 01/06/2016 (175,306) —
Total (Gross underlying exposure - USD 6,748,486) (175,306) —
BlackRock Global Event Driven Fund continued
Sector Breakdown as at 31 May 2016
% of Net Assets
Financial 40.41Consumer, Cyclical 18.02Government 10.85Communications 8.52Consumer, Non-cyclical 7.03Utilities 4.49Industrial 2.91Energy 2.45Technology 0.31Basic Materials 0.03
Securities portfolio at market value 95.02Other Net Assets 4.98
100.00
CHF Hedged Share Class
CHF 6 362 895 USD 6 533 275 State Street Bank & Trust Company 15/6/2016 (101 460)USD 135 345 CHF 131 612 State Street Bank & Trust Company 15/6/2016 2 308
(99 152)
EUR Hedged Share Class
EUR 129 262 750 USD 147 051 282 State Street Bank & Trust Company 15/6/2016 (2 609 892)USD 2 174 636 EUR 1 921 316 State Street Bank & Trust Company 15/6/2016 27 710
(2 582 182)
GBP Hedged Share Class
GBP 34 202 661 USD 49 364 449 State Street Bank & Trust Company 15/6/2016 725 629
725 629
Total (Gross underlying exposure - USD 203,243,247) (1 955 705)
CDS USD 2,000,000 Fund receives default protection on Markit CDX.NA.HY.26 and pays Fixed 5.000% Barclays Bank 20/06/2021 (12,258) (56,258)
Total (Gross underlying exposure – USD 1,943,742) (12,258) (56,258)
CDS: Credit Default Swaps

Annual Report and Audited Accounts 277
The notes on pages 489 to 503 form an integral part of these financial statements.
Transferable Securities and Money Market Instruments Admitted to an Official Stock Exchange Listing or Dealt in on Another Regulated Market
Transferable Securities and Money Market Instruments Admitted to an Official Stock Exchange Listing or Dealt in on Another Regulated Market
Holding
Description
Market Value
USD
% of Net
Assets
Holding
Description
Market Value
USD
% of Net
Assets
Portfolio of Investments as at 31 May 2016
BONDS
United States USD 7,000,000 Fannie Mae Discount Notes
3/6/2016 (Zero Coupon) 6,999,825 2.72 USD 4,000,000 Fannie Mae Discount Notes
6/6/2016 (Zero Coupon) 3,999,800 1.56 USD 19,000,000 Fannie Mae Discount Notes
10/6/2016 (Zero Coupon) 18,998,423 7.39 USD 9,000,000 Fannie Mae Discount Notes
1/7/2016 (Zero Coupon) 8,997,363 3.50 USD 3,000,000 Fannie Mae Discount Notes
5/10/2016 (Zero Coupon) 2,995,554 1.17 USD 2,500,000 Federal Farm Credit Discount Notes
9/6/2016 (Zero Coupon) 2,499,812 0.97 USD 5,000,000 Federal Home Loan Bank Discount
Notes 1/6/2016 (Zero Coupon) 4,999,960 1.95 USD 16,000,000 Federal Home Loan Bank Discount
Notes 3/6/2016 (Zero Coupon) 15,999,600 6.22 USD 1,200,000 Federal Home Loan Bank Discount
Notes 6/6/2016 (Zero Coupon) 1,199,940 0.47 USD 17,000,000 Federal Home Loan Bank Discount
Notes 8/6/2016 (Zero Coupon) 16,998,861 6.61 USD 5,000,000 Federal Home Loan Bank Discount
Notes 13/6/2016 (Zero Coupon) 4,999,460 1.95 USD 3,000,000 Federal Home Loan Bank Discount
Notes 16/6/2016 (Zero Coupon) 2,999,601 1.17 USD 6,000,000 Federal Home Loan Bank Discount
Notes 21/6/2016 (Zero Coupon) 5,998,950 2.33 USD 2,400,000 Federal Home Loan Bank Discount
Notes 1/7/2016 (Zero Coupon) 2,399,297 0.93 USD 9,000,000 Federal Home Loan Bank Discount
Notes 6/7/2016 (Zero Coupon) 8,996,940 3.50 USD 14,500,000 Federal Home Loan Bank Discount
Notes 11/7/2016 (Zero Coupon) 14,494,388 5.64 USD 14,000,000 Federal Home Loan Bank Discount
Notes 14/7/2016 (Zero Coupon) 13,994,176 5.44 USD 6,500,000 Federal Home Loan Bank Discount
Notes 19/7/2016 (Zero Coupon) 6,496,990 2.53 USD 2,000,000 Federal Home Loan Bank Discount
Notes 22/7/2016 (Zero Coupon) 1,999,018 0.78 USD 8,500,000 Federal Home Loan Bank Discount
Notes 27/7/2016 (Zero Coupon) 8,495,427 3.30
USD 2,500,000 Federal Home Loan Bank Discount Notes 29/7/2016 (Zero Coupon) 2,498,608 0.97
USD 6,000,000 Federal Home Loan Bank Discount Notes 31/8/2016 (Zero Coupon) 5,994,252 2.33
USD 6,000,000 Federal Home Loan Bank Discount Notes 1/9/2016 (Zero Coupon) 5,993,952 2.33
USD 6,000,000 Federal Home Loan Bank Discount Notes 26/9/2016 (Zero Coupon) 5,992,332 2.33
USD 3,500,000 Federal Home Loan Bank Discount Notes 17/10/2016 (Zero Coupon) 3,494,323 1.36
USD 2,500,000 Federal Home Loan Bank Discount Notes 19/10/2016 (Zero Coupon) 2,495,888 0.97
USD 2,500,000 Federal Home Loan Bank Discount Notes 16/11/2016 (Zero Coupon) 2,494,953 0.97
USD 2,000,000 Freddie Mac Discount Notes 2/6/2016 (Zero Coupon) 1,999,966 0.78
USD 10,000,000 Freddie Mac Discount Notes 10/6/2016 (Zero Coupon) 9,999,170 3.89
USD 5,000,000 Freddie Mac Discount Notes 19/9/2016 (Zero Coupon) 4,993,985 1.94
USD 3,200,000 United States Treasury Bill 16/6/2016 (Zero Coupon) 3,199,687 1.24
USD 6,000,000 United States Treasury Bill 23/6/2016 (Zero Coupon) 5,999,178 2.33
USD 10,000,000 United States Treasury Bill 11/8/2016 (Zero Coupon) 9,994,724 3.89
USD 10,000,000 United States Treasury Bill 18/8/2016 (Zero Coupon) 9,992,265 3.89
USD 3,000,000 United States Treasury Bill 8/9/2016 (Zero Coupon) 2,996,246 1.17
232,702,914 90.52
Total Bonds 232,702,914 90.52
Total Transferable Securities and Money Market Instruments Admitted to an Official Stock Exchange Listing or Dealt in on Another Regulated Market 232,702,914 90.52
Securities portfolio at market value 232,702,914 90.52
Other Net Assets 24,369,267 9.48
Total Net Assets (USD) 257,072,181 100.00
BlackRock Global Long/Short Equity Fund
United States continued

Contracts for difference as at 31 May 2016
Holding
Description Counterparty
Unrealised appreciation/
(depreciation) USD
Holding
Description Counterparty
Unrealised appreciation/
(depreciation) USD
278 BlackRock Strategic Funds (BSF)
The notes on pages 489 to 503 form an integral part of these financial statements.
BlackRock Global Long/Short Equity Fund continued
Australia 1,838 AGL Energy Ltd Bank of America
Merrill Lynch (201) 5,342 AGL Energy Ltd Goldman Sachs (180) (27,898) ALS Ltd Bank of America
Merrill Lynch 3,440 (15,844) Alumina Ltd Bank of America
Merrill Lynch (5) (71,142) Alumina Ltd Goldman Sachs (2,942) (69,418) Alumina Ltd Morgan Stanley (968) (532) Ansell Ltd Goldman Sachs (250) (1,679) Ansell Ltd Morgan Stanley (317) (96,681) APA Group (Unit) Bank of America
Merrill Lynch 23,845 (106,658) APA Group (Unit) Morgan Stanley 23,985 14,487 Aristocrat Leisure Ltd Bank of America
Merrill Lynch 4,309 27,154 BHP Billiton Ltd Morgan Stanley (1,246) 27,984 BHP Billiton Ltd Bank of America
Merrill Lynch 3,292 12,919 BHP Billiton Ltd Goldman Sachs 3,427 6,544 BlueScope Steel Ltd Goldman Sachs 550 17,986 Caltex Australia Ltd Bank of America
Merrill Lynch (14,465) 17,689 Caltex Australia Ltd Goldman Sachs (11,870) 11,361 Caltex Australia Ltd Morgan Stanley (6,431) 11,398 CIMIC Group Ltd Bank of America
Merrill Lynch (3,136) 25,109 CIMIC Group Ltd Goldman Sachs (7,640) 7,620 CIMIC Group Ltd Morgan Stanley (3,869) (33,405) Computershare Ltd Bank of America
Merrill Lynch (7,807) (8,602) Computershare Ltd Goldman Sachs (2,683) (11,844) Computershare Ltd Morgan Stanley (3,830) (3,296) Crown Resorts Ltd Bank of America
Merrill Lynch (24) (2,840) Crown Resorts Ltd Goldman Sachs (88) (7,171) Crown Resorts Ltd Morgan Stanley 52 55,092 CSR Ltd Bank of America
Merrill Lynch 2,009 95,405 CSR Ltd Goldman Sachs 4,095 109,165 CSR Ltd Morgan Stanley 2,565 86,770 DuluxGroup Ltd Bank of America
Merrill Lynch 1,888 15,397 DuluxGroup Ltd Goldman Sachs 335 39,979 DuluxGroup Ltd Morgan Stanley 6,380 295,805 Fairfax Media Ltd Goldman Sachs (1,073) 73,154 Fairfax Media Ltd Morgan Stanley (796) 525 Flight Centre Travel Group Ltd Bank of America
Merrill Lynch (105) 270 Flight Centre Travel Group Ltd Morgan Stanley (260) (126,956) Incitec Pivot Ltd Bank of America
Merrill Lynch (3,684) (94,619) Incitec Pivot Ltd Goldman Sachs (2,746) (127,360) Incitec Pivot Ltd Morgan Stanley (4,619) (17,470) Insurance Australia Group Ltd Morgan Stanley (253) (2,314) IOOF Holdings Ltd Morgan Stanley 383 10,405 JB Hi-Fi Ltd Bank of America
Merrill Lynch (7,397) 11,124 JB Hi-Fi Ltd Goldman Sachs (7,908) 8,474 JB Hi-Fi Ltd Morgan Stanley (2,705) 6,944 Medibank Private Ltd Bank of America
Merrill Lynch 326 16,052 Medibank Private Ltd Goldman Sachs 746 7,399 Medibank Private Ltd Morgan Stanley 677 67,974 Mirvac Group (Reit) Bank of America
Merrill Lynch 1,233 11,115 Mirvac Group (Reit) Morgan Stanley 282 5,559 Newcrest Mining Ltd Morgan Stanley (8,217) 104,431 Northern Star Resources Ltd Bank of America
Merrill Lynch (28,935) 74,822 Northern Star Resources Ltd Goldman Sachs (20,352)
181,128 Northern Star Resources Ltd Morgan Stanley (59,126) (15,385) Origin Energy Ltd Morgan Stanley (893) 41,339 Orora Ltd Morgan Stanley (300) 100,443 Orora Ltd Bank of America
Merrill Lynch 786 202,637 Orora Ltd Goldman Sachs 1,470 24,626 OZ Minerals Ltd Bank of America
Merrill Lynch (2,322) 28,557 OZ Minerals Ltd Goldman Sachs (2,693) 12,891 OZ Minerals Ltd Morgan Stanley (3,179) 23,087 Platinum Asset Bank of America
Management Ltd Merrill Lynch 5,910 22,597 Platinum Asset
Management Ltd Morgan Stanley 4,290 61,998 Qantas Airways Ltd Bank of America
Merrill Lynch (14,392) 110,385 Qantas Airways Ltd Goldman Sachs (25,623) 127,591 Qantas Airways Ltd Morgan Stanley (28,692) 1,333 Rio Tinto Ltd Goldman Sachs 454 3,176 Sims Metal Management Ltd Goldman Sachs (45) 6,490 Sims Metal Management Ltd Morgan Stanley 304 48,167 Stockland (Reit) Bank of America
Merrill Lynch (699) 91,162 Stockland (Reit) Morgan Stanley (2,645) 93,681 Sydney Airport (Unit) Bank of America
Merrill Lynch (11,619) 28,800 Sydney Airport (Unit) Morgan Stanley (4,414) 171,984 Sydney Airport (Unit) Goldman Sachs 34,386 2,208 WorleyParsons Ltd Morgan Stanley 1,206
(181,019)
Austria 808 OMV AG Bank of America
Merrill Lynch (609) 1,648 OMV AG Goldman Sachs (1,127) (2) Verbund AG Bank of America
Merrill Lynch (1) 5,573 Vienna Insurance Group AG Bank of America
Wiener Versicherung Gruppe Merrill Lynch 9,929 14,018 Vienna Insurance Group AG
Wiener Versicherung Gruppe Morgan Stanley 21,451 4,822 Vienna Insurance Group AG
Wiener Versicherung Gruppe Goldman Sachs 619 19,259 Wienerberger AG Goldman Sachs (10,840) 10,346 Wienerberger AG Bank of America
Merrill Lynch 7,222 3,519 Wienerberger AG Morgan Stanley 1,651
28,295
Belgium 261 bpost SA Bank of America
Merrill Lynch (191) 10,766 bpost SA Goldman Sachs (7,876) 583 bpost SA Morgan Stanley (296) (133) Colruyt SA Morgan Stanley (265) 13,031 Euronav NV Morgan Stanley 1,164 16,689 Euronav NV Bank of America
Merrill Lynch (4,728) 12,699 Euronav NV Goldman Sachs (2,633) 2,207 Proximus SADP Bank of America
Merrill Lynch 3,032 5,857 Proximus SADP Goldman Sachs 6,895 9,028 Proximus SADP Morgan Stanley 11,471 8,741 Telenet Group Holding NV Bank of America
Merrill Lynch 12,595 9,167 Telenet Group Holding NV Goldman Sachs 13,208 9,388 Telenet Group Holding NV Morgan Stanley 12,059
44,435
Australia continued

Contracts for difference as at 31 May 2016
Holding
Description Counterparty
Unrealised appreciation/
(depreciation) USD
Holding
Description Counterparty
Unrealised appreciation/
(depreciation) USD
* Amounts which are less than 0.5 USD have been rounded down to zero.
Annual Report and Audited Accounts 279
The notes on pages 489 to 503 form an integral part of these financial statements.
Canada (537) Agnico Eagle Mines Ltd Bank of America
Merrill Lynch 1,351 (274) Agnico Eagle Mines Ltd Morgan Stanley 81 (338) Agrium Inc Morgan Stanley (610) 32,164 Air Canada Bank of America
Merrill Lynch 6,899 48,114 Air Canada Goldman Sachs 10,320 54,773 Air Canada Morgan Stanley 13,846 (1,039) Allied Properties Real Estate
Investment Trust (Reit) Morgan Stanley 152 (279) AltaGas Ltd Goldman Sachs (92) (1,322) Amaya Inc Morgan Stanley (1,081) (24,829) BlackBerry Ltd Bank of America
Merrill Lynch (14,455) (32,872) Bombardier Inc 'B' Goldman Sachs (630) 4,247 CAE Inc Bank of America
Merrill Lynch 1,757 9,028 CAE Inc Goldman Sachs 8,301 3,396 CAE Inc Morgan Stanley 1,821 (2,534) Canadian Natural Bank of America
Resources Ltd Merrill Lynch (3,831) 323 Canadian Pacific Railway Ltd Morgan Stanley 573 2,848 Canfor Corp Bank of America
Merrill Lynch 3,032 2,770 Canfor Corp Goldman Sachs 2,949 21,737 Celestica Inc Goldman Sachs (22,537) 21,875 Celestica Inc Bank of America
Merrill Lynch 13,405 21,507 Celestica Inc Morgan Stanley 15,816 (507) Cominar Real Estate Bank of America
Investment Trust (Reit) Merrill Lynch 20 (12,918) Concordia Healthcare Corp Bank of America
Merrill Lynch (53,040) (9,839) Corus Entertainment Inc 'B' Bank of America
Merrill Lynch (3,519) (7,980) Corus Entertainment Inc 'B' Goldman Sachs (1,598) (1,179) Cott Corp Morgan Stanley (443) (10,836) Cott Corp Bank of America
Merrill Lynch 913 (4,868) DH Corp Morgan Stanley 1,193 (14,006) DH Corp Bank of America
Merrill Lynch 1,349 (30,144) DH Corp Goldman Sachs 2,344 3,245 Dollarama Inc Goldman Sachs 3,243 5,747 Dollarama Inc Bank of America
Merrill Lynch 9,807 867 Dollarama Inc Morgan Stanley 1,234 5,359 Domtar Corp Bank of America
Merrill Lynch 9,827 12,188 Domtar Corp Morgan Stanley 18,617 15,595 Domtar Corp Goldman Sachs (120) (7,542) Element Financial Corp Bank of America
Merrill Lynch (2,183) (19,359) Element Financial Corp Morgan Stanley (5,123) (4,373) Element Financial Corp Goldman Sachs 215 544 Enbridge Inc Goldman Sachs (66) (356) Fairfax Financial Holdings Ltd Bank of America
Merrill Lynch (3,455) (795) Fairfax Financial Holdings Ltd Morgan Stanley (6,573) (177) Fairfax Financial Holdings Ltd Goldman Sachs (381) (3,286) Finning International Inc Bank of America
Merrill Lynch (604) (11,783) Finning International Inc Goldman Sachs (2,166) (7,729) Finning International Inc Morgan Stanley (1,362) (5,617) First Majestic Silver Corp Bank of America
Merrill Lynch 4,108 (2,390) First Majestic Silver Corp Morgan Stanley 2,810 (3,774) Franco-Nevada Corp Bank of America
Merrill Lynch 12,399 (6,097) Franco-Nevada Corp Morgan Stanley 31,525
7,071 Gibson Energy Inc Goldman Sachs — 6,497 Gibson Energy Inc Morgan Stanley (2,389) (6,528) Gildan Activewear Inc Bank of America
Merrill Lynch (7,751) (240) Great-West Lifeco Inc* Bank of America
Merrill Lynch — (1,006) Great-West Lifeco Inc Goldman Sachs (730) 2,144 Home Capital Group Inc Bank of America
Merrill Lynch 3,859 8,405 Home Capital Group Inc Goldman Sachs 15,130 5,808 Home Capital Group Inc Morgan Stanley 7,697 (1,311) Hudson's Bay Co Goldman Sachs (308) (42,175) Hydro One Ltd Bank of America
Merrill Lynch (13,446) (20,596) Hydro One Ltd Goldman Sachs (6,319) (3,436) IGM Financial Inc Bank of America
Merrill Lynch (4,205) (4,577) IGM Financial Inc Goldman Sachs (3,600) (1,385) Imperial Oil Ltd Bank of America
Merrill Lynch (1,220) (5,637) Imperial Oil Ltd Morgan Stanley (5,052) 64,478 Kinross Gold Corp Bank of America
Merrill Lynch (55,318) 2,198 Kinross Gold Corp Goldman Sachs (522) 8,401 Linamar Corp Morgan Stanley 20,336 (1,516) MacDonald Dettwiler & Bank of America
Associates Ltd Merrill Lynch (1,071) (1,561) MacDonald Dettwiler &
Associates Ltd Goldman Sachs (845) (1,600) MacDonald Dettwiler &
Associates Ltd Morgan Stanley (3,235) (31,905) Manitoba Telecom Bank of America
Services Inc Merrill Lynch (15,742) (44,369) Manitoba Telecom
Services Inc Goldman Sachs (22,092) (224) Manitoba Telecom
Services Inc Morgan Stanley (120) 740 Maple Leaf Foods Inc Bank of America
Merrill Lynch (164) 1,089 Maple Leaf Foods Inc Goldman Sachs (242) 2,645 Maple Leaf Foods Inc Morgan Stanley (567) (260) Methanex Corp Bank of America
Merrill Lynch (672) 29,989 Metro Inc Bank of America
Merrill Lynch 25,269 13,299 Metro Inc Goldman Sachs 11,206 15,415 Metro Inc Morgan Stanley 24,797 (582) New Flyer Industries Inc Goldman Sachs 41 (1,558) Norbord Inc Bank of America
Merrill Lynch (2,697) (2,248) Norbord Inc Goldman Sachs (12,812) (34,463) Northland Power Inc Bank of America
Merrill Lynch 17,688 (27,783) Northland Power Inc Morgan Stanley 7,874 741 Power Corp of Canada Bank of America
Merrill Lynch 590 22,825 Power Corp of Canada Goldman Sachs 18,184 13,410 Power Corp of Canada Morgan Stanley 9,759 (759) Power Financial Corp Bank of America
Merrill Lynch (506) (1,139) PrairieSky Royalty Ltd Bank of America
Merrill Lynch (45) (5,933) Pretium Resources Inc Bank of America
Merrill Lynch 6,756 (7,543) Pretium Resources Inc Morgan Stanley 5,573 (319) Saputo Inc Goldman Sachs 442 (8,018) Silver Wheaton Corp Bank of America
Merrill Lynch 3,619 (28,532) Silver Wheaton Corp Morgan Stanley 38,985
BlackRock Global Long/Short Equity Fund continued
Canada continued
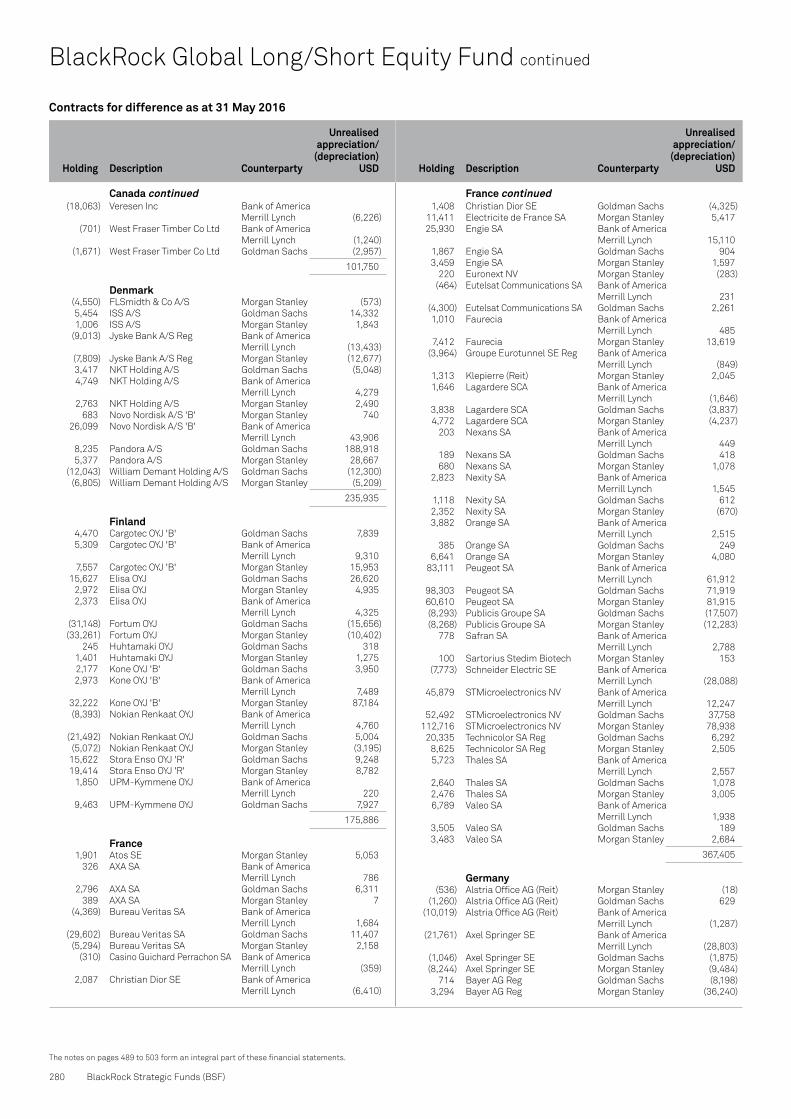
Contracts for difference as at 31 May 2016
Holding
Description Counterparty
Unrealised appreciation/
(depreciation) USD
Holding
Description Counterparty
Unrealised appreciation/
(depreciation) USD
280 BlackRock Strategic Funds (BSF)
The notes on pages 489 to 503 form an integral part of these financial statements.
BlackRock Global Long/Short Equity Fund continued
(18,063) Veresen Inc Bank of America Merrill Lynch (6,226)
(701) West Fraser Timber Co Ltd Bank of America Merrill Lynch (1,240)
(1,671) West Fraser Timber Co Ltd Goldman Sachs (2,957)
101,750
Denmark (4,550) FLSmidth & Co A/S Morgan Stanley (573) 5,454 ISS A/S Goldman Sachs 14,332 1,006 ISS A/S Morgan Stanley 1,843 (9,013) Jyske Bank A/S Reg Bank of America
Merrill Lynch (13,433) (7,809) Jyske Bank A/S Reg Morgan Stanley (12,677) 3,417 NKT Holding A/S Goldman Sachs (5,048) 4,749 NKT Holding A/S Bank of America
Merrill Lynch 4,279 2,763 NKT Holding A/S Morgan Stanley 2,490 683 Novo Nordisk A/S 'B' Morgan Stanley 740 26,099 Novo Nordisk A/S 'B' Bank of America
Merrill Lynch 43,906 8,235 Pandora A/S Goldman Sachs 188,918 5,377 Pandora A/S Morgan Stanley 28,667 (12,043) William Demant Holding A/S Goldman Sachs (12,300) (6,805) William Demant Holding A/S Morgan Stanley (5,209)
235,935
Finland 4,470 Cargotec OYJ 'B' Goldman Sachs 7,839 5,309 Cargotec OYJ 'B' Bank of America
Merrill Lynch 9,310 7,557 Cargotec OYJ 'B' Morgan Stanley 15,953 15,627 Elisa OYJ Goldman Sachs 26,620 2,972 Elisa OYJ Morgan Stanley 4,935 2,373 Elisa OYJ Bank of America
Merrill Lynch 4,325 (31,148) Fortum OYJ Goldman Sachs (15,656) (33,261) Fortum OYJ Morgan Stanley (10,402) 245 Huhtamaki OYJ Goldman Sachs 318 1,401 Huhtamaki OYJ Morgan Stanley 1,275 2,177 Kone OYJ 'B' Goldman Sachs 3,950 2,973 Kone OYJ 'B' Bank of America
Merrill Lynch 7,489 32,222 Kone OYJ 'B' Morgan Stanley 87,184 (8,393) Nokian Renkaat OYJ Bank of America
Merrill Lynch 4,760 (21,492) Nokian Renkaat OYJ Goldman Sachs 5,004 (5,072) Nokian Renkaat OYJ Morgan Stanley (3,195) 15,622 Stora Enso OYJ 'R' Goldman Sachs 9,248 19,414 Stora Enso OYJ 'R' Morgan Stanley 8,782 1,850 UPM-Kymmene OYJ Bank of America
Merrill Lynch 220 9,463 UPM-Kymmene OYJ Goldman Sachs 7,927
175,886
France 1,901 Atos SE Morgan Stanley 5,053 326 AXA SA Bank of America
Merrill Lynch 786 2,796 AXA SA Goldman Sachs 6,311 389 AXA SA Morgan Stanley 7 (4,369) Bureau Veritas SA Bank of America
Merrill Lynch 1,684 (29,602) Bureau Veritas SA Goldman Sachs 11,407 (5,294) Bureau Veritas SA Morgan Stanley 2,158 (310) Casino Guichard Perrachon SA Bank of America
Merrill Lynch (359) 2,087 Christian Dior SE Bank of America
Merrill Lynch (6,410)
1,408 Christian Dior SE Goldman Sachs (4,325) 11,411 Electricite de France SA Morgan Stanley 5,417 25,930 Engie SA Bank of America
Merrill Lynch 15,110 1,867 Engie SA Goldman Sachs 904 3,459 Engie SA Morgan Stanley 1,597 220 Euronext NV Morgan Stanley (283) (464) Eutelsat Communications SA Bank of America
Merrill Lynch 231 (4,300) Eutelsat Communications SA Goldman Sachs 2,261 1,010 Faurecia Bank of America
Merrill Lynch 485 7,412 Faurecia Morgan Stanley 13,619 (3,964) Groupe Eurotunnel SE Reg Bank of America
Merrill Lynch (849) 1,313 Klepierre (Reit) Morgan Stanley 2,045 1,646 Lagardere SCA Bank of America
Merrill Lynch (1,646) 3,838 Lagardere SCA Goldman Sachs (3,837) 4,772 Lagardere SCA Morgan Stanley (4,237) 203 Nexans SA Bank of America
Merrill Lynch 449 189 Nexans SA Goldman Sachs 418 680 Nexans SA Morgan Stanley 1,078 2,823 Nexity SA Bank of America
Merrill Lynch 1,545 1,118 Nexity SA Goldman Sachs 612 2,352 Nexity SA Morgan Stanley (670) 3,882 Orange SA Bank of America
Merrill Lynch 2,515 385 Orange SA Goldman Sachs 249 6,641 Orange SA Morgan Stanley 4,080 83,111 Peugeot SA Bank of America
Merrill Lynch 61,912 98,303 Peugeot SA Goldman Sachs 71,919 60,610 Peugeot SA Morgan Stanley 81,915 (8,293) Publicis Groupe SA Goldman Sachs (17,507) (8,268) Publicis Groupe SA Morgan Stanley (12,283) 778 Safran SA Bank of America
Merrill Lynch 2,788 100 Sartorius Stedim Biotech Morgan Stanley 153 (7,773) Schneider Electric SE Bank of America
Merrill Lynch (28,088) 45,879 STMicroelectronics NV Bank of America
Merrill Lynch 12,247 52,492 STMicroelectronics NV Goldman Sachs 37,758 112,716 STMicroelectronics NV Morgan Stanley 78,938 20,335 Technicolor SA Reg Goldman Sachs 6,292 8,625 Technicolor SA Reg Morgan Stanley 2,505 5,723 Thales SA Bank of America
Merrill Lynch 2,557 2,640 Thales SA Goldman Sachs 1,078 2,476 Thales SA Morgan Stanley 3,005 6,789 Valeo SA Bank of America
Merrill Lynch 1,938 3,505 Valeo SA Goldman Sachs 189 3,483 Valeo SA Morgan Stanley 2,684
367,405
Germany (536) Alstria Office AG (Reit) Morgan Stanley (18) (1,260) Alstria Office AG (Reit) Goldman Sachs 629 (10,019) Alstria Office AG (Reit) Bank of America
Merrill Lynch (1,287) (21,761) Axel Springer SE Bank of America
Merrill Lynch (28,803) (1,046) Axel Springer SE Goldman Sachs (1,875) (8,244) Axel Springer SE Morgan Stanley (9,484) 714 Bayer AG Reg Goldman Sachs (8,198) 3,294 Bayer AG Reg Morgan Stanley (36,240)
Canada continued France continued
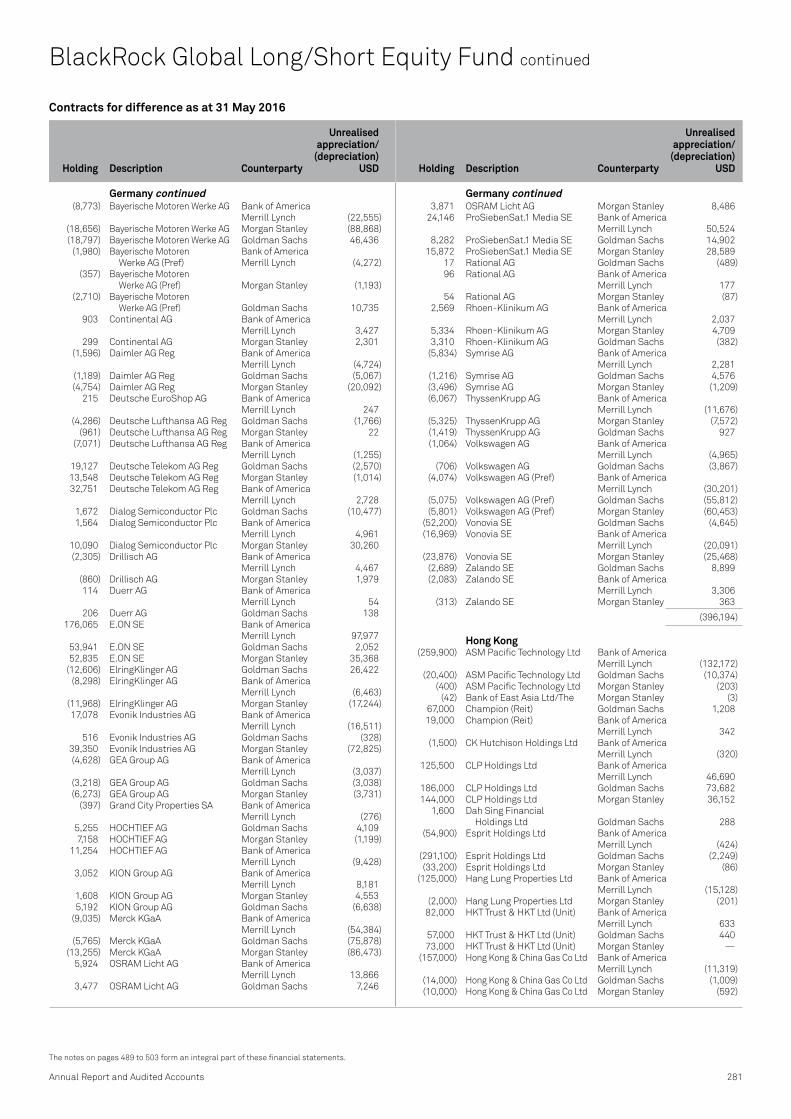
Contracts for difference as at 31 May 2016
Holding
Description Counterparty
Unrealised appreciation/
(depreciation) USD
Holding
Description Counterparty
Unrealised appreciation/
(depreciation) USD
Annual Report and Audited Accounts 281
The notes on pages 489 to 503 form an integral part of these financial statements.
(8,773) Bayerische Motoren Werke AG Bank of America Merrill Lynch (22,555)
(18,656) Bayerische Motoren Werke AG Morgan Stanley (88,868) (18,797) Bayerische Motoren Werke AG Goldman Sachs 46,436 (1,980) Bayerische Motoren Bank of America
Werke AG (Pref) Merrill Lynch (4,272) (357) Bayerische Motoren
Werke AG (Pref) Morgan Stanley (1,193) (2,710) Bayerische Motoren
Werke AG (Pref) Goldman Sachs 10,735 903 Continental AG Bank of America
Merrill Lynch 3,427 299 Continental AG Morgan Stanley 2,301 (1,596) Daimler AG Reg Bank of America
Merrill Lynch (4,724) (1,189) Daimler AG Reg Goldman Sachs (5,067) (4,754) Daimler AG Reg Morgan Stanley (20,092) 215 Deutsche EuroShop AG Bank of America
Merrill Lynch 247 (4,286) Deutsche Lufthansa AG Reg Goldman Sachs (1,766) (961) Deutsche Lufthansa AG Reg Morgan Stanley 22 (7,071) Deutsche Lufthansa AG Reg Bank of America
Merrill Lynch (1,255) 19,127 Deutsche Telekom AG Reg Goldman Sachs (2,570) 13,548 Deutsche Telekom AG Reg Morgan Stanley (1,014) 32,751 Deutsche Telekom AG Reg Bank of America
Merrill Lynch 2,728 1,672 Dialog Semiconductor Plc Goldman Sachs (10,477) 1,564 Dialog Semiconductor Plc Bank of America
Merrill Lynch 4,961 10,090 Dialog Semiconductor Plc Morgan Stanley 30,260 (2,305) Drillisch AG Bank of America
Merrill Lynch 4,467 (860) Drillisch AG Morgan Stanley 1,979 114 Duerr AG Bank of America
Merrill Lynch 54 206 Duerr AG Goldman Sachs 138 176,065 E.ON SE Bank of America
Merrill Lynch 97,977 53,941 E.ON SE Goldman Sachs 2,052 52,835 E.ON SE Morgan Stanley 35,368 (12,606) ElringKlinger AG Goldman Sachs 26,422 (8,298) ElringKlinger AG Bank of America
Merrill Lynch (6,463) (11,968) ElringKlinger AG Morgan Stanley (17,244) 17,078 Evonik Industries AG Bank of America
Merrill Lynch (16,511) 516 Evonik Industries AG Goldman Sachs (328) 39,350 Evonik Industries AG Morgan Stanley (72,825) (4,628) GEA Group AG Bank of America
Merrill Lynch (3,037) (3,218) GEA Group AG Goldman Sachs (3,038) (6,273) GEA Group AG Morgan Stanley (3,731) (397) Grand City Properties SA Bank of America
Merrill Lynch (276) 5,255 HOCHTIEF AG Goldman Sachs 4,109 7,158 HOCHTIEF AG Morgan Stanley (1,199) 11,254 HOCHTIEF AG Bank of America
Merrill Lynch (9,428) 3,052 KION Group AG Bank of America
Merrill Lynch 8,181 1,608 KION Group AG Morgan Stanley 4,553 5,192 KION Group AG Goldman Sachs (6,638) (9,035) Merck KGaA Bank of America
Merrill Lynch (54,384) (5,765) Merck KGaA Goldman Sachs (75,878) (13,255) Merck KGaA Morgan Stanley (86,473) 5,924 OSRAM Licht AG Bank of America
Merrill Lynch 13,866 3,477 OSRAM Licht AG Goldman Sachs 7,246
3,871 OSRAM Licht AG Morgan Stanley 8,486 24,146 ProSiebenSat.1 Media SE Bank of America
Merrill Lynch 50,524 8,282 ProSiebenSat.1 Media SE Goldman Sachs 14,902 15,872 ProSiebenSat.1 Media SE Morgan Stanley 28,589 17 Rational AG Goldman Sachs (489) 96 Rational AG Bank of America
Merrill Lynch 177 54 Rational AG Morgan Stanley (87) 2,569 Rhoen-Klinikum AG Bank of America
Merrill Lynch 2,037 5,334 Rhoen-Klinikum AG Morgan Stanley 4,709 3,310 Rhoen-Klinikum AG Goldman Sachs (382) (5,834) Symrise AG Bank of America
Merrill Lynch 2,281 (1,216) Symrise AG Goldman Sachs 4,576 (3,496) Symrise AG Morgan Stanley (1,209) (6,067) ThyssenKrupp AG Bank of America
Merrill Lynch (11,676) (5,325) ThyssenKrupp AG Morgan Stanley (7,572) (1,419) ThyssenKrupp AG Goldman Sachs 927 (1,064) Volkswagen AG Bank of America
Merrill Lynch (4,965) (706) Volkswagen AG Goldman Sachs (3,867) (4,074) Volkswagen AG (Pref) Bank of America
Merrill Lynch (30,201) (5,075) Volkswagen AG (Pref) Goldman Sachs (55,812) (5,801) Volkswagen AG (Pref) Morgan Stanley (60,453) (52,200) Vonovia SE Goldman Sachs (4,645) (16,969) Vonovia SE Bank of America
Merrill Lynch (20,091) (23,876) Vonovia SE Morgan Stanley (25,468) (2,689) Zalando SE Goldman Sachs 8,899 (2,083) Zalando SE Bank of America
Merrill Lynch 3,306 (313) Zalando SE Morgan Stanley 363
(396,194)
Hong Kong (259,900) ASM Pacific Technology Ltd Bank of America
Merrill Lynch (132,172) (20,400) ASM Pacific Technology Ltd Goldman Sachs (10,374) (400) ASM Pacific Technology Ltd Morgan Stanley (203) (42) Bank of East Asia Ltd/The Morgan Stanley (3) 67,000 Champion (Reit) Goldman Sachs 1,208 19,000 Champion (Reit) Bank of America
Merrill Lynch 342 (1,500) CK Hutchison Holdings Ltd Bank of America
Merrill Lynch (320) 125,500 CLP Holdings Ltd Bank of America
Merrill Lynch 46,690 186,000 CLP Holdings Ltd Goldman Sachs 73,682 144,000 CLP Holdings Ltd Morgan Stanley 36,152 1,600 Dah Sing Financial
Holdings Ltd Goldman Sachs 288 (54,900) Esprit Holdings Ltd Bank of America
Merrill Lynch (424) (291,100) Esprit Holdings Ltd Goldman Sachs (2,249) (33,200) Esprit Holdings Ltd Morgan Stanley (86) (125,000) Hang Lung Properties Ltd Bank of America
Merrill Lynch (15,128) (2,000) Hang Lung Properties Ltd Morgan Stanley (201) 82,000 HKT Trust & HKT Ltd (Unit) Bank of America
Merrill Lynch 633 57,000 HKT Trust & HKT Ltd (Unit) Goldman Sachs 440 73,000 HKT Trust & HKT Ltd (Unit) Morgan Stanley — (157,000) Hong Kong & China Gas Co Ltd Bank of America
Merrill Lynch (11,319) (14,000) Hong Kong & China Gas Co Ltd Goldman Sachs (1,009) (10,000) Hong Kong & China Gas Co Ltd Morgan Stanley (592)
BlackRock Global Long/Short Equity Fund continued
Germany continued Germany continued

Contracts for difference as at 31 May 2016
Holding
Description Counterparty
Unrealised appreciation/
(depreciation) USD
Holding
Description Counterparty
Unrealised appreciation/
(depreciation) USD
282 BlackRock Strategic Funds (BSF)
The notes on pages 489 to 503 form an integral part of these financial statements.
BlackRock Global Long/Short Equity Fund continued
108,000 Hutchison Telecommunications Bank of America Hong Kong Holdings Ltd Merrill Lynch —
24,000 Hutchison Telecommunications Hong Kong Holdings Ltd Goldman Sachs —
164,000 Hutchison Telecommunications Hong Kong Holdings Ltd Morgan Stanley 1,267
41,000 New World Development Co Ltd Goldman Sachs 1,531
193,000 New World Development Co Ltd Morgan Stanley 5,715
6,000 Sino Land Co Ltd Goldman Sachs 479 50,000 Sino Land Co Ltd Morgan Stanley 3,219 17,000 Sun Hung Kai Properties Ltd Bank of America
Merrill Lynch 10,068 7,000 Sun Hung Kai Properties Ltd Goldman Sachs 4,146 4,000 Sun Hung Kai Properties Ltd Morgan Stanley 1,468 8,000 Texwinca Holdings Ltd Bank of America
Merrill Lynch 391 32,000 WH Group Ltd '144A' Goldman Sachs (536) 35,500 WH Group Ltd '144A' Morgan Stanley (686) (9,200) Wynn Macau Ltd Bank of America
Merrill Lynch 213 (161,200) Wynn Macau Ltd Morgan Stanley 2,906 (57,600) Wynn Macau Ltd Goldman Sachs (18,020)
(2,484)
Ireland 355,305 Bank of Ireland Bank of America
Merrill Lynch 15,080 963,664 Bank of Ireland Goldman Sachs 40,902 137,651 Bank of Ireland Morgan Stanley 6,304 1 CRH Plc Goldman Sachs 2 33,673 Glanbia Plc Bank of America
Merrill Lynch 10,343 16,402 Glanbia Plc Goldman Sachs 5,038 23,606 Glanbia Plc Morgan Stanley 9,096 4,365 Kingspan Group Plc Bank of America
Merrill Lynch 8,336 930 Kingspan Group Plc Goldman Sachs 1,766 21,487 Kingspan Group Plc Morgan Stanley 41,927
138,794
Israel 8,829 Delek Automotive Systems Ltd Bank of America
Merrill Lynch 4,314 2,242 Delek Automotive Systems Ltd Morgan Stanley 1,092 3,047 Delek Automotive Systems Ltd Goldman Sachs 388 121 Elbit Systems Ltd Morgan Stanley (323) 32,497 Migdal Insurance & Financial Bank of America
Holding Ltd Merrill Lynch (642)
4,829
Italy 201,683 A2A SpA Bank of America
Merrill Lynch 13,516 46,198 A2A SpA Goldman Sachs 3,096 136,387 A2A SpA Morgan Stanley 14,472 28,712 Anima Holding SpA Goldman Sachs 1,283 1,304 Anima Holding SpA Morgan Stanley 277 15,620 Anima Holding SpA Bank of America
Merrill Lynch 698 5,301 Assicurazioni Generali SpA Goldman Sachs 3,316 38,402 Autogrill SpA Goldman Sachs 8,793 19,902 Autogrill SpA Bank of America
Merrill Lynch 4,557 77,080 Autogrill SpA Morgan Stanley 7,318 963 Brembo SpA Bank of America
Merrill Lynch (484) 2,130 Brembo SpA Goldman Sachs (1,071)
75,401 Hera SpA Bank of America Merrill Lynch 5,222
169,944 Hera SpA Goldman Sachs 11,769 164,611 Hera SpA Morgan Stanley 18,019 61,309 Mediobanca SpA Bank of America
Merrill Lynch 37,321 1,436 Moncler SpA Bank of America
Merrill Lynch (1,171) 3,424 Moncler SpA Goldman Sachs (2,792) 4,409 Moncler SpA Morgan Stanley (1,871) 3,007 Parmalat SpA Bank of America
Merrill Lynch (134) 32,046 Parmalat SpA Goldman Sachs (1,432) 74,624 Parmalat SpA Morgan Stanley (167) 8,003 Prysmian SpA Bank of America
Merrill Lynch 5,185 1,072 Prysmian SpA Goldman Sachs 695 863 Prysmian SpA Morgan Stanley 655 13,444 Recordati SpA Bank of America
Merrill Lynch 33,186 4,270 Recordati SpA Goldman Sachs 10,540 17,960 Recordati SpA Morgan Stanley 43,130 (151) Rizzoli Corriere Della Sera Bank of America
Mediagroup SpA Merrill Lynch (8) (1,290) Tenaris SA Goldman Sachs (10) 131,591 UniCredit SpA Bank of America
Merrill Lynch 6,173 30,114 UniCredit SpA Goldman Sachs 1,413 183,494 UniCredit SpA Morgan Stanley 20,085 (2,835) Yoox Net-A-Porter Group SpA Bank of America
Merrill Lynch (570) (1,984) Yoox Net-A-Porter Group SpA Goldman Sachs (679)
240,330
Japan (45,500) Acom Co Ltd Bank of America
Merrill Lynch 2,866 (140,900) Acom Co Ltd Goldman Sachs 8,916 1,700 Adastria Co Ltd Bank of America
Merrill Lynch 3,366 700 Adastria Co Ltd Goldman Sachs 1,386 1,800 Adastria Co Ltd Morgan Stanley 2,430 1 Advance Residence Bank of America
Investment Corp (Reit) Merrill Lynch (53) 28 Advance Residence
Investment Corp (Reit) Goldman Sachs (1,487) 20 Advance Residence
Investment Corp (Reit) Morgan Stanley (1,350) (8,400) Aeon Co Ltd Bank of America
Merrill Lynch (2,010) (9,700) Aeon Co Ltd Goldman Sachs (2,517) (16,500) Aeon Co Ltd Morgan Stanley (1,930) 4,400 Aeon Mall Co Ltd Bank of America
Merrill Lynch (57) 2,200 Aeon Mall Co Ltd Morgan Stanley (40) (600) Aisin Seiki Co Ltd Morgan Stanley (1,678) 3,400 Asahi Group Holdings Ltd Bank of America
Merrill Lynch 5,921 1,000 Asahi Group Holdings Ltd Goldman Sachs 1,899 12,800 Asahi Group Holdings Ltd Morgan Stanley 16,703 68,700 Astellas Pharma Inc Bank of America
Merrill Lynch 31,058 8,200 Astellas Pharma Inc Goldman Sachs 3,926 103,400 Astellas Pharma Inc Morgan Stanley 24,049 1,300 Autobacs Seven Co Ltd Goldman Sachs (164) 500 Autobacs Seven Co Ltd Morgan Stanley (45) (700) Brother Industries Ltd Goldman Sachs (402) 14,000 Calsonic Kansei Corp Bank of America
Merrill Lynch 2,646 24,000 Calsonic Kansei Corp Goldman Sachs 4,536
Hong Kong continued Italy continued

Contracts for difference as at 31 May 2016
Holding
Description Counterparty
Unrealised appreciation/
(depreciation) USD
Holding
Description Counterparty
Unrealised appreciation/
(depreciation) USD
Annual Report and Audited Accounts 283
The notes on pages 489 to 503 form an integral part of these financial statements.
13,000 Calsonic Kansei Corp Morgan Stanley (4,095) (4,100) Canon Inc Goldman Sachs (4,797) (800) Canon Inc Morgan Stanley (886) 2,700 Canon Marketing Japan Inc Bank of America
Merrill Lynch 2,527 1,100 Canon Marketing Japan Inc Goldman Sachs 1,030 7,600 Canon Marketing Japan Inc Morgan Stanley 3,557 4,000 Chiba Bank Ltd/The Bank of America
Merrill Lynch 924 5,000 Chiba Bank Ltd/The Goldman Sachs 1,436 2,000 Chiba Bank Ltd/The Morgan Stanley 408 6,900 Citizen Holdings Co Ltd Bank of America
Merrill Lynch (1,180) 17,200 Citizen Holdings Co Ltd Goldman Sachs (2,941) 6,100 Citizen Holdings Co Ltd Morgan Stanley (1,647) 7,100 COLOPL Inc Bank of America
Merrill Lynch 2,684 7,700 COLOPL Inc Morgan Stanley (1,663) (600) Cosmo Energy Holdings Co Ltd Bank of America
Merrill Lynch 34 (400) Cosmos Pharmaceutical Corp Bank of America
Merrill Lynch (3,240) (6,200) CyberAgent Inc Bank of America
Merrill Lynch (10,602) (3,200) CyberAgent Inc Goldman Sachs (5,472) (3,500) CyberAgent Inc Morgan Stanley (3,465) (6,000) Cyberdyne Inc Bank of America
Merrill Lynch (4,968) (11,300) Cyberdyne Inc Morgan Stanley (8,136) (400) Daifuku Co Ltd Bank of America
Merrill Lynch (7) 1,000 Daiichi Sankyo Co Ltd Goldman Sachs (162) 180,000 Daikyo Inc Bank of America
Merrill Lynch 6,480 87,000 Daikyo Inc Goldman Sachs 3,132 152,000 Daikyo Inc Morgan Stanley 6,840 500 Daito Trust Construction Co Ltd Bank of America
Merrill Lynch (2,047) 5,400 Daito Trust Construction Co Ltd Goldman Sachs (21,297) 4,100 Daito Trust Construction Co Ltd Morgan Stanley (3,586) (13,900) DeNA Co Ltd Goldman Sachs (21,892) (4,800) Dentsu Inc Bank of America
Merrill Lynch 1,728 (1,100) Dentsu Inc Goldman Sachs 396 (4,100) Dentsu Inc Morgan Stanley 2,214 (30,200) DMG Mori Co Ltd Bank of America
Merrill Lynch (13,590) (39,100) DMG Mori Co Ltd Goldman Sachs (18,681) (21,400) DMG Mori Co Ltd Morgan Stanley (13,064) (300) Don Quijote Holdings Co Ltd Bank of America
Merrill Lynch (34) 600 East Japan Railway Co Bank of America
Merrill Lynch 1,868 1,200 East Japan Railway Co Goldman Sachs 3,737 1,700 East Japan Railway Co Morgan Stanley 3,136 (5,000) Ebara Corp Bank of America
Merrill Lynch (440) (12,000) Ebara Corp Goldman Sachs (2,574) (20,000) Ebara Corp Morgan Stanley (3,585) 2,400 Eisai Co Ltd Goldman Sachs 1,704 400 Eisai Co Ltd Morgan Stanley 447 300 FamilyMart Co Ltd Bank of America
Merrill Lynch (282) 100 FamilyMart Co Ltd Goldman Sachs (92) (1,000) FANUC Corp Bank of America
Merrill Lynch (6,885) (1,600) FANUC Corp Morgan Stanley (8,568) (2,800) Fast Retailing Co Ltd Bank of America
Merrill Lynch (43,721) (1,000) Fast Retailing Co Ltd Morgan Stanley (11,025)
3,000 Fuji Electric Co Ltd Bank of America Merrill Lynch (378)
7,000 Fuji Electric Co Ltd Goldman Sachs (882) 16,000 Fuji Electric Co Ltd Morgan Stanley (1,872) 6,300 Fuji Heavy Industries Ltd Goldman Sachs 26,591 25,400 Fuji Heavy Industries Ltd Morgan Stanley 58,291 22,000 Fujitsu General Ltd Bank of America
Merrill Lynch 25,739 26,000 Fujitsu General Ltd Goldman Sachs 30,419 38,000 Fujitsu General Ltd Morgan Stanley 41,381 4,700 Glory Ltd Bank of America
Merrill Lynch (2,984) 3,400 Glory Ltd Goldman Sachs (1,989) (1,100) GMO internet Inc Bank of America
Merrill Lynch (416) (1,400) GMO internet Inc Goldman Sachs (437) 36,700 Gree Inc Bank of America
Merrill Lynch 11,230 36,900 Gree Inc Goldman Sachs 11,291 48,900 Gree Inc Morgan Stanley 9,682 (22,000) GS Yuasa Corp Morgan Stanley (1,584) 109,800 GungHo Online Bank of America
Entertainment Inc Merrill Lynch 50,396 151,400 GungHo Online
Entertainment Inc Goldman Sachs 69,490 83,800 GungHo Online
Entertainment Inc Morgan Stanley 37,709 2,000 Gunma Bank Ltd/The Bank of America
Merrill Lynch 394 3,000 Gunma Bank Ltd/The Goldman Sachs 726 2,000 Gunma Bank Ltd/The Morgan Stanley 475 (6,000) Hamamatsu Photonics KK Bank of America
Merrill Lynch (11,804) (9,700) Hamamatsu Photonics KK Goldman Sachs (19,205) (6,600) Hamamatsu Photonics KK Morgan Stanley (12,475) 39,300 Haseko Corp Bank of America
Merrill Lynch 60,481 32,200 Haseko Corp Goldman Sachs 47,526 28,600 Haseko Corp Morgan Stanley 35,263 300 HIS Co Ltd Bank of America
Merrill Lynch 967 600 HIS Co Ltd Goldman Sachs 1,147 1,100 Hoya Corp Bank of America
Merrill Lynch 795 (93,700) Ichigo Inc Bank of America
Merrill Lynch (13,615) (400) Idemitsu Kosan Co Ltd Goldman Sachs 223 13,400 Iida Group Holdings Co Ltd Morgan Stanley 1,085 1,100 Iida Group Holdings Co Ltd Bank of America
Merrill Lynch (79) 9,100 Iida Group Holdings Co Ltd Goldman Sachs (655) (24) Invincible Investment
Corp (Reit) Goldman Sachs (648) 1,300 Isetan Mitsukoshi Bank of America
Holdings Ltd Merrill Lynch 772 (6,000) ITOCHU Corp Bank of America
Merrill Lynch (1,484) (700) ITOCHU Corp Goldman Sachs (186) (2,700) ITOCHU Corp Morgan Stanley (676) 1,000 Itochu Techno-Solutions Corp Bank of America
Merrill Lynch 336 1,800 Itochu Techno-Solutions Corp Goldman Sachs 1,090 3,600 J Front Retailing Co Ltd Bank of America
Merrill Lynch 2,864 1,300 J Front Retailing Co Ltd Goldman Sachs 1,105 6,800 J Front Retailing Co Ltd Morgan Stanley 4,505 10,000 Japan Aviation Electronics Bank of America
Industry Ltd Merrill Lynch 15,389 7,000 Japan Aviation Electronics
Industry Ltd Goldman Sachs 10,773
BlackRock Global Long/Short Equity Fund continued
Japan continued Japan continued

Contracts for difference as at 31 May 2016
Holding
Description Counterparty
Unrealised appreciation/
(depreciation) USD
Holding
Description Counterparty
Unrealised appreciation/
(depreciation) USD
284 BlackRock Strategic Funds (BSF)
The notes on pages 489 to 503 form an integral part of these financial statements.
BlackRock Global Long/Short Equity Fund continued
7,000 Japan Aviation Electronics Industry Ltd Morgan Stanley 11,214
1,800 Japan Petroleum Exploration Co Ltd Goldman Sachs 2,851
600 Japan Petroleum Exploration Co Ltd Morgan Stanley 535
500 Japan Post Insurance Co Ltd Goldman Sachs 515 (7) Japan Real Estate Bank of America
Investment Corp (Reit) Merrill Lynch 1,953 (21) Japan Real Estate
Investment Corp (Reit) Goldman Sachs 5,859 (16) Japan Real Estate
Investment Corp (Reit) Morgan Stanley 4,752 16,000 Japan Steel Works Ltd/The Bank of America
Merrill Lynch 6,624 17,000 Japan Steel Works Ltd/The Goldman Sachs 7,038 6,000 Japan Steel Works Ltd/The Morgan Stanley 4,320 36,000 Joyo Bank Ltd/The Bank of America
Merrill Lynch 12,960 23,000 Joyo Bank Ltd/The Goldman Sachs 8,280 32,000 Joyo Bank Ltd/The Morgan Stanley 10,368 5,200 K's Holdings Corp Bank of America
Merrill Lynch (1,895) 3,800 K's Holdings Corp Goldman Sachs (1,385) 5,800 K's Holdings Corp Morgan Stanley (4,593) (4,000) Kajima Corp Morgan Stanley (911) 800 Kakaku.com Inc Goldman Sachs 117 3,300 Kakaku.com Inc Bank of America
Merrill Lynch (280) 1,700 Kakaku.com Inc Morgan Stanley (89) 2,000 Kaken Pharmaceutical Co Ltd Bank of America
Merrill Lynch 8,460 2,800 Kaken Pharmaceutical Co Ltd Goldman Sachs 11,473 3,400 Kaken Pharmaceutical Co Ltd Morgan Stanley 12,295 1,000 Kandenko Co Ltd Goldman Sachs (36) (9,000) Kaneka Corp Morgan Stanley 1,944 (11,600) Kansai Paint Co Ltd Bank of America
Merrill Lynch (13,154) (7,000) Kansai Paint Co Ltd Goldman Sachs (8,158) (4,200) Kansai Paint Co Ltd Morgan Stanley (3,773) (121,000) Kawasaki Kisen Kaisha Ltd Bank of America
Merrill Lynch (40,292) (107,000) Kawasaki Kisen Kaisha Ltd Morgan Stanley (26,963) (6) Kenedix Office Investment Bank of America
Corp (Reit) Merrill Lynch 756 (3) Kenedix Office Investment
Corp (Reit) Goldman Sachs 378 (3) Kenedix Office Investment
Corp (Reit) Morgan Stanley 567 (1,200) Keyence Corp Goldman Sachs (31,319) (4,800) Keyence Corp Morgan Stanley (73,869) 4,800 Kinden Corp Bank of America
Merrill Lynch 691 6,300 Kinden Corp Goldman Sachs 685 4,600 Kinden Corp Morgan Stanley 744 (200) Koito Manufacturing Co Ltd Bank of America
Merrill Lynch (507) 300 Komeri Co Ltd Morgan Stanley 275 8,800 Konica Minolta Inc Bank of America
Merrill Lynch 3,326 4,800 Konica Minolta Inc Goldman Sachs 1,814 4,100 Konica Minolta Inc Morgan Stanley 1,144 (26,000) Kumagai Gumi Co Ltd Goldman Sachs (2,679) (5,000) Kumagai Gumi Co Ltd Morgan Stanley (361) 800 Kyowa Exeo Corp Bank of America
Merrill Lynch (518) (300) Kyudenko Corp Morgan Stanley (137) (33,000) Laox Co Ltd Goldman Sachs (1,782) (7,000) Laox Co Ltd Morgan Stanley (126) 1,600 Lintec Corp Bank of America
Merrill Lynch 288
1,300 Lintec Corp Goldman Sachs 234 5,500 Lintec Corp Morgan Stanley 247 (700) Mabuchi Motor Co Ltd Bank of America
Merrill Lynch 1,827 (800) Mabuchi Motor Co Ltd Goldman Sachs 2,088 (1,000) Maeda Corp Bank of America
Merrill Lynch 79 10,000 Maeda Road Bank of America
Construction Co Ltd Merrill Lynch 9,180 6,000 Maeda Road
Construction Co Ltd Goldman Sachs 5,508 8,000 Maeda Road
Construction Co Ltd Morgan Stanley 6,480 (12,600) Makita Corp Bank of America
Merrill Lynch (10,206) (7,500) Makita Corp Goldman Sachs (6,075) (7,000) Makita Corp Morgan Stanley (5,040) (10,100) Maruichi Steel Tube Ltd Bank of America
Merrill Lynch (23,179) (4,400) Maruichi Steel Tube Ltd Goldman Sachs (10,098) (7,600) Maruichi Steel Tube Ltd Morgan Stanley (13,996) 3,400 Matsumotokiyoshi Bank of America
Holdings Co Ltd Merrill Lynch 14,075 3,900 Matsumotokiyoshi
Holdings Co Ltd Goldman Sachs 15,847 3,100 Matsumotokiyoshi
Holdings Co Ltd Morgan Stanley 10,602 (3,200) McDonald's Bank of America
Holdings Co Japan Ltd Merrill Lynch (59) 500 Megmilk Snow Brand Co Ltd Bank of America
Merrill Lynch 1,710 1,000 Miraca Holdings Inc Bank of America
Merrill Lynch 1,845 300 Miraca Holdings Inc Goldman Sachs 553 400 Miraca Holdings Inc Morgan Stanley 576 (17,600) MISUMI Group Inc Bank of America
Merrill Lynch (12,355) (18,000) MISUMI Group Inc Goldman Sachs (12,636) (27,700) MISUMI Group Inc Morgan Stanley (14,958) 10,000 Mitsubishi Gas Bank of America
Chemical Co Inc Merrill Lynch 2,430 4,000 Mitsubishi Gas
Chemical Co Inc Morgan Stanley 864 (22,000) Mitsubishi Logistics Corp Bank of America
Merrill Lynch (19,601) (10,000) Mitsubishi Logistics Corp Goldman Sachs (8,910) (2,000) Mitsubishi Logistics Corp Morgan Stanley (1,188) 9,200 Mitsubishi Tanabe Bank of America
Pharma Corp Merrill Lynch 4,554 15,300 Mitsubishi Tanabe
Pharma Corp Goldman Sachs 7,573 5,500 Mitsubishi Tanabe
Pharma Corp Morgan Stanley 1,633 (4,000) Mitsui Engineering &
Shipbuilding Co Ltd Goldman Sachs (100) 6,000 Mitsui OSK Lines Ltd Goldman Sachs 770 58,000 Mitsui OSK Lines Ltd Morgan Stanley 7,761 1,300 Mixi Inc Bank of America
Merrill Lynch 2,320 2,400 Mixi Inc Goldman Sachs 4,445 1,000 Mixi Inc Morgan Stanley 2,004 (4,500) MonotaRO Co Ltd Bank of America
Merrill Lynch (15,794) (10,500) MonotaRO Co Ltd Goldman Sachs (36,854) (23,400) MonotaRO Co Ltd Morgan Stanley (67,390) 22,000 Morinaga & Co Ltd/Japan Bank of America
Merrill Lynch 8,316 15,000 Morinaga & Co Ltd/Japan Morgan Stanley 5,130 (600) Nabtesco Corp Morgan Stanley (1,053) 26,100 Nagase & Co Ltd Bank of America
Merrill Lynch 22,315
Japan continued Japan continued

Contracts for difference as at 31 May 2016
Holding
Description Counterparty
Unrealised appreciation/
(depreciation) USD
Holding
Description Counterparty
Unrealised appreciation/
(depreciation) USD
Annual Report and Audited Accounts 285
The notes on pages 489 to 503 form an integral part of these financial statements.
14,600 Nagase & Co Ltd Goldman Sachs 12,483 24,900 Nagase & Co Ltd Morgan Stanley 16,359 3,700 Nexon Co Ltd Bank of America
Merrill Lynch 866 6,600 Nexon Co Ltd Goldman Sachs 1,544 2,000 Nexon Co Ltd Morgan Stanley 360 (36,500) Next Co Ltd Goldman Sachs 49,930 (6,000) Next Co Ltd Morgan Stanley 9,018 3,000 NH Foods Ltd Bank of America
Merrill Lynch 675 11,000 NH Foods Ltd Goldman Sachs 2,475 6,000 NH Foods Ltd Morgan Stanley (594) 600 Nichi-iko
Pharmaceutical Co Ltd Morgan Stanley 524 7,000 Nichirei Corp Bank of America
Merrill Lynch (945) 11,000 Nichirei Corp Goldman Sachs (1,485) (1,800) Nidec Corp Bank of America
Merrill Lynch (4,714) (3,000) Nidec Corp Goldman Sachs (7,857) (3,800) Nidec Corp Morgan Stanley (6,737) (10,900) Nihon Kohden Corp Bank of America
Merrill Lynch (12,262) (8,200) Nihon Kohden Corp Goldman Sachs (9,225) (10,900) Nihon Kohden Corp Morgan Stanley (2,452) 9,700 Nikon Corp Bank of America
Merrill Lynch 2,270 5,200 Nikon Corp Goldman Sachs 1,217 6,700 Nikon Corp Morgan Stanley 1,749 (1,900) Nintendo Co Ltd Bank of America
Merrill Lynch (14,449) (400) Nintendo Co Ltd Goldman Sachs (3,042) 2,000 Nippo Corp Bank of America
Merrill Lynch 2,736 2,000 Nippo Corp Morgan Stanley 1,764 (6,300) Nippon Paint Holdings Co Ltd Bank of America
Merrill Lynch (6,804) (500) Nippon Paint Holdings Co Ltd Goldman Sachs (540) (4,200) Nippon Paint Holdings Co Ltd Morgan Stanley (4,158) (6,800) Nippon Paper
Industries Co Ltd Goldman Sachs 2,142 15,600 Nippon Shokubai Co Ltd Bank of America
Merrill Lynch 110,774 4,800 Nippon Shokubai Co Ltd Goldman Sachs 33,799 4,100 Nippon Shokubai Co Ltd Morgan Stanley 19,187 3,300 Nippon Telegraph &
Telephone Corp Goldman Sachs 579 13,100 Nippon Telegraph &
Telephone Corp Morgan Stanley 5,044 3,400 Nippon Telegraph & Bank of America
Telephone Corp Merrill Lynch (261) (12,600) Nisshin Steel Co Ltd Goldman Sachs (1,287) 300 Nitori Holdings Co Ltd Goldman Sachs 1,031 600 Nitori Holdings Co Ltd Morgan Stanley 2,541 11,300 Nomura Real Estate Bank of America
Holdings Inc Merrill Lynch 14,034 2,600 Nomura Real Estate
Holdings Inc Goldman Sachs 3,229 6,000 Nomura Real Estate
Holdings Inc Morgan Stanley 5,616 1,200 NS Solutions Corp Bank of America
Merrill Lynch 1,274 1,800 NS Solutions Corp Goldman Sachs 1,911 1,500 NS Solutions Corp Morgan Stanley 1,458 12,000 NSK Ltd Bank of America
Merrill Lynch (3,348) 9,400 NSK Ltd Goldman Sachs (2,871) 9,200 NSK Ltd Morgan Stanley (4,223) 200 NTT Data Corp Bank of America
Merrill Lynch 105
300 NTT DOCOMO Inc Goldman Sachs 222 (1,700) Olympus Corp Bank of America
Merrill Lynch (6,808) (4,800) Olympus Corp Morgan Stanley (16,199) (3,900) Ono Pharmaceutical Co Ltd Bank of America
Merrill Lynch 4,001 33,000 Osaka Gas Co Ltd Bank of America
Merrill Lynch 687 11,000 Osaka Gas Co Ltd Goldman Sachs 856 41,000 Osaka Gas Co Ltd Morgan Stanley 2,136 10,900 Penta-Ocean Bank of America
Construction Co Ltd Merrill Lynch 4,905 4,100 Penta-Ocean
Construction Co Ltd Goldman Sachs 1,845 11,300 Penta-Ocean
Construction Co Ltd Morgan Stanley 3,864 600 Pigeon Corp Bank of America
Merrill Lynch 405 500 Pola Orbis Holdings Inc Bank of America
Merrill Lynch 1,215 900 Pola Orbis Holdings Inc Goldman Sachs 2,187 900 Pola Orbis Holdings Inc Morgan Stanley 3,321 100 Relo Holdings Inc Goldman Sachs 198 26,400 Resona Holdings Inc Bank of America
Merrill Lynch 5,655 (2,500) Ricoh Co Ltd Bank of America
Merrill Lynch (519) (3,800) Ricoh Co Ltd Morgan Stanley (879) 1,600 Rohm Co Ltd Bank of America
Merrill Lynch 6,552 400 Rohm Co Ltd Goldman Sachs 1,638 300 Rohm Co Ltd Morgan Stanley 1,161 700 Rohto Pharmaceutical Co Ltd Bank of America
Merrill Lynch 90 300 Sankyo Co Ltd Goldman Sachs 135 (2,700) Sawai Pharmaceutical Co Ltd Bank of America
Merrill Lynch (10,935) (3,000) Sawai Pharmaceutical Co Ltd Morgan Stanley (8,370) (3,000) SCREEN Holdings Co Ltd Bank of America
Merrill Lynch (1,385) (2,000) SCREEN Holdings Co Ltd Goldman Sachs (690) (5,000) SCREEN Holdings Co Ltd Morgan Stanley (6,042) 700 Sega Sammy Holdings Inc Bank of America
Merrill Lynch 922 1,000 Sega Sammy Holdings Inc Goldman Sachs 1,305 18,500 Seino Holdings Co Ltd Bank of America
Merrill Lynch (8,158) 6,900 Seino Holdings Co Ltd Goldman Sachs (3,043) 7,900 Seino Holdings Co Ltd Morgan Stanley (4,977) 800 Sekisui Chemical Co Ltd Bank of America
Merrill Lynch 15 52,200 Senshu Ikeda Holdings Inc Morgan Stanley 10,335 1,000 Shimadzu Corp Morgan Stanley (666) (1,300) Shimamura Co Ltd Goldman Sachs 1,170 (2,700) Shimamura Co Ltd Morgan Stanley 3,402 (1,000) Shimizu Corp Morgan Stanley 153 (23,700) SoftBank Group Corp Morgan Stanley (63,988) (1,200) SoftBank Group Corp Bank of America
Merrill Lynch (4,395) (120,700) Sojitz Corp Bank of America
Merrill Lynch (7,001) (55,000) Sojitz Corp Morgan Stanley (2,499) (32,600) Sony Corp Bank of America
Merrill Lynch (69,164) (1,100) Sony Corp Goldman Sachs (2,376) (2,900) Sony Corp Morgan Stanley (3,299) 400 Square Enix Holdings Co Ltd Bank of America
Merrill Lynch 293 800 Square Enix Holdings Co Ltd Morgan Stanley 983
BlackRock Global Long/Short Equity Fund continued
Japan continued Japan continued

Contracts for difference as at 31 May 2016
Holding
Description Counterparty
Unrealised appreciation/
(depreciation) USD
Holding
Description Counterparty
Unrealised appreciation/
(depreciation) USD
286 BlackRock Strategic Funds (BSF)
The notes on pages 489 to 503 form an integral part of these financial statements.
BlackRock Global Long/Short Equity Fund continued
2,700 Start Today Co Ltd Bank of America Merrill Lynch 1,719
1,800 Start Today Co Ltd Goldman Sachs 2,282 1,100 Start Today Co Ltd Morgan Stanley 1,070 100 Sugi Holdings Co Ltd Bank of America
Merrill Lynch 288 1,100 Sugi Holdings Co Ltd Goldman Sachs 3,168 1,000 Sugi Holdings Co Ltd Morgan Stanley 3,240 (1,400) Sumco Corp Bank of America
Merrill Lynch (1,474) (1,500) Sumco Corp Morgan Stanley (1,323) 1,400 Sumitomo Dainippon
Pharma Co Ltd Goldman Sachs 1,100 3,400 Sumitomo Electric Bank of America
Industries Ltd Merrill Lynch 2,004 1,800 Sumitomo Electric
Industries Ltd Goldman Sachs 1,603 7,000 Sumitomo Electric
Industries Ltd Morgan Stanley 4,008 3,000 Sumitomo Forestry Co Ltd Bank of America
Merrill Lynch 1,431 10,300 Sumitomo Forestry Co Ltd Goldman Sachs 4,913 8,800 Sumitomo Forestry Co Ltd Morgan Stanley 2,534 128,000 Sumitomo Mitsui Trust Bank of America
Holdings Inc Merrill Lynch 54,142 101,000 Sumitomo Mitsui Trust
Holdings Inc Morgan Stanley 36,540 34,000 Sumitomo Osaka Bank of America
Cement Co Ltd Merrill Lynch 3,366 70,000 Sumitomo Osaka
Cement Co Ltd Goldman Sachs 6,930 58,000 Sumitomo Osaka
Cement Co Ltd Morgan Stanley 7,830 4,100 Sumitomo Real Estate Bank of America
Sales Co Ltd Merrill Lynch 3,948 1,400 Sumitomo Real Estate
Sales Co Ltd Goldman Sachs 1,348 4,800 Sumitomo Real Estate
Sales Co Ltd Morgan Stanley 3,240 1,800 Sundrug Co Ltd Bank of America
Merrill Lynch 8,100 2,300 Sundrug Co Ltd Goldman Sachs 10,350 2,200 Sundrug Co Ltd Morgan Stanley 11,296 300 Suzuken Co Ltd/Aichi Japan Goldman Sachs 351 900 T&D Holdings Inc Bank of America
Merrill Lynch 584 900 T&D Holdings Inc Goldman Sachs 995 41,000 Tadano Ltd Bank of America
Merrill Lynch (3,690) 24,000 Tadano Ltd Goldman Sachs (2,160) 37,000 Tadano Ltd Morgan Stanley (5,661) 1,000 Taisei Corp Goldman Sachs 109 (3,900) Taisho Pharmaceutical
Holdings Co Ltd Goldman Sachs (23,516) (8,100) Taisho Pharmaceutical
Holdings Co Ltd Morgan Stanley (40,094) 5,300 Taiyo Yuden Co Ltd Bank of America
Merrill Lynch 9,110 26,200 Taiyo Yuden Co Ltd Goldman Sachs 16,977 9,400 Taiyo Yuden Co Ltd Morgan Stanley 12,690 (700) TDK Corp Bank of America
Merrill Lynch (1,654) (500) TDK Corp Goldman Sachs (1,077) (600) TDK Corp Morgan Stanley (1,529) (3,000) Teijin Ltd Goldman Sachs (130) (4,800) THK Co Ltd Goldman Sachs 1,737 (2,600) THK Co Ltd Bank of America
Merrill Lynch (175) (1,100) THK Co Ltd Morgan Stanley (153) 300 Toho Co Ltd/Tokyo Goldman Sachs 262
5,100 Tokai Rika Co Ltd Bank of America Merrill Lynch 2,846
13,200 Tokai Rika Co Ltd Goldman Sachs 7,365 4,500 Tokai Rika Co Ltd Morgan Stanley 1,093 (1,400) Tokyo Electric Power Co
Holdings Inc Morgan Stanley (53) 388,000 Tokyo Gas Co Ltd Bank of America
Merrill Lynch 35,612 359,000 Tokyo Gas Co Ltd Goldman Sachs 34,554 370,000 Tokyo Gas Co Ltd Morgan Stanley 3,991 5,200 Tokyu Fudosan Holdings Corp Bank of America
Merrill Lynch 1,030 23,000 Tokyu Fudosan Holdings Corp Goldman Sachs 4,554 4,600 Tokyu Fudosan Holdings Corp Morgan Stanley 207 22,000 TonenGeneral Sekiyu KK Bank of America
Merrill Lynch 19,635 15,000 TonenGeneral Sekiyu KK Goldman Sachs 11,437 36,000 TonenGeneral Sekiyu KK Morgan Stanley 21,839 (700) Topcon Corp Bank of America
Merrill Lynch (825) (27,000) Topcon Corp Morgan Stanley (26,729) 10,000 Toppan Forms Co Ltd Bank of America
Merrill Lynch 5,130 9,400 Toppan Forms Co Ltd Goldman Sachs 4,822 9,300 Toppan Forms Co Ltd Morgan Stanley 4,352 (62,000) Toshiba Corp Goldman Sachs (28,736) (16,000) Toshiba Corp Morgan Stanley (7,183) 6,000 Tosoh Corp Bank of America
Merrill Lynch 1,890 24,000 Tosoh Corp Goldman Sachs 7,560 23,000 Tosoh Corp Morgan Stanley 3,726 (18,000) Toyo Seikan Group Bank of America
Holdings Ltd Merrill Lynch (29,807) (11,000) Toyo Seikan Group
Holdings Ltd Goldman Sachs (18,215) (19,000) Toyo Seikan Group
Holdings Ltd Morgan Stanley (19,322) (600) Toyota Industries Corp Morgan Stanley (1,637) 1,000 TS Tech Co Ltd Bank of America
Merrill Lynch 666 800 TS Tech Co Ltd Goldman Sachs 533 1,600 TS Tech Co Ltd Morgan Stanley 475 (1,500) Ulvac Inc Bank of America
Merrill Lynch 288 (600) Ulvac Inc Goldman Sachs 504 (2,100) Ulvac Inc Morgan Stanley 159 200 United Arrows Ltd Bank of America
Merrill Lynch (153) 600 United Arrows Ltd Goldman Sachs (459) 1,200 United Arrows Ltd Morgan Stanley (1,350) (6) United Urban Investment
Corp (Reit) Goldman Sachs 20 300 Yakult Honsha Co Ltd Goldman Sachs (108) 3,800 Yakult Honsha Co Ltd Morgan Stanley (1,026) (66,400) Yamada Denki Co Ltd Morgan Stanley 4,183 (46,800) Yamada Denki Co Ltd Bank of America
Merrill Lynch (2,527) (8,800) Yamada Denki Co Ltd Goldman Sachs (475) (3,900) Yamaha Motor Co Ltd Bank of America
Merrill Lynch (5,826) (1,900) Yamaha Motor Co Ltd Goldman Sachs (2,607) (3,900) Yamaha Motor Co Ltd Morgan Stanley (4,773) 1,100 Yamato Holdings Co Ltd Goldman Sachs 93 1,100 Yamato Kogyo Co Ltd Bank of America
Merrill Lynch 1,475 2,500 Yamato Kogyo Co Ltd Goldman Sachs 3,352 4,700 Yamato Kogyo Co Ltd Morgan Stanley 3,299 (6,300) Yaskawa Electric Corp Bank of America
Merrill Lynch (4,149) (2,300) Yaskawa Electric Corp Goldman Sachs (1,412)
Japan continued Japan continued
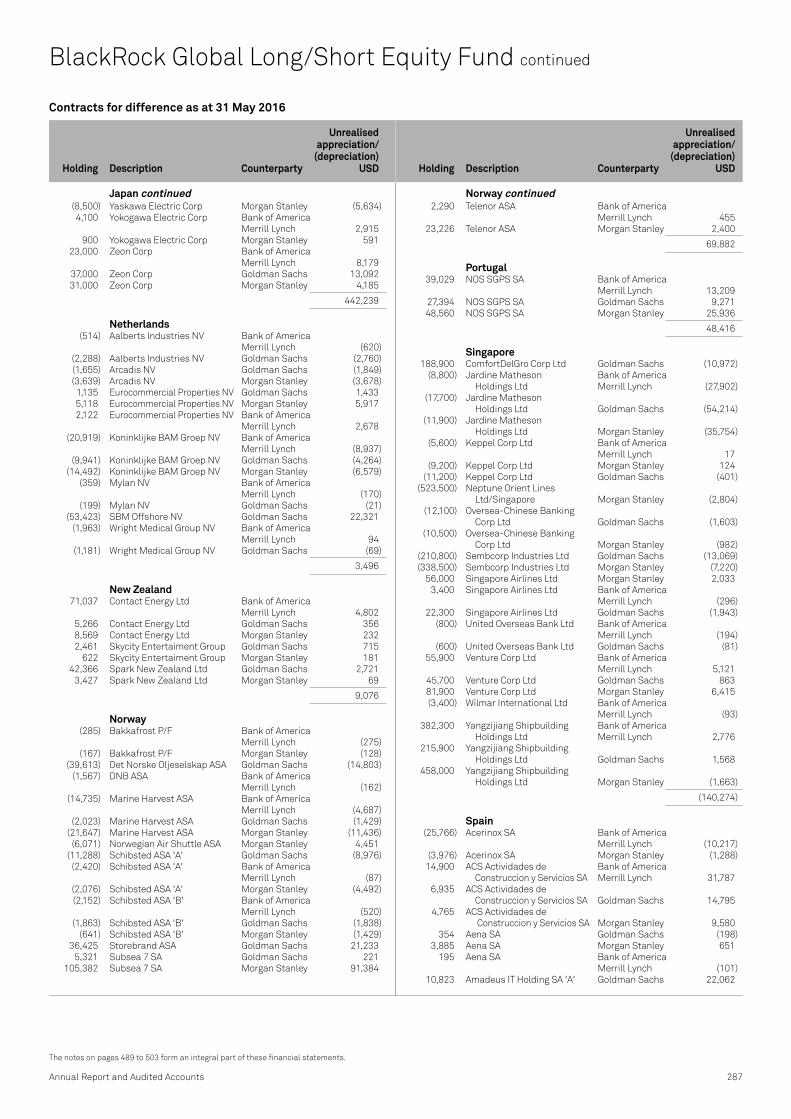
Contracts for difference as at 31 May 2016
Holding
Description Counterparty
Unrealised appreciation/
(depreciation) USD
Holding
Description Counterparty
Unrealised appreciation/
(depreciation) USD
Annual Report and Audited Accounts 287
The notes on pages 489 to 503 form an integral part of these financial statements.
(8,500) Yaskawa Electric Corp Morgan Stanley (5,634) 4,100 Yokogawa Electric Corp Bank of America
Merrill Lynch 2,915 900 Yokogawa Electric Corp Morgan Stanley 591 23,000 Zeon Corp Bank of America
Merrill Lynch 8,179 37,000 Zeon Corp Goldman Sachs 13,092 31,000 Zeon Corp Morgan Stanley 4,185
442,239
Netherlands (514) Aalberts Industries NV Bank of America
Merrill Lynch (620) (2,288) Aalberts Industries NV Goldman Sachs (2,760) (1,655) Arcadis NV Goldman Sachs (1,849) (3,639) Arcadis NV Morgan Stanley (3,678) 1,135 Eurocommercial Properties NV Goldman Sachs 1,433 5,118 Eurocommercial Properties NV Morgan Stanley 5,917 2,122 Eurocommercial Properties NV Bank of America
Merrill Lynch 2,678 (20,919) Koninklijke BAM Groep NV Bank of America
Merrill Lynch (8,937) (9,941) Koninklijke BAM Groep NV Goldman Sachs (4,264) (14,492) Koninklijke BAM Groep NV Morgan Stanley (6,579) (359) Mylan NV Bank of America
Merrill Lynch (170) (199) Mylan NV Goldman Sachs (21) (53,423) SBM Offshore NV Goldman Sachs 22,321 (1,963) Wright Medical Group NV Bank of America
Merrill Lynch 94 (1,181) Wright Medical Group NV Goldman Sachs (69)
3,496
New Zealand 71,037 Contact Energy Ltd Bank of America
Merrill Lynch 4,802 5,266 Contact Energy Ltd Goldman Sachs 356 8,569 Contact Energy Ltd Morgan Stanley 232 2,461 Skycity Entertaiment Group Goldman Sachs 715 622 Skycity Entertaiment Group Morgan Stanley 181 42,366 Spark New Zealand Ltd Goldman Sachs 2,721 3,427 Spark New Zealand Ltd Morgan Stanley 69
9,076
Norway (285) Bakkafrost P/F Bank of America
Merrill Lynch (275) (167) Bakkafrost P/F Morgan Stanley (128) (39,613) Det Norske Oljeselskap ASA Goldman Sachs (14,803) (1,567) DNB ASA Bank of America
Merrill Lynch (162) (14,735) Marine Harvest ASA Bank of America
Merrill Lynch (4,687) (2,023) Marine Harvest ASA Goldman Sachs (1,429) (21,647) Marine Harvest ASA Morgan Stanley (11,436) (6,071) Norwegian Air Shuttle ASA Morgan Stanley 4,451 (11,288) Schibsted ASA 'A' Goldman Sachs (8,976) (2,420) Schibsted ASA 'A' Bank of America
Merrill Lynch (87) (2,076) Schibsted ASA 'A' Morgan Stanley (4,492) (2,152) Schibsted ASA 'B' Bank of America
Merrill Lynch (520) (1,863) Schibsted ASA 'B' Goldman Sachs (1,838) (641) Schibsted ASA 'B' Morgan Stanley (1,429) 36,425 Storebrand ASA Goldman Sachs 21,233 5,321 Subsea 7 SA Goldman Sachs 221 105,382 Subsea 7 SA Morgan Stanley 91,384
2,290 Telenor ASA Bank of America Merrill Lynch 455
23,226 Telenor ASA Morgan Stanley 2,400
69,882
Portugal 39,029 NOS SGPS SA Bank of America
Merrill Lynch 13,209 27,394 NOS SGPS SA Goldman Sachs 9,271 48,560 NOS SGPS SA Morgan Stanley 25,936
48,416
Singapore 188,900 ComfortDelGro Corp Ltd Goldman Sachs (10,972) (8,800) Jardine Matheson Bank of America
Holdings Ltd Merrill Lynch (27,902) (17,700) Jardine Matheson
Holdings Ltd Goldman Sachs (54,214) (11,900) Jardine Matheson
Holdings Ltd Morgan Stanley (35,754) (5,600) Keppel Corp Ltd Bank of America
Merrill Lynch 17 (9,200) Keppel Corp Ltd Morgan Stanley 124 (11,200) Keppel Corp Ltd Goldman Sachs (401) (523,500) Neptune Orient Lines
Ltd/Singapore Morgan Stanley (2,804) (12,100) Oversea-Chinese Banking
Corp Ltd Goldman Sachs (1,603) (10,500) Oversea-Chinese Banking
Corp Ltd Morgan Stanley (982) (210,800) Sembcorp Industries Ltd Goldman Sachs (13,069) (338,500) Sembcorp Industries Ltd Morgan Stanley (7,220) 56,000 Singapore Airlines Ltd Morgan Stanley 2,033 3,400 Singapore Airlines Ltd Bank of America
Merrill Lynch (296) 22,300 Singapore Airlines Ltd Goldman Sachs (1,943) (800) United Overseas Bank Ltd Bank of America
Merrill Lynch (194) (600) United Overseas Bank Ltd Goldman Sachs (81) 55,900 Venture Corp Ltd Bank of America
Merrill Lynch 5,121 45,700 Venture Corp Ltd Goldman Sachs 863 81,900 Venture Corp Ltd Morgan Stanley 6,415 (3,400) Wilmar International Ltd Bank of America
Merrill Lynch (93) 382,300 Yangzijiang Shipbuilding Bank of America
Holdings Ltd Merrill Lynch 2,776 215,900 Yangzijiang Shipbuilding
Holdings Ltd Goldman Sachs 1,568 458,000 Yangzijiang Shipbuilding
Holdings Ltd Morgan Stanley (1,663)
(140,274)
Spain (25,766) Acerinox SA Bank of America
Merrill Lynch (10,217) (3,976) Acerinox SA Morgan Stanley (1,288) 14,900 ACS Actividades de Bank of America
Construccion y Servicios SA Merrill Lynch 31,787 6,935 ACS Actividades de
Construccion y Servicios SA Goldman Sachs 14,795 4,765 ACS Actividades de
Construccion y Servicios SA Morgan Stanley 9,580 354 Aena SA Goldman Sachs (198) 3,885 Aena SA Morgan Stanley 651 195 Aena SA Bank of America
Merrill Lynch (101) 10,823 Amadeus IT Holding SA 'A' Goldman Sachs 22,062
BlackRock Global Long/Short Equity Fund continued
Norway continued Japan continued

Contracts for difference as at 31 May 2016
Holding
Description Counterparty
Unrealised appreciation/
(depreciation) USD
Holding
Description Counterparty
Unrealised appreciation/
(depreciation) USD
288 BlackRock Strategic Funds (BSF)
The notes on pages 489 to 503 form an integral part of these financial statements.
BlackRock Global Long/Short Equity Fund continued
5,225 Amadeus IT Holding SA 'A' Morgan Stanley 10,097 7,357 Amadeus IT Holding SA 'A' Bank of America
Merrill Lynch 14,997 253 Atresmedia Corp de Medios Bank of America
de Comunicacion SA Merrill Lynch 175 3,271 Atresmedia Corp de Medios
de Comunicacion SA Morgan Stanley 2,411 4,768 Atresmedia Corp de Medios
de Comunicacion SA Goldman Sachs 3,302 15,865 Bankinter SA Bank of America
Merrill Lynch 9,516 34,908 Bankinter SA Goldman Sachs 20,938 16,341 Bankinter SA Morgan Stanley 9,254 5,774 Ebro Foods SA Bank of America
Merrill Lynch 2,773 6,861 Ebro Foods SA Goldman Sachs 3,295 6,610 Ebro Foods SA Morgan Stanley 4,725 2,073 Endesa SA Bank of America
Merrill Lynch 726 1,899 Endesa SA Goldman Sachs 509 574 Endesa SA Morgan Stanley 215 8,000 Industria de Diseno Textil SA Bank of America
Merrill Lynch 13,315 19,500 Industria de Diseno Textil SA Goldman Sachs 30,754 2,692 Industria de Diseno Textil SA Morgan Stanley 5,524 100,592 Mediaset Espana Bank of America
Comunicacion SA Merrill Lynch 56,740 102,904 Mediaset Espana
Comunicacion SA Goldman Sachs 58,044 117,872 Mediaset Espana
Comunicacion SA Morgan Stanley 59,246 1,299 Melia Hotels International SA Goldman Sachs 21 523 Melia Hotels International SA Bank of America
Merrill Lynch 257 (35,633) Obrascon Huarte Lain SA Bank of America
Merrill Lynch (7,078) (15,196) Obrascon Huarte Lain SA Morgan Stanley (3,378) 5,605 Repsol SA Morgan Stanley 783 (6,038) Sacyr SA Bank of America
Merrill Lynch 34
364,266
Sweden (16,118) Assa Abloy AB 'B' Goldman Sachs (14,157) (63,678) Assa Abloy AB 'B' Bank of America
Merrill Lynch (55,929) (10,912) Assa Abloy AB 'B' Morgan Stanley (11,553) 60,109 Axfood AB Bank of America
Merrill Lynch 49,232 26,842 Axfood AB Goldman Sachs 21,445 17,430 Axfood AB Morgan Stanley 13,335 1,237 Boliden AB Bank of America
Merrill Lynch 1,429 1,369 Boliden AB Morgan Stanley 1,318 13,072 Electrolux AB 'B' Goldman Sachs 12,021 7,462 Electrolux AB 'B' Morgan Stanley 3,416 6,271 Electrolux AB 'B' Bank of America
Merrill Lynch 4,536 9,759 Fabege AB Bank of America
Merrill Lynch (1,057) 19,886 Fabege AB Morgan Stanley (3,589) (7,200) Fastighets AB Balder 'B' Goldman Sachs (2,597) (2,580) Fastighets AB Balder 'B' Bank of America
Merrill Lynch (1,752) (3,575) Fastighets AB Balder 'B' Morgan Stanley (2,028) (10,059) Getinge AB 'B' Goldman Sachs (10,650) (9,516) Getinge AB 'B' Bank of America
Merrill Lynch (10,075) (389) Getinge AB 'B' Morgan Stanley (384) (31,616) Hennes & Mauritz AB 'B' Bank of America
Merrill Lynch 23,204
23,674 Intrum Justitia AB Bank of America Merrill Lynch 3,160
37,835 Intrum Justitia AB Goldman Sachs 5,007 38,973 Intrum Justitia AB Morgan Stanley 4,220 302 Investment AB Kinnevik Morgan Stanley 650 302 Investment AB Kinnevik 'B' Morgan Stanley (450) (3,409) JM AB Bank of America
Merrill Lynch (2,379) (8,937) JM AB Goldman Sachs (5,428) (2,025) JM AB Morgan Stanley (804) (1,487) Skandinaviska Enskilda
Banken AB 'A' Goldman Sachs 91 (66,092) Skandinaviska Enskilda
Banken AB 'A' Morgan Stanley (16,655) (17,198) Skandinaviska Enskilda Bank of America
Banken AB 'A' Merrill Lynch (9,031) (15,803) Svenska Handelsbanken AB 'A' Goldman Sachs (9,507) (27,017) Svenska Handelsbanken AB 'A' Bank of America
Merrill Lynch (16,253) (16,950) Swedbank AB 'A' Goldman Sachs (28,959) (7,410) Swedbank AB 'A' Bank of America
Merrill Lynch (12,660) (3,904) Swedbank AB 'A' Morgan Stanley (6,670) (30,253) Tele2 AB 'B' Goldman Sachs 21,884 (32,947) Tele2 AB 'B' Bank of America
Merrill Lynch 24,161 (44,300) Tele2 AB 'B' Morgan Stanley 30,381
(3,077)
Switzerland 4,560 Adecco Group AG Reg Goldman Sachs (17,557) 12,849 Adecco Group AG Reg Bank of America
Merrill Lynch 27,260 314 Adecco Group AG Reg Morgan Stanley 666 (743) Ams AG Bank of America
Merrill Lynch (1,913) (2,332) Ams AG Goldman Sachs (4,619) (1,161) Ams AG Morgan Stanley (1,682) (280) Aryzta AG Bank of America
Merrill Lynch 376 (359) Aryzta AG Goldman Sachs 494 (1,000) Aryzta AG Morgan Stanley 220 382 Banque Cantonale
Vaudoise Reg Goldman Sachs 2,145 555 Banque Cantonale Bank of America
Vaudoise Reg Merrill Lynch 15,139 565 Banque Cantonale
Vaudoise Reg Morgan Stanley 15,411 (28) Barry Callebaut AG Reg Bank of America
Merrill Lynch (792) (27) Barry Callebaut AG Reg Morgan Stanley (764) (17) Chocoladefabriken Lindt & Bank of America
Spruengli AG Merrill Lynch (1,116) (42) Chocoladefabriken Lindt &
Spruengli AG Goldman Sachs (3,607) (32) Chocoladefabriken Lindt &
Spruengli AG Morgan Stanley (2,101) (3) Chocoladefabriken Lindt &
Spruengli AG Reg Morgan Stanley (2,849) (21,769) Dufry AG Reg Goldman Sachs (217,723) (2,658) Dufry AG Reg Bank of America
Merrill Lynch (9,667) (4,029) Dufry AG Reg Morgan Stanley (14,186) 220 Galenica AG Reg Goldman Sachs (32,790) 127 Galenica AG Reg Morgan Stanley 409 151 Galenica AG Reg Bank of America
Merrill Lynch 610 24,023 GAM Holding AG Bank of America
Merrill Lynch 10,921 18,146 GAM Holding AG Morgan Stanley 8,249 28,659 GAM Holding AG Goldman Sachs (26,967)
Spain continued Sweden continued

Contracts for difference as at 31 May 2016
Holding
Description Counterparty
Unrealised appreciation/
(depreciation) USD
Holding
Description Counterparty
Unrealised appreciation/
(depreciation) USD
Annual Report and Audited Accounts 289
The notes on pages 489 to 503 form an integral part of these financial statements.
38 Georg Fischer AG Reg Goldman Sachs 503 28 Georg Fischer AG Reg Morgan Stanley 736 28 Georg Fischer AG Reg Bank of America
Merrill Lynch 735 5,114 Kuehne + Nagel
International AG Reg Goldman Sachs 6,511 6,124 Kuehne + Nagel Bank of America
International AG Reg Merrill Lynch 21,544 3,606 Kuehne + Nagel
International AG Reg Morgan Stanley 8,214 (2,569) LafargeHolcim Ltd Reg Goldman Sachs (3,644) (11,578) LafargeHolcim Ltd Reg Morgan Stanley 36,901 20,624 Logitech International SA Reg Bank of America
Merrill Lynch 18,752 27,165 Logitech International SA Reg Morgan Stanley 24,699 23,473 Logitech International SA Reg Goldman Sachs (7,561) 7,299 Lonza Group AG Reg Goldman Sachs 57,941 2,288 Lonza Group AG Reg Bank of America
Merrill Lynch 5,316 15,522 Lonza Group AG Reg Morgan Stanley 36,067 (130) SGS SA Reg Goldman Sachs (5,253) (231) SGS SA Reg Bank of America
Merrill Lynch (5,583) (349) SGS SA Reg Morgan Stanley (14,457) (722) Sonova Holding AG Reg Goldman Sachs (286) 522 Straumann Holding AG Reg Goldman Sachs 16,371 1,179 Straumann Holding AG Reg Morgan Stanley 10,124 53 Straumann Holding AG Reg Bank of America
Merrill Lynch 414 (18,894) UBS Group AG Reg Goldman Sachs 1,578
(46,811)
United Kingdom (14,357) AA Plc Bank of America
Merrill Lynch (442) (9,371) AA Plc Goldman Sachs (988) (3,396) AA Plc Morgan Stanley (142) (6,102) Aggreko Plc Bank of America
Merrill Lynch (9,025) (6,597) Aggreko Plc Morgan Stanley (4,251) (80,098) Antofagasta Plc Bank of America
Merrill Lynch 1,219 (40,584) Antofagasta Plc Morgan Stanley 3,269 16,079 ARM Holdings Plc Bank of America
Merrill Lynch 3,435 136,114 ARM Holdings Plc Goldman Sachs 73,761 28,839 ARM Holdings Plc Morgan Stanley 4,268 (8,166) Ashtead Group Plc Bank of America
Merrill Lynch (4,073) (17,184) Ashtead Group Plc Morgan Stanley (12,165) (30,117) Babcock International Bank of America
Group Plc Merrill Lynch (35,062) (51,759) Babcock International
Group Plc Goldman Sachs (60,258) (49,699) Babcock International
Group Plc Morgan Stanley (45,487) (55,621) Balfour Beatty Plc Morgan Stanley (3,455) (21,965) Balfour Beatty Plc Bank of America
Merrill Lynch (2,692) (24,863) Balfour Beatty Plc Goldman Sachs (3,903) (212,961) BBA Aviation Plc Bank of America
Merrill Lynch (45,532) (135,780) BBA Aviation Plc Goldman Sachs (29,030) (46,177) BBA Aviation Plc Morgan Stanley (9,129) 138,296 Booker Group Plc Bank of America
Merrill Lynch 26,252 95,316 Booker Group Plc Goldman Sachs 17,499 174,618 Booker Group Plc Morgan Stanley 35,462 3,371 British American Tobacco Plc Morgan Stanley 5,673 (42,155) Capita Plc Bank of America
Merrill Lynch 5,556
(131,518) Capita Plc Goldman Sachs 17,334 (58,069) Capita Plc Morgan Stanley 2,551 (52,858) Capital & Counties Bank of America
Properties Plc Merrill Lynch (10,373) (23,838) Capital & Counties
Properties Plc Goldman Sachs (4,713) (84,493) Capital & Counties
Properties Plc Morgan Stanley (15,449) (77,880) Cobham Plc Goldman Sachs 1,507 (231,908) Cobham Plc Morgan Stanley 4,520 1,582 Coca-Cola HBC AG Bank of America
Merrill Lynch (682) 1,657 Coca-Cola HBC AG Goldman Sachs 306 3,576 Coca-Cola HBC AG Morgan Stanley 781 3,790 DCC Plc Goldman Sachs 9,435 7,385 DS Smith Plc Goldman Sachs 568 (19,150) Essentra Plc Bank of America
Merrill Lynch (2,243) (7,926) Essentra Plc Goldman Sachs (929) (9,949) Essentra Plc Morgan Stanley (1,821) 1,082 Experian Plc Goldman Sachs 665 1,994 Experian Plc Morgan Stanley 999 18,110 GKN Plc Bank of America
Merrill Lynch 639 (43,106) GlaxoSmithKline Plc Morgan Stanley 1,578 (669) GlaxoSmithKline Plc Bank of America
Merrill Lynch 134 (12,269) Glencore Plc Bank of America
Merrill Lynch (451) (29,706) Glencore Plc Morgan Stanley (1,931) (934) Greene King Plc Bank of America
Merrill Lynch (43) (1,547) Greene King Plc Goldman Sachs (423) (49,511) HSBC Holdings Plc Bank of America
Merrill Lynch (3,493) (43,446) HSBC Holdings Plc Morgan Stanley (12,723) 61,765 Inchcape Plc Bank of America
Merrill Lynch (15,376) 20,406 Inchcape Plc Goldman Sachs (5,080) 31,046 Inchcape Plc Morgan Stanley (10,229) (4,821) Inmarsat Plc Bank of America
Merrill Lynch 1,575 (4,939) Inmarsat Plc Morgan Stanley 3,689 3,459 Intermediate Capital Bank of America
Group Plc Merrill Lynch 1,418 13,931 Intermediate Capital
Group Plc Goldman Sachs 5,648 4,141 Intermediate Capital
Group Plc Morgan Stanley 1,243 8,475 Intertek Group Plc Bank of America
Merrill Lynch (22,175) 11,938 Intertek Group Plc Goldman Sachs (12,130) 14,225 Intertek Group Plc Morgan Stanley (24,595) (77,169) J Sainsbury Plc Goldman Sachs (7,425) 19,880 Jupiter Fund Management Plc Bank of America
Merrill Lynch 6,199 28,035 Jupiter Fund Management Plc Goldman Sachs 6,804 24,969 Jupiter Fund Management Plc Morgan Stanley 5,054 (71,467) Kingfisher Plc Bank of America
Merrill Lynch (4,765) (59,465) Kingfisher Plc Goldman Sachs (4,333) (1,942) Kingfisher Plc Morgan Stanley (446) (971,340) Lloyds Banking Group Plc Bank of America
Merrill Lynch (21,623) (1,183,778) Lloyds Banking Group Plc Goldman Sachs (7,508) (588,710) Lloyds Banking Group Plc Morgan Stanley (16,919) 7,918 Man Group Plc Bank of America
Merrill Lynch 243 4,509 Marks & Spencer Group Plc Bank of America
Merrill Lynch (3,710) (15,192) Melrose Industries Plc Bank of America
Merrill Lynch 2,314
BlackRock Global Long/Short Equity Fund continued
United Kingdom continued Switzerland continued

Contracts for difference as at 31 May 2016
Holding
Description Counterparty
Unrealised appreciation/
(depreciation) USD
Holding
Description Counterparty
Unrealised appreciation/
(depreciation) USD
290 BlackRock Strategic Funds (BSF)
The notes on pages 489 to 503 form an integral part of these financial statements.
BlackRock Global Long/Short Equity Fund continued
(49,164) Melrose Industries Plc Goldman Sachs 7,488 3,012 Michael Page International Plc Bank of America
Merrill Lynch 339 (57,794) Micro Focus International Plc Bank of America
Merrill Lynch (91,404) (4,954) Micro Focus International Plc Goldman Sachs (6,745) (7,213) Micro Focus International Plc Morgan Stanley (9,363) 622 Mondi Plc Bank of America
Merrill Lynch 401 119,221 Moneysupermarket.com Bank of America
Group Plc Merrill Lynch 34,743 74,440 Moneysupermarket.com
Group Plc Goldman Sachs 21,693 94,376 Moneysupermarket.com
Group Plc Morgan Stanley 25,982 (2,076) Next Plc Bank of America
Merrill Lynch (4,081) (2,487) Next Plc Goldman Sachs (4,720) (3,840) Next Plc Morgan Stanley (5,776) (10,474) Pearson Plc Bank of America
Merrill Lynch (77) (15,712) Pearson Plc Morgan Stanley (4,602) (16,632) Prudential Plc Bank of America
Merrill Lynch (27,644) (45,150) Prudential Plc Goldman Sachs (75,043) (10,599) Prudential Plc Morgan Stanley (16,142) 694,040 QinetiQ Group Plc Bank of America
Merrill Lynch 169,731 347,814 QinetiQ Group Plc Goldman Sachs 85,060 268,174 QinetiQ Group Plc Morgan Stanley 63,227 (272) Randgold Resources Ltd Bank of America
Merrill Lynch 519 172,424 Rentokil Initial Plc Bank of America
Merrill Lynch 7,575 200,526 Rentokil Initial Plc Goldman Sachs 8,809 487,431 Rentokil Initial Plc Morgan Stanley 18,559 4,997 Rightmove Plc Bank of America
Merrill Lynch 20,270 5,273 Rightmove Plc Goldman Sachs 21,389 3,883 Rightmove Plc Morgan Stanley 12,396 (493,450) Rolls-Royce Holdings Plc Goldman Sachs — (258,014) Rolls-Royce Holdings Plc Morgan Stanley — (11,625) Rolls-Royce Holdings Plc Bank of America
Merrill Lynch 6,592 (15,830) Rolls-Royce Holdings Plc Goldman Sachs 8,925 (3,634) Rolls-Royce Holdings Plc Morgan Stanley 2,102 (495,509) Rolls-Royce Holdings Plc Bank of America
Merrill Lynch — (605,309) Rolls-Royce Holdings Plc 'C' Goldman Sachs — (227,806) Rolls-Royce Holdings Plc 'C' Morgan Stanley — (122,970) Rotork Plc Bank of America
Merrill Lynch (8,135) (96,932) Rotork Plc Goldman Sachs (5,477) (143,563) Rotork Plc Morgan Stanley (3,139) (9,351) Royal Dutch Shell Plc 'A' Goldman Sachs 10,339 (15,445) Royal Dutch Shell Plc 'B' Goldman Sachs 14,488 (9,030) Royal Dutch Shell Plc 'B' Bank of America
Merrill Lynch 9,903 (313) Royal Dutch Shell Plc 'B' Morgan Stanley 281 (15,375) RPC Group Plc Bank of America
Merrill Lynch (9,569) (9,600) RPC Group Plc Goldman Sachs (5,975) (42,079) RPC Group Plc Morgan Stanley (22,800) 252 Spirax-Sarco Engineering Plc Bank of America
Merrill Lynch (47) (26,005) Standard Chartered Plc Goldman Sachs (9,863) 1,531 Standard Life Plc Bank of America
Merrill Lynch 272 5,055 Standard Life Plc Morgan Stanley 1,547 (33,580) Tesco Plc Bank of America
Merrill Lynch 688
547,353 Thomas Cook Group Plc Bank of America Merrill Lynch (83,361)
369,463 Thomas Cook Group Plc Goldman Sachs (56,268) 2,299 Thomas Cook Group Plc Morgan Stanley (406) (336) Travis Perkins Plc Bank of America
Merrill Lynch (743) (6,116) Travis Perkins Plc Goldman Sachs (13,524) (4,505) Travis Perkins Plc Morgan Stanley (7,851) (2,652) UBM Plc Goldman Sachs (209) 2,191 Vedanta Resources Plc Bank of America
Merrill Lynch (218) 16,920 WH Smith Plc Bank of America
Merrill Lynch 21,791 12,007 WH Smith Plc Goldman Sachs 15,058 16,067 WH Smith Plc Morgan Stanley 19,167 (1,127) Whitbread Plc Bank of America
Merrill Lynch (5,298) (2,270) Whitbread Plc Goldman Sachs (317) (5,774) William Hill Plc Bank of America
Merrill Lynch (300) (5,831) William Hill Plc Goldman Sachs (630)
(96,017)
United States (978) 3D Systems Corp Bank of America
Merrill Lynch (763) 2,037 3M Co Bank of America
Merrill Lynch 5,922 524 3M Co Morgan Stanley 1,340 (1,841) 8x8 Inc Bank of America
Merrill Lynch (1,528) (351) 8x8 Inc Goldman Sachs (291) 171 A Schulman Inc Goldman Sachs (87) (2,040) AAR Corp Bank of America
Merrill Lynch (469) (81) AAR Corp Goldman Sachs (19) 665 Abaxis Inc Bank of America
Merrill Lynch 779 167 Abaxis Inc Goldman Sachs 300 857 Abbott Laboratories Bank of America
Merrill Lynch 1,433 1,126 Abbott Laboratories Goldman Sachs 707 1,646 Abengoa Yield Plc Goldman Sachs 2,262 1,613 Abengoa Yield Plc Bank of America
Merrill Lynch 2,311 1,143 Abercrombie & Fitch Co 'A' Bank of America
Merrill Lynch (407) (730) ABIOMED Inc Bank of America
Merrill Lynch (2,048) (1,596) Acadia Healthcare Co Inc Bank of America
Merrill Lynch (2,793) (1,431) Acadia Healthcare Co Inc Goldman Sachs (2,504) (1,999) Acadia Healthcare Co Inc Morgan Stanley (2,519) (3,092) ACADIA Pharmaceuticals Inc Bank of America
Merrill Lynch (17,187) (695) Acceleron Pharma Inc Bank of America
Merrill Lynch (1,105) (644) Acceleron Pharma Inc Goldman Sachs (1,024) 2,561 Accenture Plc 'A' Bank of America
Merrill Lynch 5,431 889 Accenture Plc 'A' Goldman Sachs 45 917 Accenture Plc 'A' Morgan Stanley 3,023 1,932 ACCO Brands Corp Bank of America
Merrill Lynch (213) 833 Achillion Pharmaceuticals Inc Goldman Sachs 692 (1,294) ACI Worldwide Inc Bank of America
Merrill Lynch (725) (2,672) ACI Worldwide Inc Goldman Sachs (1,496) 396 Activision Blizzard Inc Bank of America
Merrill Lynch (16)
United Kingdom continued United Kingdom continued

Contracts for difference as at 31 May 2016
Holding
Description Counterparty
Unrealised appreciation/
(depreciation) USD
Holding
Description Counterparty
Unrealised appreciation/
(depreciation) USD
Annual Report and Audited Accounts 291
The notes on pages 489 to 503 form an integral part of these financial statements.
543 Activision Blizzard Inc Goldman Sachs (22) 93 Acuity Brands Inc Goldman Sachs 1,002 3,301 Acxiom Corp Goldman Sachs (3,171) (71) Adeptus Health Inc 'A' Bank of America
Merrill Lynch 92 916 Adobe Systems Inc Bank of America
Merrill Lynch 2,585 1,627 Adobe Systems Inc Goldman Sachs 3,941 (3,819) ADTRAN Inc Bank of America
Merrill Lynch (1,719) (2,378) ADTRAN Inc Goldman Sachs (1,195) 614 Aduro Biotech Inc Bank of America
Merrill Lynch 1,860 47 Aduro Biotech Inc Goldman Sachs 142 (1,872) Advance Auto Parts Inc Bank of America
Merrill Lynch 91 (168) Advance Auto Parts Inc Goldman Sachs (141) (5,881) Advance Auto Parts Inc Morgan Stanley (69,526) (776) Advanced Drainage Bank of America
Systems Inc Merrill Lynch (897) (225) Advanced Energy Bank of America
Industries Inc Merrill Lynch (815) (57,036) Advanced Micro Devices Inc Bank of America
Merrill Lynch (46,440) 1,958 Advisory Board Co/The Bank of America
Merrill Lynch (2,075) 1,142 Aegon NV Reg Bank of America
Merrill Lynch 286 7,797 Aegon NV Reg Goldman Sachs 1,949 (396) AerCap Holdings NV Bank of America
Merrill Lynch (265) (1,348) AerCap Holdings NV Goldman Sachs (1,224) 6,206 AES Corp/VA Goldman Sachs 403 6,533 AES Corp/VA Bank of America
Merrill Lynch 467 259 Aetna Inc Bank of America
Merrill Lynch 930 692 Affiliated Managers Group Inc Bank of America
Merrill Lynch 6,754 114 Aflac Inc Bank of America
Merrill Lynch 109 5,604 Aflac Inc Goldman Sachs 5,363 1,180 Aflac Inc Morgan Stanley 532 (632) AGCO Corp Bank of America
Merrill Lynch (272) (8,809) AGCO Corp Goldman Sachs (3,788) 1,206 Agilent Technologies Inc Goldman Sachs 3,425 (339) Agios Pharmaceuticals Inc Bank of America
Merrill Lynch (1,631) 282 Air Products & Chemicals Inc Bank of America
Merrill Lynch 13 247 Air Products & Chemicals Inc Goldman Sachs 22 787 Air Products & Chemicals Inc Morgan Stanley 1,068 (145) Akorn Inc Goldman Sachs (52) (151) Akorn Inc Bank of America
Merrill Lynch (16) 482 Albemarle Corp Bank of America
Merrill Lynch 1,472 105 Albemarle Corp Goldman Sachs 320 (98,560) Alcoa Inc Goldman Sachs (19,041) (876) Alder Biopharmaceuticals Inc Bank of America
Merrill Lynch (2,937) (182) Alder Biopharmaceuticals Inc Goldman Sachs (763) 1,396 Alexander & Baldwin Inc Bank of America
Merrill Lynch 2,619 2,080 Alexander & Baldwin Inc Goldman Sachs 3,474 108 Alexandria Real Estate
Equities Inc (Reit) Goldman Sachs (144) 369 Alkermes Plc Goldman Sachs 2,382 (1,841) Allegheny Technologies Inc Bank of America
Merrill Lynch 3,314
(68) Allegiant Travel Co Bank of America Merrill Lynch 391
(398) Allegion Plc Goldman Sachs (248) (110) Allergan Plc Morgan Stanley (1,239) 132 ALLETE Inc Bank of America
Merrill Lynch 269 (716) Alliance Data Systems Corp Bank of America
Merrill Lynch (3,421) (216) Alliance Data Systems Corp Goldman Sachs (1,647) (583) Alliance Data Systems Corp Morgan Stanley (3,798) (602) Alliant Energy Corp Bank of America
Merrill Lynch (673) 4,484 Allied World Assurance Bank of America
Co Holdings AG Merrill Lynch 1,974 1,468 Allied World Assurance
Co Holdings AG Goldman Sachs 786 6,673 Allison Transmission Bank of America
Holdings Inc Merrill Lynch 231 2,877 Allison Transmission
Holdings Inc Goldman Sachs 115 10,707 Allscripts Healthcare
Solutions Inc Goldman Sachs (506) 7,882 Allscripts Healthcare Bank of America
Solutions Inc Merrill Lynch (436) 109 Alnylam Pharmaceuticals Inc Bank of America
Merrill Lynch 1,432 156 Alnylam Pharmaceuticals Inc Goldman Sachs 2,382 2,004 Alon USA Energy Inc Bank of America
Merrill Lynch (1,323) (502) AMAG Pharmaceuticals Inc Goldman Sachs (360) 632 AMC Networks Inc 'A' Bank of America
Merrill Lynch (1,134) 902 AMC Networks Inc 'A' Goldman Sachs (1,619) 4,603 Amdocs Ltd Bank of America
Merrill Lynch 2,900 3,866 Amdocs Ltd Goldman Sachs 2,436 4,900 Amdocs Ltd Morgan Stanley 5,978 (349) Amedisys Inc Goldman Sachs 100 (84) Amedisys Inc Bank of America
Merrill Lynch 78 58 AMERCO Bank of America
Merrill Lynch 687 390 AMERCO Goldman Sachs 6,560 (21,536) Ameren Corp Bank of America
Merrill Lynch (27,566) (17,782) Ameren Corp Goldman Sachs (22,761) (20,997) Ameren Corp Morgan Stanley (39,054) (2,561) American Airlines Group Inc Morgan Stanley 1,177 (3,867) American Airlines Group Inc Bank of America
Merrill Lynch 2,455 (5,573) American Airlines Group Inc Goldman Sachs 3,918 868 American Axle &
Manufacturing Holdings Inc Goldman Sachs 937 (2,520) American Capital Agency Bank of America
Corp (Reit) Merrill Lynch 617 (697) American Electric Bank of America
Power Co Inc Merrill Lynch (640) (620) American Electric
Power Co Inc Goldman Sachs (383) (292) American Equity
Investment Life Holding Co Goldman Sachs (123) (544) American Express Co Bank of America
Merrill Lynch (482) (390) American Express Co Goldman Sachs (651) (1,455) American Financial Bank of America
Group Inc/OH Merrill Lynch (1,340) (1,331) American Financial
Group Inc/OH Goldman Sachs (924) 262 American National Bank of America
Insurance Co Merrill Lynch 456
BlackRock Global Long/Short Equity Fund continued
United States continued United States continued

Contracts for difference as at 31 May 2016
Holding
Description Counterparty
Unrealised appreciation/
(depreciation) USD
Holding
Description Counterparty
Unrealised appreciation/
(depreciation) USD
292 BlackRock Strategic Funds (BSF)
The notes on pages 489 to 503 form an integral part of these financial statements.
BlackRock Global Long/Short Equity Fund continued
(172) American Railcar Bank of America Industries Inc Merrill Lynch (123)
(576) American States Water Co Goldman Sachs 455 1,800 American Tower Corp (Reit) Bank of America
Merrill Lynch (1,476) 197 American Woodmark Corp Goldman Sachs 1,643 227 Ameriprise Financial Inc Bank of America
Merrill Lynch 871 1,974 Ameriprise Financial Inc Morgan Stanley 14,114 (3,369) Ameris Bancorp Bank of America
Merrill Lynch (2,729) (1,165) Ameris Bancorp Goldman Sachs (944) 2,284 AMERISAFE Inc Bank of America
Merrill Lynch 7,265 836 AMERISAFE Inc Goldman Sachs 2,659 14,438 AmerisourceBergen Corp Morgan Stanley (1,733) 10,883 AmerisourceBergen Corp Bank of America
Merrill Lynch (1,959) (129) AmerisourceBergen Corp Bank of America
Merrill Lynch (85) (1,309) AmerisourceBergen Corp Goldman Sachs (326) 1,069 Amicus Therapeutics Inc Bank of America
Merrill Lynch (171) 807 Amicus Therapeutics Inc Goldman Sachs (74) 1,026 AMN Healthcare Services Inc Bank of America
Merrill Lynch 659 191 AMN Healthcare Services Inc Goldman Sachs (95) 1,597 Amphenol Corp 'A' Bank of America
Merrill Lynch 1,498 676 Amphenol Corp 'A' Goldman Sachs 1,285 (348) Amsurg Corp Goldman Sachs (419) (941) Amtek Inc Bank of America
Merrill Lynch (676) (472) Amtek Inc Goldman Sachs (383) 244 AmTrust Financial Services Inc Bank of America
Merrill Lynch (7) 5,898 Analog Devices Inc Bank of America
Merrill Lynch 17,434 2,252 Analog Devices Inc Goldman Sachs 6,666 (2,169) Analogic Corp Bank of America
Merrill Lynch (3,492) (2,671) Andersons Inc/The Bank of America
Merrill Lynch (26,256) (1,483) Andersons Inc/The Goldman Sachs (14,578) (1,267) Anixter International Inc Bank of America
Merrill Lynch (4,168) (1,718) Anixter International Inc Goldman Sachs (5,652) (5,673) Annaly Capital
Management Inc (Reit) Morgan Stanley 53 (11,909) Annaly Capital Bank of America
Management Inc (Reit) Merrill Lynch 525 (1,914) Annaly Capital
Management Inc (Reit) Goldman Sachs 125 (2,579) ANSYS Inc Bank of America
Merrill Lynch (6,312) (497) ANSYS Inc Goldman Sachs (1,857) 176 Antero Resources Corp Bank of America
Merrill Lynch 275 (255) AO Smith Corp Bank of America
Merrill Lynch (1,061) (292) AO Smith Corp Goldman Sachs (1,215) 2,096 Aon Plc Bank of America
Merrill Lynch 7,043 77 Aon Plc Goldman Sachs 374 161 Aon Plc Morgan Stanley 653 755 Apogee Enterprises Inc Bank of America
Merrill Lynch 3,541 683 Apogee Enterprises Inc Goldman Sachs 3,214 (1,203) Applied Industrial Bank of America
Technologies Inc Merrill Lynch (1,121)
(829) Applied Industrial Technologies Inc Goldman Sachs (1,245)
8,137 Applied Materials Inc Bank of America Merrill Lynch 29,989
6,374 Applied Materials Inc Goldman Sachs 27,663 (3,149) AptarGroup Inc Bank of America
Merrill Lynch 1,260 (3,036) Aqua America Inc Bank of America
Merrill Lynch 226 (1,523) Aqua America Inc Goldman Sachs 240 834 Aramark Bank of America
Merrill Lynch 67 (3,029) Arch Capital Group Ltd Bank of America
Merrill Lynch (1,075) (175) Arch Capital Group Ltd Goldman Sachs (225) (4,280) Archer-Daniels-Midland Co Bank of America
Merrill Lynch (14,529) (2,110) Archer-Daniels-Midland Co Goldman Sachs (2,043) 3,446 Argo Group International Bank of America
Holdings Ltd Merrill Lynch (3,055) 3,361 Argo Group International
Holdings Ltd Goldman Sachs (2,887) (2,960) ARIAD Pharmaceuticals Inc Bank of America
Merrill Lynch (2,694) (898) ARIAD Pharmaceuticals Inc Goldman Sachs (817) (326) Arista Networks Inc Bank of America
Merrill Lynch (1,640) 820 Armstrong World Bank of America
Industries Inc Merrill Lynch 574 206 Armstrong World
Industries Inc Goldman Sachs 144 1,272 ARRIS International Plc Bank of America
Merrill Lynch 1,895 (1,563) Arrow Electronics Inc Bank of America
Merrill Lynch (5,324) (1,284) Arrow Electronics Inc Goldman Sachs (4,104) (4,141) Arthur J Gallagher & Co Bank of America
Merrill Lynch (3,561) (1,884) Arthur J Gallagher & Co Goldman Sachs (1,489) (616) Asbury Automotive Group Inc Bank of America
Merrill Lynch (1,622) (731) Asbury Automotive Group Inc Goldman Sachs (2,067) 784 Ascena Retail Group Inc Goldman Sachs 31 1,488 Ascena Retail Group Inc Bank of America
Merrill Lynch 60 5,334 Aspen Insurance Holdings Ltd Bank of America
Merrill Lynch 2,423 2,454 Aspen Insurance Holdings Ltd Goldman Sachs 1,061 7,274 Aspen Technology Inc Morgan Stanley 8,874 (437) Aspen Technology Inc Goldman Sachs 84 (523) Aspen Technology Inc Bank of America
Merrill Lynch (28) (17,269) Associated Banc-Corp Bank of America
Merrill Lynch (18,474) (2,933) Associated Banc-Corp Goldman Sachs (3,138) 7,125 Assured Guaranty Ltd Goldman Sachs 14,036 (422) Astec Industries Inc Bank of America
Merrill Lynch (1,111) (12,221) AT&T Inc Bank of America
Merrill Lynch 1,955 (12,555) AT&T Inc Goldman Sachs 2,009 (20,910) AT&T Inc Morgan Stanley (209) (721) Atlantic Tele-Network Inc Goldman Sachs 173 (989) Atlantic Tele-Network Inc Bank of America
Merrill Lynch 237 291 Atlas Air Worldwide Bank of America
Holdings Inc Merrill Lynch 233 394 Atlassian Corp Plc 'A' Bank of America
Merrill Lynch 112 1,937 Atlassian Corp Plc 'A' Goldman Sachs (192) 2,075 Atlassian Corp Plc 'A' Morgan Stanley (823)
United States continued United States continued
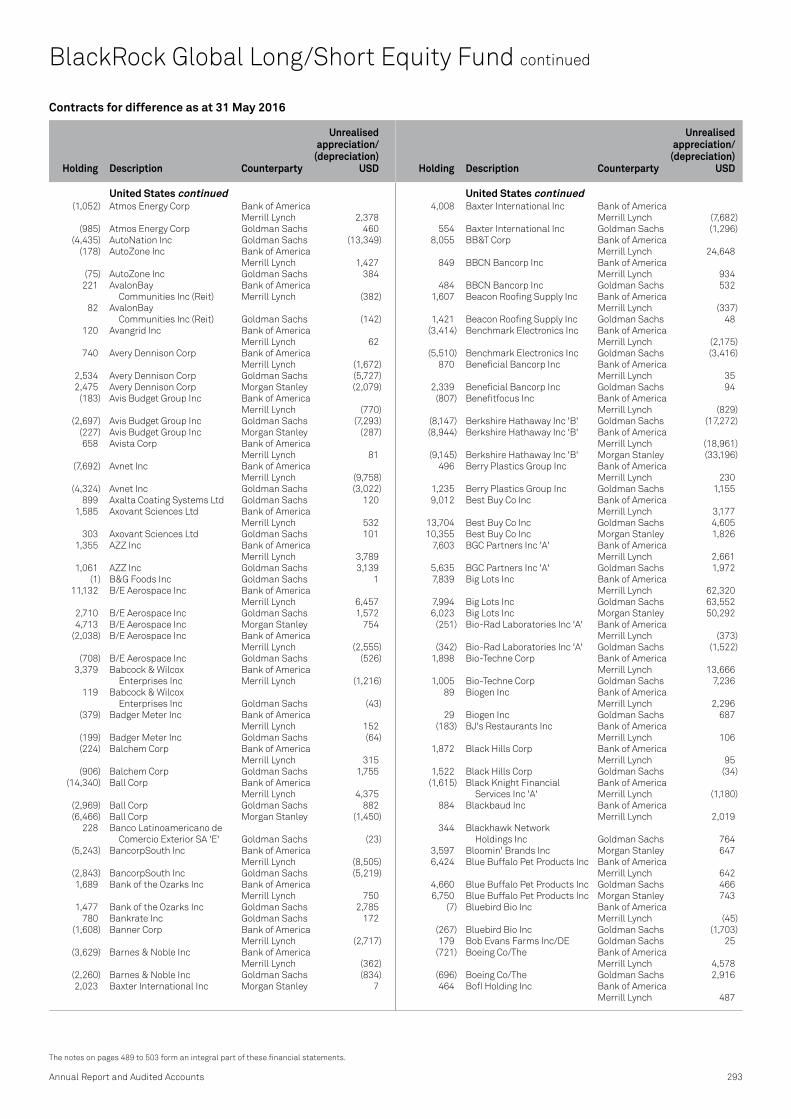
Contracts for difference as at 31 May 2016
Holding
Description Counterparty
Unrealised appreciation/
(depreciation) USD
Holding
Description Counterparty
Unrealised appreciation/
(depreciation) USD
Annual Report and Audited Accounts 293
The notes on pages 489 to 503 form an integral part of these financial statements.
(1,052) Atmos Energy Corp Bank of America Merrill Lynch 2,378
(985) Atmos Energy Corp Goldman Sachs 460 (4,435) AutoNation Inc Goldman Sachs (13,349) (178) AutoZone Inc Bank of America
Merrill Lynch 1,427 (75) AutoZone Inc Goldman Sachs 384 221 AvalonBay Bank of America
Communities Inc (Reit) Merrill Lynch (382) 82 AvalonBay
Communities Inc (Reit) Goldman Sachs (142) 120 Avangrid Inc Bank of America
Merrill Lynch 62 740 Avery Dennison Corp Bank of America
Merrill Lynch (1,672) 2,534 Avery Dennison Corp Goldman Sachs (5,727) 2,475 Avery Dennison Corp Morgan Stanley (2,079) (183) Avis Budget Group Inc Bank of America
Merrill Lynch (770) (2,697) Avis Budget Group Inc Goldman Sachs (7,293) (227) Avis Budget Group Inc Morgan Stanley (287) 658 Avista Corp Bank of America
Merrill Lynch 81 (7,692) Avnet Inc Bank of America
Merrill Lynch (9,758) (4,324) Avnet Inc Goldman Sachs (3,022) 899 Axalta Coating Systems Ltd Goldman Sachs 120 1,585 Axovant Sciences Ltd Bank of America
Merrill Lynch 532 303 Axovant Sciences Ltd Goldman Sachs 101 1,355 AZZ Inc Bank of America
Merrill Lynch 3,789 1,061 AZZ Inc Goldman Sachs 3,139 (1) B&G Foods Inc Goldman Sachs 1 11,132 B/E Aerospace Inc Bank of America
Merrill Lynch 6,457 2,710 B/E Aerospace Inc Goldman Sachs 1,572 4,713 B/E Aerospace Inc Morgan Stanley 754 (2,038) B/E Aerospace Inc Bank of America
Merrill Lynch (2,555) (708) B/E Aerospace Inc Goldman Sachs (526) 3,379 Babcock & Wilcox Bank of America
Enterprises Inc Merrill Lynch (1,216) 119 Babcock & Wilcox
Enterprises Inc Goldman Sachs (43) (379) Badger Meter Inc Bank of America
Merrill Lynch 152 (199) Badger Meter Inc Goldman Sachs (64) (224) Balchem Corp Bank of America
Merrill Lynch 315 (906) Balchem Corp Goldman Sachs 1,755 (14,340) Ball Corp Bank of America
Merrill Lynch 4,375 (2,969) Ball Corp Goldman Sachs 882 (6,466) Ball Corp Morgan Stanley (1,450) 228 Banco Latinoamericano de
Comercio Exterior SA 'E' Goldman Sachs (23) (5,243) BancorpSouth Inc Bank of America
Merrill Lynch (8,505) (2,843) BancorpSouth Inc Goldman Sachs (5,219) 1,689 Bank of the Ozarks Inc Bank of America
Merrill Lynch 750 1,477 Bank of the Ozarks Inc Goldman Sachs 2,785 780 Bankrate Inc Goldman Sachs 172 (1,608) Banner Corp Bank of America
Merrill Lynch (2,717) (3,629) Barnes & Noble Inc Bank of America
Merrill Lynch (362) (2,260) Barnes & Noble Inc Goldman Sachs (834) 2,023 Baxter International Inc Morgan Stanley 7
4,008 Baxter International Inc Bank of America Merrill Lynch (7,682)
554 Baxter International Inc Goldman Sachs (1,296) 8,055 BB&T Corp Bank of America
Merrill Lynch 24,648 849 BBCN Bancorp Inc Bank of America
Merrill Lynch 934 484 BBCN Bancorp Inc Goldman Sachs 532 1,607 Beacon Roofing Supply Inc Bank of America
Merrill Lynch (337) 1,421 Beacon Roofing Supply Inc Goldman Sachs 48 (3,414) Benchmark Electronics Inc Bank of America
Merrill Lynch (2,175) (5,510) Benchmark Electronics Inc Goldman Sachs (3,416) 870 Beneficial Bancorp Inc Bank of America
Merrill Lynch 35 2,339 Beneficial Bancorp Inc Goldman Sachs 94 (807) Benefitfocus Inc Bank of America
Merrill Lynch (829) (8,147) Berkshire Hathaway Inc 'B' Goldman Sachs (17,272) (8,944) Berkshire Hathaway Inc 'B' Bank of America
Merrill Lynch (18,961) (9,145) Berkshire Hathaway Inc 'B' Morgan Stanley (33,196) 496 Berry Plastics Group Inc Bank of America
Merrill Lynch 230 1,235 Berry Plastics Group Inc Goldman Sachs 1,155 9,012 Best Buy Co Inc Bank of America
Merrill Lynch 3,177 13,704 Best Buy Co Inc Goldman Sachs 4,605 10,355 Best Buy Co Inc Morgan Stanley 1,826 7,603 BGC Partners Inc 'A' Bank of America
Merrill Lynch 2,661 5,635 BGC Partners Inc 'A' Goldman Sachs 1,972 7,839 Big Lots Inc Bank of America
Merrill Lynch 62,320 7,994 Big Lots Inc Goldman Sachs 63,552 6,023 Big Lots Inc Morgan Stanley 50,292 (251) Bio-Rad Laboratories Inc 'A' Bank of America
Merrill Lynch (373) (342) Bio-Rad Laboratories Inc 'A' Goldman Sachs (1,522) 1,898 Bio-Techne Corp Bank of America
Merrill Lynch 13,666 1,005 Bio-Techne Corp Goldman Sachs 7,236 89 Biogen Inc Bank of America
Merrill Lynch 2,296 29 Biogen Inc Goldman Sachs 687 (183) BJ's Restaurants Inc Bank of America
Merrill Lynch 106 1,872 Black Hills Corp Bank of America
Merrill Lynch 95 1,522 Black Hills Corp Goldman Sachs (34) (1,615) Black Knight Financial Bank of America
Services Inc 'A' Merrill Lynch (1,180) 884 Blackbaud Inc Bank of America
Merrill Lynch 2,019 344 Blackhawk Network
Holdings Inc Goldman Sachs 764 3,597 Bloomin' Brands Inc Morgan Stanley 647 6,424 Blue Buffalo Pet Products Inc Bank of America
Merrill Lynch 642 4,660 Blue Buffalo Pet Products Inc Goldman Sachs 466 6,750 Blue Buffalo Pet Products Inc Morgan Stanley 743 (7) Bluebird Bio Inc Bank of America
Merrill Lynch (45) (267) Bluebird Bio Inc Goldman Sachs (1,703) 179 Bob Evans Farms Inc/DE Goldman Sachs 25 (721) Boeing Co/The Bank of America
Merrill Lynch 4,578 (696) Boeing Co/The Goldman Sachs 2,916 464 BofI Holding Inc Bank of America
Merrill Lynch 487
BlackRock Global Long/Short Equity Fund continued
United States continued United States continued
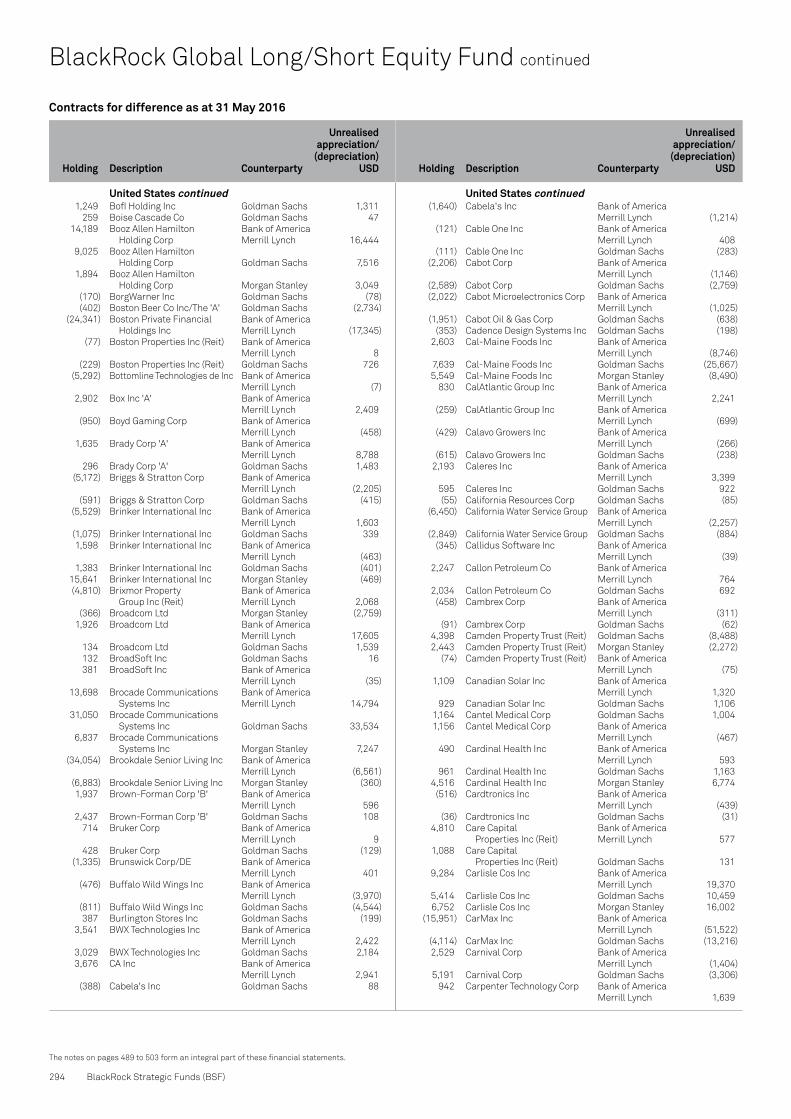
Contracts for difference as at 31 May 2016
Holding
Description Counterparty
Unrealised appreciation/
(depreciation) USD
Holding
Description Counterparty
Unrealised appreciation/
(depreciation) USD
294 BlackRock Strategic Funds (BSF)
The notes on pages 489 to 503 form an integral part of these financial statements.
BlackRock Global Long/Short Equity Fund continued
1,249 BofI Holding Inc Goldman Sachs 1,311 259 Boise Cascade Co Goldman Sachs 47 14,189 Booz Allen Hamilton Bank of America
Holding Corp Merrill Lynch 16,444 9,025 Booz Allen Hamilton
Holding Corp Goldman Sachs 7,516 1,894 Booz Allen Hamilton
Holding Corp Morgan Stanley 3,049 (170) BorgWarner Inc Goldman Sachs (78) (402) Boston Beer Co Inc/The 'A' Goldman Sachs (2,734) (24,341) Boston Private Financial Bank of America
Holdings Inc Merrill Lynch (17,345) (77) Boston Properties Inc (Reit) Bank of America
Merrill Lynch 8 (229) Boston Properties Inc (Reit) Goldman Sachs 726 (5,292) Bottomline Technologies de Inc Bank of America
Merrill Lynch (7) 2,902 Box Inc 'A' Bank of America
Merrill Lynch 2,409 (950) Boyd Gaming Corp Bank of America
Merrill Lynch (458) 1,635 Brady Corp 'A' Bank of America
Merrill Lynch 8,788 296 Brady Corp 'A' Goldman Sachs 1,483 (5,172) Briggs & Stratton Corp Bank of America
Merrill Lynch (2,205) (591) Briggs & Stratton Corp Goldman Sachs (415) (5,529) Brinker International Inc Bank of America
Merrill Lynch 1,603 (1,075) Brinker International Inc Goldman Sachs 339 1,598 Brinker International Inc Bank of America
Merrill Lynch (463) 1,383 Brinker International Inc Goldman Sachs (401) 15,641 Brinker International Inc Morgan Stanley (469) (4,810) Brixmor Property Bank of America
Group Inc (Reit) Merrill Lynch 2,068 (366) Broadcom Ltd Morgan Stanley (2,759) 1,926 Broadcom Ltd Bank of America
Merrill Lynch 17,605 134 Broadcom Ltd Goldman Sachs 1,539 132 BroadSoft Inc Goldman Sachs 16 381 BroadSoft Inc Bank of America
Merrill Lynch (35) 13,698 Brocade Communications Bank of America
Systems Inc Merrill Lynch 14,794 31,050 Brocade Communications
Systems Inc Goldman Sachs 33,534 6,837 Brocade Communications
Systems Inc Morgan Stanley 7,247 (34,054) Brookdale Senior Living Inc Bank of America
Merrill Lynch (6,561) (6,883) Brookdale Senior Living Inc Morgan Stanley (360) 1,937 Brown-Forman Corp 'B' Bank of America
Merrill Lynch 596 2,437 Brown-Forman Corp 'B' Goldman Sachs 108 714 Bruker Corp Bank of America
Merrill Lynch 9 428 Bruker Corp Goldman Sachs (129) (1,335) Brunswick Corp/DE Bank of America
Merrill Lynch 401 (476) Buffalo Wild Wings Inc Bank of America
Merrill Lynch (3,970) (811) Buffalo Wild Wings Inc Goldman Sachs (4,544) 387 Burlington Stores Inc Goldman Sachs (199) 3,541 BWX Technologies Inc Bank of America
Merrill Lynch 2,422 3,029 BWX Technologies Inc Goldman Sachs 2,184 3,676 CA Inc Bank of America
Merrill Lynch 2,941 (388) Cabela's Inc Goldman Sachs 88
(1,640) Cabela's Inc Bank of America Merrill Lynch (1,214)
(121) Cable One Inc Bank of America Merrill Lynch 408
(111) Cable One Inc Goldman Sachs (283) (2,206) Cabot Corp Bank of America
Merrill Lynch (1,146) (2,589) Cabot Corp Goldman Sachs (2,759) (2,022) Cabot Microelectronics Corp Bank of America
Merrill Lynch (1,025) (1,951) Cabot Oil & Gas Corp Goldman Sachs (638) (353) Cadence Design Systems Inc Goldman Sachs (198) 2,603 Cal-Maine Foods Inc Bank of America
Merrill Lynch (8,746) 7,639 Cal-Maine Foods Inc Goldman Sachs (25,667) 5,549 Cal-Maine Foods Inc Morgan Stanley (8,490) 830 CalAtlantic Group Inc Bank of America
Merrill Lynch 2,241 (259) CalAtlantic Group Inc Bank of America
Merrill Lynch (699) (429) Calavo Growers Inc Bank of America
Merrill Lynch (266) (615) Calavo Growers Inc Goldman Sachs (238) 2,193 Caleres Inc Bank of America
Merrill Lynch 3,399 595 Caleres Inc Goldman Sachs 922 (55) California Resources Corp Goldman Sachs (85) (6,450) California Water Service Group Bank of America
Merrill Lynch (2,257) (2,849) California Water Service Group Goldman Sachs (884) (345) Callidus Software Inc Bank of America
Merrill Lynch (39) 2,247 Callon Petroleum Co Bank of America
Merrill Lynch 764 2,034 Callon Petroleum Co Goldman Sachs 692 (458) Cambrex Corp Bank of America
Merrill Lynch (311) (91) Cambrex Corp Goldman Sachs (62) 4,398 Camden Property Trust (Reit) Goldman Sachs (8,488) 2,443 Camden Property Trust (Reit) Morgan Stanley (2,272) (74) Camden Property Trust (Reit) Bank of America
Merrill Lynch (75) 1,109 Canadian Solar Inc Bank of America
Merrill Lynch 1,320 929 Canadian Solar Inc Goldman Sachs 1,106 1,164 Cantel Medical Corp Goldman Sachs 1,004 1,156 Cantel Medical Corp Bank of America
Merrill Lynch (467) 490 Cardinal Health Inc Bank of America
Merrill Lynch 593 961 Cardinal Health Inc Goldman Sachs 1,163 4,516 Cardinal Health Inc Morgan Stanley 6,774 (516) Cardtronics Inc Bank of America
Merrill Lynch (439) (36) Cardtronics Inc Goldman Sachs (31) 4,810 Care Capital Bank of America
Properties Inc (Reit) Merrill Lynch 577 1,088 Care Capital
Properties Inc (Reit) Goldman Sachs 131 9,284 Carlisle Cos Inc Bank of America
Merrill Lynch 19,370 5,414 Carlisle Cos Inc Goldman Sachs 10,459 6,752 Carlisle Cos Inc Morgan Stanley 16,002 (15,951) CarMax Inc Bank of America
Merrill Lynch (51,522) (4,114) CarMax Inc Goldman Sachs (13,216) 2,529 Carnival Corp Bank of America
Merrill Lynch (1,404) 5,191 Carnival Corp Goldman Sachs (3,306) 942 Carpenter Technology Corp Bank of America
Merrill Lynch 1,639
United States continued United States continued

Contracts for difference as at 31 May 2016
Holding
Description Counterparty
Unrealised appreciation/
(depreciation) USD
Holding
Description Counterparty
Unrealised appreciation/
(depreciation) USD
Annual Report and Audited Accounts 295
The notes on pages 489 to 503 form an integral part of these financial statements.
746 Carpenter Technology Corp Goldman Sachs 1,298 1,952 Carrizo Oil & Gas Inc Bank of America
Merrill Lynch 3,689 (215) Carter's Inc Bank of America
Merrill Lynch (426) 1,448 Casey's General Stores Inc Bank of America
Merrill Lynch 4,377 594 Casey's General Stores Inc Goldman Sachs 1,694 (1,965) Catalent Inc Bank of America
Merrill Lynch (5,498) (1,940) Catalent Inc Goldman Sachs (6,236) (1,127) Catalent Inc Morgan Stanley (320) (6,272) Caterpillar Inc Bank of America
Merrill Lynch (12,511) (588) Caterpillar Inc Goldman Sachs (1,229) (1,491) Caterpillar Inc Morgan Stanley (2,594) 7,855 Cathay General Bancorp Bank of America
Merrill Lynch 12,170 4,206 Cathay General Bancorp Goldman Sachs 6,034 834 Cathay General Bancorp Morgan Stanley 755 2,958 Cato Corp/The 'A' Bank of America
Merrill Lynch 6,951 583 Cato Corp/The 'A' Goldman Sachs 1,370 321 Cavium Inc Bank of America
Merrill Lynch 1,152 (391) CBL & Associates Bank of America
Properties Inc (Reit) Merrill Lynch 594 (2,163) CBOE Holdings Inc Goldman Sachs 217 (1,276) CBOE Holdings Inc Bank of America
Merrill Lynch 81 847 CDK Global Inc Goldman Sachs 2,609 148 CEB Inc Goldman Sachs 802 2,466 Celanese Corp 'A' Bank of America
Merrill Lynch (123) 1,101 Celgene Corp Bank of America
Merrill Lynch 5,923 681 Celgene Corp Goldman Sachs 2,357 1,132 Celldex Therapeutics Inc Goldman Sachs 781 (3,341) Centene Corp Bank of America
Merrill Lynch (17,966) (7,251) Centene Corp Goldman Sachs (23,862) (6,078) Centene Corp Morgan Stanley (28,112) 3,234 CenterPoint Energy Inc Bank of America
Merrill Lynch 1,164 24,106 CenterPoint Energy Inc Goldman Sachs 8,678 76,043 CenterPoint Energy Inc Morgan Stanley 45,626 586 Cepheid Bank of America
Merrill Lynch 1,160 1,934 Cepheid Goldman Sachs 3,829 784 Cerner Corp Bank of America
Merrill Lynch 964 (574) CF Industries Holdings Inc Goldman Sachs 202 (576) CH Robinson Worldwide Inc Bank of America
Merrill Lynch (1,374) (731) CH Robinson Worldwide Inc Goldman Sachs (1,743) 3,128 Charles River Laboratories Bank of America
International Inc Merrill Lynch 7,101 247 Charles River Laboratories
International Inc Goldman Sachs 561 725 Charles River Laboratories
International Inc Morgan Stanley 1,813 34,584 Charles Schwab Corp/The Bank of America
Merrill Lynch 50,935 5,514 Charles Schwab Corp/The Goldman Sachs 11,654 5,543 Charles Schwab Corp/The Morgan Stanley 1,423 1,783 Check Point Software Bank of America
Technologies Ltd Merrill Lynch 2,621 1,215 Check Point Software
Technologies Ltd Goldman Sachs 1,786
3,217 Check Point Software Technologies Ltd Morgan Stanley 5,514
(1,835) Chemical Financial Corp Bank of America Merrill Lynch (3,115)
1,246 Chemtura Corp Goldman Sachs 932 341 Chemtura Corp Bank of America
Merrill Lynch (9) (3,236) Cheniere Energy Inc Bank of America
Merrill Lynch 7,346 (11,508) Cheniere Energy Inc Goldman Sachs 26,123 (5,730) Cheniere Energy Inc Morgan Stanley 15,528 1,449 Chesapeake Lodging
Trust (Reit) Goldman Sachs 19 1,601 Chesapeake Lodging Bank of America
Trust (Reit) Merrill Lynch (2,127) (672) Chevron Corp Bank of America
Merrill Lynch 178 (258) Chevron Corp Goldman Sachs 20 (1,902) Chicago Bridge & Iron Co NV Bank of America
Merrill Lynch (1,723) (543) Chicago Bridge & Iron Co NV Goldman Sachs (369) 917 Chico's FAS Inc Goldman Sachs (321) (474) Chimera Investment Bank of America
Corp (Reit) Merrill Lynch 95 (336) China Biologic Products Inc Bank of America
Merrill Lynch (636) (186) China Biologic Products Inc Goldman Sachs (335) (103) Chipotle Mexican Grill Inc Bank of America
Merrill Lynch 157 (691) Chipotle Mexican Grill Inc Goldman Sachs 1,176 (1,439) Chipotle Mexican Grill Inc Morgan Stanley 4,375 (544) Choice Hotels International Inc Bank of America
Merrill Lynch (191) (1,290) Choice Hotels International Inc Goldman Sachs (38) (252) Church & Dwight Co Inc Goldman Sachs (184) (179) Churchill Downs Inc Bank of America
Merrill Lynch (325) (70) Churchill Downs Inc Goldman Sachs (89) 4,677 Ciena Corp Bank of America
Merrill Lynch 3,426 1,054 Ciena Corp Goldman Sachs 1,322 (751) Cimpress NV Bank of America
Merrill Lynch (3,425) (5,401) Cincinnati Financial Corp Bank of America
Merrill Lynch (7,669) 17,865 Cintas Corp Bank of America
Merrill Lynch 62,885 10,725 Cintas Corp Goldman Sachs 37,752 2,308 Cintas Corp Morgan Stanley 9,209 (1,623) CIRCOR International Inc Bank of America
Merrill Lynch (1,055) (320) CIRCOR International Inc Goldman Sachs (208) (182) Cirrus Logic Inc Bank of America
Merrill Lynch (686) 9,382 Cisco Systems Inc Bank of America
Merrill Lynch 15,798 3,064 Cisco Systems Inc Goldman Sachs 5,944 1,709 Cisco Systems Inc Morgan Stanley 1,612 (2,957) CIT Group Inc Bank of America
Merrill Lynch (7,157) (303) CIT Group Inc Goldman Sachs (836) (275) CIT Group Inc Morgan Stanley (516) 43,664 Citizens Financial Group Inc Bank of America
Merrill Lynch 83,835 6,393 Citizens Financial Group Inc Goldman Sachs 12,275 3,442 Citizens Financial Group Inc Morgan Stanley 6,230 1,546 Citrix Systems Inc Bank of America
Merrill Lynch 815 1,180 Citrix Systems Inc Goldman Sachs 1,148 207 Citrix Systems Inc Morgan Stanley (125)
BlackRock Global Long/Short Equity Fund continued
United States continued United States continued

Contracts for difference as at 31 May 2016
Holding
Description Counterparty
Unrealised appreciation/
(depreciation) USD
Holding
Description Counterparty
Unrealised appreciation/
(depreciation) USD
296 BlackRock Strategic Funds (BSF)
The notes on pages 489 to 503 form an integral part of these financial statements.
BlackRock Global Long/Short Equity Fund continued
1,596 CLARCOR Inc Bank of America Merrill Lynch 4,730
688 CLARCOR Inc Goldman Sachs 1,565 (3,920) Clean Harbors Inc Bank of America
Merrill Lynch (5,245) (424) Clean Harbors Inc Goldman Sachs (864) (7,149) Clean Harbors Inc Morgan Stanley (20,661) (479) Clear Channel Outdoor Bank of America
Holdings Inc 'A' Merrill Lynch — (1,426) Clearwater Paper Corp Bank of America
Merrill Lynch (2,289) (632) Clearwater Paper Corp Goldman Sachs (1,012) 9,091 Clorox Co/The Bank of America
Merrill Lynch (27,182) 11,307 Clorox Co/The Goldman Sachs (33,808) 5,119 Clorox Co/The Morgan Stanley (2,139) 824 ClubCorp Holdings Inc Goldman Sachs 61 5,060 CME Group Inc/IL Bank of America
Merrill Lynch 17,659 14,846 CME Group Inc/IL Goldman Sachs 51,457 13,973 CME Group Inc/IL Morgan Stanley 57,150 374 CMS Energy Corp Bank of America
Merrill Lynch 309 719 CMS Energy Corp Goldman Sachs 55 746 CNA Financial Corp Bank of America
Merrill Lynch 656 (3,617) CNH Industrial NV Bank of America
Merrill Lynch (615) 2,171 CNO Financial Group Inc Bank of America
Merrill Lynch 2,735 (41,647) Coach Inc Bank of America
Merrill Lynch (50,688) (7,311) Coach Inc Goldman Sachs (7,844) (17,650) Coach Inc Morgan Stanley (1,538) (16,728) Coca-Cola Co/The Bank of America
Merrill Lynch 12,047 (456) Coca-Cola Co/The Goldman Sachs 415 7,379 Coca-Cola European Bank of America
Partners Plc Merrill Lynch (104,929) 5,951 Coca-Cola European
Partners Plc Goldman Sachs (84,623) 20,455 Coca-Cola European
Partners Plc Morgan Stanley (274,506) (1,375) Cogent Communications Bank of America
Holdings Inc Merrill Lynch (814) (103) Cogent Communications
Holdings Inc Goldman Sachs (159) 252 Cognex Corp Bank of America
Merrill Lynch 969 777 Cognex Corp Goldman Sachs 1,658 (670) Cognizant Technology
Solutions Corp 'A' Goldman Sachs (96) (392) Cognizant Technology Bank of America
Solutions Corp 'A' Merrill Lynch 131 (920) Cohen & Steers Inc Bank of America
Merrill Lynch (95) (1,062) Cohen & Steers Inc Goldman Sachs (230) 80 Coherent Inc Bank of America
Merrill Lynch 765 243 Colfax Corp Goldman Sachs 409 549 Colony Capital Inc 'A' (Reit) Bank of America
Merrill Lynch 16 (3,414) Columbia Banking Bank of America
System Inc Merrill Lynch (1,116) (1,587) Columbia Banking
System Inc Goldman Sachs (61) (2,107) Columbia Property Bank of America
Trust Inc (Reit) Merrill Lynch 2,402 268 Comcast Corp 'A' Bank of America
Merrill Lynch 177
(3,125) Comerica Inc Bank of America Merrill Lynch (14,347)
(1,816) Comerica Inc Goldman Sachs (8,644) 667 Comfort Systems USA Inc Bank of America
Merrill Lynch 712 988 Comfort Systems USA Inc Goldman Sachs 672 5,242 Commerce Bank of America
Bancshares Inc/MO Merrill Lynch 7,779 3,806 Commerce Bancshares Inc/MO Goldman Sachs 4,437 5,223 Commerce Bancshares Inc/MO Morgan Stanley 8,517 (445) Commercial Metals Co Goldman Sachs (129) 475 CommScope Holding Co Inc Goldman Sachs 576 1,858 CommScope Holding Co Inc Bank of America
Merrill Lynch 1,969 669 Communications Sales & Bank of America
Leasing Inc (Reit) Merrill Lynch 274 2,566 Communications Sales &
Leasing Inc (Reit) Goldman Sachs 1,052 (11,365) Community Bank System Inc Bank of America
Merrill Lynch (21,366) (3,429) Community Bank System Inc Goldman Sachs (6,447) 325 CommVault Systems Inc Goldman Sachs (155) (6,576) Compass Minerals
International Inc Goldman Sachs (681) (444) Compass Minerals
International Inc Morgan Stanley (449) (2,440) Computer Sciences Corp Bank of America
Merrill Lynch (36,088) (8,794) Computer Sciences Corp Goldman Sachs (44,299) (5,599) Computer Sciences Corp Morgan Stanley (20,152) 1,913 comScore Inc Bank of America
Merrill Lynch 7,743 325 comScore Inc Goldman Sachs 1,294 2,172 ConAgra Foods Inc Bank of America
Merrill Lynch 3,029 1,607 ConAgra Foods Inc Goldman Sachs 2,709 (3,081) Concho Resources Inc Bank of America
Merrill Lynch (16,303) (731) Concho Resources Inc Goldman Sachs (4,722) (586) CONMED Corp Bank of America
Merrill Lynch 785 (927) CONMED Corp Goldman Sachs 1,242 (3,317) ConocoPhillips Bank of America
Merrill Lynch (3,340) (4,909) ConocoPhillips Goldman Sachs (5,705) (3,122) ConocoPhillips Morgan Stanley (3,596) (1,544) CONSOL Energy Inc Bank of America
Merrill Lynch (1,945) (5,422) CONSOL Energy Inc Goldman Sachs (6,832) (7,487) CONSOL Energy Inc Morgan Stanley (6,139) (6,434) Consolidated Edison Inc Bank of America
Merrill Lynch 4,092 (292) Consolidated Edison Inc Goldman Sachs (226) 1,200 Constellation Brands Inc 'A' Bank of America
Merrill Lynch (5,218) 1,304 Constellation Brands Inc 'A' Goldman Sachs (5,591) 461 Continental Resources Inc/OK Bank of America
Merrill Lynch 793 408 Continental Resources Inc/OK Goldman Sachs 702 2,225 Convergys Corp Bank of America
Merrill Lynch 512 1,486 Convergys Corp Goldman Sachs 342 430 Cooper Cos Inc/The Goldman Sachs (382) (661) Cooper Cos Inc/The Bank of America
Merrill Lynch (1,712) (3,525) Cooper Cos Inc/The Goldman Sachs (9,130) (3,170) Cooper Cos Inc/The Morgan Stanley (14,962) 798 Cooper Cos Inc/The Bank of America
Merrill Lynch 2,221 1,038 Cooper Tire & Rubber Co Goldman Sachs 487
United States continued United States continued

Contracts for difference as at 31 May 2016
Holding
Description Counterparty
Unrealised appreciation/
(depreciation) USD
Holding
Description Counterparty
Unrealised appreciation/
(depreciation) USD
Annual Report and Audited Accounts 297
The notes on pages 489 to 503 form an integral part of these financial statements.
198 Cooper-Standard Holding Inc Bank of America Merrill Lynch 204
(4,794) Copa Holdings SA 'A' Bank of America Merrill Lynch 11,077
(6,367) Copa Holdings SA 'A' Morgan Stanley 14,862 (648) Copart Inc Bank of America
Merrill Lynch (3,617) (559) Copart Inc Goldman Sachs (3,116) (89) Core-Mark Holding Co Inc Bank of America
Merrill Lynch (201) (1,760) CoreLogic Inc/United States Bank of America
Merrill Lynch (389) (778) CoreLogic Inc/United States Goldman Sachs (455) 1,265 CoreSite Realty Corp (Reit) Bank of America
Merrill Lynch (1,417) 420 CoreSite Realty Corp (Reit) Goldman Sachs (470) (12,281) Corning Inc Bank of America
Merrill Lynch (18,140) (3,286) Corning Inc Goldman Sachs (4,539) (659) Corning Inc Morgan Stanley (1,208) 7,566 Cosan Ltd 'A' Bank of America
Merrill Lynch (441) 4,103 Cosan Ltd 'A' Goldman Sachs (287) 60 CoStar Group Inc Bank of America
Merrill Lynch 544 4,693 Costco Wholesale Corp Bank of America
Merrill Lynch 27,204 3,993 Costco Wholesale Corp Goldman Sachs 17,433 596 Covanta Holding Corp Bank of America
Merrill Lynch (256) 492 Covanta Holding Corp Goldman Sachs (212) (17,092) Covanta Holding Corp Morgan Stanley (342) (17,583) Covanta Holding Corp Bank of America
Merrill Lynch 7,561 (19,698) Covanta Holding Corp Goldman Sachs 8,470 2,271 CR Bard Inc Bank of America
Merrill Lynch (4,273) 2,743 CR Bard Inc Goldman Sachs (6,256) 3,044 CR Bard Inc Morgan Stanley (1,564) 975 Cracker Barrel Old Bank of America
Country Store Inc Merrill Lynch 2,697 2,021 Crane Co Bank of America
Merrill Lynch 4,662 950 Crane Co Goldman Sachs 2,166 (611) Cray Inc Bank of America
Merrill Lynch (656) (469) Cray Inc Goldman Sachs (753) (356) Credicorp Ltd Bank of America
Merrill Lynch 1,559 (343) Credicorp Ltd Goldman Sachs 597 (33) Credit Acceptance Corp Goldman Sachs (382) (2,271) Cree Inc Bank of America
Merrill Lynch (3,724) 2,048 Crown Castle International Bank of America
Corp (Reit) Merrill Lynch 298 763 Crown Holdings Inc Bank of America
Merrill Lynch (23) 5,148 CSRA Inc Bank of America
Merrill Lynch 1,849 4,895 CSRA Inc Goldman Sachs 1,637 (127) CST Brands Inc Goldman Sachs 1 (451) CST Brands Inc Bank of America
Merrill Lynch (261) 895 CSX Corp Goldman Sachs 416 348 Cubic Corp Bank of America
Merrill Lynch 732 777 Cubic Corp Goldman Sachs 1,492 (477) Cullen/Frost Bankers Inc Bank of America
Merrill Lynch (1,308) (201) Cullen/Frost Bankers Inc Goldman Sachs (608)
(765) Cummins Inc Bank of America Merrill Lynch (544)
(129) Cummins Inc Goldman Sachs (790) (1,175) CVB Financial Corp Bank of America
Merrill Lynch (1,306) (2,289) CVB Financial Corp Goldman Sachs (2,381) (3,076) CVS Health Corp Goldman Sachs 4,392 (237) CyberArk Software Ltd Bank of America
Merrill Lynch (851) (535) Cynosure Inc 'A' Bank of America
Merrill Lynch (323) (3,611) Cypress Semiconductor Corp Bank of America
Merrill Lynch (3,412) (59,598) Cypress Semiconductor Corp Goldman Sachs (56,276) (8,888) CyrusOne Inc (Reit) Goldman Sachs (5,462) 628 CyrusOne Inc (Reit) Bank of America
Merrill Lynch 188 (7,650) CyrusOne Inc (Reit) Bank of America
Merrill Lynch (3,357) (15,640) CyrusOne Inc (Reit) Morgan Stanley (22,667) (2,780) Dana Holding Corp Bank of America
Merrill Lynch (159) (1,410) Dana Holding Corp Goldman Sachs (234) 765 Danaher Corp Bank of America
Merrill Lynch (392) 427 Dave & Buster's Bank of America
Entertainment Inc Merrill Lynch (171) (6,825) DaVita HealthCare Bank of America
Partners Inc Merrill Lynch (136) (2,686) DaVita HealthCare
Partners Inc Goldman Sachs (69) (2,488) DaVita HealthCare
Partners Inc Morgan Stanley (821) 913 DCT Industrial Bank of America
Trust Inc (Reit) Merrill Lynch (393) 1,546 DCT Industrial
Trust Inc (Reit) Goldman Sachs (298) (8,610) DDR Corp (Reit) Bank of America
Merrill Lynch 2,791 (4,820) DDR Corp (Reit) Goldman Sachs 2,410 2,981 Dean Foods Co Bank of America
Merrill Lynch 33 722 Dean Foods Co Goldman Sachs 304 (486) Deckers Outdoor Corp Bank of America
Merrill Lynch (1,180) (303) Deckers Outdoor Corp Goldman Sachs (1,015) (4,707) Deere & Co Bank of America
Merrill Lynch (15,392) (7,087) Deere & Co Goldman Sachs (1,938) (5,122) Deere & Co Morgan Stanley (1,496) 1,843 Delek US Holdings Inc Bank of America
Merrill Lynch 313 520 Delek US Holdings Inc Goldman Sachs 88 (5,405) Delta Air Lines Inc Bank of America
Merrill Lynch 1,729 (10,586) Delta Air Lines Inc Goldman Sachs 11,976 747 Deluxe Corp Bank of America
Merrill Lynch 1,546 (1,791) Denbury Resources Inc Bank of America
Merrill Lynch 287 1,129 Denny's Corp Goldman Sachs (68) 1,738 Denny's Corp Bank of America
Merrill Lynch (104) 1,196 DENTSPLY SIRONA Inc Goldman Sachs 167 2,049 DENTSPLY SIRONA Inc Bank of America
Merrill Lynch 287 (660) Depomed Inc Bank of America
Merrill Lynch (943) (1,851) Depomed Inc Goldman Sachs (2,598) (462) DexCom Inc Goldman Sachs 162
BlackRock Global Long/Short Equity Fund continued
United States continued United States continued
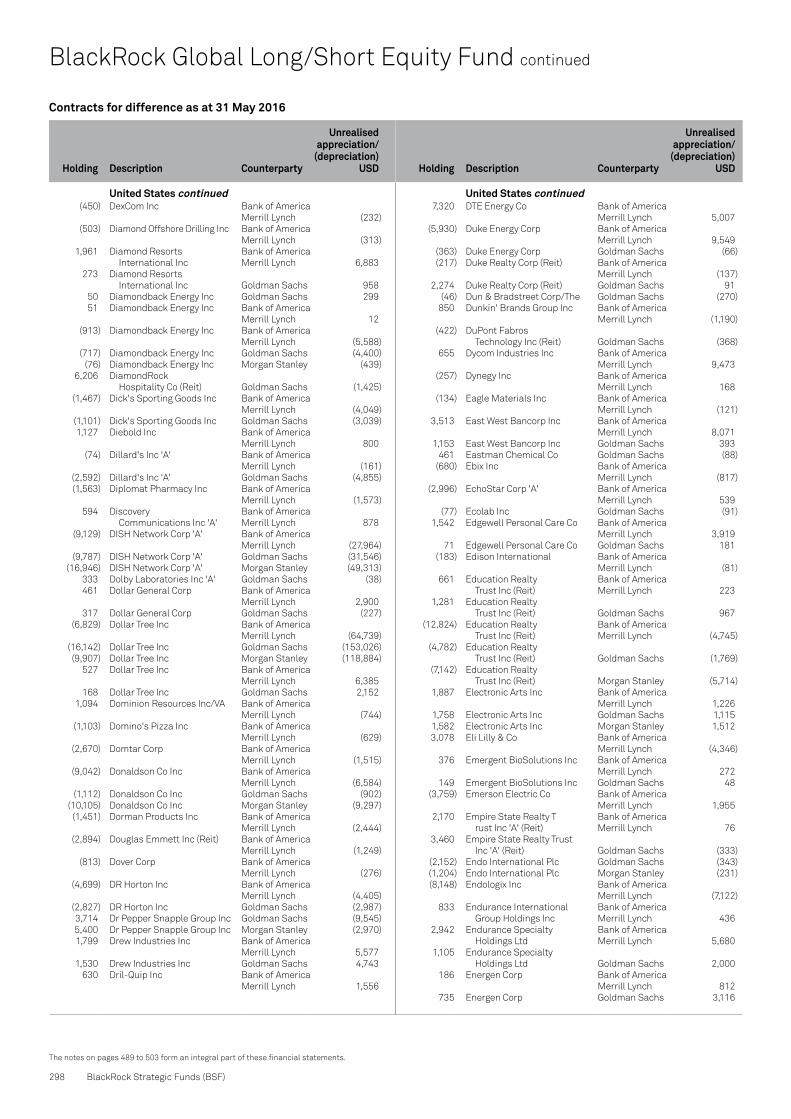
Contracts for difference as at 31 May 2016
Holding
Description Counterparty
Unrealised appreciation/
(depreciation) USD
Holding
Description Counterparty
Unrealised appreciation/
(depreciation) USD
298 BlackRock Strategic Funds (BSF)
The notes on pages 489 to 503 form an integral part of these financial statements.
BlackRock Global Long/Short Equity Fund continued
(450) DexCom Inc Bank of America Merrill Lynch (232)
(503) Diamond Offshore Drilling Inc Bank of America Merrill Lynch (313)
1,961 Diamond Resorts Bank of America International Inc Merrill Lynch 6,883
273 Diamond Resorts International Inc Goldman Sachs 958
50 Diamondback Energy Inc Goldman Sachs 299 51 Diamondback Energy Inc Bank of America
Merrill Lynch 12 (913) Diamondback Energy Inc Bank of America
Merrill Lynch (5,588) (717) Diamondback Energy Inc Goldman Sachs (4,400) (76) Diamondback Energy Inc Morgan Stanley (439) 6,206 DiamondRock
Hospitality Co (Reit) Goldman Sachs (1,425) (1,467) Dick's Sporting Goods Inc Bank of America
Merrill Lynch (4,049) (1,101) Dick's Sporting Goods Inc Goldman Sachs (3,039) 1,127 Diebold Inc Bank of America
Merrill Lynch 800 (74) Dillard's Inc 'A' Bank of America
Merrill Lynch (161) (2,592) Dillard's Inc 'A' Goldman Sachs (4,855) (1,563) Diplomat Pharmacy Inc Bank of America
Merrill Lynch (1,573) 594 Discovery Bank of America
Communications Inc 'A' Merrill Lynch 878 (9,129) DISH Network Corp 'A' Bank of America
Merrill Lynch (27,964) (9,787) DISH Network Corp 'A' Goldman Sachs (31,546) (16,946) DISH Network Corp 'A' Morgan Stanley (49,313) 333 Dolby Laboratories Inc 'A' Goldman Sachs (38) 461 Dollar General Corp Bank of America
Merrill Lynch 2,900 317 Dollar General Corp Goldman Sachs (227) (6,829) Dollar Tree Inc Bank of America
Merrill Lynch (64,739) (16,142) Dollar Tree Inc Goldman Sachs (153,026) (9,907) Dollar Tree Inc Morgan Stanley (118,884) 527 Dollar Tree Inc Bank of America
Merrill Lynch 6,385 168 Dollar Tree Inc Goldman Sachs 2,152 1,094 Dominion Resources Inc/VA Bank of America
Merrill Lynch (744) (1,103) Domino's Pizza Inc Bank of America
Merrill Lynch (629) (2,670) Domtar Corp Bank of America
Merrill Lynch (1,515) (9,042) Donaldson Co Inc Bank of America
Merrill Lynch (6,584) (1,112) Donaldson Co Inc Goldman Sachs (902) (10,105) Donaldson Co Inc Morgan Stanley (9,297) (1,451) Dorman Products Inc Bank of America
Merrill Lynch (2,444) (2,894) Douglas Emmett Inc (Reit) Bank of America
Merrill Lynch (1,249) (813) Dover Corp Bank of America
Merrill Lynch (276) (4,699) DR Horton Inc Bank of America
Merrill Lynch (4,405) (2,827) DR Horton Inc Goldman Sachs (2,987) 3,714 Dr Pepper Snapple Group Inc Goldman Sachs (9,545) 5,400 Dr Pepper Snapple Group Inc Morgan Stanley (2,970) 1,799 Drew Industries Inc Bank of America
Merrill Lynch 5,577 1,530 Drew Industries Inc Goldman Sachs 4,743 630 Dril-Quip Inc Bank of America
Merrill Lynch 1,556
7,320 DTE Energy Co Bank of America Merrill Lynch 5,007
(5,930) Duke Energy Corp Bank of America Merrill Lynch 9,549
(363) Duke Energy Corp Goldman Sachs (66) (217) Duke Realty Corp (Reit) Bank of America
Merrill Lynch (137) 2,274 Duke Realty Corp (Reit) Goldman Sachs 91 (46) Dun & Bradstreet Corp/The Goldman Sachs (270) 850 Dunkin' Brands Group Inc Bank of America
Merrill Lynch (1,190) (422) DuPont Fabros
Technology Inc (Reit) Goldman Sachs (368) 655 Dycom Industries Inc Bank of America
Merrill Lynch 9,473 (257) Dynegy Inc Bank of America
Merrill Lynch 168 (134) Eagle Materials Inc Bank of America
Merrill Lynch (121) 3,513 East West Bancorp Inc Bank of America
Merrill Lynch 8,071 1,153 East West Bancorp Inc Goldman Sachs 393 461 Eastman Chemical Co Goldman Sachs (88) (680) Ebix Inc Bank of America
Merrill Lynch (817) (2,996) EchoStar Corp 'A' Bank of America
Merrill Lynch 539 (77) Ecolab Inc Goldman Sachs (91) 1,542 Edgewell Personal Care Co Bank of America
Merrill Lynch 3,919 71 Edgewell Personal Care Co Goldman Sachs 181 (183) Edison International Bank of America
Merrill Lynch (81) 661 Education Realty Bank of America
Trust Inc (Reit) Merrill Lynch 223 1,281 Education Realty
Trust Inc (Reit) Goldman Sachs 967 (12,824) Education Realty Bank of America
Trust Inc (Reit) Merrill Lynch (4,745) (4,782) Education Realty
Trust Inc (Reit) Goldman Sachs (1,769) (7,142) Education Realty
Trust Inc (Reit) Morgan Stanley (5,714) 1,887 Electronic Arts Inc Bank of America
Merrill Lynch 1,226 1,758 Electronic Arts Inc Goldman Sachs 1,115 1,582 Electronic Arts Inc Morgan Stanley 1,512 3,078 Eli Lilly & Co Bank of America
Merrill Lynch (4,346) 376 Emergent BioSolutions Inc Bank of America
Merrill Lynch 272 149 Emergent BioSolutions Inc Goldman Sachs 48 (3,759) Emerson Electric Co Bank of America
Merrill Lynch 1,955 2,170 Empire State Realty T Bank of America
rust Inc 'A' (Reit) Merrill Lynch 76 3,460 Empire State Realty Trust
Inc 'A' (Reit) Goldman Sachs (333) (2,152) Endo International Plc Goldman Sachs (343) (1,204) Endo International Plc Morgan Stanley (231) (8,148) Endologix Inc Bank of America
Merrill Lynch (7,122) 833 Endurance International Bank of America
Group Holdings Inc Merrill Lynch 436 2,942 Endurance Specialty Bank of America
Holdings Ltd Merrill Lynch 5,680 1,105 Endurance Specialty
Holdings Ltd Goldman Sachs 2,000 186 Energen Corp Bank of America
Merrill Lynch 812 735 Energen Corp Goldman Sachs 3,116
United States continued United States continued

Contracts for difference as at 31 May 2016
Holding
Description Counterparty
Unrealised appreciation/
(depreciation) USD
Holding
Description Counterparty
Unrealised appreciation/
(depreciation) USD
Annual Report and Audited Accounts 299
The notes on pages 489 to 503 form an integral part of these financial statements.
882 Energizer Holdings Inc Bank of America Merrill Lynch 3,854
(427) Energy Transfer Partners LP Bank of America Merrill Lynch (81)
1,272 EnerSys Bank of America Merrill Lynch 2,759
1,074 EnerSys Goldman Sachs 1,300 1,874 EnPro Industries Inc Bank of America
Merrill Lynch 5,453 3,807 Entergy Corp Bank of America
Merrill Lynch (3,046) 72 Entergy Corp Goldman Sachs 90 (658) Envestnet Inc Bank of America
Merrill Lynch (1,145) (125) Envestnet Inc Goldman Sachs (220) 1,322 Envision Healthcare Bank of America
Holdings Inc Merrill Lynch 2,221 (140) EOG Resources Inc Bank of America
Merrill Lynch (109) (1,341) EPAM Systems Inc Bank of America
Merrill Lynch (3,670) (351) EPAM Systems Inc Goldman Sachs (419) (5,716) EPAM Systems Inc Morgan Stanley (28,351) (308) EPR Properties (Reit) Bank of America
Merrill Lynch 7 (925) EPR Properties (Reit) Goldman Sachs (553) (903) EPR Properties (Reit) Morgan Stanley (1,075) (3,498) EQT Corp Bank of America
Merrill Lynch (9,127) (3,315) EQT Corp Goldman Sachs (8,808) (3,650) EQT Corp Morgan Stanley (3,956) (638) Equinix Inc (Reit) Bank of America
Merrill Lynch (13,988) (1,174) Equinix Inc (Reit) Goldman Sachs (16,569) (1,565) Equinix Inc (Reit) Morgan Stanley (24,013) (3,433) Equity One Inc (Reit) Bank of America
Merrill Lynch 1,957 (1,224) Erie Indemnity Co 'A' Bank of America
Merrill Lynch (2,032) (3,844) Essendant Inc Bank of America
Merrill Lynch (5,497) (2,339) Essendant Inc Goldman Sachs (3,345) 4,862 Essent Group Ltd Bank of America
Merrill Lynch 7,099 384 Essex Property Trust Inc (Reit) Goldman Sachs (566) 304 Essex Property Trust Inc (Reit) Bank of America
Merrill Lynch (47) 332 Euronav NV Bank of America
Merrill Lynch (199) 2,218 Euronav NV Goldman Sachs (1,331) 565 Euronet Worldwide Inc Bank of America
Merrill Lynch 1,091 1,124 Euronet Worldwide Inc Goldman Sachs 1,403 (1,581) Evercore Partners Inc 'A' Bank of America
Merrill Lynch (914) (112) Evercore Partners Inc 'A' Goldman Sachs (80) (4,761) Eversource Energy Bank of America
Merrill Lynch 8,552 (378) Eversource Energy Goldman Sachs (92) (613) EW Scripps Co/The 'A' Bank of America
Merrill Lynch (3) (7,507) Exelixis Inc Bank of America
Merrill Lynch (7,582) (674) Exelon Corp Bank of America
Merrill Lynch (71) (533) Exelon Corp Goldman Sachs (226) 765 ExlService Holdings Inc Bank of America
Merrill Lynch 2,564 (1,332) Exponent Inc Bank of America
Merrill Lynch (2,997)
3,470 Express Inc Bank of America Merrill Lynch (5,499)
5,620 Express Inc Goldman Sachs (6,545) (2,125) Express Scripts Holding Co Bank of America
Merrill Lynch (4,069) (1,507) Express Scripts Holding Co Goldman Sachs (3,721) 6,170 Extended Stay Bank of America
America Inc (Unit) Merrill Lynch 1,666 3,841 Extended Stay
America Inc (Unit) Goldman Sachs 917 1,147 Extra Space Storage Inc (Reit) Bank of America
Merrill Lynch 1,272 381 Extra Space Storage Inc (Reit) Goldman Sachs (136) (2,032) Exxon Mobil Corp Goldman Sachs (396) (2,451) Exxon Mobil Corp Bank of America
Merrill Lynch (639) 204 F5 Networks Inc Goldman Sachs (82) 170 F5 Networks Inc Bank of America
Merrill Lynch 15 803 Fabrinet Bank of America
Merrill Lynch 827 1,147 FactSet Research Systems Inc Bank of America
Merrill Lynch 4,782 1,303 FactSet Research Systems Inc Goldman Sachs 8,523 (302) Fair Isaac Corp Bank of America
Merrill Lynch (807) (180) Fair Isaac Corp Goldman Sachs (68) (729) Federal Realty Investment Bank of America
Trust (Reit) Merrill Lynch 2,530 (368) Federal Realty Investment
Trust (Reit) Goldman Sachs 383 (4,245) Federated Investors Inc 'B' Bank of America
Merrill Lynch (6,198) (623) Federated Investors Inc 'B' Goldman Sachs (910) 1,417 FedEx Corp Bank of America
Merrill Lynch 6,142 921 FedEx Corp Goldman Sachs 5,677 1,810 FelCor Lodging Trust Inc (Reit) Bank of America
Merrill Lynch (1,086) 1,122 FelCor Lodging Trust Inc (Reit) Goldman Sachs (673) (503) Ferrari NV Bank of America
Merrill Lynch 509 1,728 Ferro Corp Bank of America
Merrill Lynch (195) 4,158 Ferro Corp Goldman Sachs (577) 7,774 Ferroglobe Plc Bank of America
Merrill Lynch 4,274 4,726 Ferroglobe Plc Goldman Sachs 1,554 (1,022) Fiat Chrysler Automobiles NV Bank of America
Merrill Lynch 358 590 Fidelity National Information Bank of America
Services Inc Merrill Lynch 1,313 (2,009) Fidelity National Information Bank of America
Services Inc Merrill Lynch (3,275) (17,044) Fidelity National Information
Services Inc Morgan Stanley (39,031) 1,421 Fiesta Restaurant Group Inc Bank of America
Merrill Lynch 881 1,485 Fiesta Restaurant Group Inc Goldman Sachs 921 436 Financial Engines Inc Bank of America
Merrill Lynch 643 435 Finisar Corp Goldman Sachs 132 (789) Finish Line Inc/The 'A' Goldman Sachs (546) (665) Finish Line Inc/The 'A' Bank of America
Merrill Lynch 780 555 First American Financial Corp Goldman Sachs 585 (991) First Cash Financial Bank of America
Services Inc Merrill Lynch 658 (791) First Cash Financial
Services Inc Goldman Sachs 84
BlackRock Global Long/Short Equity Fund continued
United States continued United States continued

Contracts for difference as at 31 May 2016
Holding
Description Counterparty
Unrealised appreciation/
(depreciation) USD
Holding
Description Counterparty
Unrealised appreciation/
(depreciation) USD
300 BlackRock Strategic Funds (BSF)
The notes on pages 489 to 503 form an integral part of these financial statements.
BlackRock Global Long/Short Equity Fund continued
(85) First Citizens Bank of America BancShares Inc/NC 'A' Merrill Lynch (68)
1,672 First Data Corp 'A' Bank of America Merrill Lynch 2,199
5,503 First Data Corp 'A' Goldman Sachs 3,112 408 First Majestic Silver Corp Goldman Sachs (73) 3,653 First Republic Bank/CA Bank of America
Merrill Lynch 15,289 1,554 First Republic Bank/CA Goldman Sachs 7,377 (554) First Solar Inc Goldman Sachs 5 (1,719) First Solar Inc Bank of America
Merrill Lynch (2,750) (623) First Solar Inc Morgan Stanley (1,447) 609 Fiserv Inc Bank of America
Merrill Lynch 616 591 Fiserv Inc Goldman Sachs 703 782 Fitbit Inc 'A' Bank of America
Merrill Lynch 86 86 Fitbit Inc 'A' Goldman Sachs 9 453 Fitbit Inc 'A' Morgan Stanley 67 293 Five Below Inc Bank of America
Merrill Lynch 685 252 Five Below Inc Goldman Sachs 654 97 Five Prime Therapeutics Inc Bank of America
Merrill Lynch 185 85 Five Prime Therapeutics Inc Goldman Sachs 143 (474) FleetCor Technologies Inc Bank of America
Merrill Lynch (1,901) (2,376) FleetCor Technologies Inc Goldman Sachs (9,528) (8,395) FleetCor Technologies Inc Morgan Stanley (45,585) (308) Fleetmatics Group Plc Bank of America
Merrill Lynch (74) 29,045 Flextronics International Ltd Bank of America
Merrill Lynch (581) 67,784 Flextronics International Ltd Goldman Sachs (1,356) 16,427 Flextronics International Ltd Morgan Stanley 3,614 1,014 FLIR Systems Inc Bank of America
Merrill Lynch 462 10,073 FLIR Systems Inc Goldman Sachs 5,424 38,724 FLIR Systems Inc Morgan Stanley 55,763 714 Flowers Foods Inc Bank of America
Merrill Lynch (300) (8,884) Flowserve Corp Bank of America
Merrill Lynch (23,543) (2,991) Flowserve Corp Goldman Sachs (7,926) (500) Fluor Corp Goldman Sachs (162) (25,312) FMC Corp Bank of America
Merrill Lynch (22,021) (16,549) FMC Corp Goldman Sachs (14,398) (20,232) FMC Corp Morgan Stanley (14,567) (4,019) FNB Corp/PA Bank of America
Merrill Lynch (3,014) (7,717) FNB Corp/PA Goldman Sachs (5,788) 1,268 Foot Locker Inc Bank of America
Merrill Lynch (5,085) 4,163 Ford Motor Co Bank of America
Merrill Lynch 812 660 Forest City Realty Trust Bank of America
Inc 'A' (Reit) Merrill Lynch 224 (338) Forest City Realty Trust
Inc 'A' (Reit) Goldman Sachs (32) (1,082) Forest City Realty Trust
Inc 'A' (Reit) Morgan Stanley (255) 1,476 Fortinet Inc Bank of America
Merrill Lynch 2,391 750 Fortinet Inc Goldman Sachs 1,215 924 Fortinet Inc Morgan Stanley 1,395 2,927 Fortune Brands Home & Bank of America
Security Inc Merrill Lynch 5,310 3,187 Fortune Brands Home &
Security Inc Goldman Sachs 2,307
1,018 Fortune Brands Home & Security Inc Morgan Stanley 1,015
720 Forum Energy Technologies Inc Bank of America Merrill Lynch 850
(842) Fossil Group Inc Goldman Sachs (138) 3,320 Four Corners Property Bank of America
Trust Inc (Reit) Merrill Lynch 1,062 12 Four Corners Property
Trust Inc (Reit) Goldman Sachs 4 (2,494) Franklin Resources Inc Bank of America
Merrill Lynch (5,512) (327) Freeport-McMoRan Inc Bank of America
Merrill Lynch (85) (1,360) Freeport-McMoRan Inc Goldman Sachs (354) (571) Fresh Del Monte Produce Inc Bank of America
Merrill Lynch (1,049) (269) Fresh Del Monte Produce Inc Goldman Sachs (277) 993 Frontline Ltd/Bermuda Bank of America
Merrill Lynch 535 1,210 Frontline Ltd/Bermuda Goldman Sachs 532 174 FTI Consulting Inc Goldman Sachs (14) (10,115) Fulton Financial Corp Bank of America
Merrill Lynch (4,571) (2,140) Fulton Financial Corp Goldman Sachs (1,680) (175) G&K Services Inc 'A' Bank of America
Merrill Lynch (483) (2,295) G&K Services Inc 'A' Goldman Sachs (5,027) 1,348 G-III Apparel Group Ltd Bank of America
Merrill Lynch 1,122 2,607 GameStop Corp 'A' Morgan Stanley 1,017 6,446 GameStop Corp 'A' Bank of America
Merrill Lynch (2,083) 5,158 GameStop Corp 'A' Goldman Sachs (866) (6,788) Gaming and Leisure Bank of America
Properties Inc (Reit) Merrill Lynch 8,349 (14,464) Gaming and Leisure
Properties Inc (Reit) Goldman Sachs 17,791 (41,886) Gaming and Leisure
Properties Inc (Reit) Morgan Stanley 33,090 (946) Gannett Co Inc Goldman Sachs 394 (22,142) Gap Inc/The Bank of America
Merrill Lynch (4,817) (26,545) Gap Inc/The Goldman Sachs (8,229) (23,197) Gap Inc/The Morgan Stanley (1,562) (91) Gartner Inc Goldman Sachs (12) 231 Gartner Inc Morgan Stanley 784 (2,743) GATX Corp Goldman Sachs (2,987) 1,961 GCP Applied Technologies Inc Goldman Sachs 608 4,866 GCP Applied Technologies Inc Bank of America
Merrill Lynch 276 (2,215) Generac Holdings Inc Goldman Sachs (636) (714) General Electric Co Goldman Sachs (136) (689) General Growth
Properties Inc (Reit) Goldman Sachs 116 4,266 General Mills Inc Bank of America
Merrill Lynch (471) 801 General Mills Inc Goldman Sachs 41 3,535 General Mills Inc Morgan Stanley 1,177 (8,430) Genesee & Wyoming Inc 'A' Bank of America
Merrill Lynch (29,039) (3,966) Genesee & Wyoming Inc 'A' Goldman Sachs (12,749) (2,900) Genesee & Wyoming Inc 'A' Morgan Stanley (10,266) 731 Genomic Health Inc Bank of America
Merrill Lynch 1,367 497 Genomic Health Inc Goldman Sachs (144) (3,942) Genuine Parts Co Bank of America
Merrill Lynch 118 (53) Genuine Parts Co Goldman Sachs 2 (2,648) Genworth Financial Inc 'A' Goldman Sachs (768) 1,696 GEO Group Inc/The (Reit) Bank of America
Merrill Lynch 2,234
United States continued United States continued

Contracts for difference as at 31 May 2016
Holding
Description Counterparty
Unrealised appreciation/
(depreciation) USD
Holding
Description Counterparty
Unrealised appreciation/
(depreciation) USD
Annual Report and Audited Accounts 301
The notes on pages 489 to 503 form an integral part of these financial statements.
1,562 GEO Group Inc/The (Reit) Goldman Sachs 734 (257) Gilead Sciences Inc Bank of America
Merrill Lynch (771) 163 Glacier Bancorp Inc Bank of America
Merrill Lynch 18 1,599 Glacier Bancorp Inc Goldman Sachs 703 732 Global Payments Inc Bank of America
Merrill Lynch 2,036 (1,334) Globant SA Bank of America
Merrill Lynch (698) (832) Globus Medical Inc 'A' Goldman Sachs (409) (147) GNC Holdings Inc 'A' Bank of America
Merrill Lynch (166) (569) GNC Holdings Inc 'A' Goldman Sachs (711) 577 Golar LNG Ltd Bank of America
Merrill Lynch 294 1,701 Golar LNG Ltd Goldman Sachs 773 3,735 Golar LNG Partners LP Bank of America
Merrill Lynch (435) (2,239) Goldman Sachs Group Inc/The Bank of America
Merrill Lynch (11,456) (3,429) Goldman Sachs Group Inc/The Morgan Stanley (22,124) (1,850) Goodyear Tire & Rubber Co/The Bank of America
Merrill Lynch (1,204) (738) Goodyear Tire & Rubber Co/The Goldman Sachs (370) (4,990) Goodyear Tire & Rubber Co/The Morgan Stanley (3,148) (1,197) Graco Inc Bank of America
Merrill Lynch (1,013) (71,432) Gramercy Property Trust (Reit) Bank of America
Merrill Lynch 3,225 (30,297) Gramercy Property Trust (Reit) Goldman Sachs 4,891 (63,898) Gramercy Property Trust (Reit) Morgan Stanley (4,154) (229) Grand Canyon Education Inc Bank of America
Merrill Lynch (78) (344) Grand Canyon Education Inc Goldman Sachs (202) (352) Granite Construction Inc Bank of America
Merrill Lynch 257 (108) Granite Construction Inc Goldman Sachs 79 1,861 Gray Television Inc Bank of America
Merrill Lynch 465 8,750 Great Plains Energy Inc Bank of America
Merrill Lynch (22,225) 2,429 Great Western Bancorp Inc Bank of America
Merrill Lynch 4,615 691 Greatbatch Inc Bank of America
Merrill Lynch 394 293 Green Dot Corp 'A' Goldman Sachs 41 449 Greenbrier Cos Inc/The Bank of America
Merrill Lynch 1,100 550 Greenbrier Cos Inc/The Goldman Sachs 217 1,700 Greif Inc 'A' Bank of America
Merrill Lynch 887 391 Group 1 Automotive Inc Bank of America
Merrill Lynch 200 4,459 Groupon Inc Goldman Sachs 635 (1,630) Groupon Inc Bank of America
Merrill Lynch (342) (3,938) GrubHub Inc Bank of America
Merrill Lynch 1,265 (1,947) GrubHub Inc Goldman Sachs 1,032 (2,063) GrubHub Inc Morgan Stanley (2,991) 623 Gulfport Energy Corp Goldman Sachs 735 1,139 H&R Block Inc Bank of America
Merrill Lynch 1,162 4,708 H&R Block Inc Goldman Sachs 4,802 (1,073) Haemonetics Corp Bank of America
Merrill Lynch (362) (762) Haemonetics Corp Goldman Sachs (107) (1,709) Hain Celestial Group Inc/The Bank of America
Merrill Lynch (2,434)
(803) Hain Celestial Group Inc/The Goldman Sachs (845) (1,381) Hain Celestial Group Inc/The Morgan Stanley (3,011) (1,514) Halliburton Co Bank of America
Merrill Lynch (3,279) (4,694) Halliburton Co Goldman Sachs (8,680) (477) Halyard Health Inc Bank of America
Merrill Lynch (1,135) (5,663) Hancock Holding Co Bank of America
Merrill Lynch (12,515) (15,431) Hanesbrands Inc Goldman Sachs 2,277 (7,141) Hanesbrands Inc Morgan Stanley 926 (15,683) Hanesbrands Inc Bank of America
Merrill Lynch (277) (1,045) Harley-Davidson Inc Bank of America
Merrill Lynch (1,285) 851 Harman International Bank of America
Industries Inc Merrill Lynch 3,510 (64) Harris Corp Bank of America
Merrill Lynch 42 (142) Harris Corp Goldman Sachs 109 9,125 Hasbro Inc Bank of America
Merrill Lynch 13,130 7,459 Hasbro Inc Goldman Sachs 10,452 4,352 Hasbro Inc Morgan Stanley 10,129 (460) Hawaiian Holdings Inc Bank of America
Merrill Lynch 980 (1,491) Hawaiian Holdings Inc Goldman Sachs 2,571 (1,425) HCP Inc (Reit) Bank of America
Merrill Lynch 2,196 (776) HCP Inc (Reit) Goldman Sachs 1,304 487 HD Supply Holdings Inc Bank of America
Merrill Lynch 928 752 HD Supply Holdings Inc Goldman Sachs 487 (681) Headwaters Inc Bank of America
Merrill Lynch (451) (4,769) Headwaters Inc Goldman Sachs (3,733) (4,912) Healthcare Realty
Trust Inc (Reit) Goldman Sachs 1,326 (9,329) Healthcare Realty Bank of America
Trust Inc (Reit) Merrill Lynch 2,519 (6,324) Healthcare Services Bank of America
Group Inc Merrill Lynch (1,834) 331 HEICO Corp Bank of America
Merrill Lynch 685 761 Helen of Troy Ltd Bank of America
Merrill Lynch 1,877 558 Helen of Troy Ltd Goldman Sachs 1,586 (815) Helmerich & Payne Inc Bank of America
Merrill Lynch (2,023) 274 Henry Schein Inc Bank of America
Merrill Lynch (205) 141 Henry Schein Inc Goldman Sachs 34 1,239 Herman Miller Inc Goldman Sachs 186 (772) Heron Therapeutics Inc Bank of America
Merrill Lynch (2,146) 4,162 Hersha Hospitality Trust (Reit) Bank of America
Merrill Lynch (5,078) (2,902) Hershey Co/The Bank of America
Merrill Lynch (641) (1,533) Hershey Co/The Goldman Sachs (257) 1,547 Hershey Co/The Bank of America
Merrill Lynch 3,276 900 Hershey Co/The Morgan Stanley 2,046 (916) Hertz Global Holdings Inc Bank of America
Merrill Lynch (1,548) (2,159) Hertz Global Holdings Inc Goldman Sachs (3,649) (935) Hess Corp Bank of America
Merrill Lynch (2,132) (17) Hess Corp Goldman Sachs (39)
BlackRock Global Long/Short Equity Fund continued
United States continued United States continued

Contracts for difference as at 31 May 2016
Holding
Description Counterparty
Unrealised appreciation/
(depreciation) USD
Holding
Description Counterparty
Unrealised appreciation/
(depreciation) USD
302 BlackRock Strategic Funds (BSF)
The notes on pages 489 to 503 form an integral part of these financial statements.
BlackRock Global Long/Short Equity Fund continued
758 Hexcel Corp Bank of America Merrill Lynch (682)
(640) Hibbett Sports Inc Bank of America Merrill Lynch (614)
(1,223) Highwoods Properties Inc (Reit) Bank of America Merrill Lynch (307)
711 Hill-Rom Holdings Inc Bank of America Merrill Lynch 725
1,109 Hillenbrand Inc Bank of America Merrill Lynch 993
207 Hillenbrand Inc Goldman Sachs 85 (743) Hilltop Holdings Inc Bank of America
Merrill Lynch (86) (12,161) Hilton Worldwide Holdings Inc Bank of America
Merrill Lynch 6,182 (19,197) Hilton Worldwide Holdings Inc Goldman Sachs 14,598 (58,034) Hilton Worldwide Holdings Inc Morgan Stanley 56,293 (321) HMS Holdings Corp Goldman Sachs (3) 5,995 Home BancShares Inc/AR Bank of America
Merrill Lynch 17,565 2,549 Home BancShares Inc/AR Goldman Sachs 7,469 1,499 Home Depot Inc/The Bank of America
Merrill Lynch (3,553) 172 Home Depot Inc/The Goldman Sachs 271 556 Honeywell International Inc Bank of America
Merrill Lynch (389) 754 Horace Mann Educators Corp Bank of America
Merrill Lynch 601 393 Horace Mann Educators Corp Goldman Sachs 185 (14,055) Horizon Pharma Plc Morgan Stanley (27,298) 1,265 Hormel Foods Corp Bank of America
Merrill Lynch (6,730) 959 Hospitality Properties Bank of America
Trust (Reit) Merrill Lynch (719) 29,222 Host Hotels & Bank of America
Resorts Inc (Reit) Merrill Lynch (12,273) 5,490 Host Hotels &
Resorts Inc (Reit) Goldman Sachs (1,545) 19,782 Host Hotels &
Resorts Inc (Reit) Morgan Stanley (5,539) (609) Houghton Mifflin Harcourt Co Bank of America
Merrill Lynch (51) (3,854) Houghton Mifflin Harcourt Co Goldman Sachs (768) (108) Howard Hughes Corp/The Bank of America
Merrill Lynch (211) (2,272) Howard Hughes Corp/The Goldman Sachs (5,293) (1,562) Howard Hughes Corp/The Morgan Stanley (3,718) 339 HRG Group Inc Bank of America
Merrill Lynch (104) 1,067 HRG Group Inc Goldman Sachs (331) (554) HSN Inc Goldman Sachs (148) 339 Hub Group Inc 'A' Bank of America
Merrill Lynch 251 166 Hub Group Inc 'A' Goldman Sachs 31 284 Hubbell Inc Goldman Sachs 61 (1,633) HubSpot Inc Bank of America
Merrill Lynch (2,464) 324 Hudson Pacific Bank of America
Properties Inc (Reit) Merrill Lynch (259) (29) Humana Inc Goldman Sachs 8 2,946 Huntington Bancshares Inc/OH Bank of America
Merrill Lynch 2,504 (391) Huntington Ingalls Bank of America
Industries Inc Merrill Lynch 137 (2,431) Huntsman Corp Bank of America
Merrill Lynch (1,877) (3,608) Huntsman Corp Goldman Sachs (3,754) (219) Huron Consulting Group Inc Bank of America
Merrill Lynch (554)
(1,570) Hyatt Hotels Corp 'A' Bank of America Merrill Lynch (616)
332 IBERIABANK Corp Bank of America Merrill Lynch 1,044
470 IBERIABANK Corp Goldman Sachs 1,041 858 ICON Plc Bank of America
Merrill Lynch 4,496 3,150 ICON Plc Goldman Sachs 16,506 600 ICON Plc Morgan Stanley 3,528 700 ICU Medical Inc Bank of America
Merrill Lynch 2,178 4,259 IDEXX Laboratories Inc Goldman Sachs 1,833 4,566 IDEXX Laboratories Inc Morgan Stanley 4,889 5,296 IDEXX Laboratories Inc Bank of America
Merrill Lynch 3,328 1,723 IHS Inc 'A' Bank of America
Merrill Lynch 4,643 1,980 IHS Inc 'A' Goldman Sachs 3,739 1,673 II-VI Inc Bank of America
Merrill Lynch 686 (3,551) Illumina Inc Bank of America
Merrill Lynch (11,790) (760) Illumina Inc Goldman Sachs (1,506) (996) Illumina Inc Morgan Stanley (5,391) (948) IMAX Corp Bank of America
Merrill Lynch (50) 214 Imperva Inc Bank of America
Merrill Lynch 670 180 Imperva Inc Goldman Sachs 586 (591) INC Research Holdings Inc 'A' Bank of America
Merrill Lynch 30 (42) INC Research Holdings Inc 'A' Goldman Sachs 2 1,216 Infoblox Inc Bank of America
Merrill Lynch 827 355 Infoblox Inc Goldman Sachs 108 509 InfraREIT Inc (Reit) Bank of America
Merrill Lynch (36) 3,581 InfraREIT Inc (Reit) Goldman Sachs (251) 353 Ingersoll-Rand Plc Bank of America
Merrill Lynch 241 (95) Ingevity Corp Bank of America
Merrill Lynch (2,702) (139) Ingles Markets Inc 'A' Bank of America
Merrill Lynch (217) (334) Ingles Markets Inc 'A' Goldman Sachs (49) 3,138 Ingredion Inc Bank of America
Merrill Lynch (2,612) 1,583 Ingredion Inc Goldman Sachs (1,252) 281 Ingredion Inc Morgan Stanley 343 144 Innospec Inc Goldman Sachs 258 1,547 Innoviva Inc Bank of America
Merrill Lynch 302 567 Innoviva Inc Goldman Sachs 259 (607) Inogen Inc Bank of America
Merrill Lynch (1,508) (763) Inogen Inc Goldman Sachs (1,322) 1,516 Inovalon Holdings Inc 'A' Bank of America
Merrill Lynch 1,107 711 Inovalon Holdings Inc 'A' Goldman Sachs 519 1,659 Insmed Inc Bank of America
Merrill Lynch 1,128 2,078 Insmed Inc Goldman Sachs 1,413 1,237 Insperity Inc Bank of America
Merrill Lynch 2,179 596 Insperity Inc Goldman Sachs 479 362 Installed Building Products Inc Bank of America
Merrill Lynch 352 2,694 Installed Building Products Inc Goldman Sachs 1,768 745 Insulet Corp Bank of America
Merrill Lynch 1,746
United States continued United States continued

Contracts for difference as at 31 May 2016
Holding
Description Counterparty
Unrealised appreciation/
(depreciation) USD
Holding
Description Counterparty
Unrealised appreciation/
(depreciation) USD
Annual Report and Audited Accounts 303
The notes on pages 489 to 503 form an integral part of these financial statements.
174 Integra LifeSciences Bank of America Holdings Corp Merrill Lynch 398
(526) Interactive Brokers Bank of America Group Inc 'A' Merrill Lynch (2,267)
(580) Interactive Brokers Group Inc 'A' Goldman Sachs (2,500)
(5,022) Interactive Brokers Group Inc 'A' Morgan Stanley (21,444)
42 Intercept Pharmaceuticals Inc Bank of America Merrill Lynch 122
(96) InterDigital Inc/PA Goldman Sachs (321) 1,276 Interface Inc Bank of America
Merrill Lynch 676 2,102 Interface Inc Goldman Sachs 1,114 459 International Bancshares Corp Bank of America
Merrill Lynch 1,143 110 International Business Bank of America
Machines Corp Merrill Lynch 633 558 International Business
Machines Corp Goldman Sachs 1,924 4,866 International Game Bank of America
Technology Plc Merrill Lynch 7,736 3,713 International Game
Technology Plc Goldman Sachs 4,717 (888) International Paper Co Bank of America
Merrill Lynch (133) (219) International Speedway Bank of America
Corp 'A' Merrill Lynch (214) (386) International Speedway
Corp 'A' Goldman Sachs (293) 20,105 Interpublic Group of Bank of America
Cos Inc/The Merrill Lynch (3,217) 28,972 Interpublic Group of
Cos Inc/The Goldman Sachs (4,381) 26,077 Interpublic Group of
Cos Inc/The Morgan Stanley 1,525 3,961 Intersil Corp 'A' Bank of America
Merrill Lynch 5,704 (2,002) InterXion Holding NV Bank of America
Merrill Lynch (2,967) (1,345) InterXion Holding NV Goldman Sachs (4,104) (842) Intra-Cellular Therapies Inc Bank of America
Merrill Lynch (3,115) (149) Intra-Cellular Therapies Inc Goldman Sachs (551) 2,865 Intuit Inc Bank of America
Merrill Lynch 12,864 689 Intuit Inc Goldman Sachs 876 11,422 Intuit Inc Morgan Stanley 68,189 9,287 Invesco Ltd Bank of America
Merrill Lynch 27,684 677 Invesco Ltd Goldman Sachs 1,412 4,386 Invesco Ltd Morgan Stanley 13,904 1,814 Invesco Mortgage Bank of America
Capital Inc (Reit) Merrill Lynch 145 1,778 Invesco Mortgage
Capital Inc (Reit) Goldman Sachs 142 12,473 Investors Bancorp Inc Bank of America
Merrill Lynch 4,490 444 IPG Photonics Corp Goldman Sachs 1,883 (1,414) Iridium Communications Inc Bank of America
Merrill Lynch (434) (888) Iron Mountain Inc (Reit) Bank of America
Merrill Lynch 1,252 (2,992) Ironwood Pharmaceuticals Inc Bank of America
Merrill Lynch (5,027) (428) iStar Inc (Reit) Bank of America
Merrill Lynch (310) (372) iStar Inc (Reit) Goldman Sachs (197) (283) ITT Inc Bank of America
Merrill Lynch (342)
(673) ITT Inc Goldman Sachs (824) (1,352) J&J Snack Foods Corp Bank of America
Merrill Lynch 688 (1,047) J&J Snack Foods Corp Goldman Sachs 608 1,547 Jabil Circuit Inc Bank of America
Merrill Lynch 171 1,888 Jabil Circuit Inc Goldman Sachs 1,844 (117) Jack Henry & Associates Inc Bank of America
Merrill Lynch 50 (141) Jack in the Box Inc Bank of America
Merrill Lynch (1,401) (205) Jack in the Box Inc Goldman Sachs 16 2,864 Jacobs Engineering Group Inc Bank of America
Merrill Lynch 3,528 585 Jacobs Engineering Group Inc Goldman Sachs 795 (1,192) Janus Capital Group Inc Bank of America
Merrill Lynch (147) (205) Jazz Pharmaceuticals Plc Goldman Sachs (304) 78 JB Hunt Transport Services Inc Bank of America
Merrill Lynch 105 724 JB Hunt Transport Services Inc Goldman Sachs 569 320 JetBlue Airways Corp Goldman Sachs (112) 2,739 JM Smucker Co/The Bank of America
Merrill Lynch (4,629) 1,085 JM Smucker Co/The Goldman Sachs (1,081) 214 John Bean Technologies Corp Bank of America
Merrill Lynch 68 458 John Wiley & Sons Inc 'A' Bank of America
Merrill Lynch 580 644 John Wiley & Sons Inc 'A' Goldman Sachs 226 2,613 Johnson & Johnson Bank of America
Merrill Lynch (2,163) 693 Johnson & Johnson Goldman Sachs (355) 1,297 Jones Lang LaSalle Inc Bank of America
Merrill Lynch 10,279 1,234 Jones Lang LaSalle Inc Goldman Sachs 9,690 1,915 Jones Lang LaSalle Inc Morgan Stanley 19,495 (981) Joy Global Inc Bank of America
Merrill Lynch (952) 2,199 JPMorgan Chase & Co Bank of America
Merrill Lynch 2,995 (1,478) Juniper Networks Inc Bank of America
Merrill Lynch (340) (962) Juniper Networks Inc Goldman Sachs (221) 1,055 Kaiser Aluminum Corp Bank of America
Merrill Lynch (665) (950) Kate Spade & Co Goldman Sachs (133) (5,761) Kate Spade & Co Bank of America
Merrill Lynch (581) 6,793 KBR Inc Bank of America
Merrill Lynch 1,630 1,788 KBR Inc Goldman Sachs 429 (642) KCG Holdings Inc 'A' Bank of America
Merrill Lynch (636) (1,400) Kennametal Inc Goldman Sachs (1,680) (496) Kennametal Inc Bank of America
Merrill Lynch 59 35,732 KeyCorp Bank of America
Merrill Lynch 37,161 13,979 KeyCorp Goldman Sachs 12,885 13,939 KeyCorp Morgan Stanley 13,939 (866) Keysight Technologies Inc Bank of America
Merrill Lynch (3,802) 331 Kilroy Realty Corp (Reit) Goldman Sachs (158) 300 Kilroy Realty Corp (Reit) Bank of America
Merrill Lynch (253) (2,231) Kimberly-Clark Corp Bank of America
Merrill Lynch 3,815 (8,960) Kimco Realty Corp (Reit) Bank of America
Merrill Lynch (767)
BlackRock Global Long/Short Equity Fund continued
United States continued United States continued

Contracts for difference as at 31 May 2016
Holding
Description Counterparty
Unrealised appreciation/
(depreciation) USD
Holding
Description Counterparty
Unrealised appreciation/
(depreciation) USD
304 BlackRock Strategic Funds (BSF)
The notes on pages 489 to 503 form an integral part of these financial statements.
BlackRock Global Long/Short Equity Fund continued
(3,306) Kimco Realty Corp (Reit) Goldman Sachs 1,927 (886) Kinder Morgan Inc/DE Goldman Sachs (727) 1,074 Kindred Healthcare Inc Goldman Sachs (174) (3,851) Kirby Corp Bank of America
Merrill Lynch (18,486) (753) Kirby Corp Goldman Sachs (3,870) (161) Kirby Corp Morgan Stanley (353) (737) Kite Pharma Inc Bank of America
Merrill Lynch (1,568) (718) KLX Inc Bank of America
Merrill Lynch (819) (5,850) Knight Transportation Inc Bank of America
Merrill Lynch (6,651) (11,975) Knight Transportation Inc Goldman Sachs (15,189) (5,759) Knight Transportation Inc Morgan Stanley (5,701) 8,087 Knoll Inc Bank of America
Merrill Lynch 10,726 3,981 Knoll Inc Goldman Sachs 3,608 (772) Knowles Corp Bank of America
Merrill Lynch (1,397) (489) Kohl's Corp Goldman Sachs (34) (160) Kohl's Corp Bank of America
Merrill Lynch (11) (1,191) Koninklijke Philips NV/NY Reg Bank of America
Merrill Lynch (1,846) 3,005 Korn/Ferry International Bank of America
Merrill Lynch 2,637 1,472 Korn/Ferry International Goldman Sachs 892 (3,235) Kraft Heinz Co/The Bank of America
Merrill Lynch 5,490 (4,660) Kraft Heinz Co/The Goldman Sachs 9,506 (5,052) Kraft Heinz Co/The Morgan Stanley (8,437) 7,514 Kroger Co/The Bank of America
Merrill Lynch 746 2,152 Kroger Co/The Goldman Sachs 379 3,628 Kulicke & Soffa Industries Inc Bank of America
Merrill Lynch 4,136 911 Kulicke & Soffa Industries Inc Goldman Sachs 1,039 1,618 L Brands Inc Bank of America
Merrill Lynch 1,925 (2,237) La Quinta Holdings Inc Bank of America
Merrill Lynch (898) (157) La Quinta Holdings Inc Goldman Sachs (2) 2,132 La-Z-Boy Inc Bank of America
Merrill Lynch 2,412 576 La-Z-Boy Inc Goldman Sachs 622 (167) Laboratory Corp of
America Holdings Goldman Sachs (134) (491) Laboratory Corp of
America Holdings Morgan Stanley (1,007) 374 Laboratory Corp of Bank of America
America Holdings Merrill Lynch 342 401 Laboratory Corp of
America Holdings Goldman Sachs 153 (925) Lam Research Corp Morgan Stanley (1,306) (691) Lam Research Corp Bank of America
Merrill Lynch 469 957 Lamar Advertising Co 'A' (Reit) Bank of America
Merrill Lynch 995 5,784 Landstar System Inc Bank of America
Merrill Lynch 18,624 4,456 Landstar System Inc Goldman Sachs 14,348 7,539 Landstar System Inc Morgan Stanley 20,230 (572) Lannett Co Inc Bank of America
Merrill Lynch (2,188) 734 Laredo Petroleum Inc Bank of America
Merrill Lynch 521 2,854 Laredo Petroleum Inc Goldman Sachs 169 (1,590) Las Vegas Sands Corp Bank of America
Merrill Lynch (1,224)
(484) Las Vegas Sands Corp Goldman Sachs (373) 3,140 LaSalle Hotel Properties (Reit) Bank of America
Merrill Lynch (3,925) 2,384 LaSalle Hotel Properties (Reit) Goldman Sachs (2,980) 2,095 LaSalle Hotel Properties (Reit) Morgan Stanley (1,404) (116) Lazard Ltd 'A' Bank of America
Merrill Lynch (39) 2,115 Lear Corp Bank of America
Merrill Lynch 7,910 413 Lear Corp Morgan Stanley 1,982 (1,323) LegacyTexas Financial
Group Inc Goldman Sachs (856) 4,121 Leggett & Platt Inc Bank of America
Merrill Lynch 3,088 1,340 Leggett & Platt Inc Goldman Sachs 1,118 382 Leidos Holdings Inc Bank of America
Merrill Lynch 12 3,557 LendingClub Corp Bank of America
Merrill Lynch 3,187 300 LendingClub Corp Goldman Sachs 264 292 LendingTree Inc Goldman Sachs 3,822 1,174 Lennar Corp 'A' Bank of America
Merrill Lynch (33) (4,007) Lennar Corp 'A' Bank of America
Merrill Lynch (7,533) (5,405) Lennar Corp 'A' Goldman Sachs (10,158) (1,349) Lennar Corp 'A' Morgan Stanley (2,455) (292) Lennox International Inc Bank of America
Merrill Lynch (650) (1,789) Leucadia National Corp Bank of America
Merrill Lynch (805) (3,823) Leucadia National Corp Goldman Sachs (1,743) (5,048) Leucadia National Corp Morgan Stanley (2,524) 1,269 Level 3 Communications Inc Bank of America
Merrill Lynch 1,878 879 Level 3 Communications Inc Goldman Sachs 1,301 1,536 Lexicon Pharmaceuticals Inc Bank of America
Merrill Lynch 219 (270) Liberty Broadband Corp 'A' Bank of America
Merrill Lynch 157 (1,483) Liberty Broadband Corp 'C' Bank of America
Merrill Lynch 1,542 (1,088) Liberty Broadband Corp 'C' Goldman Sachs 925 (3,381) Liberty Broadband Corp 'C' Morgan Stanley 1,495 (1,790) Liberty Global Plc 'A' Bank of America
Merrill Lynch (284) (753) Liberty Global Plc 'A' Goldman Sachs (238) (2,570) Liberty Property Trust (Reit) Bank of America
Merrill Lynch (51) 617 Liberty SiriusXM Group 'A' Bank of America
Merrill Lynch (15) 235 Liberty SiriusXM Group 'A' Goldman Sachs 5 1 Liberty TripAdvisor
Holdings Inc 'A' Goldman Sachs 1 (4,867) LifeLock Inc Bank of America
Merrill Lynch (7,349) 32 Ligand Pharmaceuticals Inc Goldman Sachs 95 (1,718) Lincoln Electric Holdings Inc Goldman Sachs (876) (822) Lincoln Electric Holdings Inc Bank of America
Merrill Lynch (442) 330 Lincoln National Corp Bank of America
Merrill Lynch 1,106 213 Lindsay Corp Goldman Sachs (48) 473 Lions Gate
Entertainment Corp Goldman Sachs 924 (71) Lithia Motors Inc 'A' Bank of America
Merrill Lynch (245) (697) Lithia Motors Inc 'A' Goldman Sachs (2,893) 104 Littelfuse Inc Bank of America
Merrill Lynch 410
United States continued United States continued

Contracts for difference as at 31 May 2016
Holding
Description Counterparty
Unrealised appreciation/
(depreciation) USD
Holding
Description Counterparty
Unrealised appreciation/
(depreciation) USD
Annual Report and Audited Accounts 305
The notes on pages 489 to 503 form an integral part of these financial statements.
486 LivaNova Plc Bank of America Merrill Lynch 310
62 LivaNova Plc Goldman Sachs 27 6,650 Live Nation Entertainment Inc Bank of America
Merrill Lynch 8,250 5,240 Live Nation Entertainment Inc Goldman Sachs 6,864 461 Live Nation Entertainment Inc Morgan Stanley 475 879 LKQ Corp Goldman Sachs 131 (3,887) Loews Corp Bank of America
Merrill Lynch (2,830) (2,371) Loews Corp Goldman Sachs (1,272) 3,853 Logitech International SA Reg Bank of America
Merrill Lynch 2,568 1,168 LogMeIn Inc Bank of America
Merrill Lynch 3,405 1,582 LogMeIn Inc Goldman Sachs 4,230 (24,620) Louisiana-Pacific Corp Bank of America
Merrill Lynch (1,231) (34,180) Louisiana-Pacific Corp Goldman Sachs (1,709) (22,064) Louisiana-Pacific Corp Morgan Stanley (7,281) 7,679 Lowe's Cos Inc Bank of America
Merrill Lynch 8,716 8,091 Lowe's Cos Inc Goldman Sachs 13,619 471 Lowe's Cos Inc Morgan Stanley 1,974 (198) LPL Financial Holdings Inc Bank of America
Merrill Lynch (403) (83) LTC Properties Inc (Reit) Bank of America
Merrill Lynch 129 (465) LTC Properties Inc (Reit) Goldman Sachs 721 1,164 lululemon athletica Inc Bank of America
Merrill Lynch 1,148 124 lululemon athletica Inc Goldman Sachs 167 579 Lumentum Holdings Inc Bank of America
Merrill Lynch 1,490 4,030 Luminex Corp Bank of America
Merrill Lynch 2,378 1,582 Luminex Corp Goldman Sachs 933 (825) Luxoft Holding Inc Bank of America
Merrill Lynch (2,115) (1,102) Luxoft Holding Inc Goldman Sachs (3,102) 10,940 LyondellBasell Bank of America
Industries NV 'A' Merrill Lynch (14,240) 19,972 LyondellBasell
Industries NV 'A' Goldman Sachs (25,484) 2,180 LyondellBasell
Industries NV 'A' Morgan Stanley (4,186) (2,720) M&T Bank Corp Morgan Stanley (18,088) 1,735 M&T Bank Corp Bank of America
Merrill Lynch 1,819 539 M/A-COM Technology Bank of America
Solutions Holdings Inc Merrill Lynch 241 (120) Macerich Co/The (Reit) Goldman Sachs (5) (1,477) Macquarie Infrastructure Corp Bank of America
Merrill Lynch (1,438) (3,188) Macquarie Infrastructure Corp Morgan Stanley (2,205) (1,547) Macy's Inc Bank of America
Merrill Lynch (2,096) (1,532) Macy's Inc Goldman Sachs (1,595) (1,024) Macy's Inc Morgan Stanley (1,533) (338) Madison Square Bank of America
Garden Co/The 'A' Merrill Lynch (513) (624) Madison Square
Garden Co/The 'A' Goldman Sachs (2,014) (55) Madison Square
Garden Co/The 'A' Morgan Stanley (11) 852 Maiden Holdings Ltd Goldman Sachs 207 (349) Mallinckrodt Plc Bank of America
Merrill Lynch (881) (408) Mallinckrodt Plc Goldman Sachs (1,485)
2,896 Manhattan Associates Inc Bank of America Merrill Lynch 8,985
2,017 Manhattan Associates Inc Goldman Sachs 5,966 2,013 Manhattan Associates Inc Morgan Stanley 7,397 9,419 ManpowerGroup Inc Bank of America
Merrill Lynch 13,351 15,107 ManpowerGroup Inc Goldman Sachs 23,265 11,532 ManpowerGroup Inc Morgan Stanley 23,763 (1,916) ManTech International Bank of America
Corp/VA 'A' Merrill Lynch (939) 634 Marathon Oil Corp Bank of America
Merrill Lynch 354 365 Marathon Oil Corp Goldman Sachs 215 283 Marcus & Millichap Inc Bank of America
Merrill Lynch (39) (396) MarketAxess Holdings Inc Bank of America
Merrill Lynch (2,631) (1,121) Marketo Inc Bank of America
Merrill Lynch (8,890) (218) Marketo Inc Goldman Sachs (1,729) 5,116 Marriott International Bank of America
Inc/MD 'A' Merrill Lynch (7,214) 17,683 Marriott International
Inc/MD 'A' Goldman Sachs (24,933) 17,601 Marriott International I
nc/MD 'A' Morgan Stanley (16,809) (1,012) Marriott Vacations Bank of America
Worldwide Corp Merrill Lynch (2,328) (408) Marriott Vacations
Worldwide Corp Goldman Sachs (938) 4,949 Marsh & McLennan Cos Inc Bank of America
Merrill Lynch 5,310 679 Marsh & McLennan Cos Inc Goldman Sachs 824 (1,287) Masco Corp Bank of America
Merrill Lynch (239) 198 Masco Corp Bank of America
Merrill Lynch 222 25,014 Masco Corp Goldman Sachs 28,040 21,276 Masco Corp Morgan Stanley 27,233 606 Masimo Corp Bank of America
Merrill Lynch 771 180 Masimo Corp Goldman Sachs 283 142 Masonite International Corp Bank of America
Merrill Lynch 129 309 MasTec Inc Bank of America
Merrill Lynch 216 405 MasTec Inc Goldman Sachs 284 2,305 MasterCard Inc 'A' Goldman Sachs 1,950 4,719 MasterCard Inc 'A' Morgan Stanley 2,244 (450) MasterCard Inc 'A' Goldman Sachs (371) 2,787 Matador Resources Co Bank of America
Merrill Lynch 3,205 2,575 Matador Resources Co Goldman Sachs 2,961 1,817 Match Group Inc Bank of America
Merrill Lynch (999) 889 Match Group Inc Goldman Sachs (489) 4,909 Match Group Inc Morgan Stanley (3,633) 1,512 Matson Inc Bank of America
Merrill Lynch 2,339 2,630 Matson Inc Goldman Sachs 4,471 (1,463) Mattel Inc Bank of America
Merrill Lynch (777) (837) Mattel Inc Goldman Sachs (39) (4,057) Matthews International Bank of America
Corp 'A' Merrill Lynch (9,250) (1,720) Matthews International
Corp 'A' Goldman Sachs (2,091) 148 Mattress Firm Holding Corp Bank of America
Merrill Lynch 169 208 Mattress Firm Holding Corp Goldman Sachs 3
BlackRock Global Long/Short Equity Fund continued
United States continued United States continued

Contracts for difference as at 31 May 2016
Holding
Description Counterparty
Unrealised appreciation/
(depreciation) USD
Holding
Description Counterparty
Unrealised appreciation/
(depreciation) USD
306 BlackRock Strategic Funds (BSF)
The notes on pages 489 to 503 form an integral part of these financial statements.
BlackRock Global Long/Short Equity Fund continued
3,326 Maxim Integrated Products Inc Bank of America Merrill Lynch 4,623
3,090 Maxim Integrated Products Inc Goldman Sachs 2,952 7,803 Maxim Integrated Products Inc Morgan Stanley 17,947 (1,243) MAXIMUS Inc Bank of America
Merrill Lynch (1,584) (866) MAXIMUS Inc Goldman Sachs (1,972) (1,972) MBIA Inc Goldman Sachs (1,144) 1,377 McCormick & Co Inc/ Bank of America
MD 'non-voting share' Merrill Lynch (614) 7,255 McCormick & Co Inc/
MD 'non-voting share' Goldman Sachs 9,535 3,915 McCormick & Co Inc/
MD 'non-voting share' Morgan Stanley 6,668 5,190 McDermott International Inc Bank of America
Merrill Lynch 2,033 4,876 McDermott International Inc Goldman Sachs 1,414 (1,471) McDonald's Corp Bank of America
Merrill Lynch 953 (491) McDonald's Corp Goldman Sachs 235 1,115 McKesson Corp Bank of America
Merrill Lynch (151) (239) McKesson Corp Bank of America
Merrill Lynch 405 200 McKesson Corp Morgan Stanley 7 (157) McKesson Corp Goldman Sachs 6 (1,589) MDC Partners Inc 'A' Bank of America
Merrill Lynch (1,065) (212) MDU Resources Group Inc Bank of America
Merrill Lynch (136) (1,422) MDU Resources Group Inc Goldman Sachs (910) (489) Mead Johnson Nutrition Co Bank of America
Merrill Lynch 347 (310) Mead Johnson Nutrition Co Goldman Sachs 118 (18,001) Medical Properties Bank of America
Trust Inc (Reit) Merrill Lynch (3,814) (29,512) Medical Properties
Trust Inc (Reit) Morgan Stanley (11,193) (4,288) Medicines Co/The Bank of America
Merrill Lynch (8,705) (20,016) Medicines Co/The Goldman Sachs (40,632) (4,054) Medicines Co/The Morgan Stanley (8,838) 1,227 Medidata Solutions Inc Bank of America
Merrill Lynch (111) 1,002 Medidata Solutions Inc Goldman Sachs 817 (2,191) MEDNAX Inc Bank of America
Merrill Lynch 767 1,727 Medtronic Plc Bank of America
Merrill Lynch (1,481) 1,766 Medtronic Plc Goldman Sachs (2,015) 183 Mellanox Technologies Ltd Bank of America
Merrill Lynch 899 (501) MercadoLibre Inc Goldman Sachs (3,319) (341) MercadoLibre Inc Morgan Stanley (1,698) (2,034) Merck & Co Inc Bank of America
Merrill Lynch 39 (199) Mercury General Corp Bank of America
Merrill Lynch (189) (1,069) Mercury General Corp Goldman Sachs (836) 1,968 Merit Medical Systems Inc Bank of America
Merrill Lynch (271) 1,691 Merit Medical Systems Inc Goldman Sachs (600) (3,481) Meritage Homes Corp Bank of America
Merrill Lynch (2,594) (1,189) Meritage Homes Corp Goldman Sachs (2,111) 1,039 Meritor Inc Bank of America
Merrill Lynch 644 1,982 Merrimack Bank of America
Pharmaceuticals Inc Merrill Lynch (206) 5,161 Merrimack
Pharmaceuticals Inc Goldman Sachs (310)
(206) Methode Electronics Inc Goldman Sachs (319) 3,583 MetLife Inc Bank of America
Merrill Lynch 8,332 2,535 MetLife Inc Goldman Sachs 6,439 (130) Mettler-Toledo Bank of America
International Inc Merrill Lynch (567) (82) Mettler-Toledo
International Inc Goldman Sachs (370) 4,398 MFA Financial Inc (Reit) Bank of America
Merrill Lynch 264 3,554 MFA Financial Inc (Reit) Goldman Sachs 213 (7,638) MGIC Investment Corp Bank of America
Merrill Lynch (2,944) (8,061) MGIC Investment Corp Morgan Stanley (2,577) 4,930 MGM Growth Bank of America
Properties LLC (Reit) Merrill Lynch 711 1,205 MGM Growth
Properties LLC (Reit) Goldman Sachs (39) (17,998) MGM Resorts International Bank of America
Merrill Lynch (16,918) (16,313) MGM Resorts International Goldman Sachs (14,927) 4,542 Michael Kors Holdings Ltd Bank of America
Merrill Lynch 2,453 3,578 Michael Kors Holdings Ltd Goldman Sachs 1,932 3,848 Michael Kors Holdings Ltd Morgan Stanley 1,424 849 Michaels Cos Inc/The Bank of America
Merrill Lynch 679 3,349 Michaels Cos Inc/The Goldman Sachs 2,679 1,568 Michaels Cos Inc/The Morgan Stanley 1,756 (2,168) Microchip Technology Inc Bank of America
Merrill Lynch (3,686) (4,154) Microchip Technology Inc Goldman Sachs (4,358) (12,635) Micron Technology Inc Bank of America
Merrill Lynch (32,851) (21,265) Micron Technology Inc Goldman Sachs (55,289) (5,722) Micron Technology Inc Morgan Stanley (14,934) 1,644 Microsemi Corp Bank of America
Merrill Lynch 2,267 219 Microsemi Corp Goldman Sachs 431 (3,414) Microsoft Corp Bank of America
Merrill Lynch (2,541) (1,569) Microsoft Corp Goldman Sachs (1,345) (29) MicroStrategy Inc 'A' Bank of America
Merrill Lynch (189) (247) MicroStrategy Inc 'A' Goldman Sachs (1,398) 183 Middleby Corp/The Bank of America
Merrill Lynch 1,104 (301) Minerals Technologies Inc Bank of America
Merrill Lynch (251) (386) Minerals Technologies Inc Goldman Sachs (348) 156 MKS Instruments Inc Bank of America
Merrill Lynch 38 204 MKS Instruments Inc Goldman Sachs 310 (697) Mobileye NV Bank of America
Merrill Lynch (146) (1,911) Molina Healthcare Inc Bank of America
Merrill Lynch (4,486) (5,332) Molina Healthcare Inc Goldman Sachs (8,809) (601) Molson Coors Brewing Co 'B' Bank of America
Merrill Lynch (8) (737) Mondelez International Inc 'A' Bank of America
Merrill Lynch (1,032) (1,027) Monogram Residential
Trust Inc (Reit) Goldman Sachs 144 (699) Monsanto Co Bank of America
Merrill Lynch (8,346) (193) Monster Beverage Corp Bank of America
Merrill Lynch (10) (725) Monster Beverage Corp Goldman Sachs 475 (3,408) Monster Beverage Corp Morgan Stanley (2,607)
United States continued United States continued

Contracts for difference as at 31 May 2016
Holding
Description Counterparty
Unrealised appreciation/
(depreciation) USD
Holding
Description Counterparty
Unrealised appreciation/
(depreciation) USD
Annual Report and Audited Accounts 307
The notes on pages 489 to 503 form an integral part of these financial statements.
(573) Moody's Corp Bank of America Merrill Lynch (2,506)
(2,628) Moody's Corp Goldman Sachs (5,934) (1,352) Moog Inc 'A' Bank of America
Merrill Lynch (1,599) (338) Moog Inc 'A' Goldman Sachs (591) (2,779) Morgan Stanley Bank of America
Merrill Lynch (4,530) 327 Morningstar Inc Goldman Sachs (57) (2,553) Mosaic Co/The Goldman Sachs 3,037 (3,307) Mosaic Co/The Morgan Stanley 4,885 (574) Motorola Solutions Inc Bank of America
Merrill Lynch 982 (1,595) Motorola Solutions Inc Goldman Sachs 248 430 MRC Global Inc Goldman Sachs 241 514 MSA Safety Inc Goldman Sachs 1,141 (363) MSC Industrial Bank of America
Direct Co Inc 'A' Merrill Lynch (546) (1,906) MSC Industrial
Direct Co Inc 'A' Goldman Sachs (1,506) 202 MSCI Inc Bank of America
Merrill Lynch 891 1,166 MSCI Inc Goldman Sachs 5,199 1,282 MSG Networks Inc 'A' Goldman Sachs 931 (2,937) Mueller Industries Inc Bank of America
Merrill Lynch (3,436) (310) Mueller Industries Inc Goldman Sachs (363) 611 Multi-Color Corp Bank of America
Merrill Lynch 446 (1,365) Murphy Oil Corp Bank of America
Merrill Lynch (1,870) (2,404) Murphy Oil Corp Goldman Sachs (2,091) 332 Myriad Genetics Inc Bank of America
Merrill Lynch (375) 74 Myriad Genetics Inc Goldman Sachs (84) (517) Nasdaq Inc Goldman Sachs (1,003) (4,580) National Fuel Gas Co Bank of America
Merrill Lynch (3,114) (6,124) National Fuel Gas Co Goldman Sachs (4,164) (1,872) National Fuel Gas Co Morgan Stanley (1,273) 1,010 National Health Bank of America
Investors Inc (Reit) Merrill Lynch 263 103 National Health
Investors Inc (Reit) Goldman Sachs 322 (1,065) National Instruments Corp Bank of America
Merrill Lynch (1,725) (1,588) National Instruments Corp Goldman Sachs (1,926) (9,423) National Oilwell Varco Inc Bank of America
Merrill Lynch (7,666) (4,224) National Oilwell Varco Inc Goldman Sachs (4,999) (926) National Oilwell Varco Inc Morgan Stanley (416) (4,635) National Retail Bank of America
Properties Inc (Reit) Merrill Lynch 3,010 (163) National Retail
Properties Inc (Reit) Goldman Sachs (25) (991) Nationstar Mortgage
Holdings Inc Goldman Sachs (217) (1,483) Natus Medical Inc Goldman Sachs 30 (732) NCR Corp Bank of America
Merrill Lynch (1,449) (1,680) NCR Corp Goldman Sachs (3,353) (264) Neenah Paper Inc Goldman Sachs (380) (3,801) Nektar Therapeutics Goldman Sachs (5,207) 371 Nelnet Inc 'A' Bank of America
Merrill Lynch 143 148 Nelnet Inc 'A' Goldman Sachs (34) (1,146) Neogen Corp Bank of America
Merrill Lynch (402) (1,367) Neogen Corp Goldman Sachs (410)
52,183 NetApp Inc Bank of America Merrill Lynch 111,427
25,554 NetApp Inc Goldman Sachs 55,197 16,405 NetApp Inc Morgan Stanley 32,154 (2,516) Netflix Inc Bank of America
Merrill Lynch (34,872) (2,679) Netflix Inc Goldman Sachs (37,131) (7,039) Netflix Inc Morgan Stanley (101,010) 1,186 NETGEAR Inc Bank of America
Merrill Lynch 2,159 (3,739) NetScout Systems Inc Bank of America
Merrill Lynch (2,449) (7,081) NetScout Systems Inc Goldman Sachs (4,461) (1,162) NetScout Systems Inc Morgan Stanley (1,220) (2,082) NetSuite Inc Bank of America
Merrill Lynch (125) (3,451) NetSuite Inc Goldman Sachs (243) (278) Neurocrine Biosciences Inc Bank of America
Merrill Lynch (1,137) (567) Nevro Corp Bank of America
Merrill Lynch (1,899) (11,113) New Residential Bank of America
Investment Corp (Reit) Merrill Lynch (2,553) (2,579) New Residential
Investment Corp (Reit) Goldman Sachs (223) (3,046) New Residential
Investment Corp (Reit) Morgan Stanley (55) 2,162 New Residential Bank of America
Investment Corp (Reit) Merrill Lynch 324 2,043 New Residential
Investment Corp (Reit) Goldman Sachs 306 1,950 New Senior Investment Bank of America
Group Inc (Reit) Merrill Lynch (2,164) (417) New York Community
Bancorp Inc Morgan Stanley (123) (3,926) New York Community Bank of America
Bancorp Inc Merrill Lynch (1,736) (1,425) New York Community
Bancorp Inc Goldman Sachs (1,133) (2,774) New York Inc (Reit) Bank of America
Merrill Lynch 1,970 (486) Newell Brands Inc Goldman Sachs (149) 3,345 Newfield Exploration Co Bank of America
Merrill Lynch 6,021 5,087 Newfield Exploration Co Goldman Sachs 9,157 5,667 Newfield Exploration Co Morgan Stanley 8,897 (59) NewMarket Corp Goldman Sachs (165) 887 Newmont Mining Corp Bank of America
Merrill Lynch (1,759) 1,101 Newmont Mining Corp Goldman Sachs (3,094) (6,304) News Corp 'A' Bank of America
Merrill Lynch (1,135) (2,678) News Corp 'A' Goldman Sachs (482) (2,897) News Corp 'B' Bank of America
Merrill Lynch (348) 7,018 NextEra Energy Inc Bank of America
Merrill Lynch (6,321) 459 NextEra Energy Inc Goldman Sachs (350) 4,129 NIKE Inc 'B' Bank of America
Merrill Lynch (4,848) 3,725 NIKE Inc 'B' Goldman Sachs (2,407) 687 Noble Energy Inc Bank of America
Merrill Lynch 324 3,639 Noble Energy Inc Goldman Sachs 845 1,769 Nordic American Tankers Ltd Bank of America
Merrill Lynch 1,893 2,875 Nordson Corp Bank of America
Merrill Lynch 28,894 4,342 Nordstrom Inc Goldman Sachs (2,878) 10,752 Nordstrom Inc Morgan Stanley 1,183
BlackRock Global Long/Short Equity Fund continued
United States continued United States continued

Contracts for difference as at 31 May 2016
Holding
Description Counterparty
Unrealised appreciation/
(depreciation) USD
Holding
Description Counterparty
Unrealised appreciation/
(depreciation) USD
308 BlackRock Strategic Funds (BSF)
The notes on pages 489 to 503 form an integral part of these financial statements.
BlackRock Global Long/Short Equity Fund continued
(491) Nordstrom Inc Bank of America Merrill Lynch 159
1,193 Northern Trust Corp Bank of America Merrill Lynch 2,747
1,195 Northern Trust Corp Goldman Sachs 2,928 205 Northrop Grumman Corp Bank of America
Merrill Lynch (242) 368 Northrop Grumman Corp Goldman Sachs (799) 5,024 NorthStar Asset Management Bank of America
Group Inc/New York Merrill Lynch 3,567 (3,515) NorthStar Realty Bank of America
Finance Corp (Reit) Merrill Lynch (1,084) (806) NorthStar Realty
Finance Corp (Reit) Goldman Sachs (425) (943) NorthStar Realty
Finance Corp (Reit) Morgan Stanley (490) (6,141) Northwest Bancshares Inc Bank of America
Merrill Lynch (1,658) (1,329) Northwest Bancshares Inc Goldman Sachs (359) (334) Northwest Natural Gas Co Goldman Sachs 66 (3,396) NorthWestern Corp Bank of America
Merrill Lynch 1,766 789 Norwegian Cruise Line Bank of America
Holdings Ltd Merrill Lynch (363) (1,556) NRG Energy Inc Bank of America
Merrill Lynch (1,136) (410) NRG Energy Inc Goldman Sachs (299) 359 NRG Yield Inc 'C' Bank of America
Merrill Lynch 108 624 NRG Yield Inc 'C' Goldman Sachs 187 3,092 Nuance Communications Inc Bank of America
Merrill Lynch 1,299 (1,929) Nucor Corp Bank of America
Merrill Lynch (1,833) (1,182) Nucor Corp Goldman Sachs (1,123) (428) NuStar Energy LP Bank of America
Merrill Lynch (195) 1,196 NuVasive Inc Bank of America
Merrill Lynch 845 (83) NVR Inc Bank of America
Merrill Lynch (5,549) (44) NVR Inc Goldman Sachs (3,024) (392) NXP Semiconductors NV Goldman Sachs (541) (254) O'Reilly Automotive Inc Bank of America
Merrill Lynch (822) (119) O'Reilly Automotive Inc Goldman Sachs (1,163) 1,515 Oasis Petroleum Inc Bank of America
Merrill Lynch 954 2,437 Oasis Petroleum Inc Goldman Sachs 1,404 (1,233) Oceaneering International Inc Bank of America
Merrill Lynch (910) (1,007) Oceaneering International Inc Goldman Sachs (401) (1,487) Office Depot Inc Bank of America
Merrill Lynch (191) 2,211 OGE Energy Corp Bank of America
Merrill Lynch (973) 8,208 OGE Energy Corp Goldman Sachs (3,536) 13,172 OGE Energy Corp Morgan Stanley (5,495) 2,769 Oil States International Inc Bank of America
Merrill Lynch 4,862 1,144 Oil States International Inc Goldman Sachs 1,749 4,057 Old National Bancorp/IN Bank of America
Merrill Lynch 3,124 1,774 Old Republic International Corp Bank of America
Merrill Lynch 532 (29,716) Olin Corp Bank of America
Merrill Lynch (39,150) (9,004) Olin Corp Goldman Sachs (13,995) (6,332) Olin Corp Morgan Stanley (8,906) 1,516 Ollie's Bargain Outlet
Holdings Inc Goldman Sachs 1,052
1,443 Omega Healthcare Investors Inc (Reit) Goldman Sachs (1,297)
(2,847) Omnicom Group Inc Bank of America Merrill Lynch 4,584
(754) ON Semiconductor Corp Bank of America Merrill Lynch (543)
(282) ONE Gas Inc Goldman Sachs 9 (7,627) OneMain Holdings Inc Bank of America
Merrill Lynch (9,042) (7,257) OneMain Holdings Inc Goldman Sachs (9,350) (8,967) OneMain Holdings Inc Morgan Stanley (11,553) (158) ONEOK Inc Bank of America
Merrill Lynch (154) (1,602) ONEOK Inc Goldman Sachs (2,916) (146) Ophthotech Corp Bank of America
Merrill Lynch (879) (101) Ophthotech Corp Goldman Sachs (658) 1,162 OPKO Health Inc Goldman Sachs 523 (1,254) Opus Bank Bank of America
Merrill Lynch 46 (1,358) Oracle Corp Bank of America
Merrill Lynch (54) 401 Orbotech Ltd Bank of America
Merrill Lynch 1,007 3,130 Ormat Technologies Inc Bank of America
Merrill Lynch 1,906 220 Oshkosh Corp Morgan Stanley (166) 3,826 Outfront Media Inc (Reit) Bank of America
Merrill Lynch (2,124) 3,408 Outfront Media Inc (Reit) Goldman Sachs (2,215) (791) Owens Corning Goldman Sachs 335 (1,344) Owens-Illinois Inc Bank of America
Merrill Lynch (158) 2,291 Oxford Industries Inc Bank of America
Merrill Lynch 8,849 624 Oxford Industries Inc Goldman Sachs 1,950 48,987 PACCAR Inc Bank of America
Merrill Lynch (53,730) 25,877 PACCAR Inc Goldman Sachs (28,465) 1,098 PACCAR Inc Morgan Stanley (538) (1,156) Pacific Biosciences Bank of America
of California Inc Merrill Lynch (574) 131 Pacira Pharmaceuticals Inc/DE Goldman Sachs 427 (2,080) Pacira Pharmaceuticals Inc/DE Bank of America
Merrill Lynch (3,723) (3,447) Pacira Pharmaceuticals Inc/DE Morgan Stanley (9,755) 624 Packaging Corp of America Morgan Stanley 3,102 2,961 PacWest Bancorp Bank of America
Merrill Lynch 1,612 236 Palo Alto Networks Inc Bank of America
Merrill Lynch (969) 508 Palo Alto Networks Inc Goldman Sachs (5,375) (18,184) Pandora Media Inc Bank of America
Merrill Lynch (30,367) (26,933) Pandora Media Inc Goldman Sachs (44,978) (44,827) Pandora Media Inc Morgan Stanley (48,207) (197) Panera Bread Co 'A' Bank of America
Merrill Lynch (1,286) (85) Panera Bread Co 'A' Goldman Sachs (555) 5,842 Papa John's International Inc Bank of America
Merrill Lynch 11,859 4,003 Papa John's International Inc Goldman Sachs 8,126 2,834 Papa John's International Inc Morgan Stanley 8,757 627 Paramount Group Inc (Reit) Bank of America
Merrill Lynch (382) 1,050 Paramount Group Inc (Reit) Goldman Sachs (640) (166) Parker-Hannifin Corp Goldman Sachs (891) 741 Parkway Properties Bank of America
Inc/Md (Reit) Merrill Lynch (15) 1,992 Parkway Properties
Inc/Md (Reit) Goldman Sachs (40)
United States continued United States continued

Contracts for difference as at 31 May 2016
Holding
Description Counterparty
Unrealised appreciation/
(depreciation) USD
Holding
Description Counterparty
Unrealised appreciation/
(depreciation) USD
Annual Report and Audited Accounts 309
The notes on pages 489 to 503 form an integral part of these financial statements.
(549) Parsley Energy Inc 'A' Morgan Stanley (534) 5,764 Parsley Energy Inc 'A' Bank of America
Merrill Lynch 4,220 202 Parsley Energy Inc 'A' Goldman Sachs 154 1,491 Party City Holdco Inc Bank of America
Merrill Lynch 1,938 1,069 Pattern Energy Group Inc Goldman Sachs 261 2,008 Patterson Cos Inc Bank of America
Merrill Lynch 6,345 (2,663) Patterson-UTI Energy Inc Goldman Sachs (562) 19,281 Paychex Inc Bank of America
Merrill Lynch 30,400 4,147 Paychex Inc Goldman Sachs 5,247 2,172 Paychex Inc Morgan Stanley 6,103 (580) Paycom Software Inc Bank of America
Merrill Lynch (313) (526) Paycom Software Inc Goldman Sachs (107) (393) Paylocity Holding Corp Bank of America
Merrill Lynch (519) (385) PayPal Holdings Inc Goldman Sachs 132 (1,567) PBF Energy Inc 'A' Bank of America
Merrill Lynch 2,460 (1,049) PBF Energy Inc 'A' Goldman Sachs 1,714 (1,847) PBF Energy Inc 'A' Morgan Stanley 2,460 903 Pebblebrook Hotel Trust (Reit) Bank of America
Merrill Lynch (1,291) 444 Pebblebrook Hotel Trust (Reit) Goldman Sachs (635) 3,494 Penn National Gaming Inc Bank of America
Merrill Lynch 2,115 1,091 Pennsylvania Real Estate Bank of America
Investment Trust (Reit) Merrill Lynch (1,713) 1,624 Pennsylvania Real Estate
Investment Trust (Reit) Goldman Sachs (2,550) 1,887 Penske Automotive Group Inc Bank of America
Merrill Lynch 5,492 (219) Penumbra Inc Bank of America
Merrill Lynch (936) (81) Penumbra Inc Goldman Sachs (94) 534 People's United Financial Inc Bank of America
Merrill Lynch 31 2,072 PepsiCo Inc Goldman Sachs (537) 7,348 PepsiCo Inc Bank of America
Merrill Lynch 4,536 386 Performance Food Group Co Bank of America
Merrill Lynch (97) 1,344 Performance Food Group Co Goldman Sachs (461) 3,161 PerkinElmer Inc Bank of America
Merrill Lynch (316) 1,147 PerkinElmer Inc Goldman Sachs (115) (672) Perrigo Co Plc Goldman Sachs 105 (5,471) Pfizer Inc Bank of America
Merrill Lynch (4,426) (5,090) Pfizer Inc Goldman Sachs (2,802) (16,629) PG&E Corp Goldman Sachs (10,393) (8,474) PG&E Corp Morgan Stanley (17,584) 171 PharMerica Corp Goldman Sachs (7) 3,543 Phillips 66 Goldman Sachs 7,263 (135) Phillips 66 Bank of America
Merrill Lynch (44) 2,518 Physicians Realty Trust (Reit) Bank of America
Merrill Lynch (508) 1,380 Physicians Realty Trust (Reit) Goldman Sachs (318) (3,891) Physicians Realty Trust (Reit) Bank of America
Merrill Lynch (41) (3,902) Physicians Realty Trust (Reit) Goldman Sachs (1,204) (7,649) Physicians Realty Trust (Reit) Morgan Stanley (1,003) (4,071) Piedmont Office Realty Bank of America
Trust Inc 'A' (Reit) Merrill Lynch 2,320 (632) Piedmont Office Realty
Trust Inc 'A' (Reit) Goldman Sachs 360
2,822 Pilgrim's Pride Corp Bank of America Merrill Lynch (2,314)
25,603 Pilgrim's Pride Corp Morgan Stanley (3,072) 1,085 Pinnacle Foods Inc Bank of America
Merrill Lynch (119) (4,298) Pinnacle West Capital Corp Bank of America
Merrill Lynch 7,087 (726) Pinnacle West Capital Corp Goldman Sachs 1,220 275 Pioneer Natural Resources Co Bank of America
Merrill Lynch (1,054) 504 Pioneer Natural Resources Co Goldman Sachs (1,775) (1,133) Plains All American Pipeline LP Bank of America
Merrill Lynch 2,553 1,504 Plains GP Holdings LP 'A' Bank of America
Merrill Lynch 422 (1,126) Platform Specialty
Products Corp Goldman Sachs (236) (462) Plexus Corp Bank of America
Merrill Lynch (369) (140) Plexus Corp Goldman Sachs (245) (2,630) PNM Resources Inc Bank of America
Merrill Lynch 924 (2,473) PNM Resources Inc Goldman Sachs 814 152 PolyOne Corp Goldman Sachs (20) 767 PolyOne Corp Bank of America
Merrill Lynch 399 154 Pool Corp Bank of America
Merrill Lynch 605 83 Pool Corp Goldman Sachs 319 125 Popeyes Louisiana Kitchen Inc Bank of America
Merrill Lynch 672 307 Popeyes Louisiana Kitchen Inc Goldman Sachs 1,279 (770) Popular Inc Bank of America
Merrill Lynch (1,692) (3,344) Popular Inc Goldman Sachs (3,557) 217 Portland General Electric Co Goldman Sachs 83 (3,587) Post Holdings Inc Bank of America
Merrill Lynch (5,380) (2,193) Post Holdings Inc Goldman Sachs (3,289) (2,813) Post Holdings Inc Morgan Stanley (8,692) 12,001 Post Properties Inc (Reit) Bank of America
Merrill Lynch (10,561) 6,519 Post Properties Inc (Reit) Goldman Sachs (5,737) 728 Post Properties Inc (Reit) Morgan Stanley (524) (254) Power Integrations Inc Bank of America
Merrill Lynch (111) (1,779) Power Integrations Inc Goldman Sachs (175) 11,360 PPL Corp Bank of America
Merrill Lynch (718) 909 PPL Corp Goldman Sachs (191) (247) PRA Group Inc Goldman Sachs (42) (1,726) PRA Health Sciences Inc Bank of America
Merrill Lynch (1,583) 375 Praxair Inc Bank of America
Merrill Lynch (887) 334 Praxair Inc Goldman Sachs (802) 1,579 Precision Drilling Corp Bank of America
Merrill Lynch 561 521 Premier Inc 'A' Bank of America
Merrill Lynch 42 6,452 Prestige Brands Holdings Inc Goldman Sachs (14,582) 1,954 Prestige Brands Holdings Inc Morgan Stanley (1,368) (87) Priceline Group Inc/The Bank of America
Merrill Lynch (834) (88) Priceline Group Inc/The Goldman Sachs (1,720) (922) PriceSmart Inc Goldman Sachs (1,807) (288) PriceSmart Inc Morgan Stanley (1,316) 632 Primerica Inc Bank of America
Merrill Lynch 3,097 (3,366) Primoris Services Corp Bank of America
Merrill Lynch (731)
BlackRock Global Long/Short Equity Fund continued
United States continued United States continued

Contracts for difference as at 31 May 2016
Holding
Description Counterparty
Unrealised appreciation/
(depreciation) USD
Holding
Description Counterparty
Unrealised appreciation/
(depreciation) USD
310 BlackRock Strategic Funds (BSF)
The notes on pages 489 to 503 form an integral part of these financial statements.
BlackRock Global Long/Short Equity Fund continued
(1,795) Primoris Services Corp Goldman Sachs (858) 985 Principal Financial Group Inc Bank of America
Merrill Lynch 2,173 293 Principal Financial Group Inc Goldman Sachs 84 1,097 PrivateBancorp Inc Bank of America
Merrill Lynch 5,244 925 PrivateBancorp Inc Goldman Sachs 4,196 (5,401) ProAssurance Corp Bank of America
Merrill Lynch (16,950) (13,072) Procter & Gamble Co/The Bank of America
Merrill Lynch 1,305 (6,787) Procter & Gamble Co/The Goldman Sachs 882 (5,733) Progress Software Corp Bank of America
Merrill Lynch (6,249) (908) Progress Software Corp Goldman Sachs (990) (1,945) Prologis Inc (Reit) Bank of America
Merrill Lynch 1,420 463 Proofpoint Inc Bank of America
Merrill Lynch 1,303 539 Proofpoint Inc Goldman Sachs 1,905 (881) Prothena Corp Plc Bank of America
Merrill Lynch (3,180) 1,758 PS Business Parks Inc (Reit) Bank of America
Merrill Lynch (3,700) 181 PS Business Parks Inc (Reit) Goldman Sachs (474) 668 Public Service Enterprise Bank of America
Group Inc Merrill Lynch (862) (155) Public Service Enterprise
Group Inc Goldman Sachs (59) 184 Public Storage (Reit) Bank of America
Merrill Lynch (275) 580 Public Storage (Reit) Goldman Sachs (201) (4,337) PulteGroup Inc Goldman Sachs (3,284) (416) PulteGroup Inc Bank of America
Merrill Lynch 25 (150) Puma Biotechnology Inc Goldman Sachs (1,078) 395 Pure Storage Inc 'A' Bank of America
Merrill Lynch 46 1,241 Pure Storage Inc 'A' Goldman Sachs (641) 260 PVH Corp Bank of America
Merrill Lynch 2,116 (192) PVH Corp Goldman Sachs (912) (1,646) QEP Resources Inc Bank of America
Merrill Lynch (1,028) (589) QEP Resources Inc Goldman Sachs (365) 257 Qlik Technologies Inc Goldman Sachs 283 1,250 Qlik Technologies Inc Bank of America
Merrill Lynch 424 640 QLogic Corp Bank of America
Merrill Lynch 375 (3,952) Qorvo Inc Bank of America
Merrill Lynch (19,843) (759) Qorvo Inc Goldman Sachs (1,363) (2,068) Qorvo Inc Morgan Stanley (10,361) 211 QTS Realty Trust Inc 'A' (Reit) Goldman Sachs (110) (216) Quaker Chemical Corp Bank of America
Merrill Lynch (303) (6,347) Qualcomm Inc Bank of America
Merrill Lynch (19,326) (4,459) Qualcomm Inc Goldman Sachs (13,595) 401 Quality Systems Inc Bank of America
Merrill Lynch (73) 1,205 Quality Systems Inc Goldman Sachs (40) 625 Quanta Services Inc Goldman Sachs 243 124 Quintiles Transnational
Holdings Inc Goldman Sachs 11 (218) Quorum Health Corp Bank of America
Merrill Lynch (462) 1,622 Rackspace Hosting Inc Bank of America
Merrill Lynch 1,941
(5,843) Radian Group Inc Bank of America Merrill Lynch (2,772)
(5,060) Radian Group Inc Goldman Sachs (1,558) (2,361) Radian Group Inc Morgan Stanley (1,373) (698) Radius Health Inc Bank of America
Merrill Lynch (2,063) (1,153) Radius Health Inc Goldman Sachs (5,880) 69 Ralph Lauren Corp Goldman Sachs 510 (7,388) Rambus Inc Goldman Sachs (4,211) 364 Ramco-Gershenson Bank of America
Properties Trust (Reit) Merrill Lynch (167) 455 Ramco-Gershenson
Properties Trust (Reit) Goldman Sachs (209) (148) Range Resources Corp Bank of America
Merrill Lynch (662) (3,425) Rayonier Inc (Reit) Bank of America
Merrill Lynch (377) (992) Rayonier Inc (Reit) Goldman Sachs (18) (20,967) Rayonier Inc (Reit) Morgan Stanley (11,742) 206 RBC Bearings Inc Bank of America
Merrill Lynch 383 1,474 RBC Bearings Inc Goldman Sachs 3,040 6,287 Realogy Holdings Corp Bank of America
Merrill Lynch 4,592 12,317 Realogy Holdings Corp Morgan Stanley 10,962 (4,227) Realty Income Corp (Reit) Bank of America
Merrill Lynch 15,445 3,318 Red Hat Inc Bank of America
Merrill Lynch 9,583 995 Red Hat Inc Goldman Sachs 1,171 348 Red Robin Gourmet Bank of America
Burgers Inc Merrill Lynch 707 98 Red Robin Gourmet
Burgers Inc Goldman Sachs (63) 346 Regal Beloit Corp Bank of America
Merrill Lynch 242 (596) Regal Entertainment Group 'A' Bank of America
Merrill Lynch (103) (3,018) Regency Centers Corp (Reit) Bank of America
Merrill Lynch (2,844) (914) Regency Centers Corp (Reit) Goldman Sachs (783) (208) Regeneron Bank of America
Pharmaceuticals Inc Merrill Lynch (1,336) (103) Regeneron
Pharmaceuticals Inc Goldman Sachs (725) 5,659 Reinsurance Group of Bank of America
America Inc Merrill Lynch 20,031 3,334 Reinsurance Group of
America Inc Goldman Sachs 10,501 688 Reinsurance Group of
America Inc Morgan Stanley 2,738 334 Reliance Steel & Aluminum Co Bank of America
Merrill Lynch 177 (303) Relypsa Inc Bank of America
Merrill Lynch (827) (8,075) RenaissanceRe Holdings Ltd Bank of America
Merrill Lynch (3,598) (2,039) RenaissanceRe Holdings Ltd Goldman Sachs (3,083) (869) RenaissanceRe Holdings Ltd Morgan Stanley (1,413) 1,503 Renasant Corp Bank of America
Merrill Lynch 1,183 616 Renasant Corp Goldman Sachs 881 (2,991) ResMed Inc Bank of America
Merrill Lynch (2,821) (596) ResMed Inc Goldman Sachs (411) (1,602) Retail Properties of Bank of America
America Inc 'A' (Reit) Merrill Lynch 517 (2,307) Retail Properties of
America Inc 'A' (Reit) Goldman Sachs 579
United States continued United States continued

Contracts for difference as at 31 May 2016
Holding
Description Counterparty
Unrealised appreciation/
(depreciation) USD
Holding
Description Counterparty
Unrealised appreciation/
(depreciation) USD
Annual Report and Audited Accounts 311
The notes on pages 489 to 503 form an integral part of these financial statements.
1,153 Rexford Industrial Bank of America Realty Inc (Reit) Merrill Lynch (219)
1,136 Rexford Industrial Realty Inc (Reit) Goldman Sachs (216)
763 Rexnord Corp Goldman Sachs 875 5,387 Reynolds American Inc Bank of America
Merrill Lynch (6,195) (932) RingCentral Inc 'A' Goldman Sachs (969) 229 RLI Corp Bank of America
Merrill Lynch (97) 681 RLI Corp Goldman Sachs 377 14,551 RLJ Lodging Trust (Reit) Bank of America
Merrill Lynch (21,390) 24,459 RLJ Lodging Trust (Reit) Goldman Sachs (35,955) 7,046 RLJ Lodging Trust (Reit) Morgan Stanley (7,469) 4,109 Robert Half International Inc Bank of America
Merrill Lynch 6,289 15,275 Robert Half International Inc Goldman Sachs 25,562 3,628 Robert Half International Inc Morgan Stanley 6,351 (598) Rockwell Automation Inc Bank of America
Merrill Lynch (1,660) (296) Rockwell Automation Inc Goldman Sachs (1,619) (1,832) Rockwell Collins Inc Bank of America
Merrill Lynch 1,962 (1,791) Rockwell Collins Inc Goldman Sachs 1,557 1,103 Rogers Corp Bank of America
Merrill Lynch 1,826 930 Rogers Corp Goldman Sachs 1,459 9,142 Rollins Inc Bank of America
Merrill Lynch 8,624 576 Rollins Inc Goldman Sachs 267 340 Ross Stores Inc Goldman Sachs (704) 10,060 Ross Stores Inc Morgan Stanley (8,551) (384) Rowan Cos Plc 'A' Goldman Sachs (38) (408) Royal Caribbean Cruises Ltd Bank of America
Merrill Lynch (450) (425) Royal Gold Inc Bank of America
Merrill Lynch 147 2,448 RPC Inc Bank of America
Merrill Lynch 2,154 2,199 RPC Inc Morgan Stanley 2,067 1,246 RSP Permian Inc Bank of America
Merrill Lynch 763 (2,417) RSP Permian Inc Morgan Stanley (1,740) 1,331 Rubicon Project Inc/The Bank of America
Merrill Lynch 253 7,194 Ryman Hospitality Bank of America
Properties Inc (Reit) Merrill Lynch (24,460) 5,039 Ryman Hospitality
Properties Inc (Reit) Goldman Sachs (17,133) 4,288 Ryman Hospitality
Properties Inc (Reit) Morgan Stanley (9,434) (199) S&P Global Inc Bank of America
Merrill Lynch (293) (167) S&P Global Inc Goldman Sachs (281) (465) Sabre Corp Goldman Sachs 77 1,068 salesforce.com Inc Bank of America
Merrill Lynch 6,910 1,179 salesforce.com Inc Goldman Sachs 7,628 (815) Sanderson Farms Inc Bank of America
Merrill Lynch (1,316) (9,290) Santander Consumer USA Bank of America
Holdings Inc Merrill Lynch (8,274) (7,064) Santander Consumer USA
Holdings Inc Goldman Sachs (7,193) (7,930) Santander Consumer USA
Holdings Inc Morgan Stanley (6,336) 478 SBA Communications Corp 'A' Bank of America
Merrill Lynch (103) (8,607) SCANA Corp Bank of America
Merrill Lynch 9,210
2,810 ScanSource Inc Goldman Sachs (140) 167 Schlumberger Ltd Bank of America
Merrill Lynch (11) 317 Schlumberger Ltd Goldman Sachs (14) (841) Scholastic Corp Bank of America
Merrill Lynch (1,386) (365) Scholastic Corp Goldman Sachs (31) 1,278 Schweitzer-Mauduit Bank of America
International Inc Merrill Lynch 744 446 Schweitzer-Mauduit
International Inc Goldman Sachs 427 2,193 Science Applications Bank of America
International Corp Merrill Lynch 648 141 Science Applications
International Corp Goldman Sachs 100 5,307 Scorpio Tankers Inc Bank of America
Merrill Lynch 585 3,637 Scorpio Tankers Inc Goldman Sachs 154 4,111 Scripps Networks Bank of America
Interactive Inc 'A' Merrill Lynch 627 7,272 Scripps Networks
Interactive Inc 'A' Goldman Sachs 239 11,156 Scripps Networks
Interactive Inc 'A' Morgan Stanley (4,313) (913) SEACOR Holdings Inc Bank of America
Merrill Lynch (2,273) (674) SEACOR Holdings Inc Goldman Sachs (1,678) 5,055 Seadrill Ltd Bank of America
Merrill Lynch (584) 13,153 Seadrill Ltd Goldman Sachs (784) (417) Seagate Technology Plc Bank of America
Merrill Lynch (1,197) (3,082) Seagate Technology Plc Goldman Sachs (7,384) (1,498) Sealed Air Corp Bank of America
Merrill Lynch 714 (544) Sealed Air Corp Goldman Sachs 484 1,719 SEI Investments Co Bank of America
Merrill Lynch 3,406 536 SEI Investments Co Goldman Sachs 520 200 SEI Investments Co Morgan Stanley 143 (2,541) Select Comfort Corp Bank of America
Merrill Lynch (1,398) (3,512) Select Comfort Corp Goldman Sachs (1,932) 329 Select Income REIT Bank of America
Merrill Lynch 39 661 Select Income REIT Goldman Sachs 209 1,175 SemGroup Corp 'A' Bank of America
Merrill Lynch 1,165 937 SemGroup Corp 'A' Goldman Sachs 759 1,223 Semtech Corp Bank of America
Merrill Lynch 2,299 (23,163) Senior Housing Properties Bank of America
Trust (Reit) Merrill Lynch (3,618) (8,205) Senior Housing Properties
Trust (Reit) Goldman Sachs (1,313) (11,634) Senior Housing Properties
Trust (Reit) Morgan Stanley (2,459) 281 Sensata Technologies Bank of America
Holding NV Merrill Lynch 798 (3,690) Sensient Technologies Corp Bank of America
Merrill Lynch (5,245) (1,293) Sensient Technologies Corp Goldman Sachs (2,193) 154 Seritage Growth Bank of America
Properties 'A' (Reit) Merrill Lynch 384 485 Seritage Growth
Properties 'A' (Reit) Goldman Sachs 238 (5,194) Service Corp International/US Bank of America
Merrill Lynch (2,233) (1,167) ServiceMaster Global Bank of America
Holdings Inc Merrill Lynch (2,988)
BlackRock Global Long/Short Equity Fund continued
United States continued United States continued

Contracts for difference as at 31 May 2016
Holding
Description Counterparty
Unrealised appreciation/
(depreciation) USD
Holding
Description Counterparty
Unrealised appreciation/
(depreciation) USD
312 BlackRock Strategic Funds (BSF)
The notes on pages 489 to 503 form an integral part of these financial statements.
BlackRock Global Long/Short Equity Fund continued
(1,246) ServiceMaster Global Holdings Inc Goldman Sachs (2,658)
(2,822) ServisFirst Bancshares Inc Bank of America Merrill Lynch (5,629)
(183) Shenandoah Telecommunications Co Goldman Sachs (320)
2,753 Sherwin-Williams Co/The Goldman Sachs (15,610) 1,040 Shutterfly Inc Bank of America
Merrill Lynch 1,071 120 Shutterfly Inc Goldman Sachs 124 989 Shutterstock Inc Bank of America
Merrill Lynch 1,444 967 Shutterstock Inc Goldman Sachs 2,178 673 Signature Bank/New York NY Bank of America
Merrill Lynch 2,335 597 Signature Bank/New York NY Goldman Sachs 4 378 Signet Jewelers Ltd Bank of America
Merrill Lynch (1,903) 556 Signet Jewelers Ltd Goldman Sachs (3,420) (632) Silgan Holdings Inc Bank of America
Merrill Lynch (190) (315) Silgan Holdings Inc Goldman Sachs (613) (438) Simmons First Bank of America
National Corp 'A' Merrill Lynch (853) 5,568 Simon Property
Group Inc (Reit) Goldman Sachs 15,172 13,079 Simon Property
Group Inc (Reit) Morgan Stanley 19,472 4,493 Simon Property Bank of America
Group Inc (Reit) Merrill Lynch (2,193) 1,082 Simpson Bank of America
Manufacturing Co Inc Merrill Lynch 1,716 190 Simpson
Manufacturing Co Inc Goldman Sachs 101 949 Sinclair Broadcast Bank of America
Group Inc 'A' Merrill Lynch 783 5,288 Sinclair Broadcast
Group Inc 'A' Goldman Sachs 2,990 4,017 Sinclair Broadcast
Group Inc 'A' Morgan Stanley 4,419 3,189 Sirius XM Holdings Inc Bank of America
Merrill Lynch 239 16,054 Sirius XM Holdings Inc Goldman Sachs 1,204 (180) Skechers U.S.A. Inc 'A' Bank of America
Merrill Lynch (121) (202) Skechers U.S.A. Inc 'A' Goldman Sachs (341) 165 SM Energy Co Bank of America
Merrill Lynch 212 1,633 Snap-on Inc Bank of America
Merrill Lynch (995) 2,819 Snap-on Inc Goldman Sachs (2,043) 2,495 Snap-on Inc Morgan Stanley (2,894) 117 Sohu.com Inc Bank of America
Merrill Lynch 281 236 Sohu.com Inc Goldman Sachs 155 (918) SolarEdge Technologies Inc Bank of America
Merrill Lynch (3,351) (237) SolarEdge Technologies Inc Goldman Sachs (239) 428 Sonic Corp Goldman Sachs 97 4,753 Sonoco Products Co Bank of America
Merrill Lynch 4,334 3,358 Sonoco Products Co Goldman Sachs 3,558 2,446 Sonoco Products Co Morgan Stanley 4,280 (1,201) Sotheby's Goldman Sachs (3,207) 401 South Jersey Industries Inc Goldman Sachs 80 2,710 South State Corp Bank of America
Merrill Lynch 10,027 (3,723) Southern Copper Corp Bank of America
Merrill Lynch 2,420 3,671 Southwest Airlines Co Bank of America
Merrill Lynch (622)
8,837 Southwest Airlines Co Morgan Stanley (795) 2,813 Southwest Airlines Co Goldman Sachs (338) (1,046) Southwest Gas Corp Bank of America
Merrill Lynch 429 (336) Southwestern Energy Co Bank of America
Merrill Lynch (192) (62) Sovran Self Storage Inc (Reit) Bank of America
Merrill Lynch (48) (273) Spark Therapeutics Inc Bank of America
Merrill Lynch (6,076) 1,033 SpartanNash Co Bank of America
Merrill Lynch 1,054 982 Spectra Energy Corp Bank of America
Merrill Lynch 481 1,638 Spectrum Brands Holdings Inc Bank of America
Merrill Lynch (360) 1,312 Spectrum Brands Holdings Inc Goldman Sachs (289) 218 Spire Inc Goldman Sachs 192 (47,960) Spirit Realty Capital Inc (Reit) Bank of America
Merrill Lynch 4,631 (26,291) Spirit Realty Capital Inc (Reit) Goldman Sachs (104) (24,808) Spirit Realty Capital Inc (Reit) Morgan Stanley 2,634 194 Splunk Inc Bank of America
Merrill Lynch 464 (4,560) Sprint Corp Bank of America
Merrill Lynch (501) 115 SPS Commerce Inc Bank of America
Merrill Lynch 155 2,217 SPX Corp Bank of America
Merrill Lynch 1,485 1,298 SPX Corp Goldman Sachs 870 (318) SPX Flow Inc Bank of America
Merrill Lynch (633) 2,091 Square Inc 'A' Bank of America
Merrill Lynch (298) (9,466) SS&C Technologies Bank of America
Holdings Inc Merrill Lynch (23,914) (6,438) SS&C Technologies
Holdings Inc Goldman Sachs (17,447) (3,784) SS&C Technologies
Holdings Inc Morgan Stanley (11,352) (1,916) St Joe Co/The Bank of America
Merrill Lynch (996) (370) Stamps.com Inc Goldman Sachs (2,661) 1,530 Staples Inc Bank of America
Merrill Lynch 368 2,342 Staples Inc Goldman Sachs 1,143 164 Starbucks Corp Goldman Sachs 6 1,349 Starbucks Corp Bank of America
Merrill Lynch (445) (2,469) State Street Corp Bank of America
Merrill Lynch (6,293) (724) State Street Corp Goldman Sachs (2,766) 3,390 Steel Dynamics Inc Goldman Sachs 959 15,198 Steelcase Inc 'A' Bank of America
Merrill Lynch 8,930 5,800 Steelcase Inc 'A' Goldman Sachs 5,172 (5,448) Sterling Bancorp/DE Bank of America
Merrill Lynch (4,304) (1,758) Sterling Bancorp/DE Goldman Sachs (1,389) (296) Steven Madden Ltd Goldman Sachs (279) (3,017) Stifel Financial Corp Bank of America
Merrill Lynch (2,867) (226) Stifel Financial Corp Goldman Sachs (240) 1,431 Stillwater Mining Co Goldman Sachs (258) (10,037) STORE Capital Corp (Reit) Morgan Stanley (875) (1,133) Stryker Corp Bank of America
Merrill Lynch 1,382 2,661 Summit Hotel Bank of America
Properties Inc (Reit) Merrill Lynch (2,555)
United States continued United States continued

Contracts for difference as at 31 May 2016
Holding
Description Counterparty
Unrealised appreciation/
(depreciation) USD
Holding
Description Counterparty
Unrealised appreciation/
(depreciation) USD
* Amounts which are less than 0.5 USD have been rounded down to zero.
Annual Report and Audited Accounts 313
The notes on pages 489 to 503 form an integral part of these financial statements.
4,718 Summit Hotel Properties Inc (Reit) Goldman Sachs (4,019)
(6,967) Sun Communities Inc (Reit) Bank of America Merrill Lynch 12,053
(3,544) Sun Communities Inc (Reit) Goldman Sachs 6,131 (8,472) Sun Communities Inc (Reit) Morgan Stanley 2,118 (2,665) SunPower Corp Goldman Sachs (1,519) 369 SunPower Corp Bank of America
Merrill Lynch 328 213 SunPower Corp Goldman Sachs 121 469 Sunstone Hotel Bank of America
Investors Inc (Reit) Merrill Lynch (399) 4,183 Sunstone Hotel
Investors Inc (Reit) Goldman Sachs (3,221) 309 SunTrust Banks Inc Bank of America
Merrill Lynch 881 (1,321) Super Micro Computer Inc Bank of America
Merrill Lynch (398) (264) Super Micro Computer Inc Goldman Sachs (41) (1,361) Superior Energy Services Inc Bank of America
Merrill Lynch (2,654) (1,849) SuperValu Inc Bank of America
Merrill Lynch 259 (1,795) SuperValu Inc Goldman Sachs 251 (457) Surgical Care Affiliates Inc Bank of America
Merrill Lynch (101) (84) Surgical Care Affiliates Inc Goldman Sachs (18) (186) SVB Financial Group Goldman Sachs (2,626) (1,916) Sykes Enterprises Inc Goldman Sachs 15 (2,627) Sykes Enterprises Inc Bank of America
Merrill Lynch 139 4,442 Symantec Corp Bank of America
Merrill Lynch 1,932 3,542 Symantec Corp Goldman Sachs 950 2,916 Symantec Corp Morgan Stanley 182 (370) Synaptics Inc Bank of America
Merrill Lynch (2,123) (263) Synaptics Inc Goldman Sachs (1,397) (349) Synchronoss Technologies Inc Goldman Sachs (199) 4,414 Synchrony Financial Bank of America
Merrill Lynch 4,843 3,691 Synchrony Financial Goldman Sachs 6,712 3,149 Synergy Resources Corp Bank of America
Merrill Lynch 189 6,086 Synergy Resources Corp Goldman Sachs 365 3,414 SYNNEX Corp Bank of America
Merrill Lynch 23,197 2,857 SYNNEX Corp Goldman Sachs 24,060 2,102 SYNNEX Corp Morgan Stanley 21,398 (4,956) Synovus Financial Corp Goldman Sachs (10,705) (954) Syntel Inc Bank of America
Merrill Lynch (2,738) (1,135) Syntel Inc Goldman Sachs (3,257) (1,742) Sysco Corp Bank of America
Merrill Lynch 2,195 (1,961) Sysco Corp Goldman Sachs 2,664 (231) T Rowe Price Group Inc Bank of America
Merrill Lynch (619) (1,758) T Rowe Price Group Inc Goldman Sachs (4,711) (181) Tableau Software Inc 'A' Bank of America
Merrill Lynch (247) (647) Tableau Software Inc 'A' Goldman Sachs (892) 314 Tahoe Resources Inc Bank of America
Merrill Lynch (410) 9,150 Take-Two Interactive
Software Inc Goldman Sachs 16,653 4,856 Take-Two Interactive
Software Inc Morgan Stanley 13,160 (738) Take-Two Interactive
Software Inc Goldman Sachs 34
1,821 Tallgrass Energy GP LP Bank of America Merrill Lynch 7,338
(3,185) Talmer Bancorp Inc '144A' Bank of America Merrill Lynch (862)
(2,700) Talmer Bancorp Inc '144A' Goldman Sachs (1,978) (6,429) Tanger Factory Outlet Bank of America
Centers Inc (Reit) Merrill Lynch (1,222) (2,409) Tanger Factory Outlet
Centers Inc (Reit) Goldman Sachs (458) (1,630) Targa Resources Corp Bank of America
Merrill Lynch 114 (1,522) Targa Resources Corp Goldman Sachs 107 (2,238) Targa Resources Corp Morgan Stanley 1,276 8,191 Target Corp Bank of America
Merrill Lynch (32,296) 16,424 Target Corp Goldman Sachs (85,413) 15,607 Target Corp Morgan Stanley (64,363) 3,668 Taylor Morrison Home Corp 'A' Bank of America
Merrill Lynch 3,961 2,789 Taylor Morrison Home Corp 'A' Goldman Sachs 3,012 24,887 TCF Financial Corp Bank of America
Merrill Lynch 31,358 17,822 TCF Financial Corp Goldman Sachs 22,456 3,214 TD Ameritrade Holding Corp Goldman Sachs 12,470 3,463 TE Connectivity Ltd Bank of America
Merrill Lynch 2,715 1,261 TE Connectivity Ltd Goldman Sachs 1,841 (1,382) Team Health Holdings Inc Goldman Sachs (1,169) (1,858) Team Health Holdings Inc Morgan Stanley (2,794) 2,331 Tech Data Corp Bank of America
Merrill Lynch 24,497 6,881 Tech Data Corp Goldman Sachs 71,796 1,455 Tech Data Corp Morgan Stanley 15,522 820 Teekay Corp Bank of America
Merrill Lynch 804 3,304 Teekay Tankers Ltd 'A' Bank of America
Merrill Lynch (1,355) 3,499 Teekay Tankers Ltd 'A' Goldman Sachs (1,435) (1,196) Teledyne Technologies Inc Bank of America
Merrill Lynch (4,509) (498) Teleflex Inc Goldman Sachs 72 (961) Teleflex Inc Bank of America
Merrill Lynch (863) (197) Teleflex Inc Morgan Stanley (250) 6,857 Telephone & Data Systems Inc Bank of America
Merrill Lynch 6,059 4,884 Telephone & Data Systems Inc Goldman Sachs 4,444 3,771 Telephone & Data Systems Inc Morgan Stanley 4,374 (200) Tempur Sealy International Inc Goldman Sachs (347) 4,176 Tenet Healthcare Corp Morgan Stanley (1,963) 3,953 Tenneco Inc Bank of America
Merrill Lynch 7,787 1,911 Tenneco Inc Goldman Sachs 3,765 2,241 Tenneco Inc Morgan Stanley 5,042 2,270 Teradata Corp Bank of America
Merrill Lynch 3,906 (1,020) Teradata Corp Bank of America
Merrill Lynch (1,699) (4,594) Teradyne Inc Bank of America
Merrill Lynch (5,141) (7,154) Teradyne Inc Goldman Sachs (6,116) (1,894) Teradyne Inc Morgan Stanley (400) (912) Terex Corp Bank of America
Merrill Lynch (173) 1 TerraForm Power Inc 'A'* Bank of America
Merrill Lynch — 511 TESARO Inc Bank of America
Merrill Lynch 1,119 (118) Tesla Motors Inc Bank of America
Merrill Lynch (1,706) (180) Tesla Motors Inc Goldman Sachs (2,603)
BlackRock Global Long/Short Equity Fund continued
United States continued United States continued

Contracts for difference as at 31 May 2016
Holding
Description Counterparty
Unrealised appreciation/
(depreciation) USD
Holding
Description Counterparty
Unrealised appreciation/
(depreciation) USD
314 BlackRock Strategic Funds (BSF)
The notes on pages 489 to 503 form an integral part of these financial statements.
BlackRock Global Long/Short Equity Fund continued
231 Tessera Technologies Inc Bank of America Merrill Lynch 37
4,982 Tetra Tech Inc Bank of America Merrill Lynch 4,135
(716) Texas Capital Bancshares Inc Bank of America Merrill Lynch (3,063)
(475) Texas Capital Bancshares Inc Goldman Sachs (1,809) (904) Texas Instruments Inc Bank of America
Merrill Lynch (2,667) (37) Texas Instruments Inc Goldman Sachs (90) (1,849) TFS Financial Corp Goldman Sachs (277) (7,232) TherapeuticsMD Inc Bank of America
Merrill Lynch (5,075) (1,596) Theravance Biopharma Inc Bank of America
Merrill Lynch (6,889) 547 Thor Industries Inc Goldman Sachs 186 1,620 Thor Industries Inc Bank of America
Merrill Lynch 551 4,277 Tiffany & Co Bank of America
Merrill Lynch (11,548) 128 Tiffany & Co Goldman Sachs (346) 4,967 Time Inc Bank of America
Merrill Lynch 3,208 7,808 Time Inc Goldman Sachs 3,165 2,295 Time Warner Inc Bank of America
Merrill Lynch 4,014 1,101 Time Warner Inc Goldman Sachs 2,606 (454) Timken Co/The Bank of America
Merrill Lynch (109) (152) Timken Co/The Goldman Sachs (36) 7,049 TJX Cos Inc/The Bank of America
Merrill Lynch 6,664 2,226 TJX Cos Inc/The Goldman Sachs 2,482 7,461 TJX Cos Inc/The Morgan Stanley 6,315 2,779 Toll Brothers Inc Bank of America
Merrill Lynch 6,287 3,040 TopBuild Corp Bank of America
Merrill Lynch 4,894 530 TopBuild Corp Goldman Sachs 853 (4,791) Torchmark Corp Bank of America
Merrill Lynch (8,260) (5,253) Torchmark Corp Goldman Sachs (14,795) (1,256) Total System Services Inc Bank of America
Merrill Lynch (804) (2,135) TransDigm Group Inc Bank of America
Merrill Lynch (32,409) (1,772) TransDigm Group Inc Goldman Sachs (26,899) (5,043) TransDigm Group Inc Morgan Stanley (80,032) 646 TransUnion Bank of America
Merrill Lynch 1 (2,859) Travelers Cos Inc/The Bank of America
Merrill Lynch (7,662) 1,023 Travelport Worldwide Ltd Bank of America
Merrill Lynch 82 1,371 Travelport Worldwide Ltd Goldman Sachs 110 (5,331) TreeHouse Foods Inc Bank of America
Merrill Lynch (3,858) (5,848) TreeHouse Foods Inc Goldman Sachs (5,487) (6,961) TreeHouse Foods Inc Morgan Stanley (24,309) 145 Trex Co Inc Bank of America
Merrill Lynch 484 5,093 TRI Pointe Group Inc Bank of America
Merrill Lynch 3,449 10,442 TRI Pointe Group Inc Goldman Sachs 6,247 (753) Tribune Media Co 'A' Bank of America
Merrill Lynch (761) (1,566) Tribune Media Co 'A' Goldman Sachs (1,582) (735) Tribune Media Co 'A' Morgan Stanley (779) (2,581) Trimble Navigation Ltd Bank of America
Merrill Lynch (3,897) (133) Trimble Navigation Ltd Goldman Sachs (201)
(1,047) TriNet Group Inc Goldman Sachs (1,222) (2,095) Trinity Industries Inc Bank of America
Merrill Lynch (2,403) (1,290) Trinity Industries Inc Goldman Sachs (1,536) (958) Trinity Industries Inc Morgan Stanley (1,008) 487 Trinseo SA Bank of America
Merrill Lynch 1,092 543 Trinseo SA Goldman Sachs 1,197 (345) TripAdvisor Inc Bank of America
Merrill Lynch (36) (504) Triumph Group Inc Bank of America
Merrill Lynch (487) (978) Triumph Group Inc Goldman Sachs (1,039) (21,345) Trustmark Corp Bank of America
Merrill Lynch (10,089) (5,197) Trustmark Corp Goldman Sachs (4,411) (1,717) Tupperware Brands Corp Bank of America
Merrill Lynch (4,550) (298) Tupperware Brands Corp Goldman Sachs (790) 456 Tutor Perini Corp Bank of America
Merrill Lynch 200 305 Tutor Perini Corp Goldman Sachs 210 (4,256) Twenty-First Century Bank of America
Fox Inc 'B' Merrill Lynch (213) (20,918) Twenty-First Century
Fox Inc 'B' Morgan Stanley (7,321) (659) Twitter Inc Goldman Sachs (718) (4,791) Two Harbors Investment
Corp (Reit) Goldman Sachs (287) (34,411) Two Harbors Investment
Corp (Reit) Morgan Stanley (2,065) (3,593) Tyco International Plc Bank of America
Merrill Lynch (8,823) (7,710) Tyco International Plc Goldman Sachs (15,337) (8,039) Tyco International Plc Morgan Stanley (20,419) (3,879) Tyler Technologies Inc Bank of America
Merrill Lynch (3,414) (3,104) Tyler Technologies Inc Morgan Stanley (24,180) (1,907) Tyson Foods Inc 'A' Bank of America
Merrill Lynch (585) (79) Tyson Foods Inc 'A' Goldman Sachs (23) (776) UDR Inc (Reit) Bank of America
Merrill Lynch 683 (205) UDR Inc (Reit) Goldman Sachs 180 209 Ulta Salon Cosmetics &
Fragrance Inc Goldman Sachs 116 189 Ultimate Software Bank of America
Group Inc/The Merrill Lynch 607 (142) Ultragenyx Pharmaceutical Inc Goldman Sachs (133) (984) UMB Financial Corp Bank of America
Merrill Lynch (3,503) (886) UMB Financial Corp Goldman Sachs (3,154) 5,493 Umpqua Holdings Corp Bank of America
Merrill Lynch 4,779 11,565 Umpqua Holdings Corp Goldman Sachs 10,062 5,412 Umpqua Holdings Corp Morgan Stanley 5,683 (36,074) Under Armour Inc 'A' Goldman Sachs (36,074) (833) Under Armour Inc 'A' Morgan Stanley (944) (1,634) Under Armour Inc 'C' Bank of America
Merrill Lynch (948) (31,276) Under Armour Inc 'C' Goldman Sachs (18,140) (566) UniFirst Corp/MA Bank of America
Merrill Lynch (2,343) (76) Union Pacific Corp Bank of America
Merrill Lynch (144) (3,124) United Bankshares Inc/WV Goldman Sachs (7,029) (7,914) United Community Bank of America
Banks Inc/GA Merrill Lynch (4,669) (712) United Continental
Holdings Inc Morgan Stanley 603
United States continued United States continued

Contracts for difference as at 31 May 2016
Holding
Description Counterparty
Unrealised appreciation/
(depreciation) USD
Holding
Description Counterparty
Unrealised appreciation/
(depreciation) USD
Annual Report and Audited Accounts 315
The notes on pages 489 to 503 form an integral part of these financial statements.
(4,303) United Continental Bank of America Holdings Inc Merrill Lynch (355)
(3,642) United Continental Holdings Inc Goldman Sachs 456
400 United Natural Foods Inc Bank of America Merrill Lynch 529
625 United Natural Foods Inc Goldman Sachs 269 (2,635) United Parcel Service Inc 'B' Bank of America
Merrill Lynch (3,024) (463) United Parcel Service Inc 'B' Goldman Sachs (865) (9,116) United Rentals Inc Bank of America
Merrill Lynch (33,948) (3,642) United Rentals Inc Goldman Sachs (20,411) (118) United Rentals Inc Morgan Stanley (466) (18,243) United States Steel Corp Goldman Sachs (13,329) (1,802) United Technologies Corp Bank of America
Merrill Lynch (103) (272) United Technologies Corp Goldman Sachs (327) (18,509) United Technologies Corp Morgan Stanley (13,141) (126) United Therapeutics Corp Bank of America
Merrill Lynch (941) 2,328 UnitedHealth Group Inc Bank of America
Merrill Lynch 5,810 479 UnitedHealth Group Inc Goldman Sachs 1,533 3,174 Univar Inc Bank of America
Merrill Lynch 1,015 2,198 Univar Inc Goldman Sachs 405 (2,871) Universal Corp/VA Bank of America
Merrill Lynch 1,595 (233) Universal Corp/VA Goldman Sachs 201 (543) Universal Display Corp Bank of America
Merrill Lynch (6,978) (286) Universal Electronics Inc Bank of America
Merrill Lynch (629) (888) Universal Electronics Inc Goldman Sachs (1,734) 72 Universal Forest Products Inc Bank of America
Merrill Lynch 73 756 Unum Group Bank of America
Merrill Lynch 1,212 1,402 Unum Group Goldman Sachs 1,600 3,247 US Bancorp Bank of America
Merrill Lynch 995 (282) US Ecology Inc Bank of America
Merrill Lynch (519) (430) US Ecology Inc Goldman Sachs (791) (174) USANA Health Sciences Inc Bank of America
Merrill Lynch 557 (868) USG Corp Goldman Sachs 92 (136) USG Corp Bank of America
Merrill Lynch (107) 2,763 Vail Resorts Inc Bank of America
Merrill Lynch 5,569 2,103 Vail Resorts Inc Goldman Sachs 4,886 909 Vail Resorts Inc Morgan Stanley 4,254 (205) Valero Energy Corp Goldman Sachs 95 (249) Valero Energy Corp Bank of America
Merrill Lynch (57) (2,351) Validus Holdings Ltd Bank of America
Merrill Lynch (1,787) (9,240) Valley National Bancorp Bank of America
Merrill Lynch (4,528) (690) Valley National Bancorp Goldman Sachs (338) (1,401) Valmont Industries Inc Bank of America
Merrill Lynch (4,378) 930 Vantiv Inc 'A' Bank of America
Merrill Lynch (856) (3,343) Varian Medical Systems Inc Bank of America
Merrill Lynch 6,920 (1,297) VASCO Data Security Bank of America
International Inc Merrill Lynch (1,089)
(266) VASCO Data Security International Inc Goldman Sachs (223)
13,080 VCA Inc Bank of America Merrill Lynch 10,333
13,644 VCA Inc Goldman Sachs 9,706 3,004 VCA Inc Morgan Stanley 2,163 3,993 Vector Group Ltd Goldman Sachs (519) 1,849 Vector Group Ltd Bank of America
Merrill Lynch (240) (1,731) Vectren Corp Bank of America
Merrill Lynch 427 (3,063) Vectren Corp Goldman Sachs 2,179 (951) Veeco Instruments Inc Bank of America
Merrill Lynch (1,046) (743) Veeco Instruments Inc Goldman Sachs (817) (6,009) Veeva Systems Inc 'A' Goldman Sachs (26,680) 2,140 Veeva Systems Inc 'A' Bank of America
Merrill Lynch 6,226 1,606 Veeva Systems Inc 'A' Goldman Sachs 6,297 (87) Ventas Inc (Reit) Bank of America
Merrill Lynch 113 (71,807) VEREIT Inc (Reit) Bank of America
Merrill Lynch 25,851 (90,510) VEREIT Inc (Reit) Goldman Sachs 32,584 (91,632) VEREIT Inc (Reit) Morgan Stanley 19,243 2,404 VeriFone Systems Inc Goldman Sachs 620 3,631 VeriFone Systems Inc Bank of America
Merrill Lynch (13) 1,646 Verint Systems Inc Bank of America
Merrill Lynch 90 1,868 Verint Systems Inc Goldman Sachs (143) 18,274 VeriSign Inc Bank of America
Merrill Lynch 16,803 8,151 VeriSign Inc Goldman Sachs 7,694 19,161 VeriSign Inc Morgan Stanley 48,861 (6,241) Verisk Analytics Inc Bank of America
Merrill Lynch (7,477) (4,312) Verisk Analytics Inc Goldman Sachs (6,120) (9,359) Verisk Analytics Inc Morgan Stanley (23,210) (4,163) Verizon Communications Inc Bank of America
Merrill Lynch 1,624 (1,448) Verizon Communications Inc Goldman Sachs 422 (1,080) Viacom Inc 'B' Bank of America
Merrill Lynch (2,266) (789) Viacom Inc 'B' Goldman Sachs (3,101) (3,310) ViaSat Inc Bank of America
Merrill Lynch 15,598 (4,093) ViaSat Inc Goldman Sachs 19,731 (1,931) ViaSat Inc Morgan Stanley 8,342 2,140 Virtu Financial Inc 'A' Bank of America
Merrill Lynch (829) 295 Virtu Financial Inc 'A' Goldman Sachs (92) (9) Virtus Investment Partners Inc Bank of America
Merrill Lynch (19) (201) Virtus Investment Partners Inc Goldman Sachs (434) 134 Virtusa Corp Bank of America
Merrill Lynch 395 276 Virtusa Corp Goldman Sachs 814 (2,410) Visa Inc 'A' Goldman Sachs (3,918) (2,656) Vishay Intertechnology Inc Bank of America
Merrill Lynch (1,487) 320 Vista Outdoor Inc Bank of America
Merrill Lynch 307 (3,696) Vista Outdoor Inc Bank of America
Merrill Lynch (3,548) (781) Vista Outdoor Inc Goldman Sachs (750) (165) Vista Outdoor Inc Morgan Stanley (274) (1,302) Visteon Corp Bank of America
Merrill Lynch (1,105) (942) Visteon Corp Goldman Sachs (1,651)
BlackRock Global Long/Short Equity Fund continued
United States continued United States continued

Contracts for difference as at 31 May 2016
Holding
Description Counterparty
Unrealised appreciation/
(depreciation) USD
Holding
Description Counterparty
Unrealised appreciation/
(depreciation) USD
316 BlackRock Strategic Funds (BSF)
The notes on pages 489 to 503 form an integral part of these financial statements.
BlackRock Global Long/Short Equity Fund continued
(1,332) Vornado Realty Trust (Reit) Bank of America Merrill Lynch 2,092
(2,789) Voya Financial Inc Bank of America Merrill Lynch (658)
(331) Vulcan Materials Co Bank of America Merrill Lynch (548)
1,647 VWR Corp Goldman Sachs — 1,029 VWR Corp Morgan Stanley 1,340 7,646 VWR Corp Bank of America
Merrill Lynch 178 (81) WABCO Holdings Inc Goldman Sachs (363) (2,971) Waddell & Reed Bank of America
Financial Inc 'A' Merrill Lynch (7,041) (227) Waddell & Reed
Financial Inc 'A' Goldman Sachs (538) 151 WageWorks Inc Bank of America
Merrill Lynch 32 91 WageWorks Inc Goldman Sachs 4 678 Walgreens Boots Alliance Inc Bank of America
Merrill Lynch 42 (967) Walt Disney Co/The Goldman Sachs 924 (1,229) Washington Federal Inc Bank of America
Merrill Lynch (909) 354 Waters Corp Bank of America
Merrill Lynch 795 528 Waters Corp Goldman Sachs 1,333 839 Waters Corp Morgan Stanley 2,953 (43) Waters Corp Goldman Sachs (83) (841) Wayfair Inc 'A' Bank of America
Merrill Lynch (1,314) (8,526) Weatherford International Plc Goldman Sachs (4,728) 3,341 Web.com Group Inc Goldman Sachs 85 1,975 Web.com Group Inc Bank of America
Merrill Lynch 40 (532) WebMD Health Corp Morgan Stanley 476 (617) WebMD Health Corp Bank of America
Merrill Lynch (657) (1,860) WebMD Health Corp Goldman Sachs (1,848) 11,963 Webster Financial Corp Bank of America
Merrill Lynch 42,259 597 Webster Financial Corp Morgan Stanley 2,519 (4,945) WEC Energy Group Inc Bank of America
Merrill Lynch 2,027 (6,094) WEC Energy Group Inc Goldman Sachs 2,499 (17,876) WEC Energy Group Inc Morgan Stanley (15,016) 427 Weight Watchers Bank of America
International Inc Merrill Lynch 628 268 Weight Watchers
International Inc Goldman Sachs 394 14,832 Weingarten Realty
Investors (Reit) Morgan Stanley (148) 15,363 Weingarten Realty Bank of America
Investors (Reit) Merrill Lynch (15,409) 1,054 Weingarten Realty
Investors (Reit) Goldman Sachs (213) (405) WellCare Health Plans Inc Bank of America
Merrill Lynch (2,851) (50) WellCare Health Plans Inc Goldman Sachs (52) (251) Welltower Inc (Reit) Bank of America
Merrill Lynch 654 (151) Welltower Inc (Reit) Goldman Sachs 56 3,460 Wendy's Co/The Bank of America
Merrill Lynch (934) 1,084 Wesco Aircraft Holdings Inc Goldman Sachs 11 3,698 Wesco Aircraft Holdings Inc Bank of America
Merrill Lynch 37 (213) West Corp Bank of America
Merrill Lynch (159) (571) West Corp Goldman Sachs (174) 224 West Pharmaceutical Bank of America
Services Inc Merrill Lynch 730
(2,948) Westamerica Bancorporation Bank of America Merrill Lynch (4,321)
4,619 Western Alliance Bancorp Bank of America Merrill Lynch 10,045
1,138 Western Alliance Bancorp Goldman Sachs 1,269 (288) Western Digital Corp Bank of America
Merrill Lynch (2,360) (675) Western Digital Corp Goldman Sachs (6,615) (148) Western Gas Partners LP Bank of America
Merrill Lynch (188) (5,937) Western Union Co/The Bank of America
Merrill Lynch (920) (710) Western Union Co/The Goldman Sachs (300) 334 Westlake Chemical Corp Bank of America
Merrill Lynch 45 495 Westlake Chemical Corp Morgan Stanley 470 258 Westlake Chemical Corp Goldman Sachs (61) (432) WestRock Co Bank of America
Merrill Lynch (151) (456) WEX Inc Goldman Sachs (209) (293) WGL Holdings Inc Bank of America
Merrill Lynch 866 (333) WGL Holdings Inc Goldman Sachs 986 (380) Whirlpool Corp Bank of America
Merrill Lynch (985) (127) Whirlpool Corp Goldman Sachs (712) (21) White Mountains Bank of America
Insurance Group Ltd Merrill Lynch 625 (11) White Mountains
Insurance Group Ltd Goldman Sachs 314 110 WhiteWave Foods Co/The Goldman Sachs 48 567 Whiting Petroleum Corp Bank of America
Merrill Lynch 629 (697) Whole Foods Market Inc Bank of America
Merrill Lynch (1,199) (1,650) Whole Foods Market Inc Goldman Sachs (1,439) 1,106 Williams-Sonoma Inc Bank of America
Merrill Lynch 3,942 352 Williams-Sonoma Inc Goldman Sachs 1,635 (266) Willis Towers Watson Plc Bank of America
Merrill Lynch (1,018) (1,490) Willis Towers Watson Plc Goldman Sachs (6,401) (1,947) Willis Towers Watson Plc Morgan Stanley (9,745) (2,676) Wilshire Bancorp Inc Bank of America
Merrill Lynch (2,569) (1,069) Wilshire Bancorp Inc Goldman Sachs (1,026) (386) WisdomTree Investments Inc Goldman Sachs (795) (343) Wix.com Ltd Bank of America
Merrill Lynch (470) (2,544) Wolverine World Wide Inc Bank of America
Merrill Lynch (2,112) (774) Wolverine World Wide Inc Goldman Sachs (642) 4,611 Woodward Inc Bank of America
Merrill Lynch 8,781 3,040 Woodward Inc Goldman Sachs 5,844 3,650 Woodward Inc Morgan Stanley 7,326 (1,887) Workday Inc 'A' Goldman Sachs (7,322) (409) Workday Inc 'A' Morgan Stanley (1,824) (1,492) World Fuel Services Corp Bank of America
Merrill Lynch (1,522) (10) World Fuel Services Corp Goldman Sachs (10) 2,860 World Fuel Services Corp Bank of America
Merrill Lynch 2,917 2,643 World Fuel Services Corp Goldman Sachs 2,696 1,432 World Fuel Services Corp Morgan Stanley 2,964 (497) World Wrestling Bank of America
Entertainment Inc 'A' Merrill Lynch 164 497 Worthington Industries Inc Bank of America
Merrill Lynch 398 1,199 Worthington Industries Inc Goldman Sachs 959
United States continued United States continued

Contracts for difference as at 31 May 2016
Holding
Description Counterparty
Unrealised appreciation/
(depreciation) USD
Holding
Description Counterparty
Unrealised appreciation/
(depreciation) USD
Annual Report and Audited Accounts 317
The notes on pages 489 to 503 form an integral part of these financial statements.
(3,105) WP Carey Inc (Reit) Bank of America Merrill Lynch 682
(8,514) WP Carey Inc (Reit) Goldman Sachs 2,129 (9,038) WP Carey Inc (Reit) Morgan Stanley (9,761) 4,555 WP Glimcher Inc (Reit) Bank of America
Merrill Lynch (1,776) 2,368 WPX Energy Inc Bank of America
Merrill Lynch 2,392 138 WR Grace & Co Goldman Sachs 77 (1,841) WR Grace & Co Bank of America
Merrill Lynch (1,031) (919) WR Grace & Co Morgan Stanley (1,011) (981) WR Grace & Co Goldman Sachs (549) (443) WW Grainger Inc Bank of America
Merrill Lynch 623 1,124 Wyndham Worldwide Corp Goldman Sachs (1,068) (8,982) Wynn Resorts Ltd Bank of America
Merrill Lynch (47,299) (1,890) Wynn Resorts Ltd Goldman Sachs (10,168) (1,239) Xcel Energy Inc Bank of America
Merrill Lynch (569) (1,568) Xcel Energy Inc Goldman Sachs (133) (980) Xenia Hotels & Bank of America
Resorts Inc (Reit) Merrill Lynch 49 (1,152) Xilinx Inc Bank of America
Merrill Lynch 32 (762) Xilinx Inc Goldman Sachs (1,430) (419) XL Group Plc Bank of America
Merrill Lynch (158) (688) XL Group Plc Goldman Sachs (282) 774 XPO Logistics Inc Goldman Sachs 3,111 2,736 Xylem Inc/NY Bank of America
Merrill Lynch 3,201 31 Xylem Inc/NY Goldman Sachs 36 (4,637) Yahoo! Inc Bank of America
Merrill Lynch (1,170)
984 Yandex NV 'A' Bank of America Merrill Lynch 979
312 Yandex NV 'A' Goldman Sachs 309 844 Yelp Inc Bank of America
Merrill Lynch 353 810 Yelp Inc Goldman Sachs 555 (139) Yum! Brands Inc Bank of America
Merrill Lynch (336) (1,954) Yum! Brands Inc Goldman Sachs (2,462) (626) Zayo Group Holdings Inc Bank of America
Merrill Lynch (541) (1,087) Zayo Group Holdings Inc Goldman Sachs (878) (652) Zayo Group Holdings Inc Morgan Stanley (659) (411) Zebra Technologies Corp 'A' Bank of America
Merrill Lynch (1,285) (294) Zebra Technologies Corp 'A' Goldman Sachs (64) (252) Zebra Technologies Corp 'A' Morgan Stanley (478) (1,771) Zendesk Inc Bank of America
Merrill Lynch (1,647) (869) Zendesk Inc Goldman Sachs (808) (11,307) Zillow Group Inc 'C' Goldman Sachs (2,035) (7,909) Zimmer Biomet Holdings Inc Bank of America
Merrill Lynch (21,750) (8,517) Zimmer Biomet Holdings Inc Morgan Stanley (32,790) (269) Zions Bancorporation Bank of America
Merrill Lynch (592) 943 ZIOPHARM Oncology Inc Bank of America
Merrill Lynch 575 1,933 Zoetis Inc Bank of America
Merrill Lynch 854 1,289 Zoetis Inc Goldman Sachs 892
(1,695,058)
Total (Gross underlying exposure - USD 611,021,045 ) (285,900)
BlackRock Global Long/Short Equity Fund continued
United States continued United States continued
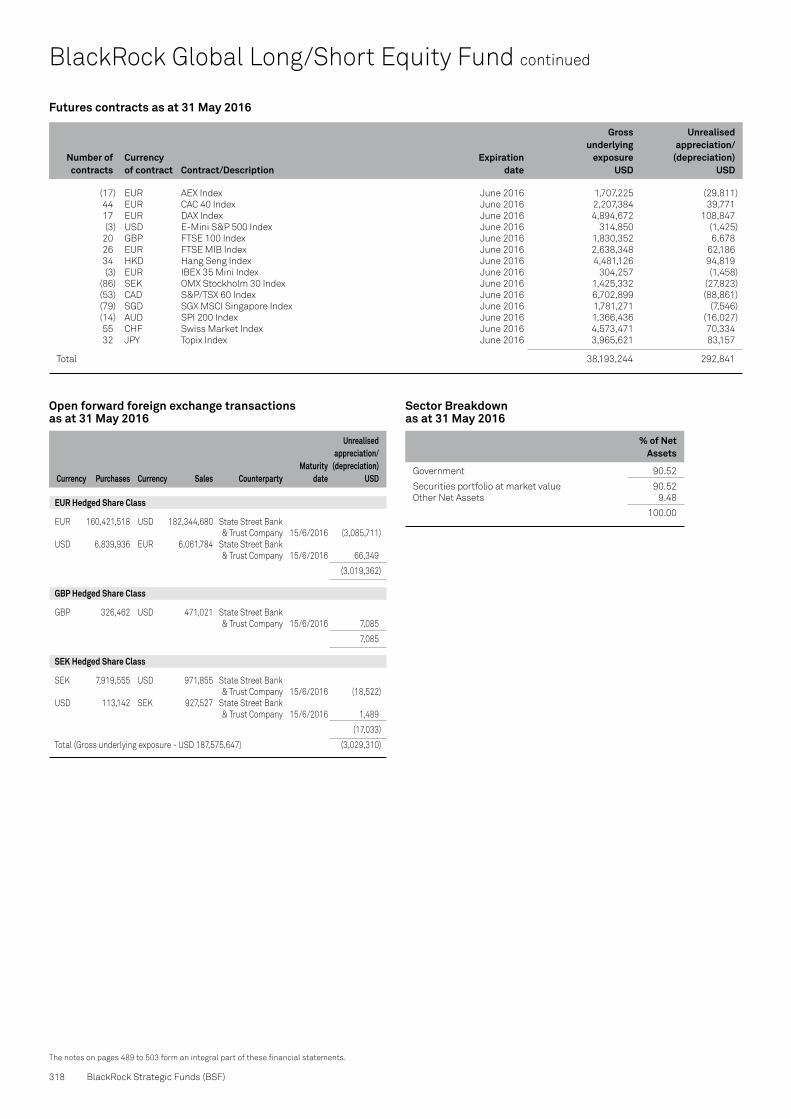
Open forward foreign exchange transactions as at 31 May 2016
Currency Purchases Currency Sales CounterpartyMaturity
date
Unrealised appreciation/
(depreciation) USD
Futures contracts as at 31 May 2016
Number of contracts
Currencyof contract Contract/Description
Expiration date
Gross underlying
exposureUSD
Unrealised appreciation/
(depreciation) USD
318 BlackRock Strategic Funds (BSF)
The notes on pages 489 to 503 form an integral part of these financial statements.
BlackRock Global Long/Short Equity Fund continued
(17) EUR AEX Index June 2016 1,707,225 (29,811) 44 EUR CAC 40 Index June 2016 2,207,384 39,771 17 EUR DAX Index June 2016 4,894,672 108,847 (3) USD E-Mini S&P 500 Index June 2016 314,850 (1,425) 20 GBP FTSE 100 Index June 2016 1,830,352 6,678 26 EUR FTSE MIB Index June 2016 2,638,348 62,186 34 HKD Hang Seng Index June 2016 4,481,126 94,819 (3) EUR IBEX 35 Mini Index June 2016 304,257 (1,458) (86) SEK OMX Stockholm 30 Index June 2016 1,425,332 (27,823) (53) CAD S&P/TSX 60 Index June 2016 6,702,899 (88,861) (79) SGD SGX MSCI Singapore Index June 2016 1,781,271 (7,546) (14) AUD SPI 200 Index June 2016 1,366,436 (16,027) 55 CHF Swiss Market Index June 2016 4,573,471 70,334 32 JPY Topix Index June 2016 3,965,621 83,157
Total 38,193,244 292,841
EUR Hedged Share Class
EUR 160,421,518 USD 182,344,680 State Street Bank & Trust Company 15/6/2016 (3,085,711)USD 6,839,936 EUR 6,061,784 State Street Bank & Trust Company 15/6/2016 66,349
(3,019,362)
GBP Hedged Share Class
GBP 326,462 USD 471,021 State Street Bank & Trust Company 15/6/2016 7,085
7,085
SEK Hedged Share Class
SEK 7,919,555 USD 971,855 State Street Bank & Trust Company 15/6/2016 (18,522)USD 113,142 SEK 927,527 State Street Bank & Trust Company 15/6/2016 1,489
(17,033)
Total (Gross underlying exposure - USD 187,575,647) (3,029,310)
Sector Breakdown as at 31 May 2016
% of Net Assets
Government 90.52
Securities portfolio at market value 90.52Other Net Assets 9.48
100.00

Annual Report and Audited Accounts 319
The notes on pages 489 to 503 form an integral part of these financial statements.
Transferable Securities and Money Market Instruments Admitted to an Official Stock Exchange Listing or Dealt in on Another Regulated Market
Transferable Securities and Money Market Instruments Admitted to an Official Stock Exchange Listing or Dealt in on Another Regulated Market
Holding
Description
Market Value
USD
% of Net
Assets
Holding
Description
Market Value
USD
% of Net
Assets
Portfolio of Investments as at 31 May 2016
COMMON STOCKS (SHARES) & RIGHTS
Australia 2,763 Aristocrat Leisure Ltd 25,775 0.01 1,579 Australia & New Zealand Banking
Group Ltd 29,185 0.01 27,605 BHP Billiton Ltd 382,071 0.16 18,612 Caltex Australia Ltd 441,757 0.19 4,135 Coca-Cola Amatil Ltd 26,636 0.01 25,013 Commonwealth Bank of Australia 1,404,923 0.59 1,927 CSL Ltd 161,815 0.07 91,951 DUET Group (Unit) 156,748 0.07 33,469 Evolution Mining Ltd 49,285 0.02 91,779 Fortescue Metals Group Ltd 198,398 0.08 10,220 Iluka Resources Ltd 47,818 0.02 18,657 Independence Group NL 38,842 0.02 1,645 Magellan Financial Group Ltd 29,450 0.01 39,102 Medibank Pvt Ltd 90,767 0.04 8,175 National Australia Bank Ltd 161,003 0.07 53,697 Northern Star Resources Ltd 167,882 0.07 40,250 OZ Minerals Ltd 159,418 0.07 131,307 Qantas Airways Ltd 293,370 0.12 1,193 Rio Tinto Ltd 38,675 0.02 1,739 Sirtex Medical Ltd 39,736 0.02 125,906 South32 Ltd 142,478 0.06 19,716 Stockland (Reit) 64,788 0.03 36,615 Suncorp Group Ltd 344,755 0.14 94,785 Sydney Airport (Unit) 486,800 0.21 5,257 Transurban Group (Unit) 45,952 0.02 12,024 Westpac Banking Corp 267,772 0.11 5,441 Woolworths Ltd 87,305 0.04
5,383,404 2.28
Austria 12,073 Erste Group Bank AG 328,493 0.14
328,493 0.14
Belgium 5,009 bpost SA 132,317 0.05 8,422 Euronav NV 87,673 0.04 8,729 Proximus SADP 287,280 0.12
507,270 0.21
Bermuda 3,182 Assured Guaranty Ltd 85,978 0.04 3,530 Bunge Ltd 232,592 0.10 26,214 Invesco Ltd 827,838 0.35 15,500 Kerry Properties Ltd 38,634 0.01
1,185,042 0.50
British Virgin Islands 1,971 Michael Kors Holdings Ltd 82,782 0.04
82,782 0.04
Canada 6,520 Alimentation Couche-Tard Inc 'B' 292,075 0.12 1,252 Bank of Montreal 79,774 0.03 15,436 Bank of Nova Scotia/The 763,021 0.32 3,332 Barrick Gold Corp 56,254 0.02 18,859 BCE Inc 876,894 0.37 2,241 Canadian Imperial Bank of
Commerce/Canada 175,527 0.07 3,688 Canadian Natural Resources Ltd 110,715 0.05 1,268 Canfor Corp 15,473 0.01 317 Constellation Software Inc/Canada 128,993 0.06 11,315 Crescent Point Energy Corp 193,892 0.08
1,745 Detour Gold Corp 34,032 0.02 522 Dollarama Inc 36,787 0.02 10,340 Enbridge Inc 417,339 0.18 4,454 Encana Corp 34,801 0.02 9,454 First Quantum Minerals Ltd 64,453 0.03 17,190 Goldcorp Inc 290,483 0.12 1,095 Home Capital Group Inc 29,668 0.01 9,560 Imperial Oil Ltd 309,842 0.13 472 Intact Financial Corp 33,387 0.01 737 Inter Pipeline Ltd 15,119 0.01 507 Keyera Corp 14,906 0.01 1,343 Linamar Corp 55,605 0.02 34,041 Lundin Mining Corp 113,170 0.05 1,751 Magna International Inc 71,008 0.03 39,713 Manulife Financial Corp 595,946 0.25 3,335 Metro Inc 114,066 0.05 14,442 Power Corp of Canada 330,558 0.14 10,557 Precision Drilling Corp 49,815 0.02 2,787 Restaurant Brands International Inc 117,825 0.05 20,831 Royal Bank of Canada 1,282,620 0.54 770 Saputo Inc 23,747 0.01 345 Sun Life Financial Inc 12,022 0.01 29,509 Suncor Energy Inc 820,090 0.35 4,767 Teck Resources Ltd 'B' 46,741 0.02 26,939 Toronto-Dominion Bank/The 1,188,416 0.50 9,156 Tourmaline Oil Corp 219,177 0.09 4,377 Veresen Inc 33,797 0.01 7,167 Yamana Gold Inc 30,415 0.01
9,078,453 3.84
Cayman Islands 7,000 Cheung Kong Property Holdings Ltd 43,664 0.02 302,500 WH Group Ltd '144A' 233,286 0.10
276,950 0.12
Curacao 6,974 Schlumberger Ltd 536,858 0.23
536,858 0.23
Denmark 2,148 ISS A/S 86,711 0.04 43,624 Novo Nordisk A/S 'B' 2,428,615 1.03 772 Novozymes A/S 'B' 36,961 0.01
2,552,287 1.08
Finland 756 Cargotec OYJ 'B' 29,453 0.01 4,459 Elisa OYJ 170,681 0.07 13,764 Kone OYJ 'B' 646,311 0.27 19,145 Nokia OYJ 109,486 0.05 4,977 Sampo OYJ 'A' 223,530 0.10 2,798 UPM-Kymmene OYJ 54,160 0.02
1,233,621 0.52
France 1,876 Accor SA 82,527 0.03 1,187 Atos SE 110,295 0.05 35,148 AXA SA 892,347 0.38 3,146 Capgemini SA 301,776 0.13 1,732 Christian Dior SE 283,800 0.12 19,670 Cie de Saint-Gobain 881,343 0.37 7,643 CNP Assurances 130,315 0.05 21,886 Electricite de France SA 293,958 0.12 12,128 Engie SA 187,075 0.08 252 Gecina SA (Reit) 35,662 0.02
BlackRock Impact World Equity Fund
Canada continued

320 BlackRock Strategic Funds (BSF)
The notes on pages 489 to 503 form an integral part of these financial statements.
Transferable Securities and Money Market Instruments Admitted to an Official Stock Exchange Listing or Dealt in on Another Regulated Market
Transferable Securities and Money Market Instruments Admitted to an Official Stock Exchange Listing or Dealt in on Another Regulated Market
Holding
Description
Market Value
USD
% of Net
Assets
Holding
Description
Market Value
USD
% of Net
Assets
* Securities on loan, see Note 16, for further details.
BlackRock Impact World Equity Fund continued
2,253 ICADE (Reit) 164,100 0.07 933 Lagardere SCA 22,098 0.01 3,669 LVMH Moet Hennessy Louis Vuitton SE 594,018 0.25 45,656 Natixis SA 224,329 0.09 18,535 Orange SA 323,169 0.14 23,484 Peugeot SA 372,473 0.16 1,378 Renault SA 131,229 0.06 1,793 Safran SA 126,250 0.05 20,358 Sanofi 1,675,628 0.71 1,957 Societe Generale SA 81,533 0.03 308 Sodexo SA 32,696 0.01 347 Technip SA 18,990 0.01 693 Thales SA 60,244 0.03 12,068 Total SA 587,969 0.25 468 Unibail-Rodamco SE (Reit) 127,468 0.05 1,367 Valeo SA 206,967 0.09
7,948,259 3.36
Germany 7,138 Allianz SE Reg 1,176,385 0.50 786 Aurubis AG 41,069 0.02 13,739 BASF SE 1,072,517 0.45 5,927 Bayer AG Reg 568,672 0.24 15,219 Daimler AG Reg 1,045,090 0.44 23,112 Deutsche Telekom AG Reg 412,007 0.18 43,233 E.ON SE 428,083 0.18 8,263 Evonik Industries AG 244,624 0.10 599 Hochtief AG 75,302 0.03 1,200 KION Group AG 66,923 0.03 1,822 OSRAM Licht AG 97,918 0.04 4,908 ProSiebenSat.1 Media SE 249,376 0.11 7,176 Siemens AG Reg 780,844 0.33 11,369 Telefonica Deutschland Holding AG 51,747 0.02 192 Volkswagen AG 30,056 0.01
6,340,613 2.68
Guernsey 6,439 Amdocs Ltd 373,913 0.16
373,913 0.16
Hong Kong 5,000 CLP Holdings Ltd 47,121 0.02 3,400 Hong Kong Exchanges and Clearing Ltd 81,288 0.04 123,000 New World Development Co Ltd 115,918 0.05 10,000 Sino Land Co Ltd 15,295 0.01 57,000 Sun Hung Kai Properties Ltd 669,276 0.28 7,000 Wheelock & Co Ltd 31,543 0.01
960,441 0.41
Ireland 11,383 Accenture Plc 'A' 1,353,780 0.57 218 CRH Plc 6,639 0.00 1,082 Eaton Corp Plc 66,933 0.03 19,742 Ingersoll-Rand Plc 1,314,028 0.56 1,249 Jazz Pharmaceuticals Plc 187,906 0.08 12,014 Medtronic Plc 964,003 0.41 3,811 Seagate Technology Plc 83,956 0.03
3,977,245 1.68
Israel 2,500 Check Point Software
Technologies Ltd 211,150 0.09
211,150 0.09
Italy 11,200 Autogrill SpA 97,639 0.04 39,246 Enel SpA 180,954 0.08 17,699 Eni SpA 274,985 0.12 12,168 Hera SpA 36,044 0.01 180,075 Intesa Sanpaolo SpA 469,851 0.20 6,484 Intesa Sanpaolo SpA - RSP * 15,846 0.01 149 Luxottica Group SpA 8,157 0.00 17,213 Mediobanca SpA 135,255 0.06 283,826 Saipem SpA 117,170 0.05 76,649 Telecom Italia SpA/Milano - RSP 60,229 0.02 154,506 Terna Rete Elettrica Nazionale SpA 863,741 0.36 108,362 UniCredit SpA 352,454 0.15
2,612,325 1.10
Japan 12,900 Ajinomoto Co Inc 310,615 0.13 2,300 Asahi Group Holdings Ltd 78,119 0.03 58,000 Asahi Kasei Corp 387,780 0.16 80,000 Astellas Pharma Inc 1,092,202 0.46 10,800 Canon Inc 312,195 0.13 2,400 Central Japan Railway Co 423,993 0.18 5,000 Chiba Bank Ltd/The 26,189 0.01 1,600 Denso Corp 62,911 0.03 4,400 East Japan Railway Co 401,332 0.17 15,000 Fuji Electric Co Ltd 60,478 0.03 12,200 Fuji Heavy Industries Ltd 455,654 0.19 18,400 FUJIFILM Holdings Corp 745,505 0.32 2,300 GungHo Online Entertainment Inc 6,665 0.00 15,200 Hino Motors Ltd 155,399 0.07 28,000 Hitachi Ltd 129,019 0.05 2,600 Hitachi Metals Ltd 27,845 0.01 11,300 Honda Motor Co Ltd 320,445 0.14 9,000 Idemitsu Kosan Co Ltd 179,652 0.08 11,000 IHI Corp 28,313 0.01 28,100 Isuzu Motors Ltd 337,862 0.14 1,200 Jafco Co Ltd 35,801 0.02 2,700 Japan Post Bank Co Ltd 32,221 0.01 113,800 JX Holdings Inc 443,463 0.19 17,000 Kao Corp 933,420 0.39 6,900 KDDI Corp 201,011 0.08 13,000 Kikkoman Corp 465,644 0.20 12,900 Konica Minolta Inc 110,988 0.05 14,000 Kubota Corp 205,436 0.09 1,200 Matsumotokiyoshi Holdings Co Ltd 65,446 0.03 4,900 Mazda Motor Corp 84,272 0.04 4,900 Mitsubishi Chemical Holdings Corp 24,889 0.01 51,000 Mitsubishi Electric Corp 614,809 0.26 142,000 Mitsubishi Heavy Industries Ltd 574,696 0.24 1,100 Mixi Inc 42,370 0.02 44,400 Mizuho Financial Group Inc 69,688 0.03 2,400 Murata Manufacturing Co Ltd 279,710 0.12 11,000 Nichirei Corp 93,849 0.04 2,000 Nippon Shokubai Co Ltd 119,516 0.05 4,000 Nippon Steel & Sumitomo Metal Corp 82,437 0.03 31,300 Nippon Telegraph & Telephone Corp 1,367,606 0.58 4,800 Nippon Television Holdings Inc 84,626 0.04 119,000 Nissan Motor Co Ltd 1,204,833 0.51 2,500 Nitto Denko Corp 163,997 0.07 49,300 NTT DOCOMO Inc 1,232,999 0.52 270,000 Osaka Gas Co Ltd 1,010,845 0.43 47,700 Panasonic Corp 442,807 0.19 500 Pola Orbis Holdings Inc 43,198 0.02 9,000 Resona Holdings Inc 34,132 0.01 9,600 Sony Corp 267,831 0.11 2,600 Sony Financial Holdings Inc 31,706 0.01 94,000 Sumitomo Chemical Co Ltd 429,753 0.18 44,700 Sumitomo Electric Industries Ltd 631,388 0.27 20,000 Sumitomo Metal Mining Co Ltd 205,733 0.09
Portfolio of Investments as at 31 May 2016
France continued

Annual Report and Audited Accounts 321
The notes on pages 489 to 503 form an integral part of these financial statements.
Transferable Securities and Money Market Instruments Admitted to an Official Stock Exchange Listing or Dealt in on Another Regulated Market
Transferable Securities and Money Market Instruments Admitted to an Official Stock Exchange Listing or Dealt in on Another Regulated Market
Holding
Description
Market Value
USD
% of Net
Assets
Holding
Description
Market Value
USD
% of Net
Assets
* Securities on loan, see Note 16, for further details.
Portfolio of Investments as at 31 May 2016
6,800 Sumitomo Mitsui Financial Group Inc 221,353 0.09 9,000 Sumitomo Mitsui Trust Holdings Inc 31,241 0.01 2,100 Suzuki Motor Corp 53,844 0.02 15,000 Taisei Corp 110,966 0.05 383,000 Tokyo Gas Co Ltd 1,543,857 0.65 13,000 Toray Industries Inc 112,211 0.05 38,400 Toyota Motor Corp 1,998,535 0.85 1,900 Yamaha Motor Co Ltd 33,549 0.01 32,000 Zeon Corp 240,760 0.10
21,519,609 9.10
Jersey 1,453 Delphi Automotive Plc 99,124 0.04 76,694 Glencore Plc 147,857 0.06 1,983 Shire Plc 124,577 0.05 12,786 Wolseley Plc 767,301 0.33 31,153 WPP Plc 730,005 0.31
1,868,864 0.79
Luxembourg 15,124 Subsea 7 SA 134,595 0.06
134,595 0.06
Netherlands 60,435 Aegon NV 311,998 0.13 92,417 ING Groep NV - CVA 1,167,477 0.49 1,477 Koninklijke Ahold NV 32,954 0.01 10,115 LyondellBasell Industries NV 'A' 829,127 0.35 6,020 NN Group NV 199,233 0.09 1,384 Randstad Holding NV 74,657 0.03 27,541 Unilever NV - CVA 1,249,396 0.53
3,864,842 1.63
Norway 33,186 Orkla ASA 303,480 0.13 15,310 Statoil ASA 245,196 0.10 995 Telenor ASA 16,757 0.01
565,433 0.24
Singapore 189,200 CapitaLand Ltd 410,737 0.17 49,900 City Developments Ltd 296,726 0.13 20,900 DBS Group Holdings Ltd 235,207 0.10 88,100 Singapore Telecommunications Ltd 247,548 0.10 5,400 Venture Corp Ltd 32,620 0.01 204,800 Wilmar International Ltd 493,673 0.21 88,500 Yangzijiang Shipbuilding Holdings Ltd 58,794 0.03 33,700 Yanlord Land Group Ltd 29,851 0.01
1,805,156 0.76
Spain 4,818 Aena SA '144A' 654,117 0.28 7,986 Amadeus IT Holding SA 'A' 370,535 0.16 101,182 Banco Bilbao Vizcaya Argentaria SA 677,979 0.29 37,299 Banco de Sabadell SA 64,408 0.03 19,757 Banco Popular Espanol SA (Right) 4,899 0.00 19,757 Banco Popular Espanol SA 32,859 0.01 76,794 Banco Santander SA 373,636 0.16 3,677 Bankinter SA 28,203 0.01 154,414 CaixaBank SA 427,215 0.18 6,411 Grifols SA 144,862 0.06 30,086 Industria de Diseno Textil SA 1,022,755 0.43 7,293 NH Hotel Group SA 37,227 0.02 2,098 Repsol SA 27,523 0.01
3,866,218 1.64
Sweden 1,887 Assa Abloy AB 'B' 39,437 0.02 3,316 Atlas Copco AB 'A' 86,337 0.04 11,593 Axfood AB 214,525 0.09 13,076 Boliden AB 233,157 0.10 3,938 Castellum AB 53,777 0.02 3,879 Castellum AB (Right) 8,588 0.00 201 Hennes & Mauritz AB 'B' 6,278 0.00 6,748 Hufvudstaden AB 'A' 105,790 0.05 903 ICA Gruppen AB 31,714 0.01 756 Intrum Justitia AB 26,560 0.01 3,235 Investor AB 'B' 113,225 0.05 77,042 Nordea Bank AB 757,313 0.32 1,611 Svenska Handelsbanken AB 'A' 20,759 0.01 13,118 Swedbank AB 'A' 292,304 0.12 1,409 Swedish Match AB 48,332 0.02 19,417 Telefonaktiebolaget LM Ericsson 'B' 150,801 0.06 10,296 Volvo AB 'B' 115,516 0.05
2,304,413 0.97
Switzerland 15,783 ABB Ltd Reg 331,493 0.14 5,815 Actelion Ltd Reg 956,977 0.40 4,586 Adecco Group AG Reg 279,835 0.12 9,559 Coca-Cola HBC AG - CDI 187,436 0.08 1,040 Flughafen Zuerich AG Reg 183,446 0.08 27 Galenica AG Reg 35,814 0.01 8,946 GAM Holding AG 113,423 0.05 442 Givaudan SA Reg 851,091 0.36 2,606 Kuehne + Nagel International AG Reg 368,581 0.16 1,851 Lonza Group AG Reg 319,580 0.14 18,181 Nestle SA Reg 1,357,353 0.57 17,841 Novartis AG Reg 1,426,595 0.60 2,653 Roche Holding AG 697,657 0.29 41 Sika AG 178,149 0.08 3,295 Swiss Life Holding AG Reg 854,500 0.36 8,148 Swiss Re AG 736,724 0.31 2,288 TE Connectivity Ltd 136,914 0.06
9,015,568 3.81
United Kingdom 1,038 3i Group Plc 8,520 0.00 13,536 ARM Holdings Plc 196,041 0.08 28,333 AstraZeneca Plc 1,679,963 0.71 19,426 Aviva Plc 128,781 0.06 3,478 Barclays Plc 9,410 0.00 1,404 Barratt Developments Plc 12,316 0.01 1,596 Bellway Plc 64,249 0.03 5,957 BHP Billiton Plc 72,396 0.03 103,973 BP Plc 547,291 0.23 12,960 British American Tobacco Plc 802,795 0.34 5,266 Bunzl Plc 157,315 0.07 129,133 Centrica Plc 384,445 0.16 6,020 Coca-Cola European Partners Plc 231,830 0.10 15,780 CYBG Plc - CDI 66,506 0.03 1,422 Diageo Plc 39,232 0.02 4,448 Dialog Semiconductor Plc 142,239 0.06 49,702 GlaxoSmithKline Plc 1,049,175 0.44 57,914 Hays Plc 114,662 0.05 85,721 HSBC Holdings Plc 561,871 0.24 5,704 Imperial Brands Plc 316,284 0.13 18,310 Investec Plc 126,746 0.05 225,184 ITV Plc 716,237 0.30 11,222 J Sainsbury Plc * 44,034 0.02 9,843 Johnson Matthey Plc 416,711 0.18 5,532 Jupiter Fund Management Plc 35,782 0.02 590,214 Lloyds Banking Group Plc 625,155 0.27 47,829 Marks & Spencer Group Plc 268,676 0.11 3,076 Moneysupermarket.com Group Plc 14,883 0.01
BlackRock Impact World Equity Fund continued
Japan continued

322 BlackRock Strategic Funds (BSF)
The notes on pages 489 to 503 form an integral part of these financial statements.
Transferable Securities and Money Market Instruments Admitted to an Official Stock Exchange Listing or Dealt in on Another Regulated Market
Transferable Securities and Money Market Instruments Admitted to an Official Stock Exchange Listing or Dealt in on Another Regulated Market
Holding
Description
Market Value
USD
% of Net
Assets
Holding
Description
Market Value
USD
% of Net
Assets
* Securities on loan, see Note 16, for further details.
BlackRock Impact World Equity Fund continued
96,479 National Grid Plc 1,423,434 0.60 13,922 Nielsen Holdings Plc 741,207 0.31 1,540 Persimmon Plc 47,855 0.02 319 Prudential Plc 6,500 0.00 3,491 Reckitt Benckiser Group Plc 353,101 0.15 7,789 Rio Tinto Plc 222,763 0.09 6,127 Royal Dutch Shell Plc 'A' 149,794 0.06 6,895 Royal Dutch Shell Plc 'B' 169,024 0.07 59,078 Royal Mail Plc 468,472 0.20 50,496 Sky Plc 716,909 0.30 12,011 Standard Chartered Plc 93,731 0.04 15,754 Standard Life Plc 78,669 0.03 12,603 Taylor Wimpey Plc 37,964 0.02 37,718 Thomas Cook Group Plc 42,420 0.02 12,247 Unilever Plc 567,178 0.24 4,904 United Utilities Group Plc 69,839 0.03 84,672 Vodafone Group Plc 287,603 0.12 2,986 Whitbread Plc 186,146 0.08
14,496,154 6.13
United States 7,520 3M Co 1,269,226 0.54 10,614 Abbott Laboratories 417,130 0.18 12,227 AbbVie Inc 772,502 0.33 3,826 Aetna Inc 436,508 0.18 3,067 Affiliated Managers Group Inc 532,523 0.23 15,584 Aflac Inc 1,086,984 0.46 2,441 Air Products & Chemicals Inc 349,356 0.15 3,222 Align Technology Inc 255,344 0.11 1,068 Allstate Corp/The 72,314 0.03 1,770 Alphabet Inc 'A' 1,331,093 0.56 1,894 Alphabet Inc 'C' 1,398,700 0.59 14,053 Altria Group Inc 894,473 0.38 2,570 Amazon.com Inc 1,846,545 0.78 3,775 AMC Networks Inc 'A' 240,109 0.10 2,444 American Express Co 160,669 0.07 11,176 Ameriprise Financial Inc 1,142,634 0.48 17,411 AmerisourceBergen Corp 1,295,553 0.55 4,649 Amgen Inc 733,845 0.31 2,577 Anadarko Petroleum Corp 134,494 0.06 6,626 Analog Devices Inc 386,892 0.16 2,629 Antero Resources Corp 75,295 0.03 3,217 Anthem Inc 422,231 0.18 2,828 Apache Corp 165,297 0.07 49,181 Apple Inc 4,924,002 2.08 42,704 Applied Materials Inc 1,033,010 0.44 20,593 Archer-Daniels-Midland Co 886,529 0.37 10,653 Aspen Technology Inc 405,347 0.17 4,483 AT&T Inc 175,375 0.07 1,928 Autodesk Inc 113,366 0.05 5,721 Automatic Data Processing Inc 504,192 0.21 9,473 Avery Dennison Corp 705,549 0.30 1,884 Baker Hughes Inc 87,436 0.04 39,827 Bank of America Corp 596,210 0.25 1,202 Bank of Hawaii Corp 86,135 0.04 2,741 Baxter International Inc 118,219 0.05 4,319 Bemis Co Inc 218,412 0.09 5,130 Best Buy Co Inc 164,365 0.07 991 Biogen Inc 287,340 0.12 1,918 Black Hills Corp 114,773 0.05 4,492 Boeing Co/The 574,078 0.24 3,202 Booz Allen Hamilton Holding Corp 93,242 0.04 564 Boston Scientific Corp 12,808 0.01 5,139 Brinker International Inc 231,512 0.10 8,357 Bristol-Myers Squibb Co 595,436 0.25 20,827 Brocade Communications Systems Inc 188,901 0.08 6,311 Cal-Maine Foods Inc * 286,267 0.12 2,688 Camden Property Trust (Reit) 228,131 0.10
10,850 Capital One Financial Corp 801,381 0.34 14,554 Cardinal Health Inc 1,143,944 0.48 7,722 Carlisle Cos Inc 801,544 0.34 18,871 CBRE Group Inc 'A' 555,374 0.23 7,744 CBS Corp 'B non-voting share' 424,371 0.18 549 Celanese Corp 'A' 38,930 0.02 5,221 Celgene Corp 558,386 0.24 39,594 CenterPoint Energy Inc 894,824 0.38 5,111 Charles Schwab Corp/The 158,237 0.07 6,750 Chevron Corp 685,665 0.29 58,937 Cisco Systems Inc 1,703,869 0.72 20,754 Citigroup Inc 969,627 0.41 18,384 Citizens Financial Group Inc 434,414 0.18 8,248 Clorox Co/The 1,064,074 0.45 10,704 CME Group Inc/IL 1,054,665 0.45 8,393 Coca-Cola Co/The 375,251 0.16 1,126 Colgate-Palmolive Co 79,541 0.03 22,621 Comcast Corp 'A' 1,417,432 0.60 2,523 Concho Resources Inc 310,884 0.13 9,632 ConocoPhillips 432,188 0.18 1,115 Continental Resources Inc/OK 47,577 0.02 12,307 Costco Wholesale Corp 1,829,436 0.77 6,245 Crown Castle International Corp (Reit) 566,422 0.24 161 Cummins Inc 18,410 0.01 18,306 CVS Health Corp 1,770,739 0.75 13,539 Danaher Corp 1,333,185 0.56 10,162 Devon Energy Corp 374,876 0.16 5,049 Discover Financial Services 287,692 0.12 1,383 Domino's Pizza Inc 168,353 0.07 16,219 Dr Pepper Snapple Group Inc 1,489,877 0.63 1,693 DTE Energy Co 152,793 0.06 2,449 East West Bancorp Inc 95,535 0.04 9,955 Ecolab Inc 1,176,681 0.50 1,907 Edwards Lifesciences Corp 189,956 0.08 1,987 Electronic Arts Inc 151,052 0.06 18,639 Eli Lilly & Co 1,404,635 0.59 6,808 EOG Resources Inc 557,371 0.24 5,544 Estee Lauder Cos Inc/The 'A' 511,157 0.22 18,928 Exxon Mobil Corp 1,702,384 0.72 4,805 F5 Networks Inc 522,784 0.22 9,802 Facebook Inc 'A' 1,169,379 0.49 12,416 First Data Corp 'A' 157,435 0.07 2,985 First Republic Bank/CA 217,815 0.09 1,617 Fitbit Inc 'A' 22,897 0.01 955 Fluor Corp 50,605 0.02 23,012 Ford Motor Co 311,007 0.13 1,194 Fortinet Inc 40,883 0.02 5,846 Fortune Brands Home & Security Inc 342,751 0.14 9,705 Franklin Resources Inc 363,549 0.15 6,208 Freeport-McMoRan Inc 70,150 0.03 1,979 GameStop Corp 'A' 57,094 0.02 47,616 General Electric Co 1,435,622 0.61 2,654 General Mills Inc 167,202 0.07 11,450 Gilead Sciences Inc 991,684 0.42 2,658 Gulfport Energy Corp 81,255 0.03 2,450 Harman International Industries Inc 192,301 0.08 4,812 Hartford Financial Services
Group Inc/The 218,754 0.09 4,422 Hasbro Inc 384,935 0.16 1,675 Hershey Co/The 155,457 0.07 3,643 Hess Corp 221,130 0.09 4,266 Hewlett Packard Enterprise Co 76,575 0.03 1,324 HollyFrontier Corp 35,814 0.02 11,911 Home Depot Inc/The 1,583,806 0.67 9,839 Hormel Foods Corp 343,578 0.15 1,315 Humana Inc 228,100 0.10 18,458 Illinois Tool Works Inc 1,948,242 0.82 1,233 Illumina Inc 178,353 0.08
Portfolio of Investments as at 31 May 2016
United Kingdom continued United States continued

Annual Report and Audited Accounts 323
The notes on pages 489 to 503 form an integral part of these financial statements.
Transferable Securities and Money Market Instruments Admitted to an Official Stock Exchange Listing or Dealt in on Another Regulated Market
Transferable Securities and Money Market Instruments Admitted to an Official Stock Exchange Listing or Dealt in on Another Regulated Market
Holding
Description
Market Value
USD
% of Net
Assets
Holding
Description
Market Value
USD
% of Net
Assets
* Securities on loan, see Note 16, for further details.
Portfolio of Investments as at 31 May 2016
274 Incyte Corp 23,274 0.01 946 Ingevity Corp 26,904 0.01 19,501 Intel Corp 613,696 0.26 196 International Business Machines Corp 29,988 0.01 9,385 Interpublic Group of Cos Inc/The 222,143 0.09 13,971 Intuit Inc 1,513,339 0.64 738 JM Smucker Co/The 95,305 0.04 19,832 Johnson & Johnson 2,230,902 0.94 5,855 Jones Lang LaSalle Inc 686,382 0.29 26,746 JPMorgan Chase & Co 1,757,747 0.74 3,923 Kimberly-Clark Corp 501,634 0.21 2,290 Kinder Morgan Inc/DE 41,312 0.02 7,362 Kroger Co/The 263,044 0.11 7,161 L Brands Inc 483,797 0.20 6,710 Laredo Petroleum Inc 80,721 0.03 1,842 Legg Mason Inc 63,641 0.03 8,057 Lincoln National Corp 374,570 0.16 759 Littelfuse Inc 86,852 0.04 21,754 Lowe's Cos Inc 1,745,976 0.74 2,783 Manhattan Associates Inc 182,426 0.08 13,504 ManpowerGroup Inc 1,078,294 0.46 4,712 Marathon Petroleum Corp 165,768 0.07 20,831 Masco Corp 679,507 0.29 136 MasterCard Inc 'A' 13,147 0.01 650 McCormick & Co Inc/MD 63,525 0.03 5,045 McKesson Corp 914,053 0.39 3,874 Medivation Inc 235,191 0.10 2,137 Merck & Co Inc 120,548 0.05 12,547 MetLife Inc 576,409 0.24 63,139 Microsoft Corp 3,309,746 1.40 5,427 NetApp Inc 138,660 0.06 974 Netflix Inc 100,303 0.04 8,366 Newfield Exploration Co 343,006 0.15 1,861 NextEra Energy Inc 223,711 0.09 27,019 NIKE Inc 'B' 1,502,527 0.64 3,731 Nordstrom Inc 140,883 0.06 554 Northern Trust Corp 41,323 0.02 1,242 Northrop Grumman Corp 265,242 0.11 5,762 NVIDIA Corp 268,970 0.11 5,806 Owens Corning 297,035 0.13 32,690 PACCAR Inc 1,827,698 0.77 17,483 Paychex Inc 948,977 0.40 12,687 PepsiCo Inc 1,289,507 0.55 61,556 Pfizer Inc 2,134,762 0.90 11,104 Philip Morris International Inc 1,095,521 0.46 13,208 Phillips 66 1,066,282 0.45 3,481 Pilgrim's Pride Corp 87,582 0.04 328 Priceline Group Inc/The 420,132 0.18 4,668 Procter & Gamble Co/The 380,442 0.16 857 Progressive Corp/The 28,581 0.01 35,687 Prologis Inc (Reit) 1,690,136 0.71 15,250 Prudential Financial Inc 1,219,085 0.52 3,787 Public Storage (Reit) 959,171 0.41 5,322 Qualcomm Inc 292,816 0.12 2,093 Raytheon Co 272,362 0.12 23,878 Realogy Holdings Corp 770,543 0.33 7,466 Red Hat Inc 570,178 0.24 2,543 Regency Centers Corp (Reit) 196,421 0.08 1,154 Reinsurance Group of America Inc 114,419 0.05 726 Reliance Steel & Aluminum Co 54,043 0.02 6,151 Reynolds American Inc 307,858 0.13 7,268 Robert Half International Inc 299,587 0.13 8,455 Ross Stores Inc 453,780 0.19
510 Ryder System Inc 35,639 0.02 6,370 Ryman Hospitality Properties Inc (Reit) 306,397 0.13 3,944 salesforce.com Inc 330,428 0.14 1,141 SBA Communications Corp 'A' 112,331 0.05 5,600 Scripps Networks Interactive Inc 'A' 358,568 0.15 1,397 Sempra Energy 148,711 0.06 4,314 Sherwin-Williams Co/The 1,259,731 0.53 2,375 Simon Property Group Inc (Reit) 467,899 0.20 1,981 Skyworks Solutions Inc 132,351 0.06 1,841 Snap-on Inc 299,862 0.13 31,169 Sonoco Products Co 1,488,631 0.63 3,851 Southwest Gas Corp 266,027 0.11 903 Splunk Inc 50,523 0.02 21,970 Starbucks Corp 1,212,744 0.51 4,411 Steel Dynamics Inc 109,657 0.05 15,627 Synchrony Financial 487,250 0.21 7,531 T Rowe Price Group Inc 583,050 0.25 2,803 Take-Two Interactive Software Inc 108,504 0.05 13,153 Target Corp 910,319 0.38 8,560 Telephone & Data Systems Inc 246,785 0.10 1,060 Tenet Healthcare Corp 30,433 0.01 2,948 Tenneco Inc 160,224 0.07 27,809 Texas Instruments Inc 1,695,515 0.72 19,395 Time Warner Inc 1,463,547 0.62 16,883 TJX Cos Inc/The 1,288,342 0.54 5,454 Tyson Foods Inc 'A' 356,201 0.15 259 Ultimate Software Group Inc/The 52,605 0.02 13,196 UnitedHealth Group Inc 1,773,015 0.75 11,867 Valero Energy Corp 649,244 0.27 2,283 VCA Inc 148,623 0.06 18,114 VeriSign Inc 1,559,072 0.66 11,581 Verizon Communications Inc 588,778 0.25 3,677 VMware Inc 'A' 219,774 0.09 2,019 Voya Financial Inc 67,374 0.03 3,094 Vulcan Materials Co 364,504 0.15 5,408 Wal-Mart Stores Inc 383,103 0.16 6,580 Walt Disney Co/The 652,604 0.28 2,322 Waters Corp 320,273 0.14 134 Watsco Inc 17,959 0.01 33,805 Wells Fargo & Co 1,725,914 0.73 1,243 Welltower Inc (Reit) 85,568 0.04 401 West Pharmaceutical Services Inc * 29,895 0.01 3,271 Western Refining Inc 71,275 0.03 996 Westlake Chemical Corp 43,963 0.02 4,239 WestRock Co 169,475 0.07 3,466 Weyerhaeuser Co (Reit) 109,630 0.05 2,270 Whirlpool Corp 394,662 0.17 3,006 Wyndham Worldwide Corp 202,484 0.09 16,637 Xilinx Inc 784,268 0.33 1,110 Xylem Inc/NY 49,506 0.02
129,706,862 54.86
Total Common Stocks (Shares) & Rights 232,736,820 98.43
Total Transferable Securities and Money Market Instruments Admitted to an Official Stock Exchange Listing or Dealt in on Another Regulated Market 232,736,820 98.43
Securities portfolio at market value 232,736,820 98.43
Other Net Assets 3,717,979 1.57
Total Net Assets (USD) 236,454,799 100.00
BlackRock Impact World Equity Fund continued
United States continued United States continued

Futures contracts as at 31 May 2016
Number of contracts
Currencyof contract Contract/Description
Expiration date
Gross underlying
exposureUSD
Unrealised appreciation/
(depreciation) USD
Open forward foreign exchange transactions as at 31 May 2016
Currency Purchases Currency Sales CounterpartyMaturity
date
Unrealised appreciation/
(depreciation) USD
324 BlackRock Strategic Funds (BSF)
The notes on pages 489 to 503 form an integral part of these financial statements.
17 USD E-Mini S&P 500 Index June 2016 1,784,150 51,188 10 EUR EURO STOXX 50 Index June 2016 342,569 17,067 2 GBP FTSE 100 Index June 2016 183,035 5,945 4 JPY Nikkei 225 Index June 2016 310,039 10,620 1 CAD S&P/TSX 60 Index June 2016 126,470 2,390 1 AUD SPI 200 Index June 2016 97,602 1,124 1 CHF Swiss Market Index June 2016 83,154 3,253
Total 2,927,019 91,587
BlackRock Impact World Equity Fund continued
JPY Hedged Share Class
JPY 21,205,141 USD 194,337 State Street Bank & Trust Company 15/6/2016 (3,425)USD 8,770 JPY 959,641 State Street Bank & Trust Company 15/6/2016 130
(3,295)
Total (Gross underlying exposure - USD 199,552) (3,295)
Sector Breakdown as at 31 May 2016
% of Net Assets
Consumer, Non-cyclical 23.64Financial 18.74Consumer, Cyclical 12.93Communications 10.24Industrial 9.46Technology 9.41Energy 5.70Basic Materials 4.77Utilities 3.54
Securities portfolio at market value 98.43Other Net Assets 1.57
100.00

Annual Report and Audited Accounts 325
The notes on pages 489 to 503 form an integral part of these financial statements.
Transferable Securities and Money Market Instruments Admitted to an Official Stock Exchange Listing or Dealt in on Another Regulated Market
Transferable Securities and Money Market Instruments Admitted to an Official Stock Exchange Listing or Dealt in on Another Regulated Market
Holding
Description
Market Value
USD
% of Net
Assets
Holding
Description
Market Value
USD
% of Net
Assets
Portfolio of Investments as at 31 May 2016
COMMON STOCKS (SHARES)
Argentina 35,000 Pampa Energia SA ADR 821,450 2.41 83,000 YPF SA ADR 1,735,530 5.08
2,556,980 7.49
Bermuda 5,000 Credicorp Ltd 701,000 2.05
701,000 2.05
Brazil 127,000 Arezzo Industria e Comercio SA 867,028 2.54 340,600 BR Malls Participacoes SA 1,088,646 3.19 344,000 EcoRodovias Infraestrutura
e Logistica SA 747,288 2.19 97,000 Iguatemi Empresa de Shopping
Centers SA 695,235 2.04 325,000 Iochpe Maxion SA 1,299,604 3.81 210,000 Klabin SA (Unit) 1,054,765 3.09 382,000 Kroton Educacional SA 1,171,286 3.43 275,000 Minerva SA/Brazil 720,680 2.11 402,000 Odontoprev SA 1,247,072 3.65 115,000 Raia Drogasil SA 1,837,531 5.39 814,000 Rumo Logistica Operadora
Multimodal SA 1,067,733 3.13 98,000 Sao Martinho SA 1,459,586 4.28 126,000 Valid Solucoes e Servicos de
Seguranca em Meios de Pagamento e Identificacao SA 1,004,206 2.94
14,260,660 41.79
Chile 80,445,000 Itau CorpBanca 643,091 1.89
643,091 1.89
Colombia 143,000 Grupo Nutresa SA 1,179,715 3.46 195,000 Organizacion Terpel SA 645,058 1.89
1,824,773 5.35
Luxembourg 75,000 Adecoagro SA 853,500 2.50
853,500 2.50
Mexico 380,000 Alfa SAB de CV 'A' 669,750 1.96 326,000 Alsea SAB de CV 1,235,344 3.62 250,000 Arca Continental SAB de CV 1,655,898 4.85 60,000 Controladora Vuela Cia de Aviacion
SAB de CV ADR 1,158,600 3.40 787,000 Corp Inmobiliaria Vesta SAB de CV 1,151,286 3.37 568,000 Credito Real SAB de CV SOFOM ER 1,187,594 3.48 125,016 Grupo Aeroportuario del Centro Norte
SAB de CV 718,122 2.11 801,800 Grupo GICSA SA de CV 578,649 1.70 521,000 Grupo Sanborns SAB de CV 685,944 2.01 310,000 Infraestructura Energetica
Nova SAB de CV 1,229,301 3.60
10,270,488 30.10
Peru 77,000 Cia de Minas Buenaventura SAA ADR 736,120 2.16 500,000 Grana y Montero SAA 629,350 1.84
1,365,470 4.00
Spain 162,000 Cemex Latam Holdings SA 706,490 2.07
706,490 2.07
Total Common Stocks (Shares) 33,182,452 97.24
BONDS
Brazil BRL 334 Hypermarcas SA (Contingent
Convertible Bond) 11.30% 15/10/2018 39,096 0.11
BRL 31,197 Klabin SA (Step-up Coupon) (Contingent Convertible Bond) 12.24% 8/1/2019 511,249 1.50
BRL 490,000 Lupatech SA (Contingent Convertible Bond) 6.50% 15/4/2018 15,594 0.05
565,939 1.66
Total Bonds 565,939 1.66
Total Transferable Securities and Money Market Instruments Admitted to an Official Stock Exchange Listing or Dealt in on Another Regulated Market 33,748,391 98.90
Other Transferable Securities and Money Market Instruments
WARRANTS
Brazil 14,703 Klabin SA (Wts 15/6/2020) — 0.00
— 0.00
Total Warrants — 0.00
BONDS
Brazil BRL 14,703 Klabin SA 1.00% 15/6/2022 73,848 0.21 BRL 14,703 Klabin SA
(Contingent Convertible Bond) 7.25% 15/6/2020 73,849 0.22
147,697 0.43
Total Bonds 147,697 0.43
Total Other Transferable Securities and Money Market Instruments 147,697 0.43
Securities portfolio at market value 33,896,088 99.33
Other Net Assets 226,967 0.67
Total Net Assets (USD) 34,123,055 100.00
BlackRock Latin American Opportunities Fund

326 BlackRock Strategic Funds (BSF)
The notes on pages 489 to 503 form an integral part of these financial statements.
BlackRock Latin American Opportunities Fund continued
Sector Breakdown as at 31 May 2016
% of Net Assets
Financial 24.31Consumer, Non-cyclical 22.93Consumer, Cyclical 20.77Industrial 7.31Basic Materials 7.18Energy 7.02Utilities 6.01Diversified 3.80
Securities portfolio at market value 99.33Other Net Assets 0.67
100.00

Annual Report and Audited Accounts 327
The notes on pages 489 to 503 form an integral part of these financial statements.
Transferable Securities and Money Market Instruments Admitted to an Official Stock Exchange Listing or Dealt in on Another Regulated Market
Collective Investment Schemes 1
Holding
Description
Market Value
EUR
% of Net
Assets
Holding
Description
Market Value
EUR
% of Net
Assets
1 Investment in connected party fund, see further information in Note 10.* Securities on loan, see Note 16, for further details.
Portfolio of Investments as at 31 May 2016
EXCHANGE TRADED FUNDS 1
Ireland 32,174 iShares $ Corporate Bond Interest
Rate Hedged UCITS ETF 2,722,725 10.10 9,827 iShares $ Corporate Bond UCITS ETF 1,011,788 3.75 4,282 iShares $ TIPS UCITS ETF 759,263 2.82 6,973 iShares $ Treasury Bond 1-3 UCITS ETF 829,229 3.08 554,616 iShares $ Treasury Bond 20+yr
UCITS ETF 2,429,773 9.01 9,169 iShares $ Treasury Bond 3-7yr
UCITS ETF (Acc) 1,015,467 3.77 7,959 iShares $ Treasury Bond 7-10yr
UCITS ETF 1,438,112 5.33 4,049 iShares Core £ Corporate Bond
UCITS ETF 729,019 2.70 1,811 iShares Core S&P 500 UCITS ETF (Acc) 319,216 1.18 131,798 iShares Core UK Gilts UCITS ETF 2,193,778 8.14 16,310 iShares Edge MSCI Europe Minimum
Volatility UCITS ETF 629,566 2.33 46,208 iShares Edge S&P 500 Minimum
Volatility UCITS ETF 1,705,999 6.33 26,774 iShares Euro Corporate Bond Interest
Rate Hedged UCITS ETF 2,625,592 9.74 5,147 iShares Euro Covered Bond UCITS ETF 803,704 2.98 10,896 iShares Euro Government Bond
0-1yr UCITS ETF 1,094,939 4.06 915 iShares Euro Government Bond
1-3yr UCITS ETF 131,897 0.49 6,286 iShares Euro Government Bond
15-30yr UCITS ETF 1,478,373 5.48 5,207 iShares Euro Government Bond
7-10yr UCITS ETF 1,091,569 4.05 5,047 iShares Euro High Yield Corporate
Bond UCITS ETF * 525,292 1.95 3,491 iShares Euro Inflation Linked
Government Bond UCITS ETF 710,506 2.63 934 iShares Italy Government Bond
UCITS ETF 151,331 0.56 961 iShares MSCI Canada UCITS ETF 91,819 0.34 2,535 iShares MSCI EMU UCITS ETF 235,945 0.88 1,517 iShares MSCI Mexico Capped
UCITS ETF 153,847 0.57 3,899 iShares MSCI Taiwan UCITS ETF 115,654 0.43 617 iShares MSCI UK UCITS ETF 67,586 0.25 18,024 iShares Physical Gold ETC 386,476 1.43 1,487 iShares Spain Government Bond
UCITS ETF 240,656 0.89
25,689,121 95.27
Total Exchange Traded Funds 25,689,121 95.27
Total Transferable Securities and Money Market Instruments Admitted to an Official Stock Exchange Listing or Dealt in on Another Regulated Market 25,689,121 95.27
Luxembourg 12,371 BlackRock Global Index Funds -
Emerging Markets Government Bond Index Fund X2 (USD) 1,239,295 4.59
1,846 BlackRock Global Index Funds - Japan Equity Index Fund X2 (EUR) 223,406 0.83
1,462,701 5.42
Total Collective Investment Schemes 1,462,701 5.42
Securities portfolio at market value 27,151,822 100.69 Other Net Liabilities (186,070) (0.69)
Total Net Assets (EUR) 26,965,752 100.00
BlackRock Managed Index Portfolios – Defensive

Open forward foreign exchange transactions as at 31 May 2016
Currency Purchases Currency Sales CounterpartyMaturity
date
Unrealised appreciation/
(depreciation) EUR
328 BlackRock Strategic Funds (BSF)
The notes on pages 489 to 503 form an integral part of these financial statements.
BlackRock Managed Index Portfolios – Defensive continued
EUR 41,308 GBP 32,756 BNP Paribas 2/6/2016 (1,637)EUR 33,045 GBP 25,893 HSBC 2/6/2016 (903)EUR 2,831,760 GBP 2,204,924 Barclays Bank 2/6/2016 (59,048)EUR 24,907 GBP 19,642 Bank of America Merrill Lynch 2/6/2016 (845)EUR 227,486 JPY 27,746,006 Barclays Bank 2/6/2016 3,926 EUR 48,634 USD 55,480 JP Morgan 2/6/2016 (1,037)EUR 121,793 USD 139,272 HSBC 2/6/2016 (2,897)EUR 111,485 USD 125,605 Goldman Sachs 2/6/2016 (968)EUR 38,254 USD 43,760 Deutsche Bank 2/6/2016 (925)EUR 188,232 USD 216,068 Barclays Bank 2/6/2016 (5,212)EUR 35,179 USD 39,401 UBS 2/6/2016 (96)EUR 333,414 USD 379,831 Bank of America Merrill Lynch 2/6/2016 (6,646)EUR 13,005,454 USD 14,850,642 BNP Paribas 2/6/2016 (290,251)GBP 27,568 EUR 35,943 Bank of New York 2/6/2016 200 USD 123,334 EUR 109,904 Bank of New York 2/6/2016 516 USD 41,002 EUR 35,912 JP Morgan 2/6/2016 797 USD 38,102 EUR 33,721 Deutsche Bank 2/6/2016 392
(364,634)
CHF Hedged Share Class
CHF 59,903 EUR 54,262 State Street Bank & Trust Company 15/6/2016 (74)EUR 484 CHF 537 State Street Bank & Trust Company 15/6/2016 (1)
(75)
GBP Hedged Share Class
EUR 41,751 GBP 31,961 State Street Bank & Trust Company 15/6/2016 (137)GBP 2,976,310 EUR 3,779,096 State Street Bank & Trust Company 15/6/2016 121,659
121,522
USD Hedged Share Class
USD 2,022,798 EUR 1,778,400 State Street Bank & Trust Company 15/6/2016 31,831
31,831
Total (Gross underlying exposure - EUR 23,432,426) (211,356)
Sector Breakdown as at 31 May 2016
% of Net Assets
Exchange Traded Funds 95.27Collective Investment Schemes 5.42
Securities portfolio at market value 100.69Other Net Liabilities (0.69)
100.00

Annual Report and Audited Accounts 329
The notes on pages 489 to 503 form an integral part of these financial statements.
Transferable Securities and Money Market Instruments Admitted to an Official Stock Exchange Listing or Dealt in on Another Regulated Market
Collective Investment Schemes 1
Holding
Description
Market Value
EUR
% of Net
Assets
Holding
Description
Market Value
EUR
% of Net
Assets
1 Investment in connected party fund, see further information in Note 10.
Portfolio of Investments as at 31 May 2016
EXCHANGE TRADED FUNDS 1
Germany 23,839 iShares Diversified Commodity Swap
UCITS ETF (DE) 460,927 2.08 893 iShares SLI UCITS ETF (DE) 70,011 0.31
530,938 2.39
Ireland 7,246 iShares $ Corporate Bond Interest
Rate Hedged UCITS ETF 613,193 2.76 638 iShares $ TIPS UCITS ETF 113,127 0.51 105,736 iShares $ Treasury Bond
20+yr UCITS ETF 463,229 2.09 1,807 iShares $ Treasury Bond
3-7yr UCITS ETF (Acc) 200,125 0.90 1,101 iShares $ Treasury Bond
7-10yr UCITS ETF 198,940 0.90 17,032 iShares Core S&P 500 UCITS ETF (Acc) 3,002,146 13.52 22,760 iShares Core UK Gilts UCITS ETF 378,840 1.71 724 iShares Core £ Corporate Bond
UCITS ETF 130,356 0.59 18,730 iShares Developed Markets Property
Yield UCITS ETF 418,803 1.89 34,694 iShares Edge MSCI Europe Minimum
Volatility UCITS ETF 1,339,188 6.03 112,442 iShares Edge S&P 500 Minimum
Volatility UCITS ETF 4,151,359 18.70 4,313 iShares Euro Corporate Bond Interest
Rate Hedged UCITS ETF 422,954 1.91 454 iShares Euro Covered Bond UCITS ETF 70,892 0.32 691 iShares Euro Government Bond
15-30yr UCITS ETF 162,513 0.73 609 iShares Euro Government Bond
7-10yr UCITS ETF 127,668 0.57 1,310 iShares Euro High Yield Corporate
Bond UCITS ETF 136,345 0.61 599 iShares Euro Inflation Linked
Government Bond UCITS ETF 121,911 0.55 7,408 iShares MSCI Canada UCITS ETF 707,797 3.19 16,978 iShares MSCI EMU UCITS ETF 1,580,227 7.12 5,943 iShares MSCI Mexico Capped UCITS ETF 602,709 2.72 34,250 iShares MSCI Taiwan UCITS ETF 1,015,941 4.58 2,899 iShares MSCI UK UCITS ETF 317,556 1.43 16,288 iShares MSCI USA UCITS ETF 2,807,970 12.65 50,674 iShares Physical Gold ETC 1,086,568 4.89
20,170,357 90.87
Total Exchange Traded Funds 20,701,295 93.26
Total Transferable Securities and Money Market Instruments Admitted to an Official Stock Exchange Listing or Dealt in on Another Regulated Market 20,701,295 93.26
Luxembourg 1,853 BlackRock Global Index Funds -
Emerging Markets Government Bond Index Fund X2 (USD) 185,638 0.84
12,282 BlackRock Global Index Funds - Japan Equity Index Fund X2 (EUR) 1,486,638 6.70
1,672,276 7.54
Total Collective Investment Schemes 1,672,276 7.54
Securities portfolio at market value 22,373,571 100.80
Other Net Liabilities (176,853) (0.80)
Total Net Assets (EUR) 22,196,718 100.00
BlackRock Managed Index Portfolios – Growth

Open forward foreign exchange transactions as at 31 May 2016
Currency Purchases Currency Sales CounterpartyMaturity
date
Unrealised appreciation/
(depreciation) EUR
330 BlackRock Strategic Funds (BSF)
The notes on pages 489 to 503 form an integral part of these financial statements.
BlackRock Managed Index Portfolios – Growth continued
EUR 814,834 GBP 634,463 Barclays Bank 2/6/2016 (16,991)EUR 22,676 JPY 2,778,996 UBS 2/6/2016 285 EUR 1,569,017 JPY 191,369,505 Barclays Bank 2/6/2016 27,081 EUR 93,602 USD 104,835 UBS 2/6/2016 (256)EUR 709,509 USD 808,283 Bank of America Merrill Lynch 2/6/2016 (14,143)EUR 84,678 USD 96,867 Deutsche Bank 2/6/2016 (2,047)EUR 46,255 USD 52,674 Goldman Sachs 2/6/2016 (904)EUR 10,731,278 USD 12,253,581 BNP Paribas 2/6/2016 (239,292)EUR 34,744 USD 38,771 Bank of New York 2/6/2016 32 EUR 73,356 USD 82,836 Barclays Bank 2/6/2016 (806)EUR 76,219 USD 84,998 Citibank 2/6/2016 120 GBP 19,204 EUR 24,854 Bank of New York 2/6/2016 324 JPY 6,580,193 EUR 52,993 Bank of America Merrill Lynch 2/6/2016 26 JPY 2,696,485 EUR 21,817 HSBC 2/6/2016 (90)JPY 5,343,857 EUR 43,658 Barclays Bank 2/6/2016 (601)USD 230,744 EUR 205,559 Bank of New York 2/6/2016 1,025 USD 54,483 EUR 48,218 Deutsche Bank 2/6/2016 560 USD 87,153 EUR 75,871 BNP Paribas 2/6/2016 2,157 USD 77,001 EUR 67,443 JP Morgan 2/6/2016 1,496 USD 28,430 EUR 24,950 HSBC 2/6/2016 505
(241,519)
CHF Hedged Share Class
CHF 227,638 EUR 205,521 State Street Bank & Trust Company 15/6/2016 402 EUR 5,504 CHF 6,101 State Street Bank & Trust Company 15/6/2016 (15)
387
GBP Hedged Share Class
EUR 8,750 GBP 6,710 State Street Bank & Trust Company 15/6/2016 (45)GBP 756,817 EUR 960,794 State Street Bank & Trust Company 15/6/2016 31,091
31,046
USD Hedged Share Class
EUR 129 USD 144 State Street Bank & Trust Company 15/6/2016 0 USD 16,014 EUR 14,086 State Street Bank & Trust Company 15/6/2016 245
245
Total (Gross underlying exposure - EUR 16,300,432) (209,841)
Sector Breakdown as at 31 May 2016
% of Net Assets
Exchange Traded Funds 93.26Collective Investment Schemes 7.54
Securities portfolio at market value 100.80Other Net Liabilities (0.80)
100.00

Annual Report and Audited Accounts 331
The notes on pages 489 to 503 form an integral part of these financial statements.
Transferable Securities and Money Market Instruments Admitted to an Official Stock Exchange Listing or Dealt in on Another Regulated Market
Collective Investment Schemes 1
Holding
Description
Market Value
EUR
% of Net
Assets
Holding
Description
Market Value
EUR
% of Net
Assets
1 Investment in connected party fund, see further information in Note 10.
Portfolio of Investments as at 31 May 2016
EXCHANGE TRADED FUNDS 1
Germany 26,916 iShares Diversified Commodity Swap
UCITS ETF (DE) 520,421 0.95 4,280 iShares SLI UCITS ETF (DE) 335,552 0.61
855,973 1.56
Ireland 30,765 iShares $ Corporate Bond Interest
Rate Hedged UCITS ETF 2,603,488 4.75 15,281 iShares $ Corporate Bond UCITS ETF 1,573,332 2.87 4,514 iShares $ TIPS UCITS ETF 800,400 1.46 2,432 iShares $ Treasury Bond 1-3 UCITS ETF 289,213 0.53 587,026 iShares $ Treasury Bond
20+yr UCITS ETF 2,571,761 4.69 9,758 iShares $ Treasury Bond
3-7yr UCITS ETF (Acc) 1,080,698 1.97 6,970 iShares $ Treasury Bond
7-10yr UCITS ETF 1,259,409 2.30 3,332 iShares Core £ Corporate
Bond UCITS ETF 599,924 1.09 26,837 iShares Core S&P 500 UCITS ETF (Acc) 4,730,424 8.63 143,531 iShares Core UK Gilts UCITS ETF 2,389,073 4.36 23,455 iShares Developed Markets Property
Yield UCITS ETF 524,454 0.96 56,652 iShares Edge MSCI Europe Minimum
Volatility UCITS ETF 2,186,767 3.99 196,098 iShares Edge S&P 500 Minimum
Volatility UCITS ETF 7,239,938 13.20 28,545 iShares Euro Corporate Bond Interest
Rate Hedged UCITS ETF 2,799,265 5.10 4,863 iShares Euro Covered Bond UCITS ETF 759,357 1.38 10,042 iShares Euro Government Bond
0-1yr UCITS ETF 1,009,121 1.84 6,934 iShares Euro Government Bond
15-30yr UCITS ETF 1,630,773 2.97 3,801 iShares Euro Government Bond
7-10yr UCITS ETF 796,823 1.45 7,249 iShares Euro High Yield Corporate
Bond UCITS ETF 754,476 1.38 3,631 iShares Euro Inflation Linked
Government Bond UCITS ETF 738,999 1.35 1,688 iShares Italy Government Bond
UCITS ETF 273,498 0.50 11,442 iShares MSCI Canada UCITS ETF 1,093,226 1.99 26,170 iShares MSCI EMU UCITS ETF 2,435,773 4.44 10,321 iShares MSCI Mexico Capped
UCITS ETF 1,046,704 1.91 59,633 iShares MSCI Taiwan UCITS ETF 1,768,864 3.23 5,282 iShares MSCI UK UCITS ETF 578,589 1.05 24,733 iShares MSCI USA UCITS ETF 4,263,846 7.77 77,235 iShares Physical Gold ETC 1,656,097 3.02 1,715 iShares Spain Government Bond
UCITS ETF 277,556 0.51
49,731,848 90.69
Total Exchange Traded Funds 50,587,821 92.25
Total Transferable Securities and Money Market Instruments Admitted to an Official Stock Exchange Listing or Dealt in on Another Regulated Market 50,587,821 92.25
Luxembourg 15,805 BlackRock Global Index Funds -
Emerging Markets Government Bond Index Fund X2 (USD) 1,583,235 2.89
19,282 BlackRock Global Index Funds - Japan Equity Index Fund X2 (EUR) 2,333,943 4.26
3,917,178 7.15
Total Collective Investment Schemes 3,917,178 7.15
Securities portfolio at market value 54,504,999 99.40
Other Net Assets 331,045 0.60
Total Net Assets (EUR) 54,836,044 100.00
BlackRock Managed Index Portfolios – Moderate

Open forward foreign exchange transactions as at 31 May 2016
Currency Purchases Currency Sales CounterpartyMaturity
date
Unrealised appreciation/
(depreciation) EUR
332 BlackRock Strategic Funds (BSF)
The notes on pages 489 to 503 form an integral part of these financial statements.
BlackRock Managed Index Portfolios – Moderate continued
EUR 3,427,639 GBP 2,668,900 Barclays Bank 2/6/2016 (71,474)EUR 53,837 GBP 42,456 Bank of America Merrill Lynch 2/6/2016 (1,825)EUR 2,486,868 JPY 303,370,518 Barclays Bank 2/6/2016 42,498 EUR 26,154,409 USD 29,865,144 BNP Paribas 2/6/2016 (583,705)EUR 320,853 USD 365,151 Barclays Bank 2/6/2016 (6,065)EUR 307,355 USD 350,948 Deutsche Bank 2/6/2016 (6,847)EUR 178,487 USD 199,906 UBS 2/6/2016 (488)EUR 103,609 USD 115,543 Citibank 2/6/2016 163 EUR 177,939 USD 200,750 Goldman Sachs 2/6/2016 (1,792)EUR 742,604 USD 845,986 Bank of America Merrill Lynch 2/6/2016 (14,803)GBP 43,588 EUR 56,412 Bank of New York 2/6/2016 735 JPY 6,238,688 EUR 51,158 Goldman Sachs 2/6/2016 (891)JPY 12,981,801 EUR 104,548 Bank of America Merrill Lynch 2/6/2016 51 USD 61,049 EUR 53,146 BNP Paribas 2/6/2016 1,511 USD 166,646 EUR 145,960 JP Morgan 2/6/2016 3,238 USD 106,788 EUR 94,509 Deutsche Bank 2/6/2016 1,098 USD 382,579 EUR 340,624 Bank of New York 2/6/2016 1,897
(636,699)
CHF Hedged Share Class
CHF 97,314 EUR 87,859 State Street Bank & Trust Company 15/6/2016 173 EUR 2,127 CHF 2,358 State Street Bank & Trust Company 15/6/2016 (6)
167
GBP Hedged Share Class
EUR 166,726 GBP 127,869 State Street Bank & Trust Company 15/6/2016 (859)GBP 20,973,883 EUR 26,620,684 State Street Bank & Trust Company 15/6/2016 867,710
866,851
USD Hedged Share Class
EUR 5,074 USD 5,686 State Street Bank & Trust Company 15/6/2016 (16)USD 944,068 EUR 830,205 State Street Bank & Trust Company 15/6/2016 14,656
14,640
Total (Gross underlying exposure - EUR 64,048,023) 244,959
Sector Breakdown as at 31 May 2016
% of Net Assets
Exchange Traded Funds 92.25Collective Investment Schemes 7.15
Securities portfolio at market value 99.40Other Net Assets 0.60
100.00

Annual Report and Audited Accounts 333
The notes on pages 489 to 503 form an integral part of these financial statements.
Transferable Securities and Money Market Instruments Admitted to an Official Stock Exchange Listing or Dealt in on Another Regulated Market
Transferable Securities and Money Market Instruments Admitted to an Official Stock Exchange Listing or Dealt in on Another Regulated Market
Holding
Description
Market Value
USD
% of Net
Assets
Holding
Description
Market Value
USD
% of Net
Assets
Portfolio of Investments as at 31 May 2016
COMMON STOCKS (SHARES)
Belgium 4,850 Bekaert SA 215,876 0.14
215,876 0.14
Canada 43,744 Magna International Inc 1,773,819 1.19
1,773,819 1.19
Cayman Islands 2,319 Baidu Inc ADR 424,563 0.28
424,563 0.28
Denmark 4,453 Chr Hansen Holding A/S 281,811 0.19 4,015 H Lundbeck A/S 158,340 0.10 1,260 Pandora A/S 188,375 0.13 13,070 William Demant Holding A/S 278,331 0.19
906,857 0.61
Faroe Islands 5,318 Bakkafrost P/F 206,750 0.14
206,750 0.14
Finland 9,190 Amer Sports OYJ 277,046 0.19 5,422 Elisa OYJ 207,543 0.14
484,589 0.33
Germany 2,976 adidas AG 383,595 0.26 6,172 DMG Mori AG 284,163 0.19 2,705 Gerresheimer AG 217,084 0.14 2,004 Hannover Rueck SE 226,859 0.15 1,543 Hochtief AG 193,975 0.13 2,956 Rheinmetall AG 203,748 0.14 4,238 SMA Solar Technology AG 233,841 0.16 5,237 Software AG 203,269 0.13
1,946,534 1.30
Italy 25,356 Davide Campari-Milano SpA 246,255 0.16 36,397 Terna Rete Elettrica Nazionale SpA 203,471 0.14
449,726 0.30
Liberia 5,319 Royal Caribbean Cruises Ltd 414,084 0.28
414,084 0.28
Malta 34,199 Unibet Group Plc SDR 393,984 0.26
393,984 0.26
Netherlands 2,646 Heineken NV 246,633 0.17 6,302 NN Group NV 208,566 0.14
455,199 0.31
Norway 12,360 Marine Harvest ASA 205,052 0.14 27,436 Orkla ASA 250,897 0.17 9,191 Salmar ASA 273,933 0.18
729,882 0.49
Portugal 13,842 Jeronimo Martins SGPS SA 225,032 0.15
225,032 0.15
Sweden 4,477 Evolution Gaming Group AB '144A' 158,096 0.11
158,096 0.11
Switzerland 155 Galenica AG Reg 205,602 0.14 4,423 Temenos Group AG Reg 247,100 0.16
452,702 0.30
United States 1,798 Alphabet Inc 'C' 1,327,805 0.89 663 Amazon.com Inc 476,365 0.32 22,740 Anadarko Petroleum Corp 1,186,801 0.79 247 AutoZone Inc 188,016 0.13 8,475 Cognizant Technology Solutions Corp 'A' 526,382 0.35 23,116 Comcast Corp 'A' 1,448,449 0.97 3,972 Constellation Brands Inc 'A' 611,847 0.41 1,822 Devon Energy Corp 67,214 0.04 6,530 Exxon Mobil Corp 587,308 0.39 14,738 Facebook Inc 'A' 1,758,243 1.18 31,848 Halliburton Co 1,361,502 0.91 6,510 Hewlett Packard Enterprise Co 116,854 0.08 4,745 Home Depot Inc/The 630,943 0.42 45,753 HP Inc 605,998 0.41 8,333 Microsoft Corp 436,816 0.29 8,053 Monster Beverage Corp 1,208,473 0.81 30,000 NII Holdings Inc 119,400 0.08 40,916 Noble Energy Inc 1,481,159 0.99 1,751 O'Reilly Automotive Inc 464,820 0.31 5,988 Pioneer Natural Resources Co 970,775 0.65 1,136 Priceline Group Inc/The 1,455,091 0.97 13,430 Raytheon Co 1,747,646 1.17 7,814 St Jude Medical Inc 611,211 0.41 12,343 Starbucks Corp 681,334 0.46 6,497 Time Warner Inc 490,264 0.33 9,535 TJX Cos Inc/The 727,616 0.49 13,344 Twenty-First Century Fox Inc 'A' 385,775 0.26 11,071 Union Pacific Corp 925,536 0.62 19,266 Valero Energy Corp 1,054,043 0.71 18,710 Verizon Communications Inc 951,216 0.64 3,980 Western Digital Corp 180,573 0.12
24,785,475 16.60
Total Common Stocks 34,023,168 22.79
BONDS
Brazil USD 602,000 Telemar Norte Leste SA RegS 5.50%
23/10/2020 172,353 0.12
172,353 0.12
Canada USD 337,000 Concordia Healthcare Corp '144A'
9.50% 21/10/2022 337,843 0.23 USD 933,000 Valeant Pharmaceuticals
International Inc '144A' 6.125% 15/4/2025 783,720 0.52
1,121,563 0.75
BlackRock Multi-Manager Alternative Strategies Fund

334 BlackRock Strategic Funds (BSF)
The notes on pages 489 to 503 form an integral part of these financial statements.
Transferable Securities and Money Market Instruments Admitted to an Official Stock Exchange Listing or Dealt in on Another Regulated Market
Transferable Securities and Money Market Instruments Admitted to an Official Stock Exchange Listing or Dealt in on Another Regulated Market
Holding
Description
Market Value
USD
% of Net
Assets
Holding
Description
Market Value
USD
% of Net
Assets
BlackRock Multi-Manager Alternative Strategies Fund continued
France USD 800,000 CGG SA 6.50% 1/6/2021 350,000 0.24 USD 1,450,000 CGG SA 6.875% 15/1/2022 630,750 0.42 USD 814,000 Numericable-SFR SA
'144A' 7.375% 1/5/2026 823,157 0.55
1,803,907 1.21
Luxembourg USD 390,000 Altice Financing SA '144A' 7.50%
15/5/2026 389,513 0.26 EUR 1,398,000 PagesJaunes Finance & Co SCA
RegS 8.875% 1/6/2018 899,375 0.61 EUR 3,200,000 Telecom Italia Finance SA RegS
(Contingent Convertible Bond) 6.125% 15/11/2016 3,911,613 2.62
5,200,501 3.49
Netherlands EUR 164,000 Oi Brasil Holdings Cooperatief UA
RegS 5.625% 22/6/2021 32,984 0.02
32,984 0.02
Spain EUR 5,200,000 Telefonica Participaciones SAU
(Contingent Convertible Bond) 4.90% 25/9/2017 5,243,881 3.51
5,243,881 3.51
United Kingdom GBP 2,000,000 Vodafone Group Plc
(Contingent Convertible Bond) 1.50% 25/8/2017 3,148,033 2.11
GBP 3,000,000 Vodafone Group Plc (Contingent Convertible Bond) 2.00% 25/2/2019 4,771,517 3.20
7,919,550 5.31
United States USD 191,000 AK Steel Corp 8.75% 1/12/2018 196,252 0.13 USD 2,650,908 Alternative Loan Trust '2006-21CB
A5' FRN 25/7/2036 1,684,706 1.13 USD 78,000 Apex Tool Group LLC
'144A' 7.00% 1/2/2021 69,030 0.05 USD 3,830,000 BAMLL Commercial Mortgage
Securities Trust '2016-FR14 A' '144A' FRN 27/2/2048 3,700,929 2.48
USD 300,000 BAMLL Re-REMIC Trust '2014-FRR5 A502' '144A' FRN 27/3/2045 288,110 0.19
USD 102,019 Banc of America Funding Ltd '2012-R5 A' '144A' FRN 3/10/2039 101,488 0.07
USD 364,696 BCMSC Trust '1999-A A2' FRN 15/3/2029 371,702 0.25
USD 1,000,000 Cheniere Energy Inc (Contingent Convertible Bond) 4.25% 15/3/2045 573,125 0.38
USD 455,572 Chinos Intermediate Holdings Inc 'A' (Pay-in-kind) '144A' 7.75% 1/5/2019 184,507 0.12
USD 1,750,000 Comm Mortgage Trust '2014-KYO F' '144A' FRN 11/6/2027 1,742,188 1.17
USD 1,992,000 CountryPlace Manufactured Housing Contract Trust '2007-1 A4' '144A' FRN 15/7/2037 2,076,631 1.39
USD 750,000 Frontier Communications Corp 11.00% 15/9/2025 766,005 0.51
USD 422,000 Harland Clarke Holdings Corp '144A' 6.875% 1/3/2020 393,515 0.26
USD 608,000 Hexion Inc 10.00% 15/4/2020 570,000 0.38 USD 1,200,000 iHeartCommunications Inc 10.625%
15/3/2023 882,000 0.59 EUR 500,000 Infor US Inc 5.75% 15/5/2022 487,619 0.33 USD 605,000 JMC Steel Group Inc
'144A' 8.25% 15/3/2018 619,747 0.42 USD 1,420,404 Lehman XS Trust Series '2007-12N
1A2' FRN 25/7/2047 1,420,393 0.95 USD 1,000,000 Liberty Interactive LLC
(Contingent Convertible Bond) 4.00% 15/11/2029 576,875 0.39
USD 702,000 Monitronics International Inc 9.125% 1/4/2020 579,150 0.39
USD 300,000 MPLX LP '144A' 4.50% 15/7/2023 284,588 0.19 USD 750,000 Neptune Finco Corp
'144A' 10.125% 15/1/2023 838,125 0.56 USD 750,000 Neptune Finco Corp
'144A' 10.875% 15/10/2025 855,000 0.57 USD 1,000,000 Netflix Inc 5.875% 15/2/2025 1,050,000 0.70 USD 1,983,890 RALI Trust Series '2006-QS17
A3' FRN 25/12/2036 1,161,628 0.78 USD 2,029,235 RALI Trust Series '2007-QS1
2A2' FRN 25/1/2037 1,152,375 0.77 USD 1,634,296 RCO Depositor II LLC '2015-2A A'
'144A' FRN 25/11/2045 1,641,940 1.10 USD 500,000 RegionalCare Hospital Partners
Holdings Inc '144A' 8.25% 1/5/2023 515,940 0.35 USD 600,000 Sabine Pass Liquefaction LLC
5.625% 1/3/2025 600,750 0.40 USD 334,000 Solera LLC Via Solera Finance Inc
'144A' 10.50% 1/3/2024 360,720 0.24 USD 572,000 TI Group Automotive Systems LLC
'144A' 8.75% 15/7/2023 566,280 0.38 USD 2,000,000 TimberStar Trust I '2006-1A F' '144A'
7.53% 15/10/2036 2,015,384 1.35 USD 2,200,000 United States Treasury Bill 23/6/2016
(Zero Coupon) 2,199,698 1.47 USD 1,150,000 United States Treasury Bill 30/6/2016
(Zero Coupon) 1,149,764 0.77 USD 1,000,000 United States Treasury Bill 21/7/2016
(Zero Coupon) 999,684 0.67 USD 1,000,000 United States Treasury Bill 28/7/2016
(Zero Coupon) 999,590 0.67 USD 1,200,000 United States Treasury Bill 11/8/2016
(Zero Coupon) 1,199,310 0.80 USD 7,500,000 United States Treasury Bill 18/8/2016
(Zero Coupon) 7,495,005 5.02 USD 4,750,000 United States Treasury Bill 1/9/2016
(Zero Coupon) 4,745,977 3.18 USD 5,100,000 United States Treasury Bill 15/9/2016
(Zero Coupon) 5,095,298 3.41 USD 1,500,000 United States Treasury Bill
10/11/2016 (Zero Coupon) 1,497,031 1.00 USD 1,750,000 United States Treasury Bill 2/2/2017
(Zero Coupon) 1,743,590 1.17 USD 1,750,000 United States Treasury Bill 2/3/2017
(Zero Coupon) 1,742,638 1.17 USD 1,300,000 United States Treasury Bill 27/4/2017
(Zero Coupon) 1,292,823 0.87 USD 2,230,894 VOLT XXII LLC '2015-NPL4 A1' (Step-
coupon) '144A' 3.50% 25/2/2055 2,211,519 1.48 USD 100,000 VOLT XXII LLC '2016-NPL5 A1' '144A'
FRN 25/5/2046 99,892 0.07 USD 1,550,590 Washington Mutual Mortgage Pass-
Through Certificates Trust '2006-7 A1B' FRN 25/9/2036 690,630 0.46
USD 227,000 Western Digital Corp '144A' 7.375% 1/4/2023 236,080 0.16
Portfolio of Investments as at 31 May 2016
United States continued
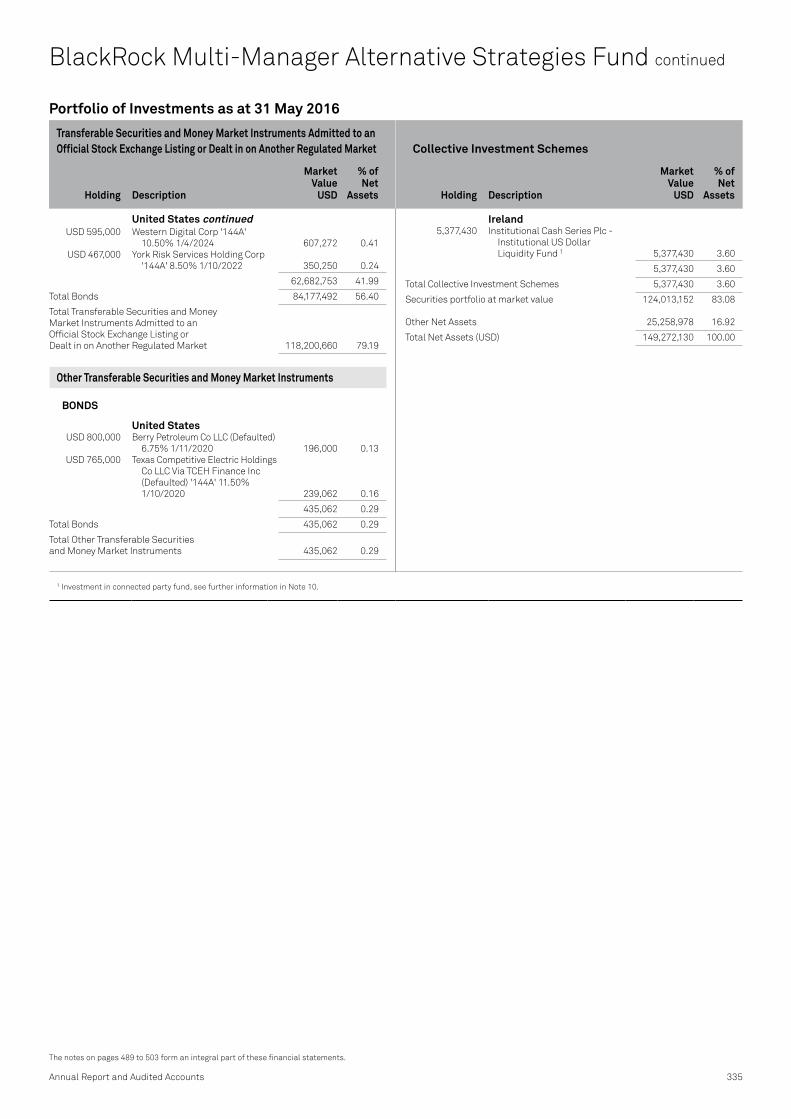
Annual Report and Audited Accounts 335
The notes on pages 489 to 503 form an integral part of these financial statements.
Transferable Securities and Money Market Instruments Admitted to an Official Stock Exchange Listing or Dealt in on Another Regulated Market
Collective Investment Schemes
Holding
Description
Market Value
USD
% of Net
Assets
Holding
Description
Market Value
USD
% of Net
Assets
1 Investment in connected party fund, see further information in Note 10.
Portfolio of Investments as at 31 May 2016
USD 595,000 Western Digital Corp '144A' 10.50% 1/4/2024 607,272 0.41
USD 467,000 York Risk Services Holding Corp '144A' 8.50% 1/10/2022 350,250 0.24
62,682,753 41.99
Total Bonds 84,177,492 56.40
Total Transferable Securities and Money Market Instruments Admitted to an Official Stock Exchange Listing or Dealt in on Another Regulated Market 118,200,660 79.19
Other Transferable Securities and Money Market Instruments
BONDS
United States USD 800,000 Berry Petroleum Co LLC (Defaulted)
6.75% 1/11/2020 196,000 0.13 USD 765,000 Texas Competitive Electric Holdings
Co LLC Via TCEH Finance Inc (Defaulted) '144A' 11.50% 1/10/2020 239,062 0.16
435,062 0.29
Total Bonds 435,062 0.29
Total Other Transferable Securities and Money Market Instruments 435,062 0.29
Ireland 5,377,430 Institutional Cash Series Plc -
Institutional US Dollar Liquidity Fund 1 5,377,430 3.60
5,377,430 3.60
Total Collective Investment Schemes 5,377,430 3.60
Securities portfolio at market value 124,013,152 83.08
Other Net Assets 25,258,978 16.92
Total Net Assets (USD) 149,272,130 100.00
BlackRock Multi-Manager Alternative Strategies Fund continued
United States continued

Contracts for difference as at 31 May 2016
Holding
Description Counterparty
Unrealised appreciation/
(depreciation) USD
Holding
Description Counterparty
Unrealised appreciation/
(depreciation) USD
336 BlackRock Strategic Funds (BSF)
The notes on pages 489 to 503 form an integral part of these financial statements.
BlackRock Multi-Manager Alternative Strategies Fund continued
Australia 8,799 APN Outdoor Group Ltd Bank of America
Merrill Lynch 2,972 580 Blackmores Ltd Bank of America
Merrill Lynch (3,413) 14,909 BlueScope Steel Ltd Bank of America
Merrill Lynch 1,078 2,433 Challenger Ltd/Australia Bank of America
Merrill Lynch 935 (656) CSL Ltd Bank of America
Merrill Lynch (1,315) (12,101) DuluxGroup Ltd Bank of America
Merrill Lynch (200) 613 Flight Centre Travel Group Ltd Bank of America
Merrill Lynch (2,162) (5,573) IPH Ltd Bank of America
Merrill Lynch (323) (10,625) Link Administration Bank of America
Holdings Ltd Merrill Lynch (5,055) 660 Magellan Financial Group Ltd Bank of America
Merrill Lynch 217 16,373 OZ Minerals Ltd Bank of America
Merrill Lynch (2,450) (2,653) QBE Insurance Group Ltd Bank of America
Merrill Lynch (627) 7,819 Sims Metal Management Ltd Bank of America
Merrill Lynch (327) (885) Sirtex Medical Ltd Bank of America
Merrill Lynch (696) (7,425) TPG Telecom Ltd Bank of America
Merrill Lynch (7,696) (9,754) Vocus Communications Ltd Bank of America
Merrill Lynch (3,746)
(22,808)
Austria (6) DO & CO AG Bank of America
Merrill Lynch 23 1,849 Kapsch TrafficCom AG Bank of America
Merrill Lynch (2,726) 2,013 Raiffeisen Bank Bank of America
International AG Merrill Lynch (4,463) 1,135 Strabag SE Bank of America
Merrill Lynch 103 (3,037) Zumtobel Group AG Bank of America
Merrill Lynch (5,733)
(12,796)
Belgium 17,185 AGFA-Gevaert NV Bank of America
Merrill Lynch (3,854) 918 Barco NV Bank of America
Merrill Lynch 543 1,468 Bekaert SA Bank of America
Merrill Lynch 2,781 (1,256) Celyad SA Bank of America
Merrill Lynch (10,979) 2,673 Delhaize Group JP Morgan 6,150 (1,921) Exmar NV Bank of America
Merrill Lynch 45 338 Ion Beam Applications Bank of America
Merrill Lynch 243 1,728 KBC Groep NV JP Morgan 14,778 1,396 Orange Belgium SA Bank of America
Merrill Lynch 3,079 (57,266) TiGenix NV Bank of America
Merrill Lynch (976)
11,810
Brazil 20 Banco Bradesco SA (Pref) Bank of America
Merrill Lynch (1) 300 Cia de Saneamento Basico Bank of America
do Estado de Sao Paulo Merrill Lynch (16) (60) Cielo SA Bank of America
Merrill Lynch 55 5,000 Cosan SA Industria e Comercio Bank of America
Merrill Lynch (628) (300) Raia Drogasil SA Bank of America
Merrill Lynch (23)
(613)
Canada 3,800 Baytex Energy Corp Bank of America
Merrill Lynch 445 2,200 Crescent Point Energy Corp Bank of America
Merrill Lynch 361 500 First Quantum Minerals Ltd Bank of America
Merrill Lynch 43 (500) Franco-Nevada Corp Bank of America
Merrill Lynch 1,877 600 IGM Financial Inc Bank of America
Merrill Lynch 4 100 Linamar Corp Bank of America
Merrill Lynch 22 100 Manulife Financial Corp Bank of America
Merrill Lynch 4 (79) PrairieSky Royalty Ltd Bank of America
Merrill Lynch 59 28 Suncor Energy Inc Bank of America
Merrill Lynch (12)
2,803
Czech Republic (3,488) CEZ AS Bank of America
Merrill Lynch 2,125 6,375 O2 Czech Republic AS Bank of America
Merrill Lynch (1,861)
264
Denmark (1,706) Bavarian Nordic A/S Bank of America
Merrill Lynch (1,219) (76) D/S Norden A/S Bank of America
Merrill Lynch 121 (64) Danske Bank A/S Bank of America
Merrill Lynch (122) (1,587) Jyske Bank A/S Reg Bank of America
Merrill Lynch (3,186) 1,353 Novozymes A/S 'B' Bank of America
Merrill Lynch 83
(4,323)
Finland (642) Fiskars OYJ Abp Bank of America
Merrill Lynch (145) 1,591 Kesko OYJ 'B' Bank of America
Merrill Lynch 2,474 (11,538) Metsa Board OYJ Bank of America
Merrill Lynch (1,496) 131,664 Nokia OYJ JP Morgan 43,793 (402) Nokia OYJ Bank of America
Merrill Lynch (47) (2,020) Outokumpu OYJ Bank of America
Merrill Lynch (181) (2,276) Outotec OYJ Bank of America
Merrill Lynch (51)

Contracts for difference as at 31 May 2016
Holding
Description Counterparty
Unrealised appreciation/
(depreciation) USD
Holding
Description Counterparty
Unrealised appreciation/
(depreciation) USD
Annual Report and Audited Accounts 337
The notes on pages 489 to 503 form an integral part of these financial statements.
(3,298) PKC Group OYJ Bank of America Merrill Lynch (6,133)
(3,867) Stockmann OYJ Abp 'B' Bank of America Merrill Lynch (268)
37,946
France 7,786 Air France-KLM Bank of America
Merrill Lynch (863) (1,038) Airbus Group SE Bank of America
Merrill Lynch (3,286) 24,035 Altran Technologies SA JP Morgan 18,524 (292) Amoeba SAS Bank of America
Merrill Lynch (79) (17,659) Bollore SA Bank of America
Merrill Lynch 3,433 (3,960) CGG SA Bank of America
Merrill Lynch 487 (9,362) CNP Assurances JP Morgan (11,659) (300) Danone SA JP Morgan (767) 2,587 Eiffage SA JP Morgan (3,496) 980 Eurazeo SA Bank of America
Merrill Lynch 549 (6,027) Europcar Groupe SA '144A' Bank of America
Merrill Lynch 3,449 520 Faurecia Bank of America
Merrill Lynch 1,154 949 Guerbet Bank of America
Merrill Lynch 4,266 153 Neopost SA Bank of America
Merrill Lynch 51 1,228 Nexans SA Bank of America
Merrill Lynch 7,599 97 Plastivaloire Bank of America
Merrill Lynch 979 856 Safran SA Bank of America
Merrill Lynch 3,649 5,152 Sanofi JP Morgan 10,818 4,463 Societe Generale SA JP Morgan 12,939 (13,832) Ste Industrielle d'Aviation Bank of America
Latecoere SA Merrill Lynch (3,411) 257 Tarkett SA Bank of America
Merrill Lynch (101) 2,606 Teleperformance JP Morgan 4,017 668 Thales SA Bank of America
Merrill Lynch 1,511 2,938 Thales SA JP Morgan 5,382 898 Trigano SA Bank of America
Merrill Lynch 2,148 2 Valeo SA Bank of America
Merrill Lynch (7) (3,195) Vallourec SA Bank of America
Merrill Lynch (1,350) 2,668 Vinci SA JP Morgan 10,698 (168) Virbac SA Bank of America
Merrill Lynch (1,153)
65,481
Germany (1,246) Allianz SE Reg JP Morgan (9,255) (1,792) CTS Eventim AG & Co KGaA Bank of America
Merrill Lynch (1,895) (766) Deutsche Bank AG Reg Bank of America
Merrill Lynch (1,088) (19,508) Deutsche Telekom AG Reg JP Morgan (9,254) 11,890 Deutz AG Bank of America
Merrill Lynch (1,509) (822) Fielmann AG Bank of America
Merrill Lynch (1,205)
(239) Hugo Boss AG Bank of America Merrill Lynch 144
963 Koenig & Bauer AG Bank of America Merrill Lynch 12,743
(926) Medigene AG Bank of America Merrill Lynch 1,141
38 Rheinmetall AG Bank of America Merrill Lynch 38
(28) RWE AG Bank of America Merrill Lynch 35
(1,217) Siltronic AG Bank of America Merrill Lynch 1,433
77 Sixt SE Bank of America Merrill Lynch 206
7,541 Suess MicroTec AG Bank of America Merrill Lynch (11,638)
(20) thyssenkrupp AG Bank of America Merrill Lynch 9
(2,067) TUI AG Bank of America Merrill Lynch (201)
9,619 VERBIO Vereinigte Bio Bank of America Energie AG Merrill Lynch (19,822)
(339) XING AG Bank of America Merrill Lynch (5,206)
(436) zooplus AG Bank of America Merrill Lynch (4,437)
(49,761)
Hong Kong 54,500 3SBio Inc '144A' Bank of America
Merrill Lynch (11,801) (20,000) Alibaba Pictures Group Ltd Bank of America
Merrill Lynch (80) (60,000) Aluminum Corp of China Ltd 'H' Bank of America
Merrill Lynch 2,086 (1,600) ASM Pacific Technology Ltd Bank of America
Merrill Lynch (161) (95,000) AviChina Industry & Bank of America
Technology Co Ltd 'H' Merrill Lynch (205) (64,000) Brilliance China Automotive Bank of America
Holdings Ltd Merrill Lynch 1,277 (8,000) BYD Electronic Bank of America
International Co Ltd Merrill Lynch (260) (188,000) CGN Power Co Ltd 'H' '144A' Bank of America
Merrill Lynch 3,147 (68,500) China Harmony New Energy Bank of America
Auto Holding Ltd Merrill Lynch 2,558 88,795 China High Speed Transmission Bank of America
Equipment Group Co Ltd Merrill Lynch (228) 8,000 China Lesso Group Holdings Ltd Bank of America
Merrill Lynch (175) 82,000 China Maple Leaf Bank of America
Educational Systems Ltd Merrill Lynch 18,976 (30,000) China Mengniu Dairy Co Ltd Bank of America
Merrill Lynch (138) 54,000 China Railway Construction Bank of America
Corp Ltd 'H' Merrill Lynch 256 41,165 China Shenhua Bank of America
Energy Co Ltd 'H' Merrill Lynch (3,219) (318,000) China Shipping Container Bank of America
Lines Co Ltd 'H' Merrill Lynch 2,727 116,000 China Telecom Corp Ltd 'H' Bank of America
Merrill Lynch (2,357) 144,400 China Zhongwang Holdings Ltd Bank of America
Merrill Lynch (869) 9,000 Chongqing Rural Commercial Bank of America
Bank Co Ltd 'H' Merrill Lynch (104) (19,000) CRRC Corp Ltd 'H' Bank of America
Merrill Lynch 489
BlackRock Multi-Manager Alternative Strategies Fund continued
Germany continued Finland continued

Contracts for difference as at 31 May 2016
Holding
Description Counterparty
Unrealised appreciation/
(depreciation) USD
Holding
Description Counterparty
Unrealised appreciation/
(depreciation) USD
338 BlackRock Strategic Funds (BSF)
The notes on pages 489 to 503 form an integral part of these financial statements.
BlackRock Multi-Manager Alternative Strategies Fund continued
60,000 FIH Mobile Ltd Bank of America Merrill Lynch 462
(47,000) Fosun International Ltd Bank of America Merrill Lynch (2,112)
(11,000) Galaxy Entertainment Bank of America Group Ltd Merrill Lynch 212
18,000 Guangzhou Automobile Bank of America Group Co Ltd 'H' Merrill Lynch 508
(7,000) Haier Electronics Bank of America Group Co Ltd Merrill Lynch (255)
(68,000) Haitong International Bank of America Securities Group Ltd Merrill Lynch (438)
(9,000) Hong Kong & China Bank of America Gas Co Ltd Merrill Lynch (487)
2,000 Huadian Power Bank of America International Corp Ltd 'H' Merrill Lynch 31
26,000 Jiangsu Expressway Co Ltd 'H' Bank of America Merrill Lynch 1,540
(28,661) Legend Holdings Bank of America Corp 'H' '144A' Merrill Lynch (2,664)
(86,000) Lenovo Group Ltd Bank of America Merrill Lynch 15,164
(59,000) Li Ning Co Ltd Bank of America Merrill Lynch 1,616
(7,500) Luye Pharma Group Ltd Bank of America Merrill Lynch 579
(38,000) MGM China Holdings Ltd Bank of America Merrill Lynch (1,957)
16,000 PetroChina Co Ltd 'H' Bank of America Merrill Lynch (726)
REXLot Holdings Ltd Bank of America Merrill Lynch 9,702
253,000 Sihuan Pharmaceutical Bank of America Holdings Group Ltd Merrill Lynch (3,909)
90,000 Tianneng Power Bank of America International Ltd Merrill Lynch (5,847)
35,000 TravelSky Technology Ltd 'H' Bank of America Merrill Lynch 1,427
(16,000) Tsingtao Brewery Co Ltd 'H' Bank of America Merrill Lynch 3,193
498,000 Universal Health International Bank of America Group Holding Ltd Merrill Lynch (8,976)
(43,200) Wynn Macau Ltd Bank of America Merrill Lynch (1,973)
22,000 Xinyi Glass Holdings Ltd Bank of America Merrill Lynch 410
132,000 Xtep International Holdings Ltd Bank of America Merrill Lynch (5,903)
180,000 Zall Development Group Ltd Bank of America Merrill Lynch (9,611)
40,000 Zhejiang Expressway Co Ltd 'H' Bank of America Merrill Lynch (3,399)
(1,000) Zhuzhou CRRC Times Bank of America Electric Co Ltd Merrill Lynch 129
(1,365)
Ireland (2,369) Glanbia Plc Bank of America
Merrill Lynch (648) 2,778 Kerry Group Plc 'A' JP Morgan 3,754 10,268 Kingspan Group Plc JP Morgan 20,300 (8,313) Origin Enterprises Plc Bank of America
Merrill Lynch (854) 333 Paddy Power Betfair Plc JP Morgan 2,287 (2,108) Permanent TSB Group Bank of America
Holdings Plc Merrill Lynch 1,328
26,167
Israel 2,487 B Communications Ltd Bank of America
Merrill Lynch (2,735) 101,420 El Al Israel Airlines Bank of America
Merrill Lynch (5,094) (7,708) Israel Chemicals Ltd Bank of America
Merrill Lynch 4,793 (49,049) Migdal Insurance & Bank of America
Financial Holding Ltd Merrill Lynch 3,174 (6,817) Shikun & Binui Ltd Bank of America
Merrill Lynch (59) 13,396 Shufersal Ltd Bank of America
Merrill Lynch (1,151)
(1,072)
Italy 34,350 A2A SpA Bank of America
Merrill Lynch 1,688 83 Astaldi SpA Bank of America
Merrill Lynch 12 720 ASTM SpA Bank of America
Merrill Lynch 83 2,444 Banca IFIS SpA Bank of America
Merrill Lynch (2,325) (11,845) Banca Monte dei Paschi Bank of America
di Siena SpA Merrill Lynch 849 (2,645) Brunello Cucinelli SpA Bank of America
Merrill Lynch (1,713) 2,535 Fiat Chrysler Automobiles NV Bank of America
Merrill Lynch (1,671) 3,910 FinecoBank Banca Fineco SpA Bank of America
Merrill Lynch (1,834) (29,013) Piaggio & C SpA Bank of America
Merrill Lynch 4,310 889 Prysmian SpA Bank of America
Merrill Lynch 1,429 2,190 Recordati SpA Bank of America
Merrill Lynch 10,200 408 Reply SpA Bank of America
Merrill Lynch 3,236 (156,059) Saipem SpA Bank of America
Merrill Lynch 6,455 17,399 Saras SpA Bank of America
Merrill Lynch 1,846 (2,084,032) Telecom Italia SpA/Milano JP Morgan (46,064) (11,347) TREVI - Finanziaria Bank of America
Industriale SpA Merrill Lynch (1,470) (2,354) UniCredit SpA Bank of America
Merrill Lynch 551 (36,677) UniCredit SpA JP Morgan 5,093
(19,325)
Japan 1,700 Acucela Inc Bank of America
Merrill Lynch (30,274) 1,400 Adastria Co Ltd Bank of America
Merrill Lynch (82) (40) Advantest Corp Bank of America
Merrill Lynch (66) 700 Asatsu-DK Inc Bank of America
Merrill Lynch 395 (1,100) Asics Corp Bank of America
Merrill Lynch (1,337) 100 Bandai Namco Holdings Inc Bank of America
Merrill Lynch 26 14 Bell System24 Holdings Inc Bank of America
Merrill Lynch (6) (7,300) Bic Camera Inc Bank of America
Merrill Lynch (3,220) (1,800) Calbee Inc Bank of America
Merrill Lynch 3,351
Hong Kong continued

Contracts for difference as at 31 May 2016
Holding
Description Counterparty
Unrealised appreciation/
(depreciation) USD
Holding
Description Counterparty
Unrealised appreciation/
(depreciation) USD
Annual Report and Audited Accounts 339
The notes on pages 489 to 503 form an integral part of these financial statements.
400 Coca-Cola West Co Ltd Bank of America Merrill Lynch (115)
(3,500) Cookpad Inc Bank of America Merrill Lynch 2,173
(4,700) Cosmo Energy Bank of America Holdings Co Ltd Merrill Lynch (2,218)
(400) Cosmos Pharmaceutical Corp Bank of America Merrill Lynch (5,040)
(1,400) Cyberdyne Inc Bank of America Merrill Lynch (1,637)
8,500 DA Consortium Inc Bank of America Merrill Lynch 5,350
2,800 Daiichi Sankyo Co Ltd Bank of America Merrill Lynch (545)
(1,700) Daio Paper Corp Bank of America Merrill Lynch (624)
3,000 Digital Garage Inc Bank of America Merrill Lynch 1,275
1,700 Doutor Nichires Bank of America Holdings Co Ltd Merrill Lynch 793
3,800 en-japan Inc Bank of America Merrill Lynch 7,875
(1,300) eRex Co Ltd Bank of America Merrill Lynch (5,522)
(4,394) euglena Co Ltd Bank of America Merrill Lynch (4,813)
(200) Fast Retailing Co Ltd Bank of America Merrill Lynch (2,419)
6,100 Financial Products Bank of America Group Co Ltd Merrill Lynch (1,578)
3,500 Foster Electric Co Ltd Bank of America Merrill Lynch 4,512
(7,000) Fujitsu Ltd Bank of America Merrill Lynch (870)
4,700 Geo Holdings Corp Bank of America Merrill Lynch (10,545)
2,200 Glory Ltd Bank of America Merrill Lynch (7,207)
(400) Goldwin Inc Bank of America Merrill Lynch (1,404)
(5,983) Gumi Inc Bank of America Merrill Lynch (8,504)
(13,000) Hachijuni Bank Ltd/The Bank of America Merrill Lynch (585)
3,200 Ichigo Inc Bank of America Merrill Lynch (374)
(10,000) IHI Corp Bank of America Merrill Lynch (1,922)
2,800 IT Holdings Corp Bank of America Merrill Lynch 1,587
3,000 J-COM Holdings Co Ltd Bank of America Merrill Lynch (5,020)
4,400 JAC Recruitment Co Ltd Bank of America Merrill Lynch 12,782
(135) Japan Airport Terminal Co Ltd Bank of America Merrill Lynch 225
(400) Japan Post Holdings Co Ltd Bank of America Merrill Lynch (64)
(3,013) Japan Post Insurance Co Ltd Bank of America Merrill Lynch 471
(16,000) Japan Steel Works Ltd/The Bank of America Merrill Lynch (1,820)
100 Keihin Corp Bank of America Merrill Lynch 13
(100) Keyence Corp Bank of America Merrill Lynch (2,916)
(5,200) Kintetsu World Express Inc Bank of America Merrill Lynch (2,385)
(10,963) KLab Inc Bank of America Merrill Lynch (6,818)
1,800 Konami Holdings Corp Bank of America Merrill Lynch 12,525
(1,100) Kusuri No Aoki Co Ltd Bank of America Merrill Lynch (8,812)
(1,600) Kyushu Financial Group Inc Bank of America Merrill Lynch (812)
(27,218) Laox Co Ltd Bank of America Merrill Lynch 2,009
3,500 Linical Co Ltd Bank of America Merrill Lynch 7,863
4,000 Lion Corp Bank of America Merrill Lynch 9,864
(2,200) M3 Inc Bank of America Merrill Lynch (3,017)
(800) McDonald's Holdings Co Bank of America Japan Ltd Merrill Lynch (36)
1,100 Megmilk Snow Brand Co Ltd Bank of America Merrill Lynch 9,017
(8,600) Minebea Co Ltd Bank of America Merrill Lynch 1,239
800 Mitsubishi Tanabe Bank of America Pharma Corp Merrill Lynch 145
(18,000) Mitsui OSK Lines Ltd Bank of America Merrill Lynch (2,430)
1,800 Mixi Inc Bank of America Merrill Lynch 1,432
900 Mochida Bank of America Pharmaceutical Co Ltd Merrill Lynch 8,495
(500) Morpho Inc Bank of America Merrill Lynch 3,690
(2,700) Nabtesco Corp Bank of America Merrill Lynch (4,787)
10,800 Namura Shipbuilding Co Ltd Bank of America Merrill Lynch (7,482)
8 NanoCarrier Co Ltd Bank of America Merrill Lynch (22)
100 NET One Systems Co Ltd Bank of America Merrill Lynch 59
(1,900) NGK Spark Plug Co Ltd Bank of America Merrill Lynch (2,305)
1,100 Nihon M&A Center Inc Bank of America Merrill Lynch 3,819
4,600 Nikon Corp Bank of America Merrill Lynch 982
700 Nippon Gas Co Ltd Bank of America Merrill Lynch 77
(1,000) Obara Group Inc Bank of America Merrill Lynch (2,678)
1,500 OBIC Business Bank of America Consultants Co Ltd Merrill Lynch 3,275
1,500 Ono Pharmaceutical Co Ltd Bank of America Merrill Lynch (823)
(1,000) Oriental Land Co Ltd/Japan Bank of America Merrill Lynch 2,510
(5,390) OSAKA Titanium Bank of America Technologies Co Ltd Merrill Lynch (1,664)
1,600 Outsourcing Inc Bank of America Merrill Lynch 14,025
(40) PeptiDream Inc Bank of America Merrill Lynch (54)
28,400 Pioneer Corp Bank of America Merrill Lynch (10,035)
600 Pola Orbis Holdings Inc Bank of America Merrill Lynch 4,374
9,700 Round One Corp Bank of America Merrill Lynch 8,154
(23,000) Sanken Electric Co Ltd Bank of America Merrill Lynch 6,082
200 Sankyo Co Ltd Bank of America Merrill Lynch 47
BlackRock Multi-Manager Alternative Strategies Fund continued
Japan continued Japan continued

Contracts for difference as at 31 May 2016
Holding
Description Counterparty
Unrealised appreciation/
(depreciation) USD
Holding
Description Counterparty
Unrealised appreciation/
(depreciation) USD
340 BlackRock Strategic Funds (BSF)
The notes on pages 489 to 503 form an integral part of these financial statements.
BlackRock Multi-Manager Alternative Strategies Fund continued
12,000 Sapporo Holdings Ltd Bank of America Merrill Lynch 626
2,100 Septeni Holdings Co Ltd Bank of America Merrill Lynch 15,558
1,400 Sohgo Security Bank of America Services Co Ltd Merrill Lynch (4,999)
(7,300) Taiyo Nippon Sanso Corp Bank of America Merrill Lynch 1,646
7,000 Takuma Co Ltd Bank of America Merrill Lynch 4,158
(21,013) Tekken Corp Bank of America Merrill Lynch (8,132)
4,200 Temp Holdings Co Ltd Bank of America Merrill Lynch 5,850
500 Terumo Corp Bank of America Merrill Lynch 970
44,000 Toa Corp/Tokyo Bank of America Merrill Lynch (6,104)
(37,273) Tobishima Corp Bank of America Merrill Lynch —
(9,988) Toho Titanium Co Ltd Bank of America Merrill Lynch 1,854
(27,979) Toshiba Corp Bank of America Merrill Lynch (11,847)
1,900 Toyo Seikan Group Bank of America Holdings Ltd Merrill Lynch 2,527
(4,866) Traders Holdings Co Ltd Bank of America Merrill Lynch 50
1,200 Tsumura & Co Bank of America Merrill Lynch 1,556
1,900 Vector Inc Bank of America Merrill Lynch 4,660
100 VeriServe Corp Bank of America Merrill Lynch (150)
(1,400) Yakult Honsha Co Ltd Bank of America Merrill Lynch 458
(3,000) Zeon Corp Bank of America Merrill Lynch (1,269)
(6,964)
Netherlands (3,806) ABN AMRO Group NV -
CVA '144A' JP Morgan (1,403) (3,759) Altice NV 'A' Bank of America
Merrill Lynch (9,437) 1,995 AMG Advanced Metallurgical Bank of America
Group NV Merrill Lynch 6,748 (986) ArcelorMittal Bank of America
Merrill Lynch (204) (181) Galapagos NV Bank of America
Merrill Lynch (1,792) 9,121 ING Groep NV - CVA JP Morgan 713 8,684 Koninklijke Ahold NV JP Morgan 6,900 52 Mylan NV Bank of America
Merrill Lynch 125 (7,100) NN Group NV JP Morgan (1,813) (7,192) TNT Express NV Bank of America
Merrill Lynch (545) (172) TomTom NV Bank of America
Merrill Lynch (13) (3,336) Wright Medical Group NV Bank of America
Merrill Lynch (2,161)
(2,882)
Norway (24,395) Akastor ASA Bank of America
Merrill Lynch 4,088 7,199 Austevoll Seafood ASA Bank of America
Merrill Lynch 3,031
(195,211) Axactor AB Bank of America Merrill Lynch (2,332)
13,045 BW LPG Ltd '144A' Bank of America Merrill Lynch (7,305)
1,734 Det Norske Oljeselskap ASA Bank of America Merrill Lynch 1,498
15,729 Fred Olsen Energy ASA Bank of America Merrill Lynch (2,879)
2,801 Grieg Seafood ASA Bank of America Merrill Lynch 1,711
9,540 Havfisk ASA Bank of America Merrill Lynch 4,430
(21,357) Hexagon Composites ASA Bank of America Merrill Lynch (4,721)
(541) Hoegh LNG Holdings Ltd Bank of America Merrill Lynch (67)
5,263 Kvaerner ASA Bank of America Merrill Lynch 183
(1,212) Norwegian Air Shuttle ASA Bank of America Merrill Lynch 4,106
(1,437) Opera Software ASA Bank of America Merrill Lynch (113)
1,415 Opera Software ASA Bank of America Merrill Lynch 7
4,950 Protector Forsikring ASA Bank of America Merrill Lynch (239)
2,228 Salmar ASA Bank of America Merrill Lynch 12,780
(13,926) Scatec Solar ASA Bank of America Merrill Lynch (9,262)
(848) Schibsted ASA 'A' Bank of America Merrill Lynch (11)
(1,240) SpareBank 1 SR-Bank ASA Bank of America Merrill Lynch (59)
(20,737) Storebrand ASA JP Morgan (8,911) (1,442) Telenor ASA JP Morgan (708)
(4,773)
Poland 3,611 Bank Millennium SA Bank of America
Merrill Lynch (340) 4,329 CD Projekt Red SA Bank of America
Merrill Lynch 424 (19,998) Enea SA Bank of America
Merrill Lynch 9,014 5,109 Eurocash SA Bank of America
Merrill Lynch (5,844) (46,641) Getin Noble Bank SA Bank of America
Merrill Lynch 238 (5,276) Jastrzebska Spolka Bank of America
Weglowa SA Merrill Lynch 7,099 4,703 Kernel Holding SA Bank of America
Merrill Lynch 3,403 (19) LPP SA Bank of America
Merrill Lynch 1,302 (19) Lubelski Wegiel Bogdanka SA Bank of America
Merrill Lynch 34 (4,015) PKP Cargo SA Bank of America
Merrill Lynch 6,344
21,674
Portugal 38,509 Banco BPI SA Reg Bank of America
Merrill Lynch 2,839 (6,750) NOS SGPS SA Bank of America
Merrill Lynch (2,280) (330) Semapa-Sociedade de Bank of America
Investimento e Gestao Merrill Lynch 2
561
Japan continued Norway continued

Contracts for difference as at 31 May 2016
Holding
Description Counterparty
Unrealised appreciation/
(depreciation) USD
Holding
Description Counterparty
Unrealised appreciation/
(depreciation) USD
* Amounts which are less than 0.5 USD have been rounded down to zero.
Annual Report and Audited Accounts 341
The notes on pages 489 to 503 form an integral part of these financial statements.
Singapore (7,500) Sembcorp Marine Ltd Bank of America
Merrill Lynch 272 (24,400) StarHub Ltd Bank of America
Merrill Lynch (3,897) 20,600 Yangzijiang Shipbuilding Bank of America
Holdings Ltd Merrill Lynch (1,122)
(4,747)
South Africa (78,220) Alexander Forbes Group Bank of America
Holdings Ltd Merrill Lynch 2,831 1,115 Anglo American Platinum Ltd Bank of America
Merrill Lynch (1,264) (112,570) ArcelorMittal South Africa Ltd Bank of America
Merrill Lynch 7,659 (50) Aveng Ltd Bank of America
Merrill Lynch 2 63,788 Blue Label Telecoms Ltd Bank of America
Merrill Lynch (1,411) 1,710 Capitec Bank Holdings Ltd Bank of America
Merrill Lynch 182 129,568 DRDGOLD Ltd Bank of America
Merrill Lynch (1,947) (424) EOH Holdings Ltd Bank of America
Merrill Lynch 8 5,559 Kumba Iron Ore Ltd Bank of America
Merrill Lynch (7,874) 639 Mondi Ltd Bank of America
Merrill Lynch 1,409 (445) Naspers Ltd 'N' Bank of America
Merrill Lynch (9,981) 2,073 Pick n Pay Holdings Ltd Bank of America
Merrill Lynch (70) (5,349) Pioneer Foods Group Ltd Bank of America
Merrill Lynch 1,325 3,787 Reunert Ltd Bank of America
Merrill Lynch (1,081) (3,496) Royal Bafokeng Platinum Ltd Bank of America
Merrill Lynch 455 6,815 Sanlam Ltd Bank of America
Merrill Lynch (1,196) (960) Vodacom Group Ltd JP Morgan 99 7,808 Wilson Bayly Bank of America
Holmes-Ovcon Ltd Merrill Lynch (2,388) (5,868) Woolworths Bank of America
Holdings Ltd/South Africa Merrill Lynch 1,094 (117,304) Zeder Investments Ltd Bank of America
Merrill Lynch 1,631
(10,517)
South Korea 2,265 Able C&C Co Ltd Bank of America
Merrill Lynch 334 339 BGF retail Co Ltd Bank of America
Merrill Lynch 7,022 (281) Cell Biotech Co Ltd Bank of America
Merrill Lynch 66 (22,513) China Ocean Resources Co Ltd Bank of America
Merrill Lynch 1,831 311 CJ Corp Bank of America
Merrill Lynch (1,874) (365) Cosmax Inc Bank of America
Merrill Lynch (985) (1,558) COSON Co Ltd Bank of America
Merrill Lynch 1,896 977 Daelim Industrial Co Ltd Bank of America
Merrill Lynch (8,271) (15,972) Daewoo Shipbuilding & Bank of America
Marine Engineering Co Ltd Merrill Lynch 9,668
1,026 Daou Technology Inc Bank of America Merrill Lynch (481)
(9,128) Deco&E Co Ltd Bank of America Merrill Lynch (257)
(3,082) Dexter Studios Co Ltd Bank of America Merrill Lynch 2,228
531 Dongbu HiTek Co Ltd Bank of America Merrill Lynch (143)
(9,041) Doosan Infracore Co Ltd Bank of America Merrill Lynch 15,180
(50) G-Smatt Global Co Ltd Bank of America Merrill Lynch 89
(580) G-treeBNT Co Ltd Bank of America Merrill Lynch 1,180
(756) Gamevil Inc Bank of America Merrill Lynch (2,952)
(4,448) GemVax & Kael Co Ltd Bank of America Merrill Lynch 11,866
(711) GeneOne Life Science Inc Bank of America Merrill Lynch 825
1,179 Green Cross Holdings Corp Bank of America Merrill Lynch (1,996)
(20,631) Hanjin Shipping Co Ltd Bank of America Merrill Lynch (10,905)
2,967 Hankook Tire Bank of America Worldwide Co Ltd Merrill Lynch 66
(18) Hansol Chemical Co Ltd Bank of America Merrill Lynch 19
3,922 HB Technology Co Ltd Bank of America Merrill Lynch (207)
(1,860) HLB Inc Bank of America Merrill Lynch 1,057
327 Hyundai Engineering & Bank of America Construction Co Ltd Merrill Lynch 150
363 Innocean Worldwide Inc Bank of America Merrill Lynch 728
(627) Jeju Air Co Ltd Bank of America Merrill Lynch 1,584
(1) K&C Global Co Ltd * Bank of America Merrill Lynch —
(374) KEPCO Engineering & Bank of America Construction Co Inc Merrill Lynch 2,085
337 Korea Petrochemical Bank of America Ind Co Ltd Merrill Lynch (5,176)
771 KT Corp Bank of America Merrill Lynch (71)
(2,628) Leaders Cosmetics Co Ltd Bank of America Merrill Lynch 8,599
6,657 LG Uplus Corp Bank of America Merrill Lynch 427
267 Lotte Chemical Corp Bank of America Merrill Lynch (4,027)
(63) Medy-Tox Inc Bank of America Merrill Lynch 501
(37,114) Mirae Corp Bank of America Merrill Lynch 897
(83) Naturecell Co Ltd Bank of America Merrill Lynch 33
(6,814) New Pride Corp Bank of America Merrill Lynch 2,079
(1,734) Nexolon Co Ltd Bank of America Merrill Lynch 283
12,052 NICE Total Cash Bank of America Management Co Ltd Merrill Lynch (9,995)
180 NongShim Co Ltd Bank of America Merrill Lynch (1,573)
(114) NutriBiotech Co Ltd Bank of America Merrill Lynch (962)
(1,443) Peptron Inc Bank of America Merrill Lynch 5,724
BlackRock Multi-Manager Alternative Strategies Fund continued
South Korea continued

Contracts for difference as at 31 May 2016
Holding
Description Counterparty
Unrealised appreciation/
(depreciation) USD
Holding
Description Counterparty
Unrealised appreciation/
(depreciation) USD
342 BlackRock Strategic Funds (BSF)
The notes on pages 489 to 503 form an integral part of these financial statements.
BlackRock Multi-Manager Alternative Strategies Fund continued
(994) Pharma Research Bank of America Products Co Ltd Merrill Lynch 8,598
(4,617) Pharmicell Co Ltd Bank of America Merrill Lynch (3,268)
(1,720) Qurient Co Ltd Bank of America Merrill Lynch (3,159)
891 S-Oil Corp Bank of America Merrill Lynch (3,641)
61 Samsung Electronics Co Ltd Bank of America Merrill Lynch 94
(6,666) Samsung Engineering Co Ltd Bank of America Merrill Lynch 18,593
(5,979) Schnell Bank of America Biopharmaceuticals Inc Merrill Lynch (6,696)
(1,908) Seegene Inc Bank of America Merrill Lynch 1,698
(4,664) Signal Entertainment Bank of America Group Corp Merrill Lynch 159
334 SK Holdings Co Ltd Bank of America Merrill Lynch (1,546)
481 SK Innovation Co Ltd Bank of America Merrill Lynch 1,144
10,623 SK Networks Co Ltd Bank of America Merrill Lynch 1,369
3,668 Songwon Industrial Co Ltd Bank of America Merrill Lynch 5,279
23,745 Tongyang Inc Bank of America Merrill Lynch (2,268)
(576) ViroMed Co Ltd Bank of America Merrill Lynch (9,474)
33,424
Spain 1,982 ACS Actividades de Bank of America
Construccion y Servicios SA Merrill Lynch 3,225 1,500 Aena SA '144A' JP Morgan (2,597) (4,030) Cellnex Telecom SAU Bank of America
Merrill Lynch (726) 2,824 CIE Automotive SA Bank of America
Merrill Lynch 3,044 (10,689) Distribuidora Internacional Bank of America
de Alimentacion SA Merrill Lynch (6,236) (6,542) Distribuidora Internacional
de Alimentacion SA JP Morgan (4,180) (1,792) Duro Felguera SA Bank of America
Merrill Lynch 641 (6,303) Euskaltel SA '144A' Bank of America
Merrill Lynch 4,198 19,493 Faes Farma SA Bank of America
Merrill Lynch 7,841 749 Gamesa Corp Tecnologica SA Bank of America
Merrill Lynch 152 15,041 Gamesa Corp Tecnologica SA JP Morgan 6,216 2,870 Grifols SA Bank of America
Merrill Lynch 4,172 297 Industria de Diseno Textil SA Bank of America
Merrill Lynch 796 (6,201) NH Hotel Group SA Bank of America
Merrill Lynch (2,866) (8) Obrascon Huarte Lain SA Bank of America
Merrill Lynch 8 (5,000) Telefonica SA Bank of America
Merrill Lynch (401) (186,492) Telefonica SA JP Morgan (27,828)
(14,541)
Sweden (580) Avanza Bank Holding AB Bank of America
Merrill Lynch (2,256) 19 Bilia AB 'A' Bank of America
Merrill Lynch 2
(12) Dometic Group AB '144A' Bank of America Merrill Lynch (2)
1,784 Fingerprint Cards AB 'B' Bank of America Merrill Lynch 1,933
(536) Haldex AB Bank of America Merrill Lynch (206)
303 IAR Systems Group AB Bank of America Merrill Lynch 30
1,028 ITAB Shop Concept AB 'B' Bank of America Merrill Lynch (573)
(1,952) Lundin Petroleum AB Bank of America Merrill Lynch (420)
4,038 Medivir AB 'B' Bank of America Merrill Lynch (2,672)
(753) Mekonomen AB Bank of America Merrill Lynch 1,268
5,322 Mycronic AB Bank of America Merrill Lynch 1,545
1,799 NCC AB 'B' Bank of America Merrill Lynch 6,628
(12,769) Nobina AB '144A' Bank of America Merrill Lynch (3,419)
24,973 Nordea Bank AB JP Morgan 17,213 (6,476) Nordnet AB 'B' Bank of America
Merrill Lynch 45 5,451 Rottneros AB Bank of America
Merrill Lynch (229) 614 Saab AB 'B' Bank of America
Merrill Lynch (325) (466) Svenska Handelsbanken AB 'A' Bank of America
Merrill Lynch (223) (3,471) Telefonaktiebolaget LM
Ericsson 'B' JP Morgan (480) 8,843 Tethys Oil AB Bank of America
Merrill Lynch 3,960 1,248 Vitrolife AB Bank of America
Merrill Lynch 7,911
29,730
Switzerland 392 Actelion Ltd Reg Bank of America
Merrill Lynch 3,106 887 Bachem Holding AG 'B' Reg Bank of America
Merrill Lynch 5,503 (815) Basilea Pharmaceutica AG Reg Bank of America
Merrill Lynch (1,059) (281) Berner Kantonalbank AG Reg Bank of America
Merrill Lynch 981 1,221 BKW AG Bank of America
Merrill Lynch 678 1,209 Bobst Group SA Reg Bank of America
Merrill Lynch 1,029 (9,904) Charles Voegele Holding AG Bank of America
Merrill Lynch (2,623) (375) Cosmo Pharmaceuticals NV Bank of America
Merrill Lynch (4,849) (1,010) Credit Suisse Group AG Reg Bank of America
Merrill Lynch 99 13 dorma+kaba Holding Bank of America
AG 'B' Reg Merrill Lynch 537 (469) Dufry AG Reg Bank of America
Merrill Lynch (3,919) (1,399) EFG International AG Bank of America
Merrill Lynch 67 (74,753) Evolva Holding SA Bank of America
Merrill Lynch (2,453) 49 Galenica AG Reg Bank of America
Merrill Lynch (3,384) (168) Geberit AG Reg Bank of America
Merrill Lynch (2,220)
South Korea continued Sweden continued

Contracts for difference as at 31 May 2016
Holding
Description Counterparty
Unrealised appreciation/
(depreciation) USD
Holding
Description Counterparty
Unrealised appreciation/
(depreciation) USD
* Amounts which are less than 0.5 USD have been rounded down to zero.
Annual Report and Audited Accounts 343
The notes on pages 489 to 503 form an integral part of these financial statements.
97 Gurit Holding AG Bank of America Merrill Lynch 5,079
(151) Inficon Holding AG Reg Bank of America Merrill Lynch (1,983)
810 Kardex AG Reg Bank of America Merrill Lynch 548
204 Kudelski SA Bank of America Merrill Lynch 721
(1,048) LafargeHolcim Ltd Reg Bank of America Merrill Lynch 3,469
375 Lonza Group AG Reg Bank of America Merrill Lynch 4,153
11 Metall Zug AG 'B' Reg Bank of America Merrill Lynch (668)
(300) Nestle SA Reg JP Morgan (743) (3,418) Newron Pharmaceuticals SpA Bank of America
Merrill Lynch 1,036 (1,039) Novartis AG Reg JP Morgan (7,453) (534) Panalpina Welttransport Bank of America
Holding AG Reg Merrill Lynch (2,817) 308 Rieter Holding AG Reg Bank of America
Merrill Lynch 3,258 (11) Santhera Pharmaceutical Bank of America
Holding AG Reg Merrill Lynch (30) (1,043) Sunrise Communications Bank of America
Group AG Merrill Lynch (1,032) (438) Swiss Life Holding AG Reg JP Morgan (8,407) (1,511) Swissquote Group Bank of America
Holding SA Reg Merrill Lynch (396) 55 U-Blox AG Bank of America
Merrill Lynch 711 (1,993) UBS Group AG Reg JP Morgan (1,245) 2 Valiant Holding AG Reg * Bank of America
Merrill Lynch — 247 Valora Holding AG Reg Bank of America
Merrill Lynch 6,743 (141) Zurich Insurance Group AG Bank of America
Merrill Lynch (4,462)
(12,025)
Taiwan 32,000 AURAS Technology Co Ltd Bank of America
Merrill Lynch 7,747 27,000 Basso Industry Corp Bank of America
Merrill Lynch (2,645) 3,000 Chen Full International Co Ltd Bank of America
Merrill Lynch (298) 60,000 E Ink Holdings Inc Bank of America
Merrill Lynch 2,446 121,000 Giantplus Technology Co Ltd Bank of America
Merrill Lynch (864) 5,000 Global Lighting Bank of America
Technologies Inc Merrill Lynch 917 (7,000) Hotai Motor Co Ltd Bank of America
Merrill Lynch 109 (19,000) HTC Corp Bank of America
Merrill Lynch (921) 33,000 Micro-Star Bank of America
International Co Ltd Merrill Lynch (982) 4,000 Pharmally International Bank of America
Holding Co Ltd Merrill Lynch 2,658 (6,000) Quanta Computer Inc Bank of America
Merrill Lynch (985) 47,000 Taiwan Semiconductor Co Ltd Bank of America
Merrill Lynch 1,915 18,000 Walsin Technology Corp Bank of America
Merrill Lynch 2,551
11,648
Turkey 2,950 Bolu Cimento Sanayii AS Bank of America
Merrill Lynch 25 4,873 Celebi Hava Servisi AS Bank of America
Merrill Lynch (4,053) 34 EGE Endustri VE Ticaret AS Bank of America
Merrill Lynch (404) 46,538 EGE Seramik Sanayi ve Bank of America
Ticaret AS Merrill Lynch 1,969 496 Goodyear Lastikleri TAS Bank of America
Merrill Lynch (5,051) (13,783) Gubre Fabrikalari TAS Bank of America
Merrill Lynch (774) 32,017 Kordsa Global Endustriyel
Iplik ve Kord Bezi Sanayi Bank of America ve Ticaret AS Merrill Lynch (1,419)
99 Tat Gida Sanayi AS Bank of America Merrill Lynch (18)
(7,075) Tofas Turk Otomobil Bank of America Fabrikasi AS Merrill Lynch 346
(131) Turk Hava Yollari AO Bank of America Merrill Lynch 28
2,703 Verusa Holding AS Bank of America Merrill Lynch (552)
(14,514) Yazicilar Holding AS 'A' Bank of America Merrill Lynch 9,997
94
United Kingdom 575 888 Holdings Plc Bank of America
Merrill Lynch 133 (4,920) AA Plc Bank of America
Merrill Lynch (749) 5,513 Admiral Group Plc JP Morgan 3,873 (7,302) Allied Minds Plc Bank of America
Merrill Lynch 4,416 (9,788) Antofagasta Plc Bank of America
Merrill Lynch 5,832 (11,234) Avanti Communications Bank of America
Group Plc Merrill Lynch 3,112 (4,248) Babcock International Bank of America
Group Plc Merrill Lynch (5,147) (18,135) Balfour Beatty Plc Bank of America
Merrill Lynch (2,931) (137) BBA Aviation Plc Bank of America
Merrill Lynch (7) 1,130 Berkeley Group Holdings Plc Bank of America
Merrill Lynch 3,368 1,490 BGEO Group Plc Bank of America
Merrill Lynch 2,367 2,362 BHP Billiton Plc Bank of America
Merrill Lynch 295 (117) Brammer Plc Bank of America
Merrill Lynch (26) (38,000) BT Group Plc Bank of America
Merrill Lynch (5,259) (2,188) BT Group Plc JP Morgan (226) (53,895) Cairn Homes Plc Bank of America
Merrill Lynch 2,005 130,000 Centamin Plc JP Morgan (28,937) (16,261) Circassia Pharmaceuticals Plc Bank of America
Merrill Lynch (47) (14,186) Countryside Properties Plc Bank of America
Merrill Lynch (523) 26,197 Darty Plc Bank of America
Merrill Lynch (268) 38,770 Direct Line Insurance
Group Plc JP Morgan (2,328) 15,133 DX Group Plc Bank of America
Merrill Lynch (554)
BlackRock Multi-Manager Alternative Strategies Fund continued
Switzerland continued

Contracts for difference as at 31 May 2016
Holding
Description Counterparty
Unrealised appreciation/
(depreciation) USD
Holding
Description Counterparty
Unrealised appreciation/
(depreciation) USD
* Amounts which are less than 0.5 USD have been rounded down to zero.
344 BlackRock Strategic Funds (BSF)
The notes on pages 489 to 503 form an integral part of these financial statements.
BlackRock Multi-Manager Alternative Strategies Fund continued
37,407 Evraz Plc Bank of America Merrill Lynch (8,373)
89,681 Ferrexpo Plc Bank of America Merrill Lynch (8,536)
21,762 Fevertree Drinks Plc JP Morgan 33,780 13,900 Fresnillo Plc JP Morgan (5,699) 1,015 Genus Plc Bank of America
Merrill Lynch 372 (2,320) GlaxoSmithKline Plc JP Morgan 798 (1,381) GW Pharmaceuticals Plc Bank of America
Merrill Lynch (1,603) 32,720 Highland Gold Mining Ltd Bank of America
Merrill Lynch (3,000) (32,600) HSBC Holdings Plc JP Morgan (7,961) (7,908) Hunting Plc Bank of America
Merrill Lynch (242) 21,882 Informa Plc JP Morgan 4,006 (21,634) J Sainsbury Plc JP Morgan (1,188) 3,372 JD Sports Fashion Plc Bank of America
Merrill Lynch 3,190 13,229 JD Sports Fashion Plc JP Morgan 7,943 12,806 Kainos Group Plc Bank of America
Merrill Lynch 328 213,000 Lloyds Banking Group Plc Bank of America
Merrill Lynch 17,655 174,853 Lloyds Banking Group Plc JP Morgan 16,588 (3,484) Marks & Spencer Group Plc JP Morgan 1,791 11,481 Melrose Industries Plc Bank of America
Merrill Lynch 1,894 (98,521) Nanoco Group Plc Bank of America
Merrill Lynch (7,553) (6,759) Nostrum Oil & Gas Plc Bank of America
Merrill Lynch (2,351) (47,949) Ophir Energy Plc Bank of America
Merrill Lynch 2,352 36,617 Paysafe Group Plc JP Morgan 20,644 1,245 Persimmon Plc Bank of America
Merrill Lynch 117 5,596 Petrofac Ltd Bank of America
Merrill Lynch (4,900) 7,098 Plus500 Ltd Bank of America
Merrill Lynch 2,978 6,729 Redde Plc Bank of America
Merrill Lynch 1,035 4,824 Ros Agro Plc GDR RegS Bank of America
Merrill Lynch (17,066) 2,589 Royal Dutch Shell Plc 'B' Bank of America
Merrill Lynch (3,866) 19,811 RPC Group Plc JP Morgan 14,796 101 RPS Group Plc Bank of America
Merrill Lynch 13 3,027 Saga Plc Bank of America
Merrill Lynch 23 (42,155) Serco Group Plc Bank of America
Merrill Lynch (7,293) 2 Skyepharma Plc* Bank of America
Merrill Lynch — 41,439 Smith & Nephew Plc JP Morgan 7,282 5,551 Soco International Plc Bank of America
Merrill Lynch (1,978) (7,279) Standard Chartered Plc Bank of America
Merrill Lynch 880 (1,768) Ted Baker Plc Bank of America
Merrill Lynch (1,278) 91 Telecom Plus Plc Bank of America
Merrill Lynch 6 19,928 Telit Communications Plc Bank of America
Merrill Lynch 8,491 (19,373) Tesco Plc JP Morgan (2,411) (6,277) Topps Tiles Plc Bank of America
Merrill Lynch (643)
(45,362) Tungsten Corp Plc Bank of America Merrill Lynch 1,291
(25,715) Vectura Group Plc Bank of America Merrill Lynch 2,714
7,363 Vedanta Resources Plc Bank of America Merrill Lynch 159
(2,065,868) Vodafone Group Plc JP Morgan (388,208) (43) Watchstone Group Plc Bank of America
Merrill Lynch (3) 8,774 WH Smith Plc JP Morgan 10,793 (1,032) Whitbread Plc Bank of America
Merrill Lynch (5,848) 3,131 WM Morrison Bank of America
Supermarkets Plc Merrill Lynch 366
(339,316)
United States (1,251) 21Vianet Group Inc ADR Bank of America
Merrill Lynch 5,243 (1,147) 2U Inc Bank of America
Merrill Lynch 206 (156) 3D Systems Corp Bank of America
Merrill Lynch 661 (104) 58.com Inc ADR Bank of America
Merrill Lynch (15) (6,804) Abbott Laboratories JP Morgan (10,055) 365 Abercrombie & Fitch Co 'A' Bank of America
Merrill Lynch (2,511) 313 Abiomed Inc Bank of America
Merrill Lynch 871 (1,147) Acadia Healthcare Co Inc Bank of America
Merrill Lynch 5,015 (313) ACADIA Pharmaceuticals Inc Bank of America
Merrill Lynch (2,429) 1,199 Acorda Therapeutics Inc Bank of America
Merrill Lynch 2,803 (3,548) Activision Blizzard Inc JP Morgan (6,652) (8,844) Activision Blizzard Inc Morgan Stanley (7,627) 1,784 Actuant Corp 'A' Bank of America
Merrill Lynch 803 (2,067) Adobe Systems Inc JP Morgan (9,684) 1,720 Advanced Energy Bank of America
Industries Inc Merrill Lynch 9,351 (1,147) Advaxis Inc Bank of America
Merrill Lynch (1,934) 313 AerCap Holdings NV Bank of America
Merrill Lynch 59 (2,137) Aerie Pharmaceuticals Inc Bank of America
Merrill Lynch (4,974) (100) Agios Pharmaceuticals Inc Bank of America
Merrill Lynch (643) 104 Alaska Air Group Inc Bank of America
Merrill Lynch (159) (2,189) Alder Biopharmaceuticals Inc Bank of America
Merrill Lynch (7,580) (261) Alere Inc Bank of America
Merrill Lynch (11) (208) Alibaba Group Bank of America
Holding Ltd ADR Merrill Lynch (603) 282 Align Technology Inc Bank of America
Merrill Lynch 1,991 (469) Allegheny Technologies Inc Bank of America
Merrill Lynch 851 (938) Allegion Plc Bank of America
Merrill Lynch (2,249) (208) Alnylam Pharmaceuticals Inc Bank of America
Merrill Lynch (684) 2,606 Alon USA Energy Inc Bank of America
Merrill Lynch (7,583) 52 Alphabet Inc 'A' Bank of America
Merrill Lynch 1,376
United Kingdom continued United Kingdom continued

Contracts for difference as at 31 May 2016
Holding
Description Counterparty
Unrealised appreciation/
(depreciation) USD
Holding
Description Counterparty
Unrealised appreciation/
(depreciation) USD
Annual Report and Audited Accounts 345
The notes on pages 489 to 503 form an integral part of these financial statements.
2,293 Altisource Portfolio Bank of America Solutions SA Merrill Lynch (4,098)
104 AMAG Pharmaceuticals Inc Bank of America Merrill Lynch 174
261 Amdocs Ltd Bank of America Merrill Lynch 328
417 Amgen Inc Bank of America Merrill Lynch (188)
(3,388) Amicus Therapeutics Inc Bank of America Merrill Lynch (66)
313 AMN Healthcare Services Inc Bank of America Merrill Lynch 359
(625) Anacor Pharmaceuticals Inc Bank of America Merrill Lynch (20,810)
329 ANI Pharmaceuticals Inc Bank of America Merrill Lynch 2,905
(21,760) Apache Corp JP Morgan (104,972) 116 Apogee Enterprises Inc Bank of America
Merrill Lynch 535 (8,578) Apple Inc JP Morgan (54,241) 625 Archrock Inc Bank of America
Merrill Lynch 501 (4,482) ARIAD Pharmaceuticals Inc Bank of America
Merrill Lynch (6,419) (3,005) AT&T Inc JP Morgan (781) 657 Atwood Oceanics Inc Bank of America
Merrill Lynch 920 1,459 Autohome Inc ADR Bank of America
Merrill Lynch (4,741) (52) Axis Capital Holdings Ltd Bank of America
Merrill Lynch (12) (209) Baker Hughes Inc Bank of America
Merrill Lynch (228) (886) Ball Corp Bank of America
Merrill Lynch (632) 834 Bankrate Inc Bank of America
Merrill Lynch 261 52 Barnes & Noble Inc Bank of America
Merrill Lynch (4) 313 Barrick Gold Corp Bank of America
Merrill Lynch (363) (782) Baxalta Inc Bank of America
Merrill Lynch (2,995) 104 Baxter International Inc Bank of America
Merrill Lynch (3) (104) Belden Inc Bank of America
Merrill Lynch (140) 1,459 Big Lots Inc Bank of America
Merrill Lynch 10,103 313 Bio-Techne Corp Bank of America
Merrill Lynch 5,359 156 Biogen Inc Bank of America
Merrill Lynch 2,599 (170) BioMarin Pharmaceutical Inc Bank of America
Merrill Lynch (950) 521 Blackhawk Network Bank of America
Holdings Inc Merrill Lynch 1,063 (573) Bluebird Bio Inc Bank of America
Merrill Lynch (435) 52 BofI Holding Inc Bank of America
Merrill Lynch (89) (156) BorgWarner Inc Bank of America
Merrill Lynch 318 (4,482) Box Inc 'A' Bank of America
Merrill Lynch 1,788 2,189 Boyd Gaming Corp Bank of America
Merrill Lynch 544 2,762 Briggs & Stratton Corp Bank of America
Merrill Lynch 3,138 (274) Bristol-Myers Squibb Co JP Morgan 25
5,629 Brocade Communications Bank of America Systems Inc Merrill Lynch 4,008
1,668 Bruker Corp Bank of America Merrill Lynch (2,759)
(1,928) Builders FirstSource Inc Bank of America Merrill Lynch (1,041)
1,407 Cabot Corp Bank of America Merrill Lynch (3,533)
(1,355) Cabot Oil & Gas Corp Bank of America Merrill Lynch (715)
5,264 Caesars Entertainment Corp Bank of America Merrill Lynch 3,161
2,345 Callon Petroleum Co Bank of America Merrill Lynch 2,542
(2,971) CARBO Ceramics Inc Bank of America Merrill Lynch 4,900
(625) CarMax Inc Bank of America Merrill Lynch (575)
730 Carpenter Technology Corp Bank of America Merrill Lynch (2,270)
1,459 Cash America International Inc Bank of America Merrill Lynch (588)
(1,251) Cavium Inc Bank of America Merrill Lynch (3,339)
313 CBOE Holdings Inc Bank of America Merrill Lynch 539
(6,567) Celldex Therapeutics Inc Bank of America Merrill Lynch (4,149)
(2,867) Cempra Inc Bank of America Merrill Lynch (4,810)
2,398 CenturyLink Inc Bank of America Merrill Lynch (6,228)
(886) CF Industries Holdings Inc Bank of America Merrill Lynch 3,812
730 Charles River Laboratories Bank of America International Inc Merrill Lynch 5,131
(52) Charter Bank of America Communications Inc 'A' Merrill Lynch 546
(5,904) Check Point Software Technologies Ltd JP Morgan (9,179)
1,511 Cheetah Mobile Inc ADR Bank of America Merrill Lynch (3,324)
(2,033) Chemours Co/The Bank of America Merrill Lynch 783
(1,167) Cheniere Energy Inc Bank of America Merrill Lynch 5,684
(4,935) Chevron Corp JP Morgan (5,519) (4,222) Chimerix Inc Bank of America
Merrill Lynch 4,602 573 China Biologic Products Inc Bank of America
Merrill Lynch 172 (104) Chubb Ltd Bank of America
Merrill Lynch (204) 100 Churchill Downs Inc Bank of America
Merrill Lynch (709) 782 Citrix Systems Inc Bank of America
Merrill Lynch 2,205 (3,231) Clovis Oncology Inc Bank of America
Merrill Lynch (10,747) (2,033) Columbia Pipeline Group Inc Bank of America
Merrill Lynch 166 625 Comfort Systems USA Inc Bank of America
Merrill Lynch 1,322 2,971 Commercial Metals Co Bank of America
Merrill Lynch (2,140) (52) CommScope Holding Co Inc Bank of America
Merrill Lynch (16) (17,297) ConocoPhillips JP Morgan (42,164) (52,745) Corning Inc JP Morgan (111,628)
BlackRock Multi-Manager Alternative Strategies Fund continued
United States continued United States continued

Contracts for difference as at 31 May 2016
Holding
Description Counterparty
Unrealised appreciation/
(depreciation) USD
Holding
Description Counterparty
Unrealised appreciation/
(depreciation) USD
346 BlackRock Strategic Funds (BSF)
The notes on pages 489 to 503 form an integral part of these financial statements.
BlackRock Multi-Manager Alternative Strategies Fund continued
(313) Covanta Holding Corp Bank of America Merrill Lynch (32)
365 Cray Inc Bank of America Merrill Lynch 784
(521) Crocs Inc Bank of America Merrill Lynch (36)
(5,302) Crown Castle International Corp (Reit) JP Morgan (4,929)
1,459 CSG Systems International Inc Bank of America Merrill Lynch (2,898)
(104) CST Brands Inc Bank of America Merrill Lynch (91)
1,147 CVR Energy Inc Bank of America Merrill Lynch (4,889)
(3,961) Cypress Semiconductor Corp Bank of America Merrill Lynch (4,548)
(313) Danaher Corp Bank of America Merrill Lynch (470)
52 Darden Restaurants Inc Bank of America Merrill Lynch 192
(782) Deere & Co Bank of America Merrill Lynch 1,171
730 Depomed Inc Bank of America Merrill Lynch 974
834 DeVry Education Group Inc Bank of America Merrill Lynch 358
(1,042) DexCom Inc Bank of America Merrill Lynch 260
1,653 DHT Holdings Inc Bank of America Merrill Lynch (479)
(2,606) Diebold Inc Bank of America Merrill Lynch 309
2,398 Discovery Bank of America Communications Inc 'A' Merrill Lynch 1,048
(730) Dollar Tree Inc Bank of America Merrill Lynch (7,425)
(7,321) Dollar Tree Inc Morgan Stanley (82,129) (886) Dominion Resources Inc/VA Bank of America
Merrill Lynch (118) (1,876) Dynavax Technologies Corp Bank of America
Merrill Lynch 454 (14,619) Electronic Arts Inc JP Morgan (114,000) (7,266) Electronic Arts Inc Morgan Stanley (11,894) 1,511 Emergent BioSolutions Inc Bank of America
Merrill Lynch 8,299 2,554 Enanta Pharmaceuticals Inc Bank of America
Merrill Lynch (10,635) (417) Endurance Specialty Bank of America
Holdings Ltd Merrill Lynch (1,501) 3,145 Ensco Plc 'A' Bank of America
Merrill Lynch (6,384) (417) Envestnet Inc Bank of America
Merrill Lynch (847) (8,761) EOG Resources Inc JP Morgan (20,611) (2,077) Equinix Inc (Reit) JP Morgan (49,066) (2,554) Esperion Therapeutics Inc Bank of America
Merrill Lynch (1,405) (4,852) Estee Lauder Cos Inc/The 'A' Morgan Stanley (7,261) 466 Euronet Worldwide Inc Bank of America
Merrill Lynch 1,198 (4,951) Exact Sciences Corp Bank of America
Merrill Lynch (49) 208 Express Inc Bank of America
Merrill Lynch (772) (416) FactSet Research Systems Inc Bank of America
Merrill Lynch (3,807) 417 Ferrari NV Bank of America
Merrill Lynch (155) (834) Fiesta Restaurant Group Inc Bank of America
Merrill Lynch 5,454
(1,251) FireEye Inc Bank of America Merrill Lynch 197
990 Five Prime Therapeutics Inc Bank of America Merrill Lynch (1,553)
(208) FMC Corp Bank of America Merrill Lynch (959)
(23,316) Ford Motor Co Morgan Stanley (6,958) 261 Francesca's Holdings Corp Bank of America
Merrill Lynch (1) 2,137 GameStop Corp 'A' Bank of America
Merrill Lynch (7,471) 782 Gilead Sciences Inc Bank of America
Merrill Lynch (1,116) 573 Globus Medical Inc 'A' Bank of America
Merrill Lynch 331 1,876 GNC Holdings Inc 'A' Bank of America
Merrill Lynch 1,910 (4,587) Gogo Inc Bank of America
Merrill Lynch (3,049) (3,648) Golar LNG Ltd Bank of America
Merrill Lynch (3,911) (417) Goldman Sachs Group Inc/The Bank of America
Merrill Lynch 494 (1,564) GoPro Inc 'A' Bank of America
Merrill Lynch (260) (208) Green Plains Inc Bank of America
Merrill Lynch (700) 1,355 Greenbrier Cos Inc/The Bank of America
Merrill Lynch (1,246) 417 Guess? Inc Bank of America
Merrill Lynch (1,122) (1,668) Habit Restaurants Inc/The 'A' Bank of America
Merrill Lynch 260 (52) Hain Celestial Group Inc/The Bank of America
Merrill Lynch (24) (1,981) Hanesbrands Inc Bank of America
Merrill Lynch 1,117 1,564 Hawaiian Holdings Inc Bank of America
Merrill Lynch (2,933) (1,042) Heartland Express Inc Bank of America
Merrill Lynch (333) 469 Herman Miller Inc Bank of America
Merrill Lynch 647 (2,970) Heron Therapeutics Inc Bank of America
Merrill Lynch 2,101 (2,436) Hess Corp JP Morgan (11,748) (986) Hexcel Corp Bank of America
Merrill Lynch 1,410 (625) Hilton Worldwide Holdings Inc Bank of America
Merrill Lynch 794 469 HollyFrontier Corp Bank of America
Merrill Lynch (1,034) 890 HP Inc Bank of America
Merrill Lynch 868 (339) HubSpot Inc Bank of America
Merrill Lynch (814) 521 Hyatt Hotels Corp 'A' Bank of America
Merrill Lynch (1,761) 5,473 Iconix Brand Group Inc Bank of America
Merrill Lynch (4,434) (156) iKang Healthcare Bank of America
Group Inc ADR Merrill Lynch (180) 208 Illumina Inc Bank of America
Merrill Lynch 2,009 (845) ImmunoGen Inc Bank of America
Merrill Lynch 1,048 1,459 INC Research Holdings Inc 'A' Bank of America
Merrill Lynch (3,662) (61,023) Infosys Ltd ADR JP Morgan (40,536) 1,824 Ingram Micro Inc 'A' Bank of America
Merrill Lynch (556)
United States continued United States continued
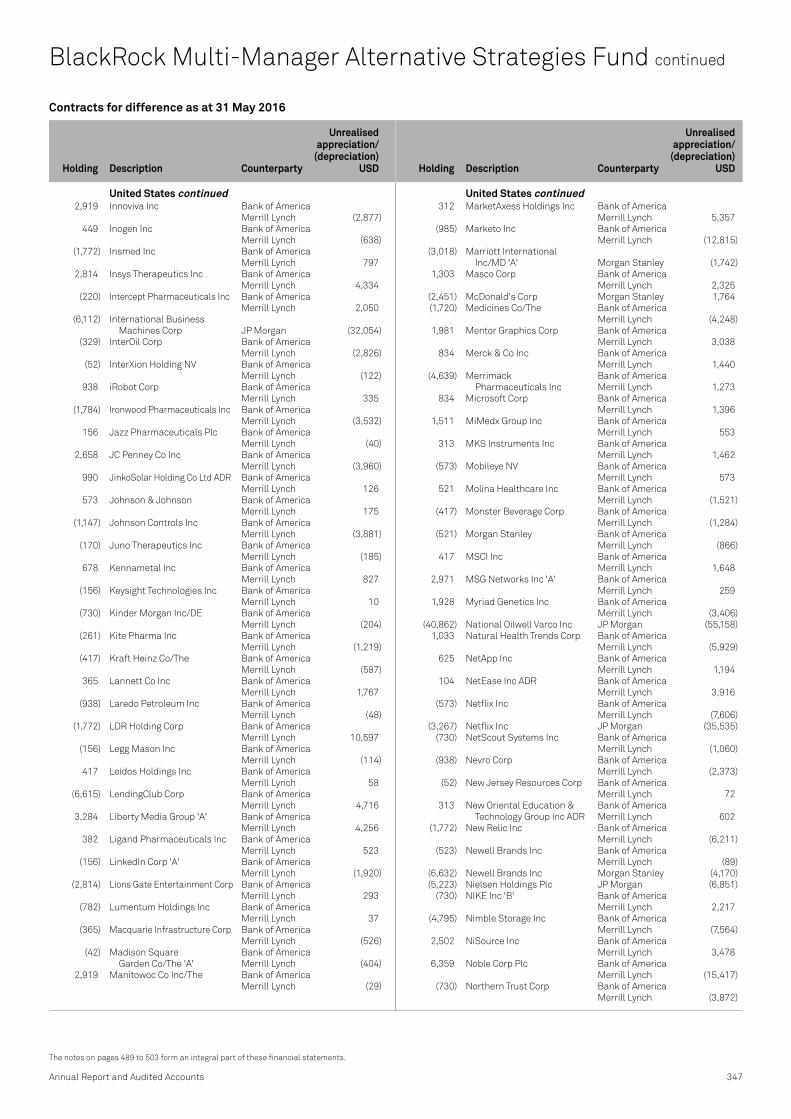
Contracts for difference as at 31 May 2016
Holding
Description Counterparty
Unrealised appreciation/
(depreciation) USD
Holding
Description Counterparty
Unrealised appreciation/
(depreciation) USD
Annual Report and Audited Accounts 347
The notes on pages 489 to 503 form an integral part of these financial statements.
2,919 Innoviva Inc Bank of America Merrill Lynch (2,877)
449 Inogen Inc Bank of America Merrill Lynch (638)
(1,772) Insmed Inc Bank of America Merrill Lynch 797
2,814 Insys Therapeutics Inc Bank of America Merrill Lynch 4,334
(220) Intercept Pharmaceuticals Inc Bank of America Merrill Lynch 2,050
(6,112) International Business Machines Corp JP Morgan (32,054)
(329) InterOil Corp Bank of America Merrill Lynch (2,826)
(52) InterXion Holding NV Bank of America Merrill Lynch (122)
938 iRobot Corp Bank of America Merrill Lynch 335
(1,784) Ironwood Pharmaceuticals Inc Bank of America Merrill Lynch (3,532)
156 Jazz Pharmaceuticals Plc Bank of America Merrill Lynch (40)
2,658 JC Penney Co Inc Bank of America Merrill Lynch (3,960)
990 JinkoSolar Holding Co Ltd ADR Bank of America Merrill Lynch 126
573 Johnson & Johnson Bank of America Merrill Lynch 175
(1,147) Johnson Controls Inc Bank of America Merrill Lynch (3,881)
(170) Juno Therapeutics Inc Bank of America Merrill Lynch (185)
678 Kennametal Inc Bank of America Merrill Lynch 827
(156) Keysight Technologies Inc Bank of America Merrill Lynch 10
(730) Kinder Morgan Inc/DE Bank of America Merrill Lynch (204)
(261) Kite Pharma Inc Bank of America Merrill Lynch (1,219)
(417) Kraft Heinz Co/The Bank of America Merrill Lynch (587)
365 Lannett Co Inc Bank of America Merrill Lynch 1,767
(938) Laredo Petroleum Inc Bank of America Merrill Lynch (48)
(1,772) LDR Holding Corp Bank of America Merrill Lynch 10,597
(156) Legg Mason Inc Bank of America Merrill Lynch (114)
417 Leidos Holdings Inc Bank of America Merrill Lynch 58
(6,615) LendingClub Corp Bank of America Merrill Lynch 4,716
3,284 Liberty Media Group 'A' Bank of America Merrill Lynch 4,256
382 Ligand Pharmaceuticals Inc Bank of America Merrill Lynch 523
(156) LinkedIn Corp 'A' Bank of America Merrill Lynch (1,920)
(2,814) Lions Gate Entertainment Corp Bank of America Merrill Lynch 293
(782) Lumentum Holdings Inc Bank of America Merrill Lynch 37
(365) Macquarie Infrastructure Corp Bank of America Merrill Lynch (526)
(42) Madison Square Bank of America Garden Co/The 'A' Merrill Lynch (404)
2,919 Manitowoc Co Inc/The Bank of America Merrill Lynch (29)
312 MarketAxess Holdings Inc Bank of America Merrill Lynch 5,357
(985) Marketo Inc Bank of America Merrill Lynch (12,815)
(3,018) Marriott International Inc/MD 'A' Morgan Stanley (1,742)
1,303 Masco Corp Bank of America Merrill Lynch 2,325
(2,451) McDonald's Corp Morgan Stanley 1,764 (1,720) Medicines Co/The Bank of America
Merrill Lynch (4,248) 1,981 Mentor Graphics Corp Bank of America
Merrill Lynch 3,038 834 Merck & Co Inc Bank of America
Merrill Lynch 1,440 (4,639) Merrimack Bank of America
Pharmaceuticals Inc Merrill Lynch 1,273 834 Microsoft Corp Bank of America
Merrill Lynch 1,396 1,511 MiMedx Group Inc Bank of America
Merrill Lynch 553 313 MKS Instruments Inc Bank of America
Merrill Lynch 1,462 (573) Mobileye NV Bank of America
Merrill Lynch 573 521 Molina Healthcare Inc Bank of America
Merrill Lynch (1,521) (417) Monster Beverage Corp Bank of America
Merrill Lynch (1,284) (521) Morgan Stanley Bank of America
Merrill Lynch (866) 417 MSCI Inc Bank of America
Merrill Lynch 1,648 2,971 MSG Networks Inc 'A' Bank of America
Merrill Lynch 259 1,928 Myriad Genetics Inc Bank of America
Merrill Lynch (3,406) (40,862) National Oilwell Varco Inc JP Morgan (55,158) 1,033 Natural Health Trends Corp Bank of America
Merrill Lynch (5,929) 625 NetApp Inc Bank of America
Merrill Lynch 1,194 104 NetEase Inc ADR Bank of America
Merrill Lynch 3,916 (573) Netflix Inc Bank of America
Merrill Lynch (7,606) (3,267) Netflix Inc JP Morgan (35,535) (730) NetScout Systems Inc Bank of America
Merrill Lynch (1,060) (938) Nevro Corp Bank of America
Merrill Lynch (2,373) (52) New Jersey Resources Corp Bank of America
Merrill Lynch 72 313 New Oriental Education & Bank of America
Technology Group Inc ADR Merrill Lynch 602 (1,772) New Relic Inc Bank of America
Merrill Lynch (6,211) (523) Newell Brands Inc Bank of America
Merrill Lynch (89) (6,632) Newell Brands Inc Morgan Stanley (4,170) (5,223) Nielsen Holdings Plc JP Morgan (6,851) (730) NIKE Inc 'B' Bank of America
Merrill Lynch 2,217 (4,795) Nimble Storage Inc Bank of America
Merrill Lynch (7,564) 2,502 NiSource Inc Bank of America
Merrill Lynch 3,478 6,359 Noble Corp Plc Bank of America
Merrill Lynch (15,417) (730) Northern Trust Corp Bank of America
Merrill Lynch (3,872)
BlackRock Multi-Manager Alternative Strategies Fund continued
United States continued United States continued

Contracts for difference as at 31 May 2016
Holding
Description Counterparty
Unrealised appreciation/
(depreciation) USD
Holding
Description Counterparty
Unrealised appreciation/
(depreciation) USD
348 BlackRock Strategic Funds (BSF)
The notes on pages 489 to 503 form an integral part of these financial statements.
BlackRock Multi-Manager Alternative Strategies Fund continued
(4,013) NorthStar Asset Management Bank of America Group Inc/New York Merrill Lynch 120
(5,681) Novavax Inc Bank of America Merrill Lynch (6,255)
156 Nu Skin Enterprises Inc 'A' Bank of America Merrill Lynch 16
886 NVIDIA Corp Bank of America Merrill Lynch 5,053
(16,929) Occidental Petroleum Corp JP Morgan (7,984) (156) Olin Corp Bank of America
Merrill Lynch (165) 208 Omnicom Group Inc Bank of America
Merrill Lynch 20 (2,803) Omnicom Group Inc JP Morgan 2,098 (365) OneMain Holdings Inc Bank of America
Merrill Lynch 223 (376) Ophthotech Corp Bank of America
Merrill Lynch (2,493) 1,017 Outerwall Inc Bank of America
Merrill Lynch 81 (3,753) Pandora Media Inc Bank of America
Merrill Lynch (6,970) (8,459) Parker-Hannifin Corp Morgan Stanley (28,816) (1,459) Pattern Energy Group Inc Bank of America
Merrill Lynch (876) (382) Paylocity Holding Corp Bank of America
Merrill Lynch 487 156 PBF Energy Inc 'A' Bank of America
Merrill Lynch (588) (261) PG&E Corp Bank of America
Merrill Lynch (398) (313) Platform Specialty Bank of America
Products Corp Merrill Lynch 39 (1,366) PPG Industries Inc Morgan Stanley (1,946) 1,355 PRA Health Sciences Inc Bank of America
Merrill Lynch 241 (3,664) Praxair Inc Morgan Stanley 911 990 Prestige Brands Holdings Inc Bank of America
Merrill Lynch (2,495) (3,596) PTC Therapeutics Inc Bank of America
Merrill Lynch (2,050) (678) Puma Biotechnology Inc Bank of America
Merrill Lynch (6,994) (4,430) Pure Storage Inc 'A' Bank of America
Merrill Lynch 11,911 678 QEP Resources Inc Bank of America
Merrill Lynch 496 127 QLogic Corp Bank of America
Merrill Lynch 98 (417) Qorvo Inc Bank of America
Merrill Lynch (1,490) 2,762 Quanta Services Inc Bank of America
Merrill Lynch 788 990 Quintiles Transnational Bank of America
Holdings Inc Merrill Lynch (2,044) (782) Qunar Cayman Bank of America
Islands Ltd ADR Merrill Lynch 4,958 (1,355) Radius Health Inc Bank of America
Merrill Lynch (2,487) 2,606 Rayonier Advanced Bank of America
Materials Inc Merrill Lynch 7,028 (3,909) Relypsa Inc Bank of America
Merrill Lynch (8,692) 2,398 Rent-A-Center Inc/TX Bank of America
Merrill Lynch (1,698) 1,042 Repligen Corp Bank of America
Merrill Lynch (2,386) (104) Restoration Hardware Bank of America
Holdings Inc Merrill Lynch 1,067 220 REX American Resources Corp Bank of America
Merrill Lynch 902
(469) Reynolds American Inc Bank of America Merrill Lynch 386
(886) Rice Energy Inc Bank of America Merrill Lynch (1,867)
(5,681) Rite Aid Corp Bank of America Merrill Lynch 1,875
(1,147) Ross Stores Inc Bank of America Merrill Lynch 2,145
4,222 Rovi Corp Bank of America Merrill Lynch (2,072)
2,345 Rowan Cos Plc 'A' Bank of America Merrill Lynch (2,801)
(313) Sage Therapeutics Inc Bank of America Merrill Lynch 367
(2,658) Santander Consumer Bank of America USA Holdings Inc Merrill Lynch 449
(13,904) Schlumberger Ltd JP Morgan (45,971) (261) Sensata Technologies Bank of America
Holding NV Merrill Lynch 133 (469) Shake Shack Inc 'A' Bank of America
Merrill Lynch (525) 573 Ship Finance International Ltd Bank of America
Merrill Lynch 356 (365) Signet Jewelers Ltd Bank of America
Merrill Lynch 2,861 1,147 Silicon Motion Bank of America
Technology Corp ADR Merrill Lynch 6,479 (3,474) SLM Corp Bank of America
Merrill Lynch (208) 521 Smith & Wesson Holding Corp Bank of America
Merrill Lynch 867 930 SouFun Holdings Ltd ADR Bank of America
Merrill Lynch (172) (1,080) Southwestern Energy Co Bank of America
Merrill Lynch (281) (509) Spark Therapeutics Inc Bank of America
Merrill Lynch (11,865) (2,658) Spectranetics Corp/The Bank of America
Merrill Lynch (3,562) 834 Steel Dynamics Inc Bank of America
Merrill Lynch 949 (1,981) Stifel Financial Corp Bank of America
Merrill Lynch (10,584) 2,189 Sucampo Bank of America
Pharmaceuticals Inc 'A' Merrill Lynch 2,320 (261) Summit Materials Inc 'A' Bank of America
Merrill Lynch (209) (1,928) SunPower Corp Bank of America
Merrill Lynch 3,527 1,876 Supernus Pharmaceuticals Inc Bank of America
Merrill Lynch 3,909 39 SuperValu Inc Bank of America
Merrill Lynch (16) (42) Synergy Resources Corp Bank of America
Merrill Lynch 49 730 SYNNEX Corp Bank of America
Merrill Lynch 5,577 1,095 TAL Education Group ADR Bank of America
Merrill Lynch 292 938 Target Corp Bank of America
Merrill Lynch (8,717) (3,439) Target Corp Morgan Stanley (3,283) (834) TCF Financial Corp Bank of America
Merrill Lynch (642) (678) Team Health Holdings Inc Bank of America
Merrill Lynch (3,763) 521 Tech Data Corp Bank of America
Merrill Lynch 3,756 313 Teradata Corp Bank of America
Merrill Lynch 468 254 Teradyne Inc Bank of America
Merrill Lynch 208
United States continued United States continued
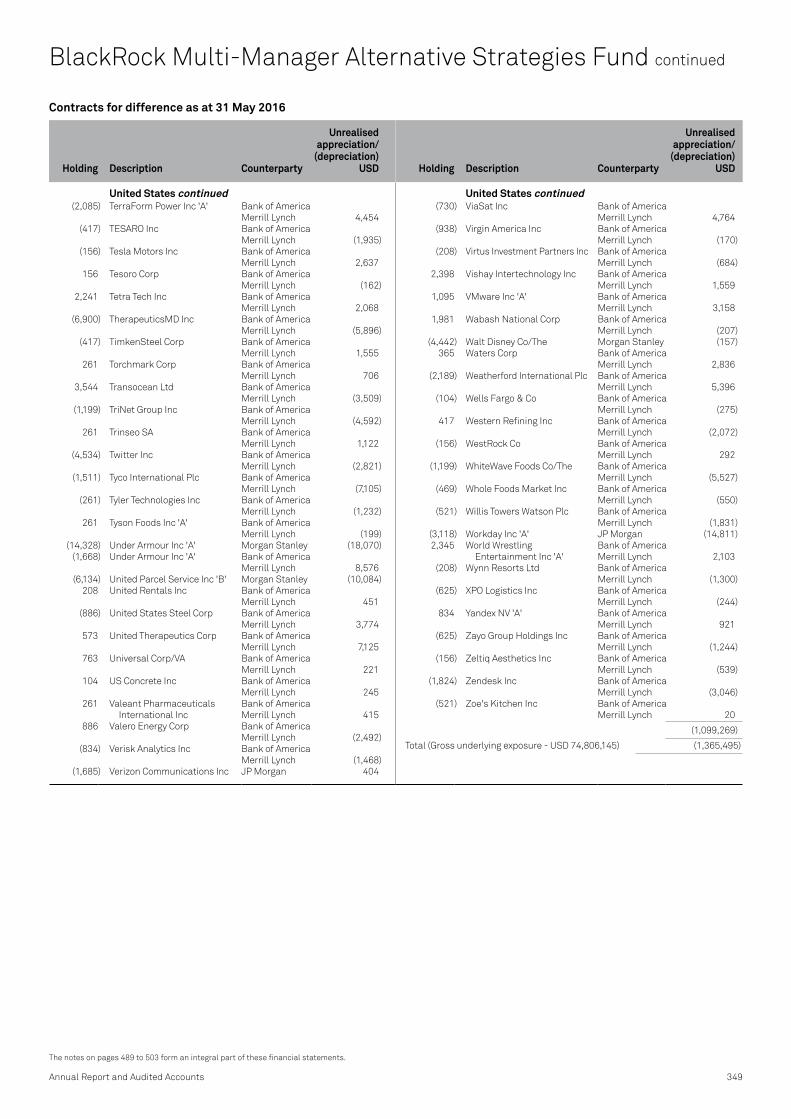
Contracts for difference as at 31 May 2016
Holding
Description Counterparty
Unrealised appreciation/
(depreciation) USD
Holding
Description Counterparty
Unrealised appreciation/
(depreciation) USD
Annual Report and Audited Accounts 349
The notes on pages 489 to 503 form an integral part of these financial statements.
(2,085) TerraForm Power Inc 'A' Bank of America Merrill Lynch 4,454
(417) TESARO Inc Bank of America Merrill Lynch (1,935)
(156) Tesla Motors Inc Bank of America Merrill Lynch 2,637
156 Tesoro Corp Bank of America Merrill Lynch (162)
2,241 Tetra Tech Inc Bank of America Merrill Lynch 2,068
(6,900) TherapeuticsMD Inc Bank of America Merrill Lynch (5,896)
(417) TimkenSteel Corp Bank of America Merrill Lynch 1,555
261 Torchmark Corp Bank of America Merrill Lynch 706
3,544 Transocean Ltd Bank of America Merrill Lynch (3,509)
(1,199) TriNet Group Inc Bank of America Merrill Lynch (4,592)
261 Trinseo SA Bank of America Merrill Lynch 1,122
(4,534) Twitter Inc Bank of America Merrill Lynch (2,821)
(1,511) Tyco International Plc Bank of America Merrill Lynch (7,105)
(261) Tyler Technologies Inc Bank of America Merrill Lynch (1,232)
261 Tyson Foods Inc 'A' Bank of America Merrill Lynch (199)
(14,328) Under Armour Inc 'A' Morgan Stanley (18,070) (1,668) Under Armour Inc 'A' Bank of America
Merrill Lynch 8,576 (6,134) United Parcel Service Inc 'B' Morgan Stanley (10,084) 208 United Rentals Inc Bank of America
Merrill Lynch 451 (886) United States Steel Corp Bank of America
Merrill Lynch 3,774 573 United Therapeutics Corp Bank of America
Merrill Lynch 7,125 763 Universal Corp/VA Bank of America
Merrill Lynch 221 104 US Concrete Inc Bank of America
Merrill Lynch 245 261 Valeant Pharmaceuticals Bank of America
International Inc Merrill Lynch 415 886 Valero Energy Corp Bank of America
Merrill Lynch (2,492) (834) Verisk Analytics Inc Bank of America
Merrill Lynch (1,468) (1,685) Verizon Communications Inc JP Morgan 404
(730) ViaSat Inc Bank of America Merrill Lynch 4,764
(938) Virgin America Inc Bank of America Merrill Lynch (170)
(208) Virtus Investment Partners Inc Bank of America Merrill Lynch (684)
2,398 Vishay Intertechnology Inc Bank of America Merrill Lynch 1,559
1,095 VMware Inc 'A' Bank of America Merrill Lynch 3,158
1,981 Wabash National Corp Bank of America Merrill Lynch (207)
(4,442) Walt Disney Co/The Morgan Stanley (157) 365 Waters Corp Bank of America
Merrill Lynch 2,836 (2,189) Weatherford International Plc Bank of America
Merrill Lynch 5,396 (104) Wells Fargo & Co Bank of America
Merrill Lynch (275) 417 Western Refining Inc Bank of America
Merrill Lynch (2,072) (156) WestRock Co Bank of America
Merrill Lynch 292 (1,199) WhiteWave Foods Co/The Bank of America
Merrill Lynch (5,527) (469) Whole Foods Market Inc Bank of America
Merrill Lynch (550) (521) Willis Towers Watson Plc Bank of America
Merrill Lynch (1,831) (3,118) Workday Inc 'A' JP Morgan (14,811) 2,345 World Wrestling Bank of America
Entertainment Inc 'A' Merrill Lynch 2,103 (208) Wynn Resorts Ltd Bank of America
Merrill Lynch (1,300) (625) XPO Logistics Inc Bank of America
Merrill Lynch (244) 834 Yandex NV 'A' Bank of America
Merrill Lynch 921 (625) Zayo Group Holdings Inc Bank of America
Merrill Lynch (1,244) (156) Zeltiq Aesthetics Inc Bank of America
Merrill Lynch (539) (1,824) Zendesk Inc Bank of America
Merrill Lynch (3,046) (521) Zoe's Kitchen Inc Bank of America
Merrill Lynch 20
(1,099,269)
Total (Gross underlying exposure - USD 74,806,145) (1,365,495)
BlackRock Multi-Manager Alternative Strategies Fund continued
United States continued United States continued

TypeNominal
Value Description CounterpartyExpiration
date
Unrealised appreciation/
(depreciation) USD
Market Value
USD
Swaps as at 31 May 2016
350 BlackRock Strategic Funds (BSF)
The notes on pages 489 to 503 form an integral part of these financial statements.
CDS EUR 275,000 Fund receives default protection on Casino Guichard Perrachon SA Bank of America and pays Fixed 1.000% Merrill Lynch 20/12/2020 (23,111) 19,365
CDS EUR 300,000 Fund receives default protection on Rallye SA and pays Fixed 5.000% Bank of America Merrill Lynch 20/06/2021 (22,329) 27,597
CDS EUR 400,000 Fund receives default protection on ArcelorMittal and pays Fixed 5.000% Barclays Bank 20/12/2020 (76,746) (9,418)
CDS EUR 1,300,000 Fund receives Fixed 1.000% and provides default protection on Deutsche Bank AG Barclays Bank 20/12/2020 9,576 (37,478)
CDS USD 600,000 Fund receives default protection on DISH DBS Corp and pays Fixed 5.000% Barclays Bank 20/12/2020 (24,323) (43,484)
CDS USD 1,500,000 Fund receives default protection on Markit CDX.NA.IG.26 and pays Fixed 1.000% Barclays Bank 20/12/2020 (18,787) (11,187)
CDS USD 300,000 Fund receives default protection on Neiman Marcus Group Inc and pays Fixed 5.000% Barclays Bank 20/12/2020 (27,504) (22,946)
CDS USD 450,000 Fund receives default protection on Republic of Chile and pays Fixed 1.000% Barclays Bank 20/12/2020 (8,210) (308)
CDS USD 1,000,000 Fund receives default protection on Safeway Inc and pays Fixed 1.000% Barclays Bank 20/12/2020 (25,648) 54,042CDS USD 600,000 Fund receives default protection on Xerox Corp and pays Fixed 1.000% Barclays Bank 20/12/2020 (3,985) 33,999CDS USD 500,000 Fund receives default protection on Yum! Brands Inc
and pays Fixed 1.000% Barclays Bank 20/12/2020 (19,915) 20,960CDS USD 300,000 Fund receives default protection on Neiman Marcus Group Inc
and pays Fixed 5.000% Barclays Bank 20/06/2021 5,333 (20,090)CDS USD 95,000 Fund receives default protection on Yum! Brands Inc
and pays Fixed 1.000% Barclays Bank 20/06/2021 (464) 5,429CDS EUR 336,000 Fund receives default protection on Portugal Telecom International
Finance BV and pays Fixed 5.000% JP Morgan 20/03/2020 32,234 284,753CDS EUR 500,000 Fund receives default protection on Brisa Concessao Rodoviaria SA
and pays Fixed 5.000% JP Morgan 20/12/2020 (14,962) (91,848)CDS EUR 2,400,000 Fund receives default protection on Markit iTraxx Europe Senior Financial
Series 24 Version 1 and pays Fixed 1.000% JP Morgan 20/12/2020 (12,562) (21,353)CDS EUR 275,000 Fund receives default protection on Rallye SA and pays Fixed 5.000% JP Morgan 20/12/2020 (67,640) 21,036CDS USD 300,000 Fund receives default protection on Alcoa Inc and pays Fixed 5.000% JP Morgan 20/12/2020 (42,561) (22,601)CDS USD 450,000 Fund receives default protection on Boyd Gaming Corp
and pays Fixed 5.000% JP Morgan 20/12/2020 (5,882) (39,526)CDS USD 450,000 Fund receives default protection on Brazilian Government International
Bond and pays Fixed 1.000% JP Morgan 20/12/2020 (28,667) 41,786CDS USD 400,000 Fund receives default protection on DDR Corp and pays Fixed 1.000% JP Morgan 20/12/2020 1,204 8,316CDS USD 600,000 Fund receives default protection on Devon Energy Corp
and pays Fixed 1.000% JP Morgan 20/12/2020 (86,219) 52,906CDS USD 300,000 Fund receives default protection on Sears Roebuck Acceptance Corp
and pays Fixed 5.000% JP Morgan 20/12/2020 33,824 114,467CDS USD 750,000 Fund receives default protection on Windstream Services LLC
and pays Fixed 5.000% JP Morgan 20/12/2020 (73,785) 55,499CDS USD 400,000 Fund receives default protection on Teck Resources Ltd
and pays Fixed 5.000% JP Morgan 20/06/2021 (69,646) 39,949
Total (Gross underlying exposure - USD 15,917,539) (570,775) 459,865
CDS: Credit Default Swaps
BlackRock Multi-Manager Alternative Strategies Fund continued

Open forward foreign exchange transactions as at 31 May 2016
Currency Purchases Currency Sales CounterpartyMaturity
date
Unrealised appreciation/
(depreciation) USD
Open forward foreign exchange transactions as at 31 May 2016
Currency Purchases Currency Sales CounterpartyMaturity
date
Unrealised appreciation/
(depreciation) USD
Annual Report and Audited Accounts 351
The notes on pages 489 to 503 form an integral part of these financial statements.
BlackRock Multi-Manager Alternative Strategies Fund continued
BRL 8,818,934 USD 2,488,307 Bank of America Merrill Lynch 2/6/2016 (28,285)USD 2,453,888 BRL 8,818,934 Bank of America Merrill Lynch 2/6/2016 (6,134)USD 72,241 CHF 69,444 Bank of America Merrill Lynch 7/6/2016 2,072 USD 283,390 EUR 251,571 Bank of America Merrill Lynch 7/6/2016 2,357 USD 70,056 GBP 48,394 Bank of America Merrill Lynch 7/6/2016 (813)USD 31,304 HKD 243,104 Bank of America Merrill Lynch 7/6/2016 3 USD 311,570 JPY 33,833,000 Bank of America Merrill Lynch 7/6/2016 7,053 USD 31,317 NOK 261,782 Bank of America Merrill Lynch 7/6/2016 (17)USD 66,916 SEK 557,674 Bank of America Merrill Lynch 7/6/2016 (193)USD 113,127 ZAR 1,693,950 Bank of America Merrill Lynch 7/6/2016 5,675 AUD 5,530,247 USD 4,176,207 UBS 15/6/2016 (166,528)CAD 8,603,577 USD 6,661,814 UBS 15/6/2016 (71,496)CAD 767,564 USD 601,699 Bank of America Merrill Lynch 15/6/2016 (13,747)CHF 1,280,160 USD 1,319,368 Bank of America Merrill Lynch 15/6/2016 (25,342)CLP 355,270,726 USD 529,239 Bank of America Merrill Lynch 15/6/2016 (13,757)CZK 14,604,674 USD 616,109 Bank of America Merrill Lynch 15/6/2016 (12,217)EUR 7,468,399 USD 8,429,315 UBS 15/6/2016 (83,942)EUR 2,295,011 USD 2,600,770 Bank of America Merrill Lynch 15/6/2016 (36,268)GBP 3,746,427 USD 5,379,889 UBS 15/6/2016 106,784 GBP 1,421,053 USD 2,032,267 Bank of America Merrill Lynch 15/6/2016 48,877 HUF 201,873,344 USD 732,900 Bank of America Merrill Lynch 15/6/2016 (14,890)ILS 6,570,700 USD 1,743,846 Bank of America Merrill Lynch 15/6/2016 (35,754)INR 404,752,702 USD 6,003,264 Bank of America Merrill Lynch 15/6/2016 10,582 JPY 829,587,751 USD 7,557,767 UBS 15/6/2016 (88,896)JPY 258,012,711 USD 2,327,635 Bank of America Merrill Lynch 15/6/2016 (4,718)KRW 2,640,748,033 USD 2,294,390 Bank of America Merrill Lynch 15/6/2016 (74,643)MXN 33,723,933 USD 1,876,016 Bank of America Merrill Lynch 15/6/2016 (45,320)MYR 2,752,608 USD 698,463 Bank of America Merrill Lynch 15/6/2016 (30,959)NOK 12,418,945 USD 1,514,766 UBS 15/6/2016 (28,303)NOK 4,439,913 USD 543,147 Bank of America Merrill Lynch 15/6/2016 (11,720)NZD 4,910,913 USD 3,306,860 UBS 15/6/2016 10,386 NZD 1,511,800 USD 1,043,052 Bank of America Merrill Lynch 15/6/2016 (21,854)PHP 29,888,436 USD 645,640 Bank of America Merrill Lynch 15/6/2016 (6,544)PLN 763,087 USD 203,243 Bank of America Merrill Lynch 15/6/2016 (8,848)RUB 37,772,418 USD 542,314 Bank of America Merrill Lynch 15/6/2016 28,788 SEK 12,151,289 USD 1,495,184 Bank of America Merrill Lynch 15/6/2016 (32,450)SEK 6,043,846 USD 746,480 UBS 15/6/2016 (18,941)SGD 1,405,757 USD 1,035,576 Bank of America Merrill Lynch 15/6/2016 (15,072)TRY 14,267,385 USD 4,901,486 Bank of America Merrill Lynch 15/6/2016 (74,610)TWD 24,651,978 USD 763,360 Bank of America
Merrill Lynch 15/6/2016 (6,721)USD 2,577,470 AUD 3,473,237 UBS 15/6/2016 59,216 USD 1,683,903 AUD 2,246,995 Bank of America Merrill Lynch 15/6/2016 54,730 USD 5,065,976 CAD 6,542,378 UBS 15/6/2016 54,531 USD 2,987,812 CAD 3,893,230 Bank of America Merrill Lynch 15/6/2016 5,608 USD 2,912,238 CHF 2,815,955 Bank of America Merrill Lynch 15/6/2016 65,782 USD 193,482 CLP 133,396,295 Bank of America Merrill Lynch 15/6/2016 (71)USD 146,089 CZK 3,526,768 Bank of America Merrill Lynch 15/6/2016 260 USD 8,736,241 EUR 7,751,265 UBS 15/6/2016 74,786 USD 2,510,742 EUR 2,228,729 Bank of America Merrill Lynch 15/6/2016 20,305 USD 7,459,699 GBP 5,176,508 UBS 15/6/2016 (121,339)USD 1,645,898 GBP 1,143,596 Bank of America Merrill Lynch 15/6/2016 (28,908)USD 193,733 HUF 54,597,558 Bank of America Merrill Lynch 15/6/2016 (456)USD 1,009,517 ILS 3,881,307 Bank of America Merrill Lynch 15/6/2016 548 USD 785,768 INR 53,057,878 Bank of America Merrill Lynch 15/6/2016 (2,570)USD 5,843,954 JPY 638,511,574 UBS 15/6/2016 95,363 USD 1,999,760 JPY 222,057,722 Bank of America Merrill Lynch 15/6/2016 549 USD 3,322,305 KRW 3,939,833,511 Bank of America Merrill Lynch 15/6/2016 10,578 USD 2,502,633 MXN 44,018,369 Bank of America Merrill Lynch 15/6/2016 113,106 USD 173,152 MYR 707,659 Bank of America Merrill Lynch 15/6/2016 1,545 USD 2,786,248 NOK 23,006,704 UBS 15/6/2016 32,504 USD 183,304 NOK 1,536,981 Bank of America Merrill Lynch 15/6/2016 (662)USD 2,009,694 NZD 2,935,905 UBS 15/6/2016 26,535 USD 201,470 NZD 296,798 Bank of America Merrill Lynch 15/6/2016 988 USD 322,859 PHP 15,127,495 Bank of America Merrill Lynch 15/6/2016 (608)USD 368,886 PLN 1,449,075 Bank of America Merrill Lynch 15/6/2016 (264)USD 7,436 RUB 496,482 Bank of America Merrill Lynch 15/6/2016 (71)USD 2,380,737 SEK 19,823,475 UBS 15/6/2016 (5,551)USD 616,609 SEK 5,104,961 Bank of America Merrill Lynch 15/6/2016 2,090 USD 696,293 SGD 948,256 Bank of America Merrill Lynch 15/6/2016 7,910 USD 983,886 TRY 2,867,587 Bank of America Merrill Lynch 15/6/2016 13,737 USD 4,470,175 TWD 144,889,105 Bank of America Merrill Lynch 15/6/2016 23,120 USD 2,032,158 ZAR 30,395,752 Bank of America Merrill Lynch 15/6/2016 107,166 ZAR 39,961,615 USD 2,579,618 Bank of America Merrill Lynch 15/6/2016 (48,811)USD 450,000 CHF 445,485 JP Morgan 30/6/2016 (646)USD 800,000 DKK 5,312,865 JP Morgan 30/6/2016 1,311 USD 14,536,670 EUR 13,000,000 JP Morgan 30/6/2016 2,198 USD 7,200,000 GBP 4,916,619 JP Morgan 30/6/2016 (1,280)USD 800,000 NOK 6,667,080 JP Morgan 30/6/2016 2,027 USD 600,000 SEK 4,979,341 JP Morgan 30/6/2016 215 BRL 6,165,394 USD 1,688,019 Bank of America Merrill Lynch 5/7/2016 15,905 USD 43,181 BRL 158,056 Bank of America Merrill Lynch 5/7/2016 (501)
(175,530)

Open forward foreign exchange transactions as at 31 May 2016
Currency Purchases Currency Sales CounterpartyMaturity
date
Unrealised appreciation/
(depreciation) USD
Open forward foreign exchange transactions as at 31 May 2016
Currency Purchases Currency Sales CounterpartyMaturity
date
Unrealised appreciation/
(depreciation) USD
Futures contracts as at 31 May 2016
Number of contracts
Currencyof contract Contract/Description
Expiration date
Gross underlying
exposureUSD
Unrealised appreciation/
(depreciation) USD
352 BlackRock Strategic Funds (BSF)
The notes on pages 489 to 503 form an integral part of these financial statements.
BlackRock Multi-Manager Alternative Strategies Fund continued
CHF Hedged Share Class
CHF 4,970 USD 5,018 State Street Bank & Trust Company 15/6/2016 5
5
EUR Hedged Share Class
EUR 34,641,512 USD 39,361,522 State Street Bank & Trust Company 15/6/2016 (652,240)USD 430,016 EUR 381,145 State Street Bank & Trust Company 15/6/2016 4,115
(648,125)
GBP Hedged Share Class
GBP 424,894 USD 613,050 State Street Bank & Trust Company 15/6/2016 9,212 USD 3,457 GBP 2,349 State Street Bank & Trust Company 15/6/2016 17
9,229
Total (Gross underlying exposure - USD 214,094,601) (814,421)
(45) CAD 3 Month Canadian Bankers Acceptances Index June 2017 34,376,009 728 48 EUR 3 Month Euribor June 2017 53,259,024 (154) (1) EUR 3 Month Euribor December 2016 1,109,563 (42) (1) EUR 3 Month Euribor June 2016 1,109,563 (28) (1) EUR 3 Month Euribor June 2017 1,109,563 (28) (15) EUR 3 Month Euribor March 2017 16,643,445 (349) (1) EUR 3 Month Euribor September 2016 1,109,563 (28) (34) CHF 3 Month Euro Swiss Franc March 2017 34,048,720 1,137 1 AUD 90 Day Bank Bill September 2016 723,500 53 26 AUD 90 Day Bank Bill March 2017 18,811,002 (2,092) 81 USD 90 Day Euro March 2017 81,000,000 (16,012) 35 USD 90 Day Euro September 2017 35,000,000 (4,075) 73 GBP 90 Day Sterling June 2017 53,301,155 (5,455) 15 GBP 90 Day Sterling March 2017 10,849,899 (897) 6 EUR AEX Index June 2016 602,550 20,116 (1) EUR AEX Index June 2016 100,425 (447) 1 USD AUD/USD June 2016 72,450 (3,230) (6) AUD Australian 10 Year Bond June 2016 759 1,224 8 AUD Australian 10 Year Bond June 2016 769,142 5,991 9 AUD Australian 3 Year Bond June 2016 733,928 (1,434) (6) USD British Pound June 2016 548,925 (15,019) (2) EUR CAC 40 Index June 2016 100,336 (4,462) 39 EUR CAC 40 Index June 2016 1,956,545 25,076 28 CAD Canadian 10 Year Bond September 2016 2,326,962 (620) 6 USD Canadian Dollar June 2016 459,480 (16,200) (76) USD CBOE Volatility Index June 2016 1,164,320 178,140 (8) EUR DAX Index June 2016 2,303,375 (70,368) 3 EUR DAX Index June 2016 863,766 14,841 31 USD DJIA Mini Index June 2016 2,766,285 23,195 2 USD E-Mini S&P 500 Index June 2016 209,900 138 (44) USD E-Mini S&P 500 Index June 2016 4,617,800 (103,213) 24 CHF EUR/CHF June 2016 3,351,114 26,077 5 GBP EUR/GBP June 2016 698,518 (29,242) (10) JPY EUR/JPY June 2016 1,396,976 (7,740) 27 EUR Euro BOBL June 2016 3,400,586 1,631 (9) EUR Euro BOBL June 2016 1,133,529 514 37 EUR Euro BTP June 2016 5,381,049 32,883 29 EUR Euro BTP June 2016 3,533,714 3,437 (15) EUR Euro Bund June 2016 1,738,286 7,003 6 USD Euro FX June 2016 837,975 (16,363) 55 EUR Euro Schatz June 2016 6,158,435 (2,463) (6) EUR Euro Schatz June 2016 2,240 140 (291) EUR Euro STOXX 50 Index June 2016 9,968,748 (305,743) 24 EUR Euro STOXX 50 Index June 2016 822,165 33,017 3 EUR Euro-BUXL June 2016 624,698 (1,608) 36 EUR Euro-OAT June 2016 5,182,090 8,478

Futures contracts as at 31 May 2016
Number of contracts
Currencyof contract Contract/Description
Expiration date
Gross underlying
exposureUSD
Unrealised appreciation/
(depreciation) USD
Annual Report and Audited Accounts 353
The notes on pages 489 to 503 form an integral part of these financial statements.
BlackRock Multi-Manager Alternative Strategies Fund continued
(51) GBP FTSE 100 Index June 2016 4,667,398 (33,081) 78 MYR FTSE Bursa Malaysia KLCI Index June 2016 1,530,153 (12,751) 55 USD FTSE China A50 June 2016 522,225 21,175 (10) EUR FTSE MIB Index June 2016 1,014,749 (13,571) (68) ZAR FTSE/JSE Top 40 Index June 2016 2,090,464 (102,859) 24 HKD H-Shares Index June 2016 1,302,091 14,014 (10) HKD Hang Seng Index June 2016 1,317,978 (27,339) (6) EUR IBEX 35 Index June 2016 608,515 (25,779) 3 JPY Japan 10 Year Bond June 2016 2,902,772 3,780 10 USD Japanese Yen June 2016 1,124,500 (13,075) 40 KRW Korean 10 Year Bond June 2016 4,336,298 7,384 (31) KRW KOSPI 200 Index June 2016 3,164,898 (5,223) (39) USD Mexican Peso June 2016 1,058,460 9,535 5 USD Mini MSCI EAFE Index June 2016 418,525 10,370 (39) USD MSCI Mini Emerging Markets Index June 2016 1,576,380 35,275 10 USD MSCI Taiwan Index June 2016 311,800 4,080 (1) USD NASDAQ 100 E-Mini Stock Index June 2016 90,415 345 10 USD NASDAQ 100 E-Mini Stock Index June 2016 904,150 12,050 6 USD New Zealand Dollar June 2016 405,060 (9,280) (4) JPY Nikkei 225 Index June 2016 620,258 (25,379) (18) JPY Nikkei 225 Index June 2016 1,393,961 (73,617) (279) NOK OBX Index June 2016 1,851,774 (45,752) (21) SEK OMX Stockholm 30 Index June 2016 348,046 (12,473) 53 SEK OMX Stockholm 30 Index June 2016 878,402 27,697 (4) USD Russell 2000 Mini Index June 2016 460,440 (12,870) 2 USD Russell 2000 Mini Index June 2016 230,220 4,910 (17) USD S&P E-mini Consumer Staples Sector Index June 2016 899,470 3,691 (13) USD S&P MidCap 400 June 2016 1,941,550 (85,560) 13 CAD S&P/TSX 60 Index June 2016 1,644,107 11,827 (129) USD SGX CNX NIFTY Index June 2016 2,112,633 (91,464) (50) SGD SGX MSCI Singapore Index June 2016 1,127,387 (3,474) 19 AUD SPI 200 Index June 2016 1,854,448 14,943 (7) USD Swiss Franc June 2016 884,187 (1,050) (17) CHF Swiss Market Index June 2016 1,413,618 (50,684) 43 TWD Taiwan Stock Exchange Weighted Index June 2016 2,244,109 121,303 (9) JPY Topix Index June 2016 1,115,331 (28,304) 5 GBP UK Long Gilt Bond September 2016 758,192 (2,856) (12) GBP UK Long Gilt Bond September 2016 1,819,659 3,339 (15) USD US Dollar Index June 2016 1,432,950 (13,680) 10 USD US Long Bond September 2016 1,368,330 (5,125) (2) USD US Treasury 10 Year Note September 2016 201,416 234 23 USD US Treasury 10 Year Note September 2016 2,316,284 (7,211) 19 USD US Treasury 2 Year Note September 2016 3,836,746 (4,406) (3) USD US Treasury 5 Year Note September 2016 303,897 305 23 USD US Treasury 5 Year Note September 2016 2,329,877 (6,086) (318) EUR VSTOXX Mini Index June 2016 875,544 60,321 17 PLN WIG20 Index June 2016 158,387 (1,820)
Total 472,046,131 (571,684)
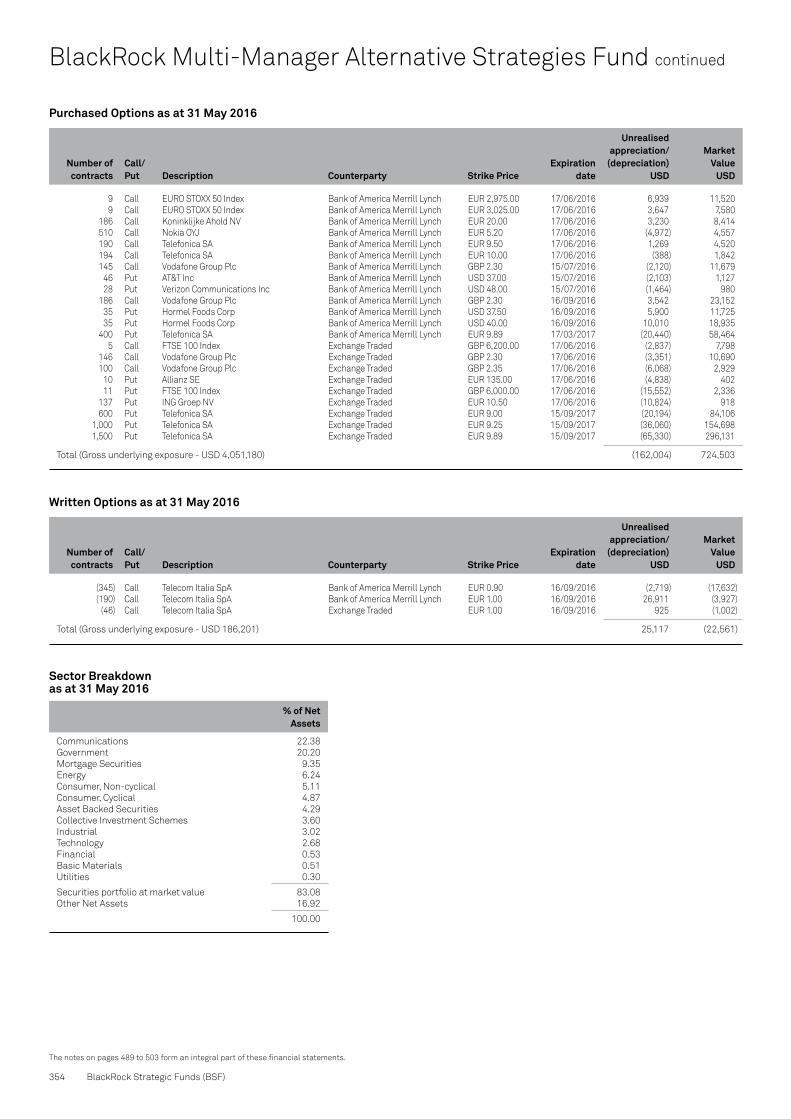
Purchased Options as at 31 May 2016
Number of contracts
Call/Put Description Counterparty
Strike Price
Expiration date
Unrealised appreciation/
(depreciation) USD
Market Value
USD
Written Options as at 31 May 2016
Number of contracts
Call/Put Description Counterparty
Strike Price
Expiration date
Unrealised appreciation/
(depreciation) USD
Market Value
USD
354 BlackRock Strategic Funds (BSF)
The notes on pages 489 to 503 form an integral part of these financial statements.
BlackRock Multi-Manager Alternative Strategies Fund continued
9 Call EURO STOXX 50 Index Bank of America Merrill Lynch EUR 2,975.00 17/06/2016 6,939 11,520 9 Call EURO STOXX 50 Index Bank of America Merrill Lynch EUR 3,025.00 17/06/2016 3,647 7,580 186 Call Koninklijke Ahold NV Bank of America Merrill Lynch EUR 20.00 17/06/2016 3,230 8,414 510 Call Nokia OYJ Bank of America Merrill Lynch EUR 5.20 17/06/2016 (4,972) 4,557 190 Call Telefonica SA Bank of America Merrill Lynch EUR 9.50 17/06/2016 1,269 4,520 194 Call Telefonica SA Bank of America Merrill Lynch EUR 10.00 17/06/2016 (388) 1,842 145 Call Vodafone Group Plc Bank of America Merrill Lynch GBP 2.30 15/07/2016 (2,120) 11,679 46 Put AT&T Inc Bank of America Merrill Lynch USD 37.00 15/07/2016 (2,103) 1,127 28 Put Verizon Communications Inc Bank of America Merrill Lynch USD 48.00 15/07/2016 (1,464) 980 186 Call Vodafone Group Plc Bank of America Merrill Lynch GBP 2.30 16/09/2016 3,542 23,152 35 Put Hormel Foods Corp Bank of America Merrill Lynch USD 37.50 16/09/2016 5,900 11,725 35 Put Hormel Foods Corp Bank of America Merrill Lynch USD 40.00 16/09/2016 10,010 18,935 400 Put Telefonica SA Bank of America Merrill Lynch EUR 9.89 17/03/2017 (20,440) 58,464 5 Call FTSE 100 Index Exchange Traded GBP 6,200.00 17/06/2016 (2,837) 7,798 146 Call Vodafone Group Plc Exchange Traded GBP 2.30 17/06/2016 (3,351) 10,690 100 Call Vodafone Group Plc Exchange Traded GBP 2.35 17/06/2016 (6,068) 2,929 10 Put Allianz SE Exchange Traded EUR 135.00 17/06/2016 (4,838) 402 11 Put FTSE 100 Index Exchange Traded GBP 6,000.00 17/06/2016 (15,552) 2,336 137 Put ING Groep NV Exchange Traded EUR 10.50 17/06/2016 (10,824) 918 600 Put Telefonica SA Exchange Traded EUR 9.00 15/09/2017 (20,194) 84,106 1,000 Put Telefonica SA Exchange Traded EUR 9.25 15/09/2017 (36,060) 154,698 1,500 Put Telefonica SA Exchange Traded EUR 9.89 15/09/2017 (65,330) 296,131
Total (Gross underlying exposure - USD 4,051,180) (162,004) 724,503
(345) Call Telecom Italia SpA Bank of America Merrill Lynch EUR 0.90 16/09/2016 (2,719) (17,632) (190) Call Telecom Italia SpA Bank of America Merrill Lynch EUR 1.00 16/09/2016 26,911 (3,927) (46) Call Telecom Italia SpA Exchange Traded EUR 1.00 16/09/2016 925 (1,002)
Total (Gross underlying exposure - USD 186,201) 25,117 (22,561)
Sector Breakdown as at 31 May 2016
% of Net Assets
Communications 22.38Government 20.20Mortgage Securities 9.35Energy 6.24Consumer, Non-cyclical 5.11Consumer, Cyclical 4.87Asset Backed Securities 4.29Collective Investment Schemes 3.60Industrial 3.02Technology 2.68Financial 0.53Basic Materials 0.51Utilities 0.30
Securities portfolio at market value 83.08Other Net Assets 16.92
100.00

Annual Report and Audited Accounts 355
The notes on pages 489 to 503 form an integral part of these financial statements.
Transferable Securities and Money Market Instruments Admitted to an Official Stock Exchange Listing or Dealt in on Another Regulated Market
Transferable Securities and Money Market Instruments Admitted to an Official Stock Exchange Listing or Dealt in on Another Regulated Market
Holding
Description
Market Value
EUR
% of Net
Assets
Holding
Description
Market Value
EUR
% of Net
Assets
Portfolio of Investments as at 31 May 2016
COMMON STOCKS (SHARES)
Ireland 419 Accenture Plc 'A' 44,614 0.07 803 Mallinckrodt Plc 45,436 0.07
90,050 0.14
United States 278 3M Co 42,008 0.07 817 AbbVie Inc 46,213 0.07 679 Altria Group Inc 38,693 0.06 76 Amazon.com Inc 48,888 0.08 1,008 American Airlines Group Inc 28,373 0.04 1,106 Baxalta Inc 45,331 0.07 361 Boeing Co/The 41,305 0.06 414 Brown-Forman Corp 'B' 36,335 0.06 888 CBS Corp 'B non-voting share' 43,567 0.07 764 Cognizant Technology Solutions Corp 'A' 42,484 0.07 434 Cummins Inc 44,432 0.07 650 DaVita HealthCare Partners Inc 44,862 0.07 880 Dow Chemical Co/The 40,953 0.06 644 Eastman Chemical Co 42,487 0.07 472 Edwards Lifesciences Corp 42,093 0.07 702 EI du Pont de Nemours & Co 42,078 0.07 565 Eli Lilly & Co 38,120 0.06 405 Equifax Inc 45,633 0.07 393 Facebook Inc 'A' 41,976 0.07 312 FedEx Corp 46,352 0.07 903 Fluor Corp 42,840 0.07 1,133 FMC Corp 48,558 0.08 1,413 Goodyear Tire & Rubber Co/The 35,409 0.06 1,255 H&R Block Inc 23,595 0.04 556 Harris Corp 38,807 0.06 1,117 International Paper Co 42,362 0.07 422 Intuit Inc 40,925 0.06 565 Kellogg Co 37,716 0.06 484 MasterCard Inc 'A' 41,889 0.07 833 Merck & Co Inc 42,069 0.07 472 Monsanto Co 46,577 0.07 571 Motorola Solutions Inc 35,335 0.05 218 Northrop Grumman Corp 41,681 0.06 2,374 Pitney Bowes Inc 39,650 0.06 818 Qualcomm Inc 40,294 0.06 338 Raytheon Co 39,379 0.06 528 Rockwell Collins Inc 41,755 0.07 454 S&P Global Inc 45,467 0.07 859 Southern Co/The 37,684 0.06 821 Texas Instruments Inc 44,815 0.07 887 Total System Services Inc 42,716 0.07 727 TripAdvisor Inc 43,850 0.07 419 United Parcel Service Inc 'B' 38,710 0.06 545 Varian Medical Systems Inc 39,952 0.06 516 VeriSign Inc 39,762 0.06 495 Vertex Pharmaceuticals Inc 40,732 0.06 1,142 Viacom Inc 'B' 44,578 0.07 597 Yum! Brands Inc 44,101 0.07
1,983,391 3.12
Total Common Stocks 2,073,441 3.26
BONDS
Argentina USD 201,000 Argentine Republic Government
International Bond RegS 7.625% 22/4/2046 182,564 0.29
182,564 0.29
Australia EUR 850,000 Australia & New Zealand Banking
Group Ltd FRN 4/10/2016 850,833 1.34 GBP 150,000 BHP Billiton Finance Ltd
RegS FRN 22/10/2077 200,706 0.31 EUR 400,000 Commonwealth Bank of Australia
RegS FRN 21/10/2016 400,400 0.63 EUR 450,000 National Australia Bank Ltd
RegS FRN 19/7/2016 450,252 0.71 EUR 100,000 National Australia Bank Ltd
RegS FRN 25/3/2019 100,377 0.16 EUR 100,000 Origin Energy Finance Ltd
RegS 2.50% 23/10/2020 99,250 0.15 GBP 100,000 Suncorp-Metway Ltd
RegS FRN 6/10/2017 131,186 0.21 USD 16,761 Virgin Australia 2013-1A
Trust '144A' 5.00% 23/10/2023 15,531 0.02 EUR 300,000 Westpac Banking Corp
RegS 4.25% 22/9/2016 304,053 0.48
2,552,588 4.01
Belgium EUR 37,000 Anheuser-Busch InBev SA/NV
RegS 1.50% 17/3/2025 38,114 0.06 EUR 5,000 Anheuser-Busch InBev SA/NV
RegS 2.00% 17/3/2028 (traded in United Kingdom) 5,244 0.01
EUR 44,000 Anheuser-Busch InBev SA/NV RegS 2.00% 17/3/2028 (traded in Belgium) 46,148 0.07
EUR 36,000 Anheuser-Busch InBev SA/NV RegS 2.75% 17/3/2036 39,303 0.06
EUR 100,000 KBC Groep NV RegS 1.00% 26/4/2021 101,128 0.16
229,937 0.36
Bermuda USD 200,000 GCX Ltd RegS 7.00% 1/8/2019 171,684 0.27
171,684 0.27
British Virgin Islands USD 250,000 Huarong Finance II Co Ltd
RegS 3.25% 3/6/2021 222,362 0.35 USD 200,000 Huarong Finance II Co Ltd
RegS 5.00% 19/11/2025 184,046 0.29 USD 200,000 Huarong Finance II Co Ltd
RegS 4.625% 3/6/2026 177,601 0.28
584,009 0.92
Canada EUR 400,000 Bank of Montreal RegS FRN 4/11/2016 400,448 0.63 EUR 400,000 Bank of Nova Scotia/The
RegS FRN 30/9/2016 400,334 0.63 EUR 100,000 Province of Quebec Canada
3.375% 20/6/2016 100,180 0.15 EUR 100,000 Toronto-Dominion Bank /The
RegS 0.625% 8/3/2021 100,852 0.16
1,001,814 1.57
BlackRock Multi-Strategy Absolute Return Fund

356 BlackRock Strategic Funds (BSF)
The notes on pages 489 to 503 form an integral part of these financial statements.
Transferable Securities and Money Market Instruments Admitted to an Official Stock Exchange Listing or Dealt in on Another Regulated Market
Transferable Securities and Money Market Instruments Admitted to an Official Stock Exchange Listing or Dealt in on Another Regulated Market
Holding
Description
Market Value
EUR
% of Net
Assets
Holding
Description
Market Value
EUR
% of Net
Assets
* Securities on loan, see Note 16, for further details.
BlackRock Multi-Strategy Absolute Return Fund continued
Cayman Islands USD 200,000 361 Degrees International Ltd
RegS 7.25% 3/6/2021 179,747 0.28 USD 200,000 China Aoyuan Property Group Ltd
RegS 6.525% 25/4/2019 179,308 0.28 GBP 75,000 Yorkshire Water Services Bradford
Finance Ltd FRN 24/4/2025 101,784 0.16
460,839 0.72
China USD 600,000 Sunshine Life Insurance Co Ltd
RegS 3.15% 20/4/2021 528,158 0.83
528,158 0.83
Cyprus EUR 50,000 Cyprus Government International
Bond RegS '144A' 4.625% 3/2/2020 53,353 0.08
53,353 0.08
Denmark EUR 100,000 AP Moeller - Maersk A/S
RegS FRN 18/3/2019 102,028 0.16
102,028 0.16
France GBP 155,000 AXA SA 7.125% 15/12/2020 244,993 0.39 EUR 100,000 AXA SA RegS 1.125% 15/5/2028 98,673 0.16 EUR 1,300,000 Banque Federative du Credit Mutuel SA
RegS FRN 23/3/2017 1,300,845 2.04 EUR 200,000 Cars Alliance Auto Loans Germany
V '2016-1 A' RegS FRN 18/5/2027 200,283 0.31 EUR 100,000 Casino Guichard Perrachon SA
RegS 3.311% 25/1/2023 105,950 0.17 GBP 300,000 Dexia Credit Local SA
RegS 2.125% 12/2/2025 390,878 0.61 GBP 200,000 Electricite de France SA
RegS FRN (Perpetual) 224,015 0.35 EUR 100,000 Eutelsat SA RegS 2.625% 13/1/2020 106,068 0.17 EUR 320,000 France Treasury Bill BTF
RegS 6/7/2016 (Zero Coupon) 320,157 0.50 EUR 75,000 RCI Banque SA RegS FRN 18/3/2019 75,843 0.12 EUR 100,000 Renault SA 5.625% 22/3/2017 104,440 0.16 EUR 105,000 Renault SA RegS 3.625% 19/9/2018 112,971 0.18 EUR 100,000 Sanofi RegS 0.875% 22/9/2021 102,950 0.16 EUR 100,000 Unibail-Rodamco SE
RegS 2.00% 28/4/2036 102,245 0.16
3,490,311 5.48
Germany EUR 100,000 Bertelsmann SE & Co KGaA
RegS FRN 23/4/2075 92,481 0.14 EUR 56,000 Bundesrepublik Deutschland
RegS 2.50% 15/8/2046 79,908 0.12 EUR 100,000 Daimler AG RegS FRN 12/1/2019 100,268 0.16 EUR 83,000 Daimler AG RegS 0.25% 11/5/2020 82,680 0.13 EUR 400,000 Erste Abwicklungsanstalt
0.50% 4/11/2016 401,330 0.63 EUR 400,000 FMS Wertmanagement AoeR
RegS 0.375% 14/11/2016 401,318 0.63 EUR 200,000 FMS Wertmanagement AoeR
RegS 1.625% 22/2/2017 202,880 0.32 GBP 200,000 FMS Wertmanagement AoeR
RegS 1.25% 8/3/2019 264,492 0.41 EUR 50,000 HeidelbergCement AG
RegS 2.25% 3/6/2024 50,325 0.08 EUR 845,000 KFW 2.00% 7/9/2016 850,535 1.34
EUR 350,000 Landeskreditbank Baden-Wuerttemberg Foerderbank 3.50% 4/7/2016 351,228 0.55
EUR 135,000 State of North Rhine-Westphalia 0.50% 15/9/2016 135,333 0.21
EUR 425,000 State of North Rhine-Westphalia 1.75% 15/2/2017 431,222 0.68
EUR 100,000 Volkswagen Financial Services AG RegS FRN 16/10/2017 99,425 0.16
3,543,425 5.56
Hong Kong USD 300,000 Bank of East Asia Ltd/The
RegS FRN (Perpetual)* 260,563 0.41
260,563 0.41
Iceland USD 100,000 Iceland Government International
Bond '144A' 4.875% 16/6/2016 89,828 0.14
89,828 0.14
Indonesia USD 200,000 Indonesia Government International
Bond RegS 4.75% 8/1/2026 190,257 0.30 USD 200,000 Pertamina Persero PT
RegS 5.625% 20/5/2043 164,899 0.26
355,156 0.56
Ireland EUR 590,000 GE Capital European Funding
Unlimited Co 4.25% 1/3/2017 609,098 0.96 EUR 84,000 GE Capital European Funding
Unlimited Co FRN 17/5/2021 83,251 0.13 EUR 260,000 Ireland Government Bond
RegS 1.00% 15/5/2026 265,207 0.41 EUR 83,000 Ireland Government Bond
RegS 2.00% 18/2/2045 87,414 0.14
1,044,970 1.64
Italy EUR 53,403 Asset Backed European
Securitisation Transaction Nine Srl 'A' RegS FRN 10/12/2028 53,509 0.08
EUR 100,000 Assicurazioni Generali SpA RegS FRN 27/10/2047 105,587 0.17
EUR 60,619 Berica ABS Srl '2012-2 A1' RegS FRN 30/11/2051 60,485 0.09
EUR 100,000 Intesa Sanpaolo SpA RegS 3.928% 15/9/2026 103,339 0.16
EUR 867,000 Italy Buoni Poliennali Del Tesoro 4.75% 1/5/2017 906,037 1.42
EUR 434,003 Italy Buoni Poliennali Del Tesoro 1.70% 15/9/2018 455,443 0.71
EUR 143,089 Italy Buoni Poliennali Del Tesoro RegS 2.15% 12/11/2017 147,436 0.23
EUR 750,483 Italy Buoni Poliennali Del Tesoro RegS '144A' 2.35% 15/9/2024 864,309 1.36
EUR 145,053 Italy Buoni Poliennali Del Tesoro RegS 3.10% 15/9/2026 180,093 0.28
EUR 332,098 Italy Buoni Poliennali Del Tesoro RegS '144A' 1.25% 15/9/2032 347,523 0.55
EUR 727,000 Italy Buoni Poliennali Del Tesoro RegS '144A' 2.70% 1/3/2047 749,210 1.18
EUR 939,000 Italy Certificati di Credito del Tesoro FRN 1/7/2016 939,357 1.48
Portfolio of Investments as at 31 May 2016
Germany continued

Annual Report and Audited Accounts 357
The notes on pages 489 to 503 form an integral part of these financial statements.
Transferable Securities and Money Market Instruments Admitted to an Official Stock Exchange Listing or Dealt in on Another Regulated Market
Transferable Securities and Money Market Instruments Admitted to an Official Stock Exchange Listing or Dealt in on Another Regulated Market
Holding
Description
Market Value
EUR
% of Net
Assets
Holding
Description
Market Value
EUR
% of Net
Assets
Portfolio of Investments as at 31 May 2016
EUR 67,677 SIENA PMI Srl '2015-1 A1B' RegS FRN 5/11/2055 67,716 0.11
EUR 200,000 Sunrise Srl '2015-2 A' RegS FRN 27/12/2032 201,078 0.32
5,181,122 8.14
Japan JPY 18,500,000 Japan Government 10 Year Bond
2.00% 20/6/2016 149,212 0.23
149,212 0.23
Luxembourg USD 45,000 Actavis Funding SCS 2.35% 12/3/2018 40,627 0.06 GBP 146,505 Compartment Driver UK Two SA 'A'
RegS FRN 25/1/2023 190,762 0.30 EUR 77,648 Compartment VCL 22 'A'
RegS FRN 21/8/2021 77,807 0.12 EUR 54,226 German Mittelstand Equipment
Finance No SA '2 A' RegS FRN 26/7/2024 54,244 0.09
EUR 100,000 Glencore Finance Europe SA RegS 5.25% 22/3/2017 103,796 0.16
EUR 454,000 Nestle Finance International Ltd RegS 0.75% 17/10/2016 455,510 0.72
EUR 80,000 Nestle Finance International Ltd RegS 0.75% 8/11/2021 82,374 0.13
EUR 450,000 Novartis Finance SA RegS 4.25% 15/6/2016 450,711 0.71
EUR 100,000 Novartis Finance SA RegS 0.75% 9/11/2021 103,276 0.16
1,559,107 2.45
Malaysia MYR 250,000 Malaysia Government Bond
3.795% 30/9/2022 54,073 0.08 MYR 284,000 Malaysia Government Investment
Issue 3.99% 15/10/2025 60,964 0.10 MYR 910,000 Malaysia Government Investment
Issue 4.07% 30/9/2026 197,316 0.31
312,353 0.49
Mexico MXN 4,000,000 Mexican Bonos 5.75% 5/3/2026 189,361 0.29 EUR 30,000 Petroleos Mexicanos
RegS 6.375% 5/8/2016 30,316 0.05
219,677 0.34
Netherlands EUR 200,000 Airbus Group Finance BV
RegS 1.375% 13/5/2031 195,496 0.31 EUR 821,000 Bank Nederlandse Gemeenten NV
4.125% 28/6/2016 823,734 1.29 EUR 1,575,000 Bank Nederlandse Gemeenten NV
RegS 2.25% 24/8/2016 1,584,474 2.49 EUR 200,000 Bank Nederlandse Gemeenten NV
RegS 2.25% 12/1/2017 203,211 0.32 GBP 100,000 BAT Netherlands Finance BV
5.50% 15/9/2016 132,809 0.21 EUR 100,000 BMW Finance NV FRN 26/5/2017 99,917 0.16 EUR 1,800,000 Cooperatieve Rabobank UA
FRN 19/1/2017 1,801,971 2.83 EUR 100,000 Cooperatieve Rabobank UA
RegS FRN 29/5/2020 99,604 0.16 EUR 67,000 Deutsche Bahn Finance BV
4.375% 23/9/2021 82,056 0.13
EUR 960,000 Deutsche Bahn Finance BV RegS 2.875% 30/6/2016 962,160 1.51
EUR 100,000 Gas Natural Fenosa Finance BV RegS FRN (Perpetual) 89,788 0.14
EUR 590,000 Nederlandse Waterschapsbank NV RegS 3.00% 12/7/2016 592,233 0.93
EUR 100,000 Nederlandse Waterschapsbank NV RegS 2.25% 17/1/2017 101,634 0.16
EUR 200,000 Netherlands Government Bond RegS '144A' 4.00% 15/7/2016 201,070 0.31
USD 290,000 Petrobras Global Finance BV 8.375% 23/5/2021 258,337 0.40
USD 55,000 Shell International Finance BV 1.375% 10/5/2019 48,951 0.08
EUR 100,000 Shell International Finance BV RegS 1.625% 24/3/2021 106,539 0.17
EUR 60,000 Volkswagen International Finance NV RegS FRN (Perpetual) 59,351 0.09
EUR 100,000 Volkswagen International Finance NV RegS FRN (Perpetual) 90,500 0.14
7,533,835 11.83
New Zealand EUR 150,000 Westpac Securities NZ Ltd/London
RegS FRN 10/3/2017 150,293 0.24
150,293 0.24
Portugal EUR 182,000 Portugal Obrigacoes do Tesouro OT
RegS '144A' 2.20% 17/10/2022 180,817 0.28 EUR 108,000 Portugal Obrigacoes do Tesouro OT
RegS '144A' 2.875% 21/7/2026 106,199 0.17 EUR 172,650 Portugal Obrigacoes do Tesouro OT
RegS '144A' 3.875% 15/2/2030 179,247 0.28 EUR 376,252 Portugal Obrigacoes do Tesouro OT
RegS '144A' 4.10% 15/2/2045 378,995 0.60
845,258 1.33
Russia RUB 19,285,000 Russian Federal Bond - OFZ
8.15% 3/2/2027 252,366 0.40
252,366 0.40
Slovenia USD 200,000 Slovenia Government International
Bond RegS 5.25% 18/2/2024 201,106 0.32
201,106 0.32
South Africa ZAR 5,507,000 South Africa Government Bond
8.75% 28/2/2048 275,053 0.43
275,053 0.43
Spain EUR 100,000 Bankia SA RegS FRN 22/5/2024 97,694 0.15 EUR 593,000 Spain Government Bond
2.75% 30/4/2019 639,610 1.01 EUR 21,000 Spain Government Bond
RegS '144A' 2.15% 31/10/2025 22,367 0.04 EUR 36,000 Spain Government Bond
RegS '144A' 1.95% 30/4/2026 37,532 0.06 EUR 224,937 Spain Government Inflation Linked
Bond RegS '144A' 0.55% 30/11/2019 232,090 0.36
1,029,293 1.62
BlackRock Multi-Strategy Absolute Return Fund continued
Netherlands continued Italy continued

358 BlackRock Strategic Funds (BSF)
The notes on pages 489 to 503 form an integral part of these financial statements.
Transferable Securities and Money Market Instruments Admitted to an Official Stock Exchange Listing or Dealt in on Another Regulated Market
Transferable Securities and Money Market Instruments Admitted to an Official Stock Exchange Listing or Dealt in on Another Regulated Market
Holding
Description
Market Value
EUR
% of Net
Assets
Holding
Description
Market Value
EUR
% of Net
Assets
BlackRock Multi-Strategy Absolute Return Fund continued
Sri Lanka USD 200,000 Sri Lanka Government International
Bond RegS 6.125% 3/6/2025 164,292 0.26 USD 200,000 Sri Lanka Government International
Bond RegS 6.85% 3/11/2025 171,454 0.27
335,746 0.53
Supranational EUR 100,000 Corp Andina de Fomento
RegS 1.00% 10/11/2020 101,984 0.16 GBP 205,000 European Investment Bank
RegS 1.50% 1/2/2019 272,953 0.43
374,937 0.59
Sweden EUR 400,000 Nordea Bank AB RegS FRN 25/11/2016 400,380 0.63 EUR 450,000 Skandinaviska Enskilda Banken AB
RegS 3.875% 12/4/2017 465,464 0.73 EUR 150,000 Skandinaviska Enskilda Banken AB
RegS FRN 26/5/2020 151,044 0.24 EUR 450,000 Svenska Handelsbanken AB
3.75% 24/2/2017 462,654 0.72 EUR 100,000 Svenska Handelsbanken AB
RegS 2.25% 27/8/2020 108,412 0.17 EUR 380,000 Swedbank AB 3.375% 9/2/2017 389,109 0.61
1,977,063 3.10
Switzerland EUR 450,000 Credit Suisse AG/London
RegS FRN 22/7/2016 450,169 0.71 EUR 305,000 UBS AG RegS FRN 12/2/2026 323,632 0.51
773,801 1.22
United Arab Emirates USD 200,000 Abu Dhabi National Energy Co PJSC
RegS 5.875% 13/12/2021 198,870 0.31 EUR 100,000 Glencore Finance Dubai Ltd
2.625% 19/11/2018 100,750 0.16
299,620 0.47
United Kingdom EUR 100,000 Anglo American Capital Plc
RegS 2.75% 7/6/2019 97,704 0.15 EUR 100,000 AstraZeneca Plc
RegS 0.25% 12/5/2021 99,604 0.16 USD 35,000 AXIS Specialty Finance Plc
2.65% 1/4/2019 31,442 0.05 GBP 100,000 Delamare Cards '2015-1 A1'
RegS FRN 19/4/2020 130,065 0.20 GBP 94,215 Duncan Funding Plc '2015-1 A1'
RegS FRN 17/12/2062 123,357 0.19 GBP 400,000 Duncan Funding Plc '2016-1X A1B'
RegS FRN 17/4/2063 524,847 0.82 GBP 90,055 E-Carat 5 Plc 'A' RegS FRN 18/4/2023 117,564 0.18 EUR 296,184 Eddystone Finance Plc '2006-1 A1B'
RegS FRN 19/4/2021 290,117 0.46 GBP 35,942 Eurosail-UK Plc '2007-4X A2A'
RegS FRN 13/6/2045 46,896 0.07 GBP 170,000 FCE Bank Plc RegS 2.727% 3/6/2022 223,651 0.35 GBP 159,498 Fosse Master Issuer Plc '2014-1X A2'
RegS FRN 18/10/2054 208,810 0.33 GBP 100,000 Fosse Master Issuer Plc '2015-1X A3'
RegS FRN 18/10/2054 130,476 0.20 GBP 57,595 Gemgarto Plc '2015-1 A'
RegS FRN 16/2/2047 74,982 0.12 GBP 95,851 Gemgarto Plc '2015-2 A'
RegS FRN 16/2/2054 125,896 0.20
GBP 81,619 Gosforth Funding Plc '2014-1 A1' RegS FRN 19/10/2056 106,721 0.17
GBP 178,927 Gosforth Funding Plc '2016-1 A1B' RegS FRN 15/2/2058 233,983 0.37
GBP 140,000 Gosforth Funding Plc '2016-2 A1B' RegS FRN 24/7/2058 183,803 0.29
USD 210,000 Holmes Master Issuer Plc '2016-1A A1' '144A' FRN 15/4/2017 188,031 0.30
GBP 100,000 Imperial Brands Finance Plc 5.50% 22/11/2016 133,646 0.21
GBP 91,870 Lanark Master Issuer Plc '2012-2X 2A' RegS FRN 22/12/2054 121,935 0.19
GBP 270,000 Lanark Master Issuer Plc '2015-1X 1A' RegS FRN 22/12/2054 352,258 0.55
GBP 288,000 LCR Finance Plc RegS 4.50% 7/12/2028 475,878 0.75 EUR 100,000 Leek Finance Number Eighteen Plc
'18X MC' RegS FRN 21/9/2038 99,082 0.16 EUR 430,000 Lloyds Bank Plc
RegS 6.375% 17/6/2016 431,131 0.68 GBP 60,000 Lloyds Bank Plc
RegS 7.625% 22/4/2025 98,860 0.16 GBP 208,416 Motor Plc '2015-1X A2'
RegS FRN 25/6/2022 272,953 0.43 GBP 120,000 Nationwide Building Society
RegS 3.00% 6/5/2026 159,719 0.25 GBP 98,072 Paragon Mortgages No 24 Plc 'A2'
RegS FRN 15/7/2043 128,185 0.20 GBP 184,138 Precise Mortgage Funding Plc
'2014-1 A' RegS FRN 12/9/2047 238,407 0.37 GBP 100,000 RELX Investments Plc
5.625% 20/10/2016 133,261 0.21 GBP 100,000 Silverstone Master Issuer Plc
'2015-1X 1A' RegS FRN 21/1/2070 130,576 0.20 USD 45,000 Sky Plc '144A' 6.10% 15/2/2018 43,124 0.07 EUR 100,000 Sky Plc RegS 2.25% 17/11/2025 103,450 0.16 GBP 23,808 Turbo Finance 4 Plc 'A'
RegS FRN 20/1/2021 31,187 0.05 GBP 131,962 Turbo Finance 5 Plc 'A'
RegS FRN 20/8/2021 172,753 0.27 GBP 217,000 United Kingdom Gilt Inflation Linked
RegS 2.50% 26/7/2016 908,351 1.43 GBP 52,660 United Kingdom Gilt Inflation Linked
RegS 0.125% 22/3/2046 91,658 0.14 GBP 9,022 United Kingdom Gilt Inflation Linked
RegS 0.125% 22/11/2065 20,264 0.03 GBP 103,000 United Kingdom Gilt
RegS 4.25% 7/6/2032 176,923 0.28 GBP 148,000 United Kingdom Gilt
RegS 4.50% 7/9/2034 264,809 0.42 GBP 130,000 United Kingdom Gilt
RegS 4.25% 7/12/2046 246,416 0.39 EUR 100,000 Vodafone Group Plc
RegS FRN 25/2/2019 101,158 0.16 GBP 232,861 Warwick Finance Residential
Mortgages Number Two Plc '2 A' RegS FRN (Perpetual) 306,529 0.48
8,180,462 12.85
United States USD 32,000 AbbVie Inc 1.75% 6/11/2017 28,699 0.04 USD 6,000 AbbVie Inc 1.80% 14/5/2018 5,389 0.01 USD 33,000 AbbVie Inc 2.30% 14/5/2021 29,413 0.05 USD 45,000 AbbVie Inc 2.85% 14/5/2023 40,049 0.06 USD 41,000 AbbVie Inc 3.20% 14/5/2026 36,510 0.06 USD 27,000 AbbVie Inc 4.50% 14/5/2035 24,540 0.04 USD 20,000 American International Group Inc
5.85% 16/1/2018 19,104 0.03 USD 14,000 American International Group Inc
3.30% 1/3/2021 12,871 0.02
Portfolio of Investments as at 31 May 2016
United Kingdom continued

Annual Report and Audited Accounts 359
The notes on pages 489 to 503 form an integral part of these financial statements.
Transferable Securities and Money Market Instruments Admitted to an Official Stock Exchange Listing or Dealt in on Another Regulated Market
Transferable Securities and Money Market Instruments Admitted to an Official Stock Exchange Listing or Dealt in on Another Regulated Market
Holding
Description
Market Value
EUR
% of Net
Assets
Holding
Description
Market Value
EUR
% of Net
Assets
Portfolio of Investments as at 31 May 2016
USD 26,000 American Tower Corp 3.375% 15/10/2026 22,937 0.04 USD 50,000 AmeriCredit Automobile Receivables
'2016-1 A2B' FRN 10/6/2019 44,842 0.07 GBP 100,000 Apple Inc 3.05% 31/7/2029 133,544 0.21 USD 10,000 AT&T Inc 2.30% 11/3/2019 9,082 0.01 USD 5,000 AT&T Inc 2.45% 30/6/2020 4,497 0.01 USD 6,000 AutoZone Inc 3.125% 21/4/2026 5,382 0.01 USD 60,000 AvalonBay Communities Inc
5.75% 15/9/2016 54,377 0.09 USD 15,000 Aviation Capital Group Corp '144A'
4.625% 31/1/2018 13,765 0.02 EUR 100,000 Bank of America Corp 4.625% 7/2/2017 103,056 0.16 USD 80,000 Bank of America Corp 2.00% 11/1/2018 71,913 0.11 USD 40,000 Bank of America Corp 2.60% 15/1/2019 36,386 0.06 USD 25,000 Bank of America Corp 3.95% 21/4/2025 22,381 0.04 USD 41,000 Bank of New York Mellon Corp/The
2.05% 3/5/2021 36,664 0.06 USD 12,000 Bank of New York Mellon Corp/The
2.80% 4/5/2026 10,801 0.02 USD 30,000 BB&T Corp 2.45% 15/1/2020 27,389 0.04 USD 10,000 Burlington Northern Santa Fe LLC
3.90% 1/8/2046 8,980 0.01 USD 25,000 Capital One Financial Corp
2.45% 24/4/2019 22,599 0.04 USD 70,000 CarMax Auto Owner Trust
'2016-2 A3' 1.52% 16/2/2021 62,734 0.10 USD 10,000 Charter Communications Operating
LLC Via Charter Communications Operating Capital '144A' 3.579% 23/7/2020 9,227 0.01
USD 100,000 Chase Issuance Trust '2014-A6' 1.26% 15/7/2019 89,623 0.14
USD 75,427 Chrysler Capital Auto Receivables Trust '2014-BA A3' '144A' 1.27% 15/5/2019 67,406 0.11
USD 10,000 Chubb INA Holdings Inc 2.30% 3/11/2020 9,116 0.01 USD 100,000 Citibank Credit Card Issuance Trust
'2014-A2' 1.02% 22/2/2019 89,416 0.14 USD 985,576 Citigroup Commercial Mortgage Trust
'2014-GC23 XA' FRN 10/7/2047 57,090 0.09 USD 2,586,048 Citigroup Commercial Mortgage Trust
'2015-P1 XA' FRN 15/9/2048 124,793 0.20 USD 50,000 CNH Equipment Trust '2016-B A3'
1.63% 15/8/2021 44,754 0.07 EUR 900,000 Coca-Cola Co/The FRN 9/3/2017 900,729 1.41 USD 100,000 Comm Mortgage Trust '2013-CCRE11
C' '144A' FRN 10/10/2046 95,300 0.15 USD 2,976,231 COMM Mortgage Trust '2015-CR24
XA' FRN 10/8/2055 155,796 0.24 USD 3,182,964 COMM Mortgage Trust '2015-CR25
XA' FRN 10/8/2048 182,450 0.29 USD 1,000,000 Core Industrial Trust '2015-WEST XA'
'144A' FRN 10/2/2037 62,985 0.10 USD 3,000 Crown Castle International Corp
3.40% 15/2/2021 2,770 0.00 USD 6,000 Crown Castle International Corp
3.70% 15/6/2026 5,422 0.01 USD 6,457,662 CSAIL Commercial Mortgage Trust
'2015-C3 XA' FRN 15/8/2048 303,008 0.48 USD 20,000 CVS Health Corp 2.125% 1/6/2021 17,803 0.03 USD 70,000 CVS Health Corp 2.875% 1/6/2026 62,504 0.10 USD 35,000 DDR Corp 7.50% 1/4/2017 32,824 0.05 USD 5,000 Equifax Inc 2.30% 1/6/2021 4,468 0.01 USD 5,000 Exelon Corp 2.45% 15/4/2021 4,491 0.01 USD 28,225 Fannie Mae Pool 4.50% 1/2/2026 26,877 0.04 USD 19,342 Fannie Mae Pool 4.00% 1/5/2027 18,453 0.03 USD 76,679 Fannie Mae Pool 3.00% 1/9/2027 71,760 0.11 USD 15,767 Fannie Mae Pool 2.50% 1/12/2027 14,537 0.02 USD 55,324 Fannie Mae Pool 2.50% 1/3/2028 51,008 0.08
USD 24,334 Fannie Mae Pool 3.50% 1/9/2028 23,188 0.04 USD 22,386 Fannie Mae Pool 3.50% 1/4/2029 21,326 0.03 USD 58,324 Fannie Mae Pool 3.50% 1/10/2029 55,659 0.09 USD 45,496 Fannie Mae Pool 2.50% 1/7/2030 41,812 0.07 USD 16,743 Fannie Mae Pool FRN 1/12/2040 15,696 0.02 USD 95,192 Fannie Mae Pool FRN 1/10/2045 88,398 0.14 USD 50,004 Fannie Mae REMICS 3.50% 25/8/2042 47,174 0.07 USD 13,111,606 Fannie Mae-Aces '2014-M13 X2'
FRN 25/8/2024 124,560 0.20 USD 40,000 Federal Home Loan Mortgage Corp
1.25% 30/3/2018 35,832 0.06 USD 55,000 Federal Home Loan Mortgage Corp
1.05% 26/4/2018 49,136 0.08 USD 60,000 Federal Home Loan Mortgage Corp
1.00% 27/4/2018 53,667 0.08 USD 60,000 Federal Home Loan Mortgage Corp
1.05% 27/4/2018 53,507 0.08 USD 40,000 Federal Home Loan Mortgage Corp
1.125% 11/10/2018 35,667 0.06 USD 20,000 Federal Home Loan Mortgage Corp
1.30% 29/4/2019 17,851 0.03 USD 100,000 Federal Home Loan Mortgage Corp
1.29% 3/5/2019 89,519 0.14 USD 5,000 FedEx Corp 4.55% 1/4/2046 4,631 0.01 USD 498,522 FHLMC Multifamily Structured Pass
Through Certificates 'K043 X1' FRN 25/12/2024 17,599 0.03
USD 2,320,190 FHLMC Multifamily Structured Pass Through Certificates 'K718 X1' FRN 25/1/2022 63,770 0.10
USD 87,500 FHLMC Multifamily Structured Pass Through Certificates 'KP03 A2' 1.78% 25/7/2019 78,878 0.12
USD 150,000 Ford Credit Auto Owner Trust '2014-C A3' 1.06% 15/5/2019 134,127 0.21
USD 47,000 Ford Credit Auto Owner Trust '2016-B A3' 1.33% 15/10/2020 42,118 0.07
USD 100,000 Ford Motor Credit Co LLC 3.984% 15/6/2016 89,634 0.14
USD 65,848 Freddie Mac REMICS '4253 PA' 3.50% 15/8/2041 61,243 0.10
USD 17,032 Freddie Mac REMICS '4390 CA' 3.50% 15/6/2050 16,105 0.03
USD 87,678 Freddie Mac REMICS '4446 MA' 3.50% 15/12/2050 82,747 0.13
USD 9,956,755 FREMF Mortgage Trust '2015-K151 X2A' '144A' FRN 25/4/2030 87,979 0.14
USD 198,167 GAHR Commercial Mortgage Trust '2015-NRF AFL1' '144A' FRN 15/12/2016 176,919 0.28
USD 200,000 GAHR Commercial Mortgage Trust '2015-NRF DFX' '144A' FRN 15/12/2019 176,015 0.28
USD 20,000 GATX Corp 1.25% 4/3/2017 17,865 0.03 USD 25,000 General Motors Financial Co Inc
3.10% 15/1/2019 22,761 0.04 USD 5,000 General Motors Financial Co Inc
2.40% 9/5/2019 4,473 0.01 USD 22,000 Goldman Sachs Group Inc/The
2.625% 25/4/2021 19,786 0.03 EUR 175,000 Goldman Sachs Group Inc/The
RegS FRN 29/4/2019 175,065 0.27 USD 23,877 Government National Mortgage
Association '1999-10 ZC' 6.50% 20/4/2029 24,266 0.04
USD 12,581 Government National Mortgage Association '1999-2 E' 6.50% 20/1/2029 12,719 0.02
USD 8,000 Harris Corp 2.70% 27/4/2020 7,164 0.01
BlackRock Multi-Strategy Absolute Return Fund continued
United States continued United States continued

360 BlackRock Strategic Funds (BSF)
The notes on pages 489 to 503 form an integral part of these financial statements.
Transferable Securities and Money Market Instruments Admitted to an Official Stock Exchange Listing or Dealt in on Another Regulated Market
Transferable Securities and Money Market Instruments Admitted to an Official Stock Exchange Listing or Dealt in on Another Regulated Market
Holding
Description
Market Value
EUR
% of Net
Assets
Holding
Description
Market Value
EUR
% of Net
Assets
* Securities on loan, see Note 16, for further details.
BlackRock Multi-Strategy Absolute Return Fund continued
USD 20,000 HCP Inc 6.70% 30/1/2018 19,217 0.03 USD 29,000 Hewlett Packard Enterprise Co
'144A' 2.85% 5/10/2018 26,420 0.04 USD 50,000 Honda Auto Receivables 2016-2
Owner Trust 'A3' 1.39% 15/4/2020 44,799 0.07 USD 38,142 Honda Auto Receivables Owner Trust
'2014-4 A3' 0.99% 17/9/2018 34,095 0.05 USD 45,000 Hyundai Auto Receivables Trust
'2016-A A2A' 1.21% 17/6/2019 40,303 0.06 USD 94,000 International Lease Finance Corp
'144A' 6.75% 1/9/2016 85,158 0.13 USD 50,000 Interpublic Group of Cos Inc/The
2.25% 15/11/2017 44,843 0.07 EUR 225,000 Johnson & Johnson 0.65% 20/5/2024 226,139 0.35 EUR 225,000 Johnson & Johnson 1.15% 20/11/2028 224,986 0.35 USD 1,000,915 JPMBB Commercial Mortgage
Securities Trust '2014-C21 XA' FRN 15/8/2047 58,336 0.09
USD 25,000 JPMorgan Chase & Co 2.35% 28/1/2019 22,737 0.04 USD 70,000 JPMorgan Chase & Co 2.70% 18/5/2023 62,204 0.10 USD 15,000 Kraft Heinz Foods Co '144A' 2.00%
2/7/2018 13,529 0.02 USD 7,000 Kraft Heinz Foods Co '144A' 3.00%
1/6/2026 6,201 0.01 USD 2,000 Lam Research Corp 2.75% 15/3/2020 1,812 0.00 USD 8,000 Lam Research Corp 2.80% 15/6/2021 7,213 0.01 USD 14,000 Lam Research Corp 3.45% 15/6/2023 12,687 0.02 USD 18,000 Lam Research Corp 3.90% 15/6/2026 16,432 0.03 USD 250,000 LB Commercial Mortgage Trust
'2007-C3 AM' FRN 15/7/2044 232,061 0.36 USD 250,000 LB-UBS Commercial Mortgage Trust
'2006-C4 AM' FRN 15/6/2038 225,035 0.35 USD 20,000 Lowe's Cos Inc 3.70% 15/4/2046 17,521 0.03 USD 25,000 Lubrizol Corp 8.875% 1/2/2019 26,709 0.04 USD 15,000 Marsh & McLennan Cos Inc 2.35%
10/9/2019 13,630 0.02 USD 5,000 McDonald's Corp 2.75% 9/12/2020 4,599 0.01 USD 15,000 Medtronic Inc 2.50% 15/3/2020 13,805 0.02 EUR 150,000 Metropolitan Life Global Funding I
4.625% 16/5/2017 156,658 0.25 EUR 100,000 Microsoft Corp 2.125% 6/12/2021 110,141 0.17 USD 190,126 ML-CFC Commercial Mortgage Trust
'2007-9 A4' 5.70% (Perpetual) 175,855 0.28 USD 33,000 Morgan Stanley 2.50% 21/4/2021 29,521 0.05 USD 4,118,580 Morgan Stanley Bank of America
Merrill Lynch Trust '2015-C25 XA' FRN 15/10/2048 283,001 0.44
USD 179,672 Morgan Stanley Capital I Trust '2007-IQ15 A4' FRN (Perpetual) 167,197 0.26
USD 82,621 Morgan Stanley Re-REMIC Trust '2009-GG10 A4A' '144A' FRN 12/8/2045 75,736 0.12
USD 30,000 Mylan Inc 1.80% 24/6/2016 26,873 0.04 USD 14,699 Navient Private Education Loan Trust
'2014-AA A1' '144A' FRN 16/5/2022 13,154 0.02 USD 100,000 Nissan Auto Receivables 2016-B
Owner Trust 1.32% 15/1/2021 89,512 0.14 USD 20,000 Penske Truck Leasing Co Lp Via PTL
Finance Corp '144A' 2.875% 17/7/2018 18,110 0.03 USD 14,000 Philip Morris International Inc 4.25%
10/11/2044 13,125 0.02
EUR 100,000 Procter & Gamble Co/The 2.00% 5/11/2021 108,970 0.17
USD 15,000 QVC Inc 3.125% 1/4/2019 13,657 0.02 USD 50,000 Reynolds American Inc 3.50% 4/8/2016 44,968 0.07 USD 125,000 Sabine Pass LNG LP 7.50% 30/11/2016 114,780 0.18 USD 23,109 Santander Drive Auto Receivables
Trust '2012-1 D' 4.56% 15/11/2017 20,717 0.03 USD 150,000 Santander Drive Auto Receivables
Trust '2014-1 D' 2.91% 15/4/2020 135,315 0.21 USD 125,000 Santander Drive Auto Receivables
Trust '2014-3 C' 2.13% 17/8/2020 112,396 0.18 USD 125,000 Santander Drive Auto Receivables
Trust '2014-3 D' 2.65% 17/8/2020 112,271 0.18 USD 10,000 Santander Drive Auto Receivables
Trust '2016-2 A3' 1.56% 15/5/2020 8,938 0.01 USD 25,000 Schlumberger Holdings Corp
'144A' 2.35% 21/12/2018 22,680 0.04 USD 79,509 SLM Private Education Loan Trust
'2012-B A2' '144A' 3.48% 15/10/2030 72,436 0.11 USD 250,000 SLM Private Education Loan Trust
'2013-A A2B' '144A' FRN 17/5/2027 222,109 0.35 USD 34,000 Southern Co/The 2.95% 1/7/2023 30,867 0.05 USD 30,000 Southern Co/The 3.25% 1/7/2026 27,226 0.04 USD 53,000 State Street Corp 2.65% 19/5/2026 47,251 0.07 USD 100,000 Synchrony Credit Card Master Note
Trust '2016-2 A' 2.21% 15/5/2024 89,526 0.14 USD 30,000 Synchrony Financial 1.875% 15/8/2017 26,847 0.04 USD 30,000 Thermo Fisher Scientific Inc
1.30% 1/2/2017 26,869 0.04 USD 10,000 Toyota Auto Receivables Owner Trust
'2016-B A3' 1.30% 15/4/2020 8,949 0.01 USD 4,848 UAL Pass Through Trust '2009-2A'
9.75% 15/1/2017 4,519 0.01 USD 20,000 United States Treasury Bond
2.50% 15/2/2046 17,369 0.03 USD 716,200 United States Treasury Bond
2.50% 15/5/2046 622,625 0.98 USD 552,230 United States Treasury Inflation
Indexed Bonds 0.625% 15/1/2026 512,991 0.81 USD 85,945 United States Treasury Inflation
Indexed Bonds 0.75% 15/2/2045 73,948 0.12 USD 243,179 United States Treasury Inflation
Indexed Bonds 1.00% 15/2/2046 225,164 0.35 USD 40,000 United States Treasury Note
1.625% 15/2/2026 35,098 0.05 USD 32,000 Verizon Communications Inc
3.65% 14/9/2018 30,106 0.05 USD 10,000 Virginia Electric & Power Co
1.20% 15/1/2018 8,933 0.01 USD 21,000 Walgreens Boots Alliance Inc
2.60% 1/6/2021 18,897 0.03 USD 7,000 Walgreens Boots Alliance Inc
3.10% 1/6/2023 6,279 0.01 USD 16,000 Walgreens Boots Alliance Inc
3.45% 1/6/2026 14,347 0.02 USD 20,000 Wells Fargo & Co 2.15% 15/1/2019 18,153 0.03
10,935,925 17.18
Total Bonds 55,237,456 86.76
Portfolio of Investments as at 31 May 2016
United States continued United States continued

Annual Report and Audited Accounts 361
The notes on pages 489 to 503 form an integral part of these financial statements.
Transferable Securities and Money Market Instruments Admitted to an Official Stock Exchange Listing or Dealt in on Another Regulated Market
Holding
Description
Market Value
EUR
% of Net
Assets
1 Investment in connected party fund, see further information in Note 10.
Portfolio of Investments as at 31 May 2016
EXCHANGE TRADED FUNDS
Guernsey 100,364 Better Capital PCC Ltd 113,491 0.18
113,491 0.18
Ireland 4,219 Source Physical Gold P-ETC 448,964 0.70
448,964 0.70
Jersey 8,800 ETFS Physical Silver 120,701 0.19
120,701 0.19
Total Exchange Traded Funds 683,156 1.07
Total Transferable Securities and Money Market Instruments Admitted to an Official Stock Exchange Listing or Dealt in on Another Regulated Market 57,994,053 91.09
Collective Investment Schemes
Ireland 1,500,031 Institutional Cash Series Plc -
Institutional Euro Assets Liquidity Fund 1 1,500,031 2.35
141 Institutional Cash Series Plc - Institutional Euro Liquidity Fund 1 141 0.00
1,500,172 2.35
Total Collective Investment Schemes 1,500,172 2.35
Securities portfolio at market value 59,494,225 93.44
Other Net Assets 4,174,645 6.56
Total Net Assets (EUR) 63,668,870 100.00
BlackRock Multi-Strategy Absolute Return Fund continued

Contracts for difference as at 31 May 2016
Holding
Description Counterparty
Unrealised appreciation/
(depreciation) EUR
Holding
Description Counterparty
Unrealised appreciation/
(depreciation) EUR
362 BlackRock Strategic Funds (BSF)
The notes on pages 489 to 503 form an integral part of these financial statements.
BlackRock Multi-Strategy Absolute Return Fund continued
Australia 805 AGL Energy Ltd Bank of America
Merrill Lynch (57) 1,611 AGL Energy Ltd Citibank (76) (1,226) ALS Ltd Citibank 162 (21,041) Alumina Ltd Bank of America
Merrill Lynch (629) (3,241) Alumina Ltd Citibank 32 (1,456) Ansell Ltd Bank of America
Merrill Lynch (180) (382) Ansell Ltd Citibank (30) (8,149) APA Group (Unit) Citibank 582 (101) APA Group (Unit) Bank of America
Merrill Lynch 14 1,394 Aristocrat Leisure Ltd Bank of America
Merrill Lynch 396 678 Aristocrat Leisure Ltd Citibank 152 5,199 AusNet Services Bank of America
Merrill Lynch (101) 1,968 AusNet Services Citibank 26 583 Bank of Queensland Ltd Bank of America
Merrill Lynch 74 242 Bank of Queensland Ltd Citibank 20 1,860 BHP Billiton Ltd Bank of America
Merrill Lynch 430 2,610 BHP Billiton Ltd Citibank 1,000 2,439 BlueScope Steel Ltd Bank of America
Merrill Lynch 517 655 BlueScope Steel Ltd Citibank 35 (2,500) Boral Ltd Citibank 16 (1,060) Boral Ltd Bank of America
Merrill Lynch (61) (270) Brambles Ltd Citibank (21) 1,575 Caltex Australia Ltd Bank of America
Merrill Lynch (1,074) 1,370 Caltex Australia Ltd Citibank (672) 304 Challenger Ltd/Australia Citibank 36 721 CIMIC Group Ltd Bank of America
Merrill Lynch (178) 1,716 CIMIC Group Ltd Citibank (925) (172) Commonwealth Bank of America
Bank of Australia Merrill Lynch 77 (341) Commonwealth
Bank of Australia Citibank 117 (5,471) Computershare Ltd Bank of America
Merrill Lynch (1,529) (6,813) Computershare Ltd Citibank (1,416) (2,986) Crown Resorts Ltd Bank of America
Merrill Lynch (23) (2,890) Crown Resorts Ltd Citibank (113) 6,313 CSR Ltd Bank of America
Merrill Lynch 328 10,872 CSR Ltd Citibank 565 2,327 Dexus Property Group (Reit) Citibank (91) (179) Domino's Pizza Bank of America
Enterprises Ltd Merrill Lynch (106) (937) Downer EDI Ltd Bank of America
Merrill Lynch (43) 188 DuluxGroup Ltd Bank of America
Merrill Lynch 4 4,617 DuluxGroup Ltd Citibank 669 257 Flight Centre Travel Group Ltd Bank of America
Merrill Lynch (158) 208 Flight Centre Travel Group Ltd Citibank (117) 1,518 Fortescue Metals Group Ltd Bank of America
Merrill Lynch 49 3,757 Fortescue Metals Group Ltd Citibank 171 161 Iluka Resources Ltd Citibank 3 (13,151) Incitec Pivot Ltd Bank of America
Merrill Lynch (342) (268) Independence Group NL Bank of America
Merrill Lynch (16)
(13,150) Insurance Australia Group Ltd Bank of America Merrill Lynch (256)
(9,251) IOOF Holdings Ltd Bank of America Merrill Lynch 4,102
(302) IOOF Holdings Ltd Citibank (26) (8,578) Macquarie Atlas Roads Bank of America
Group (Unit) Merrill Lynch (516) (4,079) Macquarie Atlas Roads
Group (Unit) Citibank (147) (122) Macquarie Group Ltd Citibank (68) 4,535 Medibank Pvt Ltd Citibank 313 24,304 Mirvac Group (Reit) Bank of America
Merrill Lynch 395 903 Newcrest Mining Ltd Bank of America
Merrill Lynch (1,152) 63 Newcrest Mining Ltd Citibank (50) 5,001 Northern Star Resources Ltd Bank of America
Merrill Lynch (1,267) 6,239 Northern Star Resources Ltd Citibank (810) (105) Orica Ltd Bank of America
Merrill Lynch 3 (526) Orica Ltd Citibank 113 13,043 Orora Ltd Bank of America
Merrill Lynch 85 15,412 Orora Ltd Citibank 300 2,026 OZ Minerals Ltd Bank of America
Merrill Lynch (174) 4,320 OZ Minerals Ltd Citibank (505) 1,107 Platinum Asset
Management Ltd Citibank 223 5,996 Platinum Asset Bank of America
Management Ltd Merrill Lynch 1,485 9,819 Qantas Airways Ltd Bank of America
Merrill Lynch (1,541) 1,021 Qantas Airways Ltd Citibank (52) 708 QBE Insurance Group Ltd Bank of America
Merrill Lynch 246 (439) Ramsay Health Care Ltd Bank of America
Merrill Lynch (400) (194) Ramsay Health Care Ltd Citibank (176) 762 Rio Tinto Ltd Bank of America
Merrill Lynch 137 499 Rio Tinto Ltd Citibank 186 3,216 Sims Metal Management Ltd Citibank 193 (182) Sonic Healthcare Ltd Bank of America
Merrill Lynch 23 (188) Sonic Healthcare Ltd Citibank 35 1,368 Stockland (Reit) Citibank — 4,552 Stockland (Reit) Bank of America
Merrill Lynch (59) 10,588 Sydney Airport (Unit) Citibank 2,166 6,787 Sydney Airport (Unit) Bank of America
Merrill Lynch (467) 2,412 Tabcorp Holdings Ltd Bank of America
Merrill Lynch 172 928 Tabcorp Holdings Ltd Citibank 50 (1,081) TPG Telecom Ltd Bank of America
Merrill Lynch (504) (261) TPG Telecom Ltd Citibank (17) (561) Vicinity Centres (Reit) Citibank (11) (5,093) Vicinity Centres (Reit) Bank of America
Merrill Lynch 98 (398) Wesfarmers Ltd Bank of America
Merrill Lynch 576 (102) Westfield Corp (Reit) Citibank (26) 4,331 Whitehaven Coal Ltd Citibank 281 4,595 Whitehaven Coal Ltd Bank of America
Merrill Lynch 343 (116) Woodside Petroleum Ltd Bank of America
Merrill Lynch 41
Australia continued

Contracts for difference as at 31 May 2016
Holding
Description Counterparty
Unrealised appreciation/
(depreciation) EUR
Holding
Description Counterparty
Unrealised appreciation/
(depreciation) EUR
Annual Report and Audited Accounts 363
The notes on pages 489 to 503 form an integral part of these financial statements.
474 WorleyParsons Ltd Bank of America Merrill Lynch 236
844 WorleyParsons Ltd Citibank 466
1,561
Austria 195 Erste Group Bank AG Bank of America
Merrill Lynch 163 104 Erste Group Bank AG Citibank 122 13,144 Erste Group Bank AG HSBC 11,172 471 OMV AG Citibank (139) 336 OMV AG Bank of America
Merrill Lynch (227) 130 voestalpine AG Bank of America
Merrill Lynch 242 218 voestalpine AG Citibank 455 2,199 Wienerberger AG Bank of America
Merrill Lynch 1,374
13,162
Belgium (150) Anheuser-Busch InBev SA/NV Bank of America
Merrill Lynch (660) (70) Anheuser-Busch InBev SA/NV Citibank (116) 25 Bekaert SA Bank of America
Merrill Lynch 82 194 Bekaert SA Citibank 440 (302) Colruyt SA Bank of America
Merrill Lynch (589) (1,408) Colruyt SA Citibank (1,704) 1,186 Euronav NV Citibank 638 1,452 Euronav NV Bank of America
Merrill Lynch (364) (209) Groupe Bruxelles Lambert SA Bank of America
Merrill Lynch (595) (265) Groupe Bruxelles Lambert SA Citibank (593) 1,226 Proximus SADP Citibank 1,300 661 Proximus SADP Bank of America
Merrill Lynch 813 1,209 Telenet Group Holding NV Bank of America
Merrill Lynch 1,560 707 Telenet Group Holding NV Citibank 728 (179) Umicore SA Bank of America
Merrill Lynch (138) (181) Umicore SA Citibank (202)
600
Brazil (31,400) BM&FBovespa SA - Bolsa de
Valores Mercadorias e Futuros HSBC 2,388 71,647 Kroton Educacional SA Citibank (13,147) (28,488) Raia Drogasil SA HSBC (17,486)
(28,245)
Canada (15) Agnico Eagle Mines Ltd Bank of America
Merrill Lynch (7) (44) Agnico Eagle Mines Ltd Citibank (23) (294) Agrium Inc Bank of America
Merrill Lynch (579) (36) Agrium Inc Citibank (65) 5,377 Air Canada Citibank 664 (1,158) Allied Properties Real Estate
Investment Trust (Reit) Citibank 120 (239) AltaGas Ltd Citibank 25 (282) Amaya Inc Citibank (141) 105 ARC Resources Ltd Bank of America
Merrill Lynch 37
41 ARC Resources Ltd Citibank 11 741 Bank of Nova Scotia/The Bank of America
Merrill Lynch 496 180 Bank of Nova Scotia/The Citibank 72 1,203 Barrick Gold Corp Bank of America
Merrill Lynch (1,221) 309 Barrick Gold Corp Citibank (42) 127 BCE Inc Citibank (1) (1,736) Bombardier Inc 'B' Bank of America
Merrill Lynch (30) 2,236 CAE Inc Bank of America
Merrill Lynch 828 3,404 CAE Inc Citibank 910 (137) Cameco Corp Bank of America
Merrill Lynch (11) (363) Cameco Corp Citibank (13) 122 Canadian National Railway Co Citibank 143 59 Canadian Pacific Railway Ltd Bank of America
Merrill Lynch 103 234 Canadian Pacific Railway Ltd Citibank 359 48 Canadian Tire Corp Ltd 'A' Citibank 182 (314) Canadian Western Bank Bank of America
Merrill Lynch (174) 868 Canfor Corp Citibank 631 1,205 Capital Power Corp Bank of America
Merrill Lynch 620 409 Capital Power Corp Citibank 185 2,786 Celestica Inc Bank of America
Merrill Lynch 1,529 2,319 Celestica Inc Citibank 954 127 Cenovus Energy Inc Bank of America
Merrill Lynch 30 342 Cenovus Energy Inc Citibank 122 107 Centerra Gold Inc Citibank (21) (28) CGI Group Inc 'A' Bank of America
Merrill Lynch (46) (51) CGI Group Inc 'A' Citibank (37) (118) Cominar Real Estate Bank of America
Investment Trust (Reit) Merrill Lynch 8 (350) Concordia Healthcare Corp Bank of America
Merrill Lynch (1,287) (3,779) Corus Entertainment Inc 'B' Bank of America
Merrill Lynch (1,048) (1,467) Cott Corp Bank of America
Merrill Lynch 111 46 Crescent Point Energy Corp Citibank 26 (1,530) DH Corp Bank of America
Merrill Lynch 105 (1,680) DH Corp Citibank 127 311 Dollarama Inc Bank of America
Merrill Lynch 399 762 Dollarama Inc Citibank 549 690 Domtar Corp Bank of America
Merrill Lynch 1,127 605 Domtar Corp Citibank 212 191 Dream Office Real Estate Bank of America
Investment Trust (Reit) Merrill Lynch (51) 615 Dream Office Real Estate
Investment Trust (Reit) Citibank 59 (2,207) Eldorado Gold Corp Bank of America
Merrill Lynch 1,165 (1,590) Element Financial Corp Bank of America
Merrill Lynch (667) (414) Element Financial Corp Citibank 31 229 Emera Inc Citibank 110 (290) Empire Co Ltd 'A' Bank of America
Merrill Lynch (24) (68) Empire Co Ltd 'A' Citibank (9) 466 Enbridge Inc Bank of America
Merrill Lynch (28)
BlackRock Multi-Strategy Absolute Return Fund continued
Australia continued Canada continued

Contracts for difference as at 31 May 2016
Holding
Description Counterparty
Unrealised appreciation/
(depreciation) EUR
Holding
Description Counterparty
Unrealised appreciation/
(depreciation) EUR
364 BlackRock Strategic Funds (BSF)
The notes on pages 489 to 503 form an integral part of these financial statements.
BlackRock Multi-Strategy Absolute Return Fund continued
652 Enbridge Inc Citibank (173) (176) Fairfax Financial Holdings Ltd Citibank (976) (45) Fairfax Financial Holdings Ltd Bank of America
Merrill Lynch (524) (311) First Capital Realty Inc Citibank (6) (1,217) First Capital Realty Inc Bank of America
Merrill Lynch 417 (389) First Majestic Silver Corp Bank of America
Merrill Lynch 235 153 Fortis Inc/Canada Bank of America
Merrill Lynch 60 222 Fortis Inc/Canada Citibank 27 (139) Franco-Nevada Corp Citibank (184) (180) Franco-Nevada Corp Bank of America
Merrill Lynch 620 300 Gibson Energy Inc Citibank (82) 446 Gibson Energy Inc Bank of America
Merrill Lynch — (673) Gildan Activewear Inc Citibank (272) 178 Goldcorp Inc Bank of America
Merrill Lynch 19 89 Goldcorp Inc Citibank 31 (1,684) Great-West Lifeco Inc Citibank (198) (975) Great-West Lifeco Inc Bank of America
Merrill Lynch (238) (101) H&R Real Estate Bank of America
Investment Trust (Reit) Merrill Lynch 4 448 Home Capital Group Inc Bank of America
Merrill Lynch 722 (966) Hudson's Bay Co Citibank 6 (1,225) Hydro One Ltd Bank of America
Merrill Lynch (361) (8,223) Hydro One Ltd Citibank 282 (1,218) IGM Financial Inc Bank of America
Merrill Lynch (1,277) (911) IGM Financial Inc Citibank (662) (399) Imperial Oil Ltd Bank of America
Merrill Lynch (315) (404) Imperial Oil Ltd Citibank (213) 25 Inter Pipeline Ltd Bank of America
Merrill Lynch 3 277 Inter Pipeline Ltd Citibank 28 (1,074) Jean Coutu Group Bank of America
PJC Inc/The 'A' Merrill Lynch (987) (907) Jean Coutu Group
PJC Inc/The 'A' Citibank (603) 72 Keyera Corp Bank of America
Merrill Lynch 24 477 Keyera Corp Citibank 124 2,297 Kinross Gold Corp Citibank (63) (18) Loblaw Cos Ltd Bank of America
Merrill Lynch (3) (100) Loblaw Cos Ltd Citibank (36) (609) MacDonald Dettwiler & Bank of America
Associates Ltd Merrill Lynch 66 (484) MacDonald Dettwiler &
Associates Ltd Citibank (1,119) (951) Manitoba Telecom Services Inc Bank of America
Merrill Lynch (424) (2,545) Manitoba Telecom Services Inc Citibank (279) 1,041 Maple Leaf Foods Inc Bank of America
Merrill Lynch (197) 775 Maple Leaf Foods Inc Citibank 27 (119) Methanex Corp Bank of America
Merrill Lynch (40) 1,653 Metro Inc Citibank 408 (193) New Flyer Industries Inc Bank of America
Merrill Lynch 11 (1,549) Norbord Inc Bank of America
Merrill Lynch (2,401) (2,226) Northland Power Inc Citibank 412
(252) Novagold Resources Inc Bank of America Merrill Lynch 218
175 Onex Corp Bank of America Merrill Lynch 287
584 Pan American Silver Corp Bank of America Merrill Lynch 2,985
1,878 Power Corp of Canada Bank of America Merrill Lynch 1,339
(206) Power Financial Corp Bank of America Merrill Lynch (123)
(598) Power Financial Corp Citibank (98) (460) PrairieSky Royalty Ltd Bank of America
Merrill Lynch (81) 268 Precision Drilling Corp Bank of America
Merrill Lynch 46 1,004 Precision Drilling Corp Citibank 250 (1,013) Pretium Resources Inc Bank of America
Merrill Lynch 823 303 Quebecor Inc 'B' Bank of America
Merrill Lynch 133 17 Ritchie Bros Auctioneers Inc Citibank (5) 331 Ritchie Bros Auctioneers Inc Bank of America
Merrill Lynch 162 218 Rogers Communications Inc 'B' Bank of America
Merrill Lynch 401 (1,214) Saputo Inc Citibank (316) (205) Saputo Inc Bank of America
Merrill Lynch 254 (366) Shaw Communications Inc 'B' Bank of America
Merrill Lynch (33) (100) Shaw Communications Inc 'B' Citibank (5) (917) Silver Wheaton Corp Bank of America
Merrill Lynch 635 (1,705) Silver Wheaton Corp Citibank 47 (685) Stantec Inc Citibank (705) 80 Sun Life Financial Inc Citibank 2 730 Sun Life Financial Inc Bank of America
Merrill Lynch 232 (16) Toromont Industries Ltd Bank of America
Merrill Lynch 3 (440) Toromont Industries Ltd Citibank 112 294 TransAlta Corp Citibank (24) 588 TransCanada Corp Bank of America
Merrill Lynch 796 28 TransCanada Corp Citibank 17 (912) Veresen Inc Bank of America
Merrill Lynch (281) 63 Vermilion Energy Inc Bank of America
Merrill Lynch 17 153 Vermilion Energy Inc Citibank 129 (6) West Fraser Timber Co Ltd Bank of America
Merrill Lynch (10) (259) West Fraser Timber Co Ltd Citibank (789)
4,836
Denmark (1,345) FLSmidth & Co A/S Bank of America
Merrill Lynch 1,248 48 ISS A/S Bank of America
Merrill Lynch 79 397 ISS A/S Citibank 454 (671) Jyske Bank A/S Reg Bank of America
Merrill Lynch (1,374) (1,164) Jyske Bank A/S Reg Citibank (1,941) 222 NKT Holding A/S Citibank 140 554 NKT Holding A/S Bank of America
Merrill Lynch 447 1,105 Novo Nordisk A/S 'B' Bank of America
Merrill Lynch 1,451 316 Novo Nordisk A/S 'B' Citibank 544
Canada continued Canada continued

Contracts for difference as at 31 May 2016
Holding
Description Counterparty
Unrealised appreciation/
(depreciation) EUR
Holding
Description Counterparty
Unrealised appreciation/
(depreciation) EUR
Annual Report and Audited Accounts 365
The notes on pages 489 to 503 form an integral part of these financial statements.
495 Pandora A/S Bank of America Merrill Lynch 2,363
(91) Sydbank A/S Bank of America Merrill Lynch (139)
91 Tryg A/S Bank of America Merrill Lynch 5
(4,716) William Demant Holding A/S Citibank (2,314)
963
Finland 835 Cargotec Oyj 'B' Citibank 1,086 316 Cargotec OYJ 'B' Bank of America
Merrill Lynch 496 777 Elisa OYJ Bank of America
Merrill Lynch 1,285 918 Elisa OYJ Citibank 1,726 (2,513) Fortum OYJ Citibank (980) 271 Huhtamaki OYJ Bank of America
Merrill Lynch 611 720 Huhtamaki OYJ Citibank 755 (120) Kesko OYJ 'B' Bank of America
Merrill Lynch (106) (92) Kesko OYJ 'B' Citibank (108) 785 Kone OYJ 'B' Citibank 1,790 574 Kone OYJ 'B' Bank of America
Merrill Lynch 1,314 (276) Neste Oyj Bank of America
Merrill Lynch (228) (26) Neste Oyj Citibank (24) (5,912) Nokia OYJ Bank of America
Merrill Lynch (3,173) (526) Nokian Renkaat OYJ Bank of America
Merrill Lynch 279 (1,258) Nokian Renkaat OYJ Citibank (969) 2,955 Stora Enso OYJ 'R' Bank of America
Merrill Lynch 1,566 1,696 UPM-Kymmene OYJ Citibank 1,221 780 UPM-Kymmene OYJ Bank of America
Merrill Lynch 585
7,126
France (53) Aeroports de Paris Bank of America
Merrill Lynch 62 (62) Aeroports de Paris Citibank 51 632 Air France-KLM Bank of America
Merrill Lynch (60) 518 Air France-KLM Citibank (80) (332) Airbus Group SE Bank of America
Merrill Lynch (446) (15) Airbus Group SE Citibank (28) 474 AXA SA Citibank 780 2,319 AXA SA Bank of America
Merrill Lynch 4,996 (280) BioMerieux Citibank 210 (144) BioMerieux Bank of America
Merrill Lynch (454) (1,242) Bollore SA Citibank 25 (5,061) Bollore SA Bank of America
Merrill Lynch (343) (4,025) Bureau Veritas SA Citibank (805) (152) Bureau Veritas SA Bank of America
Merrill Lynch 52 (253) Casino Guichard Perrachon SA Citibank (827) (52) Casino Guichard Perrachon SA Bank of America
Merrill Lynch (106) 271 Christian Dior SE Citibank 461 468 Cie de Saint-Gobain Bank of America
Merrill Lynch 811 377 Cie de Saint-Gobain Citibank 556
758 Credit Agricole SA Citibank 223 (102) Danone SA Bank of America
Merrill Lynch (31) (54) Danone SA Citibank (35) (164) Dassault Systemes Citibank (344) 465 Electricite de France SA Bank of America
Merrill Lynch 163 551 Electricite de France SA Citibank (56) 490 Engie SA Citibank 274 4,668 Engie SA Bank of America
Merrill Lynch 2,077 16 Euler Hermes Group Bank of America
Merrill Lynch (52) 20 Euler Hermes Group Citibank 2 92 Euronext NV '144A' Bank of America
Merrill Lynch (97) (955) Eutelsat Communications SA Citibank 544 (2,805) Eutelsat Communications SA Bank of America
Merrill Lynch 1,224 (2,165) Groupe Eurotunnel SE Reg Bank of America
Merrill Lynch (429) (314) Groupe Eurotunnel SE Reg Citibank 22 (1) Hermes International Citibank (8) (169) Imerys SA Bank of America
Merrill Lynch (433) (160) Imerys SA Citibank (267) (168) Ingenico Group SA Bank of America
Merrill Lynch (1,193) (50) Ingenico Group SA Citibank (203) (39) Ipsen SA Bank of America
Merrill Lynch (151) (99) Kering Bank of America
Merrill Lynch (267) (57) Kering Citibank (197) 1,430 Klepierre (Reit) Bank of America
Merrill Lynch 1,394 21 Klepierre (Reit) Citibank 23 (65) L'Oreal SA Bank of America
Merrill Lynch (180) (31) L'Oreal SA Citibank (53) 980 Lagardere SCA Bank of America
Merrill Lynch (877) 653 Lagardere SCA Citibank (212) (190) Legrand SA Citibank (54) 897 Natixis SA Bank of America
Merrill Lynch 172 2,439 Natixis SA Citibank (3) 519 Nexans SA Citibank 990 220 Nexans SA Bank of America
Merrill Lynch 436 1,024 Nexity SA Citibank (154) 123 Nexity SA Bank of America
Merrill Lynch 60 1,431 Orange SA Citibank 830 1,104 Orange SA Bank of America
Merrill Lynch 640 (33) Orpea Bank of America
Merrill Lynch 1 (59) Pernod Ricard SA Bank of America
Merrill Lynch (130) (123) Pernod Ricard SA Citibank (485) 36 Peugeot SA Citibank 6 5,721 Peugeot SA Bank of America
Merrill Lynch 3,747 36 Plastic Omnium SA Bank of America
Merrill Lynch 57 66 Plastic Omnium SA Citibank 91 (271) Publicis Groupe SA Bank of America
Merrill Lynch (512) (564) Publicis Groupe SA Citibank (338)
BlackRock Multi-Strategy Absolute Return Fund continued
France continued Denmark continued

Contracts for difference as at 31 May 2016
Holding
Description Counterparty
Unrealised appreciation/
(depreciation) EUR
Holding
Description Counterparty
Unrealised appreciation/
(depreciation) EUR
366 BlackRock Strategic Funds (BSF)
The notes on pages 489 to 503 form an integral part of these financial statements.
BlackRock Multi-Strategy Absolute Return Fund continued
(243) Rexel SA Bank of America Merrill Lynch (187)
(788) Rexel SA Citibank (423) 36 Safran SA Citibank 114 557 Safran SA Bank of America
Merrill Lynch 1,946 172 Sartorius Stedim Biotech Bank of America
Merrill Lynch 350 111 Sartorius Stedim Biotech Citibank 239 (717) Schneider Electric SE Bank of America
Merrill Lynch (2,323) (220) Schneider Electric SE Citibank (418) (358) SES SA Bank of America
Merrill Lynch 684 (591) SES SA Citibank 1,034 595 Societe Generale SA Citibank 1,496 1,178 STMicroelectronics NV Bank of America
Merrill Lynch 759 4,392 STMicroelectronics NV Citibank 874 (36) Teleperformance Citibank (19) (1,970) Television Francaise 1 Citibank (771) 417 Thales SA Citibank 334 709 Thales SA Bank of America
Merrill Lynch 284 555 Valeo SA Citibank 2,636 86 Valeo SA Bank of America
Merrill Lynch 171 1,003 Veolia Environnement SA Bank of America
Merrill Lynch 452 668 Veolia Environnement SA Citibank 375
18,677
Germany (4,529) Alstria Office AG (Reit) Bank of America
Merrill Lynch (521) (29) alstria office REIT-AG (Reit) Citibank (11) 158 Aurubis AG Bank of America
Merrill Lynch 148 (560) Axel Springer SE Citibank (381) (836) Axel Springer SE Bank of America
Merrill Lynch (991) 275 Bayer AG Reg Bank of America
Merrill Lynch (2,817) 221 Bayer AG Reg Citibank 327 (894) Bayerische Motoren Werke AG Citibank (4,479) (136) Bayerische Motoren Werke AG Bank of America
Merrill Lynch (280) (879) Bayerische Motoren Bank of America
Werke AG (Pref) Merrill Lynch (1,301) (569) Bayerische Motoren
Werke AG (Pref) Citibank (1,969) (536) Bilfinger SE Citibank (397) (378) Commerzbank AG Bank of America
Merrill Lynch (308) (1,071) Commerzbank AG Citibank (525) 92 Continental AG Citibank 803 204 Continental AG Bank of America
Merrill Lynch 1,986 206 Covestro AG Bank of America
Merrill Lynch 479 508 Covestro AG Citibank 1,689 (547) CTS Eventim AG & Co KGaA Bank of America
Merrill Lynch 671 (274) Daimler AG Reg Bank of America
Merrill Lynch (726) (377) Daimler AG Reg Citibank (1,719) 328 Deutsche EuroShop AG Citibank 141 805 Deutsche EuroShop AG Bank of America
Merrill Lynch 660 (1,448) Deutsche Lufthansa AG Reg Citibank (343)
1,814 Deutsche Telekom AG Reg Bank of America Merrill Lynch (51)
2,612 Deutsche Telekom AG Reg Citibank 254 226 Dialog Semiconductor Plc Bank of America
Merrill Lynch 642 249 Dialog Semiconductor Plc Citibank 177 (310) Drillisch AG Citibank 335 (839) Drillisch AG Bank of America
Merrill Lynch 1,456 285 Duerr AG Bank of America
Merrill Lynch 235 1,341 E.ON SE Bank of America
Merrill Lynch 653 6,106 E.ON SE Citibank 3,389 (504) ElringKlinger AG Citibank (650) (2,010) ElringKlinger AG Bank of America
Merrill Lynch (1,357) 179 Evonik Industries AG Citibank 5 2,660 Evonik Industries AG Bank of America
Merrill Lynch (2,874) (621) Fielmann AG Bank of America
Merrill Lynch (776) (151) Fielmann AG Citibank (193) (251) Fraport AG Frankfurt Airport Bank of America
Services Worldwide Merrill Lynch (77) (166) Fraport AG Frankfurt Airport
Services Worldwide Citibank (176) (155) Fresenius SE & Co KGaA Citibank (505) (1,420) GEA Group AG Citibank (714) (956) GEA Group AG Bank of America
Merrill Lynch (582) (490) Grand City Properties SA Citibank (216) (124) Grand City Properties SA Bank of America
Merrill Lynch (72) 168 Hannover Rueck SE Bank of America
Merrill Lynch 770 228 Hannover Rueck SE Citibank 934 (20) Hella KGaA Hueck & Co Citibank (28) (176) Henkel AG & Co KGaA Bank of America
Merrill Lynch (757) (372) Henkel AG & Co KGaA Citibank (1,239) 344 HOCHTIEF AG Citibank 258 489 HOCHTIEF AG Bank of America
Merrill Lynch (367) (30) Hugo Boss AG Bank of America
Merrill Lynch 87 (27) Hugo Boss AG Citibank 7 768 KION Group AG Citibank 891 409 KION Group AG Bank of America
Merrill Lynch 982 190 Lanxess AG Citibank 25 49 Linde AG Bank of America
Merrill Lynch 192 6 Linde AG Citibank 40 (784) Merck KGaA Bank of America
Merrill Lynch (5,623) (630) Merck KGaA Citibank (1,386) 131 Norma Group SE Citibank 51 196 Norma Group SE Bank of America
Merrill Lynch (118) 939 OSRAM Licht AG Citibank 1,798 154 OSRAM Licht AG Bank of America
Merrill Lynch 346 1,433 ProSiebenSat.1 Media SE Bank of America
Merrill Lynch 2,973 1,400 ProSiebenSat.1 Media SE Citibank 1,134 (84) QIAGEN NV Bank of America
Merrill Lynch (100) 38 Rational AG Citibank (76) 52 Rational AG Bank of America
Merrill Lynch 86
France continued Germany continued

Contracts for difference as at 31 May 2016
Holding
Description Counterparty
Unrealised appreciation/
(depreciation) EUR
Holding
Description Counterparty
Unrealised appreciation/
(depreciation) EUR
Annual Report and Audited Accounts 367
The notes on pages 489 to 503 form an integral part of these financial statements.
1,278 Rhoen-Klinikum AG Citibank 256 462 Rhoen-Klinikum AG Bank of America
Merrill Lynch 330 7 RTL Group SA Bank of America
Merrill Lynch (8) 289 RWE AG Citibank (17) (252) SAP SE Citibank (824) (30) Sartorius AG (Pref) Citibank (374) (141) Siemens AG Reg Bank of America
Merrill Lynch (539) 51 SMA Solar Technology AG Bank of America
Merrill Lynch 46 21 SMA Solar Technology AG Citibank 5 72 Software AG Bank of America
Merrill Lynch 19 (256) Symrise AG Citibank (120) (1,192) Symrise AG Bank of America
Merrill Lynch 417 388 TAG Immobilien AG Bank of America
Merrill Lynch 32 438 TAG Immobilien AG Citibank 166 197 Talanx AG Bank of America
Merrill Lynch 366 356 Talanx AG Citibank 662 (201) Volkswagen AG Citibank (1,286) (106) Volkswagen AG (Pref) Citibank (816) (148) Volkswagen AG (Pref) Bank of America
Merrill Lynch (1,006) (1,460) Vonovia SE Citibank (1,270) (533) Zalando SE Bank of America
Merrill Lynch 804 (328) Zalando SE Citibank 287
(12,951)
Greece 97,119 Alpha Bank AE Citibank 30,107 680,797 National Bank of Greece SA HSBC 1,362 40,711 OPAP SA HSBC 26,055
57,524
Hong Kong 215,000 3SBio Inc '144A' HSBC (29,006) (64,200) AIA Group Ltd Citibank (12,357) (400) AIA Group Ltd Bank of America
Merrill Lynch (81) (200) AIA Group Ltd Citibank (51) (9,200) ASM Pacific Technology Ltd Bank of America
Merrill Lynch (4,189) 891,000 Bank of China Ltd 'H' HSBC 20,664 (11,585) Bank of East Asia Ltd/The Bank of America
Merrill Lynch (2,470) (3,800) Bank of East Asia Ltd/The Citibank (482) 27,500 BOC Aviation Ltd '144A' Deutsche Bank (1,792) (3,000) Brightoil Petroleum Bank of America
Holdings Ltd Merrill Lynch (3) 276,000 Brilliance China Automotive
Holdings Ltd HSBC 8,589 2,000 Champion (Reit) Bank of America
Merrill Lynch 32 3,000 Champion REIT (Reit) Citibank 42 (4,000) Cheung Kong Property Bank of America
Holdings Ltd Merrill Lynch (1,268) (500) Cheung Kong Property
Holdings Ltd Citibank (184) 86,000 China Merchants Holdings
International Co Ltd Citibank 8,924 74,000 China Oilfield Services Ltd 'H' Deutsche Bank (1,025) 296,000 China Petroleum &
Chemical Corp 'H' Citibank 6,336 (1,000) CK Hutchison Holdings Ltd Citibank (219)
(2,500) CK Hutchison Holdings Ltd Bank of America Merrill Lynch 205
11,500 CLP Holdings Ltd Bank of America Merrill Lynch 4,109
15,000 CLP Holdings Ltd Citibank 3,285 800 Dah Sing Financial Bank of America
Holdings Ltd Merrill Lynch 129 (19,100) Esprit Holdings Ltd Citibank (264) (1,000) Great Eagle Holdings Ltd Bank of America
Merrill Lynch (467) (1,000) Great Eagle Holdings Ltd Citibank (380) (10,000) Guotai Junan International
Holdings Ltd Citibank (92) (2,000) Haitong International Bank of America
Securities Group Ltd Merrill Lynch (59) (2,000) Haitong International
Securities Group Ltd Citibank (76) 8,000 Hang Lung Group Ltd Bank of America
Merrill Lynch 830 2,000 Hang Lung Group Ltd Citibank 242 8,000 HKT Trust & HKT Ltd (Unit) Bank of America
Merrill Lynch 55 20,000 HKT Trust & HKT Ltd (Unit) Citibank 92 (59,000) Hong Kong & China Gas Co Ltd Bank of America
Merrill Lynch (3,808) (4,000) Hong Kong & China Gas Co Ltd Citibank (267) 60,000 Hutchison Telecommunications
Hong Kong Holdings Ltd Citibank 69 34,000 Hutchison Telecommunications Bank of America
Hong Kong Holdings Ltd Merrill Lynch — (14,000) Johnson Electric Holdings Ltd Bank of America
Merrill Lynch 5,099 2,000 Li & Fung Ltd Citibank (13) (500) Lifestyle International Bank of America
Holdings Ltd Merrill Lynch 13 (1,600) MGM China Holdings Ltd Bank of America
Merrill Lynch (151) (6,000) MTR Corp Ltd Bank of America
Merrill Lynch 731 (1,000) MTR Corp Ltd Citibank (109) 5,000 New World Bank of America
Development Co Ltd Merrill Lynch 167 20,000 New World
Development Co Ltd Citibank 484 2,000 NWS Holdings Ltd Bank of America
Merrill Lynch 9 5,000 NWS Holdings Ltd Citibank 81 (4,200) Prada SpA Citibank 347 (4,000) Shangri-La Asia Ltd Citibank (120) (10,000) Shangri-La Asia Ltd Bank of America
Merrill Lynch (58) (6,000) Shun Tak Holdings Ltd Bank of America
Merrill Lynch (28) 6,000 Sino Land Co Ltd Bank of America
Merrill Lynch 429 14,000 Sino Land Co Ltd Citibank 775 1,000 Sun Hung Kai Properties Ltd Citibank 490 3,000 Sun Hung Kai Properties Ltd Bank of America
Merrill Lynch 1,591 (77,000) Sunny Optical Technology
Group Co Ltd Deutsche Bank (28,974) 1,600 Swire Properties Ltd Bank of America
Merrill Lynch 439 2,400 Swire Properties Ltd Citibank 636 12,000 Texwinca Holdings Ltd Citibank (14) 8,000 Texwinca Holdings Ltd Bank of America
Merrill Lynch 351 (1,000) Value Partners Group Ltd Citibank (60) 100 VTech Holdings Ltd Bank of America
Merrill Lynch 3 100 VTech Holdings Ltd Citibank 10
BlackRock Multi-Strategy Absolute Return Fund continued
Hong Kong continued Germany continued
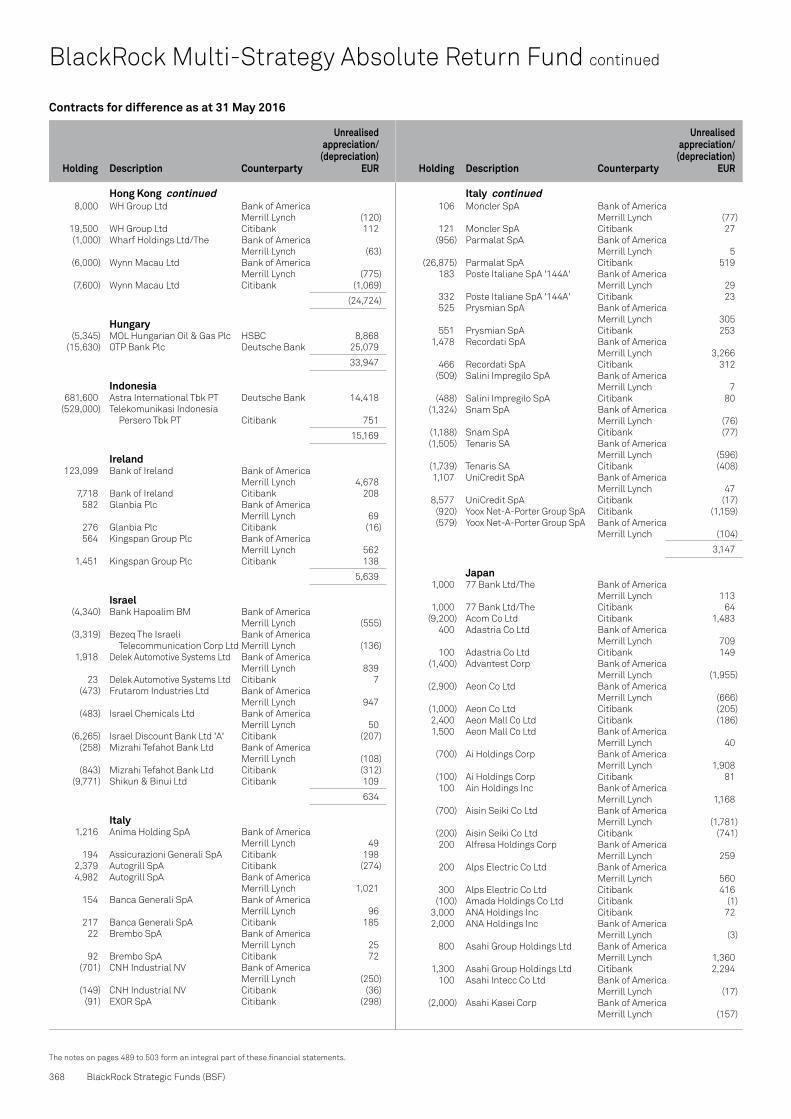
Contracts for difference as at 31 May 2016
Holding
Description Counterparty
Unrealised appreciation/
(depreciation) EUR
Holding
Description Counterparty
Unrealised appreciation/
(depreciation) EUR
368 BlackRock Strategic Funds (BSF)
The notes on pages 489 to 503 form an integral part of these financial statements.
BlackRock Multi-Strategy Absolute Return Fund continued
8,000 WH Group Ltd Bank of America Merrill Lynch (120)
19,500 WH Group Ltd Citibank 112 (1,000) Wharf Holdings Ltd/The Bank of America
Merrill Lynch (63) (6,000) Wynn Macau Ltd Bank of America
Merrill Lynch (775) (7,600) Wynn Macau Ltd Citibank (1,069)
(24,724)
Hungary (5,345) MOL Hungarian Oil & Gas Plc HSBC 8,868 (15,630) OTP Bank Plc Deutsche Bank 25,079
33,947
Indonesia 681,600 Astra International Tbk PT Deutsche Bank 14,418 (529,000) Telekomunikasi Indonesia
Persero Tbk PT Citibank 751
15,169
Ireland 123,099 Bank of Ireland Bank of America
Merrill Lynch 4,678 7,718 Bank of Ireland Citibank 208 582 Glanbia Plc Bank of America
Merrill Lynch 69 276 Glanbia Plc Citibank (16) 564 Kingspan Group Plc Bank of America
Merrill Lynch 562 1,451 Kingspan Group Plc Citibank 138
5,639
Israel (4,340) Bank Hapoalim BM Bank of America
Merrill Lynch (555) (3,319) Bezeq The Israeli Bank of America
Telecommunication Corp Ltd Merrill Lynch (136) 1,918 Delek Automotive Systems Ltd Bank of America
Merrill Lynch 839 23 Delek Automotive Systems Ltd Citibank 7 (473) Frutarom Industries Ltd Bank of America
Merrill Lynch 947 (483) Israel Chemicals Ltd Bank of America
Merrill Lynch 50 (6,265) Israel Discount Bank Ltd 'A' Citibank (207) (258) Mizrahi Tefahot Bank Ltd Bank of America
Merrill Lynch (108) (843) Mizrahi Tefahot Bank Ltd Citibank (312) (9,771) Shikun & Binui Ltd Citibank 109
634
Italy 1,216 Anima Holding SpA Bank of America
Merrill Lynch 49 194 Assicurazioni Generali SpA Citibank 198 2,379 Autogrill SpA Citibank (274) 4,982 Autogrill SpA Bank of America
Merrill Lynch 1,021 154 Banca Generali SpA Bank of America
Merrill Lynch 96 217 Banca Generali SpA Citibank 185 22 Brembo SpA Bank of America
Merrill Lynch 25 92 Brembo SpA Citibank 72 (701) CNH Industrial NV Bank of America
Merrill Lynch (250) (149) CNH Industrial NV Citibank (36) (91) EXOR SpA Citibank (298)
106 Moncler SpA Bank of America Merrill Lynch (77)
121 Moncler SpA Citibank 27 (956) Parmalat SpA Bank of America
Merrill Lynch 5 (26,875) Parmalat SpA Citibank 519 183 Poste Italiane SpA '144A' Bank of America
Merrill Lynch 29 332 Poste Italiane SpA '144A' Citibank 23 525 Prysmian SpA Bank of America
Merrill Lynch 305 551 Prysmian SpA Citibank 253 1,478 Recordati SpA Bank of America
Merrill Lynch 3,266 466 Recordati SpA Citibank 312 (509) Salini Impregilo SpA Bank of America
Merrill Lynch 7 (488) Salini Impregilo SpA Citibank 80 (1,324) Snam SpA Bank of America
Merrill Lynch (76) (1,188) Snam SpA Citibank (77) (1,505) Tenaris SA Bank of America
Merrill Lynch (596) (1,739) Tenaris SA Citibank (408) 1,107 UniCredit SpA Bank of America
Merrill Lynch 47 8,577 UniCredit SpA Citibank (17) (920) Yoox Net-A-Porter Group SpA Citibank (1,159) (579) Yoox Net-A-Porter Group SpA Bank of America
Merrill Lynch (104)
3,147
Japan 1,000 77 Bank Ltd/The Bank of America
Merrill Lynch 113 1,000 77 Bank Ltd/The Citibank 64 (9,200) Acom Co Ltd Citibank 1,483 400 Adastria Co Ltd Bank of America
Merrill Lynch 709 100 Adastria Co Ltd Citibank 149 (1,400) Advantest Corp Bank of America
Merrill Lynch (1,955) (2,900) Aeon Co Ltd Bank of America
Merrill Lynch (666) (1,000) Aeon Co Ltd Citibank (205) 2,400 Aeon Mall Co Ltd Citibank (186) 1,500 Aeon Mall Co Ltd Bank of America
Merrill Lynch 40 (700) Ai Holdings Corp Bank of America
Merrill Lynch 1,908 (100) Ai Holdings Corp Citibank 81 100 Ain Holdings Inc Bank of America
Merrill Lynch 1,168 (700) Aisin Seiki Co Ltd Bank of America
Merrill Lynch (1,781) (200) Aisin Seiki Co Ltd Citibank (741) 200 Alfresa Holdings Corp Bank of America
Merrill Lynch 259 200 Alps Electric Co Ltd Bank of America
Merrill Lynch 560 300 Alps Electric Co Ltd Citibank 416 (100) Amada Holdings Co Ltd Citibank (1) 3,000 ANA Holdings Inc Citibank 72 2,000 ANA Holdings Inc Bank of America
Merrill Lynch (3) 800 Asahi Group Holdings Ltd Bank of America
Merrill Lynch 1,360 1,300 Asahi Group Holdings Ltd Citibank 2,294 100 Asahi Intecc Co Ltd Bank of America
Merrill Lynch (17) (2,000) Asahi Kasei Corp Bank of America
Merrill Lynch (157)
Hong Kong continued Italy continued

Contracts for difference as at 31 May 2016
Holding
Description Counterparty
Unrealised appreciation/
(depreciation) EUR
Holding
Description Counterparty
Unrealised appreciation/
(depreciation) EUR
* Amounts which are less than 0.5 EUR have been rounded down to zero.
Annual Report and Audited Accounts 369
The notes on pages 489 to 503 form an integral part of these financial statements.
1,900 Astellas Pharma Inc Bank of America Merrill Lynch 663
5,200 Astellas Pharma Inc Citibank 1,571 300 Autobacs Seven Co Ltd Bank of America
Merrill Lynch (34) 600 Autobacs Seven Co Ltd Citibank (19) (500) Azbil Corp Bank of America
Merrill Lynch 181 3,000 Bank of Kyoto Ltd/The Bank of America
Merrill Lynch 1,426 300 Benesse Holdings Inc Citibank 3 (1,100) Brother Industries Ltd Bank of America
Merrill Lynch (573) (1,700) Brother Industries Ltd Citibank (880) 2,000 Calsonic Kansei Corp Bank of America
Merrill Lynch 338 3,000 Calsonic Kansei Corp Citibank (218) (2,300) Canon Inc Bank of America
Merrill Lynch (2,409) (1,200) Canon Inc Citibank (938) 2,100 Canon Marketing Japan Inc Bank of America
Merrill Lynch 1,760 500 Canon Marketing Japan Inc Citibank 375 (200) Capcom Co Ltd Bank of America
Merrill Lynch (276) (800) Capcom Co Ltd Citibank (387) 200 Central Japan Railway Co Bank of America
Merrill Lynch 655 5,000 Chiba Bank Ltd/The Citibank 869 2,000 Chiba Bank Ltd/The Bank of America
Merrill Lynch 449 2,000 Chiyoda Corp Citibank (97) 700 Chubu Electric Power Co Inc Bank of America
Merrill Lynch 138 400 Chubu Electric Power Co Inc Citibank 156 (500) Chugai Pharmaceutical Co Ltd Citibank (282) 600 Chugoku Bank Ltd/The Bank of America
Merrill Lynch 561 200 Chugoku Bank Ltd/The Citibank 64 1,700 Citizen Holdings Co Ltd Bank of America
Merrill Lynch (260) 3,000 Citizen Holdings Co Ltd Citibank 314 (100) Coca-Cola East Japan Co Ltd Bank of America
Merrill Lynch 19 400 COLOPL Inc Bank of America
Merrill Lynch 112 200 COLOPL Inc Citibank 154 (500) COMSYS Holdings Corp Bank of America
Merrill Lynch 238 (800) Cosmo Energy Holdings Co Ltd Bank of America
Merrill Lynch (60) (100) Cosmos Pharmaceutical Corp Citibank (491) (600) CyberAgent Inc Bank of America
Merrill Lynch (919) 600 Dai-ichi Life Bank of America
Insurance Co Ltd/The Merrill Lynch 322 100 Daicel Corp Bank of America
Merrill Lynch (8) 1,000 Daido Steel Co Ltd Bank of America
Merrill Lynch 290 4,000 Daido Steel Co Ltd Citibank 967 (600) Daifuku Co Ltd Bank of America
Merrill Lynch 49 (800) Daifuku Co Ltd Citibank 200 200 Daiichi Sankyo Co Ltd Bank of America
Merrill Lynch (102) 32,000 Daikyo Inc Bank of America
Merrill Lynch 1,031 22,000 Daikyo Inc Citibank 532 (1,000) Daishi Bank Ltd/The Bank of America
Merrill Lynch (153)
900 Daito Trust Construction Co Ltd Citibank (1,740) 200 Daito Trust Construction Co Ltd Bank of America
Merrill Lynch (733) 2,000 Denka Co Ltd Bank of America
Merrill Lynch (64) 2,000 Denka Co Ltd Citibank — (200) Denso Corp Citibank (39) (300) Dentsu Inc Citibank (459) (2,000) DIC Corp Bank of America
Merrill Lynch (170) (400) Disco Corp Bank of America
Merrill Lynch (4,093) (3,800) DMG Mori Co Ltd Bank of America
Merrill Lynch (1,531) (700) Don Quijote Holdings Co Ltd Bank of America
Merrill Lynch (57) (200) Don Quijote Holdings Co Ltd Citibank (121) 1,000 Dowa Holdings Co Ltd Citibank (113) 600 East Japan Railway Co Citibank 1,765 (4,000) Ebara Corp Bank of America
Merrill Lynch (905) (8,000) Ebara Corp Citibank (580) 200 Eisai Co Ltd Bank of America
Merrill Lynch 170 (500) euglena Co Ltd Bank of America
Merrill Lynch (349) (100) euglena Co Ltd Citibank (107) (700) Exedy Corp Bank of America
Merrill Lynch 237 200 FamilyMart Co Ltd Citibank (42) (200) FANUC Corp Citibank (1,579) (100) Fast Retailing Co Ltd Bank of America
Merrill Lynch (1,398) (100) FP Corp Bank of America
Merrill Lynch 64 900 Fuji Heavy Industries Ltd Citibank 2,016 (1,700) Fuji Oil Holdings Inc Bank of America
Merrill Lynch 863 2,000 Fujikura Ltd Citibank 435 2,000 Fujitsu General Ltd Bank of America
Merrill Lynch 2,095 2,000 Fukuoka Financial Group Inc Citibank 403 300 Glory Ltd Citibank (45) 900 Glory Ltd Bank of America
Merrill Lynch (548) (2,400) GMO internet Inc Bank of America
Merrill Lynch (772) 2,400 Gree Inc Bank of America
Merrill Lynch 657 4,000 Gree Inc Citibank 226 (200) Gulliver International Co Ltd* Bank of America
Merrill Lynch — 10,000 GungHo Online Bank of America
Entertainment Inc Merrill Lynch 4,109 6,000 Gunma Bank Ltd/The Citibank 1,174 3,000 Gunma Bank Ltd/The Bank of America
Merrill Lynch 598 (300) H2O Retailing Corp Citibank (93) 300 Hakuhodo DY Holdings Inc Bank of America
Merrill Lynch 31 300 Hakuhodo DY Holdings Inc Citibank 63 (1,100) Hamamatsu Photonics KK Bank of America
Merrill Lynch (1,950) (2,200) Hamamatsu Photonics KK Citibank (2,854) 1,000 Hankyu Hanshin Holdings Inc Citibank 79 100 Haseko Corp Bank of America
Merrill Lynch (21) 1,500 Haseko Corp Citibank 395 (300) Heiwa Corp Bank of America
Merrill Lynch (79)
BlackRock Multi-Strategy Absolute Return Fund continued
Japan continued Japan continued

Contracts for difference as at 31 May 2016
Holding
Description Counterparty
Unrealised appreciation/
(depreciation) EUR
Holding
Description Counterparty
Unrealised appreciation/
(depreciation) EUR
370 BlackRock Strategic Funds (BSF)
The notes on pages 489 to 503 form an integral part of these financial statements.
BlackRock Multi-Strategy Absolute Return Fund continued
(200) Hikari Tsushin Inc Bank of America Merrill Lynch (1,128)
(100) Hirose Electric Co Ltd Citibank (580) 900 HIS Co Ltd Citibank 1,508 300 HIS Co Ltd Bank of America
Merrill Lynch 865 (200) Hisamitsu Bank of America
Pharmaceutical Co Inc Merrill Lynch (806) (100) Hitachi Kokusai Electric Inc Bank of America
Merrill Lynch (145) (800) Hitachi Kokusai Electric Inc Citibank (385) 300 Hitachi Metals Ltd Bank of America
Merrill Lynch 117 800 Hitachi Metals Ltd Citibank 264 300 Hitachi Transport System Ltd Bank of America
Merrill Lynch (2) 600 Hitachi Transport System Ltd Citibank (71) (1,000) Hokkaido Electric Power Co Inc Bank of America
Merrill Lynch (298) (800) Hokkaido Electric Power Co Inc Citibank (342) (100) Hokuriku Electric Power Co Citibank (34) (100) Horiba Ltd Bank of America
Merrill Lynch (94) 600 Hoya Corp Citibank 374 (900) Hulic Co Ltd Citibank (22) (1,000) Hyakugo Bank Ltd/The Bank of America
Merrill Lynch (234) (9,800) Ichigo Inc Citibank (237) (800) Idemitsu Kosan Co Ltd Bank of America
Merrill Lynch (587) 800 Iida Group Holdings Co Ltd Bank of America
Merrill Lynch (52) 1,100 Iida Group Holdings Co Ltd Citibank (674) (46) Invincible Investment Bank of America
Corp (Reit) Merrill Lynch (1,079) 700 Isetan Mitsukoshi Holdings Ltd Citibank 457 1,000 Isetan Mitsukoshi Holdings Ltd Bank of America
Merrill Lynch 532 (300) Isuzu Motors Ltd Bank of America
Merrill Lynch (108) (700) Isuzu Motors Ltd Citibank (380) 100 Ito En Ltd Citibank 77 (1,500) ITOCHU Corp Bank of America
Merrill Lynch (82) (1,700) ITOCHU Corp Citibank (365) 800 Itochu Techno-Solutions Corp Bank of America
Merrill Lynch (78) 600 J Front Retailing Co Ltd Bank of America
Merrill Lynch 431 2,400 J Front Retailing Co Ltd Citibank 1,910 100 Jafco Co Ltd Citibank 72 2,000 Japan Aviation Electronics Bank of America
Industry Ltd Merrill Lynch 2,756 900 Japan Display Inc Bank of America
Merrill Lynch 171 1,400 Japan Display Inc Citibank 273 (300) Japan Exchange Group Inc Citibank 60 (1) Japan Hotel REIT Bank of America
Investment Corp (Reit) Merrill Lynch (7) 100 Japan Post Insurance Co Ltd Bank of America
Merrill Lynch 92 (2) Japan Prime Realty Bank of America
Investment Corp (Reit) Merrill Lynch (29) (3) Japan Prime Realty
Investment Corp (Reit) Citibank (108) (3) Japan Real Estate
Investment Corp (Reit) Citibank 242 (7) Japan Real Estate Bank of America
Investment Corp (Reit) Merrill Lynch 1,748 (8) Japan Retail Fund
Investment Corp (Reit) Citibank (69)
2,000 Japan Steel Works Ltd/The Citibank 306 (1,000) JGC Corp Citibank (109) 6,000 Joyo Bank Ltd/The Citibank 967 11,000 Joyo Bank Ltd/The Bank of America
Merrill Lynch 3,545 (300) JSR Corp Bank of America
Merrill Lynch (78) (300) JSR Corp Citibank (116) (1,000) Juroku Bank Ltd/The Citibank (40) 2,200 JX Holdings Inc Bank of America
Merrill Lynch 142 2,300 JX Holdings Inc Citibank 163 400 K's Holdings Corp Citibank 79 1,200 K's Holdings Corp Bank of America
Merrill Lynch (392) 100 Kadokawa Dwango Citibank (67) (6,000) Kajima Corp Bank of America
Merrill Lynch (1,650) 300 Kakaku.com Inc Bank of America
Merrill Lynch (39) 500 Kakaku.com Inc Citibank (125) 400 Kaken Pharmaceutical Co Ltd Citibank 1,160 1,000 Kandenko Co Ltd Bank of America
Merrill Lynch (32) (1,000) Kaneka Corp Bank of America
Merrill Lynch 282 (2,000) Kaneka Corp Citibank 32 100 Kansai Electric Bank of America
Power Co Inc/The Merrill Lynch 63 (2,600) Kansai Paint Co Ltd Bank of America
Merrill Lynch (2,640) (2,000) Kansai Paint Co Ltd Citibank (2,159) 200 Kao Corp Citibank 132 3,000 Kawasaki Heavy Industries Ltd Bank of America
Merrill Lynch 677 (6,000) Kawasaki Kisen Kaisha Ltd Bank of America
Merrill Lynch (414) (100) KDDI Corp Citibank 12 (2,000) Keihan Holdings Co Ltd Bank of America
Merrill Lynch (145) (1,000) Keihan Holdings Co Ltd Citibank 48 (1) Kenedix Office
Investment Corp (Reit) Citibank 32 (5) Kenedix Office Bank of America
Investment Corp (Reit) Merrill Lynch 564 100 Kewpie Corp Citibank 37 (300) Keyence Corp Citibank (5,995) 900 Kinden Corp Bank of America
Merrill Lynch 116 5,200 Kinden Corp Citibank 647 400 Kissei Pharmaceutical Co Ltd Bank of America
Merrill Lynch — (100) Koito Manufacturing Co Ltd Bank of America
Merrill Lynch (274) (200) Koito Manufacturing Co Ltd Citibank (420) (1,000) Komatsu Ltd Bank of America
Merrill Lynch (620) (100) Komatsu Ltd Citibank (74) 100 Komeri Co Ltd Bank of America
Merrill Lynch 82 (300) Konami Holdings Corp Bank of America
Merrill Lynch (1,692) 1,200 Konica Minolta Inc Bank of America
Merrill Lynch 406 100 Kose Corp Bank of America
Merrill Lynch 473 (16,000) Kumagai Gumi Co Ltd Citibank (2,578) (300) Kusuri No Aoki Co Ltd Bank of America
Merrill Lynch (1,088) 300 Kyowa Exeo Corp Bank of America
Merrill Lynch (166)
Japan continued Japan continued

Contracts for difference as at 31 May 2016
Holding
Description Counterparty
Unrealised appreciation/
(depreciation) EUR
Holding
Description Counterparty
Unrealised appreciation/
(depreciation) EUR
Annual Report and Audited Accounts 371
The notes on pages 489 to 503 form an integral part of these financial statements.
900 Kyowa Exeo Corp Citibank (157) (500) Kyowa Hakko Kirin Co Ltd Bank of America
Merrill Lynch (153) (900) Kyudenko Corp Bank of America
Merrill Lynch (401) (2,500) Kyushu Financial Group Inc Bank of America
Merrill Lynch (1,370) (5,200) Kyushu Financial Group Inc Citibank (1,844) (4,000) Laox Co Ltd Bank of America
Merrill Lynch (137) (1,000) Laox Co Ltd Citibank (40) 1,200 Lintec Corp Bank of America
Merrill Lynch 193 1,500 Lintec Corp Citibank 508 (200) Mabuchi Motor Co Ltd Citibank (226) (300) Mabuchi Motor Co Ltd Bank of America
Merrill Lynch 701 (2,000) Maeda Corp Bank of America
Merrill Lynch (258) 1,000 Maeda Road
Construction Co Ltd Citibank 56 3,000 Maeda Road Bank of America
Construction Co Ltd Merrill Lynch 2,466 (100) Makita Corp Bank of America
Merrill Lynch (73) (2,300) Makita Corp Citibank (927) (900) Marui Group Co Ltd Citibank (370) (1,000) Marui Group Co Ltd Bank of America
Merrill Lynch 709 (1,000) Maruichi Steel Tube Ltd Citibank (1,410) (2,000) Maruichi Steel Tube Ltd Bank of America
Merrill Lynch (4,109) (3,200) Matsui Securities Co Ltd Bank of America
Merrill Lynch (1,263) 600 Matsumotokiyoshi
Holdings Co Ltd Citibank 1,015 600 Matsumotokiyoshi Bank of America
Holdings Co Ltd Merrill Lynch 2,224 (800) McDonald's Holdings Co
Japan Ltd Citibank 13 (3,200) McDonald's Holdings Co Bank of America
Japan Ltd Merrill Lynch 99 100 Medipal Holdings Corp Bank of America
Merrill Lynch (6) 100 Medipal Holdings Corp Citibank (11) 400 Megmilk Snow Brand Co Ltd Bank of America
Merrill Lynch 978 400 Megmilk Snow Brand Co Ltd Citibank 999 400 Miraca Holdings Inc Bank of America
Merrill Lynch 661 400 Miraca Holdings Inc Citibank 419 (2,800) MISUMI Group Inc Bank of America
Merrill Lynch (1,760) (1,600) MISUMI Group Inc Citibank (219) 300 Mitsubishi Chemical Bank of America
Holdings Corp Merrill Lynch 6 2,000 Mitsubishi Chemical
Holdings Corp Citibank 100 (100) Mitsubishi Corp Bank of America
Merrill Lynch (41) (200) Mitsubishi Corp Citibank (112) 1,000 Mitsubishi Estate Co Ltd Bank of America
Merrill Lynch 329 3,000 Mitsubishi Heavy
Industries Ltd Citibank 718 (3,000) Mitsubishi Logistics Corp Bank of America
Merrill Lynch (2,393) 100 Mitsubishi Shokuhin Co Ltd Bank of America
Merrill Lynch 127 1,600 Mitsubishi Tanabe
Pharma Corp Citibank 425
4,000 Mitsubishi UFJ Lease & Finance Co Ltd Citibank 258
(1,300) Mitsui & Co Ltd Bank of America Merrill Lynch (375)
(6,000) Mitsui Engineering & Bank of America Shipbuilding Co Ltd Merrill Lynch 5
1,000 Mitsui Fudosan Co Ltd Bank of America Merrill Lynch 497
12,000 Mitsui OSK Lines Ltd Bank of America Merrill Lynch 2,611
400 Mixi Inc Bank of America Merrill Lynch 768
2,500 Mizuho Financial Group Inc Bank of America Merrill Lynch 232
18,100 Mizuho Financial Group Inc Citibank 642 (600) MonotaRO Co Ltd Bank of America
Merrill Lynch (1,885) (1) Mori Hills REIT I
nvestment Corp (Reit) Citibank (4) 1,000 Morinaga & Co Ltd/Japan Citibank — (100) Musashino Bank Ltd/The Citibank (35) (900) Nabtesco Corp Bank of America
Merrill Lynch (1,298) (700) Nabtesco Corp Citibank (536) 5,600 Nagase & Co Ltd Bank of America
Merrill Lynch 4,287 6,000 Nagase & Co Ltd Citibank 2,659 (1,000) Nagoya Railroad Co Ltd Bank of America
Merrill Lynch (213) (1,000) Nankai Electric Railway Co Ltd Bank of America
Merrill Lynch (226) (4,000) NEC Corp Citibank (387) 400 Nexon Co Ltd Citibank (39) 900 Nexon Co Ltd Bank of America
Merrill Lynch 189 (1,900) Next Co Ltd Bank of America
Merrill Lynch 2,327 (700) Next Co Ltd Citibank 609 3,000 NH Foods Ltd Bank of America
Merrill Lynch 604 (100) NHK Spring Co Ltd Citibank 1 100 Nichi-iko Bank of America
Pharmaceutical Co Ltd Merrill Lynch 72 100 Nichi-iko
Pharmaceutical Co Ltd Citibank 35 2,000 Nichirei Corp Citibank — 1,000 Nichirei Corp Bank of America
Merrill Lynch (121) (300) Nidec Corp Bank of America
Merrill Lynch (703) (400) Nidec Corp Citibank (548) (500) Nihon Kohden Corp Bank of America
Merrill Lynch (504) (100) Nihon M&A Center Inc Bank of America
Merrill Lynch (161) 600 Nikon Corp Bank of America
Merrill Lynch 126 (200) Nintendo Co Ltd Citibank (451) 1,000 Nippo Corp Citibank 363 (1) Nippon Building Fund Inc (Reit) Bank of America
Merrill Lynch 169 (2,000) Nippon Electric Glass Co Ltd Bank of America
Merrill Lynch (341) (300) Nippon Paint Holdings Co Ltd Bank of America
Merrill Lynch (290) (200) Nippon Paint Holdings Co Ltd Citibank (234) (1,200) Nippon Paper Industries Co Ltd Bank of America
Merrill Lynch 188 100 Nippon Shokubai Co Ltd Bank of America
Merrill Lynch 637 800 Nippon Shokubai Co Ltd Citibank 2,643
BlackRock Multi-Strategy Absolute Return Fund continued
Japan continued Japan continued

Contracts for difference as at 31 May 2016
Holding
Description Counterparty
Unrealised appreciation/
(depreciation) EUR
Holding
Description Counterparty
Unrealised appreciation/
(depreciation) EUR
372 BlackRock Strategic Funds (BSF)
The notes on pages 489 to 503 form an integral part of these financial statements.
BlackRock Multi-Strategy Absolute Return Fund continued
800 Nippon Telegraph & Bank of America Telephone Corp Merrill Lynch (704)
1,100 Nippon Telegraph & Telephone Corp Citibank 709
9,000 Nishi-Nippon City Bank of America Bank Ltd/The Merrill Lynch 1,450
2,000 Nishi-Nippon City Bank Ltd/The Citibank 129
(5,000) Nishi-Nippon Railroad Co Ltd Bank of America Merrill Lynch (524)
(9,000) Nishimatsu Bank of America Construction Co Ltd Merrill Lynch (501)
(1,600) Nisshin Steel Co Ltd Citibank (297) (100) Nisshinbo Holdings Inc Bank of America
Merrill Lynch 65 200 Nitori Holdings Co Ltd Bank of America
Merrill Lynch 577 (100) Nitto Denko Corp Citibank (243) (300) NOK Corp Bank of America
Merrill Lynch (458) (200) NOK Corp Citibank (81) 400 Nomura Holdings Inc Bank of America
Merrill Lynch 57 2,700 Nomura Holdings Inc Citibank 181 2,400 Nomura Real Estate Bank of America
Holdings Inc Merrill Lynch 2,669 100 Nomura Real Estate
Holdings Inc Citibank 73 (17) Nomura Real Estate Bank of America
Master Fund Inc (Reit) Merrill Lynch (1,164) 300 North Pacific Bank Ltd Bank of America
Merrill Lynch 18 1,300 NS Solutions Corp Bank of America
Merrill Lynch 1,236 300 NS Solutions Corp Citibank 230 1,100 NSK Ltd Citibank 204 4,900 NSK Ltd Bank of America
Merrill Lynch (1,224) 200 NTT Urban Development Corp Citibank (24) 100 OBIC Business
Consultants Co Ltd Citibank 97 (100) Obic Co Ltd Bank of America
Merrill Lynch (137) 1,000 Oji Holdings Corp Citibank 274 (3,000) Oki Electric Industry Co Ltd Bank of America
Merrill Lynch (24) (700) Olympus Corp Citibank (1,918) (700) Ono Pharmaceutical Co Ltd Bank of America
Merrill Lynch 643 (100) Open House Co Ltd Citibank (84) (9,100) Orient Corp Bank of America
Merrill Lynch (663) (2) Orix JREIT Inc (Reit) Citibank 16 13,000 Osaka Gas Co Ltd Bank of America
Merrill Lynch 947 13,000 Osaka Gas Co Ltd Citibank 765 1,900 Panasonic Corp Citibank 1,049 1,200 Panasonic Corp Bank of America
Merrill Lynch 946 (100) Park24 Co Ltd Citibank 32 1,900 Penta-Ocean
Construction Co Ltd Citibank 322 400 Pigeon Corp Bank of America
Merrill Lynch 307 100 Pigeon Corp Citibank 115 200 Pola Orbis Holdings Inc Citibank 870 100 Relo Holdings Inc Citibank (89) 600 Resona Holdings Inc Bank of America
Merrill Lynch (5) 8,000 Resona Holdings Inc Citibank (380) (4,000) Ricoh Co Ltd Citibank (740)
(2,900) Ricoh Co Ltd Bank of America Merrill Lynch (526)
400 Rohm Co Ltd Bank of America Merrill Lynch 1,466
100 Rohm Co Ltd Citibank 197 200 Rohto Pharmaceutical Co Ltd Citibank 6 600 Sankyo Co Ltd Bank of America
Merrill Lynch 242 100 Sankyo Co Ltd Citibank 28 100 Sanrio Co Ltd Bank of America
Merrill Lynch 29 (200) Santen Pharmaceutical Co Ltd Bank of America
Merrill Lynch (115) (2,000) Sapporo Holdings Ltd Bank of America
Merrill Lynch (108) (100) Sawai Pharmaceutical Co Ltd Bank of America
Merrill Lynch (363) (300) Sawai Pharmaceutical Co Ltd Citibank (121) (2,000) SCREEN Holdings Co Ltd Bank of America
Merrill Lynch (2,578) (2,000) SCREEN Holdings Co Ltd Citibank (596) 100 SCSK Corp Bank of America
Merrill Lynch 144 1,200 Sega Sammy Holdings Inc Bank of America
Merrill Lynch 1,368 1,600 Sega Sammy Holdings Inc Citibank 1,482 800 Seino Holdings Co Ltd Bank of America
Merrill Lynch (316) 3,000 Seino Holdings Co Ltd Citibank (532) 900 Sekisui Chemical Co Ltd Bank of America
Merrill Lynch 261 300 Sekisui Chemical Co Ltd Citibank 1 (1,700) Sekisui House Ltd Bank of America
Merrill Lynch (411) (3,800) Senshu Ikeda Holdings Inc Bank of America
Merrill Lynch (735) (2,200) Senshu Ikeda Holdings Inc Citibank (160) 1,300 Seven Bank Ltd Bank of America
Merrill Lynch 2 1,000 Shiga Bank Ltd/The Bank of America
Merrill Lynch 258 100 Shikoku Electric Power Co Inc Bank of America
Merrill Lynch 37 1,000 Shimadzu Corp Bank of America
Merrill Lynch (379) (300) Shimamura Co Ltd Citibank (435) (100) Shimamura Co Ltd Bank of America
Merrill Lynch 81 (100) Shimano Inc Bank of America
Merrill Lynch (814) (1,000) Shimizu Corp Citibank (81) (3,000) Shimizu Corp Bank of America
Merrill Lynch 97 200 Shin-Etsu Chemical Co Ltd Citibank 340 (400) Ship Healthcare Holdings Inc Bank of America
Merrill Lynch (438) 1,000 Shizuoka Bank Ltd/The Bank of America
Merrill Lynch 272 1,000 Shizuoka Bank Ltd/The Citibank 208 (1,000) Shochiku Co Ltd Bank of America
Merrill Lynch (491) 500 SKY Perfect JSAT Holdings Inc Citibank 45 (200) Skylark Co Ltd Citibank (100) (400) SoftBank Group Corp Citibank (313) (600) Sohgo Security Services Co Ltd Bank of America
Merrill Lynch 1,740 (20,000) Sojitz Corp Bank of America
Merrill Lynch (1,359) (7,800) Sojitz Corp Citibank (322) (400) Sony Corp Bank of America
Merrill Lynch (774)
Japan continued Japan continued

Contracts for difference as at 31 May 2016
Holding
Description Counterparty
Unrealised appreciation/
(depreciation) EUR
Holding
Description Counterparty
Unrealised appreciation/
(depreciation) EUR
Annual Report and Audited Accounts 373
The notes on pages 489 to 503 form an integral part of these financial statements.
(1,700) Sony Corp Citibank (2,692) 400 Sony Financial Holdings Inc Bank of America
Merrill Lynch 90 500 Sony Financial Holdings Inc Citibank 129 (1,000) Sotetsu Holdings Inc Bank of America
Merrill Lynch (89) 200 Square Enix Holdings Co Ltd Bank of America
Merrill Lynch 318 100 Square Enix Holdings Co Ltd Citibank 64 300 Start Today Co Ltd Bank of America
Merrill Lynch 560 600 Start Today Co Ltd Citibank 830 100 Sugi Holdings Co Ltd Bank of America
Merrill Lynch 258 300 Sugi Holdings Co Ltd Citibank 774 (1,400) Sumco Corp Bank of America
Merrill Lynch (1,320) 200 Sumitomo Dainippon
Pharma Co Ltd Citibank 131 3,400 Sumitomo Electric Bank of America
Industries Ltd Merrill Lynch 2,549 1,900 Sumitomo Electric
Industries Ltd Citibank 1,409 3,100 Sumitomo Forestry Co Ltd Bank of America
Merrill Lynch 1,324 1,000 Sumitomo Heavy Bank of America
Industries Ltd Merrill Lynch 89 1,000 Sumitomo Heavy
Industries Ltd Citibank 64 10,000 Sumitomo Mitsui Trust
Holdings Inc Citibank 1,362 1,500 Sumitomo Real Estate
Sales Co Ltd Citibank (97) 1,900 Sumitomo Real Estate Bank of America
Sales Co Ltd Merrill Lynch 1,638 1,000 Sumitomo Realty & Bank of America
Development Co Ltd Merrill Lynch 299 (400) Sumitomo Rubber Bank of America
Industries Ltd Merrill Lynch (290) (200) Sumitomo Rubber
Industries Ltd Citibank (78) 400 Sundrug Co Ltd Citibank 1,257 (300) Suntory Beverage & Food Ltd Citibank (435) (800) Suruga Bank Ltd Citibank (1,676) 600 Suzuken Co Ltd/Aichi Japan Bank of America
Merrill Lynch 628 500 Suzuken Co Ltd/Aichi Japan Citibank 403 700 Suzuki Motor Corp Citibank 582 2,900 T&D Holdings Inc Bank of America
Merrill Lynch 2,743 1,000 T&D Holdings Inc Citibank 641 1,000 Tadano Ltd Bank of America
Merrill Lynch (81) 2,000 Tadano Ltd Citibank (661) 1,000 Taiheiyo Cement Corp Bank of America
Merrill Lynch (16) 1,000 Taisei Corp Bank of America
Merrill Lynch 61 1,000 Taisei Corp Citibank 175 (500) Taisho Pharmaceutical Bank of America
Holdings Co Ltd Merrill Lynch (2,699) (200) Taisho Pharmaceutical
Holdings Co Ltd Citibank (902) 200 Taiyo Nippon Sanso Corp Bank of America
Merrill Lynch (78) 700 Taiyo Nippon Sanso Corp Citibank (44) (500) Takeda Pharmaceutical Co Ltd Bank of America
Merrill Lynch (76) (300) Takeda Pharmaceutical Co Ltd Citibank (160) (200) TDK Corp Bank of America
Merrill Lynch (656)
(300) TDK Corp Citibank (701) (2,000) Teijin Ltd Bank of America
Merrill Lynch (205) (5,000) Teijin Ltd Citibank (282) 300 Terumo Corp Citibank 263 (1,600) THK Co Ltd Citibank (1,237) (1,300) THK Co Ltd Bank of America
Merrill Lynch 586 (1,000) Tobu Railway Co Ltd Bank of America
Merrill Lynch (145) (1,000) Tobu Railway Co Ltd Citibank (97) (2,000) Toda Corp Bank of America
Merrill Lynch (131) 300 Toho Co Ltd/Tokyo Citibank 177 200 Toho Holdings Co Ltd Bank of America
Merrill Lynch 337 700 Tohoku Electric Power Co Inc Bank of America
Merrill Lynch 90 700 Tokai Tokyo Financial Bank of America
Holdings Inc Merrill Lynch 117 1,100 Tokai Tokyo Financial
Holdings Inc Citibank 127 100 Tokio Marine Holdings Inc Citibank 81 (1,200) Tokyo Electric Power Co
Holdings Inc Citibank (3) (300) Tokyo Electron Ltd Bank of America
Merrill Lynch (2,011) 8,000 Tokyo Gas Co Ltd Bank of America
Merrill Lynch 690 38,000 Tokyo Gas Co Ltd Citibank 3,919 4,000 Tokyu Fudosan Holdings Corp Citibank (32) 1,000 TonenGeneral Sekiyu KK Bank of America
Merrill Lynch 822 4,000 TonenGeneral Sekiyu KK Citibank 1,257 (2,100) Topcon Corp Bank of America
Merrill Lynch (2,217) (400) Topcon Corp Citibank (351) 2,800 Toppan Forms Co Ltd Bank of America
Merrill Lynch 1,286 4,600 Toppan Forms Co Ltd Citibank 1,038 (8,000) Toshiba Corp Citibank (2,849) 2,000 Tosoh Corp Bank of America
Merrill Lynch 564 (200) TOTO Ltd Bank of America
Merrill Lynch (524) (900) Toyo Seikan Group
Holdings Ltd Citibank (609) (7,000) Toyobo Co Ltd Bank of America
Merrill Lynch (508) 300 Toyota Boshoku Corp Citibank 210 (800) Toyota Industries Corp Bank of America
Merrill Lynch (2,061) (400) Toyota Industries Corp Citibank (1,039) 700 Toyota Tsusho Corp Citibank 739 300 TS Tech Co Ltd Citibank 87 600 TS Tech Co Ltd Bank of America
Merrill Lynch 358 (400) Tsumura & Co Bank of America
Merrill Lynch (635) 1,000 Ube Industries Ltd Bank of America
Merrill Lynch 145 3,000 Ube Industries Ltd Citibank 242 (600) Ulvac Inc Bank of America
Merrill Lynch 45 (300) Ulvac Inc Citibank 96 400 United Arrows Ltd Bank of America
Merrill Lynch (274) 200 United Arrows Ltd Citibank (24) (9) United Urban Bank of America
Investment Corp (Reit) Merrill Lynch 544
BlackRock Multi-Strategy Absolute Return Fund continued
Japan continued Japan continued

Contracts for difference as at 31 May 2016
Holding
Description Counterparty
Unrealised appreciation/
(depreciation) EUR
Holding
Description Counterparty
Unrealised appreciation/
(depreciation) EUR
374 BlackRock Strategic Funds (BSF)
The notes on pages 489 to 503 form an integral part of these financial statements.
BlackRock Multi-Strategy Absolute Return Fund continued
(18) United Urban Investment Corp (Reit) Citibank 817
(100) Ushio Inc Bank of America Merrill Lynch (40)
(100) Welcia Holdings Co Ltd Bank of America Merrill Lynch (185)
(700) Welcia Holdings Co Ltd Citibank (1,748) 100 West Japan Railway Co Bank of America
Merrill Lynch 359 100 West Japan Railway Co Citibank 342 (4,500) Yahoo Japan Corp Bank of America
Merrill Lynch 23 (7,900) Yahoo Japan Corp Citibank 572 200 Yakult Honsha Co Ltd Bank of America
Merrill Lynch 266 (1,700) Yamada Denki Co Ltd Bank of America
Merrill Lynch (34) (6,300) Yamada Denki Co Ltd Citibank (1,371) (1,100) Yamaha Motor Co Ltd Bank of America
Merrill Lynch (1,471) (1,000) Yamaha Motor Co Ltd Citibank (967) 1,000 Yamato Holdings Co Ltd Bank of America
Merrill Lynch 68 200 Yamato Kogyo Co Ltd Bank of America
Merrill Lynch 240 (2,600) Yaskawa Electric Corp Bank of America
Merrill Lynch (2,773) (2,000) Yaskawa Electric Corp Citibank (1,153) 100 Yokogawa Electric Corp Bank of America
Merrill Lynch 64 1,500 Yokogawa Electric Corp Citibank 544 (400) Yokohama Rubber Co Ltd/The Citibank (380) (200) Zenkoku Hosho Co Ltd Bank of America
Merrill Lynch 443 4,000 Zeon Corp Bank of America
Merrill Lynch 1,289 4,000 Zeon Corp Citibank 387
5,738
Malaysia (243,100) IHH Healthcare Bhd Deutsche Bank 9,440 (56,200) Public Bank Bhd Deutsche Bank 972
10,412
Mexico (21,234) El Puerto de Liverpool SAB
de CV 'C1' Citibank (17,503) (25,079) Fomento Economico Mexicano
SAB de CV (Unit) HSBC (10,409)
(27,912)
Netherlands (745) Aalberts Industries NV Bank of America
Merrill Lynch (805) (855) Aalberts Industries NV Citibank (569) 1,640 Aegon NV Bank of America
Merrill Lynch 481 (346) Altice NV 'B' Bank of America
Merrill Lynch (400) (74) Altice NV 'B' Citibank (43) 241 Aperam SA Bank of America
Merrill Lynch 519 55 Aperam SA Citibank 98 (687) Arcadis NV Bank of America
Merrill Lynch (691) (585) Arcadis NV Citibank (433) 330 ASM International NV Bank of America
Merrill Lynch (253) 120 ASM International NV Citibank 3
108 ASML Holding NV Bank of America Merrill Lynch 158
234 ASML Holding NV Citibank 785 (6,252) Boskalis Westminster Citibank 18,225 136 Delta Lloyd NV Citibank 5 189 Eurocommercial Bank of America
Properties NV - CVA Merrill Lynch 214 1,152 Eurocommercial
Properties NV - CVA Citibank 1,215 (100) Gemalto NV Bank of America
Merrill Lynch (85) (134) GrandVision NV '144A' Bank of America
Merrill Lynch (83) (88) GrandVision NV '144A' Citibank 15 50 Heineken Holding NV Bank of America
Merrill Lynch (3) 100 Heineken NV Citibank 24 (1,478) Koninklijke BAM Groep NV Bank of America
Merrill Lynch (568) (5,077) Koninklijke BAM Groep NV Citibank (1,889) 548 NN Group NV Citibank 280 (1,315) SBM Offshore NV Bank of America
Merrill Lynch 513 (573) SBM Offshore NV Citibank 34 19 Wereldhave NV (Reit) Citibank 41
16,788
New Zealand 2,852 Contact Energy Ltd Citibank (69) 670 Contact Energy Ltd Bank of America
Merrill Lynch 41
(28)
Norway 2 Akastor ASA Bank of America
Merrill Lynch — 1 Akastor ASA Citibank — (281) Bakkafrost P/F Bank of America
Merrill Lynch (210) (3,121) Det Norske Oljeselskap ASA Citibank (1,120) (1,311) DNB ASA Citibank (89) 1,267 Gjensidige Forsikring ASA Bank of America
Merrill Lynch 1,033 140 Gjensidige Forsikring ASA Citibank 98 (948) Marine Harvest ASA Citibank (589) (2,290) Marine Harvest ASA Bank of America
Merrill Lynch (1,914) (519) Norwegian Air Shuttle ASA Bank of America
Merrill Lynch 200 (891) Schibsted ASA 'A' Citibank (19) (1,032) Schibsted ASA 'B' Bank of America
Merrill Lynch 321 (1,247) Schibsted ASA 'B' Citibank 494 2,692 Storebrand ASA Bank of America
Merrill Lynch 622 4,565 Storebrand ASA Citibank 1,072 1,172 Subsea 7 SA Citibank (333) 5,424 Subsea 7 SA Bank of America
Merrill Lynch 596 1,545 Telenor ASA Bank of America
Merrill Lynch 138 1,174 Telenor ASA Citibank 214
514
Philippines (390,800) Ayala Land Inc Deutsche Bank (3,716) (29,000) Bank of the Philippine Islands HSBC (1,631) (83,570) Bank of the Philippine Islands Deutsche Bank 19
(5,328)
Japan continued Netherlandscontinued

Contracts for difference as at 31 May 2016
Holding
Description Counterparty
Unrealised appreciation/
(depreciation) EUR
Holding
Description Counterparty
Unrealised appreciation/
(depreciation) EUR
Annual Report and Audited Accounts 375
The notes on pages 489 to 503 form an integral part of these financial statements.
Poland 35,067 Powszechny Zaklad
Ubezpieczen SA Citibank (18,620)
(18,620)
Portugal (353) CTT-Correios de Portugal SA Citibank (74) (240) CTT-Correios de Portugal SA Bank of America
Merrill Lynch 8 1,950 NOS SGPS SA Bank of America
Merrill Lynch 591
525
Singapore 11,500 CapitaLand Commercial
Trust (Reit) Citibank (150) 7,200 CapitaLand Commercial Bank of America
Trust Ltd (Reit) Merrill Lynch (128) (800) CapitaLand Mall Trust (Reit) Bank of America
Merrill Lynch 16 (2,800) CapitaLand Mall Trust (Reit) Citibank 63 1,600 ComfortDelGro Corp Ltd Bank of America
Merrill Lynch (18) 1,900 ComfortDelGro Corp Ltd Citibank (24) (3,400) Frasers Centrepoint Ltd Bank of America
Merrill Lynch 26 2,100 Global Logistic Properties Ltd Bank of America
Merrill Lynch 19 (29,800) Golden Agri-Resources Ltd Bank of America
Merrill Lynch (422) (2,500) Golden Agri-Resources Ltd Citibank (25) (1,800) Jardine Matheson Holdings Ltd Bank of America
Merrill Lynch (5,028) (4,200) Keppel Corp Ltd Bank of America
Merrill Lynch (737) (2,600) Keppel Corp Ltd Citibank (135) (8,100) Neptune Orient Lines Bank of America
Ltd/Singapore Merrill Lynch (53) (47,600) Neptune Orient Lines
Ltd/Singapore Citibank — (4,500) Oversea-Chinese Bank of America
Banking Corp Ltd Merrill Lynch (450) (11,400) Oversea-Chinese
Banking Corp Ltd Citibank (1,125) 7,800 SATS Ltd Bank of America
Merrill Lynch (1,203) 5,600 SATS Ltd Citibank (281) (37,400) Sembcorp Industries Ltd Citibank (486) (200) SIA Engineering Co Ltd Bank of America
Merrill Lynch (1) 2,600 Singapore Airlines Ltd Bank of America
Merrill Lynch (203) 3,700 Singapore Airlines Ltd Citibank 337 (2,600) Singapore Bank of America
Telecommunications Ltd Merrill Lynch (201) (9,800) Singapore
Telecommunications Ltd Citibank — 2,600 Singapore Bank of America
Telecommunications Ltd Merrill Lynch (43) (2,800) United Overseas Bank Ltd Bank of America
Merrill Lynch (628) (800) United Overseas Bank Ltd Citibank (62) 11,700 Venture Corp Ltd Citibank 293 11,000 Venture Corp Ltd Bank of America
Merrill Lynch 738 (5,500) Wilmar International Ltd Bank of America
Merrill Lynch (121) (8,700) Wilmar International Ltd Citibank (72) 21,100 Yangzijiang Shipbuilding
Holdings Ltd Citibank 137
30,000 Yangzijiang Shipbuilding Bank of America Holdings Ltd Merrill Lynch 195
(9,772)
South Africa (5,421) Capitec Bank Holdings Ltd HSBC (5,236) (34,995) Liberty Holdings Ltd HSBC 31,192 31,083 Mr Price Group Ltd Citibank 10,181 (12,774) Tiger Brands Ltd Citibank (9,145)
26,992
South Korea 762 Lotte Shopping Co Ltd Citibank (4,364) 256 NAVER Corp HSBC 4,243 1,375 POSCO Citibank (1,086) 1 Wonik Holdings Co Ltd HSBC 1
(1,206)
Spain (1,650) Acerinox SA Citibank (828) (991) Acerinox SA Bank of America
Merrill Lynch (352) 1,314 ACS Actividades de
Construccion y Servicios SA Citibank 1,899 771 ACS Actividades de Bank of America
Construccion y Servicios SA Merrill Lynch 1,473 86 Aena SA Bank of America
Merrill Lynch (13) 198 Aena SA '144A' Citibank (334) 458 Amadeus IT Holding SA 'A' Bank of America
Merrill Lynch 836 903 Atresmedia Corp de Medios Bank of America
de Comunicacion SA Merrill Lynch 120 6,216 Banco Popular Espanol SA Bank of America
Merrill Lynch (761) 6,216 Banco Popular Bank of America
Espanol SA (Right) Merrill Lynch 1,380 1,937 Bankinter SA Citibank 664 (201) Cellnex Telecom SAU Bank of America
Merrill Lynch (87) (602) Cellnex Telecom SAU Citibank (187) (24) Corp Financiera Alba SA Citibank (31) (641) Distribuidora Internacional
de Alimentacion SA Citibank (116) 840 Ebro Foods SA Citibank 319 924 Ebro Foods SA Bank of America
Merrill Lynch 397 673 Endesa SA Citibank 313 672 Endesa SA Bank of America
Merrill Lynch 161 (2,743) Indra Sistemas SA Bank of America
Merrill Lynch (1,470) (159) Indra Sistemas SA Citibank (44) 1,367 Industria de Diseno Textil SA Citibank 2,385 979 Industria de Diseno Textil SA Bank of America
Merrill Lynch 1,935 (1,040) International Consolidated Bank of America
Airlines Group SA Merrill Lynch (600) (208) International Consolidated
Airlines Group SA Citibank (68) 7,072 Mediaset Espana
Comunicacion SA Citibank 2,405 710 Melia Hotels International SA Citibank 186 1,558 Melia Hotels International SA Bank of America
Merrill Lynch 527 154 NH Hotel Group SA Bank of America
Merrill Lynch 7 (1,501) Obrascon Huarte Lain SA Citibank (302)
BlackRock Multi-Strategy Absolute Return Fund continued
Singapore continued

Contracts for difference as at 31 May 2016
Holding
Description Counterparty
Unrealised appreciation/
(depreciation) EUR
Holding
Description Counterparty
Unrealised appreciation/
(depreciation) EUR
376 BlackRock Strategic Funds (BSF)
The notes on pages 489 to 503 form an integral part of these financial statements.
BlackRock Multi-Strategy Absolute Return Fund continued
(5,314) Obrascon Huarte Lain SA Bank of America Merrill Lynch (946)
(4,723) Prosegur Cia de Seguridad SA Bank of America Merrill Lynch 1,263
(4,839) Prosegur Cia de Seguridad SA Citibank 1,307 681 Repsol SA Bank of America
Merrill Lynch (3) (4,833) Sacyr SA Citibank (217)
11,218
Sweden (45) Alfa Laval AB Bank of America
Merrill Lynch (4) (673) Alfa Laval AB Citibank (87) (1,271) Assa Abloy AB 'B' Bank of America
Merrill Lynch (999) 5,996 Axfood AB Bank of America
Merrill Lynch 4,521 684 Axfood AB Citibank 464 (210) Betsson AB Bank of America
Merrill Lynch (102) (210) Betsson AB Bank of America
Merrill Lynch 43 (269) BillerudKorsnas AB Bank of America
Merrill Lynch (85) (453) BillerudKorsnas AB Citibank (135) 818 Boliden AB Bank of America
Merrill Lynch 846 1,418 Boliden AB Citibank 886 816 Castellum AB Citibank 31 174 Castellum AB (Right) Citibank 345 926 Electrolux AB 'B' Bank of America
Merrill Lynch 615 1,035 Electrolux AB 'B' Citibank 736 566 Fabege AB Bank of America
Merrill Lynch (55) 2,166 Fabege AB Citibank (350) (1,279) Fastighets AB Balder 'B' Bank of America
Merrill Lynch (678) (567) Fastighets AB Balder 'B' Citibank (154) (1,065) Getinge AB 'B' Citibank (585) (739) Getinge AB 'B' Bank of America
Merrill Lynch (701) (2,192) Hennes & Mauritz AB 'B' Citibank (1,322) (323) Holmen AB 'B' Bank of America
Merrill Lynch (393) (69) Holmen AB 'B' Citibank (66) 729 Husqvarna AB 'B' Bank of America
Merrill Lynch 23 (1,700) Industrivarden AB 'C' Bank of America
Merrill Lynch (434) (194) Industrivarden AB 'C' Citibank (84) 777 Intrum Justitia AB Bank of America
Merrill Lynch 92 3,132 Intrum Justitia AB Citibank 675 487 Investment AB Kinnevik Bank of America
Merrill Lynch 939 127 Investment AB Kinnevik Citibank 245 487 Investment AB Kinnevik 'B' Bank of America
Merrill Lynch (861) 278 Investment AB Kinnevik 'B' Citibank (275) (17) Investment AB Latour 'B' Citibank 6 (1,523) JM AB Bank of America
Merrill Lynch (952) (166) Melker Schorling AB Bank of America
Merrill Lynch — (46) Melker Schorling AB Citibank 25 (158) Modern Times Group
MTG AB 'B' Citibank 77 (572) Modern Times Group Bank of America
MTG AB 'B' Merrill Lynch 105
372 NCC AB 'B' Citibank 425 1,002 Nordea Bank AB Bank of America
Merrill Lynch 539 1,300 Nordea Bank AB Citibank 616 152 Saab AB 'B' Bank of America
Merrill Lynch (106) 106 Saab AB 'B' Citibank (63) (153) Securitas AB 'B' Bank of America
Merrill Lynch (25) (1,070) Securitas AB 'B' Citibank (394) (5,178) Skandinaviska Enskilda
Banken AB 'A' Citibank (2,333) (3,102) Skandinaviska Enskilda Bank of America
Banken AB 'A' Merrill Lynch (1,630) 1,106 Skanska AB 'B' Citibank 917 (417) SKF AB 'B' Bank of America
Merrill Lynch (27) (447) SKF AB 'B' Citibank (14) (2,511) Svenska Handelsbanken AB 'A' Bank of America
Merrill Lynch (1,352) (1,187) Swedbank AB 'A' Bank of America
Merrill Lynch (1,816) (4,240) Tele2 AB 'B' Bank of America
Merrill Lynch 2,832 (4,550) Tele2 AB 'B' Citibank 3,039 1,143 Telefonaktiebolaget Bank of America
LM Ericsson 'B' Merrill Lynch 84 1,693 Telefonaktiebolaget LM
Ericsson 'B' Citibank 119 123 Trelleborg AB 'B' Bank of America
Merrill Lynch 57 496 Unibet Group Plc SDR Bank of America
Merrill Lynch 64 1,167 Unibet Group Plc SDR Citibank 196
3,480
Switzerland 1,225 Adecco Group AG Reg Bank of America
Merrill Lynch 2,327 (371) ams AG Citibank (487) (350) ams AG Bank of America
Merrill Lynch (1,314) (191) Aryzta AG Citibank 31 (276) Aryzta AG Bank of America
Merrill Lynch (11) 25 Banque Cantonale
Vaudoise Reg Citibank 475 80 Banque Cantonale Bank of America
Vaudoise Reg Merrill Lynch 1,954 (25) Barry Callebaut AG Reg Bank of America
Merrill Lynch (633) 637 Cembra Money Bank AG Bank of America
Merrill Lynch 249 46 Cembra Money Bank AG Citibank 2 (10) Chocoladefabriken Lindt &
Spruengli AG Citibank (362) (4) Chocoladefabriken Lindt & Bank of America
Spruengli AG Merrill Lynch (235) (1) Chocoladefabriken Lindt & Bank of America
Spruengli AG Reg Merrill Lynch (850) (356) Cie Financiere
Richemont SA Reg Citibank (29) (275) DKSH Holding AG Bank of America
Merrill Lynch 50 (572) DKSH Holding AG Citibank 103 (945) Dufry AG Reg Citibank (1,197) 50 EMS-Chemie Holding AG Reg Bank of America
Merrill Lynch 259 19 EMS-Chemie Holding AG Reg Citibank 108 2 Galenica AG Reg Citibank (47)
Spain continued Sweden continued

Contracts for difference as at 31 May 2016
Holding
Description Counterparty
Unrealised appreciation/
(depreciation) EUR
Holding
Description Counterparty
Unrealised appreciation/
(depreciation) EUR
Annual Report and Audited Accounts 377
The notes on pages 489 to 503 form an integral part of these financial statements.
35 Galenica AG Reg Bank of America Merrill Lynch 127
3,546 GAM Holding AG Citibank (160) 2,305 GAM Holding AG Bank of America
Merrill Lynch 938 (45) Geberit AG Reg Bank of America
Merrill Lynch (444) (17) Geberit AG Reg Citibank (58) 55 Georg Fischer AG Reg Citibank 366 18 Georg Fischer AG Reg Bank of America
Merrill Lynch 440 (7) Helvetia Holding AG Reg Citibank (86) 507 Kuehne + Nagel Bank of America
International AG Reg Merrill Lynch 2,014 714 Kuehne + Nagel I
nternational AG Reg Citibank 1,333 (423) LafargeHolcim Ltd Reg Bank of America
Merrill Lynch (577) (476) LafargeHolcim Ltd Reg Citibank (422) 594 Logitech International SA Reg Citibank 322 1,107 Logitech International SA Reg Bank of America
Merrill Lynch 901 159 Lonza Group AG Reg Citibank (14) 420 Lonza Group AG Reg Bank of America
Merrill Lynch 874 (740) Novartis AG Reg Bank of America
Merrill Lynch (3,465) (348) Novartis AG Reg Citibank (677) (10) Pargesa Holding SA Citibank (16) 35 PSP Swiss Property AG Reg Bank of America
Merrill Lynch 87 33 PSP Swiss Property AG Reg Citibank 15 27 Roche Holding AG Bank of America
Merrill Lynch 223 98 Roche Holding AG Citibank 1,099 19 Schindler Holding AG Bank of America
Merrill Lynch 148 101 Schindler Holding AG Citibank 210 (58) SGS SA Reg Bank of America
Merrill Lynch (1,626) (229) Sonova Holding AG Reg Bank of America
Merrill Lynch (73) (402) Sonova Holding AG Reg Citibank (519) 178 Straumann Holding AG Reg Bank of America
Merrill Lynch 1,373 48 Straumann Holding AG Reg Citibank 308 (41) Swatch Group AG/The Bank of America
Merrill Lynch 234 (70) Swatch Group AG/The Reg Citibank (89) 107 Swiss Life Holding AG Reg Citibank 1,335 311 Temenos Group AG Reg Citibank 42 (1,047) UBS Group AG Reg Bank of America
Merrill Lynch 78 (231) Zurich Insurance Group AG Bank of America
Merrill Lynch (1,078)
3,556
Taiwan (114,550) Hon Hai Precision
Industry Co Ltd HSBC (26,666)
(26,666)
Thailand (31,300) Airports of Thailand PCL Deutsche Bank (5,154) (897,700) BTS Group Holdings PCL Deutsche Bank (4,183) (191,000) CP ALL PCL Deutsche Bank (4,532) 33,100 PTT PCL NVDR Deutsche Bank (3,954)
(17,823)
Turkey (59,519) Akbank TAS Citibank (8,370) 17,480 Coca-Cola Icecek AS Citibank 10,879 (177,379) Eregli Demir ve Celik
Fabrikalari TAS Deutsche Bank 7,401 10,695 Tupras Turkiye Petrol
Rafinerileri AS HSBC (629) (121,479) Turk Telekomunikasyon AS Deutsche Bank (3,234) 113,929 Turkiye Halk Bankasi AS Deutsche Bank 548
6,595
United Arab Emirates (252,646) Aldar Properties PJSC HSBC (4,520) (81,166) Arabtec Holding PJSC Bank of America
Merrill Lynch 1,175 1,082 DP World Ltd HSBC (160) 226 DP World Ltd HSBC (16) (109,324) Dubai Islamic Bank PJSC Bank of America
Merrill Lynch 10,938 (3,083) Dubai Islamic Bank PJSC Citibank 326 (27,331) Dubai Islamic Bank Bank of America
PJSC (Right) Merrill Lynch (12,391) (770) Dubai Islamic Bank P
JSC (Right) Citibank (349) (293,124) Emaar Malls Group PJSC Bank of America
Merrill Lynch (1,366) (9,772) Emirates Telecommunications
Group Co PJSC HSBC 2,082 (14,223) Emirates Telecommunications Bank of America
Group Co PJSC Merrill Lynch 836 (25,974) Emirates Telecommunications
Group Co PJSC Deutsche Bank 1,596 (78,184) First Gulf Bank PJSC HSBC 5,183
3,334
United Kingdom (993) AA Plc Bank of America
Merrill Lynch (174) (4,155) AA Plc Citibank (179) (1,128) Aggreko Plc Bank of America
Merrill Lynch (1,494) (943) Aggreko Plc Citibank 309 (781) Amec Foster Wheeler Plc Citibank 85 283 Anglo American Plc Bank of America
Merrill Lynch (13) (5,506) Antofagasta Plc Bank of America
Merrill Lynch (145) (513) Antofagasta Plc Citibank 65 4,178 ARM Holdings Plc Bank of America
Merrill Lynch 2,647 3,019 ARM Holdings Plc Citibank 1,029 (1,058) Ashtead Group Plc Bank of America
Merrill Lynch (1,401) 103 Associated British Foods Plc Bank of America
Merrill Lynch 20 53 Associated British Foods Plc Citibank 17 216 Auto Trader Group Plc '144A' Citibank (7) 161 Auto Trader Group Plc '144A' Bank of America
Merrill Lynch 35 9,422 Axis Bank Ltd GDR Reg HSBC 32,872 (1,252) B&M European Value Retail SA Bank of America
Merrill Lynch (484) (4,570) B&M European Value Retail SA Citibank (1,708) (51) Babcock International Bank of America
Group Plc Merrill Lynch (53) (4,515) Babcock International
Group Plc Citibank (2,901) (8,601) Balfour Beatty Plc Bank of America
Merrill Lynch (1,192) (2,018) Balfour Beatty Plc Citibank (183) (6,348) BBA Aviation Plc Bank of America
Merrill Lynch (1,215)
BlackRock Multi-Strategy Absolute Return Fund continued
Switzerland continued

Contracts for difference as at 31 May 2016
Holding
Description Counterparty
Unrealised appreciation/
(depreciation) EUR
Holding
Description Counterparty
Unrealised appreciation/
(depreciation) EUR
378 BlackRock Strategic Funds (BSF)
The notes on pages 489 to 503 form an integral part of these financial statements.
BlackRock Multi-Strategy Absolute Return Fund continued
(18,041) BBA Aviation Plc Citibank (355) 2,736 Beazley Plc Bank of America
Merrill Lynch 657 1,014 Beazley Plc Citibank 42 960 Berendsen Plc Citibank 38 17,539 Booker Group Plc Bank of America
Merrill Lynch 3,794 13,488 Booker Group Plc Citibank 283 1,070 British American Tobacco Plc Bank of America
Merrill Lynch 626 777 British American Tobacco Plc Citibank 1,072 (861) British Land Co Plc/The (Reit) Bank of America
Merrill Lynch 83 (470) Bunzl Plc Citibank (55) (3,555) Capita Plc Bank of America
Merrill Lynch 419 (2,782) Capita Plc Citibank 36 (9,682) Capital & Counties Bank of America
Properties Plc Merrill Lynch (1,714) (7,025) Capital & Counties
Properties Plc Citibank 46 670 Carnival Plc Citibank (61) 7,090 Centrica Plc Bank of America
Merrill Lynch 132 2,868 Centrica Plc Citibank 11 (4,178) Cobham Plc Bank of America
Merrill Lynch 27 (15,922) Cobham Plc Citibank (83) (6,672) Coca-Cola HBC AG Citibank 492 830 Coca-Cola HBC AG Citibank (124) 2,063 Coca-Cola HBC AG Bank of America
Merrill Lynch (220) (381) Daily Mail & General Bank of America
Trust Plc 'A' Merrill Lynch (58) (671) Daily Mail & General
Trust Plc 'A' Citibank (259) 190 DCC Plc Citibank (735) 2,068 Direct Line Insurance Bank of America
Group Plc Merrill Lynch 168 2,294 Direct Line Insurance
Group Plc Citibank 174 232 Domino's Pizza Group Plc Citibank 43 5,435 DS Smith Plc Bank of America
Merrill Lynch 368 3,746 DS Smith Plc Citibank 496 (576) easyJet Plc Bank of America
Merrill Lynch (284) (695) easyJet Plc Citibank (347) (440) Essentra Plc Bank of America
Merrill Lynch (46) (2,034) Essentra Plc Citibank (427) 3,223 Experian Plc Bank of America
Merrill Lynch 1,775 861 Experian Plc Citibank 316 (310) Fresnillo Plc Bank of America
Merrill Lynch 46 (111) Fresnillo Plc Citibank 23 (3,121) G4S Plc Bank of America
Merrill Lynch 7 (231) G4S Plc Citibank (3) 8,695 GKN Plc Bank of America
Merrill Lynch 181 5,187 GKN Plc Citibank 177 (2,748) GlaxoSmithKline Plc Bank of America
Merrill Lynch 180 (792) GlaxoSmithKline Plc Citibank (25) (739) Glencore Plc Bank of America
Merrill Lynch (24) (1,034) Greene King Plc Bank of America
Merrill Lynch (480) (1,568) Greene King Plc Citibank (236)
(327) GVC Holdings Plc Bank of America Merrill Lynch (47)
928 Halma Plc Citibank 291 (15,130) HSBC Holdings Plc Bank of America
Merrill Lynch (3,191) (4,567) HSBC Holdings Plc Citibank (918) (933) ICAP Plc Citibank 30 (891) IMI Plc Citibank (82) 2,776 Inchcape Plc Bank of America
Merrill Lynch (619) 444 Inchcape Plc Citibank (65) 718 Informa Plc Bank of America
Merrill Lynch 126 1,165 Informa Plc Citibank 298 (2,955) Inmarsat Plc Bank of America
Merrill Lynch 817 (692) Inmarsat Plc Citibank (32) 3,009 Intermediate Capital
Group Plc Citibank (118) 5,999 Intermediate Capital Bank of America
Group Plc Merrill Lynch 2,202 1,666 Intertek Group Plc Bank of America
Merrill Lynch (3,848) 1,089 Intertek Group Plc Citibank (1,853) 12,754 Intu Properties Plc (Reit) Bank of America
Merrill Lynch 1,489 (3,122) J Sainsbury Plc Bank of America
Merrill Lynch (473) (10,392) J Sainsbury Plc Citibank (1,267) 10,324 Jupiter Fund Management Plc Citibank 1,304 3,645 Jupiter Fund Management Plc Bank of America
Merrill Lynch 1,075 (1,224) Just Eat Plc Bank of America
Merrill Lynch (703) (7,467) Kingfisher Plc Bank of America
Merrill Lynch (1,016) (8,568) Kingfisher Plc Citibank (1,067) 1,142 Legal & General Group Plc Bank of America
Merrill Lynch 7 (64,948) Lloyds Banking Group Plc Bank of America
Merrill Lynch (2,678) (25,283) Lloyds Banking Group Plc Citibank (576) 21,611 Mail.Ru Group Ltd GDR Reg Citibank 21,107 9,688 Man Group Plc Citibank (216) 7,370 Man Group Plc Bank of America
Merrill Lynch 208 2,642 Marks & Spencer Group Plc Bank of America
Merrill Lynch (1,444) 873 Marks & Spencer Group Plc Citibank (658) (6,036) Melrose Industries Plc Bank of America
Merrill Lynch 823 (4,053) Melrose Industries Plc Citibank 287 (4,435) Merlin Entertainments Plc Citibank (424) (1,419) Merlin Entertainments Plc Bank of America
Merrill Lynch 63 927 Michael Page International Plc Citibank 56 847 Michael Page International Plc Bank of America
Merrill Lynch 32 (2,415) Micro Focus International Plc Citibank (1,615) (1,199) Micro Focus International Plc Bank of America
Merrill Lynch (1,698) 17,234 MMC Norilsk Nickel PJSC ADR Citibank 18,422 1,178 Mondi Plc Bank of America
Merrill Lynch 210 547 Mondi Plc Citibank 129 5,738 Moneysupermarket.com
Group Plc Citibank 888 5,240 Moneysupermarket.com Bank of America
Group Plc Merrill Lynch 1,367 (480) Next Plc Bank of America
Merrill Lynch (746)
United Kingdom continued United Kingdom continued

Contracts for difference as at 31 May 2016
Holding
Description Counterparty
Unrealised appreciation/
(depreciation) EUR
Holding
Description Counterparty
Unrealised appreciation/
(depreciation) EUR
Annual Report and Audited Accounts 379
The notes on pages 489 to 503 form an integral part of these financial statements.
(378) Next Plc Citibank (421) (98) Paysafe Group Plc Bank of America
Merrill Lynch (57) (1,886) Paysafe Group Plc Citibank (695) (643) Pearson Plc Bank of America
Merrill Lynch (278) (1,826) Pearson Plc Citibank (598) (722) Playtech Plc Bank of America
Merrill Lynch (65) 1,176 Provident Financial Plc Bank of America
Merrill Lynch 1,613 (3,007) Prudential Plc Citibank (2,681) 34,788 QinetiQ Group Plc Bank of America
Merrill Lynch 7,617 31,910 QinetiQ Group Plc Citibank 5,271 (160) Randgold Resources Ltd Bank of America
Merrill Lynch 501 (31) Randgold Resources Ltd Citibank 139 4,662 Regus Plc Reg Citibank 581 9,391 Rentokil Initial Plc Bank of America
Merrill Lynch 369 18,950 Rentokil Initial Plc Citibank 348 168 Rightmove Plc Bank of America
Merrill Lynch 610 634 Rightmove Plc Citibank 898 (1,458) Rolls-Royce Holdings Plc Citibank 201 (967) Rolls-Royce Holdings Plc Bank of America
Merrill Lynch 483 (58,078) Rolls-Royce Holdings Plc Bank of America
Merrill Lynch — (66,740) Rolls-Royce Holdings Plc Citibank (87) (35,927) Rosneft OAO GDR Reg Deutsche Bank 525 (14,559) Rotork Plc Bank of America
Merrill Lynch (878) (8,104) Rotork Plc Citibank (32) (1,176) Royal Dutch Shell Plc 'A' Bank of America
Merrill Lynch 1,122 (1,425) Royal Dutch Shell Plc 'A' Citibank (196) (2,065) Royal Dutch Shell Plc 'B' Bank of America
Merrill Lynch 2,071 (809) Royal Dutch Shell Plc 'B' Citibank (74) (127) Royal Mail Plc Citibank (47) (922) Royal Mail Plc Bank of America
Merrill Lynch (393) (877) RPC Group Plc Bank of America
Merrill Lynch (489) (2,767) RPC Group Plc Citibank (889) 2,974 Segro Plc (Reit) Citibank 289 1,485 Serco Group Plc Bank of America
Merrill Lynch (5) 102 Smiths Group Plc Bank of America
Merrill Lynch 14 153 Spirax-Sarco Engineering Plc Citibank 30 776 Spirax-Sarco Engineering Plc Bank of America
Merrill Lynch (61) 821 SSE Plc Citibank 183 (304) Standard Chartered Plc Citibank 38 (2,058) Standard Chartered Plc Bank of America
Merrill Lynch (699) 3,431 Standard Life Plc Bank of America
Merrill Lynch 988 5,080 Standard Life Plc Citibank 873 (4,211) Tesco Plc Bank of America
Merrill Lynch (106) (2,242) Tesco Plc Citibank (153) 11,142 Thomas Cook Group Plc Citibank 373 (1,696) Travis Perkins Plc Bank of America
Merrill Lynch (3,358) (1,290) Travis Perkins Plc Citibank (761) (509) UBM Plc Bank of America
Merrill Lynch (143) (4,606) UBM Plc Citibank (437)
1,626 Vedanta Resources Plc Citibank 62 1,679 Vedanta Resources Plc Bank of America
Merrill Lynch (150) 2,216 WH Smith Plc Bank of America
Merrill Lynch 2,847 2,342 WH Smith Plc Citibank 1,474 (447) Whitbread Plc Citibank 35 (531) Whitbread Plc Bank of America
Merrill Lynch (1,341) (4,358) William Hill Plc Bank of America
Merrill Lynch (404) (3,755) William Hill Plc Citibank (266) 1,592 Worldpay Group Plc '144A' Bank of America
Merrill Lynch 173 2,191 Worldpay Group Plc '144A' Citibank 171
72,118
United States 363 3M Co Bank of America
Merrill Lynch (19) 185 3M Co Citibank 442 (375) Acadia Healthcare Co Inc Citibank (598) 115 Accenture Plc 'A' Citibank 283 386 Accenture Plc 'A' Bank of America
Merrill Lynch 615 (28) Acuity Brands Inc Bank of America
Merrill Lynch (163) (10) Acuity Brands Inc Citibank (62) 26 Adobe Systems Inc Bank of America
Merrill Lynch 69 90 Adobe Systems Inc Citibank 289 (491) Advance Auto Parts Inc Bank of America
Merrill Lynch (3,348) (11) Advance Auto Parts Inc Citibank (20) (293) AECOM Citibank (228) 15 Affiliated Managers Group Inc Citibank 117 43 Affiliated Managers Group Inc Bank of America
Merrill Lynch 85 898 Aflac Inc Bank of America
Merrill Lynch 747 584 Aflac Inc Citibank 483 (523) AGCO Corp Citibank (993) 294 Agrium Inc Bank of America
Merrill Lynch (1,343) 249 Air Products & Chemicals Inc Bank of America
Merrill Lynch (94) 199 Air Products & Chemicals Inc Citibank 258 (4,347) Alcoa Inc Citibank (311) 84 Align Technology Inc Bank of America
Merrill Lynch 49 170 Align Technology Inc Citibank 178 (45) Allegiant Travel Co Citibank (39) (36) Allegiant Travel Co Bank of America
Merrill Lynch 185 127 Allegion Plc Citibank 91 (138) Allergan Plc Citibank (1,649) (58) Alliance Data Systems Corp Bank of America
Merrill Lynch (382) (102) Alliance Data Systems Corp Citibank (842) (648) Ally Financial Inc Bank of America
Merrill Lynch (632) (534) Ally Financial Inc Citibank (602) 15 Altria Group Inc Bank of America
Merrill Lynch (5) 978 Altria Group Inc Citibank 333 188 AMC Networks Inc 'A' Bank of America
Merrill Lynch (302) 235 Amdocs Ltd Bank of America
Merrill Lynch 133 (2,351) Ameren Corp Bank of America
Merrill Lynch (2,694) (743) Ameren Corp Citibank (1,656)
BlackRock Multi-Strategy Absolute Return Fund continued
United Kingdom continued United Kingdom continued

Contracts for difference as at 31 May 2016
Holding
Description Counterparty
Unrealised appreciation/
(depreciation) EUR
Holding
Description Counterparty
Unrealised appreciation/
(depreciation) EUR
* Amounts which are less than 0.5 EUR have been rounded down to zero.
380 BlackRock Strategic Funds (BSF)
The notes on pages 489 to 503 form an integral part of these financial statements.
BlackRock Multi-Strategy Absolute Return Fund continued
(203) American Airlines Group Inc Bank of America Merrill Lynch 125
(243) American Airlines Group Inc Citibank 63 (24) American Financial
Group Inc/OH Citibank (17) (105) American Financial Bank of America
Group Inc/OH Merrill Lynch (90) (1,105) American Homes Bank of America
4 Rent 'A' (Reit) Merrill Lynch (599) (1,121) American Homes
4 Rent 'A' (Reit) Citibank (729) 104 American Water Works Co Inc Bank of America
Merrill Lynch (95) 658 Ameriprise Financial Inc Bank of America
Merrill Lynch 4,524 19 Ameriprise Financial Inc Citibank 25 948 AmerisourceBergen Corp Bank of America
Merrill Lynch (153) 92 AmerisourceBergen Corp Citibank 39 (78) AMETEK Inc Citibank (7) (350) AMETEK Inc Bank of America
Merrill Lynch (222) 316 Amphenol Corp 'A' Bank of America
Merrill Lynch 566 219 Amphenol Corp 'A' Citibank 383 (41) Amsurg Corp Citibank (15) (50) Amsurg Corp Bank of America
Merrill Lynch 21 (43) AmTrust Financial Services Inc Bank of America
Merrill Lynch (8) (143) AmTrust Financial Services Inc Citibank (46) 28 Anadarko Petroleum Corp Bank of America
Merrill Lynch 78 144 Anadarko Petroleum Corp Citibank 385 516 Analog Devices Inc Bank of America
Merrill Lynch 1,367 (2,459) Annaly Capital
Management Inc (Reit) Citibank 258 (4,032) Annaly Capital Bank of America
Management Inc (Reit) Merrill Lynch 379 213 Aon Plc Bank of America
Merrill Lynch 648 340 Aon Plc Citibank 1,342 260 Apache Corp Bank of America
Merrill Lynch 850 52 Apache Corp Citibank 40 154 Apartment Investment & Bank of America
Management Co 'A' (Reit) Merrill Lynch 26 (55) Aramark Bank of America
Merrill Lynch (19) (78) Aramark Citibank (43) (168) Arch Capital Group Ltd Bank of America
Merrill Lynch (70) (449) Arch Capital Group Ltd Citibank (647) (1,576) Arthur J Gallagher & Co Bank of America
Merrill Lynch (1,213) (1,390) Arthur J Gallagher & Co Citibank (834) (1) Ashford Hospitality
Prime Inc (Reit) Citibank 3 (117) Ashland Inc Bank of America
Merrill Lynch (113) (195) Ashland Inc Citibank (253) 100 Aspen Insurance Holdings Ltd Bank of America
Merrill Lynch 60 246 Aspen Insurance Holdings Ltd Citibank 233 (801) AT&T Inc Bank of America
Merrill Lynch 115 (3,188) AT&T Inc Citibank (2,283) 4 athenahealth Inc Bank of America
Merrill Lynch 2
119 Atlantica Yield Plc Bank of America Merrill Lynch 151
39 Atlantica Yield Plc* Citibank — 224 Atlassian Corp Plc 'A' Bank of America
Merrill Lynch (24) 229 Atlassian Corp Plc 'A' Citibank (30) (134) Atmos Energy Corp Citibank (16) (165) Autodesk Inc Citibank (272) (102) Autoliv Inc Bank of America
Merrill Lynch 97 (71) AutoNation Inc Citibank (176) 24 AutoZone Inc Bank of America
Merrill Lynch (385) 27 AvalonBay
Communities Inc (Reit) Citibank (45) (61) Avangrid Inc Bank of America
Merrill Lynch (30) (131) Avangrid Inc Citibank (136) 191 Avery Dennison Corp Bank of America
Merrill Lynch (386) 723 Avery Dennison Corp Citibank 667 (66) Avis Budget Group Inc Bank of America
Merrill Lynch (90) (25) Avis Budget Group Inc Citibank (27) (772) Avnet Inc Bank of America
Merrill Lynch (840) (341) Avnet Inc Citibank (366) 872 B/E Aerospace Inc Citibank 960 1,004 Baidu Inc ADR HSBC 15,074 (267) Ball Corp Citibank (244) (1,462) Ball Corp Bank of America
Merrill Lynch 1,492 40 Bank of Hawaii Corp Bank of America
Merrill Lynch 33 105 Bank of Hawaii Corp Citibank 229 177 Bank of the Ozarks Inc Citibank 265 (243) BankUnited Inc Citibank (100) 651 Baxter International Inc Bank of America
Merrill Lynch (1,361) 914 Baxter International Inc Citibank 352 (259) Beacon Roofing Supply Inc Bank of America
Merrill Lynch 49 72 Belden Inc Bank of America
Merrill Lynch 242 68 Belden Inc Citibank 191 (1,501) Berkshire Hathaway Inc 'B' Citibank (3,346) (532) Berry Plastics Group Inc Bank of America
Merrill Lynch (248) 1,194 Best Buy Co Inc Citibank (1,026) 35 Big Lots Inc Bank of America
Merrill Lynch 191 533 Big Lots Inc Citibank 4,952 259 Black Hills Corp Citibank 383 (706) Blackstone Mortgage Bank of America
Trust Inc 'A' (Reit) Merrill Lynch 4 (333) Blackstone Mortgage
Trust Inc 'A' (Reit) Citibank (120) 133 Bloomin' Brands Inc Bank of America
Merrill Lynch 9 125 Blue Buffalo Pet Products Inc Citibank 6 624 Blue Buffalo Pet Products Inc Bank of America
Merrill Lynch 56 15 Boeing Co/The Bank of America
Merrill Lynch (10) 1,057 Booz Allen Hamilton Bank of America
Holding Corp Merrill Lynch 1,155 793 Booz Allen Hamilton
Holding Corp Citibank 78 (175) BorgWarner Inc Bank of America
Merrill Lynch (73) (337) BorgWarner Inc Citibank (428)
United States continued United States continued

Contracts for difference as at 31 May 2016
Holding
Description Counterparty
Unrealised appreciation/
(depreciation) EUR
Holding
Description Counterparty
Unrealised appreciation/
(depreciation) EUR
Annual Report and Audited Accounts 381
The notes on pages 489 to 503 form an integral part of these financial statements.
(74) Boston Beer Co Inc/The 'A' Citibank (202) 831 Brinker International Inc Bank of America
Merrill Lynch (59) 251 Brinker International Inc Citibank 230 112 Brixmor Property Bank of America
Group Inc (Reit) Merrill Lynch 48 (60) Broadcom Ltd Citibank (106) 2,939 Brocade Communications
Systems Inc Citibank 2,394 37 Brocade Communications Bank of America
Systems Inc Merrill Lynch 36 (1,163) Brookdale Senior Living Inc Bank of America
Merrill Lynch (219) (597) Brookdale Senior Living Inc Citibank 86 (132) Bruker Corp Citibank (12) (97) Bruker Corp Bank of America
Merrill Lynch 30 (92) Buffalo Wild Wings Inc Citibank (435) 237 BWX Technologies Inc Bank of America
Merrill Lynch 161 138 BWX Technologies Inc Citibank 74 311 CA Inc Citibank 345 (40) Cabela's Inc Citibank (17) (17) Cable One Inc Bank of America
Merrill Lynch (13) (8) Cable One Inc Citibank (5) 70 Cabot Corp Bank of America
Merrill Lynch 14 (23) Cabot Oil & Gas Corp Citibank (12) 21 Caesarstone Sdot-Yam Ltd Citibank 23 490 Cal-Maine Foods Inc Citibank (26) 86 Cal-Maine Foods Inc Bank of America
Merrill Lynch (259) (131) CalAtlantic Group Inc Bank of America
Merrill Lynch (317) (325) CalAtlantic Group Inc Citibank (693) 151 Camden Property Trust (Reit) Bank of America
Merrill Lynch (261) 686 Camden Property Trust (Reit) Citibank 430 (872) Campbell Soup Co Citibank (306) (209) Campbell Soup Co Bank of America
Merrill Lynch 425 218 Canadian Solar Inc Bank of America
Merrill Lynch 232 201 Canadian Solar Inc Citibank 27 34 Cardinal Health Inc Bank of America
Merrill Lynch 37 970 Cardinal Health Inc Citibank 1,615 754 Carlisle Cos Inc Bank of America
Merrill Lynch 1,384 295 Carlisle Cos Inc Citibank 454 (606) CarMax Inc Citibank (944) 233 Carnival Corp Bank of America
Merrill Lynch (272) 699 Carnival Corp Citibank (546) (150) Catalent Inc Bank of America
Merrill Lynch (253) (791) Catalent Inc Citibank (254) (594) Caterpillar Inc Bank of America
Merrill Lynch (1,111) (357) Caterpillar Inc Citibank (764) 775 Cathay General Bancorp Bank of America
Merrill Lynch 862 812 Cathay General Bancorp Citibank 578 (114) Cavium Inc Citibank (292) (93) CBOE Holdings Inc Citibank (8) 16 CDK Global Inc Bank of America
Merrill Lynch 46 29 CDK Global Inc Citibank 59 (533) Centene Corp Bank of America
Merrill Lynch (2,586)
(368) Centene Corp Citibank (1,577) 1,397 CenterPoint Energy Inc Bank of America
Merrill Lynch 450 3,682 CenterPoint Energy Inc Citibank 2,044 (566) CenturyLink Inc Bank of America
Merrill Lynch (85) (392) CenturyLink Inc Citibank (54) 246 Charles River Laboratories Bank of America
International Inc Merrill Lynch 500 2,378 Charles Schwab Corp/The Bank of America
Merrill Lynch 5,654 785 Charles Schwab Corp/The Citibank 1,160 188 Check Point Software
Technologies Ltd Citibank 178 144 Check Point Software Bank of America
Technologies Ltd Merrill Lynch 190 26 Cheesecake Factory Inc/The Citibank 8 127 Chemed Corp Bank of America
Merrill Lynch 312 (202) Cheniere Energy Inc Bank of America
Merrill Lynch 411 (178) Cheniere Energy Inc Citibank 70 273 Chesapeake Energy Corp Bank of America
Merrill Lynch 88 949 Chesapeake Energy Corp Citibank 501 (335) Chevron Corp Citibank (660) (65) Chevron Corp Bank of America
Merrill Lynch 41 (150) Chicago Bridge & Iron Co NV Bank of America
Merrill Lynch (97) (179) Chicago Bridge & Iron Co NV Citibank (260) 21,355 China Life
Insurance Co Ltd ADR HSBC 9,999 5,528 China Mobile Ltd ADR HSBC 9,723 1,901 China Petroleum &
Chemical Corp ADR Citibank 2,241 (88) Chipotle Mexican Grill Inc Citibank 1,056 12,976 Cia Brasileira de
Distribuicao ADR Citibank (19,618) (96) Cimpress NV Citibank (228) 127 Cincinnati Financial Corp Bank of America
Merrill Lynch 99 40 Cincinnati Financial Corp Citibank 27 111 Cinemark Holdings Inc Bank of America
Merrill Lynch 23 45 Cinemark Holdings Inc Citibank 7 980 Cintas Corp Bank of America
Merrill Lynch 2,975 839 Cisco Systems Inc Bank of America
Merrill Lynch 1,519 2,552 Cisco Systems Inc Citibank 2,216 (409) CIT Group Inc Bank of America
Merrill Lynch (1,011) (528) CIT Group Inc Citibank (875) 3,655 Citizens Financial Group Inc Citibank 2,160 240 Citrix Systems Inc Bank of America
Merrill Lynch 370 369 Citrix Systems Inc Citibank 340 (109) CLARCOR Inc Bank of America
Merrill Lynch (180) (41) CLARCOR Inc Citibank (102) (832) Clean Harbors Inc Bank of America
Merrill Lynch (2,160) (472) Clean Harbors Inc Citibank (368) 744 Clorox Co/The Citibank (27) 403 Clorox Co/The Bank of America
Merrill Lynch (1,079) 1,083 CME Group Inc/IL Citibank 1,842 262 CMS Energy Corp Bank of America
Merrill Lynch 147 596 CMS Energy Corp Citibank 517
BlackRock Multi-Strategy Absolute Return Fund continued
United States continued United States continued

Contracts for difference as at 31 May 2016
Holding
Description Counterparty
Unrealised appreciation/
(depreciation) EUR
Holding
Description Counterparty
Unrealised appreciation/
(depreciation) EUR
382 BlackRock Strategic Funds (BSF)
The notes on pages 489 to 503 form an integral part of these financial statements.
BlackRock Multi-Strategy Absolute Return Fund continued
1,247 CNO Financial Group Inc Citibank 960 (603) Coach Inc Bank of America
Merrill Lynch (390) (2,110) Coach Inc Citibank (680) (766) Coca-Cola Co/The Citibank (507) (565) Coca-Cola Co/The Bank of America
Merrill Lynch 460 487 Coca-Cola European
Partners Plc Citibank (5,049) 1,583 Coca-Cola European Bank of America
Partners Plc Merrill Lynch (20,153) (68) Cognizant Technology
Solutions Corp 'A' Citibank 32 (84) Cognizant Technology Bank of America
Solutions Corp 'A' Merrill Lynch (6) (49) Colony Starwood Homes (Reit) Bank of America
Merrill Lynch 5 (391) Colony Starwood Homes (Reit) Citibank (196) 441 Comcast Corp 'A' Bank of America
Merrill Lynch 161 (131) Comerica Inc Bank of America
Merrill Lynch (547) 849 Commerce Bancshares Inc/MO Citibank 1,011 1,629 Commerce Bancshares Inc/MO Bank of America
Merrill Lynch 2,377 83 CommScope Holding Co Inc Bank of America
Merrill Lynch 69 (661) Compass Minerals
International Inc Citibank (137) (757) Computer Sciences Corp Bank of America
Merrill Lynch (10,031) (1,665) Computer Sciences Corp Citibank (19,036) (70) Concho Resources Inc Bank of America
Merrill Lynch (332) (105) Concho Resources Inc Citibank (525) (482) ConocoPhillips Bank of America
Merrill Lynch (341) (179) CONSOL Energy Inc Bank of America
Merrill Lynch (38) (302) Convergys Corp Bank of America
Merrill Lynch (137) (187) Cooper Cos Inc/The Citibank (305) (191) Cooper Cos Inc/The Bank of America
Merrill Lynch (443) (679) Copa Holdings SA 'A' Citibank 1,714 (1,349) Corning Inc Bank of America
Merrill Lynch (1,825) (821) Corning Inc Citibank (750) 257 Costco Wholesale Corp Bank of America
Merrill Lynch 745 248 Costco Wholesale Corp Citibank 1,474 (429) Coty Inc 'A' Citibank (315) (2,466) Covanta Holding Corp Bank of America
Merrill Lynch 949 557 CR Bard Inc Bank of America
Merrill Lynch (1,536) 85 CR Bard Inc Citibank (103) (1,530) Credicorp Ltd HSBC (10,276) 194 Crown Castle Bank of America
International Corp (Reit) Merrill Lynch (43) 379 CSRA Inc Bank of America
Merrill Lynch (31) 156 CSRA Inc Citibank (70) (40) CST Brands Inc Bank of America
Merrill Lynch (27) (145) CST Brands Inc Citibank (113) (3,960) Ctrip.com
International Ltd ADR HSBC (12,842) (487) Cullen/Frost Bankers Inc Citibank (1,482) (77) Cummins Inc Bank of America
Merrill Lynch (11)
(155) Cummins Inc Citibank (859) (5,028) Cypress Semiconductor Corp Citibank (1,778) (1,478) CyrusOne Inc (Reit) Citibank (2,036) (629) CyrusOne Inc (Reit) Bank of America
Merrill Lynch (198) 55 Darden Restaurants Inc Bank of America
Merrill Lynch 164 38 Darden Restaurants Inc Citibank 3 (517) DaVita HealthCare Partners Inc Citibank (143) (643) DaVita HealthCare Partners Inc Bank of America
Merrill Lynch (11) 422 DCT Industrial Trust Inc (Reit) Citibank 304 955 DCT Industrial Trust Inc (Reit) Bank of America
Merrill Lynch (359) (1,048) Deere & Co Citibank (4,419) (411) Delta Air Lines Inc Bank of America
Merrill Lynch 61 (633) Delta Air Lines Inc Citibank 102 221 Devon Energy Corp Citibank 465 (119) DexCom Inc Bank of America
Merrill Lynch (100) (192) Diamondback Energy Inc Citibank (1,007) (40) Diebold Inc Bank of America
Merrill Lynch (27) (22) Dillard's Inc 'A' Bank of America
Merrill Lynch 14 (31) Dillard's Inc 'A' Citibank (42) (249) Diplomat Pharmacy Inc Bank of America
Merrill Lynch (348) (25) Diplomat Pharmacy Inc Citibank (25) (696) DISH Network Corp 'A' Bank of America
Merrill Lynch (2,038) (286) DISH Network Corp 'A' Citibank (615) (623) Dollar Tree Inc Bank of America
Merrill Lynch (5,288) (338) Dollar Tree Inc Citibank (4,221) (1,184) Donaldson Co Inc Bank of America
Merrill Lynch (933) (368) Donaldson Co Inc Citibank (102) 614 Dr Pepper Snapple Group Inc Bank of America
Merrill Lynch (1,413) 208 DST Systems Inc Citibank 438 20 DTE Energy Co Citibank 7 54 DTE Energy Co Bank of America
Merrill Lynch 41 (8) Duke Energy Corp Bank of America
Merrill Lynch (9) 1,617 Duke Realty Corp (Reit) Bank of America
Merrill Lynch 58 2,311 Duke Realty Corp (Reit) Citibank 972 25 Dun & Bradstreet Corp/The Bank of America
Merrill Lynch 132 78 Dun & Bradstreet Corp/The Citibank 413 (247) DuPont Fabros Bank of America
Technology Inc (Reit) Merrill Lynch (240) (38) DuPont Fabros
Technology Inc (Reit) Citibank (21) 75 E*TRADE Financial Corp Bank of America
Merrill Lynch 79 74 E*TRADE Financial Corp Citibank 70 609 East West Bancorp Inc Bank of America
Merrill Lynch 962 233 East West Bancorp Inc Citibank 306 174 Eastman Chemical Co Citibank 81 260 Eastman Chemical Co Bank of America
Merrill Lynch (84) 84 Eaton Vance Corp Bank of America
Merrill Lynch 125 139 eBay Inc Bank of America
Merrill Lynch 27 246 eBay Inc Citibank 225
United States continued United States continued

Contracts for difference as at 31 May 2016
Holding
Description Counterparty
Unrealised appreciation/
(depreciation) EUR
Holding
Description Counterparty
Unrealised appreciation/
(depreciation) EUR
Annual Report and Audited Accounts 383
The notes on pages 489 to 503 form an integral part of these financial statements.
(363) Education Realty Trust Inc (Reit) Citibank (299)
(914) Education Realty Bank of America Trust Inc (Reit) Merrill Lynch (303)
50 Edwards Lifesciences Corp Bank of America Merrill Lynch (199)
51 Edwards Lifesciences Corp Citibank (19) 341 Electronic Arts Inc Bank of America
Merrill Lynch 390 127 Electronic Arts Inc Citibank 296 142 Eli Lilly & Co Citibank (27) (41) Ellie Mae Inc Citibank (73) (194) Emerson Electric Co Bank of America
Merrill Lynch 90 (172) Endo International Plc Citibank (64) (9) Endurance Specialty Bank of America
Holdings Ltd Merrill Lynch (5) (142) Endurance Specialty
Holdings Ltd Citibank (151) (215) EPAM Systems Inc Bank of America
Merrill Lynch (597) (234) EPAM Systems Inc Citibank (815) (217) EPR Properties (Reit) Citibank (221) (1,139) EPR Properties (Reit) Bank of America
Merrill Lynch (687) (470) EQT Corp Bank of America
Merrill Lynch (1,296) (47) EQT Corp Citibank (158) (53) Equinix Inc (Reit) Citibank (1,051) (209) Equinix Inc (Reit) Bank of America
Merrill Lynch (3,350) 335 Equity Commonwealth (Reit) Bank of America
Merrill Lynch 162 1,162 Equity Commonwealth (Reit) Citibank 1,176 241 Equity LifeStyle Bank of America
Properties Inc (Reit) Merrill Lynch (191) 542 Equity LifeStyle
Properties Inc (Reit) Citibank 106 (1,016) Equity One Inc (Reit) Bank of America
Merrill Lynch 518 10 Essex Property Trust Inc (Reit) Citibank (23) 15 Essex Property Trust Inc (Reit) Bank of America
Merrill Lynch 19 44 Euronet Worldwide Inc Bank of America
Merrill Lynch 110 135 Euronet Worldwide Inc Citibank (14) (140) Eversource Energy Bank of America
Merrill Lynch (50) (273) Eversource Energy Citibank (183) (301) Exelon Corp Citibank (148) (944) Exelon Corp Bank of America
Merrill Lynch 77 410 Express Scripts Holding Co Bank of America
Merrill Lynch 855 (535) Extra Space Storage Inc (Reit) Bank of America
Merrill Lynch 513 (140) Exxon Mobil Corp Bank of America
Merrill Lynch (46) (776) Exxon Mobil Corp Citibank (236) 118 F5 Networks Inc Bank of America
Merrill Lynch 155 43 F5 Networks Inc Citibank 83 (130) Facebook Inc 'A' Citibank (388) 63 FactSet Research Systems Inc Bank of America
Merrill Lynch 277 (8) Fair Isaac Corp Bank of America
Merrill Lynch (10) (1,312) Fidelity National Information
Services Inc Citibank (2,208) 712 Fifth Third Bancorp Bank of America
Merrill Lynch 763
315 Fifth Third Bancorp Citibank 189 271 First American Financial Corp Bank of America
Merrill Lynch 142 181 First American Financial Corp Citibank 57 585 First Data Corp 'A' Bank of America
Merrill Lynch 986 747 First Data Corp 'A' Citibank 412 812 First Horizon National Corp Bank of America
Merrill Lynch 392 665 First Horizon National Corp Citibank 186 110 First Industrial Realty
Trust Inc (Reit) Citibank 39 61 First Industrial Realty Bank of America
Trust Inc (Reit) Merrill Lynch (5) 203 First Republic Bank/CA Bank of America
Merrill Lynch 412 75 First Republic Bank/CA Citibank 215 (210) First Solar Inc Bank of America
Merrill Lynch (206) (37) First Solar Inc Citibank (3) (162) FirstEnergy Corp Citibank (42) 304 Fiserv Inc Bank of America
Merrill Lynch 278 170 Fitbit Inc 'A' Bank of America
Merrill Lynch 11 383 Fitbit Inc 'A' Citibank (141) (443) FleetCor Technologies Inc Bank of America
Merrill Lynch (1,590) 3,677 Flextronics International Ltd Bank of America
Merrill Lynch (66) 6,255 Flextronics International Ltd Citibank (28) 834 FLIR Systems Inc Bank of America
Merrill Lynch 403 766 FLIR Systems Inc Citibank 693 (649) Flowserve Corp Citibank (1,458) 396 Fluor Corp Bank of America
Merrill Lynch 652 (537) FMC Corp Bank of America
Merrill Lynch (418) (1,173) FMC Corp Citibank (452) (1,438) FNB Corp/PA Citibank (301) (2,382) FNB Corp/PA Bank of America
Merrill Lynch (1,326) (204) FNF Group Citibank (126) (643) Forest City Realty Bank of America
Trust Inc 'A' (Reit) Merrill Lynch (182) (1,037) Forest City Realty
Trust Inc 'A' (Reit) Citibank (622) 386 Fortinet Inc Citibank 197 440 Fortinet Inc Bank of America
Merrill Lynch 638 906 Fortune Brands Home & Bank of America
Security Inc Merrill Lynch 1,304 415 Fortune Brands Home &
Security Inc Citibank 490 435 GameStop Corp 'A' Bank of America
Merrill Lynch (165) 463 GameStop Corp 'A' Citibank 153 (2,229) Gaming and Leisure
Properties Inc (Reit) Citibank 419 (2,479) Gap Inc/The Citibank 1,216 (1,728) Gap Inc/The Bank of America
Merrill Lynch (512) 96 Gartner Inc Bank of America
Merrill Lynch 370 324 Gartner Inc Citibank 1,036 (48) Generac Holdings Inc Citibank (6) (780) General Electric Co Bank of America
Merrill Lynch (133) 345 General Growth Bank of America
Properties Inc (Reit) Merrill Lynch (230)
BlackRock Multi-Strategy Absolute Return Fund continued
United States continued United States continued

Contracts for difference as at 31 May 2016
Holding
Description Counterparty
Unrealised appreciation/
(depreciation) EUR
Holding
Description Counterparty
Unrealised appreciation/
(depreciation) EUR
384 BlackRock Strategic Funds (BSF)
The notes on pages 489 to 503 form an integral part of these financial statements.
BlackRock Multi-Strategy Absolute Return Fund continued
90 General Growth Properties Inc (Reit) Citibank 22
1,269 General Mills Inc Citibank 341 514 General Mills Inc Bank of America
Merrill Lynch (722) (197) Genesee & Wyoming Inc 'A' Bank of America
Merrill Lynch (608) (664) Genesee & Wyoming Inc 'A' Citibank (1,867) 88 GEO Group Inc/The (Reit) Citibank 103 184 GEO Group Inc/The (Reit) Bank of America
Merrill Lynch 77 (130) Golar LNG Ltd Citibank (101) (288) Goldman Sachs Group Inc/The Citibank (1,495) (146) Goldman Sachs Group Inc/The Bank of America
Merrill Lynch (767) (489) Goodyear Tire & Rubber Co/The Bank of America
Merrill Lynch (282) (434) Goodyear Tire & Rubber Co/The Citibank (222) (66) Graco Inc Bank of America
Merrill Lynch (46) (23) Graco Inc Citibank (20) (4,491) Gramercy Property Trust (Reit) Citibank (563) (13,121) Gramercy Property Trust (Reit) Bank of America
Merrill Lynch 2,286 1,451 Groupon Inc Bank of America
Merrill Lynch 273 2,211 Groupon Inc Citibank 396 (834) GrubHub Inc Citibank (941) (18) Guidewire Software Inc Citibank (21) 92 Gulfport Energy Corp Bank of America
Merrill Lynch 43 166 Gulfport Energy Corp Citibank 181 81 H&R Block Inc Bank of America
Merrill Lynch 74 (105) Hain Celestial Group Inc/The Citibank (93) (197) Hain Celestial Group Inc/The Bank of America
Merrill Lynch (351) (36) Halliburton Co Bank of America
Merrill Lynch (54) (452) Halliburton Co Citibank (536) (6) Hancock Holding Co Bank of America
Merrill Lynch (12) (503) Hancock Holding Co Citibank (662) (747) Hanesbrands Inc Citibank (21) (1,212) Hanesbrands Inc Bank of America
Merrill Lynch 95 217 Harley-Davidson Inc Bank of America
Merrill Lynch 249 275 Harley-Davidson Inc Citibank 467 122 Harman International
Industries Inc Citibank 516 158 Harman International Bank of America
Industries Inc Merrill Lynch 611 (133) Harris Corp Citibank 44 (139) Harris Corp Bank of America
Merrill Lynch (69) 18 Hartford Financial Services
Group Inc/The Citibank 13 561 Hasbro Inc Bank of America
Merrill Lynch 799 565 Hasbro Inc Citibank 1,052 (19) Hawaiian Holdings Inc Bank of America
Merrill Lynch 39 (1,210) Healthcare Realty
Trust Inc (Reit) Citibank (964) (1,977) Healthcare Realty Bank of America
Trust Inc (Reit) Merrill Lynch 478 (486) Healthcare Trust of Bank of America
America Inc 'A' (Reit) Merrill Lynch 96 (682) Healthcare Trust of
America Inc 'A' (Reit) Citibank (189)
242 Hershey Co/The Citibank 446 203 Hershey Co/The Bank of America
Merrill Lynch 410 (783) Highwoods
Properties Inc (Reit) Citibank (1,034) (686) Highwoods Bank of America
Properties Inc (Reit) Merrill Lynch (739) (27) Hill-Rom Holdings Inc Bank of America
Merrill Lynch (1) (3,242) Hilton Worldwide Holdings Inc Citibank (464) (619) Hilton Worldwide Holdings Inc Bank of America
Merrill Lynch 543 373 Hologic Inc Bank of America
Merrill Lynch 102 130 Hologic Inc Citibank 137 22 Home Depot Inc/The Citibank 31 355 Home Depot Inc/The Bank of America
Merrill Lynch (574) (13) Honeywell International Inc Bank of America
Merrill Lynch 1 (6) Honeywell International Inc Citibank 3 (964) Horizon Pharma Plc Citibank (1,355) 652 Hospitality Properties
Trust (Reit) Citibank 350 3,653 Host Hotels & Bank of America
Resorts Inc (Reit) Merrill Lynch (1,374) 1,574 Host Hotels &
Resorts Inc (Reit) Citibank 606 (368) Howard Hughes Corp/The Bank of America
Merrill Lynch (794) 418 HP Inc Citibank 103 630 Huntington Bancshares Inc/OH Citibank 243 (25) Huntington Ingalls
Industries Inc Citibank (12) (483) Huntsman Corp Bank of America
Merrill Lynch (433) (246) Huntsman Corp Citibank (128) 168 IAC/InterActiveCorp Bank of America
Merrill Lynch 278 27 IAC/InterActiveCorp Citibank 54 (270) IBERIABANK Corp Bank of America
Merrill Lynch (446) 532 IDACORP Inc Citibank 1,157 364 IDACORP Inc Bank of America
Merrill Lynch (310) 48 IDEX Corp Bank of America
Merrill Lynch 58 103 IDEX Corp Citibank 82 564 IDEXX Laboratories Inc Bank of America
Merrill Lynch 388 417 IDEXX Laboratories Inc Citibank 429 120 Illinois Tool Works Inc Bank of America
Merrill Lynch 98 446 Illinois Tool Works Inc Citibank 872 (70) Illumina Inc Bank of America
Merrill Lynch (129) (173) Illumina Inc Citibank (747) (396) IMAX Corp Bank of America
Merrill Lynch (282) (232) Impax Laboratories Inc Bank of America
Merrill Lynch (666) 10 Ingersoll-Rand Plc Citibank 2 137 Ingredion Inc Citibank 177 400 Ingredion Inc Bank of America
Merrill Lynch (371) (420) Inovalon Holdings Inc 'A' Citibank (102) (258) Integra LifeSciences Bank of America
Holdings Corp Merrill Lynch (494) (171) Integra LifeSciences
Holdings Corp Citibank (337) (12) Intercontinental Exchange Inc Citibank (5)
United States continued United States continued

Contracts for difference as at 31 May 2016
Holding
Description Counterparty
Unrealised appreciation/
(depreciation) EUR
Holding
Description Counterparty
Unrealised appreciation/
(depreciation) EUR
Annual Report and Audited Accounts 385
The notes on pages 489 to 503 form an integral part of these financial statements.
4,300 Interpublic Group of Cos Inc/The Citibank 1,116
1,272 Interpublic Group of Bank of America Cos Inc/The Merrill Lynch (182)
(516) InterXion Holding NV Citibank (1,283) 52 Intuit Inc Bank of America
Merrill Lynch 236 1,004 Intuit Inc Citibank 3,293 2,315 Invesco Ltd Citibank 3,544 (395) Iron Mountain Inc (Reit) Citibank (226) (333) Iron Mountain Inc (Reit) Bank of America
Merrill Lynch 420 26,434 Itau Unibanco Holding SA
ADR (Pref) Citibank (8,204) (70) j2 Global Inc Bank of America
Merrill Lynch (190) (174) j2 Global Inc Citibank (576) 502 Jabil Circuit Inc Bank of America
Merrill Lynch 306 186 Jabil Circuit Inc Citibank 192 142 Jack Henry & Associates Inc Bank of America
Merrill Lynch (55) 208 Jack Henry & Associates Inc Citibank 385 214 Jacobs Engineering Group Inc Bank of America
Merrill Lynch 309 272 JB Hunt Transport Services Inc Citibank 360 230 JB Hunt Transport Services Inc Bank of America
Merrill Lynch 292 7,644 JD.com Inc ADR HSBC 11,905 414 Jones Lang LaSalle Inc Citibank 1,961 27 JPMorgan Chase & Co Bank of America
Merrill Lynch 12 472 JPMorgan Chase & Co Citibank 715 (641) Juniper Networks Inc Bank of America
Merrill Lynch (132) (183) Juniper Networks Inc Citibank (123) (66) Kansas City Southern Bank of America
Merrill Lynch (313) (57) Kansas City Southern Citibank (175) 66 KBR Inc Citibank 25 4,788 KeyCorp Citibank 1,972 (291) Keysight Technologies Inc Citibank (138) 143 Kilroy Realty Corp (Reit) Citibank 23 247 Kilroy Realty Corp (Reit) Bank of America
Merrill Lynch (157) (158) Kirby Corp Bank of America
Merrill Lynch (607) (237) Kirby Corp Citibank (398) (311) Knight Transportation Inc Bank of America
Merrill Lynch (275) (1,652) Knight Transportation Inc Citibank (1,316) (126) Kohl's Corp Bank of America
Merrill Lynch (79) (75) Kohl's Corp Citibank (45) (111) Kraft Heinz Co/The Citibank (101) (484) Kraft Heinz Co/The Bank of America
Merrill Lynch 884 302 Kroger Co/The Citibank 231 904 Kroger Co/The Bank of America
Merrill Lynch 789 (294) Laboratory Corp of Bank of America
America Holdings Merrill Lynch (211) (308) Lam Research Corp Bank of America
Merrill Lynch (158) (59) Lam Research Corp Citibank (150) 468 Lamar Advertising Co 'A' (Reit) Bank of America
Merrill Lynch 406 236 Lamar Advertising Co 'A' (Reit) Citibank 136 59 Lancaster Colony Corp Bank of America
Merrill Lynch 92 26 Lancaster Colony Corp Citibank 78
446 Landstar System Inc Bank of America Merrill Lynch 1,286
544 Landstar System Inc Citibank 886 626 Laredo Petroleum Inc Bank of America
Merrill Lynch 317 788 Laredo Petroleum Inc Citibank 635 1,623 LaSalle Hotel Properties (Reit) Citibank 799 668 LaSalle Hotel Properties (Reit) Bank of America
Merrill Lynch (748) 218 Lear Corp Bank of America
Merrill Lynch 730 373 Lear Corp Citibank 1,893 158 Leggett & Platt Inc Bank of America
Merrill Lynch 31 208 Leggett & Platt Inc Citibank 153 (688) Lennar Corp 'A' Bank of America
Merrill Lynch (1,158) 202 Lennox International Inc Bank of America
Merrill Lynch (42) 13 Lennox International Inc Citibank 42 (2,737) Leucadia National Corp Bank of America
Merrill Lynch (1,103) (1,204) Leucadia National Corp Citibank (539) (1,123) Liberty Broadband Corp 'C' Bank of America
Merrill Lynch 873 (311) Liberty Broadband Corp 'C' Citibank 273 (51) Liberty Global Plc 'A' Citibank (10) (674) Liberty Ventures 'A' Bank of America
Merrill Lynch 410 (167) Liberty Ventures 'A' Citibank (70) (42) LifePoint Health Inc Bank of America
Merrill Lynch 43 325 Lincoln National Corp Bank of America
Merrill Lynch 975 20 Linear Technology Corp Bank of America
Merrill Lynch 43 385 Linear Technology Corp Citibank 576 (76) Lithia Motors Inc 'A' Bank of America
Merrill Lynch (304) (13) Lithia Motors Inc 'A' Citibank (60) (9) Littelfuse Inc Citibank (29) 173 LivaNova Plc Bank of America
Merrill Lynch 67 37 LivaNova Plc Citibank (14) 1,545 Live Nation Entertainment Inc Citibank 1,549 549 Live Nation Entertainment Inc Bank of America
Merrill Lynch 580 (246) Loews Corp Citibank (170) (1,576) Louisiana-Pacific Corp Citibank (959) 639 Lowe's Cos Inc Citibank 795 617 Lowe's Cos Inc Bank of America
Merrill Lynch 1,656 4,946 Luxoft Holding Inc Deutsche Bank 14,128 924 LyondellBasell
Industries NV 'A' Citibank 1,547 271 LyondellBasell Bank of America
Industries NV 'A' Merrill Lynch (315) (152) M&T Bank Corp Citibank (543) (503) Macquarie Infrastructure Corp Citibank (261) (259) Macquarie Infrastructure Corp Bank of America
Merrill Lynch (111) (286) Macy's Inc Citibank (391) (530) Macy's Inc Bank of America
Merrill Lynch (992) (157) Madison Square
Garden Co/The 'A' Citibank (144) (175) Madison Square Bank of America
Garden Co/The 'A' Merrill Lynch (636) (73) Mallinckrodt Plc Citibank (259) 218 Manhattan Associates Inc Bank of America
Merrill Lynch 835
BlackRock Multi-Strategy Absolute Return Fund continued
United States continued United States continued
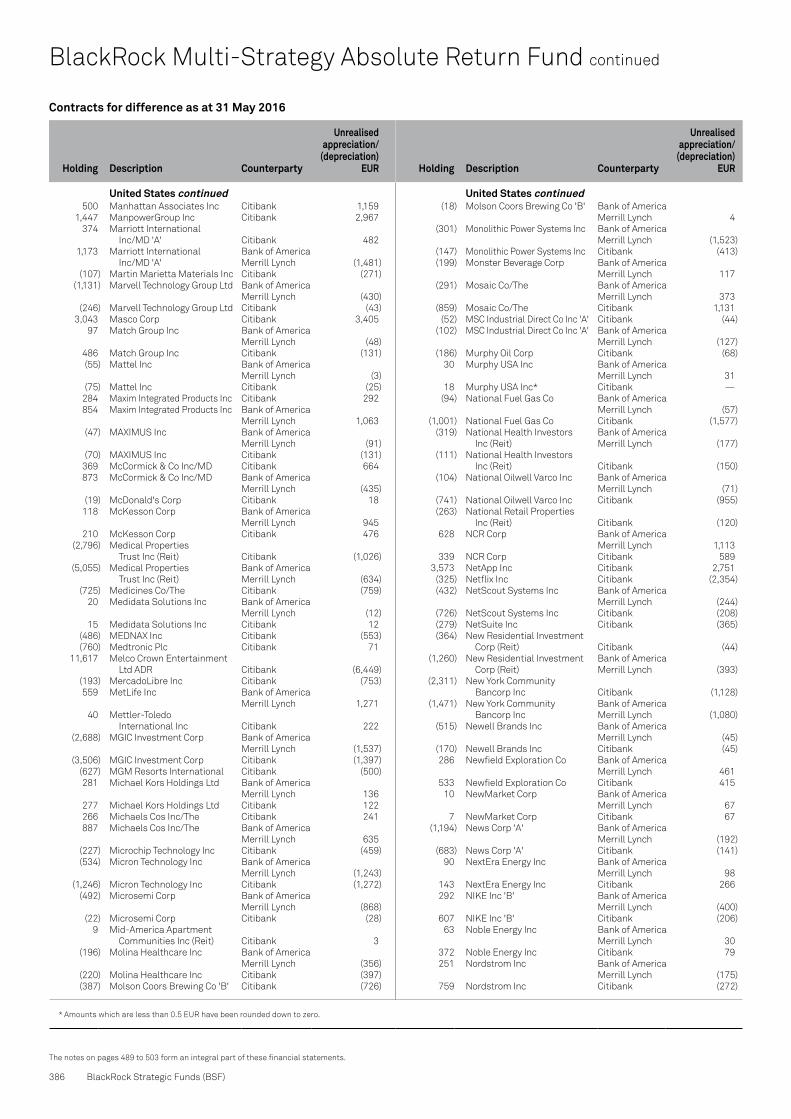
Contracts for difference as at 31 May 2016
Holding
Description Counterparty
Unrealised appreciation/
(depreciation) EUR
Holding
Description Counterparty
Unrealised appreciation/
(depreciation) EUR
* Amounts which are less than 0.5 EUR have been rounded down to zero.
386 BlackRock Strategic Funds (BSF)
The notes on pages 489 to 503 form an integral part of these financial statements.
BlackRock Multi-Strategy Absolute Return Fund continued
500 Manhattan Associates Inc Citibank 1,159 1,447 ManpowerGroup Inc Citibank 2,967 374 Marriott International
Inc/MD 'A' Citibank 482 1,173 Marriott International Bank of America
Inc/MD 'A' Merrill Lynch (1,481) (107) Martin Marietta Materials Inc Citibank (271) (1,131) Marvell Technology Group Ltd Bank of America
Merrill Lynch (430) (246) Marvell Technology Group Ltd Citibank (43) 3,043 Masco Corp Citibank 3,405 97 Match Group Inc Bank of America
Merrill Lynch (48) 486 Match Group Inc Citibank (131) (55) Mattel Inc Bank of America
Merrill Lynch (3) (75) Mattel Inc Citibank (25) 284 Maxim Integrated Products Inc Citibank 292 854 Maxim Integrated Products Inc Bank of America
Merrill Lynch 1,063 (47) MAXIMUS Inc Bank of America
Merrill Lynch (91) (70) MAXIMUS Inc Citibank (131) 369 McCormick & Co Inc/MD Citibank 664 873 McCormick & Co Inc/MD Bank of America
Merrill Lynch (435) (19) McDonald's Corp Citibank 18 118 McKesson Corp Bank of America
Merrill Lynch 945 210 McKesson Corp Citibank 476 (2,796) Medical Properties
Trust Inc (Reit) Citibank (1,026) (5,055) Medical Properties Bank of America
Trust Inc (Reit) Merrill Lynch (634) (725) Medicines Co/The Citibank (759) 20 Medidata Solutions Inc Bank of America
Merrill Lynch (12) 15 Medidata Solutions Inc Citibank 12 (486) MEDNAX Inc Citibank (553) (760) Medtronic Plc Citibank 71 11,617 Melco Crown Entertainment
Ltd ADR Citibank (6,449) (193) MercadoLibre Inc Citibank (753) 559 MetLife Inc Bank of America
Merrill Lynch 1,271 40 Mettler-Toledo
International Inc Citibank 222 (2,688) MGIC Investment Corp Bank of America
Merrill Lynch (1,537) (3,506) MGIC Investment Corp Citibank (1,397) (627) MGM Resorts International Citibank (500) 281 Michael Kors Holdings Ltd Bank of America
Merrill Lynch 136 277 Michael Kors Holdings Ltd Citibank 122 266 Michaels Cos Inc/The Citibank 241 887 Michaels Cos Inc/The Bank of America
Merrill Lynch 635 (227) Microchip Technology Inc Citibank (459) (534) Micron Technology Inc Bank of America
Merrill Lynch (1,243) (1,246) Micron Technology Inc Citibank (1,272) (492) Microsemi Corp Bank of America
Merrill Lynch (868) (22) Microsemi Corp Citibank (28) 9 Mid-America Apartment
Communities Inc (Reit) Citibank 3 (196) Molina Healthcare Inc Bank of America
Merrill Lynch (356) (220) Molina Healthcare Inc Citibank (397) (387) Molson Coors Brewing Co 'B' Citibank (726)
(18) Molson Coors Brewing Co 'B' Bank of America Merrill Lynch 4
(301) Monolithic Power Systems Inc Bank of America Merrill Lynch (1,523)
(147) Monolithic Power Systems Inc Citibank (413) (199) Monster Beverage Corp Bank of America
Merrill Lynch 117 (291) Mosaic Co/The Bank of America
Merrill Lynch 373 (859) Mosaic Co/The Citibank 1,131 (52) MSC Industrial Direct Co Inc 'A' Citibank (44) (102) MSC Industrial Direct Co Inc 'A' Bank of America
Merrill Lynch (127) (186) Murphy Oil Corp Citibank (68) 30 Murphy USA Inc Bank of America
Merrill Lynch 31 18 Murphy USA Inc* Citibank — (94) National Fuel Gas Co Bank of America
Merrill Lynch (57) (1,001) National Fuel Gas Co Citibank (1,577) (319) National Health Investors Bank of America
Inc (Reit) Merrill Lynch (177) (111) National Health Investors
Inc (Reit) Citibank (150) (104) National Oilwell Varco Inc Bank of America
Merrill Lynch (71) (741) National Oilwell Varco Inc Citibank (955) (263) National Retail Properties
Inc (Reit) Citibank (120) 628 NCR Corp Bank of America
Merrill Lynch 1,113 339 NCR Corp Citibank 589 3,573 NetApp Inc Citibank 2,751 (325) Netflix Inc Citibank (2,354) (432) NetScout Systems Inc Bank of America
Merrill Lynch (244) (726) NetScout Systems Inc Citibank (208) (279) NetSuite Inc Citibank (365) (364) New Residential Investment
Corp (Reit) Citibank (44) (1,260) New Residential Investment Bank of America
Corp (Reit) Merrill Lynch (393) (2,311) New York Community
Bancorp Inc Citibank (1,128) (1,471) New York Community Bank of America
Bancorp Inc Merrill Lynch (1,080) (515) Newell Brands Inc Bank of America
Merrill Lynch (45) (170) Newell Brands Inc Citibank (45) 286 Newfield Exploration Co Bank of America
Merrill Lynch 461 533 Newfield Exploration Co Citibank 415 10 NewMarket Corp Bank of America
Merrill Lynch 67 7 NewMarket Corp Citibank 67 (1,194) News Corp 'A' Bank of America
Merrill Lynch (192) (683) News Corp 'A' Citibank (141) 90 NextEra Energy Inc Bank of America
Merrill Lynch 98 143 NextEra Energy Inc Citibank 266 292 NIKE Inc 'B' Bank of America
Merrill Lynch (400) 607 NIKE Inc 'B' Citibank (206) 63 Noble Energy Inc Bank of America
Merrill Lynch 30 372 Noble Energy Inc Citibank 79 251 Nordstrom Inc Bank of America
Merrill Lynch (175) 759 Nordstrom Inc Citibank (272)
United States continued United States continued

Contracts for difference as at 31 May 2016
Holding
Description Counterparty
Unrealised appreciation/
(depreciation) EUR
Holding
Description Counterparty
Unrealised appreciation/
(depreciation) EUR
Annual Report and Audited Accounts 387
The notes on pages 489 to 503 form an integral part of these financial statements.
78 Northern Trust Corp Bank of America Merrill Lynch 126
13 Northern Trust Corp Citibank 7 111 Northrop Grumman Corp Citibank (23) 3 Northrop Grumman Corp Bank of America
Merrill Lynch 2 (505) NorthStar Asset Management Bank of America
Group Inc/New York Merrill Lynch (321) (550) NorthStar Asset Management
Group Inc/New York Citibank (305) (40) NorthStar Realty Finance
Corp (Reit) Citibank (22) (355) NorthStar Realty Finance Bank of America
Corp (Reit) Merrill Lynch (7) (457) NRG Energy Inc Citibank (241) 1,037 Nuance Communications Inc Citibank 511 (265) Occidental Petroleum Corp Bank of America
Merrill Lynch (179) (629) Office Depot Inc Bank of America
Merrill Lynch (73) (471) Office Depot Inc Citibank (62) 1,052 OGE Energy Corp Bank of America
Merrill Lynch (414) 516 OGE Energy Corp Citibank 51 (3,439) Old Republic International Corp Bank of America
Merrill Lynch (924) (1,237) Old Republic International Corp Citibank (188) (959) Olin Corp Citibank (1,606) (949) Olin Corp Bank of America
Merrill Lynch (994) (220) Omega Healthcare
Investors Inc (Reit) Citibank (138) (760) OneMain Holdings Inc Bank of America
Merrill Lynch (857) (358) OneMain Holdings Inc Citibank (462) (2,464) Oracle Corp Citibank (1,831) 229 Oshkosh Corp Bank of America
Merrill Lynch (83) 36 Oshkosh Corp Citibank 16 269 Outfront Media Inc (Reit) Citibank 123 143 Outfront Media Inc (Reit) Bank of America
Merrill Lynch (83) (61) Owens & Minor Inc Bank of America
Merrill Lynch 12 239 Owens Corning Bank of America
Merrill Lynch 392 133 Owens Corning Citibank 27 1,101 PACCAR Inc Bank of America
Merrill Lynch (1,084) 1,131 PACCAR Inc Citibank 2,754 (59) Pacira Pharmaceuticals Inc/DE Citibank (184) (192) Pacira Pharmaceuticals Inc/DE Bank of America
Merrill Lynch (308) 250 Packaging Corp of America Bank of America
Merrill Lynch 747 223 Packaging Corp of America Citibank 689 (397) PacWest Bancorp Bank of America
Merrill Lynch (1,521) (253) PacWest Bancorp Citibank (537) (584) Pan American Silver Corp Bank of America
Merrill Lynch 890 (3,002) Pandora Media Inc Citibank (2,204) 293 Papa John's International Inc Bank of America
Merrill Lynch 533 186 Papa John's International Inc Citibank 305 (1,342) Paramount Group Inc (Reit) Bank of America
Merrill Lynch 733 (373) Paramount Group Inc (Reit) Citibank (47) 554 Paychex Inc Bank of America
Merrill Lynch 1,023 1,460 Paychex Inc Citibank 3,210
(166) PBF Energy Inc 'A' Bank of America Merrill Lynch 247
(388) PBF Energy Inc 'A' Citibank 411 99 Pebblebrook Hotel Trust (Reit) Citibank 49 453 Pebblebrook Hotel Trust (Reit) Bank of America
Merrill Lynch (580) 340 Penske Automotive Group Inc Bank of America
Merrill Lynch 18 147 Pentair Plc Citibank 89 44 Pentair Plc Bank of America
Merrill Lynch (5) 134 PepsiCo Inc Citibank (34) 165 PepsiCo Inc Bank of America
Merrill Lynch 37 (197) Perrigo Co Plc Citibank (427) (93) Pfizer Inc Bank of America
Merrill Lynch (108) (1,105) PG&E Corp Bank of America
Merrill Lynch (618) 358 Phillips 66 Bank of America
Merrill Lynch 657 (2,796) Physicians Realty Trust (Reit) Citibank (426) (2,639) Physicians Realty Trust (Reit) Bank of America
Merrill Lynch 662 829 Pilgrim's Pride Corp Citibank 148 556 PolyOne Corp Bank of America
Merrill Lynch 270 305 PolyOne Corp Citibank 292 1,308 POSCO ADR HSBC 917 (50) Post Holdings Inc Bank of America
Merrill Lynch (67) (382) Post Holdings Inc Citibank (841) 881 Post Properties Inc (Reit) Citibank 394 712 Post Properties Inc (Reit) Bank of America
Merrill Lynch (561) 195 Prestige Brands Holdings Inc Bank of America
Merrill Lynch (395) (2) Priceline Group Inc/The Bank of America
Merrill Lynch (35) (263) PriceSmart Inc Citibank (412) 183 Principal Financial Group Inc Citibank 247 (1,538) Procter & Gamble Co/The Citibank (1,790) 433 Prologis Inc (Reit) Bank of America
Merrill Lynch 52 179 Prologis Inc (Reit) Citibank 131 397 Prudential Financial Inc Citibank 974 98 PTC Inc Bank of America
Merrill Lynch 19 (566) Public Service Enterprise Bank of America
Group Inc Merrill Lynch (129) (496) Public Service Enterprise
Group Inc Citibank (162) 295 Public Storage (Reit) Citibank 267 119 Public Storage (Reit) Bank of America
Merrill Lynch (690) (128) PulteGroup Inc Bank of America
Merrill Lynch (70) (437) PulteGroup Inc Citibank (379) (101) PVH Corp Bank of America
Merrill Lynch (570) (111) PVH Corp Citibank (574) 84 QIAGEN NV Bank of America
Merrill Lynch 301 177 Qlik Technologies Inc Bank of America
Merrill Lynch 169 270 Qlik Technologies Inc Citibank 240 (94) Qorvo Inc Bank of America
Merrill Lynch (444) (192) Qorvo Inc Citibank (76) (498) Qualcomm Inc Citibank (375)
BlackRock Multi-Strategy Absolute Return Fund continued
United States continued United States continued

Contracts for difference as at 31 May 2016
Holding
Description Counterparty
Unrealised appreciation/
(depreciation) EUR
Holding
Description Counterparty
Unrealised appreciation/
(depreciation) EUR
388 BlackRock Strategic Funds (BSF)
The notes on pages 489 to 503 form an integral part of these financial statements.
BlackRock Multi-Strategy Absolute Return Fund continued
719 Quanta Services Inc Bank of America Merrill Lynch 467
208 Quanta Services Inc Citibank 199 147 Quintiles Transnational Bank of America
Holdings Inc Merrill Lynch 159 350 Rackspace Hosting Inc Bank of America
Merrill Lynch 633 186 Rackspace Hosting Inc Citibank 225 (1,429) Radian Group Inc Bank of America
Merrill Lynch (743) (3,090) Radian Group Inc Citibank (1,065) 5 Ralph Lauren Corp Bank of America
Merrill Lynch 1 79 Ralph Lauren Corp Citibank 76 35 Range Resources Corp Citibank 14 36 Raymond James Financial Inc Bank of America
Merrill Lynch 65 93 Raymond James Financial Inc Citibank 292 (349) Rayonier Inc (Reit) Bank of America
Merrill Lynch (34) 23 Raytheon Co Bank of America
Merrill Lynch (2) 207 Realogy Holdings Corp Bank of America
Merrill Lynch 87 1,581 Realogy Holdings Corp Citibank 2,452 (52) Realty Income Corp (Reit) Citibank (25) (915) Realty Income Corp (Reit) Bank of America
Merrill Lynch (84) 22 Red Hat Inc Citibank 13 131 Regions Financial Corp Bank of America
Merrill Lynch 105 1,436 Regions Financial Corp Citibank 611 401 Reinsurance Group of
America Inc Citibank 1,149 593 Reinsurance Group of Bank of America
America Inc Merrill Lynch 1,800 (1,102) RenaissanceRe Holdings Ltd Bank of America
Merrill Lynch (1,419) (860) RenaissanceRe Holdings Ltd Citibank (1,080) (109) Retail Properties of
America Inc 'A' (Reit) Citibank 8 (569) Reynolds American Inc Bank of America
Merrill Lynch 586 2,001 RLJ Lodging Trust (Reit) Citibank 1,971 503 RLJ Lodging Trust (Reit) Bank of America
Merrill Lynch (662) 972 Robert Half International Inc Bank of America
Merrill Lynch 1,445 942 Robert Half International Inc Citibank 1,855 (227) Rockwell Collins Inc Bank of America
Merrill Lynch 206 (96) Rockwell Collins Inc Citibank 8 (218) Rogers Communications Inc 'B' Bank of America
Merrill Lynch 599 738 Ross Stores Inc Citibank 839 529 RPC Inc Bank of America
Merrill Lynch 417 991 RPC Inc Citibank 754 299 RPM International Inc Bank of America
Merrill Lynch 115 (284) RR Donnelley & Sons Co Bank of America
Merrill Lynch (97) (954) RR Donnelley & Sons Co Citibank (623) (181) RSP Permian Inc Bank of America
Merrill Lynch (94) (105) RSP Permian Inc Citibank (121) 168 Ryder System Inc Bank of America
Merrill Lynch 699 651 Ryman Hospitality
Properties Inc (Reit) Citibank (449)
1,212 Ryman Hospitality P Bank of America roperties Inc (Reit) Merrill Lynch (3,689)
422 Sabre Corp Citibank 193 (529) Santander Consumer USA
Holdings Inc Citibank (360) (1,633) Santander Consumer USA Bank of America
Holdings Inc Merrill Lynch (1,477) 99 SBA Communications Corp 'A' Bank of America
Merrill Lynch (21) (55) SCANA Corp Citibank (90) (384) SCANA Corp Bank of America
Merrill Lynch 368 673 Scripps Networks
Interactive Inc 'A' Citibank 1,350 660 Scripps Networks Bank of America
Interactive Inc 'A' Merrill Lynch (90) (255) Sealed Air Corp Citibank (189) 191 SEI Investments Co Bank of America
Merrill Lynch 266 617 SEI Investments Co Citibank 744 (12) Sempra Energy Bank of America
Merrill Lynch (18) (15) Sempra Energy Citibank (21) (2,926) Senior Housing Properties
Trust (Reit) Citibank (760) (1,957) Senior Housing Properties Bank of America
Trust (Reit) Merrill Lynch (280) (45) ServiceMaster Global
Holdings Inc Citibank (64) (206) ServiceMaster Global Bank of America
Holdings Inc Merrill Lynch (472) 78 Sherwin-Williams Co/The Bank of America
Merrill Lynch (396) 177 Sherwin-Williams Co/The Citibank (112) 1,275 Ship Finance International Ltd Citibank 514 995 Simon Property
Group Inc (Reit) Citibank 1,122 397 Simon Property Bank of America
Group Inc (Reit) Merrill Lynch 350 795 Sinclair Broadcast
Group Inc 'A' Citibank 833 447 Sinclair Broadcast Bank of America
Group Inc 'A' Merrill Lynch 192 3,425 Sirius XM Holdings Inc Bank of America
Merrill Lynch 230 3,649 Sirius XM Holdings Inc Citibank 245 171 Six Flags Entertainment Corp Bank of America
Merrill Lynch (142) 252 Snap-on Inc Citibank 160 441 Snap-on Inc Bank of America
Merrill Lynch (363) (427) Snyder's-Lance Inc Bank of America
Merrill Lynch (118) (457) Snyder's-Lance Inc Citibank (299) 934 Sonoco Products Co Bank of America
Merrill Lynch 753 1,218 Sonoco Products Co Citibank 1,723 271 Southwest Airlines Co Bank of America
Merrill Lynch (29) 989 Southwest Airlines Co Citibank (89) (3,420) Spirit Realty Capital Inc (Reit) Citibank (92) (7,206) Spirit Realty Capital Inc (Reit) Bank of America
Merrill Lynch 2,723 46 Splunk Inc Bank of America
Merrill Lynch 80 (693) SS&C Technologies Bank of America
Holdings Inc Merrill Lynch (1,559) (390) SS&C Technologies
Holdings Inc Citibank (600) 35 Stanley Black & Decker Inc Bank of America
Merrill Lynch 2
United States continued United States continued
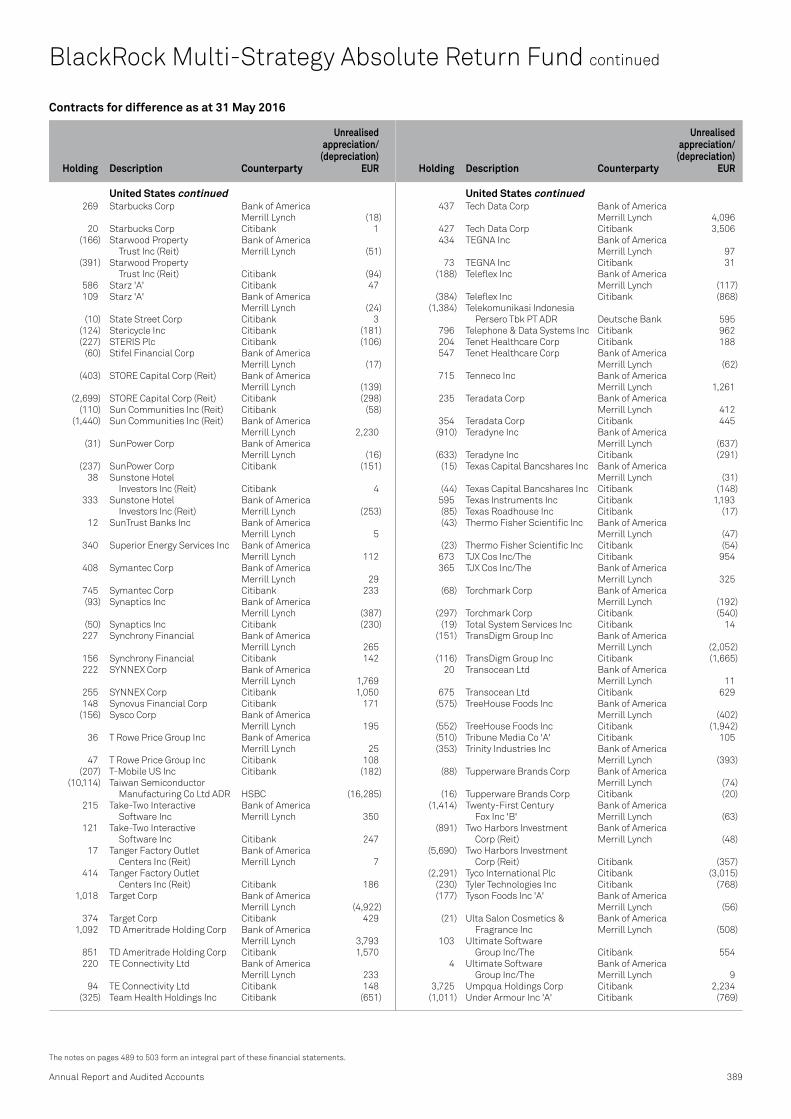
Contracts for difference as at 31 May 2016
Holding
Description Counterparty
Unrealised appreciation/
(depreciation) EUR
Holding
Description Counterparty
Unrealised appreciation/
(depreciation) EUR
Annual Report and Audited Accounts 389
The notes on pages 489 to 503 form an integral part of these financial statements.
269 Starbucks Corp Bank of America Merrill Lynch (18)
20 Starbucks Corp Citibank 1 (166) Starwood Property Bank of America
Trust Inc (Reit) Merrill Lynch (51) (391) Starwood Property
Trust Inc (Reit) Citibank (94) 586 Starz 'A' Citibank 47 109 Starz 'A' Bank of America
Merrill Lynch (24) (10) State Street Corp Citibank 3 (124) Stericycle Inc Citibank (181) (227) STERIS Plc Citibank (106) (60) Stifel Financial Corp Bank of America
Merrill Lynch (17) (403) STORE Capital Corp (Reit) Bank of America
Merrill Lynch (139) (2,699) STORE Capital Corp (Reit) Citibank (298) (110) Sun Communities Inc (Reit) Citibank (58) (1,440) Sun Communities Inc (Reit) Bank of America
Merrill Lynch 2,230 (31) SunPower Corp Bank of America
Merrill Lynch (16) (237) SunPower Corp Citibank (151) 38 Sunstone Hotel
Investors Inc (Reit) Citibank 4 333 Sunstone Hotel Bank of America
Investors Inc (Reit) Merrill Lynch (253) 12 SunTrust Banks Inc Bank of America
Merrill Lynch 5 340 Superior Energy Services Inc Bank of America
Merrill Lynch 112 408 Symantec Corp Bank of America
Merrill Lynch 29 745 Symantec Corp Citibank 233 (93) Synaptics Inc Bank of America
Merrill Lynch (387) (50) Synaptics Inc Citibank (230) 227 Synchrony Financial Bank of America
Merrill Lynch 265 156 Synchrony Financial Citibank 142 222 SYNNEX Corp Bank of America
Merrill Lynch 1,769 255 SYNNEX Corp Citibank 1,050 148 Synovus Financial Corp Citibank 171 (156) Sysco Corp Bank of America
Merrill Lynch 195 36 T Rowe Price Group Inc Bank of America
Merrill Lynch 25 47 T Rowe Price Group Inc Citibank 108 (207) T-Mobile US Inc Citibank (182) (10,114) Taiwan Semiconductor
Manufacturing Co Ltd ADR HSBC (16,285) 215 Take-Two Interactive Bank of America
Software Inc Merrill Lynch 350 121 Take-Two Interactive
Software Inc Citibank 247 17 Tanger Factory Outlet Bank of America
Centers Inc (Reit) Merrill Lynch 7 414 Tanger Factory Outlet
Centers Inc (Reit) Citibank 186 1,018 Target Corp Bank of America
Merrill Lynch (4,922) 374 Target Corp Citibank 429 1,092 TD Ameritrade Holding Corp Bank of America
Merrill Lynch 3,793 851 TD Ameritrade Holding Corp Citibank 1,570 220 TE Connectivity Ltd Bank of America
Merrill Lynch 233 94 TE Connectivity Ltd Citibank 148 (325) Team Health Holdings Inc Citibank (651)
437 Tech Data Corp Bank of America Merrill Lynch 4,096
427 Tech Data Corp Citibank 3,506 434 TEGNA Inc Bank of America
Merrill Lynch 97 73 TEGNA Inc Citibank 31 (188) Teleflex Inc Bank of America
Merrill Lynch (117) (384) Teleflex Inc Citibank (868) (1,384) Telekomunikasi Indonesia
Persero Tbk PT ADR Deutsche Bank 595 796 Telephone & Data Systems Inc Citibank 962 204 Tenet Healthcare Corp Citibank 188 547 Tenet Healthcare Corp Bank of America
Merrill Lynch (62) 715 Tenneco Inc Bank of America
Merrill Lynch 1,261 235 Teradata Corp Bank of America
Merrill Lynch 412 354 Teradata Corp Citibank 445 (910) Teradyne Inc Bank of America
Merrill Lynch (637) (633) Teradyne Inc Citibank (291) (15) Texas Capital Bancshares Inc Bank of America
Merrill Lynch (31) (44) Texas Capital Bancshares Inc Citibank (148) 595 Texas Instruments Inc Citibank 1,193 (85) Texas Roadhouse Inc Citibank (17) (43) Thermo Fisher Scientific Inc Bank of America
Merrill Lynch (47) (23) Thermo Fisher Scientific Inc Citibank (54) 673 TJX Cos Inc/The Citibank 954 365 TJX Cos Inc/The Bank of America
Merrill Lynch 325 (68) Torchmark Corp Bank of America
Merrill Lynch (192) (297) Torchmark Corp Citibank (540) (19) Total System Services Inc Citibank 14 (151) TransDigm Group Inc Bank of America
Merrill Lynch (2,052) (116) TransDigm Group Inc Citibank (1,665) 20 Transocean Ltd Bank of America
Merrill Lynch 11 675 Transocean Ltd Citibank 629 (575) TreeHouse Foods Inc Bank of America
Merrill Lynch (402) (552) TreeHouse Foods Inc Citibank (1,942) (510) Tribune Media Co 'A' Citibank 105 (353) Trinity Industries Inc Bank of America
Merrill Lynch (393) (88) Tupperware Brands Corp Bank of America
Merrill Lynch (74) (16) Tupperware Brands Corp Citibank (20) (1,414) Twenty-First Century Bank of America
Fox Inc 'B' Merrill Lynch (63) (891) Two Harbors Investment Bank of America
Corp (Reit) Merrill Lynch (48) (5,690) Two Harbors Investment
Corp (Reit) Citibank (357) (2,291) Tyco International Plc Citibank (3,015) (230) Tyler Technologies Inc Citibank (768) (177) Tyson Foods Inc 'A' Bank of America
Merrill Lynch (56) (21) Ulta Salon Cosmetics & Bank of America
Fragrance Inc Merrill Lynch (508) 103 Ultimate Software
Group Inc/The Citibank 554 4 Ultimate Software Bank of America
Group Inc/The Merrill Lynch 9 3,725 Umpqua Holdings Corp Citibank 2,234 (1,011) Under Armour Inc 'A' Citibank (769)
BlackRock Multi-Strategy Absolute Return Fund continued
United States continued United States continued

390 BlackRock Strategic Funds (BSF)
The notes on pages 489 to 503 form an integral part of these financial statements.
Contracts for difference as at 31 May 2016
Holding
Description Counterparty
Unrealised appreciation/
(depreciation) EUR
Holding
Description Counterparty
Unrealised appreciation/
(depreciation) EUR
BlackRock Multi-Strategy Absolute Return Fund continued
(1,930) Under Armour Inc 'C' Citibank (501) (102) Union Pacific Corp Bank of America
Merrill Lynch (172) (154) Union Pacific Corp Citibank (291) (508) United Continental
Holdings Inc Citibank (79) (323) United Parcel Service Inc 'B' Citibank (407) (120) United Parcel Service Inc 'B' Bank of America
Merrill Lynch (64) (150) United Rentals Inc Bank of America
Merrill Lynch (877) (260) United Rentals Inc Citibank (954) (1,030) United Technologies Corp Citibank (1,724) (89) United Technologies Corp Bank of America
Merrill Lynch 27 406 UnitedHealth Group Inc Bank of America
Merrill Lynch 1,352 101 UnitedHealth Group Inc Citibank 329 (75) Universal Health Bank of America
Services Inc 'B' Merrill Lynch (115) (110) Universal Health
Services Inc 'B' Citibank 79 108 Unum Group Bank of America
Merrill Lynch 68 409 Unum Group Citibank 450 1 Urban Edge Properties (Reit) Citibank 1 78 Urban Outfitters Inc Citibank 30 516 US Bancorp Citibank 339 326 Vail Resorts Inc Bank of America
Merrill Lynch 658 122 Vail Resorts Inc Citibank 380 (267) Validus Holdings Ltd Citibank (167) (1,730) Valley National Bancorp Bank of America
Merrill Lynch (759) (133) Valley National Bancorp Citibank (51) (135) Valmont Industries Inc Citibank (592) (134) Valmont Industries Inc Bank of America
Merrill Lynch (440) 576 VCA Inc Bank of America
Merrill Lynch 407 786 VCA Inc Citibank 922 (141) Vectren Corp Citibank (62) (141) Vectren Corp Bank of America
Merrill Lynch 47 (265) Veeva Systems Inc 'A' Citibank (671) (2,349) VEREIT Inc (Reit) Citibank (400) (8,482) VEREIT Inc (Reit) Bank of America
Merrill Lynch 2,734 326 VeriFone Systems Inc Bank of America
Merrill Lynch 48 253 VeriFone Systems Inc Citibank 57 1,145 VeriSign Inc Bank of America
Merrill Lynch 943 438 VeriSign Inc Citibank 1,106 (1,267) Verisk Analytics Inc Bank of America
Merrill Lynch (1,633) (109) Verizon Communications Inc Citibank (144) 250 VF Corp Citibank 208 (33) ViaSat Inc Bank of America
Merrill Lynch 163 (740) ViaSat Inc Citibank 1,312 46,362 VimpelCom Ltd ADR HSBC 15,938 (610) Vista Outdoor Inc Bank of America
Merrill Lynch (524) (237) Vista Outdoor Inc Citibank (191) (18) Visteon Corp Bank of America
Merrill Lynch (16) (105) Visteon Corp Citibank (151) (189) Voya Financial Inc Bank of America
Merrill Lynch (111) (244) Voya Financial Inc Citibank (119)
590 VWR Corp Bank of America Merrill Lynch 100
109 VWR Corp Citibank 54 (326) Walgreens Boots Alliance Inc Bank of America
Merrill Lynch 549 (108) Walt Disney Co/The Bank of America
Merrill Lynch 74 (685) Walt Disney Co/The Citibank 89 215 Waste Management Inc Bank of America
Merrill Lynch 33 307 Waste Management Inc Citibank 143 190 Waters Corp Bank of America
Merrill Lynch 327 73 Waters Corp Citibank 184 203 Watsco Inc Citibank 912 (616) Weatherford International Plc Citibank (345) (28) WebMD Health Corp Citibank (38) (444) WebMD Health Corp Bank of America
Merrill Lynch 439 181 Webster Financial Corp Bank of America
Merrill Lynch 567 1,139 Webster Financial Corp Citibank 1,836 (1,423) WEC Energy Group Inc Citibank (2,230) (232) WEC Energy Group Inc Bank of America
Merrill Lynch 85 265 Weingarten Realty
Investors (Reit) Citibank 26 2,683 Weingarten Realty Bank of America
Investors (Reit) Merrill Lynch (1,965) 75 WellCare Health Plans Inc Citibank 266 52 West Pharmaceutical Bank of America
Services Inc Merrill Lynch 26 178 Western Alliance Bancorp Citibank 96 281 Western Refining Inc Bank of America
Merrill Lynch (35) 244 Westlake Chemical Corp Bank of America
Merrill Lynch 94 366 Westlake Chemical Corp Citibank 219 40 WestRock Co Bank of America
Merrill Lynch 20 115 WestRock Co Citibank 142 65 Weyerhaeuser Co (Reit) Bank of America
Merrill Lynch 46 339 Weyerhaeuser Co (Reit) Citibank 231 (144) WGL Holdings Inc Bank of America
Merrill Lynch (88) (376) WGL Holdings Inc Citibank (330) 53 Whirlpool Corp Bank of America
Merrill Lynch 298 32 Williams-Sonoma Inc Citibank 105 197 Williams-Sonoma Inc Bank of America
Merrill Lynch 676 (870) Willis Towers Watson Plc Citibank (1,920) 129 Wintrust Financial Corp Bank of America
Merrill Lynch 71 224 Woodward Inc Bank of America
Merrill Lynch 387 1,101 Woodward Inc Citibank 1,804 (223) Workday Inc 'A' Citibank (220) 164 World Fuel Services Corp Bank of America
Merrill Lynch 150 189 World Fuel Services Corp Citibank 252 (626) WP Carey Inc (Reit) Citibank (600) (1,514) WP Carey Inc (Reit) Bank of America
Merrill Lynch 339 290 WPX Energy Inc Bank of America
Merrill Lynch 262 168 WPX Energy Inc Citibank 117 (86) WR Grace & Co Bank of America
Merrill Lynch (43) (412) WR Grace & Co Citibank (789)
United States continued United States continued

Annual Report and Audited Accounts 391
The notes on pages 489 to 503 form an integral part of these financial statements.
Contracts for difference as at 31 May 2016
Holding
Description Counterparty
Unrealised appreciation/
(depreciation) EUR
Holding
Description Counterparty
Unrealised appreciation/
(depreciation) EUR
(92) WW Grainger Inc Citibank (348) 133 Wyndham Worldwide Corp Bank of America
Merrill Lynch (113) 526 Wyndham Worldwide Corp Citibank 466 (2) Wynn Resorts Ltd Citibank (9) (263) Wynn Resorts Ltd Bank of America
Merrill Lynch (1,267) 339 Xilinx Inc Citibank 683 (1,397) XL Group Plc Citibank (502) (49) Yum! Brands Inc Citibank 18 (229) Yum! Brands Inc Bank of America
Merrill Lynch (258) (184) Zayo Group Holdings Inc Bank of America
Merrill Lynch (114) (605) Zayo Group Holdings Inc Citibank (282)
(14) Zebra Technologies Corp 'A' Bank of America Merrill Lynch (22)
(96) Zebra Technologies Corp 'A' Citibank (149) (924) Zillow Group Inc 'C' Citibank (645) (35) Zimmer Biomet Holdings Inc Bank of America
Merrill Lynch (86) (644) Zimmer Biomet Holdings Inc Citibank (1,684) (704) Zions Bancorporation Citibank (807) (326) Zynga Inc 'A' Bank of America
Merrill Lynch 6 (318) Zynga Inc 'A' Citibank 6
(47,488)
Total (Gross underlying exposure - EUR 61,153,223 ) 103,492
BlackRock Multi-Strategy Absolute Return Fund continued
United States continued United States continued
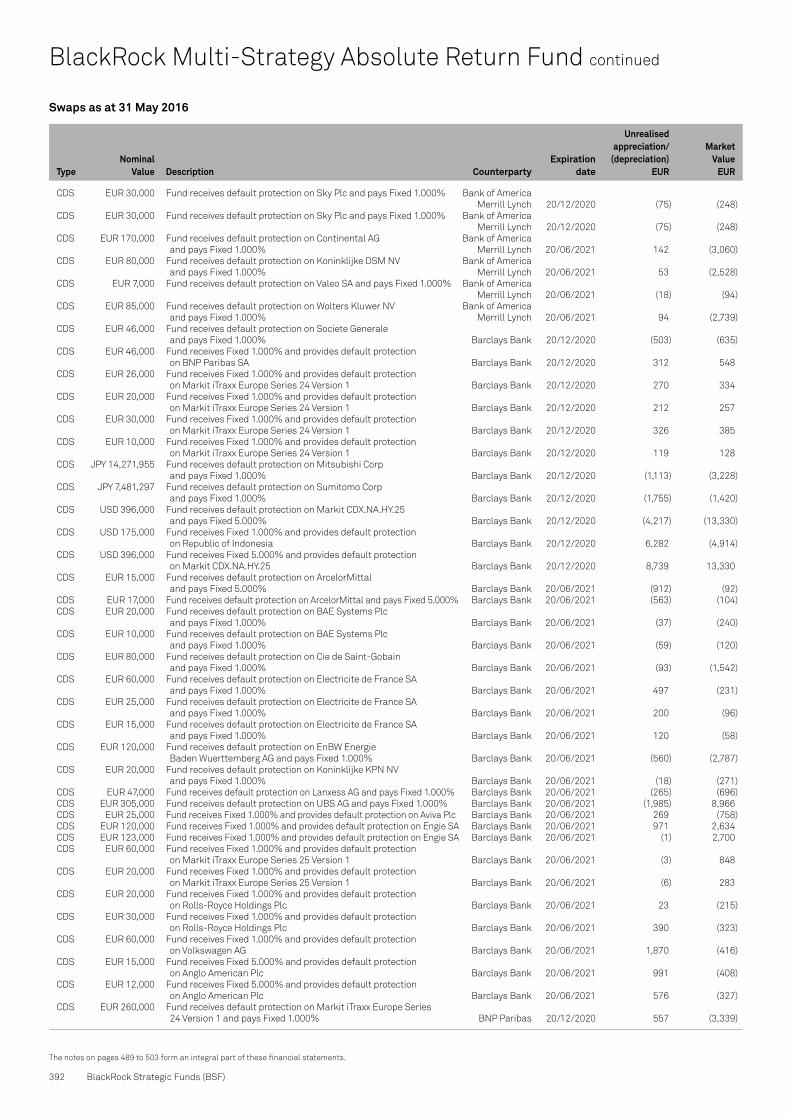
TypeNominal
Value Description CounterpartyExpiration
date
Unrealised appreciation/
(depreciation) EUR
Market Value
EUR
Swaps as at 31 May 2016
392 BlackRock Strategic Funds (BSF)
The notes on pages 489 to 503 form an integral part of these financial statements.
BlackRock Multi-Strategy Absolute Return Fund continued
CDS EUR 30,000 Fund receives default protection on Sky Plc and pays Fixed 1.000% Bank of America Merrill Lynch 20/12/2020 (75) (248)
CDS EUR 30,000 Fund receives default protection on Sky Plc and pays Fixed 1.000% Bank of America Merrill Lynch 20/12/2020 (75) (248)
CDS EUR 170,000 Fund receives default protection on Continental AG Bank of America and pays Fixed 1.000% Merrill Lynch 20/06/2021 142 (3,060)
CDS EUR 80,000 Fund receives default protection on Koninklijke DSM NV Bank of America and pays Fixed 1.000% Merrill Lynch 20/06/2021 53 (2,528)
CDS EUR 7,000 Fund receives default protection on Valeo SA and pays Fixed 1.000% Bank of America Merrill Lynch 20/06/2021 (18) (94)
CDS EUR 85,000 Fund receives default protection on Wolters Kluwer NV Bank of America and pays Fixed 1.000% Merrill Lynch 20/06/2021 94 (2,739)
CDS EUR 46,000 Fund receives default protection on Societe Generale and pays Fixed 1.000% Barclays Bank 20/12/2020 (503) (635)
CDS EUR 46,000 Fund receives Fixed 1.000% and provides default protection on BNP Paribas SA Barclays Bank 20/12/2020 312 548
CDS EUR 26,000 Fund receives Fixed 1.000% and provides default protection on Markit iTraxx Europe Series 24 Version 1 Barclays Bank 20/12/2020 270 334
CDS EUR 20,000 Fund receives Fixed 1.000% and provides default protection on Markit iTraxx Europe Series 24 Version 1 Barclays Bank 20/12/2020 212 257
CDS EUR 30,000 Fund receives Fixed 1.000% and provides default protection on Markit iTraxx Europe Series 24 Version 1 Barclays Bank 20/12/2020 326 385
CDS EUR 10,000 Fund receives Fixed 1.000% and provides default protection on Markit iTraxx Europe Series 24 Version 1 Barclays Bank 20/12/2020 119 128
CDS JPY 14,271,955 Fund receives default protection on Mitsubishi Corp and pays Fixed 1.000% Barclays Bank 20/12/2020 (1,113) (3,228)
CDS JPY 7,481,297 Fund receives default protection on Sumitomo Corp and pays Fixed 1.000% Barclays Bank 20/12/2020 (1,755) (1,420)
CDS USD 396,000 Fund receives default protection on Markit CDX.NA.HY.25 and pays Fixed 5.000% Barclays Bank 20/12/2020 (4,217) (13,330)
CDS USD 175,000 Fund receives Fixed 1.000% and provides default protection on Republic of Indonesia Barclays Bank 20/12/2020 6,282 (4,914)
CDS USD 396,000 Fund receives Fixed 5.000% and provides default protection on Markit CDX.NA.HY.25 Barclays Bank 20/12/2020 8,739 13,330
CDS EUR 15,000 Fund receives default protection on ArcelorMittal and pays Fixed 5.000% Barclays Bank 20/06/2021 (912) (92)
CDS EUR 17,000 Fund receives default protection on ArcelorMittal and pays Fixed 5.000% Barclays Bank 20/06/2021 (563) (104)CDS EUR 20,000 Fund receives default protection on BAE Systems Plc
and pays Fixed 1.000% Barclays Bank 20/06/2021 (37) (240)CDS EUR 10,000 Fund receives default protection on BAE Systems Plc
and pays Fixed 1.000% Barclays Bank 20/06/2021 (59) (120)CDS EUR 80,000 Fund receives default protection on Cie de Saint-Gobain
and pays Fixed 1.000% Barclays Bank 20/06/2021 (93) (1,542)CDS EUR 60,000 Fund receives default protection on Electricite de France SA
and pays Fixed 1.000% Barclays Bank 20/06/2021 497 (231)CDS EUR 25,000 Fund receives default protection on Electricite de France SA
and pays Fixed 1.000% Barclays Bank 20/06/2021 200 (96)CDS EUR 15,000 Fund receives default protection on Electricite de France SA
and pays Fixed 1.000% Barclays Bank 20/06/2021 120 (58)CDS EUR 120,000 Fund receives default protection on EnBW Energie
Baden Wuerttemberg AG and pays Fixed 1.000% Barclays Bank 20/06/2021 (560) (2,787)CDS EUR 20,000 Fund receives default protection on Koninklijke KPN NV
and pays Fixed 1.000% Barclays Bank 20/06/2021 (18) (271)CDS EUR 47,000 Fund receives default protection on Lanxess AG and pays Fixed 1.000% Barclays Bank 20/06/2021 (265) (696)CDS EUR 305,000 Fund receives default protection on UBS AG and pays Fixed 1.000% Barclays Bank 20/06/2021 (1,985) 8,966CDS EUR 25,000 Fund receives Fixed 1.000% and provides default protection on Aviva Plc Barclays Bank 20/06/2021 269 (758)CDS EUR 120,000 Fund receives Fixed 1.000% and provides default protection on Engie SA Barclays Bank 20/06/2021 971 2,634CDS EUR 123,000 Fund receives Fixed 1.000% and provides default protection on Engie SA Barclays Bank 20/06/2021 (1) 2,700CDS EUR 60,000 Fund receives Fixed 1.000% and provides default protection
on Markit iTraxx Europe Series 25 Version 1 Barclays Bank 20/06/2021 (3) 848CDS EUR 20,000 Fund receives Fixed 1.000% and provides default protection
on Markit iTraxx Europe Series 25 Version 1 Barclays Bank 20/06/2021 (6) 283CDS EUR 20,000 Fund receives Fixed 1.000% and provides default protection
on Rolls-Royce Holdings Plc Barclays Bank 20/06/2021 23 (215)CDS EUR 30,000 Fund receives Fixed 1.000% and provides default protection
on Rolls-Royce Holdings Plc Barclays Bank 20/06/2021 390 (323)CDS EUR 60,000 Fund receives Fixed 1.000% and provides default protection
on Volkswagen AG Barclays Bank 20/06/2021 1,870 (416)CDS EUR 15,000 Fund receives Fixed 5.000% and provides default protection
on Anglo American Plc Barclays Bank 20/06/2021 991 (408)CDS EUR 12,000 Fund receives Fixed 5.000% and provides default protection
on Anglo American Plc Barclays Bank 20/06/2021 576 (327)CDS EUR 260,000 Fund receives default protection on Markit iTraxx Europe Series
24 Version 1 and pays Fixed 1.000% BNP Paribas 20/12/2020 557 (3,339)

TypeNominal
Value Description CounterpartyExpiration
date
Unrealised appreciation/
(depreciation) EUR
Market Value
EUR
Swaps as at 31 May 2016
Annual Report and Audited Accounts 393
The notes on pages 489 to 503 form an integral part of these financial statements.
CDS EUR 23,000 Fund receives default protection on Standard Chartered Bank and pays Fixed 1.000% BNP Paribas 20/12/2020 (2,114) 1,582
CDS EUR 5,000 Fund receives Fixed 1.000% and provides default protection on Markit iTraxx Europe Series 24 Version 1 BNP Paribas 20/12/2020 48 64
CDS EUR 5,000 Fund receives Fixed 1.000% and provides default protection on Markit iTraxx Europe Series 24 Version 1 BNP Paribas 20/12/2020 59 64
CDS EUR 30,000 Fund receives default protection on Koninklijke KPN NV and pays Fixed 1.000% BNP Paribas 20/06/2021 (27) (406)
CDS EUR 410,000 Fund receives default protection on Markit iTraxx Europe Crossover Series 25 Version 1 and pays Fixed 5.000% BNP Paribas 20/06/2021 1,464 (35,636)
CDS EUR 770,000 Fund receives default protection on Markit iTraxx Europe Series 25 Version 1 and pays Fixed 1.000% BNP Paribas 20/06/2021 (61) (10,884)
CDS EUR 65,000 Fund receives default protection on Pernod Ricard SA and pays Fixed 1.000% BNP Paribas 20/06/2021 (128) (1,061)
CDS EUR 83,000 Fund receives default protection on RWE AG and pays Fixed 1.000% BNP Paribas 20/06/2021 327 1,362CDS EUR 80,000 Fund receives default protection on RWE AG and pays Fixed 1.000% BNP Paribas 20/06/2021 430 1,312CDS EUR 65,000 Fund receives default protection on TDC A/S and pays Fixed 1.000% BNP Paribas 20/06/2021 (235) 422CDS EUR 28,000 Fund receives default protection on Valeo SA and pays Fixed 1.000% BNP Paribas 20/06/2021 (45) (374)CDS EUR 200,000 Fund receives default protection on Vattenfall AB and pays Fixed 1.000% BNP Paribas 20/06/2021 (110) (4,619)CDS EUR 70,000 Fund receives Fixed 1.000% and provides default protection
on British Telecom Plc BNP Paribas 20/06/2021 377 815CDS EUR 82,000 Fund receives Fixed 1.000% and provides default protection on E.On SE BNP Paribas 20/06/2021 (21) 390CDS EUR 200,000 Fund receives Fixed 1.000% and provides default protection on E.On SE BNP Paribas 20/06/2021 486 952CDS EUR 81,000 Fund receives Fixed 1.000% and provides default protection on E.On SE BNP Paribas 20/06/2021 19 386CDS USD 60,000 Fund receives Fixed 1.000% and provides default protection
on Markit CDX.NA.IG.26 BNP Paribas 20/06/2021 127 604CDS EUR 10,000 Fund receives default protection on Banco Santander SA
and pays Fixed 1.000% Citibank 20/12/2020 (100) 669CDS EUR 12,000 Fund receives default protection on Banco Santander SA
and pays Fixed 1.000% Citibank 20/12/2020 (775) 802CDS EUR 60,000 Fund receives default protection on Sky Plc and pays Fixed 1.000% Citibank 20/12/2020 (178) (495)CDS EUR 23,000 Fund receives default protection on Standard Chartered Bank
and pays Fixed 1.000% Citibank 20/12/2020 (1,875) 1,582CDS USD 100,000 Fund receives default protection on Australia & New Zealand
Banking Group Ltd and pays Fixed 1.000% Citibank 20/12/2020 (660) (745)CDS USD 100,000 Fund receives default protection on National Australia Bank Ltd
and pays Fixed 1.000% Citibank 20/12/2020 (730) (815)CDS USD 100,000 Fund receives default protection on Westpac Banking Corp
and pays Fixed 1.000% Citibank 20/12/2020 (467) (766)CDS USD 200,000 Fund receives Fixed 1.000% and provides default protection
on Republic of Indonesia Citibank 20/12/2020 5,409 (5,616)CDS EUR 25,000 Fund receives default protection on Aegon NV and pays Fixed 1.000% Citibank 20/06/2021 (263) 777CDS EUR 100,000 Fund receives default protection on Daimler AG and pays Fixed 1.000% Citibank 20/06/2021 (545) (1,876)CDS EUR 8,000 Fund receives default protection on Lanxess AG and pays Fixed 1.000% Citibank 20/06/2021 (102) (118)CDS EUR 780,000 Fund receives default protection on Markit iTraxx Europe Series
25 Version 1 and pays Fixed 1.000% Citibank 20/06/2021 (2,631) (11,025)CDS EUR 50,000 Fund receives default protection on Markit iTraxx Europe Series
25 Version 1 and pays Fixed 1.000% Citibank 20/06/2021 (178) (707)CDS EUR 200,000 Fund receives default protection on Markit iTraxx Europe Series
25 Version 1 and pays Fixed 1.000% Citibank 20/06/2021 (754) (2,827)CDS EUR 130,000 Fund receives default protection on Vodafone Group Plc and pays Fixed 1.000% Citibank 20/06/2021 (767) (638)CDS EUR 130,000 Fund receives Fixed 1.000% and provides default protection
on British Telecom Plc Citibank 20/06/2021 732 1,514CDS EUR 40,000 Fund receives Fixed 1.000% and provides default protection
on Markit iTraxx Europe Crossover Series 25 Version 1 Citibank 20/06/2021 22 565CDS EUR 200,000 Fund receives Fixed 1.000% and provides default protection
on Markit iTraxx Europe Senior Financial Series 25 Version 1 Citibank 20/06/2021 1,070 1,145CDS USD 80,505 Fund receives default protection on Federation of Malaysia
and pays Fixed 1.000% Citibank 20/06/2021 34 2,055CDS EUR 24,000 Fund receives default protection on Standard Chartered Bank
and pays Fixed 1.000% Credit Suisse 20/12/2020 (200) 1,651CDS EUR 8,000 Fund receives Fixed 1.000% and provides default protection
on Markit iTraxx Europe Series 24 Version 1 Credit Suisse 20/12/2020 88 103CDS EUR 15,000 Fund receives Fixed 1.000% and provides default protection
on Markit iTraxx Europe Series 24 Version 1 Credit Suisse 20/12/2020 162 193CDS EUR 25,000 Fund receives Fixed 1.000% and provides default protection
on Markit iTraxx Europe Series 24 Version 1 Credit Suisse 20/12/2020 248 321CDS EUR 25,000 Fund receives Fixed 1.000% and provides default protection
on Markit iTraxx Europe Series 24 Version 1 Credit Suisse 20/12/2020 261 321CDS EUR 15,000 Fund receives Fixed 1.000% and provides default protection
on Markit iTraxx Europe Series 24 Version 1 Credit Suisse 20/12/2020 158 193CDS EUR 20,000 Fund receives Fixed 1.000% and provides default protection
on Markit iTraxx Europe Series 24 Version 1 Credit Suisse 20/12/2020 245 257
BlackRock Multi-Strategy Absolute Return Fund continued

TypeNominal
Value Description CounterpartyExpiration
date
Unrealised appreciation/
(depreciation) EUR
Market Value
EUR
Swaps as at 31 May 2016
394 BlackRock Strategic Funds (BSF)
The notes on pages 489 to 503 form an integral part of these financial statements.
BlackRock Multi-Strategy Absolute Return Fund continued
CDS EUR 20,000 Fund receives Fixed 1.000% and provides default protection on Markit iTraxx Europe Series 24 Version 1 Credit Suisse 20/12/2020 245 257
CDS EUR 18,000 Fund receives default protection on ArcelorMittal and pays Fixed 5.000% Credit Suisse 20/06/2021 (956) (110)CDS EUR 80,000 Fund receives default protection on ITV Plc and pays Fixed 5.000% Credit Suisse 20/06/2021 365 (15,229)CDS EUR 180,000 Fund receives default protection on Koninklijke KPN NV
and pays Fixed 1.000% Credit Suisse 20/06/2021 43 (2,436)CDS EUR 20,000 Fund receives Fixed 1.000% and provides default protection
on Glencore International AG Credit Suisse 20/06/2021 516 (3,118)CDS EUR 130,000 Fund receives Fixed 1.000% and provides default protection on Orange SA Credit Suisse 20/06/2021 464 2,472CDS EUR 50,000 Fund receives Fixed 1.000% and provides default protection on Orange SA Credit Suisse 20/06/2021 133 951CDS EUR 18,000 Fund receives Fixed 5.000% and provides default protection
on Anglo American Plc Credit Suisse 20/06/2021 806 (490)CDS EUR 30,000 Fund receives default protection on Sky Plc and pays Fixed 1.000% Goldman Sachs 20/12/2020 (75) (248)CDS EUR 30,000 Fund receives Fixed 1.000% and provides default protection
on Markit iTraxx Europe Series 24 Version 1 Goldman Sachs 20/12/2020 307 385CDS JPY 8,797,654 Fund receives default protection on ITOCHU Corp and pays Fixed 1.000% Goldman Sachs 20/12/2020 (1,182) (1,746)CDS JPY 8,797,654 Fund receives default protection on ITOCHU Corp and pays Fixed 1.000% Goldman Sachs 20/12/2020 (1,219) (1,817)CDS JPY 8,797,654 Fund receives default protection on ITOCHU Corp and pays Fixed 1.000% Goldman Sachs 20/12/2020 (1,386) (1,817)CDS JPY 9,607,038 Fund receives default protection on ITOCHU Corp and pays Fixed 1.000% Goldman Sachs 20/12/2020 (1,304) (1,984)CDS JPY 8,797,654 Fund receives default protection on Mitsubishi Corp
and pays Fixed 1.000% Goldman Sachs 20/12/2020 (821) (1,990)CDS JPY 17,595,308 Fund receives default protection on Mitsui & Co Ltd
and pays Fixed 1.000% Goldman Sachs 20/12/2020 (2,653) (3,580)CDS JPY 8,797,654 Fund receives default protection on Mitsui & Co Ltd
and pays Fixed 1.000% Goldman Sachs 20/12/2020 (1,459) (1,790)CDS EUR 20,000 Fund receives default protection on BAE Systems Plc
and pays Fixed 1.000% Goldman Sachs 20/06/2021 (57) (240)CDS EUR 630,000 Fund receives default protection on Markit iTraxx Europe Crossover
Series 25 Version 1 and pays Fixed 5.000% Goldman Sachs 20/06/2021 (7,203) (54,758)CDS EUR 40,000 Fund receives default protection on Markit iTraxx Europe
Sub Financials Series 25 Version 1 and pays Fixed 1.000% Goldman Sachs 20/06/2021 (774) 1,778CDS EUR 70,000 Fund receives default protection on Vodafone Group Plc
and pays Fixed 1.000% Goldman Sachs 20/06/2021 77 (343)CDS EUR 30,000 Fund receives Fixed 1.000% and provides default protection
on Markit iTraxx Europe Series 25 Version 1 Goldman Sachs 20/06/2021 (5) 424CDS EUR 600,000 Fund receives default protection on Markit iTraxx Europe
Series 25 Version 1 and pays Fixed 1.000% HSBC 20/06/2021 (275) (8,481)CDS EUR 650,000 Fund receives Fixed 1.000% and provides default protection
on Markit iTraxx Europe Senior Financial Series 25 Version 1 HSBC 20/06/2021 497 3,720CDS USD 180,397 Fund receives default protection on Federation of Malaysia and
pays Fixed 1.000% HSBC 20/06/2021 (293) 4,490CDS USD 120,264 Fund receives default protection on Federation of Malaysia and
pays Fixed 1.000% HSBC 20/06/2021 (197) 2,993CDS EUR 17,000 Fund receives default protection on Banco Santander SA
and pays Fixed 1.000% Morgan Stanley 20/12/2020 (172) 1,137CDS EUR 20,000 Fund receives default protection on ArcelorMittal and pays Fixed 5.000% Morgan Stanley 20/06/2021 268 (122)CDS USD 118,834 Fund receives default protection on Federation of Malaysia
and pays Fixed 1.000% Morgan Stanley 20/06/2021 (405) 2,958CDS EUR 120,000 Fund receives default protection on EnBW Energie Baden
Wuerttemberg AG and pays Fixed 1.000% Societe Generale 20/06/2021 287 (2,787)CDS EUR 50,000 Fund receives default protection on HeidelbergCement AG
and pays Fixed 5.000% Societe Generale 20/06/2021 (270) (9,348)CDS EUR 70,000 Fund receives default protection on Vodafone Group Plc
and pays Fixed 1.000% Societe Generale 20/06/2021 (378) (343)ILS GBP 18,000 Fund receives Floating GBP 12 Month UKRPI and pays Fixed 3.207% Bank of America
Merrill Lynch 24/05/2046 (546) (546)ILS EUR 238,000 Fund receives Fixed 1.545% and pays Floating EUR 12 Month CPTFEMU Citibank 24/06/2025 14,149 14,149ILS GBP 135,000 Fund receives Fixed 2.975% and pays Floating GBP 12 Month UKRPI Goldman Sachs 18/04/2026 1,924 1,924ILS GBP 32,000 Fund receives Floating GBP 12 Month UKRPI and pays Fixed 3.262% Goldman Sachs 18/04/2046 (2,063) (2,063)IRS CNY 535,000 Fund receives Fixed 2.230% and pays Floating CNY 3 Month LIBOR Bank of America
Merrill Lynch 16/03/2018 (493) (493)IRS CNY 370,000 Fund receives Fixed 2.250% and pays Floating CNY 3 Month LIBOR Bank of America
Merrill Lynch 16/03/2018 (324) (324)IRS CNY 150,000 Fund receives Fixed 2.495% and pays Floating CNY 3 Month LIBOR Bank of America
Merrill Lynch 16/03/2021 (385) (385)IRS USD 1,000,000 Fund receives Fixed 1.310% and pays Floating USD 3 Month LIBOR Barclays Bank 18/04/2020 (3,401) (3,401)IRS USD 530,000 Fund receives Floating USD 3 Month LIBOR and pays Fixed 1.333% Barclays Bank 08/05/2020 1,646 1,646IRS USD 360,000 Fund receives Floating USD 12 Month 1D Overnight Fed Funds
Effective Rate and pays Fixed 1.383% Barclays Bank 31/05/2020 (5,050) (5,050)IRS USD 520,000 Fund receives Floating USD 3 Month LIBOR and pays Fixed 1.480% Barclays Bank 31/05/2020 358 358IRS USD 1,140,000 Fund receives Floating USD 3 Month LIBOR and pays Fixed 1.320% Barclays Bank 30/11/2020 2,823 2,823IRS EUR 380,000 Fund receives Fixed 0.024% and pays Floating EUR 6 Month LIBOR Barclays Bank 04/01/2021 (164) (164)IRS USD 260,000 Fund receives Floating USD 3 Month LIBOR and pays Fixed 1.461% Barclays Bank 31/12/2022 855 855

TypeNominal
Value Description CounterpartyExpiration
date
Unrealised appreciation/
(depreciation) EUR
Market Value
EUR
Swaps as at 31 May 2016
Annual Report and Audited Accounts 395
The notes on pages 489 to 503 form an integral part of these financial statements.
IRS EUR 160,000 Fund receives Fixed 0.421% and pays Floating EUR 6 Month EURIBOR Barclays Bank 15/02/2025 (311) (311)IRS GBP 101,000 Fund receives Fixed 1.812% and pays Floating GBP 6 Month LIBOR Barclays Bank 07/03/2025 3,982 3,982IRS GBP 100,000 Fund receives Fixed 1.826% and pays Floating GBP 6 Month LIBOR Barclays Bank 03/07/2025 3,990 3,990IRS GBP 100,000 Fund receives Fixed 1.846% and pays Floating GBP 6 Month LIBOR Barclays Bank 03/07/2025 4,224 4,224IRS USD 100,000 Fund receives Fixed 2.832% and pays Floating USD 3 Month LIBOR Barclays Bank 13/01/2026 1,010 1,010IRS USD 100,000 Fund receives Floating USD 3 Month LIBOR and pays Fixed 2.832% Barclays Bank 13/01/2026 (1,185) (1,185)IRS USD 150,000 Fund receives Floating USD 3 Month LIBOR and pays Fixed 1.714% Barclays Bank 04/05/2026 241 241IRS USD 40,000 Fund receives Fixed 1.688% and pays Floating USD 3 Month LIBOR Barclays Bank 05/05/2026 (151) (151)IRS USD 100,000 Fund receives Fixed 1.716% and pays Floating USD 3 Month LIBOR Barclays Bank 27/05/2026 (178) (178)IRS USD 50,000 Fund receives Floating USD 3 Month LIBOR and pays Fixed 1.726% Barclays Bank 27/05/2026 47 47IRS GBP 56,000 Fund receives Floating GBP 6 Month LIBOR and pays Fixed 2.030% Barclays Bank 07/06/2032 (3,042) (3,042)IRS GBP 57,530 Fund receives Floating GBP 6 Month LIBOR and pays Fixed 2.052% Barclays Bank 07/06/2032 (3,376) (3,376)IRS GBP 54,000 Fund receives Floating GBP 6 Month LIBOR and pays Fixed 2.089% Barclays Bank 07/09/2034 (3,734) (3,734)IRS SGD 300,000 Fund receives Floating SGD 6 Month LIBOR and pays Fixed 1.670% BNP Paribas 15/06/2018 455 455IRS SGD 300,000 Fund receives Floating SGD 6 Month LIBOR and pays Fixed 1.720% BNP Paribas 15/06/2018 263 263IRS CNY 530,000 Fund receives Fixed 2.165% and pays Floating CNY 3 Month LIBOR Citibank 16/03/2018 (570) (570)IRS CNY 1,440,000 Fund receives Fixed 2.575% and pays Floating CNY 3 Month LIBOR Citibank 15/06/2018 (234) (234)IRS GBP 275,000 Fund receives Floating GBP 6 Month LIBOR and pays Fixed 0.861% Citibank 12/04/2019 863 863IRS USD 1,470,000 Fund receives Floating USD 3 Month LIBOR and pays Fixed 1.321% Citibank 11/04/2020 4,645 4,645IRS CNY 220,000 Fund receives Fixed 2.415% and pays Floating CNY 3 Month LIBOR Citibank 16/03/2021 (671) (671)IRS CNY 220,000 Fund receives Fixed 2.505% and pays Floating CNY 3 Month LIBOR Citibank 16/03/2021 (551) (551)IRS USD 100,000 Fund receives Floating USD 3 Month LIBOR and pays
Floating USD 3 Month SIFMA Citibank 29/08/2034 978 978IRS USD 100,000 Fund receives Floating USD 3 Month LIBOR and pays
Floating USD 3 Month SIFMA Citibank 12/09/2034 1,096 1,096IRS USD 200,000 Fund receives Floating USD 3 Month LIBOR and pays Floating 3 Month
SIFMA Citibank 24/10/2034 2,222 2,222IRS USD 100,000 Fund receives Floating 3 Month SIFMA and pays Floating USD 3 Month
LIBOR Citibank 09/06/2035 875 875IRS USD 100,000 Fund receives Floating 3 Month SIFMA and pays Floating USD 3 Month
LIBOR Citibank 09/06/2035 896 896IRS CAD 200,000 Fund receives Fixed 0.985% and pays Floating CAD 3 Month CDOR Credit Suisse 18/05/2018 (109) (109)IRS USD 200,000 Fund receives Floating USD 3 Month LIBOR and pays Fixed 1.017% Credit Suisse 20/05/2018 158 158IRS USD 300,000 Fund receives Floating USD 3 Month LIBOR and pays Fixed 1.336% Credit Suisse 08/05/2020 915 915IRS CNY 1,440,000 Fund receives Fixed 2.475% and pays Floating CNY 3 Month LIBOR Goldman Sachs 15/06/2018 381 381IRS USD 1,460,000 Fund receives Floating USD 3 Month LIBOR and pays Fixed 1.486% Goldman Sachs 28/03/2020 262 262IRS SEK 11,540,000 Fund receives Fixed 0.420% and pays Floating SEK 3 Month STIBOR Goldman Sachs 29/03/2020 1,593 1,593IRS USD 1,180,000 Fund receives Fixed 1.320% and pays Floating USD 3 Month LIBOR Goldman Sachs 29/04/2021 (2,568) (2,568)IRS USD 160,000 Fund receives Fixed 1.268% and pays Floating USD 3 Month LIBOR Goldman Sachs 03/05/2021 (717) (717)IRS CNY 600,000 Fund receives Fixed 2.560% and pays Floating CNY 3 Month LIBOR Goldman Sachs 15/06/2021 (1,451) (1,451)IRS INR 27,980,000 Fund receives Fixed 6.678% and pays Floating INR 6 Month MIBOR Goldman Sachs 21/09/2021 (4,358) (4,358)IRS EUR 160,000 Fund receives Fixed 0.407% and pays Floating EUR 6 Month EURIBOR Goldman Sachs 15/02/2025 (444) (444)IRS GBP 201,000 Fund receives Fixed 1.840% and pays Floating GBP 6 Month LIBOR Goldman Sachs 07/03/2025 8,544 8,544IRS USD 35,000 Fund receives Fixed 1.571% and pays Floating USD 3 Month LIBOR Goldman Sachs 01/03/2026 (439) (439)IRS USD 1,250,000 Fund receives Floating USD 3 Month LIBOR and pays Fixed 1.759% Goldman Sachs 29/04/2026 (2,873) (2,873)IRS USD 200,000 Fund receives Floating USD 3 Month LIBOR
and pays Floating 3 Month SIFMA Goldman Sachs 08/07/2034 2,797 2,797IRS GBP 109,000 Fund receives Floating GBP 6 Month LIBOR and pays Fixed 2.114% Goldman Sachs 07/09/2034 (8,087) (8,087)IRS USD 10,000 Fund receives Floating USD 3 Month LIBOR and pays Fixed 2.298% Goldman Sachs 25/01/2046 (215) (215)IRS USD 10,000 Fund receives Floating USD 3 Month LIBOR and pays Fixed 2.216% Goldman Sachs 05/02/2046 (45) (45)IRS USD 10,000 Fund receives Floating USD 3 Month LIBOR and pays Fixed 2.029% Goldman Sachs 12/02/2046 343 343IRS USD 35,000 Fund receives Floating USD 3 Month LIBOR and pays Fixed 2.081% Goldman Sachs 01/03/2046 825 825IRS USD 10,000 Fund receives Floating USD 3 Month LIBOR and pays Fixed 2.104% Goldman Sachs 08/04/2046 189 189IRS USD 270,000 Fund receives Fixed 2.255% and pays Floating USD 3 Month LIBOR Goldman Sachs 29/04/2046 3,434 3,434IRS EUR 270,000 Fund receives Fixed 0.948% and pays Floating EUR 6 Month EURIBOR HSBC 06/01/2026 10,722 10,722IRS SEK 2,520,000 Fund receives Floating SEK 3 Month STIBOR and pays Fixed 1.590% HSBC 07/01/2026 (13,334) (13,334)IRS KRW 124,825,000 Fund receives Fixed 1.855% and pays Floating KRW 3 Month LIBOR HSBC 19/02/2026 1,928 1,928IRS KRW 82,585,000 Fund receives Fixed 1.890% and pays Floating KRW 3 Month LIBOR HSBC 19/02/2026 1,471 1,471IRS USD 100,000 Fund receives Floating USD 3 Month LIBOR and pays Fixed 1.900% HSBC 19/02/2026 (1,459) (1,459)IRS USD 70,000 Fund receives Floating USD 3 Month LIBOR and pays Fixed 1.940% HSBC 19/02/2026 (1,250) (1,250)IRS THB 3,195,000 Fund receives Floating THB 6 Month LIBOR and pays Fixed 2.605% HSBC 16/03/2026 (1,471) (1,471)IRS THB 675,000 Fund receives Floating THB 6 Month LIBOR and pays Fixed 2.632% HSBC 16/03/2026 (353) (353)IRS SEK 11,540,000 Fund receives Fixed 0.405% and pays Floating SEK Royal Bank
3 Month STIBOR of Scotland 29/03/2020 1,216 1,216IRS KRW 82,590,000 Fund receives Fixed 1.872% and pays Floating KRW 3 Month LIBOR UBS 19/02/2026 1,373 1,373IRS USD 70,000 Fund receives Floating USD 3 Month LIBOR and pays Fixed 1.922% UBS 19/02/2026 (1,147) (1,147)TRS USD 85 Fund receives Merrill Lynch MLBXWUDB Total Return Index Bank of America
and pays 12 Month LIBOR Merrill Lynch 18/11/2016 8,365 8,365TRS USD 94 Fund receives Merrill Lynch MLBXWUDC Total Return Index Bank of America
and pays 12 Month LIBOR Merrill Lynch 18/11/2016 9,459 9,459TRS USD 620 Fund receives Merrill Lynch MLBXWDK5 Index Bank of America
and pays 12 Month LIBOR Merrill Lynch 24/05/2017 2,376 2,376
BlackRock Multi-Strategy Absolute Return Fund continued

TypeNominal
Value Description CounterpartyExpiration
date
Unrealised appreciation/
(depreciation) EUR
Market Value
EUR
Swaps as at 31 May 2016
396 BlackRock Strategic Funds (BSF)
The notes on pages 489 to 503 form an integral part of these financial statements.
BlackRock Multi-Strategy Absolute Return Fund continued
TRS USD 2,528 Fund receives BofAML Vortex Alpha Index and pays Fixed 0.000% Bank of America Merrill Lynch 17/09/2018 11,475 11,475
TRS USD 3,925 Fund receives BofAML Vortex Alpha Index and pays Fixed 0.000% Bank of America Merrill Lynch 17/09/2018 6,571 6,571
TRS USD 1,533 Fund receives Vortex Alpha Index and pays Fixed 0.000% Bank of America Merrill Lynch 17/09/2018 14,109 14,109
TRS USD 499 Fund receives Emerging Lifestyle Trend Series 3 Basket Index and pays 12 Month LIBOR Citibank 02/09/2016 42,221 42,221
TRS USD 516 Fund receives Emerging Lifestyle Trend Series 3 Basket Index and pays 6 Month LIBOR Citibank 02/09/2016 14,867 14,867
TRS USD 183,666 Fund receives Goldman Sachs Vol Carry Basket Index B001 and pays Fixed 0.000% Goldman Sachs 01/06/2016 2,368 2,368
TRS USD 29 Fund receives 3 Month LIBOR and pays S&P Oil & Gas Exploration & Production Select Industry Index Goldman Sachs 16/03/2017 (25,420) (25,420)
TRS USD 15 Fund receives 3 Month LIBOR and pays S&P Oil & Gas Exploration & Production Select Industry Index Goldman Sachs 16/03/2017 (14,125) (14,125)
TRS USD 660 Fund receives JPEBEUOT Index and pays 12 Month LIBOR JP Morgan 01/02/2017 641 641TRS USD 4,749 Fund receives JPEBEUOT Index and pays 3 Month LIBOR JP Morgan 01/02/2017 27,184 27,184TRS USD 2,030 Fund receives JPEBEUOT Index and pays 3 Month LIBOR JP Morgan 01/02/2017 (778) (778)TRS USD 2,567 Fund receives JPEBEUOT Index and pays 3 Month LIBOR JP Morgan 01/02/2017 (7,158) (7,158)TRS USD 343 Fund receives 3 Month LIBOR and pays MSCI Daily TR Gross
Emerging Markets United Arab Emirates USD Index Morgan Stanley 02/01/2017 (14,333) (14,333)TRS USD 308 Fund receives 3 Month LIBOR and pays MSCI Daily TR Gross
Emerging Markets United Arab Emirates USD Index Morgan Stanley 02/02/2017 1,079 1,079VAR KRW 8,421,000 KOSPI 200 Index strike price KRW 21.40 Societe Generale 08/12/2016 (31,846) (31,846)VAR USD 7,000 S&P 500 Index strike price USD 22.25 Societe Generale 16/12/2016 30,634 30,634VOL USD 270 Fund buys 1 Year EURUSD FX volatility and sells Bank of America
1 Year GBPUSD FX volatility Merrill Lynch 19/04/2017 495 495VOL USD 270 Fund buys 1 Year EURUSD FX volatility and sells Bank of America
1 Year GBPUSD FX volatility Merrill Lynch 19/04/2017 (205) (205)VOL USD 265 Fund buys 1 Year EURUSD FX volatility and sells 1 Year GBPUSD FX
volatility Citibank 18/05/2017 151 151VOL USD 265 Fund buys 1 Year EURUSD FX volatility and sells 1 Year GBPUSD FX
volatility Citibank 18/05/2017 (163) (163)
Total (Gross underlying exposure - EUR 34,349,525) 87,390 (68,862)
CDS: Credit Default SwapsILS: Inflation Linked SwapsIRS: Interest Rate SwapsTRS: Total Return SwapsVAR: Variance SwapsVOL: Volatility Swaps

Open forward foreign exchange transactions as at 31 May 2016
Currency Purchases Currency Sales CounterpartyMaturity
date
Unrealised appreciation/
(depreciation) EUR
Open forward foreign exchange transactions as at 31 May 2016
Currency Purchases Currency Sales CounterpartyMaturity
date
Unrealised appreciation/
(depreciation) EUR
Annual Report and Audited Accounts 397
The notes on pages 489 to 503 form an integral part of these financial statements.
BRL 20,000 USD 5,672 Morgan Stanley 2/6/2016 (91)BRL 110,000 USD 30,676 JP Morgan 2/6/2016 8 BRL 50,000 USD 14,038 Bank of America Merrill Lynch 2/6/2016 (81)BRL 120,000 USD 33,762 Deutsche Bank 2/6/2016 (258)BRL 220,000 USD 60,976 Citibank 2/6/2016 352 USD 13,977 BRL 50,000 Bank of America Merrill Lynch 2/6/2016 26 USD 18,343 BRL 65,000 Goldman Sachs 2/6/2016 190 USD 35,337 BRL 125,000 JP Morgan 2/6/2016 420 USD 80,354 BRL 280,000 BNP Paribas 2/6/2016 2,013 CAD 194,667 EUR 131,432 HSBC 6/6/2016 2,056 CAD 263,333 USD 204,461 State Street Bank & Trust Company 6/6/2016 (2,458)EUR 132,844 CAD 194,000 Citibank 6/6/2016 (186)EUR 5,250,716 USD 5,999,114 Morgan Stanley 6/6/2016 (119,629)EUR 341,900 USD 386,660 State Street Bank & Trust Company 6/6/2016 (4,234)EUR 209,438 USD 239,000 Royal Bank of Scotland 6/6/2016 (4,512)EUR 2,331,167 USD 2,667,000 Citibank 6/6/2016 (56,304)EUR 65,850 USD 75,000 HSBC 6/6/2016 (1,289)USD 204,436 CAD 264,000 Morgan Stanley 6/6/2016 1,978 USD 17,000 EUR 14,898 Citibank 6/6/2016 321 USD 233,224 EUR 203,172 Morgan Stanley 6/6/2016 5,607 USD 5,750 EUR 5,000 State Street Bank & Trust Company 6/6/2016 147 EUR 31,892 USD 35,778 Royal Bank of Scotland 7/6/2016 (135)EUR 3,788,296 USD 4,356,578 HSBC 7/6/2016 (111,553)EUR 479,310 USD 545,500 JP Morgan 7/6/2016 (9,001)EUR 44,175 USD 49,974 BNP Paribas 7/6/2016 (560)JPY 1,399,251 USD 13,067 BNP Paribas 7/6/2016 (423)USD 650,000 EUR 569,903 Royal Bank of Scotland 7/6/2016 11,953 USD 472,287 EUR 417,976 BNP Paribas 7/6/2016 4,798 USD 5,419 HKD 42,043 Morgan Stanley 7/6/2016 6 IDR 2,243,419,988 USD 167,419 State Street Bank & Trust Company 8/6/2016 (2,432)IDR 1,861,109,331 USD 135,600 Citibank 8/6/2016 927 IDR 550,066,000 USD 40,268 UBS 8/6/2016 103 IDR 127,212,288 USD 9,518 Deutsche Bank 8/6/2016 (160)MYR 670,002 USD 171,041 Bank of America Merrill Lynch 8/6/2016 (7,674)MYR 185,168 USD 47,309 JP Morgan 8/6/2016 (2,155)THB 259,523 USD 7,390 Bank of New York 8/6/2016 (113)USD 353,861 IDR 4,699,273,000 Goldman Sachs 8/6/2016 7,930 USD 14,332 IDR 191,498,635 UBS 8/6/2016 245 USD 276,175 KRW 318,429,650 UBS 8/6/2016 7,652 USD 22,018 MYR 93,102 Deutsche Bank 8/6/2016 (500)USD 135,375 MYR 555,939 State Street Bank & Trust Company 8/6/2016 507 USD 50,137 MYR 213,734 JP Morgan 8/6/2016 (1,514)AUD 30,000 EUR 19,756 Morgan Stanley 15/6/2016 (291)AUD 13,109 USD 10,073 BNP Paribas 15/6/2016 (509)AUD 455,335 USD 338,689 Citibank 15/6/2016 (7,658)AUD 116,606 USD 86,923 Westpac 15/6/2016 (2,130)AUD 334,685 USD 252,012 Morgan Stanley 15/6/2016 (8,372)AUD 265,850 USD 203,667 Credit Suisse 15/6/2016 (9,770)AUD 312,956 USD 232,848 Bank of America Merrill Lynch 15/6/2016 (5,320)AUD 106,011 USD 77,690 Goldman Sachs 15/6/2016 (742)AUD 65,450 USD 48,660 JP Morgan 15/6/2016 (1,080)AUD 20,000 USD 15,270 HSBC 15/6/2016 (689)AUD 10,000 USD 7,503 Deutsche Bank 15/6/2016 (226)AUD 10,000 USD 7,184 Royal Bank of Canada 15/6/2016 59 CAD 45,000 USD 34,622 Westpac 15/6/2016 (137)CAD 457,706 USD 352,109 Credit Suisse 15/6/2016 (1,351)CAD 146,367 USD 110,900 Barclays Bank 15/6/2016 1,088 CAD 53,522 USD 41,786 JP Morgan 15/6/2016 (705)
CAD 168,469 USD 127,763 BNP Paribas 15/6/2016 1,148 CAD 263,888 USD 204,399 Goldman Sachs 15/6/2016 (2,025)CAD 712,774 USD 544,383 Citibank 15/6/2016 1,428 CAD 113,711 USD 87,684 HSBC 15/6/2016 (521)CAD 117,473 USD 91,398 Morgan Stanley 15/6/2016 (1,266)CAD 67,618 USD 52,295 Deutsche Bank 15/6/2016 (448)CAD 126,751 USD 98,517 Bank of America Merrill Lynch 15/6/2016 (1,277)CAD 12,721 USD 9,471 UBS 15/6/2016 244 CAD 10,000 USD 7,627 Royal Bank of Canada 15/6/2016 30 CHF 40,000 USD 41,181 HSBC 15/6/2016 (669)CHF 10,000 USD 10,257 Credit Suisse 15/6/2016 (133)CHF 20,000 USD 20,669 Citibank 15/6/2016 (405)CHF 10,000 USD 10,284 UBS 15/6/2016 (157)CHF 40,000 USD 41,638 JP Morgan 15/6/2016 (1,078)CHF 20,000 USD 20,492 Morgan Stanley 15/6/2016 (247)CHF 10,000 USD 10,299 Bank of America Merrill Lynch 15/6/2016 (171)CLP 16,000,000 USD 23,915 BNP Paribas 15/6/2016 (627)CLP 28,000,000 USD 40,660 HSBC 15/6/2016 (31)CLP 83,000,000 USD 122,537 Credit Suisse 15/6/2016 (1,890)CLP 26,000,000 USD 37,486 Goldman Sachs 15/6/2016 213 CLP 3,525,803 USD 5,356 Citibank 15/6/2016 (215)CLP 7,474,197 USD 11,051 Deutsche Bank 15/6/2016 (185)CLP 3,000,000 USD 4,420 JP Morgan 15/6/2016 (60)COP 69,637,185 USD 21,978 Credit Suisse 15/6/2016 476 COP 206,078,842 USD 68,730 HSBC 15/6/2016 (1,894)COP 256,314,822 USD 84,771 Deutsche Bank 15/6/2016 (1,717)COP 92,969,151 USD 30,303 Citibank 15/6/2016 (225)COP 55,000,000 USD 17,547 BNP Paribas 15/6/2016 207 COP 30,000,000 USD 9,876 Bank of America Merrill Lynch 15/6/2016 (160)COP 20,000,000 USD 6,896 Goldman Sachs 15/6/2016 (385)EUR 20,039 AUD 30,000 Goldman Sachs 15/6/2016 574 EUR 10,914 CAD 16,000 Morgan Stanley 15/6/2016 (54)EUR 13,973 CAD 20,000 HSBC 15/6/2016 263 EUR 61,265 CAD 90,000 Bank of New York 15/6/2016 (430)EUR 13,983 CAD 20,000 State Street Bank & Trust Company 15/6/2016 273 EUR 10,380 CAD 15,000 Citibank 15/6/2016 98 EUR 28,179 HUF 8,845,443 HSBC 15/6/2016 24 EUR 91,650 HUF 28,825,697 Credit Suisse 15/6/2016 (101)EUR 21,351 HUF 6,694,886 Bank of America Merrill Lynch 15/6/2016 42 EUR 62,031 HUF 19,528,380 Citibank 15/6/2016 (126)EUR 64,961 HUF 20,323,664 Deutsche Bank 15/6/2016 272 EUR 152,703 HUF 47,767,742 Barclays Bank 15/6/2016 661 EUR 6,304 HUF 1,985,042 Goldman Sachs 15/6/2016 (14)EUR 46,704 HUF 14,698,527 JP Morgan 15/6/2016 (81)EUR 36,057 HUF 11,250,000 Morgan Stanley 15/6/2016 249 EUR 5,380 HUF 1,680,617 UBS 15/6/2016 30 EUR 17,274 HUF 5,400,000 BNP Paribas 15/6/2016 86 EUR 70,248 IDR 1,075,000,000 State Street Bank & Trust Company 15/6/2016 (333)EUR 102,378 PLN 447,825 Credit Suisse 15/6/2016 286 EUR 69,978 PLN 304,708 HSBC 15/6/2016 513 EUR 56,464 PLN 248,398 JP Morgan 15/6/2016 (164)EUR 78,387 PLN 341,379 Citibank 15/6/2016 561 EUR 248,184 PLN 1,074,540 Barclays Bank 15/6/2016 3,216 EUR 15,627 PLN 67,320 Morgan Stanley 15/6/2016 280 EUR 8,372 PLN 36,799 Bank of America Merrill Lynch 15/6/2016 (18)EUR 1,651 PLN 7,272 UBS 15/6/2016 (7)EUR 27,552 PLN 120,000 BNP Paribas 15/6/2016 195 EUR 223,376 USD 249,960 Citibank 15/6/2016 (317)EUR 230,000 USD 258,576 HSBC 15/6/2016 (1,403)EUR 106,562 USD 116,302 UBS 15/6/2016 2,481 EUR 91,848 USD 102,830 Morgan Stanley 15/6/2016 (177)EUR 200,000 USD 220,031 Deutsche Bank 15/6/2016 3,091 EUR 231,900 USD 258,563 Bank of America
BlackRock Multi-Strategy Absolute Return Fund continued
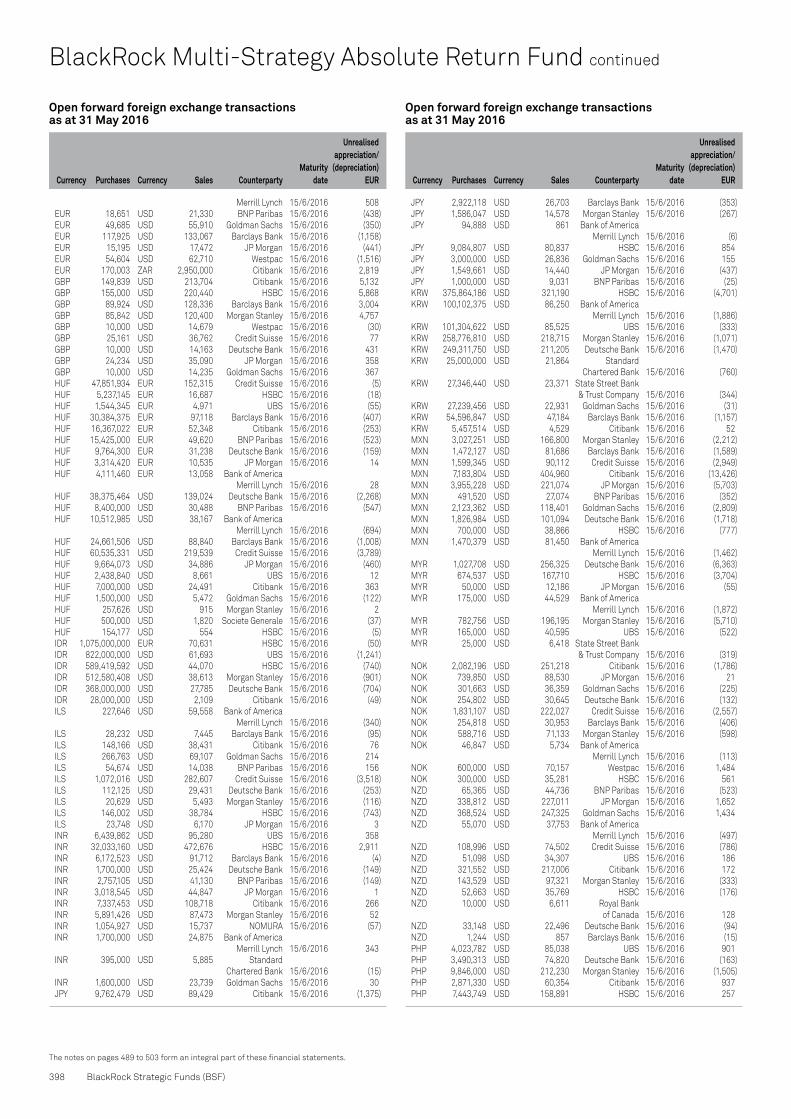
Open forward foreign exchange transactions as at 31 May 2016
Currency Purchases Currency Sales CounterpartyMaturity
date
Unrealised appreciation/
(depreciation) EUR
Open forward foreign exchange transactions as at 31 May 2016
Currency Purchases Currency Sales CounterpartyMaturity
date
Unrealised appreciation/
(depreciation) EUR
398 BlackRock Strategic Funds (BSF)
The notes on pages 489 to 503 form an integral part of these financial statements.
BlackRock Multi-Strategy Absolute Return Fund continued
Merrill Lynch 15/6/2016 508 EUR 18,651 USD 21,330 BNP Paribas 15/6/2016 (438)EUR 49,685 USD 55,910 Goldman Sachs 15/6/2016 (350)EUR 117,925 USD 133,067 Barclays Bank 15/6/2016 (1,158)EUR 15,195 USD 17,472 JP Morgan 15/6/2016 (441)EUR 54,604 USD 62,710 Westpac 15/6/2016 (1,516)EUR 170,003 ZAR 2,950,000 Citibank 15/6/2016 2,819 GBP 149,839 USD 213,704 Citibank 15/6/2016 5,132 GBP 155,000 USD 220,440 HSBC 15/6/2016 5,868 GBP 89,924 USD 128,336 Barclays Bank 15/6/2016 3,004 GBP 85,842 USD 120,400 Morgan Stanley 15/6/2016 4,757 GBP 10,000 USD 14,679 Westpac 15/6/2016 (30)GBP 25,161 USD 36,762 Credit Suisse 15/6/2016 77 GBP 10,000 USD 14,163 Deutsche Bank 15/6/2016 431 GBP 24,234 USD 35,090 JP Morgan 15/6/2016 358 GBP 10,000 USD 14,235 Goldman Sachs 15/6/2016 367 HUF 47,851,934 EUR 152,315 Credit Suisse 15/6/2016 (5)HUF 5,237,145 EUR 16,687 HSBC 15/6/2016 (18)HUF 1,544,345 EUR 4,971 UBS 15/6/2016 (55)HUF 30,384,375 EUR 97,118 Barclays Bank 15/6/2016 (407)HUF 16,367,022 EUR 52,348 Citibank 15/6/2016 (253)HUF 15,425,000 EUR 49,620 BNP Paribas 15/6/2016 (523)HUF 9,764,300 EUR 31,238 Deutsche Bank 15/6/2016 (159)HUF 3,314,420 EUR 10,535 JP Morgan 15/6/2016 14 HUF 4,111,460 EUR 13,058 Bank of America Merrill Lynch 15/6/2016 28 HUF 38,375,464 USD 139,024 Deutsche Bank 15/6/2016 (2,268)HUF 8,400,000 USD 30,488 BNP Paribas 15/6/2016 (547)HUF 10,512,985 USD 38,167 Bank of America Merrill Lynch 15/6/2016 (694)HUF 24,661,506 USD 88,840 Barclays Bank 15/6/2016 (1,008)HUF 60,535,331 USD 219,539 Credit Suisse 15/6/2016 (3,789)HUF 9,664,073 USD 34,886 JP Morgan 15/6/2016 (460)HUF 2,438,840 USD 8,661 UBS 15/6/2016 12 HUF 7,000,000 USD 24,491 Citibank 15/6/2016 363 HUF 1,500,000 USD 5,472 Goldman Sachs 15/6/2016 (122)HUF 257,626 USD 915 Morgan Stanley 15/6/2016 2 HUF 500,000 USD 1,820 Societe Generale 15/6/2016 (37)HUF 154,177 USD 554 HSBC 15/6/2016 (5)IDR 1,075,000,000 EUR 70,631 HSBC 15/6/2016 (50)IDR 822,000,000 USD 61,693 UBS 15/6/2016 (1,241)IDR 589,419,592 USD 44,070 HSBC 15/6/2016 (740)IDR 512,580,408 USD 38,613 Morgan Stanley 15/6/2016 (901)IDR 368,000,000 USD 27,785 Deutsche Bank 15/6/2016 (704)IDR 28,000,000 USD 2,109 Citibank 15/6/2016 (49)ILS 227,646 USD 59,558 Bank of America Merrill Lynch 15/6/2016 (340)ILS 28,232 USD 7,445 Barclays Bank 15/6/2016 (95)ILS 148,166 USD 38,431 Citibank 15/6/2016 76 ILS 266,763 USD 69,107 Goldman Sachs 15/6/2016 214 ILS 54,674 USD 14,038 BNP Paribas 15/6/2016 156 ILS 1,072,016 USD 282,607 Credit Suisse 15/6/2016 (3,518)ILS 112,125 USD 29,431 Deutsche Bank 15/6/2016 (253)ILS 20,629 USD 5,493 Morgan Stanley 15/6/2016 (116)ILS 146,002 USD 38,784 HSBC 15/6/2016 (743)ILS 23,748 USD 6,170 JP Morgan 15/6/2016 3 INR 6,439,862 USD 95,280 UBS 15/6/2016 358 INR 32,033,160 USD 472,676 HSBC 15/6/2016 2,911 INR 6,172,523 USD 91,712 Barclays Bank 15/6/2016 (4)INR 1,700,000 USD 25,424 Deutsche Bank 15/6/2016 (149)INR 2,757,105 USD 41,130 BNP Paribas 15/6/2016 (149)INR 3,018,545 USD 44,847 JP Morgan 15/6/2016 1 INR 7,337,453 USD 108,718 Citibank 15/6/2016 266 INR 5,891,426 USD 87,473 Morgan Stanley 15/6/2016 52 INR 1,054,927 USD 15,737 NOMURA 15/6/2016 (57)INR 1,700,000 USD 24,875 Bank of America Merrill Lynch 15/6/2016 343 INR 395,000 USD 5,885 Standard Chartered Bank 15/6/2016 (15)INR 1,600,000 USD 23,739 Goldman Sachs 15/6/2016 30 JPY 9,762,479 USD 89,429 Citibank 15/6/2016 (1,375)
JPY 2,922,118 USD 26,703 Barclays Bank 15/6/2016 (353)JPY 1,586,047 USD 14,578 Morgan Stanley 15/6/2016 (267)JPY 94,888 USD 861 Bank of America Merrill Lynch 15/6/2016 (6)JPY 9,084,807 USD 80,837 HSBC 15/6/2016 854 JPY 3,000,000 USD 26,836 Goldman Sachs 15/6/2016 155 JPY 1,549,661 USD 14,440 JP Morgan 15/6/2016 (437)JPY 1,000,000 USD 9,031 BNP Paribas 15/6/2016 (25)KRW 375,864,186 USD 321,190 HSBC 15/6/2016 (4,701)KRW 100,102,375 USD 86,250 Bank of America Merrill Lynch 15/6/2016 (1,886)KRW 101,304,622 USD 85,525 UBS 15/6/2016 (333)KRW 258,776,810 USD 218,715 Morgan Stanley 15/6/2016 (1,071)KRW 249,311,750 USD 211,205 Deutsche Bank 15/6/2016 (1,470)KRW 25,000,000 USD 21,864 Standard Chartered Bank 15/6/2016 (760)KRW 27,346,440 USD 23,371 State Street Bank & Trust Company 15/6/2016 (344)KRW 27,239,456 USD 22,931 Goldman Sachs 15/6/2016 (31)KRW 54,596,847 USD 47,184 Barclays Bank 15/6/2016 (1,157)KRW 5,457,514 USD 4,529 Citibank 15/6/2016 52 MXN 3,027,251 USD 166,800 Morgan Stanley 15/6/2016 (2,212)MXN 1,472,127 USD 81,686 Barclays Bank 15/6/2016 (1,589)MXN 1,599,345 USD 90,112 Credit Suisse 15/6/2016 (2,949)MXN 7,183,804 USD 404,960 Citibank 15/6/2016 (13,426)MXN 3,955,228 USD 221,074 JP Morgan 15/6/2016 (5,703)MXN 491,520 USD 27,074 BNP Paribas 15/6/2016 (352)MXN 2,123,362 USD 118,401 Goldman Sachs 15/6/2016 (2,809)MXN 1,826,984 USD 101,094 Deutsche Bank 15/6/2016 (1,718)MXN 700,000 USD 38,866 HSBC 15/6/2016 (777)MXN 1,470,379 USD 81,450 Bank of America Merrill Lynch 15/6/2016 (1,462)MYR 1,027,708 USD 256,325 Deutsche Bank 15/6/2016 (6,363)MYR 674,537 USD 167,710 HSBC 15/6/2016 (3,704)MYR 50,000 USD 12,186 JP Morgan 15/6/2016 (55)MYR 175,000 USD 44,529 Bank of America Merrill Lynch 15/6/2016 (1,872)MYR 782,756 USD 196,195 Morgan Stanley 15/6/2016 (5,710)MYR 165,000 USD 40,595 UBS 15/6/2016 (522)MYR 25,000 USD 6,418 State Street Bank & Trust Company 15/6/2016 (319)NOK 2,082,196 USD 251,218 Citibank 15/6/2016 (1,786)NOK 739,850 USD 88,530 JP Morgan 15/6/2016 21 NOK 301,663 USD 36,359 Goldman Sachs 15/6/2016 (225)NOK 254,802 USD 30,645 Deutsche Bank 15/6/2016 (132)NOK 1,831,107 USD 222,027 Credit Suisse 15/6/2016 (2,557)NOK 254,818 USD 30,953 Barclays Bank 15/6/2016 (406)NOK 588,716 USD 71,133 Morgan Stanley 15/6/2016 (598)NOK 46,847 USD 5,734 Bank of America Merrill Lynch 15/6/2016 (113)NOK 600,000 USD 70,157 Westpac 15/6/2016 1,484 NOK 300,000 USD 35,281 HSBC 15/6/2016 561 NZD 65,365 USD 44,736 BNP Paribas 15/6/2016 (523)NZD 338,812 USD 227,011 JP Morgan 15/6/2016 1,652 NZD 368,524 USD 247,325 Goldman Sachs 15/6/2016 1,434 NZD 55,070 USD 37,753 Bank of America Merrill Lynch 15/6/2016 (497)NZD 108,996 USD 74,502 Credit Suisse 15/6/2016 (786)NZD 51,098 USD 34,307 UBS 15/6/2016 186 NZD 321,552 USD 217,006 Citibank 15/6/2016 172 NZD 143,529 USD 97,321 Morgan Stanley 15/6/2016 (333)NZD 52,663 USD 35,769 HSBC 15/6/2016 (176)NZD 10,000 USD 6,611 Royal Bank of Canada 15/6/2016 128 NZD 33,148 USD 22,496 Deutsche Bank 15/6/2016 (94)NZD 1,244 USD 857 Barclays Bank 15/6/2016 (15)PHP 4,023,782 USD 85,038 UBS 15/6/2016 901 PHP 3,490,313 USD 74,820 Deutsche Bank 15/6/2016 (163)PHP 9,846,000 USD 212,230 Morgan Stanley 15/6/2016 (1,505)PHP 2,871,330 USD 60,354 Citibank 15/6/2016 937 PHP 7,443,749 USD 158,891 HSBC 15/6/2016 257

Open forward foreign exchange transactions as at 31 May 2016
Currency Purchases Currency Sales CounterpartyMaturity
date
Unrealised appreciation/
(depreciation) EUR
Open forward foreign exchange transactions as at 31 May 2016
Currency Purchases Currency Sales CounterpartyMaturity
date
Unrealised appreciation/
(depreciation) EUR
Annual Report and Audited Accounts 399
The notes on pages 489 to 503 form an integral part of these financial statements.
PHP 1,388,820 USD 29,711 JP Morgan 15/6/2016 (11)PHP 1,058,469 USD 22,694 Goldman Sachs 15/6/2016 (53)PHP 77,537 USD 1,674 Barclays Bank 15/6/2016 (14)PHP 2,600,000 USD 55,360 NOMURA 15/6/2016 213 PLN 2,485 EUR 561 UBS 15/6/2016 6 PLN 665,693 EUR 152,946 JP Morgan 15/6/2016 (1,185)PLN 515,178 EUR 117,935 Credit Suisse 15/6/2016 (488)PLN 806,830 EUR 186,415 Barclays Bank 15/6/2016 (2,478)PLN 60,000 EUR 13,969 BNP Paribas 15/6/2016 (291)PLN 109,920 EUR 25,473 Deutsche Bank 15/6/2016 (414)PLN 24,638 EUR 5,681 HSBC 15/6/2016 (64)PLN 82,583 EUR 19,010 Citibank 15/6/2016 (183)PLN 30,912 EUR 7,134 Bank of America Merrill Lynch 15/6/2016 (87)PLN 756,195 USD 196,218 Barclays Bank 15/6/2016 (3,205)PLN 197,265 USD 51,271 JP Morgan 15/6/2016 (911)PLN 2,272 USD 585 HSBC 15/6/2016 (6)PLN 100,000 USD 25,424 Goldman Sachs 15/6/2016 46 PLN 1,147,123 USD 300,621 Credit Suisse 15/6/2016 (7,515)PLN 1,863 USD 492 Morgan Stanley 15/6/2016 (15)PLN 256,878 USD 66,406 BNP Paribas 15/6/2016 (866)PLN 184,274 USD 47,795 Deutsche Bank 15/6/2016 (762)PLN 51,858 USD 13,716 Bank of America Merrill Lynch 15/6/2016 (452)PLN 2,271 USD 585 UBS 15/6/2016 (6)RON 300,000 USD 75,184 BNP Paribas 15/6/2016 (810)RON 100,000 USD 25,407 Bank of America Merrill Lynch 15/6/2016 (580)RON 50,000 USD 12,697 Societe Generale 15/6/2016 (284)RUB 6,635,622 USD 100,072 Barclays Bank 15/6/2016 215 RUB 4,324,847 USD 64,654 JP Morgan 15/6/2016 649 RUB 2,272,462 USD 33,853 Citibank 15/6/2016 447 RUB 4,645,793 USD 63,214 Credit Suisse 15/6/2016 6,280 RUB 3,600,000 USD 50,602 Bank of America Merrill Lynch 15/6/2016 3,418 RUB 421,276 USD 6,310 Goldman Sachs 15/6/2016 53 SEK 2,416,977 USD 294,213 Credit Suisse 15/6/2016 (2,922)SEK 200,000 USD 24,076 HSBC 15/6/2016 (1)SEK 914,542 USD 110,737 Citibank 15/6/2016 (579)SEK 1,411,678 USD 169,653 Bank of America Merrill Lynch 15/6/2016 251 SEK 324,801 USD 39,478 Morgan Stanley 15/6/2016 (339)SEK 1,509,848 USD 178,184 JP Morgan 15/6/2016 3,192 SEK 211,245 USD 25,634 Deutsche Bank 15/6/2016 (184)SEK 135,909 USD 16,868 Goldman Sachs 15/6/2016 (454)SEK 100,000 USD 12,129 Barclays Bank 15/6/2016 (81)SEK 75,000 USD 9,221 BNP Paribas 15/6/2016 (172)SGD 179,675 USD 131,082 Deutsche Bank 15/6/2016 (581)SGD 34,647 USD 25,516 BNP Paribas 15/6/2016 (326)SGD 42,303 USD 30,999 Bank of America Merrill Lynch 15/6/2016 (259)SGD 60,000 USD 43,889 Credit Suisse 15/6/2016 (298)SGD 10,647 USD 7,842 UBS 15/6/2016 (102)SGD 48,401 USD 35,689 Barclays Bank 15/6/2016 (495)SGD 226,118 USD 166,107 Citibank 15/6/2016 (1,754)SGD 178,379 USD 131,752 JP Morgan 15/6/2016 (2,022)SGD 90,000 USD 64,206 HSBC 15/6/2016 1,010 SGD 84,831 USD 62,276 Morgan Stanley 15/6/2016 (621)SGD 20,000 USD 14,695 Goldman Sachs 15/6/2016 (158)SGD 5,000 USD 3,668 Westpac 15/6/2016 (34)THB 1,000,000 USD 28,497 Credit Suisse 15/6/2016 (458)THB 3,105,000 USD 87,899 Barclays Bank 15/6/2016 (898)THB 7,010,000 USD 198,947 Goldman Sachs 15/6/2016 (2,478)THB 9,600,000 USD 273,498 HSBC 15/6/2016 (4,329)THB 475,000 USD 13,611 Bank of America Merrill Lynch 15/6/2016 (284)THB 1,725,000 USD 49,227 UBS 15/6/2016 (852)THB 1,505,000 USD 42,940 JP Morgan 15/6/2016 (736)THB 400,000 USD 11,356 Deutsche Bank 15/6/2016 (145)THB 680,000 USD 19,448 State Street Bank & Trust Company 15/6/2016 (374)
THB 1,000,000 USD 28,220 Citibank 15/6/2016 (210)TRY 352,980 USD 120,102 Citibank 15/6/2016 (571)TRY 108,004 USD 36,866 Barclays Bank 15/6/2016 (280)TRY 69,508 USD 24,164 Credit Suisse 15/6/2016 (572)TRY 85,000 USD 28,556 HSBC 15/6/2016 189 TRY 106,170 USD 35,831 Deutsche Bank 15/6/2016 91 TRY 150,523 USD 52,054 JP Morgan 15/6/2016 (994)TRY 88,000 USD 30,382 Morgan Stanley 15/6/2016 (536)TRY 66,727 USD 22,502 Bank of America Merrill Lynch 15/6/2016 73 TRY 22,596 USD 7,564 UBS 15/6/2016 75 TRY 50,492 USD 17,488 Goldman Sachs 15/6/2016 (358)TWD 3,103,232 USD 94,372 Deutsche Bank 15/6/2016 794 TWD 1,840,425 USD 56,188 Barclays Bank 15/6/2016 275 TWD 1,257,912 USD 38,588 BNP Paribas 15/6/2016 23 TWD 1,695,174 USD 52,185 Citibank 15/6/2016 (133)TWD 1,924,498 USD 59,089 HSBC 15/6/2016 (12)TWD 2,813,344 USD 86,710 Morgan Stanley 15/6/2016 (313)TWD 2,605,932 USD 80,192 UBS 15/6/2016 (177)TWD 936,154 USD 28,911 Bank of America Merrill Lynch 15/6/2016 (156)TWD 1,326,777 USD 40,844 Goldman Sachs 15/6/2016 (104)TWD 256,931 USD 7,872 Credit Suisse 15/6/2016 14 TWD 200,000 USD 6,066 Westpac 15/6/2016 66 TWD 1,000,000 USD 30,432 Standard Chartered Bank 15/6/2016 237 TWD 439,621 USD 13,446 JP Morgan 15/6/2016 44 USD 267,117 AUD 359,336 Citibank 15/6/2016 5,894 USD 302,337 AUD 402,787 Morgan Stanley 15/6/2016 9,221 USD 19,264 AUD 26,145 Deutsche Bank 15/6/2016 276 USD 2,844 AUD 3,875 Goldman Sachs 15/6/2016 31 USD 262,591 AUD 350,927 Bank of America Merrill Lynch 15/6/2016 7,301 USD 10,599 AUD 14,730 BNP Paribas 15/6/2016 (72)USD 263,785 AUD 364,079 Westpac 15/6/2016 (165)USD 36,911 AUD 50,000 HSBC 15/6/2016 590 USD 61,263 AUD 79,993 Credit Suisse 15/6/2016 2,922 USD 13,644 AUD 18,127 JP Morgan 15/6/2016 449 USD 7,184 AUD 10,000 Royal Bank of Canada 15/6/2016 (59)USD 297,229 CAD 390,629 Goldman Sachs 15/6/2016 (1,780)USD 155,495 CAD 202,440 Credit Suisse 15/6/2016 382 USD 377,426 CAD 495,468 Citibank 15/6/2016 (1,877)USD 92,178 CAD 119,431 BNP Paribas 15/6/2016 622 USD 170,569 CAD 228,492 Barclays Bank 15/6/2016 (3,986)USD 119,413 CAD 155,484 Bank of America Merrill Lynch 15/6/2016 281 USD 80,978 CAD 104,838 HSBC 15/6/2016 602 USD 55,845 CAD 71,923 JP Morgan 15/6/2016 673 USD 134,336 CAD 175,109 Morgan Stanley 15/6/2016 183 USD 17,737 CAD 23,294 Royal Bank of Canada 15/6/2016 (95)USD 38,959 CAD 50,000 Deutsche Bank 15/6/2016 590 USD 22,388 CAD 28,893 Westpac 15/6/2016 229 USD 38,633 CAD 50,000 UBS 15/6/2016 298 USD 51,185 CHF 50,000 Morgan Stanley 15/6/2016 575 USD 77,678 CHF 74,992 Citibank 15/6/2016 1,676 USD 10,346 CHF 10,000 Deutsche Bank 15/6/2016 213 USD 10,522 CHF 10,000 HSBC 15/6/2016 370 USD 5,057 CHF 5,008 Bank of America Merrill Lynch 15/6/2016 (5)USD 78,853 CLP 53,982,486 HSBC 15/6/2016 474 USD 59,266 CLP 40,410,000 BNP Paribas 15/6/2016 568 USD 32,526 CLP 22,144,262 Deutsche Bank 15/6/2016 355 USD 130,921 CLP 88,753,252 Credit Suisse 15/6/2016 1,922 USD 22,823 CLP 15,500,000 JP Morgan 15/6/2016 298 USD 6,448 CLP 4,420,000 Morgan Stanley 15/6/2016 31 USD 10,739 CLP 7,290,000 Bank of America Merrill Lynch 15/6/2016 145 USD 3,637 CLP 2,500,000 Citibank 15/6/2016 9 USD 42,089 COP 130,000,000 Credit Suisse 15/6/2016 60
BlackRock Multi-Strategy Absolute Return Fund continued

Open forward foreign exchange transactions as at 31 May 2016
Currency Purchases Currency Sales CounterpartyMaturity
date
Unrealised appreciation/
(depreciation) EUR
Open forward foreign exchange transactions as at 31 May 2016
Currency Purchases Currency Sales CounterpartyMaturity
date
Unrealised appreciation/
(depreciation) EUR
400 BlackRock Strategic Funds (BSF)
The notes on pages 489 to 503 form an integral part of these financial statements.
BlackRock Multi-Strategy Absolute Return Fund continued
USD 26,192 COP 80,000,000 HSBC 15/6/2016 297 USD 4,615 COP 15,000,000 BNP Paribas 15/6/2016 (209)USD 61,578 COP 185,000,000 Deutsche Bank 15/6/2016 1,591 USD 13,673 COP 40,000,000 Goldman Sachs 15/6/2016 665 USD 25,524 COP 80,000,000 Citibank 15/6/2016 (300)USD 287,769 EUR 260,000 Barclays Bank 15/6/2016 (2,471)USD 119,938 EUR 107,379 Goldman Sachs 15/6/2016 (44)USD 150,520 EUR 134,360 Bank of America Merrill Lynch 15/6/2016 343 USD 367,683 EUR 330,000 HSBC 15/6/2016 (955)USD 152,526 EUR 134,214 Citibank 15/6/2016 2,283 USD 161,093 EUR 141,482 JP Morgan 15/6/2016 2,683 USD 178,176 EUR 158,545 Morgan Stanley 15/6/2016 907 USD 154,055 EUR 140,000 Deutsche Bank 15/6/2016 (2,134)USD 22,637 EUR 20,313 BNP Paribas 15/6/2016 (55)USD 59,990 EUR 55,000 UBS 15/6/2016 (1,315)USD 24,438 EUR 21,476 Credit Suisse 15/6/2016 394 USD 32,756 GBP 22,852 Goldman Sachs 15/6/2016 (636)USD 283,478 GBP 198,490 HSBC 15/6/2016 (6,453)USD 154,971 GBP 108,647 Citibank 15/6/2016 (3,707)USD 116,868 GBP 82,787 Morgan Stanley 15/6/2016 (3,914)USD 107,211 GBP 74,934 Barclays Bank 15/6/2016 (2,265)USD 19,720 GBP 13,558 JP Morgan 15/6/2016 (122)USD 14,679 GBP 10,000 Westpac 15/6/2016 30 USD 41,806 GBP 29,124 Credit Suisse 15/6/2016 (758)USD 28,307 GBP 19,608 Bank of America Merrill Lynch 15/6/2016 (366)USD 65,927 HUF 18,310,687 Deutsche Bank 15/6/2016 717 USD 34,707 HUF 9,584,490 Bank of America Merrill Lynch 15/6/2016 553 USD 10,944 HUF 3,000,000 Goldman Sachs 15/6/2016 245 USD 63,226 HUF 17,591,824 JP Morgan 15/6/2016 588 USD 102,106 HUF 28,450,767 Barclays Bank 15/6/2016 819 USD 97,902 HUF 26,925,000 BNP Paribas 15/6/2016 1,913 USD 133,877 HUF 37,173,890 Credit Suisse 15/6/2016 1,487 USD 2,292 HUF 636,220 HSBC 15/6/2016 26 USD 10,919 HUF 3,000,000 Societe Generale 15/6/2016 222 USD 21,000 HUF 6,000,000 Citibank 15/6/2016 (305)USD 4,714 HUF 1,327,125 Morgan Stanley 15/6/2016 (5)USD 6,689 IDR 88,952,547 Citibank 15/6/2016 146 USD 107,014 IDR 1,438,097,132 HSBC 15/6/2016 1,347 USD 7,492 IDR 100,000,000 Bank of America Merrill Lynch 15/6/2016 139 USD 49,687 IDR 670,469,781 Morgan Stanley 15/6/2016 445 USD 61,604 IDR 825,812,118 UBS 15/6/2016 911 USD 28,856 IDR 386,668,422 Deutsche Bank 15/6/2016 437 USD 2,264 IDR 30,000,000 Barclays Bank 15/6/2016 56 USD 123,304 ILS 468,656 Deutsche Bank 15/6/2016 1,320 USD 60,863 ILS 229,963 Morgan Stanley 15/6/2016 969 USD 51,717 ILS 198,063 Bank of America Merrill Lynch 15/6/2016 205 USD 87,567 ILS 331,993 Goldman Sachs 15/6/2016 1,131 USD 129,046 ILS 487,549 Credit Suisse 15/6/2016 2,063 USD 23,236 ILS 87,585 HSBC 15/6/2016 419 USD 66,506 ILS 252,729 Citibank 15/6/2016 723 USD 6,629 ILS 25,131 Barclays Bank 15/6/2016 86 USD 4,763 ILS 18,333 JP Morgan 15/6/2016 (3)USD 94,064 INR 6,337,172 Morgan Stanley 15/6/2016 (81)USD 34,209 INR 2,298,596 JP Morgan 15/6/2016 52 USD 375,245 INR 25,384,264 HSBC 15/6/2016 (1,699)USD 37,336 INR 2,522,165 BNP Paribas 15/6/2016 (122)USD 21,723 INR 1,464,152 Goldman Sachs 15/6/2016 (27)USD 157,064 INR 10,563,675 Barclays Bank 15/6/2016 103 USD 103,574 INR 6,999,159 UBS 15/6/2016 (371)USD 118,283 INR 8,100,000 Bank of America Merrill Lynch 15/6/2016 (1,845)USD 65,532 INR 4,416,325 Deutsche Bank 15/6/2016 (74)USD 230,090 INR 15,629,492 Citibank 15/6/2016 (1,900)USD 17,655 INR 1,185,000 Standard Chartered Bank 15/6/2016 44 USD 9,132 JPY 1,000,000 Goldman Sachs 15/6/2016 115
USD 106,795 JPY 12,000,000 HSBC 15/6/2016 (1,112)USD 78,620 JPY 8,709,047 Citibank 15/6/2016 189 USD 9,072 JPY 1,000,000 Bank of America Merrill Lynch 15/6/2016 62 USD 36,728 JPY 4,000,000 BNP Paribas 15/6/2016 640 USD 29,141 JPY 3,290,953 Barclays Bank 15/6/2016 (437)USD 9,210 JPY 1,000,000 Morgan Stanley 15/6/2016 186 USD 8,917 JPY 1,000,000 Credit Suisse 15/6/2016 (77)USD 511,737 KRW 602,897,443 HSBC 15/6/2016 4,442 USD 224,799 KRW 263,091,328 Morgan Stanley 15/6/2016 3,270 USD 172,106 KRW 200,400,193 Deutsche Bank 15/6/2016 3,273 USD 44,400 KRW 51,994,658 Bank of America Merrill Lynch 15/6/2016 622 USD 104,710 KRW 128,602,675 Goldman Sachs 15/6/2016 (3,032)USD 32,081 KRW 37,110,655 Barclays Bank 15/6/2016 794 USD 9,246 KRW 10,903,048 Citibank 15/6/2016 72 USD 29,756 KRW 35,000,000 UBS 15/6/2016 301 USD 8,547 KRW 10,000,000 JP Morgan 15/6/2016 127 USD 59,693 MXN 1,056,956 Credit Suisse 15/6/2016 2,075 USD 36,537 MXN 647,837 Goldman Sachs 15/6/2016 1,226 USD 61,969 MXN 1,117,453 HSBC 15/6/2016 1,173 USD 49,510 MXN 887,646 Morgan Stanley 15/6/2016 1,187 USD 89,880 MXN 1,596,260 Barclays Bank 15/6/2016 2,891 USD 212,545 MXN 3,801,249 JP Morgan 15/6/2016 5,551 USD 329,779 MXN 5,816,371 Citibank 15/6/2016 12,573 USD 14,033 MXN 250,388 BNP Paribas 15/6/2016 395 USD 53,234 MXN 946,868 Bank of America Merrill Lynch 15/6/2016 1,643 USD 107,634 MXN 1,928,972 Deutsche Bank 15/6/2016 2,616 USD 142,498 MYR 567,939 Deutsche Bank 15/6/2016 4,274 USD 4,444 MYR 18,517 Barclays Bank 15/6/2016 (41)USD 337,891 MYR 1,346,157 HSBC 15/6/2016 10,251 USD 34,344 MYR 137,959 Citibank 15/6/2016 796 USD 18,669 MYR 75,000 Standard Chartered Bank 15/6/2016 431 USD 138,462 MYR 554,428 Morgan Stanley 15/6/2016 3,594 USD 31,880 MYR 125,000 UBS 15/6/2016 1,404 USD 60,024 MYR 250,000 Bank of America Merrill Lynch 15/6/2016 (537)USD 6,440 MYR 25,000 JP Morgan 15/6/2016 338 USD 24,246 NOK 200,000 Goldman Sachs 15/6/2016 275 USD 71,971 NOK 600,000 Deutsche Bank 15/6/2016 140 USD 152,908 NOK 1,283,461 Citibank 15/6/2016 (637)USD 56,565 NOK 479,598 JP Morgan 15/6/2016 (751)USD 19,643 NOK 167,459 Bank of America Merrill Lynch 15/6/2016 (358)USD 206,129 NOK 1,716,539 Credit Suisse 15/6/2016 602 USD 162,021 NOK 1,400,000 HSBC 15/6/2016 (4,965)USD 53,952 NOK 452,943 Morgan Stanley 15/6/2016 (234)USD 24,478 NOK 200,000 Barclays Bank 15/6/2016 483 USD 58,464 NOK 500,000 Westpac 15/6/2016 (1,236)USD 173,786 NZD 254,196 JP Morgan 15/6/2016 1,865 USD 64,046 NZD 94,479 Bank of America Merrill Lynch 15/6/2016 204 USD 203,829 NZD 300,920 Citibank 15/6/2016 507 USD 31,469 NZD 47,046 UBS 15/6/2016 (277)USD 99,859 NZD 147,696 HSBC 15/6/2016 85 USD 144,080 NZD 209,992 Credit Suisse 15/6/2016 2,002 USD 294,752 NZD 432,520 Morgan Stanley 15/6/2016 2,325 USD 30,526 NZD 45,000 Westpac 15/6/2016 116 USD 77,867 NZD 114,721 Goldman Sachs 15/6/2016 337 USD 18,491 NZD 27,632 BNP Paribas 15/6/2016 (155)USD 17,389 NZD 25,798 Deutsche Bank 15/6/2016 (33)USD 6,611 NZD 10,000 Royal Bank of Canada 15/6/2016 (128)USD 241,245 PHP 11,251,173 HSBC 15/6/2016 580 USD 85,861 PHP 3,998,262 Citibank 15/6/2016 324 USD 176,285 PHP 8,226,630 Morgan Stanley 15/6/2016 327 USD 57,095 PHP 2,655,593 Goldman Sachs 15/6/2016 275 USD 5,959 PHP 277,893 BNP Paribas 15/6/2016 15 USD 14,141 PHP 655,230 Barclays Bank 15/6/2016 116

Open forward foreign exchange transactions as at 31 May 2016
Currency Purchases Currency Sales CounterpartyMaturity
date
Unrealised appreciation/
(depreciation) EUR
Open forward foreign exchange transactions as at 31 May 2016
Currency Purchases Currency Sales CounterpartyMaturity
date
Unrealised appreciation/
(depreciation) EUR
Annual Report and Audited Accounts 401
The notes on pages 489 to 503 form an integral part of these financial statements.
USD 42,557 PHP 1,997,621 JP Morgan 15/6/2016 (143)USD 12,668 PHP 585,000 Credit Suisse 15/6/2016 141 USD 40,267 PHP 1,880,000 Deutsche Bank 15/6/2016 58 USD 25,551 PHP 1,200,000 NOMURA 15/6/2016 (98)USD 14,975 PHP 700,000 UBS 15/6/2016 5 USD 16,471 PHP 772,598 Bank of America Merrill Lynch 15/6/2016 (45)USD 3,783 PLN 14,278 Morgan Stanley 15/6/2016 130 USD 23,405 PLN 90,000 BNP Paribas 15/6/2016 428 USD 188,659 PLN 727,205 Barclays Bank 15/6/2016 3,049 USD 1,614 PLN 6,317 Bank of America Merrill Lynch 15/6/2016 4 USD 138,299 PLN 520,017 Credit Suisse 15/6/2016 5,215 USD 47,070 PLN 182,273 JP Morgan 15/6/2016 569 USD 40,076 PLN 152,938 Deutsche Bank 15/6/2016 999 USD 824 PLN 3,203 HSBC 15/6/2016 7 USD 969 PLN 3,768 UBS 15/6/2016 8 USD 13,118 PLN 50,000 Citibank 15/6/2016 341 USD 87,750 PLN 350,000 Goldman Sachs 15/6/2016 (1,262)USD 12,908 PLN 50,000 Societe Generale 15/6/2016 152 USD 121,225 RON 480,000 BNP Paribas 15/6/2016 2,130 USD 5,065 RON 20,000 Goldman Sachs 15/6/2016 101 USD 43,451 RUB 2,900,000 Barclays Bank 15/6/2016 (348)USD 66,975 RUB 4,693,707 JP Morgan 15/6/2016 (3,563)USD 316,401 RUB 21,705,000 Citibank 15/6/2016 (10,488)USD 12,353 RUB 900,000 Credit Suisse 15/6/2016 (1,121)USD 12,054 RUB 806,293 Goldman Sachs 15/6/2016 (120)USD 34,421 RUB 2,500,000 Bank of America Merrill Lynch 15/6/2016 (3,018)USD 572,916 SEK 4,667,430 Credit Suisse 15/6/2016 9,901 USD 24,076 SEK 200,000 HSBC 15/6/2016 1 USD 62,334 SEK 507,270 Goldman Sachs 15/6/2016 1,137 USD 79,350 SEK 674,401 JP Morgan 15/6/2016 (1,640)USD 225,277 SEK 1,872,792 Bank of America Merrill Lynch 15/6/2016 (147)USD 194,647 SEK 1,595,377 Citibank 15/6/2016 2,327 USD 43,715 SEK 356,037 Morgan Stanley 15/6/2016 766 USD 15,123 SEK 126,693 BNP Paribas 15/6/2016 (115)USD 23,989 SEK 200,000 Deutsche Bank 15/6/2016 (77)USD 70,520 SGD 95,249 JP Morgan 15/6/2016 1,231 USD 76,339 SGD 104,157 Goldman Sachs 15/6/2016 651 USD 160,275 SGD 217,950 Citibank 15/6/2016 1,841 USD 45,858 SGD 63,302 Credit Suisse 15/6/2016 (85)USD 78,930 SGD 107,414 Deutsche Bank 15/6/2016 854 USD 139,412 SGD 188,566 BNP Paribas 15/6/2016 2,260 USD 72,556 SGD 100,000 HSBC 15/6/2016 (34)USD 96,764 SGD 132,472 Morgan Stanley 15/6/2016 535 USD 11,619 SGD 15,940 Barclays Bank 15/6/2016 43 USD 29,528 SGD 39,952 Bank of America Merrill Lynch 15/6/2016 470 USD 11,004 SGD 15,000 Westpac 15/6/2016 103 USD 22,084 SGD 30,000 UBS 15/6/2016 274 USD 94,457 THB 3,350,000 Barclays Bank 15/6/2016 632 USD 34,204 THB 1,200,000 Deutsche Bank 15/6/2016 556 USD 67,327 THB 2,400,000 Citibank 15/6/2016 145 USD 185,478 THB 6,550,000 Goldman Sachs 15/6/2016 1,945 USD 17,109 THB 600,000 Credit Suisse 15/6/2016 284 USD 115,891 THB 4,081,301 HSBC 15/6/2016 1,498 USD 26,360 THB 925,000 UBS 15/6/2016 424 USD 36,838 THB 1,300,000 Bank of America Merrill Lynch 15/6/2016 409 USD 27,698 THB 975,000 BNP Paribas 15/6/2016 369 USD 3,393 THB 118,699 Morgan Stanley 15/6/2016 64 USD 28,473 THB 1,000,000 JP Morgan 15/6/2016 436 USD 79,100 TRY 231,851 Barclays Bank 15/6/2016 565 USD 112,553 TRY 334,873 Deutsche Bank 15/6/2016 (701)USD 20,471 TRY 59,845 Morgan Stanley 15/6/2016 194 USD 28,591 TRY 83,675 HSBC 15/6/2016 243 USD 102,998 TRY 302,101 Citibank 15/6/2016 675 USD 75,061 TRY 219,892 JP Morgan 15/6/2016 572 USD 17,081 TRY 50,000 Royal Bank
of Scotland 15/6/2016 142 USD 12,764 TRY 37,763 Bank of America Merrill Lynch 15/6/2016 (15)USD 13,722 TRY 40,000 Credit Suisse 15/6/2016 165 USD 6,947 TRY 20,000 BNP Paribas 15/6/2016 160 USD 24,060 TWD 782,543 HSBC 15/6/2016 35 USD 45,972 TWD 1,485,644 Credit Suisse 15/6/2016 329 USD 60,200 TWD 1,946,128 Deutsche Bank 15/6/2016 412 USD 53,722 TWD 1,751,414 UBS 15/6/2016 (37)USD 7,481 TWD 242,356 Bank of America Merrill Lynch 15/6/2016 37 USD 143,896 TWD 4,655,902 Goldman Sachs 15/6/2016 872 USD 143,798 TWD 4,651,554 Morgan Stanley 15/6/2016 905 USD 43,180 TWD 1,402,560 Citibank 15/6/2016 113 USD 42,605 TWD 1,400,000 Standard Chartered Bank 15/6/2016 (332)USD 20,651 TWD 673,921 Barclays Bank 15/6/2016 (32)USD 5,565 TWD 180,981 JP Morgan 15/6/2016 9 USD 3,886 TWD 126,997 BNP Paribas 15/6/2016 (11)USD 6,117 ZAR 100,000 Credit Suisse 15/6/2016 (193)USD 6,671 ZAR 100,000 JP Morgan 15/6/2016 303 USD 13,121 ZAR 200,000 Citibank 15/6/2016 408 USD 6,584 ZAR 100,000 Deutsche Bank 15/6/2016 225 ZAR 350,000 USD 22,198 Citibank 15/6/2016 (30)ZAR 100,000 USD 6,889 Bank of America Merrill Lynch 15/6/2016 (498)ZAR 150,000 USD 10,217 JP Morgan 15/6/2016 (642)USD 171,873 JPY 18,685,000 State Street Bank & Trust Company 20/6/2016 3,235 AUD 121,386 USD 92,794 Barclays Bank 30/6/2016 (4,325)AUD 61,999 USD 47,206 Morgan Stanley 30/6/2016 (2,040)CHF 189,470 USD 191,573 Credit Suisse 30/6/2016 84 CHF 18,220 USD 18,427 Barclays Bank 30/6/2016 4 CZK 3,652,012 EUR 135,000 JP Morgan 30/6/2016 123 EUR 76,000 CHF 82,923 JP Morgan 30/6/2016 971 EUR 845,000 GBP 675,648 JP Morgan 30/6/2016 (40,111)EUR 76,000 JPY 9,622,816 JP Morgan 30/6/2016 (1,536)EUR 130,000 PLN 553,444 JP Morgan 30/6/2016 3,948 EUR 2,020,577 USD 2,290,886 Barclays Bank 30/6/2016 (28,449)EUR 270,000 USD 308,151 Citibank 30/6/2016 (5,618)GBP 91,503 EUR 115,000 JP Morgan 30/6/2016 4,870 GBP 103,704 EUR 130,000 Barclays Bank 30/6/2016 5,854 GBP 103,420 EUR 130,000 Citibank 30/6/2016 5,482 GBP 213,289 USD 305,000 Barclays Bank 30/6/2016 6,612 INR 19,120,650 USD 285,000 Barclays Bank 30/6/2016 (1,447)JPY 15,477,162 USD 143,205 Morgan Stanley 30/6/2016 (3,379)JPY 12,424,905 USD 114,974 Credit Suisse 30/6/2016 (2,722)JPY 14,627,033 USD 135,399 Barclays Bank 30/6/2016 (3,247)JPY 5,020,684 USD 46,422 Goldman Sachs 30/6/2016 (1,067)KRW 77,285,000 USD 65,000 Barclays Bank 30/6/2016 (55)KRW 172,622,500 USD 145,000 JP Morgan 30/6/2016 41 MXN 2,724,962 USD 155,000 Citibank 30/6/2016 (6,566)MYR 441,775 USD 110,000 Barclays Bank 30/6/2016 (2,612)MYR 140,595 USD 35,000 Morgan Stanley 30/6/2016 (824)NOK 2,264,573 USD 277,820 Credit Suisse 30/6/2016 (6,069)NOK 58,291 USD 7,180 Morgan Stanley 30/6/2016 (182)PLN 338,215 EUR 76,324 JP Morgan 30/6/2016 708 PLN 108,073 EUR 24,388 Credit Suisse 30/6/2016 226 PLN 94,329 EUR 21,288 Bank of America Merrill Lynch 30/6/2016 196 PLN 35,449 EUR 8,000 Barclays Bank 30/6/2016 74 PLN 1,108,372 USD 285,000 JP Morgan 30/6/2016 (2,470)SEK 1,347,851 EUR 146,977 Credit Suisse 30/6/2016 (1,762)SEK 434,308 EUR 47,369 Morgan Stanley 30/6/2016 (577)SEK 508,378 EUR 55,655 Barclays Bank 30/6/2016 (883)TRY 124,163 USD 41,375 Citibank 30/6/2016 442 TRY 179,228 USD 59,689 Goldman Sachs 30/6/2016 670 TRY 74,988 USD 25,000 Royal Bank of Scotland 30/6/2016 256 TRY 710,422 USD 235,936 JP Morgan 30/6/2016 3,244 TRY 90,169 USD 30,000 Barclays Bank 30/6/2016 363
BlackRock Multi-Strategy Absolute Return Fund continued

Open forward foreign exchange transactions as at 31 May 2016
Currency Purchases Currency Sales CounterpartyMaturity
date
Unrealised appreciation/
(depreciation) EUR
Open forward foreign exchange transactions as at 31 May 2016
Currency Purchases Currency Sales CounterpartyMaturity
date
Unrealised appreciation/
(depreciation) EUR
402 BlackRock Strategic Funds (BSF)
The notes on pages 489 to 503 form an integral part of these financial statements.
BlackRock Multi-Strategy Absolute Return Fund continued
USD 475,000 BRL 1,740,353 JP Morgan 30/6/2016 (5,823)USD 280,000 CAD 367,282 Barclays Bank 30/6/2016 (1,189)USD 15,000 CAD 19,496 Commonwealth Bank of Australia 30/6/2016 60 USD 590,000 CHF 563,983 Barclays Bank 30/6/2016 17,419 USD 170,000 CNY 1,117,580 JP Morgan 30/6/2016 290 USD 85,000 CNY 559,003 Citibank 30/6/2016 116 USD 270,000 CNY 1,765,101 Barclays Bank 30/6/2016 1,801 USD 60,000 CNY 395,010 Goldman Sachs 30/6/2016 25 USD 11,198 EUR 10,000 Commonwealth Bank of Australia 30/6/2016 16 USD 245,595 GBP 170,000 Barclays Bank 30/6/2016 (3,037)USD 285,000 HUF 79,153,150 JP Morgan 30/6/2016 3,157 USD 440,000 JPY 48,853,420 Barclays Bank 30/6/2016 (90)USD 495,000 KRW 570,537,000 Citibank 30/6/2016 13,960 USD 155,000 MXN 2,782,731 Citibank 30/6/2016 3,767 USD 56,034 NZD 80,050 JP Morgan 30/6/2016 1,795 USD 223,063 NZD 320,699 Citibank 30/6/2016 5,918 USD 5,903 NZD 8,424 Bank of America Merrill Lynch 30/6/2016 195 USD 13,467 NZD 20,000 Commonwealth Bank of Australia 30/6/2016 (28)USD 45,000 RUB 3,035,250 Citibank 30/6/2016 (627)USD 21,170 RUB 1,438,913 Credit Suisse 30/6/2016 (443)USD 43,830 RUB 2,967,303 Societe Generale 30/6/2016 (759)USD 30,000 RUB 2,036,100 Goldman Sachs 30/6/2016 (588)USD 465,000 SGD 629,722 Citibank 30/6/2016 7,134 USD 35,000 SGD 48,003 Barclays Bank 30/6/2016 145 USD 40,000 SGD 54,828 JP Morgan 30/6/2016 186 USD 35,000 SGD 48,025 Goldman Sachs 30/6/2016 130 USD 392,000 TRY 1,127,642 Citibank 30/6/2016 10,505 USD 260,000 TWD 8,345,740 Barclays Bank 30/6/2016 3,491 USD 255,000 TWD 8,212,275 Goldman Sachs 30/6/2016 2,682 BRL 430,000 USD 117,830 JP Morgan 5/7/2016 867 USD 60,391 BRL 220,000 Citibank 5/7/2016 (349)USD 8,203 BRL 30,000 JP Morgan 5/7/2016 (76)AUD 20,000 CAD 18,785 Westpac 6/7/2016 89 AUD 20,000 NZD 21,301 Westpac 6/7/2016 105 CAD 18,732 AUD 20,000 HSBC 6/7/2016 (126)USD 13,493 NZD 20,000 Westpac 6/7/2016 (1)CNY 2,230,725 USD 350,000 Goldman Sachs 8/7/2016 (10,273)USD 350,000 CNY 2,235,275 JP Morgan 8/7/2016 9,656 EUR 94,609 USD 105,227 Citibank 11/7/2016 527 CLP 114,000,000 USD 165,645 JP Morgan 15/7/2016 (642)CLP 10,000,000 USD 14,304 Credit Suisse 15/7/2016 146 CLP 9,000,000 USD 13,375 Goldman Sachs 15/7/2016 (317)COP 90,000,000 USD 29,155 Deutsche Bank 15/7/2016 (199)COP 80,000,000 USD 25,865 JP Morgan 15/7/2016 (132)EUR 60,000 USD 67,868 Deutsche Bank 15/7/2016 (672)EUR 30,000 USD 33,936 JP Morgan 15/7/2016 (338)EUR 20,000 USD 22,510 Goldman Sachs 15/7/2016 (123)HUF 4,000,000 USD 14,209 Goldman Sachs 15/7/2016 12 HUF 21,000,000 USD 75,945 Deutsche Bank 15/7/2016 (1,142)IDR 710,000,000 USD 53,086 HSBC 15/7/2016 (1,136)IDR 510,000,000 USD 37,955 Deutsche Bank 15/7/2016 (658)IDR 200,000,000 USD 14,611 JP Morgan 15/7/2016 (14)INR 4,000,000 USD 59,258 HSBC 15/7/2016 (99)JPY 2,000,000 USD 18,432 Citibank 15/7/2016 (363)JPY 1,000,000 USD 8,979 Goldman Sachs 15/7/2016 30 JPY 7,000,000 USD 65,550 Deutsche Bank 15/7/2016 (2,198)JPY 3,000,000 USD 27,576 JP Morgan 15/7/2016 (480)MXN 900,000 USD 49,393 Goldman Sachs 15/7/2016 (627)MXN 1,600,000 USD 89,514 Citibank 15/7/2016 (2,637)MXN 300,000 USD 16,802 JP Morgan 15/7/2016 (511)MXN 500,000 USD 26,920 Deutsche Bank 15/7/2016 117 MYR 200,000 USD 51,331 HSBC 15/7/2016 (2,570)MYR 100,000 USD 24,891 JP Morgan 15/7/2016 (593)PEN 100,000 USD 30,396 Goldman Sachs 15/7/2016 (746)PEN 200,000 USD 59,233 JP Morgan 15/7/2016 (99)PHP 1,100,000 USD 23,545 Deutsche Bank 15/7/2016 (52)PHP 1,400,000 USD 30,201 HSBC 15/7/2016 (277)
PLN 500,000 USD 129,364 Goldman Sachs 15/7/2016 (1,861)PLN 100,000 USD 25,366 JP Morgan 15/7/2016 81 RON 100,000 USD 24,800 Goldman Sachs 15/7/2016 (26)RUB 5,200,000 USD 76,214 JP Morgan 15/7/2016 1,566 THB 600,000 USD 17,079 Citibank 15/7/2016 (265)THB 900,000 USD 25,195 Goldman Sachs 15/7/2016 (18)TRY 60,000 USD 20,602 Deutsche Bank 15/7/2016 (401)TRY 70,000 USD 23,803 JP Morgan 15/7/2016 (260)USD 31,008 CLP 21,000,000 Deutsche Bank 15/7/2016 560 USD 13,368 CLP 9,000,000 BNP Paribas 15/7/2016 311 USD 27,839 CLP 19,000,000 Credit Suisse 15/7/2016 314 USD 81,528 CNY 530,000 HSBC 15/7/2016 1,024 USD 224,002 CNY 1,460,000 Citibank 15/7/2016 2,296 USD 13,136 COP 40,000,000 Citibank 15/7/2016 248 USD 13,418 COP 40,000,000 Deutsche Bank 15/7/2016 500 USD 89,960 COP 280,000,000 JP Morgan 15/7/2016 (46)USD 125,505 EUR 110,000 Deutsche Bank 15/7/2016 2,197 USD 61,470 HUF 17,000,000 Deutsche Bank 15/7/2016 916 USD 29,089 HUF 8,000,000 Citibank 15/7/2016 576 USD 14,959 IDR 200,000,000 Citibank 15/7/2016 325 USD 29,905 IDR 400,000,000 Barclays Bank 15/7/2016 638 USD 105,158 INR 7,100,000 Deutsche Bank 15/7/2016 154 USD 29,459 INR 2,000,000 HSBC 15/7/2016 (102)USD 119,790 JPY 13,000,000 Citibank 15/7/2016 2,343 USD 2,666 MXN 46,684 Citibank 15/7/2016 125 USD 28,218 MXN 500,000 HSBC 15/7/2016 1,043 USD 14,464 MXN 253,316 Credit Suisse 15/7/2016 679 USD 11,102 MXN 200,000 JP Morgan 15/7/2016 252 USD 34,006 MXN 600,000 Deutsche Bank 15/7/2016 1,380 USD 25,674 MYR 100,000 Citibank 15/7/2016 1,293 USD 12,291 MYR 50,000 Deutsche Bank 15/7/2016 158 USD 37,684 MYR 150,000 JP Morgan 15/7/2016 1,200 USD 29,125 PEN 100,000 JP Morgan 15/7/2016 (390)USD 15,106 PHP 700,000 Citibank 15/7/2016 143 USD 23,674 PHP 1,100,000 Deutsche Bank 15/7/2016 168 USD 25,738 PLN 100,000 JP Morgan 15/7/2016 251 USD 26,213 PLN 100,000 Citibank 15/7/2016 676 USD 51,607 PLN 200,000 Barclays Bank 15/7/2016 620 USD 52,990 PLN 200,000 Deutsche Bank 15/7/2016 1,857 USD 25,316 RON 100,000 JP Morgan 15/7/2016 487 USD 63,628 RON 250,000 Goldman Sachs 15/7/2016 1,520 USD 106,688 RUB 7,100,000 JP Morgan 15/7/2016 209 USD 31,001 RUB 2,100,000 Citibank 15/7/2016 (434)USD 28,410 THB 1,000,000 Deutsche Bank 15/7/2016 392 USD 150,808 THB 5,300,000 Citibank 15/7/2016 2,287 USD 76,908 THB 2,700,000 JP Morgan 15/7/2016 1,238 USD 13,888 TRY 40,000 Barclays Bank 15/7/2016 405 USD 30,956 TRY 90,000 Citibank 15/7/2016 649 USD 61,038 ZAR 900,000 Citibank 15/7/2016 3,926 ZAR 800,000 USD 52,288 Deutsche Bank 15/7/2016 (1,730)ZAR 400,000 USD 26,280 Goldman Sachs 15/7/2016 (987)ZAR 400,000 USD 26,410 JP Morgan 15/7/2016 (1,103)EUR 13,025 AUD 20,000 JP Morgan 20/7/2016 80 EUR 13,654 AUD 20,000 Citibank 20/7/2016 709 EUR 39,306 GBP 30,000 Morgan Stanley 20/7/2016 27 EUR 9,742,945 GBP 7,798,000 Royal Bank of Scotland 20/7/2016 (466,956)EUR 532,284 GBP 420,000 Barclays Bank 20/7/2016 (17,621)EUR 1,085 SEK 10,000 Royal Bank of Scotland 20/7/2016 8 EUR 177,974 USD 200,000 Goldman Sachs 20/7/2016 (789)EUR 1,559,954 USD 1,782,000 Deutsche Bank 20/7/2016 (32,828)EUR 167,035 ZAR 2,870,000 Royal Bank of Scotland 20/7/2016 5,731 EUR 112,357 ZAR 2,030,000 Barclays Bank 20/7/2016 (1,736)GBP 330,000 EUR 428,716 Deutsche Bank 20/7/2016 3,353 GBP 440,000 EUR 548,531 JP Morgan 20/7/2016 27,560 GBP 700,000 EUR 917,386 Barclays Bank 20/7/2016 (877)USD 400,000 EUR 358,211 Barclays Bank 20/7/2016 (685)USD 20,000 EUR 17,310 HSBC 20/7/2016 567 ZAR 2,870,000 EUR 173,761 JP Morgan 20/7/2016 (12,457)

Open forward foreign exchange transactions as at 31 May 2016
Currency Purchases Currency Sales CounterpartyMaturity
date
Unrealised appreciation/
(depreciation) EUR
Open forward foreign exchange transactions as at 31 May 2016
Currency Purchases Currency Sales CounterpartyMaturity
date
Unrealised appreciation/
(depreciation) EUR
Annual Report and Audited Accounts 403
The notes on pages 489 to 503 form an integral part of these financial statements.
USD 34,006 EUR 30,000 Royal Bank of Scotland 5/8/2016 379 ZAR 5,558,000 USD 359,524 HSBC 10/8/2016 (10,238)ZAR 1,918,300 USD 119,455 Deutsche Bank 10/8/2016 603 MYR 224,549 USD 55,872 JP Morgan 11/8/2016 (1,350)USD 223,219 MYR 902,362 State Street Bank & Trust Company 11/8/2016 4,258 USD 188,798 MYR 770,107 HSBC 11/8/2016 2,111 AUD 70,000 USD 50,820 Royal Bank of Scotland 16/8/2016 (158)CAD 70,000 USD 53,354 Citibank 16/8/2016 241 CHF 160,000 USD 163,499 Deutsche Bank 16/8/2016 (1,152)CNY 370,000 USD 56,321 Citibank 16/8/2016 (305)CNY 380,000 USD 58,037 HSBC 16/8/2016 (487)EUR 191,237 MXN 4,000,000 JP Morgan 16/8/2016 (1,389)EUR 100,000 USD 114,211 Goldman Sachs 16/8/2016 (1,989)IDR 730,000,000 USD 53,894 JP Morgan 16/8/2016 (817)IDR 780,000,000 USD 56,350 HSBC 16/8/2016 230 INR 6,660,000 USD 98,732 JP Morgan 16/8/2016 (645)INR 6,660,000 USD 98,740 UBS 16/8/2016 (652)INR 4,575,000 USD 67,568 Deutsche Bank 16/8/2016 (215)KRW 135,000,000 USD 113,943 HSBC 16/8/2016 (538)MXN 700,000 USD 38,244 JP Morgan 16/8/2016 (442)MXN 4,600,000 USD 251,693 Citibank 16/8/2016 (3,240)MYR 250,000 USD 61,698 Citibank 16/8/2016 (1,058)NOK 900,000 USD 109,625 Barclays Bank 16/8/2016 (1,713)SEK 1,900,000 USD 233,983 UBS 16/8/2016 (4,184)SGD 120,000 USD 87,257 Deutsche Bank 16/8/2016 (213)THB 1,000,000 USD 28,071 Deutsche Bank 16/8/2016 (101)USD 109,926 AUD 150,000 Goldman Sachs 16/8/2016 1,255 USD 115,913 CAD 150,000 Citibank 16/8/2016 897 USD 53,967 CAD 70,000 Deutsche Bank 16/8/2016 306 USD 50,607 CHF 50,000 Citibank 16/8/2016 (74)USD 227,245 CHF 220,000 Goldman Sachs 16/8/2016 3,758 USD 84,971 CNY 560,000 Deutsche Bank 16/8/2016 219
USD 28,949 CNY 190,000 HSBC 16/8/2016 182 USD 169,724 EUR 150,000 Barclays Bank 16/8/2016 1,562 USD 53,558 IDR 730,000,000 Deutsche Bank 16/8/2016 517 USD 110,200 JPY 12,000,000 Barclays Bank 16/8/2016 1,730 USD 59,855 KRW 70,000,000 Citibank 16/8/2016 969 USD 55,456 KRW 65,000,000 Deutsche Bank 16/8/2016 790 USD 107,550 MXN 2,000,000 Deutsche Bank 16/8/2016 (272)USD 48,714 NOK 400,000 Deutsche Bank 16/8/2016 754 USD 114,121 NZD 170,000 Goldman Sachs 16/8/2016 (322)USD 50,308 PLN 200,000 Citibank 16/8/2016 (514)USD 60,357 SEK 500,000 Citibank 16/8/2016 14 USD 57,929 SGD 80,000 Citibank 16/8/2016 (74)USD 145,892 SGD 200,000 Barclays Bank 16/8/2016 769 USD 56,693 THB 2,000,000 Barclays Bank 16/8/2016 693 USD 28,243 THB 1,000,000 Deutsche Bank 16/8/2016 254 USD 58,246 TWD 1,900,000 Deutsche Bank 16/8/2016 (36)USD 55,402 TWD 1,800,000 JP Morgan 16/8/2016 164
(811,146)
GBP Hedged Share Class
GBP 2,978,057 EUR 3,777,646 State Street Bank & Trust Company 15/6/2016 125,399
125,399
USD Hedged Share Class
EUR 1 USD 1 State Street Bank & Trust Company 15/6/2016 0 USD 144 EUR 127 State Street Bank & Trust Company 15/6/2016 2
2
Total (Gross underlying exposure - EUR 141,075,965) (685,745)
BlackRock Multi-Strategy Absolute Return Fund continued
Purchased Options as at 31 May 2016
Number of contracts
Call/Put Description Counterparty
Strike Price
Expiration date
Unrealised appreciation/
(depreciation) EUR
Market Value
EUR
710,000 Call OTC USD/JPY Citibank USD 115.00 01/08/2016 (1,517) 3,358 425,000 Call OTC USD/CHF Citibank USD 1.00 02/08/2016 (100) 3,955 20,000 Put OTC EUR/CZK Citibank EUR 25.75 10/08/2016 (107) 21 80,000 Put OTC EUR/CZK Citibank EUR 25.75 10/08/2016 (429) 86 20,000 Put OTC AUD/USD Commonwealth Bank of Australia AUD 0.70 26/08/2016 (237) 142 5 Put Eurodollar Futures Exchange Traded USD 97.88 13/06/2016 (912) 28 5 Put Eurodollar Futures Exchange Traded USD 98.63 13/06/2016 (2,903) 28 141 Call Euro STOXX Banks Index Exchange Traded EUR 120.00 17/06/2016 (15,862) 1,058 22 Put EURO STOXX 50 Index Exchange Traded EUR 2,925.00 17/06/2016 (32,391) 2,310 3 Put S&P 500 Index Exchange Traded USD 2,050.00 17/06/2016 (6,132) 1,867 4 Put E-Mini S&P 500 Index Exchange Traded USD 2,070.00 15/07/2016 (6,267) 5,014 5 Put FTSE 100 Index Exchange Traded GBP 6,000.00 15/07/2016 (5,083) 4,802 65 Call CBOE SPX Volatility Index Exchange Traded USD 23.00 20/07/2016 (3,331) 5,237 1 Put US Treasury 10 Year Note Futures Exchange Traded USD 129.00 22/07/2016 146 769 27 Call S+P 500 INDEX Exchange Traded USD 2,225.00 19/08/2016 3,165 7,977 2 Call US Treasury 10 Year Note Futures Exchange Traded USD 131.50 26/08/2016 (999) 895 45 Call EURO STOXX 50 Index Exchange Traded EUR 2,925.00 16/09/2016 31,923 100,912 8 Call EURO STOXX 50 Index Exchange Traded EUR 4,000.00 15/12/2017 (7,330) 2,400 40,000 Put OTC AUD/USD HSBC AUD 0.70 26/08/2016 (476) 284
Total (Gross underlying exposure - EUR 2,376,208) (48,842) 141,143
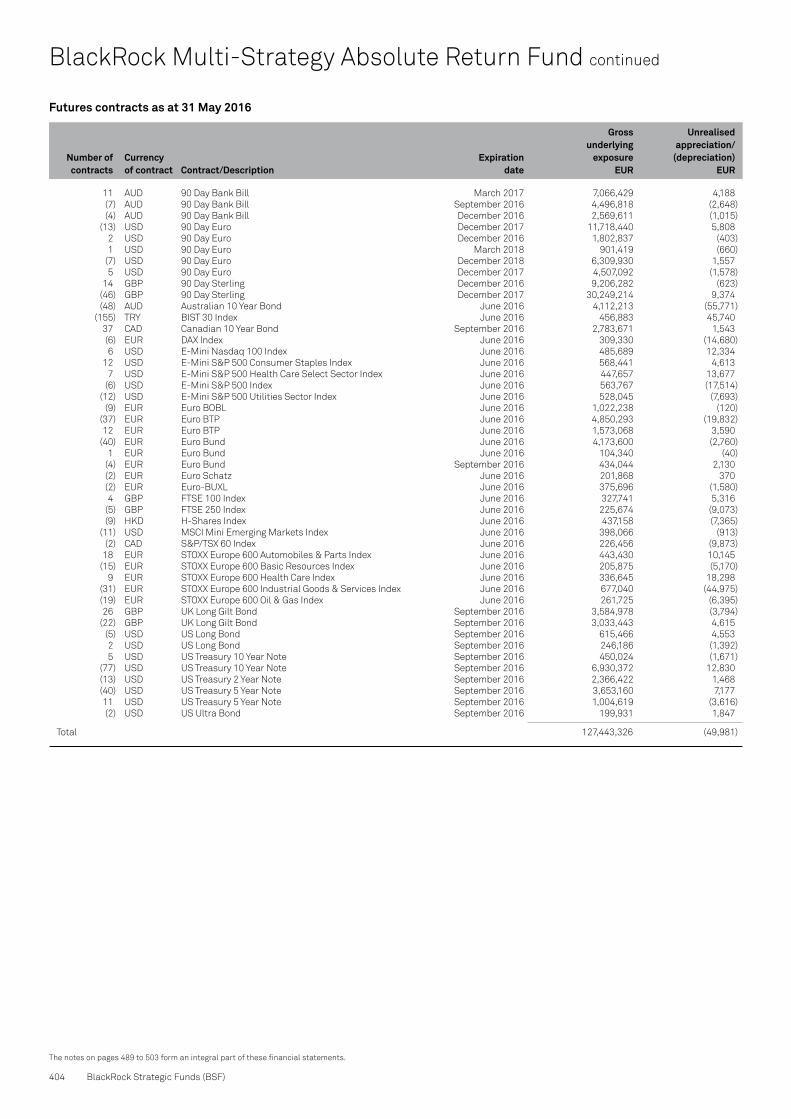
Futures contracts as at 31 May 2016
Number of contracts
Currencyof contract Contract/Description
Expiration date
Gross underlying
exposureEUR
Unrealised appreciation/
(depreciation) EUR
404 BlackRock Strategic Funds (BSF)
The notes on pages 489 to 503 form an integral part of these financial statements.
BlackRock Multi-Strategy Absolute Return Fund continued
11 AUD 90 Day Bank Bill March 2017 7,066,429 4,188 (7) AUD 90 Day Bank Bill September 2016 4,496,818 (2,648) (4) AUD 90 Day Bank Bill December 2016 2,569,611 (1,015) (13) USD 90 Day Euro December 2017 11,718,440 5,808 2 USD 90 Day Euro December 2016 1,802,837 (403) 1 USD 90 Day Euro March 2018 901,419 (660) (7) USD 90 Day Euro December 2018 6,309,930 1,557 5 USD 90 Day Euro December 2017 4,507,092 (1,578) 14 GBP 90 Day Sterling December 2016 9,206,282 (623) (46) GBP 90 Day Sterling December 2017 30,249,214 9,374 (48) AUD Australian 10 Year Bond June 2016 4,112,213 (55,771) (155) TRY BIST 30 Index June 2016 456,883 45,740 37 CAD Canadian 10 Year Bond September 2016 2,783,671 1,543 (6) EUR DAX Index June 2016 309,330 (14,680) 6 USD E-Mini Nasdaq 100 Index June 2016 485,689 12,334 12 USD E-Mini S&P 500 Consumer Staples Index June 2016 568,441 4,613 7 USD E-Mini S&P 500 Health Care Select Sector Index June 2016 447,657 13,677 (6) USD E-Mini S&P 500 Index June 2016 563,767 (17,514) (12) USD E-Mini S&P 500 Utilities Sector Index June 2016 528,045 (7,693) (9) EUR Euro BOBL June 2016 1,022,238 (120) (37) EUR Euro BTP June 2016 4,850,293 (19,832) 12 EUR Euro BTP June 2016 1,573,068 3,590 (40) EUR Euro Bund June 2016 4,173,600 (2,760) 1 EUR Euro Bund June 2016 104,340 (40) (4) EUR Euro Bund September 2016 434,044 2,130 (2) EUR Euro Schatz June 2016 201,868 370 (2) EUR Euro-BUXL June 2016 375,696 (1,580) 4 GBP FTSE 100 Index June 2016 327,741 5,316 (5) GBP FTSE 250 Index June 2016 225,674 (9,073) (9) HKD H-Shares Index June 2016 437,158 (7,365) (11) USD MSCI Mini Emerging Markets Index June 2016 398,066 (913) (2) CAD S&P/TSX 60 Index June 2016 226,456 (9,873) 18 EUR STOXX Europe 600 Automobiles & Parts Index June 2016 443,430 10,145 (15) EUR STOXX Europe 600 Basic Resources Index June 2016 205,875 (5,170) 9 EUR STOXX Europe 600 Health Care Index June 2016 336,645 18,298 (31) EUR STOXX Europe 600 Industrial Goods & Services Index June 2016 677,040 (44,975) (19) EUR STOXX Europe 600 Oil & Gas Index June 2016 261,725 (6,395) 26 GBP UK Long Gilt Bond September 2016 3,584,978 (3,794) (22) GBP UK Long Gilt Bond September 2016 3,033,443 4,615 (5) USD US Long Bond September 2016 615,466 4,553 2 USD US Long Bond September 2016 246,186 (1,392) 5 USD US Treasury 10 Year Note September 2016 450,024 (1,671) (77) USD US Treasury 10 Year Note September 2016 6,930,372 12,830 (13) USD US Treasury 2 Year Note September 2016 2,366,422 1,468 (40) USD US Treasury 5 Year Note September 2016 3,653,160 7,177 11 USD US Treasury 5 Year Note September 2016 1,004,619 (3,616) (2) USD US Ultra Bond September 2016 199,931 1,847
Total 127,443,326 (49,981)

Written Options as at 31 May 2016
Number of contracts
Call/Put Description Counterparty
Strike Price
Expiration date
Unrealised appreciation/
(depreciation) EUR
Market Value
EUR
Purchased Swaptions as at 31 May 2016
Nominal Value
Call/Put Description Counterparty
Strike Price
Expiration date
Unrealised appreciation/
(depreciation) EUR
Market Value
EUR
Annual Report and Audited Accounts 405
The notes on pages 489 to 503 form an integral part of these financial statements.
BlackRock Multi-Strategy Absolute Return Fund continued
(710,000) Call OTC USD/JPY Citibank USD 120.00 01/08/2016 828 (594) (425,000) Call OTC USD/CHF Citibank USD 1.02 02/08/2016 423 (1,334) (20,000) Put OTC AUD/USD Commonwealth Bank of Australia AUD 0.66 26/08/2016 152 (34) (10) Put Eurodollar Futures Exchange Traded USD 98.25 13/06/2016 3,262 (56) (8) Call S&P 500 Index Exchange Traded USD 1,875.00 17/06/2016 (79,534) (159,183) (22) Put EURO STOXX 50 Index Exchange Traded EUR 2,800.00 17/06/2016 23,364 (836) (8) Put EURO STOXX 50 Index Exchange Traded EUR 2,975.00 17/06/2016 21,440 (1,408) (22) Put EURO STOXX Utilities Index Exchange Traded EUR 235.00 17/06/2016 10,197 (495) (3) Put S&P 500 Index Exchange Traded USD 1,975.00 17/06/2016 3,663 (443) (2) Call US Treasury 10 Year Note Exchange Traded USD 133.00 24/06/2016 481 (42) (10) Put FTSE 100 Index Exchange Traded GBP 5,750.00 15/07/2016 6,779 (4,622) (130) Call CBOE SPX Volatility Index Exchange Traded USD 30.00 20/07/2016 4,495 (4,074) (3) Put S&P 500 Index Exchange Traded USD 1,850.00 19/08/2016 2,627 (2,533) (45) Call EURO STOXX 50 Index Exchange Traded EUR 3,050.00 16/09/2016 (22,613) (64,013) (1) Call 90 Day Euro Futures Exchange Traded USD 99.25 19/12/2016 330 (78) (1) Put 90 Day Euro Futures Exchange Traded USD 99.25 19/12/2016 (173) (582) (40,000) Put OTC AUD/USD HSBC AUD 0.66 26/08/2016 291 (69)
Total (Gross underlying exposure - EUR 3,664,944) (23,988) (240,396)
100,000 Put Fund purchases an option to enter into an Interest Rate Swap. If exercised Fund receives Floating USD LIBOR 3 Month BBA quarterly from 3/5/2021; Bank of America and pays 3.5% Fixed semi-annually from 3/2/2021 Merrill Lynch USD 3.50 01/02/2021 (812) 2,122
130,000 Call Fund purchases an option to enter into an Interest Rate Swap. If exercised Fund receives 1.5% Fixed semi-annually from 6/2/2019; and pays Floating USD LIBOR 3 Month BBA quarterly from 6/5/2019 Bank of New York USD 1.50 04/02/2019 441 3,334
130,000 Put Fund purchases an option to enter into an Interest Rate Swap. If exercised Fund receives Floating USD LIBOR 3 Month BBA quarterly from 6/5/2019; and pays 3% Fixed semi-annually from 6/2/2019 Bank of New York USD 3.00 04/02/2019 (618) 2,284
120,000 Put Fund purchases an option to enter into an Interest Rate Swap. If exercised Fund receives Floating USD LIBOR 3 Month BBA quarterly from 23/12/2016; and pays 3.3% Fixed semi-annually from 23/9/2016 Barclays Bank USD 3.30 21/09/2016 (3,061) 14
100,000 Call Fund purchases an option to enter into an Interest Rate Swap. If exercised Fund receives 1.357% Fixed semi-annually from 21/11/2016; and pays Floating USD LIBOR 3 Month BBA quarterly from 21/2/2017 Barclays Bank USD 1.36 17/11/2016 (305) 659
100,000 Put Fund purchases an option to enter into an Interest Rate Swap. If exercised Fund receives Floating USD LIBOR 3 Month BBA quarterly from 21/2/2017; and pays 1.357% Fixed semi-annually from 21/11/2016 Barclays Bank USD 1.36 17/11/2016 252 1,215
80,000 Put Fund purchases an option to enter into an Interest Rate Swap. If exercised Fund receives Floating USD LIBOR 3 Month BBA quarterly from 19/7/2017; and pays 2.4% Fixed semi-annually from 19/4/2017 Barclays Bank USD 2.40 13/04/2017 (80) 3,558
240,000 Call Fund purchases an option to enter into an Interest Rate Swap. If exercised Fund receives 1.65% Fixed semi-annually from 9/1/2019; and pays Floating USD LIBOR 3 Month BBA quarterly from 9/4/2019 Barclays Bank USD 1.65 07/01/2019 2,827 7,002
240,000 Put Fund purchases an option to enter into an Interest Rate Swap. If exercised Fund receives Floating USD LIBOR 3 Month BBA quarterly from 9/4/2019; and pays 3.65% Fixed semi-annually from 9/1/2019 Barclays Bank USD 3.65 07/01/2019 (1,914) 1,879
100,000 Call Fund purchases an option to enter into an Interest Rate Swap. If exercised Fund receives 1.385% Fixed semi-annually from 22/11/2016; and pays Floating USD LIBOR 3 Month BBA quarterly from 22/2/2017 Citibank USD 1.39 18/11/2016 (272) 709

Purchased Swaptions as at 31 May 2016
Nominal Value
Call/Put Description Counterparty
Strike Price
Expiration date
Unrealised appreciation/
(depreciation) EUR
Market Value
EUR
406 BlackRock Strategic Funds (BSF)
The notes on pages 489 to 503 form an integral part of these financial statements.
BlackRock Multi-Strategy Absolute Return Fund continued
100,000 Put Fund purchases an option to enter into an Interest Rate Swap. If exercised Fund receives Floating USD LIBOR 3 Month BBA quarterly from 22/2/2017; and pays 1.385% Fixed semi-annually from 22/11/2016 Citibank USD 1.39 18/11/2016 167 1,147
1,500,000 Call Fund purchases an option to enter into an Interest Rate Swap. If exercised Fund receives 1.55% Fixed semi-annually from 29/1/2018; and pays Floating USD LIBOR 3 Month BBA quarterly from 29/4/2018 Citibank USD 1.55 25/01/2018 (981) 10,782
50,000 Call Fund purchases an option to enter into an Interest Rate Swap. If exercised Fund receives 2.47% Fixed semi-annually from 24/1/2019; and pays Floating USD LIBOR 3 Month BBA quarterly from 24/4/2019 Citibank USD 2.47 22/01/2019 222 5,499
50,000 Put Fund purchases an option to enter into an Interest Rate Swap. If exercised Fund receives Floating USD LIBOR 3 Month BBA quarterly from 24/4/2019; and pays 2.47% Fixed semi-annually from 24/1/2019 Citibank USD 2.47 22/01/2019 (1,023) 4,253
140,000 Put Fund purchases an option to enter into an Interest Rate Swap. If exercised Fund receives Floating USD LIBOR 3 Month BBA quarterly from 8/7/2019; and pays 2.55% Fixed semi-annually from 8/4/2019 Citibank USD 2.55 04/04/2019 (155) 11,412
50,000 Call Fund purchases an option to enter into an Interest Rate Swap. If exercised Fund receives 2.4% Fixed semi-annually from 10/2/2021; and pays Floating USD LIBOR 3 Month BBA quarterly from 10/5/2021 Citibank USD 2.40 08/02/2021 (489) 5,975
50,000 Put Fund purchases an option to enter into an Interest Rate Swap. If exercised Fund receives Floating USD LIBOR 3 Month BBA quarterly from 10/5/2021; and pays 2.4% Fixed semi-annually from 10/2/2021 Citibank USD 2.40 08/02/2021 (424) 6,040
100,000 Call Fund purchases an option to enter into an Interest Rate Swap. If exercised Fund receives 2.85% Fixed semi-annually from 7/11/2020; and pays USD Libor 3-month-BBA quarterly from 7/8/2020 Goldman Sachs USD 2.85 05/05/2020 4,855 4,855
100,000 Put Fund purchases an option to enter into an Interest Rate Swap. If exercised Fund receives USD Libor 3-month-BBA quarterly from 07/8/2020; and pays 2.85% Fixed semi-annually from 07/11/2020 Goldman Sachs USD 2.85 05/05/2020 (4,516) (4,516)
38,500,000 Put Fund purchases an option to enter into an Interest Rate Swap. If exercised Fund receives Floating JPY LIBOR 6 Month BBA semi-annually from 24/10/2017; and pays 0.45% Fixed semi-annually from 24/4/2017 JP Morgan JPY 0.45 20/04/2017 (2,175) 10,090
100,000 Put Fund purchases an option to enter into an Interest Rate Swap. If exercised Fund receives Floating USD LIBOR 3 Month BBA quarterly from 18/1/2017; and pays 2.85% Fixed semi-annually from 18/10/2016 UBS USD 2.85 14/10/2016 (449) 314
Total (Gross underlying exposure - EUR 8,611,389) (8,510) 78,627

Written Swaptions as at 31 May 2016
Nominal Value
Call/Put Description Counterparty
Strike Price
Expiration date
Unrealised appreciation/
(depreciation) EUR
Market Value
EUR
Annual Report and Audited Accounts 407
The notes on pages 489 to 503 form an integral part of these financial statements.
(250,000) Put Fund writes an option to enter into an Interest Rate Swap. If exercised Fund receives 5.5% Fixed semi-annually from 3/2/2021; and pays Floating USD LIBOR 3 Month BBA Bank of America quarterly from 3/5/2021 Merrill Lynch USD 5.50 01/02/2021 177 (1,587)
(600,000) Put Fund writes an option to enter into an Interest Rate Swap. If exercised Fund receives 1.7% Fixed semi-annually from 2/9/2016; and pays Floating USD LIBOR 3 Month BBA quarterly from 2/12/2016 Bank of New York USD 1.70 31/08/2016 344 (1,513)
(600,000) Call Fund writes an option to enter into an Interest Rate Swap. If exercised Fund receives Floating USD LIBOR 3 Month BBA quarterly from 13/3/2017; and pays 2.5% Fixed semi-annually from 13/12/2016 Bank of New York USD 2.50 09/12/2016 2,974 (286)
(700,000) Call Fund writes an option to enter into an Interest Rate Swap. If exercised Fund receives Floating USD LIBOR 3 Month BBA quarterly from 20/3/2018; and pays 1.05% Fixed semi-annually from 20/12/2017 Bank of New York USD 1.05 18/12/2017 873 (2,475)
(700,000) Put Fund writes an option to enter into an Interest Rate Swap. If exercised Fund receives 2.015% Fixed semi-annually from 20/12/2017; and pays Floating USD LIBOR 3 Month BBA quarterly from 20/3/2018 Bank of New York USD 2.02 18/12/2017 3,800 (1,927)
(400,000) Call Fund writes an option to enter into an Interest Rate Swap. If exercised Fund receives Floating USD LIBOR 3 Month BBA quarterly from 2/8/2018; and pays 0.8% Fixed semi-annually from 2/5/2018 Bank of New York USD 0.80 30/04/2018 361 (1,148)
(400,000) Put Fund writes an option to enter into an Interest Rate Swap. If exercised Fund receives 1.8% Fixed semi-annually from 2/5/2018; and pays Floating USD LIBOR 3 Month BBA quarterly from 2/8/2018 Bank of New York USD 1.80 30/04/2018 (239) (2,060)
(100,000) Call Fund writes an option to enter into an Interest Rate Swap. If exercised Fund receives Floating USD LIBOR 3 Month BBA quarterly from 6/5/2019; and pays 2.15% Fixed semi-annually from 6/2/2019 Bank of New York USD 2.15 04/02/2019 (355) (4,564)
(100,000) Put Fund writes an option to enter into an Interest Rate Swap. If exercised Fund receives 2.35% Fixed semi-annually from 6/2/2019; and pays Floating USD LIBOR 3 Month BBA quarterly from 6/5/2019 Bank of New York USD 2.35 04/02/2019 798 (3,410)
(500,000) Put Fund writes an option to enter into an Interest Rate Swap. If exercised Fund receives 2.45% Fixed semi-annually from 23/9/2016; and pays Floating USD LIBOR 3 Month BBA quarterly from 23/12/2016 Barclays Bank USD 2.45 21/09/2016 3,135 (64)
(1,000,000) Call Fund writes an option to enter into an Interest Rate Swap. If exercised Fund receives Floating EUR EURIBOR 6 Month semi-annually from 14/8/2017; and pays 0.01% Fixed annually from 14/2/2017 Barclays Bank EUR 0.01 10/02/2017 1,032 (4,093)
(1,300,000) Put Fund writes an option to enter into an Interest Rate Swap. If exercised Fund receives 0.5% Fixed annually from 14/2/2017; and pays Floating EUR EURIBOR 6 Month semi-annually from 14/8/2017 Barclays Bank EUR 0.50 10/02/2017 4,873 (2,107)
(110,000) Call Fund writes an option to enter into an Interest Rate Swap. If exercised Fund receives Floating EUR EURIBOR 6 Month semi-annually from 21/8/2017; and pays 0.01% Fixed annually from 21/2/2017 Barclays Bank EUR 0.01 17/02/2017 23 (457)
(150,000) Put Fund writes an option to enter into an Interest Rate Swap. If exercised Fund receives 0.51% Fixed annually from 21/2/2017; and pays Floating EUR EURIBOR 6 Month semi-annually from 21/8/2017 Barclays Bank EUR 0.51 17/02/2017 576 (249)
(600,000) Put Fund writes an option to enter into an Interest Rate Swap. If exercised Fund receives 0.45% Fixed annually from 27/2/2017; and pays Floating EUR EURIBOR 6 Month semi-annually from 27/8/2017 Barclays Bank EUR 0.45 23/02/2017 1,778 (1,312)
(400,000) Put Fund writes an option to enter into an Interest Rate Swap. If exercised Fund receives 1.6% Fixed semi-annually from 19/4/2017; and pays Floating USD LIBOR 3 Month BBA quarterly from 19/7/2017 Barclays Bank USD 1.60 13/04/2017 (678) (4,748)
(1,400,000) Call Fund writes an option to enter into an Interest Rate Swap. If exercised Fund receives Floating USD LIBOR 3 Month BBA quarterly from 19/3/2018; and pays 1.05% Fixed semi-annually from 19/12/2017 Barclays Bank USD 1.05 15/12/2017 1,697 (4,928)
(1,400,000) Put Fund writes an option to enter into an Interest Rate Swap. If exercised Fund receives 1.9525% Fixed semi-annually from 19/12/2017; and pays Floating USD LIBOR 3 Month BBA quarterly from 19/3/2018 Barclays Bank USD 1.95 15/12/2017 7,418 (4,242)
BlackRock Multi-Strategy Absolute Return Fund continued
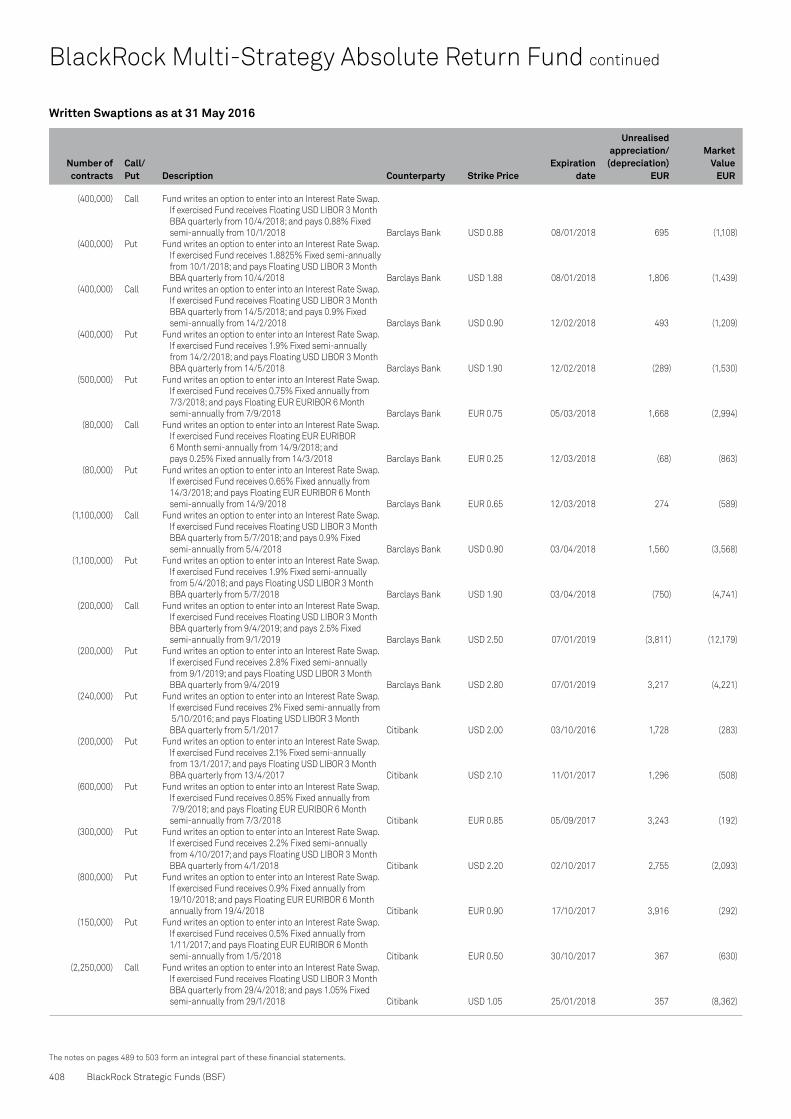
Written Swaptions as at 31 May 2016
Number of contracts
Call/Put Description Counterparty
Strike Price
Expiration date
Unrealised appreciation/
(depreciation) EUR
Market Value
EUR
408 BlackRock Strategic Funds (BSF)
The notes on pages 489 to 503 form an integral part of these financial statements.
BlackRock Multi-Strategy Absolute Return Fund continued
(400,000) Call Fund writes an option to enter into an Interest Rate Swap. If exercised Fund receives Floating USD LIBOR 3 Month BBA quarterly from 10/4/2018; and pays 0.88% Fixed semi-annually from 10/1/2018 Barclays Bank USD 0.88 08/01/2018 695 (1,108)
(400,000) Put Fund writes an option to enter into an Interest Rate Swap. If exercised Fund receives 1.8825% Fixed semi-annually from 10/1/2018; and pays Floating USD LIBOR 3 Month BBA quarterly from 10/4/2018 Barclays Bank USD 1.88 08/01/2018 1,806 (1,439)
(400,000) Call Fund writes an option to enter into an Interest Rate Swap. If exercised Fund receives Floating USD LIBOR 3 Month BBA quarterly from 14/5/2018; and pays 0.9% Fixed semi-annually from 14/2/2018 Barclays Bank USD 0.90 12/02/2018 493 (1,209)
(400,000) Put Fund writes an option to enter into an Interest Rate Swap. If exercised Fund receives 1.9% Fixed semi-annually from 14/2/2018; and pays Floating USD LIBOR 3 Month BBA quarterly from 14/5/2018 Barclays Bank USD 1.90 12/02/2018 (289) (1,530)
(500,000) Put Fund writes an option to enter into an Interest Rate Swap. If exercised Fund receives 0.75% Fixed annually from 7/3/2018; and pays Floating EUR EURIBOR 6 Month semi-annually from 7/9/2018 Barclays Bank EUR 0.75 05/03/2018 1,668 (2,994)
(80,000) Call Fund writes an option to enter into an Interest Rate Swap. If exercised Fund receives Floating EUR EURIBOR 6 Month semi-annually from 14/9/2018; and pays 0.25% Fixed annually from 14/3/2018 Barclays Bank EUR 0.25 12/03/2018 (68) (863)
(80,000) Put Fund writes an option to enter into an Interest Rate Swap. If exercised Fund receives 0.65% Fixed annually from 14/3/2018; and pays Floating EUR EURIBOR 6 Month semi-annually from 14/9/2018 Barclays Bank EUR 0.65 12/03/2018 274 (589)
(1,100,000) Call Fund writes an option to enter into an Interest Rate Swap. If exercised Fund receives Floating USD LIBOR 3 Month BBA quarterly from 5/7/2018; and pays 0.9% Fixed semi-annually from 5/4/2018 Barclays Bank USD 0.90 03/04/2018 1,560 (3,568)
(1,100,000) Put Fund writes an option to enter into an Interest Rate Swap. If exercised Fund receives 1.9% Fixed semi-annually from 5/4/2018; and pays Floating USD LIBOR 3 Month BBA quarterly from 5/7/2018 Barclays Bank USD 1.90 03/04/2018 (750) (4,741)
(200,000) Call Fund writes an option to enter into an Interest Rate Swap. If exercised Fund receives Floating USD LIBOR 3 Month BBA quarterly from 9/4/2019; and pays 2.5% Fixed semi-annually from 9/1/2019 Barclays Bank USD 2.50 07/01/2019 (3,811) (12,179)
(200,000) Put Fund writes an option to enter into an Interest Rate Swap. If exercised Fund receives 2.8% Fixed semi-annually from 9/1/2019; and pays Floating USD LIBOR 3 Month BBA quarterly from 9/4/2019 Barclays Bank USD 2.80 07/01/2019 3,217 (4,221)
(240,000) Put Fund writes an option to enter into an Interest Rate Swap. If exercised Fund receives 2% Fixed semi-annually from 5/10/2016; and pays Floating USD LIBOR 3 Month BBA quarterly from 5/1/2017 Citibank USD 2.00 03/10/2016 1,728 (283)
(200,000) Put Fund writes an option to enter into an Interest Rate Swap. If exercised Fund receives 2.1% Fixed semi-annually from 13/1/2017; and pays Floating USD LIBOR 3 Month BBA quarterly from 13/4/2017 Citibank USD 2.10 11/01/2017 1,296 (508)
(600,000) Put Fund writes an option to enter into an Interest Rate Swap. If exercised Fund receives 0.85% Fixed annually from 7/9/2018; and pays Floating EUR EURIBOR 6 Month semi-annually from 7/3/2018 Citibank EUR 0.85 05/09/2017 3,243 (192)
(300,000) Put Fund writes an option to enter into an Interest Rate Swap. If exercised Fund receives 2.2% Fixed semi-annually from 4/10/2017; and pays Floating USD LIBOR 3 Month BBA quarterly from 4/1/2018 Citibank USD 2.20 02/10/2017 2,755 (2,093)
(800,000) Put Fund writes an option to enter into an Interest Rate Swap. If exercised Fund receives 0.9% Fixed annually from 19/10/2018; and pays Floating EUR EURIBOR 6 Month annually from 19/4/2018 Citibank EUR 0.90 17/10/2017 3,916 (292)
(150,000) Put Fund writes an option to enter into an Interest Rate Swap. If exercised Fund receives 0.5% Fixed annually from 1/11/2017; and pays Floating EUR EURIBOR 6 Month semi-annually from 1/5/2018 Citibank EUR 0.50 30/10/2017 367 (630)
(2,250,000) Call Fund writes an option to enter into an Interest Rate Swap. If exercised Fund receives Floating USD LIBOR 3 Month BBA quarterly from 29/4/2018; and pays 1.05% Fixed semi-annually from 29/1/2018 Citibank USD 1.05 25/01/2018 357 (8,362)

Written Swaptions as at 31 May 2016
Nominal Value
Call/Put Description Counterparty
Strike Price
Expiration date
Unrealised appreciation/
(depreciation) EUR
Market Value
EUR
Annual Report and Audited Accounts 409
The notes on pages 489 to 503 form an integral part of these financial statements.
(750,000) Put Fund writes an option to enter into an Interest Rate Swap. If exercised Fund receives 2.3% Fixed semi-annually from 29/1/2018; and pays Floating USD LIBOR 3 Month BBA quarterly from 29/4/2018 Citibank USD 2.30 25/01/2018 1,806 (1,446)
(580,000) Put Fund writes an option to enter into an Interest Rate Swap. If exercised Fund receives 0.35% Fixed annually from 13/3/2018; and pays Floating EUR EURIBOR 6 Month semi-annually from 13/9/2018 Citibank EUR 0.35 09/03/2018 1,798 (7,366)
(2,100,000) Call Fund writes an option to enter into an Interest Rate Swap. If exercised Fund receives Floating USD LIBOR 3 Month BBA quarterly from 21/6/2018; and pays 1% Fixed semi-annually from 21/3/2018 Citibank USD 1.00 19/03/2018 1,522 (7,757)
(2,100,000) Put Fund writes an option to enter into an Interest Rate Swap. If exercised Fund receives 2% Fixed semi-annually from 21/3/2018; and pays Floating USD LIBOR 3 Month BBA quarterly from 21/6/2018 Citibank USD 2.00 19/03/2018 1,084 (7,639)
(600,000) Put Fund writes an option to enter into an Interest Rate Swap. If exercised Fund receives 1.85% Fixed semi-annually from 4/4/2018; and pays Floating USD LIBOR 3 Month BBA quarterly from 4/7/2018 Citibank USD 1.85 29/03/2018 35 (2,736)
(600,000) Call Fund writes an option to enter into an Interest Rate Swap. If exercised Fund receives Floating USD LIBOR 3 Month BBA quarterly from 10/7/2018; and pays 0.85% Fixed semi-annually from 10/4/2018 Citibank USD 0.85 06/04/2018 988 (1,805)
(600,000) Put Fund writes an option to enter into an Interest Rate Swap. If exercised Fund receives 1.85% Fixed semi-annually from 10/4/2018; and pays Floating USD LIBOR 3 Month BBA quarterly from 10/7/2018 Citibank USD 1.85 06/04/2018 (535) (2,775)
(500,000) Call Fund writes an option to enter into an Interest Rate Swap. If exercised Fund receives Floating USD LIBOR 3 Month BBA quarterly from 1/8/2018; and pays 0.9% Fixed semi-annually from 1/5/2018 Citibank USD 0.90 27/04/2018 158 (1,676)
(500,000) Put Fund writes an option to enter into an Interest Rate Swap. If exercised Fund receives 1.9% Fixed semi-annually from 1/5/2018; and pays Floating USD LIBOR 3 Month BBA quarterly from 1/8/2018 Citibank USD 1.90 27/04/2018 36 (2,262)
(1,500,000) Put Fund writes an option to enter into an Interest Rate Swap. If exercised Fund receives 1.75% Fixed semi-annually from 8/4/2019; and pays Floating USD LIBOR 3 Month BBA quarterly from 8/7/2019 Citibank USD 1.75 04/04/2019 (191) (12,950)
(100,000) Put Fund writes an option to enter into an Interest Rate Swap. If exercised Fund receives 2.15% Fixed semi-annually from 30/9/2019; and pays Floating EUR EURIBOR 6 Month quarterly from 31/3/2020 CItibank EUR 2.15 26/09/2019 1,823 (467)
(200,000) Put Fund writes an option to enter into an Interest Rate Swap. If exercised Fund receives 1.95% Fixed semi-annually from 1/7/2016; and pays Floating USD LIBOR 3 Month BBA quarterly from 1/10/2016 Goldman Sachs USD 1.95 29/06/2016 1,299 (4)
(600,000) Put Fund writes an option to enter into an Interest Rate Swap. If exercised Fund receives 1.15% Fixed annually from 13/9/2017; and pays Floating EUR EURIBOR 6 Month semi-annually from 13/3/2018 JP Morgan EUR 1.15 11/09/2017 5,501 (709)
(300,000) Put Fund writes an option to enter into an Interest Rate Swap. If exercised Fund receives 1% Fixed annually from 1/11/2017; and pays Floating EUR EURIBOR 6 Month semi-annually from 1/5/2018 JP Morgan EUR 1.00 30/10/2017 1,992 (652)
(300,000) Call Fund writes an option to enter into an Interest Rate Swap. If exercised Fund receives Floating EUR EURIBOR 6 Month semi-annually from 6/6/2018; and pays 0.15% Fixed annually from 6/12/2017 JP Morgan EUR 0.15 04/12/2017 797 (2,534)
(300,000) Put Fund writes an option to enter into an Interest Rate Swap. If exercised Fund receives 0.65% Fixed annually from 6/12/2017; and pays Floating EUR EURIBOR 6 Month semi-annually from 6/6/2018 JP Morgan EUR 0.65 04/12/2017 3,032 (1,603)
(200,000) Put Fund writes an option to enter into an Interest Rate Swap. If exercised Fund receives 2.1% Fixed annually from 14/10/2020; and pays Floating EUR EURIBOR 6 Month Royal Bank semi-annually from 14/10/2020 of Scotland EUR 2.10 10/10/2019 3,445 (1,010)
(300,000) Call Fund writes an option to enter into an Interest Rate Swap. If exercised Fund receives Floating EUR EURIBOR 6 Month semi-annually from 14/9/2017; and pays 0.01% Fixed annually from 14/3/2017 UBS EUR 0.01 10/03/2017 216 (1,299)
BlackRock Multi-Strategy Absolute Return Fund continued
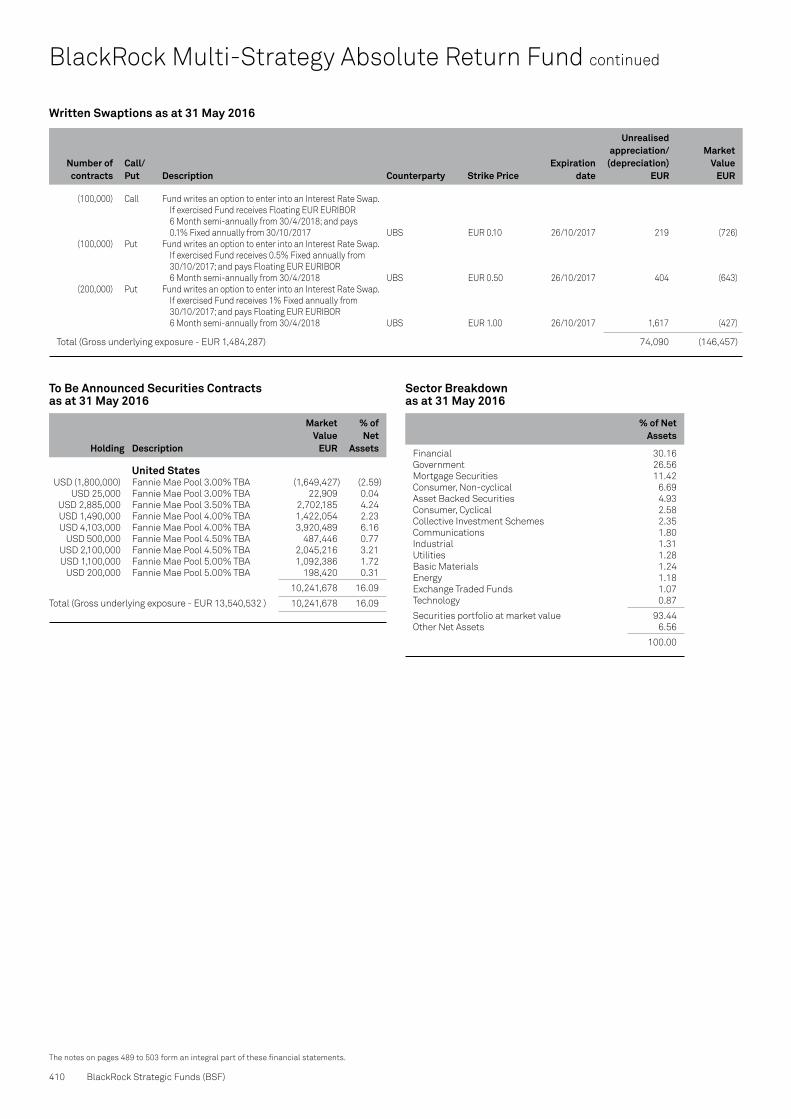
410 BlackRock Strategic Funds (BSF)
The notes on pages 489 to 503 form an integral part of these financial statements.
Written Swaptions as at 31 May 2016
Number of contracts
Call/Put Description Counterparty
Strike Price
Expiration date
Unrealised appreciation/
(depreciation) EUR
Market Value
EUR
BlackRock Multi-Strategy Absolute Return Fund continued
(100,000) Call Fund writes an option to enter into an Interest Rate Swap. If exercised Fund receives Floating EUR EURIBOR 6 Month semi-annually from 30/4/2018; and pays 0.1% Fixed annually from 30/10/2017 UBS EUR 0.10 26/10/2017 219 (726)
(100,000) Put Fund writes an option to enter into an Interest Rate Swap. If exercised Fund receives 0.5% Fixed annually from 30/10/2017; and pays Floating EUR EURIBOR 6 Month semi-annually from 30/4/2018 UBS EUR 0.50 26/10/2017 404 (643)
(200,000) Put Fund writes an option to enter into an Interest Rate Swap. If exercised Fund receives 1% Fixed annually from 30/10/2017; and pays Floating EUR EURIBOR 6 Month semi-annually from 30/4/2018 UBS EUR 1.00 26/10/2017 1,617 (427)
Total (Gross underlying exposure - EUR 1,484,287) 74,090 (146,457)
Sector Breakdown as at 31 May 2016
% of Net Assets
Financial 30.16Government 26.56Mortgage Securities 11.42Consumer, Non-cyclical 6.69Asset Backed Securities 4.93Consumer, Cyclical 2.58Collective Investment Schemes 2.35Communications 1.80Industrial 1.31Utilities 1.28Basic Materials 1.24Energy 1.18Exchange Traded Funds 1.07Technology 0.87
Securities portfolio at market value 93.44Other Net Assets 6.56
100.00
To Be Announced Securities Contracts as at 31 May 2016
Holding Description
Market Value
EUR
% of Net
Assets
United States USD (1,800,000) Fannie Mae Pool 3.00% TBA (1,649,427) (2.59) USD 25,000 Fannie Mae Pool 3.00% TBA 22,909 0.04 USD 2,885,000 Fannie Mae Pool 3.50% TBA 2,702,185 4.24 USD 1,490,000 Fannie Mae Pool 4.00% TBA 1,422,054 2.23 USD 4,103,000 Fannie Mae Pool 4.00% TBA 3,920,489 6.16 USD 500,000 Fannie Mae Pool 4.50% TBA 487,446 0.77 USD 2,100,000 Fannie Mae Pool 4.50% TBA 2,045,216 3.21 USD 1,100,000 Fannie Mae Pool 5.00% TBA 1,092,386 1.72 USD 200,000 Fannie Mae Pool 5.00% TBA 198,420 0.31
10,241,678 16.09
Total (Gross underlying exposure - EUR 13,540,532 ) 10,241,678 16.09

Annual Report and Audited Accounts 411
The notes on pages 489 to 503 form an integral part of these financial statements.
Transferable Securities and Money Market Instruments Admitted to an Official Stock Exchange Listing or Dealt in on Another Regulated Market
Holding
Description
Market Value
USD
% of Net
Assets
Portfolio of Investments as at 31 May 2016
BONDS
United States USD 11,153,800 United States Treasury Bill 2/6/2016
(Zero Coupon) 11,153,723 12.15 USD 11,152,300 United States Treasury Bill 23/6/2016
(Zero Coupon) 11,150,871 12.15 USD 11,157,200 United States Treasury Bill 7/7/2016
(Zero Coupon) 11,154,240 12.15 USD 11,164,100 United States Treasury Bill 25/8/2016
(Zero Coupon) 11,154,644 12.16 USD 11,167,900 United States Treasury Bill 15/9/2016
(Zero Coupon) 11,156,135 12.16 USD 11,166,600 United States Treasury Bill 6/10/2016
(Zero Coupon) 11,151,704 12.15 USD 11,200,200 United States Treasury Bill 2/2/2017
(Zero Coupon) 11,157,320 12.16
78,078,637 85.08
Total Bonds 78,078,637 85.08
Total Transferable Securities and Money Market Instruments Admitted to an Official Stock Exchange Listing or Dealt in on Another Regulated Market 78,078,637 85.08
Securities portfolio at market value 78,078,637 85.08
Other Net Assets 13,689,391 14.92
Total Net Assets (USD) 91,768,028 100.00
BlackRock Style Advantage Fund

Contracts for difference as at 31 May 2016
Holding
Description Counterparty
Unrealised appreciation/
(depreciation) USD
Holding
Description Counterparty
Unrealised appreciation/
(depreciation) USD
412 BlackRock Strategic Funds (BSF)
The notes on pages 489 to 503 form an integral part of these financial statements.
BlackRock Style Advantage Fund continued
Austria 163 ANDRITZ AG Bank of America
Merrill Lynch 230 1,580 ANDRITZ AG Citibank 1,641 31 ANDRITZ AG JP Morgan 10 (703) Erste Group Bank AG Bank of America
Merrill Lynch (656) (1,063) Erste Group Bank AG Citibank (1,395) (275) Erste Group Bank AG JP Morgan (261) (14,125) Immofinanz AG Bank of America
Merrill Lynch (1,367) (1,207) Immofinanz AG JP Morgan (104) 24 Lenzing AG Bank of America
Merrill Lynch 135 269 Lenzing AG Citibank 757 1,297 Oesterreichische Post AG Bank of America
Merrill Lynch 36 5,347 Oesterreichische Post AG Citibank 985 1,465 Oesterreichische Post AG JP Morgan (1,980) 1,948 OMV AG JP Morgan 936 5,427 OMV AG Citibank (1,788) (17,859) Raiffeisen Bank
International AG JP Morgan 50 (1,239) Raiffeisen Bank Bank of America
International AG Merrill Lynch (1,024) (389) Raiffeisen Bank
International AG Citibank (198) 1,590 UNIQA Insurance Group AG Bank of America
Merrill Lynch 366 1,548 UNIQA Insurance Group AG Citibank 176 892 UNIQA Insurance Group AG JP Morgan 236 572 voestalpine AG JP Morgan 1,182 4,152 voestalpine AG Bank of America
Merrill Lynch 9,265 838 voestalpine AG Citibank 1,952 (2,353) Wienerberger AG Citibank (1,104) (324) Wienerberger AG JP Morgan (318)
7,762
Belgium (94) Ackermans & van Haaren NV Bank of America
Merrill Lynch (152) (255) Ackermans & van Haaren NV Citibank (1,225) (621) Ackermans & van Haaren NV JP Morgan (2,417) 1,137 Ageas Bank of America
Merrill Lynch 4,762 2,685 Ageas Citibank 5,038 (697) Anheuser-Busch InBev SA/NV JP Morgan (2,141) (1,777) Anheuser-Busch InBev SA/NV Citibank (9,825) 74 Befimmo SA (Reit) Bank of America
Merrill Lynch 118 461 Befimmo SA (Reit) Citibank 814 93 Befimmo SA (Reit) JP Morgan 148 1,125 Bekaert SA JP Morgan 3,394 2,631 Bekaert SA Bank of America
Merrill Lynch 5,888 9,839 bpost SA Citibank (8,462) 302 bpost SA JP Morgan (320) 852 bpost SA Bank of America
Merrill Lynch (623) (219) Cie d'Entreprises CFE Citibank (856) (125) Cie d'Entreprises CFE JP Morgan (211) 277 Cofinimmo SA (Reit) JP Morgan (557) 123 Cofinimmo SA (Reit) Bank of America
Merrill Lynch 357 183 Cofinimmo SA (Reit) Citibank 572 2,464 Colruyt SA Bank of America
Merrill Lynch 3,793 256 Colruyt SA Citibank 346 208 Colruyt SA JP Morgan 604 380 D'ieteren SA/NV Bank of America
Merrill Lynch 964
1,298 D'ieteren SA/NV Citibank 2,225 115 D'ieteren SA/NV JP Morgan 569 (253) Elia System Operator SA/NV Bank of America
Merrill Lynch 122 (31) Elia System Operator SA/NV Citibank (7) (345) Elia System Operator SA/NV JP Morgan (86) 1,078 Groupe Bruxelles Lambert SA Bank of America
Merrill Lynch 3,714 168 KBC Ancora Citibank 420 1,358 KBC Ancora JP Morgan 4,719 153 KBC Groep NV Citibank 619 905 KBC Groep NV JP Morgan 4,949 (335) Ontex Group NV Bank of America
Merrill Lynch (209) (2,153) Ontex Group NV Citibank (1,455) (996) Ontex Group NV JP Morgan (594) 998 Proximus SADP JP Morgan 1,488 4,240 Proximus SADP Bank of America
Merrill Lynch 5,030 247 Solvay SA Bank of America
Merrill Lynch 1,511 75 Solvay SA JP Morgan 258 (20) Telenet Group Holding NV Citibank (23) (40) Telenet Group Holding NV JP Morgan (12) (439) UCB SA Citibank 1,569 (653) UCB SA JP Morgan 2,525 (276) Umicore SA Bank of America
Merrill Lynch (231)
27,110
Denmark 31 AP Moeller - Maersk A/S 'B' Bank of America
Merrill Lynch (1,373) 213 AP Moeller - Maersk A/S 'B' Citibank (4,158) 22 AP Moeller - Maersk A/S 'B' JP Morgan (1,024) 68 Carlsberg A/S 'B' Citibank 169 (224) Chr Hansen Holding A/S Bank of America
Merrill Lynch (316) (139) Chr Hansen Holding A/S Citibank (271) (1,483) Chr Hansen Holding A/S JP Morgan (2,215) 107 Coloplast A/S 'B' Bank of America
Merrill Lynch 146 1,913 Coloplast A/S 'B' Citibank 2,815 427 Coloplast A/S 'B' JP Morgan 872 (275) Danske Bank A/S JP Morgan (421) (542) Danske Bank A/S Bank of America
Merrill Lynch (902) (221) DSV A/S Bank of America
Merrill Lynch (231) (497) DSV A/S Citibank (172) (39) DSV A/S JP Morgan (199) (108) Genmab A/S Bank of America
Merrill Lynch (3,082) (496) Genmab A/S JP Morgan (3,287) (341) Genmab A/S Citibank 51 402 GN Store Nord A/S Bank of America
Merrill Lynch 199 1,810 GN Store Nord A/S JP Morgan 1,340 159 ISS A/S JP Morgan 358 287 ISS A/S Bank of America
Merrill Lynch 526 1,274 ISS A/S Citibank 1,626 (20) Jyske Bank A/S Reg JP Morgan (44) 150 Novo Nordisk A/S 'B' JP Morgan 286 705 Novo Nordisk A/S 'B' Bank of America
Merrill Lynch 1,186 4,141 Novo Nordisk A/S 'B' Citibank 9,204 (3,383) Novozymes A/S 'B' Bank of America
Merrill Lynch 258 (947) Novozymes A/S 'B' Citibank 114 13 Pandora A/S Citibank 1
Belgium continued

Contracts for difference as at 31 May 2016
Holding
Description Counterparty
Unrealised appreciation/
(depreciation) USD
Holding
Description Counterparty
Unrealised appreciation/
(depreciation) USD
Annual Report and Audited Accounts 413
The notes on pages 489 to 503 form an integral part of these financial statements.
151 Pandora A/S JP Morgan 3,232 462 Pandora A/S Bank of America
Merrill Lynch (37) 43 Rockwool International A/S 'B' Citibank 252 228 Rockwool International A/S 'B' JP Morgan 3,914 724 Sydbank A/S Bank of America
Merrill Lynch 2,109 64 Sydbank A/S Citibank 96 1,051 TDC A/S JP Morgan (41) 790 Topdanmark A/S Bank of America
Merrill Lynch 1,210 2,713 Topdanmark A/S Citibank 1,833 350 Topdanmark A/S JP Morgan 604 (73) Tryg A/S Bank of America
Merrill Lynch (43) (2,639) Tryg A/S Citibank (1,942) 131 Vestas Wind Systems A/S JP Morgan 539 (3,440) William Demant Holding A/S JP Morgan (2,123) (135) William Demant Holding A/S Citibank (83)
10,976
Finland 1,253 Cargotec OYJ 'B' Bank of America
Merrill Lynch 2,215 122 Cargotec OYJ 'B' JP Morgan 271 178 Elisa OYJ Bank of America
Merrill Lynch 334 2,719 Elisa OYJ Citibank 5,710 283 Elisa OYJ JP Morgan 629 (4,311) Fortum OYJ Bank of America
Merrill Lynch (1,934) (821) Fortum OYJ Citibank (358) (36) Fortum OYJ JP Morgan (26) (177) Huhtamaki OYJ JP Morgan (575) 183 Kemira OYJ Bank of America
Merrill Lynch 65 1,461 Kemira OYJ Citibank 180 893 Kesko OYJ 'B' Bank of America
Merrill Lynch 1,387 180 Kesko OYJ 'B' JP Morgan 287 (795) Konecranes OYJ Bank of America
Merrill Lynch (613) (2,343) Konecranes OYJ JP Morgan (7,126) (1,227) Metso OYJ Citibank (946) (73) Metso OYJ JP Morgan (88) 396 Neste OYJ Bank of America
Merrill Lynch 783 2,365 Neste OYJ JP Morgan 3,501 (2,789) Nokia OYJ Bank of America
Merrill Lynch (1,639) (21,574) Nokia OYJ Citibank (10,506) (8,283) Nokia OYJ JP Morgan (1,018) (478) Nokian Renkaat OYJ Bank of America
Merrill Lynch 283 (586) Nokian Renkaat OYJ Citibank (504) (5,513) Nokian Renkaat OYJ JP Morgan (3,351) 332 Orion OYJ 'B' Bank of America
Merrill Lynch 745 849 Orion OYJ 'B' JP Morgan 858 (1,224) Sampo OYJ 'A' Bank of America
Merrill Lynch (1,914) (496) Sampo OYJ 'A' Citibank (283) (4,107) Sampo OYJ 'A' JP Morgan (2,828) 8,409 Stora Enso OYJ 'R' Citibank 4,367 22,950 Stora Enso OYJ 'R' JP Morgan 12,564 3,354 Stora Enso OYJ 'R' Bank of America
Merrill Lynch 1,986 2,277 Tieto OYJ Bank of America
Merrill Lynch 3,561 1,987 Tieto OYJ Citibank 2,153
5,503 Tieto OYJ JP Morgan 6,257 8,078 UPM-Kymmene OYJ Bank of America
Merrill Lynch 6,515 494 UPM-Kymmene OYJ Citibank 397 3,208 UPM-Kymmene OYJ JP Morgan 2,723 (534) Wartsila OYJ Abp Bank of America
Merrill Lynch (423) (1,263) Wartsila OYJ Abp Citibank (973) (96) Wartsila OYJ Abp JP Morgan (75)
22,591
France 35 Accor SA Bank of America
Merrill Lynch 50 179 Accor SA Citibank 91 956 Accor SA JP Morgan 749 (503) Aeroports de Paris JP Morgan 20 (1,176) Aeroports de Paris Bank of America
Merrill Lynch 911 (118) Aeroports de Paris Citibank 92 4,288 Air France-KLM JP Morgan (846) 3,645 Air France-KLM Bank of America
Merrill Lynch (387) 17,304 Air France-KLM Citibank (2,339) (938) Air Liquide SA Citibank (3,028) (1,898) Air Liquide SA JP Morgan (5,744) 137 Airbus Group SE Bank of America
Merrill Lynch 326 (1,576) Alstom SA Bank of America
Merrill Lynch (2,086) (7,268) Alstom SA Citibank (8,159) (1,414) Alstom SA JP Morgan (1,785) 4,056 Altran Technologies SA Bank of America
Merrill Lynch 938 102 Altran Technologies SA Citibank 13 431 Altran Technologies SA JP Morgan 332 12 Arkema SA Bank of America
Merrill Lynch 36 782 Arkema SA Citibank 2,079 214 Arkema SA JP Morgan 1,432 169 Atos SE Bank of America
Merrill Lynch 715 763 Atos SE Citibank 1,670 5,956 Atos SE JP Morgan 16,558 4,584 AXA SA JP Morgan 10,547 3,260 AXA SA Bank of America
Merrill Lynch 7,847 15,720 AXA SA Citibank 28,884 63 BNP Paribas SA Bank of America
Merrill Lynch 436 2,471 BNP Paribas SA Citibank 11,509 762 BNP Paribas SA JP Morgan 5,064 (12,826) Bollore SA JP Morgan 1,676 (60,093) Bollore SA Bank of America
Merrill Lynch 1,062 (28,732) Bollore SA Citibank 642 378 Bouygues SA Citibank 169 (11,588) Bureau Veritas SA JP Morgan (278) (105) Bureau Veritas SA Bank of America
Merrill Lynch 40 (2,593) Bureau Veritas SA Citibank (579) 920 Capgemini SA Bank of America
Merrill Lynch 3,163 136 Capgemini SA Citibank 454 205 Capgemini SA JP Morgan 1,088 1,047 Carrefour SA Bank of America
Merrill Lynch 987 601 Carrefour SA Citibank 581 186 Casino Guichard Perrachon SA Bank of America
Merrill Lynch 707
BlackRock Style Advantage Fund continued
Finland continued Denmark continued

Contracts for difference as at 31 May 2016
Holding
Description Counterparty
Unrealised appreciation/
(depreciation) USD
Holding
Description Counterparty
Unrealised appreciation/
(depreciation) USD
414 BlackRock Strategic Funds (BSF)
The notes on pages 489 to 503 form an integral part of these financial statements.
BlackRock Style Advantage Fund continued
466 Casino Guichard Perrachon SA Citibank 1,702 84 Casino Guichard Perrachon SA JP Morgan 309 22 Christian Dior SE Bank of America
Merrill Lynch (68) 182 Christian Dior SE Citibank 346 524 Christian Dior SE JP Morgan 18 170 Cie de Saint-Gobain Bank of America
Merrill Lynch 282 282 Cie de Saint-Gobain JP Morgan 553 2,866 Cie Generale des Bank of America
Etablissements Michelin Merrill Lynch 7,938 313 Cie Generale des
Etablissements Michelin Citibank 1,161 7,247 CNP Assurances Bank of America
Merrill Lynch 7,059 1,364 CNP Assurances Citibank 1,318 744 CNP Assurances JP Morgan 927 2,191 Credit Agricole SA Bank of America
Merrill Lynch 1,184 5,419 Credit Agricole SA JP Morgan 1,617 527 Credit Agricole SA Citibank 173 (76) Danone SA Bank of America
Merrill Lynch (262) (60) Danone SA Citibank (203) (10) Danone SA JP Morgan (26) (185) Dassault Systemes Bank of America
Merrill Lynch (641) (1,488) Dassault Systemes Citibank (3,490) (511) Dassault Systemes JP Morgan (1,473) (1,425) Edenred Citibank (119) (3,558) Edenred JP Morgan (271) 80 Eiffage SA Citibank 8 707 Eiffage SA Bank of America
Merrill Lynch (674) 746 Electricite de France SA JP Morgan 462 4,255 Electricite de France SA Bank of America
Merrill Lynch 3,208 10,669 Electricite de France SA Citibank 5,303 (840) Elior Group Citibank (690) 5,129 Engie SA JP Morgan 3,226 319 Engie SA Bank of America
Merrill Lynch 159 2,171 Engie SA Citibank 1,358 (688) Essilor International SA Bank of America
Merrill Lynch (3,881) (348) Essilor International SA Citibank (1,419) (1,575) Essilor International SA JP Morgan (7,022) 18 Euler Hermes Group Bank of America
Merrill Lynch (91) 53 Euler Hermes Group Citibank (140) 143 Euler Hermes Group JP Morgan (882) 295 Eurazeo SA JP Morgan 606 (346) Eurofins Scientific SE Bank of America
Merrill Lynch (6,407) (139) Eurofins Scientific SE Citibank (2,453) (12) Eurofins Scientific SE JP Morgan (351) 75 Euronext NV JP Morgan 18 (524) Eutelsat Communications SA JP Morgan 5,472 (814) Eutelsat Communications SA Bank of America
Merrill Lynch 536 (4,193) Eutelsat Communications SA Citibank 2,670 530 Faurecia Citibank 761 3,650 Faurecia JP Morgan 4,791 1,017 Faurecia Bank of America
Merrill Lynch 488 138 Fonciere Des Regions (Reit) Bank of America
Merrill Lynch 279 177 Fonciere Des Regions (Reit) JP Morgan (374) 94 Gecina SA (Reit) JP Morgan (42) (4,973) Groupe Eurotunnel SE Reg JP Morgan (2,583)
(10,746) Groupe Eurotunnel SE Reg Bank of America Merrill Lynch 610
(3,376) Groupe Eurotunnel SE Reg Citibank 264 1,847 Havas SA Bank of America
Merrill Lynch 761 3,603 Havas SA Citibank 749 453 Havas SA JP Morgan 169 (236) Hermes International Bank of America
Merrill Lynch (1,977) (145) Hermes International Citibank (1,474) (654) Hermes International JP Morgan (6,341) (34) ICADE (Reit) Bank of America
Merrill Lynch 157 (188) ICADE (Reit) JP Morgan 721 (1,421) Iliad SA Citibank (4,206) (173) Iliad SA JP Morgan (647) (133) Imerys SA JP Morgan (232) (21) Ingenico Group SA JP Morgan (155) (1,823) Ingenico Group SA Bank of America
Merrill Lynch (10,519) (31) Ingenico Group SA Citibank (140) 2,442 Ipsen SA Citibank 8,619 262 Ipsen SA JP Morgan 1,147 (7) JCDecaux SA JP Morgan 19 (481) JCDecaux SA Citibank (771) (14) Kering Bank of America
Merrill Lynch (42) (152) Kering Citibank (586) (923) Kering JP Morgan (3,052) (2,851) Klepierre (Reit) Citibank (3,487) (7,108) Korian SA Bank of America
Merrill Lynch (7,175) (604) Korian SA Citibank (624) (364) L'Oreal SA JP Morgan (3,293) (919) L'Oreal SA Bank of America
Merrill Lynch (8,955) (114) L'Oreal SA Citibank (1,063) 6,400 Lagardere SCA Citibank (2,323) 943 Lagardere SCA JP Morgan (889) (77) Legrand SA Bank of America
Merrill Lynch (87) (828) Legrand SA JP Morgan (407) (388) Legrand SA Citibank (124) (122) LVMH Moet Hennessy
Louis Vuitton SE Citibank (347) (1,113) LVMH Moet Hennessy
Louis Vuitton SE JP Morgan (1,831) (18) LVMH Moet Hennessy Bank of America
Louis Vuitton SE Merrill Lynch 2 286 Mercialys SA (Reit) Bank of America
Merrill Lynch 51 333 Mercialys SA (Reit) Citibank 203 232 Mercialys SA (Reit) JP Morgan 122 2,801 Metropole Television SA Citibank 720 534 Metropole Television SA Bank of America
Merrill Lynch (167) 478 Metropole Television SA JP Morgan (77) 9,108 Natixis SA JP Morgan 45 462 Nexans SA JP Morgan 1,956 703 Nexans SA Bank of America
Merrill Lynch 1,555 1,883 Nexans SA Citibank 4,175 1,695 Nexity SA JP Morgan 3,521 5,938 Nexity SA Bank of America
Merrill Lynch (1,363) 1,094 Nexity SA Citibank (183) (1,114) Numericable-SFR SA Bank of America
Merrill Lynch (703) (7,383) Numericable-SFR SA Citibank (2,227) 2,509 Orange SA JP Morgan 2,957
France continued France continued

Contracts for difference as at 31 May 2016
Holding
Description Counterparty
Unrealised appreciation/
(depreciation) USD
Holding
Description Counterparty
Unrealised appreciation/
(depreciation) USD
Annual Report and Audited Accounts 415
The notes on pages 489 to 503 form an integral part of these financial statements.
11,647 Orange SA Bank of America Merrill Lynch 7,445
1,068 Orange SA Citibank 692 (91) Orpea Bank of America
Merrill Lynch (327) (499) Pernod Ricard SA JP Morgan (1,026) (76) Pernod Ricard SA Bank of America
Merrill Lynch (188) (712) Pernod Ricard SA Citibank (3,133) 8,560 Peugeot SA JP Morgan 7,936 24,574 Peugeot SA Bank of America
Merrill Lynch 28,847 2,972 Peugeot SA Citibank 3,602 2,504 Plastic Omnium SA JP Morgan 3,734 242 Plastic Omnium SA Citibank 372 (178) Publicis Groupe SA Bank of America
Merrill Lynch (376) (944) Publicis Groupe SA Citibank (633) (401) Remy Cointreau SA Bank of America
Merrill Lynch (1,577) (889) Remy Cointreau SA Citibank (2,780) 2,943 Renault SA Bank of America
Merrill Lynch 19,973 899 Renault SA Citibank 6,306 287 Renault SA JP Morgan 1,484 (2,294) Rexel SA JP Morgan (1,448) (584) Rexel SA Bank of America
Merrill Lynch (502) (777) Rubis SCA Bank of America
Merrill Lynch (1,753) (1,720) Rubis SCA Citibank (2,709) 334 Safran SA JP Morgan 1,627 903 Safran SA Citibank 3,197 987 Sanofi Bank of America
Merrill Lynch 3,748 132 Sanofi Citibank 515 136 Sanofi JP Morgan 286 18 Sartorius Stedim Biotech JP Morgan 108 (2,010) Schneider Electric SE Citibank (4,266) (439) Schneider Electric SE JP Morgan (2,084) 1,842 SCOR SE Bank of America
Merrill Lynch 2,304 8,200 SCOR SE Citibank 16,669 742 SCOR SE JP Morgan 319 254 SEB SA Bank of America
Merrill Lynch 3,683 113 SEB SA JP Morgan 1,777 (6,625) SES SA JP Morgan 16,199 (599) SES SA Bank of America
Merrill Lynch 1,281 (88) SES SA Citibank 172 (45) Societe BIC SA Bank of America
Merrill Lynch 170 506 Societe Generale SA Bank of America
Merrill Lynch 2,272 1,880 Societe Generale SA Citibank 5,281 339 Societe Generale SA JP Morgan 1,655 (66) Sodexo SA Bank of America
Merrill Lynch (402) (462) Sodexo SA Citibank (1,853) (253) Sodexo SA JP Morgan (1,367) 14,140 STMicroelectronics NV Bank of America
Merrill Lynch 4,668 2,026 STMicroelectronics NV Citibank 450 4,753 STMicroelectronics NV JP Morgan 3,520 309 Suez Citibank 174 (2,756) Technicolor SA Reg Citibank (234) (1,430) Technicolor SA Reg JP Morgan (392) 2,071 Technip SA Bank of America
Merrill Lynch 3,214
1,292 Technip SA JP Morgan 3,961 (109) Teleperformance Bank of America
Merrill Lynch (265) (1,577) Teleperformance Citibank (3,206) (160) Teleperformance JP Morgan (254) (607) Television Francaise 1 Bank of America
Merrill Lynch (661) (7,849) Television Francaise 1 JP Morgan (5,344) 2,590 Thales SA Bank of America
Merrill Lynch 2,109 297 Thales SA JP Morgan 544 566 Total SA Bank of America
Merrill Lynch 297 108 Total SA Citibank 148 1,827 Total SA JP Morgan 2,478 301 UBISOFT Entertainment Bank of America
Merrill Lynch 1,022 913 UBISOFT Entertainment Citibank 2,070 97 UBISOFT Entertainment JP Morgan 724 299 Valeo SA JP Morgan (250) 1,165 Valeo SA Bank of America
Merrill Lynch 5,988 219 Valeo SA Citibank 1,186 2,346 Veolia Environnement SA Citibank 1,651 (353) Vicat SA Bank of America
Merrill Lynch (887) (1,211) Vicat SA Citibank (2,719) (316) Vicat SA JP Morgan (236) (10) Vinci SA Citibank (13) (177) Vinci SA JP Morgan (653) (11,214) Vivendi SA Bank of America
Merrill Lynch (8,602) (1,505) Vivendi SA Citibank (1,151) (3,611) Vivendi SA JP Morgan (3,690) 26 Wendel SA Bank of America
Merrill Lynch 24 (6,728) Zodiac Aerospace JP Morgan 2,401 (4,051) Zodiac Aerospace Bank of America
Merrill Lynch (1,493)
180,872
Germany 1,256 Aareal Bank AG Bank of America
Merrill Lynch — 246 Aareal Bank AG JP Morgan 966 2,623 Aareal Bank AG Citibank (1,743) 636 adidas AG Bank of America
Merrill Lynch 1,203 54 adidas AG Citibank 81 546 Allianz SE Reg Bank of America
Merrill Lynch 5,852 142 Allianz SE Reg Citibank 1,562 113 Allianz SE Reg JP Morgan 736 1,090 Aurubis AG Citibank 1,771 317 Aurubis AG JP Morgan (43) 176 Aurubis AG Bank of America
Merrill Lynch 184 (1,726) Axel Springer SE Bank of America
Merrill Lynch (1,218) (707) Axel Springer SE Citibank (537) (235) Axel Springer SE JP Morgan (341) 1,220 BASF SE Bank of America
Merrill Lynch 3,435 195 BASF SE Citibank 579 532 BASF SE JP Morgan 660 544 Bayer AG Reg Citibank 899 78 Bayer AG Reg Bank of America
Merrill Lynch (892) 268 Bayer AG Reg JP Morgan (4,240) (1,276) Bayerische Motoren Werke AG JP Morgan (5,797)
BlackRock Style Advantage Fund continued
France continued France continued
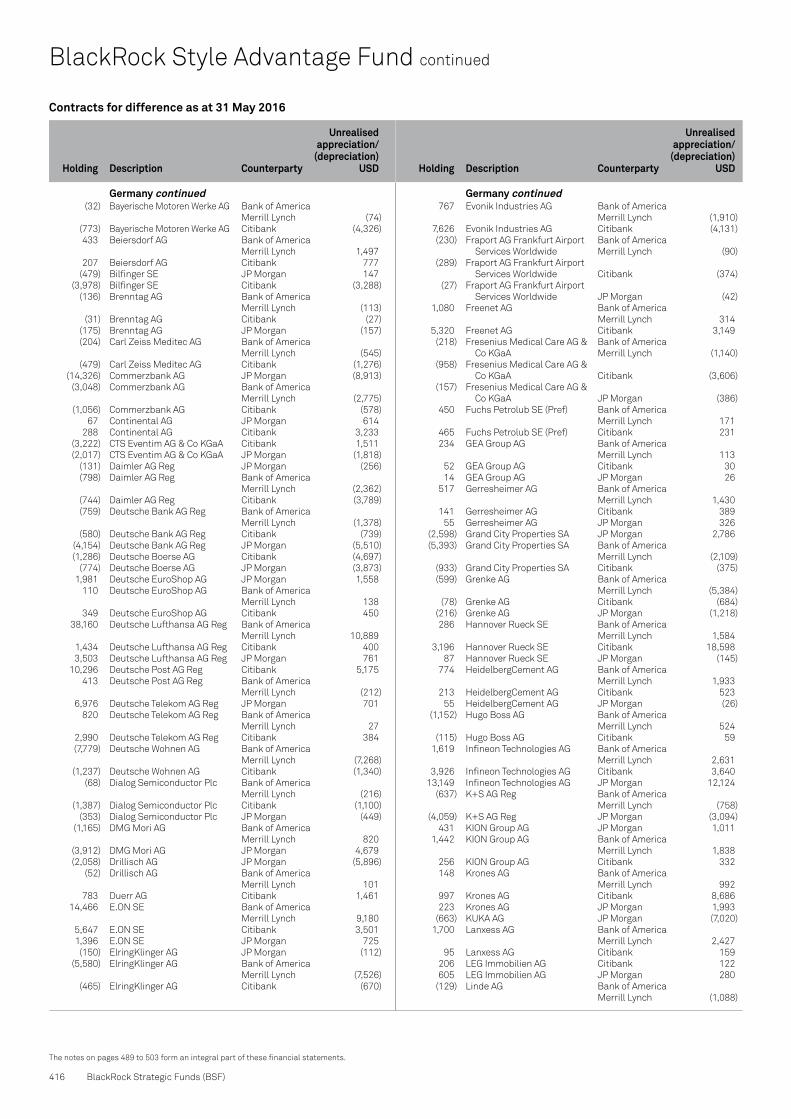
Contracts for difference as at 31 May 2016
Holding
Description Counterparty
Unrealised appreciation/
(depreciation) USD
Holding
Description Counterparty
Unrealised appreciation/
(depreciation) USD
416 BlackRock Strategic Funds (BSF)
The notes on pages 489 to 503 form an integral part of these financial statements.
BlackRock Style Advantage Fund continued
(32) Bayerische Motoren Werke AG Bank of America Merrill Lynch (74)
(773) Bayerische Motoren Werke AG Citibank (4,326) 433 Beiersdorf AG Bank of America
Merrill Lynch 1,497 207 Beiersdorf AG Citibank 777 (479) Bilfinger SE JP Morgan 147 (3,978) Bilfinger SE Citibank (3,288) (136) Brenntag AG Bank of America
Merrill Lynch (113) (31) Brenntag AG Citibank (27) (175) Brenntag AG JP Morgan (157) (204) Carl Zeiss Meditec AG Bank of America
Merrill Lynch (545) (479) Carl Zeiss Meditec AG Citibank (1,276) (14,326) Commerzbank AG JP Morgan (8,913) (3,048) Commerzbank AG Bank of America
Merrill Lynch (2,775) (1,056) Commerzbank AG Citibank (578) 67 Continental AG JP Morgan 614 288 Continental AG Citibank 3,233 (3,222) CTS Eventim AG & Co KGaA Citibank 1,511 (2,017) CTS Eventim AG & Co KGaA JP Morgan (1,818) (131) Daimler AG Reg JP Morgan (256) (798) Daimler AG Reg Bank of America
Merrill Lynch (2,362) (744) Daimler AG Reg Citibank (3,789) (759) Deutsche Bank AG Reg Bank of America
Merrill Lynch (1,378) (580) Deutsche Bank AG Reg Citibank (739) (4,154) Deutsche Bank AG Reg JP Morgan (5,510) (1,286) Deutsche Boerse AG Citibank (4,697) (774) Deutsche Boerse AG JP Morgan (3,873) 1,981 Deutsche EuroShop AG JP Morgan 1,558 110 Deutsche EuroShop AG Bank of America
Merrill Lynch 138 349 Deutsche EuroShop AG Citibank 450 38,160 Deutsche Lufthansa AG Reg Bank of America
Merrill Lynch 10,889 1,434 Deutsche Lufthansa AG Reg Citibank 400 3,503 Deutsche Lufthansa AG Reg JP Morgan 761 10,296 Deutsche Post AG Reg Citibank 5,175 413 Deutsche Post AG Reg Bank of America
Merrill Lynch (212) 6,976 Deutsche Telekom AG Reg JP Morgan 701 820 Deutsche Telekom AG Reg Bank of America
Merrill Lynch 27 2,990 Deutsche Telekom AG Reg Citibank 384 (7,779) Deutsche Wohnen AG Bank of America
Merrill Lynch (7,268) (1,237) Deutsche Wohnen AG Citibank (1,340) (68) Dialog Semiconductor Plc Bank of America
Merrill Lynch (216) (1,387) Dialog Semiconductor Plc Citibank (1,100) (353) Dialog Semiconductor Plc JP Morgan (449) (1,165) DMG Mori AG Bank of America
Merrill Lynch 820 (3,912) DMG Mori AG JP Morgan 4,679 (2,058) Drillisch AG JP Morgan (5,896) (52) Drillisch AG Bank of America
Merrill Lynch 101 783 Duerr AG Citibank 1,461 14,466 E.ON SE Bank of America
Merrill Lynch 9,180 5,647 E.ON SE Citibank 3,501 1,396 E.ON SE JP Morgan 725 (150) ElringKlinger AG JP Morgan (112) (5,580) ElringKlinger AG Bank of America
Merrill Lynch (7,526) (465) ElringKlinger AG Citibank (670)
767 Evonik Industries AG Bank of America Merrill Lynch (1,910)
7,626 Evonik Industries AG Citibank (4,131) (230) Fraport AG Frankfurt Airport Bank of America
Services Worldwide Merrill Lynch (90) (289) Fraport AG Frankfurt Airport
Services Worldwide Citibank (374) (27) Fraport AG Frankfurt Airport
Services Worldwide JP Morgan (42) 1,080 Freenet AG Bank of America
Merrill Lynch 314 5,320 Freenet AG Citibank 3,149 (218) Fresenius Medical Care AG & Bank of America
Co KGaA Merrill Lynch (1,140) (958) Fresenius Medical Care AG &
Co KGaA Citibank (3,606) (157) Fresenius Medical Care AG &
Co KGaA JP Morgan (386) 450 Fuchs Petrolub SE (Pref) Bank of America
Merrill Lynch 171 465 Fuchs Petrolub SE (Pref) Citibank 231 234 GEA Group AG Bank of America
Merrill Lynch 113 52 GEA Group AG Citibank 30 14 GEA Group AG JP Morgan 26 517 Gerresheimer AG Bank of America
Merrill Lynch 1,430 141 Gerresheimer AG Citibank 389 55 Gerresheimer AG JP Morgan 326 (2,598) Grand City Properties SA JP Morgan 2,786 (5,393) Grand City Properties SA Bank of America
Merrill Lynch (2,109) (933) Grand City Properties SA Citibank (375) (599) Grenke AG Bank of America
Merrill Lynch (5,384) (78) Grenke AG Citibank (684) (216) Grenke AG JP Morgan (1,218) 286 Hannover Rueck SE Bank of America
Merrill Lynch 1,584 3,196 Hannover Rueck SE Citibank 18,598 87 Hannover Rueck SE JP Morgan (145) 774 HeidelbergCement AG Bank of America
Merrill Lynch 1,933 213 HeidelbergCement AG Citibank 523 55 HeidelbergCement AG JP Morgan (26) (1,152) Hugo Boss AG Bank of America
Merrill Lynch 524 (115) Hugo Boss AG Citibank 59 1,619 Infineon Technologies AG Bank of America
Merrill Lynch 2,631 3,926 Infineon Technologies AG Citibank 3,640 13,149 Infineon Technologies AG JP Morgan 12,124 (637) K+S AG Reg Bank of America
Merrill Lynch (758) (4,059) K+S AG Reg JP Morgan (3,094) 431 KION Group AG JP Morgan 1,011 1,442 KION Group AG Bank of America
Merrill Lynch 1,838 256 KION Group AG Citibank 332 148 Krones AG Bank of America
Merrill Lynch 992 997 Krones AG Citibank 8,686 223 Krones AG JP Morgan 1,993 (663) KUKA AG JP Morgan (7,020) 1,700 Lanxess AG Bank of America
Merrill Lynch 2,427 95 Lanxess AG Citibank 159 206 LEG Immobilien AG Citibank 122 605 LEG Immobilien AG JP Morgan 280 (129) Linde AG Bank of America
Merrill Lynch (1,088)
Germany continued Germany continued

Contracts for difference as at 31 May 2016
Holding
Description Counterparty
Unrealised appreciation/
(depreciation) USD
Holding
Description Counterparty
Unrealised appreciation/
(depreciation) USD
Annual Report and Audited Accounts 417
The notes on pages 489 to 503 form an integral part of these financial statements.
(750) Linde AG Citibank (5,613) (428) MAN SE Bank of America
Merrill Lynch (439) (6,172) MAN SE Citibank (2,275) (2,299) MAN SE JP Morgan (154) 429 Merck KGaA Bank of America
Merrill Lynch 2,575 1,123 Metro AG Bank of America
Merrill Lynch 1,449 1,007 Metro AG Citibank 1,541 3,933 Metro AG JP Morgan 5,881 (123) MorphoSys AG Citibank (405) (4,056) MorphoSys AG JP Morgan (20,342) 469 MTU Aero Engines AG Bank of America
Merrill Lynch 600 51 MTU Aero Engines AG Citibank 69 844 Muenchener
Rueckversicherungs- Gesellschaft AG in Bank of America Muenchen Reg Merrill Lynch 9,207
198 Muenchener Rueckversicherungs- Gesellschaft AG in Muenchen Reg JP Morgan 2,008
(181) Nordex SE Bank of America Merrill Lynch (206)
78 OSRAM Licht AG JP Morgan 247 1,135 OSRAM Licht AG Bank of America
Merrill Lynch 2,384 (1,945) Porsche Automobil Bank of America
Holding SE (Pref) Merrill Lynch (5,258) (643) Porsche Automobil
Holding SE (Pref) JP Morgan (1,039) 177 ProSiebenSat.1 Media SE Citibank 160 873 ProSiebenSat.1 Media SE JP Morgan 1,292 1,947 ProSiebenSat.1 Media SE Bank of America
Merrill Lynch 1,358 1,154 Qiagen NV Bank of America
Merrill Lynch 233 164 Qiagen NV JP Morgan 10 (26) Rational AG Citibank 58 (39) Rational AG JP Morgan 76 (7) Rational AG Bank of America
Merrill Lynch (13) 1,895 Rheinmetall AG Citibank 4,381 315 Rheinmetall AG JP Morgan (1,481) 163 Rheinmetall AG Bank of America
Merrill Lynch 379 3,022 Rhoen-Klinikum AG JP Morgan 1,148 1,531 Rhoen-Klinikum AG Bank of America
Merrill Lynch 1,223 5,850 Rhoen-Klinikum AG Citibank 1,307 (31) RTL Group SA Bank of America
Merrill Lynch (206) (436) RTL Group SA Citibank (976) (83) RTL Group SA JP Morgan (683) 1,740 RWE AG Bank of America
Merrill Lynch 757 1,685 RWE AG JP Morgan 640 4,302 Salzgitter AG Bank of America
Merrill Lynch 16,522 2,397 Salzgitter AG Citibank 9,036 (267) SAP SE Bank of America
Merrill Lynch (588) (774) SAP SE Citibank (2,827) (3,425) SAP SE JP Morgan (12,677) (73) Sartorius AG (Pref) Citibank (1,015) (25) Sartorius AG (Pref) JP Morgan (383) 924 Siemens AG Reg Bank of America
Merrill Lynch 3,957 327 Siemens AG Reg Citibank 1,439
2,060 Software AG Citibank 771 277 Software AG JP Morgan 308 5,647 Software AG Bank of America
Merrill Lynch 1,890 2,808 Stada Arzneimittel AG Bank of America
Merrill Lynch 11,914 1,384 Stada Arzneimittel AG Citibank 5,689 13 Stada Arzneimittel AG JP Morgan 109 (2,449) Stroeer SE & Co KGaA JP Morgan (4,604) (7,975) Suedzucker AG Bank of America
Merrill Lynch (12,880) (604) Suedzucker AG Citibank (813) (1,715) Symrise AG JP Morgan (1,073) (867) Symrise AG Bank of America
Merrill Lynch 339 (247) Symrise AG Citibank (130) (39,965) Telefonica Deutschland
Holding AG Citibank 402 (14,163) Telefonica Deutschland
Holding AG JP Morgan 7,403 839 thyssenkrupp AG Bank of America
Merrill Lynch 1,167 494 thyssenkrupp AG Citibank 899 3,289 thyssenkrupp AG JP Morgan 6,145 514 United Internet AG Reg Bank of America
Merrill Lynch (747) 260 United Internet AG Reg Citibank (309) 33 United Internet AG Reg JP Morgan (43) (101) Volkswagen AG (Pref) JP Morgan (1,309) (93) Volkswagen AG (Pref) Bank of America
Merrill Lynch (706) (588) Volkswagen AG (Pref) Citibank (5,057) (4,259) Vonovia SE Bank of America
Merrill Lynch (5,043) (7,725) Vonovia SE JP Morgan (6,937) (520) Wacker Chemie AG Citibank (970) (65) Wacker Chemie AG JP Morgan (132) (446) Wirecard AG JP Morgan (1,039) (1,848) Zalando SE Citibank 1,806 (8,415) Zalando SE JP Morgan 10,635
36,446
Hong Kong (20,000) AAC Technologies Holdings Inc Citibank (7,339) (18,000) AAC Technologies Holdings Inc JP Morgan (19,003) (46,000) Agile Property Holdings Ltd JP Morgan (361) 237,000 Agricultural Bank of Bank of America
China Ltd 'H' Merrill Lynch 3,359 45,000 Agricultural Bank of
China Ltd 'H' Citibank 695 147,000 Agricultural Bank of
China Ltd 'H' JP Morgan 2,460 (200) AIA Group Ltd Bank of America
Merrill Lynch (45) (2,000) AIA Group Ltd Citibank (566) (5,200) AIA Group Ltd JP Morgan (1,563) 82,000 Air China Ltd 'H' Bank of America
Merrill Lynch (4,120) 22,000 Air China Ltd 'H' Citibank (736) (250,000) Alibaba Pictures Group Ltd Bank of America
Merrill Lynch (966) (220,000) Alibaba Pictures Group Ltd Citibank (1,983) (770,000) Alibaba Pictures Group Ltd JP Morgan (6,302) 1,000 Anhui Conch Cement Co Ltd 'H' Bank of America
Merrill Lynch 72 3,500 Anhui Conch Cement Co Ltd 'H' Citibank 279 4,000 Anhui Conch Cement Co Ltd 'H' JP Morgan 330 59,000 ANTA Sports Products Ltd Citibank 1,063 8,000 ANTA Sports Products Ltd Bank of America
Merrill Lynch (2,225)
BlackRock Style Advantage Fund continued
Germany continued Germany continued

Contracts for difference as at 31 May 2016
Holding
Description Counterparty
Unrealised appreciation/
(depreciation) USD
Holding
Description Counterparty
Unrealised appreciation/
(depreciation) USD
418 BlackRock Strategic Funds (BSF)
The notes on pages 489 to 503 form an integral part of these financial statements.
BlackRock Style Advantage Fund continued
(800) ASM Pacific Technology Ltd Citibank (309) (3,200) ASM Pacific Technology Ltd JP Morgan (803) (24,000) ASM Pacific Technology Ltd Bank of America
Merrill Lynch (10,875) 53,000 Bank of China Ltd 'H' Bank of America
Merrill Lynch 1,228 119,000 Bank of China Ltd 'H' Citibank 1,992 539,000 Bank of China Ltd 'H' JP Morgan 8,503 39,000 Bank of Communications Bank of America
Co Ltd 'H' Merrill Lynch 1,305 362,000 Bank of Communications
Co Ltd 'H' Citibank 11,652 53,000 Bank of Communications
Co Ltd 'H' JP Morgan 711 7,600 Bank of East Asia Ltd/The Citibank 1,076 33,200 Bank of East Asia Ltd/The JP Morgan 3,820 31,000 Beijing Enterprises Bank of America
Holdings Ltd Merrill Lynch 6,799 (6,000) Beijing Enterprises Water
Group Ltd Citibank (386) (486,000) Beijing Enterprises Water
Group Ltd JP Morgan (20,160) 117,000 Belle International Bank of America
Holdings Ltd Merrill Lynch (3,615) 22,000 Belle International
Holdings Ltd Citibank (368) 297,000 Belle International
Holdings Ltd JP Morgan (3,474) 10,000 BOC Hong Kong Holdings Ltd Bank of America
Merrill Lynch 2,768 46,000 BOC Hong Kong Holdings Ltd JP Morgan 7,200 (30,000) Brilliance China Automotive
Holdings Ltd Citibank (850) (8,000) Brilliance China Automotive
Holdings Ltd JP Morgan (124) (154,000) Brilliance China Automotive Bank of America
Holdings Ltd Merrill Lynch (4,177) (7,500) BYD Co Ltd 'H' Citibank (2,945) (1,000) BYD Co Ltd 'H' JP Morgan (387) 215,000 Cathay Pacific Airways Ltd Bank of America
Merrill Lynch 204 76,000 Cathay Pacific Airways Ltd Citibank 587 43,000 Cathay Pacific Airways Ltd JP Morgan 111 (1,484,000) CGN Power Co Ltd 'H' Bank of America
Merrill Lynch 10,178 (183,000) CGN Power Co Ltd 'H' Citibank 471 21,000 Champion (Reit) Bank of America
Merrill Lynch 378 101,000 Champion (Reit) JP Morgan 1,501 (8,000) Cheung Kong Infrastructure
Holdings Ltd JP Morgan 2,046 (30,000) Cheung Kong Infrastructure
Holdings Ltd Citibank (1,545) (5,000) Cheung Kong Property
Holdings Ltd JP Morgan 97 (7,500) Cheung Kong Property Bank of America
Holdings Ltd Merrill Lynch (2,655) (20,500) Cheung Kong Property
Holdings Ltd Citibank (8,446) (287,000) China Cinda Asset Bank of America
Management Co Ltd 'H' Merrill Lynch (3,695) (44,000) China Cinda Asset
Management Co Ltd 'H' Citibank (566) (504,000) China Cinda Asset
Management Co Ltd 'H' JP Morgan (7,438) 94,000 China CITIC Bank Corp Ltd 'H' Bank of America
Merrill Lynch 1,452 350,000 China CITIC Bank Corp Ltd 'H' Citibank 5,407 110,000 China CITIC Bank Corp Ltd 'H' JP Morgan (721) 71,000 China Communications Bank of America
Construction Co Ltd 'H' Merrill Lynch 1,663
10,000 China Communications Construction Co Ltd 'H' JP Morgan 118
(82,500) China Conch Venture Bank of America Holdings Ltd Merrill Lynch (10,254)
(44,000) China Conch Venture Holdings Ltd Citibank (5,778)
478,000 China Construction Bank Corp 'H' Citibank 23,386
60,000 China Construction Bank Corp 'H' JP Morgan 1,931
123,000 China Everbright Bank of America Bank Co Ltd 'H' Merrill Lynch 2,692
127,000 China Everbright Bank Co Ltd 'H' Citibank 2,616
486,000 China Everbright Bank Co Ltd 'H' JP Morgan 8,881
(264,000) China Everbright Bank of America International Ltd Merrill Lynch (9,723)
(39,000) China Everbright International Ltd Citibank (1,306)
(50,000) China Everbright International Ltd JP Morgan 64
2,000 China Everbright Ltd Bank of America Merrill Lynch 134
20,000 China Everbright Ltd Citibank 1,133 102,000 China Everbright Ltd JP Morgan 3,812 (285,500) China Galaxy Securities Bank of America
Co Ltd 'H' Merrill Lynch (18,582) (29,500) China Galaxy
Securities Co Ltd 'H' Citibank (1,899) (6,500) China Galaxy
Securities Co Ltd 'H' JP Morgan (494) (74,000) China Gas Holdings Ltd Bank of America
Merrill Lynch (3,271) (28,000) China Gas Holdings Ltd Citibank (1,009) (4,000) China Gas Holdings Ltd JP Morgan (237) (278,000) China Jinmao Bank of America
Holdings Group Ltd Merrill Lynch (8,845) (8,000) China Jinmao
Holdings Group Ltd Citibank (216) (48,000) China Jinmao
Holdings Group Ltd JP Morgan (1,483) 11,000 China Life
Insurance Co Ltd 'H' Citibank 1,246 3,000 China Life
Insurance Co Ltd 'H' JP Morgan 170 (67,000) China Longyuan Power Bank of America
Group Corp Ltd 'H' Merrill Lynch (567) (3,000) China Longyuan Power
Group Corp Ltd 'H' Citibank (43) (24,000) China Longyuan Power
Group Corp Ltd 'H' JP Morgan (803) (22,000) China Medical System Bank of America
Holdings Ltd Merrill Lynch (2,342) (1,000) China Medical System
Holdings Ltd Citibank (106) (5,000) China Medical System
Holdings Ltd JP Morgan (489) (18,000) China Mengniu Dairy Co Ltd Citibank (1,993) (8,000) China Mengniu Dairy Co Ltd JP Morgan (412) (44,000) China Mengniu Dairy Co Ltd Bank of America
Merrill Lynch (4,075) 1,500 China Merchants Bank of America
Bank Co Ltd 'H' Merrill Lynch 35 7,000 China Merchants
Bank Co Ltd 'H' Citibank 631 23,000 China Merchants
Bank Co Ltd 'H' JP Morgan 1,237 8,000 China Merchants Holdings
International Co Ltd Citibank 1,236
Hong Kong continued Hong Kong continued

Contracts for difference as at 31 May 2016
Holding
Description Counterparty
Unrealised appreciation/
(depreciation) USD
Holding
Description Counterparty
Unrealised appreciation/
(depreciation) USD
Annual Report and Audited Accounts 419
The notes on pages 489 to 503 form an integral part of these financial statements.
2,000 China Merchants Holdings International Co Ltd JP Morgan 237
25,500 China Minsheng Bank of America Banking Corp Ltd 'H' Merrill Lynch 919
41,500 China Minsheng Banking Corp Ltd 'H' Citibank 801
105,500 China Minsheng Banking Corp Ltd 'H' JP Morgan 2,200
31,000 China Mobile Ltd JP Morgan 13,686 4,000 China Overseas Land & Bank of America
Investment Ltd Merrill Lynch 747 54,000 China Overseas Land &
Investment Ltd JP Morgan 4,218 2,000 China Pacific Insurance Bank of America
Group Co Ltd 'H' Merrill Lynch 257 4,600 China Pacific Insurance
Group Co Ltd 'H' Citibank 533 33,800 China Pacific Insurance
Group Co Ltd 'H' JP Morgan 3,202 16,000 China Petroleum & Bank of America
Chemical Corp 'H' Merrill Lynch 371 10,000 China Power International Bank of America
Development Ltd Merrill Lynch 129 247,000 China Power International
Development Ltd Citibank 3,180 6,000 China Power International
Development Ltd JP Morgan (62) 22,000 China Railway Bank of America
Construction Corp Ltd 'H' Merrill Lynch 963 8,500 China Railway
Construction Corp Ltd 'H' Citibank 646 88,000 China Railway
Construction Corp Ltd 'H' JP Morgan 5,799 22,000 China Railway Group Ltd 'H' Citibank 651 59,000 China Railway Group Ltd 'H' JP Morgan 1,442 (92,000) China Resources Beer Bank of America
Holdings Co Ltd Merrill Lynch 2,221 (16,000) China Resources Beer
Holdings Co Ltd Citibank 618 (16,000) China Resources Gas Bank of America
Group Ltd Merrill Lynch (370) (10,000) China Resources Gas
Group Ltd Citibank (579) (4,000) China Resources Gas
Group Ltd JP Morgan (258) 8,000 China Resources Land Ltd Bank of America
Merrill Lynch 1,071 18,000 China Resources Land Ltd JP Morgan 1,024 132,000 China Resources Power Bank of America
Holdings Co Ltd Merrill Lynch (7,314) 28,000 China Resources Power
Holdings Co Ltd Citibank (1,081) (9,500) China Shenhua Bank of America
Energy Co Ltd 'H' Merrill Lynch (636) (50,500) China Shenhua
Energy Co Ltd 'H' Citibank (2,991) (158,000) China State Construction Bank of America
International Holdings Ltd Merrill Lynch 4,387 (20,000) China State Construction
International Holdings Ltd Citibank 232 (10,000) China State Construction
International Holdings Ltd JP Morgan 1,622 (77,600) China Taiping Insurance Bank of America
Holdings Co Ltd Merrill Lynch (7,814) (19,200) China Taiping Insurance
Holdings Co Ltd Citibank (2,027) (3,400) China Taiping Insurance
Holdings Co Ltd JP Morgan (9) 180,000 China Telecom Corp Ltd 'H' Bank of America
Merrill Lynch (2,178) 80,000 China Telecom Corp Ltd 'H' Citibank (824)
96,000 China Telecom Corp Ltd 'H' JP Morgan (1,112) 52,000 China Unicom Hong Kong Ltd Bank of America
Merrill Lynch (3,548) 154,000 China Unicom Hong Kong Ltd Citibank (1,388) (221,000) CITIC Ltd Bank of America
Merrill Lynch (11,079) (41,000) CITIC Ltd Citibank (1,689) (9,000) CITIC Ltd JP Morgan (209) (8,500) CITIC Securities Co Ltd 'H' Citibank (1,204) (3,500) CITIC Securities Co Ltd 'H' JP Morgan (433) (500) CITIC Securities Co Ltd 'H' Bank of America
Merrill Lynch (67) (500) CK Hutchison Holdings Ltd JP Morgan 161 (12,000) CK Hutchison Holdings Ltd Bank of America
Merrill Lynch (1,144) (3,000) CK Hutchison Holdings Ltd Citibank (734) 21,000 CLP Holdings Ltd Bank of America
Merrill Lynch 5,175 2,000 CLP Holdings Ltd Citibank 489 2,500 CLP Holdings Ltd JP Morgan 113 16,000 CNOOC Ltd Bank of America
Merrill Lynch 386 6,000 CNOOC Ltd Citibank 170 2,000 COSCO Pacific Ltd Citibank 13 2,000 COSCO Pacific Ltd Bank of America
Merrill Lynch (23) 46,000 Country Garden Bank of America
Holdings Co Ltd Merrill Lynch 592 87,000 Country Garden
Holdings Co Ltd Citibank 1,120 (290,000) CRRC Corp Ltd 'H' Citibank (10,828) (127,000) CRRC Corp Ltd 'H' JP Morgan (2,616) (48,000) CSPC Pharmaceutical Bank of America
Group Ltd Merrill Lynch (1,174) (8,000) CSPC Pharmaceutical
Group Ltd Citibank (247) (12,000) CSPC Pharmaceutical
Group Ltd JP Morgan (726) 13,600 Dah Sing Banking Group Ltd Bank of America
Merrill Lynch 945 63,200 Dah Sing Banking Group Ltd Citibank 1,627 42,000 Dah Sing Banking Group Ltd JP Morgan 2,487 10,000 Dah Sing Financial
Holdings Ltd Citibank 901 5,200 Dah Sing Financial
Holdings Ltd JP Morgan 770 2,400 Dah Sing Financial Bank of America
Holdings Ltd Merrill Lynch 433 (9,200) Dalian Wanda Commercial Bank of America
Properties Co Ltd 'H' Merrill Lynch 2,369 (29,700) Dalian Wanda Commercial
Properties Co Ltd 'H' JP Morgan 7,648 44,000 Dongfeng Motor Bank of America
Group Co Ltd 'H' Merrill Lynch 4,702 60,000 Dongfeng Motor
Group Co Ltd 'H' Citibank 6,103 190,000 Dongfeng Motor
Group Co Ltd 'H' JP Morgan 19,075 (2,000) ENN Energy Holdings Ltd Bank of America
Merrill Lynch (245) (9,600) Esprit Holdings Ltd Citibank (110) 6,000 Evergrande Real Estate
Group Ltd Citibank 62 22,000 Evergrande Real Estate
Group Ltd JP Morgan 116 6,000 Evergrande Real Bank of America
Estate Group Ltd Merrill Lynch (15) (33,000) Far East Horizon Ltd JP Morgan 1,105 (387,000) Far East Horizon Ltd Bank of America
Merrill Lynch (10,409) (57,000) Far East Horizon Ltd Citibank (1,835)
BlackRock Style Advantage Fund continued
Hong Kong continued Hong Kong continued

Contracts for difference as at 31 May 2016
Holding
Description Counterparty
Unrealised appreciation/
(depreciation) USD
Holding
Description Counterparty
Unrealised appreciation/
(depreciation) USD
420 BlackRock Strategic Funds (BSF)
The notes on pages 489 to 503 form an integral part of these financial statements.
BlackRock Style Advantage Fund continued
110,000 FIH Mobile Ltd Bank of America Merrill Lynch 1,416
76,000 FIH Mobile Ltd JP Morgan 881 255,000 FIH Mobile Ltd Citibank (1,313) (4,000) Fosun International Ltd Bank of America
Merrill Lynch (361) (8,500) Fosun International Ltd Citibank (613) (500) Fosun International Ltd JP Morgan (68) (7,000) Galaxy Entertainment
Group Ltd Citibank (2,028) (3,000) Galaxy Entertainment
Group Ltd JP Morgan (541) (32,000) Galaxy Entertainment Bank of America
Group Ltd Merrill Lynch (7,413) (144,000) GCL-Poly Energy Holdings Ltd Citibank — (113,000) GCL-Poly Energy Holdings Ltd JP Morgan 582 (1,368,000) GCL-Poly Energy Holdings Ltd Bank of America
Merrill Lynch (1,041) 85,000 Geely Automobile Holdings Ltd Bank of America
Merrill Lynch 4,706 15,000 Geely Automobile Holdings Ltd Citibank 502 355,000 Geely Automobile Holdings Ltd JP Morgan 11,491 1,400 GF Securities Co Ltd 'H' Bank of America
Merrill Lynch 227 1,200 GF Securities Co Ltd 'H' Citibank 185 3,600 GF Securities Co Ltd 'H' JP Morgan 667 (13,000) GOME Electrical Appliances Bank of America
Holding Ltd Merrill Lynch (50) (281,000) GOME Electrical Appliances
Holding Ltd JP Morgan (733) (162,000) Great Wall Motor Co Ltd 'H' Bank of America
Merrill Lynch (8,992) (35,500) Great Wall Motor Co Ltd 'H' Citibank (1,965) (11,000) Great Wall Motor Co Ltd 'H' JP Morgan (649) 20,000 Guangdong Investment Ltd Bank of America
Merrill Lynch 412 38,000 Guangdong Investment Ltd Citibank 881 46,000 Guangdong Investment Ltd JP Morgan 813 83,000 Haier Electronics Group Co Ltd Bank of America
Merrill Lynch 4,938 13,000 Haier Electronics Group Co Ltd Citibank 937 12,000 Haier Electronics Group Co Ltd JP Morgan 278 11,000 Haitian International Bank of America
Holdings Ltd Merrill Lynch 1,133 95,000 Haitian International
Holdings Ltd Citibank 6,605 21,000 Haitian International
Holdings Ltd JP Morgan 595 (10,000) Haitong International
Securities Group Ltd JP Morgan (528) (192,000) Haitong International Bank of America
Securities Group Ltd Merrill Lynch (7,056) (108,000) Haitong International
Securities Group Ltd Citibank (4,589) (10,400) Haitong Securities Co Ltd 'H' Bank of America
Merrill Lynch (1,125) (10,800) Haitong Securities Co Ltd 'H' Citibank (1,112) (2,000) Haitong Securities Co Ltd 'H' JP Morgan (172) 5,000 Hang Lung Properties Ltd JP Morgan 255 (4,200) Hang Seng Bank Ltd Bank of America
Merrill Lynch (2,256) (900) Hang Seng Bank Ltd Citibank (487) (800) Hang Seng Bank Ltd JP Morgan (17) 37,000 Henderson Land Bank of America
Development Co Ltd Merrill Lynch 11,156 10,000 Henderson Land
Development Co Ltd Citibank 3,412 (12,500) Hengan International Bank of America
Group Co Ltd Merrill Lynch (7,976) (3,500) Hengan International
Group Co Ltd Citibank (2,433)
(2,000) Hengan International Group Co Ltd JP Morgan (721)
179,500 HK Electric Investments & Bank of America HK Electric Investments Ltd Merrill Lynch (2,302)
91,000 HK Electric Investments & HK Electric Investments Ltd Citibank (820)
54,000 HK Electric Investments & HK Electric Investments Ltd JP Morgan (904)
(2,000) HKT Trust & HKT Ltd (Unit) Bank of America Merrill Lynch (15)
(147,000) Hong Kong & China Gas Co Ltd Bank of America Merrill Lynch (10,422)
(26,000) Hong Kong & China Gas Co Ltd Citibank (1,942) (14,000) Hong Kong & China Gas Co Ltd JP Morgan (649) 16,000 Huaneng Power Bank of America
International Inc 'H' Merrill Lynch 103 34,000 Huaneng Power
International Inc 'H' Citibank 394 94,000 Huaneng Power
International Inc 'H' JP Morgan 20 37,400 Huatai Securities Co Ltd 'H' Bank of America
Merrill Lynch 5,866 5,600 Huatai Securities Co Ltd 'H' JP Morgan 735 3,000 Hysan Development Co Ltd Citibank 715 83,000 Industrial & Commercial Bank of America
Bank of China Ltd 'H' Merrill Lynch 2,671 68,000 Industrial & Commercial
Bank of China Ltd 'H' Citibank 2,101 509,000 Industrial & Commercial
Bank of China Ltd 'H' JP Morgan 12,868 12,500 Kerry Properties Ltd Citibank 97 83,500 Kerry Properties Ltd JP Morgan (1,880) 38,000 Kingsoft Corp Ltd Citibank 1,076 3,000 Kingsoft Corp Ltd Bank of America
Merrill Lynch (888) 2,000 Kingsoft Corp Ltd JP Morgan (556) (120,000) Kunlun Energy Co Ltd Bank of America
Merrill Lynch (3,955) (14,000) Kunlun Energy Co Ltd Citibank (451) (12,000) Kunlun Energy Co Ltd JP Morgan (201) 27,000 Lee & Man Paper Bank of America
Manufacturing Ltd Merrill Lynch 869 86,000 Lee & Man Paper
Manufacturing Ltd Citibank 3,432 1,000 Lee & Man Paper
Manufacturing Ltd JP Morgan 31 6,000 Lenovo Group Ltd Bank of America
Merrill Lynch (160) 14,000 Lenovo Group Ltd Citibank (216) 10,000 Lenovo Group Ltd JP Morgan (1,210) (8,000) Li & Fung Ltd Bank of America
Merrill Lynch 268 (4,000) Li & Fung Ltd Citibank 72 (42,000) Li & Fung Ltd JP Morgan 1,192 (90,500) Link (Reit) Bank of America
Merrill Lynch (13,513) (28,500) Link (Reit) Citibank (4,587) 500 Longfor Properties Co Ltd Bank of America
Merrill Lynch 30 2,000 Longfor Properties Co Ltd Citibank 142 (12,000) Luk Fook Holdings Bank of America
International Ltd Merrill Lynch (1,650) (9,600) Man Wah Holdings Ltd Bank of America
Merrill Lynch (2,076) (40,000) Melco International
Development Ltd Citibank (3,914) (114,000) Melco International
Development Ltd JP Morgan (5,747) (19,600) MGM China Holdings Ltd Bank of America
Merrill Lynch (2,658) (2,400) MGM China Holdings Ltd Citibank (352) (5,200) MGM China Holdings Ltd JP Morgan (656)
Hong Kong continued Hong Kong continued

Contracts for difference as at 31 May 2016
Holding
Description Counterparty
Unrealised appreciation/
(depreciation) USD
Holding
Description Counterparty
Unrealised appreciation/
(depreciation) USD
* Amounts which are less than 0.5 USD have been rounded down to zero.
Annual Report and Audited Accounts 421
The notes on pages 489 to 503 form an integral part of these financial statements.
(1,500) MTR Corp Ltd JP Morgan 318 (1,500) MTR Corp Ltd Bank of America
Merrill Lynch 290 (27,500) MTR Corp Ltd Citibank (3,364) 1,600 New China Life Bank of America
Insurance Co Ltd 'H' Merrill Lynch 453 12,900 New China Life
Insurance Co Ltd 'H' Citibank 3,322 19,000 New China Life
Insurance Co Ltd 'H' JP Morgan 4,203 (2,000) New World Bank of America
Development Co Ltd Merrill Lynch (75) (3,000) New World
Development Co Ltd JP Morgan (19) 36,000 Nine Dragons Paper Bank of America
Holdings Ltd Merrill Lynch 1,761 38,000 Nine Dragons Paper
Holdings Ltd Citibank 1,761 2,000 Nine Dragons Paper
Holdings Ltd JP Morgan 120 13,500 Orient Overseas Bank of America
International Ltd Merrill Lynch 4,867 18,000 Orient Overseas
International Ltd JP Morgan 5,600 (103,000) People's Insurance Co Group Bank of America
of China Ltd/The 'H' Merrill Lynch (1,933) (226,000) People's Insurance Co Group
of China Ltd/The 'H' JP Morgan (3,783) (112,000) PetroChina Co Ltd 'H' Bank of America
Merrill Lynch (1,450) (24,000) PetroChina Co Ltd 'H' Citibank (402) (14,000) PetroChina Co Ltd 'H' JP Morgan (83) (32,000) PICC Property &
Casualty Co Ltd 'H' JP Morgan (2,966) 16,000 Ping An Insurance
Group Co of China Ltd 'H' Citibank 3,296 42,000 Ping An Insurance
Group Co of China Ltd 'H' JP Morgan 6,519 1,000 Power Assets Holdings Ltd Bank of America
Merrill Lynch (13) 4,500 Power Assets Holdings Ltd JP Morgan (666) (1,600) Sands China Ltd Bank of America
Merrill Lynch (464) (1,200) Sands China Ltd Citibank (371) (1,600) Sands China Ltd JP Morgan (482) 12,000 Semiconductor Manufacturing
International Corp JP Morgan 77 29,000 Shanghai Industrial
Holdings Ltd JP Morgan 2,107 (90,000) Shangri-La Asia Ltd Bank of America
Merrill Lynch (1,842) (14,000) Shangri-La Asia Ltd Citibank (469) 13,000 Shimao Property Holdings Ltd Bank of America
Merrill Lynch 402 6,500 Shimao Property Holdings Ltd Citibank 167 500 Shimao Property Holdings Ltd JP Morgan (50) 255,000 Shui On Land Ltd Bank of America
Merrill Lynch (311) 221,000 Sino Biopharmaceutical Ltd Bank of America
Merrill Lynch 12,014 153,000 Sino Biopharmaceutical Ltd JP Morgan (3,743) 166,000 Sino Land Co Ltd Bank of America
Merrill Lynch 10,450 64,000 Sino Land Co Ltd Citibank 3,955 41,500 Sino-Ocean Land Holdings Ltd Bank of America
Merrill Lynch 641 20,500 Sino-Ocean Land Holdings Ltd Citibank 238 3,500 Sino-Ocean Land Holdings Ltd JP Morgan (77) 14,800 Sinopharm Group Co Ltd 'H' Citibank 953
164,000 SJM Holdings Ltd Bank of America Merrill Lynch 4,033
37,000 SJM Holdings Ltd Citibank 667 (179,500) SOHO China Ltd Bank of America
Merrill Lynch 1,732 (14,000) SOHO China Ltd JP Morgan 523 16,500 Sun Art Retail Group Ltd Bank of America
Merrill Lynch (446) 8,000 Sun Art Retail Group Ltd Citibank (165) 16,000 Sun Art Retail Group Ltd JP Morgan (721) (1,000) Sun Hung Kai Properties Ltd Bank of America
Merrill Lynch (592) (1,000) Sun Hung Kai Properties Ltd Citibank (547) (3,000) Sun Hung Kai Properties Ltd JP Morgan (1,579) 4,000 Sunac China Holdings Ltd JP Morgan (82) (500) Swire Pacific Ltd 'A' Citibank (200) (10,500) Swire Pacific Ltd 'A' JP Morgan (4,746) (2,500) Swire Pacific Ltd 'A' Bank of America
Merrill Lynch (692) (36,400) Swire Properties Ltd Bank of America
Merrill Lynch (10,983) (2,600) Swire Properties Ltd Citibank (770) (12,800) Swire Properties Ltd JP Morgan (3,461) 23,000 Techtronic Industries Co Ltd Bank of America
Merrill Lynch 740 4,000 Techtronic Industries Co Ltd Citibank 386 12,000 Techtronic Industries Co Ltd JP Morgan 2,472 1,800 Tencent Holdings Ltd Bank of America
Merrill Lynch 2,943 18,000 Tencent Holdings Ltd JP Morgan 31,813 (60,000) Tingyi Cayman Islands Bank of America
Holding Corp Merrill Lynch 6,793 (4,000) Tingyi Cayman Islands
Holding Corp JP Morgan 623 (18,000) Tsingtao Brewery Co Ltd 'H' Bank of America
Merrill Lynch 191 (6,000) Tsingtao Brewery Co Ltd 'H' JP Morgan 888 4,000 Value Partners Group Ltd Bank of America
Merrill Lynch 257 24,000 Value Partners Group Ltd JP Morgan 1,710 2,000 VTech Holdings Ltd Bank of America
Merrill Lynch 1,558 800 VTech Holdings Ltd Citibank 93 3,900 VTech Holdings Ltd JP Morgan 980 63,000 Want Want China Holdings Ltd Bank of America
Merrill Lynch (769) 16,000 Want Want China Holdings Ltd JP Morgan (824) 11,500 WH Group Ltd JP Morgan 104 264,000 WH Group Ltd Citibank 1,699 42,500 WH Group Ltd Bank of America
Merrill Lynch (711) (1,000) Wharf Holdings Ltd/The JP Morgan (19) 1,000 Wheelock & Co Ltd Citibank 264 2,000 Wheelock & Co Ltd JP Morgan 13 (79,600) Wynn Macau Ltd Citibank (12,503) (8,400) Wynn Macau Ltd JP Morgan (1,406) 152,000 Xinyi Glass Holdings Ltd Bank of America
Merrill Lynch 2,411 4,000 Xinyi Glass Holdings Ltd Citibank 62 22,000 Xinyi Glass Holdings Ltd JP Morgan 453 7,500 Yue Yuen Industrial Bank of America
Holdings Ltd Merrill Lynch 180 5,500 Yue Yuen Industrial
Holdings Ltd Citibank 283 112,000 Yuexiu Property Co Ltd Bank of America
Merrill Lynch 577 780,000 Yuexiu Property Co Ltd* Citibank — 346,000 Yuexiu Property Co Ltd JP Morgan (4,009) (5,500) Zhuzhou CRRC Times
Electric Co Ltd Citibank (885)
BlackRock Style Advantage Fund continued
Hong Kong continued Hong Kong continued

Contracts for difference as at 31 May 2016
Holding
Description Counterparty
Unrealised appreciation/
(depreciation) USD
Holding
Description Counterparty
Unrealised appreciation/
(depreciation) USD
422 BlackRock Strategic Funds (BSF)
The notes on pages 489 to 503 form an integral part of these financial statements.
BlackRock Style Advantage Fund continued
(1,000) Zhuzhou CRRC Times Electric Co Ltd JP Morgan (232)
(41,500) Zhuzhou CRRC Times Bank of America Electric Co Ltd Merrill Lynch (6,168)
(11,526)
Italy 123,063 A2A SpA JP Morgan 10,992 24,834 A2A SpA Bank of America
Merrill Lynch 1,664 12,320 ACEA SpA Bank of America
Merrill Lynch 4,580 3,082 ACEA SpA Citibank 826 3,301 ACEA SpA JP Morgan 1,327 1,249 Assicurazioni Generali SpA Bank of America
Merrill Lynch 781 1,327 Assicurazioni Generali SpA JP Morgan 341 11,517 Assicurazioni Generali SpA Citibank 13,121 (6,608) Atlantia SpA Bank of America
Merrill Lynch (1,531) (1,320) Atlantia SpA Citibank (516) (19) Atlantia SpA JP Morgan (4) 242 Autogrill SpA JP Morgan 93 15,190 Autogrill SpA Citibank (1,951) 3,252 Banca Generali SpA Bank of America
Merrill Lynch 4,319 534 Banca Generali SpA Citibank 907 808 Banca Generali SpA JP Morgan 54 4,899 Banca Mediolanum SpA Bank of America
Merrill Lynch 1,148 298 Banca Mediolanum SpA Citibank 55 504 Banca Mediolanum SpA JP Morgan 119 (34,744) Banca Popolare dell'Emilia
Romagna SC Citibank (13,583) (2,896) Banca Popolare dell'Emilia
Romagna SC JP Morgan (660) (35,074) Banca Popolare di Milano Scarl Citibank (1,022) (183,095) Banca Popolare di Milano Scarl JP Morgan (4,510) (35,681) Banca Popolare di Milano Scarl Bank of America
Merrill Lynch 618 (4,677) Banca Popolare di Bank of America
Sondrio SCARL Merrill Lynch (384) (3,738) Banco Popolare SC Bank of America
Merrill Lynch 67 (1,269) Banco Popolare SC Citibank (366) (28,007) Banco Popolare SC JP Morgan (5,257) 3,676 Brembo SpA Citibank 2,258 1,463 Brembo SpA Bank of America
Merrill Lynch (735) (5,510) Brunello Cucinelli SpA Bank of America
Merrill Lynch (1,066) (2,774) Brunello Cucinelli SpA JP Morgan (1,487) 1,011 Buzzi Unicem SpA Bank of America
Merrill Lynch 1,062 346 Buzzi Unicem SpA Citibank 274 4,129 Buzzi Unicem SpA JP Morgan 3,338 (15,434) CNH Industrial NV Citibank (7,240) (2,855) CNH Industrial NV JP Morgan (1,244) (384) Credito Emiliano SpA Bank of America
Merrill Lynch (99) 398 Davide Campari-Milano SpA Bank of America
Merrill Lynch 69 885 Davide Campari-Milano SpA Citibank 390 156 Davide Campari-Milano SpA JP Morgan (12) 84 De' Longhi SpA Bank of America
Merrill Lynch 196 332 DiaSorin SpA Bank of America
Merrill Lynch 742 2,077 DiaSorin SpA Citibank 2,668 115 DiaSorin SpA JP Morgan 225
9,100 Enel SpA Bank of America Merrill Lynch 1,138
25,447 Enel SpA Citibank 4,946 17,650 Enel SpA JP Morgan 4,692 (2,244) Eni SpA Bank of America
Merrill Lynch (2,204) (362) ERG SpA Bank of America
Merrill Lynch 340 (209) ERG SpA Citibank (56) (1,985) ERG SpA JP Morgan (88) 244 EXOR SpA Citibank 891 188 EXOR SpA JP Morgan 514 (2,404) Ferrari NV JP Morgan (3,692) 3,787 Fiat Chrysler Automobiles NV Citibank 1,650 7,243 FinecoBank Banca Fineco SpA Bank of America
Merrill Lynch 1,898 453 FinecoBank Banca Fineco SpA Citibank 142 2,026 FinecoBank Banca Fineco SpA JP Morgan 487 (355) Infrastrutture Wireless
Italiane SpA JP Morgan 41 (33,408) Infrastrutture Wireless
Italiane SpA Citibank (597) 1,557 Intesa Sanpaolo SpA Bank of America
Merrill Lynch 237 6,905 Intesa Sanpaolo SpA Citibank 1,136 927 Intesa Sanpaolo SpA JP Morgan 99 (236) Luxottica Group SpA Citibank 66 (2,734) Luxottica Group SpA JP Morgan 1,551 (67) Luxottica Group SpA Bank of America
Merrill Lynch (85) 18,975 Mediaset SpA Bank of America
Merrill Lynch 2,400 5,211 Mediaset SpA Citibank 664 6,110 Mediaset SpA JP Morgan 1,147 4,524 Mediobanca SpA Citibank 2,299 471 Mediobanca SpA JP Morgan 416 (2,273) Moncler SpA Bank of America
Merrill Lynch 1,853 (3,870) Moncler SpA Citibank (951) (1,089) Moncler SpA JP Morgan (414) 3,838 Prysmian SpA Bank of America
Merrill Lynch 2,486 6,908 Prysmian SpA Citibank 3,549 1,035 Prysmian SpA JP Morgan 2,046 400 Recordati SpA Bank of America
Merrill Lynch 987 443 Recordati SpA Citibank 332 6,495 Recordati SpA JP Morgan 8,120 (1,080) Salvatore Ferragamo SpA Bank of America
Merrill Lynch 353 (958) Salvatore Ferragamo SpA JP Morgan 471 (5,662) Snam SpA Bank of America
Merrill Lynch 32 (1,388) Snam SpA Citibank (332) (23,474) Snam SpA JP Morgan (2,704) 686 Societa Iniziative Autostradali Bank of America
e Servizi SpA Merrill Lynch 211 4,082 Societa Iniziative Autostradali
e Servizi SpA Citibank 1,778 4,631 Societa Iniziative Autostradali
e Servizi SpA JP Morgan (440) 128,004 Telecom Italia SpA/Milano Bank of America
Merrill Lynch 3,338 21,729 Telecom Italia SpA/Milano Citibank 667 26,321 Telecom Italia SpA/Milano JP Morgan 206 (547) Tenaris SA JP Morgan (308) (161) Tenaris SA Bank of America
Merrill Lynch (68) 7,780 Terna Rete Elettrica Bank of America
Nazionale SpA Merrill Lynch 1,193
Hong Kong continued Italy continued

Contracts for difference as at 31 May 2016
Holding
Description Counterparty
Unrealised appreciation/
(depreciation) USD
Holding
Description Counterparty
Unrealised appreciation/
(depreciation) USD
Annual Report and Audited Accounts 423
The notes on pages 489 to 503 form an integral part of these financial statements.
4,139 Terna Rete Elettrica Nazionale SpA Citibank 754
877 Terna Rete Elettrica Nazionale SpA JP Morgan 105
(958) Tod's SpA JP Morgan 797 (4,537) UniCredit SpA JP Morgan 222 (4,984) Unione di Banche Italiane SpA JP Morgan (215) (11,039) Unipol Gruppo Finanziario SpA Bank of America
Merrill Lynch (1,554) (2,657) Unipol Gruppo Finanziario SpA Citibank (700) (28,814) Unipol Gruppo Finanziario SpA JP Morgan (6,815) (4,142) Yoox Net-A-Porter Group SpA JP Morgan (8,103) (3,721) Yoox Net-A-Porter Group SpA Bank of America
Merrill Lynch (748) (13,135) Yoox Net-A-Porter Group SpA Citibank (18,486)
18,261
Japan (3,600) ABC-Mart Inc Bank of America
Merrill Lynch (3,894) (1,300) ABC-Mart Inc Citibank (1,170) (16,200) Acom Co Ltd JP Morgan 596 (100) Advantest Corp JP Morgan (67) (8,800) Aeon Co Ltd Citibank (2,086) (11,200) AEON Financial Service Co Ltd Bank of America
Merrill Lynch (7,116) (47,500) Aiful Corp Bank of America
Merrill Lynch (4,630) (800) Aiful Corp Citibank (65) (13,300) Aiful Corp JP Morgan (239) (1,000) Air Water Inc Citibank (284) (2,100) Aisin Seiki Co Ltd Citibank (7,462) (1,100) Aisin Seiki Co Ltd JP Morgan (4,075) 3,500 Ajinomoto Co Inc Bank of America
Merrill Lynch 5,479 300 Alfresa Holdings Corp Citibank (49) 5,300 Alfresa Holdings Corp JP Morgan 8,772 (2,100) Alps Electric Co Ltd Citibank (2,867) (1,900) Alps Electric Co Ltd JP Morgan (8,550) 12,400 Amada Holdings Co Ltd JP Morgan 5,433 (4,000) ANA Holdings Inc JP Morgan (28) 1,600 Aoyama Trading Co Ltd Citibank (744) 2,000 Aozora Bank Ltd Bank of America
Merrill Lynch 18 72,000 Aozora Bank Ltd JP Morgan 2,419 11,000 Asahi Glass Co Ltd Bank of America
Merrill Lynch 614 3,000 Asahi Glass Co Ltd Citibank 216 (100) Asahi Group Holdings Ltd Citibank (183) (100) Asahi Group Holdings Ltd JP Morgan (234) (4,100) Asahi Intecc Co Ltd Bank of America
Merrill Lynch 4,134 (12,000) Asahi Kasei Corp Bank of America
Merrill Lynch (3,594) (4,500) Asics Corp Bank of America
Merrill Lynch (2,752) (1,800) Asics Corp JP Morgan (6,285) 19,800 Astellas Pharma Inc JP Morgan 12,732 21,800 Autobacs Seven Co Ltd Bank of America
Merrill Lynch (935) 600 Azbil Corp Citibank 189 1,200 Azbil Corp JP Morgan 3,283 2,600 Bandai Namco Holdings Inc Citibank 1,094 4,000 Bank of Kyoto Ltd/The JP Morgan 1,302 (500) Benesse Holdings Inc Bank of America
Merrill Lynch (291) (100) Benesse Holdings Inc Citibank (22) (2,900) Benesse Holdings Inc JP Morgan (525) 4,000 Bridgestone Corp Bank of America
Merrill Lynch 5,499
8,300 Brother Industries Ltd Citibank 4,366 (3,500) Calbee Inc JP Morgan (3,826) (700) Calbee Inc Bank of America
Merrill Lynch 945 3,000 Calsonic Kansei Corp Bank of America
Merrill Lynch 567 9,000 Calsonic Kansei Corp JP Morgan 7,031 4,900 Canon Inc Citibank 4,192 12,100 Canon Marketing Japan Inc Citibank 7,575 200 Casio Computer Co Ltd Bank of America
Merrill Lynch 103 5,700 Casio Computer Co Ltd JP Morgan 151 1,200 Central Japan Railway Co JP Morgan 4,361 (1,100) Century Tokyo Leasing Corp Bank of America
Merrill Lynch (448) 1,000 Chiba Bank Ltd/The JP Morgan 205 7,000 Chiba Bank Ltd/The Bank of America
Merrill Lynch 1,501 3,000 Chiba Bank Ltd/The Citibank 594 (8,000) Chiyoda Corp JP Morgan 586 (6,000) Chiyoda Corp Bank of America
Merrill Lynch (864) (900) Chugai Pharmaceutical Co Ltd Bank of America
Merrill Lynch (576) (1,700) Chugai Pharmaceutical Co Ltd Citibank (1,394) (1,900) Chugai Pharmaceutical Co Ltd JP Morgan (5,215) 8,000 Chugoku Bank Ltd/The JP Morgan 3,574 500 Citizen Holdings Co Ltd JP Morgan 134 (4,800) Coca-Cola East Japan Co Ltd JP Morgan (2,003) (3,200) Coca-Cola East Japan Co Ltd Bank of America
Merrill Lynch (939) 7,200 Coca-Cola West Co Ltd Citibank (1,239) 400 Coca-Cola West Co Ltd JP Morgan (105) 5,000 Coca-Cola West Co Ltd Bank of America
Merrill Lynch (2,250) (1,100) COLOPL Inc Citibank (455) (7,200) COLOPL Inc JP Morgan (3,300) 3,100 COMSYS Holdings Corp Bank of America
Merrill Lynch (869) 8,700 Concordia Financial Group Ltd JP Morgan 1,715 (1,300) Cosmos Pharmaceutical Corp JP Morgan (10,261) (3,300) Credit Saison Co Ltd Bank of America
Merrill Lynch (1,504) (500) Credit Saison Co Ltd Citibank (303) (1,000) CyberAgent Inc Citibank (2,610) (2,000) CyberAgent Inc JP Morgan (4,696) 8,000 Dai Nippon Printing Co Ltd Citibank 951 9,000 Dai Nippon Printing Co Ltd JP Morgan 1,720 (4,000) Dai-ichi Life Bank of America
Insurance Co Ltd/The Merrill Lynch (2,671) 3,900 Daicel Corp Citibank 2,281 (9,000) Daido Steel Co Ltd Bank of America
Merrill Lynch (2,178) (8,000) Daido Steel Co Ltd JP Morgan (2,808) (4,400) Daihatsu Motor Co Ltd JP Morgan (2,694) 3,900 Daiichi Sankyo Co Ltd JP Morgan (809) 1,400 Daiichi Sankyo Co Ltd Bank of America
Merrill Lynch 372 2,400 Daiichikosho Co Ltd Citibank 342 (600) Daikin Industries Ltd Citibank (1,097) 1,000 Daishi Bank Ltd/The JP Morgan 91 3,000 Daiwa Securities Group Inc Citibank 310 21,000 Daiwa Securities Group Inc JP Morgan 2,113 (12,500) DeNA Co Ltd JP Morgan (20,825) 23,000 Denka Co Ltd Bank of America
Merrill Lynch 366 14,000 Denka Co Ltd Citibank — (8,100) Denso Corp Citibank (11,253) (700) Dentsu Inc Bank of America
Merrill Lynch (1,128)
BlackRock Style Advantage Fund continued
Japan continued Italy continued

Contracts for difference as at 31 May 2016
Holding
Description Counterparty
Unrealised appreciation/
(depreciation) USD
Holding
Description Counterparty
Unrealised appreciation/
(depreciation) USD
424 BlackRock Strategic Funds (BSF)
The notes on pages 489 to 503 form an integral part of these financial statements.
BlackRock Style Advantage Fund continued
4,000 DIC Corp JP Morgan 390 (100) Disco Corp JP Morgan (615) (8,900) DMG Mori Co Ltd Bank of America
Merrill Lynch (5,848) (3,700) DMG Mori Co Ltd Citibank (1,365) (4,100) DMG Mori Co Ltd JP Morgan (6,974) (7,700) Don Quijote Holdings Co Ltd Bank of America
Merrill Lynch (3,656) (1,000) Dowa Holdings Co Ltd Bank of America
Merrill Lynch (63) (4,000) Dowa Holdings Co Ltd JP Morgan 173 300 East Japan Railway Co Citibank 985 700 East Japan Railway Co JP Morgan 2,412 (9,000) Ebara Corp Citibank (894) (2,000) Ebara Corp JP Morgan (1,584) (1,300) Eisai Co Ltd Bank of America
Merrill Lynch (982) (500) Eisai Co Ltd Citibank (321) (500) Eisai Co Ltd JP Morgan (1,242) (900) Ezaki Glico Co Ltd Bank of America
Merrill Lynch (1,148) (2,300) FamilyMart Co Ltd Bank of America
Merrill Lynch (1,187) (500) FamilyMart Co Ltd Citibank 315 (400) FamilyMart Co Ltd JP Morgan 252 (600) FANUC Corp Citibank (5,292) (100) Fast Retailing Co Ltd Bank of America
Merrill Lynch (1,556) (100) Fast Retailing Co Ltd JP Morgan (1,147) (3,400) FP Corp JP Morgan (861) (1,200) FP Corp Bank of America
Merrill Lynch 864 1,000 Fuji Electric Co Ltd JP Morgan (54) 10,000 Fuji Electric Co Ltd Citibank 168 2,800 Fuji Heavy Industries Ltd Bank of America
Merrill Lynch 6,073 12,100 Fuji Heavy Industries Ltd Citibank 29,755 (1,500) Fuji Oil Holdings Inc Bank of America
Merrill Lynch 850 (3,100) Fuji Oil Holdings Inc JP Morgan 1,107 2,100 FUJIFILM Holdings Corp Bank of America
Merrill Lynch 578 3,100 FUJIFILM Holdings Corp JP Morgan 548 7,000 Fujikura Ltd Bank of America
Merrill Lynch 3,087 17,000 Fujikura Ltd Citibank 2,488 1,000 Fujikura Ltd JP Morgan 566 36,000 Fujitsu Ltd Citibank 11,188 (8,000) Fukuoka Financial Group Inc Bank of America
Merrill Lynch (2,258) (4,000) Fukuoka Financial Group Inc Citibank (900) (3,000) Fukuyama Transporting Co Ltd Citibank (274) (1,000) Fukuyama Transporting Co Ltd JP Morgan 26 39,000 Furukawa Electric Co Ltd JP Morgan (3,458) 900 Glory Ltd Bank of America
Merrill Lynch (483) 800 Glory Ltd Citibank (92) 100 Glory Ltd JP Morgan (279) (1,900) GMO Payment Gateway Inc JP Morgan (337) 19,400 Gree Inc Bank of America
Merrill Lynch 1,848 (16,000) GS Yuasa Corp Bank of America
Merrill Lynch (3,209) (14,000) GS Yuasa Corp JP Morgan (1,500) 3,200 GungHo Online Bank of America
Entertainment Inc Merrill Lynch 1,735 13,000 Gunma Bank Ltd/The Citibank 2,469 (7,500) H2O Retailing Corp Bank of America
Merrill Lynch (5,934) (300) H2O Retailing Corp JP Morgan 170 2,000 Hachijuni Bank Ltd/The JP Morgan (19)
800 Hachijuni Bank Ltd/The Bank of America Merrill Lynch 259
2,800 Hakuhodo DY Holdings Inc Bank of America Merrill Lynch 328
10,600 Hakuhodo DY Holdings Inc Citibank 1,374 (3,300) Hamamatsu Photonics KK JP Morgan (5,512) 4,000 Hankyu Hanshin Holdings Inc Bank of America
Merrill Lynch 1,620 600 Haseko Corp Bank of America
Merrill Lynch 232 6,300 Heiwa Corp Citibank 602 300 Hikari Tsushin Inc Bank of America
Merrill Lynch (142) 1,900 Hino Motors Ltd Bank of America
Merrill Lynch 1,419 6,600 Hino Motors Ltd Citibank 2,142 200 Hirose Electric Co Ltd Bank of America
Merrill Lynch 1,476 100 Hirose Electric Co Ltd Citibank 392 100 Hirose Electric Co Ltd JP Morgan 653 4,000 Hiroshima Bank Ltd/The Citibank 700 1,100 Hisamitsu
Pharmaceutical Co Inc Citibank 1,980 2,800 Hisamitsu
Pharmaceutical Co Inc JP Morgan 6,234 (2,600) Hitachi Capital Corp Bank of America
Merrill Lynch (3,381) 7,000 Hitachi Chemical Co Ltd Bank of America
Merrill Lynch 4,701 2,200 Hitachi Chemical Co Ltd JP Morgan 3,861 4,600 Hitachi Construction
Machinery Co Ltd Citibank 1,325 3,900 Hitachi Construction
Machinery Co Ltd JP Morgan 92 2,000 Hitachi High-
Technologies Corp Citibank 720 2,000 Hitachi High-
Technologies Corp JP Morgan 809 4,000 Hitachi Ltd Citibank 623 (2,700) Hitachi Metals Ltd Bank of America
Merrill Lynch (1,344) (3,800) Hitachi Metals Ltd Citibank (1,402) (4,900) Hitachi Metals Ltd JP Morgan (1,970) 1,900 Hitachi Transport System Ltd Bank of America
Merrill Lynch (17) 1,000 Hitachi Transport System Ltd JP Morgan (448) 13,000 Hokuhoku Financial Group Inc Bank of America
Merrill Lynch 826 16,000 Hokuhoku Financial Group Inc JP Morgan 570 (300) Honda Motor Co Ltd Bank of America
Merrill Lynch (556) (2,600) Honda Motor Co Ltd Citibank (3,857) (1,100) Honda Motor Co Ltd JP Morgan (1,496) 800 Hoshizaki Electric Co Ltd Bank of America
Merrill Lynch 2,498 (4,400) House Foods Group Inc JP Morgan (151) 100 Hoya Corp Citibank 66 12,800 Hoya Corp JP Morgan 8,923 10,400 Ibiden Co Ltd Citibank 1,330 700 Ibiden Co Ltd JP Morgan 806 4,900 Idemitsu Kosan Co Ltd Bank of America
Merrill Lynch (4,318) 1,900 Idemitsu Kosan Co Ltd JP Morgan (1,795) (68,000) IHI Corp Citibank (5,508) (3,400) Iida Group Holdings Co Ltd JP Morgan (7,803) (13,000) Iida Group Holdings Co Ltd Bank of America
Merrill Lynch 9,777 (3,100) Inpex Corp Citibank (2,081) (57,200) Inpex Corp JP Morgan (41,645) 3,100 Isetan Mitsukoshi Holdings Ltd JP Morgan 2,327 2,500 Isuzu Motors Ltd JP Morgan 1,540
Japan continued Japan continued

Contracts for difference as at 31 May 2016
Holding
Description Counterparty
Unrealised appreciation/
(depreciation) USD
Holding
Description Counterparty
Unrealised appreciation/
(depreciation) USD
Annual Report and Audited Accounts 425
The notes on pages 489 to 503 form an integral part of these financial statements.
5,600 Ito En Ltd Bank of America Merrill Lynch 4,409
1,600 Ito En Ltd Citibank 1,368 1,800 Ito En Ltd JP Morgan 4,941 4,300 ITOCHU Corp Bank of America
Merrill Lynch 806 1,700 ITOCHU Corp Citibank 352 8,800 ITOCHU Corp JP Morgan 1,668 700 Itochu Techno-Solutions Corp Bank of America
Merrill Lynch 603 1,000 Izumi Co Ltd Bank of America
Merrill Lynch (450) 1,400 Izumi Co Ltd Citibank (970) 5,000 J Front Retailing Co Ltd Bank of America
Merrill Lynch 4,923 (2,600) Jafco Co Ltd Bank of America
Merrill Lynch (2,307) (600) Jafco Co Ltd JP Morgan (1,296) (200) Japan Airport Terminal Co Ltd Citibank (216) (200) Japan Airport Terminal Co Ltd JP Morgan (441) (6,700) Japan Display Inc Bank of America
Merrill Lynch (1,507) (96,100) Japan Display Inc JP Morgan (20,712) (9,300) Japan Exchange Group Inc Bank of America
Merrill Lynch (1,306) 1,800 Japan Petroleum
Exploration Co Ltd JP Morgan 2,377 (6,200) Japan Post Bank Co Ltd Bank of America
Merrill Lynch (3,069) (500) Japan Post Bank Co Ltd Citibank (27) (15,600) Japan Post Bank Co Ltd JP Morgan (3,858) (21,800) Japan Post Holdings Co Ltd Citibank (2,747) 2,000 Japan Steel Works Ltd/The JP Morgan 295 1,900 Japan Tobacco Inc Citibank 648 8,300 JFE Holdings Inc JP Morgan 2,030 (4,000) JGC Corp Bank of America
Merrill Lynch (414) (4,000) JGC Corp JP Morgan 2,772 21,000 Joyo Bank Ltd/The Bank of America
Merrill Lynch 3,146 8,500 JSR Corp Bank of America
Merrill Lynch 4,939 2,100 JTEKT Corp JP Morgan 1,557 (4,000) Juroku Bank Ltd/The Citibank (180) (12,500) JX Holdings Inc JP Morgan (884) (400) K's Holdings Corp Citibank (88) (4,000) K's Holdings Corp JP Morgan (608) (5,400) Kagome Co Ltd Bank of America
Merrill Lynch (912) (12,000) Kajima Corp Bank of America
Merrill Lynch (4,183) (1,000) Kajima Corp Citibank (83) 2,300 Kakaku.com Inc Bank of America
Merrill Lynch (870) 1,600 Kakaku.com Inc Citibank (677) 200 Kakaku.com Inc JP Morgan 2 (1,000) Kaken Pharmaceutical Co Ltd Bank of America
Merrill Lynch (3,829) 4,000 Kamigumi Co Ltd Citibank (627) 3,000 Kamigumi Co Ltd JP Morgan 1,242 16,000 Kaneka Corp Citibank (288) 3,000 Kaneka Corp JP Morgan — (6,800) Kansai Paint Co Ltd Bank of America
Merrill Lynch (8,105) (600) Kansai Paint Co Ltd Citibank (724) 7,100 Kao Corp Bank of America
Merrill Lynch 11,090 23,000 Kawasaki Heavy Industries Ltd Citibank 2,901 6,000 Kawasaki Kisen Kaisha Ltd Bank of America
Merrill Lynch 581
900 KDDI Corp Citibank 616 (9,000) Keihan Holdings Co Ltd Citibank 1,151 (5,000) Keikyu Corp Bank of America
Merrill Lynch (4,095) (16,000) Keikyu Corp JP Morgan (3,267) 3,000 Keio Corp JP Morgan 738 (2,000) Keisei Electric Railway Co Ltd Citibank (1,026) (5,000) Keisei Electric Railway Co Ltd JP Morgan (2,665) (900) Kewpie Corp Bank of America
Merrill Lynch (189) (1,100) Kewpie Corp JP Morgan (444) (700) Keyence Corp JP Morgan (14,186) (1,000) Kikkoman Corp Bank of America
Merrill Lynch (1,810) 200 Kinden Corp Bank of America
Merrill Lynch 29 12,000 Kinden Corp JP Morgan 1,897 (29,000) Kintetsu Group Holdings Co Ltd Citibank (2,269) 14,000 Kirin Holdings Co Ltd Citibank 3,131 600 Kissei Pharmaceutical Co Ltd Citibank (536) (400) Kobayashi
Pharmaceutical Co Ltd Citibank (873) (13,000) Kobe Steel Ltd Bank of America
Merrill Lynch 182 700 Koito Manufacturing Co Ltd Bank of America
Merrill Lynch 2,142 1,200 Koito Manufacturing Co Ltd Citibank 2,562 3,000 Komatsu Ltd Bank of America
Merrill Lynch 2,515 1,500 Komatsu Ltd Citibank 1,485 1,300 Komeri Co Ltd Bank of America
Merrill Lynch 1,232 6,100 Konami Holdings Corp Bank of America
Merrill Lynch 13,079 2,900 Konami Holdings Corp Citibank 7,960 700 Konami Holdings Corp JP Morgan 4,599 18,200 Konica Minolta Inc Citibank 6,058 400 Konica Minolta Inc JP Morgan 65 800 Kose Corp Bank of America
Merrill Lynch 4,852 1,100 Kose Corp JP Morgan 5,418 (7,300) Kubota Corp Bank of America
Merrill Lynch (1,018) 2,400 Kuraray Co Ltd Bank of America
Merrill Lynch 914 1,800 Kurita Water Industries Ltd JP Morgan 316 (5,100) Kyocera Corp Bank of America
Merrill Lynch (1,571) 3,500 Kyorin Holdings Inc JP Morgan (1,751) 400 Kyowa Exeo Corp JP Morgan 349 (2,900) Kyowa Hakko Kirin Co Ltd Citibank 852 2,600 Kyushu Financial Group Inc JP Morgan 1,069 (500) Lawson Inc JP Morgan (1,374) 1,300 Lintec Corp Bank of America
Merrill Lynch 234 5,600 Lintec Corp Citibank 2,229 19,000 Lion Corp JP Morgan 19,168 (5,800) Lixil Group Corp Bank of America
Merrill Lynch (4,952) (800) M3 Inc JP Morgan (288) (10,100) M3 Inc Bank of America
Merrill Lynch 3,395 (4,400) M3 Inc Citibank 1,584 1,300 Mabuchi Motor Co Ltd Citibank 2,163 1,100 Mabuchi Motor Co Ltd JP Morgan 1,596 (2,500) Makita Corp Citibank (354) 16,300 Marubeni Corp JP Morgan (4,988) 40,100 Marubeni Corp Bank of America
Merrill Lynch 6,920 100 Marubeni Corp Citibank 22
BlackRock Style Advantage Fund continued
Japan continued Japan continued

Contracts for difference as at 31 May 2016
Holding
Description Counterparty
Unrealised appreciation/
(depreciation) USD
Holding
Description Counterparty
Unrealised appreciation/
(depreciation) USD
426 BlackRock Strategic Funds (BSF)
The notes on pages 489 to 503 form an integral part of these financial statements.
BlackRock Style Advantage Fund continued
4,400 Marui Group Co Ltd JP Morgan 1,439 (700) Maruichi Steel Tube Ltd Citibank (605) 1,000 Matsui Securities Co Ltd Bank of America
Merrill Lynch 144 6,300 Matsui Securities Co Ltd Citibank 1,701 4,600 Matsui Securities Co Ltd JP Morgan 1,409 2,800 Matsumotokiyoshi
Holdings Co Ltd JP Morgan 10,513 100 Matsumotokiyoshi Bank of America
Holdings Co Ltd Merrill Lynch 414 600 Matsumotokiyoshi
Holdings Co Ltd Citibank 1,134 1,700 Mazda Motor Corp Bank of America
Merrill Lynch 2,517 3,300 Mazda Motor Corp Citibank 3,893 (800) McDonald's Holdings Co
Japan Ltd JP Morgan (1,123) (1,000) McDonald's Holdings Co
Japan Ltd Citibank 18 2,600 Medipal Holdings Corp Bank of America
Merrill Lynch (839) 6,200 Medipal Holdings Corp JP Morgan 8,713 (100) MEIJI Holdings Co Ltd Citibank (165) (10,500) Minebea Co Ltd Bank of America
Merrill Lynch (4,710) (6,000) Minebea Co Ltd JP Morgan (1,728) 1,000 Miraca Holdings Inc JP Morgan 989 (5,500) MISUMI Group Inc JP Morgan (1,696) 65,100 Mitsubishi Chemical
Holdings Corp Citibank 4,696 5,200 Mitsubishi Corp Bank of America
Merrill Lynch 4,349 6,000 Mitsubishi Electric Corp Citibank 2,808 13,000 Mitsubishi Electric Corp JP Morgan 5,998 9,000 Mitsubishi Gas Bank of America
Chemical Co Inc Merrill Lynch 12 6,000 Mitsubishi Heavy
Industries Ltd JP Morgan 1,990 (5,000) Mitsubishi Logistics Corp Bank of America
Merrill Lynch (1,704) (1,000) Mitsubishi Logistics Corp JP Morgan (1,026) 14,000 Mitsubishi Materials Corp Bank of America
Merrill Lynch 882 18,000 Mitsubishi Materials Corp Citibank 903 6,000 Mitsubishi Materials Corp JP Morgan 340 3,700 Mitsubishi Motors Corp Citibank 966 7,700 Mitsubishi Tanabe Bank of America
Pharma Corp Merrill Lynch 3,124 8,500 Mitsubishi UFJ Financial
Group Inc Citibank 1,385 10,900 Mitsubishi UFJ Lease &
Finance Co Ltd Citibank 785 2,700 Mitsui & Co Ltd Bank of America
Merrill Lynch 888 1,300 Mitsui & Co Ltd Citibank 380 30,000 Mitsui Chemicals Inc Bank of America
Merrill Lynch 12,125 15,000 Mitsui Chemicals Inc JP Morgan 3,008 39,000 Mitsui Engineering & Bank of America
Shipbuilding Co Ltd Merrill Lynch (892) 10,000 Mitsui OSK Lines Ltd Citibank 128 200 Mixi Inc Bank of America
Merrill Lynch 311 (162,000) Mizuho Financial Group Inc JP Morgan (6,635) 700 Mochida
Pharmaceutical Co Ltd Citibank 4,536 1,000 Mochida
Pharmaceutical Co Ltd JP Morgan 4,237 (7,000) MonotaRO Co Ltd JP Morgan (7,235) 700 MS&AD Insurance Group Bank of America
Holdings Inc Merrill Lynch 1,701
1,100 MS&AD Insurance Group Holdings Inc Citibank 1,564
(800) Murata Manufacturing Co Ltd Citibank (5,125) (400) Nabtesco Corp Bank of America
Merrill Lynch (835) (300) Nabtesco Corp Citibank (256) 4,700 Nagase & Co Ltd Bank of America
Merrill Lynch 4,018 3,300 Nagase & Co Ltd Citibank 1,633 9,800 Nagase & Co Ltd JP Morgan 5,546 8,000 Nagoya Railroad Co Ltd Citibank 630 (17,000) Nankai Electric Railway Co Ltd Citibank (3,246) (2,000) Nankai Electric Railway Co Ltd JP Morgan (486) (4,000) Nankai Electric Railway Co Ltd Bank of America
Merrill Lynch (1,008) (4,000) NEC Corp Bank of America
Merrill Lynch (612) 500 Nexon Co Ltd Citibank (54) 2,000 Nexon Co Ltd Bank of America
Merrill Lynch 448 (1,000) NGK Insulators Ltd Bank of America
Merrill Lynch (726) (1,000) NGK Insulators Ltd Citibank (855) (100) NGK Spark Plug Co Ltd Bank of America
Merrill Lynch (158) (7,500) NGK Spark Plug Co Ltd Citibank (10,929) (1,000) NGK Spark Plug Co Ltd JP Morgan (909) (1,000) NH Foods Ltd Bank of America
Merrill Lynch (225) (4,000) NH Foods Ltd JP Morgan (2,898) 4,300 NHK Spring Co Ltd Bank of America
Merrill Lynch 238 5,700 NHK Spring Co Ltd Citibank 256 2,500 NHK Spring Co Ltd JP Morgan 71 (4,500) Nidec Corp Bank of America
Merrill Lynch (5,713) (200) Nidec Corp JP Morgan (1,129) 200 Nifco Inc/Japan Citibank 432 4,300 Nikon Corp Citibank (227) (1,000) Nintendo Co Ltd Bank of America
Merrill Lynch (3,891) (700) Nintendo Co Ltd JP Morgan (7,749) (4,000) Nippon Electric Glass Co Ltd Bank of America
Merrill Lynch (648) (9,000) Nippon Electric Glass Co Ltd Citibank (602) (1,000) Nippon Electric Glass Co Ltd JP Morgan (225) 6,000 Nippon Express Co Ltd Citibank (377) (25,000) Nippon Kayaku Co Ltd Bank of America
Merrill Lynch (8,608) (5,800) Nippon Paint Holdings Co Ltd Bank of America
Merrill Lynch (6,264) (10,400) Nippon Paint Holdings Co Ltd JP Morgan (26,282) 1,300 Nippon Paper Industries Co Ltd JP Morgan (143) (1,800) Nippon Shinyaku Co Ltd Bank of America
Merrill Lynch (7,388) (2,700) Nippon Shinyaku Co Ltd JP Morgan (19,193) (500) Nippon Shokubai Co Ltd JP Morgan (3,549) 2,800 Nippon Steel & Sumitomo Bank of America
Metal Corp Merrill Lynch 2,211 1,600 Nippon Steel & Sumitomo
Metal Corp JP Morgan 1,750 (400) Nippon Telegraph &
Telephone Corp JP Morgan 49 66,000 Nippon Yusen KK Citibank 1,583 (4,900) Nipro Corp JP Morgan (376) (40,000) Nishi-Nippon City
Bank Ltd/The Citibank (2,880) (11,000) Nishi-Nippon City
Bank Ltd/The JP Morgan (1,980) 12,000 Nishi-Nippon Railroad Co Ltd Bank of America
Merrill Lynch (380)
Japan continued Japan continued

Contracts for difference as at 31 May 2016
Holding
Description Counterparty
Unrealised appreciation/
(depreciation) USD
Holding
Description Counterparty
Unrealised appreciation/
(depreciation) USD
Annual Report and Audited Accounts 427
The notes on pages 489 to 503 form an integral part of these financial statements.
4,000 Nishi-Nippon Railroad Co Ltd JP Morgan (1,476) (2,300) Nisshin Seifun Group Inc Citibank (1,098) (1,000) Nisshinbo Holdings Inc JP Morgan 207 (1,500) Nissin Foods Holdings Co Ltd Bank of America
Merrill Lynch (945) (300) Nissin Foods Holdings Co Ltd JP Morgan (1,026) (2,000) Nitori Holdings Co Ltd JP Morgan (4,809) (400) Nitto Denko Corp Citibank (2,005) (400) Nitto Denko Corp JP Morgan (1,450) (1,500) NOK Corp Bank of America
Merrill Lynch (2,615) (1,300) NOK Corp Citibank (1,954) (200) NOK Corp JP Morgan (344) 18,600 Nomura Holdings Inc Citibank 1,389 2,300 Nomura Holdings Inc JP Morgan 704 (2,600) Nomura Research Institute Ltd JP Morgan (1,365) 2,300 NS Solutions Corp Bank of America
Merrill Lynch 2,443 1,600 NS Solutions Corp Citibank 1,011 3,500 NS Solutions Corp JP Morgan 3,037 2,000 NSK Ltd Bank of America
Merrill Lynch 813 13,100 NSK Ltd JP Morgan 5,464 (12,000) NTN Corp Citibank (1,944) 100 NTT Data Corp Bank of America
Merrill Lynch 171 400 NTT Data Corp JP Morgan 216 400 NTT DOCOMO Inc Citibank 340 100 NTT DOCOMO Inc JP Morgan 85 (3,800) Obayashi Corp Bank of America
Merrill Lynch (1,078) (1,300) Obayashi Corp Citibank (293) (1,100) Obayashi Corp JP Morgan (1,158) (400) OBIC Business
Consultants Co Ltd Citibank (432) (1,300) OBIC Business
Consultants Co Ltd JP Morgan (2,751) 800 Obic Co Ltd Citibank 1,440 1,600 Obic Co Ltd JP Morgan 2,391 (5,000) Odakyu Electric Railway Co Ltd Citibank (1,573) 21,000 Oji Holdings Corp Citibank 6,426 2,000 Okuma Corp JP Morgan 446 (1,000) Olympus Corp Bank of America
Merrill Lynch (1,979) (600) Olympus Corp Citibank (1,836) 500 Omron Corp JP Morgan 834 (3,000) Ono Pharmaceutical Co Ltd Citibank 1,091 5,000 Oracle Corp Japan Citibank 2,008 (16,800) Orient Corp Bank of America
Merrill Lynch (1,782) (800) Oriental Land Co Ltd/Japan Citibank 266 10,200 ORIX Corp Bank of America
Merrill Lynch 1,872 2,000 ORIX Corp Citibank 324 3,300 OSG Corp Bank of America
Merrill Lynch 112 700 OSG Corp JP Morgan 380 900 Otsuka Corp Bank of America
Merrill Lynch (508) 100 Otsuka Corp JP Morgan (199) (100) Otsuka Holdings Co Ltd Citibank 20 (600) Otsuka Holdings Co Ltd JP Morgan 358 29,000 Panasonic Corp Citibank 15,192 (4,600) Park24 Co Ltd JP Morgan (16) (3,800) PeptiDream Inc Citibank (14,597) (100) PeptiDream Inc JP Morgan (380) (1,000) Pigeon Corp Bank of America
Merrill Lynch (1,188) (900) Pigeon Corp JP Morgan (1,774) 1,600 Pola Orbis Holdings Inc Bank of America
Merrill Lynch 5,057
100 Pola Orbis Holdings Inc Citibank 486 (1,600) Rakuten Inc JP Morgan 439 (23,900) Rakuten Inc Bank of America
Merrill Lynch (7,364) (11,000) Rakuten Inc Citibank (2,871) (3,200) Recruit Holdings Co Ltd Bank of America
Merrill Lynch (2,354) (7,000) Recruit Holdings Co Ltd Citibank (6,930) (6,600) Resorttrust Inc Bank of America
Merrill Lynch 716 7,400 Ricoh Co Ltd Bank of America
Merrill Lynch 1,761 400 Ricoh Co Ltd Citibank 88 (1,800) Rinnai Corp Bank of America
Merrill Lynch (4,326) 400 Rohm Co Ltd Citibank 882 2,100 Rohm Co Ltd JP Morgan 4,562 3,500 Rohto Pharmaceutical Co Ltd JP Morgan (4,693) 5,700 Rohto Pharmaceutical Co Ltd Bank of America
Merrill Lynch 1,518 200 Rohto Pharmaceutical Co Ltd Citibank 7 (500) Ryohin Keikaku Co Ltd Citibank (2,212) 5,600 Sankyo Co Ltd JP Morgan 1,474 (1,000) Sankyu Inc Bank of America
Merrill Lynch (460) (1,000) Sanrio Co Ltd JP Morgan 873 (2,200) Santen Pharmaceutical Co Ltd JP Morgan (413) 4,000 Sapporo Holdings Ltd Bank of America
Merrill Lynch 300 (4,900) Sawai Pharmaceutical Co Ltd JP Morgan (12,541) 2,200 SBI Holdings Inc/Japan Citibank (1,980) (100) SCSK Corp Bank of America
Merrill Lynch (163) (1,000) Secom Co Ltd JP Morgan (920) (2,600) Sega Sammy Holdings Inc Bank of America
Merrill Lynch (3,393) (3,400) Sega Sammy Holdings Inc JP Morgan (3,665) (16,100) Seibu Holdings Inc Bank of America
Merrill Lynch 119 3,600 Seiko Epson Corp JP Morgan 2,583 (4,600) Seino Holdings Co Ltd Bank of America
Merrill Lynch 849 15,800 Sekisui Chemical Co Ltd Bank of America
Merrill Lynch 3,888 3,600 Sekisui House Ltd Citibank 778 1,400 Seven & i Holdings Co Ltd Bank of America
Merrill Lynch 1,214 200 Seven & i Holdings Co Ltd JP Morgan 168 (11,200) Seven Bank Ltd Citibank (449) (1,700) Seven Bank Ltd Bank of America
Merrill Lynch 551 (11,500) Seven Bank Ltd JP Morgan 2,077 (19,000) Shiga Bank Ltd/The Bank of America
Merrill Lynch (4,390) (2,000) Shiga Bank Ltd/The JP Morgan (198) 400 Shimachu Co Ltd JP Morgan (9) 900 Shimachu Co Ltd Bank of America
Merrill Lynch 381 3,000 Shimadzu Corp JP Morgan (667) (100) Shimamura Co Ltd Citibank (162) (200) Shimano Inc Citibank (1,584) (500) Shimano Inc JP Morgan (3,801) (15,000) Shimizu Corp Citibank (909) (4,000) Shimizu Corp Bank of America
Merrill Lynch 144 (600) Shin-Etsu Chemical Co Ltd Bank of America
Merrill Lynch (1,242) (300) Shin-Etsu Chemical Co Ltd Citibank (570) (1,300) Shin-Etsu Chemical Co Ltd JP Morgan (1,571) (19,000) Shinsei Bank Ltd Bank of America
Merrill Lynch (1,494)
BlackRock Style Advantage Fund continued
Japan continued Japan continued

Contracts for difference as at 31 May 2016
Holding
Description Counterparty
Unrealised appreciation/
(depreciation) USD
Holding
Description Counterparty
Unrealised appreciation/
(depreciation) USD
428 BlackRock Strategic Funds (BSF)
The notes on pages 489 to 503 form an integral part of these financial statements.
BlackRock Style Advantage Fund continued
(76,000) Shinsei Bank Ltd Citibank (4,788) 1,500 Shionogi & Co Ltd JP Morgan 5,586 5,400 Shiseido Co Ltd JP Morgan 6,011 1,000 Shizuoka Bank Ltd/The JP Morgan 295 3,000 Shizuoka Bank Ltd/The Bank of America
Merrill Lynch 876 2,000 Shizuoka Bank Ltd/The Citibank 558 67,000 Showa Denko KK JP Morgan 1,554 (5,500) Showa Shell Sekiyu KK JP Morgan (199) 4,300 SKY Perfect JSAT Holdings Inc JP Morgan (2,515) 1,400 SKY Perfect JSAT Holdings Inc Bank of America
Merrill Lynch 25 22,100 SKY Perfect JSAT Holdings Inc Citibank 1,959 16,300 Skylark Co Ltd JP Morgan 10,523 (300) SoftBank Group Corp JP Morgan (470) (100) SoftBank Group Corp Citibank (87) 2,300 Sohgo Security Services Co Ltd Bank of America
Merrill Lynch 1,636 22,600 Sojitz Corp Bank of America
Merrill Lynch 3,458 46,600 Sojitz Corp Citibank 2,097 7,600 Sompo Japan Nipponkoa Bank of America
Holdings Inc Merrill Lynch 4,227 900 Sompo Japan Nipponkoa
Holdings Inc Citibank 980 900 Sompo Japan Nipponkoa
Holdings Inc JP Morgan 2,713 (1,300) Sony Corp Bank of America
Merrill Lynch (2,808) (3,600) Sony Corp Citibank (2,589) 2,300 Sony Financial Holdings Inc Bank of America
Merrill Lynch 548 2,000 Sony Financial Holdings Inc JP Morgan 977 (700) Sosei Group Corp Citibank (5,285) (100) Sosei Group Corp JP Morgan 4,194 6,000 Sotetsu Holdings Inc Bank of America
Merrill Lynch (83) (2,300) Square Enix Holdings Co Ltd JP Morgan (7,106) (6,800) Stanley Electric Co Ltd JP Morgan (5,126) 300 Start Today Co Ltd Bank of America
Merrill Lynch 553 1,200 Sugi Holdings Co Ltd Bank of America
Merrill Lynch 2,862 300 Sugi Holdings Co Ltd Citibank 864 700 Sugi Holdings Co Ltd JP Morgan 1,810 (24,500) Sumco Corp Bank of America
Merrill Lynch (15,480) (10,400) Sumco Corp JP Morgan (8,540) 33,000 Sumitomo Chemical Co Ltd Bank of America
Merrill Lynch 5,878 12,000 Sumitomo Chemical Co Ltd Citibank 2,484 4,000 Sumitomo Chemical Co Ltd JP Morgan 1,044 24,700 Sumitomo Corp Bank of America
Merrill Lynch 7,621 8,000 Sumitomo Corp JP Morgan 2,240 200 Sumitomo Dainippon
Pharma Co Ltd Citibank 89 600 Sumitomo Electric
Industries Ltd Citibank 478 3,100 Sumitomo Forestry Co Ltd Bank of America
Merrill Lynch 1,479 4,300 Sumitomo Forestry Co Ltd JP Morgan 3,255 7,000 Sumitomo Heavy Industries Ltd JP Morgan 2 1,000 Sumitomo Heavy Industries Ltd Bank of America
Merrill Lynch 99 (16,000) Sumitomo Metal Mining Co Ltd JP Morgan (2,051) (1,000) Sumitomo Metal Mining Co Ltd Citibank 59 (1,000) Sumitomo Mitsui Financial
Group Inc JP Morgan (1,361) (42,000) Sumitomo Mitsui Trust
Holdings Inc Citibank (7,508)
2,800 Sumitomo Rubber Industries Ltd JP Morgan 1,173
400 Sundrug Co Ltd Bank of America Merrill Lynch 1,800
1,900 Sundrug Co Ltd JP Morgan 7,955 (7,000) Suntory Beverage & Food Ltd JP Morgan (12,039) (2,900) Suntory Beverage & Food Ltd Bank of America
Merrill Lynch 1,827 1,100 Suruga Bank Ltd Bank of America
Merrill Lynch 3,564 10,100 Suruga Bank Ltd JP Morgan 19,694 4,900 Suzuken Co Ltd/Aichi Japan Bank of America
Merrill Lynch 3,351 2,600 Suzuken Co Ltd/Aichi Japan Citibank 2,340 13,700 Suzuki Motor Corp Citibank 13,262 (900) Sysmex Corp Bank of America
Merrill Lynch (2,926) 1,800 T&D Holdings Inc Bank of America
Merrill Lynch 1,989 4,900 T&D Holdings Inc Citibank 2,620 (1,000) Taiheiyo Cement Corp Citibank (181) (3,000) Taiheiyo Cement Corp JP Morgan (541) (2,000) Taiheiyo Cement Corp Bank of America
Merrill Lynch 36 (10,000) Taisei Corp Bank of America
Merrill Lynch (3,690) (4,000) Taisei Corp Citibank (936) (18,000) Taisei Corp JP Morgan (4,015) 2,500 Taisho Pharmaceutical
Holdings Co Ltd Citibank 10,064 (16,800) Taiyo Nippon Sanso Corp JP Morgan (621) (9,900) Taiyo Nippon Sanso Corp Bank of America
Merrill Lynch 3,362 (400) Taiyo Yuden Co Ltd Bank of America
Merrill Lynch (401) (5,900) Takara Bio Inc JP Morgan 491 3,400 Takara Holdings Inc JP Morgan (230) 2,000 Takashimaya Co Ltd Citibank 540 1,600 Takeda Pharmaceutical Co Ltd Citibank 990 1,600 TDK Corp Citibank 4,257 400 TDK Corp JP Morgan 2,232 67,000 Teijin Ltd JP Morgan 7,322 (10,500) Temp Holdings Co Ltd Citibank (2,686) (2,100) Terumo Corp JP Morgan (5,591) (1,600) THK Co Ltd Citibank (1,590) (1,700) THK Co Ltd JP Morgan (1,975) (1,900) THK Co Ltd Bank of America
Merrill Lynch 1,077 (13,000) Tobu Railway Co Ltd Citibank (1,558) 200 Toho Co Ltd/Tokyo Bank of America
Merrill Lynch 324 800 Toho Co Ltd/Tokyo JP Morgan 1,526 1,300 Toho Co Ltd/Tokyo Citibank 1,123 700 Tokai Rika Co Ltd Bank of America
Merrill Lynch 391 2,600 Tokai Rika Co Ltd JP Morgan 1,174 1,900 Tokai Tokyo Financial
Holdings Inc JP Morgan 173 23,400 Tokai Tokyo Financial
Holdings Inc Citibank 2,243 1,500 Tokio Marine Holdings Inc Bank of America
Merrill Lynch 2,349 5,900 Tokio Marine Holdings Inc JP Morgan 3,516 (7,500) Tokyo Broadcasting System
Holdings Inc JP Morgan (1,480) 1,000 Tokyu Corp Citibank (30) 11,000 Tokyu Corp JP Morgan 464 37,000 TonenGeneral Sekiyu KK Bank of America
Merrill Lynch 15,024 (6,700) Topcon Corp Bank of America
Merrill Lynch (7,899)
Japan continued Japan continued

Contracts for difference as at 31 May 2016
Holding
Description Counterparty
Unrealised appreciation/
(depreciation) USD
Holding
Description Counterparty
Unrealised appreciation/
(depreciation) USD
Annual Report and Audited Accounts 429
The notes on pages 489 to 503 form an integral part of these financial statements.
(14,800) Topcon Corp JP Morgan (15,674) 11,000 Toppan Printing Co Ltd Citibank 1,188 2,000 Toppan Printing Co Ltd JP Morgan 1,386 (2,000) Toray Industries Inc Bank of America
Merrill Lynch (311) (11,000) Toray Industries Inc Citibank (3,247) (25,000) Toray Industries Inc JP Morgan (7,708) (58,000) Toshiba Corp JP Morgan (26,058) 1,000 Tosoh Corp Citibank (46) 600 TOTO Ltd Bank of America
Merrill Lynch 889 1,500 TOTO Ltd Citibank 1,964 (2,700) Toyo Seikan Group
Holdings Ltd Citibank (1,471) 200 Toyo Suisan Kaisha Ltd Bank of America
Merrill Lynch 585 600 Toyo Suisan Kaisha Ltd Citibank 412 (6,400) Toyo Tire & Rubber Co Ltd JP Morgan (5,632) (9,000) Toyobo Co Ltd Citibank (59) 8,400 Toyoda Gosei Co Ltd Bank of America
Merrill Lynch 8,868 800 Toyoda Gosei Co Ltd Citibank 634 500 Toyota Boshoku Corp Bank of America
Merrill Lynch 373 2,100 Toyota Boshoku Corp Citibank 1,644 2,000 Toyota Boshoku Corp JP Morgan 1,589 (6,000) Toyota Industries Corp JP Morgan (15,072) (900) Toyota Motor Corp Bank of America
Merrill Lynch (2,560) (1,300) Toyota Motor Corp Citibank (3,241) 100 Toyota Tsusho Corp Bank of America
Merrill Lynch 89 1,400 Toyota Tsusho Corp Citibank 1,651 3,500 Toyota Tsusho Corp JP Morgan 4,398 1,700 Trend Micro Inc/Japan Bank of America
Merrill Lynch (1,483) 1,200 TS Tech Co Ltd Bank of America
Merrill Lynch (92) (500) Tsumura & Co JP Morgan 195 (1,200) Tsuruha Holdings Inc JP Morgan (3,516) (5,500) TV Asahi Holdings Corp JP Morgan (1,861) 42,000 Ube Industries Ltd Bank of America
Merrill Lynch 6,426 76,000 Ube Industries Ltd Citibank 7,207 (13,600) Unicharm Corp Citibank (2,851) 300 UNY Group Holdings Co Ltd JP Morgan (22) 20,100 UNY Group Holdings Co Ltd Citibank 3,461 400 Ushio Inc JP Morgan (378) 1,200 Ushio Inc Bank of America
Merrill Lynch 400 3,300 Ushio Inc Citibank 1,307 600 USS Co Ltd Bank of America
Merrill Lynch 756 2,100 USS Co Ltd JP Morgan 1,696 5,000 Wacoal Holdings Corp Citibank — (1,700) Welcia Holdings Co Ltd Citibank (3,792) 700 West Japan Railway Co Bank of America
Merrill Lynch 2,843 1,800 West Japan Railway Co Citibank 6,885 (25,700) Yahoo Japan Corp Citibank 1,129 (2,100) Yakult Honsha Co Ltd Citibank (4,162) (1,400) Yakult Honsha Co Ltd JP Morgan 2,016 (41,600) Yamada Denki Co Ltd Bank of America
Merrill Lynch (8,479) 1,600 Yamaha Corp Bank of America
Merrill Lynch 3,456 5,100 Yamaha Corp JP Morgan 4,536 (4,800) Yamaha Motor Co Ltd Citibank (4,456) (2,300) Yamato Holdings Co Ltd Bank of America
Merrill Lynch 553 (900) Yamato Holdings Co Ltd Citibank 267
(1,200) Yamato Kogyo Co Ltd Citibank (1,080) 4,000 Yamazaki Baking Co Ltd Bank of America
Merrill Lynch 3,680 1,000 Yamazaki Baking Co Ltd JP Morgan 153 (7,100) Yaskawa Electric Corp Citibank (4,133) 1,100 Yokogawa Electric Corp Bank of America
Merrill Lynch 258 3,000 Yokohama Rubber Co Ltd/The Citibank 2,393 2,900 Zenkoku Hosho Co Ltd Bank of America
Merrill Lynch (123) (100) Zensho Holdings Co Ltd JP Morgan (45) (1,000) Zeon Corp JP Morgan (232)
(62,074)
Netherlands (163) Aalberts Industries NV Citibank (121) 7,516 Aegon NV Bank of America
Merrill Lynch 1,425 4,757 Aegon NV Citibank 909 2,049 Aegon NV JP Morgan (474) 4,034 Akzo Nobel NV Bank of America
Merrill Lynch (854) 309 Akzo Nobel NV Citibank (131) (2,693) Altice NV 'A' Citibank (1,730) (13,386) Altice NV 'A' JP Morgan (16,082) (233) Altice NV 'B' Bank of America
Merrill Lynch (301) (8,106) Altice NV 'B' Citibank (5,297) (1,123) Altice NV 'B' JP Morgan (3,155) 79 Aperam SA JP Morgan 304 498 Aperam SA Bank of America
Merrill Lynch 1,129 169 Aperam SA Citibank 338 (556) Arcadis NV Bank of America
Merrill Lynch (621) (2,429) Arcadis NV JP Morgan (2,241) (29,366) ArcelorMittal Bank of America
Merrill Lynch (18,621) (3,672) ArcelorMittal Citibank (2,395) (6,251) ArcelorMittal JP Morgan (2,409) 1,437 ASM International NV Citibank 8 3,176 ASM International NV JP Morgan 855 (2,063) ASML Holding NV Bank of America
Merrill Lynch (10,337) (530) ASML Holding NV JP Morgan (4,862) (71) Boskalis Westminster Bank of America
Merrill Lynch 40 (1,068) Boskalis Westminster JP Morgan 835 (2,497) Delta Lloyd NV Citibank (452) (25,923) Delta Lloyd NV JP Morgan (8,149) 192 Eurocommercial
Properties NV - CVA JP Morgan 172 528 Eurocommercial Bank of America
Properties NV - CVA Merrill Lynch 666 727 Eurocommercial
Properties NV - CVA Citibank 857 (441) Flow Traders JP Morgan 109 (1,091) Flow Traders Citibank (1,462) (2,317) Fugro NV - CVA Bank of America
Merrill Lynch 285 (386) Fugro NV - CVA JP Morgan (133) (2,737) Gemalto NV JP Morgan (1,352) (47) Gemalto NV Bank of America
Merrill Lynch (45) (746) Heineken NV Bank of America
Merrill Lynch (1,194) (208) Heineken NV Citibank (469) (20) Heineken NV JP Morgan (13) 466 ING Groep NV - CVA Bank of America
Merrill Lynch 565
BlackRock Style Advantage Fund continued
Japan continued Japan continued

Contracts for difference as at 31 May 2016
Holding
Description Counterparty
Unrealised appreciation/
(depreciation) USD
Holding
Description Counterparty
Unrealised appreciation/
(depreciation) USD
430 BlackRock Strategic Funds (BSF)
The notes on pages 489 to 503 form an integral part of these financial statements.
BlackRock Style Advantage Fund continued
219 ING Groep NV - CVA Citibank 206 3,044 ING Groep NV - CVA JP Morgan 2,908 1,803 Koninklijke Ahold NV Bank of America
Merrill Lynch 1,460 2,649 Koninklijke Ahold NV Citibank 2,278 19,985 Koninklijke Ahold NV JP Morgan 16,889 (462) Koninklijke DSM NV Bank of America
Merrill Lynch (415) (222) Koninklijke DSM NV JP Morgan (518) (29,580) Koninklijke KPN NV Bank of America
Merrill Lynch (3,682) (21,657) Koninklijke KPN NV JP Morgan (4,295) 2,143 Koninklijke Philips NV Bank of America
Merrill Lynch 3,596 82 Koninklijke Philips NV Citibank 115 (272) Koninklijke Vopak NV Citibank (82) (4,329) Koninklijke Vopak NV JP Morgan (2,361) 86 Mylan NV Citibank 167 947 NN Group NV Bank of America
Merrill Lynch 471 1,150 NN Group NV Citibank 655 6,917 NN Group NV JP Morgan 3,172 (1,831) OCI NV JP Morgan 3,574 (2,647) OCI NV Bank of America
Merrill Lynch (292) (3,017) OCI NV Citibank (2,342) 2,889 PostNL NV Bank of America
Merrill Lynch 1,200 13,766 PostNL NV Citibank 4,720 7,104 PostNL NV JP Morgan 2,412 616 Randstad Holding NV Bank of America
Merrill Lynch 1,913 2,289 Randstad Holding NV JP Morgan 5,893 (11,099) SBM Offshore NV Citibank 744 (26,499) SBM Offshore NV JP Morgan 2,512 (4,389) TomTom NV Citibank (1,667) (15,649) TomTom NV JP Morgan (6,065) (238) TomTom NV Bank of America
Merrill Lynch (162) (115) Unibail-Rodamco SE (Reit) Bank of America
Merrill Lynch (1,008) (19) Unibail-Rodamco SE (Reit) Citibank (193) (330) Unibail-Rodamco SE (Reit) JP Morgan (3,215) 654 Unilever NV - CVA Bank of America
Merrill Lynch 1,306 146 Unilever NV - CVA JP Morgan 226 (650) Wereldhave NV (Reit) Bank of America
Merrill Lynch (1,505) (309) Wereldhave NV (Reit) JP Morgan (283) 1,942 Wolters Kluwer NV Bank of America
Merrill Lynch 4,045 282 Wolters Kluwer NV Citibank 400 7,174 Wolters Kluwer NV JP Morgan 9,668 (10,236) Wright Medical Group NV Citibank (1,331)
(33,289)
Norway 3,438 DNB ASA Citibank 2,881 1,209 DNB ASA JP Morgan 1,288 (1,125) Gjensidige Forsikring ASA Bank of America
Merrill Lynch (929) (3,793) Gjensidige Forsikring ASA Citibank (2,951) (11,206) Gjensidige Forsikring ASA JP Morgan (8,810) 184 Leroy Seafood Group ASA Bank of America
Merrill Lynch 396 987 Leroy Seafood Group ASA Citibank 945 (198) Marine Harvest ASA Bank of America
Merrill Lynch (185) (900) Marine Harvest ASA Citibank (625) (4,103) Marine Harvest ASA JP Morgan (2,939)
3,020 Norsk Hydro ASA Bank of America Merrill Lynch 452
57,048 Norsk Hydro ASA Citibank 6,487 13,504 Norsk Hydro ASA JP Morgan 2,845 1,023 Salmar ASA Citibank 2,327 251 Salmar ASA Bank of America
Merrill Lynch 676 (1,098) Schibsted ASA 'A' Bank of America
Merrill Lynch (39) (7,999) Schibsted ASA 'A' Citibank (192) (2,594) Schibsted ASA 'B' Citibank 1,149 60 Seadrill Ltd Bank of America
Merrill Lynch (30) 1,035 Statoil ASA Bank of America
Merrill Lynch (427) (136) Storebrand ASA Bank of America
Merrill Lynch (40) (2,931) Storebrand ASA Citibank (902) (1,167) Storebrand ASA JP Morgan (501) 24,449 Subsea 7 SA JP Morgan (7,782) 9,145 Subsea 7 SA Citibank (2,901) 5,007 Subsea 7 SA Bank of America
Merrill Lynch 719 5,122 Telenor ASA Bank of America
Merrill Lynch 966 2,130 Telenor ASA Citibank 433 1,032 Telenor ASA JP Morgan 506 1,459 TGS Nopec Geophysical Co ASA Bank of America
Merrill Lynch (205) 438 TGS Nopec Geophysical Co ASA JP Morgan (215) 312 Yara International ASA JP Morgan (698) 35 Yara International ASA Bank of America
Merrill Lynch 21
(8,280)
Portugal (22,203) Banco BPI SA Reg Bank of America
Merrill Lynch (1,240) (72,405) Banco BPI SA Reg JP Morgan (750) (1,349,506) Banco Comercial
Portugues SA 'R' Citibank 1,055 (250,000) Banco Comercial
Portugues SA 'R' JP Morgan 304 (6,397) Galp Energia SGPS SA Bank of America
Merrill Lynch (775) (2,865) Galp Energia SGPS SA Citibank (544) (1,820) Galp Energia SGPS SA JP Morgan (325) (710) Jeronimo Martins SGPS SA Bank of America
Merrill Lynch (654) (1,484) Jeronimo Martins SGPS SA Citibank (928) (305) Jeronimo Martins SGPS SA JP Morgan (213) (1,870) NOS SGPS SA Citibank (292) (12,256) NOS SGPS SA JP Morgan (2,151) (3,962) NOS SGPS SA Bank of America
Merrill Lynch (1,341) 4,552 Sonae SGPS SA Bank of America
Merrill Lynch 147 37,935 Sonae SGPS SA JP Morgan 930
(6,777)
Singapore (24,800) Ascendas Real Estate Bank of America
Investment Trust (Reit) Merrill Lynch 900 (52,300) Ascendas Real Estate
Investment Trust (Reit) Citibank 990 (10,000) Ascendas Real Estate
Investment Trust (Reit) JP Morgan 1,089 8,700 CapitaLand Commercial
Trust Ltd (Reit) JP Morgan —
Netherlands continued Norway continued

Contracts for difference as at 31 May 2016
Holding
Description Counterparty
Unrealised appreciation/
(depreciation) USD
Holding
Description Counterparty
Unrealised appreciation/
(depreciation) USD
Annual Report and Audited Accounts 431
The notes on pages 489 to 503 form an integral part of these financial statements.
69,900 CapitaLand Commercial Bank of America Trust Ltd (Reit) Merrill Lynch 373
8,900 CapitaLand Ltd Citibank — 8,800 CapitaLand Ltd JP Morgan 88 (22,000) CapitaLand Mall Trust (Reit) JP Morgan 1,597 (16,000) CapitaLand Mall Trust (Reit) Bank of America
Merrill Lynch 348 (53,400) CapitaLand Mall Trust (Reit) Citibank 1,123 22,300 City Developments Ltd Bank of America
Merrill Lynch (156) 7,700 City Developments Ltd Citibank 1,062 8,600 City Developments Ltd JP Morgan 624 91,800 ComfortDelGro Corp Ltd Bank of America
Merrill Lynch (2,741) 6,100 ComfortDelGro Corp Ltd JP Morgan (177) (1,700) DBS Group Holdings Ltd Bank of America
Merrill Lynch (704) (7,100) DBS Group Holdings Ltd Citibank (1,815) (1,700) DBS Group Holdings Ltd JP Morgan (728) (85,100) First Resources Ltd Citibank 5,805 (4,700) First Resources Ltd JP Morgan 239 (38,000) Genting Singapore Plc Citibank (431) (26,500) Genting Singapore Plc JP Morgan 481 (14,400) Global Logistic Properties Ltd Bank of America
Merrill Lynch (627) (43,400) Global Logistic Properties Ltd Citibank (1,891) (107,000) Global Logistic Properties Ltd JP Morgan (1,444) 29,800 Golden Agri-Resources Ltd Bank of America
Merrill Lynch 541 55,200 Golden Agri-Resources Ltd JP Morgan 944 (13,300) Hongkong Land Holdings Ltd Bank of America
Merrill Lynch 242 (8,000) Hongkong Land Holdings Ltd JP Morgan 1,120 712,800 Hutchison Port Holdings
Trust (Unit) Citibank (3,564) 101,700 Hutchison Port Holdings Bank of America
Trust (Unit) Merrill Lynch — 50,500 Hutchison Port Holdings
Trust (Unit) JP Morgan 252 46,600 Keppel Corp Ltd Citibank (9,482) 42,700 Mapletree Commercial
Trust (Reit) Citibank (245) (147,400) Mapletree Industrial Bank of America
Trust (Reit) Merrill Lynch (1,124) (61,400) Mapletree Logistics Trust (Reit) Citibank 223 (41,700) Mapletree Logistics Trust (Reit) JP Morgan 22 (528,200) Noble Group Ltd Citibank 9,588 (1,151,000) Noble Group Ltd JP Morgan 10,016 (25,700) Oversea-Chinese
Banking Corp Ltd JP Morgan (3,545) (43,800) Oversea-Chinese
Banking Corp Ltd Citibank (6,379) 95,900 SATS Ltd Bank of America
Merrill Lynch (15,218) 17,500 SATS Ltd JP Morgan (2,287) (74,100) Sembcorp Industries Ltd JP Morgan (2,851) 2,300 Singapore Airlines Ltd Citibank (200) 4,900 Singapore Airlines Ltd Bank of America
Merrill Lynch 91 (12,200) Singapore Post Ltd Bank of America
Merrill Lynch (266) 28,800 Singapore Technologies Bank of America
Engineering Ltd Merrill Lynch 1,464 72,100 Singapore Technologies
Engineering Ltd Citibank 4,932 18,700 Singapore Technologies
Engineering Ltd JP Morgan 272 (131,500) Singapore
Telecommunications Ltd Citibank (5,100) (13,300) Singapore Bank of America
Telecommunications Ltd Merrill Lynch —
69,200 SMRT Corp Ltd JP Morgan 1,333 16,200 StarHub Ltd Bank of America
Merrill Lynch 1,647 15,500 StarHub Ltd Citibank 1,576 70,700 StarHub Ltd JP Morgan 4,883 (50,200) Suntec Real Estate Bank of America
Investment Trust (Reit) Merrill Lynch (1,334) (5,200) United Overseas Bank Ltd Bank of America
Merrill Lynch (2,379) (21,200) United Overseas Bank Ltd Citibank (201) 17,700 UOL Group Ltd JP Morgan (386) 25,600 UOL Group Ltd Citibank 198 9,500 Wilmar International Ltd Bank of America
Merrill Lynch 621 11,400 Wilmar International Ltd Citibank 745 36,500 Wilmar International Ltd JP Morgan 827 833,400 Yangzijiang Shipbuilding
Holdings Ltd Citibank (23,407) 12,700 Yangzijiang Shipbuilding Bank of America
Holdings Ltd Merrill Lynch 92
(32,334)
South Korea 62 Amorepacific Corp JP Morgan (1,202) 112 Amorepacific Corp Bank of America
Merrill Lynch 62 2 Amorepacific Corp Citibank 1 10 BGF retail Co Ltd JP Morgan 173 (22,382) BNK Financial Group Inc JP Morgan (1,548) (92) CJ CheilJedang Corp Bank of America
Merrill Lynch 780 150 CJ Corp Bank of America
Merrill Lynch (2,192) 393 CJ Corp Citibank (2,462) 84 CJ Corp JP Morgan (773) (1,290) CJ Korea Express Corp Citibank (7,194) 212 Coway Co Ltd Bank of America
Merrill Lynch 168 1,491 Coway Co Ltd Citibank 3,309 16 Coway Co Ltd JP Morgan (17) 98 Daelim Industrial Co Ltd Bank of America
Merrill Lynch 38 622 Daelim Industrial Co Ltd Citibank 1,560 2,008 Daelim Industrial Co Ltd JP Morgan 3,664 3,107 Daewoo Engineering &
Construction Co Ltd Citibank 58 561 Daewoo Engineering & Bank of America
Construction Co Ltd Merrill Lynch (233) 1,055 Daewoo Engineering &
Construction Co Ltd JP Morgan (22) 1,082 Dongbu Insurance Co Ltd Bank of America
Merrill Lynch 834 26 Dongbu Insurance Co Ltd Citibank 38 345 Dongbu Insurance Co Ltd JP Morgan 1,002 (3,623) Dongsuh Cos Inc Bank of America
Merrill Lynch (2,415) (1,353) Dongsuh Cos Inc Citibank (723) (156) E-MART Inc JP Morgan 63 (1,587) GS Holdings Corp JP Morgan (1,834) (1,438) GS Holdings Corp Bank of America
Merrill Lynch (316) (360) GS Retail Co Ltd Bank of America
Merrill Lynch 294 (346) GS Retail Co Ltd JP Morgan 1,177 (4,247) Hana Financial Group Inc Bank of America
Merrill Lynch (5,006) 573 Hankook Tire Co Ltd Citibank (259) 5,930 Hankook Tire Co Ltd Bank of America
Merrill Lynch (2,146) (43) Hanmi Pharm Co Ltd JP Morgan (1,644) (71) Hanmi Science Co ltd Citibank (180)
BlackRock Style Advantage Fund continued
Singapore continued Singapore continued

Contracts for difference as at 31 May 2016
Holding
Description Counterparty
Unrealised appreciation/
(depreciation) USD
Holding
Description Counterparty
Unrealised appreciation/
(depreciation) USD
432 BlackRock Strategic Funds (BSF)
The notes on pages 489 to 503 form an integral part of these financial statements.
BlackRock Style Advantage Fund continued
(324) Hanmi Science Co ltd JP Morgan (3,930) (4,483) Hanon Systems JP Morgan (7,062) (598) Hanssem Co Ltd Citibank (5,200) (41) Hanssem Co Ltd JP Morgan (34) 92 Hanwha Chemical Corp Citibank 35 553 Hanwha Chemical Corp JP Morgan 69 725 Hanwha Life Insurance Co Ltd Bank of America
Merrill Lynch (102) 1,328 Hanwha Life Insurance Co Ltd JP Morgan (263) (1,651) Hotel Shilla Co Ltd Citibank 2,413 (1,449) Hotel Shilla Co Ltd JP Morgan 6,883 1,992 Hyosung Corp Bank of America
Merrill Lynch (2,981) 94 Hyosung Corp JP Morgan (247) 244 Hyundai Department Bank of America
Store Co Ltd Merrill Lynch (971) 128 Hyundai Department
Store Co Ltd Citibank (202) 38 Hyundai Department
Store Co Ltd JP Morgan (339) 917 Hyundai Development Co-
Engineering & Construction Citibank 1,903 1,358 Hyundai Development Co-
Engineering & Construction JP Morgan 2,152 273 Hyundai Development Co- Bank of America
Engineering & Construction Merrill Lynch 205 391 Hyundai Engineering & Bank of America
Construction Co Ltd Merrill Lynch (515) 68 Hyundai Engineering &
Construction Co Ltd Citibank 39 288 Hyundai Engineering &
Construction Co Ltd JP Morgan (468) (2,383) Hyundai Glovis Co Ltd Bank of America
Merrill Lynch 5,897 (302) Hyundai Heavy
Industries Co Ltd Citibank (1,603) (2,758) Hyundai Heavy
Industries Co Ltd JP Morgan (15,732) (722) Hyundai Mobis Co Ltd Bank of America
Merrill Lynch (4,626) (2,949) Hyundai Motor Co Bank of America
Merrill Lynch (10,446) (2,675) Hyundai Motor Co (Pref) Bank of America
Merrill Lynch (12,894) (237) Hyundai Wia Corp JP Morgan (412) (539) Industrial Bank of Korea Bank of America
Merrill Lynch 31 (512) Industrial Bank of Korea JP Morgan 131 (2,191) Kakao Corp JP Morgan 2,002 (2,939) Kakao Corp Bank of America
Merrill Lynch (3,810) 678 Kangwon Land Inc Citibank 643 1,254 Kangwon Land Inc JP Morgan 258 263 Kangwon Land Inc Bank of America
Merrill Lynch (109) (792) KB Financial Group Inc Bank of America
Merrill Lynch (435) (609) KCC Corp Bank of America
Merrill Lynch (2,747) (1,148) KEPCO Plant Service &
Engineering Co Ltd JP Morgan 3,109 (1,417) Kia Motors Corp Bank of America
Merrill Lynch 15 (489) Korea Aerospace Industries Ltd Citibank (233) (441) Korea Aerospace Industries Ltd JP Morgan (380) (12) Korea Aerospace Industries Ltd Bank of America
Merrill Lynch (19) 1,851 Korea Electric Power Corp Bank of America
Merrill Lynch 3,061 1,853 Korea Electric Power Corp Citibank 4,052
7,218 Korea Electric Power Corp JP Morgan 16,913 1,999 Korea Investment
Holdings Co Ltd Citibank 2,040 748 Korea Investment
Holdings Co Ltd JP Morgan 1,232 6,469 Korea Investment Bank of America
Holdings Co Ltd Merrill Lynch 6,076 (21) Korea Zinc Co Ltd Bank of America
Merrill Lynch 362 547 KT Corp Bank of America
Merrill Lynch (15) 121 KT&G Corp Bank of America
Merrill Lynch (289) 995 KT&G Corp Citibank (699) 109 KT&G Corp JP Morgan (681) 61 LG Chem Ltd Bank of America
Merrill Lynch (659) 24 LG Chem Ltd Citibank (97) 2,681 LG Corp Bank of America
Merrill Lynch (1,573) 319 LG Corp Citibank (197) 1,073 LG Display Co Ltd Bank of America
Merrill Lynch 986 101 LG Display Co Ltd Citibank 15 3,250 LG Electronics Inc Bank of America
Merrill Lynch 8,466 518 LG Electronics Inc Citibank 1,283 1,283 LG Electronics Inc JP Morgan (1,347) 21 LG Household & Bank of America
Health Care Ltd Merrill Lynch 2 47 LG Household &
Health Care Ltd Citibank 1,394 13,437 LG Uplus Corp Bank of America
Merrill Lynch 1,681 2,933 LG Uplus Corp JP Morgan 247 673 Lotte Chemical Corp Bank of America
Merrill Lynch (2,014) 175 Lotte Chemical Corp Citibank (1,087) (121) Lotte Confectionery Co Ltd Citibank 2,700 (299) Lotte Shopping Co Ltd JP Morgan 2,414 1,470 Mirae Asset Daewoo Co Ltd JP Morgan 84 21,263 Mirae Asset Daewoo Co Ltd Bank of America
Merrill Lynch (8,291) 4,482 Mirae Asset Daewoo Co Ltd Citibank (802) (251) NAVER Corp Bank of America
Merrill Lynch (6,334) 15 NCSoft Corp Citibank 138 159 NCSoft Corp JP Morgan 1,534 21 NCSoft Corp Bank of America
Merrill Lynch (44) 2,243 NH Investment & Bank of America
Securities Co Ltd Merrill Lynch (1,072) 3,720 NH Investment &
Securities Co Ltd JP Morgan (899) (91) Orion Corp/Republic of Korea JP Morgan 1,949 (87) Ottogi Corp Bank of America
Merrill Lynch 1,710 (44) Ottogi Corp Citibank 875 (4) Ottogi Corp JP Morgan 238 84 POSCO Bank of America
Merrill Lynch (117) 280 POSCO Citibank (203) 93 POSCO JP Morgan (287) (1,010) S-1 Corp JP Morgan 562 97 S-Oil Corp Citibank 77 1,278 S-Oil Corp JP Morgan 2,297 2,524 S-Oil Corp Bank of America
Merrill Lynch 4,835 (5,905) Samsung C&T Corp Bank of America
Merrill Lynch 10,679
South Korea continued South Korea continued

Contracts for difference as at 31 May 2016
Holding
Description Counterparty
Unrealised appreciation/
(depreciation) USD
Holding
Description Counterparty
Unrealised appreciation/
(depreciation) USD
Annual Report and Audited Accounts 433
The notes on pages 489 to 503 form an integral part of these financial statements.
(472) Samsung C&T Corp Citibank 512 (1,489) Samsung C&T Corp JP Morgan 11,007 (745) Samsung Card Co Ltd Bank of America
Merrill Lynch 314 (182) Samsung Electro-
Mechanics Co Ltd JP Morgan (193) (3,078) Samsung Electro- Bank of America
Mechanics Co Ltd Merrill Lynch (2,199) 57 Samsung Electronics Co Ltd JP Morgan (917) (489) Samsung Fire & Marine Bank of America
Insurance Co Ltd Merrill Lynch 3,936 (2,725) Samsung Heavy
Industries Co Ltd JP Morgan 136 (108) Samsung Life Insurance Co Ltd Bank of America
Merrill Lynch (85) (3,048) Samsung SDI Co Ltd Bank of America
Merrill Lynch (10,692) (2,199) Samsung SDS Co Ltd Bank of America
Merrill Lynch (2,660) (10) Samsung SDS Co Ltd JP Morgan (60) 821 Samsung Securities Co Ltd Citibank 151 1,459 Samsung Securities Co Ltd Bank of America
Merrill Lynch (2,249) 6,247 Samsung Securities Co Ltd JP Morgan (1,640) (954) Shinhan Financial Bank of America
Group Co Ltd Merrill Lynch 393 (67) SK Holdings Co Ltd Bank of America
Merrill Lynch 106 930 SK Hynix Inc Bank of America
Merrill Lynch 1,194 1,306 SK Hynix Inc Citibank 1,448 1,327 SK Hynix Inc JP Morgan 2,645 106 SK Innovation Co Ltd Bank of America
Merrill Lynch 657 518 SK Innovation Co Ltd Citibank 4,127 1,477 SK Innovation Co Ltd JP Morgan 12,578 156 SK Telecom Co Ltd Citibank 1,522 21 SK Telecom Co Ltd JP Morgan 129 2,483 Woori Bank Bank of America
Merrill Lynch (341) 194 Yuhan Corp Bank of America
Merrill Lynch 1,765 416 Yuhan Corp JP Morgan 6,610
12,469
Spain 2,197 Abertis Infraestructuras SA Bank of America
Merrill Lynch (1,508) 1,851 Abertis Infraestructuras SA JP Morgan (1,168) 2,197 Abertis Infraestructuras SA Bank of America
(Right) Merrill Lynch 1,701 1,851 Abertis Infraestructuras SA
(Right) JP Morgan 1,433 1,784 Acciona SA JP Morgan 3,076 126 Acciona SA Citibank 305 (1,944) Acerinox SA Bank of America
Merrill Lynch (771) (4,981) Acerinox SA Citibank (2,793) 3,551 ACS Actividades de
Construccion y Servicios SA JP Morgan 8,126 8,473 ACS Actividades de Bank of America
Construccion y Servicios SA Merrill Lynch 14,544 970 ACS Actividades de
Construccion y Servicios SA Citibank 1,566 (1,045) Aena SA Bank of America
Merrill Lynch 1,673 (74) Aena SA Citibank 145 (377) Aena SA JP Morgan 653 8,762 Almirall SA Bank of America
Merrill Lynch 9,432
2,129 Amadeus IT Holding SA 'A' Citibank 4,007 393 Amadeus IT Holding SA 'A' JP Morgan 538 289 Amadeus IT Holding SA 'A' Bank of America
Merrill Lynch 589 (534) Atresmedia Corp de Medios Bank of America
de Comunicacion SA Merrill Lynch (370) (5,902) Atresmedia Corp de Medios
de Comunicacion SA Citibank (3,626) (1,246) Atresmedia Corp de Medios
de Comunicacion SA JP Morgan (765) 1,200 Banco Bilbao Vizcaya Bank of America
Argentaria SA Merrill Lynch 618 12,925 Banco Bilbao Vizcaya
Argentaria SA Citibank 6,482 5,148 Banco Bilbao Vizcaya
Argentaria SA JP Morgan 2,714 (69,746) Banco de Sabadell SA Citibank 2,103 (35,429) Banco de Sabadell SA JP Morgan (594) (10,116) Banco Popular Espanol SA Citibank 6,904 (50,932) Banco Popular Espanol SA JP Morgan 34,753 (10,116) Banco Popular Espanol SA
(Right) Citibank (2,508) (50,932) Banco Popular Espanol SA
(Right) JP Morgan (12,629) 1,376 Banco Santander SA Bank of America
Merrill Lynch 460 12,457 Banco Santander SA Citibank 3,952 1,178 Banco Santander SA JP Morgan 520 (138,398) Bankia SA Bank of America
Merrill Lynch (3,283) (52,611) Bankia SA JP Morgan (816) (247) Bankinter SA Bank of America
Merrill Lynch (94) (1,625) Bankinter SA Citibank (623) (18,743) CaixaBank SA Bank of America
Merrill Lynch (1,064) (2,537) CaixaBank SA Citibank (142) (6,594) CaixaBank SA JP Morgan (705) (1,487) Cellnex Telecom SAU Bank of America
Merrill Lynch (723) (12,343) Cellnex Telecom SAU Citibank (4,274) (3,791) Cellnex Telecom SAU JP Morgan (2,011) 2,791 Cia de Distribucion Integral Bank of America
Logista Holdings SA Merrill Lynch 1,294 1,079 Cia de Distribucion Integral
Logista Holdings SA Citibank 127 3,938 Cia de Distribucion Integral
Logista Holdings SA JP Morgan 791 5,795 Distribuidora Internacional
de Alimentacion SA Citibank 1,172 14,498 Distribuidora Internacional
de Alimentacion SA JP Morgan 4,443 326 Ebro Foods SA JP Morgan 258 821 Ebro Foods SA Bank of America
Merrill Lynch 316 1,339 Ebro Foods SA Citibank 568 (94) Enagas SA Bank of America
Merrill Lynch (57) (822) Enagas SA Citibank (321) (3,248) Enagas SA JP Morgan (1,529) 2,208 Endesa SA JP Morgan 436 127 Endesa SA Citibank 66 (388) Ferrovial SA Bank of America
Merrill Lynch (451) (5,479) Ferrovial SA Citibank (4,804) (388) Ferrovial SA (Right) Bank of America
Merrill Lynch (143) (5,479) Ferrovial SA (Right) Citibank (2,013) 2,261 Gamesa Corp Tecnologica SA Citibank 745 108 Gamesa Corp Tecnologica SA Bank of America
Merrill Lynch 8
BlackRock Style Advantage Fund continued
Spain continued South Korea continued
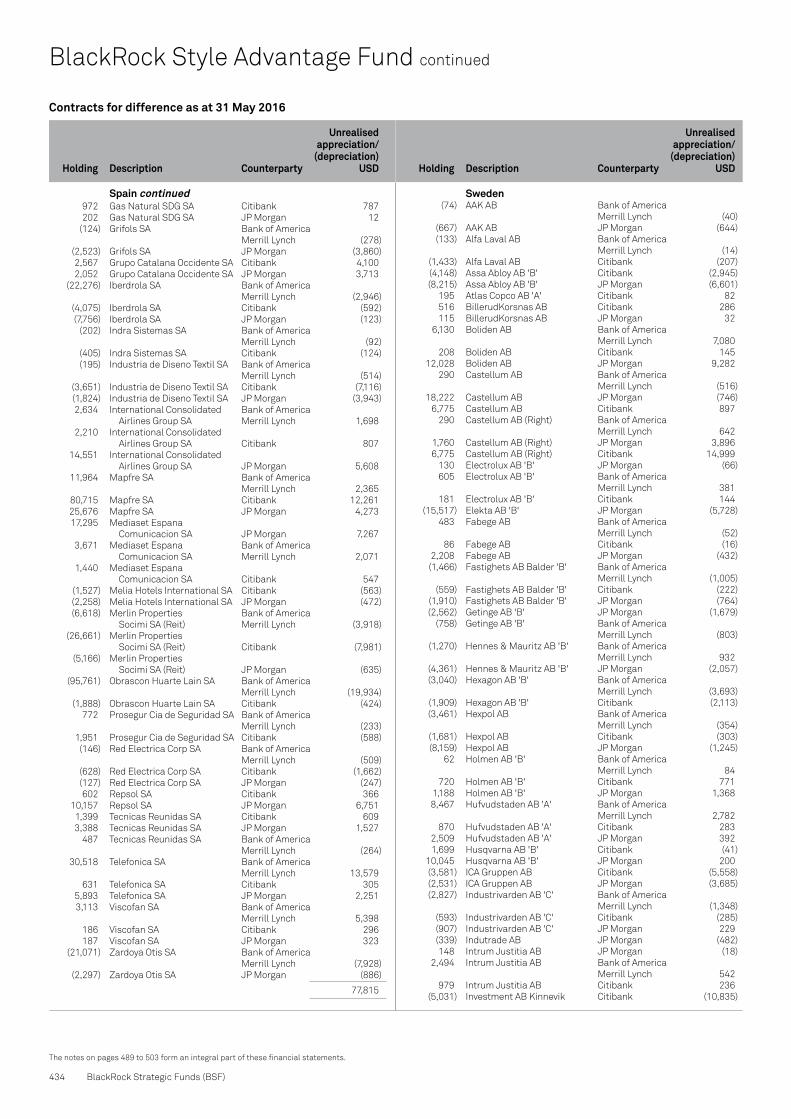
Contracts for difference as at 31 May 2016
Holding
Description Counterparty
Unrealised appreciation/
(depreciation) USD
Holding
Description Counterparty
Unrealised appreciation/
(depreciation) USD
434 BlackRock Strategic Funds (BSF)
The notes on pages 489 to 503 form an integral part of these financial statements.
BlackRock Style Advantage Fund continued
972 Gas Natural SDG SA Citibank 787 202 Gas Natural SDG SA JP Morgan 12 (124) Grifols SA Bank of America
Merrill Lynch (278) (2,523) Grifols SA JP Morgan (3,860) 2,567 Grupo Catalana Occidente SA Citibank 4,100 2,052 Grupo Catalana Occidente SA JP Morgan 3,713 (22,276) Iberdrola SA Bank of America
Merrill Lynch (2,946) (4,075) Iberdrola SA Citibank (592) (7,756) Iberdrola SA JP Morgan (123) (202) Indra Sistemas SA Bank of America
Merrill Lynch (92) (405) Indra Sistemas SA Citibank (124) (195) Industria de Diseno Textil SA Bank of America
Merrill Lynch (514) (3,651) Industria de Diseno Textil SA Citibank (7,116) (1,824) Industria de Diseno Textil SA JP Morgan (3,943) 2,634 International Consolidated Bank of America
Airlines Group SA Merrill Lynch 1,698 2,210 International Consolidated
Airlines Group SA Citibank 807 14,551 International Consolidated
Airlines Group SA JP Morgan 5,608 11,964 Mapfre SA Bank of America
Merrill Lynch 2,365 80,715 Mapfre SA Citibank 12,261 25,676 Mapfre SA JP Morgan 4,273 17,295 Mediaset Espana
Comunicacion SA JP Morgan 7,267 3,671 Mediaset Espana Bank of America
Comunicacion SA Merrill Lynch 2,071 1,440 Mediaset Espana
Comunicacion SA Citibank 547 (1,527) Melia Hotels International SA Citibank (563) (2,258) Melia Hotels International SA JP Morgan (472) (6,618) Merlin Properties Bank of America
Socimi SA (Reit) Merrill Lynch (3,918) (26,661) Merlin Properties
Socimi SA (Reit) Citibank (7,981) (5,166) Merlin Properties
Socimi SA (Reit) JP Morgan (635) (95,761) Obrascon Huarte Lain SA Bank of America
Merrill Lynch (19,934) (1,888) Obrascon Huarte Lain SA Citibank (424) 772 Prosegur Cia de Seguridad SA Bank of America
Merrill Lynch (233) 1,951 Prosegur Cia de Seguridad SA Citibank (588) (146) Red Electrica Corp SA Bank of America
Merrill Lynch (509) (628) Red Electrica Corp SA Citibank (1,662) (127) Red Electrica Corp SA JP Morgan (247) 602 Repsol SA Citibank 366 10,157 Repsol SA JP Morgan 6,751 1,399 Tecnicas Reunidas SA Citibank 609 3,388 Tecnicas Reunidas SA JP Morgan 1,527 487 Tecnicas Reunidas SA Bank of America
Merrill Lynch (264) 30,518 Telefonica SA Bank of America
Merrill Lynch 13,579 631 Telefonica SA Citibank 305 5,893 Telefonica SA JP Morgan 2,251 3,113 Viscofan SA Bank of America
Merrill Lynch 5,398 186 Viscofan SA Citibank 296 187 Viscofan SA JP Morgan 323 (21,071) Zardoya Otis SA Bank of America
Merrill Lynch (7,928) (2,297) Zardoya Otis SA JP Morgan (886)
77,815
Sweden (74) AAK AB Bank of America
Merrill Lynch (40) (667) AAK AB JP Morgan (644) (133) Alfa Laval AB Bank of America
Merrill Lynch (14) (1,433) Alfa Laval AB Citibank (207) (4,148) Assa Abloy AB 'B' Citibank (2,945) (8,215) Assa Abloy AB 'B' JP Morgan (6,601) 195 Atlas Copco AB 'A' Citibank 82 516 BillerudKorsnas AB Citibank 286 115 BillerudKorsnas AB JP Morgan 32 6,130 Boliden AB Bank of America
Merrill Lynch 7,080 208 Boliden AB Citibank 145 12,028 Boliden AB JP Morgan 9,282 290 Castellum AB Bank of America
Merrill Lynch (516) 18,222 Castellum AB JP Morgan (746) 6,775 Castellum AB Citibank 897 290 Castellum AB (Right) Bank of America
Merrill Lynch 642 1,760 Castellum AB (Right) JP Morgan 3,896 6,775 Castellum AB (Right) Citibank 14,999 130 Electrolux AB 'B' JP Morgan (66) 605 Electrolux AB 'B' Bank of America
Merrill Lynch 381 181 Electrolux AB 'B' Citibank 144 (15,517) Elekta AB 'B' JP Morgan (5,728) 483 Fabege AB Bank of America
Merrill Lynch (52) 86 Fabege AB Citibank (16) 2,208 Fabege AB JP Morgan (432) (1,466) Fastighets AB Balder 'B' Bank of America
Merrill Lynch (1,005) (559) Fastighets AB Balder 'B' Citibank (222) (1,910) Fastighets AB Balder 'B' JP Morgan (764) (2,562) Getinge AB 'B' JP Morgan (1,679) (758) Getinge AB 'B' Bank of America
Merrill Lynch (803) (1,270) Hennes & Mauritz AB 'B' Bank of America
Merrill Lynch 932 (4,361) Hennes & Mauritz AB 'B' JP Morgan (2,057) (3,040) Hexagon AB 'B' Bank of America
Merrill Lynch (3,693) (1,909) Hexagon AB 'B' Citibank (2,113) (3,461) Hexpol AB Bank of America
Merrill Lynch (354) (1,681) Hexpol AB Citibank (303) (8,159) Hexpol AB JP Morgan (1,245) 62 Holmen AB 'B' Bank of America
Merrill Lynch 84 720 Holmen AB 'B' Citibank 771 1,188 Holmen AB 'B' JP Morgan 1,368 8,467 Hufvudstaden AB 'A' Bank of America
Merrill Lynch 2,782 870 Hufvudstaden AB 'A' Citibank 283 2,509 Hufvudstaden AB 'A' JP Morgan 392 1,699 Husqvarna AB 'B' Citibank (41) 10,045 Husqvarna AB 'B' JP Morgan 200 (3,581) ICA Gruppen AB Citibank (5,558) (2,531) ICA Gruppen AB JP Morgan (3,685) (2,827) Industrivarden AB 'C' Bank of America
Merrill Lynch (1,348) (593) Industrivarden AB 'C' Citibank (285) (907) Industrivarden AB 'C' JP Morgan 229 (339) Indutrade AB JP Morgan (482) 148 Intrum Justitia AB JP Morgan (18) 2,494 Intrum Justitia AB Bank of America
Merrill Lynch 542 979 Intrum Justitia AB Citibank 236 (5,031) Investment AB Kinnevik Citibank (10,835)
Spain continued

Contracts for difference as at 31 May 2016
Holding
Description Counterparty
Unrealised appreciation/
(depreciation) USD
Holding
Description Counterparty
Unrealised appreciation/
(depreciation) USD
Annual Report and Audited Accounts 435
The notes on pages 489 to 503 form an integral part of these financial statements.
(8,090) Investment AB Kinnevik JP Morgan (17,423) (5,031) Investment AB Kinnevik 'B' Citibank 11,804 (8,090) Investment AB Kinnevik 'B' JP Morgan 17,724 (1,341) Investor AB 'B' Bank of America
Merrill Lynch (2,452) (7,065) Investor AB 'B' Citibank (9,350) (2,457) Investor AB 'B' JP Morgan (1,502) 1,060 JM AB Bank of America
Merrill Lynch 370 (2,553) L E Lundbergforetagen AB 'B' Bank of America
Merrill Lynch (8,440) (441) L E Lundbergforetagen AB 'B' Citibank (1,268) (485) L E Lundbergforetagen AB 'B' JP Morgan (2,428) (357) Loomis AB 'B' Citibank (219) (1,073) Loomis AB 'B' JP Morgan (737) (461) Lundin Petroleum AB Citibank (83) (1,530) Lundin Petroleum AB JP Morgan (1,362) (9,294) Lundin Petroleum AB Bank of America
Merrill Lynch (711) (2,971) Meda AB 'A' Bank of America
Merrill Lynch (393) (8,701) Meda AB 'A' JP Morgan (200) (798) Modern Times Bank of America
Group MTG AB 'B' Merrill Lynch 309 2,995 NCC AB 'B' Bank of America
Merrill Lynch 3,979 1,133 NCC AB 'B' Citibank 1,445 211 NCC AB 'B' JP Morgan 774 (1,504) Nibe Industrier AB 'B' Bank of America
Merrill Lynch (538) (4,496) Nibe Industrier AB 'B' Citibank (1,339) (68) Nibe Industrier AB 'B' JP Morgan (21) (3,728) Nordea Bank AB Bank of America
Merrill Lynch (2,220) (9,665) Nordea Bank AB Citibank (5,117) 5,116 Peab AB Bank of America
Merrill Lynch 846 5,011 Peab AB Citibank 739 24,976 Peab AB JP Morgan 3,893 (4,442) Ratos AB 'B' Bank of America
Merrill Lynch (420) (429) Ratos AB 'B' Citibank (36) (1,632) Saab AB 'B' Bank of America
Merrill Lynch 1,076 (439) Saab AB 'B' Citibank 291 (1,344) Saab AB 'B' JP Morgan 162 (6,343) Sandvik AB JP Morgan 127 725 Securitas AB 'B' Bank of America
Merrill Lynch 637 9,689 Securitas AB 'B' Citibank 4,313 (101) Skandinaviska Enskilda
Banken AB 'A' JP Morgan (69) 1,124 Skanska AB 'B' Bank of America
Merrill Lynch 757 1,696 Skanska AB 'B' JP Morgan 1,203 6,963 Skanska AB 'B' Citibank 6,451 (151) SKF AB 'B' JP Morgan (98) (2,357) SKF AB 'B' Bank of America
Merrill Lynch (67) (62) Svenska Cellulosa AB SCA 'B' Bank of America
Merrill Lynch (77) (82) Svenska Cellulosa AB SCA 'B' Citibank (84) (49) Svenska Cellulosa AB SCA 'B' JP Morgan (81) (1,307) Svenska Handelsbanken AB 'A' Citibank (692) (4,948) Svenska Handelsbanken AB 'A' JP Morgan (2,416) (500) Svenska Handelsbanken AB 'A' Bank of America
Merrill Lynch (301) (1,347) Swedbank AB 'A' Bank of America
Merrill Lynch (2,301) (3,156) Swedbank AB 'A' JP Morgan (4,302)
823 Swedish Match AB Bank of America Merrill Lynch 1,109
6,336 Swedish Match AB Citibank 8,462 (4,417) Swedish Orphan Biovitrum AB Bank of America
Merrill Lynch (1,754) (2,407) Swedish Orphan Biovitrum AB Citibank 1,940 (12,089) Swedish Orphan Biovitrum AB JP Morgan 9,565 451 Tele2 AB 'B' JP Morgan (98) 1,448 Telefonaktiebolaget LM
Ericsson 'B' JP Morgan 200 9,206 Telefonaktiebolaget LM Bank of America
Ericsson 'B' Merrill Lynch 1,104 5,026 Telefonaktiebolaget LM
Ericsson 'B' Citibank 454 15,499 Telia Co AB Bank of America
Merrill Lynch 2,443 39,432 Telia Co AB Citibank 4,317 1,204 Trelleborg AB 'B' Citibank 348 3,094 Unibet Group Plc SDR JP Morgan 498 692 Unibet Group Plc SDR Bank of America
Merrill Lynch 25 320 Unibet Group Plc SDR Citibank 54 (8,261) Volvo AB 'B' JP Morgan (2,268) (521) Volvo AB 'B' Bank of America
Merrill Lynch 3 210 Wallenstam AB 'B' Bank of America
Merrill Lynch 61 1,955 Wallenstam AB 'B' Citibank 412 8,410 Wallenstam AB 'B' JP Morgan 1,785
10,001
Switzerland (690) ABB Ltd Reg Bank of America
Merrill Lynch (516) (4,102) ABB Ltd Reg Citibank (1,492) 1,261 Actelion Ltd Reg Citibank 5,478 126 Actelion Ltd Reg JP Morgan 1,006 4,067 Adecco Group AG Reg Bank of America
Merrill Lynch 5,350 659 Adecco Group AG Reg JP Morgan (965) 24 Adecco Group AG Reg Citibank 25 (226) Allreal Holding AG Reg Bank of America
Merrill Lynch (571) (82) Allreal Holding AG Reg Citibank (124) (1,164) Allreal Holding AG Reg JP Morgan (2,031) (468) ams AG JP Morgan (2,128) (4,213) ams AG Bank of America
Merrill Lynch (8,338) (948) ams AG Citibank (1,389) (520) Aryzta AG JP Morgan (1,112) (2,550) Aryzta AG Bank of America
Merrill Lynch (62) (613) Aryzta AG Citibank 111 348 Baloise Holding AG Reg Bank of America
Merrill Lynch 1,793 97 Baloise Holding AG Reg Citibank 343 276 Baloise Holding AG Reg JP Morgan 1,005 (16) Banque Cantonale Bank of America
Vaudoise Reg Merrill Lynch (436) (8) Banque Cantonale
Vaudoise Reg Citibank (170) (111) Banque Cantonale
Vaudoise Reg JP Morgan (2,991) (4) Barry Callebaut AG Reg Bank of America
Merrill Lynch (113) (13) Barry Callebaut AG Reg Citibank (26) (144) Barry Callebaut AG Reg JP Morgan (1,617) 23 Bucher Industries AG Reg Bank of America
Merrill Lynch 230 105 Bucher Industries AG Reg Citibank 753
BlackRock Style Advantage Fund continued
Sweden continued Sweden continued

Contracts for difference as at 31 May 2016
Holding
Description Counterparty
Unrealised appreciation/
(depreciation) USD
Holding
Description Counterparty
Unrealised appreciation/
(depreciation) USD
436 BlackRock Strategic Funds (BSF)
The notes on pages 489 to 503 form an integral part of these financial statements.
BlackRock Style Advantage Fund continued
309 Bucher Industries AG Reg JP Morgan 2,846 (674) Cie Financiere Bank of America
Richemont SA Reg Merrill Lynch 1,294 (55) Cie Financiere
Richemont SA Reg JP Morgan 156 (1,659) Cie Financiere
Richemont SA Reg Citibank (3,268) 255 Clariant AG Reg Bank of America
Merrill Lynch (10) 160 Clariant AG Reg JP Morgan (13) 537 Clariant AG Reg Citibank 76 (494) Cosmo Pharmaceuticals NV Bank of America
Merrill Lynch (4,392) (315) Cosmo Pharmaceuticals NV Citibank (3,914) (257) Cosmo Pharmaceuticals NV JP Morgan (3,090) (4,272) Credit Suisse Group AG Reg JP Morgan 30 (26) dorma+kaba
Holding AG Reg 'B' Citibank (250) (220) dorma+kaba
Holding AG Reg 'B' JP Morgan (5,274) (469) Dufry AG Reg Bank of America
Merrill Lynch (1,706) (1,914) Dufry AG Reg Citibank (2,707) (111) EMS-Chemie Holding AG Reg Citibank (673) (238) EMS-Chemie Holding AG Reg JP Morgan (2,137) (5) Flughafen Zuerich AG Reg JP Morgan (4) (25) Flughafen Zuerich AG Reg Bank of America
Merrill Lynch 28 155 Forbo Holding AG Reg Citibank (2,662) 47 Forbo Holding AG Reg Bank of America
Merrill Lynch 1,899 (2) Galenica AG Reg Citibank 54 (18) Galenica AG Reg JP Morgan 2,799 17,863 GAM Holding AG JP Morgan 3,118 8,459 GAM Holding AG Citibank (427) 1,687 GAM Holding AG Bank of America
Merrill Lynch 767 (98) Geberit AG Reg Bank of America
Merrill Lynch (475) (25) Geberit AG Reg Citibank (96) (76) Geberit AG Reg JP Morgan (1,276) 488 Georg Fischer AG Reg JP Morgan 6,698 64 Georg Fischer AG Reg Citibank 453 (19) Givaudan SA Reg JP Morgan 279 (2) Givaudan SA Reg Bank of America
Merrill Lynch 81 (20) Givaudan SA Reg Citibank 768 (5) Helvetia Holding AG Reg JP Morgan (109) 967 Kuehne + Nagel
International AG Reg JP Morgan 3,662 84 Kuehne + Nagel
International AG Reg Citibank 195 3,649 Logitech International SA Reg JP Morgan 1,694 209 Logitech International SA Reg Bank of America
Merrill Lynch 190 11,233 Logitech International SA Reg Citibank 6,809 1,329 Lonza Group AG Reg JP Morgan 1,903 92 Lonza Group AG Reg Citibank (9) 79 Lonza Group AG Reg Bank of America
Merrill Lynch 184 (42) Nestle SA Reg Bank of America
Merrill Lynch (49) (6,517) Nestle SA Reg Citibank (5,925) (58) Nestle SA Reg JP Morgan (144) (630) Novartis AG Reg Citibank (1,368) (4,904) OC Oerlikon Corp AG Reg Citibank (347) (1,471) OC Oerlikon Corp AG Reg JP Morgan 35 179 Panalpina Welttransport
Holding AG Reg Citibank 145 64 Panalpina Welttransport
Holding AG Reg JP Morgan 427
(1,203) Pargesa Holding SA Bank of America Merrill Lynch (2,432)
(490) Pargesa Holding SA JP Morgan (1,110) (33) Partners Group Holding AG Bank of America
Merrill Lynch (725) (370) Partners Group Holding AG JP Morgan (6,680) 74 PSP Swiss Property AG Reg Citibank 112 671 PSP Swiss Property AG Reg JP Morgan 1,069 63 Roche Holding AG Bank of America
Merrill Lynch 1,044 (2,399) SFS Group AG Bank of America
Merrill Lynch (1,769) (708) SFS Group AG JP Morgan (2,181) (5) SGS SA Reg JP Morgan (258) (3) SGS SA Reg Citibank 85 (1) Sika AG Bank of America
Merrill Lynch (71) (2) Sika AG Citibank (4) (1) Sika AG JP Morgan (212) (41) Sonova Holding AG Reg Bank of America
Merrill Lynch 149 (216) Sonova Holding AG Reg JP Morgan (443) 38 Straumann Holding AG Reg Bank of America
Merrill Lynch 326 476 Straumann Holding AG Reg Citibank 4,087 11 Straumann Holding AG Reg JP Morgan 153 (827) Sulzer AG Reg Bank of America
Merrill Lynch (1,350) (223) Sulzer AG Reg JP Morgan (890) (488) Sunrise Communications
Group AG JP Morgan (1,183) (1,707) Sunrise Communications
Group AG Citibank 862 (494) Sunrise Communications Bank of America
Group AG Merrill Lynch 1,173 488 Swiss Life Holding AG Reg Bank of America
Merrill Lynch 7,839 1,058 Swiss Life Holding AG Reg Citibank 14,750 (80) Swiss Prime Site AG Reg Bank of America
Merrill Lynch (16) (1,208) Swiss Prime Site AG Reg Citibank (488) (83) Swiss Prime Site AG Reg JP Morgan 29 252 Swiss Re AG Bank of America
Merrill Lynch 827 1,232 Swiss Re AG Citibank 4,170 208 Swiss Re AG JP Morgan 483 18 Swisscom AG Reg Bank of America
Merrill Lynch (165) 22 Swisscom AG Reg Citibank 253 155 Swisscom AG Reg JP Morgan 363 133 Temenos Group AG Reg Bank of America
Merrill Lynch 349 863 Temenos Group AG Reg JP Morgan 753 22,906 UBS Group AG Reg Citibank 12,033 (725) Valiant Holding AG Reg Bank of America
Merrill Lynch (2,251) (30) Valiant Holding AG Reg Citibank (73) 2,361 Vontobel Holding AG Reg Citibank 4,651 445 Vontobel Holding AG Reg JP Morgan 2,001 71 Zurich Insurance Group AG Citibank 337
23,875
Taiwan 31,000 Advanced Semiconductor Bank of America
Engineering Inc Merrill Lynch 7,177 9,000 Advanced Semiconductor
Engineering Inc Citibank 1,569 167,000 Advanced Semiconductor
Engineering Inc JP Morgan 34,125 (1,000) Advantech Co Ltd Citibank (238)
Switzerland continued Switzerland continued

Contracts for difference as at 31 May 2016
Holding
Description Counterparty
Unrealised appreciation/
(depreciation) USD
Holding
Description Counterparty
Unrealised appreciation/
(depreciation) USD
Annual Report and Audited Accounts 437
The notes on pages 489 to 503 form an integral part of these financial statements.
(3,000) Advantech Co Ltd JP Morgan (1,860) (13,000) Asia Cement Corp Citibank (170) (246,000) Asia Cement Corp JP Morgan (1,526) (26,000) Asustek Computer Inc Bank of America
Merrill Lynch (19,966) (1,000) Asustek Computer Inc JP Morgan (428) 327,000 AU Optronics Corp Bank of America
Merrill Lynch 3,046 165,000 AU Optronics Corp JP Morgan 1,006 10,000 Catcher Technology Co Ltd Bank of America
Merrill Lynch 10,233 19,000 Catcher Technology Co Ltd JP Morgan 5,052 4,000 Cathay Financial
Holding Co Ltd JP Morgan 245 (7,000) Chailease Holding Co Ltd Bank of America
Merrill Lynch (40) (10,000) Chailease Holding Co Ltd Citibank 259 (5,000) Chang Hwa Commercial Bank of America
Bank Ltd Merrill Lynch (112) 4,000 Cheng Shin Rubber Bank of America
Industry Co Ltd Merrill Lynch 198 88,000 Cheng Shin Rubber
Industry Co Ltd JP Morgan 2,404 18,000 Cheng Shin Rubber
Industry Co Ltd Citibank (14) 3,000 China Development Financial
Holding Corp JP Morgan 37 30,000 China Life Insurance Co
Ltd/Taiwan Citibank 1,082 11,000 China Life Insurance Co
Ltd/Taiwan JP Morgan 497 230,000 China Life Insurance Co Bank of America
Ltd/Taiwan Merrill Lynch 12,364 (5,000) China Steel Corp Citibank 4 (48,000) China Steel Corp JP Morgan 987 (170,000) China Steel Corp Bank of America
Merrill Lynch (2,578) (16,000) Chunghwa Telecom Co Ltd JP Morgan 560 (66,000) Chunghwa Telecom Co Ltd Bank of America
Merrill Lynch (635) 35,000 Compal Electronics Inc Citibank 398 113,000 Compal Electronics Inc JP Morgan 3,995 (53,000) CTBC Financial Holding Co Ltd JP Morgan (1,432) (64,000) Delta Electronics Inc Bank of America
Merrill Lynch (22,589) (63,000) E.Sun Financial Holding Co Ltd Bank of America
Merrill Lynch (2,216) (4,000) Eclat Textile Co Ltd Citibank (5,194) 215,000 Eva Airways Corp Bank of America
Merrill Lynch 4,279 15,000 Eva Airways Corp Citibank 283 56,000 Eva Airways Corp JP Morgan (407) 362,000 Far Eastern New Century Corp Bank of America
Merrill Lynch 7,206 53,000 Far Eastern New Century Corp Citibank (39) (54,000) Far EasTone Bank of America
Telecommunications Co Ltd Merrill Lynch (215) (1,000) Feng TAY Enterprise Co Ltd Citibank 72 (360,000) First Financial Holding Co Ltd Bank of America
Merrill Lynch (6,376) (909,000) First Financial Holding Co Ltd JP Morgan (15,736) 42,000 Formosa Chemicals & Bank of America
Fibre Corp Merrill Lynch 3,165 11,000 Formosa Chemicals &
Fibre Corp JP Morgan 483 (10,000) Formosa Petrochemical Corp Citibank 215 (15,000) Formosa Petrochemical Corp Bank of America
Merrill Lynch (1,613) (15,000) Formosa Plastics Corp Bank of America
Merrill Lynch (889) (9,000) Formosa Plastics Corp Citibank (576)
(24,000) Formosa Plastics Corp JP Morgan (2,713) 15,000 Foxconn Technology Co Ltd Bank of America
Merrill Lynch 3,457 140,000 Foxconn Technology Co Ltd JP Morgan 22,872 6,000 Fubon Financial Holding Co Ltd Citibank 127 10,000 Fubon Financial Holding Co Ltd JP Morgan 425 93,000 Fubon Financial Holding Co Ltd Bank of America
Merrill Lynch 6,274 (10,000) Hermes Microvision Inc Citibank (15,710) 33,000 Hon Hai Precision
Industry Co Ltd Citibank 2,820 20,000 Hon Hai Precision
Industry Co Ltd JP Morgan 4,341 1,000 Hotai Motor Co Ltd Bank of America
Merrill Lynch 629 5,000 Hotai Motor Co Ltd Citibank 1,355 16,000 Hotai Motor Co Ltd JP Morgan 10,444 (229,000) Hua Nan Financial Bank of America
Holdings Co Ltd Merrill Lynch (5,030) 611,000 Innolux Corp Bank of America
Merrill Lynch 2,482 343,000 Innolux Corp JP Morgan 673 62,000 Innolux Corp Citibank (131) 73,000 Inventec Corp Citibank 1,172 262,000 Inventec Corp Bank of America
Merrill Lynch 10,492 1,000 Largan Precision Co Ltd Citibank 400 54,000 Lite-On Technology Corp Citibank 2,062 157,000 Lite-On Technology Corp Bank of America
Merrill Lynch 9,594 (30,000) MediaTek Inc Bank of America
Merrill Lynch (15,891) (659,000) Mega Financial Holding Co Ltd Bank of America
Merrill Lynch (23,440) (19,000) Mega Financial Holding Co Ltd Citibank (277) (107,000) Mega Financial Holding Co Ltd JP Morgan (2,844) 19,000 Nan Ya Plastics Corp Bank of America
Merrill Lynch 1,781 16,000 Nan Ya Plastics Corp Citibank 720 9,000 Nan Ya Plastics Corp JP Morgan 94 16,000 Novatek Microelectronics Corp Citibank 1,775 29,000 Novatek Microelectronics Corp JP Morgan 3,358 6,000 Pegatron Corp Bank of America
Merrill Lynch 958 28,000 Pegatron Corp Citibank 1,352 78,000 Pegatron Corp JP Morgan 13,547 16,000 Pou Chen Corp Citibank 735 7,000 Pou Chen Corp JP Morgan 1,036 88,000 Pou Chen Corp Bank of America
Merrill Lynch 5,349 6,000 President Chain Store Corp Bank of America
Merrill Lynch 1,364 9,000 President Chain Store Corp Citibank 1,868 25,000 President Chain Store Corp JP Morgan 8,597 (161,000) Quanta Computer Inc Bank of America
Merrill Lynch (17,726) (42,000) Quanta Computer Inc JP Morgan (9,151) (18,000) Shin Kong Financial
Holding Co Ltd JP Morgan (373) 10,000 SinoPac Financial Bank of America
Holdings Co Ltd Merrill Lynch 158 25,000 SinoPac Financial
Holdings Co Ltd Citibank 169 1,000 Taishin Financial Bank of America
Holding Co Ltd Merrill Lynch 24 337,000 Taishin Financial
Holding Co Ltd Citibank 3,239 70,000 Taishin Financial
Holding Co Ltd JP Morgan 926 (10,000) Taiwan Cement Corp JP Morgan 38
BlackRock Style Advantage Fund continued
Taiwan continued Taiwan continued

Contracts for difference as at 31 May 2016
Holding
Description Counterparty
Unrealised appreciation/
(depreciation) USD
Holding
Description Counterparty
Unrealised appreciation/
(depreciation) USD
438 BlackRock Strategic Funds (BSF)
The notes on pages 489 to 503 form an integral part of these financial statements.
BlackRock Style Advantage Fund continued
(54,000) Taiwan Cement Corp Bank of America Merrill Lynch (3,622)
(2,000) Taiwan Cement Corp Citibank (79) (91,000) Taiwan Cooperative Financial Bank of America
Holding Co Ltd Merrill Lynch (2,158) (555,000) Taiwan Cooperative Financial
Holding Co Ltd Citibank (7,922) (18,000) Taiwan Cooperative Financial
Holding Co Ltd JP Morgan (204) (47,000) Taiwan Mobile Co Ltd Bank of America
Merrill Lynch (1,717) (43,000) Taiwan Mobile Co Ltd JP Morgan (2,302) 30,000 Taiwan Semiconductor
Manufacturing Co Ltd Citibank 2,458 8,000 Taiwan Semiconductor
Manufacturing Co Ltd JP Morgan 2,084 6,000 Taiwan Semiconductor Bank of America
Manufacturing Co Ltd Merrill Lynch 2,254 30,000 Uni-President
Enterprises Corp Citibank 1,350 11,000 Uni-President
Enterprises Corp JP Morgan 1,778 1,000 Uni-President Bank of America
Enterprises Corp Merrill Lynch 55 272,000 United Microelectronics Corp Bank of America
Merrill Lynch 6,420 1,101,000 United Microelectronics Corp Citibank 13,949 43,000 Yuanta Financial
Holding Co Ltd Citibank 675
62,532
United Kingdom (2,179) AA Plc Bank of America
Merrill Lynch (523) (23,194) AA Plc JP Morgan (2,296) 2,619 Aberdeen Asset Bank of America
Management Plc Merrill Lynch 656 10,376 Aberdeen Asset
Management Plc Citibank 836 6,420 Aberdeen Asset
Management Plc JP Morgan 1,589 (2,292) Admiral Group Plc Bank of America
Merrill Lynch (2,811) (1,497) Admiral Group Plc Citibank (1,819) (328) Aggreko Plc Citibank 120 (1,386) Amec Foster Wheeler Plc Bank of America
Merrill Lynch 455 (16,742) Amec Foster Wheeler Plc Citibank 2,035 (2,786) Amec Foster Wheeler Plc JP Morgan 207 2,056 Anglo American Plc Citibank 352 1,676 Anglo American Plc JP Morgan 511 (20,870) Antofagasta Plc Citibank 886 (7,730) Antofagasta Plc Bank of America
Merrill Lynch (306) (2,209) ARM Holdings Plc Bank of America
Merrill Lynch (1,731) (809) ARM Holdings Plc Citibank (308) (9,457) ARM Holdings Plc JP Morgan (3,918) 2,172 Ashmore Group Plc Bank of America
Merrill Lynch 270 12,990 Ashmore Group Plc Citibank 742 2,496 Ashmore Group Plc JP Morgan 157 (5,223) Ashtead Group Plc Bank of America
Merrill Lynch (668) (1,283) Ashtead Group Plc Citibank (75) (3,233) Ashtead Group Plc JP Morgan (4,895) (363) Asos Plc Bank of America
Merrill Lynch 1,289 (1,097) Asos Plc JP Morgan 2,659 (3,537) Asos Plc Citibank (1,010)
(221) Associated British Foods Plc Bank of America Merrill Lynch 282
(754) Associated British Foods Plc Citibank (707) (2,197) Associated British Foods Plc JP Morgan (1,199) 1,537 AstraZeneca Plc Bank of America
Merrill Lynch 3,249 467 AstraZeneca Plc Citibank 1,016 43 AstraZeneca Plc JP Morgan 66 (9,370) Auto Trader Group Plc Citibank (2,387) (6,797) Auto Trader Group Plc JP Morgan (2,221) 305 Aviva Plc Bank of America
Merrill Lynch 150 1,143 Aviva Plc Citibank 331 1,686 Aviva Plc JP Morgan 649 (3,289) Babcock International Bank of America
Group Plc Merrill Lynch (3,829) (12,904) Babcock International
Group Plc Citibank (9,259) (1,576) Babcock International
Group Plc JP Morgan (2,250) 13,023 BAE Systems Plc Citibank 801 4,732 BAE Systems Plc Bank of America
Merrill Lynch (430) 4,027 BAE Systems Plc JP Morgan (425) (74,947) Balfour Beatty Plc Citibank (7,573) (12,374) Balfour Beatty Plc JP Morgan (1,924) 6,689 Barratt Developments Plc Bank of America
Merrill Lynch 5,975 19,826 Barratt Developments Plc JP Morgan 6,624 (59,141) BBA Aviation Plc Bank of America
Merrill Lynch (4,563) (6,206) BBA Aviation Plc Citibank (136) (4,381) BBA Aviation Plc JP Morgan (847) 1,993 Beazley Plc Citibank 312 1,068 Bellway Plc Bank of America
Merrill Lynch 3,331 3,035 Bellway Plc JP Morgan 3,625 3,012 Berendsen Plc Bank of America
Merrill Lynch 662 11,795 Berendsen Plc Citibank 518 196 Berendsen Plc JP Morgan 20 4,343 Berkeley Group Holdings Plc Citibank 3,752 381 Berkeley Group Holdings Plc JP Morgan 1,763 561 Bodycote Plc Citibank 99 909 Bodycote Plc JP Morgan 359 4,255 Bodycote Plc Bank of America
Merrill Lynch 996 (3,485) Booker Group Plc Bank of America
Merrill Lynch (842) (38,485) Booker Group Plc JP Morgan (4,605) 8,420 BP Plc Citibank 240 12,827 BP Plc JP Morgan 166 2,175 BP Plc Bank of America
Merrill Lynch (209) 1,670 British American Tobacco Plc Citibank 2,788 666 British American Tobacco Plc Bank of America
Merrill Lynch (49) (2,091) British Land Co Plc/The (Reit) JP Morgan (222) (461) British Land Co Plc/The (Reit) Bank of America
Merrill Lynch (240) 3,286 Britvic Plc Bank of America
Merrill Lynch (1,997) 17,168 Britvic Plc Citibank (4,023) 913 Britvic Plc JP Morgan (525) 8,141 BT Group Plc Bank of America
Merrill Lynch 819 307 BT Group Plc Citibank 34 1,592 BT Group Plc JP Morgan 150 (29,048) BTG Plc Bank of America
Merrill Lynch (17,103) (1,655) BTG Plc JP Morgan (2,101)
Taiwan continued United Kingdom continued

Contracts for difference as at 31 May 2016
Holding
Description Counterparty
Unrealised appreciation/
(depreciation) USD
Holding
Description Counterparty
Unrealised appreciation/
(depreciation) USD
Annual Report and Audited Accounts 439
The notes on pages 489 to 503 form an integral part of these financial statements.
(3,125) Bunzl Plc Citibank (412) (1,525) Bunzl Plc Bank of America
Merrill Lynch 715 (193) Bunzl Plc JP Morgan 80 (68) Burberry Group Plc JP Morgan 87 (381) Burberry Group Plc Bank of America
Merrill Lynch (9) (46,331) Cable & Wireless
Communications Plc JP Morgan 68 (18,605) Cairn Energy Plc Bank of America
Merrill Lynch 3,827 (19,084) Cairn Energy Plc Citibank 3,801 (3,276) Capita Plc JP Morgan (602) (274) Capita Plc Citibank 4 (37,533) Capital & Counties Bank of America
Properties Plc Merrill Lynch (165) (16,723) Capital & Counties
Properties Plc Citibank 122 (2,342) Capital & Counties
Properties Plc JP Morgan 123 660 Carillion Plc Bank of America
Merrill Lynch 70 1,544 Carillion Plc Citibank 52 61,309 Carillion Plc JP Morgan 788 5,379 Centrica Plc Bank of America
Merrill Lynch 88 8,261 Centrica Plc Citibank 36 665 Close Brothers Group Plc Bank of America
Merrill Lynch 1,607 537 Close Brothers Group Plc Citibank 236 1,377 Close Brothers Group Plc JP Morgan 1,231 282 Cobham Plc Citibank 2 1,725 Cobham Plc JP Morgan 8 1,188 Coca-Cola HBC AG JP Morgan (974) 10,860 Coca-Cola HBC AG Bank of America
Merrill Lynch (4,676) 1,286 Coca-Cola HBC AG Citibank (490) 365 Compass Group Plc Bank of America
Merrill Lynch 86 1,014 Compass Group Plc Citibank 297 232 Compass Group Plc JP Morgan 129 (1,158) Croda International Plc Bank of America
Merrill Lynch 899 (263) Croda International Plc Citibank 85 (2,767) Croda International Plc JP Morgan 1,056 14,363 CYBG Plc Bank of America
Merrill Lynch 8,835 579 Daily Mail & General Bank of America
Trust Plc 'A' Merrill Lynch (301) 117 Daily Mail & General
Trust Plc 'A' Citibank (71) 459 Daily Mail & General
Trust Plc 'A' JP Morgan (156) 58 DCC Plc Bank of America
Merrill Lynch 144 475 DCC Plc Citibank (2,052) 122,531 Debenhams Plc Bank of America
Merrill Lynch (806) 14,908 Debenhams Plc Citibank (131) 34,204 Debenhams Plc JP Morgan (125) (2,873) Derwent London Plc (Reit) Bank of America
Merrill Lynch 2,832 (1,042) Derwent London Plc (Reit) Citibank 1,175 (1,130) Derwent London Plc (Reit) JP Morgan 1,556 (1,877) Diageo Plc Bank of America
Merrill Lynch 137 (8,993) Diageo Plc Citibank (6,387) 11,914 Direct Line Insurance Bank of America
Group Plc Merrill Lynch 1,287 (99) Dixons Carphone Plc Bank of America
Merrill Lynch (42)
(935) Dixons Carphone Plc Citibank (62) (2,377) Dixons Carphone Plc JP Morgan (876) (399) Domino's Pizza Group Plc Bank of America
Merrill Lynch (345) (696) Domino's Pizza Group Plc Citibank (143) (705) Domino's Pizza Group Plc JP Morgan (180) (34,263) Drax Group Plc Citibank (2,007) (18,497) Drax Group Plc JP Morgan (596) 12,760 DS Smith Plc Bank of America
Merrill Lynch 1,813 5,053 DS Smith Plc Citibank 747 165 DS Smith Plc JP Morgan 11 10,116 Dunelm Group Plc Bank of America
Merrill Lynch (448) 3,889 Dunelm Group Plc Citibank (456) 427 Dunelm Group Plc JP Morgan 307 (1,675) easyJet Plc Bank of America
Merrill Lynch (2,453) (3,548) easyJet Plc JP Morgan (3,040) 8,209 Electrocomponents Plc Citibank 697 4,094 Electrocomponents Plc JP Morgan 1,565 (223) Essentra Plc Bank of America
Merrill Lynch (26) (13,995) Essentra Plc Citibank (3,279) (5,256) Essentra Plc JP Morgan (1,963) (58) Experian Plc Citibank (24) (3,096) Experian Plc JP Morgan (1,374) 9,476 Firstgroup Plc Citibank 284 8,065 Firstgroup Plc JP Morgan 1,069 (5,123) Fresnillo Plc Bank of America
Merrill Lynch 600 (10,544) Fresnillo Plc Citibank 10,191 (6,497) G4S Plc JP Morgan 50 33,696 GKN Plc Bank of America
Merrill Lynch 670 3,551 GKN Plc Citibank 203 5,460 GKN Plc JP Morgan 192 5,878 GlaxoSmithKline Plc Citibank 301 388 GlaxoSmithKline Plc Bank of America
Merrill Lynch (48) 711 GlaxoSmithKline Plc JP Morgan (319) (48,866) Glencore Plc Bank of America
Merrill Lynch (2,861) (11,655) Glencore Plc Citibank (486) (6,873) Glencore Plc JP Morgan 91 (3,288) Grafton Group Plc (Unit) JP Morgan (1,882) (1,455) Great Portland
Estates Plc (Reit) Citibank 778 (25,787) Great Portland
Estates Plc (Reit) JP Morgan 13,933 4,789 Greencore Group Plc Bank of America
Merrill Lynch (1,434) (10,410) Greene King Plc Bank of America
Merrill Lynch (2,713) (2,567) Greene King Plc Citibank (432) (2,918) Greene King Plc JP Morgan (2,436) 3,424 Halma Plc Bank of America
Merrill Lynch 2,305 344 Halma Plc Citibank 227 355 Halma Plc JP Morgan 265 112 Hammerson Plc (Reit) Bank of America
Merrill Lynch 21 132 Hammerson Plc (Reit) Citibank 18 (2,612) Hargreaves Lansdown Plc Citibank (2,371) (1,520) Hargreaves Lansdown Plc JP Morgan (1,970) (39,808) Hays Plc Bank of America
Merrill Lynch (1,714) (9,744) Hays Plc Citibank (314) (11,153) Hays Plc JP Morgan (1,078) 20,134 Henderson Group Plc Bank of America
Merrill Lynch 6,663
BlackRock Style Advantage Fund continued
United Kingdom continued United Kingdom continued

Contracts for difference as at 31 May 2016
Holding
Description Counterparty
Unrealised appreciation/
(depreciation) USD
Holding
Description Counterparty
Unrealised appreciation/
(depreciation) USD
440 BlackRock Strategic Funds (BSF)
The notes on pages 489 to 503 form an integral part of these financial statements.
BlackRock Style Advantage Fund continued
10,481 Henderson Group Plc Citibank 1,136 66,742 Henderson Group Plc JP Morgan 8,490 (1,263) Hikma Pharmaceuticals Plc JP Morgan (1,141) (5,431) Hikma Pharmaceuticals Plc Bank of America
Merrill Lynch 306 (504) Hiscox Ltd Bank of America
Merrill Lynch (122) (909) Hiscox Ltd JP Morgan (599) (1,782) Hiscox Ltd Citibank 378 (2,993) Home Retail Group Plc Bank of America
Merrill Lynch (158) (36,244) Home Retail Group Plc Citibank (1,964) (925) Home Retail Group Plc JP Morgan (60) (4,976) HomeServe Plc Citibank (4,226) (1,656) HomeServe Plc JP Morgan (1,699) 6,556 Howden Joinery Group Plc Bank of America
Merrill Lynch 2,275 15,552 Howden Joinery Group Plc Citibank 1,366 1,414 Howden Joinery Group Plc JP Morgan 242 (643) HSBC Holdings Plc Bank of America
Merrill Lynch (177) (3,551) HSBC Holdings Plc JP Morgan (754) 539 ICAP Plc Citibank 97 3,722 ICAP Plc JP Morgan (2,158) (3,264) IG Group Holdings Plc Bank of America
Merrill Lynch (1,565) (974) IMI Plc Citibank (100) 2,056 Imperial Brands Plc Bank of America
Merrill Lynch 2,792 337 Imperial Brands Plc JP Morgan (37) 3,039 Inchcape Plc Bank of America
Merrill Lynch (757) 7,122 Inchcape Plc Citibank (4,120) 16,634 Inchcape Plc JP Morgan (10,418) 71,719 Indivior Plc Bank of America
Merrill Lynch 3,864 17,585 Indivior Plc Citibank 773 37,448 Indivior Plc JP Morgan 10,529 17,596 Informa Plc Bank of America
Merrill Lynch 4,033 442 Informa Plc JP Morgan 32 (1,866) Inmarsat Plc Citibank (96) (2,503) Inmarsat Plc JP Morgan (50) (416) Inmarsat Plc Bank of America
Merrill Lynch 125 25 InterContinental Hotels
Group Plc JP Morgan (8) 123 InterContinental Hotels Bank of America
Group Plc Merrill Lynch 103 1,244 InterContinental Hotels
Group Plc Citibank 1,694 817 Intermediate Capital Group Plc JP Morgan 520 6,408 Intermediate Capital Group Plc Bank of America
Merrill Lynch (123) 679 Intermediate Capital Group Plc Citibank (30) (192) Intertek Group Plc Bank of America
Merrill Lynch 551 (464) Intertek Group Plc JP Morgan 747 (1,570) Intu Properties Plc (Reit) JP Morgan (93) (620) Investec Plc Bank of America
Merrill Lynch 48 (1,597) Investec Plc Citibank 201 (3,854) Investec Plc JP Morgan 417 5,051 ITV Plc Bank of America
Merrill Lynch 932 15,243 ITV Plc JP Morgan 1,131 6,821 J Sainsbury Plc Citibank 964 36,298 J Sainsbury Plc JP Morgan 4,136 9,216 John Wood Group Plc Bank of America
Merrill Lynch (86) 3,546 John Wood Group Plc Citibank 156
151 John Wood Group Plc JP Morgan 31 (384) Johnson Matthey Plc Citibank (112) (155) Johnson Matthey Plc Bank of America
Merrill Lynch 2 54,434 Jupiter Fund Management Plc JP Morgan 8,620 3,079 Jupiter Fund Management Plc Bank of America
Merrill Lynch 1,015 20,120 Jupiter Fund Management Plc Citibank 3,064 (17,167) Just Eat Plc Citibank (2,941) (34,784) Just Eat Plc JP Morgan (8,894) 2,587 Kingfisher Plc Bank of America
Merrill Lynch 470 16,443 Kingfisher Plc Citibank 2,288 2,192 Kingfisher Plc JP Morgan 222 (15,860) Ladbrokes Plc Bank of America
Merrill Lynch (4,901) (50,399) Ladbrokes Plc Citibank (4,428) (1,116) Ladbrokes Plc JP Morgan (327) (350) Lancashire Holdings Ltd Bank of America
Merrill Lynch (26) (889) Lancashire Holdings Ltd JP Morgan (171) (3,315) Lancashire Holdings Ltd Citibank 769 (4,111) Land Securities
Group Plc (Reit) Citibank 602 (732) Land Securities Bank of America
Group Plc (Reit) Merrill Lynch (407) 1,908 Legal & General Group Plc Bank of America
Merrill Lynch 665 51,038 Legal & General Group Plc Citibank 11,659 3,461 Legal & General Group Plc JP Morgan 1,130 (3,222) Lloyds Banking Group Plc Bank of America
Merrill Lynch (267) (13,748) Lloyds Banking Group Plc JP Morgan (743) (593) London Stock Bank of America
Exchange Group Plc Merrill Lynch (1,147) (534) London Stock
Exchange Group Plc JP Morgan (1,245) 81,139 Man Group Plc JP Morgan 308 16,011 Man Group Plc Citibank (399) 7,725 Marks & Spencer Group Plc Bank of America
Merrill Lynch (4,717) 22,961 Marks & Spencer Group Plc JP Morgan (17,163) (807) Mediclinic International Plc Citibank (236) (31,620) Mediclinic International Plc JP Morgan (8,229) (1,047) Meggitt Plc Citibank (72) (13,952) Meggitt Plc JP Morgan (69) (16,144) Merlin Entertainments Plc JP Morgan (1,066) (355) Merlin Entertainments Plc Bank of America
Merrill Lynch 18 (4,103) Merlin Entertainments Plc Citibank (439) 6,480 Michael Page International Plc Bank of America
Merrill Lynch 835 12,115 Michael Page International Plc Citibank 869 2,123 Michael Page International Plc JP Morgan (239) (546) Micro Focus International Plc JP Morgan (661) (3,496) Micro Focus International Plc Bank of America
Merrill Lynch (3,220) (2,339) Micro Focus International Plc Citibank (1,747) 1,332 Mitchells & Butlers Plc Bank of America
Merrill Lynch 423 3,783 Mitchells & Butlers Plc Citibank 626 4,571 Mitchells & Butlers Plc JP Morgan 1,029 1,074 Mitie Group Plc JP Morgan 170 20,156 Mitie Group Plc Citibank (2,361) 8,382 Mondi Plc Bank of America
Merrill Lynch 1,797 2,257 Mondi Plc Citibank 661 507 Mondi Plc JP Morgan 364 22,608 Moneysupermarket.com
Group Plc Citibank 3,907
United Kingdom continued United Kingdom continued

Contracts for difference as at 31 May 2016
Holding
Description Counterparty
Unrealised appreciation/
(depreciation) USD
Holding
Description Counterparty
Unrealised appreciation/
(depreciation) USD
Annual Report and Audited Accounts 441
The notes on pages 489 to 503 form an integral part of these financial statements.
6,826 Moneysupermarket.com Group Plc JP Morgan 2,019
2,095 National Express Group Plc Bank of America Merrill Lynch 420
4,021 National Express Group Plc Citibank 177 48,123 National Express Group Plc JP Morgan 3,579 (552) National Grid Plc Bank of America
Merrill Lynch (16) (7,587) National Grid Plc Citibank (2,366) (14,308) National Grid Plc JP Morgan (4,213) 349 Next Plc Bank of America
Merrill Lynch 690 2,021 Next Plc JP Morgan 3,951 (45,558) Ocado Group Plc JP Morgan (2,754) 19,582 Old Mutual Plc Bank of America
Merrill Lynch 2,936 4,075 Old Mutual Plc Citibank 656 9,235 Old Mutual Plc JP Morgan 757 (8,532) Paysafe Group Plc Bank of America
Merrill Lynch (5,585) (26,325) Paysafe Group Plc Citibank (10,833) (4,826) Paysafe Group Plc JP Morgan (2,721) (8,787) Pearson Plc Bank of America
Merrill Lynch (3,235) (518) Pearson Plc Citibank (190) (2,153) Pearson Plc JP Morgan (845) (482) Pennon Group Plc Bank of America
Merrill Lynch (473) (18,522) Pennon Group Plc Citibank (11,663) 7,196 Persimmon Plc Bank of America
Merrill Lynch 2,993 1,923 Persimmon Plc Citibank 1,070 2,150 Persimmon Plc JP Morgan 4,817 1,831 Petrofac Ltd Bank of America
Merrill Lynch (506) 1,444 Petrofac Ltd Citibank (370) 130 Petrofac Ltd JP Morgan (42) (510) Phoenix Group Holdings Bank of America
Merrill Lynch (355) (7,529) Phoenix Group Holdings Citibank (5,513) (5,275) Phoenix Group Holdings JP Morgan (2,356) (331) Playtech Plc Bank of America
Merrill Lynch (237) (3,840) Playtech Plc Citibank (815) (1,069) Playtech Plc JP Morgan (817) (600) Provident Financial Plc Bank of America
Merrill Lynch (465) (227) Provident Financial Plc Citibank (106) (455) Provident Financial Plc JP Morgan (346) 2,803 Prudential Plc Bank of America
Merrill Lynch 4,659 9,788 Prudential Plc Citibank 9,747 1,896 Prudential Plc JP Morgan 2,459 23,717 QinetiQ Group Plc Bank of America
Merrill Lynch 5,800 54,553 QinetiQ Group Plc Citibank 10,066 13,955 QinetiQ Group Plc JP Morgan 3,822 (85) Reckitt Benckiser Group Plc Citibank (147) (225) Reckitt Benckiser Group Plc JP Morgan (231) (1,087) Redrow Plc Bank of America
Merrill Lynch (670) (912) Redrow Plc Citibank (23) 1,787 Regus Plc Reg Bank of America
Merrill Lynch 513 8,984 Regus Plc Reg Citibank 1,250 223 RELX Plc Bank of America
Merrill Lynch 59 11,659 RELX Plc Citibank 3,073 5,978 RELX Plc JP Morgan 1,313 14,060 Rentokil Initial Plc Bank of America
Merrill Lynch 449
5,371 Rentokil Initial Plc JP Morgan 94 258 Rightmove Plc Bank of America
Merrill Lynch 1,047 222 Rightmove Plc Citibank 351 2,362 Rightmove Plc JP Morgan 4,212 (174,518) Rolls-Royce Holdings Plc JP Morgan (256) (664) Rolls-Royce Holdings Plc Bank of America
Merrill Lynch 374 (3,016) Rolls-Royce Holdings Plc Citibank 464 (14,770) Rolls-Royce Holdings Plc JP Morgan 2,806 (12,851) Rolls-Royce Holdings Plc Bank of America
Merrill Lynch — (214,136) Rolls-Royce Holdings Plc Citibank (314) (23,943) Rotork Plc Bank of America
Merrill Lynch (1,613) (57,691) Rotork Plc Citibank (253) (10,098) Rotork Plc JP Morgan (1,567) (5,697) Royal Bank of Scotland Bank of America
Group Plc Merrill Lynch (3,045) (23,520) Royal Bank of Scotland
Group Plc Citibank (5,132) (50,235) Royal Bank of Scotland
Group Plc JP Morgan (11,487) (1,076) Royal Dutch Shell Plc 'B' Citibank (110) (3,629) Royal Dutch Shell Plc 'B' Bank of America
Merrill Lynch 191 (339) Royal Mail Plc Bank of America
Merrill Lynch (229) (4,074) Royal Mail Plc Citibank (1,700) (1,081) Royal Mail Plc JP Morgan (725) (5,804) RPC Group Plc Bank of America
Merrill Lynch (3,612) (13,456) RPC Group Plc Citibank (4,828) (2,922) RSA Insurance Group Plc Bank of America
Merrill Lynch (783) (3,775) RSA Insurance Group Plc Citibank (663) (14,703) RSA Insurance Group Plc JP Morgan (2,430) 26,581 Sage Group Plc/The Bank of America
Merrill Lynch 7,669 4,836 Sage Group Plc/The Citibank 1,593 7,660 Sage Group Plc/The JP Morgan 2,458 1,561 Schroders Plc Bank of America
Merrill Lynch 4,960 3,928 Schroders Plc JP Morgan 9,488 (332,782) Serco Group Plc Citibank (78,459) (9,042) Serco Group Plc JP Morgan (1,887) (304) Severn Trent Plc Bank of America
Merrill Lynch (298) (1,128) Severn Trent Plc Citibank (1,404) (373) Severn Trent Plc JP Morgan (262) (6,770) Shaftesbury Plc (Reit) Bank of America
Merrill Lynch 1,685 (5,191) Shaftesbury Plc (Reit) Citibank 1,900 (24,117) Shaftesbury Plc (Reit) JP Morgan 8,375 (364) Shire Plc Bank of America
Merrill Lynch (1,173) (1,014) Shire Plc JP Morgan (288) (21,506) SIG Plc Bank of America
Merrill Lynch (1,366) (2,343) SIG Plc Citibank (137) (5,577) SIG Plc JP Morgan (695) 278 Sky Plc Bank of America
Merrill Lynch 157 8,974 Sky Plc JP Morgan 3,315 5,865 Smith & Nephew Plc JP Morgan 1,482 1,067 Smith & Nephew Plc Bank of America
Merrill Lynch 375 953 Smith & Nephew Plc Citibank 265 307 Smiths Group Plc Bank of America
Merrill Lynch 193 2,405 Smiths Group Plc Citibank 986
BlackRock Style Advantage Fund continued
United Kingdom continued United Kingdom continued

Contracts for difference as at 31 May 2016
Holding
Description Counterparty
Unrealised appreciation/
(depreciation) USD
Holding
Description Counterparty
Unrealised appreciation/
(depreciation) USD
442 BlackRock Strategic Funds (BSF)
The notes on pages 489 to 503 form an integral part of these financial statements.
BlackRock Style Advantage Fund continued
(880) Spectris Plc JP Morgan 478 (222) Spirax-Sarco Engineering Plc Bank of America
Merrill Lynch (26) (3,017) Sports Direct International Plc Bank of America
Merrill Lynch (371) (21,841) Sports Direct International Plc Citibank (8,380) (4,428) Sports Direct International Plc JP Morgan (117) 185 SSE Plc Bank of America
Merrill Lynch 43 180 SSE Plc Citibank 45 (1,881) St James's Place Plc Citibank (826) (6,429) St James's Place Plc JP Morgan (3,659) 8,866 Stagecoach Group Plc Citibank 351 43,677 Stagecoach Group Plc JP Morgan 1,678 (102) Standard Life Plc Citibank (20) (322) Standard Life Plc JP Morgan (55) 797 Tate & Lyle Plc Citibank 193 2,091 Tate & Lyle Plc JP Morgan 536 37,446 Taylor Wimpey Plc Bank of America
Merrill Lynch 125 20,877 Taylor Wimpey Plc JP Morgan 6,634 (75,096) Tesco Plc Citibank (5,718) (12,776) Tesco Plc JP Morgan (1,590) 18,063 Thomas Cook Group Plc Bank of America
Merrill Lynch (2,751) 31,264 Thomas Cook Group Plc JP Morgan (78) 3,856 Thomas Cook Group Plc Citibank 144 (720) Travis Perkins Plc Bank of America
Merrill Lynch (1,592) (1,364) Travis Perkins Plc JP Morgan (1,045) (6,346) TUI AG Bank of America
Merrill Lynch (800) (941) TUI AG Citibank (152) (653) TUI AG JP Morgan (182) (4,786) Tullow Oil Plc Citibank 680 (2,154) Tullow Oil Plc JP Morgan (9) (415) UBM Plc JP Morgan (67) (122) Ultra Electronics Holdings Plc Bank of America
Merrill Lynch 4 (1,735) Ultra Electronics Holdings Plc JP Morgan 33 (362) Ultra Electronics Holdings Plc Citibank (5) (2,866) United Utilities Group Plc Bank of America
Merrill Lynch (860) (926) United Utilities Group Plc Citibank (224) (7,177) United Utilities Group Plc JP Morgan (2,059) 5,230 Vesuvius Plc Bank of America
Merrill Lynch 561 2,759 Vesuvius Plc Citibank (81) (171) Victrex Plc Bank of America
Merrill Lynch 140 (640) Victrex Plc Citibank — (5,700) Victrex Plc JP Morgan (964) (1,129) Virgin Money Holdings UK Plc JP Morgan (731) (1,837) Virgin Money Holdings UK Plc Bank of America
Merrill Lynch (812) (7,822) Virgin Money Holdings UK Plc Citibank (1,649) (2,024) Vodafone Group Plc Citibank (181) (20,741) Vodafone Group Plc JP Morgan (2,400) (1,641) Weir Group Plc/The Citibank 1,178 (7,695) Weir Group Plc/The JP Morgan 5,435 (2,413) Weir Group Plc/The Bank of America
Merrill Lynch (2,085) 16,020 WH Smith Plc Bank of America
Merrill Lynch 13,870 2,463 WH Smith Plc Citibank 1,731 297 WH Smith Plc JP Morgan 365 (769) Whitbread Plc JP Morgan (1,785) 3,472 William Hill Plc Citibank 259 3,171 William Hill Plc JP Morgan 75
8,597 WM Morrison Supermarkets Plc Citibank 770
21,783 WM Morrison Supermarkets Plc JP Morgan 2,138
1,400 WM Morrison Bank of America Supermarkets Plc Merrill Lynch 158
2,022 Wolseley Plc Bank of America Merrill Lynch 3,828
239 Wolseley Plc JP Morgan 623 (143) Workspace Group Plc (Reit) Bank of America
Merrill Lynch (84) (5,624) Workspace Group Plc (Reit) JP Morgan (1,235) (13,468) Workspace Group Plc (Reit) Citibank 986 (32,264) Worldpay Group Plc JP Morgan (6,806) 401 WPP Plc Bank of America
Merrill Lynch 30 11,853 WPP Plc Citibank 2,980 786 WPP Plc JP Morgan (125) 10,277 WS Atkins Plc Bank of America
Merrill Lynch 1,958 1,935 WS Atkins Plc Citibank 595 2,447 WS Atkins Plc JP Morgan 502
(87,228)
United States (947) 3M Co Citibank (2,528) (40) 3M Co JP Morgan (10) (84) 3M Co Bank of America
Merrill Lynch 65 (5,503) 58.com Inc ADR JP Morgan (27,243) (1,785) 58.com Inc ADR Bank of America
Merrill Lynch (6,176) (1,029) Aaron's Inc Bank of America
Merrill Lynch (1,087) (57) Aaron's Inc Citibank (71) 468 AbbVie Inc JP Morgan (243) 2,174 AbbVie Inc Bank of America
Merrill Lynch 8,133 353 AbbVie Inc Citibank 1,370 1,867 Abercrombie & Fitch Co 'A' Bank of America
Merrill Lynch (9,274) 179 Abercrombie & Fitch Co 'A' JP Morgan (960) (537) Abiomed Inc Bank of America
Merrill Lynch (1,136) (197) Abiomed Inc JP Morgan (524) (623) Acadia Healthcare Co Inc Bank of America
Merrill Lynch (1,090) (1,783) Acadia Healthcare Co Inc Citibank (3,174) (59) ACADIA Pharmaceuticals Inc Bank of America
Merrill Lynch (345) (1,370) ACADIA Pharmaceuticals Inc Citibank (2,219) (725) Acadia Realty Trust (Reit) Citibank (218) (118) Acadia Realty Trust (Reit) Bank of America
Merrill Lynch 122 (185) Acadia Realty Trust (Reit) JP Morgan 355 300 Accenture Plc 'A' JP Morgan 783 77 Accenture Plc 'A' Citibank 212 (1,767) ACI Worldwide Inc Bank of America
Merrill Lynch (1,765) (311) ACI Worldwide Inc Citibank (345) (40) ACI Worldwide Inc JP Morgan (17) 2,895 Activision Blizzard Inc Bank of America
Merrill Lynch 3,342 95 Actuant Corp 'A' Bank of America
Merrill Lynch 124 74 Actuant Corp 'A' Citibank 84 398 Actuant Corp 'A' JP Morgan 456 163 Acuity Brands Inc Bank of America
Merrill Lynch 1,893 29 Acuity Brands Inc Citibank 329
United Kingdom continued United Kingdom continued

Contracts for difference as at 31 May 2016
Holding
Description Counterparty
Unrealised appreciation/
(depreciation) USD
Holding
Description Counterparty
Unrealised appreciation/
(depreciation) USD
Annual Report and Audited Accounts 443
The notes on pages 489 to 503 form an integral part of these financial statements.
9 Acuity Brands Inc JP Morgan 121 (521) Acxiom Corp Bank of America
Merrill Lynch (736) (135) Acxiom Corp Citibank (223) (76) Acxiom Corp JP Morgan 116 50 Adobe Systems Inc Bank of America
Merrill Lynch 161 (21) Advance Auto Parts Inc Bank of America
Merrill Lynch (176) (9) Advance Auto Parts Inc Citibank (96) (147) Advance Auto Parts Inc JP Morgan (1,488) (7,968) Advanced Micro Devices Inc JP Morgan (7,609) (16,859) Advanced Micro Devices Inc Bank of America
Merrill Lynch (10,174) (315) Advisory Board Co/The Bank of America
Merrill Lynch 334 (2,614) Advisory Board Co/The Citibank (2,797) 505 AECOM Bank of America
Merrill Lynch 227 67 AECOM JP Morgan 64 665 AerCap Holdings NV Bank of America
Merrill Lynch 1,423 405 AerCap Holdings NV Citibank 960 9,360 AES Corp/VA JP Morgan 2,721 1,453 AES Corp/VA Bank of America
Merrill Lynch 94 56 Aetna Inc Citibank 224 42 Aetna Inc JP Morgan 7 347 Affiliated Managers Group Inc JP Morgan 2,942 90 Affiliated Managers Group Inc Bank of America
Merrill Lynch 878 56 Affiliated Managers Group Inc Citibank 489 183 Aflac Inc Citibank 229 1,935 Aflac Inc JP Morgan 2,323 288 AGCO Corp Bank of America
Merrill Lynch 527 97 AGCO Corp JP Morgan 108 215 Agilent Technologies Inc Bank of America
Merrill Lynch 611 1,362 Agilent Technologies Inc Citibank 1,648 629 Agilent Technologies Inc JP Morgan 2,799 (1,891) Agios Pharmaceuticals Inc Citibank (12,859) (123) Agios Pharmaceuticals Inc JP Morgan (948) 122 Air Lease Corp Bank of America
Merrill Lynch 150 29 Air Lease Corp Citibank 29 1,061 Air Lease Corp JP Morgan 738 (307) Air Products & Chemicals Inc Bank of America
Merrill Lynch (255) (27) Air Products & Chemicals Inc Citibank (39) (217) Akamai Technologies Inc Bank of America
Merrill Lynch (702) (81) Akamai Technologies Inc Citibank (262) (553) Akorn Inc Bank of America
Merrill Lynch (1,228) (1,292) Akorn Inc Citibank 581 (106) Albemarle Corp Bank of America
Merrill Lynch (172) (235) Albemarle Corp Citibank (719) (63) Albemarle Corp JP Morgan (765) 411 Alcoa Inc JP Morgan (41) 3,296 Alcoa Inc Citibank 264 (2) Alexander's Inc (Reit) Citibank (10) (16) Alexander's Inc (Reit) JP Morgan 107 (659) Alexandria Real Estate Bank of America
Equities Inc (Reit) Merrill Lynch 247
(97) Alexandria Real Estate Equities Inc (Reit) Citibank 42
(260) Alexion Pharmaceuticals Inc Bank of America Merrill Lynch (2,533)
(74) Alexion Pharmaceuticals Inc JP Morgan (660) (5,522) Alibaba Group Holding Ltd ADR Citibank (8,780) 148 Align Technology Inc Citibank 277 345 Align Technology Inc JP Morgan 572 (1,515) Alkermes Plc Citibank (6,924) (6) Alleghany Corp Bank of America
Merrill Lynch (78) (8) Alleghany Corp Citibank (109) (6,701) Allegheny Technologies Inc Bank of America
Merrill Lynch (3,100) (993) Allegheny Technologies Inc Citibank (606) (30) Allegheny Technologies Inc JP Morgan 53 (21) Allegiant Travel Co Bank of America
Merrill Lynch 3 (18) Allegiant Travel Co JP Morgan 240 17 Allegion Plc Bank of America
Merrill Lynch 29 47 Allegion Plc Citibank 38 456 Allegion Plc JP Morgan 461 (545) Allergan Plc Citibank (7,276) (461) Allete Inc Bank of America
Merrill Lynch (1,106) (103) Allete Inc Citibank (285) (19) Alliance Data Systems Corp Citibank (175) (248) Alliance Data Systems Corp JP Morgan (2,455) (14) Alliant Energy Corp Bank of America
Merrill Lynch 1 1,237 Allied World Assurance Co
Holdings AG JP Morgan 626 53 Allied World Assurance Co Bank of America
Holdings AG Merrill Lynch 28 277 Allison Transmission
Holdings Inc Citibank 205 2,501 Allison Transmission
Holdings Inc JP Morgan 1,545 775 Allison Transmission Bank of America
Holdings Inc Merrill Lynch 31 (1,547) Allscripts Healthcare Bank of America
Solutions Inc Merrill Lynch (180) (427) Allstate Corp/The Bank of America
Merrill Lynch (307) (33) Allstate Corp/The JP Morgan (17) (1,226) Ally Financial Inc Citibank (1,545) (568) Ally Financial Inc JP Morgan (506) (1,000) Alnylam Pharmaceuticals Inc Citibank (14,260) (232) Alnylam Pharmaceuticals Inc JP Morgan (2,905) 9 Alphabet Inc 'A' Bank of America
Merrill Lynch 196 14 Alphabet Inc 'A' Citibank 487 188 Alphabet Inc 'A' JP Morgan 5,801 6 Alphabet Inc 'C' Bank of America
Merrill Lynch 132 10 Alphabet Inc 'C' Citibank 342 56 Alphabet Inc 'C' JP Morgan 1,710 41 Altria Group Inc JP Morgan — 189 Altria Group Inc Citibank 77 (1,723) Ambarella Inc Citibank (2,119) 8 AMC Networks Inc 'A' JP Morgan (16) 47 AMERCO Bank of America
Merrill Lynch 824 53 AMERCO Citibank 564 250 AMERCO JP Morgan 2,208 139 Ameren Corp Bank of America
Merrill Lynch 178 958 Ameren Corp JP Morgan 1,956 790 American Airlines Group Inc JP Morgan (688) (499) American Campus Bank of America
Communities Inc (Reit) Merrill Lynch 594 (648) American Campus
Communities Inc (Reit) JP Morgan 1,030
BlackRock Style Advantage Fund continued
United States continued United States continued

Contracts for difference as at 31 May 2016
Holding
Description Counterparty
Unrealised appreciation/
(depreciation) USD
Holding
Description Counterparty
Unrealised appreciation/
(depreciation) USD
444 BlackRock Strategic Funds (BSF)
The notes on pages 489 to 503 form an integral part of these financial statements.
BlackRock Style Advantage Fund continued
(3,196) American Campus Communities Inc (Reit) Citibank (575)
(1,932) American Capital Agency Corp (Reit) JP Morgan (29)
(11,284) American Capital Agency Corp (Reit) Citibank 2,765
(2,139) American Capital Bank of America Agency Corp (Reit) Merrill Lynch 524
149 American Eagle Outfitters Inc Citibank (9) 668 American Eagle Outfitters Inc JP Morgan 668 2,717 American Eagle Outfitters Inc Bank of America
Merrill Lynch (294) (877) American Express Co Citibank (1,886) 789 American Financial Bank of America
Group Inc/OH Merrill Lynch 1,375 74 American Financial
Group Inc/OH JP Morgan 164 (161) American Homes
4 Rent 'A' (Reit) Citibank (129) (9,137) American Homes Bank of America
4 Rent 'A' (Reit) Merrill Lynch (6,333) (1,244) American Homes
4 Rent 'A' (Reit) JP Morgan (1,182) 322 American International Bank of America
Group Inc Merrill Lynch 1,059 488 American International
Group Inc JP Morgan 784 (12) American National
Insurance Co Citibank (25) (17) American National
Insurance Co JP Morgan (47) (224) American Tower Corp (Reit) Citibank (336) 8 American Water Works Co Inc Bank of America
Merrill Lynch (8) 37 American Water Works Co Inc Citibank 38 576 American Water Works Co Inc JP Morgan 338 95 Ameriprise Financial Inc Bank of America
Merrill Lynch 730 366 Ameriprise Financial Inc Citibank 1,717 1,214 Ameriprise Financial Inc JP Morgan 5,914 139 AmerisourceBergen Corp Citibank 65 139 AmerisourceBergen Corp Bank of America
Merrill Lynch (25) 1,662 AmerisourceBergen Corp JP Morgan (605) (326) AMETEK Inc Citibank (95) (1,543) AMETEK Inc JP Morgan (372) (362) AMETEK Inc Bank of America
Merrill Lynch (308) 2,225 Amgen Inc Citibank 19,024 70 Amgen Inc JP Morgan 52 (624) Amphenol Corp 'A' Bank of America
Merrill Lynch (1,710) (2,509) Amphenol Corp 'A' Citibank (5,043) (49) Amsurg Corp JP Morgan 129 (645) Amsurg Corp Bank of America
Merrill Lynch (896) (132) Amsurg Corp Citibank (227) 70 AmTrust Financial Services Inc Citibank 25 729 AmTrust Financial Services Inc JP Morgan 312 (216) Anacor Pharmaceuticals Inc Bank of America
Merrill Lynch 283 (34) Anacor Pharmaceuticals Inc Citibank 1 304 Analog Devices Inc Bank of America
Merrill Lynch 532 42 Analog Devices Inc Citibank 68 32 Analog Devices Inc JP Morgan 101 (72) Anixter International Inc Bank of America
Merrill Lynch (237) (411) Anixter International Inc Citibank (1,369) (22) Anixter International Inc JP Morgan (36)
(2,852) Annaly Capital Management Inc (Reit) JP Morgan 884
(10,588) Annaly Capital Bank of America Management Inc (Reit) Merrill Lynch 2,724
(84) Ansys Inc Bank of America Merrill Lynch (286)
(936) Ansys Inc Citibank (2,920) (171) Ansys Inc JP Morgan (718) (4,651) Antero Resources Corp JP Morgan (10,326) 94 Anthem Inc Bank of America
Merrill Lynch (562) 11 Anthem Inc Citibank (21) 262 Anthem Inc JP Morgan (620) 1,097 AO Smith Corp Bank of America
Merrill Lynch 3,305 64 AO Smith Corp Citibank 167 (386) Aon Plc Citibank (1,702) 416 Apache Corp Bank of America
Merrill Lynch 1,518 2,473 Apache Corp Citibank 2,102 279 Apache Corp JP Morgan 1,726 496 Apartment Investment & Bank of America
Management Co 'A' (Reit) Merrill Lynch (69) 15 Apartment Investment &
Management Co 'A' (Reit) Citibank 14 1,627 Apartment Investment &
Management Co 'A' (Reit) JP Morgan 1,437 322 Apple Hospitality Inc (Reit) Bank of America
Merrill Lynch (251) 4,136 Apple Hospitality Inc (Reit) JP Morgan (536) (105) Apple Inc Bank of America
Merrill Lynch (655) (355) Apple Inc Citibank (1,310) (53) Apple Inc JP Morgan (388) (115) Applied Industrial
Technologies Inc Citibank (236) (21) Applied Industrial
Technologies Inc JP Morgan (17) 3,307 Applied Materials Inc Bank of America
Merrill Lynch 4,614 1,073 Applied Materials Inc JP Morgan 4,582 (280) AptarGroup Inc Bank of America
Merrill Lynch (116) (769) Aqua America Inc Citibank (684) (99) Aqua America Inc Bank of America
Merrill Lynch 48 (329) Aramark Bank of America
Merrill Lynch (26) (1,997) Aramark Citibank (1,677) (636) Arch Capital Group Ltd Bank of America
Merrill Lynch (981) (369) Arch Capital Group Ltd JP Morgan (716) 981 Archer-Daniels-Midland Co Bank of America
Merrill Lynch 2,461 487 Archer-Daniels-Midland Co Citibank 1,271 31 Archer-Daniels-Midland Co JP Morgan 165 (19) Arista Networks Inc Bank of America
Merrill Lynch (95) (1,883) Arista Networks Inc JP Morgan (5,934) (6) Armstrong Flooring Inc JP Morgan (6) (58) Armstrong World Industries Inc Bank of America
Merrill Lynch (50) (31) Armstrong World Industries Inc Citibank (46) (12) Armstrong World Industries Inc JP Morgan (18) (492) ARRIS International Plc Citibank (576) 286 Arrow Electronics Inc Citibank 809 1,215 Arrow Electronics Inc JP Morgan 3,783 63 Arrow Electronics Inc Bank of America
Merrill Lynch 220 (622) Arthur J Gallagher & Co Bank of America
Merrill Lynch (535)
United States continued United States continued

Contracts for difference as at 31 May 2016
Holding
Description Counterparty
Unrealised appreciation/
(depreciation) USD
Holding
Description Counterparty
Unrealised appreciation/
(depreciation) USD
Annual Report and Audited Accounts 445
The notes on pages 489 to 503 form an integral part of these financial statements.
(3,083) Arthur J Gallagher & Co Citibank (2,066) (204) Arthur J Gallagher & Co JP Morgan (277) (417) Ascena Retail Group Inc Citibank (46) (8) Ashland Inc JP Morgan (27) 580 Aspen Insurance Holdings Ltd Citibank 766 1,841 Aspen Insurance Holdings Ltd JP Morgan 2,211 628 Aspen Technology Inc Bank of America
Merrill Lynch 421 2,351 Aspen Technology Inc Citibank 1,387 192 Associated Banc-Corp Citibank 113 191 Assurant Inc Bank of America
Merrill Lynch 113 83 Assurant Inc Citibank 68 1,379 Assurant Inc JP Morgan 1,194 182 Assured Guaranty Ltd Bank of America
Merrill Lynch 359 2,263 Assured Guaranty Ltd Citibank 2,851 617 Assured Guaranty Ltd JP Morgan 487 (123) AT&T Inc Citibank (98) (1,763) AT&T Inc JP Morgan (1,208) (153) AT&T Inc Bank of America
Merrill Lynch 24 (508) athenahealth Inc Citibank (798) (52) athenahealth Inc Bank of America
Merrill Lynch 263 (153) athenahealth Inc JP Morgan 731 94 Atmos Energy Corp Bank of America
Merrill Lynch (212) 559 Atmos Energy Corp Citibank 710 12 Autodesk Inc Citibank 22 100 Autodesk Inc JP Morgan 189 (6) Autoliv Inc JP Morgan 14 (196) Autoliv Inc Bank of America
Merrill Lynch (291) (1,606) Automatic Data Processing Inc Bank of America
Merrill Lynch (4,106) (124) Automatic Data Processing Inc Citibank (357) (60) Automatic Data Processing Inc JP Morgan (13) 158 AutoNation Inc Bank of America
Merrill Lynch 607 690 AutoNation Inc JP Morgan 1,991 136 AutoZone Inc JP Morgan (369) (356) AvalonBay Bank of America
Communities Inc (Reit) Merrill Lynch 1,038 (39) AvalonBay
Communities Inc (Reit) Citibank 77 (80) AvalonBay
Communities Inc (Reit) JP Morgan 859 1,171 Avery Dennison Corp Citibank 1,206 77 Avery Dennison Corp Bank of America
Merrill Lynch (174) 268 Avery Dennison Corp JP Morgan (190) 171 Avis Budget Group Inc Bank of America
Merrill Lynch 336 120 Avis Budget Group Inc Citibank 226 55 Avista Corp Citibank 25 50 Avista Corp Bank of America
Merrill Lynch (67) 1,262 Avista Corp JP Morgan (87) 389 Avnet Inc Bank of America
Merrill Lynch 537 113 Avnet Inc Citibank 174 1,213 Avnet Inc JP Morgan 1,824 (1,203) Avon Products Inc JP Morgan 217 (3,608) Avon Products Inc Citibank (541) (60) Axalta Coating Systems Ltd JP Morgan 1 (207) Axalta Coating Systems Ltd Bank of America
Merrill Lynch (119) (234) Axalta Coating Systems Ltd Citibank (131) (821) Axis Capital Holdings Ltd Bank of America
Merrill Lynch (618)
(128) Axis Capital Holdings Ltd Citibank (104) (403) Axis Capital Holdings Ltd JP Morgan (197) (288) B/E Aerospace Inc Bank of America
Merrill Lynch (167) (943) B/E Aerospace Inc Citibank (1,160) (80) B/E Aerospace Inc JP Morgan (52) (130) Baidu Inc ADR Citibank (1,730) (784) Ball Corp JP Morgan (394) 55 BancorpSouth Inc Bank of America
Merrill Lynch 95 51 BancorpSouth Inc JP Morgan 78 (50) Bank of Hawaii Corp Citibank (131) 118 Bank of New York
Mellon Corp/The Citibank 171 39 Bank of New York
Mellon Corp/The JP Morgan 66 2,122 Bank of the Ozarks Inc JP Morgan 3,834 195 Bank of the Ozarks Inc Citibank 326 (213) Baxter International Inc Citibank (92) (381) BB&T Corp Bank of America
Merrill Lynch (1,166) (3,217) BB&T Corp Citibank (5,179) (465) Beacon Roofing Supply Inc Bank of America
Merrill Lynch 98 (1,727) Beacon Roofing Supply Inc Citibank (1,261) (11) Becton Dickinson and Co Bank of America
Merrill Lynch 24 (187) Becton Dickinson and Co JP Morgan (203) 1,632 Bed Bath & Beyond Inc Bank of America
Merrill Lynch 3,422 314 Bed Bath & Beyond Inc Citibank 719 136 Bed Bath & Beyond Inc JP Morgan (68) (109) Belden Inc Bank of America
Merrill Lynch (409) (430) Belden Inc Citibank (1,346) 12 Bemis Co Inc Bank of America
Merrill Lynch 16 95 Bemis Co Inc Citibank 216 483 Bemis Co Inc JP Morgan 991 (35) Berkshire Hathaway Inc 'B' Bank of America
Merrill Lynch (74) (305) Berkshire Hathaway Inc 'B' Citibank (759) (1,745) Berkshire Hathaway Inc 'B' JP Morgan (3,840) 20 Berry Plastics Group Inc Bank of America
Merrill Lynch 10 166 Berry Plastics Group Inc Citibank 173 50 Berry Plastics Group Inc JP Morgan 147 2,598 Best Buy Co Inc Bank of America
Merrill Lynch (2,199) 381 Best Buy Co Inc Citibank (366) 445 Best Buy Co Inc JP Morgan (276) 148 Big Lots Inc Bank of America
Merrill Lynch 1,177 960 Big Lots Inc Citibank 10,013 (164) Bio-Rad Laboratories Inc 'A' Citibank (854) (18) Bio-Rad Laboratories Inc 'A' Bank of America
Merrill Lynch (91) (318) Bio-Techne Corp Bank of America
Merrill Lynch (1,688) (102) Bio-Techne Corp Citibank (530) (7) Bio-Techne Corp JP Morgan (59) 12 Biogen Inc Bank of America
Merrill Lynch 284 6 Biogen Inc Citibank 151 147 Biogen Inc JP Morgan 3,361 (524) BioMarin Pharmaceutical Inc Citibank (2,494) (151) BioMarin Pharmaceutical Inc JP Morgan (860) 537 Black Hills Corp Bank of America
Merrill Lynch 675 27 Black Hills Corp JP Morgan (25)
BlackRock Style Advantage Fund continued
United States continued United States continued

Contracts for difference as at 31 May 2016
Holding
Description Counterparty
Unrealised appreciation/
(depreciation) USD
Holding
Description Counterparty
Unrealised appreciation/
(depreciation) USD
446 BlackRock Strategic Funds (BSF)
The notes on pages 489 to 503 form an integral part of these financial statements.
BlackRock Style Advantage Fund continued
(13) Blackbaud Inc Bank of America Merrill Lynch (20)
(1,184) Blackhawk Network Bank of America Holdings Inc Merrill Lynch (2,095)
(313) Blackhawk Network Holdings Inc Citibank (501)
(4,173) Blackstone Mortgage Trust Inc 'A' (Reit) Citibank (2,253)
(551) Blackstone Mortgage Bank of America Trust Inc 'A' (Reit) Merrill Lynch 176
127 Bloomin' Brands Inc Citibank 64 (862) Blue Buffalo Pet Products Inc JP Morgan 70 (568) Blue Buffalo Pet Products Inc Citibank (28) (194) Bluebird Bio Inc Bank of America
Merrill Lynch (1,238) (2,288) Bluebird Bio Inc JP Morgan (7,626) 366 Boeing Co/The JP Morgan (142) 60 Boeing Co/The Bank of America
Merrill Lynch (380) 27 BOK Financial Corp Bank of America
Merrill Lynch 154 (291) Booz Allen Hamilton Bank of America
Holding Corp Merrill Lynch (84) (99) Booz Allen Hamilton
Holding Corp Citibank (11) (315) BorgWarner Inc Bank of America
Merrill Lynch (145) (792) BorgWarner Inc JP Morgan (1,057) (173) Boston Beer Co Inc/The 'A' Citibank (839) 51 Boston Properties Inc (Reit) JP Morgan (340) 120 Boston Properties Inc (Reit) Bank of America
Merrill Lynch 91 118 Boston Scientific Corp Bank of America
Merrill Lynch 5 267 Boston Scientific Corp Citibank 93 1,082 Boston Scientific Corp JP Morgan 321 3,976 Brandywine Realty Trust (Reit) Bank of America
Merrill Lynch 2,554 944 Brandywine Realty Trust (Reit) Citibank 717 214 Brandywine Realty Trust (Reit) JP Morgan 6 (275) Bright Horizons Family Bank of America
Solutions Inc Merrill Lynch (76) (127) Bright Horizons Family
Solutions Inc Citibank (65) 786 Brinker International Inc Bank of America
Merrill Lynch 728 316 Brinker International Inc Citibank 386 111 Bristol-Myers Squibb Co Bank of America
Merrill Lynch 96 18 Bristol-Myers Squibb Co Citibank 15 229 Brixmor Property
Group Inc (Reit) Citibank 192 3,116 Brixmor Property
Group Inc (Reit) JP Morgan 1,454 234 Brixmor Property Bank of America
Group Inc (Reit) Merrill Lynch (101) 40 Broadcom Ltd JP Morgan 182 23 Broadridge Financial Bank of America
Solutions Inc Merrill Lynch 50 10,257 Brocade Communications Bank of America
Systems Inc Merrill Lynch 9,227 744 Brocade Communications
Systems Inc Citibank 677 1,984 Brocade Communications
Systems Inc JP Morgan 1,990 (2,062) Brookdale Senior Living Inc Citibank 330 (822) Brookdale Senior Living Inc Bank of America
Merrill Lynch (173) (191) Brown & Brown Inc Bank of America
Merrill Lynch (132) (2,846) Brown & Brown Inc Citibank (2,988)
124 Brown-Forman Corp 'B' JP Morgan (2) 70 Brown-Forman Corp 'B' Bank of America
Merrill Lynch 147 237 Bruker Corp Bank of America
Merrill Lynch (133) 340 Bruker Corp Citibank 122 2,197 Bruker Corp JP Morgan 781 148 Brunswick Corp/DE Citibank 342 1,535 Brunswick Corp/DE JP Morgan 2,836 55 Brunswick Corp/DE Bank of America
Merrill Lynch (17) 91 Buckle Inc/The JP Morgan (137) (454) Buffalo Wild Wings Inc Citibank (2,751) (132) Buffalo Wild Wings Inc JP Morgan (1,412) 107 Bunge Ltd Bank of America
Merrill Lynch 530 192 Bunge Ltd Citibank 413 81 Burlington Stores Inc Bank of America
Merrill Lynch 438 21 Burlington Stores Inc Citibank 122 9 Burlington Stores Inc JP Morgan 33 1,445 BWX Technologies Inc Bank of America
Merrill Lynch 1,014 191 BWX Technologies Inc Citibank 139 401 BWX Technologies Inc JP Morgan 778 729 CA Inc Bank of America
Merrill Lynch 583 2,548 CA Inc JP Morgan 3,392 (1,896) Cabela's Inc JP Morgan 411 (326) Cabela's Inc Bank of America
Merrill Lynch (241) (9) Cable One Inc Bank of America
Merrill Lynch (2) (89) Cable One Inc Citibank (61) 65 Cabot Corp Bank of America
Merrill Lynch 47 2,192 Cabot Corp Citibank 2,872 412 Cabot Corp JP Morgan 523 (99) Cabot Oil & Gas Corp Citibank (57) (102) Cabot Oil & Gas Corp Bank of America
Merrill Lynch (15) (1,399) Cabot Oil & Gas Corp JP Morgan (725) 12 CACI International Inc 'A' Bank of America
Merrill Lynch 49 445 CACI International Inc 'A' JP Morgan 2,554 52 Cadence Design Systems Inc Bank of America
Merrill Lynch 51 244 Cadence Design Systems Inc JP Morgan 176 185 Cal-Maine Foods Inc Citibank (11) 1,314 Cal-Maine Foods Inc JP Morgan (340) (5,394) CalAtlantic Group Inc Bank of America
Merrill Lynch (12,852) (648) CalAtlantic Group Inc Citibank (1,542) 268 Calpine Corp Bank of America
Merrill Lynch (5) 659 Calpine Corp Citibank (53) 92 Calpine Corp JP Morgan (15) 183 Camden Property Trust (Reit) JP Morgan 11 208 Campbell Soup Co Bank of America
Merrill Lynch (1,094) 122 Campbell Soup Co JP Morgan (527) 979 Campbell Soup Co Citibank 705 (29) Cantel Medical Corp Bank of America
Merrill Lynch 58 695 Capital One Financial Corp Bank of America
Merrill Lynch 2,332 36 Capital One Financial Corp Citibank 116 40 Capital One Financial Corp JP Morgan 170 (1,202) Capitol Federal Financial Inc Citibank (276) (3,079) Capitol Federal Financial Inc JP Morgan (725)
United States continued United States continued

Contracts for difference as at 31 May 2016
Holding
Description Counterparty
Unrealised appreciation/
(depreciation) USD
Holding
Description Counterparty
Unrealised appreciation/
(depreciation) USD
Annual Report and Audited Accounts 447
The notes on pages 489 to 503 form an integral part of these financial statements.
1,534 Cardinal Health Inc Bank of America Merrill Lynch 2,264
69 Cardinal Health Inc Citibank 128 98 Cardinal Health Inc JP Morgan 13 124 Care Capital
Properties Inc (Reit) Citibank 146 19 Care Capital
Properties Inc (Reit) JP Morgan (17) (501) Carlisle Cos Inc Bank of America
Merrill Lynch (928) (51) Carlisle Cos Inc Citibank (88) (452) CarMax Inc Bank of America
Merrill Lynch (1,460) (168) CarMax Inc Citibank (292) (1,995) CarMax Inc JP Morgan (3,068) 408 Carnival Corp Bank of America
Merrill Lynch (530) 1,458 Carnival Corp Citibank (1,779) (14) Carpenter Technology Corp Bank of America
Merrill Lynch (24) (43) Carrizo Oil & Gas Inc Bank of America
Merrill Lynch (81) (430) Carrizo Oil & Gas Inc Citibank (366) 94 Carter's Inc Bank of America
Merrill Lynch (19) 19 Carter's Inc JP Morgan (46) 78 Casey's General Stores Inc Citibank 293 74 Casey's General Stores Inc JP Morgan 186 434 Casey's General Stores Inc Bank of America
Merrill Lynch 1,468 (1,070) Catalent Inc JP Morgan (1,807) 55 Caterpillar Inc Bank of America
Merrill Lynch 115 206 Caterpillar Inc Citibank 492 46 Caterpillar Inc JP Morgan 92 1,552 Cathay General Bancorp Citibank 1,878 (1,380) Cavium Inc Bank of America
Merrill Lynch (3,401) (395) Cavium Inc Citibank (1,130) 6,121 CBL & Associates Bank of America
Properties Inc (Reit) Merrill Lynch (5,693) 129 CBL & Associates
Properties Inc (Reit) Citibank (99) 486 CBL & Associates
Properties Inc (Reit) JP Morgan (1,298) (2,525) CBOE Holdings Inc Citibank (253) (128) CBOE Holdings Inc JP Morgan (45) (292) CBOE Holdings Inc Bank of America
Merrill Lynch 23 4,900 CBRE Group Inc 'A' Bank of America
Merrill Lynch 4,085 497 CBRE Group Inc 'A' Citibank 408 1,167 CBRE Group Inc 'A' JP Morgan 467 100 CBS Corp 'B non-voting share' Bank of America
Merrill Lynch 115 263 CBS Corp 'B non-voting share' Citibank 621 1,285 CBS Corp 'B non-voting share' JP Morgan 2,288 69 CDK Global Inc Bank of America
Merrill Lynch 176 76 CDK Global Inc JP Morgan 301 276 CDW Corp/DE Citibank 86 68 CDW Corp/DE JP Morgan 92 458 CEB Inc Bank of America
Merrill Lynch 1,759 69 CEB Inc JP Morgan 176 235 Celanese Corp 'A' Bank of America
Merrill Lynch (12) 1,260 Celanese Corp 'A' Citibank 1,109 68 Celanese Corp 'A' JP Morgan 78 165 Celgene Corp Bank of America
Merrill Lynch 888
97 Celgene Corp Citibank 575 862 Celgene Corp JP Morgan 4,700 1,169 Centene Corp Citibank 6,009 361 Centene Corp JP Morgan 686 111 CenterPoint Energy Inc Bank of America
Merrill Lynch 40 3,881 CenterPoint Energy Inc Citibank 2,406 633 CenterPoint Energy Inc JP Morgan 560 223 CenturyLink Inc Bank of America
Merrill Lynch (158) 5,648 CenturyLink Inc JP Morgan (1,108) (1,844) Cepheid Bank of America
Merrill Lynch (2,261) (424) Cepheid Citibank (441) (29) Cerner Corp Bank of America
Merrill Lynch (36) (982) Cerner Corp Citibank (1,522) (289) Cerner Corp JP Morgan (75) (1,382) CF Industries Holdings Inc Bank of America
Merrill Lynch 3,717 (106) CF Industries Holdings Inc Citibank 266 (218) CF Industries Holdings Inc JP Morgan 669 (276) CH Robinson Worldwide Inc Citibank (237) (94) CH Robinson Worldwide Inc JP Morgan (196) (62) CH Robinson Worldwide Inc Bank of America
Merrill Lynch (172) 984 Charles River Laboratories
International Inc Citibank 1,712 159 Charles River Laboratories Bank of America
International Inc Merrill Lynch 361 4,362 Charles Schwab Corp/The Bank of America
Merrill Lynch 8,168 262 Charles Schwab Corp/The Citibank 440 777 Charles Schwab Corp/The JP Morgan 2,867 (1) Charter Communications Inc 'A' Citibank (7) 257 Cheesecake Factory Inc/The Bank of America
Merrill Lynch 237 154 Cheesecake Factory Inc/The Citibank 182 137 Chemed Corp Bank of America
Merrill Lynch 375 9 Chemed Corp Citibank 18 629 Chemed Corp JP Morgan 876 1,642 Chemtura Corp Bank of America
Merrill Lynch 1,609 (672) Cheniere Energy Inc JP Morgan (417) (699) Cheniere Energy Inc Bank of America
Merrill Lynch 1,587 (3,691) Cheniere Energy Inc Citibank 1,624 (200) Chesapeake Energy Corp JP Morgan (5) 40 Chevron Corp Bank of America
Merrill Lynch (28) 119 Chevron Corp Citibank 262 (229) Chicago Bridge & Iron Co NV Bank of America
Merrill Lynch (360) (146) Chicago Bridge & Iron Co NV JP Morgan (210) 3,678 Chico's FAS Inc Bank of America
Merrill Lynch (906) 441 Chico's FAS Inc JP Morgan (627) 844 Chimera Investment Corp (Reit) Bank of America
Merrill Lynch (169) 2,288 Chimera Investment Corp (Reit) JP Morgan (38) (329) Chipotle Mexican Grill Inc Citibank 4,409 (94) Chipotle Mexican Grill Inc JP Morgan 962 (17) Choice Hotels International Inc Bank of America
Merrill Lynch 14 (234) Choice Hotels International Inc JP Morgan (37) (617) Chubb Ltd Citibank (901) (101) Church & Dwight Co Inc Bank of America
Merrill Lynch (211) (43) Church & Dwight Co Inc Citibank (34) (451) Church & Dwight Co Inc JP Morgan (375)
BlackRock Style Advantage Fund continued
United States continued United States continued
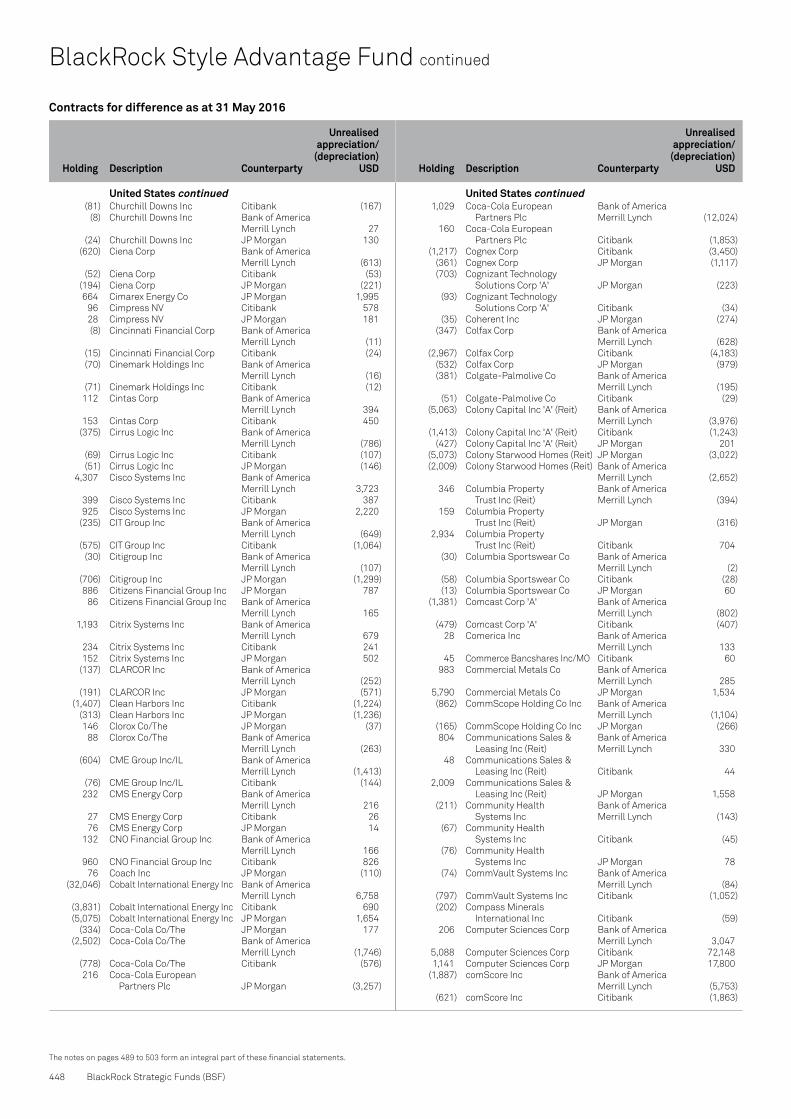
Contracts for difference as at 31 May 2016
Holding
Description Counterparty
Unrealised appreciation/
(depreciation) USD
Holding
Description Counterparty
Unrealised appreciation/
(depreciation) USD
448 BlackRock Strategic Funds (BSF)
The notes on pages 489 to 503 form an integral part of these financial statements.
BlackRock Style Advantage Fund continued
(81) Churchill Downs Inc Citibank (167) (8) Churchill Downs Inc Bank of America
Merrill Lynch 27 (24) Churchill Downs Inc JP Morgan 130 (620) Ciena Corp Bank of America
Merrill Lynch (613) (52) Ciena Corp Citibank (53) (194) Ciena Corp JP Morgan (221) 664 Cimarex Energy Co JP Morgan 1,995 96 Cimpress NV Citibank 578 28 Cimpress NV JP Morgan 181 (8) Cincinnati Financial Corp Bank of America
Merrill Lynch (11) (15) Cincinnati Financial Corp Citibank (24) (70) Cinemark Holdings Inc Bank of America
Merrill Lynch (16) (71) Cinemark Holdings Inc Citibank (12) 112 Cintas Corp Bank of America
Merrill Lynch 394 153 Cintas Corp Citibank 450 (375) Cirrus Logic Inc Bank of America
Merrill Lynch (786) (69) Cirrus Logic Inc Citibank (107) (51) Cirrus Logic Inc JP Morgan (146) 4,307 Cisco Systems Inc Bank of America
Merrill Lynch 3,723 399 Cisco Systems Inc Citibank 387 925 Cisco Systems Inc JP Morgan 2,220 (235) CIT Group Inc Bank of America
Merrill Lynch (649) (575) CIT Group Inc Citibank (1,064) (30) Citigroup Inc Bank of America
Merrill Lynch (107) (706) Citigroup Inc JP Morgan (1,299) 886 Citizens Financial Group Inc JP Morgan 787 86 Citizens Financial Group Inc Bank of America
Merrill Lynch 165 1,193 Citrix Systems Inc Bank of America
Merrill Lynch 679 234 Citrix Systems Inc Citibank 241 152 Citrix Systems Inc JP Morgan 502 (137) CLARCOR Inc Bank of America
Merrill Lynch (252) (191) CLARCOR Inc JP Morgan (571) (1,407) Clean Harbors Inc Citibank (1,224) (313) Clean Harbors Inc JP Morgan (1,236) 146 Clorox Co/The JP Morgan (37) 88 Clorox Co/The Bank of America
Merrill Lynch (263) (604) CME Group Inc/IL Bank of America
Merrill Lynch (1,413) (76) CME Group Inc/IL Citibank (144) 232 CMS Energy Corp Bank of America
Merrill Lynch 216 27 CMS Energy Corp Citibank 26 76 CMS Energy Corp JP Morgan 14 132 CNO Financial Group Inc Bank of America
Merrill Lynch 166 960 CNO Financial Group Inc Citibank 826 76 Coach Inc JP Morgan (110) (32,046) Cobalt International Energy Inc Bank of America
Merrill Lynch 6,758 (3,831) Cobalt International Energy Inc Citibank 690 (5,075) Cobalt International Energy Inc JP Morgan 1,654 (334) Coca-Cola Co/The JP Morgan 177 (2,502) Coca-Cola Co/The Bank of America
Merrill Lynch (1,746) (778) Coca-Cola Co/The Citibank (576) 216 Coca-Cola European
Partners Plc JP Morgan (3,257)
1,029 Coca-Cola European Bank of America Partners Plc Merrill Lynch (12,024)
160 Coca-Cola European Partners Plc Citibank (1,853)
(1,217) Cognex Corp Citibank (3,450) (361) Cognex Corp JP Morgan (1,117) (703) Cognizant Technology
Solutions Corp 'A' JP Morgan (223) (93) Cognizant Technology
Solutions Corp 'A' Citibank (34) (35) Coherent Inc JP Morgan (274) (347) Colfax Corp Bank of America
Merrill Lynch (628) (2,967) Colfax Corp Citibank (4,183) (532) Colfax Corp JP Morgan (979) (381) Colgate-Palmolive Co Bank of America
Merrill Lynch (195) (51) Colgate-Palmolive Co Citibank (29) (5,063) Colony Capital Inc 'A' (Reit) Bank of America
Merrill Lynch (3,976) (1,413) Colony Capital Inc 'A' (Reit) Citibank (1,243) (427) Colony Capital Inc 'A' (Reit) JP Morgan 201 (5,073) Colony Starwood Homes (Reit) JP Morgan (3,022) (2,009) Colony Starwood Homes (Reit) Bank of America
Merrill Lynch (2,652) 346 Columbia Property Bank of America
Trust Inc (Reit) Merrill Lynch (394) 159 Columbia Property
Trust Inc (Reit) JP Morgan (316) 2,934 Columbia Property
Trust Inc (Reit) Citibank 704 (30) Columbia Sportswear Co Bank of America
Merrill Lynch (2) (58) Columbia Sportswear Co Citibank (28) (13) Columbia Sportswear Co JP Morgan 60 (1,381) Comcast Corp 'A' Bank of America
Merrill Lynch (802) (479) Comcast Corp 'A' Citibank (407) 28 Comerica Inc Bank of America
Merrill Lynch 133 45 Commerce Bancshares Inc/MO Citibank 60 983 Commercial Metals Co Bank of America
Merrill Lynch 285 5,790 Commercial Metals Co JP Morgan 1,534 (862) CommScope Holding Co Inc Bank of America
Merrill Lynch (1,104) (165) CommScope Holding Co Inc JP Morgan (266) 804 Communications Sales & Bank of America
Leasing Inc (Reit) Merrill Lynch 330 48 Communications Sales &
Leasing Inc (Reit) Citibank 44 2,009 Communications Sales &
Leasing Inc (Reit) JP Morgan 1,558 (211) Community Health Bank of America
Systems Inc Merrill Lynch (143) (67) Community Health
Systems Inc Citibank (45) (76) Community Health
Systems Inc JP Morgan 78 (74) CommVault Systems Inc Bank of America
Merrill Lynch (84) (797) CommVault Systems Inc Citibank (1,052) (202) Compass Minerals
International Inc Citibank (59) 206 Computer Sciences Corp Bank of America
Merrill Lynch 3,047 5,088 Computer Sciences Corp Citibank 72,148 1,141 Computer Sciences Corp JP Morgan 17,800 (1,887) comScore Inc Bank of America
Merrill Lynch (5,753) (621) comScore Inc Citibank (1,863)
United States continued United States continued

Contracts for difference as at 31 May 2016
Holding
Description Counterparty
Unrealised appreciation/
(depreciation) USD
Holding
Description Counterparty
Unrealised appreciation/
(depreciation) USD
Annual Report and Audited Accounts 449
The notes on pages 489 to 503 form an integral part of these financial statements.
76 ConAgra Foods Inc JP Morgan 33 (82) Concho Resources Inc Bank of America
Merrill Lynch (415) (593) Concho Resources Inc Citibank (3,309) (28) Concho Resources Inc JP Morgan (271) 290 ConocoPhillips Citibank 371 2,592 ConocoPhillips JP Morgan 4,383 (769) CONSOL Energy Inc Citibank (1,384) (2,956) CONSOL Energy Inc JP Morgan (5,349) (390) Consolidated Edison Inc Bank of America
Merrill Lynch (159) (22) Consolidated Edison Inc Citibank (20) (108) Consolidated Edison Inc JP Morgan 188 53 Constellation Brands Inc 'A' Citibank (13) 224 Constellation Brands Inc 'A' JP Morgan (84) (1,211) Continental Resources Inc/OK JP Morgan (3,167) 397 Convergys Corp Bank of America
Merrill Lynch 91 4,986 Convergys Corp Citibank 4,039 427 Convergys Corp JP Morgan 495 (218) Cooper Cos Inc/The JP Morgan (840) (25) Cooper Cos Inc/The Bank of America
Merrill Lynch (65) 1,600 Cooper Tire & Rubber Co Bank of America
Merrill Lynch 1,090 123 Cooper Tire & Rubber Co Citibank 130 59 Copart Inc Bank of America
Merrill Lynch 318 40 Copart Inc JP Morgan 232 (8) Core Laboratories NV JP Morgan (8) 128 CoreLogic Inc/United States Citibank 60 62 CoreLogic Inc/United States JP Morgan 30 (329) Cornerstone OnDemand Inc Citibank (790) (903) Cornerstone OnDemand Inc JP Morgan (1,971) (65) Corning Inc Citibank (66) 341 Corporate Office Properties
Trust (Reit) Citibank 276 456 Corrections Corp of Bank of America
America (Reit) Merrill Lynch 59 1,996 Corrections Corp of
America (Reit) Citibank 2,415 53 Corrections Corp of
America (Reit) JP Morgan (1) 5 CoStar Group Inc JP Morgan 48 (13) Costco Wholesale Corp Bank of America
Merrill Lynch (37) (346) Costco Wholesale Corp Citibank (2,297) (68) Costco Wholesale Corp JP Morgan (4) 143 Cousins Properties Inc (Reit) JP Morgan (7) 965 Cousins Properties Inc (Reit) Bank of America
Merrill Lynch 198 (62) Covanta Holding Corp Citibank (11) (1,033) Covanta Holding Corp Bank of America
Merrill Lynch 31 81 CR Bard Inc JP Morgan 89 132 CR Bard Inc Bank of America
Merrill Lynch (134) 21 Cracker Barrel Old Country
Store Inc Citibank 153 277 Cracker Barrel Old Country
Store Inc JP Morgan 1,661 17 Cracker Barrel Old Country Bank of America
Store Inc Merrill Lynch 60 37 Crane Co Citibank 94 207 Crane Co JP Morgan 596 (346) Cree Inc Bank of America
Merrill Lynch (567) (3,261) Cree Inc Citibank (2,968) (313) Crown Castle International Bank of America
Corp (Reit) Merrill Lynch (110)
(1,153) Crown Castle International Corp (Reit) Citibank (392)
796 Crown Holdings Inc Citibank 398 133 Crown Holdings Inc Bank of America
Merrill Lynch (239) 39 Crown Holdings Inc JP Morgan (46) 38 CSRA Inc JP Morgan (53) (1,028) CST Brands Inc Bank of America
Merrill Lynch (727) (16) CST Brands Inc Citibank (14) (339) CSX Corp Citibank (232) (1,370) Ctrip.com International
Ltd ADR Citibank (4,740) (2,984) Ctrip.com International
Ltd ADR JP Morgan (10,093) 55 Cullen/Frost Bankers Inc Bank of America
Merrill Lynch 335 169 Cullen/Frost Bankers Inc Citibank 575 277 Cullen/Frost Bankers Inc JP Morgan 1,005 (111) Curtiss-Wright Corp Bank of America
Merrill Lynch (240) (349) Curtiss-Wright Corp Citibank (1,005) (9) Curtiss-Wright Corp JP Morgan (35) 1,339 CVR Energy Inc Bank of America
Merrill Lynch (536) 271 CVR Energy Inc Citibank (51) 220 CVR Energy Inc JP Morgan (2) 215 CVS Health Corp Citibank (288) (11,121) Cypress Semiconductor Corp JP Morgan (5,822) (303) CyrusOne Inc (Reit) JP Morgan (406) (116) CyrusOne Inc (Reit) Bank of America
Merrill Lynch (35) (784) CyrusOne Inc (Reit) Citibank (1,231) (2,257) CYS Investments Inc (Reit) Citibank (68) (836) CYS Investments Inc (Reit) Bank of America
Merrill Lynch 217 772 Dana Holding Corp JP Morgan (216) 814 Dana Holding Corp Bank of America
Merrill Lynch 65 6,032 Dana Holding Corp Citibank 4,584 (2,000) Danaher Corp Bank of America
Merrill Lynch 500 (61) Danaher Corp JP Morgan (86) (776) Danaher Corp Citibank 287 20 Darden Restaurants Inc Bank of America
Merrill Lynch 85 382 Darden Restaurants Inc Citibank 966 62 Darden Restaurants Inc JP Morgan 191 (1,900) Darling Ingredients Inc Citibank (1,102) (993) Darling Ingredients Inc JP Morgan (1,281) (116) DaVita HealthCare Partners Inc JP Morgan (122) (414) DaVita HealthCare Partners Inc Citibank (128) 507 DCT Industrial Trust Inc (Reit) JP Morgan (218) 2,328 DCT Industrial Trust Inc (Reit) Bank of America
Merrill Lynch 1,431 173 DDR Corp (Reit) Bank of America
Merrill Lynch (87) 110 DDR Corp (Reit) Citibank 31 615 DDR Corp (Reit) JP Morgan 170 4,160 Dean Foods Co Bank of America
Merrill Lynch 6 913 Dean Foods Co Citibank 82 394 Dean Foods Co JP Morgan 83 (20) Deckers Outdoor Corp Bank of America
Merrill Lynch (50) (152) Deckers Outdoor Corp Citibank (456) (50) Deckers Outdoor Corp JP Morgan 202 (488) Deere & Co Bank of America
Merrill Lynch (2,141) (216) Deere & Co Citibank (1,017) 13 Delphi Automotive Plc Citibank 26
BlackRock Style Advantage Fund continued
United States continued United States continued

Contracts for difference as at 31 May 2016
Holding
Description Counterparty
Unrealised appreciation/
(depreciation) USD
Holding
Description Counterparty
Unrealised appreciation/
(depreciation) USD
450 BlackRock Strategic Funds (BSF)
The notes on pages 489 to 503 form an integral part of these financial statements.
BlackRock Style Advantage Fund continued
343 Delphi Automotive Plc JP Morgan 281 3,329 Delta Air Lines Inc Bank of America
Merrill Lynch (1,581) 162 Delta Air Lines Inc Citibank (29) 1,137 Delta Air Lines Inc JP Morgan 421 2,494 Deluxe Corp Bank of America
Merrill Lynch 5,202 (530) Demandware Inc Bank of America
Merrill Lynch (1,670) (1,160) Demandware Inc Citibank (4,211) 126 Dentsply Sirona Inc Citibank 257 469 Devon Energy Corp Citibank 1,102 4,262 Devon Energy Corp JP Morgan 14,801 34 Devon Energy Corp Bank of America
Merrill Lynch 105 (48) DexCom Inc Bank of America
Merrill Lynch (45) (858) DexCom Inc Citibank (223) (121) DexCom Inc JP Morgan (157) 1,375 Diamond Offshore Drilling Inc Bank of America
Merrill Lynch 3,129 132 Diamond Offshore Drilling Inc Citibank 301 121 Diamond Offshore Drilling Inc JP Morgan 342 (226) Diamond Resorts
International Inc Citibank (560) (168) Diamond Resorts
International Inc JP Morgan (454) (85) Diamondback Energy Inc Bank of America
Merrill Lynch (520) (1,343) Diamondback Energy Inc Citibank (7,870) (29) Diamondback Energy Inc JP Morgan (202) 343 DiamondRock Bank of America
Hospitality Co (Reit) Merrill Lynch 81 256 DiamondRock
Hospitality Co (Reit) Citibank 82 155 DiamondRock
Hospitality Co (Reit) JP Morgan (149) 35 Dick's Sporting Goods Inc Bank of America
Merrill Lynch 97 86 Dick's Sporting Goods Inc Citibank 52 361 Dick's Sporting Goods Inc JP Morgan (99) (548) Diebold Inc JP Morgan (581) (1,803) Digital Realty Trust Inc (Reit) Bank of America
Merrill Lynch 21 (129) Digital Realty Trust Inc (Reit) Citibank (67) 126 Dillard's Inc 'A' JP Morgan (975) 1,203 Dillard's Inc 'A' Citibank 2,971 (3,406) Diplomat Pharmacy Inc Bank of America
Merrill Lynch (3,688) (1,287) Diplomat Pharmacy Inc Citibank (1,429) (207) Diplomat Pharmacy Inc JP Morgan (311) 304 Discover Financial Services Bank of America
Merrill Lynch 660 147 Discover Financial Services JP Morgan 268 2,608 Discovery Communications
Inc 'A' JP Morgan 2,589 265 Discovery Communications Bank of America
Inc 'A' Merrill Lynch 56 65 DISH Network Corp 'A' Bank of America
Merrill Lynch 148 54 Dolby Laboratories Inc 'A' Bank of America
Merrill Lynch 69 28 Dollar General Corp Bank of America
Merrill Lynch 206 9 Dollar General Corp Citibank 72 (910) Dollar Tree Inc Citibank (12,695) (338) Dollar Tree Inc JP Morgan (2,501) (190) Dominion Resources Inc/VA Citibank (266) (1,926) Dominion Resources Inc/VA JP Morgan (1,875) (550) Dominion Resources Inc/VA Bank of America
Merrill Lynch 374
535 Domino's Pizza Inc Bank of America Merrill Lynch (345)
16 Domino's Pizza Inc Citibank (2) 37 Domino's Pizza Inc JP Morgan (9) 1,550 Domtar Corp Bank of America
Merrill Lynch 1,500 498 Domtar Corp Citibank 563 56 Domtar Corp JP Morgan 89 (106) Donaldson Co Inc Citibank (124) (101) Donaldson Co Inc JP Morgan (137) 461 Douglas Emmett Inc (Reit) Bank of America
Merrill Lynch 115 416 Douglas Emmett Inc (Reit) Citibank 349 2,804 Douglas Emmett Inc (Reit) JP Morgan 2,288 (240) Dover Corp JP Morgan (575) (886) DR Horton Inc Bank of America
Merrill Lynch (991) (65) DR Horton Inc Citibank (81) (263) DR Horton Inc JP Morgan (231) 361 Dr Pepper Snapple Group Inc Bank of America
Merrill Lynch (928) 140 Dr Pepper Snapple Group Inc Citibank (7) 1,215 Dr Pepper Snapple Group Inc JP Morgan (18) (650) DreamWorks Animation
SKG Inc 'A' JP Morgan (156) 74 Dril-Quip Inc Citibank 177 27 Dril-Quip Inc JP Morgan 52 6 DST Systems Inc Bank of America
Merrill Lynch 2 221 DST Systems Inc Citibank 519 34 DST Systems Inc JP Morgan 32 (34) DSW Inc 'A' Citibank 23 (616) DSW Inc 'A' JP Morgan 894 (7) DTE Energy Co Bank of America
Merrill Lynch 4 (2,482) Duke Energy Corp Bank of America
Merrill Lynch (3,976) (416) Duke Energy Corp Citibank (811) (565) Duke Energy Corp JP Morgan 1,107 893 Duke Realty Corp (Reit) JP Morgan 98 3,883 Duke Realty Corp (Reit) Bank of America
Merrill Lynch 1,790 260 Duke Realty Corp (Reit) Citibank 122 69 Dun & Bradstreet Corp/The Bank of America
Merrill Lynch 406 714 Dun & Bradstreet Corp/The Citibank 4,220 75 Dun & Bradstreet Corp/The JP Morgan 1,093 (743) Dunkin' Brands Group Inc Bank of America
Merrill Lynch 172 (17) Dunkin' Brands Group Inc Citibank 5 (244) Dunkin' Brands Group Inc JP Morgan 830 68 DuPont Fabros Technology Bank of America
Inc (Reit) Merrill Lynch (50) 157 DuPont Fabros Technology
Inc (Reit) JP Morgan (36) 776 DuPont Fabros Technology
Inc (Reit) Citibank 691 (105) Dycom Industries Inc Citibank (1,356) (3,817) Dynegy Inc Bank of America
Merrill Lynch 2,084 (1,020) Dynegy Inc Citibank 571 230 E*TRADE Financial Corp JP Morgan 694 83 E*TRADE Financial Corp Bank of America
Merrill Lynch 234 965 E*TRADE Financial Corp Citibank 1,409 (88) Eagle Materials Inc Bank of America
Merrill Lynch (241) (68) Eagle Materials Inc Citibank (180) (939) Eagle Materials Inc JP Morgan (2,923) 144 East West Bancorp Inc Bank of America
Merrill Lynch 419
United States continued United States continued
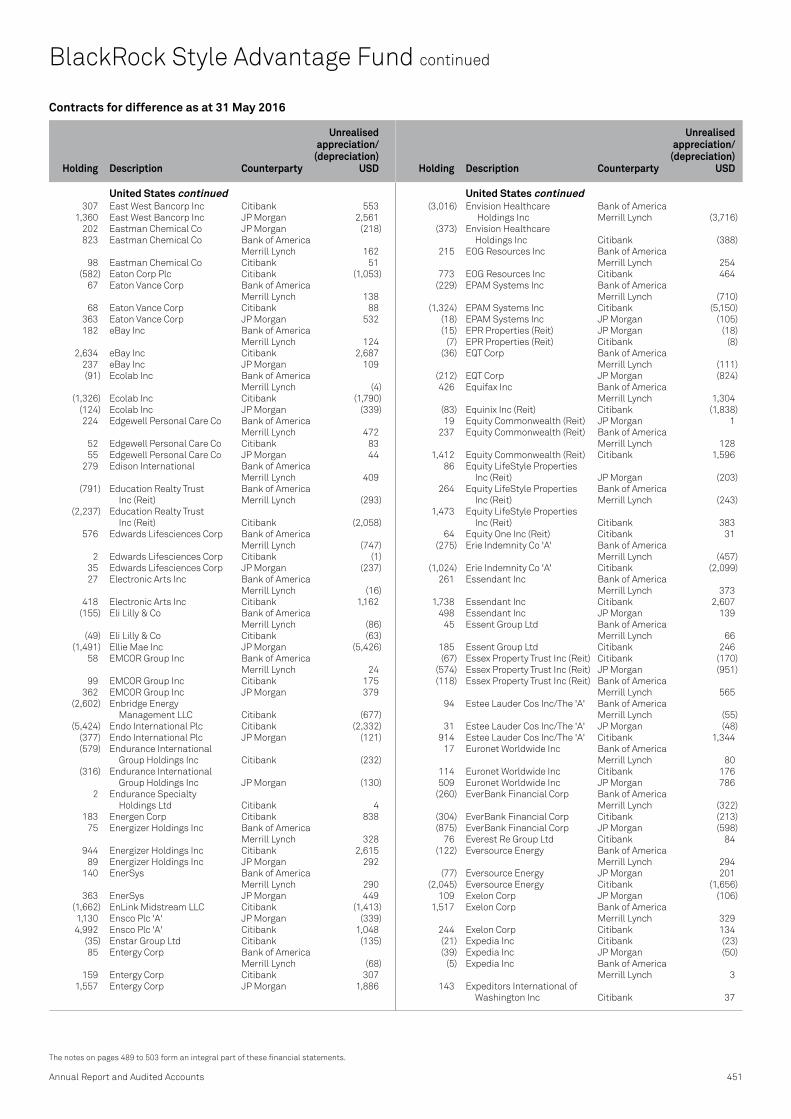
Contracts for difference as at 31 May 2016
Holding
Description Counterparty
Unrealised appreciation/
(depreciation) USD
Holding
Description Counterparty
Unrealised appreciation/
(depreciation) USD
Annual Report and Audited Accounts 451
The notes on pages 489 to 503 form an integral part of these financial statements.
307 East West Bancorp Inc Citibank 553 1,360 East West Bancorp Inc JP Morgan 2,561 202 Eastman Chemical Co JP Morgan (218) 823 Eastman Chemical Co Bank of America
Merrill Lynch 162 98 Eastman Chemical Co Citibank 51 (582) Eaton Corp Plc Citibank (1,053) 67 Eaton Vance Corp Bank of America
Merrill Lynch 138 68 Eaton Vance Corp Citibank 88 363 Eaton Vance Corp JP Morgan 532 182 eBay Inc Bank of America
Merrill Lynch 124 2,634 eBay Inc Citibank 2,687 237 eBay Inc JP Morgan 109 (91) Ecolab Inc Bank of America
Merrill Lynch (4) (1,326) Ecolab Inc Citibank (1,790) (124) Ecolab Inc JP Morgan (339) 224 Edgewell Personal Care Co Bank of America
Merrill Lynch 472 52 Edgewell Personal Care Co Citibank 83 55 Edgewell Personal Care Co JP Morgan 44 279 Edison International Bank of America
Merrill Lynch 409 (791) Education Realty Trust Bank of America
Inc (Reit) Merrill Lynch (293) (2,237) Education Realty Trust
Inc (Reit) Citibank (2,058) 576 Edwards Lifesciences Corp Bank of America
Merrill Lynch (747) 2 Edwards Lifesciences Corp Citibank (1) 35 Edwards Lifesciences Corp JP Morgan (237) 27 Electronic Arts Inc Bank of America
Merrill Lynch (16) 418 Electronic Arts Inc Citibank 1,162 (155) Eli Lilly & Co Bank of America
Merrill Lynch (86) (49) Eli Lilly & Co Citibank (63) (1,491) Ellie Mae Inc JP Morgan (5,426) 58 EMCOR Group Inc Bank of America
Merrill Lynch 24 99 EMCOR Group Inc Citibank 175 362 EMCOR Group Inc JP Morgan 379 (2,602) Enbridge Energy
Management LLC Citibank (677) (5,424) Endo International Plc Citibank (2,332) (377) Endo International Plc JP Morgan (121) (579) Endurance International
Group Holdings Inc Citibank (232) (316) Endurance International
Group Holdings Inc JP Morgan (130) 2 Endurance Specialty
Holdings Ltd Citibank 4 183 Energen Corp Citibank 838 75 Energizer Holdings Inc Bank of America
Merrill Lynch 328 944 Energizer Holdings Inc Citibank 2,615 89 Energizer Holdings Inc JP Morgan 292 140 EnerSys Bank of America
Merrill Lynch 290 363 EnerSys JP Morgan 449 (1,662) EnLink Midstream LLC Citibank (1,413) 1,130 Ensco Plc 'A' JP Morgan (339) 4,992 Ensco Plc 'A' Citibank 1,048 (35) Enstar Group Ltd Citibank (135) 85 Entergy Corp Bank of America
Merrill Lynch (68) 159 Entergy Corp Citibank 307 1,557 Entergy Corp JP Morgan 1,886
(3,016) Envision Healthcare Bank of America Holdings Inc Merrill Lynch (3,716)
(373) Envision Healthcare Holdings Inc Citibank (388)
215 EOG Resources Inc Bank of America Merrill Lynch 254
773 EOG Resources Inc Citibank 464 (229) EPAM Systems Inc Bank of America
Merrill Lynch (710) (1,324) EPAM Systems Inc Citibank (5,150) (18) EPAM Systems Inc JP Morgan (105) (15) EPR Properties (Reit) JP Morgan (18) (7) EPR Properties (Reit) Citibank (8) (36) EQT Corp Bank of America
Merrill Lynch (111) (212) EQT Corp JP Morgan (824) 426 Equifax Inc Bank of America
Merrill Lynch 1,304 (83) Equinix Inc (Reit) Citibank (1,838) 19 Equity Commonwealth (Reit) JP Morgan 1 237 Equity Commonwealth (Reit) Bank of America
Merrill Lynch 128 1,412 Equity Commonwealth (Reit) Citibank 1,596 86 Equity LifeStyle Properties
Inc (Reit) JP Morgan (203) 264 Equity LifeStyle Properties Bank of America
Inc (Reit) Merrill Lynch (243) 1,473 Equity LifeStyle Properties
Inc (Reit) Citibank 383 64 Equity One Inc (Reit) Citibank 31 (275) Erie Indemnity Co 'A' Bank of America
Merrill Lynch (457) (1,024) Erie Indemnity Co 'A' Citibank (2,099) 261 Essendant Inc Bank of America
Merrill Lynch 373 1,738 Essendant Inc Citibank 2,607 498 Essendant Inc JP Morgan 139 45 Essent Group Ltd Bank of America
Merrill Lynch 66 185 Essent Group Ltd Citibank 246 (67) Essex Property Trust Inc (Reit) Citibank (170) (574) Essex Property Trust Inc (Reit) JP Morgan (951) (118) Essex Property Trust Inc (Reit) Bank of America
Merrill Lynch 565 94 Estee Lauder Cos Inc/The 'A' Bank of America
Merrill Lynch (55) 31 Estee Lauder Cos Inc/The 'A' JP Morgan (48) 914 Estee Lauder Cos Inc/The 'A' Citibank 1,344 17 Euronet Worldwide Inc Bank of America
Merrill Lynch 80 114 Euronet Worldwide Inc Citibank 176 509 Euronet Worldwide Inc JP Morgan 786 (260) EverBank Financial Corp Bank of America
Merrill Lynch (322) (304) EverBank Financial Corp Citibank (213) (875) EverBank Financial Corp JP Morgan (598) 76 Everest Re Group Ltd Citibank 84 (122) Eversource Energy Bank of America
Merrill Lynch 294 (77) Eversource Energy JP Morgan 201 (2,045) Eversource Energy Citibank (1,656) 109 Exelon Corp JP Morgan (106) 1,517 Exelon Corp Bank of America
Merrill Lynch 329 244 Exelon Corp Citibank 134 (21) Expedia Inc Citibank (23) (39) Expedia Inc JP Morgan (50) (5) Expedia Inc Bank of America
Merrill Lynch 3 143 Expeditors International of
Washington Inc Citibank 37
BlackRock Style Advantage Fund continued
United States continued United States continued

Contracts for difference as at 31 May 2016
Holding
Description Counterparty
Unrealised appreciation/
(depreciation) USD
Holding
Description Counterparty
Unrealised appreciation/
(depreciation) USD
452 BlackRock Strategic Funds (BSF)
The notes on pages 489 to 503 form an integral part of these financial statements.
BlackRock Style Advantage Fund continued
45 Expeditors International of Washington Inc JP Morgan 19
49 Express Scripts Holding Co Bank of America Merrill Lynch 114
1,081 Express Scripts Holding Co Citibank 2,357 273 Express Scripts Holding Co JP Morgan 360 (1,937) Extended Stay America
Inc (Unit) Citibank (1,356) (80) Extended Stay America
Inc (Unit) JP Morgan 62 (15) Extra Space Storage Inc (Reit) JP Morgan 13 (22) Extra Space Storage Inc (Reit) Citibank (30) (136) Exxon Mobil Corp Citibank (46) (392) Exxon Mobil Corp JP Morgan (228) 174 F5 Networks Inc Bank of America
Merrill Lynch 256 347 F5 Networks Inc JP Morgan 644 (11) Facebook Inc 'A' Citibank (37) (376) Facebook Inc 'A' Bank of America
Merrill Lynch (1,079) (115) Facebook Inc 'A' JP Morgan (7) 33 FactSet Research Systems Inc Bank of America
Merrill Lynch 251 243 FactSet Research Systems Inc Citibank 843 27 FactSet Research Systems Inc JP Morgan 211 110 Fair Isaac Corp Citibank 616 40 Fair Isaac Corp JP Morgan 168 (258) Fastenal Co Bank of America
Merrill Lynch (98) (1,407) Fastenal Co Citibank (1,731) (137) Fastenal Co JP Morgan 33 (26) Federal Realty Investment Bank of America
Trust (Reit) Merrill Lynch 90 (83) Federal Realty Investment
Trust (Reit) Citibank (145) (353) Federal Realty Investment
Trust (Reit) JP Morgan (492) 276 Federated Investors Inc 'B' Bank of America
Merrill Lynch 1,490 815 Federated Investors Inc 'B' JP Morgan 1,720 950 FedEx Corp Bank of America
Merrill Lynch 3,979 61 FedEx Corp Citibank 238 142 FedEx Corp JP Morgan 518 (887) FEI Co Bank of America
Merrill Lynch (16,367) (21) FEI Co Citibank (376) (682) Fidelity National Information
Services Inc JP Morgan (1,725) (2,375) Fidelity National Information Bank of America
Services Inc Merrill Lynch (4,217) (1,453) Financial Engines Inc Citibank (1,438) (436) Financial Engines Inc JP Morgan 1,125 (869) Finisar Corp Bank of America
Merrill Lynch (886) (1,468) Finisar Corp Citibank (1,659) (4,511) FireEye Inc Citibank (6,857) (773) FireEye Inc JP Morgan (2,273) 29 First American Financial Corp JP Morgan 36 48 First American Financial Corp Bank of America
Merrill Lynch 48 48 First American Financial Corp Citibank 45 (7) First Citizens BancShares
Inc/NC 'A' Citibank (52) (94) First Citizens BancShares
Inc/NC 'A' JP Morgan (821) 32 First Financial Bankshares Inc Citibank 30 184 First Horizon National Corp Bank of America
Merrill Lynch 171 177 First Horizon National Corp Citibank 80
1,026 First Industrial Realty Trust Inc (Reit) JP Morgan 328
309 First Industrial Realty Trust Inc (Reit) Citibank 124
27 First Republic Bank/CA Bank of America Merrill Lynch 76
(1,552) First Solar Inc Bank of America Merrill Lynch (1,493)
(122) First Solar Inc Citibank (137) (47) First Solar Inc JP Morgan 21 2,158 FirstEnergy Corp Bank of America
Merrill Lynch 501 66 FirstEnergy Corp Citibank 39 214 FirstEnergy Corp JP Morgan (193) 132 Fiserv Inc Bank of America
Merrill Lynch 135 562 Fiserv Inc Citibank 1,916 123 Fiserv Inc JP Morgan 203 (3,197) Five Below Inc Bank of America
Merrill Lynch (9,277) (12) FleetCor Technologies Inc Bank of America
Merrill Lynch (48) (21) FleetCor Technologies Inc Citibank (81) (828) FleetCor Technologies Inc JP Morgan (2,254) 4,000 Flextronics International Ltd Bank of America
Merrill Lynch (80) 7,726 Flextronics International Ltd JP Morgan 261 (746) FLIR Systems Inc Bank of America
Merrill Lynch (403) (2,272) FLIR Systems Inc Citibank (2,295) 47 Flowers Foods Inc Citibank 27 1,379 Flowers Foods Inc JP Morgan 237 41 Flowers Foods Inc Bank of America
Merrill Lynch (17) (272) Flowserve Corp Bank of America
Merrill Lynch (685) 2,173 Fluor Corp Bank of America
Merrill Lynch 6,286 200 Fluor Corp Citibank 564 529 Fluor Corp JP Morgan 921 (2,060) FMC Corp Bank of America
Merrill Lynch (614) (430) FMC Corp JP Morgan (546) 29 FMC Technologies Inc Citibank 5 135 FMC Technologies Inc Bank of America
Merrill Lynch (221) 291 FMC Technologies Inc JP Morgan (108) (308) FNB Corp/PA Bank of America
Merrill Lynch (231) (3,498) FNB Corp/PA Citibank (1,749) (3,000) FNF Group Citibank (2,070) 234 Foot Locker Inc Citibank 285 1,300 Foot Locker Inc JP Morgan 1,214 254 Foot Locker Inc Bank of America
Merrill Lynch (1,019) 5,567 Ford Motor Co Bank of America
Merrill Lynch 1,943 2,527 Ford Motor Co Citibank 973 (252) Fortinet Inc Bank of America
Merrill Lynch (408) (845) Fortinet Inc Citibank (482) (238) Fortune Brands Home & Bank of America
Security Inc Merrill Lynch (299) (84) Fortune Brands Home &
Security Inc Citibank (111) (37) Fortune Brands Home &
Security Inc JP Morgan (70) (214) Forum Energy Technologies Inc Bank of America
Merrill Lynch (248) (2,977) Forum Energy Technologies Inc JP Morgan (2,241) (861) Fossil Group Inc JP Morgan 1,545
United States continued United States continued

Contracts for difference as at 31 May 2016
Holding
Description Counterparty
Unrealised appreciation/
(depreciation) USD
Holding
Description Counterparty
Unrealised appreciation/
(depreciation) USD
Annual Report and Audited Accounts 453
The notes on pages 489 to 503 form an integral part of these financial statements.
(257) Frank's International NV Citibank (208) (571) Frank's International NV JP Morgan (495) 2,303 Franklin Resources Inc Bank of America
Merrill Lynch 4,145 340 Franklin Resources Inc Citibank 609 258 Franklin Resources Inc JP Morgan 390 (2,109) Freeport-McMoRan Inc JP Morgan (543) (824) Frontier Communications Corp JP Morgan (107) (824) FTI Consulting Inc Bank of America
Merrill Lynch (914) (75) FTI Consulting Inc Citibank (89) 461 Fulton Financial Corp Bank of America
Merrill Lynch 362 1,846 Fulton Financial Corp Citibank 1,006 227 Fulton Financial Corp JP Morgan 212 (1,650) G-III Apparel Group Ltd Bank of America
Merrill Lynch (2,057) (302) G-III Apparel Group Ltd Citibank (471) 1,147 GameStop Corp 'A' Bank of America
Merrill Lynch 213 40 GameStop Corp 'A' Citibank 15 329 GameStop Corp 'A' JP Morgan (441) 968 Gap Inc/The Citibank (532) 4,515 Gap Inc/The JP Morgan (3,727) 34 Gap Inc/The Bank of America
Merrill Lynch 11 (60) Garmin Ltd Citibank (100) (26) Gartner Inc Bank of America
Merrill Lynch (112) (219) Gartner Inc Citibank (782) 114 GATX Corp Bank of America
Merrill Lynch 212 2,078 GATX Corp JP Morgan 2,796 (678) Generac Holdings Inc Citibank (434) (183) Generac Holdings Inc JP Morgan (490) (3,020) General Electric Co Citibank (1,993) (982) General Electric Co JP Morgan (275) 1,229 General Growth Properties
Inc (Reit) JP Morgan 33 124 General Growth Properties Bank of America
Inc (Reit) Merrill Lynch (136) 100 General Growth Properties
Inc (Reit) Citibank 35 (599) General Mills Inc Bank of America
Merrill Lynch 91 (58) General Mills Inc Citibank (17) 327 General Motors Co Bank of America
Merrill Lynch 268 3,649 General Motors Co Citibank 3,284 560 General Motors Co JP Morgan 398 50 Genesco Inc Bank of America
Merrill Lynch 98 82 Genesco Inc JP Morgan 192 (1,404) Genesee & Wyoming Inc 'A' Bank of America
Merrill Lynch (4,216) (93) Genesee & Wyoming Inc 'A' Citibank (292) (17) Genesee & Wyoming Inc 'A' JP Morgan 18 (413) Gentex Corp Bank of America
Merrill Lynch (107) (1,070) Gentex Corp Citibank (920) 20 Genuine Parts Co Citibank 64 80 Genuine Parts Co JP Morgan 142 19 Genuine Parts Co Bank of America
Merrill Lynch (1) (5,021) Genworth Financial Inc 'A' Bank of America
Merrill Lynch (1,456) (13,011) Genworth Financial Inc 'A' Citibank (2,212) 1,105 GEO Group Inc/The (Reit) JP Morgan 1,206 197 GEO Group Inc/The (Reit) Bank of America
Merrill Lynch 93 128 GEO Group Inc/The (Reit) Citibank 168
156 Gilead Sciences Inc Bank of America Merrill Lynch 468
332 Gilead Sciences Inc Citibank 1,089 3,153 Gilead Sciences Inc JP Morgan 8,626 1,512 Global Payments Inc Citibank 2,964 111 Global Payments Inc JP Morgan 424 (895) Globus Medical Inc 'A' Bank of America
Merrill Lynch (555) (107) Globus Medical Inc 'A' Citibank (81) 194 GNC Holdings Inc 'A' JP Morgan (68) 40 GNC Holdings Inc 'A' Citibank 52 922 GNC Holdings Inc 'A' Bank of America
Merrill Lynch 948 (55) Goldman Sachs Group Inc/The JP Morgan (9) (347) Goldman Sachs Group Inc/The Bank of America
Merrill Lynch (2,167) 168 Goodyear Tire & Rubber Co/The Bank of America
Merrill Lynch 72 3,735 Goodyear Tire & Rubber Co/The Citibank 3,959 185 Goodyear Tire & Rubber Co/The JP Morgan (35) 14 Graco Inc Bank of America
Merrill Lynch 9 221 Graco Inc Citibank 376 47 Graham Holdings Co 'B' Bank of America
Merrill Lynch 941 11 Graham Holdings Co 'B' JP Morgan 251 (1,457) Gramercy Property Trust (Reit) JP Morgan 335 (12,260) Gramercy Property Trust (Reit) Citibank (1,716) 1,210 Graphic Packaging Holding Co Bank of America
Merrill Lynch 361 98 Graphic Packaging Holding Co Citibank 42 124 Great Plains Energy Inc Bank of America
Merrill Lynch (315) 35 Great Plains Energy Inc Citibank (58) (2,780) Groupon Inc JP Morgan (533) (2,421) GrubHub Inc Citibank (3,050) (164) GrubHub Inc JP Morgan (64) (557) GrubHub Inc Bank of America
Merrill Lynch 295 55 Guess? Inc Bank of America
Merrill Lynch (24) 136 Guess? Inc Citibank (99) 422 Guess? Inc JP Morgan (369) (1,531) Guidewire Software Inc Citibank (2,021) (553) Guidewire Software Inc JP Morgan (1,714) (721) Gulfport Energy Corp Bank of America
Merrill Lynch (851) (5,555) Gulfport Energy Corp Citibank (6,610) 35 H&R Block Inc Bank of America
Merrill Lynch 36 52 H&R Block Inc JP Morgan 60 (202) Haemonetics Corp Bank of America
Merrill Lynch (60) (92) Haemonetics Corp JP Morgan (64) (84) Hain Celestial Group Inc/The JP Morgan (104) (156) Hain Celestial Group Inc/The Bank of America
Merrill Lynch (310) (1,303) Hain Celestial Group Inc/The Citibank (1,290) (113) Halliburton Co Bank of America
Merrill Lynch (290) (277) Halliburton Co JP Morgan (382) (1,959) Halozyme Therapeutics Inc Citibank (1,391) (244) Hancock Holding Co Bank of America
Merrill Lynch (539) (1,171) Hancock Holding Co Citibank (1,721) (134) Hancock Holding Co JP Morgan (374) (119) Hanesbrands Inc Citibank (4) 201 Hanover Insurance Bank of America
Group Inc/The Merrill Lynch (10) 118 Hanover Insurance
Group Inc/The Citibank 151
BlackRock Style Advantage Fund continued
United States continued United States continued

Contracts for difference as at 31 May 2016
Holding
Description Counterparty
Unrealised appreciation/
(depreciation) USD
Holding
Description Counterparty
Unrealised appreciation/
(depreciation) USD
454 BlackRock Strategic Funds (BSF)
The notes on pages 489 to 503 form an integral part of these financial statements.
BlackRock Style Advantage Fund continued
1,041 Hanover Insurance Group Inc/The JP Morgan 1,224
(128) Harley-Davidson Inc Citibank (260) (244) Harley-Davidson Inc JP Morgan (83) (940) Harley-Davidson Inc Bank of America
Merrill Lynch (1,881) (273) Harman International Bank of America
Industries Inc Merrill Lynch (1,247) (69) Harman International
Industries Inc Citibank (326) (42) Harman International
Industries Inc JP Morgan (218) 9 Harris Corp Bank of America
Merrill Lynch 8 232 Harris Corp Citibank (86) 2,339 Hartford Financial Services
Group Inc/The Citibank 1,824 431 Hartford Financial Services Bank of America
Group Inc/The Merrill Lynch 500 276 Hasbro Inc Bank of America
Merrill Lynch 547 53 Hasbro Inc Citibank 110 14 Hasbro Inc JP Morgan 12 (171) Hatteras Financial Corp (Reit) Bank of America
Merrill Lynch 84 1,218 Hawaiian Holdings Inc Bank of America
Merrill Lynch (1,656) 284 Hawaiian Holdings Inc Citibank (312) 202 HB Fuller Co Bank of America
Merrill Lynch 374 17 HB Fuller Co JP Morgan 14 257 HCA Holdings Inc Bank of America
Merrill Lynch (111) 233 HCA Holdings Inc Citibank 270 1,479 HCA Holdings Inc JP Morgan 1,623 (255) HCP Inc (Reit) JP Morgan 844 (895) HCP Inc (Reit) Citibank (197) 1,195 HD Supply Holdings Inc Bank of America
Merrill Lynch 1,784 484 HD Supply Holdings Inc JP Morgan 953 (248) Healthcare Realty
Trust Inc (Reit) JP Morgan (224) (264) Healthcare Realty Bank of America
Trust Inc (Reit) Merrill Lynch 71 (28) Healthcare Services Group Inc Citibank (37) (673) Healthcare Services Group Inc JP Morgan (794) (37) Healthcare Services Group Inc Bank of America
Merrill Lynch (11) (172) Healthcare Trust of Bank of America
America Inc 'A' (Reit) Merrill Lynch 127 (2,561) Healthcare Trust of
America Inc 'A' (Reit) Citibank (794) (122) Heartland Express Inc JP Morgan (65) 19 Helen of Troy Ltd JP Morgan 61 252 Helmerich & Payne Inc Bank of America
Merrill Lynch 456 63 Helmerich & Payne Inc Citibank 181 863 Helmerich & Payne Inc JP Morgan 2,625 174 Henry Schein Inc Bank of America
Merrill Lynch 446 10 Henry Schein Inc Citibank 40 61 Henry Schein Inc JP Morgan 151 2,360 Herman Miller Inc Bank of America
Merrill Lynch 2,978 659 Herman Miller Inc JP Morgan 585 (48) Hershey Co/The JP Morgan (16) (706) Hershey Co/The Bank of America
Merrill Lynch (1,390) 108 Hertz Global Holdings Inc Citibank 63 97 Hertz Global Holdings Inc JP Morgan 61
956 Hess Corp Bank of America Merrill Lynch 2,115
261 Hess Corp Citibank 551 173 Hess Corp JP Morgan 1,078 2,809 Hewlett Packard Enterprise Co Bank of America
Merrill Lynch 5,590 347 Hewlett Packard Enterprise Co Citibank 652 11,504 Hewlett Packard Enterprise Co JP Morgan 21,557 (676) Hexcel Corp Bank of America
Merrill Lynch (213) (197) Hexcel Corp Citibank (97) 2,592 Highwoods Properties Inc (Reit) Bank of America
Merrill Lynch 3,819 382 Highwoods Properties Inc (Reit) Citibank 604 14 Highwoods Properties Inc (Reit) JP Morgan (10) 540 Hill-Rom Holdings Inc Citibank 497 20 Hill-Rom Holdings Inc JP Morgan 18 187 Hill-Rom Holdings Inc Bank of America
Merrill Lynch 191 (47) Hillenbrand Inc Bank of America
Merrill Lynch (19) (22) Hillenbrand Inc Citibank (22) (145) Hilton Worldwide Holdings Inc JP Morgan 282 (1,930) Hilton Worldwide Holdings Inc Bank of America
Merrill Lynch 113 82 HollyFrontier Corp Bank of America
Merrill Lynch (57) 230 HollyFrontier Corp Citibank (71) 1,197 HollyFrontier Corp JP Morgan (688) 324 Hologic Inc Bank of America
Merrill Lynch 94 1,279 Hologic Inc JP Morgan 1,451 (29) Home BancShares Inc/AR Bank of America
Merrill Lynch (85) (15) Home BancShares Inc/AR Citibank (35) 1,143 Home Depot Inc/The JP Morgan 665 238 Home Depot Inc/The Bank of America
Merrill Lynch (564) (111) Honeywell International Inc Citibank (149) (57) Honeywell International Inc Bank of America
Merrill Lynch 40 (13) Honeywell International Inc JP Morgan 12 (4,134) Horizon Pharma Plc Citibank (6,490) 201 Hormel Foods Corp Bank of America
Merrill Lynch (1,069) 28 Hormel Foods Corp JP Morgan (135) 2,112 Hormel Foods Corp Citibank 106 4,865 Host Hotels & Bank of America
Resorts Inc (Reit) Merrill Lynch 1,198 259 Host Hotels &
Resorts Inc (Reit) Citibank 111 308 Houghton Mifflin Harcourt Co JP Morgan (416) 743 Houghton Mifflin Harcourt Co Citibank 74 23 Howard Hughes Corp/The Bank of America
Merrill Lynch 55 341 Howard Hughes Corp/The JP Morgan 847 14,563 HP Inc Bank of America
Merrill Lynch 22,208 3,259 HP Inc Citibank 5,133 1,516 HP Inc JP Morgan 2,574 (137) HRG Group Inc Bank of America
Merrill Lynch 48 129 HSN Inc Bank of America
Merrill Lynch 384 322 HSN Inc Citibank 1,056 44 HSN Inc JP Morgan 84 409 Hub Group Inc 'A' JP Morgan 513 (74) Hubbell Inc Bank of America
Merrill Lynch (63) (71) Hubbell Inc Citibank (78) (402) Hubbell Inc JP Morgan (414)
United States continued United States continued

Contracts for difference as at 31 May 2016
Holding
Description Counterparty
Unrealised appreciation/
(depreciation) USD
Holding
Description Counterparty
Unrealised appreciation/
(depreciation) USD
Annual Report and Audited Accounts 455
The notes on pages 489 to 503 form an integral part of these financial statements.
(5,054) Hudson Pacific Properties Inc (Reit) Citibank (708)
(1,418) Hudson Pacific Bank of America Properties Inc (Reit) Merrill Lynch 1,134
(293) Hudson Pacific Properties Inc (Reit) JP Morgan 598
191 Huntington Bank of America Bancshares Inc/OH Merrill Lynch 162
1,379 Huntington Bancshares Inc/OH Citibank 593
126 Huntington Ingalls Bank of America Industries Inc Merrill Lynch (44)
458 Huntington Ingalls Industries Inc Citibank (92)
45 Huntington Ingalls Industries Inc JP Morgan (20)
2,260 Huntsman Corp Bank of America Merrill Lynch 1,301
81 Huntsman Corp Citibank 47 594 Huntsman Corp JP Morgan 677 1,358 IAC/InterActiveCorp Bank of America
Merrill Lynch 2,742 220 IAC/InterActiveCorp Citibank 493 27 IAC/InterActiveCorp JP Morgan 70 (104) Iberiabank Corp Citibank (239) 62 IDACORP Inc Bank of America
Merrill Lynch (59) 228 IDACORP Inc Citibank 554 529 IDACORP Inc JP Morgan 1,130 25 IDEX Corp Bank of America
Merrill Lynch 27 10 IDEX Corp Citibank 12 36 IDEX Corp JP Morgan 69 189 IDEXX Laboratories Inc Citibank 217 54 IDEXX Laboratories Inc JP Morgan 112 28 Illinois Tool Works Inc JP Morgan 41 206 Illinois Tool Works Inc Citibank 476 (107) Illumina Inc Bank of America
Merrill Lynch (455) (308) Illumina Inc Citibank (1,485) (2,908) IMAX Corp Bank of America
Merrill Lynch (2,416) (1,791) Impax Laboratories Inc Bank of America
Merrill Lynch (4,079) (84) Impax Laboratories Inc Citibank (151) (213) Impax Laboratories Inc JP Morgan (752) 715 INC Research Holdings Inc 'A' Bank of America
Merrill Lynch 625 222 INC Research Holdings Inc 'A' Citibank 151 (54) Incyte Corp Bank of America
Merrill Lynch (457) (468) Incyte Corp Citibank (1,994) (137) Infinera Corp Bank of America
Merrill Lynch (137) (4,991) Infinera Corp Citibank (898) (252) Infinera Corp JP Morgan (207) (144) Ingersoll-Rand Plc Citibank (285) (13) Ingevity Corp Bank of America
Merrill Lynch (370) (6) Ingevity Corp Citibank (8) 176 Ingredion Inc Bank of America
Merrill Lynch (215) 1,387 Ingredion Inc JP Morgan 2,388 (187) Insulet Corp Bank of America
Merrill Lynch (320) (1,187) Insulet Corp JP Morgan (599) (51) Integra LifeSciences
Holdings Corp JP Morgan (43) (496) Integra LifeSciences Bank of America
Holdings Corp Merrill Lynch (1,009)
(168) Integra LifeSciences Holdings Corp Citibank (370)
752 Integrated Device Bank of America Technology Inc Merrill Lynch 1,677
3,343 Integrated Device Technology Inc JP Morgan 4,296
239 Intel Corp Bank of America Merrill Lynch 258
333 Intel Corp Citibank 413 1,041 Intel Corp JP Morgan 1,174 23 Interactive Brokers
Group Inc 'A' JP Morgan 63 (367) Intercept Pharmaceuticals Inc Citibank (1,035) (87) Intercept Pharmaceuticals Inc JP Morgan (346) (30) Intercept Pharmaceuticals Inc Bank of America
Merrill Lynch (220) (451) Intercontinental Exchange Inc Bank of America
Merrill Lynch (2,849) (68) Intercontinental Exchange Inc JP Morgan (644) (13) Intercontinental Exchange Inc Citibank (78) 154 InterDigital Inc/PA Bank of America
Merrill Lynch 514 709 InterDigital Inc/PA JP Morgan 1,592 11 International Bancshares Corp Citibank 18 45 International Bancshares Corp JP Morgan 124 23 International Business Bank of America
Machines Corp Merrill Lynch 81 5 International Business
Machines Corp JP Morgan 26 (204) International Flavors & Bank of America
Fragrances Inc Merrill Lynch (115) (93) International Flavors &
Fragrances Inc JP Morgan (796) 279 International Paper Co JP Morgan (45) 1,076 International Paper Co Bank of America
Merrill Lynch 1,135 102 International Paper Co Citibank 146 1,191 Interpublic Group of Bank of America
Cos Inc/The Merrill Lynch (191) 3,203 Interpublic Group of
Cos Inc/The Citibank 929 929 Intersil Corp 'A' Bank of America
Merrill Lynch 685 131 Intersil Corp 'A' Citibank 100 265 Intersil Corp 'A' JP Morgan 403 (2,994) Intrexon Corp Citibank (4,401) 50 Intuit Inc Bank of America
Merrill Lynch 229 828 Intuit Inc Citibank 3,064 45 Intuit Inc JP Morgan 299 (221) Intuitive Surgical Inc Bank of America
Merrill Lynch (516) (30) Intuitive Surgical Inc JP Morgan (298) 4,075 Invesco Ltd Bank of America
Merrill Lynch 8,516 353 Invesco Ltd JP Morgan 597 (2,886) Invesco Mortgage Bank of America
Capital Inc (Reit) Merrill Lynch (471) (655) Invesco Mortgage
Capital Inc (Reit) Citibank (131) (741) Investors Bancorp Inc Bank of America
Merrill Lynch (267) (879) Investors Bancorp Inc Citibank (325) (212) Ionis Pharmaceuticals Inc Bank of America
Merrill Lynch 2,436 (94) Ionis Pharmaceuticals Inc Citibank 1,125 (530) IPG Photonics Corp Citibank (2,205) 191 Iron Mountain Inc (Reit) Citibank 122 186 Iron Mountain Inc (Reit) JP Morgan 137 18 Iron Mountain Inc (Reit) Bank of America
Merrill Lynch (25)
BlackRock Style Advantage Fund continued
United States continued United States continued

Contracts for difference as at 31 May 2016
Holding
Description Counterparty
Unrealised appreciation/
(depreciation) USD
Holding
Description Counterparty
Unrealised appreciation/
(depreciation) USD
456 BlackRock Strategic Funds (BSF)
The notes on pages 489 to 503 form an integral part of these financial statements.
BlackRock Style Advantage Fund continued
(420) Itron Inc Bank of America Merrill Lynch (643)
(135) Itron Inc Citibank (200) 514 ITT Inc Bank of America
Merrill Lynch 622 25 ITT Inc Citibank 30 109 ITT Inc JP Morgan 162 152 j2 Global Inc Bank of America
Merrill Lynch 699 647 j2 Global Inc Citibank 2,640 2,164 Jabil Circuit Inc Citibank 2,489 5,416 Jabil Circuit Inc JP Morgan 6,638 (49) Jack Henry & Associates Inc Bank of America
Merrill Lynch 21 (205) Jack Henry & Associates Inc JP Morgan (384) 147 Jack in the Box Inc Citibank 1,532 598 Jack in the Box Inc JP Morgan 6,451 73 Jacobs Engineering Group Inc Citibank 139 45 Janus Capital Group Inc Bank of America
Merrill Lynch 43 582 Janus Capital Group Inc JP Morgan 401 70 Jazz Pharmaceuticals Plc Bank of America
Merrill Lynch 53 46 Jazz Pharmaceuticals Plc JP Morgan 127 (150) JB Hunt Transport Services Inc Bank of America
Merrill Lynch (209) (7) JB Hunt Transport Services Inc Citibank (10) (574) JC Penney Co Inc Bank of America
Merrill Lynch (230) (1,161) JC Penney Co Inc Citibank (128) (7,534) JC Penney Co Inc JP Morgan 416 181 JD.com Inc ADR Bank of America
Merrill Lynch 246 3,231 JD.com Inc ADR Citibank 5,945 1,364 JD.com Inc ADR JP Morgan 1,773 (41) JM Smucker Co/The JP Morgan 11 (147) JM Smucker Co/The Bank of America
Merrill Lynch (257) (14) JM Smucker Co/The Citibank (31) 63 John Wiley & Sons Inc 'A' Bank of America
Merrill Lynch 197 70 John Wiley & Sons Inc 'A' Citibank 155 85 Johnson & Johnson Bank of America
Merrill Lynch (166) 125 Johnson & Johnson JP Morgan (154) 591 Johnson & Johnson Citibank 195 1,039 Jones Lang LaSalle Inc Bank of America
Merrill Lynch 5,396 197 Jones Lang LaSalle Inc Citibank 1,042 141 Jones Lang LaSalle Inc JP Morgan 532 (60) JPMorgan Chase & Co Bank of America
Merrill Lynch (244) (953) JPMorgan Chase & Co Citibank (2,154) 908 Juniper Networks Inc Bank of America
Merrill Lynch 209 3,148 Juniper Networks Inc Citibank 2,361 603 Juniper Networks Inc JP Morgan 320 (233) Juno Therapeutics Inc Citibank (697) (1,621) Juno Therapeutics Inc JP Morgan (5,563) (62) Kansas City Southern Bank of America
Merrill Lynch (328) (67) Kansas City Southern Citibank (229) (935) Kansas City Southern JP Morgan (2,864) 517 KAR Auction Services Inc Bank of America
Merrill Lynch 319 120 KAR Auction Services Inc Citibank 101 185 KAR Auction Services Inc JP Morgan 340 (1,694) Kate Spade & Co Bank of America
Merrill Lynch 310 (556) Kate Spade & Co Citibank 22 (88) Kate Spade & Co JP Morgan 134
2,844 KBR Inc Bank of America Merrill Lynch 1,033
145 KBR Inc JP Morgan 45 (439) Kellogg Co Bank of America
Merrill Lynch 280 (60) Kellogg Co Citibank (9) 209 Kemper Corp Bank of America
Merrill Lynch 311 44 Kemper Corp Citibank 40 444 Kemper Corp JP Morgan 303 (6) Kennametal Inc JP Morgan (13) (2,676) Kennedy-Wilson Holdings Inc Bank of America
Merrill Lynch (1,251) (639) Kennedy-Wilson Holdings Inc Citibank (268) 149 KeyCorp JP Morgan 170 (127) Keysight Technologies Inc JP Morgan (627) (1,056) Keysight Technologies Inc Bank of America
Merrill Lynch (908) (266) Keysight Technologies Inc Citibank (141) (214) Kilroy Realty Corp (Reit) Citibank (39) (126) Kilroy Realty Corp (Reit) JP Morgan 398 494 Kimberly-Clark Corp Bank of America
Merrill Lynch 544 15 Kimberly-Clark Corp Citibank 29 365 Kimco Realty Corp (Reit) Bank of America
Merrill Lynch (434) 1,949 Kimco Realty Corp (Reit) Citibank 1,247 (7,555) Kinder Morgan Inc/DE Citibank (4,609) (175) Kinder Morgan Inc/DE Bank of America
Merrill Lynch (144) (113) Kirby Corp Bank of America
Merrill Lynch (581) (606) Kirby Corp Citibank (1,345) (43) Kirby Corp JP Morgan (282) (231) Kite Pharma Inc Bank of America
Merrill Lynch (1,088) (31) Kite Pharma Inc Citibank (49) (1,364) Kite Pharma Inc JP Morgan (2,807) (2,116) Kite Realty Group Trust (Reit) Bank of America
Merrill Lynch (533) (630) Kite Realty Group Trust (Reit) Citibank (38) (127) Kite Realty Group Trust (Reit) JP Morgan 185 (91) Knight Transportation Inc Bank of America
Merrill Lynch (38) (1,003) Knowles Corp Citibank (1,113) (4,087) Knowles Corp JP Morgan (4,180) 171 Kosmos Energy Ltd JP Morgan 80 (562) Kraft Heinz Co/The JP Morgan 242 (1,394) Kraft Heinz Co/The Citibank (1,422) 3,252 Kroger Co/The JP Morgan 3,046 649 Kroger Co/The Bank of America
Merrill Lynch 630 544 Kroger Co/The Citibank 506 9 L Brands Inc JP Morgan (22) 120 L Brands Inc Bank of America
Merrill Lynch 143 644 L Brands Inc Citibank 2,756 (93) La Quinta Holdings Inc Citibank (40) (1,438) La Quinta Holdings Inc JP Morgan (318) 55 Laboratory Corp of Bank of America
America Holdings Merrill Lynch 44 18 Laboratory Corp of
America Holdings Citibank 30 194 Lam Research Corp JP Morgan 1,362 217 Lam Research Corp Bank of America
Merrill Lynch 1,890 1,503 Lam Research Corp Citibank 8,041 386 Lamar Advertising Co 'A' (Reit) Bank of America
Merrill Lynch 401 487 Lamar Advertising Co 'A' (Reit) Citibank 555 2,615 Lamar Advertising Co 'A' (Reit) JP Morgan 2,699
United States continued United States continued

Contracts for difference as at 31 May 2016
Holding
Description Counterparty
Unrealised appreciation/
(depreciation) USD
Holding
Description Counterparty
Unrealised appreciation/
(depreciation) USD
Annual Report and Audited Accounts 457
The notes on pages 489 to 503 form an integral part of these financial statements.
132 Lancaster Colony Corp Bank of America Merrill Lynch 395
45 Lancaster Colony Corp Citibank 185 27 Lancaster Colony Corp JP Morgan (4) (158) Landstar System Inc JP Morgan (292) (4,919) Laredo Petroleum Inc Bank of America
Merrill Lynch (5,117) (604) Laredo Petroleum Inc Citibank (544) (1,388) Laredo Petroleum Inc JP Morgan (902) (225) Las Vegas Sands Corp Bank of America
Merrill Lynch (173) (1,126) Las Vegas Sands Corp JP Morgan (1,305) (1,124) LaSalle Hotel Properties (Reit) Bank of America
Merrill Lynch (280) (197) LaSalle Hotel Properties (Reit) JP Morgan 410 1,839 Lear Corp Bank of America
Merrill Lynch 8,831 100 Lear Corp JP Morgan 341 343 Legg Mason Inc Bank of America
Merrill Lynch 1,207 254 Legg Mason Inc Citibank 602 2,133 Legg Mason Inc JP Morgan 5,353 463 Leggett & Platt Inc Bank of America
Merrill Lynch 236 1,388 Leggett & Platt Inc Citibank 1,138 152 Leidos Holdings Inc Bank of America
Merrill Lynch 23 30 Leidos Holdings Inc Citibank 26 828 Leidos Holdings Inc JP Morgan 498 (489) Lennar Corp 'A' Bank of America
Merrill Lynch (919) (167) Lennar Corp 'A' Citibank (281) (2,017) Lennar Corp 'A' JP Morgan (3,265) 11 Lennox International Inc Citibank 40 10 Lennox International Inc JP Morgan (22) 98 Lennox International Inc Bank of America
Merrill Lynch 346 (1,773) Leucadia National Corp Bank of America
Merrill Lynch (754) (256) Level 3 Communications Inc Bank of America
Merrill Lynch (379) (429) Level 3 Communications Inc Citibank (815) (1,937) Level 3 Communications Inc JP Morgan (3,223) 259 Lexington Realty Trust (Reit) Bank of America
Merrill Lynch — 4,960 Lexington Realty Trust (Reit) Citibank 1,587 29 Lexmark International Inc 'A' JP Morgan (5) (473) Liberty Broadband Corp 'C' Bank of America
Merrill Lynch 598 (88) Liberty Broadband Corp 'C' JP Morgan 141 (177) Liberty Broadband Corp 'C' Citibank 173 (1,032) Liberty Global Plc 'A' Citibank (1,073) (1,173) Liberty Global Plc 'C' Citibank (657) 144 Liberty Interactive Corp
QVC Group 'A' Citibank 181 910 Liberty Property Trust (Reit) Bank of America
Merrill Lynch 981 65 Liberty Property Trust (Reit) Citibank 92 78 Liberty Property Trust (Reit) JP Morgan 45 (308) Liberty Ventures 'A' Citibank (145) (452) Liberty Ventures 'A' Bank of America
Merrill Lynch 307 (2,339) Liberty Ventures 'A' JP Morgan (900) 725 LifePoint Health Inc JP Morgan 235 219 LifePoint Health Inc Bank of America
Merrill Lynch (151) (16) Ligand Pharmaceuticals Inc Citibank (47) 329 Lincoln Electric Holdings Inc Citibank 467 95 Lincoln Electric Holdings Inc JP Morgan 51
40 Lincoln Electric Holdings Inc Bank of America Merrill Lynch 20
257 Lincoln National Corp Bank of America Merrill Lynch 861
4,086 Lincoln National Corp Citibank 9,112 173 Lincoln National Corp JP Morgan 846 36 Linear Technology Corp Bank of America
Merrill Lynch 50 107 Linear Technology Corp Citibank 179 101 Linear Technology Corp JP Morgan 300 (716) LinkedIn Corp 'A' Citibank (7,747) (185) LinkedIn Corp 'A' JP Morgan (2,658) (6,631) Lions Gate Entertainment Corp Citibank (15,649) (622) Lithia Motors Inc 'A' Bank of America
Merrill Lynch (2,578) (32) Lithia Motors Inc 'A' Citibank (166) (204) Littelfuse Inc Bank of America
Merrill Lynch (909) 11 LivaNova Plc Bank of America
Merrill Lynch 5 231 LivaNova Plc Citibank (97) (312) Live Nation Entertainment Inc Citibank (349) (269) LKQ Corp Bank of America
Merrill Lynch (151) (273) LKQ Corp Citibank (374) (978) LKQ Corp JP Morgan (1,271) (162) Loews Corp Bank of America
Merrill Lynch (165) (1,106) Loews Corp Citibank (852) (181) Louisiana-Pacific Corp Bank of America
Merrill Lynch (9) (4,347) Louisiana-Pacific Corp Citibank (2,956) 1,075 Lowe's Cos Inc JP Morgan 1,548 267 Lowe's Cos Inc Bank of America
Merrill Lynch 870 936 LPL Financial Holdings Inc Citibank 2,855 458 LPL Financial Holdings Inc JP Morgan 2,121 (2,066) lululemon athletica Inc JP Morgan (3,283) 103 LyondellBasell
Industries NV 'A' JP Morgan 83 375 LyondellBasell Bank of America
Industries NV 'A' Merrill Lynch (488) 1,929 LyondellBasell
Industries NV 'A' Citibank 3,607 (112) M&T Bank Corp Bank of America
Merrill Lynch (646) (831) M&T Bank Corp JP Morgan (3,613) (21) M&T Bank Corp Citibank (84) (1,069) Macerich Co/The (Reit) Bank of America
Merrill Lynch (1,443) (226) Macerich Co/The (Reit) Citibank (298) (143) Macerich Co/The (Reit) JP Morgan 649 767 Mack-Cali Realty Corp (Reit) Bank of America
Merrill Lynch (307) 3,272 Mack-Cali Realty Corp (Reit) Citibank 3,010 (1,442) Macquarie Infrastructure Corp JP Morgan (728) (195) Macquarie Infrastructure Corp Bank of America
Merrill Lynch (94) (357) Macquarie Infrastructure Corp Citibank (207) 165 Macy's Inc Bank of America
Merrill Lynch 342 13 Macy's Inc Citibank 20 822 Macy's Inc JP Morgan 324 (30) Madison Square Bank of America
Garden Co/The 'A' Merrill Lynch (104) (897) Mallinckrodt Plc Citibank (3,561) (8) Mallinckrodt Plc JP Morgan (27) 1,945 Manhattan Associates Inc Citibank 5,038 102 Manhattan Associates Inc JP Morgan 711 (198) Manitowoc Foodservice Inc JP Morgan (242)
BlackRock Style Advantage Fund continued
United States continued United States continued

Contracts for difference as at 31 May 2016
Holding
Description Counterparty
Unrealised appreciation/
(depreciation) USD
Holding
Description Counterparty
Unrealised appreciation/
(depreciation) USD
458 BlackRock Strategic Funds (BSF)
The notes on pages 489 to 503 form an integral part of these financial statements.
BlackRock Style Advantage Fund continued
1,862 ManpowerGroup Inc Bank of America Merrill Lynch 3,409
46 ManpowerGroup Inc JP Morgan 141 825 Marathon Oil Corp Bank of America
Merrill Lynch 485 1,351 Marathon Oil Corp JP Morgan 301 473 Marathon Petroleum Corp Bank of America
Merrill Lynch (213) 1,481 Marathon Petroleum Corp Citibank (578) (22) Markel Corp Bank of America
Merrill Lynch (444) (113) Markel Corp Citibank 389 39 MarketAxess Holdings Inc JP Morgan 210 104 Marriott International
Inc/MD 'A' JP Morgan (294) 1,665 Marriott International
Inc/MD 'A' Citibank 2,398 241 Marriott Vacations Bank of America
Worldwide Corp Merrill Lynch 554 1,534 Marriott Vacations
Worldwide Corp Citibank 4,065 70 Marriott Vacations
Worldwide Corp JP Morgan 46 (95) Marsh & McLennan Cos Inc Bank of America
Merrill Lynch (155) (147) Marsh & McLennan Cos Inc Citibank (237) (683) Marsh & McLennan Cos Inc JP Morgan (1,133) (443) Martin Marietta Materials Inc Bank of America
Merrill Lynch (1,306) (16) Martin Marietta Materials Inc JP Morgan (150) (148) Martin Marietta Materials Inc Citibank (418) 800 Marvell Technology Group Ltd Citibank 118 316 Marvell Technology Group Ltd JP Morgan 136 2,928 Masco Corp Bank of America
Merrill Lynch 3,505 507 Masco Corp Citibank 634 173 Masco Corp JP Morgan 156 1,223 Masimo Corp Bank of America
Merrill Lynch 1,456 230 Masimo Corp Citibank 308 102 Masimo Corp JP Morgan 288 (105) MasTec Inc Citibank (65) (419) Mattel Inc Bank of America
Merrill Lynch (251) (725) Mattel Inc JP Morgan (430) (263) Maxim Integrated Products Inc Citibank (302) (19) Maxim Integrated Products Inc JP Morgan (36) (336) MAXIMUS Inc Bank of America
Merrill Lynch (885) (99) MAXIMUS Inc Citibank (276) (104) MAXIMUS Inc JP Morgan (345) (205) MB Financial Inc Bank of America
Merrill Lynch (383) 320 McCormick & Co Inc/MD
'non-voting share' JP Morgan 462 (155) McDonald's Corp JP Morgan 1,242 (481) McDonald's Corp Bank of America
Merrill Lynch 519 111 McKesson Corp Bank of America
Merrill Lynch 47 24 McKesson Corp Citibank 61 69 McKesson Corp JP Morgan 618 (155) MDC Holdings Inc Citibank (183) (2,108) MDC Holdings Inc JP Morgan (1,960) 128 MDU Resources Group Inc Bank of America
Merrill Lynch 82 280 MDU Resources Group Inc Citibank 347 164 MDU Resources Group Inc JP Morgan 175 143 Mead Johnson Nutrition Co Bank of America
Merrill Lynch (229) 116 Mead Johnson Nutrition Co JP Morgan (171)
565 Mead Johnson Nutrition Co Citibank 605 (6,068) Medical Properties
Trust Inc (Reit) JP Morgan (1,829) (696) Medical Properties
Trust Inc (Reit) Citibank (285) (2,755) Medicines Co/The Bank of America
Merrill Lynch (3,329) (1,119) Medicines Co/The Citibank (1,309) (1,557) Medidata Solutions Inc Bank of America
Merrill Lynch (703) (512) Medidata Solutions Inc Citibank (302) (199) Medidata Solutions Inc JP Morgan (336) (180) Medivation Inc Bank of America
Merrill Lynch 182 (1,155) Medivation Inc Citibank 46 (323) MEDNAX Inc Bank of America
Merrill Lynch (305) (70) MEDNAX Inc JP Morgan 102 (332) Medtronic Plc Citibank 20 (1,545) Medtronic Plc JP Morgan 279 (9,176) Melco Crown Entertainment
Ltd ADR Citibank (4,588) (2,989) Melco Crown Entertainment
Ltd ADR JP Morgan (986) (1,076) Mellanox Technologies Ltd Citibank (3,314) (334) Memorial Resource Bank of America
Development Corp Merrill Lynch (564) (624) Memorial Resource
Development Corp Citibank (168) (318) Memorial Resource
Development Corp JP Morgan (1,173) (178) Mentor Graphics Corp Citibank (116) 157 Merck & Co Inc Citibank 234 425 Merck & Co Inc JP Morgan 594 (103) Mercury General Corp Bank of America
Merrill Lynch (98) (65) Mercury General Corp Citibank (90) (336) Mercury General Corp JP Morgan (405) 1,672 MetLife Inc Bank of America
Merrill Lynch 2,572 85 MetLife Inc Citibank 128 495 MetLife Inc JP Morgan 1,495 12 Mettler-Toledo Bank of America
International Inc Merrill Lynch 30 69 Mettler-Toledo
International Inc JP Morgan 860 379 Mettler-Toledo
International Inc Citibank 2,350 (630) MFA Financial Inc (Reit) Bank of America
Merrill Lynch (97) 2,539 MGIC Investment Corp JP Morgan 1,061 229 MGIC Investment Corp Bank of America
Merrill Lynch 152 366 MGIC Investment Corp Citibank 163 (2,301) MGM Resorts International Bank of America
Merrill Lynch (2,156) (23) MGM Resorts International Citibank (20) (143) MGM Resorts International JP Morgan (167) (1,074) Michael Kors Holdings Ltd Citibank (526) (95) Michael Kors Holdings Ltd JP Morgan 810 168 Michaels Cos Inc/The Bank of America
Merrill Lynch 161 66 Microchip Technology Inc Citibank 149 52 Microchip Technology Inc JP Morgan 103 (56) Micron Technology Inc Citibank (64) (889) Micron Technology Inc JP Morgan (1,079) 91 Microsemi Corp Bank of America
Merrill Lynch 179 339 Microsemi Corp Citibank 481 44 Microsemi Corp JP Morgan 64
United States continued United States continued

Contracts for difference as at 31 May 2016
Holding
Description Counterparty
Unrealised appreciation/
(depreciation) USD
Holding
Description Counterparty
Unrealised appreciation/
(depreciation) USD
Annual Report and Audited Accounts 459
The notes on pages 489 to 503 form an integral part of these financial statements.
57 Microsoft Corp Bank of America Merrill Lynch 34
1,401 Microsoft Corp Citibank 3,348 100 Microsoft Corp JP Morgan 157 71 Mid-America Apartment
Communities Inc (Reit) JP Morgan (91) 296 Mid-America Apartment Bank of America
Communities Inc (Reit) Merrill Lynch 695 (60) Middleby Corp/The Bank of America
Merrill Lynch (362) (165) Middleby Corp/The Citibank (898) (545) Middleby Corp/The JP Morgan (3,050) 134 Minerals Technologies Inc JP Morgan (88) 57 Minerals Technologies Inc Bank of America
Merrill Lynch 8 595 Minerals Technologies Inc Citibank 1,017 114 MKS Instruments Inc Bank of America
Merrill Lynch 497 528 MKS Instruments Inc Citibank 1,579 32 Mohawk Industries Inc Bank of America
Merrill Lynch 91 2 Mohawk Industries Inc Citibank 10 109 Mohawk Industries Inc JP Morgan 433 685 Molina Healthcare Inc Bank of America
Merrill Lynch 1,480 2,573 Molina Healthcare Inc Citibank 5,326 285 Molina Healthcare Inc JP Morgan 568 (127) Molson Coors Brewing Co 'B' Bank of America
Merrill Lynch 43 (569) Molson Coors Brewing Co 'B' JP Morgan (1,188) 465 Mondelez International Inc 'A' Citibank 674 279 Mondelez International Inc 'A' JP Morgan 100 (286) Monsanto Co JP Morgan (6,009) (691) Monster Beverage Corp Citibank (1,199) 1,385 Moody's Corp Bank of America
Merrill Lynch 6,620 100 Moody's Corp Citibank 509 61 Moog Inc 'A' Bank of America
Merrill Lynch 115 325 Moog Inc 'A' Citibank 780 (94) Morgan Stanley Bank of America
Merrill Lynch (153) (147) Morgan Stanley Citibank (148) (2,427) Morgan Stanley JP Morgan (2,792) (1,024) Morningstar Inc Bank of America
Merrill Lynch (1,699) (64) Morningstar Inc Citibank (109) (115) Morningstar Inc JP Morgan (145) 303 Mosaic Co/The Bank of America
Merrill Lynch (446) 159 Mosaic Co/The Citibank (237) 91 Motorola Solutions Inc JP Morgan (172) 983 Motorola Solutions Inc Citibank 334 (175) MRC Global Inc Citibank (105) (48) MSA Safety Inc JP Morgan (87) (426) MSC Industrial Direct Bank of America
Co Inc 'A' Merrill Lynch (614) (229) MSC Industrial Direct
Co Inc 'A' Citibank (327) 114 MSCI Inc Bank of America
Merrill Lynch 388 19 MSCI Inc JP Morgan 57 147 Mueller Industries Inc Citibank 191 446 Mueller Industries Inc JP Morgan 495 3,889 Murphy Oil Corp Bank of America
Merrill Lynch 7,086 345 Murphy Oil Corp Citibank 621 214 Murphy USA Inc Bank of America
Merrill Lynch 708 35 Murphy USA Inc Citibank 85 434 Murphy USA Inc JP Morgan 821
579 Myriad Genetics Inc JP Morgan (420) 34 Myriad Genetics Inc Bank of America
Merrill Lynch (38) 1,310 Nabors Industries Ltd Bank of America
Merrill Lynch 1,818 96 Nabors Industries Ltd JP Morgan 141 (68) Nasdaq Inc JP Morgan (89) 28 National Fuel Gas Co Bank of America
Merrill Lynch 19 824 National Fuel Gas Co Citibank 1,450 73 National Fuel Gas Co JP Morgan 98 118 National Health Bank of America
Investors Inc (Reit) Merrill Lynch 240 (878) National Instruments Corp Bank of America
Merrill Lynch (1,422) (520) National Instruments Corp Citibank (562) (3,707) National Instruments Corp JP Morgan (3,836) (436) National Oilwell Varco Inc Bank of America
Merrill Lynch (614) (70) National Oilwell Varco Inc JP Morgan (84) (2,047) National Retail
Properties Inc (Reit) Citibank (1,044) (746) National Retail Bank of America
Properties Inc (Reit) Merrill Lynch 1,596 3,781 Navient Corp Bank of America
Merrill Lynch 3,509 758 Navient Corp JP Morgan 371 1,303 NCR Corp Bank of America
Merrill Lynch 2,443 38 NCR Corp Citibank 74 177 NCR Corp JP Morgan 422 495 NetApp Inc Bank of America
Merrill Lynch 1,069 1,670 NetApp Inc Citibank 1,436 342 NetApp Inc JP Morgan 869 1,878 NetEase Inc ADR Citibank 26,574 1,149 NetEase Inc ADR JP Morgan 45,259 239 NetEase Inc ADR Bank of America
Merrill Lynch 3,998 (181) Netflix Inc Bank of America
Merrill Lynch (2,509) (59) Netflix Inc Citibank (477) (702) Netflix Inc JP Morgan (5,934) (909) NetScout Systems Inc Bank of America
Merrill Lynch (573) (2,827) NetScout Systems Inc Citibank (905) (190) NetScout Systems Inc JP Morgan (44) (213) NetSuite Inc Bank of America
Merrill Lynch (320) (108) NetSuite Inc Citibank (158) (79) Neurocrine Biosciences Inc Bank of America
Merrill Lynch (323) (57) Neurocrine Biosciences Inc Citibank (95) (492) Neurocrine Biosciences Inc JP Morgan (1,170) 220 New Jersey Resources Corp JP Morgan (288) 576 New Jersey Resources Corp Citibank 444 6,264 New Oriental Education &
Technology Group Inc ADR Citibank 6,264 759 New Oriental Education &
Technology Group Inc ADR JP Morgan 2,368 (7,390) New Residential Investment Bank of America
Corp (Reit) Merrill Lynch (2,200) (1,331) New Residential Investment
Corp (Reit) Citibank (453) (1,548) New York Community
Bancorp Inc JP Morgan (837) (788) New York Community Bank of America
Bancorp Inc Merrill Lynch (626) (71) New York Community
Bancorp Inc Citibank (39) (141) New York Times Co/The 'A' JP Morgan (4)
BlackRock Style Advantage Fund continued
United States continued United States continued

Contracts for difference as at 31 May 2016
Holding
Description Counterparty
Unrealised appreciation/
(depreciation) USD
Holding
Description Counterparty
Unrealised appreciation/
(depreciation) USD
* Amounts which are less than 0.5 USD have been rounded down to zero.
460 BlackRock Strategic Funds (BSF)
The notes on pages 489 to 503 form an integral part of these financial statements.
BlackRock Style Advantage Fund continued
97 Newell Brands Inc Bank of America Merrill Lynch (11)
1,074 Newell Brands Inc JP Morgan 259 1,890 Newfield Exploration Co Bank of America
Merrill Lynch 2,318 208 Newfield Exploration Co Citibank 181 (2) NewMarket Corp Bank of America
Merrill Lynch (6) 398 Newmont Mining Corp Citibank (597) 2,661 Newmont Mining Corp JP Morgan (3,219) 1,426 News Corp 'A' JP Morgan (499) 430 News Corp 'A' Bank of America
Merrill Lynch 77 4,299 News Corp 'A' Citibank 989 (663) NextEra Energy Inc Bank of America
Merrill Lynch (749) (57) NextEra Energy Inc Citibank (127) (47) NextEra Energy Inc JP Morgan (62) (1,583) Nielsen Holdings Plc Citibank (1,615) 1,360 NIKE Inc 'B' Bank of America
Merrill Lynch (1,201) 86 NIKE Inc 'B' Citibank (33) 112 NIKE Inc 'B' JP Morgan (348) 657 NiSource Inc Bank of America
Merrill Lynch 228 157 NiSource Inc Citibank 66 153 NiSource Inc JP Morgan 77 413 Noble Corp Plc Bank of America
Merrill Lynch (186) 1,364 Noble Corp Plc Citibank 546 6 Noble Energy Inc* Bank of America
Merrill Lynch — 61 Nordson Corp Bank of America
Merrill Lynch 613 477 Nordson Corp Citibank 5,500 22 Nordson Corp JP Morgan 249 148 Nordstrom Inc Citibank (59) 1,885 Nordstrom Inc JP Morgan (5,320) 34 Northern Trust Corp Bank of America
Merrill Lynch 190 172 Northern Trust Corp Citibank 562 684 Northern Trust Corp JP Morgan 2,392 74 Northrop Grumman Corp Bank of America
Merrill Lynch (161) 26 Northrop Grumman Corp JP Morgan (28) 327 Northrop Grumman Corp Citibank 458 (60) NorthStar Realty Finance Bank of America
Corp (Reit) Merrill Lynch 5 (5,916) NorthStar Realty Finance
Corp (Reit) Citibank (3,195) (106) NorthWestern Corp Bank of America
Merrill Lynch 55 (18) NorthWestern Corp Citibank (32) (402) NorthWestern Corp JP Morgan (648) (402) Norwegian Cruise Line
Holdings Ltd Citibank (60) (1,536) Novavax Inc Citibank (1,121) (11,328) Novavax Inc JP Morgan (9,910) (1,593) NOW Inc Bank of America
Merrill Lynch (731) (680) NOW Inc JP Morgan (245) 374 NRG Energy Inc Bank of America
Merrill Lynch 216 48 NRG Energy Inc Citibank 28 (20) Nu Skin Enterprises Inc 'A' Citibank (30) (795) Nu Skin Enterprises Inc 'A' JP Morgan (1,374) 638 Nuance Communications Inc Bank of America
Merrill Lynch 268 589 Nucor Corp Bank of America
Merrill Lynch 1,013 73 Nucor Corp Citibank 141
138 Nucor Corp JP Morgan 315 (431) NuVasive Inc Bank of America
Merrill Lynch (462) (197) NuVasive Inc Citibank (230) 87 NVIDIA Corp Bank of America
Merrill Lynch 391 3,028 NVIDIA Corp JP Morgan 14,397 25 NVR Inc Bank of America
Merrill Lynch 1,321 10 NVR Inc JP Morgan 953 (759) NXP Semiconductors NV Citibank (2,664) (1,657) NXP Semiconductors NV JP Morgan (5,382) 326 O'Reilly Automotive Inc Citibank 3,958 117 O'Reilly Automotive Inc Bank of America
Merrill Lynch 424 (190) Occidental Petroleum Corp Bank of America
Merrill Lynch (220) (21) Occidental Petroleum Corp Citibank (25) 65 Oceaneering International Inc Bank of America
Merrill Lynch 69 281 Oceaneering International Inc Citibank 96 84 Oceaneering International Inc JP Morgan 88 (43) OGE Energy Corp Bank of America
Merrill Lynch 7 51 Oil States International Inc Bank of America
Merrill Lynch 88 59 Oil States International Inc Citibank 85 134 Oil States International Inc JP Morgan 219 349 Old Dominion Freight Line Inc Bank of America
Merrill Lynch 493 16 Old Dominion Freight Line Inc Citibank 21 9 Old Dominion Freight Line Inc JP Morgan 2 1,703 Old Republic International Corp Bank of America
Merrill Lynch 339 239 Old Republic International Corp Citibank 41 130 Old Republic International Corp JP Morgan 43 (3,600) Olin Corp Bank of America
Merrill Lynch (6,145) (309) Olin Corp JP Morgan (426) (576) Omega Healthcare Bank of America
Investors Inc (Reit) Merrill Lynch (159) (269) Omega Healthcare
Investors Inc (Reit) Citibank (188) 48 Omnicom Group Inc JP Morgan (49) 77 Omnicom Group Inc Citibank 35 712 Omnicom Group Inc Bank of America
Merrill Lynch (147) 1,148 ON Semiconductor Corp Bank of America
Merrill Lynch 827 264 ON Semiconductor Corp Citibank 143 3,816 ON Semiconductor Corp JP Morgan 1,796 89 ONE Gas Inc JP Morgan (145) 368 ONE Gas Inc Bank of America
Merrill Lynch 630 132 ONE Gas Inc Citibank 236 (497) OneMain Holdings Inc Bank of America
Merrill Lynch (649) (32) OneMain Holdings Inc Citibank (46) (782) ONEOK Inc Bank of America
Merrill Lynch (1,414) (359) Ophthotech Corp Bank of America
Merrill Lynch (1,307) (196) Ophthotech Corp Citibank (645) (1,407) OPKO Health Inc Citibank (521) (8,709) OPKO Health Inc JP Morgan (2,382) (251) Oracle Corp Bank of America
Merrill Lynch (10) (933) Oracle Corp JP Morgan (687) (104) Oshkosh Corp Bank of America
Merrill Lynch (823) (441) Oshkosh Corp Citibank (216)
United States continued United States continued

Contracts for difference as at 31 May 2016
Holding
Description Counterparty
Unrealised appreciation/
(depreciation) USD
Holding
Description Counterparty
Unrealised appreciation/
(depreciation) USD
Annual Report and Audited Accounts 461
The notes on pages 489 to 503 form an integral part of these financial statements.
117 Outfront Media Inc (Reit) JP Morgan (2) 291 Owens & Minor Inc Bank of America
Merrill Lynch 23 1,095 Owens & Minor Inc Citibank 646 48 Owens & Minor Inc JP Morgan 64 57 Owens Corning Bank of America
Merrill Lynch 104 54 Owens Corning Citibank 12 481 Owens Corning JP Morgan 129 2,669 Owens-Illinois Inc Bank of America
Merrill Lynch 811 326 Owens-Illinois Inc JP Morgan 121 52 PACCAR Inc Citibank 141 159 PACCAR Inc JP Morgan 415 (545) Pacira Pharmaceuticals Inc/DE JP Morgan 817 (3,070) Pacira Pharmaceuticals Inc/DE Citibank (10,714) (89) Packaging Corp of America Citibank (307) (36) Packaging Corp of America Bank of America
Merrill Lynch (85) 14 PacWest Bancorp Citibank 33 (41) Palo Alto Networks Inc Bank of America
Merrill Lynch 259 (200) Palo Alto Networks Inc JP Morgan 2,963 (938) Pandora Media Inc Bank of America
Merrill Lynch (1,566) (10,451) Pandora Media Inc Citibank (8,570) (1,606) Pandora Media Inc JP Morgan (3,084) (45) Panera Bread Co 'A' Bank of America
Merrill Lynch (294) (172) Panera Bread Co 'A' Citibank (1,103) 24 Papa John's International Inc Bank of America
Merrill Lynch 49 75 Papa John's International Inc Citibank 137 210 Papa John's International Inc JP Morgan 333 (2,844) Paramount Group Inc (Reit) Bank of America
Merrill Lynch (436) (1,300) Paramount Group Inc (Reit) Citibank (182) 37 PAREXEL International Corp Bank of America
Merrill Lynch 141 120 PAREXEL International Corp Citibank 401 602 PAREXEL International Corp JP Morgan 1,874 221 Parker-Hannifin Corp Bank of America
Merrill Lynch 1,045 30 Parker-Hannifin Corp Citibank 145 33 Parker-Hannifin Corp JP Morgan 112 (1,134) Parsley Energy Inc 'A' Bank of America
Merrill Lynch (862) (5,256) Parsley Energy Inc 'A' Citibank (4,730) 16 Patterson Cos Inc Bank of America
Merrill Lynch 51 71 Patterson Cos Inc Citibank 264 38 Patterson Cos Inc JP Morgan 198 51 Patterson-UTI Energy Inc Bank of America
Merrill Lynch 57 1,598 Patterson-UTI Energy Inc Citibank 2,413 282 Patterson-UTI Energy Inc JP Morgan 499 (50) Paychex Inc Bank of America
Merrill Lynch (111) (841) Paychex Inc Citibank (2,145) (11) Paycom Software Inc Bank of America
Merrill Lynch (6) (1,710) Paycom Software Inc JP Morgan (628) (124) Paycom Software Inc Citibank 36 (3,548) PayPal Holdings Inc Bank of America
Merrill Lynch 940 (585) PayPal Holdings Inc Citibank 205 (451) PayPal Holdings Inc JP Morgan 857 1,208 PBF Energy Inc 'A' Bank of America
Merrill Lynch (1,802) 267 PBF Energy Inc 'A' Citibank (302) 40 PBF Energy Inc 'A' JP Morgan (119)
(821) PDC Energy Inc Bank of America Merrill Lynch 902
(220) PDC Energy Inc Citibank 202 (3,528) Pebblebrook Hotel Trust (Reit) Citibank (1,940) (467) Pebblebrook Hotel Trust (Reit) Bank of America
Merrill Lynch 668 52 Penske Automotive Group Inc Bank of America
Merrill Lynch 139 25 Penske Automotive Group Inc Citibank 58 25 Penske Automotive Group Inc JP Morgan 57 220 Pentair Plc Bank of America
Merrill Lynch 434 (364) People's United Financial Inc Bank of America
Merrill Lynch (248) (1,185) People's United Financial Inc JP Morgan (660) (499) PepsiCo Inc Bank of America
Merrill Lynch (57) (35) PepsiCo Inc Citibank (43) 908 PerkinElmer Inc Citibank 863 150 PerkinElmer Inc JP Morgan 134 984 Pfizer Inc Citibank 994 237 Pfizer Inc JP Morgan 204 (20) PG&E Corp Citibank (42) (132) PG&E Corp JP Morgan (80) (296) PG&E Corp Bank of America
Merrill Lynch (619) 66 Philip Morris International Inc JP Morgan 51 2,383 Phillips 66 Bank of America
Merrill Lynch 6,486 506 Phillips 66 JP Morgan 1,219 2,900 Piedmont Office Realty Bank of America
Trust Inc 'A' (Reit) Merrill Lynch (211) 134 Piedmont Office Realty
Trust Inc 'A' (Reit) JP Morgan (90) 254 Piedmont Office Realty
Trust Inc 'A' (Reit) Citibank 13 103 Pinnacle West Capital Corp Bank of America
Merrill Lynch (173) 530 Pinnacle West Capital Corp Citibank 959 (10) Pioneer Natural Resources Co JP Morgan (22) (150) Pioneer Natural Resources Co Bank of America
Merrill Lynch 172 (20) Pioneer Natural Resources Co Citibank 10 304 Pitney Bowes Inc Bank of America
Merrill Lynch 172 5,211 Pitney Bowes Inc Citibank 4,247 327 Pitney Bowes Inc JP Morgan 139 43 Plantronics Inc Bank of America
Merrill Lynch 68 461 Plantronics Inc Citibank 807 1,104 Plantronics Inc JP Morgan 1,695 (1,899) Platform Specialty
Products Corp Citibank (703) (13,474) Platform Specialty
Products Corp JP Morgan (4,879) (2,926) Platform Specialty Bank of America
Products Corp Merrill Lynch (614) (13) Polaris Industries Inc Bank of America
Merrill Lynch (31) (403) Polaris Industries Inc JP Morgan (1,245) 1,379 Polycom Inc Bank of America
Merrill Lynch 1,014 1,473 Polycom Inc Citibank 1,304 7,370 Polycom Inc JP Morgan 5,726 184 PolyOne Corp Bank of America
Merrill Lynch 96 249 PolyOne Corp JP Morgan 288 131 Pool Corp Bank of America
Merrill Lynch 279 486 Pool Corp Citibank 1,866 49 Pool Corp JP Morgan 96
BlackRock Style Advantage Fund continued
United States continued United States continued
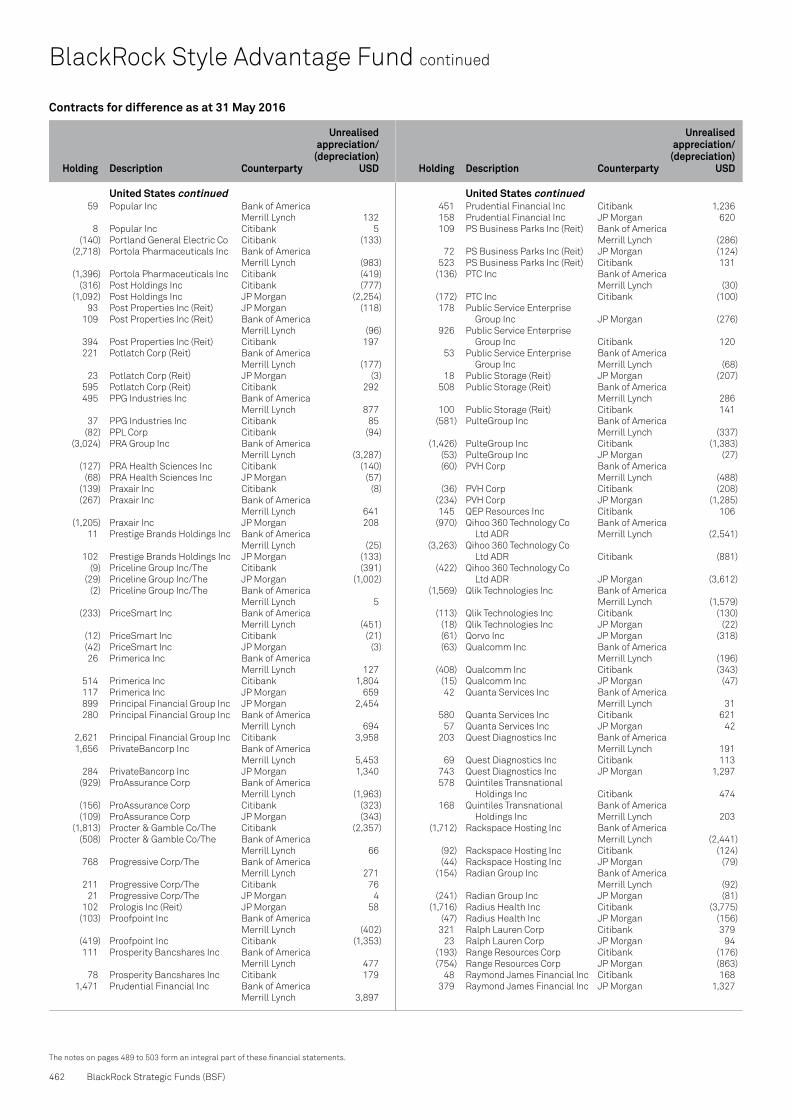
Contracts for difference as at 31 May 2016
Holding
Description Counterparty
Unrealised appreciation/
(depreciation) USD
Holding
Description Counterparty
Unrealised appreciation/
(depreciation) USD
462 BlackRock Strategic Funds (BSF)
The notes on pages 489 to 503 form an integral part of these financial statements.
BlackRock Style Advantage Fund continued
59 Popular Inc Bank of America Merrill Lynch 132
8 Popular Inc Citibank 5 (140) Portland General Electric Co Citibank (133) (2,718) Portola Pharmaceuticals Inc Bank of America
Merrill Lynch (983) (1,396) Portola Pharmaceuticals Inc Citibank (419) (316) Post Holdings Inc Citibank (777) (1,092) Post Holdings Inc JP Morgan (2,254) 93 Post Properties Inc (Reit) JP Morgan (118) 109 Post Properties Inc (Reit) Bank of America
Merrill Lynch (96) 394 Post Properties Inc (Reit) Citibank 197 221 Potlatch Corp (Reit) Bank of America
Merrill Lynch (177) 23 Potlatch Corp (Reit) JP Morgan (3) 595 Potlatch Corp (Reit) Citibank 292 495 PPG Industries Inc Bank of America
Merrill Lynch 877 37 PPG Industries Inc Citibank 85 (82) PPL Corp Citibank (94) (3,024) PRA Group Inc Bank of America
Merrill Lynch (3,287) (127) PRA Health Sciences Inc Citibank (140) (68) PRA Health Sciences Inc JP Morgan (57) (139) Praxair Inc Citibank (8) (267) Praxair Inc Bank of America
Merrill Lynch 641 (1,205) Praxair Inc JP Morgan 208 11 Prestige Brands Holdings Inc Bank of America
Merrill Lynch (25) 102 Prestige Brands Holdings Inc JP Morgan (133) (9) Priceline Group Inc/The Citibank (391) (29) Priceline Group Inc/The JP Morgan (1,002) (2) Priceline Group Inc/The Bank of America
Merrill Lynch 5 (233) PriceSmart Inc Bank of America
Merrill Lynch (451) (12) PriceSmart Inc Citibank (21) (42) PriceSmart Inc JP Morgan (3) 26 Primerica Inc Bank of America
Merrill Lynch 127 514 Primerica Inc Citibank 1,804 117 Primerica Inc JP Morgan 659 899 Principal Financial Group Inc JP Morgan 2,454 280 Principal Financial Group Inc Bank of America
Merrill Lynch 694 2,621 Principal Financial Group Inc Citibank 3,958 1,656 PrivateBancorp Inc Bank of America
Merrill Lynch 5,453 284 PrivateBancorp Inc JP Morgan 1,340 (929) ProAssurance Corp Bank of America
Merrill Lynch (1,963) (156) ProAssurance Corp Citibank (323) (109) ProAssurance Corp JP Morgan (343) (1,813) Procter & Gamble Co/The Citibank (2,357) (508) Procter & Gamble Co/The Bank of America
Merrill Lynch 66 768 Progressive Corp/The Bank of America
Merrill Lynch 271 211 Progressive Corp/The Citibank 76 21 Progressive Corp/The JP Morgan 4 102 Prologis Inc (Reit) JP Morgan 58 (103) Proofpoint Inc Bank of America
Merrill Lynch (402) (419) Proofpoint Inc Citibank (1,353) 111 Prosperity Bancshares Inc Bank of America
Merrill Lynch 477 78 Prosperity Bancshares Inc Citibank 179 1,471 Prudential Financial Inc Bank of America
Merrill Lynch 3,897
451 Prudential Financial Inc Citibank 1,236 158 Prudential Financial Inc JP Morgan 620 109 PS Business Parks Inc (Reit) Bank of America
Merrill Lynch (286) 72 PS Business Parks Inc (Reit) JP Morgan (124) 523 PS Business Parks Inc (Reit) Citibank 131 (136) PTC Inc Bank of America
Merrill Lynch (30) (172) PTC Inc Citibank (100) 178 Public Service Enterprise
Group Inc JP Morgan (276) 926 Public Service Enterprise
Group Inc Citibank 120 53 Public Service Enterprise Bank of America
Group Inc Merrill Lynch (68) 18 Public Storage (Reit) JP Morgan (207) 508 Public Storage (Reit) Bank of America
Merrill Lynch 286 100 Public Storage (Reit) Citibank 141 (581) PulteGroup Inc Bank of America
Merrill Lynch (337) (1,426) PulteGroup Inc Citibank (1,383) (53) PulteGroup Inc JP Morgan (27) (60) PVH Corp Bank of America
Merrill Lynch (488) (36) PVH Corp Citibank (208) (234) PVH Corp JP Morgan (1,285) 145 QEP Resources Inc Citibank 106 (970) Qihoo 360 Technology Co Bank of America
Ltd ADR Merrill Lynch (2,541) (3,263) Qihoo 360 Technology Co
Ltd ADR Citibank (881) (422) Qihoo 360 Technology Co
Ltd ADR JP Morgan (3,612) (1,569) Qlik Technologies Inc Bank of America
Merrill Lynch (1,579) (113) Qlik Technologies Inc Citibank (130) (18) Qlik Technologies Inc JP Morgan (22) (61) Qorvo Inc JP Morgan (318) (63) Qualcomm Inc Bank of America
Merrill Lynch (196) (408) Qualcomm Inc Citibank (343) (15) Qualcomm Inc JP Morgan (47) 42 Quanta Services Inc Bank of America
Merrill Lynch 31 580 Quanta Services Inc Citibank 621 57 Quanta Services Inc JP Morgan 42 203 Quest Diagnostics Inc Bank of America
Merrill Lynch 191 69 Quest Diagnostics Inc Citibank 113 743 Quest Diagnostics Inc JP Morgan 1,297 578 Quintiles Transnational
Holdings Inc Citibank 474 168 Quintiles Transnational Bank of America
Holdings Inc Merrill Lynch 203 (1,712) Rackspace Hosting Inc Bank of America
Merrill Lynch (2,441) (92) Rackspace Hosting Inc Citibank (124) (44) Rackspace Hosting Inc JP Morgan (79) (154) Radian Group Inc Bank of America
Merrill Lynch (92) (241) Radian Group Inc JP Morgan (81) (1,716) Radius Health Inc Citibank (3,775) (47) Radius Health Inc JP Morgan (156) 321 Ralph Lauren Corp Citibank 379 23 Ralph Lauren Corp JP Morgan 94 (193) Range Resources Corp Citibank (176) (754) Range Resources Corp JP Morgan (863) 48 Raymond James Financial Inc Citibank 168 379 Raymond James Financial Inc JP Morgan 1,327
United States continued United States continued
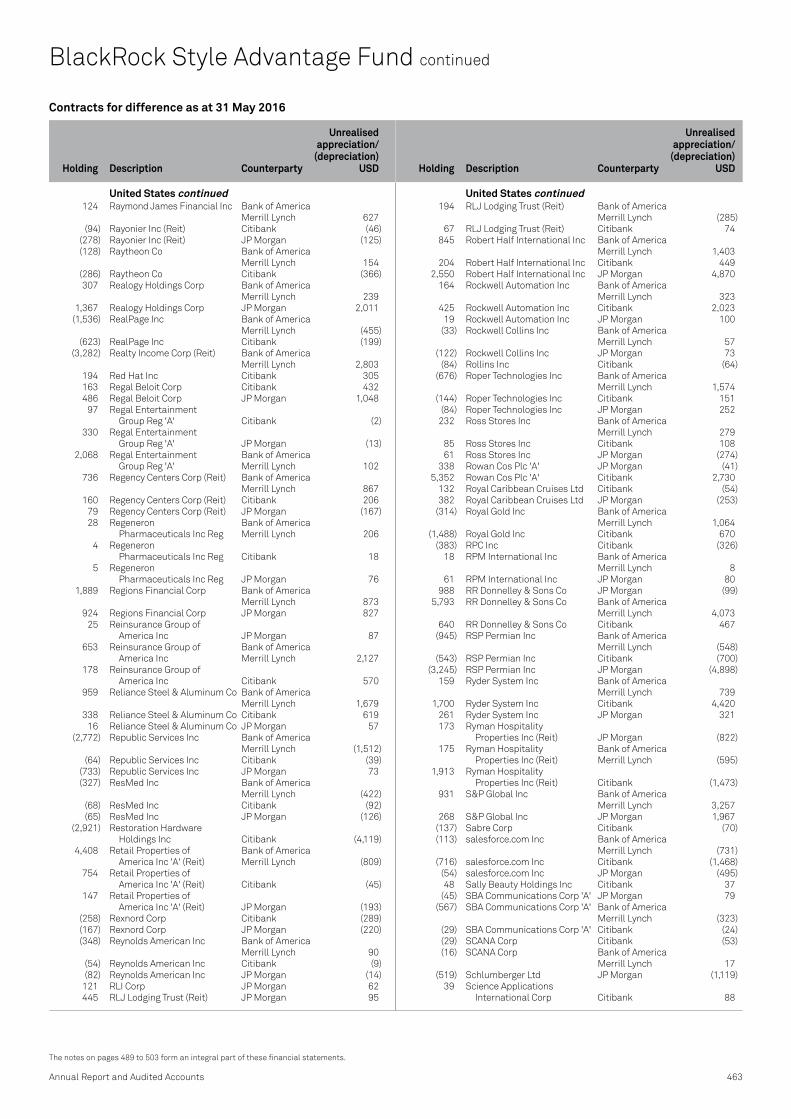
Contracts for difference as at 31 May 2016
Holding
Description Counterparty
Unrealised appreciation/
(depreciation) USD
Holding
Description Counterparty
Unrealised appreciation/
(depreciation) USD
Annual Report and Audited Accounts 463
The notes on pages 489 to 503 form an integral part of these financial statements.
124 Raymond James Financial Inc Bank of America Merrill Lynch 627
(94) Rayonier Inc (Reit) Citibank (46) (278) Rayonier Inc (Reit) JP Morgan (125) (128) Raytheon Co Bank of America
Merrill Lynch 154 (286) Raytheon Co Citibank (366) 307 Realogy Holdings Corp Bank of America
Merrill Lynch 239 1,367 Realogy Holdings Corp JP Morgan 2,011 (1,536) RealPage Inc Bank of America
Merrill Lynch (455) (623) RealPage Inc Citibank (199) (3,282) Realty Income Corp (Reit) Bank of America
Merrill Lynch 2,803 194 Red Hat Inc Citibank 305 163 Regal Beloit Corp Citibank 432 486 Regal Beloit Corp JP Morgan 1,048 97 Regal Entertainment
Group Reg 'A' Citibank (2) 330 Regal Entertainment
Group Reg 'A' JP Morgan (13) 2,068 Regal Entertainment Bank of America
Group Reg 'A' Merrill Lynch 102 736 Regency Centers Corp (Reit) Bank of America
Merrill Lynch 867 160 Regency Centers Corp (Reit) Citibank 206 79 Regency Centers Corp (Reit) JP Morgan (167) 28 Regeneron Bank of America
Pharmaceuticals Inc Reg Merrill Lynch 206 4 Regeneron
Pharmaceuticals Inc Reg Citibank 18 5 Regeneron
Pharmaceuticals Inc Reg JP Morgan 76 1,889 Regions Financial Corp Bank of America
Merrill Lynch 873 924 Regions Financial Corp JP Morgan 827 25 Reinsurance Group of
America Inc JP Morgan 87 653 Reinsurance Group of Bank of America
America Inc Merrill Lynch 2,127 178 Reinsurance Group of
America Inc Citibank 570 959 Reliance Steel & Aluminum Co Bank of America
Merrill Lynch 1,679 338 Reliance Steel & Aluminum Co Citibank 619 16 Reliance Steel & Aluminum Co JP Morgan 57 (2,772) Republic Services Inc Bank of America
Merrill Lynch (1,512) (64) Republic Services Inc Citibank (39) (733) Republic Services Inc JP Morgan 73 (327) ResMed Inc Bank of America
Merrill Lynch (422) (68) ResMed Inc Citibank (92) (65) ResMed Inc JP Morgan (126) (2,921) Restoration Hardware
Holdings Inc Citibank (4,119) 4,408 Retail Properties of Bank of America
America Inc 'A' (Reit) Merrill Lynch (809) 754 Retail Properties of
America Inc 'A' (Reit) Citibank (45) 147 Retail Properties of
America Inc 'A' (Reit) JP Morgan (193) (258) Rexnord Corp Citibank (289) (167) Rexnord Corp JP Morgan (220) (348) Reynolds American Inc Bank of America
Merrill Lynch 90 (54) Reynolds American Inc Citibank (9) (82) Reynolds American Inc JP Morgan (14) 121 RLI Corp JP Morgan 62 445 RLJ Lodging Trust (Reit) JP Morgan 95
194 RLJ Lodging Trust (Reit) Bank of America Merrill Lynch (285)
67 RLJ Lodging Trust (Reit) Citibank 74 845 Robert Half International Inc Bank of America
Merrill Lynch 1,403 204 Robert Half International Inc Citibank 449 2,550 Robert Half International Inc JP Morgan 4,870 164 Rockwell Automation Inc Bank of America
Merrill Lynch 323 425 Rockwell Automation Inc Citibank 2,023 19 Rockwell Automation Inc JP Morgan 100 (33) Rockwell Collins Inc Bank of America
Merrill Lynch 57 (122) Rockwell Collins Inc JP Morgan 73 (84) Rollins Inc Citibank (64) (676) Roper Technologies Inc Bank of America
Merrill Lynch 1,574 (144) Roper Technologies Inc Citibank 151 (84) Roper Technologies Inc JP Morgan 252 232 Ross Stores Inc Bank of America
Merrill Lynch 279 85 Ross Stores Inc Citibank 108 61 Ross Stores Inc JP Morgan (274) 338 Rowan Cos Plc 'A' JP Morgan (41) 5,352 Rowan Cos Plc 'A' Citibank 2,730 132 Royal Caribbean Cruises Ltd Citibank (54) 382 Royal Caribbean Cruises Ltd JP Morgan (253) (314) Royal Gold Inc Bank of America
Merrill Lynch 1,064 (1,488) Royal Gold Inc Citibank 670 (383) RPC Inc Citibank (326) 18 RPM International Inc Bank of America
Merrill Lynch 8 61 RPM International Inc JP Morgan 80 988 RR Donnelley & Sons Co JP Morgan (99) 5,793 RR Donnelley & Sons Co Bank of America
Merrill Lynch 4,073 640 RR Donnelley & Sons Co Citibank 467 (945) RSP Permian Inc Bank of America
Merrill Lynch (548) (543) RSP Permian Inc Citibank (700) (3,245) RSP Permian Inc JP Morgan (4,898) 159 Ryder System Inc Bank of America
Merrill Lynch 739 1,700 Ryder System Inc Citibank 4,420 261 Ryder System Inc JP Morgan 321 173 Ryman Hospitality
Properties Inc (Reit) JP Morgan (822) 175 Ryman Hospitality Bank of America
Properties Inc (Reit) Merrill Lynch (595) 1,913 Ryman Hospitality
Properties Inc (Reit) Citibank (1,473) 931 S&P Global Inc Bank of America
Merrill Lynch 3,257 268 S&P Global Inc JP Morgan 1,967 (137) Sabre Corp Citibank (70) (113) salesforce.com Inc Bank of America
Merrill Lynch (731) (716) salesforce.com Inc Citibank (1,468) (54) salesforce.com Inc JP Morgan (495) 48 Sally Beauty Holdings Inc Citibank 37 (45) SBA Communications Corp 'A' JP Morgan 79 (567) SBA Communications Corp 'A' Bank of America
Merrill Lynch (323) (29) SBA Communications Corp 'A' Citibank (24) (29) SCANA Corp Citibank (53) (16) SCANA Corp Bank of America
Merrill Lynch 17 (519) Schlumberger Ltd JP Morgan (1,119) 39 Science Applications
International Corp Citibank 88
BlackRock Style Advantage Fund continued
United States continued United States continued

Contracts for difference as at 31 May 2016
Holding
Description Counterparty
Unrealised appreciation/
(depreciation) USD
Holding
Description Counterparty
Unrealised appreciation/
(depreciation) USD
464 BlackRock Strategic Funds (BSF)
The notes on pages 489 to 503 form an integral part of these financial statements.
BlackRock Style Advantage Fund continued
27 Science Applications International Corp JP Morgan 46
830 Science Applications Bank of America International Corp Merrill Lynch 1,571
(76) Scotts Miracle-Gro Co/The 'A' Bank of America Merrill Lynch (132)
(509) Scotts Miracle-Gro Co/The 'A' Citibank (886) 949 Scripps Networks
Interactive Inc 'A' JP Morgan 1,870 110 Scripps Networks Bank of America
Interactive Inc 'A' Merrill Lynch (25) 240 Scripps Networks
Interactive Inc 'A' Citibank 538 103 Seagate Technology Plc Citibank 127 173 Seagate Technology Plc JP Morgan 548 1,352 Seagate Technology Plc Bank of America
Merrill Lynch 1,852 125 Sealed Air Corp Bank of America
Merrill Lynch (111) 163 Sealed Air Corp Citibank 135 1,037 Sealed Air Corp JP Morgan 499 (39) Seattle Genetics Inc Bank of America
Merrill Lynch (259) 196 SEI Investments Co Citibank 298 1,282 SEI Investments Co JP Morgan 2,519 (76) Sempra Energy Bank of America
Merrill Lynch (140) (634) Sempra Energy Citibank (2,295) (996) Senior Housing Properties
Trust (Reit) JP Morgan 70 (2,553) Senior Housing Properties Bank of America
Trust (Reit) Merrill Lynch (911) (440) Senior Housing Properties
Trust (Reit) Citibank (128) (607) Sensata Technologies
Holding NV Citibank (649) 28 Sensient Technologies Corp JP Morgan 78 58 Sensient Technologies Corp Bank of America
Merrill Lynch 87 100 Sensient Technologies Corp Citibank 171 (85) Service Corp International/US Bank of America
Merrill Lynch (50) (41) ServiceMaster Global Bank of America
Holdings Inc Merrill Lynch (105) (419) ServiceMaster Global
Holdings Inc Citibank (670) (38) ServiceNow Inc Citibank (11) 180 Sherwin-Williams Co/The Bank of America
Merrill Lynch 103 30 Sherwin-Williams Co/The Citibank (21) 466 Signature Bank/New York NY Bank of America
Merrill Lynch 672 150 Signature Bank/New York NY Citibank 243 36 Signature Bank/New York NY JP Morgan 176 (18) Signet Jewelers Ltd Bank of America
Merrill Lynch 139 (28) Signet Jewelers Ltd Citibank 265 (2,002) Silgan Holdings Inc Bank of America
Merrill Lynch (3,576) (368) Silgan Holdings Inc Citibank (758) (33) Silicon Laboratories Inc Bank of America
Merrill Lynch (120) (19) Silicon Laboratories Inc Citibank (50) (226) Silicon Laboratories Inc JP Morgan (491) 199 Simon Property Bank of America
Group Inc (Reit) Merrill Lynch 272 19 Simon Property
Group Inc (Reit) Citibank 24 105 Sinclair Broadcast
Group Inc 'A' JP Morgan (97)
1,205 Sinclair Broadcast Group Inc 'A' Citibank 1,410
583 Six Flags Entertainment Corp Bank of America Merrill Lynch (1,004)
76 Six Flags Entertainment Corp Citibank (135) 118 Six Flags Entertainment Corp JP Morgan (126) (92) Skechers U.S.A. Inc 'A' JP Morgan 131 (31) Skechers U.S.A. Inc 'A' Citibank (33) 100 Skyworks Solutions Inc Bank of America
Merrill Lynch 439 375 Skyworks Solutions Inc JP Morgan 183 921 SL Green Realty Corp (Reit) Citibank 1,317 84 SL Green Realty Corp (Reit) Bank of America
Merrill Lynch (135) 40 SL Green Realty Corp (Reit) JP Morgan (180) 369 SLM Corp Bank of America
Merrill Lynch 199 10,156 SLM Corp Citibank 6,500 662 SLM Corp JP Morgan 205 218 Snap-on Inc Bank of America
Merrill Lynch 94 (309) Snyder's-Lance Inc Bank of America
Merrill Lynch (22) (1,687) Snyder's-Lance Inc Citibank (1,232) (238) Snyder's-Lance Inc JP Morgan 376 (28) Sotheby's Citibank (13) (535) South Jersey Industries Inc Citibank (417) (1,559) South Jersey Industries Inc JP Morgan (1,202) (2,546) Southern Co/The Citibank (2,317) (548) Southern Co/The JP Morgan 444 549 Southwest Airlines Co Bank of America
Merrill Lynch (66) 1,983 Southwest Airlines Co Citibank (198) 161 Southwest Airlines Co JP Morgan (13) 49 Southwest Gas Corp Bank of America
Merrill Lynch (60) 21 Southwest Gas Corp Citibank 31 152 Southwest Gas Corp JP Morgan 207 (1,962) Southwestern Energy Co Citibank (3,335) (786) Southwestern Energy Co JP Morgan (1,698) (23) Spectra Energy Corp Bank of America
Merrill Lynch (11) (364) Spectra Energy Corp Citibank (353) (33) Spectrum Brands Holdings Inc Citibank (20) (157) Spectrum Brands Holdings Inc Bank of America
Merrill Lynch 7 127 Spirit AeroSystems
Holdings Inc 'A' Citibank 94 2,295 Spirit AeroSystems
Holdings Inc 'A' JP Morgan 1,701 732 Spirit AeroSystems Bank of America
Holdings Inc 'A' Merrill Lynch 220 (1,725) Spirit Airlines Inc Citibank (1,915) (265) Spirit Airlines Inc JP Morgan (462) (336) Spirit Airlines Inc Bank of America
Merrill Lynch (662) (1,168) Spirit Realty Capital Inc (Reit) Citibank (35) (4,543) Spirit Realty Capital Inc (Reit) Bank of America
Merrill Lynch 270 43 Splunk Inc Bank of America
Merrill Lynch 345 446 Splunk Inc Citibank 999 12 Splunk Inc JP Morgan 106 (8,421) Sprint Corp Bank of America
Merrill Lynch (1,789) (853) Sprint Corp Citibank (179) (2,144) Sprint Corp JP Morgan (815) (991) Sprouts Farmers Market Inc Bank of America
Merrill Lynch (406) (478) Sprouts Farmers Market Inc Citibank (215)
United States continued United States continued

Contracts for difference as at 31 May 2016
Holding
Description Counterparty
Unrealised appreciation/
(depreciation) USD
Holding
Description Counterparty
Unrealised appreciation/
(depreciation) USD
Annual Report and Audited Accounts 465
The notes on pages 489 to 503 form an integral part of these financial statements.
(683) SS&C Technologies Bank of America Holdings Inc Merrill Lynch (1,259)
(121) SS&C Technologies Holdings Inc Citibank (217)
(25) SS&C Technologies Holdings Inc JP Morgan (100)
16 St Jude Medical Inc Bank of America Merrill Lynch 29
(149) Stanley Black & Decker Inc Bank of America Merrill Lynch (159)
(96) Stanley Black & Decker Inc Citibank (32) 79 Staples Inc Bank of America
Merrill Lynch 38 691 Staples Inc Citibank 377 (961) Starbucks Corp Citibank (577) (141) Starbucks Corp Bank of America
Merrill Lynch 47 (47) Starbucks Corp JP Morgan 68 (4,066) Starwood Property
Trust Inc (Reit) JP Morgan (1,578) (118) Starwood Property Bank of America
Trust Inc (Reit) Merrill Lynch — 1,121 Starz 'A' Citibank 101 160 Starz 'A' JP Morgan (171) (23) State Street Corp Bank of America
Merrill Lynch (88) (139) State Street Corp Citibank (317) 563 Steel Dynamics Inc Bank of America
Merrill Lynch 220 2,248 Steel Dynamics Inc Citibank 1,978 132 Steel Dynamics Inc JP Morgan 173 (3) Stericycle Inc Bank of America
Merrill Lynch (7) (327) Stericycle Inc Citibank (533) (777) Stericycle Inc JP Morgan (1,141) (559) STERIS Plc JP Morgan 211 (104) STERIS Plc Citibank (54) (79) Steven Madden Ltd JP Morgan 21 (1,577) Steven Madden Ltd Bank of America
Merrill Lynch (1,122) (478) Stifel Financial Corp Citibank (1,190) (1,427) STORE Capital Corp (Reit) JP Morgan 1,570 (450) STORE Capital Corp (Reit) Bank of America
Merrill Lynch 328 (6,402) STORE Capital Corp (Reit) Citibank (1,536) (2,553) Sun Communities Inc (Reit) JP Morgan 151 (271) Sun Communities Inc (Reit) Citibank (160) (70) Sun Communities Inc (Reit) Bank of America
Merrill Lynch 121 (723) SunPower Corp JP Morgan (578) (9,699) SunPower Corp Citibank (6,886) 132 Sunstone Hotel
Investors Inc (Reit) JP Morgan (141) 845 Sunstone Hotel
Investors Inc (Reit) Citibank 93 321 SunTrust Banks Inc Bank of America
Merrill Lynch 915 229 SunTrust Banks Inc Citibank 330 884 SunTrust Banks Inc JP Morgan 1,321 74 Superior Energy Services Inc Bank of America
Merrill Lynch 144 150 Superior Energy Services Inc Citibank 237 1,562 Superior Energy Services Inc JP Morgan 2,825 9,336 SuperValu Inc JP Morgan (414) 1,717 SuperValu Inc Citibank 69 546 SVB Financial Group Bank of America
Merrill Lynch 4,277 104 SVB Financial Group Citibank 759 36 SVB Financial Group JP Morgan 469 134 Swift Transportation Co Bank of America
Merrill Lynch 110
679 Swift Transportation Co Citibank 570 2,676 Swift Transportation Co JP Morgan 1,989 99 Symantec Corp Bank of America
Merrill Lynch 43 246 Symantec Corp Citibank 105 1,539 Symantec Corp JP Morgan 660 (127) Synaptics Inc Bank of America
Merrill Lynch (486) (498) Synaptics Inc JP Morgan (2,298) 18 Synchrony Financial Citibank 24 803 Synchrony Financial JP Morgan 1,050 (60) SYNNEX Corp Bank of America
Merrill Lynch (534) (165) SYNNEX Corp Citibank (759) (12) SYNNEX Corp JP Morgan (122) 457 Synopsys Inc Citibank 896 147 Synopsys Inc JP Morgan 554 913 Synovus Financial Corp Citibank 1,178 119 Synovus Financial Corp JP Morgan 296 (106) Syntel Inc JP Morgan (340) 999 Sysco Corp Bank of America
Merrill Lynch (226) 46 Sysco Corp Citibank 12 (99) T Rowe Price Group Inc Bank of America
Merrill Lynch (265) (10) T Rowe Price Group Inc Citibank (29) (162) T Rowe Price Group Inc JP Morgan (435) (166) T-Mobile US Inc Bank of America
Merrill Lynch (332) (1,701) T-Mobile US Inc Citibank (1,667) (79) Tableau Software Inc 'A' Citibank (122) (447) Tableau Software Inc 'A' JP Morgan (949) 632 Take-Two Interactive
Software Inc JP Morgan 2,541 336 Take-Two Interactive Bank of America
Software Inc Merrill Lynch 612 2,622 Take-Two Interactive
Software Inc Citibank 5,978 1,374 Tanger Factory Outlet
Centers Inc (Reit) JP Morgan 552 38 Tanger Factory Outlet Bank of America
Centers Inc (Reit) Merrill Lynch 7 255 Tanger Factory Outlet
Centers Inc (Reit) Citibank 168 (1,828) Targa Resources Corp Bank of America
Merrill Lynch (319) (660) Targa Resources Corp Citibank (290) 158 Target Corp Bank of America
Merrill Lynch (853) 92 Target Corp JP Morgan (992) 855 Target Corp Citibank 1,094 225 TCF Financial Corp Bank of America
Merrill Lynch 283 186 TCF Financial Corp Citibank 138 711 TD Ameritrade Holding Corp Bank of America
Merrill Lynch 2,759 1,774 TD Ameritrade Holding Corp Citibank 3,654 19 TE Connectivity Ltd Citibank 36 (557) Team Health Holdings Inc Bank of America
Merrill Lynch (1,504) (1,441) Team Health Holdings Inc Citibank (3,862) 79 Tech Data Corp Bank of America
Merrill Lynch 827 13 Tech Data Corp Citibank 119 1,098 Tech Data Corp JP Morgan 10,590 2,780 TEGNA Inc Bank of America
Merrill Lynch 1,114 193 TEGNA Inc Citibank 93 755 TEGNA Inc JP Morgan 30 (30) Teledyne Technologies Inc Bank of America
Merrill Lynch (113)
BlackRock Style Advantage Fund continued
United States continued United States continued

Contracts for difference as at 31 May 2016
Holding
Description Counterparty
Unrealised appreciation/
(depreciation) USD
Holding
Description Counterparty
Unrealised appreciation/
(depreciation) USD
466 BlackRock Strategic Funds (BSF)
The notes on pages 489 to 503 form an integral part of these financial statements.
BlackRock Style Advantage Fund continued
(160) Teledyne Technologies Inc Citibank (765) 31 Teleflex Inc Bank of America
Merrill Lynch (25) 231 Teleflex Inc JP Morgan 368 294 Telephone & Data Systems Inc Bank of America
Merrill Lynch 268 3,255 Telephone & Data Systems Inc Citibank 4,394 283 Telephone & Data Systems Inc JP Morgan 275 134 TeleTech Holdings Inc JP Morgan (134) 91 TeleTech Holdings Inc Bank of America
Merrill Lynch 78 291 TeleTech Holdings Inc Citibank 285 146 Tempur Sealy International Inc Citibank 215 367 Tempur Sealy International Inc JP Morgan 528 26 Tenet Healthcare Corp Bank of America
Merrill Lynch (3) 169 Tenneco Inc Bank of America
Merrill Lynch 333 96 Tenneco Inc Citibank 298 1,154 Tenneco Inc JP Morgan 3,290 168 Teradata Corp Bank of America
Merrill Lynch 276 1,630 Teradata Corp Citibank 2,543 452 Teradata Corp JP Morgan 443 4,932 Teradyne Inc Bank of America
Merrill Lynch 4,117 267 Teradyne Inc Citibank 235 223 Teradyne Inc JP Morgan 203 (206) Tesla Motors Inc Citibank (1,345) (48) Tesla Motors Inc JP Morgan (715) 167 Tesoro Corp Bank of America
Merrill Lynch 80 1,000 Tesoro Corp Citibank 1,200 170 Tetra Tech Inc Bank of America
Merrill Lynch 141 1,841 Tetra Tech Inc Citibank 3,240 413 Tetra Tech Inc JP Morgan 339 (52) Texas Capital Bancshares Inc Bank of America
Merrill Lynch (400) (706) Texas Capital Bancshares Inc Citibank (2,655) 708 Texas Instruments Inc Bank of America
Merrill Lynch 1,526 194 Texas Instruments Inc JP Morgan 788 202 Texas Roadhouse Inc Bank of America
Merrill Lynch 148 77 Texas Roadhouse Inc Citibank 111 (728) TFS Financial Corp Bank of America
Merrill Lynch (109) (916) TFS Financial Corp Citibank (165) (2,153) TFS Financial Corp JP Morgan (558) 134 Thermo Fisher Scientific Inc Bank of America
Merrill Lynch 313 18 Thermo Fisher Scientific Inc JP Morgan 63 (81) Tiffany & Co Bank of America
Merrill Lynch 219 (657) Tiffany & Co Citibank 979 6,462 Time Inc Bank of America
Merrill Lynch 7,487 467 Time Inc Citibank 532 330 Time Inc JP Morgan 66 (8) Time Warner Inc Bank of America
Merrill Lynch (19) (237) Time Warner Inc Citibank (803) 197 Timken Co/The Bank of America
Merrill Lynch 47 126 Timken Co/The Citibank 123 980 Timken Co/The JP Morgan 932 (37) TJX Cos Inc/The JP Morgan 54 (483) TJX Cos Inc/The Bank of America
Merrill Lynch (670) (45) TJX Cos Inc/The Citibank (72)
(175) Toll Brothers Inc Bank of America Merrill Lynch (392)
(262) Toll Brothers Inc Citibank (540) (1,498) Toll Brothers Inc JP Morgan (2,940) 589 Torchmark Corp Bank of America
Merrill Lynch 1,194 162 Torchmark Corp Citibank 329 337 Torchmark Corp JP Morgan 1,102 105 Toro Co/The Bank of America
Merrill Lynch 97 479 Toro Co/The Citibank 1,466 69 Toro Co/The JP Morgan 161 142 Total System Services Inc Citibank (21) 209 Total System Services Inc JP Morgan (27) 41 Total System Services Inc Bank of America
Merrill Lynch 26 (60) Tractor Supply Co Citibank (186) (26) TransDigm Group Inc Bank of America
Merrill Lynch (395) (118) TransDigm Group Inc Citibank (1,892) (21) TransDigm Group Inc JP Morgan (607) 2,046 Transocean Ltd Bank of America
Merrill Lynch 2,007 (1,692) TransUnion Bank of America
Merrill Lynch (2,215) 31 Travelers Cos Inc/The Bank of America
Merrill Lynch 83 97 Travelers Cos Inc/The Citibank 342 743 Travelers Cos Inc/The JP Morgan 2,541 (115) TreeHouse Foods Inc Citibank (452) (1,246) TreeHouse Foods Inc JP Morgan (4,768) (131) TRI Pointe Group Inc Bank of America
Merrill Lynch (115) (15,363) TRI Pointe Group Inc Citibank (10,600) (337) Tribune Media Co 'A' Bank of America
Merrill Lynch (340) (2,052) Tribune Media Co 'A' Citibank 472 (133) Tribune Media Co 'A' JP Morgan (301) (3,558) Trimble Navigation Ltd Bank of America
Merrill Lynch (5,099) (279) Trimble Navigation Ltd Citibank (421) (245) Trimble Navigation Ltd JP Morgan (507) 2,377 Trinity Industries Inc Bank of America
Merrill Lynch 2,486 87 Trinity Industries Inc Citibank 95 (1,635) TripAdvisor Inc Bank of America
Merrill Lynch (548) (120) TripAdvisor Inc Citibank (60) (277) TripAdvisor Inc JP Morgan (1,186) (1,568) Triumph Group Inc Bank of America
Merrill Lynch (2,643) (75) Triumph Group Inc Citibank (172) 244 Trustmark Corp JP Morgan 288 641 Tupperware Brands Corp Citibank 1,397 148 Tupperware Brands Corp JP Morgan 247 (1,042) Twitter Inc Citibank (865) (12,014) Twitter Inc JP Morgan (9,463) (1,574) Twitter Inc Bank of America
Merrill Lynch (1,495) (13,403) Two Harbors Investment
Corp (Reit) JP Morgan (1,234) (1,415) Two Harbors Investment Bank of America
Corp (Reit) Merrill Lynch (85) (3,250) Two Harbors Investment
Corp (Reit) Citibank (228) (332) Tyler Technologies Inc Bank of America
Merrill Lynch (1,222) (20) Tyler Technologies Inc Citibank (75) (129) Tyler Technologies Inc JP Morgan (969) 60 Tyson Foods Inc 'A' Bank of America
Merrill Lynch (182)
United States continued United States continued

Contracts for difference as at 31 May 2016
Holding
Description Counterparty
Unrealised appreciation/
(depreciation) USD
Holding
Description Counterparty
Unrealised appreciation/
(depreciation) USD
Annual Report and Audited Accounts 467
The notes on pages 489 to 503 form an integral part of these financial statements.
BlackRock Style Advantage Fund continued
263 Tyson Foods Inc 'A' JP Morgan (784) 1,615 Tyson Foods Inc 'A' Citibank 533 677 UDR Inc (Reit) Bank of America
Merrill Lynch 14 130 UDR Inc (Reit) Citibank 7 71 UDR Inc (Reit) JP Morgan (124) 1,885 UGI Corp Bank of America
Merrill Lynch 1,222 363 UGI Corp Citibank 280 172 UGI Corp JP Morgan 361 (32) Ulta Salon Cosmetics & Bank of America
Fragrance Inc Merrill Lynch (796) (10) Ulta Salon Cosmetics &
Fragrance Inc JP Morgan (249) (196) Ultimate Software
Group Inc/The Citibank (1,562) (68) Ultimate Software
Group Inc/The JP Morgan (776) (8) Ultimate Software Bank of America
Group Inc/The Merrill Lynch (60) (196) Ultragenyx Pharmaceutical Inc Bank of America
Merrill Lynch (2,078) (621) Ultragenyx Pharmaceutical Inc JP Morgan (2,785) (110) UMB Financial Corp Bank of America
Merrill Lynch (392) (928) UMB Financial Corp Citibank (1,364) (2,005) Umpqua Holdings Corp Bank of America
Merrill Lynch (1,369) (596) Umpqua Holdings Corp Citibank (399) (2,219) Under Armour Inc 'A' JP Morgan (591) (910) Under Armour Inc 'A' Citibank (774) (48) Union Pacific Corp Bank of America
Merrill Lynch (76) (606) Union Pacific Corp Citibank (1,279) (120) Union Pacific Corp JP Morgan 124 (1,294) United Bankshares Inc/WV Citibank (1,993) 135 United Continental Bank of America
Holdings Inc Merrill Lynch (14) 282 United Continental
Holdings Inc JP Morgan (344) 1,868 United Continental
Holdings Inc Citibank 542 (210) United Natural Foods Inc Bank of America
Merrill Lynch (378) (231) United Natural Foods Inc Citibank (571) (1,551) United Natural Foods Inc JP Morgan (3,313) 45 United Parcel Service Inc 'B' Bank of America
Merrill Lynch 69 168 United Parcel Service Inc 'B' Citibank 353 63 United Rentals Inc Bank of America
Merrill Lynch 514 1,096 United Rentals Inc Citibank 4,537 32 United Rentals Inc JP Morgan 259 114 United States Cellular Corp Bank of America
Merrill Lynch 58 326 United States Cellular Corp Citibank 492 2,219 United States Cellular Corp JP Morgan 2,270 (3,956) United States Steel Corp JP Morgan (2,214) (896) United Technologies Corp Bank of America
Merrill Lynch (1,406) (20) United Technologies Corp Citibank (37) (123) United Technologies Corp JP Morgan (84) 7 United Therapeutics Corp Bank of America
Merrill Lynch 52 64 United Therapeutics Corp Citibank 250 814 United Therapeutics Corp JP Morgan 3,487 603 UnitedHealth Group Inc JP Morgan 2,000 (253) Universal Display Corp Bank of America
Merrill Lynch (3,251) (609) Universal Display Corp Citibank (3,593)
43 Universal Health Services Inc 'B' Citibank 102
83 Universal Health Services Inc 'B' JP Morgan 206
647 Unum Group Bank of America Merrill Lynch 1,935
4,073 Unum Group Citibank 6,720 188 Unum Group JP Morgan 662 5,337 Urban Edge Properties (Reit) Bank of America
Merrill Lynch 1,608 29 Urban Edge Properties (Reit) Citibank 22 304 Urban Outfitters Inc Citibank 131 (413) US Bancorp Bank of America
Merrill Lynch (603) (2,936) US Bancorp Citibank (4,375) (143) US Bancorp JP Morgan (230) (2,560) USG Corp Bank of America
Merrill Lynch (2,145) (22) Vail Resorts Inc Bank of America
Merrill Lynch (54) (12) Vail Resorts Inc Citibank (42) 490 Valero Energy Corp Bank of America
Merrill Lynch (235) 3,147 Valero Energy Corp JP Morgan (1,007) 217 Valero Energy Corp Citibank 54 68 Validus Holdings Ltd Bank of America
Merrill Lynch 52 39 Validus Holdings Ltd Citibank 38 (948) Valley National Bancorp Bank of America
Merrill Lynch (465) (732) Valley National Bancorp Citibank (315) 19 Valmont Industries Inc Citibank 74 823 Vantiv Inc 'A' Bank of America
Merrill Lynch 539 191 Vantiv Inc 'A' JP Morgan (388) 34 Varian Medical Systems Inc Bank of America
Merrill Lynch (70) 96 Varian Medical Systems Inc Citibank (114) 110 Varian Medical Systems Inc JP Morgan (195) 84 VCA Inc Bank of America
Merrill Lynch 66 548 VCA Inc Citibank 718 100 Vector Group Ltd Bank of America
Merrill Lynch (13) 199 Vector Group Ltd JP Morgan 101 264 Vectren Corp Bank of America
Merrill Lynch (304) 25 Vectren Corp Citibank 31 864 Vectren Corp JP Morgan 721 (1,121) Ventas Inc (Reit) Citibank (482) (452) Ventas Inc (Reit) Bank of America
Merrill Lynch 588 (3,936) VEREIT Inc (Reit) Bank of America
Merrill Lynch 1,417 (20,292) VEREIT Inc (Reit) Citibank (3,855) 21 VeriFone Systems Inc Bank of America
Merrill Lynch 5 643 VeriFone Systems Inc Citibank 19 71 VeriFone Systems Inc JP Morgan (16) (913) Verint Systems Inc Bank of America
Merrill Lynch (621) (131) Verint Systems Inc Citibank (111) 2,648 VeriSign Inc Bank of America
Merrill Lynch 6,992 709 VeriSign Inc Citibank 1,999 190 VeriSign Inc JP Morgan 298 (500) Verisk Analytics Inc Bank of America
Merrill Lynch (720) (1,662) Verisk Analytics Inc JP Morgan (3,644) 618 Verizon Communications Inc Citibank 1,051 96 Verizon Communications Inc JP Morgan (23)
United States continued United States continued
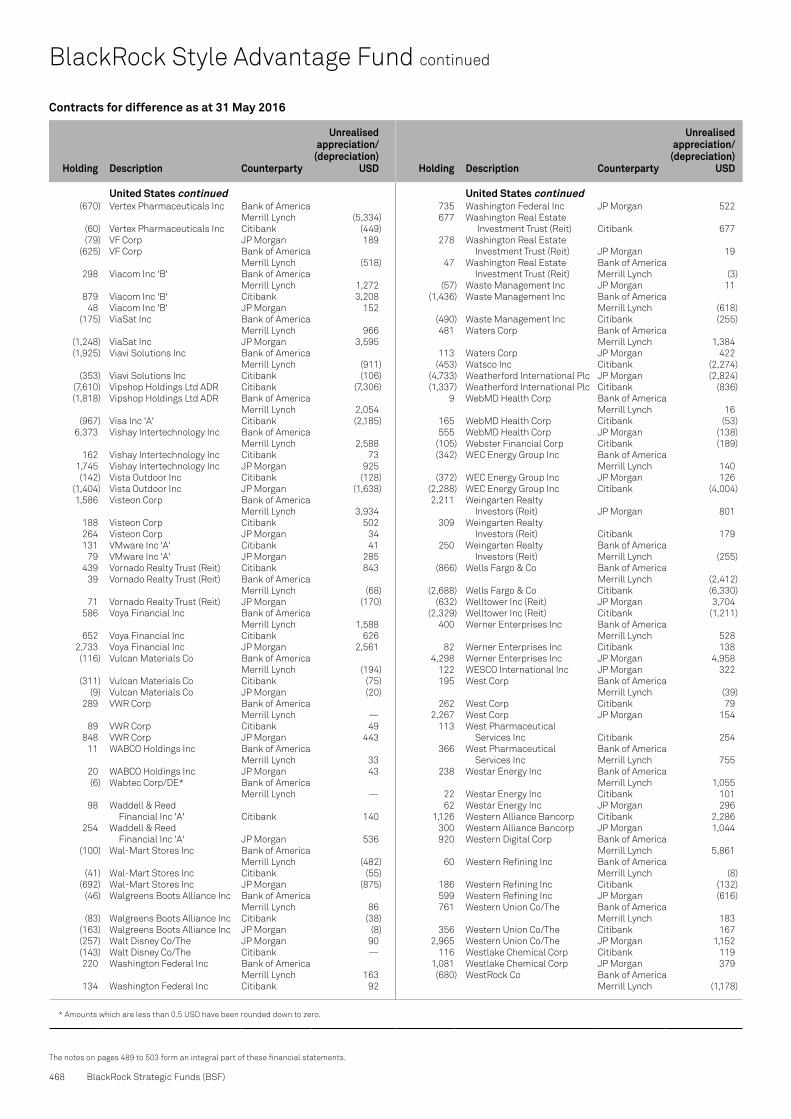
468 BlackRock Strategic Funds (BSF)
The notes on pages 489 to 503 form an integral part of these financial statements.
Contracts for difference as at 31 May 2016
Holding
Description Counterparty
Unrealised appreciation/
(depreciation) USD
Holding
Description Counterparty
Unrealised appreciation/
(depreciation) USD
* Amounts which are less than 0.5 USD have been rounded down to zero.
BlackRock Style Advantage Fund continued
(670) Vertex Pharmaceuticals Inc Bank of America Merrill Lynch (5,334)
(60) Vertex Pharmaceuticals Inc Citibank (449) (79) VF Corp JP Morgan 189 (625) VF Corp Bank of America
Merrill Lynch (518) 298 Viacom Inc 'B' Bank of America
Merrill Lynch 1,272 879 Viacom Inc 'B' Citibank 3,208 48 Viacom Inc 'B' JP Morgan 152 (175) ViaSat Inc Bank of America
Merrill Lynch 966 (1,248) ViaSat Inc JP Morgan 3,595 (1,925) Viavi Solutions Inc Bank of America
Merrill Lynch (911) (353) Viavi Solutions Inc Citibank (106) (7,610) Vipshop Holdings Ltd ADR Citibank (7,306) (1,818) Vipshop Holdings Ltd ADR Bank of America
Merrill Lynch 2,054 (967) Visa Inc 'A' Citibank (2,185) 6,373 Vishay Intertechnology Inc Bank of America
Merrill Lynch 2,588 162 Vishay Intertechnology Inc Citibank 73 1,745 Vishay Intertechnology Inc JP Morgan 925 (142) Vista Outdoor Inc Citibank (128) (1,404) Vista Outdoor Inc JP Morgan (1,638) 1,586 Visteon Corp Bank of America
Merrill Lynch 3,934 188 Visteon Corp Citibank 502 264 Visteon Corp JP Morgan 34 131 VMware Inc 'A' Citibank 41 79 VMware Inc 'A' JP Morgan 285 439 Vornado Realty Trust (Reit) Citibank 843 39 Vornado Realty Trust (Reit) Bank of America
Merrill Lynch (68) 71 Vornado Realty Trust (Reit) JP Morgan (170) 586 Voya Financial Inc Bank of America
Merrill Lynch 1,588 652 Voya Financial Inc Citibank 626 2,733 Voya Financial Inc JP Morgan 2,561 (116) Vulcan Materials Co Bank of America
Merrill Lynch (194) (311) Vulcan Materials Co Citibank (75) (9) Vulcan Materials Co JP Morgan (20) 289 VWR Corp Bank of America
Merrill Lynch — 89 VWR Corp Citibank 49 848 VWR Corp JP Morgan 443 11 WABCO Holdings Inc Bank of America
Merrill Lynch 33 20 WABCO Holdings Inc JP Morgan 43 (6) Wabtec Corp/DE* Bank of America
Merrill Lynch — 98 Waddell & Reed
Financial Inc 'A' Citibank 140 254 Waddell & Reed
Financial Inc 'A' JP Morgan 536 (100) Wal-Mart Stores Inc Bank of America
Merrill Lynch (482) (41) Wal-Mart Stores Inc Citibank (55) (692) Wal-Mart Stores Inc JP Morgan (875) (46) Walgreens Boots Alliance Inc Bank of America
Merrill Lynch 86 (83) Walgreens Boots Alliance Inc Citibank (38) (163) Walgreens Boots Alliance Inc JP Morgan (8) (257) Walt Disney Co/The JP Morgan 90 (143) Walt Disney Co/The Citibank — 220 Washington Federal Inc Bank of America
Merrill Lynch 163 134 Washington Federal Inc Citibank 92
735 Washington Federal Inc JP Morgan 522 677 Washington Real Estate
Investment Trust (Reit) Citibank 677 278 Washington Real Estate
Investment Trust (Reit) JP Morgan 19 47 Washington Real Estate Bank of America
Investment Trust (Reit) Merrill Lynch (3) (57) Waste Management Inc JP Morgan 11 (1,436) Waste Management Inc Bank of America
Merrill Lynch (618) (490) Waste Management Inc Citibank (255) 481 Waters Corp Bank of America
Merrill Lynch 1,384 113 Waters Corp JP Morgan 422 (453) Watsco Inc Citibank (2,274) (4,733) Weatherford International Plc JP Morgan (2,824) (1,337) Weatherford International Plc Citibank (836) 9 WebMD Health Corp Bank of America
Merrill Lynch 16 165 WebMD Health Corp Citibank (53) 555 WebMD Health Corp JP Morgan (138) (105) Webster Financial Corp Citibank (189) (342) WEC Energy Group Inc Bank of America
Merrill Lynch 140 (372) WEC Energy Group Inc JP Morgan 126 (2,288) WEC Energy Group Inc Citibank (4,004) 2,211 Weingarten Realty
Investors (Reit) JP Morgan 801 309 Weingarten Realty
Investors (Reit) Citibank 179 250 Weingarten Realty Bank of America
Investors (Reit) Merrill Lynch (255) (866) Wells Fargo & Co Bank of America
Merrill Lynch (2,412) (2,688) Wells Fargo & Co Citibank (6,330) (632) Welltower Inc (Reit) JP Morgan 3,704 (2,329) Welltower Inc (Reit) Citibank (1,211) 400 Werner Enterprises Inc Bank of America
Merrill Lynch 528 82 Werner Enterprises Inc Citibank 138 4,298 Werner Enterprises Inc JP Morgan 4,958 122 WESCO International Inc JP Morgan 322 195 West Corp Bank of America
Merrill Lynch (39) 262 West Corp Citibank 79 2,267 West Corp JP Morgan 154 113 West Pharmaceutical
Services Inc Citibank 254 366 West Pharmaceutical Bank of America
Services Inc Merrill Lynch 755 238 Westar Energy Inc Bank of America
Merrill Lynch 1,055 22 Westar Energy Inc Citibank 101 62 Westar Energy Inc JP Morgan 296 1,126 Western Alliance Bancorp Citibank 2,286 300 Western Alliance Bancorp JP Morgan 1,044 920 Western Digital Corp Bank of America
Merrill Lynch 5,861 60 Western Refining Inc Bank of America
Merrill Lynch (8) 186 Western Refining Inc Citibank (132) 599 Western Refining Inc JP Morgan (616) 761 Western Union Co/The Bank of America
Merrill Lynch 183 356 Western Union Co/The Citibank 167 2,965 Western Union Co/The JP Morgan 1,152 116 Westlake Chemical Corp Citibank 119 1,081 Westlake Chemical Corp JP Morgan 379 (680) WestRock Co Bank of America
Merrill Lynch (1,178)
United States continued United States continued

Annual Report and Audited Accounts 469
The notes on pages 489 to 503 form an integral part of these financial statements.
Contracts for difference as at 31 May 2016
Holding
Description Counterparty
Unrealised appreciation/
(depreciation) USD
Holding
Description Counterparty
Unrealised appreciation/
(depreciation) USD
BlackRock Style Advantage Fund continued
(38) WestRock Co Citibank (73) 24 WEX Inc Bank of America
Merrill Lynch 95 16 WEX Inc Citibank 55 13 WEX Inc JP Morgan 38 278 Weyerhaeuser Co (Reit) JP Morgan 189 1,170 WGL Holdings Inc Bank of America
Merrill Lynch 1,318 203 WGL Holdings Inc Citibank 278 265 WGL Holdings Inc JP Morgan (888) 177 Whirlpool Corp Bank of America
Merrill Lynch 1,079 63 Whirlpool Corp Citibank 440 (155) White Mountains Insurance
Group Ltd Citibank 381 (28) White Mountains Insurance Bank of America
Group Ltd Merrill Lynch 944 (41) WhiteWave Foods Co/The Citibank (19) (998) Whole Foods Market Inc Citibank (898) (57) Whole Foods Market Inc JP Morgan (99) 27 Williams-Sonoma Inc JP Morgan (103) 260 Williams-Sonoma Inc Bank of America
Merrill Lynch 924 104 Williams-Sonoma Inc Citibank 380 755 Willis Towers Watson Plc Bank of America
Merrill Lynch 2,115 172 Willis Towers Watson Plc Citibank 424 34 Willis Towers Watson Plc JP Morgan 169 (323) Wintrust Financial Corp Bank of America
Merrill Lynch (780) (37) Wintrust Financial Corp Citibank (78) (48) Wintrust Financial Corp JP Morgan (140) (117) WisdomTree Investments Inc Citibank (192) (3,192) WisdomTree Investments Inc JP Morgan (5,673) (172) Wolverine World Wide Inc JP Morgan 210 (87) Wolverine World Wide Inc Bank of America
Merrill Lynch (72) (1,079) Wolverine World Wide Inc Citibank (734) 75 Woodward Inc Bank of America
Merrill Lynch 145 418 Woodward Inc Citibank 765 17 Woodward Inc JP Morgan 32 716 Workday Inc 'A' Bank of America
Merrill Lynch 936 95 Workday Inc 'A' Citibank 105 9 Workday Inc 'A' JP Morgan 55 170 World Fuel Services Corp Citibank 253 52 World Fuel Services Corp Bank of America
Merrill Lynch 53 131 Worthington Industries Inc JP Morgan 293 650 Worthington Industries Inc Bank of America
Merrill Lynch 557 (491) WP Carey Inc (Reit) Bank of America
Merrill Lynch (566) 250 WP Glimcher Inc (Reit) Citibank 60 91 WP Glimcher Inc (Reit) JP Morgan (106) (97) WPX Energy Inc Bank of America
Merrill Lynch (98)
(175) WPX Energy Inc Citibank (137) (46) WR Berkley Corp Bank of America
Merrill Lynch (35) (916) WR Berkley Corp Citibank (1,182) (101) WR Berkley Corp JP Morgan (191) (340) WR Grace & Co Bank of America
Merrill Lynch (190) (1,301) WR Grace & Co Citibank (2,784) (45) WW Grainger Inc Bank of America
Merrill Lynch 70 (205) WW Grainger Inc JP Morgan (782) 72 Wyndham Worldwide Corp Bank of America
Merrill Lynch (68) 335 Wyndham Worldwide Corp Citibank 332 1,113 Wyndham Worldwide Corp JP Morgan 1,059 (146) Wynn Resorts Ltd Citibank (698) (880) Wynn Resorts Ltd JP Morgan (4,774) (297) Xcel Energy Inc Citibank (270) (541) Xcel Energy Inc JP Morgan (386) 11,890 Xerox Corp Bank of America
Merrill Lynch 8,783 1,373 Xerox Corp Citibank 1,057 75 Xerox Corp JP Morgan 40 32 Xilinx Inc Bank of America
Merrill Lynch 116 121 Xilinx Inc Citibank 272 75 Xilinx Inc JP Morgan 305 1,108 XL Group Plc Citibank 488 (1,563) XPO Logistics Inc Citibank (4,767) (5,372) XPO Logistics Inc JP Morgan (16,097) 11 Xylem Inc/NY JP Morgan 33 (475) Yahoo! Inc Citibank (513) (3,705) Yahoo! Inc JP Morgan (3,476) (353) Yahoo! Inc Bank of America
Merrill Lynch (92) (6,509) Yelp Inc Citibank (7,941) (8) Yum! Brands Inc Bank of America
Merrill Lynch (10) (244) Yum! Brands Inc Citibank (617) (889) Zebra Technologies Corp 'A' Bank of America
Merrill Lynch (2,163) (28) Zebra Technologies Corp 'A' Citibank (67) (1,220) Zillow Group Inc 'C' Citibank (952) (18) Zimmer Biomet Holdings Inc Bank of America
Merrill Lynch (50) (266) Zimmer Biomet Holdings Inc Citibank (777) (35) Zimmer Biomet Holdings Inc JP Morgan (207) 370 Zoetis Inc Bank of America
Merrill Lynch 244 650 Zoetis Inc JP Morgan 556 (35,127) Zynga Inc 'A' Bank of America
Merrill Lynch 699 (10,523) Zynga Inc 'A' JP Morgan (105)
94,618
Total (Gross underlying exposure - USD 270,063,201) 343,820
United States continued United States continued

TypeNominal
Value Description CounterpartyExpiration
date
Unrealised appreciation/
(depreciation) USD
Market Value
USD
Swaps as at 31 May 2016
470 BlackRock Strategic Funds (BSF)
The notes on pages 489 to 503 form an integral part of these financial statements.
CDS USD 340,000 Fund receives default protection on Markit iTraxx Australia Bank of America Series 25 Version 1 and pays Fixed 1.000% Merrill Lynch 20/06/2021 (1,350) 4,321
CDS USD 919,000 Fund receives default protection on Markit iTraxx Australia Bank of America Series 25 Version 1 and pays Fixed 1.000% Merrill Lynch 20/06/2021 (7,902) 11,678
CDS EUR 4,630,000 Fund receives default protection on Markit iTraxx Europe Series 25 Version 1 and pays Fixed 1.000% Barclays Bank 20/06/2021 (18,834) (73,098)
CDS EUR 1,778,000 Fund receives default protection on Markit iTraxx Europe Series 25 Version 1 and pays Fixed 1.000% Barclays Bank 20/06/2021 2,322 (28,071)
CDS USD 5,100,000 Fund receives Fixed 1.000% and provides default protection on Markit iTraxx Asia ex-Japan IG Series 25 Version 1 Barclays Bank 20/06/2021 11,228 (98,873)
CDS USD 1,110,000 Fund receives Fixed 5.000% and provides default protection on Markit CDX.NA.HY.26 Barclays Bank 20/06/2021 11,798 31,223
CDS USD 580,000 Fund receives Fixed 5.000% and provides default protection on Markit CDX.NA.HY.26 Barclays Bank 20/06/2021 1,525 16,315
CDS EUR 380,000 Fund receives default protection on Markit iTraxx Europe Series 25 Version 1 and pays Fixed 1.000% BNP Paribas 20/06/2021 (10) (5,999)
CDS USD 3,530,000 Fund receives default protection on Markit iTraxx Australia Series 25 Version 1 and pays Fixed 1.000% BNP Paribas 20/06/2021 (9,286) 44,859
CDS USD 900,000 Fund receives default protection on Markit iTraxx Australia Series 25 Version 1 and pays Fixed 1.000% BNP Paribas 20/06/2021 (8,166) 11,437
CDS EUR 230,000 Fund receives default protection on Markit iTraxx Europe Crossover Series 25 Version 1 and pays Fixed 5.000% Deutsche Bank 20/06/2021 1,611 (22,329)
CDS USD 2,434,000 Fund receives Fixed 1.000% and provides default protection on Markit iTraxx Asia ex-Japan IG Series 25 Version 1 Goldman Sachs 20/06/2021 10,442 (47,188)
IRS BRL 3,569,005 Fund receives Floating BRL One Day Brazil Interbank Deposit Bank of America Overnight Rate and pays Fixed 13.085% Merrill Lynch 02/01/2018 (2,475) (2,475)
IRS CAD 1,330,000 Fund receives Fixed 0.962% and pays Floating CAD 3 Month LIBOR Bank of America Merrill Lynch 09/03/2021 (8,295) (8,295)
IRS CAD 1,340,000 Fund receives Fixed 1.030% and pays Floating CAD 3 Month CDOR Bank of America Merrill Lynch 10/05/2021 (5,568) (5,568)
IRS CAD 5,760,000 Fund receives Fixed 1.118% and pays Floating CAD 3 Month CDOR Bank of America Merrill Lynch 24/05/2021 (6,520) (6,520)
IRS MXN 24,970,000 Fund receives Fixed 5.635% and pays Floating MXN 1 Month LIBOR Bank of America Merrill Lynch 15/09/2021 (9,316) (9,316)
IRS MXN 22,230,000 Fund receives Fixed 5.781% and pays Floating MXN 1 Month Bank of America Mexican Interbank Rate Merrill Lynch 15/09/2021 (476) (476)
IRS INR 112,400,000 Fund receives Floating INR 6 Month LIBOR and pays Fixed 6.605% Bank of America Merrill Lynch 21/09/2021 12,513 12,513
IRS INR 157,710,000 Fund receives Floating INR 6 Month MIBOR and pays Fixed 6.640% Bank of America Merrill Lynch 21/09/2021 (6,570) (6,570)
IRS KRW 3,436,770,000 Fund receives Fixed 1.495% and pays Floating KRW 3 Month LIBOR Bank of America Merrill Lynch 21/09/2021 (3,566) (3,566)
IRS MYR 11,880,000 Fund receives Fixed 3.820% and pays Floating MYR 3 Month LIBOR Bank of America Merrill Lynch 21/09/2021 2,598 2,598
IRS MYR 2,230,000 Fund receives Fixed 3.845% and pays Floating MYR 3 Month LIBOR Bank of America Merrill Lynch 21/09/2021 1,108 1,108
IRS THB 88,550,000 Fund receives Fixed 1.888% and pays Floating THB 6 Month LIBOR Bank of America Merrill Lynch 21/09/2021 (21,742) (21,742)
IRS THB 15,540,000 Fund receives Fixed 1.960% and pays Floating THB 6 Month Bank of America Thailand Fixing Rate Merrill Lynch 21/09/2021 (2,304) (2,304)
IRS CAD 560,000 Fund receives Fixed 1.510% and pays Floating CAD 3 Month LIBOR Bank of America Merrill Lynch 09/03/2026 (2,242) (2,242)
IRS CAD 2,040,000 Fund receives Fixed 1.568% and pays Floating CAD 3 Month CDOR Bank of America Merrill Lynch 24/05/2026 (216) (216)
IRS MXN 6,130,000 Fund receives Floating MXN 1 Month LIBOR and pays Fixed 6.300% Bank of America Merrill Lynch 09/09/2026 3,149 3,149
IRS MXN 9,570,000 Fund receives Floating MXN 1 Month Mexican Interbank Rate Bank of America and pays Fixed 6.474% Merrill Lynch 09/09/2026 (2,128) (2,128)
IRS KRW 214,570,000 Fund receives Floating KRW 3 Month LIBOR and pays Fixed 1.610% Bank of America Merrill Lynch 21/09/2026 529 529
IRS KRW 6,232,970,000 Fund receives Floating KRW 3 Month LIBOR and pays Fixed 1.628% Bank of America Merrill Lynch 21/09/2026 6,951 6,951
IRS KRW 601,540,000 Fund receives Floating KRW 3 Month LIBOR and pays Fixed 1.652% Bank of America Merrill Lynch 21/09/2026 (490) (490)
IRS MYR 5,120,000 Fund receives Floating MYR 3 Month LIBOR and pays Fixed 4.130% Bank of America Merrill Lynch 21/09/2026 (2,538) (2,538)
IRS MYR 1,740,000 Fund receives Floating MYR 3 Month LIBOR and pays Fixed 4.170% Bank of America Merrill Lynch 21/09/2026 (2,296) (2,296)
IRS MYR 1,720,000 Fund receives Floating MYR 3 Month LIBOR and pays Fixed 4.215% Bank of America Merrill Lynch 21/09/2026 (3,864) (3,864)
IRS SGD 540,000 Fund receives Floating SGD 6 Month LIBOR and pays Fixed 2.700% Bank of America Merrill Lynch 21/09/2026 18,361 18,361
BlackRock Style Advantage Fund continued
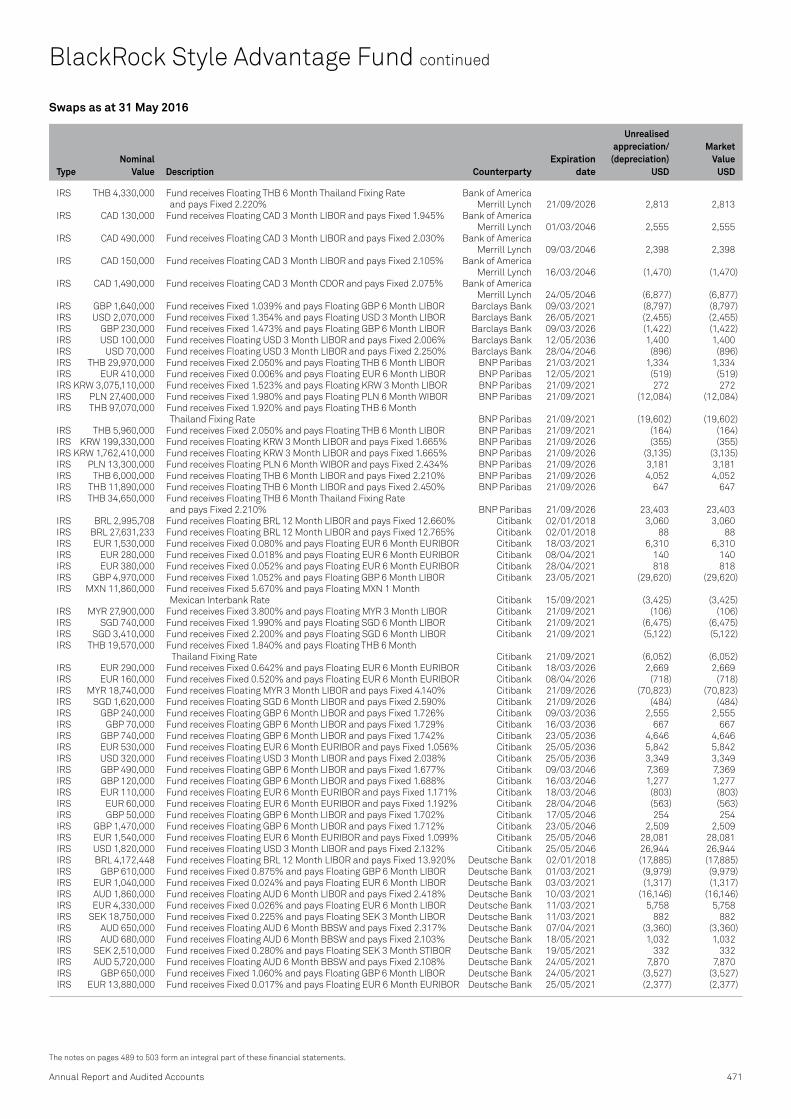
TypeNominal
Value Description CounterpartyExpiration
date
Unrealised appreciation/
(depreciation) USD
Market Value
USD
Swaps as at 31 May 2016
Annual Report and Audited Accounts 471
The notes on pages 489 to 503 form an integral part of these financial statements.
BlackRock Style Advantage Fund continued
IRS THB 4,330,000 Fund receives Floating THB 6 Month Thailand Fixing Rate Bank of America and pays Fixed 2.220% Merrill Lynch 21/09/2026 2,813 2,813
IRS CAD 130,000 Fund receives Floating CAD 3 Month LIBOR and pays Fixed 1.945% Bank of America Merrill Lynch 01/03/2046 2,555 2,555
IRS CAD 490,000 Fund receives Floating CAD 3 Month LIBOR and pays Fixed 2.030% Bank of America Merrill Lynch 09/03/2046 2,398 2,398
IRS CAD 150,000 Fund receives Floating CAD 3 Month LIBOR and pays Fixed 2.105% Bank of America Merrill Lynch 16/03/2046 (1,470) (1,470)
IRS CAD 1,490,000 Fund receives Floating CAD 3 Month CDOR and pays Fixed 2.075% Bank of America Merrill Lynch 24/05/2046 (6,877) (6,877)
IRS GBP 1,640,000 Fund receives Fixed 1.039% and pays Floating GBP 6 Month LIBOR Barclays Bank 09/03/2021 (8,797) (8,797)IRS USD 2,070,000 Fund receives Fixed 1.354% and pays Floating USD 3 Month LIBOR Barclays Bank 26/05/2021 (2,455) (2,455)IRS GBP 230,000 Fund receives Fixed 1.473% and pays Floating GBP 6 Month LIBOR Barclays Bank 09/03/2026 (1,422) (1,422)IRS USD 100,000 Fund receives Floating USD 3 Month LIBOR and pays Fixed 2.006% Barclays Bank 12/05/2036 1,400 1,400IRS USD 70,000 Fund receives Floating USD 3 Month LIBOR and pays Fixed 2.250% Barclays Bank 28/04/2046 (896) (896)IRS THB 29,970,000 Fund receives Fixed 2.050% and pays Floating THB 6 Month LIBOR BNP Paribas 21/03/2021 1,334 1,334IRS EUR 410,000 Fund receives Fixed 0.006% and pays Floating EUR 6 Month LIBOR BNP Paribas 12/05/2021 (519) (519)IRS KRW 3,075,110,000 Fund receives Fixed 1.523% and pays Floating KRW 3 Month LIBOR BNP Paribas 21/09/2021 272 272IRS PLN 27,400,000 Fund receives Fixed 1.980% and pays Floating PLN 6 Month WIBOR BNP Paribas 21/09/2021 (12,084) (12,084)IRS THB 97,070,000 Fund receives Fixed 1.920% and pays Floating THB 6 Month
Thailand Fixing Rate BNP Paribas 21/09/2021 (19,602) (19,602)IRS THB 5,960,000 Fund receives Fixed 2.050% and pays Floating THB 6 Month LIBOR BNP Paribas 21/09/2021 (164) (164)IRS KRW 199,330,000 Fund receives Floating KRW 3 Month LIBOR and pays Fixed 1.665% BNP Paribas 21/09/2026 (355) (355)IRS KRW 1,762,410,000 Fund receives Floating KRW 3 Month LIBOR and pays Fixed 1.665% BNP Paribas 21/09/2026 (3,135) (3,135)IRS PLN 13,300,000 Fund receives Floating PLN 6 Month WIBOR and pays Fixed 2.434% BNP Paribas 21/09/2026 3,181 3,181IRS THB 6,000,000 Fund receives Floating THB 6 Month LIBOR and pays Fixed 2.210% BNP Paribas 21/09/2026 4,052 4,052IRS THB 11,890,000 Fund receives Floating THB 6 Month LIBOR and pays Fixed 2.450% BNP Paribas 21/09/2026 647 647IRS THB 34,650,000 Fund receives Floating THB 6 Month Thailand Fixing Rate
and pays Fixed 2.210% BNP Paribas 21/09/2026 23,403 23,403IRS BRL 2,995,708 Fund receives Floating BRL 12 Month LIBOR and pays Fixed 12.660% Citibank 02/01/2018 3,060 3,060IRS BRL 27,631,233 Fund receives Floating BRL 12 Month LIBOR and pays Fixed 12.765% Citibank 02/01/2018 88 88IRS EUR 1,530,000 Fund receives Fixed 0.080% and pays Floating EUR 6 Month EURIBOR Citibank 18/03/2021 6,310 6,310IRS EUR 280,000 Fund receives Fixed 0.018% and pays Floating EUR 6 Month EURIBOR Citibank 08/04/2021 140 140IRS EUR 380,000 Fund receives Fixed 0.052% and pays Floating EUR 6 Month EURIBOR Citibank 28/04/2021 818 818IRS GBP 4,970,000 Fund receives Fixed 1.052% and pays Floating GBP 6 Month LIBOR Citibank 23/05/2021 (29,620) (29,620)IRS MXN 11,860,000 Fund receives Fixed 5.670% and pays Floating MXN 1 Month
Mexican Interbank Rate Citibank 15/09/2021 (3,425) (3,425)IRS MYR 27,900,000 Fund receives Fixed 3.800% and pays Floating MYR 3 Month LIBOR Citibank 21/09/2021 (106) (106)IRS SGD 740,000 Fund receives Fixed 1.990% and pays Floating SGD 6 Month LIBOR Citibank 21/09/2021 (6,475) (6,475)IRS SGD 3,410,000 Fund receives Fixed 2.200% and pays Floating SGD 6 Month LIBOR Citibank 21/09/2021 (5,122) (5,122)IRS THB 19,570,000 Fund receives Fixed 1.840% and pays Floating THB 6 Month
Thailand Fixing Rate Citibank 21/09/2021 (6,052) (6,052)IRS EUR 290,000 Fund receives Fixed 0.642% and pays Floating EUR 6 Month EURIBOR Citibank 18/03/2026 2,669 2,669IRS EUR 160,000 Fund receives Fixed 0.520% and pays Floating EUR 6 Month EURIBOR Citibank 08/04/2026 (718) (718)IRS MYR 18,740,000 Fund receives Floating MYR 3 Month LIBOR and pays Fixed 4.140% Citibank 21/09/2026 (70,823) (70,823)IRS SGD 1,620,000 Fund receives Floating SGD 6 Month LIBOR and pays Fixed 2.590% Citibank 21/09/2026 (484) (484)IRS GBP 240,000 Fund receives Floating GBP 6 Month LIBOR and pays Fixed 1.726% Citibank 09/03/2036 2,555 2,555IRS GBP 70,000 Fund receives Floating GBP 6 Month LIBOR and pays Fixed 1.729% Citibank 16/03/2036 667 667IRS GBP 740,000 Fund receives Floating GBP 6 Month LIBOR and pays Fixed 1.742% Citibank 23/05/2036 4,646 4,646IRS EUR 530,000 Fund receives Floating EUR 6 Month EURIBOR and pays Fixed 1.056% Citibank 25/05/2036 5,842 5,842IRS USD 320,000 Fund receives Floating USD 3 Month LIBOR and pays Fixed 2.038% Citibank 25/05/2036 3,349 3,349IRS GBP 490,000 Fund receives Floating GBP 6 Month LIBOR and pays Fixed 1.677% Citibank 09/03/2046 7,369 7,369IRS GBP 120,000 Fund receives Floating GBP 6 Month LIBOR and pays Fixed 1.688% Citibank 16/03/2046 1,277 1,277IRS EUR 110,000 Fund receives Floating EUR 6 Month EURIBOR and pays Fixed 1.171% Citibank 18/03/2046 (803) (803)IRS EUR 60,000 Fund receives Floating EUR 6 Month EURIBOR and pays Fixed 1.192% Citibank 28/04/2046 (563) (563)IRS GBP 50,000 Fund receives Floating GBP 6 Month LIBOR and pays Fixed 1.702% Citibank 17/05/2046 254 254IRS GBP 1,470,000 Fund receives Floating GBP 6 Month LIBOR and pays Fixed 1.712% Citibank 23/05/2046 2,509 2,509IRS EUR 1,540,000 Fund receives Floating EUR 6 Month EURIBOR and pays Fixed 1.099% Citibank 25/05/2046 28,081 28,081IRS USD 1,820,000 Fund receives Floating USD 3 Month LIBOR and pays Fixed 2.132% Citibank 25/05/2046 26,944 26,944IRS BRL 4,172,448 Fund receives Floating BRL 12 Month LIBOR and pays Fixed 13.920% Deutsche Bank 02/01/2018 (17,885) (17,885)IRS GBP 610,000 Fund receives Fixed 0.875% and pays Floating GBP 6 Month LIBOR Deutsche Bank 01/03/2021 (9,979) (9,979)IRS EUR 1,040,000 Fund receives Fixed 0.024% and pays Floating EUR 6 Month LIBOR Deutsche Bank 03/03/2021 (1,317) (1,317)IRS AUD 1,860,000 Fund receives Floating AUD 6 Month LIBOR and pays Fixed 2.418% Deutsche Bank 10/03/2021 (16,146) (16,146)IRS EUR 4,330,000 Fund receives Fixed 0.026% and pays Floating EUR 6 Month LIBOR Deutsche Bank 11/03/2021 5,758 5,758IRS SEK 18,750,000 Fund receives Fixed 0.225% and pays Floating SEK 3 Month LIBOR Deutsche Bank 11/03/2021 882 882IRS AUD 650,000 Fund receives Floating AUD 6 Month BBSW and pays Fixed 2.317% Deutsche Bank 07/04/2021 (3,360) (3,360)IRS AUD 680,000 Fund receives Floating AUD 6 Month BBSW and pays Fixed 2.103% Deutsche Bank 18/05/2021 1,032 1,032IRS SEK 2,510,000 Fund receives Fixed 0.280% and pays Floating SEK 3 Month STIBOR Deutsche Bank 19/05/2021 332 332IRS AUD 5,720,000 Fund receives Floating AUD 6 Month BBSW and pays Fixed 2.108% Deutsche Bank 24/05/2021 7,870 7,870IRS GBP 650,000 Fund receives Fixed 1.060% and pays Floating GBP 6 Month LIBOR Deutsche Bank 24/05/2021 (3,527) (3,527)IRS EUR 13,880,000 Fund receives Fixed 0.017% and pays Floating EUR 6 Month EURIBOR Deutsche Bank 25/05/2021 (2,377) (2,377)

TypeNominal
Value Description CounterpartyExpiration
date
Unrealised appreciation/
(depreciation) USD
Market Value
USD
Swaps as at 31 May 2016
472 BlackRock Strategic Funds (BSF)
The notes on pages 489 to 503 form an integral part of these financial statements.
IRS EUR 1,110,000 Fund receives Fixed 0.021% and pays Floating EUR 6 Month EURIBOR Deutsche Bank 26/05/2021 45 45IRS MXN 74,410,000 Fund receives Fixed 5.680% and pays Floating MXN 12 Month LIBOR Deutsche Bank 15/09/2021 (19,696) (19,696)IRS EUR 210,000 Fund receives Fixed 0.518% and pays Floating EUR 3 Month LIBOR Deutsche Bank 03/03/2026 (739) (739)IRS CHF 130,000 Fund receives Fixed 0.180% and pays Floating CHF 6 Month LIBOR Deutsche Bank 04/03/2026 (455) (455)IRS AUD 1,790,000 Fund receives Floating AUD 6 Month LIBOR and pays Fixed 2.708% Deutsche Bank 10/03/2026 (28,466) (28,466)IRS CHF 730,000 Fund receives Fixed 0.143% and pays Floating CHF 6 Month LIBOR Deutsche Bank 11/03/2026 128 128IRS EUR 1,390,000 Fund receives Fixed 0.609% and pays Floating EUR 6 Month LIBOR Deutsche Bank 11/03/2026 8,604 8,604IRS USD 600,000 Fund receives Fixed 1.695% and pays Floating USD 3 Month LIBOR Deutsche Bank 11/03/2026 (1,671) (1,671)IRS AUD 440,000 Fund receives Floating AUD 6 Month BBSW and pays Fixed 2.628% Deutsche Bank 01/04/2026 (4,651) (4,651)IRS CHF 180,000 Fund receives Fixed 0.135% and pays Floating CHF 6 Month LIBOR Deutsche Bank 08/04/2026 45 45IRS EUR 370,000 Fund receives Fixed 0.547% and pays Floating EUR 6 Month EURIBOR Deutsche Bank 18/04/2026 (690) (690)IRS CHF 490,000 Fund receives Fixed 0.183% and pays Floating CHF 6 Month LIBOR Deutsche Bank 12/05/2026 7,747 7,747IRS AUD 4,090,000 Fund receives Floating AUD 6 Month BBSW and pays Fixed 2.415% Deutsche Bank 24/05/2026 10,993 10,993IRS CHF 2,630,000 Fund receives Fixed 0.140% and pays Floating CHF 6 Month LIBOR Deutsche Bank 25/05/2026 (3,359) (3,359)IRS EUR 4,840,000 Fund receives Fixed 0.550% and pays Floating EUR 6 Month EURIBOR Deutsche Bank 25/05/2026 (12,619) (12,619)IRS NZD 940,000 Fund receives Floating NZD 3 Month New Zealand Bank Bill Rate
and pays Fixed 2.907% Deutsche Bank 26/05/2026 1,370 1,370IRS MXN 18,580,000 Fund receives Floating MXN 1 Month LIBOR and pays Fixed 6.400% Deutsche Bank 09/09/2026 1,662 1,662IRS MXN 3,910,000 Fund receives Floating MXN 1 Month Mexican Interbank Rate
and pays Fixed 6.305% Deutsche Bank 09/09/2026 1,926 1,926IRS EUR 50,000 Fund receives Floating EUR 6 Month LIBOR and pays Fixed 0.987% Deutsche Bank 03/03/2036 1,224 1,224IRS USD 30,000 Fund receives Floating USD 3 Month LIBOR and pays Fixed 2.030% Deutsche Bank 03/03/2036 332 332IRS EUR 140,000 Fund receives Floating EUR 6 Month LIBOR and pays Fixed 1.129% Deutsche Bank 11/03/2036 (714) (714)IRS USD 100,000 Fund receives Floating USD 3 Month LIBOR and pays Fixed 2.053% Deutsche Bank 11/03/2036 576 576IRS GBP 140,000 Fund receives Floating GBP 6 Month LIBOR and pays Fixed 1.546% Deutsche Bank 01/03/2046 8,503 8,503IRS EUR 90,000 Fund receives Floating EUR 6 Month LIBOR and pays Fixed 1.041% Deutsche Bank 03/03/2046 3,171 3,171IRS USD 80,000 Fund receives Floating USD 3 Month LIBOR and pays Fixed 2.140% Deutsche Bank 03/03/2046 1,014 1,014IRS EUR 480,000 Fund receives Floating EUR 6 Month LIBOR and pays Fixed 1.165% Deutsche Bank 11/03/2046 (672) (672)IRS USD 550,000 Fund receives Floating USD 3 Month LIBOR and pays Fixed 2.142% Deutsche Bank 11/03/2046 6,726 6,726IRS USD 120,000 Fund receives Floating USD 3 Month LIBOR and pays Fixed 2.221% Deutsche Bank 18/03/2046 (936) (936)IRS SEK 3,900,000 Fund receives Fixed 0.245% and pays Floating SEK 3 Month STIBOR Goldman Sachs 08/04/2021 260 260IRS GBP 340,000 Fund receives Fixed 1.151% and pays Floating GBP 6 Month LIBOR Goldman Sachs 26/04/2021 501 501IRS GBP 520,000 Fund receives Fixed 0.986% and pays Floating GBP 6 Month LIBOR Goldman Sachs 10/05/2021 (5,359) (5,359)IRS HKD 60,250,000 Fund receives Fixed 1.560% and pays Floating HKD 3 Month HIBOR Goldman Sachs 21/09/2021 (6,384) (6,384)IRS SGD 13,330,000 Fund receives Fixed 2.090% and pays Floating SGD 6 Month SIBOR Goldman Sachs 21/09/2021 (70,632) (70,632)IRS THB 337,490,000 Fund receives Fixed 1.950% and pays Floating THB 6 Month
Thailand Fixing Rate Goldman Sachs 21/09/2021 (54,573) (54,573)IRS ZAR 87,450,000 Fund receives Fixed 8.605% and pays Floating ZAR 3 Month JIBAR Goldman Sachs 21/09/2021 (21,991) (21,991)IRS HKD 26,030,000 Fund receives Floating HKD 3 Month HIBOR and pays Fixed 1.775% Goldman Sachs 21/09/2026 13,314 13,314IRS SGD 5,720,000 Fund receives Floating SGD 6 Month SIBOR and pays Fixed 2.470% Goldman Sachs 21/09/2026 43,570 43,570IRS THB 133,110,000 Fund receives Floating THB 6 Month Thailand Fixing Rate
and pays Fixed 2.330% Goldman Sachs 21/09/2026 48,572 48,572IRS ZAR 54,370,000 Fund receives Floating ZAR 3 Month JIBAR and pays Fixed 9.000% Goldman Sachs 21/09/2026 21,558 21,558IRS EUR 90,000 Fund receives Floating EUR 6 Month EURIBOR and pays Fixed 1.032% Goldman Sachs 12/05/2036 1,616 1,616IRS SEK 6,310,000 Fund receives Fixed 0.192% and pays Floating SEK 3 Month LIBOR JP Morgan 03/03/2021 (733) (733)IRS SEK 2,860,000 Fund receives Fixed 0.320% and pays Floating SEK 3 Month STIBOR JP Morgan 18/03/2021 1,644 1,644IRS SEK 60,420,000 Fund receives Fixed 0.252% and pays Floating SEK 3 Month STIBOR JP Morgan 25/05/2021 (2,947) (2,947)IRS SEK 16,160,000 Fund receives Fixed 0.245% and pays Floating SEK 3 Month STIBOR JP Morgan 26/05/2021 (1,566) (1,566)IRS MXN 244,800,000 Fund receives Fixed 5.890% and pays Floating MXN 1 Month
Mexican Interbank Rate JP Morgan 15/09/2021 59,033 59,033IRS HKD 3,440,000 Fund receives Fixed 1.535% and pays Floating HKD 3 Month HIBOR JP Morgan 21/09/2021 (897) (897)IRS HKD 19,740,000 Fund receives Fixed 1.552% and pays Floating HKD 3 Month LIBOR JP Morgan 21/09/2021 (3,008) (3,008)IRS PLN 8,370,000 Fund receives Fixed 1.825% and pays Floating PLN 6 Month LIBOR JP Morgan 21/09/2021 (19,329) (19,329)IRS PLN 2,200,000 Fund receives Fixed 1.965% and pays Floating PLN 6 Month WIBOR JP Morgan 21/09/2021 (1,368) (1,368)IRS PLN 2,050,000 Fund receives Fixed 2.007% and pays Floating PLN 6 Month WIBOR JP Morgan 21/09/2021 (225) (225)IRS SGD 1,570,000 Fund receives Fixed 2.255% and pays Floating SGD 6 Month LIBOR JP Morgan 21/09/2021 622 622IRS THB 22,460,000 Fund receives Fixed 1.805% and pays Floating THB 6 Month
Thailand Fixing Rate JP Morgan 21/09/2021 (8,000) (8,000)IRS ZAR 25,380,000 Fund receives Fixed 8.695% and pays Floating ZAR 3 Month LIBOR JP Morgan 21/09/2021 (706) (706)IRS ZAR 8,940,000 Fund receives Fixed 8.760% and pays Floating ZAR 3 Month LIBOR JP Morgan 21/09/2021 1,195 1,195IRS ZAR 1,520,000 Fund receives Fixed 8.760% and pays Floating ZAR 3 Month LIBOR JP Morgan 21/09/2021 203 203IRS ZAR 7,260,000 Fund receives Fixed 8.815% and pays Floating ZAR 3 Month JIBAR JP Morgan 21/09/2021 1,963 1,963IRS USD 1,850,000 Fund receives Fixed 1.671% and pays Floating USD 3 Month LIBOR JP Morgan 25/05/2026 (11,443) (11,443)IRS SEK 4,810,000 Fund receives Floating SEK 3 Month STIBOR and pays Fixed 1.122% JP Morgan 26/05/2026 (711) (711)IRS MXN 70,220,000 Fund receives Floating MXN 1 Month Mexican Interbank Rate
and pays Fixed 6.450% JP Morgan 09/09/2026 (8,612) (8,612)IRS HKD 2,400,000 Fund receives Floating HKD 3 Month LIBOR and pays Fixed 1.775% JP Morgan 21/09/2026 1,228 1,228IRS HKD 8,530,000 Fund receives Floating HKD 3 Month LIBOR and pays Fixed 1.788% JP Morgan 21/09/2026 3,095 3,095IRS PLN 1,180,000 Fund receives Floating PLN 6 Month LIBOR and pays Fixed 2.258% JP Morgan 21/09/2026 4,962 4,962IRS PLN 3,540,000 Fund receives Floating PLN 6 Month LIBOR and pays Fixed 2.310% JP Morgan 21/09/2026 10,739 10,739IRS PLN 660,000 Fund receives Floating PLN 6 Month LIBOR and pays Fixed 2.310% JP Morgan 21/09/2026 2,002 2,002IRS PLN 1,060,000 Fund receives Floating PLN 6 Month WIBOR and pays Fixed 2.360% JP Morgan 21/09/2026 2,021 2,021
BlackRock Style Advantage Fund continued
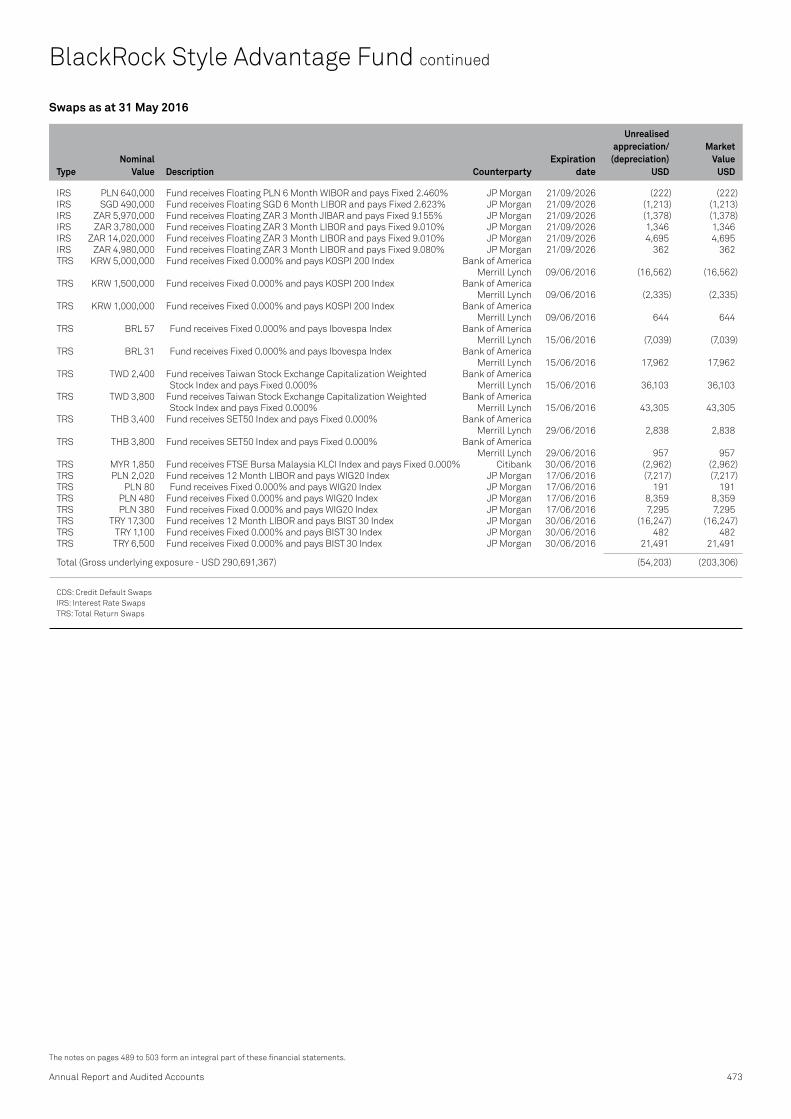
TypeNominal
Value Description CounterpartyExpiration
date
Unrealised appreciation/
(depreciation) USD
Market Value
USD
Swaps as at 31 May 2016
Annual Report and Audited Accounts 473
The notes on pages 489 to 503 form an integral part of these financial statements.
BlackRock Style Advantage Fund continued
IRS PLN 640,000 Fund receives Floating PLN 6 Month WIBOR and pays Fixed 2.460% JP Morgan 21/09/2026 (222) (222)IRS SGD 490,000 Fund receives Floating SGD 6 Month LIBOR and pays Fixed 2.623% JP Morgan 21/09/2026 (1,213) (1,213)IRS ZAR 5,970,000 Fund receives Floating ZAR 3 Month JIBAR and pays Fixed 9.155% JP Morgan 21/09/2026 (1,378) (1,378)IRS ZAR 3,780,000 Fund receives Floating ZAR 3 Month LIBOR and pays Fixed 9.010% JP Morgan 21/09/2026 1,346 1,346IRS ZAR 14,020,000 Fund receives Floating ZAR 3 Month LIBOR and pays Fixed 9.010% JP Morgan 21/09/2026 4,695 4,695IRS ZAR 4,980,000 Fund receives Floating ZAR 3 Month LIBOR and pays Fixed 9.080% JP Morgan 21/09/2026 362 362TRS KRW 5,000,000 Fund receives Fixed 0.000% and pays KOSPI 200 Index Bank of America
Merrill Lynch 09/06/2016 (16,562) (16,562)TRS KRW 1,500,000 Fund receives Fixed 0.000% and pays KOSPI 200 Index Bank of America
Merrill Lynch 09/06/2016 (2,335) (2,335)TRS KRW 1,000,000 Fund receives Fixed 0.000% and pays KOSPI 200 Index Bank of America
Merrill Lynch 09/06/2016 644 644TRS BRL 57 Fund receives Fixed 0.000% and pays Ibovespa Index Bank of America
Merrill Lynch 15/06/2016 (7,039) (7,039)TRS BRL 31 Fund receives Fixed 0.000% and pays Ibovespa Index Bank of America
Merrill Lynch 15/06/2016 17,962 17,962TRS TWD 2,400 Fund receives Taiwan Stock Exchange Capitalization Weighted Bank of America
Stock Index and pays Fixed 0.000% Merrill Lynch 15/06/2016 36,103 36,103TRS TWD 3,800 Fund receives Taiwan Stock Exchange Capitalization Weighted Bank of America
Stock Index and pays Fixed 0.000% Merrill Lynch 15/06/2016 43,305 43,305TRS THB 3,400 Fund receives SET50 Index and pays Fixed 0.000% Bank of America
Merrill Lynch 29/06/2016 2,838 2,838TRS THB 3,800 Fund receives SET50 Index and pays Fixed 0.000% Bank of America
Merrill Lynch 29/06/2016 957 957TRS MYR 1,850 Fund receives FTSE Bursa Malaysia KLCI Index and pays Fixed 0.000% Citibank 30/06/2016 (2,962) (2,962)TRS PLN 2,020 Fund receives 12 Month LIBOR and pays WIG20 Index JP Morgan 17/06/2016 (7,217) (7,217)TRS PLN 80 Fund receives Fixed 0.000% and pays WIG20 Index JP Morgan 17/06/2016 191 191TRS PLN 480 Fund receives Fixed 0.000% and pays WIG20 Index JP Morgan 17/06/2016 8,359 8,359TRS PLN 380 Fund receives Fixed 0.000% and pays WIG20 Index JP Morgan 17/06/2016 7,295 7,295TRS TRY 17,300 Fund receives 12 Month LIBOR and pays BIST 30 Index JP Morgan 30/06/2016 (16,247) (16,247)TRS TRY 1,100 Fund receives Fixed 0.000% and pays BIST 30 Index JP Morgan 30/06/2016 482 482TRS TRY 6,500 Fund receives Fixed 0.000% and pays BIST 30 Index JP Morgan 30/06/2016 21,491 21,491
Total (Gross underlying exposure - USD 290,691,367) (54,203) (203,306)
CDS: Credit Default SwapsIRS: Interest Rate SwapsTRS: Total Return Swaps

Open forward foreign exchange transactions as at 31 May 2016
Currency Purchases Currency Sales CounterpartyMaturity
date
Unrealised appreciation/
(depreciation) USD
Open forward foreign exchange transactions as at 31 May 2016
Currency Purchases Currency Sales CounterpartyMaturity
date
Unrealised appreciation/
(depreciation) USD
474 BlackRock Strategic Funds (BSF)
The notes on pages 489 to 503 form an integral part of these financial statements.
AUD 26,000 USD 19,324 JP Morgan 15/6/2016 (473)AUD 154,000 USD 114,251 Citibank 15/6/2016 (2,594)AUD 185,000 USD 137,762 Deutsche Bank 15/6/2016 (3,629)AUD 290,000 USD 217,935 Bank of America Merrill Lynch 15/6/2016 (7,672)AUD 315,000 USD 235,935 UBS 15/6/2016 (7,546)BRL 226,000 USD 62,778 Citibank 15/6/2016 24 BRL 345,000 USD 90,196 UBS 15/6/2016 5,674 BRL 260,000 USD 71,835 HSBC 15/6/2016 415 BRL 4,727,000 USD 1,320,059 Deutsche Bank 15/6/2016 (6,500)BRL 2,417,000 USD 635,785 Morgan Stanley 15/6/2016 35,862 BRL 847,000 USD 205,583 Goldman Sachs 15/6/2016 29,786 CAD 138,000 USD 107,223 Deutsche Bank 15/6/2016 (1,515)CAD 2,072,000 USD 1,575,089 Barclays Bank 15/6/2016 12,058 CAD 202,000 USD 154,103 Goldman Sachs 15/6/2016 629 CAD 383,000 USD 302,133 JP Morgan 15/6/2016 (8,756)CAD 38,000 USD 29,444 Northern Trust Company 15/6/2016 (336)CAD 68,000 USD 51,635 Bank of America Merrill Lynch 15/6/2016 452 CHF 39,000 EUR 35,271 Barclays Bank 15/6/2016 9 CHF 161,000 EUR 147,995 Bank of America Merrill Lynch 15/6/2016 (2,629)CHF 30,000 EUR 27,310 Royal Bank of Scotland 15/6/2016 (192)CHF 718,000 EUR 660,922 Deutsche Bank 15/6/2016 (12,754)CLP 110,584,000 USD 159,688 UBS 15/6/2016 765 CLP 34,154,000 USD 50,338 JP Morgan 15/6/2016 (782)CLP 341,078,000 USD 500,137 BNP Paribas 15/6/2016 (5,248)CLP 13,033,000 USD 19,409 Deutsche Bank 15/6/2016 (498)CLP 94,860,000 USD 134,716 Goldman Sachs 15/6/2016 2,922 CLP 564,698,000 USD 812,223 Credit Suisse 15/6/2016 7,129 EUR 20,072 CHF 22,000 Morgan Stanley 15/6/2016 191 EUR 4,142,800 CHF 4,599,000 Citibank 15/6/2016 (19,547)EUR 2,223,809 CHF 2,429,000 BNP Paribas 15/6/2016 29,630 EUR 580,653 CHF 635,000 JP Morgan 15/6/2016 6,958 EUR 116,991 CHF 128,000 Barclays Bank 15/6/2016 1,342 EUR 1,477,608 HUF 465,604,000 Citibank 15/6/2016 (4,914)EUR 37,816 HUF 11,755,000 BNP Paribas 15/6/2016 448 EUR 132,962 HUF 41,742,000 Bank of America Merrill Lynch 15/6/2016 109 EUR 310,892 HUF 97,808,000 Deutsche Bank 15/6/2016 (478)EUR 28,062 HUF 8,783,000 UBS 15/6/2016 119 EUR 5,074 HUF 1,582,000 JP Morgan 15/6/2016 46 EUR 87,363 HUF 27,354,000 Barclays Bank 15/6/2016 330 EUR 150,385 NOK 1,431,000 Bank of America Merrill Lynch 15/6/2016 (3,237)EUR 1,674,082 NOK 15,641,000 Citibank 15/6/2016 (1,460)EUR 542,718 NOK 5,109,000 BNP Paribas 15/6/2016 (5,066)EUR 135,850 NOK 1,295,000 JP Morgan 15/6/2016 (3,200)EUR 124,805 NOK 1,163,000 UBS 15/6/2016 257 EUR 48,549 NOK 450,000 Morgan Stanley 15/6/2016 387 EUR 182,291 NOK 1,727,000 Goldman Sachs 15/6/2016 (3,013)EUR 47,797 NOK 448,000 Barclays Bank 15/6/2016 (213)EUR 20,526 PLN 89,000 BNP Paribas 15/6/2016 264 EUR 16,067 PLN 70,000 Goldman Sachs 15/6/2016 121 EUR 30,079 PLN 130,000 Barclays Bank 15/6/2016 493 EUR 684,892 PLN 3,027,000 Citibank 15/6/2016 (5,810)EUR 298,388 PLN 1,295,000 Deutsche Bank 15/6/2016 3,526 EUR 102,746 PLN 450,000 UBS 15/6/2016 174 EUR 1,815,320 SEK 16,941,000 Citibank 15/6/2016 (10,821)EUR 47,509 SEK 441,000 HSBC 15/6/2016 2 EUR 291,946 SEK 2,693,000 JP Morgan 15/6/2016 2,053 EUR 43,419 SEK 401,000 UBS 15/6/2016 246 EUR 697,546 SEK 6,484,000 BNP Paribas 15/6/2016 (1,069)EUR 47,049 SEK 440,000 Morgan Stanley 15/6/2016 (392)EUR 108,143 SEK 1,001,000 Bank of America Merrill Lynch 15/6/2016 345 EUR 622,000 USD 696,565 Deutsche Bank 15/6/2016 (1,527)EUR 22,000 USD 24,921 Northern Trust Company 15/6/2016 (338)
EUR 53,000 USD 59,934 Citibank 15/6/2016 (711)GBP 107,000 USD 152,312 Citibank 15/6/2016 4,391 HKD 189,000 USD 24,355 Citibank 15/6/2016 (18)HKD 1,137,000 USD 146,695 BNP Paribas 15/6/2016 (282)HUF 3,353,000 EUR 10,773 BNP Paribas 15/6/2016 (112)INR 52,988,000 USD 768,165 Goldman Sachs 15/6/2016 17,560 INR 3,087,000 USD 45,983 JP Morgan 15/6/2016 (208)INR 431,882,000 USD 6,393,097 Deutsche Bank 15/6/2016 11,002 INR 58,562,000 USD 856,613 UBS 15/6/2016 11,765 INR 162,485,000 USD 2,379,345 Citibank 15/6/2016 30,040 JPY 336,373,000 USD 3,057,947 Citibank 15/6/2016 (29,544)JPY 32,664,000 USD 290,187 JP Morgan 15/6/2016 3,891 JPY 3,079,340 USD 27,711 Morgan Stanley 15/6/2016 13 JPY 10,309,000 USD 91,456 Goldman Sachs 15/6/2016 1,357 JPY 27,895,000 USD 252,858 Bank of America Merrill Lynch 15/6/2016 (1,716)JPY 34,201,000 USD 304,395 HSBC 15/6/2016 3,520 JPY 33,535,000 USD 302,353 Deutsche Bank 15/6/2016 (434)KRW 101,836,000 USD 87,646 Goldman Sachs 15/6/2016 (2,222)KRW 70,778,000 USD 61,568 Citibank 15/6/2016 (2,196)KRW 38,256,000 USD 33,347 Bank of America Merrill Lynch 15/6/2016 (1,256)MXN 2,723,000 USD 153,150 Bank of America Merrill Lynch 15/6/2016 (5,332)MXN 927,000 USD 52,392 Barclays Bank 15/6/2016 (2,070)MXN 19,032,000 USD 1,078,594 Citibank 15/6/2016 (45,446)MYR 864,000 USD 219,596 Goldman Sachs 15/6/2016 (10,537)MYR 1,029,000 USD 253,234 Citibank 15/6/2016 (4,250)MYR 1,238,000 USD 311,086 HSBC 15/6/2016 (11,531)MYR 1,816,000 USD 452,304 JP Morgan 15/6/2016 (12,892)MYR 10,646,000 USD 2,614,306 Morgan Stanley 15/6/2016 (38,329)MYR 366,000 USD 90,437 Deutsche Bank 15/6/2016 (1,878)NOK 1,167,000 EUR 122,738 Deutsche Bank 15/6/2016 2,531 NZD 4,460,000 USD 3,026,348 Citibank 15/6/2016 (13,687)NZD 547,000 USD 358,947 Goldman Sachs 15/6/2016 10,543 NZD 636,000 USD 418,669 JP Morgan 15/6/2016 10,940 NZD 46,000 USD 31,462 Barclays Bank 15/6/2016 (389)NZD 49,000 USD 33,352 Northern Trust Company 15/6/2016 (254)PLN 418,000 EUR 97,162 Citibank 15/6/2016 (2,086)PLN 312,000 EUR 72,320 JP Morgan 15/6/2016 (1,330)PLN 512,000 EUR 119,824 Bank of America Merrill Lynch 15/6/2016 (3,463)RUB 115,140,000 USD 1,709,178 JP Morgan 15/6/2016 31,577 RUB 11,225,000 USD 147,503 Goldman Sachs 15/6/2016 22,203 RUB 34,122,000 USD 468,878 Citibank 15/6/2016 46,998 RUB 6,311,000 USD 86,904 UBS 15/6/2016 8,509 SEK 570,000 EUR 62,101 Citibank 15/6/2016 (778)SEK 1,060,000 EUR 114,738 Deutsche Bank 15/6/2016 (612)SEK 336,000 EUR 36,548 Barclays Bank 15/6/2016 (393)SEK 342,000 EUR 36,651 Northern Trust Company 15/6/2016 215 SGD 133,000 USD 97,393 BNP Paribas 15/6/2016 (842)SGD 59,000 USD 43,571 Barclays Bank 15/6/2016 (740)SGD 120,000 USD 88,640 Morgan Stanley 15/6/2016 (1,526)THB 2,790,000 USD 79,798 UBS 15/6/2016 (1,717)THB 68,532,000 USD 1,923,036 Goldman Sachs 15/6/2016 (5,110)THB 27,911,000 USD 789,832 Citibank 15/6/2016 (8,719)THB 7,489,000 USD 212,011 Bank of America Merrill Lynch 15/6/2016 (2,425)THB 6,684,000 USD 190,106 JP Morgan 15/6/2016 (3,048)TRY 366,000 USD 124,325 Deutsche Bank 15/6/2016 (502)TRY 2,447,000 USD 817,720 BNP Paribas 15/6/2016 10,137 TRY 135,000 USD 46,960 UBS 15/6/2016 (1,287)TRY 5,542,000 USD 1,867,349 Citibank 15/6/2016 7,595 TRY 11,615,000 USD 3,876,952 Barclays Bank 15/6/2016 52,581 TRY 1,732,000 USD 582,725 JP Morgan 15/6/2016 3,238 TWD 27,900,000 USD 858,808 JP Morgan 15/6/2016 (3,071)USD 38,799 AUD 53,000 Citibank 15/6/2016 372 USD 22,334 AUD 31,000 Commonwealth Bank of Australia 15/6/2016 (142)USD 312,169 AUD 420,000 BNP Paribas 15/6/2016 7,650
BlackRock Style Advantage Fund continued

Open forward foreign exchange transactions as at 31 May 2016
Currency Purchases Currency Sales CounterpartyMaturity
date
Unrealised appreciation/
(depreciation) USD
Open forward foreign exchange transactions as at 31 May 2016
Currency Purchases Currency Sales CounterpartyMaturity
date
Unrealised appreciation/
(depreciation) USD
Annual Report and Audited Accounts 475
The notes on pages 489 to 503 form an integral part of these financial statements.
BlackRock Style Advantage Fund continued
USD 135,530 AUD 185,000 Northern Trust Company 15/6/2016 1,397 USD 128,780 AUD 167,000 Barclays Bank 15/6/2016 7,698 USD 7,340 AUD 10,000 Goldman Sachs 15/6/2016 90 USD 7,608 AUD 10,000 Deutsche Bank 15/6/2016 358 USD 114,390 BRL 428,002 Morgan Stanley 15/6/2016 (4,545)USD 302,560 BRL 1,131,998 HSBC 15/6/2016 (12,005)USD 77,478 BRL 279,000 JP Morgan 15/6/2016 (51)USD 40,365 BRL 146,000 Deutsche Bank 15/6/2016 (206)USD 460,323 CAD 615,000 JP Morgan 15/6/2016 (10,765)USD 1,293,247 CAD 1,712,000 Citibank 15/6/2016 (18,141)USD 44,945 CAD 57,000 Barclays Bank 15/6/2016 1,283 USD 7,792 CAD 10,000 Bank of America Merrill Lynch 15/6/2016 132 USD 495,750 CAD 669,000 BNP Paribas 15/6/2016 (16,702)USD 16,601 CAD 22,000 Morgan Stanley 15/6/2016 (251)USD 338,308 CLP 231,352,000 JP Morgan 15/6/2016 2,626 USD 95,919 CLP 64,587,000 Deutsche Bank 15/6/2016 2,206 USD 2,294,545 EUR 2,043,000 Citibank 15/6/2016 11,646 USD 506,333 EUR 447,000 UBS 15/6/2016 6,844 USD 228,912 EUR 201,000 Bank of America Merrill Lynch 15/6/2016 4,310 USD 226,342 EUR 199,000 Deutsche Bank 15/6/2016 3,974 USD 231,778 EUR 205,000 Barclays Bank 15/6/2016 2,705 USD 89,131 EUR 80,000 Commonwealth Bank of Australia 15/6/2016 (263)USD 43,731 EUR 40,000 State Street Bank & Trust Company 15/6/2016 (966)USD 1,294,561 EUR 1,175,000 BNP Paribas 15/6/2016 (18,413)USD 420,056 EUR 377,000 JP Morgan 15/6/2016 (1,213)USD 165,649 EUR 150,000 Morgan Stanley 15/6/2016 (1,965)USD 2,660,484 GBP 1,833,000 Citibank 15/6/2016 (23,959)USD 91,605 GBP 63,000 UBS 15/6/2016 (659)USD 97,668 GBP 69,000 Bank of America Merrill Lynch 15/6/2016 (3,383)USD 202,197 GBP 142,000 BNP Paribas 15/6/2016 (5,763)USD 39,368 GBP 27,161 Westpac 15/6/2016 (410)USD 139,058 GBP 96,000 Barclays Bank 15/6/2016 (1,535)USD 57,926 GBP 40,127 Deutsche Bank 15/6/2016 (841)USD 165,774 GBP 117,000 JP Morgan 15/6/2016 (5,573)USD 34,137 GBP 24,000 Morgan Stanley 15/6/2016 (1,011)USD 9,413 HKD 73,000 JP Morgan 15/6/2016 12 USD 13,643 HKD 106,000 Citibank 15/6/2016 (7)USD 42,775 HKD 332,000 Deutsche Bank 15/6/2016 23 USD 44,749 HKD 346,912 Royal Bank of Scotland 15/6/2016 77 USD 40,969 HKD 318,000 UBS 15/6/2016 19 USD 25,789 HKD 200,000 Commonwealth Bank of Australia 15/6/2016 35 USD 81,431 INR 5,464,000 Goldman Sachs 15/6/2016 409 USD 1,041,470 INR 70,645,000 JP Morgan 15/6/2016 (6,079)USD 71,126 JPY 7,900,000 Morgan Stanley 15/6/2016 2 USD 329,499 JPY 34,975,000 Credit Suisse 15/6/2016 14,615 USD 27,303 JPY 3,100,000 Citibank 15/6/2016 (607)USD 47,249 JPY 5,135,000 Deutsche Bank 15/6/2016 1,018 USD 60,524 JPY 6,665,000 BNP Paribas 15/6/2016 518 USD 57,366 JPY 6,212,000 Barclays Bank 15/6/2016 1,438 USD 119,679 KRW 140,671,000 NOMURA 15/6/2016 1,678 USD 467,564 KRW 539,375,000 HSBC 15/6/2016 15,113 USD 3,852,321 KRW 4,563,459,000 Morgan Stanley 15/6/2016 24,298 USD 418,458 KRW 489,462,000 JP Morgan 15/6/2016 7,877 USD 254,560 KRW 315,145,000 Goldman Sachs 15/6/2016 (9,797)USD 808,100 KRW 978,544,000 Citibank 15/6/2016 (12,744)USD 3,060,997 MXN 56,208,000 JP Morgan 15/6/2016 9,758 USD 4,617,476 MXN 83,727,000 Citibank 15/6/2016 72,375 USD 169,218 MXN 2,984,000 UBS 15/6/2016 7,232 USD 105,563 MXN 1,858,000 BNP Paribas 15/6/2016 4,702 USD 738,125 MXN 13,420,000 Goldman Sachs 15/6/2016 9,623 USD 68,991 MXN 1,256,000 Barclays Bank 15/6/2016 809 USD 47,916 MYR 200,000 Goldman Sachs 15/6/2016 (478)USD 38,268 MYR 154,000 JP Morgan 15/6/2016 1,005 USD 95,539 NZD 141,000 Bank of America Merrill Lynch 15/6/2016 295
USD 162,632 NZD 235,000 Credit Suisse 15/6/2016 3,893 USD 114,411 NZD 166,000 BNP Paribas 15/6/2016 2,281 USD 6,915 NZD 10,000 JP Morgan 15/6/2016 160 USD 568,026 NZD 852,000 Deutsche Bank 15/6/2016 (7,487)USD 63,976 RUB 4,297,000 HSBC 15/6/2016 (989)USD 27,661 RUB 1,863,000 Citibank 15/6/2016 (504)USD 38,619 RUB 2,525,000 JP Morgan 15/6/2016 445 USD 29,354 SGD 40,000 JP Morgan 15/6/2016 316 USD 441,730 SGD 600,000 Bank of America Merrill Lynch 15/6/2016 6,162 USD 3,464,423 SGD 4,778,000 Citibank 15/6/2016 (4,149)USD 39,891 SGD 54,000 UBS 15/6/2016 690 USD 1,010,029 SGD 1,382,000 HSBC 15/6/2016 6,771 USD 46,298 SGD 64,000 Morgan Stanley 15/6/2016 (163)USD 14,235 SGD 20,000 Royal Bank of Canada 15/6/2016 (284)USD 38,400 SGD 52,000 Deutsche Bank 15/6/2016 651 USD 27,453 SGD 38,000 Standard Chartered Bank 15/6/2016 (133)USD 272,745 THB 9,572,000 BNP Paribas 15/6/2016 4,865 USD 140,488 THB 4,938,000 Barclays Bank 15/6/2016 2,294 USD 101,171 THB 3,574,000 HSBC 15/6/2016 1,150 USD 80,322 THB 2,817,000 Deutsche Bank 15/6/2016 1,486 USD 270,333 TRY 779,000 Bank of America Merrill Lynch 15/6/2016 6,785 USD 45,409 TRY 131,000 Barclays Bank 15/6/2016 1,090 USD 850,991 TRY 2,506,000 Citibank 15/6/2016 3,172 USD 4,323,018 TWD 141,233,000 JP Morgan 15/6/2016 (8,817)USD 124,335 TWD 4,021,000 Morgan Stanley 15/6/2016 1,005 USD 567,176 TWD 18,578,000 HSBC 15/6/2016 (2,640)USD 738,151 TWD 24,399,000 Goldman Sachs 15/6/2016 (10,205)USD 1,955,156 TWD 64,160,000 Citibank 15/6/2016 (12,731)USD 82,029 ZAR 1,246,000 Bank of America Merrill Lynch 15/6/2016 3,119 USD 10,928 ZAR 171,000 Citibank 15/6/2016 99 USD 98,223 ZAR 1,449,000 BNP Paribas 15/6/2016 6,456 ZAR 160,000 USD 10,872 Morgan Stanley 15/6/2016 (739)ZAR 2,339,000 USD 144,207 JP Morgan 15/6/2016 3,924 ZAR 29,451,000 USD 1,884,848 Citibank 15/6/2016 (19,689)ZAR 1,886,000 USD 128,054 UBS 15/6/2016 (8,612)ZAR 2,980,000 USD 191,037 HSBC 15/6/2016 (2,311)ZAR 1,751,000 USD 109,035 BNP Paribas 15/6/2016 1,857 ZAR 1,620,000 USD 106,113 Deutsche Bank 15/6/2016 (3,517)
131,669
AUD Hedged Share Class
AUD 7,372 USD 5,401 State Street Bank & Trust Company 15/6/2016 (56)USD 222 AUD 302 State Street Bank & Trust Company 15/6/2016 3
(53)
EUR Hedged Share Class
EUR 7,549,702 USD 8,585,300 State Street Bank & Trust Company 15/6/2016 (149,077)USD 32,113 EUR 28,178 State Street Bank & Trust Company 15/6/2016 627
(148,450)
GBP Hedged Share Class
GBP 40,003,609 USD 58,158,367 State Street Bank & Trust Company 15/6/2016 427,247
427,247
Total (Gross underlying exposure - USD 201,076,507) 410,413

Futures contracts as at 31 May 2016
Number of contracts
Currencyof contract Contract/Description
Expiration date
Gross underlying
exposureUSD
Unrealised appreciation/
(depreciation) USD
476 BlackRock Strategic Funds (BSF)
The notes on pages 489 to 503 form an integral part of these financial statements.
BlackRock Style Advantage Fund continued
19 EUR Amsterdam Index June 2016 1,908,075 75,629 13 AUD Australian 10 Year Bond June 2016 1,249,854 7,955 21 EUR CAC 40 Index June 2016 1,053,524 48,738 1 CAD Canadian 10 Year Bond September 2016 83,105 (123) (3) EUR DAX Index June 2016 863,765 (31,400) 14 USD E-Mini S&P 500 Index June 2016 1,469,300 44,928 5 EUR Euro Bund June 2016 578,720 1,307 (1) GBP FTSE 100 Index June 2016 91,518 (2,182) 1 EUR FTSE MIB Index June 2016 101,475 3,881 (1) ZAR FTSE/JSE Top 40 Index June 2016 30,742 (1,035) (11) HKD H-Shares Index June 2016 596,792 (14,375) 1 HKD Hang Seng Index June 2016 131,798 2,710 (3) EUR IBEX 35 Mini Index June 2016 304,257 (12,610) (6) JPY Japan 10 Year Bond June 2016 5,822,721 (27,269) (5) SGD MSCI Singapore Index June 2016 112,739 (523) 98 SEK OMX Stockholm 30 Index June 2016 1,624,215 50,465 (1) CAD S&P/TSX 60 Index June 2016 126,470 (6,718) (72) USD SGX CNX NIFTY Index June 2016 1,179,144 (56,412) (1) AUD SPI 200 Index June 2016 97,602 (8,669) 3 CHF Swiss Market Index June 2016 249,462 8,729 1 JPY Topix Index June 2016 123,926 2,565 12 GBP UK Long Gilt Bond September 2016 1,819,658 (3,339) 24 USD US Treasury 10 Year Note September 2016 2,416,992 (5,250)
Total 22,035,854 77,002
Sector Breakdown as at 31 May 2016
% of Net Assets
Government 85.08
Securities portfolio at market value 85.08Other Net Assets 14.92
100.00

Annual Report and Audited Accounts 477
The notes on pages 489 to 503 form an integral part of these financial statements.
Transferable Securities and Money Market Instruments Admitted to an Official Stock Exchange Listing or Dealt in on Another Regulated Market
Transferable Securities and Money Market Instruments Admitted to an Official Stock Exchange Listing or Dealt in on Another Regulated Market
Holding
Description
Market Value
EUR
% of Net
Assets
Holding
Description
Market Value
EUR
% of Net
Assets
* Securities on loan, see Note 16, for further details.
Portfolio of Investments as at 31 May 2016
COMMON / PREFERRED STOCKS (SHARES) & RIGHTS
Austria 336 Wienerberger AG 5,437 0.04
5,437 0.04
Belgium 2,999 Anheuser-Busch InBev SA/NV 340,536 2.30 1,669 bpost SA 39,472 0.27 5,184 Euronav NV 48,315 0.32 3,464 Proximus SADP 102,067 0.69 1,716 Telenet Group Holding NV 73,677 0.50 217 UCB SA 14,044 0.09
618,111 4.17
Bermuda 2,935 BW LPG Ltd '144A' 13,141 0.09
13,141 0.09
Denmark 331 ISS A/S 11,963 0.08 4,986 Novo Nordisk A/S 'B' 248,514 1.68 276 Pandora A/S 36,943 0.25 2,287 Royal Unibrew A/S 94,064 0.63 2,830 Vestas Wind Systems A/S 181,806 1.23
573,290 3.87
Finland 324 Huhtamaki OYJ 12,153 0.08 4,333 Kone OYJ 'B' 182,159 1.23 2,292 Metsa Board OYJ 11,494 0.08 42,690 Nokia OYJ 218,573 1.47 18,587 Stora Enso OYJ 'R' 143,399 0.97
567,778 3.83
France 134 Atos SE 11,147 0.07 4,268 BNP Paribas SA 213,827 1.44 4,068 Electricite de France SA 48,918 0.33 5,587 Engie SA 77,157 0.52 309 Ingenico Group SA 33,727 0.23 636 Klepierre (Reit) 26,187 0.18 576 Nexity SA 27,763 0.19 5,642 Orange SA 88,072 0.59 11,221 Peugeot SA 159,338 1.08 2,107 Renault SA 179,643 1.21 2,366 Safran SA 149,153 1.01 4,453 Sanofi 328,142 2.22 3,063 Scor SE 92,656 0.63 6,562 Total SA 286,234 1.93 886 Valeo SA 120,097 0.81
1,842,061 12.44
Germany 3,404 Bayer AG Reg 292,404 1.97 898 Bayerische Motoren Werke AG 68,095 0.46 237 Bayerische Motoren Werke AG (Pref) 15,590 0.11 61 Beiersdorf AG 4,994 0.03 584 Continental AG 112,916 0.76 4,496 Daimler AG Reg 276,414 1.87 7,470 Deutsche Post AG Reg 197,171 1.33 16,066 Deutsche Telekom AG Reg 256,413 1.73 12,196 E.ON SE 108,118 0.73 4,609 Evonik Industries AG 122,162 0.82 2,082 Freenet AG 51,863 0.35 363 Fresenius SE & Co KGaA 24,767 0.17 504 Hannover Rueck SE 51,080 0.34
357 Henkel AG & Co KGaA 33,394 0.23 2,366 Infineon Technologies AG 31,929 0.22 313 K+S AG Reg 6,983 0.05 159 Krones AG 17,180 0.12 1,380 Linde AG 185,196 1.25 2,405 ProSiebenSat.1 Media SE 109,403 0.74 4,130 SAP SE 301,573 2.04 81 Siemens AG Reg 7,891 0.05 97 Symrise AG 5,479 0.04 5,694 Vonovia SE 176,713 1.19
2,457,728 16.60
Ireland 98 DCC Plc 8,120 0.06
8,120 0.06
Isle of Man 5,421 Paysafe Group Plc 29,495 0.20 5,383 Playtech Plc 60,165 0.41
89,660 0.61
Italy 10,337 Assicurazioni Generali SpA 136,035 0.92 1,632 Atlantia SpA 39,527 0.26 4,152 Eni SpA 57,754 0.39 13,777 Intesa Sanpaolo SpA 32,183 0.22 121 Rizzoli Corriere Della Sera
Mediagroup SpA 91 0.00 11,438 Snam SpA * 58,791 0.40 10,881 Terna Rete Elettrica Nazionale SpA 54,460 0.37 27,014 UniCredit SpA 78,665 0.53
457,506 3.09
Jersey 3,589 Glencore Plc 6,195 0.04 2,043 Shire Plc 114,908 0.78 104 Wolseley Plc 5,588 0.04
126,691 0.86
Luxembourg 1,917 Grand City Properties SA 36,174 0.24
36,174 0.24
Netherlands 3,069 Airbus Group SE 173,061 1.17 971 Eurocommercial Properties NV - CVA 41,224 0.28 1,797 Fiat Chrysler Automobiles NV 11,537 0.08 589 Heineken NV 49,152 0.33 9,098 Koninklijke Ahold NV 181,732 1.23 360 Koninklijke DSM NV 19,343 0.13 1,631 Koninklijke KPN NV 5,850 0.04 3,903 NN Group NV 115,646 0.78 14,441 STMicroelectronics NV 77,548 0.52 3,260 Unilever NV - CVA 132,405 0.90 3,149 Wereldhave NV (Reit) 145,295 0.98
952,793 6.44
Norway 4,582 Orkla ASA 37,514 0.25 6,673 Statoil ASA 95,681 0.65 1,191 Telenor ASA 17,958 0.12 375 Yara International ASA 12,032 0.08
163,185 1.10
BlackRock Systematic European Equity Fund
Germany continued

478 BlackRock Strategic Funds (BSF)
The notes on pages 489 to 503 form an integral part of these financial statements.
Transferable Securities and Money Market Instruments Admitted to an Official Stock Exchange Listing or Dealt in on Another Regulated Market
Transferable Securities and Money Market Instruments Admitted to an Official Stock Exchange Listing or Dealt in on Another Regulated Market
Holding
Description
Market Value
EUR
% of Net
Assets
Holding
Description
Market Value
EUR
% of Net
Assets
BlackRock Systematic European Equity Fund continued
Spain 1,293 Aena SA '144A' 157,164 1.06 3,883 Almirall SA 55,838 0.38 660 Amadeus IT Holding SA 'A' 27,416 0.18 22,018 Banco Bilbao Vizcaya Argentaria SA 132,086 0.89 18,138 Banco Santander SA 79,009 0.53 1,412 Bankinter SA 9,696 0.07 3,754 Gas Natural SDG SA 67,046 0.45 3,699 Grifols SA 74,831 0.50 11,501 Iberdrola SA 70,444 0.48 6,410 International Consolidated Airlines
Group SA 45,331 0.31 2,419 Mapfre SA 5,598 0.04
724,459 4.89
Sweden 414 Castellum AB (Right) 821 0.01 6,553 Electrolux AB 'B' 158,823 1.07 3,620 Fingerprint Cards AB 'B' 43,479 0.29 211 ICA Gruppen AB 6,635 0.04 981 Intrum Justitia AB 30,856 0.21 618 NetEnt AB 6,105 0.04 336 Svenska Cellulosa AB SCA 'B' 9,678 0.06 1,911 Swedish Match AB 58,688 0.40 27,610 Telefonaktiebolaget LM Ericsson 'B' 191,979 1.30 14,185 Telia Co AB 60,279 0.41
567,343 3.83
Switzerland 10,143 ABB Ltd Reg 190,729 1.29 218 Actelion Ltd Reg 32,120 0.22 1,379 Cie Financiere Richemont SA Reg 73,402 0.49 1,874 Coca-Cola HBC AG - CDI 32,899 0.22 11 Georg Fischer AG Reg 7,954 0.05 8,680 Nestle SA Reg 580,178 3.92 2,610 Novartis AG Reg 186,848 1.26 1,639 Roche Holding AG 385,878 2.61 3 Sika AG 11,670 0.08 138 Syngenta AG Reg 48,816 0.33 9,132 UBS Group AG Reg 126,290 0.85
1,676,784 11.32
United Kingdom 2,891 Anglo American Plc 23,125 0.16 540 ARM Holdings Plc 7,002 0.05 2,010 Ashtead Group Plc 25,760 0.17 2,647 AstraZeneca Plc 140,516 0.95 24,841 Aviva Plc 147,437 1.00 4,092 BAE Systems Plc 25,961 0.17 57,850 Barclays Plc 140,124 0.95 1,418 Bellway Plc 51,107 0.34 1,920 Berendsen Plc 30,534 0.21 158 Berkeley Group Holdings Plc 6,836 0.05 35,151 Booker Group Plc 83,875 0.57 10,046 BP Plc 47,343 0.32 5,772 British American Tobacco Plc 320,105 2.16 18,978 BT Group Plc 111,295 0.75
877 Burberry Group Plc 12,521 0.08 2,494 Centrica Plc 6,648 0.04 6,215 Diageo Plc 153,514 1.04 6,009 Dixons Carphone Plc 34,948 0.24 188 easyJet Plc 3,798 0.03 10,436 GKN Plc 37,791 0.25 1,984 GlaxoSmithKline Plc 37,496 0.25 8,715 Hammerson Plc (Reit) 66,499 0.45 52,525 HSBC Holdings Plc 308,235 2.08 5,036 Imperial Brands Plc 250,005 1.69 520 Intertek Group Plc 21,496 0.14 3,211 Intu Properties Plc (Reit) 12,714 0.09 43,466 ITV Plc 123,776 0.84 955 Land Securities Group Plc (Reit) 14,737 0.10 4,976 Legal & General Group Plc 15,696 0.11 202,225 Lloyds Banking Group Plc 191,769 1.29 2,969 Mediclinic International Plc 33,943 0.23 1,864 Meggitt Plc 9,482 0.06 29 Michael Page International Plc 151 0.00 4,257 Mondi Plc 75,346 0.51 7,791 National Grid Plc 102,911 0.69 6,748 Old Mutual Plc 15,774 0.11 1,438 Rio Tinto Plc 36,820 0.25 9,014 Royal Dutch Shell Plc 'A' 197,301 1.33 7,543 Royal Dutch Shell Plc 'B' 165,548 1.12 8,987 Royal Mail Plc 63,803 0.43 853 SABMiller Plc 47,731 0.32 1,761 Sage Group Plc/The 14,199 0.10 489 Severn Trent Plc 14,733 0.10 4,043 Shaftesbury Plc (Reit) 48,421 0.33 4,609 Sky Plc 58,584 0.39 1,848 Smith & Nephew Plc 28,517 0.19 15,841 Tullow Oil Plc 48,246 0.33 3,497 Unilever Plc 144,995 0.98 2,725 Vedanta Resources Plc 13,394 0.09 36,925 Vodafone Group Plc 112,290 0.76 120 Whitbread Plc 6,697 0.04
3,691,549 24.93
United States 1,031 Autoliv Inc SDR 112,835 0.76
112,835 0.76
Total Common / Preferred Stocks (Shares) & Rights 14,684,645 99.17
Total Transferable Securities and Money Market Instruments Admitted to an Official Stock Exchange Listing or Dealt in on Another Regulated Market 14,684,645 99.17
Securities portfolio at market value 14,684,645 99.17
Other Net Assets 122,981 0.83
Total Net Assets (EUR) 14,807,626 100.00
Portfolio of Investments as at 31 May 2016
United Kingdom continued

Annual Report and Audited Accounts 479
The notes on pages 489 to 503 form an integral part of these financial statements.
BlackRock Systematic European Equity Fund continued
Sector Breakdown as at 31 May 2016
% of Net Assets
Consumer, Non-cyclical 31.87Financial 16.82Communications 10.88Consumer, Cyclical 10.38Industrial 9.09Energy 7.36Basic Materials 4.80Utilities 4.11Technology 3.86
Securities portfolio at market value 99.17Other Net Assets 0.83
100.00

480 BlackRock Strategic Funds (BSF)
The notes on pages 489 to 503 form an integral part of these financial statements.
Transferable Securities and Money Market Instruments Admitted to an Official Stock Exchange Listing or Dealt in on Another Regulated Market
Transferable Securities and Money Market Instruments Admitted to an Official Stock Exchange Listing or Dealt in on Another Regulated Market
Holding
Description
Market Value
USD
% of Net
Assets
Holding
Description
Market Value
USD
% of Net
Assets
* Securities on loan, see Note 16, for further details.
Portfolio of Investments as at 31 May 2016
COMMON / PREFERRED STOCKS (SHARES) & RIGHTS
Australia 5,090 Aristocrat Leisure Ltd 47,483 0.02 47,563 Australia & New Zealand Banking
Group Ltd 879,116 0.38 42,226 BHP Billiton Ltd 584,434 0.25 20,722 Caltex Australia Ltd 491,838 0.21 217 CIMIC Group Ltd 5,887 0.00 7,829 Commonwealth Bank of Australia 439,737 0.19 5,311 DuluxGroup Ltd 24,811 0.01 30,574 Evolution Mining Ltd 45,022 0.02 59,056 Fortescue Metals Group Ltd 127,661 0.06 10,656 Iluka Resources Ltd 49,858 0.02 1,530 JB Hi-Fi Ltd 25,882 0.01 9,159 LendLease Group (Unit) 89,228 0.04 5,296 Macquarie Group Ltd 287,629 0.13 36,663 National Australia Bank Ltd 722,063 0.31 8,453 Newcrest Mining Ltd 116,934 0.05 46,131 Northern Star Resources Ltd 144,227 0.06 13,054 OZ Minerals Ltd 51,703 0.02 81,518 Qantas Airways Ltd 182,130 0.08 3,841 Rio Tinto Ltd 124,518 0.05 123,970 Stockland (Reit) 407,373 0.18 28,308 Suncorp Group Ltd 266,539 0.12 77,102 Sydney Airport (Unit) 395,983 0.17 168,181 Telstra Corp Ltd 681,972 0.30 27,156 Westpac Banking Corp 604,758 0.26 5,998 Woodside Petroleum Ltd 119,216 0.05
6,916,002 2.99
Austria 15,577 Erste Group Bank AG 423,833 0.18 1,551 OMV AG 43,440 0.02 1,497 Wienerberger AG 27,054 0.01
494,327 0.21
Belgium 7,542 Ageas 306,804 0.13 1,145 bpost SA 30,246 0.01 2,672 Euronav NV 27,815 0.01 472 Groupe Bruxelles Lambert SA 40,257 0.02 6,071 Proximus SADP 199,802 0.09 2,131 Telenet Group Holding NV 102,195 0.05
707,119 0.31
Bermuda 1,901 Assured Guaranty Ltd 51,365 0.02 6,407 BW LPG Ltd '144A' 32,041 0.01 704 Credicorp Ltd 100,348 0.04 3,795 Essent Group Ltd 82,200 0.04 261 Everest Re Group Ltd 46,811 0.02 4,393 Golar LNG Ltd 78,327 0.04 5,009 Nordic American Tankers Ltd 76,988 0.03 2,545 Ship Finance International Ltd 40,262 0.02
508,342 0.22
Brazil 13,300 Braskem SA 'A' (Pref) 77,131 0.03 21,795 BRF SA 275,470 0.12 40,600 Cia Energetica de Minas Gerais (Pref) 61,836 0.03 24,200 Fibria Celulose SA 220,878 0.10 56,300 Gerdau SA (Pref) 88,418 0.04 153,780 Itausa - Investimentos Itau SA (Pref) 311,429 0.13 89,100 JBS SA 251,276 0.11 13,300 Kroton Educacional SA 40,773 0.02 13,900 Marfrig Global Foods SA 23,846 0.01 24,900 Suzano Papel e Celulose SA 'A' (Pref) 101,200 0.04
6,538 Tim Participacoes SA ADR 64,334 0.03
1,516,591 0.66
British Virgin Islands 4,021 Michael Kors Holdings Ltd 168,882 0.07
168,882 0.07
Canada 14,902 Alimentation Couche-Tard Inc 'B' 667,562 0.29 3,680 Bank of Nova Scotia/The 181,907 0.08 18,093 Barrick Gold Corp 305,465 0.13 1,009 Canadian National Railway Co 60,565 0.03 7,585 Canadian Natural Resources Ltd 227,704 0.10 6,866 First Quantum Minerals Ltd 46,809 0.02 1,722 H&R Real Estate Investment Trust (Reit) 28,294 0.01 1,700 Linamar Corp 70,386 0.03 8,513 Magna International Inc 345,228 0.15 38,850 Manulife Financial Corp * 582,996 0.25 1,800 Power Corp of Canada 41,200 0.02 4,886 Suncor Energy Inc 135,788 0.06 5,335 Tahoe Resources Inc 63,508 0.03 4,927 Teck Resources Ltd 'B' 48,309 0.02 10,765 Toronto-Dominion Bank/The 474,899 0.20
3,280,620 1.42
Cayman Islands 4,341 Alibaba Group Holding Ltd ADR 349,841 0.15 1,406 Autohome Inc ADR 35,094 0.02 12,500 Cheung Kong Property Holdings Ltd 77,972 0.04 500 CK Hutchison Holdings Ltd 5,797 0.00 145,000 Geely Automobile Holdings Ltd 76,540 0.03 6,000 General Interface Solution Holding Ltd 17,110 0.01 6,536 NetEase Inc ADR 1,165,696 0.50 3,955 New Oriental Education &
Technology Group Inc ADR 168,087 0.07 723 Qihoo 360 Technology Co Ltd ADR 53,263 0.02 36,800 Tencent Holdings Ltd 817,757 0.35 31,000 Uni-President China Holdings Ltd 28,177 0.01 8,000 Zhen Ding Technology Holding Ltd 15,062 0.01
2,810,396 1.21
China 121,000 Agricultural Bank of China Ltd 'H' 43,931 0.02 13,500 Anhui Conch Cement Co Ltd 'H' 32,606 0.01 386,000 Bank of China Ltd 'H' 157,040 0.07 34,000 Bank of Communications Co Ltd 'H' 21,012 0.01 26,000 Beijing Capital International Airport
Co Ltd 'H' 28,051 0.01 208,000 China Cinda Asset Management
Co Ltd 'H' 67,752 0.03 789,000 China Construction Bank Corp 'H' 506,889 0.22 67,500 China Galaxy Securities Co Ltd 'H' 59,616 0.03 63,000 China Life Insurance Co Ltd 'H' 140,970 0.06 66,400 China Pacific Insurance Group Co
Ltd 'H' 226,542 0.10 540,000 China Petroleum & Chemical Corp 'H' 367,082 0.16 34,000 China Shenhua Energy Co Ltd 'H' 53,929 0.02 196,000 China Telecom Corp Ltd 'H' 91,096 0.04 78,500 CITIC Securities Co Ltd 'H' 169,993 0.07 36,000 Dongfeng Motor Group Co Ltd 'H' 40,092 0.02 26,000 GF Securities Co Ltd 'H' 60,186 0.03 91,000 Great Wall Motor Co Ltd 'H' 69,944 0.03 8,000 Guangzhou Baiyunshan
Pharmaceutical Holdings Co Ltd 'H' 18,148 0.01 36,000 Haitong Securities Co Ltd 'H' 58,770 0.03
BlackRock Systematic Global Equity Fund
Brazil continued

Annual Report and Audited Accounts 481
The notes on pages 489 to 503 form an integral part of these financial statements.
Transferable Securities and Money Market Instruments Admitted to an Official Stock Exchange Listing or Dealt in on Another Regulated Market
Transferable Securities and Money Market Instruments Admitted to an Official Stock Exchange Listing or Dealt in on Another Regulated Market
Holding
Description
Market Value
USD
% of Net
Assets
Holding
Description
Market Value
USD
% of Net
Assets
BlackRock Systematic Global Equity Fund continued
974,000 Industrial & Commercial Bank of China Ltd 'H' 516,644 0.22
22,900 New China Life Insurance Co Ltd 'H' 78,425 0.03 87,000 People's Insurance Co Group of China
Ltd/The 'H' 34,611 0.01 82,000 PetroChina Co Ltd 'H' 56,270 0.02 71,000 Ping An Insurance Group Co of China
Ltd 'H' 317,650 0.14 108,000 Sinopec Shanghai Petrochemical Co
Ltd 'H' 52,838 0.02 22,000 Weichai Power Co Ltd 'H' 25,662 0.01
3,295,749 1.42
Curacao 3,272 Schlumberger Ltd 251,879 0.11
251,879 0.11
Czech Republic 585 Komercni banka as 23,214 0.01
23,214 0.01
Denmark 143 AP Moeller - Maersk A/S 'B' 184,906 0.08 10,104 Danske Bank A/S 293,164 0.12 33,296 Novo Nordisk A/S 'B' 1,853,639 0.80 4,453 Pandora A/S 665,740 0.29 6,084 Vestas Wind Systems A/S 436,562 0.19
3,434,011 1.48
Finland 2,407 Amer Sports OYJ 72,563 0.03 995 Cargotec OYJ 'B' 38,764 0.02 959 Elisa OYJ 36,709 0.02 381 Huhtamaki OYJ 15,963 0.01 2,689 Kesko OYJ 'B' 109,176 0.05 29,883 Kone OYJ 'B' 1,403,204 0.60 5,315 Metso OYJ 124,906 0.05 5,353 Neste OYJ 180,746 0.08 42,107 Stora Enso OYJ 'R' 362,847 0.16 11,153 UPM-Kymmene OYJ 215,886 0.09
2,560,764 1.11
France 3,986 Air France-KLM 32,198 0.01 3,284 Atos SE 305,146 0.13 11,815 AXA SA 299,963 0.13 17,306 BNP Paribas SA 968,430 0.42 849 Bouygues SA 27,728 0.01 1,818 Capgemini SA 174,389 0.08 14,111 Cie de Saint-Gobain 632,264 0.27 6,673 Credit Agricole SA 67,737 0.03 22,411 Electricite de France SA 301,009 0.13 2,557 Faurecia 103,046 0.04 261 L'Oreal SA 49,107 0.02 8,609 Orange SA 150,103 0.07 70,719 Peugeot SA 1,121,652 0.48 7,002 Renault SA 666,809 0.29 7,509 Safran SA 528,728 0.23 11,768 Sanofi 968,601 0.42 1,378 Societe Generale SA 57,411 0.02 5,296 Technip SA 289,824 0.13 1,611 Thales SA 140,048 0.06 5,445 Total SA 265,288 0.11 846 UBISOFT Entertainment 31,287 0.01 2,452 Valeo SA 371,239 0.16 17,082 Vallourec SA 66,817 0.03
1,816 Veolia Environnement SA 40,912 0.02 823 Vinci SA 62,059 0.03
7,721,795 3.33
Germany 2,201 Allianz SE Reg 362,738 0.16 1,379 Aurubis AG 72,054 0.03 8,726 Bayer AG Reg 837,225 0.36 617 Continental AG 133,249 0.06 7,630 Deutsche Post AG Reg 224,947 0.10 50,131 Deutsche Telekom AG Reg 893,662 0.39 96,642 E.ON SE 956,926 0.41 21,949 Evonik Industries AG 649,795 0.28 4,523 Freenet AG 125,845 0.05 400 Gerresheimer AG 32,101 0.01 6,767 Hochtief AG 850,698 0.37 741 Hugo Boss AG 45,645 0.02 4,615 KION Group AG 257,375 0.11 1,480 Linde AG 221,844 0.10 1,292 OSRAM Licht AG 69,435 0.03 400 Pfeiffer Vacuum Technology AG 37,874 0.02 921 Porsche Automobil Holding SE (Pref) 51,335 0.02 17,170 ProSiebenSat.1 Media SE 872,409 0.38 409 Rheinmetall AG 28,191 0.01 6,188 RWE AG 82,353 0.04 940 Salzgitter AG 30,385 0.01 1,245 Software AG 48,324 0.02 213 Volkswagen AG 33,343 0.01
6,917,753 2.99
Guernsey 6,987 Amdocs Ltd 405,735 0.18
405,735 0.18
Hong Kong 10,000 China Everbright Ltd 19,106 0.01 81,500 China Mobile Ltd 930,715 0.40 18,000 China Resources Beer Holdings
Company Ltd 38,979 0.02 9,200 China Taiping Insurance Holdings
Co Ltd 17,767 0.01 112,000 China Unicom Hong Kong Ltd 120,692 0.05 13,000 CLP Holdings Ltd 122,515 0.05 245,000 CNOOC Ltd 292,403 0.13 4,000 Henderson Land Development Co Ltd 24,256 0.01 7,200 Hong Kong Exchanges and Clearing Ltd 172,139 0.07 54,000 Lenovo Group Ltd 33,093 0.01 33,000 Sun Hung Kai Properties Ltd 387,476 0.17
2,159,141 0.93
Hungary 1,743 MOL Hungarian Oil & Gas Plc 99,213 0.04 4,991 Richter Gedeon Nyrt 102,469 0.05
201,682 0.09
Indonesia 32,500 Bank Central Asia Tbk PT 30,930 0.01 39,900 Bank Rakyat Indonesia Persero Tbk PT 30,231 0.01 34,400 Matahari Department Store Tbk PT 47,785 0.02 734,900 Telekomunikasi Indonesia Persero
Tbk PT 199,058 0.09
308,004 0.13
Ireland 2,987 Accenture Plc 'A' 355,244 0.15 375 Allergan Plc 89,572 0.04 674 DCC Plc 62,379 0.03
Portfolio of Investments as at 31 May 2016
China continued France continued

482 BlackRock Strategic Funds (BSF)
The notes on pages 489 to 503 form an integral part of these financial statements.
Transferable Securities and Money Market Instruments Admitted to an Official Stock Exchange Listing or Dealt in on Another Regulated Market
Transferable Securities and Money Market Instruments Admitted to an Official Stock Exchange Listing or Dealt in on Another Regulated Market
Holding
Description
Market Value
USD
% of Net
Assets
Holding
Description
Market Value
USD
% of Net
Assets
* Securities on loan, see Note 16, for further details.
Portfolio of Investments as at 31 May 2016
571 ICON Plc 39,462 0.02 4,706 Ingersoll-Rand Plc 313,231 0.13
859,888 0.37
Isle of Man 5,281 Playtech Plc 65,928 0.03
65,928 0.03
Italy 28,449 A2A SpA 40,991 0.02 3,392 Anima Holding SpA '144A' 20,857 0.01 8,599 Assicurazioni Generali SpA 126,397 0.05 2,444 Atlantia SpA 66,116 0.03 14,324 Banca Popolare dell'Emilia
Romagna SC 73,852 0.03 48,520 Enel SpA 223,715 0.10 14,619 Eni SpA 227,132 0.10 5,114 FinecoBank Banca Fineco SpA 37,643 0.01 328,104 Intesa Sanpaolo SpA 856,088 0.37 51,802 Mediaset SpA 233,640 0.10 59,348 Mediobanca SpA 466,342 0.20 1,316 Moncler SpA 21,975 0.01 1,010 Recordati SpA 29,737 0.01 149,742 Saipem SpA 61,817 0.03 1,008 Salvatore Ferragamo SpA 21,842 0.01 24,177 Saras SpA * 42,883 0.02 80,232 Snam SpA * 460,622 0.20 34,942 Terna Rete Elettrica Nazionale SpA 195,338 0.08 227,184 UniCredit SpA 738,929 0.32
3,945,916 1.70
Japan 800 ABC-Mart Inc 51,694 0.02 1,000 Adastria Co Ltd 32,939 0.01 10,000 Ajinomoto Co Inc 240,787 0.10 2,000 Asahi Group Holdings Ltd 67,930 0.03 63,000 Asahi Kasei Corp 421,210 0.18 106,300 Astellas Pharma Inc 1,451,263 0.63 4,000 Bank of Kyoto Ltd/The 26,351 0.01 1,000 Bridgestone Corp 34,433 0.02 18,300 Canon Inc 528,998 0.23 1,700 Casio Computer Co Ltd 26,392 0.01 800 Central Japan Railway Co 141,331 0.06 3,600 Chubu Electric Power Co Inc 49,068 0.02 900 Chugai Pharmaceutical Co Ltd 31,548 0.01 20,800 Dai-ichi Life Insurance Co Ltd/The 273,396 0.12 1,900 Daifuku Co Ltd 32,848 0.01 3,900 Daiichi Sankyo Co Ltd 90,432 0.04 2,200 Daito Trust Construction Co Ltd 318,670 0.14 4,800 Daiwa House Industry Co Ltd 138,970 0.06 13,000 DIC Corp 30,770 0.01 4,000 East Japan Railway Co 364,847 0.16 900 Ezaki Glico Co Ltd 48,355 0.02 24,800 Fuji Heavy Industries Ltd 926,248 0.40 6,900 FUJIFILM Holdings Corp 279,564 0.12 2,200 GungHo Online Entertainment Inc 6,375 0.00 10,000 Haseko Corp 109,796 0.05 1,400 Hitachi Capital Corp 31,360 0.01 10,000 Hitachi Ltd 46,078 0.02 8,400 Honda Motor Co Ltd 238,207 0.10 15,200 Hoya Corp 534,459 0.23 10,700 ITOCHU Corp 133,997 0.06 700 Izumi Co Ltd 26,869 0.01 2,400 Japan Exchange Group Inc 32,615 0.01 15,900 Japan Tobacco Inc 629,904 0.27 3,000 JTEKT Corp 41,444 0.02
1,500 Kaken Pharmaceutical Co Ltd 84,912 0.04 3,200 Kao Corp 175,703 0.08 6,800 KDDI Corp 198,097 0.09 11,000 Kumagai Gumi Co Ltd 30,689 0.01 10,500 Mazda Motor Corp 180,583 0.08 3,000 Minebea Co Ltd 24,002 0.01 12,000 Mitsubishi Heavy Industries Ltd 48,566 0.02 59,000 Mitsubishi UFJ Financial Group Inc 294,057 0.13 16,000 Mitsui Mining & Smelting Co Ltd 28,079 0.01 270,500 Mizuho Financial Group Inc 424,562 0.18 4,500 Murata Manufacturing Co Ltd 524,457 0.23 3,400 Nabtesco Corp 86,258 0.04 3,000 NGK Insulators Ltd 65,851 0.03 2,100 NGK Spark Plug Co Ltd 40,615 0.02 4,000 NH Foods Ltd 93,165 0.04 1,200 Nihon M&A Center Inc 73,005 0.03 500 Nippon Shokubai Co Ltd 29,879 0.01 16,400 Nippon Telegraph & Telephone Corp 716,573 0.31 1,800 Nippon Television Holdings Inc 31,735 0.01 13,000 Nippon Yusen KK 24,569 0.01 35,000 Nissan Motor Co Ltd 354,363 0.15 2,300 Nisshin Seifun Group Inc 39,060 0.02 1,400 Nitto Denko Corp 91,838 0.04 10,500 Nomura Holdings Inc 45,396 0.02 5,300 NSK Ltd 46,983 0.02 7,100 NTT DOCOMO Inc 177,572 0.08 21,000 ORIX Corp 291,050 0.13 3,200 Panasonic Corp 29,706 0.01 2,300 Park24 Co Ltd 65,617 0.03 4,600 Pigeon Corp 125,024 0.05 500 Pola Orbis Holdings Inc 43,198 0.02 37,500 Resona Holdings Inc 142,217 0.06 1,100 Sankyo Co Ltd 40,935 0.02 3,500 SBI Holdings Inc/Japan 36,444 0.02 7,000 Shimizu Corp 62,494 0.03 5,200 Shin-Etsu Chemical Co Ltd 302,692 0.13 2,300 Shionogi & Co Ltd 129,101 0.06 400 SMC Corp/Japan 101,696 0.04 1,700 Sompo Japan Nipponkoa Holdings Inc 47,826 0.02 600 Start Today Co Ltd 27,323 0.01 45,800 Sumitomo Mitsui Construction Co Ltd 40,806 0.02 5,600 Sumitomo Mitsui Financial Group Inc 182,290 0.08 40,000 Sumitomo Mitsui Trust Holdings Inc 138,847 0.06 2,200 Sumitomo Rubber Industries Ltd 32,273 0.01 900 Sundrug Co Ltd 74,274 0.03 1,600 Sysmex Corp 116,636 0.05 1,000 Tadano Ltd 9,090 0.00 2,200 Taiyo Yuden Co Ltd 23,898 0.01 2,800 Takeda Pharmaceutical Co Ltd 120,880 0.05 3,400 TDK Corp 198,281 0.09 10,000 Teijin Ltd 35,099 0.02 6,100 Tokio Marine Holdings Inc 210,754 0.09 8,400 Tokyo Electric Power Co Holdings Inc 39,386 0.02 2,000 Tokyo Electron Ltd 147,991 0.06 78,000 Tokyo Gas Co Ltd 314,415 0.14 12,000 Toray Industries Inc 103,579 0.04 9,000 Tosoh Corp 44,224 0.02 2,500 TOTO Ltd 94,722 0.04 1,500 Toyo Suisan Kaisha Ltd 57,980 0.03 22,500 Toyota Motor Corp 1,171,016 0.51 3,600 Toyota Tsusho Corp 84,885 0.04 15,000 Ube Industries Ltd 28,079 0.01 4,100 West Japan Railway Co 255,856 0.11 12,800 Yahoo Japan Corp 57,368 0.02
16,397,669 7.08
BlackRock Systematic Global Equity Fund continued
Japan continued Ireland continued

Annual Report and Audited Accounts 483
The notes on pages 489 to 503 form an integral part of these financial statements.
Transferable Securities and Money Market Instruments Admitted to an Official Stock Exchange Listing or Dealt in on Another Regulated Market
Transferable Securities and Money Market Instruments Admitted to an Official Stock Exchange Listing or Dealt in on Another Regulated Market
Holding
Description
Market Value
USD
% of Net
Assets
Holding
Description
Market Value
USD
% of Net
Assets
* Securities on loan, see Note 16, for further details.
BlackRock Systematic Global Equity Fund continued
Jersey 120,614 Glencore Plc 232,529 0.10 5,563 Henderson Group Plc - CDI 22,114 0.01 330 Randgold Resources Ltd 27,735 0.01 4,834 Shire Plc 303,685 0.13
586,063 0.25
Luxembourg 7,999 ArcelorMittal 39,490 0.02 34,450 Subsea 7 SA 306,586 0.13
346,076 0.15
Malaysia 26,800 Axiata Group Bhd 33,881 0.01 17,000 IHH Healthcare Bhd 26,597 0.01 23,200 Malayan Banking Bhd 45,850 0.02 126,400 MISC Bhd 236,330 0.10 95,100 Petronas Chemicals Group Bhd 151,552 0.07 14,000 Public Bank Bhd 64,829 0.03 20,700 Tenaga Nasional Bhd 70,086 0.03 16,000 Top Glove Corp Bhd 19,647 0.01
648,772 0.28
Malta 5,352 Unibet Group Plc SDR 61,657 0.03
61,657 0.03
Marshall Islands 5,729 Scorpio Tankers Inc 33,457 0.01
33,457 0.01
Mexico 40,500 Alfa SAB de CV 'A' 72,696 0.03 75,700 America Movil SAB de CV 'L' 47,240 0.02 584,597 Cemex SAB de CV (Unit) 381,976 0.17 13,739 Cemex SAB de CV ADR 89,716 0.04 9,710 Gruma SAB de CV 'B' 142,256 0.06
733,884 0.32
Netherlands 32,835 Aegon NV 169,512 0.07 4,916 Airbus Group SE 309,634 0.13 506 Boskalis Westminster 18,544 0.01 658 Euronext NV '144A' 27,686 0.01 1,894 Ferrari NV 80,770 0.04 18,943 Fiat Chrysler Automobiles NV 135,837 0.06 598 Heineken Holding NV 49,113 0.02 5,686 Heineken NV 529,989 0.23 13,626 ING Groep NV - CVA 172,133 0.08 60,576 Koninklijke Ahold NV 1,351,516 0.58 9,120 LyondellBasell Industries NV 'A' 747,566 0.32 10,459 NN Group NV 346,143 0.15 1,051 NXP Semiconductors NV 97,186 0.04 3,180 Randstad Holding NV 171,539 0.07 5,792 Steinhoff International Holdings NV 34,177 0.02 12,269 STMicroelectronics NV 73,590 0.03 807 TKH Group NV 31,485 0.01 12,867 Unilever NV - CVA 583,711 0.25 1,619 Wereldhave NV (Reit) 83,437 0.04
5,013,568 2.16
Norway 40,328 DNB ASA 519,882 0.22 48,382 Norsk Hydro ASA 192,324 0.08 87,786 Orkla ASA 802,788 0.35
1,130 Schibsted ASA 'A' 35,113 0.02 19,304 Statoil ASA 309,162 0.13 6,225 Storebrand ASA 27,301 0.01 22,239 Telenor ASA 374,534 0.16 2,551 TGS Nopec Geophysical Co ASA 38,443 0.02
2,299,547 0.99
Papua New Guinea 8,693 Oil Search Ltd 42,817 0.02
42,817 0.02
Poland 2,021 Bank Pekao SA 77,306 0.03 8,132 Eurocash SA 101,566 0.04 5,554 KGHM Polska Miedz SA 86,904 0.04 27,370 Orange Polska SA 40,455 0.02 11,308 PGE Polska Grupa Energetyczna SA 36,799 0.02 28,557 Polski Koncern Naftowy ORLEN SA 508,401 0.22 66,111 Polskie Gornictwo Naftowe i
Gazownictwo SA 92,493 0.04 22,351 Powszechna Kasa Oszczednosci
Bank Polski SA 142,170 0.06 7,570 Powszechny Zaklad Ubezpieczen SA 60,999 0.03
1,147,093 0.50
Portugal 3,422 Galp Energia SGPS SA 45,140 0.02 11,502 Jeronimo Martins SGPS SA 186,990 0.08 3,631 NOS SGPS SA 27,023 0.01
259,153 0.11
Russia 1,487 Magnit PJSC GDR Reg 52,759 0.02 3,094 Mobile TeleSystems PJSC ADR 27,784 0.01 521 NovaTek OAO GDR Reg 52,881 0.03
133,424 0.06
Singapore 65,500 CapitaLand Mall Trust (Reit) 96,540 0.04 11,600 ComfortDelGro Corp Ltd 23,077 0.01 43,600 DBS Group Holdings Ltd 490,670 0.21 30,227 Flextronics International Ltd 376,326 0.16 17,400 Keppel Corp Ltd 67,968 0.03 87,100 Oversea-Chinese Banking Corp Ltd 545,126 0.24 3,100 Singapore Airlines Ltd 24,039 0.01 75,100 Yangzijiang Shipbuilding Holdings Ltd 49,892 0.02
1,673,638 0.72
South Africa 4,108 AngloGold Ashanti Ltd ADR 55,170 0.02 2,594 Barclays Africa Group Ltd 23,842 0.01 14,562 Bid Corp Ltd 270,912 0.12 14,562 Bidvest Group Ltd/The 113,297 0.05 10,493 MTN Group Ltd 83,058 0.04 733 Naspers Ltd 'N' 107,515 0.05 11,111 Netcare Ltd * 23,458 0.01 7,038 Pick n Pay Stores Ltd 32,614 0.01 2,332 Remgro Ltd 36,239 0.02 26,737 RMB Holdings Ltd 90,506 0.04 1,031 Sasol Ltd 31,382 0.01 14,888 Standard Bank Group Ltd 117,459 0.05 3,002 Vodacom Group Ltd * 31,524 0.01
1,016,976 0.44
Portfolio of Investments as at 31 May 2016
Norway continued

484 BlackRock Strategic Funds (BSF)
The notes on pages 489 to 503 form an integral part of these financial statements.
Transferable Securities and Money Market Instruments Admitted to an Official Stock Exchange Listing or Dealt in on Another Regulated Market
Transferable Securities and Money Market Instruments Admitted to an Official Stock Exchange Listing or Dealt in on Another Regulated Market
Holding
Description
Market Value
USD
% of Net
Assets
Holding
Description
Market Value
USD
% of Net
Assets
* Securities on loan, see Note 16, for further details.
Portfolio of Investments as at 31 May 2016
South Korea 1,441 Able C&C Co Ltd 43,225 0.02 334 Coway Co Ltd 28,865 0.01 2,860 Hyundai Engineering & Construction
Co Ltd 82,071 0.04 133 Hyundai Mobis Co Ltd 28,457 0.01 1,630 Kangwon Land Inc 58,195 0.03 536 Kia Motors Corp 20,980 0.01 1,470 Korea Electric Power Corp 77,583 0.03 1,870 KT Corp 50,367 0.02 297 KT&G Corp 31,773 0.01 926 Kumho Petrochemical Co Ltd 49,571 0.02 243 Lotte Chemical Corp 57,906 0.03 116 NAVER Corp 70,079 0.03 114 NongShim Co Ltd 36,444 0.02 164 POSCO 28,622 0.01 1,012 S-Oil Corp 72,941 0.03 300 Samsung Life Insurance Co Ltd 26,179 0.01 17,692 SK Hynix Inc 426,045 0.18 801 SK Innovation Co Ltd 109,887 0.05
1,299,190 0.56
Spain 2,393 Abertis Infraestructuras SA 37,032 0.02 2,393 Abertis Infraestructuras SA (Right) 1,852 0.00 2,874 ACS Actividades de Construccion y
Servicios SA 95,051 0.04 4,376 Aena SA '144A' 594,109 0.26 8,222 Amadeus IT Holding SA 'A' 381,485 0.16 2,770 Atresmedia Corp de Medios de
Comunicacion SA 36,168 0.02 4,859 Banco Bilbao Vizcaya Argentaria SA 32,558 0.01 23,997 Banco de Sabadell SA 41,438 0.02 17,648 Banco Popular Espanol SA (Right) 4,376 0.00 17,648 Banco Popular Espanol SA 29,351 0.01 27,907 Banco Santander SA 135,780 0.06 24,214 Bankinter SA 185,724 0.08 56,966 CaixaBank SA 157,607 0.07 31,762 Industria de Diseno Textil SA 1,079,730 0.47 3,720 International Consolidated Airlines
Group SA 29,385 0.01 20,203 Mediaset Espana Comunicacion SA 270,563 0.12 22,980 Repsol SA 301,465 0.13 1,111 Tecnicas Reunidas SA 35,094 0.01 450 Viscofan SA 25,348 0.01
3,474,116 1.50
Sweden 3,930 Axfood AB 72,723 0.03 4,635 Castellum AB 63,295 0.03 4,566 Castellum AB (Right) 10,108 0.00 1,873 Fabege AB 30,535 0.01 5,653 Hexpol AB 57,371 0.02 2,479 Hufvudstaden AB 'A' 38,864 0.02 5,418 Industrivarden AB 'C' 92,632 0.04 6,997 Intrum Justitia AB 245,822 0.11 1,427 Investment AB Kinnevik 3,073 0.00 1,427 Investment AB Kinnevik 'B' 35,197 0.02 2,783 Investor AB 'B' 97,405 0.04 1,896 NCC AB 'B' 69,965 0.03 24,545 Nordea Bank AB 241,274 0.10 4,710 Peab AB 39,116 0.02 21,188 Skanska AB 'B' 468,046 0.20 2,408 Swedish Match AB 82,600 0.04 38,073 Telefonaktiebolaget LM Ericsson 'B' 295,692 0.13 10,220 Telia Co AB 48,509 0.02
1,992,227 0.86
Switzerland 702 Actelion Ltd Reg 115,528 0.05 14,585 Adecco Group AG Reg 889,967 0.38 720 Baloise Holding AG Reg 89,468 0.04 133 EMS-Chemie Holding AG Reg 65,771 0.03 6,274 GAM Holding AG 79,546 0.03 115 Georg Fischer AG Reg 92,885 0.04 1,590 Kuehne + Nagel International AG Reg 224,883 0.10 8,232 Logitech International SA Reg 127,241 0.05 3,246 Lonza Group AG Reg 560,430 0.24 8,080 Nestle SA Reg 603,235 0.26 2,084 Novartis AG Reg 166,640 0.07 1,278 Roche Holding AG 336,075 0.15 19 Sika AG 82,557 0.04 1,295 Swiss Life Holding AG Reg 335,835 0.15 2,613 Swiss Re AG 236,262 0.10 3,294 Transocean Ltd 33,236 0.01
4,039,559 1.74
Taiwan 148,000 AU Optronics Corp 41,115 0.02 111,000 Cathay Financial Holding Co Ltd 128,316 0.05 288,000 Chunghwa Telecom Co Ltd 971,407 0.42 12,000 Elite Advanced Laser Corp 55,009 0.02 99,000 Foxconn Technology Co Ltd 226,156 0.10 160,000 Fubon Financial Holding Co Ltd 188,885 0.08 728,000 Hon Hai Precision Industry Co Ltd 1,788,051 0.77 72,000 Innolux Corp 21,349 0.01 300,000 Inotera Memories Inc 268,149 0.12 13,000 MediaTek Inc 87,696 0.04 13,000 Merry Electronics Co Ltd 28,501 0.01 25,000 Micro-Star International Co Ltd 39,862 0.02 27,000 Novatek Microelectronics Corp 89,827 0.04 26,000 Realtek Semiconductor Corp 70,476 0.03 62,000 Taiwan Semiconductor
Manufacturing Co Ltd 297,524 0.13
22,000 Uni-President Enterprises Corp 41,892 0.02
4,344,215 1.88
Thailand 66,700 Airports of Thailand PCL NVDR 739,348 0.32 56,000 Bangchak Petroleum PCL/The NVDR 47,418 0.02 12,000 Bumrungrad Hospital PCL NVDR 66,172 0.03 76,000 Central Pattana PCL NVDR 122,855 0.05 43,000 Delta Electronics Thailand PCL NVDR 86,361 0.04 48,000 Indorama Ventures PCL NVDR 44,675 0.02 410,000 IRPC PCL NVDR 57,153 0.03 83,400 PTT Exploration & Production PCL
NVDR 181,507 0.08 55,000 PTT Global Chemical PCL NVDR 91,603 0.04 34,300 Siam Cement PCL/The NVDR 464,694 0.20 51,000 Thai Beverage PCL 32,400 0.01 49,000 Thai Oil PCL NVDR 87,096 0.04 54,000 Thai Union Group PCL NVDR 33,405 0.01 77,000 Tipco Asphalt PCL NVDR 52,591 0.02
2,107,278 0.91
Turkey 17,431 Arcelik AS 117,205 0.05 12,810 BIM Birlesik Magazalar AS 255,138 0.11 23,922 Enka Insaat ve Sanayi AS 34,770 0.02 173,207 Eregli Demir ve Celik Fabrikalari TAS 242,926 0.11 24,000 Haci Omer Sabanci Holding AS 76,042 0.03 64,392 KOC Holding AS 286,896 0.12 13,676 Tupras Turkiye Petrol Rafinerileri AS 308,380 0.13 11,849 Turk Hava Yollari AO * 25,229 0.01 49,939 Turk Telekomunikasyon AS 102,602 0.05
BlackRock Systematic Global Equity Fund continued

Annual Report and Audited Accounts 485
The notes on pages 489 to 503 form an integral part of these financial statements.
Transferable Securities and Money Market Instruments Admitted to an Official Stock Exchange Listing or Dealt in on Another Regulated Market
Transferable Securities and Money Market Instruments Admitted to an Official Stock Exchange Listing or Dealt in on Another Regulated Market
Holding
Description
Market Value
USD
% of Net
Assets
Holding
Description
Market Value
USD
% of Net
Assets
* Securities on loan, see Note 16, for further details.
BlackRock Systematic Global Equity Fund continued
7,166 Turkiye Halk Bankasi AS 21,756 0.01 66,294 Turkiye Is Bankasi 'C' 102,434 0.04 68,203 Turkiye Vakiflar Bankasi TAO 'D' * 103,068 0.05 37,709 Yapi ve Kredi Bankasi AS 52,888 0.02
1,729,334 0.75
United Kingdom 35,169 Anglo American Plc 314,210 0.14 3,337 Aon Plc 365,535 0.16 11,210 ARM Holdings Plc 162,353 0.07 1,464 ARRIS International Plc 34,916 0.01 667 Associated British Foods Plc 28,951 0.01 4,652 AstraZeneca Plc 275,833 0.12 7,688 Auto Trader Group Plc '144A' 45,146 0.02 30,326 Aviva Plc 201,041 0.09 27,892 Barclays Plc 75,461 0.03 4,387 Berendsen Plc 77,927 0.03 627 Berkeley Group Holdings Plc 30,300 0.01 15,136 BHP Billiton Plc 183,949 0.08 26,340 Booker Group Plc 70,202 0.03 196,926 BP Plc 1,036,576 0.45 2,357 British American Tobacco Plc
(traded in South Africa) 145,982 0.06 15,908 British American Tobacco Plc
(traded in United Kingdom) 985,406 0.43 2,333 Britvic Plc 23,163 0.01 66,953 BT Group Plc 438,559 0.19 3,216 Burberry Group Plc 51,287 0.02 1,234 Close Brothers Group Plc 24,395 0.01 3,849 CYBG Plc - CDI 16,222 0.01 10,091 Diageo Plc 278,403 0.12 1,155 Dialog Semiconductor Plc 36,935 0.02 11,144 Dixons Carphone Plc 72,392 0.03 4,446 Ensco Plc 'A' 44,149 0.02 17,919 Hays Plc 35,477 0.01 2,694 Hikma Pharmaceuticals Plc 90,264 0.04 3,502 Howden Joinery Group Plc 26,078 0.01 88,571 HSBC Holdings Plc 580,552 0.25 3,190 Imperial Brands Plc 176,884 0.08 2,472 Inchcape Plc 24,797 0.01 7,087 Indivior Plc 17,871 0.01 515 InterContinental Hotels Group Plc 20,189 0.01 2,123 Intertek Group Plc 98,024 0.04 159,536 ITV Plc 507,432 0.22 4,674 John Wood Group Plc 42,402 0.02 5,552 Jupiter Fund Management Plc 35,912 0.02 15,368 Just Eat Plc 101,767 0.04 959 Liberty Global Plc LiLAC 'C' 40,642 0.02 11,278 Man Group Plc 21,817 0.01 10,531 Moneysupermarket.com Group Plc 50,953 0.02 43,216 National Grid Plc 637,601 0.27 4,942 Noble Corp Plc 42,946 0.02 978 Persimmon Plc 30,391 0.01 8,166 QinetiQ Group Plc 29,489 0.01 3,401 Reckitt Benckiser Group Plc 343,998 0.15 74,646 Rentokil Initial Plc 195,668 0.08 641 Rightmove Plc 39,556 0.02 8,053 Rio Tinto Plc 230,313 0.10 3,626 Rowan Cos Plc 'A' 62,077 0.03 25,255 Royal Dutch Shell Plc 'A' 617,438 0.27 24,860 Royal Dutch Shell Plc 'B' 609,419 0.26 1,749 SABMiller Plc 109,290 0.05 5,175 Sky Plc 73,471 0.03 24,261 Standard Chartered Plc 189,328 0.08 17,150 Thomas Cook Group Plc 19,288 0.01 22,204 Tullow Oil Plc 75,534 0.03 13,576 Unilever Plc ADR 628,162 0.27
101,924 Vodafone Group Plc 346,203 0.15 1,833 WH Smith Plc 47,538 0.02
11,218,064 4.84
United States 6,274 3M Co 1,058,926 0.46 2,869 Aaron's Inc 71,782 0.03 9,692 AbbVie Inc 612,341 0.26 4,425 Adobe Systems Inc 443,429 0.19 497 Aetna Inc 56,703 0.02 522 Affiliated Managers Group Inc 90,635 0.04 6,231 Aflac Inc 434,612 0.19 1,483 Air Lease Corp 45,024 0.02 5,610 Air Products & Chemicals Inc 802,903 0.35 408 Alexandria Real Estate Equities
Inc (Reit) 38,878 0.02 4,843 Allstate Corp/The 327,920 0.14 1,837 Ally Financial Inc 32,864 0.01 1,672 Alphabet Inc 'A' 1,257,394 0.54 981 Alphabet Inc 'C' 724,459 0.31 43,330 Altria Group Inc 2,757,954 1.19 1,994 Amazon.com Inc 1,432,689 0.62 612 AMC Networks Inc 'A' 38,926 0.02 3,215 American Express Co 211,354 0.09 8,910 American Water Works Co Inc 660,944 0.29 14,766 Ameriprise Financial Inc 1,509,676 0.65 22,568 AmerisourceBergen Corp 1,679,285 0.73 8,751 Amgen Inc 1,381,345 0.60 1,564 AmTrust Financial Services Inc 41,477 0.02 1,157 Anadarko Petroleum Corp 60,384 0.03 10,059 Analog Devices Inc 587,345 0.25 7,853 Anthem Inc 1,030,706 0.45 1,439 AO Smith Corp 119,739 0.05 2,575 Apache Corp 150,509 0.06 539 Apogee Enterprises Inc 24,821 0.01 36,559 Apple Inc 3,660,287 1.58 2,099 AptarGroup Inc 161,623 0.07 5,617 Archer-Daniels-Midland Co 241,812 0.10 1,025 Aspen Technology Inc 39,001 0.02 15,021 AT&T Inc 587,622 0.25 6,500 Automatic Data Processing Inc 572,845 0.25 287 AutoZone Inc 218,464 0.09 3,255 B/E Aerospace Inc 155,882 0.07 2,922 Bank of America Corp 43,742 0.02 2,413 Barnes & Noble Inc 28,160 0.01 940 Bemis Co Inc 47,536 0.02 820 Berkshire Hathaway Inc 'B' 118,055 0.05 1,989 Best Buy Co Inc 63,728 0.03 1,154 Big Lots Inc 60,493 0.03 1,393 Biogen Inc 403,900 0.17 417 Black Hills Corp 24,953 0.01 1,900 Blackstone Mortgage Trust Inc 'A' (Reit) 53,162 0.02 2,101 Blue Buffalo Pet Products Inc 54,626 0.02 4,875 Boeing Co/The 623,025 0.27 934 Booz Allen Hamilton Holding Corp 27,198 0.01 536 Brinker International Inc 24,147 0.01 14,654 Bristol-Myers Squibb Co 1,044,098 0.45 2,638 Broadridge Financial Solutions Inc 170,336 0.07 4,095 Brocade Communications Systems Inc 37,142 0.02 1,161 Brown-Forman Corp 'B' 113,813 0.05 3,158 CA Inc 101,972 0.04 911 Cabot Corp 41,651 0.02 4,674 Cal-Maine Foods Inc 212,013 0.09 896 Camden Property Trust (Reit) 76,044 0.03 9,151 Capital One Financial Corp 675,893 0.29 14,882 Cardinal Health Inc 1,169,725 0.51 4,661 Carlisle Cos Inc 483,812 0.21
Portfolio of Investments as at 31 May 2016
Turkey continued United Kingdom continued
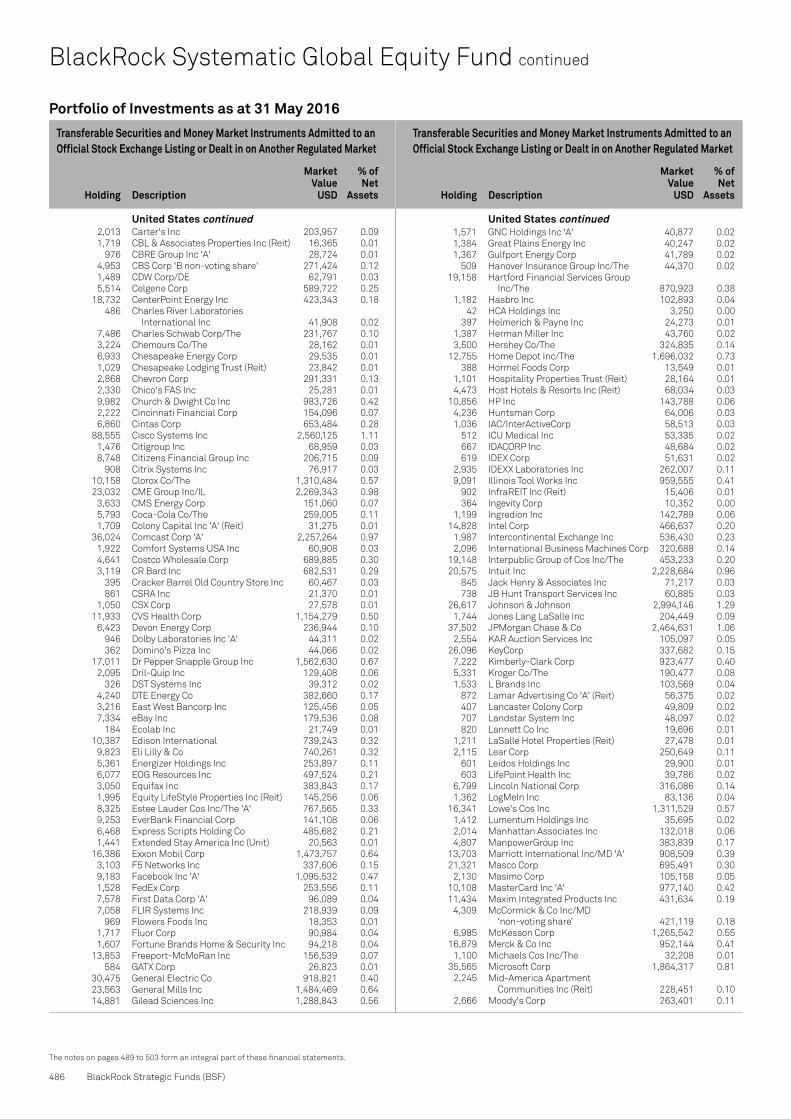
486 BlackRock Strategic Funds (BSF)
The notes on pages 489 to 503 form an integral part of these financial statements.
Transferable Securities and Money Market Instruments Admitted to an Official Stock Exchange Listing or Dealt in on Another Regulated Market
Transferable Securities and Money Market Instruments Admitted to an Official Stock Exchange Listing or Dealt in on Another Regulated Market
Holding
Description
Market Value
USD
% of Net
Assets
Holding
Description
Market Value
USD
% of Net
Assets
Portfolio of Investments as at 31 May 2016
2,013 Carter's Inc 203,957 0.09 1,719 CBL & Associates Properties Inc (Reit) 16,365 0.01 976 CBRE Group Inc 'A' 28,724 0.01 4,953 CBS Corp 'B non-voting share' 271,424 0.12 1,489 CDW Corp/DE 62,791 0.03 5,514 Celgene Corp 589,722 0.25 18,732 CenterPoint Energy Inc 423,343 0.18 486 Charles River Laboratories
International Inc 41,908 0.02 7,486 Charles Schwab Corp/The 231,767 0.10 3,224 Chemours Co/The 28,162 0.01 6,933 Chesapeake Energy Corp 29,535 0.01 1,029 Chesapeake Lodging Trust (Reit) 23,842 0.01 2,868 Chevron Corp 291,331 0.13 2,330 Chico's FAS Inc 25,281 0.01 9,982 Church & Dwight Co Inc 983,726 0.42 2,222 Cincinnati Financial Corp 154,096 0.07 6,860 Cintas Corp 653,484 0.28 88,555 Cisco Systems Inc 2,560,125 1.11 1,476 Citigroup Inc 68,959 0.03 8,748 Citizens Financial Group Inc 206,715 0.09 908 Citrix Systems Inc 76,917 0.03 10,158 Clorox Co/The 1,310,484 0.57 23,032 CME Group Inc/IL 2,269,343 0.98 3,633 CMS Energy Corp 151,060 0.07 5,793 Coca-Cola Co/The 259,005 0.11 1,709 Colony Capital Inc 'A' (Reit) 31,275 0.01 36,024 Comcast Corp 'A' 2,257,264 0.97 1,922 Comfort Systems USA Inc 60,908 0.03 4,641 Costco Wholesale Corp 689,885 0.30 3,119 CR Bard Inc 682,531 0.29 395 Cracker Barrel Old Country Store Inc 60,467 0.03 861 CSRA Inc 21,370 0.01 1,050 CSX Corp 27,578 0.01 11,933 CVS Health Corp 1,154,279 0.50 6,423 Devon Energy Corp 236,944 0.10 946 Dolby Laboratories Inc 'A' 44,311 0.02 362 Domino's Pizza Inc 44,066 0.02 17,011 Dr Pepper Snapple Group Inc 1,562,630 0.67 2,095 Dril-Quip Inc 129,408 0.06 326 DST Systems Inc 39,312 0.02 4,240 DTE Energy Co 382,660 0.17 3,216 East West Bancorp Inc 125,456 0.05 7,334 eBay Inc 179,536 0.08 184 Ecolab Inc 21,749 0.01 10,387 Edison International 739,243 0.32 9,823 Eli Lilly & Co 740,261 0.32 5,361 Energizer Holdings Inc 253,897 0.11 6,077 EOG Resources Inc 497,524 0.21 3,050 Equifax Inc 383,843 0.17 1,995 Equity LifeStyle Properties Inc (Reit) 145,256 0.06 8,325 Estee Lauder Cos Inc/The 'A' 767,565 0.33 9,253 EverBank Financial Corp 141,108 0.06 6,468 Express Scripts Holding Co 485,682 0.21 1,441 Extended Stay America Inc (Unit) 20,563 0.01 16,386 Exxon Mobil Corp 1,473,757 0.64 3,103 F5 Networks Inc 337,606 0.15 9,183 Facebook Inc 'A' 1,095,532 0.47 1,528 FedEx Corp 253,556 0.11 7,578 First Data Corp 'A' 96,089 0.04 7,058 FLIR Systems Inc 218,939 0.09 969 Flowers Foods Inc 18,353 0.01 1,717 Fluor Corp 90,984 0.04 1,607 Fortune Brands Home & Security Inc 94,218 0.04 13,853 Freeport-McMoRan Inc 156,539 0.07 584 GATX Corp 26,823 0.01 30,475 General Electric Co 918,821 0.40 23,563 General Mills Inc 1,484,469 0.64 14,881 Gilead Sciences Inc 1,288,843 0.56
1,571 GNC Holdings Inc 'A' 40,877 0.02 1,384 Great Plains Energy Inc 40,247 0.02 1,367 Gulfport Energy Corp 41,789 0.02 509 Hanover Insurance Group Inc/The 44,370 0.02 19,158 Hartford Financial Services Group
Inc/The 870,923 0.38 1,182 Hasbro Inc 102,893 0.04 42 HCA Holdings Inc 3,250 0.00 397 Helmerich & Payne Inc 24,273 0.01 1,387 Herman Miller Inc 43,760 0.02 3,500 Hershey Co/The 324,835 0.14 12,755 Home Depot Inc/The 1,696,032 0.73 388 Hormel Foods Corp 13,549 0.01 1,101 Hospitality Properties Trust (Reit) 28,164 0.01 4,473 Host Hotels & Resorts Inc (Reit) 68,034 0.03 10,856 HP Inc 143,788 0.06 4,236 Huntsman Corp 64,006 0.03 1,036 IAC/InterActiveCorp 58,513 0.03 512 ICU Medical Inc 53,335 0.02 667 IDACORP Inc 48,684 0.02 619 IDEX Corp 51,631 0.02 2,935 IDEXX Laboratories Inc 262,007 0.11 9,091 Illinois Tool Works Inc 959,555 0.41 902 InfraREIT Inc (Reit) 15,406 0.01 364 Ingevity Corp 10,352 0.00 1,199 Ingredion Inc 142,789 0.06 14,828 Intel Corp 466,637 0.20 1,987 Intercontinental Exchange Inc 536,430 0.23 2,096 International Business Machines Corp 320,688 0.14 19,148 Interpublic Group of Cos Inc/The 453,233 0.20 20,575 Intuit Inc 2,228,684 0.96 845 Jack Henry & Associates Inc 71,217 0.03 738 JB Hunt Transport Services Inc 60,885 0.03 26,617 Johnson & Johnson 2,994,146 1.29 1,744 Jones Lang LaSalle Inc 204,449 0.09 37,502 JPMorgan Chase & Co 2,464,631 1.06 2,554 KAR Auction Services Inc 105,097 0.05 26,096 KeyCorp 337,682 0.15 7,222 Kimberly-Clark Corp 923,477 0.40 5,331 Kroger Co/The 190,477 0.08 1,533 L Brands Inc 103,569 0.04 872 Lamar Advertising Co 'A' (Reit) 56,375 0.02 407 Lancaster Colony Corp 49,809 0.02 707 Landstar System Inc 48,097 0.02 820 Lannett Co Inc 19,696 0.01 1,211 LaSalle Hotel Properties (Reit) 27,478 0.01 2,115 Lear Corp 250,649 0.11 601 Leidos Holdings Inc 29,900 0.01 603 LifePoint Health Inc 39,786 0.02 6,799 Lincoln National Corp 316,086 0.14 1,362 LogMeIn Inc 83,136 0.04 16,341 Lowe's Cos Inc 1,311,529 0.57 1,412 Lumentum Holdings Inc 35,695 0.02 2,014 Manhattan Associates Inc 132,018 0.06 4,807 ManpowerGroup Inc 383,839 0.17 13,703 Marriott International Inc/MD 'A' 908,509 0.39 21,321 Masco Corp 695,491 0.30 2,130 Masimo Corp 105,158 0.05 10,108 MasterCard Inc 'A' 977,140 0.42 11,434 Maxim Integrated Products Inc 431,634 0.19 4,309 McCormick & Co Inc/MD
‘non-voting share’ 421,119 0.18 6,985 McKesson Corp 1,265,542 0.55 16,879 Merck & Co Inc 952,144 0.41 1,100 Michaels Cos Inc/The 32,208 0.01 35,565 Microsoft Corp 1,864,317 0.81 2,245 Mid-America Apartment
Communities Inc (Reit) 228,451 0.10 2,666 Moody's Corp 263,401 0.11
BlackRock Systematic Global Equity Fund continued
United States continued United States continued

Annual Report and Audited Accounts 487
The notes on pages 489 to 503 form an integral part of these financial statements.
Transferable Securities and Money Market Instruments Admitted to an Official Stock Exchange Listing or Dealt in on Another Regulated Market
Transferable Securities and Money Market Instruments Admitted to an Official Stock Exchange Listing or Dealt in on Another Regulated Market
Holding
Description
Market Value
USD
% of Net
Assets
Holding
Description
Market Value
USD
% of Net
Assets
* Securities on loan, see Note 16, for further details.
BlackRock Systematic Global Equity Fund continued
5,352 Nasdaq Inc 351,466 0.15 16,564 NetApp Inc 423,210 0.18 7,485 Newfield Exploration Co 306,885 0.13 5,857 Newmont Mining Corp 189,357 0.08 9,615 NextEra Energy Inc 1,155,819 0.50 16,602 NIKE Inc 'B' 923,237 0.40 410 NorthWestern Corp 23,661 0.01 27 NVR Inc 47,035 0.02 458 O'Reilly Automotive Inc 121,581 0.05 3,524 Oasis Petroleum Inc 36,227 0.02 2,313 ON Semiconductor Corp 22,482 0.01 1,401 Owens Corning 71,675 0.03 31,409 PACCAR Inc * 1,756,077 0.76 457 Papa John's International Inc 28,832 0.01 1,054 PDC Energy Inc 61,343 0.03 1,190 Pebblebrook Hotel Trust (Reit) 29,238 0.01 1,009 Penske Automotive Group Inc 39,593 0.02 2,043 PepsiCo Inc 207,651 0.09 10,666 Pfizer Inc 369,897 0.16 6,167 Philip Morris International Inc 608,436 0.26 2,131 Phillips 66 172,036 0.07 18,814 Pilgrim's Pride Corp 473,360 0.20 1,096 Post Properties Inc (Reit) 66,078 0.03 848 Prestige Brands Holdings Inc 46,012 0.02 5,928 Procter & Gamble Co/The 483,132 0.21 6,184 Progressive Corp/The 206,236 0.09 13,930 Prudential Financial Inc 1,113,564 0.48 1,179 Public Service Enterprise Group Inc 52,642 0.02 525 Quest Diagnostics Inc 40,814 0.02 2,403 Rackspace Hosting Inc 59,979 0.03 2,137 Raytheon Co 278,088 0.12 207 Regal Beloit Corp 11,770 0.01 332 Reinsurance Group of America Inc 32,918 0.01 507 Reliance Steel & Aluminum Co 37,741 0.02 941 RLJ Lodging Trust (Reit) 18,876 0.01 2,783 Robert Half International Inc 114,715 0.05 5,473 Ross Stores Inc 293,736 0.13 546 Ryder System Inc 38,154 0.02 480 Ryman Hospitality Properties Inc (Reit) 23,088 0.01 3,296 Sabre Corp 92,782 0.04 1,209 SBA Communications Corp 'A' 119,026 0.05 6,289 Scripps Networks Interactive Inc 'A' 402,685 0.17 3,201 SEI Investments Co 164,884 0.07 3,343 Sherwin-Williams Co/The 976,189 0.42 11,753 Simon Property Group Inc (Reit) 2,315,459 1.00 939 Sinclair Broadcast Group Inc 'A' 29,269 0.01 316 Snap-on Inc 51,470 0.02 2,576 Sohu.com Inc 105,951 0.05 1,204 Sonoco Products Co 57,503 0.02 7,454 Southwest Airlines Co 313,888 0.14 3,740 Southwestern Energy Co 51,201 0.02 2,257 Spectra Energy Corp 72,043 0.03 989 Spirit AeroSystems Holdings Inc 'A' 46,542 0.02 14,415 Starbucks Corp 795,708 0.34 7,570 SuperValu Inc 34,898 0.02 629 Synchronoss Technologies Inc 22,330 0.01 10,155 Synchrony Financial 316,633 0.14 391 SYNNEX Corp 35,272 0.02 4,316 Synopsys Inc 223,396 0.10 2,963 Take-Two Interactive Software Inc 114,698 0.05 3,583 Talen Energy Corp 40,201 0.02 2,600 Tanger Factory Outlet Centers Inc (Reit) 91,572 0.04 22,357 Target Corp 1,547,328 0.67 4,295 Telephone & Data Systems Inc 123,825 0.05 2,976 Tenet Healthcare Corp 85,441 0.04
532 Tenneco Inc 28,914 0.01 2,879 TerraForm Power Inc 'A' 24,587 0.01 6,841 Tessera Technologies Inc 218,844 0.09 21,079 Texas Instruments Inc 1,285,187 0.55 461 Thor Industries Inc 30,219 0.01 13,328 Time Warner Inc 1,005,731 0.43 1,228 TopBuild Corp 44,454 0.02 2,790 Tyson Foods Inc 'A' 182,215 0.08 943 UGI Corp 40,898 0.02 6,644 Umpqua Holdings Corp 106,038 0.05 2,027 United Therapeutics Corp 239,368 0.10 11,972 UnitedHealth Group Inc 1,608,558 0.69 491 Universal Forest Products Inc 41,386 0.02 855 Universal Insurance Holdings Inc 16,553 0.01 3,989 US Bancorp 172,125 0.07 1,146 USG Corp 33,475 0.01 363 Vail Resorts Inc 47,342 0.02 4,555 Valero Energy Corp 249,204 0.11 3,759 VCA Inc 244,711 0.11 1,060 Vector Group Ltd 22,599 0.01 8,476 VeriSign Inc 729,529 0.32 16,065 Verizon Communications Inc 816,745 0.35 4,484 Viacom Inc 'B' 195,502 0.08 21,847 Visa Inc 'A' 1,736,181 0.75 1,030 Walt Disney Co/The 102,155 0.04 231 Waters Corp 31,862 0.01 2,012 Watsco Inc 269,648 0.12 2,534 Weingarten Realty Investors (Reit) 94,721 0.04 30,300 Wells Fargo & Co 1,546,967 0.67 1,775 Western Digital Corp 80,532 0.03 1,137 WestRock Co 45,457 0.02 1,084 Whole Foods Market Inc 34,753 0.02 685 World Fuel Services Corp 31,770 0.01 2,005 WP Glimcher Inc (Reit) 20,090 0.01 2,965 WPX Energy Inc 31,577 0.01 780 Wyndham Worldwide Corp 52,541 0.02 12,989 Xilinx Inc 612,301 0.26 3,274 Xylem Inc/NY 146,020 0.06
117,796,115 50.86
Total Common / Preferred Stocks (Shares) & Rights 226,947,630 97.99
EXCHANGE TRADED FUNDS
France 119,358 Lyxor ETF MSCI India USD 1,799,322 0.78
1,799,322 0.78
Switzerland 475 BB Biotech AG Reg 23,586 0.01
23,586 0.01
Total Exchange Traded Funds 1,822,908 0.79
Total Transferable Securities and Money Market Instruments Admitted to an Official Stock Exchange Listing or Dealt in on Another Regulated Market 228,770,53 98.78
Securities portfolio at market value 228,770,538 98.78
Other Net Assets 2,820,744 1.22
Total Net Assets (USD) 231,591,282 100.00
Portfolio of Investments as at 31 May 2016
United States continued United States continued

Open forward foreign exchange transactions as at 31 May 2016
Currency Purchases Currency Sales CounterpartyMaturity
date
Unrealised appreciation/
(depreciation) USD
Futures contracts as at 31 May 2016
Number of contracts
Currencyof contract Contract/Description
Expiration date
Gross underlying
exposureUSD
Unrealised appreciation/
(depreciation) USD
488 BlackRock Strategic Funds (BSF)
The notes on pages 489 to 503 form an integral part of these financial statements.
BlackRock Systematic Global Equity Fund continued
EUR Hedged Share Class
EUR 4,627 USD 5,260 State Street Bank & Trust Company 15/6/2016 (90)USD 129 EUR 114 State Street Bank & Trust Company 15/6/2016 2
(88)
Total (Gross underlying exposure - USD 5,298) (88)
12 USD E-Mini S&P 500 Index June 2016 1,259,400 11,212 8 EUR Euro STOXX 50 Index June 2016 274,055 2,904 1 GBP FTSE 100 Index June 2016 91,518 (190) 4 USD Mini MSCI Emerging Markets Index June 2016 161,680 2,030 3 JPY Nikkei 225 Index June 2016 232,529 2,902 1 CAD S&P/TSX 60 Index June 2016 126,470 4,596 1 AUD SPI 200 Index June 2016 97,602 5,586 1 CHF Swiss Market Index June 2016 83,154 1,647
Total 2,326,408 30,687
Sector Breakdown as at 31 May 2016
% of Net Assets
Consumer, Non-cyclical 24.13Financial 19.41Communications 11.46Consumer, Cyclical 10.74Industrial 9.67Technology 8.60Energy 5.52Basic Materials 4.60Utilities 3.26Exchange Traded Funds 0.79Diversified 0.60
Securities portfolio at market value 98.78Other Net Assets 1.22
100.00

Annual Report and Audited Accounts 489
Notes to the Financial Statements
1. OrganisationBlackRock Strategic Funds (the “Company”) is a public limited company (société anonyme) established under the laws of the Grand Duchy of Luxembourg as an open-ended variable capital investment company (société d’investissement à capital variable). The Company has been authorised by the Commission de Surveillance du Secteur Financier (the “CSSF”) as a UCITS pursuant to the provisions of Part I of the law of 17 December 2010 relating to undertakings for collective investment, as amended and is regulated pursuant to such law. The Company is an “umbrella” structure comprising a number of different Funds, each having a separate portfolio of investments.
The Company has appointed BlackRock (Luxembourg) S.A. as its Management Company.
As at 31 May 2016, the Company offered shares in 26 Funds (each a “Fund”, together the “Funds”). Each Fund is a separate pool of assets and is represented by separate shares of each Fund which are divided into Share Classes as follows:
A Class
A Class distributing share CHF hedgedA Class distributing share EURA Class distributing share EUR hedgedA Class distributing share USDA Class distributing share USD hedgedA Class distributing UK reporting fund share GBPA Class distributing UK reporting fund share GBP hedgedA Class non-distributing share AUDA Class non-distributing share CHF hedgedA Class non-distributing share EURA Class non-distributing share EUR hedgedA Class non-distributing share SEK hedgedA Class non-distributing share USDA Class non-distributing share USD hedgedA Class non-distributing UK reporting fund share EURA Class non-distributing UK reporting fund share EUR hedgedA Class non-distributing UK reporting fund share GBPA Class non-distributing UK reporting fund share GBP hedged
C Class
C Class non-distributing share USD
D Class
D Class distributing (G) share EURD Class distributing share EURD Class distributing share GBP hedgedD Class distributing share USDD Class distributing share USD hedgedD Class distributing UK reporting fund share GBPD Class distributing UK reporting fund share GBP hedgedD Class non-distributing share CHF hedgedD Class non-distributing share EURD Class non-distributing share EUR hedgedD Class non-distributing share GBP hedgedD Class non-distributing share USDD Class non-distributing share USD hedgedD Class non-distributing UK reporting fund share EURD Class non-distributing UK reporting fund share EUR hedged
D Class continued
D Class non-distributing UK reporting fund share GBPD Class non-distributing UK reporting fund share GBP hedged
E Class
E Class distributing share EURE Class non-distributing share EURE Class non-distributing share EUR hedgedE Class non-distributing share USD
H Class
H Class non-distributing share CHF hedgedH Class non-distributing share USD hedgedH Class non-distributing fund share GBP hedgedH Class non-distributing share EUR
I Class
I Class distributing share EUR 1
I Class distributing share EUR hedged 1
I Class distributing UK reporting fund share GBP 1
I Class distributing UK reporting fund share GBP hedged 1
I Class non-distributing share CAD hedged 1
I Class non-distributing share CHF hedged 1
I Class non-distributing share EUR 1
I Class non-distributing share EUR hedged 1
I Class non-distributing share GBP hedged 1
I Class non-distributing share JPY 1
I Class non-distributing share JPY hedged 1
I Class non-distributing share SEK hedged 1
I Class non-distributing share USD 1
I Class non-distributing UK reporting fund share EUR 1
I Class non-distributing UK reporting fund share GBP hedged 1
I Class non-distributing UK reporting fund share USD hedged 1
J Class
J Class distributing share USD 1
T Class
T Class non-distributing share EUR 1
U Class
U Class non-distributing share CHF hedgedU Class non-distributing share EUR U Class non-distributing UK reporting fund share GBPU Class non-distributing UK reporting fund share USD hedged
X Class
X Class distributing share AUD 1
X Class distributing share EUR 1
X Class non-distributing share AUD hedged 1
X Class non-distributing share EUR 1
X Class non-distributing share EUR hedged 1
X Class non-distributing share GBP 1
X Class non-distributing share GBP hedged 1
X Class non-distributing share USD 1
Z Class
Z Class non-distributing share CHF hedged 2
Z Class non-distributing share EUR hedged 2
Z Class non-distributing share USD 2
Z Class non-distributing UK reporting fund share EUR hedged 2
Z Class non-distributing UK reporting fund share GBP hedged 2
1 available to institutional investors. 2 available at the Management Company’s discretion.

490 BlackRock Strategic Funds (BSF)
The classes of shares have equivalent rights in the Company but carry different features and charging structures which are more fully described in the Company’s Prospectus.
Significant events during the yearEffective 5 August 2015, the BlackRock Global Event Driven Fund, denominated in USD was launched.
In a letter to shareholders dated 19 August 2015, the Board of Directors of the Company advised shareholders that the performance fee for the BlackRock Global Absolute Return Bond Fund shall no longer be applicable with effect from 14 August 2015.
In the same letter to shareholders, the Board of Directors of the Company advised shareholders that the legal costs associated with filing EU withholding tax reclaims will no longer be paid out of the administration fee, but will instead be paid for directly by the relevant Funds with effect from 19 September 2015, as the Company has had a good degree of success with its reclaims and the tax recovered has substantially outweighed the associated legal costs of filing such reclaims. Such costs will be allocated between the relevant Funds (plus any taxes thereon) on a fair and equitable basis.
Effective 19 August 2015, the BlackRock European Select Strategies Fund, denominated in EUR was launched.
Effective 20 August 2015, the BlackRock Impact World Equity Fund, denominated in USD was launched.
Effective 18 September 2015, the BlackRock Emerging Markets Equity Strategies Fund and the BlackRock Systematic Global Equity Fund, both denominated in USD were launched.
Effective 27 October 2015, the BlackRock European Absolute Return Fund reached its capacity limit, closing the Fund to new subscriptions, in order to ensure that the Fund can be optimally managed and for the interests of shareholders to be protected.
Effective 30 November 2015, the BlackRock European Constrained Credit Strategies Fund, denominated in EUR was terminated.
Effective 18 January 2016 BlackRock Investment Management (UK) Limited replaced BlackRock (Channel Islands) Limited as Principal Distributor to the Company.
A new Prospectus was issued on 14 August 2015 and subsequently on 20 January 2016.
Effective 28 January 2016, the BlackRock Multi-Manager Alternative Strategies Fund, denominated in USD was launched.
Effective 29 February 2016, the BlackRock Style Advantage Fund, denominated in USD was launched.
During the year, the Company commenced a securities lending program. See further information in Note 16: Efficient Portfolio Management Techniques.
During the year, the Company entered into a credit facility agreement. See further information in Note 13: Credit Facility.
Notes to the Financial Statements continued
Share Classes Launched
Effective date Type Fund
3 June 2015 D Class non-distributing share CHF hedged BlackRock Americas Diversified Equity Absolute Return Fund3 June 2015 A Class non-distributing UK reporting fund
share EUR BlackRock Managed Index Portfolios – Defensive3 June 2015 A Class non-distributing UK reporting fund
share EUR BlackRock Managed Index Portfolios – Growth3 June 2015 A Class non-distributing UK reporting fund
share EUR BlackRock Managed Index Portfolios – Moderate10 June 2015 D Class distributing (G) share EUR BlackRock European Opportunities Extension Fund17 June 2015 D Class distributing share USD hedged BlackRock Managed Index Portfolios – Defensive17 June 2015 D Class distributing share USD hedged BlackRock Managed Index Portfolios – Growth17 June 2015 D Class distributing share USD hedged BlackRock Managed Index Portfolios – Moderate
1 July 2015 D Class non-distributing share GBP hedged BlackRock Americas Diversified Equity Absolute Return Fund15 July 2015 I Class non-distributing share CHF hedged BlackRock European Credit Strategies Fund15 July 2015 X Class distributing share EUR BlackRock Fixed Income Strategies Fund29 July 2015 E Class non-distributing share EUR hedged BlackRock Americas Diversified Equity Absolute Return Fund
5 August 2015 A Class non-distributing share USD BlackRock Global Event Driven Fund5 August 2015 D Class non-distributing share USD BlackRock Global Event Driven Fund5 August 2015 X Class non-distributing share USD BlackRock Global Event Driven Fund5 August 2015 Z Class non-distributing share USD BlackRock Global Event Driven Fund
12 August 2015 A Class distributing share EUR BlackRock Managed Index Portfolios – Defensive12 August 2015 A Class distributing share EUR BlackRock Managed Index Portfolios – Growth

Annual Report and Audited Accounts 491
Notes to the Financial Statements continued
Effective date Type Fund
12 August 2015 A Class distributing share EUR BlackRock Managed Index Portfolios – Moderate19 August 2015 A Class non-distributing share EUR BlackRock European Select Strategies Fund19 August 2015 D Class non-distributing share EUR BlackRock European Select Strategies Fund19 August 2015 E Class non-distributing share EUR BlackRock European Select Strategies Fund19 August 2015 E Class distributing share EUR BlackRock European Select Strategies Fund19 August 2015 I Class distributing share EUR BlackRock European Select Strategies Fund19 August 2015 X Class non-distributing share EUR BlackRock European Select Strategies Fund20 August 2015 A Class non-distributing share USD BlackRock Impact World Equity Fund 20 August 2015 D Class non-distributing share EUR BlackRock Impact World Equity Fund 20 August 2015 X Class non-distributing share GBP BlackRock Impact World Equity Fund 26 August 2015 U Class non-distributing share CHF hedged BlackRock European Credit Strategies Fund26 August 2015 E Class non-distributing share EUR BlackRock Global Event Driven Fund
2 September 2015 E Class non-distributing share EUR BlackRock Impact World Equity Fund 2 September 2015 I Class non-distributing share JPY BlackRock Impact World Equity Fund 2 September 2015 I Class non-distributing share JPY hedged BlackRock Impact World Equity Fund 2 September 2015 D Class non-distributing share USD hedged BlackRock Managed Index Portfolios – Defensive2 September 2015 D Class non-distributing share USD hedged BlackRock Managed Index Portfolios – Growth2 September 2015 D Class non-distributing share USD hedged BlackRock Managed Index Portfolios – Moderate9 September 2015 E Class non-distributing share USD hedged BlackRock Global Event Driven Fund
18 September 2015 A Class non-distributing share USD BlackRock Emerging Markets Equity Strategies Fund18 September 2015 X Class non-distributing share USD BlackRock Emerging Markets Equity Strategies Fund18 September 2015 Z Class non-distributing share USD BlackRock Emerging Markets Equity Strategies Fund18 September 2015 A Class non-distributing share USD BlackRock Systematic Global Equity Fund18 September 2015 D Class non-distributing share EUR BlackRock Systematic Global Equity Fund18 September 2015 E Class non-distributing share EUR BlackRock Systematic Global Equity Fund18 September 2015 E Class non-distributing share EUR hedged BlackRock Systematic Global Equity Fund18 September 2015 X Class non-distributing share GBP BlackRock Systematic Global Equity Fund23 September 2015 Z Class non-distributing UK reporting fund
share EUR hedged BlackRock Global Event Driven Fund23 September 2015 Z Class non-distributing UK reporting fund
share GBP hedged BlackRock Global Event Driven Fund30 September 2015 A Class non-distributing share USD hedged BlackRock Managed Index Portfolios – Defensive30 September 2015 A Class non-distributing share USD hedged BlackRock Managed Index Portfolios – Growth30 September 2015 A Class non-distributing share USD hedged BlackRock Managed Index Portfolios – Moderate
14 October 2015 D Class non-distributing share EUR BlackRock Managed Index Portfolios – Defensive14 October 2015 D Class non-distributing share EUR BlackRock Managed Index Portfolios – Growth14 October 2015 D Class non-distributing share EUR BlackRock Managed Index Portfolios – Moderate21 October 2015 D Class distributing share USD BlackRock Emerging Markets Flexi Dynamic Bond Fund21 October 2015 A Class distributing share EUR BlackRock European Select Strategies Fund28 October 2015 D Class distributing share USD hedged BlackRock European Select Strategies Fund
11 November 2015 D Class non-distributing share CHF hedged BlackRock Global Absolute Return Bond Fund11 November 2015 X Class distributing share AUD BlackRock Impact World Equity Fund 18 November 2015 D Class non-distributing share EUR BlackRock Emerging Markets Equity Strategies Fund18 November 2015 D Class non-distributing share USD BlackRock Emerging Markets Equity Strategies Fund18 November 2015 E Class non-distributing share EUR BlackRock Emerging Markets Equity Strategies Fund25 November 2015 I Class non-distributing share EUR hedged BlackRock Americas Diversified Equity Absolute Return Fund
2 December 2015 D Class non-distributing share EUR hedged BlackRock Emerging Markets Equity Strategies Fund6 January 2016 I Class non-distributing share SEK hedged BlackRock European Diversified Equity Absolute Return Fund
20 January 2016 Z Class non-distributing share CHF hedged BlackRock Global Event Driven Fund28 January 2016 A Class non-distributing share USD BlackRock Multi-Manager Alternative Strategies Fund28 January 2016 D Class non-distributing share EUR hedged BlackRock Multi-Manager Alternative Strategies Fund28 January 2016 I Class non-distributing share EUR hedged BlackRock Multi-Manager Alternative Strategies Fund28 January 2016 X Class non-distributing share EUR hedged BlackRock Multi-Manager Alternative Strategies Fund28 January 2016 X Class non-distributing share USD BlackRock Multi-Manager Alternative Strategies Fund28 January 2016 Z Class non-distributing share EUR hedged BlackRock Multi-Manager Alternative Strategies Fund28 January 2016 Z Class non-distributing share USD BlackRock Multi-Manager Alternative Strategies Fund28 January 2016 Z Class non-distributing UK reporting fund
share GBP hedged BlackRock Multi-Manager Alternative Strategies Fund10 February 2016 X Class non-distributing share GBP hedged BlackRock Emerging Markets Flexi Dynamic Bond Fund

492 BlackRock Strategic Funds (BSF)
Notes to the Financial Statements continued
Effective date Type Fund
29 February 2016 A Class non-distributing share USD BlackRock Style Advantage Fund29 February 2016 D Class non-distributing share EUR hedged BlackRock Style Advantage Fund29 February 2016 I Class non-distributing share EUR hedged BlackRock Style Advantage Fund29 February 2016 X Class non-distributing share AUD hedged BlackRock Style Advantage Fund29 February 2016 X Class non-distributing share USD BlackRock Style Advantage Fund29 February 2016 Z Class non-distributing share EUR hedged BlackRock Style Advantage Fund29 February 2016 Z Class non-distributing share USD BlackRock Style Advantage Fund29 February 2016 Z Class non-distributing UK reporting fund
share GBP hedged BlackRock Style Advantage Fund2 March 2016 I Class non-distributing share CAD hedged BlackRock Euro Dynamic Diversified Growth Fund2 March 2016 D Class non-distributing UK reporting fund
share EUR hedged BlackRock Global Event Driven Fund2 March 2016 D Class non-distributing UK reporting fund
share GBP hedged BlackRock Global Event Driven Fund2 March 2016 D Class non-distributing share EUR BlackRock Multi-Manager Alternative Strategies Fund2 March 2016 D Class non-distributing share USD BlackRock Multi-Manager Alternative Strategies Fund2 March 2016 E Class non-distributing share EUR BlackRock Multi-Manager Alternative Strategies Fund2 March 2016 E Class non-distributing share EUR hedged BlackRock Multi-Manager Alternative Strategies Fund9 March 2016 A Class non-distributing UK reporting fund
share EUR hedged BlackRock Global Event Driven Fund9 March 2016 A Class distributing share EUR hedged BlackRock Multi-Manager Alternative Strategies Fund9 March 2016 A Class distributing share USD BlackRock Multi-Manager Alternative Strategies Fund
16 March 2016 D Class non-distributing share EUR BlackRock Style Advantage Fund16 March 2016 D Class non-distributing share USD BlackRock Style Advantage Fund16 March 2016 E Class non-distributing share EUR BlackRock Style Advantage Fund16 March 2016 E Class non-distributing share EUR hedged BlackRock Style Advantage Fund23 March 2016 I Class non-distributing share EUR hedged BlackRock Global Event Driven Fund
6 April 2016 D Class non-distributing share CHF hedged BlackRock Global Event Driven Fund13 April 2016 A Class distributing share EUR hedged BlackRock Style Advantage Fund13 April 2016 A Class distributing share USD BlackRock Style Advantage Fund13 April 2016 I Class non-distributing share EUR BlackRock Systematic Global Equity Fund20 April 2016 I Class non-distributing share USD BlackRock Multi-Manager Alternative Strategies Fund27 April 2016 A Class non-distributing share CHF hedged BlackRock Global Event Driven Fund
4 May 2016 A Class non-distributing share EUR hedged BlackRock Multi-Manager Alternative Strategies Fund25 May 2016 I Class distributing share EUR hedged BlackRock Emerging Markets Flexi Dynamic Bond Fund25 May 2016 D Class non-distributing share CHF hedged BlackRock Multi-Manager Alternative Strategies Fund
Share Classes Closed
Effective date Type Fund
4 June 2015 X Class non-distributing share USD hedged BlackRock European Credit Strategies Fund12 August 2015 D Class distributing share EUR BlackRock European Opportunities Extension Fund
16 September 2015 X Class non-distributing share USD BlackRock Emerging Markets Absolute Return Fund30 November 2015 I Class non-distributing share EUR BlackRock European Constrained Credit Strategies Fund
2. Summary of Significant Accounting Policies:The financial statements have been prepared in accordance with generally accepted accounting principles in Luxembourg and with the legal and regulatory requirements relating to the preparation of the financial statements as prescribed by the Luxembourg authorities for Luxembourg investment companies and generally accepted accounting principles and include the following significant accounting policies:
(a) Valuation of Investments and Other Assets
The Company’s investments and other assets are valued as follows:
} the value of all securities and other assets forming any particular Fund’s portfolio is determined by last known prices upon close of the exchange on which those securities or assets are traded or admitted for trading. For securities traded on markets closing after the time of the valuation, last known prices as of this time or such other time may be used. The value of any securities or assets traded on any other regulated market is determined in the same way.
Where such securities or other assets are quoted or dealt in on more than one stock exchange or regulated market the Board of Directors of the Company may in their discretion

Annual Report and Audited Accounts 493
Notes to the Financial Statements continued
select one of such stock exchanges or regulated markets for such purposes;
} for non-quoted securities or securities not traded or dealt in on any stock exchange or other regulated market (including securities of closed-ended investment funds), as well as quoted or non quoted securities on such other markets for which no valuation price is available, or securities for which the quoted prices are, in the opinion of the Board of Directors of the Company, not representative of the fair market value, the value shall be determined prudently and in good faith by the Board of Directors of the Company on the basis of their expected disposal or acquisition price;
} investments in open-ended collective investment schemes are valued on the basis of the last available net asset value (“NAV”) of the units or shares of such collective investment scheme;
} securities lending: securities are delivered to a third party broker in accordance with lending agent instructions, the assets of which continue to be valued as part of the portfolio of the Fund;
} liquid assets such as time deposits and money market instruments are valued at amortised cost basis which approximates their fair value;
} cash and prepaid expenses are valued at their nominal amount;
} assets which include, in particular, interest and dividends receivable, receivable for investments sold and receivable for Fund shares subscribed are valued at nominal value;
} liabilities which include, in particular, interest and dividends payable, income distribution payable, payable for investments purchased and payable for Fund shares redeemed are valued at nominal value.
(b) Realised gains and losses on Sales of Investments
Realised gains and losses on sales of investments have been determined on the basis of the average cost method.
(c) Income/Expense from Investments
The Company takes credit for income from its investments on the following basis:
} interest income is accrued daily and includes the amortisation on a straight line basis of premiums and accretion of discounts;
} bank interest, fixed deposit and money market deposit income are recognised on an accrual basis;
} dividend income is accrued on the ex-dividend date and is shown net of withholding tax.
} securities lending income is accrued on a weekly basis;
} Negative yield expense on financial assets relating to interest from a negative effective interest rate on assets held is accreted daily and is recognised in the Statement of Operations and Changes in Net Assets over the life of the underlying instrument.
(d) Financial Derivative Instruments
During the year, the Funds have entered into a number of forward foreign exchange transactions and futures contracts. Open forward foreign exchange transactions and futures contracts are valued at the fair market value to close the contracts on the valuation date. Surpluses/deficits arising from these and closed unsettled contracts are taken to unrealised appreciation/depreciation and are included under assets or liabilities (as appropriate) in the Statement of Net Assets. The net change in unrealised appreciation or depreciation and the realised gains or losses on settlement or closing transactions of forward foreign exchange transactions and futures contracts are presented in the Statement of Operations and Changes in Net Assets.
The Funds can write covered call and put options or swaptions and purchase call and put options or swaptions. When the Funds write and/or purchase an option or a swaption, an amount equal to the premium received or paid by the Funds is reflected as a liability or an asset. The liability for a written option or swaption and the asset for a purchased option or swaption is subsequently marked to market to reflect the current value of the option or the swaption. When a security is sold or bought through an exercise of an option or a swaption, the premium received (or paid) is deducted from (or added to) the basis of the security sold or bought. When an option or a swaption expires (or the Funds enter into a closing transaction), the Funds realise a gain or loss on the option or the swaption to the extent of the premiums received or paid (or gain or loss to the extent the cost of the closing transactions exceeds premium paid or received). For futures-style options, the Fund does not prepay the premium. The Fund posts margin as in a futures contract, and the option premium is marked to the market daily. The net change in unrealised appreciation or depreciation and the realised gains or losses on expiration or closing transactions of options or swaptions are presented in the Statement of Operations and Changes in Net Assets.
During the year, the Funds have entered into contracts for difference (“CFDs”). CFDs allow investors to take synthetic long or synthetic short positions with a variable margin. Unlike shares, with CFDs the buyer is potentially liable for far more than the amount they paid on margin. This will result in the Funds holding cash received from shareholders on deposit with various institutions as described in the Prospectus. CFD positions are entered into subject to a daily financing charge, applied at a previously agreed rate above or below the applicable benchmark. The related interest income or expense is disclosed net of withholding tax in the Statement of Operations and Changes in Net Assets.

494 BlackRock Strategic Funds (BSF)
Notes to the Financial Statements continued
The market value of the CFDs is determined by the traded price on the exchange on which the underlying securities or assets are traded or admitted for trading. For underlying securities traded on markets closing after the time of the valuation, last known prices as of this time or such other time may be used. The change in market value, if any, is recorded as net change in unrealised appreciation or depreciation in the Statement of Operations and Changes in Net Assets. Realised gains or losses on maturity or termination of the CFDs are presented in the Statement of Operations and Changes in Net Assets.
Realised gains and losses on sales of CFDs have been determined on the basis of the First In First Out (“FIFO”) cost method.
The Funds have entered into swap transactions to exchange the return generated by one instrument for the return generated by another investment. The Funds can write credit default swaps (“CDS”) and purchase CDS. When the Funds write and/or purchase a CDS, a series of premiums is paid to or received by the Funds, in return for a payment contingent on a credit event (predefined in the agreement). The premiums are included in the cost of CDS. Where possible, swaps are marked to market based upon daily prices obtained from third party pricing agents and verified against the actual market maker. Where such quotations are not available swaps are priced based upon daily quotations from the market maker. In both cases changes in quotations are recorded as net change in unrealised appreciation or depreciation in the Statement of Operations and Changes in Net Assets. Realised gains or losses on maturity or termination of the swaps and the interest earned in relation to the swaps are presented in the Statement of Operations and Changes in Net Assets.
Funds may purchase “To Be Announced” securities contracts (“TBAs”). This refers to the common trading practice in the mortgage-backed securities market whereby a contract is purchased which entitles the buyer to a security from a mortgage pool for a fixed price at a future date. At the time of purchase the exact security is not known, but its main characteristics are specified. Although the price has been established at the time of purchase, the principal value has not been finalised. As a TBA is not settled at the time of purchase, this may lead to leveraged positions within a Fund. Purchasing a TBA involves a risk of loss if the value of the security to be purchased declines prior to the settlement date. Risks may also arise upon entering into these contracts from the potential inability of counterparties to meet the terms of their contracts. TBAs are separately disclosed after the Portfolio of Investments.
The Funds may dispose of a commitment prior to settlement if it is deemed appropriate to do so. Proceeds of TBA sales are not received until the contractual settlement date. During the time a TBA sale commitment is outstanding, equivalent deliverable securities, or an offsetting TBA purchase commitment (deliverable on or before the sale commitment date), are held as cover for the transaction.
If the TBA sale commitment is closed through the acquisition of an offsetting purchase commitment, the Fund realises a gain or
loss on the commitment without regard to any unrealised gain or loss on the underlying security. If the Fund delivers securities under the commitment, the Fund realises a gain or loss from the sale of the securities upon the unit price established at the date the commitment was entered into.
The Funds had unsettled TBAs as of 31 May 2016, which are included within receivable for investments sold and payable for investments purchased in the Statement of Net Assets.
The market values of the TBAs are presented in the Statement of Net Assets. The net change in unrealised appreciation or depreciation and the realised gains or losses on sales of the TBAs are presented in the Statement of Operations and Changes in Net Assets.
(e) Foreign Exchange
The cost of investments in currencies other than the currency of denomination of the respective Fund has been translated at the rates of exchange ruling at the time of purchase. Investments and other assets in currencies other than the currency of denomination of the respective Fund have been translated at the exchange rate prevailing at the Fund ’s valuation point in Luxembourg on 31 May 2016. The net change in unrealised appreciation or depreciation and the realised gains or losses on disposal or settlement of other assets or liabilities in currencies other than the currency of denomination of the respective Fund are presented in the Statement of Operations and Changes in Net Assets.
Income and expenses in currencies other than the currency of denomination of the respective Fund have been translated at the rates of exchange prevailing on transaction date.
The following exchange rates were used to translate the investments and other assets and other liabilities denominated in currencies for all Funds other than the base currency of the Fund at the respective Funds’ valuation point at 31 May 2016:
All Funds (except the BlackRock Euro Dynamic Diversified Growth Fund and BlackRock Latin American Opportunities Fund)
BlackRock Euro Dynamic Diversified Growth Fund
BlackRock Latin American Opportunities Fund
CCY EUR USD EUR USD
AED 0.2437 0.2722 0.2446 0.2722ARS 0.0640 0.0715 0.0641 0.0715AUD 0.6494 0.7254 0.6508 0.7228BRL 0.2497 0.2789 0.2494 0.2767CAD 0.6858 0.7660 0.6867 0.7626CHF 0.9045 1.0103 0.9035 1.0060CLP 0.0013 0.0015 0.0013 0.0014CNY 0.1360 0.1519 0.1364 0.1519COP 0.0003 0.0003 0.0003 0.0003CZK 0.0370 0.0413 0.0370 0.0412DKK 0.1345 0.1502 0.1344 0.1496EUR 1.0000 1.1170 1.0000 1.1127GBP 1.3111 1.4644 1.3074 1.4483HKD 0.1153 0.1287 0.1156 0.1287
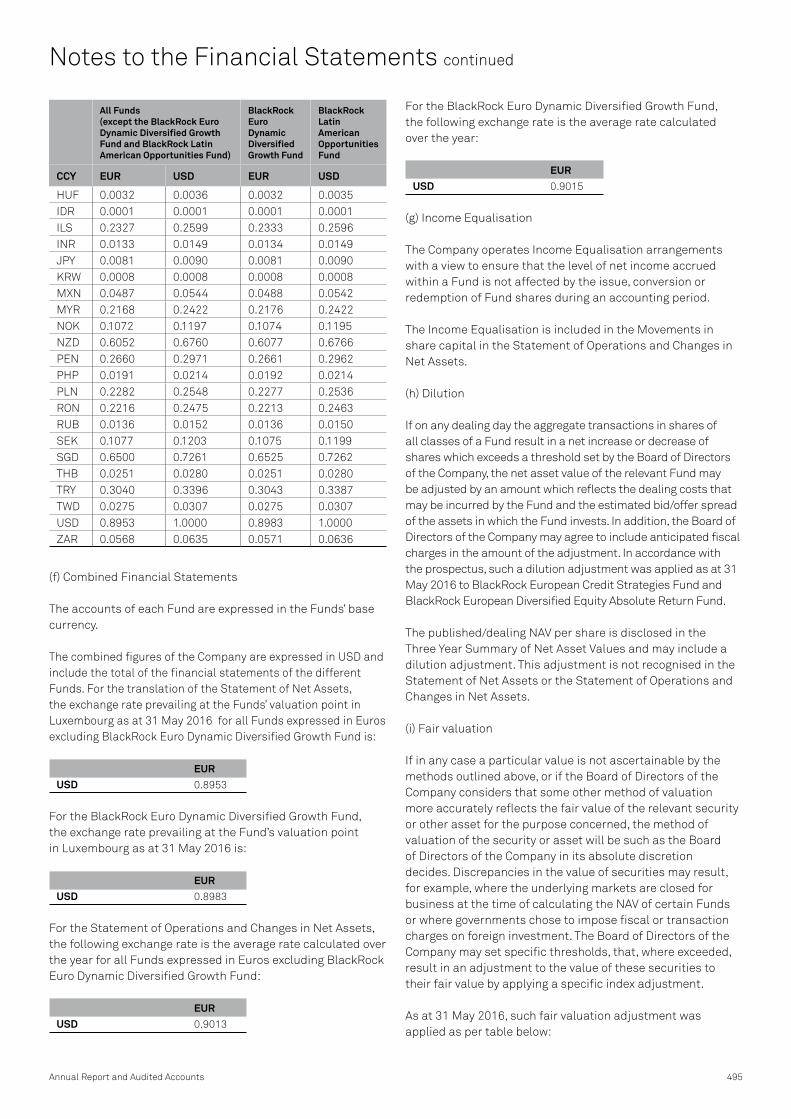
Annual Report and Audited Accounts 495
Notes to the Financial Statements continued
All Funds (except the BlackRock Euro Dynamic Diversified Growth Fund and BlackRock Latin American Opportunities Fund)
BlackRock Euro Dynamic Diversified Growth Fund
BlackRock Latin American Opportunities Fund
CCY EUR USD EUR USD
HUF 0.0032 0.0036 0.0032 0.0035IDR 0.0001 0.0001 0.0001 0.0001ILS 0.2327 0.2599 0.2333 0.2596INR 0.0133 0.0149 0.0134 0.0149JPY 0.0081 0.0090 0.0081 0.0090KRW 0.0008 0.0008 0.0008 0.0008MXN 0.0487 0.0544 0.0488 0.0542MYR 0.2168 0.2422 0.2176 0.2422NOK 0.1072 0.1197 0.1074 0.1195NZD 0.6052 0.6760 0.6077 0.6766PEN 0.2660 0.2971 0.2661 0.2962PHP 0.0191 0.0214 0.0192 0.0214PLN 0.2282 0.2548 0.2277 0.2536RON 0.2216 0.2475 0.2213 0.2463RUB 0.0136 0.0152 0.0136 0.0150SEK 0.1077 0.1203 0.1075 0.1199SGD 0.6500 0.7261 0.6525 0.7262THB 0.0251 0.0280 0.0251 0.0280TRY 0.3040 0.3396 0.3043 0.3387TWD 0.0275 0.0307 0.0275 0.0307USD 0.8953 1.0000 0.8983 1.0000ZAR 0.0568 0.0635 0.0571 0.0636
(f) Combined Financial Statements
The accounts of each Fund are expressed in the Funds’ base currency.
The combined figures of the Company are expressed in USD and include the total of the financial statements of the different Funds. For the translation of the Statement of Net Assets, the exchange rate prevailing at the Funds’ valuation point in Luxembourg as at 31 May 2016 for all Funds expressed in Euros excluding BlackRock Euro Dynamic Diversified Growth Fund is:
EURUSD 0.8953
For the BlackRock Euro Dynamic Diversified Growth Fund, the exchange rate prevailing at the Fund’s valuation point in Luxembourg as at 31 May 2016 is:
EURUSD 0.8983
For the Statement of Operations and Changes in Net Assets, the following exchange rate is the average rate calculated over the year for all Funds expressed in Euros excluding BlackRock Euro Dynamic Diversified Growth Fund:
EURUSD 0.9013
For the BlackRock Euro Dynamic Diversified Growth Fund, the following exchange rate is the average rate calculated over the year:
EURUSD 0.9015
(g) Income Equalisation
The Company operates Income Equalisation arrangements with a view to ensure that the level of net income accrued within a Fund is not affected by the issue, conversion or redemption of Fund shares during an accounting period.
The Income Equalisation is included in the Movements in share capital in the Statement of Operations and Changes in Net Assets.
(h) Dilution
If on any dealing day the aggregate transactions in shares of all classes of a Fund result in a net increase or decrease of shares which exceeds a threshold set by the Board of Directors of the Company, the net asset value of the relevant Fund may be adjusted by an amount which reflects the dealing costs that may be incurred by the Fund and the estimated bid/offer spread of the assets in which the Fund invests. In addition, the Board of Directors of the Company may agree to include anticipated fiscal charges in the amount of the adjustment. In accordance with the prospectus, such a dilution adjustment was applied as at 31 May 2016 to BlackRock European Credit Strategies Fund and BlackRock European Diversified Equity Absolute Return Fund.
The published/dealing NAV per share is disclosed in the Three Year Summary of Net Asset Values and may include a dilution adjustment. This adjustment is not recognised in the Statement of Net Assets or the Statement of Operations and Changes in Net Assets.
(i) Fair valuation
If in any case a particular value is not ascertainable by the methods outlined above, or if the Board of Directors of the Company considers that some other method of valuation more accurately reflects the fair value of the relevant security or other asset for the purpose concerned, the method of valuation of the security or asset will be such as the Board of Directors of the Company in its absolute discretion decides. Discrepancies in the value of securities may result, for example, where the underlying markets are closed for business at the time of calculating the NAV of certain Funds or where governments chose to impose fiscal or transaction charges on foreign investment. The Board of Directors of the Company may set specific thresholds, that, where exceeded, result in an adjustment to the value of these securities to their fair value by applying a specific index adjustment.
As at 31 May 2016, such fair valuation adjustment was applied as per table below:

496 BlackRock Strategic Funds (BSF)
Notes to the Financial Statements continued
Fund Currency Market value of fair valued securities
% of Net Assets
BlackRock European Credit Strategies Fund
EUR 14,196,885 3.42
BlackRock Fixed Income Strategies Fund
EUR — 0.00
(j) Transaction costs
Transaction costs are incremental costs that are directly attributable to the acquisition, issue or disposal of securities. An incremental cost is one that would not have been incurred if the entity had not acquired, issued or disposed of the security. When a security is recognised initially, it is measured at its market value, plus transaction costs that are directly attributable to the acquisition or issue of the security. Refer to Note 12 for further information.
Transaction costs excluding custodian transaction fees on purchases or sales of securities are included within net realised gain/(loss) or net change in unrealised appreciation/(depreciation) within the Statement of Operations and Changes in Net Assets of each Fund. Custodian transaction fees are included in Custodian and depositary fees in the Statement of Operations and Changes in Net Assets of the Fund. Refer to Note 6 for further information.
(k) Foreign currencies on other transactions
Foreign currencies on other transactions relate to realised and unrealised appreciation or depreciation on cash balances and spot contracts.
3. Management CompanyBlackRock (Luxembourg) S.A. has been appointed by the Company to act as its Management Company. The Management Company is authorised to act as a Fund Management Company in accordance with Chapter 15 of the amended 17 December 2010 Law relating to undertakings for collective investment.
The Company has signed a management company agreement with the Management Company. Under this agreement, the Management Company is entrusted with the day-to-day management of the Company, with responsibility for performing directly or by way of delegation all operational functions relating to the Company’s investment management, administration and marketing of the Funds.
In agreement with the Company, the Management Company has decided to delegate several of its functions as is further described in the Prospectus.
BlackRock (Luxembourg) S.A. is a wholly owned subsidiary within the BlackRock Group. It is regulated by the CSSF.
4. Management, External Sub-Advisory and Distribution FeesDuring the year the Company paid management fees to the Management Company.
The Company pays management fees at an annual rate as shown in Appendix F of the Prospectus. The level of management fee varies from 0.37% to 2.00% of the NAV, with the exception of Class X shares, which do not pay a management fee but rather a fee to the Investment Adviser or affiliates under an agreement. The level of management fee varies according to which Fund and Share Class the investor buys. These fees accrue daily, are based on the NAV of the relevant Fund and are paid monthly. Certain costs and fees are paid out of the management fee, including the fees of the Investment Advisers.
In respect of the BlackRock Multi-Manager Alternative Strategies Fund, the Company pays the applicable external sub-advisory fees at an aggregate amount of up to 1.00% per annum with the exception of Class X, which do not pay external sub-advisory fees.
Detailed below are the fees paid to each External Sub-Adviser for BlackRock Multi-Manager Alternative Strategies Fund for the year ended 31 May 2016.
External Sub-Adviser Sub-Advisory Fees
Benefit Street Partners LLC 40,221Boussard & Gavaudan Asset Management LP 42,492GSA Capital Partners LLP 50,033LibreMax Capital LLC 27,787Pine River Capital Management LP 26,868QMS Capital Management LP 15,805
Where a Fund invests a substantial proportion of its net assets in other UCITS and other Undertakings for Collective Investment (“UCIs”), the Investment Adviser will ensure that the total management fee (excluding any performance fee, if any) charged to such Fund (including management fees from other UCITS and UCIs in which it invests) shall not exceed 3.75% of the NAV of the Fund.
During the year, the following Funds were subject to management fee rebate linked to investments into target funds managed by BlackRock:
BlackRock Emerging Markets Absolute Return Fund, BlackRock Euro Dynamic Diversified Growth Fund, BlackRock European Credit Strategies Fund, BlackRock European Select Strategies Fund, BlackRock Fixed Income Strategies Fund, BlackRock Managed Index Portfolios – Defensive, BlackRock Managed Index Portfolios – Growth, BlackRock Managed Index Portfolios – Moderate.
During the year, the following Funds were subject to fee reimbursement from the Management Company:
BlackRock Emerging Markets Equity Strategies Fund, BlackRock Emerging Markets Flexi Dynamic Bond Fund, BlackRock European Select Strategies Fund, BlackRock Global Event Driven Fund, BlackRock Latin American Opportunities Fund, BlackRock Managed Index Portfolios – Defensive, BlackRock Managed Index Portfolios – Growth, BlackRock Managed Index Portfolios – Moderate, BlackRock

Annual Report and Audited Accounts 497
Notes to the Financial Statements continued
Multi-Manager Alternative Strategies Fund, BlackRock Systematic European Equity Fund, BlackRock Systematic Global Equity Fund.
During the year, the Company paid distribution fees to BlackRock Investment Management (UK) Limited (to BlackRock (Channel Islands) Limited until 18 January 2016) who acted as Principal Distributor.
The Company pays annual distribution fees of 1.00% of the NAV for Class C Shares and 0.50% of the NAV for Class E Shares. These fees accrue daily, are based on the NAV of the relevant Fund reflecting, when applicable, any adjustment to the NAV of the relevant Fund, and are paid monthly.
The management and distribution fees per Share Class per Fund are disclosed in detail in the Prospectus and KIID of the Company.
5. Administration FeesThe Company pays an administration fee to the Management Company.
The level of administration fee may vary at the Board of Directors of the Company’s discretion, as agreed with the Management Company, and will apply at different rates across the various Funds and Share Classes issued by the Company. However, it has been agreed between the Board of Directors of the Company and the Management Company that the administration fee currently paid shall not exceed 0.30% per annum. It is accrued daily, based on the NAV of the relevant Share Class and paid monthly.
The Board of Directors of the Company and the Management Company set the level of the administration fee at a rate which aims to ensure that the total expense ratio of each Fund remains competitive when compared across a broad market of similar investment products available to investors in the Funds, taking into account a number of criteria such as the market sector of each Fund and the Fund’s performance relative to its peer group.
The administration fee is used by the Management Company to meet all fixed and variable operating and administrative costs and expenses incurred by the Company, with the exception of the custodian fees, distribution fees and securities lending fees, and any legal costs relating to European Union withholding tax reclaims, plus any taxes thereon and any taxes at an investment or Company level.
From 19 September 2015 any legal costs relating to European Union withholding tax reclaims are paid by the Company and will be allocated between the relevant Funds (plus any taxes thereon) on a fair and equitable basis. Prior to this date, such legal costs were paid out of the Administration Fee.
These operating and administrative expenses include all third party expenses and other recoverable costs incurred by or on behalf of the Company from time to time, including but not limited to, fund accounting fees, transfer agency fees (including sub-transfer agency and associated
platform dealing charges), all professional costs, such as consultancy, legal, tax advisory and audit fees, Directors’ fees, travel expenses, reasonable out-of-pocket expenses, printing, publication, translation and all other costs relating to shareholder reporting, regulatory filing and licence fees, correspondent and other banking charges, software support and maintenance, operational costs and expenses attributed to the Investor Servicing teams and other global administration services provided by various BlackRock Group companies.
The Management Company bears the financial risk of ensuring that the Funds’ total expense ratio remains competitive. Accordingly the Management Company is entitled to retain any amount of the administration fee paid to it which is in excess of the actual expenses incurred by the Company during any year whereas any costs and expenses incurred by the Company in any year which exceed the amount of administration fee that is paid to the Management Company, shall be borne by the Management Company or another BlackRock Group company.
Directors of the Fund who are not employees of the BlackRock Group received a fee of EUR 30,000 per annum gross of taxation in return for their duties performed during the year ended 31 May 2016. The Chairman receives a fee of EUR 33,500 per annum gross of taxation. Directors who are employees of the BlackRock Group are not entitled to receive a Directors fee.
The administration fee includes amounts paid to Deloitte Audit S.à r.l. relating to audit and audit related services. Detailed below are the fees paid to Deloitte Audit S.à r.l. for the year ended 31 May 2016.
31 May 2016 USD
Audit and audit related services 376,268
Non-audit services –
There were no fees paid to Deloitte Audit S.à r.l. other than those disclosed above.
6. Custodian and Depositary FeesThe Custodian receives a fee in respect of each Fund. These fees are to remunerate the Custodian for safekeeping and transaction costs applicable to each Fund. These fees will vary in respect of each Fund depending on the value of assets under management and the volume of trading in that Fund.
For Funds which have a low volume of trading the safekeeping fee which accrues daily, will range from 0.005% to 0.40% per annum and the transaction fees will range from USD 7 to USD 125 per transaction.
For Funds which engage in higher trading volumes, the Custodian does not charge separate safekeeping and transaction fees. The Custodian receives a fee which is charged on a sliding scale, based on the value of assets under management and the volume of trading within each Fund. These fees range from 1 basis point to 20 basis points

498 BlackRock Strategic Funds (BSF)
Notes to the Financial Statements continued
(15 basis points prior to 14 August 2015) of assets under management of each Fund, depending on whether a particular Fund is considered to be a ‘medium volume trading Fund’ or ‘high volume trading Fund’.
Each of the Funds is also subject to a minimum annual fee which will be set at either, USD 30,000 for the aggregate of low volume trading Funds, USD 100,000 for each medium volume trading Fund, USD 150,000 for each high volume trading Fund and USD 350,000 for each very high trading volume Fund.
Trading volumes for each Fund vary according to the investment strategy of each Fund. The combined custody cost to each Fund depends on its asset allocation and trading activity at any time.
7. Performance FeesA performance fee may be payable out of each Share Class of each Fund with the exception of Class X shares which do not pay a performance fee, in addition to other fees and expenses mentioned in the Prospectus. The performance fee accrues on each Valuation Day and is equal to 10% (until 14 August 2015), 20% or 24% (as applicable to the relevant Fund, as stated in Appendix F of the Prospectus) of the amount by which the NAV per share return exceeds the appropriate benchmark return described in further detail in Appendix E of the Prospectus. Two methods of calculation are used and are referred to as Type A and Type B – the method applicable to each Fund is indicated in Appendix E of the Prospectus.
Crystallisation of the performance fee occurs on the last day of each Performance Period or where a shareholder redeems or converts all or part of his shares before the end of a Performance Period.
8. TaxesLuxembourgThe Company is registered under Luxembourg law as an investment company. Accordingly, no Luxembourg income or capital gains tax is at present payable by the Company. However, it is subject to an annual “taxe d’abonnement” calculated at an annual rate of 0.05%, and in the case of all Class I, Class J, Class T and Class X Shares, of 0.01% of the NAV of each Fund at the end of each quarter. For the year ended 31 May 2016, USD 5,487,860 was charged in relation to Luxembourg tax.
BelgiumThe Company is registered with the Banking and Finance Commission in Belgium in accordance with Article 154 of the Law of 3 August 2012 relating to financial transactions and the financial markets. Funds registered for public distribution in Belgium are subject to an annual tax of 0.0925% on the net assets value of units distributed in Belgium via Belgian intermediaries as at 31 December of the previous year. For the year ended 31 May 2016, USD 76,656 was charged in relation to Belgian tax.
United KingdomReporting FundsThe UK Reporting Funds regime applies to the Company. Under this regime, investors in UK Reporting Funds are subject to tax on the share of the UK Reporting Funds income attributable to their holdings in the Fund, whether or not distributed, but any gains on disposal of their holdings are subject to capital gains tax. A list of the Funds which currently have UK Reporting Fund status is available at: https://www.gov.uk/government/publications/offshore-funds-list-of-reporting-funds.
Other transaction taxesOther jurisdictions may impose taxes, financial transactions taxes (“FTT”) or other transaction taxes on certain assets held by the Funds (for example UK stamp duty, French FTT).
Withholding taxDividends and interest received by the Company on its investments may be subject to withholding taxes in the countries of origin which are generally irrecoverable as the Company itself is exempt from income tax. Recent European Union case law may, however, reduce the amount of such irrecoverable tax. Investors should inform themselves of, and when appropriate consult their professional advisers on, the possible tax consequences of subscribing for, buying, holding, redeeming, converting or selling Shares under the laws of their country of citizenship, residence or domicile. Investors should note that the levels and bases of, and reliefs from, taxation can change. The potential of withholding tax charges is further described in the Prospectus.
9. Investment AdvisersThe Management Company, BlackRock (Luxembourg) S.A., has delegated some management and provision of investment advice to the Investment Advisers: BlackRock Financial Management, Inc. (BFM Inc.), BlackRock Institutional Trust Company N.A. (BTC), BlackRock Investment Management LLC (BIMLLC), BlackRock Investment Management (UK) Limited (BIM UK) and BlackRock (Singapore) Limited (BLKSin) as described in the Prospectus.
The Investment Advisers provide advice and management in the areas of stock and sector selection and strategic allocation. BIM UK has sub-delegated some of these functions to BlackRock Asset Management North Asia Limited (BAMNA) and BlackRock Investment Management (Australia) Limited (BLKAUS) and, in relation to the BlackRock Multi-Manager Alternative Strategies Fund, the External Sub-Advisers: Benefit Street Partners LLC (Benefit Street), Boussard & Gavaudan Asset Management LP (Boussard & Gavaudan), GSA Capital Partners LLP (GSA), LibreMax Capital LLC (LibreMax), Pine River Capital Management LP (PRCMLP), QMS Capital Management LP (QMS). Notwithstanding the appointment of the Investment Advisers, the Management Company accepts full responsibility to the Company for all investment transactions.

Annual Report and Audited Accounts 499
Notes to the Financial Statements continued
FundInvestment
Adviser(s)
Sub-Investment
Adviser(s)
External Sub-Investment
Adviser(s)
BlackRock Americas Diversified Equity Absolute Return Fund BTC – –BlackRock Asia Extension Fund BTC – –BlackRock Emerging Markets Absolute Return Fund BIM UK – –BlackRock Emerging Markets Allocation Fund
BTC, BIM UK, BLKSin BAMNA –
BlackRock Emerging Markets Equity Strategies Fund BIM UK – –BlackRock Emerging Markets Flexi Dynamic Bond Fund BIM UK – –BlackRock Euro Dynamic Diversified Growth Fund BIM UK – –BlackRock European Absolute Return Fund BIM UK – –BlackRock European Constrained Credit Strategies Fund(1)
BIM UK, BFM Inc. – –
BlackRock European Credit Strategies Fund
BIM UK, BFM Inc. – –
BlackRock European Diversified Equity Absolute Return Fund BIM UK – –BlackRock European Opportunities Extension Fund BIM UK – –BlackRock European Select Strategies Fund BIM UK – –BlackRock Fixed Income Strategies Fund BIM UK – –BlackRock Global Absolute Return Bond Fund
BTC, BIM UK, BFM Inc., BLKSin
BAMNA, BLKAUS –
BlackRock Global Event Driven Fund BIMLLC – –BlackRock Global Long/Short Equity Fund
BIM UK, BFM Inc. – –
BlackRock Impact World Equity Fund BIMLLC – –BlackRock Latin American Opportunities Fund BIMLLC – –BlackRock Managed Index Portfolios – Defensive
BIM UK, BIMLLC – –
BlackRock Managed Index Portfolios – Growth
BIM UK, BIMLLC – –
BlackRock Managed Index Portfolios – Moderate
BIM UK, BIMLLC – –
BlackRock Multi-Manager Alternative Strategies Fund
BIM UK –
Benefit Street, Boussard &
Gavaudan, GSA,
LibreMax, PRCMLP, QMS
BlackRock Multi-Strategy Absolute Return Fund
BIM UK, BFM Inc. – –
BlackRock Style Advantage Fund
BIM UK, BIM LLC –
BlackRock Systematic European Equity Fund BIM UK – –BlackRock Systematic Global Equity Fund BIMLLC – –
(1) Fund terminated, see Note 1 for further details.
10. Transactions with Connected PersonsThe ultimate holding company of the Management Company, the Principal Distributor and the Investment Advisers is
BlackRock, Inc., a company incorporated in Delaware, USA. PNC Financial Services Group Inc., is a substantial shareholder in BlackRock Inc.. When arranging transactions in securities for the Company, companies in the PNC Group may have provided securities, brokerage, foreign exchange banking and other services or may have acted as principal on their usual terms and may benefit therefrom. Commission has been paid to brokers and agents in accordance with the relevant market practice and the benefit of any bulk or other commission discounts or cash commission rebates provided by brokers or agents have been passed on to the Company. The services of PNC Group companies could have been used by the Investment Advisers where it was considered appropriate to do so provided that their commissions and other terms of business are generally comparable with those available from unassociated brokers and agents in the markets concerned, and that this is consistent with the above policy of obtaining best results.
During the year, there have been no significant transactions which were outside the ordinary course of business or which were not on normal commercial terms. There were no transactions of the Company effected through BlackRock companies.
The Company has appointed BlackRock Advisors (UK) Limited, a related party to the Company, as securities lending agent. BlackRock Advisors (UK) Limited bears all operational costs directly related to securities loan transactions.
See further information in Note 16: Efficient Portfolio Management Techniques.
11. DividendsThe Directors’ current policy is to retain and reinvest all net income except for income attributable to Distributing Share Classes.
For the Distributing Share Classes, the policy is to distribute substantially all the investment income (where available) for the period after deduction of expenses (or gross income in the case of Distributing (G) Shares). The Directors may also determine if and to what extent dividends may include distributions from both net realised and net unrealised capital gains. Where Distributing Share Classes pay dividends that include net realised capital gains or net unrealised capital gains, or, in the case of Funds which distribute income gross of expenses, dividends may include initially subscribed capital. Shareholders should note that dividends distributed in this manner may be taxable as income, depending on the local tax legislation, and should seek their own professional tax advice in this regard.
Where a Fund has UK Reporting Fund status and reported income exceeds distributions made then the surplus shall be treated as a deemed dividend and will be taxed as income, subject to the tax status of the investor.
The Company may operate income equalisation arrangements with a view to ensuring that the level of net income accrued within a Fund (or gross income in the case of Distributing (G) Shares) and attributable to each Share is not affected by the

500 BlackRock Strategic Funds (BSF)
Notes to the Financial Statements continued
issue, conversion or redemption of those Shares during an accounting period.
12. Transaction costsIn order to achieve its investment objective, a Fund will incur transactions costs in relation to trading activity on its portfolio. Disclosed in the table below are separately identifiable transaction costs incurred by each Fund for the year ended 31 May 2016. These include commission costs, settlement fees and broker fees.
Fund CCYTransaction
Costs
BlackRock Americas Diversified Equity Absolute Return Fund USD –BlackRock Asia Extension Fund USD –BlackRock Emerging Markets Absolute Return Fund USD 743,419BlackRock Emerging Markets Allocation Fund USD –BlackRock Emerging Markets Equity Strategies Fund USD 33,239BlackRock Emerging Markets Flexi Dynamic Bond Fund USD 30BlackRock Euro Dynamic Diversified Growth Fund EUR 130,619BlackRock European Absolute Return Fund EUR 3,026,372BlackRock European Constrained Credit Strategies Fund (1) EUR 1,870BlackRock European Credit Strategies Fund EUR 42,178BlackRock European Diversified Equity Absolute Return Fund EUR –BlackRock European Opportunities Extension Fund EUR 473,266BlackRock European Select Strategies Fund EUR 151,798BlackRock Fixed Income Strategies Fund EUR 13,014BlackRock Global Absolute Return Bond Fund EUR 18,355BlackRock Global Event Driven Fund USD 259BlackRock Global Long/Short Equity Fund USD –BlackRock Impact World Equity Fund USD 246,904BlackRock Latin American Opportunities Fund USD 105,444BlackRock Managed Index Portfolios – Defensive EUR 1,568BlackRock Managed Index Portfolios – Growth EUR 2,189BlackRock Managed Index Portfolios – Moderate EUR 7,487BlackRock Multi-Manager Alternative Strategies Fund USD –BlackRock Multi-Strategy Absolute Return Fund EUR –BlackRock Style Advantage Fund USD –BlackRock Systematic European Equity Fund EUR 36,422BlackRock Systematic Global Equity Fund USD 240,076
(1 ) Fund terminated, see Note 1 for further details.
Not all transaction costs are separately identifiable. For fixed income investments, forward currency contracts and other derivative contracts, transaction costs will be included in the purchase and sales price of the investment. Whilst not separately identifiable these transaction costs will be captured within the performance of each Fund.
13. Credit Facility In April 2016, the Company entered into a credit facility with JPMorgan Chase Bank, N.A. (“JPMorgan”) whereby JPMorgan, together with other syndicated lenders, will make a USD 775 million credit facility available to the Funds. This credit facility will be utilised by the Funds for temporary funding purposes, including, without limitation, the funding of investor redemptions. Any interest and commitment fees in relation to drawdowns from such credit facility are borne out of the administration fee paid to the Management Company.
As at 31 May 2016 the Funds did not have any outstanding amounts from such credit facility.
14. Securities Pledged or Given in GuaranteeSecurities which are pledged as collateral or given in guarantee for OTC derivatives traded under International Swaps and Derivatives Association (“ISDA”) agreements, are individually identified in the relevant Funds’ Portfolio of Investments. As at 31 May 2016 the value of these securities amounts to USD 14,287,908.
Securities which have been received in guarantee are detailed in the table below. As at 31 May 2016 the value of these securities amounts to USD 760,998.
Fund Holdings Description Value (USD)
BlackRock Fixed Income Strategies Fund
8,000 Bundesrepublik Deutschland 2.5% 4/7/2044 12,644
BlackRock Fixed Income Strategies Fund
672,000 Deutsche Bundesrepublik Coupon Strips 4/7/2024 (Zero Coupon) 748,354
15. Cash CollateralThe Funds trade derivatives with a range of counterparties. The counterparties to the swap contracts, forward transactions, futures contracts, options written (put and call), options purchased (put and call), swaptions and contracts for difference are shown in the Portfolio of Investments.
The swap contracts, forward transactions, futures contracts, options written (put and call), options purchased (put and call) and swaptions are traded with the following counterparties: Bank of America Merrill Lynch, Bank of New York, Banque Nationale de Paris, Barclays Bank, BNP Paribas, Citibank, Commonwealth Bank of Australia, Credit Suisse, Deutsche Bank, Goldman Sachs, HSBC, JP Morgan, Morgan Stanley, Nomura International, Northern Trust Company, Royal Bank of Canada, Royal Bank of Scotland, Societe Generale, Standard Chartered Bank, State Street Bank & Trust Company, UBS and Westpac.
Cash collateral/margin is paid or received on swap contracts, futures contracts, options written (put and call), options purchased (put and call) and swaptions to cover any exposure by the counterparty to the Company or by the Company to the counterparty. Due from/to brokers on the Statement of Net Assets consists of cash collateral and margin paid/

Annual Report and Audited Accounts 501
Notes to the Financial Statements continued
received to/from the Funds’ clearing brokers and various counterparties.
16. Efficient Portfolio Management TechniquesEach of the Funds may use derivatives to hedge market and currency risk and for the purposes of efficient portfolio management. Please see further disclosures in Note 17: Financial Derivative Instruments and each Portfolio of Investments of the Funds.
The Company is entitled to appoint companies within the BlackRock Group as securities lending agent. Any such securities lending agent will have the discretion to arrange stock loans with highly rated specialist financial institutions (the “counterparties”). Such counterparties can include associates of BlackRock, Inc.. Collateral is marked to market on a daily basis and stock loans are repayable upon demand. The securities lending agent shall be entitled to receive remuneration in relation to its activities above. Such remuneration shall not exceed 37.5% of the net revenue from the activities, with all the operational costs borne out of the remuneration received by BlackRock Advisers (UK) Limited.
At 31 May 2016 the Company had securities on loan with Citigroup, HSBC, JP Morgan, Macquarie Bank Plc and UBS. Such lending may only be effected in accordance with the terms of the Prospectus.
The income earned from the securities lending program is shown in the specific Fund’s Statement of Operations and Changes in Net Assets.
The collateral received consists of securities admitted to or dealt in on a regulated market. This collateral is held by the Custodian, or its agent. Securities collateral received is not reflected in the primary financial statements.
The table below provides the value of securities on loan which are individually identified in the relevant Fund’s Portfolio of Investments and the value of collateral held. As at 31 May 2016 the total value of securities on loan is USD 76,119,574 and the market value of securities collateral received is USD 88,034,096. These are based on the closing prices of the previous day.
Fund
Values of Securities on loan
USD
Collateral Market Value
USD
BlackRock Emerging Markets Equity Strategies Fund 108,117 118,924
BlackRock Euro Dynamic Diversified Growth Fund 3,613,870 4,210,354
BlackRock European Absolute Return Fund 6,538,816 7,192,431
BlackRock European Opportunities Extension Fund 7,451,380 8,215,289
BlackRock European Select Strategies Fund 584,045 642,426
BlackRock Fixed Income Strategies Fund 53,987,364 62,765,154
Fund
Values of Securities on loan
USD
Collateral Market Value
USD
BlackRock Global Absolute Return Bond Fund 237,207 292,544
BlackRock Impact World Equity Fund 361,104 405,749
BlackRock Managed Index Portfolios – Defensive 509,687 560,635
BlackRock Multi-Strategy Absolute Return Fund 285,249 351,794
BlackRock Systematic European Equity Fund 62,252 68,475
BlackRock Systematic Global Equity Fund 2,380,483 3,210,321
17. Financial Derivative InstrumentsThe Funds may engage in derivative transactions not only for the purpose of hedging or risk management but also for investment purposes in accordance with the investment policy of the respective Fund. See further details in the specific Fund’s Portfolio of Investments.
Underlying exposure, as disclosed in the respective Portfolio of Investments, has been calculated according to the guidelines issued by the European Securities and Market Authority (“ESMA”) and represents the market value of an equivalent position in the assets underlying each financial derivative instrument. The underlying exposure on the bond futures is calculated off the market value of the bonds rather than the cheapest to deliver security.
18. Subsequent EventsA new Prospectus was issued on 22 July 2016.
In correspondence to shareholders dated 22 July 2016, the Board of Directors of the Company advised shareholders on the following updates:
} In a United Kingdom (“UK”) referendum held on 23 June 2016, the electorate of the UK resolved to leave the European Union. For further details on the impact of the results of the referendum please refer to the Investment Adviser’s Report.
} Effective 22 July 2016, BlackRock Euro Dynamic Diversified Growth Fund has changed its name to BlackRock Dynamic Diversified Growth Fund. Separately, the Fund is also changing the expected level of leverage from 120% to 500% due mainly to anticipated greater use of derivatives linked to short term interest rates. There are no changes to the investment objectives, policies, overall risk profile or how the Fund is currently managed as a result of the change to the expected leverage.
} Effective 22 July 2016, any fees arising from borrowings (including for the avoidance of doubt any commitment fee that may be due to the lender) will no longer be paid out of the administration fee paid to the Management Company, but will instead be paid out of the assets of the relevant Funds.

502 BlackRock Strategic Funds (BSF)
} Effective 22 August 2016, the legal costs associated with non-EU withholding tax reclaims will no longer be paid out of the Administration Fee, but will instead be paid out of the assets of the relevant Funds. Such costs will be allocated between the relevant Funds (plus any taxes thereon) on a fair and equitable basis and may result in an immaterial increase in the fee applied to the relevant Funds to the extent a reclaim is not successful.
} Effective 22 August 2016, the level of fees payable for each Fund to the Depositary (formerly Custodian) will range from 1 basis point to 25 basis points of assets under management for each Fund. The increase in range is being triggered by the implementation of the UCITS V Directive which increases the Depositary’s duties to the Funds.
} Effective 22 August 2016, any commitment fee associated with entering into a credit line by the Company on a short term basis for the benefit of the Funds, will no longer be paid out of the Administration Fee, but will instead be paid out of the assets of the relevant Funds. Such fee will be allocated between the relevant Funds on a pro rata basis and may result in an immaterial increase in the fees applied to the relevant Funds.
} Effective 22 August 2016, a distribution fee of 0.50% is payable on the Class E Share Class of the BlackRock Multi-Manager Alternative Strategies Fund and BlackRock Style Advantage Fund. This fee is an annual fee, calculated on the Net Asset Value of Class E and is accrued daily.
} Effective 15 September 2016, the following External Sub-Adviser will be added to the existing list of External Sub-Advisers to the BlackRock Multi-Manager Alternative Strategies Fund:
} GLG Partners LP of 1 Curzon Street, London, W1J 5HB, United Kingdom.
Effective 18 August 2016, the BlackRock UK Equity Absolute Return Fund, denominated in GBP was launched.
Effective 23 August 2016, the BlackRock Sustainable Euro Bond Fund, denominated in EUR was launched.
Effective 31 August 2016, the BlackRock Asia Pacific Absolute Return Fund, denominated in USD was launched.
19. Total Expense RatioTotal Expense Ratio (“TER”) is calculated as the total of all expenses (excluding bank interest, negative yield expense on financial assets and including expense reimbursements), divided by the average net assets of the Fund, expressed as a percentage. All data is annualised.
The Management Fee may be used in part to pay remuneration for distribution activities concerning the Fund. Reimbursement may be made to institutional investors which from a commercial perspective hold shares of the Fund for third parties.
The TER for the year from 1 June 2015 to 31 May 2016 is as follows:
Fund Name
TER (including
Performance Fee)
Performance-related Fee (as a percentage
of the average net assets)
BlackRock Americas Diversified Equity Absolute Return Fund
Class A 2.374% 0.514%
Class D 2.174% 0.809%
Class E 2.877% 0.524%
Class I 1.885% 0.822%
Class X 0.062% –
BlackRock Asia Extension Fund
Class A 1.846% –
Class D 1.354% –
Class E 2.347% –
Class X 0.061% –
BlackRock Emerging Markets Absolute Return Fund
Class A 1.955% –
Class D 1.444% –
Class E 2.469% –
Class I 1.159% –
Class X 0.046% –
BlackRock Emerging Markets Allocation Fund
Class A 1.807% –
Class C 2.802% –
Class D 1.047% –
Class E 2.308% –
Class I 0.812% –
Class X 0.068% –
BlackRock Emerging Markets Equity Strategies Fund (1)
Class A 1.906% –
Class D 1.444% –
Class E 2.418% –
Class X 0.118% –
Class Z 0.819% –
BlackRock Emerging Markets Flexi Dynamic Bond Fund
Class A 1.790% –
Class D 1.032% –
Class E 2.290% –
Class I 0.838% –
Class X 0.090% –
BlackRock Euro Dynamic Diversified Growth Fund (2)
Class A 1.651% –
Class D 1.048% –
Class E 2.152% –
Class I 0.812% –
Class X 0.164% –
BlackRock European Absolute Return Fund
Class A 2.429% 0.571%
Class D 2.147% 0.791%
Class E 3.083% 0.723%
Class I 1.846% 0.780%
BlackRock European Constrained Credit Strategies Fund (3) Class I 1.063% –
BlackRock European Credit Strategies Fund
Class H 1.726% –
Class I 1.039% –
Class T 0.989% 0.001%
Class U 1.230% –
Class X 0.034% –
Notes to the Financial Statements continued

Annual Report and Audited Accounts 503
Fund Name
TER (including
Performance Fee)
Performance-related Fee (as a percentage
of the average net assets)
BlackRock European Diversified Equity Absolute Return Fund
Class A 1.884% 0.026%
Class D 1.496% 0.140%
Class E 2.364% 0.006%
Class I 1.066% 0.003%
Class X 0.063% –
BlackRock European Opportunities Extension Fund
Class A 6.552% 4.677%
Class D 6.119% 4.741%
Class E 6.953% 4.575%
Class I 5.954% 4.870%
Class X 0.070% –
BlackRock European Select Strategies Fund (1)(2)
Class A 1.529% –
Class D 0.924% –
Class E 2.022% –
Class I 0.711% –
Class X 0.062% –
BlackRock Fixed Income Strategies Fund
Class A 1.254% –
Class D 0.854% –
Class E 1.754% –
Class I 0.661% –
Class X 0.061% –
BlackRock Global Absolute Return Bond Fund
Class A 1.257% –
Class D 0.752% –
Class E 1.757% –
Class I 0.563% –
Class X 0.062% –
BlackRock Global Event Driven Fund (1)
Class A 1.903% –
Class D 1.413% –
Class E 2.598% 0.218%
Class I 1.085% –
Class X 0.068% –
Class Z 1.190% 0.254%
BlackRock Global Long/Short Equity Fund
Class A 2.153% –
Class C 3.153% –
Class D 1.558% –
Class E 2.660% –
Class I 1.266% –
Class J 1.567% –
Class X 0.061% –
BlackRock Impact World Equity Fund (1)
Class A 1.020% –
Class D 0.604% –
Class E 1.615% –
Class I 0.467% –
Class X 0.067% –
Fund Name
TER (including
Performance Fee)
Performance-related Fee (as a percentage
of the average net assets)
BlackRock Latin American Opportunities Fund
Class A 2.551% –
Class C 3.562% –
Class D 2.209% 0.383%
BlackRock Managed Index Portfolios – Defensive (2)
Class A 1.148% –
Class D 0.520% –
Class X 0.062% –
BlackRock Managed Index Portfolios – Growth (2)
Class A 1.151% –
Class D 0.520% –
Class X 0.073% –
BlackRock Managed Index Portfolios – Moderate (2)
Class A 1.138% –
Class D 0.500% –
Class X 0.062% –
BlackRock Multi-Manager Alternative Strategies Fund (1)
Class A 2.781% –
Class D 2.111% –
Class E 2.749% –
Class I 1.689% –
Class X 0.060% –
Class Z 1.751% –
BlackRock Multi-Strategy Absolute Return Fund
Class A 1.548% –
Class D 1.057% –
Class I 0.816% –
Class X 0.064% –
BlackRock Style Advantage Fund (1)
Class A 1.835% –
Class D 1.277% –
Class E 0.001% –
Class I 0.973% –
Class X 0.069% –
Class Z 1.053% –
BlackRock Systematic European Equity Fund
Class A 1.112% –
Class D 0.732% –
Class E 1.620% –
Class X 0.073% –
BlackRock Systematic Global Equity Fund (1)
Class A 1.108% –
Class D 0.720% –
Class E 1.621% –
Class I 0.468% –
Class X 0.064% –
(1) New Fund launch, see Note 1 for further details.(2) A synthetic TER has been calculated as the total of the fund’s TER and the pro-rata TER
of the underlying target funds less any management fee rebates received.(3) Fund terminated, see Note 1 for further details.
Notes to the Financial Statements continued

504 BlackRock Strategic Funds (BSF)
Deloitte. Deloitte Audit Société à responsabilité limitée
560, rue de Neudorf L-2220 Luxembourg
B.P. 1173 L-1011 Luxembourg
Tel: +352 451 451 Fax: +352 451 452 992
www.deloitte.lu
Société à responsabilité limitée au capital de 35.000 EUR RCS Luxembourg B 67.895 N° d’autorisation d’établissement 10022179
To the Shareholders of
BlackRock Strategic Funds
REPORT OF THE REVISEUR D’ENTREPRISES AGREE
Following our appointment by the annual general meeting of the Shareholders dated 20 November 2015,
we have audited the accompanying financial statements of BlackRock Strategic Funds (the “Company”)
and of each of its sub-funds, which comprise the statement of net assets and the portfolio of investments as
at 31 May 2016 and the statement of operations and changes in net assets for the year then ended, and a
summary of significant accounting policies and other explanatory notes to the financial statements.
Responsibility of the Board of Directors of the Company for the financial statements
The Board of Directors of the Company is responsible for the preparation and fair presentation of these
financial statements in accordance with Luxembourg legal and regulatory requirements relating to the
preparation of the financial statements and for such internal control as the Board of Directors of the
Company determines is necessary to enable the preparation of financial statements that are free from
material misstatement, whether due to fraud or error.
Responsibility of the réviseur d’entreprises agréé
Our responsibility is to express an opinion on these financial statements based on our audit. We conducted
our audit in accordance with International Standards on Auditing as adopted for Luxembourg by the
Commission de Surveillance du Secteur Financier. Those standards require that we comply with ethical
requirements and plan and perform the audit to obtain reasonable assurance about whether the financial
statements are free from material misstatement.
An audit involves performing procedures to obtain audit evidence about the amounts and disclosures in the
financial statements. The procedures selected depend on the réviseur d’entreprises agréé’s judgement,
including the assessment of the risks of material misstatement of the financial statements, whether due to
fraud or error. In making those risk assessments, the réviseur d’entreprises agréé considers internal control
relevant to the entity’s preparation and fair presentation of the financial statements in order to design audit
procedures that are appropriate in the circumstances, but not for the purpose of expressing an opinion on
the effectiveness of the entity’s internal control. An audit also includes evaluating the appropriateness of

Deloitte
accounting policies used and the reasonableness of accounting estimates made by the Board of Directors of
the Company, as well as evaluating the overall presentation of the financial statements.
We believe that the audit evidence we have obtained is sufficient and appropriate to provide a basis for our
audit opinion.
Opinion
In our opinion, the financial statements give a true and fair view of the financial position of BlackRock
Strategic Funds and of each of its sub-funds as of 31 May 2016, and of the results of their operations and
changes in their net assets for the year then ended in accordance with Luxembourg legal and regulatory
requirements relating to the preparation of the financial statements .
Other matter
Supplementary information included in the annual report has been reviewed in the context of our mandate
but has not been subject to specific audit procedures carried out in accordance with the standards described
above. Consequently, we express no opinion on such information. However, we have no observation to
make concerning such information in the context of the financial statements taken as a whole.
Luxembourg, 28 September 2016
Socie1e a responsabihte fimilee au capital de 35.000 EUR RCS lu>iembourg 8 67 .895 W d'autorisat1on d'etablissement 10022179
Annual Report and Audited Accounts 505

506 BlackRock Strategic Funds (BSF)
General Information
Current ProspectusThe Company’s Prospectus dated 20 January 2016 and the latest KIIDs along with copies of the Application Form may be obtained from the local Investor Servicing team, the Manager or any of the Representatives or Distributors. Copies of the Company’s Articles of Association and the Audited Annual and Unaudited Interim Report and Accounts may also be obtained free of charge from any of these offices and from the Paying Agents. All these documents are also available from www.blackrockinternational.com.
RepresentativesThe representative in Poland is Dubinski Fabrycki Jelenski, ul. Zielna 37, 00-108 Warsaw, Poland.
The representative in Switzerland is BlackRock Asset Management Switzerland Limited, Bahnhofstrasse 39, 8001 Zurich, Switzerland.
Portfolio of InvestmentsEquities are primarily classified by the country of incorporation of the entity in which the Fund holds shares.
Corporate and government fixed and variable income securities are primarily classified by the country of incorporation of the issuer.
Liquidity instruments are primarily classified by the country of issuer of the liquidity instruments.
Collective Investment Schemes (“CIS”) and Exchange Traded Funds (“ETF”) are primarily classified by the country of domicile of the CIS or ETF.
Purchases and SalesA detailed list of investments purchased and sold for any Fund during the year is available upon request, free of charge, from the Registered office, or the offices of the Representatives as mentioned above.
Authorised StatusThe Company is a UCITS under the part I of the Luxembourg Law of 17 December 2010, as amended. Regulatory consents have been obtained or appropriate notifications have been made for the distribution of shares of the Company’s Funds in the umbrella in the following countries: Austria, Belgium, Chile, Czech Republic, Denmark, Finland, France, Germany, Greece, Hungary, Ireland, Italy, Jersey, Luxembourg, Netherlands, Norway, Poland, Portugal, Slovakia Republic, Spain, Sweden, Switzerland and the United Kingdom.
Shares of certain of the Company’s Funds may also be offered in Singapore by private placement.
Paying AgentsAustriaRaiffeisen Bank International AGAm Stadtpark 91030 ViennaAustria
BelgiumJ.P. Morgan Chase BankBrussels Branch1 Boulevard du Roi Albert IIBrusselsB-1210 Belgium
Czech RepublicUniCredit Bank Czech Republic and Slovakia a.s.Prague 4 – Michle, Želetavská 1525/1Postcal Code 140 92Czech Republic
FranceCACEIS Bank11 Place Valhubert, 75013 Paris, France
ItalyAllfunds Bank, S.A.Milan branchVia Santa Margherita 720121 MilanItaly
BNP Paribas Securities ServicesSuccursale di MilanoVia Ansperto 520123 MilanItaly

Annual Report and Audited Accounts 507
General Information continued
Societe Generale Securities Services S.p.A.Via Benigno Crespi19/A, MAC II20159 MilanItaly
Italy (continued)Banca Monte dei Paschi di Siena S.p.A.Piazza Salimbeni 353100 SienaItaly
State Street Bank S.p.A.Via Ferrante Aporti 1020125 MilanItaly
Banca Sella Holding S.p.A.Piazza Gaudenzio Sella 113900 Biella (BI) Italy
Luxembourg (Central Paying Agent) J.P. Morgan Bank Luxembourg S.A.6C, route de TrèvesL-2633, SenningerbergLuxembourg
SwitzerlandUntil 15 February 2016:JP Morgan Chase BankNational AssociationColumbusZurich BranchDreikönigstrasse 21CH-8002 ZurichSwitzerland
As from 15 February 2016:State Street Bank GmbH,Munich, Zurich branch Beethovenstrasse 19, CH-8027 Zurich,Switzerland
With effect from 28 April 2016 State Street Bank GmbH changed name to State Street Bank International GmbH.
United KingdomJ.P. Morgan Trustee and Depositary Company LimitedHampshire Building, 1st FloorChasesideBournemouth BH7 7DA, UK
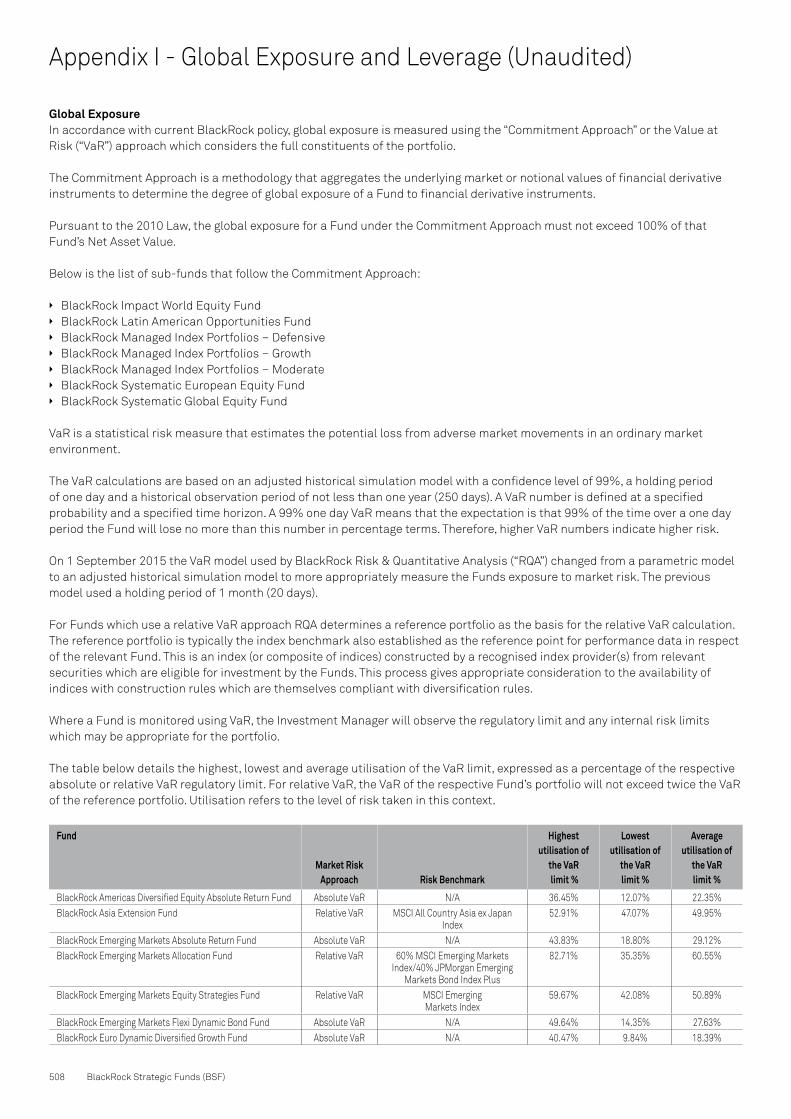
508 BlackRock Strategic Funds (BSF)
Appendix I - Global Exposure and Leverage (Unaudited)
Global ExposureIn accordance with current BlackRock policy, global exposure is measured using the “Commitment Approach” or the Value at Risk (“VaR”) approach which considers the full constituents of the portfolio.
The Commitment Approach is a methodology that aggregates the underlying market or notional values of financial derivative instruments to determine the degree of global exposure of a Fund to financial derivative instruments.
Pursuant to the 2010 Law, the global exposure for a Fund under the Commitment Approach must not exceed 100% of that Fund’s Net Asset Value.
Below is the list of sub-funds that follow the Commitment Approach:
} BlackRock Impact World Equity Fund} BlackRock Latin American Opportunities Fund} BlackRock Managed Index Portfolios – Defensive} BlackRock Managed Index Portfolios – Growth} BlackRock Managed Index Portfolios – Moderate} BlackRock Systematic European Equity Fund} BlackRock Systematic Global Equity Fund
VaR is a statistical risk measure that estimates the potential loss from adverse market movements in an ordinary market environment.
The VaR calculations are based on an adjusted historical simulation model with a confidence level of 99%, a holding period of one day and a historical observation period of not less than one year (250 days). A VaR number is defined at a specified probability and a specified time horizon. A 99% one day VaR means that the expectation is that 99% of the time over a one day period the Fund will lose no more than this number in percentage terms. Therefore, higher VaR numbers indicate higher risk.
On 1 September 2015 the VaR model used by BlackRock Risk & Quantitative Analysis (“RQA”) changed from a parametric model to an adjusted historical simulation model to more appropriately measure the Funds exposure to market risk. The previous model used a holding period of 1 month (20 days).
For Funds which use a relative VaR approach RQA determines a reference portfolio as the basis for the relative VaR calculation. The reference portfolio is typically the index benchmark also established as the reference point for performance data in respect of the relevant Fund. This is an index (or composite of indices) constructed by a recognised index provider(s) from relevant securities which are eligible for investment by the Funds. This process gives appropriate consideration to the availability of indices with construction rules which are themselves compliant with diversification rules.
Where a Fund is monitored using VaR, the Investment Manager will observe the regulatory limit and any internal risk limits which may be appropriate for the portfolio.
The table below details the highest, lowest and average utilisation of the VaR limit, expressed as a percentage of the respective absolute or relative VaR regulatory limit. For relative VaR, the VaR of the respective Fund’s portfolio will not exceed twice the VaR of the reference portfolio. Utilisation refers to the level of risk taken in this context.
Fund
Market Risk Approach Risk Benchmark
Highest utilisation of
the VaR limit %
Lowest utilisation of
the VaR limit %
Average utilisation of
the VaR limit %
BlackRock Americas Diversified Equity Absolute Return Fund Absolute VaR N/A 36.45% 12.07% 22.35%BlackRock Asia Extension Fund Relative VaR MSCI All Country Asia ex Japan
Index52.91% 47.07% 49.95%
BlackRock Emerging Markets Absolute Return Fund Absolute VaR N/A 43.83% 18.80% 29.12%BlackRock Emerging Markets Allocation Fund Relative VaR 60% MSCI Emerging Markets
Index/40% JPMorgan Emerging Markets Bond Index Plus
82.71% 35.35% 60.55%
BlackRock Emerging Markets Equity Strategies Fund Relative VaR MSCI Emerging Markets Index
59.67% 42.08% 50.89%
BlackRock Emerging Markets Flexi Dynamic Bond Fund Absolute VaR N/A 49.64% 14.35% 27.63%BlackRock Euro Dynamic Diversified Growth Fund Absolute VaR N/A 40.47% 9.84% 18.39%

Annual Report and Audited Accounts 509
Fund
Market Risk Approach Risk Benchmark
Highest utilisation of
the VaR limit %
Lowest utilisation of
the VaR limit %
Average utilisation of
the VaR limit %
BlackRock European Absolute Return Fund Absolute VaR N/A 20.12% 6.85% 12.86%BlackRock European Constrained Credit Strategies Fund (1) Absolute VaR N/A N/A N/A N/A BlackRock European Credit Strategies Fund Absolute VaR N/A 26.61% 5.81% 15.21%BlackRock European Diversified Equity Absolute Return Fund Absolute VaR N/A 30.19% 14.70% 21.77%BlackRock European Opportunities Extension Fund Relative VaR S&P Europe BMI Index 56.74% 41.95% 47.35%BlackRock European Select Strategies Fund Relative VaR 75% Barclays Pan European
Aggregate Index (Hedged EUR)/ 25% MSCI Europe Index (Hedged EUR)
62.24% 39.69% 51.60%
BlackRock Fixed Income Strategies Fund Absolute VaR N/A 12.75% 2.68% 5.48%BlackRock Global Absolute Return Bond Fund Absolute VaR N/A 8.94% 2.25% 5.04%BlackRock Global Event Driven Fund Absolute VaR N/A 61.05% 16.85% 38.73%BlackRock Global Long/Short Equity Fund Absolute VaR N/A 20.12% 9.85% 13.15%BlackRock Multi-Manager Alternative Strategies Fund Absolute VaR N/A 14.47% 5.37% 8.62%BlackRock Multi-Strategy Absolute Return Fund Absolute VaR N/A 17.44% 7.00% 9.88%BlackRock Style Advantage Fund Absolute VaR N/A 18.92% 5.16% 13.23%
(1) As the Fund was liquidated on 30 November 2015, no statistical data has been calculated.
LeverageThe use of derivatives may expose Funds to a higher degree of risk. In particular, derivative contracts can be highly volatile, and the amount of initial margin is generally small relative to the size of the contract so that transactions may be leveraged in terms of market exposure. A relatively small market movement may have a potentially larger impact on derivatives than on standard bonds or equities. Leveraged derivative positions can therefore increase Funds volatility.
The leverage is calculated on a gross exposure basis, by taking the sum of the notional values of the derivatives used by a Fund, without netting, and is expressed as a percentage of the NAV.
Disclosed in the table below is the level of leverage employed during the year.
FundAverage leverage
employed during the year
BlackRock Americas Diversified Equity Absolute Return Fund 581.36%
BlackRock Asia Extension Fund 152.44%
BlackRock Emerging Markets Absolute Return Fund 83.73%
BlackRock Emerging Markets Allocation Fund 213.06%
BlackRock Emerging Markets Equity Strategies Fund 24.07%
BlackRock Emerging Markets Flexi Dynamic Bond Fund 600.40%
BlackRock Euro Dynamic Diversified Growth Fund 308.38%
BlackRock European Absolute Return Fund 61.71%
BlackRock European Constrained Credit Strategies Fund (1) N/A
BlackRock European Credit Strategies Fund 275.48%
BlackRock European Diversified Equity Absolute Return Fund 583.11%
BlackRock European Opportunities Extension Fund 121.28%
BlackRock European Select Strategies Fund 115.05%
BlackRock Fixed Income Strategies Fund 279.23%
BlackRock Global Absolute Return Bond Fund 713.98%
BlackRock Global Event Driven Fund 141.17%
BlackRock Global Long/Short Equity Fund 213.56%
BlackRock Multi-Manager Alternative Strategies Fund 311.75%
BlackRock Multi-Strategy Absolute Return Fund 629.24%
BlackRock Style Advantage Fund 798.93%
(1) As the Fund was liquidated on 30 November 2015, no statistical data has been calculated
Appendix I - Global Exposure and Leverage (Unaudited) continued


© 2016 BlackRock, Inc. All Rights reserved. BLACKROCK, BLACKROCK SOLUTIONS, iSHARES, SO WHAT DO I DO WITH MY MONEY, INVESTING FOR A NEW WORLD, and BUILT FOR THESE TIMES are registered and unregistered trademarks of BlackRock, Inc. or its subsidiaries in the United States and elsewhere. All other trademarks are those of their respective owners.
Want to know more?
+44 (0)20 7743 3300 blackrockinternational.com 31 MAY 2016